Embed Size (px)
Citation preview

Contrasts in Cancer Prevalence in Connecticut, lowa,and Utah
Andrea Micheli, Ph.D.1
Rosemary Yancik, Ph.D.2
Vittorio Krogh, M.D, M.S.1
Arduino Verdecchia, Ph.D.3
Milena Sant, M.D.1
Riccardo Capocaccia, Ph.D.3
Franco Berrino, M.D.1
Lynn Ries, M.S.4
1 Unita di Epidemiologia, Istituto Nazionale per loStudio e la Cura dei Tumori, Milan, Italy.
2 National Institutes of Aging, Bethesda, Maryland.
3 Laboratorio di Epidemiologia e Biostatistica, Isti-tuto Superiore di Sanita, Rome, Italy.
4 National Cancer Institute, Cancer StatisticsBranch, SEER Program, Bethesda, Maryland.
This study was supported by an NIA ProfessionalService Contract and by the Italian Ministry ofHealth Contract RF 97.1ICS030.1.
The authors thank Dr. Silvia Francisci and Dr. ErikaMassimiliani for helping with the statistical analy-sis and D.C. Ward for reviewing the manuscript.
This study was produced as part of a continuingcollaboration between U.S. and European cancerregistry networks that began in 1997 and initiallyfocused on selected cancers in the elderly. Theagencies involved are the National Institute onAging. National Institutes of Health (NIH), Be-thesda, MD; National Cancer Institute, NIH, Be-thesda, MD; Istituto Nazionale per lo Studio e laCura dei Tumori, Milan, Italy; and Istituto SuperioreSanita, Rome, Italy.
Address for reprints: Andrea Micheli, Ph.D., Unitadi Epidemiologia, Istituto Nazionale per lo Studio ela Cura dei Tumori, via Venezian 1, 20133 Milan,Italy; Fax: 011-39-02-2668-1292; E-mail:[email protected]
Received September 20, 2001; revision receivedJanuary 25, 2002; accepted February 4, 2002.
BACKGROUND. Cancer prevalence—the proportion of a population with cancer,
including those recently diagnosed, those in treatment, and survivors—is an im-
portant indicator of future health care requirements. Only limited information on
cancer prevalence is available for the United States. In particular, comparative
interstate studies are not available. In this study, we estimate and analyze the
prevalence of seven major cancers in Connecticut, lowa, and Utah using the tried
and tested PREVAL method applied to National Cancer Institute registry data.
METHODS. We analyzed data on 242,851 carcinomas of the stomach, colorectum,
pancreas, breast, uterus (corpus), ovary, and non-Hodgkin lymphoma (NHL),
diagnosed in white Americans from 1973 through 1992. Observed prevalence was
estimated by applying the PREVAL method to incidence and life status data from
the cancer registries. Complete prevalence was estimated by applying correction
factors obtained by modeling incidence and survival rates.
RESULTS. The ratio of the highest to the lowest prevalence (as proportions) ranged
from 1.69 for uterine carcinoma to 2.73 for stomach carcinoma, showing that
marked differences in cancer prevalence exist within the United States. Utah had
the lowest prevalence for each carcinoma. Connecticut and lowa had similar
prevalence levels for carcinomas of the colorectum, pancreas, and ovary and for
NHL. Breast carcinoma was the most prevalent, with 826 cases per 100,000 of
population in Utah, 1518 per 100,000 in lowa, and 1619 per 100,000 in Connecticut.
Cancer survival did not differ greatly among the three registry populations. The
major determinants of prevalence differences were incidence and the population
age distribution.
CONCLUSIONS. PREVAL provides reliable estimates of the numbers of living people
in a population who have had a cancer diagnosis. Prevalence depends on incidence
and survival and on the age structure of population. All these factors have changed
markedly in recent years and will continue to do so in the future. Cancer preva-
lence should be monitored over time to evaluate changes by area, sex, age, and
cancer site. The prevalence figures presented are directly comparable with those
from European cancer registries. Cancer 2002;95:430 –9.
© 2002 American Cancer Society.
DOI 10.1002/cncr.10675
KEYWORDS: cancer prevalence, stomach carcinoma, colorectal carcinoma, pancre-atic carcinoma, breast carcinoma, carcinoma of the corpus uteri, ovarian carci-noma, non-Hodgkin lymphoma.
Cancer prevalence is an indicator of public health status that isbecoming increasingly important, particularly as the proportion
of older people in the population rises. By 2030, one in five Americanswill be 65 years or older.1 Currently, 60% of all cancers and 69% of allcancer deaths occur in this age group.2 This, combined with the factthat most older cancer patients have one or more additional health
430
© 2002 American Cancer Society

problems, renders the public health challenge posedby this age group considerably more urgent.3,4
The prevalence of cancer reflects both incidenceand survival. Prevalent cases include recently diag-nosed patients, those in treatment, and survivors,some of whom may be considered cured.
Following primary treatment, cancer survivorscontinue to require health care. In the short-term, thiswill be adjuvant therapy and follow-up. Later, cancersurvivors should be monitored for cancer recurrenceand concurrent health problems. Long-term cancersurvivors require surveillance for late effects of treat-ment, cancer recurrence, or a second primary tumor.5
Cancer survivors are expected to have long-termhealth services needs, which will vary with time sincetreatment.
Accurate knowledge of cancer prevalence on aregional basis can assist in planning the managementof these diseases by public health authorities. Unfor-tunately, cancer prevalence data are scarce and in-complete because of lack of adequate measurementmethods. Direct survey involving interviews of per-sons (usually in population-based samples) is one ap-proach. However, there are various difficulties withthis method. For example, cancer is a relatively raredisease, the self-reported information might be sub-ject to biases (e.g., difficulties in distinguishing be-tween invasive and in situ breast carcinoma), andinterviewing is costly. Existing cancer mortality andsurvival data can be used to calculate cancer preva-lence using sophisticated statistical/mathematicalmodels.6,7 This we define as the indirect approach toprevalence estimation. We define the direct approachas the direct calculation of cancer prevalence from theincidence and life-status data available from popula-tion-based cancer registries that have been estab-lished long enough so that essentially all survivingcases are registered.
Various direct approaches have been employed inthe United States8,9 and Europe10,11 to determine can-cer prevalence in areas covered by cancer registration.The PREVAL software has been developed to calculatedirectly cancer prevalence by age, time since diagno-sis, and period of diagnosis from available cancer reg-istry data.12,13 Use of this method, combined with anew set of routines to estimate prevalence from cancerregistry data covering a relatively brief registrationperiod,14,15 makes it possible to study and compareprevalence data on a large scale from different areasemploying a uniform methodologic approach. Work isongoing that aims to provide prevalence data by thesemethods for much of Europe16 using cancer registryincidence data up to 1992.17
The current study presents the results obtained by
applying the PREVAL method to U.S. data, specificallyto the cancer registries of Connecticut, lowa, andUtah, participants in the National Cancer Institute’sSurveillance, Epidemiology, and End Results (SEER)program since its inception in 1973. These results aredirectly comparable to those from European cancerregistries.16
MATERIALS AND METHODSThe Connecticut registry, one of the oldest cancerregistries in the world, has been the object of previousprevalence studies.8,9 The lowa and Utah registrieswere selected because of their statewide coverage andhigh-quality registration. The registries cover about2.9, 2.7, and 1.7 million people, respectively (Table 1).The populations of Connecticut and lowa had similarage distributions with 14 –15% of the population being65 years or older. The population of Utah was youngerwith only 9% being 65 years or older (Fig. 1). Much ofConnecticut is urbanized. lowa is predominantly rural.The population of Utah outside Salt Lake City is alsomainly rural. Members of the Mormon sect form asignificant proportion of the population of Utah andare characterized by a distinct lifestyle and diet. In allthree states, the population is predominantly white.
Data on 242,871 white male and female cancerpatients diagnosed in the period 1973–1992 were an-alyzed (Table 1). Seven cancer sites were selected:stomach, colorectum, pancreas, breast (female only),corpus uteri, ovary, and non-Hodgkin lymphoma(NHL). The SEER primary site and histology codes(based on the International Classification of Diseasesfor Oncology [ICD-0], 2nd edition) were converted tothe codes of the International Classification of Dis-eases, ICD-9.18 We chose cancer sites that principallyaffect the elderly and are therefore of major interestfor planning and allocating health care resources. Forindividuals diagnosed with multiple primary tumors,bilateral cancers of paired organs, and subsequentcancers of the same type as the index cancer, only thefirst cancer was considered. To preserve patient ano-nymity, the day and month of birth of individuals andthe day of diagnosis are not available in the databases.For the purposes of the analysis, events were assumedto have occurred on the 15th day of the month. Themonth of birth was estimated using available informa-tion on age at diagnosis and date of diagnosis. For afew patients (generally less than 1% of patients), themonth of diagnosis was not known, so the event wasattributed to June of the year of diagnosis. All patientsregistered were checked for life status at least throughDecember 31, 1992. Less than 2.6% of patients in lowa,2.2– 6.1% in Utah, and 3.7– 8.7% in Connecticut werelost to follow-up (Table 1). Patients are lost to fol-
Cancer prevalence in CT, IA, UT/Micheli et al. 431

low-up if they are known to be alive on a date beforeDecember 31 1992, but their life status was unknownon December 31, 1992.
The PREVAL approach12 to prevalence estimationemploys a matrix of three dimensions that considersage (years) (i ), calendar year (year) ( j ), and years fromdiagnosis (interval) (k). Each cancer patient is countedas an element of the cell Xi, j, k if he/she has survivedfor k years and belongs to the cohort of patients diag-nosed at age i-k in the calendar year j-k. For eachcalendar year, the method updates X and counts thetotal number of patients alive in each cell belonging toeach cohort. This produces the prevalence by calendaryear, age at the chosen day, and time since diagnosis.Importantly, the method incorporates an adjustmentto take account of the effect of patient loss duringfollow-up. This adjustment assumes that lost patientshave the same probability of surviving as those notlost (i.e., patients diagnosed in the same year andhaving the same age).
To implement this correction to the i, j, k cell(which contains the cohort of patients who survivedfor k years and were diagnosed at age i-k in the cal-endar year j-k, i.e., Ak), the following formula is ap-plied:
Ek � Ak � �m�0
k
Lm �s�m
k As
As � Ds(1)
Where, for the cohort being considered, Ds is the num-ber of patients who died s years from diagnosis and Lm
is the number of patients lost to follow-up at a given myear from diagnosis. Using this formula, the intervalsurvival probability (As/(As � Ds)) is applied to lost-to-follow-up cases. Ek is the expected number of patientsdiagnosed at age i and alive at the end of year j, takinginto account the survival of those lost to follow-up.This formula implies a highly precise adjustment spe-cific for the year of age and calendar year being con-sidered. However, if in a particular cell, only a lost-to-follow-up case is present, then no adjustment isperformed for that particular case. We calculated the20-year prevalence at December 31, 1992, i.e., thenumber of patients estimated to be alive on that dateamong those diagnosed with cancer over the previous20 years. To determine the total prevalence in a pop-ulation (i.e., all persons alive with a past diagnosis ofcancer in a population) from cancer registry data, it isnecessary to have a very long period of incidenceobservation (theoretically, as long as the maximumpossible time a person can survive after cancer diag-nosis). However, by modeling age-specific incidenceand relative survival rates, we estimated the propor-TA
BLE
1Ca
ncer
Case
sIn
clud
edin
the
Stud
y,by
Regi
stry
:Inc
iden
cePe
riod
1973
–199
2
Regi
stry
Popu
latio
nco
vere
d(th
ousa
nds)
m�
f
Canc
ersit
e(IC
D-9
code
)
Stom
ach
(151
.0-1
51.9
)Co
lore
ctum
(153
.0-1
54.1
,159
.0)
Panc
reas
(157
.0-1
57.9
)Br
east
(174
.0-1
74.9
)Co
rpus
uter
i(1
82.0
-182
.8)
Ovar
y(1
83)
Non-
Hod
gkin
lym
phom
a(2
00.0
-200
.8,2
02.0
-20
2.2,
202.
8-20
9.9)
No.o
fm
�f
Lost
(%)a
DCOb
No.o
fm
�f
Lost
(%)a
DCOb
No.o
fm
�f
Lost
(%)a
DCOb
Noof
fLo
st(%
)a
DCOb
No.o
ff
Lost
(%)a
DCOb
No.o
ff
Lost
(%)a
DCOb
No.o
fm
�f
Lost
(%)a
DCOb
mf
mf
mf
ff
fm
f
Conn
ectic
ut29
2564
453.
71
239
,092
4.6
11
6812
6.4
48
37,6
257.
441
8647
8.7
052
386.
72
8530
5.9
01
Iow
a27
2043
952.
11
137
,202
1.2
11
6254
2.6
23
32,2
071.
21
8172
1.2
050
391.
51
8581
1.7
11
Uta
h17
3213
823.
30
18,
166
2.5
00
1667
6.1
11
10,1
992.
20
2892
3.2
016
253.
80
2701
3.4
01
ICD-
9:In
tern
atio
nalC
lass
ifica
tion
ofDi
seas
es.
aPe
rcen
tage
ofin
ciden
tcas
es(m
ales
�fe
mal
es)l
ostt
ofo
llow-
up.
bPr
opor
tion
(%)o
fcas
eskn
own
byde
ath
certi
ficat
eon
ly(D
CO),
1988
–199
2pe
riod.
17
432 CANCER July 15, 2002 / Volume 95 / Number 2

tion of the total prevalent cases that were recorded bya registry during its observation period.14 This propor-tion, called the completeness index, R, varies withregistry observation, patient age, patient sex, and can-cer site, Site, age, sex, and length of follow-up–specificvalues of R were estimated from the pool of SEERregistries19 and then applied to the area-specific 20-year observed prevalence.
Other indices were calculated to provide referencepoints to help explain the prevalence figures. To pro-vide measures of trends over time, we calculated theyearly mean percentage change in the 10-year preva-lence and the estimated annual percentage change inincidence rates over the 5-year period 1988 –1992. Forcomparison between states, we calculated incidencerates and ratios of the prevalence proportions for eachcancer site. We also estimated the relative risk (RR) ofdying of cancer in the 5 years after diagnosis, which isan easily intelligible measure of survival differences. Inthese comparisons, Connecticut was the referenceregistry. For prevalence, crude data were most useful.In addition, age-standardized prevalence figures werealso provided using both the U.S. and the world stan-dard population (the latter for international compari-son purposes.16 The incidence and survival data usedfor calculating prevalence during the period 1973–1992 for the three cancer registries were extractedfrom the SEER public-use CD-ROM,20 which was theunique source of individual data. The SEER*STAT pro-cedure for calculating relative survival rates was todivide the observed survival by the expected survivalof the general U.S. population, matched by age, sex,and period of time period.
Definition of TermsTotal prevalence refers to all persons in a populationdiagnosed in the past and alive at some reference date
after diagnosis (in this case, December 31, 1992). The2-year, 5-year, and 20-year prevalence data are frac-tions of the total prevalence and refer to all survivingcases diagnosed, respectively, in the 2, 5, and 20 yearspreceding the reference date. The observed preva-lence refers to the figures produced by applying PRE-VAL directly to cancer registry data without using theR completeness index. The total prevalence is thatobtained applying R to the observed prevalence.
RESULTSFigure 2 compares prevalence curves by age group inthe three registries for both sexes combined. Table 2shows the estimated total prevalence, as well as the 2,5, and 20-year prevalence. Tables 3 and 4 show worldage-standardized prevalence in relation to incidenceand survival for females and males, respectively.
Stomach and Colorectal CarcinomasFor stomach carcinoma, Utah and lowa shared thesame pattern of prevalence by age. In Connecticut,prevalence rose much more steeply with increasingage (Fig. 2). The prevalence of stomach carcinoma wasmuch higher in Connecticut than in the other tworegistries and was lowest in Utah (Table 2). The 2-yearprevalence was 33% of the total prevalence in Con-necticut (10 of 30 per 100,000) and 45% of the totalprevalence in Utah. When the data were corrected forthe age distribution of the populations (both worldand U.S. age standardized), the greater prevalence ofstomach carcinoma in Connecticut remained. Thiswas because Connecticut had the highest levels ofboth incidence and survival for this cancer (Table 3). Itis expected that the large between-registry differencesin stomach carcinoma prevalence will decline in thefuture because the incidence of stomach carcinoma inthe three registry populations seemed to be converg-
FIGURE 1. Populations of Connecticut,
Iowa, and Utah in 1992 by age class (%).
Cancer prevalence in CT, IA, UT/Micheli et al. 433

FIGURE 2. Total prevalence in 1992 of selected cancers by age, in Connecticut, Iowa, and Utah.
434 CANCER July 15, 2002 / Volume 95 / Number 2

ing, although in different ways, for males and females(compare Tables 3 and 4).
The pattern for colorectal carcinoma differedfrom that for stomach carcinoma. The prevalencecurves by age were similar for Connecticut and lowa,but the prevalence curve for Utah increased lesssteeply with age (Fig. 2). The overall colorectal carci-noma prevalence figures for lowa and Connecticutwere also similar, and more than double those ofUtah, for males and females combined (Table 2). InConnecticut, the incidence of colorectal carcinoma infemales was declining, as was the prevalence, al-though at a slower rate.
Carcinoma of the PancreasFor this tumor, which has a very poor prognosis, thepattern was different again. Prevalence by age in-creased at similar rates in all three registries (Fig. 2).The 2-year prevalence ranged from 64% of the total in
lowa to 80% in Utah (Table 2). The total prevalence forthis cancer was low everywhere, but was lowest inUtah (Table 2). However, the age-adjusted prevalencefigures for this cancer were similar (Tables 3 and 4).
Breast, Corpus Uteri, and Ovarian CarcinomasBreast carcinoma prevalence by age increased moresteeply in Connecticut and lowa than in Utah (Fig. 2).The pattern resembled that for colorectal carcinoma.Total prevalence was approximately the same in Con-necticut and lowa and about double that in Utah(Table 2). After age adjustment, the prevalence differ-ences were reduced, but the rank of the registries didnot change, with highest prevalence in Connecticut(Table 3). Trend calculations indicated that 10-yearprevalence was increasing 2.6 – 4.2% per year over the5 years considered (1988 –1992; Table 3). The 2-yearprevalence ranged from 154 per 100,000 in Utah to 282per 100,000 in Connecticut (Table 2).
TABLE 2Cancer Prevalencea per 100,000 by Years from Diagnosis, all ages
Cancer registry
Yrs from diagnosis
Up to 2 yrs Up to 5 yrs Up to 20 yrs Totalb
Stomachc
Connecticut 10 16 27 30Iowa 8 11 17 19Utah 5 6 10 11
Colorectumc
Connecticut 103 215 456 513Iowa 109 228 476 538Utah 45 90 182 203
Pancreasc
Connecticut 7 8 10 10Iowa 7 9 11 11Utah 4 4 5 5
Breast (women)Connecticut 282 639 1386 1619Iowa 259 582 1285 1518Utah 154 337 716 826
Corpus uteriConnecticut 60 122 351 474Iowa 52 116 367 501Utah 37 78 220 297
OvaryConnecticut 25 48 102 149Iowa 24 47 109 160Utah 17 29 66 94
Non-Hodgkin lymphomac
Connecticut 29 58 107 118Iowa 30 59 108 121Utah 18 35 63 69
a Prevalence at December 31, 1992.b Estimated using the correction factor.19
c Males and females combined.
Cancer prevalence in CT, IA, UT/Micheli et al. 435
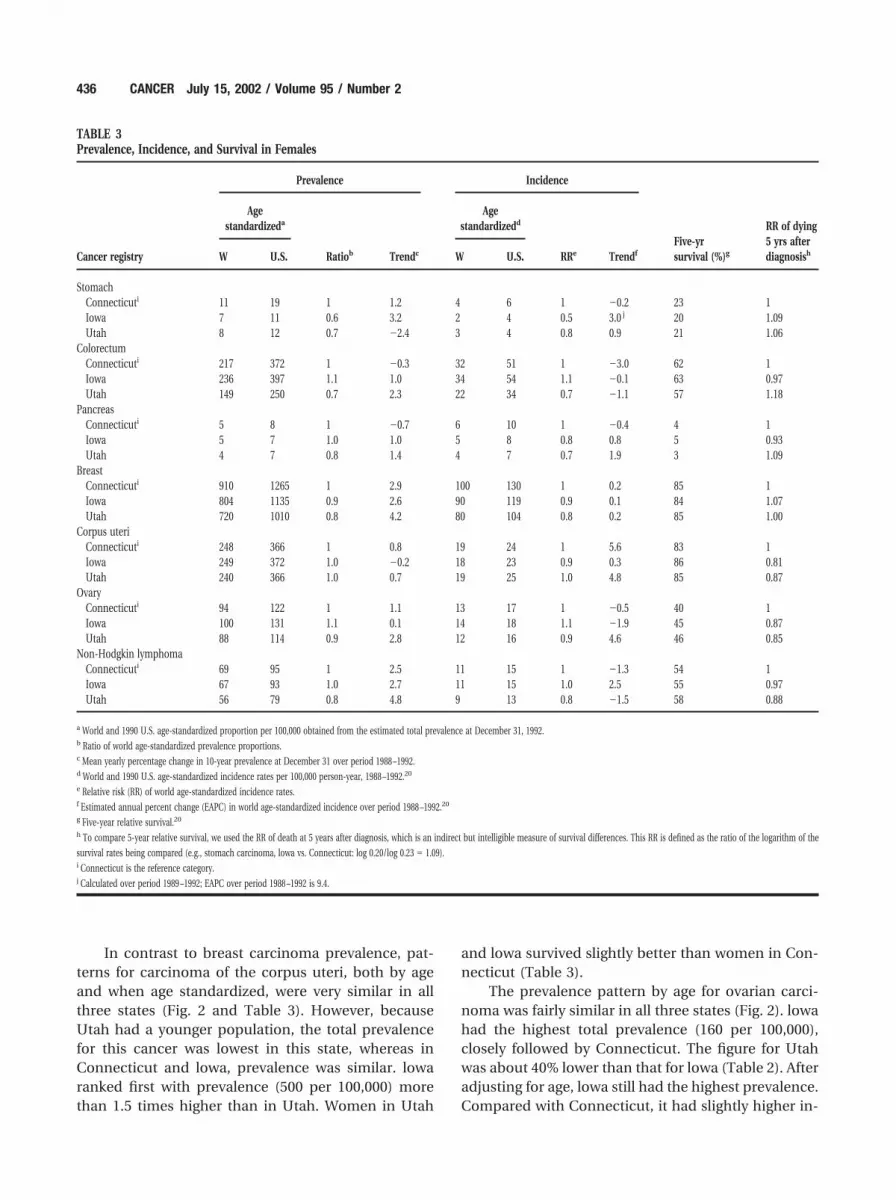
In contrast to breast carcinoma prevalence, pat-terns for carcinoma of the corpus uteri, both by ageand when age standardized, were very similar in allthree states (Fig. 2 and Table 3). However, becauseUtah had a younger population, the total prevalencefor this cancer was lowest in this state, whereas inConnecticut and lowa, prevalence was similar. lowaranked first with prevalence (500 per 100,000) morethan 1.5 times higher than in Utah. Women in Utah
and lowa survived slightly better than women in Con-necticut (Table 3).
The prevalence pattern by age for ovarian carci-noma was fairly similar in all three states (Fig. 2). lowahad the highest total prevalence (160 per 100,000),closely followed by Connecticut. The figure for Utahwas about 40% lower than that for lowa (Table 2). Afteradjusting for age, lowa still had the highest prevalence.Compared with Connecticut, it had slightly higher in-
TABLE 3Prevalence, Incidence, and Survival in Females
Cancer registry
Prevalence Incidence
Five-yrsurvival (%)g
RR of dying5 yrs afterdiagnosish
Agestandardizeda
Ratiob Trendc
Agestandardizedd
RRe TrendfW U.S. W U.S.
StomachConnecticuti 11 19 1 1.2 4 6 1 �0.2 23 1Iowa 7 11 0.6 3.2 2 4 0.5 3.0 j 20 1.09Utah 8 12 0.7 �2.4 3 4 0.8 0.9 21 1.06
ColorectumConnecticuti 217 372 1 �0.3 32 51 1 �3.0 62 1Iowa 236 397 1.1 1.0 34 54 1.1 �0.1 63 0.97Utah 149 250 0.7 2.3 22 34 0.7 �1.1 57 1.18
PancreasConnecticuti 5 8 1 �0.7 6 10 1 �0.4 4 1Iowa 5 7 1.0 1.0 5 8 0.8 0.8 5 0.93Utah 4 7 0.8 1.4 4 7 0.7 1.9 3 1.09
BreastConnecticuti 910 1265 1 2.9 100 130 1 0.2 85 1Iowa 804 1135 0.9 2.6 90 119 0.9 0.1 84 1.07Utah 720 1010 0.8 4.2 80 104 0.8 0.2 85 1.00
Corpus uteriConnecticuti 248 366 1 0.8 19 24 1 5.6 83 1Iowa 249 372 1.0 �0.2 18 23 0.9 0.3 86 0.81Utah 240 366 1.0 0.7 19 25 1.0 4.8 85 0.87
OvaryConnecticuti 94 122 1 1.1 13 17 1 �0.5 40 1Iowa 100 131 1.1 0.1 14 18 1.1 �1.9 45 0.87Utah 88 114 0.9 2.8 12 16 0.9 4.6 46 0.85
Non-Hodgkin lymphomaConnecticuti 69 95 1 2.5 11 15 1 �1.3 54 1Iowa 67 93 1.0 2.7 11 15 1.0 2.5 55 0.97Utah 56 79 0.8 4.8 9 13 0.8 �1.5 58 0.88
a World and 1990 U.S. age-standardized proportion per 100,000 obtained from the estimated total prevalence at December 31, 1992.b Ratio of world age-standardized prevalence proportions.c Mean yearly percentage change in 10-year prevalence at December 31 over period 1988 –1992.d World and 1990 U.S. age-standardized incidence rates per 100,000 person-year, 1988 –1992.20
e Relative risk (RR) of world age-standardized incidence rates.f Estimated annual percent change (EAPC) in world age-standardized incidence over period 1988 –1992.20
g Five-year relative survival.20
h To compare 5-year relative survival, we used the RR of death at 5 years after diagnosis, which is an indirect but intelligible measure of survival differences. This RR is defined as the ratio of the logarithm of the
survival rates being compared (e.g., stomach carcinoma, lowa vs. Connecticut: log 0.20/log 0.23 � 1.09).i Connecticut is the reference category.j Calculated over period 1989 –1992; EAPC over period 1988 –1992 is 9.4.
436 CANCER July 15, 2002 / Volume 95 / Number 2

cidence and better survival, with a 13% lower RR ofdying (Table 3). Compared with Utah, Iowa had ahigher proportion of elderly people (18% vs. 10% ofwomen 75 years and older), with no substantial differ-ence in incidence and survival.
NHLIn terms of the pattern of prevalence by age, the dif-ferences between Iowa and Connecticut were smallfor NHL (Fig. 2). Again, Connecticut and Iowa hadsimilar prevalence, whereas the prevalence was dis-tinctly lower in Utah (Table 2). After correcting for theage distribution of both the U.S. and the world popu-lations, prevalence differences diminished, but re-mained lowest in Utah (Tables 3 and 4). The preva-lence of these tumors was increasing markedly overthe 5 years considered: from 2.5% to 4.8% per year inwomen and from 2.7% to 6.6% in men (Tables 3and 4).
DISCUSSIONThe major finding of this study is that there are widedifferences in cancer prevalence among the threestates. For all cancers examined, Utah had the lowestcancer prevalence, whereas Connecticut and Iowa hadsimilar levels of prevalence except for stomach, breast,and uterine carcinomas (Table 2). In general, survivaldid not vary greatly among the three states (Tables 3and 4). The major determinants of prevalence differ-ences were differences in incidence and in the agedistribution of the population (particularly for wom-en). Prevalence differences were most striking forstomach and colorectal carcinomas, explained largelyby substantial differences in incidence. The ratios ofthe highest to the lowest crude total cancer prevalencewere 2.73 for stomach carcinoma and 2.65 for colo-rectal carcinoma. The lowest ratio was 1.69 for carci-noma of the corpus uteri (Table 2).
Utah had the lowest crude cancer prevalencemainly because its population was the youngest of the
TABLE 4Prevalence, Incidence, and Survival in Males
Cancer registry
Prevalence Incidence
Five-yrsurvival (%)g
RR of dying5 yrs afterdiagnosish
Agestandardizeda
Ratiob Trendc
Agestandardizedd
RRe TrendfW U.S. W U.S.
StomachConnecticuti 22 36 1 �2.1 9 15 1 �2.5 17 1Iowa 14 22 0.6 2.7 6 10 0.7 �3.4 16 1.03Utah 12 20 0.5 0.8 5 9 0.6 �1.8 14 1.11
ColorectumConnecticuti 300 521 1 0.3 48 78 1 �3.4 62 1Iowa 267 457 0.9 1.3 46 74 1.0 �1.4 62 1.00Utah 185 311 0.6 2.7 33 53 0.7 0.2 63 0.97
PancreasConnecticuti 7 10 1 �2.3 8 12 1 �5.6 4 1Iowa 7 11 1.0 2.7 7 12 0.92 2.9 5 0.93Utah 5 7 0.7 2.9 6 9 0.74 �0.5 2 1.22
Non-Hodgkin lymphomaConnecticuti 85 116 1 3.6 15 21 1 4.7 52 1Iowa 85 117 1.0 2.7 14 20 0.9 2.1 55 0.91Utah 72 101 0.8 6.6 13 18 0.9 3.0 51 1.03
a World and 1990 U.S. age-standardized proportion per 100,000 obtained from the estimated total prevalence at December 31, 1992.b Ratio of world age-standardized prevalence proportions.c Mean yearly percentage change in 10-year prevalence at December 31 over period 1988 –1992.d World and 1990 U.S. age-standardized incidence rates per 100,000 person-year, 1988 –1992.20
e Relative risk (RR) of world age-standardized incidence rates.f Estimated annual percent change in world age-standardized incidence over period 1988 –1992.20
g Five-year relative survival.20
h To compare 5-year relative survival we used the RR of death at 5 years after diagnosis, which is an indirect but intelligible measure of survival differences. This RR is defined as the ratio of the logarithm of the
survival rates being compared.i Connecticut is the reference category.
Cancer prevalence in CT, IA, UT/Micheli et al. 437

three states investigated. However, when U.S. age-standardized prevalence was calculated, the preva-lence was still lowest in Utah although prevalencedifferences diminished, indicating that cancer inci-dence is definitely lower in this state even after cor-recting for differences in the age structure of the pop-ulation. There is evidence that a considerableproportion of all cancers are caused by environmentalfactors. The lower overall rate of cancer incidence inUtah, and indirectly of cancer prevalence, might berelated to the lifestyle of the Mormon population.
For stomach carcinoma, we found that low inci-dence correlated with slightly lower survival. Becausesurvival rates varied less than incidence, the differ-ences in prevalence are likely due to differences inincidence. For pancreatic carcinoma, prevalence wassimilar in all three states although incidence and sur-vival figures differed somewhat (Tables 3 and 4). Withregard to colorectal carcinoma, the extent to whichmodern procedures (e.g., fecal occult blood detectionand endoscopy) have been introduced may differamong states. Where these procedures have been in-troduced on a wide scale relatively recently, they arelikely to increase temporarily the incidence of caseswith relatively good prognosis. This may partly explaindifferences in incidence and survival and, conse-quently, in prevalence.
For carcinomas of the corpus uteri, ovary, andNHL, the low prevalence in Utah can only partly beexplained by lower incidence because survival for pa-tients with these carcinomas was rather high, tendingto increase the prevalence. Once again, it is theyounger population of this state that makes a decisivecontribution to the low prevalence in Utah.
Unlike other epidemiologic quantities (e.g., sur-vival and mortality rates), prevalence is difficult toestimate reliably. Our approach was to estimate di-rectly prevalence from the incidence and life statusdata provided by cancer registries.12 We also used acorrection for cases lost to follow-up. If these were notconsidered, the method would underestimate theprevalence.
The correction assumed that lost cases have thesame survival as those not lost to follow-up. If thegroups of lost-to-follow-up cases differ from othercases by some factor that influences their survival, theassumption of the same survival rate will be flawed.For example, they may have a better than averageprognosis and be healthy enough to move out of thearea where the cancer was diagnosed. Furthermore, ifthe registry has good death clearance, then the pa-tients lost to follow-up are likely to be alive than dead.However, not correcting for losses implies assuming
that all lost cases have died, which would underesti-mate the real prevalence.
Other factors that can influence the accuracy ofprevalence estimates from cancer registry data arepatient migration and the proportion of cases knownby death certificate only (DCO). We assumed thatcases migrated from a given registry area at the samerate as cancer cases from other areas moved in. Thisassumption may not be true. For example, once diag-nosed, cancer patients may decide to move from theirhome state to one where cancer treatments are con-sidered better. Another possibility is that several yearsafter diagnosis, patients may decide to spend the restof their lives elsewhere (perhaps where support ser-vices are better) or they may decide to stay where theyhave roots.
These possible behavioral responses are difficultto quantify and could not be corrected for in thecurrent study. DCO cases form a small but variableproportion of incident cases in any cancer registryseries (Table 1). These cases are important becausethe date of incidence of the cancer is unknown andcan therefore lead to an underestimate of prevalence.However, it is unlikely that these errors have seriouslyaffected our prevalence estimates and comparisons.
For validation purposes, an independent indi-rect modeling approach that estimates prevalenceusing mortality and survival data6 was applied to thelowa cancer registry. The results obtained werecompared with those obtained by the PREVAL plusR factor approach. The results produced by the twomethods agreed closely for colorectal, pancreatic,breast, corpus uteri, and ovarian carcinomas (datanot presented).
For the purposes of long-term health planningand resource allocation, the total prevalence is animportant item of information. This is the case, par-ticularly for breast carcinoma for which increasedrisks of recurrence, multiple tumor development, anddeath persist for many years after diagnosis. Patientswith breast carcinoma are likely to make demands onhealth services throughout their lives. However,knowledge of prevalence by years from diagnosis isalso essential, particularly for colorectal carcinoma forwhich the excess risk of death declines with time andequals that of the general population about 5 yearsafter diagnosis (at this point, most surviving patientsare considered to be cured).21 For patients with thesetumors, the demand for medical services is high in theinitial years after diagnosis, but declines consistentlythereafter. For colorectal carcinoma, the 5 year prev-alence is the key statistic. For other cancers, a shorteror longer prevalence might be more appropriate forplanning the availability of health resources.
438 CANCER July 15, 2002 / Volume 95 / Number 2

Our approach provides this information directly.Prevalence depends on cancer incidence and survival.Because both cancer and general mortality rates de-pend on age, prevalence is also sensitive to the age ofthe population. All these factors have changed mark-edly in recent years and will continue to do so in thefuture. Therefore, cancer prevalence is an importantcancer descriptive measure.
REFERENCES1. U.S. Bureau of Census. Current population reports: special
studies. P23–190, 65� in the United States. Washington: U.S.Government Printing Office, 1996.
2. Ries LAG, Eisner MP, Kosary CL, et al. eds. SEER cancerstatistics review, 1973–1997. Bethesda, MD: National CancerInstitute.
3. Yancik R, Havlik, RJ, Wesley MN, et al. Cancer and comor-bidity in older patients: a descriptive profile. Ann Epidemiol.1996;6:399 – 412.
4. Satariano WA. Comorbidity and functional status in olderwomen with breast cancer: implications for screening, treat-ment, and prognosis. J Gerontol. 1992;47:24 –31.
5. Yancik R. Integration of aging and cancer research in geri-atric medicine. J Gerontol Med Sci. 1997;52A:M329 –M332.
6. Verdecchia A, Capocaccia R, Egidi V, Golini A. A method forthe estimation of chronic disease morbidity and trends frommortality data. Stat Med. 1989;8:201–216.
7. De Angelis G, De Angelis R, Frova L, Verdecchia A. MI-AMOD: a computer package to estimate chronic diseasesmorbidity using mortality and survival data. Comput Meth-ods Programs Biomed. 1994;44:99 –107.
8. Feldman AR, Kessler L, Myers MH, Naughton MD. Theprevalence of cancer. Estimates based on the Connecticuttumor registry. N Engl J Med. 1986;315:1394 –1397.
9. Polednak AP. Estimating the prevalence of cancer in theUnited States. Cancer. 1997;80:136 –141.
10. Hakama M, Hakulinen T, Teppo L, Saxen E. Incidence,mortality or prevalence as indicators of the cancer problem.Cancer. 1975;36:2227–2231.
11. Adami HO, Gunnarson T, Sparen P, Eklund G. The preva-lence of cancer in Sweden 1984. Acta Oncol. 1989;28:463–470.
12. Krogh V, Micheli A. Measure of cancer prevalence with acomputerized program: an example on larynx cancer. Tu-mori. 1996;82:287–290.
13. Micheli A, Gatta G, Sant M, et al. Breast cancer prevalencemeasured by the Lombardy cancer registry. Tumori. 1997;83:875– 879.
14. Capocaccia R, De Angelis R. Estimating the completeness ofprevalence based on cancer registry data. Stat Med. 1997;16:425– 440.
15. Micheli A, ed. Cancer prevalence in Italy: the ITAPREVALStudy. Tumori. 1999;85-5:307– 420.
16. Micheli A, Mugno E, Krogh V, et al. Cancer prevalence inEuropean registry areas. Ann Oncol. (in press).
17. Parkin DM, Whelan SL, Ferlay L, Raymond L, Young J., eds.Cancer incidence in five continents (Volume VII) Lyon: In-ternational Agency for Research on Cancer (IARC ScientificPublication no. 143), 1997.
18. World Health Organization. Manual of the international sta-tistical classification of diseases, injuries, and causes ofdeath. Geneva: World Health Organization, 1977.
19. Merrill RM, Capocaccia R, Feuer EJ, Mariotto A. Cancerprevalence estimates based on tumor registry data in theSurveillance, Epidemiology, and End Results (SEER) pro-gram. Int J Epidemiol. 2000;29:197–207.
20. SEER 1973-93 Public-use CD-ROM. Washington, DC: U.S.Department of Health and Human Services, PHS/NIH/NCI/NCI/CSB, August 1996.
21. Verdecchia A, De Angelis R, Capocaccia R, et al. The cure forcolon cancer: results from the EUROCARE study. Int J Can-cer. 1998;77:322–329.
Cancer prevalence in CT, IA, UT/Micheli et al. 439


