Embed Size (px)
Citation preview

DOI: 10.1002/cmdc.201000533
Contribution of Explicit Solvent Effects to the BindingAffinity of Small-Molecule Inhibitors in Blood CoagulationFactor Serine ProteasesRobert Abel,[a] Noeris K. Salam,[a] John Shelley,[a] Ramy Farid,[a] Richard A. Friesner,[b] andWoody Sherman*[a]
Introduction
Trypsin-like serine proteases (fac-tors VIIa, IXa, Xa, XIa, and throm-bin (IIa)) are well characterized inthe regulation of hemostasis andthromboembolic diseases suchas deep vein thrombosis, myo-cardial infarction, and pulmonaryembolism.[1] Serine proteases inthe blood coagulation cascadehave been the target of manypharmaceutical campaigns, andpotent compounds were foundin early work.[2] However, poorpharmacokinetic (PK) profiles ofthe early inhibitors presented asignificant clinical challenge foranticoagulant drug design anddevelopment, primarily due to apositive charge on the ligands inthe S1 pocket that was thought to be required for potency.[3]
However, after many years of work, researchers were able tofind compounds that bind with a neutral group in the S1pocket while retaining a high level of potency.[4]
Early inhibitors of thrombin typically contained basic moiet-ies in the S1 pocket, such as guanidine or benzamidine, whichmimic the P1 arginine side chain of the natural substrate fibri-nopeptide A (Figure 1).[2a, 3, 5] This allowed greater potency andspecificity toward the hydrophobically buried Asp189 in the S1pocket of trypsin-like serine proteases over other serine pro-tease families. Following a similar design, first-generation in-hibitors of factors VIIa, Xa, and XIa also shared a basic S1
moiety to interact with Asp189. Although a number of theseinhibitors with basic S1 variants have shown promise in early
The prevention of blood coagulation is important in treatingthromboembolic disorders, and several serine proteases in-volved in the coagulation cascade have been classified as phar-maceutically relevant. Whereas structure-based drug designhas contributed to the development of some serine proteaseinhibitors, traditional computational methods have not beenable to fully describe structure–activity relationships (SAR).Here, we study the SAR for a number of serine proteases byusing a method that calculates the thermodynamic properties(enthalpy and entropy) of the water that solvates the active
site. We show that the displacement of water from specificsubpockets (such as S1–4 and the ester binding pocket) of theactive site by the ligand can govern potency, especially forcases in which small chemical changes (i.e. , a methyl group orhalogen) result in a substantial increase in potency. Further-more, we describe how relative binding free energies can beestimated by combining the water displacement energy withcomplementary terms from an implicit solvent molecular me-chanics description binding.
Figure 1. A timeline that chronicles the progression of thrombin and factor Xa (FXa) inhibitor designs from theearly basic P1 arginine-based peptidomimetics to the latter neutral low-molecular-weight drug-like inhibitors withoral bioavailability.
[a] Dr. R. Abel,+ Dr. N. K. Salam,+ Dr. J. Shelley, Dr. R. Farid, Dr. W. ShermanSchrçdinger, 120 West 45th Street, 17th Floor, New York, NY 10036 (USA)Fax: (+ 1) 212-295-5801E-mail : [email protected]
[b] Prof. R. A. FriesnerDepartment of Chemistry and Center for Biomolecular SimulationColumbia University, New York, NY 10027 (USA)
[+] These authors contributed equally to this work.
Supporting information for this article is available on the WWW underhttp://dx.doi.org/10.1002/cmdc.201000533.
ChemMedChem 2011, 6, 1049 – 1066 � 2011 Wiley-VCH Verlag GmbH & Co. KGaA, Weinheim 1049

studies,[1e] translation into the clinic has encountered severalbioavailability challenges associated with a highly basic moiety.There were attempts to increase oral bioavailability by maskingthe basic P1 substituent through various prodrug strategies;[6]
however, a significant breakthrough came with the discoveryof a new generation of inhibitors that contain neutral P1 sub-stituents, thereby providing new opportunities for design. Ofthese, the most potent derivatives possess an S1-bindingchloro substituent, such as in the m-chlorobenzyl and chloro-benzothiophene groups of thrombin and factor Xa inhibitors,respectively.[7]
An accurate understanding of the SAR surrounding thechloro substituents has remained somewhat elusive. A purelipophilic interaction with the S1 pocket has been claimed notto fully account for the large affinity gains associated with thesingle chlorine atom, which can be up to 2–2.5 kcal mol�1. Thishas lead research groups to postulate more exotic explana-tions, such as contributions from an attractive electrostatic in-teraction between the chloro and the p-electron system of S1residue Tyr228.[8] Indeed, the Cl···p attraction has been predict-ed by computational techniques to contribute favorably tobinding in serine proteases,[9] as well as in many non-serineprotease systems throughout the Protein Data Bank (PDB) re-cords.[8a] Furthermore, polarization of the C�H bond adjacentto the chlorine atom can allow favorable interaction withAsp189.[10] However, a Cl···p interaction can only partially ex-plain the significant gain in affinity associated with the chloro-based inhibitors.[11] Furthermore, they cannot explain the sub-stantial boost in potency from functional groups of similar sizeto chloro, such as methyl, that are not capable of making p in-teractions with an aromatic ring.[12]
In the many high-resolution X-ray crystal structures of tryp-sin-like serine proteases without potent chloro-containing S1substituents, a single water molecule is observed buried in theS1 pocket sub-groove, adjacent to Tyr228. The water is evidentin both the apo structures[7a] and co-crystals with P1 argininemimics.[13] However, the neutral chloro/methyl S1 binders dis-place this water molecule,[7a] suggesting that the water dis-placement may be related to the potency gain observed withchloro/methyl ligand variants.
Previous studies have stated that displacement of the S1water can lead to enhanced potency toward factor Xa,[7b, 8b]
and can also improve specificity for inhibitors of urokinase-type plasminogen activator[14]—another member of the tryp-sin-like serine protease family. Quantifying the thermodynamicproperties of the S1 water in blood-coagulation serine proteas-es—and understanding the effects of displacing this water bythe P1 neutral inhibitors—should therefore help describe thebinding affinity brought about by the neutral P1 substituents.
The method used in this work, referred to as WaterMap,computes the thermodynamic properties of water in the bind-ing site based on an all-atom explicit water molecular dynam-ics simulation followed by a statistical thermodynamic analy-sis.[15] In short, an explicit solvent molecular dynamics simula-tion is run on the protein system of interest, and the watermolecules from each saved frame of the simulation are clus-tered into spheres of 1 � radius (hydration sites). Each hydra-
tion site is analyzed to compute the local enthalpic (DH) andentropic (�TDS) properties of the water occupying the site.The free energy (DG) of the water in each hydration site isthen taken to be the sum of DH and �TDS contributions.[15b]
When a ligand binds to the protein, the solvent occupying thehydration sites is displaced from the active site of the proteininto the bulk fluid, and the extent to which the solvent is dis-placed from the active site into the bulk may be approximatedfrom the steric overlap of the bound ligand with the hydrationsites of the active site. It is well appreciated that evacuatingwater from sites that are comparatively less favorable thanbulk contributes favorably to binding, whereas evacuatingwater from hydration sites that are more favorable than bulkopposes binding. Thus, the contribution of solvent expulsionto the binding of a small molecule may be numerically ap-proximated by an analysis of the extent to which the stericbulk of the ligand evacuates water from the hydration sitesinto the bulk.[15a, 16]
There have been a number of recent successful applicationsof WaterMap. Abel et al. first showed that the free energy asso-ciated with displacing hydration sites in factor Xa is able to ac-curately predict affinity differences between pairs of congene-ric molecules.[16] WaterMap was also shown to accurately pre-dict the SAR trend of a series of triazolylpurine derivatives thatbind to the G-protein-coupled A2A adenosine receptor,[17] anda of series of peptides that bind to the PDZ domain Erbin.[18] Inaddition to explaining the activity trend for the PDZ domainpeptides, selectivity between the PDZ domains HTRA1, HTRA2,and HTRA3 could be described based on the hydration sitethermodynamic profiles. In a different study, the selectivity pro-files of a number of challenging pairs of kinases such as Abl/c-Kit, Syk/ZAP-70, and CDK2/CDK4 were explained by using Wa-terMap.[19] In other works, WaterMap has been used to improveMM-GBSA scoring[20] and estimate binding kinetics.[21]
This paper is organized as follows: First, we show that Wa-terMap is able to accurately predict the spatial arrangement ofwater molecules observed in apo-thrombin crystal structures.We then present WaterMap activity predictions for thrombin,factor Xa, and factor VIIa. Furthermore, we demonstrate a com-bined WaterMap MM-GBSA analysis (referred to herein as WM/MM, which is very similar in spirit to the method proposed byGuimar¼es et al. ,[20] but differs in the nature of the decomposi-tion of the terms) that improves the overall agreement of thepredicted small-molecule binding potencies with the experi-mental data. Lastly, we conclude with a discussion aboutfuture directions and applications of this methodology. A de-tailed description of the WaterMap methodology itself is avail-able in the Supporting Information.
Results and Discussion
For the calculations below, WaterMap was run in the defaultmode after preparation of the structures with the Protein Prep-aration Wizard in Maestro (Maestro version 9.0, Schrçdinger,LLC, New York, NY, USA). WaterMap calculations consist of anexplicit solvent molecular dynamics simulation followed by astatistical thermodynamic analysis of water clusters (hydration
1050 www.chemmedchem.org � 2011 Wiley-VCH Verlag GmbH & Co. KGaA, Weinheim ChemMedChem 2011, 6, 1049 – 1066
MED W. Sherman et al.

sites) based on inhomogeneous solvation theory. This permitsan assignment of entropy (�TDS), enthalpy (DH), and freeenergy (DG) associated with water occupying each hydrationsite. Furthermore, the solvent expulsion contribution to aligand molecule binding to the active site of the protein maybe estimated by the extent to which the ligand evacuates thesolvent from the hydration sites into the bulk fluid, as de-scribed by Abel et al.[16]
Hydration site locations
First, we show that the predicted location of hydration sites isconsistent with experimental structural information. An analy-sis of eight apo-thrombin crystal structures reveals that thereare only four crystal water molecules conserved in at least fiveof eight structures, and 15 crystal water molecules conservedin at least three of the eight structures. A WaterMap analysison each of the eight thrombin apo crystal structures showsclose agreement with the crystal structures. Figure 2 A showsthe crystallographic water molecules and WaterMap hydrationsites that are conserved in at least five of the eight apo-throm-
bin structures, and those conserved in at least three of theeight apo-thrombin structures are displayed in Figure 2 B. Inter-estingly, Figure 2 indicates a greater number of conserved Wa-terMap hydration sites than conserved crystal waters. All fourwaters conserved in five of the eight crystal structures arefound to be very close to conserved hydration sties. The agree-ment of the conserved hydration sites positions at a three-of-eight conservation threshold is not as high, as can be seen inFigure 2 B. However, the four crystal waters that are >2.0 �from any conserved hydration are all near a highly mobile loopregion (displayed in purple in Figure 2), and it is possible thatthe mobility of the protein that is not fully described in theWaterMap analysis contributes to the disagreement.
The highest-resolution apo-thrombin crystal structure avail-able at the time of this study is PDB code 2UUF, which wassolved to a resolution of 1.26 �. WaterMap results for thisstructure show that most of the water locations are accuratelypredicted as hydration sites (Figure 3). For example, 39 % of
the crystal waters are within 0.5 � of a hydration site, 76 % ofthe crystal waters are within 1.0 �, 88 % are within 1.5 �, and93 % are within 2.0 �. From Figure 3, it is evident that there aremore predicted hydration sites than crystal waters. However,this is somewhat expected, as it was previously shown that thenumber of identified crystal waters is highly dependent on theresolution of the structure. For example, an average of 1.0 crys-tal water molecules per amino acid would be expected at aresolution of 2.0 �, and an average of 1.6 crystal waters peramino acid at a resolution of 1.0 �.[22] Note the 2UUF crystalstructure itself has a total of 346 assigned crystal waters for atotal of 290 residues occupying the unit cell, which yields 1.2water molecules per residue, and is squarely within thebounds suggested by the earlier work. If anything, we find thestructure to contain surprisingly few water molecules given itshigh resolution (1.26 �), as a simple linear interpolation would
Figure 2. All eight apo-thrombin crystal structures are superimposed inribbon representation. A) The crystal waters conserved in five of the eightstructures are depicted in red, and the computationally determined hydra-tion sites conserved in five of the eight structures are depicted in green.(Note: only one red sphere is clearly visible due to the tight overlap be-tween crystal waters and hydration sites.) B) The crystal waters conserved inthree of the eight structures are depicted in red, and the computationallydetermined hydration sites conserved in three of the eight structures are de-picted in green. Those conserved crystal waters that are >2 � from any con-served computationally conserved hydration site are depicted in pink.
Figure 3. The apo-thrombin crystal structure (PBB code 2UUF) is depicted inribbon representation. The crystal waters found in the active site are depict-ed in red, and the computationally identified hydration sites are shown ingreen. Those crystal waters that do not map to hydration sites are displayedin pink. Those hydration sites that do not map to crystal waters are shownas green dots.
ChemMedChem 2011, 6, 1049 – 1066 � 2011 Wiley-VCH Verlag GmbH & Co. KGaA, Weinheim www.chemmedchem.org 1051
Explicit Solvent Effects
suggest a hydration numbercloser to 1.3 water moleculesper residue.
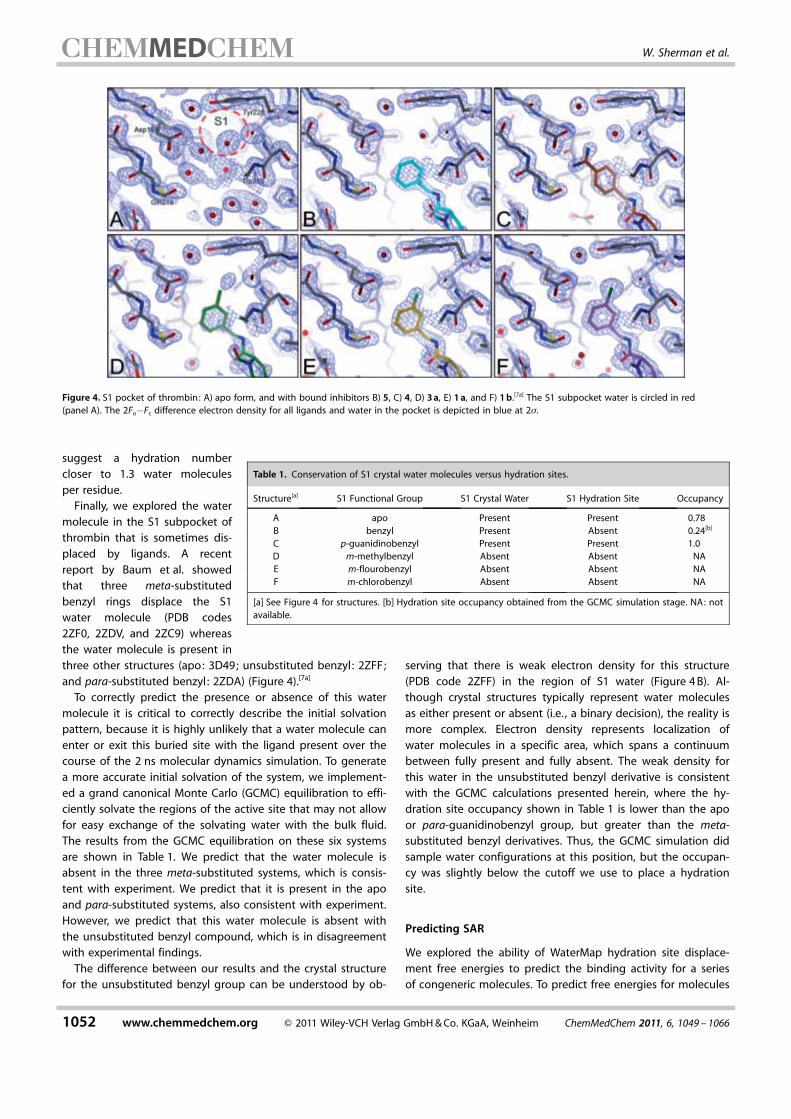
Finally, we explored the watermolecule in the S1 subpocket ofthrombin that is sometimes dis-placed by ligands. A recentreport by Baum et al. showedthat three meta-substitutedbenzyl rings displace the S1water molecule (PDB codes2ZF0, 2ZDV, and 2ZC9) whereasthe water molecule is present inthree other structures (apo: 3D49; unsubstituted benzyl: 2ZFF;and para-substituted benzyl : 2ZDA) (Figure 4).[7a]
To correctly predict the presence or absence of this watermolecule it is critical to correctly describe the initial solvationpattern, because it is highly unlikely that a water molecule canenter or exit this buried site with the ligand present over thecourse of the 2 ns molecular dynamics simulation. To generatea more accurate initial solvation of the system, we implement-ed a grand canonical Monte Carlo (GCMC) equilibration to effi-ciently solvate the regions of the active site that may not allowfor easy exchange of the solvating water with the bulk fluid.The results from the GCMC equilibration on these six systemsare shown in Table 1. We predict that the water molecule isabsent in the three meta-substituted systems, which is consis-tent with experiment. We predict that it is present in the apoand para-substituted systems, also consistent with experiment.However, we predict that this water molecule is absent withthe unsubstituted benzyl compound, which is in disagreementwith experimental findings.
The difference between our results and the crystal structurefor the unsubstituted benzyl group can be understood by ob-
serving that there is weak electron density for this structure(PDB code 2ZFF) in the region of S1 water (Figure 4 B). Al-though crystal structures typically represent water moleculesas either present or absent (i.e. , a binary decision), the reality ismore complex. Electron density represents localization ofwater molecules in a specific area, which spans a continuumbetween fully present and fully absent. The weak density forthis water in the unsubstituted benzyl derivative is consistentwith the GCMC calculations presented herein, where the hy-dration site occupancy shown in Table 1 is lower than the apoor para-guanidinobenzyl group, but greater than the meta-substituted benzyl derivatives. Thus, the GCMC simulation didsample water configurations at this position, but the occupan-cy was slightly below the cutoff we use to place a hydrationsite.
Predicting SAR
We explored the ability of WaterMap hydration site displace-ment free energies to predict the binding activity for a seriesof congeneric molecules. To predict free energies for molecules
Figure 4. S1 pocket of thrombin: A) apo form, and with bound inhibitors B) 5, C) 4, D) 3 a, E) 1 a, and F) 1 b.[7a] The S1 subpocket water is circled in red(panel A). The 2Fo�Fc difference electron density for all ligands and water in the pocket is depicted in blue at 2s.
Table 1. Conservation of S1 crystal water molecules versus hydration sites.
Structure[a] S1 Functional Group S1 Crystal Water S1 Hydration Site Occupancy
A apo Present Present 0.78B benzyl Present Absent 0.24[b]
C p-guanidinobenzyl Present Present 1.0D m-methylbenzyl Absent Absent NAE m-flourobenzyl Absent Absent NAF m-chlorobenzyl Absent Absent NA
[a] See Figure 4 for structures. [b] Hydration site occupancy obtained from the GCMC simulation stage. NA: notavailable.
1052 www.chemmedchem.org � 2011 Wiley-VCH Verlag GmbH & Co. KGaA, Weinheim ChemMedChem 2011, 6, 1049 – 1066
MED W. Sherman et al.
that vary by more than shape modifications, such as differen-ces in electrostatics or van der Waals energies, it is necessaryto augment the WaterMap score with other components ofthe binding energy. We did this by combining WaterMap withthe relevant terms from an MM-GBSA calculation. The combi-nation of the terms is based on a rigorous decomposition ofthe energetic contributions to binding. The weight of the MM-GBSA energy relative to the WaterMap energy is the only pa-rameter in the model, and a single coefficient of 1/3 is used inthis work to scale the MM-GBSA energies. This value was deter-mined based on in-house SAR datasets and was not fit to thedata in this paper. The combination of WaterMap and MM-GBSA is referred to throughout this work as WM/MM scoringand is summarized in the Experi-mental Section below along witha detailed energetic decomposi-tion in the Supporting Informa-tion. Decomposition of the MM-GBSA energy is necessary toavoid double counting of thecontribution to binding comput-ed by WaterMap.
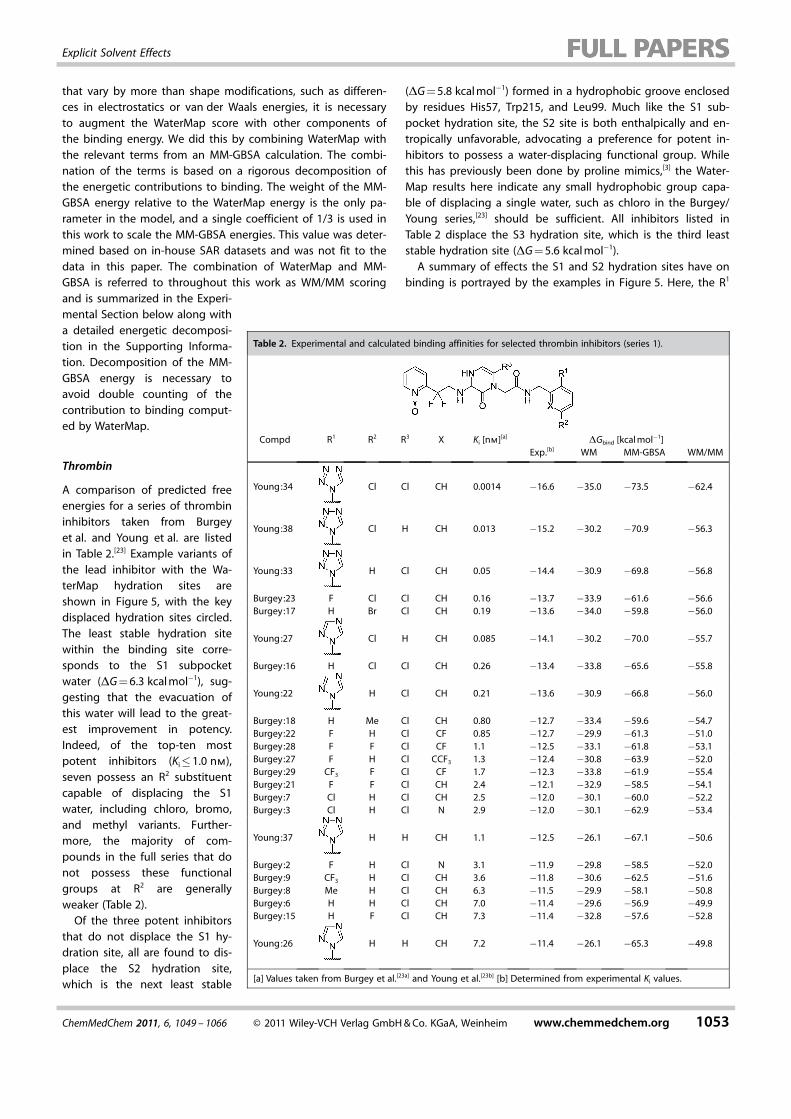
Thrombin
A comparison of predicted freeenergies for a series of thrombininhibitors taken from Burgeyet al. and Young et al. are listedin Table 2.[23] Example variants ofthe lead inhibitor with the Wa-terMap hydration sites areshown in Figure 5, with the keydisplaced hydration sites circled.The least stable hydration sitewithin the binding site corre-sponds to the S1 subpocketwater (DG = 6.3 kcal mol�1), sug-gesting that the evacuation ofthis water will lead to the great-est improvement in potency.Indeed, of the top-ten mostpotent inhibitors (Ki�1.0 nm),seven possess an R2 substituentcapable of displacing the S1water, including chloro, bromo,and methyl variants. Further-more, the majority of com-pounds in the full series that donot possess these functionalgroups at R2 are generallyweaker (Table 2).
Of the three potent inhibitorsthat do not displace the S1 hy-dration site, all are found to dis-place the S2 hydration site,which is the next least stable
(DG = 5.8 kcal mol�1) formed in a hydrophobic groove enclosedby residues His57, Trp215, and Leu99. Much like the S1 sub-pocket hydration site, the S2 site is both enthalpically and en-tropically unfavorable, advocating a preference for potent in-hibitors to possess a water-displacing functional group. Whilethis has previously been done by proline mimics,[3] the Water-Map results here indicate any small hydrophobic group capa-ble of displacing a single water, such as chloro in the Burgey/Young series,[23] should be sufficient. All inhibitors listed inTable 2 displace the S3 hydration site, which is the third leaststable hydration site (DG = 5.6 kcal mol�1).
A summary of effects the S1 and S2 hydration sites have onbinding is portrayed by the examples in Figure 5. Here, the R1
Table 2. Experimental and calculated binding affinities for selected thrombin inhibitors (series 1).
Compd R1 R2 R3 X Ki [nm][a] DGbind [kcal mol�1]Exp.[b] WM MM-GBSA WM/MM
Young:34 Cl Cl CH 0.0014 �16.6 �35.0 �73.5 �62.4
Young:38 Cl H CH 0.013 �15.2 �30.2 �70.9 �56.3
Young:33 H Cl CH 0.05 �14.4 �30.9 �69.8 �56.8
Burgey:23 F Cl Cl CH 0.16 �13.7 �33.9 �61.6 �56.6Burgey:17 H Br Cl CH 0.19 �13.6 �34.0 �59.8 �56.0
Young:27 Cl H CH 0.085 �14.1 �30.2 �70.0 �55.7
Burgey:16 H Cl Cl CH 0.26 �13.4 �33.8 �65.6 �55.8
Young:22 H Cl CH 0.21 �13.6 �30.9 �66.8 �56.0
Burgey:18 H Me Cl CH 0.80 �12.7 �33.4 �59.6 �54.7Burgey:22 F H Cl CF 0.85 �12.7 �29.9 �61.3 �51.0Burgey:28 F F Cl CF 1.1 �12.5 �33.1 �61.8 �53.1Burgey:27 F H Cl CCF3 1.3 �12.4 �30.8 �63.9 �52.0Burgey:29 CF3 F Cl CF 1.7 �12.3 �33.8 �61.9 �55.4Burgey:21 F F Cl CH 2.4 �12.1 �32.9 �58.5 �54.1Burgey:7 Cl H Cl CH 2.5 �12.0 �30.1 �60.0 �52.2Burgey:3 Cl H Cl N 2.9 �12.0 �30.1 �62.9 �53.4
Young:37 H H CH 1.1 �12.5 �26.1 �67.1 �50.6
Burgey:2 F H Cl N 3.1 �11.9 �29.8 �58.5 �52.0Burgey:9 CF3 H Cl CH 3.6 �11.8 �30.6 �62.5 �51.6Burgey:8 Me H Cl CH 6.3 �11.5 �29.9 �58.1 �50.8Burgey:6 H H Cl CH 7.0 �11.4 �29.6 �56.9 �49.9Burgey:15 H F Cl CH 7.3 �11.4 �32.8 �57.6 �52.8
Young:26 H H CH 7.2 �11.4 �26.1 �65.3 �49.8
[a] Values taken from Burgey et al.[23a] and Young et al.[23b] [b] Determined from experimental Ki values.
ChemMedChem 2011, 6, 1049 – 1066 � 2011 Wiley-VCH Verlag GmbH & Co. KGaA, Weinheim www.chemmedchem.org 1053
Explicit Solvent Effects

and X positions are fixed with a tetrazole and CH, respectively,while the R2 and R3 positions are sampled with chloro to deter-mine the effects at the S1 subpocket and S2, respectively. InFigure 5 A, it is evident that Young:37 lacks both chlorogroups, rendering it incapable of displacing either the S1 sub-pocket or S2 hydration site, and thus resulting in a relativelyweak inhibitor (Ki = 1.1 nm). Conversely, the inclusion of thewater-displacing chloro group at either R2 or R3 (Figure 5 B and5 C) as observed with Young:38 and Young:33, respectively,shows an improvement in potency (Ki = 0.013 and 0.05 nm, re-spectively), whereas the combination of chloro at both sites re-sults in the most potent inhibitor, Young:34 (Ki = 0.0014 nm).
The gain in potency by the R1 tetrazole and o-triazole ringsis less prominent than what is achieved in the S1 or S2 pock-ets. Here the rings extend into a solvent-exposed region, over-lapping with a moderately unstable hydration site (DG =
1.7 kcal mol�1) as well as a stable site (DG =�0.5 kcal mol�1).Both have equivalent entropies (�TDS) of 1.3 kcal mol�1, butenthalpies (DH) of 0.5 and �1.8 kcal mol�1, respectively. Theselow (favorable) enthalpies suggest the placement of polargroups, such as tetrazole and o-triazole, as functional replace-ments of the water in this region. More thorough analyses ofthe comparisons between experimental and predicted bindingenergies are described in subsequent sections.
A similar study was performed on a second congenericseries of thrombin inhibitors from Baum et al. ,[7a] shown inTable 3. As in the previous example, the least stable hydrationsites (DG>5.0 kcal mol�1) are found in the S1, S2, and S3 pock-ets, confirming these as key regions for large gains in potency.
Significant gains in affinity are achieved with neutral P1 sub-stituents (i.e. , R2) that optimally fit into the S1 subpocket, dis-placing the trapped water that is both entropically and en-thalpically unstable (�TDS = 3.0 kcal mol�1; DH = 3.4 kcal mol�1;Figure 6). This series also demonstrates the potency gains ac-cessible by several non-chloro functional groups in the S1 sub-pocket, such as methyl (3 a), bromo (1 d), and iodo (1 c) var-iants. Although the chloro (1 b) substituent is the most potent,the other substituents show that significant gains in affinitycan be attributed to something other than the special interac-tions from a chloro group, which in this case can be describedby the displacement of the unstable S1 subpocket water.
Notably, prior experimental determination of Ki and isother-mal titration calorimetry (ITC) data for this series disagrees re-garding the relative contributions of the desolvation-relatedand quantum effects, which suggests there may be a furtheropportunity for experimental analysis to reconcile the discrep-ancy (Table 3 and Figure 5).[7a] The nature of this discrepancycan be most easily discerned from the data depicted inFigure 5 in comparing the experimentally determined bindingfree energies of the methyl-containing species 3 a to thechloro-containing species 1 b. In particular, the ITC-based ex-perimental measurements of the binding affinities seem to in-dicate the special interactions from the chloro group are re-sponsible for a mere 0.14 kcal mol�1 of binding free energy inexcess of the methyl group variant. In contrast, however, theKi-based measurements of the binding affinities seem to indi-cate a chloro group is responsible for a full 1.1 kcal mol�1 ofbinding free energy in excess of the methyl variant. Because
Figure 5. WaterMap of the thrombin binding site (PDB code 1MUE receptor) and comparison of various series 1 inhibitors. Compounds shown: A) Young:37(1.1 nm), B) Young:33 (0.05 nm), C) Young:38 (0.013 nm), and D) Young:34 (0.0014 nm). Unstable hydration sites (DG>1.0 kcal mol�1) are shown with largespheres. Stable (DG<0.0 kcal mol�1) and moderately unstable (0.0<DG<1.0 kcal mol�1) hydration sites are shown with small spheres. The color spectrumranges from red (more unfavorable) to green (less unfavorable). The thrombin binding site is shown as solvent-accessible surface (grey).
1054 www.chemmedchem.org � 2011 Wiley-VCH Verlag GmbH & Co. KGaA, Weinheim ChemMedChem 2011, 6, 1049 – 1066
MED W. Sherman et al.

both Ki and ITC-based measurements are routinely treated as“gold-standard” methods, and the above measurements wereperformed within the same laboratory, the source of the dis-crepancy remains unclear.
While the WaterMap results are in qualitative agreementwith the experimental activities for modifications within eachof the S1, S2, and S3 pockets, WaterMap scoring by itself doesnot provide an accurate prediction of the activity trends acrossthe entire dataset (R2 = 0.16 for series 1 and R2 = 0.20 forseries 2; Figure 7). MM-GBSA correlation is much better (R2 =
0.62 and R2 = 0.75, respectively), suggesting the inclusion ofother binding energy terms such as van der Waals, electrostat-ics, and desolvation are required to supplement the WaterMapscore. Indeed, for series 1 the combined WM/MM scoring re-sults in an improved correlation (R2 = 0.79). This is a significantimprovement, given that the frequency to achieve an R2 valueof 0.62 at random with 12 data points is 1.7 % whereas toobtain 0.79 is only 0.1 %. However, for series 2 a significant de-
Table 3. Experimental and calculated binding affinities for selected thrombin inhibitors (series 2).
Compd R1 R2 R3 Ki [nm][a] DGbind [kcal mol�1]Exp.[a] ITC[a] WM MM-GBSA WM/MM
4 H H C(=NH2+)NH2 4.0 �11.6 �11.02�0.14 �25.6 �60.3 �46.0
6a Cl Cl H 60.0 �10.0 �9.18�0.05 �26.5 �57.6 �47.81 b[c] H Cl H 180.0 �9.3 �8.46�0.07 �25.5 �51.2 �45.06 b Me Cl H 260.0 �9.1 �8.89�0.12 �26.5 �52.8 �47.16 e F Cl H 500.0 �8.7 �8.91�0.17 �26.4 �50.5 �47.21 d H I H 540.0 �8.7 �8.25�0.19 �25.8 �51.3 �46.61 c H Br H 560.0 �8.6 �8.56�0.14 �25.6 �50.7 �45.6
3 a[c] H Me H 1210.0 �8.2 �8.32�0.07 �25.3 �52.1 �42.27 a Me Me H 2780.0 �7.7 �8.22�0.02 �26.4 �50.9 �43.61 a H F H 3990.0 �7.5 �7.48�0.05 �24.8 �48.6 �41.53 b H Et H 5170.0 �7.3 �7.86�0.12 �25.0 �43.9 �41.85[c] H H H 11 210.0 �6.8 �7.58 �24.7 �47.9 �40.6
[a] Values taken from Baum et al.[7a] [b] Determined from experimental Ki values. [c] Compounds relevant to determining the solvation-related contributionsto the binding affinity of S1-subgroove-filling groups are denoted in bold text.
Figure 6. Effects of neutral P1 substituents in the S1 subpocket of thrombin.Left : unstable hydration site observed between series 1 thrombin inhibitor 5and Tyr228. Right: comparison of neutral P1 substituents for series 1 inhibi-tors. Compounds shown: 5, 3 a, and 1 b. Experimental DG binding energiesfrom ITC and Ki values are from Baum et al.[7a]
Figure 7. Correlations between experimental binding energies for series 1 thrombin inhibitors and calculated binding energies from A) WaterMap, B) MM-GBSA, and C) WM/MM.
ChemMedChem 2011, 6, 1049 – 1066 � 2011 Wiley-VCH Verlag GmbH & Co. KGaA, Weinheim www.chemmedchem.org 1055
Explicit Solvent Effects

crease in correlation (R2 = 0.42) is observed. Removing com-pound 4 improves WM/MM scoring for series 2 (R2 = 0.81),which is better than WM and MM-GBSA results alone(Figure 8). The removal of compound 4 can be reasoned bythe fact that it is the only charged inhibitor within series 2,forming a salt bridge interaction with Asp189. The accurate es-timation of relative energies for strong charge–charge interac-tions compared with neutral interactions is a known limitationof implicit solvent models.[24] Interestingly, the MM-GBSAmethod performs very well on this compound, suggesting thatthe balance of terms between WaterMap and MM-GBSA whendealing with charged interactions requires additional develop-ment efforts that are beyond the scope of this work. Forseries 1 there is a moderate correlation between activity andmolecular weight (R2 = 0.42), whereas for series 2 only a weakcorrelation exists (R2 = 0.15). The moderate correlations of mo-lecular weight with series 1 and some of the series presentedbelow are expected, given that compounds generally getlarger as potency is increased during a lead optimization proj-ect. Furthermore, the larger compounds that lose substantialactivity (or are inactive) are typically not published in lead opti-mization papers.
Factor Xa
A similar study was performed on factor Xa using two inhibitordatasets (Table 4, Table 5, and Table 6). The first set, series 3, in-cludes all neutral P1 groups taken from Nazar� et al. ,[25] andthe second, series 4, is derived from Phillips et al.[26] and con-
tains all basic amidine P1 groups. As with thrombin, the S1subpocket water in factor Xa (Figure 9) corresponds to themost unstable hydration site in the binding site, with DG>5.5 kcal mol�1. This might be expected, considering the se-quence in the S1 subpocket is identical between factor Xa andthrombin. The S4 pocket, a deep hydrophobic cavity enclosedby Tyr99, Phe174, and Trp215, is unique to factor Xa. As shownin Figure 9 A, a large cluster of unstable waters is predicted inthe S4 pocket, consistent with the fact that a majority of themost potent compounds reported consistently bind to the S1and S4 sites.[27]
In addition to S1 and S4, an unstable hydration site is ob-served in the solvent-exposed “ester-binding pocket” (EBP), asshown in Figure 9 A and Figure 10. This pocket is surroundedby the Cys220–Cys191 disulfide bridge and polar flexible resi-dues Gln192, Glu147, and Arg143. Interestingly, the hydrationsite at this region is both enthalpically and entropically unsta-ble (DH = 3.7 kcal mol�1, �TDS = 1.3 kcal mol�1). The region ofthis site could easily be classified as polar given the close prox-imity of Gln192 (Figure 10). Indeed, this residue’s amide groupprojects a hydrogen bond donor shell (blue mesh) to which itcan accept a hydrogen bond interaction. Therefore, one couldordinarily rationalize placing a hydrogen bond donor group atR2 for the series 3 compounds; however, to our knowledge, nodonor groups at R2 have been described. The WaterMap andWM/MM analyses suggest that the displacement of water fromthis site by either nonpolar (methyl/chloro) or polar (nitro)groups would be favorable for binding. This is supported byfour of the top-five most potent inhibitors for this series
Figure 8. Correlations between experimental binding energies for series 2 thrombin inhibitors and calculated binding energies from A) WaterMap, B) MM-GBSA, and C) WM/MM. D)–F) Same respective results as in A)–C), but with the exclusion of the only charged molecule in the series : compound 4.
1056 www.chemmedchem.org � 2011 Wiley-VCH Verlag GmbH & Co. KGaA, Weinheim ChemMedChem 2011, 6, 1049 – 1066
MED W. Sherman et al.

Table 4. Experimental and calculated binding affinities for selected factor Xa inhibitors (series 3).
Compd R1 R2 R3 Ki [nm][a] DGbind [kcal mol�1]Exp.[b] WM MM-GBSA WM/MM
29 b H H 1 �12.6 �29.6 �44.5 �45.8
22 b H H 3 �11.9 �31.2 �56.3 �50.1
23 b H H 3 �11.9 �31.2 �56 �49
27 b H H 3 �11.9 �31.2 �37.8 �43.6
24 b H H 4 �11.8 �31.2 �56.9 �50
26 b H H 15 �11 �29.8 �42 �46
46 Me CN 26 �10.6 �31.8 �41.1 �44.8
17 b H H 40 �10.4 �30.3 �52.5 �47.7
25 b H H 57 �10.1 �31.2 �55 �49.4
14 b H H 73 �10 �27.4 �49.3 �46.6
12 b H H 89 �9.9 �26.7 �41.8 �42.8
43 Me H 89 �9.9 �26.7 �39 �42.8
28 b H H 287 �9.2 �28.6 �39.8 �43.7
19 b H H 400 �9 �32 �49 �46.1
44 Me CN 406 �9 �27.5 �29 �41
15 b H H 474 �8.9 �27.8 �46 �46.7
13 b H H 654 �8.7 �26 �37.6 �39.4
18 b H H 810 �8.5 �27.7 �50.5 �47
8 b H H 2100 �8 �26.5 �41 �40.8
ChemMedChem 2011, 6, 1049 – 1066 � 2011 Wiley-VCH Verlag GmbH & Co. KGaA, Weinheim www.chemmedchem.org 1057
Explicit Solvent Effects

(Table 5). The directional hydro-gen bonding effects that lead tothe poor solvation at this siteare depicted in Figure 10. Thewater occupying this site makesless than one time-averagedwater–protein hydrogen bonddespite being within a hydrogenbonding distance of three hydro-philic residues. The basis for thelack of water–protein hydrogenbonding is the peculiar spatialarrangement of the protein hy-drogen bonding groups sur-rounding the site. In particular,the angle between the Gln192side chain carbonyl group andthe Glu147 backbone carbonylgroup is ~1178, so in principle, awater molecule could donate hy-drogen bonds to both groups.However, this would lead to ahighly unfavorable electrostaticinteraction with Arg143, as thepositive end of the dipolemoment of the water moleculewould become oriented towardthe center of the positive chargeof the arginine side chain. Thus,the orientation of arginine in thecrystal structure does not permit
Table 4. (Continued)
Compd R1 R2 R3 Ki [nm][a] DGbind [kcal mol�1]Exp.[b] WM MM-GBSA WM/MM
20 b H H 2230 �7.9 �32 �46.9 �48.4
9 b H H 2480 �7.9 �26.9 �42.4 �41
11 b H H 2500 �7.8 �26.3 �46.1 �42.1
21 b H H 2730 �7.8 �27.7 �47.5 �46.2
10 b H H 9010 �7.1 �26.4 �41.5 �40.2
16 b H H 10 000 �7 �28.3 �35.3 �41.2
[a] Values taken from Nazar� et al.[25] [b] Determined from experimental Ki values.
Table 5. Experimental and calculated binding affinities for selected factor Xa inhibitors (series 3 continued).
Compd Indole Ki [nm][a] DGbind [kcal mol�1]Exp.[b] WM MM-GBSA WM/MM
21 0.07 �14.2 �31.8 �58.7 �52.2
39 0.1 �14 �31.6 �54.9 �51
37 0.25 �13.4 �31.6 �55.9 �50.8
41 0.3 �13.3 �31.4 �60 �51.5
35 0.7 �12.8 �31.6 �54.2 �50.4
32 1 �12.6 �30.2 �60.5 �49.7
38 1 �12.6 �31.6 �56.4 �50.7
1058 www.chemmedchem.org � 2011 Wiley-VCH Verlag GmbH & Co. KGaA, Weinheim ChemMedChem 2011, 6, 1049 – 1066
MED W. Sherman et al.

greater stabilization of the wateroccupying the site by way of fa-vorable hydrogen bonding inter-actions. The consequence of thisarrangement is that water sol-vating this site mainly donates ahydrogen bond to the side chainof Gln192, while becoming moreorientationally disordered withrespect to Glu147 and Arg143.This diminishment in hydrogenbonding opportunities leads towater molecules in this regionbeing enthalpically unfavorable.
Unlike in series 3, none of theseries 4 factor Xa inhibitors dis-place the S1 water (Figure 11);instead it remains trapped, form-ing hydrogen bonds with the in-hibitor amidine group and car-bonyl of Ile227.[28] In Figure 11 B,the hydration sites are coloredcyan, yellow, and green to repre-sent waters dominated by lowerenthalpy, lower entropy, andsimilar enthalpy/entropy values,respectively; color brightnesssignifies the magnitude of thesevalues. Here it is clear that theS1 pocket is filled with severalbright cyan hydration sites, sug-gesting a region that is enthalpi-cally favorable for waters be-cause they solvate the aspartate.A functional replacement ofthese waters, as opposed to adisplacement, by a polar func-tional group would be consid-ered favorable, and is indeedachieved by guanidine/amidinegroups. Because a good portionof the affinity can likely be at-tributed to the benzamidine–Asp189 salt bridge interaction,as in the prior examples, a morecomplete description of bindingcan be obtained by combiningWaterMap scoring with a fullmolecular mechanics treatmentof binding provided by the MM-GBSA model. For factor Xaseries 3 and 4, the WaterMapcorrelations with experiment areR2 = 0.42 and R2 = 0.46, respec-tively (see Figure 12 andFigure 13). MM-GBSA also per-forms well (R2 = 0.47 and R2 =
Table 5. (Continued)
Compd Indole Ki [nm][a] DGbind [kcal mol�1]Exp.[b] WM MM-GBSA WM/MM
22 2 �12.2 �31.3 �60.1 �50.5
23 2 �12.2 �31.3 �60.6 �51.5
24 2 �12.2 �31.3 �61.3 �51.8
30 2 �12.2 �29.6 �56.9 �48.8
17 3 �11.9 �31.3 �57.6 �50.3
25 3 �11.9 �31.3 �57.4 �49.2
36 3 �11.9 �31.3 �55.7 �49.9
26 5 �11.6 �30.8 �57.3 �49.3
33 7 �11.4 �31.2 �57 �50.4
34 7 �11.4 �31.8 �56.4 �48.4
42 7 �11.4 �31.8 �58.9 �49.9
27 9 �11.3 �30.6 �56.9 �49.1
29 9 �11.3 �31 �56.1 �48.9
13 18 �10.8 �31.8 �55.4 �48.5
ChemMedChem 2011, 6, 1049 – 1066 � 2011 Wiley-VCH Verlag GmbH & Co. KGaA, Weinheim www.chemmedchem.org 1059
Explicit Solvent Effects

0.44, respectively), but the best results are obtained with WM/MM scoring (R2 = 0.54 and R2 = 0.60, respectively). The correla-tion between molecular weight and activity was significant forseries 3 (R2 = 0.36) and series 4 (R2 = 0.32), but still lower thanthe physics-based methods. The high-molecular-weight corre-lations, as discussed in the case of thrombin above, are likely aresult of larger inactive compounds not being reported in theoriginal experimental work.
Factor VIIa
A final study was performed onfactor VIIa using inhibitors fromthe dataset of Shiraishi et al.(Table 7 and Table 8).[29] Unlikethrombin and factor Xa, the S1subpocket in factor VIIa differsby the substitution of alanine forserine at position 190(Figure 14). Despite this differ-ence, the S1 subpocket hydra-tion site still has the most unfav-orable free energy (DG =
5.8 kcal mol�1), similar to theaverage free energies observedfor thrombin and factor Xa (6.4and 6.1 kcal mol�1, respectively).This site has more favorable en-thalpy (2.0 kcal mol�1) and moreunfavorable entropy (3.8 kcalmol�1) compared with the S1subpocket hydration in thrombin(DH = 3.5 kcal mol�1, �TDS =
2.9 kcal mol�1) and factor Xa(DH = 3.4 kcal mol�1, �TDS =
2.7 kcal mol�1). This similarity infree energy with a different ther-modynamic signature can be un-derstood from enthalpy/entropycompensation effects, by whichthe water in factor VIIa losesmore degrees of freedom (worseentropy) as a result of making afavorable hydrogen bond withSer190 (better enthalpy).
Whereas reports of neutral P1inhibitors of factor Xa andthrombin are more prevalent,there is evidence that neutralhaloaromatic-fragment-contain-ing inhibitors can bind to factorVIIa.[30] X-ray crystal structuresshow the haloaromatic frag-ments displace the S1 subpocketwater in the same manner as theneutral P1 groups of thrombin
and factor Xa inhibitors, consistent with the WaterMap predic-tions. Figure 15 shows the correlations between predicted andexperimental scoring for factor VIIa. The combined WM/MMscoring (R2 = 0.50) shows an improvement over the individualWM and MM-GBSA scores (R2 = 0.26 and R2 = 0.21, respectively).Given the small number of compounds in this series, wecannot rule out the possibility that the high correlation be-tween the WM/MM predictions and the experimental data issomewhat fortuitous. For 14 data points, there is a 3 % randomchance of achieving an R2 correlation of at least 0.50, which is
Table 5. (Continued)
Compd Indole Ki [nm][a] DGbind [kcal mol�1]Exp.[b] WM MM-GBSA WM/MM
31 20 �10.8 �33.5 �56.9 �48.5
40 55 �10.2 �32 �61.9 �51.4
[a] Values taken from Nazar� et al.[25] [b] Determined from experimental Ki values.
Table 6. Experimental and calculated binding affinities for selected factor Xa inhibitors (series 4).
Compd R1 R2 R3 Ki [nm][a] DGbind [kcal mol�1]Exp.[b] WM MM-GBSA WM/MM
18 CONMe2 H 6-OH 1.8 �12.2 �27.5 �62.8 �46.920 NMe2 H 6-OH 3.0 �11.9 �26.8 �68.8 �46.817 CONMe2 H 6-NH2 14.0 �11.0 �27.5 �61.8 �46.53 CONMe2 H H 80.0 �9.9 �27.0 �58.2 �44.3
15 CONMe2 5-OMe H 140.0 �9.6 �27.5 �58.1 �45.38 NMe2 H H 160.0 �9.5 �26.3 �65.0 �44.41 CONH2 H H 280.0 �9.2 �25.9 �53.4 �42.1
16 NMe2 2-Me H 320.0 �9.1 �26.3 �60.4 �45.89 NHEt H H 530.0 �8.8 �24.8 �63.4 �43.42 CONHMe H H 1200.0 �8.3 �26.3 �55.2 �42.0
19 NMe2 H 6-Me 1200.0 �8.3 �26.9 �65.1 �45.710 OMe H H 1350.0 �8.2 �24.7 �49.4 �40.54 COMe H H 1400.0 �8.2 �25.5 �53.1 �41.6
21 NMe2 H 6-OMe 1400.0 �8.2 �27.3 �63.5 �45.314 CF3 H H 1600.0 �8.1 �26.1 �48.1 �40.112 Cl H H 1700.0 �8.1 �24.7 �51.4 �36.911 OCF3 H H 1800.0 �8.0 �26.5 �50.4 �39.85 NO2 H H 2500.0 �7.8 �25.9 �50.8 �40.17 F H H 3200.0 �7.7 �24.2 �48.9 �34.56 NH2 H H 3300.0 �7.7 �24.3 �47.6 �34.0
13 OH H H 5000.0 �7.4 �24.3 �51.1 �36.2
[a] Values taken from Phillips et al.[26] [b] Determined from experimental Ki values.
1060 www.chemmedchem.org � 2011 Wiley-VCH Verlag GmbH & Co. KGaA, Weinheim ChemMedChem 2011, 6, 1049 – 1066
MED W. Sherman et al.

significantly lower than the random probability of achieving atleast R2 = 0.26 (18 %) and R2 = 0.21 (23 %), suggesting the re-sults are indeed significant. However, recent work has high-lighted the relatively high likelihood of spuriously attaininghigh correlations with small ranges in experimental data andfew data points.[31] There is a significant correlation betweenmolecular weight and activity for this series (R2 = 0.39), al-though it is lower than the WM/MM predictions and, as men-tioned above, likely reflects that most high-molecular-weightinactive compounds are not published.
Finally, there is promise that a more accurate scoring func-tion such as WM/MM can be used to compare binding ener-gies across different targets. In fact, for the aggregate set of all118 compounds presented herein, the R2 value for WM/MM is0.62, whereas for WaterMap, MM-GBSA, and molecular weight,it is 0.09, 0.13, and 0.41, respectively (see Supporting Informa-tion figure S4). A global scoring function without target-specif-ic parameters has significant implications in drug discoverythat extend beyond affinity-based lead optimization. In particu-lar, if relative energies can be accurately predicted across mul-tiple targets, then the scoring function could be used to assessselectivity among targets. A more comprehensive study of se-lectivity is beyond the scope of this work and will be the focusof future research.
Conclusions
In this work, we have highlighted the importance of account-ing for explicit water molecule energetics in determining bind-ing affinity within a number of serine proteases. Specifically,the hydration site corresponding to the S1 subpocket waterwas consistently found to be among the highest-energy site inthrombin, factor VIIa, and factor Xa. Other high-energy hydra-
Figure 9. WaterMap of the factor Xa binding site (PDB code 2BOH receptor)and comparison between series 3 inhibitors 21 (cyan carbons, 0.07 nm) and16 b (yellow carbons, 10 000 nm). A) Unstable hydration sites in the S4pocket are displaced by the 4-isopropylpiperidine P4 groups in both ligands.Unstable hydration site in the ester-binding pocket (EBP) is displaced onlyby 21 via a methyl group. B) S1 subpocket hydration site is displaced onlyby 21 via a chloro group. The color scheme and free energy thresholds ofthe hydration sites are as described for Figure 5.
Figure 10. Series 3 factor Xa inhibitor 21 displaces the unstable hydrationsite in the EBP. A) SiteMap hydrogen bond donor region (blue mesh) is pro-jected by the acyl group on Gln192 amide (see the Experimental Section forSiteMap details). B) The interactions of water solvating the EBP in factor Xa(PDB code 2BOH). The arrow represents the average dipole of the water,where the arrowhead points toward d-.
ChemMedChem 2011, 6, 1049 – 1066 � 2011 Wiley-VCH Verlag GmbH & Co. KGaA, Weinheim www.chemmedchem.org 1061
Explicit Solvent Effects

tion sites were found in the S2, S4, and ester binding pocket(EBP). It was shown that the most potent inhibitors for thesetargets typically displace all of the highest-energy hydrationsites. Furthermore, structure–activity relationships (SAR) couldbe explained based on the hydration site displacement ener-gies. However, WaterMap only computes one component ofthe binding free energy (the water displacement energy), andtherefore a more complete model of the total binding freeenergy should result in better predictions of experimental ac-
tivities. Indeed, a hybrid approach developed here, called WM/MM, in which the WaterMap displacement energy is appropri-ately combined with energy components from MM-GBSA, con-sistently produced better correlations with experiment.
Although the results presented herein are encouraging,there are still limitations in the methodology. First, if substan-tial protein rearrangement is required for the accommodationof ligands within the series, then this approach will not beable to accurately represent those movements. The WaterMapcalculations were run with harmonic restraints on the proteinthat only allow small variations in the protein atom coordi-nates over the course of the molecular dynamics simulation.Furthermore, we used a single snapshot MM-GBSA approachwith energy-minimized structures, which appears to be suffi-cient for the cases presented herein, but may not be for casesin which larger movements are required. In such cases, molec-ular dynamics, Monte Carlo, or other sampling approachesmay be needed.
Another limitation in the work presented here is the difficul-ty of comparing charged interactions with neutral interactions.Indeed, results for the WM/MM method were suboptimal inthe case of factor Xa, where a series contained a mixture ofneutral and charged S1 binders. Results improved considerablywhen only species of the same net charge were compared. Ad-vances in the implicit solvent methodology and the combina-tion of WaterMap with MM-GBSA should improve the ability tocompare molecules with different formal charges.
Finally, serine proteases have very specific binding site char-acteristics, which may lend them to the approach presentedhere. Specifically, the binding sites are relatively rigid, andthere are well-defined hydration sites that are displaced by li-gands. Although WaterMap has been successfully applied to awide range of other target classes in previous publications, thechemical modifications in those studies were complementarywith the receptor, which represents a best-case scenario forWaterMap. The WM/MM methodology presented herein pro-duced improvements over WaterMap or MM-GBSA in mostcases, which is encouraging for scoring more diverse ligandmodifications.
This WM/MM method has been shown to improve the pre-dictions in most cases relative to WaterMap alone or MM-GBSA. In fact, in only a single case (MM-GBSA scoring ofseries 2) does another method outperform WM/MM. Moreover,the WM/MM method provides consistency, in that it is the onlymethod that produces good results for all of the datasets inthis work. The worst WM/MM R2 value for any series is 0.42,and the R2 correlations for all other series are >0.50. On theother hand, each of the other methods has at least one casethat performs poorly. Additional work is needed to fully under-stand the applicability of the WM/MM methodology to theprediction of binding free energies, and we are making effortsto expand our datasets to cover a larger set of target classesand ligand series.
Figure 11. Comparisons of two WaterMap color schemes, with series 4 inhib-itor 18 in the factor Xa binding site (PDB code 1FJS). A) The color spectrumranges from red (more unfavorable) to green (less unfavorable). The S1 sub-pocket hydration site is circled and represents the most unfavorable site.B) The hydration sites are colored cyan, yellow, and green to representwaters dominated by lower enthalpy, lower entropy, and similar enthalpy/entropy values, respectively; color brightness signifies the magnitude ofthese values.
1062 www.chemmedchem.org � 2011 Wiley-VCH Verlag GmbH & Co. KGaA, Weinheim ChemMedChem 2011, 6, 1049 – 1066
MED W. Sherman et al.

Experimental Section
Structure preparation
Protein coordinates were retrieved from the RCSB Protein DataBank (PDB).[32] PDB structures include: thrombin (1O2G, 1MUE,2ZFF, 2ZF0, 2ZDV, 2ZC9, 2ZDA, and 3D49); factor Xa (2BOH and
1FJS); and factor VIIa (1WQV and2ZP0). Each structure was preparedby using the Protein PreparationWizard, which is part of the Maes-tro software package (Maestro ver-sion 9.0, Schrçdinger, LLC, NewYork, NY, USA). Bond orders andformal charges were added forheteroatomic groups, and hydro-gens were added to all atoms inthe system. To optimize the hydro-gen bond network, histidine tauto-mers and ionization states werepredicted, 1808 rotations of theterminal dihedral angle of Asn,Gln, and His residues were as-signed, and hydroxy and thiol hy-drogen atoms were sampled. Theprotonation states of the catalytictriad (Ser195, His57, and Asp102)were in agreement with previousreports.[33] Effects of using an incor-rectly protonated catalytic triadwere examined during the courseof this work and was shown toproduce poorer correlations be-tween predicted and experimentalbinding energies (see SupportingInformation, S3). Crystal waters inall structures were removed beforeperforming calculations.
For each structure, a brief relaxa-tion was performed by using anall-atom constrained minimizationcarried out with the Impact Refine-ment module (Impref) (Impactv5.5, Schrçdinger, LLC, New York,NY, USA) using the OPLS-2005force field to alleviate steric clashes
that may be present in the original PDB structures. The minimiza-tion was terminated when the energy converged or the RMSDreached a maximum cutoff of 0.30 � for heavy atoms.
Table 7. Experimental and calculated binding affinities for selected factor VIIa inhibitors (series 5).
Compd R1 R2 R3 Ki [nm][a] DGbind [kcal mol�1]Exp.[b] WM MM-GBSA WM/MM
9 l-Met d-Ile Benzyl 15 �11.2 �12.8 �93.3 �44.25 l-Gln d-Ile Benzyl 25 �10.9 �8.2 �95.4 �40.78 l-Met d-Ile Propyl 35 �10.7 �12.1 �87 �41.8
11 l-Met d-Thr Benzyl 42 �10.6 �11.6 �90.9 �42.34 l-Gln d-Ile Propyl 69 �10.3 �7.5 �89.4 �38.37 l-Gln d-Thr Benzyl 114 �9.9 �7.2 �92.8 �39
10 l-Met d-Thr Propyl 130 �9.9 �11.2 �84.7 �40.26 l-Gln d-Thr Propyl 198 �9.6 �6.9 �86.6 �37
[a] Values taken from Shiraishi et al.[29] [b] Determined from experimental Ki values.
Table 8. Experimental and calculated binding affinities for selected factor VIIa inhibitors (series 5 continued).
Compd R1 R2 R3 Ki [nm][a] DGbind [kcal mol�1]Exp.[b] WM MM-GBSA WM/MM
12 b l-Gln d-Ile m-CO2H 18 �11.1 �7.8 �92.7 �39.412 f l-Met d-Ile m-CO2H 20 �11 �12.7 �90 �43.212 e l-Met d-Thr m-CO2H 30 �10.8 �11.3 �88.2 �41.212 c l-Gln d-Ile p-CO2H 35 �10.7 �11.2 �84.9 �40.512 a l-Gln d-Ile o-CO2H 43 �10.6 �7.7 �89.6 �38.412 d l-Gln d-Thr m-CO2H 74 �10.2 �6.9 �90.1 �37.9
[a] Values taken from Shiraishi et al.[29] [b] Determined from experimental Ki values.
Figure 12. Correlations between experimental binding energies for series 3 factor Xa inhibitors and calculated binding energies from A) WaterMap, B) MM-GBSA, and C) WM/MM.
ChemMedChem 2011, 6, 1049 – 1066 � 2011 Wiley-VCH Verlag GmbH & Co. KGaA, Weinheim www.chemmedchem.org 1063
Explicit Solvent Effects

WaterMap calculations
The binding site for WaterMap simulations was defined by the po-sition of the crystallized ligand, except in the case of the apo struc-tures, in which a docked ligand was used. The exact docked posi-
tion of the ligand did not have a significant impact on the hydra-tion site locations and energetics (data not shown), as the coordi-nates of the protein were identical, and the ligand was only usedto define the volume where the statistical thermodynamic analysisof hydration sites was performed. In the analysis of the dataset ofBaum et al. ,[7a] WaterMap was run in two modes corresponding tothe presence or absence of bound ligand in the simulation. For theSAR studies, WaterMap was run without the bound ligand in thesimulation.
Each ligand was scored with WaterMap using the default scoringfunction that computes the binding free energy of a ligand as thesum of the free energies associated with the displacement ofwater from the hydration sites by the ligand upon binding, as de-scribed in previous works.[16–17] This includes only one componentof the binding free energy (namely, the water displacement), andtherefore does not provide a complete picture of binding when li-gands differ in ways beyond simple hydrophobic modificationsthat fit into the binding site. To account for modifications beyondsteric changes, we implemented a scoring protocol that incorpo-rates terms from an MM-GBSA calculation, such as protein–ligandvan der Waals contacts, electrostatic interactions, ligand desolva-tion, and internal strain (ligand and protein). This new scoring pro-tocol, called WM/MM, combines the full WaterMap score with theaforementioned terms from a MM-GBSA calculation performedwith Prime (Prime v2.2, Schrçdinger, LLC, New York, NY, USA). It is
Figure 13. Correlations between experimental binding energies for series 4 factor Xa inhibitors and calculated binding energies from A) WaterMap, B) MM-GBSA, and C) WM/MM.
Figure 14. S1 subpocket of factor VIIa (PDB code 1WQV). The unstable S1 hy-dration site is shown as a red sphere.
Figure 15. Correlations between experimental binding energies for series 5 factor VIIa inhibitors and calculated binding energies from A) WaterMap, B) MM-GBSA, and C) WM/MM.
1064 www.chemmedchem.org � 2011 Wiley-VCH Verlag GmbH & Co. KGaA, Weinheim ChemMedChem 2011, 6, 1049 – 1066
MED W. Sherman et al.

important to use the correct subset of terms from the MM-GBSA inorder to avoid double counting. The details of the WM/MM imple-mentation are given in the Supporting Information (S1).
Ligand preparation
Thrombin inhibitors were taken from Baum et al. ,[7a] Burgeyet al. ,[23a] and Young et al.[23b] Factor Xa inhibitors were taken fromNazar� et al.[25] and Phillips et al.[26] Structures were built usingMaestro based on the lead compounds of thrombin (series 1,1MUE; and series 2, 2ZDA), factor Xa (series 3, 2BOH; and series 4,1FJS), and factor VIIa (series 5, 1WQV and 2ZPO). Ligand protona-tion states were predicted with Epik (Epik, v2.0, Schrçdinger, LLC,New York, NY, USA). Compounds with the lowest Epik State Penaltywere used, except for factor Xa inhibitors, for which positive ioniza-ble P4 groups were selected because of experimental evidence insupport of the S4 pocket preference for basic groups.[7b]
Modifications to the lead compound by substituents containingone rotatable bond were refined using the Rapid Torsion Scan utili-ty in Maestro. Rotamers were sampled in 18 increments and rankedby the sum of van der Waals, electrostatic, strain, and WaterMapenergies. Rotamers with the total lowest energy were chosen forall subsequent calculations. Ligands with substituents of two ormore rotatable bonds were docked into the binding site usingGlide XP (Glide v5.5, Schrçdinger, LLC, New York, NY, USA) to allowfor conformational sampling of the functional group. Core con-straints with an RMSD tolerance of 1.0 � were applied to restrictdocking to the crystallographic position of the common core ofthe lead compound. A maximum of the 10 best-scoring poseswere saved from the Glide docking calculations and rescored withWaterMap. The lowest-energy pose based on the WaterMap ener-gies was retained for the final results. To focus the WaterMapenergy differences on sites of variation (as opposed to minor varia-tions in the core), final poses were realigned onto the core of thelead compound from the crystal structure using the Superpositiontool in Maestro before WaterMap scoring.
Keywords: factor VIIa · factor Xa · serine proteases ·thrombin · WaterMap
[1] a) N. R. Goldsack, R. C. Chambers, K. Dabbagh, G. J. Laurent, Int. J. Bio-chem. Cell Biol. 1998, 30, 641 – 646; b) M. D. Freedman, Am. J. Ther.1996, 3, 771 – 783; c) S. R. Coughlin, Nature 2000, 407, 258 – 264; d) D.Leung, G. Abbenante, D. P. Fairlie, J. Med. Chem. 2000, 43, 305 – 341;e) J. Hirsh, M. O’Donnell, J. I. Weitz, Blood 2005, 105, 453 – 463.
[2] a) S. Okamoto, A. Hijikata, R. Kikumoto, S. Tonomura, H. Hara, K. Nino-miya, A. Maruyama, M. Sugano, Y. Tamao, Biochem. Biophys. Res.Commun. 1981, 101, 440 – 446; b) T. Nagahara, Y. Yokoyama, K. Inamura,S. Katakura, S. Komoriya, H. Yamaguchi, T. Hara, M. Iwamoto, J. Med.Chem. 1994, 37, 1200 – 1207; c) K. Hilpert, J. Ackermann, D. W. Banner,A. Gast, K. Gubernator, P. Hadv�ry, L. Labler, K. M�ller, G. Schmid, T. B.Tschopp, J. Med. Chem. 1994, 37, 3889 – 3901.
[3] T. Steinmetzer, J. St�rzebecher, Curr. Med. Chem. 2004, 11, 2297 – 2321.[4] a) W. C. Lumma, K. M. Witherup, T. J. Tucker, S. F. Brady, J. T. Sisko, A. M.
Naylor-Olsen, S. D. Lewis, B. J. Lucas, J. P. Vacca, J. Med. Chem. 1998, 41,1011 – 1013; b) T. J. Tucker, S. F. Brady, W. C. Lumma, S. D. Lewis, S. J. Gar-dell, A. M. Naylor-Olsen, Y. Yan, J. T. Sisko, K. J. Stauffer, B. J. Lucas, J. J.Lynch, J. J. Cook, M. T. Stranieri, M. A. Holahan, E. A. Lyle, E. P. Baskin,I. W. Chen, K. B. Dancheck, J. A. Krueger, C. M. Cooper, J. P. Vacca, J. Med.Chem. 1998, 41, 3210 – 3219; c) T. J. Tucker, W. C. Lumma, A. M. Muli-chak, Z. Chen, A. M. Naylor-Olsen, S. D. Lewis, R. Lucas, R. M. Freidinger,L. C. Kuo, J. Med. Chem. 1997, 40, 830 – 832.
[5] a) W. Bode, I. Mayr, U. Baumann, R. Huber, S. R. Stone, J. Hofsteenge,EMBO J. 1989, 8, 3467 – 3475; b) W. D. Shrader, W. B. Young, P. A.
Sprengeler, J. C. Sangalang, K. Elrod, G. Carr, Bioorg. Med. Chem. Lett.2001, 11, 1801 – 1804.
[6] a) K. G. Zbinden, U. Obst-Sander, K. Hilpert, H. Kuhne, D. W. Banner, H. J.Bohm, M. Stahl, J. Ackermann, L. Alig, L. Weber, H. P. Wessel, M. A. Rie-derer, T. B. Tschopp, T. Lave, Bioorg. Med. Chem. Lett. 2005, 15, 5344 –5352; b) S.-J. Ho, T. A. Brighton, Vasc. Health Risk Manage. 2006, 2, 49 –58.
[7] a) B. Baum, M. Mohamed, M. Zayed, C. Gerlach, A. Heine, D. Hangauer,G. Klebe, J. Mol. Biol. 2009, 390, 56 – 69; b) S. Maignan, J. P. Guilloteau,Y. M. Choi-Sledeski, M. R. Becker, W. R. Ewing, H. W. Pauls, A. P. Spada, V.Mikol, J. Med. Chem. 2003, 46, 685 – 690; c) M. Nazar�, M. Essrich, D. W.Will, H. Matter, K. Ritter, M. Urmann, A. Bauer, H. Schreuder, A. Dudda, J.Czech, M. Lorenz, V. Laux, V. Wehner, Bioorg. Med. Chem. Lett. 2004, 14,4191 – 4195.
[8] a) H. Matter, M. Nazar�, S. Gussregen, D. W. Will, H. Schreuder, A. Bauer,M. Urmann, K. Ritter, M. Wagner, V. Wehner, Angew. Chem. 2009, 121,2955 – 2960; Angew. Chem. Int. Ed. 2009, 48, 2911 – 2916; b) H. Matter,D. W. Will, M. Nazar�, H. Schreuder, V. Laux, V. Wehner, J. Med. Chem.2005, 48, 3290 – 3312.
[9] Y. N. Imai, Y. Inoue, I. Nakanishi, K. Kitaura, Protein Sci. 2008, 17, 1129 –1137.
[10] K. Manikandan, S. Ramakumar, Proteins Struct. Funct. Bioinf. 2004, 56,768 – 781.
[11] D. Sitkoff, “Role of the Chlorine Atom in a Series of 3-Chloroindole-7-yl-Based FXa Inhibitors” in Abstracts of Papers, 236th ACS National Meeting,Division of Medicinal Chemistry, Vol. MEDI 307, Philadelphia, PA (USA),August 17 – 21, 2008.
[12] Y. Shi, D. Sitkoff, J. Zhang, H. E. Klei, K. Kish, E. C. Liu, K. S. Hartl, S. M.Seiler, M. Chang, C. Huang, S. Youssef, T. E. Steinbacher, W. A. Schu-macher, N. Grazier, A. Pudzianowski, A. Apedo, L. Discenza, J. Yanchu-nas, P. D. Stein, K. S. Atwal, J. Med. Chem. 2008, 51, 7541 – 7551.
[13] W. Bode, D. Turk, A. Karshikov, Protein Sci. 1992, 1, 426 – 471.[14] B. A. Katz, P. A. Sprengeler, C. Luong, E. Verner, K. Elrod, M. Kirtley, J.
Janc, J. R. Spencer, J. G. Breitenbucher, H. Hui, D. McGee, D. Allen, A.Martelli, R. L. Mackman, Chem. Biol. 2001, 8, 1107 – 1121.
[15] a) T. Lazaridis, J. Phys. Chem. B 1998, 102, 3531 – 3541; b) T. Young, R.Abel, B. Kim, B. J. Berne, R. A. Friesner, Proc. Natl. Acad. Sci. USA 2007,104, 808 – 813.
[16] R. Abel, T. Young, R. Farid, B. J. Berne, R. A. Friesner, J. Am. Chem. Soc.2008, 130, 2817 – 2831.
[17] C. Higgs, T. Beuming, W. Sherman, ACS Med. Chem. Lett. 2010, 1, 160 –164.
[18] T. Beuming, R. Farid, W. Sherman, Protein Sci. 2009, 18, 1609 – 1619.[19] D. D. Robinson, W. Sherman, R. Farid, ChemMedChem 2010, 5, 618 – 627.[20] C. R. Guimar¼es, A. M. Mathiowetz, J. Chem. Inf. Model. 2010, 50, 547 –
559.[21] R. A. Pearlstein, Q. Y. Hu, J. Zhou, D. Yowe, J. Levell, B. Dale, V. K. Kaush-
ik, D. Daniels, S. Hanrahan, W. Sherman, R. Abel, Proteins 2010, 78,2571 – 2586.
[22] M. Nakasako, J. Mol. Biol. 1999, 289, 547 – 564.[23] a) C. S. Burgey, K. A. Robinson, T. A. Lyle, P. G. Nantermet, H. G. Selnick,
R. C. A. Isaacs, S. D. Lewis, B. J. Lucas, J. A. Krueger, R. Singh, C. Miller-Stein, R. B. White, B. Wong, E. A. Lyle, M. T. Stranieri, J. J. Cook, D. R. Mc-Masters, J. M. Pellicore, S. Pal, A. A. Wallace, F. C. Clayton, D. Bohn, D. C.Welsh, J. J. Lynch, Y. Yan, Z. Chen, L. Kuo, S. J. Gardell, J. A. Shafer, J. P.Vacca, Bioorg. Med. Chem. Lett. 2003, 13, 1353 – 1357; b) M. B. Young,J. C. Barrow, K. L. Glass, G. F. Lundell, C. L. Newton, J. M. Pellicore, K. E.Rittle, H. G. Selnick, K. J. Stauffer, J. P. Vacca, P. D. Williams, D. Bohn, F. C.Clayton, J. J. Cook, J. A. Krueger, L. C. Kuo, S. D. Lewis, B. J. Lucas, D. R.McMasters, C. Miller-Stein, B. L. Pietrak, A. A. Wallace, R. B. White, B.Wong, Y. Yan, P. G. Nantermet, J. Med. Chem. 2004, 47, 2995 – 3008.
[24] K. Zhu, M. R. Shirts, R. A. Friesner, J. Chem. Theory Comput. 2007, 3,2108 – 2119.
[25] a) M. Nazar�, M. Essrich, D. W. Will, H. Matter, K. Ritter, M. Urmann, A.Bauer, H. Schreuder, A. Dudda, J. Czech, M. Lorenz, V. Laux, V. Wehner,Bioorg. Med. Chem. Lett. 2004, 14, 4191 – 4195; b) M. Nazar�, D. W. Will,H. Matter, H. Schreuder, K. Ritter, M. Urmann, M. Essrich, A. Bauer, M.Wagner, J. Czech, M. Lorenz, V. Laux, V. Wehner, J. Med. Chem. 2005, 48,4511 – 4525.
[26] a) G. Phillips, D. D. Davey, K. A. Eagen, S. K. Koovakkat, A. Liang, H. P. Ng,M. Pinkerton, L. Trinh, M. Whitlow, A. M. Beatty, M. M. Morrissey, J. Med.
ChemMedChem 2011, 6, 1049 – 1066 � 2011 Wiley-VCH Verlag GmbH & Co. KGaA, Weinheim www.chemmedchem.org 1065
Explicit Solvent Effects

Chem. 1999, 42, 1749 – 1756; b) G. Phillips, W. J. Guilford, B. O. Buckman,D. D. Davey, K. A. Eagen, S. Koovakkat, A. Liang, M. McCarrick, R. Mohan,H. P. Ng, M. Pinkerton, B. Subramanyam, E. Ho, L. Trinh, M. Whitlow, S.Wu, W. Xu, M. M. Morrissey, J. Med. Chem. 2002, 45, 2484 – 2493.
[27] D. J. Pinto, J. M. Smallheer, D. L. Cheney, R. M. Knabb, R. R. Wexler, J.Med. Chem. 2010, 53, 6243 – 6274.
[28] M. Adler, D. D. Davey, G. B. Phillips, S. H. Kim, J. Jancarik, G. Rumennik,D. R. Light, M. Whitlow, Biochemistry 2000, 39, 12534 – 12542.
[29] T. Shiraishi, S. Kadono, M. Haramura, H. Kodama, Y. Ono, H. Iikura, T.Esaki, T. Koga, K. Hattori, Y. Watanabe, A. Sakamoto, K. Yoshihashi, T. Ki-tazawa, K. Esaki, M. Ohta, H. Sato, T. Kozono, Bioorg. Med. Chem. Lett.2008, 18, 4533 – 4537.
[30] J. Blaney, V. Nienaber, S. K. Burley in Fragment-Based Lead Discovery andOptimization, Vol. 34 (Eds. : W. Jahnke, D. A. Erlanson), Wiley-VCH, Wein-heim, 2006, pp. 228 – 230.
[31] S. P. Brown, S. W. Muchmore, P. J. Hajduk, Drug Discovery Today 2009,14, 420 – 427.
[32] H. M. Berman, J. Westbrook, Z. Feng, G. Gilliland, T. N. Bhat, H. Weissig,I. N. Shindyalov, P. E. Bourne, Nucleic Acids Res. 2000, 28, 235 – 242.
[33] a) L. Hedstrom, Chem. Rev. 2002, 102, 4501 – 4524; b) E. Zakharova, M. P.Horvath, D. P. Goldenberg, Proc. Natl. Acad. Sci. USA 2009, 106, 11034 –11039.
Received: December 10, 2010
Revised: March 8, 2011
Published online on April 19, 2011
1066 www.chemmedchem.org � 2011 Wiley-VCH Verlag GmbH & Co. KGaA, Weinheim ChemMedChem 2011, 6, 1049 – 1066
MED W. Sherman et al.


