Embed Size (px)
Citation preview
ARTICLE IN PRESS
1352-2310/$ - se
doi:10.1016/j.at
�Correspondfax: +3493411
E-mail addr
Atmospheric Environment 41 (2007) 6366–6378
www.elsevier.com/locate/atmosenv
Contribution of harbour activities to levels of particulate matterin a harbour area: Hada Project-Tarragona Spain
A. Alastueya,�, N. Morenoa, X. Querola, M. Vianaa, B. Artınanob, J.A. Luacesc,J. Basorac, A. Guerrad
aInstitute of Earth Sciences ‘‘Jaume Almera’’, (CSIC), c/Lluıs Sole i Sabarıs s/n, 08028 Barcelona, SpainbCIEMAT, Av. Complutense 22, 28040 Madrid, Spain
cPort de Tarragona, Passeig de l’Escullera s/n, 43004 Tarragona, SpaindEnte Publico Puertos del Estado, Av. Partenon 10, 28224 Madrid, Spain
Received 5 September 2006; received in revised form 23 February 2007; accepted 16 March 2007
Abstract
The present study seeks to estimate the impact of harbour activities on PM10 levels based on a complete chemical
characterisation of 90 PM10 samples periodically collected between September 2004 and September 2005 in the harbour of
Tarragona as part of the HADA (LIFE Program EC) project. Interpretation of the time series of major and trace PM10
components allowed us to identify peaks of PM10 components related to the activities in the harbour. A factor analysis of
PM10 enabled us to identify the crustal, traffic, secondary and sea spray sources, and one other source related to the re-
suspension of materials handled in the harbour. The multi-linear regression analysis demonstrated a high anthropogenic
contribution (62%) for PM10 at the harbour, mainly related to traffic (34% of PM10). Comparison with an earlier study,
using the same methodology, at an urban background monitoring station in Tarragona, showed a good correlation for the
annual average concentrations of most PM10 components at the two stations. At the harbour higher concentrations were
obtained for tracers (P and Mn, and V and Ni in a lesser extent) of some mineral bulk cargo materials. Re-suspension of
loose materials by means of wind and/or traffic was identified as one of the major contributors to PM10 in the harbour.
Abatement strategies designed to reduce levels of PM10 in the harbour and nearby areas are provided.
r 2007 Elsevier Ltd. All rights reserved.
Keywords: Fugitive emissions; Source contribution; PM10; Trace elements; Air quality
1. Introduction
Harbours, which are often located close to urbanareas, may be at the root of problems related toatmospheric and water pollution and noise in the
e front matter r 2007 Elsevier Ltd. All rights reserved
mosenv.2007.03.015
ing author. Tel.: +34 934095410;
0012.
ess: [email protected] (A. Alastuey).
adjacent cities. Thus, in the last decade a number ofresearch studies have addressed the evaluation ofthe impact of atmospheric shipping emissions on airquality at local scale and on climate at regionalscale. Studies by Corbett and Fischbeck (1997),Corbett and Koehler (2003) and Endresen et al.(2003) estimated the magnitude of shipping emis-sions to the atmosphere. A number of works haveaddressed the characterisation of emissions from
.
ARTICLE IN PRESS
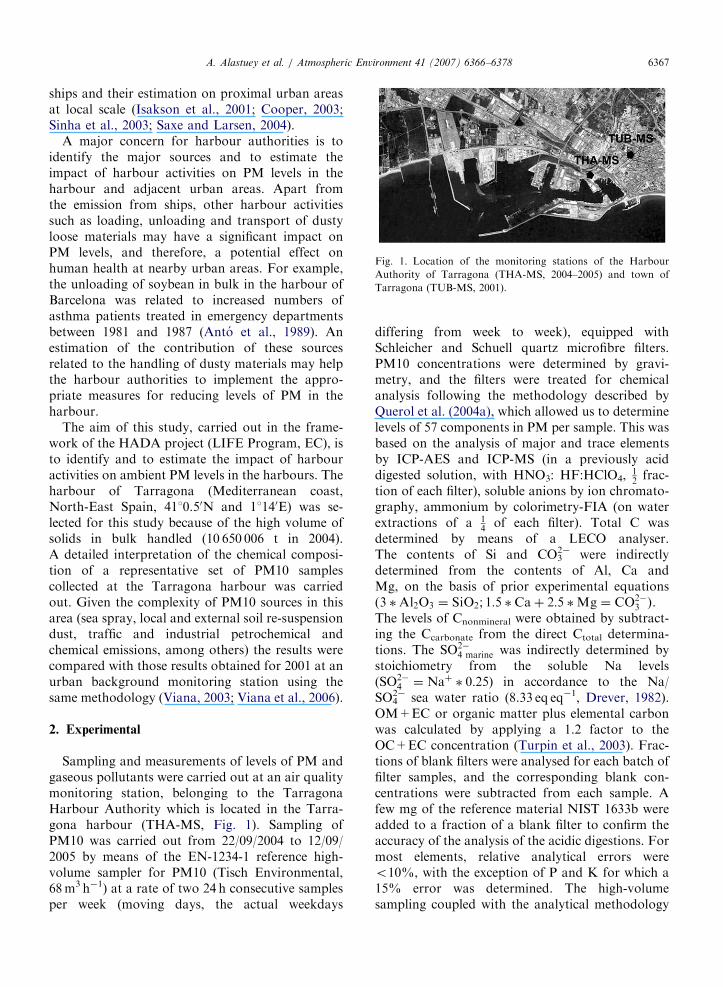
Fig. 1. Location of the monitoring stations of the Harbour
Authority of Tarragona (THA-MS, 2004–2005) and town of
Tarragona (TUB-MS, 2001).
A. Alastuey et al. / Atmospheric Environment 41 (2007) 6366–6378 6367
ships and their estimation on proximal urban areasat local scale (Isakson et al., 2001; Cooper, 2003;Sinha et al., 2003; Saxe and Larsen, 2004).
A major concern for harbour authorities is toidentify the major sources and to estimate theimpact of harbour activities on PM levels in theharbour and adjacent urban areas. Apart fromthe emission from ships, other harbour activitiessuch as loading, unloading and transport of dustyloose materials may have a significant impact onPM levels, and therefore, a potential effect onhuman health at nearby urban areas. For example,the unloading of soybean in bulk in the harbour ofBarcelona was related to increased numbers ofasthma patients treated in emergency departmentsbetween 1981 and 1987 (Anto et al., 1989). Anestimation of the contribution of these sourcesrelated to the handling of dusty materials may helpthe harbour authorities to implement the appro-priate measures for reducing levels of PM in theharbour.
The aim of this study, carried out in the frame-work of the HADA project (LIFE Program, EC), isto identify and to estimate the impact of harbouractivities on ambient PM levels in the harbours. Theharbour of Tarragona (Mediterranean coast,North-East Spain, 4110.50N and 11140E) was se-lected for this study because of the high volume ofsolids in bulk handled (10 650 006 t in 2004).A detailed interpretation of the chemical composi-tion of a representative set of PM10 samplescollected at the Tarragona harbour was carriedout. Given the complexity of PM10 sources in thisarea (sea spray, local and external soil re-suspensiondust, traffic and industrial petrochemical andchemical emissions, among others) the results werecompared with those results obtained for 2001 at anurban background monitoring station using thesame methodology (Viana, 2003; Viana et al., 2006).
2. Experimental
Sampling and measurements of levels of PM andgaseous pollutants were carried out at an air qualitymonitoring station, belonging to the TarragonaHarbour Authority which is located in the Tarra-gona harbour (THA-MS, Fig. 1). Sampling ofPM10 was carried out from 22/09/2004 to 12/09/2005 by means of the EN-1234-1 reference high-volume sampler for PM10 (Tisch Environmental,68m3 h�1) at a rate of two 24 h consecutive samplesper week (moving days, the actual weekdays
differing from week to week), equipped withSchleicher and Schuell quartz microfibre filters.PM10 concentrations were determined by gravi-metry, and the filters were treated for chemicalanalysis following the methodology described byQuerol et al. (2004a), which allowed us to determinelevels of 57 components in PM per sample. This wasbased on the analysis of major and trace elementsby ICP-AES and ICP-MS (in a previously aciddigested solution, with HNO3: HF:HClO4,
12frac-
tion of each filter), soluble anions by ion chromato-graphy, ammonium by colorimetry-FIA (on waterextractions of a 1
4of each filter). Total C was
determined by means of a LECO analyser.The contents of Si and CO3
2� were indirectlydetermined from the contents of Al, Ca andMg, on the basis of prior experimental equations(3 �Al2O3 ¼ SiO2; 1:5 � Caþ 2:5 �Mg ¼ CO2�
3 ).The levels of Cnonmineral were obtained by subtract-ing the Ccarbonate from the direct Ctotal determina-tions. The SO2�
4 marine was indirectly determined bystoichiometry from the soluble Na levels(SO2�
4 ¼ Naþ � 0:25) in accordance to the Na/SO4
2� sea water ratio (8.33 eq eq�1, Drever, 1982).OM+EC or organic matter plus elemental carbonwas calculated by applying a 1.2 factor to theOC+EC concentration (Turpin et al., 2003). Frac-tions of blank filters were analysed for each batch offilter samples, and the corresponding blank con-centrations were subtracted from each sample. Afew mg of the reference material NIST 1633b wereadded to a fraction of a blank filter to confirm theaccuracy of the analysis of the acidic digestions. Formost elements, relative analytical errors wereo10%, with the exception of P and K for which a15% error was determined. The high-volumesampling coupled with the analytical methodology
ARTICLE IN PRESSA. Alastuey et al. / Atmospheric Environment 41 (2007) 6366–63786368
allowed to reach actual detection limitso0.01 ngm�3 for most metals.
The main sources affecting the PM compositionat the harbour of Tarragona were identified byapplying a varimax rotated factor analysis (FA), inaccordance with the methodology of Thurston andSpengler (1985). The factors with eigenvalues great-er than one were identified as particle sources on thebasis of their loadings. The respective quantitativecontributions were then derived by applying amulti-linear regression analysis (MLRA), usingPM concentration values as the dependent variableand absolute factor scores as independent variables.
The origin of air masses influencing the monitor-ing stations for each day during the sampling periodwas interpreted on the basis of daily computed 5-day isentropic back-trajectories using the HYSPLITmodel (Draxler and Hess, 1998), and ECMWFsynoptic charts (surface and upper levels). Further-more, African dust outbreaks affecting the IberianPeninsula were also detected with the aid of dailyTOMS-NASA aerosol index maps, SKIRON(Athens University) and NAAPS (Naval ResearchLaboratory-Marine Meteorology Division) mod-elled dust concentration maps and SeaWIFS-NASAsatellite imagery.
The record of the different activities carried out inthe harbour for these periods was also consideredin order to interpret the time evolution of selectedelements. Special attention was paid to thegroups of elements identified as tracers for specificoperations in the harbour of Tarragona (Morenoet al., 2007).
The results obtained in this study were comparedwith those obtained for 2001 at an urban back-ground monitoring station (TUB-MS) in Tarragona(Viana et al., 2006). This site was located on therooftop of a seven-storey building (60m.a.s.l.) in thecity, at a 1 km distance from THA-MS (Fig. 1; seeViana et al., 2006 for details). Levels registered atthis site may be considered as representative of thepollution levels in the city. At this site, PM10 andPM2.5 were sampled and characterised followingthe same methodology described above.
3. Results
3.1. Chemical characterisation of PM10 at THA-
MS and comparison with TUB-MS
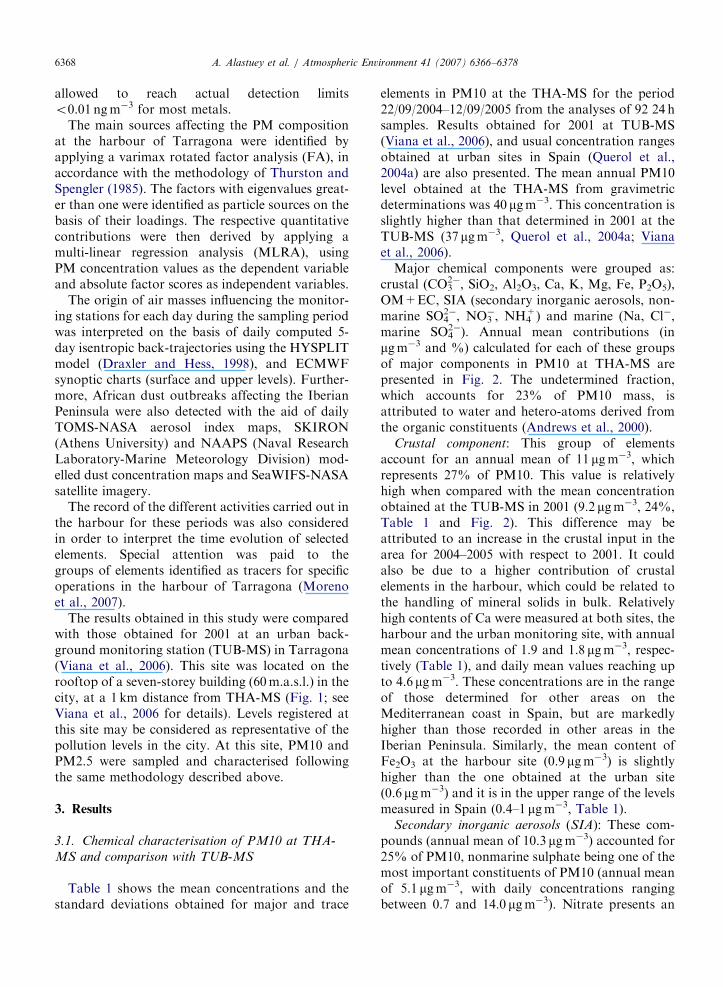
Table 1 shows the mean concentrations and thestandard deviations obtained for major and trace
elements in PM10 at the THA-MS for the period22/09/2004–12/09/2005 from the analyses of 92 24 hsamples. Results obtained for 2001 at TUB-MS(Viana et al., 2006), and usual concentration rangesobtained at urban sites in Spain (Querol et al.,2004a) are also presented. The mean annual PM10level obtained at the THA-MS from gravimetricdeterminations was 40 mgm�3. This concentration isslightly higher than that determined in 2001 at theTUB-MS (37 mgm�3, Querol et al., 2004a; Vianaet al., 2006).
Major chemical components were grouped as:crustal (CO3
2�, SiO2, Al2O3, Ca, K, Mg, Fe, P2O5),OM+EC, SIA (secondary inorganic aerosols, non-marine SO4
2�, NO3�, NH4
+) and marine (Na, Cl�,marine SO4
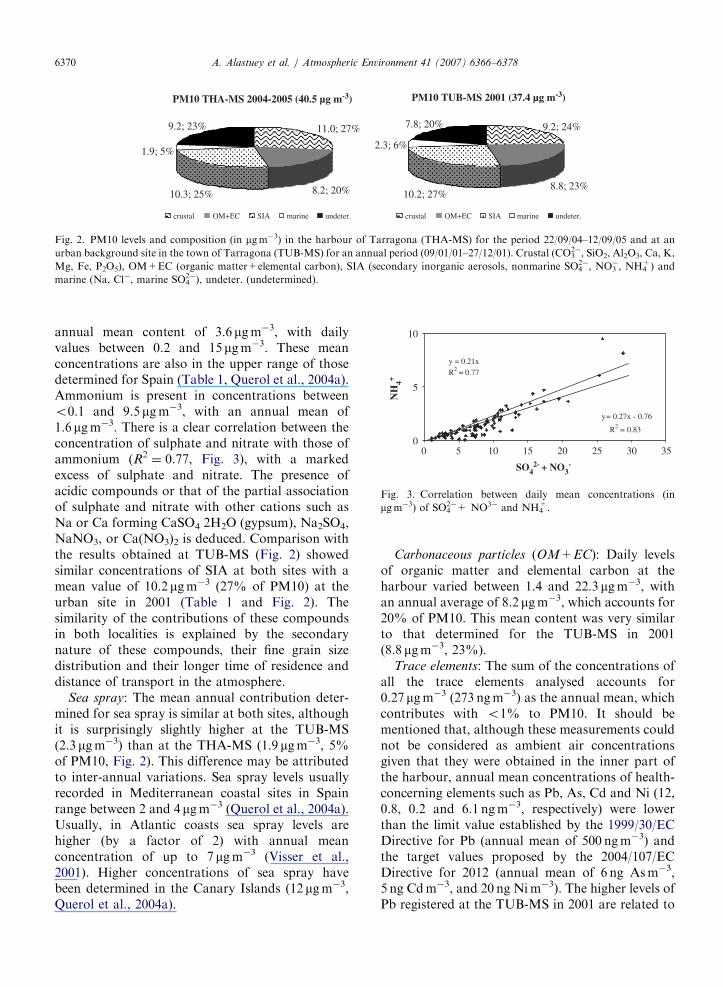
2�). Annual mean contributions (inmgm�3 and %) calculated for each of these groupsof major components in PM10 at THA-MS arepresented in Fig. 2. The undetermined fraction,which accounts for 23% of PM10 mass, isattributed to water and hetero-atoms derived fromthe organic constituents (Andrews et al., 2000).
Crustal component: This group of elementsaccount for an annual mean of 11 mgm�3, whichrepresents 27% of PM10. This value is relativelyhigh when compared with the mean concentrationobtained at the TUB-MS in 2001 (9.2 mgm�3, 24%,Table 1 and Fig. 2). This difference may beattributed to an increase in the crustal input in thearea for 2004–2005 with respect to 2001. It couldalso be due to a higher contribution of crustalelements in the harbour, which could be related tothe handling of mineral solids in bulk. Relativelyhigh contents of Ca were measured at both sites, theharbour and the urban monitoring site, with annualmean concentrations of 1.9 and 1.8 mgm�3, respec-tively (Table 1), and daily mean values reaching upto 4.6 mgm�3. These concentrations are in the rangeof those determined for other areas on theMediterranean coast in Spain, but are markedlyhigher than those recorded in other areas in theIberian Peninsula. Similarly, the mean content ofFe2O3 at the harbour site (0.9 mgm�3) is slightlyhigher than the one obtained at the urban site(0.6 mgm�3) and it is in the upper range of the levelsmeasured in Spain (0.4–1 mgm�3, Table 1).
Secondary inorganic aerosols (SIA): These com-pounds (annual mean of 10.3 mgm�3) accounted for25% of PM10, nonmarine sulphate being one of themost important constituents of PM10 (annual meanof 5.1 mgm�3, with daily concentrations rangingbetween 0.7 and 14.0 mgm�3). Nitrate presents an
ARTICLE IN PRESS
Table 1
Mean concentration and standard deviation for major (mgm�3) and trace elements (ngm�3) in PM10 at the THA-MS for the period 22/09/
2004–12/09/2005
Sampling period no samples THA-MS 22/09/04–12/09/05 TUB-MS 09/01/01–27/12/01 Range for urban background in Spain
92 90
Mean St. dev. Mean St. dev.
mgm�3
PM10 40 15 37 13 30–47
OM+EC 8.2 4.6 8.8 3.4 4–11
CO32� 3.6 1.7 3.3 1.8 1.6–3.9
SiO2 3.0 2.5 2.2 1.6 1.8–5.8
Al2O3 1.0 0.8 0.8 0.6 0.7–1.9
Ca 1.9 1.0 1.8 1.1 1–2.0
K 0.3 0.2 0.3 0.1 0.2–0.5
Na 1.0 0.7 1.2 0.6 0.4–2.3
Mg 0.3 0.1 0.3 0.1 0.15–0.7
Fe2O3 0.9 0.5 0.6 0.3 0.4–1.0
SO2�4 marine
0.3 0.2 0.3 0.2 0.2–0.9
SO2�4 nonmarine
5.1 2.8 4.9 2.7 2.5–5
NO3� 3.6 2.9 3.9 2.9 1.4–3.1
Cl� 0.6 0.6 0.8 0.8 0.7–1.3 (6.6 canaries)
NH4+ 1.6 1.6 1.5 1.3 1.3–2
Determined% 78 10 82 8
ngm�3
Li 0.6 0.8 0.4 0.2 0.2–0.7
P 76 73 29 17 18–32 (480 Huelva)
Sc 0.1 0.3 0.3 0.3 0.1–0.3
Ti 31 31 23 14 20–85
V 11 8 8 6 5–15
Cr 4 2 3 2 1–8 (25 metallurgy)
Mn 33 73 9 6 10–25 (85 metallurgy)
Co 0.3 0.2 0.2 0.1 0.2–0.5
Ni 6 3 4 3 2–7 (30 metallurgy)
Cu 25 16 33 28 20–50 (100 metallurgy)
Zn 37 21 35 22 20–100 (415 metallurgy)
Ga 0.2 0.2 0.2 0.3 0.2–0.4
Ge 0.3 0.2 0.1 0.2 0.1–0.3
As 0.8 0.6 0.8 0.5 0.3–1.8
Se 0.4 0.5 0.5 0.5 0.3–1.1
Rb 0.8 0.5 0.8 0.5 0.6–1.8
Sr 5.7 3.2 4.8 2.7 2–6
Y 0.3 0.2 0.1 0.1 0.1–0.4
Zr 5.9 4.6 2.3 2.6 2–4
Mo 4.2 2.3 2.2 3.0 1–21
Cd 0.2 0.1 0.3 0.2 0.2–0.8
Sn 2.7 1.9 1.7 0.7 1–4
Sb 3.0 1.9 6.9 11.9 1–10
Cs 0.1 0.1 0.1 0.1 0.1
Ba 13 8 12 5 15–40
LREE 1.2 1.2 1.4 0.9 0.8–2.6
HREE 0.2 0.2 0.4 0.4 0.15–0.6
Hf 0.5 0.6 0.2 0.2 0.1–0.35
Pb 12 11 25 18 10–60
Bi 0.3 0.3 0.2 0.4 0.1–0.5
Th 0.1 0.1 0.2 0.2 0.1–0.4
U 0.2 0.2 0.3 0.5 0.2–0.5
Data obtained for the TUB-MS in 2001 (Viana, 2003) and range of levels of major and trace elements at urban background sites in Spain
also included (Querol et al., 2004a).
A. Alastuey et al. / Atmospheric Environment 41 (2007) 6366–6378 6369
ARTICLE IN PRESS
y = 0.21x
R2 = 0.77
y= 0.27x - 0.76
R2 = 0.83
0
5
10
0 5 10 15 20 25 30 35
SO42- + NO3
-
NH
4+
Fig. 3. Correlation between daily mean concentrations (in
mgm�3) of SO42�+ NO3� and NH4
+.
PM10 THA-MS 2004-2005 (40.5 µg m-3)
11.0; 27%
8.2; 20%10.3; 25%
9.2; 23%
1.9; 5%
crustal OM+EC SIA marine undeter.
PM10 TUB-MS 2001 (37.4 µg m-3)
9.2; 24%
8.8; 23%10.2; 27%
2.3; 6%
7.8; 20%
crustal OM+EC SIA marine undeter.
Fig. 2. PM10 levels and composition (in mgm�3) in the harbour of Tarragona (THA-MS) for the period 22/09/04–12/09/05 and at an
urban background site in the town of Tarragona (TUB-MS) for an annual period (09/01/01–27/12/01). Crustal (CO32�, SiO2, Al2O3, Ca, K,
Mg, Fe, P2O5), OM+EC (organic matter+elemental carbon), SIA (secondary inorganic aerosols, nonmarine SO42�, NO3
�, NH4+) and
marine (Na, Cl�, marine SO42�), undeter. (undetermined).
A. Alastuey et al. / Atmospheric Environment 41 (2007) 6366–63786370
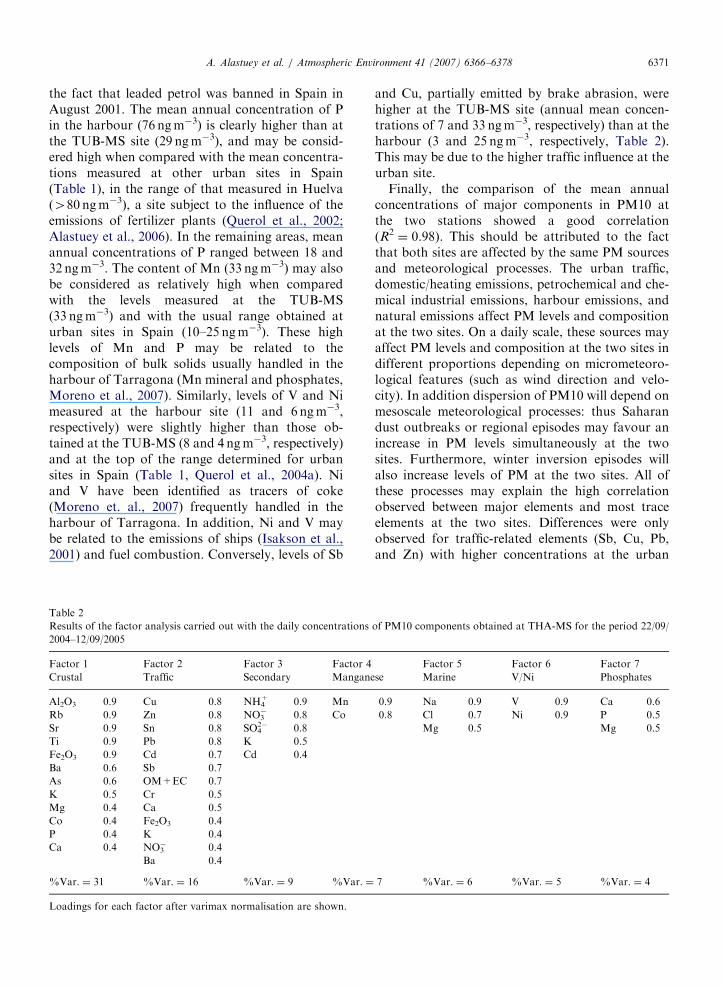
annual mean content of 3.6 mgm�3, with dailyvalues between 0.2 and 15 mgm�3. These meanconcentrations are also in the upper range of thosedetermined for Spain (Table 1, Querol et al., 2004a).Ammonium is present in concentrations betweeno0.1 and 9.5 mgm�3, with an annual mean of1.6 mgm�3. There is a clear correlation between theconcentration of sulphate and nitrate with those ofammonium (R2
¼ 0.77, Fig. 3), with a markedexcess of sulphate and nitrate. The presence ofacidic compounds or that of the partial associationof sulphate and nitrate with other cations such asNa or Ca forming CaSO4 2H2O (gypsum), Na2SO4,NaNO3, or Ca(NO3)2 is deduced. Comparison withthe results obtained at TUB-MS (Fig. 2) showedsimilar concentrations of SIA at both sites with amean value of 10.2 mgm�3 (27% of PM10) at theurban site in 2001 (Table 1 and Fig. 2). Thesimilarity of the contributions of these compoundsin both localities is explained by the secondarynature of these compounds, their fine grain sizedistribution and their longer time of residence anddistance of transport in the atmosphere.
Sea spray: The mean annual contribution deter-mined for sea spray is similar at both sites, althoughit is surprisingly slightly higher at the TUB-MS(2.3 mgm�3) than at the THA-MS (1.9 mgm�3, 5%of PM10, Fig. 2). This difference may be attributedto inter-annual variations. Sea spray levels usuallyrecorded in Mediterranean coastal sites in Spainrange between 2 and 4 mgm�3 (Querol et al., 2004a).Usually, in Atlantic coasts sea spray levels arehigher (by a factor of 2) with annual meanconcentration of up to 7 mgm�3 (Visser et al.,2001). Higher concentrations of sea spray havebeen determined in the Canary Islands (12 mgm�3,Querol et al., 2004a).
Carbonaceous particles (OM+EC): Daily levelsof organic matter and elemental carbon at theharbour varied between 1.4 and 22.3 mgm�3, withan annual average of 8.2 mgm�3, which accounts for20% of PM10. This mean content was very similarto that determined for the TUB-MS in 2001(8.8 mgm�3, 23%).
Trace elements: The sum of the concentrations ofall the trace elements analysed accounts for0.27 mgm�3 (273 ngm�3) as the annual mean, whichcontributes with o1% to PM10. It should bementioned that, although these measurements couldnot be considered as ambient air concentrationsgiven that they were obtained in the inner part ofthe harbour, annual mean concentrations of health-concerning elements such as Pb, As, Cd and Ni (12,0.8, 0.2 and 6.1 ngm�3, respectively) were lowerthan the limit value established by the 1999/30/ECDirective for Pb (annual mean of 500 ngm�3) andthe target values proposed by the 2004/107/ECDirective for 2012 (annual mean of 6 ng Asm�3,5 ng Cdm�3, and 20 ng Nim�3). The higher levels ofPb registered at the TUB-MS in 2001 are related to
ARTICLE IN PRESSA. Alastuey et al. / Atmospheric Environment 41 (2007) 6366–6378 6371
the fact that leaded petrol was banned in Spain inAugust 2001. The mean annual concentration of Pin the harbour (76 ngm�3) is clearly higher than atthe TUB-MS site (29 ngm�3), and may be consid-ered high when compared with the mean concentra-tions measured at other urban sites in Spain(Table 1), in the range of that measured in Huelva(480 ngm�3), a site subject to the influence of theemissions of fertilizer plants (Querol et al., 2002;Alastuey et al., 2006). In the remaining areas, meanannual concentrations of P ranged between 18 and32 ngm�3. The content of Mn (33 ngm�3) may alsobe considered as relatively high when comparedwith the levels measured at the TUB-MS(33 ngm�3) and with the usual range obtained aturban sites in Spain (10–25 ngm�3). These highlevels of Mn and P may be related to thecomposition of bulk solids usually handled in theharbour of Tarragona (Mn mineral and phosphates,Moreno et al., 2007). Similarly, levels of V and Nimeasured at the harbour site (11 and 6 ngm�3,respectively) were slightly higher than those ob-tained at the TUB-MS (8 and 4 ngm�3, respectively)and at the top of the range determined for urbansites in Spain (Table 1, Querol et al., 2004a). Niand V have been identified as tracers of coke(Moreno et. al., 2007) frequently handled in theharbour of Tarragona. In addition, Ni and V maybe related to the emissions of ships (Isakson et al.,2001) and fuel combustion. Conversely, levels of Sb
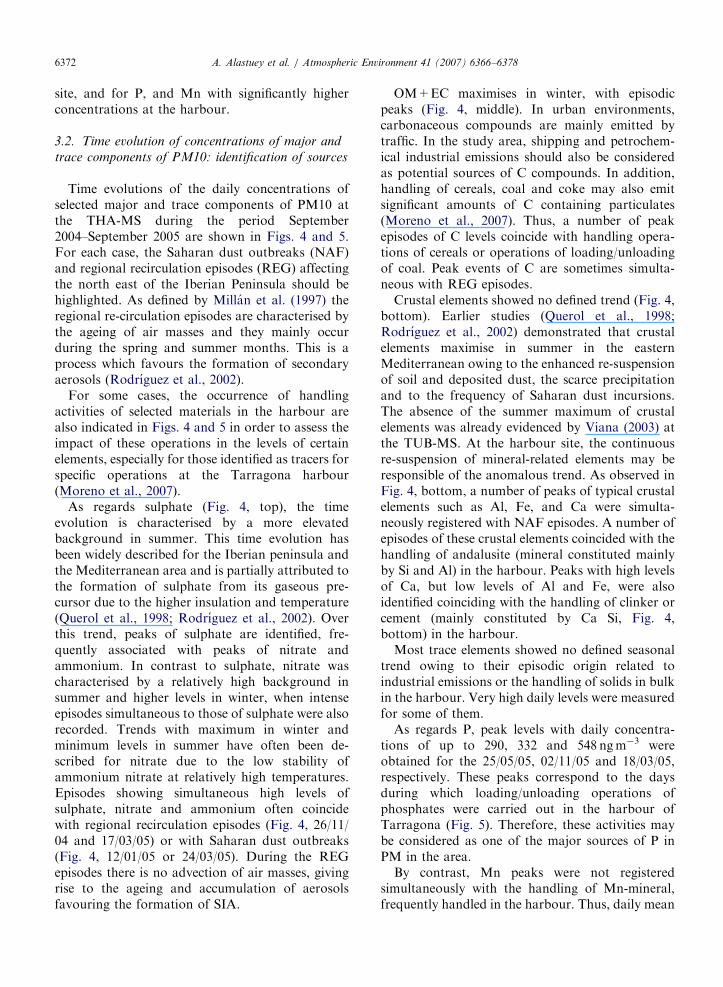
Table 2
Results of the factor analysis carried out with the daily concentrations
2004–12/09/2005
Factor 1 Factor 2 Factor 3 Factor 4
Crustal Traffic Secondary Mangane
Al2O3 0.9 Cu 0.8 NH4+ 0.9 Mn
Rb 0.9 Zn 0.8 NO3� 0.8 Co
Sr 0.9 Sn 0.8 SO42� 0.8
Ti 0.9 Pb 0.8 K 0.5
Fe2O3 0.9 Cd 0.7 Cd 0.4
Ba 0.6 Sb 0.7
As 0.6 OM+EC 0.7
K 0.5 Cr 0.5
Mg 0.4 Ca 0.5
Co 0.4 Fe2O3 0.4
P 0.4 K 0.4
Ca 0.4 NO3� 0.4
Ba 0.4
%Var. ¼ 31 %Var. ¼ 16 %Var. ¼ 9 %Var. ¼
Loadings for each factor after varimax normalisation are shown.
and Cu, partially emitted by brake abrasion, werehigher at the TUB-MS site (annual mean concen-trations of 7 and 33 ngm�3, respectively) than at theharbour (3 and 25 ngm�3, respectively, Table 2).This may be due to the higher traffic influence at theurban site.
Finally, the comparison of the mean annualconcentrations of major components in PM10 atthe two stations showed a good correlation(R2¼ 0.98). This should be attributed to the fact
that both sites are affected by the same PM sourcesand meteorological processes. The urban traffic,domestic/heating emissions, petrochemical and che-mical industrial emissions, harbour emissions, andnatural emissions affect PM levels and compositionat the two sites. On a daily scale, these sources mayaffect PM levels and composition at the two sites indifferent proportions depending on micrometeoro-logical features (such as wind direction and velo-city). In addition dispersion of PM10 will depend onmesoscale meteorological processes: thus Saharandust outbreaks or regional episodes may favour anincrease in PM levels simultaneously at the twosites. Furthermore, winter inversion episodes willalso increase levels of PM at the two sites. All ofthese processes may explain the high correlationobserved between major elements and most traceelements at the two sites. Differences were onlyobserved for traffic-related elements (Sb, Cu, Pb,and Zn) with higher concentrations at the urban
of PM10 components obtained at THA-MS for the period 22/09/
Factor 5 Factor 6 Factor 7
se Marine V/Ni Phosphates
0.9 Na 0.9 V 0.9 Ca 0.6
0.8 Cl 0.7 Ni 0.9 P 0.5
Mg 0.5 Mg 0.5
7 %Var. ¼ 6 %Var. ¼ 5 %Var. ¼ 4
ARTICLE IN PRESSA. Alastuey et al. / Atmospheric Environment 41 (2007) 6366–63786372
site, and for P, and Mn with significantly higherconcentrations at the harbour.
3.2. Time evolution of concentrations of major and
trace components of PM10: identification of sources
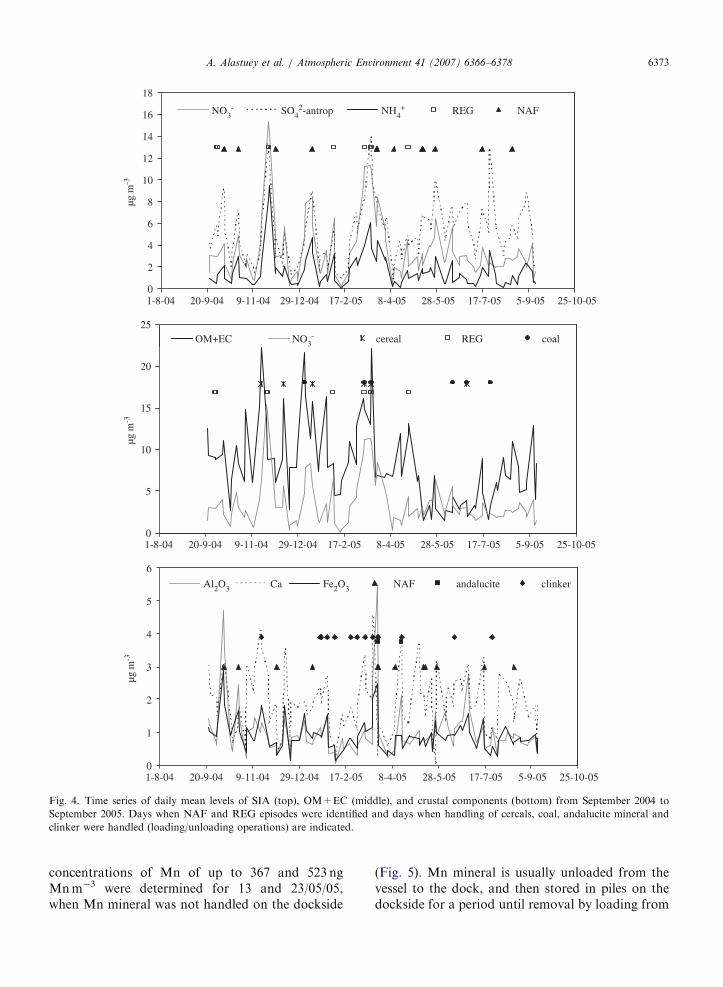
Time evolutions of the daily concentrations ofselected major and trace components of PM10 atthe THA-MS during the period September2004–September 2005 are shown in Figs. 4 and 5.For each case, the Saharan dust outbreaks (NAF)and regional recirculation episodes (REG) affectingthe north east of the Iberian Peninsula should behighlighted. As defined by Millan et al. (1997) theregional re-circulation episodes are characterised bythe ageing of air masses and they mainly occurduring the spring and summer months. This is aprocess which favours the formation of secondaryaerosols (Rodrıguez et al., 2002).
For some cases, the occurrence of handlingactivities of selected materials in the harbour arealso indicated in Figs. 4 and 5 in order to assess theimpact of these operations in the levels of certainelements, especially for those identified as tracers forspecific operations at the Tarragona harbour(Moreno et al., 2007).
As regards sulphate (Fig. 4, top), the timeevolution is characterised by a more elevatedbackground in summer. This time evolution hasbeen widely described for the Iberian peninsula andthe Mediterranean area and is partially attributed tothe formation of sulphate from its gaseous pre-cursor due to the higher insulation and temperature(Querol et al., 1998; Rodrıguez et al., 2002). Overthis trend, peaks of sulphate are identified, fre-quently associated with peaks of nitrate andammonium. In contrast to sulphate, nitrate wascharacterised by a relatively high background insummer and higher levels in winter, when intenseepisodes simultaneous to those of sulphate were alsorecorded. Trends with maximum in winter andminimum levels in summer have often been de-scribed for nitrate due to the low stability ofammonium nitrate at relatively high temperatures.Episodes showing simultaneous high levels ofsulphate, nitrate and ammonium often coincidewith regional recirculation episodes (Fig. 4, 26/11/04 and 17/03/05) or with Saharan dust outbreaks(Fig. 4, 12/01/05 or 24/03/05). During the REGepisodes there is no advection of air masses, givingrise to the ageing and accumulation of aerosolsfavouring the formation of SIA.
OM+EC maximises in winter, with episodicpeaks (Fig. 4, middle). In urban environments,carbonaceous compounds are mainly emitted bytraffic. In the study area, shipping and petrochem-ical industrial emissions should also be consideredas potential sources of C compounds. In addition,handling of cereals, coal and coke may also emitsignificant amounts of C containing particulates(Moreno et al., 2007). Thus, a number of peakepisodes of C levels coincide with handling opera-tions of cereals or operations of loading/unloadingof coal. Peak events of C are sometimes simulta-neous with REG episodes.
Crustal elements showed no defined trend (Fig. 4,bottom). Earlier studies (Querol et al., 1998;Rodrıguez et al., 2002) demonstrated that crustalelements maximise in summer in the easternMediterranean owing to the enhanced re-suspensionof soil and deposited dust, the scarce precipitationand to the frequency of Saharan dust incursions.The absence of the summer maximum of crustalelements was already evidenced by Viana (2003) atthe TUB-MS. At the harbour site, the continuousre-suspension of mineral-related elements may beresponsible of the anomalous trend. As observed inFig. 4, bottom, a number of peaks of typical crustalelements such as Al, Fe, and Ca were simulta-neously registered with NAF episodes. A number ofepisodes of these crustal elements coincided with thehandling of andalusite (mineral constituted mainlyby Si and Al) in the harbour. Peaks with high levelsof Ca, but low levels of Al and Fe, were alsoidentified coinciding with the handling of clinker orcement (mainly constituted by Ca Si, Fig. 4,bottom) in the harbour.
Most trace elements showed no defined seasonaltrend owing to their episodic origin related toindustrial emissions or the handling of solids in bulkin the harbour. Very high daily levels were measuredfor some of them.
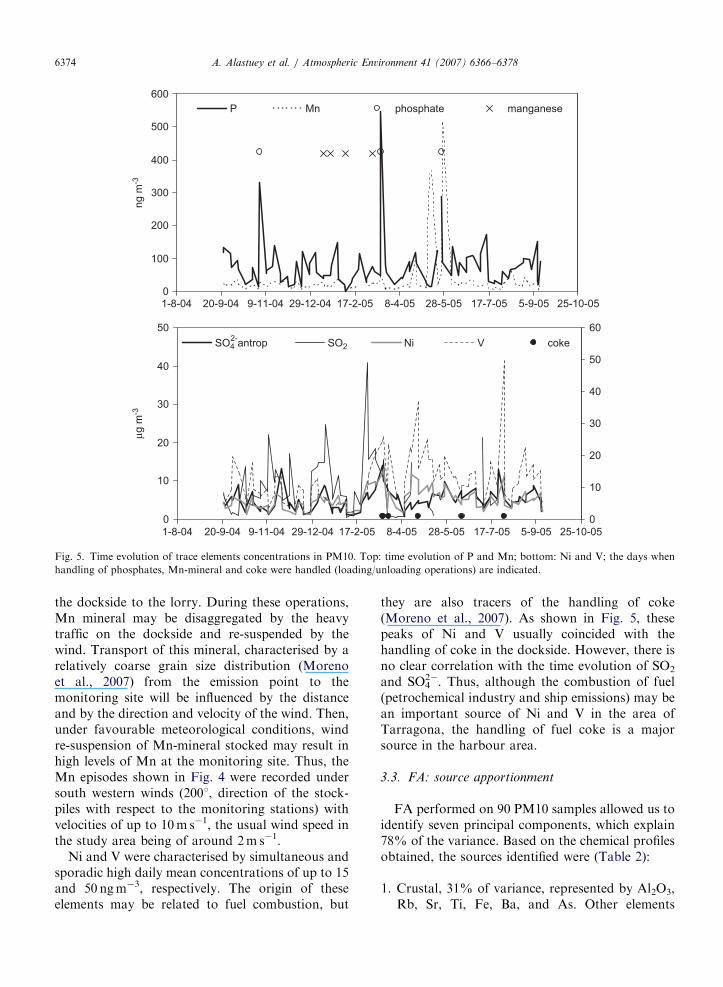
As regards P, peak levels with daily concentra-tions of up to 290, 332 and 548 ngm�3 wereobtained for the 25/05/05, 02/11/05 and 18/03/05,respectively. These peaks correspond to the daysduring which loading/unloading operations ofphosphates were carried out in the harbour ofTarragona (Fig. 5). Therefore, these activities maybe considered as one of the major sources of P inPM in the area.
By contrast, Mn peaks were not registeredsimultaneously with the handling of Mn-mineral,frequently handled in the harbour. Thus, daily mean
ARTICLE IN PRESS
0
2
4
6
8
10
12
14
16
18
1-8-04 20-9-04 9-11-04 29-12-04 17-2-05 8-4-05 28-5-05 17-7-05 5-9-05 25-10-05
µg m
-3µg
m-3
µg m
-3
NO3- SO4
2-antrop NH4+ REG NAF
0
5
10
15
20
25OM+EC NO3
- cereal REG coal
0
1
2
3
4
5
6
Al2O3 Ca Fe2O3 NAF andalucite clinker
1-8-04 20-9-04 9-11-04 29-12-04 17-2-05 8-4-05 28-5-05 17-7-05 5-9-05 25-10-05
1-8-04 20-9-04 9-11-04 29-12-04 17-2-05 8-4-05 28-5-05 17-7-05 5-9-05 25-10-05
Fig. 4. Time series of daily mean levels of SIA (top), OM+EC (middle), and crustal components (bottom) from September 2004 to
September 2005. Days when NAF and REG episodes were identified and days when handling of cereals, coal, andalucite mineral and
clinker were handled (loading/unloading operations) are indicated.
A. Alastuey et al. / Atmospheric Environment 41 (2007) 6366–6378 6373
concentrations of Mn of up to 367 and 523 ngMnm�3 were determined for 13 and 23/05/05,when Mn mineral was not handled on the dockside
(Fig. 5). Mn mineral is usually unloaded from thevessel to the dock, and then stored in piles on thedockside for a period until removal by loading from
ARTICLE IN PRESS
0
100
200
300
400
500
600
1-8-04 20-9-04 9-11-04 29-12-04 17-2-05 8-4-05 28-5-05 17-7-05 5-9-05 25-10-05
ng
m-3
P Mn phosphate manganese
1-8-04 20-9-04 9-11-04 29-12-04 17-2-05 8-4-05 28-5-05 17-7-05 5-9-05 25-10-05
µg m
-3
0
10
20
30
40
50
0
10
20
30
40
50
60
SO4 antrop SO2 Ni V coke2-
Fig. 5. Time evolution of trace elements concentrations in PM10. Top: time evolution of P and Mn; bottom: Ni and V; the days when
handling of phosphates, Mn-mineral and coke were handled (loading/unloading operations) are indicated.
A. Alastuey et al. / Atmospheric Environment 41 (2007) 6366–63786374
the dockside to the lorry. During these operations,Mn mineral may be disaggregated by the heavytraffic on the dockside and re-suspended by thewind. Transport of this mineral, characterised by arelatively coarse grain size distribution (Morenoet al., 2007) from the emission point to themonitoring site will be influenced by the distanceand by the direction and velocity of the wind. Then,under favourable meteorological conditions, windre-suspension of Mn-mineral stocked may result inhigh levels of Mn at the monitoring site. Thus, theMn episodes shown in Fig. 4 were recorded undersouth western winds (2001, direction of the stock-piles with respect to the monitoring stations) withvelocities of up to 10m s�1, the usual wind speed inthe study area being of around 2m s�1.
Ni and V were characterised by simultaneous andsporadic high daily mean concentrations of up to 15and 50 ngm�3, respectively. The origin of theseelements may be related to fuel combustion, but
they are also tracers of the handling of coke(Moreno et al., 2007). As shown in Fig. 5, thesepeaks of Ni and V usually coincided with thehandling of coke in the dockside. However, there isno clear correlation with the time evolution of SO2
and SO42�. Thus, although the combustion of fuel
(petrochemical industry and ship emissions) may bean important source of Ni and V in the area ofTarragona, the handling of fuel coke is a majorsource in the harbour area.
3.3. FA: source apportionment
FA performed on 90 PM10 samples allowed us toidentify seven principal components, which explain78% of the variance. Based on the chemical profilesobtained, the sources identified were (Table 2):
1.
Crustal, 31% of variance, represented by Al2O3,Rb, Sr, Ti, Fe, Ba, and As. Other elements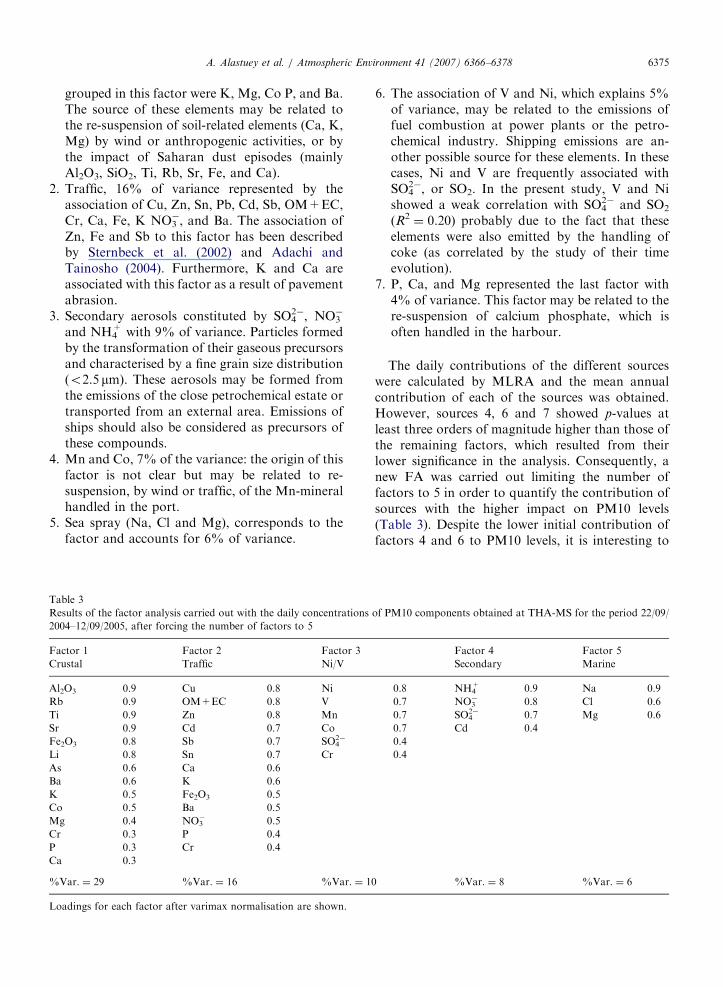
ARTICLE IN PRESS
Ta
Re
200
Fa
Cru
Al2Rb
Ti
Sr
Fe2Li
As
Ba
K
Co
Mg
Cr
P
Ca
%V
Lo
A. Alastuey et al. / Atmospheric Environment 41 (2007) 6366–6378 6375
grouped in this factor were K, Mg, Co P, and Ba.The source of these elements may be related tothe re-suspension of soil-related elements (Ca, K,Mg) by wind or anthropogenic activities, or bythe impact of Saharan dust episodes (mainlyAl2O3, SiO2, Ti, Rb, Sr, Fe, and Ca).
2.
Traffic, 16% of variance represented by theassociation of Cu, Zn, Sn, Pb, Cd, Sb, OM+EC,Cr, Ca, Fe, K NO3�, and Ba. The association ofZn, Fe and Sb to this factor has been describedby Sternbeck et al. (2002) and Adachi andTainosho (2004). Furthermore, K and Ca areassociated with this factor as a result of pavementabrasion.
3.
Secondary aerosols constituted by SO42�, NO3�
and NH4+ with 9% of variance. Particles formed
by the transformation of their gaseous precursorsand characterised by a fine grain size distribution(o2.5 mm). These aerosols may be formed fromthe emissions of the close petrochemical estate ortransported from an external area. Emissions ofships should also be considered as precursors ofthese compounds.
4.
Mn and Co, 7% of the variance: the origin of thisfactor is not clear but may be related to re-suspension, by wind or traffic, of the Mn-mineralhandled in the port.5.
Sea spray (Na, Cl and Mg), corresponds to thefactor and accounts for 6% of variance.ble 3
sults of the factor analysis carried out with the daily concentrations
4–12/09/2005, after forcing the number of factors to 5
ctor 1 Factor 2 Factor 3
stal Traffic Ni/V
O3 0.9 Cu 0.8 Ni
0.9 OM+EC 0.8 V
0.9 Zn 0.8 Mn
0.9 Cd 0.7 Co
O3 0.8 Sb 0.7 SO42�
0.8 Sn 0.7 Cr
0.6 Ca 0.6
0.6 K 0.6
0.5 Fe2O3 0.5
0.5 Ba 0.5
0.4 NO3� 0.5
0.3 P 0.4
0.3 Cr 0.4
0.3
ar. ¼ 29 %Var. ¼ 16 %Var. ¼ 1
adings for each factor after varimax normalisation are shown.
6.
of P
0
The association of V and Ni, which explains 5%of variance, may be related to the emissions offuel combustion at power plants or the petro-chemical industry. Shipping emissions are an-other possible source for these elements. In thesecases, Ni and V are frequently associated withSO4
2�, or SO2. In the present study, V and Nishowed a weak correlation with SO4
2� and SO2
(R2¼ 0.20) probably due to the fact that these
elements were also emitted by the handling ofcoke (as correlated by the study of their timeevolution).
7.
P, Ca, and Mg represented the last factor with4% of variance. This factor may be related to there-suspension of calcium phosphate, which isoften handled in the harbour.The daily contributions of the different sourceswere calculated by MLRA and the mean annualcontribution of each of the sources was obtained.However, sources 4, 6 and 7 showed p-values atleast three orders of magnitude higher than those ofthe remaining factors, which resulted from theirlower significance in the analysis. Consequently, anew FA was carried out limiting the number offactors to 5 in order to quantify the contribution ofsources with the higher impact on PM10 levels(Table 3). Despite the lower initial contribution offactors 4 and 6 to PM10 levels, it is interesting to
M10 components obtained at THA-MS for the period 22/09/
Factor 4 Factor 5
Secondary Marine
0.8 NH4+ 0.9 Na 0.9
0.7 NO3� 0.8 Cl 0.6
0.7 SO42� 0.7 Mg 0.6
0.7 Cd 0.4
0.4
0.4
%Var. ¼ 8 %Var. ¼ 6
ARTICLE IN PRESS
PM10 Harbour of Tarragona 2004-2005 (40.1µg m-3)
Crustal; 8.1; 17%Ni/V; 7.3; 16%
A. Alastuey et al. / Atmospheric Environment 41 (2007) 6366–63786376
observe that these sources were identified by the FA.The factors identified were similar to those pre-viously obtained with the following differences:
Marine; 6.0; 13%Undeterm.; 4.0; 8%
(a)
Traffic; 15.7; 34%
Industrial; 5.9; 12%
PM10 Tarragona city 2001 (37.4 µg m-3)
Undeterm.; 0.4; 1%
Mn and Co (previous factor 4) are groupedtogether with V/Ni (previous factor 6), probablybecause these elements are emitted by re-suspension of the materials (Mn mineral andcoke) stocked in piles in the dock or handled inthe harbour.
Crustal; 11.5; 32%Industrial; 10.5; 28%
(b)Traffic; 11.2; 30%Marine; 3.4; 9%
Fig. 6. Source contribution to PM10 annual mean from factors
determined by receptor model for the period between September
2004 and September 2005 at THA-MS and for TUB-MS in 2001
(Viana 2003).
P and Ca (previous factor 7), are now associatedwith the traffic source. The absence of the P–Cafactor in this re-analysis is especially interesting,as it indicates that the influence on PM levelsand composition of two initially independentsources (traffic and re-suspension of materialstored on the dockside) may be simultaneousunder specific conditions (heavy-duty trafficalong the dockside). As will be shown below,the re-suspension of raw materials stored on thedocks is at times coupled with traffic and thusincreases the contribution of the traffic source toPM levels, while at times it is observed asan independent source influenced only bymeteorological factors such as wind speed anddirection.
In order to verify the quality of results, PM10gravimetric concentrations were correlated with thePM10 modelled obtaining a high correlation(R2¼ 0.89) that demonstrated the applicability of
the analysis. The contribution to PM10 levels ofeach of the sources, which resulted from MLRA,showed that 34% of the PM10 mass was derivedfrom traffic, 17% from the crustal source, 16%related to the re-suspension of coke (Ni/V) and Mn-mineral, 13% sea spray, 12% from the secondarysource, and 8% undetermined (Fig. 6).
This source apportionment demonstrates the highrelevance of the anthropogenic emissions of PM10in the harbour of Tarragona, which accounts for62% of PM10. The source distribution is differentfrom the results obtained from the grouping ofmajor elements (Fig. 2), although consistent withthe sources. Modelled traffic emissions are higherthan the levels of OM+EC due to the fact that thetraffic source includes mineral matter re-suspendedby the vehicles. Consequently, levels of the modelledmineral source are lower than those of thechemically determined crustal elements. The levelsof SIA are higher than the modelled industrialcontributions given that these aerosols are distrib-
uted among different sources (traffic, V/Ni, indus-trial) in the model. The only source showing acertain disagreement is the marine source, whichwas clearly overestimated in the model.
Comparison of results with those obtained byapplying the receptor model to PM10 at the TUB-MS (Viana, 2003) demonstrated a higher contribu-tion of traffic in the harbour of Tarragona than inthe urban background, and by contrast a lowercontribution of the crustal source. This could beattributed to the heavy traffic in the harbour, whichdisaggregates the powder materials deposited on thedockside during the handling operations andincreases the levels of re-suspended PM10. There-fore, an important fraction of the typically crustal-related elements will be associated with the trafficemissions. It has to be taken into account that thetraffic emissions are related with: (1) exhaustemissions; (2) tyre and brake wear; and (3) roaddust re-suspension. This third contribution includesthe re-suspension of both material eroded from thestreet, and of material deposited onto the road. InSpain, the contribution of this third component isvery important given the low rainfall, which difficultthe washing out of the material deposited (Querolet al., 2004b). In the harbour, the contribution ofthis third factor increases given the large amounts ofbulk material deposited on the dockside and thehigh frequency of heavy traffic which contributes todisaggregate the powder material and to re-suspendit. This is the reason why, in spite of the lower
ARTICLE IN PRESSA. Alastuey et al. / Atmospheric Environment 41 (2007) 6366–6378 6377
values of Sb (tracer of traffic) determined, thecontribution of traffic is more important in theharbour than in the city. Finally, the sourceidentified in this study at the harbour as V/Ni andsecondary aerosols was interpreted at the urban siteas a general industrial source (Viana et al., 2006).After the results obtained at the present study, it isclear that a fraction of these trace elements shouldbe attributed to harbour emissions.
4. Conclusions and recommendations
When comparing the results of chemical char-acterisation of PM10 obtained at the harbour site(THA-MS) with those at the urban background site(TUB-MS) we observed an increase of 3 mgm�3 inthe PM10 annual mean in the harbour site. This ismainly due to the emission of mineral matter.Moreover, combustion emissions in the harbour(traffic, vessels, etc.) may also contribute to levels ofPM10 in the city. These harbour contributions maybe significant at a daily scale and therefore couldhave an important impact on the exceedences of thedaily limit value established by the 1999/30/ECdirective (daily values of 50 mgm�3 not to beexceeded by more than 35 days per year in 2005).
A good correlation was obtained for the annualaverage concentrations of most PM10 componentsat the two stations, due to the fact that both sites areaffected by the same PM sources and meteorologi-cal processes. On a daily scale, differences mayincrease depending on emissions and micro/mesometeorological features. Differences were onlyobserved for traffic-related elements (Sb, Cu, Pb,and Zn) with higher concentrations at the urbansite, and for tracers (P and Mn, and V and Ni in alesser extent) of some mineral bulk cargo materialswith significantly higher concentrations at theharbour. Interpretation of time series of PM10components demonstrated that handling operationsmay increase the levels of specific elements. How-ever, re-suspension by wind and traffic of materialsthat accumulate in the docks may have a higherimpact on PM10 than loading and unloadingoperations.
Harbour activities, traffic and wind re-suspensionof Mn mineral, of Ca-phosphates, and of coke,usually stocked in piles in the dock, result in annuallevels of Mn and P, and to a lesser extent of V andNi, which may be considered as relatively high ifcompared with the usual ranges obtained at urbansites in Spain.
FA enabled us to identify the following sources;crustal, traffic, secondary aerosols, sea spray. Inaddition, three sources related to the re-suspensionof materials handled in the harbour were deter-mined: coke, represented by the association of Niand V; Mn mineral, and calcium phosphate. MLRA(performed for only five sources) showed a highcontribution of traffic to PM10 levels at the THA-MS, which is markedly higher than that calculatedfor the TUB-MS by Viana (2003). In the harbourthis factor includes, in addition to the typicallytraffic-related elements (Cu, Zn, Sn, Pb, Cd, Sb,OM+EC, Cr, Fe, K, NO3
�), other components suchas Ca and P, due to the re-suspension of calciumphosphates by heavy traffic.
Wind and traffic re-suspension of materialdeposited on the dockside is one of the majorcontributors to PM10 at the harbour. The action ofheavy traffic disaggregating the materials favoursthe re-suspension of dust, increasing PM10. The re-suspension of raw materials stored on the docks isat times coupled with traffic and thus increases thecontribution of the traffic source to PM levels, whileat times it is observed as an independent sourceinfluenced only by meteorological factors such aswind speed and direction.
Based on these conclusions the following recom-mendations addressed to reduce fugitive emissionsmay be made: (a) adoption of measures to diminishthe amount of particulates deposited in the docksidewhich could help to reduce levels of PM10 in theharbour: one solution would be to dampen thedockside after handling of some powdered materialssuch as clinker, Mn-mineral, phosphates, cereals,etc.; (b) obligatory use of canvas on lorries tominimise loss of materials during transport; and (c)adoption of measures to diminish re-suspension (ofmaterials accumulated in piles by wind) such as theuse of parapets in the wind direction, to dampenbulk materials or the application of specificproducts to reduce re-suspension.
Acknowledgements
This work was supported by the EuropeanProgramme LIFE under contract LIFE02/ENV/E/000274, Project HADA, and coordinated by theSpanish ‘‘Ente Publico Puertos del Estado’’. Theauthors gratefully acknowledge the NOAA AirResources Laboratory (ARL) for the provision ofthe HYSPLIT transport and dispersion model usedin this publication (http://www.arl.noaa.gov/ready/
ARTICLE IN PRESSA. Alastuey et al. / Atmospheric Environment 41 (2007) 6366–63786378
hysplit4.html). The authors would like to thankNASA/Goddard Space Flight Center (Maryland,USA), the Atmospheric Modelling and WeatherForecasting Group (University of Athens), theMarine Meteorology Division, Naval ResearchLaboratory (Monterrey, USA) and the SeaWIFSProject (NASA) for the valuable informationsupplied by the TOMS, SKIRON and NAAPSmaps and satellite images, respectively. The authorN. Moreno wishes to thank the financial support ofthe CSIC under I3P Program Doctors Contracts ofthe European Social Found.
References
1999/30/CE Council Directive relating to limit values for sulphur
dioxide, nitrogen dioxide and oxide of nitrogen, particulate
matter and lead in ambient air. The Council of the European
Union.
Adachi, K., Tainosho, Y., 2004. Characterization of heavy metal
particles embedded in tire dust. Environment International
30, 1009–1017.
Alastuey, A., Sanchez-de-la-Campa, A., Querol, X., de la Rosa,
J., Plana, F., Mantilla, E., Viana, M., Ruiz, C.R., Garcıa dos
Santos, S., 2006. Identification and chemical characterisation
of industrial PM sources in SW Spain. Journal of the Air
Waste Management Association 56, 993–1006.
Andrews, E., Saxena, P., Musarra, S., Hildemann, L.M.,
Koutrakis, P., McMurry, P.H., Olmez, I., White, W.H.,
2000. Concentration and composition of atmospheric aerosols
from the 1995 SEAVS experiment and a review of the closure
between chemical and gravimetric measurements. Journal of
the Air Waste Management Association 50, 648–664.
Anto, J.M., Sunyer, J., Rodriguez-Roisin, R., Suarez-Cervera,
M., Vazquez, L., 1989. Community outbreaks of asthma
associated with inhalation of soybean dust. New England
Journal of Medicine 320, 1097–1102.
Cooper, D.A., 2003. Exhaust emissions from ships at berth.
Atmospheric Environment 37, 3817–3830.
Corbett, J.J., Fischbeck, P., 1997. Emissions from ships. Science
278 (5339), 823–824.
Corbett, J.J., Koehler, H.W., 2003. Updated emissions from
ocean shipping. Journal of Geophysical Research 108.
Draxler, R.R., Hess, G.D., 1998. Description of the HYSPLIT 4
modelling system. NOAA Technical Memorando ERL ARL-
224.
Drever, J.J., 1982. The Geochemistry of Natural Waters.
Prentice-Hall Inc., Englewood Cliffs, NJ.
Endresen, Ø., Sørgard, E., Sundet, J.K., Dalsøren, S.B., Isaksen,
I.S.A., Berglen, T.F., Gravir, G., 2003. Emission from
international sea transportation and environmental impact.
Journal of Geophysical Research 108, 4560.
Isakson, J., Persson, T.A., Selin Lindgren, E., 2001. Identification
and assessment of ship emissions and their effects in the
harbour of Goteborg, Sweden. Atmospheric Environment 35,
3659–3666.
Millan, M.M., Salvador, R., Mantilla, E., Kallos, G., 1997.
Photooxidant dynamics in the Mediterranean basin in
summer: Results from European research projects. Journal
of Geophysical Research-Atmospheres 102, 8811–8823.
Moreno, N., Alastuey, A., Querol, X., Artinano, B., Guerra, A.,
Luaces, J.A., Lorente, A., Basora, J., 2007. Characterisation
of dust material emitted during harbour operations (Hada
Project), Atmospheric Environment, this issue, doi:10.1016/
j.atmosenv.2007.03.028.
Querol, X., Alastuey, A., Lopez-Soler, A., Plana, F., Puicercus,
J.A., Ruiz, C.R., Mantilla, E., Juan, R., 1998. Seasonal
evolution of atmospheric suspended particles around a coal-
fired power station: chemical characterisation. Atmospheric
Environment 32, 719–731.
Querol, X., Alastuey, A., de la Rosa, J., Sanchez, A., Plana, F.,
Ruiz, C.R., 2002. Source apportionment analysis of atmo-
spheric particulates in an industrialised urban site (Huelva
City) in South-western Spain. Atmospheric Environment 36,
3113–3125.
Querol, X., Alastuey, A., Viana, M.M., Rodrıguez, S., Artinano,
B., Salvador, P., Garcia Dos Santos, S., Fernandez Patier, R.,
Ruiz, C., de la Rosa, J., Sanchez de la Campa, A., Menendez,
M., Gil, J.I., 2004a. Speciation and origin of PM10 and
PM2.5 in Spain. Journal of Aerosol Science 35, 1151–1172.
Querol, X., Alastuey, A., Ruiz, C.R., Artinano, B., Hasson, H.C.,
Harrison, R.M., Buringh, E., ten Brink, H.M., Lutz, M.,
Bruckmann, P., Straehl, P., Schneider, J., 2004b. Speciation
and origin of PM10 and PM2.5 in selected European cities.
Atmospheric Environment 38, 6547–6565.
Rodrıguez, S., Querol, X., Alastuey, A., Plana, F., 2002. Sources
and processes affecting levels and composition of atmospheric
aerosol in the Western Mediterranean. Journal of Geophysi-
cal Research 107 (D24), 12-1–12-4.
Saxe, H., Larsen, T., 2004. Air pollution from ships in three
Danish ports. Atmospheric Environment 38, 4057–4067.
Sinha, P., Hobbs, P.V., Yokelson, R.J., Christian, T.J., Kirch-
stetter, T.W., Bruintjes, R., 2003. Emissions of trace gases and
particles from two ships in the southern Atlantic Ocean.
Atmospheric Environment 37, 2139–2148.
Sternbeck, J., Sjodin, A., Andreasson, K., 2002. Metal emissions
from road traffic and the influence of resuspension—results
from two tunnel studies. Atmospheric Environment 36 (30),
4735–4744.
Thurston, G.D., Spengler, J.D., 1985. A quantitative assessment
of source contribution to inhalable particulate matter pollu-
tion in Metropolitan Boston. Atmospheric Environment 19,
9–25.
Turpin, B.J., Saxena, P., Andrews, E., 2003. Measuring and
simulating particulate organics in the atmosphere: problems
and prospects. Atmospheric Environment 34, 2983–3013.
Viana, M., 2003. Niveles, composicion y origen del material
particulado atmosferico en los sectores Norte y Este de la
Penınsula Iberica y Canarias. Ph.D. Thesis, University of
Barcelona.
Viana, M., Querol, X., Alastuey, A., 2006. Chemical character-
isation of PM episodes in NE Spain. Chemosphere 62/6,
947–956.
Visser, H., Buringh, E., van Breugel, P.B., 2001. Composition
and origin of airborne particulate matter in the Netherlands.
Report 650010029, National Institute for Public Health and
the Environment, RIVM, The Netherlands, 104pp.


![Proceedings.] PALMER ON FREMANTLE HARBOUR-WORKS](https://img.pdfslide.net/doc/110x75/635470ac2f45713c8a071edf/proceedings-palmer-on-fremantle-harbour-works.jpg)