Embed Size (px)
Citation preview
www.newphytologist.org
1
Research
Blackwell Publishing Ltd
Contribution of new photosynthetic assimilates to respiration by perennial grasses and shrubs:
residence times and allocation patterns
Mariah S. Carbone and Susan E. Trumbore
Department of Earth System Science, University of California, Irvine, CA 92697-3100, USA
Summary
• Quantification of the fate of carbon (C) used by plant metabolism is necessary toimprove predictions of terrestrial ecosystem respiration and its sources.• Here, a dual isotope (
13
C and
14
C) pulse-label was used to determine the allocationof new C to different respiratory pathways in the early and late growing seasons fortwo plant functional types, perennial grasses and shrubs, in the Owens Valley, CA, USA.• Allocation differences between plant types exceeded seasonal allocation varia-tion. Grasses respired 71 and 64% and shrubs respired 22 and 17% of the labelbelow-ground in the early and late growing seasons, respectively. Across seasonsand plant types, ~48–61% of the label recovered was respired in 24 h, ~68–84% in6 d, and ~16–33% in 6–36 d after labeling.• Three C pools were identified for plant metabolism: a
fast pool
with mean resi-dence times (MRTs) of ~0.5 and ~1 d below- and above-ground, respectively; an
intermediate pool
with MRTs of 19.9 and 18.9 d; and a
storage pool
detected innew leaf early growing season respiration
>
9 months after assimilation. Differencesin allocation to
fast
vs
intermediate C pools
resulted in the mean age of C respiredby shrubs being shorter (3.8–4.5 d) than that of the grasses (4.8–8.2 d).
Key words:
accelerator mass spectrometry, allocation, autotrophic respiration,Owens Valley, plant metabolism, pulse-chase label,
13
C,
14
C.
New Phytologist
(2007)
doi
: 10.1111/j.1469-8137.2007.02153.x
No claim to original US government works. Journal compilation ©
New Phytologist
(2007)
Author for correspondence:
Mariah S. Carbone
Tel:
+
1 949 8241987
Fax:
+
1 949 8243874
Email: [email protected]
Received:
5 March 2007
Accepted:
10 May 2007
Introduction
Recent literature has highlighted the need to better understandplant carbon (C) allocation patterns in order to accuratelypredict terrestrial ecosystem respiration sources (Trumbore,2006). The allocation of recently assimilated C (henceforth‘new’ C) to below- vs above-ground plant components and togrowth vs respiration are key uncertainties in global terrestrialecosystem C models (Friedlingstein
et al
., 1999). How plantsallocate C determines how long that C may remain in theplant or soil before returning to the atmosphere by respiration.The C allocated to constructing plant tissues (e.g. stems,leaves, and roots) will typically reside in the plant and soillonger than C used for plant metabolism (e.g. growth andmaintenance respiration). Growth and maintenance respiration
accounts for a large percentage of assimilated C, from
∼
30 to70% depending on the ecosystem (Amthor, 2000). Determinationof this ecosystem C use efficiency (the fraction of photosyntheticuptake respired by plant metabolism) has been particularlychallenging because below-ground respiration (soil respiration)is the sum of plant and microbial sources that are methodo-logically difficult to quantify individually (Hanson
et al
., 2000;Norby & Jackson, 2000; Trumbore, 2006). Additionally, notmuch is known about the sources of C that support plantmetabolism, but there is clear evidence that both new andstored (nonstructural carbohydrate) C sources contribute(Dickson, 1991; Ekblad & Högberg, 2001; Högberg
et al
.,2001; Bhupinderpal-Singh
et al
., 2003; Körner, 2003;Czimczik
et al
., 2006; Keel
et al
., 2006; Schuur & Trumbore,2006; Taneva
et al
., 2006).
www.newphytologist.org
No claim to original US government works.Journal compilation ©
New Phytologist
(2007)
Research2
Plant biomass is commonly used to describe plant alloca-tion patterns. Jackson
et al
. (1996) demonstrated that plantfunctional types follow universal biomass distributions. Bothshrubs and grasses generally posses high biomass root to shootratios (
B
R:S
) of
∼
4.5 and 3.7, respectively, and trees have typi-cally lower
B
R:S
of
<
1. The
B
R:S
is a direct indicator of C usedto build structural tissues, but it does not necessarily representthe C spent on metabolic respiration (Litton
et al.
, 2007). Theturnover of different plant components is also essential forunderstanding how much C is allocated to the growth andmaintenance of tissues. For example, while minirhizotron studieshave shown that there is a dynamic fine-root population withlifetimes of weeks to months, there is also evidence that themajority of tree root biomass is long-lived (i.e. years) (Gaud-inski
et al
., 2001; Matamala
et al
., 2003). Thus, the allocationof C below-ground to support the growth and maintenance ofroots that live for many years will differ from that of roots thatare replaced frequently (Trumbore
et al
., 2006). Yet, few studieshave demonstrated how the partitioning of C in respiration(
R
R:S
) or net primary production (
P
R:S
) relates to that of biomass.Within the plant, the allocation of C is thought to be deter-
mined by source–sink interactions (Wardlaw, 1990; Dickson,1991; Farrar & Jones, 2000). At the whole-plant level, sources(e.g. mature photosynthetically active leaves) supply new C,and sinks (e.g. developing leaves, shoots, roots, and other plantorgans) compete for new C. The flow of C to sinks dependson the strength of the sink, which is determined by the size ofsink tissue (or organ), growth rate, metabolic activity, andrespiration rate. Thus, sink demands should vary with envi-ronmental conditions, plant functional type, plant age andphenology (Dickson, 1991).
Nearly all of our knowledge of how plants allocate newlyassimilated C comes from pulse-chase labeling studies conductedin controlled laboratory and glasshouse settings (Isebrands &Dickson, 1991). The few studies that have been performedunder field conditions used radiocarbon (
14
C) pulse-chaselabeling techniques at high concentrations that are no longerfeasible today, because of increased regulation of radioactivityin the environment (Dahlman & Kucera, 1968; Caldwell &Camp, 1974; Milchunas
et al
., 1985, 1992; Isebrands &Dickson, 1991). Additionally, only a handful of these directlyquantified the C allocated to plant metabolism (Warembourg& Paul, 1973, 1977; Horwath
et al
., 1994).This study was designed to look at plant functional and
seasonal differences in the respiration of newly assimilatedC in perennial grasses and shrubs under field conditions.Understanding the fundamental C cycling patterns in grassesand shrubs is of interest because of the prevalence of vegeta-tion shifts from herbaceous to woody species in the arid andsemiarid western USA, and globally (Schlesinger
et al
., 1990;Jackson
et al
., 2000; Asner
et al
., 2003; Elmore
et al
., 2003).Observed modifications to the C budget associated with a shiftfrom grass to shrub vegetation include increases in standingbiomass, altered root and leaf litter inputs, changes in spatial
distributions of organic matter and nutrients, and potentialshifts in soil C storage (Jackson
et al
., 2000). Yet, there is littledata that demonstrates how such vegetation shifts affect theresidence time of C used for plant metabolism, or may alterthe partitioning of new C to respiration below- vs above-ground on both short and longer time scales.
There were three primary goals here: to determine the frac-tion of newly assimilated C respired below- vs above-ground;to understand how that partitioning varied seasonally; and toquantify the speed at which new C was respired by (cycledthrough) the ecosystem. It was hypothesized that the intrinsicdifferences in plant functional types, such as woody vs herba-ceous tissues, growth rates, and rooting depth would result indifferent overall respiration partitioning between below- andabove-ground plant components. It was also hypothesized thatseasonal differences in the environment and plant phenologywould exhibit control on respiration partitioning and speed ofcycling of new assimilates.
In order to address our research goals we used a dual (
13
Cand
14
C) isotope pulse-chase labeling approach. This techniqueallowed allocation patterns to be safely observed in the fieldunder ambient CO
2
concentrations, and with less disturbanceto the plants and soil in comparison with other methods oftracking plant contributions to below-ground respiration,such as continuous labeling, trenching and girdling (Hanson
et al
., 2000). The use of both C isotopes permitted us to quantifyC used for respiration on different time scales. The
13
C labelfor the short-term (hours to days) response was used to takeadvantage of its greater ease and lower cost of analysis. The
14
C label measured by accelerator mass spectrometry (AMS)was used to detect the small quantities of label in CO
2
respiredweeks to months following the label application. For a morethorough discussion of the pros and cons of using
13
C and
14
Clabels under field conditions, see Carbone
et al
. (2007).
Materials and Methods
Field site description
This study took place near the city of Bishop (37
°
60
′
N,118
°
60
′
W), in the Owens Valley, California, USA. TheOwens Valley is located in eastern California between theSierra Nevada and the White-Inyo Mountain ranges at approx.1250 m elevation. The climate is like that of the nearby GreatBasin desert, with average temperatures ranging from 11 : 6
°
C(daytime high:nighttime low) in winter to 37 : 14
°
C insummer. The average annual precipitation is
∼
150 mm, with75% falling in the winter months between November andMarch. Runoff from the snow pack in the Sierra Nevada andWhite-Inyo Mountains flows into the valley in the spring andsummer, resulting in a high groundwater table (Hollett
et al
.,1991) and providing an additional water supply for plants.The vegetation in the valley floor is dominated by phreatophytes(groundwater-using plants) typical of the Great Basin region.
No claim to original US government works. Journal compilation ©
New Phytologist
(2007)
www.newphytologist.org
Research 3
Two representative sites were selected that differed in dom-inant vegetation. The first (grass site) was an alkali meadowplant community, with the perennial grasses
Distichlis spicata
(L.) E. Greene (inland saltgrass) and
Juncus balticus
Willd.(wirerush), and a water table that remained relatively shallow(
∼
1–2 m depth) during the period of observation. The sec-ond (shrub site) was a phreatophytic scrub plant communitycomprised of the winter deciduous perennial shrubs
Ericame-ria nauseosa
(Pall. ex Pursh) (rubber rabbitbrush, formerly
Chrysothamnus naseosus
) and
Sarcobatus vermiculatus
(Hook.)Torrey (greasewood).
Atriplex lentiformis
ssp.
torreyi
(saltbush)was also present at this site, but not represented in the experi-mental plots. Shrubs located in the experimental plots wereclassified as adults (based on size and yearly flowering) accord-ing to criteria used in Toft & Fraizer (2003). The water tabledepth at the shrub site was greater than at the grass site, rang-ing from
∼
1.7 to 2.5 m depth during the period of observa-tion. Together, alkali meadow and phreatophytic scrub plantcommunities make up
∼
23.6 and 29.9% of land cover in theOwens Valley, respectively (Elmore
et al
., 2003).The grasses and shrubs have similar phenologies. Growth
begins in the spring (April). Maximum leaf area is reachedby early summer (June), and flowering occurs in mid to latesummer (July–August). Changes in the
δ
18
O of stem watershow that the more shallow-rooted grasses lose contact withthe groundwater in late summer, resulting in earlier senes-cence (D. Pataki, unpublished data). By contrast, the deeper-rooting shrubs maintain access to groundwater throughoutthe growing season (D. Pataki, unpublished data), and remainphysiologically active until temperatures drop below freezingin autumn (Donovan
et al
., 1996).
Experimental set-up
Paired control and label plots, each
∼
14 m
2
, were establishedat both sites. Two pulse-chase labeling campaigns took placeover the course of the experiment, using the same labelplots. The late growing season label was applied in late July2005. The early growing season label was applied in early May2006. Annual precipitation (water year) and groundwatertable were comparable and above average for both 2005 and2006 (Inyo County Water Department, pers. comm.). Airtemperature, air relative humidity, soil temperature andmoisture (at multiple depths) were continually measured andrecorded on a CR10X data logger in both plots and sites(Campbell Scientific, Logan, UT, USA).
Labeling procedure
A modified version of the field labeling procedure described inCarbone
et al
. (2007) was used. Briefly, a dual isotope (
13
Cand
14
C) label was applied by enclosing the vegetation in a
∼
24-m
3
translucent polyethylene dome (described by Arnone& Obrist, 2003) over a period of
∼
45–60 min. The dome was
sealed to the ground by placing the PVC base on top of aclosed-cell foam gasket, and weighting with 12 cinder blocks.If needed, fine sand was used to complete the dome sealing tothe ground surface. Dilute HCl was injected with a syringeinto a mason jar with isotopically enriched NaHCO
3
solutionto produce CO
2
with a label signature of
∼
20 and
∼
200times background abundance for
13
C and
14
C, respectively.The enriched isotope solution contained
∼
1 g of
13
C and
∼
300 Bq of
14
C. The radioactivity in the label solution wasconsidered ‘exempt quantities’ (specific activity
<
296 Bq ml
–1
liquid; California Code of Regulations (California Departmentof Health Services)). The labeled CO
2
was circulated (1 l min
–1
)into the dome, where six fans were used to mix air throughoutthe labeling period. The CO
2
concentrations in the dome werecontinuously monitored with a LI-800 Infrared Gas Analyzer(IRGA) (Li-Cor, Lincoln, NE, USA). Immediately following thelabel addition, CO
2
concentrations increased by no more than20 ppm and then decreased as a result of net photosyntheticuptake of CO
2
by vegetation. During the early growing seasonlabeling, an additional unlabeled
∼1.4 g C was acidified andreleased to prevent CO2 concentrations from dropping belowambient concentrations. The CO2 concentrations within thelabeling dome were kept within the range of 320–420 ppmduring all labeling applications. To lessen the environmentaleffects of the dome, the length of the labeling period wasminimized, and labeling took place at mid-morning whenplants were most photosynthetically active (Kajji et al., 1993).Nonetheless, air temperatures within the dome were elevated8–10°C above ambient temperatures, but they never exceededdaily maximum air temperatures for the given season.Condensation of water observed on the dome walls suggestedthat air relative humidity reached saturation by the end of thelabeling periods (while those outside the tent did not exceed35%). Multiple samples to monitor the 13C and 14C contentof CO2 in the dome air were taken throughout the labelingperiod and used together with the change in CO2 concentrationto quantify the rate of uptake of the label by plants.
CO2 measurements
Within each plot, measurements of soil respiration (below-ground respiration) and leaf and stem respiration (above-ground respiration) were made for the duration of the earlyand late growing season labeling campaigns. Soil respirationmeasurements were conducted with automated soil respirationchambers developed and built at UC Irvine based on thedesign of Goulden & Crill (1997). Eight chambers (internaldiameter 25 cm, height 21 cm, volume ∼11 l) were installedat each site, four in each plot. Soil respiration was measuredin each chamber every ∼1.5 h and continually at the site forthe entire measurement period. At the grass site, living above-ground vegetation was removed (by clipping grass at the soilsurface) from some of the chambers to separate below- andabove-ground respiration sources. Chamber bases were not
www.newphytologist.org No claim to original US government works.Journal compilation © New Phytologist (2007)
Research4
inserted into the soil but, instead, a sand ring diffusion barrierwas used to seal the chamber to the ground. Thus, roots freelyextended underneath all chambers, and the clipped chamberswere representative of below-ground respiration.
Above-ground leaf respiration was measured with branchbags made of opaque polyethylene sheet. The bags wereplaced over the vegetation, and the opening was lined withclosed-cell foam and sealed with compression fittings. TheCO2 flux was measured over ∼5 min by connecting tubing inthe bag with the LI-800 IRGA and a pump (1 l min–1). Fourbags were used in each plot.
Isotope sampling and processing
Within each plot, CO2 was collected to determine theisotopic content (13C and 14C) of soil respiration and leafrespiration 24 h before labeling (background measurements),and frequently after labeling (chase measurements). The dualisotope label approach was designed to maximize theresolution of sampling (with 13C measurements), and tocapture the slower and smaller cycling pools (with 14C), whileminimizing the time and cost associated with 14C analyses.The chase measurement sample intervals for 13C were 4 h, 1,2, 3 and 6 d after labeling. Sample intervals for 14C were 1, 3,13 and 36–50 d after labeling.
Samples for 13C content in soil respiration and leaf respira-tion were collected from the chambers and branch bags bysyringe. The CO2 was allowed to accumulate to ∼1000 ppm,and then two 60-ml syringe samples were extracted. The firstsample was used to measure the CO2 concentration with theLI-800 IRGA. The second was flushed through a 12-ml exitainerwith a septum cap and returned for 13C analyses on a ThermoElectron Gas Bench II coupled with a Delta Plus IRMS(Thermo Scientific, Waltham, MA, USA) at UC Irvine. All13C samples were analyzed less than 5 d after collection tominimize storage effects. Temporal variability in the δ13Csignature of respiration, including that attributable to isotopicfractionation during dark respiration and photorespiration,was not quantified (Ghashghaie et al., 2003; Prater et al., 2006)but was likely small compared with our large label signal overthe 6-d time period, and spatial heterogeneity.
Samples for 14C content in soil respiration and leaf respira-tion were collected from the chambers and branch bags bymolecular sieve traps. Samples were allowed to accumulateCO2, and the concentration was measured. Sample air wasthen pumped from the chamber or bag (1 l min–1) through aMgClO4 drying column to an activated molecular sieve 13×trap which quantitatively removed CO2. The air was thenreturned to the chamber or bag. Samples were returned to UCIrvine, where the CO2 was extracted from the molecular sieve,purified on a vacuum line, and converted to graphite (Xuet al., 2007). The 14C content of the graphite was measuredusing accelerator mass spectrometry (NEC 0.5MV 1.5SDH-2 AMS system; National Electrostatics Corp., Middleton,
WI, USA) at the W. M. Keck-CCAMS facility of UC Irvine(Southon et al., 2004).
The radiocarbon data (∆14C) are reported in per mil (‰),the deviation (in parts per thousand) of the ratio of 14C : 12Cin a sample divided by that of a standard of fixed isotopic com-position (0.95 times the 14C : 12C ratio of oxalic acid I stand-ard; decay corrected to 1950). Measurements were correctedfor the effects of mass-dependent isotope fractionation by cor-recting to a common δ13C value (–25‰) and assuming that14C is fractionated twice as much as 13C (Stuiver & Polach,1977). Measurements taken early in the chase period (1 and3 d after labeling) had elevated δ13C values as a consequenceof the use of the dual isotope labeling method, and thereforethe δ13C of the sample was not the correct measure of isotopicfractionation. In these cases, the sample 14C content was cor-rected for isotopic fractionation with average backgroundδ13C values following the method described by Torn & Sou-thon (2001).
Data analyses and definition of terms
The 13,14C contents of soil respiration and leaf respirationwere combined with CO2 flux measurements to estimate thetotal amount of 13,14C respired during the period from 4 h to36 d following the application of the label (Carbone et al.,2007). We assumed that 13,14C concentrations varied linearlybetween observations. We estimated errors in the allocation ofC over the measurement period following the labeling bypropagating errors (±1 standard deviation) from isotopemeasurements, and using the mean of the continuous CO2flux measurements over time. Continuous CO2 fluxes werenot available for the leaf respiration in the shrub ecosystem,and empirically derived exponential temperature relationshipsbased on branch bag CO2 flux measurements and hourly airtemperatures were used to estimate fluxes. Differences in thephotosynthetic assimilation of the label on different datesand between vegetation types meant that we did not makecomparisons based on the absolute amount of label respiredand how it was allocated. Instead, we compared the proportionalallocation of the total label recovered.
The total label recovered (TLR) was defined as the calcu-lated sum of the label respired (13,14C g) from below- andabove-ground between 4 h to 36 d after the label was applied.This quantity was defined as 100% for each labeling. Thebelow- and above-ground components were then partitionedinto percentage of TLR over two different time periods, using13C to calculate allocation partitioning from 4 h to 6 d, and14C for 6 to 36 d after labeling.
The fraction of respiration from label (FRL) for below- andabove-ground components was defined with the same equa-tions as described in Carbone et al. (2007), where an isotopemass balance approach was used to partition the fraction ofrespiration coming from the label with time for both 13C and14C measurements. For example, the equation used for 13C was:
No claim to original US government works. Journal compilation © New Phytologist (2007) www.newphytologist.org
Research 5
FRL = (δ13CS – δ13CB)/(δ13CL – δ13CB) Eqn 1
(FRL, the fraction of respiration from the label; δ13CS, themeasured sample respiration signature; δ13CB, the backgroundrespiration signature (prelabel); δ13CL, the label signature.)δ13CL was determined as the measured mean of δ13C of CO2assimilated during the ∼1 h of label application.
The mean residence time (MRT) of the label in the below-and above-ground components was calculated by fittingexponential decay functions to the FRL. The MRT representsthe time required for the amount of label in respiration to bereduced to 1/e times its initial value. As a single decay func-tion would not fit all data points, we calculated separateMRTs for the first 6 d (13C data) and 6–36 d (14C data) afterlabeling.
The mean age (MA) of (autotrophically) respired C wascalculated for below-ground, above-ground, and total ecosys-tem respiration by combining the percentage of TLR and theMRT for each component over the two defined time periods.For example, the following equation was used for the below-ground component:
Eqn 2
(MAB, the mean age of respired C from below-ground;TLRB(0–6), TLRB(6–36), and TLRB, the percentages of totallabel in respiration from the below-ground component for thefirst 6 d, for 6–36 d, and in total (0–36 d), respectively;MRTB(0–6) and MRTB(6–36), the corresponding mean residencetimes of the label below-ground over the same defined timeperiods.) For total ecosystem respiration, the mean age ofrespired C was calculated as a weighted sum of the below- andabove-ground components. While we define MA as ‘autotrophic’,this measurement invariably incorporates respiration fromroot-associated microbes and the decomposition of veryshort-lived fine roots.
Results
Environmental conditions
Mean (24-h) air temperatures, air relative humidity, volumetricsoil moisture content at 20 cm, and depth to ground water areshown in Table 1 for both measurement periods (early and lategrowing seasons) and sites. In general, the early growing seasonwas cooler, with greater surface soil moisture, and shallowerwater tables. The late growing season was much warmer, withlower surface soil moisture, and deeper water tables.
Raw isotopic values
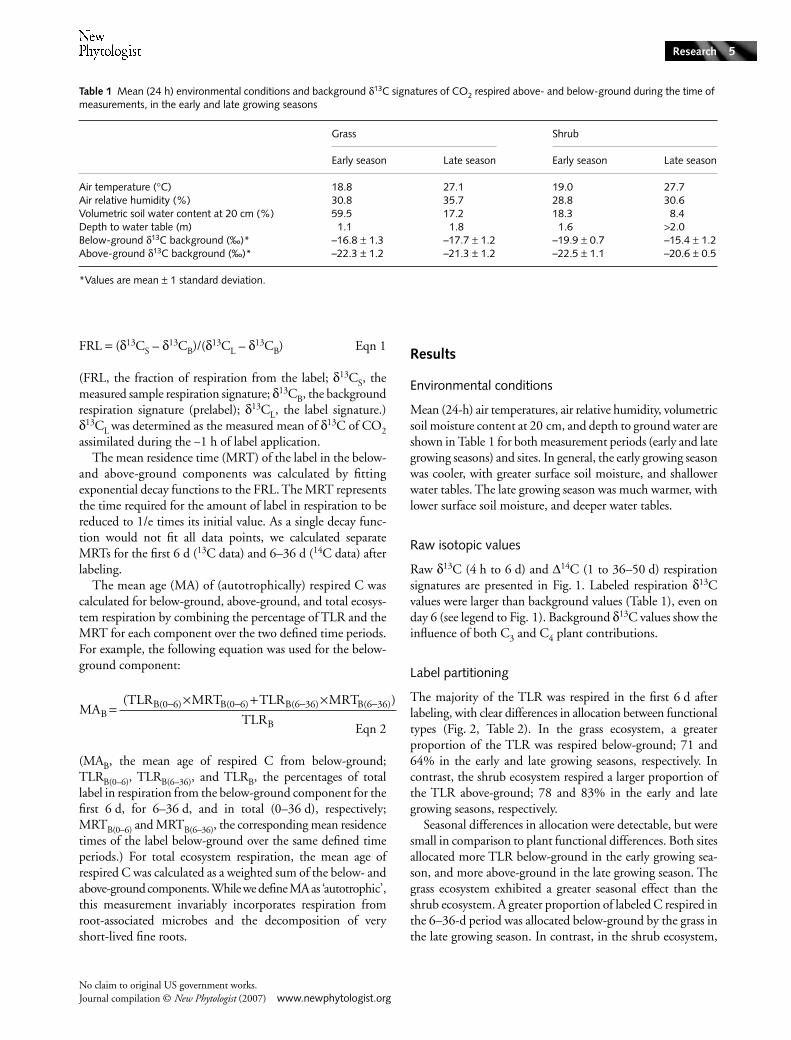
Raw δ13C (4 h to 6 d) and ∆14C (1 to 36–50 d) respirationsignatures are presented in Fig. 1. Labeled respiration δ13Cvalues were larger than background values (Table 1), even onday 6 (see legend to Fig. 1). Background δ13C values show theinfluence of both C3 and C4 plant contributions.
Label partitioning
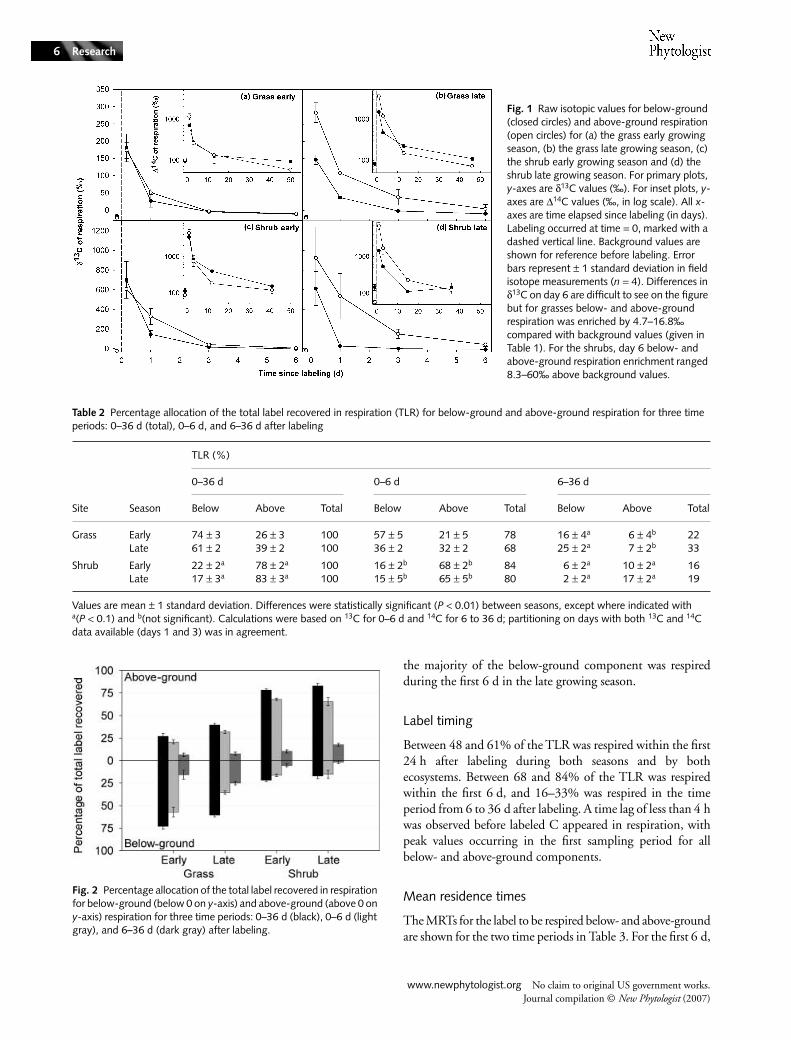
The majority of the TLR was respired in the first 6 d afterlabeling, with clear differences in allocation between functionaltypes (Fig. 2, Table 2). In the grass ecosystem, a greaterproportion of the TLR was respired below-ground; 71 and64% in the early and late growing seasons, respectively. Incontrast, the shrub ecosystem respired a larger proportion ofthe TLR above-ground; 78 and 83% in the early and lategrowing seasons, respectively.
Seasonal differences in allocation were detectable, but weresmall in comparison to plant functional differences. Both sitesallocated more TLR below-ground in the early growing sea-son, and more above-ground in the late growing season. Thegrass ecosystem exhibited a greater seasonal effect than theshrub ecosystem. A greater proportion of labeled C respired inthe 6–36-d period was allocated below-ground by the grass inthe late growing season. In contrast, in the shrub ecosystem,
Table 1 Mean (24 h) environmental conditions and background δ13C signatures of CO2 respired above- and below-ground during the time of measurements, in the early and late growing seasons
Grass Shrub
Early season Late season Early season Late season
Air temperature (°C) 18.8 27.1 19.0 27.7Air relative humidity (%) 30.8 35.7 28.8 30.6Volumetric soil water content at 20 cm (%) 59.5 17.2 18.3 8.4Depth to water table (m) 1.1 1.8 1.6 >2.0Below-ground δ13C background (‰)* –16.8 ± 1.3 –17.7 ± 1.2 –19.9 ± 0.7 –15.4 ± 1.2Above-ground δ13C background (‰)* –22.3 ± 1.2 –21.3 ± 1.2 –22.5 ± 1.1 –20.6 ± 0.5
*Values are mean ± 1 standard deviation.
MA(TLR MRT TLR MRT )
TLRBB(0 6) B(0 6) B(6 6) B(6 6)
B=
× + ×− − − −3 3
www.newphytologist.org No claim to original US government works.Journal compilation © New Phytologist (2007)
Research6
the majority of the below-ground component was respiredduring the first 6 d in the late growing season.
Label timing
Between 48 and 61% of the TLR was respired within the first24 h after labeling during both seasons and by bothecosystems. Between 68 and 84% of the TLR was respiredwithin the first 6 d, and 16–33% was respired in the timeperiod from 6 to 36 d after labeling. A time lag of less than 4 hwas observed before labeled C appeared in respiration, withpeak values occurring in the first sampling period for allbelow- and above-ground components.
Mean residence times
The MRTs for the label to be respired below- and above-groundare shown for the two time periods in Table 3. For the first 6 d,
Fig. 1 Raw isotopic values for below-ground (closed circles) and above-ground respiration (open circles) for (a) the grass early growing season, (b) the grass late growing season, (c) the shrub early growing season and (d) the shrub late growing season. For primary plots, y-axes are δ13C values (‰). For inset plots, y-axes are ∆14C values (‰, in log scale). All x-axes are time elapsed since labeling (in days). Labeling occurred at time = 0, marked with a dashed vertical line. Background values are shown for reference before labeling. Error bars represent ± 1 standard deviation in field isotope measurements (n = 4). Differences in δ13C on day 6 are difficult to see on the figure but for grasses below- and above-ground respiration was enriched by 4.7–16.8‰ compared with background values (given in Table 1). For the shrubs, day 6 below- and above-ground respiration enrichment ranged 8.3–60‰ above background values.
Table 2 Percentage allocation of the total label recovered in respiration (TLR) for below-ground and above-ground respiration for three time periods: 0–36 d (total), 0–6 d, and 6–36 d after labeling
Site Season
TLR (%)
0–36 d 0–6 d 6–36 d
Below Above Total Below Above Total Below Above Total
Grass Early 74 ± 3 26 ± 3 100 57 ± 5 21 ± 5 78 16 ± 4a 6 ± 4b 22Late 61 ± 2 39 ± 2 100 36 ± 2 32 ± 2 68 25 ± 2a 7 ± 2b 33
Shrub Early 22 ± 2a 78 ± 2a 100 16 ± 2b 68 ± 2b 84 6 ± 2a 10 ± 2a 16Late 17 ± 3a 83 ± 3a 100 15 ± 5b 65 ± 5b 80 2 ± 2a 17 ± 2a 19
Values are mean ± 1 standard deviation. Differences were statistically significant (P < 0.01) between seasons, except where indicated with a(P < 0.1) and b(not significant). Calculations were based on 13C for 0–6 d and 14C for 6 to 36 d; partitioning on days with both 13C and 14C data available (days 1 and 3) was in agreement.
Fig. 2 Percentage allocation of the total label recovered in respiration for below-ground (below 0 on y-axis) and above-ground (above 0 on y-axis) respiration for three time periods: 0–36 d (black), 0–6 d (light gray), and 6–36 d (dark gray) after labeling.
No claim to original US government works. Journal compilation © New Phytologist (2007) www.newphytologist.org
Research 7
the labeled C cycled rapidly, with MRTs of < 1 d in all cases,except for the early growing season above-ground componentat the shrub site. For this time period, the MRTs were generallyshorter below-ground (0.54 d) than above-ground (1.0 d).Much slower cycling of labeled C was observed for the timeperiod of 6–36 d after labeling, with little difference in MRTsbetween the below-ground (19.9 d) and above-ground (18.9 d)components. The longest MRT of 26.2 d was observed in thelate growing season below-ground at the grass site.
Mean age of autotrophically respired C
Overall, the MA of C respired by shrubs was shorter than thatof the grasses (Table 4). In the early growing season, the MAsof respired C from the grass and shrub ecosystems were similar;4.5 and 5.0 d, respectively. By contrast, the MAs deviated inthe late growing season, with the grass ecosystem MA increasingto 8.2 d, and the shrub MA decreasing to 3.8 d. These differenceswere largely attributable to the differential allocation to themore slowly cycling C pool in the below-ground components,where the MA of below-ground respired C from the grassesincreased to 11.2 d, and that from the shrubs decreased to 1.8 d.
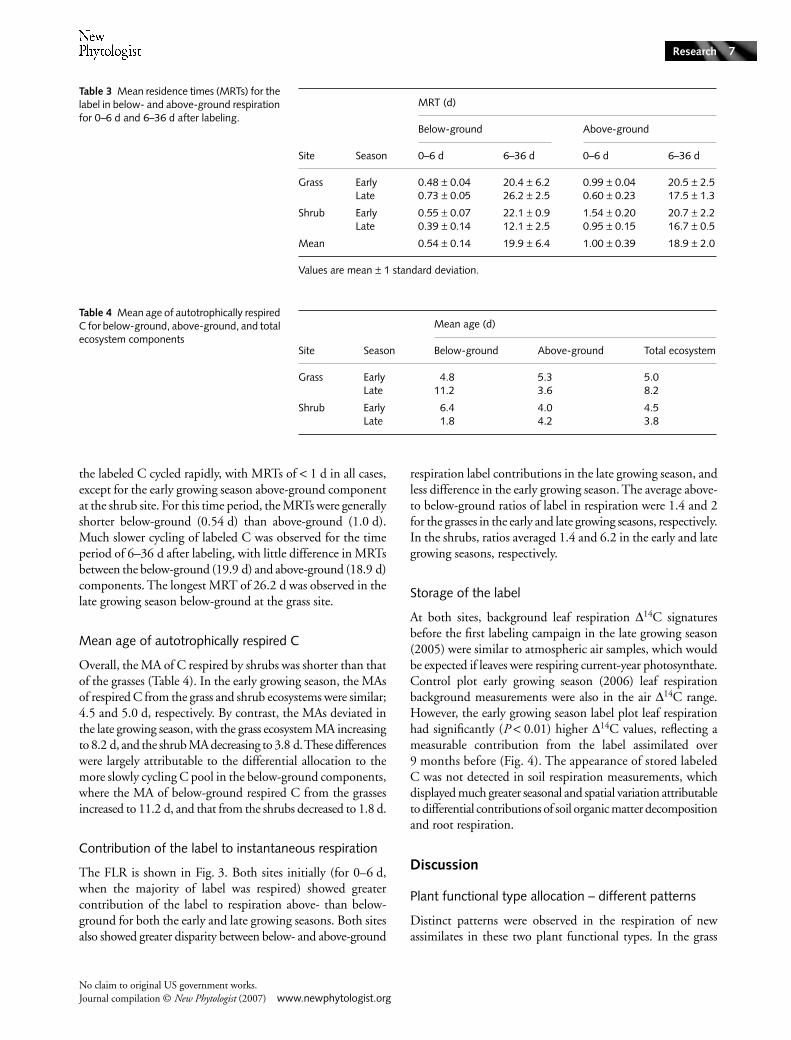
Contribution of the label to instantaneous respiration
The FLR is shown in Fig. 3. Both sites initially (for 0–6 d,when the majority of label was respired) showed greatercontribution of the label to respiration above- than below-ground for both the early and late growing seasons. Both sitesalso showed greater disparity between below- and above-ground
respiration label contributions in the late growing season, andless difference in the early growing season. The average above-to below-ground ratios of label in respiration were 1.4 and 2for the grasses in the early and late growing seasons, respectively.In the shrubs, ratios averaged 1.4 and 6.2 in the early and lategrowing seasons, respectively.
Storage of the label
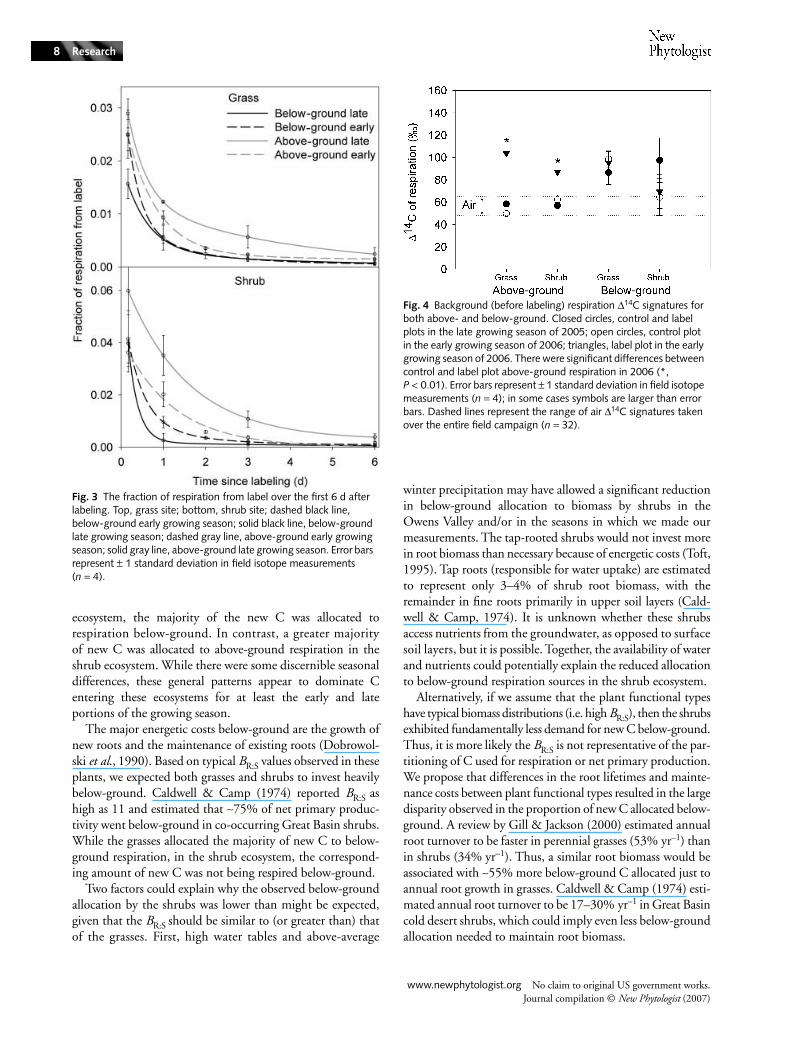
At both sites, background leaf respiration ∆14C signaturesbefore the first labeling campaign in the late growing season(2005) were similar to atmospheric air samples, which wouldbe expected if leaves were respiring current-year photosynthate.Control plot early growing season (2006) leaf respirationbackground measurements were also in the air ∆14C range.However, the early growing season label plot leaf respirationhad significantly (P < 0.01) higher ∆14C values, reflecting ameasurable contribution from the label assimilated over9 months before (Fig. 4). The appearance of stored labeledC was not detected in soil respiration measurements, whichdisplayed much greater seasonal and spatial variation attributableto differential contributions of soil organic matter decompositionand root respiration.
Discussion
Plant functional type allocation – different patterns
Distinct patterns were observed in the respiration of newassimilates in these two plant functional types. In the grass
Site Season
MRT (d)
Below-ground Above-ground
0–6 d 6–36 d 0–6 d 6–36 d
Grass Early 0.48 ± 0.04 20.4 ± 6.2 0.99 ± 0.04 20.5 ± 2.5Late 0.73 ± 0.05 26.2 ± 2.5 0.60 ± 0.23 17.5 ± 1.3
Shrub Early 0.55 ± 0.07 22.1 ± 0.9 1.54 ± 0.20 20.7 ± 2.2Late 0.39 ± 0.14 12.1 ± 2.5 0.95 ± 0.15 16.7 ± 0.5
Mean 0.54 ± 0.14 19.9 ± 6.4 1.00 ± 0.39 18.9 ± 2.0
Values are mean ± 1 standard deviation.
Table 3 Mean residence times (MRTs) for the label in below- and above-ground respiration for 0–6 d and 6–36 d after labeling.
Site Season
Mean age (d)
Below-ground Above-ground Total ecosystem
Grass Early 4.8 5.3 5.0Late 11.2 3.6 8.2
Shrub Early 6.4 4.0 4.5Late 1.8 4.2 3.8
Table 4 Mean age of autotrophically respired C for below-ground, above-ground, and total ecosystem components
www.newphytologist.org No claim to original US government works.Journal compilation © New Phytologist (2007)
Research8
ecosystem, the majority of the new C was allocated torespiration below-ground. In contrast, a greater majorityof new C was allocated to above-ground respiration in theshrub ecosystem. While there were some discernible seasonaldifferences, these general patterns appear to dominate Centering these ecosystems for at least the early and lateportions of the growing season.
The major energetic costs below-ground are the growth ofnew roots and the maintenance of existing roots (Dobrowol-ski et al., 1990). Based on typical BR:S values observed in theseplants, we expected both grasses and shrubs to invest heavilybelow-ground. Caldwell & Camp (1974) reported BR:S ashigh as 11 and estimated that ∼75% of net primary produc-tivity went below-ground in co-occurring Great Basin shrubs.While the grasses allocated the majority of new C to below-ground respiration, in the shrub ecosystem, the correspond-ing amount of new C was not being respired below-ground.
Two factors could explain why the observed below-groundallocation by the shrubs was lower than might be expected,given that the BR:S should be similar to (or greater than) thatof the grasses. First, high water tables and above-average
winter precipitation may have allowed a significant reductionin below-ground allocation to biomass by shrubs in theOwens Valley and/or in the seasons in which we made ourmeasurements. The tap-rooted shrubs would not invest morein root biomass than necessary because of energetic costs (Toft,1995). Tap roots (responsible for water uptake) are estimatedto represent only 3–4% of shrub root biomass, with theremainder in fine roots primarily in upper soil layers (Cald-well & Camp, 1974). It is unknown whether these shrubsaccess nutrients from the groundwater, as opposed to surfacesoil layers, but it is possible. Together, the availability of waterand nutrients could potentially explain the reduced allocationto below-ground respiration sources in the shrub ecosystem.
Alternatively, if we assume that the plant functional typeshave typical biomass distributions (i.e. high BR:S), then the shrubsexhibited fundamentally less demand for new C below-ground.Thus, it is more likely the BR:S is not representative of the par-titioning of C used for respiration or net primary production.We propose that differences in the root lifetimes and mainte-nance costs between plant functional types resulted in the largedisparity observed in the proportion of new C allocated below-ground. A review by Gill & Jackson (2000) estimated annualroot turnover to be faster in perennial grasses (53% yr–1) thanin shrubs (34% yr–1). Thus, a similar root biomass would beassociated with ∼55% more below-ground C allocated just toannual root growth in grasses. Caldwell & Camp (1974) esti-mated annual root turnover to be 17–30% yr–1 in Great Basincold desert shrubs, which could imply even less below-groundallocation needed to maintain root biomass.
Fig. 3 The fraction of respiration from label over the first 6 d after labeling. Top, grass site; bottom, shrub site; dashed black line, below-ground early growing season; solid black line, below-ground late growing season; dashed gray line, above-ground early growing season; solid gray line, above-ground late growing season. Error bars represent ± 1 standard deviation in field isotope measurements (n = 4).
Fig. 4 Background (before labeling) respiration ∆14C signatures for both above- and below-ground. Closed circles, control and label plots in the late growing season of 2005; open circles, control plot in the early growing season of 2006; triangles, label plot in the early growing season of 2006. There were significant differences between control and label plot above-ground respiration in 2006 (*, P < 0.01). Error bars represent ± 1 standard deviation in field isotope measurements (n = 4); in some cases symbols are larger than error bars. Dashed lines represent the range of air ∆14C signatures taken over the entire field campaign (n = 32).
No claim to original US government works. Journal compilation © New Phytologist (2007) www.newphytologist.org
Research 9
It has been suggested that plants growing in nutrient-poorenvironments might increase root lifespan to avoid nutrientloss (Ryser, 1996). Soil nitrogen content was also over 10 timeslower in the shrub ecosystem (D. Pataki, unpublished data).Additionally, there is strong evidence that root maintenancerespiration is minimized in cold desert shrubs (Dobrowolskiet al., 1990). Thus, longer shrub root lifetimes (i.e. less newroot growth respiration) and lower specific root respirationmay also explain the observed allocation and differencesbetween the grasses and shrubs in this study.
In addition to small below-ground C sinks, the shrubs hadgreater above-ground C costs. The construction of woodybiomass during the growing season and maintenance over theentire year requires continuous C investment. The grasseshave no above-ground maintenance costs outside of the grow-ing season because the leaves senesce. Additionally, the grassesare rhizomatous, and thus most of the leaf growth respirationtakes place below-ground. These plant functional differencesin above-ground demands for C may have contributed toeither one or a combination of our above explanations.
Below-ground respiration of the label may have beenunderestimated in both the grasses and the shrubs. To minimizedisturbance to the plants and soils, the plots were not trenched.Therefore, loss of labeled C to transport outside the plot byroots may have occurred. In addition, the transport of unla-beled C by roots into the plot was also possible, causing addi-tional dilution of the label. Because samples were not takenoutside the plots, this is a source of error we cannot quantify.However, we believe that this error was likely small, becausesamples of soil respiration and soil pore space CO2 (data notshown) taken near the edge of the label plots were not statis-tically different from those taken from the center of the plots.
Seasonal allocation – similar patterns and evidence of storage
Variations in seasonal allocation patterns were smaller thanthe plant functional differences in allocation. Both the grassesand the shrubs allocated more new C to respiration below-ground in the early growing season, when root growth hasbeen shown to be greatest in upper soil layers in co-occurringGreat Basin grasses and shrubs (Fernandez & Caldwell, 1975;Peek et al., 2005). Additionally, Great Basin shrubs have beenshown to regulate root respiration capacity, with the maximumoccurring in spring and the minimum in late summer(Holthausen & Caldwell, 1980). In the late growing season,proportionally more new C was allocated to respirationabove-ground. This coincided with greater above-groundbiomass, vegetative flowering, and high daily air temperatures,all of which raise metabolic C costs above-ground.
While the two plant functional types exhibited similarseasonal patterns, a greater seasonal effect was observed in thegrass ecosystem. Although surface soil moisture markedlydecreased over the growing season, continued access to
groundwater by the shrubs may explain the relatively smallvariation in allocation observed between the early and lategrowing seasons. Differences in the potential rooting depth ofplant functional types (grasses are more shallowly rooted thanshrubs) and depth to water (the water table becomes deeperover the growing season) between the early and late growingseasons most likely explain the larger seasonal effect observedin the grasses vs the shrubs. Additionally, the grasses werephenologically more advanced (nearer to senescence) thanthe shrubs at the time of the late growing season labelingcampaign.
Stored C from the late growing season labeling campaigncontributed to above-ground respiration in the following earlygrowing season, > 9 months later. We estimated the stored Cused for leaf respiration by assuming that the 14C content inleaf respiration was constant for the initial stages of new leafgrowth in the spring. Based on growth observations in thefield, we assumed that the duration of respiration with this14C signature was 60–90 d for the grass leaves and 45–75 dfor the shrub leaves, and redefined TLR (100%) to includethis amount. The result suggests that 4–6 and 2–3% of TLRand 9–13 and 3–4% of the above-ground respiration from thelate growing season labeling was stored and remobilized in thefollowing early growing season in the grass and shrub ecosys-tems, respectively. This is consistent with the findings of otherstudies which demonstrated that stored C can be used for newshoot growth in the spring and for maintenance in the dormantseason (Lippu & Puttonen, 1989; Dickson, 1991; Pregizter,2003). Thus, the size of this stored pool may be underesti-mated, particularly if it contributed to dormant season main-tenance respiration, as a result of a lack of winter measurementsin stem respiration in the shrubs and below-ground respira-tion at both sites.
Speed of cycling
New C cycled quickly within and through these ecosystems,with approximately half of the new C respired within the firstday. Translocation of C from leaves to roots and into soilrespiration occurred before we made our initial measurement,4 h after assimilation. This time lag is significantly shorterthan the ∼3–5 d observed in trees, and comparable to previousobservations in grasses (Warembourg & Paul, 1973; Horwathet al., 1994; Ekblad & Högberg, 2001; Bowling et al., 2002;Carbone et al., 2007). We would expect this time lag to be evenshorter for the grasses, because it may depend on path lengthand plant size (Farrar & Jones, 2000). Because our first samplingpoint was 4 h after labeling, we may have underestimated themost rapidly cycling C in these ecosystems.
The rate of loss of labeled C from the leaf (or root) dependson pool size, respiratory losses, assimilation, and rate of Cexport in phloem (rate of C import in phloem) (Wardlaw,1990). Undoubtedly these factors varied between seasons,plant functional types, and even plant species, making it
www.newphytologist.org No claim to original US government works.Journal compilation © New Phytologist (2007)
Research10
difficult to compare seasons or attribute differences in therates of cycling to specific plant physiological mechanisms.Yet, there were general patterns in the MRTs of new C. Sur-prisingly, the MRTs were similar between plant functionaltypes, in spite of the allocation patterns which were verydifferent. Most respired new C cycled quickly (i.e. ∼1–6 d)with MRTs consistently shorter below-ground than those forabove-ground respiration; half a day and a day, respectively,for both grasses and shrubs. However, there were also signifi-cant detectable pools of new C with much longer MRTs,ranging from many days to months, and perhaps years. Thedifferential allocation by grasses (larger) and shrubs (smaller)to a more slowly cycling pool was noticeable below-ground inthe late growing season (Fig. 2, Table 2).
Sources of plant respired C
Our data show that there were potentially three C poolsfueling plant respiration in this ecosystem at any given time:the fast pool, composed of assimilation of the current day; anintermediate pool, which integrated assimilation during thegrowing season with MRTs of tens of days; and a storage pool,which was mobilized when necessary, such as during initialleaf growth in the spring, with MRTs of months to years. Theintegration of the fast and intermediate pools resulted in theMA of respired C from both plant types being several days,with longer MAs in the grasses than the shrubs. Mobilizationof the stored C pool affects the MA of respired C from theseecosystems. If we conservatively estimated a MRT of 60 d forthis storage pool, and included it in our MA calculation, theMA for the total ecosystem respiration increased by 30–55%.In the early growing season, when this stored pool was easilydetected, the MA of respired C increased from 5.0 to 7.7 d.In the shrub ecosystem, it increased from 4.5 to 5.9 d.
Thus, including the contribution of the storage pool, theMA of respired C from these ecosystems was still only days.While the MA of respired C from trees will differ from thatof grasses and shrubs, our data concur with the findings of for-est studies that correlated changes in the δ13C of assimilation(associated with stomatal response to relative air humidity) tothat of soil respiration with a lag of several days (Ekblad &Högberg, 2001; Bowling et al., 2002). However, in theOwens Valley ecosystems, a deviation in the δ13C of assimila-tion would result in a much more rapid (< 0.5–1 d) change inthe δ13C of autotrophic respiration, and the observed changewould be diluted by a longer term average signal to a greater(grasses) or lesser (shrubs) degree. These results also directlysupport the findings of Tang et al. (2005), where soil respira-tion was linked to photosynthetic uptake with two differenttime lags, several hours and 5–6 d. Our measured MA ofrespired C from grasses and shrubs most likely differs fromthat observed in trees because transport distances from leavesto roots are longer and stored nonstructural C pools may begreater in large-stature vegetation.
In conclusion, there were significant longer lived C poolsused for plant metabolism in these ecosystems, but the major-ity of new C respired cycled quickly through the plants andsoils. The contribution of these pools to respiration wasdifferent for below- and above-ground sources. It could be thatthis ‘buffering’ of below-ground respiration by longer lived Cpools that inhibits directly relating above-ground processessuch as photosynthesis to soil respiration. Additional researchis required to better understand the roles of these different Cpools in respiration, and would enhance our ability to predictterrestrial ecosystem respiration fluxes. Furthermore, the eco-logical importance, size, and residence times of these longerlived pools remain poorly understood (Körner, 2003).
Acknowledgements
We thank Xiaomei Xu for laboratory assistance and 14Cexpertise. Field work and technical assistance was provided byClaudia Czimczik, Andrew Delaney, Chris Doughty, AaronFellows, Matt Khosh, Christiane Kramer, Fabio Marzaioli,Kelsey McDuffee, Nicole Nowinski, Thien Nyguen, CameronPorter, Sami Rifai, Adrian Rocha, Imran Sheikh and GregWinston. Robert Harrington and Aaron Steinwand at InyoCounty Water Department provided additional field siteinformation. The Los Angeles Department of Water and Powerprovided access to field sites. Michael Goulden, Diane Patakiand two anonymous reviewers provided valuable input. Thiswork was supported by The Kearney Foundation of Soil Science.
References
Amthor JS. 2000. The McCree–de Wit–Penning de Vries–Thornley respiration paradigms: 30 years later. Annals of Botany 86: 1–20.
Arnone JA, Obrist D. 2003. A large daylight geodesic dome for quantification of whole-ecosystem CO2 and water vapour fluxes in arid shrublands. Journal of Arid Environments 55: 629–643.
Asner GP, Archer S, Hughes RF, Ansley JR, Wessman CA. 2003. Net changes in regional woody vegetation cover and carbon storage in Texas Drylands, 1937–99. Global Change Biology 9: 316–335.
Bhupinderpal-Singh, Nordgren A, Löfvenius MO, Högberg MN, Mellander P-E, Högberg P. 2003. Tree root and soil heterotrophic respiration as revealed by girdling of boreal Scots pine forest: extending observations beyond the first year. Plant, Cell & Environment 26: 1287–1296.
Bowling DR, McDowell NG, Bond BJ, Law BE, Ehleringer JR. 2002. C-13 content of ecosystem respiration is linked to precipitation and vapor pressure deficit. Oecologia 131: 113–124.
Caldwell MM, Camp LB. 1974. Belowground productivity of 2 cool desert communities. Oecologia 17: 123–130.
California Department of Health Services. 2005. California Code of Regulations. Title 17. Division 1. Chapter 5. Subchapter 4. Group 2. Article 9. par. 30237. Schedule C. http://government.westlaw.com/linkedslice/default.asp?RS=GVT1.0&VR=2.0&SP=CCR-1000&Action=Welcome
Carbone MS, Czimczik CI, McDuffee KE, Trumbore SE. 2007. Allocation and residence time of photosynthetic products in a boreal forest using a low-level 14C pulse-chase labeling technique. Global Change Biology 13: 466–477.
No claim to original US government works. Journal compilation © New Phytologist (2007) www.newphytologist.org
Research 11
Czimczik CI, Trumbore SE, Carbone MS, Winston GC. 2006. Changing sources of soil respiration with time since fire in a boreal forest. Global Change Biology 12: 957–971.
Dahlman RC, Kucera CL. 1968. Tagging native grassland vegetation with carbon-14. Ecology 49: 1199–1206.
Dickson RE. 1991. Assimilate distribution and storage. In: Raghavendra AS, ed. Physiology of trees. New York, NY, USA: John Wiley and Sons, Inc, 51–85.
Dobrowolski JP, Caldwell MM, Richards JH. 1990. Basin hydrology and plant root systems. In: Osmond CB, Pitelka LF, Hidy GM, eds. Plant biology of the basin and range. Berlin, Germany: Springer-Verlag, 243–292.
Donovan LA, Richards JH, Muller MW. 1996. Water relations and leaf chemistry of Chrysothamnus nauseosus ssp. consimilis (Asteraceae) and Sarcobatus vermiculatus (Chenopodiaceae). American Journal of Botany 83: 1637–1646.
Ekblad A, Högberg P. 2001. Natural abundance of C-13 in CO2 respired from forest soils reveals speed of link between tree photosynthesis and root respiration. Oecologia 127: 305–308.
Elmore AJ, Mustard JF, Manning SJ. 2003. Regional patterns of plant community response to changes in water: Owens Valley, California. Ecological Applications 13: 443–460.
Farrar JF, Jones DL. 2000. The control of carbon acquisition by roots. New Phytologist 147: 43–53.
Fernandez OA, Caldwell MM. 1975. Phenology and dynamics of root growth of three cool semi-desert shrubs under field conditions. Journal of Ecology 63: 703–714.
Friedlingstein P, Joel G, Field CB, Fung IY. 1999. Toward an allocation scheme for global terrestrial carbon models. Global Change Biology 5: 755–770.
Gaudinski JB, Trumbore SE, Davidson EA, Cook A, Markewitz D, Richter D. 2001. The age of fine-root carbon in three forests of the eastern United States measured by radiocarbon. Oecologia 129: 420–429.
Ghashghaie J, Badeck FW, Lanigan G, Nogués S, Tcherkez G, Deléens E, Cornic G, Griffiths H. 2003. Carbon isotope fractionation during dark respiration and photorespiration in C3 plants. Phytochemistry Reviews 2: 145–161.
Gill RA, Jackson RB. 2000. Global patterns of root turnover for terrestrial ecosystems. New Phytologist 147: 13–31.
Goulden ML, Crill PM. 1997. Automated measurements of CO2 exchange at the moss surface of a black spruce forest. Tree Physiology 17: 537–542.
Hanson PJ, Edwards NT, Garten CT, Andrews JA. 2000. Separating root and soil microbial contributions to soil respiration: a review of methods and observations. Biogeochemistry 48: 115–146.
Högberg P, Nordgren A, Buchmann N, Taylor AF, Ekblad A, Högberg MN, Nyberg G, Ottosson-Löfvenius M, Read DJ. 2001. Large-scale forest girdling shows that current photosynthesis drives soil respiration. Nature 411: 789–779.
Hollett KJ, Danskin WR, McCaffrey WF, Walti CL. 1991. Geology and water resources of Owens Valley, California. Water-Supply Paper 2370-B. Denver, CO, USA: US Geological Survey.
Holthausen RS, Caldwell MM. 1980. Seasonal dynamics of root-system respiration in Atriplex-Confertifolia. Plant and Soil 55: 307–317.
Horwath WR, Pregitzer KS, Paul EA. 1994. C-14 allocation in tree soil systems. Tree Physiology 14: 1163–1176.
Isebrands JG, Dickson RE. 1991. Measuring carbohydrate production and distribution: radiotracer techniques and applications. In: Lassoie JP, Hinckley TM, eds. Techniques and approaches in forest tree ecophysiology. Boca Raton, FL, USA: CRC Press, 357–392.
Jackson RB, Canadell J, Ehleringer JR, Mooney HA, Sala OE, Schulze ED. 1996. A global analysis of root distributions for terrestrial biomes. Oecologia 108: 389–411.
Jackson RB, Schenk HJ, Jobbagy EG, Canadell J, Colello GD, Dickinson RE, Field CB, Friedlingstein P, Heimann M, Hibbard K et al. 2000.
Belowground consequences of vegetation change and their treatment in models. Ecological Applications 10: 470–483.
Kajji A, Lacointe A, Daudet FA, Archer P, Frossard JS. 1993. An experimental system for the quantitative C-14 labeling of whole trees in-situ. Annales des Sciences Forestieres 50: 309–318.
Keel SG, Siegwolf RTW, Körner C. 2006. Canopy CO2 enrichment permits tracing the fate of recently assimilated carbon in a mature deciduous forest. New Phytologist 172: 319–329.
Körner C. 2003. Carbon limitation in trees. Journal of Ecology 91: 4–17.Lippu J, Puttonen P. 1989. Effects of soil-temperature on gas-exchange and
morphological structure of shoot and root in 1 yr old Scots pine (Pinus sylvestris L.) seedlings. Annales des Sciences Forestieres 46: S459–S463.
Litton CM, Raich JW, Ryan MG. (in press.) Review: Carbon allocation in forest ecosystems. Global Change Biology.
Matamala R, Gonzàlez-Meler MA, Jastrow JD, Norby RJ, Schlesinger WH. 2003. Impacts of fine root turnover on forest NPP and soil C sequestration potential. Science 302: 1385–1387.
Milchunas DG, Lauenroth WK. 1992. Carbon dynamics and estimates of primary production by harvest, C-14 dilution, and C-14 turnover. Ecology 73: 593–607.
Milchunas DG, Lauenroth WK, Singh JS, Cole CV, Hunt HW. 1985. Root turnover and production by C-14 dilution – Implications of carbon partitioning in plants. Plant and Soil 88: 353–365.
Norby RJ, Jackson RB. 2000. Root dynamics and global change: seeking an ecosystem perspective. New Phytologist 147: 3–12.
Peek MS, Leffler AJ, Ivans CY, Ryel RJ, Caldwell MM. 2005. Fine root distribution and persistence under field conditions of three co-occurring Great Basin species of different life form. New Phytologist 165: 171–180.
Prater JL, Mortazavi B, Chanton JP. 2006. Diurnal variation of the delta C-13 of pine needle respired CO2 evolved in darkness. Plant, Cell & Environment 29: 202–211.
Pregitzer KS. 2003. Woody plants, carbon allocation and fine roots. New Phytologist 158: 421–424.
Ryser P. 1996. The importance of tissue density for growth and life span of leaves and roots: a comparison of five ecologically contrasting grasses. Functional Ecology 10: 717–723.
Schlesinger WH, Reynolds JF, Cunningham GL, Huenneke LF, Jarrell WM, Virginia RA, Whitford WG. 1990. Biological feedbacks in global desertification. Science 247: 1043–1048.
Schuur EA, Trumbore SE. 2006. Partitioning sources of soil respiration in boreal black spruce forest using radiocarbon. Global Change Biology 12: 165–176.
Southon J, Santos G, Druffel-Rodriguez K, Druffel E, Trumbore SE, Xu X, Griffin S, Ali S, Mazon M, Beavan Athfield N, Sparks RJ. 2004. The Keck Carbon Cycle AMS laboratory, University of California, Irvine: Initial operation and a background surprise. Radiocarbon 46: 41–49.
Stuiver M, Polach HA. 1977. Reporting of C-14 data – discussion. Radiocarbon 19: 55–363.
Taneva L, Pippen JS, Schlesinger WH, González-Meler MA. 2006. The turnover of carbon pools contributing to soil CO2 and soil respiration in a temperate forest exposed to elevated CO2 concentration. Global Change Biology 12: 983–994.
Tang JW, Baldocchi DD, Xu L. 2005. Tree photosynthesis modulates soil respiration on a diurnal time scale. Global Change Biology 11: 1298–1304.
Toft CA. 1995. A 10-year demographic study of rabbitbrush (Chrysothamnus nauseosus) – growth, survival and water limitation. Oecologia 101: 1–12.
Toft CA, Fraizer T. 2003. Spatial dispersion and density dependence in a perennial desert shrub (Chrysothamnus nauseosus: Asteraceae). Ecological Monographs 73: 605–624.
Torn MS, Southon J. 2001. A new C-13 correction for radiocarbon samples from elevated-CO2 experiments. Radiocarbon 43: 691–694.
Trumbore S. 2006. Carbon respired by terrestrial ecosystems – recent progress and challenges. Global Change Biology 12: 141–153.

www.newphytologist.org No claim to original US government works.Journal compilation © New Phytologist (2007)
Research12
Trumbore SE, Da Costa ES, Nepstad DC, De Camargo PB, Martinelli LA, Ray D, Restom T, Silver W. 2006. Dynamics of fine root carbon in Amazonian tropical ecosystems and the contribution of roots to soil respiration. Global Change Biology 12: 217–229.
Wardlaw IF. 1990. Tansley Review, 27 – the control of carbon partitioning in plants. New Phytologist 116: 341–381.
Warembourg FR, Paul EA. 1973. Use of C-14 O2 canopy techniques for measuring carbon transfer through plant–soil system. Plant and Soil 38: 331–345.
Warembourg FR, Paul EA. 1977. Seasonal transfers of assimilated C-14 in grassland – plant production and turnover, soil and plant respiration. Soil Biology and Biochemistry 9: 295–301.
Xu X, Trumbore SE, Zheng S, Southon JR, McDuffee KE, Luttgen M, Liu JC. 2007. Modifying a sealed tube zinc reduction method for preparation of AMS graphite targets: reducing background and attaining high precision. Nuclear Instruments & Methods in Physics Research, Section B 259: 320–329.


