Embed Size (px)
Citation preview

RESEARCH ARTICLE Open Access
Coordinated gene expression during gilthead seabream skeletogenesis and its disruption bynutritional hypervitaminosis AIgnacio Fernández1*, Maria Darias1, Karl B Andree1, David Mazurais2, Jose Luís Zambonino-Infante2, Enric Gisbert1
Abstract
Background: Vitamin A (VA) has a key role in vertebrate morphogenesis, determining body patterning and growththrough the control of cell proliferation and differentiation processes. VA regulates primary molecular pathways ofthose processes by the binding of its active metabolite (retinoic acid) to two types of specific nuclear receptors:retinoic acid receptors (RARs) and retinoid X receptors (RXRs), which promote transcription of downstream targetgenes. This process is well known in most of higher vertebrates; however, scarce information is available regardingfishes. Therefore, in order to gain further knowledge of fish larval development and its disruption by nutritional VAimbalance, the relative expression of some RARs and RXRs, as well as several genes involved in morpho- andskeletogenesis such as peroxisome proliferator-activated receptors (PPARA, PPARB and PPARG); retinol-bindingprotein (RBP); insulin-like growth factors I and II (IGF1 and IGF2, respectively); bone morphogenetic protein 2(Bmp2); transforming growth factor b-1 (TGFB1); and genes encoding different extracellular matrix (ECM) proteinssuch as matrix Gla protein (mgp), osteocalcin (bglap), osteopontin (SPP1), secreted protein acidic and rich incysteine (SPARC) and type I collagen a1 chain (COL1A1) have been studied in gilthead sea bream.
Results: During gilthead sea bream larval development, specific expression profiles for each gene were tightlyregulated during fish morphogenesis and correlated with specific morphogenetic events and tissue development.Dietary hypervitaminosis A during early larval development disrupted the normal gene expression profile for genesinvolved in RA signalling (RARA), VA homeostasis (RBP) and several genes encoding ECM proteins that are linked toskeletogenesis, such as bglap and mgp.
Conclusions: Present data reflects the specific gene expression patterns of several genes involved in larval fish RAsignalling and skeletogenesis; and how specific gene disruption induced by a nutritional VA imbalance underlie theskeletal deformities. Our results are of basic interest for fish VA signalling and point out some of the potentialmolecular players involved in fish skeletogenesis. Increased incidences of skeletal deformities in gilthead sea breamfed with hypervitaminosis A were the likely ultimate consequence of specific gene expression disruption at criticaldevelopment stages.
BackgroundSkeletogenesis is a critical process in vertebrates duringwhich the skeleton develops in a genetically programmedmanner, leading to normal anatomy that provides supportand protection for the internal organs. In mammals, thisprocess includes the differentiation and proliferation ofdifferent cell types, such as chondrocytes, osteoblasts,
osteocytes and osteoclasts, which determine the size,shape and mineral composition of bone structures. Theexpression of specific genes deeply underlies these pro-cesses of cell proliferation and differentiation, which arealso controlled by biotic and abiotic factors as well as indi-vidual genetic characteristics. Thus, determining factorsand conditions that control and perturb those processes atthe transcriptional level could be useful for decipheringthe specific mechanisms behind these processes.Teleost fish are considered to be the first vertebrate
group to develop a bony skeleton, and with it, the
* Correspondence: [email protected] de Cultius Experimentals, IRTA Centre de Sant Carles de la Ràpita(IRTA-SCR), Crta. del Poble Nou s/n, 43540 - Sant Carles de la Ràpita (Spain)Full list of author information is available at the end of the article
Fernández et al. BMC Developmental Biology 2011, 11:7http://www.biomedcentral.com/1471-213X/11/7
© 2011 Fernández et al; licensee BioMed Central Ltd. This is an Open Access article distributed under the terms of the CreativeCommons Attribution License (http://creativecommons.org/licenses/by/2.0), which permits unrestricted use, distribution, andreproduction in any medium, provided the original work is properly cited.

molecular machinery necessary for its formation andmaintenance. Thus, fish have been recognized as a suita-ble vertebrate model for understanding skeletogenesis inlower and higher vertebrates for both comparative [1]and evolutionary [2] purposes. In addition, marine fishlarvae hatch much earlier in their development thanother vertebrates, suggesting that the spatiotemporalsequences of the skeletal development in teleosts arequite different from those of higher vertebrates [3]. Thismakes marine fish species a very interesting model tostudy the influence of several nutrients, such as vitaminA, in morphogenesis and skeletogenesis during early lar-val development [4].Nutritional research has recently focused on the role
of nutrients on gene expression and regulation (nutrige-nomics) [5]. The main pathway by which some nutrientscontrol gene expression is by the activation of transcrip-tion factors, with the nuclear receptor superfamily beingone of the most important. Within this family, the reti-noic acid receptors (RARs) and retinoid X receptors(RXRs) are the specific receptors that transduce the vita-min A (VA) signalling by binding to their specificligands, the retinoic acid isomers. RARs and RXRs havebeen found in all vertebrate tissues examined, andwithin both are present three different isotypes (a, band g), each one encoded by a separate gene. TheseRARs and RXRs bind to retinoic acid (RA, the mainactive metabolite of VA), becoming ligand-activatedreceptors. Then, they form homo- and/or heterodimersthat bind to specific nucleotide sequences (retinoic acidresponse elements, RAREs) in the promoter region of alarge number of genes [6,7], regulating their transcrip-tional activity. These RARs and RXRs can also affectindirectly the transcription of many other genes withoutany RARE in their promoter [6]. Then, through thosemolecular pathways, RA plays a key role in morphogen-esis, cellular proliferation and differentiation processesof bone formation [8].Skeletogenesis has been extensively described in sev-
eral marine fish species [9-12], but gene expression pat-terns during larval development have only been partiallycharacterized in European sea bass (Dicentrarchus lab-rax; [13,14]) and gilthead sea bream (Sparus aurata;[15]). In addition, studies have shown that fish fed dietswith deficient or excess VA content had compromiseddevelopment, showing reduced growth and survival rate,delayed digestive system maturation and high incidenceof skeletal deformities [16-22]. However, while mostreports are related to the consequences of dietary VAimbalance, limited work has focused on the molecularpathways involved in retinoid homeostasis that leads toan abnormal fish phenotype [23]. Moreover, such workshave focused mainly on embryonic development ratherthan larval development [24-26]. Therefore, following
our previous work on the description of abnormal phe-notypes in gilthead sea bream larvae fed with hypervita-minosis A [18], in the present study we evaluated therelative expression of several genes involved in giltheadsea bream morpho- and skeletogenesis during larvaldevelopment, and their disruption when fish were fedwith high VA doses. In addition to retinoic acid recep-tors (RARA, RARG and RXRB), we evaluated the expres-sion of different genes interacting with the RA signallingpathway, such as peroxisome proliferator-activatedreceptors (PPARA, PPARB and PPARG) that act as regu-lators of lipid and lipoprotein metabolism, glucosehomeostasis, cellular proliferation and differentiation, aswell as apoptosis in mammals [27]; the gene encodingretinol-binding protein (RBP) as the main protein thatspecifically transports retinol from liver to peripheral tis-sues [28]; and insulin-like growth factors I and II (IGF1and IGF2, respectively), which control cell growth andproliferation. Bone morphogenetic protein 2 (Bmp2) andtransforming growth factor b-1 (TGFB1) were also stu-died as they are key transcriptional factors for normaldevelopment [29], controlling the production of differ-ent extracellular matrix (ECM) proteins of bone. Addi-tionally, relative expression of genes encoding differentECM proteins was evaluated such as matrix Gla protein(mgp) and osteocalcin (bglap, also known as bone Glaprotein) as important regulators of calcium metabolismand skeletal development; osteopontin (SPP1) andsecreted protein acidic and rich in cysteine (SPARC), asexamples of important matricellular proteins acting asmodulators of ECM interactions; and type I collagen a1chain (COL1A1), which represents 90% of collagen pro-teins in bone tissues. Present results, describing theexpression of several genes involved in gilthead seabream morpho- and skeletogenesis processes understandard larval rearing conditions and their disruptionof expression under hypervitaminosis A regimens, are ofbasic interest for understanding normal skeletogenesisand the appearance of skeletal deformities, as well as atool for assessing fish nutritional VA imbalance.
ResultsGilthead sea bream larval growth and bonemineralizationLarval growth in standard length (SL) and dry weight(DW) under standard rearing conditions are presented inFigure 1. Growth in DW and SL shows the typical expo-nential and linear increase with age, respectively. Growthperformance of larval rearing under hypervitaminosis Aconditions was affected by the level of dietary VA [18].Whereas no clear effects were found in larval SL at 18days post hatch (dph), larvae fed with the highest dietaryVA content (10×VA; 10- fold VA increase in relation tothe control diet) were significantly smaller (7%) than the
Fernández et al. BMC Developmental Biology 2011, 11:7http://www.biomedcentral.com/1471-213X/11/7
Page 2 of 20

control group at 60 dph. Similarly, no differences in DWwere found between experimental groups at 18 dph,while at 60 dph 10×VA larvae (56.86 ± 11.27 mg) pre-sented a reduction of 27% in DW with respect to controland 1.5×VA (1.5-fold VA increase in relation to the con-trol diet) larvae (74.61 ± 8.84 and 69.31 ± 10.24 mg,respectively).Regarding the bone mineralization of larvae, bone and
cartilage staining quantification performed by IMAQVision Builder is summarized in Figure 2. Mineralizationvalues were expressed as the ratio of red/blue colour aswell as the specific amounts of each colour per larval sur-face, from stained fish for each experimental group. Therewere three patterns observed (Figure 3): (i) in control lar-vae most of the structures were red coloured with theexception of few structures (mainly pterygiophores andsclerotic related structures); (ii) the 1.5×VA larvae hadmany structures quite blue in colouration (pectoral andcaudal fin related structures, pterygiophores, and splanch-nocranium related structures such as frontral, pterotic,sphenotic and sclerotic related structures); and (iii) in the10×VA larvae blue colouration was intermediate withrespect to the previously enumerated structures of 1.5×VAlarvae (skeletal structure nomenclature was as in [9-11]).Mineralization values in 1.5×VA and 10×VA larvae at 60dph were higher than in the control group, although therewere no significant differences (ANOVA, P > 0.05; Figure2a). The absence of a statistically significant differencebetween treatments is likely due to the high variabilityobserved among replicates from each treatment. Interest-ingly, significantly higher cartilage staining was found in
1.5×VA and 10×VA larvae with respect to the controlgroup (ANOVA; P < 0.05; Figure 2b). In addition, theratio of red/blue coloration (bone/cartilage mineralization)showed that both larvae fed with VA supplemented diets(1.5×VA and 10×VA) had lower values than the controlgroup; although this tendency was not statistically signifi-cant (ANOVA, P > 0.05; Figure 2c).
Gene expression patterns during gilthead sea breamontogeny development under standard rearingconditionsDuring larval development, RA nuclear receptors, RARA,RARG and RXRB, exhibited different expression patternsin gilthead sea bream (Figure 4). Under our rearing
Figure 1 Gilthead sea bream larval growth from 2 to 60 dph.Growth in standard length (long dash line) was measured in mmand weight in mg dry weight (solid line). Values are expressed asmean ± standard deviation. Equation of the linear regression for thegrowth in standard length was y = 1,6562x - 0,666 (R2 = 0,9112),while the exponential regression line for the growth in dry weightwas y = 0,0252e0,8815x (R2 = 0,9614).
Figure 2 Gilthead sea bream bone mineralization at 60 dph offishes from the different dietary treatments. Bone mineralizationmeasured as ratios of red pixels (a), blue pixels per larval surface (b),and red pixels over blue pixels (c). Ratios are expressed as mean ±standard deviation. Letters denotes significant differences betweendietary groups (ANOVA, P < 0.05; n = 26 larvae per treatment). C,larvae fed with control diet (0.66*108 total VA IU kg-1 DW); 1.5×VA,larvae fed with 1.5 fold increase in dietary VA content (1.00*108 totalVA IU kg-1 DW); 10×VA, larvae fed with 10 fold increase in dietaryVA content (6.82*108 total VA IU kg-1 DW).
Fernández et al. BMC Developmental Biology 2011, 11:7http://www.biomedcentral.com/1471-213X/11/7
Page 3 of 20

Figure 3 Examples of double stained fish with alcian blue/alizarin red from different dietary treatments showing different levels ofossifications and typologies of skeletal deformities. (a) Larva fed with control diet (0.66*108 total VA IU kg-1 DW) exhibiting mostly redcoloured skeletal structures (calcified bone) with the exception of pterygiophores and sclerotic elements still stained with alcian blue (cartilage). (b)Larva fed moderately increased levels of VA (1.5×VA group, 1.00*108 total VA IU kg-1 DW) showing a larger proportion of skeletal structures stained inblue (cartilage) in comparison to the control group; e.g. pectoral fin girdle, epurals, parahypural and specialized neural arch in the caudal fin complex,and frontal, pterotic and parietal bones in the cranium. (c) Larva fed with the highest levels of VA (10×VA group, 6.82*108 total VA IU kg-1 DW)showing intermediate values in blue colouration with regards to the control group. The skeletal structures stained in blue (cartilage) are those alreadyreported in the larva from the 1.5×VA group. (d) Larva showing a severe deformity (double lordosis and kyphosis) affecting haemal vertebrae. (e)Deformed caudal fin complex showing the fusion of the hypurals 3-4 (HF3-4) and 1-2 (HF1-2), as well as the fusion (VF) and compression (VC) ofdifferent haemal vertebrae centra (23-24 and 22-23, respectively). (f) Fusion of vertebral bodies (VF) from haemal vertebrae number 22 and 23 andunderdevelopment of vertebrae 24 (UV). (e) Head of a larva with a slight prognathism (asterisk) due to an underdevelopment of the premaxillar andmaxillar bones, and vertebral compression (VC) between centra of prehaemal vertebrae number 2 and 3.
Fernández et al. BMC Developmental Biology 2011, 11:7http://www.biomedcentral.com/1471-213X/11/7
Page 4 of 20

conditions, gilthead sea bream larvae showed a highoverall level of RARA gene expression until 10 dph, afterwhich levels decreased significantly and thereafterremained constant until the end of the experiment (60dph) (ANOVA, P < 0.05; Figure 4a). Conversely, theexpression of RARG and RXRB were lower during theinitial larval development, after which the levelsincreased. However, while RARG increased significantly
from 29 dph, with a peak at 37 dph (1.8 fold changecompared to 2 dph), its expression level significantlydecreased at 60 dph (ANOVA, P < 0.05; Figure 4b) withrespect to the levels at 37 dph. The expression of RXRBincreased significantly only between 29 and 60 dph(ANOVA, P < 0.05; Figure 4c).There were no significant differences in the RBP gene
expression profile during the larval development(ANOVA, P > 0.05; Figure 5a). PPARA expression wasconstant from 2 to 37 dph, whereas at 45 dph a peak ofgene expression was noted (2.94 fold increase withrespect to 2 dph larvae; P < 0.05; Figure 5b). PPARBexpression remained constant from 2 to 60 dph(ANOVA, P > 0.05; Figure 5c). The PPARG expressionlevel did not change from 2 to 52 dph; however, at theend of the study (60 dph), expression values were signif-icantly higher than those mostly observed between 7and 37 dph (ANOVA, P < 0.05; Figure 5d), but not sig-nificantly different to those observed at 2 dph.Overall, the IGF1 and IGF2 gene expression had sig-
nificantly increased at the end of larval development.However, while IGF1 gene expression increased signifi-cantly and progressively from 0.54 at 7 dph to 6.52 at60 dph (ANOVA, P < 0.05; Figure 5e), IGF2 expressionremained constant from 2 to 29 dph (ANOVA, P >0.05; Figure 5f). Expression values of IGF2 increased sig-nificantly between 37 and 45 (1.43 ± 0.06 mean expres-sion ratio; ANOVA, P < 0.05; Figure 5f) and remainedconstant until the end of the study. Bmp2 did not showsignificant variations in its mean gene expression ratiothroughout larval development (ANOVA, P > 0.05),although a tendency for higher expression values wasobserved from 37 dph onwards (Figure 5g). Interest-ingly, TGFB1 presented an overall significant increase inits gene expression ratio from 29 dph until the end ofthe trial (ANOVA, P < 0.05; Figure 5h).With respect to the expression patterns of genes
encoding ECM proteins during larval development, allof them increased at the end of the study. However, themean gene expression ratios reached at the end of theexperiment by each gene were different. The genes mgpand bglap showed the highest mean expression ratios at60 dph (199.38 and 7956.15, respectively; ANOVA, P <0.05; Figure 6a,b). In both Gla protein genes, a signifi-cant increase in the mean gene expression ratio wasobserved near the end of the trial (around 45 dph). Incontrast, SPP1 and SPARC showed lower mean values(23.38 and 3.25, respectively) at the end of the experi-ment (Figure 6c and 6d, respectively) compared withmgp and bglap ratios, although presenting significantincreases as well in comparison to results from early lar-val stages (ANOVA, P < 0.05). Furthermore, both SPP1and SPARC showed a significant increase at 37 dph intheir mean gene expression ratios, earlier than mgp and
Figure 4 Ontogenetic gene expression patterns of RARA (a),RARG (b) and RXRB (c). Gene expression measured as the meanexpression ratio of the target gene with respect to the house-keeping gene (EF1a) at each sample time compared with initial
Fernández et al. BMC Developmental Biology 2011, 11:7http://www.biomedcentral.com/1471-213X/11/7
Page 5 of 20

Figure 5 Ontogenetic gene expression patterns of RBP (a), PPARA (b), PPARB (c), PPARG (d), IGF1 (e), IGF2 (f), Bmp2 (g), and TGFB1 (h).Gene expression measured as the mean expression ratio of the target gene with respect to the house-keeping gene (EF1a) at each sample timecompared with initial sample time (2 dph). Different letters denote significant differences of the global gene expression (ANOVA, P < 0.05; n = 3).
Fernández et al. BMC Developmental Biology 2011, 11:7http://www.biomedcentral.com/1471-213X/11/7
Page 6 of 20

bglap. Finally, COL1A1 presented a similar gene expres-sion profile to those of other ECM protein genes, with asignificant increase in the mean gene expression ratio at60 dph (ANOVA, P < 0.05; Figure 6e).Global hierarchical clustering was applied on the gene
expression ratios during larval development for the 16studied genes (Figure 7). This clustering was used toclassify genes on the basis of similarity of their expres-sion profile during larval development sampling times.Two gene clusters were found: (i) genes whose meangene expression level increased from 37 dph, such asIGF1, TGFB1, RXRB, IGF2 and genes encoding extracel-lular matrix proteins (mgp, bglap, SPP1, SPARC andCOL1A1); and (ii) genes whose mean gene expressionratio decreased progressively from an initial relativelyhigh level of expression (PPARB, RARA and RBP).
Gene expression in gilthead sea bream larvae fed withincreasing levels of dietary VAAt 18 dph, larvae fed with increasing dietary VA levelsexhibited disruption in the expression of several studiedgenes. While some of them showed an up-regulation,others were down-regulated with respect to the controlfeeding regime. That gene disruption was also noted insome genes even when the dietary VA imbalance hadfinished more than 40 days before (60 dph).
Figure 6 Ontogenetic gene expression patterns of mgp (a),bglap (b), SPP1 (c), SPARC (d), and COL1A1 (e). Gene expressionmeasured as the mean expression ratio of the target gene respectto the house-keeping gene (EF1a) at each sample time comparedwith initial sample time (2 dph). Different letters denote significantdifferences of the global gene expression (ANOVA, P < 0.05; n = 3).
Figure 7 Hierarchical clustering of the 16 target genesanalysed based on mRNA expression, showing the cluster ofthe different studied genes with similar expression profileduring larval development. Columns represent the mean datavalues for each of the 10 sampling times (days post hatching; dph)and rows represent single genes. Expression level of each gene isrepresented relative to its median abundance across the differentstages and is depicted by a colour scale: green, black, and redindicating low, medium, and high relative expression levels,respectively. Coloured bars to the right indicate the location of twogene clusters: red corresponds to genes with a progressive increasein mean gene expression level from 2 to 60 dph; and green withthose whose mean gene expression level decreased progressivelyfrom an initial relative high level of expression.
Fernández et al. BMC Developmental Biology 2011, 11:7http://www.biomedcentral.com/1471-213X/11/7
Page 7 of 20
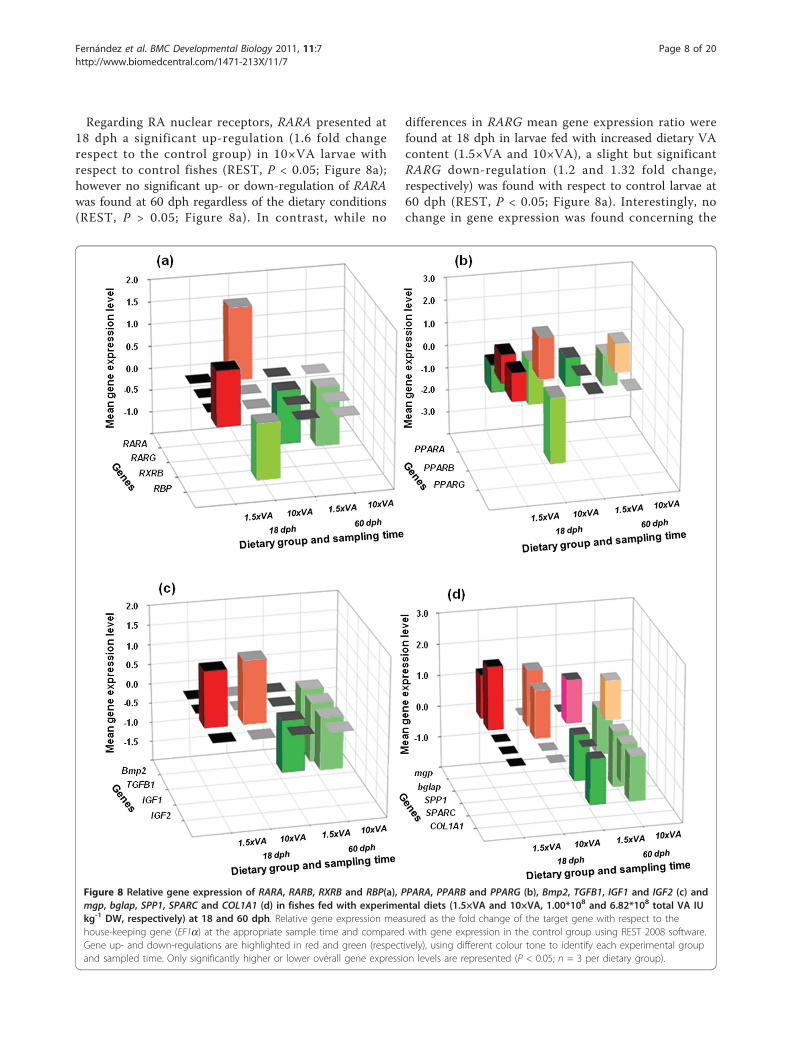
Regarding RA nuclear receptors, RARA presented at18 dph a significant up-regulation (1.6 fold changerespect to the control group) in 10×VA larvae withrespect to control fishes (REST, P < 0.05; Figure 8a);however no significant up- or down-regulation of RARAwas found at 60 dph regardless of the dietary conditions(REST, P > 0.05; Figure 8a). In contrast, while no
differences in RARG mean gene expression ratio werefound at 18 dph in larvae fed with increased dietary VAcontent (1.5×VA and 10×VA), a slight but significantRARG down-regulation (1.2 and 1.32 fold change,respectively) was found with respect to control larvae at60 dph (REST, P < 0.05; Figure 8a). Interestingly, nochange in gene expression was found concerning the
Figure 8 Relative gene expression of RARA, RARB, RXRB and RBP(a), PPARA, PPARB and PPARG (b), Bmp2, TGFB1, IGF1 and IGF2 (c) andmgp, bglap, SPP1, SPARC and COL1A1 (d) in fishes fed with experimental diets (1.5×VA and 10×VA, 1.00*108 and 6.82*108 total VA IUkg-1 DW, respectively) at 18 and 60 dph. Relative gene expression measured as the fold change of the target gene with respect to thehouse-keeping gene (EF1a) at the appropriate sample time and compared with gene expression in the control group using REST 2008 software.Gene up- and down-regulations are highlighted in red and green (respectively), using different colour tone to identify each experimental groupand sampled time. Only significantly higher or lower overall gene expression levels are represented (P < 0.05; n = 3 per dietary group).
Fernández et al. BMC Developmental Biology 2011, 11:7http://www.biomedcentral.com/1471-213X/11/7
Page 8 of 20

gene RXRB at both sample times analyzed (REST, P >0.05; Figure 8a).At 18 dph, an inverse correlation between increasing
dietary VA and RBP gene expression was observed(Figure 8a). Larvae fed with a moderate increase in diet-ary VA content (1.5×VA) showed a significant up-regu-lation in the RBP gene expression ratio (1.23 foldchange respect to the control group), whereas those ani-mals fed with the highest levels of VA in diet (10×VA)presented a down-regulation with respect to control lar-vae (1.3 fold change; REST, P < 0.05; Figure 8a). How-ever, no significant differences in RBP gene expressionratios were found at 60 dph between experimentalgroups (REST, P > 0.05; Figure 8a).Expression levels of PPARs were also affected by diet-
ary VA levels, however each one to a different extent(Figure 8b). Larvae fed with higher dietary levels of VA(1.5×VA and 10×VA) presented a significant down-regulation in PPARA at both sample times analyzed (18and 60 dph); up to 1.9 fold change in 10×VA larvae at18 dph compared with control larvae (REST, P < 0.05;Figure 8b). In contrast, larvae fed with higher VA dietsshowed a significant up-regulation in PPARB geneexpression (up to 1.82 fold change in 10×VA 18 dph lar-vae) with respect to control larvae (REST, P < 0.05;Figure 8b), whereas no differences were observed in lar-vae from the 1.5×VA group at 60 dph. Interestingly,PPARG showed a contrary effect to the increase of VAdietary content at 18 dph. While there was a slight sig-nificant up-regulation in 1.5×VA larvae (1.2 fold changewith respect to control fish; REST, P < 0.05; Figure 8b),10×VA larvae exhibited a significant down-regulation(ca. 2.87 fold change with respect to the control group;REST, P < 0.05; Figure 8b). However, no differences ingene expression ratio were found in 1.5×VA and 10×VAlarvae at 60 dph (REST, P > 0.05; Figure 8b).At the end of the feeding phase with high dietary VA
content (18 dph), Bmp2 and TGFB1 did not present sig-nificantly different gene expression ratios in larvae fedwith supplemented VA diets (1.5×VA and 10×VA) com-pared with those from the control group (REST, P >0.05; Figure 8c). This pattern was also observed at 60dph in 1.5×VA larvae. However, Bmp2 and TGFB1 geneexpression levels were significantly reduced with a 1.57and 1.5 fold change (respectively) at 60 dph in larvaefed with the highest dietary VA content (10×VA) withrespect to control larvae (REST, P < 0.05; Figure 8c).The IGF axis showed different responses to dietary VAcontent (Figure 8c). IGF1 gene expression was up-regulated in larvae fed with higher dietary VA levels at18 dph (1.4 and 1.6 fold change in 1.5×VA and 10×VA,respectively) with respect to the control group (REST,P < 0.05); whereas a significant down-regulation at60 dph (between 1.11 and 1.14 fold change) in IGF1
transcription was found with respect to the controlgroup (REST, P < 0.05). Interestingly, IGF2 expressionwas not significantly different among experimentalgroups at both analyzed sampling times (REST, P >0.05).Genes encoding extracellular matrix (ECM) proteins
were also differentially affected by dietary VA content(Figure 8d). The expression of mgp gene from 1.5×VAlarvae at 18 dph was significantly up-regulated (1.39 foldchange) compared with the control larvae (REST, P <0.05), while non-significant differences were found in10×VA larvae (REST, P > 0.05). Conversely, at 60 dphmRNA levels of mgp in 1.5×VA larvae was no signifi-cantly different with respect to the control group (REST,P > 0.05); whereas 10×VA larvae presented a signifi-cantly lower gene expression ratio (1.5 fold change) thanthe control larvae (REST, P > 0.05). Furthermore, thegene encoding the other Gla protein analyzed (bglap)showed significantly higher gene expression levels at18 dph (2.02 and 1.81 fold change in 1.5×VA and10×VA larvae, respectively) in groups fed with higherdietary VA content than the control (REST, P < 0.05).The effect of increasing dietary VA level at 60 dph wasthe same in 1.5×VA and 10×VA larvae. Fish from bothtreatments showed significant up-regulation on bglapexpression (1.39 and 1.29 fold change) with respect tocontrol larvae (REST, P < 0.05). In addition, when ana-lyzing the expression of genes encoding matricellularproteins, SPP1 did not show significant differences in1.5×VA larvae with respect to control larvae at 18 dph.However, a significantly higher gene expression ratio(1.54 fold change) was found in 10×VA larvae comparedto the control group (REST, P < 0.05). Furthermore,SPP1 was down-regulated at 60 dph in both larvae fedwith higher VA dietary content (1.48 and 1.78 foldchange in 1.5×VA and 10×VA, respectively) with respectto the control group (REST, P > 0.05). Interestingly,SPARC only showed significant differences in expressionin 10×VA larvae at 60 dph with respect to the controlgroup (REST, P < 0.05), being lower by a 1.28 foldchange. Finally, mRNA levels of COL1A1 were notaffected by the dietary level of VA when compared tothe experimental groups (REST, P > 0.05) at 18 dph.However, at 60 dph gene expression of COL1A1 wassignificantly lower in 1.5×VA and 10×VA larvae (1.45fold change for both 1.5×VA and 10×VA groups) ascompared to the control group (REST, P < 0.05).
DiscussionThe present study analysed the expression profile of sev-eral gene markers for skeletogenesis during the larvaldevelopment in gilthead sea bream, and the influence ofdietary hypervitaminosis A on their expression. Reliablenutritional, physiological and gene expression results
Fernández et al. BMC Developmental Biology 2011, 11:7http://www.biomedcentral.com/1471-213X/11/7
Page 9 of 20

can be drawn from this work, as results in growth (dryweight and standard length) fell within the range of pre-viously reported values [30,31]. Results from this studysupported the idea that dietary VA content controllednormal fish development through binding of its activemetabolite, retinoic acid (RA), with specific nuclearreceptors RARs and RXRs, and regulated target genesexpression levels including retinoic receptors themselves.However, as RNA extractions were obtained frompooled whole larvae, the expression profiles of eachgene reflect the expression level from a mix of differentcell types and tissues. Thus, the variation of geneexpression ratios observed during larval developmentunder standard conditions could reflect changes in pro-portions of different tissues throughout ontogenesisand/or gene expression regulation in a specific tissue. Inthis sense, two different types of gene expression profilesduring gilthead sea bream larval development werefound by hierarchical clustering, showing that transcrip-tion is time- and tissue-dependent for each gene. Forexample, it is evident that higher expression of genesencoding ECM proteins are correlated with bodygrowth, as increased fish size requires increasing bonestrength and skeleton size in order to support theincreased body weight. As ECM genes are expressedonly in specific tissues (e.g. skeleton), the disruption oftheir tissue and developmental stage dependent expres-sion by VA could be inferred; whereas it would remainunclear for the other genes that are ubiquitouslyexpressed (e.g. IGFs, PPARs, Bmp2 and TGFB1), sincetheir disruption would be masked by the overall expres-sion in other tissues.
Retinoid ReceptorsThe different expression profiles of RARA, RARG andRXRB found in this study supported the hypothesis thateach gene had a temporal and spatial specific expres-sion; suggesting specific roles for each of them[13,32,33]; in which contrasted with the suggestedredundancy among them as found in mouse null mutantstudies [34]. Previous works pointed out that RARAplays a crucial role in vertebrate RA signalling, beingubiquitously expressed in embryonic and adult mammal[35,36] and fish tissues [13]. However, the reported evo-lution of RARA gene expression in this study is notin agreement with that found by Villeneuve and co-workers [13], where European sea bass RARA geneexpression increased from 10 to 42 dph. It is possiblethat although both fish species are evolutionarily closelyrelated, their timing of development is quite different,which may explain the above-mentioned differences.Interestingly, the fact that RARA is predominantlyexpressed at 5 dph in the jaws of European sea bass[13], supports the idea that high expression of RARA
observed in 10×VA larvae may be specifically implicatedin the development of jaw deformities detailed in ourprevious work [18]. Two factors would explain the highRARA gene expression found in 10×VA larvae comparedto 1.5×VA and control larvae: (i) the transcriptional acti-vation of RARA through the presence of a RARE in itspromoter [7], is due to an increase in RA levels; and (ii)the increased gene expression of Cyp26 enzymesmediated through RARa receptor, in order to degradethe excessive RA into other metabolites [37]. Under nor-mal conditions, chondrogenesis is accompanied by adecrease in RARA expression [38], a process that nor-mally takes place at 10 dph in gilthead sea bream. Thisresult supports the idea that the overexpression ofRARA was dietary induced by an increase of VA, asreported in fish exposed to Am80 (a RAR-selective ago-nist [39]), RA [32] or hypervitaminosis A [16]. In addi-tion, high transcription levels of RARA might be directlyresponsible for the disruption of normal patterns of ske-letogenesis, and could be responsible for the high inci-dence of skeletal deformities found in fish fed with highlevels of VA [18]. The RARA disruption might have alsoactivated a downstream gene cascade, including Hoxd-4and Shh [40] that would also have affected larval mor-phogenesis [41], and delaying the maturation of thedigestive system as it was found at 18 dph larvae fromthe 10×VA group [18]. Furthermore, such differences inthe development of the digestive system were notobserved at 60 dph [18], when VA imbalance was cor-rected and RARA expression was normalized in relationto the control group.The expression pattern of RARG during larval devel-
opment suggests that this gene plays a crucial role inthe transcriptional RA signal regulation during verte-brate morphogenesis, chondrogenesis and differentia-tion of squamous epithelia [42,43]. Our results showthat the RARG gene expression ratio was highestbetween 37 and 52 dph, which is concomitant with theonset of the typical adult skin development in giltheadsea bream; and in concordance with that reported inEuropean sea bass between 10-42 dph [13]. The modu-lation of RARG expression by hypervitaminosis A hasbeen demonstrated in mammals [44] and fishes[16,17,32]. Nevertheless, no regulation of RARGexpression by hypervitaminosis A was detected in gilt-head sea bream larvae at 18 dph. This might be due tothe fact that chondrogenesis in chondral bones isalmost completed at that stage of development [9,11],and RARG is expressed at a lower level in hypertrophicthan in pre-hypertrophic chondrocytes [45]. In contrastto 18 dph, larvae aged 60 dph exhibited a down-regulation of RARG in 1.5×VA and 10×VA groups,which under present experimental conditions seemedto be linked to different rates of larval development
Fernández et al. BMC Developmental Biology 2011, 11:7http://www.biomedcentral.com/1471-213X/11/7
Page 10 of 20

(e.g. chondrogenesis and skin differentiation) amongdietary treatments.The role of RXRs on retinoid signal transduction dur-
ing development of vertebrates depends on each sub-type. Despite null RXRB or RXRG mutant mice beingviable, and do not display VA associated abnormalities,RXRA null mutants die [34]. In teleosts, RXRa isinvolved in the development of the anterior hindbrain,tailbud, neural crest, pharynx and fins; whereas RXRbplayed different roles in early larval development; andRXRg plays a key role in brain and nervous systemdevelopment and function [26]. In the present study, theontogenic increase in expression of RXRB during thestandard experimental trial was in agreement with pre-viously reported results [16], and it is related to thedevelopment of those tissues where RXRB is mainlyexpressed [26]. The expression levels of RXRB in gilt-head sea bream larvae were not affected by high levelsof dietary VA, which seems to confirm that all-trans-RA(the most abundant RA isomer in nature) does not bindto this nuclear receptor nor is it transcriptionally acti-vated by RAREs [46].In this study, we present data from gene expression at
specific time points, which is a static representation of adynamic process involving the formation of homo- andheterodimers of the translated proteins leading to down-stream cascades of gene expression. Variations in RAR-RXR homo-/heterodimer equilibrium have been shownto cause severe abnormalities in zebrafish embryos [47].Thus, abnormal skeletogenesis and/or morphogenesis ingilthead sea bream could be interpreted as a perturba-tion of the nuclear RAR-RXR homo-/heterodimer equili-brium, as higher amount of RARA transcripts couldinduce increased formation of RARa-RXR heterodimersor decreased formation of RXR heterodimers with itsdifferent partners (VDR, TR, PPARs, etc).
Retinol-Binding ProteinRetinol Binding Protein (RBP) is reputed for transport-ing retinol from the liver to different target tissues [48].In agreement with previous studies in fish [48] andother vertebrates [49], RBP gene expression was lowduring larval development, and remained constant untilmetamorphosis. Such low RBP expression might be dueto either low retinol mobilization requirements duringearly fish larval development, or to the fact that thedaily requirements for VA were already fulfilled. There-fore, retinol mobilization from liver to target tissues wasnot needed, and consequently the RBP not transcribed.When gilthead sea bream larvae were fed with moder-ately increased levels of VA (1.5×VA group) at 18 dph,RBP expression was up-regulated, whereas this gene wasdown-regulated in fish fed with the highest levels of VA(10×VA group). Those changes in RBP gene expression
by the dietary VA levels may be due to transcriptionalregulation through the double RARE in its promoter.Considering that VA homeostasis via its release fromstorage tissues is a tightly controlled process [50], wesuggest that the observed RBP gene expression in gilt-head sea bream larvae in response to dietary VA contentis part of a protective mechanism to avoid VA toxicity.Under slight dietary hypervitaminosis A (1.5×VA group)conditions, an increase in RBP mRNA level could bedirectly induced by binding of ligand activated RARsand RXRs to its RARE [51]; whereas during exposure toelevated VA levels (10×VA group), a decrease in RBPexpression might take place to reduce the mobilizationof VA from the adipose tissue and liver [52].
Peroxisome proliferator-activated receptorsThe peroxisome proliferator-activated receptors (PPARs)are well known fatty acid and eicosanoid induciblenuclear receptors in vertebrates, playing multiple physio-logical functions [53]. Molecular studies recently showedthat there exist differences in tissue expression andligand-binding properties between fish and mammalianPPARs [54-56].Considering that PPARa is implicated in the regula-
tion of fatty acid metabolism [27], the progressiveincrease in PPARA expression at late larval stagesseemed to be correlated to larval growth and progressivedifferentiation of the liver, intestine and muscle, wherethis receptor is mainly expressed [54,57]. However,PPARA expression was down-regulated when larvaewere exposed to high levels of dietary VA at 18 dph,which might be linked to the impaired maturation ofthe digestive system of 1.5×VA and 10×VA larvae incomparison to the control group [18]. This is in agree-ment with [54], PPARA expression being dependant onthe nutritional status of the animal and its changingenergy requirements during development. As PPARaplays an important role in adipocyte differentiation infishes [56], its down-regulation in gilthead sea breamearly juveniles fed with hypervitaminosis A might havealso perturbed the normal differentiation rate ofmesenchymal cells into myogenic, osteogenic and/oradipocytic cells, leading to skeletal deformities.PPARb in mammals is involved in the skeletal, brain
and skin functions as well as in adipose tissue differen-tiation and fatty acid metabolism [58,59]. Its earlyexpression in gilthead sea bream might be linked to themobilization of endogenous reserves stored in the yolksac [54] and to the synthesis and turnover of cellularmembranes [60]. However, it did not correlate signifi-cantly with growth or fat deposition, as it has been pre-viously reported in cobia (Rachycentron canadum) [57].Increased expression of PPARB has been described inthe early phase of adipogenesis in mammals [61] and
Fernández et al. BMC Developmental Biology 2011, 11:7http://www.biomedcentral.com/1471-213X/11/7
Page 11 of 20

red sea bream (Pagrus major) [56]; but in contrast tomammalian PPARB, its expression in adipocytes did notseem to be under nutritional control. Primary osteoblas-tic cells showed a high expression of PPARB [59], thenthe higher gene expression of PPARB in 1.5×VA and10×VA larvae compared to the control group at 18 dphmight indicate a premature osteoblastogenesis in thosegroups, as has been suggested in our previous study[18]. Interestingly, it has been reported that muscle-specific overexpression of PPARB in mice resulted in aprofound change in muscle fibre composition due tohyperplasia [62]. Impaired muscle development could inturn induce some vertebral deformities [63] and lead tothose skeletal deformities (e.g. lordosis) reported in ourprevious study [18]. These changes in muscle werecoupled with a reduction in the mass of body fat ofmice [62] that may be in agreement with the geneexpression of the above-mentioned PPARA and PPARG.In addition, PPARB was up-regulated in 10×VA larvaeat 60 dph, which could reflect a retarded adipogenesis.It is clear that more research is needed to reveal therole of PPARb in regulating the muscle fibre growthand the adiposity of marine fish, as well as the potentialinduction of skeletal deformities by such impaired mus-cle development.In mammalians, PPARg regulates adipogenesis at its
early phase through heterodimerization with RXR [64].In fish, it seems that PPARg fulfil the same roles,although they are not activated by the same specificligands [54]. Under normal rearing conditions, PPARGexpression increased with gilthead sea bream ontogen-esis similarly to data reported in cobia where PPARGexpression increased with fish growth and fat deposition[57]. However, it has been reported that retinaldehyde(the metabolic precursor of RA) inhibits PPARG, result-ing in a lower PPAR-RXR complex formation [65],which in turn could enhance osteogenesis instead of adi-pogenesis in mesenchymal cells. Thus, lower PPARGexpression in fish fed with high levels of VA (10×VAgroup) at 18 dph could reflect an enhancement of osteo-genesis and disrupt normal skeletogenesis in gilthead seabream larvae. This hypothesis is also reinforced by theincreased blue coloured surfaces (chondrocytes) in both1.5×VA and 10×VA larvae compared with controllarvae.
Growth FactorsSkeletal cells synthesize different growth factors, such asfibroblast growth factor, platelet-derived growth factor,IGFs, TGFb, and additional cytokines. The expression ofIGF1 is found in different soft and calcified tissues inadult gilthead sea bream [66], where three spliced var-iants with a specific pattern of expression have beenfound [67,68]. Our Taqman assay was designed to
recognise all three IGF1 splice variants; therefore, ourreported gene expression ratio for IGF1 is the sum ofthe expression for all three splice variants. In the pre-sent study, the progressive increase of IGF1 expressionwas in accordance with the high cell proliferation rate,and/or the increase in specific cell activity in differenttissues during larval morphogenesis [66]. The dose-dependent overexpression of IGF1 found at 18 dph ingilthead sea bream larvae fed hypervitaminosis A, was inagreement with previous works [16,69]. The higherIGF1 expression in the 10×VA group might be due tosynergistic direct and indirect effects. The growth hor-mone promoter contains a RARE [70], and has beenfound to be regulated by RARa/g isoforms in pituitarycells of carp (Cyprinus carpio; [71]). In turn, increasedRARA expression might induce growth hormone tran-scription and secretion, which finally would induce anincrease in IGF1 hepatic transcripts. In addition,increased levels of thyroxin (T4) were observed in fishunder hypervitaminosis A [19], while T4 is reported toinduces IGF1 expression in in vitro fish studies [72].Then, it seems plausible that the increase in expressionof IGF1 in gilthead sea bream larvae fed with high VAlevels (1.5×VA and 10×VA groups) could be due also toincreased T4 levels. Such high IGF1 expression, which isknown to promote muscle differentiation and growth[73], coupled with that of PPARB, might have caused animbalance in the development of the musculoskeletalsystem in gilthead sea bream fed with high levels of VA,leading to a higher incidence of lordosis in those larvae[18].In the present study, the abrupt increase in IGF2
expression recorded at the end of the larval phase (29dph) corresponds with the onset of ossification in mostof the bone structures [9,11], which is mainly due to itsrole in osteoblast proliferation and differentiation [74].In contrast to IGF1, the expression of IGF2 in giltheadsea bream fed with hypervitaminosis A was not dis-rupted, supporting the idea that different hormonal sig-nals and mechanisms of gene transcription control theregulation of expression of both IGF forms [67].Other growth factors such as transforming growth fac-
tors beta (TGFbs) or the bone morphogenetic proteins(BMPs) are important for the development of bone,among other tissues [29]. Among those BMP’s, BMP-2plays a key role in bone development, inducing the dif-ferentiation of mesenchymal cells into osteoblast precur-sors and promoting the maturation of osteoblaststhrough the expression of Runx2/Cbfa1 [75]. TGFb1 isinvolved in the regulation of a broad range of biologicalprocesses, including cell proliferation, differentiation andmigration, production of extracellular matrix [76], aswell as maintaining bone homeostasis and turnover [77].In our study, the gene expression profile of Bmp2 in
Fernández et al. BMC Developmental Biology 2011, 11:7http://www.biomedcentral.com/1471-213X/11/7
Page 12 of 20

larvae reared under standard conditions seemed to cor-relate with the biological function of BMP2. Bmp2expression between 18 and 22 dph might be associatedwith the onset of pre-osteoblasts proliferation [9,11];whereas the observed tendency of Bmp2 to increasebetween 29 and 37 dph might be due to its role as apromoter of osteoblast differentiation. Furthermore,increased expression of TGFB1 was concomitant withan increase in expression of several genes encodingECM proteins, as has been reported [76].Bmp2 expression in early larval stages (18 dph) fed
with hypervitaminosis A was not affected. However, thepossibility cannot be neglected that in those larvae RAmight have disrupted Bmp2 expression prior to oursampling point, as has been shown in vitro studies [33].In contrast, Bmp2 was down-regulated in 10×VA larvaeat 60 dph, suggesting a negatively controlled regulationof Bmp2 [78]. This down-regulation of Bmp2 concomi-tant with lower RARG gene expression is in accordancewith the reported loss of the RA-inducible expression ofBmp2 in the absence of RARG gene expression [33].In addition, the Bmp2 down-regulation might down-regulate the expression of ECM encoding genes (mgp,SPP1, SPARC, COL1A1) observed in 10×VA larvaethrough the transcriptional regulation of Runx2/Cbfa1[78].BMP-2 and TGFb1 have opposing actions on osteo-
blast function and differentiation. While BMP-2enhances Runx2/Cbfa1 expression, TGFb1 inhibits itsexpression; then, both genes regulate the coordinatedexpression of several genes encoding ECM proteins [78].The fact that both genes (Bmp2 and TGFB1) weredown-regulated in gilthead sea bream larvae fed withhypervitaminosis A (10×VA group) at 60 dph, could beexplained by the ubiquitous expression of TGFB1 whichhad a variety of other biological functions and therefore,this down-regulation of TGFB1 may not be representa-tive of the skeletal tissue alone.
Genes encoding bone extracellular matrix proteinsUntil the beginning of the ossification process at 18 dph(5.7-6.0 mm standard length; [9], gene expression pro-files of the genes encoding ECM proteins (mgp, bglap,SPP1, SPARC and COL1A1) showed low gene expres-sion values. These results were in accordance with theongoing development of most skeletal structures, thatwere not yet ossified, with the exception of some locatedin the viscerocranial and caudal region [9-11]. Highergene expression was found from 37 dph onwards, con-comitantly with the intense ossification of most of thebone structures, such as vertebrae centra (9.0-9.4 mmstandard length; [9]). The expression of ECM proteinsprogressively increased during larval ontogeny. However,the significant increases of each gene occurred at
different developmental times, the first to increase beingSPARC and SPP1, followed by mgp, and finally by thatof COL1A1 and bglap, which shows the progression ofgene transcription of specific bone matrix developmentmarkers.The early increase in expression of SPARC during gilt-
head sea bream ontogenesis reflects the many key pro-cesses during early larval development in which thatprotein is involved, showing an enhanced expression inareas undergoing chondrogenesis, osteogenesis, somito-genesis and angiogenesis [79]. SPARC is also reputed forinhibiting adipogenesis and enhancing osteoblastogenesisand fibrogenesis in rainbow trout [80], as well as for par-ticipating in the final mineralization and remodelling ofthe ECM. Our increase in SPARC expression during gilt-head sea bream larval development is in agreement withthat reported in rainbow trout (Oncorhynchus mykiss)[80], but was contrary to the results found in gilthead seabream [79]. Although results are methodologicallyincompatible with those of [79] for comparative pur-poses, the increase in expression of SPARC during earlylarval ontogeny would seem more plausible, consideringthe participation of SPARC in many biological processes.Regarding SPP1, its early increased expression might beattributed to the differentiation of hypertrophic chondro-cytes and osteoblasts [81].In mammals, MGP is a decisive factor for differentia-
tion and maturation of chondrocytes and a key regulatorof chondral and intramembranous ossification [82]. Infish, branchial arches are the sites with higher levels ofmgp expression, followed by the heart, vertebra, kidneyand liver [83]. Thus, increased gene expression duringlarval ontogeny in our experiment could reflect thedevelopment of the above-mentioned organs and vitalsystems in order to match the biological needs of thedeveloping larva.COL1A1 is mainly expressed in connective tissues and
is abundant in bone, cornea, and dermis, and in two celltypes, osteoblasts and fibroblasts. Collagen fibres com-prise 90% of the ECM proteins in skeletal tissues andconfer most of their physical properties [84]. The pre-sent ontogeny of the COL1A1 expression was in agree-ment with previous results found in European sea bass,where COL1A1 was highly expressed from 31 dphonwards [14]. According to this data, the earlier increasein COL1A1 expression in comparison to that of bglap isin agreement with the temporal coordination of bothECM encoding genes [85]. Osteocalcin is a specific bonemarker [86] that is required for the correct maturationof hydroxyapatite crystals during the process of calcifica-tion [87]. However, the relationship between osteocalcinand mineralization remains unclear even within thesame species, since some authors detected bglap priorto mineralization and others at the onset or after the
Fernández et al. BMC Developmental Biology 2011, 11:7http://www.biomedcentral.com/1471-213X/11/7
Page 13 of 20

beginning of mineralization [82]. Its early detection at 2dph, in contrast to the previous reported detection ingilthead sea bream at 37 dph [86], might be linked tothe different molecular techniques used, since qPCR ismore sensitive than Northern blot analysis. This earlierdetection, prior to the development of mature osteo-blasts and calcification processes, might be linked to itsexpression in chondrocytes undergoing chondral calcifi-cation, as reported in zebrafish [82]. However, theincrease in bglap expression at older stages of develop-ment (52-60 dph) seemed to be due to the completionof the ossification of skeletal structures in the axial ske-leton [9-11,18], similar to that found in European seabass [88,89]. Considering that osteopontin and osteocal-cin are involved in the modulation of hydroxyapatitecrystallization [90], the advanced SPP1 expression mightbe related to the inhibition of osteoblast mineralization[91] occurring in vertebrae centra during their intra-membranous ossification, thus allowing osteoblast tomaintain their proliferative state; while bglap expressionwould be an indicator of the osteoblast mineralizationin those structures [89].The colour pixel analysis of skeletal structures
revealed that bone development was affected by hypervi-taminosis A, showing a disequilibrium between boneand cartilage, as 1.5×VA and 10×VA larvae displayhigher amounts of cartilage and lower values of red/bluecoloration ratio with respect to the control group,respectively. Those lower ratios are in agreement withhigher growth of some cartilage elements leading to thefusion of caudal fin complex structures [18]. Those dif-ferences in bone mineralization levels and ossificationprocesses were reflected by changes in gene transcrip-tion, describing two different scenarios of mineralizationstage for particular skeletal elements (splanchnocranium,dorsal and caudal fin elements) depending on thedietary VA level. Through its active metabolite RA, VApromotes terminal differentiation of hypertrophic chon-drocytes [92], which could explain the higher amount ofcartilage tissue in 1.5×VA and 10×VA larvae. Further-more, mgp over-expression in 1.5×VA larvae at 18 dphindicated an abnormal development of cartilage, as mgphas been reported to control bone mineralization [93].In contrast, high levels of VA in 10×VA larvae inducedadvancement of the mineralization process of chondralstructures leading to a higher mineralization stage [18].Such advanced mineralization could be explained by thedown-regulation of mgp in 10×VA larvae at 60 dph andthe higher expression of SPP1 at 18 dph compared tocontrol and 1.5×VA larvae, as osteopontin is involved inosteoblast differentiation [91]. These results are inagreement with those reported in cell culture studies[94] and in vivo experiments [4]. At the end of thestudy, the down-regulation of SPP1 in 1.5×VA and
10×VA larvae might be considered as another sign of anabnormal osteoblast development, since SPP1 likelyplays a key role in determining the biochemical proper-ties of the bone [81]. In addition, another sign of theadvancement of the mineralization process in skeletalstructures in 10×VA larvae was the down-regulation ofSPARC at 60 dph.Regarding bglap transcriptional regulation, it was up-
regulated at 18 dph in 1.5×VA and 10×VA larvalgroups, reflecting an earlier chondral ossification ofsome skeletal elements derived from the splanchnocra-nium (e.g. maxillar, premaxillar, Meckel ’s cartilage,articular) which are the unique skeletal structures thatwere ossifying during that stage of development [11].This precocious ossification process could be responsi-ble for the high incidence of deformities in the above-mentioned structures described in our previous study[18]. Furthermore, at the end of the study (60 dph), fishfed with higher levels of VA (1.5×VA and 10×VA)showed a higher bglap expression than those from thecontrol group. The over-expression of bglap in the fishfed hypervitaminosis A indicated an increased ongoingosteogenic processes, as those larvae presented a higheramount of osteogenic tissue (sum of red and bluecoloured surfaces) compared to the control group. Con-sequently, present results suggest that if normal rangesfor bglap expression are established, this gene might bea reliable marker for detecting disorders in bone forma-tion and mineralization processes [95,89].Finally, results of COL1A1 expression were not as
informative as the other analyzed genes from the ECMregarding the skeletogenesis process. No changes ingene expression were found in COL1A1 in larvae fedwith hypervitaminosis A at 18 dph compared to thecontrol group, even though it has been shown that thisgene contains a RARE in its promoter [6]. Differentresults from the effects of RA on the expression ofCOL1A1 are reported in the literature [6], which sug-gests an indirect regulation of COL1A1 by RA. However,larvae from the 1.5×VA and 10×VA groups showedlower expression of COL1A1 at 60 dph, which seems tobe attributed to the lower expression of RARG detectedin those animals, since this RAR binds specifically to theRARE of the COL1A1 promoter [84].
ConclusionsThe present study showed that the analysed geneexpression patterns in the gilthead sea bream were cor-related with skeletogenesis during early larval develop-ment, as they showed a temporally coordinated geneexpression for specific markers of the ECM. Further-more, results from this study supported the idea thatperturbations in specific dietary nutrients can alter nor-mal anatomic development mediated by specific genes
Fernández et al. BMC Developmental Biology 2011, 11:7http://www.biomedcentral.com/1471-213X/11/7
Page 14 of 20

controlled by ligand-receptor interactions. Althoughboth experimental groups (1.5×VA and 10×VA) werefed with an excess of VA, there were differences in theirjuvenile phenotype depending on the degree of hypervi-taminosis A. 1.5×VA and 10×VA larvae were fed respec-tively with moderate and high dietary VA content (1.5and up to 10 fold increase of VA content in the dietwith respect to the control group). From this we con-clude, only hypervitaminosis A in the 10×VA groupimpaired larval performance in terms of growth, matura-tion of the digestive system and survival rate, in whichthe down-regulation of RBP is illustrative of excessivedietary VA. However, both doses of VA differentiallyaffected the coordinated expression of genes duringskeletogenesis, some of them being markers for the dif-ferences in the processes of chondrogenesis and osteo-blastogenesis observed among dietary groups at earlystages of larval development (i.e., PPARG and mgp for1.5×VA; RARA and SPP1 for 10×VA). In particular, theup-regulation of bglap in 1.5×VA and 10×VA larvaeindicated an advanced ossification in some skeletalstructures. Early disturbance of skeletogenesis were stillmanifest after 40 days, as revealed by differences in geneexpression, highlighting the importance of a good nutri-tional balance during larval development that deter-mines juvenile phenotype.Concluding, present results showed that fish are reliable
animal models to study the effects of nutritional hypervita-minosis A. However, since only global effects of dietaryVA on fish larval physiology could be inferred from thisstudy due to the use of whole organisms, in vitro researchwith bone cell lines is needed to understand the mechan-isms by which RA controls skeletogenesis.
MethodsLarval rearing and dietsGilthead sea bream larvae (1 dph) were obtained from aSpanish private hatchery and shipped to the IRTA facil-ities. After their acclimation, larvae were distributed atan initial density of 100 larvae L-1 in 2 and 24 cylindri-cal tanks, of 500 and 100 L respectively, connected to awater recirculation unit. Water conditions were as fol-lows: 18-19°C, 35 ppt salinity, pH 7.8-8.2. Water wasprovided with gentle aeration and oxygenation (> 4 mgl-1) and 20% was exchanged daily. Photoperiod was12L:12 D, and light intensity of 500 lux at water surface.All animal experimental procedures were conducted incompliance with the experimental research protocolapproved by the Committee of Ethic and Animal Experi-mentation of the IRTA (reference number 621303898-3898-4-8), which followed the international principles ofreplacement, reduction and refinement for the use ofanimals in research.
On one hand, in order to characterize gene expres-sion patterns of selected genes during larval develop-ment until the juvenile stage, larvae kept in 500 Lcylindrical tanks were reared following a commercialproduction procedure. Feeding schedule was as follows:from day 4 to 20 post hatch (dph) rotifers (Brachionusplicatilis), whose density was progressively increasedfrom 5 to 10 rotifers mL-1; Artemia nauplii (EG, INVE,Belgium) from 16 to 22 dph, in increasing densityfrom 0.5 to 2 nauplii mL-1, and 2 days enriched-meta-nauplii from 20 to 40 dph (1 to 5 metanauplii mL-1).Both live preys were enriched with Easy Selco (ES;INVE, Belgium) according to manufacturer’s instruc-tions. From 36 dph to the end of the experiment(60 dph), larvae were progressively weaned onto dryfeed, first with Proton 1/2 and 1/4 (INVE, Belgium)and then with Gemma Micro (size range: 75 to 500μm; Skretting, Spain). On the other hand, larvae keptin 100 L tanks were reared in order to evaluate theeffects of high dietary VA content on gilthead seabream larval performance and quality ([18], as well asskeletogenesis-related gene expression (present work).Feeding sequence and dietary experimental conditionsare described in detail in [18]. In brief, three differentdietary regimes (each one in triplicate) were evaluatedduring the early larval development (rotifer feedingphase), containing graded levels of VA. The graded VAlevels in live prey were obtained by adding retinol pal-mitate (1,600,000 IU g-1, Sigma-Aldrich, Spain) to thecommercial enriching emulsion, Easy Selco™(ES,INVE, Belgium). Those dietary treatments are referredto as Control, 1.5×VA and 10×VA; and contained amean of 0.66*108, 1.00*108 and 6.82*108 total VA IUkg-1 DW in enriched rotifers [18], while mean totalvitamin A content in larvae was 60157, 71617 and72909 IU g-1 DW at 18 dph respectively.
Sample collectionBiological samples were taken at 2, 7, 10, 18, 22, 29, 37,45, 52 and 60 dph, in order to establish the gene expres-sion patterns of skeletogenesis-related genes and larvalgrowth during larval development. In order to evaluategene expression regulation by hypervitaminosis A andbone mineralization, larvae reared under hypervitamino-sis A were sampled at 18 dph, coinciding with the endof the nutritional challenge with VA (end of rotifer-feed-ing phase) and the onset of mineralization of the skele-ton [9-11], and the end of the weaning period (60 dph).In all cases, larvae were sacrificed with an overdose ofanaesthetic (Tricaine methanesulfonate, MS-222, Sigma).In both experiments, samples were frozen in RNA later(Ambion®) and stored at -80°C until gene expressionanalysis.
Fernández et al. BMC Developmental Biology 2011, 11:7http://www.biomedcentral.com/1471-213X/11/7
Page 15 of 20

Larval growth and bone mineralizationFor larval growth, sampled larvae (n = 15) from eachtank were washed with distilled water to avoid marinesalts and used for body length and dry weight determi-nation. Larval standard length was measured with adigital camera connected to a binocular microscopeNikon SMZ 800, AnalySIS (Soft Imaging Systems,GmbH). Once larvae lengths were measured, they weredried at 60°C until their weight was constant. Weightswere obtained with an analytic microbalance SartoriusBP211 D. Thirty larvae per dietary group (ten larvae pertank) were stained with alcian blue and alizarin red S[18] in order to evaluate the level of bone mineraliza-tion under different nutritional circumstances and quan-tified as described in [22], using a computerized imageanalysis package (IMAQ Vision Builder, National Instru-ments, Austin, TX). Total red and blue pixels were con-sidered as a marker of the relative ratio of osteoblastsand chondrocytes (respectively) and normalized by lar-vae body surface, as larval size were highly variablewithin tanks.
RNA extraction and qPCR conditionsTotal RNA was extracted from pools of fish larvae (100to 5 individuals per sample time and tank depending offish size) using the TRIzol reagent (Invitrogen®, SanDiego, CA, USA) as specified by the manufacturer. Thequantity of RNA isolated was determined using a Gene-Quant spectrophotometer (Amersham Biosciences),measuring optical density at 260 nm and its purity wasestablished by the absorbance ratio 260/280 nm (1.7-2.0). The quality of the RNA was examined using 1.2%agarose gel electrophoresis. A reverse transcription reac-tion was carried out using equal quantities of total RNA(1 μg) from each sample and Quanti Tect Reverse Tran-scription Kit (Qiagen®). Electrophoresis using a 1.2%agarose gel was run to assess the RT-PCR product.Real-time qPCR was performed using an ABI PRISM
7300 (Applied Biosystems). For each gene, a species-specific Taqman assay was designed (Applied Biosystems)using the sequences acquired from the GenBank database(Table 1). The efficiency of the Taqman assay for eachgene was previously evaluated to assure that it was close
Table 1 Accession number, primers and probes used for relative quantification of gene expression during gilthead seabream ontogenic development and dietary vitamin A nutritional imbalance
Gene name Genebank Component 5’ to 3’ nucleotide sequences
RARA EU643830 Forward CCTGTCTGGACATCCTGATACTTC
Reverse CGTGAGTCCATCTGAGAAAGTCAT
FAM probe CTCTGGTGTGTAGCGTGTAC
RARG EU643831 Forward GTGCGTAATGACAGAAACAAGAAGA
Reverse ACTCCTCTAGCTCTCCACTTAGC
FAM probe CTTTCTGGAAGCACCACCTC
RXRB AM980430 Forward CCTGAGGCCCATGCAATCTC
Reverse ACACACATGCGTTTCTGAGACAA
FAM probe CAGCCCTGGACTAATG
PPARA AY590299 Forward CTTTTCGTGGCTGCCATTATCTG
Reverse CTCCACCAAAGGCACATCCA
FAM probe CCTGGGCGATCTCC
PPARB AY590301 Forward GTTTGTTGCTGCCATCATTCTCT
Reverse CACCTGCTTCACGTTCATTAGC
FAM probe CCGGGACGATCTCCAC
PPARG AY590304 Forward CAATGTCGGCATGTCACACAAC
Reverse CTCCTTCTCCGCCTGGG
FAM probe CCGGCCAAAACGAATG
IGF1 AY996779 Forward GGGCGAGCCCAGAGA
Reverse GCCGTAGCCAGGTTTACTGAAATAA
FAM probe TCCACACACAAACTGC
IGF2 AY996778 Forward GTCGGCCACCTCTCTACAG
Reverse TGCTTCCTTGAGACTTCCTGTTTT
FAM probe TTACCCGTGATGCCCC
Bmp2 AY500244 Forward GTGGCTTCCATCGTATCAACATTTT
Reverse GCTCCCCGCCATGAGT
FAM probe CAGGAGCTCCAAATAA
Fernández et al. BMC Developmental Biology 2011, 11:7http://www.biomedcentral.com/1471-213X/11/7
Page 16 of 20

to 100%. All reactions were performed in 96 well platesin triplicate in 20 μl reaction volumes containing: 10 μlof 2× TaqMan universal PCR master mix (Applied Bio-systems); 1 μl of the 20× Taqman primer/probe solutioncorresponding to the analyzed gene; 8 μl of molecularbiology grade water; and 1 μl of cDNA diluted 1:10, withthe exception of bglap, which was evaluated with straightdilution. Standard amplification parameters were as fol-lows: 95°C for 10 min, followed by 45 amplificationcycles, each of which comprised 95°C for 15 s and 60°Cfor 1 min. Real time qPCR was performed for each gene,and therefore, a calibrator sample was included withineach plate.
Data processingThe relative gene expression ratio for each gene wasbased on the PCR efficiency (E) and Ct of a samplecompared with the control, and expressed in compari-son to the reference gene, according to Pfaffl’s mathe-matical model:
RatioE
E target gene (dCt target gene control sample )
en( )
ddogenous control gene (dCt RNA (control sample))EF1
Statistical differences in gene expression between dif-ferent developmental stages in larval rearing under stan-dard conditions were analyzed by ANOVA, whiledifferences in gene expression ratios between dietarytreatments at each sampled time in larval rearing underhypervitaminosis A were performed by randomizationtests using REST 2008 software [96].As reference genes, 18S and EF1a were evaluated as
those have been suggested to be reliable house-keepinggenes for qPCR analyses of developmental processes[97]. However, results were finally evaluated only withEF1a as the reference gene, due to the low efficiency ofthe 18S Taqman probe (< 90%). In the Control group,target and housekeeping gene expressions were mea-sured at 2, 7, 10, 18, 22, 29, 37, 45, 52 and 60 dph usinggene expression at 2 dph as the reference time point, toestablish the normal ontogeny of target gene expression;while in the excess dietary VA groups (1.5×VA and10×VA) the relative gene expression of the same targetgenes was evaluated at 18 and 60 dph, using the controlgroup gene expression as the reference.A supervised hierarchical clustering was applied [98]
to the samples from the larval rearing under standard
Table 1 Accession number, primers and probes used for relative quantification of gene expression during gilthead seabream ontogenic development and dietary vitamin A nutritional imbalance (Continued)
TGFB1 AF424703 Forward TTTTCCAACTTCGGCTGTACTGT
Reverse GAGATGCCAAAACTGAAGGTACTGA
FAM probe ATTGCGGCCGTTCTAG
RBP AY550957 Forward TGGCCACCTTCGAGACAAC
Reverse GATGCGGCTCCCCAGTAG
FAM probe CCCCGCCAAGTTCAG
mgp AY065652 Forward CGCCCGAAATACACCTCAGA
Reverse GACGGACGGATACTAGGAGTCTA
FAM probe ACCAGCCGCGACTCG
bglap AF048703 Forward CGAGCACATGATGGACACTGA
Reverse GTCCGTAGTAGGCCGTGTAG
FAM probe CAGCGATGATTCCC
COL1A1 DQ324363 Forward GGCAACAGTCGCTTCACCTA
Reverse CCCCATGTACCGGTGTGT
FAM probe ACGTGCATCCATCCTC
SPP1 AY651247 Forward CCAGCCAGGAGTCAGAGGAT
Reverse ACTCTCATCTGAGTCGCTGTCA
FAM probe CTGCTCTGGCTCTCC
SPARC AJ564190 Forward AAGCTGCACCTCGACTACATC
Reverse CCTTCAGCTCGCTGTCCAT
FAM probe CAGGGCTCGATCATTT
EF1a AF184170 Forward CCCGGTATGGTTGTCACCTT
Reverse GGTGCATCTCCACAGACTTGAC
FAM probe CCCCAGCTGACCACTG
18S TaqMan® Gene Expression Assay\Eukaryotic 18S rRNA, 20X (Part Number 4331182)
18S accession number, forward and reverse primers, as well as probe sequences are not shown as the Taqman assay used is proprietary.
Fernández et al. BMC Developmental Biology 2011, 11:7http://www.biomedcentral.com/1471-213X/11/7
Page 17 of 20

conditions and each gene was classified according to itsgene expression profile. Tree View software, was used togenerate visual representations of the classification [98].In order to represent gene expression of target genes
in a more comprehensive manner, gene expressionratios in larval rearing under hypervitaminosis A werereported as fold change regulation, and then ratiosbetween 0 and 1 were transformed and represented as-1/(target gene ratio).
List of abbreviationsbglap: osteocalcin or bone Gla protein gene; BMPs: bone morphogeneticproteins; BMP-2: bone morphogenetic protein 2; Bmp2: bone morphogeneticprotein 2 gene; Cbfa1: core binding factor α 1 protein; Cbfa1: core bindingfactor α 1 gene; COL1A1: type I collagen α1 chain gene: Ct: Cycle threshold;dl: decilitre; dph: days post hatch; DW: dry weight; E: efficiency; ECM:extracellular matrix proteins; EF1α: elongation factor 1 α gene; GH: growthhormone protein; GH: growth hormone gene; Gla: y-carboxyglutamic acid;IGF-I: insulin-like growth factor I protein; IGF1: insulin-like growth factor Igene; IGF-II: insulin-like growth factor II protein; IGF2: insulin-like growthfactor II gene; MGP: matrix Gla protein; mgp: matrix Gla protein gene; mRNA:messenger ribonucleic acid; PPARα: peroxisome proliferator-activatedreceptor α protein; PPARA: peroxisome proliferator-activated receptor α gene;PPARβ: peroxisome proliferator-activated receptor β protein; PPARB:peroxisome proliferator-activated receptor β gene; PPAR γ: peroxisomeproliferator-activated receptor γ protein; PPARG : peroxisome proliferator-activated receptor γ gene; qPCR: semiquantitative polymerase chain reaction;RA: retinoic acid; RARα: retinoic acid receptor α protein; RARA: retinoic acidreceptor α gene;RARβ: retinoic acid receptor β protein; RARB: retinoic acidreceptor β gene; RARE: retinoic acid response element; RARγ: retinoic acidreceptor γ protein; RARG: retinoic acid receptor γ gene; RBP: retinol bindingprotein; RBP: retinol binding protein gene; REST: Relative expression softwaretool; RNA: ribonucleic acid; RXRα: retinoid × receptor α protein; RXRA:retinoid × receptor α gene; RXRβ: retinoid × receptor β protein; RXRB:retinoid × receptor β gene; RXRγ: retinoid × receptor γ protein; RXRG:retinoid × receptor γ gene; Runx2: runt related transcription factor 2 protein;shh: Sonic hedge hog gene; SL: standard length; SPARC: secreted proteinacidic and rich in cysteine; SPARC: secreted protein acidic and rich incysteine gene; SPP1: osteopontin gene; T4: thyroxin; TGFβ1: transforminggrowth factor β 1 protein; TGFB1: transforming growth factor β 1 gene; TR:thyroid receptor; VA: vitamin A; VDR: vitamin D receptor.
AcknowledgementsAuthors are greatly indebted to the technical staff of IRTA-Sant Carlesresearch centre for their excellent technical assistance during larvae trialswith gilthead seabream, especially to M. Monllaó, and J. Canoura; as well asB. Desbruyères from IFREMER-Brest research centre for its technicalassistance in bone mineralization analysis. Funding was provided to EG bythe Ministry of Science and Innovation of the Spanish Government(MINCINN, projects AGL2005-02478, HF2008-0079 and AGL2008-03897-C04-01). I.F was supported by a predoctoral fellowship (reference BES-2006-12650).
Author details1Unitat de Cultius Experimentals, IRTA Centre de Sant Carles de la Ràpita(IRTA-SCR), Crta. del Poble Nou s/n, 43540 - Sant Carles de la Ràpita (Spain).2Nutrition Aquaculture and Genomics Research Unit, UMR 1067, IFREMERMarine Fish Nutrition Team. IFREMER, Technopole Brest-Iroise, BP 70, 29280Plouzané (France).
Authors’ contributionsIF participated in the design of the nutritional dose-response experimentand conducted it, carried out the gene expression analyses and drafted themanuscript. MD participated in the gene expression analyses and in the finalredaction of the manuscript. KA designed and optimized gene expressionanalyses and participated in the final redaction of the manuscript. DM andJZ participated in the gene expression analysis and in the final redaction of
the manuscript. EG got the funding, conceived part of the study,participated in the experimental design and in the final redaction of themanuscript. All authors read and approved the final manuscript.
Received: 17 September 2010 Accepted: 9 February 2011Published: 9 February 2011
References1. Witten PE, Huysseune A: Mechanisms of chondrogenesis and
osteogenesis in fins. In Fins and Limbs; Development, Evolution andTransformation. Edited by: Hall BK. Chicago: Chicago University Press;2007:79-92.
2. Sire JY, Donoghue PCJ, Vickaryous MK: Origin and evolution of theintegumentary skeleton in non-tetrapod vertebrates. J Anat 2009,214:409-440.
3. Haga Y, Suzuki T, Takeuchi T: Retinoic acid isomers producemalformations in postembryonic development of flounder, Paralichthysolivaceus. Zool Sci 2002, 19:1105-1112.
4. Haga Y, Dominique VJ, Du SJ: Analyzing notochord segmentation andintervertebral disc formation using the twhh: gfp transgenic zebrafishmodel. Transgen Res 2009, 18:669-683.
5. Trayhurn P: Nutritional genomics - “Nutrigenomics”. Br J Nutr 2003, 89:1-2.6. Balmer JE, Blomhoff R: Gene expression regulation by retinoic acid. J Lipid
Res 2002, 43:1773-1808.7. Balmer JE, Blomhoff R: A robust characterization of retinoic acid response
elements based on a comparison of sites in three species. J SteroidBiochem Mol Biol 2005, 96:347-354.
8. Ross SA, Caffery PJ, Draguer UC, De Luca LM: Retinoids in embryonaldevelopment. Physiol Rev 2000, 80:1021-1054.
9. Faustino M, Power DM: Development of osteological structures in the seabream: vertebral column and caudal fin complex. J Fish Biol 1998,52:11-22.
10. Faustino M, Power DM: Development of the pectoral, pelvic, dorsal andanal fins in cultured sea bream. J Fish Biol 1999, 54:1094-1110.
11. Faustino M, Power DM: Osteologic development of the viscerocranialskeleton in sea bream: alternative ossification strategies in teleost fish.J Fish Biol 2001, 58:537-572.
12. Gavaia PJ, Dinis MT, Cancela ML: Osteological development andabnormalities of the vertebral column and caudal skeleton in larval andjuvenile stages of hatchery-reared Senegal sole (Solea senegalensis).Aquaculture 2002, 211:305-323.
13. Villeneuve L, Gisbert E, Cahu CL, Le Gall MM, Zambonino-Infante JL:Expression and localization of some retinoid receptors during Europeansea bass (Dicentrarchus labrax) larvae development. Aquaculture 2004,242:537-551.
14. Darias MJ, Zambonino-Infante JL, Hugot K, Cahu CL, Mazurais D: Geneexpression patterns during the larval development of European sea bass(Dicentrarchus labrax) by microarray analysis. Mar Biotechnol 2008,10:416-428.
15. Sarropoulou E, Kotoulas G, Power DM, Geisler R: Gene expression profilingof gilthead sea bream during early development and detection ofstress-related genes by the application of cDNA microarray technology.Physiol Genomics 2005, 23:182-191.
16. Villeneuve L, Gisbert E, Le Delliou H, Cahu CL, Zambonino-Infante JL:Dietary levels of all-trans retinol affect retinoid nuclear receptorexpression and skeletal development in European sea bass larvae. Br JNutr 2005, 93:791-801.
17. Villeneuve L, Gisbert E, Moriceau J, Cahu CL, Zambonino JL: Intake of highlevels of vitamin A and polyunsaturated fatty acids during differentdevelopmental periods modifies the expression of morphogenesisgenes in European sea bass (Dicentrarchus labrax). Br J Nutr 2006,95:677-687.
18. Fernández I, Hontoria F, Ortiz-Delgado JB, Kotzamanis Y, Estévez A,Zambonino-Infante JL, Gisbert E: Larval performance and skeletaldeformities in farmed gilthead sea bream (Sparus aurata) fed withgraded levels of Vitamin A enriched rotifers (Brachionus plicatilis).Aquaculture 2008, 283:102-115.
19. Fernández I, Pimentel MS, Ortiz-Delgado JB, Hontoria F, Sarasquete C,Estévez A, Zambonino-Infante JL, Gisbert E: Effect of dietary vitamin A onSenegalese sole (Solea senegalensis) skeletogenesis and larval quality.Aquaculture 2009, 295:250-265.
Fernández et al. BMC Developmental Biology 2011, 11:7http://www.biomedcentral.com/1471-213X/11/7
Page 18 of 20

20. Fernández I, Gisbert E: Senegalese sole bone tissue originated fromchondral ossification is more sensitive than dermal bone to highvitamin A content in enriched Artemia. J Appl Icthyol 2010, 26:344-349.
21. Geay F, Darias MJ, Santigosa E, Desbruyères E, Quazuguel P, Zambonino-Infante JL, Cahu CL, Mazurais D: Cloning of endothelin-1 (ET-1) fromEuropean sea bass (Dicentrarchus labrax) and its gene expressionanalysis in larvae with retinoic acid-induced malformations. Aquaculture2009, 287:169-173.
22. Mazurais D, Glynatsi N, Darias MJ, Christodoulopoulou S, Cahu CL,Zambonino-Infante JL, Koumoundouros G: Optimal levels of dietaryvitamin A for reduced deformity incidence during development ofEuropean sea bass larvae (Dicentrarchus labrax) depend onmalformation type. Aquaculture 2009, 294:262-270.
23. Ferraresso S, Milan M, Pellizzari C, Vitulo N, Reinhardt R, Canario AVM,Patarnello T, Bargelloni L: Development of an oligo DNA microarray forthe European sea bass and its application to expression profiling of jawdeformity. BMC Genomics 2010, 11:354-371.
24. Hale AL, Tallafuss A, Yan Y, Dudley L, Eisen JS, Postlethwait JH:Characterization of the retinoica cid receptor genes raaa, rarab and rargduring zebrafish development. Gene Expr Patterns 2006, 6:546-555.
25. Tallafuss A, Hale LA, Yan Y, Duley L, Eisen JS, Postlethwait JH:Characterization of retinoid-X receptor genes rxra, rxrab, rxrbb and rxrgduring zebrafish development. Gene Expr Patterns 2006, 6:556-565.
26. He Ch, Wang Ch, Li B, Xie F, Chen Y, Zuo Z: Tissue-specific and embryonicexpression of the retinoid × receptors in Sebastiscus marmoratus. CompBiochem Physiol B 2009, 154:221-228.
27. Desvergne B, Wahli W: Peroxisome proliferator-activated receptors:Nuclear control of metabolism. Endocr Rev 1999, 20:649-688.
28. Napoli JL: Biochemical pathways of retinoid transport, metabolism, andsignal transduction. Clin Inmunol Inmunopathol 1996, 80(Suppl 3):52-62.
29. Rosen V: BMP2 signaling in bone development and repair. CytokineGrowth F R 2009, 20:475-480.
30. Tandler A, Anav FA, Choshniak I: The effect of salinity on growth rate,survival and swimbladder inflation in gilthead seabream, Sparus aurata,larvae. Aquaculture 1995, 135:343-353.
31. Saka S, Çoban D, Kamaci HO, Süzer C, Firat K: Early development ofcephalic skeleton in hatchery-reared gilthead seabream, Sparus aurata.Turk J Fish Aquat Sc 2008, 8:341-345.
32. Joore J, van der Lans GB, Lanser PH, Vervaart JM, Zivkovic D, Speksnijder JE,Kruijer W: Effects of retinoic acid on the expression of retinoic acidreceptors during zebrafish embryogenesis. Mech Dev 1994, 46:137-150.
33. Boylan JF, Lufkin T, Achkar CC, Taneja R, Chambon P, Gudas LJ: TargetedDisruption of Retinoic Acid Receptor α (RARα) and RARγ Results inReceptor-Specific Alterations in Retinoic Acid-Mediated Differentiationand Retinoic Acid Metabolism. Mol Cell Biol 1995, 15:843-851.
34. Kastner P, Mark M, Ghyselinck N, Krezel W, Dupé V, Grondona JM,Chambon P: Genetic evidence that the retinoid signal is transduced byheterodimeric RXR/RAR functional units during mouse development.Development 1997, 124:313-326.
35. Lufkin T, Lohnes D, Mark M, Dierich A, Gorry P, Gaub MP, LeMeur M,Chambon P: High postnatal lethality and testis degenerationin retinoicacid receptor a mutant mice. Proc Natl Acad Sci 1993, 90:7225-7229.
36. Ruberte E, Dollé P, Chambon P, Morriss-Kay G: Retinoic acid receptors andcellular retinoid binding proteins. II. Their differential pattern oftranscription during early morphogenesis in mouse embryos.Development 1991, 111:45-60.
37. Reijntjes S, Blentic A, Gale E, Maden M: The control of morphogensignalling: Regulation of the synthesis and catabolism of retinoic acid inthe developing embryo. Dev Biol 2005, 285:224-237.
38. Shimono K, Morrison TN, Tung W, Chandraratna RA, Williams JA,Iwamoto M, Pacifici M: Inhibition of Ectopic Bone Formation by aSelective Retinoic Acid Receptor α-Agonist: A New Therapy forHeterotopic Ossification? Inc J Orthop Res 2010, 28:271-277.
39. Haga Y, Suzuki T, Kagechika H, Takeuchi T: A retinoic acid receptor-selective agonist causes jaw deformity in the Japanese flounder,Paralichthys olivaceus. Aquaculture 2003, 221:381-392.
40. Suzuki T, Oochara I, Kurokawa T: Retinoic acid given at late embryonicstage depresses sonic hedgehog and Hoxd-4 expression in thepharyngeal area and induces skeletal malformation in flounder(Paralichthys olivaceus) embryos. Dev Growth Differ 1999, 41:143-152.
41. Dollé P, Ruberte E, Leroy P, Morriss-Kay G, Chambon P: Retinoic acidreceptors and cellular retinoid binding proteins I. A systematic study oftheir differential pattern of transcription during mouse Organogenesis.Development 1990, 110:1133-1151.
42. Ruberte E, Dollé P, Krust A, Zelent A, Morriss-Kay G, Chambon P: Specificspatial and temporal distribution of retinoic acid receptor gammatranscripts during mouse embryogenesis. Development 1990, 108:213-222.
43. Kim Y, Sharma RP: Histochemical localization of retinoic acid receptors inthe developing hamster fetus. Reprod Toxicol 1995, 9:435-447.
44. Colon-Teicher LS, Raviprakash RD, Raghubir PS: Temporal expression ofretinoic acid receptors in hamster fetus during organogenesis andalteration by retinoic acid treatment. Comp Biochem Physiol 1996,114C:71-78.
45. Koyama E, Golden EB, Kirsch T, Adams SL, Chandraratna RAS, Michaille J,Pacifici M: Retinoid Signaling Is Required for Chondrocyte Maturationand Endochondral Bone Formation during Limb Skeletogenesis. Dev Biol1999, 208:375-391.
46. Germain P, Chambon P, Eichele G, Evans RM, Lazar MA, Leid M, de Lera AR,Lotan R, Mangelsdorf DJ, Gronemeyer H: International Union ofPharmacology. LXIII. Retinoid × receptors. Pharmacol Rev 2006,58:760-772.
47. Minucci S, Leid M, Toyama R, Saint-Jeannet JP, Peterson VJ, Hoern V,Ishmael JE, Bhattacharyya N, Dey A, Dawid IB, Ozato K: Retinoid × Receptor(RXR) within the RXR-Retinoic Acid Receptor Heterodimer Binds ItsLigand and Enhances Retinoid-Dependent Gene Expression. Mol Cell Biol1997, 17:644-655.
48. Funkenstein B: Developmental expression, tissue distribution andhormonal regulation of fish (Sparus aurata) serum retinol-bindingprotein. Comp Biochem Phys B 2001, 129:613-622.
49. Sapin V, Ward SJ, Bronner S, Chambon P, Dollé P: Differential Expression ofTranscripts Encoding Retinoid Binding Proteins and Retinoic AcidReceptors During Placentation of the Mouse. Dev Dyn 1997, 208:199-210.
50. Wolf G: Multiple functions of vitamin-A. Physiol Rev 1984, 64:873-937.51. Jenssen KA, Satre MA: Mouse retinol binding protein gene: Cloning,
expression and regulation by retinoic acid. Mol Cell Biochem 2000,211:85-94.
52. Mercader J, Granados N, Bonet ML, Palou A: All-Trans Retinoic AcidDecreases Murine Adipose Retinol Binding Protein 4 Production. CellPhysiol Biochem 2008, 22:363-372.
53. Escher P, Wahli W: Peroxisome proliferator-activated receptors: insightinto multiple cellular functions. Mutat Res 2000, 448:121-138.
54. Leaver MJ, Boukouvala E, Antonopoulou E, Diez A, Favre-Krey L, Ezaz MT,Bautista JM, Tocher DR, Krey G: Three Peroxisome Proliferator-ActivatedReceptor Isotypes from Each of Two Species of Marine Fish.Endocrinology 2005, 146:3150-3162.
55. Kondo H, Misaki R, Gelman L, Watabe S: Ligand-dependent transcriptionalactivities of four torafugu pufferfish Takifugu rubripes peroxisomeproliferator-activated receptors. Gen Comp Endocr 2007, 154:120-127.
56. Oku H, Umino T: Molecular characterization of peroxisome proliferator-activated receptors (PPARs) and their gene expression in thedifferentiating adipocytes of red sea bream Pagrus major. Comp BiochemPhys B 2008, 151:268-277.
57. Tsai ML, Chen HY, Tseng MH, Chang R: Cloning of peroxisomeproliferators activated receptors in the cobia (Rachycentron canadum)and their expression at different life-cycle stages under cageaquaculture. Gene 2008, 425:69-78.
58. Lee CH, Olson P, Evans RM: Lipid Metabolism, Metabolic Diseases, andPeroxisome Proliferator-Activated Receptors. Endocrinology 2003,144:2201-2207.
59. Giaginis C, Tsantili-Kakoulidou A, Theocharis S: Peroxisome proliferator-activated receptors (PPARs) in the control of bone metabolism. FundamClin Pharm 2007, 21:231-244.
60. Braissant O, Wahli W: Differential expression of peroxisome proliferator-activated receptor-alpha, -beta, and -gamma during rat embryonicdevelopment. Endocrinology 1998, 139:2748-2754.
61. Peters JM, Lee SST, Li W, Ward JM, Gavrilova O, Everett C, Reitman ML,Hudson LD, Gonzalez FJ: Growth, adipose, brain, and skin alterationsresulting from targeted disruption of the mouse peroxisomeproliferator-activated receptor beta (delta). Mol Cell Biol 2000,20:5119-5128.
Fernández et al. BMC Developmental Biology 2011, 11:7http://www.biomedcentral.com/1471-213X/11/7
Page 19 of 20

62. Luquet S, Lopez-Soriano J, Holst D, Fredenrich A, Melki J,Rassoulzadegan M, Grimaldi PA: Peroxisome proliferator-activatedreceptor δ controls muscle development and oxydative capability. FASEBJ 2003, 17:2299-2301.
63. Kranenbarg S, Waarsing JH, Muller M, Weinans H, van Leeuwen JL: Lordoticvertebrae in sea bass (Dicentrarchus labrax L.) are adapted to increasedloads. J Biomech 2005, 38:1239-1246.
64. Tontonoz P, Hu E, Graves RA, Budavari AI, Spiegelman BM: mPPAR/2:tissue-specific regulator of an adipocyte enhancer. Gene Dev 1994,8:1224-1234.
65. Ziouzenkova O, Plutzky J: Retinoid metabolism and nuclear receptorresponses: New insights into coordinated regulation of the PPAR-RXRcomplex. FEBS Letters 2008, 582:32-38.
66. Perrot V, Moiseeva EB, Gozes Y, Chan SJ, Ingleton P, Funkenstein B:Ontogeny of the Insulin-like Growth Factor System (IGF-I, IGF-II, and IGF-1R) in Gilthead Seabream (Sparus aurata): Expression and CellularLocalization. Gen Comp Endocr 1999, 116:445-460.
67. Canalis E, McCarthy TL, Centrella M: Growth factors and cytokines in bonecell metabolism. Annu Rev Med 1991, 42:17-24.
68. Tiago DM, Laizé V, Cancela ML: Alternatively spliced transcripts of Sparusaurata insulin-like growth factor 1 are differentially expressed in adulttissues and during early development. Gen Comp Endocr 2008,157:107-115.
69. Fu Z, Noguchi T, Kato H: Vitamin A deficiency reduces insulinlike growthfactor (IGF)-I gene expression and increases IGF-I receptor and insulinreceptor gene expression in tissues of Japanese Quail (Coturnix coturnixjaponica). J Nutr 2001, 131:1189-1194.
70. Carnevali O, Cardinali M, Maradonna F, Parisi M, Olivotto I, Polzonetti-Magni AM, Mosconi G, Funkenstein B: Hormonal Regulation of HepaticIGF-I and IGF-II Gene Expression in the Marine Teleost Sparus aurata.Mol Reprod Dev 2005, 71:12-18.
71. Sternberg H, Moav B: Regulation of the growth hormone gene by fishthyroid/retinoid receptors. Fish Physiol Biochem 1999, 20:331-339.
72. Leung LY, Kwong AKY, Man AKY, Woo NYS: Direct actions of cortisol,thyroxin and growth hormone on IGF-I mRNA expression in sea breamhepatocytes. Comp Biochem Phys A 2008, 151:705-710.
73. Goldspink G, Yang SY: The splicing of the IGF-I gene to yield differentmuscle growth factors. Adv Genet 2004, 52:23-49.
74. McCarthy TL, Centrella M, Canalis E: Regulatory effects of insuline-likegrowth factors I and II on bone collagen synthesis in rat calvarialcultures. Endocrinology 1989, 124:301-309.
75. Marie PJ, Debiais F, Haÿ E: Regulation of human cranial osteoblastphenotype by FGF-2, FGFR-2 and BMP-2 signaling. Histol Histopathol2002, 17:877-885.
76. Janssens K, ten Dijke P, Janssens S, Van Hul W: Transforming GrowthFactor-β1 to the Bone. Endocr Rev 2005, 26:743-774.
77. Canalis E, Economides AN, Gazzerro E: Bone Morphogenetic Proteins,Their Antagonists, and the Skeleton. Endocr Rev 2003, 24:218-235.
78. Shen ZJ, Kim SK, Jun DJ, Park W, Kim YH, Malter JS, Moon BJ: Antisensetargeting of TGF-β1 augments BMP-induced upregulation ofosteopontin, type I collagen and Cbfa1 in human Saos-2 cells. Exp CellRes 2007, 313:1415-1425.
79. Estêvão MD, Redruello B, Canario AVM, Power DM: Ontogeny ofosteonectin expression in embryos and larvae of sea bream (Sparusauratus). Gen Comp Endocr 2005, 142:155-162.
80. Tang S, McKeown BA: Cloning and expression of the SPARC cDNA fromrainbow trout. J Fish Biol 1997, 50:608-619.
81. Sodek J, Ganss B, McKee MD: Osteopontin. Crit Rev Oral Biol Med 2000,11:279-303.
82. Gavaia PJ, Simes DC, Ortiz-Delgado JB, Viegas CSB, Pinto JP, Kelsh RN,Sarasquete MC, Cancela ML: Osteocalcin and matrix Gla protein inzebrafish (Danio rerio) and Senegal sole (Solea senegalensis):Comparative gene and protein expression during larval developmentthrough adulthood. Gene Expr Patterns 2006, 6:637-652.
83. Roberto VP, Cavaco S, Viegas CSB, Simes DC, Ortiz-Delgado JB,Sarasquete MC, Gavaia PJ, Cancela ML: Matrix Gla protein in turbot(Scophthalmus maximus): Gene expression analysis and identification ofsites of protein accumulation. Aquaculture 2009, 294:202-211.
84. Meisler NT, Parrelli J, Gendimenico GJ, Mezick JA, Cutroneo KR: All-trans-retinoic acid inhibition of Proα1(I) collagen gene expression in fetal rat
skin fibroblast: identification of a retinoic acid response element in theProα1(I) collagen gene. J Invest Dermatol 1997, 108:476-481.
85. Ducy P, Starbuck M, Priemel M, Shen J, Pinero G, Geoffroy V, Amling M,Karsenty G: A Cbfa1-dependent genetic pathway controls boneformation beyond embryonic development. Gene Dev 1999, 13:1025-1036.
86. Pinto JP, Ohresser MCP, Cancela ML: Cloning of the bone Gla proteingene from the teleost fish Sparus aurata. Evidence for overallconservation in gene organization and bone-specific expression fromfish to man. Gene 2001, 270:77-91.
87. Boskey AL, Gadaleta S, Gundberg C, Doty SB, Ducy P, Karsenty G: Fouriertransform infrared microspectroscopic analysis of bones of osteocalcin-deficient mice provides insight into the function of osteocalcin. Bone1998, 23:187-196.
88. Darias MJ, Mazurais D, Koumoundouros G, Glynatsi N,Christodoulopoulou S, Desbruyeres E, Le Gall MM, Quazuguel P, Cahu CL,Zambonino-Infante JL: Dietary vitamin D3 affects digestive systemontogenesis and ossification in European sea bass (Dicentrachus labrax,Linnaeus, 1758). Aquaculture 2010, 298:300-307.
89. Darias MJ, Lan Chow Wing O, Cahu CL, Zambonino-Infante JL, Mazurais D:Double staining protocol for developing European sea bass(Dicentrarchus labrax) larvae. J Appl Ichthyol 2010, 26:280-285.
90. Fonseca VG, Laizé V, Valente MS, Cancela ML: Identification of anosteopontin-like protein in fish associated with mineral formation. FEBS J2007, 274:4428-4439.
91. Addison WN, Azari F, Sørensen ES, Kaartinen MT, McKee MD:Pyrophosphate inhibits mineralization of osteoblast cultures by bindingto mineral, up-regulating osteopontin, and inhibiting alkalinephosphatase activity. J Biol Chem 2007, 282:15872-15883.
92. Iwamoto M, Shapiro IM, Yagami K, Boskey AL, Leboy PS, Adams SL,Pacifici M: Retinoic acid induces rapid mineralization and expression ofmineralization-related genes in chondrocytes. Exp Cell Res 1993,207:413-420.
93. Yagami K, Suh JY, Enomoto-Iwamoto M, Koyama E, Abrams WR, Shapiro IM,Pacifici M, Iwamoto M: Matrix GLA protein is a developmental regulatorof chondrocyte mineralization and, when constitutively expressed,blocks endochondral and intramembranous ossification in the limb. JCell Biol 1999, 147:1097-1108.
94. Cheung AMS, Tam CKH, Chow HCH, Verfaillie CM, Liang R, Leung AYH: All-trans retinoic acid induces proliferation of an irradiated stem cellsupporting stromal cell line AFT024. Exp Hematol 2007, 35:56-63.
95. Mazurais D, Darias MJ, Gouillou-Coustans MF, Le Gall MM, Huelvan C,Desbruyères E, Quazuguel P, Cahu CL, Zambonino-Infante JL: Dietaryvitamin mix levels influence the ossification process in European seabass (Dicentrarchus labrax) larvae. Am J Physiol Regul Integr Comp Physiol2008, 294:520-527.
96. Gene-Quantification. [http://www.gene-quantification.de/rest-2008.html].97. Mitter K, Kotoulas G, Magoulas A, Mulero V, Sepulcre P, Figueras A, Novoa B,
Sarropoulou E: Evaluation of candidate reference genes for QPCR duringontogenesis and of immune-relevant tissues of European seabass(Dicentrarchus labrax). Comp Biochem Physiol B 2009, 153:340-347.
98. Gene Cluster. [http://rana.lbl.gov/].
doi:10.1186/1471-213X-11-7Cite this article as: Fernández et al.: Coordinated gene expressionduring gilthead sea bream skeletogenesis and its disruption bynutritional hypervitaminosis A. BMC Developmental Biology 2011 11:7.
Fernández et al. BMC Developmental Biology 2011, 11:7http://www.biomedcentral.com/1471-213X/11/7
Page 20 of 20


