Embed Size (px)
Citation preview

Economic Modelling 33 (2013) 965–976
Contents lists available at SciVerse ScienceDirect
Economic Modelling
j ourna l homepage: www.e lsev ie r .com/ locate /ecmod
Coordination costs and research joint ventures☆
Rod Falvey a, Joanna Poyago-Theotoky b,c,d,e,⁎, Khemarat Talerngsri Teerasuwannajak f
a School of Business, Bond University, Australiab School of Economics, La Trobe University, Australiac CRIEFF, University of St Andrews, UKd Rimini Centre for Economic Analysis (RCEA), Italye SIERC, Massey University, New Zealandf Faculty of Economics, Chulalongkorn University, Thailand
☆ We gratefully acknowledge the comments by SimonVassilios Zikos, Maria Gil-Molto, John Beath and Arijit Mare the authors' responsibility alone. Poyago-Theotoky aport by the Spanish Ministry of Science and Technology⁎ Corresponding author at: School of Economics, La Tr
3086, Australia.E-mail address: [email protected] (
1 In a study of joint ventures in the United States, Kogterminated within the first seven years. A study by Arth1996) found that 30% of alliances were reported as outrwere “unsatisfactory”. Harrigan (1985) found that almfailure.
0264-9993/$ – see front matter © 2013 Elsevier B.V. Allhttp://dx.doi.org/10.1016/j.econmod.2013.03.005
a b s t r a c t
a r t i c l e i n f oArticle history:Accepted 6 March 2013
JEL classification:O30L13D43
Keywords:Research joint venture (RJV)Process innovationCoordination costs
We consider a simple oligopoly model where firms engage in cost-reducing R&D and compare two R&D re-gimes: R&D competition and R&D cooperation in the form of a research joint venture (RJV). We introduce co-ordination costs for the RJV and examine how these affect the equilibrium outcomes.We find that the performance of the RJV in comparison to R&D competition is sensitive to the level of coor-dination costs. Although the RJV may no longer conduct a unit of R&D at a lower cost compared to an inde-pendent firm in the non-cooperative R&D regime, RJV members can still make savings on their own R&Doutlay through information sharing. We establish that there can be profitable but welfare-reducing RJVsand that R&D competition can generate a better outcome depending on the extent of coordination costs.
© 2013 Elsevier B.V. All rights reserved.
1. Introduction
Competing firms collaborate in their R&D strategies and activitiesfor a variety of reasons. Collaborating enables firms to share costs(and risks) and to have access to each others' technology, marketsand products. Together the partner firms can exploit economies ofscale and scope in the generation and distribution of R&D, and benefitfrom the synergies from exchanging and sharing information andknow-how. But successful collaboration requires coordination, andcoordination incurs costs (Cassiman and Veugelers, 2002). The largerthe number of collaborators, the larger these coordination costs arelikely to be.1 A study of US government-funded RJVs (Dyer andPowell, 2001) concluded that one of the main factors detracting
a Fabrizi, Steffen Lippert,uhkerjiee. All remaining errorscknowledges the financial sup-(ECO2008-01691).obe University, Melbourne, Vic
J. Poyago-Theotoky).ut (1989) finds that 54% wereur Andersen (Alliance Analyst,ight “failures” and another 27%ost 50% of alliances ended in
rights reserved.
from a project's success was the cost of coordinating the venture'sR&D activities, which were found to increase with the consortiumsize.2 Governments have long recognized the externalities associatedwith R&D and the potential benefits of R&D collaboration amongfirms. While some governments have been generous in their finan-cial support of RJVs, this support has often acknowledged, at least im-plicitly, the importance of coordination costs to the collaborations'success.3
To the best of our knowledge, there has been very little theoreticalwork on modeling explicitly the cost associated with forming or runningan RJV. Most standard multi-stage models assume implicitly that coop-eration is costless (e.g., Atallah, 2005; D'Aspremont and Jacquemin,
2 For example, one strong opinion noted that “When we joined the ATP [AdvancedTechnology Program] we didn't realize there would be so many participants. Frommy perspective, there were just too many. First, it took so long getting to know every-one. In addition, scheduling meetings was a nightmare; we had to schedule meetings ayear in advance. It was too difficult to coordinate…” (Dyer and Powell, 2001).
3 Campbell et al. (2009) emphasize the role of coordination costs in fashioning jointventure size for the 142 R&D joint ventures funded by the ATP between 1990 and 2004.In a study of Spanish RJV participants within the EUs R&D Framework Programme,Barajas and Huergo (2010) show that factors relating to coordination costs (geograph-ical distance, prior experience in R&D cooperation and the coordination capacity of theconsortium leader) had a significant influence on the probability of the venture receiv-ing funding from the EU.

6 In Section 5 we relax this assumption and allow for imperfect appropriability andhence spillovers.
7 We build on the d'Aspremont and Jacquemin (1988) model, where spillovers oper-ate on the R&D output (results) as opposed to Kamien et al. (1992) where they operateon the R&D input (efforts). The two ways of modeling R&D spillover are not equivalent
966 R. Falvey et al. / Economic Modelling 33 (2013) 965–976
1988; De Bondt et al., 1992; Gil Moltó et al., 2005; Kamien et al., 1992;Poyago-Theotoky, 1995).4
We fill this gap in the literature by asking how the coordinationcosts of operating the RJV affect its performance and to what extentan RJV is preferable or not when compared to independent R&D com-petition. Since coordination costs tend to increase with the size of theresearch joint venture, we postulate that the marginal cost of R&D in-creases with the number of participants.
We find that coordination costs not only decrease an RJV-firm'sprofit but alter a firm's expectation of the benefit from being an RJVmember. For a given size of the RJV, its members decrease their ownR&D as coordination costs increase. This results in lower output andprofits. On the contrary, the non-RJV firms increase their R&D in re-sponse to the fall in the RJV firms' R&D and supply larger quantitiesto the market and profit more, unless spillovers are very large. Weshow how the performance of the RJV (in terms of R&D, profit andwelfare) in comparison to R&D competition is sensitive to the levelof coordination costs. Indeed, we establish that there can be profitablebut welfare-reducing RJVs and that R&D competition can generate a bet-ter outcome depending on coordination costs. This result points outthe role a government or regulator can play in disallowing and/or con-trolling RJVs while at the same time encouraging R&D competitionwhen coordination costs are relatively high. Alternatively, measurescould be taken to reduce the coordination costs and thus restorecongruence between private and social incentives. As the formationof an RJV is not always welfare enhancing, policy measures that areintended to deter/encourage RJVs should be carefully evaluated, pay-ing particular attention to industry characteristics, such as the numberof operating firms and the extent of coordination costs within RJVs.
Coordination costs in research joint ventures are rather well docu-mented in the managerial and business literature.5 There is thus aclear need to provide a theoretical explanation and understanding oftheir effects. Despite this need the relevant theoretical literature isscant apart from the contributions of Vilasuso and Frascatore (2000),Manasakis and Petrakis (2009) and Fabrizi and Lippert (2012).Vilasuso and Frascatore (2000) were the first to incorporate explicitlythe cost arising from forming an RJV. Their analysis is cast in a duopolyand the cost of forming an RJV is modeled as fixed and does not de-pend on the scale of R&D output. They find that the perceived superi-ority of RJVs may not hold anymore and that firms' and society'sinterests may not be aligned, a point that the present paper reinforcesand elaborates further. Nevertheless, issues pertaining to the size of aresearch joint venture and coordination costs that can vary accordingto the R&D activities undertaken and the number of RJV participantswere not addressed. This is where the present paper differs in that itgeneralizes the number of firms and concentrates on the way inwhich RJV-specific coordination costs are modeled. Manasakis andPetrakis (2009), still in a duopoly setting, introduce the effects of alter-native labor union organization and the costs imposed by unions onthe performance of an RJV. The issue of variable coordination costsis not dealt with. Rather, the RJV costs in Manasakis and Petrakis(2009) are fixed too. They also find that RJVs are not always welfareenhancing. In the present paper a similar result is obtained but in anoligopoly setting with a partial RJV with the mechanism leading tothis result being substantially different as it relies on the interplay be-tween RJV members and outsiders and the severity of the explicit andvariable coordination costs.
In a rather different vein, Fabrizi and Lippert (2012) examine howinformation asymmetries within firms affect the final decision to co-operate in R&D as well as the incentives to innovate offered to re-searchers. They clearly point out the impact of the costs associatedwith the formation and operation of RJVs stemming from informationasymmetries within the firms and the RJV. In the context of a duopoly
4 Also see De Bondt (1996) for an excellent survey.5 As discussed above; see also Footnotes 1–3.
and within an agency framework they focus on the consequences ofadditional information asymmetries in RJVs in relation to indepen-dent firms and explore the implications of involving researcherswithin firms in the due diligence process of assessing the costs andbenefits associated with the formation of the RJV.
The paper is organized as follows. In Section 2we examine the R&Dcompetition regime in the oligopolistic framework. The model of a re-search joint venture with general coordination costs is formalized inSection 3 while Section 4 compares the two R&D regimes. Section 5extends the analysis to allow for interfirm spillovers. Finally, conclud-ing remarks are provided in Section 6. Proofs of the various proposi-tions appear together with a summary of the notation used in theAppendix A.
2. R&D competition
In this section we discuss briefly a standardmodel of deterministicR&D competition in an oligopolistic environment. There are n identicalfirms selling a homogenous product in a market with linear inversedemand P = A − ∑i = 1
n qi, where P, A and qi denote price, marketsize and firm i's output respectively. Consumer surplus is CS Qð Þ ¼ Q2
2 ,where Q = ∑i = 1
n qi. As a benchmark for comparison and to focussolely on the role of coordination costs, we assume here that intellec-tual property rights are well protected, so that firms cannot free rideon each other's R&D (i.e., there are no R&D spillovers betweenfirms).6 In addition, there are no fixed costs and firm i's marginalcost of production (ci), can be reduced by R&D, which, in the absenceof R&D cooperation, is equal to the firm's own R&D investment (xi).Hence, firm i's unit cost of production is ci = c − xi, where c is abase cost (i.e., if the firm undertakes no R&D) and 0 b c b A. The R&Dcost function takes the form: Ri ¼ γ x2i
2 , where Ri denotes firm i's R&Dcost and γ(> 0) captures R&D efficiency.7
We consider a two-stage game. Firms make decisions independentlyand simultaneously on R&D in the first stage, taking each others' R&D de-cisions as given. They then compete in quantity in the second stage, on thebasis of the marginal production costs from the previous stage. We usethe subgame perfect equilibrium concept, solving the game backwards.
In the second stage, eachfirm chooses its output tomaximize profits,yielding equilibrium output
q�i ¼A−nci þ∑n
i≠j cjnþ 1
ð1Þ
with associated equilibrium price, p� ¼ Aþ∑nj cj
nþ1 , and equilibrium profits
π�i ¼ q�i
� �2: ð2Þ
Substituting for unit costs, expression (2) can be written as π�i ¼
K þ nxi−X−iÞnþ 1
� �2;where X− i = ∑i ≠ j
n xj and K ≡ A − c > 0measures
the ‘effective’ market size.In the first stage, each firm chooses R&D to maximize second stage
profit net of R&D costs, i.e.,
maxxi
υi ¼ maxxi
K þ nxi−X−i
nþ 1
� �2−γx2i
2
#:
"
in general (Amir, 2000; Amir et al., 2008). However with β = 0 (no spillovers) the twoapproaches yield the same results in the R&D competition case. As most related paperson the topic of this paper follow the AJ specification, we stick with it and leave aside anextension to the alternative KMZ specification.
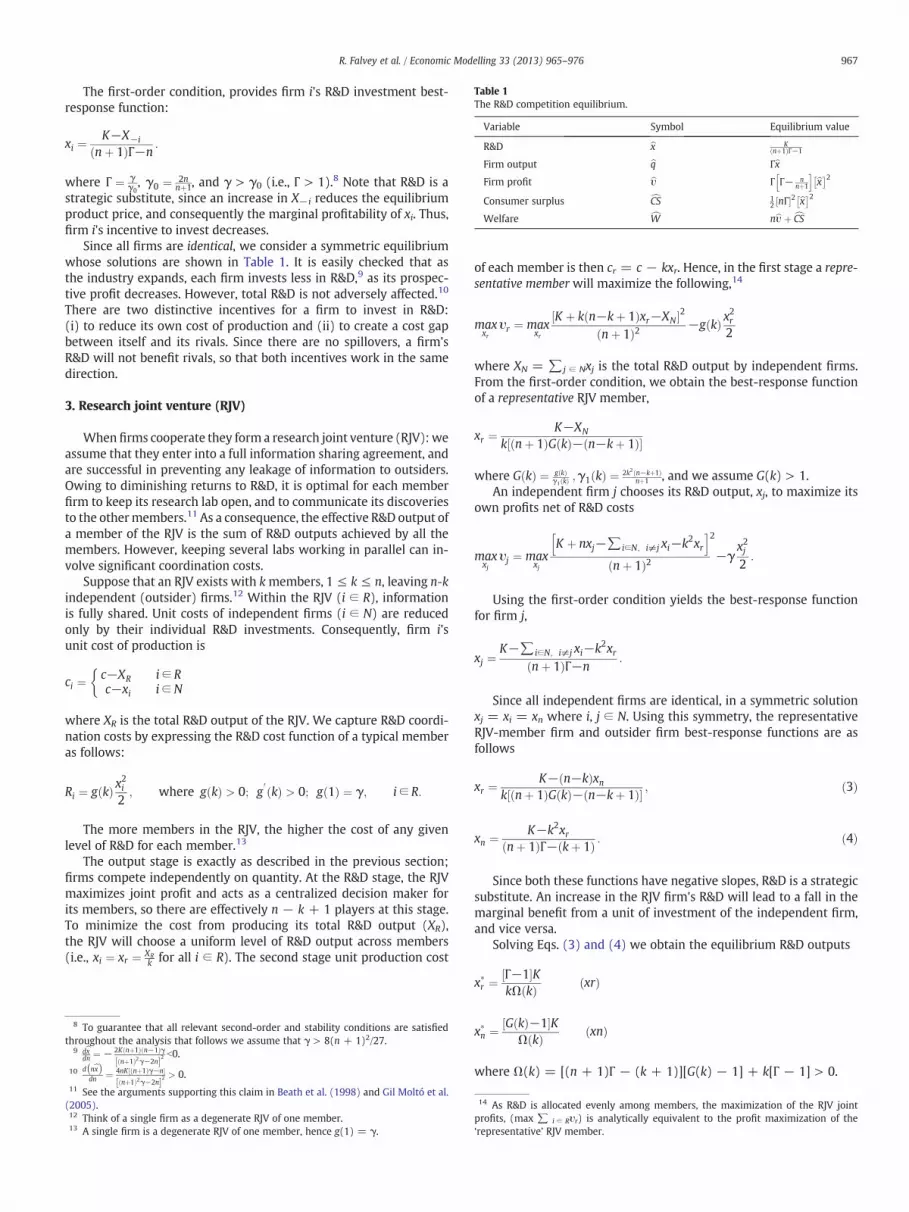
Table 1The R&D competition equilibrium.
Variable Symbol Equilibrium value
R&D bx Knþ1ð ÞΓ−1
Firm output bq ΓbxFirm profit bυ Γ Γ− n
nþ1
h i bx� �2Consumer surplus cCS 1
2 nΓ½ �2 bx� �2Welfare cW nbυ þcCS
967R. Falvey et al. / Economic Modelling 33 (2013) 965–976
The first-order condition, provides firm i's R&D investment best-response function:
xi ¼K−X−i
nþ 1ð ÞΓ−n:
where Γ ¼ γγ0, γ0 ¼ 2n
nþ1, and γ > γ0 (i.e., Γ > 1).8 Note that R&D is astrategic substitute, since an increase in X− i reduces the equilibriumproduct price, and consequently the marginal profitability of xi. Thus,firm i's incentive to invest decreases.
Since all firms are identical, we consider a symmetric equilibriumwhose solutions are shown in Table 1. It is easily checked that asthe industry expands, each firm invests less in R&D,9 as its prospec-tive profit decreases. However, total R&D is not adversely affected.10
There are two distinctive incentives for a firm to invest in R&D:(i) to reduce its own cost of production and (ii) to create a cost gapbetween itself and its rivals. Since there are no spillovers, a firm'sR&D will not benefit rivals, so that both incentives work in the samedirection.
3. Research joint venture (RJV)
When firms cooperate they form a research joint venture (RJV):weassume that they enter into a full information sharing agreement, andare successful in preventing any leakage of information to outsiders.Owing to diminishing returns to R&D, it is optimal for each memberfirm to keep its research lab open, and to communicate its discoveriesto the othermembers.11 As a consequence, the effective R&D output ofa member of the RJV is the sum of R&D outputs achieved by all themembers. However, keeping several labs working in parallel can in-volve significant coordination costs.
Suppose that an RJV exists with kmembers, 1 ≤ k ≤ n, leaving n-kindependent (outsider) firms.12 Within the RJV (i ∈ R), informationis fully shared. Unit costs of independent firms (i ∈ N) are reducedonly by their individual R&D investments. Consequently, firm i'sunit cost of production is
ci ¼ c−XR i∈ Rc−xi i∈N
�where XR is the total R&D output of the RJV. We capture R&D coordi-nation costs by expressing the R&D cost function of a typical memberas follows:
Ri ¼ g kð Þ x2i
2; where g kð Þ > 0; g′ kð Þ > 0; g 1ð Þ ¼ γ; i∈ R:
The more members in the RJV, the higher the cost of any givenlevel of R&D for each member.13
The output stage is exactly as described in the previous section;firms compete independently on quantity. At the R&D stage, the RJVmaximizes joint profit and acts as a centralized decision maker forits members, so there are effectively n − k + 1 players at this stage.To minimize the cost from producing its total R&D output (XR),the RJV will choose a uniform level of R&D output across members(i.e., xi ¼ xr ¼ XR
k for all i ∈ R). The second stage unit production cost
8 To guarantee that all relevant second-order and stability conditions are satisfiedthroughout the analysis that follows we assume that γ > 8(n + 1)2/27.
9 dbxdn ¼ − 2K nþ1ð Þ n−1ð Þγ
nþ1ð Þ2γ−2n½ �2 b0.10 d nbx
dn ¼ 4nK nþ1ð Þγ−n½ �nþ1ð Þ2γ−2n½ �2 > 0.
11 See the arguments supporting this claim in Beath et al. (1998) and Gil Moltó et al.(2005).12 Think of a single firm as a degenerate RJV of one member.13 A single firm is a degenerate RJV of one member, hence g(1) = γ.
of each member is then cr = c − kxr. Hence, in the first stage a repre-sentative member will maximize the following,14
maxxr
υr ¼ maxxr
K þ k n−kþ 1ð Þxr−XN½ �2nþ 1ð Þ2 −g kð Þ x
2r
2
where XN = ∑j ∈ Nxj is the total R&D output by independent firms.From the first-order condition, we obtain the best-response functionof a representative RJV member,
xr ¼K−XN
k nþ 1ð ÞG kð Þ− n−kþ 1ð Þ½ �
where G kð Þ ¼ g kð Þγ1 kð Þ ;γ1 kð Þ ¼ 2k2 n−kþ1ð Þ
nþ1 , and we assume G(k) > 1.An independent firm j chooses its R&D output, xj, to maximize its
own profits net of R&D costs
maxxj
υj ¼ maxxj
K þ nxj−∑i∈N; i≠j xi−k2xrh i
nþ 1ð Þ2
2
−γx2j2:
Using the first-order condition yields the best-response functionfor firm j,
xj ¼K−∑i∈N; i≠j xi−k2xr
nþ 1ð ÞΓ−n:
Since all independent firms are identical, in a symmetric solutionxj = xi = xn where i, j ∈ N. Using this symmetry, the representativeRJV-member firm and outsider firm best-response functions are asfollows
xr ¼K− n−kð Þxn
k nþ 1ð ÞG kð Þ− n−kþ 1ð Þ½ � ; ð3Þ
xn ¼ K−k2xrnþ 1ð ÞΓ− kþ 1ð Þ : ð4Þ
Since both these functions have negative slopes, R&D is a strategicsubstitute. An increase in the RJV firm's R&D will lead to a fall in themarginal benefit from a unit of investment of the independent firm,and vice versa.
Solving Eqs. (3) and (4) we obtain the equilibrium R&D outputs
x�r ¼Γ−1½ �KkΩ kð Þ xrð Þ
x�n ¼ G kð Þ−1½ �KΩ kð Þ xnð Þ
where Ω(k) = [(n + 1)Γ − (k + 1)][G(k) − 1] + k[Γ − 1] > 0.
14 As R&D is allocated evenly among members, the maximization of the RJV jointprofits, (max ∑ i ∈ Rυr) is analytically equivalent to the profit maximization of the‘representative’ RJV member.

Fig. 1. Best-response functions of the RJV and non-RJV firms.
Table 2The RJV equilibrium.
Variable Symbol Equilibrium value Sign ∂∂g kð Þ
RJV-member R&D xr∗ Γ−1½ �
kK
Ω kð Þ −Outsider R&D xn
∗ G kð Þ−1½ � KΩ kð Þ +
Member output qr∗ kG(k)xr∗ −
Outsider output qn∗ Γxn∗ +
Member profit υr∗ G kð Þk2 G kð Þ− n−kþ1nþ1
h ix�r� �2 −
Outsider profit υn∗ Γ Γ− nnþ1
h ix�n� �2 +
Consumer surplus CS∗kq�rþ n−kð Þq�n½ �2
2 −Welfare W∗ kυr∗ + (n − k)υn∗ + CS∗ −
968 R. Falvey et al. / Economic Modelling 33 (2013) 965–976
In Fig. 1, ar and br represent the xr and xn-intercepts of xr(xn)respectively
ar ≡K
k nþ 1ð ÞG kð Þ− n−kþ 1ð Þ½ � ; br ≡K
n−k;
while an and bn represent the xn and xr-intercepts of xn(xr) respectively
an ≡K
nþ 1ð ÞΓ− kþ 1ð Þ ; bn ≡Kk2
:
Equilibrium A in Fig. 1 illustrates the unique interior and stable so-lution where both RJV members and outsider firms invest in R&D. Forthis equilibrium to hold, we require that coordination costs are notnegligible in the following sense: We do require that (i) ar b bn, forwhich a sufficient condition, since ar is decreasing in g(k) and istherefore largest when g(k) = γ, is γ > γ1(k) and (ii) an b br, forwhich γ > γ0 is sufficient. Observing that γ1 kð Þ ¼ k2 n−kþ1ð Þ
n γ0 > γ0, asufficient condition for an equilibrium with both types of firmR&D-active is that γ > γ1(k).15
The corresponding equilibrium values are summarized in Table 2.How do coordination costs affect these equilibrium values for a
given size of the RJV? In the last column of Table 2, we report thecomparative statics obtained.16 These results shed some light onhow coordination costs alter the equilibria values relative to thecase where there are no coordination costs. The divergence of resultsobtained in this model of a costly RJV from those in the conventionalRJV model, where coordination costs are absent, can be clearly seenfrom the comparative statics and are in the expected direction.
4. Comparing R&D regimes (RJV vs R&D competition)
In this section we provide a comparison of the two R&D regimes interms of R&D, quantities, profits and welfare.17 First, we present a re-sult on the ranking or R&D output; Fig. 2 illustrates.
Proposition 1. There exist critical values for the coordination costs, g1,g2 and g3 where g1 b g3 b g2, such that R&D output is ranked as follows:
(i) In general, R&D output in R&D competition is larger than thesmallest of the R&D output of insider/outsider in the RJV regime(bx > min x�r ; x
�n
).
(ii) For sufficiently high coordination costs, in the RJV regime the R&Doutput of an outsider exceeds that of an RJV insider (xn
∗ > xr∗ if
g(k) > g3).(iii) Except for very high or very low coordination costs, R&D output in
the R&D competition regime is higher than the larger R&D output
15 Note that γ1(k) reaches its maximum when k ¼ 23 nþ 1ð Þ. Thus γ > 2
3
� �3nþ 1½ �2 is
sufficient for an interior solution for all k. See also Footnote 8.16 Full derivations are available from the authors upon request.17 See Table A0 in the Appendix for definitions of all variables.
of an insider/outsider in the RJV regime (bx > max x�r ; x�n
if g1 b
g(k) b g2).(iv) For not very high coordination costs, effective R&D in the RJV ex-
ceeds R&D ouput per firm in the R&D competition regime (XR > bxif g(k) b g2).
When there are no coordination costs, g(k) = γ, so that γ b g1 b
g3 b g2, hence x�r > bx > x�n. This is the well-known conventional resultthat points to the superiority of RJVs. However, as Proposition 1 estab-lishes, when coordination costs are taken into account the relevantrankings change substantially. The RJV-firm's R&D can fall dramatical-ly to a level below that of R&D competition if the coordination costsare sufficiently high (part (iii)).18 The intuition is that, although theRJV-firms benefit from an agreement to share information and thecost of conducting R&D equally among them, there are also extracosts. These extra costs reflect the expenses of conducting a transpar-ent and effective transmission of R&D information among memberfirms and ensuring no duplication of research. For a given size of theRJV, the presence of coordination costs reduces the marginal profit-ability of the RJV's R&D, hence reduces the incentive of an RJV-firmto conduct R&D. To put it differently, the positive effect of informationsharing on each member firm's incentive to invest is counteracted bythe negative impact of higher marginal cost of R&D due to the coordi-nation costs, coupled with the effect of internalization due to jointprofit maximization. As a result, the RJV's investment is lower whenthere are coordination costs compared to the case of no coordinationcosts. And when these costs are sufficiently high, the marginal costof research is relatively large, the RJV-firms' R&D falls below thatunder the R&D competition regime.
An outsider firm realizes that when the RJV is costly to operate,ceteris paribus, an RJV-firm reduces its R&D as a result of a decreasein its marginal profitability. Since R&D is a strategic substitute forboth sets of firms, an outsider firm increases its R&D when it antici-pates a reduction in the RJV-firm's R&D. When coordination costsare sufficiently high, the outsider firm's R&D can overtake that ofthe independent firm under the non-cooperative regime.
Our analysis, by including coordination costs, provides results verydifferent from the extant literature where in general (i) a firm doesmore R&D under the R&D cooperative regime (sharing information andcost) compared with R&D competition because of the joint profit max-imization and the information sharing agreement and (ii) RJV-firms al-ways produce larger R&D output than the non-RJV firms. In contrast, weshow thatwith coordination costs each RJV-firm is better off conductingless R&D compared to the R&D competition regime if these coordinationcosts are sufficiently high and in addition it may invest less than itsnon-RJV counterparts depending on the size of these costs.
Furthermore, net R&D output experienced by RJV-members, i.e.,XR, is always greater than that of an independent firm under R&Dcompetition as long as g(k) is less than g2 (part (ii) of Proposition 1above). Even though an RJV-member is affected by coordination
18 For example, with linear coordination costs it can be easily shown that g1 b g3 b
γk b g2, so that bx > x�n > x�r .

Fig. 2. Illustration of Proposition 1.
969R. Falvey et al. / Economic Modelling 33 (2013) 965–976
costs and reduces its R&D output as these costs rise, the benefits fromsharing information still make member firms' net cost reductionhigher than if they were to compete in R&D.
Next, we consider the precise level of coordination costs at whichboth RJV-members and outsiders would have the same sales in equi-librium. This will only occur if both have identical production costsat the second (quantity) stage, which requires that kxr
∗ = xn∗ from
the first stage. From the solutions in Table 2 this only occurs if Γ =G(k). Substituting we find that the corresponding coordination costfunction is
dg kð Þ ¼ k2 n−kþ 1ð Þn
γ ¼ γ1 kð ÞΓ ¼ g2:
With this cost function,19 q�r ¼ q�n ¼ bq, i.e., per firm output in theR&D competition equilibrium. This implies that outsider-firm R&Doutput and profits are as in the R&D competition equilibrium, as aretotal industry sales and therefore consumer surplus. But theRJV-members are able to take advantage of their sharing of R&D out-put, so that x�r ¼ x�n
k and, despite coordination costs, members' profitsexceed those of the outsiders,
υ�r ¼ Γ Γ−n−kþ 1
n
� �x�� �2
≥ Γ Γ−nþ 1n
� �x�� �2
¼ υ�n ¼ bυ:
This implies that total industry profits, and therefore total welfare,exceed that in the R&D competition regime. Combining this observa-tion with the comparative static results from Table 2 and the resultsin Table 1, we summarize these findings in the following Propositionwhich is illustrated in Fig. 3.
Proposition 2. There exists a critical value of coordination costs g2 =γ1(k)Γ, such that:
(i) If g(k) = g2 then: (1) both RJV-members and outsider firms havethe same sales as in the R&D competition equilibrium,q�r ¼ q�n ¼ bq;(2) total sales and hence consumer surplus are as in the R&D com-petition equilibrium, CS� ¼ cCS; (3) outsider's R&D output is as inthe R&D competition equilibrium, but total member firm R&D out-put is equal to that of a single firm in the R&D competition equilib-rium; (4) outsider firm profits equal those in the R&D competitionequilibrium,υ�
n ¼ bυ, but member firm profits are higher than in theR&D competition equilibrium, υ�
r > bυ.(ii) If g(k) > g2, q�n > bq > q�r , but total sales and hence consumer sur-
plus are less than in the R&D competition equilibrium, CS�bcCS.(iii) If g(k) b g2, q�r > bq > q�n, but total sales and hence consumer sur-
plus are higher than in the R&D competition equilibrium, CS� > cCS.We then provide a detailed comparison of equilibrium profits
(Fig. 4 illustrates).
Proposition 3. There exist critical values of coordination costs: g2, g4and g5, where g2 b g5 b g4 such that:
(i) In general, profit per firm in the R&D competition is smaller thanthe largest of insider or outsider profit in the RJV regime ( bυbmax υ�
r ;υ�n
).
19 Note that dg 1ð Þ ¼ γ and dg nð Þ ¼ nγ, but dg kð Þ reaches a maximum at dg 2 nþ1ð Þ3ð Þ ¼
4 nþ 13
h i3γ.
(ii) For low to intermediate coordination costs, in the RJV regime, theprofit of an insider exceeds that of an outsider (υr∗ > υn∗ if g(k) b g5).
(iii) For low coordination costs, firm profit in the R&D competition re-gime exceeds the profit of an outsider in the RJV regime and forhigh coordination costs, firm profit in the R&D competition regimeexceeds the profit of an insider in the RJV regime (bυ > min υ�
n;υ�r
if g(k) b g2 or if g(k) > g4).
In the absence of coordination costs g(k) = γ, with γ b g2 b g5 b
g4, so that υ�r > bυ > υ�
n. With coordination costs, the RJV-firms investless than they would have done if there were no coordination costs,hence they experience lower total cost reduction, and consequently
supply less output to the market and make less profits (i.e., dυ�r
dg kð Þb0).
Also, a unit of R&D becomes more costly. On the contrary, thenon-RJV firms benefit more. This is because they take into accountthe fact that the RJV firms reduce their investments and supply less,which means that the non-RJV firms' prospective market shares arethen higher. As a result, the non-RJV firms invest more, supply more
and hence gain higher profit (i.e., dυ�ndg kð Þ > 0).
While maximizing joint profits, the RJV-firms take into consider-ation all possible costs arising from R&D and as coordination costsrise, each member firm conducts less R&D for the joint venture, buteach may still experience higher cost reduction from sharing R&Dwith other members relative to non-cooperation. If the coordinationcosts are not too high, an RJV-firm still benefits from being a memberof the RJV, as its profit is still higher than its non-RJV rival's and that ofthe independent firm under the non-cooperative regime. For exam-ple, when the coordination costs are linear in k (i.e., g(k) = γk), theresult υ�
r > bυ > υ�n still holds. As for a non-RJV firm, the increase in
its investment in response to the reduction in the RJV-firms' R&Draises its total reduction in marginal cost, and thus, its quantity sup-plied and profit. If the coordination costs are sufficiently large, thenon-RJV firm's profit can be higher than that of the RJV firm.
Finally, we provide a brief welfare comparison across regimes.
Proposition 4. Social welfare in the RJV regime is higher than in R&Dcompetition (lower) when the coordination costs are below (above) a crit-ical level (W�TcW if g(k) S g6).
In this instance, we have used simulations20 to establish that g2 b
g6 b g5. In the case of no coordination costs (g(k) = γ) since γ b
g2 b g6, W� > cW , i.e., the RJV regime always benefits society morethan R&D competition. This result reaffirms that of Katz (1986) andothers. With coordination costs, W� > cW does not hold in general.Recall that dW�
dg kð Þb0, so that welfare decreases in the coordinationcosts. This is largely attributed to the fall in consumer surplus.When coordination costs become too large, W�bcW and this happensfor g(k) > g6.
The following Corollary is a direct implication of combining theabove two propositions. Fig. 4 illustrates.
Corollary. When coordination costs are in the interval g6 b g(k) b g4,the RJV is profitable but welfare-reducing.
Similar results to the corollary above on the divergence betweenthe private and social incentives to form RJVs, have also been identi-fied by Vilasuso and Frascatore (2000) and Manasakis and Petrakis(2009) in very different settings (both papers are cast in the contextof a duopolywith fixed coordination costs and information spillovers).What we identify here is that when coordination costs are variableand increase with the size of the RJV, there is a range of coordinationcosts such that forming an RJV is privately profitable for the RJV mem-bers but at the same time welfare reducing as it decreases consumerssurplus and hurts outsiders. Clearly then RJVs can be detrimental to
20 The simulation results are available from the authors upon request.

Fig. 4. Illustration of Propositions 3, 4 and Corollary.
Fig. 3. Illustration of Proposition 2.
970 R. Falvey et al. / Economic Modelling 33 (2013) 965–976
welfare. This result points out to the role a regulator can play in thesense that RJVs should be hindered and R&D competition encouragedwhen coordination costs are relatively high, or alternatively, measures
Fig. 5. Spillovers and coordinat
taken to reduce the coordination costs and thus restore alignment be-tween private and social incentives. As the formation of an RJV can bedetrimental for welfare, policy measures that are intended to deter/
ion costs in the R&D stage.

21 The detailed solution to this is given in Appendix A.
Fig. 6. Showing xn, xr against g(k).
971R. Falvey et al. / Economic Modelling 33 (2013) 965–976
encourage RJVs should be carefully evaluated and monitored, payingparticular attention to industry characteristics, such as the numberof operating firms and the extent of coordination costs within RJVs.
5. Extension: R&D spillovers
In this section we introduce involuntary spillovers between thenon-cooperating firms in the R&D competition case and, betweenRJV and non-RJV members in the R&D cooperation case (within theRJV the spillover is complete). To model this we follow closely the ap-proach used in Poyago-Theotoky (1995) where we refer the readerfor full details.
The presence of spillovers affects the unit costs of competing firmsso that now these are represented by ci = c − xi − β∑i ≠ j
n xj, where0 ≤ β ≤ 1, is the R&D spillover in the sense of D'Aspremont andJacquemin (1988). For the case of independent R&D it is straightfor-ward to calculate the symmetric equilibrium in R&D (see pp. 212–213 in Poyago-Theotoky (1995))
bx ¼ 2 n 1−βð Þ þ β½ �Kγ nþ 1ð Þ2−2 n 1−βð Þ þ β½ � β n−1ð Þ þ 1½ � :
Each firm's R&D falls as the spillover increases. Since a firm's motivein using R&D is to capture more market share this is weakened with in-creasing spillovers and firms tend to free ride more on competitors.
For the case of the RJV note that with respect to the no spilloverscase of Section 3, the new element here is the existence of involuntaryspillovers among the non-member firms and between the RJV firmsand the outsiders, 0 ≤ β ≤ 1, along with the existence of coordinationcosts. The remaining elements of the model and the characteristics ofthe RJV remain the same. We can then establish that expressions (3)and (4) for the best-response functions become
xr ¼KM1
þM2
M1xn; RJV firm½ � ð7Þ
xr ¼ − KM3
þM4
M3xn; Outsider firm½ � ð8Þ
whereM1 ¼ nþ1ð Þ2g kð Þ−2k2 n−kð Þ 1−βð Þþ1½ �2½ �2k n−kð Þ 1−βð Þþ1½ � ,M2 = (n − k)(2β − 1),M3 =
k[β(k + 1) − k],M4 ¼ nþ1ð Þ2γ−2 n 1−βð Þþβ½ � β n−kð Þþ 1−βð Þ kþ1ð Þ½ �½ �2k n 1−βð Þþβ½ � β kþ1ð Þ−k½ � .
From Eq. (7), the slope of the best-response function for an RJVfirm is given by dxr=dxn ¼ M2
M1and sign(dxr/dxn) = signM2 as M1 > 0.
It is then easy to establish that M2 ≥ 0 (resp. b0) as β ≥ 1/2 (resp.b1/2). Similarly, from Eq. (8), dxn=dxr ¼ M4
M3so that sign(dxn/dxr) =
signM3 as M4 > 0. It is then straightforward to observe that M3 ≥ 0(resp. b0) as β≥ k
kþ1 (resp. bk
kþ1). Thus, the interplay of the spilloverand the number of firms in an RJV determine whether R&D is a strate-gic substitute (definitely the case for zero spillovers) or a strategic
complement (Poyago-Theotoky, 1995). As a consequence, there arethree potential equilibria of the RJV/non-RJV R&D game. The roleplayed by the coordination costs g(k) is clearly captured within M1
which affects the intercept and slope of the best response function ofRJV-firms. Fig. 5 illustrates.
The effect from introducing coordination costs, g(k), when invol-untary spillovers exist is evident when examining Fig. 5 in detail:
(i) When spillovers are “small” (β b 1/2), R&D is a strategic sub-stitute for all firms. Any increase in g(k) reduces the equilibri-um R&D of the RJV-firm while it increases that of the non-RJVfirm.
(ii) When spillovers are “intermediate” (1/2 ≤ β ≤ k/(k + 1)), theRJV-firm's R&D is a strategic complement and the non-RJVfirm's R&D is a strategic substitute. An increase in g(k) resultsin a fall in the-RJV firm's equilibrium R&D and an increase inthe non-RJV firm's R&D, as in case (i).
(iii) When spillovers are “large” (k/(k + 1) b β ≤ 1), R&D is a stra-tegic complement for all firms. An increase in g(k) results in afall in equilibrium R&D for both the RJV and non-RJV firms.
To establish a solution to the R&D game, notice that the expres-sions (5) and (6) that characterize the equilibrium R&D output can
be presented by a matrix equation x�rx�n
� �¼ KM−11 whose solution21
is given by x�r ¼ KMj j M2 þM4ð Þ and x�n ¼ K
Mj j M1 þM3ð Þ.As mentioned already, there are two incentives driving a firm's
R&D: (i) to reduce its own production cost (investment effect) and(ii) to gain market share by creating a cost gap with its rivals (strate-gic effect). Spillovers directly reduce the second motive, but alsomake a firm prefer free-riding, so the first motive is also reduced.Spillovers decrease the RJV-firm R&D incentives vis-a-vis the out-siders. The addition of coordination costs within the RJV makes eachunit of R&D more costly, thus reducing incentives further. Thus con-trolling and reducing coordination costs would improve firm incen-tives towards R&D.
We then proceed to explore in more detail how spillovers mightaffect the results obtained in Section 4 and pay particular attentionto the results on R&D output (as summarized in Proposition 1). Recallfrom Proposition 1, that in the absence of involuntary spillovers, thecomparison of R&D levels reveals that their ranking varies with theextent of the coordination costs, g(k). In particular, the RJV firm'sR&D outperforms that of the non-RJV firm (xr∗ > xn
∗) when g(k) b g3and vice versa (see Fig. 2). What will happen when there are involun-tary spillovers?
The first step is to check whether in the presence of spillovers,there still exists a critical level for the coordination costs that would

Table 4The RJV equilibrium (β = 0.5).
Variable Symbol Equilibrium value
RJV-member R&D xr∗ 2k n−kþ2ð ÞK
Δ0:5
Outsider R&D xn∗ 2 2 nþ1ð Þg kð Þ−k2 n−kþ2ð Þ½ �K
2γ−1ð ÞΔ0:5
Member output qr⁎2 nþ1ð Þg kð ÞK
Δ0:5¼ nþ1ð Þg kð Þ
k n−kþ2ð Þ x�r
Outsider output qn⁎2γ 2 nþ1ð Þg kð Þ−k2 n−kþ2ð Þ½ �K
2γ−1ð ÞΔ0:5¼ γx�n
Member profit υr⁎g kð ÞΔ0:5
2k2 n−kþ2ð Þ2 x�r 2
Outsider profit υn⁎γ2 2γ−1ð Þ x�n
2Consumer surplus CS* 1
2
2K nþ 1ð Þ 2γn−kð Þg kð Þ− n−kð Þγk2 n−kþ 2ð Þh i
2γ−1ð ÞΔ0:5
24 352
Welfare W* CS* + vr⁎ + vn⁎
[note: ▵0.5 = 2(n + 1)2g(k) − k2(n − k + 2)2].
Table 3The R&D competition equilibrium (β = 0.5).
Variable Symbol Equilibrium value
R&D bx 2Knþ1ð Þ 2γ−1ð Þ
Firm output bq γbxFirm profit bυ γ
2 2γ−1ð Þbx2
Consumer surplus cCS 12 nγð Þ2bx2
Welfare cW nγ2 2þ nð Þγ−1½ �bx2
972 R. Falvey et al. / Economic Modelling 33 (2013) 965–976
switch the R&D ranking. Poyago-Theotoky (1995) finds that, in the ab-sence of coordination costs, xr > xn for all 0 ≤ β b 1 (and xr = xn forβ = 1). In other words, with g(k) = γ (i.e., zero coordination costs)we start off with xr > xn. When coordination costs are present,g(k) > γ, we distinguish between two cases: (a) β b k
kþ1: here xr de-creases with g(k) while xn increases in g(k) so that there exists a crit-ical level for g(k) beyond which xr b xn, i.e., there is a reversal in theranking; and (b) β≥ k
kþ1: here both xr and xn decrease with g(k) sothat we need to establish whether xr falls at a faster rate than xn soas to have a reversal in the ranking of R&D. Extensive numerical sim-ulations22 have revealed this to be the case. So we can conclude thatgiven spillovers, (0 ≤ β ≤ 1), there is a critical level of g(k) that re-verses the ranking of R&D. Fig. 6 summarizes this discussion.
The next step is to find out how incorporating spillovers affectsthis critical g(k). Denote this critical value23as g3β(k); we need to com-pare this with g3, the critical value when spillovers are absent. TableA1 in the Appendix illustrates24 that the relationship between g3
β(k)and β is non-monotonic (initially decreasing in β and then increas-ing), except for k = n in which case it is increasing in β. In relationto Fig. 2, the effect of introducing spillovers results in a shift of thecritical value of the coordination costs to the left of g3 when spilloversare not too large, and a shift to the right when spillovers are suffi-ciently large.
Hence for sufficiently large spillovers the region where xr b xn be-comes smaller: despite the increasing coordination costs RJV firmscan gain from the R&D of the outsiders via spillovers (free-riding).It would seem then that there is no real concern with coordinationcosts in this instance as essentially R&D becomes a public good.More interestingly, for small spillovers, the region where xr b xn in-creases: the RJV is outperformed in a larger region and the spilloversare not enough to compensate for increasing coordination costs. It isin this instance that policy can have a role in providing support toRJVs so as to overcome the problems associated with coordinationcosts. However, the qualitative content of Proposition 1 on the rankingof R&D output remains unchanged.
This detailed investigation of R&D activity has demonstrated thatthe equilibrium outcomes are sensitive to the level of spillovers. Un-fortunately when we move to consider relative outputs, profits andwelfare, the general solutions become analytically intractable andspace constraints (and reader patience) preclude the extensive re-course to simulations that would be required to establish the generaloutcomes.25Fortunately we can provide an indication of the sensitiv-ity of the other propositions to the strength of R&D spillovers by con-sidering two special cases where analytical solutions can be derived.
We begin with an intermediate level of spillovers (β = 0.5).As shown above, in this case firms' R&D is strategically independentunder competition and the RJV R&D is a strategic substitute for theoutsiders. The equilibrium outcomes are shown in Tables 3 and 4,
22 Available from the authors upon request.23 Setting xr∗ = xn
∗ and solving for g(k) yieldsgβ3 kð Þ ¼ k 1þ n−kð Þ 1−βð Þ½ � nþ1ð Þγþ2 k−1ð Þ n 1−βð Þþβð Þ 1−βð Þ½ �nþ1ð Þ n 1−βð Þþβ½ � .
In the special case of β = 0, this expression becomes g3 in the main text (see Proposition 1).24 The results reported here refer to representative simulations. Changing the param-eters in the simulations does not alter the qualitative aspect of the results.25 We would also need to assume a specific functional form for g(k).
and the coordination cost thresholds26 for relative R&D, outputs, prof-its and welfare are shown in Fig. 7.
Proposition 2 in Section 4 above, established the existence of a crit-ical value of coordination costs in which the RJV equilibrium replicat-ed the firm sales and consumer surplus of the R&D competitionequilibrium, in the absence of spillovers. When β = 0.5, we find thatthere is no coordination cost that replicates the competitive outputs(i.e., q�r ¼ q�n ¼ bq). When g(k) = g7
0.5, both members and outsidershave the same output, but this is less than the R&D competition out-
put. There is a value of coordination costs (g kð Þ ¼ k n−kþ2ð Þ nþkð Þnþ1ð Þ2 γ≡g0:58 )
at which total output is the same in the competitive and RJV equilibria,so that CS� ¼ cCS when g(k) = g8
0.5 and CS�≷cCS when g(k) ≶ g80.5.
Proposition 2 holds in this modified form.Proposition 3 ranked relative firmprofits under different coordination
costs, again assuming zero spillovers. Most importantly it established thatif coordination costs were not too high, RJV member profits could behigher than both those of outsider firms in the RJV equilibrium andthose of independent firms in the non-cooperative equilibrium. This re-sult continues to hold at this intermediate level of spillovers. RJV profitsare higher than both outsider and competitive profits if g(k) b g4
0.5. Like-wise Proposition 4, that welfare is higher under the RJV regime if coordi-nation costs are low enough, also continues to apply. Most significantlythe Corollary to Propositions 3 and 4 is retained, that is there is a rangeof coordination costs (g60.5 bg(k) b g4
0.5) for which the RJV delivers higherprofits to its members but a lower overall welfare level.
The second special case that we consider is the opposite limitingcase to that considered in the previous sections, namely where spill-overs are complete even in the non-cooperative R&D equilibrium(β = 1). Clearly these are the circumstances least favorable to aresearch-coordinating RJV since all firms receive the full benefits ofeach other's research anyway. The only potential gains to the RJVcome through the anti-competitive regulation of the level of R&D ofits members. The solutions are shown in Tables 5 and 6 and the out-comes are represented in Fig. 8.
Now R&D is a strategic complement for all firms. We find thatRJV-member R&D exceeds that of both the competitive and outsidefirms if coordination costs are low (specifically if g(k) b γk), and isless than both the others if coordination costs are higher. When spill-overs are complete, all firms end up with the same production costsand hence have the same outputs in the relevant equilibrium. Thusqr∗ = qn
∗ in the RJV equilibrium, and this common output is alsoequal to the competitive output when g(k) = γk. Proposition 2 there-fore carries over when spillovers are at their full value. The same is nottrue for Proposition 3, however. RJV member profits are higher thancompetitive firm profits when coordination costs are low (g(k) b g4
1),but are only higher than outsider profits when coordination costsare relatively high (i.e., g(k) > γk2 > g4
1). Thus there is no range of
26 g0:53 ¼ k n−kþ2ð Þ 2γþk−1ð Þ2 nþ1ð Þ , g0:54 ¼ k2γ n−kþ2ð Þ2
nþ1ð Þ2 , g0:57 ¼ k2γ n−kþ2ð Þnþ1 .

Table 6The RJV equilibrium (β = 1).
Variable Symbol Equilibrium value
R&D bx 2Knþ1ð Þ2γ−2n
¼ Kn nþ1ð ÞΓ−1½ �
Firm output bq nþ1ð Þγ2bx ¼ nΓbx
Firm profit bv γ2
nþ1ð Þ2γ2 −1
h ibx2 ¼ nΓ nΓ− 1nþ1
� �bx2
Consumer surplus cCS n nþ1ð Þγ½ �22
bx2 ¼ 2 nΓð Þ2bx2Welfare cW n2Γ 2þ nð ÞΓ− 1
nþ1
h ibx2
[note that ▵1 = g(k)[(n + 1)2γ − 2(n − k)]− 2k2γ].
Table 5The R&D competition equilibrium (β = 1).
Variable Symbol Equilibrium value
R&D bx 2Knþ1ð Þ2γ−2n
¼ Kn nþ1ð ÞΓ−1½ �
Firm output bq nþ1ð Þγ2bx ¼ nΓbx
Firm profit bv γ2
nþ1ð Þ2γ2 −1
h ibx2 ¼ nΓ nΓ− 1nþ1
� �bx2
Consumer surplus cCS n nþ1ð Þγ½ �22
bx2 ¼ 2 nΓð Þ2bx2Welfare cW n2Γ 2þ nð ÞΓ− 1
nþ1
h ibx2
973R. Falvey et al. / Economic Modelling 33 (2013) 965–976
coordination costs for which RJV members have higher profits thanboth outsiders and competitive firms, indicating that RJV formationwill be unattractive at high levels of spillovers. With regard toProposition 4, we see that RJV formation can lead to higher welfarethan in the competitive equilibrium, but only if coordination costsare low (i.e., g(k) b g6
1 b γk). Whenwe combine the profit andwelfareoutcomes we find that the Corollary to Propositions 3 and 4 no longerholds, that is there is no range of coordination costs for which the RJVis profitable and welfare reducing. When spillovers are complete, ourresults indicate that governments need not be concerned that RJVs arewelfare-reducing. However, with complete spillovers, there are welfaregains from the formation of an RJV but at the same time the RJV is notprivately profitable (g41 b g(k) b g6
1, not very high coordination costs),suggesting a role for the regulator/government to support of RJVs.
In summary, the results of this section extend those for β = 0 in theearly sections of the paper. In essence our results carry over (sometimesinmodified form)when spillovers are present. Onlywhen spillovers be-come very large do we lose the case where the RJV is profitable butwelfare reducing, primarily because the RJV is no longer profitable(i.e., cannot give higher profits to members than the alternatives).
Fig. 7. Coordination cost t
6. Concluding remarks
In this paper we make a contribution to the literature by address-ing one important drawback of running an RJV, namely, the coordina-tion costs associated with its running. In the model we presented,these coordination costs were embodied in the cost efficiency param-eter of the R&D cost function; the larger the RJV, the costlier a unit ofR&D output. We have established that increasing coordination costsreduce RJV-member's incentive to invest, so that the RJVwould supplyless to themarket and profit less. Indeed, the effect of the coordinationcosts might suffice to bring the RJV-firm's own R&D to a level belowthat in the R&D competition scenario and below that of the non-RJVcounterpart. Furthermore, with sufficiently large coordination costs,the effective R&D of the RJV-members can fall short of that of an inde-pendent firm under R&D competition. On the contrary, non-memberfirms increase their own R&D in response to a fall in the RJV-firms'R&D, thus they supply more to the market and profit more. However,the increase in the non-members' quantities is not enough to compen-sate for the fall in the RJV-firms' outputs, as a result, consumer surplusfalls. Although the total industry profit can rise as the non-RJV firmsnow profit more, this is not sufficient to compensate for the fall inthe consumer surplus. The overall effect is thus a decline in social wel-fare. It is then generally the case that the R&D competition regime be-comes socially preferable to the RJV regime (for sufficiently highcoordination costs). In this instance, market and social incentives forthe formation of an RJV diverge.
Our results are generally robust when considering the extent ofinformation spillovers operating between competing firms, or theRJV and the outsider firms. Only when spillovers become very largedo we lose the case where the RJV is profitable but welfare reducing,primarily because the RJV is no longer profitable. However, in this lat-ter case, for relatively contained coordination costs, RJVs can still bewelfare enhancing, so that government support may be worthwhile.Our findings thus suggest that policy measures towards RJVs shouldbe carefully designed, taking into account all the features of the indus-try, such as the number of firms, the extent of coordination costs andthe severity of spillovers.
Our analysis on coordination costs highlights the observation thatoften the real gains in terms of profit and welfare from R&D coopera-tive ventures might have been exaggerated. In an environment whereinstitutions or organizational designs are not flexible the R&D compe-tition regime could easily outperform an RJV.
hresholds (β = 0.5).

Fig. 8. Coordination cost thresholds (β = 1).
974 R. Falvey et al. / Economic Modelling 33 (2013) 965–976
Appendix A.
Table A0. Summary notation
Summary notation.
Symbol Definition
γ02nnþ1
Γ γγ0
γ1(k)2k2 n−kþ1ð Þ
nþ1
G(k) g kð Þγ1 kð Þbx R&D ouput in R&D competition
xr∗ RJV-member R&Dxn∗ Outsider R&Dbq Output in R&D competitionqr∗ RJV-member Output
qn∗ Outsider outputbυ Firm profit in R&D competition
υr∗ RJV-member profit in RJVυn∗ Outsider profit in RJV regimecCS CS in R&D competitionCS∗ CS in RJV regimecW Welfare in R&D competitionW∗ Welfare in RJV regime
A.2. Proof of Proposition 1
Proof. Using the equilibrium values from Tables 1 and 2, we have:
(a) x�r≷bx⇒ Γ−1ð ÞkΩ kð Þ ≷ 1
nþ1ð ÞΓ−1. After some manipulation we obtain, x�r ≷bx⇒ ABγ1 kð Þ≡g1≷g kð Þ, where A=(Γ− 1)[(n+1)Γ − 1 − k2] +
k[(n + 1)Γ − (k + 1)] and B = k[(n + 1)Γ − (k + 1)], A > B;
(b) x�n≷bx⇒ G kð Þ−1½ �Ω kð Þ ≷ 1
nþ1ð ÞΓ−1. This reduces to x�n≷bx⇒G kð Þ≷Γ⇒g kð Þ≷γ1 kð ÞΓ≡g2;
(c) x�n≷x�r⇒ G kð Þ−1½ �≷ Γ−1ð Þk . This is equivalent to x�n≷x�r⇒G kð Þ≷ Γ−1
k þ1⇒g kð Þ≷γ1 kð Þ Γ−1
k þ 1� �
≡g3.(d) XR≡kx�r ≷bx⇒ Γ−1ð Þ
Ω kð Þ ≷ 1nþ1ð ÞΓ−1. This reduces to XR≷bx⇒Γ≷G kð Þ⇒
g kð Þ≶γ1 kð ÞΓ≡g2;
It is easy to check that g2 > g3 and g3 > g1. Combining this togeth-er with (a), (b) and (c) completes the proof. ■
A.3. Proof of Proposition 3
Proof. Using the expressions for firm profit from Tables 1 and 2 andhaving substituted for Γ, γ0, G(k) and γ1(k) into these we obtain:
(a) υ�r−bυ ¼
¼ 2K2 nþ 1ð Þ2Ψ2Ω2 − nþ 1ð ÞI g kð Þð Þ2 þ k2 n−kþ 1ð ÞJ g kð Þð Þ−k4 n−kþ 1ð Þ2L
h i
whereI≡n nþ 1ð Þhnþ 1ð Þ4γ3 n−2kþ 2ð Þ−2n nþ 1ð Þ2γ2
�n nþ 4ð Þ
−2k nþ 1ð Þ−k2 þ 5�þ 4n2γ 4þ n 2n−k kþ 2ð Þ þ 5ð Þð Þ−8n3
i;
J≡ nþ 1ð Þ6γ4 n−kþ 1ð Þ−4nk nþ 1ð Þ4 n−kþ 2ð Þγ3
−4n2 nþ 1ð Þ2γ2 4−8kþ 2n k−3ð Þ k−1ð Þ−3n3 k−1ð Þ þ n3� �
þ16n3 nþ 1ð Þγ n nþ 2ð Þ−2k nþ 1ð Þ þ 2ð Þ−16n4 n−kþ 1ð Þ;L≡2γ
hnþ 1ð Þ4 n−kþ 1ð Þ2γ3−2n nþ 1ð Þ2 n−kþ 1ð Þ n n−kþ 3ð Þ þ 2ð Þγ2
þ4n2 nþ 1ð Þγ n 2n−2kþ 3ð Þ þ 1ð Þ−8n4
and
Ψ≡ nþ 1ð Þ2γ−2n > 0;Ω ¼ nþ 1ð Þ2g kð Þ−2k2 n−kþ 1ð Þ2
h inþ 1ð Þ2γ−2n kþ 1ð Þ
h i−4nk3 n−kð Þ n−kþ 1ð Þ > 0:
Given our assumptions, after some algebraic manipulations, wefind that I, J, and L > 0. Observe that the quadratic functionf(g(k)) = −(n + 1)I(g(k))2 + k2(n − k + 1)J(g(k)) − k4(n −k + 1)2L is concave in g(k), reaches its maximum when g(k) ispositive and is negative when g(k) = 0. Thus the inequality

975R. Falvey et al. / Economic Modelling 33 (2013) 965–976
f(g(k)) > 0, cuts the g(k) axis at:
dg kð Þ4a ¼ 2k2 n−kþ 1ð Þnþ 1ð Þ
−J þffiffiffiffiffiffiffiffiffiffiffiffiffiffiffiffiffiffiffiffiffiffiffiffiffiffiffiffiffiffiJ2−4 nþ 1ð ÞIL
q−4I
0@ 1Adg kð Þ4b ¼ 2k2 n−kþ 1ð Þ
nþ 1ð Þ−J−
ffiffiffiffiffiffiffiffiffiffiffiffiffiffiffiffiffiffiffiffiffiffiffiffiffiffiffiffiffiffiJ2−4 nþ 1ð ÞIL
q−4I
0@ 1A:
Note that J2 − 4(n + 1)IL > 0. Since I, J andL > 0; dg kð Þ4ab dg kð Þ4b.Hence f(g(k)) > 0 if dg kð Þ4abg kð Þbdg kð Þ4b.
It can be shown that −JþffiffiffiffiffiffiffiffiffiffiffiffiffiffiffiffiffiffiffiffiJ2−4 nþ1ð ÞIL
p−4I
� �b1, so dg kð Þ4a is discarded
given g(k) > γ1(k). The relevant root is then dg kð Þ4b.Let g4 ≡ dg kð Þ4b. It then follows that υr∗ T υ∗ if g(k) S g4.
(b)
bυ−υ�n ¼
2k nþ 1ð Þ2γK2 nþ 1ð Þ2γ−2n2h i
Ψ2Ω2 M g kð Þð Þ2 þ N g kð Þð Þ þ Oh i
where,
M≡−2n nþ 1ð Þ2 nþ 1ð Þ2γ−n kþ 2ð Þ� �
;
N≡2k2 n−kþ 1ð Þhnþ 1ð Þ2γ nþ 1ð Þ2γ−n kþ 2ð Þ
� �þ
n 4n nþ 1ð Þ− nþ 1ð Þ2γ 2 nþ 1ð Þ−kð Þ� i
;
O≡−2k4 n−kþ 1ð Þ2γ nþ 1ð Þ2γ 2 nþ 1ð Þ−kð Þ−4n nþ 1ð Þ:�
Therefore sign bυ−υ�n
� � ¼ sign M g kð Þð Þ2 þ N g kð Þð Þ þ Oh i
. It is clear
thatM(g(k))2 + N(g(k)) + O is concave in g(k) andM(g(k))2 +N(g(k)) + O = 0 at
dg kð Þa ¼ k2 n−kþ 1ð Þγndg kð Þb ¼ 2k2 n−kþ 1ð Þ
nþ 1ð Þnþ 1ð Þ 2 nþ 1ð Þ−kð Þγ−4n2 nþ 1ð Þ2γ−n kþ 2ð Þ !
:
Consider dg kð Þb. Given our assumptions, nþ1ð Þ 2 nþ1ð Þ−kð Þγ−4n2 nþ1ð Þ2γ−n kþ2ð Þð Þ b 1,
which implies that this root can be discarded. Hence,M(g(k))2 +
N(g(k)) + O T 0 if g kð ÞSdg kð Þa. Notice that dg kð Þa is identical to
g2 in Proposition 1, so it follows that bυ−υ�nT0 if g(k) T g2.
(c)
υ�r−υ�
n ¼ −S g kð Þð Þ2 þ T g kð Þð Þ−UΩ2 ;
where,
S≡2n nþ 1ð Þ2 nþ 2ð Þγ−2nð Þ;T≡2k2 n−kþ 1ð Þ nþ 1ð Þ2 nþ kþ 1ð Þγ2−4n nþ 1ð Þ k−1ð Þγ−4n2 n−kþ 1ð Þ
h i;
U≡4k4 n−kþ 1ð Þ2γ nþ 1ð Þ2γ−2n2� �
:
Given our assumptions, S, T and U > 0.It is clear that −S(g(k))2 + T(g(k)) − U is concave in g(k). Solv-
ing this quadratic equation, υr∗ − υn∗ = 0 at g kð Þ ¼ −T�ffiffiffiffiffiffiffiffiffiffiffiffiffiT2−4SU
p−2S . Letdg kð Þ5a and dg kð Þ5b denote the two roots:
dg kð Þ5a ¼−T þ
ffiffiffiffiffiffiffiffiffiffiffiffiffiffiffiffiffiffiffiT2−4SU
p
−2S; dg kð Þ5b ¼ −T−
ffiffiffiffiffiffiffiffiffiffiffiffiffiffiffiffiffiffiffiT2−4SU
p
−2S:
Consider the square root term, i.e., T2 − 4SU; it can be written as4k4(n − k + 1)2[(n + 1)2(n + k + 1)2γ2 − 4n(n + 1)((n +1)2 + k(k − 2))γ + 4n2(n − k + 1)2]. This quadratic functionis convex in γ and is positive at its minimum (when γ ¼2n nþ1ð Þ2þk k−2ð Þð Þ
nþkþ1ð Þ2 ). So T2 − 4SU > 0. It is then clear that dg kð Þ5a is
negative, given our assumption Γ > 1, or equivalently, γ > 2nnþ1,
and thus discarded. Next, we check dg kð Þ5b, which can also bewritten as:
dg kð Þ5b ¼ 2k2 n−kþ 1ð Þnþ 1ð Þ
−V−ffiffiffiffiffiffiffiffiffiffiffiffiffiffiV2−X
p
−4n nþ 1ð Þ nþ 2ð Þγ−2nð Þ
!V≡ nþ 1ð Þ2 nþ kþ 1ð Þγ2−4n nþ 1ð Þ k−1ð Þγ−4n2 n−kþ 1ð Þh i
;
X≡8n nþ 1ð Þ2γ nþ 2ð Þγ−2nð Þ nþ 1ð Þ2γ−2n2� �
:
It can be checked that −V−ffiffiffiffiffiffiffiffiffiffiV2−X
p−4n nþ1ð Þ nþ2ð Þγ−2nð Þ > 1 so that dg kð Þ5b is the
relevant root. Let g5≡−T−ffiffiffiffiffiffiffiffiffiffiffiffiffiT2−4SU
p−2S ≡ dg kð Þ5b. It follows then that
υr∗ T υn∗ if g(k) S g5. Note that it can be shown that g2 b g5 b g4.Combining this together with (a), (b) and (c) completes the proof. ■
A.4. Proof of Proposition 4
Proof. Using the expressions for welfare from Tables 1 and 2 andhaving substituted for Γ, γ0, G(k) and γ1(k) into these we obtain:
W�−cW ¼
¼ 2kK2 nþ 1ð Þ2Γ2Ω2 − nþ 1ð Þ D g kð Þð Þ2 þ k2 n−kþ 1ð Þ E g kð Þð Þ−k4 n−kþ 1ð Þ2 F
h iwhere
D≡n nþ 1ð Þ2 nþ 1ð Þ4γ3−n nþ 1ð Þ2γ2 8nþ kþ 10ð Þ
þ4n2γ n nþ 6ð Þ þ k 2nþ 1ð Þ þ 4ð ÞÞ−4n3 kþ 2ð Þ
264375;
E≡nþ 1ð Þ6 kþ 1ð Þγ4−2n nþ 1ð Þ4 k 2nþ 5ð Þ þ nð Þγ3
þ4n2 nþ 1ð Þ2 n nþ 10ð Þ þ 8ð Þk−n 3n−5ð Þ−4½ �γ2
þ8n3 nþ 1ð Þ nþ 1ð Þ nþ 4ð Þ− 3nþ 5ð Þkð Þγ−16n4 n−kþ 1ð Þ
264375;
F≡γnþ 1ð Þ4 2 nþ 1ð Þ−kð Þγ3−4n nþ 1ð Þ2 nþ 1ð Þ 3nþ 2ð Þ−k 2nþ 1ð Þð Þγ2
þ4n2 nþ 1ð Þγ 2 n2 þ 4nþ 1� �
−k nþ 1ð Þ� �
−16n4
" #:
Following algebraic manipulations and given our assumptions, D,E, and F > 0. The quadratic function f g kð Þð Þ ¼ − nþ 1ð Þ D g kð Þð Þ2 þk2 n−kþ 1ð Þ E g kð Þð Þ−k4 n−kþ 1ð Þ2 F is concave in g(k), reaches itsmaximum when g(k) is positive, and is negative when g(k) = 0. Fur-thermore f(g(k)) > 0, cuts the g(k) axis at:
dg kð Þ6a ¼ 2k2 n−kþ 1ð Þnþ 1ð Þ
− E þffiffiffiffiffiffiffiffiffiffiffiffiffiffiffiffiffiffiffiffiffiffiffiffiffiffiffiffiffiffiffiffiffiffiffiffiE2−4 nþ 1ð Þ D F
q−4˜D
0@ 1Adg kð Þ6b ¼ 2k2 n−kþ 1ð Þ
nþ 1ð Þ− E−
ffiffiffiffiffiffiffiffiffiffiffiffiffiffiffiffiffiffiffiffiffiffiffiffiffiffiffiffiffiffiffiffiffiffiffiffiE2−4 nþ 1ð Þ D F
q−4 D
0@ 1ANote that E
2−4 nþ 1ð Þ D F > 0. Since D, ˜E and F > 0, dg kð Þ6abdg kð Þ6b. So, f(g(k)) > 0 for dg kð Þ6abg kð Þbdg kð Þ6b. It can be shown that
− EþffiffiffiffiffiffiffiffiffiffiffiffiffiffiffiffiffiffiffiffiffiffiffiffiffiffiE
2
−4 nþ1ð Þ D F
q−4 Db1
so that dg kð Þ6a is discarded given our assumptions.
Following a similar procedure, dg kð Þ6b is found to be the relevant
root. Let g6≡dg kð Þ6b ¼ 2k2 n−kþ1ð Þnþ1ð Þ
EþffiffiffiffiffiffiffiffiffiffiffiffiffiffiffiffiffiffiffiffiffiffiffiffiffiffiE
2
−4 nþ1ð Þ D F
q4˜D
0@ 1A. It follows then
that W�TcW when g(k) S g6. ■
A.5. Extension: R&D spillovers
A.5.1. Solving the R&D equilibrium (the RJV case)Using Eqs. (7) and (8) we can rewrite these as a matrix equation
xrxn
� �¼ KM−11 whose solution is given by x�r ¼ K
Mj j M2 þM4ð Þ and

976 R. Falvey et al. / Economic Modelling 33 (2013) 965–976
x�n ¼ KMj j M1 þM3ð Þ. Substituting for M1, M2, M3 andM4 results in equi-
librium R&D levels given by:
x�r ¼2kK n−kð Þ 1−βð Þ þ 1ð Þ nþ 1ð Þ2γ−2 n 1−βð Þ þ βð Þ 1−βð Þ nþ 1ð Þ
h iΩrΩn−B
x�n ¼2K n 1−βð Þ þ βð Þ nþ 1ð Þ2g kð Þ−2k2 n−kð Þ 1−βð Þ þ 1ð Þ 1−βð Þ nþ 1ð Þ
h iΩrΩn−B
where Ωr ≡ (n + 1)2g(k) − 2k2((n − k)(1 − β) + 1)2, Ωn ≡ (n +1)2γ − 2(n(1 − β) + β)(β(n − k) + (1 − β)(k + 1)) and B ≡
g3β(k) (n = 10, γ = 40, K = 250).
β 0.0 0.1 0.2 0.3 0.4
k2 75.273 74.772 74.348 74.009 73.7663 104.727 103.431 102.345 101.492 100.9044 127.273 125.095 123.294 121.914 121.0225 141.818 138.879 136.497 134.742 133.7276 147.273 143.900 141.254 139.441 138.6277 142.545 139.275 136.868 135.475 135.3298 126.545 124.120 122.642 122.311 123.449 98.182 97.550 97.875 99.414 102.567
10 56.364 58.683 61.871 66.249 72.318
Table A1
4k2((n − k)(1 −β) + 1)(n − k)(2β − 1)(β(k + 1) − k)(n(1 − β) +β). Note that the conditions γ > 8(n + 1)2/27 and g(k) > 8(n + 1)2/27are sufficient for positive R&D output as well as for guaranteeing thesecond-order and stability conditions.
A.5.2. Critical value of coordination costs, g3β(k), in the case of spillovers
Table A1 gives the critical value for the coordination costs, g3β(k),that equates xr and xn. Note that when β = 0, g3β(k) = g3 (numbersin bold). Numbers in italics indicate the case where g3
β(k) > g3, other-wise g3
β(k) b g3.
0.5 0.6 0.7 0.8 0.9
73.636 73.654 73.884 74.475 75.855100.636 100.789 101.555 103.381 107.554120.727 121.228 122.914 126.674 135.086133.636 134.798 137.862 144.312 158.440139.091 141.325 146.303 156.249 177.606136.818 140.633 148.137 162.444 192.572126.545 132.548 143.266 162.851 203.327108.000 116.896 131.592 157.428 209.86180.909 93.502 113.017 146.130 212.163
References
Alliance Analyst, 1996. Managing Alliances: Skills for the Modern Era. Alliance Analyst,Philadelphia.
Amir, R., 2000. Modelling imperfectly appropriable R&D via spillovers. InternationalJournal of Industrial Organization 18, 1013–1032.
Amir, R., Jin, J.Y., Troege, M., 2008. On additive spillovers and returns to scale in R&D.International Journal of Industrial Organization 26, 695–703.
Atallah, G., 2005. R&D cooperation with asymmetric spillovers. Canadian Journal ofEconomics 38, 919–936.
Barajas, A., Huergo, E., 2010. International R&D cooperation within the EU FrameworkProgramme: empirical evidence for Spanish firms. Economics of Innovation andNew Technology 19, 87–111.
Beath, J., Poyago-Theotoky, J., Ulph, D., 1998. Organization design and informationsharing in a research joint venture with spillovers. Bulletin of Economic Research50, 47–59.
Campbell, S., Shipp, S., Mulcahy, T., Allen, T.W., 2009. Informing public policy on scienceand innovation: the Advanced Technology Program's experience. The Journal ofTechnology Transfer 34, 304–319.
Cassiman, B., Veugelers, R., 2002. R&D cooperation and spillovers: some empirical evi-dence. American Economic Review 92, 1169–1184.
d'Aspremont, C., Jacquemin, A., 1988. Cooperative and noncooperative R&D in duopolywith spillovers. American Economic Review 78, 1133–1137.
De Bondt, R., 1996. Spillovers and innovative activities. International Journal of Indus-trial Organization 15, 1–28.
De Bondt, R., Slaets, P., Cassiman, B., 1992. The degree of spillover and the number ofrivals for maximum effective R&D. International Journal of Industrial Organization10, 35–54.
Dyer, J.H., Powell, B.C., 2001. Determinants of success in ATP funded R&D joint ventures:a preliminary analysis based on 18 automobile manufacturing projects. availablefrom http://www.atp.nist.gov/eao/gcr-803.pdf.
Fabrizi, S., Lippert, S., 2012. Due diligence, research joint ventures, and incentives to innovate.Journal of Institutional and Theoretical Economics 168, 588–611.
Gil Moltó, M.J., Georgantzis, N., Orts, V., 2005. Cooperative R&Dwith endogenous technol-ogy differentiation. Journal of Economics and Management Strategy 14, 461–476.
Harrigan, K.R., 1985. Strategies for Joint Ventures. Lexington Books, Lexington, MA.Kamien, M.I., Muller, E., Zang, I., 1992. Research joint ventures and R&D cartels. American
Economic Review 82, 1293–1306.Katz, M., 1986. An analysis of cooperative research and development. The RAND Journal
of Economics 17, 527–543.Kogut, B., 1989. The stability of joint ventures: reciprocity and competitive rivalry. The
Journal of Industrial Economics 38, 183–198.Manasakis, C., Petrakis, E., 2009. Union structure and firms' incentives for cooperative
R&D investments. Canadian Journal of Economics 42, 665–693.Poyago-Theotoky, J., 1995. Equilibrium and optimal size of research joint venture in an
oligopoly with spillovers. The Journal of Industrial Economics 43, 209–226.Vilasuso, J., Frascatore, M.R., 2000. Public policy and R&D when research joint ventures
are costly. Canadian Journal of Economics 33, 818–839.


