Embed Size (px)
Citation preview

Coordination Chemistry Reuiews Elsevier Publishing Company, Amsterdam Printed in the Netherlands
COPPER(U) AMMONIA COMPLEXES
B. J. HATHAWAY AND A. A. G. TOMLINSON*
The Chemistry Department, Uriversity of Essex, Colchester, Essex (Great Britain)
(Received May 27th, 1969)
CONTENTS
A. B. C.
D.
E. F.
G.
H. I.
J.
Introduction Solution data, formation constants and electronic spectra, pentaammine effect Preparation and thermal properties; hexaammines, pentaammines, tetraam- mines, decaammines, diammines and monoammines X-ray crystallographic data (i) Single crystal data; tetraammines, diammines and pentaammines
(ii) Powder data; hexaammines, pentaammines and diammines Magnetic data Electron spin resonance spectra (i) General introduction; g-value expressions, isotropic, axial and rhombic,
relationship of crystal g-values to molecular g-values, effect of exchange coupling
(ii) Experimental data; powder and single crystal data Electronic spectra (i) Polarised single crystal spectra; tetraammines, pentaammines and diam-
mines (ii) Reflectance spectra; hexaammines, pentaammines, tetraammines, deca-
ammines, diammines and monoammines Orbital reduction factors Infrared spectra
(i) Ammonia vibrations (ii) Copper-nitrogen vibrations
(iii) poly-atomic anion vibrations Conclusion
References
* Present address: Istituto di Chimicn Generate e Inorganica, University of Perugia, Italy.
Coordin. Chem. Rev., 5 (1970) 143

2 B. J. HATHAWAY, A. A. G. TO~INSON
A. INTRODUCTION
More X-ray crystal structures have been determined for compfexes of the copper(IIj ion than for any other first row transition metal ion. Despite this, littIe attempt has been made to correlate this structural information with the electronic properties of the copper(H) ion. An attempt at such a correlation is made more difficult by the wide range of stereochemistries exhibited by the copper(H) ion and its tendency to give rise to a large number of structures which involve distortion from otherwise regular structures. In order to examine the effect of different stereo- chemistries on the electronic properties of the copper(H) ion, in the absence of steric and n-bonding effects, the most convenient ligand with which to work is ammonia_ A wide range of complexes are formed with this ligand and more than twenty are of known crystal structure.
This article attempts to clarify the rather compIex preparative chemistry of the copper@) ammines, describes their structural and efectronic properties and infrared spectra and attempts to relate these to the stereochemistries present,
B. SOLUTION STUDIES
Addition’ of ammonia solution to an aqueous solution of the copper(U) ion results in the setting up of complex equilibria, involving the successive replacement of coordinated water by ammonia according to the equation:
CU(H~O)~~ + + nNH, = CU(NH,),(H,O),_,~ f + aH,O blue mrp~=
The successive formation constants’ for these reactions are shown in Table 1 together with those for the Ni(H20)ti2t cation. For nickel(H) these show a smooth decrease from Kr to KS, whereas for copper(H), KG is zero and KS is very small, indicating a negligible tendency to take up more than four ammonia groups. The enhanced stabi!ity of the species over the corresponding nickel(H) species is re- fiected in the combined formation constants fi4, namely 2.3 x 10*2 and 5.6x 10’ respectively.
The changes in the electronic spectrum3 of the aqueous copper(H) solution oceuring on addition of aqueous ammonia, are shown in Fig.1. The absorption
TABLE 1
lfiE SUCCESSIVE FORMATION CONSTAKIS* FOR THE NICKEL(SI) AND COPPER@) IONS WITH AirUlONfA
AS A LIUAND
K1 KZ K3 K4 KS KG
Ni” 500 150 15 5 I Cal= rt,ooo 3.ooo I20 0.3 -

COPPER@) AMMONIA COMPLEXES
I I I I I ,
20 18 16 14 12 10 8 c
6
- Energy CkK)
Fig. 1. Electronic spectra of CU(NH~)JH+O)~_,~+ cations in aqueous solution.
maximum and the molecular intensity increases with increasing ammonia con- centration up to n = 4, thereafter addition of further ammonia results in a sub- stantial decrease in the energy of the absorption maximum and a substantial in- crease in the intensity. This has been termed3*4 the “pentaammine effect” and is ascribed to the formation of a five coordinate Cu(NH&‘+ cation, probably as- sociated with a molecule of water, CU(NH&(I-I~O)~“. As the electronic spectrum of anhydrous copper nitrate in liquid ammonia closely resemblesS the “penta- ammine” spectrum in aqueous solution 3, the molecule of water may be only weakly associated with the copper(I1) ion in the sixth coordinate position forming a tetra- gonal octahedral stereochemistry with non-equivalent ligands at unequal distances along the tetragonal axis.
C. PREPARATION AND THEXMAL STARILITIES OF AMMINE COPPJZR(II) COMPLMES
Reflecting this rather complex behaviour in solution is the existence of an extensive series of ammine copper(H) complexes in the solid state, involving copper to ammonia ratios from I :I to I :6. Three routes may he used to prepare these complexes : 1. recrystallisation of the anhydrous or hydrated simple salt from aqueous am-
monia solutions of various strengths; 2. recrystallisation of an anhydrous salt or lower ammine copper(G) complex
from liquid ammonia; 3. controlled thermal decomposition of a higher ammine. Method 1 is the most versatile and, depending upon the concentration of am-
Caofdin. Chem, !?ea, 5 (1970) 143

4 B. J. HATHAWAY, A. A. G. TOMLINSON
monk, the temperature, and the reaction time used, may yield complexes contain- ing from one to five molecules of a~onia per ~opper(~~ ion.
The hexaammines may be preparedsm8, using method 2, either from the anhydrous halide (X = Cl- and Br-), the pentaammine (X = I-, IIF,-, and CIO,-) or from the anhydrous tetraanmine (X = BF,- and C104’). They may also be prepared by passing dry ammonia gas over the anhydrous parent salt or lower ammine7, but this procedure is believed to lead to phases containing more than six mofecules of ammonia per copper(D) ion. Using these methods the hexa- ammines are prepared as pale blue powders (bubbling dry ammonia gas into a solution of anhydrous CuBr, in ethyl acetate is reported9 to give Cu(NH,),Br, in a crystahine form). All the hexaammines are extremefy unstabfe and must be handled in an atmosphere of ammonia’.
(ii) Cu(.iiH,),X,
The pentaammines may be preparedroV1’ using method 1, starting from the hydrated salts and concentrated ammonia solution (d, 0.88) at ca. 70” (X = Br-, SF,-, GO,-) and at 0” (X = C204’- )_ Cu(NH,),I, may be prepared from CuCI,2H,O plus two moles of ICI in concentrated ammonia, CU(NH,)~CI, by careful decomposition of the hexaammine and Cu(NH,),SO, from the anhydrous sulphate in liquid ammonia solution”L*‘2.
The double salts NH,fCu(NH,),]X,, where X = ClO,- and PFs-, may be prepared by adding the required molar quantities of NH,CI04 to a solution of Cu(NO,),3H,O in concentrated ammonia (d, 0.88) and NH,PF, to a solution of CuC1,2H,O in concentrated ammonia (d, 0.88), respectively”.
The pentaammines are more stable13 than the hexaammines; Fig. 2 shows two examples of the thermogravimetric analyses of Cu(NH&X, complexes”. The chloride loses its fifth ammonia below lOO”, while the tetrafiuoroborate, double perchlorate and hexafluorophosphate require a temperature of ca. 150”. Thermal decomposition of the pentaammines yield the corresponding tetraammines in the case of the perchlorate, tetra~uoroborate and hexafluorophosphate. With the hali- des decoinposition proceeds initially to the phase Cu(NH,),_,X2 and ultimately to the diammines.
(iii) Cu(.iV2i3)4X2
The tetraammines are best prepared by method 1 using hot dilute ammonia solution and the anhydrous or hydrated parent saIt14. In the preparation of the tetraammines of complex anions (e.g. [CU(S,O,),]~-) it is conve;iient to start with

COPPER(U) AhfMONIA COhiPLEXES
65%
z - A :I 3 5’1.
% m- -t rb z $ 2-
$ P 0 1 1 1
0 x)0 200 300 400 0 100 200 300 400 Temperature (“C) -
Fig. 2. Thermogravimetric analysis of A, CU(NH&CIZ; B, Cu(NH&(BF&.
an aqueous solution of the sodium salt of the anion and add it to an aqueous ammonia solution of copper acetate14. The latter does not form a tetraammine or pentaammine and the diammine is extremely soluble even in concentrated aqueous ammonia solution. With X = $5G042- and Cl- the wet method gives the cor- responding tetraammine monohydrate. Thermal decomposition of the correspond- ing pentaammines’ 1 (method 3) yields the tetraammines as amorphous powders, when X = tSOh2-, BF,- and CI04-.
Despite the apparent stability of the CU(NH&(H~O)~~+ cation inaqueous solution (Table 1) the tetraammine copper(U) complexes are all rather unstable and need to be stored in a closed system. Loss of ammonia generally yields a
diammine, but in a moist atmosphere hydrolysis may also occur.
04 Ctla (NH,) 1 &
The decaammines are prepared by method 3, involving careful decomposi- tion of the pentaammines; their formation is restricted to the halides. The bromide and iodide may also be prepared as black and brown crystals, respectively, by mixing the required molar amounts of copper acetate and KX or NH,X in a very dilute aqueous ammonia solution’ 5. The decaammines rapidly decompose to the
diammines if left in the atmosphere.
(0) WNHJ,X,
The diammines’ 6 may be prepared using methods 1 and 3. Crystallisation from concentrated ammonia (d, 0.88) of the appropriate hydrated salt yields the
Coordin. Chem. Rev., 5 (1970) l-43

6 5. J. HATHAWAY, A; A. G. TOMLINSON
diammine, (X = fCOJ2-, CH,C02-, HCOz-), Thermal decomposition of the corresponding tetraammine gives the diammine (X = NOB-, $S042-, $ie0,2-, NO,-). Cu(NH,),(NO,), exists in a high temperature green form and a room temperature purple form. Cu(NHs)2Ag(SCN)3 may be prepared by boiling an aqueous ammonia solution of the corresponding tetraammine’ ‘; prolonged boil- ing yields CU(NH,),(SCN)~. There are two forms of the diammine chloride and bromide’ * ; the a-forms are prepared by bubbling dry ammonia gas into a solution of Cu(NO& - 3H,O and LiX - Hz0 in acetone. The /3-forms are obtained when the a-forms are recrystallised from a solution of the corresponding ammonium halide1”*20. The isomers are sensitive to changes of temperature and pressure21:
80’
@Zu(NH3)2Br2 =: a-Cu(NH3)2Br2
CU(NII~)~I, is prepared by slow evaporation over Pz05 of the mother liquor ob- tained from the preparation of Cu,(NH,),,16 (as above). Several diammine oxala- tes are obtained from the reaction of CuC204 * _tH20 and aqueous ammonia solution’6*22, and thermal decomposition of the products (Fig. 3).
cu C2Q. Q&O O0
Cu(NH&C204
9o” I 0.88 NH4 OH -3 NH3 25O
I
1000 a-Cu(NH&C204 - /?- CtdNti3), C,04
Fig. 3. The preparation of diammine copper(H) oxalate complexes.
(vi) [cu(N-N*),Nw3]x2
A number of monoammine copper(H) complexes are known especially where chelate ligands are involved. Recrystallisation23g24 of Cuen,X, complexes from liquid ammonia yields the corresponding [Cuen2(NHs)]X2 complexes as unstable bright blue crystals (when X = Br-, I-, N03-, BF,-, and ClO,-); the chloride yields an amorphous powder. The perchlorate and tetrafluoroborate are more stable and may be prepared from concentrated aqueous ammonia solution. Re- crystallisation of Cubipy,X, (X = ClO,-, and BF,-) from concentrated aqueous

COPPER(H) AMMONIA-COMPLEXES 7
amaaaaaia (cl, 0.88) yields only the monoammines [Cubipy,(NH,)]Xz as pale blue stable crystals25*26. *N-N = chelate nitrogen iigand, e.g. ethylenediamine or a, a’-bipyridyl.
D. X-RAY CRYSTALLOGRAPHIC DATA
fi) Single crystal data
Crystal structures are reported for pentaammine, tetraammine, triammine and diammine complexes of the copper(H) ion (Table 2).
In the tetraammines the predominant symmetry is axial, but within this symmetry, coordination numbers of four, five and six occur (Fig. 4). The structures include the square-coplanar complex 27~30 (I), Na,CU(NH,),{CU(S,o,),)2, the te- tra gonal octahedral complexes32 (II), CU(NH,),(NO,)~, with equivalent ligands in the long-bonded tetragonal positions, the complex3’ (III), Cu(NH,),PtCI, with equivalent bridging ligands in the long-bonded tetragonal positions at equal distan- ces and the complex34 (IV), Cu(NH,),SeO,H,O with bridging groups in the long- bonded positions at unequal distances. The rhombic octahedral complex (V), Cu(NH&(CuI&. and the square-based pyramidal complex (VI), Cu(NH3),H20- SO,, have also been reported 33*34. In complex (VI), the copper(U) ion lies 0.2 %I out of the plane of the four nitrogen ligands34, in complexes (I)-(V) it lies in the plane. The least common structure is that of a strictly square-coplanar CU(NH&~+ cation; it is considered2 ‘s3’ to occur in Na,Cu(NH,)4(Cu(S,03)2)2 and Cu(NH3)@rBr-J2, Both complexes have the tetragonal axes of the CuN4 chro- mophores aligned parallel and involve further copper ions as the nearest neigh- bours at a distance of 5.76 and 5.71 A respectively, aIong this tetragonal axis. This suggests the absence of bonding in this tetragonal direction and of a strictly square-coplanar CuN, chromophore, A reexamination28y2g of the original X-ray
27 crystallographic data of Na,Cu(NH,),{Cu(S,0,),j2 suggests that there is either an additional water or ammonia group present in the lattice, positioned midway between the copper ions. A comparable structure has previousiy3* been sug- gested for Cu(NH3)4(CuC12)2H20 (Table 2) and also44 for (NH.+)Cu(NH,)s- (CIO,),. A reexamination of the preparative conditions for obtaining Na4Cu- (NH3)4(C~(SZ03)2)2 - L has established the existence of a blue monoammine (L = NH,) and a violet monohydrate (L = H,O); precession data showed that both are strictly isostructural. A reassessment2’ of the analytical dataI on Cu(NH&(CuBrz), suggests that it is also a monohydrate; it has the same space group 3o as CU~H~)~~CUC~~~~H~O, namely, ~4/~~~, with a sy~etri~lIy placed water molecule bridging the copper(H) ions [Fig. 4 fJII)I_ These considerations indicate that there is no clear crystallographic evidence for the existence of a strictly square-copIanar CU(NH,)~~ + cation.
Coordin. C/rem. Rev., 5 (1970) 143

TA
BL
E 2
.
CRYS
TALt
OCi
RAPH
IC
DATA
, BO
ND
LENG
TM
AND
DEO
REB
OF
TETR
AGO
NALI
TY
Com
plex
S
pace
G
rorr
p Z
R
%
Cn-
N
lRsN
) t’i
lhd.
” C
l14
Cor
rect
ed
T =
R
sN/R
LX R
eJ
(&:I
il (R
I.~) A
I
A,
C14
(NH
JaX
2 co
mpl
exes
Cu(
NH
&H
zO
* SO
$ P
nanr
Cu(
NH
3)S
eOh
‘ P
2&
Cu(
~HM
SC
Nh
12/m
C
WH
MC
~Izh
Pi
2 2 2 2 2 2 4 4 2 1 4
11.5
10
994
5,6
1.99
11
.1
1,99
6 16
(Iik
O)
2.04
9.
7 2,
025
1.99
10
2,
04
2,O
Y
-280
6 4.
7 2.
03 1
4#9
2,00
5
JO,8
2,
OE
13
,O
2.11
4 2.14
e 2,
163
11.1
N
2.0
24
2.04
8 2.
061
SC
N 1
.987
0.00
6
0.02
9
0.02
0
-
C14
5.76
N
2.
88
Cl1
5.71
P
I 3.
21
0 2.
73
N
2.65
0
2059
0 3,
37
0,00
6 0
2.33
9 0
3.47
5 0.
009
0 2.
451
0 2,
607
s 3.
00
0,07
3 I
3.17
0.06
3
a.02
5 S
2.
946
3,28
6
5,71
0.
34
2888
0.
69
5.71
0.
34
2.8
1 0.
72
2.65
0‘
75
2.67
0.
77
2,39
0.
85
3s4
0.57
2s
o 0.
80
2,66
0.
75
2.s9
* 0.
80
2,44
* 0.
88
2.65
0.
77’
27
28,2
9 30
31
30
32
33
34
34
F
r
35
30
E
E
“5
?

n T
AB
LE
2 (
CO
/Jtt
/JJt
d)
I:
&
Con
rple
x C
IOSS
Sp
ace
2 R
%
Lin
e-lip
of
Env
iron
trte
rrf
C&
-N
Cll
-x
Rcj
: 3
Gro
Jip
teir
ngot
Jn1
of Cl
l(II
) iO
lJ
(4
(4
9 O
XC
S It
. $ C
, Cu(N~3)2X2
cont
plex
es
2 J a-
Cu(
NH
&C
l~
-
5 j?
Gr(
NH
J)&
lz@
cu
bic
2 B
aJ.Z
u(N
He)
JW
mon
oclin
ic
BX
NH
&W
cu
bic
CW
H&
(NW
2 m
onoc
linic
Cu~
H~)
~(~H
~CO
~)~
mon
oclin
ic
Cu(
NH
s)zC
Ck
mon
oclin
ic
aCu(
NH
&C
zO~
orth
o-
rhom
bic
Cu(
NH
j)zC
zOa *
2H
aO” -
Cu(
NH
3)&
WN
)a
hexa
gona
l
D,
C~1
(N~~
~~X
2 cot~
~lex
~s
PW
W&
(NN
3,1~
te
trag
onal
CJn
cnJ
C2/
nt
PJJ
tJlR
P21
1c
P/1
2,/#
2 4”
2 4 (2 s
ets)
4
- 10,O
Q
13.0
9
10,o
o - - - 10
.9
?A4 -
2 13
.0
4 *-
- rand
om
para
llel
rand
om
near
ly
para
llel
near
ly
para
llel
near
ly
para
llel
not
para
llel
para
llel
para
llel
com
pres
sed t
etra
gona
l (c
hain
s)
com
pres
sed t
etra
gona
l (r
ando
m)
rhom
bic
com
pres
sed t
etra
gona
l rh
ombi
c
rhom
bic
squa
rew
base
d py
ram
idal
rhom
bic,
but
w
ith u
nequ
al
axia
l lig
and
bond
leng
ths
com
pres
sed
rhom
bic
trig
onal
bi
pyra
mid
ai
“squ
are-
copl
anar
”*
1.93
2.03
2.
03
I .97
1.85
2.
00
1.93
l,9
9
1.98
2,oo
2,os
Br
2.54
B
r 30
8 B
r 2,
88
N 1
.99
N 1
.97
s 3.
05
0 2.
07
2,77
0
2.05
0
1.87
0
2.57
0
2,02
0
2,05
0
2048
0
2.33
0
2.10
0
2.15
N
1.9
2
N 3
.75
37
20
19,3
8
20
18,3
9
40
41,4
2
22
22
43
44
(“) E
,s,d
, = e
stim
ated
stan
dard
dev
iatio
n (*
) Est
imat
ed va
lues
. (‘)
Mea
n. (“
) Mon
ohyd
rate
or m
onoc
enam
inc.
(“) C
oppe
r(H
) ion
dis
plac
ed 0.
194
A
out-
of-p
lane
. (/)
Cal
c, us
ing m
ean o
f C-N
H,
bond
s, 2,
044 a
nd C
u-S
of 2
,946
. (‘3 P
owde
r dat
a on
ly. (
*) Pr
elim
inar
y dat
a. (I
) See
text
,

10 B. J. HATHAWAY, A. A. G. TOMLINSON
X
N, 4,N NL_C”/N ‘:
N/=;\N N\I/N
N/ ; ---.,., N/c*-LN j IV - v VI
x x
Fig. 4. The molecular structures of Cu(NH&Xz compIexes (see text for descriptions).
A square-based pyramidal stereochemistry is present33 in Cu(NH&H20* SO,; the X-ray data for this complex have recentlyj4 been redetermined and ap- preciably reduced the Cu-N and Cu-0 bond lengths, Table 2A. More significantly, the position of the copper(H) ion lies 0.2 A above the plane of the four nitrogen atoms. The remaining tetraammine structures are tetragonal octahedral except30 for Cu(NHJ4(CuI,),, which has a significant rhombic distortion in the plane. Since the analysis has an R value of 13.0% the determination may not be very accurate especially as the Cu-N bond lengths 2.11 and 2.16 L% are significantly longer tfian that of 2.11 A observed in the octahedral complex4’ I&Pb Cu(NO&. A rhombic or tetragonal octahedral chromophore CuN,X, would be expected to have a shorter Cu-N bond length than that I4 of a regular octahedral CuNs chro- mophore. By the same criterion, the Cu-N bond length of 2.08 A in CU(NH~)~- (SCN), is rather high. The structure of CU(NH~)~(NO&, although determined using limited data agrees closely with that of the more accurately determined struc- ture34 of Cu(NH,),SeO,, notwithstanding the involvement of the nitrite group in nitro-coordination3’ rather than the anticipated nitrito coordination14.
In tetragonal octahedral copper(U) complexes with six equivalent ligands, the tetragonal distortionI present (T) may be defined by &/&, where & is the in-plane copper-ligand bond length and RL is the out-of-plane bond length. By considering the available crystallographic data on a large number of copper(U) complexes’4 the value of T was shown to be ca. 0.8 and to be independent of the type of ligand present. In Cu(NH3),X, complexes the value of RLX (obs.) is dependent upon the ligand atom X. If these are corrected to relate to the ligand atomin-the-plane, in this case nitrogen, by the relationship RLx(corr.) = R,X(obs.) x i?sL/&x, the value of Tis then a true measure of the tetragonal distortion present.
The corrected values of RLx(corr.) are given in Table 2 along with the correspond-

COPPER@) AMMONIA COMPLEXES 11
ing values of T. The values of RLx(corr.) are plotted against RsN in Fig. 5. Using the original crystallographic data (points o and 0), the points suggest that the shorter the axial bond length R, the longer is the in-plane bond length R, and that the latter are sensitive to the out-of-plane bond lengths. It emphasises that the groups present along the tetragonal direction are definitely coordinated to the copper(H) ion and not merely positioned by lattice packing factors. The term
\ I *and o -original data \ : cu1; xand @ -revised data I \
21 - \ ;SCN-
sm
I =-
so$&.o @ \ .PtClz-
SeO$; ‘*,cuc1; I$0
CLEW-
R,Nt& NC;
x2- --_-__--_---__-- --..- -2
~g$qL .
C”(S20-$
X9- semi-coordination e -square coplanar I
t 1 I I I 2Cl 30 40 50 60
R f(corr) 6) -
Fig. 5. A graph of the in-plane bond lengths (RsN) against the corrected axial bond lengths (RLx corr.) for Cu(NH,),X, complexes.
semi-coordination has been introduced 46 to describe this structural situation. The inclusion of the accurate data for Cu(NH&Se04 in Fig. 5 gives a point well off the best fit curve. The reassessment28’2g of the crystal structure of the complex Na.&u(NH,)4{Cu(S20,)2}zHz0 [and along with it that of Cu(NH3),(CuBr,),- Hz01 indicating the presence of a semi-coordinated molecule of water or ammonia between the copper ions, removes the two points for the two strictly square- coplanar complexes from Fig. 5. There is still a slight variation of RsN with RLX(corr.), but the differences are now hardly significant. In the complexes Na,&u(NH,)4{Cu(S203)2)2L, (where L = Hz0 or NH3) and CU(NH~)~(CUB~&- H,O, the value of RLX(obs.) of 2.8-2.9 A is longer than that predicted for semi-
coordination’4 (ca. 2.5 & and the in-plane Cu-N bond lengths are still signi- ficantly shorter than those for the other tetraammines14 of Fig. 5. This suggests that in these complexes the CU(NH~)~*+ cation is as near a strictly square-co- planar stereochemistry as it can attain. The observation of a high temperature factor parallel to the c-axis for the tetragoqal groups suggests that the water or ammonia groups are either vibrating parallel to the tetragonal axis or that there is some disorder in their exact positions along the tetragonal axis. In the latter
Coordin. Chem. Rev., 5 (1970) l-43

12 B. J. HATHAWAY, A. A. G. TOMLINSON
case the effective local stereochemistry may be considered as tetragonal octahedral with equivalent bridging ligands bonding at unequal distances (Fig. 4, IV).
The elimination of these strictly square coplanar tetraammines from,the data
of Fig. 5 weakens the crystallographic evidence for the concepti of varying tetra- gonal distortion (see later) suggested by Fig. 5 (but see CuO, systems, ref. 68). It raises the question of whether a strictly square copIanar CU(NH&~’ cation can actually exist with purely o-bonding ligands. The existence of the square coplanar Cu(acac), complexes would suggest that this stereochemistry for the copper(H)
ion is only stable if the in-plane ligands can also be involved in a n-bonding function. The only way in which a CU(NH~)~~+ cation can remain stable is for semi-coordination to occur above and below the plane, especially with potentially z-bonding ligandst4.
X’ T N I
N.,‘“/X x\ I C”lN _ x- 1 ,0x -
x/INN x/;--N “al’_
1 - .x,/- -x --
/;: I k II I N III
X IN .>““lx
Fig. 6. The molecular structures of Cu(NH&X, complexes.
The stereochemistries present in the diammines are much more varied (Ta- ble 2C) and dependent upon the anion present. With only two ammonia groups available the anion must occupy two positions in a four coordinate, three in a five coordinate and four in a six coordinate complex (Fig. 6); consequently extensive briiJging may occur. In practice no strictly square-coplanar diammines are known. Two five coordinate diammine complexes are known. The carbonate41*42 has a square-based pyramidal stereochemistry (IV), with a bidentate carbonate group in the plane, the two ammonia groups assuming a c&configuration. These involve the shortest observed copper-nitrogen bond length of 1.85 A and 2.00 A. Cu(NH,),Ag(SCN), has an almost regular 4s trigonal bipyramidal stereochemistry (VI) with all of the trigonal axes aligned. The ammonia groups coordinate out of the plane at 2.00 A and the three thiocyanate nitrogens coordinate in the plane

COPPER(I1) AMMONIA COhlPLEXES 13
at 1.92 A, at the trigonal angle of 120” imposed by the stacking of the planar Ag(SCN) 32 - anions. A compressed tetragonal octahedral stereochemistry, Fig. 6 (III),_ occurs in a-Cu(NH&Clt 37, @Cu(NH.J,Br, *O and /?-CU(NH,),C~,~~,
but the structures of the first two complexes have been determined only from powder data. The rhombic octahedral stereochemistry normally occurs with an elongated tetragonai disortion (JJ as in a-Cu(NH&Br2 1g*38, Cu(NH,),(SCN),, (Ref. 18, 39), CU(NH~)~(CH~CO~)~ 4o and a-Cu(NH,),C,O, 22_ A compressed rhombic distortion22 has been suggested in a preliminary communication on
Cu(NH,),C,O, - 2H,O. The published X-ray crystallographic data44 for (NH,) [Cu(NH,),] (ClO,),,
Table 2, suggest that it should be formulated as a square-copIanar CU(NH,),~* cation with ammonia groups occupying the tetragonal positions at a distance of 3.75 A, a non-bonding distance_ Although the electronic spectra4* of this complex have been interpreted in terms of a square-coplanar CU(NH,),~+ cation, a more recent examination” of both its electronic spectra and ESR spectra suggest that this complex should best be described as a pentaammine rather than a tetra- amine and that the crystal structure is in error.
The only triammine3 6 Of known crystal structure is Cu,(NH&SCN),, the molecular structure of the copper ion is tetragonal octahedral, with one thio- cyanate and three ammonia nitrogen atoms bonding in the plane. The tetragonal positions involve semi-coordinated thiocyanate sulphur atoms at slightly different distances, 3.29 and 2.94 A (Fig. 4, IV).
(ii) X-ray powder data
Due to the difficulty of obtaining the higher ammines of copper(U) in other than a polycrystalline form, plus the low stability of many of these complexes to loss of ammonia, little attempt has been made to carry out single crystal X-ray work on either the hexaammines or pentaammines of the copper ion (but see references 7, 9 and 11). Powder X-ray data, Table 3, have been obtained in both series**‘*” but are plagued by the uncertainty of the precise phase examined. In- the original hexaammine report6, the samples were preheated before taking the X-ray measurements and could well be contaminated by the presence of lower ammines. rn more recent reports ‘** although the samples were Ioaded in an , ammonia atmosphere, no definite check on the samples examined was carried out and differing results were obtained. A further complication is that many of the pentaammine copper complexes’ ’ are also cubic, with comparable unit cell parameters. As they can be isolated in crystalline form and are rather more stable than the corresponding hexaammines, the powder data are more reliable and sug- gest a face-centred cubic lattice. A Weissenberg photograph of a single crystal of
Cu(NHMBF4)2 confirms ’ 1 this cubic structure and indicates a very low intensity for the reflections at high &value (compared with the values for the isomorphous
Coordin. Chem. Rev., 5 (1970) 143

14 B. J. HATHAWAY, A. A. G. TOML~SON
TABLE 3
X-RAY POWDER DATA
X Type of unit cdl d9 e c”la
A. Crr(NH3.1aXz {ref, 8)
CI Tetragonal 10.27 9.42 0.917 Br FCC IO.25 I FCC 10.78
BFa FCC 11.16 CKV, FCC 11.34
_- .._~ -. M BY- r- BF*_ CIOJ -
Ca 10.39 10.91 11.31 11.45 Ni 10.34 10.88 11.27 11.41 10.60 Cu 10.25 10.78 11.16 11.34 10.70 ZrI 10.46 10.96
= & 0.01 A; FCC = face centred cubic.
N~~H~)~~~~)~ complex). The latter suggests some high thermal motion or dis- order in the lattice which may well be accounted for in termsll of freely rotating Cu(NH&’ + cations.
In the light of the existence of the pentaammines the structure of the hexa- ammines have been formulated” i (see later for the electronic and infrared evidence) as Cu(NH&X2 - NH3, in which the sixth ammonia molecule occupies a vacant lattice site in the pentaammine iattice. If this is the case, then many of the dif- ficulties observed in the early literature, for example, the difficulty of obtaining phases with exactly six molecules of ammonia and the possible formation of solid solutions7 between the p~ntaa~in~s and the maxi ‘IS, are u~ders~dab~e.
The powder data on Cu(NH&X, (X = Cl-, Br- and I-) have been inter- preted7 assuming a tetragonally distorted octahedral CuN, cbromophore giving Cu--N bond lengths of 2.1 and 2.6 A, results which aIthough reasonable (2“ = CUU), conflict with the pent~m~ne structures suggested by the electronic spectra of these complexes. If a local tetragonal octahedral copper ion stereochemistry were present, the unit cell parameter Q should be intermediates between those of the corresponding nickel(D) and zinc(H) hexaamminea (as4g in the cubic K,PbMn- (NO& complexes, Table 3). In ali of the cases examined @able 3) the copper@) hexaammines have a lower &value than the nickel compfex’.

COPPER@) AMMONIA COMPLEXES 15
Linear (6)
t
Trtgonal Bipyramidal(88) Cu(NH&Ag6CN13
Square-Based Pyramidal (9)~n-plane00)out-of-plane
I
Cu(NH,&l+OSO4
Compressed Tetragonal- /
Octahedral Octahedral (5)
-Slongated Tetragenal Square
~-CU(NH~), Et-,
T”g o$“\
Octahedral (21
1
Cu(NH3),,(SCN12 -Co&““’
Ca-DIstorted Compressed 01) Octahedral
\
Rhombic (7) (12) Elongated
Cu(NH3)2C2042H20 Rhombic (41
Cu(NH#CH3CQ&
Compressed -Tetrahedral- Elongated (13) Tetrahedral
05)
Fig. 7. The fifteen basic stereochemistries of the copper(I1) ion, with examples from ammine complexes.
The structural data on a- and /$Cu(NH&Cl, were obtained from the inter- pretation of the X-ray powder data of these cubic complexes37*38.
Fig. 7 summarises the fifteen known stereochemistries for the copper(H) ion and illustrates those which occur in the copper(H) ammines with definite examples.
E. MAGNETIC DATA
Table 4 shows some examplesso of the room temperature magnetic moments
of the various copper(I1) ammine complexes; they all lie above :he spin-only value of 1.73 B.M. and occur in the range 1.8-2.0 B.M. normally found for copper(H) complexes in the absence of any antiferromagnetic coupling. The values are con- sistent” with an orbitally non-degenerate ground state for the copper(H) ion, the
TABLE 4
SOhE REPRESENTA-~WE ROOM TEMPERATURE MAGNETIC MOMENTS (B.M.) FOR
Cu(NH,),X, COF.WLEXES~~
~(NHMBF& 1.89 Cu(NH&HIO - SO, 1.87 (NHdCuWHd,l(PFds 1.85 CU(-NH~)~A~(.SCN), 1.83 Na4Cu(NH~)~CCu(S20~)ZIZNHJ 1.90 CCuenJWM(BF.& 1.85 Cu(NJ&)dNWz 1.84 [Cubipy2NHB](C10& l-92* Cu(NHMSCN)z 1.81
a Ref. 25.
slight increase above the spin-only value arising from the mixing in of an orbitally degenerate excited state into the ground state viaspin-orbit coupling. The latter effect is clearly dependent upon the symmetry of the excited states present and upon their energies, both of which will depend upon the stereochemistry present. However, the total contribution to the magnetic moment by this mechanism is so
Cuordin. Chem. Rea., 5 (1970) 143

16 B. J. HATHAWAY, A. A. G. TOhfLiNSON
small, and the accuracy with which p can be measured is such that no stereo- chemical information can be obtained from the measurement of the room-temper- ature magnetic moments. More information would be available from the measure- ment of single crystal magnetic anisotropies52*53, but to date no such data are available on the ammines of copper(U).
Consequently although the observed magnetic moments are consistent with a single unptied electron in these copper(n) ammines, they cannot distinguish between a & _,,* ground state (for an elongated tetragonal environment) or a dzl ground state (for a compressed tetragonal environment).
F. ELECTRON SPIN RESONANCE
(i) General introduction
The copper@) ion with a dg configuration, has an effective spin of s = 3 and associated spin angular momentum of m, = + 4 leading to a doubly degenerate spin energy state in the absence of a magnetic field. On application of a magnetic field this degeneracy is removed and transitions occur between the two levels given by the condition hv = g/lH. For a free electron, the Land6 splitting factor g has the value 2.0023, whilst for an electron in a crystal field the value can differ from 2.0023; g is only isotropic in a cubic environment, in axial and rhombic crystal
TABLE 5
THEORETICAL EXPRESSIONS FOR THE g-VALUES FOR A COPPER(I1) ION IN LIGAND FIELDS OF DXFFERENT
SYhfMETRIES5J~5s
1. Ocrahedral gr=2-s!c lOD,
2. Tetragonal: a) elongated g,=2- 2klZR
JX’E, - ‘&I
8k,, ‘1
g” = 2 - E(2&, - 2&J
b) compressed g1=2- 6kLzL
EC’& - 24J
gu = 2.00
3. Rhombic, elongated g==2- 2kx2A(cos a-43 sin a)2
E(2J%~ - *4
g,=2- 2k,2lt(cos a+2/3 SiIl a)2
EC’&, - ‘4)
g,=z- Skz2A cos2 cc
-Hz&o - ‘Ad

COPPER(U) AMMONIA COMPLEXES 17
fields two and three different g-values are obtained, respectively. The expressions for these are given in Table 5. In practice, the observed crystal g-values for cop- per(H) complexes will be determined by: a) the symmetry of the ligand field about the copper(U) ion; b) whether the tetragonal axes of the copper(H) ions present in the unit cell are aligned parallel. This must be the case if the number of molecules (2) in the unit cell is one, but is not necessarily the case, if the number is greater than one. If all the tetragonal axes are aligned parallel then the crystal g-values
TABLE 6
TYPICAL g-VALUES FOR Cu(NH&X, COMPLEXES IN WHICH A, THE TETRAGONAL AXES ARE ALIGNED
PARALLEL AND B, THE TETRAGONAL AXFS ARE NOT ALIGNED OR THEIR ALIGNENT LS UNKNOWN
gl_ NH&uCNH~S(PF& 2.033 CW’JH3M04 2.051 CU(NHJL(SCN)~ 2.056 CuWH3)4(NWz 2.052
N~LC~(NH~)~{CU(S~O,>,)~ * NH3 2.058 Na4Cu~H3)J(Cu(S20j)2)2 - Hz0 2.052
91 s2 CUWHJMCHKWZ 2.049 2.100 Cu(NH3)2(NCS), 2.058 2.278 Cu(NH&AidSCN)z 2.207 2.004
2.046 2.227 - 2.049 2.126 2.175 2.068 2.23 1 -
911 2.240
2.230 2.237 2.234 2.230 2.200
93
2.214 - -
G 4.52 4.51
4.23 4.50 3.96 3.85
G -
4.79 -
4.93 -
3.4
CuWH3)2SO4 2.155 CutNH&Se04 2.192 ICubrpyzNH3KClW2 2.009 2.207 ICubiPy&BI&BF4)2 2.008 2.219 [CuenzNH3]1, 2.048 2.218 ICuen2NH&No3)2 2.045 2.200
- - 4.54 4.44
accurately reflect the local copper(H) ion environment g-values, and these may be measured using either single crystal techniques or (slightly less accurately) by measurements upon polycrystalline samples. Table 6 lists some typical copper(I1)
ammine g-value data in which the observed g-values reflect the local copper(I1)
ion g-values. For the axial spectras6 C, equal to (g ,, - 2)/(g1-2), approximately
equals 4.0 and is evidence that a dx2_,2 ground state is present. The g-values for a regular trigonal bipyramidal-stereochemistry have been shown17 to be equi- valent to those for a compressed tetragonal distortion. The ESR spectrum’7 of
Coodin. Chem. Rea., 5 (1970) l-43

18 B. J. HATHAWAY, A. A. G. TOhUINSON
Cu(NH&Ag(SCN)3 shows a low g-value only slightly greater than 2.00 consistent with a dz2 ground state in this trigonal-bipyramidal stereochemistry. .
If the tetragonal axes in the unit cell are not aligned parallel, then the ob- served crys?aZg-values are not simply related to the g-values of the local copper ion environments6. If the complexes are of known crystal structure then the ob- served g-vaIues may be related to the local g-values”. It is not possible to specify preciseIy the Iocal g-values if the crystal structure is unknown, but three situations are observed in practice.
Isotropic Spectra
These are predicted for a copper(I1) ion in a regular octahedral or tetrahedral stereochemistry, neither of which occur in practice (but see ref. 45). They can occur with a dynamically distorted octahedral stereochemistry, or one involving pseudo-rotation of a CuL,‘+ chromophore, this situation is believed to4g*58 occur in KzPbCu(NO,),. An isotropic ESR spectrum would also occur if a CuL, chromophore of symmetry lower than octahedral was undergoing free rotation in the crystal lattice; the CLI(NH~)~~~ cation, thought*’ to be present in the penta- ammines and hexaammines of the copper(I1) ion, is considered to be freely rotating in these complexes and exhibits an isotropic ESR spectrum. The observation of some type of tetragonal ESR spectrum at temperatures lower than room temper- ature is consistent” with the termination of free rotation at this lower temperature. The most common reason for observing an isotropic ESR spectrum is through extensive exchange coupling between grossly misaligned local copper(H) ions, as in a-Cu(NH,),Br,. In these cases the line width is so broadI that it is sometimes difficult even to observe an ESR spectrum (e.g. @-Cu(NH&Br,).
Axial spectra
This type of spectrum is most commonly observed with tetragonal local copper(B) ion environments in which the tetragonal axes are aligned parallel. For14 Cu(NH,),(SCN), g1 = 2.056, g 11 = 2.237 and G = 4.23. This type of spec- trum may also be observed, with systems of symmetry lower than tetragonal, where the misalignment is small. The effect of exchange coupling is then to decrease the spread of the observed g-vaIues which is reflected in the observation of a G-value lower than 4.0; thus Cu(NH,),(NO& has an ESR spectrum with
91 = 2.068, g ,l = 2.231 and G = 3.4. Consequently the value of G is a useful indication of the extent of exchange couplibg in tetragonal systems. The lower accuracy of the powder technique ” for measuring the ESR of rhombic systems can result in the observation of an axial spectrum even when no misalignment is present. For example, CU(NH~)~(CUI~)~ ha6 an ESR spectrum with g1 = 2.054,
911 = 2.219 and G = 4.21 measured as a powder but gives three g-values as a

COPPER(U) AMMONIA COMPLEXES 19
single crystal, gr = 2.054, g2 = 2.058, g3 = 2.223, the two lowest g-values not being resolved in the powder method.
Rhombic spectra
This type of spectrum can arise from the slight misalignment of rhombic or axial local copper(H) ion environments. The axial environments33*34 of Cu(NH,)JI,O - SO4 are misaligned by 61” and give rise to three g-values, gr = 2.047, g2 = 2.126 and g3 = 2.172. The effect of exchange coupling is to reduce the spread of the Iocal g-values.
(ii) Experimental data
In the chemistry of the ammines of the copper(H) ion the most important items of information that the measurement of the ESR spectrum can give are: a) a distinction5 ’ between a dxz + and a d,,ground state, Table 6. The latter is in- dicated by a low g-value (c 2.04) the former by an axial (or approximately axial,
91. = 92 = gs) spectrum with G > 4.0; b) the angular directions55 of the three crystal g-values with respect to the pro- minent face of a crystal. These directions can then be related to the directions of maximum polarisation or the single crystal polarised electronic spectra and enable the latter to be assigned in relation to the local molecular x-, y- and z-coordinate axes. In axial systems, where the tetragonal axes are simply reiated to the crys- tallographic axes43 ta 7, as in Cu(NH,),Ag(SCN), and Na,Cu(NH,),{Cu(S,O,)),- NH3, this is a simple process’4. In rhombic systems, where in general there is not a simple relationship between the Iocal moiecuIar axes and the crystallographic axes, such as CU(NH,),(CH~CO~)~. it is much more complicated and the angular ESR data are invaluable in assigning the electronic spectra’ *.
The ESR spectra of the hexaammines are most frequently isotropic at room temperature, but become anisotropic below room temperature’, That of Cu- (NH,),CI, is exceptional in being anisotropic at room temperature but isotropic above 70”. The anisotropic spectra (at all temperatures) suggest the presence of exchange coupling (G < 4.0). None of the spectra show any evidence of a low g-value ~2.04 and indicate a dxz _yz ground state, consistent with (but not diag- nostic of) the square-based pyramidal structure” suggested for the CI,I(NH~)~~~ cation.
Similar comments apply to the ESR spectra observed” for the pentaammines except that the anisotropic spectra for the sulphate and hexafluorophosphate (Table 6) at room temperature and the perchlorate and iodide at low temperature, all show G > 4.0. They indicate much Iess evidence for the presence of exchange coupling and more certain evidence for a dxz-,,3 ground state and hence the proposed square-base pyramidal stereochemistry. The isotropic spectrum observed
Coordin. Chem. Rev., 5 (1970) 143

20 B. J. HATHAWAY, A. A. G. TOMLINSON
for the Cu(NH&2f cation in aqueous solution with g = 2.118 fits the equation 3&i = 2g,+gIIT and has been interpreted as due to a tumbling motion of the cation in s01ution~~.
All the tetraammines of known crystal structure, except the sulphate, have their tetragonal axes aligned parallel and consequently give rise to two g-values (but see Cu~H~)~~CuI~)*). The Cu(NH&X2 complexes [where X = CR&- and NO,-), give three g-values indicative cf the presence of misaligned tetragonal axes and hence of exchange coupling in these complexes, the other properties of which indicate a tetragonal octahedral CU(NH~)~~ f cation1 ‘.
The necessity of involving anion bridging in the diammines in order to make up the coordination number to six, increases the possibility of exchange coupling complicating the observed ESR spectra. This has already been noticed in the diammine hahdesi6. Some evidence for the reversed tetragonal octahedral environment of some of these has been obtained from the dilution of these com- plexes in the appropriate isomorphous ammonium halide6’, Fig. 8. All three
B-CU~NH&C~~/N~~,C~
A Room temperature
8 Low temperature
g-value -
I?;@;_ 8. The ESR spectra of Cu(NH&X2 complexes diluted in N&X.
spectra indicate a Iow g-value of ~2.05. In the diammine complexes, other than the halides, three g-values are observed, as in CU(NH&(CH~CO~)~. but only two g-values are obtained if the two lowest g-values de numericalty dose together
[see Cu(Nl&),(SCN),]. The observed ESR spectrum17 of Cu(NH&Ag(SCN)s, Table 6, with g I = 2.00 and g1 = 2.207 has been used to establish an ESR crite- rion for trigonal bipyr~idal structures. Exchange couljiing through misaligned trigonal axes can still modify the observed crystal g-values”; this mechanism has been suggested to explain the isotropic ESR spectra observedI for Cu(NH&S04 and Cu(NH&SeO,, which both have electronic spectra (see later) consistent with a t~gon~-bipyr~da~ stereochemistry.

COPPER(U) AMMONIA COMPLEXES 21
Both Cu(NH,),CO, and Cu(NH&C204 have axial spectra with G > 4.0 consistent’ 6 with the rather distorted square-based pyramidal stereochemistries in- dicated by the X-ray data.
Of the monoammine complexes the spectra of the [Cu(bipy),NH,]X, com- plexesz6, where X = BF,- and C104- show (Fig. 9) a low g-value less than 2.04. This suggests a dz2 ground state and is consistent with a distorted trigonal bipyra-
._-. . :. i : . A ; . . i ‘.
: _
; .
f-,
‘-.
_c- -2.2 --&.. ---__ I
I\ I . . . . . ..___
-.._ \ .I. . . . . . . _._
-5 . . . . ..y’ ,
\ I \ I
g-value -
Fig. 9. The powder ESR spectra (first derivative) of A, (ClO.&; C, [CueqNHslIl.
CU(NH&A&CN)I; B, Wubipy~NH4
midal stereochemistry for these compIexes (see electronic spectra). The ESR spectra of the [Cuen,NH,]X, type compIexesz4 are comphcated by exchange coupling but a number (such as the iodide, Fig. 9) shows two g-values with G > 4.0 con- sistent with a dxl _,,t ground state and with a square-based pyramidal stereochem- istry. The ESR spectra of the decaammines” are isotropic in agreement with the presence of strong exchange coupling suggested by the electronic spectra be- tween the two non-equivalent stereochemistries (see later).
G. ELECTRONIC SPECTRA
The ammines of the copper(U) ion are characterised by colours ranging from the pale blue of the hexaammines’ and pentaammines” to the royal blue to purple of the tetraammines’4. A number of the amminesL6 are green, i.e. Cu(NH,),- Ag(SCN),, or red-brown, Le. Cu(NH,),(CuBr ) 2 214, but these colours probably arise from the presence of low energy copper-anion charge transfer bands. In general, the colour of a copper(U) ammine gives little indication of the environ- ment of the copper(H) ion present.
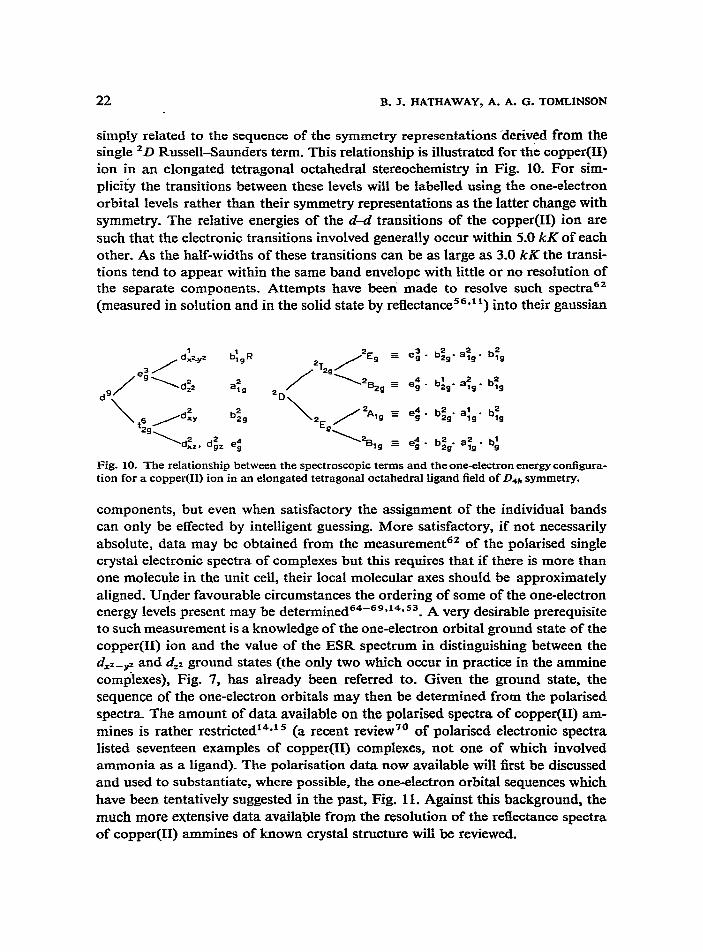
A better criterion of the stereochemistry of the cop_oer(II) ion in a complex, is its electronic spectrum as this is determined by the relative ordering and the energies of the one-electron energy levels, Fig. 10. For the copper(B) ion these are
C’uurdin. Chem. Reu., 5 (1970) 143
22 B. J. HATHAWAY, A. A. G. TOMLINSON
simply related to the sequence of the symmetry representations -derived from the single ‘D Russell-Saunders term. This relationship is illustrated for the copper(H) ion in an elongated tetragonal octahedral stereochemistry in Fig. 10. For sim- pliciiy the transitions between these levels will be labelled using the one-electron orbital levels rather than their symmetry representations as the latter change with symmetry. The relative energies of the d-d transitions of the copper(H) ion are such that the electronic transitions involved generally occur within 5.0 kK of each other. As the half-widths of these transitions can be as large as 3.0 kK the transi- tions tend to appear within the same band envelope with little or no resolution of the separate components. Attempts have beeti made to resolve such spectra6’ (measured in solution and in the solid state by reflectance56B”) into their gaussian
Fig. 10. The relationship between the spectroscopic terms and the one-electron energy configura- tion for a copper(H) ion in an elongated tetragonal octahedral ligand field of Dab symmetry.
components, but even when satisfactory the assignment of the individual bands can only be effected by intelligent guessing. More satisfactory, if not necessarily absolute, data may be obtained from the measurement62 of the polarised single crystal electronic spectra of complexes but this requires that if there is more than one molecule in the unit cell, their local molecular axes should be approximately aligned. Under favourable circumstances the ordering of some of the one-electron energy levels present may be determined64-6g*‘4g53. A very desirable prerequisite to such measurement is a knowledge of the one-electron orbital ground state of the copper(I1) ion and the value of the ESR spectrum in distinguishing between the dx2_yz and dzl ground states (the only two which occur in practice in the ammine compiexes), Fig. 7, has already been referred to. Given the ground state, the sequence of the one-electron orbitals may then be determined from the polarised spectra. The amount of data available on the polarised spectra of copper(n) am- mines is rather restricted14*15 (a recent review” of polarised electronic spectra listed seventeen examples of copper(H) complexes, not one of which involved ammonia as a ligand). The polarisation data now available will first be discussed and used to substantiate, where possible, the one-electron orbital sequences which have been tentatively suggested in the past, Fig. 11. Against this background, the much more extensive data available from the resolution of the reflectance spectra of copper ammines of known crystal structure will be reviewed.

coPPER(I1) AMMONIA cmhfPLExEs 23
2E 2%1 _a ZTpJJ ____------=‘, zzg
,-=- \ --_ 20 \ ,/
-. 2% 2% \ ---_____
‘x2D ’ , 2AP % -\ -__9 \
,’ \\ ZA 24g 2As
,,-# *------- -
\ r’ \ ‘, 2E ,’ ‘. 2 ,I
;s-’ ‘._&’ \
I
2* 2A ,’ ‘\
L__lgl ‘. 2
\a -we_ *e, 2Ag --_a_-
‘2h %h Oh Oh C4Y ‘4h ‘2h
Compressed Elongated
Fig. 11. The splitting of the ‘0 term of the copper ion in ligand fields of different symmetries.
(i) Polarised single crystal data
The best data available is on the tetraammine copper complexes14; those for Cu(NH,),(NO,), and Cu(NH,),(SCN), are very similar, the spectra of the latter being shown in Fig. 12 at room temperature and at liquid nitrogen tem- perature. Both compIexes can be considered as tetragona1 octahedra1 despite some uncertainties in the X-ray crystallographic data 32S3 ‘. Both spectra involve the bulk of the intensity in xy-polarisation in a band at 17.5 kK. The z-polarised spectrum
16 12 6
- Energy (kK)
Fig. 12. The polarised electronic spectra and molecular structure of Cu(NHS),(SCN),. (In tbis and following Figs., the solid line is the room-temperature spectrum, and the broken line the Quid nitrogen temperature spectrum.)
c00r&2. Chem. l?ev., 5 (1970) 143

24 B. J. HATHAWAY, A. A. G. TOMLlNSON
is much less intense with a maximum at 14.3 kK. The low temperature xypolar- ised spectrum of Cu(NH,),(SCN), shows some evidence of a weak shoulder at 15.7 kK. Both spectra have been assigned’4 in D4,, symmetry and the individual bands reasonably assigned as the d,,, d,, --, dx2_,,z, dzz + dx2+ and dx. + d,,_,z
transitions respectively and establish a one-electron orbital sequence of dx++ >
dzz > d,, > d,=, d,= for the copper(U) ammines of tetragonal octahedral stereo- chemistry-
The original polarised electronic spectra of Na,Cu(NH,),{Cu(S,O,),},. Fig. 13, compares14 very closely with that of Cu(NH,),(SCN),, both in band positions and polarisation, substantiating the more recent X-ray crystahographic data2* which considers the complex to be a tetragonal octahedral monoammine
c-axis t z-axts
192 174
- EnergytkK)
Fig. 13. The polarised electronic spectra and molecular structure of Na,Cu(NH,),{Cu(S,O,)z),,L; A. NH3 (-); B, Hz0 G--j.
with the additional ammonia group positioned between the copper@) ions along
the c-axis. As the crystallographic data requires a centre of symmetry at the
[0, 0, +] position, the ammonia group cannot sit strictly on this position_ It is considered to undergo an inversion vibration along the c-axis coupled with free rotation about this axis consistent with the high temperature anisotropy of the ammine group parallel to the c-axis. The establishment of an isostructural mono- hydrate’ ’ of the above tetraammine is of particular interest as the electronic spectra (for the ESR spectra and infrared spectra, see later) are clearly different from that of the monoammine, Fig. 13, and shows marked resemblancer4 to that of Cu(NH,),(CuBr,),,H,O. The bands in both polarisations lie to significantly higher energy than those of the monoammine. In Da,, symmetry the dxz, dyz -+ d,+pz
transitions lie at 19.2 and 17.4 kK and the d =Z + dxz_u2 transitions at 18.4 and

COPPER@) AMMONIA COMPLEXES 25
13.7 kK for the monohydrate and monoammine, respectively. The greater energy of the monohydrate d,, + dxz+ transition suggests that the monohydrate involves a greater tetragonal distortion than the monoammine; Le. the CU(NH~)~‘+ ipn is more nearly square-coplanar and the water molecule in the monohydrate is not coordinated to the copper(U) ion. In order to fulfil the centre of symmetry require- ment of the [0, 0, $1 position, the water molecule is considered to lie in the plane at right angles to the c-axis and to be rotating about its centre of gravity.
The energy levels of a strictly square-coplanar CU(NH&~+ would be ex- pected to occur (Fig. 11) at even higher energy14 than those for a tetragonal- octahedral complex (an increase of 2.6 kK has been established for the CuO,X, cbromophore6’). No tretraammine spectra’ 5 have been observed with energies appreciably higher than those observed above and suggest that a strictly square- coplanar CU(NH~)~~+ cation has not yet been prepared. The polarised single crystal spectra of (NH,) [Cu(NH,),] (CIO,), have been reported previously4* and interpreted as a tetraammine, but in view of the uncertainty about the structure of the complex44, this assignment should be treated with caution. Numerically, the transitions4’ are consistent with a tetragonal octahedral CU(NH,),~+ cation (in conflict with the X-ray data), but the inability to reproduce this data and the resemblance of the electronic and infrared spectra to that of a pentaammine”, leaves the structure of this complex uncertain.
The polarised single crystal spectra’ 5 of (NH,)Cu(NH,),(PF,), are shown in Fig. 14. Only two bands are observed at 11.4 and 15.0 kK, both appreciably
20 18 16 14 12 10 8
- Eneqy(kK)
Fig. 14. The polarised electronic spectra and molecular structure of NH.JCu(NH&](PF&_
Fig. 15. The polarised electronic spectra and molecular structure of Cu(NH&H20, S04.
Coordin. Chem. Rev., 5 (1970) 143

26 B. J. HATHAWAY, A. A. CL TOhfLINSON
lower in energy than the bands of the tetragonal octahediaI tetraammines and consistent with the reduced tetragonal distortion (Fig. 11) expected for the square- based pyramidal stereochemistry predicted for this complex. The polarised spec- tra have heen interpreted15, using the directions given by the single crystal ESR
. spectra m C,, symmetry. The maximum at 15.0 kK has been assigned as the
&z, d,.: 4 dkr 2 transition and the 11.4 kK band as the dzz 4 dxz.+ transition. A square-based pyramidal CU(NH~)~OH,~ + stereochemistry has been confirmed recently34 for the Cu(NH,),H,O - SO, complex. The crystal structure is not ideal for polarisation measurements as the local molecular tetragonal axes of the four molecules per unit cell are misaligned by 61”. The polarised spectra” are shown in Fig. 15. It consists of a single intense maximum at 17.5 kIC in xy-polarisation which simply loses intensity in z-polarisation. There is some evidence of a weak shoulder at low temperature. Of particular interest is that in going from a tetra- gonal octahedral to a square-based pyramidal tetraammine, Cu(NH&(SCIQ to CU(NH,)~H,O, SO, with a single Cu-ON2 bond of 2.3& the position of the absorption maximum, 17.5 kK, does not change and the position of the low energy band, if anything, has increased in energy not decreased, as found in the pentaammines. Why the presence of a fifth ammonia group should have such a marked effect on the spectrum of the CU(NH,),~+ cation while that of a single water molecule has much less effect, is not clear. The only obvious difference be- tween these two ligands is the z-bonding potential of the water molecule. It may be significant that in the Cu(NH,),HzOZf unit of the sulphate complex the cop- per(I1) ion is lifted 0.2 A out of the plane of the four nitrogen atoms34 towards the water molecule, leaving an “empty space” below the copper(U) ion; the second molecule of water lies at a distance of 3.7 A. It is suggested, in order to account for these results, that the two electrons normally distributed equally in a dz2 orbital above and below the copper ion remain equally distributed in the CU(NH&~~ cation, Fig. 16B. The copper(H) ion then remains situated in the plane of the four nitrogen atoms and the degree of tetragonal distortion (as measured by the energy of the dzz + dxz _y2 transition) is reduced. In the CU(NH&OH~~+ cation
No,N N,o,N 6 N
N/ON N"6‘N l:fN
A. Regulartetragonal 8. In-plane C. Out-of-plane octahedral square-based
pyramidal square-based pyramldal
Fig. 16. The distribution of the electron density in the +-orbital in square-based pyramidal stereochemistries.

COPPER(I1) AMMONIA COMPLEXES 27
the charge distribution is not equal, Fig. 16C, but is mainly distributed below the copper ion which is then displaced out of the plane of the four nitrogen atoms. In this situation, the degree of tetragonal distortion as measured by the energy of the dz2 --, d,z-g2 transition is no longer strictly comparable to that obtained in the tetragonal octahedral complexes. The data in Fig. 15 suggest that the energy of the dz2 + d ,L,,z transition has actually increased in energy relative to that of the tetragonal octahedral case as the copper(U) ion moves out of the plane of the four nitrogen atoms. The possibility that the dzz + dx2_yl transition lies at very much lower energy, namely below 5.0 kK, is ruled out as this would decrease the energy of the d,,, d,,= + dxl _pz transition as well, this being equal to 10D,+&zl _, dX~--y~. The complex Cu(NH,),Ag(SCN), contains probably the best example43 of a “regular” trigonal bipyramidal CuN, chromophore, with all of its trigonal axes aligned parallel. Fig. 17 shows the polarised spectra’ ‘. Two clear bands
t Y”3
I
18 16 14 12 10 8 6
- Energy (kK)
Fig. 17. The pohrised electronic spectra and molecular structure of Cu(NH&Ag(SC2&.
are observed, one at 10.5 kK in xy-polarisation and one at 14.6 kK in x-, y- and z-polarisation. There is also one or possibly two bands in xy-polarisation at ap- proximately 13.3 kK. The single crystal ESR spectrum establishes that the g-value is isotropic within the xy plane. The appearance of three (or possibly four) elec- tronic transitions is surprising as a crystal field model’l would predict only the two transitions d,,,d,, --, dzz and dx~+,dx,, + dz2 with the latter at lower energy. Either a symmetry lower than D3,, (C,, D,, or C,,) is present or spin-orbit coupling is responsible. The possible energy level diagram including spin-orbit coupling” is shown in Fig. 18 along with the polarisations predicted for a Df,, double group.
Coordin. Chem. Rev., 5 (1970) 1-43

28 B. J. HATHAWAY, A. A. G..TOMJ.JNSON
a) Crystal field splittmg Dfh symmetry
b) including out-of- c) including spin- plane TT-bonding orbit coupling
d) El$ion rules 3h
Fig. 18. The one-electron energy levels of the copper(U) ion in a crystal field of a) Da,, sy-mmetry ;
b) including out-of-plane z-bonding; c) including spin-orbit coupling; d) the electronic selection rules in the Dsk double group.
_
As the splitting of the e’ and e” levels by spin-orbit coupling is less than 1.66 and 0.83 kK respectively, the polarised spectra allows the assignment of the band at 14.7 kKas the “r7 - 2r, transition and those at 13.3 and 10.5 kK as the ‘r, f- 2rs transitions. This assignment places the e’ level at higher energy than the e” level contradicting the order suggested by crystal-field calculations”. Some support for this reversal in order has been obtained from the interpretation (in C,, symmetry) of the polarised electronic spectrum of the distorted trigonal bipyramidal complex [Cubipy,I]I which also places the parent e’ level above that of the e” level’ ‘. These results suggest that a substantial amount of z-bonding is affecting the relative positions of the e’ and e” levels. As the ammonia molecule can only function as a
20 16 16 14 12 l0
- Energy(kK)
Fig. 19. The polarised electronic spectrum and molecular structure of CU(NHJ)~(CH&O,),.

COPPER@) AMMONIA COMPLEXES 29
o-bonding ligand, the sc-bonding can only occur through the in-plane thiocyanate ligands, which can It-bond out of the plane through the d,,- and d,,= orbitals. It may be significant that the in-plane copper-nitrogen bonds are the shortest (1.92 & being appreciably shorter than those observed in other nitrogen-bonded copper thiocyanate complexes, l.9936 and 1.97 A”‘.
The polarised single crystal spectra’ ’ of CU(NH,)~(CH,CO,)~ are shown in Fig. 19; the local molecular structure is rhombic, but the two molecules in the unit cel140 are misaligned by 60”. The polarisation data show a main band at 17.5-18.0 kK and a significant shoulder at 15.0 kK. The polarisation data have been tentatively interpreted in D ?,, symmetry with the bands at 17.8, 17.5 and 15.0 kK assigned as the d,=, dpz and d, + d,,_,, transitions, respectively. The position of the dzl + dx2+ transition is less certain but probably lies at 17.5 f 0.5 kK. The high energy of the latter transition reflects the relatively high tetragonal distortion of this complex towards square-coplanarity due to the displacement of the chelate oxygen groups 40” away from the z-axis. The separation of the d, and dyz levels by 0.5 kK reflects a comparable rhombic distortion66 to that present in Ba,Cu(HCO&-4H20.
No polarised single crystal spectra have been obtained for a compressed tetragonal stereochemistry, but preliminary X-ray crystallographic dataZZ have suggested that Cu(NH3),C204 - 2H20 has a compressed rhombic stereochemistry. The single crystal ESR spectrum was not able to contim that this complex has a dz2 ground state. The polarised single crystal spectra are shown in Fig. 20; they closely resemble those of an elongated rhombic Cuo6 chromophore with a dy2_,,2
- Eneqy(kK)
Fig. 20. The polarised electronic spectra and molecular structure of Cu(NHdzCz042H~0.
Cuordin. Chem. Rev., 5 (1970) 143
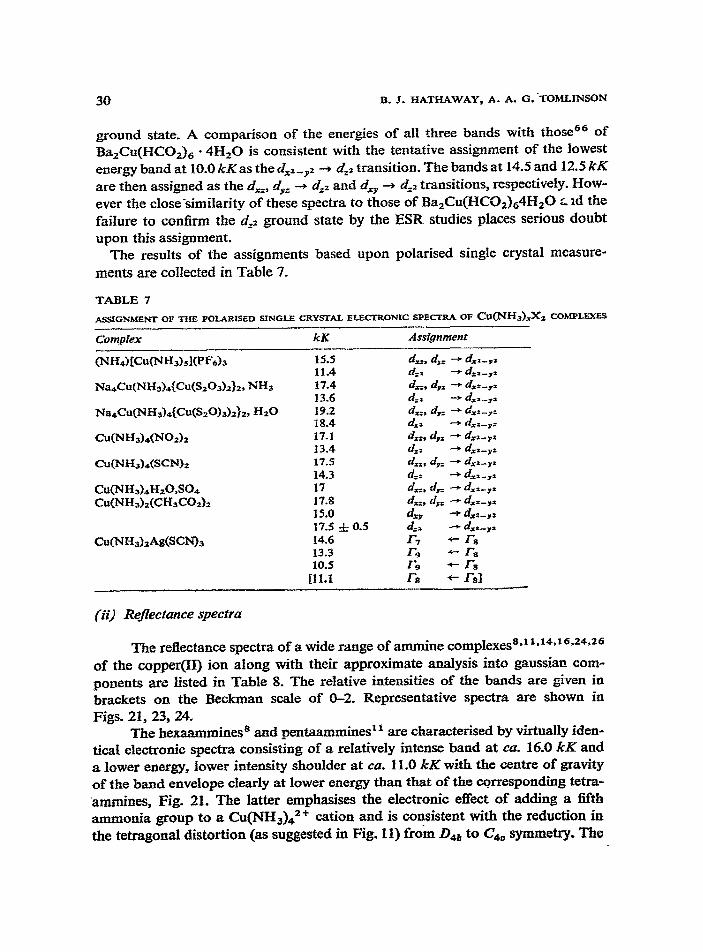
30 B. 3. HATHAWAY, A. A. G. ‘TOMLINSON
ground state. A comparison of the energies of ati three bands with those66 of BazCu(HCOz)B - 4HZ0 is consistent with the tentative assignment of the lowest energy band at 10.0 kK as the d’+ _* z + dzl transition. The bands at 14.5 and 12.5 kK
are then assigned as the d,, dYz --+ dzz and d’ -P dz2 transitions, respectively. HOW-
ever the close-simiiarity of these spectra to those of Ba,Cu(HC02),4H,0 L, ld the faifure to confhm the & ground state by the ESR studies places serious doubt upon this assignment.
The results of the assignments based upon polarised single crystal measure- ments are collected in Table 7,
(ii) Re~ectance spectra
The reflectance spectra of a wide rauge of ammine complexessgX 1y14*1 6*24*26 of the copper ion along with their approximate analysis into gaussian com- ponents are listed in Table 8. The relative intensities of the bands are given in brackets on the Beckman scale of O-2. Representative spectra are shown in Figs. 21, 23,24.
The hexaammines* and gentles” are characterised by virtuahy iden- tical electronic spectra consisting of a relatively intense band at CCI, 16.0 k.K and a lower energy, lower intensity shoulder at cu. 1 LO kK with the centre of gravity of the band envelope clearly at lower energy than that of the corresponding tetra- -ammines, Fig. 21. The latter emphasises the electronic effect of adding a fifth ammonia group to a Cu(NH3)42f cation and is consistent with the reduction in
the tetragonal distortion (as suggested in Fig. II) from D.+* to C,, symmetry. The

COPPER AMMONIA COhfPLEXES 31
24 20 16 12 8
24 20 16 12 8 - Energy(kK)
Fig 21. The electronic reflectance spectra of A, Cu(NH&(BF&; B, Cu(NHI),(BF&; C, CMNHd~Ag(SCN)s ; D, CuenKKU ; E, ICuen2NH3IWld2.
A. Cu bipyz CClO,$ 6. [Cu bipyz I]1 C. [C” bfPy2 (ON08 NO3 Twisted tetragonal Disixx-ted trigcnal Cis-distorted octahedral blpyramidal octahedral
Fig. 22. The moleculx structure of some complexes of the Cubipy,‘+ cation.
* close similarity of the hexaammine and pentaammine spectrais strikingandstrongly suggests that the stereochemistry of the copper(H) ion is similar in both series of complexes. The difference between these spectra and those of a tetragonal octa- hedral stereochemistry for the Cu(NH,),‘+ ion [as in the Cu(NH,),X, complexes], Fig. 21A, argues against this environment for the hexaammines. The possibility of a CU(NH,)~~+ cation being present with a strictly square-coplanar stereoche- mistry is ruled out, by the earlier suggestion that this cation, due to an even higher tetragonal distortion than in the tetragonal octahedral tetmammines, would have an electronic spectrum at even higher energy than that of 17.5 kK shown by
@ordin. Chem. Reu., 5 (1970) l-43

B. J. HATHAWAY, A. A. G. TOMUNSON
, 24 20 16 12 8 24 20 16 12 8
24 20 16 12 6 24 20 16 12 8
- EnergyCkK) - EnergyCkK)
Fig. 23. The electronic reflectance spectra of A, Cubipy,(ClO&; B, [Cubipy2NHs](CI0,&;
C, [Cnbipy~(ON0)lN0~; D, C~W-LLOLCWZ; E, C~(NHS)KOS; F, CU(NHMNWZ. Fig. 24. The electronic reflectance spectra of A, a-Cu(NH&Clz; B, &CLI(NH~)~B~~; C, fi- Cu(NHj)rBrz diluted in NH,Br; D, Cu(NH&C20.,2H20; E, a-Cu(NH&C,O,; F, fl-Cu-
(NH&CKL; G, ~-C~(NH&CZO.S.
the latterr4. The possibility of a trigonal bipyramidal stereochemistry for the common CU(NH~)~‘+ cation of the hexaammines and pentaammines is not sup- ported by the observation17 of a single peak for the trigonal bipyramidal CuN, chromophore known to be present in Cu(NH3)2Ag(SCN),. The band maximum occurs at 12.8 kK at lower energy than the band maximum of the pentaammines, Fig. 21C.
The reflectance spectra of the tetraammines14 are characterised by a single maximum at 17.5 kK of relatively low intensity with occasionally a weak shoulder on the low frequency side, the former is assigned as the d,,, d,= + dxz_y2 transition and the latter as the dzz -P d,,+ by comparison with the single crystal spectra. As the bulk of the intensity resides in the former transition (see polarised spectra) reasonably accurate values for these two transitions may be obtained from these reflectance spectra. ’
Comparable changes in the electronic reflectance spectra are shown by the Cuenz2+ cation56*67 upon addition of a molecule of ammonia24, Fig. 21D and E. The tetragonal octahedral Cuen,X, complexes have a single low intensity band at 19.0 kK. The adducts have a characteristic “pentaammine” type electronic spec- trum, but at slightly higher energy than that of the pentaammines. The electronic spectra of the monoammine adductsZ6 of the Cubipy,‘+ cation are also signifi-

COPPER(U) AMMONIA COMPLEXES 33
cantlydifferent from the parent cation; the latter cannot assume a strictly coplanar conformation due to steric hindrance by the hydrogen atoms73 in the 3,3’ positions of the bipyridyl ligands. In Cubipy,(CIO,), the conformation probably involves a tetragonal octahedral stereochemistry with the bipyridyls twisted out of the plane’ 6, Fig. 22; this twist is exaggerated to give a trigonal bipyramidal stereochemistry74 in [CubipylI]I and a c&distorted octahedral stereochemistry in [Cubipy,(ONO)]- NO,. The close similarity of the reflectance spectra76*26, Fig. 23B, of [Cubipy,I]I and [Cubipy,NH,]ClO, strongly suggest a trigonal bipyramidal stereochemistry (with the iodine atom of Fig. 22B replaced by a molecule of ammonia) for these adducts rather than a square-based pyramid, as suggested for the monoammine adducts of the Cu(NHJdzf and Cuenz2+ cations, a difference presumably im- posed by the steric requirements of the Cubipy22+ cation.
The diammine complexes of the copper(U) ion exhibit the widest range of stereochemistries of any class of ammines due to the involvement of the anions present in coordination to the copper(M) ion. Consequently, they exhibit the widest range of reflectance spectra16. The spectrum of Cu(NH,),Ag(SCN), (Fig. 21C) has been already taken as characteristic” of a trigonal bipyramidal CuN, chro- mophore. The close similarity of the reflectance spectra, Table 8, of Cu(NH3)$04 and Cu(NH3)2SeOJ suggests a similar stereochemistry in these two complexes. The reflectance spectrum of the square-based pyramidal Cu(NH,),CO,, Fig. 23E, shows a relatively intense maximum at 15.75 kK typical of this stereochemistry, but shows no evidence of the low frequency shoulder characteristic of the penta- ammine spectra. This complex has a fifth copper-oxygen bond of 2.57 A compar- able to that in Cu(NH,),H,O,SO, which also failed to produce a “pentaammine” type spectra. In the carbonate the relatively high intensity could be produced by the &-arrangement of the two ammonia groups removing the strict in-plane centre of symmetry. The rhombic diammines, Fig. 23A, show relatively low intensity reflectance spectra, sometimes split into two bands, as in Cu(NH,),(CH,CO,) and Cu(NH3),Iz but occasionally only a single peak at approximately 17.0 kK as in CU(NH,),(SCN)~ and Cu(NH,),(NO,),. Cu(NH,),(NO,),, Fig. 23F, and CU(NH,)~(ONO)~ have single bands at 18.2 and 16.7 kK respectively, consistent with the relative positions of the nitro and nitrito ligands in the spectrochemical series4; both spectra are rather more intense than that predicted for a rhombic stereochemistry, an intensity which may well arise from the close proximity of the ligand charge transfer bands of the nitrite ligands. The interpretation of the chlor- ide and bromide spectra is less clear, Fig. 24. ‘The &chloride and the a- and /I- bromides are characterised by a relatively intense maximum at 14.5kK and a low frequency shoulder at 9.5 kK, whilst a-Cu(NH3)zC1, has a single intense peak at 14.7 kK. AU four spectra lie at rather lower energy than the remaining diammines, this fact and the relatively high intensity of the spectra may be associated with the reversed tetragonal stereochemistry present. The rather complicated number of phases isolated from the Cu(NH3),C204 system has been summarised in Fig. 3.
Coordin. Chem. Rev., 5 (1970) 143

TABLE 8
ELEClXONIC REFLECTANCE SPECTRA (kK) OF Cu(NH&XS COMPLEXES AND IN CERTAIN CASES THEIR
QAUSSIAN COMpONENlS
Complex Electronic spectra Gaussian components
1. CU(N&)BX~ CI- Br- I- cio*- BF,-
2. CU(N~I~)&~ Cl- Br- I- ClO*- BF,- *so,=-
WH~WJ@JH,M(ClO& WII4)CCuCN&M(PKih
3. Cu[NH3).&.. BF,- clod- *s043-
+S042- - Hz0
4. Cu,(NHdmXs Br- I-
5. Cu(NHJzX, a-c1-
i-z;-
B-Br- I- NOz- ONO- NO,- SCN- CH3COI- HCOz- ico32-
#042-
g%O.%2- Q-CMNH&G~~
8-CuWH3K204
y-~~H3)2C204
8c204 3-, 2Hz0 6. [&en, NW,]X,
cl- - Br- I-
g%42- BF*- N03”
7. [Cubipy2NwJ]X2
16.4 11.2 16.2 11.0 15.9 10.5 15.9 11.0 15.6 10.9
16.4 (1.3) 11.4 (0.8) 17.1 13.4 10.2 16.3 (0.8) 11.8 (0.6) 17.0 13.2 10.4 16.1 (1.1) 11.6 (0.8) 16.9 13.2 10.3 15.9 (1.1) 11.2 (0.8) 16.8 13.0 10.0 15.9 (1.2) 11.2 (0.8) 16.8 13.0 10.0 17.0 (0.8) 11.6 (0.3) 17.6 16.2 12.3 15.9 (1.0) 11.2 (0.9) 15.8 13.0 10.4 15.3 (1.0) 11.0 (0.7) 16.5 13.6 10.3
17.3 (1.0) 17.8 (0.9) 17.0 (0.75) 17.5 (0.8)
17.3 sh (1.5) 13.6 (2.0) masked 12.5 (1.1)
14.7 (1.0) 9.6 (0.8) 9.1 (0.7) 9.7 (0.9)
16.0 (0.7) 18.2 (1.3) 16.7 (1.2) 16.4 (0.8) 17.0 (0.5) 15.7 (0.7) 16.1 (1.1) 15.75 (1.4) 12.5 (1.4) 12.5 (1.3) 15.75 (1.1) 15.75 (0.8) 13.5 (0.9) 14.7 (0.6)
14.2 (1.3) 29.0 (1.6) 14.7 (1.1) 23.0 (1.7) 14.5 (1.2) 21.0 18.5 (0.7) 30.0 (1.6) 30.0 (1.6)
17.7 (0.8)
11.4 (0.7) 11.4 (0.5) 9.3 (0.9)
13.5 10.0 (0.3)
17.3 (1.0). 17.2 (0.9) 16.8 (1.4) 16.7 (1.5) 16.5 (1.1) 16.5 (1.7) 16.7 (1.2)
12.2 (0.4) 17.7 (1.0) 14.7 10.8 (0.4) 12.2 (0.5) 17.6 (0.9) 15.1 10.8 (0.45) 12.2 (0.8) 17.5 (1.4) 15.0 10.0 (0.75) 12.2 (1.4) 17.4 (1.4) 14.9 10.0 (1.2) 11.9 (0.6) 17.2 (1.1) 15.1 10.4 (0.6) 12.2 (1.4) 17.2 (1.6) 14.7 10.0 (1.2) 12.5 (1.0) - - -
12.3 (1.0) 12.3 (1.2)

COPPER@) AMMONIA COMPLEXES 35
The reflectance spectra’6 of Cu(NH3)&04, 2Hz0 resemble those of the diam- mine halides and support the compressed tetragonal stereochemistryz2 suggested for this complex. The specta of a- and ~?-CU(NH~)~C~O~, Fig. 24, are of the pentaammine type and support the square-based pyramidal stereochemistry sug- gested for the a-form. The spectrum of y-Cu(NH,),C,O, is unique in giving two almost equally intense peaks at the relatively low energies of 9.5 and 13.5 kK_ This spectrum shows a clear resemblance’g*26 to that of the &-distorted octahedral [Cubipy,(ONO)]NO,, (Fig. 23C) and suggests a similar ‘stereochemistry for the oxalate. Unfortunately, this complex is only obtained as an amorphous powder which prevents single crystal work to confirm this suggestion.
I I I 1 t 0
22 20 16 76 14 12 10 8
- Energ‘/
Fig. 25. The electronic refiectance spectrum of [Cu(NH,),],[Cu(NH,),Br,~Brp.
The reflectance spectrum’ 5 of the decaammine bromide is shown in Fig. 25. It shows a single relatively intense maximum at 13.3 kK and a substantial, high frequency shoulder, at 17.6 kK. This is interpreted in terms of a mixed stereo- chemistry in these complexes, namely, a tetragonal octahedral tetraammine plus a trigonal bipyramidal diammine and suggests the formulation: [Cu(NH,),],-
ICu(NH3Mh1Br3. The polarised single crystal and reflectance spectra establish a reasonably
consistent sequence of energy levels for the copper(I1) ammine complexes of dif- ferent stereochemistries. The results substantiate the one-electron levels in Fig. 11 for the copper ion in a nitrogen environment using the above experimental values. For the diammines, ligands other than ammonia such as oxygen and halide ions are present and the observed energies will be lower because of this.
Coodin. Chem. Rev., 5 (1970) 143

36 8. J. HATHAWAY, A. A. G. TOMLINSON
H. ORBITAL REDUCTION FACTORS
When both the g-values and the assignment of the electronic spectra for an axial copper(H) complex are known accurately, it should be possible to determine the combined orbital and spin-orbit reduction parameters66*77, k, from the ex- pressions given in Table 5. The only ammine complexes for which sufficientIy accurate data are available are the tetraammines14. The k-values obtained are listed in Table 9 along with the moIecuIar orbital coefficients estimated from them. The more accurate values all lie between 0.73478 and, where known, k,, x k, (as found in the Cuen,X, complexes56*6 ‘). As the energies of the d,,,d,, + d,z._, z transitions are most accurately known, the values of k, are generally more reliable
TABLE 9
COMBINED ORBITAL AND SPIN-ORBIT REDUCTION PARAMETERS kL AND k,, AND THE hIOLECULAR
ORBITAL COEFFICIENTS C?, j?, AND &
Compound
Na4Cu~H3),(Cu(SzOj)~~~, I-MB, Na4Cu(NH3),{Cu<SZO3)2)2, NH3 Cu(NH,),(CuB~z)z, Hz0 CU(NH,),WA)Z Cu(NH,)&CNL Cu(NH ) H 0 SO* 34 2 I Cu(NHdAiz(SW~ ku = a - h klma-$
kt, k.l a B h
0.76 0.78 0.78 2.0 2.0 0.78 0.77 0.78 2.0 1.0 0.6.5-0.76 0.73 - - -
0.75 0.73 0.75 0.98 <I.01 0.74 0.76 0.74 1.0 (2.0) - 0.76 - - -. - 0.67 - - -_
than those of kll. Notwithstanding this, there appears to be no obvious relation- ship between the k-values and the lengths of the in-plane Cu-N bonds. In order to estimate the molecular orbital coefficients it is necessary to assume that pl, (representing the in-plane rc-bond coefficient) equals one. It is then possible to estimate cc, the in-plane a-bonding coefficient, and /I the out-of-plane z-bonding coefficient. In the four complexes for which the k values are accurately known, the estimated coefficients indicate substantial in-plane o-bonding and very little out-of-plane z-bonding. Comparable results have been found for the Cuen,X, complexes 56.57. In the trigonal bipyramidal complexes, only the value of k, is obtained, in the case of Cu(NH3)2Ag(SCN)3 this equals 0.67 and is appreciably lower than the value of k, in the axial system above. Assuming that k, is still a measure of the a and p molecular orbital coefficients the value of 0.67 is consistent with the presence of appreciable out-of-plane z-bonding as was required above to expIain the order of the e’ and e” levels.

COPPER@) AMMONIA COMPLEXES 37
I. INFRARED SPECTRA
(i) Ammonia vibrations
Table 10 summarises the ammonia and copper-nitrogen band frequencies of the ammines of copper( The ammonia vibrations change very little upon coor- dination’s, but there is a systematic variation7’ in the frequencies of the asym- metric deformation a,, - 1600 cm-‘, the symmetric deformation &, 1180 cm-l and the rocking mode p,. 650 cm-l in a series of M”(NH&Cl, complexes [from iron(H) to zinc(H)], Table 1 I. The frequencies all increase to a maximum at copper and fall again to zinc. This sequence is said to reflect the Irving-Williams * Series”: this may be true for the complexes excluding copper(H), but the previous data8*” have demonstrated that Cu(NH,),Cl, should be formulated as a pen- taammine rather than a hexaammine. The sequence probably reflects the increase in the metal nitrogen bond strength from manganese to nickel due to a decrease in ionic size of the divalent ions. The significantly larger jump in frequency from
TABLE 10
SOME INFRAREDASSIGNMENTSFOR Cu(NHI),X2 COMPLEXES (CM-‘)
NH3 NH3 NH3 Ci-N N-Cu-N asymmetric symLetric rocking stretching bending defotmation deformation
Hexaammines’* 1609-l 587 1229-1223 732-694 522-510 - 1105-1087 406-399 1058-1013
Pentaammines” 1645-1595 1302-1230 742-716 537-509 264-230 1272-1087 420-390
Tetraammines’* 1635-1590 1300-1240 725-680 4fiO-408 250-232 Diamrnines16 1673-1585 1310-1227 755-700 500-437 268-220
685-640
TABLE 11
SOME INFRARED DATA FOR THE SERIES ".'S MI1(NH&CIZ, Mn” -Zn”
NH3 degen. deform.
NH3
Mn
1592
Fe
1597
sym. deform. 1134 1151
NHo rocking 617 641
M-N stretching 307 321
co Ni cu ZIl
1602 1607 1609 1596
1229 1163 1175 1087 1145
1013
654 650 732 645 519
327 334 406 300
Coordin. Chem. Rev., 5 (1970) l-43

38 B. J. HATHAWAY, A. A. G. TOMLINSON
the nickel(I1) to the copper(I1) complex reflects the formation of an even shorter copper-nitrogen bond due to the formation of a tetragonally distorted (rather than regular octahedral) stereochemistry in which four significantly shorter in- plane bonds are formed.
This difference is also noticed in the sequence of metal-nitrogen frequencies in the series in Table 11, where there is an increase of only 27 cm- ’ from manganese to nickel, but then one of 72 cm-r from nickel to copper.
The close similarity of the infrared spectra of the hexaammines and penta- ammines and their difference from the tetraammines, again emphasises the simi- larity in stereochemistry of the copper(H) ions present in both series of complexes (see copper-nitrogen vibrations).
The symmetric deformation mode is split into three components, 1229, 1087, 1013 cm-’ in the hexaammines’g, into two, 1225, 1087 cm-l in the penta- ammines’l, and appears as a singIe peak at 1230 cm-’ in the tetraammines’ ’ and diammines16. This splitting is consistent with a single type of short copper- nitrogen bond in the tetraammines, a short type and a long type of copper- nitrogen bond in the pentaammines and an additional even longer type of copper- nitrogen bond in the hexaammines, which may reasonably be considered to involve ammonia in the crystal lattice. What is surprising in view of this sensitivity of S, to stereochemistry is the small variation it shows within the tetraammine and diammine series. Bond length data are available in both series but there seems to be a complete absence of any correlation between these and the observed frequencies.
(ii) Copper-nitrogen vihations
These would be expected to give rise to more specific stereochemical infor- mation. The metal-nitrogen bending modes all appear in the region 250-300 cm-’ irrespective of the stereochemistry present 78. The copper-nitrogen stretching modes are more variable. In the tetraammines’ ‘, a band at 408440 cm- ’ is assigned as the E,, v=-_~ with the rather high frequency being due to the shorter bonds in copper complexes relative to those of other metals in Table 11. Thus the complex Na,Cu~~H,),(Cu(S,O,)~}~NH~(Cu-N, 1.99 A) absorbs at 436 cm-’ while Cu(NH,),H,O, SO.+ (Cu-N, 2.03 A) absorbs at 423 cm-’ Na,Cu(NH,), {CU(S~O&~, H,O absorbs at 455 cm-’ suggesting a copper-nitrogen bond length of less than 1.99 A consistent with the more nearly square-coplanar stereo- chemistry suggested to be present by the electronic properties. The rhombic tetraammine, Cu(NH,),(CuI,), with two different in-the-plane copper-nitrogen bonds of 2.11 and 2.17 A absorbs at 427 and 437 cm-‘. The pentaammines” are characterised by two bands in this region, a medium intensity one at 390420 cm-l and a broader band at 509-537 cm- ‘. Both have heen tentatively assigned as copper-nitrogen stretching modes. The band at 400 cm-r is assigned as the

COPPJZR(I1) AMMONIA COMPLEXES 39
asymmetric copper-nitrogen stretching vibration which has moved to slightly lower energy than the corresponding band in the tetraammines. This is consistent with the slight increase in copper-nitrogen bond length in this in-plane square- based pyramidal complex, in which the tetragonal distortioni is not too pronounc- ed (see crystallography section). The band at 520 cm-’ is assigned as the symmetric copper-nitrogen stretch of the relatively long fifth (apical) copper-nitrogen bond. Some support for this assignment is the observation24 of a band at a similar frequency in the [Cuen,NH,]X, complexes which has also been assigned a square-based pyramidal stereochemistry. The infrared spectra” of the hexaam- mines in this region are also seen to be closely comparable to that of the pentaam- mines, consistent with their formulation as Cu(NH,),X,NH,.The infrared spectrum of (NH,)[Cu(NH,),](ClO,), with two bands at 536 and 417 cm-‘, is typical of a pentaammine rather than of a tetraammine. (NH,)[Cu(NH,),](PF,), is unique’ ’ in only having a single peak at 485 cm-‘, the reason for this is not under- stood.
The diamines16 are characterised by single bands in the regions 437-500 cm-’ and 20-268 cm- ‘. The former has been assigned as the assymmetric stretch of the linear CU(NH~)~~+ unit. In the diammines the copper-nitrogen bond lengths vary from 1.93-2.03 A but there appears to be no correlation between the length of the copper-nitrogen bond lengths and the frequency of the vcu-_N band. Equally, the energy of the v=“_~ mode of the linear CU(NH~)~‘+ does not appear to vary significantly with the overall stereochemistry of the copper(H) ion.
In the complex Cu(NH&COf where the two ammonia groups have a &-configuration, the infrared spectral6 show two bands at 432 and 460 cm-’ which have tentatively been assigned as the symmetric and asymmetric stretching modes of the cis-Cu(NH,?, group.
(iii) Polyatomic anion spectra
The infrared spectra of the polyatomic anions preseut in transition metal com- plexes may be used as criteria of their coordination. The tetrahedral symmetry (TJ of the perchlorate”, tetrafluoroboratesl and sulphatea2 ions is lowered to CJU symmetry when they act as monodentate ligands and to C,, symmetry when they act as bidentate ligands. These different symmetries are reflected in the successive splitting of the triply degenerate v3 mode of the free ions and in the symmetric stretching vl mode becoming infrared active. Thus the infrared spectra of Cu-
(NH3),(C104)211 and [Cuen2NH3](C104)224 both indicate the presence of a free perchlorate ion and hence suggest that the cations are strictly five coordinate and do not involve coordination of the perchlorate ion in the sixth coordinate position. The infrared spectra* ‘, Fig. 26, of CU(NH,),(CIO~)~ and Cu(NH,),SO, show clear evidence of splitting intermediate between that of the ionic and fully coor-
Coordin. Chem. Rev., 5 (1970) 143

B. J. HATHAWAY, A. A. Ci. TOMLINSON
Fig. 26. Thepolyatomic anion infrared spectra of Cu(NH&X2 complexes: A, Cu(NH&(ClO&;
B, ‘WNHaMO,.
dinated anions, indicative of weak or semi-coordination46s56 and suggest the presence of a tetragonal octahedral stereochemistry, as indicated by the electronic properties of these complexes.
In the diamminel’ complexes of copper(U), the coordination number of the copper ion is increased above two by the coordination of the anions present. If these anions are polyatomic then their infrared spectra can give evidence of their coordination to the copper@) ion. In Cu(NH,)&O,, anion bands at 1560-1520, 1285-1260, 765 and 702 cm-’ are consistent with the presence of a bidentate carbonato group”, rather than a monodentate or ionic carbonate group. Cu- (NH,),(NO,), occurs in two forms, the one involving nitro-coordination” having infrared bands at 1360 and 1325 cm-‘, assigned as the assymmetric and symmetric stretching modes of the coordinated nitro group. The second form has bands at
1368 and 1161 cm-’ consistent with nitrito coordination”.
3. CONCLUSION
This article has reviewed, for the various ammines of the copper(U) ion, their rather complex preparative chemistry, X-ray crystallographic structures, ESR, electronic and infrared spectra. The above results have shown that useful stereochemica1 information may be obtained from a complementary examination of the electronic properties of the copper(I1) ion in its complexes. The most im- mediately informative and easily measured electronic property is that of the electronic reflectance spectra. By comparing the spectra of a series of copper complexes with the same Iigand, in the present article ammonia, it is possible to

COPPER(l1) AMMONIA COMPLEXES 41
distinguish at least six of the more common stereochemistries of the copper(I1)
tion, Fig. 7. The ESR spectra have proved invaluable for establishing the electronic ground state and in particular for distinguishing between a dX+_Y2 or a dzT ground state. The measurement of the polarised single crystal spectra of copper(H) complexes, has established at least a partial one-electron orbital sequence for the copper(U) ion in tetragonal octahedral, trigonal bipyramidal and rhombic stereo- chemistries.
This review has emphasised the limitations of much of the crystallographic data that exists in the literature. In the case of the copper(I1) ammines, it has raised serious doubts oncerning the ability of the CU(NH&~~ cation to exist in a strictly square-coplanar stereochemistry. A great deal more work needs to be carried out on the measurement of the polarised single crystal spectra of copper(I1) complexes with the emphasis placed on measuring a closely related series of com- plexes in each case. More spectra are required of square-based pyramidal com- plexes, with the copper ion both in- and out-of-the plane of the four coplanar ligands. Virtually no data exist on complexes with a compressed tetragonal or rhombic stereochemistry. An attempt to rectify some of these deficiencies is being carried out in the above laboratories.
ACKNOWLEDGMENT
Permission of the Chemical Society to reproduce Figs. 12,13,17,18,23 and
24 is acknowledged.
REFERENCES
1
2 3 4
10 11 12 13 14
J. BJEruzunr, Metal Ammine Formation in Aqueous Solution, Haase, Copenhagen, 1941, (reprinted 1957). Stabiiity Constants of’MetaI Zon Complexes, Chem. Sot. Special Publ., NO. 17 (1964). J. BJERRUM, C. J. BALLHAIJSEN AND C. K. JBRGENSEN, Acta. Chem. Stand., 8 (1954) 1275. C. K. JORGENSEN, EIectronic Spectra and Chemical Bonding in Complexes, Pergamon, Oxford, 1962. J. BJERRUM, Kgl. Danske Videnskab. Selskab, Mat.-fys. Medd., 12 (1954) No. 15. G. PEYRONEL, Gazetta, 71 (1941) 363. T. DISTLER AND P. A. VAUGHAN, Inorg. Chem., 6 (1967) 126. H. ELLIOTAND B. J. HATMAWAY,ZMW~. Chem., 5 (1966) 885. S. HARKEMA, B. NIELKVENHYSE, D. FIEL AND P. J. GELLING, 9th I.C.C.C. St. bforitz, (1966)
397. F. EPHRAIM, Ber., 52 (1919) 940. A. A. G. TOMLINSON AND B. I. ~THAWAY, J. Chem. Sot. (A), (1968) 1905. D. W. HORN, Amer. Chem. J., 36 (1907) 184. J. P. SMITH AND W. W. WENDLANDT, J. Inorg. Nucl. Chem., 26 (1964) 1157. A. A. G. TOMLMSO~, B. J. HATHAWAY, D. E. BILLING AND P. NICHOLLS, J. Chem. Sot. (A), (1969) 65.
Coordin. Chem. Rev., 5 (1970) 1-43

42 B. J. HATHAWAY, A. A. G. TOMLINSON
15 16 17
18 19 20 21 22 23 24 25 26
27 28 29 30 31 32 33 34 3s 36
37 38 39 40
41 42 43 44 45
46
47 48 49 50 51 52 53
54
Y. A. SI~~ONOO, A. V. Asroo AND T. I. MOLINOSKI, Kristallografiya, 8 (1963) 205; M. Bu- KOWSKA-STRZYZEWSKA, Roczniki Chemii., 40 (1966) 711. F. HANIC, Acud. Sri. Hung., 32 (1962) 305. F. HANIC, Absrrucfs 7rh -IC.C.C., (1962j 78; Chem. Zcesti, 17 (1963) 365. J. HUANG, J. Lr AND J. Lu, Acfa Chem. Sin.&., 32 (1966) 162. M. BUKOSKA AND M. A. PORAI-KOSHITS, Kristallograflya, 5 (1960) 140.
N. W. ISAACS, C. H. L. KENNARD AND D. A. WHEELER, Chem. Commun., (1967) 587; N. W. ISAACS AND C. H. L. KENNARD, J. Chem. Sot. (A/, (1969) 386. D. S. BROWN, J. D. LEE, B. G. A. MELSOM, B. J. HATHAWAY, I. M. PROCTER AND A. A. G. TOMLINSON, Chem. Commun., (1967) 367. L. H. DAHL, personal communication to M. R. TRUTER, J. Chem. Sot. (A), (1967) 309. D. W. SMITH, Inorg. Chem., 5 (1966) 885. H. ELLIOT, B. J. HATHAWAY AND R. C. SLADE. Inorg. Chem., 5 (1966) 669. LANDOLT-BORNSTEIN, New Series, Group II, Vol. 2, Springer, Berlin, 1966, p. 362. B. N. FIGGIS AND J. LEWIS, Progr. Inorg. Chem., 6 (1964) 37. B. N. FIGGIS, M. GERLOCH, J. L~vrs AND R. C. SLADE, J. Chem. Sot. (A), (1969) 2028. D. E. BILLING, R. DUDLEY, B. J. HATHAWAY, P. NICHOLLS AND I. M. PROCIER, J. Chem. Sot. (A), (1969) 312. C. J. BALLHAUSEN, Introduction to Ligund Field Theory, McGraw-Hill, New York, 1962, p. 134.
55 D. E. BILLING AND B. J. HATHAWAY, Coordin. Chem. Rev., 5 (1970) 143. 56 I. M. PROCTER, B. J. ~THAWAY AND P. NICHOLLS, J. Chem. Sot. (A), (1968) 1678. 57 D. E. BILLING AND B. J. HATHAWAY, J. Chem. Phys., 50 (1969) 1476; 2258. 58 B. J. J!LQHAWAY AND R. C. S-E, J. Chem. Sot. (A), (1968) 85. 59 F. K. KNEUBUHL, J. Chem. Phys., 33 (1960) 1074. 60 K. I. SUMARAEV AND N. N. TIKHOMIROVA, Zhur. Strukt. Khim., 5 (1964) 691. 61 D. E. BILLING, B. J. HATHAWAY AND A. A. G. TO~~SON, unpublished results.
A. A. G. TOMLINSON, Ph. D. Thesis, University of Essex, 1968, and unpublished results. A. A. G. TOMLMSON AND B. J. HATHAWAY, J. C&m. Sot. (A/, (1968) 2578. R. C. SLADE, A. A. G. TOMLINSON, B. J. HATHAWAY AND D. E. BILLING, J. Chem. Sot. /A), (1968) 61. J. GARAJ, Chem. Zvesti., 17 (1963) 488. F. H&X, Acta Cryst., 12 (1959) 739. F. HANK AND A. CAKAJDOVA, Acra. Crust., 11 (1958) 610. J. GAZO. Chem. Zuesti., 20 (1966) 3. J. GARAJ, Chem. Commun., (1968) 904. W. LANGE, Ber., 59 (1926) 2107. A. A. G. TOMLINSON AND B. J. HATHAWAY, 3_ Chem. Sec. (A), (1968) 1685. C. M. HARRIS, T. N. LOCICYER AND H. WATERMAN, Narttre, 192 (1961) 424. B. J_ HATHAWAY, I. M. PROCTER, R. C. SLADE AND A. A. G. TOMLINSON, J. Chem. Sot. (A), (1969) 2219. A_ FERRARI, A. BRAIBANTS AND A_ TIRIPICCHIO. Acta Cryst-, 21 (1966) 605. B. MOROSIN AND A. C. LARSON, Acfu Cryst., 25B (1969) 1417. B. J. HATHAWAY AND F. S. STEPHENS, J. Chem. Sot. (A), accepted for publication. A. BAGLIO, Thesis, Rutgers, The State University (1965). M. BUKOSKA AND M. A. PORAI-KOSH~, Kristallogra$ya, 5 (1960) 137. M. BUKOSKA AND M. A. PORAI-KOSHITS, Zhur. Srrukt. Kbim., 7 (1961) 712. F. MAZZI, Acru Crysr., 8 (1955) 137. B. MOROSIN, Acru Cryst., 24 (1969) 19. M. A. PORAI-KOSHITS, Zhur. Strukt. Khim., 4 (1963) 584. J. GARAJ, Inorg. Chem., 8 (1969) 304; and see M. DUNAJ-JURCZO AND M. A. PORAI-KOSHITS, Chem. Zuesti., 20 (1966) 241. L. Z~OLDOS, Mugyaf Fis. Zolyoirur, 10 (1962) 189. F. HANIC, Absfrucrs, 5rh I.C.C.C. (London), (1959). J. GARAJ, Ctiem. Zvesti., 17 (1966) 727.

COPPER@) AMMONIA COMPLEXES 43
62 R. L. BELFORD, M. CALVIN AND G. BELFORD. J. Chem. Phys.. 26 (1957) 1165; L. L. FUNCK AND T. R. ORTO LANO, Inurg. Chem., 7 (1968) 567.
63 B. J. HATHAWAY, P. NICHOLLS AND D. BARNARD, Spectrovision, 22 (1969) 4. 64 C. FURLAN I, E. CERVONE, F. CALZENA AND B. BALDANZO, Theor. Chim. Acfu (Eerl.), 7
(1967) 375. 65 R. A. PALMER AND T. S. PIPER, Inorg. Chem., 5 (1966) 864. 66 D. E. BILLING AND B. J. HA-WAY, J. C&m. Sue. (A), (1968) 1516. 67 D. E. BILLING, B. J. IFATHAWAY, P. NICHOLLS AND I. M. PROCTER. J. Chem. Sot. (A),
(1969) 319. 68 D. E. BILLING, B. J. HATHAWAY AND P. NICHOLLS, I. Chem. Sx. (A), (1969) 3 16. 69 I. M. PROCIER,B.J_ HATHAWAY, D.E.B~LLING,R. DUDLEY AND P.Nrc~orrs, J. Chem.
Sot. (A). (1969) 1192. 70 N. S. HUSH AND R. J. M. HOBBS, Progr. Inorg. Chem., 10 (1968) 259. 71 Ref. 54; A. L. COMPANION AND M. A. KOMAR~SKY, J. Chem. E&c., 41(1964) 257; C. FUR-
LANI, Coordin. Chem. Rev.. 3 (1968) 141: P. DAY, Proc. Chem. Sot.. (1964) 84: S. T. SPEES. JR.,J.R.PERUMAREDDIANDA.W.ADAMSON, J.Phys. Chem.,72(1968)1822.
72 C. A. L. BECKER, D. W. MEEK AND T. M. DUNN, J. Phys. Chem., 72 (1968) 3588. 73 F. P. D‘IKYER, H. A. GOODWIN AND E. C. GY~AS, AIM. J. Chem., 16 (1963) 544; E. D.
MCKENZIE, Ph. D. Thesis, University of New South Wales, 1962. 74 G. A. BARCLAY, B. F. HOSKINS AND C. H. L. KENNARD, J. Chem. Sue., (1963) 5691. 75 I. M. PROCZR AND F. S. STEPHENS, J. Chem. Sot. (A), (1969) 1248. 76 H. ELLIOT AND B. J. HA~WAY, J. Chem. Sac. (A), (1966) 1443. 77 M. GERLOCH AND J. R. MILLI%, Progr. Znorg. Chem., 10 (1968) 1. 78 K. NAICAMOTO, Infrared Spectra of Inorganic and Coordination Compounds, John Wiley and
Sons Inc., New York, 1962. 79 L. SACCONI AND A. SABATINI, Abstracts 7th I.C.C.C., (1962) 13.
_ 80 B. J. HATHAWAY AND A. E. UNDERHILL, J. Chem. Sue., (1961) 3091. 81 B.J.HATHAWAY AND D.E.WEBSIER, Proc. Chem_Soc.,(1963)14. 82 K. NAKAMOTO,J. FU~A,S.TANAKAAND M.KOBAYASKI, .T. Amer. Chem. Soc.,79(1957)
4904.
Coordin. Chem. Rev., 5 (1970) 1-43


