Embed Size (px)
Citation preview
ESTABLISHMENT OF AIS MANUFACTURING: MAKER OF CORN HUSK STUFFORGANIZER AT SAN CARLOS, LIPA CITY
A Feasibility Study Presented toThe Faculty of College of Accountancy Business and Economics
Batangas State UniversityDon Claro Mayo Recto Campus
Maraouy, Lipa City
In Partial Fulfillment of the Requirements for the DegreeBachelor of Science in Business Administration
Major in Marketing Management
Andal, Maribel A.Benedicto, Leiwiehilda S.
Gulla, Mary Rose P.Lucero, Cristine L.
October 2013
APPROVAL SHEET
In partial fulfillment of the requirements for thedegree of Bachelor of Science in Business Administrationmajor in Marketing Management, this project feasibilitystudy entitled “ESTABLISHMENT OF AIS MANUFACTURING: MAKER OFCORN HUSK STUFF ORGANIZER AT SAN CARLOS, LIPA CITY”,prepared and submitted by Maribel A. Andal, Leiwiehilda S.Benedicto, Mary Rose P. Gulla and Cristine L. Lucero hasbeen submitted and recommended for acceptance and approvalfor Oral Examination.
__________________________ROSELLE B. TIBAYAN, MBA
Adviser
Approved by the Committee of Oral Examination with a gradeof ____.
PANEL OF EXAMINERS
______________________________CARMELA S.MACATANGAY, MBA
Chairman
JERRY P. LUMBERA LUCILA V. HERNANDEZ, CPA
Member Member
Accepted and approved in partial fulfillment of therequirements for the degree of Bachelor of ScienceinBusiness Administration Major in Marketing Management.
____________________________________________Date MICHAEL C. GODOY, MBA
Dean of Colleges
ACKNOWLEDGEMENT
The proponents would have never been able to finish
their feasibility study without the guidance of their dean,
associate dean, adviser, support from family, friends and
classmates, help from their panels, grammarian, different
offices, their respondents and retailers, support from
school, and lastly, from our Almighty God.
The proponents would also want to thank their Associate
Dean, Mr. Sandy Gonzales, for advises and ideas he had
shared for the betterment of the study.
Also, the proponents want to express their sincere
gratitude to their adviser, Ms. Roselle B.Tibayan for her
continuous support to their feasibility study, for her
patience, motivation, enthusiasm, and immense knowledge. Her
guidance helped the proponents in the entire days of
research and writing of the feasibility study. The
proponents could not have imagined having a better adviser
and mentor for this study.
The proponents also wish to thank the members of their
panel, Ms. Carmela Macatangay, their chairman and its
members Mr. Jerry Lumbera and Ms. Lucy Hernandez for giving
suggestion for the betterment of the study.
The proponents also wish to thank Batangas State
University for imparting knowledge that greatly helps them
not only for the pursuance of the study but also for dealing
in day to day challenges of their life.
To their grammarian, Ms. Kathrina Perez for sharing
her knowledge and for making the study grammatically
correct.
To the different offices which provided the proponents
with different information crucial in the pursuance of the
study.
To the respondents and retailers for the ideas they
shared for the betterment of the study and for the time they
allocated in answering questionnaire provided by the
proponents which served as the basis of their study.
To their friends and classmates for believing that the
proponents can finish the feasibility study before the date
of submission and for all their insightful comments.
To their families for their generous support,
encouragement and inspiration. Also, for morally uplifting
the proponents and for the financial support granted for the
study.
Lastly, to Our Almighty God for helping them and
enabling them to carry out the study. Also, for all the
grace and guidance they receive upon completion of the
study.
Maribel A. Andal
Leiwiehilda S. Benedicto
Mary Rose P. Gulla
Cristine L. Lucero
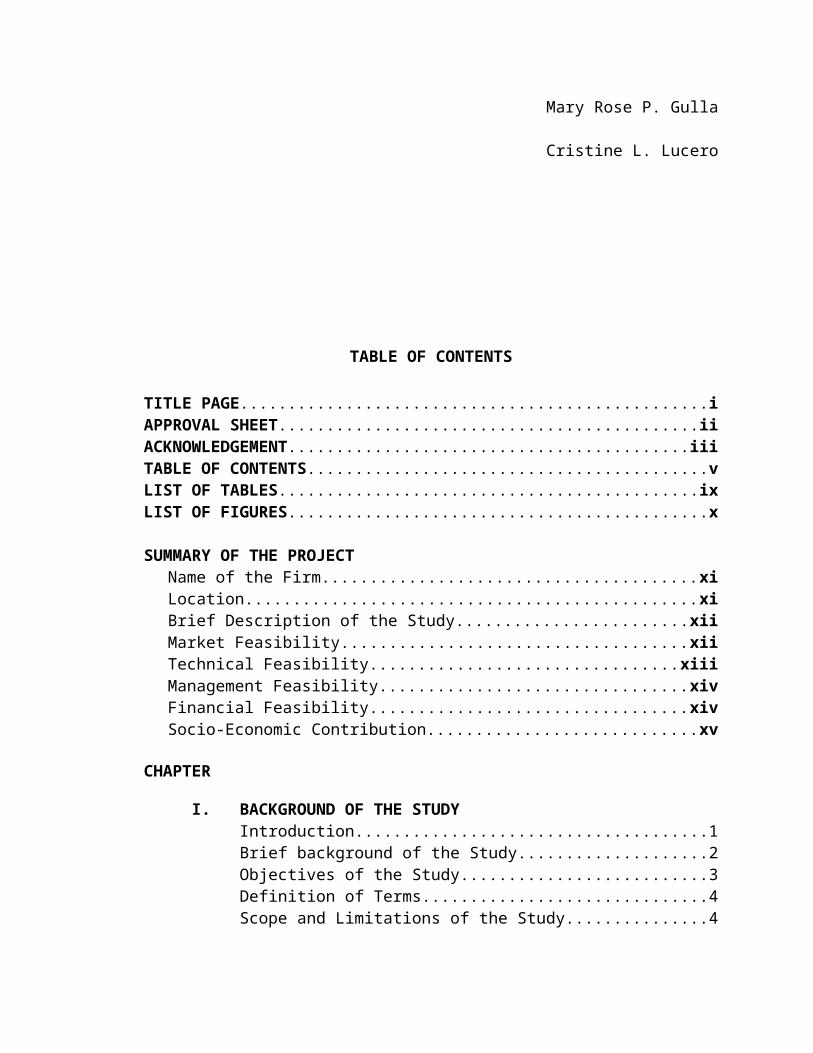
TABLE OF CONTENTS
TITLE PAGE.................................................iAPPROVAL SHEET............................................iiACKNOWLEDGEMENT..........................................iiiTABLE OF CONTENTS..........................................vLIST OF TABLES............................................ixLIST OF FIGURES............................................x
SUMMARY OF THE PROJECTName of the Firm.......................................xiLocation...............................................xiBrief Description of the Study........................xiiMarket Feasibility....................................xiiTechnical Feasibility................................xiiiManagement Feasibility................................xivFinancial Feasibility.................................xivSocio-Economic Contribution............................xv
CHAPTER
I. BACKGROUND OF THE STUDYIntroduction.....................................1Brief background of the Study....................2Objectives of the Study..........................3Definition of Terms..............................4Scope and Limitations of the Study...............4
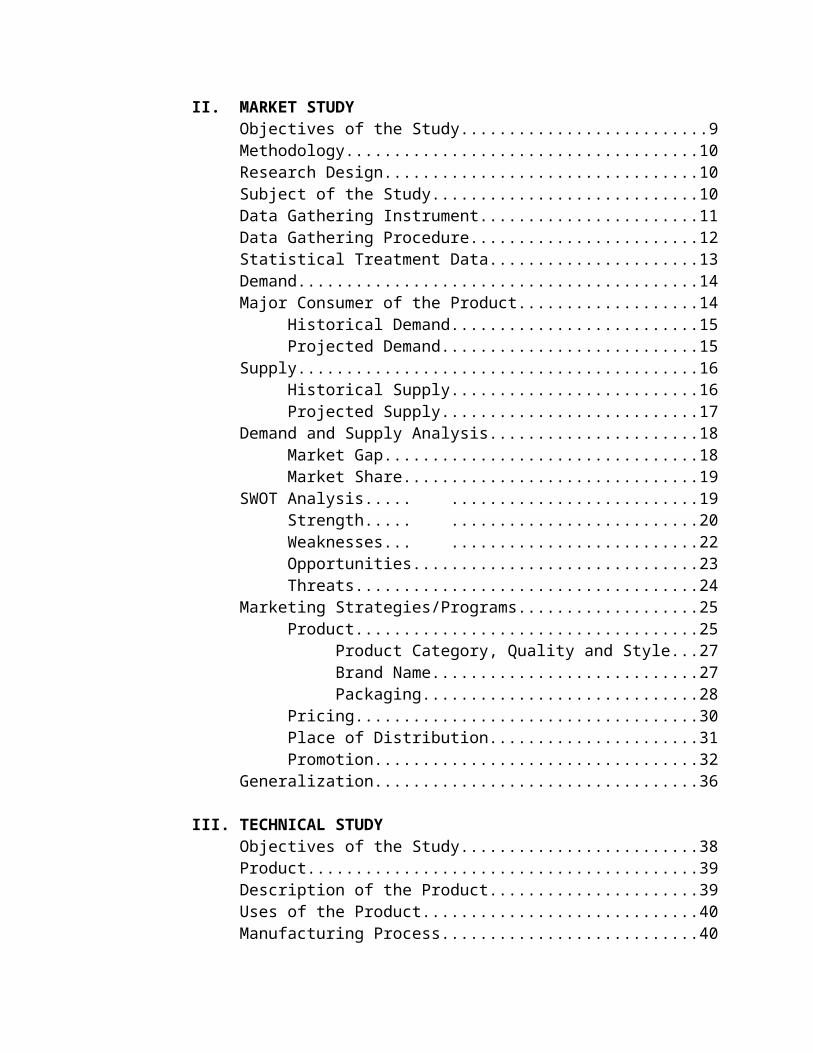
II. MARKET STUDYObjectives of the Study..........................9Methodology.....................................10Research Design.................................10Subject of the Study............................10Data Gathering Instrument.......................11Data Gathering Procedure........................12Statistical Treatment Data......................13Demand..........................................14Major Consumer of the Product...................14
Historical Demand..........................15Projected Demand...........................15
Supply..........................................16Historical Supply..........................16Projected Supply...........................17
Demand and Supply Analysis......................18Market Gap.................................18Market Share...............................19
SWOT Analysis...................................19Strength...................................20Weaknesses.................................22Opportunities..............................23Threats....................................24
Marketing Strategies/Programs...................25Product....................................25
Product Category, Quality and Style...27Brand Name............................27Packaging.............................28
Pricing....................................30Place of Distribution......................31Promotion..................................32
Generalization..................................36
III. TECHNICAL STUDYObjectives of the Study.........................38Product.........................................39Description of the Product......................39Uses of the Product.............................40Manufacturing Process...........................40
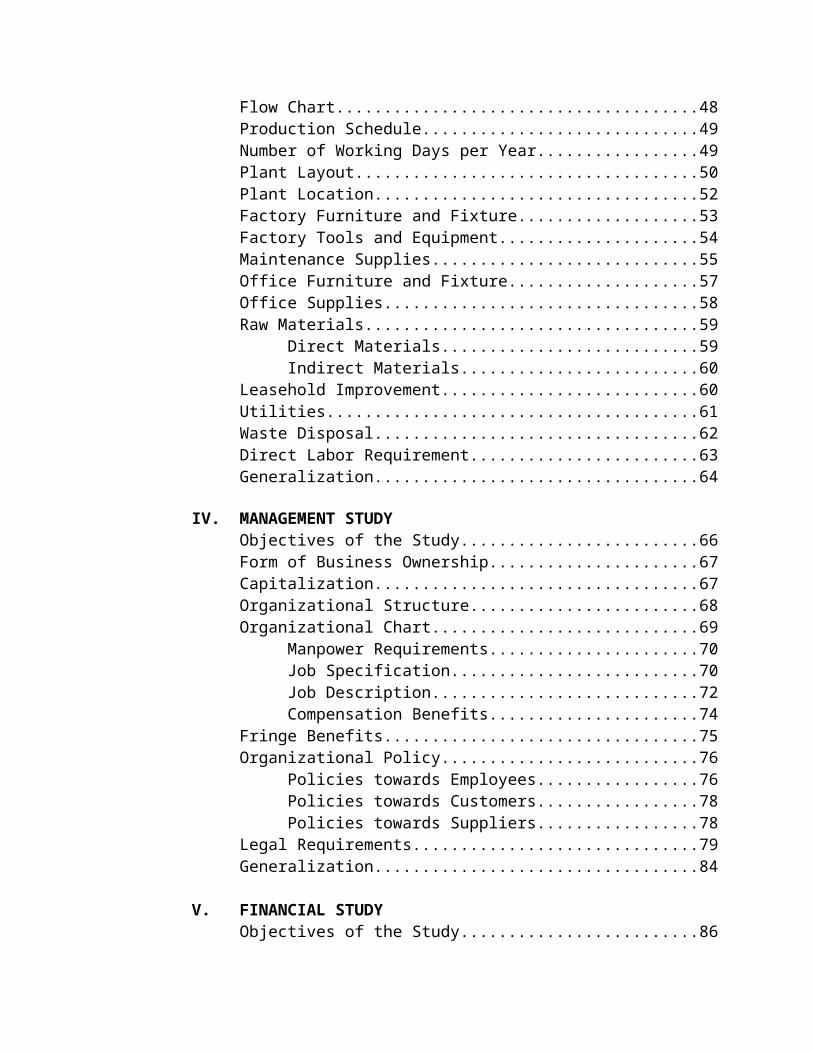
Flow Chart......................................48Production Schedule.............................49Number of Working Days per Year.................49Plant Layout....................................50Plant Location..................................52Factory Furniture and Fixture...................53Factory Tools and Equipment.....................54Maintenance Supplies............................55Office Furniture and Fixture....................57Office Supplies.................................58Raw Materials...................................59
Direct Materials...........................59Indirect Materials.........................60
Leasehold Improvement...........................60Utilities.......................................61Waste Disposal..................................62Direct Labor Requirement........................63Generalization..................................64
IV. MANAGEMENT STUDYObjectives of the Study.........................66Form of Business Ownership......................67Capitalization..................................67Organizational Structure........................68Organizational Chart............................69
Manpower Requirements......................70Job Specification..........................70Job Description............................72Compensation Benefits......................74
Fringe Benefits.................................75Organizational Policy...........................76
Policies towards Employees.................76Policies towards Customers.................78Policies towards Suppliers.................78
Legal Requirements..............................79Generalization..................................84
V. FINANCIAL STUDYObjectives of the Study.........................86
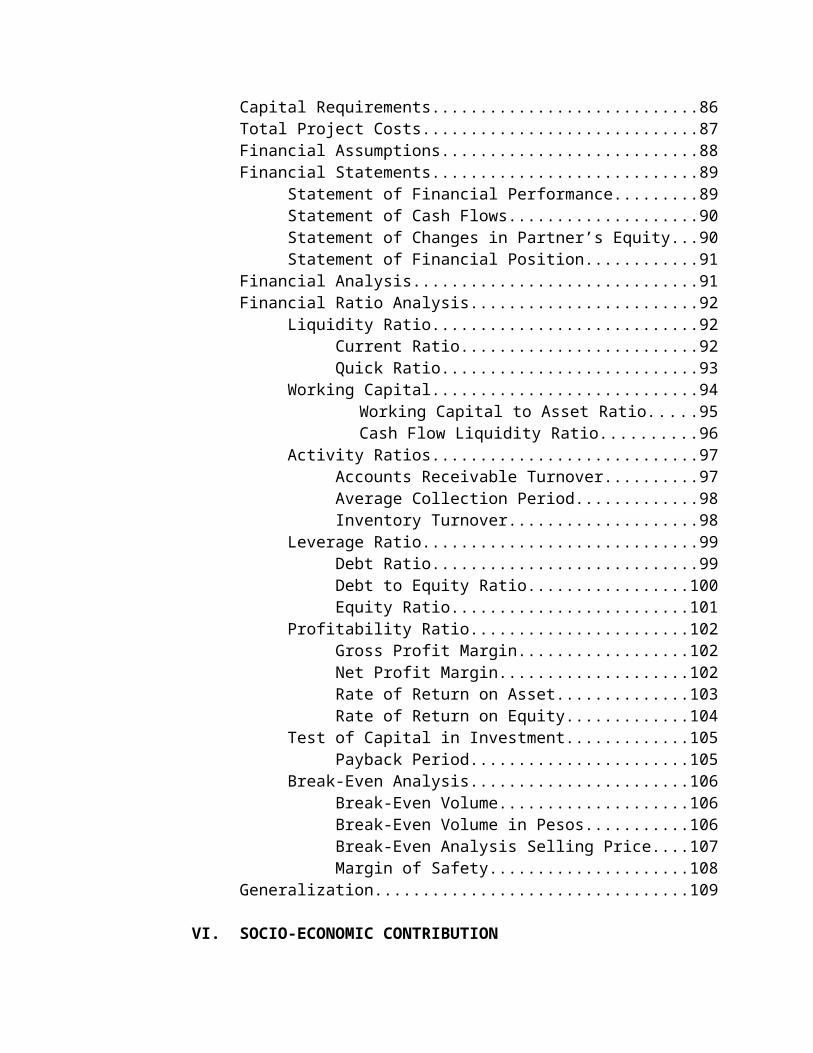
Capital Requirements............................86Total Project Costs.............................87Financial Assumptions...........................88Financial Statements............................89
Statement of Financial Performance.........89Statement of Cash Flows....................90Statement of Changes in Partner’s Equity...90Statement of Financial Position............91
Financial Analysis..............................91Financial Ratio Analysis........................92
Liquidity Ratio............................92Current Ratio.........................92Quick Ratio...........................93
Working Capital............................94Working Capital to Asset Ratio.....95Cash Flow Liquidity Ratio..........96
Activity Ratios............................97Accounts Receivable Turnover..........97Average Collection Period.............98Inventory Turnover....................98
Leverage Ratio.............................99Debt Ratio............................99Debt to Equity Ratio.................100Equity Ratio.........................101
Profitability Ratio.......................102Gross Profit Margin..................102Net Profit Margin....................102Rate of Return on Asset..............103Rate of Return on Equity.............104
Test of Capital in Investment.............105Payback Period.......................105
Break-Even Analysis.......................106Break-Even Volume....................106Break-Even Volume in Pesos...........106Break-Even Analysis Selling Price....107Margin of Safety.....................108
Generalization.................................109
VI. SOCIO-ECONOMIC CONTRIBUTION
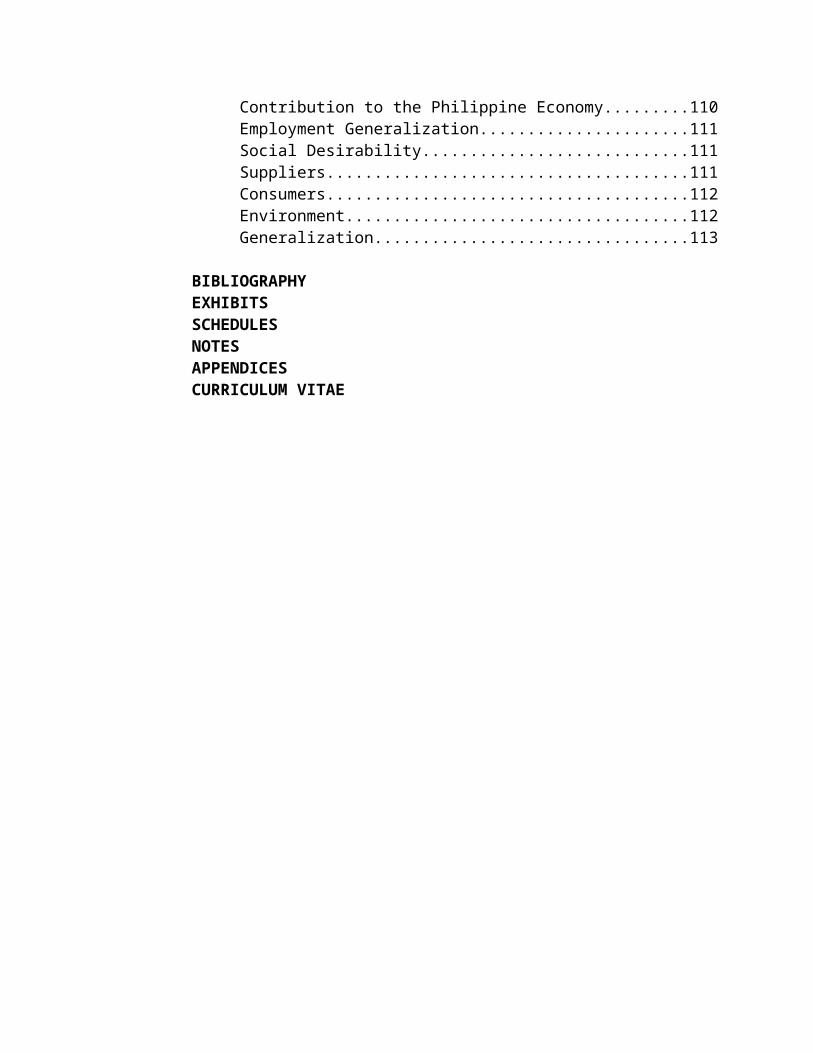
Contribution to the Philippine Economy.........110Employment Generalization......................111Social Desirability............................111Suppliers......................................111Consumers......................................112Environment....................................112Generalization.................................113
BIBLIOGRAPHYEXHIBITSSCHEDULESNOTESAPPENDICESCURRICULUM VITAE
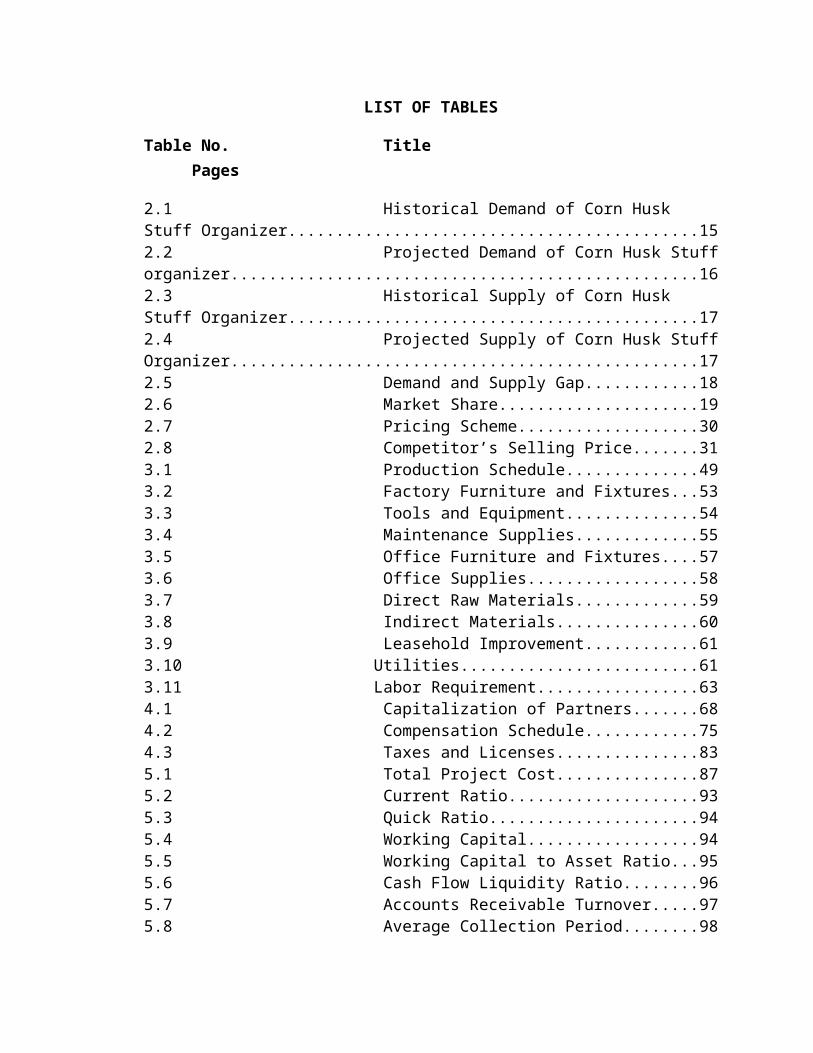
LIST OF TABLES
Table No. TitlePages
2.1 Historical Demand of Corn Husk Stuff Organizer...........................................152.2 Projected Demand of Corn Husk Stufforganizer.................................................162.3 Historical Supply of Corn Husk Stuff Organizer...........................................172.4 Projected Supply of Corn Husk StuffOrganizer.................................................172.5 Demand and Supply Gap............182.6 Market Share.....................192.7 Pricing Scheme...................302.8 Competitor’s Selling Price.......313.1 Production Schedule..............493.2 Factory Furniture and Fixtures...533.3 Tools and Equipment..............543.4 Maintenance Supplies.............553.5 Office Furniture and Fixtures....573.6 Office Supplies..................583.7 Direct Raw Materials.............593.8 Indirect Materials...............603.9 Leasehold Improvement............613.10 Utilities.........................613.11 Labor Requirement.................634.1 Capitalization of Partners.......684.2 Compensation Schedule............754.3 Taxes and Licenses...............835.1 Total Project Cost...............875.2 Current Ratio....................935.3 Quick Ratio......................945.4 Working Capital..................945.5 Working Capital to Asset Ratio...955.6 Cash Flow Liquidity Ratio........965.7 Accounts Receivable Turnover.....975.8 Average Collection Period........98
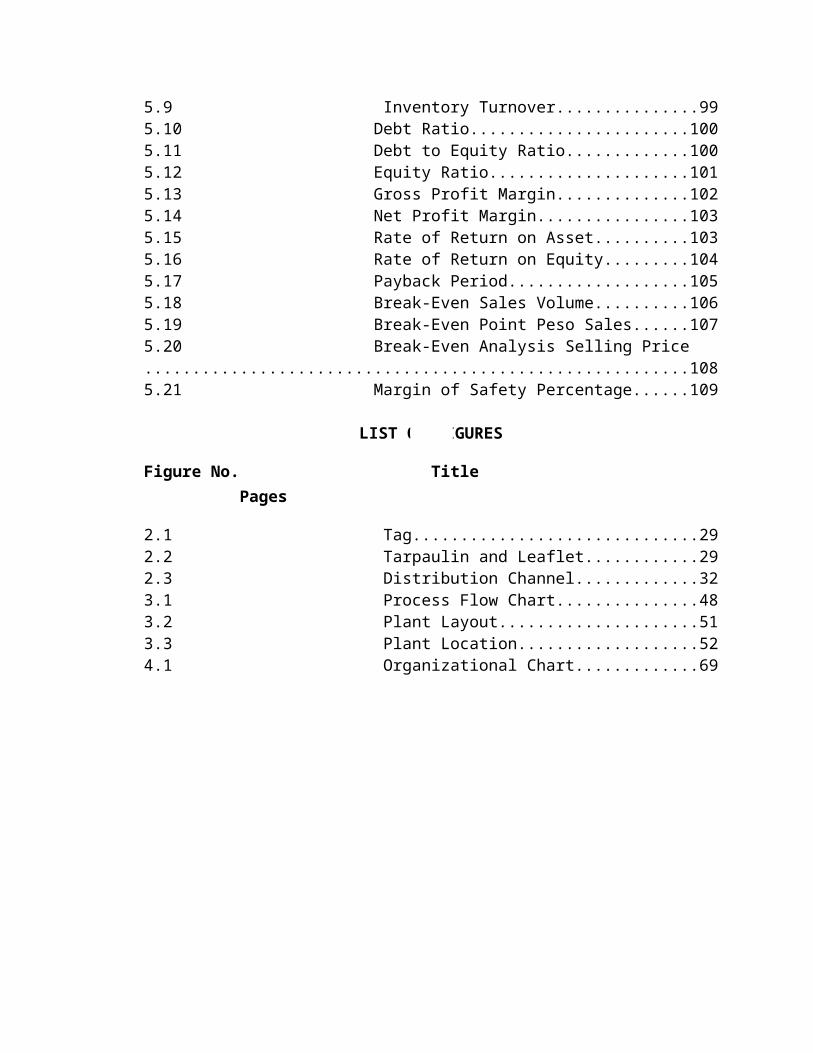
5.9 Inventory Turnover...............995.10 Debt Ratio.......................1005.11 Debt to Equity Ratio.............1005.12 Equity Ratio.....................1015.13 Gross Profit Margin..............1025.14 Net Profit Margin................1035.15 Rate of Return on Asset..........1035.16 Rate of Return on Equity.........1045.17 Payback Period...................1055.18 Break-Even Sales Volume..........1065.19 Break-Even Point Peso Sales......1075.20 Break-Even Analysis Selling Price.........................................................1085.21 Margin of Safety Percentage......109
LIST OF FIGURES
Figure No. TitlePages
2.1 Tag..............................292.2 Tarpaulin and Leaflet............292.3 Distribution Channel.............323.1 Process Flow Chart...............483.2 Plant Layout.....................513.3 Plant Location...................524.1 Organizational Chart.............69
SUMMARY OF THE PROJECT
This portion is about the creation of AIS
Manufacturing, the maker of Corn Husk Stuff Organizer. This
part sums up all information about the paper which includes
the name of the firm, location, brief description of the
product, market feasibility, technical feasibility,
management feasibility, financial feasibility and socio
economic contribution of the business.
Name of the Firm
The proposed business is named as AIS Manufacturing.
The name was derived from the organization the proponents
had when they were still in college. AIS stands for
Association of Irregular Students since the proponents are
considered as irregular students when they were in college.
Moreover, the idea of using AIS as a name is to forever
recall the friendship and happy moments they had with the
other irregular students. It’s the same thing the proponents
want for their business. They want to develop friendship
with their customer as a way of having loyal customers and
bring them happiness and satisfaction with the product they
are offering.
Location
The business will be located at Purok 1, San Carlos,
Lipa City. It is 64 sq.m. It is chosen because it is near
to the possiblesuppliers and accessible for the
transportation of the raw materials needed for the
production. Also, it is near to its retailer for easy
distribution of the finished product. Aside from that, the
proponents sought advices from the experts and they
recommended the location because it will suit the business.
Brief Description of the Project
The project is named as Establishment of AIS
Manufacturing: Maker of Corn Husk Stuff Organizer at San
Carlos, Lipa City. The organizer is made up from corn husk
which is normally thrown elsewhere after peeling from corn.
Upon the introduction of the aforementioned organizer, waste
is reduced thereby making the environment safe place to live
in. Also, the proponents want to come up with something new
to offer in the market.
Market Feasibility
In the market aspect, the study aims to determine the
market feasibility of the proposed business having Corn Husk
Stuff Organizer as the product. The proponents used
descriptive research design and chooses household in urban
barangay in Lipa City having an income of Php10,000.00 and
above as target market. They used questionnaire as a mode of
gathering pertinent information about their target market
and they went in their houses to ask their respondents to
fill up the questionnaires. In computing for the sample
size, the proponents made use of the Slovins formula and
they came up having 369 as sample size. Demand and supply
were also computed to assess if the product would be viable.
The historical demand for the first year of operation is
9,659 and will increase to 10,666 in 2019. The historical
supply on the other hand is 1,620 for the first year of
business operation and will increase to 2,194 in 2019.
Projected demand for the first year of operation is 11,412
and the projected supply is 2,618. The market gap to be
filled for the first year of operation is 8,794 while the
market share is 31.975. SWOT analysis were also taken into
consideration to determine in what aspect the product is
weak so it could be turned into strength through strategic
planning to cope up with the competitive environment. This
will be done through the use of marketing strategies. The
product Corn Husk Stuff Organizer falls under category of
handicraft and its brand name is Handi-Stuff. It cost
Php292.77 per unit. In terms of product distribution, the
flow will be from manufacturer down to retailers then to the
customers. In terms of promotion, the proponents will use
flyers, internet marketing and tarpaulin as a mode of
introducing their product to the market.
Technical Feasibility
The proponents named their product as Corn Husk Stuff
Organizer which is four (4) inches in height, eleven (11)
inches in length and eight and one-half (8 ½) inches width.
The manufacturing of the aforementioned product involves
eleven (11) processes to secure the quality of the output.
The annual production will be 3,840 pieces for 2015 and will
increase by 4,800 pieces in the year 2019 considering the
240 working days per year. In terms of manufacturing plant,
the proponents will rent a 64 sq.m plant area which will be
divided into eight (8) parts. The location of the plant will
be at San Carlos, Lipa City. The raw materials, equipment
and maintenance supplies which will ensure the efficiency of
the production process are also indicated in this paper.
Proper waste segregation and disposal will be highly
observed in the production since the main goal of the
business is to help the environment so strict compliance to
waste segregation will be observed.
Management Feasibility
The proposed business will operate under the general
partnership and will abide on all the laws that govern the
aforementioned partnership. The business will be registered
with the name AIS Manufacturing having Corn husk Stuff
Organizer as the product.
The proponents will start by having Php160, 000.00 as
initial capital which is equally contributed by the four
partners. They will hire two workers which will be paid at
Php322.50 per day and will be given all the benefits a
worker must have. A bookkeeper will also be hired to monitor
the financial and accounting matters of the business. He
will be compensated with at Php 1,600.00 per month since he
will work as part time only. The general manager who will be
responsible in supervising the business will be compensated
with of Php 500.00 per day. The firm had established
organizational policies to be followed for a proper
systematic operation of the business. This will lead to the
success of the business and as well as its employees and
workers. Before the business operates, all necessary
documents needed will be accomplished. All fees and license
will be paid as well amounting to Php 5,928.42.
Financial Feasibility
In the financial aspect, AIS Manufacturing will have an
initial capital of P160, 000.00 from the initial investment
of four partners. Financial feasibility will have a five-
year financial projection and the sales will be assumed as
60 % cash sales and 40% credit sales. The firm will have a
net income of Php 55,298.51for the first year of operation
and it will increase to Php 159,327.64 in 2019. Net cash
flow for the first year would be Php 213,066.51. Financial
ratios were also computed to analyze the financial health of
the business. Current ratio for the first year of operation
is 2.82 while the quick acid ratio is 1.99 which indicates
that the firm is expected to gain profit for the next year
of operation with the payback period of 1.62 which means
that in a year and a half period of business operation, the
partners can recover their initial investment.
With a breakeven point of 2,348.24, the company is
expected to earn profit having the aforementioned sales
volume.With the efficient management of inventory and other
assets of the firm, the business is expected to gain profit.
Socio-Economic Contribution
The purpose of the proposed business is not solely for
profit generation but also it is geared toward social and
economic benefits. AIS Manufacturing will contribute in
employment generation in Lipa City in such way that it can
provide jobs for Lipeños to lessen the number of
unemployment. In social desirability, the firm will be
beneficial in such way that it can contribute to promote
waste reduction since the raw materials it will be using is
out of corn husk which can be considered as waste. For
suppliers, the firm could be another customer who can
generate sales and will serve as a new customer for the
suppliers. Customers, on the other hand, can also benefit
from the firm since they can avail a new and unique kind of
organizer in a low price but with high quality. Lastly, for
the environment, the proposed product will also be
beneficialsince it will lessen the waste. Instead of
throwing the corn husk elsewhere, it will be converted into
a more useful product.
BIBLIOGRAPHY
A. Books
Ac-ac, Maria Victoria M. Ed. D., 2009, Principles of Marketing,Anvil Publishing Inc., 8007-B Pioneer Street, Brgy.Kapitolyo, Pasig City, Philippines
Beekun, RaffikIssa, 2008, Strategic Planning and Implementation,The International Institute of Islamic Thought, 669Herndon, VA, USA
Brewer, Peter, 2008, Measuring of Balance Sheet Leverage
Bose, Chandra D. 2006, Principles of Management and Application,Prentice Hall of India Private Limited, M-97 ConnaughtCircus, New Delhi
Carillo, Josefina L., 2008, Partnership and Corporation Accounting,Rex Bookstore Inc., 856 Nicanor Reyes St., Sampaloc, Manila
Daft, Richard L., 2012, Management: Tenth Edition, South-WesternCengage Learning, 5191 Natorp Boulevard Manson, Ohio
Daft, Richard L., 2010, Organization Theory and Design , South-Western Cengage Learning, 5191 Natorp Boulevard Manson,Ohio
Davis, Melissa, 2009, An Introduction to Branding, AVA PublishingSA, Luasanne, Switzerland
Dutta, Manash, 2008, Cost Accounting, Dorling Kindersley (India)Pvt., 7th Floor, Knowledge Boulevard, A-8, Sector 62, Noida,India
Friedlob, Cynthia, 2008, Sorting It Out, The Alice Jean MarkCompany, 392 North Hollywood, California
Gallagher and Andrew, 2000, Financial Management; Principles andPractices
Grevetter, Frederick J., 2010, Research Method for BehavioralSciences, Wadsworth Cengage Learning, 20 Davis Drive,Belmont, California
Grewal, Dhruv& Levy, Michael, 2010, McGraw Hill Education
Halevi, Gideon, 2010, Process and Operation Planning, KluwerAcademic Publisher, 3300 AA Dordreeht, The Netherlands
Hermanson Edward, 2010, Managerial Accounting
Heisinger, Kurt, 2009, Essentials of Managerial Accounting, South-Western Cengage Learning, 5191 Natorp Boulevard, MasonOhio, USA
Houston, Joel F., 2010, Fundamentals of Financial Management,South- Western Cengage Learning, 5191 Natorp Boulevard,Mason Ohio, USA
Iñigo, Conrado E., Jr. Ph. D., 2008, Management for Filipinos:Principles and Applications, Design Plus, 30 Narig Street,Veterans Village, Project 7, Quezon City
J. Kroon, 2008, General Management, Creda Communications,Forest Drive, Pinelands, Cape Town, South Africa
Koontz, Harold &Weihrich, Heinz, 2007, Essentials of Management,Tata McGraw-Hill Publishing Company Limited7 West PatelNagar, New Delhi
Mankiw, Gregory, 2011, Principles of Economics, South-WesternCengage Learning, 5191 Natorp Boulevard Manson, Ohio
William Megginson, 2008 ,Introduction to Corporate Finance
NenitaMejorada, 2008, Business Finance, Goodwill TradingCo.Inc.
Peter Moles, Robert Parrino, David S. Kidwell, 2011,Corporate Finance
Weygantt,Jerry 2009, Managerial Accounting: Tools for Business Decision Making, Copyright Clearance Center Inc., 222 Rosewood
Drive, Danvers, MA
Medina, Robert G., 2008, Principles of Economics, Rex BookstoreInc.,856 Nicanor Reyes, Sr. St., Sampaloc, Manila.
Montanaro, Lisa, 2008, The Ultimate Life Organizer, Peter PauperPress Inc., 202 Mamaroneck Avenue, White Plains, New York
Clark, Ephraim, 2010, International Finance, Chapman & Hall,Great Britain
Nelson, Stephen, 2008, Quick Books All-in-One Desk Reference forDummies, Whey Publishing Inc., 111 River Street, Hoboken,New Jersey
Pojezny, Nikolas, 2008, Value Creation in European Equity Carve- Outs,Deutscher University- Verlag, Wiesbaden
Dubrin, Andrew J., 2000, South-Western Cengage Learning, 5191Natorp Boulevard, Mason, Ohio
Cafferky. Michael, 2010, Breakeven Analysis, Business ExpertPress Inc., 222 East 46th Street, New York, New York
O’Connor, David E. & Faille, Christopher, 2008, Basic EconomicPrinciple, Greenwood Press, 88 Post Road West, Westport, CT
Smart, Scott B., 2009, Introduction to Corporate Finance, South-Western Cengage Learning, 5191 Natorp Boulevard, Mason,Ohio
Routledge, 2009, Strategic Innovation, 270 Madison Avenue, NewYork, New York
Schaffer, Talia, 2008, Novel Craft, Oxford University Press,Inc., 198 Madison Avenue, New York, New York
O’Shaughnessy, John, 2008, Competitive Marketing: A StrategicApproach
Porter, Frank W., 2003, Art of Native American Basketry, GreenwoodPress Inc., 88 Post Road West, Westport, Conneticut
Peter Moles, Robert Parrino, David S. Kidwell, 2011,Corporate Finances
Pershing, James, 2008, Handbook of Human performance technology: Principles, Practices and Potentials
Peterson, Pamela, 2008, Analysis of Financial Statement, John Wiley& Sons Inc., Hoboken, New Jersey
Sinha, Gokul, 2013, Financial Statement Analysis, PHI LearningPrivate Limited, -97 Connaught Circus, New Delhi
Terry, Gorge Robert, 2000, Principles of Buisness Management,Atlantic Publishers and Distributors, B-2 Vishal Enclave,Opp. Rajouri Garden, New delhi-27
Trumbauer, Lisa, 2009, Corn, Red Brick Learning, 7825 TelegraphRoad, Bloomington, Minnesota
Tsorakidis,Nikolaus, 2010, Breakeven Analysis
Weil, Roman L. 2012, Financial Acounting: An Introduction to Concepts, Methods and Uses
Wessels, Walter J., 2007, Economics, Business Review Books
Wisner, Joel D., 2009, Principles of Supply Chain Management and Balanced Approach
Young, Felina, 2008, Principles of Marketing, Rex Book StoreInc., 856 Nicanor Reyes St., Sampaloc, Manila
B. Websites

www.investopedia.com
www.google.com
Chapter IBACKGROUND OF THE STUDY
Introduction
Philippines is said to be blessed for having a rich
natural resources. Agriculture is one of the primary sources
of income in this country. Some of the commonly planted
crops are rice, corn and variety of vegetables. Corn, as a
close substitute for rice is planted after rice has been
harvested. The top ten regions that produce corn are Cagayan
Valley, where 25 % of their harvest which is approximately
7,389,425 metric tons is derived from corn. Next are
Northern Mindanao with 17 %, SOCCSKSARGEN with 16 %, ARMM
with 10 %, Ilocos Region with 10%, Western Visayas with
4.5%, Bicol Region with 3.1 %, CAR with 3%, Zamboaga
Peninsula with 2.9%, and Central Luzon with 2.8%.
Given the fact that almost all regions in the
Philippines are planting corn, there is an abundant supply
of corn husk. Corn husk is normally thrown after it has been
peeled from the corn. It is considered as waste since its
only function is to serve as the outer covering of corn.
AIS Manufacturing is a firm that will be producing an
organizer out of corn husk. It will belong to the handicraft
industry that will continue to spread the culture of
Filipinos with the touch of innovation on its product. The
proponents aim to utilize the use of corn husk. Instead of
throwing corn husk, they will instead use this material in
making an organizer that will be beneficial for most of the
Filipinos since they are known to be organized with their
things. The organizer that the firm will be proposing will
meet the taste and preferences of its consumer without
compromising the quality of the product. This proposed study
will be calling the product as Corn Husk Stuff Organizer.
Brief Background of the Study
In this modernized and civilized society where in
technology produces advance products and services, people
overlook things that are environment- friendly and products
that anticipate reusability of waste materials. Handicraft
also talks about making articles by hand that uses scrap
materials and this product is manufactured by recycling. In
relation to this, the proponents came up with the idea of
making Corn Husk Stuff Organizer using the waste material
from corn which is its husk. They thought of turning the
said material into a useful, functional and trendy organizer
that can satisfy consumers in organizing their stuffs in one
place. The product is durable and affordable for the
consumers.
Handicraft is a type of work where useful and
decorative things are made completely by hand or by using
only some simple tools (Schaffer, 2008).
Handicraft business in the municipality of Lipa is
small in number. Some of the stores that sell handicraft
products import them from Bicol, Laguna, Taal, Pangasinan
and other provinces. There is no certain manufacturing firm
that produces handicrafts in Lipa City. This scenario helps
the proponents to uplift the handicraft industry by offering
Lipa City the Corn Husk Stuff Organizer which is
environment-friendly, unique and with good quality because
it is made by skillful hands of the workers. Given the fact
that the material to be used is considered as waste, Corn
Husk Stuff Organizer is cheaper compared to the organizer
previously offered in the market in which quality is almost
the same. The proponents also see that elimination of
plastic in the said city is an advantage, that’s why
handicraft business fit the latest trend in the market.
Objectives of the Study
The main objective of this study is to determine the
viability of Corn Husk organizer in the market. To make the
study viable, the proponents set specific objectives.
1. To assess the potential of the product in the market and
to determine the gap that needs to be filled taking into
consideration the SWOT analysis and marketing strategies to
survive the competitive environment.
2. To determine the technical feasibility of the product,
the manufacturing process used in the production, the annual
production, working days in a year, plant location and
layout, tools and equipments and other necessary
requirements needed in the operation.
3. To ascertain the management feasibility of the project
through the selection of the right management structure,
form of business ownership, capitalization, man power
requirements, job specification and description and legal
requirements needed in the operation of business.
4. To evaluate the profitability of the proposed business
through analyzing the financial statement, statement of
financial performance, cash flows and through the use of
financial ratios such as liquidity ratios, activity ratios,
leverage ratios, and profitability ratios to determine the
liquidity of the proposed business.
5. To determine the contribution to the community and
economy derived from the proposed product.
Definition of Terms
In this study, the following terms are defined theoretically
and operationally.
Corn Husk. This refers to the leaves of the corn (Trumbauer,
2009). In this study, it is the main raw materials that will
be used in the production of the organizer.
Handicraft. This refers to decorative artifacts or anything
made by hand (Schaffer, 2008). In this study, it is the
industry business where the proposed product belongs to.
Basketry. This refers to product of culturally distinct
tribes at different times and different places. It is the
process of weaving vegetable fibers into a basket or other
similar form. (Porter, 2003) In this study, the proponents
consider the organizer as one of those products that can be
classified as basket.
Stuff. This refers to a person’s belonging, equipment or
baggage. (Friedlob, 2008) In this study, it refers to the
materials that will be placed inside the organizer.
Organizer. This refers to a container with number of
compartments for storage. (Montanaro, 2008) In this study,
it refers to the product the proponents will be producing.
Scope and Limitation
The study is entitled “Establishment of AIS
Manufacturing: Maker of Corn Husk Stuff Organizer at San
Carlos, Lipa City”. The business is a maker of stuff
organizer out of corn husk. The business will be located at
Purok 1, San Carlos along Ayala Highway, Lipa City. The
proponents chose the location of their business because it
is near the retailers it will be serving and to the source
of raw materials the business needs for its production.
Also, upon seeking the help of experts, they suggested the
location is suited for the business.
Insufficient published materials which will support and
help the proponents in developing the potentials of the
business became the major limitation of the study. The
researchers found difficulty in looking for enough
information to support the study due to the fact that there
are few retailers of same industry. Because the proposed
business is new in the native product industry, adopting
corn husk organizer design and qualities that conforms to
what an organizer should be become narrow and experimental.
In the market aspect, chosen target markets were
households residing in the Bgry 1-11 of Lipa City having a
monthly income of Php10,000.00 and above. The target market
was chosen with the conviction that they are able to avail
the product, they have the purchasing power. The proponents
used descriptive method of research in conducting its study
and the primary tool used in determining the viability of
the business is survey questionnaire. These questionnaires
were distributed to the proponents’ chosen target market who
the households were residing in the municipality of Lipa,
Barangay 1 to 11 to be specific. Questionnaires were first
validated and revised by their adviser and panels before
handing it to its respondents to ensure that the details are
correct. Strengths, weaknesses, opportunities and threats
analysis were also discussed to help on how to create a
strategy that fully utilizes one’s strength and
opportunities and improves and prepare for its own
weaknesses and threats. Promotional strategies are also a
great help in introducing the product so the proponents make
sure that the strategies will help in launching the product
in the market.
Giving awareness to consumers became significant and
may require extensive marketing effort on the part of the
proponents. Aside from that, viability of the business was
difficult to determine due to respondent’s personal reasons.
Some were afraid to answer questionnaire because of
uncertainty of where the information will be used. Others
were busy and had urgent appointments to attend to. There
were some who didn’t want to take the questions seriously
which affected the reliability of the results and others
were not honest to mark their true choices.
In the technical aspect, the business will be
manufacturing Corn Husk Stuff Organizer and its main
material is corn husk. It indicates the manufacturing
process the product will undergo as well as the production
schedule for its five years of operation. Supplies,
furniture, fixtures and equipments that are needed to make
the production area, offices and stockrooms more comfortable
to work at are also included in this portion. Direct
materials and indirect materials used are also stated.
Utilities and proper waste management are also indicated in
this part.
Suppliers of corn husk have difficult for no formal
establishment or location can be contacted. The processing
was also difficult because the texture of the corn husk to
make the design perfect is unidentifiable. Compatibility of
the materials to be used with the procedure took much of the
time of the proponents.
In the management aspect, the study aims to determine
the appropriate form of business ownership and suitable
organization structure to be adopted by the proposed
business. Manpower needed by the firm and their job
specifications and descriptions were formulated to better
suit the industry. Effective and efficient policies will be
implemented to serve as guidelines to the process and to the
organization.
Faced with the truth that even the proponents are
taking up Business Administration course, they still
encountered problems in conducting this study. They looked
for the help of different government agencies to supply them
the needed documents as well as different private offices
and individuals. Some were not cooperative enough and
gaining of the needed materials was slow. The proponents
considered their lack of personal experience in handling a
business and limited resources as limitation which resulted
to an average performance.
In financial feasibility, it focused on the financial
stability of the proposed business. It tackles the financial
ratios as well as the income statement of the proposed
business. It indicates the five years financial projections
of cost that will be incurred as well as the sales
projection for the next five years. Statement of cash flow
and changes in partner’s equity is also indicated here.
Different ratios are also indicated to secure the liquidity
of the business.
Given the fact that the proponents are Business
Students, they experienced difficulty in computing the
entire financial statement. Applying the knowledge their
acquired in their accounting subjects and with the aid of
their accountant, they were able to create a reliable
financial assumption of their proposed business.
In socio-economic aspect, the proposed business focused
on its benefits and contribution to the welfare of the
community as well as to the economy of the Philippines. It
aims to create jobs for Filipinos, promote environment
friendly product, contribute to the number of tax payer for
the improvement of the society and relive the handicraft
business in Lipa City. For customers, it offers an
additional variety of organizer for them to choose from.
Since most of the organizers present in the market are made
out of plastic or metal, the proponents’ organizer could be
a new option for those who want to avail new organizer. It
could also be beneficial for the environment in such way
that the outer covering of the corn which is the husk is no
longer thrown anywhere but converted into a more useful
product. It could help to minimize the waste seen in our
environment.
The foreseen conflict that may be faced by the
proponents is a negative relation with its suppliers. Since
suppliers are important, having conflict with them will
delay the raw materials needed in the production of the
organizer. Suppliers are assets of every business so a good
relationship with them must always be put into
consideration.
Chapter IIMARKET STUDY
Market study is crucial to assess if the business will
have an adequate demand to pursue its operation. Also, it is
vital in gathering information which is essential in
formation of strategies.
Generally, the main purpose of a business is to gain
profit. In line with this, the proponents conducted market
study to analyze whether the business to establish will meet
its purpose. Also, in this part, the proponents were
gathered information needed in evaluating the market share
of the proposed business along with the SWOT analysis and
marketing strategies to be used.
Objectives of the Study
The proponents aimed to assess the potential of the
product in the market and to determine the gap that needs to
be filled taking into consideration the SWOT analysis and
marketing strategies to survive the competitive environment.
1. The research methodology, design and data gathering,
instrument and procedure to be used.
2. The historical and projected demand and supply of the
proposed business.
3. The strengths, weaknesses, opportunities and threats of
the proposed business.
4. The marketing programs and strategies that will be
utilized.
Methodology
This part discusses about the design of the study, the
subject, data gathering instrument, procedures and
statistical treatment of data.
In determining the crucial points regarding the aspects
of the feasibility study, the proponents, through the use of
descriptive method, prepared questionnaire for the customers
and business related services. Survey and interview with the
respondents were also done to gather information.
Research Design
Descriptive research design involves measuring a
variety or set of variables as they exist naturally. It
describes the characteristics or behaviors of a particular
population in a systematic and accurate fashion (Gravetter,
2010). Through the aid of this method, the proponents were
able to determine the position of their proposed business in
the market.
Using survey questionnaires as the primary tool for the
gathering of information, along with interviews and
observations, the group was able to use descriptive method
which helped them forecast the feasibility of Corn Husk
Stuff Organizer. Descriptive method was used because it
observes its subjects without affecting them.
Subject of the Study
The proponents choose urban barangays in Lipa City as
subject of their study. Incorporated in their identified
respondents are households from Barangay 1 up to 11 with an
income of P10, 000.00. This categorization of barangays was
gathered from the record of the City Planning and
Development Office.
The subject was chosen to represent the potential
consumers of the product with the assumption of their status
to have the purchasing power which is relatively higher
compared to urbanizing and rural barangays. The total
population of the subject is 4,823 having 369 as the sample
size for the distribution of questionnaire.
In terms of the supply, the proponents chose retailers
which will help them establish the supply of the product and
other aspects with regards to the related products. The
retailers which were chosen to be the respondents are Jose
Garcia native products, Mane’s native products, Ben’s native
products, Luz native products, and San Vicente native
products, SM Department store, SM Supermarket, Ace Hardware,
National Bookstore, Robinsons Supermarket, Lipa Sampaguita
Mart, and Tagumpay Mart.
Data Gathering Instrument
The proponents constructed a questionnaire to be used
as an instrument to gather data from selected respondents
and retailers. They created two sets of questionnaires: one
for the consumers and one for the retailer of the product.
Both questionnaires were divided into four parts but the
contents were not the same. The first is respondent’s
profile which contains the customer name, address, and
income bracket. For retailers, the first part of the
questionnaire was the demographic profile which is comprised
of the name and location of the store, nature of the
business and forms of business organization. Related
product, the second part, is comprised of the information
about the related product. Product introduction intends to
make the customer familiar with the product. Lastly,
willingness is the part which evaluates whether the
respondent is interested in buying or selling the product or
not. With the help and suggestion from their adviser and
panels, the proponents were able to improve and revise the
questionnaire
After it was constructed, it was checked by their
adviser and validated by the chairman of the panelist. The
questionnaires were distributed to their respondents and
retailers to gather data about the feasibility of the
product and suggestions about the possible improvements. The
proponents used questionnaire as a mode of gathering
pertinent data to determine the viability of product. The
obtain results were tallied and served as the basis in
pursuant of the study.
Data Gathering Procedure
The formulated questionnaires were distributed to the
urban barangays of Lipa City for the determination of the
demand of the product and retailer within the municipality
for the supply. The proponents went to each barangay asking
the people they run by if qualified to answer the survey
before handing them the questionnaire. They went door to
door, interviewed bystanders and even passersby. The
proponents waited the target consumers to finish answering
the set of questions and aided answers to their queries
about the questionnaires and the product. Some of the
respondents were kind enough to give suggestions and
recommendations for the betterment of the proposal. Private
establishments were given copies of questionnaires where
some answered and surrendered it immediately while others
asked for time in answering the survey due to operational
conflicts.
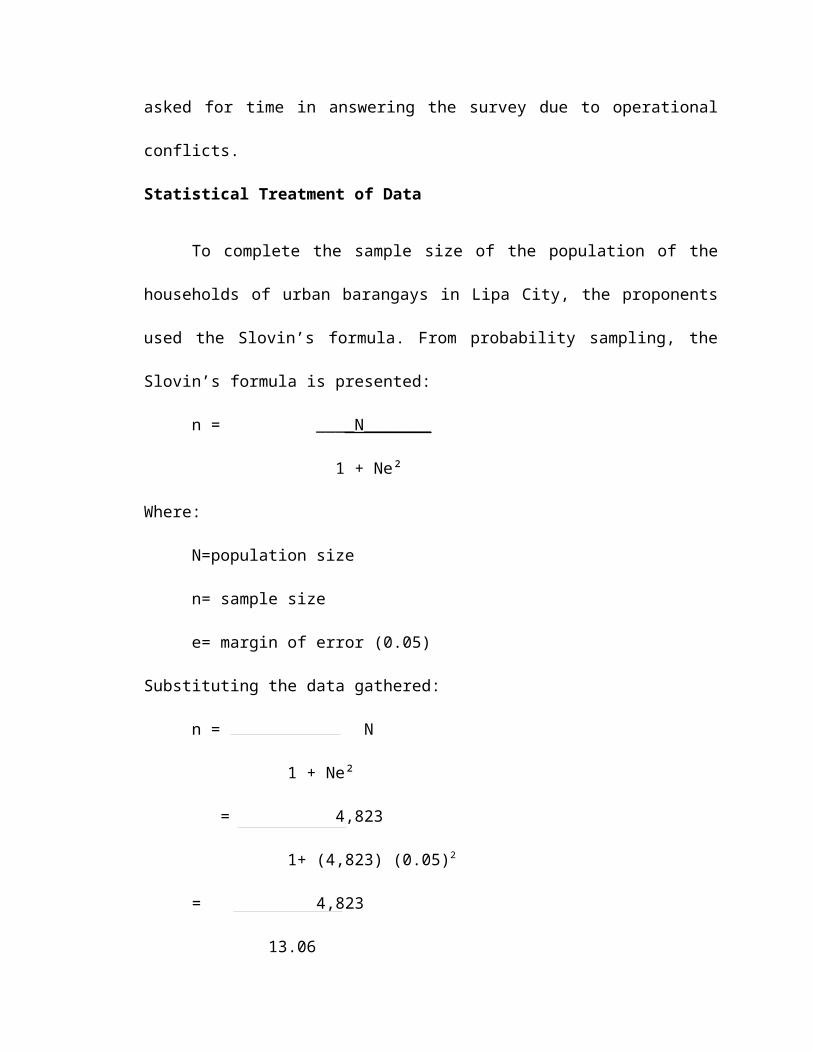
Statistical Treatment of Data
To complete the sample size of the population of the
households of urban barangays in Lipa City, the proponents
used the Slovin’s formula. From probability sampling, the
Slovin’s formula is presented:
n = ____N_______
1 + Ne²
Where:
N=population size
n= sample size
e= margin of error (0.05)
Substituting the data gathered:
n = N
1 + Ne²
= 4,823
1+ (4,823) (0.05)2
= 4,823
13.06
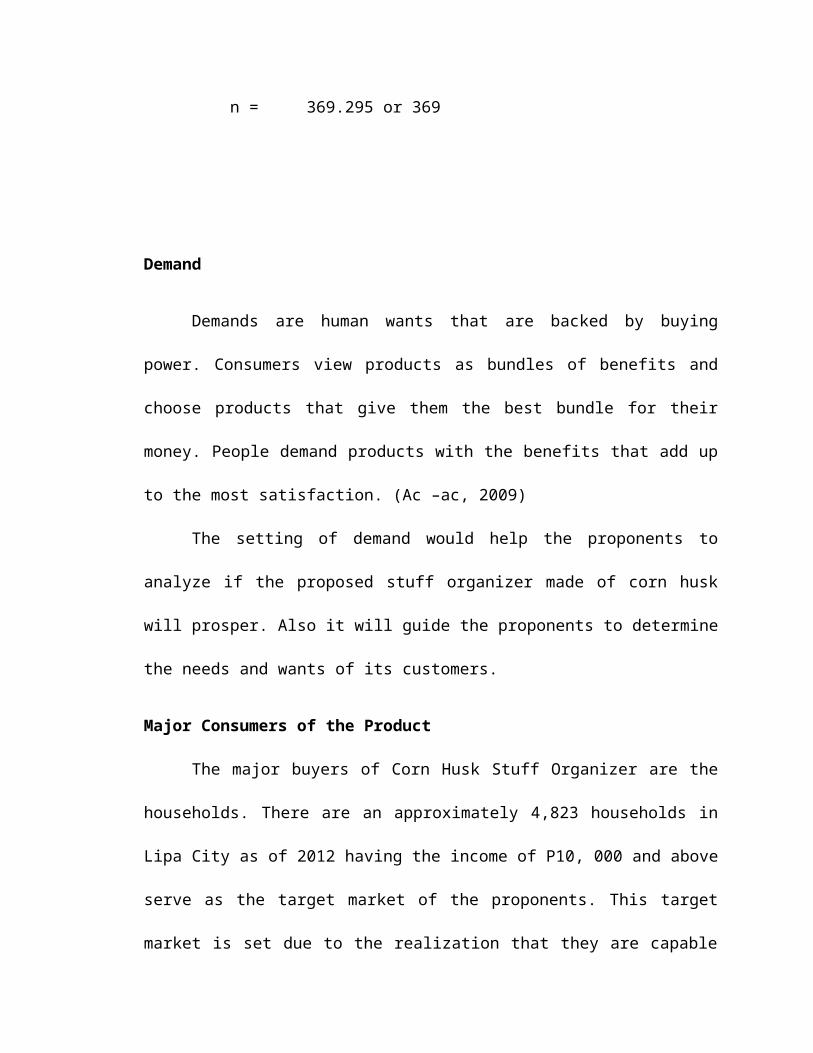
n = 369.295 or 369
Demand
Demands are human wants that are backed by buying
power. Consumers view products as bundles of benefits and
choose products that give them the best bundle for their
money. People demand products with the benefits that add up
to the most satisfaction. (Ac –ac, 2009)
The setting of demand would help the proponents to
analyze if the proposed stuff organizer made of corn husk
will prosper. Also it will guide the proponents to determine
the needs and wants of its customers.
Major Consumers of the Product
The major buyers of Corn Husk Stuff Organizer are the
households. There are an approximately 4,823 households in
Lipa City as of 2012 having the income of P10, 000 and above
serve as the target market of the proponents. This target
market is set due to the realization that they are capable
of buying the product and mostly, in households many things
are not placed properly that’s why when someone need
something it is hard for them to find it. Unlike if they
have the Corn Husk Stuff Organizer, there is a designated
place where they can place their stuff and get it when
needed. It can be placed anywhere in the house such as in
the kitchen, bedroom, living room and also in the bathroom
if they desire. Different things can be placed in the Corn
Husk Stuff Organizer according to where it would be located.
For example, in the living room, they can put the remote of
television, stereo and DVD player into it, pen and paper for
the telephone contacts and other stuffs they have.
Historical Demand
The historical demand is founded by the information
accumulated through surveys and interviews. The population
of Lipa City’s urban barangays households from CPDO helped
in determining the product’s historical demand. Since Corn
Husk Stuff Organizer is a new entrant in the market, the
proponents decided to base their historical demand on the
previous sales of related product in which those organizers
were made of plastic and metal.
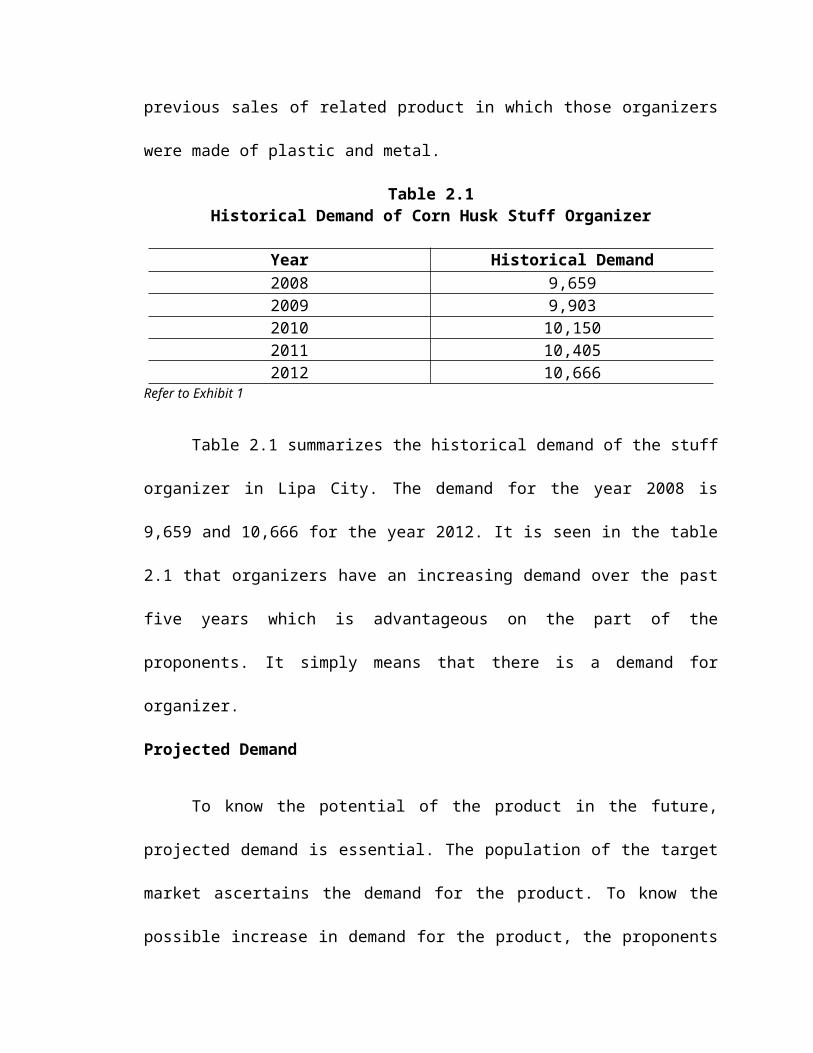
Table 2.1Historical Demand of Corn Husk Stuff Organizer
Year Historical Demand2008 9,6592009 9,9032010 10,1502011 10,4052012 10,666
Refer to Exhibit 1
Table 2.1 summarizes the historical demand of the stuff
organizer in Lipa City. The demand for the year 2008 is
9,659 and 10,666 for the year 2012. It is seen in the table
2.1 that organizers have an increasing demand over the past
five years which is advantageous on the part of the
proponents. It simply means that there is a demand for
organizer.
Projected Demand
To know the potential of the product in the future,
projected demand is essential. The population of the target
market ascertains the demand for the product. To know the
possible increase in demand for the product, the proponents
used the straight line method. By applying this method, they
were able to measure the projected demand of the product in
Lipa City from 2015 to 2019.
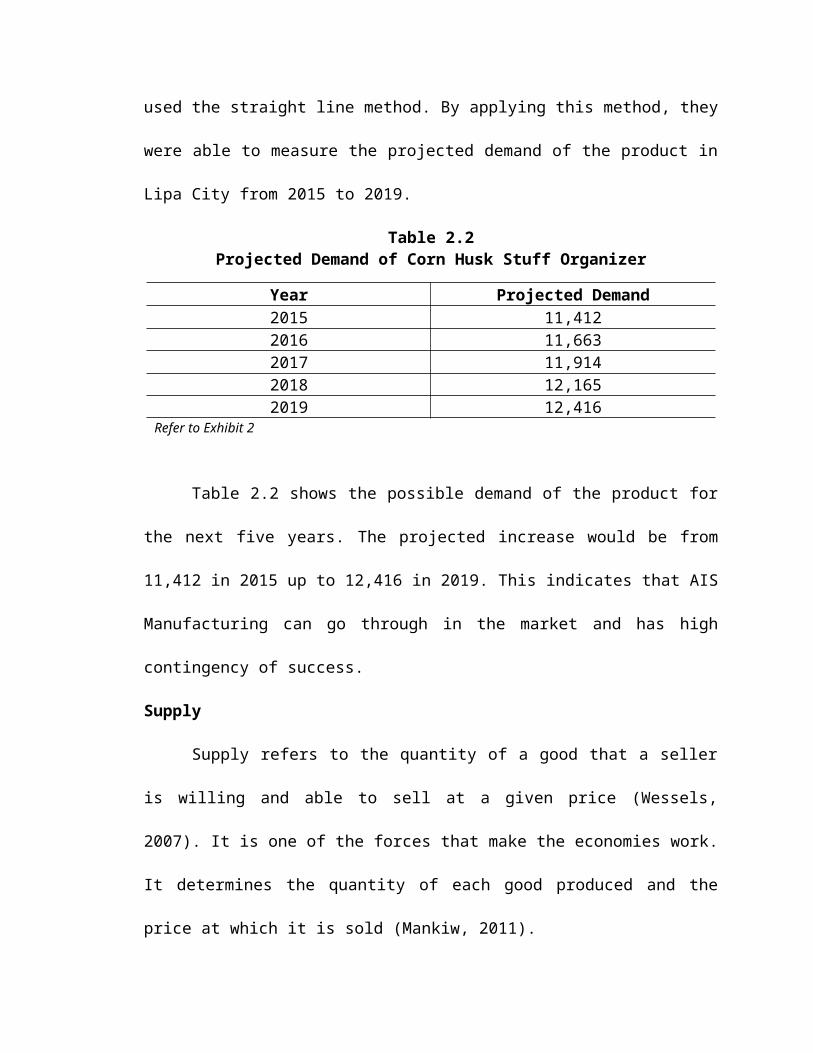
Table 2.2Projected Demand of Corn Husk Stuff Organizer
Year Projected Demand2015 11,4122016 11,6632017 11,9142018 12,1652019 12,416
Refer to Exhibit 2
Table 2.2 shows the possible demand of the product for
the next five years. The projected increase would be from
11,412 in 2015 up to 12,416 in 2019. This indicates that AIS
Manufacturing can go through in the market and has high
contingency of success.
Supply
Supply refers to the quantity of a good that a seller
is willing and able to sell at a given price (Wessels,
2007). It is one of the forces that make the economies work.
It determines the quantity of each good produced and the
price at which it is sold (Mankiw, 2011).

Historical Supply
Historical supply is the record of the related
product’s supply for the past years. The proponents were
aided by the information they have gotten from the retailers
through surveys and interviews. Based on the data supplied,
it is noticeabe and is consistently increasing which
signifies that the product is viable in the market.
Table 2.3Historical Supply of Corn Husk Stuff Organizer
Year Historical Supply2008 1,6202009 1,7272010 1,8502011 2,0362012 2,194
Refer to Exhibit 3
Table 2.3 shows the historical supply of the retailers
in Lipa City for the past five years. The supply for the
year 2008 is 1,620 and for the year 2012 is 2,194. It shows
an increasing supply to suffice the increasing demand of
product.
Projected Supply
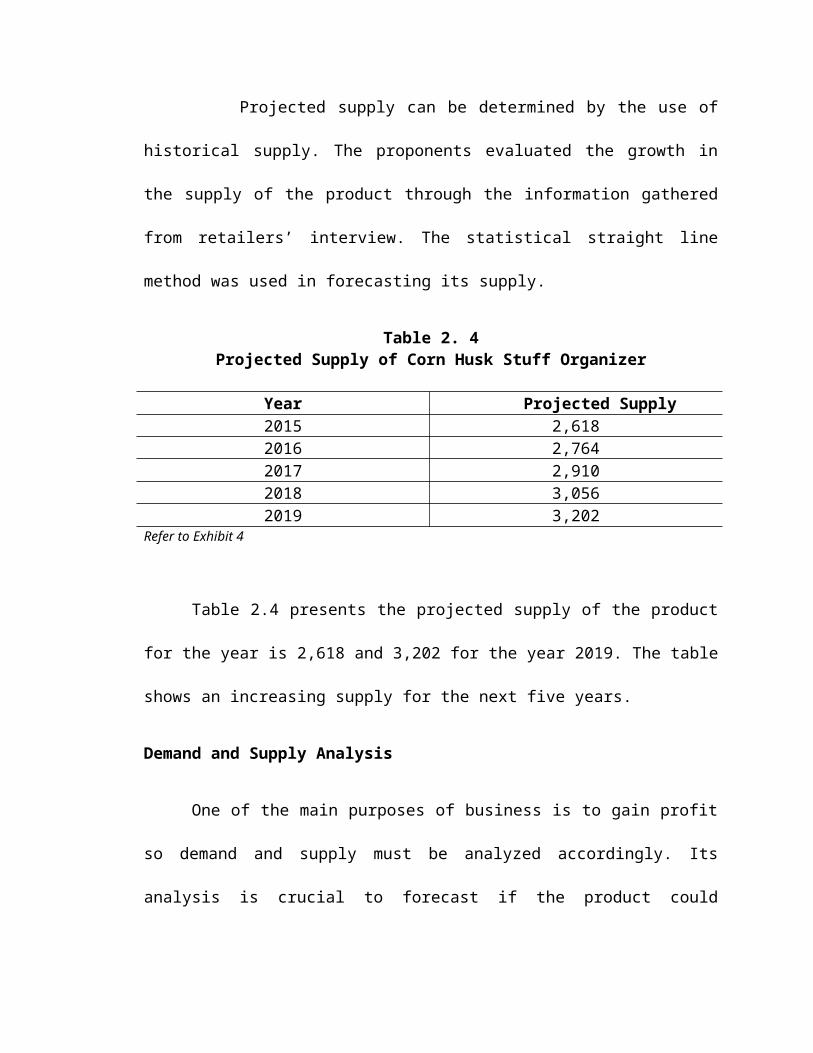
Projected supply can be determined by the use of
historical supply. The proponents evaluated the growth in
the supply of the product through the information gathered
from retailers’ interview. The statistical straight line
method was used in forecasting its supply.
Table 2. 4Projected Supply of Corn Husk Stuff Organizer
Year Projected Supply2015 2,6182016 2,7642017 2,9102018 3,0562019 3,202
Refer to Exhibit 4
Table 2.4 presents the projected supply of the product
for the year is 2,618 and 3,202 for the year 2019. The table
shows an increasing supply for the next five years.
Demand and Supply Analysis
One of the main purposes of business is to gain profit
so demand and supply must be analyzed accordingly. Its
analysis is crucial to forecast if the product could
penetrate the market. It could also serve as the basis for
the evaluation of market share.
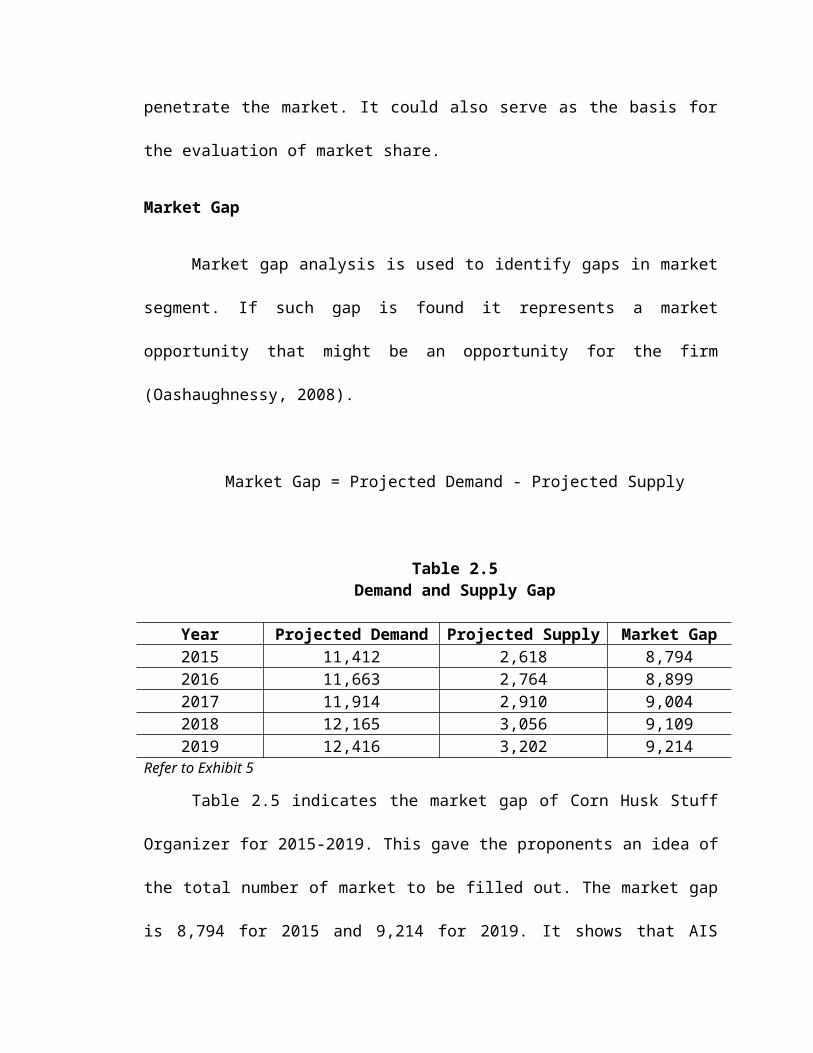
Market Gap
Market gap analysis is used to identify gaps in market
segment. If such gap is found it represents a market
opportunity that might be an opportunity for the firm
(Oashaughnessy, 2008).
Market Gap = Projected Demand - Projected Supply
Table 2.5Demand and Supply Gap
Year Projected Demand Projected Supply Market Gap2015 11,412 2,618 8,7942016 11,663 2,764 8,8992017 11,914 2,910 9,0042018 12,165 3,056 9,1092019 12,416 3,202 9,214
Refer to Exhibit 5
Table 2.5 indicates the market gap of Corn Husk Stuff
Organizer for 2015-2019. This gave the proponents an idea of
the total number of market to be filled out. The market gap
is 8,794 for 2015 and 9,214 for 2019. It shows that AIS
Manufacturing could enter the market since it reflects high
and increasing market gap considering the volume of products
needed per year.
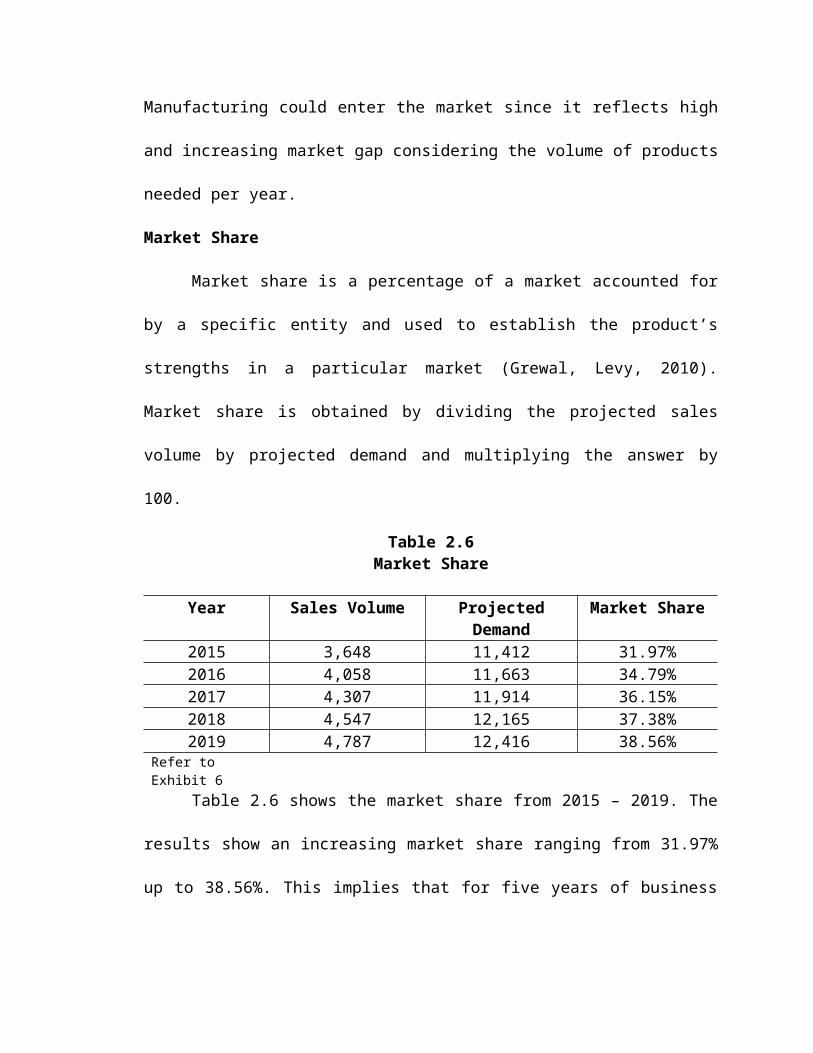
Market Share
Market share is a percentage of a market accounted for
by a specific entity and used to establish the product’s
strengths in a particular market (Grewal, Levy, 2010).
Market share is obtained by dividing the projected sales
volume by projected demand and multiplying the answer by
100.
Table 2.6Market Share
Year Sales Volume ProjectedDemand
Market Share
2015 3,648 11,412 31.97%2016 4,058 11,663 34.79%2017 4,307 11,914 36.15%2018 4,547 12,165 37.38%2019 4,787 12,416 38.56%
Refer to Exhibit 6
Table 2.6 shows the market share from 2015 – 2019. The
results show an increasing market share ranging from 31.97%
up to 38.56%. This implies that for five years of business
operation, the business will earn profit since there is a
continuous patronage of product by their customer.
SWOT Analysis
SWOT analysis provides a basis for improving weaknesses
or at least minimizing them and avoiding or managing
environmental threats to operations. SWOT study helps
identify a distinctive competence that can be used to tap an
important opportunity in the environment. It is the process
of reviewing internal operations for strengths and
weaknesses and scanning the organization’s external
environment for opportunities. (Routledge, 2009)
The starting point in formulating strategy is usually
SWOT Analysis. This analysis works well for strategic
planning, evaluating competitors and business development.
It helps on how to create a strategy that fully utilizes
one’s strength and opportunities and improves and prepare
for its own weaknesses and threats.
Strengths
Strengths are something internal to the organization.
It is something the organization is good at or a resource
that gives it an important capability, a useful competence,
a critical or proprietary know how, or a valuable
organizational achievement (Beekun, 2008).Strengths are the
qualities that enable us to accomplish the organization’s
mission. This involves the distinctive capability that can
be used effectively to achieve its performance objectives.
The following factors are the strengths of the proposed
business have.
Competitive price. The main raw material to be used
which is a corn husk is abundant and can be collected at low
cost. Therefore the cost incurred in the production of the
organizer is cheaper compared to the production cost of
other organizer manufacturing. As a result, the price of the
organizer is cheaper than its competitor. The price of Corn
Husk Stuff Organizer is P 272.19 compared to P 394.15 which
is the average price of competitor’s related product.
Availability of raw materials. Philippines is an
agricultural country and corn is one of the major crops
planted in the country. The abundant supply of corn makes it
possible for the production of corn husk organizer. Instead
of throwing the corn husk, it will be converted and used in
the production of the organizer. To strengthen this
statement, we found different suppliers in Lipa City and
from its nearby municipality. Vendors in public market of
Lipa City agreed to sell their corn husk to us as well as
the plantations in Padre Garcia, Rosario, Ibaan, and Malvar
which will be harvesting two times a year depending on the
time they plant it.
Competitive management. The proponents are students of
Bachelor of Science in Business Administration major in
Marketing Management giving them background on how to run a
business along with its operation. Their skills gained and
knowledge obtained while taking up the course secures an
edge for the firm’s success.
Being eco-friendly. Corn husk is being considered as
waste. Through the pursuant of Corn Husk Stuff Organizer,
corn husk which is thrown after peeled off from corn is
converted to more useful product. The raw material being
used cannot harm the environment and will help to eliminate
waste and turn into being a useful material.
Well oriented and trained workers. Workers are assets
of the enterprise. Before letting them do the real work,
they must first undergo trainings in order to be prepared
and equipped with all knowledge they need so they won’t be
shocked upon starting their work. Having skilled and trained
workers will fasten the production, thereby, making more
quality output.
Weaknesses
Weaknesses are considered to be anything the
organization lacks, does not perform well, or a condition
that hampers in some way (Beekun, 2008). Weaknesses
deteriorate influences on the organizational success and
growth. These are factors which can obstruct the attainment
of the proposed study. The following are the disadvantages
of the business which are internally observed and must be
surpassed.
Limited source of funds. Capital must first be
considered when establishing a business. Financial source
will be very limited, thus, creating funds for the business
to be minimal. Loan grants may not be that possible for lack
of personal background for its approval is subject to the
proponents. Thus, necessary equipments and other financial
related betterment must be prioritized and managed properly.
Lack of customer awareness. Since the product is a new
entrant, it is hard to penetrate the market. Through the
effective use of different strategies, this will help make
the public knowledgeable about the product offered.
High cost of labor. Labor cost is considered as one
factor in the operation of the business. It plays a
prominent role in business operations. The employees who
will be hired must have the skills needed to produce high
quality product.
Capacity to handle limited orders. Since the business
is a start up having two workers, chances are, the business
cannot at first accommodate bulk orders.
Still confined to rural areas and small cities.
Handicraft is a type of business usually present in rural
places since this type of business is handmade and less
technology is used.
Opportunities
Opportunities originate from the external environment
of the organization. They represent potential areas for
growth, technological changes, and demographic trends
(Beekun, 2008).
Technological change. The evolution of technology is
continuously growing. It helps the proponents to acquire the
latest equipment to be used which can increase the
production and assure the quality output of the product.
New trends on the market. Since most of the organizers
present in the market place are made of plastic, Filipinos
will be curious about the organizer made out of corn husk.
Their curiosity will be maximized by the proponents for them
to avail the product. Being new in the market will attract
the customers interest to try the product.
Business expansion. The goal of every business is to
expand their business to cater more customer needs. As long
as there is an increasing demand for a product, an entity
can get the opportunity for the growth of the business. It
sees an opportunity for the enterprise because it can cater
the increasing of the product.
Environmental usefulness of raw materials used. The
adaptation of an eco-friendly product where more and more
are being captivated that has been a trend not only
domestically but also internationally. Stuff organizer made
of Corn Husk is one of these products which represent
creativity in recycling the scrap corn husk that lessens the
waste in our municipality.
Similar product in the market is more expensive. Since
the related products offer in the market are more expensive,
chances are, the customers are more likely to shift in the
proponents’ organizer since it has a more affordable price
and the quality is just the same.
Threats
Threats are external factors that have the potential to
reduce the organization’s performance (Pershing, 2008). It
arises when conditions in external environment risk the
reliability and profitability of the business.
Changing preference. This is the responsibility of the
firm. As AIS Manufacturing is made to satisfy the consumer
needs, they should also conform to its consumer’s changing
preferences as time goes by.
Strong competition. AIS Manufacturing is considered new
in the field of native product industry. Competition in the
said industry is very stiff and rendering consumer with
quality products at cheap price while still giving variety
that meets the qualification of more than one segment of the
market is never easy. That illustrates the difficulty that
AIS manufacturing must overcome.
Economic instability. It has been the greatest threat
not only to starting up businesses but even with those which
are established by years. This economic instability scopes
up to the devaluation of peso, inflation, poverty and
others. It must be handled well for it dictates the status
of manufacturing of the product as well as the purchasing
power of Lipeños.
Price of substitute product. Prices of substitute
product could hinder the business to raise the price since
it could be the reason for its customer to switch to another
product.
Marketing Program and Strategies
A successful marketing planning and development begins
with the consideration of marketing strategies through
careful and precise evaluation of a marketing program.
Marketing Programs and Strategies focus on customer
satisfaction base on product, promotion, pricing, and place
which will be further discussed in the latter part of the
study.
Product
The product is under the category of household
handicraft. It is used to keep small things in place for the
future use. Unlike any other product which falls into its
competition, Corn Husk Stuff Organizer possesses unique
characteristics that could be an edge over the stiff
competition it may face as it enters the market. The
following could be seen in its features, benefits and
advantages.
The product is made of corn husk which is used to weave
on the outer part of the organizer to cover up the frame.
The frame is made of yantok as the base of organizer which
cannot easily crack. The corn husk has the quality that
cannot be simply split and cut into strips.
The product is the best example of encapsulating and
satisfying one’s need while contributing to the human
welfare and environment. It conforms to the organization’s
principle on low capitalization and production cost to offer
it cheaper in the market while still securing profit. These
types of products tend to be those which are prioritized
with today’s attention.
Corn Husk Stuff Organizer has its benefits that are
apparently valuable than others. Its aid in the conservation
of the environment and minimize waste are big factors
considered in making purchase decision. It is made up of
waste corn husk that is ready to be disposed but helpful to
humans if used in a functional way. The emergence of
awareness in how people can contribute to the greater and
friendlier products to be able to conserve the natural
resources helps the proposed product to be seen more
significant and wiser choice than the others.
The greatest advantage of this product could be its
cheaper price compared to competing brands which are made of
plastic. It consists of many divisions where people can put
lots of personal belongings. In terms of raw materials,
instead of throwing away and additional to the waste of
municipality, it will be converted into functional stuff
organizer. It is a great advantage in line with the disposal
of wastages. The product, being affordable, secures the
quality that is lacking in the lower priced brands, making
it a good alternative to high organizer that is too
expensive and cheaper brands that lacks the quality.
Product Category/Quality and Size
A product category is a way to organize products in a
store by the type of products people will be selling. The
proponents’ product falls under the category of handicraft.
Its main purpose is to provide convenience on the part of
the customer since it will put things in order.
Product quality is a collection of features and
characteristics of a product that contribute to its ability
to meet the given requirements. It includes the products’
overall reliability, ease of use and other valued
attributes. In terms of quality, Corn Husk Stuff Organizer
is made out from corn husk as the main raw material of the
organizer. The corn husk contains fiber and even it is
thrown and ignored after peeling from corn, it has been
proven to be sturdy. The finished product out of it is said
to be durable because the proponents examined the durability
of the husk with or without the use of chemicals in
preserving and strengthening the corn husk before using.
The product’s size will be 8 ½ inches in width, 11
inches in length and 4 inches in height. Different sizes
will be made to accommodate the needs of the consumers with
different preferences. Designs will be incorporated to give
more value and add beauty to the product.
Brand Name
Brand is a promise of something. That something is
intangible; it could be guarantee of quality, sense of
prestige, or of heritage. Brands also offer a
differentiating factor that makes it easier to choose
between the many competing product variants (Davis, 2009).
Brands help the consumers recognize a specific product among
others.
The proponents decided that the brand name is Handi-
Stuff. This brand name is easy to be recognized by an
individual because it comes from the word handicraft and the
stuff which is something we can put in place. As a business
entity, it is important to identify the right positioning of
the brand name. A competitive branding can simply increase
the potential of getting the prospects in order to attain
profit maximization. A good brand will serve a strategy on
how to recognize the value of the business and it can
motivate the customers to buy the products.
Packaging
Packaging is the activity of designing the container or
wrapper for a product. (Ac –ac, 2009). The proponents view
packaging as the first point of contact that a consumer has
with the brand, so they believe that it is important that it
initially draws their attention and also quickly convey the
message that both present and support the brand. There will
be consistency with the message of positioning the product.
In line with this, the proponents will use a tag as its
primary packaging. The name of the business and the picture
of raw materials to be used will be printed on the tag for
customer awareness. The secondary packaging would be plastic
bags to cover up when the customers buy.
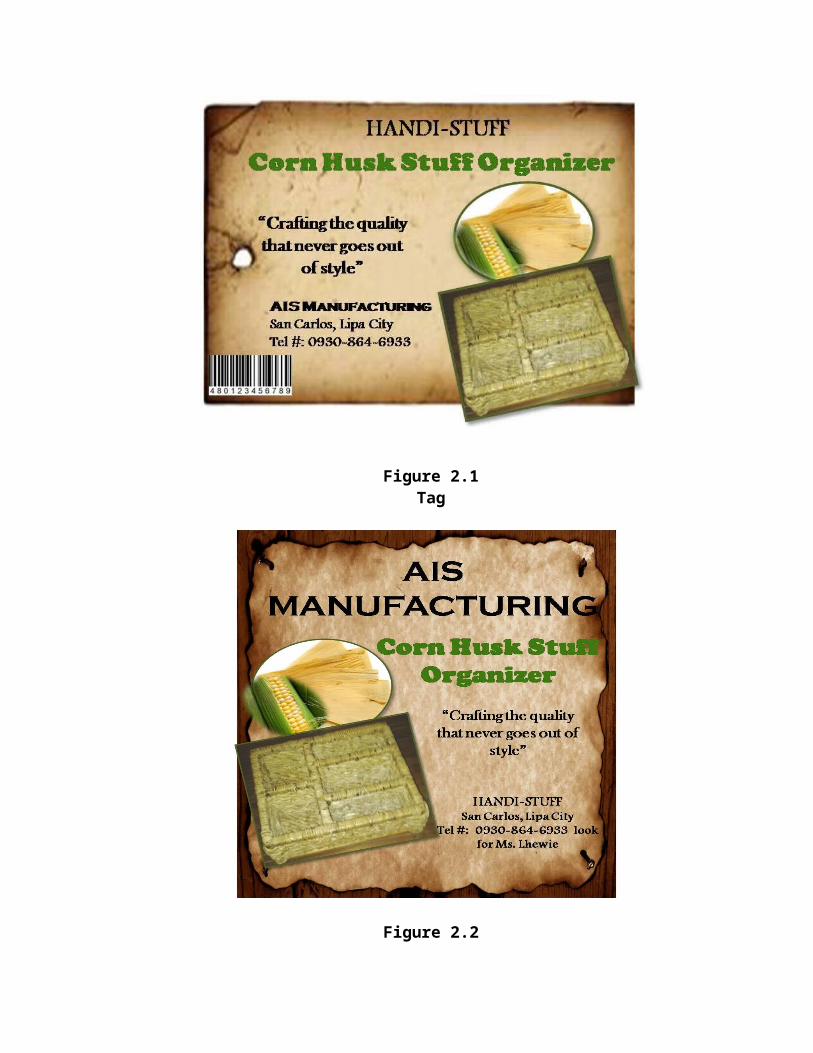
Figure 2.1Tag
Figure 2.2
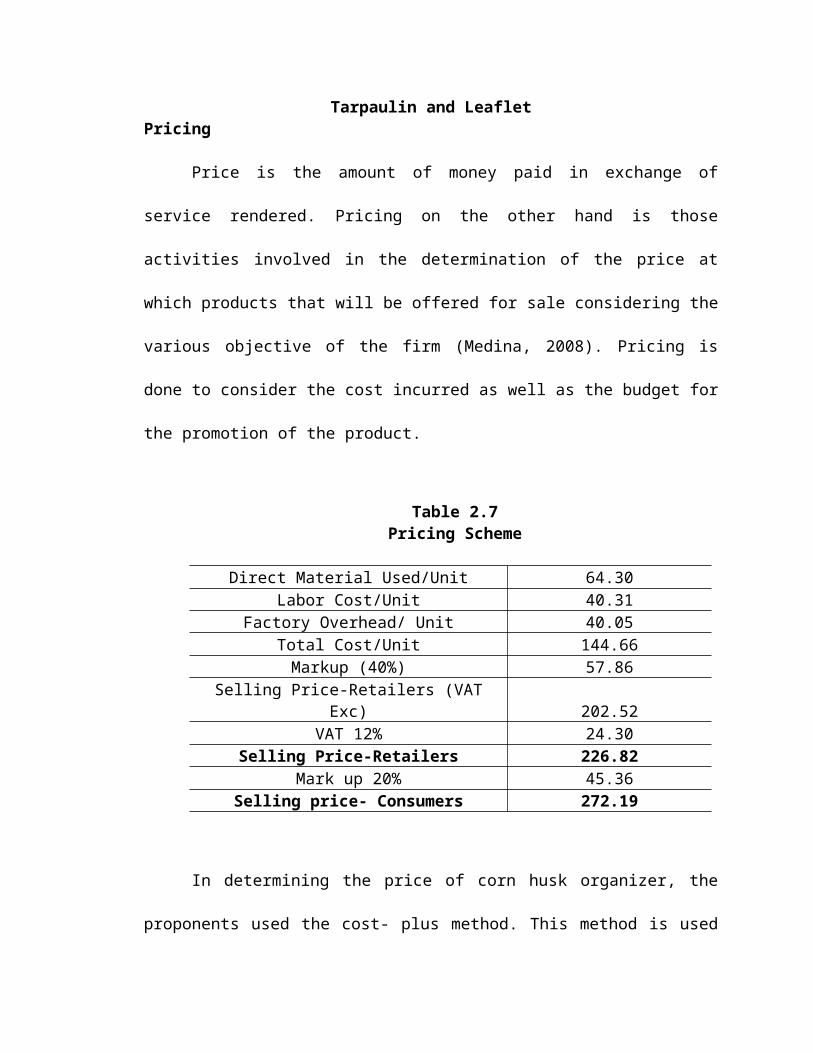
Tarpaulin and LeafletPricing
Price is the amount of money paid in exchange of
service rendered. Pricing on the other hand is those
activities involved in the determination of the price at
which products that will be offered for sale considering the
various objective of the firm (Medina, 2008). Pricing is
done to consider the cost incurred as well as the budget for
the promotion of the product.
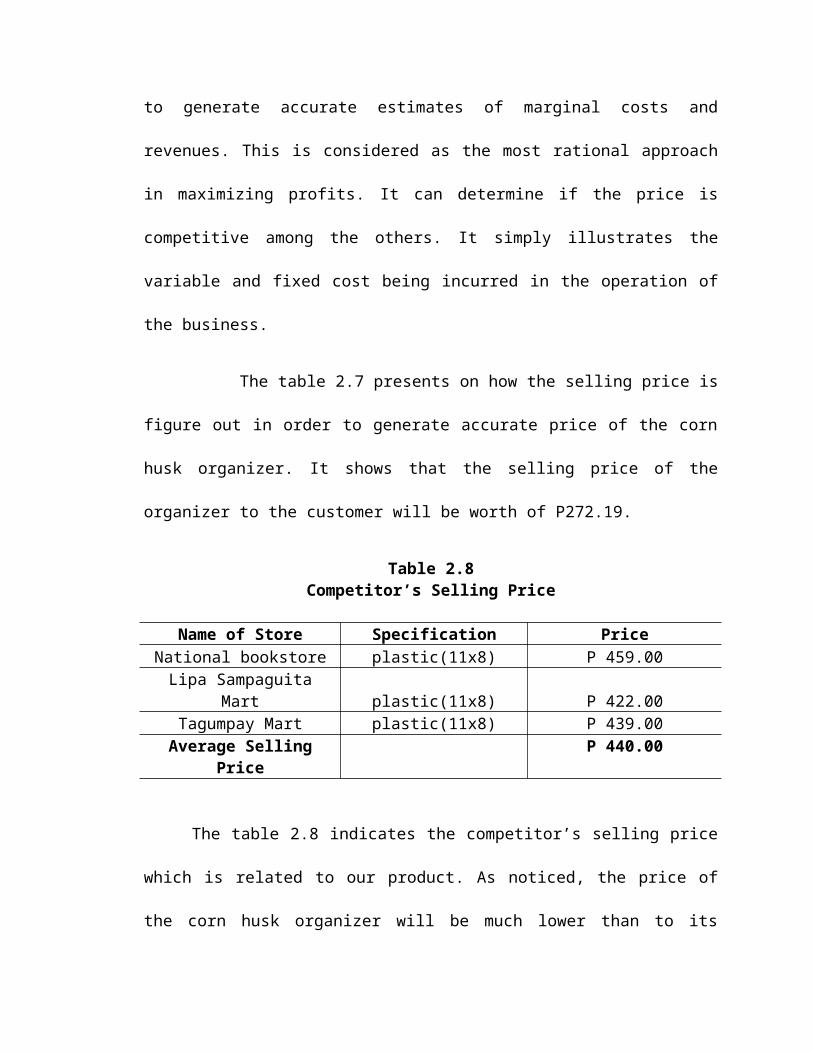
Table 2.7Pricing Scheme
Direct Material Used/Unit 64.30Labor Cost/Unit 40.31
Factory Overhead/ Unit 40.05Total Cost/Unit 144.66Markup (40%) 57.86
Selling Price-Retailers (VATExc) 202.52
VAT 12% 24.30Selling Price-Retailers 226.82
Mark up 20% 45.36Selling price- Consumers 272.19
In determining the price of corn husk organizer, the
proponents used the cost- plus method. This method is used
to generate accurate estimates of marginal costs and
revenues. This is considered as the most rational approach
in maximizing profits. It can determine if the price is
competitive among the others. It simply illustrates the
variable and fixed cost being incurred in the operation of
the business.
The table 2.7 presents on how the selling price is
figure out in order to generate accurate price of the corn
husk organizer. It shows that the selling price of the
organizer to the customer will be worth of P272.19.
Table 2.8Competitor’s Selling Price
Name of Store Specification PriceNational bookstore plastic(11x8) P 459.00Lipa Sampaguita
Mart plastic(11x8) P 422.00Tagumpay Mart plastic(11x8) P 439.00Average Selling
PriceP 440.00
The table 2.8 indicates the competitor’s selling price
which is related to our product. As noticed, the price of
the corn husk organizer will be much lower than to its
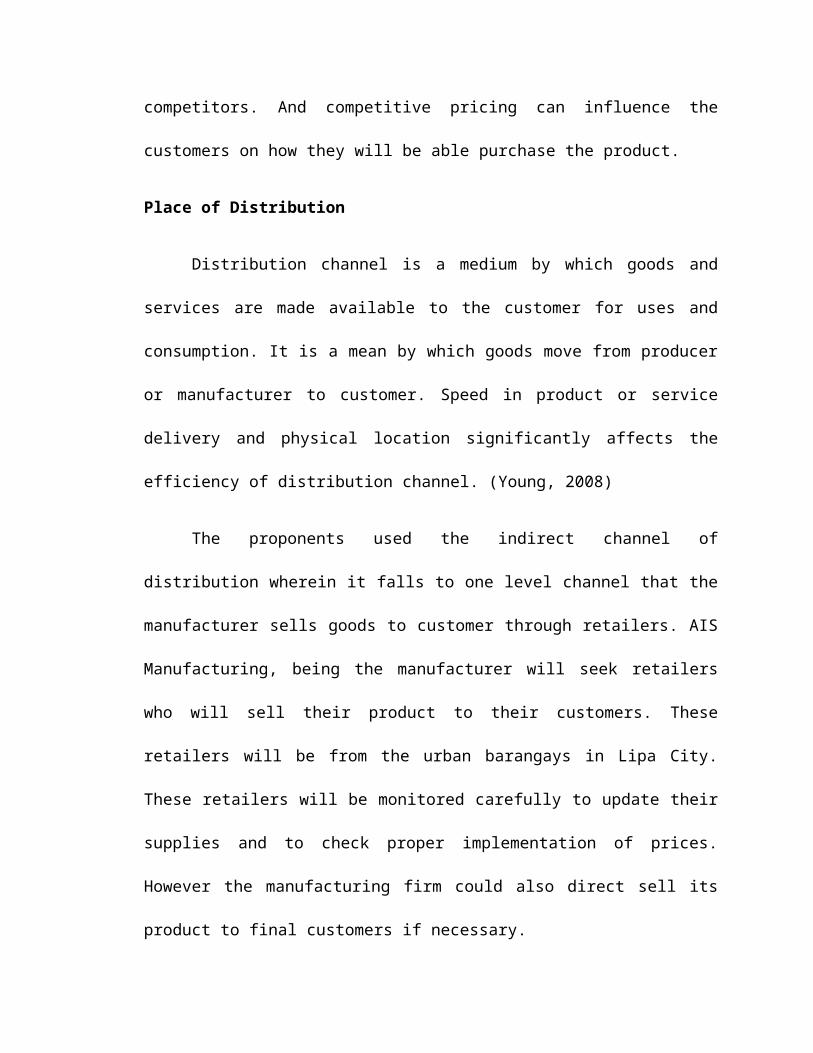
competitors. And competitive pricing can influence the
customers on how they will be able purchase the product.
Place of Distribution
Distribution channel is a medium by which goods and
services are made available to the customer for uses and
consumption. It is a mean by which goods move from producer
or manufacturer to customer. Speed in product or service
delivery and physical location significantly affects the
efficiency of distribution channel. (Young, 2008)
The proponents used the indirect channel of
distribution wherein it falls to one level channel that the
manufacturer sells goods to customer through retailers. AIS
Manufacturing, being the manufacturer will seek retailers
who will sell their product to their customers. These
retailers will be from the urban barangays in Lipa City.
These retailers will be monitored carefully to update their
supplies and to check proper implementation of prices.
However the manufacturing firm could also direct sell its
product to final customers if necessary.
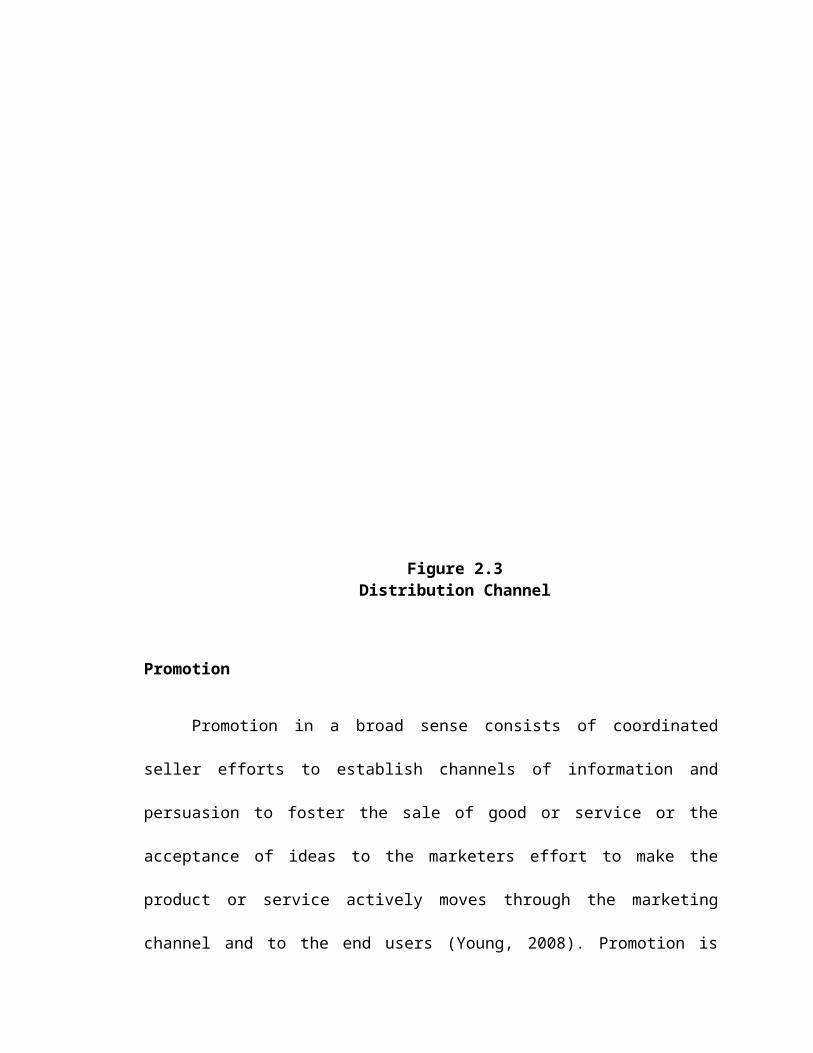
Figure 2.3Distribution Channel
Promotion
Promotion in a broad sense consists of coordinated
seller efforts to establish channels of information and
persuasion to foster the sale of good or service or the
acceptance of ideas to the marketers effort to make the
product or service actively moves through the marketing
channel and to the end users (Young, 2008). Promotion is
also a form of corporate communication that uses various
methods to reach targeted customers with a certain message
in order to achieve specific organizational objectives. Like
most marketing decisions, an effective promotional strategy
requires the marketer to understand how promotion fits with
other pieces of the marketing puzzle. Consequently,
promotion decisions should be made with an appreciation to
how it affects other areas of the business. In addition to
coordinating general promotion decisions with other business
areas, individual promotions must also work together. Under
the concept of Integrated Marketing Communication (IMC)
marketers attempt to develop a unified promotional strategy
involving the coordination of many different types of
promotional techniques. The key idea for the marketer who
employs several promotional options to reach objectives for
the service is to employ a consistent message across all
options.
The proponents then chose sales promotion and internet
marketing as factors of its IMC program. The use of
advertising is too expensive for the firm yet and lower
promotional tools are considered until necessary.
Under sales promotion, it offers three distinctive
benefits such as communication, incentive and invitation.
This IMC program draws a quicker customer response. The
sales promotion tools to be used are loyalty reward. Since
customers wants to be pampered by businesses, loyalty
rewards can help to develop loyal customers and to encourage
repeat purchased among this customers. A good sales
promotion will not only increase profit by also help to
build a long relationship with the customers which is
crucial to sustain business operation and to remain in
business.
The proponents will also use flyers and tarpaulins that
will be posted and distributed in areas allowed and near to
its retailers so that the customer could easily recognized
the store where they can avail the product. Flyers will also
be distributed to help the customer be more aware of the
product. Flyers will be distributed in the public market
three days before of the opening. Public market is the
places suited for the distribution since most of the
retailers are found near the area.
The use of social media marketing will also be
considered to take advantage of posting free promotion
online (Young, 2008). This strategy could lessen the cost on
the part of the proponents while also helping to promote the
product. The growth of social media can provide its full
potential to promote the product as well as the brand. It
also serves as strategy on how an entity will introduce the
product. As competition continuously growing, efficient and
effective used of promotional tool and strategy will serve
as a perimeter to defy the stiff competition in the market.
Also, this could be an edge of a company to stand among its
competitors.
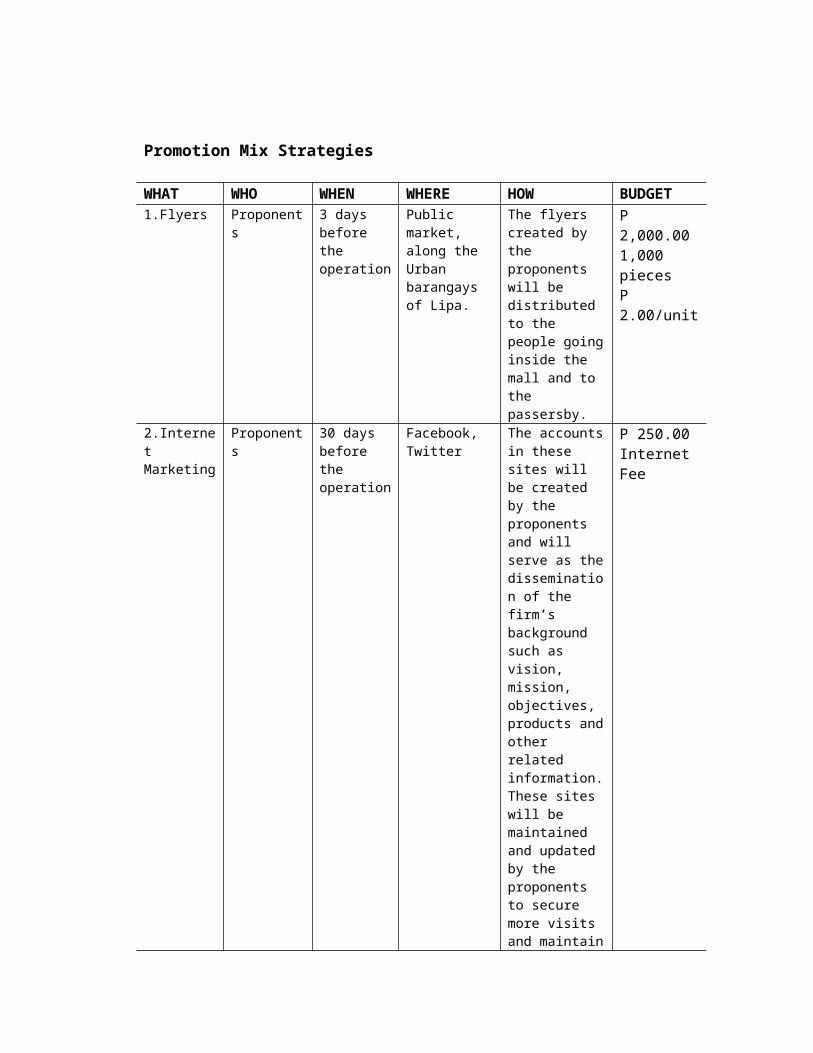
Promotion Mix Strategies
WHAT WHO WHEN WHERE HOW BUDGET1.Flyers Proponent
s3 days before the operation
Public market, along the Urban barangays of Lipa.
The flyers created by the proponents will be distributed to the people goinginside the mall and to the passersby.
P 2,000.001,000 piecesP 2.00/unit
2.Internet Marketing
Proponents
30 days before the operation
Facebook, Twitter
The accountsin these sites will be created by the proponents and will serve as thedissemination of the firm’s background such as vision, mission, objectives, products andother related information.These sites will bemaintained and updated by the proponents to secure more visits and maintain
P 250.00Internet Fee
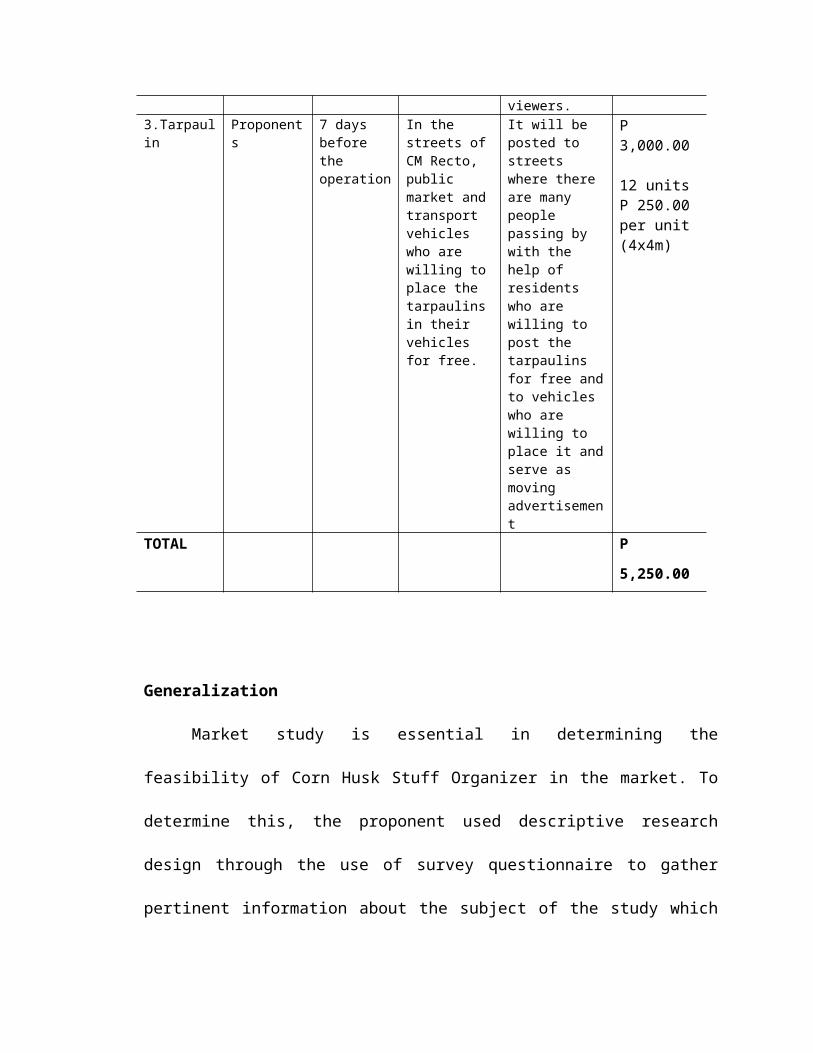
viewers.3.Tarpaulin
Proponents
7 days before the operation
In the streets ofCM Recto, public market andtransport vehicles who are willing toplace the tarpaulinsin their vehicles for free.
It will be posted to streets where there are many people passing by with the help of residents who are willing to post the tarpaulins for free andto vehicles who are willing to place it andserve as moving advertisement
P 3,000.00
12 unitsP 250.00 per unit (4x4m)
TOTAL P
5,250.00
Generalization
Market study is essential in determining the
feasibility of Corn Husk Stuff Organizer in the market. To
determine this, the proponent used descriptive research
design through the use of survey questionnaire to gather
pertinent information about the subject of the study which
were the households in urban barangay in Lipa City with the
monthly income of P10,000.00 and above. The proponents went
in different barangays in Lipa City to hand their
respondents the questionnaires they need to filled up. The
sample size is 369 and it is computed through the use of
Slovin’s formula from the total household of 4823. Data
about the total household are from CPDO. Questionnaire for
the retailer was also prepared and the proponents also
conduct interview with its retailers namely: Jose Garcia
Native Store, Manes Native Store, Ben’s Native Store, Luz
Native Store, San Vicente Native Product, SM Department
store, SM Supermarket, Ace Hardware, National Bookstore,
Robinsons Supermarket, Lipa Sampaguita Mart, and Tagumpay
Mart. The data gather from the retailers serve as the basis
for the historical demand of the product which is crucial in
the pursuance of the study and determining the viability of
the research.
The historical demand of the related product from 2008-
2012 are 9,659 to 10,666 respectively, while the historical
supply are 1,620 to 2,194 accumulating this data from the
retailer’s interview and observation. The projected demand
and supply are computed to straight line method. The results
are 11,412 in 2015 and 12,416 in 2019 for projected demand
while 2,618and 3,202 for projected supply respectively.
Advantages and disadvantages were also evaluated by the
proponents. Among the strengths considered by the proponents
are competitive price, availability of raw materials,
competitive management and being earth friendly. The
weaknesses foreseen by the proponents are availability of
capital, lack of customer awareness, high cost of labor,
capacity to handle limited orders and still confined to
rural areas and small cities. The opportunities are
technological change, new trend on the market, business
expansion and environment usefulness. However, the possible
threats to be faced are changing preference, strong
competition and economic instability. The business will
maximize the strength and opportunities and will strategize
to cover weaknesses and avoid threats.
The proponents had also created their marketing
strategy while focusing the four P’s of marketing mix. The
product developed with high consideration of quality and the
price establishes is reasonable with its characteristics and
competitive enough to wind stand the competition in the
market. Its distribution is simple yet flexible to ensure
that the customers are serving well and their expectations
about the product and service of the business are met. And
lastly, for promotion, it will use sales promotion using
flyers and tarpaulins that will be distributed and posted
near its retailer so the customer will easily recognized
where they can avail the product. Online advertisement will
also be used not only to reduce cost but also to maximize
the opportunities that now a days most of the people are
browsing the internet and through posting online, the people
will be aware of the product.
Chapter IIITECHNICAL STUDY
After determining the market feasibility, the
proponents proceeded in analyzing the technical feasibility
of the proposed business. This part could be considered
complete if all pertinent technical aspects of the project
have been taken into account in the analysis and if the
planned construction conforms to accept engineering standard
and practices. The estimated cost of the project should be
as low as any other reasonably available alternative which
would produce the intended results. (Iñigo, 2008)
Objectives of the Study:
In technical study, the proponents aimed to determine
the technical feasibility of the product, the manufacturing
process used in the production, the annual production,
working days in a year, plant location and layout, tools and
equipment and other necessary requirements needed in the
operation.
1. To impel the product description and its uses.
2. To determine the manufacturing process and the time
scheme of each process.
3. To identify the raw materials, tools, and equipment to
be used.
4. To choose the best plant location and its layout.
5. To conform to the strict compliance of waste
management.
Product
The proponents’ product is named “Corn Husk Stuff
Organizer”. It is the conversion of corn husk, its main raw
material that makes it different from any other organizer
and native products in the market. This came from the
thought of using them into more useful and unique way.
The corn husk will be woven on its designed frame as an
outer layer and also for its design. This product can help
the environment through minimization of wastages in the
municipality. Processing of plastics will be lessened and
creativity and craftsmanship can be developed.
Description of the Product
The product is made of corn husk as its main raw
materials supported by yantok and bamboo as their base.
Twined wicker is the kind of weaving the proponents used,
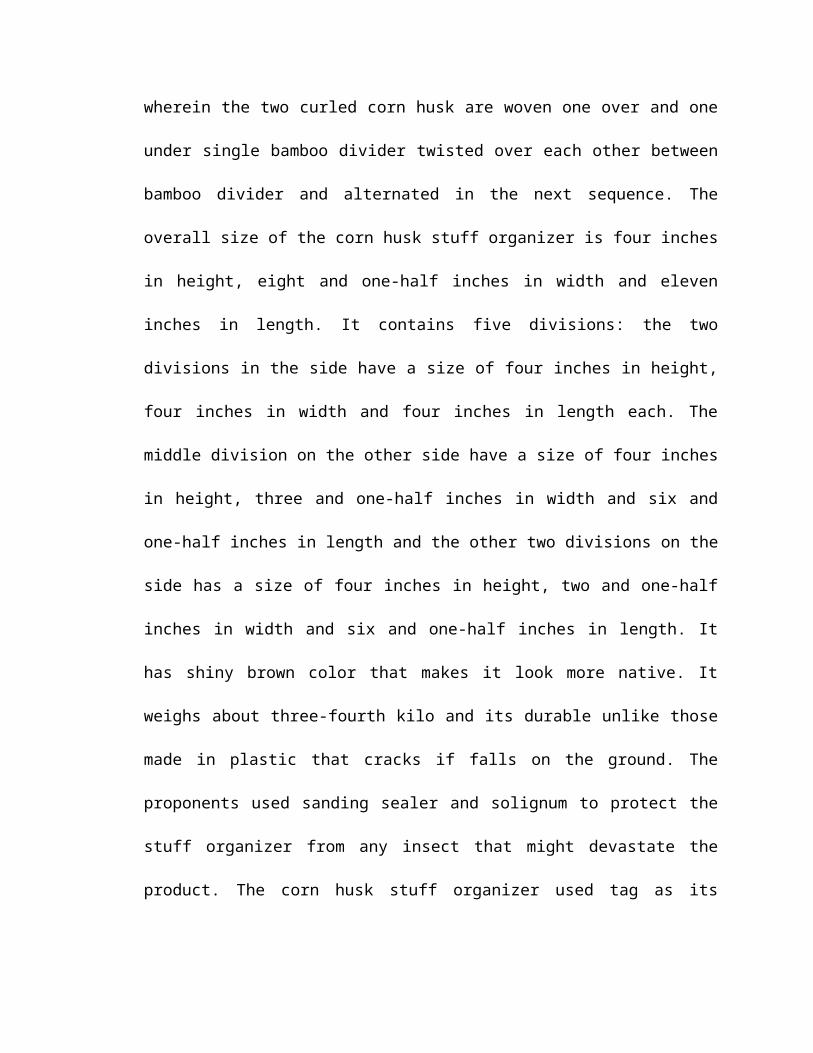
wherein the two curled corn husk are woven one over and one
under single bamboo divider twisted over each other between
bamboo divider and alternated in the next sequence. The
overall size of the corn husk stuff organizer is four inches
in height, eight and one-half inches in width and eleven
inches in length. It contains five divisions: the two
divisions in the side have a size of four inches in height,
four inches in width and four inches in length each. The
middle division on the other side have a size of four inches
in height, three and one-half inches in width and six and
one-half inches in length and the other two divisions on the
side has a size of four inches in height, two and one-half
inches in width and six and one-half inches in length. It
has shiny brown color that makes it look more native. It
weighs about three-fourth kilo and its durable unlike those
made in plastic that cracks if falls on the ground. The
proponents used sanding sealer and solignum to protect the
stuff organizer from any insect that might devastate the
product. The corn husk stuff organizer used tag as its
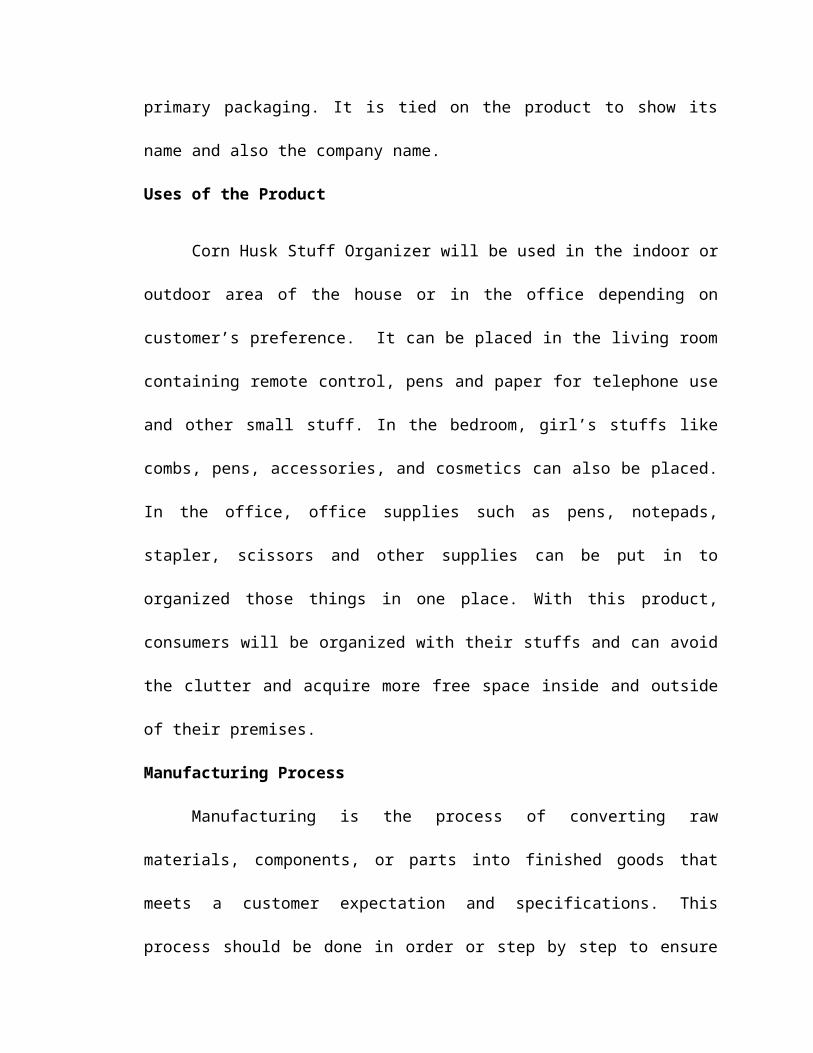
primary packaging. It is tied on the product to show its
name and also the company name.
Uses of the Product
Corn Husk Stuff Organizer will be used in the indoor or
outdoor area of the house or in the office depending on
customer’s preference. It can be placed in the living room
containing remote control, pens and paper for telephone use
and other small stuff. In the bedroom, girl’s stuffs like
combs, pens, accessories, and cosmetics can also be placed.
In the office, office supplies such as pens, notepads,
stapler, scissors and other supplies can be put in to
organized those things in one place. With this product,
consumers will be organized with their stuffs and can avoid
the clutter and acquire more free space inside and outside
of their premises.
Manufacturing Process
Manufacturing is the process of converting raw
materials, components, or parts into finished goods that
meets a customer expectation and specifications. This
process should be done in order or step by step to ensure
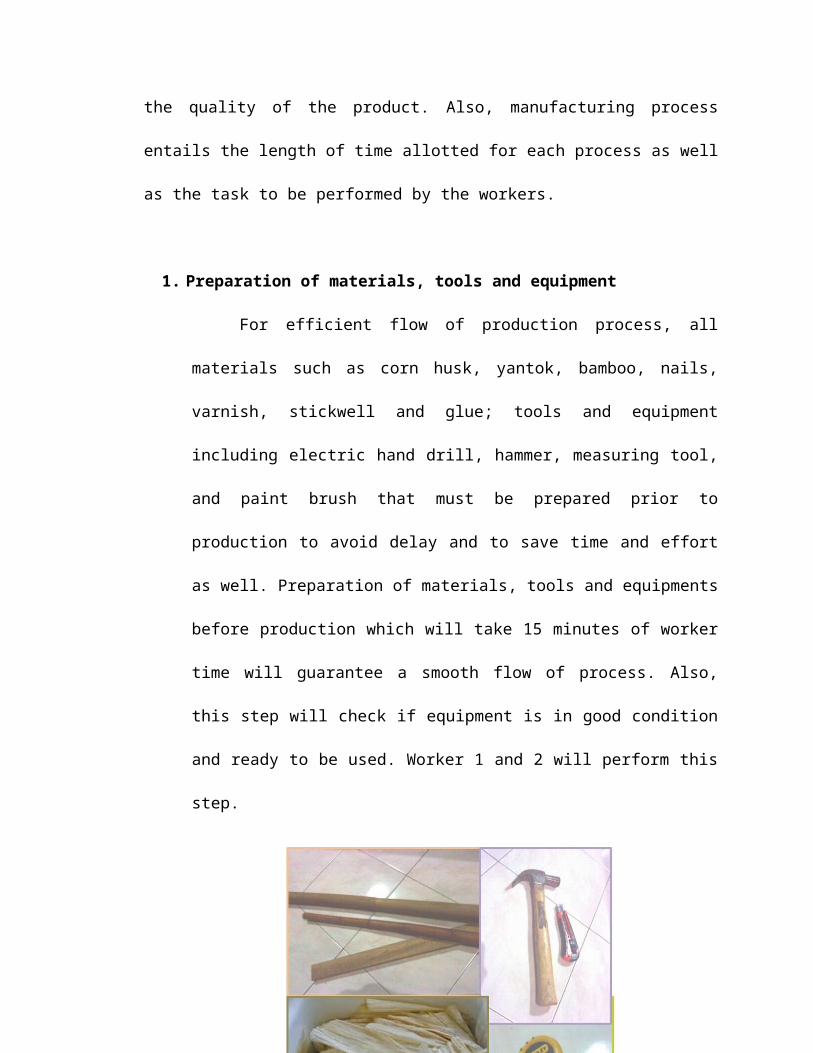
the quality of the product. Also, manufacturing process
entails the length of time allotted for each process as well
as the task to be performed by the workers.
1. Preparation of materials, tools and equipment
For efficient flow of production process, all
materials such as corn husk, yantok, bamboo, nails,
varnish, stickwell and glue; tools and equipment
including electric hand drill, hammer, measuring tool,
and paint brush that must be prepared prior to
production to avoid delay and to save time and effort
as well. Preparation of materials, tools and equipments
before production which will take 15 minutes of worker
time will guarantee a smooth flow of process. Also,
this step will check if equipment is in good condition
and ready to be used. Worker 1 and 2 will perform this
step.
2. Measuring and cutting of wood
After preparing the materials needed, measuring
and cutting will be done to ensure that the sizes of
materials will conform to the standard size necessary
in assembling the product. Proper measurement and
cutting is crucial to produce a product with quality.
This process will take 45 minutes; therefore, worker 1
and 2 will be responsible in doing this step.
3. Making of frame
This process is crucial and must be done
carefully. Frame will be the foundation of the stuff
organizer so it must be strong and all edges must be
aligned. Worker 1 and 2 who are responsible for this
step must drill yantok carefully making hole big enough
for bamboo to be attached. Stick well must be place
after the bamboo has been inserted in holes of yantok.
This step will require 1hour to be accomplished.
4. Weaving of corn husk
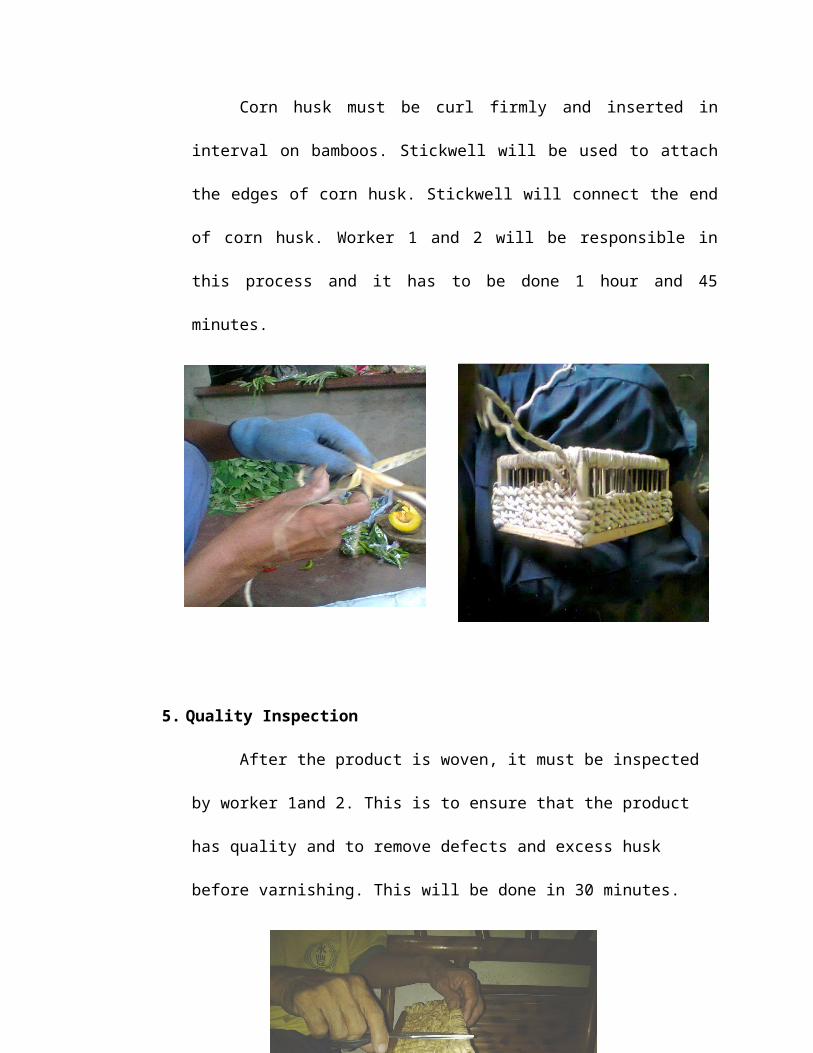
Corn husk must be curl firmly and inserted in
interval on bamboos. Stickwell will be used to attach
the edges of corn husk. Stickwell will connect the end
of corn husk. Worker 1 and 2 will be responsible in
this process and it has to be done 1 hour and 45
minutes.
5. Quality Inspection
After the product is woven, it must be inspected
by worker 1and 2. This is to ensure that the product
has quality and to remove defects and excess husk
before varnishing. This will be done in 30 minutes.
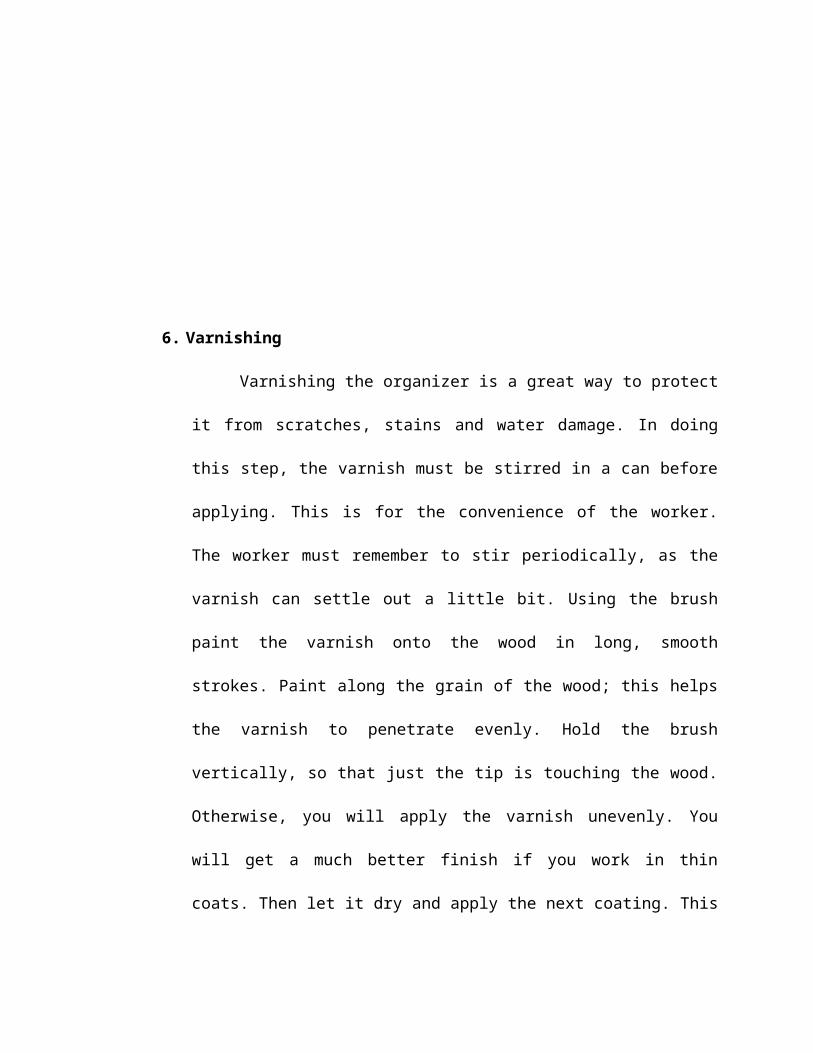
6. Varnishing
Varnishing the organizer is a great way to protect
it from scratches, stains and water damage. In doing
this step, the varnish must be stirred in a can before
applying. This is for the convenience of the worker.
The worker must remember to stir periodically, as the
varnish can settle out a little bit. Using the brush
paint the varnish onto the wood in long, smooth
strokes. Paint along the grain of the wood; this helps
the varnish to penetrate evenly. Hold the brush
vertically, so that just the tip is touching the wood.
Otherwise, you will apply the varnish unevenly. You
will get a much better finish if you work in thin
coats. Then let it dry and apply the next coating. This
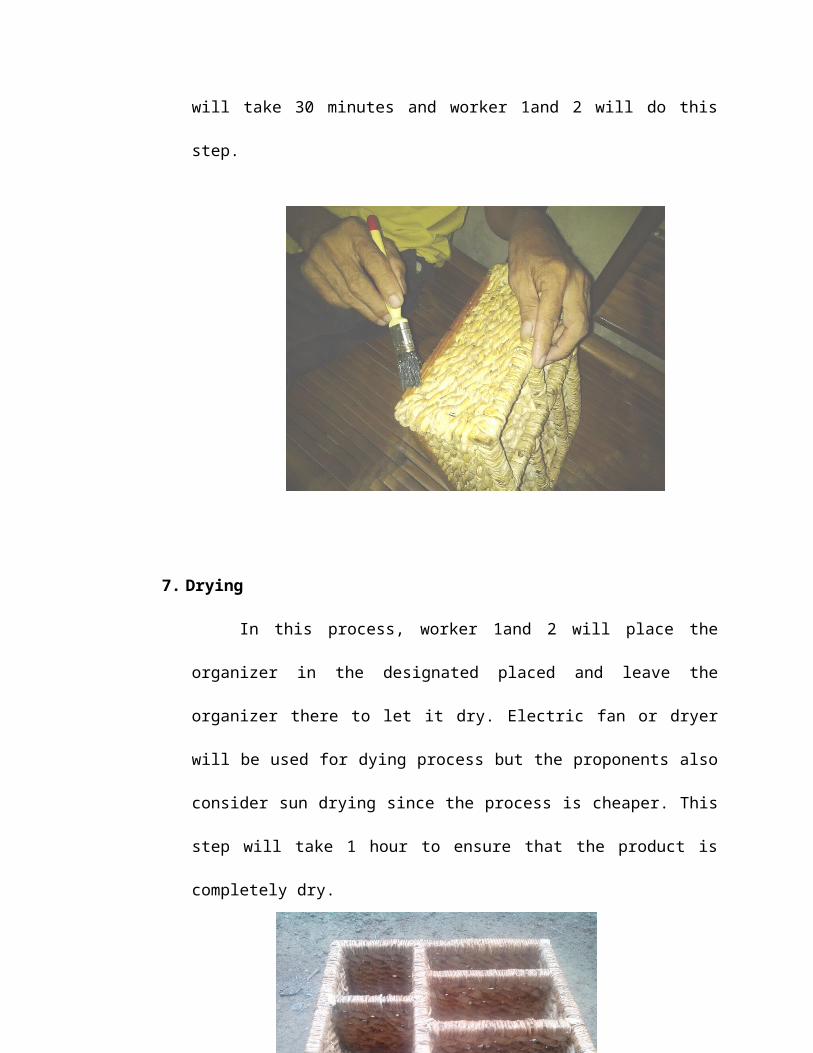
will take 30 minutes and worker 1and 2 will do this
step.
7. Drying
In this process, worker 1and 2 will place the
organizer in the designated placed and leave the
organizer there to let it dry. Electric fan or dryer
will be used for dying process but the proponents also
consider sun drying since the process is cheaper. This
step will take 1 hour to ensure that the product is
completely dry.
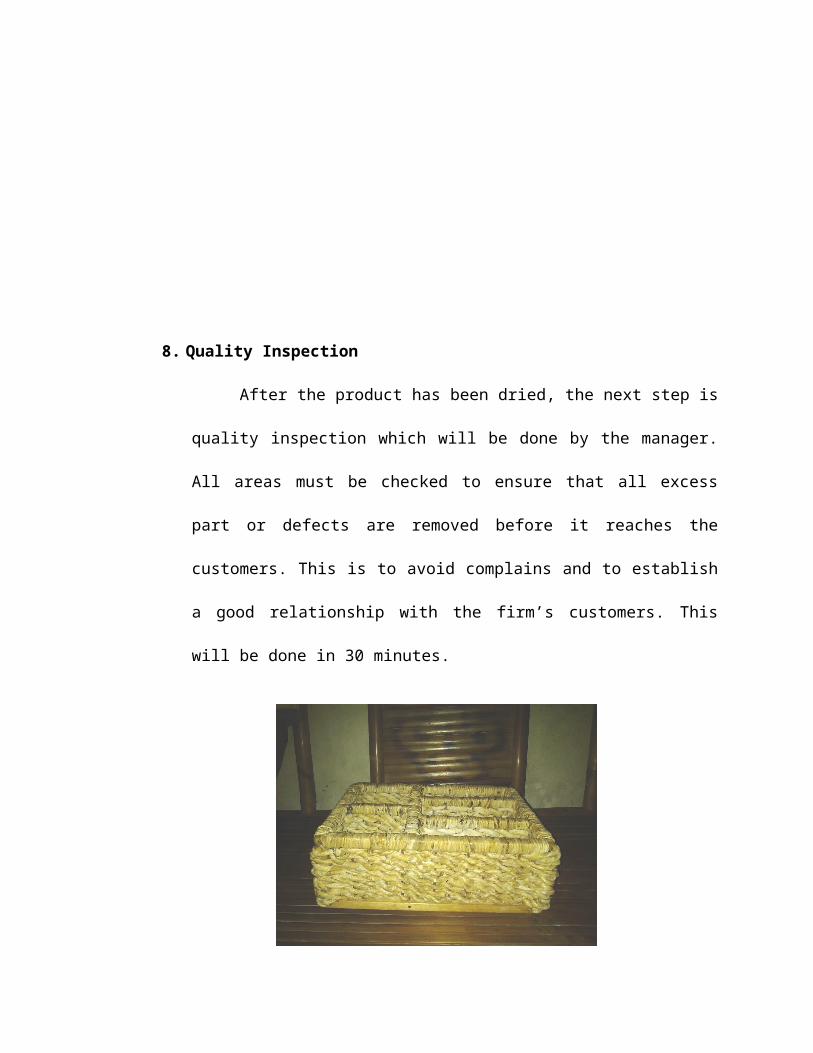
8. Quality Inspection
After the product has been dried, the next step is
quality inspection which will be done by the manager.
All areas must be checked to ensure that all excess
part or defects are removed before it reaches the
customers. This is to avoid complains and to establish
a good relationship with the firm’s customers. This
will be done in 30 minutes.
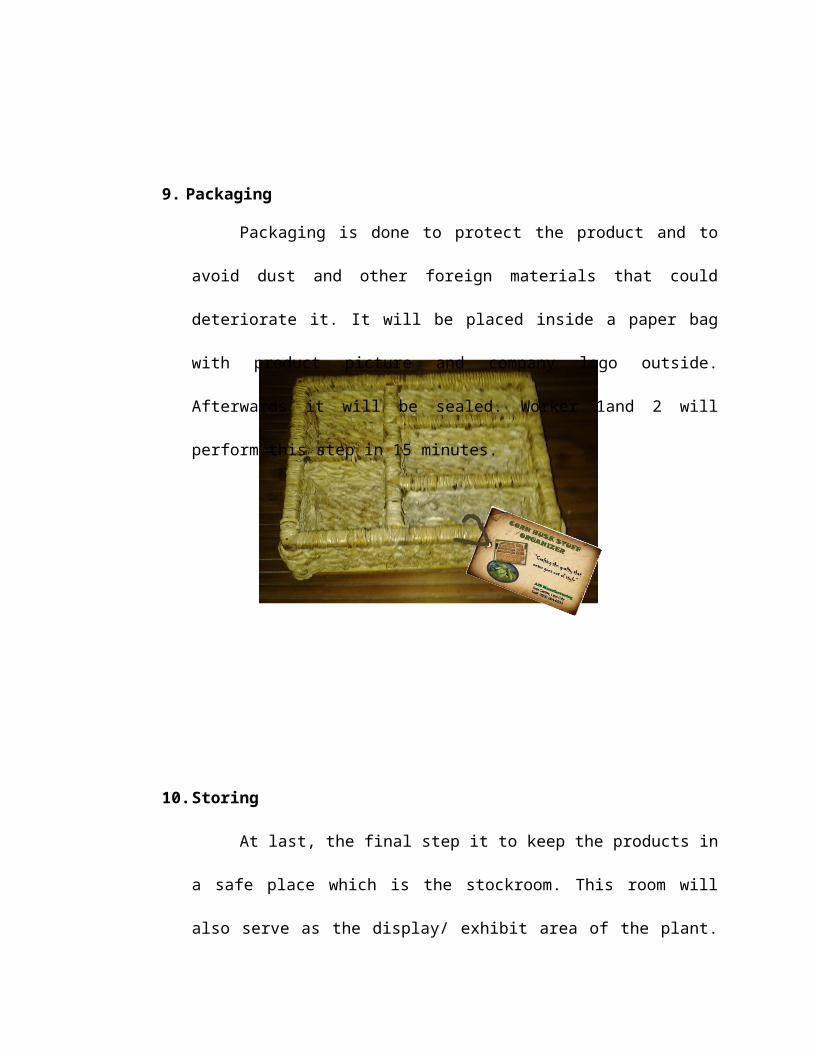
9. Packaging
Packaging is done to protect the product and to
avoid dust and other foreign materials that could
deteriorate it. It will be placed inside a paper bag
with product picture and company logo outside.
Afterwards it will be sealed. Worker 1and 2 will
perform this step in 15 minutes.
10.Storing
At last, the final step it to keep the products in
a safe place which is the stockroom. This room will
also serve as the display/ exhibit area of the plant.
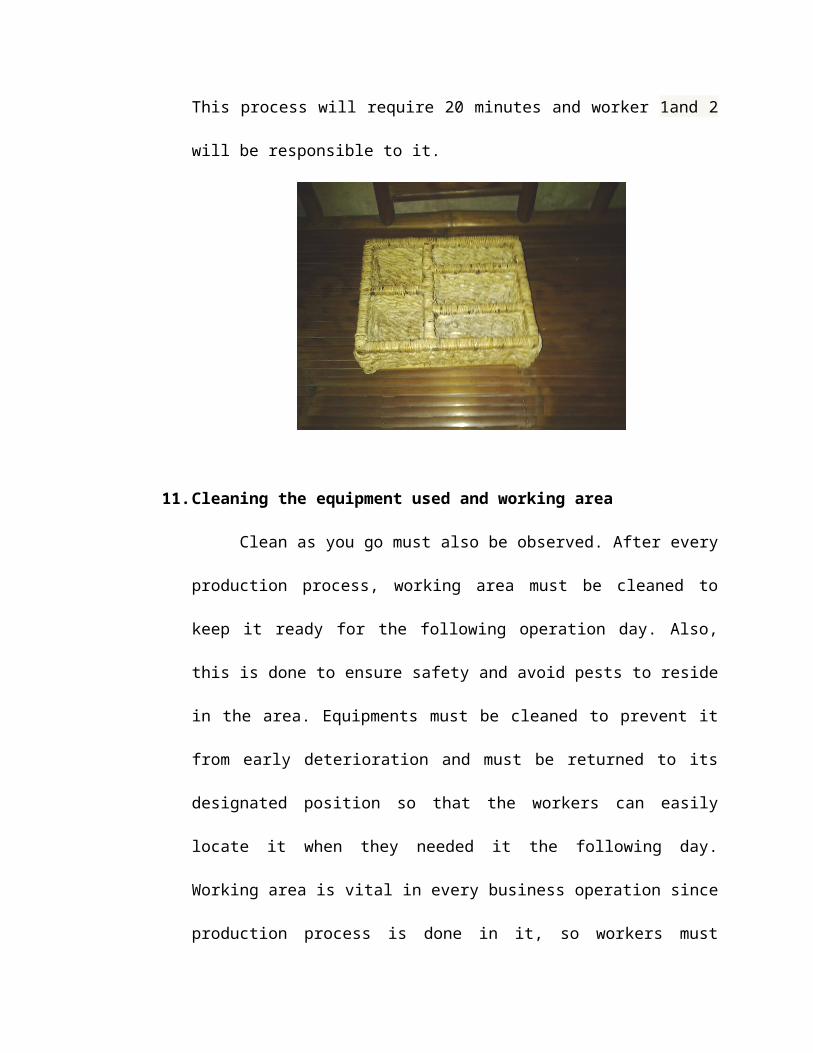
This process will require 20 minutes and worker 1and 2
will be responsible to it.
11.Cleaning the equipment used and working area
Clean as you go must also be observed. After every
production process, working area must be cleaned to
keep it ready for the following operation day. Also,
this is done to ensure safety and avoid pests to reside
in the area. Equipments must be cleaned to prevent it
from early deterioration and must be returned to its
designated position so that the workers can easily
locate it when they needed it the following day.
Working area is vital in every business operation since
production process is done in it, so workers must
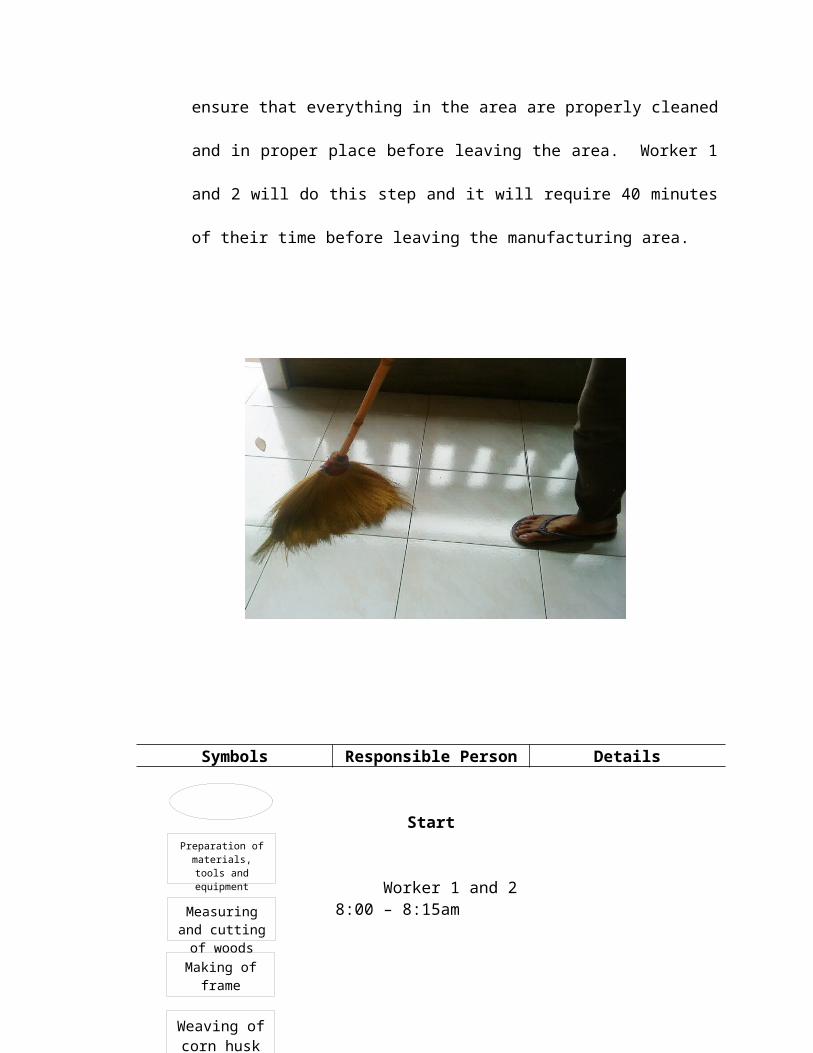
Preparation of materials, tools and equipment
Measuring and cutting of woodsMaking of frame
Weaving of corn husk
ensure that everything in the area are properly cleaned
and in proper place before leaving the area. Worker 1
and 2 will do this step and it will require 40 minutes
of their time before leaving the manufacturing area.
Symbols Responsible Person Details
Start
Worker 1 and 2 8:00 – 8:15am
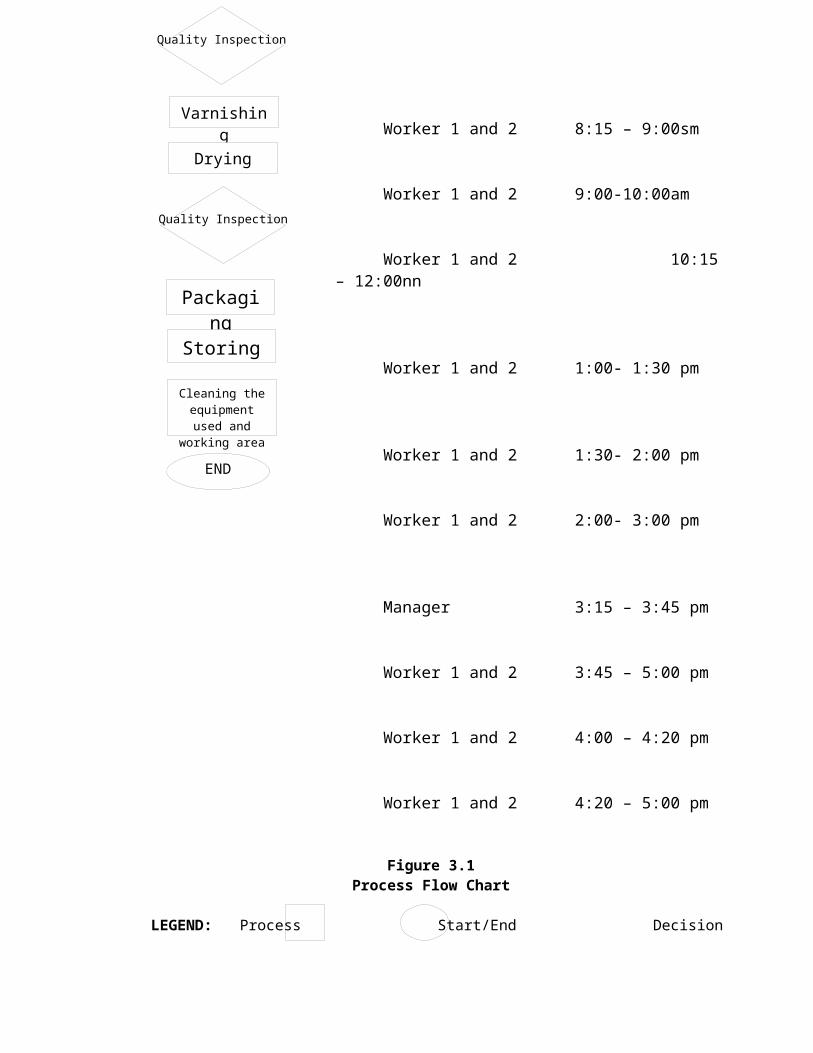
Quality Inspection
Packaging
Storing
Varnishing
Drying
Quality Inspection
Cleaning the equipment used and
working area
END
Worker 1 and 2 8:15 – 9:00sm
Worker 1 and 2 9:00-10:00am
Worker 1 and 2 10:15– 12:00nn
Worker 1 and 2 1:00- 1:30 pm
Worker 1 and 2 1:30- 2:00 pm
Worker 1 and 2 2:00- 3:00 pm
Manager 3:15 – 3:45 pm
Worker 1 and 2 3:45 – 5:00 pm
Worker 1 and 2 4:00 – 4:20 pm
Worker 1 and 2 4:20 – 5:00 pm
Figure 3.1Process Flow Chart
LEGEND: Process Start/End Decision
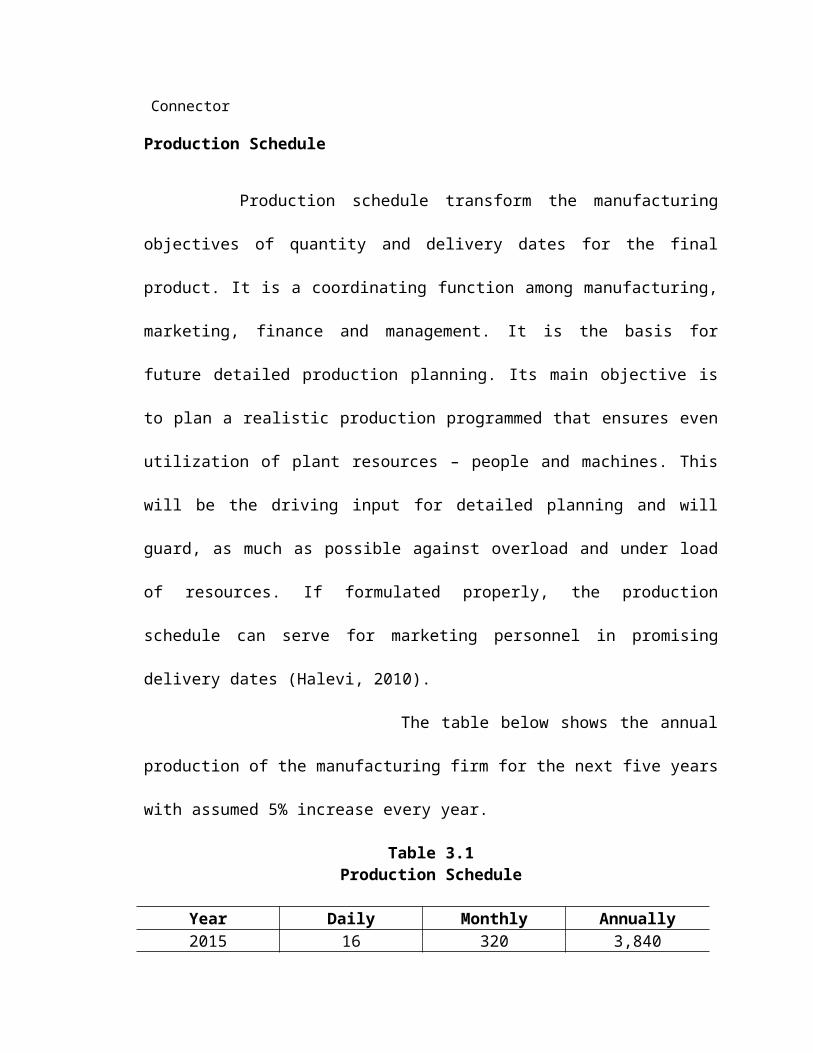
Connector
Production Schedule
Production schedule transform the manufacturing
objectives of quantity and delivery dates for the final
product. It is a coordinating function among manufacturing,
marketing, finance and management. It is the basis for
future detailed production planning. Its main objective is
to plan a realistic production programmed that ensures even
utilization of plant resources – people and machines. This
will be the driving input for detailed planning and will
guard, as much as possible against overload and under load
of resources. If formulated properly, the production
schedule can serve for marketing personnel in promising
delivery dates (Halevi, 2010).
The table below shows the annual
production of the manufacturing firm for the next five years
with assumed 5% increase every year.
Table 3.1Production Schedule
Year Daily Monthly Annually2015 16 320 3,840
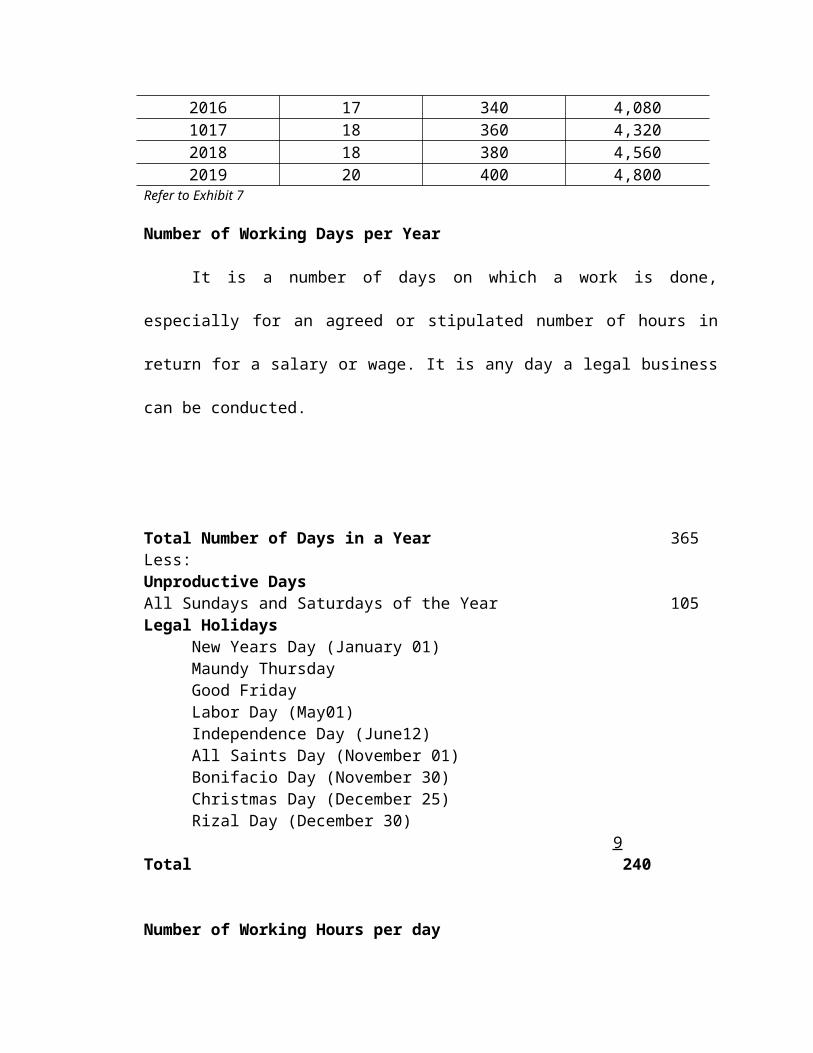
2016 17 340 4,0801017 18 360 4,3202018 18 380 4,5602019 20 400 4,800
Refer to Exhibit 7
Number of Working Days per Year
It is a number of days on which a work is done,
especially for an agreed or stipulated number of hours in
return for a salary or wage. It is any day a legal business
can be conducted.
Total Number of Days in a Year 365Less:Unproductive DaysAll Sundays and Saturdays of the Year 105Legal Holidays
New Years Day (January 01)Maundy ThursdayGood FridayLabor Day (May01)Independence Day (June12)All Saints Day (November 01)Bonifacio Day (November 30)Christmas Day (December 25)Rizal Day (December 30)
9Total 240
Number of Working Hours per day
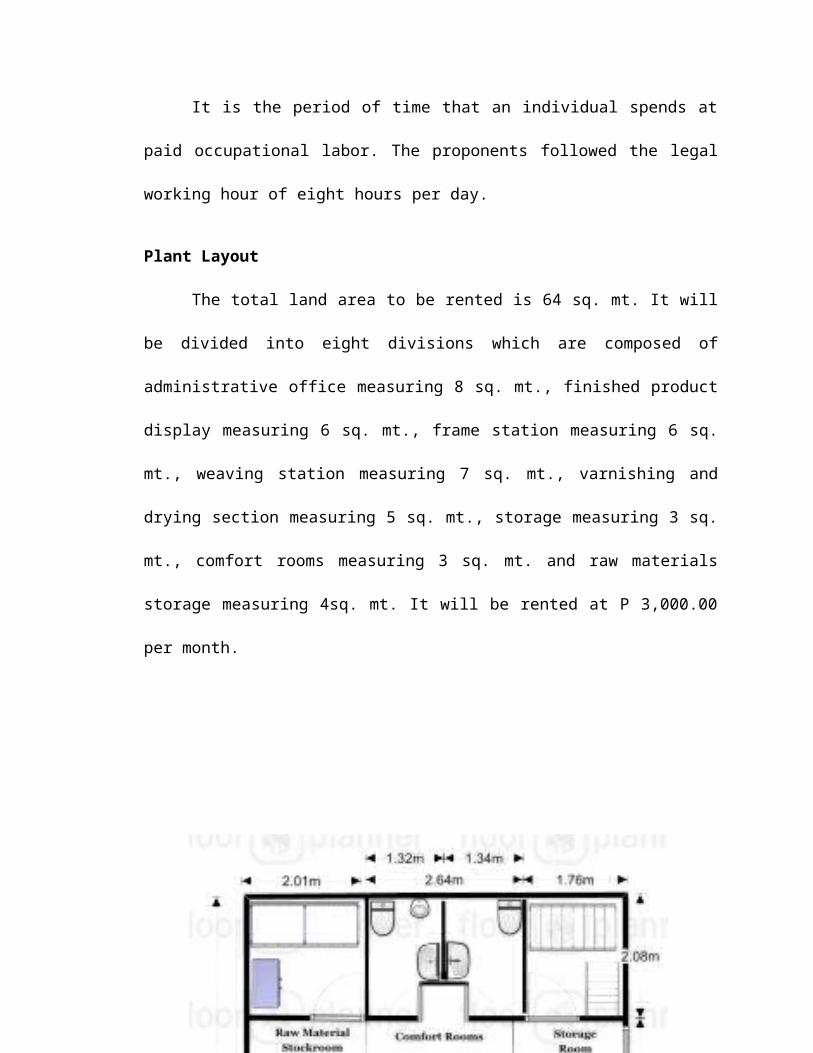
It is the period of time that an individual spends at
paid occupational labor. The proponents followed the legal
working hour of eight hours per day.
Plant Layout
The total land area to be rented is 64 sq. mt. It will
be divided into eight divisions which are composed of
administrative office measuring 8 sq. mt., finished product
display measuring 6 sq. mt., frame station measuring 6 sq.
mt., weaving station measuring 7 sq. mt., varnishing and
drying section measuring 5 sq. mt., storage measuring 3 sq.
mt., comfort rooms measuring 3 sq. mt. and raw materials
storage measuring 4sq. mt. It will be rented at P 3,000.00
per month.

Figure 3.2
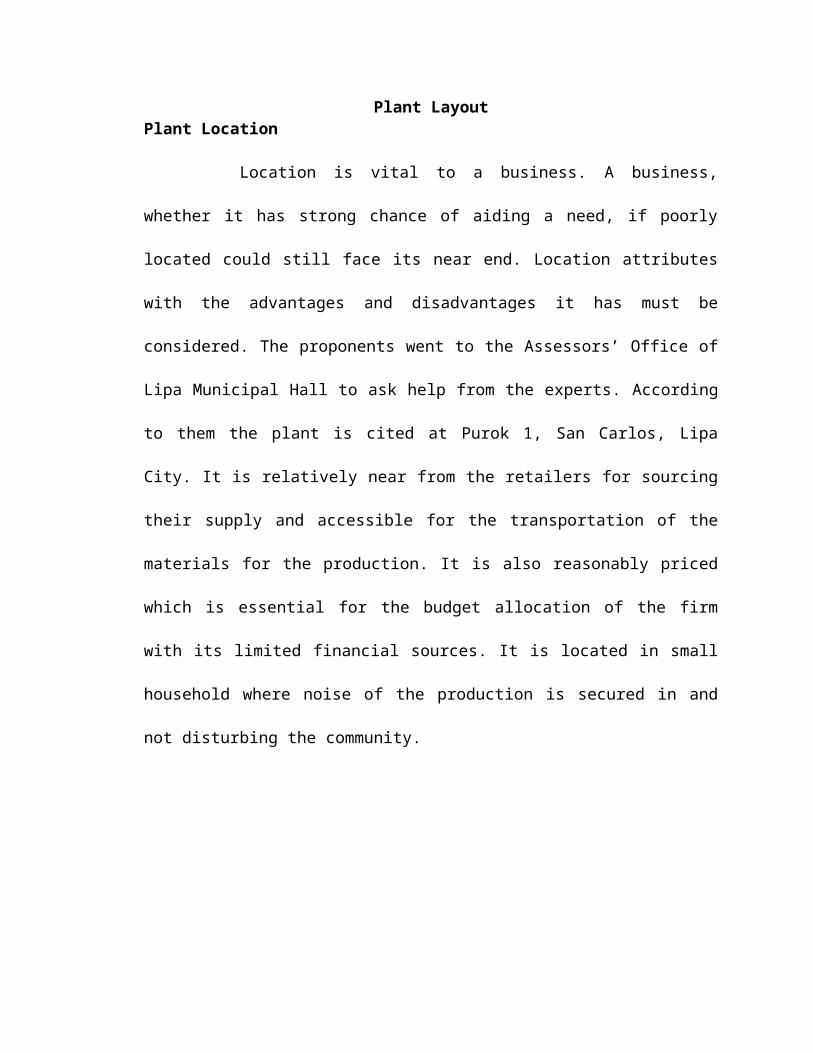
Plant LayoutPlant Location
Location is vital to a business. A business,
whether it has strong chance of aiding a need, if poorly
located could still face its near end. Location attributes
with the advantages and disadvantages it has must be
considered. The proponents went to the Assessors’ Office of
Lipa Municipal Hall to ask help from the experts. According
to them the plant is cited at Purok 1, San Carlos, Lipa
City. It is relatively near from the retailers for sourcing
their supply and accessible for the transportation of the
materials for the production. It is also reasonably priced
which is essential for the budget allocation of the firm
with its limited financial sources. It is located in small
household where noise of the production is secured in and
not disturbing the community.
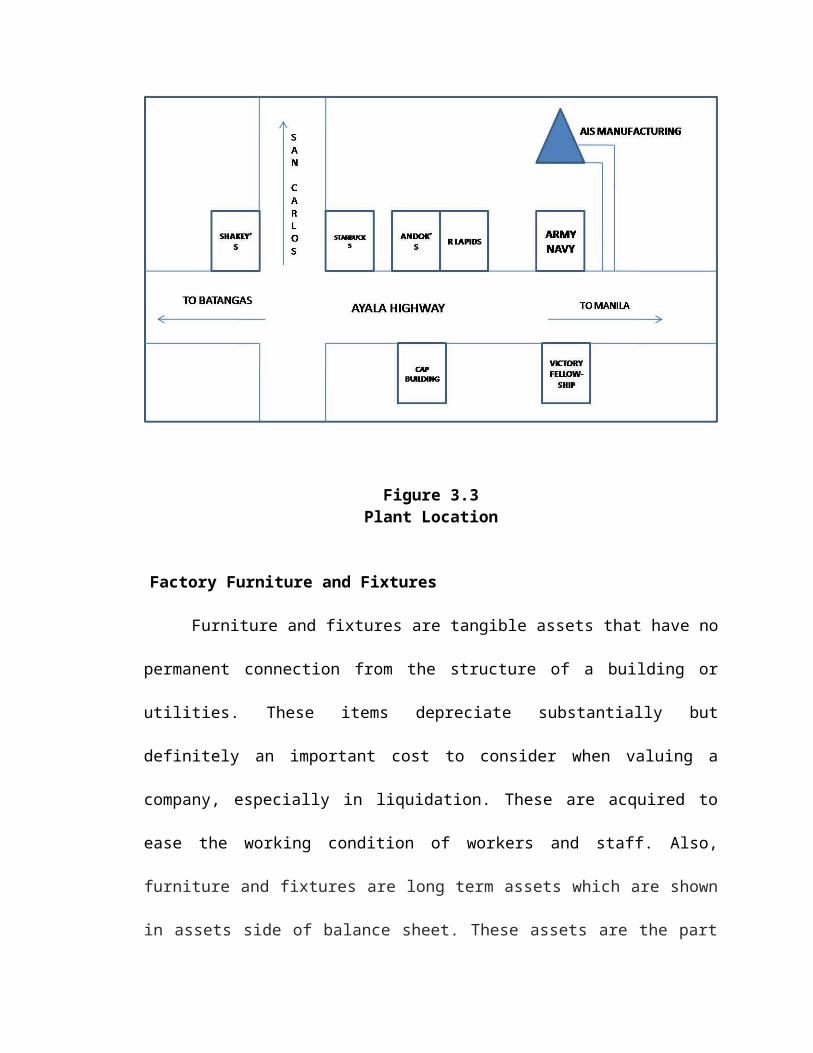
Figure 3.3Plant Location
Factory Furniture and Fixtures
Furniture and fixtures are tangible assets that have no
permanent connection from the structure of a building or
utilities. These items depreciate substantially but
definitely an important cost to consider when valuing a
company, especially in liquidation. These are acquired to
ease the working condition of workers and staff. Also,
furniture and fixtures are long term assets which are shown
in assets side of balance sheet. These assets are the part
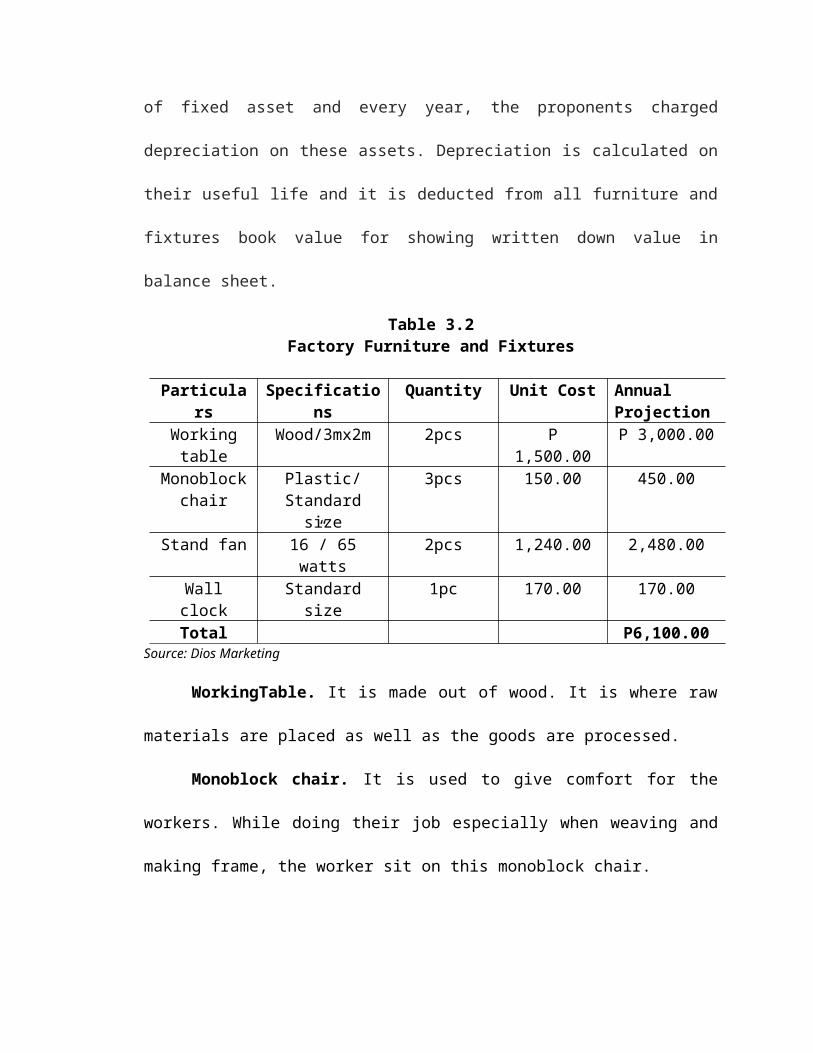
of fixed asset and every year, the proponents charged
depreciation on these assets. Depreciation is calculated on
their useful life and it is deducted from all furniture and
fixtures book value for showing written down value in
balance sheet.
Table 3.2Factory Furniture and Fixtures
Particulars
Specifications
Quantity Unit Cost Annual Projection
Workingtable
Wood/3mx2m 2pcs P1,500.00
P 3,000.00
Monoblockchair
Plastic/Standardsize
3pcs 150.00 450.00
Stand fan 16”/ 65watts
2pcs 1,240.00 2,480.00
Wallclock
Standardsize
1pc 170.00 170.00
Total P6,100.00 Source: Dios Marketing
WorkingTable. It is made out of wood. It is where raw
materials are placed as well as the goods are processed.
Monoblock chair. It is used to give comfort for the
workers. While doing their job especially when weaving and
making frame, the worker sit on this monoblock chair.
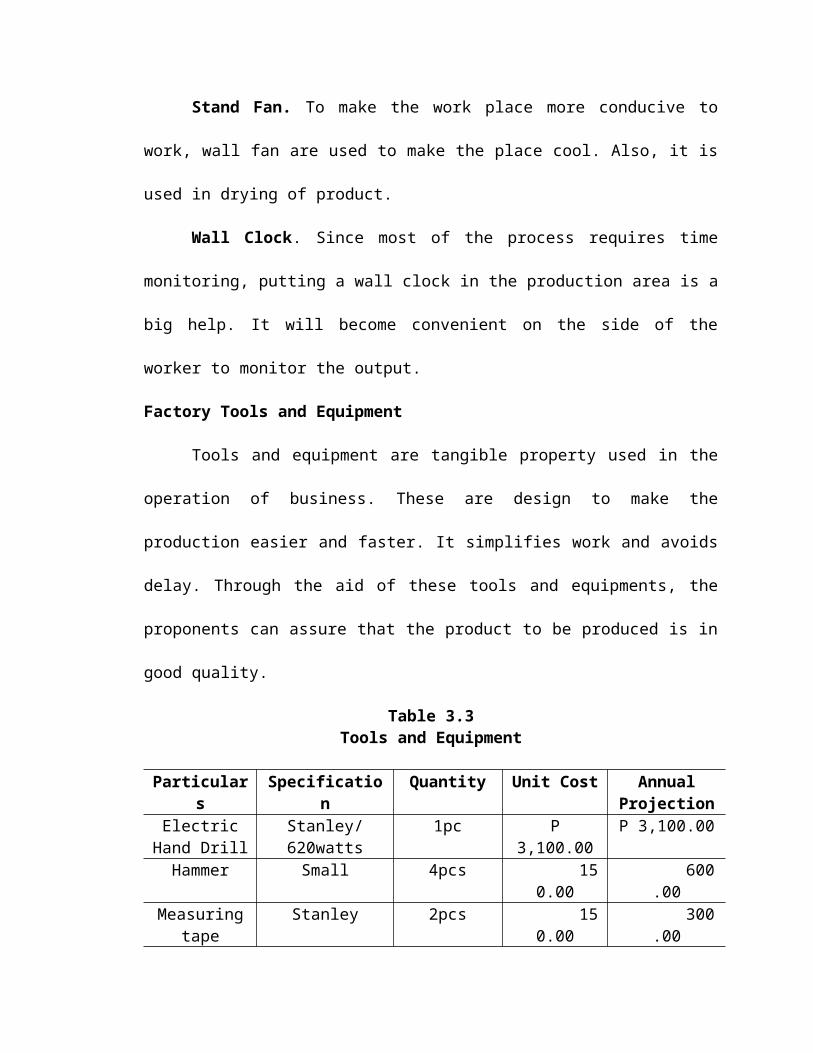
Stand Fan. To make the work place more conducive to
work, wall fan are used to make the place cool. Also, it is
used in drying of product.
Wall Clock. Since most of the process requires time
monitoring, putting a wall clock in the production area is a
big help. It will become convenient on the side of the
worker to monitor the output.
Factory Tools and Equipment
Tools and equipment are tangible property used in the
operation of business. These are design to make the
production easier and faster. It simplifies work and avoids
delay. Through the aid of these tools and equipments, the
proponents can assure that the product to be produced is in
good quality.
Table 3.3Tools and Equipment
Particulars
Specification
Quantity Unit Cost AnnualProjection
ElectricHand Drill
Stanley/620watts
1pc P3,100.00
P 3,100.00
Hammer Small 4pcs 150.00
600.00
Measuringtape
Stanley 2pcs 150.00
300.00
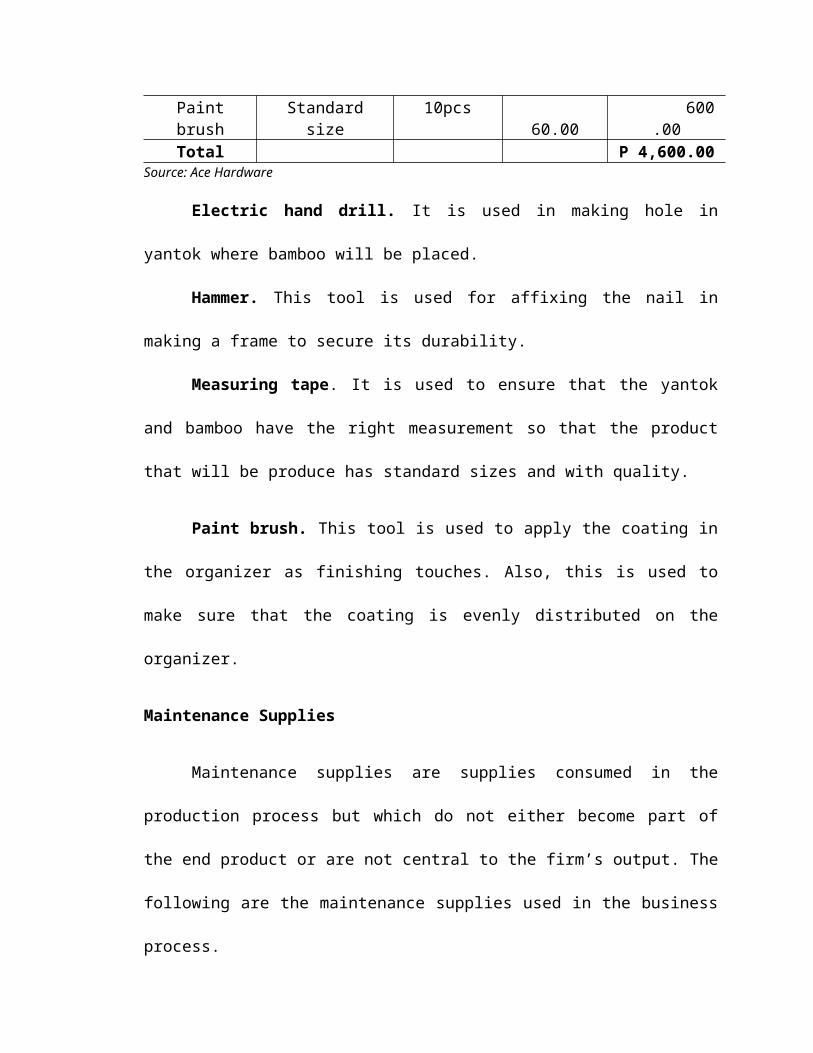
Paintbrush
Standardsize
10pcs 60.00
600.00
Total P 4,600.00Source: Ace Hardware
Electric hand drill. It is used in making hole in
yantok where bamboo will be placed.
Hammer. This tool is used for affixing the nail in
making a frame to secure its durability.
Measuring tape. It is used to ensure that the yantok
and bamboo have the right measurement so that the product
that will be produce has standard sizes and with quality.
Paint brush. This tool is used to apply the coating in
the organizer as finishing touches. Also, this is used to
make sure that the coating is evenly distributed on the
organizer.
Maintenance Supplies
Maintenance supplies are supplies consumed in the
production process but which do not either become part of
the end product or are not central to the firm’s output. The
following are the maintenance supplies used in the business
process.
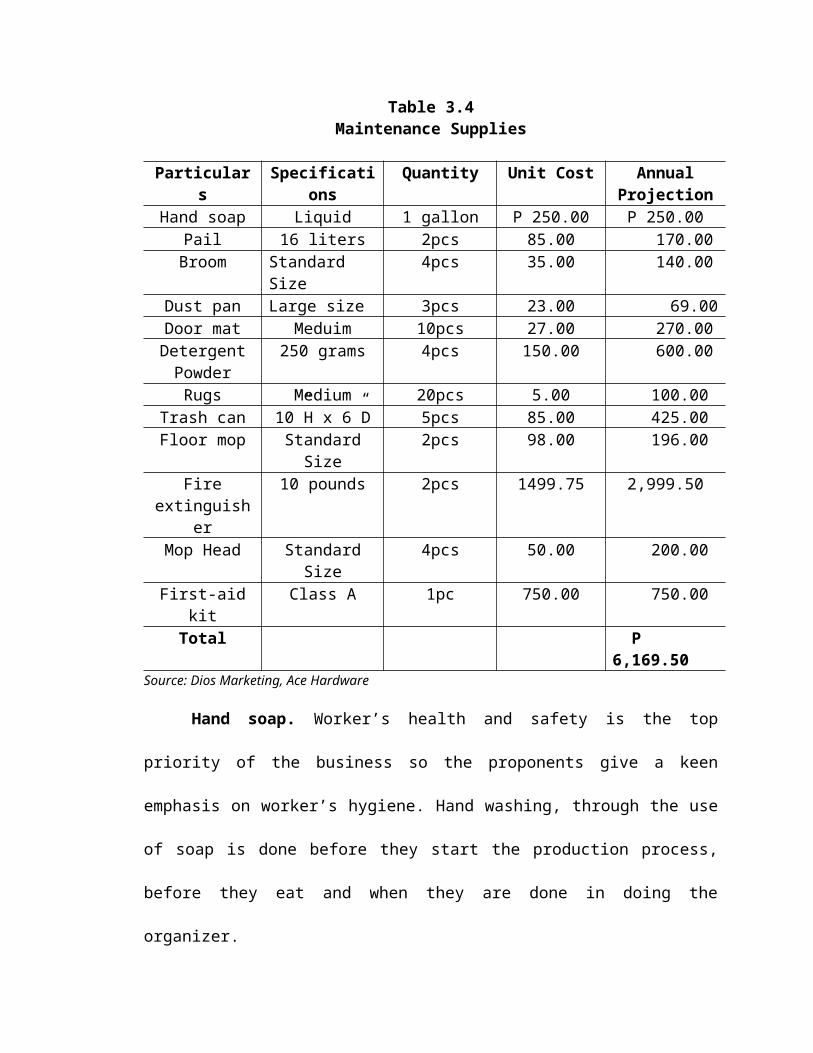
Table 3.4Maintenance Supplies
Particulars
Specifications
Quantity Unit Cost AnnualProjection
Hand soap Liquid 1 gallon P 250.00 P 250.00Pail 16 liters 2pcs 85.00 170.00Broom Standard
Size4pcs 35.00 140.00
Dust pan Large size 3pcs 23.00 69.00Door mat Meduim 10pcs 27.00 270.00DetergentPowder
250 grams 4pcs 150.00 600.00
Rugs Medium 20pcs 5.00 100.00Trash can 10”H x 6”D 5pcs 85.00 425.00Floor mop Standard
Size2pcs 98.00 196.00
Fireextinguish
er
10 pounds 2pcs 1499.75 2,999.50
Mop Head StandardSize
4pcs 50.00 200.00
First-aidkit
Class A 1pc 750.00 750.00
Total P 6,169.50
Source: Dios Marketing, Ace Hardware
Hand soap. Worker’s health and safety is the top
priority of the business so the proponents give a keen
emphasis on worker’s hygiene. Hand washing, through the use
of soap is done before they start the production process,
before they eat and when they are done in doing the
organizer.
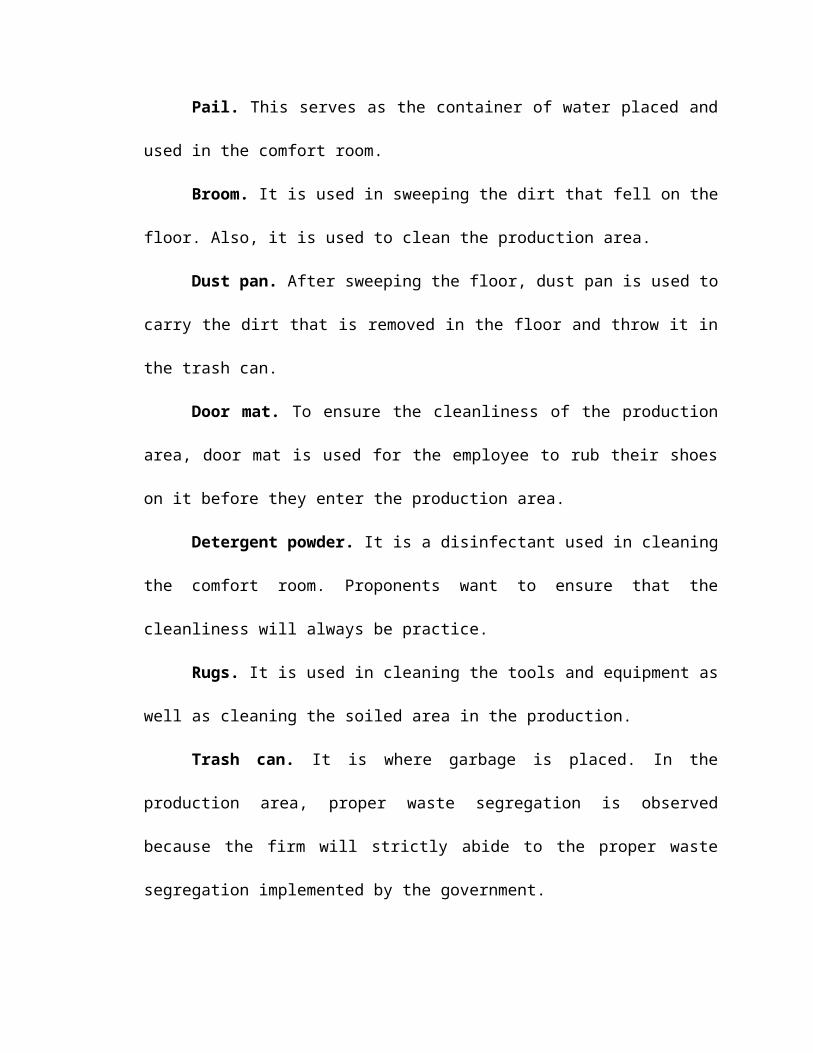
Pail. This serves as the container of water placed and
used in the comfort room.
Broom. It is used in sweeping the dirt that fell on the
floor. Also, it is used to clean the production area.
Dust pan. After sweeping the floor, dust pan is used to
carry the dirt that is removed in the floor and throw it in
the trash can.
Door mat. To ensure the cleanliness of the production
area, door mat is used for the employee to rub their shoes
on it before they enter the production area.
Detergent powder. It is a disinfectant used in cleaning
the comfort room. Proponents want to ensure that the
cleanliness will always be practice.
Rugs. It is used in cleaning the tools and equipment as
well as cleaning the soiled area in the production.
Trash can. It is where garbage is placed. In the
production area, proper waste segregation is observed
because the firm will strictly abide to the proper waste
segregation implemented by the government.
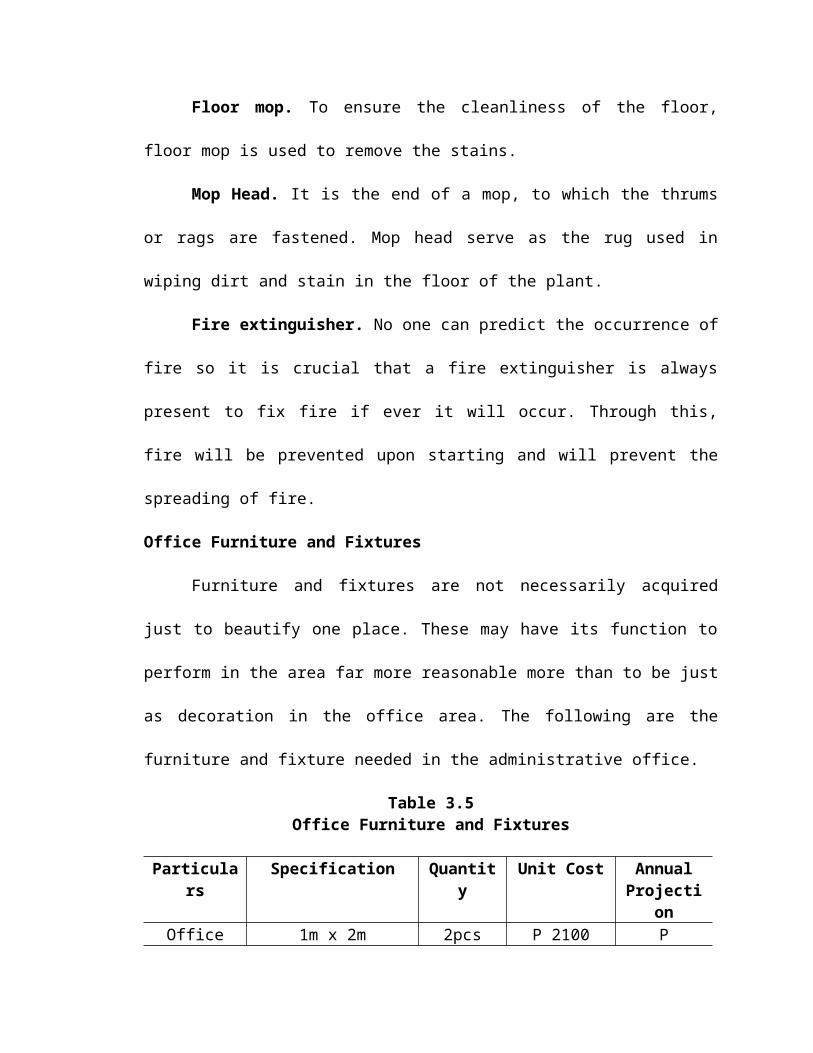
Floor mop. To ensure the cleanliness of the floor,
floor mop is used to remove the stains.
Mop Head. It is the end of a mop, to which the thrums
or rags are fastened. Mop head serve as the rug used in
wiping dirt and stain in the floor of the plant.
Fire extinguisher. No one can predict the occurrence of
fire so it is crucial that a fire extinguisher is always
present to fix fire if ever it will occur. Through this,
fire will be prevented upon starting and will prevent the
spreading of fire.
Office Furniture and Fixtures
Furniture and fixtures are not necessarily acquired
just to beautify one place. These may have its function to
perform in the area far more reasonable more than to be just
as decoration in the office area. The following are the
furniture and fixture needed in the administrative office.
Table 3.5Office Furniture and Fixtures
Particulars
Specification Quantity
Unit Cost AnnualProjecti
onOffice 1m x 2m 2pcs P 2100 P
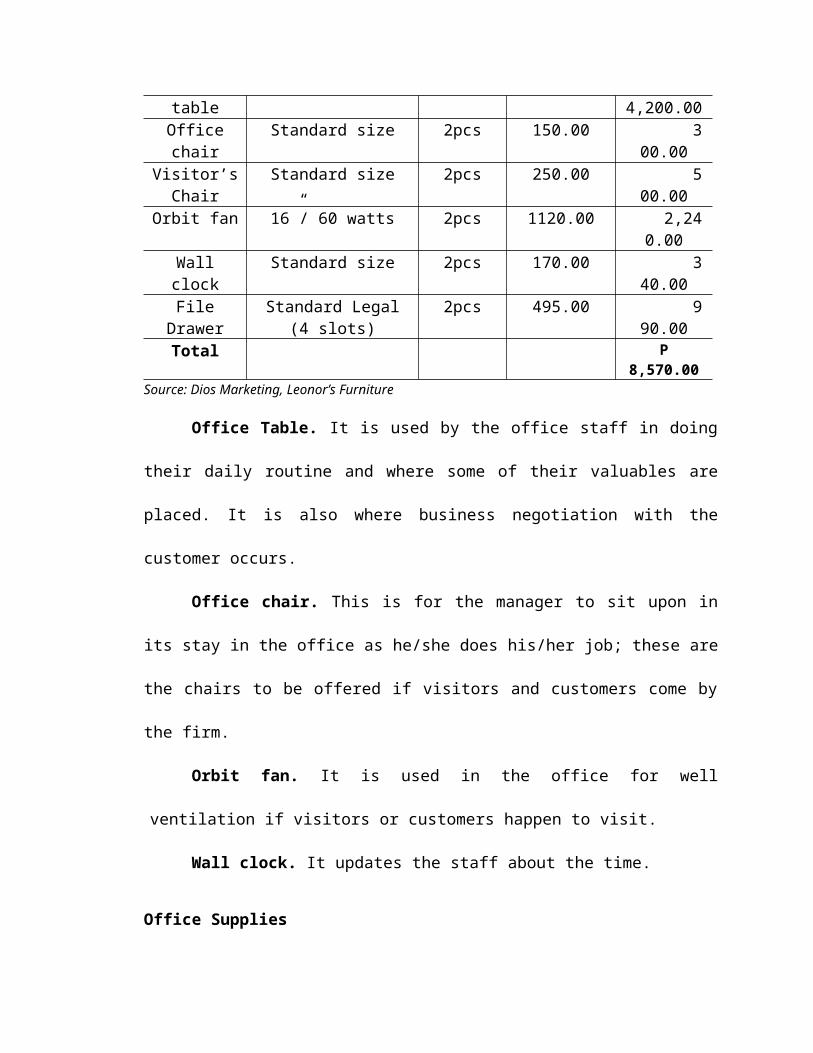
table 4,200.00Officechair
Standard size 2pcs 150.00 300.00
Visitor’sChair
Standard size 2pcs 250.00 500.00
Orbit fan 16”/ 60 watts 2pcs 1120.00 2,240.00
Wallclock
Standard size 2pcs 170.00 340.00
FileDrawer
Standard Legal(4 slots)
2pcs 495.00 990.00
Total P8,570.00
Source: Dios Marketing, Leonor’s Furniture
Office Table. It is used by the office staff in doing
their daily routine and where some of their valuables are
placed. It is also where business negotiation with the
customer occurs.
Office chair. This is for the manager to sit upon in
its stay in the office as he/she does his/her job; these are
the chairs to be offered if visitors and customers come by
the firm.
Orbit fan. It is used in the office for well
ventilation if visitors or customers happen to visit.
Wall clock. It updates the staff about the time.
Office Supplies
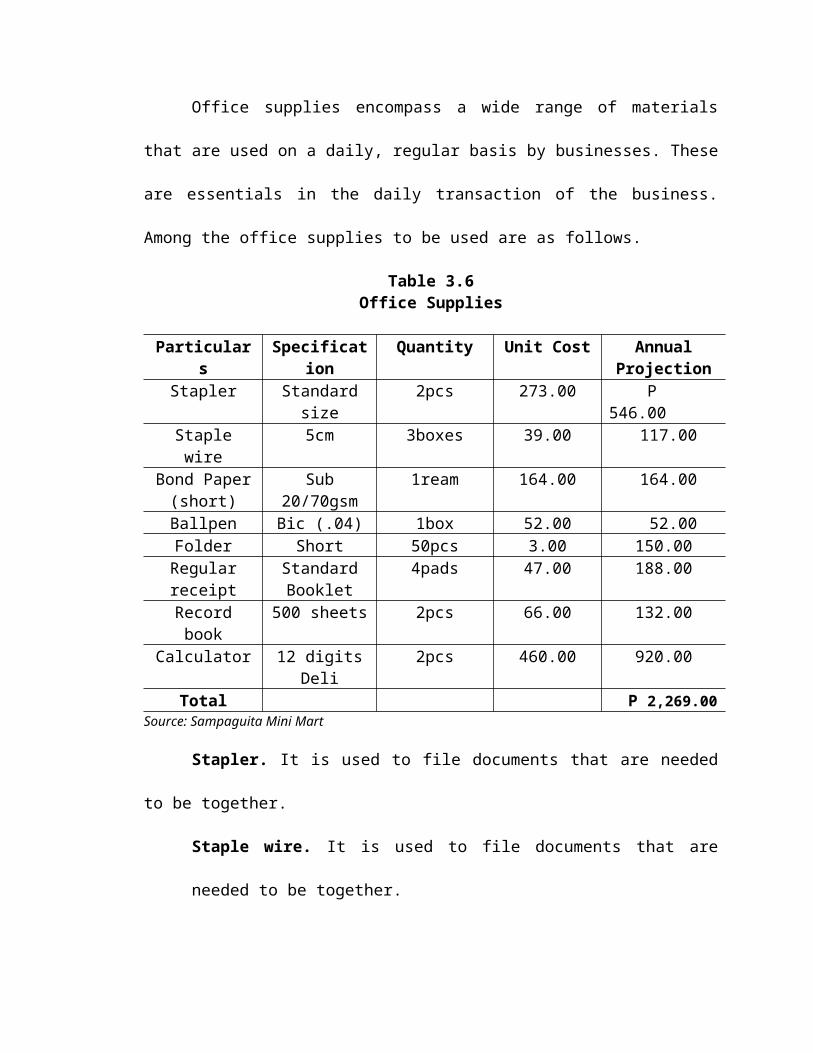
Office supplies encompass a wide range of materials
that are used on a daily, regular basis by businesses. These
are essentials in the daily transaction of the business.
Among the office supplies to be used are as follows.
Table 3.6Office Supplies
Particulars
Specification
Quantity Unit Cost AnnualProjection
Stapler Standardsize
2pcs 273.00 P 546.00
Staplewire
5cm 3boxes 39.00 117.00
Bond Paper(short)
Sub20/70gsm
1ream 164.00 164.00
Ballpen Bic (.04) 1box 52.00 52.00Folder Short 50pcs 3.00 150.00Regularreceipt
StandardBooklet
4pads 47.00 188.00
Recordbook
500 sheets 2pcs 66.00 132.00
Calculator 12 digitsDeli
2pcs 460.00 920.00
Total P 2,269.00Source: Sampaguita Mini Mart
Stapler. It is used to file documents that are needed
to be together.
Staple wire. It is used to file documents that are
needed to be together.
Bond Paper. It is used in printing manuals of the
process, announcement and other documents needed.
Ballpen. It is used in writing or in signing documents
or receipts.
Folder. It is used to keep the documents intact.
Regular receipt. In every transaction with the
customer, official receipt is issue.
Record book. It is used to record the events in the
business such as time in and out of employees,
purchases or list of visitors.
Calculator. It is used in computing for the
transactions in the business to secure accuracy of the
computations.
Direct Materials
Direct material is directly identifiable with the
product and forms a part of the product (Dutta, 2008).
Also, it is the material used in manufacturing processes
which becomes an integral part of the product and the cost
of which is identifiable and chargeable directly to it.
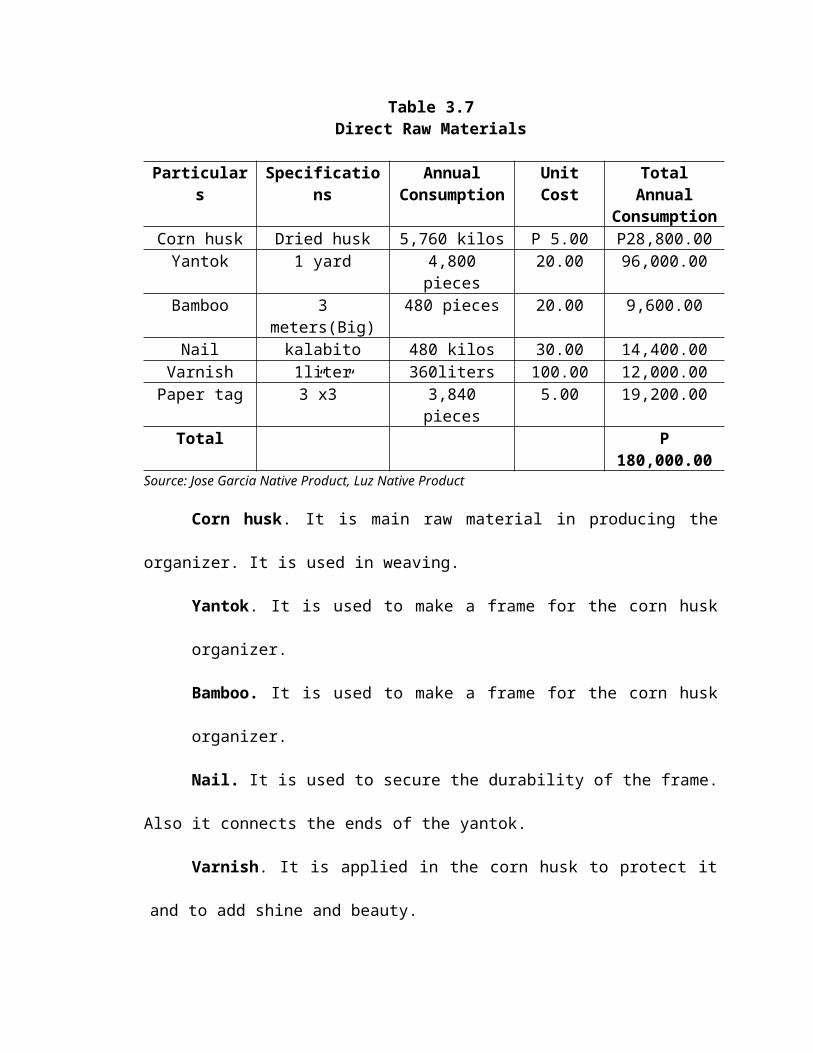
Table 3.7Direct Raw Materials
Particulars
Specifications
AnnualConsumption
UnitCost
TotalAnnual
ConsumptionCorn husk Dried husk 5,760 kilos P 5.00 P28,800.00Yantok 1 yard 4,800
pieces20.00 96,000.00
Bamboo 3meters(Big)
480 pieces 20.00 9,600.00
Nail kalabito 480 kilos 30.00 14,400.00Varnish 1liter 360liters 100.00 12,000.00Paper tag 3”x3” 3,840
pieces5.00 19,200.00
Total P180,000.00
Source: Jose Garcia Native Product, Luz Native Product
Corn husk. It is main raw material in producing the
organizer. It is used in weaving.
Yantok. It is used to make a frame for the corn husk
organizer.
Bamboo. It is used to make a frame for the corn husk
organizer.
Nail. It is used to secure the durability of the frame.
Also it connects the ends of the yantok.
Varnish. It is applied in the corn husk to protect it
and to add shine and beauty.
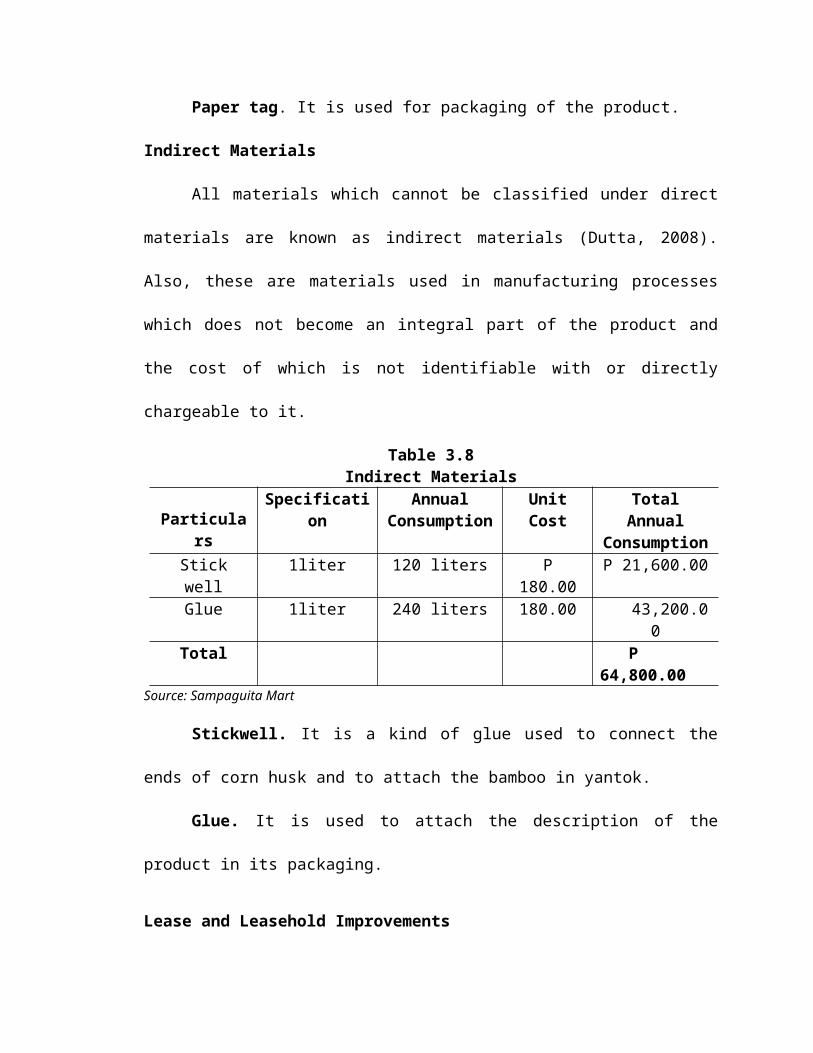
Paper tag. It is used for packaging of the product.
Indirect Materials
All materials which cannot be classified under direct
materials are known as indirect materials (Dutta, 2008).
Also, these are materials used in manufacturing processes
which does not become an integral part of the product and
the cost of which is not identifiable with or directly
chargeable to it.
Table 3.8Indirect Materials
Particulars
Specification
AnnualConsumption
UnitCost
TotalAnnual
ConsumptionStickwell
1liter 120 liters P180.00
P 21,600.00
Glue 1liter 240 liters 180.00 43,200.00
Total P 64,800.00
Source: Sampaguita Mart
Stickwell. It is a kind of glue used to connect the
ends of corn husk and to attach the bamboo in yantok.
Glue. It is used to attach the description of the
product in its packaging.
Lease and Leasehold Improvements
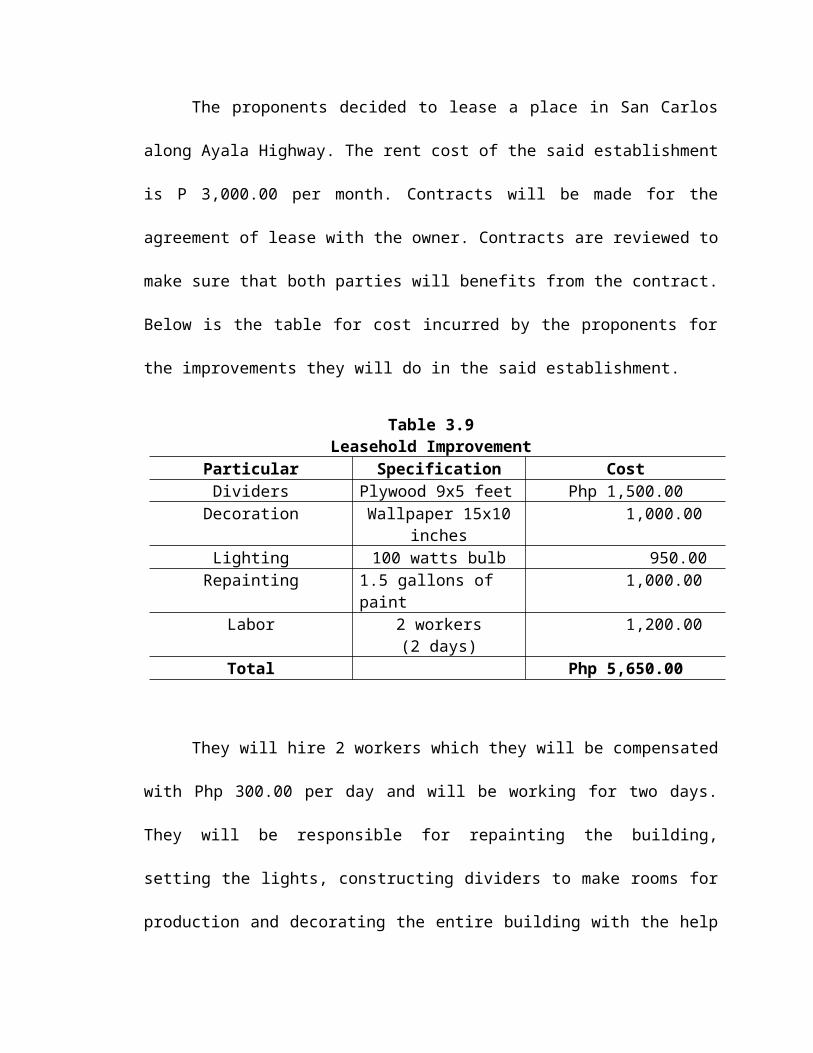
The proponents decided to lease a place in San Carlos
along Ayala Highway. The rent cost of the said establishment
is P 3,000.00 per month. Contracts will be made for the
agreement of lease with the owner. Contracts are reviewed to
make sure that both parties will benefits from the contract.
Below is the table for cost incurred by the proponents for
the improvements they will do in the said establishment.
Table 3.9Leasehold Improvement
Particular Specification CostDividers Plywood 9x5 feet Php 1,500.00Decoration Wallpaper 15x10
inches 1,000.00
Lighting 100 watts bulb 950.00Repainting 1.5 gallons of
paint 1,000.00
Labor 2 workers(2 days)
1,200.00
Total Php 5,650.00
They will hire 2 workers which they will be compensated
with Php 300.00 per day and will be working for two days.
They will be responsible for repainting the building,
setting the lights, constructing dividers to make rooms for
production and decorating the entire building with the help
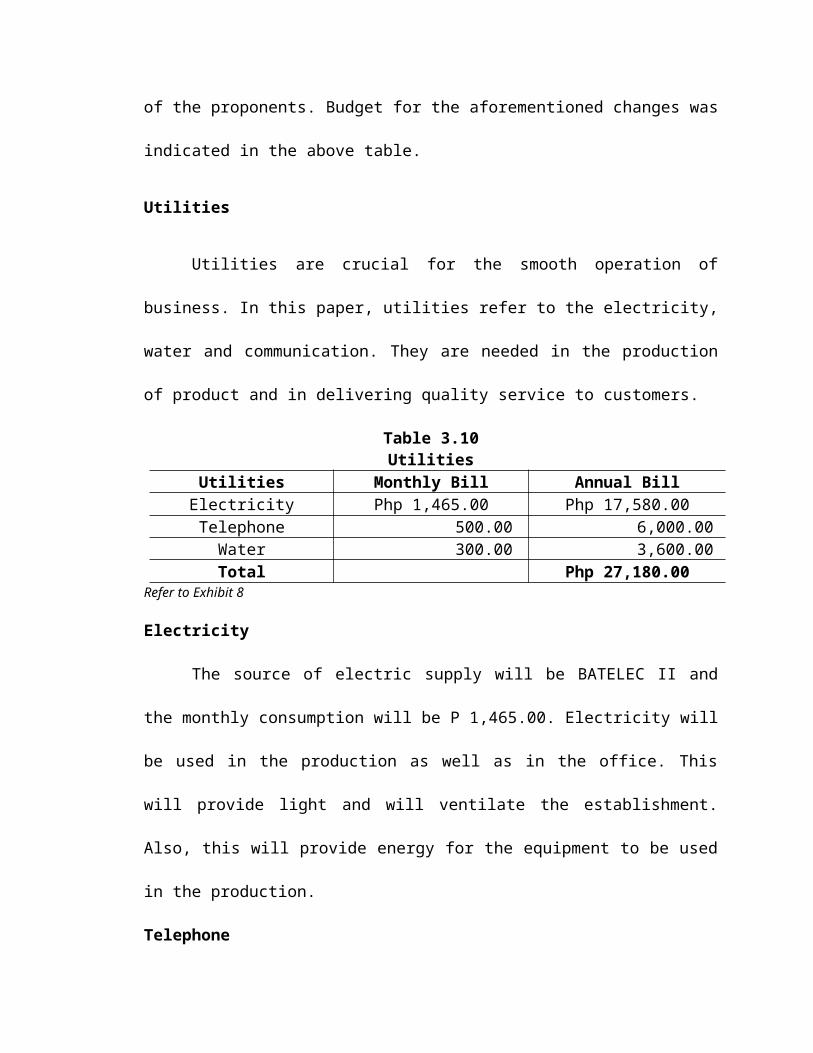
of the proponents. Budget for the aforementioned changes was
indicated in the above table.
Utilities
Utilities are crucial for the smooth operation of
business. In this paper, utilities refer to the electricity,
water and communication. They are needed in the production
of product and in delivering quality service to customers.
Table 3.10Utilities
Utilities Monthly Bill Annual BillElectricity Php 1,465.00 Php 17,580.00Telephone 500.00 6,000.00
Water 300.00 3,600.00Total Php 27,180.00
Refer to Exhibit 8
Electricity
The source of electric supply will be BATELEC II and
the monthly consumption will be P 1,465.00. Electricity will
be used in the production as well as in the office. This
will provide light and will ventilate the establishment.
Also, this will provide energy for the equipment to be used
in the production.
Telephone
Communication is crucial in every business. Through the
aid of this, the proponent can keep in touch with their
customers and they can also use this to obtain orders from
their customers.
Digitel will provide the telecommunication system. The
estimated monthly consumption charge will be P500.00 based
on the promo they are offering.
Water
Water is vital to maintain the cleanliness of the
establishment. The provider of water will be Metro Lipa
Water District. The manufacturing will have minimum monthly
consumption of P300.00 since water will not be used most of
the time in the manufacturing process. It will only be used
in cleaning and in comfort rooms.
Waste Disposal
The proposed business is responsible in making sure
that the wastes are handled and disposed properly. Waste-
garbage will be located at a particular place wherein it
could be easily spotted by the garbage collector. The
business will have strict conformance to the standards and
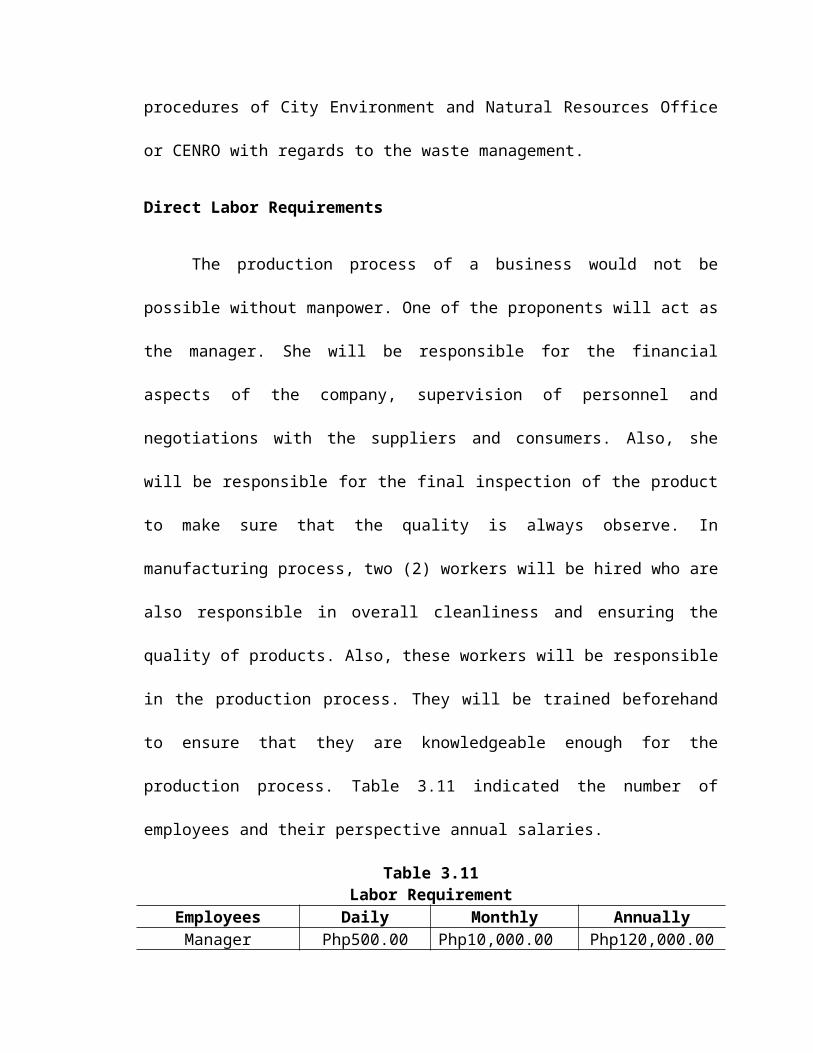
procedures of City Environment and Natural Resources Office
or CENRO with regards to the waste management.
Direct Labor Requirements
The production process of a business would not be
possible without manpower. One of the proponents will act as
the manager. She will be responsible for the financial
aspects of the company, supervision of personnel and
negotiations with the suppliers and consumers. Also, she
will be responsible for the final inspection of the product
to make sure that the quality is always observe. In
manufacturing process, two (2) workers will be hired who are
also responsible in overall cleanliness and ensuring the
quality of products. Also, these workers will be responsible
in the production process. They will be trained beforehand
to ensure that they are knowledgeable enough for the
production process. Table 3.11 indicated the number of
employees and their perspective annual salaries.
Table 3.11Labor Requirement
Employees Daily Monthly AnnuallyManager Php500.00 Php10,000.00 Php120,000.00
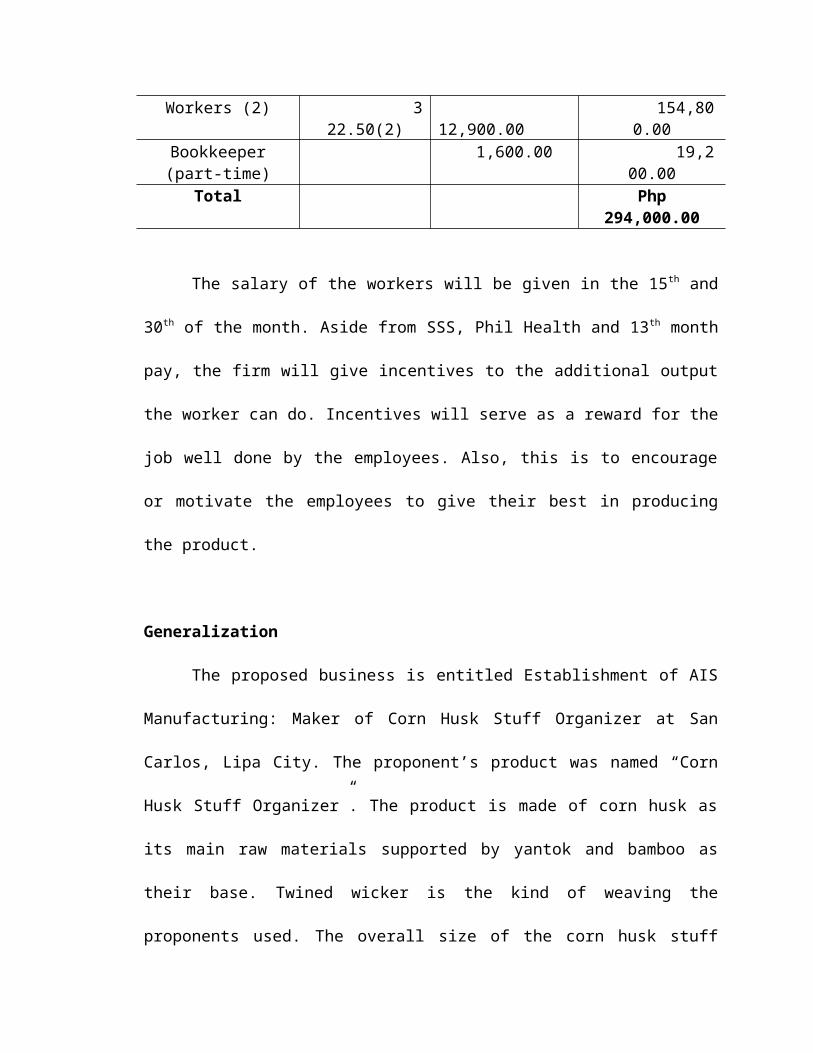
Workers (2) 322.50(2)
12,900.00
154,800.00
Bookkeeper(part-time)
1,600.00 19,200.00
Total Php294,000.00
The salary of the workers will be given in the 15th and
30th of the month. Aside from SSS, Phil Health and 13th month
pay, the firm will give incentives to the additional output
the worker can do. Incentives will serve as a reward for the
job well done by the employees. Also, this is to encourage
or motivate the employees to give their best in producing
the product.
Generalization
The proposed business is entitled Establishment of AIS
Manufacturing: Maker of Corn Husk Stuff Organizer at San
Carlos, Lipa City. The proponent’s product was named “Corn
Husk Stuff Organizer”. The product is made of corn husk as
its main raw materials supported by yantok and bamboo as
their base. Twined wicker is the kind of weaving the
proponents used. The overall size of the corn husk stuff
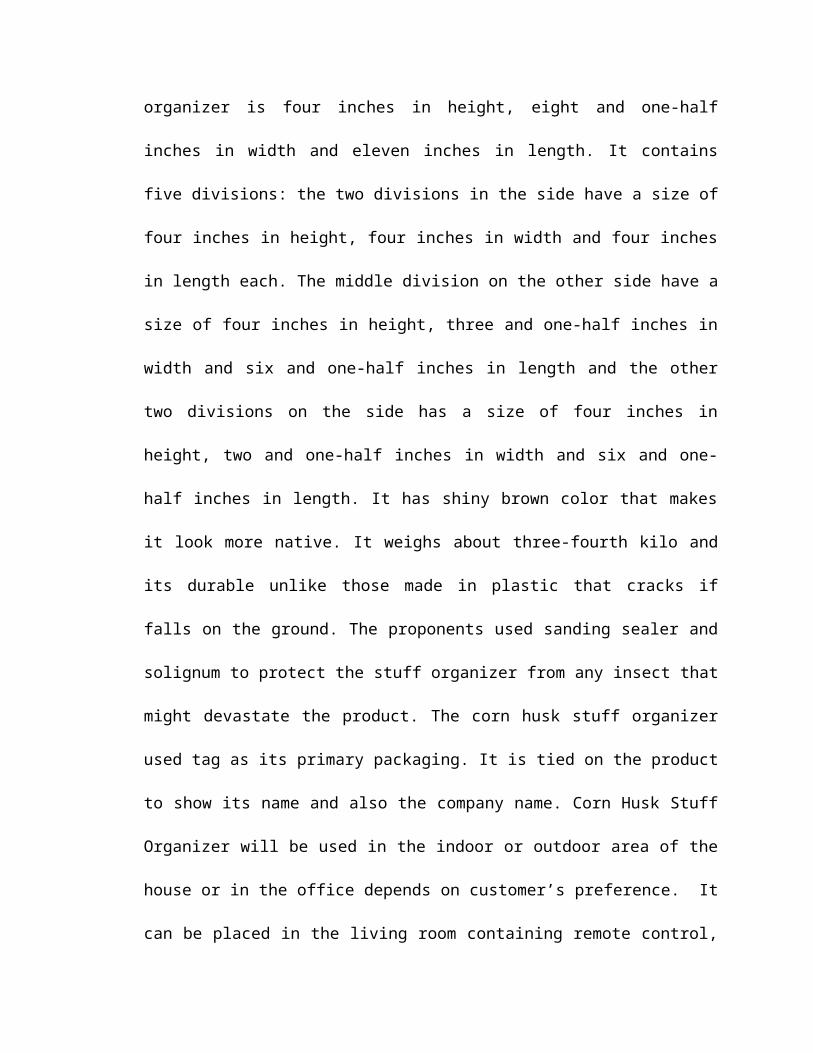
organizer is four inches in height, eight and one-half
inches in width and eleven inches in length. It contains
five divisions: the two divisions in the side have a size of
four inches in height, four inches in width and four inches
in length each. The middle division on the other side have a
size of four inches in height, three and one-half inches in
width and six and one-half inches in length and the other
two divisions on the side has a size of four inches in
height, two and one-half inches in width and six and one-
half inches in length. It has shiny brown color that makes
it look more native. It weighs about three-fourth kilo and
its durable unlike those made in plastic that cracks if
falls on the ground. The proponents used sanding sealer and
solignum to protect the stuff organizer from any insect that
might devastate the product. The corn husk stuff organizer
used tag as its primary packaging. It is tied on the product
to show its name and also the company name. Corn Husk Stuff
Organizer will be used in the indoor or outdoor area of the
house or in the office depends on customer’s preference. It
can be placed in the living room containing remote control,
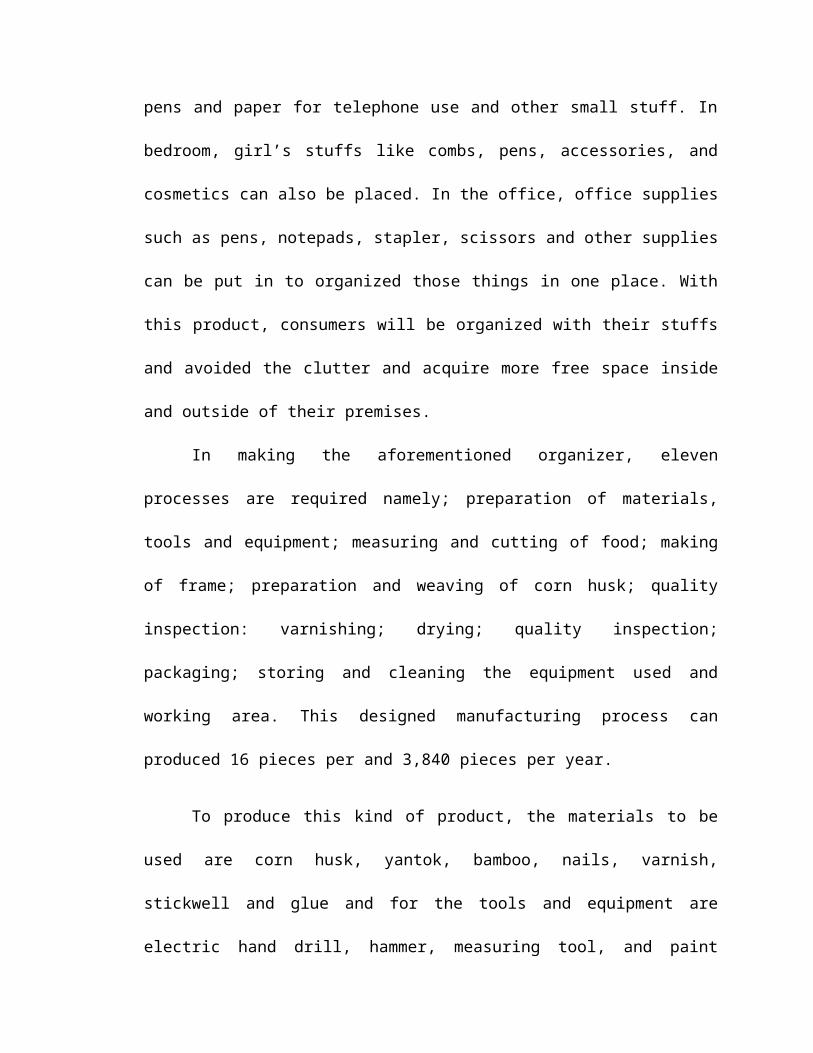
pens and paper for telephone use and other small stuff. In
bedroom, girl’s stuffs like combs, pens, accessories, and
cosmetics can also be placed. In the office, office supplies
such as pens, notepads, stapler, scissors and other supplies
can be put in to organized those things in one place. With
this product, consumers will be organized with their stuffs
and avoided the clutter and acquire more free space inside
and outside of their premises.
In making the aforementioned organizer, eleven
processes are required namely; preparation of materials,
tools and equipment; measuring and cutting of food; making
of frame; preparation and weaving of corn husk; quality
inspection: varnishing; drying; quality inspection;
packaging; storing and cleaning the equipment used and
working area. This designed manufacturing process can
produced 16 pieces per and 3,840 pieces per year.
To produce this kind of product, the materials to be
used are corn husk, yantok, bamboo, nails, varnish,
stickwell and glue and for the tools and equipment are
electric hand drill, hammer, measuring tool, and paint
brush. The assurance of the quality output will conform to
the standards in choosing the materials to be used in the
operation.
The proposed business will be located at San Carlos,
Lipa City. The location is suited for a start up business
like this due to its nearness to different business
establishment like malls and other fast food restaurant.
Also, the placed is visible and accessible to its retailer
and suppliers. Since this organizer is an eco-friendly
product, the organization can secure the proper waste
management. Also, the materials to be used will not
sacrifice the health of an individual since the product is
made to satisfy the need of its customers.
Chapter IVMANAGEMENT STUDY
Management is the process of designing and maintaining
an environment in which individuals, working together in
groups, efficiently accomplish selected goals (Koontz&
Weihrich, 2007) Management focuses on the entire
organization from both a short and a long-term perspective.
Management aims to increase the effectiveness of
organizations. It’s about making the most of the resources
entrusted to you, and making sure the expectations of
customers, employees and shareholders are met.
Management aspect includes the study on how the
business will be managed and how the process will be guided
before and during the operation, form of the business
ownership, organization structure and its chart, manpower
requirement and its corresponding job description,
compensation and benefits, organizational policies to be
followed and the legal requirements needed.
Objectives of the Study
The proponents’ management study aims to ascertain the
management feasibility of the project through the selection
of the right management structure, form of business
ownership, capitalization, man power requirements, job
specification and description and legal requirements needed
in the operation.
1. To determine the appropriate form of business
ownership.
2. To decide the initial capitalization needed and the
contribution by each partners.
3. To determine the suitable organization structure to be
adopted by the proposed business.
4. To determine the manpower needed by the firm with their
specification and description.
5. To be able to generate an effective and efficient
policy that will serve as guidelines to the
organization.
6. To be able to comply with the requirements for the
legality of the business.
Form of Business Ownership
The business will be named as AIS Manufacturing owned
by four individuals. The business is a manufacturer of stuff
organizer out of corn husk. For this venture, these four
people agreed to form a business under general partnership
due to its advantages that can help more for its future
expansion. Such advantages are it is easy to establish
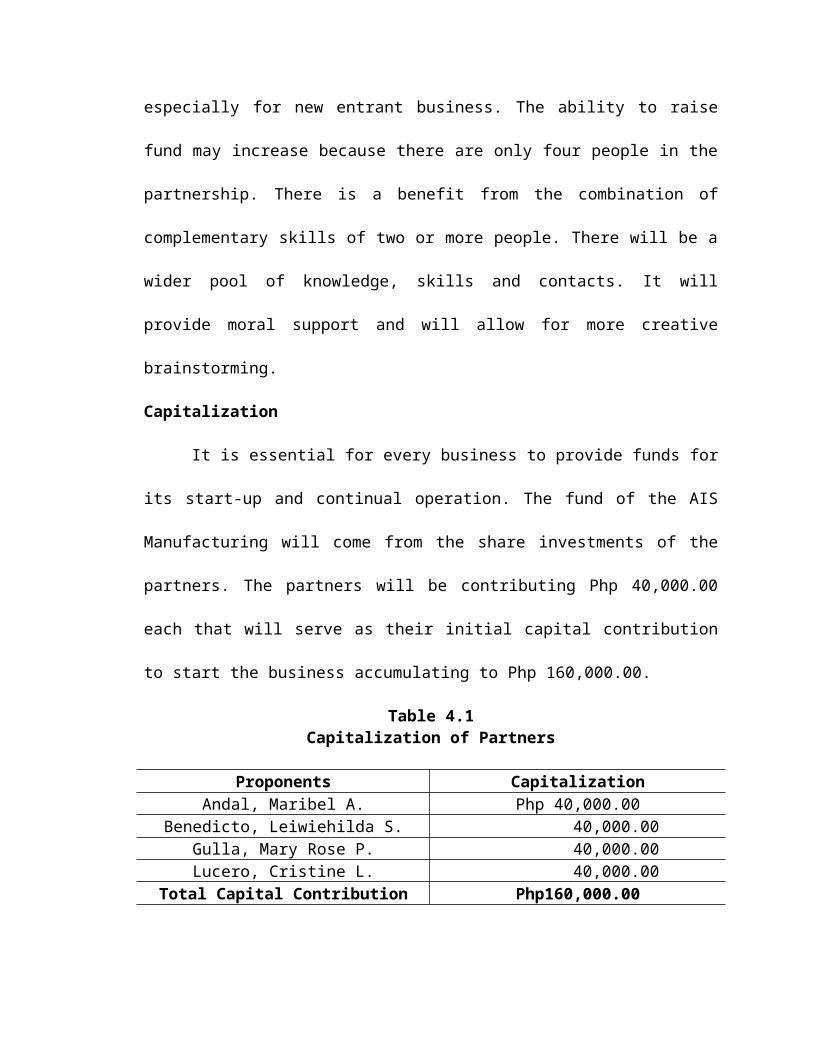
especially for new entrant business. The ability to raise
fund may increase because there are only four people in the
partnership. There is a benefit from the combination of
complementary skills of two or more people. There will be a
wider pool of knowledge, skills and contacts. It will
provide moral support and will allow for more creative
brainstorming.
Capitalization
It is essential for every business to provide funds for
its start-up and continual operation. The fund of the AIS
Manufacturing will come from the share investments of the
partners. The partners will be contributing Php 40,000.00
each that will serve as their initial capital contribution
to start the business accumulating to Php 160,000.00.
Table 4.1Capitalization of Partners
Proponents CapitalizationAndal, Maribel A. Php 40,000.00
Benedicto, Leiwiehilda S. 40,000.00Gulla, Mary Rose P. 40,000.00Lucero, Cristine L. 40,000.00
Total Capital Contribution Php160,000.00
Organizational Structure
Organization Structure is defined as the framework in
which the organization defines how tasks are divided,
resources are deployed, and departments are coordinated.
(Daft, 2012) It determines how the roles, power and
responsibilities are assigned, controlled, and coordinated,
and how information flows between the different levels of
management.
AIS Manufacturing implements line organization as the
firm’s type of organization because of its simplest approach
and clear authority structure. The authority lies to firm’s
general manager who happens to be one of the contributing
partners of the business. The general manager has the sole
authority and direct control over the other partners and
workers. In this kind of organization structure, the
superior and subordinates relationship is clearly
distinguished because of fixed responsibility of all
employees in the firm. Every employees of the firm must
abide to the laws that governed the business to maintain the
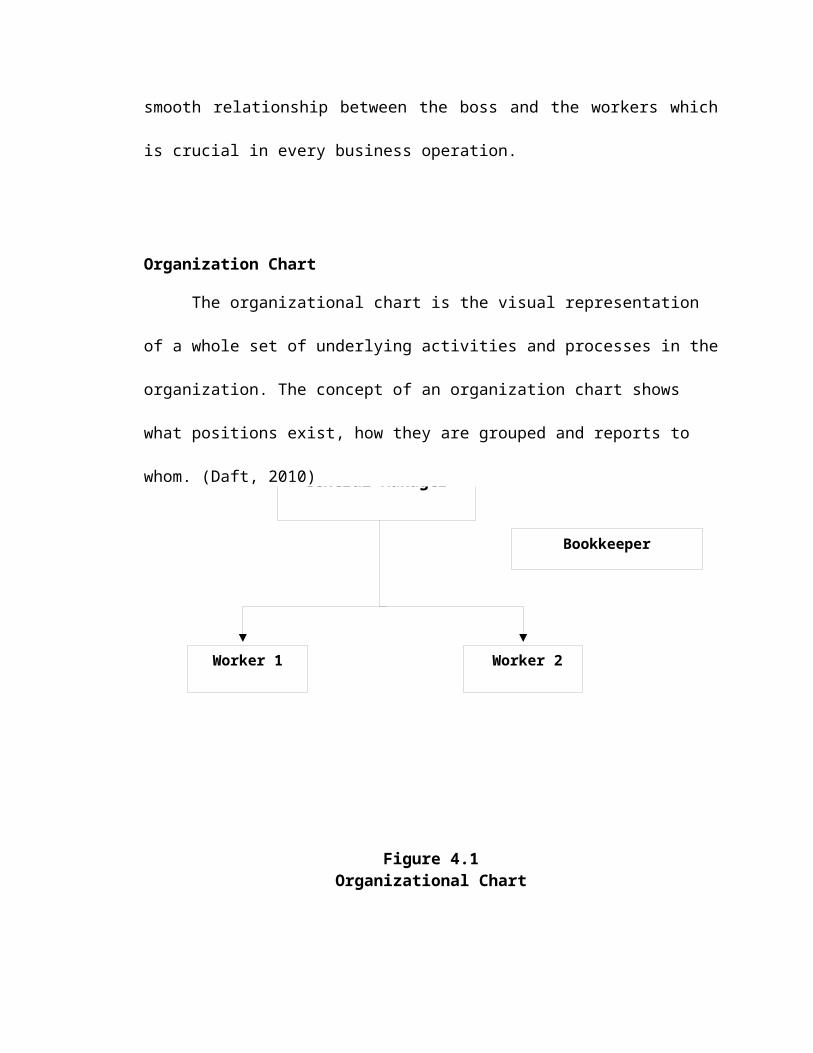
Worker 2Worker 1
Bookkeeper
General Manager
smooth relationship between the boss and the workers which
is crucial in every business operation.
Organization Chart
The organizational chart is the visual representation
of a whole set of underlying activities and processes in the
organization. The concept of an organization chart shows
what positions exist, how they are grouped and reports to
whom. (Daft, 2010)
Figure 4.1Organizational Chart
The figure above shows visual representation of AIS
organization’s structure. The vertical structure implies
that the firm’s general manager has superior control and
authority over his/her subordinates. The line connecting
general manager, bookkeeper and workers shows a simple
superior- subordinates relationship. Being at the top level,
general manager has full control and is accountable for
effectively managing business operations and resources. On
the other hand, workers are also accountable to follow
whatever the firm’s set up organizational plans and must
report directly to general manager. The line connecting
bookkeeper and general manager signifies that bookkeeper has
part time responsibility and accountable directly to general
manager. Since the book keeper is only responsible in
financial aspect of the firm, he can work on part time basis
considering that he will ensure the liquidity and
profitability of the establishment is stable.
Manpower requirement
Manpower is in terms of the number of people available
or needed to do something (Terry, 2000).
Investment doesn’t always talk about how much capital
is needed and the plant, property and equipment to be used
but more importantly, business must empower manpower
resources. It is essential for every business to hire
qualified workers because they are the one who works
everyday to produce products and services of the firm.
AIS Manufacturing will be having general manager who
will formulate functional, administrative and operational
policies of the business, two employees to be deployed at
the production section and a part time bookkeeper to assist
the business financial transaction. In line with this, the
firm enumerates job specification of desired positions and
description of the job that they must perform.
Job Specification
Job specification states the qualities needed in an
individual to perform the job description successfully. It
prescribes the qualities required for acceptable performance
of a particular job such as formal education, experience
psychological attitude, physical measurements, etc. (Bose,
2006)
The following are the detailed job specifications for
AIS manufacturing proposed business.
General Manager
At least 21 years old; male or female
Must be a graduate of a business related course and
bonafide partner
Possesses adequate managerial and entrepreneurial
skills
Must have excellent oral and written communication
skills
Must be physically and mentally fit for the job
Able to observe changes in the internal and external
environment of the business
Must know how to relate and cooperate with workers and
customers
Effective decision maker and has sense of
responsibility
Must be honest, hardworking, motivated, and of good
moral character
Strong leadership skills and hands-on manager with
financial knowledge
Must inspect the quality of the product made by the
workers
Bookkeeper (Part-time)
Male or female; 23 years old
Must be a graduate of BS Accountancy or has Certificate
of Bookkeeping
Computer literate
Must be physically and mentally fit for the job
Ability to work to tight deadlines.
Must be capable of preparing reliable financial reports
and attention to detail and accuracy.
Must be competent in his/her field
Must be honest, hardworking, motivated, and of good
moral character
Reporting
Workers
Male; 18-35 years old
Must be physically and mentally fit
Must have knowledge in producing the product and
different kinds of weaving preferably TESDA graduate or
has related work experience
Must be hardworking and responsible
Possesses good moral character
Job Description
Job description describes a job and specifies the
requirements of the job. (Bose, 2006)
The following are the designed job description of AIS
Manufacturing for the positions available.
General Manager
Overseeing the production process, drawing up a
production schedule
Ensuring that the production is cost effective
Making sure that products are produced on time and
are of good quality
Working out the human and material resources needed
Drafting a timescale for the job
Estimating costs and setting the quality standards
Monitoring the production processes and adjusting
schedules as needed
Do the quality inspection of every finished product
Being responsible for the selection and maintenance
of equipment
Monitoring product standards and implementing
quality-control
Ensuring that health and safety guidelines are
followed
Supervising and motivating workers
Reviewing worker performance
Identifying training needs
Bookkeeper
Creates financial transactions and creates financial
reports
Reconciles accounts to the manager to ensure their
accuracy
Analyzes the company’s financial position
In charge of ensuring that there is existing funds for
the operations
Secures all the company records, makes sales inventory,
financial statements and payroll administration
Helps the manager in all management activities
Must report at least twice a month
Checking company bank statements
Repairing cash flow statements
Completing VAT returns
Monitoring the liquidity of the firms operation.
Workers
Prepares the needed raw materials and tools for
production
Responsible for the efficient flow of the production
process and efficiently utilizes the company’s
resources
Performs manual jobs and actual assembly of the product
Meet the demand schedule in line with the quality
standard
Inform the manager about the problems concerning the
production
Organize and maintain cleanliness in the working area
as well as to the equipments
Works in accordance with the objectives of the business
Compensation benefits
Compensation is defined as monetary payments (wages,
salaries) and nonmonetary goods/commodities (benefits,
vacations) used to rewards employees. (Daft, 2012). It is a
payment meant to give someone a fair exchange for their
effort and output.
Employees are applying for work because they are
expecting something in return for the service they will
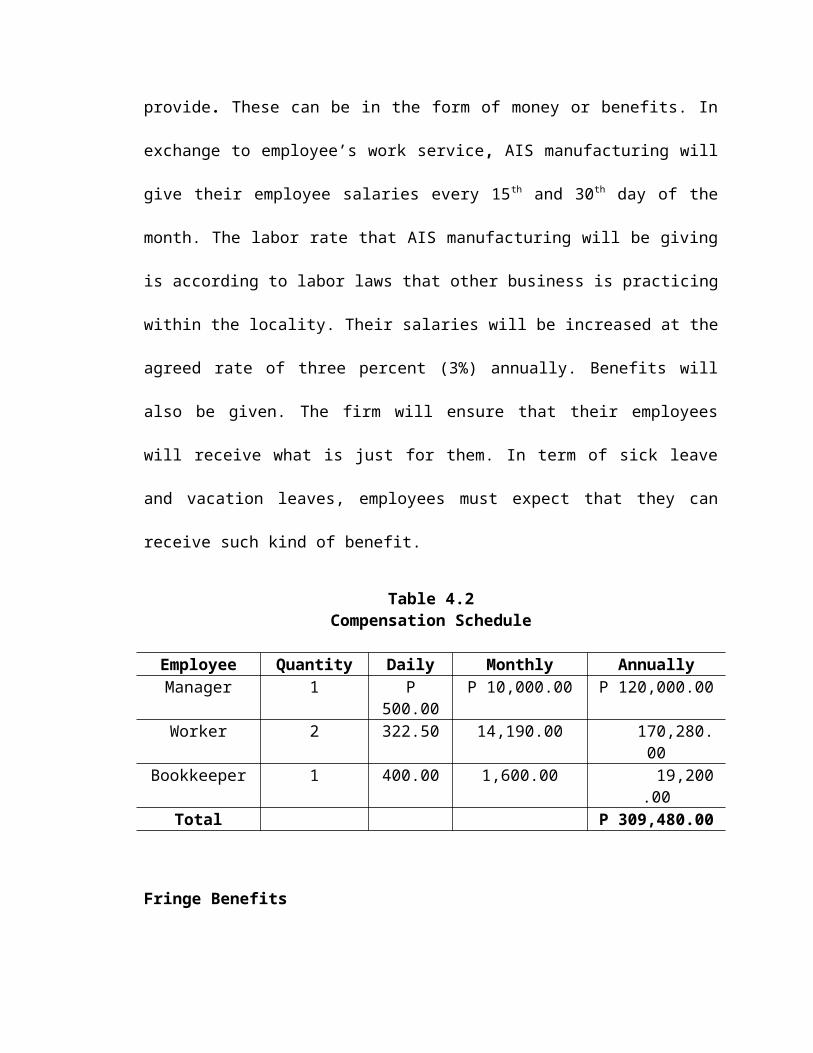
provide. These can be in the form of money or benefits. In
exchange to employee’s work service, AIS manufacturing will
give their employee salaries every 15th and 30th day of the
month. The labor rate that AIS manufacturing will be giving
is according to labor laws that other business is practicing
within the locality. Their salaries will be increased at the
agreed rate of three percent (3%) annually. Benefits will
also be given. The firm will ensure that their employees
will receive what is just for them. In term of sick leave
and vacation leaves, employees must expect that they can
receive such kind of benefit.
Table 4.2Compensation Schedule
Employee Quantity Daily Monthly AnnuallyManager 1 P
500.00P 10,000.00 P 120,000.00
Worker 2 322.50 14,190.00 170,280.00
Bookkeeper 1 400.00 1,600.00 19,200.00
Total P 309,480.00
Fringe Benefits
Fringe benefits are the additional benefits provided to
an employee. It is any additional or incidental advantage
derived from a particular activity (Drebin, 2000).
Nowadays, company employees are expecting extra in
addition to their cash salary. These fringe benefits or
employee benefits will help the firm in motivating their
employees to work hard, avoid absences and feel satisfied
with their job. AIS Manufacturing will give their employees
thirteenth (13th) month pay, contribution on SSS and Phil
health in accordance to government laws.
Organizational policies
Policy is defined as a general guideline for management
when making decisions and sets the limits within which such
decisions must be made when similar situations occur
repeatedly. (Kroon, 2008)
To ensure that there is unified set of rules and
actions within organization business policies must be
clearly defined. These policies serve as guidelines for
conducting business operations and other resources of the
firm. Policies are formulated by general manager and other
contributing partners in the proposed business. Below are
policies that AIS management considered in conducting its
business.
Policies towards the Employees
Workers are required to provide the firm all the
relevant personal information about himself and
complete all the necessary forms so that the firm will
have something to work on if needs in relation to
employment arises.
Working days will be from Monday to Friday from 8:00 am
to 5:00 pm.
Workers/employees must affix their signatures at the
logbook for their “time in and time out”.
There will be a one (1) hour lunch break per day and 15
minutes break in the morning and in the afternoon.
Punctuality must be observed by the personnel.
Tardiness and unreasonable absences will not be
tolerated. There will be a corresponding salary
deduction based on a daily rate which will serve as a
punishment for non- compliance.
Employees who have accumulated a tardiness of 30
minutes during one week period shall be subject to
disciplinary action and a salary deduction which is
computed proportionally in accordance with his monthly
compensation.
Absences shall mean failure to report on work without
prior application for leave or notice given to the
manager during the first hour of work. However,
unreasonable absences will be subject to disciplinary
actions.
For the efficient production and for superior quality,
workers will undergo training before they start the
regular work.
Workers must maintain cleanliness in the workplace.
Those workers, who suffered from any injury or damages
due to non- compliance with the policies previously
enumerated will not be the responsibility of the firm.
Labor wage will be paid every 15th and 30th day of the
month. Employees working on regular/ special holidays
will be fully compensated based on current rate and
practices in the industry.
Benefits from SSS and Philhealth are also provided and
their contributions will be deducted from their monthly
salaries. These benefits will provide assistance
hospitalization, retirement and other benefits.
Workers who shall be found guilty of illegal acts
and/or fraud will be suspended or terminated depending
upon the degree of the offense.
Policies towards the Customers
The product will be subjected to customer inspection
before and after purchase.
Return of defective product will be entertained only
within 7 days warranty with official receipt.
To avoid possible damages to the product, it will be
delivered to the respective distributor/ retailer a day
after the purchase order has been received.
Concerning credit sales, payment shall be made within a
month after the date of purchase with a term n/30.
Cash sales of retailers will be given 3% discount for
the first year of operation and no credit discount are
imposed.
Policies towards the Supplier
The forms and conditions between and suppliers must be
clearly stated to avoid conflicts.
Quality of raw materials, especially the outsourced
product parts must be ensured by their corresponding
suppliers.
Damaged supplies will be returned immediately after
inspection and will be replaced by another of same
quality.
The suppliers must deliver the product on agreed
specification and date.
Since the firm has not yet established a good credit
rating, purchase will be more on cash basis.
If not avoided, punctual payment of the firm’s debts
toward its suppliers will be exercised to be able to
create a sound customer-supplier relationship.
Legal requirements
Government creates way of protecting the people from
hideous scams and illegal conducts of business. To prevent
this from happening, different agencies and stages with it
are formed to make all the transaction of an established
business to legal and at their watch. The process includes
the submission of articles of partnership to the Securities
and Exchange Commission, registration in the Department of
Trade and Industry and the Bureau of Internal Revenue and
securing a mayor’s permit and others.
Articles of Partnership must be registered in the
Security and Exchange Commission.
The following essential provisions are contained in the
article: the partnership name, nature, purpose and location.
1. The name, citizenship and residence of the partners.
2. The date of formation and duration of partnership.
3. The capital contribution of each partner, the procedure
for non-cash investments, treatment of excise
contribution and the penalties for a partner’s failure to
invest and to maintain the agreed capital.
4. The rights and duties of each partner.
5. The accounting period to be adopted, the nature of
accounting records, financial statements and audits by
independent public accountants.
6. The method of sharing net income or net loss, frequency
of income measurement and distribution, including the
provisions for the recognition of differences in
contributions.
7. The drawings or salaries allowed to partners.
8. The provision for arbitration or disputes, dissolution
and liquidation.
II. Registration of the Business Name at the Department of
Trade and Industry
A firm needs an identity to create a better positioning
in the mindset of its consumers. This is the very reason why
business names are needed to be registered at Department of
Trade and Industry (DTI). The prevention of duplication and
misidentification are the primary objective of this
establishment.
In the process, applicant would pay the amount of
Php500.00. An application form is filled up and submitted
along with two passport size pictures, a certificate of
Filipino Citizenship or both certificate and three business
proposals.
III. Acquisition of Barangay Clearance
The proposed business will be benefiting to the
community where it is located, thus it must return the favor
by giving its right contribution to such community. It
should acquire a clearance from the barangay where the
industry is to be located for it to be considered legal and
legitimate. A community tax must be paid to secure this
clearance.
IV. Application for Mayor’s Permit
An application for Mayor’s Permit is done be able to
monitor the business establishments within the municipality.
It is also important to secure that businesses are complying
not only to the national rules implemented but by the
municipal declarations as well. Application of these is done
at the City Mayor’s Office at the Permits and Licenses
Division. The requirements that should be complied with are
the following:
1. Location sketch of the proposed business
2. Sworn Capital investment of the partners
3. Certificate attesting to the tax free exemption, if the
business is exempted from payment of fee or tax.
4. Certification from the officer-in-charge of the zoning
division where the location of the proposed business is
in accordance with the zoning rules and regulation.
5. Tax clearance showing that the operation has paid all the
taxes obligations.
6. Two passport size pictures
7. Presentation of the community tax certificate and receipt
for the payments of professionals tax, occupation fee, as
the case maybe, the applicant is liable thereof
8. Lease Contract if the building is rented
9. Barangay Clearance, and
10. Photocopy of the DTI registration form.
V. Confirmation of the Application form with the following
offices for its inspection, endorsement, assessment and
signing.
1. City Planning and Development Office
2. City Engineer’s Office
3. City Treasurer’s Office
4. City Health Office
VI. Payment of all the necessary fees and taxes at City
Treasurer’s Office.
1. Legal Fees
2. Environmental Protection Fee
3. Fire Inspection Fee
VII. Registration with the Bureau of Internal Revenue
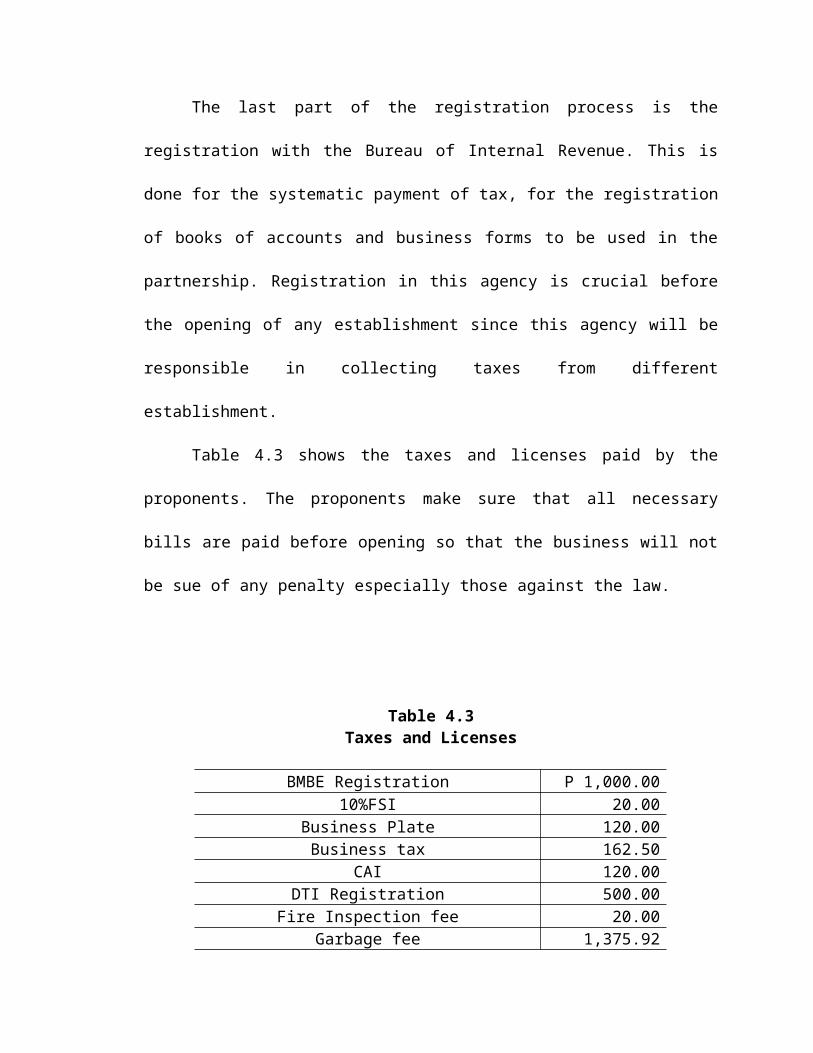
The last part of the registration process is the
registration with the Bureau of Internal Revenue. This is
done for the systematic payment of tax, for the registration
of books of accounts and business forms to be used in the
partnership. Registration in this agency is crucial before
the opening of any establishment since this agency will be
responsible in collecting taxes from different
establishment.
Table 4.3 shows the taxes and licenses paid by the
proponents. The proponents make sure that all necessary
bills are paid before opening so that the business will not
be sue of any penalty especially those against the law.
Table 4.3Taxes and Licenses
BMBE Registration P 1,000.0010%FSI 20.00
Business Plate 120.00Business tax 162.50
CAI 120.00DTI Registration 500.00
Fire Inspection fee 20.00Garbage fee 1,375.92
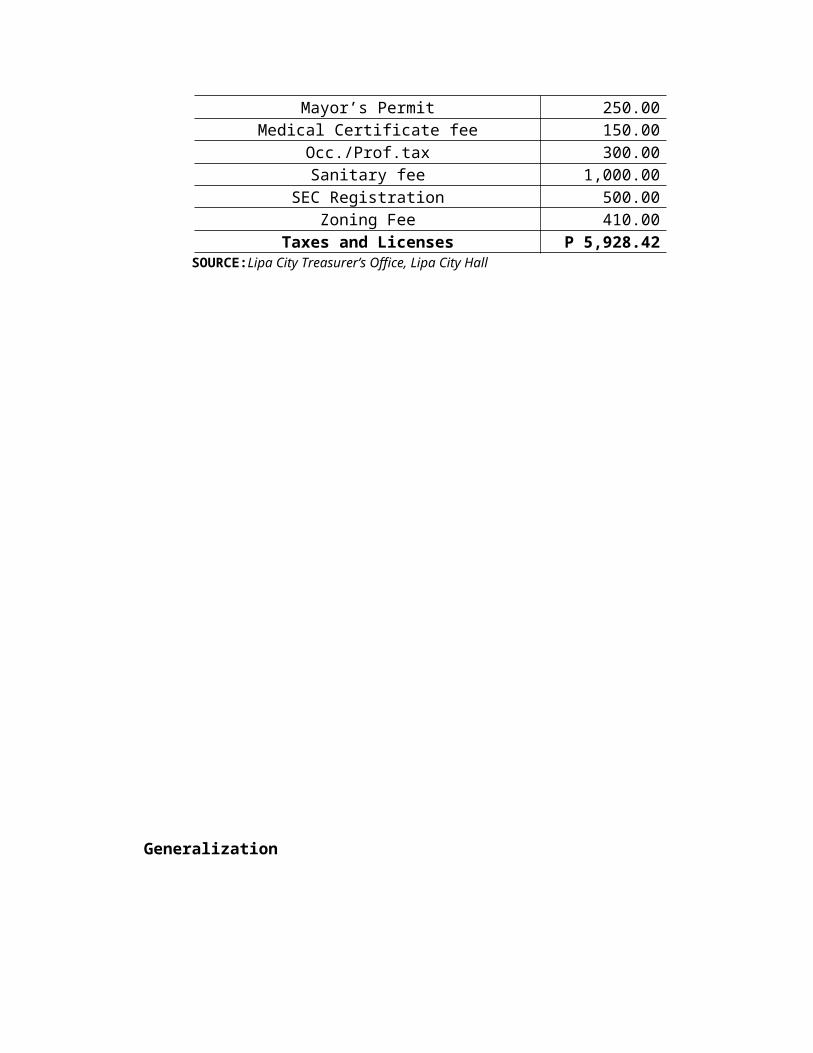
Mayor’s Permit 250.00Medical Certificate fee 150.00
Occ./Prof.tax 300.00Sanitary fee 1,000.00
SEC Registration 500.00Zoning Fee 410.00
Taxes and Licenses P 5,928.42SOURCE:Lipa City Treasurer’s Office, Lipa City Hall
Generalization
AIS manufacturing chose to be formed as general
partnership because of benefits that the partnership has.
Through this, contribution of each partner can be in the
form of money, skills, property and equipment. This
advantage of general partnership is very beneficial to the
proposed business because of wider scope of contribution.
The proposed business has Php 160,000 as its initial
capital. The partners agreed to contribute Php 40,000 each
to make the business run successfully.
AIS Manufacturing is a new entrant in the business
under the category of small scale industry. In relation to
this, the firm integrates line organization as its
organization structure because its best suits to the
proposed business size. Because of fixed responsibility,
clear task and authority of every partners and employees in
the business, improper management will be avoided.
The firm also discussed manpower needed, their
requirements for the job and the qualities of employees to
perform the job description successfully. The employees will
also be given Php322.50 per day as their minimum wage salary
and 13th month pay, SSS and Phil Health contribution as
their additional compensation. The manager will be given
Php10, 000.00 monthly salary and the bookkeeper will be
receiving Php1, 600.00 per month.
AIS Manufacturing set policy towards employees,
customers, suppliers and prescribed legal requirements for
lawfully managing the proposed business.
AIS Manufacturing comply with the requirements needed
to legalized the business. The said requirements are
Registration of Business Name, acquisition of Barangay
Clearance, application of Mayor’s Permit, payment of
necessary fees and taxes, and the registration at the Bureau
of Internal Revenue. The conformance of the said
requirements will assure that the proposed business is
legally registered.
Chapter VFINANCIAL STUDY
This chapter will present the financial aspect of the
whole study expressed in terms of peso. Since the company is
just a new entrant, and the competition is very stiff, it is
necessary to know if the company will spawn income. In
addition, it will cover the capital requirements needed, the
company’s over-all financial performance and the analysis
and interpretation of its financial statements.
Objectives of the Study
The study specifically aims to evaluate the
profitability of the proposed business through analyzing the
financial statement, statement of financial performance,
cash flows and through the use of financial ratios such as
liquidity ratios, activity ratios, leverage ratios and
profitability ratios to determine the liquidity of the
proposed business.
1. To determine the initial requirements needed to cover
the projected cost of the proposed business.
2. To evaluate the company's performance, solvency,
liquidity and stability.
3. To analyze the projected financial statement through
the use of financial ratios.
4. To oversee the growth of the company through its
performance and status.
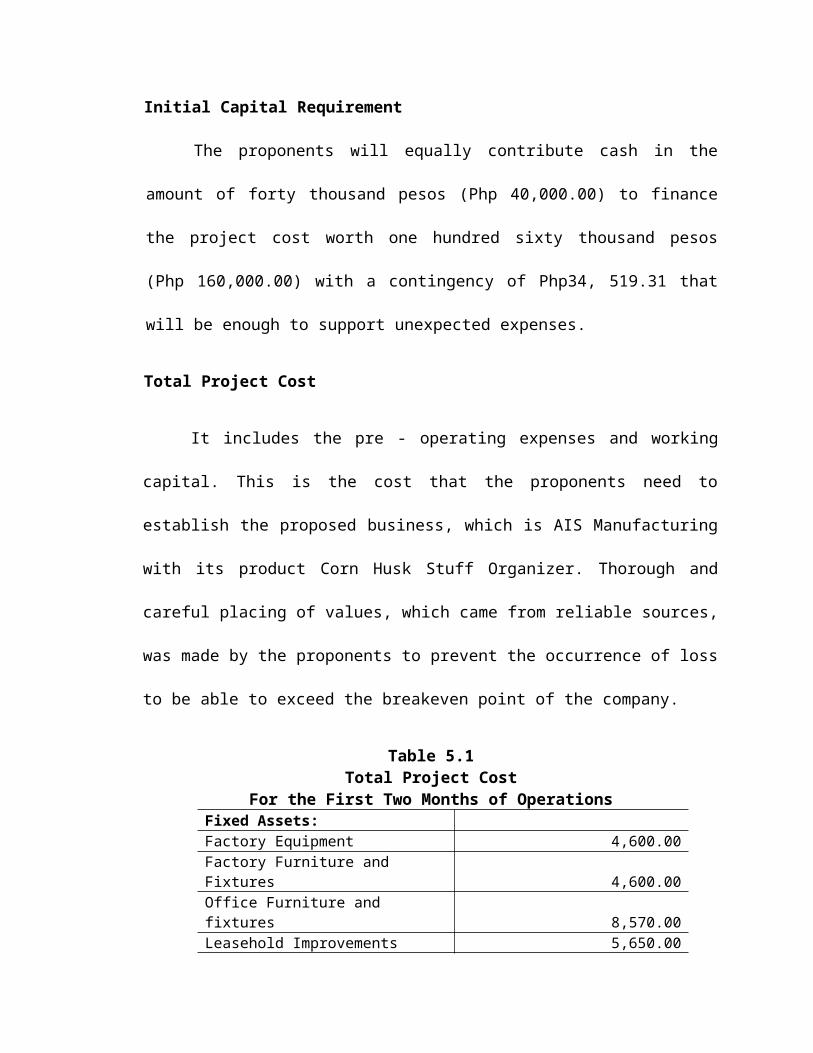
Initial Capital Requirement
The proponents will equally contribute cash in the
amount of forty thousand pesos (Php 40,000.00) to finance
the project cost worth one hundred sixty thousand pesos
(Php 160,000.00) with a contingency of Php34, 519.31 that
will be enough to support unexpected expenses.
Total Project Cost
It includes the pre - operating expenses and working
capital. This is the cost that the proponents need to
establish the proposed business, which is AIS Manufacturing
with its product Corn Husk Stuff Organizer. Thorough and
careful placing of values, which came from reliable sources,
was made by the proponents to prevent the occurrence of loss
to be able to exceed the breakeven point of the company.
Table 5.1Total Project Cost
For the First Two Months of OperationsFixed Assets: Factory Equipment 4,600.00Factory Furniture and Fixtures 4,600.00Office Furniture and fixtures 8,570.00Leasehold Improvements 5,650.00
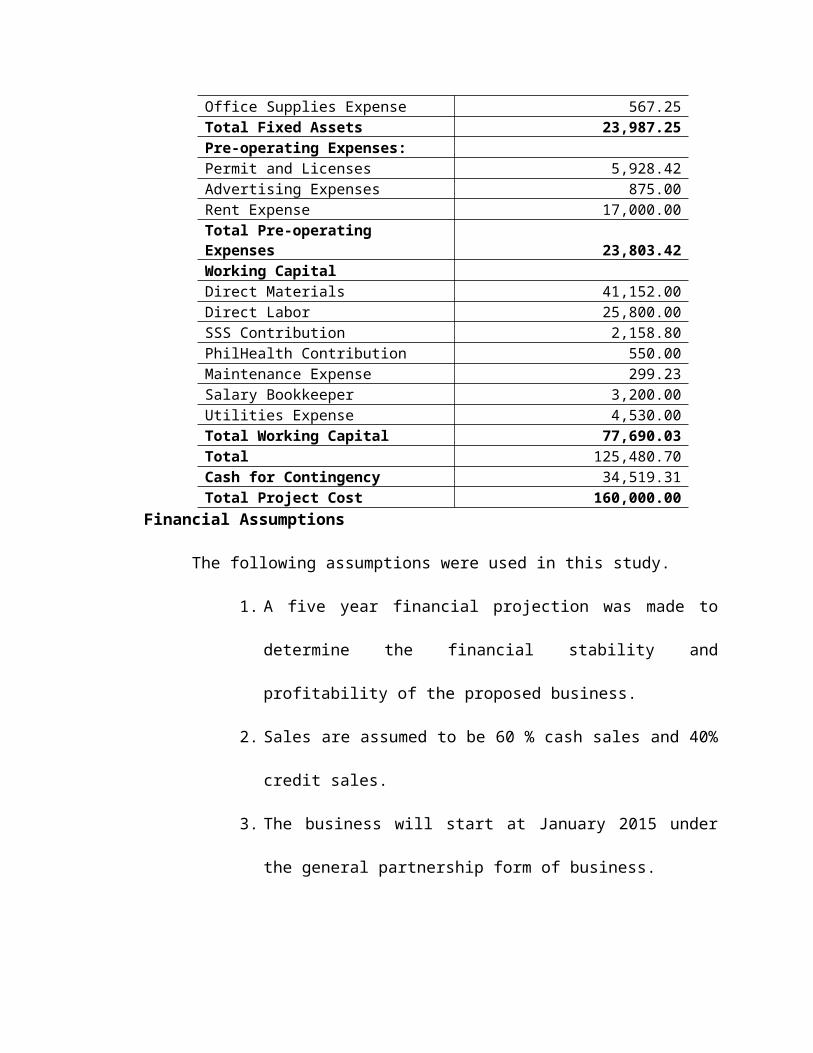
Office Supplies Expense 567.25Total Fixed Assets 23,987.25Pre-operating Expenses:Permit and Licenses 5,928.42Advertising Expenses 875.00Rent Expense 17,000.00Total Pre-operating Expenses 23,803.42Working CapitalDirect Materials 41,152.00Direct Labor 25,800.00SSS Contribution 2,158.80PhilHealth Contribution 550.00Maintenance Expense 299.23Salary Bookkeeper 3,200.00Utilities Expense 4,530.00Total Working Capital 77,690.03Total 125,480.70Cash for Contingency 34,519.31Total Project Cost 160,000.00
Financial Assumptions
The following assumptions were used in this study.
1. A five year financial projection was made to
determine the financial stability and
profitability of the proposed business.
2. Sales are assumed to be 60 % cash sales and 40%
credit sales.
3. The business will start at January 2015 under
the general partnership form of business.
4. The partnership will hire two workers. Each
worker will receive P 322.50 per day as their
salary. It will be given every 15th and 30th of
the month. Salary of workers will be increase
by 5% every year.
5. Workers will receive benefits such as SSS,
PhilHealth and 13th month pay.
6. Raw materials usage will be based on the
projected production schedule. The projected
production schedule for the first year is 3840
pieces and it will be increase by 5 % every
year.
7. The allocation of expense for rent, utilities,
maintenance supplies, leasehold improvements
and administrative expense is 70% and 30%
respectively.
8. Advertising expense is 5,250.00 on the first
year because of the intensive promotion for the
introduction of the proposed product. This
advertising expense will decrease the following
year.
9. Net income and loss will be shared by all
partners. Partners are allowed to withdraw 25%
of their share in net income.
10. Available cash balance will be used for the
other expense for the following year.
Financial Statements
Financial statement refers to that statement which
reflects collection of fund from various sources, cost of
using such funds, investment of such funds in various
assets, return accrued from such resources and similar bits
of information. Financial statements speak of the impact of
exchanges but these statements cannot speak directly about
employee relation, consumer loyalty, or intellectual
capacity of an entity. (Sinha, 2013)
Statement of Financial Performance
It is a measure of how well a firm can use assets from
its primary mode of business and generate revenues. It is
also used as a general measure of a firm’s overall financial
health over a given period of time, and can be used to
compare similar firms across the same industry or to compare
industries or sectors in aggregation.
Financial performance is also called “income
statement”. It is assessed by giving a summary of how the
business incurs its revenues and expenses through both
operating and non operating activities. It also shows the
net profit or loss incurred over a specific accounting
period, typically over a fiscal quarter or year.
AIS Manufacturing is forecasted to have a net income of
P 55,298.51 on its first year. It will increase to P
159,327.64 for the next four years of operation.
Statement of Cash Flow
Cash flow is either an inflow (source of receipt) or an
outflow (use or disbursement) are classified as operating
activities, investing activities and financing activities.
It is vital to the financial health of the business (Manuel,
2009).
The net cash flow of AIS Manufacturing for 2015 is Php
213, 066.51and it will be increased by Php157, 176.50 in
2019.
Cash flow is the amount of money generated and used by
the company in a given period. It is essential in company’s
solvency. It can be presented as record of something that
has happened in the past or forecasted in the future,
representing what the business expect to take in and to
spend. Cash flow is also crucial in entity’s survival.
Having ample cash on hand will ensure that creditor,
employees and others can be paid on time.
Statement of Changes in Partner’s Equity
Partner’s equity is the equity of a partner which is
affected by investment, withdrawals, share of net income or
net loss. There are two important ledger accounts which are
maintained for each partner for the purpose of recording
transactions affecting equity. These are Partner’s Capital
and Partner’s Equity (Carillo, 2008). A business entity is
required to prepare a separate statement that shows the
changes in its owner’s equity between two or more balance
sheet dates. It is necessary to maintain separate capital
and withdrawal accounts for each partner and to divide the
income and losses of the company among partners.
Andal, Gulla and Lucero are expected to have the ending
share of Php 51,059.70 each equally shared and Benedicto is
expected to have an ending share of Php 62, 119.40.
Statement of Financial Position
Financial position or structure of an enterprise is
affected by the economic resources it controls, its
financial structure, its liquidity and solvency. It refers
to the financing or borrowing posture of the enterprise. It
shows how much of the assets of the enterprise are being
funded by the creditors and how much are being contributed
by the investors (Manuel, 2009).
The firm is projected to have Php 322, 498.11 as total
asset, wherein Php 302, 429.11 is the current asset while
Php 20,072.00is the non current asset for the first year of
operation. For liabilities, the firm will have Php
107,199.61as total liabilities for its first year of
operation. This show that firm is liquid and capable to pay
all its liabilities with remaining cash to suffice its
operating expense.
Financial Analysis
Financial Analysis is the selection, evaluation and
interpretation of financial data and other pertinent
information to assist in evaluating the operating
performance and financial condition of a company (Peterson,
2008). Typically, financial analysis is used to analyze
whether an entity is stable, solvent, liquid, or profitable
enough to be invested in. One key area of financial analysis
involves extrapolating the company's past performance into
an estimate of the company's future performance.
Financial Ratio Analysis
Financial ratio is simply an expression of the relation
between two financial statement accounts. Financial ratio
analysis is the investigation of the company’s condition and
performance using one or more ratios (Peterson, 2008). A
sustainable business and mission requires effective planning
and financial management. Financial ratio analysis is a
useful management tool that will improve an understanding of
financial results and trends over time, and provide key
indicators of organizational performance. It use ratio
analysis to pinpoint strengths and weaknesses from which
strategies and initiatives can be formed.
A. Liquidity Ratio
Liquidity ratio is a ratio that shows relationship of a
firm’s cash and other current assets to its current
liabilities (Houston, 2010). It gives the idea of the firm’s
ability to pay off debts that are maturing within a year.
Current Ratio
Current ratio indicates the extent to which current
liabilities are covered by those assets expected to be
converted to cash in the near future. An indication of a
company’s abilities to meet short term debt obligations: the
higher the ratio the more liquid the company is. If the
current asset of a company is more than twice the current
liabilities, then the company is considered to have good
short term financial strength. If the liabilities exceed
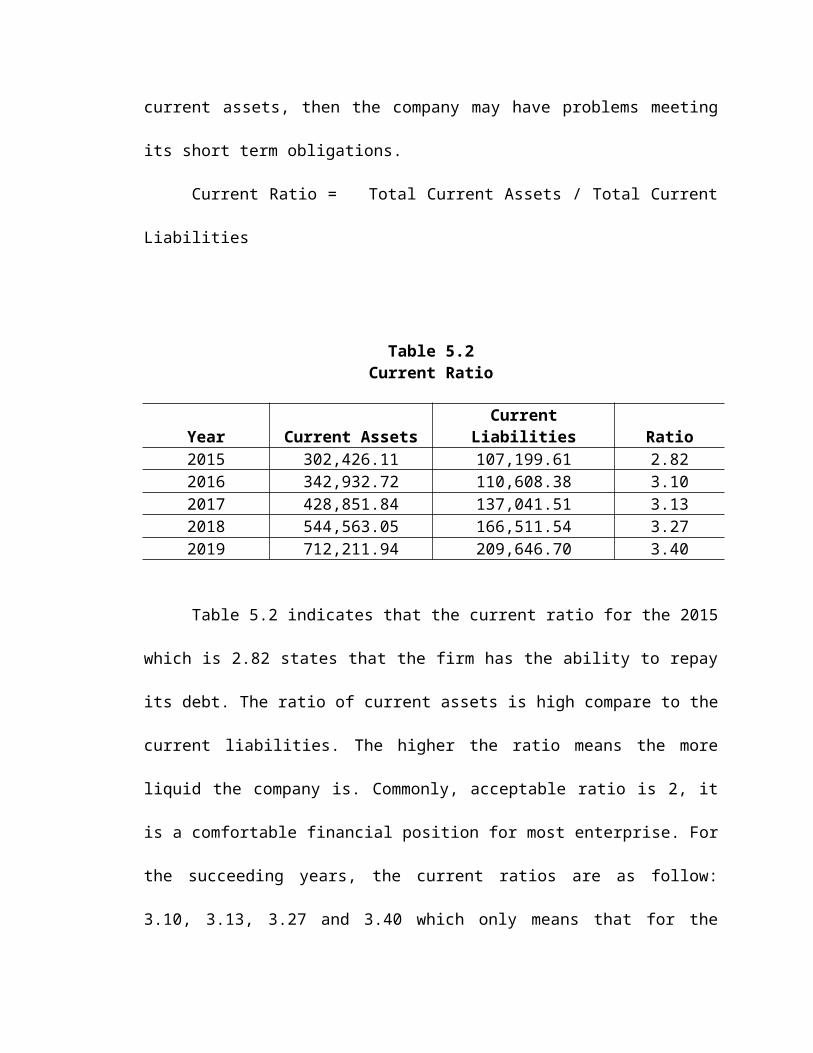
current assets, then the company may have problems meeting
its short term obligations.
Current Ratio = Total Current Assets / Total Current
Liabilities
Table 5.2Current Ratio
Year Current AssetsCurrent
Liabilities Ratio2015 302,426.11 107,199.61 2.822016 342,932.72 110,608.38 3.102017 428,851.84 137,041.51 3.132018 544,563.05 166,511.54 3.272019 712,211.94 209,646.70 3.40
Table 5.2 indicates that the current ratio for the 2015
which is 2.82 states that the firm has the ability to repay
its debt. The ratio of current assets is high compare to the
current liabilities. The higher the ratio means the more
liquid the company is. Commonly, acceptable ratio is 2, it
is a comfortable financial position for most enterprise. For
the succeeding years, the current ratios are as follow:
3.10, 3.13, 3.27 and 3.40 which only means that for the
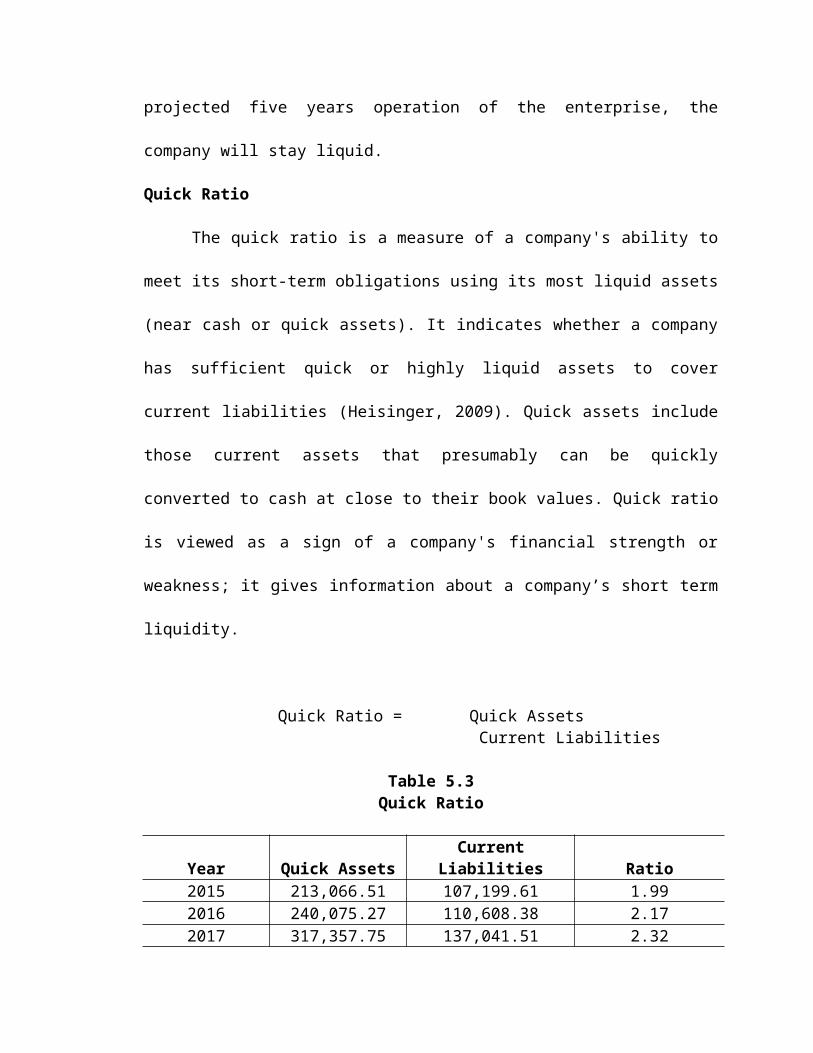
projected five years operation of the enterprise, the
company will stay liquid.
Quick Ratio
The quick ratio is a measure of a company's ability to
meet its short-term obligations using its most liquid assets
(near cash or quick assets). It indicates whether a company
has sufficient quick or highly liquid assets to cover
current liabilities (Heisinger, 2009). Quick assets include
those current assets that presumably can be quickly
converted to cash at close to their book values. Quick ratio
is viewed as a sign of a company's financial strength or
weakness; it gives information about a company’s short term
liquidity.
Quick Ratio = Quick Assets Current Liabilities
Table 5.3Quick Ratio
Year Quick AssetsCurrent
Liabilities Ratio2015 213,066.51 107,199.61 1.992016 240,075.27 110,608.38 2.172017 317,357.75 137,041.51 2.32
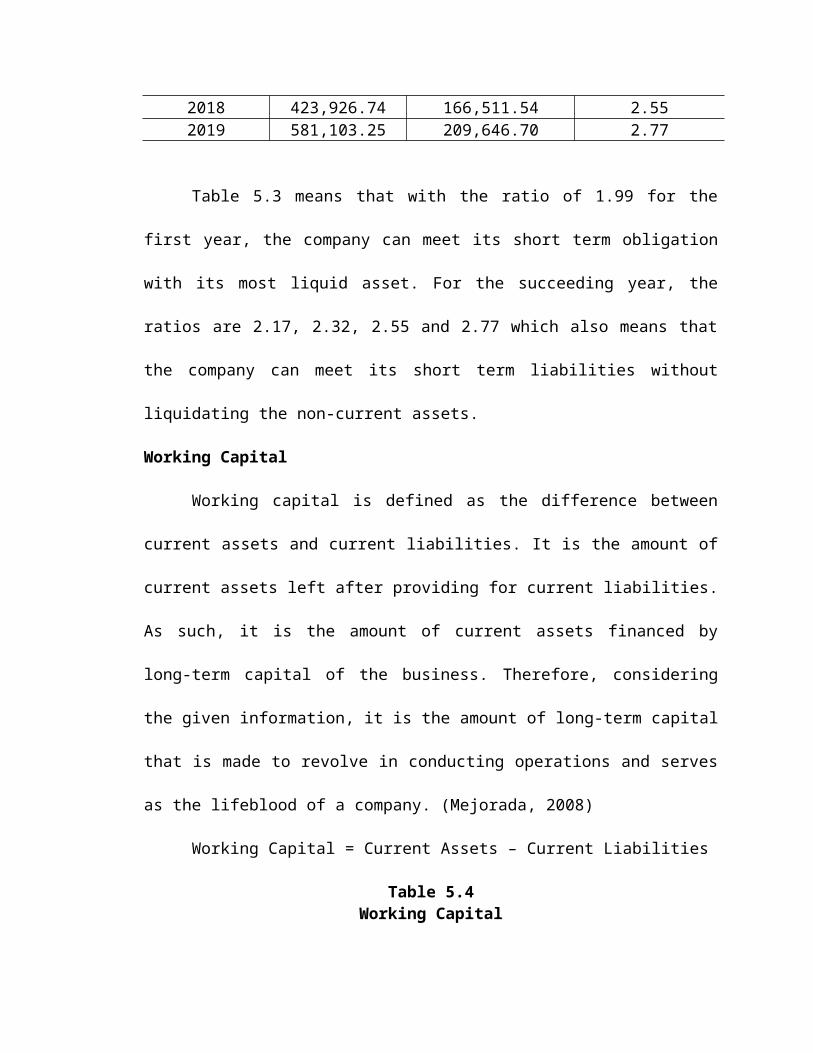
2018 423,926.74 166,511.54 2.552019 581,103.25 209,646.70 2.77
Table 5.3 means that with the ratio of 1.99 for the
first year, the company can meet its short term obligation
with its most liquid asset. For the succeeding year, the
ratios are 2.17, 2.32, 2.55 and 2.77 which also means that
the company can meet its short term liabilities without
liquidating the non-current assets.
Working Capital
Working capital is defined as the difference between
current assets and current liabilities. It is the amount of
current assets left after providing for current liabilities.
As such, it is the amount of current assets financed by
long-term capital of the business. Therefore, considering
the given information, it is the amount of long-term capital
that is made to revolve in conducting operations and serves
as the lifeblood of a company. (Mejorada, 2008)
Working Capital = Current Assets – Current Liabilities
Table 5.4Working Capital
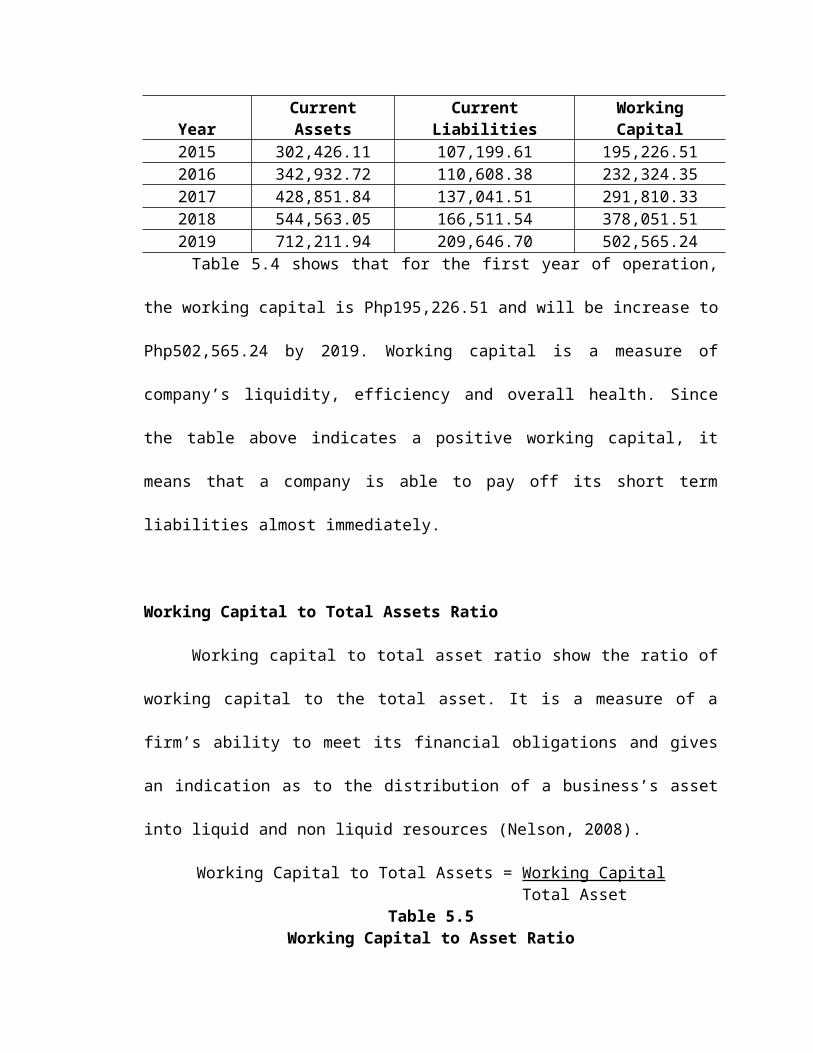
YearCurrentAssets
CurrentLiabilities
WorkingCapital
2015 302,426.11 107,199.61 195,226.512016 342,932.72 110,608.38 232,324.352017 428,851.84 137,041.51 291,810.332018 544,563.05 166,511.54 378,051.512019 712,211.94 209,646.70 502,565.24Table 5.4 shows that for the first year of operation,
the working capital is Php195,226.51 and will be increase to
Php502,565.24 by 2019. Working capital is a measure of
company’s liquidity, efficiency and overall health. Since
the table above indicates a positive working capital, it
means that a company is able to pay off its short term
liabilities almost immediately.
Working Capital to Total Assets Ratio
Working capital to total asset ratio show the ratio of
working capital to the total asset. It is a measure of a
firm’s ability to meet its financial obligations and gives
an indication as to the distribution of a business’s asset
into liquid and non liquid resources (Nelson, 2008).
Working Capital to Total Assets = Working Capital Total Asset
Table 5.5Working Capital to Asset Ratio
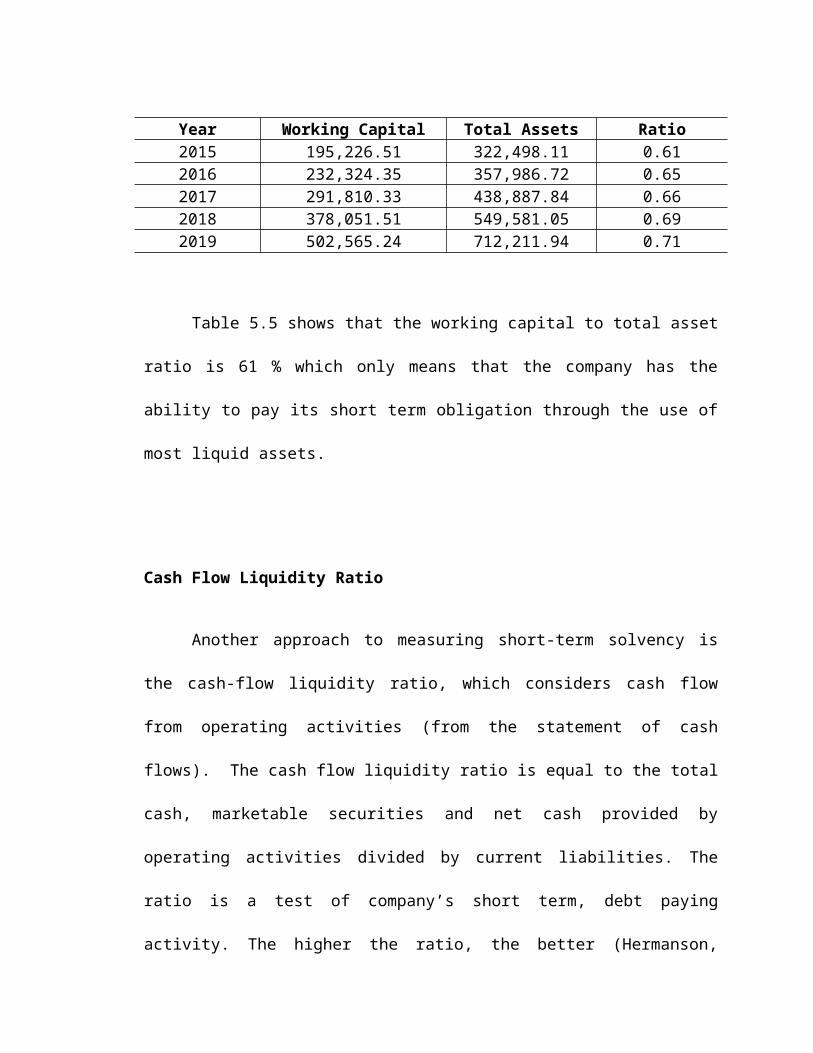
Year Working Capital Total Assets Ratio2015 195,226.51 322,498.11 0.612016 232,324.35 357,986.72 0.652017 291,810.33 438,887.84 0.662018 378,051.51 549,581.05 0.692019 502,565.24 712,211.94 0.71
Table 5.5 shows that the working capital to total asset
ratio is 61 % which only means that the company has the
ability to pay its short term obligation through the use of
most liquid assets.
Cash Flow Liquidity Ratio
Another approach to measuring short-term solvency is
the cash-flow liquidity ratio, which considers cash flow
from operating activities (from the statement of cash
flows). The cash flow liquidity ratio is equal to the total
cash, marketable securities and net cash provided by
operating activities divided by current liabilities. The
ratio is a test of company’s short term, debt paying
activity. The higher the ratio, the better (Hermanson,
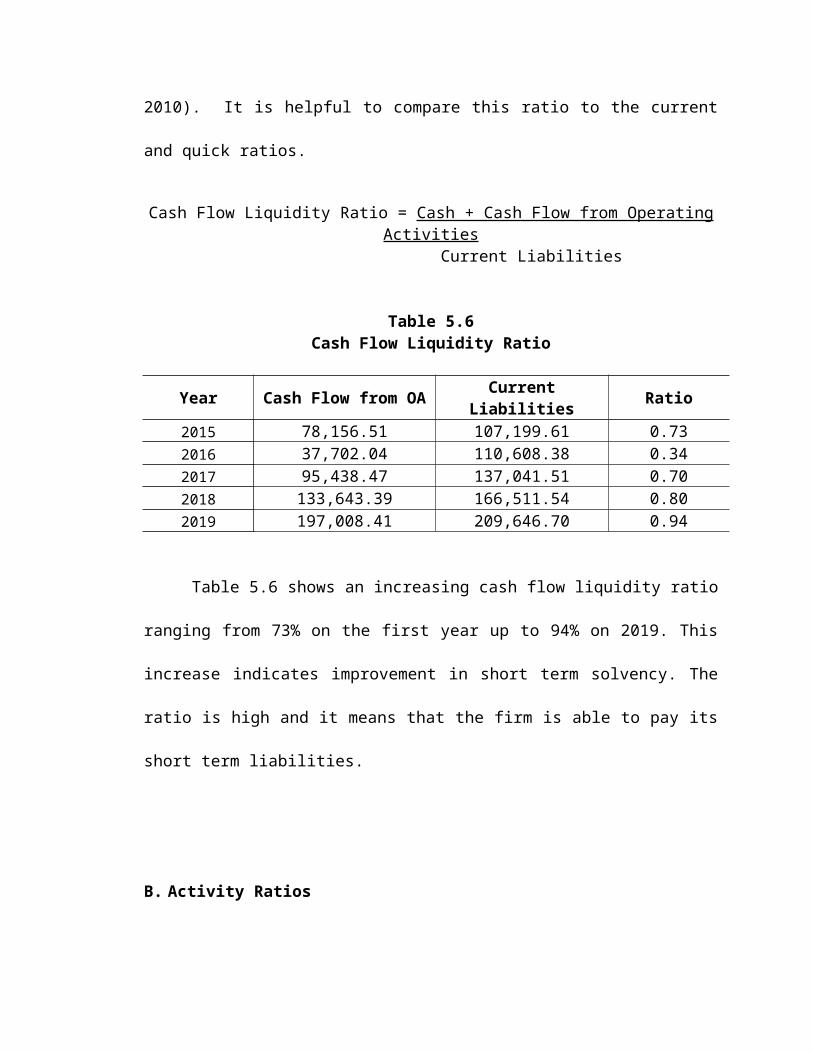
2010). It is helpful to compare this ratio to the current
and quick ratios.
Cash Flow Liquidity Ratio = Cash + Cash Flow from OperatingActivities Current Liabilities
Table 5.6Cash Flow Liquidity Ratio
Year Cash Flow from OA CurrentLiabilities Ratio
2015 78,156.51 107,199.61 0.732016 37,702.04 110,608.38 0.342017 95,438.47 137,041.51 0.702018 133,643.39 166,511.54 0.802019 197,008.41 209,646.70 0.94
Table 5.6 shows an increasing cash flow liquidity ratio
ranging from 73% on the first year up to 94% on 2019. This
increase indicates improvement in short term solvency. The
ratio is high and it means that the firm is able to pay its
short term liabilities.
B. Activity Ratios
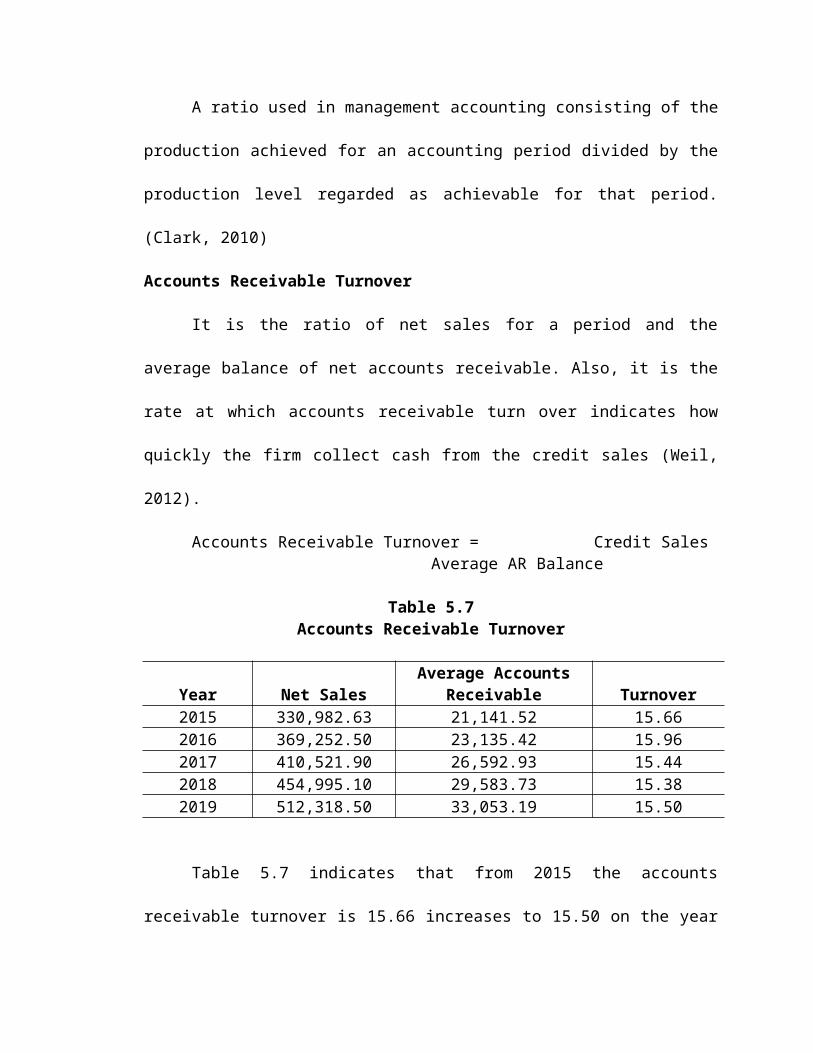
A ratio used in management accounting consisting of the
production achieved for an accounting period divided by the
production level regarded as achievable for that period.
(Clark, 2010)
Accounts Receivable Turnover
It is the ratio of net sales for a period and the
average balance of net accounts receivable. Also, it is the
rate at which accounts receivable turn over indicates how
quickly the firm collect cash from the credit sales (Weil,
2012).
Accounts Receivable Turnover = Credit SalesAverage AR Balance
Table 5.7Accounts Receivable Turnover
Year Net SalesAverage Accounts
Receivable Turnover2015 330,982.63 21,141.52 15.662016 369,252.50 23,135.42 15.962017 410,521.90 26,592.93 15.442018 454,995.10 29,583.73 15.382019 512,318.50 33,053.19 15.50
Table 5.7 indicates that from 2015 the accounts
receivable turnover is 15.66 increases to 15.50 on the year
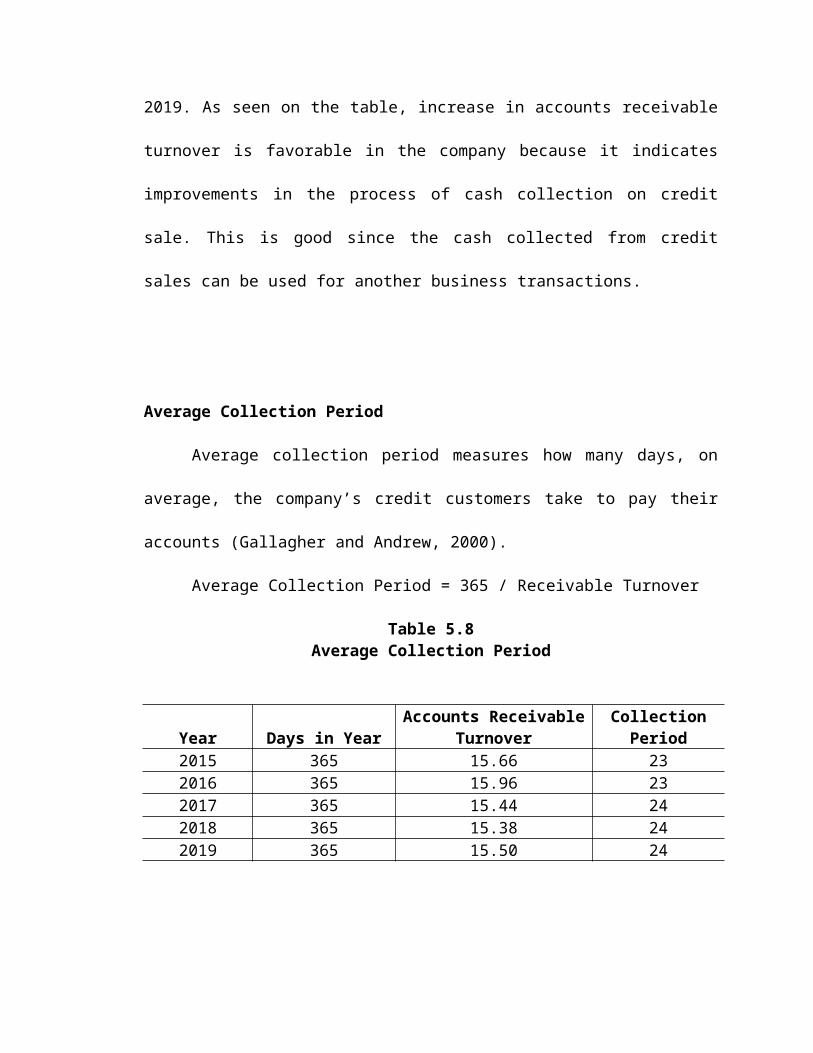
2019. As seen on the table, increase in accounts receivable
turnover is favorable in the company because it indicates
improvements in the process of cash collection on credit
sale. This is good since the cash collected from credit
sales can be used for another business transactions.
Average Collection Period
Average collection period measures how many days, on
average, the company’s credit customers take to pay their
accounts (Gallagher and Andrew, 2000).
Average Collection Period = 365 / Receivable Turnover
Table 5.8Average Collection Period
Year Days in YearAccounts Receivable
TurnoverCollectionPeriod
2015 365 15.66 232016 365 15.96 232017 365 15.44 242018 365 15.38 242019 365 15.50 24
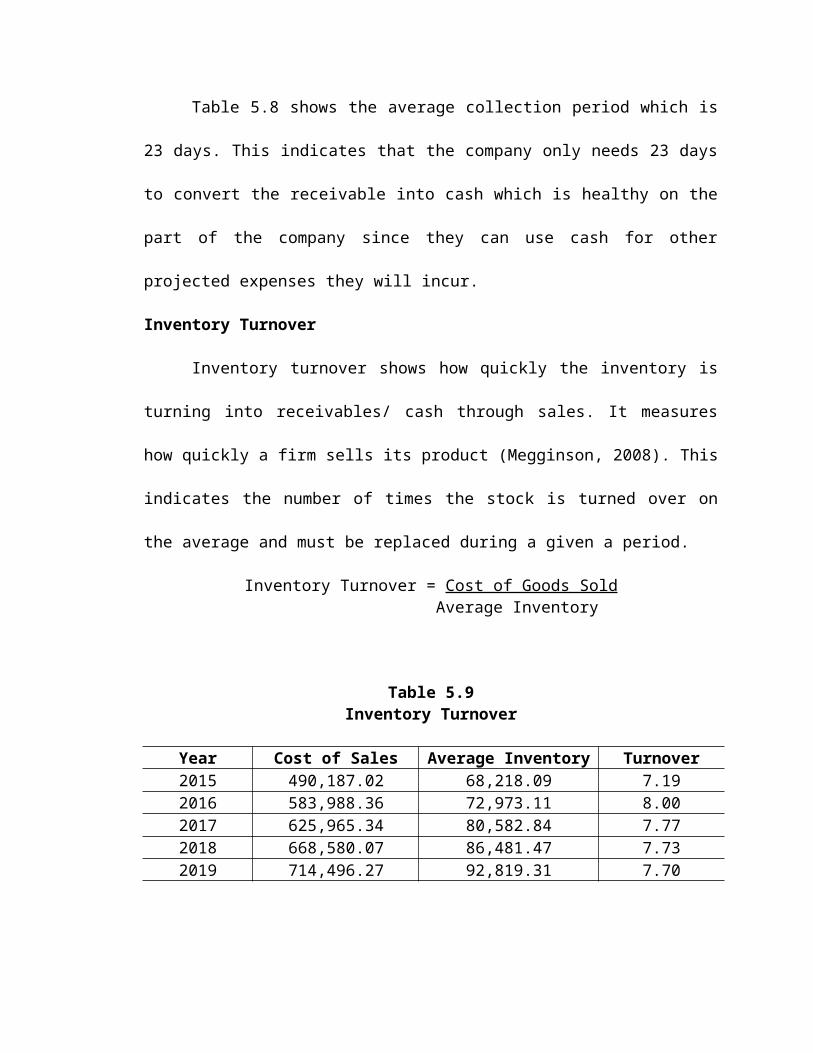
Table 5.8 shows the average collection period which is
23 days. This indicates that the company only needs 23 days
to convert the receivable into cash which is healthy on the
part of the company since they can use cash for other
projected expenses they will incur.
Inventory Turnover
Inventory turnover shows how quickly the inventory is
turning into receivables/ cash through sales. It measures
how quickly a firm sells its product (Megginson, 2008). This
indicates the number of times the stock is turned over on
the average and must be replaced during a given a period.
Inventory Turnover = Cost of Goods Sold Average Inventory
Table 5.9Inventory Turnover
Year Cost of Sales Average Inventory Turnover2015 490,187.02 68,218.09 7.192016 583,988.36 72,973.11 8.002017 625,965.34 80,582.84 7.772018 668,580.07 86,481.47 7.732019 714,496.27 92,819.31 7.70
Table 5.9 shows that the inventory turnover for 2015 is
7.19 and was increased to 7.70 by the year 2019. Since the
company obtains a high inventory turnover, it means the
company performance is better and it is efficient in
controlling its inventory levels. More inventories are
converted into cash faster thereby making profit for the
company.
C. Leverage Ratios
Leverage ratio is used to calculate the financial
leverage of a company to get an idea of the company’s method
of financing or to measures its ability to meet financial
obligation (Brewer, 2008).
Debt Ratio
Debt ratio measures the proportion of the total assets
financed by the firm’s creditors (Megginson, 2008) .A debt
ratio of greater than 1 indicates that a company has more
debt than assets; meanwhile, a debt ratio of less than 1
indicates that a company has more assets than debt.
Debt Ratio = Total Liabilities
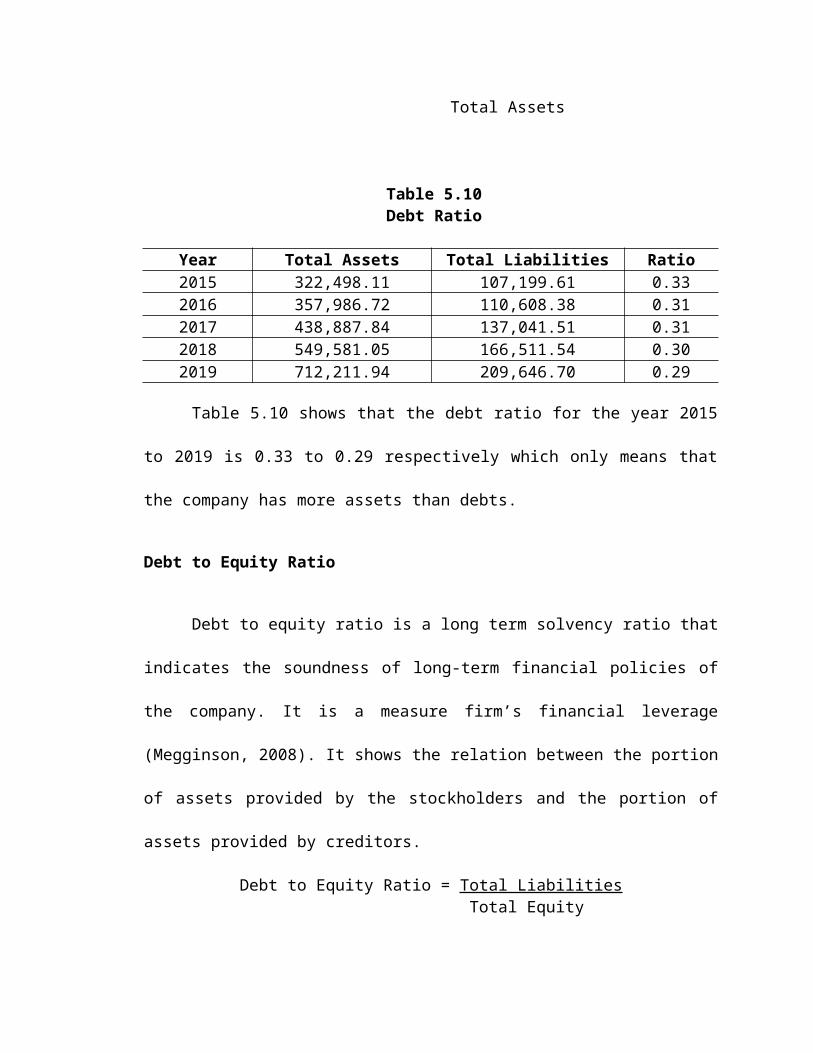
Total Assets
Table 5.10Debt Ratio
Year Total Assets Total Liabilities Ratio2015 322,498.11 107,199.61 0.332016 357,986.72 110,608.38 0.312017 438,887.84 137,041.51 0.312018 549,581.05 166,511.54 0.302019 712,211.94 209,646.70 0.29
Table 5.10 shows that the debt ratio for the year 2015
to 2019 is 0.33 to 0.29 respectively which only means that
the company has more assets than debts.
Debt to Equity Ratio
Debt to equity ratio is a long term solvency ratio that
indicates the soundness of long-term financial policies of
the company. It is a measure firm’s financial leverage
(Megginson, 2008). It shows the relation between the portion
of assets provided by the stockholders and the portion of
assets provided by creditors.
Debt to Equity Ratio = Total Liabilities Total Equity
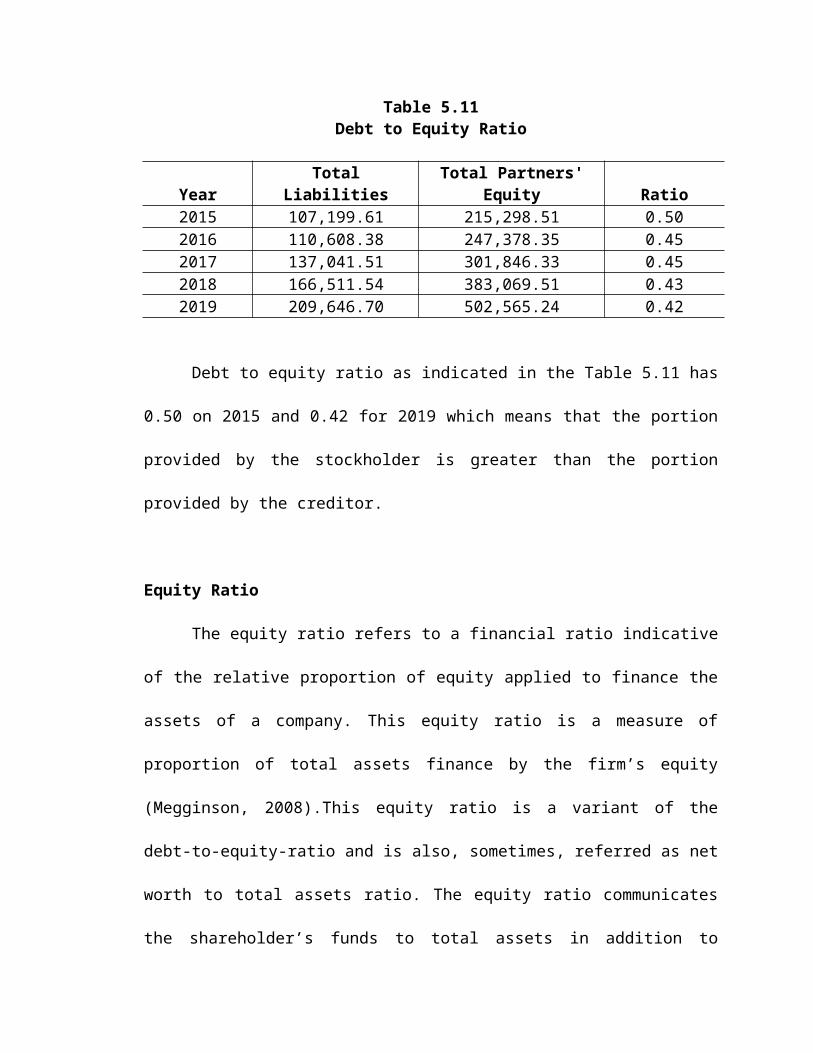
Table 5.11Debt to Equity Ratio
YearTotal
LiabilitiesTotal Partners'
Equity Ratio2015 107,199.61 215,298.51 0.502016 110,608.38 247,378.35 0.452017 137,041.51 301,846.33 0.452018 166,511.54 383,069.51 0.432019 209,646.70 502,565.24 0.42
Debt to equity ratio as indicated in the Table 5.11 has
0.50 on 2015 and 0.42 for 2019 which means that the portion
provided by the stockholder is greater than the portion
provided by the creditor.
Equity Ratio
The equity ratio refers to a financial ratio indicative
of the relative proportion of equity applied to finance the
assets of a company. This equity ratio is a measure of
proportion of total assets finance by the firm’s equity
(Megginson, 2008).This equity ratio is a variant of the
debt-to-equity-ratio and is also, sometimes, referred as net
worth to total assets ratio. The equity ratio communicates
the shareholder’s funds to total assets in addition to
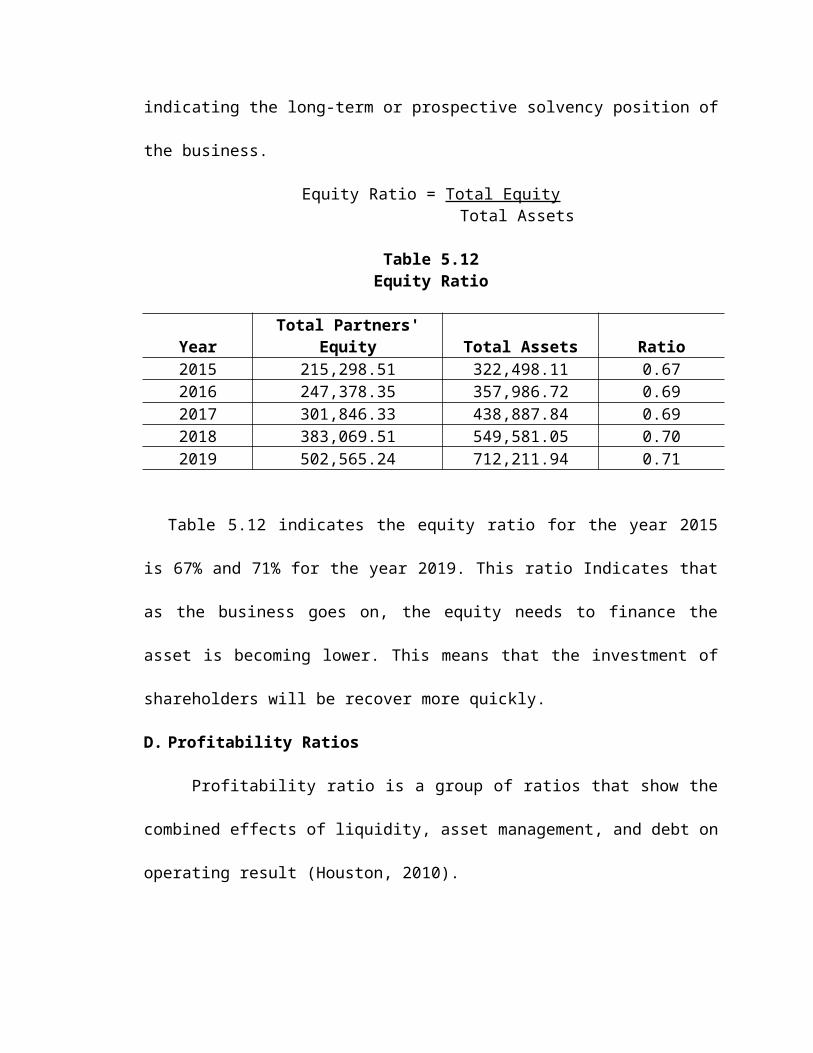
indicating the long-term or prospective solvency position of
the business.
Equity Ratio = Total Equity Total Assets
Table 5.12Equity Ratio
YearTotal Partners'
Equity Total Assets Ratio2015 215,298.51 322,498.11 0.672016 247,378.35 357,986.72 0.692017 301,846.33 438,887.84 0.692018 383,069.51 549,581.05 0.702019 502,565.24 712,211.94 0.71
Table 5.12 indicates the equity ratio for the year 2015
is 67% and 71% for the year 2019. This ratio Indicates that
as the business goes on, the equity needs to finance the
asset is becoming lower. This means that the investment of
shareholders will be recover more quickly.
D. Profitability Ratios
Profitability ratio is a group of ratios that show the
combined effects of liquidity, asset management, and debt on
operating result (Houston, 2010).
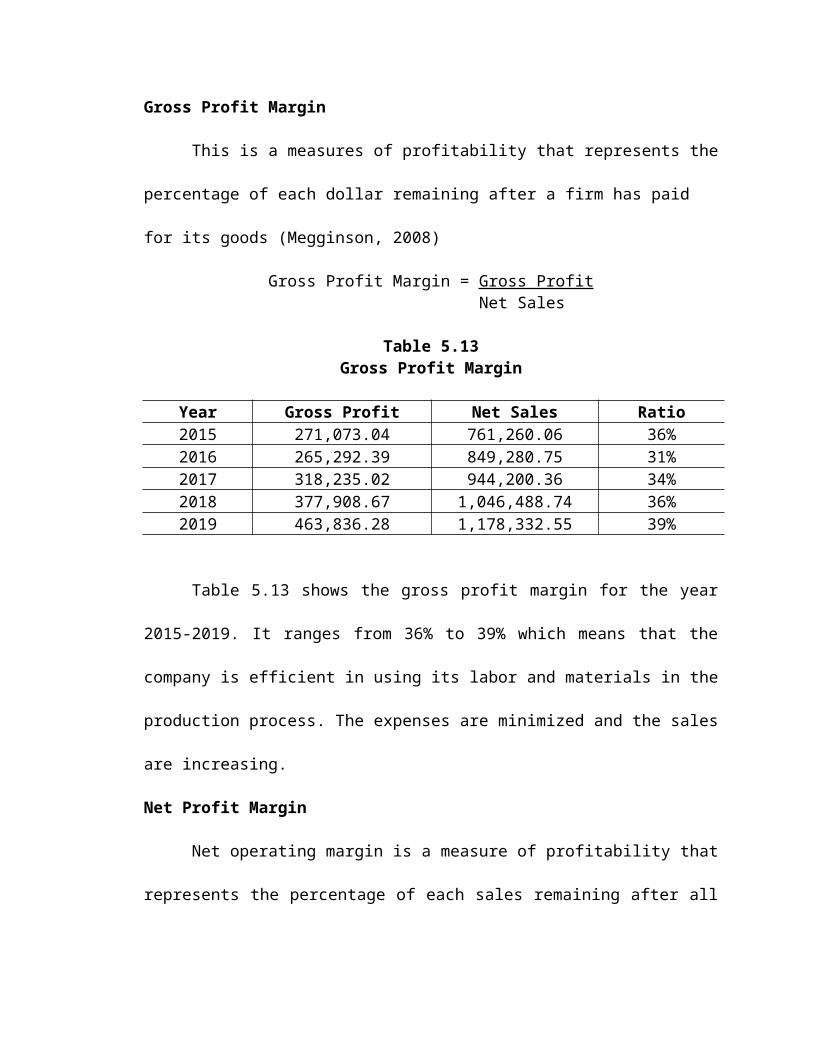
Gross Profit Margin
This is a measures of profitability that represents the
percentage of each dollar remaining after a firm has paid
for its goods (Megginson, 2008)
Gross Profit Margin = Gross Profit Net Sales
Table 5.13Gross Profit Margin
Year Gross Profit Net Sales Ratio2015 271,073.04 761,260.06 36%2016 265,292.39 849,280.75 31%2017 318,235.02 944,200.36 34%2018 377,908.67 1,046,488.74 36%2019 463,836.28 1,178,332.55 39%
Table 5.13 shows the gross profit margin for the year
2015-2019. It ranges from 36% to 39% which means that the
company is efficient in using its labor and materials in the
production process. The expenses are minimized and the sales
are increasing.
Net Profit Margin
Net operating margin is a measure of profitability that
represents the percentage of each sales remaining after all
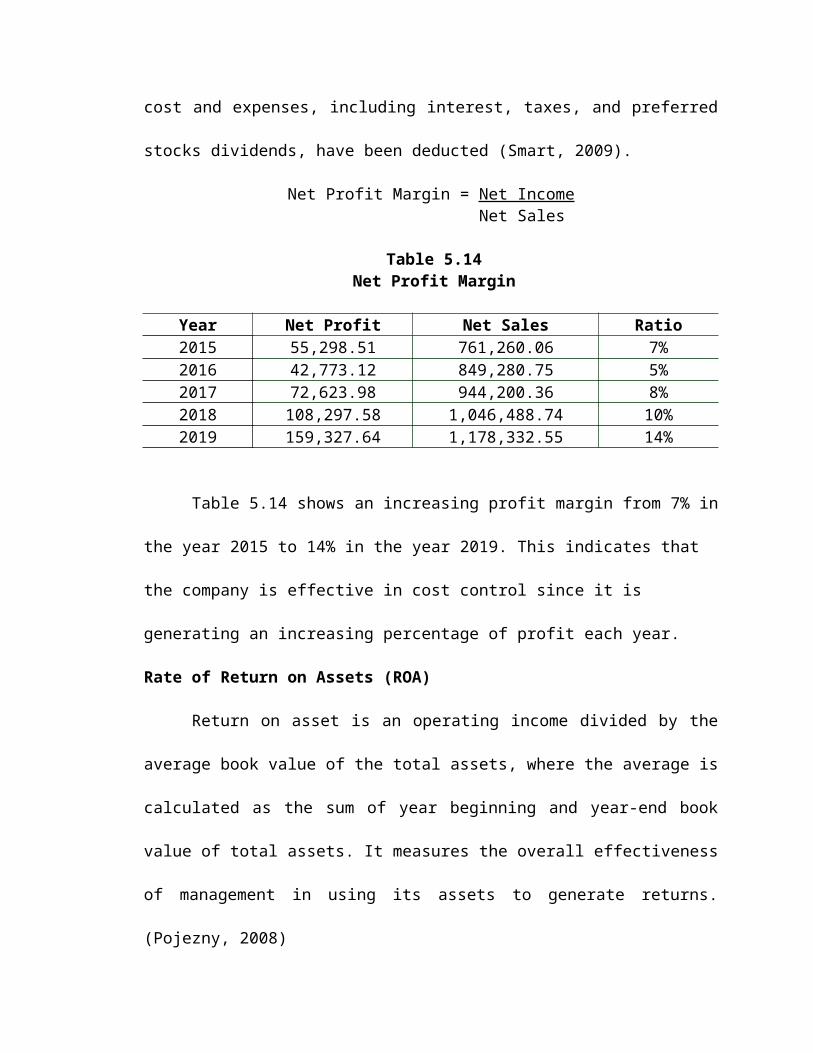
cost and expenses, including interest, taxes, and preferred
stocks dividends, have been deducted (Smart, 2009).
Net Profit Margin = Net Income Net Sales
Table 5.14Net Profit Margin
Year Net Profit Net Sales Ratio2015 55,298.51 761,260.06 7%2016 42,773.12 849,280.75 5%2017 72,623.98 944,200.36 8%2018 108,297.58 1,046,488.74 10%2019 159,327.64 1,178,332.55 14%
Table 5.14 shows an increasing profit margin from 7% in
the year 2015 to 14% in the year 2019. This indicates that
the company is effective in cost control since it is
generating an increasing percentage of profit each year.
Rate of Return on Assets (ROA)
Return on asset is an operating income divided by the
average book value of the total assets, where the average is
calculated as the sum of year beginning and year-end book
value of total assets. It measures the overall effectiveness
of management in using its assets to generate returns.
(Pojezny, 2008)
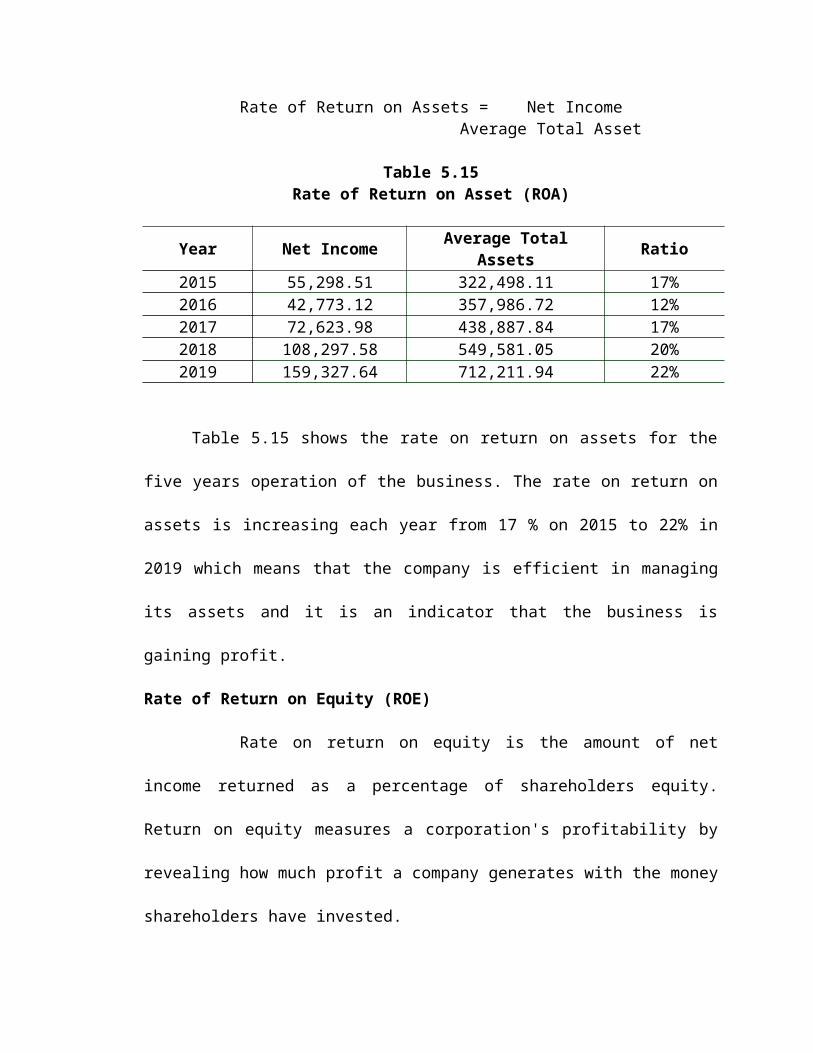
Rate of Return on Assets = Net IncomeAverage Total Asset
Table 5.15Rate of Return on Asset (ROA)
Year Net Income Average TotalAssets Ratio
2015 55,298.51 322,498.11 17%2016 42,773.12 357,986.72 12%2017 72,623.98 438,887.84 17%2018 108,297.58 549,581.05 20%2019 159,327.64 712,211.94 22%
Table 5.15 shows the rate on return on assets for the
five years operation of the business. The rate on return on
assets is increasing each year from 17 % on 2015 to 22% in
2019 which means that the company is efficient in managing
its assets and it is an indicator that the business is
gaining profit.
Rate of Return on Equity (ROE)
Rate on return on equity is the amount of net
income returned as a percentage of shareholders equity.
Return on equity measures a corporation's profitability by
revealing how much profit a company generates with the money
shareholders have invested.
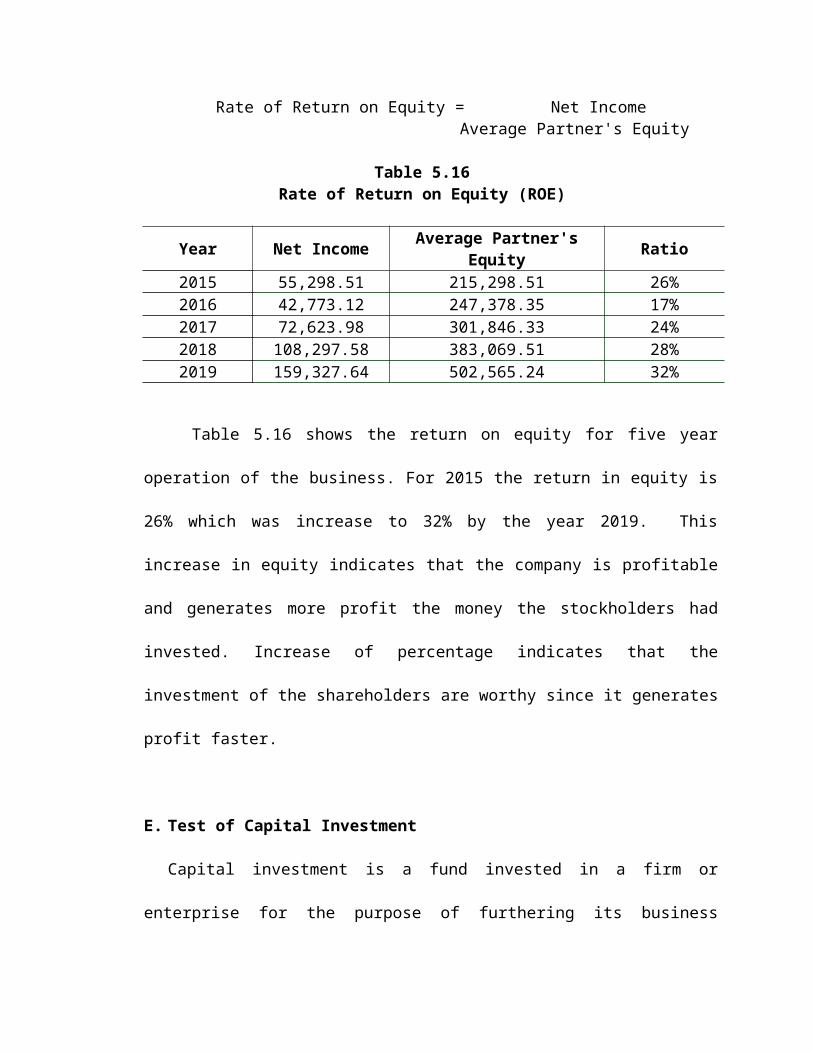
Rate of Return on Equity = Net IncomeAverage Partner's Equity
Table 5.16Rate of Return on Equity (ROE)
Year Net Income Average Partner'sEquity Ratio
2015 55,298.51 215,298.51 26%2016 42,773.12 247,378.35 17%2017 72,623.98 301,846.33 24%2018 108,297.58 383,069.51 28%2019 159,327.64 502,565.24 32%
Table 5.16 shows the return on equity for five year
operation of the business. For 2015 the return in equity is
26% which was increase to 32% by the year 2019. This
increase in equity indicates that the company is profitable
and generates more profit the money the stockholders had
invested. Increase of percentage indicates that the
investment of the shareholders are worthy since it generates
profit faster.
E. Test of Capital Investment
Capital investment is a fund invested in a firm or
enterprise for the purpose of furthering its business
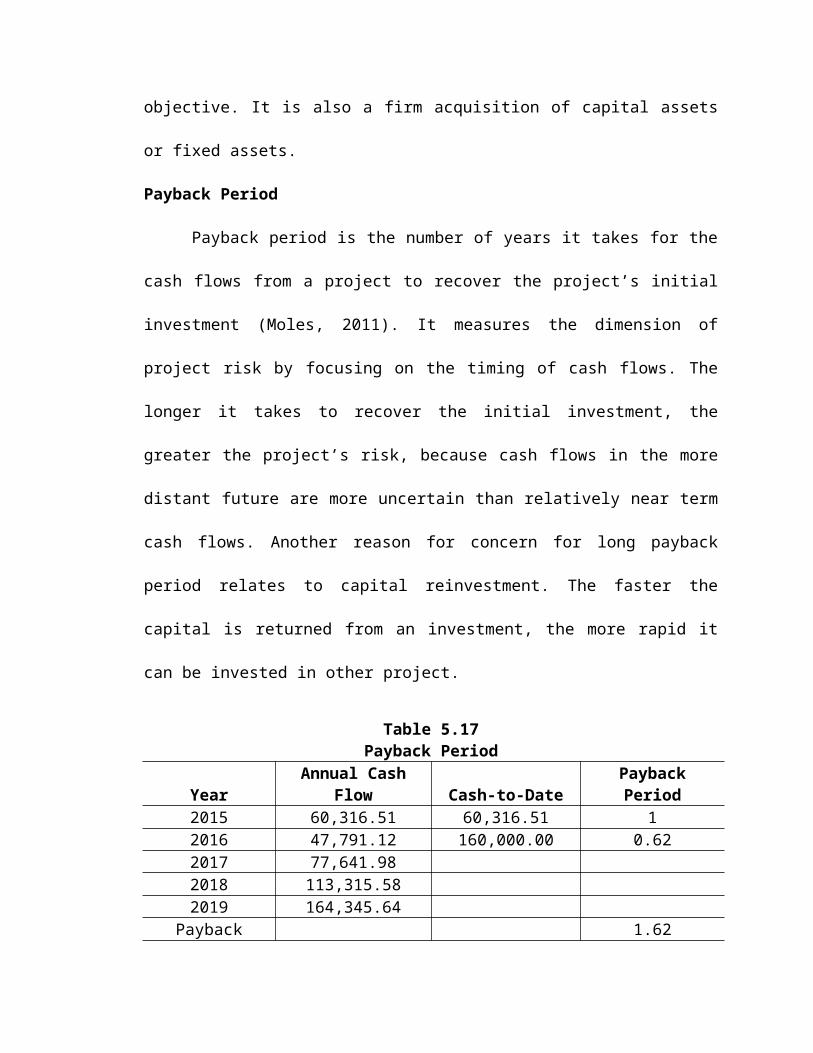
objective. It is also a firm acquisition of capital assets
or fixed assets.
Payback Period
Payback period is the number of years it takes for the
cash flows from a project to recover the project’s initial
investment (Moles, 2011). It measures the dimension of
project risk by focusing on the timing of cash flows. The
longer it takes to recover the initial investment, the
greater the project’s risk, because cash flows in the more
distant future are more uncertain than relatively near term
cash flows. Another reason for concern for long payback
period relates to capital reinvestment. The faster the
capital is returned from an investment, the more rapid it
can be invested in other project.
Table 5.17Payback Period
YearAnnual Cash
Flow Cash-to-DatePaybackPeriod
2015 60,316.51 60,316.51 12016 47,791.12 160,000.00 0.622017 77,641.982018 113,315.582019 164,345.64
Payback 1.62
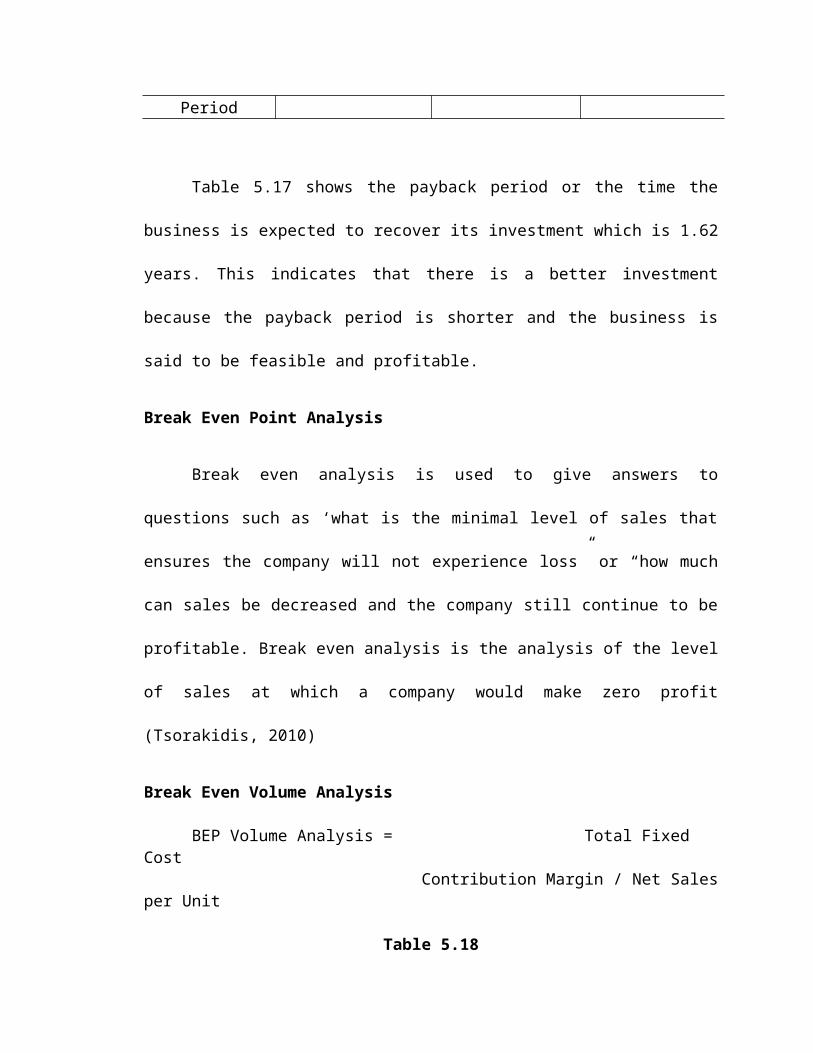
Period
Table 5.17 shows the payback period or the time the
business is expected to recover its investment which is 1.62
years. This indicates that there is a better investment
because the payback period is shorter and the business is
said to be feasible and profitable.
Break Even Point Analysis
Break even analysis is used to give answers to
questions such as ‘what is the minimal level of sales that
ensures the company will not experience loss” or “how much
can sales be decreased and the company still continue to be
profitable. Break even analysis is the analysis of the level
of sales at which a company would make zero profit
(Tsorakidis, 2010)
Break Even Volume Analysis
BEP Volume Analysis = Total Fixed Cost
Contribution Margin / Net Salesper Unit
Table 5.18
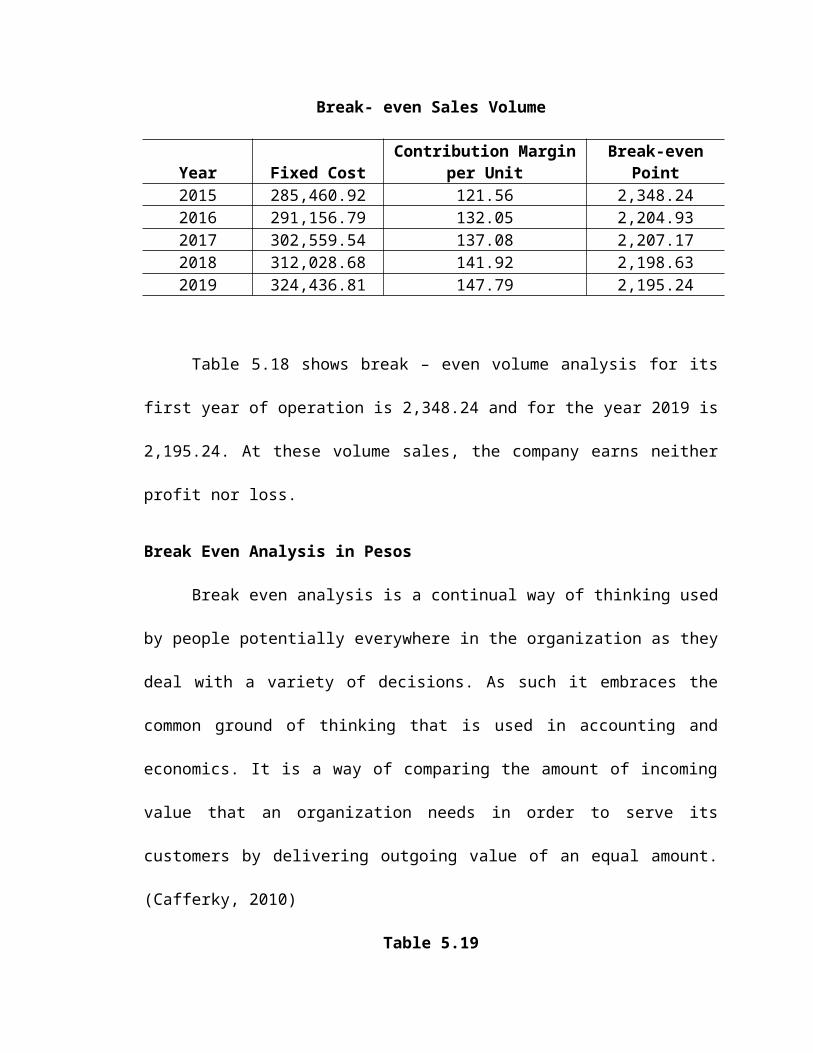
Break- even Sales Volume
Year Fixed CostContribution Margin
per UnitBreak-even
Point2015 285,460.92 121.56 2,348.242016 291,156.79 132.05 2,204.932017 302,559.54 137.08 2,207.172018 312,028.68 141.92 2,198.632019 324,436.81 147.79 2,195.24
Table 5.18 shows break – even volume analysis for its
first year of operation is 2,348.24 and for the year 2019 is
2,195.24. At these volume sales, the company earns neither
profit nor loss.
Break Even Analysis in Pesos
Break even analysis is a continual way of thinking used
by people potentially everywhere in the organization as they
deal with a variety of decisions. As such it embraces the
common ground of thinking that is used in accounting and
economics. It is a way of comparing the amount of incoming
value that an organization needs in order to serve its
customers by delivering outgoing value of an equal amount.
(Cafferky, 2010)
Table 5.19
Break-even Point Peso Sales
Year Fixed CostContribution Margin
PercentageBreak-evenPeso Sales
2015 285,460.92 53.59% 532,638.292016 291,156.79 55.44% 525,138.612017 302,559.54 54.82% 551,957.242018 312,028.68 54.05% 577,312.602019 324,436.81 53.60% 605,241.69
Table 5.19 shows the break even analysis in pesos for
the year 2015 which is 532,638.29 and 605,241.69 for the
year 2019. The table above indicates the break even profit
indicates in peso.
Break – Even Analysis Selling Price
If the product can be sold in a larger quantity that
occurs at breakeven point, then the firm will make a profit;
below point, the firm will make a loss. Break-even analysis
calculates what is known as a margin of safety, the amount
that revenues exceed the break-even point. This is the
amount that revenues can fall while still staying above the
break-even point. Breakeven analysis is used to determine
when your business will be able to cover all its expenses
and begin to make profit.
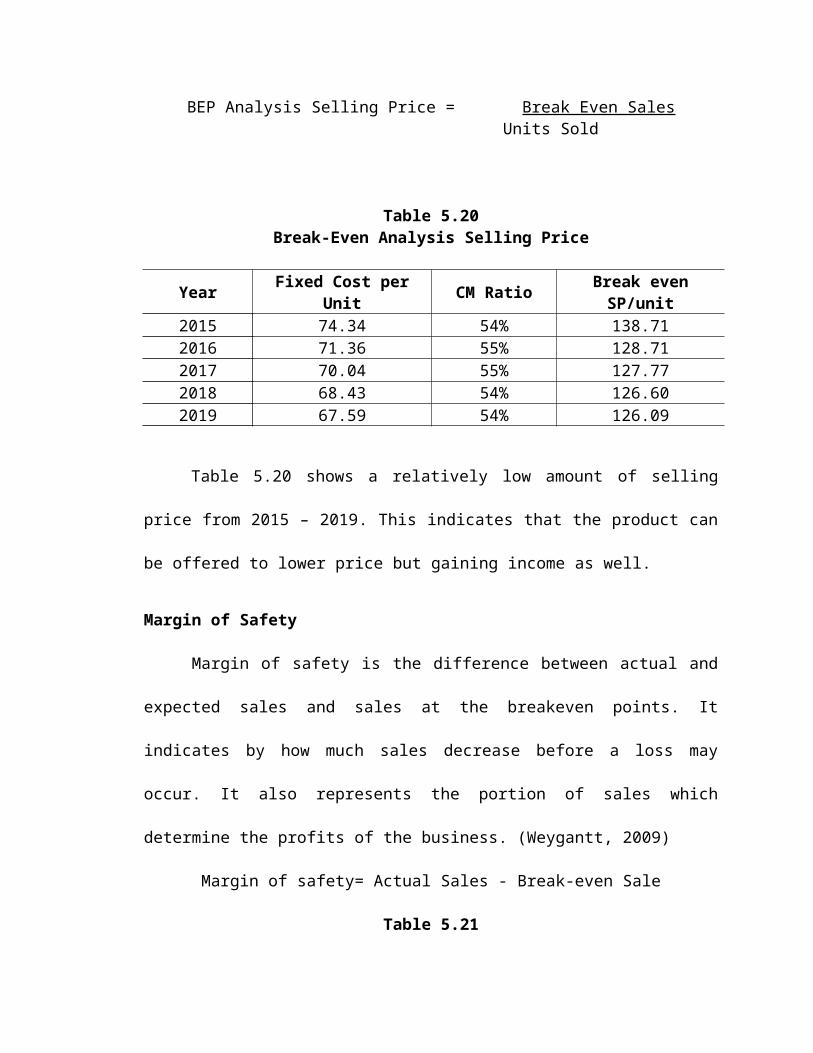
BEP Analysis Selling Price = Break Even SalesUnits Sold
Table 5.20Break-Even Analysis Selling Price
Year Fixed Cost perUnit CM Ratio Break even
SP/unit2015 74.34 54% 138.712016 71.36 55% 128.712017 70.04 55% 127.772018 68.43 54% 126.602019 67.59 54% 126.09
Table 5.20 shows a relatively low amount of selling
price from 2015 – 2019. This indicates that the product can
be offered to lower price but gaining income as well.
Margin of Safety
Margin of safety is the difference between actual and
expected sales and sales at the breakeven points. It
indicates by how much sales decrease before a loss may
occur. It also represents the portion of sales which
determine the profits of the business. (Weygantt, 2009)
Margin of safety= Actual Sales - Break-even Sale
Table 5.21
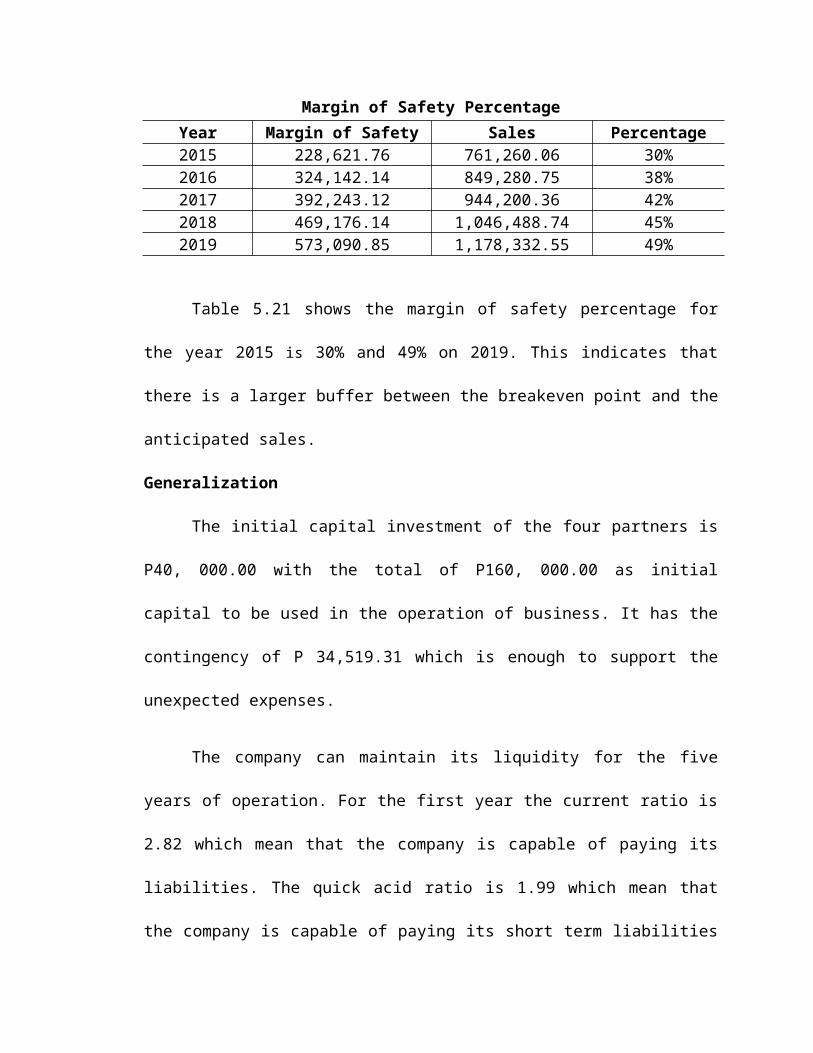
Margin of Safety PercentageYear Margin of Safety Sales Percentage2015 228,621.76 761,260.06 30%2016 324,142.14 849,280.75 38%2017 392,243.12 944,200.36 42%2018 469,176.14 1,046,488.74 45%2019 573,090.85 1,178,332.55 49%
Table 5.21 shows the margin of safety percentage for
the year 2015 is 30% and 49% on 2019. This indicates that
there is a larger buffer between the breakeven point and the
anticipated sales.
Generalization
The initial capital investment of the four partners is
P40, 000.00 with the total of P160, 000.00 as initial
capital to be used in the operation of business. It has the
contingency of P 34,519.31 which is enough to support the
unexpected expenses.
The company can maintain its liquidity for the five
years of operation. For the first year the current ratio is
2.82 which mean that the company is capable of paying its
liabilities. The quick acid ratio is 1.99 which mean that
the company is capable of paying its short term liabilities
using its most liquid assets. Working capital is Php
195,226.51 and the average collection period is 23 day to
convert the receivable into cash which is healthy on the
part of the company since they can use cash for other
projected expenses they will incur. The partnership managed
its inventory efficiently. Flow of inventory is fast so they
were able to sustain more assets than debts.
The business has a high margin of safety of 7% on its
first year which means that the business will be profitable
for the next four years of operation. The business has a
return on equity of 26% which equity indicates that the
company is profitable and generates more profit the money
the stockholders had invested. The payback period of 1.62
which is short that means the partners can recover their
investment in a shorter period of time. Also, this indicates
that there is a better investment because the payback period
is shorter and the business is said to be feasible and
profitable.
Chapter VISOCIO-ECONOMIC CONTRIBUTION
Business is the cornerstone of prosperity in society
and considered as the growth engine of the most successful
economy. The purpose of business is not only to increase
profit but also to support social development and welfare.
AIS Manufacturing is committed to providing products that
contributes in uplifting the standard of living of any
Filipinos and concern with what is beneficial to society.
Contribution to Philippine Economy
The term economy refers to all the production and
consumption decision and all activities that relate to the
use of resources in a society (O’Connor, Faile, 2008). Like
any other businesses, AIS Manufacturing contribute a lot in
reinforcing Philippine economy. It adds to the income of the
country specifically in Lipa City by means of paying taxes,
thus strengthen the city’s economic sustainability.
Moreover, the establishment of AIS Manufacturing helps in
providing employment to every Lipenos which will in turn
reduce the problem of increasing rate of unemployed in the
city. AIS Manufacturing also creates young entrepreneurs who
will enhance corporate prosperity, provide comfortable
living environment and will become pioneers for next
generation. Also, the establishment the business will help
to relive the handicraft business in the municipality.
AIS Manufacturing is maker of corn husk stuff organizer
which uses corn husk to produce a product. The good side of
business production helps the society in proper waste
disposal in the Lipa City.
Employment Generation
The establishment of AIS manufacturing generate
employability by means of providing work for every Filipino
especially Lipenos. Job growth permits improvement of the
society’s quality of life and make the city more attractive
location for businesses in the future. The proponents
proposed business gives additional employment to Lipenos and
serves as an additional attraction for future entrepreneurs
to create more jobs in Lipa City.
Social Desirability
Since the business operation of the firm is mainly
traditional because of its simple approach of handicraft
making such as weaving, measuring, varnishing and cutting,
workers health and safety is secure. The fact that the firm
uses the outer part of the corn which is the husk,
agricultural waste in the locality will be minimized. And
also the partners will maintain clean and green approach for
their waste management system. The partners also assure that
no harmful waste is created within the environment and will
observe safety first.
Suppliers
AIS Manufacturing will benefit from its supplier as
their suppliers will also benefit from them. AIS
Manufacturing will create a win-win relationship with its
suppliers. It will ensure that they will maintain a good
communication, an open communication in able to create a
sound relationship with its supplier since suppliers is
crucial in the operation of the enterprise. All documents
and transaction will be handle with utmost confidentiality
to ensure that trust will always dominates their
relationship.
Consumers
The offering of cornhusk stuff organizer in the market
adds awareness to consumers that the waste part of a corn is
worthy. Handicraft making has become a means of livelihood
that can be done at home or in the community. Consumers will
be sure that Corn husk stuff is unique because this product
is producing using the creativity and artistic hands of the
workers. Consumer suggestion for product improvement is one
of the partners concern and this suggestions are greatly
appreciated.
Environment
Waste is an inevitable by-product of our use of natural
resources. The amount and make-up of waste in any given area
depends on factors such as the local population density,
economic prosperity, time of year, type of housing and
whether there are local waste minimisation initiatives such
as home composting. Waste is everywhere. Through simple
consumption of corn husk, the business can contribute in
minimizing waste thereby making the environment safe to live
with.
AIS Manufacturing use raw materials from corn that are
very abundant in Lipa City. The firm utilizes the use of its
outer covering by making Corn Husk Stuff Organizer offer in
the market. Corn Husk Stuff Organizer is eco-friendly
products. It produces minimum waste output. Through
creativeness of partners, resourcefulness and environmental
friendliness, the firm turn corn husk into simple, yet
useful tools which market can use for whatever purpose it
may serve them.
Generalization
Every business enterprise is accountable for the
society’s social and economic development. Like any other
business, AIS Manufacturing is concerned with every part of
the community and with the things that is beneficial to
others. The proposed business contributes to Philippine
economy specifically to Lipa City’s economy by means of
paying income taxes that could help to improve
infrastructure in the municipality or can be used to other
projects for the betterment of the Lipa City. Also, through
the pursuant of this business, it could help to lessen the
unemployment rate in the aforementioned municipality. For
suppliers, the business could help them in terms of
increasing their profit since AIS will be another customer.
For customers, this establishment could offer them a new
variety of organizer. AIS Manufacturing helps the
environment eliminate agricultural waste and promote
products to market that is worthy and unique.
In general, the business will strengthen handicraft
making in Lipa City and strengthens economic growth because
of employment generation and initiate the use of local
materials in the locality. The business is also eco-friendly
because it uses fewer amounts of energy and produce less
waste output. AIS Manufacturing is open for product
innovation and advancement to comply with the consumers
changing preferences. Since the product is formulated to
suffice the preference f the customers, suggestions and
comments from customers will be highly appreciated by the

firm. After, the firm will assess and work out the pursuance
of their suggestions for the betterment of the product.


