Embed Size (px)
Citation preview
Corporate Governance Report
A n n u a l R e p o r t 2 0 1 4 95
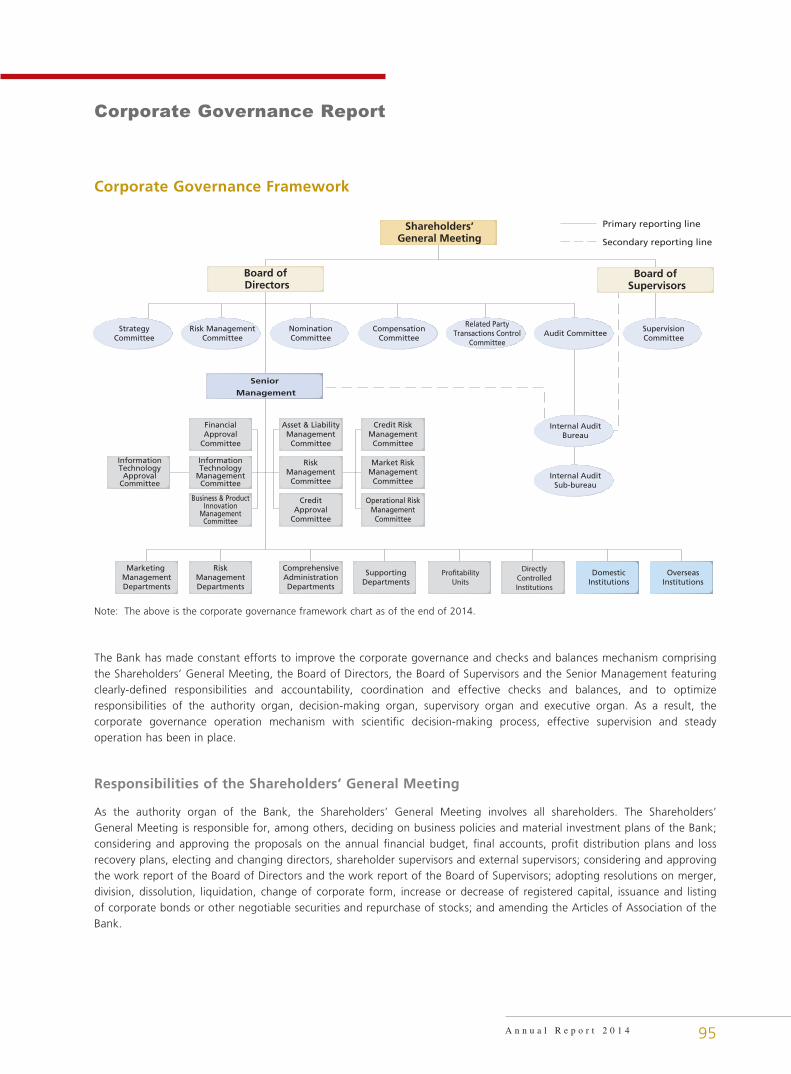
Corporate Governance Framework
Board of Supervisors
Board of Directors
Senior
Management
Asset & LiabilityManagementCommittee
RiskManagementCommittee
CreditApproval
Committee
Credit RiskManagementCommittee
Market RiskManagementCommittee
Operational RiskManagementCommittee
FinancialApproval
Committee
InformationTechnology
ManagementCommittee
InformationTechnologyApproval
Committee
Business & ProductInnovation
ManagementCommittee
ComprehensiveAdministrationDepartments
SupportingDepartments
Pro�tabilityUnits
DirectlyControlledInstitutions
DomesticInstitutions
OverseasInstitutions
Marketing ManagementDepartments
RiskManagementDepartments
NominationCommittee
Risk ManagementCommittee
StrategyCommittee
CompensationCommittee
Related PartyTransactions Control
CommitteeAudit Committee
SupervisionCommittee
Internal AuditBureau
Internal AuditSub-bureau
Shareholders’General Meeting
Primary reporting line
Secondary reporting line
Note: The above is the corporate governance framework chart as of the end of 2014.
The Bank has made constant efforts to improve the corporate governance and checks and balances mechanism comprising the Shareholders’ General Meeting, the Board of Directors, the Board of Supervisors and the Senior Management featuring clearly-defined responsibilities and accountability, coordination and effective checks and balances, and to optimize responsibilities of the authority organ, decision-making organ, supervisory organ and executive organ. As a result, the corporate governance operation mechanism with scientific decision-making process, effective supervision and steady operation has been in place.
Responsibilities of the Shareholders’ General Meeting
As the authority organ of the Bank, the Shareholders’ General Meeting involves all shareholders. The Shareholders’ General Meeting is responsible for, among others, deciding on business policies and material investment plans of the Bank; considering and approving the proposals on the annual financial budget, final accounts, profit distribution plans and loss recovery plans, electing and changing directors, shareholder supervisors and external supervisors; considering and approving the work report of the Board of Directors and the work report of the Board of Supervisors; adopting resolutions on merger, division, dissolution, liquidation, change of corporate form, increase or decrease of registered capital, issuance and listing of corporate bonds or other negotiable securities and repurchase of stocks; and amending the Articles of Association of the Bank.
Corporate Governance Report
96
Responsibilities of the Board of Directors
As the decision-making organ of the Bank, the Board of Directors of the Bank is accountable to, and shall report to, the Shareholders’ General Meeting. The Board of Directors is responsible for, among others, convening the Shareholders’ General Meeting; implementing resolutions of the Shareholders’ General Meeting; deciding on business plans, investment plans and development strategies of the Bank; formulating annual financial budgets and final accounts of the Bank; formulating profit distribution plans and loss recovery plans; formulating proposals on the increase or decrease of registered capital of the Bank; formulating fundamental management rules on risk management and internal control, and supervising the implementation of these rules; appointing or removing the President and the Board Secretary, and based on the President’s nomination, appointing or removing Senior Executive Vice Presidents and other Senior Management members (except the Board Secretary), and deciding on their remuneration, rewards and sanctions; deciding or authorizing the President to set up relevant internal institutions of the Bank; regularly evaluating and improving corporate governance of the Bank; managing information disclosure matters of the Bank; and supervising and ensuring effective performance of management responsibilities of the President and other Senior Management members.
Responsibilities of the Board of Supervisors
As the supervisory organ of the Bank, the Board of Supervisors is accountable to, and shall report to, the Shareholders’ General Meeting. The Board of Supervisors is responsible for, among others, supervising the performance and due diligence of Directors and Senior Management members; supervising the performance of duties of the Board of Directors and the Senior Management; conducting audits on retiring or resigning Directors and Senior Management members where appropriate; examining and supervising the Bank’s financial activities; examining financial information such as financial report, business report and profit distribution plan to be submitted to the Shareholders’ General Meeting by the Board of Directors; examining and supervising business decisions, risk management and internal control of the Bank, and providing guidance for the internal audit departments of the Bank; formulating performance assessment measures for supervisors, assessing the performance and conduct of supervisors, and reporting to the Shareholders’ General Meeting for approval; presenting proposals to the Shareholders’ General Meeting; proposing to convene extraordinary general meetings, and convening and presiding over such meetings in case the Board of Directors fails to perform its duty of convening Shareholders’ General Meeting; proposing to convene interim meetings of the Board of Directors.
Responsibilities of the Senior Management
As the executive organ of the Bank, the Senior Management is accountable to the Board of Directors. The Senior Management is responsible for, among others, carrying out operational management of the Bank; organizing the implementation of business plan and investment plan approved by the Board of Directors; formulating detailed regulations and rules for operational management; formulating proposals on remuneration distribution and performance assessment for heads of internal departments and branches of the Bank; reporting operating results to the Board of Directors and the Board of Supervisors; preparing the annual financial budget, final accounts, profit distribution plans and loss recovery plans, and proposals on the increase or decrease of registered capital, issuance or listing of bonds, and making recommendations to the Board of Directors.
Overview of Corporate Governance
During the reporting period, the Bank highlighted the improvement of corporate governance as a key move in responding to the challenges and opportunities under the new normal in economic development. The Bank accommodated to supervisory requirements on Global Systemically Important Banks, intensified the duty performance and effective checks and balances mechanism of the Shareholders’ General Meeting, the Board of Directors, the Board of Supervisors and the Senior Management, and enhanced the enterprise risk management of the Group and interaction between the parent bank and subsidiaries and between domestic and overseas institutions. Additionally, the Bank focused on service quality improvement, enhanced the core competitiveness, and boosted the healthy development of businesses in an all-around manner. There is neither material divergence between actual corporate governance of the Bank and applicable regulations and requirements of regulatory authorities including CSRC, nor any problem identified by regulatory authorities but remain unresolved in respect of corporate governance. During the reporting period, the Bank received various important domestic and overseas corporate awards, including the “Platinum Award for All-Round Excellence” by The Asset, the Citation for Corporate Governance Disclosure by The Hong Kong Management Association and the “Icon on Corporate Governance” by the Corporate Governance Asia.
97
Corporate Governance Report
A n n u a l R e p o r t 2 0 1 4
Construction of the Organizational Framework of Corporate Governance
During the reporting period, the Bank appointed and renewed the appointments of some Directors and changed the chairman of some special committees of the Board of Directors to ensure the Board of Directors operate in compliance with laws and regulations. The Bank also implemented the strategies of simplification, efficiency and good service and improved its organizational structure by organizing and implementing institutional restructuring of the Head Office and domestic branches. In addition, the Bank proactively explored the Group’s corporate governance, and perfected group management and control and collaboration mechanism as well as the corporate governance framework, institutional system and working mechanism of its subsidiaries.
Construction of the Corporate Governance Mechanism
The Bank put the strategic decision-making role and corporate governance leading role of the Board of Directors into good use. The Board of Directors focused on the reform of important fields and key links, constantly followed up the implementation of strategies, plans and decisions, promptly adjusted strategic priorities, and thoroughly studied various matters including objectives of transformation and development, institution and business layout, resource allocation and integration of the Group and enterprise risk management, ensuring the stable results growth of the Group. Supporting rules and regulations for performance standards of the Board of Directors were established and improved to ensure the Board of Directors fulfill its duties in accordance with relevant laws and regulations.
The Bank put the supervisory function of the Board of Supervisors into good use. The Board of Supervisors reinforced its supervision over performance standards of the Board of Directors, the Senior Management and their members in accordance with the priorities of the Bank. In order to help the Bank continue to improve corporate governance and realize healthy and sustainable growth, supervision over material risks and internal control system was enhanced. On-site inspections on compliance of financial income and expenses and use efficiency of financial resources were also scaled up.
The Bank improved its enterprise risk management system and implemented supervisory requirements on Global Systemically Important Banks. External and internal audit achievements were used to improve internal control and audit supervision. The overall risk of the Group was under control. The Bank improved the compensation management system and resource allocation mechanism of the Group, and steadily enhanced employee performance management and compensation incentive system, to boost vitality of all institutions and enthusiasm of all employees of the Bank. Besides, the Bank vigorously fulfilled its social responsibilities by enhancing social responsibilities management and communication and actively answering justified appeals of the stakeholders.
The Bank continuously increased the level of transparency. Adhering to the principle of “authenticity, accuracy, completeness, timeliness and fairness” and the orientation of meeting investors’ needs, the Bank continuously enhanced voluntary disclosure, to effectively guarantee shareholders’ right to information. The Bank strictly implemented the administrative measures for inside information and insiders to prevent inside transactions and fully protect the interests of shareholders. The Bank improved its comprehensive investor relation management system, to reconcile the market value and inherent value of the Bank.
Development of Corporate Governance Regulations
During the reporting period, the Bank amended the Articles of Association according to the regulatory requirements and the Bank’s actual circumstances. The amended Articles of Association was approved by the Second Extraordinary General Meeting of the Bank of 2014 and by CBRC. Chapter 21 “Special Provisions regarding Preference Shares” was added, including articles on management of preference shares, issuance limit of preference shares, types of shareholders, conversion and repurchase of preference shares, rights and obligations of preference shareholders, rules for voting rights of preference shares, profit distribution for preference shares and distribution of residual properties. Besides, the Bank amended the Rules on the Recommendation and Nomination of Candidates for Directors, adding relevant provisions on diversified composition of the Board of Directors.
Corporate Governance Report
98
Compliance with the Corporate Governance Code
Regarding Code Provisions A.2.7 and E.1.2 of the Corporate Governance Code (the “Code”) under Appendix 14 of the Hong Kong Listing Rules, Mr. Jiang Jianqing, Chairman of the Bank, held a meeting with the Non-executive Directors without other Executive Directors present on 22 January 2015; Mr. Jiang Jianqing, Chairman of the Bank, was absent from the Annual General Meeting for the Year 2013 held on 6 June 2014 due to important business arrangement, and thus delegated Mr. Yi Huiman, Vice Chairman and President of the Bank, to attend and chair the meeting. Save as disclosed above, during the reporting period, the Bank fully complied with the code provisions and the recommended best practices as stipulated in the Code.
Shareholders’ Rights
Proposing the convening of an extraordinary general meeting
An extraordinary general meeting should be convened within 2 months from the date when shareholders holding more than 10% of the voting shares of the Bank, either individually or jointly, request to convene in writing. Proposing shareholders shall have the right to request the board of directors in writing to convene an extraordinary general meeting of shareholders. The Board of Directors shall make a written response as to whether or not it agrees to convene such a meeting within 10 days upon receipt of the request in accordance with laws, administrative regulations, rules and the Articles of Association of the Bank. Reasonable expenses incurred from the case where shareholders convene the meeting by themselves due to the failure of the Board of Directors to convene the meeting shall be borne by the Bank, and deducted from the payment to those negligent directors.
Submitting interim proposals for the shareholders’ general meeting
Shareholders who hold more than 3% of shares of the Bank, either individually or jointly, may prepare an interim proposal and submit it in writing to the Board of Directors 10 days before the Shareholders’ General Meeting is convened. The Board of Directors shall issue a supplementary notice for the Shareholders’ General Meeting within 2 days upon receipt of the proposal and submit such proposal to the Shareholders’ General Meeting for approval.
Putting forward suggestions or inquiries
Shareholders are entitled to supervise business operation of the Bank and put forward suggestions or inquiries accordingly. Shareholders are entitled to review the information of the Bank such as the Articles of Association, the register of shareholders, share capital documents and minutes of Shareholders’ General Meetings, etc.
Rights of preference shareholders
Preference shareholders of the Bank enjoy precedence over ordinary shareholders in dividend distribution and are entitled to propose recommendations or questions on the Bank’s business activities, review the Articles of Association, the register of shareholders, receipts of company bonds, minutes of the shareholders’ general meeting, resolutions made at meetings of the Board of Directors, resolutions made at meetings of the Board of Supervisors, financial accounting reports, etc.
In the calculation of shareholding ratio in case of requesting the convening of an extraordinary general meeting, convening and chairing a shareholders’ general meeting, submitting interim proposals to a shareholders’ general meeting, etc., only ordinary shares and preference shares with restored voting rights shall be included.
Other rights
Shareholders have the right to collect dividends and other forms of benefits distributed on the basis of the number of shares held by them. Shareholders have other rights conferred by laws, administrative regulations, rules and the Articles of Association of the Bank.
99
Corporate Governance Report
A n n u a l R e p o r t 2 0 1 4
Effective Communication with Shareholders
The Bank has strictly complied with laws, regulations, regulatory requirements and fundamental regulations of corporate governance, and has taken various measures such as improving information disclosure management, strengthening investor relations management and optimizing the operations mechanism of the Shareholders’ General Meeting, with a view to safeguarding the rights of all shareholders, especially minority investors, and increasing communication and exchange among shareholders.
The Bank continued to improve the management of group information disclosure affairs by adhering to the principle of “authenticity, accuracy, completeness, timeliness and fairness” and the orientation of meeting investors’ needs. While ensuring legal and regulatory compliance of information disclosure, the Bank moderately enhanced voluntary disclosure and continued to expand the depth and breadth of information disclosure, to effectively guarantee shareholders’ right to information.
The Bank improved various communication channels for investors through organizing press conferences in relation to periodic results, domestic and overseas road shows and reverse road shows and attending famous investment forums at home and abroad and delivering keynote speeches during the reporting period. The Bank gave full play to the communication platforms including investor interactive platform of SSE, investor relations website, investor hotline and investor email of the Bank, to understand investors’ needs and provide sufficient information feedback in a timely manner.
During the reporting period, convening, holding, notices, announcements, proposals, voting and other procedures of the shareholders’ general meetings of the Bank strictly complied with the relevant provisions of the Company Law and the Articles of Association of the Bank, ensuring that shareholders could exercise their right of participation in the shareholders’ general meetings smoothly. Since it was listed, in order to treat A and H minority shareholders fairly, the Bank has held the Annual General Meeting for the Year 2013 in Beijing and Hong Kong concurrently by satellite and set up registration offices of A and H shareholders both in Beijing and Hong Kong to facilitate the voting of shareholders. The number of shareholders who participated in voting at the Annual General Meeting for the Year 2013 amounted to 2,528, further increasing compared to the previous year.
Contacts
Pursuant to relevant laws and regulations as well as the Articles of Association of the Bank, shareholders can put forward suggestions and inquiries through participating in activities including the shareholders’ general meetings, press conferences in relation to periodic results and road shows of the Bank or by means of platforms including investor interactive platform of SSE, investor relations website, investor hotline and investor email and hotline, fax and email of the shareholders’ general meetings of the Bank as well. For contact details, please refer to the section headed “Corporate Governance Report — Investor Relations”.
If a shareholder wishes to enquire about share transfer, changes in name or address, reporting loss of share certificates and dividend notes or any other information relating to his/her shares, please contact the Share Registrars of the Bank. For contact details, please refer to “Corporate Information”.
Corporate Governance Report
100
Shareholders’ General Meeting
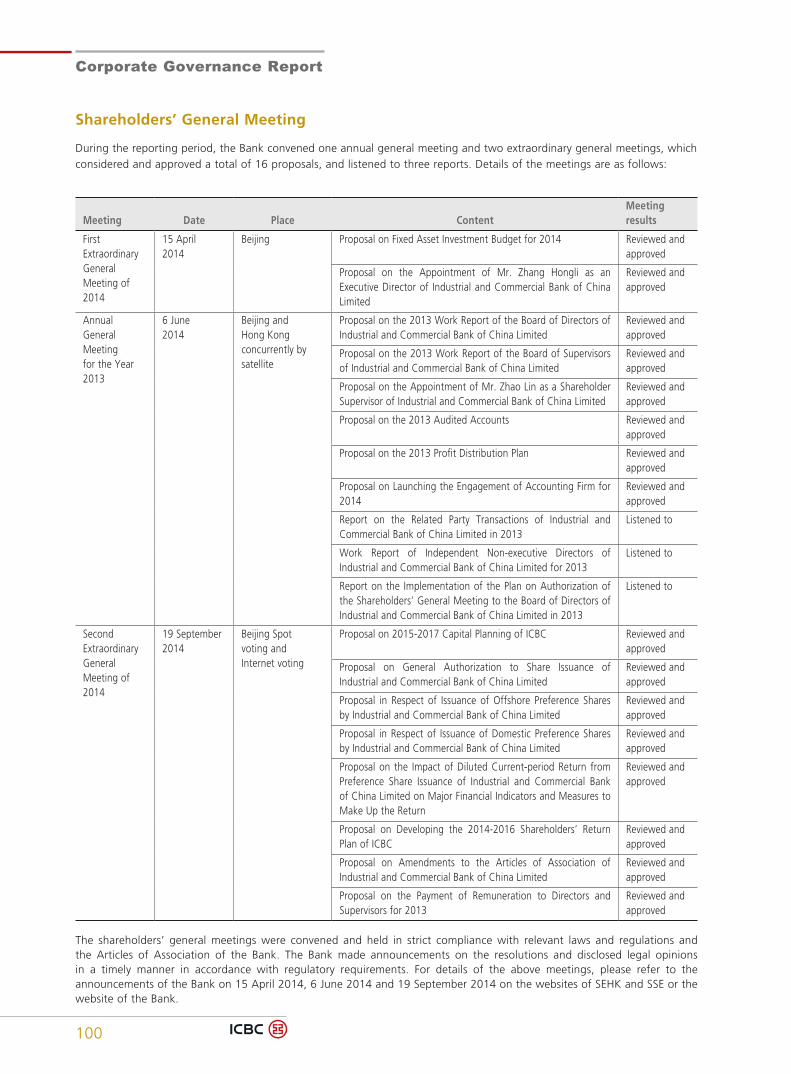
During the reporting period, the Bank convened one annual general meeting and two extraordinary general meetings, which considered and approved a total of 16 proposals, and listened to three reports. Details of the meetings are as follows:
Meeting Date Place ContentMeeting results
First Extraordinary General Meeting of 2014
15 April 2014
Beijing Proposal on Fixed Asset Investment Budget for 2014 Reviewed and approved
Proposal on the Appointment of Mr. Zhang Hongli as an Executive Director of Industrial and Commercial Bank of China Limited
Reviewed and approved
Annual General Meeting for the Year 2013
6 June 2014
Beijing and Hong Kong concurrently by satellite
Proposal on the 2013 Work Report of the Board of Directors of Industrial and Commercial Bank of China Limited
Reviewed and approved
Proposal on the 2013 Work Report of the Board of Supervisors of Industrial and Commercial Bank of China Limited
Reviewed and approved
Proposal on the Appointment of Mr. Zhao Lin as a Shareholder Supervisor of Industrial and Commercial Bank of China Limited
Reviewed and approved
Proposal on the 2013 Audited Accounts Reviewed and approved
Proposal on the 2013 Profit Distribution Plan Reviewed and approved
Proposal on Launching the Engagement of Accounting Firm for 2014
Reviewed and approved
Report on the Related Party Transactions of Industrial and Commercial Bank of China Limited in 2013
Listened to
Work Report of Independent Non-executive Directors of Industrial and Commercial Bank of China Limited for 2013
Listened to
Report on the Implementation of the Plan on Authorization of the Shareholders’ General Meeting to the Board of Directors of Industrial and Commercial Bank of China Limited in 2013
Listened to
Second Extraordinary General Meeting of 2014
19 September 2014
Beijing Spot voting and Internet voting
Proposal on 2015-2017 Capital Planning of ICBC Reviewed and approved
Proposal on General Authorization to Share Issuance of Industrial and Commercial Bank of China Limited
Reviewed and approved
Proposal in Respect of Issuance of Offshore Preference Shares by Industrial and Commercial Bank of China Limited
Reviewed and approved
Proposal in Respect of Issuance of Domestic Preference Shares by Industrial and Commercial Bank of China Limited
Reviewed and approved
Proposal on the Impact of Diluted Current-period Return from Preference Share Issuance of Industrial and Commercial Bank of China Limited on Major Financial Indicators and Measures to Make Up the Return
Reviewed and approved
Proposal on Developing the 2014-2016 Shareholders’ Return Plan of ICBC
Reviewed and approved
Proposal on Amendments to the Articles of Association of Industrial and Commercial Bank of China Limited
Reviewed and approved
Proposal on the Payment of Remuneration to Directors and Supervisors for 2013
Reviewed and approved
The shareholders’ general meetings were convened and held in strict compliance with relevant laws and regulations and the Articles of Association of the Bank. The Bank made announcements on the resolutions and disclosed legal opinions in a timely manner in accordance with regulatory requirements. For details of the above meetings, please refer to the announcements of the Bank on 15 April 2014, 6 June 2014 and 19 September 2014 on the websites of SEHK and SSE or the website of the Bank.
101
Corporate Governance Report
A n n u a l R e p o r t 2 0 1 4
Implementation of Resolutions of the Shareholders’ General Meeting by the Board of Directors
The Board of Directors of the Bank earnestly and fully implemented the resolutions adopted by the Shareholders’ General Meeting of the Bank during the reporting period.
Board of Directors and Special Committees
Composition of the Board of Directors
The Bank formulated relatively complete procedures for nominating and electing directors. With diversified backgrounds, the Directors complemented each other on one hand with regard to their expertise, professional competence and experience and expressed diversified perspectives and views, which ensured scientific decision-making of the Board of Directors. As at the disclosure date of this annual report, the Board of Directors of the Bank consisted of 14 directors, including two Executive Directors: Mr. Jiang Jianqing and Mr. Yi Huiman; six Non-executive Directors: Ms. Wang Xiaoya, Ms. Ge Rongrong, Mr. Fu Zhongjun, Mr. Zheng Fuqing, Mr. Fei Zhoulin and Mr. Cheng Fengchao; six Independent Non-executive Directors: Mr. Wong Kwong Shing, Frank, Sir Malcolm Christopher McCarthy, Mr. Kenneth Patrick Chung, Mr. Or Ching Fai, Mr. Hong Yongmiao and Mr. Yi Xiqun. Mr. Jiang Jianqing was Chairman and Mr. Yi Huiman was Vice Chairman of the Board of Directors. All Executive Directors have worked in the areas of banking and management for a long time, possess extensive professional expertise and experience in those areas and are familiar with operation and management of the Bank. Most Non-executive Directors specialize in economic management and have rich management experience and good understanding of relevant polices and theories. The Independent Non-executive Directors are prestigious experts in the areas of economy, finance and audit, respectively, and most of them once worked at international institutions and are familiar with corporate finance and management. The number of Independent Non-executive Directors of the Bank accounted for more than one-third of the total members of the Board of Directors, complying with relevant regulatory requirements.
Meetings of the Board of Directors
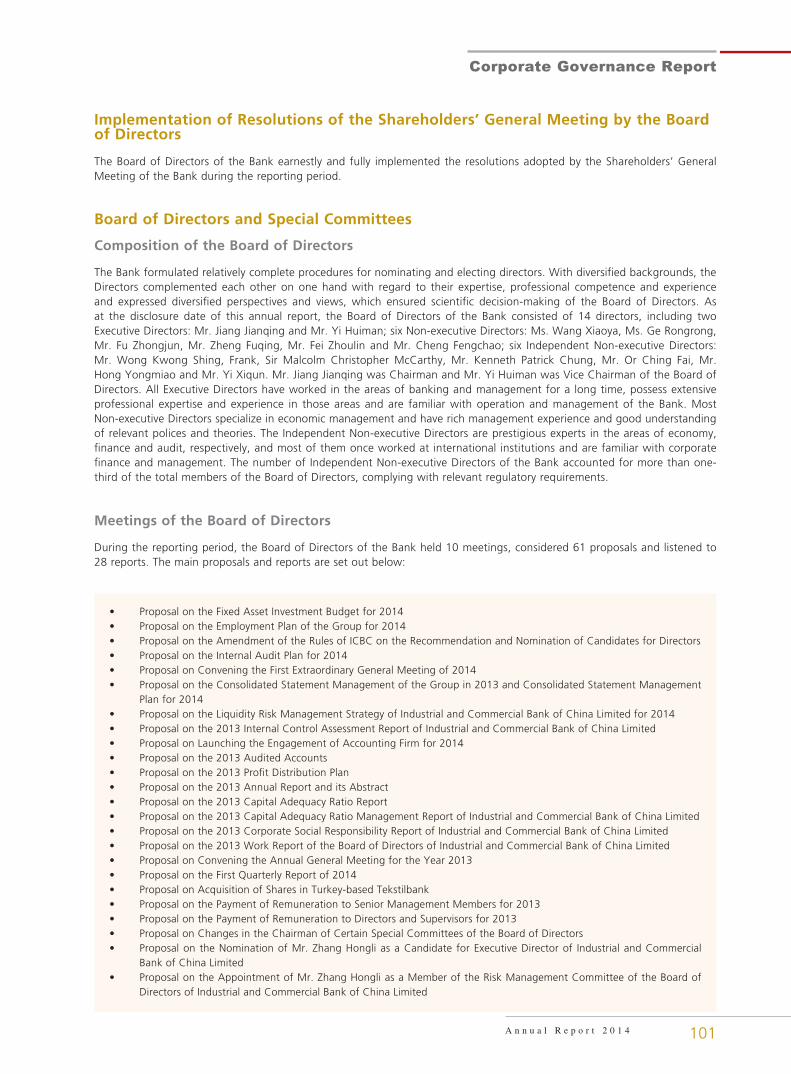
During the reporting period, the Board of Directors of the Bank held 10 meetings, considered 61 proposals and listened to 28 reports. The main proposals and reports are set out below:
• Proposal on the Fixed Asset Investment Budget for 2014• Proposal on the Employment Plan of the Group for 2014• Proposal on the Amendment of the Rules of ICBC on the Recommendation and Nomination of Candidates for Directors• Proposal on the Internal Audit Plan for 2014• Proposal on Convening the First Extraordinary General Meeting of 2014• Proposal on the Consolidated Statement Management of the Group in 2013 and Consolidated Statement Management
Plan for 2014• Proposal on the Liquidity Risk Management Strategy of Industrial and Commercial Bank of China Limited for 2014• Proposal on the 2013 Internal Control Assessment Report of Industrial and Commercial Bank of China Limited• Proposal on Launching the Engagement of Accounting Firm for 2014• Proposal on the 2013 Audited Accounts• Proposal on the 2013 Profit Distribution Plan• Proposal on the 2013 Annual Report and its Abstract• Proposal on the 2013 Capital Adequacy Ratio Report• Proposal on the 2013 Capital Adequacy Ratio Management Report of Industrial and Commercial Bank of China Limited• Proposal on the 2013 Corporate Social Responsibility Report of Industrial and Commercial Bank of China Limited• Proposal on the 2013 Work Report of the Board of Directors of Industrial and Commercial Bank of China Limited• Proposal on Convening the Annual General Meeting for the Year 2013• Proposal on the First Quarterly Report of 2014• Proposal on Acquisition of Shares in Turkey-based Tekstilbank• Proposal on the Payment of Remuneration to Senior Management Members for 2013• Proposal on the Payment of Remuneration to Directors and Supervisors for 2013• Proposal on Changes in the Chairman of Certain Special Committees of the Board of Directors• Proposal on the Nomination of Mr. Zhang Hongli as a Candidate for Executive Director of Industrial and Commercial
Bank of China Limited• Proposal on the Appointment of Mr. Zhang Hongli as a Member of the Risk Management Committee of the Board of
Directors of Industrial and Commercial Bank of China Limited
Corporate Governance Report
102
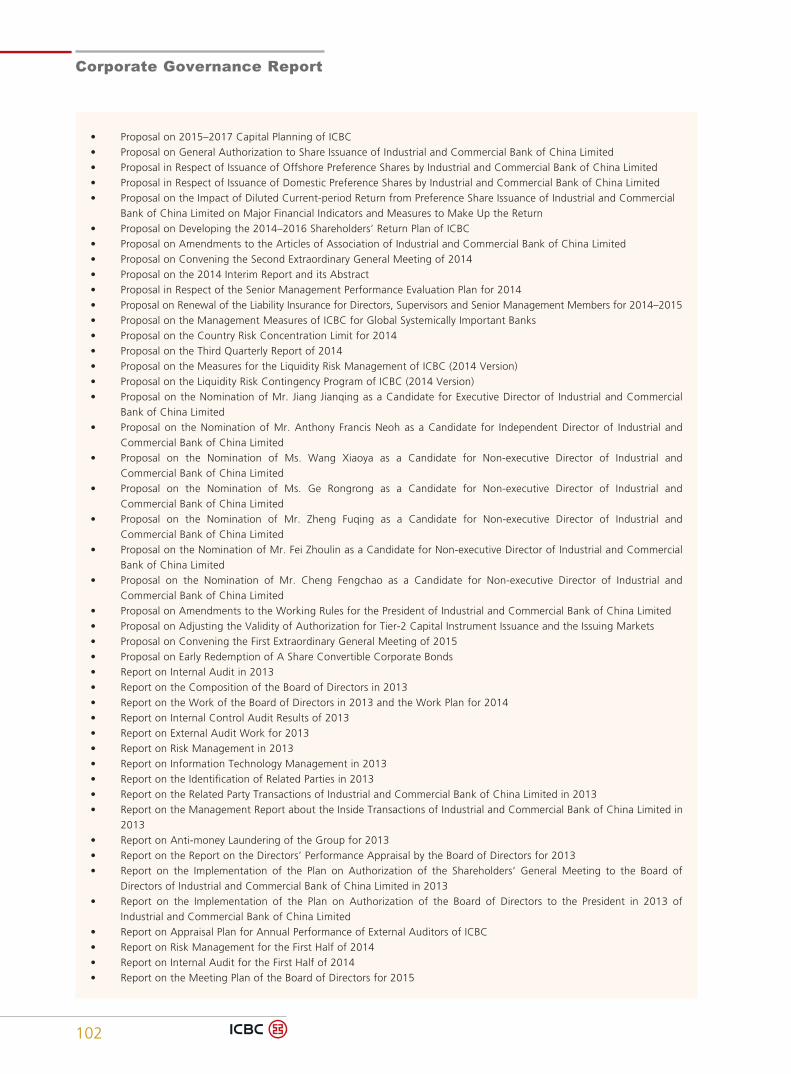
• Proposal on 2015–2017 Capital Planning of ICBC• Proposal on General Authorization to Share Issuance of Industrial and Commercial Bank of China Limited• Proposal in Respect of Issuance of Offshore Preference Shares by Industrial and Commercial Bank of China Limited• Proposal in Respect of Issuance of Domestic Preference Shares by Industrial and Commercial Bank of China Limited• Proposal on the Impact of Diluted Current-period Return from Preference Share Issuance of Industrial and Commercial
Bank of China Limited on Major Financial Indicators and Measures to Make Up the Return• Proposal on Developing the 2014–2016 Shareholders’ Return Plan of ICBC• Proposal on Amendments to the Articles of Association of Industrial and Commercial Bank of China Limited• Proposal on Convening the Second Extraordinary General Meeting of 2014• Proposal on the 2014 Interim Report and its Abstract• Proposal in Respect of the Senior Management Performance Evaluation Plan for 2014• Proposal on Renewal of the Liability Insurance for Directors, Supervisors and Senior Management Members for 2014–2015• Proposal on the Management Measures of ICBC for Global Systemically Important Banks• Proposal on the Country Risk Concentration Limit for 2014• Proposal on the Third Quarterly Report of 2014• Proposal on the Measures for the Liquidity Risk Management of ICBC (2014 Version)• Proposal on the Liquidity Risk Contingency Program of ICBC (2014 Version)• Proposal on the Nomination of Mr. Jiang Jianqing as a Candidate for Executive Director of Industrial and Commercial
Bank of China Limited• Proposal on the Nomination of Mr. Anthony Francis Neoh as a Candidate for Independent Director of Industrial and
Commercial Bank of China Limited• Proposal on the Nomination of Ms. Wang Xiaoya as a Candidate for Non-executive Director of Industrial and
Commercial Bank of China Limited• Proposal on the Nomination of Ms. Ge Rongrong as a Candidate for Non-executive Director of Industrial and
Commercial Bank of China Limited• Proposal on the Nomination of Mr. Zheng Fuqing as a Candidate for Non-executive Director of Industrial and
Commercial Bank of China Limited• Proposal on the Nomination of Mr. Fei Zhoulin as a Candidate for Non-executive Director of Industrial and Commercial
Bank of China Limited• Proposal on the Nomination of Mr. Cheng Fengchao as a Candidate for Non-executive Director of Industrial and
Commercial Bank of China Limited• Proposal on Amendments to the Working Rules for the President of Industrial and Commercial Bank of China Limited• Proposal on Adjusting the Validity of Authorization for Tier-2 Capital Instrument Issuance and the Issuing Markets• Proposal on Convening the First Extraordinary General Meeting of 2015• Proposal on Early Redemption of A Share Convertible Corporate Bonds• Report on Internal Audit in 2013• Report on the Composition of the Board of Directors in 2013• Report on the Work of the Board of Directors in 2013 and the Work Plan for 2014• Report on Internal Control Audit Results of 2013• Report on External Audit Work for 2013• Report on Risk Management in 2013• Report on Information Technology Management in 2013• Report on the Identification of Related Parties in 2013• Report on the Related Party Transactions of Industrial and Commercial Bank of China Limited in 2013• Report on the Management Report about the Inside Transactions of Industrial and Commercial Bank of China Limited in
2013• Report on Anti-money Laundering of the Group for 2013• Report on the Report on the Directors’ Performance Appraisal by the Board of Directors for 2013• Report on the Implementation of the Plan on Authorization of the Shareholders’ General Meeting to the Board of
Directors of Industrial and Commercial Bank of China Limited in 2013• Report on the Implementation of the Plan on Authorization of the Board of Directors to the President in 2013 of
Industrial and Commercial Bank of China Limited• Report on Appraisal Plan for Annual Performance of External Auditors of ICBC• Report on Risk Management for the First Half of 2014• Report on Internal Audit for the First Half of 2014• Report on the Meeting Plan of the Board of Directors for 2015
103
Corporate Governance Report
A n n u a l R e p o r t 2 0 1 4
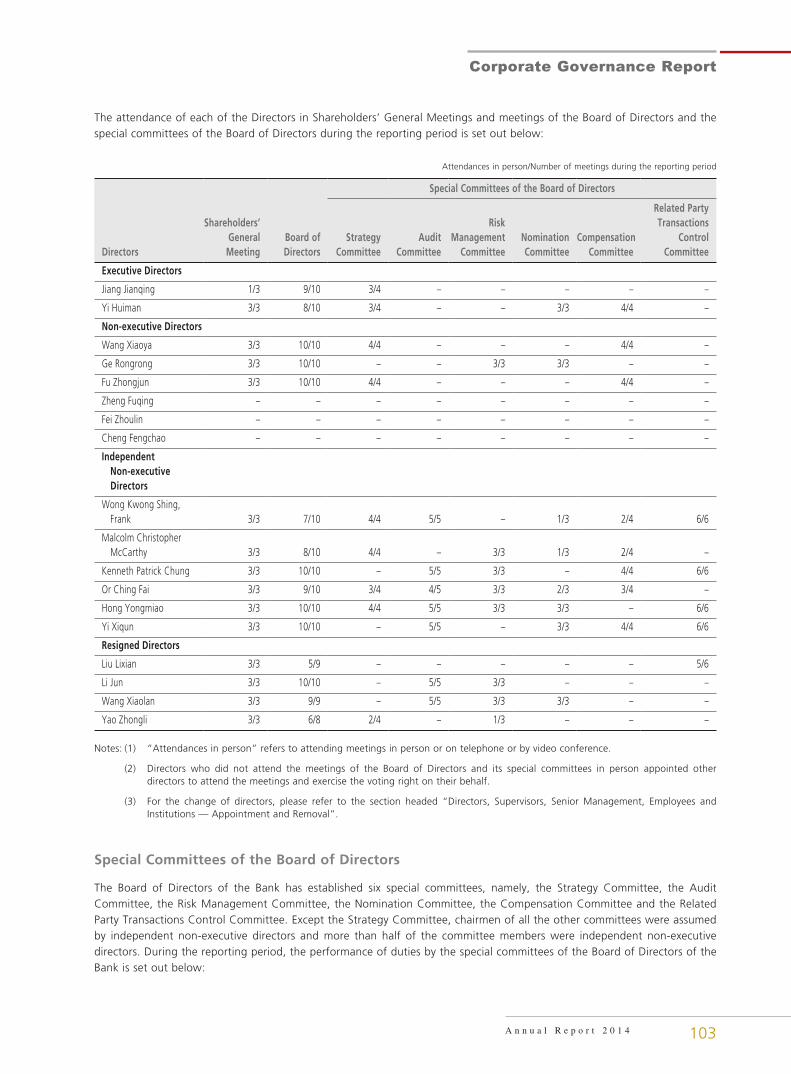
The attendance of each of the Directors in Shareholders’ General Meetings and meetings of the Board of Directors and the special committees of the Board of Directors during the reporting period is set out below:
Attendances in person/Number of meetings during the reporting period
Shareholders’ General Meeting
Board of Directors
Special Committees of the Board of Directors
DirectorsStrategy
CommitteeAudit
Committee
Risk Management
CommitteeNomination Committee
Compensation Committee
Related Party Transactions
Control Committee
Executive Directors
Jiang Jianqing 1/3 9/10 3/4 – – – – –
Yi Huiman 3/3 8/10 3/4 – – 3/3 4/4 –
Non-executive Directors
Wang Xiaoya 3/3 10/10 4/4 – – – 4/4 –
Ge Rongrong 3/3 10/10 – – 3/3 3/3 – –
Fu Zhongjun 3/3 10/10 4/4 – – – 4/4 –
Zheng Fuqing – – – – – – – –
Fei Zhoulin – – – – – – – –
Cheng Fengchao – – – – – – – –
Independent Non-executive Directors
Wong Kwong Shing, Frank 3/3 7/10 4/4 5/5 – 1/3 2/4 6/6
Malcolm Christopher McCarthy 3/3 8/10 4/4 – 3/3 1/3 2/4 –
Kenneth Patrick Chung 3/3 10/10 – 5/5 3/3 – 4/4 6/6
Or Ching Fai 3/3 9/10 3/4 4/5 3/3 2/3 3/4 –
Hong Yongmiao 3/3 10/10 4/4 5/5 3/3 3/3 – 6/6
Yi Xiqun 3/3 10/10 – 5/5 – 3/3 4/4 6/6
Resigned Directors
Liu Lixian 3/3 5/9 – – – – – 5/6
Li Jun 3/3 10/10 – 5/5 3/3 – – –
Wang Xiaolan 3/3 9/9 – 5/5 3/3 3/3 – –
Yao Zhongli 3/3 6/8 2/4 – 1/3 – – –
Notes: (1) “Attendances in person” refers to attending meetings in person or on telephone or by video conference.
(2) Directors who did not attend the meetings of the Board of Directors and its special committees in person appointed other directors to attend the meetings and exercise the voting right on their behalf.
(3) For the change of directors, please refer to the section headed “Directors, Supervisors, Senior Management, Employees and Institutions — Appointment and Removal”.
Special Committees of the Board of Directors
The Board of Directors of the Bank has established six special committees, namely, the Strategy Committee, the Audit Committee, the Risk Management Committee, the Nomination Committee, the Compensation Committee and the Related Party Transactions Control Committee. Except the Strategy Committee, chairmen of all the other committees were assumed by independent non-executive directors and more than half of the committee members were independent non-executive directors. During the reporting period, the performance of duties by the special committees of the Board of Directors of the Bank is set out below:
Corporate Governance Report
104
� Strategy Committee
The Strategy Committee is mainly responsible for considering the Bank’s strategic development plan, business and institutional development plan, major investment and financing plan and other major matters critical to the Bank’s development, making recommendations to the Board, and examining and assessing the soundness of the corporate governance framework to ensure financial reporting, risk management and internal control are compliant with corporate governance criteria of the Bank. As at the disclosure date of this annual report, the Strategy Committee of the Bank consisted of nine directors, including Executive Directors Mr. Jiang Jianqing and Mr. Yi Huiman; Independent Non-executive Directors Sir Malcolm Christopher McCarthy, Mr. Wong Kwong Shing, Frank, Mr. Or Ching Fai and Mr. Hong Yongmiao; Non-executive Directors Ms. Wang Xiaoya, Mr. Fu Zhongjun and Mr. Zheng Fuqing. Chairman of the Board of Directors Mr. Jiang Jianqing and Independent Non-executive Director Sir Malcolm Christopher McCarthy were the chairman and vice chairman of the committee, respectively.
Performance Standards of the Strategy CommitteeDuring the reporting period, the Strategy Committee of the Board of Directors held four meetings, considered 12 proposals including the Final Accounts Plan for 2013, the 2015-2017 Capital Planning and the Issuance Plan for Preference Shares. The Strategy Committee put forward comments or suggestions on matters including the strategic development planning, strategic capital allocation and major investment and financing plan of the Bank.
� Audit Committee
The Audit Committee is mainly responsible for supervising, inspecting and evaluating internal control, financial information and internal audit of the Bank and assessing mechanisms for the Bank’s staff to report misconducts in financial statements, internal control, etc. and for the Bank to make independent and fair investigations and take appropriate actions. As at the disclosure date of this annual report, the Audit Committee of the Bank consisted of seven directors, including Independent Non-executive Directors Mr. Wong Kwong Shing, Frank, Mr. Kenneth Patrick Chung, Mr. Or Ching Fai, Mr. Hong Yongmiao and Mr. Yi Xiqun; Non-executive Directors Mr. Fei Zhoulin and Mr. Cheng Fengchao. Independent Non-executive Director Mr. Wong Kwong Shing, Frank was the chairman of the committee.
Performance Standards of the Audit CommitteeDuring the reporting period, the Audit Committee held five meetings, considered eight proposals including the 2013 Annual Report, the 2013 Capital Adequacy Ratio Report, the 2013 Internal Control Assessment Report and the Internal Audit Plan for 2014, and heard 13 reports including the internal audit report and appraisal plan for performance of external auditors. The Audit Committee put forward comments or suggestions on matters including the preparation of regular reports and the arrangement of internal and external audit.
The Audit Committee reviewed financial statements of the Bank on a regular basis, and had reviewed and submitted to the Board of Directors to approve the annual report, interim report and quarterly reports of the Bank. It also organized and conducted the internal control assessment for 2013 of the Group and engaged external auditors to audit the assessment report and procedures of the Bank with respect to the relevant regulatory requirements. Additionally, it strengthened communication with external auditors, attached importance to the supervision of external auditors and heard several reports of external auditors concerning annual audit results, management proposal and audit plan.
During the preparation and audit of the 2014 financial statements, the Audit Committee set out related matters such as audit schedule and arrangement through negotiation with external auditors, followed the status of external audit and conducted supervisions over relevant works at appropriate time by means of listening to reports and holding informal discussions, and reviewed the unaudited and preliminarily audited annual financial statements respectively. The Audit Committee held a meeting on 24 March 2015, and considered that the annual financial statements truly and completely reflected the financial position of the Bank. The Audit Committee reviewed the summary of audit work performed by external auditors during the year and made an overall and objective assessment on its performance and quality of practice. It also approved the renewal of the engagement of KPMG Huazhen (Special General Partnership) and KPMG as the external auditors of the Bank for 2015 and the engagement of KPMG Huazhen (Special General Partnership) as the internal control auditors of the Bank for 2015, and presented the proposals to the Board of Directors for consideration.
105
Corporate Governance Report
A n n u a l R e p o r t 2 0 1 4
� Risk Management Committee
The Risk Management Committee is primarily responsible for reviewing and revising the strategy, policy and procedures of risk management and internal control process of the Bank, and supervising and evaluating the performance of Senior Management members and risk management department in respect of risk management. As at the disclosure date of this annual report, the Risk Management Committee of the Bank consisted of eight directors, including Independent Non-executive Directors Mr. Or Ching Fai, Sir Malcolm Christopher McCarthy, Mr. Kenneth Patrick Chung and Mr. Hong Yongmiao; Non-executive Directors Ms. Ge Rongrong, Mr. Zheng Fuqing, Mr. Fei Zhoulin and Mr. Cheng Fengchao. Independent Non-executive Director Mr. Or Ching Fai was the chairman of the committee.
Performance Standards of the Risk Management CommitteeDuring the reporting period, the Risk Management Committee held three meetings, considered seven proposals including the liquidity risk management strategy for 2014, the country risk concentration limit for 2014, the measures for the liquidity risk management and the management measures for Global Systemically Important Banks, and heard six reports including the risk management for 2013 and the first half of 2014. The Risk Management Committee put forward comments or suggestions on matters including the enterprise risk management of the Bank.
� Nomination Committee
The Nomination Committee is mainly responsible for making recommendations to the Board of Directors on candidates for directors and Senior Management members, nominating candidates for chairmen and members of special committees of the Board of Directors, and formulating the standards and procedures for selection and appointment of directors and Senior Management members as well as the training and development plans for Senior Management members and key reserved talents. The Nomination Committee is also responsible for assessing the structure, size and composition of the Board of Directors on a yearly basis and making recommendations to the Board of Directors based on the Bank’s development strategy. As at the disclosure date of this annual report, the Nomination Committee of the Bank consisted of eight directors, including Executive Director Mr. Yi Huiman; Independent Non-executive Directors Mr. Hong Yongmiao, Mr. Wong Kwong Shing, Frank, Sir Malcolm Christopher McCarthy, Mr. Or Ching Fai and Mr. Yi Xiqun; Non-executive Directors Ms. Ge Rongrong and Mr. Fei Zhoulin. Independent Non-executive Director Mr. Hong Yongmiao was the chairman of the committee.
The Articles of Association of the Bank specifies methods and procedures to nominate directors. Please refer to Article 115 of the Articles of Association of the Bank. During the reporting period, the Bank appointed and renewed the appointments of directors of the Bank in strict accordance with the Articles of Association of the Bank. The Nomination Committee reviews the qualifications of candidates for directors based on whether the candidate complies with applicable laws, administrative rules, regulations and the Articles of Association of the Bank. According to the requirement on diversified composition of the Board of Directors in the Rules for Recommendation and Nomination of Board Candidates of the Bank, the Nomination Committee shall pay attention to the complementarity in terms of expertise, professional competence and experience, cultural and educational background, gender, etc. of the candidates, to ensure the directors are well equipped, experienced and have diversified perspectives and views. In order to implement the requirement, the Nomination Committee assesses the improvement of diversified composition of the Board of Directors in addition to framework, number of directors and formation on a yearly basis, and discusses and designs measurable goals according to actual conditions. As at the disclosure date of this annual report, there were six Independent Non-executive Directors and two female Directors, accounting for three-seventh and one-seventh of the total members of the Board of Directors, respectively. The Bank attached importance on diversified sources and backgrounds of directors and continued the efforts to build a professional board, thus underpinning the effective operation and scientific decision-making of the Board of the Directors.
Performance Standards of the Nomination CommitteeDuring the reporting period, the Nomination Committee held three meetings, considered 11 proposals including the nomination of Mr. Jiang Jianqing and Mr. Zhang Hongli as candidates for Executive Directors, the nomination of Mr. Anthony Francis Neoh as a candidate for Independent Non-executive Director, the nomination of Ms. Wang Xiaoya, Ms. Ge Rongrong, Mr. Zheng Fuqing, Mr. Fei Zhoulin and Mr. Cheng Fengchao as candidates for Non-executive Directors and the amendment of the Rules of ICBC on the Recommendation and Nomination of Candidates for Directors, and heard the report in respect of the composition of the Board of Directors in 2013. The Nomination Committee put forward comments or suggestions on matters including the preparation of diversified policy for members of the Board of Directors and recommendation and nomination of candidates for directors.
Corporate Governance Report
106
� Compensation Committee
The Compensation Committee is mainly responsible for formulating assessment measures on the performance of duties for directors, organizing the assessment on the performance of duties of Directors, putting forth proposal on remuneration distribution for Directors, putting forth proposal on remuneration distribution for Supervisors based on the performance assessment on Supervisors carried out by the Board of Supervisors, formulating and reviewing the assessment measures and compensation plans for Senior Management members of the Bank and evaluating the performance and behaviors of Senior Management members. As at the disclosure date of this annual report, the Compensation Committee of the Bank consisted of eight directors, including Executive Director Mr. Yi Huiman; Independent Non-executive Directors Mr. Yi Xiqun, Mr. Wong Kwong Shing, Frank, Sir Malcolm Christopher McCarthy, Mr. Kenneth Patrick Chung and Mr. Or Ching Fai; Non-executive Directors Ms. Wang Xiaoya and Mr. Fu Zhongjun. Independent Non-executive Director Mr. Yi Xiqun was the chairman of the committee.
Performance Standards of the Compensation CommitteeDuring the reporting period, the Compensation Committee held four meetings, considered three proposals on the payment of remuneration to Directors, Supervisors and Senior Management members for 2013 and the 2014 performance evaluation plan for Senior Management members, etc., and heard two reports including the 2013 assessment report on the performance of duties of the directors by the Board of Directors. The Compensation Committee put forward comments or suggestions on matters including improvement of performance standards assessment of directors.
The Compensation Committee organized the performance assessment of directors, and put forth proposal on remuneration distribution for directors and submitted the same to the Shareholders’ General Meeting after the approval of the Board of Directors. It also formulated and reviewed the assessment measures and compensation plans for Senior Management members of the Bank and evaluated the performance and behaviors of Senior Management members, results of which were submitted to the Board of Directors or the Shareholders’ General Meeting, if falling into the responsibilities of the Shareholders’ General Meeting, for approval. According to applicable regulations including the Measures on the Assessment of Performance of Duties of Directors in Commercial Banks (Trial) issued by CBRC, the Articles of Association and the Rules on the Assessment of Performance of Duties of Directors by the Board of Directors (Trial) of the Bank, the Compensation Committee organized the performance assessment of directors by the Board of Directors for 2013.
� Related Party Transactions Control Committee
The Related Party Transactions Control Committee is mainly responsible for identifying the Bank’s related parties, reviewing major related party transactions, and receiving related party transaction statistics and reporting information of general related party transactions. As at the disclosure date of this annual report, the Related Party Transactions Control Committee of the Bank consisted of four directors, including Independent Non-executive Directors Mr. Kenneth Patrick Chung, Mr. Wong Kwong Shing, Frank, Mr. Hong Yongmiao and Mr. Yi Xiqun. Independent Non-executive Director Mr. Kenneth Patrick Chung was the chairman of the committee.
Performance Standards of the Related Party Transactions Control CommitteeDuring the reporting period, the Related Party Transactions Control Committee held six meetings, considered four proposals in respect of, among others, the identification of related parties of the Bank, and heard four reports on the related party transactions in 2013, the inside transactions management in 2013 and the identification of related parties of the Bank in 2013, etc. The Related Party Transaction Control Committee put forward comments or suggestions on matters including the improvement of management of related party transactions and inside transactions of the Bank.
107
Corporate Governance Report
A n n u a l R e p o r t 2 0 1 4
� Important Comments and Suggestions Put Forward by Special Committees of the Board of Directors
During the reporting period, the Strategy Committee put forward comments or suggestions on matters including the strategic development planning, strategic capital allocation and major investment and financing plans of the Bank. The Audit Committee put forward comments or suggestions on matters including the preparation of regular reports, the internal audit plan and the assessment of performance standards of external auditors. The Risk Management Committee put forward comments or suggestions on matters including the enterprise risk management, management measures for Global Systemically Important Banks, anti-money laundering of the Group. The Nomination Committee put forward comments or suggestions on matters including the diversified composition of directors, recommendation and nomination of directors, the adjustment of members of special committees of the Board of Directors and the assessment of composition of the Board of Directors. The Compensation Committee put forward comments or suggestions on matters including the assessment of performance standards of directors, the payment of remuneration to Directors, Supervisors and Senior Management members and the Senior Management performance evaluation plan. The Related Party Transaction Control Committee put forward comments or suggestions on matters including the identification of related parties, the improvement of related party transactions management system and the management of inside transactions.
Working Groups of Special Committees of the Board of DirectorsTo effectively play the role of special committees of the Board of Directors in offering professional support to the Board of Directors, according to the working regulations for special committees, the Bank established a mechanism of working groups of special committees. The Board of Directors’ Office led relevant departments of the Bank and set up working groups of special committees of the Board of Directors as decision-making support center, research supporting institution and regular communication bridge for special committees. Working groups provided service support work for special committees in terms of information gathering, research support, day-to-day contact, etc.
The working groups of special committees of the Board of Directors are mainly responsible for, among others, assisting on the formulation of annual work plans of the Board of Directors and special committees; preparing for regular meetings of special committees of the Board of Directors; assisting special committee members to draft their research plans and carry out related researches; assisting special committees to communicate with Senior Management and relevant departments of the Bank; and providing assistance in daily operation of special committees.
During the reporting period, the working groups of the special committees provided various services and supports to the performance of duties by special committees with the focus on transformation and development as well as reform and innovation. In particular, the working groups researched and discussed many activities to support and complement the work of the special committees, assisted in the surveys of special committees in respect of “making good use of both existing and additional monetary and financial resources and strictly controlling credit risk”, “training and management of employees”, etc., arranged special reports and seminars and provided references to directors, to further enhance the involvement of the special committees in the reform and development of the Bank and the communication and exchange between the Directors, between the Directors and the Management and between branches.
Responsibilities of Directors in Respect of Financial Statements
The Directors of the Bank acknowledged that they are responsible for the preparation of the financial statements of the Bank. During the reporting period, in strict compliance with relevant provisions, the Bank published the 2013 Annual Report, the First Quarterly Report, the Interim Report and the Third Quarterly Report of 2014 as scheduled.
Term of Directors
The Bank has strictly complied with the provisions of the places where the Bank is listed and the Articles of Association of the Bank that Directors are elected by the Shareholders’ General Meeting with a term of three years, and the appointment shall take effect from the date of approval by CBRC. Directors may be re-appointed through re-election at the Shareholders’ General Meeting after expiry of their term. The term for re-appointment is from the date of approval by the Shareholders’ General Meeting.
Corporate Governance Report
108
Investigation and Training of Directors
During the reporting period, the Bank developed the training plan for the Board of Directors, increased training resources, and encouraged and actively organized the Directors to attend trainings, with the aim of assisting the Directors in continuing to improve their comprehensive quality and ability to perform their duties. During the reporting period, the Directors of the Bank complied with Code Provision A.6.5 of the Corporate Governance Code under Appendix 14 of the Hong Kong Listing Rules and the relevant regulatory requirements in the PRC, and attended relevant trainings according to work needs. Besides, the Directors of the Bank enhanced their professional level by attending forums and seminars as well as conducting on-site investigations in some domestic and overseas peers and affiliates of the Bank. Subject matters of the trainings attended by the Directors of the Bank during the reporting period were mainly as follows:
Trainings held by the regulatory institutions:• Introduction to best corporate governance practices• Interpretation of regulatory policies• Overview of regulation over Global Systemically Important Banks• Training on qualifications of independent directors of listed companies
Special business trainings of the Bank:• Cash flow statement of commercial banks• Internet-based finance and e-commerce platforms• Introduction to RMB bonds business• Review of Chinese listed banks in 2013 and outlook• From the perspective of bank governance leadership network — Status quo of the banking sector five years after the
financial crisis• Introduction to investigation of the International Audit Committee in 2014• Introduction to deposits models of commercial banks
Introduction trainings for newly-appointed directors of the Bank:• Introduction to corporate governance of the Bank and operation of the Board of Directors• Introduction to provisions on related party transactions management• Introduction to management of inside information and insiders
Training of Board Secretary
During the reporting period, the Board Secretary of the Bank attended the specialized trainings held by the regulatory institutions and The Hong Kong Institute of Charted Secretaries, with the training hours over 15 hours, which meets relevant regulatory requirements.
Independence and Performance of Duties of Independent Non-executive Directors
The qualifications, number and proportion of the Bank’s Independent Non-executive Directors fully comply with regulatory requirements. The Bank’s Independent Non-executive Directors do not have any business or financial interests in the Bank or its subsidiaries, and they have not assumed any managerial position in the Bank. The Bank has received the annual confirmation on independence from all Independent Non-executive Directors and considered that they were independent.
During the reporting period, the Bank’s Independent Non-executive Directors earnestly attended the meetings of the Board of Directors and special committees, gave independent opinions during consideration of issues, and provided recommendations on areas such as business development and significant decision-making of the Bank. During the adjournment, Independent Non-executive Directors of the Bank conducted on-site investigations in terms of localized operation and development of overseas institutions, risk management, Internet-based finance and talent cultivation, etc. Additionally, they also exchanged opinions with the Management during special-topic discussions. During the reporting period, the Bank’s Independent Non-executive Directors put forward comments and suggestions in respect of operation and management and the implementation of the strategies of the Bank, such as improving the Group’s corporate governance, controlling asset quality, implementing capital planning and so on. The Bank paid close attention to the comments and suggestions, and organized the implementation thereof according to the actual conditions.
109
Corporate Governance Report
A n n u a l R e p o r t 2 0 1 4
During the reporting period, the Bank’s Independent Non-executive Directors did not raise any objection on proposals of the Board of Directors and special committees of the Board of Directors.
For information of performance of duties of Independent Non-executive Directors of the Bank during the reporting period, please refer to the Work Report of Independent Non-executive Directors for 2014 issued by the Bank on 26 March 2015.
Board of Supervisors and Special Committee
Composition of the Board of Supervisors
As at the end of the reporting period, the Board of Supervisors of the Bank consisted of six members, including two Shareholder Supervisors, namely Mr. Zhao Lin and Ms. Wang Chixi, two External Supervisors, namely Ms. Dong Juan and Mr. Meng Yan, and two Employee Supervisors, namely Mr. Zhang Wei and Mr. Li Mingtian.
Operation of the Board of Supervisors
The Board of Supervisors discusses official matters at the meeting of the Board of Supervisors, which includes regular meetings and special meetings. Regular meetings shall be held at least four times a year and such meetings shall, in principle, be held before the disclosure of periodical reports.
As the day-to-day administrative organ of the Board of Supervisors, the Supervisory Board Office, as entrusted by the Board of Supervisors, is responsible for supervising and scrutinizing matters such as corporate governance, financial activities, risk management and internal control of the Bank, and organizing meetings of the Board of Supervisors and its special committee, preparing meeting documents, and taking minutes of the meetings.
Supervision Committee
As the special committee of the Board of Supervisors established pursuant to the Articles of Association of the Bank, the Supervision Committee operates in accordance with the authorization of the Board of Supervisors and is accountable to the Board of Supervisors. The Supervision Committee is mainly responsible for formulating plans for the inspection and supervision of financial activities of the Bank; formulating plans for the audits on retiring or resigning Directors, President and other Senior Management members; formulating plans for the audits on business policies, risk management and internal control of the Bank when necessary; providing comments after review of the financial report of the Bank and reporting to the Board of Supervisors; reviewing the investigation report on significant events in the annual operation and financial status of the Bank submitted by the Supervisory Board Office, and reporting to the Board of Supervisors; giving opinions on the performance assessment of directors and Senior Management members, and reporting to the Board of Supervisors; giving opinions on the assessment of the development and implementation of risk management and internal control system, and reporting to the Board of Supervisors; and other functions and duties as may be authorized by the Board of Supervisors. The Supervision Committee consists of four Supervisors, including Ms. Dong Juan, Ms. Wang Chixi, Mr. Meng Yan and Mr. Zhang Wei. Ms. Dong Juan serves as the head member of the Supervision Committee. Daily operations of the Supervision Committee are conducted by the Supervisory Board Office.
For information of meetings of the Board of Supervisors and the Supervision Committee, please refer to the section headed “Report of the Board of Supervisors — Meetings of the Board of Supervisors and its Special Committee”.
Securities Transactions of Directors and Supervisors
The Bank has adopted a set of codes of conduct concerning the securities transactions by directors and supervisors which are no less stringent than the standards set out in the Model Code for Securities Transactions by Directors of Listed Issuers, Appendix 10 to the Hong Kong Listing Rules. After making enquiries with all Directors and Supervisors of the Bank, each Director and Supervisor confirmed that he/she has complied with the provisions of the aforesaid codes of conduct during the year ended 31 December 2014.
Chairman and President
Pursuant to Code Provision A.2.1 of the Corporate Governance Code (Appendix 14 to the Hong Kong Listing Rules) and the Articles of Association of the Bank, the roles of Chairman and President should be separated, and the Chairman shall not concurrently hold the position of legal representative or chief responsible officer of the controlling shareholder.
Corporate Governance Report
110
Mr. Jiang Jianqing is the Chairman and legal representative of the Bank, who is responsible for leading the Board of Directors in considering and formulating business development strategies, risk management, internal control and other significant matters of the Bank.
Mr. Yi Huiman is the President of the Bank, who is responsible for the daily management of the business operations of the Bank. The President is appointed by and accountable to the Board of Directors, and performs his responsibilities as stipulated in the Articles of Association of the Bank and as authorized by the Board of Directors.
Powers and Functions of the Senior Management
The powers of the Board of Directors and the Senior Management are separated in strict compliance with the Articles of Association and other corporate governance documents of the Bank. During the reporting period, the Bank made an inspection on the implementation of the plan on authorization of the Board of Directors to the President, and no matter was found to be beyond the approval authority of the President.
Inside Information Management
During the reporting period, the Bank actively implemented regulatory requirements and strictly implemented the registration and reporting system in respect of insiders to strengthen inside information confidentiality management and control the number of insiders, and also organized insider transaction self-inspection activities. After self examination, none of the insider of the Bank was found to be involved in dealings in shares of the Bank which has taken advantage of inside information during the reporting period.
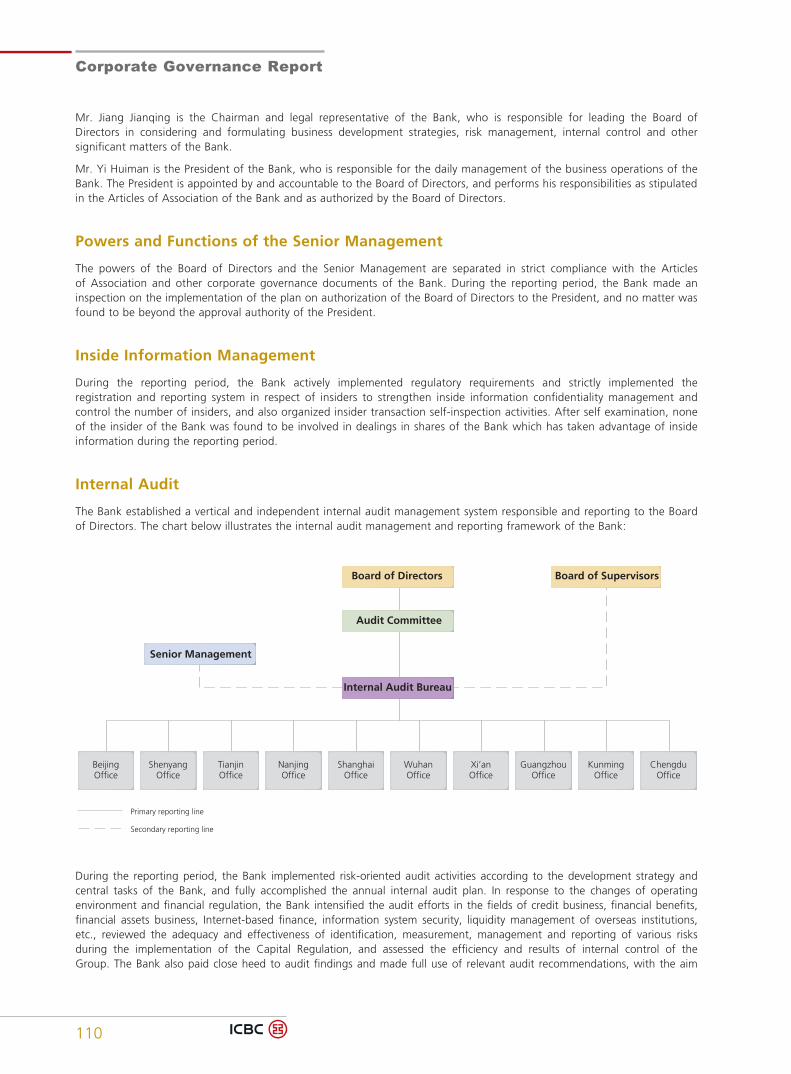
Internal Audit
The Bank established a vertical and independent internal audit management system responsible and reporting to the Board of Directors. The chart below illustrates the internal audit management and reporting framework of the Bank:
Primary reporting line
Secondary reporting line
Board of Directors Board of Supervisors
Audit Committee
Senior Management
Internal Audit Bureau
BeijingOffice
ShenyangOffice
TianjinOffice
NanjingOffice
ShanghaiOffice
WuhanOffice
Xi’anOffice
GuangzhouOffice
KunmingOffice
ChengduOffice
During the reporting period, the Bank implemented risk-oriented audit activities according to the development strategy and central tasks of the Bank, and fully accomplished the annual internal audit plan. In response to the changes of operating environment and financial regulation, the Bank intensified the audit efforts in the fields of credit business, financial benefits, financial assets business, Internet-based finance, information system security, liquidity management of overseas institutions, etc., reviewed the adequacy and effectiveness of identification, measurement, management and reporting of various risks during the implementation of the Capital Regulation, and assessed the efficiency and results of internal control of the Group. The Bank also paid close heed to audit findings and made full use of relevant audit recommendations, with the aim
111
Corporate Governance Report
A n n u a l R e p o r t 2 0 1 4
of enhancing risk management and internal control of the Bank. Moreover, in order to address efficiency and effectiveness of audits, the Bank improved audit procedures, integrated audit resources, strengthened quality management, promoted information-based audit, upgraded audit information system platforms and popularized new audit technologies. Last but not least, the Bank continued to build a professional audit team by strengthening professional training and continuous education after obtaining professional qualifications for audit personnel and improving the structure and qualifications of the audit team.
Engagement of Auditors
The Annual General Meeting for the Year 2013 of the Bank reviewed and approved the Proposal on Launching the Engagement of Accounting Firm for 2014, engaging KPMG Huazhen (Special General Partnership) to be domestic auditors of the Bank for the financial statements audit in 2014, and KPMG was international auditors of the Bank for the financial statements audit in 2014. KPMG Huazhen (Special General Partnership) was also auditors of internal control of the Bank in 2014.
KPMG Huazhen (Special General Partnership) and KPMG have been providers of audit services for the Bank for two consecutive years (2013 and 2014). Ernst & Young Hua Ming (LLP) and Ernst & Young were external auditors of the Bank in 2012.
During the reporting period, the Group paid KPMG and its member institutions a total fee of RMB161 million for the audit of financial statements (including the audit of financial statements of subsidiaries and overseas branches), of which, RMB135 million (including fee for internal control audit of RMB11.40 million) was paid by the Bank.
During the reporting period, KPMG and its member institutions provided the Group with non-audit services such as tax advisory services and professional services for the RMB-denominated bonds issuance project, and received RMB8.11 million for such professional non-audit services.
Investor Relations
Overview of Investor Relations Activities in 2014
In 2014, against the backdrop of more stringent financial regulation around the globe and the new normal in Chinese economic development and operation of banks, the Bank strived to improve the quality of investor relations services and the generation of good return to shareholders following the principle of serving investors in a proactive, detailed, efficient and interactive manner.
The Bank established a comprehensive management system for investor relations across regions and types of investors, and further enhanced the awareness to serve the investors in a more detailed manner. The Bank explored the effect of reform, predictable prospect and strategic consistency of the Bank through press conference in relation to periodic results, domestic and overseas non-transactional road shows, press conferences with large institutions, reverse road shows and daily investor communication platform. The Bank improved investor relations information collection and market information feedback transmission mechanism, strengthened dynamic monitoring of share price valuation, analyst reports and media public opinions, followed and analyzed spotlight issues of the capital market, and effectively enhanced the quality of communication with the investors. The Bank actively understood and solicited the opinions and suggestions of the capital market on the Bank, facilitated the timely reaction of the Management with the help of many operation and communication strategies, and minimized the influence of emergencies on the share price, so as to continuously strengthen the level of corporate governance and core values of the Bank.
In 2015, the Bank will further and proactively deepen the communication and exchange with investors to enhance the investors’ understanding and acceptance of the Bank and protect legitimate interests of the investors, and at the same time expect to arouse more support from, and attention of, the investors.
Investor Enquiries
If an investor wishes to enquire any questions related to operation performance of the Bank, please contact:
Telephone: 86-10-66108608
Facsimile: 86-10-66107571
E-mail: [email protected]
Address: Corporate Strategy and Investor Relations Department, Industrial and Commercial Bank of China Limited, 55 Fuxingmennei Avenue, Xicheng District, Beijing, PRC
Postal code: 100140
Internal Control
112
The Board of Directors is responsible for formulating the basic regulations for internal control and supervising the implementation of such regulations. The Audit Committee, the Risk Management Committee and the Related Party Transactions Control Committee of the Board of Directors perform the responsibilities of internal control management and review the effectiveness of internal control. The Bank has set up the Internal Audit Bureau and the Internal Audit Sub-bureau, which adopt a hierarchical management system and are responsible to and report to the Board of Directors. The Head Office and branches have internal control and compliance departments which are responsible for the bank-wide organization, promotion and coordination of internal control.
The internal control environment has been optimized continuously. The Bank revised the Articles of Association, adjusted the composition of special committees under the Board of Directors, and intensified the duty fulfillment and effective checks and balances mechanism of “the Shareholders’ General Meeting, the Board of Directors, the Board of Supervisors and the Senior Management”. The Development Plan of the Internal Control System for 2012–2014 was completed successfully.
The enterprise risk management system has been continuously improved. The Bank formulated the Administrative Measures of ICBC for Global Systemically Important Banks and proactively carried forward the implementation of advanced capital management approaches.
Control measures on business operations have been intensified. The Bank continuously ameliorated the financial resource allocation mechanism and performance assessment method. The standardized management reform of outlet operations was carried out to achieve unified monitoring and control of operational risks. Besides, the Bank optimized the global credit line approval system and strengthened the Group’s anti-money laundering management.
Information communication has been further smoothed. The Bank reinforced the information disclosure and investor relations management, enhanced its voluntary disclosure constantly and improved the communication with shareholders. It strengthened the development of the Group’s information standardization and intensified data management and application to fulfill the task of IT-based banking development in an all-round manner. Moreover, the Bank improved the petition working mechanism and put more efforts on direct investigation of important petition letters.
Supervision and inspection have been strengthened continuously. All business lines and internal control and compliance departments launched the supervision and inspection activities within the scope of their respective business and effectively fulfilled the responsibilities of the first and second defense lines of internal control. Centering on the bank-wide reform and development strategy as well as central tasks, the internal audit departments conducted effective audit and supervision activities on bank-wide major risks, important systems and key business fields, provided constructive decisions and management suggestions from a systematic and strategic perspective, and paid attention to the following up of problem rectification. They effectively fulfilled the responsibilities of the third defense line of internal control.
Internal Control Evaluation Report and Internal Control Audit
While disclosing the annual report, the Bank also disclosed the Internal Control Assessment Report of Industrial and Commercial Bank of China Limited in accordance with the requirements of MOF, CSRC and SSE. The report stated that, as at 31 December 2014 (benchmark date) the Bank had maintained effective internal control over financial reporting in all material aspects in accordance with the standard system for enterprise internal control and relevant rules as at 31 December 2014 (benchmark date). The Bank engaged KPMG Huazhen (Special General Partnership) to audit and issue standardized audit report on internal controls of the Bank.
113
Internal Control
A n n u a l R e p o r t 2 0 1 4
Internal Control Evaluation and Defects
The Board of Directors of the Bank conducted a self-assessment on the effectiveness of the Group’s internal control during the reporting period in accordance with the Basic Standard for Enterprise Internal Control and its supporting guidelines, the Guidelines for Internal Control of Listed Companies issued by SSE and relevant regulatory requirements of CBRC. No material or significant deficiencies were detected in the Bank’s internal control system during the assessment. Risks that may arise from ordinary deficiencies are controllable and corrective actions have been or are being taken, which have no material impact on the fulfillment of internal control objectives of the Bank.
There was no factor that affected the assessment conclusion of internal control effectiveness from the benchmark date to the issuance date of the internal control assessment report.
Declaration of the Board of Directors on Internal Control Responsibility
To establish, improve and effectively implement internal control and to evaluate the effectiveness of the internal control are the responsibilities of the Board of Directors of the Bank. The target for the internal control of the Bank is to reasonably assure its operation and management are in compliance with relevant laws, safety of its assets, as well as the authenticity and completeness of its financial reports and relevant information, to enhance operation efficiency and results, and to facilitate the Bank to achieve its development strategy. Due to inherent limitation of internal control, only reasonable assurance can be provided for the above target.
Establishment and Implementation of the Accountability System for Material Errors in Information Disclosure in Annual Report
During the reporting period, the Bank strictly implemented regulations and rules on annual report preparation and disclosure, and constantly reinforced the responsibility awareness of concerned parties to guarantee the quality of information disclosure in quality of annual report. During the reporting period, no correction of significant accounting errors, remediation of material omissions or modification of results preview referred in the Accountability System for Material Errors in Information Disclosure in Annual Report took place at the Bank.
Report of the Board of Directors
114
Principal Business The principal business of the Bank and its subsidiaries is the provision of banking and related financial services.
Profits and Dividends Distribution
The profit and financial status of the Bank during the reporting period are presented in the Independent Auditors’ Report and Financial Statements of the Annual Report.
Upon the approval at the Annual General Meeting for the Year 2013 held on 6 June 2014, the Bank has distributed cash dividends of RMB91,960 million, or RMB2.617 per ten shares (pre-tax), for the period from 1 January 2013 to 31 December 2013 to the ordinary shareholders whose names appeared on the share register after the close of market on 19 June 2014.
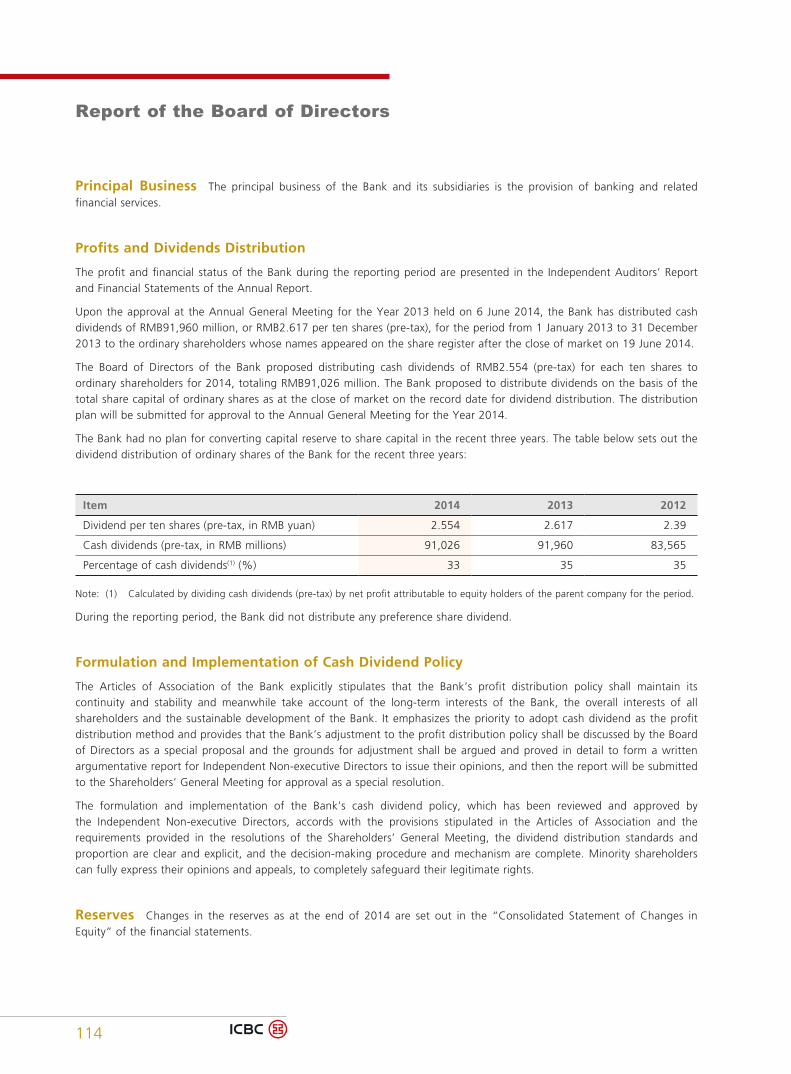
The Board of Directors of the Bank proposed distributing cash dividends of RMB2.554 (pre-tax) for each ten shares to ordinary shareholders for 2014, totaling RMB91,026 million. The Bank proposed to distribute dividends on the basis of the total share capital of ordinary shares as at the close of market on the record date for dividend distribution. The distribution plan will be submitted for approval to the Annual General Meeting for the Year 2014.
The Bank had no plan for converting capital reserve to share capital in the recent three years. The table below sets out the dividend distribution of ordinary shares of the Bank for the recent three years:
Item 2014 2013 2012
Dividend per ten shares (pre-tax, in RMB yuan) 2.554 2.617 2.39
Cash dividends (pre-tax, in RMB millions) 91,026 91,960 83,565
Percentage of cash dividends(1) (%) 33 35 35
Note: (1) Calculated by dividing cash dividends (pre-tax) by net profit attributable to equity holders of the parent company for the period.
During the reporting period, the Bank did not distribute any preference share dividend.
Formulation and Implementation of Cash Dividend Policy
The Articles of Association of the Bank explicitly stipulates that the Bank’s profit distribution policy shall maintain its continuity and stability and meanwhile take account of the long-term interests of the Bank, the overall interests of all shareholders and the sustainable development of the Bank. It emphasizes the priority to adopt cash dividend as the profit distribution method and provides that the Bank’s adjustment to the profit distribution policy shall be discussed by the Board of Directors as a special proposal and the grounds for adjustment shall be argued and proved in detail to form a written argumentative report for Independent Non-executive Directors to issue their opinions, and then the report will be submitted to the Shareholders’ General Meeting for approval as a special resolution.
The formulation and implementation of the Bank’s cash dividend policy, which has been reviewed and approved by the Independent Non-executive Directors, accords with the provisions stipulated in the Articles of Association and the requirements provided in the resolutions of the Shareholders’ General Meeting, the dividend distribution standards and proportion are clear and explicit, and the decision-making procedure and mechanism are complete. Minority shareholders can fully express their opinions and appeals, to completely safeguard their legitimate rights.
Reserves Changes in the reserves as at the end of 2014 are set out in the “Consolidated Statement of Changes in Equity” of the financial statements.
115
Report of the Board of Directors
A n n u a l R e p o r t 2 0 1 4
Distributable Reserves Details of the distributable reserves of the Bank as at 31 December 2014 are set out in “Note 42. to the Financial Statements: Reserves” of this annual report.
Financial Summary The summary of results, assets and liabilities for the five years ended 31 December 2014 is set out in the section headed “Financial Highlights” of this annual report.
Donations During the reporting period, the Group made external donations of RMB50,863.3 thousand in total.
Property and Equipment Changes in property and equipment for the year ended 31 December 2014 are set out in “Note 30. to the Financial Statements: Property and Equipment” in this annual report.
Subsidiaries Particulars of the Bank’s major subsidiaries as at 31 December 2014 are set out in the sections headed “Discussion and Analysis — Business Overview — Internationalized and Diversified Operation” and “Note 28. to the Financial Statements: Investments in Subsidiaries” in this annual report respectively.
Share Capital and Public Float Changes in the share capital of the Bank for the year ended 31 December 2014 are set out in “Note 40. to the Financial Statements: Share Capital”. As at the latest practicable date before the publication of this annual report, the Bank has maintained the minimum public float of 23.45%, based on the publicly available information and to the best knowledge of the Board of Directors of the Bank.
Purchase, Sale or Redemption of Securities For details on the redemption of ICBC Convertible Bonds, please refer to “Details of Changes in Share Capital and Shareholding of Substantial Shareholders — Particulars of A Share Convertible Bonds”. Save as disclosed above, during the reporting period, neither the Bank nor any of its subsidiaries purchased, sold or redeemed any listed securities of the Bank.
Pre-emptive Rights The Articles of Association of the Bank does not have any mandatory provision regarding pre-emptive rights. Pursuant to the Articles of Association, the Bank may increase its registered capital by issuing shares through public or non-public offering, issuing bonus shares to the existing shareholders, converting capital reserve to share capital or using other methods as allowed by applicable laws and administrative regulations or approved by relevant authorities.
Major Customers In 2014, the aggregate interest income and other operating income from top five customers of the Bank did not exceed 30% of the interest income and other operating income of the Bank during the year.
Use of Proceeds from Fundraising Activities The funds raised from the Bank’s fundraising activities were used for the purposes as disclosed in the prospectuses, namely, strengthening the capital base to support the ongoing growth of the Bank. For future planning disclosed in the public disclosure documents such as previous offering prospectuses and fund raising prospectuses issued by the Bank which has continued during the reporting period, its implementation progress conformed to the planning as described after verification and analysis. For details on the use of funds raised from the issue of preference shares of the Bank, please refer to “Details of Changes in Share Capital and Shareholding of Substantial Shareholders — Particulars of Preference Shares”.
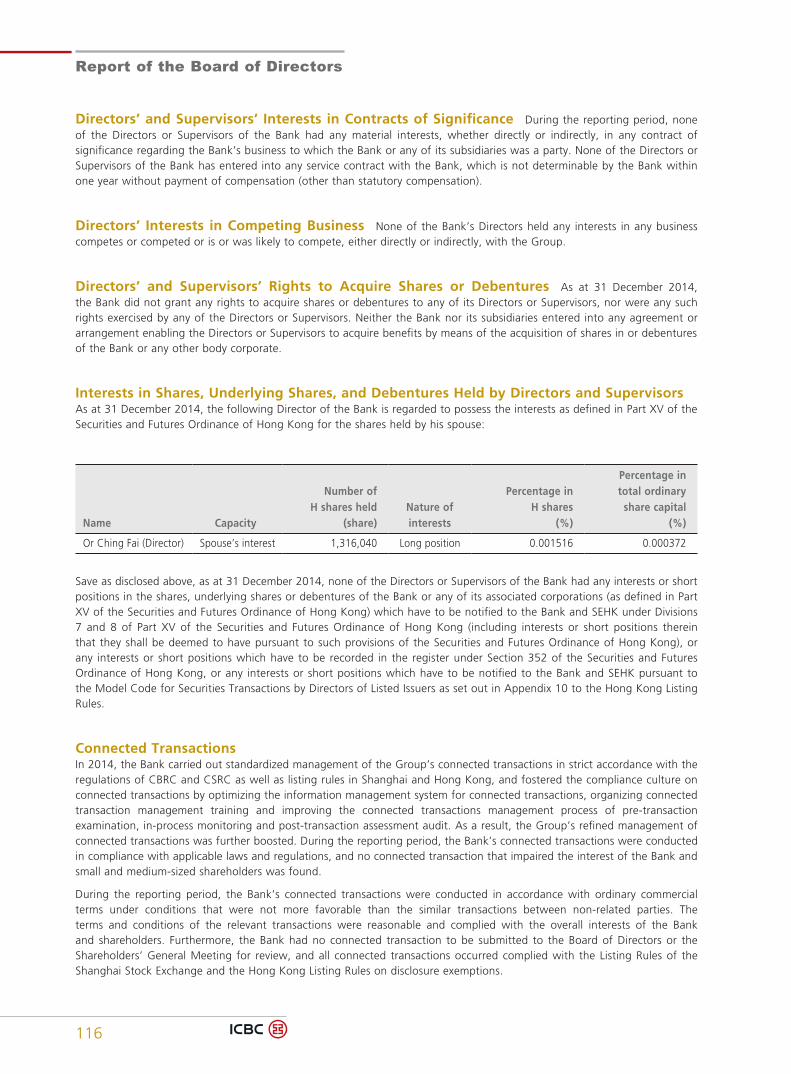
Report of the Board of Directors
116
Directors’ and Supervisors’ Interests in Contracts of Significance During the reporting period, none of the Directors or Supervisors of the Bank had any material interests, whether directly or indirectly, in any contract of significance regarding the Bank’s business to which the Bank or any of its subsidiaries was a party. None of the Directors or Supervisors of the Bank has entered into any service contract with the Bank, which is not determinable by the Bank within one year without payment of compensation (other than statutory compensation).
Directors’ Interests in Competing Business None of the Bank’s Directors held any interests in any business competes or competed or is or was likely to compete, either directly or indirectly, with the Group.
Directors’ and Supervisors’ Rights to Acquire Shares or Debentures As at 31 December 2014, the Bank did not grant any rights to acquire shares or debentures to any of its Directors or Supervisors, nor were any such rights exercised by any of the Directors or Supervisors. Neither the Bank nor its subsidiaries entered into any agreement or arrangement enabling the Directors or Supervisors to acquire benefits by means of the acquisition of shares in or debentures of the Bank or any other body corporate.
Interests in Shares, Underlying Shares, and Debentures Held by Directors and SupervisorsAs at 31 December 2014, the following Director of the Bank is regarded to possess the interests as defined in Part XV of the Securities and Futures Ordinance of Hong Kong for the shares held by his spouse:
Name Capacity
Number of H shares held
(share)Nature of interests
Percentage in H shares
(%)
Percentage in total ordinary
share capital (%)
Or Ching Fai (Director) Spouse’s interest 1,316,040 Long position 0.001516 0.000372
Save as disclosed above, as at 31 December 2014, none of the Directors or Supervisors of the Bank had any interests or short positions in the shares, underlying shares or debentures of the Bank or any of its associated corporations (as defined in Part XV of the Securities and Futures Ordinance of Hong Kong) which have to be notified to the Bank and SEHK under Divisions 7 and 8 of Part XV of the Securities and Futures Ordinance of Hong Kong (including interests or short positions therein that they shall be deemed to have pursuant to such provisions of the Securities and Futures Ordinance of Hong Kong), or any interests or short positions which have to be recorded in the register under Section 352 of the Securities and Futures Ordinance of Hong Kong, or any interests or short positions which have to be notified to the Bank and SEHK pursuant to the Model Code for Securities Transactions by Directors of Listed Issuers as set out in Appendix 10 to the Hong Kong Listing Rules.
Connected TransactionsIn 2014, the Bank carried out standardized management of the Group’s connected transactions in strict accordance with the regulations of CBRC and CSRC as well as listing rules in Shanghai and Hong Kong, and fostered the compliance culture on connected transactions by optimizing the information management system for connected transactions, organizing connected transaction management training and improving the connected transactions management process of pre-transaction examination, in-process monitoring and post-transaction assessment audit. As a result, the Group’s refined management of connected transactions was further boosted. During the reporting period, the Bank’s connected transactions were conducted in compliance with applicable laws and regulations, and no connected transaction that impaired the interest of the Bank and small and medium-sized shareholders was found.
During the reporting period, the Bank’s connected transactions were conducted in accordance with ordinary commercial terms under conditions that were not more favorable than the similar transactions between non-related parties. The terms and conditions of the relevant transactions were reasonable and complied with the overall interests of the Bank and shareholders. Furthermore, the Bank had no connected transaction to be submitted to the Board of Directors or the Shareholders’ General Meeting for review, and all connected transactions occurred complied with the Listing Rules of the Shanghai Stock Exchange and the Hong Kong Listing Rules on disclosure exemptions.
117
Report of the Board of Directors
A n n u a l R e p o r t 2 0 1 4
Please refer to “Note 52. to the Financial Statements: Related Party Disclosures” for particulars on the related party transactions defined under the laws, regulations and accounting standards of China.
Relations among Directors, Supervisors and Senior Management Directors, Supervisors and Senior Management members of the Bank do not relate to one another with respect to finance, business, family, or other material relations required to be disclosed.
Remuneration Policy for Directors, Supervisors and Senior Management The Bank has clearly documented the remuneration policy for Directors, Supervisors and Senior Management members, and has continuously improved performance assessment system and incentive restriction mechanism. From the perspectives of economic benefit, risk cost control and social responsibilities, the Bank adopted a system composed of balanced scorecard-based indicators for management and duties allocation based indicators for individuals. Payment of part of the performance-based annual remuneration of the Bank’s Chairman of the Board of Directors, President, Chairman of the Board of Supervisors, Shareholder Supervisors and other Senior Management members is deferred and shall be paid in three years, and the proportion payable each year will be one-third of the amount. The deferred payment is accrued in the Bank’s accounts, and shall be made with regard to the operating performance and status for the said years. The Bank has contributed to statutory retirement programs organized by Chinese governmental organizations at different levels for Directors, Supervisors and Senior Management members concurrently as the employees of the Bank. Upon obtaining all applicable approvals, the Bank will implement a long-term incentive program. As at 31 December 2014, the Bank had not granted any share appreciation rights to any Director, Supervisor, Senior Management member, or other core business personnel designated by the Board of Directors.
Members of the Board of DirectorsExecutive Directors: Mr. Jiang Jianqing and Mr. Yi Huiman;Non-executive Directors: Ms. Wang Xiaoya, Ms. Ge Rongrong, Mr. Fu Zhongjun, Mr. Zheng Fuqing, Mr. Fei Zhoulin and Mr. Cheng Fengchao;Independent Non-executive Directors: Mr. Wong Kwong Shing, Frank, Sir Malcolm Christopher McCarthy, Mr. Kenneth Patrick Chung, Mr. Or Ching Fai, Mr. Hong Yongmiao and Mr. Yi Xiqun.
By Order of the Board of DirectorsJiang Jianqing
Chairman
Report of the Board of Supervisors
118
Meetings of the Board of Supervisors and its Special Committee
Meetings of the Board of Supervisors
During the reporting period, the Board of Supervisors held eight meetings, reviewed and approved 20 proposals and listened to 44 reports, of which the major ones are listed as follows:
• Proposal on the 2013 Work Report of the Board of Supervisors of Industrial and Commercial Bank of China Limited• Proposal on the 2014 Annual Work Plan of the Board of Supervisors of Industrial and Commercial Bank of China Limited• Proposal on the 2013 Annual Report and its Abstract• Proposal on the 2013 Audited Accounts• Proposal on the 2013 Profit Distribution Plan• Proposal on the 2013 Internal Control Assessment Report of Industrial and Commercial Bank of China Limited• Proposal on the 2013 Corporate Social Responsibility Report of Industrial and Commercial Bank of China Limited• Proposal on the 2013 Supervision Report of the Board of Supervisors of Industrial and Commercial Bank of China Limited• Proposal on the 2013 Assessment Report on the Performance of Duties of the Board of Directors, the Senior
Management and their Members• Proposal on the 2013 Assessment Report on the Performance of Duties of the Supervisors• Proposal on the First Quarterly Report of 2014• Proposal on the 2014 Interim Report and its Abstract• Proposal on the Third Quarterly Report of 2014• Proposal on Amendments to the Articles of Association of Industrial and Commercial Bank of China Limited• Proposal on the Implementation Measures for Duty Performance of Financial Internal Control Risk Supervision by the
Board of Supervisors of Industrial and Commercial Bank of China Limited• Proposal on the Nomination of Candidates for Shareholder Supervisor of Industrial and Commercial Bank of China
Limited• Proposal on the 2014 Implementation Plan on the Performance Assessment of Duties of the Board of Directors, the
Senior Management and their Members by the Board of Supervisors• Proposal on the 2014 Implementation Plan on the Performance Assessment of Duties of the Supervisors by the Board of
Supervisors• Proposal on the Engagement of Accounting Firm for 2014• Report on Interviews with Directors and Senior Management• Report on the Supervision for the Fourth Quarter of 2013• Report on the Supervision for the First Quarter of 2014• Report on the Supervision for the Second Quarter of 2014• Report on the Supervision for the Third Quarter of 2014• Report on the Special Research• Report on the Special Inspection of Financial Income and Expenses• Report on the Special Investigation and Research concerning Idle Fixed Assets of ICBC• Report on the Special Investigation and Research concerning Inter-bank Business of ICBC• Report on the Implementation of 2013 Supervision Report and 2014 Special Research Report of the Board of
Supervisors• Report on the Audit Results of 2013 Financial Statements• Report on the Management Recommendations for 2013• Report on Internal Control Audit Results of 2013• Report on the Agreed-upon Procedures for the First Quarter of 2014• Report on Review Results of the 2014 Interim Financial Report• Report on the Agreed-upon Procedures for the Third Quarter of 2014• Report on Internal Audit for 2013 and Internal Audit Plan for 2014• Report on Internal Control and Compliance• Report on the Operating Results for the First Quarter of 2014• Report on the Operating Results for the First Half Year of 2014• Report on the Operating Results for the Third Quarter of 2014• Report on the Financial Management• Report on the Group’s Consolidated Management• Report on the Implementation of Risk Appetite• Report on the Liquidity Risk Management• Report on the Inter-bank Business Management• Report on the Disposal and Write-off of Assets• Report on the Credit Risk Management of Overseas Institutions• Report on the Risk Management of Asset Business• Report on the Specialized Financing Business Management
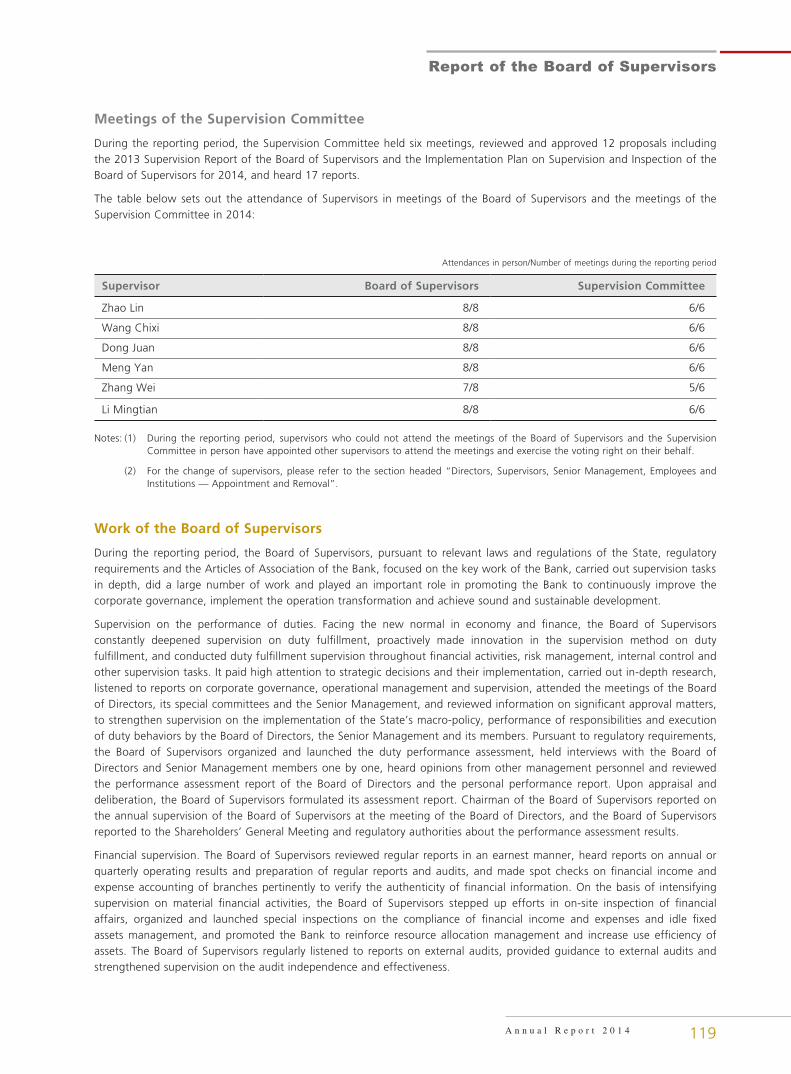
119
Report of the Board of Supervisors
A n n u a l R e p o r t 2 0 1 4
Meetings of the Supervision Committee
During the reporting period, the Supervision Committee held six meetings, reviewed and approved 12 proposals including the 2013 Supervision Report of the Board of Supervisors and the Implementation Plan on Supervision and Inspection of the Board of Supervisors for 2014, and heard 17 reports.
The table below sets out the attendance of Supervisors in meetings of the Board of Supervisors and the meetings of the Supervision Committee in 2014:
Attendances in person/Number of meetings during the reporting period
Supervisor Board of Supervisors Supervision Committee
Zhao Lin 8/8 6/6
Wang Chixi 8/8 6/6
Dong Juan 8/8 6/6
Meng Yan 8/8 6/6
Zhang Wei 7/8 5/6
Li Mingtian 8/8 6/6
Notes: (1) During the reporting period, supervisors who could not attend the meetings of the Board of Supervisors and the Supervision Committee in person have appointed other supervisors to attend the meetings and exercise the voting right on their behalf.
(2) For the change of supervisors, please refer to the section headed “Directors, Supervisors, Senior Management, Employees and Institutions — Appointment and Removal”.
Work of the Board of Supervisors
During the reporting period, the Board of Supervisors, pursuant to relevant laws and regulations of the State, regulatory requirements and the Articles of Association of the Bank, focused on the key work of the Bank, carried out supervision tasks in depth, did a large number of work and played an important role in promoting the Bank to continuously improve the corporate governance, implement the operation transformation and achieve sound and sustainable development.
Supervision on the performance of duties. Facing the new normal in economy and finance, the Board of Supervisors constantly deepened supervision on duty fulfillment, proactively made innovation in the supervision method on duty fulfillment, and conducted duty fulfillment supervision throughout financial activities, risk management, internal control and other supervision tasks. It paid high attention to strategic decisions and their implementation, carried out in-depth research, listened to reports on corporate governance, operational management and supervision, attended the meetings of the Board of Directors, its special committees and the Senior Management, and reviewed information on significant approval matters, to strengthen supervision on the implementation of the State’s macro-policy, performance of responsibilities and execution of duty behaviors by the Board of Directors, the Senior Management and its members. Pursuant to regulatory requirements, the Board of Supervisors organized and launched the duty performance assessment, held interviews with the Board of Directors and Senior Management members one by one, heard opinions from other management personnel and reviewed the performance assessment report of the Board of Directors and the personal performance report. Upon appraisal and deliberation, the Board of Supervisors formulated its assessment report. Chairman of the Board of Supervisors reported on the annual supervision of the Board of Supervisors at the meeting of the Board of Directors, and the Board of Supervisors reported to the Shareholders’ General Meeting and regulatory authorities about the performance assessment results.
Financial supervision. The Board of Supervisors reviewed regular reports in an earnest manner, heard reports on annual or quarterly operating results and preparation of regular reports and audits, and made spot checks on financial income and expense accounting of branches pertinently to verify the authenticity of financial information. On the basis of intensifying supervision on material financial activities, the Board of Supervisors stepped up efforts in on-site inspection of financial affairs, organized and launched special inspections on the compliance of financial income and expenses and idle fixed assets management, and promoted the Bank to reinforce resource allocation management and increase use efficiency of assets. The Board of Supervisors regularly listened to reports on external audits, provided guidance to external audits and strengthened supervision on the audit independence and effectiveness.
Report of the Board of Supervisors
120
Supervision on risk management. The Board of Supervisors took initiative to adapt to changes in operating position and reinforce the risk management supervision. It highlighted regional features and risk management on cross-market, cross-industry and cross-field business, kept a watchful eye on new situations and new issues arising in the process of operating transformation and structural adjustment, and intensified supervision on the material risk management. It regularly heard reports on risk management supervision, reviewed the risk management report, and specially listened to ten reports on the Group’s consolidated management, implementation of risk appetite, liquidity risk management, risk management on assets business, specialized financing business management, credit risk management of overseas institutions and so on. Furthermore, the Board of Supervisors carried out special investigations and researches on assets quality, management on small enterprise loans and personal business loans, wealth management and agency sales and financial interbank business to offer risk alerts in a timely manner.
Supervision on internal control. The Board of Supervisors, in accordance with the Basic Standard for Enterprise Internal Control and the Guidelines for Internal Control of Commercial Banks, conducted internal control supervision throughout financial activities, risk management and duty performance supervision, and mainly reinforced supervision on the soundness and effectiveness of internal control system as well as internal control status of key institutions and business areas. The Board of Supervisors carried out special investigations and researches on domestic subsidiaries and some overseas institutions, to get insights on corporate governance, risk management, internal control and legal and compliant operation. It listened to reports on internal control assessment and audit results, and reviewed the annual internal control assessment report. Besides, it strengthened supervision on swindle prevention and control, and reviewed inspection reports, to reinforce guidance on the internal audit as well as internal control and compliance.
Further strengthening the team building. During the reporting period, the Board of Supervisors reviewed and approved the Proposal on the Implementation Measures for Duty Performance of Financial Internal Control Risk Supervision by the Board of Supervisors of Industrial and Commercial Bank of China Limited to improve the rule system of the Board of Supervisors with ICBC features. It organized and carried out the annual assessment on duty performance of supervisors. The members of the Board of Supervisors fulfilled their duties with due diligence, actively attended the meetings, earnestly deliberated the proposals, conducted in-depth surveys and studies and regularly participated in trainings to step up communication with peers and enhance performance capability constantly. During the reporting period, all external supervisors worked for the Bank exceeding 15 working days.
Independent Opinions of the Board of Supervisors on Relevant Issues
Compliant Operation During the reporting period, the Bank continued to operate in compliance with applicable laws and regulations and improve its internal control system, and the decision-making procedures complied with applicable laws and regulations and the Articles of Association of the Bank. Members of the Board of Directors and the Senior Management earnestly performed their duties. The Board of Supervisors did not find any violation of laws and regulations, or any act that contravened the interests of the Bank in the performance of duties during the reporting period.
Preparation of Annual Report Preparation and review procedures of this annual report were in compliance with laws, administrative regulations and regulatory rules. Contents of this report reflected the actual conditions of the Bank truly, accurately and completely.
Use of Proceeds from Fundraising Activities During the reporting period, the use of proceeds from the Bank’s fundraising activities was consistent with the purpose stated in the prospectuses.
Purchase and Sale of Assets During the reporting period, the Board of Supervisors did not find any insider trading or any act that contravened the shareholders’ interests or caused the loss of the Bank’s assets in the process of the Bank’s purchase or sale of assets.
Connected Transactions During the reporting period, the connected transactions of the Bank were conducted on normal commercial terms. The Board of Supervisors did not find any act that infringed upon the interests of the Bank. The approval, voting, disclosure and implementation of connected transactions complied with applicable laws and regulations and the Articles of Association of the Bank.
Implementation of Resolutions Passed at the Shareholders’ General Meeting During the reporting period, the Board of Supervisors had no objection to the reports or proposals presented by the Board of Directors to the Shareholders’ General Meeting for consideration. The Board of Directors earnestly implemented the resolutions approved at the Shareholders’ General Meeting.
Internal Control Assessment Report of the Board of Directors The Board of Supervisors reviewed the 2014 Internal Control Assessment Report of the Board of Directors and had no objection to the report.
Implementation of Information Disclosure Management Rules During the reporting period, the Bank performed its duty of information disclosure in strict compliance with the regulatory policies, implemented the information disclosure management rules in earnest, and disclosed information in a timely and fair manner. Information disclosed during the reporting period was authentic, accurate and complete.
Save as disclosed above, the Board of Supervisors had no objection to other supervision matters during the reporting period.
Significant Events
A n n u a l R e p o r t 2 0 1 4 121
Material Legal Proceedings and Arbitration The Bank was involved in several legal proceedings in the ordinary course of business. Most of these legal proceedings were initiated by the Bank for recovering non-performing loans. In addition, some legal proceedings arose from customer disputes. As at 31 December 2014, the amount of pending proceedings which the Bank and/or its subsidiaries acted as defendants totaled RMB3,001 million. The Bank does not expect any material adverse effect from the abovementioned pending legal proceedings on the Bank’s business, financial position or operating results.
Common Queries from the Media During the year, the Bank did not have any common queries from the media.
Material Assets Acquisition, Sale and Merger
Acquisition of 20% Shares in Bank SinoPac On 2 April 2013, the Bank, SinoPac Financial Holdings Co., Ltd. (“SinoPac Holdings”) and Bank SinoPac Co., Ltd. (“Bank SinoPac”) entered into an agreement, pursuant to which the Bank shall subscribe 20% shares of SinoPac Holdings or Bank SinoPac. On 27 February 2014, the Bank, SinoPac Holdings and Bank SinoPac entered into an supplemental agreement on the extension of the transaction waiting period. The transaction will be carried out after the limit of shareholding percentage of a commercial bank from Mainland China is relaxed to 20% by the Taiwan’s financial regulator. At that time, the Bank will subscribe for shares of Bank SinoPac. The final completion of the abovementioned transaction is subject to approvals of relevant regulatory authorities.
Acquisition of 60% Shares in Standard Bank PLC On 29 January 2014, the Bank entered into a share purchase agreement to acquire 60% of the existing issued shares in Standard Bank PLC (“Target Bank”) from Standard Bank London Holdings Limited (“SBLH”). In addition, the Bank also has a five-year option to acquire additional 20% of the existing issued shares of Target Bank exercisable from the second anniversary of the date that the transaction is completed (the “Call Option”). SBLH will have a put option, exercisable six months following the date on which the Bank’s Call Option is exercised, to require the Bank to purchase all shares of the Target Bank that are held by SBLH and its related parties. This transaction was completed on 1 February 2015 (Beijing time) after obtaining approval from domestic and overseas regulatory authorities and complying with relevant preconditions for completion.
Acquisition of 75.5% Shares of Tekstilbank On 29 April 2014, the Bank entered into a share purchase agreement to acquire 75.5% of the existing issued shares in Tekstilbank from GSD Holding A.Ş. of Turkey. According to the capital markets law of Turkey, this transaction will trigger the provision that a mandatory tender offer shall be issued to purchase all the remaining shares of Tekstilbank that are traded on the Istanbul Stock Exchange. The Board of Directors of the Bank has authorized the Bank to issue a mandatory tender offer for the remaining shares at a proper time. The final completion of the abovementioned transaction is subject to approval of relevant regulatory authorities.
Implementation of Share Incentive Plan The Fourth Extraordinary General Meeting of 2006 of the Bank held on 31 July 2006 approved the share appreciation rights plan. As at the end of the reporting period, the Bank did not grant any share appreciation right. Please refer to “Note 47. to the Financial Statements: Share Appreciation Rights Plan” for details.
Material Related Party Transactions During the reporting period, the Bank had not entered into any material related party transactions. Please refer to “Note 52. to the Financial Statements: Related Party Disclosures” for particulars on the related party transactions defined under the laws, regulations and accounting standards of China.
Significant Events
122
Material Contracts and Performance of Obligations thereunder
Material Trust, Sub-contract and Lease During the reporting period, the Bank had not held on trust to a material extent or entered into any material subcontract or lease arrangement in respect of assets of other corporations, which were subject to disclosure, and no other corporation had held on trust to a material extent or entered into any material sub-contract or lease arrangement in respect of the Bank’s material assets, which were subject to disclosure.
Material Guarantees The provision of guarantees is in the ordinary course of business of the Bank. During the reporting period, the Bank did not have any material guarantee that needed to be disclosed except for the financial guarantee services within the business scope as approved by PBC and CBRC.
Independent Non-executive Directors’ Special Explanation and Independent Opinions on External Guarantees of the Bank
In accordance with the Circular Concerning Several Issues on Regulating Fund Transfers between Listed Companies and Their Related Parties and External Guarantee of Listed Companies (Zheng Jian Fa [2003] No. 56) issued by CSRC and relevant provisions of SSE, we, in the capacity of Independent Non-executive Directors of the Bank, reviewed external guarantees of the Bank on the principles of fairness, impartiality and objectivity, and hereby give our specific explanation and opinions as follows: upon review, external guarantees provided by the Bank mainly focus on issuance of letters of guarantee, which is part of the ordinary banking services within the business scope of the Bank as approved by PBC and CBRC. As at 31 December 2014, the balance of letters of guarantee offered by the Bank totaled RMB307,555 million.
The Bank has attached great importance to the management of risks arising from such business, formulated strict rules on the credit ratings of the entities to which the guarantee was provided and on the operation process and review procedures of provision of guarantee services, and carried out relevant business on such basis.
Independent Non-executive Directors of Industrial and Commercial Bank of China Limited
Wong Kwong Shing, Frank, Malcolm Christopher McCarthy,
Kenneth Patrick Chung, Or Ching Fai, Hong Yongmiao, Yi Xiqun
Occupation of Fund by Controlling Shareholders and Other Related Parties During the reporting period, none of the controlling shareholders or related parties of the Bank occupied any fund of the Bank. The auditors have issued the Special Explanation on the Occupation of Fund by Controlling Shareholders and Other Related Parties of Industrial and Commercial Bank of China Limited in 2014.
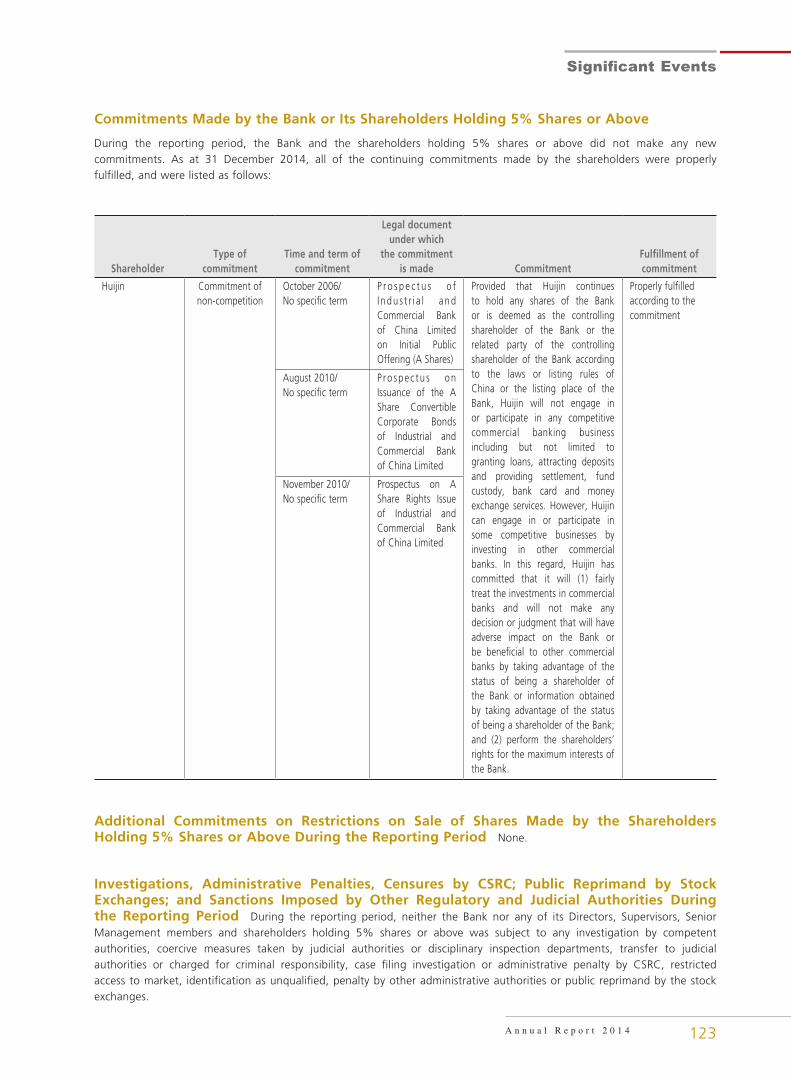
123
Significant Events
A n n u a l R e p o r t 2 0 1 4
Commitments Made by the Bank or Its Shareholders Holding 5% Shares or Above
During the reporting period, the Bank and the shareholders holding 5% shares or above did not make any new commitments. As at 31 December 2014, all of the continuing commitments made by the shareholders were properly fulfilled, and were listed as follows:
ShareholderType of
commitmentTime and term of
commitment
Legal document under which
the commitment is made Commitment
Fulfillment of commitment
Huijin Commitment of non-competition
October 2006/No specific term
P r o s p e c t u s o f I n d u s t r i a l a n d Commercial Bank of China Limited on Initial Public Offering (A Shares)
Provided that Huijin continues to hold any shares of the Bank or is deemed as the controlling shareholder of the Bank or the related party of the controlling shareholder of the Bank according to the laws or listing rules of China or the listing place of the Bank, Huijin will not engage in or participate in any competitive commercial banking business including but not limited to granting loans, attracting deposits and providing settlement, fund custody, bank card and money exchange services. However, Huijin can engage in or participate in some competitive businesses by investing in other commercial banks. In this regard, Huijin has committed that it will (1) fairly treat the investments in commercial banks and will not make any decision or judgment that will have adverse impact on the Bank or be beneficial to other commercial banks by taking advantage of the status of being a shareholder of the Bank or information obtained by taking advantage of the status of being a shareholder of the Bank; and (2) perform the shareholders’ rights for the maximum interests of the Bank.
Properly fulfilled according to the commitment
August 2010/No specific term
P ro spec tu s on Issuance of the A Share Convertible Corporate Bonds of Industrial and Commercial Bank of China Limited
November 2010/No specific term
Prospectus on A Share Rights Issue of Industrial and Commercial Bank of China Limited
Additional Commitments on Restrictions on Sale of Shares Made by the Shareholders Holding 5% Shares or Above During the Reporting Period None.
Investigations, Administrative Penalties, Censures by CSRC; Public Reprimand by Stock Exchanges; and Sanctions Imposed by Other Regulatory and Judicial Authorities During the Reporting Period During the reporting period, neither the Bank nor any of its Directors, Supervisors, Senior Management members and shareholders holding 5% shares or above was subject to any investigation by competent authorities, coercive measures taken by judicial authorities or disciplinary inspection departments, transfer to judicial authorities or charged for criminal responsibility, case filing investigation or administrative penalty by CSRC, restricted access to market, identification as unqualified, penalty by other administrative authorities or public reprimand by the stock exchanges.
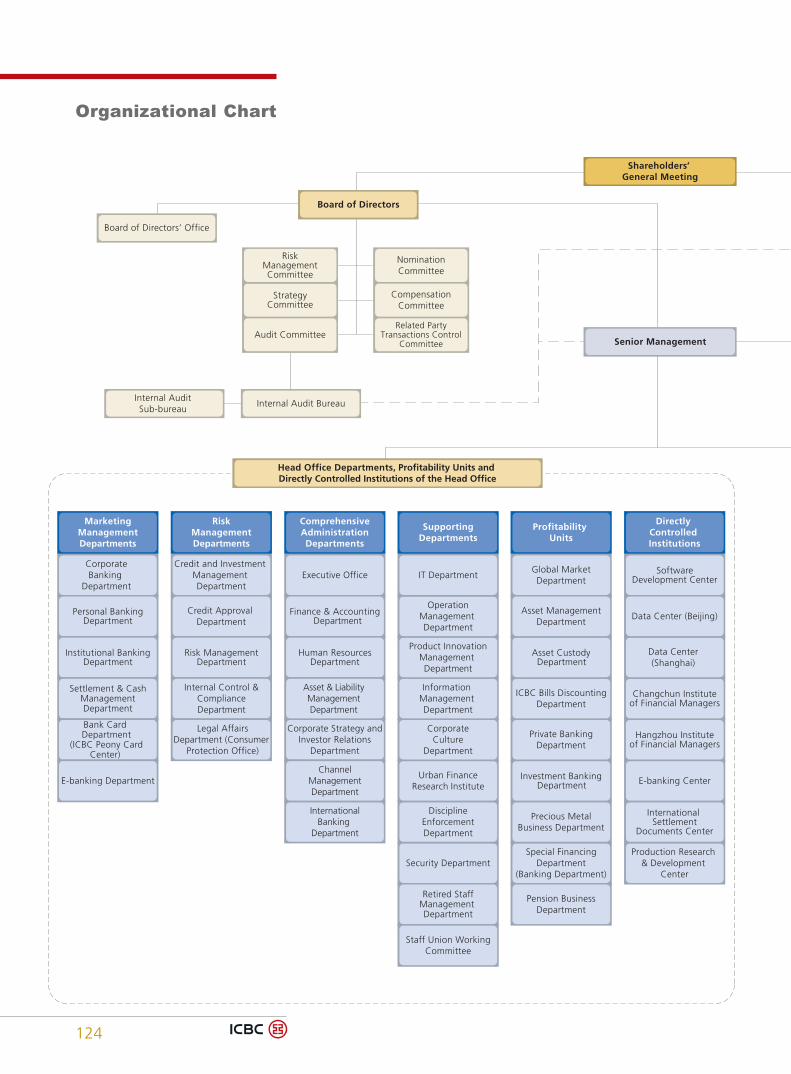
Organizational Chart
124
境外中心(1家)
境外分行及其分支機構(21家)
境外控股公司及其分支機構(181家)
董事會
監事會辦公室
Senior Management
Board of Directors’ Office
Shareholders’ General Meeting
Board of Directors
Head Office Departments, Profitability Units and Directly Controlled Institutions of the Head Office
Internal AuditSub-bureau
Board of Supervisors
SupervisionCommittee
Supervisory Board Office
Internal Audit Bureau
enilgnitroperyradnoceSenilgnitroperyramirP
Domestic Subsidiaries and their Branches
Domestic Branches
Domestic Institutions Overseas Institutions
Profitability Units
Directly Controlled Institutions
MarketingManagementDepartments
RiskManagementDepartments
ComprehensiveAdministrationDepartments
SupportingDepartments
Audit Committee
StrategyCommittee
RiskManagementCommittee
NominationCommittee
CompensationCommittee
Related PartyTransactions Control
Committee
Information TechnologyManagement Committee
Asset & Liability Management Committee
Financial ApprovalCommittee
Credit ApprovalCommittee
Risk ManagementCommittee
Business andProduct Innovation
Management Committee
Market Risk ManagementCommittee
Credit Risk ManagementCommittee
Information TechnologyApproval Committee
Operational RiskManagement Committee
Tier-oneBranches
(31)
Branches Directly Controlledby the Head Office
(5)
Outlets(13,467)
Subsidiaries with DiversifiedOperation and their Branches
(76)
Rural Banks (2)
Tier-one Sub-branches(3,081)
Banking Departments ofTier-one Branches
(26)
Tier-two Branches(403)
Overseas Branchesand their Institutions
(36)
Overseas Subsidiariesand their Institutions
(299)
Overseas Center and its Representative Offices
(3)
Credit Approval Department
Retired StaffManagement Department
Personal BankingDepartment
CorporateBanking
Department
Institutional BankingDepartment
Settlement & CashManagementDepartment
Bank Card Department
(ICBC Peony CardCenter)
E-banking Department
Credit and Investment Management Department
Risk ManagementDepartment
Internal Control &ComplianceDepartment
Legal AffairsDepartment (Consumer
Protection Office)
Executive Office
Finance & AccountingDepartment
Human ResourcesDepartment
Asset & LiabilityManagementDepartment
ChannelManagementDepartment
InternationalBanking
Department
Corporate Strategy andInvestor Relations
Department
IT DepartmentGlobal MarketDepartment
Special FinancingDepartment
(Banking Department)
Asset ManagementDepartment
CorporateCulture
Department
Information Management Department
OperationManagement Department
Product InnovationManagement Department
Urban FinanceResearch Institute
DisciplineEnforcementDepartment
Security Department
Staff Union WorkingCommittee
Asset CustodyDepartment
ICBC Bills DiscountingDepartment
Private BankingDepartment
Investment BankingDepartment
Precious MetalBusiness Department
Pension BusinessDepartment
SoftwareDevelopment Center
Data Center(Shanghai)
Data Center (Beijing)
Hangzhou Instituteof Financial Managers
Changchun Instituteof Financial Managers
E-banking Center
Production Research & Development
Center
International Settlement
Documents Center
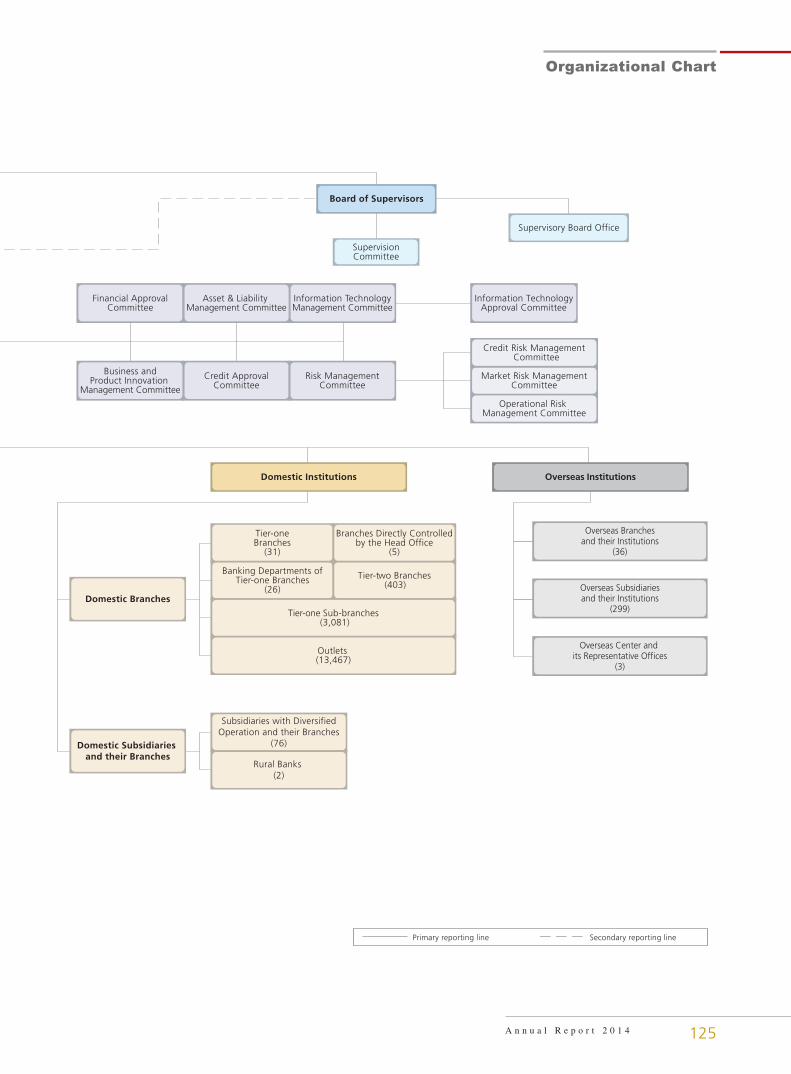
125
Organizational Chart
A n n u a l R e p o r t 2 0 1 4
境外中心(1家)
境外分行及其分支機構(21家)
境外控股公司及其分支機構(181家)
董事會
監事會辦公室
Senior Management
Board of Directors’ Office
Shareholders’ General Meeting
Board of Directors
Head Office Departments, Profitability Units and Directly Controlled Institutions of the Head Office
Internal AuditSub-bureau
Board of Supervisors
SupervisionCommittee
Supervisory Board Office
Internal Audit Bureau
enilgnitroperyradnoceSenilgnitroperyramirP
Domestic Subsidiaries and their Branches
Domestic Branches
Domestic Institutions Overseas Institutions
Profitability Units
Directly Controlled Institutions
MarketingManagementDepartments
RiskManagementDepartments
ComprehensiveAdministrationDepartments
SupportingDepartments
Audit Committee
StrategyCommittee
RiskManagementCommittee
NominationCommittee
CompensationCommittee
Related PartyTransactions Control
Committee
Information TechnologyManagement Committee
Asset & Liability Management Committee
Financial ApprovalCommittee
Credit ApprovalCommittee
Risk ManagementCommittee
Business andProduct Innovation
Management Committee
Market Risk ManagementCommittee
Credit Risk ManagementCommittee
Information TechnologyApproval Committee
Operational RiskManagement Committee
Tier-oneBranches
(31)
Branches Directly Controlledby the Head Office
(5)
Outlets(13,467)
Subsidiaries with DiversifiedOperation and their Branches
(76)
Rural Banks (2)
Tier-one Sub-branches(3,081)
Banking Departments ofTier-one Branches
(26)
Tier-two Branches(403)
Overseas Branchesand their Institutions
(36)
Overseas Subsidiariesand their Institutions
(299)
Overseas Center and its Representative Offices
(3)
Credit Approval Department
Retired StaffManagement Department
Personal BankingDepartment
CorporateBanking
Department
Institutional BankingDepartment
Settlement & CashManagementDepartment
Bank Card Department
(ICBC Peony CardCenter)
E-banking Department
Credit and Investment Management Department
Risk ManagementDepartment
Internal Control &ComplianceDepartment
Legal AffairsDepartment (Consumer
Protection Office)
Executive Office
Finance & AccountingDepartment
Human ResourcesDepartment
Asset & LiabilityManagementDepartment
ChannelManagementDepartment
InternationalBanking
Department
Corporate Strategy andInvestor Relations
Department
IT DepartmentGlobal MarketDepartment
Special FinancingDepartment
(Banking Department)
Asset ManagementDepartment
CorporateCulture
Department
Information Management Department
OperationManagement Department
Product InnovationManagement Department
Urban FinanceResearch Institute
DisciplineEnforcementDepartment
Security Department
Staff Union WorkingCommittee
Asset CustodyDepartment
ICBC Bills DiscountingDepartment
Private BankingDepartment
Investment BankingDepartment
Precious MetalBusiness Department
Pension BusinessDepartment
SoftwareDevelopment Center
Data Center(Shanghai)
Data Center (Beijing)
Hangzhou Instituteof Financial Managers
Changchun Instituteof Financial Managers
E-banking Center
Production Research & Development
Center
International Settlement
Documents Center

Organizational Chart
126
Independent Auditors’ Report and Financial Statements
Independent Auditors’ Report and Financial Statements
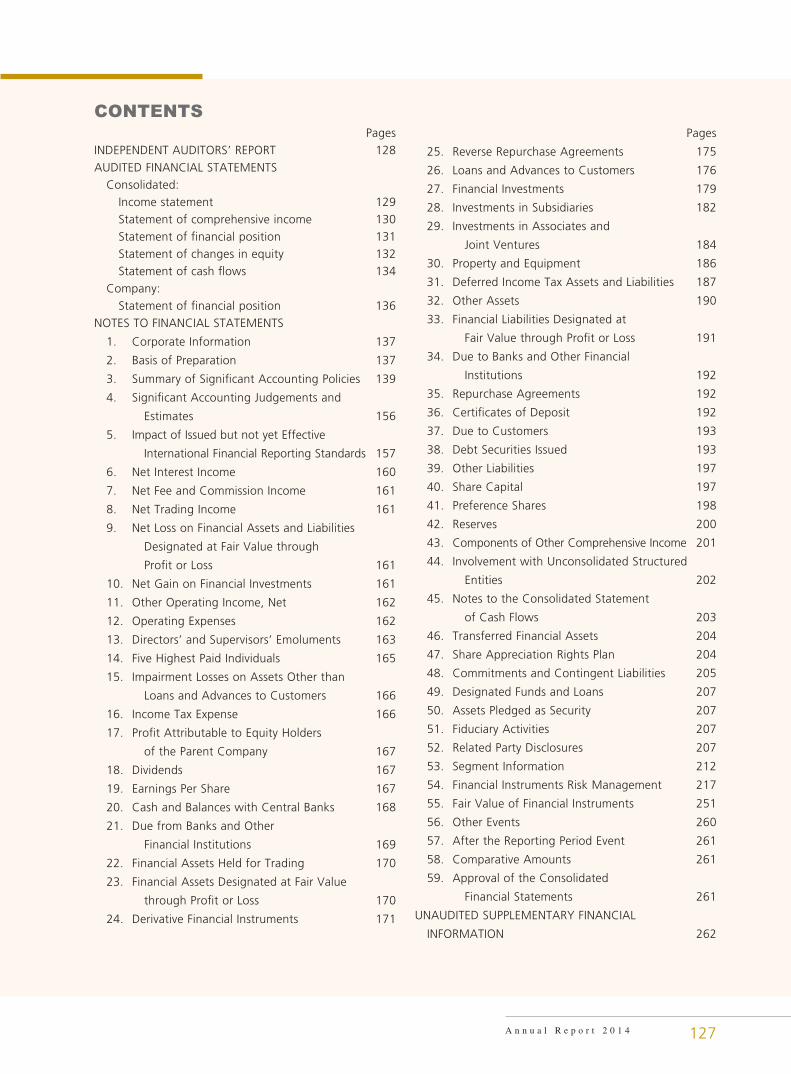
CONTENTS
A n n u a l R e p o r t 2 0 1 4 127
PagesINDEPENDENT AUDITORS’ REPORT 128AUDITED FINANCIAL STATEMENTS Consolidated: Income statement 129 Statement of comprehensive income 130 Statement of financial position 131 Statement of changes in equity 132 Statement of cash flows 134 Company: Statement of financial position 136NOTES TO FINANCIAL STATEMENTS
1. Corporate Information 137
2. Basis of Preparation 137
3. Summary of Significant Accounting Policies 139
4. Significant Accounting Judgements and
Estimates 156
5. Impact of Issued but not yet Effective
International Financial Reporting Standards 157
6. Net Interest Income 160
7. Net Fee and Commission Income 161
8. Net Trading Income 161
9. Net Loss on Financial Assets and Liabilities
Designated at Fair Value through
Profit or Loss 161
10. Net Gain on Financial Investments 161
11. Other Operating Income, Net 162
12. Operating Expenses 162
13. Directors’ and Supervisors’ Emoluments 163
14. Five Highest Paid Individuals 165
15. Impairment Losses on Assets Other than
Loans and Advances to Customers 166
16. Income Tax Expense 166
17. Profit Attributable to Equity Holders
of the Parent Company 167
18. Dividends 167
19. Earnings Per Share 167
20. Cash and Balances with Central Banks 168
21. Due from Banks and Other
Financial Institutions 169
22. Financial Assets Held for Trading 170
23. Financial Assets Designated at Fair Value
through Profit or Loss 170
24. Derivative Financial Instruments 171
Pages
25. Reverse Repurchase Agreements 175
26. Loans and Advances to Customers 176
27. Financial Investments 179
28. Investments in Subsidiaries 182
29. Investments in Associates and
Joint Ventures 184
30. Property and Equipment 186
31. Deferred Income Tax Assets and Liabilities 187
32. Other Assets 190
33. Financial Liabilities Designated at
Fair Value through Profit or Loss 191
34. Due to Banks and Other Financial
Institutions 192
35. Repurchase Agreements 192
36. Certificates of Deposit 192
37. Due to Customers 193
38. Debt Securities Issued 193
39. Other Liabilities 197
40. Share Capital 197
41. Preference Shares 198
42. Reserves 200
43. Components of Other Comprehensive Income 201
44. Involvement with Unconsolidated Structured
Entities 202
45. Notes to the Consolidated Statement
of Cash Flows 203
46. Transferred Financial Assets 204
47. Share Appreciation Rights Plan 204
48. Commitments and Contingent Liabilities 205
49. Designated Funds and Loans 207
50. Assets Pledged as Security 207
51. Fiduciary Activities 207
52. Related Party Disclosures 207
53. Segment Information 212
54. Financial Instruments Risk Management 217
55. Fair Value of Financial Instruments 251
56. Other Events 260
57. After the Reporting Period Event 261
58. Comparative Amounts 261
59. Approval of the Consolidated
Financial Statements 261
UNAUDITED SUPPLEMENTARY FINANCIAL
INFORMATION 262
Independent Auditors’ Report
128
To the shareholders of Industrial and Commercial Bank of China Limited
(Incorporated in the People’s Republic of China with limited liability)
We have audited the consolidated financial statements of Industrial and Commercial Bank of China Limited (the “Bank”) and its subsidiaries (together, the “Group”) set out on pages 129 to 261, which comprise the consolidated and Bank’s statements of financial position as at 31 December 2014, and the consolidated statement of profit or loss, the consolidated statement of profit or loss and other comprehensive income, the consolidated statement of changes in equity and the consolidated statement of cash flows for the year then ended, and a summary of significant accounting policies and other explanatory information.
Directors’ responsibility for the consolidated financial statements
The directors of the Bank are responsible for the preparation of consolidated financial statements that give a true and fair view in accordance with International Financial Reporting Standards and the disclosure requirements of the Hong Kong Companies Ordinance, and for such internal control as the directors determine is necessary to enable the preparation of consolidated financial statements that are free from material misstatement, whether due to fraud or error.
Auditors’ responsibility
Our responsibility is to express an opinion on these consolidated financial statements based on our audit. Our report is made solely to you, as a body, and for no other purpose. We do not assume responsibility towards or accept liability to any other person for the contents of this report.
We conducted our audit in accordance with International Standards on Auditing. Those standards require that we comply with ethical requirements and plan and perform the audit to obtain reasonable assurance about whether the consolidated financial statements are free from material misstatement.
An audit involves performing procedures to obtain audit evidence about the amounts and disclosures in the consolidated financial statements. The procedures selected depend on the auditors’ judgement, including the assessment of the risks of material misstatement of the consolidated financial statements, whether due to fraud or error. In making those risk assessments, the auditors consider internal control relevant to the entity’s preparation of consolidated financial statements that give a true and fair view in order to design audit procedures that are appropriate in the circumstances, but not for the purpose of expressing an opinion on the effectiveness of the entity’s internal control. An audit also includes evaluating the appropriateness of accounting policies used and the reasonableness of accounting estimates made by the directors, as well as evaluating the overall presentation of the consolidated financial statements.
We believe that the audit evidence we have obtained is sufficient and appropriate to provide a basis for our audit opinion.
Opinion
In our opinion, the consolidated financial statements give a true and fair view of the state of affairs of the Bank and of the Group as at 31 December 2014 and of the Group’s profit and cash flows for the year then ended in accordance with International Financial Reporting Standards and have been properly prepared in accordance with the disclosure requirements of the Hong Kong Companies Ordinance.
KPMGCertified Public Accountants8th Floor, Prince’s Building10 Chater RoadCentral, Hong Kong
26 March 2015
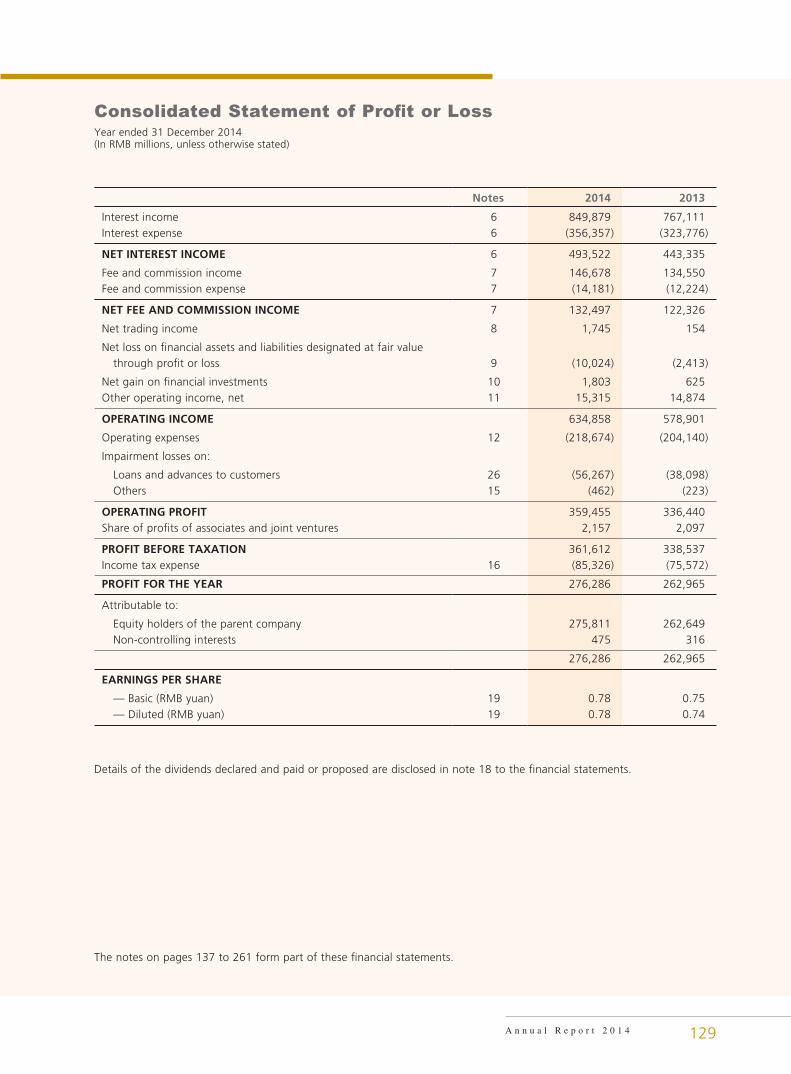
Year ended 31 December 2014(In RMB millions, unless otherwise stated)
Consolidated Statement of Profit or Loss
A n n u a l R e p o r t 2 0 1 4 129
Notes 2014 2013
Interest income 6 849,879 767,111Interest expense 6 (356,357) (323,776)
NET INTEREST INCOME 6 493,522 443,335
Fee and commission income 7 146,678 134,550Fee and commission expense 7 (14,181) (12,224)
NET FEE AND COMMISSION INCOME 7 132,497 122,326
Net trading income 8 1,745 154
Net loss on financial assets and liabilities designated at fair value through profit or loss 9 (10,024) (2,413)
Net gain on financial investments 10 1,803 625Other operating income, net 11 15,315 14,874
OPERATING INCOME 634,858 578,901
Operating expenses 12 (218,674) (204,140)
Impairment losses on:
Loans and advances to customers 26 (56,267) (38,098) Others 15 (462) (223)
OPERATING PROFIT 359,455 336,440Share of profits of associates and joint ventures 2,157 2,097
PROFIT BEFORE TAXATION 361,612 338,537Income tax expense 16 (85,326) (75,572)
PROFIT FOR THE YEAR 276,286 262,965
Attributable to:
Equity holders of the parent company 275,811 262,649 Non-controlling interests 475 316
276,286 262,965
EARNINGS PER SHARE
— Basic (RMB yuan) 19 0.78 0.75 — Diluted (RMB yuan) 19 0.78 0.74
Details of the dividends declared and paid or proposed are disclosed in note 18 to the financial statements.
The notes on pages 137 to 261 form part of these financial statements.
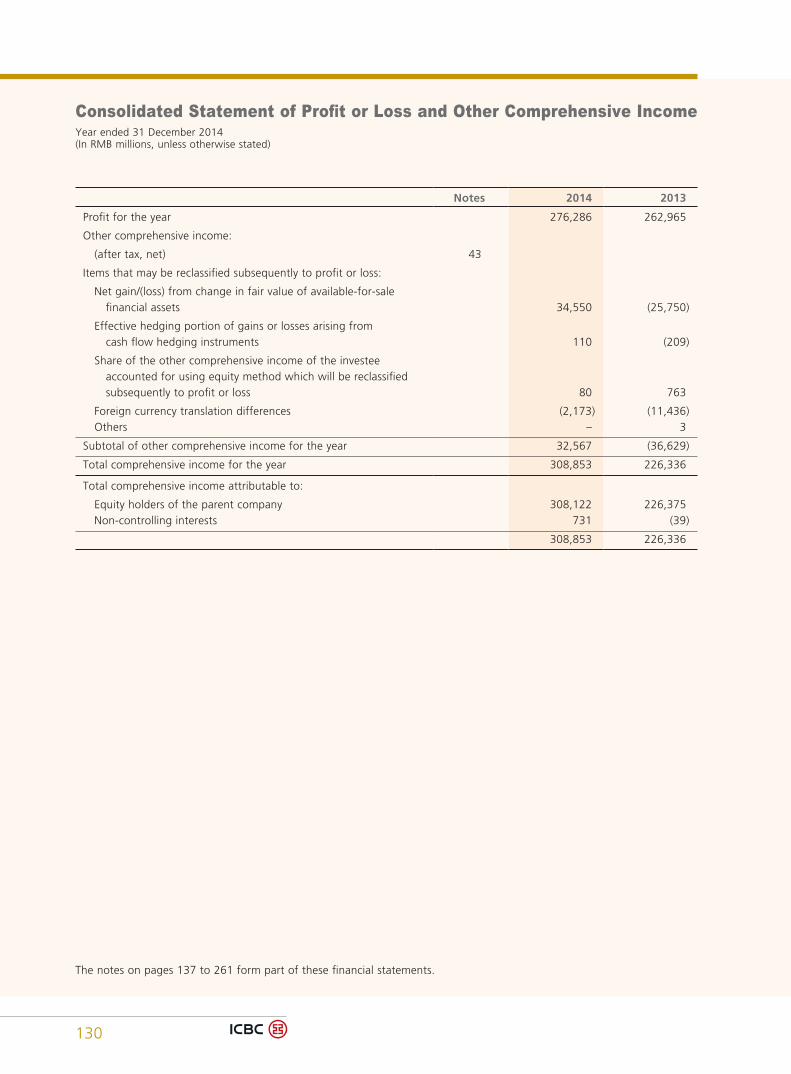
Consolidated Statement of Profit or Loss and Other Comprehensive IncomeYear ended 31 December 2014(In RMB millions, unless otherwise stated)
130
Notes 2014 2013
Profit for the year 276,286 262,965
Other comprehensive income:
(after tax, net) 43
Items that may be reclassified subsequently to profit or loss:
Net gain/(loss) from change in fair value of available-for-sale financial assets 34,550 (25,750)
Effective hedging portion of gains or losses arising from cash flow hedging instruments 110 (209)
Share of the other comprehensive income of the investee accounted for using equity method which will be reclassified subsequently to profit or loss 80 763
Foreign currency translation differences (2,173) (11,436) Others – 3
Subtotal of other comprehensive income for the year 32,567 (36,629)
Total comprehensive income for the year 308,853 226,336
Total comprehensive income attributable to:
Equity holders of the parent company 308,122 226,375 Non-controlling interests 731 (39)
308,853 226,336
The notes on pages 137 to 261 form part of these financial statements.
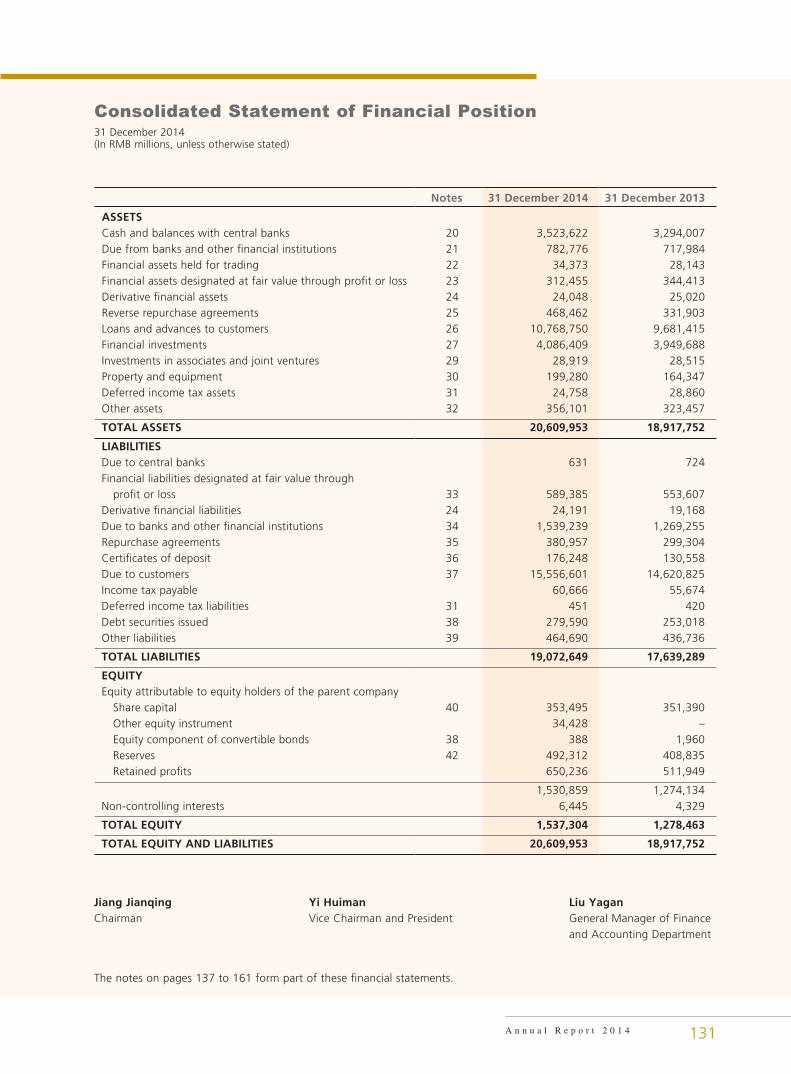
31 December 2014(In RMB millions, unless otherwise stated)
Consolidated Statement of Financial Position
A n n u a l R e p o r t 2 0 1 4 131
Notes 31 December 2014 31 December 2013
ASSETSCash and balances with central banks 20 3,523,622 3,294,007Due from banks and other financial institutions 21 782,776 717,984Financial assets held for trading 22 34,373 28,143Financial assets designated at fair value through profit or loss 23 312,455 344,413Derivative financial assets 24 24,048 25,020Reverse repurchase agreements 25 468,462 331,903Loans and advances to customers 26 10,768,750 9,681,415Financial investments 27 4,086,409 3,949,688Investments in associates and joint ventures 29 28,919 28,515Property and equipment 30 199,280 164,347Deferred income tax assets 31 24,758 28,860Other assets 32 356,101 323,457
TOTAL ASSETS 20,609,953 18,917,752
LIABILITIESDue to central banks 631 724Financial liabilities designated at fair value through profit or loss 33 589,385 553,607Derivative financial liabilities 24 24,191 19,168Due to banks and other financial institutions 34 1,539,239 1,269,255Repurchase agreements 35 380,957 299,304Certificates of deposit 36 176,248 130,558Due to customers 37 15,556,601 14,620,825Income tax payable 60,666 55,674Deferred income tax liabilities 31 451 420Debt securities issued 38 279,590 253,018Other liabilities 39 464,690 436,736
TOTAL LIABILITIES 19,072,649 17,639,289
EQUITYEquity attributable to equity holders of the parent company Share capital 40 353,495 351,390 Other equity instrument 34,428 – Equity component of convertible bonds 38 388 1,960 Reserves 42 492,312 408,835 Retained profits 650,236 511,949
1,530,859 1,274,134Non-controlling interests 6,445 4,329
TOTAL EQUITY 1,537,304 1,278,463
TOTAL EQUITY AND LIABILITIES 20,609,953 18,917,752
Jiang Jianqing Yi Huiman Liu YaganChairman Vice Chairman and President General Manager of Finance
and Accounting Department
The notes on pages 137 to 161 form part of these financial statements.
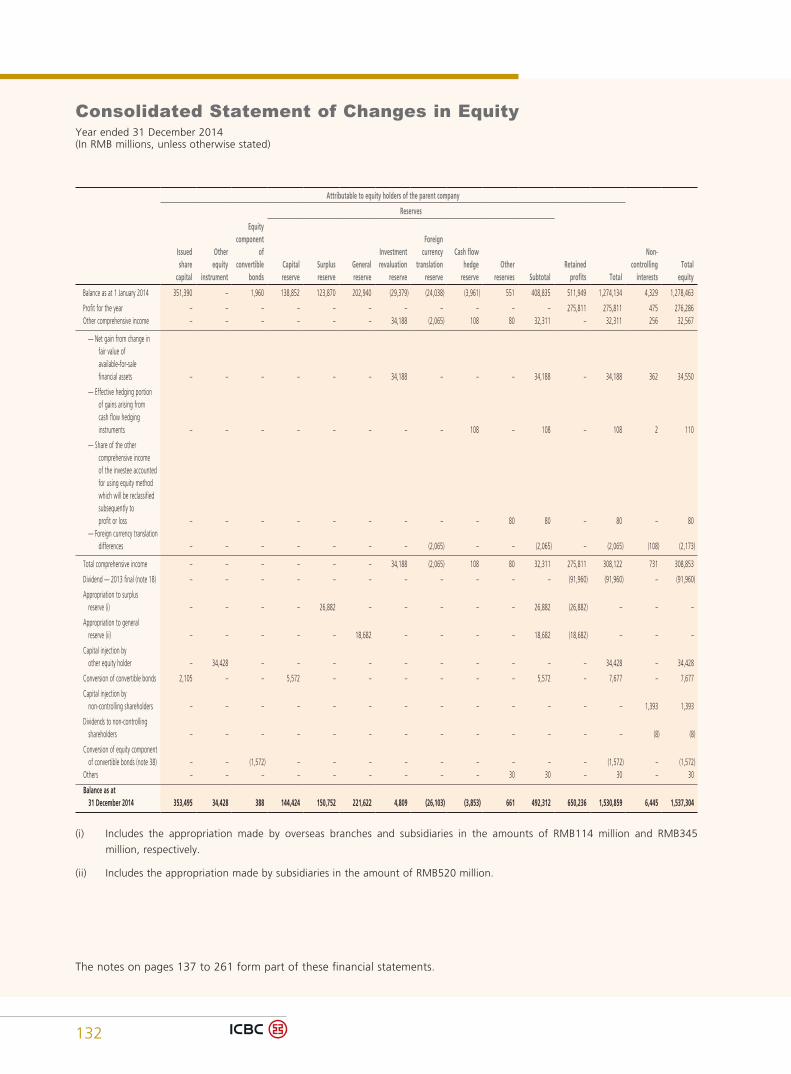
Consolidated Statement of Changes in EquityYear ended 31 December 2014(In RMB millions, unless otherwise stated)
132
Attributable to equity holders of the parent company
Reserves
Issuedshare
capital
Otherequity
instrument
Equitycomponent
ofconvertible
bondsCapitalreserve
Surplusreserve
Generalreserve
Investmentrevaluation
reserve
Foreigncurrency
translationreserve
Cash flowhedge
reserveOther
reserves SubtotalRetained
profits Total
Non- controlling
interestsTotal
equity
Balance as at 1 January 2014 351,390 – 1,960 138,852 123,870 202,940 (29,379) (24,038) (3,961) 551 408,835 511,949 1,274,134 4,329 1,278,463
Profit for the year – – – – – – – – – – – 275,811 275,811 475 276,286Other comprehensive income – – – – – – 34,188 (2,065) 108 80 32,311 – 32,311 256 32,567
— Net gain from change in fair value of available-for-sale financial assets – – – – – – 34,188 – – – 34,188 – 34,188 362 34,550
— Effective hedging portion of gains arising from cash flow hedging instruments – – – – – – – – 108 – 108 – 108 2 110
— Share of the other comprehensive income of the investee accounted for using equity method which will be reclassified subsequently to profit or loss – – – – – – – – – 80 80 – 80 – 80 — Foreign currency translation differences – – – – – – – (2,065) – – (2,065) – (2,065) (108) (2,173)
Total comprehensive income – – – – – – 34,188 (2,065) 108 80 32,311 275,811 308,122 731 308,853
Dividend — 2013 final (note 18) – – – – – – – – – – – (91,960) (91,960) – (91,960)
Appropriation to surplus reserve (i) – – – – 26,882 – – – – – 26,882 (26,882) – – –
Appropriation to general reserve (ii) – – – – – 18,682 – – – – 18,682 (18,682) – – –
Capital injection by other equity holder – 34,428 – – – – – – – – – – 34,428 – 34,428
Conversion of convertible bonds 2,105 – – 5,572 – – – – – – 5,572 – 7,677 – 7,677
Capital injection by non-controlling shareholders – – – – – – – – – – – – – 1,393 1,393
Dividends to non-controlling shareholders – – – – – – – – – – – – – (8) (8)
Conversion of equity component of convertible bonds (note 38) – – (1,572) – – – – – – – – – (1,572) – (1,572)Others – – – – – – – – – 30 30 – 30 – 30
Balance as at 31 December 2014 353,495 34,428 388 144,424 150,752 221,622 4,809 (26,103) (3,853) 661 492,312 650,236 1,530,859 6,445 1,537,304
(i) Includes the appropriation made by overseas branches and subsidiaries in the amounts of RMB114 million and RMB345
million, respectively.
(ii) Includes the appropriation made by subsidiaries in the amount of RMB520 million.
The notes on pages 137 to 261 form part of these financial statements.
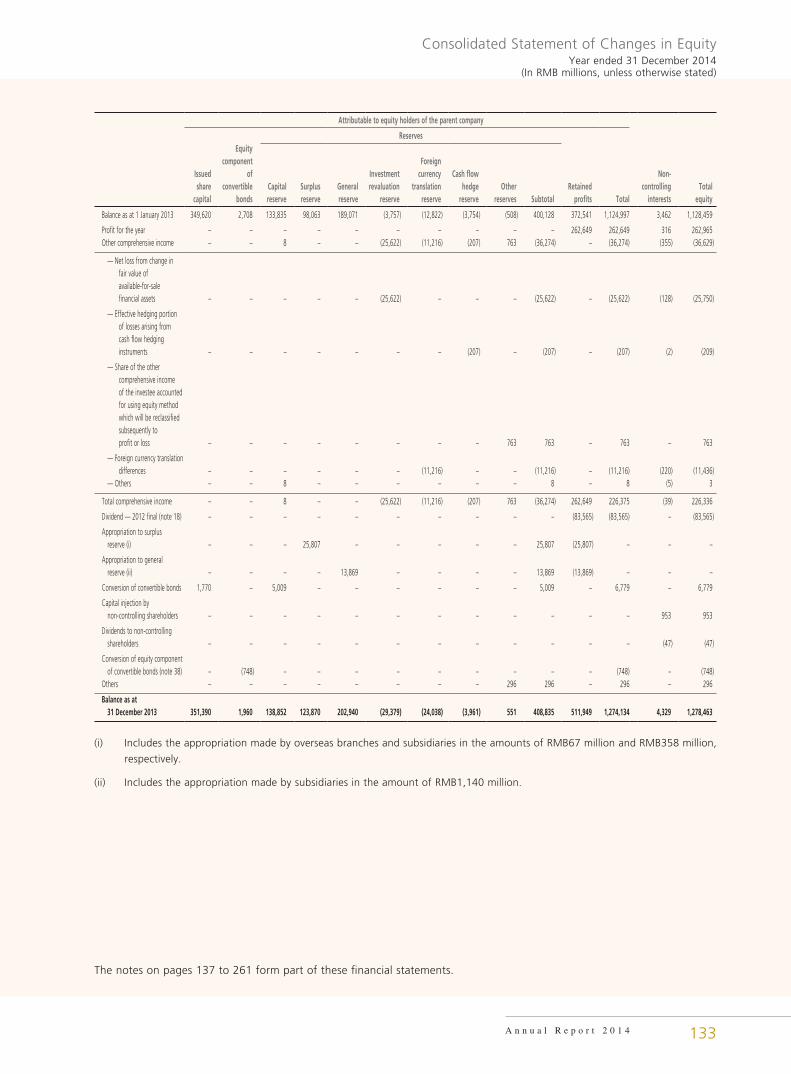
Consolidated Statement of Changes in EquityYear ended 31 December 2014
(In RMB millions, unless otherwise stated)
A n n u a l R e p o r t 2 0 1 4 133
Attributable to equity holders of the parent company
Reserves
Issuedshare
capital
Equitycomponent
ofconvertible
bondsCapitalreserve
Surplusreserve
Generalreserve
Investment revaluation
reserve
Foreigncurrency
translationreserve
Cash flowhedge
reserveOther
reserves SubtotalRetained
profits Total
Non- controlling
interestsTotal
equity
Balance as at 1 January 2013 349,620 2,708 133,835 98,063 189,071 (3,757) (12,822) (3,754) (508) 400,128 372,541 1,124,997 3,462 1,128,459
Profit for the year – – – – – – – – – – 262,649 262,649 316 262,965Other comprehensive income – – 8 – – (25,622) (11,216) (207) 763 (36,274) – (36,274) (355) (36,629)
— Net loss from change in fair value of available-for-sale financial assets – – – – – (25,622) – – – (25,622) – (25,622) (128) (25,750)
— Effective hedging portion of losses arising from cash flow hedging instruments – – – – – – – (207) – (207) – (207) (2) (209)
— Share of the other comprehensive income of the investee accounted for using equity method which will be reclassified subsequently to profit or loss – – – – – – – – 763 763 – 763 – 763
— Foreign currency translation differences – – – – – – (11,216) – – (11,216) – (11,216) (220) (11,436) — Others – – 8 – – – – – – 8 – 8 (5) 3
Total comprehensive income – – 8 – – (25,622) (11,216) (207) 763 (36,274) 262,649 226,375 (39) 226,336
Dividend — 2012 final (note 18) – – – – – – – – – – (83,565) (83,565) – (83,565)
Appropriation to surplus reserve (i) – – – 25,807 – – – – – 25,807 (25,807) – – –
Appropriation to general reserve (ii) – – – – 13,869 – – – – 13,869 (13,869) – – –
Conversion of convertible bonds 1,770 – 5,009 – – – – – – 5,009 – 6,779 – 6,779
Capital injection by non-controlling shareholders – – – – – – – – – – – – 953 953
Dividends to non-controlling shareholders – – – – – – – – – – – – (47) (47)
Conversion of equity component of convertible bonds (note 38) – (748) – – – – – – – – – (748) – (748)Others – – – – – – – – 296 296 – 296 – 296
Balance as at 31 December 2013 351,390 1,960 138,852 123,870 202,940 (29,379) (24,038) (3,961) 551 408,835 511,949 1,274,134 4,329 1,278,463
(i) Includes the appropriation made by overseas branches and subsidiaries in the amounts of RMB67 million and RMB358 million,
respectively.
(ii) Includes the appropriation made by subsidiaries in the amount of RMB1,140 million.
The notes on pages 137 to 261 form part of these financial statements.
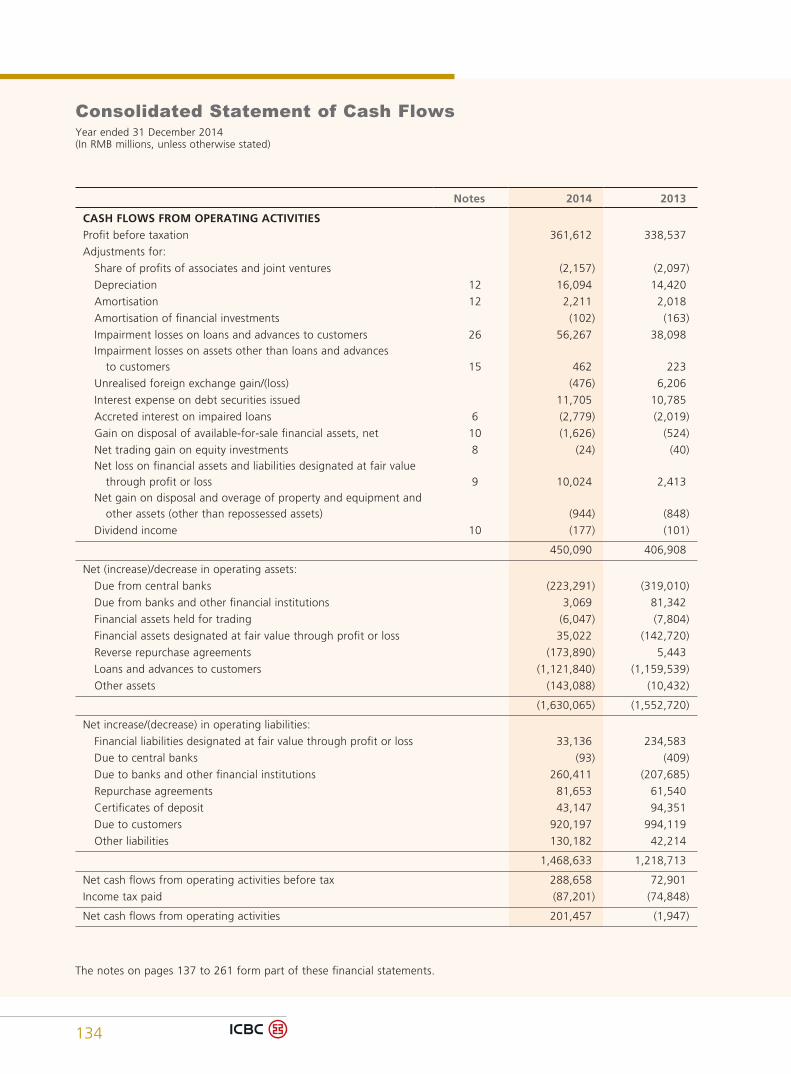
Consolidated Statement of Cash FlowsYear ended 31 December 2014(In RMB millions, unless otherwise stated)
134
Notes 2014 2013
CASH FLOWS FROM OPERATING ACTIVITIESProfit before taxation 361,612 338,537
Adjustments for:
Share of profits of associates and joint ventures (2,157) (2,097)
Depreciation 12 16,094 14,420
Amortisation 12 2,211 2,018
Amortisation of financial investments (102) (163)
Impairment losses on loans and advances to customers 26 56,267 38,098 Impairment losses on assets other than loans and advances to customers 15 462 223
Unrealised foreign exchange gain/(loss) (476) 6,206
Interest expense on debt securities issued 11,705 10,785
Accreted interest on impaired loans 6 (2,779) (2,019)
Gain on disposal of available-for-sale financial assets, net 10 (1,626) (524)
Net trading gain on equity investments 8 (24) (40) Net loss on financial assets and liabilities designated at fair value through profit or loss 9 10,024 2,413 Net gain on disposal and overage of property and equipment and other assets (other than repossessed assets) (944) (848)
Dividend income 10 (177) (101)
450,090 406,908
Net (increase)/decrease in operating assets:
Due from central banks (223,291) (319,010)
Due from banks and other financial institutions 3,069 81,342
Financial assets held for trading (6,047) (7,804)
Financial assets designated at fair value through profit or loss 35,022 (142,720)
Reverse repurchase agreements (173,890) 5,443
Loans and advances to customers (1,121,840) (1,159,539)
Other assets (143,088) (10,432)
(1,630,065) (1,552,720)
Net increase/(decrease) in operating liabilities:
Financial liabilities designated at fair value through profit or loss 33,136 234,583
Due to central banks (93) (409)
Due to banks and other financial institutions 260,411 (207,685)
Repurchase agreements 81,653 61,540
Certificates of deposit 43,147 94,351
Due to customers 920,197 994,119
Other liabilities 130,182 42,214
1,468,633 1,218,713
Net cash flows from operating activities before tax 288,658 72,901
Income tax paid (87,201) (74,848)
Net cash flows from operating activities 201,457 (1,947)
The notes on pages 137 to 261 form part of these financial statements.
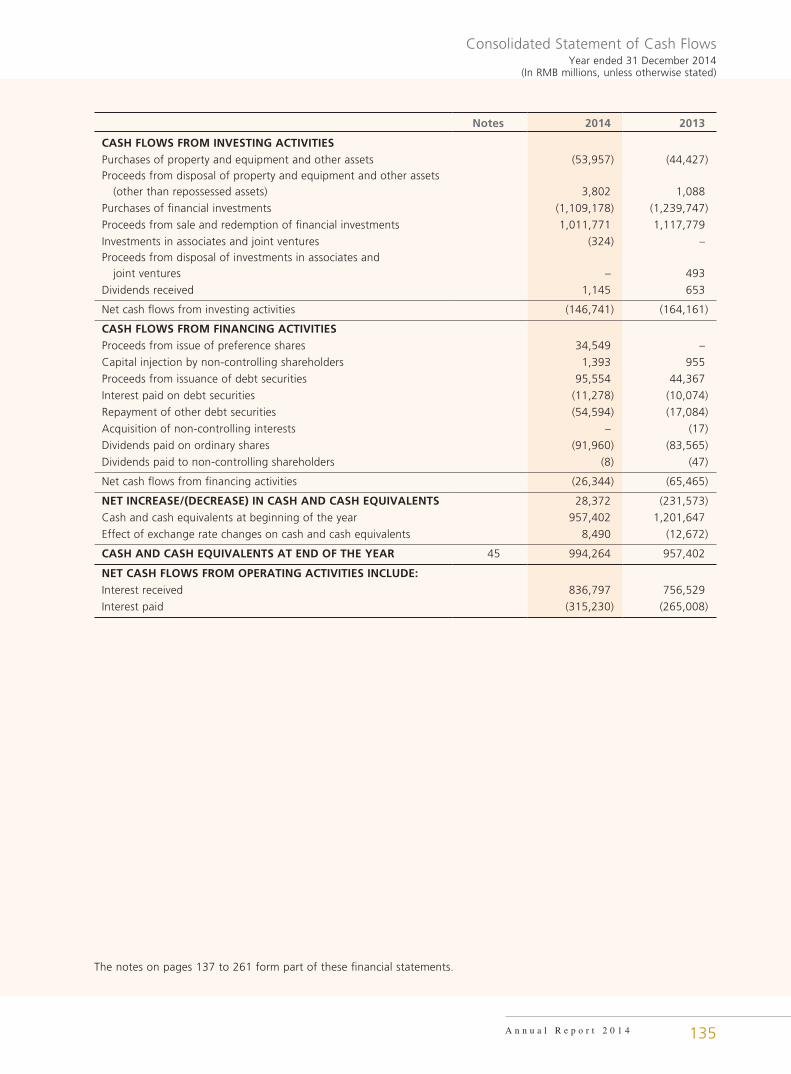
Consolidated Statement of Cash FlowsYear ended 31 December 2014
(In RMB millions, unless otherwise stated)
A n n u a l R e p o r t 2 0 1 4 135
Notes 2014 2013
CASH FLOWS FROM INVESTING ACTIVITIESPurchases of property and equipment and other assets (53,957) (44,427)Proceeds from disposal of property and equipment and other assets (other than repossessed assets) 3,802 1,088
Purchases of financial investments (1,109,178) (1,239,747)
Proceeds from sale and redemption of financial investments 1,011,771 1,117,779
Investments in associates and joint ventures (324) –Proceeds from disposal of investments in associates and joint ventures – 493
Dividends received 1,145 653
Net cash flows from investing activities (146,741) (164,161)
CASH FLOWS FROM FINANCING ACTIVITIESProceeds from issue of preference shares 34,549 –
Capital injection by non-controlling shareholders 1,393 955
Proceeds from issuance of debt securities 95,554 44,367
Interest paid on debt securities (11,278) (10,074)
Repayment of other debt securities (54,594) (17,084)
Acquisition of non-controlling interests – (17)
Dividends paid on ordinary shares (91,960) (83,565)
Dividends paid to non-controlling shareholders (8) (47)
Net cash flows from financing activities (26,344) (65,465)
NET INCREASE/(DECREASE) IN CASH AND CASH EQUIVALENTS 28,372 (231,573)
Cash and cash equivalents at beginning of the year 957,402 1,201,647
Effect of exchange rate changes on cash and cash equivalents 8,490 (12,672)
CASH AND CASH EQUIVALENTS AT END OF THE YEAR 45 994,264 957,402
NET CASH FLOWS FROM OPERATING ACTIVITIES INCLUDE:Interest received 836,797 756,529
Interest paid (315,230) (265,008)
The notes on pages 137 to 261 form part of these financial statements.
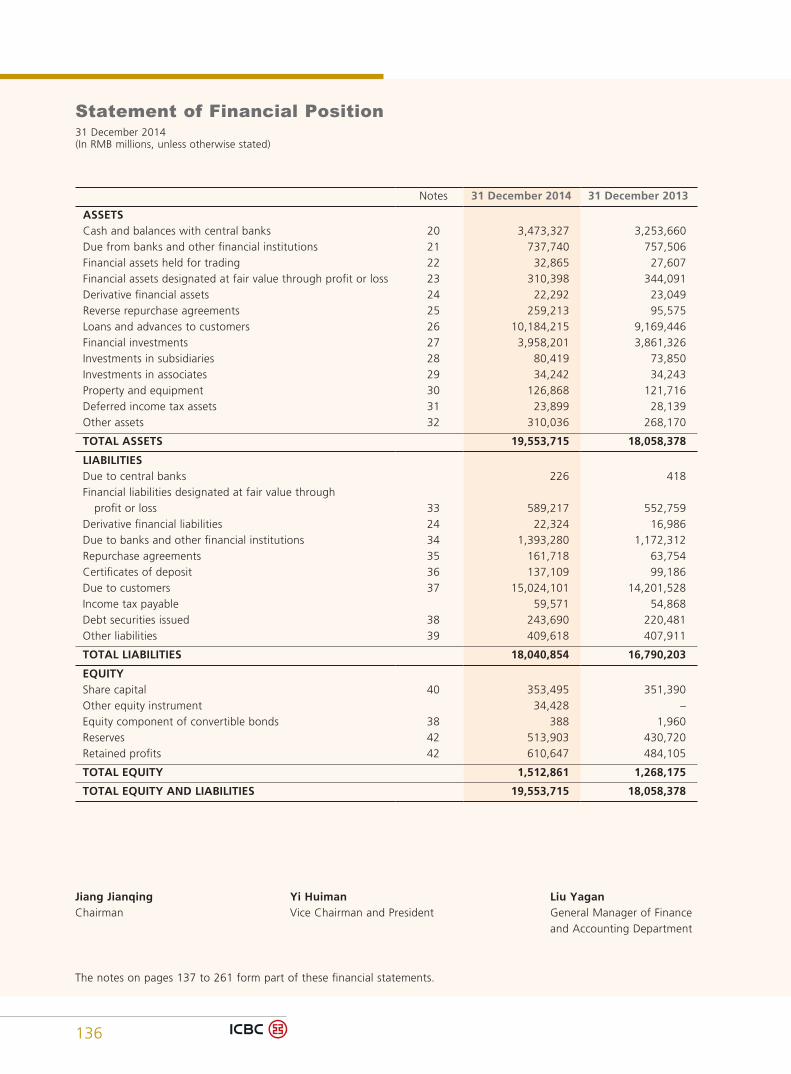
Statement of Financial Position31 December 2014(In RMB millions, unless otherwise stated)
136
Notes 31 December 2014 31 December 2013
ASSETSCash and balances with central banks 20 3,473,327 3,253,660Due from banks and other financial institutions 21 737,740 757,506Financial assets held for trading 22 32,865 27,607Financial assets designated at fair value through profit or loss 23 310,398 344,091Derivative financial assets 24 22,292 23,049Reverse repurchase agreements 25 259,213 95,575Loans and advances to customers 26 10,184,215 9,169,446Financial investments 27 3,958,201 3,861,326Investments in subsidiaries 28 80,419 73,850Investments in associates 29 34,242 34,243Property and equipment 30 126,868 121,716Deferred income tax assets 31 23,899 28,139Other assets 32 310,036 268,170
TOTAL ASSETS 19,553,715 18,058,378
LIABILITIESDue to central banks 226 418Financial liabilities designated at fair value through profit or loss 33 589,217 552,759Derivative financial liabilities 24 22,324 16,986Due to banks and other financial institutions 34 1,393,280 1,172,312Repurchase agreements 35 161,718 63,754Certificates of deposit 36 137,109 99,186Due to customers 37 15,024,101 14,201,528Income tax payable 59,571 54,868Debt securities issued 38 243,690 220,481Other liabilities 39 409,618 407,911
TOTAL LIABILITIES 18,040,854 16,790,203
EQUITYShare capital 40 353,495 351,390Other equity instrument 34,428 –Equity component of convertible bonds 38 388 1,960Reserves 42 513,903 430,720Retained profits 42 610,647 484,105
TOTAL EQUITY 1,512,861 1,268,175
TOTAL EQUITY AND LIABILITIES 19,553,715 18,058,378
Jiang Jianqing Yi Huiman Liu YaganChairman Vice Chairman and President General Manager of Finance
and Accounting Department
The notes on pages 137 to 261 form part of these financial statements.
31 December 2014(In RMB millions, unless otherwise stated)
Notes to Financial Statements
A n n u a l R e p o r t 2 0 1 4 137
1. CORPORATE INFORMATION
Industrial and Commercial Bank of China Limited (the “Bank”), which was previously known as Industrial and Commercial Bank of China (“ICBC”), used to be a wholly-state-owned commercial bank established on 1 January 1984 based on the authorisation of the State Council and the People’s Bank of China (the “PBOC”) of the People’s Republic of China (the “PRC”). On 28 October 2005, with the approval of the State Council, ICBC was restructured and incorporated as a joint-stock limited company. The joint-stock limited company undertook all the assets and liabilities of ICBC upon the restructuring.
The Bank obtained its finance permit No. B0001H111000001 from the China Banking Regulatory Commission (the “CBRC”) of the PRC. The Bank obtained its business license No. 100000000003965 from the State Administration for Industry and Commerce of the PRC. The legal representative is Jiang Jianqing and the registered office is located at No. 55 Fuxingmennei Avenue, Xicheng District, Beijing, the PRC.
The Bank’s A Shares and H Shares are listed on the Shanghai Stock Exchange and the Stock Exchange of Hong Kong Limited and the stock codes are 601398 and 1398, respectively.
The principal activities of the Bank and its subsidiaries (collectively referred to as the “Group”) comprise corporate and personal banking, treasury operations, investment banking, asset management, trust, financial leasing, insurance and other financial services. Domestic establishments refer to the Head Office of the Bank, branches and subsidiaries established inside Mainland China. Overseas establishments refer to branches and subsidiaries established under local jurisdictions outside Mainland China.
2. BASIS OF PREPARATION(1) Statement of compliance
The consolidated financial statements have been prepared in accordance with International Financial Reporting Standards (“IFRSs”) and interpretations promulgated by the International Accounting Standards Board (the “IASB”) and the disclosure requirements of the Hong Kong Companies Ordinance.
(2) Basis of preparation
The consolidated financial statements have been prepared under the historical cost convention, except for derivative financial instruments, financial assets and liabilities held for trading, financial assets and liabilities designated at fair value through profit or loss and available-for-sale financial assets (unless the fair value cannot be reliably measured) that have been measured at fair value, as further explained in the respective accounting policies below.
The preparation of financial statements in conformity with IFRSs requires management to make judgements, estimates and assumptions that affect the application of policies and reported amounts of assets and liabilities, income and expenses. Actual results may differ from these estimates. Judgements made by management in the application of IFRSs that have significant effect on the financial statements and major sources of estimation uncertainty are discussed in Note 4.
Notes to Financial Statements31 December 2014(In RMB millions, unless otherwise stated)
138
(3) Change in accounting policies
The IASB has issued the following revised IFRSs (including International Accounting Standards (“IASs”)) and amendments to standards that are effective in 2014 and relevant to the Group’s operation.
Amendments to IFRS 10, IFRS 12 and IAS 27,
Investment entities
Amendments to IAS 32 Financial instruments: presentation — Offsetting financial assets and financial liabilitiesAmendments to IAS 36 Impairment of assets — recoverable amount disclosures for non-financial assetsAmendments to IAS 39 Financial instruments: recognition and measurement — Novation of derivatives and
continuation of hedge accountingIFRIC 21 Levies — Accounting for levies
The principal effects of adopting these new and amended IFRSs are as follows:
Amendments to IFRS 10, IFRS 12 and IAS 27, Investment entities
The amendments provide consolidation relief to those parents which qualify to be an investment entity as defined in the amended IFRS 10. Investment entities are required to measure their subsidiaries at fair value through profit or loss. The adoption does not have any material impact on the Group’s financial statements.
Amendments to IAS 32 — Financial instruments: presentation — offsetting financial assets and financial liabilities
The amendments to IAS 32 clarify the offsetting criteria in IAS 32. The amendments to IAS 32 clarify the meaning of “currently has a legally enforceable right to set-off”. To the extent that the requirements are applicable to the Group, the Group has provided those disclosures in notes 24 and 25.
Amendments to IAS 36 — Impairment of assets — Recoverable amount disclosures for non-financial assets
The amendments to IAS 36 modify the disclosure requirements for impaired non-financial assets. Among them, the amendments expand the disclosures required for an impaired asset or cash generating units (“CGU”) whose recoverable amount is based on fair value less costs of disposal. The adoption does not have any material impact on the Group’s financial statements.
Amendments to IAS 39 — Financial instruments: recognition and measurement — Novation of derivatives and continuation of hedge accounting
The amendments to IAS 39 provide relief from discontinuing hedge accounting when novation of a derivative designated as a hedging instrument meets certain criteria. The adoption does not have any material impact on the Group’s financial statements.
IFRIC 21 — Levies — Accounting for levies
The interpretation defines a levy as an outflow from an entity imposed by a government in accordance with legislation. The interpretation provides guidance on when a liability to pay a levy imposed by a government should be recognised. The adoption does not have significant impact on the Group’s financial statements.
The Group does not adopt any issued but not yet effective international financial reporting standards, interpretation and amendments.
Notes to Financial Statements31 December 2014
(In RMB millions, unless otherwise stated)
A n n u a l R e p o r t 2 0 1 4 139
3. SUMMARY OF SIGNIFICANT ACCOUNTING POLICIES(1) Subsidiaries
Subsidiaries are entities controlled by the Group. The Group controls an entity if it is exposed, or has rights to, variable returns from its involvement with the entity and has the ability to affect those returns through its power over the entity. The Group reassesses whether it has control if there are changes to one or more of the elements of control. This includes circumstances in which protective rights held (e.g. those resulting from a lending relationship) become substantive and lead to the Group having power over an entity.
An investment in a subsidiary is consolidated into the consolidated financial statements from the date that control commences until the date that control ceases. Intra-group balances, transactions and any unrealised profit or loss arising from intra-group transactions are eliminated in full in preparing the consolidated financial statements.
In the Bank’s statement of financial position, its investments in subsidiaries are stated at cost less impairment losses (see note 3(21)).
(2) Non-controlling interests
Non-controlling interests represent the equity in a subsidiary not attributable directly or indirectly to the Group.
Non-controlling interests are presented in the consolidated statement of financial position within equity, separately from equity attributable to the equity shareholders of the Bank. Non-controlling interests in the results of the Group are presented on the face of the consolidated statement of profit or loss and the consolidated statement of profit or loss and other comprehensive income as an allocation of the total profit or loss and total comprehensive income for the year between non-controlling interests and the equity shareholders of the Bank.
Changes in the Group’s interests in a subsidiary that do not result in a loss of control are accounted for as equity transactions, whereby adjustments are made to the amounts of controlling and non-controlling interests within consolidated equity to reflect the change in relative interests, but no adjustments are made to goodwill and no gain or loss is recognised.
(3) Associates and Joint ventures
An associate is an entity in which the Group or Bank has significant influence.
A joint venture is an arrangement whereby the Group or Bank and other parties contractually agree to share control of the arrangement, and have rights to the net assets of the arrangement.
The Group’s investments in associates or joint ventures are accounted for under the equity method of accounting. Under the equity method, an investment in an associate or joint venture is carried in the consolidated statement of financial position at cost plus post-acquisition changes in the Group’s share of the net assets of the associate or joint venture, less any impairment losses. The consolidated statement of profit or loss reflects the share of the results of operations of the associate or joint venture. Where there has been a change recognised directly in the equity of the associate or joint venture, the Group recognises its share of any changes and discloses this, when applicable, in the consolidated statement of changes in equity. Under the equity method, unrealised profits and losses resulting from transactions between the Group and the associates or joint ventures are eliminated to the extent of the Group’s interests in the associates or joint ventures.
If an investment in an associate becomes an investment in a joint venture or vice versa, retained interest is not remeasured. Instead, the investment continues to be accounted for under the equity method.
In the Bank’s statement of financial position, investments in associates and joint ventures are stated at cost less impairment losses (see note 3(21)).
Notes to Financial Statements31 December 2014(In RMB millions, unless otherwise stated)
140
(4) Foreign currency translation
The consolidated financial statements are presented in RMB, being the functional and presentation currency of the Bank’s operations in Mainland China. Each entity in the Group determines its own functional currency and the financial statements of each entity are presented using that functional currency.
Foreign currency transactions are initially recorded in the functional currency using the exchange rates ruling at the dates of the transactions. Monetary assets and liabilities denominated in foreign currencies are retranslated into the functional currency at the applicable exchange rates ruling at the end of the reporting period. Exchange differences arising on the settlement of monetary items or on translating monetary items at period end rates are recognised in profit or loss, with the exception that they are taken directly to other comprehensive income when the monetary items are designated as part of the hedge of the Bank’s net investment of a foreign entity, and the aggregate exchange differences are not recognised in profit or loss until the disposal of such net investment. Tax charges and credits attributable to exchange differences on those monetary items are also recorded in other comprehensive income.
Non-monetary items that are measured at historical cost in a foreign currency are translated using the exchange rates as at the dates of the initial transactions. Non-monetary items measured at fair value in a foreign currency are translated using the exchange rates as at the date when the fair value is determined. Any goodwill arising on the acquisition of a foreign operation and any fair value adjustments to the carrying amounts of assets and liabilities arising on the acquisition are treated as assets and liabilities of the foreign operation and translated at the rates ruling at the end of the reporting period. The exchange differences are recognised in profit or loss or in other comprehensive income, depending on the nature of non-monetary items.
As at the end of the reporting period, the assets and liabilities of foreign operations are translated into the presentation currency of the Bank at the exchange rates ruling at the end of the reporting period. All items within equity except for retained profits are translated at the exchange rates ruling at the dates of the initial transactions. Income and expenses in the statement of profit or loss are translated at the weighted average exchange rates for the year. The exchange differences arising on the above translation are taken directly to other comprehensive income. On disposal of a foreign operation, the deferred cumulative amount recognised in other comprehensive income relating to that particular foreign operation is recognised in profit or loss.
Cash flows arising from transactions in foreign currencies and cash flows of overseas subsidiaries are translated using the weighted average exchange rates for the year. The effect of exchange rate movements on cash is presented separately in the statement of cash flows as a reconciling item.
(5) Financial instruments
A financial instrument is any contract that gives rise to a financial asset of one entity and a financial liability or equity instrument of another entity.
Initial recognition of financial instruments
At initial recognition, financial assets are classified into four categories: financial assets at fair value through profit or loss, held-to-maturity financial investments, loans and receivables and available-for-sale financial assets.
At initial recognition, financial liabilities are classified into two categories: financial liabilities at fair value through profit or loss and other financial liabilities.
A financial asset or financial liability is measured initially at its fair value plus, in the case of a financial asset or financial liability not at fair value through profit or loss, transaction costs that are directly attributable to the acquisition or issue of the financial asset or financial liability.
Notes to Financial Statements31 December 2014
(In RMB millions, unless otherwise stated)
A n n u a l R e p o r t 2 0 1 4 141
Measurement of fair value
Fair value is the price that would be received to sell an asset or paid to transfer a liability in an orderly transaction between market participants at the measurement date.
When measuring fair value, the Group shall take into account the characteristics of the asset or liability if market participants would take those characteristics into account when pricing the asset or liability at the measurement date (including the condition and location of the asset; and restrictions, if any, on the sale or use of the asset, etc.), and use valuation techniques that are appropriate in the circumstances and for which sufficient data and other information are available to measure fair value. The adopted valuation techniques mainly include market approach, income approach and cost approach.
Financial assets or financial liabilities at fair value through profit or loss
Financial assets or financial liabilities at fair value through profit or loss include financial assets or financial liabilities held for trading and financial assets or financial liabilities designated at fair value through profit or loss.
Financial assets or financial liabilities held for trading
A financial asset or financial liability is classified as held for trading if:
(i) it is acquired or incurred principally for the purpose of selling or repurchasing it in the near term;
(ii) on initial recognition it is part of a portfolio of identified financial instruments that are managed together and for which there is evidence of a recent actual pattern of short term profit-taking; or
(iii) it is a derivative that is not designated as an effective hedging instrument.
Financial assets or financial liabilities held for trading are measured at fair value after initial recognition. Realised or unrealised income or expenses are recognised in profit or loss.
Financial assets or financial liabilities designated at fair value through profit or loss
A financial instrument may be designated as a financial asset or financial liability at fair value through profit or loss upon initial recognition, if it meets any of the criteria set out below.
(i) It eliminates or significantly reduces a measurement or recognition inconsistency that would otherwise arise from measuring the financial asset or financial liability or from recognising the gains and losses on them on different bases;
(ii) It applies to a group of financial assets, financial liabilities or both which is managed and its performance evaluated on a fair value basis, in accordance with a documented risk management or investment strategy, and where information about that group of financial instruments is provided internally on that basis to key management personnel; or
(iii) The financial instrument contains one or more embedded derivatives, unless the embedded derivative(s) does not significantly modify the cash flows or it is clear, with little or no analysis, that it would not be separately recorded.
In the case of an equity investment, if neither a quoted market price in an active market exists nor its fair value can be reliably measured, it cannot be designated as a financial asset at fair value through profit or loss.
Financial assets and liabilities designated at fair value through profit or loss are measured at fair value after initial recognition. Realised and unrealised income or expenses are recognised in profit or loss.
Notes to Financial Statements31 December 2014(In RMB millions, unless otherwise stated)
142
Held-to-maturity financial investments
Held-to-maturity financial investments are non-derivative financial assets with fixed or determinable payments and a fixed maturity and which the Group has the positive intention and ability to hold to maturity. After initial measurement, held-to-maturity financial investments are subsequently measured at amortised cost using the effective interest rate method, less any impairment loss. Gains and losses are recognised in profit or loss when the held-to-maturity financial investments are derecognised or impaired, as well as through the amortisation process.
If, as a result of a change in intention or ability, it is no longer appropriate to classify an investment as held-to-maturity, it shall be reclassified as available-for-sale and remeasured at fair value.
Loans and receivables
Loans and receivables are non-derivative financial assets with fixed or determinable payments that are not quoted in an active market and the Group has no intention of trading the assets immediately or in the near term. After initial measurement, such assets are subsequently carried at amortised cost using the effective interest rate method, less any allowance for impairment losses. Gains and losses are recognised in profit or loss when such assets are derecognised or impaired, as well as through the amortisation process.
Discounted bills are granted by the Group to its customers based on the bank acceptance held which has not matured. Discounted bills are carried at face value less unrealised interest income and the interest income of the discounted bills is recognised using the effective interest rate method.
Available-for-sale financial assets
Available-for-sale financial assets are non-derivative financial assets which are designated as such or are not classified in any of the three preceding categories. After initial recognition, available-for-sale financial assets are subsequently measured at fair value. Premiums and discounts on available-for-sale financial assets are amortised using the effective interest rate method and are taken to the statement of profit or loss as interest income. Changes in fair value of available-for-sale financial assets are recognised as a separate component of other comprehensive income until the financial asset is derecognised or determined to be impaired at which time the cumulative gains or losses previously recorded in other comprehensive income are transferred to profit or loss. Dividend and interest income on available-for-sale financial assets are recorded in profit or loss.
In the case of an equity investment classified as available for sale, if neither a quoted market price in an active market exists nor its fair value can be reliably measured, it will be measured at cost less any impairment loss.
Other financial liabilities
Other financial liabilities are carried at amortised cost using the effective interest rate method after initial recognition.
(6) Impairment of the financial assets
An assessment on carrying amount of financial assets is made at the end of each reporting period. Impairment is recognised if there is objective evidence of impairment of financial assets, i.e., one or more events that occur after the initial recognition of those assets and have an impact on the estimated future cash flows of the financial assets or group of financial assets that can be reliably estimated. Evidence of impairment may include indications that the borrower or a group of borrowers is experiencing significant financial difficulty, default or delinquency in interest or principal payments, they would probably enter into bankruptcy or other financial reorganisation and where observable data indicate that there is a measurable decrease in the estimated future cash flows.
Notes to Financial Statements31 December 2014
(In RMB millions, unless otherwise stated)
A n n u a l R e p o r t 2 0 1 4 143
Financial assets carried at amortised cost
If there is objective evidence that an impairment loss on loans and receivables or held-to-maturity investments has been incurred, the amount of the loss is measured as the difference between the asset’s carrying amount and the present value of estimated future cash flows (excluding future credit losses that have not been incurred) discounted at the financial asset’s original effective interest rate and shall include the value of any relevant collateral. The original effective interest rate is the rate used to determine the values of financial assets at initial recognition. With respect to floating-rate loans, receivables and held-to-maturity investments, the discount rate could be the current effective interest rate determined under the contract. The carrying amount of the asset is reduced through the use of an impairment provision account and the amount of the loss is recognised in profit or loss.
The Group first assesses whether objective evidence of impairment exists individually for financial assets that are individually significant, and individually or collectively for financial assets that are not individually significant. If it is determined that no objective evidence of impairment exists for an individually assessed financial asset, whether significant or not, the asset is included in a group of financial assets with similar credit risk characteristics and that group of financial assets is collectively assessed for impairment. Assets that are individually assessed for impairment and for which an impairment loss is or continues to be recognised are not included in a collective assessment of impairment.
Future cash flows of a group of financial assets that are collectively evaluated for impairment are estimated on the basis of historical loss experience for assets with credit risk characteristics similar to those in the group. Historical loss experience is adjusted on the basis of current observable data to reflect the impact of current conditions that did not affect the period on which the historical loss experience is based and to eliminate the impact of historical conditions that do not exist currently. The methodology and assumptions used for estimating future cash flows are reviewed regularly by the Group.
If, in a subsequent period, the amount of an impairment loss decreases and the decrease can be attributed objectively to an event occurring after the impairment was recognised, the previously recognised impairment loss is reversed. Any subsequent reversal of an impairment loss is recognised in profit or loss, to the extent that the carrying value of the assets does not exceed its amortised cost at the reversal date.
When an item of loans and receivables is uncollectible, it is written off against the related allowance for impairment losses. Such loans and receivables are written off after all the necessary procedures have been completed and the amount of the loss has been determined. Subsequent recoveries of the amounts previously written off decrease the amount of the provision for loan impairment in profit or loss.
Financial assets carried at cost
If there is objective evidence that an impairment loss has been incurred on the financial asset, the amount of impairment loss, measured as the difference between the carrying amount of that financial asset and the present value of estimated future cash flows discounted at the current market rate of return for a similar financial asset, is recognised in profit or loss. In the case of an equity investment, if neither a quoted market price in an active market exists nor its fair value can be reliably measured, the amount of impairment loss is recognised in profit or loss. Impairment losses on these assets are not reversed.
Available-for-sale financial assets
If there is objective evidence that the financial asset is impaired, the cumulative loss, measured as the difference between the acquisition cost (net of any principal repayment and amortisation) and the current fair value, less any impairment loss on that financial asset previously recognised in profit or loss, is removed from other comprehensive income and recognised in profit or loss.
In the case of equity investments classified as available-for-sale, objective evidence would include a significant or prolonged decline in the fair value of the investment below its cost. The Group considers the time period and continuity of the magnitude of the decline to evaluate whether the decline in fair value is prolonged. More significantly the fair value declines relative to the cost, the less the volatility moves, and the longer the decline lasts or the more obvious the continuity of the magnitude of the decline is, the more likely the equity investment impairs. In general, the Group considers the situation when fair value is less than 40% of the cost as significant decline and that when fair value falls below the cost in a period over 12 months as prolonged decline
Notes to Financial Statements31 December 2014(In RMB millions, unless otherwise stated)
144
If, after an impairment loss has been recognised on an available-for-sale debt instrument, the fair value of the debt instrument increases in a subsequent period and the increase can be objectively related to an event occurring after the impairment loss was recognised the impairment loss is reversed through profit or loss. An impairment loss recognised for an investment in an equity instrument classified as available-for-sale is not reversed through profit or loss. The impairment loss on an investment in unquoted equity instrument whose fair value cannot be reliably measured is not reversed.
(7) Renegotiated loans
Where possible, the Group seeks to restructure loans rather than to take possession of collateral. This may involve extending the payment arrangements and the agreement of new loan conditions. Once the terms have been renegotiated, the loan is no longer considered past due. Management continuously reviews renegotiated loans to ensure that all criteria are met and that future payments are likely to occur. The loans continue to be subject to individual or collective impairment assessment, and the provision is calculated using the loan’s original effective interest rate.
(8) Derecognition of financial assets and liabilitiesFinancial assets
A financial asset (or, where applicable, a part of a financial asset or part of a group of similar financial assets) is derecognised when:
• The rights to receive cash flows from the asset have expired; or
• The Group has transferred its rights to receive cash flows from the asset; or has retained its rights to receive cash flows from the asset but has assumed an obligation to pay them in full without material delay to a third party under a “pass-through” arrangement; and either the Group has transferred substantially all the risks and rewards of ownership of the financial asset; or the Group has neither transferred nor retained substantially all the risks and rewards of ownership of the financial asset, but has transferred control of the asset.
Where the Group has transferred its rights to receive cash flows from an asset or has retained its rights to receive cash flows from the asset but has entered into a pass-through arrangement, and has neither transferred nor retained substantially all the risks and rewards of the asset nor transferred control of the asset, the asset is recognised to the extent of the Group’s continuing involvement in the asset.
Continuing involvement that takes the form of a guarantee over the transferred asset is measured at the lower of the original carrying amount of the asset and the maximum amount of consideration that the Group could be required to repay.
Securitisation
As part of its operational activities, the Group securitises financial assets, generally through the sale of these assets to structured entities which issue securities to investors. Further details on prerequisites for derecognition of financial assets are set out above. When a securitisation of financial assets does not qualify for derecognition, the relevant financial assets are not derecognised, and the consideration paid by third parties are recorded as a financial liability; when the securitisation of financial assets partially qualifies for derecognition, the Group continue to recognise the transferred assets to the extent of its continuing involvement, derecognise the remaining. The book value of the transferred assets is apportioned between the derecognised portion and the retained portion based on their respective relative fair values, and the difference between the book value of the derecognised portion and the total consideration paid for the derecognised portion is recorded in profit or loss.
Sales of assets on condition of repurchase
The derecognition of financial assets sold on condition of repurchase is determined by the economic substance of the transaction. If a financial asset is sold under an agreement to repurchase the same or substantially the same asset at a fixed price or at the sale price plus a reasonable return, the Group will not derecognise the asset. If a financial asset is sold together with an option to repurchase the financial asset at its fair value at the time of repurchase (in case of transferor sells such financial asset), the Group will derecognise the financial asset.
Notes to Financial Statements31 December 2014
(In RMB millions, unless otherwise stated)
A n n u a l R e p o r t 2 0 1 4 145
Financial liabilities
A financial liability is derecognised when the obligation under the liability is discharged, cancelled or expires.
(9) Convertible instruments
Convertible instruments issued by the Group that can be converted to equity shares, where the number of shares to be issued and the value of consideration to be received at that time do not vary, are accounted for as compound financial instruments containing both liability and equity components.
The initial carrying amount of a compound financial instrument is allocated to its equity and liability components. The amount recognised in the equity is the difference between the fair value of the instrument as a whole and the separately determined fair value of the liability component (including the value of any embedded derivatives other than the equity component). Transaction costs that relate to the issue of a compound financial instrument are allocated to the liability and equity components in proportion to the allocation of proceeds.
Subsequent to initial recognition, the liability component is measured at amortised cost using the effective interest method, unless it is designated upon recognition at fair value through profit or loss. The equity component is not re-measured.
If the convertible instrument is converted, the liability component, together with the equity component, is transferred to equity. If the convertible instrument is redeemed, the consideration paid for the redemption, are allocated to the liability and equity components. The method used to allocate the consideration and transaction costs is the same as that used for issuance. After allocating the consideration and transaction costs, the difference between the allocated and carrying amounts is charged to profit or loss if it relates to the liability component or directly recognised in equity if it relates to the equity component.
(10) Preference shares
Such preference shares or their components are initially recognised as financial assets, financial liabilities or equity instruments according to the terms and the economic substance combined with the definition of financial assets, financial liabilities and equity instruments.
When the issued preference shares contain equity and liability components, the Group follows the same accounting policy as for convertible bonds with equity components. For the issued preference shares which do not contain equity component, the Group follows the accounting policy as accounting for the convertible bonds only with liability component.
For the issued preference shares that should be classified as equity instruments, will be recognised as equity in actual amount received. Dividends payables are recognised as distribution of profits. Redemption before maturity will write down equity as redemption price.
(11) Derivatives and hedge accountingDerivatives
Derivative financial instruments are initially recognised at fair value on the date on which a derivative contract is entered into and are subsequently remeasured at fair value. Derivatives are carried as assets when the fair value is positive and as liabilities when the fair value is negative.
Certain derivatives embedded in other financial instruments are treated as separate derivatives when their economic characteristics and risks are not closely related to those of the host contract and the hybrid instrument is not carried at fair value through profit or loss. These embedded derivatives are measured at fair value with the changes in fair value recognised in profit or loss.
Any gains or losses arising from changes in fair value on derivatives that do not qualify for hedge accounting are taken directly to profit or loss.
For less complex derivative products, the fair values are principally determined by valuation models which are commonly used by market participants. Inputs to valuation models are determined from observable market data wherever possible, including foreign exchange spot and forward rates and interest rate yield curves. For more complex derivative products, the fair values are mainly determined by quoted prices from dealers.
Notes to Financial Statements31 December 2014(In RMB millions, unless otherwise stated)
146
Hedge accounting
At the inception of a hedge relationship, the Group formally designates and documents the hedge relationship to which the Group wishes to apply hedge accounting and the risk management objective and strategy for undertaking the hedge. The documentation includes identification of the hedging instrument, the hedged item or transaction, the nature of the risk being hedged and how the entity will assess the hedging instrument’s effectiveness in offsetting the exposure to changes in the hedged item’s fair value or cash flows attributable to the hedged risk. Such hedges are expected to be highly effective in achieving offsetting changes in fair value or cash flows and are assessed on an ongoing basis to determine that they have actually been highly effective throughout the financial reporting periods for which they were designated.
Certain derivative transactions, while providing effective economic hedges under the Group’s risk management positions, do not qualify for hedge accounting and are therefore treated as derivatives held for trading with fair value gains or losses recognised in profit or loss. Hedges which meet the strict criteria for hedge accounting are accounted for in accordance with the Group’s accounting policy as set out below.
Fair value hedges
Fair value hedges are hedges of the Group’s exposure to changes in the fair value of a recognised asset or liability or an unrecognised firm commitment, or an identified portion of such an asset, liability or unrecognised firm commitment, that is attributable to a particular risk and could affect the profit or loss. For fair value hedges, the carrying amount of the hedged item is adjusted for gains and losses attributable to the risk being hedged, the derivative is remeasured at fair value and the gains and losses from both are taken to profit or loss.
For hedged items recorded at amortised cost, the difference between the carrying value of the hedged item and the face value is amortised over the remaining term of the original hedge using the effective interest rate method.
When an unrecognised firm commitment is designated as a hedged item, the subsequent cumulative change in the fair value of the firm commitment attributable to the hedged risk is recognised as an asset or liability with a corresponding gain or loss recognised in profit or loss. The changes in the fair value of the hedging instrument are also recognised in profit or loss.
The Group discontinues fair value hedge accounting if the hedging instrument expires or is sold, terminated or exercised, the hedge no longer meets the criteria for hedge accounting or the Group revokes the designation. If the hedged items are derecognised, the unamortised fair value is recorded in profit or loss.
Cash flow hedges
Cash flow hedges are hedges of the Group’s exposure to variability in cash flows that is attributable to a particular risk associated with a recognised asset or liability or a highly probable forecast transaction and could affect profit or loss. For designated and qualifying cash flow hedges, the effective portion of the gain or loss on the hedging instrument is initially recognised directly in other comprehensive income. The ineffective portion of the gain or loss on the hedging instrument is recognised immediately in profit or loss.
When the hedged cash flow affects profit or loss, the gain or loss on the hedging instrument recognised directly in other comprehensive income is recycled in the corresponding income or expense line of the statement of profit or loss. When a hedging instrument expires, or is sold, terminated, exercised, or when a hedge no longer meets the criteria for hedge accounting, any cumulative gain or loss existing in other comprehensive income at that time remains in other comprehensive income until the hedged forecast transaction ultimately occurs. When a forecast transaction is no longer expected to occur, the cumulative gain or loss that was reported in other comprehensive income is immediately transferred to profit or loss.
(12) Trade date accounting
All regular way purchases and sales of financial assets are recognised at the trade date, which is the date that the Group commits to purchase or sell the assets. A regular way purchase or sale is the purchase or sale of financial assets that requires delivery of assets within the time frame generally established by regulation or convention in the marketplace.
Notes to Financial Statements31 December 2014
(In RMB millions, unless otherwise stated)
A n n u a l R e p o r t 2 0 1 4 147
(13) Offsetting of financial instruments
Financial assets and financial liabilities are generally presented separately in the statement of financial position and are not offset. However, a financial asset and a financial liability are offset and the net amount is presented in the statement of financial position when both the following conditions are satisfied:
• the Group currently has a legally enforceable right to set off the recognised amounts; and
• the Group intends either to settle on a net basis, or to realise the financial asset and settle the financial liability simultaneously.
(14) Repurchase and reverse repurchase transactions (including securities borrowing and lending)
Assets sold under agreements to repurchase at a specified future date (“repos”) are not derecognised from the statement of financial position. The corresponding cash received, including accrued interest, is recognised on the statement of financial position as a “repurchase agreement”, reflecting its economic substance as a loan to the Group. The difference between the sale and repurchase prices is treated as an interest expense and is accrued over the life of the agreement using the effective interest rate method.
Conversely, assets purchased under agreements to resell at a specified future date (“reverse repos”) are not recognised on the statement of financial position. The corresponding cash paid, including accrued interest, is recognised on the statement of financial position as a “reverse repurchase agreement”. The difference between the purchase and resale prices is treated as an interest income and is accrued over the life of the agreement using the effective interest rate method.
Securities borrowing and lending transactions are usually collateralised by securities or cash. The transfer of the securities to counterparties is only reflected on the statement of financial position if the risks and rewards of ownership are also transferred. Cash advanced or received as collateral is recorded as an asset or liability.
Securities borrowed are not recognised on the statement of financial position, unless they are then sold to third parties, in which case the obligation to return the securities is recorded as a financial liability held for trading and measured at fair value with any gains or losses included in profit or loss.
(15) Precious metals
Precious metals comprise gold, silver and other precious metals. Precious metals that are not related to the Group’s precious metals trading activities are initially measured at acquisition cost and subsequently measured at the lower of cost and net realisable value. Precious metals acquired by the Group for trading purposes are initially measured at fair value and subsequent changes in fair value are recorded in profit or loss.
The Group records the precious metals received as an asset. A liability to return the amount of precious metals deposited is also recognised. The precious metals deposited in the Group are measured at fair value both on initial recognition and in subsequent measurement.
(16) Property and equipment
Property and equipment, other than construction in progress are stated at cost less accumulated depreciation and any impairment losses. The cost of an item of property and equipment comprises its purchase price, tax and any directly attributable costs of bringing the asset to its present working condition and location for its intended use. Expenditure incurred after items of property and equipment have been put into operation, such as repairs and maintenance, is normally charged to profit or loss in the period in which it is incurred. In situations where the recognition criteria are satisfied, the expenditure for a major inspection is capitalised in the carrying amount of the asset as a replacement.
Construction in progress comprises the direct costs of construction during the period of construction and is not depreciated. Construction in progress is reclassified to the appropriate category of property and equipment when completed and ready for use.
The carrying values of property and equipment are reviewed for impairment when events or changes in circumstances indicate that the carrying values may not be recoverable.
Notes to Financial Statements31 December 2014(In RMB millions, unless otherwise stated)
148
Depreciation is calculated on the straight-line basis to write off the cost of each item of property and equipment, less any estimated residual value, over the estimated useful life. The estimated useful life, estimated residual value and the annual depreciation rate of each item of property and equipment (excluding aircraft and vessels) are as follows:
Estimateduseful life
Estimatedresidual
value rateAnnual
depreciation rate
Properties and buildings 5–35 years 3% 2.77%–19.40%
Office equipment and motor vehicles (excluding aircraft and vessels) 3–6 years – 16.67%–33.33%
Leasehold improvementsOver the shorter of the economic useful lives
and remaining lease terms
Equipment under operating leases where the Group is the lessor is aircraft, aircraft engines and vessels. The estimated useful lives and depreciation methods are determined according to the real conditions of each individual aircraft and vessels. The residual values are assessed by an independent valuer based on historical data. The estimated useful lives range from 15 to 25 years.
For an item of impaired fixed assets, the depreciation is calculated based on the carrying value less the cumulative impairment losses.
Where parts of an item of property and equipment have different useful lives, the cost of that item is allocated on a reasonable basis among the parts and each part is depreciated separately.
Residual values, useful lives and depreciation methods are reviewed, and adjusted if appropriate, at least at each financial year end.
An item of property and equipment and any significant part initially recognised is derecognised upon disposal or when no future economic benefits are expected from its use or disposal. Any gain or loss arising on derecognition of the asset (calculated as the difference between the net disposal proceeds and the carrying amount of the asset) is included in the statement of profit or loss in the year the asset is derecognised.
(17) Land use rights
Land use rights are recognised at cost, being the fair value at the time of injection from the central government of the PRC (the “Government”) or the consideration paid. The rights are amortised using the straight-line basis over the period of the leases. When the prepaid land lease payments cannot be allocated reliably between the land and buildings elements, the entire lease payments are included in the cost of properties and buildings as finance leases in property and equipment.
(18) Repossessed assets
Repossessed assets are initially recognised at fair value, and are subsequently measured at the lower of the carrying value and net recoverable amount. If the recoverable amount is lower than the carrying value of the repossessed assets, the assets are written down to the recoverable amount.
(19) Business combination and goodwill
Business combinations are accounted for using the acquisition method. The consideration transferred is measured at acquisition date fair value which is the sum of the acquisition date fair values of assets transferred by the Group, liabilities assumed by the Group to the former owners of the acquiree and the equity interests issued by the Group in exchange for control of the acquiree. Acquisition costs incurred are expensed.
Notes to Financial Statements31 December 2014
(In RMB millions, unless otherwise stated)
A n n u a l R e p o r t 2 0 1 4 149
When the Group acquires a business, it assesses the financial assets and liabilities assumed for appropriate classification and designation in accordance with the contractual terms, economic circumstances and pertinent conditions as at the acquisition date. This includes the separation of embedded derivatives in host contracts by the acquiree.
If the business combination is achieved in stages, the acquisition date fair value of the acquirer’s previously held equity interest in the acquiree is remeasured to fair value as at the acquisition date through profit or loss.
Any contingent consideration to be transferred by the acquirer is recognised at fair value at the acquisition date. Subsequent changes to the fair value of the contingent consideration which is deemed to be an asset or liability, is recognised either in profit or loss or as change to other comprehensive income. If the contingent consideration is classified as equity, it shall not be remeasured until it is finally settled within equity.
Goodwill is initially measured at cost, being the excess of the aggregate of the consideration transferred, the amount recognised for non-controlling interests and any fair value of the Group’s previously held equity interests in the acquiree over the net identifiable assets acquired and liabilities assumed. If the sum of this consideration and other items is lower than the fair value of the net assets of the subsidiary acquired, the difference is, after reassessment, recognised in profit or loss as gain on bargain purchase.
After initial recognition, goodwill is measured at cost less any accumulated impairment losses. Goodwill is tested for impairment annually or more frequently if events or changes in circumstances indicate that the carrying value may be impaired. The Group performs its annual impairment test of goodwill as at 31 December. For the purpose of impairment testing, goodwill acquired in a business combination is, from the acquisition date, allocated to each of the Group’s cash-generating units (“CGU”), or groups of CGUs, that are expected to benefit from the synergies of the combination, irrespective of whether other assets or liabilities of the Group are assigned to those units or groups of units.
Impairment is determined by assessing the recoverable amount of the CGU (group of CGUs) to which the goodwill relates. Where the recoverable amount of the CGU (group of CGUs) is less than the carrying amount, an impairment loss is recognised. An impairment loss recognised for goodwill is not reversed in a subsequent period.
Where goodwill forms part of a CGU (group of CGUs) and part of the operation within that unit is disposed of, the goodwill associated with the operation disposed of is included in the carrying amount of the operation when determining the gain or loss on disposal of the operation. Goodwill disposed of in this circumstance is measured based on the relative values of the operation disposed of and the portion of the CGU retained.
(20) Provisions
Provisions are recognised when the Group has a present obligation (legal or constructive) as a result of a past event, and it is probable that an outflow of resources embodying economic benefits will be required to settle the obligation and a reliable estimate can be made of the amount of the obligation.
A provision shall be initially measured at the best estimate of the expenditure required to settle the related present obligation. When the effect of the time value of money is material, the best estimate shall be determined by discounting the related future cash outflows. When determining the best estimate, the Group considers factors pertaining to a contingency such as risks, uncertainties and time of value of money. Where there is a continuous range of the expenditure required, and each possible outcome in that range is as likely as any other, the best estimate shall be the mid-point of that range. In other cases, the best estimate shall be determined according to the following circumstances:
— Where the contingency involves a single item, the best estimate shall be the most likely outcome.
— Where the contingency involves a large population of items, the best estimate shall be determined by weighting all possible outcomes by their associated probabilities.
The Group shall review the carrying amount of a provision at the end of reporting period. The carrying amount shall be adjusted to the current best estimate.
Notes to Financial Statements31 December 2014(In RMB millions, unless otherwise stated)
150
(21) Asset impairment
Impairment losses on assets except for deferred tax assets, financial assets and goodwill are determined based on the following:
The Group assesses at the end of each reporting period whether there is any indication that an asset may be impaired. If any such indication exists, or when impairment testing for an asset is required, the Group makes an estimate of the asset’s recoverable amount. An asset’s recoverable amount is the higher of its fair value less costs to sell and its value in use and is determined on an individual basis, unless the asset does not generate cash inflows that are largely independent of those from other assets or groups of assets, in which case the recoverable amount is determined for the CGU to which the asset belongs. Where the carrying amount of an asset exceeds its recoverable amount, the asset is considered to be impaired and is written down to its recoverable amount. In assessing value in use of an asset, the estimated future cash flows are discounted to their present values using a pre-tax discount rate that reflects current market assessments of the time value of money and the risks specific to the asset.
An assessment is made at the end of each reporting period as to whether there is any indication that previously recognised impairment losses may no longer exist or may have decreased. If such an indication exists, the recoverable amount is estimated. A previously recognised impairment loss is reversed only if there has been a change in the estimates used to determine the asset’s recoverable amount since the last impairment loss was recognised. If that is the case, the carrying amount of the asset is increased to its recoverable amount. That increased amount cannot exceed the carrying amount that would have been determined, net of any depreciation/amortisation, had no impairment loss been recognised for the asset in prior years. Any such reversal is recognised in profit or loss. After such a reversal, the depreciation/amortisation charge is adjusted in future periods to allocate the asset’s revised carrying amount, less any residual value, on a systematic basis over its remaining useful life.
(22) Cash and cash equivalents
Cash and cash equivalents refer to short term highly liquid assets, which are readily convertible into known amounts of cash and subject to an insignificant risk of changes in value. Cash and cash equivalents comprise cash, unrestricted balances with central banks, amounts due from banks and other financial institutions and reverse repurchase agreements with original maturity of less than three months.
(23) Employee benefits
Employee benefits refer to all forms of consideration and other related expenditure given by the Group in exchange for services rendered by employees. The benefits payable are recognised as liabilities during the period in which the employees have rendered services to the Group. If the effect of discounting the benefits payable which are payable after one year from the end of the reporting period is significant, the Group will present them at their present value.
Short-term employee benefits
Employee wages or salaries, bonuses, social security contributions such as medical insurance, work injury insurance, maternity insurance and housing fund, measured at the amount incurred or at the applicable benchmarks and rates, are recognised as a liability as the employee provides services, with a corresponding charge to profit or loss or included in the cost of assets where appropriate.
All eligible employees outside Mainland China participate in local defined contribution schemes. The Group contributes to these defined contribution schemes based on the requirements of the local regulatory bodies.
Notes to Financial Statements31 December 2014
(In RMB millions, unless otherwise stated)
A n n u a l R e p o r t 2 0 1 4 151
Post-employment benefits-defined contribution plans
Pursuant to the relevant laws and regulations of the PRC, the Group participated in a defined contribution basic pension insurance in the social insurance system established and managed by government organizations. The Group makes contributions to basic pension insurance plans based on the applicable benchmarks and rates stipulated by the government. Basic pension insurance contributions are recognised as part of the cost of the assets or charged to profit or loss as the related services are rendered by the employees.
In addition, employees in Mainland China also participate in a defined contribution retirement benefit plan established by the Group (the “Annuity Plan”). The Group and its employees are required to contribute a certain percentage of the employees’ previous year basic salaries to the Annuity Plan. The contribution is charged to profit or loss when it is incurred. The Group pays a fixed contribution into the Annuity Plan and has no obligation to pay further contributions if the Annuity Plan does not hold sufficient assets to pay all employee benefits.
Termination benefits
Termination benefits are payable as a result of either the Group’s decision to terminate an employee’s employment before the normal retirement date or an employee’s decision to accept an offer of benefits in exchange for the termination of employment. The Group recognise termination benefits in profit or loss at the earlier of:
— When the Group can no longer withdraw an offer of those benefits; and
— When the Group has a specific, formal restructure plan involving payment of termination benefits, and the plan has started or informed each affected party about the influence of the plan, therefore each party formed reasonable expectations.
Early retirement benefits
According to the Bank’s policy on early retirement benefits, certain employees are entitled to take leave of absence and in return receive a certain level of staff salaries and related benefits from the Bank. The salaries and benefit payments are made from the date of early retirement to the normal retirement date. Differences arising from changes in assumptions and estimates of the present value of the liabilities are recognised in profit or loss when it is incurred.
(24) Fiduciary activities
Where the Group acts in a fiduciary capacity such as custodian or agent, assets arising thereon together with related undertakings to return such assets to customers are excluded from the statement of financial position.
The asset custody services of the Group refer to the business that the Group as trustee approved by regulatory authorities, signs custody agreement with clients and takes the responsibility of trustee in accordance with relevant laws and regulations. The assets under custody are recorded as off-balance sheet items as the Group merely fulfils the responsibility as trustee and charges fees in accordance with these agreements without retaining any risks or rewards of the assets under custody.
The Group grants entrusted loans on behalf of trustors, which are recorded off-balance sheet. The Group, as a trustee, grants such entrusted loans to borrowers under the direction of those trustors who fund these loans. The Group has been contracted by those trustors to manage the administration and collection of these loans on their behalf. Those trustors determine both the underwriting criteria for and the terms of all entrusted loans including their purposes, amounts, interest rates, and repayment schedules. The Group charges a commission related to its activities in connection with entrusted loans which are recognised ratably over the period in which the service is provided. The risk of loss is borne by those trustors.
Notes to Financial Statements31 December 2014(In RMB millions, unless otherwise stated)
152
(25) Insurance contractsInsurance contracts classification
The Group’s insurance subsidiary executes the contract with the policyholder. Where the Group undertakes insurance risk, which means a risk, rather than a financial risk, transferred from the holder of a contract to the insurance provider and over time, the combined cost of claims, administration and acquisition of the contract may exceed the aggregate amount of premiums received and investment income, the contract is classified as an insurance contract; where the Group undertakes the risks other than insurance risk. the contract is classified as non-insurance contract; and where the Group undertakes both insurance risk and other risks, forming a contract with mixed risks, the following stipulations are applied:
(i) Where the insurance risk and other risks can be distinguished from each other and separately measured, the insurance risk is separated from other risks. The insurance risk is accounted for as an insurance contract and other risks are accounted for according to the relevant accounting standards.
(ii) Where the insurance risk and other risks cannot be distinguished from each other, or can be distinguished but cannot be separately measured, an umbrella contract applies and significant insurance risk test shall be performed based on it. If the insurance risk is significant, the contract is accounted for as an insurance contract; otherwise, it is accounted for as a non-insurance contract.
Insurance income recognition
Insurance premium income is recognised when:
(i) The insurance contract is issued, and related insurance risk is undertaken by the Group;
(ii) The related economic benefits are likely to flow to the Group; and
(iii) Related income can be reliably measured.
Insurance contract liabilities
When measuring insurance contract liabilities, the Group classifies insurance contracts whose insurance risks are of similar nature as a measurement unit. Insurance contract liabilities are measured based on a reasonably estimated amount of payment that the Group is obliged to pay to fulfill relevant obligations under the insurance contract. At the end of each reporting period, liability adequacy tests are performed. If the insurance contract liabilities re-calculated with the insurance actuarial method exceed their carrying amounts on date of the liability adequacy test, an additional provision shall be made for the respective insurance contract liabilities based on the difference. Otherwise, no adjustment is made to the respective insurance contract liabilities.
(26) Revenue recognition
Revenue is recognised to the extent that it is probable that the economic benefits will flow to the Group and when the revenue can be reliably measured. The following specific recognition criteria must also be met before revenue is recognised:
Interest income
For all financial instruments measured at amortised cost and interest-generating financial instruments classified as available-for-sale financial assets, interest income is recorded at the effective interest rate, which is the rate that exactly discounts estimated future cash payments or receipts through the expected life of the financial instrument or a shorter period, where appropriate, to the net carrying amount of the financial asset. The calculation takes into account all contractual terms of the financial instrument (for example, prepayment options) and includes any fees or incremental costs that are directly attributable to the instrument and are an integral part of the effective interest rate, but not future credit losses. The carrying amount of the financial asset is adjusted if the Group revises its estimates of payments or receipts. The adjusted carrying amount is calculated based on the original effective interest rate and the change in carrying amount is recorded in profit or loss.
Notes to Financial Statements31 December 2014
(In RMB millions, unless otherwise stated)
A n n u a l R e p o r t 2 0 1 4 153
Once a financial asset or a group of similar financial assets has been written down as a result of an impairment loss, interest income is recognised using the rate of interest used to discount the future cash flows for the purpose of measuring the impairment loss.
Fee and commission income
The Group earns fee and commission income from a diverse range of services it provides to its customers. Fee income can be divided into the following two categories:
(i) Fee income on transactions conducted or from services provided over a period of time
These fees mainly include fee income on settlement and clearing business, commission income and fee income on asset management, custody and other management advisory services. Fee income is recognised on the basis of when the transaction is completed or on an accrual basis when the service is provided over a period of time.
(ii) Fee income from providing transaction services
Fees arising from negotiating or participating in the negotiation of a transaction for a third party, such as the arrangement of the acquisition of shares or other securities or the purchase or sale of businesses, are recognised on completion of the underlying transaction. Fees or components of fees that are linked to a certain performance are recognised after fulfilling the corresponding criteria.
The fair value of the award credits granted to the bank card holders is deferred and recognised as fee and commission income when the award credits are redeemed or expire.
Dividend income
Dividend income is recognised when the Group’s right to receive payment is established.
Net trading income
Results arising from trading activities include all gains and losses from changes in fair value for financial assets and financial liabilities that are held for trading. This includes gains and losses from changes in fair value relating to the ineffective portion of the hedging arrangements.
(27) Income tax
Income tax comprises current and deferred income tax. Income tax is recognised in profit or loss except that it relates to items recognised directly in equity, in which case it is recognised in equity.
Current tax
Current tax assets and liabilities for the current and prior periods are measured at the amount expected to be recovered from or paid to the taxation authorities. The tax rates and tax laws used to compute the amount are those that are enacted or substantively enacted by the end of each reporting period.
Deferred income tax
Deferred income tax is provided using the liability method on temporary differences at the end of the reporting period between the tax bases of assets and liabilities and their carrying amounts.
Deferred income tax liabilities are recognised for all taxable temporary differences, except:
(i) Where the deferred income tax liability arises from the initial recognition of goodwill or of an asset or liability in a transaction that is not a business combination and, at the time of the transaction, affects neither the accounting profit nor taxable income or deductible expenses; and
Notes to Financial Statements31 December 2014(In RMB millions, unless otherwise stated)
154
(ii) In respect of taxable temporary differences associated with investments in subsidiaries, associates and joint ventures, where the timing of the reversal of the temporary differences can be controlled and it is probable that the temporary differences will not be reversed in the foreseeable future.
Deferred income tax assets are recognised for all deductible temporary differences, carryforward of unused tax credits and unused tax losses, to the extent that it is probable that taxable profit will be available against which the deductible temporary differences, and the carryforward of unused tax credits and unused tax losses can be utilised, except:
(i) Where the deferred income tax asset relating to the deductible temporary differences arises from the initial recognition of an asset or liability in a transaction that is not a business combination and, at the time of the transaction, affects neither the accounting profit nor taxable income or deductible expenses; and
(ii) In respect of deductible temporary differences associated with investments in subsidiaries, associates and joint ventures, deferred income tax assets are recognised only to the extent that it is probable that the temporary differences will be reversed in the foreseeable future and taxable profit will be available against which the temporary differences can be utilised.
Deferred income tax assets and deferred income tax liabilities are measured at the tax rates that are expected to apply to the period when the asset is realised or the liability is settled, based on tax rates (and tax laws) that have been enacted or substantively enacted by the end of each reporting period and reflect the corresponding tax effect.
The carrying amount of deferred income tax assets is reviewed at the end of each reporting period and reduced to the extent that it is no longer probable that sufficient taxable income will be available to allow all or part of the deferred income tax asset to be utilised. When it is virtually probable that sufficient taxable income will be available, the reduced amount can be reversed accordingly.
Deferred income tax assets and deferred income tax liabilities are offset if a legally enforceable right exists to set off current tax assets against current tax liabilities and the deferred income taxes relate to the same taxable entity and the same taxation authority.
(28) Leases
Leases which transfer substantially all the risks and rewards of ownership of the assets to the lessees are classified as finance leases. Leases where substantially all the rewards and risks of the assets remain with the lessor are accounted for as operating leases.
Finance leases
When the Group is a lessor under finance leases, an amount representing the minimum lease payment receivables and initial direct costs is included in the statement of financial position as loans and advances to customers. Any unguaranteed residual value is also recognised at the inception of the lease. The difference between the sum of the minimum lease payment receivables, initial direct costs, the unguaranteed residual value and their present value is recognised as unearned finance income. Unearned finance income is recognised over the period of the lease using the effective interest rate method.
Operating leases
Rental payments applicable to operating leases are charged to profit or loss on the straight-line basis over the lease terms.
When the Group is the lessor under operating leases, the assets subject to operating leases are accounted for as the Group’s assets. Rental income is recognised as “other operating income, net” in the statement of profit or loss on the straight-line basis over the lease term.
Notes to Financial Statements31 December 2014
(In RMB millions, unless otherwise stated)
A n n u a l R e p o r t 2 0 1 4 155
(29) Related parties
A party is considered to be related to the Group if:
(a) the party is a person or a close member of that person’s family and that person,
(i) has control or joint control over the Group;
(ii) has significant influence over the Group; or
(iii) is a member of the key management personnel of the Group or of a parent of the Group;
or
(b) the party is an entity where any of the following conditions applies:
(i) the entity and the Group are members of the same group;
(ii) one entity is an associate or joint venture of the other entity (or of a parent, subsidiary or fellow subsidiary of the other entity);
(iii) the entity and the Group are joint ventures of the same third party;
(iv) one entity is a joint venture of a third entity and the other entity is an associate of the third entity;
(v) the entity is a post-employment benefit plan for the benefit of employees of either the Group or an entity related to the Group;
(vi) the entity is controlled or jointly controlled by a person identified in (a); and
(vii) a person identified in (a)(i) has significant influence over the entity or is a member of the key management personnel of the entity (or of a parent of the entity).
(30) Financial guarantee contracts
The Group issues financial guarantee contracts, including letters of credit, letters of guarantee and acceptance. These financial guarantee contracts provide for specified payments to be made to reimburse the holders for the losses they incur when a guaranteed party defaults under the original or modified terms of a debt instrument, loan or any other obligation.
The Group initially measures all financial contracts at fair value, in other liabilities, being the premium received. This amount is recognised ratably over the period of the contract as fee and commission income. Subsequently, the liabilities are measured at the higher of the initial fair value less cumulative amortisation and the best estimate of expenditure being required to settle any financial obligation arising as a result of the guarantee. Any increase in the liability relating to a financial guarantee is taken to the statement of profit or loss.
(31) Contingent liabilities
A contingent liability is a possible obligation that arises from past events and whose existence will only be confirmed by the occurrence or non-occurrence of one or more uncertain future events not wholly within the control of the Group. It can also be a present obligation arising from past events that is not recognised because it is not probable that an outflow of economic resources will be required or the amount of obligation cannot be measured reliably. Contingent liabilities are disclosed in the notes to the financial statements. When a change in the probability of an outflow occurs so that outflow is probable and can be reliably estimated, it will then be recognised as a provision.
(32) Dividends
Dividends are recognised as a liability and deducted from equity when they are approved by the Bank’s shareholders in general meetings and declared. Interim dividends are deducted from equity when they are approved and declared, and no longer at the discretion of the Bank. Dividend for the year that is approved after the end of the reporting period is disclosed as an event after the reporting period.
Notes to Financial Statements31 December 2014(In RMB millions, unless otherwise stated)
156
4. SIGNIFICANT ACCOUNTING JUDGEMENTS AND ESTIMATES
In the process of applying the Group’s accounting policies, management has used its judgements and made assumptions of the effects of uncertain future events on the financial statements. The most significant use of judgements and key assumptions concerning the future and other key sources of estimation uncertainty at the end of the reporting period that have a significant risk of causing a material adjustment to the carrying amounts of assets and liabilities within the next financial period are described below.
Designation of held-to-maturity investments
Non-derivative financial assets with fixed or determinable payments and fixed maturity are classified as held-to-maturity investments when the Group has the positive intention and ability to hold the investments to maturity. Accordingly, in evaluating whether a financial asset shall be classified as a held-to-maturity investment, significant management judgement is required. If the Group fails correctly to assess its intention and ability to hold the investments to maturity and the Group sells or reclassifies more than an insignificant amount of held-to-maturity investments before maturity, the Group would reclassify the whole held-to-maturity investment portfolio as available for sale.
Impairment losses of loans and advances and amounts due from banks and other financial institutions
The Group determines periodically whether there is any objective evidence that impairment losses have occurred on loans and advances and amounts due from banks and other financial institutions. If any such evidence exists, the Group assesses the amount of impairment losses. The amount of impairment losses is measured as the difference between the carrying amount and the present value of estimated future cash flows. Assessing the amount of impairment losses requires significant judgement on whether the objective evidence for impairment exists and also significant estimates when determining the present value of the expected future cash flows.
Impairment losses of available-for-sale and held-to-maturity investments
In determining whether there is any objective evidence that impairment losses have occurred on available-for-sale and held-to-maturity investments, the Group assesses periodically whether there has been a significant or prolonged decline in the fair value below its cost or carrying amount, or whether other objective evidence of impairment exists based on the investee’s financial conditions and business prospects, including industry environment, change of technology as well as operating and financing cash flows. This requires a significant level of judgement, which would affect the amount of impairment losses.
Impairment of goodwill
The Group determines whether goodwill is impaired at least on an annual basis and when circumstances indicate that the carrying value may be impaired. This requires an estimation of the recoverable amount of the CGU or groups of CGUs to which the goodwill is allocated. Estimating the recoverable amount requires the Group to make an estimate of the expected future cash flows from the CGU or groups of CGUs and also to choose a suitable discount rate in order to calculate the present value of those cash flows.
Income tax
Determining income tax provisions requires the Group to estimate the future tax treatment of certain transactions. The Group carefully evaluates tax implications of transactions in accordance with prevailing tax regulations and makes tax provisions accordingly. In addition, deferred income tax assets are recognised to the extent that it is probable that future taxable profit will be available against which the deductible temporary differences can be utilised. This requires significant estimation on the tax treatments of certain transactions and also significant assessment on the probability that adequate future taxable profits will be available for the deferred income tax assets to be recovered.
Fair value of financial instruments
If the market for a financial instrument is not active, the Group establishes fair value by using a valuation technique. Valuation techniques include using recent arm’s length market transactions between knowledgeable and willing parties, if available, reference to the current fair value of another instrument that is substantially the same, discounted cash flow analysis and option pricing models. To the extent practicable, valuation technique makes maximum use of market inputs. However, where market inputs are not available, management needs to make estimates on such unobservable market inputs.
Notes to Financial Statements31 December 2014
(In RMB millions, unless otherwise stated)
A n n u a l R e p o r t 2 0 1 4 157
Determination of control over investees
Management applies its judgement to determine whether the control indicators set out in Note 3(1) indicate that the Group controls a securitisation vehicle, an investment fund, a non-principal guaranteed wealth management product, a segregated asset management plan, trust plans or asset-backed financings.
Securitisation vehicles
Certain securitisation vehicles sponsored by the Group under its securitisation programme are run according to predetermined criteria that are part of the initial design of the vehicles. In addition, the Group is exposed to variability of returns from the vehicles through its holding of debt securities in the vehicles. Outside the day-to-day servicing of the receivables (which is carried out by the Group under a servicing contract), key decisions are usually required only when receivables in the vehicles go into default. Therefore, in considering whether it has control, the Group considers whether it manages these key decisions that most significantly affect these vehicles’ returns.
Investment funds, non-principal guaranteed wealth management products, segregated asset management plans, trust plans and asset-backed financings
The Group acts as manager to a number of investment funds, non-principal guaranteed wealth management products, segregated asset management plans, trust plans and assets-backed financings. Determining whether the Group controls such a structured entity usually focuses on the assessment of the aggregate economic interests of the Group in the entity (comprising any carried interests and expected management fees) and the decision-making authority of the entity. For all these structured entities managed by the Group, the Group’s aggregate economic interest is in each case not significant and the decision makers establish, market and manage them according to restricted parameters as set out in the investment agreements as required by laws and regulations. As a result, the Group has concluded that it acts as agent as opposed to principal for the investors in all cases, and therefore has not consolidated these structured entities.
For further disclosure in respect of unconsolidated investment funds, non-principal guaranteed wealth management products, segregated asset management plans, trust plans and assets-backed financings in which the Group has an interest or for which it is a sponsor, see Note 44.
5. IMPACT OF ISSUED BUT NOT YET EFFECTIVE INTERNATIONAL FINANCIAL REPORTING STANDARDS
The Group has not applied the following new and revised IFRSs and IASs that have been issued but are not yet effective, in these financial statements.
Annual Improvements to IFRSs 2010–2012 Cycle and 2011–2013 Cycle1
IAS 19 Amendments Employee benefits1
IFRS 11 Amendments Joint Arrangements2
IFRS 14 Regulatory deferral accounts2
IAS 16 and IAS 38 Amendments Clarification of acceptable methods of depreciation and amortization2
IAS 27 Amendments Separate financial statements2
IFRS 10 and IAS 28 Amendments Sale or contribution of assets between an investor and its associate or joint venture2
Annual Improvements to IFRSs 2012–2014 Cycle2
IFRS 15 Revenue from contracts with customers3
IFRS 9 Financial instruments4
1 Effective for annual periods beginning on or after 30 June 2015.
2 Effective for annual periods beginning on or after 1 January 2016, early adoption is permitted.
3 Effective for annual periods beginning on or after 1 January 2017, early adoption is permitted.
4 Effective for annual periods beginning on or after 1 January 2018, early adoption is permitted.
Notes to Financial Statements31 December 2014(In RMB millions, unless otherwise stated)
158
Further information about those changes that are expected to affect the Group is as follows:
Annual Improvements to IFRSs 2010–2012 Cycle and 2011–2013 Cycle
The 2010–2012 cycle of annual improvement contains amendments to seven standards with consequential amendments to other standards and interpretations including IFRS 2 Share based payment, IFRS 3 Business combinations, IFRS 8 Operating segments, IFRS 13 Fair value measurement, IAS 24 Related party disclosures, IAS 16 Property, plant and equipment and IAS 38, Intangible assets.
The 2011–2013 cycle of annual improvement contains amendments to four standards with consequential amendments to other standards and interpretations including IFRS 1 First-time adoption of International Financial Reporting Standards, IFRS 3 Business combinations, IFRS 13, Fair value measurement, IAS 40 Investment property.
The adoption of these annual improvements will not have any material impact on the financial position and the financial result of the Group.
Amendments to IAS 19, Employee benefits “Defined benefit plans: Employee contributions”
The amendments introduce a relief to reduce the complexity of accounting for certain contributions from employees or third parties under defined benefit plans. When the contributions meet the criteria set out in the amendments, a company is permitted (but not required) to recognise the contributions as a reduction of the service cost in the period in which the related service is rendered, instead of including them in calculating the defined benefit obligation.
The adoption will not have any material impact on the financial position and the financial result of the Group.
IFRS14, Regulatory deferral accounts
This interim standard permits first-time adopters of IFRS to continue to use previous GAAP to account for regulatory deferral account balances while the IASB completes its comprehensive project in this area.
As an existing IFRS adopter, the Group is not applicable for the new standard.
Amendments to IFRS 11, Joint Arrangements “Accounting for acquisitions of interests in joint operations”
The amendments provide new guidance on how to account for the acquisition of an interest in a joint operation that constitutes a business. Specifically, the amendments require business combination accounting to be applied in this situation.
The adoption will not have any material impact on the financial position and the financial result of the Group.
Amendments to IAS 16 and IAS 38, Clarification of acceptable methods of depreciation and amortization
The amendments introduce a rebuttable presumption to IAS 38 that the use of revenue-based amortisation methods for intangible assets is inappropriate. This presumption can be overcome only when revenue and the consumption of the economic benefits of the intangible asset are ‘highly correlated’, or when the intangible asset is expressed as a measure of revenue. The amendments also prohibit the use of revenue-based depreciation methods for property, plant and equipment under IAS 16.
The adoption will not have any material impact on the financial position and the financial result of the Group.
Notes to Financial Statements31 December 2014
(In RMB millions, unless otherwise stated)
A n n u a l R e p o r t 2 0 1 4 159
Amendments to IAS 27, Separate financial statements “Equity method in separate financial statements”
The amendments allow an entity to apply the equity method to account for its investments in subsidiaries, joint ventures and associates in its separate financial statements. As a result of the amendments, the entity can choose to account for these investments either:
• at cost;
• in accordance with IFRS 9 (or IAS 39); or
• using the equity method as described in IAS 28.
The adoption will not have any material impact on the financial position and the financial result of the Group.
Amendments to IFRS10 and IAS28, Sale or contribution of assets between an investor and its associate or joint venture
The amendments address a long-standing conflict on transactions with Joint Venture, by creating a new dividing line-namely whether a business has been sold- with a new approach to steps-up. The amendments require the full gain to be recognised when the assets transferred meet the definition of the business under IFRS 3 Business Combinations.
The adoption will not have any material impact on the financial position and the financial result of the Group.
Annual Improvements to IFRSs 2012–2014 Cycle
The 2012–2014 cycle of annual improvement contains amendments to four standards with consequential amendments to other standards and interpretations including IFRS 5 Non-current assets held for sale and discounted operations, IFRS 7 Financial instruments: disclosures, IAS 19 Employee benefits, IAS 34 Interim financial reporting.
The adoption of these annual improvements will not have any material impact on the financial position and the financial result of the Group.
IFRS 15, Revenue from contracts with customers
The standard contains a single model that applies to contracts with customers and two approaches to recognising revenue: at a point in time or over time. The model features a contract-based five-step analysis of transactions to determine whether, how much and when revenue is recognised.
IFRS 15 also introduces extensive qualitative and quantitative disclosure requirements which aim to enable users of the financial statements to understand the nature, amount, timing and uncertainty of revenue and cash flows arising from contracts with customers. Some of these apply to interim financial reports prepared under IAS 34 as well as to annual financial statements. An entity may adopt IFRS 15 on a full retrospective basis. Alternatively, it may choose to adopt it from the date of initial application by adjusting opening balances at that date. Transitional disclosures are different depending on the approach adopted by the entity.
The adoption will not have any material impact on the financial position and the financial result of the Group.
IFRS 9, Financial instruments
On 24 July 2014, the IASB issued the complete standard of IFRS 9 (IFRS 9 (2014)).
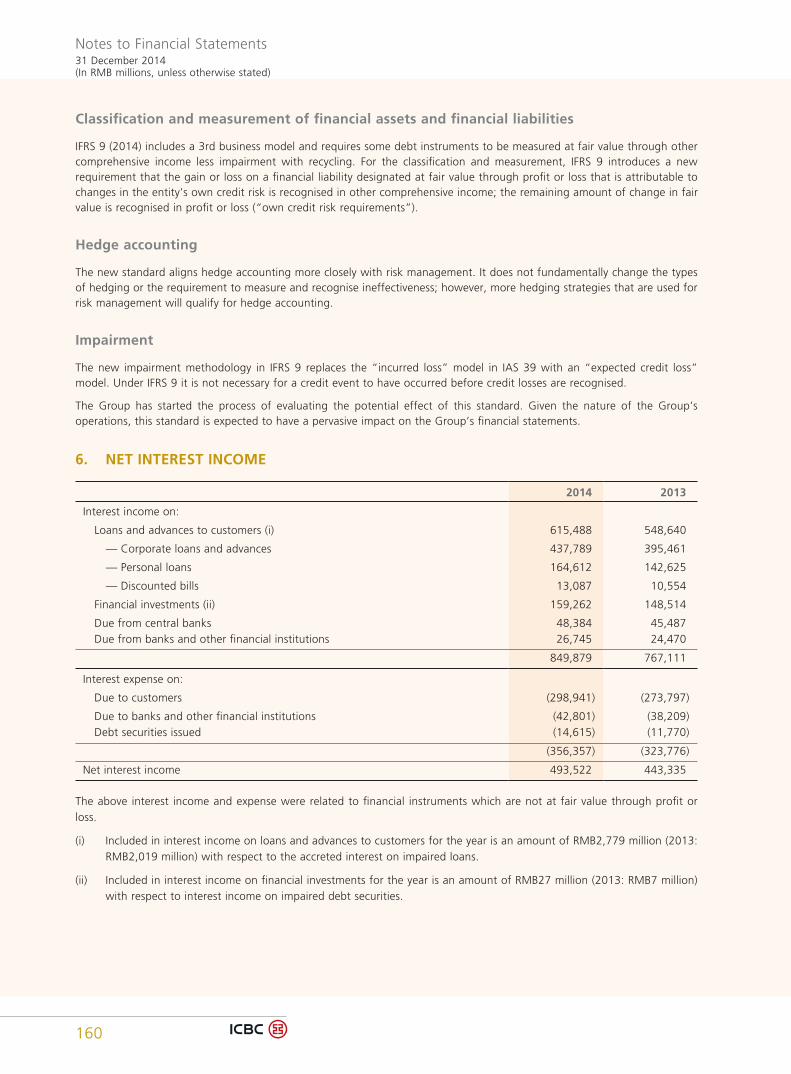
Notes to Financial Statements31 December 2014(In RMB millions, unless otherwise stated)
160
Classification and measurement of financial assets and financial liabilities
IFRS 9 (2014) includes a 3rd business model and requires some debt instruments to be measured at fair value through other comprehensive income less impairment with recycling. For the classification and measurement, IFRS 9 introduces a new requirement that the gain or loss on a financial liability designated at fair value through profit or loss that is attributable to changes in the entity’s own credit risk is recognised in other comprehensive income; the remaining amount of change in fair value is recognised in profit or loss (“own credit risk requirements”).
Hedge accounting
The new standard aligns hedge accounting more closely with risk management. It does not fundamentally change the types of hedging or the requirement to measure and recognise ineffectiveness; however, more hedging strategies that are used for risk management will qualify for hedge accounting.
Impairment
The new impairment methodology in IFRS 9 replaces the “incurred loss” model in IAS 39 with an “expected credit loss” model. Under IFRS 9 it is not necessary for a credit event to have occurred before credit losses are recognised.
The Group has started the process of evaluating the potential effect of this standard. Given the nature of the Group’s operations, this standard is expected to have a pervasive impact on the Group’s financial statements.
6. NET INTEREST INCOME
2014 2013
Interest income on:
Loans and advances to customers (i) 615,488 548,640
— Corporate loans and advances 437,789 395,461
— Personal loans 164,612 142,625
— Discounted bills 13,087 10,554
Financial investments (ii) 159,262 148,514
Due from central banks 48,384 45,487 Due from banks and other financial institutions 26,745 24,470
849,879 767,111
Interest expense on:
Due to customers (298,941) (273,797)
Due to banks and other financial institutions (42,801) (38,209) Debt securities issued (14,615) (11,770)
(356,357) (323,776)
Net interest income 493,522 443,335
The above interest income and expense were related to financial instruments which are not at fair value through profit or loss.
(i) Included in interest income on loans and advances to customers for the year is an amount of RMB2,779 million (2013: RMB2,019 million) with respect to the accreted interest on impaired loans.
(ii) Included in interest income on financial investments for the year is an amount of RMB27 million (2013: RMB7 million) with respect to interest income on impaired debt securities.
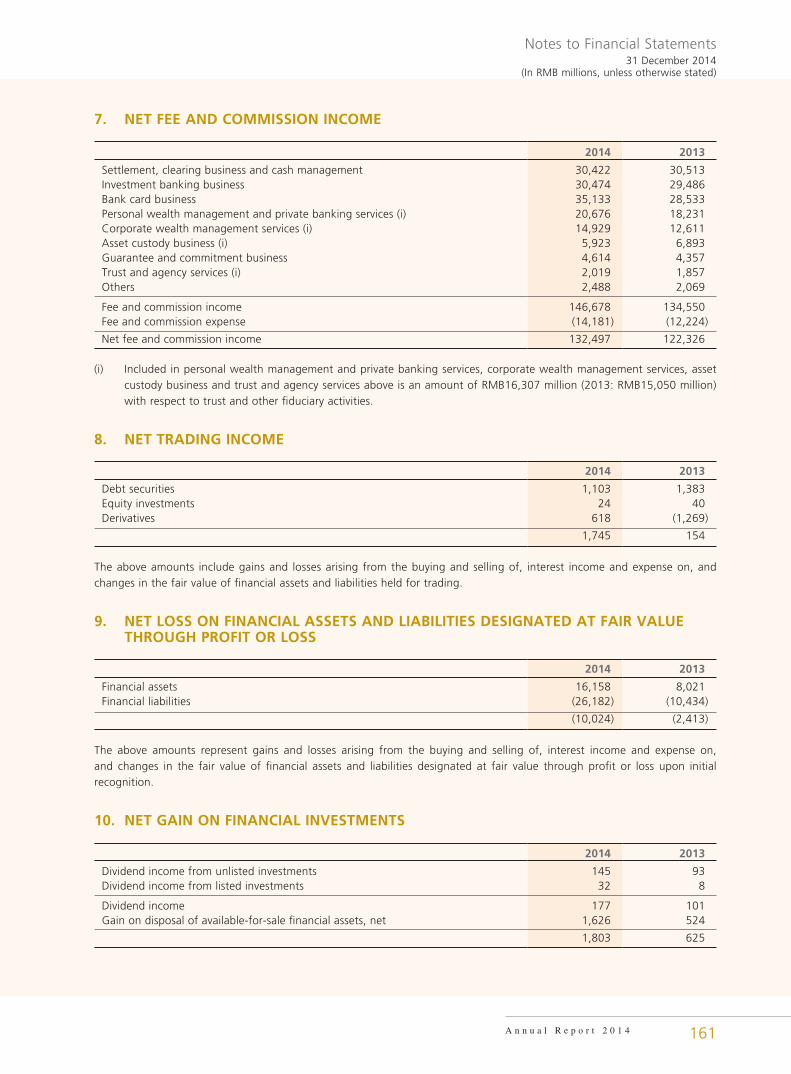
Notes to Financial Statements31 December 2014
(In RMB millions, unless otherwise stated)
A n n u a l R e p o r t 2 0 1 4 161
7. NET FEE AND COMMISSION INCOME
2014 2013
Settlement, clearing business and cash management 30,422 30,513Investment banking business 30,474 29,486Bank card business 35,133 28,533Personal wealth management and private banking services (i) 20,676 18,231Corporate wealth management services (i) 14,929 12,611Asset custody business (i) 5,923 6,893Guarantee and commitment business 4,614 4,357Trust and agency services (i) 2,019 1,857Others 2,488 2,069
Fee and commission income 146,678 134,550Fee and commission expense (14,181) (12,224)
Net fee and commission income 132,497 122,326
(i) Included in personal wealth management and private banking services, corporate wealth management services, asset custody business and trust and agency services above is an amount of RMB16,307 million (2013: RMB15,050 million) with respect to trust and other fiduciary activities.
8. NET TRADING INCOME
2014 2013
Debt securities 1,103 1,383Equity investments 24 40Derivatives 618 (1,269)
1,745 154
The above amounts include gains and losses arising from the buying and selling of, interest income and expense on, and changes in the fair value of financial assets and liabilities held for trading.
9. NET LOSS ON FINANCIAL ASSETS AND LIABILITIES DESIGNATED AT FAIR VALUE THROUGH PROFIT OR LOSS
2014 2013
Financial assets 16,158 8,021Financial liabilities (26,182) (10,434)
(10,024) (2,413)
The above amounts represent gains and losses arising from the buying and selling of, interest income and expense on, and changes in the fair value of financial assets and liabilities designated at fair value through profit or loss upon initial recognition.
10. NET GAIN ON FINANCIAL INVESTMENTS
2014 2013
Dividend income from unlisted investments 145 93Dividend income from listed investments 32 8
Dividend income 177 101Gain on disposal of available-for-sale financial assets, net 1,626 524
1,803 625
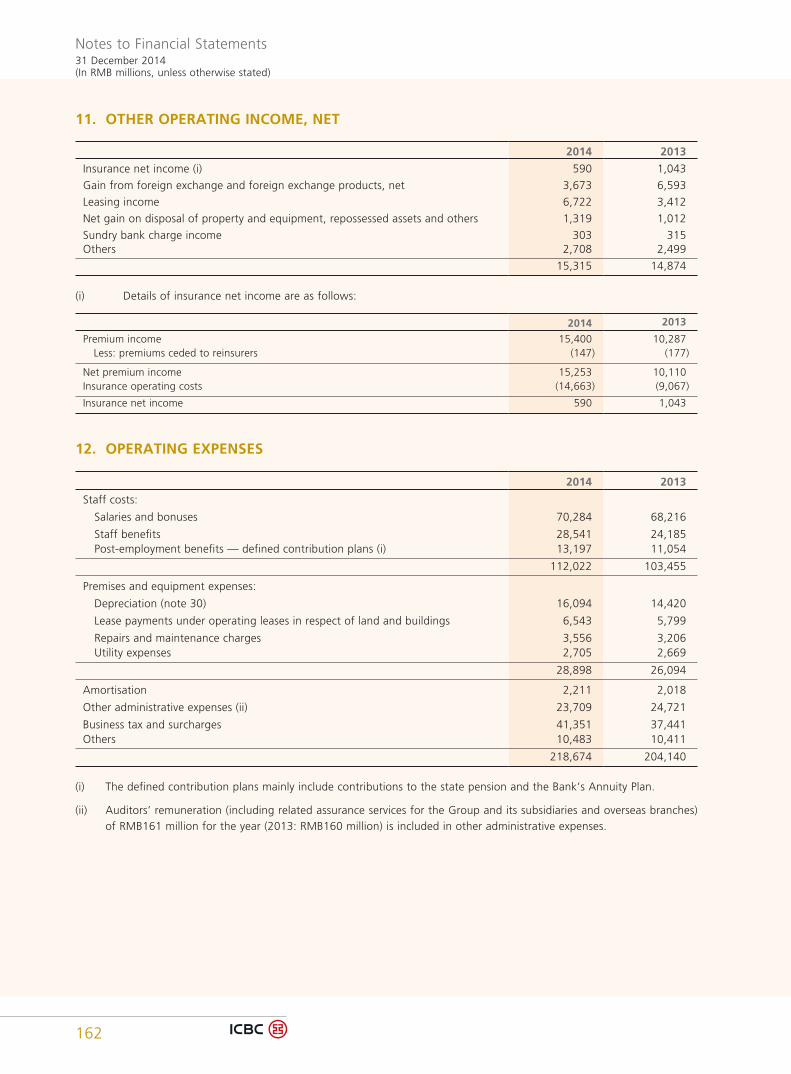
Notes to Financial Statements31 December 2014(In RMB millions, unless otherwise stated)
162
11. OTHER OPERATING INCOME, NET
2014 2013
Insurance net income (i) 590 1,043
Gain from foreign exchange and foreign exchange products, net 3,673 6,593
Leasing income 6,722 3,412
Net gain on disposal of property and equipment, repossessed assets and others 1,319 1,012
Sundry bank charge income 303 315Others 2,708 2,499
15,315 14,874
(i) Details of insurance net income are as follows:
2014 2013
Premium income 15,400 10,287 Less: premiums ceded to reinsurers (147) (177)
Net premium income 15,253 10,110Insurance operating costs (14,663) (9,067)
Insurance net income 590 1,043
12. OPERATING EXPENSES
2014 2013
Staff costs:
Salaries and bonuses 70,284 68,216
Staff benefits 28,541 24,185 Post-employment benefits — defined contribution plans (i) 13,197 11,054
112,022 103,455
Premises and equipment expenses:
Depreciation (note 30) 16,094 14,420
Lease payments under operating leases in respect of land and buildings 6,543 5,799
Repairs and maintenance charges 3,556 3,206 Utility expenses 2,705 2,669
28,898 26,094
Amortisation 2,211 2,018
Other administrative expenses (ii) 23,709 24,721
Business tax and surcharges 41,351 37,441Others 10,483 10,411
218,674 204,140
(i) The defined contribution plans mainly include contributions to the state pension and the Bank’s Annuity Plan.
(ii) Auditors’ remuneration (including related assurance services for the Group and its subsidiaries and overseas branches) of RMB161 million for the year (2013: RMB160 million) is included in other administrative expenses.
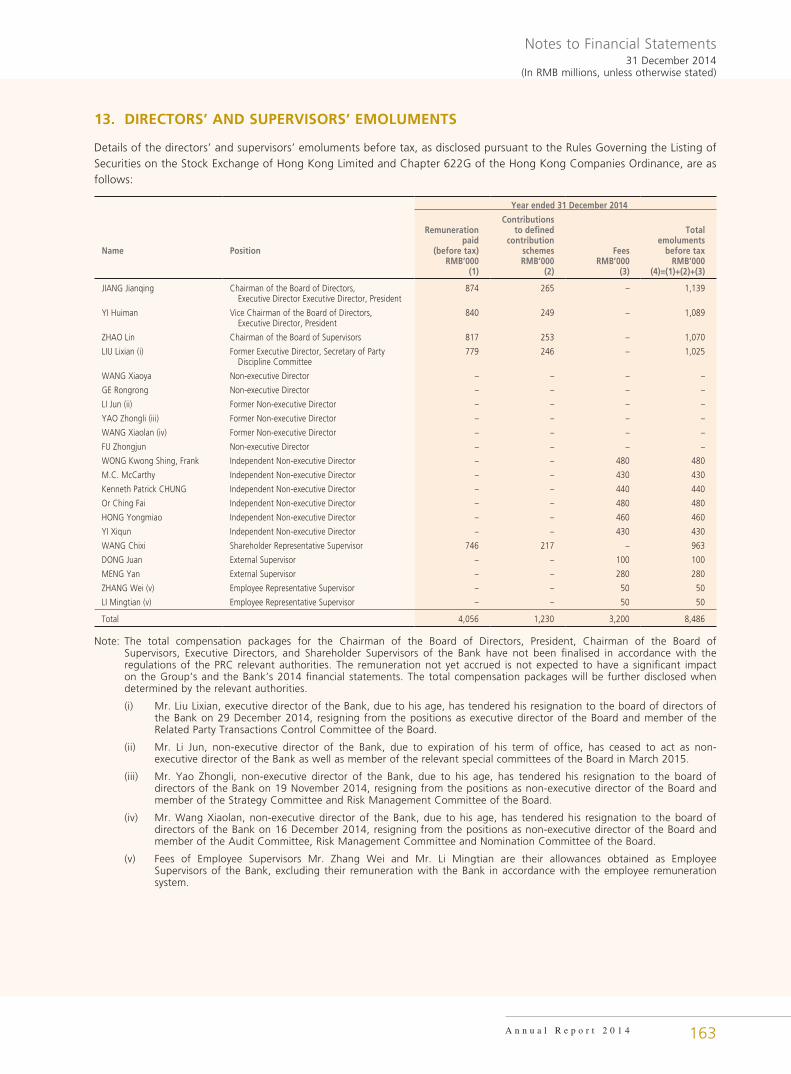
Notes to Financial Statements31 December 2014
(In RMB millions, unless otherwise stated)
A n n u a l R e p o r t 2 0 1 4 163
13. DIRECTORS’ AND SUPERVISORS’ EMOLUMENTS
Details of the directors’ and supervisors’ emoluments before tax, as disclosed pursuant to the Rules Governing the Listing of Securities on the Stock Exchange of Hong Kong Limited and Chapter 622G of the Hong Kong Companies Ordinance, are as follows:
Year ended 31 December 2014
Name Position
Remunerationpaid
(before tax)
Contributionsto defined
contributionschemes Fees
Total emoluments
before taxRMB’000 RMB’000 RMB’000 RMB’000
(1) (2) (3) (4)=(1)+(2)+(3)
JIANG Jianqing Chairman of the Board of Directors, Executive Director Executive Director, President
874 265 – 1,139
YI Huiman Vice Chairman of the Board of Directors, Executive Director, President
840 249 – 1,089
ZHAO Lin Chairman of the Board of Supervisors 817 253 – 1,070
LIU Lixian (i) Former Executive Director, Secretary of Party Discipline Committee
779 246 – 1,025
WANG Xiaoya Non-executive Director – – – –
GE Rongrong Non-executive Director – – – –
LI Jun (ii) Former Non-executive Director – – – –
YAO Zhongli (iii) Former Non-executive Director – – – –
WANG Xiaolan (iv) Former Non-executive Director – – – –
FU Zhongjun Non-executive Director – – – –
WONG Kwong Shing, Frank Independent Non-executive Director – – 480 480
M.C. McCarthy Independent Non-executive Director – – 430 430
Kenneth Patrick CHUNG Independent Non-executive Director – – 440 440
Or Ching Fai Independent Non-executive Director – – 480 480
HONG Yongmiao Independent Non-executive Director – – 460 460
YI Xiqun Independent Non-executive Director – – 430 430
WANG Chixi Shareholder Representative Supervisor 746 217 – 963
DONG Juan External Supervisor – – 100 100
MENG Yan External Supervisor – – 280 280
ZHANG Wei (v) Employee Representative Supervisor – – 50 50
LI Mingtian (v) Employee Representative Supervisor – – 50 50
Total 4,056 1,230 3,200 8,486
Note: The total compensation packages for the Chairman of the Board of Directors, President, Chairman of the Board of Supervisors, Executive Directors, and Shareholder Supervisors of the Bank have not been finalised in accordance with the regulations of the PRC relevant authorities. The remuneration not yet accrued is not expected to have a significant impact on the Group’s and the Bank’s 2014 financial statements. The total compensation packages will be further disclosed when determined by the relevant authorities.
(i) Mr. Liu Lixian, executive director of the Bank, due to his age, has tendered his resignation to the board of directors of the Bank on 29 December 2014, resigning from the positions as executive director of the Board and member of the Related Party Transactions Control Committee of the Board.
(ii) Mr. Li Jun, non-executive director of the Bank, due to expiration of his term of office, has ceased to act as non-executive director of the Bank as well as member of the relevant special committees of the Board in March 2015.
(iii) Mr. Yao Zhongli, non-executive director of the Bank, due to his age, has tendered his resignation to the board of directors of the Bank on 19 November 2014, resigning from the positions as non-executive director of the Board and member of the Strategy Committee and Risk Management Committee of the Board.
(iv) Mr. Wang Xiaolan, non-executive director of the Bank, due to his age, has tendered his resignation to the board of directors of the Bank on 16 December 2014, resigning from the positions as non-executive director of the Board and member of the Audit Committee, Risk Management Committee and Nomination Committee of the Board.
(v) Fees of Employee Supervisors Mr. Zhang Wei and Mr. Li Mingtian are their allowances obtained as Employee Supervisors of the Bank, excluding their remuneration with the Bank in accordance with the employee remuneration system.
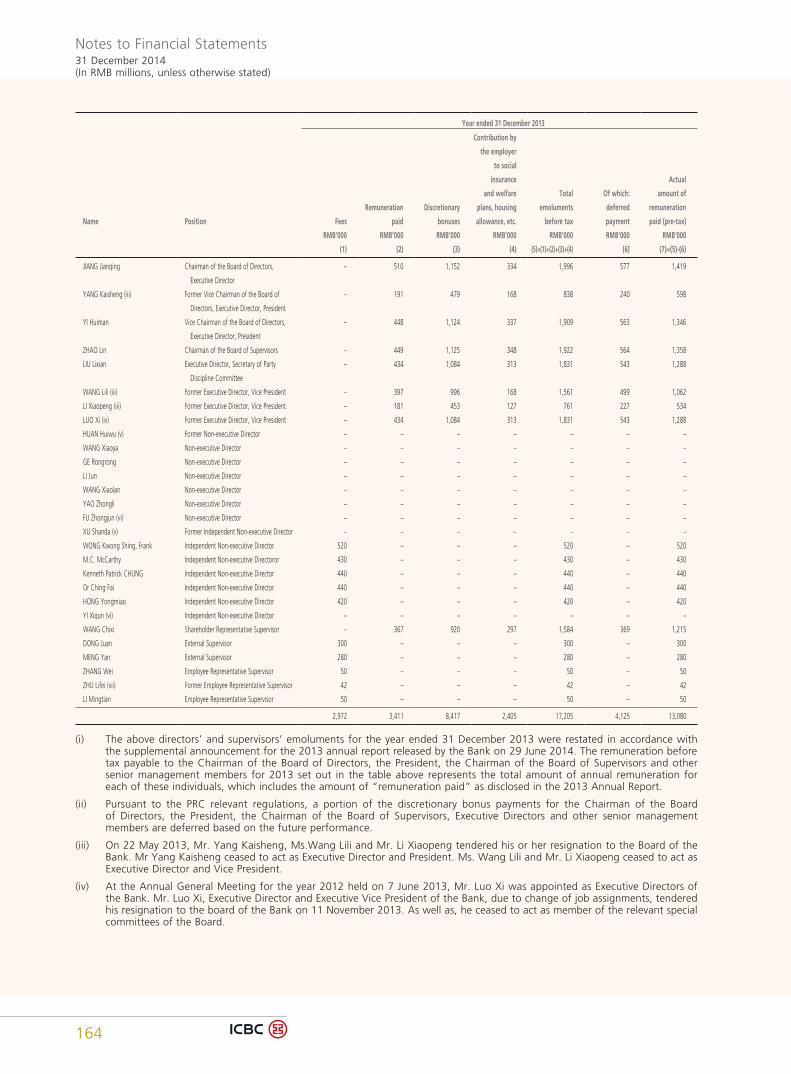
Notes to Financial Statements31 December 2014(In RMB millions, unless otherwise stated)
164
Year ended 31 December 2013
Name Position Fees
Remuneration
paid
Discretionary
bonuses
Contribution by
the employer
to social
insurance
and welfare
plans, housing
allowance, etc.
Total
emoluments
before tax
Of which:
deferred
payment
Actual
amount of
remuneration
paid (pre-tax)
RMB’000 RMB’000 RMB’000 RMB’000 RMB’000 RMB’000 RMB’000
(1) (2) (3) (4) (5)=(1)+(2)+(3)+(4) (6) (7)=(5)-(6)
JIANG Jianqing Chairman of the Board of Directors,
Executive Director
– 510 1,152 334 1,996 577 1,419
YANG Kaisheng (iii) Former Vice Chairman of the Board of
Directors, Executive Director, President
– 191 479 168 838 240 598
YI Huiman Vice Chairman of the Board of Directors,
Executive Director, President
– 448 1,124 337 1,909 563 1,346
ZHAO Lin Chairman of the Board of Supervisors – 449 1,125 348 1,922 564 1,358
LIU Lixian Executive Director, Secretary of Party
Discipline Committee
– 434 1,084 313 1,831 543 1,288
WANG Lili (iii) Former Executive Director, Vice President – 397 996 168 1,561 499 1,062
LI Xiaopeng (iii) Former Executive Director, Vice President – 181 453 127 761 227 534
LUO Xi (iv) Former Executive Director, Vice President – 434 1,084 313 1,831 543 1,288
HUAN Huiwu (v) Former Non-executive Director – – – – – – –
WANG Xiaoya Non-executive Director – – – – – – –
GE Rongrong Non-executive Director – – – – – – –
LI Jun Non-executive Director – – – – – – –
WANG Xiaolan Non-executive Director – – – – – – –
YAO Zhongli Non-executive Director – – – – – – –
FU Zhongjun (vi) Non-executive Director – – – – – – –
XU Shanda (v) Former Independent Non-executive Director – – – – – – –
WONG Kwong Shing, Frank Independent Non-executive Director 520 – – – 520 – 520
M.C. McCarthy Independent Non-executive Directoror 430 – – – 430 – 430
Kenneth Patrick CHUNG Independent Non-executive Director 440 – – – 440 – 440
Or Ching Fai Independent Non-executive Director 440 – – – 440 – 440
HONG Yongmiao Independent Non-executive Director 420 – – – 420 – 420
YI Xiqun (vi) Independent Non-executive Director – – – – – – –
WANG Chixi Shareholder Representative Supervisor – 367 920 297 1,584 369 1,215
DONG Juan External Supervisor 300 – – – 300 – 300
MENG Yan External Supervisor 280 – – – 280 – 280
ZHANG Wei Employee Representative Supervisor 50 – – – 50 – 50
ZHU Lifei (vii) Former Employee Representative Supervisor 42 – – – 42 – 42
LI Mingtian Employee Representative Supervisor 50 – – – 50 – 50
2,972 3,411 8,417 2,405 17,205 4,125 13,080
(i) The above directors’ and supervisors’ emoluments for the year ended 31 December 2013 were restated in accordance with the supplemental announcement for the 2013 annual report released by the Bank on 29 June 2014. The remuneration before tax payable to the Chairman of the Board of Directors, the President, the Chairman of the Board of Supervisors and other senior management members for 2013 set out in the table above represents the total amount of annual remuneration for each of these individuals, which includes the amount of “remuneration paid” as disclosed in the 2013 Annual Report.
(ii) Pursuant to the PRC relevant regulations, a portion of the discretionary bonus payments for the Chairman of the Board of Directors, the President, the Chairman of the Board of Supervisors, Executive Directors and other senior management members are deferred based on the future performance.
(iii) On 22 May 2013, Mr. Yang Kaisheng, Ms.Wang Lili and Mr. Li Xiaopeng tendered his or her resignation to the Board of the Bank. Mr Yang Kaisheng ceased to act as Executive Director and President. Ms. Wang Lili and Mr. Li Xiaopeng ceased to act as Executive Director and Vice President.
(iv) At the Annual General Meeting for the year 2012 held on 7 June 2013, Mr. Luo Xi was appointed as Executive Directors of the Bank. Mr. Luo Xi, Executive Director and Executive Vice President of the Bank, due to change of job assignments, tendered his resignation to the board of the Bank on 11 November 2013. As well as, he ceased to act as member of the relevant special committees of the Board.
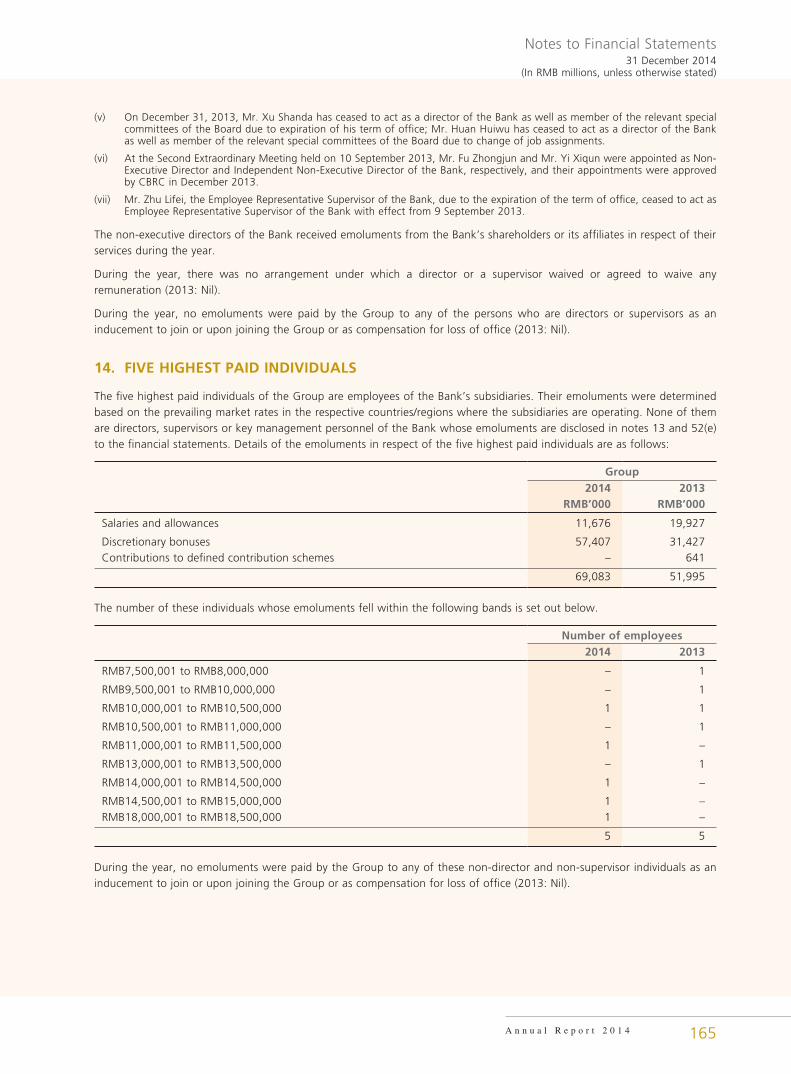
Notes to Financial Statements31 December 2014
(In RMB millions, unless otherwise stated)
A n n u a l R e p o r t 2 0 1 4 165
(v) On December 31, 2013, Mr. Xu Shanda has ceased to act as a director of the Bank as well as member of the relevant special committees of the Board due to expiration of his term of office; Mr. Huan Huiwu has ceased to act as a director of the Bank as well as member of the relevant special committees of the Board due to change of job assignments.
(vi) At the Second Extraordinary Meeting held on 10 September 2013, Mr. Fu Zhongjun and Mr. Yi Xiqun were appointed as Non-Executive Director and Independent Non-Executive Director of the Bank, respectively, and their appointments were approved by CBRC in December 2013.
(vii) Mr. Zhu Lifei, the Employee Representative Supervisor of the Bank, due to the expiration of the term of office, ceased to act as Employee Representative Supervisor of the Bank with effect from 9 September 2013.
The non-executive directors of the Bank received emoluments from the Bank’s shareholders or its affiliates in respect of their services during the year.
During the year, there was no arrangement under which a director or a supervisor waived or agreed to waive any remuneration (2013: Nil).
During the year, no emoluments were paid by the Group to any of the persons who are directors or supervisors as an inducement to join or upon joining the Group or as compensation for loss of office (2013: Nil).
14. FIVE HIGHEST PAID INDIVIDUALS
The five highest paid individuals of the Group are employees of the Bank’s subsidiaries. Their emoluments were determined based on the prevailing market rates in the respective countries/regions where the subsidiaries are operating. None of them are directors, supervisors or key management personnel of the Bank whose emoluments are disclosed in notes 13 and 52(e) to the financial statements. Details of the emoluments in respect of the five highest paid individuals are as follows:
Group2014 2013
RMB’000 RMB’000
Salaries and allowances 11,676 19,927
Discretionary bonuses 57,407 31,427Contributions to defined contribution schemes – 641
69,083 51,995
The number of these individuals whose emoluments fell within the following bands is set out below.
Number of employees2014 2013
RMB7,500,001 to RMB8,000,000 – 1
RMB9,500,001 to RMB10,000,000 – 1
RMB10,000,001 to RMB10,500,000 1 1
RMB10,500,001 to RMB11,000,000 – 1
RMB11,000,001 to RMB11,500,000 1 –
RMB13,000,001 to RMB13,500,000 – 1
RMB14,000,001 to RMB14,500,000 1 –
RMB14,500,001 to RMB15,000,000 1 –RMB18,000,001 to RMB18,500,000 1 –
5 5
During the year, no emoluments were paid by the Group to any of these non-director and non-supervisor individuals as an inducement to join or upon joining the Group or as compensation for loss of office (2013: Nil).
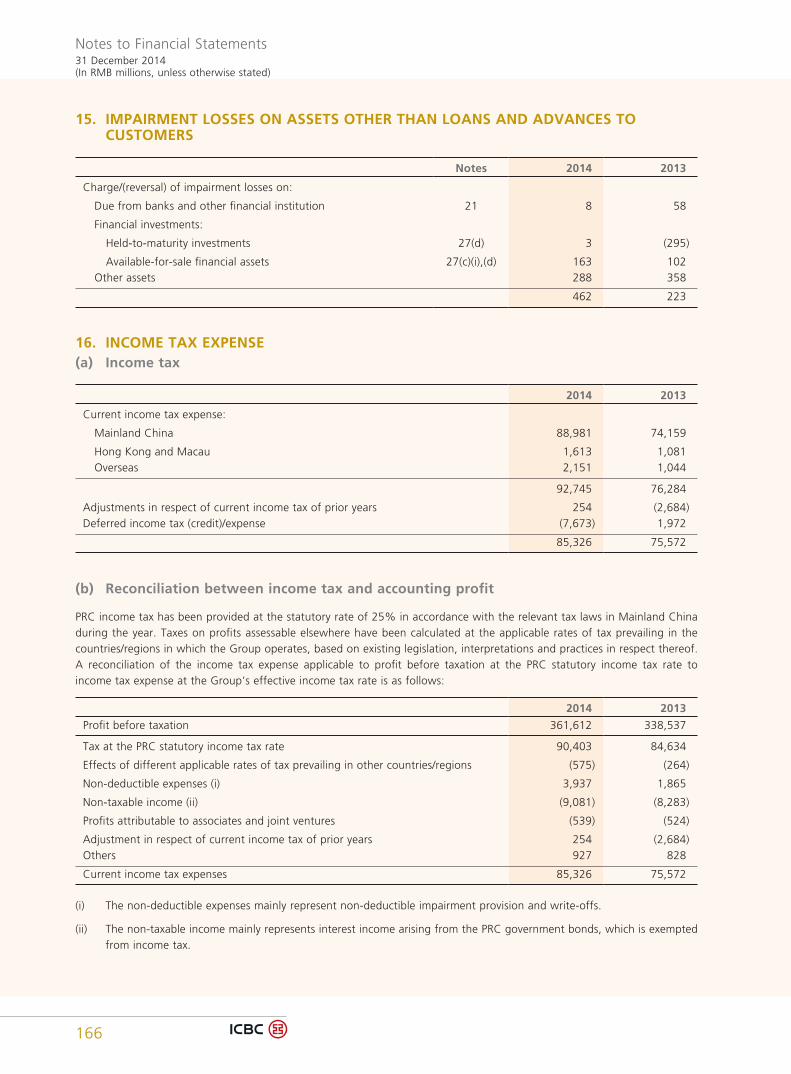
Notes to Financial Statements31 December 2014(In RMB millions, unless otherwise stated)
166
15. IMPAIRMENT LOSSES ON ASSETS OTHER THAN LOANS AND ADVANCES TO CUSTOMERS
Notes 2014 2013
Charge/(reversal) of impairment losses on:
Due from banks and other financial institution 21 8 58
Financial investments:
Held-to-maturity investments 27(d) 3 (295)
Available-for-sale financial assets 27(c)(i),(d) 163 102 Other assets 288 358
462 223
16. INCOME TAX EXPENSE(a) Income tax
2014 2013
Current income tax expense:
Mainland China 88,981 74,159
Hong Kong and Macau 1,613 1,081 Overseas 2,151 1,044
92,745 76,284
Adjustments in respect of current income tax of prior years 254 (2,684)Deferred income tax (credit)/expense (7,673) 1,972
85,326 75,572
(b) Reconciliation between income tax and accounting profit
PRC income tax has been provided at the statutory rate of 25% in accordance with the relevant tax laws in Mainland China during the year. Taxes on profits assessable elsewhere have been calculated at the applicable rates of tax prevailing in the countries/regions in which the Group operates, based on existing legislation, interpretations and practices in respect thereof. A reconciliation of the income tax expense applicable to profit before taxation at the PRC statutory income tax rate to income tax expense at the Group’s effective income tax rate is as follows:
2014 2013
Profit before taxation 361,612 338,537
Tax at the PRC statutory income tax rate 90,403 84,634
Effects of different applicable rates of tax prevailing in other countries/regions (575) (264)
Non-deductible expenses (i) 3,937 1,865
Non-taxable income (ii) (9,081) (8,283)
Profits attributable to associates and joint ventures (539) (524)
Adjustment in respect of current income tax of prior years 254 (2,684)Others 927 828
Current income tax expenses 85,326 75,572
(i) The non-deductible expenses mainly represent non-deductible impairment provision and write-offs.
(ii) The non-taxable income mainly represents interest income arising from the PRC government bonds, which is exempted from income tax.
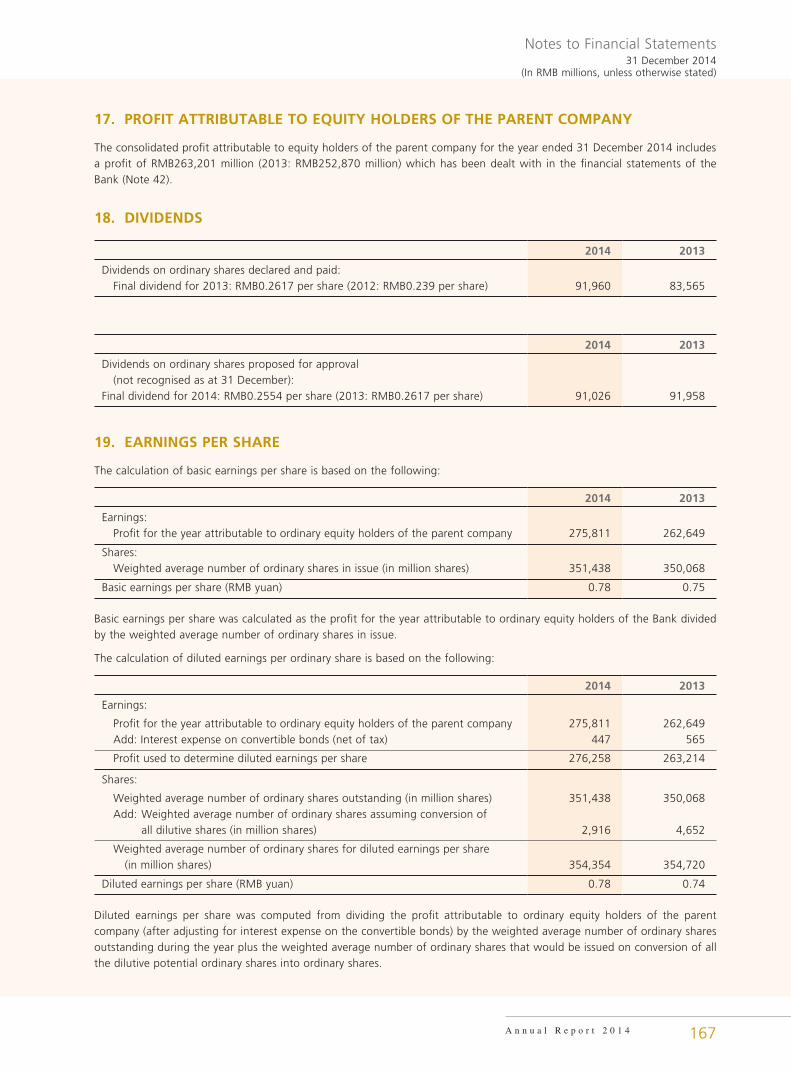
Notes to Financial Statements31 December 2014
(In RMB millions, unless otherwise stated)
A n n u a l R e p o r t 2 0 1 4 167
17. PROFIT ATTRIBUTABLE TO EQUITY HOLDERS OF THE PARENT COMPANY
The consolidated profit attributable to equity holders of the parent company for the year ended 31 December 2014 includes a profit of RMB263,201 million (2013: RMB252,870 million) which has been dealt with in the financial statements of the Bank (Note 42).
18. DIVIDENDS
2014 2013
Dividends on ordinary shares declared and paid: Final dividend for 2013: RMB0.2617 per share (2012: RMB0.239 per share) 91,960 83,565
2014 2013
Dividends on ordinary shares proposed for approval (not recognised as at 31 December):Final dividend for 2014: RMB0.2554 per share (2013: RMB0.2617 per share) 91,026 91,958
19. EARNINGS PER SHARE
The calculation of basic earnings per share is based on the following:
2014 2013
Earnings: Profit for the year attributable to ordinary equity holders of the parent company 275,811 262,649
Shares: Weighted average number of ordinary shares in issue (in million shares) 351,438 350,068
Basic earnings per share (RMB yuan) 0.78 0.75
Basic earnings per share was calculated as the profit for the year attributable to ordinary equity holders of the Bank divided by the weighted average number of ordinary shares in issue.
The calculation of diluted earnings per ordinary share is based on the following:
2014 2013
Earnings:
Profit for the year attributable to ordinary equity holders of the parent company 275,811 262,649 Add: Interest expense on convertible bonds (net of tax) 447 565
Profit used to determine diluted earnings per share 276,258 263,214
Shares:
Weighted average number of ordinary shares outstanding (in million shares) 351,438 350,068 Add: Weighted average number of ordinary shares assuming conversion of all dilutive shares (in million shares) 2,916 4,652
Weighted average number of ordinary shares for diluted earnings per share (in million shares) 354,354 354,720
Diluted earnings per share (RMB yuan) 0.78 0.74
Diluted earnings per share was computed from dividing the profit attributable to ordinary equity holders of the parent company (after adjusting for interest expense on the convertible bonds) by the weighted average number of ordinary shares outstanding during the year plus the weighted average number of ordinary shares that would be issued on conversion of all the dilutive potential ordinary shares into ordinary shares.
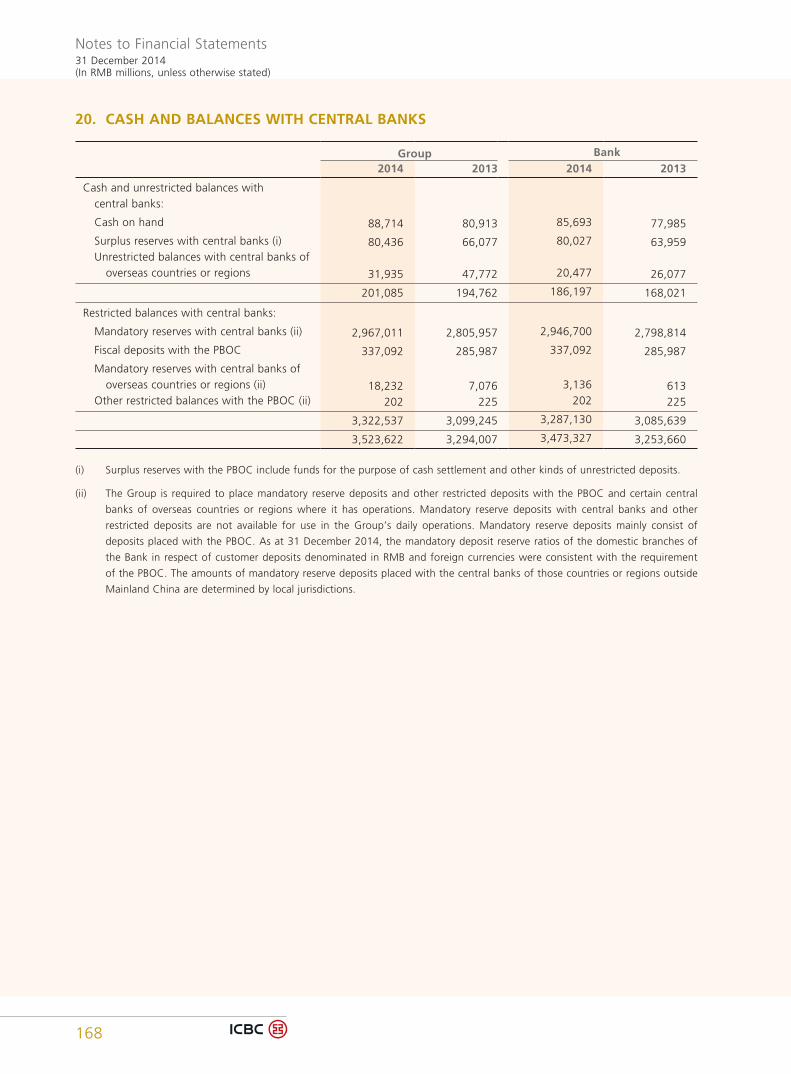
Notes to Financial Statements31 December 2014(In RMB millions, unless otherwise stated)
168
20. CASH AND BALANCES WITH CENTRAL BANKS
Group Bank2014 2013 2014 2013
Cash and unrestricted balances with central banks:
Cash on hand 88,714 80,913 85,693 77,985
Surplus reserves with central banks (i) 80,436 66,077 80,027 63,959 Unrestricted balances with central banks of overseas countries or regions 31,935 47,772 20,477 26,077
201,085 194,762 186,197 168,021
Restricted balances with central banks:
Mandatory reserves with central banks (ii) 2,967,011 2,805,957 2,946,700 2,798,814
Fiscal deposits with the PBOC 337,092 285,987 337,092 285,987
Mandatory reserves with central banks of overseas countries or regions (ii) 18,232 7,076 3,136 613 Other restricted balances with the PBOC (ii) 202 225 202 225
3,322,537 3,099,245 3,287,130 3,085,639
3,523,622 3,294,007 3,473,327 3,253,660
(i) Surplus reserves with the PBOC include funds for the purpose of cash settlement and other kinds of unrestricted deposits.
(ii) The Group is required to place mandatory reserve deposits and other restricted deposits with the PBOC and certain central
banks of overseas countries or regions where it has operations. Mandatory reserve deposits with central banks and other
restricted deposits are not available for use in the Group’s daily operations. Mandatory reserve deposits mainly consist of
deposits placed with the PBOC. As at 31 December 2014, the mandatory deposit reserve ratios of the domestic branches of
the Bank in respect of customer deposits denominated in RMB and foreign currencies were consistent with the requirement
of the PBOC. The amounts of mandatory reserve deposits placed with the central banks of those countries or regions outside
Mainland China are determined by local jurisdictions.
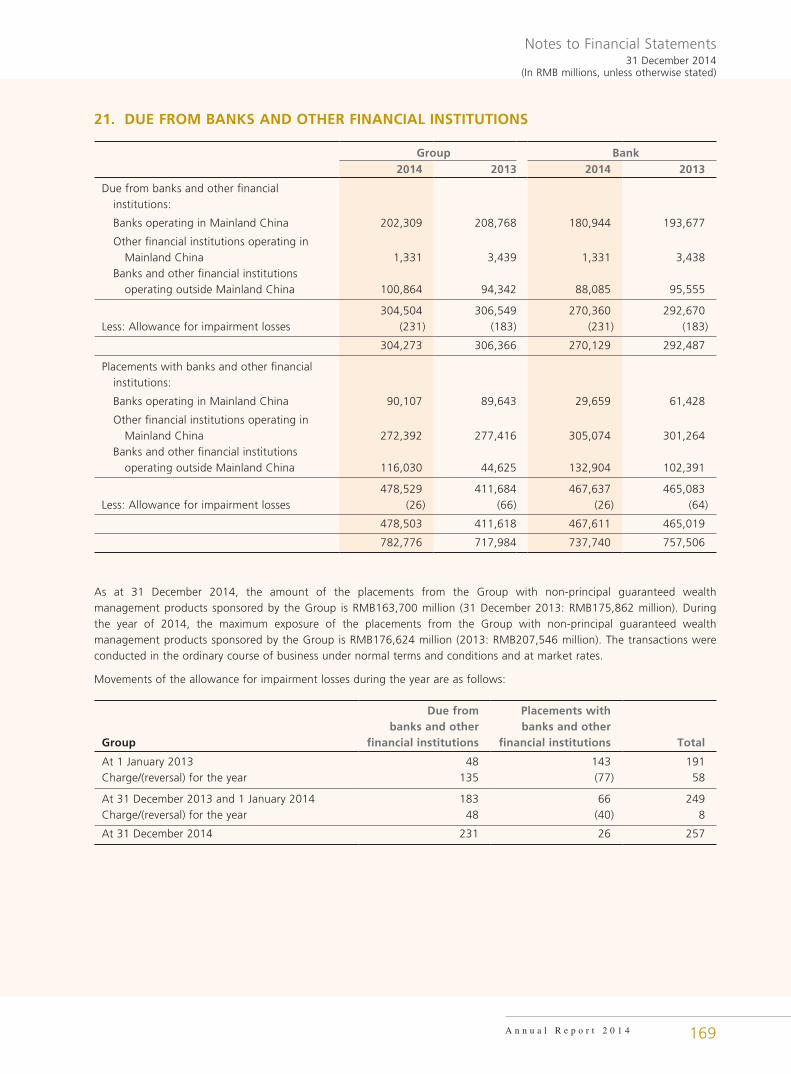
Notes to Financial Statements31 December 2014
(In RMB millions, unless otherwise stated)
A n n u a l R e p o r t 2 0 1 4 169
21. DUE FROM BANKS AND OTHER FINANCIAL INSTITUTIONS
Group Bank2014 2013 2014 2013
Due from banks and other financial institutions:
Banks operating in Mainland China 202,309 208,768 180,944 193,677
Other financial institutions operating in Mainland China 1,331 3,439 1,331 3,438 Banks and other financial institutions operating outside Mainland China 100,864 94,342 88,085 95,555
304,504 306,549 270,360 292,670Less: Allowance for impairment losses (231) (183) (231) (183)
304,273 306,366 270,129 292,487
Placements with banks and other financial institutions:
Banks operating in Mainland China 90,107 89,643 29,659 61,428
Other financial institutions operating in Mainland China 272,392 277,416 305,074 301,264 Banks and other financial institutions operating outside Mainland China 116,030 44,625 132,904 102,391
478,529 411,684 467,637 465,083Less: Allowance for impairment losses (26) (66) (26) (64)
478,503 411,618 467,611 465,019
782,776 717,984 737,740 757,506
As at 31 December 2014, the amount of the placements from the Group with non-principal guaranteed wealth management products sponsored by the Group is RMB163,700 million (31 December 2013: RMB175,862 million). During the year of 2014, the maximum exposure of the placements from the Group with non-principal guaranteed wealth management products sponsored by the Group is RMB176,624 million (2013: RMB207,546 million). The transactions were conducted in the ordinary course of business under normal terms and conditions and at market rates.
Movements of the allowance for impairment losses during the year are as follows:
Group
Due frombanks and other
financial institutions
Placements with banks and other
financial institutions Total
At 1 January 2013 48 143 191Charge/(reversal) for the year 135 (77) 58
At 31 December 2013 and 1 January 2014 183 66 249Charge/(reversal) for the year 48 (40) 8
At 31 December 2014 231 26 257
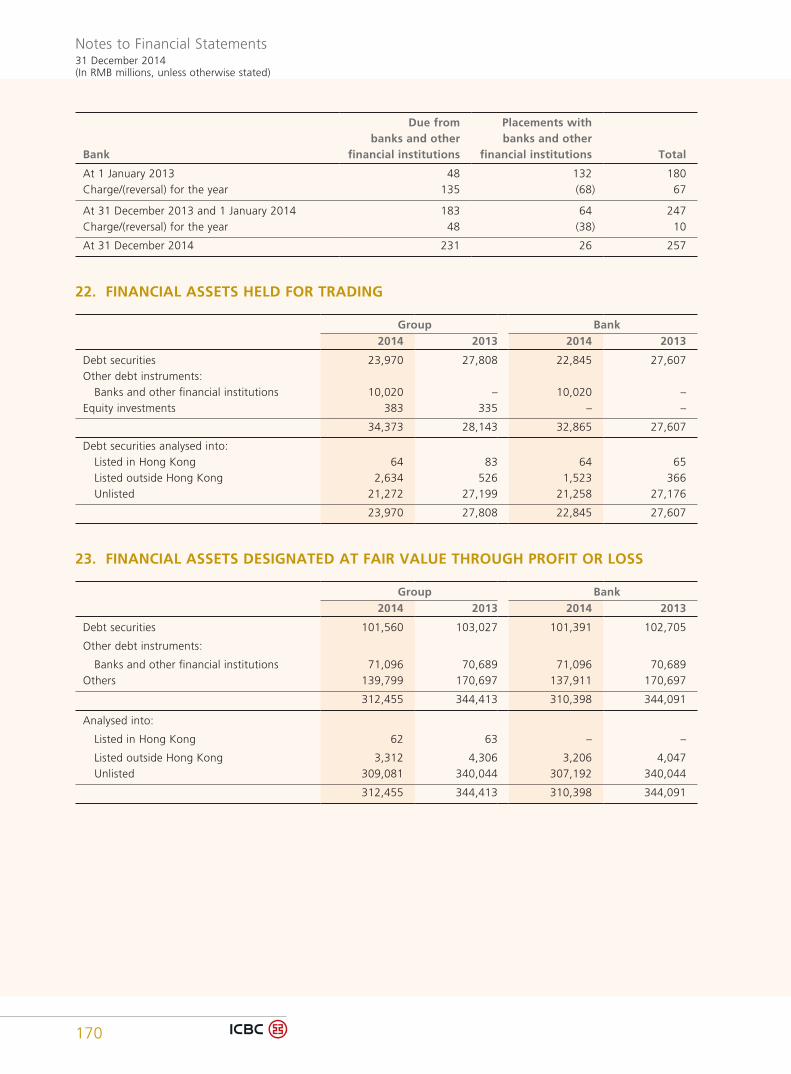
Notes to Financial Statements31 December 2014(In RMB millions, unless otherwise stated)
170
Bank
Due frombanks and other
financial institutions
Placements with banks and other
financial institutions Total
At 1 January 2013 48 132 180Charge/(reversal) for the year 135 (68) 67
At 31 December 2013 and 1 January 2014 183 64 247Charge/(reversal) for the year 48 (38) 10
At 31 December 2014 231 26 257
22. FINANCIAL ASSETS HELD FOR TRADING
Group Bank2014 2013 2014 2013
Debt securities 23,970 27,808 22,845 27,607Other debt instruments: Banks and other financial institutions 10,020 – 10,020 –Equity investments 383 335 – –
34,373 28,143 32,865 27,607
Debt securities analysed into: Listed in Hong Kong 64 83 64 65 Listed outside Hong Kong 2,634 526 1,523 366 Unlisted 21,272 27,199 21,258 27,176
23,970 27,808 22,845 27,607
23. FINANCIAL ASSETS DESIGNATED AT FAIR VALUE THROUGH PROFIT OR LOSS
Group Bank2014 2013 2014 2013
Debt securities 101,560 103,027 101,391 102,705
Other debt instruments:
Banks and other financial institutions 71,096 70,689 71,096 70,689Others 139,799 170,697 137,911 170,697
312,455 344,413 310,398 344,091
Analysed into:
Listed in Hong Kong 62 63 – –
Listed outside Hong Kong 3,312 4,306 3,206 4,047 Unlisted 309,081 340,044 307,192 340,044
312,455 344,413 310,398 344,091
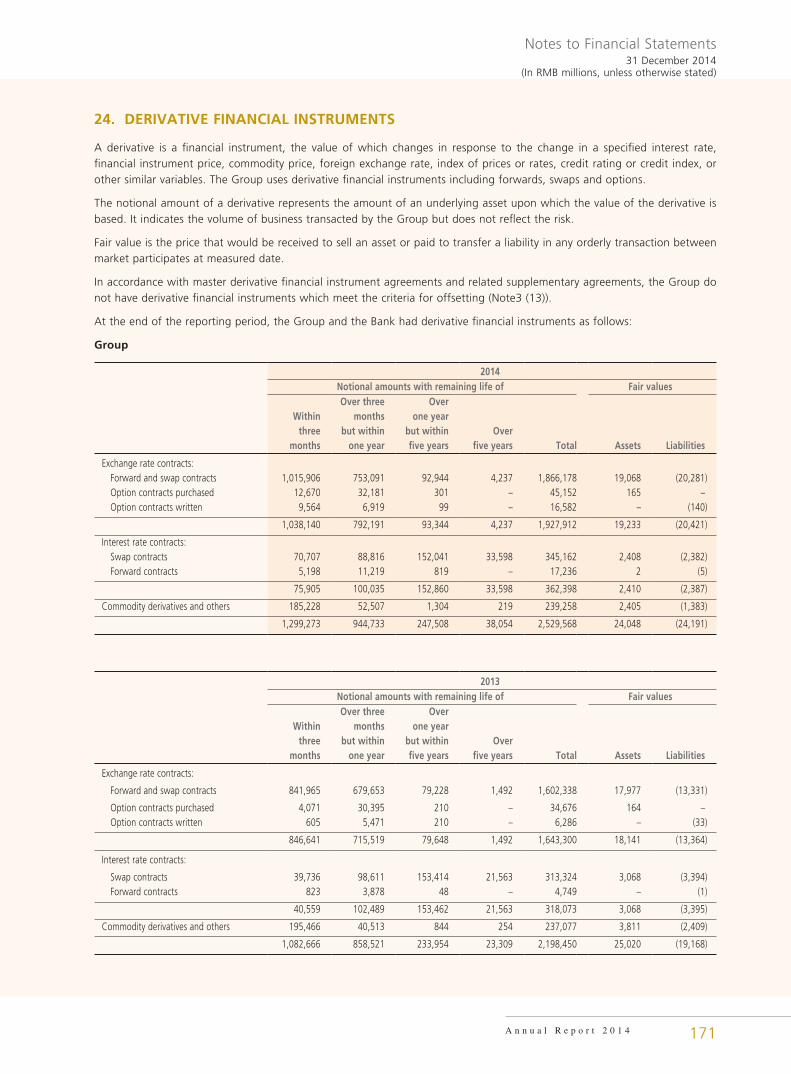
Notes to Financial Statements31 December 2014
(In RMB millions, unless otherwise stated)
A n n u a l R e p o r t 2 0 1 4 171
24. DERIVATIVE FINANCIAL INSTRUMENTS
A derivative is a financial instrument, the value of which changes in response to the change in a specified interest rate, financial instrument price, commodity price, foreign exchange rate, index of prices or rates, credit rating or credit index, or other similar variables. The Group uses derivative financial instruments including forwards, swaps and options.
The notional amount of a derivative represents the amount of an underlying asset upon which the value of the derivative is based. It indicates the volume of business transacted by the Group but does not reflect the risk.
Fair value is the price that would be received to sell an asset or paid to transfer a liability in any orderly transaction between market participates at measured date.
In accordance with master derivative financial instrument agreements and related supplementary agreements, the Group do not have derivative financial instruments which meet the criteria for offsetting (Note3 (13)).
At the end of the reporting period, the Group and the Bank had derivative financial instruments as follows:
Group
2014Notional amounts with remaining life of Fair values
Within three
months
Over three months
but within one year
Overone year
but within five years
Overfive years Total Assets Liabilities
Exchange rate contracts: Forward and swap contracts 1,015,906 753,091 92,944 4,237 1,866,178 19,068 (20,281) Option contracts purchased 12,670 32,181 301 – 45,152 165 – Option contracts written 9,564 6,919 99 – 16,582 – (140)
1,038,140 792,191 93,344 4,237 1,927,912 19,233 (20,421)
Interest rate contracts: Swap contracts 70,707 88,816 152,041 33,598 345,162 2,408 (2,382) Forward contracts 5,198 11,219 819 – 17,236 2 (5)
75,905 100,035 152,860 33,598 362,398 2,410 (2,387)
Commodity derivatives and others 185,228 52,507 1,304 219 239,258 2,405 (1,383)
1,299,273 944,733 247,508 38,054 2,529,568 24,048 (24,191)
2013Notional amounts with remaining life of Fair values
Within three
months
Over three months
but within one year
Overone year
but within five years
Overfive years Total Assets Liabilities
Exchange rate contracts:
Forward and swap contracts 841,965 679,653 79,228 1,492 1,602,338 17,977 (13,331)
Option contracts purchased 4,071 30,395 210 – 34,676 164 – Option contracts written 605 5,471 210 – 6,286 – (33)
846,641 715,519 79,648 1,492 1,643,300 18,141 (13,364)
Interest rate contracts:
Swap contracts 39,736 98,611 153,414 21,563 313,324 3,068 (3,394) Forward contracts 823 3,878 48 – 4,749 – (1)
40,559 102,489 153,462 21,563 318,073 3,068 (3,395)
Commodity derivatives and others 195,466 40,513 844 254 237,077 3,811 (2,409)
1,082,666 858,521 233,954 23,309 2,198,450 25,020 (19,168)
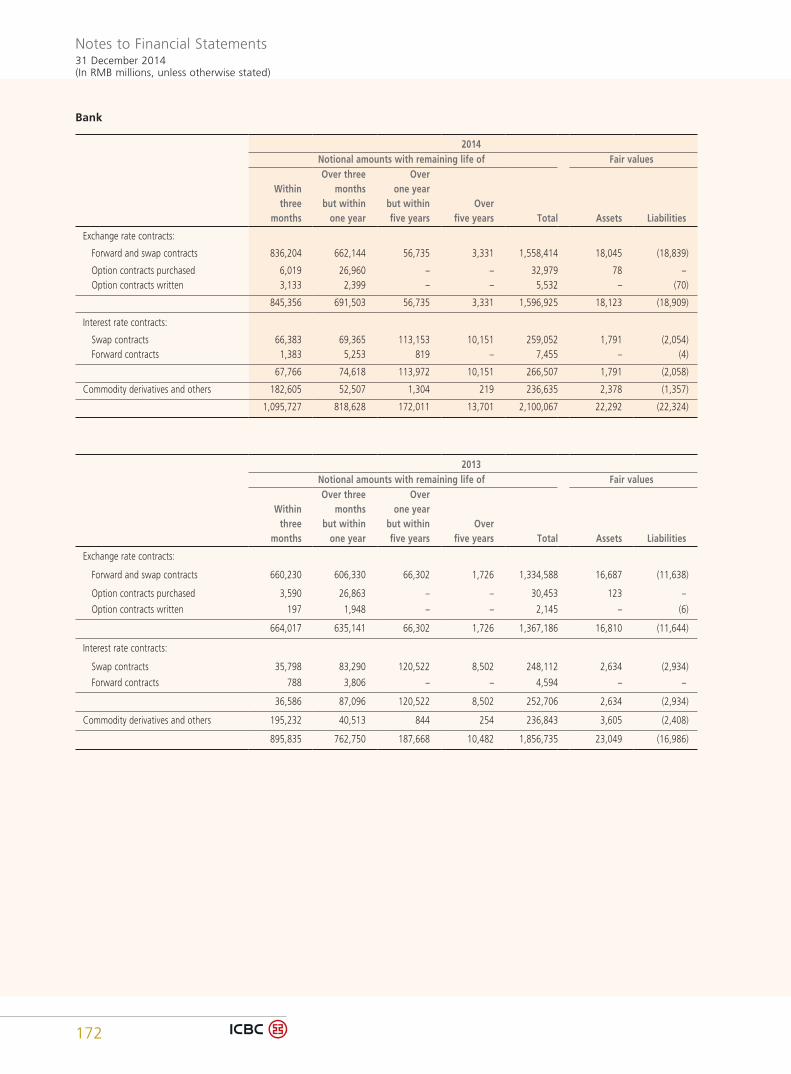
Notes to Financial Statements31 December 2014(In RMB millions, unless otherwise stated)
172
Bank
2014Notional amounts with remaining life of Fair values
Within three
months
Over three months
but within one year
Overone year
but within five years
Overfive years Total Assets Liabilities
Exchange rate contracts:
Forward and swap contracts 836,204 662,144 56,735 3,331 1,558,414 18,045 (18,839)
Option contracts purchased 6,019 26,960 – – 32,979 78 – Option contracts written 3,133 2,399 – – 5,532 – (70)
845,356 691,503 56,735 3,331 1,596,925 18,123 (18,909)
Interest rate contracts:
Swap contracts 66,383 69,365 113,153 10,151 259,052 1,791 (2,054) Forward contracts 1,383 5,253 819 – 7,455 – (4)
67,766 74,618 113,972 10,151 266,507 1,791 (2,058)
Commodity derivatives and others 182,605 52,507 1,304 219 236,635 2,378 (1,357)
1,095,727 818,628 172,011 13,701 2,100,067 22,292 (22,324)
2013Notional amounts with remaining life of Fair values
Within three
months
Over three months
but within one year
Overone year
but within five years
Overfive years Total Assets Liabilities
Exchange rate contracts:
Forward and swap contracts 660,230 606,330 66,302 1,726 1,334,588 16,687 (11,638)
Option contracts purchased 3,590 26,863 – – 30,453 123 –
Option contracts written 197 1,948 – – 2,145 – (6)
664,017 635,141 66,302 1,726 1,367,186 16,810 (11,644)
Interest rate contracts:
Swap contracts 35,798 83,290 120,522 8,502 248,112 2,634 (2,934)
Forward contracts 788 3,806 – – 4,594 – –
36,586 87,096 120,522 8,502 252,706 2,634 (2,934)
Commodity derivatives and others 195,232 40,513 844 254 236,843 3,605 (2,408)
895,835 762,750 187,668 10,482 1,856,735 23,049 (16,986)
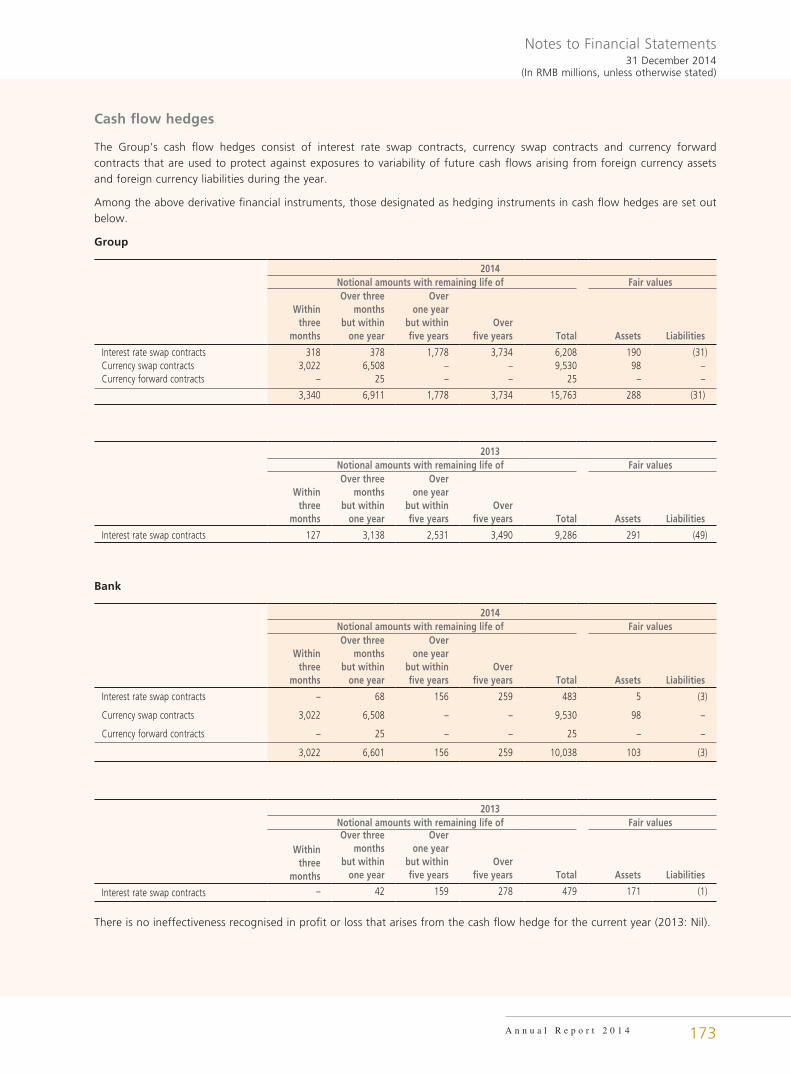
Notes to Financial Statements31 December 2014
(In RMB millions, unless otherwise stated)
A n n u a l R e p o r t 2 0 1 4 173
Cash flow hedges
The Group’s cash flow hedges consist of interest rate swap contracts, currency swap contracts and currency forward contracts that are used to protect against exposures to variability of future cash flows arising from foreign currency assets and foreign currency liabilities during the year.
Among the above derivative financial instruments, those designated as hedging instruments in cash flow hedges are set out below.
Group
2014Notional amounts with remaining life of Fair values
Within three
months
Over three months
but within one year
Overone year
but within five years
Overfive years Total Assets Liabilities
Interest rate swap contracts 318 378 1,778 3,734 6,208 190 (31)Currency swap contracts 3,022 6,508 – – 9,530 98 –Currency forward contracts – 25 – – 25 – –
3,340 6,911 1,778 3,734 15,763 288 (31)
2013Notional amounts with remaining life of Fair values
Within three
months
Over three months
but within one year
Overone year
but within five years
Overfive years Total Assets Liabilities
Interest rate swap contracts 127 3,138 2,531 3,490 9,286 291 (49)
Bank
2014Notional amounts with remaining life of Fair values
Within three
months
Over three months
but within one year
Overone year
but within five years
Overfive years Total Assets Liabilities
Interest rate swap contracts – 68 156 259 483 5 (3)
Currency swap contracts 3,022 6,508 – – 9,530 98 –
Currency forward contracts – 25 – – 25 – –
3,022 6,601 156 259 10,038 103 (3)
2013Notional amounts with remaining life of Fair values
Within three
months
Over three months
but withinone year
Overone year
but within five years
Overfive years Total Assets Liabilities
Interest rate swap contracts – 42 159 278 479 171 (1)
There is no ineffectiveness recognised in profit or loss that arises from the cash flow hedge for the current year (2013: Nil).
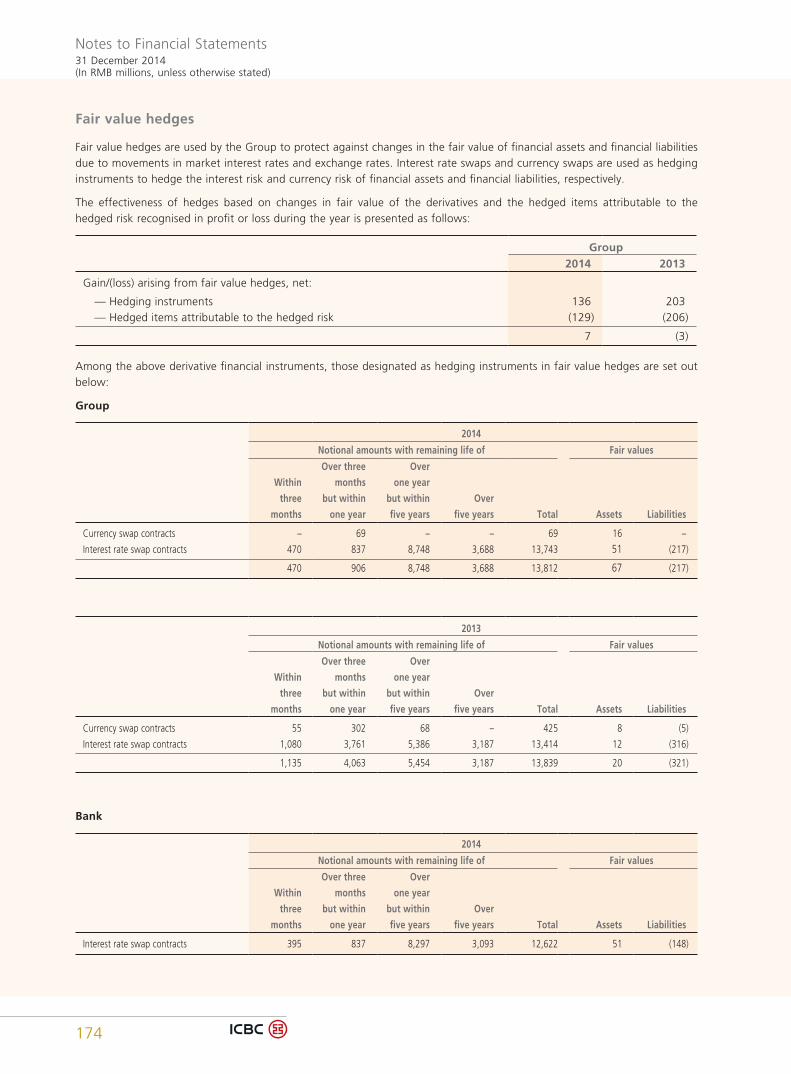
Notes to Financial Statements31 December 2014(In RMB millions, unless otherwise stated)
174
Fair value hedges
Fair value hedges are used by the Group to protect against changes in the fair value of financial assets and financial liabilities due to movements in market interest rates and exchange rates. Interest rate swaps and currency swaps are used as hedging instruments to hedge the interest risk and currency risk of financial assets and financial liabilities, respectively.
The effectiveness of hedges based on changes in fair value of the derivatives and the hedged items attributable to the hedged risk recognised in profit or loss during the year is presented as follows:
Group2014 2013
Gain/(loss) arising from fair value hedges, net:
— Hedging instruments 136 203 — Hedged items attributable to the hedged risk (129) (206)
7 (3)
Among the above derivative financial instruments, those designated as hedging instruments in fair value hedges are set out below:
Group
2014
Notional amounts with remaining life of Fair values
Within
three
months
Over three
months
but within
one year
Over
one year
but within
five years
Over
five years Total Assets Liabilities
Currency swap contracts – 69 – – 69 16 –
Interest rate swap contracts 470 837 8,748 3,688 13,743 51 (217)
470 906 8,748 3,688 13,812 67 (217)
2013
Notional amounts with remaining life of Fair values
Within
three
months
Over three
months
but within
one year
Over
one year
but within
five years
Over
five years Total Assets Liabilities
Currency swap contracts 55 302 68 – 425 8 (5)
Interest rate swap contracts 1,080 3,761 5,386 3,187 13,414 12 (316)
1,135 4,063 5,454 3,187 13,839 20 (321)
Bank
2014
Notional amounts with remaining life of Fair values
Within
three
months
Over three
months
but within
one year
Over
one year
but within
five years
Over
five years Total Assets Liabilities
Interest rate swap contracts 395 837 8,297 3,093 12,622 51 (148)
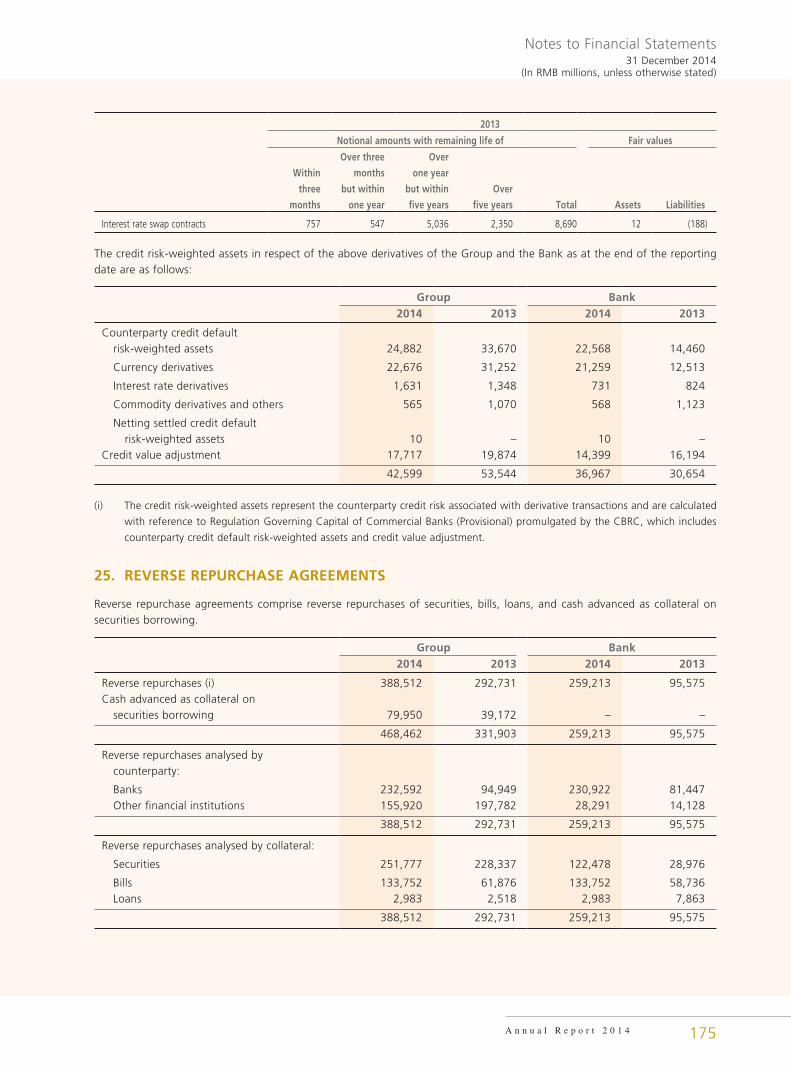
Notes to Financial Statements31 December 2014
(In RMB millions, unless otherwise stated)
A n n u a l R e p o r t 2 0 1 4 175
2013
Notional amounts with remaining life of Fair values
Within
three
months
Over three
months
but within
one year
Over
one year
but within
five years
Over
five years Total Assets Liabilities
Interest rate swap contracts 757 547 5,036 2,350 8,690 12 (188)
The credit risk-weighted assets in respect of the above derivatives of the Group and the Bank as at the end of the reporting date are as follows:
Group Bank2014 2013 2014 2013
Counterparty credit default risk-weighted assets 24,882 33,670 22,568 14,460
Currency derivatives 22,676 31,252 21,259 12,513
Interest rate derivatives 1,631 1,348 731 824
Commodity derivatives and others 565 1,070 568 1,123
Netting settled credit default risk-weighted assets 10 – 10 –Credit value adjustment 17,717 19,874 14,399 16,194
42,599 53,544 36,967 30,654
(i) The credit risk-weighted assets represent the counterparty credit risk associated with derivative transactions and are calculated
with reference to Regulation Governing Capital of Commercial Banks (Provisional) promulgated by the CBRC, which includes
counterparty credit default risk-weighted assets and credit value adjustment.
25. REVERSE REPURCHASE AGREEMENTS
Reverse repurchase agreements comprise reverse repurchases of securities, bills, loans, and cash advanced as collateral on securities borrowing.
Group Bank2014 2013 2014 2013
Reverse repurchases (i) 388,512 292,731 259,213 95,575Cash advanced as collateral on securities borrowing 79,950 39,172 – –
468,462 331,903 259,213 95,575
Reverse repurchases analysed by counterparty:
Banks 232,592 94,949 230,922 81,447 Other financial institutions 155,920 197,782 28,291 14,128
388,512 292,731 259,213 95,575
Reverse repurchases analysed by collateral:
Securities 251,777 228,337 122,478 28,976
Bills 133,752 61,876 133,752 58,736 Loans 2,983 2,518 2,983 7,863
388,512 292,731 259,213 95,575
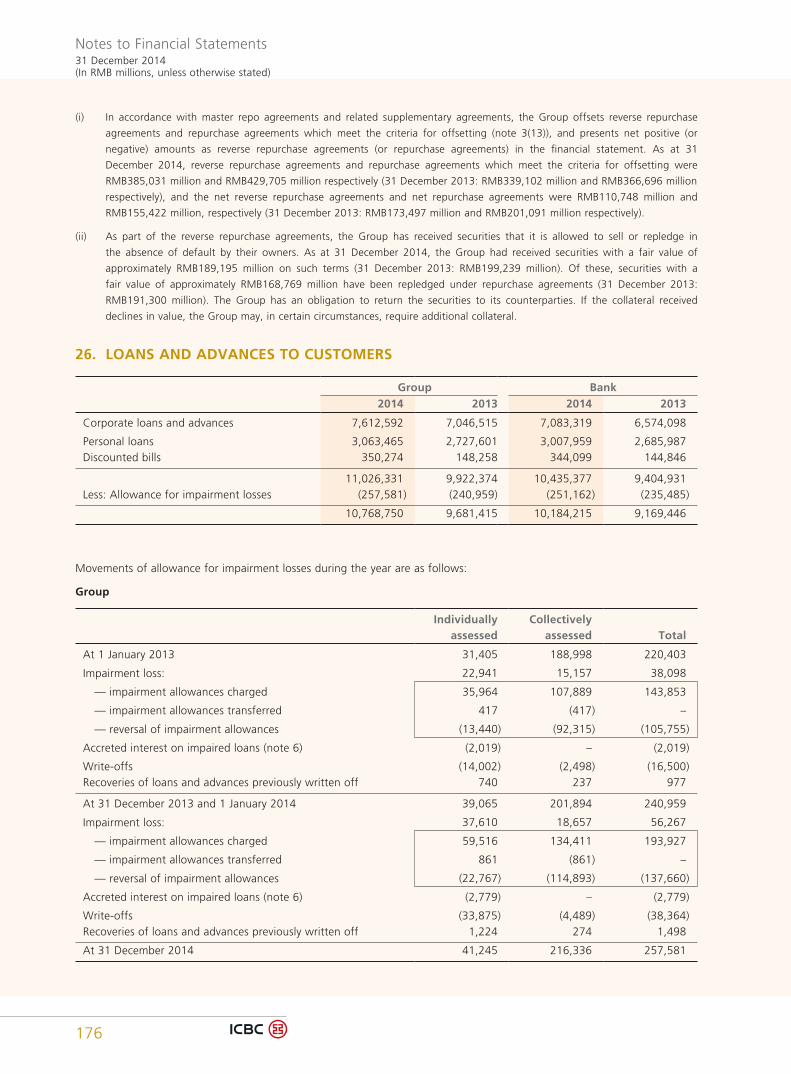
Notes to Financial Statements31 December 2014(In RMB millions, unless otherwise stated)
176
(i) In accordance with master repo agreements and related supplementary agreements, the Group offsets reverse repurchase
agreements and repurchase agreements which meet the criteria for offsetting (note 3(13)), and presents net positive (or
negative) amounts as reverse repurchase agreements (or repurchase agreements) in the financial statement. As at 31
December 2014, reverse repurchase agreements and repurchase agreements which meet the criteria for offsetting were
RMB385,031 million and RMB429,705 million respectively (31 December 2013: RMB339,102 million and RMB366,696 million
respectively), and the net reverse repurchase agreements and net repurchase agreements were RMB110,748 million and
RMB155,422 million, respectively (31 December 2013: RMB173,497 million and RMB201,091 million respectively).
(ii) As part of the reverse repurchase agreements, the Group has received securities that it is allowed to sell or repledge in
the absence of default by their owners. As at 31 December 2014, the Group had received securities with a fair value of
approximately RMB189,195 million on such terms (31 December 2013: RMB199,239 million). Of these, securities with a
fair value of approximately RMB168,769 million have been repledged under repurchase agreements (31 December 2013:
RMB191,300 million). The Group has an obligation to return the securities to its counterparties. If the collateral received
declines in value, the Group may, in certain circumstances, require additional collateral.
26. LOANS AND ADVANCES TO CUSTOMERS
Group Bank2014 2013 2014 2013
Corporate loans and advances 7,612,592 7,046,515 7,083,319 6,574,098
Personal loans 3,063,465 2,727,601 3,007,959 2,685,987Discounted bills 350,274 148,258 344,099 144,846
11,026,331 9,922,374 10,435,377 9,404,931Less: Allowance for impairment losses (257,581) (240,959) (251,162) (235,485)
10,768,750 9,681,415 10,184,215 9,169,446
Movements of allowance for impairment losses during the year are as follows:
Group
Individually assessed
Collectively assessed Total
At 1 January 2013 31,405 188,998 220,403
Impairment loss: 22,941 15,157 38,098
— impairment allowances charged 35,964 107,889 143,853
— impairment allowances transferred 417 (417) –
— reversal of impairment allowances (13,440) (92,315) (105,755)
Accreted interest on impaired loans (note 6) (2,019) – (2,019)
Write-offs (14,002) (2,498) (16,500)Recoveries of loans and advances previously written off 740 237 977
At 31 December 2013 and 1 January 2014 39,065 201,894 240,959
Impairment loss: 37,610 18,657 56,267
— impairment allowances charged 59,516 134,411 193,927
— impairment allowances transferred 861 (861) –
— reversal of impairment allowances (22,767) (114,893) (137,660)
Accreted interest on impaired loans (note 6) (2,779) – (2,779)
Write-offs (33,875) (4,489) (38,364)Recoveries of loans and advances previously written off 1,224 274 1,498
At 31 December 2014 41,245 216,336 257,581
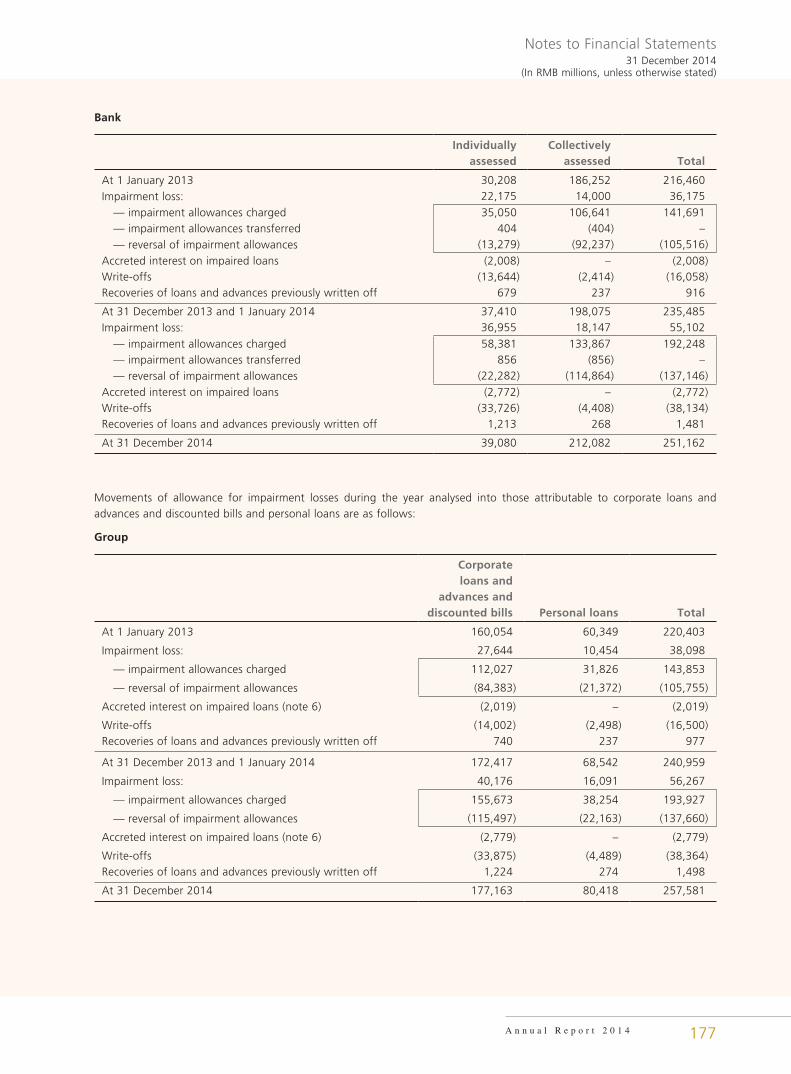
Notes to Financial Statements31 December 2014
(In RMB millions, unless otherwise stated)
A n n u a l R e p o r t 2 0 1 4 177
Bank
Individually assessed
Collectively assessed Total
At 1 January 2013 30,208 186,252 216,460Impairment loss: 22,175 14,000 36,175 — impairment allowances charged 35,050 106,641 141,691 — impairment allowances transferred 404 (404) – — reversal of impairment allowances (13,279) (92,237) (105,516)Accreted interest on impaired loans (2,008) – (2,008)Write-offs (13,644) (2,414) (16,058)Recoveries of loans and advances previously written off 679 237 916
At 31 December 2013 and 1 January 2014 37,410 198,075 235,485Impairment loss: 36,955 18,147 55,102 — impairment allowances charged 58,381 133,867 192,248 — impairment allowances transferred 856 (856) – — reversal of impairment allowances (22,282) (114,864) (137,146)Accreted interest on impaired loans (2,772) – (2,772)Write-offs (33,726) (4,408) (38,134)Recoveries of loans and advances previously written off 1,213 268 1,481
At 31 December 2014 39,080 212,082 251,162
Movements of allowance for impairment losses during the year analysed into those attributable to corporate loans and advances and discounted bills and personal loans are as follows:
Group
Corporate loans and
advances and discounted bills Personal loans Total
At 1 January 2013 160,054 60,349 220,403
Impairment loss: 27,644 10,454 38,098
— impairment allowances charged 112,027 31,826 143,853
— reversal of impairment allowances (84,383) (21,372) (105,755)
Accreted interest on impaired loans (note 6) (2,019) – (2,019)
Write-offs (14,002) (2,498) (16,500)Recoveries of loans and advances previously written off 740 237 977
At 31 December 2013 and 1 January 2014 172,417 68,542 240,959
Impairment loss: 40,176 16,091 56,267
— impairment allowances charged 155,673 38,254 193,927
— reversal of impairment allowances (115,497) (22,163) (137,660)
Accreted interest on impaired loans (note 6) (2,779) – (2,779)
Write-offs (33,875) (4,489) (38,364)Recoveries of loans and advances previously written off 1,224 274 1,498
At 31 December 2014 177,163 80,418 257,581
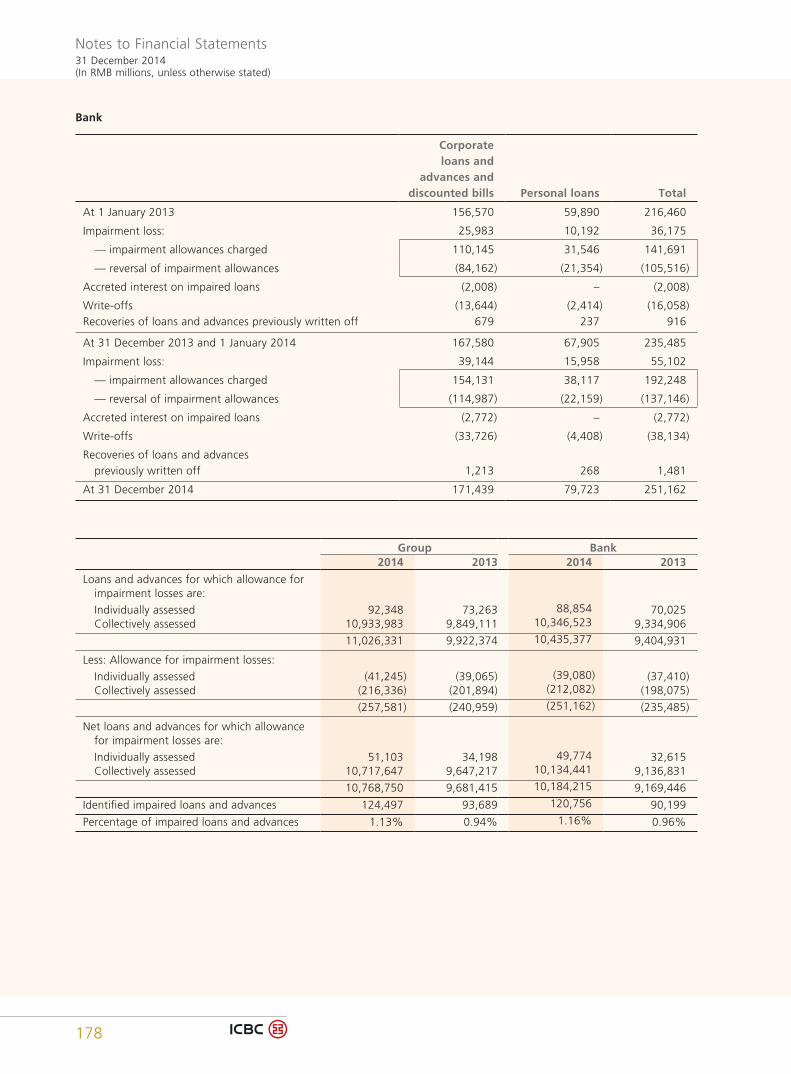
Notes to Financial Statements31 December 2014(In RMB millions, unless otherwise stated)
178
Bank
Corporate loans and
advances and discounted bills Personal loans Total
At 1 January 2013 156,570 59,890 216,460
Impairment loss: 25,983 10,192 36,175
— impairment allowances charged 110,145 31,546 141,691
— reversal of impairment allowances (84,162) (21,354) (105,516)
Accreted interest on impaired loans (2,008) – (2,008)
Write-offs (13,644) (2,414) (16,058)Recoveries of loans and advances previously written off 679 237 916
At 31 December 2013 and 1 January 2014 167,580 67,905 235,485
Impairment loss: 39,144 15,958 55,102
— impairment allowances charged 154,131 38,117 192,248
— reversal of impairment allowances (114,987) (22,159) (137,146)
Accreted interest on impaired loans (2,772) – (2,772)
Write-offs (33,726) (4,408) (38,134)
Recoveries of loans and advances previously written off 1,213 268 1,481
At 31 December 2014 171,439 79,723 251,162
Group Bank2014 2013 2014 2013
Loans and advances for which allowance for impairment losses are:
Individually assessed 92,348 73,263 88,854 70,025 Collectively assessed 10,933,983 9,849,111 10,346,523 9,334,906
11,026,331 9,922,374 10,435,377 9,404,931
Less: Allowance for impairment losses:
Individually assessed (41,245) (39,065) (39,080) (37,410) Collectively assessed (216,336) (201,894) (212,082) (198,075)
(257,581) (240,959) (251,162) (235,485)
Net loans and advances for which allowance for impairment losses are:
Individually assessed 51,103 34,198 49,774 32,615 Collectively assessed 10,717,647 9,647,217 10,134,441 9,136,831
10,768,750 9,681,415 10,184,215 9,169,446
Identified impaired loans and advances 124,497 93,689 120,756 90,199
Percentage of impaired loans and advances 1.13% 0.94% 1.16% 0.96%
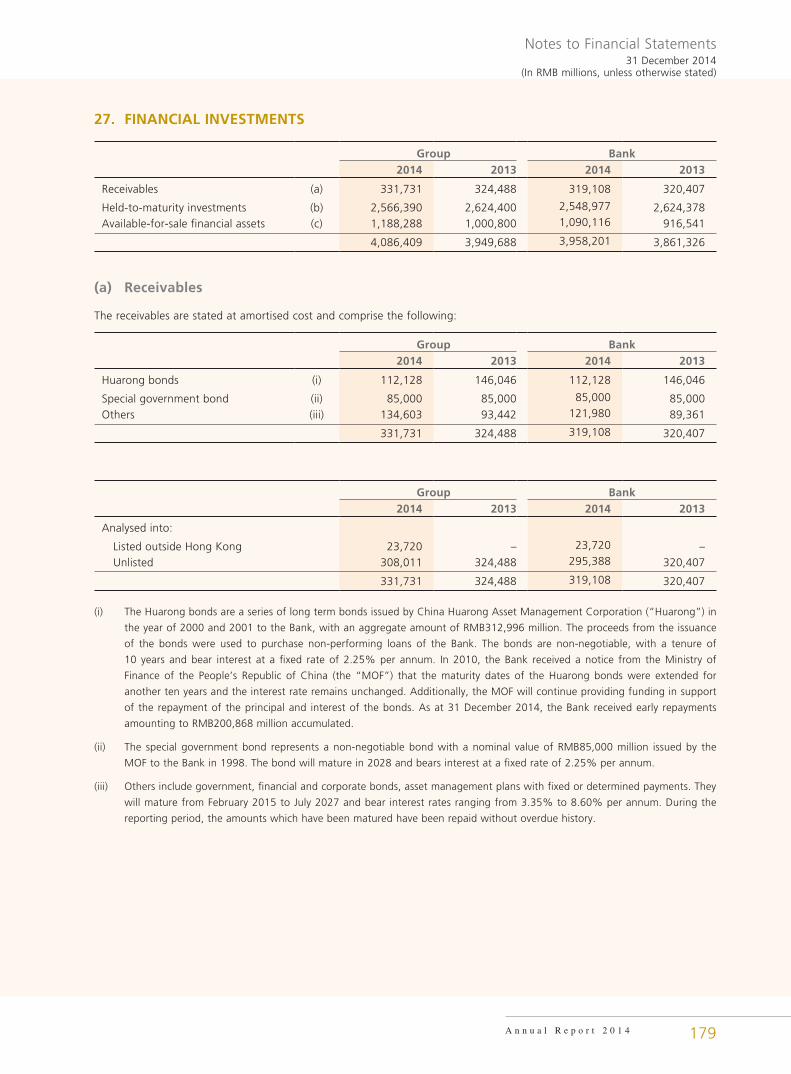
Notes to Financial Statements31 December 2014
(In RMB millions, unless otherwise stated)
A n n u a l R e p o r t 2 0 1 4 179
27. FINANCIAL INVESTMENTS
Group Bank2014 2013 2014 2013
Receivables (a) 331,731 324,488 319,108 320,407
Held-to-maturity investments (b) 2,566,390 2,624,400 2,548,977 2,624,378Available-for-sale financial assets (c) 1,188,288 1,000,800 1,090,116 916,541
4,086,409 3,949,688 3,958,201 3,861,326
(a) Receivables
The receivables are stated at amortised cost and comprise the following:
Group Bank2014 2013 2014 2013
Huarong bonds (i) 112,128 146,046 112,128 146,046
Special government bond (ii) 85,000 85,000 85,000 85,000Others (iii) 134,603 93,442 121,980 89,361
331,731 324,488 319,108 320,407
Group Bank2014 2013 2014 2013
Analysed into:
Listed outside Hong Kong 23,720 – 23,720 – Unlisted 308,011 324,488 295,388 320,407
331,731 324,488 319,108 320,407
(i) The Huarong bonds are a series of long term bonds issued by China Huarong Asset Management Corporation (“Huarong”) in
the year of 2000 and 2001 to the Bank, with an aggregate amount of RMB312,996 million. The proceeds from the issuance
of the bonds were used to purchase non-performing loans of the Bank. The bonds are non-negotiable, with a tenure of
10 years and bear interest at a fixed rate of 2.25% per annum. In 2010, the Bank received a notice from the Ministry of
Finance of the People’s Republic of China (the “MOF”) that the maturity dates of the Huarong bonds were extended for
another ten years and the interest rate remains unchanged. Additionally, the MOF will continue providing funding in support
of the repayment of the principal and interest of the bonds. As at 31 December 2014, the Bank received early repayments
amounting to RMB200,868 million accumulated.
(ii) The special government bond represents a non-negotiable bond with a nominal value of RMB85,000 million issued by the
MOF to the Bank in 1998. The bond will mature in 2028 and bears interest at a fixed rate of 2.25% per annum.
(iii) Others include government, financial and corporate bonds, asset management plans with fixed or determined payments. They
will mature from February 2015 to July 2027 and bear interest rates ranging from 3.35% to 8.60% per annum. During the
reporting period, the amounts which have been matured have been repaid without overdue history.
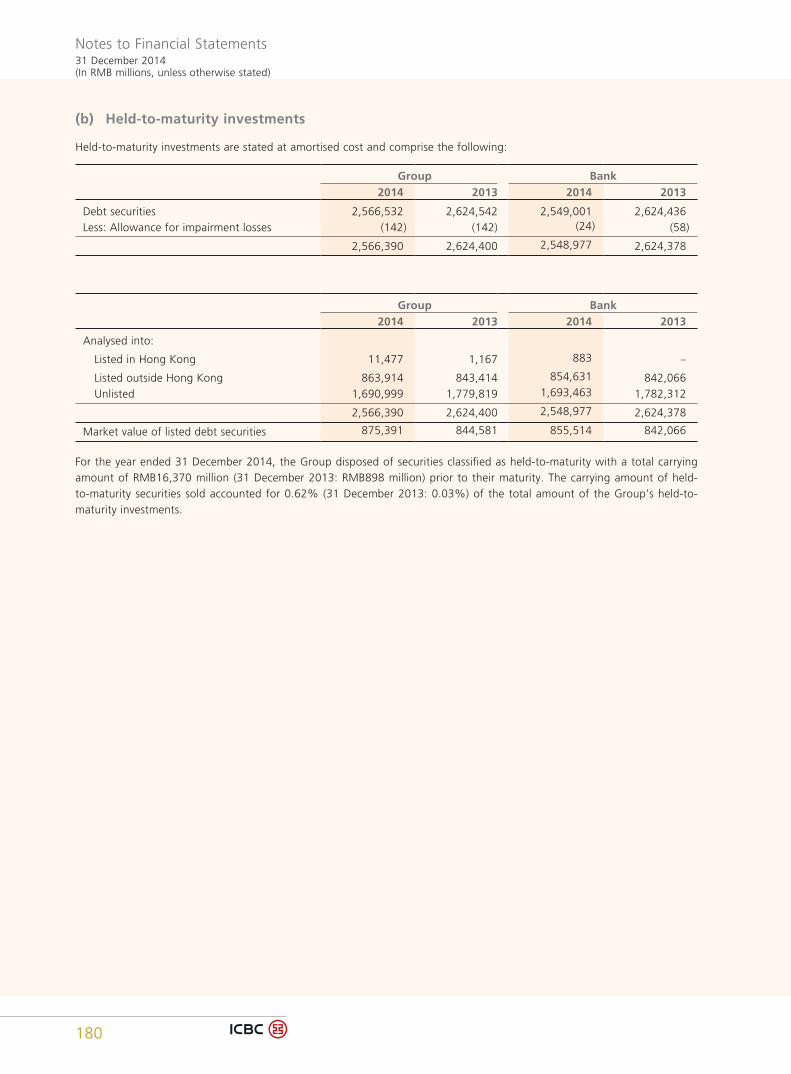
Notes to Financial Statements31 December 2014(In RMB millions, unless otherwise stated)
180
(b) Held-to-maturity investments
Held-to-maturity investments are stated at amortised cost and comprise the following:
Group Bank2014 2013 2014 2013
Debt securities 2,566,532 2,624,542 2,549,001 2,624,436Less: Allowance for impairment losses (142) (142) (24) (58)
2,566,390 2,624,400 2,548,977 2,624,378
Group Bank2014 2013 2014 2013
Analysed into:
Listed in Hong Kong 11,477 1,167 883 –
Listed outside Hong Kong 863,914 843,414 854,631 842,066 Unlisted 1,690,999 1,779,819 1,693,463 1,782,312
2,566,390 2,624,400 2,548,977 2,624,378
Market value of listed debt securities 875,391 844,581 855,514 842,066
For the year ended 31 December 2014, the Group disposed of securities classified as held-to-maturity with a total carrying amount of RMB16,370 million (31 December 2013: RMB898 million) prior to their maturity. The carrying amount of held-to-maturity securities sold accounted for 0.62% (31 December 2013: 0.03%) of the total amount of the Group’s held-to-maturity investments.
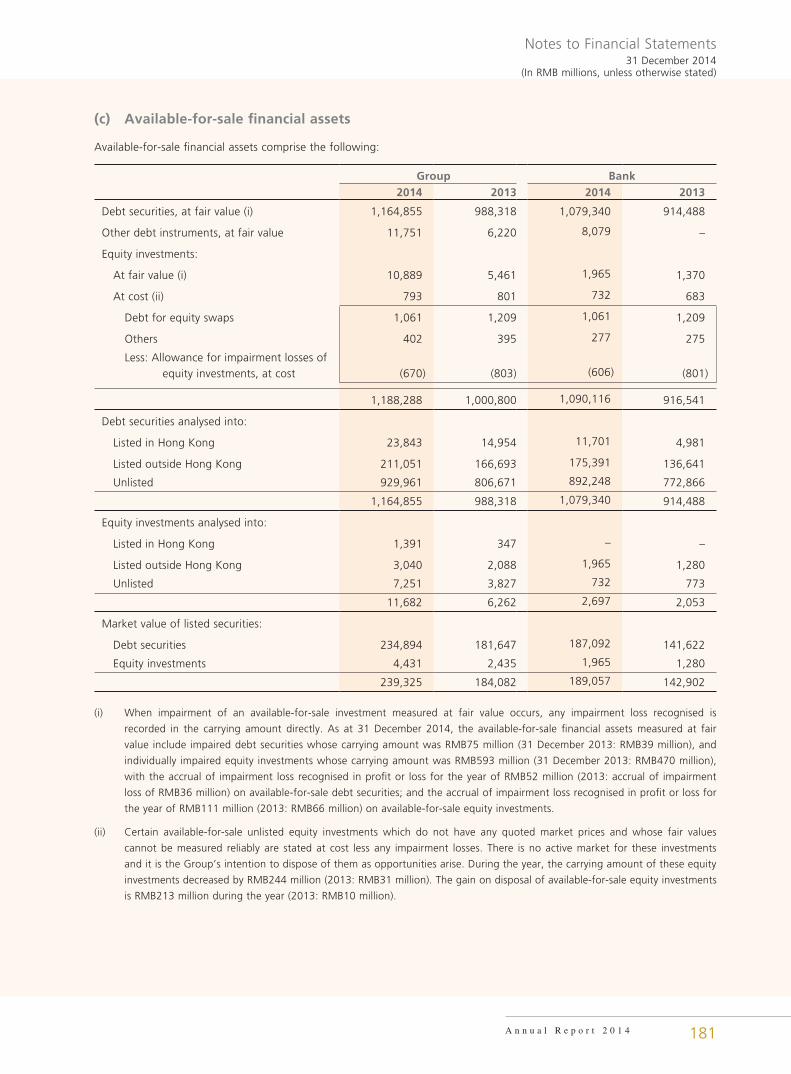
Notes to Financial Statements31 December 2014
(In RMB millions, unless otherwise stated)
A n n u a l R e p o r t 2 0 1 4 181
(c) Available-for-sale financial assets
Available-for-sale financial assets comprise the following:
Group Bank2014 2013 2014 2013
Debt securities, at fair value (i) 1,164,855 988,318 1,079,340 914,488
Other debt instruments, at fair value 11,751 6,220 8,079 –
Equity investments:
At fair value (i) 10,889 5,461 1,965 1,370
At cost (ii) 793 801 732 683
Debt for equity swaps 1,061 1,209 1,061 1,209
Others 402 395 277 275
Less: Allowance for impairment losses of equity investments, at cost (670) (803) (606) (801)
1,188,288 1,000,800 1,090,116 916,541
Debt securities analysed into:
Listed in Hong Kong 23,843 14,954 11,701 4,981
Listed outside Hong Kong 211,051 166,693 175,391 136,641
Unlisted 929,961 806,671 892,248 772,866
1,164,855 988,318 1,079,340 914,488
Equity investments analysed into:
Listed in Hong Kong 1,391 347 – –
Listed outside Hong Kong 3,040 2,088 1,965 1,280
Unlisted 7,251 3,827 732 773
11,682 6,262 2,697 2,053
Market value of listed securities:
Debt securities 234,894 181,647 187,092 141,622
Equity investments 4,431 2,435 1,965 1,280
239,325 184,082 189,057 142,902
(i) When impairment of an available-for-sale investment measured at fair value occurs, any impairment loss recognised is
recorded in the carrying amount directly. As at 31 December 2014, the available-for-sale financial assets measured at fair
value include impaired debt securities whose carrying amount was RMB75 million (31 December 2013: RMB39 million), and
individually impaired equity investments whose carrying amount was RMB593 million (31 December 2013: RMB470 million),
with the accrual of impairment loss recognised in profit or loss for the year of RMB52 million (2013: accrual of impairment
loss of RMB36 million) on available-for-sale debt securities; and the accrual of impairment loss recognised in profit or loss for
the year of RMB111 million (2013: RMB66 million) on available-for-sale equity investments.
(ii) Certain available-for-sale unlisted equity investments which do not have any quoted market prices and whose fair values
cannot be measured reliably are stated at cost less any impairment losses. There is no active market for these investments
and it is the Group’s intention to dispose of them as opportunities arise. During the year, the carrying amount of these equity
investments decreased by RMB244 million (2013: RMB31 million). The gain on disposal of available-for-sale equity investments
is RMB213 million during the year (2013: RMB10 million).
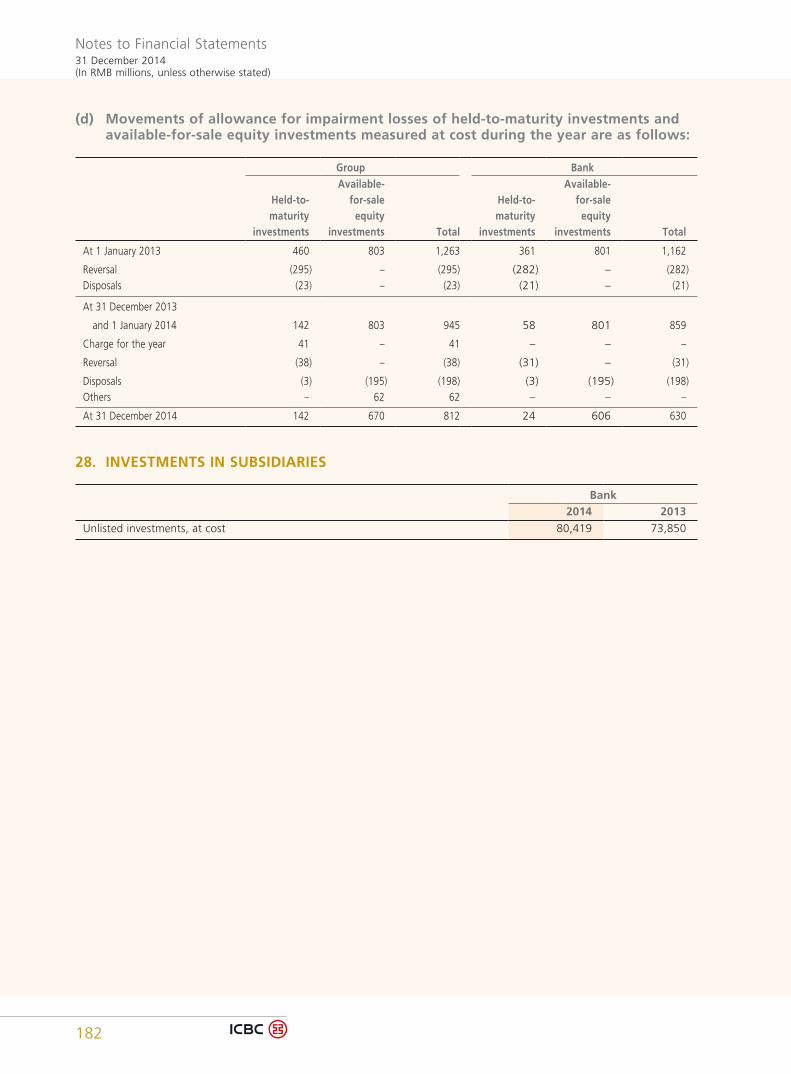
Notes to Financial Statements31 December 2014(In RMB millions, unless otherwise stated)
182
(d) Movements of allowance for impairment losses of held-to-maturity investments and available-for-sale equity investments measured at cost during the year are as follows:
Group Bank
Held-to- maturity
investments
Available- for-sale
equity investments Total
Held-to- maturity
investments
Available- for-sale
equity investments Total
At 1 January 2013 460 803 1,263 361 801 1,162
Reversal (295) – (295) (282) – (282)Disposals (23) – (23) (21) – (21)
At 31 December 2013
and 1 January 2014 142 803 945 58 801 859
Charge for the year 41 – 41 – – –
Reversal (38) – (38) (31) – (31)
Disposals (3) (195) (198) (3) (195) (198)Others – 62 62 – – –
At 31 December 2014 142 670 812 24 606 630
28. INVESTMENTS IN SUBSIDIARIES
Bank2014 2013
Unlisted investments, at cost 80,419 73,850
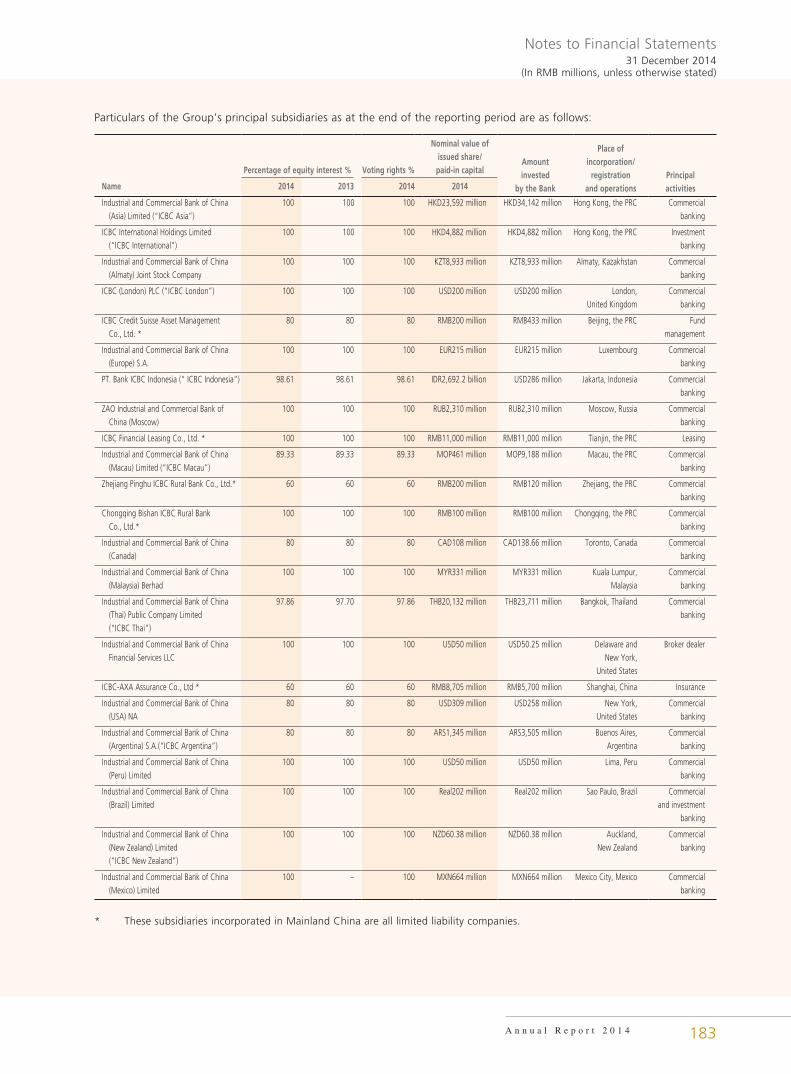
Notes to Financial Statements31 December 2014
(In RMB millions, unless otherwise stated)
A n n u a l R e p o r t 2 0 1 4 183
Particulars of the Group’s principal subsidiaries as at the end of the reporting period are as follows:
Percentage of equity interest % Voting rights %
Nominal value of issued share/paid-in capital
Amountinvested
by the Bank
Place ofincorporation/
registrationand operations
PrincipalactivitiesName 2014 2013 2014 2014
Industrial and Commercial Bank of China (Asia) Limited (“ICBC Asia”)
100 100 100 HKD23,592 million HKD34,142 million Hong Kong, the PRC Commercial banking
ICBC International Holdings Limited (“ICBC International”)
100 100 100 HKD4,882 million HKD4,882 million Hong Kong, the PRC Investment banking
Industrial and Commercial Bank of China (Almaty) Joint Stock Company
100 100 100 KZT8,933 million KZT8,933 million Almaty, Kazakhstan Commercial banking
ICBC (London) PLC (“ICBC London”) 100 100 100 USD200 million USD200 million London,United Kingdom
Commercial banking
ICBC Credit Suisse Asset Management Co., Ltd. *
80 80 80 RMB200 million RMB433 million Beijing, the PRC Fund management
Industrial and Commercial Bank of China (Europe) S.A.
100 100 100 EUR215 million EUR215 million Luxembourg Commercial banking
PT. Bank ICBC Indonesia (“ ICBC Indonesia”) 98.61 98.61 98.61 IDR2,692.2 billion USD286 million Jakarta, Indonesia Commercial banking
ZAO Industrial and Commercial Bank of China (Moscow)
100 100 100 RUB2,310 million RUB2,310 million Moscow, Russia Commercial banking
ICBC Financial Leasing Co., Ltd. * 100 100 100 RMB11,000 million RMB11,000 million Tianjin, the PRC Leasing
Industrial and Commercial Bank of China (Macau) Limited (“ICBC Macau”)
89.33 89.33 89.33 MOP461 million MOP9,188 million Macau, the PRC Commercial banking
Zhejiang Pinghu ICBC Rural Bank Co., Ltd.* 60 60 60 RMB200 million RMB120 million Zhejiang, the PRC Commercial banking
Chongqing Bishan ICBC Rural Bank Co., Ltd.*
100 100 100 RMB100 million RMB100 million Chongqing, the PRC Commercial banking
Industrial and Commercial Bank of China (Canada)
80 80 80 CAD108 million CAD138.66 million Toronto, Canada Commercial banking
Industrial and Commercial Bank of China (Malaysia) Berhad
100 100 100 MYR331 million MYR331 million Kuala Lumpur, Malaysia
Commercial banking
Industrial and Commercial Bank of China (Thai) Public Company Limited (“ICBC Thai”)
97.86 97.70 97.86 THB20,132 million THB23,711 million Bangkok, Thailand Commercial banking
Industrial and Commercial Bank of China Financial Services LLC
100 100 100 USD50 million USD50.25 million Delaware andNew York,
United States
Broker dealer
ICBC-AXA Assurance Co., Ltd * 60 60 60 RMB8,705 million RMB5,700 million Shanghai, China Insurance
Industrial and Commercial Bank of China (USA) NA
80 80 80 USD309 million USD258 million New York,United States
Commercial banking
Industrial and Commercial Bank of China (Argentina) S.A.(“ICBC Argentina”)
80 80 80 ARS1,345 million ARS3,505 million Buenos Aires, Argentina
Commercial banking
Industrial and Commercial Bank of China (Peru) Limited
100 100 100 USD50 million USD50 million Lima, Peru Commercial banking
Industrial and Commercial Bank of China (Brazil) Limited
100 100 100 Real202 million Real202 million Sao Paulo, Brazil Commercial and investment
banking
Industrial and Commercial Bank of China (New Zealand) Limited (“ICBC New Zealand”)
100 100 100 NZD60.38 million NZD60.38 million Auckland,New Zealand
Commercial banking
Industrial and Commercial Bank of China (Mexico) Limited
100 – 100 MXN664 million MXN664 million Mexico City, Mexico Commercial banking
* These subsidiaries incorporated in Mainland China are all limited liability companies.
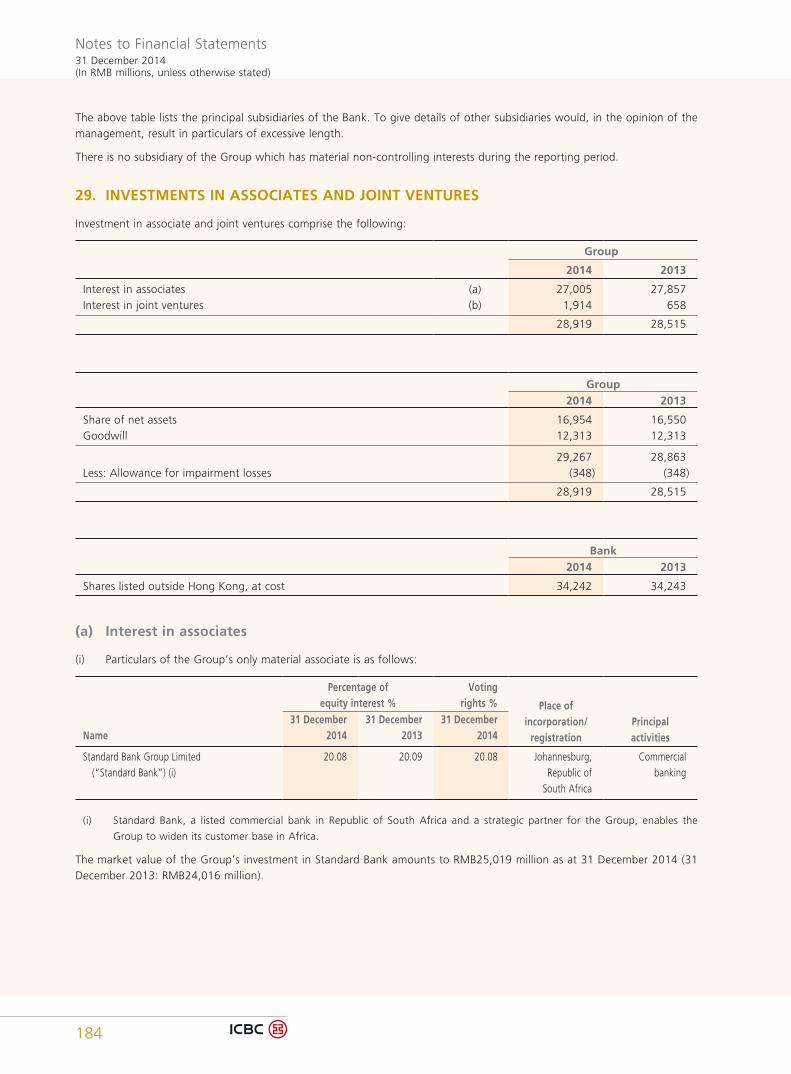
Notes to Financial Statements31 December 2014(In RMB millions, unless otherwise stated)
184
The above table lists the principal subsidiaries of the Bank. To give details of other subsidiaries would, in the opinion of the management, result in particulars of excessive length.
There is no subsidiary of the Group which has material non-controlling interests during the reporting period.
29. INVESTMENTS IN ASSOCIATES AND JOINT VENTURES
Investment in associate and joint ventures comprise the following:
Group
2014 2013
Interest in associates (a) 27,005 27,857Interest in joint ventures (b) 1,914 658
28,919 28,515
Group2014 2013
Share of net assets 16,954 16,550Goodwill 12,313 12,313
29,267 28,863Less: Allowance for impairment losses (348) (348)
28,919 28,515
Bank2014 2013
Shares listed outside Hong Kong, at cost 34,242 34,243
(a) Interest in associates
(i) Particulars of the Group’s only material associate is as follows:
Percentage ofequity interest %
Votingrights % Place of
incorporation/ registration
PrincipalactivitiesName
31 December2014
31 December2013
31 December2014
Standard Bank Group Limited (“Standard Bank”) (i)
20.08 20.09 20.08 Johannesburg, Republic of
South Africa
Commercialbanking
(i) Standard Bank, a listed commercial bank in Republic of South Africa and a strategic partner for the Group, enables the
Group to widen its customer base in Africa.
The market value of the Group’s investment in Standard Bank amounts to RMB25,019 million as at 31 December 2014 (31 December 2013: RMB24,016 million).
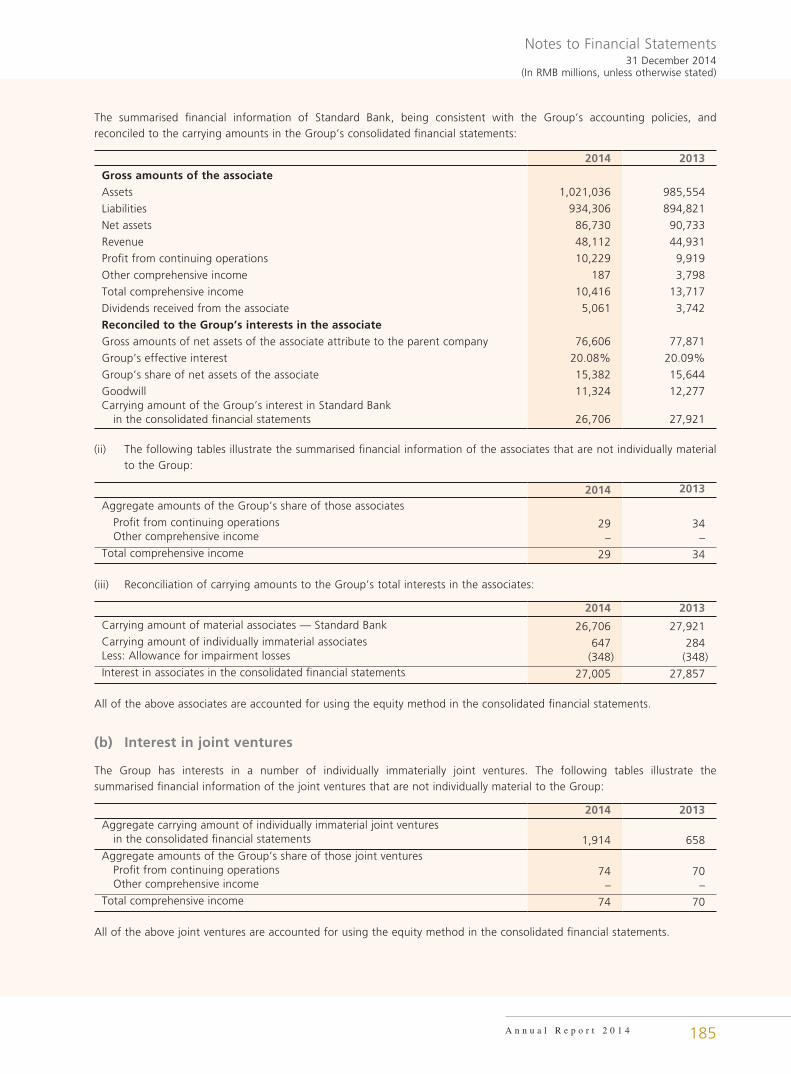
Notes to Financial Statements31 December 2014
(In RMB millions, unless otherwise stated)
A n n u a l R e p o r t 2 0 1 4 185
The summarised financial information of Standard Bank, being consistent with the Group’s accounting policies, and reconciled to the carrying amounts in the Group’s consolidated financial statements:
2014 2013
Gross amounts of the associateAssets 1,021,036 985,554
Liabilities 934,306 894,821
Net assets 86,730 90,733
Revenue 48,112 44,931
Profit from continuing operations 10,229 9,919
Other comprehensive income 187 3,798
Total comprehensive income 10,416 13,717
Dividends received from the associate 5,061 3,742
Reconciled to the Group’s interests in the associateGross amounts of net assets of the associate attribute to the parent company 76,606 77,871
Group’s effective interest 20.08% 20.09%
Group’s share of net assets of the associate 15,382 15,644
Goodwill 11,324 12,277Carrying amount of the Group’s interest in Standard Bank in the consolidated financial statements 26,706 27,921
(ii) The following tables illustrate the summarised financial information of the associates that are not individually material to the Group:
2014 2013
Aggregate amounts of the Group’s share of those associates
Profit from continuing operations 29 34 Other comprehensive income – –Total comprehensive income 29 34
(iii) Reconciliation of carrying amounts to the Group’s total interests in the associates:
2014 2013
Carrying amount of material associates — Standard Bank 26,706 27,921Carrying amount of individually immaterial associates 647 284Less: Allowance for impairment losses (348) (348)Interest in associates in the consolidated financial statements 27,005 27,857
All of the above associates are accounted for using the equity method in the consolidated financial statements.
(b) Interest in joint ventures
The Group has interests in a number of individually immaterially joint ventures. The following tables illustrate the summarised financial information of the joint ventures that are not individually material to the Group:
2014 2013Aggregate carrying amount of individually immaterial joint ventures in the consolidated financial statements 1,914 658Aggregate amounts of the Group’s share of those joint ventures Profit from continuing operations 74 70 Other comprehensive income – –Total comprehensive income 74 70
All of the above joint ventures are accounted for using the equity method in the consolidated financial statements.
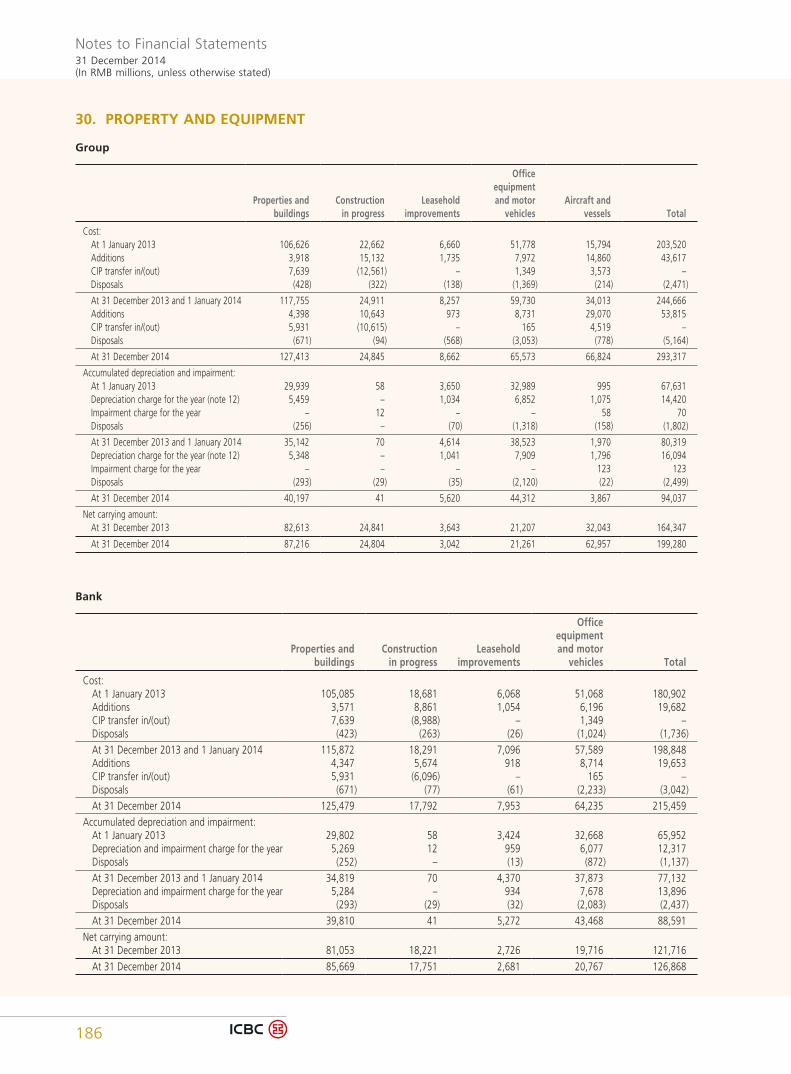
Notes to Financial Statements31 December 2014(In RMB millions, unless otherwise stated)
186
30. PROPERTY AND EQUIPMENT
Group
Properties and buildings
Construction in progress
Leasehold improvements
Office equipment and motor
vehiclesAircraft and
vessels Total
Cost: At 1 January 2013 106,626 22,662 6,660 51,778 15,794 203,520 Additions 3,918 15,132 1,735 7,972 14,860 43,617 CIP transfer in/(out) 7,639 (12,561) – 1,349 3,573 – Disposals (428) (322) (138) (1,369) (214) (2,471)
At 31 December 2013 and 1 January 2014 117,755 24,911 8,257 59,730 34,013 244,666 Additions 4,398 10,643 973 8,731 29,070 53,815 CIP transfer in/(out) 5,931 (10,615) – 165 4,519 – Disposals (671) (94) (568) (3,053) (778) (5,164)
At 31 December 2014 127,413 24,845 8,662 65,573 66,824 293,317
Accumulated depreciation and impairment: At 1 January 2013 29,939 58 3,650 32,989 995 67,631 Depreciation charge for the year (note 12) 5,459 – 1,034 6,852 1,075 14,420 Impairment charge for the year – 12 – – 58 70 Disposals (256) – (70) (1,318) (158) (1,802)
At 31 December 2013 and 1 January 2014 35,142 70 4,614 38,523 1,970 80,319 Depreciation charge for the year (note 12) 5,348 – 1,041 7,909 1,796 16,094 Impairment charge for the year – – – – 123 123 Disposals (293) (29) (35) (2,120) (22) (2,499)
At 31 December 2014 40,197 41 5,620 44,312 3,867 94,037
Net carrying amount: At 31 December 2013 82,613 24,841 3,643 21,207 32,043 164,347
At 31 December 2014 87,216 24,804 3,042 21,261 62,957 199,280
Bank
Properties and buildings
Construction in progress
Leasehold improvements
Office equipment and motor
vehicles Total
Cost: At 1 January 2013 105,085 18,681 6,068 51,068 180,902 Additions 3,571 8,861 1,054 6,196 19,682 CIP transfer in/(out) 7,639 (8,988) – 1,349 – Disposals (423) (263) (26) (1,024) (1,736) At 31 December 2013 and 1 January 2014 115,872 18,291 7,096 57,589 198,848 Additions 4,347 5,674 918 8,714 19,653 CIP transfer in/(out) 5,931 (6,096) – 165 – Disposals (671) (77) (61) (2,233) (3,042) At 31 December 2014 125,479 17,792 7,953 64,235 215,459Accumulated depreciation and impairment: At 1 January 2013 29,802 58 3,424 32,668 65,952 Depreciation and impairment charge for the year 5,269 12 959 6,077 12,317 Disposals (252) – (13) (872) (1,137) At 31 December 2013 and 1 January 2014 34,819 70 4,370 37,873 77,132 Depreciation and impairment charge for the year 5,284 – 934 7,678 13,896 Disposals (293) (29) (32) (2,083) (2,437) At 31 December 2014 39,810 41 5,272 43,468 88,591Net carrying amount: At 31 December 2013 81,053 18,221 2,726 19,716 121,716 At 31 December 2014 85,669 17,751 2,681 20,767 126,868
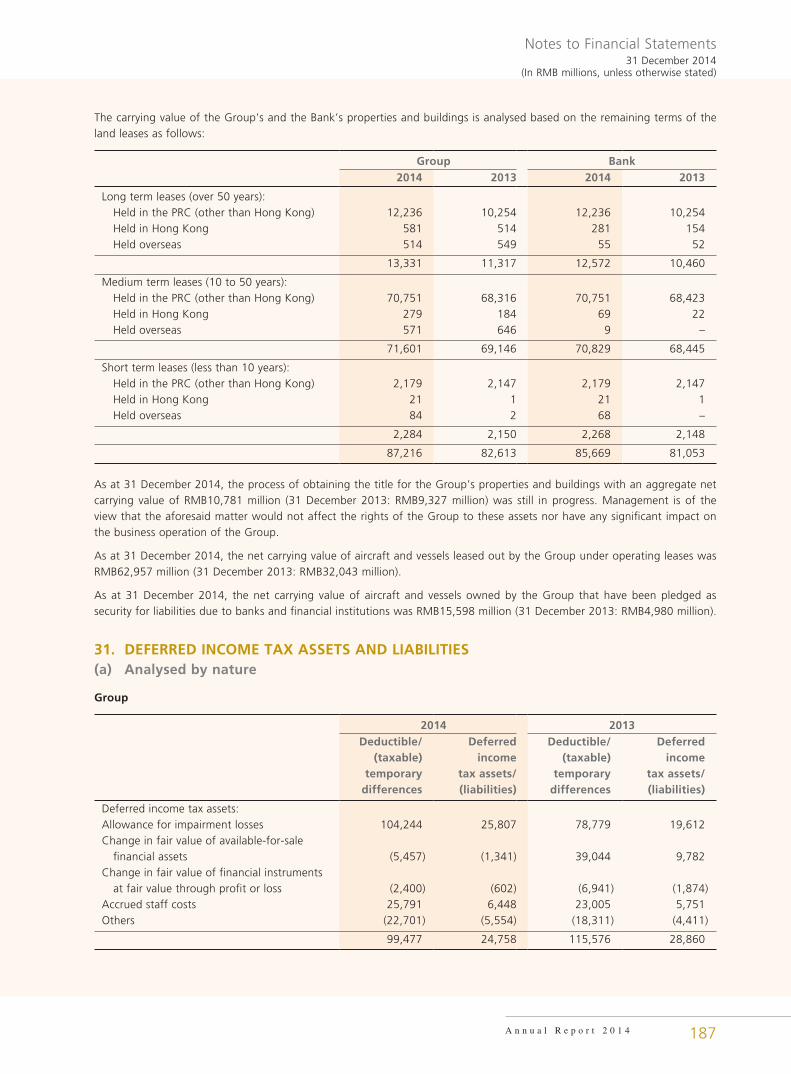
Notes to Financial Statements31 December 2014
(In RMB millions, unless otherwise stated)
A n n u a l R e p o r t 2 0 1 4 187
The carrying value of the Group’s and the Bank’s properties and buildings is analysed based on the remaining terms of the land leases as follows:
Group Bank2014 2013 2014 2013
Long term leases (over 50 years): Held in the PRC (other than Hong Kong) 12,236 10,254 12,236 10,254 Held in Hong Kong 581 514 281 154 Held overseas 514 549 55 52
13,331 11,317 12,572 10,460
Medium term leases (10 to 50 years): Held in the PRC (other than Hong Kong) 70,751 68,316 70,751 68,423 Held in Hong Kong 279 184 69 22 Held overseas 571 646 9 –
71,601 69,146 70,829 68,445
Short term leases (less than 10 years): Held in the PRC (other than Hong Kong) 2,179 2,147 2,179 2,147 Held in Hong Kong 21 1 21 1 Held overseas 84 2 68 –
2,284 2,150 2,268 2,148
87,216 82,613 85,669 81,053
As at 31 December 2014, the process of obtaining the title for the Group’s properties and buildings with an aggregate net carrying value of RMB10,781 million (31 December 2013: RMB9,327 million) was still in progress. Management is of the view that the aforesaid matter would not affect the rights of the Group to these assets nor have any significant impact on the business operation of the Group.
As at 31 December 2014, the net carrying value of aircraft and vessels leased out by the Group under operating leases was RMB62,957 million (31 December 2013: RMB32,043 million).
As at 31 December 2014, the net carrying value of aircraft and vessels owned by the Group that have been pledged as security for liabilities due to banks and financial institutions was RMB15,598 million (31 December 2013: RMB4,980 million).
31. DEFERRED INCOME TAX ASSETS AND LIABILITIES(a) Analysed by nature
Group
2014 2013Deductible/
(taxable) temporary
differences
Deferred income
tax assets/ (liabilities)
Deductible/ (taxable)
temporary differences
Deferred income
tax assets/ (liabilities)
Deferred income tax assets:Allowance for impairment losses 104,244 25,807 78,779 19,612Change in fair value of available-for-sale financial assets (5,457) (1,341) 39,044 9,782Change in fair value of financial instruments at fair value through profit or loss (2,400) (602) (6,941) (1,874)Accrued staff costs 25,791 6,448 23,005 5,751Others (22,701) (5,554) (18,311) (4,411)
99,477 24,758 115,576 28,860
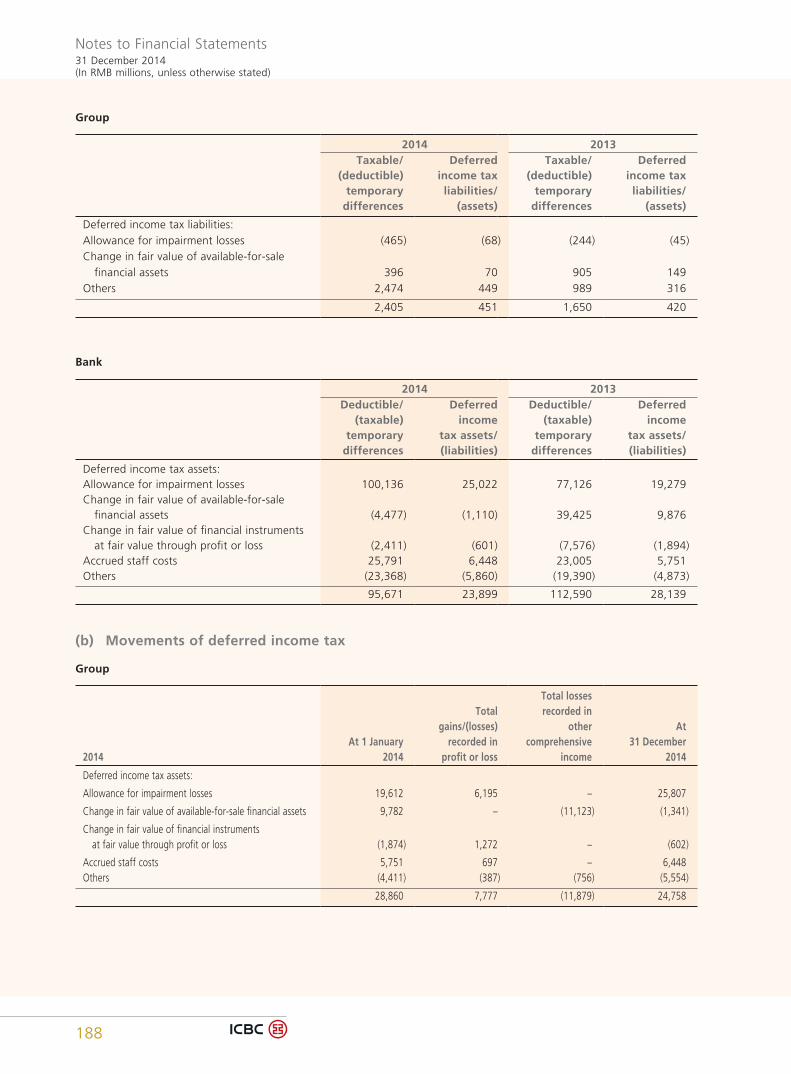
Notes to Financial Statements31 December 2014(In RMB millions, unless otherwise stated)
188
Group
2014 2013Taxable/
(deductible) temporary
differences
Deferred income tax liabilities/
(assets)
Taxable/ (deductible)
temporary differences
Deferred income tax liabilities/
(assets)
Deferred income tax liabilities:Allowance for impairment losses (465) (68) (244) (45)Change in fair value of available-for-sale financial assets 396 70 905 149Others 2,474 449 989 316
2,405 451 1,650 420
Bank
2014 2013Deductible/
(taxable) temporary
differences
Deferred income
tax assets/ (liabilities)
Deductible/ (taxable)
temporary differences
Deferred income
tax assets/ (liabilities)
Deferred income tax assets:Allowance for impairment losses 100,136 25,022 77,126 19,279Change in fair value of available-for-sale financial assets (4,477) (1,110) 39,425 9,876Change in fair value of financial instruments at fair value through profit or loss (2,411) (601) (7,576) (1,894)Accrued staff costs 25,791 6,448 23,005 5,751Others (23,368) (5,860) (19,390) (4,873)
95,671 23,899 112,590 28,139
(b) Movements of deferred income tax
Group
2014At 1 January
2014
Totalgains/(losses)
recorded in profit or loss
Total lossesrecorded in
othercomprehensive
income
At31 December
2014
Deferred income tax assets:
Allowance for impairment losses 19,612 6,195 – 25,807
Change in fair value of available-for-sale financial assets 9,782 – (11,123) (1,341)
Change in fair value of financial instruments at fair value through profit or loss (1,874) 1,272 – (602)
Accrued staff costs 5,751 697 – 6,448Others (4,411) (387) (756) (5,554)
28,860 7,777 (11,879) 24,758
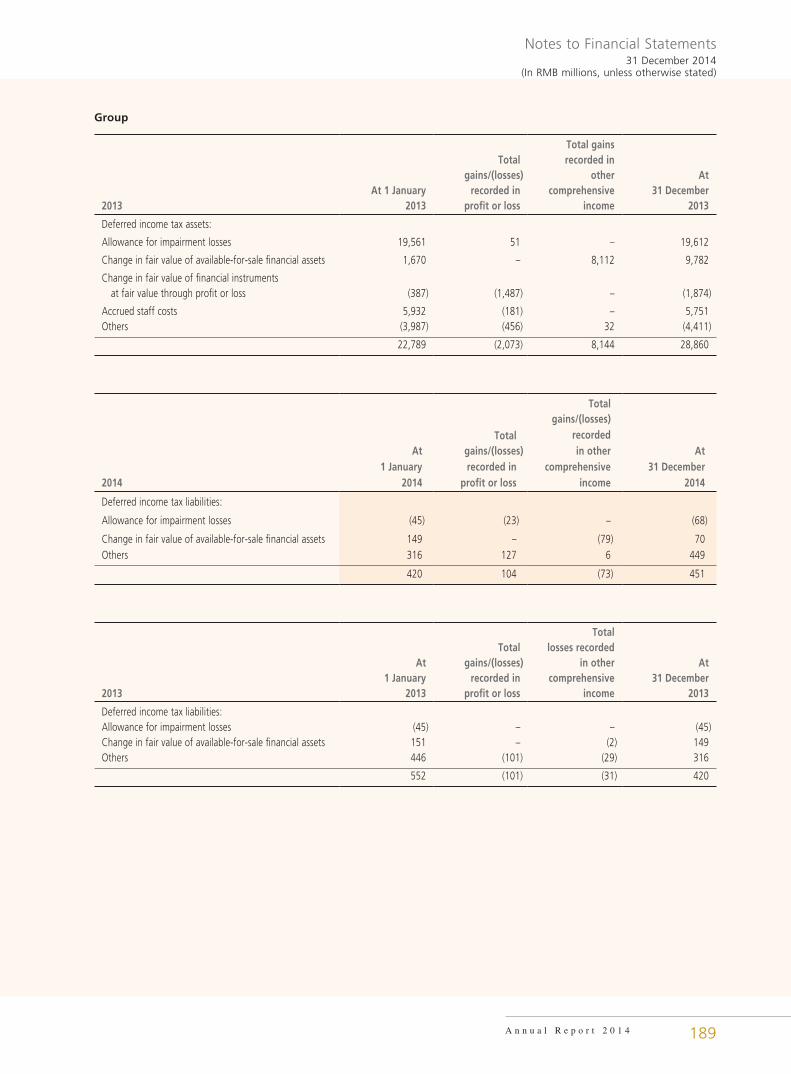
Notes to Financial Statements31 December 2014
(In RMB millions, unless otherwise stated)
A n n u a l R e p o r t 2 0 1 4 189
Group
2013At 1 January
2013
Totalgains/(losses)
recorded inprofit or loss
Total gainsrecorded in
other comprehensive
income
At31 December
2013
Deferred income tax assets:
Allowance for impairment losses 19,561 51 – 19,612
Change in fair value of available-for-sale financial assets 1,670 – 8,112 9,782
Change in fair value of financial instruments at fair value through profit or loss (387) (1,487) – (1,874)
Accrued staff costs 5,932 (181) – 5,751Others (3,987) (456) 32 (4,411)
22,789 (2,073) 8,144 28,860
2014
At1 January
2014
Totalgains/(losses)recorded in
profit or loss
Total gains/(losses)
recorded in other
comprehensive income
At31 December
2014
Deferred income tax liabilities:
Allowance for impairment losses (45) (23) – (68)
Change in fair value of available-for-sale financial assets 149 – (79) 70Others 316 127 6 449
420 104 (73) 451
2013
At1 January
2013
Totalgains/(losses)
recorded inprofit or loss
Totallosses recorded
in othercomprehensive
income
At31 December
2013
Deferred income tax liabilities:Allowance for impairment losses (45) – – (45)Change in fair value of available-for-sale financial assets 151 – (2) 149Others 446 (101) (29) 316
552 (101) (31) 420
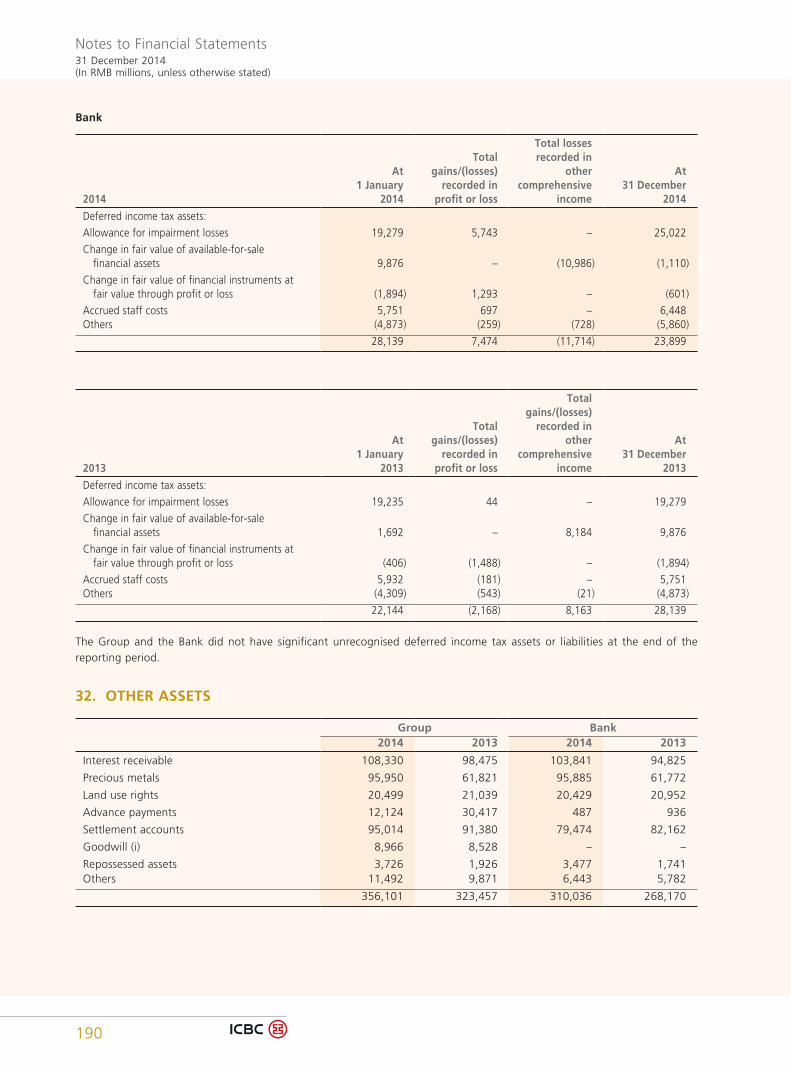
Notes to Financial Statements31 December 2014(In RMB millions, unless otherwise stated)
190
Bank
2014
At1 January
2014
Totalgains/(losses)
recorded in profit or loss
Total losses recorded in
other comprehensive
income
At31 December
2014
Deferred income tax assets:
Allowance for impairment losses 19,279 5,743 – 25,022
Change in fair value of available-for-sale financial assets 9,876 – (10,986) (1,110)
Change in fair value of financial instruments at fair value through profit or loss (1,894) 1,293 – (601)
Accrued staff costs 5,751 697 – 6,448Others (4,873) (259) (728) (5,860)
28,139 7,474 (11,714) 23,899
2013
At1 January
2013
Totalgains/(losses)
recorded in profit or loss
Total gains/(losses)
recorded inother
comprehensive income
At31 December
2013
Deferred income tax assets:
Allowance for impairment losses 19,235 44 – 19,279
Change in fair value of available-for-sale financial assets 1,692 – 8,184 9,876
Change in fair value of financial instruments at fair value through profit or loss (406) (1,488) – (1,894)
Accrued staff costs 5,932 (181) – 5,751Others (4,309) (543) (21) (4,873)
22,144 (2,168) 8,163 28,139
The Group and the Bank did not have significant unrecognised deferred income tax assets or liabilities at the end of the reporting period.
32. OTHER ASSETS
Group Bank2014 2013 2014 2013
Interest receivable 108,330 98,475 103,841 94,825
Precious metals 95,950 61,821 95,885 61,772
Land use rights 20,499 21,039 20,429 20,952
Advance payments 12,124 30,417 487 936
Settlement accounts 95,014 91,380 79,474 82,162
Goodwill (i) 8,966 8,528 – –
Repossessed assets 3,726 1,926 3,477 1,741Others 11,492 9,871 6,443 5,782
356,101 323,457 310,036 268,170
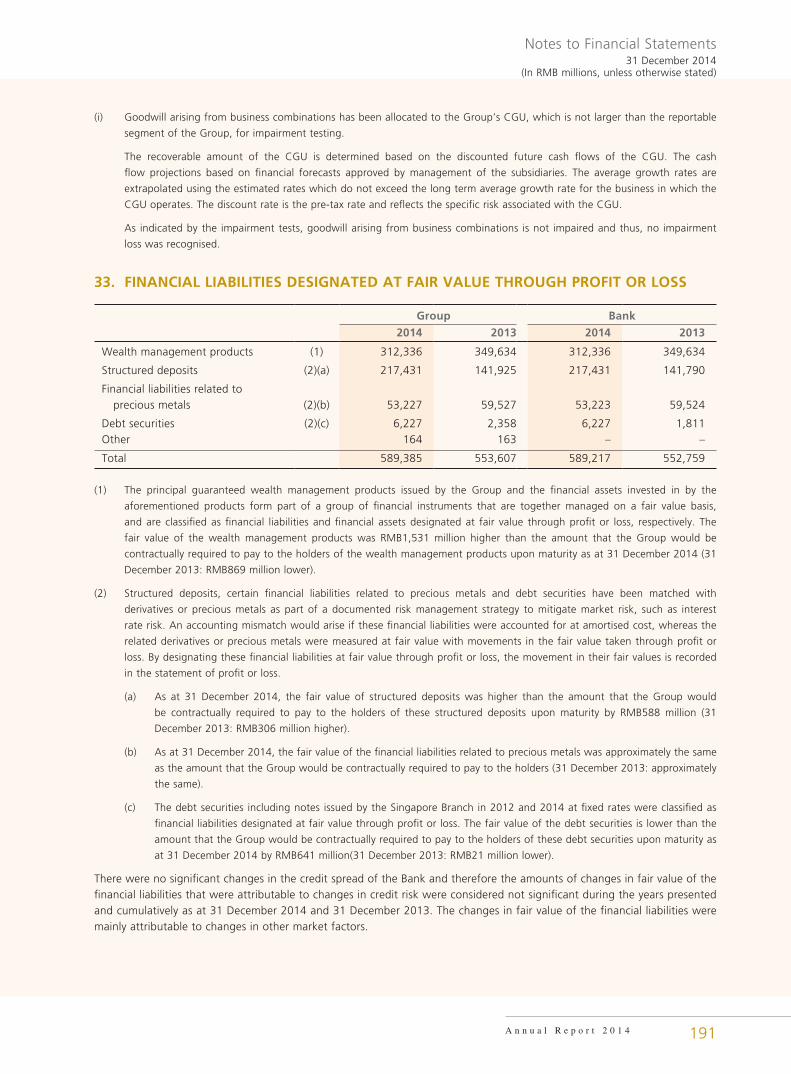
Notes to Financial Statements31 December 2014
(In RMB millions, unless otherwise stated)
A n n u a l R e p o r t 2 0 1 4 191
(i) Goodwill arising from business combinations has been allocated to the Group’s CGU, which is not larger than the reportable
segment of the Group, for impairment testing.
The recoverable amount of the CGU is determined based on the discounted future cash flows of the CGU. The cash
flow projections based on financial forecasts approved by management of the subsidiaries. The average growth rates are
extrapolated using the estimated rates which do not exceed the long term average growth rate for the business in which the
CGU operates. The discount rate is the pre-tax rate and reflects the specific risk associated with the CGU.
As indicated by the impairment tests, goodwill arising from business combinations is not impaired and thus, no impairment
loss was recognised.
33. FINANCIAL LIABILITIES DESIGNATED AT FAIR VALUE THROUGH PROFIT OR LOSS
Group Bank
2014 2013 2014 2013
Wealth management products (1) 312,336 349,634 312,336 349,634
Structured deposits (2)(a) 217,431 141,925 217,431 141,790
Financial liabilities related to precious metals (2)(b) 53,227 59,527 53,223 59,524
Debt securities (2)(c) 6,227 2,358 6,227 1,811Other 164 163 – –
Total 589,385 553,607 589,217 552,759
(1) The principal guaranteed wealth management products issued by the Group and the financial assets invested in by the
aforementioned products form part of a group of financial instruments that are together managed on a fair value basis,
and are classified as financial liabilities and financial assets designated at fair value through profit or loss, respectively. The
fair value of the wealth management products was RMB1,531 million higher than the amount that the Group would be
contractually required to pay to the holders of the wealth management products upon maturity as at 31 December 2014 (31
December 2013: RMB869 million lower).
(2) Structured deposits, certain financial liabilities related to precious metals and debt securities have been matched with
derivatives or precious metals as part of a documented risk management strategy to mitigate market risk, such as interest
rate risk. An accounting mismatch would arise if these financial liabilities were accounted for at amortised cost, whereas the
related derivatives or precious metals were measured at fair value with movements in the fair value taken through profit or
loss. By designating these financial liabilities at fair value through profit or loss, the movement in their fair values is recorded
in the statement of profit or loss.
(a) As at 31 December 2014, the fair value of structured deposits was higher than the amount that the Group would
be contractually required to pay to the holders of these structured deposits upon maturity by RMB588 million (31
December 2013: RMB306 million higher).
(b) As at 31 December 2014, the fair value of the financial liabilities related to precious metals was approximately the same
as the amount that the Group would be contractually required to pay to the holders (31 December 2013: approximately
the same).
(c) The debt securities including notes issued by the Singapore Branch in 2012 and 2014 at fixed rates were classified as
financial liabilities designated at fair value through profit or loss. The fair value of the debt securities is lower than the
amount that the Group would be contractually required to pay to the holders of these debt securities upon maturity as
at 31 December 2014 by RMB641 million(31 December 2013: RMB21 million lower).
There were no significant changes in the credit spread of the Bank and therefore the amounts of changes in fair value of the financial liabilities that were attributable to changes in credit risk were considered not significant during the years presented and cumulatively as at 31 December 2014 and 31 December 2013. The changes in fair value of the financial liabilities were mainly attributable to changes in other market factors.
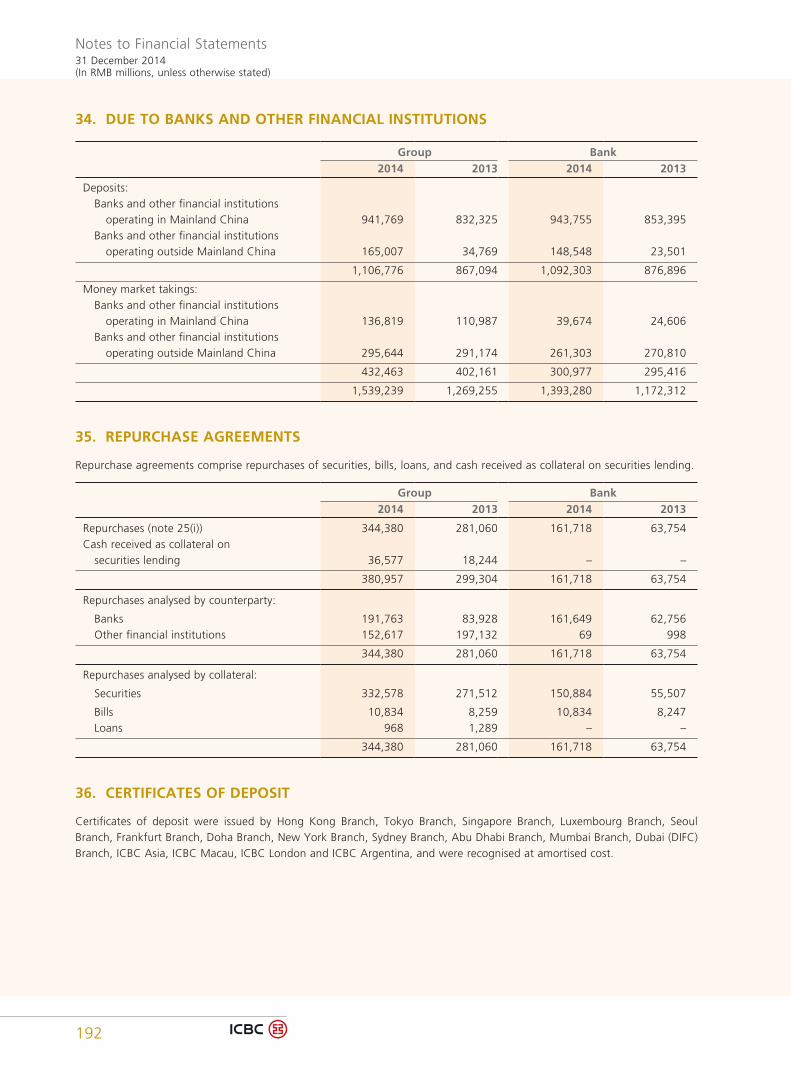
Notes to Financial Statements31 December 2014(In RMB millions, unless otherwise stated)
192
34. DUE TO BANKS AND OTHER FINANCIAL INSTITUTIONS
Group Bank2014 2013 2014 2013
Deposits: Banks and other financial institutions operating in Mainland China 941,769 832,325 943,755 853,395 Banks and other financial institutions operating outside Mainland China 165,007 34,769 148,548 23,501
1,106,776 867,094 1,092,303 876,896
Money market takings: Banks and other financial institutions operating in Mainland China 136,819 110,987 39,674 24,606 Banks and other financial institutions operating outside Mainland China 295,644 291,174 261,303 270,810
432,463 402,161 300,977 295,416
1,539,239 1,269,255 1,393,280 1,172,312
35. REPURCHASE AGREEMENTS
Repurchase agreements comprise repurchases of securities, bills, loans, and cash received as collateral on securities lending.
Group Bank2014 2013 2014 2013
Repurchases (note 25(i)) 344,380 281,060 161,718 63,754Cash received as collateral on securities lending 36,577 18,244 – –
380,957 299,304 161,718 63,754
Repurchases analysed by counterparty:
Banks 191,763 83,928 161,649 62,756 Other financial institutions 152,617 197,132 69 998
344,380 281,060 161,718 63,754
Repurchases analysed by collateral:
Securities 332,578 271,512 150,884 55,507
Bills 10,834 8,259 10,834 8,247 Loans 968 1,289 – –
344,380 281,060 161,718 63,754
36. CERTIFICATES OF DEPOSIT
Certificates of deposit were issued by Hong Kong Branch, Tokyo Branch, Singapore Branch, Luxembourg Branch, Seoul Branch, Frankfurt Branch, Doha Branch, New York Branch, Sydney Branch, Abu Dhabi Branch, Mumbai Branch, Dubai (DIFC) Branch, ICBC Asia, ICBC Macau, ICBC London and ICBC Argentina, and were recognised at amortised cost.
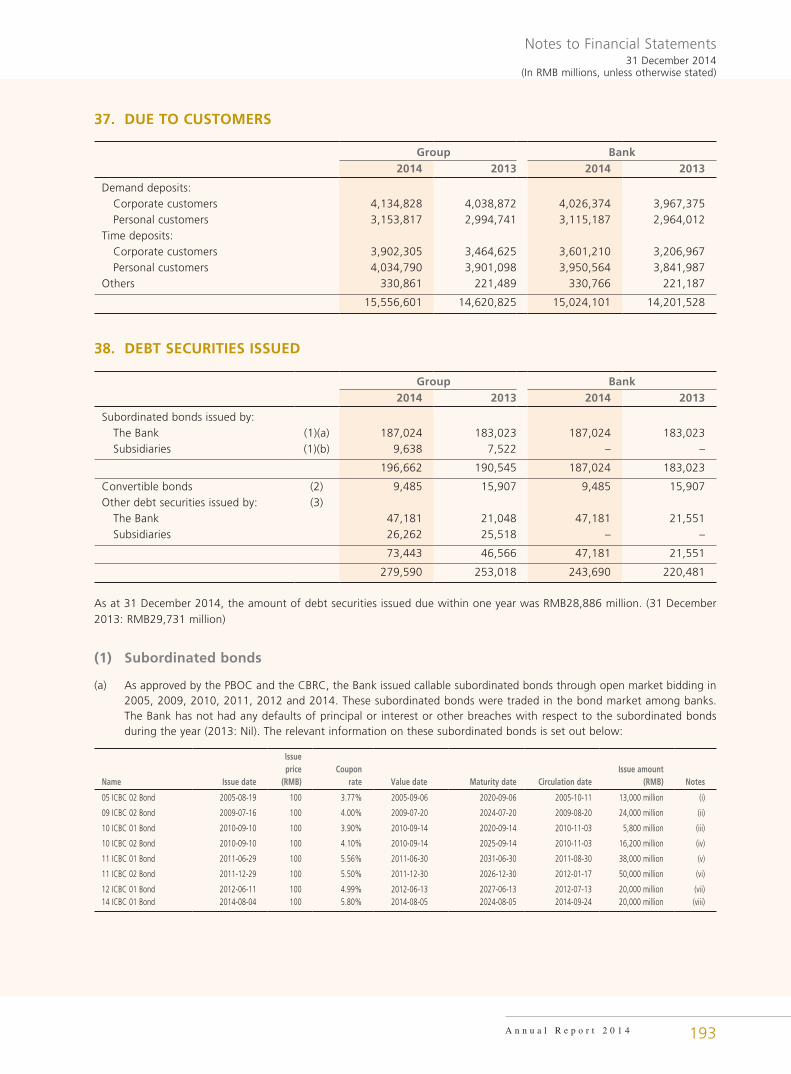
Notes to Financial Statements31 December 2014
(In RMB millions, unless otherwise stated)
A n n u a l R e p o r t 2 0 1 4 193
37. DUE TO CUSTOMERS
Group Bank2014 2013 2014 2013
Demand deposits: Corporate customers 4,134,828 4,038,872 4,026,374 3,967,375 Personal customers 3,153,817 2,994,741 3,115,187 2,964,012Time deposits: Corporate customers 3,902,305 3,464,625 3,601,210 3,206,967 Personal customers 4,034,790 3,901,098 3,950,564 3,841,987Others 330,861 221,489 330,766 221,187
15,556,601 14,620,825 15,024,101 14,201,528
38. DEBT SECURITIES ISSUED
Group Bank2014 2013 2014 2013
Subordinated bonds issued by: The Bank (1)(a) 187,024 183,023 187,024 183,023 Subsidiaries (1)(b) 9,638 7,522 – –
196,662 190,545 187,024 183,023
Convertible bonds (2) 9,485 15,907 9,485 15,907Other debt securities issued by: (3) The Bank 47,181 21,048 47,181 21,551 Subsidiaries 26,262 25,518 – –
73,443 46,566 47,181 21,551
279,590 253,018 243,690 220,481
As at 31 December 2014, the amount of debt securities issued due within one year was RMB28,886 million. (31 December 2013: RMB29,731 million)
(1) Subordinated bonds
(a) As approved by the PBOC and the CBRC, the Bank issued callable subordinated bonds through open market bidding in 2005, 2009, 2010, 2011, 2012 and 2014. These subordinated bonds were traded in the bond market among banks. The Bank has not had any defaults of principal or interest or other breaches with respect to the subordinated bonds during the year (2013: Nil). The relevant information on these subordinated bonds is set out below:
Name Issue date
Issue price
(RMB)Coupon
rate Value date Maturity date Circulation dateIssue amount
(RMB) Notes
05 ICBC 02 Bond 2005-08-19 100 3.77% 2005-09-06 2020-09-06 2005-10-11 13,000 million (i)
09 ICBC 02 Bond 2009-07-16 100 4.00% 2009-07-20 2024-07-20 2009-08-20 24,000 million (ii)
10 ICBC 01 Bond 2010-09-10 100 3.90% 2010-09-14 2020-09-14 2010-11-03 5,800 million (iii)
10 ICBC 02 Bond 2010-09-10 100 4.10% 2010-09-14 2025-09-14 2010-11-03 16,200 million (iv)
11 ICBC 01 Bond 2011-06-29 100 5.56% 2011-06-30 2031-06-30 2011-08-30 38,000 million (v)
11 ICBC 02 Bond 2011-12-29 100 5.50% 2011-12-30 2026-12-30 2012-01-17 50,000 million (vi)
12 ICBC 01 Bond 2012-06-11 100 4.99% 2012-06-13 2027-06-13 2012-07-13 20,000 million (vii)14 ICBC 01 Bond 2014-08-04 100 5.80% 2014-08-05 2024-08-05 2014-09-24 20,000 million (viii)
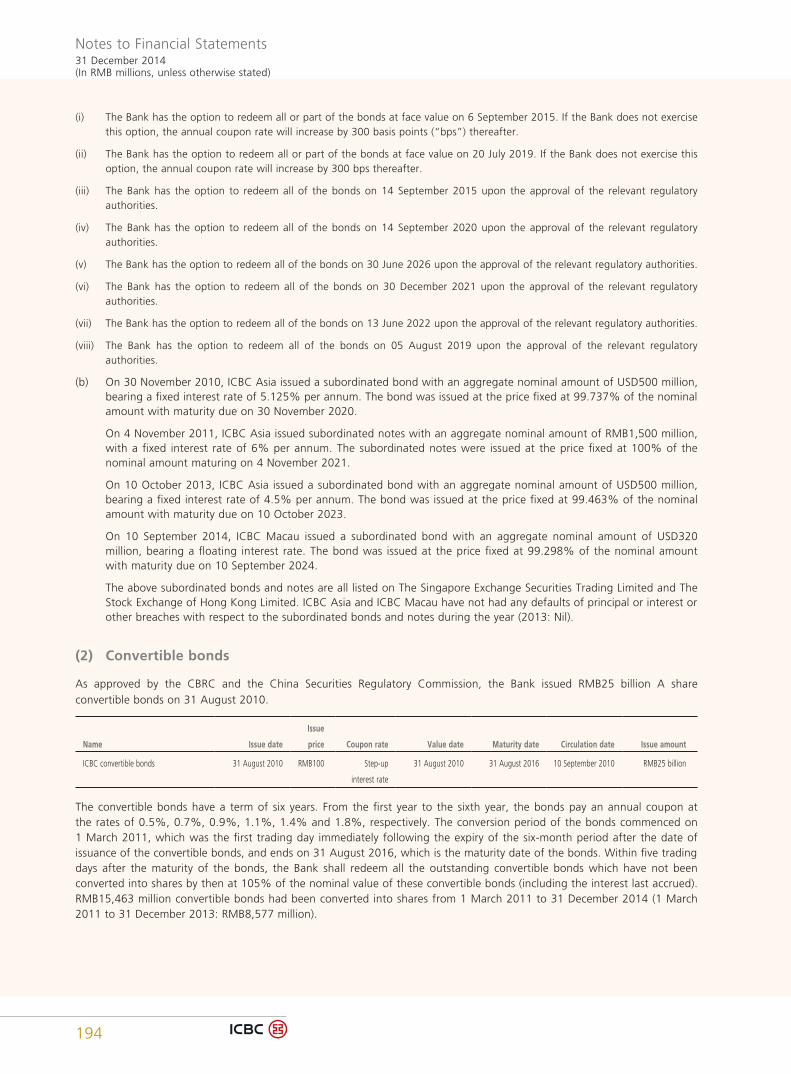
Notes to Financial Statements31 December 2014(In RMB millions, unless otherwise stated)
194
(i) The Bank has the option to redeem all or part of the bonds at face value on 6 September 2015. If the Bank does not exercise this option, the annual coupon rate will increase by 300 basis points (“bps”) thereafter.
(ii) The Bank has the option to redeem all or part of the bonds at face value on 20 July 2019. If the Bank does not exercise this option, the annual coupon rate will increase by 300 bps thereafter.
(iii) The Bank has the option to redeem all of the bonds on 14 September 2015 upon the approval of the relevant regulatory authorities.
(iv) The Bank has the option to redeem all of the bonds on 14 September 2020 upon the approval of the relevant regulatory authorities.
(v) The Bank has the option to redeem all of the bonds on 30 June 2026 upon the approval of the relevant regulatory authorities.
(vi) The Bank has the option to redeem all of the bonds on 30 December 2021 upon the approval of the relevant regulatory authorities.
(vii) The Bank has the option to redeem all of the bonds on 13 June 2022 upon the approval of the relevant regulatory authorities.
(viii) The Bank has the option to redeem all of the bonds on 05 August 2019 upon the approval of the relevant regulatory authorities.
(b) On 30 November 2010, ICBC Asia issued a subordinated bond with an aggregate nominal amount of USD500 million, bearing a fixed interest rate of 5.125% per annum. The bond was issued at the price fixed at 99.737% of the nominal amount with maturity due on 30 November 2020.
On 4 November 2011, ICBC Asia issued subordinated notes with an aggregate nominal amount of RMB1,500 million, with a fixed interest rate of 6% per annum. The subordinated notes were issued at the price fixed at 100% of the nominal amount maturing on 4 November 2021.
On 10 October 2013, ICBC Asia issued a subordinated bond with an aggregate nominal amount of USD500 million, bearing a fixed interest rate of 4.5% per annum. The bond was issued at the price fixed at 99.463% of the nominal amount with maturity due on 10 October 2023.
On 10 September 2014, ICBC Macau issued a subordinated bond with an aggregate nominal amount of USD320 million, bearing a floating interest rate. The bond was issued at the price fixed at 99.298% of the nominal amount with maturity due on 10 September 2024.
The above subordinated bonds and notes are all listed on The Singapore Exchange Securities Trading Limited and The Stock Exchange of Hong Kong Limited. ICBC Asia and ICBC Macau have not had any defaults of principal or interest or other breaches with respect to the subordinated bonds and notes during the year (2013: Nil).
(2) Convertible bonds
As approved by the CBRC and the China Securities Regulatory Commission, the Bank issued RMB25 billion A share convertible bonds on 31 August 2010.
Name Issue date
Issue
price Coupon rate Value date Maturity date Circulation date Issue amount
ICBC convertible bonds 31 August 2010 RMB100 Step-up
interest rate
31 August 2010 31 August 2016 10 September 2010 RMB25 billion
The convertible bonds have a term of six years. From the first year to the sixth year, the bonds pay an annual coupon at the rates of 0.5%, 0.7%, 0.9%, 1.1%, 1.4% and 1.8%, respectively. The conversion period of the bonds commenced on 1 March 2011, which was the first trading day immediately following the expiry of the six-month period after the date of issuance of the convertible bonds, and ends on 31 August 2016, which is the maturity date of the bonds. Within five trading days after the maturity of the bonds, the Bank shall redeem all the outstanding convertible bonds which have not been converted into shares by then at 105% of the nominal value of these convertible bonds (including the interest last accrued). RMB15,463 million convertible bonds had been converted into shares from 1 March 2011 to 31 December 2014 (1 March 2011 to 31 December 2013: RMB8,577 million).
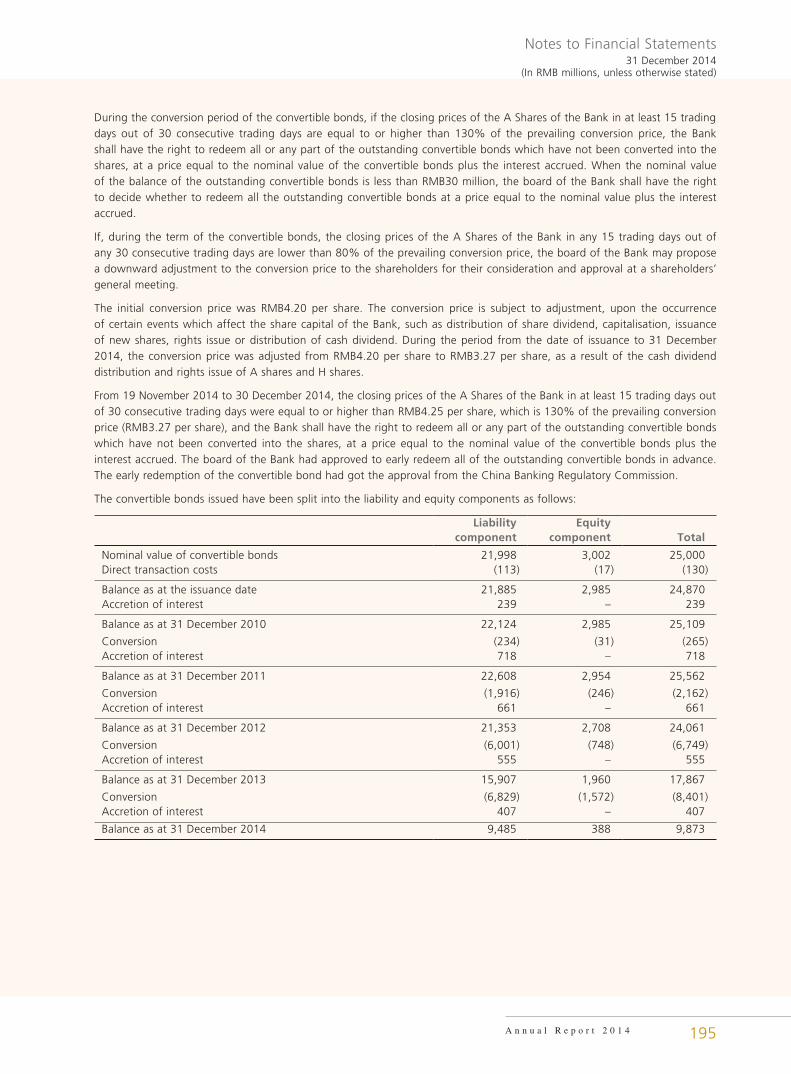
Notes to Financial Statements31 December 2014
(In RMB millions, unless otherwise stated)
A n n u a l R e p o r t 2 0 1 4 195
During the conversion period of the convertible bonds, if the closing prices of the A Shares of the Bank in at least 15 trading days out of 30 consecutive trading days are equal to or higher than 130% of the prevailing conversion price, the Bank shall have the right to redeem all or any part of the outstanding convertible bonds which have not been converted into the shares, at a price equal to the nominal value of the convertible bonds plus the interest accrued. When the nominal value of the balance of the outstanding convertible bonds is less than RMB30 million, the board of the Bank shall have the right to decide whether to redeem all the outstanding convertible bonds at a price equal to the nominal value plus the interest accrued.
If, during the term of the convertible bonds, the closing prices of the A Shares of the Bank in any 15 trading days out of any 30 consecutive trading days are lower than 80% of the prevailing conversion price, the board of the Bank may propose a downward adjustment to the conversion price to the shareholders for their consideration and approval at a shareholders’ general meeting.
The initial conversion price was RMB4.20 per share. The conversion price is subject to adjustment, upon the occurrence of certain events which affect the share capital of the Bank, such as distribution of share dividend, capitalisation, issuance of new shares, rights issue or distribution of cash dividend. During the period from the date of issuance to 31 December 2014, the conversion price was adjusted from RMB4.20 per share to RMB3.27 per share, as a result of the cash dividend distribution and rights issue of A shares and H shares.
From 19 November 2014 to 30 December 2014, the closing prices of the A Shares of the Bank in at least 15 trading days out of 30 consecutive trading days were equal to or higher than RMB4.25 per share, which is 130% of the prevailing conversion price (RMB3.27 per share), and the Bank shall have the right to redeem all or any part of the outstanding convertible bonds which have not been converted into the shares, at a price equal to the nominal value of the convertible bonds plus the interest accrued. The board of the Bank had approved to early redeem all of the outstanding convertible bonds in advance. The early redemption of the convertible bond had got the approval from the China Banking Regulatory Commission.
The convertible bonds issued have been split into the liability and equity components as follows:
Liability component
Equity component Total
Nominal value of convertible bonds 21,998 3,002 25,000Direct transaction costs (113) (17) (130)
Balance as at the issuance date 21,885 2,985 24,870Accretion of interest 239 – 239
Balance as at 31 December 2010 22,124 2,985 25,109
Conversion (234) (31) (265)Accretion of interest 718 – 718
Balance as at 31 December 2011 22,608 2,954 25,562
Conversion (1,916) (246) (2,162)Accretion of interest 661 – 661
Balance as at 31 December 2012 21,353 2,708 24,061
Conversion (6,001) (748) (6,749)Accretion of interest 555 – 555
Balance as at 31 December 2013 15,907 1,960 17,867
Conversion (6,829) (1,572) (8,401)Accretion of interest 407 – 407
Balance as at 31 December 2014 9,485 388 9,873
Notes to Financial Statements31 December 2014(In RMB millions, unless otherwise stated)
196
(3) Other debt securities issued
As at 31 December 2014, the Group’s other debt securities issued mainly include:
The Bank:
(i) Sydney Branch issued debt securities amounting to RMB4,452 million denominated in AUD, HKD and JPY. These securities were issued with maturities between 2015 and 2023 at fixed or floating interest rates. In 2014, Sydney Branch newly issued debt securities amounting to RMB7,998 million denominated in AUD, CHF, RMB, EUR, USD, HKD and JPY. These securities were issued with maturities between 2015 and 2024 at a fixed interest rate.
(ii) In 2013, Singapore Branch issued debt securities amounting to RMB2,000 million with maturities in 2015 at a fixed interest rate. In 2014, Singapore branch issued debt securities amounting to RMB4,000 million with maturities between 2016 and 2021 at a fixed interest rate.
(iii) In 2014, Tokyo Branch issued interest free commercial papers amounting to RMB2,380 million denominated in HKD, JPY and RMB. These commercial papers were issued at a discount with maturities in 2015.
(iv) The Head Office issued debt securities in Hong Kong amounting to RMB3,495 million denominated in RMB with maturities between 2015 and 2019 at a fixed interest rate.
(v) The Head Office issued first to eighth edition interbank deposit and the unsettlement amount was RMB6,959 million with maturities in 2015.
(vi) In 2013, Head Office issued debt securities in London amounting to RMB1,300 million and RMB700 million respectively denominated in RMB with maturities between 2016 and 2018 at a fixed interest rate.
(vii) In 2014, New York Branch issued medium-term notes amounting to RMB13,914 million denominated in USD with maturities between 2017 and 2019 at fixed and floating interest rates.
Subsidiaries:
(i) ICBC Asia issued medium-term notes amounting to RMB9,414 million denominated in RMB, HKD and USD. The notes were issued at the price between 98.447% and 100% of the nominal amount with maturities between 2015 and 2016. In 2014, ICBC Asia issued interbank deposit at a discount of RMB498 million with maturities in 2015.
(ii) Skysea International Capital Management Limited (“Skysea International”), which is controlled by the Group, issued guaranteed notes of USD750 million with a fixed interest rate of 4.875%. The notes were guaranteed by Hong Kong Branch and were issued at the price fixed at 97.708% of the nominal amount with maturities due on 7 December 2021 amounted to RMB4,494 million. By satisfying certain conditions, Skysea International has the option to redeem all of the notes at any time. The notes were listed on the Stock Exchange of Hong Kong Limited.
(iii) ICBC Thai issued debt securities amounting to RMB2,220 million denominated in THB with maturities between 2015 and 2018 at a fixed interest rate. In 2014, ICBC Thai issued debt securities of RMB4,705 million denominated in THB with maturities between 2015 and 2019 at a fixed interest rate.
(iv) In 2014, ICBC International issued fixed interest rate bonds amounting to RMB4,014 million denominated in USD with maturities in 2017.
(v) In 2014, ICBC New Zealand issued medium-term notes amounting to RMB243 million denominated in NZD with maturities in 2017 at fixed or floating interest rates.
(vi) In 2014, ICBC Indonesia issued fixed interest rate notes amounting to RMB250 million denominated in IDR with maturities between 2015 and 2017.
(vii) In 2014, ICBC Argentina issued floating interest rate notes amounting to RMB424 million denominated in ARS with maturities between 2015 and 2016.
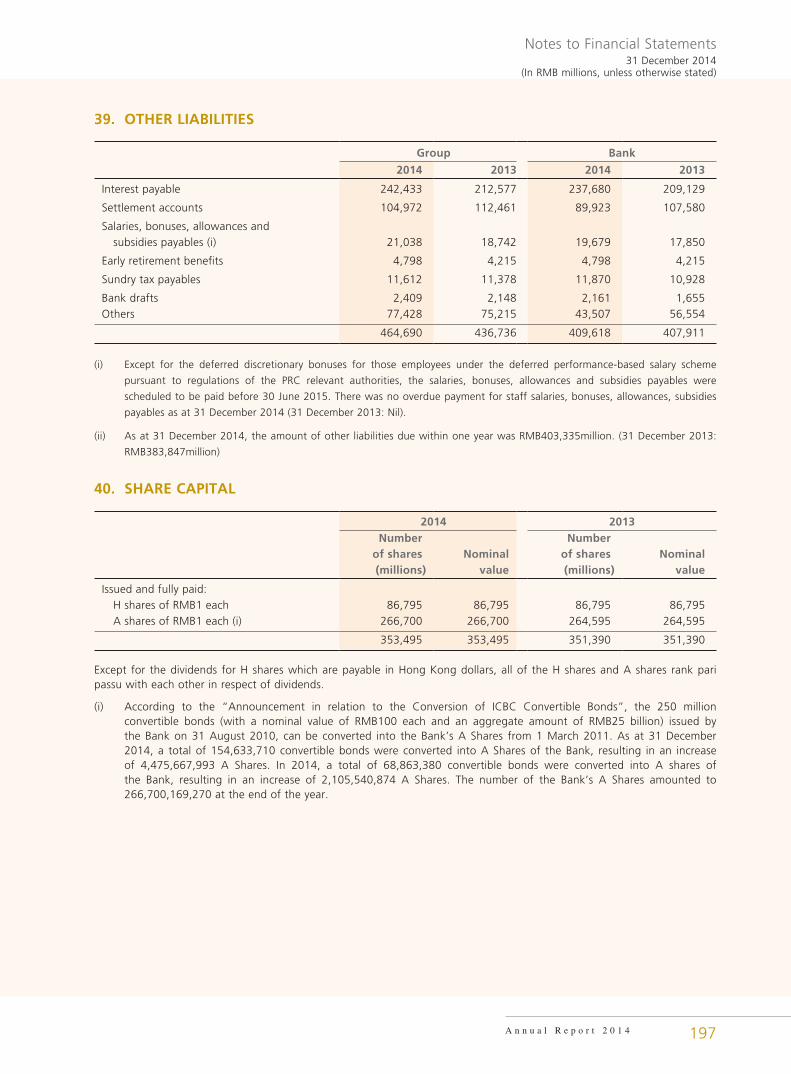
Notes to Financial Statements31 December 2014
(In RMB millions, unless otherwise stated)
A n n u a l R e p o r t 2 0 1 4 197
39. OTHER LIABILITIES
Group Bank
2014 2013 2014 2013
Interest payable 242,433 212,577 237,680 209,129
Settlement accounts 104,972 112,461 89,923 107,580
Salaries, bonuses, allowances and subsidies payables (i) 21,038 18,742 19,679 17,850
Early retirement benefits 4,798 4,215 4,798 4,215
Sundry tax payables 11,612 11,378 11,870 10,928
Bank drafts 2,409 2,148 2,161 1,655Others 77,428 75,215 43,507 56,554
464,690 436,736 409,618 407,911
(i) Except for the deferred discretionary bonuses for those employees under the deferred performance-based salary scheme
pursuant to regulations of the PRC relevant authorities, the salaries, bonuses, allowances and subsidies payables were
scheduled to be paid before 30 June 2015. There was no overdue payment for staff salaries, bonuses, allowances, subsidies
payables as at 31 December 2014 (31 December 2013: Nil).
(ii) As at 31 December 2014, the amount of other liabilities due within one year was RMB403,335million. (31 December 2013:
RMB383,847million)
40. SHARE CAPITAL
2014 2013Number
of shares(millions)
Nominalvalue
Numberof shares(millions)
Nominalvalue
Issued and fully paid: H shares of RMB1 each 86,795 86,795 86,795 86,795 A shares of RMB1 each (i) 266,700 266,700 264,595 264,595
353,495 353,495 351,390 351,390
Except for the dividends for H shares which are payable in Hong Kong dollars, all of the H shares and A shares rank pari passu with each other in respect of dividends.
(i) According to the “Announcement in relation to the Conversion of ICBC Convertible Bonds”, the 250 million convertible bonds (with a nominal value of RMB100 each and an aggregate amount of RMB25 billion) issued by the Bank on 31 August 2010, can be converted into the Bank’s A Shares from 1 March 2011. As at 31 December 2014, a total of 154,633,710 convertible bonds were converted into A Shares of the Bank, resulting in an increase of 4,475,667,993 A Shares. In 2014, a total of 68,863,380 convertible bonds were converted into A shares of the Bank, resulting in an increase of 2,105,540,874 A Shares. The number of the Bank’s A Shares amounted to 266,700,169,270 at the end of the year.
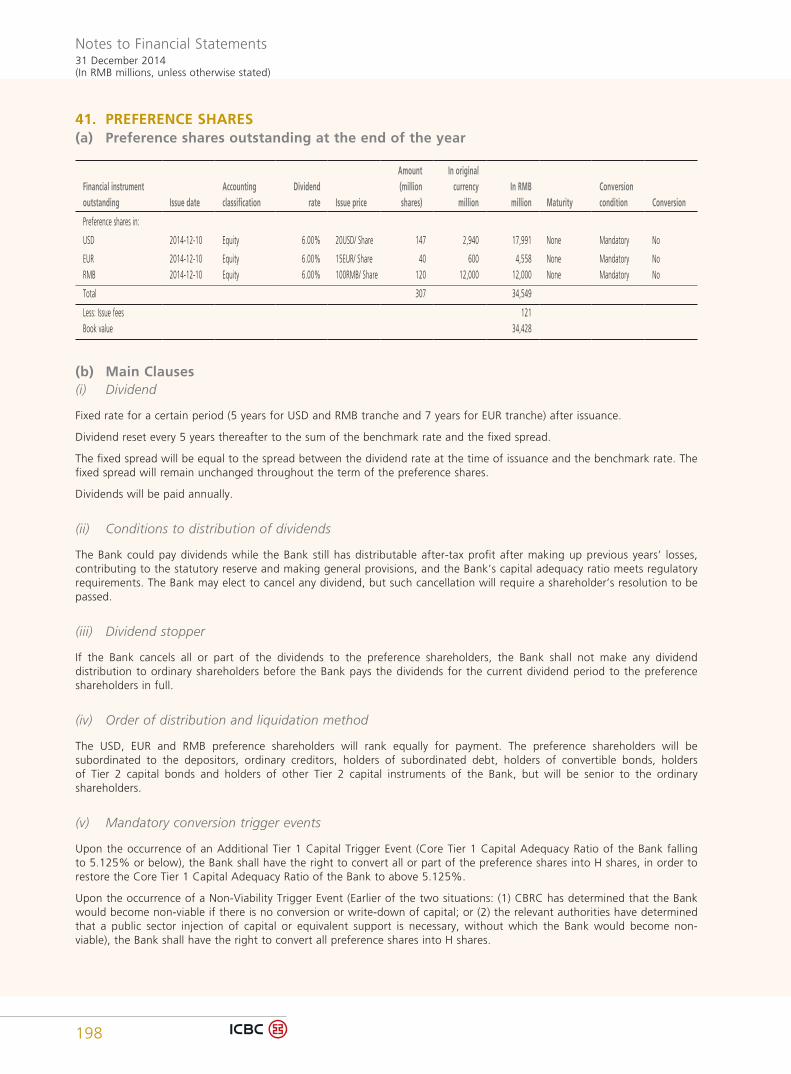
Notes to Financial Statements31 December 2014(In RMB millions, unless otherwise stated)
198
41. PREFERENCE SHARES(a) Preference shares outstanding at the end of the year
Financial instrument outstanding Issue date
Accountingclassification
Dividend rate Issue price
Amount (million shares)
In originalcurrency
millionIn RMBmillion Maturity
Conversion condition Conversion
Preference shares in:
USD 2014-12-10 Equity 6.00% 20USD/ Share 147 2,940 17,991 None Mandatory No
EUR 2014-12-10 Equity 6.00% 15EUR/ Share 40 600 4,558 None Mandatory NoRMB 2014-12-10 Equity 6.00% 100RMB/ Share 120 12,000 12,000 None Mandatory No
Total 307 34,549
Less: Issue fees 121Book value 34,428
(b) Main Clauses(i) Dividend
Fixed rate for a certain period (5 years for USD and RMB tranche and 7 years for EUR tranche) after issuance.
Dividend reset every 5 years thereafter to the sum of the benchmark rate and the fixed spread.
The fixed spread will be equal to the spread between the dividend rate at the time of issuance and the benchmark rate. The fixed spread will remain unchanged throughout the term of the preference shares.
Dividends will be paid annually.
(ii) Conditions to distribution of dividends
The Bank could pay dividends while the Bank still has distributable after-tax profit after making up previous years’ losses, contributing to the statutory reserve and making general provisions, and the Bank’s capital adequacy ratio meets regulatory requirements. The Bank may elect to cancel any dividend, but such cancellation will require a shareholder’s resolution to be passed.
(iii) Dividend stopper
If the Bank cancels all or part of the dividends to the preference shareholders, the Bank shall not make any dividend distribution to ordinary shareholders before the Bank pays the dividends for the current dividend period to the preference shareholders in full.
(iv) Order of distribution and liquidation method
The USD, EUR and RMB preference shareholders will rank equally for payment. The preference shareholders will be subordinated to the depositors, ordinary creditors, holders of subordinated debt, holders of convertible bonds, holders of Tier 2 capital bonds and holders of other Tier 2 capital instruments of the Bank, but will be senior to the ordinary shareholders.
(v) Mandatory conversion trigger events
Upon the occurrence of an Additional Tier 1 Capital Trigger Event (Core Tier 1 Capital Adequacy Ratio of the Bank falling to 5.125% or below), the Bank shall have the right to convert all or part of the preference shares into H shares, in order to restore the Core Tier 1 Capital Adequacy Ratio of the Bank to above 5.125%.
Upon the occurrence of a Non-Viability Trigger Event (Earlier of the two situations: (1) CBRC has determined that the Bank would become non-viable if there is no conversion or write-down of capital; or (2) the relevant authorities have determined that a public sector injection of capital or equivalent support is necessary, without which the Bank would become non-viable), the Bank shall have the right to convert all preference shares into H shares.
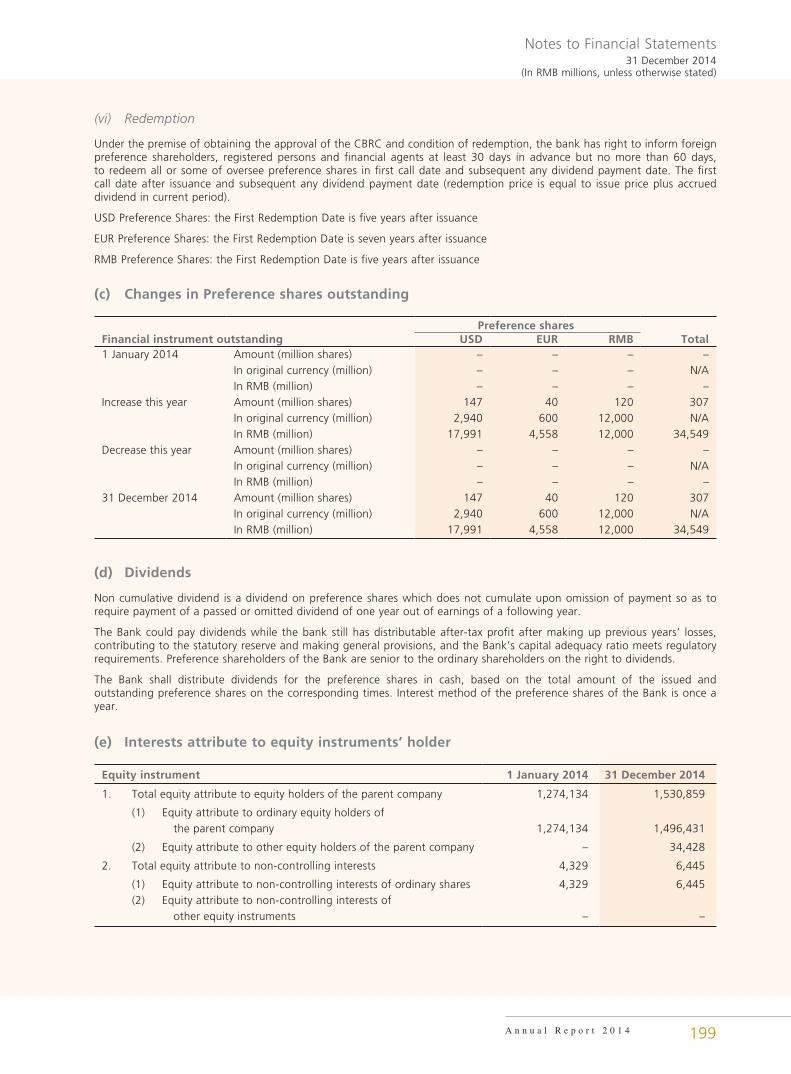
Notes to Financial Statements31 December 2014
(In RMB millions, unless otherwise stated)
A n n u a l R e p o r t 2 0 1 4 199
(vi) Redemption
Under the premise of obtaining the approval of the CBRC and condition of redemption, the bank has right to inform foreign preference shareholders, registered persons and financial agents at least 30 days in advance but no more than 60 days, to redeem all or some of oversee preference shares in first call date and subsequent any dividend payment date. The first call date after issuance and subsequent any dividend payment date (redemption price is equal to issue price plus accrued dividend in current period).
USD Preference Shares: the First Redemption Date is five years after issuance
EUR Preference Shares: the First Redemption Date is seven years after issuance
RMB Preference Shares: the First Redemption Date is five years after issuance
(c) Changes in Preference shares outstanding
Preference sharesFinancial instrument outstanding USD EUR RMB Total1 January 2014 Amount (million shares) – – – –
In original currency (million) – – – N/AIn RMB (million) – – – –
Increase this year Amount (million shares) 147 40 120 307In original currency (million) 2,940 600 12,000 N/AIn RMB (million) 17,991 4,558 12,000 34,549
Decrease this year Amount (million shares) – – – –In original currency (million) – – – N/AIn RMB (million) – – – –
31 December 2014 Amount (million shares) 147 40 120 307In original currency (million) 2,940 600 12,000 N/AIn RMB (million) 17,991 4,558 12,000 34,549
(d) Dividends
Non cumulative dividend is a dividend on preference shares which does not cumulate upon omission of payment so as to require payment of a passed or omitted dividend of one year out of earnings of a following year.
The Bank could pay dividends while the bank still has distributable after-tax profit after making up previous years’ losses, contributing to the statutory reserve and making general provisions, and the Bank’s capital adequacy ratio meets regulatory requirements. Preference shareholders of the Bank are senior to the ordinary shareholders on the right to dividends.
The Bank shall distribute dividends for the preference shares in cash, based on the total amount of the issued and outstanding preference shares on the corresponding times. Interest method of the preference shares of the Bank is once a year.
(e) Interests attribute to equity instruments’ holder
Equity instrument 1 January 2014 31 December 2014
1. Total equity attribute to equity holders of the parent company 1,274,134 1,530,859
(1) Equity attribute to ordinary equity holders of the parent company 1,274,134 1,496,431
(2) Equity attribute to other equity holders of the parent company – 34,428
2. Total equity attribute to non-controlling interests 4,329 6,445
(1) Equity attribute to non-controlling interests of ordinary shares 4,329 6,445(2) Equity attribute to non-controlling interests of
other equity instruments – –
Notes to Financial Statements31 December 2014(In RMB millions, unless otherwise stated)
200
42. RESERVES(a) Capital reserve
Capital reserve mainly includes share premium arising from the issuance of new shares at prices in excess of par value.
(b) Surplus reserves(i) Statutory surplus reserve
The Bank is required to appropriate 10% of its profit for the year pursuant to the Company Law of the People’s Republic of China and the Articles to the statutory surplus reserve until the reserve balance reaches 50% of its registered capital.
Subject to the approval of the shareholders, the statutory surplus reserve may be used to offset accumulated losses of the Bank, if any, and may also be converted into capital of the Bank, provided that the balance of the statutory surplus reserve after such capitalisation is not less than 25% of the registered capital immediately before capitalisation.
Pursuant to the resolution of the board of directors’ meeting held on 26 March 2015, an appropriation of 10% of the profit for the year determined under the generally accepted accounting principles of PRC (“PRC GAAP”) to the statutory surplus reserve, in the amount of RMB26,423 million (2013: RMB25,382 million) was approved.
(ii) Discretionary surplus reserve
After making the appropriation to the statutory surplus reserve, the Bank may also appropriate its profit for the year determined under PRC GAAP to the discretionary surplus reserve upon approval by the shareholders in general meetings. Subject to the approval by the shareholders, the discretionary surplus reserve may be used to offset accumulated losses of the Bank, if any, and may be converted into capital.
(iii) Other surplus reserve
The Bank’s overseas entities appropriate their profits to the surplus reserves in accordance with the relevant regulations promulgated by the local regulatory bodies.
(c) General reserve
From 1 July 2012, the Bank is required by the MOF to maintain a general reserve within equity, through the appropriation of profit, which should not be less than 1.5% of the year end balance of its risk assets.
The Bank’s subsidiaries appropriate their profits to the general reserve according to the applicable local regulations.
The general reserve balance of the Bank as at 31 December 2014 amounted to RMB218,078 million (2013: RMB199,916 million), which has reached 1.5 % of the year end balance of the Bank’s risk assets.
(d) Investment revaluation reserve
The investment revaluation reserve records the fair value changes of available-for-sale financial assets.
(e) Foreign currency translation reserve
The foreign currency translation reserve is used to record exchange differences arising from the translation of the financial statements of the subsidiaries and branches incorporated outside Mainland China.
(f) Cash flow hedge reserve
The cash flow hedge reserve comprises the effective portion of the gain or loss on the hedging instrument.
(g) Other reserves
Other reserves represent share of reserves of associates and joint ventures.
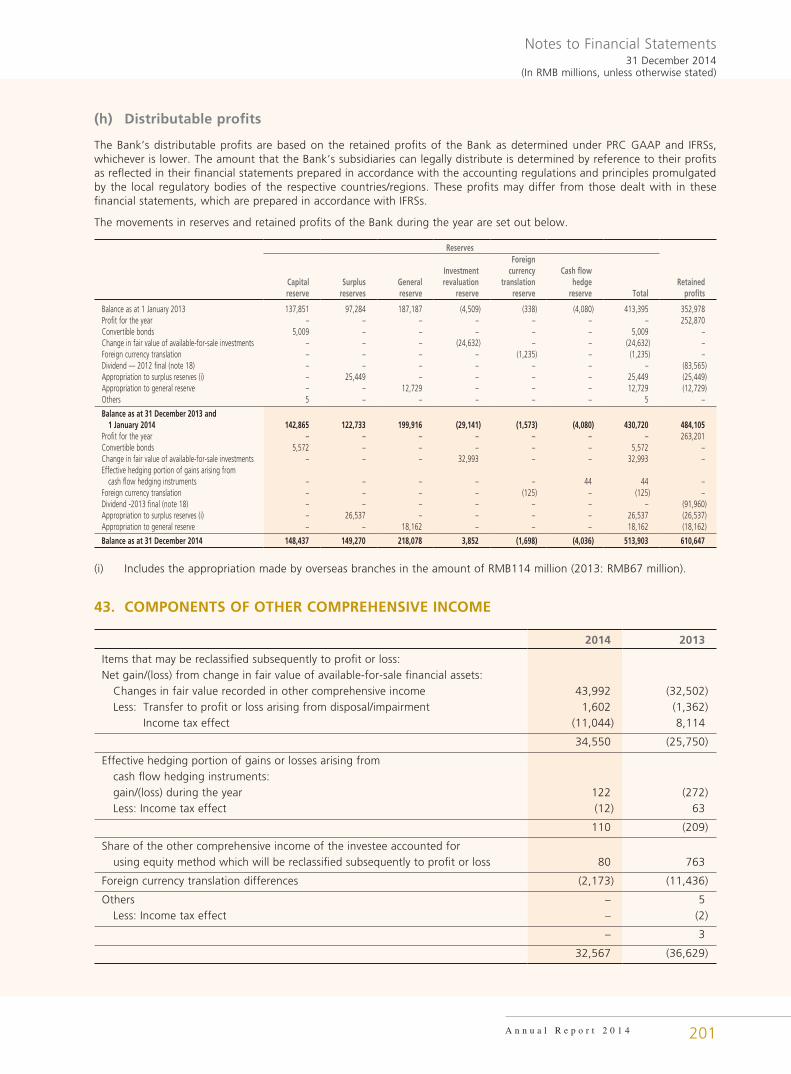
Notes to Financial Statements31 December 2014
(In RMB millions, unless otherwise stated)
A n n u a l R e p o r t 2 0 1 4 201
(h) Distributable profits
The Bank’s distributable profits are based on the retained profits of the Bank as determined under PRC GAAP and IFRSs, whichever is lower. The amount that the Bank’s subsidiaries can legally distribute is determined by reference to their profits as reflected in their financial statements prepared in accordance with the accounting regulations and principles promulgated by the local regulatory bodies of the respective countries/regions. These profits may differ from those dealt with in these financial statements, which are prepared in accordance with IFRSs.
The movements in reserves and retained profits of the Bank during the year are set out below.
Reserves
Capital reserve
Surplus reserves
General reserve
Investment revaluation
reserve
Foreign currency
translation reserve
Cash flow hedge
reserve TotalRetained
profits
Balance as at 1 January 2013 137,851 97,284 187,187 (4,509) (338) (4,080) 413,395 352,978Profit for the year – – – – – – – 252,870Convertible bonds 5,009 – – – – – 5,009 –Change in fair value of available-for-sale investments – – – (24,632) – – (24,632) –Foreign currency translation – – – – (1,235) – (1,235) –Dividend — 2012 final (note 18) – – – – – – – (83,565)Appropriation to surplus reserves (i) – 25,449 – – – – 25,449 (25,449)Appropriation to general reserve – – 12,729 – – – 12,729 (12,729)Others 5 – – – – – 5 –
Balance as at 31 December 2013 and 1 January 2014 142,865 122,733 199,916 (29,141) (1,573) (4,080) 430,720 484,105Profit for the year – – – – – – – 263,201Convertible bonds 5,572 – – – – – 5,572 –Change in fair value of available-for-sale investments – – – 32,993 – – 32,993 –Effective hedging portion of gains arising from cash flow hedging instruments – – – – – 44 44 –Foreign currency translation – – – – (125) – (125) –Dividend -2013 final (note 18) – – – – – – – (91,960)Appropriation to surplus reserves (i) – 26,537 – – – – 26,537 (26,537)Appropriation to general reserve – – 18,162 – – – 18,162 (18,162)
Balance as at 31 December 2014 148,437 149,270 218,078 3,852 (1,698) (4,036) 513,903 610,647
(i) Includes the appropriation made by overseas branches in the amount of RMB114 million (2013: RMB67 million).
43. COMPONENTS OF OTHER COMPREHENSIVE INCOME
2014 2013
Items that may be reclassified subsequently to profit or loss:Net gain/(loss) from change in fair value of available-for-sale financial assets: Changes in fair value recorded in other comprehensive income 43,992 (32,502) Less: Transfer to profit or loss arising from disposal/impairment 1,602 (1,362) Income tax effect (11,044) 8,114
34,550 (25,750)
Effective hedging portion of gains or losses arising from cash flow hedging instruments: gain/(loss) during the year 122 (272) Less: Income tax effect (12) 63
110 (209)
Share of the other comprehensive income of the investee accounted for using equity method which will be reclassified subsequently to profit or loss 80 763
Foreign currency translation differences (2,173) (11,436)
Others – 5 Less: Income tax effect – (2)
– 3
32,567 (36,629)
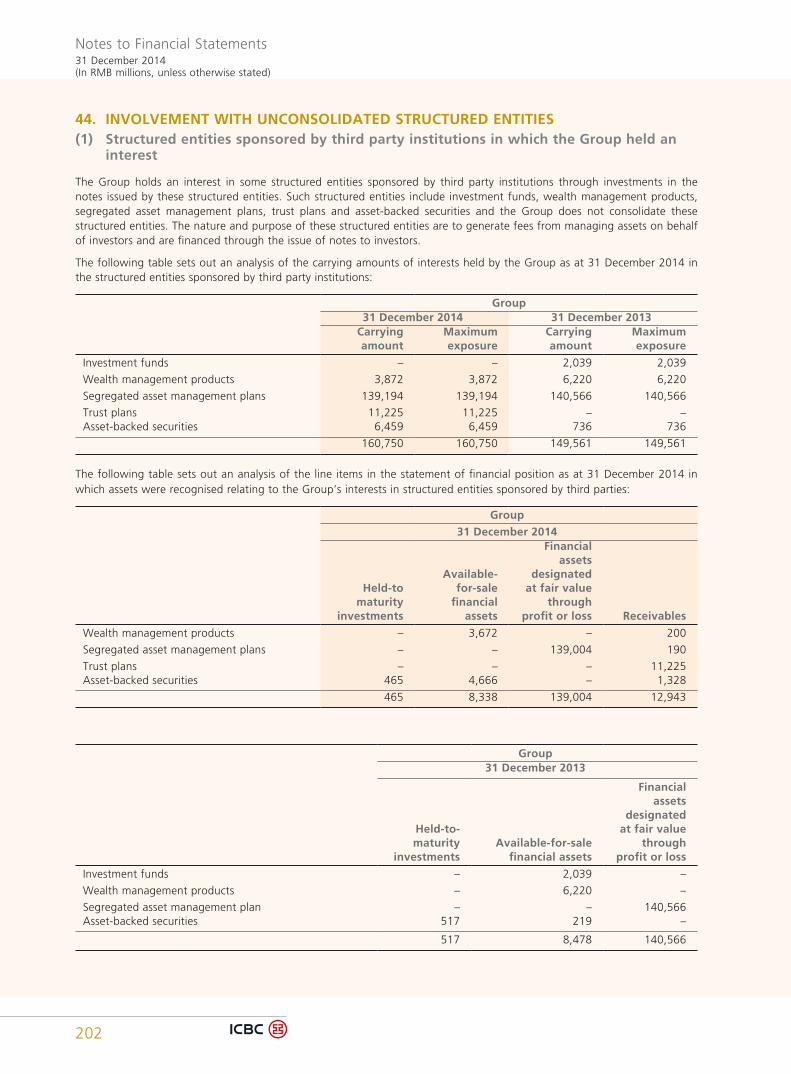
Notes to Financial Statements31 December 2014(In RMB millions, unless otherwise stated)
202
44. INVOLVEMENT WITH UNCONSOLIDATED STRUCTURED ENTITIES(1) Structured entities sponsored by third party institutions in which the Group held an
interest
The Group holds an interest in some structured entities sponsored by third party institutions through investments in the notes issued by these structured entities. Such structured entities include investment funds, wealth management products, segregated asset management plans, trust plans and asset-backed securities and the Group does not consolidate these structured entities. The nature and purpose of these structured entities are to generate fees from managing assets on behalf of investors and are financed through the issue of notes to investors.
The following table sets out an analysis of the carrying amounts of interests held by the Group as at 31 December 2014 in the structured entities sponsored by third party institutions:
Group31 December 2014 31 December 2013
Carrying amount
Maximum exposure
Carrying amount
Maximum exposure
Investment funds – – 2,039 2,039
Wealth management products 3,872 3,872 6,220 6,220
Segregated asset management plans 139,194 139,194 140,566 140,566
Trust plans 11,225 11,225 – –Asset-backed securities 6,459 6,459 736 736
160,750 160,750 149,561 149,561
The following table sets out an analysis of the line items in the statement of financial position as at 31 December 2014 in which assets were recognised relating to the Group’s interests in structured entities sponsored by third parties:
Group
31 December 2014
Held-to maturity
investments
Available- for-sale
financial assets
Financial assets
designated at fair value
through profit or loss Receivables
Wealth management products – 3,672 – 200
Segregated asset management plans – – 139,004 190
Trust plans – – – 11,225Asset-backed securities 465 4,666 – 1,328
465 8,338 139,004 12,943
Group31 December 2013
Held-to- maturity
investmentsAvailable-for-sale
financial assets
Financial assets
designated at fair value
through profit or loss
Investment funds – 2,039 –
Wealth management products – 6,220 –
Segregated asset management plan – – 140,566Asset-backed securities 517 219 –
517 8,478 140,566
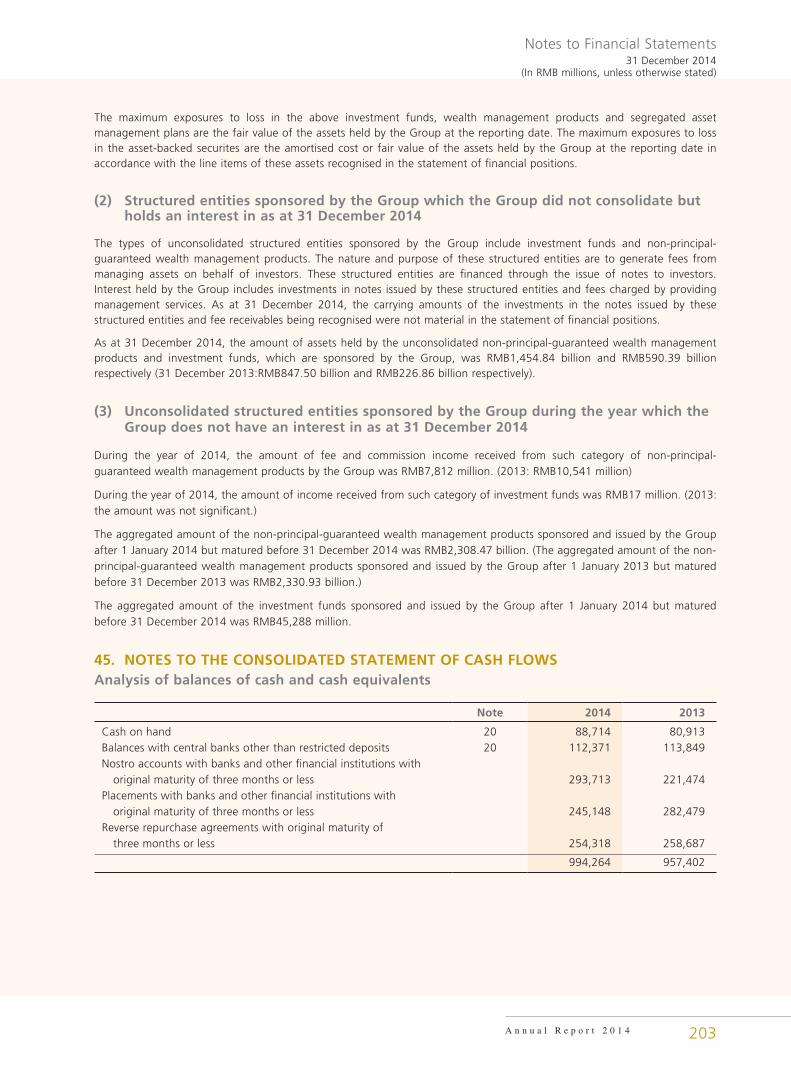
Notes to Financial Statements31 December 2014
(In RMB millions, unless otherwise stated)
A n n u a l R e p o r t 2 0 1 4 203
The maximum exposures to loss in the above investment funds, wealth management products and segregated asset management plans are the fair value of the assets held by the Group at the reporting date. The maximum exposures to loss in the asset-backed securites are the amortised cost or fair value of the assets held by the Group at the reporting date in accordance with the line items of these assets recognised in the statement of financial positions.
(2) Structured entities sponsored by the Group which the Group did not consolidate but holds an interest in as at 31 December 2014
The types of unconsolidated structured entities sponsored by the Group include investment funds and non-principal-guaranteed wealth management products. The nature and purpose of these structured entities are to generate fees from managing assets on behalf of investors. These structured entities are financed through the issue of notes to investors. Interest held by the Group includes investments in notes issued by these structured entities and fees charged by providing management services. As at 31 December 2014, the carrying amounts of the investments in the notes issued by these structured entities and fee receivables being recognised were not material in the statement of financial positions.
As at 31 December 2014, the amount of assets held by the unconsolidated non-principal-guaranteed wealth management products and investment funds, which are sponsored by the Group, was RMB1,454.84 billion and RMB590.39 billion respectively (31 December 2013:RMB847.50 billion and RMB226.86 billion respectively).
(3) Unconsolidated structured entities sponsored by the Group during the year which the Group does not have an interest in as at 31 December 2014
During the year of 2014, the amount of fee and commission income received from such category of non-principal-guaranteed wealth management products by the Group was RMB7,812 million. (2013: RMB10,541 million)
During the year of 2014, the amount of income received from such category of investment funds was RMB17 million. (2013: the amount was not significant.)
The aggregated amount of the non-principal-guaranteed wealth management products sponsored and issued by the Group after 1 January 2014 but matured before 31 December 2014 was RMB2,308.47 billion. (The aggregated amount of the non-principal-guaranteed wealth management products sponsored and issued by the Group after 1 January 2013 but matured before 31 December 2013 was RMB2,330.93 billion.)
The aggregated amount of the investment funds sponsored and issued by the Group after 1 January 2014 but matured before 31 December 2014 was RMB45,288 million.
45. NOTES TO THE CONSOLIDATED STATEMENT OF CASH FLOWSAnalysis of balances of cash and cash equivalents
Note 2014 2013
Cash on hand 20 88,714 80,913Balances with central banks other than restricted deposits 20 112,371 113,849Nostro accounts with banks and other financial institutions with original maturity of three months or less 293,713 221,474Placements with banks and other financial institutions with original maturity of three months or less 245,148 282,479Reverse repurchase agreements with original maturity of three months or less 254,318 258,687
994,264 957,402
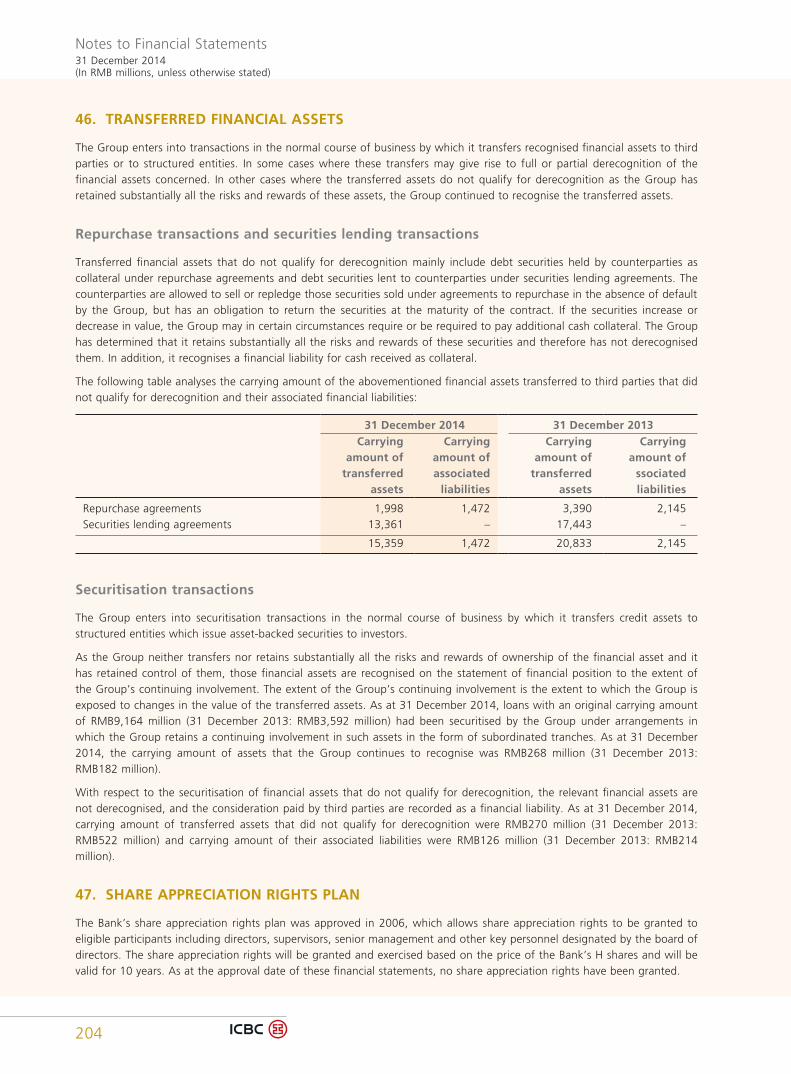
Notes to Financial Statements31 December 2014(In RMB millions, unless otherwise stated)
204
46. TRANSFERRED FINANCIAL ASSETS
The Group enters into transactions in the normal course of business by which it transfers recognised financial assets to third parties or to structured entities. In some cases where these transfers may give rise to full or partial derecognition of the financial assets concerned. In other cases where the transferred assets do not qualify for derecognition as the Group has retained substantially all the risks and rewards of these assets, the Group continued to recognise the transferred assets.
Repurchase transactions and securities lending transactions
Transferred financial assets that do not qualify for derecognition mainly include debt securities held by counterparties as collateral under repurchase agreements and debt securities lent to counterparties under securities lending agreements. The counterparties are allowed to sell or repledge those securities sold under agreements to repurchase in the absence of default by the Group, but has an obligation to return the securities at the maturity of the contract. If the securities increase or decrease in value, the Group may in certain circumstances require or be required to pay additional cash collateral. The Group has determined that it retains substantially all the risks and rewards of these securities and therefore has not derecognised them. In addition, it recognises a financial liability for cash received as collateral.
The following table analyses the carrying amount of the abovementioned financial assets transferred to third parties that did not qualify for derecognition and their associated financial liabilities:
31 December 2014 31 December 2013Carrying
amount of transferred
assets
Carrying amount of associated
liabilities
Carrying amount of
transferred assets
Carrying amount of
ssociated liabilities
Repurchase agreements 1,998 1,472 3,390 2,145Securities lending agreements 13,361 – 17,443 –
15,359 1,472 20,833 2,145
Securitisation transactions
The Group enters into securitisation transactions in the normal course of business by which it transfers credit assets to structured entities which issue asset-backed securities to investors.
As the Group neither transfers nor retains substantially all the risks and rewards of ownership of the financial asset and it has retained control of them, those financial assets are recognised on the statement of financial position to the extent of the Group’s continuing involvement. The extent of the Group’s continuing involvement is the extent to which the Group is exposed to changes in the value of the transferred assets. As at 31 December 2014, loans with an original carrying amount of RMB9,164 million (31 December 2013: RMB3,592 million) had been securitised by the Group under arrangements in which the Group retains a continuing involvement in such assets in the form of subordinated tranches. As at 31 December 2014, the carrying amount of assets that the Group continues to recognise was RMB268 million (31 December 2013: RMB182 million).
With respect to the securitisation of financial assets that do not qualify for derecognition, the relevant financial assets are not derecognised, and the consideration paid by third parties are recorded as a financial liability. As at 31 December 2014, carrying amount of transferred assets that did not qualify for derecognition were RMB270 million (31 December 2013: RMB522 million) and carrying amount of their associated liabilities were RMB126 million (31 December 2013: RMB214 million).
47. SHARE APPRECIATION RIGHTS PLAN
The Bank’s share appreciation rights plan was approved in 2006, which allows share appreciation rights to be granted to eligible participants including directors, supervisors, senior management and other key personnel designated by the board of directors. The share appreciation rights will be granted and exercised based on the price of the Bank’s H shares and will be valid for 10 years. As at the approval date of these financial statements, no share appreciation rights have been granted.
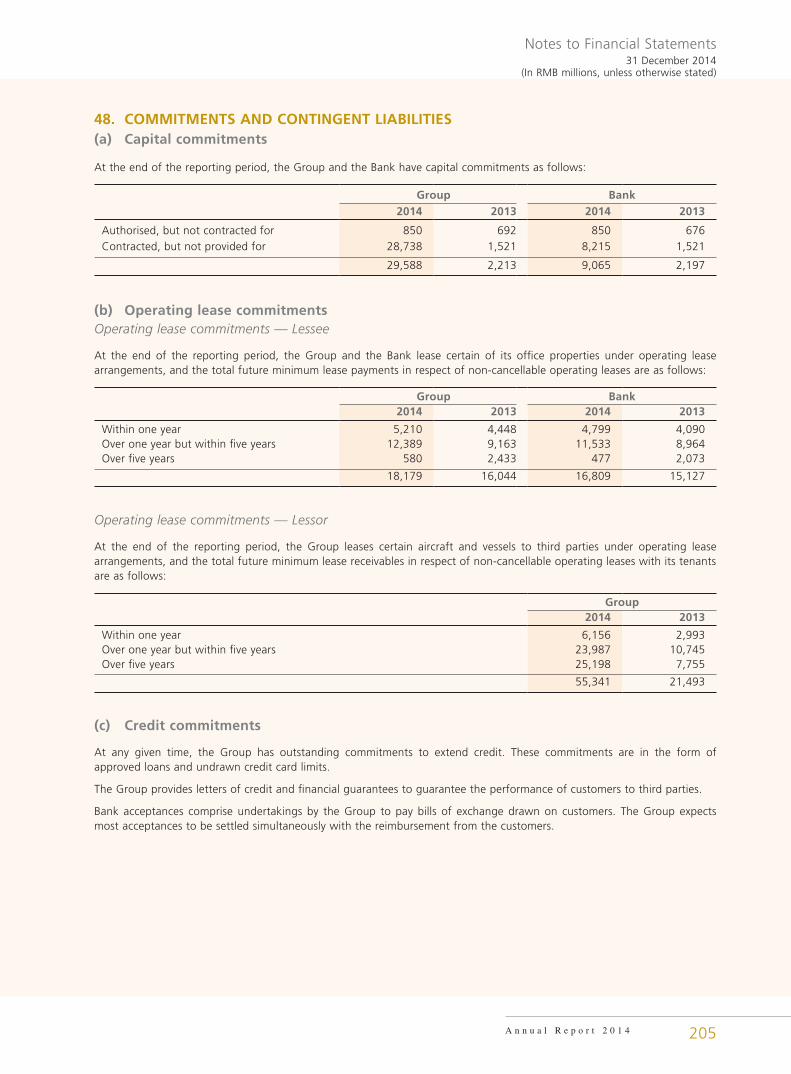
Notes to Financial Statements31 December 2014
(In RMB millions, unless otherwise stated)
A n n u a l R e p o r t 2 0 1 4 205
48. COMMITMENTS AND CONTINGENT LIABILITIES(a) Capital commitments
At the end of the reporting period, the Group and the Bank have capital commitments as follows:
Group Bank2014 2013 2014 2013
Authorised, but not contracted for 850 692 850 676Contracted, but not provided for 28,738 1,521 8,215 1,521
29,588 2,213 9,065 2,197
(b) Operating lease commitmentsOperating lease commitments — Lessee
At the end of the reporting period, the Group and the Bank lease certain of its office properties under operating lease arrangements, and the total future minimum lease payments in respect of non-cancellable operating leases are as follows:
Group Bank2014 2013 2014 2013
Within one year 5,210 4,448 4,799 4,090Over one year but within five years 12,389 9,163 11,533 8,964Over five years 580 2,433 477 2,073
18,179 16,044 16,809 15,127
Operating lease commitments — Lessor
At the end of the reporting period, the Group leases certain aircraft and vessels to third parties under operating lease arrangements, and the total future minimum lease receivables in respect of non-cancellable operating leases with its tenants are as follows:
Group2014 2013
Within one year 6,156 2,993Over one year but within five years 23,987 10,745Over five years 25,198 7,755
55,341 21,493
(c) Credit commitments
At any given time, the Group has outstanding commitments to extend credit. These commitments are in the form of approved loans and undrawn credit card limits.
The Group provides letters of credit and financial guarantees to guarantee the performance of customers to third parties.
Bank acceptances comprise undertakings by the Group to pay bills of exchange drawn on customers. The Group expects most acceptances to be settled simultaneously with the reimbursement from the customers.
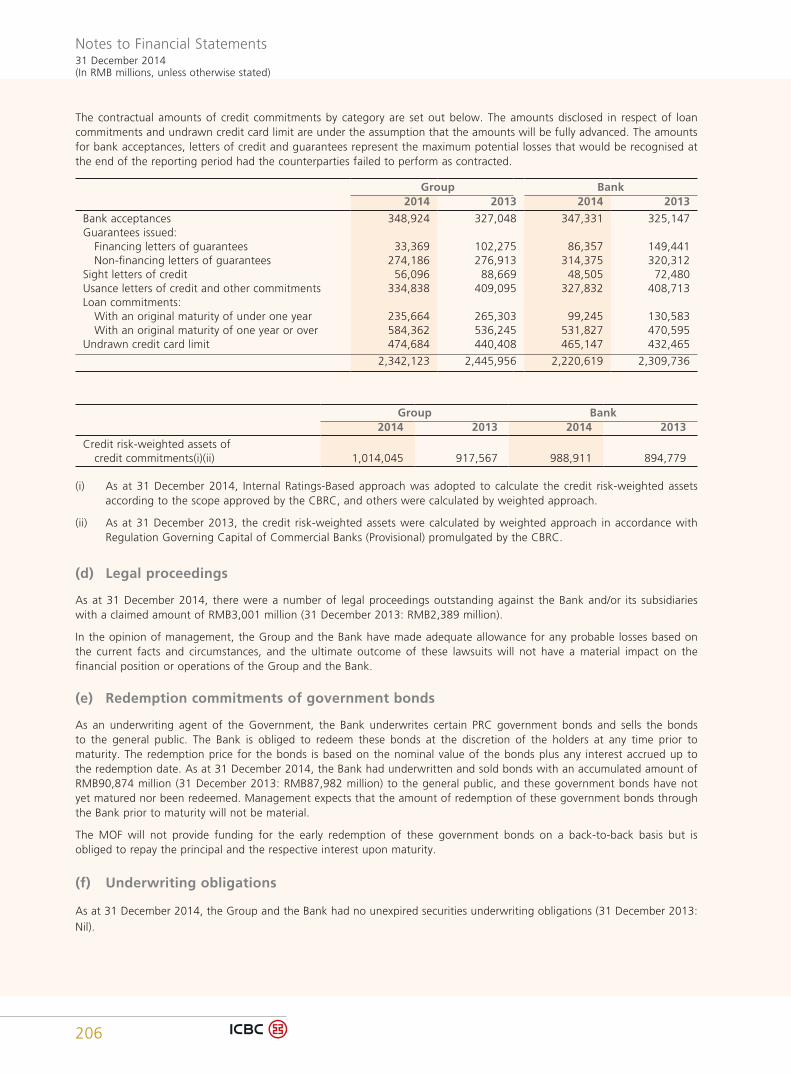
Notes to Financial Statements31 December 2014(In RMB millions, unless otherwise stated)
206
The contractual amounts of credit commitments by category are set out below. The amounts disclosed in respect of loan commitments and undrawn credit card limit are under the assumption that the amounts will be fully advanced. The amounts for bank acceptances, letters of credit and guarantees represent the maximum potential losses that would be recognised at the end of the reporting period had the counterparties failed to perform as contracted.
Group Bank2014 2013 2014 2013
Bank acceptances 348,924 327,048 347,331 325,147Guarantees issued: Financing letters of guarantees 33,369 102,275 86,357 149,441 Non-financing letters of guarantees 274,186 276,913 314,375 320,312Sight letters of credit 56,096 88,669 48,505 72,480Usance letters of credit and other commitments 334,838 409,095 327,832 408,713Loan commitments: With an original maturity of under one year 235,664 265,303 99,245 130,583 With an original maturity of one year or over 584,362 536,245 531,827 470,595Undrawn credit card limit 474,684 440,408 465,147 432,465
2,342,123 2,445,956 2,220,619 2,309,736
Group Bank2014 2013 2014 2013
Credit risk-weighted assets of credit commitments(i)(ii) 1,014,045 917,567 988,911 894,779
(i) As at 31 December 2014, Internal Ratings-Based approach was adopted to calculate the credit risk-weighted assets according to the scope approved by the CBRC, and others were calculated by weighted approach.
(ii) As at 31 December 2013, the credit risk-weighted assets were calculated by weighted approach in accordance with Regulation Governing Capital of Commercial Banks (Provisional) promulgated by the CBRC.
(d) Legal proceedings
As at 31 December 2014, there were a number of legal proceedings outstanding against the Bank and/or its subsidiaries with a claimed amount of RMB3,001 million (31 December 2013: RMB2,389 million).
In the opinion of management, the Group and the Bank have made adequate allowance for any probable losses based on the current facts and circumstances, and the ultimate outcome of these lawsuits will not have a material impact on the financial position or operations of the Group and the Bank.
(e) Redemption commitments of government bonds
As an underwriting agent of the Government, the Bank underwrites certain PRC government bonds and sells the bonds to the general public. The Bank is obliged to redeem these bonds at the discretion of the holders at any time prior to maturity. The redemption price for the bonds is based on the nominal value of the bonds plus any interest accrued up to the redemption date. As at 31 December 2014, the Bank had underwritten and sold bonds with an accumulated amount of RMB90,874 million (31 December 2013: RMB87,982 million) to the general public, and these government bonds have not yet matured nor been redeemed. Management expects that the amount of redemption of these government bonds through the Bank prior to maturity will not be material.
The MOF will not provide funding for the early redemption of these government bonds on a back-to-back basis but is obliged to repay the principal and the respective interest upon maturity.
(f) Underwriting obligations
As at 31 December 2014, the Group and the Bank had no unexpired securities underwriting obligations (31 December 2013: Nil).
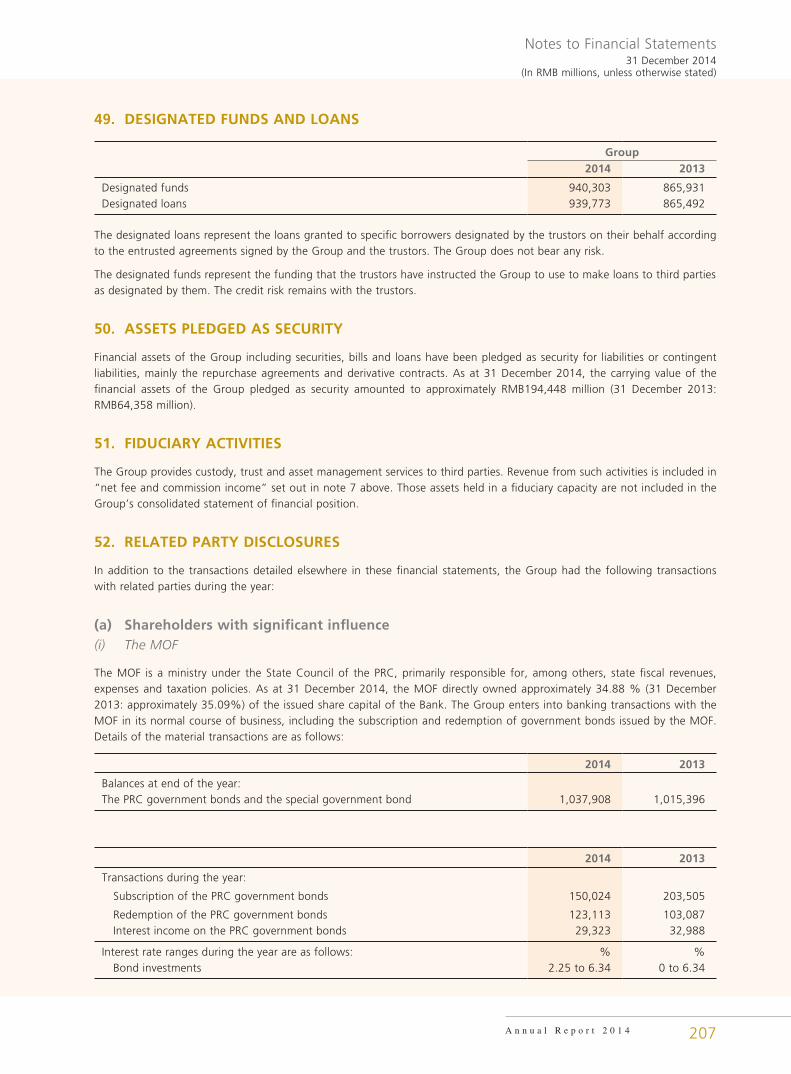
Notes to Financial Statements31 December 2014
(In RMB millions, unless otherwise stated)
A n n u a l R e p o r t 2 0 1 4 207
49. DESIGNATED FUNDS AND LOANS
Group2014 2013
Designated funds 940,303 865,931Designated loans 939,773 865,492
The designated loans represent the loans granted to specific borrowers designated by the trustors on their behalf according to the entrusted agreements signed by the Group and the trustors. The Group does not bear any risk.
The designated funds represent the funding that the trustors have instructed the Group to use to make loans to third parties as designated by them. The credit risk remains with the trustors.
50. ASSETS PLEDGED AS SECURITY
Financial assets of the Group including securities, bills and loans have been pledged as security for liabilities or contingent liabilities, mainly the repurchase agreements and derivative contracts. As at 31 December 2014, the carrying value of the financial assets of the Group pledged as security amounted to approximately RMB194,448 million (31 December 2013: RMB64,358 million).
51. FIDUCIARY ACTIVITIES
The Group provides custody, trust and asset management services to third parties. Revenue from such activities is included in “net fee and commission income” set out in note 7 above. Those assets held in a fiduciary capacity are not included in the Group’s consolidated statement of financial position.
52. RELATED PARTY DISCLOSURES
In addition to the transactions detailed elsewhere in these financial statements, the Group had the following transactions with related parties during the year:
(a) Shareholders with significant influence(i) The MOF
The MOF is a ministry under the State Council of the PRC, primarily responsible for, among others, state fiscal revenues, expenses and taxation policies. As at 31 December 2014, the MOF directly owned approximately 34.88 % (31 December 2013: approximately 35.09%) of the issued share capital of the Bank. The Group enters into banking transactions with the MOF in its normal course of business, including the subscription and redemption of government bonds issued by the MOF. Details of the material transactions are as follows:
2014 2013
Balances at end of the year:The PRC government bonds and the special government bond 1,037,908 1,015,396
2014 2013
Transactions during the year:
Subscription of the PRC government bonds 150,024 203,505
Redemption of the PRC government bonds 123,113 103,087 Interest income on the PRC government bonds 29,323 32,988
Interest rate ranges during the year are as follows: % % Bond investments 2.25 to 6.34 0 to 6.34
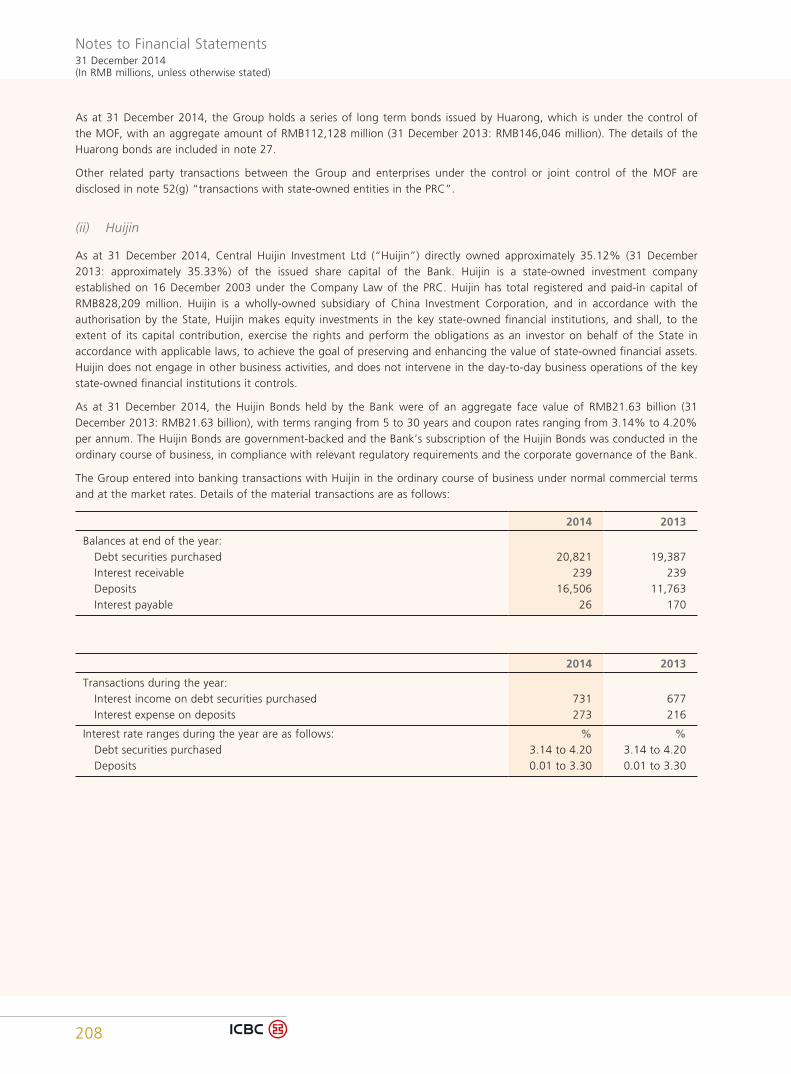
Notes to Financial Statements31 December 2014(In RMB millions, unless otherwise stated)
208
As at 31 December 2014, the Group holds a series of long term bonds issued by Huarong, which is under the control of the MOF, with an aggregate amount of RMB112,128 million (31 December 2013: RMB146,046 million). The details of the Huarong bonds are included in note 27.
Other related party transactions between the Group and enterprises under the control or joint control of the MOF are disclosed in note 52(g) “transactions with state-owned entities in the PRC”.
(ii) Huijin
As at 31 December 2014, Central Huijin Investment Ltd (“Huijin”) directly owned approximately 35.12% (31 December 2013: approximately 35.33%) of the issued share capital of the Bank. Huijin is a state-owned investment company established on 16 December 2003 under the Company Law of the PRC. Huijin has total registered and paid-in capital of RMB828,209 million. Huijin is a wholly-owned subsidiary of China Investment Corporation, and in accordance with the authorisation by the State, Huijin makes equity investments in the key state-owned financial institutions, and shall, to the extent of its capital contribution, exercise the rights and perform the obligations as an investor on behalf of the State in accordance with applicable laws, to achieve the goal of preserving and enhancing the value of state-owned financial assets. Huijin does not engage in other business activities, and does not intervene in the day-to-day business operations of the key state-owned financial institutions it controls.
As at 31 December 2014, the Huijin Bonds held by the Bank were of an aggregate face value of RMB21.63 billion (31 December 2013: RMB21.63 billion), with terms ranging from 5 to 30 years and coupon rates ranging from 3.14% to 4.20% per annum. The Huijin Bonds are government-backed and the Bank’s subscription of the Huijin Bonds was conducted in the ordinary course of business, in compliance with relevant regulatory requirements and the corporate governance of the Bank.
The Group entered into banking transactions with Huijin in the ordinary course of business under normal commercial terms and at the market rates. Details of the material transactions are as follows:
2014 2013
Balances at end of the year: Debt securities purchased 20,821 19,387 Interest receivable 239 239 Deposits 16,506 11,763 Interest payable 26 170
2014 2013
Transactions during the year: Interest income on debt securities purchased 731 677 Interest expense on deposits 273 216
Interest rate ranges during the year are as follows: % % Debt securities purchased 3.14 to 4.20 3.14 to 4.20 Deposits 0.01 to 3.30 0.01 to 3.30
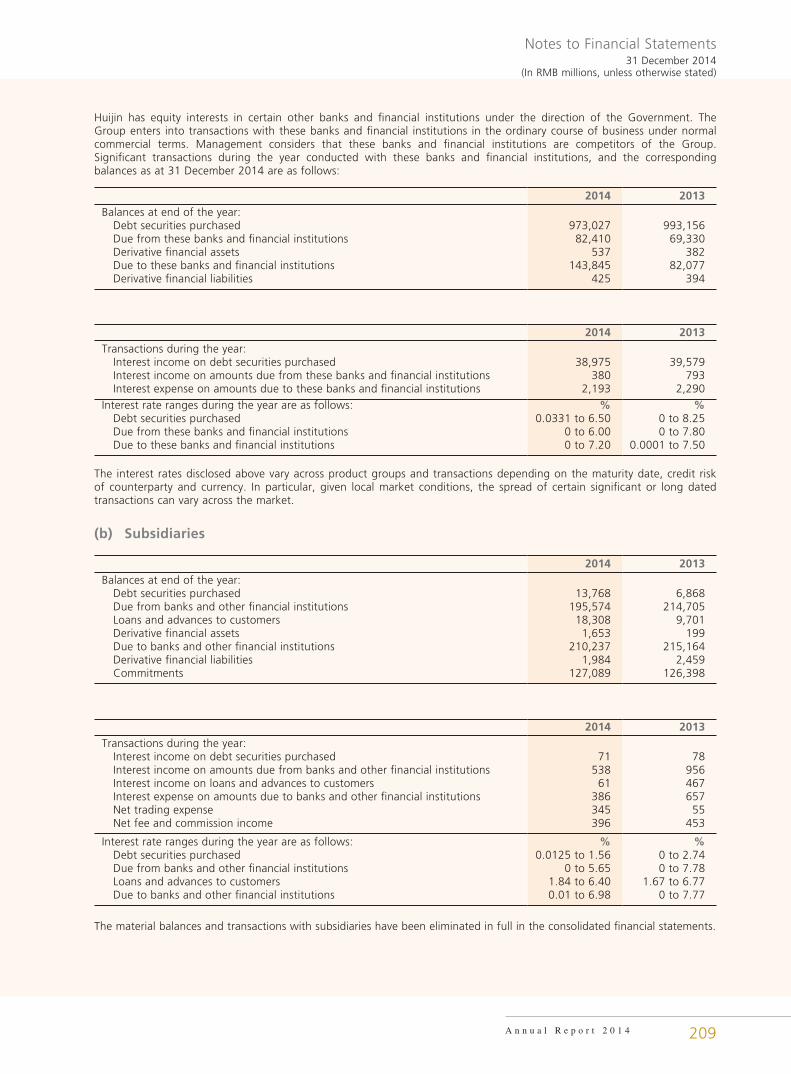
Notes to Financial Statements31 December 2014
(In RMB millions, unless otherwise stated)
A n n u a l R e p o r t 2 0 1 4 209
Huijin has equity interests in certain other banks and financial institutions under the direction of the Government. The Group enters into transactions with these banks and financial institutions in the ordinary course of business under normal commercial terms. Management considers that these banks and financial institutions are competitors of the Group. Significant transactions during the year conducted with these banks and financial institutions, and the corresponding balances as at 31 December 2014 are as follows:
2014 2013Balances at end of the year: Debt securities purchased 973,027 993,156 Due from these banks and financial institutions 82,410 69,330 Derivative financial assets 537 382 Due to these banks and financial institutions 143,845 82,077 Derivative financial liabilities 425 394
2014 2013Transactions during the year: Interest income on debt securities purchased 38,975 39,579 Interest income on amounts due from these banks and financial institutions 380 793 Interest expense on amounts due to these banks and financial institutions 2,193 2,290Interest rate ranges during the year are as follows: % % Debt securities purchased 0.0331 to 6.50 0 to 8.25 Due from these banks and financial institutions 0 to 6.00 0 to 7.80 Due to these banks and financial institutions 0 to 7.20 0.0001 to 7.50
The interest rates disclosed above vary across product groups and transactions depending on the maturity date, credit risk of counterparty and currency. In particular, given local market conditions, the spread of certain significant or long dated transactions can vary across the market.
(b) Subsidiaries
2014 2013Balances at end of the year: Debt securities purchased 13,768 6,868 Due from banks and other financial institutions 195,574 214,705 Loans and advances to customers 18,308 9,701 Derivative financial assets 1,653 199 Due to banks and other financial institutions 210,237 215,164 Derivative financial liabilities 1,984 2,459 Commitments 127,089 126,398
2014 2013Transactions during the year: Interest income on debt securities purchased 71 78 Interest income on amounts due from banks and other financial institutions 538 956 Interest income on loans and advances to customers 61 467 Interest expense on amounts due to banks and other financial institutions 386 657 Net trading expense 345 55 Net fee and commission income 396 453
Interest rate ranges during the year are as follows: % % Debt securities purchased 0.0125 to 1.56 0 to 2.74 Due from banks and other financial institutions 0 to 5.65 0 to 7.78 Loans and advances to customers 1.84 to 6.40 1.67 to 6.77 Due to banks and other financial institutions 0.01 to 6.98 0 to 7.77
The material balances and transactions with subsidiaries have been eliminated in full in the consolidated financial statements.
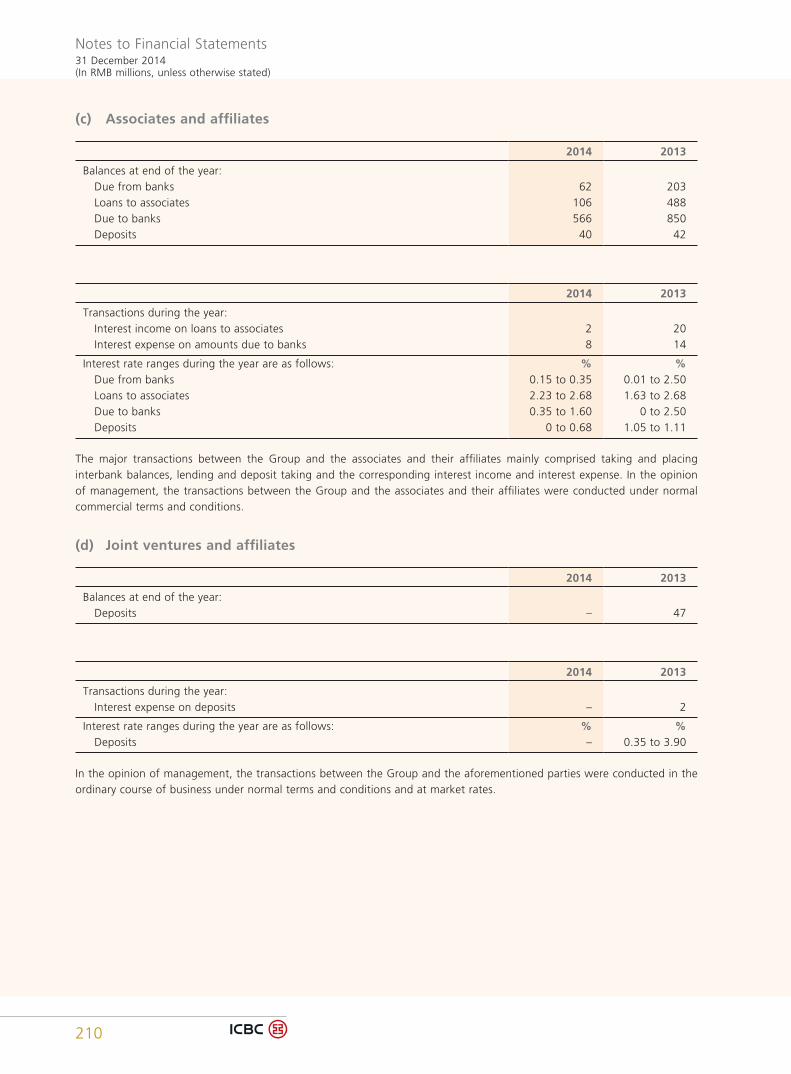
Notes to Financial Statements31 December 2014(In RMB millions, unless otherwise stated)
210
(c) Associates and affiliates
2014 2013
Balances at end of the year: Due from banks 62 203 Loans to associates 106 488 Due to banks 566 850 Deposits 40 42
2014 2013
Transactions during the year: Interest income on loans to associates 2 20 Interest expense on amounts due to banks 8 14
Interest rate ranges during the year are as follows: % % Due from banks 0.15 to 0.35 0.01 to 2.50 Loans to associates 2.23 to 2.68 1.63 to 2.68 Due to banks 0.35 to 1.60 0 to 2.50 Deposits 0 to 0.68 1.05 to 1.11
The major transactions between the Group and the associates and their affiliates mainly comprised taking and placing interbank balances, lending and deposit taking and the corresponding interest income and interest expense. In the opinion of management, the transactions between the Group and the associates and their affiliates were conducted under normal commercial terms and conditions.
(d) Joint ventures and affiliates
2014 2013
Balances at end of the year: Deposits – 47
2014 2013
Transactions during the year: Interest expense on deposits – 2
Interest rate ranges during the year are as follows: % % Deposits – 0.35 to 3.90
In the opinion of management, the transactions between the Group and the aforementioned parties were conducted in the ordinary course of business under normal terms and conditions and at market rates.
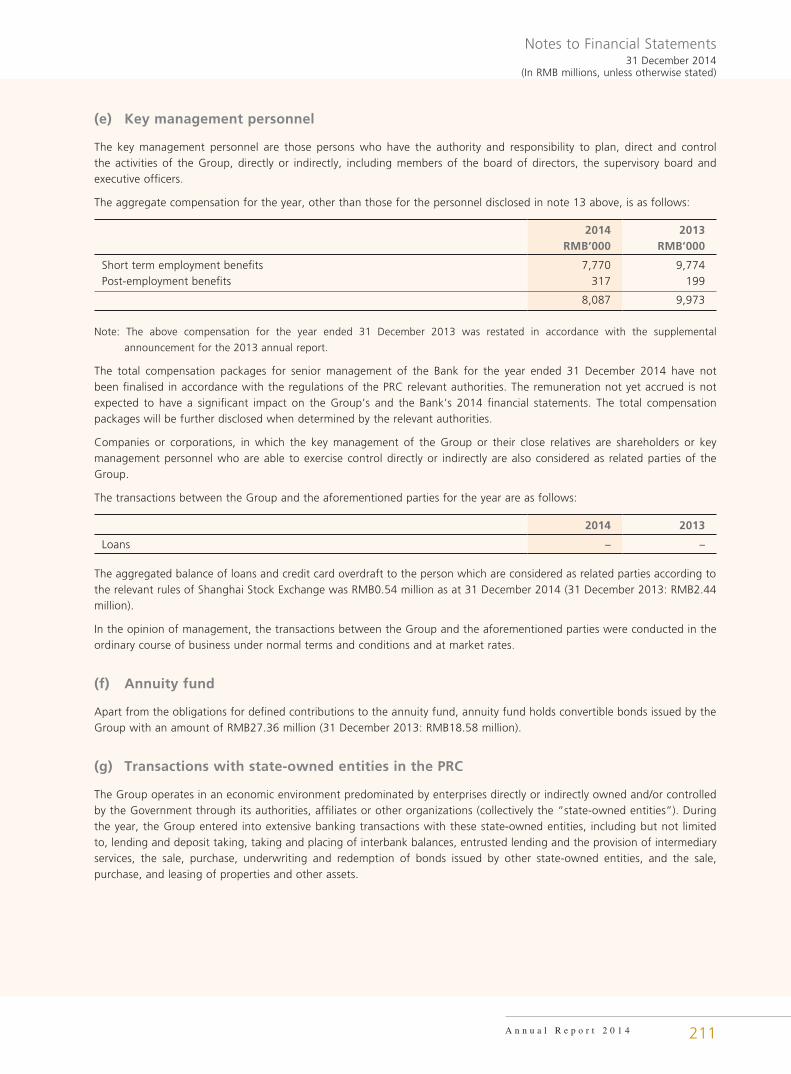
Notes to Financial Statements31 December 2014
(In RMB millions, unless otherwise stated)
A n n u a l R e p o r t 2 0 1 4 211
(e) Key management personnel
The key management personnel are those persons who have the authority and responsibility to plan, direct and control the activities of the Group, directly or indirectly, including members of the board of directors, the supervisory board and executive officers.
The aggregate compensation for the year, other than those for the personnel disclosed in note 13 above, is as follows:
2014 2013RMB’000 RMB’000
Short term employment benefits 7,770 9,774Post-employment benefits 317 199
8,087 9,973
Note: The above compensation for the year ended 31 December 2013 was restated in accordance with the supplemental
announcement for the 2013 annual report.
The total compensation packages for senior management of the Bank for the year ended 31 December 2014 have not been finalised in accordance with the regulations of the PRC relevant authorities. The remuneration not yet accrued is not expected to have a significant impact on the Group’s and the Bank’s 2014 financial statements. The total compensation packages will be further disclosed when determined by the relevant authorities.
Companies or corporations, in which the key management of the Group or their close relatives are shareholders or key management personnel who are able to exercise control directly or indirectly are also considered as related parties of the Group.
The transactions between the Group and the aforementioned parties for the year are as follows:
2014 2013
Loans – –
The aggregated balance of loans and credit card overdraft to the person which are considered as related parties according to the relevant rules of Shanghai Stock Exchange was RMB0.54 million as at 31 December 2014 (31 December 2013: RMB2.44 million).
In the opinion of management, the transactions between the Group and the aforementioned parties were conducted in the ordinary course of business under normal terms and conditions and at market rates.
(f) Annuity fund
Apart from the obligations for defined contributions to the annuity fund, annuity fund holds convertible bonds issued by the Group with an amount of RMB27.36 million (31 December 2013: RMB18.58 million).
(g) Transactions with state-owned entities in the PRC
The Group operates in an economic environment predominated by enterprises directly or indirectly owned and/or controlled by the Government through its authorities, affiliates or other organizations (collectively the “state-owned entities”). During the year, the Group entered into extensive banking transactions with these state-owned entities, including but not limited to, lending and deposit taking, taking and placing of interbank balances, entrusted lending and the provision of intermediary services, the sale, purchase, underwriting and redemption of bonds issued by other state-owned entities, and the sale, purchase, and leasing of properties and other assets.
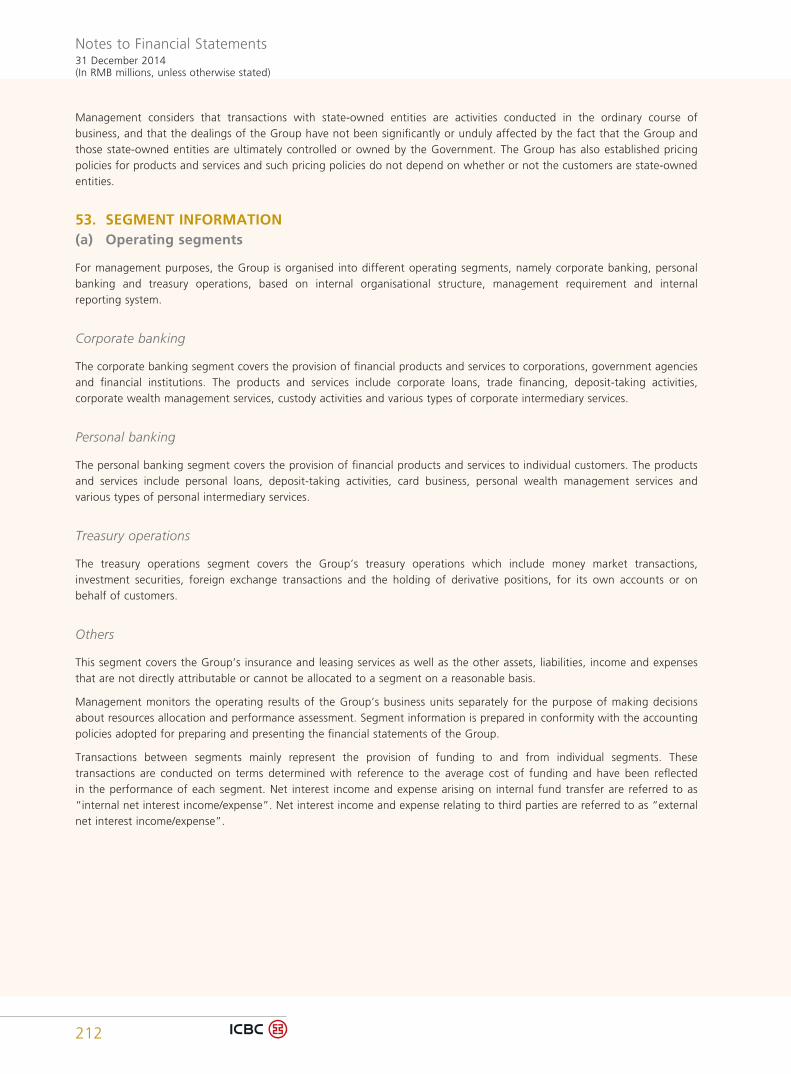
Notes to Financial Statements31 December 2014(In RMB millions, unless otherwise stated)
212
Management considers that transactions with state-owned entities are activities conducted in the ordinary course of business, and that the dealings of the Group have not been significantly or unduly affected by the fact that the Group and those state-owned entities are ultimately controlled or owned by the Government. The Group has also established pricing policies for products and services and such pricing policies do not depend on whether or not the customers are state-owned entities.
53. SEGMENT INFORMATION(a) Operating segments
For management purposes, the Group is organised into different operating segments, namely corporate banking, personal banking and treasury operations, based on internal organisational structure, management requirement and internal reporting system.
Corporate banking
The corporate banking segment covers the provision of financial products and services to corporations, government agencies and financial institutions. The products and services include corporate loans, trade financing, deposit-taking activities, corporate wealth management services, custody activities and various types of corporate intermediary services.
Personal banking
The personal banking segment covers the provision of financial products and services to individual customers. The products and services include personal loans, deposit-taking activities, card business, personal wealth management services and various types of personal intermediary services.
Treasury operations
The treasury operations segment covers the Group’s treasury operations which include money market transactions, investment securities, foreign exchange transactions and the holding of derivative positions, for its own accounts or on behalf of customers.
Others
This segment covers the Group’s insurance and leasing services as well as the other assets, liabilities, income and expenses that are not directly attributable or cannot be allocated to a segment on a reasonable basis.
Management monitors the operating results of the Group’s business units separately for the purpose of making decisions about resources allocation and performance assessment. Segment information is prepared in conformity with the accounting policies adopted for preparing and presenting the financial statements of the Group.
Transactions between segments mainly represent the provision of funding to and from individual segments. These transactions are conducted on terms determined with reference to the average cost of funding and have been reflected in the performance of each segment. Net interest income and expense arising on internal fund transfer are referred to as “internal net interest income/expense”. Net interest income and expense relating to third parties are referred to as “external net interest income/expense”.
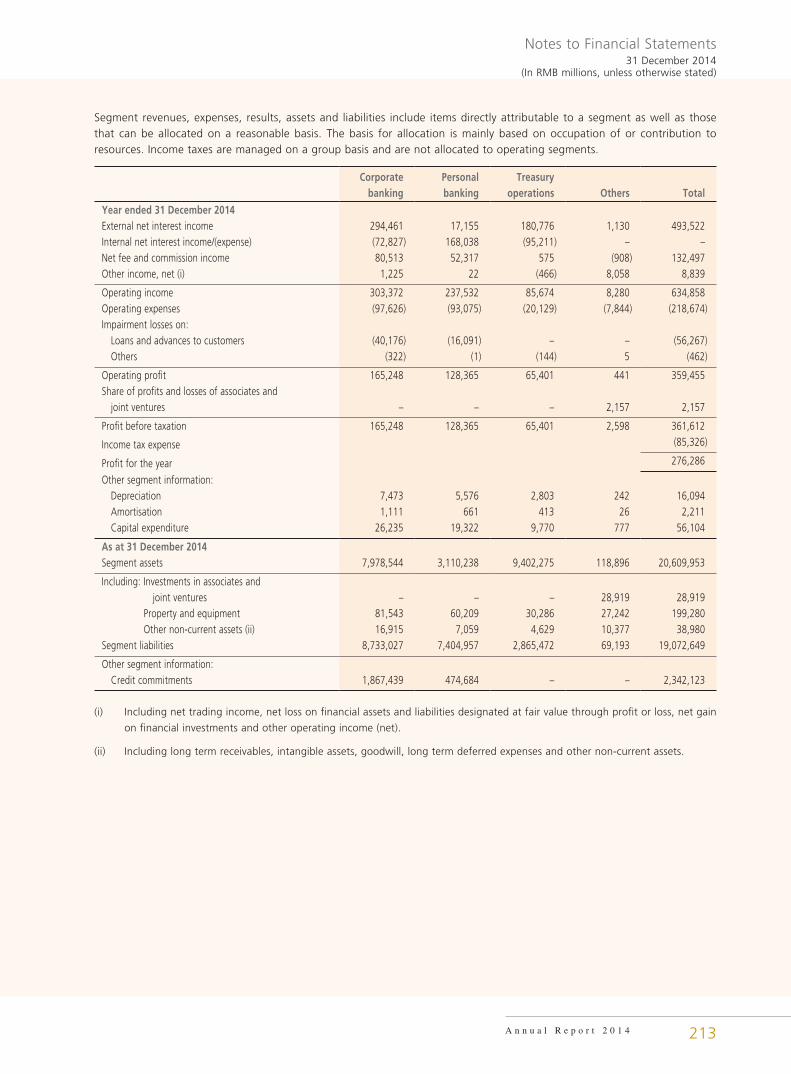
Notes to Financial Statements31 December 2014
(In RMB millions, unless otherwise stated)
A n n u a l R e p o r t 2 0 1 4 213
Segment revenues, expenses, results, assets and liabilities include items directly attributable to a segment as well as those that can be allocated on a reasonable basis. The basis for allocation is mainly based on occupation of or contribution to resources. Income taxes are managed on a group basis and are not allocated to operating segments.
Corporate banking
Personal banking
Treasury operations Others Total
Year ended 31 December 2014External net interest income 294,461 17,155 180,776 1,130 493,522Internal net interest income/(expense) (72,827) 168,038 (95,211) – –Net fee and commission income 80,513 52,317 575 (908) 132,497Other income, net (i) 1,225 22 (466) 8,058 8,839
Operating income 303,372 237,532 85,674 8,280 634,858Operating expenses (97,626) (93,075) (20,129) (7,844) (218,674)Impairment losses on: Loans and advances to customers (40,176) (16,091) – – (56,267) Others (322) (1) (144) 5 (462)
Operating profit 165,248 128,365 65,401 441 359,455Share of profits and losses of associates and joint ventures – – – 2,157 2,157
Profit before taxation 165,248 128,365 65,401 2,598 361,612
Income tax expense (85,326)
Profit for the year 276,286
Other segment information: Depreciation 7,473 5,576 2,803 242 16,094 Amortisation 1,111 661 413 26 2,211 Capital expenditure 26,235 19,322 9,770 777 56,104
As at 31 December 2014Segment assets 7,978,544 3,110,238 9,402,275 118,896 20,609,953
Including: Investments in associates and joint ventures – – – 28,919 28,919Property and equipment 81,543 60,209 30,286 27,242 199,280Other non-current assets (ii) 16,915 7,059 4,629 10,377 38,980
Segment liabilities 8,733,027 7,404,957 2,865,472 69,193 19,072,649
Other segment information: Credit commitments 1,867,439 474,684 – – 2,342,123
(i) Including net trading income, net loss on financial assets and liabilities designated at fair value through profit or loss, net gain
on financial investments and other operating income (net).
(ii) Including long term receivables, intangible assets, goodwill, long term deferred expenses and other non-current assets.
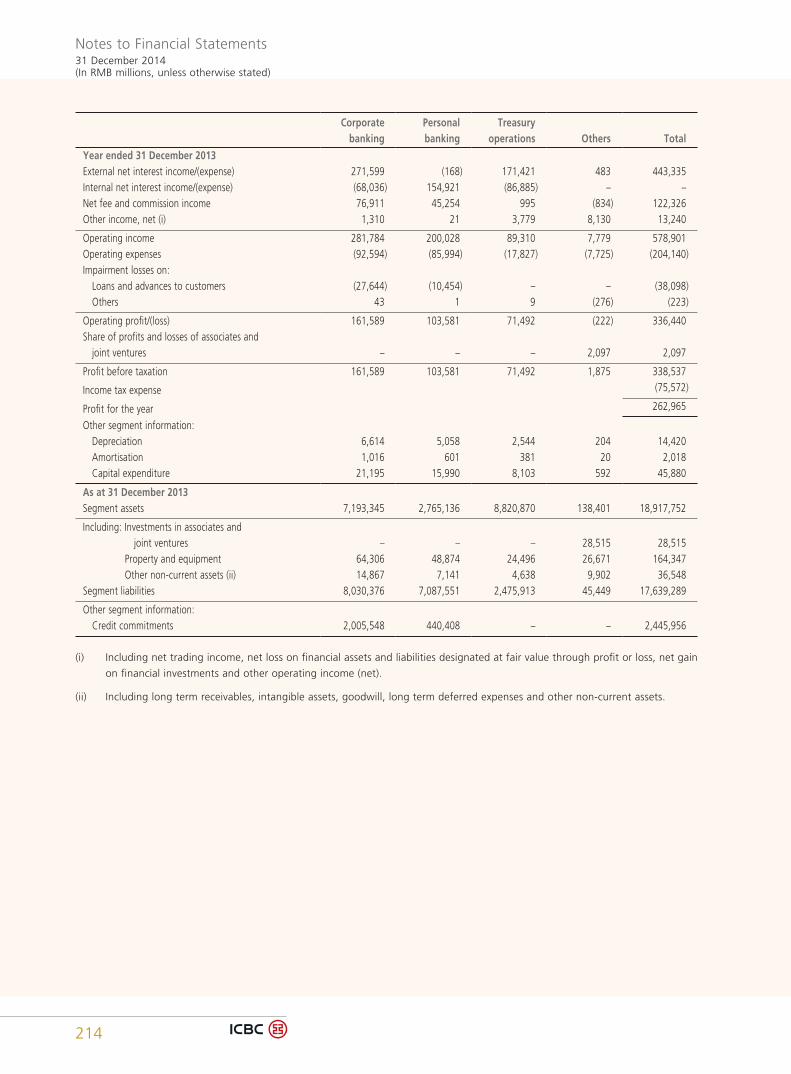
Notes to Financial Statements31 December 2014(In RMB millions, unless otherwise stated)
214
Corporate banking
Personal banking
Treasury operations Others Total
Year ended 31 December 2013External net interest income/(expense) 271,599 (168) 171,421 483 443,335Internal net interest income/(expense) (68,036) 154,921 (86,885) – –Net fee and commission income 76,911 45,254 995 (834) 122,326Other income, net (i) 1,310 21 3,779 8,130 13,240
Operating income 281,784 200,028 89,310 7,779 578,901Operating expenses (92,594) (85,994) (17,827) (7,725) (204,140)Impairment losses on: Loans and advances to customers (27,644) (10,454) – – (38,098) Others 43 1 9 (276) (223)
Operating profit/(loss) 161,589 103,581 71,492 (222) 336,440Share of profits and losses of associates and joint ventures – – – 2,097 2,097
Profit before taxation 161,589 103,581 71,492 1,875 338,537
Income tax expense (75,572)
Profit for the year 262,965
Other segment information: Depreciation 6,614 5,058 2,544 204 14,420 Amortisation 1,016 601 381 20 2,018 Capital expenditure 21,195 15,990 8,103 592 45,880
As at 31 December 2013Segment assets 7,193,345 2,765,136 8,820,870 138,401 18,917,752
Including: Investments in associates and joint ventures – – – 28,515 28,515Property and equipment 64,306 48,874 24,496 26,671 164,347Other non-current assets (ii) 14,867 7,141 4,638 9,902 36,548
Segment liabilities 8,030,376 7,087,551 2,475,913 45,449 17,639,289
Other segment information: Credit commitments 2,005,548 440,408 – – 2,445,956
(i) Including net trading income, net loss on financial assets and liabilities designated at fair value through profit or loss, net gain
on financial investments and other operating income (net).
(ii) Including long term receivables, intangible assets, goodwill, long term deferred expenses and other non-current assets.
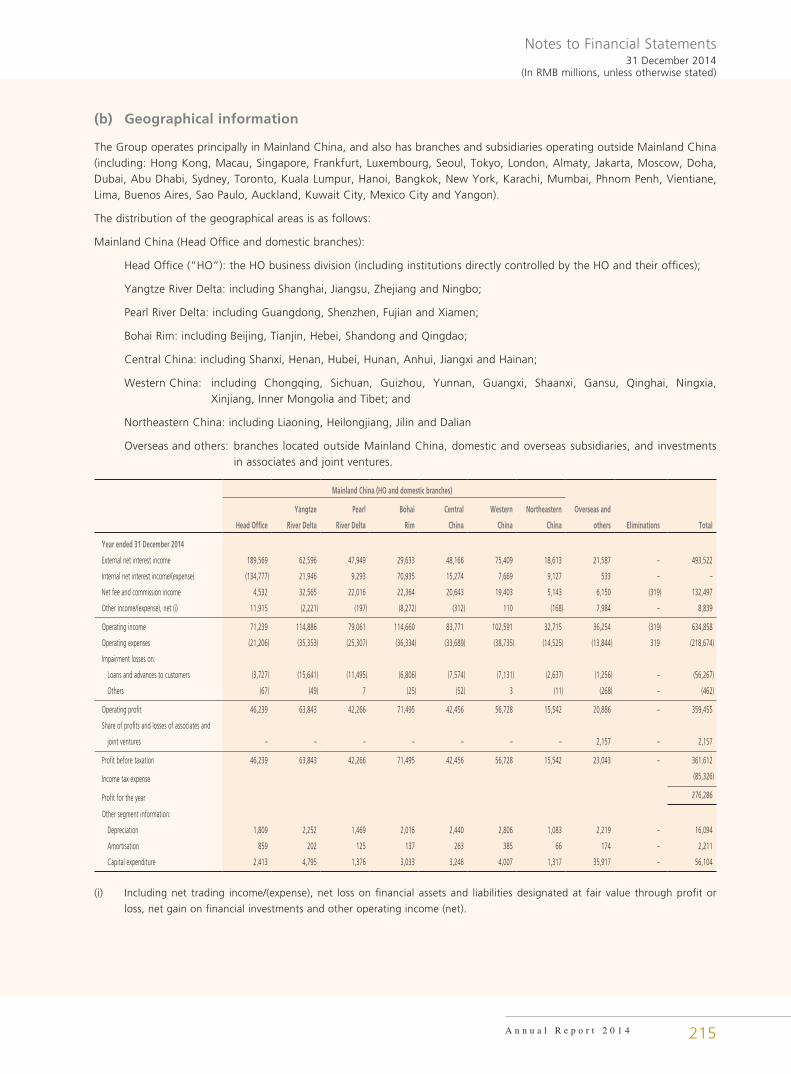
Notes to Financial Statements31 December 2014
(In RMB millions, unless otherwise stated)
A n n u a l R e p o r t 2 0 1 4 215
(b) Geographical information
The Group operates principally in Mainland China, and also has branches and subsidiaries operating outside Mainland China (including: Hong Kong, Macau, Singapore, Frankfurt, Luxembourg, Seoul, Tokyo, London, Almaty, Jakarta, Moscow, Doha, Dubai, Abu Dhabi, Sydney, Toronto, Kuala Lumpur, Hanoi, Bangkok, New York, Karachi, Mumbai, Phnom Penh, Vientiane, Lima, Buenos Aires, Sao Paulo, Auckland, Kuwait City, Mexico City and Yangon).
The distribution of the geographical areas is as follows:
Mainland China (Head Office and domestic branches):
Head Office (“HO”): the HO business division (including institutions directly controlled by the HO and their offices);
Yangtze River Delta: including Shanghai, Jiangsu, Zhejiang and Ningbo;
Pearl River Delta: including Guangdong, Shenzhen, Fujian and Xiamen;
Bohai Rim: including Beijing, Tianjin, Hebei, Shandong and Qingdao;
Central China: including Shanxi, Henan, Hubei, Hunan, Anhui, Jiangxi and Hainan;
Western China: including Chongqing, Sichuan, Guizhou, Yunnan, Guangxi, Shaanxi, Gansu, Qinghai, Ningxia, Xinjiang, Inner Mongolia and Tibet; and
Northeastern China: including Liaoning, Heilongjiang, Jilin and Dalian
Overseas and others: branches located outside Mainland China, domestic and overseas subsidiaries, and investments in associates and joint ventures.
Mainland China (HO and domestic branches)
Head Office
Yangtze
River Delta
Pearl
River Delta
Bohai
Rim
Central
China
Western
China
Northeastern
China
Overseas and
others Eliminations Total
Year ended 31 December 2014
External net interest income 189,569 62,596 47,949 29,633 48,166 75,409 18,613 21,587 – 493,522
Internal net interest income/(expense) (134,777) 21,946 9,293 70,935 15,274 7,669 9,127 533 – –
Net fee and commission income 4,532 32,565 22,016 22,364 20,643 19,403 5,143 6,150 (319) 132,497
Other income/(expense), net (i) 11,915 (2,221) (197) (8,272) (312) 110 (168) 7,984 – 8,839
Operating income 71,239 114,886 79,061 114,660 83,771 102,591 32,715 36,254 (319) 634,858
Operating expenses (21,206) (35,353) (25,307) (36,334) (33,689) (38,735) (14,525) (13,844) 319 (218,674)
Impairment losses on:
Loans and advances to customers (3,727) (15,641) (11,495) (6,806) (7,574) (7,131) (2,637) (1,256) – (56,267)
Others (67) (49) 7 (25) (52) 3 (11) (268) – (462)
Operating profit 46,239 63,843 42,266 71,495 42,456 56,728 15,542 20,886 – 359,455
Share of profits and losses of associates and
joint ventures – – – – – – – 2,157 – 2,157
Profit before taxation 46,239 63,843 42,266 71,495 42,456 56,728 15,542 23,043 – 361,612
Income tax expense (85,326)
Profit for the year 276,286
Other segment information:
Depreciation 1,809 2,252 1,469 2,016 2,440 2,806 1,083 2,219 – 16,094
Amortisation 859 202 125 137 263 385 66 174 – 2,211
Capital expenditure 2,413 4,795 1,376 3,033 3,246 4,007 1,317 35,917 – 56,104
(i) Including net trading income/(expense), net loss on financial assets and liabilities designated at fair value through profit or
loss, net gain on financial investments and other operating income (net).
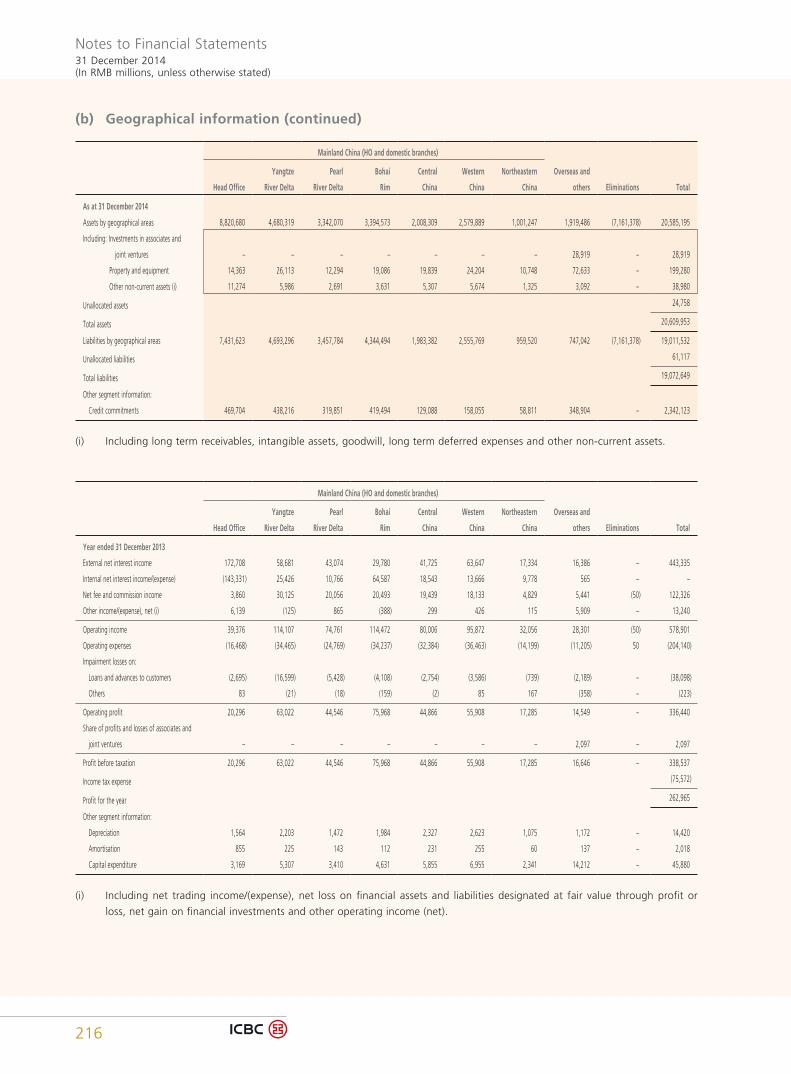
Notes to Financial Statements31 December 2014(In RMB millions, unless otherwise stated)
216
(b) Geographical information (continued)
Mainland China (HO and domestic branches)
Head Office
Yangtze
River Delta
Pearl
River Delta
Bohai
Rim
Central
China
Western
China
Northeastern
China
Overseas and
others Eliminations Total
As at 31 December 2014
Assets by geographical areas 8,820,680 4,680,319 3,342,070 3,394,573 2,008,309 2,579,889 1,001,247 1,919,486 (7,161,378) 20,585,195
Including: Investments in associates and
joint ventures – – – – – – – 28,919 – 28,919
Property and equipment 14,363 26,113 12,294 19,086 19,839 24,204 10,748 72,633 – 199,280
Other non-current assets (i) 11,274 5,986 2,691 3,631 5,307 5,674 1,325 3,092 – 38,980
Unallocated assets 24,758
Total assets 20,609,953
Liabilities by geographical areas 7,431,623 4,693,296 3,457,784 4,344,494 1,983,382 2,555,769 959,520 747,042 (7,161,378) 19,011,532
Unallocated liabilities 61,117
Total liabilities 19,072,649
Other segment information:
Credit commitments 469,704 438,216 319,851 419,494 129,088 158,055 58,811 348,904 – 2,342,123
(i) Including long term receivables, intangible assets, goodwill, long term deferred expenses and other non-current assets.
Mainland China (HO and domestic branches)
Head Office
Yangtze
River Delta
Pearl
River Delta
Bohai
Rim
Central
China
Western
China
Northeastern
China
Overseas and
others Eliminations Total
Year ended 31 December 2013
External net interest income 172,708 58,681 43,074 29,780 41,725 63,647 17,334 16,386 – 443,335
Internal net interest income/(expense) (143,331) 25,426 10,766 64,587 18,543 13,666 9,778 565 – –
Net fee and commission income 3,860 30,125 20,056 20,493 19,439 18,133 4,829 5,441 (50) 122,326
Other income/(expense), net (i) 6,139 (125) 865 (388) 299 426 115 5,909 – 13,240
Operating income 39,376 114,107 74,761 114,472 80,006 95,872 32,056 28,301 (50) 578,901
Operating expenses (16,468) (34,465) (24,769) (34,237) (32,384) (36,463) (14,199) (11,205) 50 (204,140)
Impairment losses on:
Loans and advances to customers (2,695) (16,599) (5,428) (4,108) (2,754) (3,586) (739) (2,189) – (38,098)
Others 83 (21) (18) (159) (2) 85 167 (358) – (223)
Operating profit 20,296 63,022 44,546 75,968 44,866 55,908 17,285 14,549 – 336,440
Share of profits and losses of associates and
joint ventures – – – – – – – 2,097 – 2,097
Profit before taxation 20,296 63,022 44,546 75,968 44,866 55,908 17,285 16,646 – 338,537
Income tax expense (75,572)
Profit for the year 262,965
Other segment information:
Depreciation 1,564 2,203 1,472 1,984 2,327 2,623 1,075 1,172 – 14,420
Amortisation 855 225 143 112 231 255 60 137 – 2,018
Capital expenditure 3,169 5,307 3,410 4,631 5,855 6,955 2,341 14,212 – 45,880
(i) Including net trading income/(expense), net loss on financial assets and liabilities designated at fair value through profit or
loss, net gain on financial investments and other operating income (net).
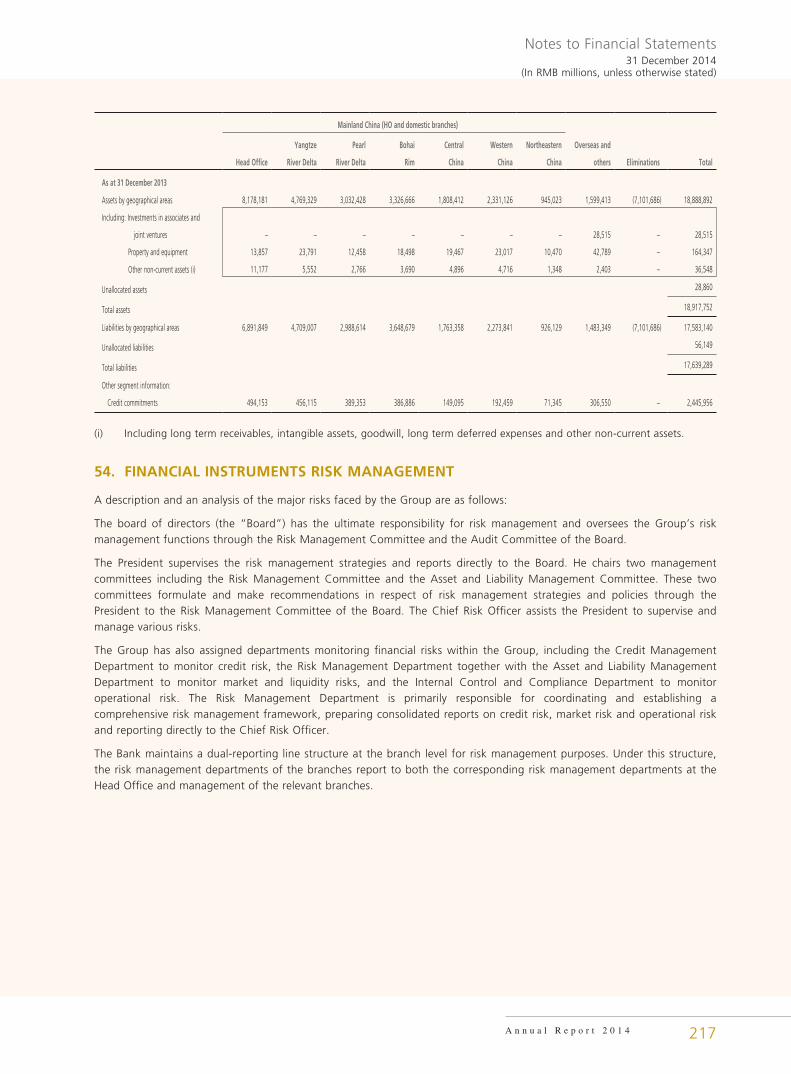
Notes to Financial Statements31 December 2014
(In RMB millions, unless otherwise stated)
A n n u a l R e p o r t 2 0 1 4 217
Mainland China (HO and domestic branches)
Head Office
Yangtze
River Delta
Pearl
River Delta
Bohai
Rim
Central
China
Western
China
Northeastern
China
Overseas and
others Eliminations Total
As at 31 December 2013
Assets by geographical areas 8,178,181 4,769,329 3,032,428 3,326,666 1,808,412 2,331,126 945,023 1,599,413 (7,101,686) 18,888,892
Including: Investments in associates and
joint ventures – – – – – – – 28,515 – 28,515
Property and equipment 13,857 23,791 12,458 18,498 19,467 23,017 10,470 42,789 – 164,347
Other non-current assets (i) 11,177 5,552 2,766 3,690 4,896 4,716 1,348 2,403 – 36,548
Unallocated assets 28,860
Total assets 18,917,752
Liabilities by geographical areas 6,891,849 4,709,007 2,988,614 3,648,679 1,763,358 2,273,841 926,129 1,483,349 (7,101,686) 17,583,140
Unallocated liabilities 56,149
Total liabilities 17,639,289
Other segment information:
Credit commitments 494,153 456,115 389,353 386,886 149,095 192,459 71,345 306,550 – 2,445,956
(i) Including long term receivables, intangible assets, goodwill, long term deferred expenses and other non-current assets.
54. FINANCIAL INSTRUMENTS RISK MANAGEMENT
A description and an analysis of the major risks faced by the Group are as follows:
The board of directors (the “Board”) has the ultimate responsibility for risk management and oversees the Group’s risk management functions through the Risk Management Committee and the Audit Committee of the Board.
The President supervises the risk management strategies and reports directly to the Board. He chairs two management committees including the Risk Management Committee and the Asset and Liability Management Committee. These two committees formulate and make recommendations in respect of risk management strategies and policies through the President to the Risk Management Committee of the Board. The Chief Risk Officer assists the President to supervise and manage various risks.
The Group has also assigned departments monitoring financial risks within the Group, including the Credit Management Department to monitor credit risk, the Risk Management Department together with the Asset and Liability Management Department to monitor market and liquidity risks, and the Internal Control and Compliance Department to monitor operational risk. The Risk Management Department is primarily responsible for coordinating and establishing a comprehensive risk management framework, preparing consolidated reports on credit risk, market risk and operational risk and reporting directly to the Chief Risk Officer.
The Bank maintains a dual-reporting line structure at the branch level for risk management purposes. Under this structure, the risk management departments of the branches report to both the corresponding risk management departments at the Head Office and management of the relevant branches.
Notes to Financial Statements31 December 2014(In RMB millions, unless otherwise stated)
218
(a) Credit risk
Credit risk is the risk of loss arising from a borrower’s or counterparty’s inability to meet its obligations. Credit risk can also arise from operational failures that result in an unauthorised or inappropriate guarantee, commitment or investment of funds. The Group is exposed to credit risk primarily due to loans, guarantees and other credit related commitments.
The principal features of the Group’s credit risk management function include:
• Centralised credit management policies and procedures;
• Risk management rules and procedures that focus on risk control throughout the entire credit business process, including customer investigation and credit rating, granting of credit limits, loan evaluation, loan review and approval, granting of loan and post-disbursement loan monitoring;
• Stringent qualification system for the loan approval officers; and
• Information management systems designed to enable a real time risk monitoring.
To enhance the credit risk management practices, the Group also launches training programs periodically for credit officers at different levels.
In addition to the credit risk exposures on credit-related assets and amounts due from or lending to banks and other financial institutions, credit risk also arises in other areas. For instance, credit risk exposure also arises from derivative financial instruments which is, however, limited to those with positive fair values, as recorded in the statement of financial position. In addition, the Group also makes available to its customers’ guarantees which may require the Group to make payments on their behalf. Such payments are collected from customers based on the terms of the agreements signed. They expose the Group to similar risks as loans and these are mitigated by the same control processes and policies.
The Group will normally sign an ISDA Master Agreement, a China Interbank Market Financial Derivatives Master Agreement (“NAFMII master agreement”) with its counterparties for documenting over-the-counter derivative activities. Each of these master agreements provides the contractual framework within which derivative dealing activities are conducted. Under each of these master agreements, close-out netting shall be applied across all outstanding transactions covered by the agreement if either party defaults.
Risk concentration
Credit risk is often greater when counterparties are concentrated in one single industry or geographical location or have comparable economic characteristics.
Impairment assessment
The main considerations for the loan impairment assessment include whether any payments of principal or interest are overdue or whether there are any liquidity problems of counterparties, credit rating downgrades, or infringement of the original terms of the contract. The Group addresses impairment assessment in two areas: individually assessed impairment and collectively assessed impairment.
Individually assessed loans
All corporate loans and discounted bills are individually reviewed for objective evidence of impairment and classified based on a five-tier classification system. Corporate loans and discounted bills that are classified as substandard, doubtful or loss are assessed individually for impairment.
Notes to Financial Statements31 December 2014
(In RMB millions, unless otherwise stated)
A n n u a l R e p o r t 2 0 1 4 219
(a) Credit risk (continued)
If there is objective evidence that an impairment loss on a loan or advance has been incurred on an individual basis, the amount of the loss is measured as the difference between the asset’s carrying amount and the present value of estimated future cash flows discounted at the asset’s original effective interest rate. The allowance for impairment loss is deducted in the carrying amount. The impairment loss is recognised in profit or loss. In determining allowances on an individual basis, the following factors are considered:
• The sustainability of the counterparty’s business plan;
• The borrower’s ability to improve performance once a financial difficulty has arisen;
• Projected receipts and the expected payout should bankruptcy ensue;
• The availability of other financial support and the realisable value of collateral; and
• The timing of the expected cash flows.
It may not be possible to identify a single, discrete event that caused the impairment, but it may be possible to identify impairment through the combined effect of several events. The impairment losses are evaluated at the end of each reporting period, unless unforeseen circumstances require more careful attention.
Collectively assessed loans
Loans that are assessed for impairment losses on a collective basis include the following:
• Homogeneous groups of loans, including all personal loans; and
• All loans for which no impairment can be identified individually, either due to the absence of any loss events or due to an inability to measure reliably the impact of potential loss events on future cash flows.
For the purpose of collective assessment, assets are grouped on the basis of similar credit risk characteristics that are indicative of the debtors’ ability to pay all amounts due according to the contractual terms.
Objective evidence of impairment losses on a collective basis consists of observable data indicating a measurable decrease in the estimated future cash flows from a portfolio of loans since the initial recognition of those loans, including:
• Adverse changes in the payment status of borrowers in the group of loans; and
• National or local economic conditions that correlate with defaults on assets in the portfolio of loans.
Homogenous groups of loans not considered individually significant
For homogeneous groups of loans, the Group uses a collective assessment approach for impairment losses. The approach analyses historical trends of probability of default and the amount of the consequential loss, as well as evaluates current economic conditions that may have a consequential impact on inherent losses in the portfolio.
Notes to Financial Statements31 December 2014(In RMB millions, unless otherwise stated)
220
(a) Credit risk (continued)Individually assessed loans with no objective evidence of impairment
Individually assessed loans with no objective evidence of impairment are grouped together in portfolios of similar credit risk characteristics for the purpose of assessing a collective impairment loss. The collective impairment loss is assessed after taking into account:
• Historical loss experience in portfolios of similar risk characteristics; and
• The current economic and credit environment and, whether these, in management’s experience, indicate that the actual level of incurred but not yet identified losses is likely to be greater or less than that suggested by historical experience.
As soon as information that specifically identifies objective evidence of impairment on individual assets in a pool is available, those assets are excluded and individually assessed. Assets that are individually assessed for impairment and for which an impairment loss is or continues to be recognised are not included in a collective assessment for impairment.
Collateral
The amount and type of collateral required depend on the assessment of the credit risk of the counterparty. Guidelines are in place specifying the types of collateral and valuation parameters which can be accepted.
Reverse repurchase business is mainly collateralised by bills, loans or investment securities. As part of the reverse repurchase agreements, the Group has received securities that it is allowed to sell or repledge in the absence of default by their owners. Fair value of collateral is shown in note 25.
Corporate loans are mainly collateralised by properties or other assets. As at 31 December 2014, the carrying value of corporate loans and discounted bills covered by collateral amounted to RMB7,962,866 million (31 December 2013: RMB7,194,773 million), of which credit exposure of corporate loans covered by collateral amounted to RMB3,666,694million (31 December 2013: RMB3,256,175 million).
Retail loans are mainly collateralised by residential properties. As at 31 December 2014, the carrying value of retail loans covered by collateral amounted to RMB3,063,465 million (31 December 2013: RMB2,727,601 million), of which credit exposure of retail loans covered by collateral amounted to RMB2,577,534 million (31 December 2013: RMB2,336,089 million).
The Group prefers more liquid collateral with relatively stable market value and does not accept collateral that is illiquid, with difficulties in registration or high fluctuations in market value. The value of collateral should be assessed and confirmed by the Group or valuation agents identified by the Group. The value of collateral should adequately cover the outstanding balance of loans. The loan-to-value ratio depends on types of collateral, usage condition, liquidity, price volatility and realisation cost. All collateral has to be registered in accordance with the relevant laws and regulations. The credit officers inspect the collateral and assess the changes in the value of collateral regularly.
Although collateral can be an important mitigation of credit risk, the Group grants loans based on the assessment of the borrowers’ ability to meet obligations out of their cash flow, instead of the value of collateral. The necessity of a collateral is dependent on the nature of the loan. In the event of default, the Group might sell the collateral for repayment. The fair value of collateral of past due but not impaired loans and impaired loans are disclosed in note 54(a)(iii).
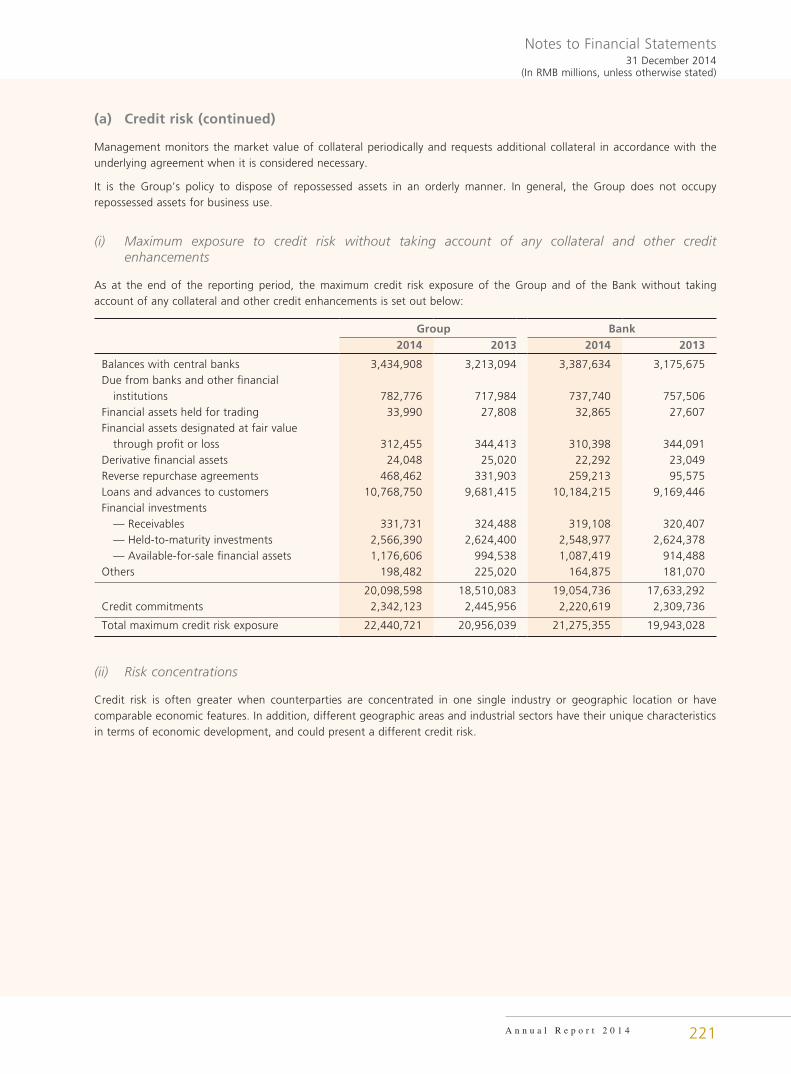
Notes to Financial Statements31 December 2014
(In RMB millions, unless otherwise stated)
A n n u a l R e p o r t 2 0 1 4 221
(a) Credit risk (continued)
Management monitors the market value of collateral periodically and requests additional collateral in accordance with the underlying agreement when it is considered necessary.
It is the Group’s policy to dispose of repossessed assets in an orderly manner. In general, the Group does not occupy repossessed assets for business use.
(i) Maximum exposure to credit risk without taking account of any collateral and other credit enhancements
As at the end of the reporting period, the maximum credit risk exposure of the Group and of the Bank without taking account of any collateral and other credit enhancements is set out below:
Group Bank2014 2013 2014 2013
Balances with central banks 3,434,908 3,213,094 3,387,634 3,175,675Due from banks and other financial institutions 782,776 717,984 737,740 757,506Financial assets held for trading 33,990 27,808 32,865 27,607Financial assets designated at fair value through profit or loss 312,455 344,413 310,398 344,091Derivative financial assets 24,048 25,020 22,292 23,049Reverse repurchase agreements 468,462 331,903 259,213 95,575Loans and advances to customers 10,768,750 9,681,415 10,184,215 9,169,446Financial investments — Receivables 331,731 324,488 319,108 320,407 — Held-to-maturity investments 2,566,390 2,624,400 2,548,977 2,624,378 — Available-for-sale financial assets 1,176,606 994,538 1,087,419 914,488Others 198,482 225,020 164,875 181,070
20,098,598 18,510,083 19,054,736 17,633,292Credit commitments 2,342,123 2,445,956 2,220,619 2,309,736
Total maximum credit risk exposure 22,440,721 20,956,039 21,275,355 19,943,028
(ii) Risk concentrations
Credit risk is often greater when counterparties are concentrated in one single industry or geographic location or have comparable economic features. In addition, different geographic areas and industrial sectors have their unique characteristics in terms of economic development, and could present a different credit risk.
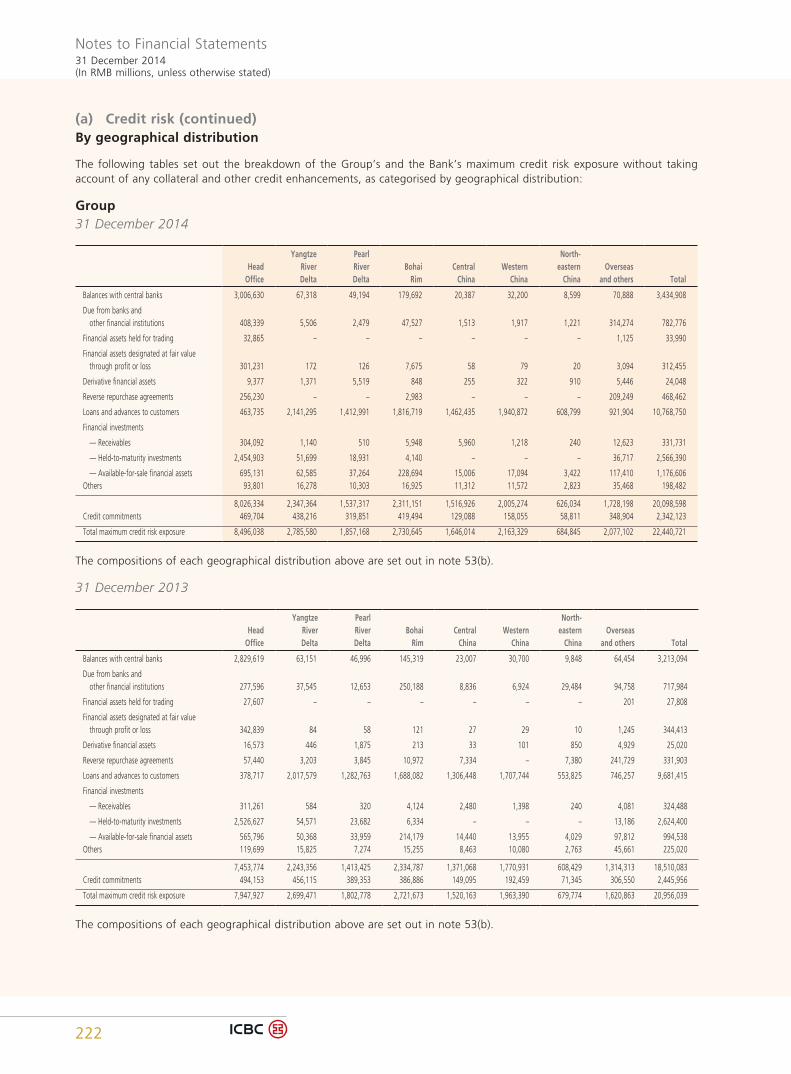
Notes to Financial Statements31 December 2014(In RMB millions, unless otherwise stated)
222
(a) Credit risk (continued)By geographical distribution
The following tables set out the breakdown of the Group’s and the Bank’s maximum credit risk exposure without taking account of any collateral and other credit enhancements, as categorised by geographical distribution:
Group31 December 2014
Head Office
Yangtze River Delta
Pearl River Delta
Bohai Rim
Central China
Western China
North- eastern
ChinaOverseas
and others Total
Balances with central banks 3,006,630 67,318 49,194 179,692 20,387 32,200 8,599 70,888 3,434,908
Due from banks and other financial institutions 408,339 5,506 2,479 47,527 1,513 1,917 1,221 314,274 782,776
Financial assets held for trading 32,865 – – – – – – 1,125 33,990
Financial assets designated at fair value through profit or loss 301,231 172 126 7,675 58 79 20 3,094 312,455
Derivative financial assets 9,377 1,371 5,519 848 255 322 910 5,446 24,048
Reverse repurchase agreements 256,230 – – 2,983 – – – 209,249 468,462
Loans and advances to customers 463,735 2,141,295 1,412,991 1,816,719 1,462,435 1,940,872 608,799 921,904 10,768,750
Financial investments
— Receivables 304,092 1,140 510 5,948 5,960 1,218 240 12,623 331,731
— Held-to-maturity investments 2,454,903 51,699 18,931 4,140 – – – 36,717 2,566,390
— Available-for-sale financial assets 695,131 62,585 37,264 228,694 15,006 17,094 3,422 117,410 1,176,606Others 93,801 16,278 10,303 16,925 11,312 11,572 2,823 35,468 198,482
8,026,334 2,347,364 1,537,317 2,311,151 1,516,926 2,005,274 626,034 1,728,198 20,098,598Credit commitments 469,704 438,216 319,851 419,494 129,088 158,055 58,811 348,904 2,342,123
Total maximum credit risk exposure 8,496,038 2,785,580 1,857,168 2,730,645 1,646,014 2,163,329 684,845 2,077,102 22,440,721
The compositions of each geographical distribution above are set out in note 53(b).
31 December 2013
Head Office
Yangtze River Delta
Pearl River Delta
Bohai Rim
Central China
Western China
North- eastern
ChinaOverseas
and others Total
Balances with central banks 2,829,619 63,151 46,996 145,319 23,007 30,700 9,848 64,454 3,213,094
Due from banks and other financial institutions 277,596 37,545 12,653 250,188 8,836 6,924 29,484 94,758 717,984
Financial assets held for trading 27,607 – – – – – – 201 27,808
Financial assets designated at fair value through profit or loss 342,839 84 58 121 27 29 10 1,245 344,413
Derivative financial assets 16,573 446 1,875 213 33 101 850 4,929 25,020
Reverse repurchase agreements 57,440 3,203 3,845 10,972 7,334 – 7,380 241,729 331,903
Loans and advances to customers 378,717 2,017,579 1,282,763 1,688,082 1,306,448 1,707,744 553,825 746,257 9,681,415
Financial investments
— Receivables 311,261 584 320 4,124 2,480 1,398 240 4,081 324,488
— Held-to-maturity investments 2,526,627 54,571 23,682 6,334 – – – 13,186 2,624,400
— Available-for-sale financial assets 565,796 50,368 33,959 214,179 14,440 13,955 4,029 97,812 994,538Others 119,699 15,825 7,274 15,255 8,463 10,080 2,763 45,661 225,020
7,453,774 2,243,356 1,413,425 2,334,787 1,371,068 1,770,931 608,429 1,314,313 18,510,083Credit commitments 494,153 456,115 389,353 386,886 149,095 192,459 71,345 306,550 2,445,956
Total maximum credit risk exposure 7,947,927 2,699,471 1,802,778 2,721,673 1,520,163 1,963,390 679,774 1,620,863 20,956,039
The compositions of each geographical distribution above are set out in note 53(b).
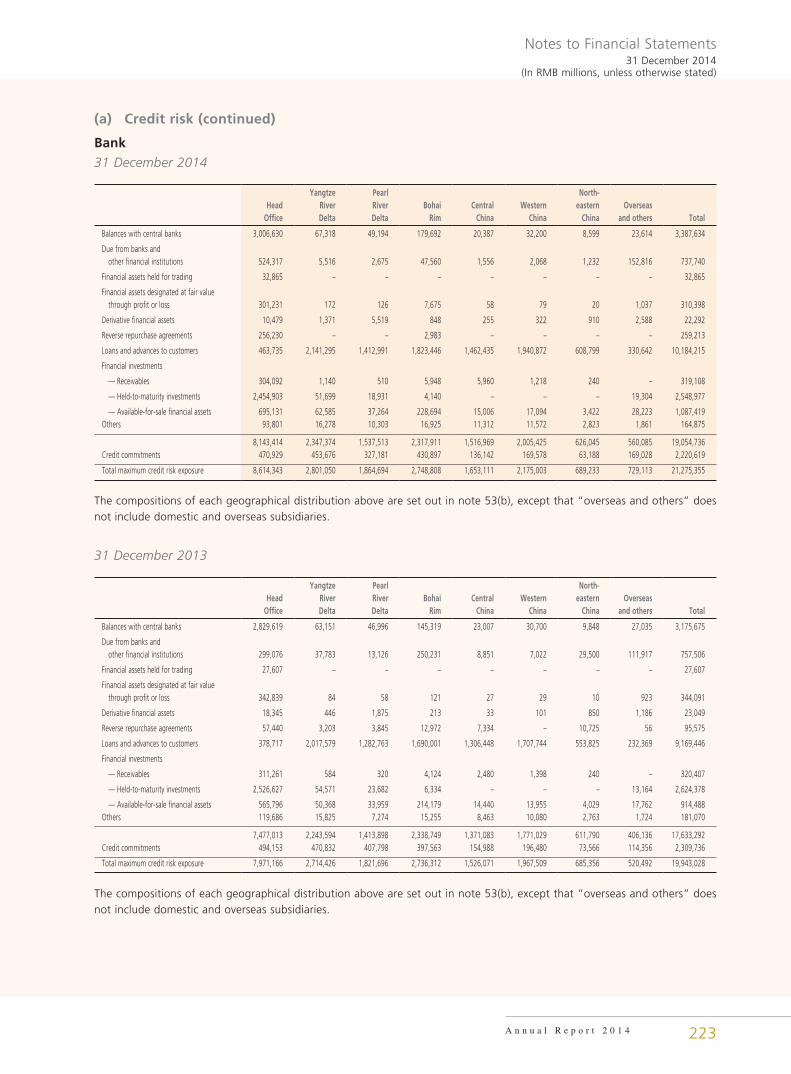
Notes to Financial Statements31 December 2014
(In RMB millions, unless otherwise stated)
A n n u a l R e p o r t 2 0 1 4 223
(a) Credit risk (continued)
Bank
31 December 2014
Head Office
Yangtze River Delta
Pearl River Delta
Bohai Rim
Central China
Western China
North- eastern
ChinaOverseas
and others Total
Balances with central banks 3,006,630 67,318 49,194 179,692 20,387 32,200 8,599 23,614 3,387,634
Due from banks and other financial institutions 524,317 5,516 2,675 47,560 1,556 2,068 1,232 152,816 737,740
Financial assets held for trading 32,865 – – – – – – – 32,865
Financial assets designated at fair value through profit or loss 301,231 172 126 7,675 58 79 20 1,037 310,398
Derivative financial assets 10,479 1,371 5,519 848 255 322 910 2,588 22,292
Reverse repurchase agreements 256,230 – – 2,983 – – – – 259,213
Loans and advances to customers 463,735 2,141,295 1,412,991 1,823,446 1,462,435 1,940,872 608,799 330,642 10,184,215
Financial investments
— Receivables 304,092 1,140 510 5,948 5,960 1,218 240 – 319,108
— Held-to-maturity investments 2,454,903 51,699 18,931 4,140 – – – 19,304 2,548,977
— Available-for-sale financial assets 695,131 62,585 37,264 228,694 15,006 17,094 3,422 28,223 1,087,419Others 93,801 16,278 10,303 16,925 11,312 11,572 2,823 1,861 164,875
8,143,414 2,347,374 1,537,513 2,317,911 1,516,969 2,005,425 626,045 560,085 19,054,736Credit commitments 470,929 453,676 327,181 430,897 136,142 169,578 63,188 169,028 2,220,619
Total maximum credit risk exposure 8,614,343 2,801,050 1,864,694 2,748,808 1,653,111 2,175,003 689,233 729,113 21,275,355
The compositions of each geographical distribution above are set out in note 53(b), except that “overseas and others” does not include domestic and overseas subsidiaries.
31 December 2013
Head Office
Yangtze River Delta
Pearl River Delta
Bohai Rim
Central China
Western China
North- eastern
ChinaOverseas
and others Total
Balances with central banks 2,829,619 63,151 46,996 145,319 23,007 30,700 9,848 27,035 3,175,675
Due from banks and other financial institutions 299,076 37,783 13,126 250,231 8,851 7,022 29,500 111,917 757,506
Financial assets held for trading 27,607 – – – – – – – 27,607
Financial assets designated at fair value through profit or loss 342,839 84 58 121 27 29 10 923 344,091
Derivative financial assets 18,345 446 1,875 213 33 101 850 1,186 23,049
Reverse repurchase agreements 57,440 3,203 3,845 12,972 7,334 – 10,725 56 95,575
Loans and advances to customers 378,717 2,017,579 1,282,763 1,690,001 1,306,448 1,707,744 553,825 232,369 9,169,446
Financial investments
— Receivables 311,261 584 320 4,124 2,480 1,398 240 – 320,407
— Held-to-maturity investments 2,526,627 54,571 23,682 6,334 – – – 13,164 2,624,378
— Available-for-sale financial assets 565,796 50,368 33,959 214,179 14,440 13,955 4,029 17,762 914,488Others 119,686 15,825 7,274 15,255 8,463 10,080 2,763 1,724 181,070
7,477,013 2,243,594 1,413,898 2,338,749 1,371,083 1,771,029 611,790 406,136 17,633,292Credit commitments 494,153 470,832 407,798 397,563 154,988 196,480 73,566 114,356 2,309,736
Total maximum credit risk exposure 7,971,166 2,714,426 1,821,696 2,736,312 1,526,071 1,967,509 685,356 520,492 19,943,028
The compositions of each geographical distribution above are set out in note 53(b), except that “overseas and others” does not include domestic and overseas subsidiaries.
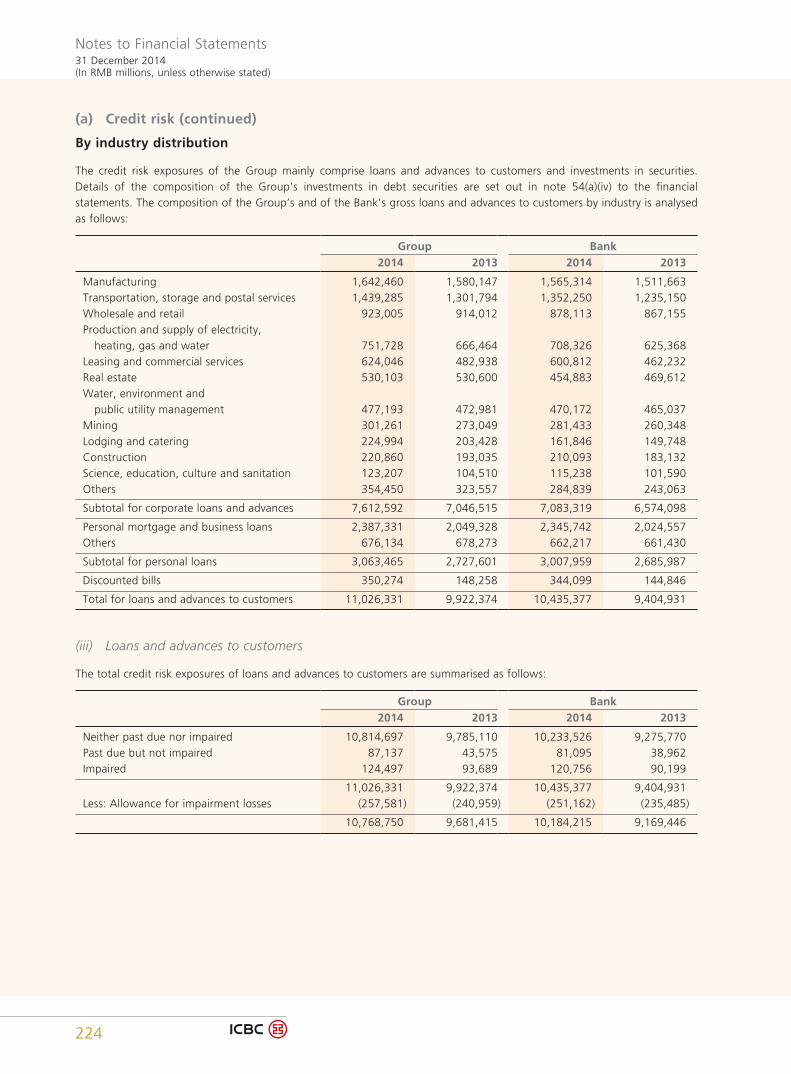
Notes to Financial Statements31 December 2014(In RMB millions, unless otherwise stated)
224
(a) Credit risk (continued)
By industry distribution
The credit risk exposures of the Group mainly comprise loans and advances to customers and investments in securities. Details of the composition of the Group’s investments in debt securities are set out in note 54(a)(iv) to the financial statements. The composition of the Group’s and of the Bank’s gross loans and advances to customers by industry is analysed as follows:
Group Bank2014 2013 2014 2013
Manufacturing 1,642,460 1,580,147 1,565,314 1,511,663Transportation, storage and postal services 1,439,285 1,301,794 1,352,250 1,235,150Wholesale and retail 923,005 914,012 878,113 867,155Production and supply of electricity, heating, gas and water 751,728 666,464 708,326 625,368Leasing and commercial services 624,046 482,938 600,812 462,232Real estate 530,103 530,600 454,883 469,612Water, environment and public utility management 477,193 472,981 470,172 465,037Mining 301,261 273,049 281,433 260,348Lodging and catering 224,994 203,428 161,846 149,748Construction 220,860 193,035 210,093 183,132Science, education, culture and sanitation 123,207 104,510 115,238 101,590Others 354,450 323,557 284,839 243,063
Subtotal for corporate loans and advances 7,612,592 7,046,515 7,083,319 6,574,098
Personal mortgage and business loans 2,387,331 2,049,328 2,345,742 2,024,557Others 676,134 678,273 662,217 661,430
Subtotal for personal loans 3,063,465 2,727,601 3,007,959 2,685,987
Discounted bills 350,274 148,258 344,099 144,846
Total for loans and advances to customers 11,026,331 9,922,374 10,435,377 9,404,931
(iii) Loans and advances to customers
The total credit risk exposures of loans and advances to customers are summarised as follows:
Group Bank2014 2013 2014 2013
Neither past due nor impaired 10,814,697 9,785,110 10,233,526 9,275,770Past due but not impaired 87,137 43,575 81,095 38,962Impaired 124,497 93,689 120,756 90,199
11,026,331 9,922,374 10,435,377 9,404,931Less: Allowance for impairment losses (257,581) (240,959) (251,162) (235,485)
10,768,750 9,681,415 10,184,215 9,169,446
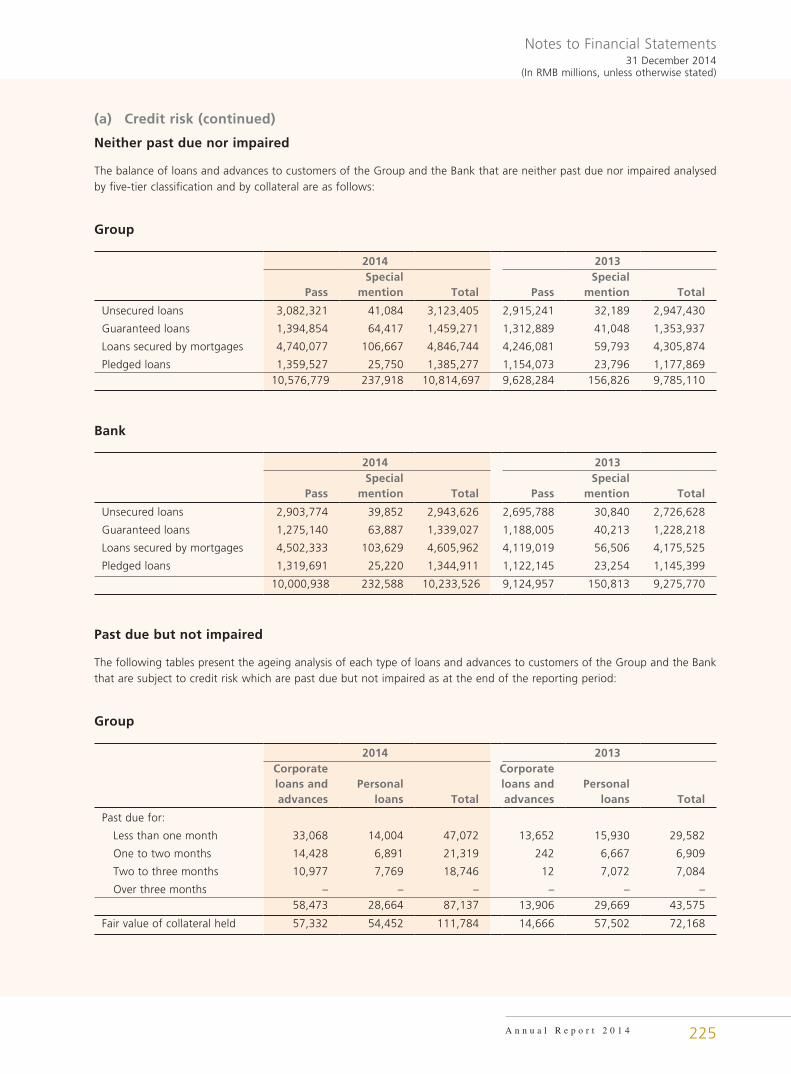
Notes to Financial Statements31 December 2014
(In RMB millions, unless otherwise stated)
A n n u a l R e p o r t 2 0 1 4 225
(a) Credit risk (continued)
Neither past due nor impaired
The balance of loans and advances to customers of the Group and the Bank that are neither past due nor impaired analysed by five-tier classification and by collateral are as follows:
Group
2014 2013
PassSpecial
mention Total PassSpecial
mention Total
Unsecured loans 3,082,321 41,084 3,123,405 2,915,241 32,189 2,947,430
Guaranteed loans 1,394,854 64,417 1,459,271 1,312,889 41,048 1,353,937
Loans secured by mortgages 4,740,077 106,667 4,846,744 4,246,081 59,793 4,305,874
Pledged loans 1,359,527 25,750 1,385,277 1,154,073 23,796 1,177,86910,576,779 237,918 10,814,697 9,628,284 156,826 9,785,110
Bank
2014 2013
PassSpecial
mention Total PassSpecial
mention Total
Unsecured loans 2,903,774 39,852 2,943,626 2,695,788 30,840 2,726,628
Guaranteed loans 1,275,140 63,887 1,339,027 1,188,005 40,213 1,228,218
Loans secured by mortgages 4,502,333 103,629 4,605,962 4,119,019 56,506 4,175,525
Pledged loans 1,319,691 25,220 1,344,911 1,122,145 23,254 1,145,399
10,000,938 232,588 10,233,526 9,124,957 150,813 9,275,770
Past due but not impaired
The following tables present the ageing analysis of each type of loans and advances to customers of the Group and the Bank that are subject to credit risk which are past due but not impaired as at the end of the reporting period:
Group
2014 2013Corporate loans and advances
Personal loans Total
Corporate loans and advances
Personal loans Total
Past due for:
Less than one month 33,068 14,004 47,072 13,652 15,930 29,582
One to two months 14,428 6,891 21,319 242 6,667 6,909
Two to three months 10,977 7,769 18,746 12 7,072 7,084
Over three months – – – – – –58,473 28,664 87,137 13,906 29,669 43,575
Fair value of collateral held 57,332 54,452 111,784 14,666 57,502 72,168
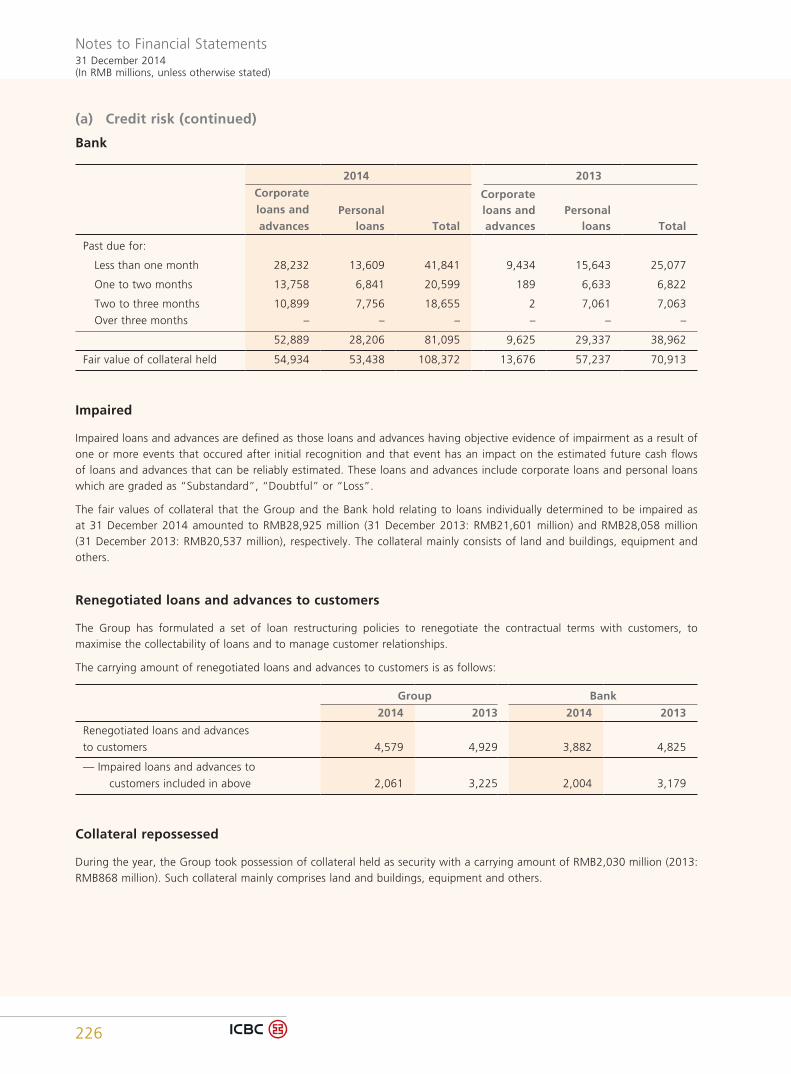
Notes to Financial Statements31 December 2014(In RMB millions, unless otherwise stated)
226
(a) Credit risk (continued)
Bank
2014 2013
Corporate loans and advances
Personal loans Total
Corporate loans and advances
Personal loans Total
Past due for:
Less than one month 28,232 13,609 41,841 9,434 15,643 25,077
One to two months 13,758 6,841 20,599 189 6,633 6,822
Two to three months 10,899 7,756 18,655 2 7,061 7,063
Over three months – – – – – –
52,889 28,206 81,095 9,625 29,337 38,962
Fair value of collateral held 54,934 53,438 108,372 13,676 57,237 70,913
Impaired
Impaired loans and advances are defined as those loans and advances having objective evidence of impairment as a result of one or more events that occured after initial recognition and that event has an impact on the estimated future cash flows of loans and advances that can be reliably estimated. These loans and advances include corporate loans and personal loans which are graded as “Substandard”, “Doubtful” or “Loss”.
The fair values of collateral that the Group and the Bank hold relating to loans individually determined to be impaired as at 31 December 2014 amounted to RMB28,925 million (31 December 2013: RMB21,601 million) and RMB28,058 million (31 December 2013: RMB20,537 million), respectively. The collateral mainly consists of land and buildings, equipment and others.
Renegotiated loans and advances to customers
The Group has formulated a set of loan restructuring policies to renegotiate the contractual terms with customers, to maximise the collectability of loans and to manage customer relationships.
The carrying amount of renegotiated loans and advances to customers is as follows:
Group Bank
2014 2013 2014 2013
Renegotiated loans and advances
to customers 4,579 4,929 3,882 4,825
— Impaired loans and advances to
customers included in above 2,061 3,225 2,004 3,179
Collateral repossessed
During the year, the Group took possession of collateral held as security with a carrying amount of RMB2,030 million (2013: RMB868 million). Such collateral mainly comprises land and buildings, equipment and others.
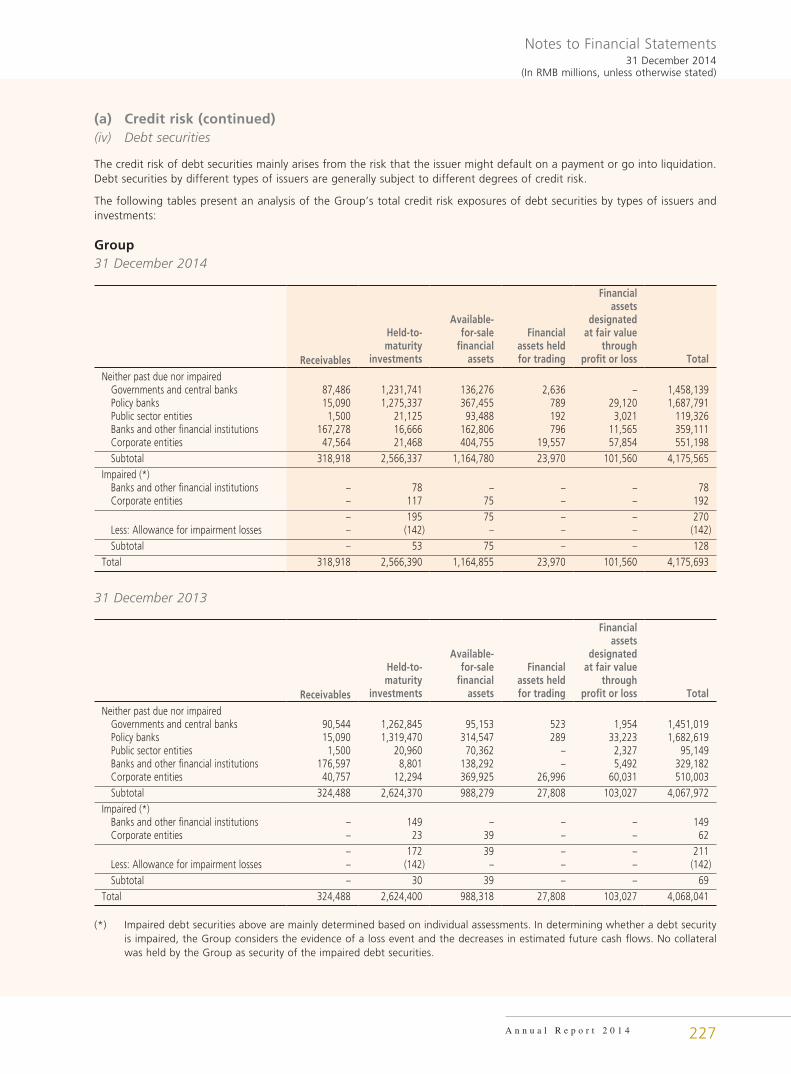
Notes to Financial Statements31 December 2014
(In RMB millions, unless otherwise stated)
A n n u a l R e p o r t 2 0 1 4 227
(a) Credit risk (continued)(iv) Debt securities
The credit risk of debt securities mainly arises from the risk that the issuer might default on a payment or go into liquidation. Debt securities by different types of issuers are generally subject to different degrees of credit risk.
The following tables present an analysis of the Group’s total credit risk exposures of debt securities by types of issuers and investments:
Group31 December 2014
Receivables
Held-to- maturity
investments
Available- for-sale
financial assets
Financial assets held for trading
Financial assets
designated at fair value
through profit or loss Total
Neither past due nor impaired Governments and central banks 87,486 1,231,741 136,276 2,636 – 1,458,139 Policy banks 15,090 1,275,337 367,455 789 29,120 1,687,791 Public sector entities 1,500 21,125 93,488 192 3,021 119,326 Banks and other financial institutions 167,278 16,666 162,806 796 11,565 359,111 Corporate entities 47,564 21,468 404,755 19,557 57,854 551,198 Subtotal 318,918 2,566,337 1,164,780 23,970 101,560 4,175,565Impaired (*) Banks and other financial institutions – 78 – – – 78 Corporate entities – 117 75 – – 192
– 195 75 – – 270 Less: Allowance for impairment losses – (142) – – – (142) Subtotal – 53 75 – – 128Total 318,918 2,566,390 1,164,855 23,970 101,560 4,175,693
31 December 2013
Receivables
Held-to- maturity
investments
Available- for-sale
financial assets
Financial assets held for trading
Financial assets
designated at fair value
through profit or loss Total
Neither past due nor impaired Governments and central banks 90,544 1,262,845 95,153 523 1,954 1,451,019 Policy banks 15,090 1,319,470 314,547 289 33,223 1,682,619 Public sector entities 1,500 20,960 70,362 – 2,327 95,149 Banks and other financial institutions 176,597 8,801 138,292 – 5,492 329,182 Corporate entities 40,757 12,294 369,925 26,996 60,031 510,003 Subtotal 324,488 2,624,370 988,279 27,808 103,027 4,067,972Impaired (*) Banks and other financial institutions – 149 – – – 149 Corporate entities – 23 39 – – 62
– 172 39 – – 211 Less: Allowance for impairment losses – (142) – – – (142) Subtotal – 30 39 – – 69Total 324,488 2,624,400 988,318 27,808 103,027 4,068,041
(*) Impaired debt securities above are mainly determined based on individual assessments. In determining whether a debt security is impaired, the Group considers the evidence of a loss event and the decreases in estimated future cash flows. No collateral was held by the Group as security of the impaired debt securities.
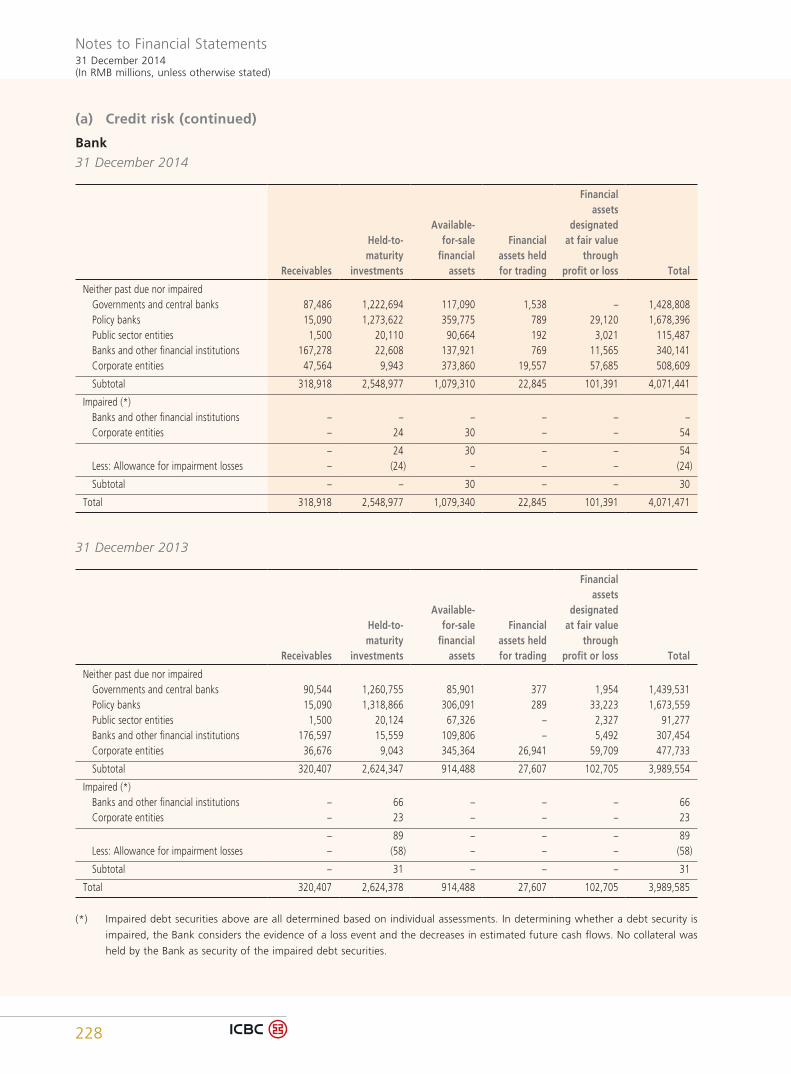
Notes to Financial Statements31 December 2014(In RMB millions, unless otherwise stated)
228
(a) Credit risk (continued)
Bank
31 December 2014
Receivables
Held-to- maturity
investments
Available- for-sale
financial assets
Financial assets held for trading
Financial assets
designated at fair value
through profit or loss Total
Neither past due nor impaired Governments and central banks 87,486 1,222,694 117,090 1,538 – 1,428,808 Policy banks 15,090 1,273,622 359,775 789 29,120 1,678,396 Public sector entities 1,500 20,110 90,664 192 3,021 115,487 Banks and other financial institutions 167,278 22,608 137,921 769 11,565 340,141 Corporate entities 47,564 9,943 373,860 19,557 57,685 508,609
Subtotal 318,918 2,548,977 1,079,310 22,845 101,391 4,071,441
Impaired (*) Banks and other financial institutions – – – – – – Corporate entities – 24 30 – – 54
– 24 30 – – 54 Less: Allowance for impairment losses – (24) – – – (24)
Subtotal – – 30 – – 30
Total 318,918 2,548,977 1,079,340 22,845 101,391 4,071,471
31 December 2013
Receivables
Held-to- maturity
investments
Available- for-sale
financial assets
Financial assets held for trading
Financial assets
designated at fair value
through profit or loss Total
Neither past due nor impaired Governments and central banks 90,544 1,260,755 85,901 377 1,954 1,439,531 Policy banks 15,090 1,318,866 306,091 289 33,223 1,673,559 Public sector entities 1,500 20,124 67,326 – 2,327 91,277 Banks and other financial institutions 176,597 15,559 109,806 – 5,492 307,454 Corporate entities 36,676 9,043 345,364 26,941 59,709 477,733
Subtotal 320,407 2,624,347 914,488 27,607 102,705 3,989,554
Impaired (*) Banks and other financial institutions – 66 – – – 66 Corporate entities – 23 – – – 23
– 89 – – – 89 Less: Allowance for impairment losses – (58) – – – (58)
Subtotal – 31 – – – 31
Total 320,407 2,624,378 914,488 27,607 102,705 3,989,585
(*) Impaired debt securities above are all determined based on individual assessments. In determining whether a debt security is
impaired, the Bank considers the evidence of a loss event and the decreases in estimated future cash flows. No collateral was
held by the Bank as security of the impaired debt securities.
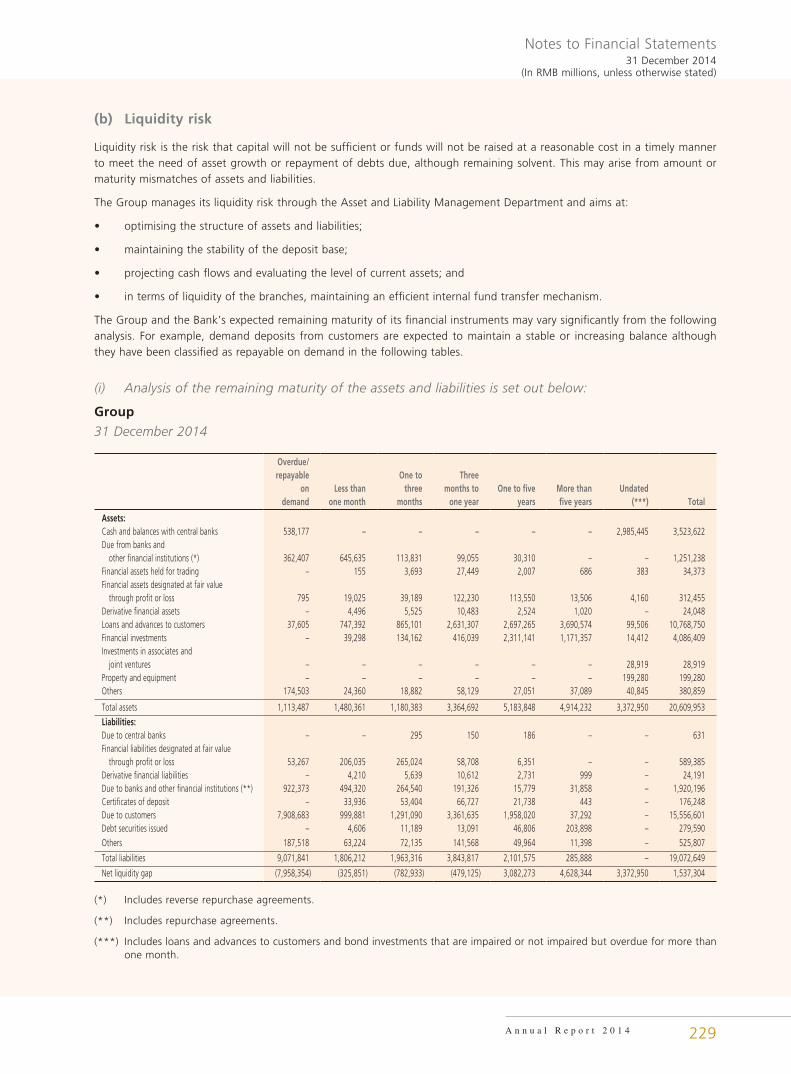
Notes to Financial Statements31 December 2014
(In RMB millions, unless otherwise stated)
A n n u a l R e p o r t 2 0 1 4 229
(b) Liquidity risk
Liquidity risk is the risk that capital will not be sufficient or funds will not be raised at a reasonable cost in a timely manner to meet the need of asset growth or repayment of debts due, although remaining solvent. This may arise from amount or maturity mismatches of assets and liabilities.
The Group manages its liquidity risk through the Asset and Liability Management Department and aims at:
• optimising the structure of assets and liabilities;
• maintaining the stability of the deposit base;
• projecting cash flows and evaluating the level of current assets; and
• in terms of liquidity of the branches, maintaining an efficient internal fund transfer mechanism.
The Group and the Bank’s expected remaining maturity of its financial instruments may vary significantly from the following analysis. For example, demand deposits from customers are expected to maintain a stable or increasing balance although they have been classified as repayable on demand in the following tables.
(i) Analysis of the remaining maturity of the assets and liabilities is set out below:
Group
31 December 2014
Overdue/ repayable
on demand
Less than one month
One to three
months
Three months to
one yearOne to five
yearsMore than five years
Undated (***) Total
Assets:Cash and balances with central banks 538,177 – – – – – 2,985,445 3,523,622Due from banks and other financial institutions (*) 362,407 645,635 113,831 99,055 30,310 – – 1,251,238Financial assets held for trading – 155 3,693 27,449 2,007 686 383 34,373Financial assets designated at fair value through profit or loss 795 19,025 39,189 122,230 113,550 13,506 4,160 312,455Derivative financial assets – 4,496 5,525 10,483 2,524 1,020 – 24,048Loans and advances to customers 37,605 747,392 865,101 2,631,307 2,697,265 3,690,574 99,506 10,768,750Financial investments – 39,298 134,162 416,039 2,311,141 1,171,357 14,412 4,086,409Investments in associates and joint ventures – – – – – – 28,919 28,919Property and equipment – – – – – – 199,280 199,280Others 174,503 24,360 18,882 58,129 27,051 37,089 40,845 380,859
Total assets 1,113,487 1,480,361 1,180,383 3,364,692 5,183,848 4,914,232 3,372,950 20,609,953
Liabilities:Due to central banks – – 295 150 186 – – 631Financial liabilities designated at fair value through profit or loss 53,267 206,035 265,024 58,708 6,351 – – 589,385Derivative financial liabilities – 4,210 5,639 10,612 2,731 999 – 24,191Due to banks and other financial institutions (**) 922,373 494,320 264,540 191,326 15,779 31,858 – 1,920,196Certificates of deposit – 33,936 53,404 66,727 21,738 443 – 176,248Due to customers 7,908,683 999,881 1,291,090 3,361,635 1,958,020 37,292 – 15,556,601Debt securities issued – 4,606 11,189 13,091 46,806 203,898 – 279,590Others 187,518 63,224 72,135 141,568 49,964 11,398 – 525,807
Total liabilities 9,071,841 1,806,212 1,963,316 3,843,817 2,101,575 285,888 – 19,072,649
Net liquidity gap (7,958,354) (325,851) (782,933) (479,125) 3,082,273 4,628,344 3,372,950 1,537,304
(*) Includes reverse repurchase agreements.
(**) Includes repurchase agreements.
(***) Includes loans and advances to customers and bond investments that are impaired or not impaired but overdue for more than one month.
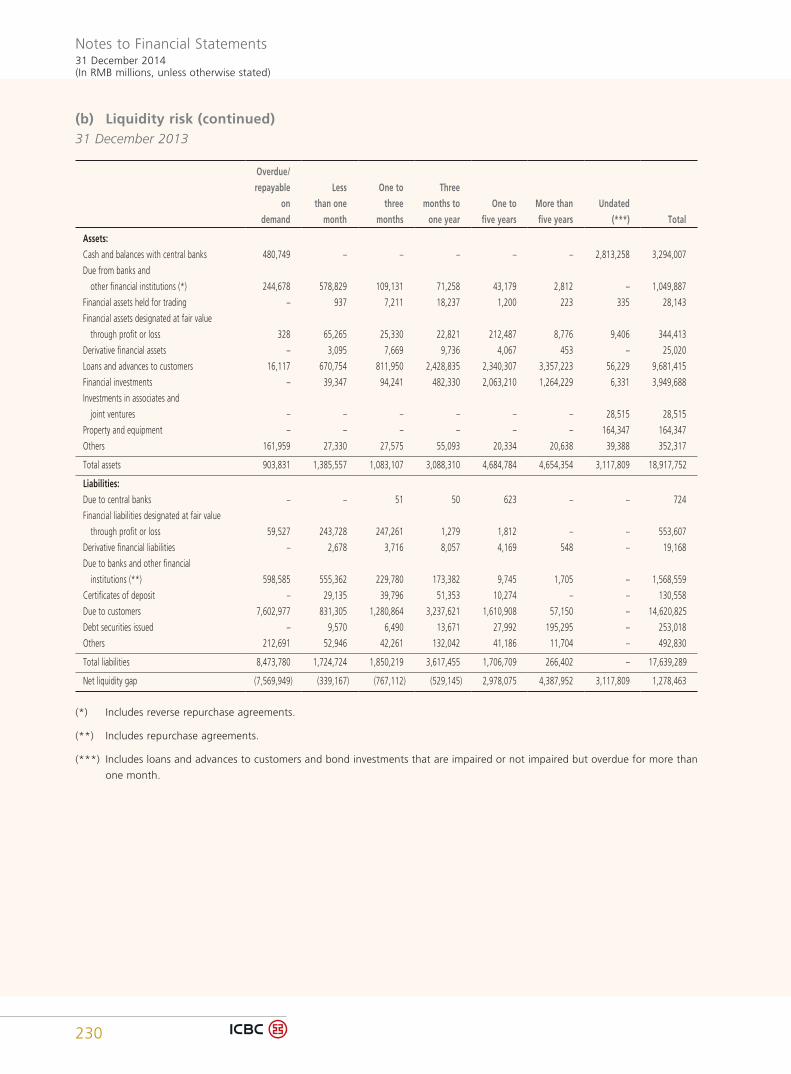
Notes to Financial Statements31 December 2014(In RMB millions, unless otherwise stated)
230
(b) Liquidity risk (continued)31 December 2013
Overdue/
repayable
on
demand
Less
than one
month
One to
three
months
Three
months to
one year
One to
five years
More than
five years
Undated
(***) Total
Assets:
Cash and balances with central banks 480,749 – – – – – 2,813,258 3,294,007
Due from banks and
other financial institutions (*) 244,678 578,829 109,131 71,258 43,179 2,812 – 1,049,887
Financial assets held for trading – 937 7,211 18,237 1,200 223 335 28,143
Financial assets designated at fair value
through profit or loss 328 65,265 25,330 22,821 212,487 8,776 9,406 344,413
Derivative financial assets – 3,095 7,669 9,736 4,067 453 – 25,020
Loans and advances to customers 16,117 670,754 811,950 2,428,835 2,340,307 3,357,223 56,229 9,681,415
Financial investments – 39,347 94,241 482,330 2,063,210 1,264,229 6,331 3,949,688
Investments in associates and
joint ventures – – – – – – 28,515 28,515
Property and equipment – – – – – – 164,347 164,347
Others 161,959 27,330 27,575 55,093 20,334 20,638 39,388 352,317
Total assets 903,831 1,385,557 1,083,107 3,088,310 4,684,784 4,654,354 3,117,809 18,917,752
Liabilities:
Due to central banks – – 51 50 623 – – 724
Financial liabilities designated at fair value
through profit or loss 59,527 243,728 247,261 1,279 1,812 – – 553,607
Derivative financial liabilities – 2,678 3,716 8,057 4,169 548 – 19,168
Due to banks and other financial
institutions (**) 598,585 555,362 229,780 173,382 9,745 1,705 – 1,568,559
Certificates of deposit – 29,135 39,796 51,353 10,274 – – 130,558
Due to customers 7,602,977 831,305 1,280,864 3,237,621 1,610,908 57,150 – 14,620,825
Debt securities issued – 9,570 6,490 13,671 27,992 195,295 – 253,018
Others 212,691 52,946 42,261 132,042 41,186 11,704 – 492,830
Total liabilities 8,473,780 1,724,724 1,850,219 3,617,455 1,706,709 266,402 – 17,639,289
Net liquidity gap (7,569,949) (339,167) (767,112) (529,145) 2,978,075 4,387,952 3,117,809 1,278,463
(*) Includes reverse repurchase agreements.
(**) Includes repurchase agreements.
(***) Includes loans and advances to customers and bond investments that are impaired or not impaired but overdue for more than
one month.
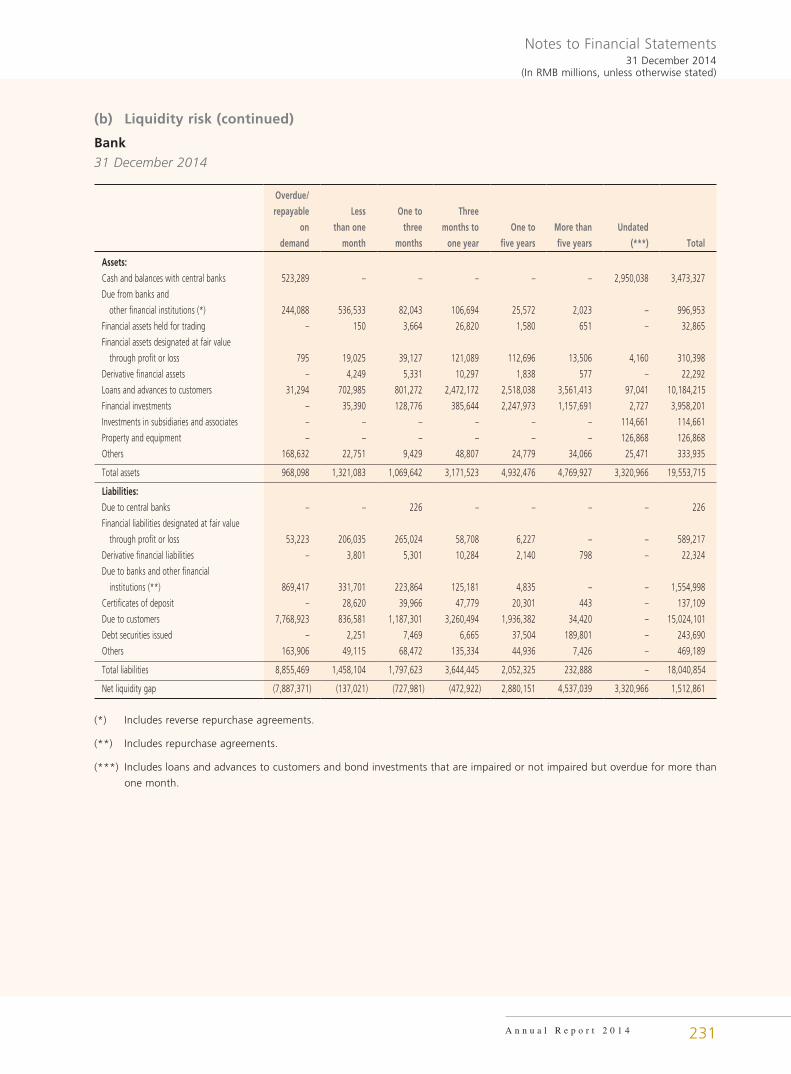
Notes to Financial Statements31 December 2014
(In RMB millions, unless otherwise stated)
A n n u a l R e p o r t 2 0 1 4 231
(b) Liquidity risk (continued)
Bank
31 December 2014
Overdue/
repayable
on
demand
Less
than one
month
One to
three
months
Three
months to
one year
One to
five years
More than
five years
Undated
(***) Total
Assets:
Cash and balances with central banks 523,289 – – – – – 2,950,038 3,473,327
Due from banks and
other financial institutions (*) 244,088 536,533 82,043 106,694 25,572 2,023 – 996,953
Financial assets held for trading – 150 3,664 26,820 1,580 651 – 32,865
Financial assets designated at fair value
through profit or loss 795 19,025 39,127 121,089 112,696 13,506 4,160 310,398
Derivative financial assets – 4,249 5,331 10,297 1,838 577 – 22,292
Loans and advances to customers 31,294 702,985 801,272 2,472,172 2,518,038 3,561,413 97,041 10,184,215
Financial investments – 35,390 128,776 385,644 2,247,973 1,157,691 2,727 3,958,201
Investments in subsidiaries and associates – – – – – – 114,661 114,661
Property and equipment – – – – – – 126,868 126,868
Others 168,632 22,751 9,429 48,807 24,779 34,066 25,471 333,935
Total assets 968,098 1,321,083 1,069,642 3,171,523 4,932,476 4,769,927 3,320,966 19,553,715
Liabilities:
Due to central banks – – 226 – – – – 226
Financial liabilities designated at fair value
through profit or loss 53,223 206,035 265,024 58,708 6,227 – – 589,217
Derivative financial liabilities – 3,801 5,301 10,284 2,140 798 – 22,324
Due to banks and other financial
institutions (**) 869,417 331,701 223,864 125,181 4,835 – – 1,554,998
Certificates of deposit – 28,620 39,966 47,779 20,301 443 – 137,109
Due to customers 7,768,923 836,581 1,187,301 3,260,494 1,936,382 34,420 – 15,024,101
Debt securities issued – 2,251 7,469 6,665 37,504 189,801 – 243,690
Others 163,906 49,115 68,472 135,334 44,936 7,426 – 469,189
Total liabilities 8,855,469 1,458,104 1,797,623 3,644,445 2,052,325 232,888 – 18,040,854
Net liquidity gap (7,887,371) (137,021) (727,981) (472,922) 2,880,151 4,537,039 3,320,966 1,512,861
(*) Includes reverse repurchase agreements.
(**) Includes repurchase agreements.
(***) Includes loans and advances to customers and bond investments that are impaired or not impaired but overdue for more than
one month.
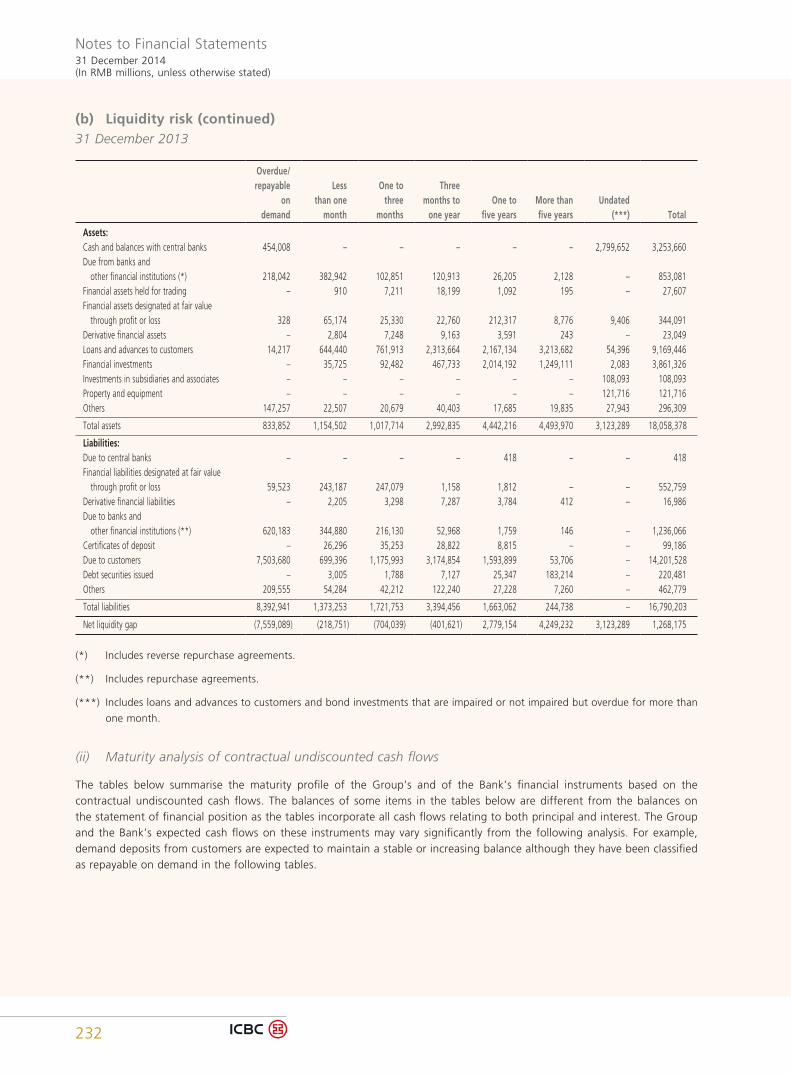
Notes to Financial Statements31 December 2014(In RMB millions, unless otherwise stated)
232
(b) Liquidity risk (continued)31 December 2013
Overdue/ repayable
on demand
Less than one
month
One to three
months
Three months to
one yearOne to
five yearsMore than five years
Undated (***) Total
Assets:Cash and balances with central banks 454,008 – – – – – 2,799,652 3,253,660Due from banks and other financial institutions (*) 218,042 382,942 102,851 120,913 26,205 2,128 – 853,081Financial assets held for trading – 910 7,211 18,199 1,092 195 – 27,607Financial assets designated at fair value through profit or loss 328 65,174 25,330 22,760 212,317 8,776 9,406 344,091Derivative financial assets – 2,804 7,248 9,163 3,591 243 – 23,049Loans and advances to customers 14,217 644,440 761,913 2,313,664 2,167,134 3,213,682 54,396 9,169,446Financial investments – 35,725 92,482 467,733 2,014,192 1,249,111 2,083 3,861,326Investments in subsidiaries and associates – – – – – – 108,093 108,093Property and equipment – – – – – – 121,716 121,716Others 147,257 22,507 20,679 40,403 17,685 19,835 27,943 296,309
Total assets 833,852 1,154,502 1,017,714 2,992,835 4,442,216 4,493,970 3,123,289 18,058,378
Liabilities:Due to central banks – – – – 418 – – 418Financial liabilities designated at fair value through profit or loss 59,523 243,187 247,079 1,158 1,812 – – 552,759Derivative financial liabilities – 2,205 3,298 7,287 3,784 412 – 16,986Due to banks and other financial institutions (**) 620,183 344,880 216,130 52,968 1,759 146 – 1,236,066Certificates of deposit – 26,296 35,253 28,822 8,815 – – 99,186Due to customers 7,503,680 699,396 1,175,993 3,174,854 1,593,899 53,706 – 14,201,528Debt securities issued – 3,005 1,788 7,127 25,347 183,214 – 220,481Others 209,555 54,284 42,212 122,240 27,228 7,260 – 462,779
Total liabilities 8,392,941 1,373,253 1,721,753 3,394,456 1,663,062 244,738 – 16,790,203
Net liquidity gap (7,559,089) (218,751) (704,039) (401,621) 2,779,154 4,249,232 3,123,289 1,268,175
(*) Includes reverse repurchase agreements.
(**) Includes repurchase agreements.
(***) Includes loans and advances to customers and bond investments that are impaired or not impaired but overdue for more than
one month.
(ii) Maturity analysis of contractual undiscounted cash flows
The tables below summarise the maturity profile of the Group’s and of the Bank’s financial instruments based on the contractual undiscounted cash flows. The balances of some items in the tables below are different from the balances on the statement of financial position as the tables incorporate all cash flows relating to both principal and interest. The Group and the Bank’s expected cash flows on these instruments may vary significantly from the following analysis. For example, demand deposits from customers are expected to maintain a stable or increasing balance although they have been classified as repayable on demand in the following tables.
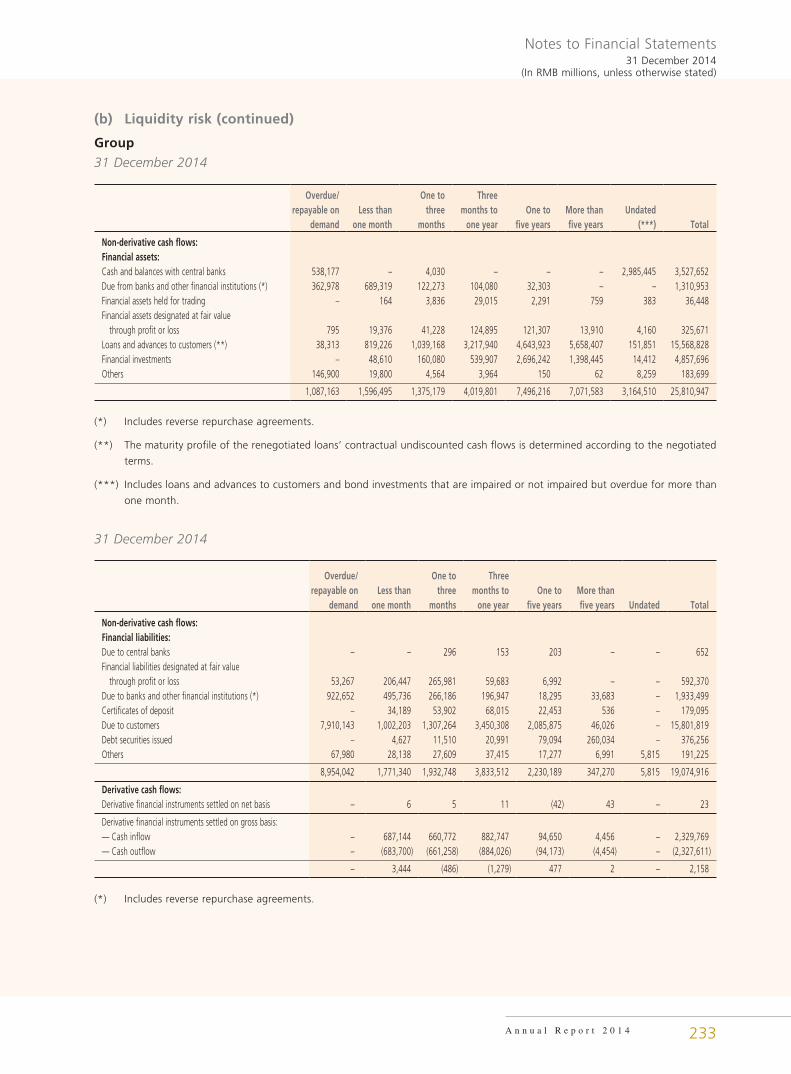
Notes to Financial Statements31 December 2014
(In RMB millions, unless otherwise stated)
A n n u a l R e p o r t 2 0 1 4 233
(b) Liquidity risk (continued)
Group
31 December 2014
Overdue/ repayable on
demandLess than
one month
One to three
months
Three months to
one yearOne to
five yearsMore than five years
Undated (***) Total
Non-derivative cash flows:Financial assets:Cash and balances with central banks 538,177 – 4,030 – – – 2,985,445 3,527,652Due from banks and other financial institutions (*) 362,978 689,319 122,273 104,080 32,303 – – 1,310,953Financial assets held for trading – 164 3,836 29,015 2,291 759 383 36,448Financial assets designated at fair value through profit or loss 795 19,376 41,228 124,895 121,307 13,910 4,160 325,671Loans and advances to customers (**) 38,313 819,226 1,039,168 3,217,940 4,643,923 5,658,407 151,851 15,568,828Financial investments – 48,610 160,080 539,907 2,696,242 1,398,445 14,412 4,857,696Others 146,900 19,800 4,564 3,964 150 62 8,259 183,699
1,087,163 1,596,495 1,375,179 4,019,801 7,496,216 7,071,583 3,164,510 25,810,947
(*) Includes reverse repurchase agreements.
(**) The maturity profile of the renegotiated loans’ contractual undiscounted cash flows is determined according to the negotiated
terms.
(***) Includes loans and advances to customers and bond investments that are impaired or not impaired but overdue for more than
one month.
31 December 2014
Overdue/ repayable on
demandLess than
one month
One to three
months
Three months to
one yearOne to
five yearsMore than five years Undated Total
Non-derivative cash flows:Financial liabilities:Due to central banks – – 296 153 203 – – 652Financial liabilities designated at fair value through profit or loss 53,267 206,447 265,981 59,683 6,992 – – 592,370Due to banks and other financial institutions (*) 922,652 495,736 266,186 196,947 18,295 33,683 – 1,933,499Certificates of deposit – 34,189 53,902 68,015 22,453 536 – 179,095Due to customers 7,910,143 1,002,203 1,307,264 3,450,308 2,085,875 46,026 – 15,801,819Debt securities issued – 4,627 11,510 20,991 79,094 260,034 – 376,256Others 67,980 28,138 27,609 37,415 17,277 6,991 5,815 191,225
8,954,042 1,771,340 1,932,748 3,833,512 2,230,189 347,270 5,815 19,074,916
Derivative cash flows:Derivative financial instruments settled on net basis – 6 5 11 (42) 43 – 23
Derivative financial instruments settled on gross basis:— Cash inflow – 687,144 660,772 882,747 94,650 4,456 – 2,329,769— Cash outflow – (683,700) (661,258) (884,026) (94,173) (4,454) – (2,327,611)
– 3,444 (486) (1,279) 477 2 – 2,158
(*) Includes reverse repurchase agreements.
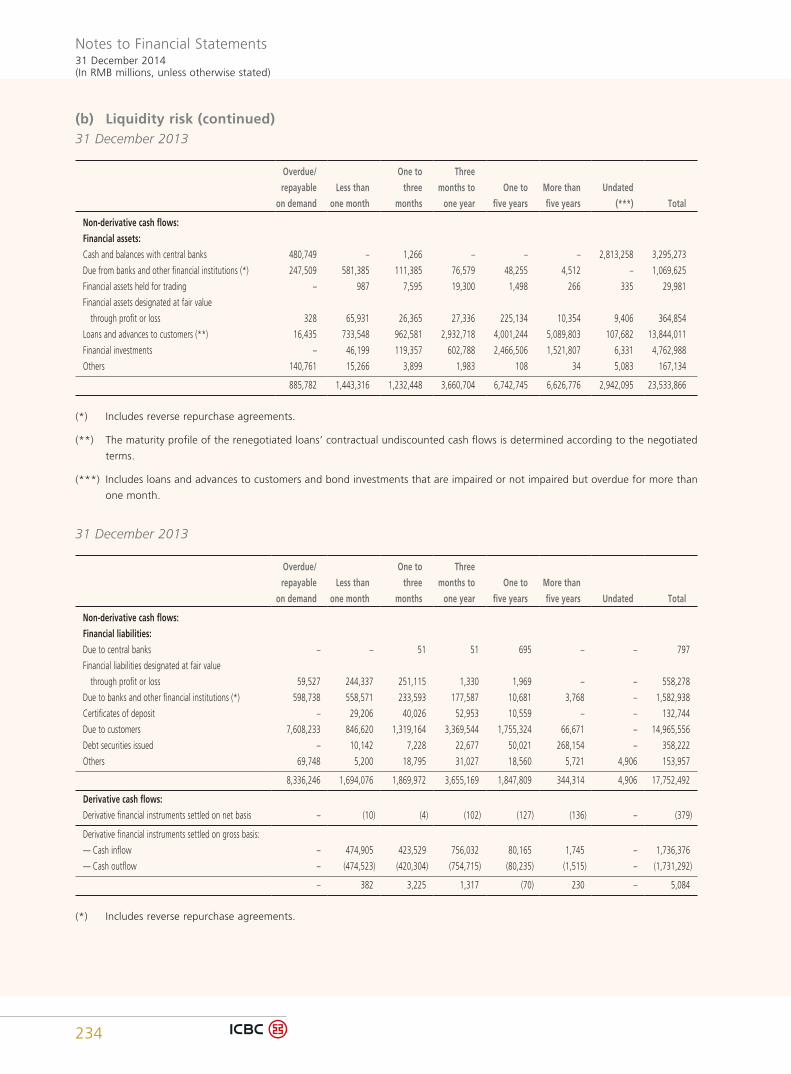
Notes to Financial Statements31 December 2014(In RMB millions, unless otherwise stated)
234
(b) Liquidity risk (continued)31 December 2013
Overdue/
repayable
on demand
Less than
one month
One to
three
months
Three
months to
one year
One to
five years
More than
five years
Undated
(***) Total
Non-derivative cash flows:
Financial assets:
Cash and balances with central banks 480,749 – 1,266 – – – 2,813,258 3,295,273
Due from banks and other financial institutions (*) 247,509 581,385 111,385 76,579 48,255 4,512 – 1,069,625
Financial assets held for trading – 987 7,595 19,300 1,498 266 335 29,981
Financial assets designated at fair value
through profit or loss 328 65,931 26,365 27,336 225,134 10,354 9,406 364,854
Loans and advances to customers (**) 16,435 733,548 962,581 2,932,718 4,001,244 5,089,803 107,682 13,844,011
Financial investments – 46,199 119,357 602,788 2,466,506 1,521,807 6,331 4,762,988
Others 140,761 15,266 3,899 1,983 108 34 5,083 167,134
885,782 1,443,316 1,232,448 3,660,704 6,742,745 6,626,776 2,942,095 23,533,866
(*) Includes reverse repurchase agreements.
(**) The maturity profile of the renegotiated loans’ contractual undiscounted cash flows is determined according to the negotiated
terms.
(***) Includes loans and advances to customers and bond investments that are impaired or not impaired but overdue for more than
one month.
31 December 2013
Overdue/
repayable
on demand
Less than
one month
One to
three
months
Three
months to
one year
One to
five years
More than
five years Undated Total
Non-derivative cash flows:
Financial liabilities:
Due to central banks – – 51 51 695 – – 797
Financial liabilities designated at fair value
through profit or loss 59,527 244,337 251,115 1,330 1,969 – – 558,278
Due to banks and other financial institutions (*) 598,738 558,571 233,593 177,587 10,681 3,768 – 1,582,938
Certificates of deposit – 29,206 40,026 52,953 10,559 – – 132,744
Due to customers 7,608,233 846,620 1,319,164 3,369,544 1,755,324 66,671 – 14,965,556
Debt securities issued – 10,142 7,228 22,677 50,021 268,154 – 358,222
Others 69,748 5,200 18,795 31,027 18,560 5,721 4,906 153,957
8,336,246 1,694,076 1,869,972 3,655,169 1,847,809 344,314 4,906 17,752,492
Derivative cash flows:
Derivative financial instruments settled on net basis – (10) (4) (102) (127) (136) – (379)
Derivative financial instruments settled on gross basis:
— Cash inflow – 474,905 423,529 756,032 80,165 1,745 – 1,736,376
— Cash outflow – (474,523) (420,304) (754,715) (80,235) (1,515) – (1,731,292)
– 382 3,225 1,317 (70) 230 – 5,084
(*) Includes reverse repurchase agreements.
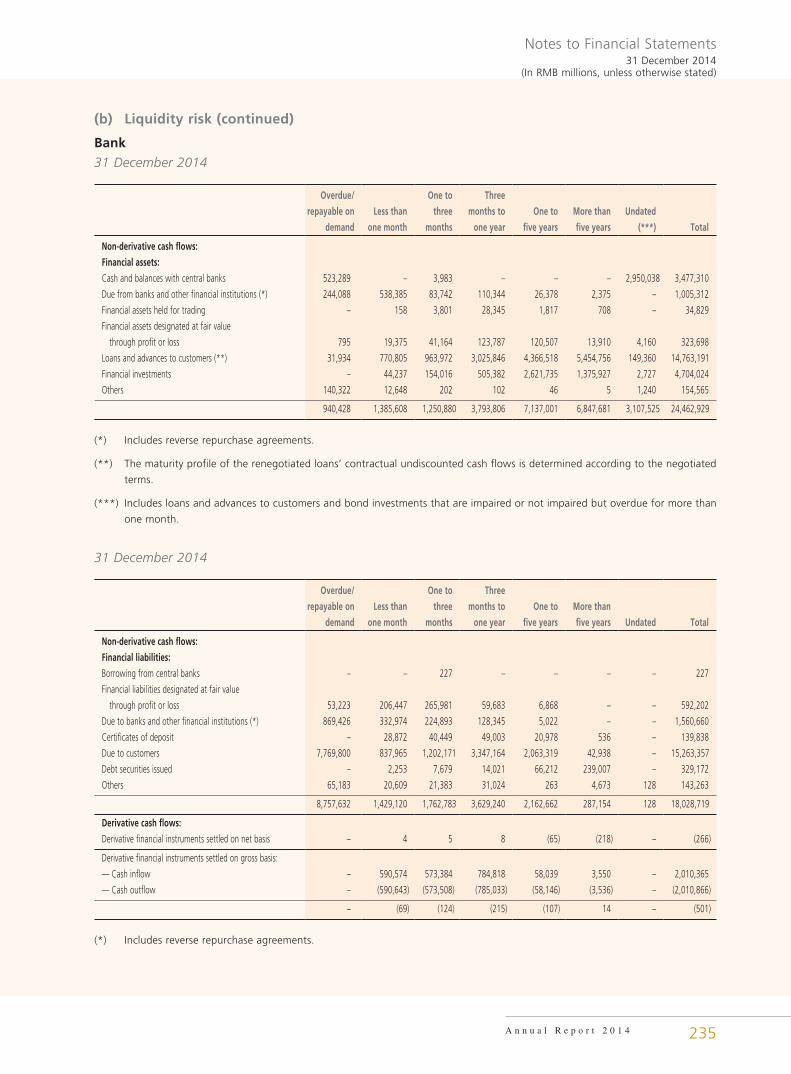
Notes to Financial Statements31 December 2014
(In RMB millions, unless otherwise stated)
A n n u a l R e p o r t 2 0 1 4 235
(b) Liquidity risk (continued)
Bank
31 December 2014
Overdue/
repayable on
demand
Less than
one month
One to
three
months
Three
months to
one year
One to
five years
More than
five years
Undated
(***) Total
Non-derivative cash flows:
Financial assets:
Cash and balances with central banks 523,289 – 3,983 – – – 2,950,038 3,477,310
Due from banks and other financial institutions (*) 244,088 538,385 83,742 110,344 26,378 2,375 – 1,005,312
Financial assets held for trading – 158 3,801 28,345 1,817 708 – 34,829
Financial assets designated at fair value
through profit or loss 795 19,375 41,164 123,787 120,507 13,910 4,160 323,698
Loans and advances to customers (**) 31,934 770,805 963,972 3,025,846 4,366,518 5,454,756 149,360 14,763,191
Financial investments – 44,237 154,016 505,382 2,621,735 1,375,927 2,727 4,704,024
Others 140,322 12,648 202 102 46 5 1,240 154,565
940,428 1,385,608 1,250,880 3,793,806 7,137,001 6,847,681 3,107,525 24,462,929
(*) Includes reverse repurchase agreements.
(**) The maturity profile of the renegotiated loans’ contractual undiscounted cash flows is determined according to the negotiated
terms.
(***) Includes loans and advances to customers and bond investments that are impaired or not impaired but overdue for more than
one month.
31 December 2014
Overdue/
repayable on
demand
Less than
one month
One to
three
months
Three
months to
one year
One to
five years
More than
five years Undated Total
Non-derivative cash flows:
Financial liabilities:
Borrowing from central banks – – 227 – – – – 227
Financial liabilities designated at fair value
through profit or loss 53,223 206,447 265,981 59,683 6,868 – – 592,202
Due to banks and other financial institutions (*) 869,426 332,974 224,893 128,345 5,022 – – 1,560,660
Certificates of deposit – 28,872 40,449 49,003 20,978 536 – 139,838
Due to customers 7,769,800 837,965 1,202,171 3,347,164 2,063,319 42,938 – 15,263,357
Debt securities issued – 2,253 7,679 14,021 66,212 239,007 – 329,172
Others 65,183 20,609 21,383 31,024 263 4,673 128 143,263
8,757,632 1,429,120 1,762,783 3,629,240 2,162,662 287,154 128 18,028,719
Derivative cash flows:
Derivative financial instruments settled on net basis – 4 5 8 (65) (218) – (266)
Derivative financial instruments settled on gross basis:
— Cash inflow – 590,574 573,384 784,818 58,039 3,550 – 2,010,365
— Cash outflow – (590,643) (573,508) (785,033) (58,146) (3,536) – (2,010,866)
– (69) (124) (215) (107) 14 – (501)
(*) Includes reverse repurchase agreements.
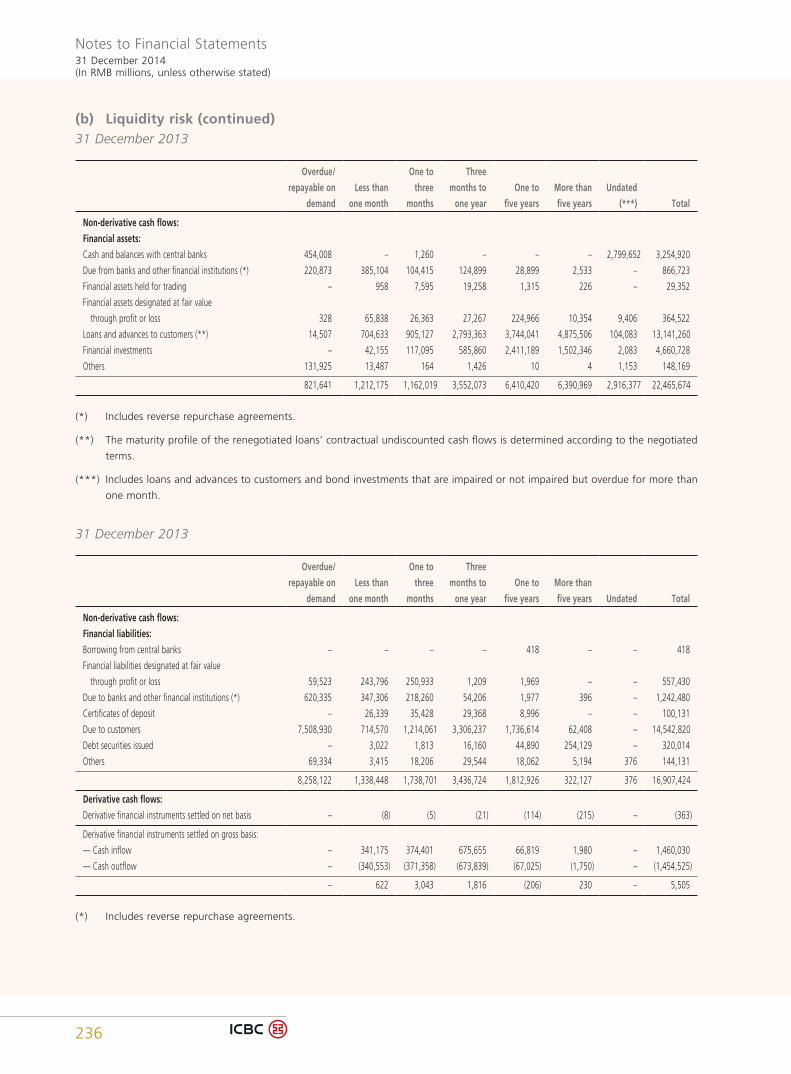
Notes to Financial Statements31 December 2014(In RMB millions, unless otherwise stated)
236
(b) Liquidity risk (continued)31 December 2013
Overdue/
repayable on
demand
Less than
one month
One to
three
months
Three
months to
one year
One to
five years
More than
five years
Undated
(***) Total
Non-derivative cash flows:
Financial assets:
Cash and balances with central banks 454,008 – 1,260 – – – 2,799,652 3,254,920
Due from banks and other financial institutions (*) 220,873 385,104 104,415 124,899 28,899 2,533 – 866,723
Financial assets held for trading – 958 7,595 19,258 1,315 226 – 29,352
Financial assets designated at fair value
through profit or loss 328 65,838 26,363 27,267 224,966 10,354 9,406 364,522
Loans and advances to customers (**) 14,507 704,633 905,127 2,793,363 3,744,041 4,875,506 104,083 13,141,260
Financial investments – 42,155 117,095 585,860 2,411,189 1,502,346 2,083 4,660,728
Others 131,925 13,487 164 1,426 10 4 1,153 148,169
821,641 1,212,175 1,162,019 3,552,073 6,410,420 6,390,969 2,916,377 22,465,674
(*) Includes reverse repurchase agreements.
(**) The maturity profile of the renegotiated loans’ contractual undiscounted cash flows is determined according to the negotiated
terms.
(***) Includes loans and advances to customers and bond investments that are impaired or not impaired but overdue for more than
one month.
31 December 2013
Overdue/
repayable on
demand
Less than
one month
One to
three
months
Three
months to
one year
One to
five years
More than
five years Undated Total
Non-derivative cash flows:
Financial liabilities:
Borrowing from central banks – – – – 418 – – 418
Financial liabilities designated at fair value
through profit or loss 59,523 243,796 250,933 1,209 1,969 – – 557,430
Due to banks and other financial institutions (*) 620,335 347,306 218,260 54,206 1,977 396 – 1,242,480
Certificates of deposit – 26,339 35,428 29,368 8,996 – – 100,131
Due to customers 7,508,930 714,570 1,214,061 3,306,237 1,736,614 62,408 – 14,542,820
Debt securities issued – 3,022 1,813 16,160 44,890 254,129 – 320,014
Others 69,334 3,415 18,206 29,544 18,062 5,194 376 144,131
8,258,122 1,338,448 1,738,701 3,436,724 1,812,926 322,127 376 16,907,424
Derivative cash flows:
Derivative financial instruments settled on net basis – (8) (5) (21) (114) (215) – (363)
Derivative financial instruments settled on gross basis:
— Cash inflow – 341,175 374,401 675,655 66,819 1,980 – 1,460,030
— Cash outflow – (340,553) (371,358) (673,839) (67,025) (1,750) – (1,454,525)
– 622 3,043 1,816 (206) 230 – 5,505
(*) Includes reverse repurchase agreements.
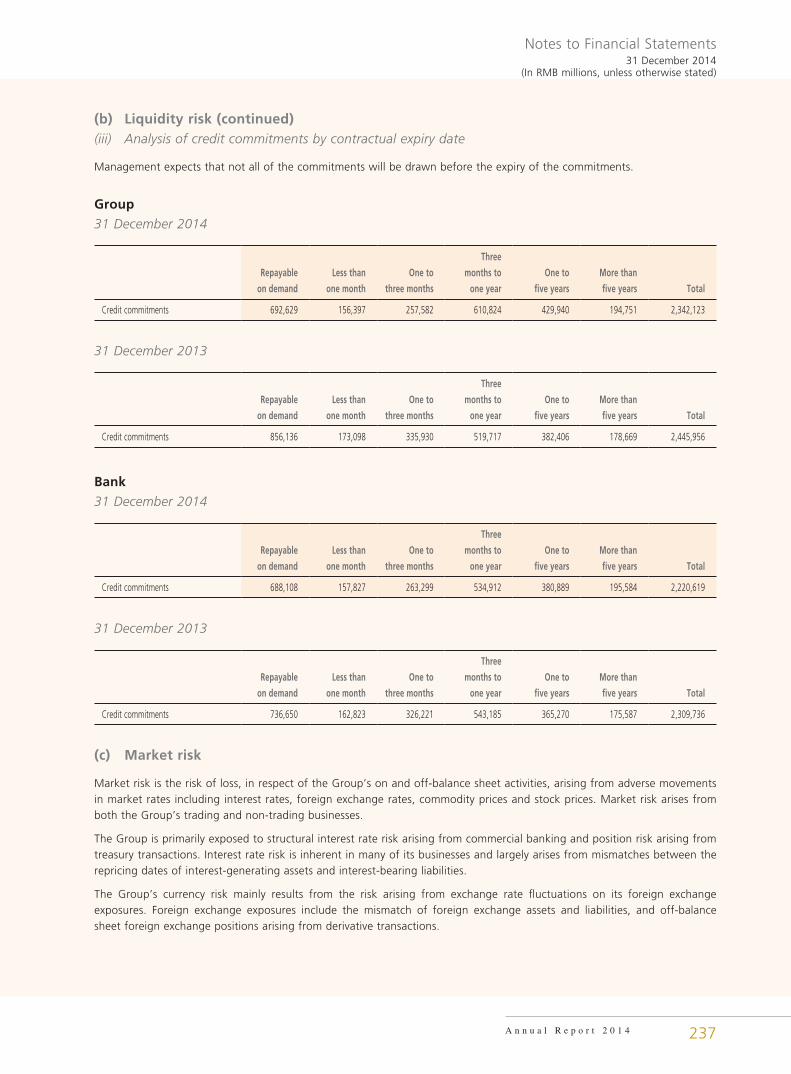
Notes to Financial Statements31 December 2014
(In RMB millions, unless otherwise stated)
A n n u a l R e p o r t 2 0 1 4 237
(b) Liquidity risk (continued)(iii) Analysis of credit commitments by contractual expiry date
Management expects that not all of the commitments will be drawn before the expiry of the commitments.
Group
31 December 2014
Repayable
on demand
Less than
one month
One to
three months
Three
months to
one year
One to
five years
More than
five years Total
Credit commitments 692,629 156,397 257,582 610,824 429,940 194,751 2,342,123
31 December 2013
Repayable
on demand
Less than
one month
One to
three months
Three
months to
one year
One to
five years
More than
five years Total
Credit commitments 856,136 173,098 335,930 519,717 382,406 178,669 2,445,956
Bank
31 December 2014
Repayable
on demand
Less than
one month
One to
three months
Three
months to
one year
One to
five years
More than
five years Total
Credit commitments 688,108 157,827 263,299 534,912 380,889 195,584 2,220,619
31 December 2013
Repayable
on demand
Less than
one month
One to
three months
Three
months to
one year
One to
five years
More than
five years Total
Credit commitments 736,650 162,823 326,221 543,185 365,270 175,587 2,309,736
(c) Market risk
Market risk is the risk of loss, in respect of the Group’s on and off-balance sheet activities, arising from adverse movements in market rates including interest rates, foreign exchange rates, commodity prices and stock prices. Market risk arises from both the Group’s trading and non-trading businesses.
The Group is primarily exposed to structural interest rate risk arising from commercial banking and position risk arising from treasury transactions. Interest rate risk is inherent in many of its businesses and largely arises from mismatches between the repricing dates of interest-generating assets and interest-bearing liabilities.
The Group’s currency risk mainly results from the risk arising from exchange rate fluctuations on its foreign exchange exposures. Foreign exchange exposures include the mismatch of foreign exchange assets and liabilities, and off-balance sheet foreign exchange positions arising from derivative transactions.
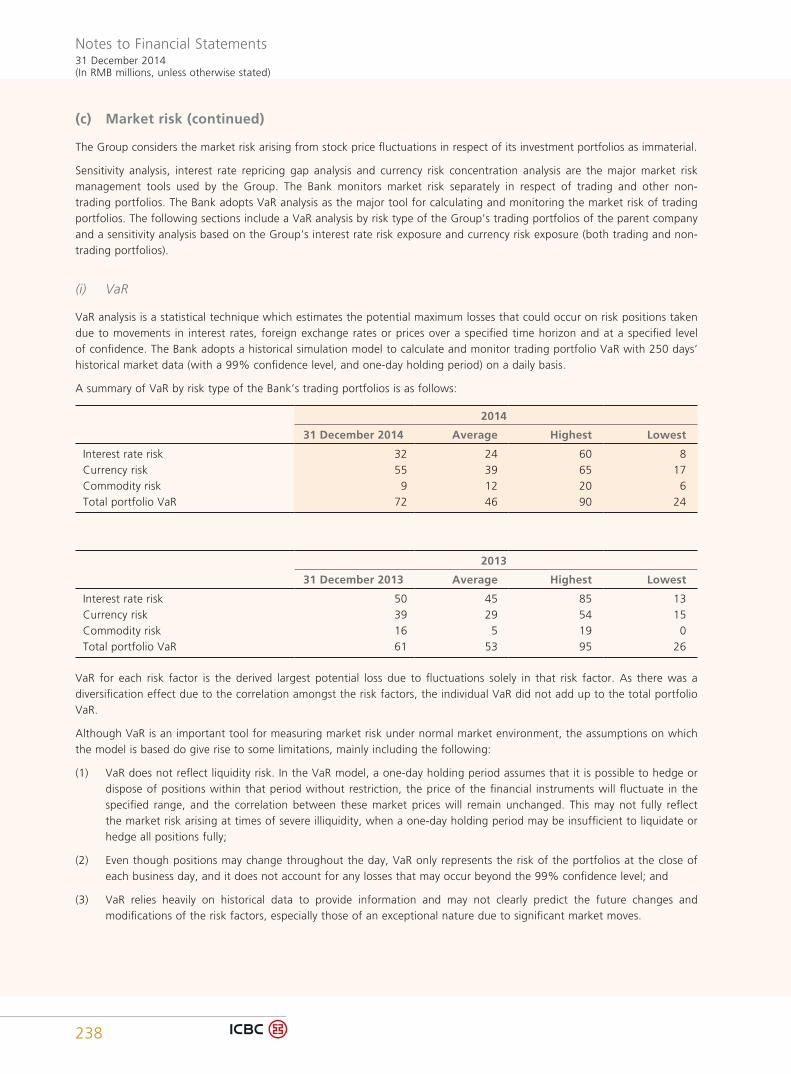
Notes to Financial Statements31 December 2014(In RMB millions, unless otherwise stated)
238
(c) Market risk (continued)
The Group considers the market risk arising from stock price fluctuations in respect of its investment portfolios as immaterial.
Sensitivity analysis, interest rate repricing gap analysis and currency risk concentration analysis are the major market risk management tools used by the Group. The Bank monitors market risk separately in respect of trading and other non-trading portfolios. The Bank adopts VaR analysis as the major tool for calculating and monitoring the market risk of trading portfolios. The following sections include a VaR analysis by risk type of the Group’s trading portfolios of the parent company and a sensitivity analysis based on the Group’s interest rate risk exposure and currency risk exposure (both trading and non-trading portfolios).
(i) VaR
VaR analysis is a statistical technique which estimates the potential maximum losses that could occur on risk positions taken due to movements in interest rates, foreign exchange rates or prices over a specified time horizon and at a specified level of confidence. The Bank adopts a historical simulation model to calculate and monitor trading portfolio VaR with 250 days’ historical market data (with a 99% confidence level, and one-day holding period) on a daily basis.
A summary of VaR by risk type of the Bank’s trading portfolios is as follows:
2014
31 December 2014 Average Highest Lowest
Interest rate risk 32 24 60 8Currency risk 55 39 65 17Commodity risk 9 12 20 6Total portfolio VaR 72 46 90 24
2013
31 December 2013 Average Highest Lowest
Interest rate risk 50 45 85 13Currency risk 39 29 54 15Commodity risk 16 5 19 0Total portfolio VaR 61 53 95 26
VaR for each risk factor is the derived largest potential loss due to fluctuations solely in that risk factor. As there was a diversification effect due to the correlation amongst the risk factors, the individual VaR did not add up to the total portfolio VaR.
Although VaR is an important tool for measuring market risk under normal market environment, the assumptions on which the model is based do give rise to some limitations, mainly including the following:
(1) VaR does not reflect liquidity risk. In the VaR model, a one-day holding period assumes that it is possible to hedge or dispose of positions within that period without restriction, the price of the financial instruments will fluctuate in the specified range, and the correlation between these market prices will remain unchanged. This may not fully reflect the market risk arising at times of severe illiquidity, when a one-day holding period may be insufficient to liquidate or hedge all positions fully;
(2) Even though positions may change throughout the day, VaR only represents the risk of the portfolios at the close of each business day, and it does not account for any losses that may occur beyond the 99% confidence level; and
(3) VaR relies heavily on historical data to provide information and may not clearly predict the future changes and modifications of the risk factors, especially those of an exceptional nature due to significant market moves.
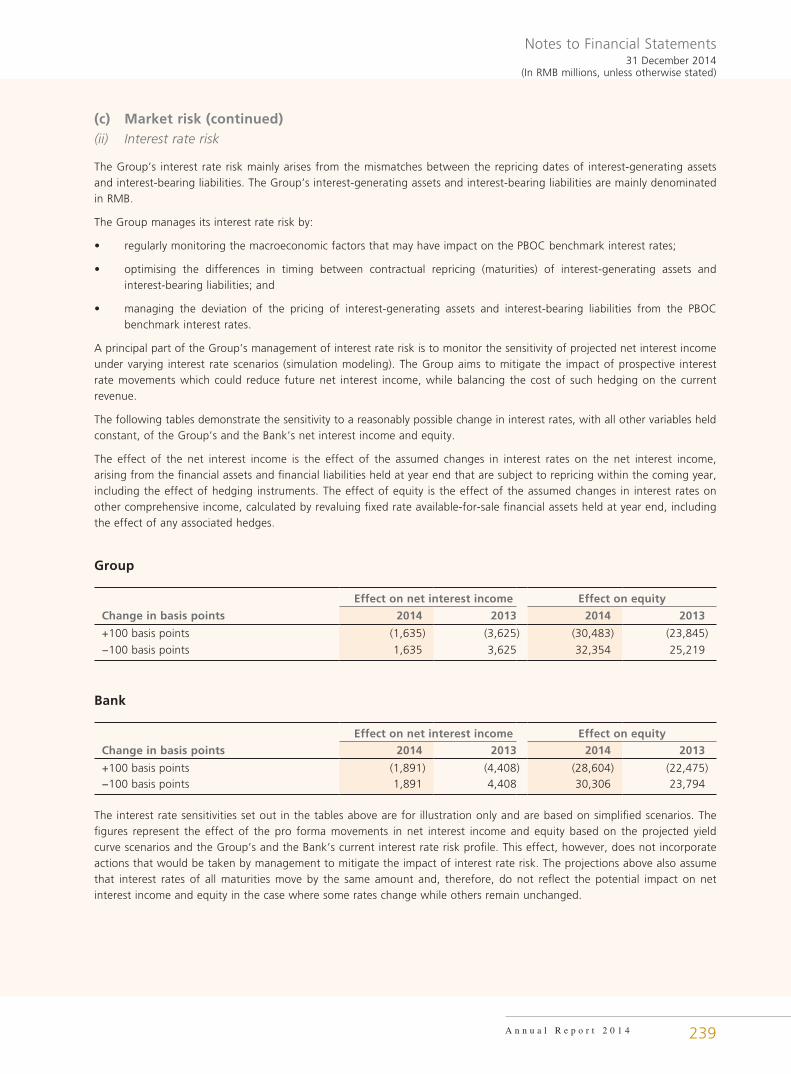
Notes to Financial Statements31 December 2014
(In RMB millions, unless otherwise stated)
A n n u a l R e p o r t 2 0 1 4 239
(c) Market risk (continued)(ii) Interest rate risk
The Group’s interest rate risk mainly arises from the mismatches between the repricing dates of interest-generating assets and interest-bearing liabilities. The Group’s interest-generating assets and interest-bearing liabilities are mainly denominated in RMB.
The Group manages its interest rate risk by:
• regularly monitoring the macroeconomic factors that may have impact on the PBOC benchmark interest rates;
• optimising the differences in timing between contractual repricing (maturities) of interest-generating assets and interest-bearing liabilities; and
• managing the deviation of the pricing of interest-generating assets and interest-bearing liabilities from the PBOC benchmark interest rates.
A principal part of the Group’s management of interest rate risk is to monitor the sensitivity of projected net interest income under varying interest rate scenarios (simulation modeling). The Group aims to mitigate the impact of prospective interest rate movements which could reduce future net interest income, while balancing the cost of such hedging on the current revenue.
The following tables demonstrate the sensitivity to a reasonably possible change in interest rates, with all other variables held constant, of the Group’s and the Bank’s net interest income and equity.
The effect of the net interest income is the effect of the assumed changes in interest rates on the net interest income, arising from the financial assets and financial liabilities held at year end that are subject to repricing within the coming year, including the effect of hedging instruments. The effect of equity is the effect of the assumed changes in interest rates on other comprehensive income, calculated by revaluing fixed rate available-for-sale financial assets held at year end, including the effect of any associated hedges.
Group
Effect on net interest income Effect on equity
Change in basis points 2014 2013 2014 2013
+100 basis points (1,635) (3,625) (30,483) (23,845)
−100 basis points 1,635 3,625 32,354 25,219
Bank
Effect on net interest income Effect on equity
Change in basis points 2014 2013 2014 2013
+100 basis points (1,891) (4,408) (28,604) (22,475)−100 basis points 1,891 4,408 30,306 23,794
The interest rate sensitivities set out in the tables above are for illustration only and are based on simplified scenarios. The figures represent the effect of the pro forma movements in net interest income and equity based on the projected yield curve scenarios and the Group’s and the Bank’s current interest rate risk profile. This effect, however, does not incorporate actions that would be taken by management to mitigate the impact of interest rate risk. The projections above also assume that interest rates of all maturities move by the same amount and, therefore, do not reflect the potential impact on net interest income and equity in the case where some rates change while others remain unchanged.
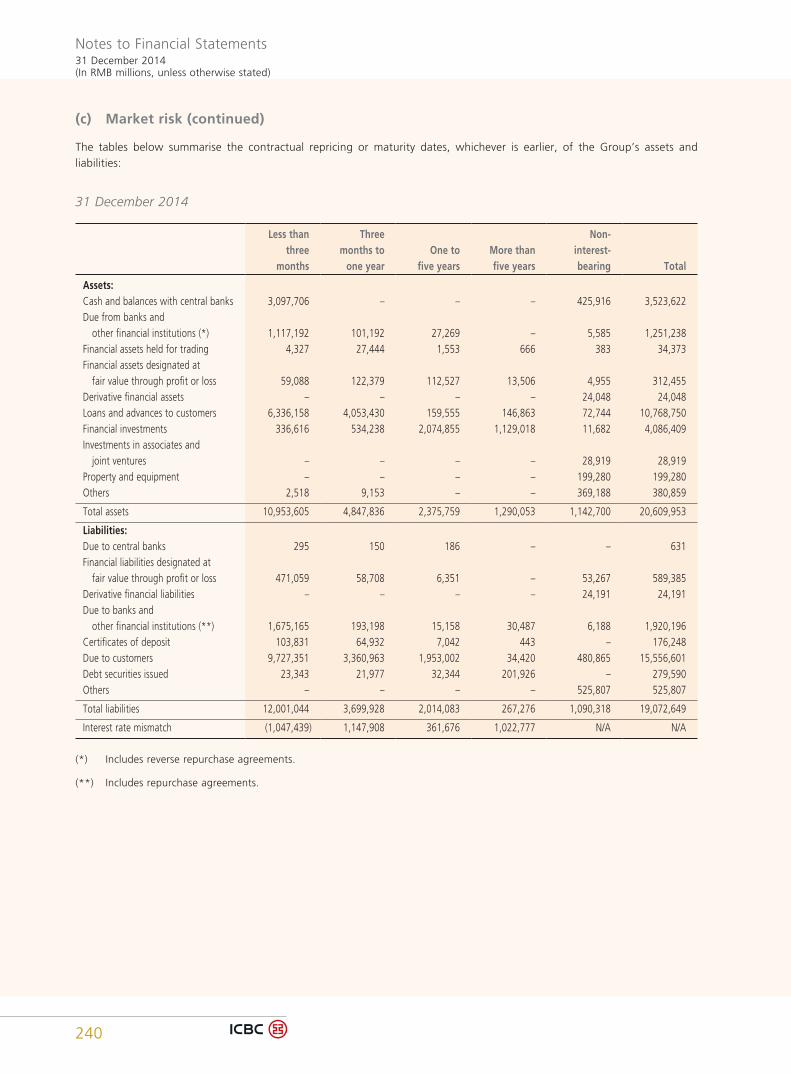
Notes to Financial Statements31 December 2014(In RMB millions, unless otherwise stated)
240
(c) Market risk (continued)
The tables below summarise the contractual repricing or maturity dates, whichever is earlier, of the Group’s assets and liabilities:
31 December 2014
Less than three
months
Three months to
one yearOne to
five yearsMore than five years
Non- interest- bearing Total
Assets:Cash and balances with central banks 3,097,706 – – – 425,916 3,523,622Due from banks and other financial institutions (*) 1,117,192 101,192 27,269 – 5,585 1,251,238Financial assets held for trading 4,327 27,444 1,553 666 383 34,373Financial assets designated at fair value through profit or loss 59,088 122,379 112,527 13,506 4,955 312,455Derivative financial assets – – – – 24,048 24,048Loans and advances to customers 6,336,158 4,053,430 159,555 146,863 72,744 10,768,750Financial investments 336,616 534,238 2,074,855 1,129,018 11,682 4,086,409Investments in associates and joint ventures – – – – 28,919 28,919Property and equipment – – – – 199,280 199,280Others 2,518 9,153 – – 369,188 380,859
Total assets 10,953,605 4,847,836 2,375,759 1,290,053 1,142,700 20,609,953
Liabilities:Due to central banks 295 150 186 – – 631Financial liabilities designated at fair value through profit or loss 471,059 58,708 6,351 – 53,267 589,385Derivative financial liabilities – – – – 24,191 24,191Due to banks and other financial institutions (**) 1,675,165 193,198 15,158 30,487 6,188 1,920,196Certificates of deposit 103,831 64,932 7,042 443 – 176,248Due to customers 9,727,351 3,360,963 1,953,002 34,420 480,865 15,556,601Debt securities issued 23,343 21,977 32,344 201,926 – 279,590Others – – – – 525,807 525,807
Total liabilities 12,001,044 3,699,928 2,014,083 267,276 1,090,318 19,072,649
Interest rate mismatch (1,047,439) 1,147,908 361,676 1,022,777 N/A N/A
(*) Includes reverse repurchase agreements.
(**) Includes repurchase agreements.

Notes to Financial Statements31 December 2014
(In RMB millions, unless otherwise stated)
A n n u a l R e p o r t 2 0 1 4 241
(c) Market risk (continued)31 December 2013
Less than three
months
Three months to
one yearOne to
five yearsMore than five years
Non- interest- bearing Total
Assets:Cash and balances with central banks 2,925,637 – – – 368,370 3,294,007Due from banks and other financial institutions (*) 904,190 112,495 12,998 3,133 17,071 1,049,887Financial assets held for trading 8,599 18,442 597 170 335 28,143Financial assets designated at fair value through profit or loss 94,699 26,644 206,352 6,984 9,734 344,413Derivative financial assets – – – – 25,020 25,020Loans and advances to customers 5,948,681 3,447,561 96,671 146,208 42,294 9,681,415Financial investments 327,092 623,507 1,810,986 1,181,841 6,262 3,949,688Investments in associates and joint ventures – – – – 28,515 28,515Property and equipment – – – – 164,347 164,347Others 32,904 1,449 28 6 317,930 352,317
Total assets 10,241,802 4,230,098 2,127,632 1,338,342 979,878 18,917,752
Liabilities:Due to central banks 51 50 623 – – 724Financial liabilities designated at fair value through profit or loss 490,989 1,279 1,812 – 59,527 553,607Derivative financial liabilities – – – – 19,168 19,168Due to banks and other financial institutions (**) 1,380,493 173,563 9,543 2,211 2,749 1,568,559Certificates of deposit 68,931 51,353 10,274 – – 130,558Due to customers 9,380,482 3,237,299 1,607,592 54,442 341,010 14,620,825Debt securities issued 27,632 11,483 24,195 189,708 – 253,018Others – – – – 492,830 492,830
Total liabilities 11,348,578 3,475,027 1,654,039 246,361 915,284 17,639,289
Interest rate mismatch (1,106,776) 755,071 473,593 1,091,981 N/A N/A
(*) Includes reverse repurchase agreements.
(**) Includes repurchase agreements.
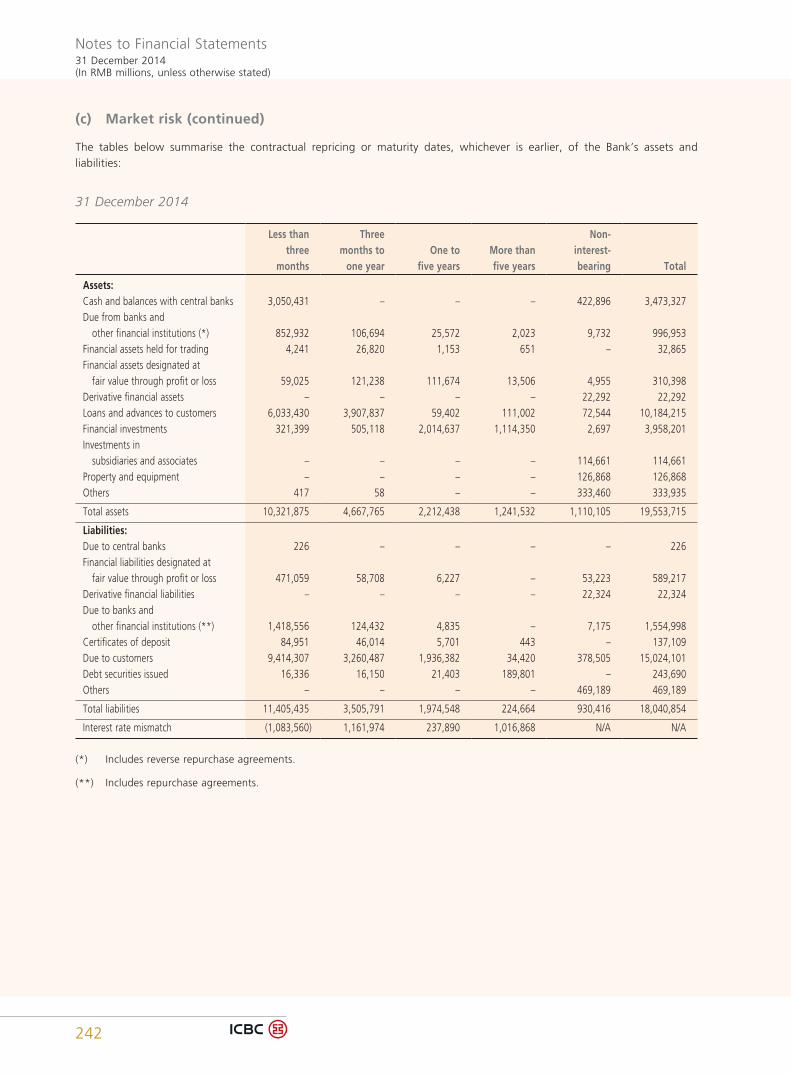
Notes to Financial Statements31 December 2014(In RMB millions, unless otherwise stated)
242
(c) Market risk (continued)
The tables below summarise the contractual repricing or maturity dates, whichever is earlier, of the Bank’s assets and liabilities:
31 December 2014
Less than three
months
Three months to
one yearOne to
five yearsMore than five years
Non- interest- bearing Total
Assets:Cash and balances with central banks 3,050,431 – – – 422,896 3,473,327Due from banks and other financial institutions (*) 852,932 106,694 25,572 2,023 9,732 996,953Financial assets held for trading 4,241 26,820 1,153 651 – 32,865Financial assets designated at fair value through profit or loss 59,025 121,238 111,674 13,506 4,955 310,398Derivative financial assets – – – – 22,292 22,292Loans and advances to customers 6,033,430 3,907,837 59,402 111,002 72,544 10,184,215Financial investments 321,399 505,118 2,014,637 1,114,350 2,697 3,958,201Investments in subsidiaries and associates – – – – 114,661 114,661Property and equipment – – – – 126,868 126,868Others 417 58 – – 333,460 333,935
Total assets 10,321,875 4,667,765 2,212,438 1,241,532 1,110,105 19,553,715
Liabilities:Due to central banks 226 – – – – 226Financial liabilities designated at fair value through profit or loss 471,059 58,708 6,227 – 53,223 589,217Derivative financial liabilities – – – – 22,324 22,324Due to banks and other financial institutions (**) 1,418,556 124,432 4,835 – 7,175 1,554,998Certificates of deposit 84,951 46,014 5,701 443 – 137,109Due to customers 9,414,307 3,260,487 1,936,382 34,420 378,505 15,024,101Debt securities issued 16,336 16,150 21,403 189,801 – 243,690Others – – – – 469,189 469,189
Total liabilities 11,405,435 3,505,791 1,974,548 224,664 930,416 18,040,854
Interest rate mismatch (1,083,560) 1,161,974 237,890 1,016,868 N/A N/A
(*) Includes reverse repurchase agreements.
(**) Includes repurchase agreements.
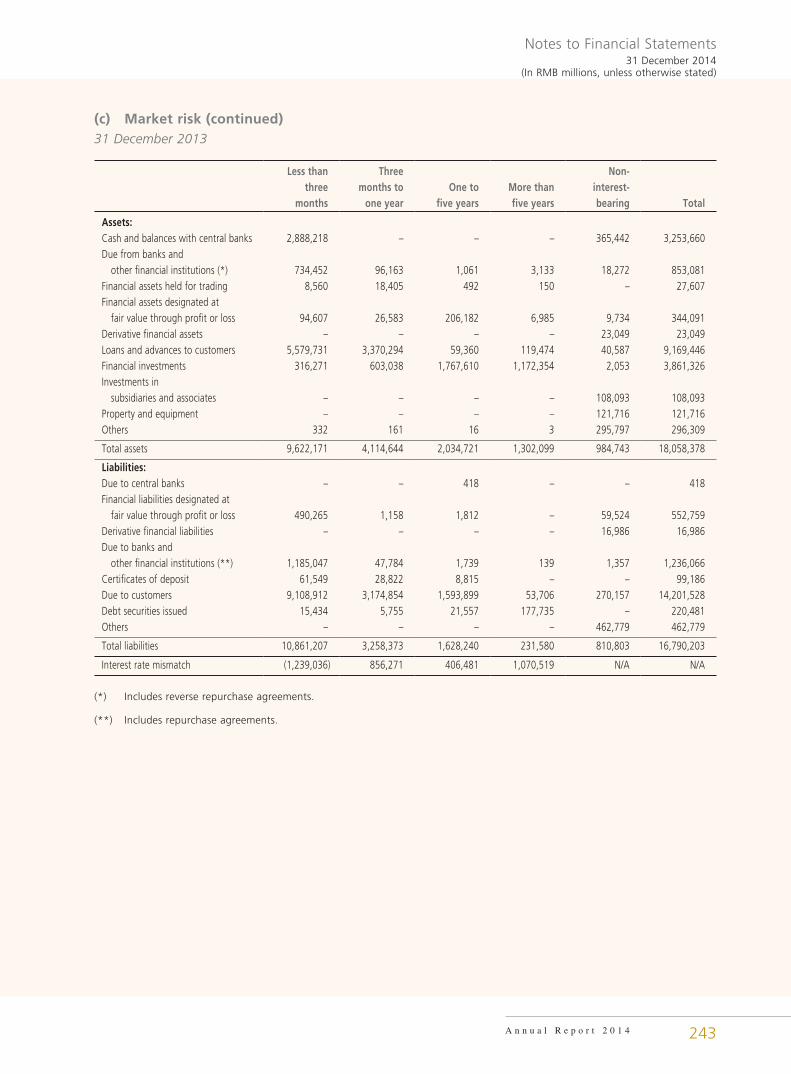
Notes to Financial Statements31 December 2014
(In RMB millions, unless otherwise stated)
A n n u a l R e p o r t 2 0 1 4 243
(c) Market risk (continued)31 December 2013
Less than three
months
Three months to
one yearOne to
five yearsMore than five years
Non- interest- bearing Total
Assets:Cash and balances with central banks 2,888,218 – – – 365,442 3,253,660Due from banks and other financial institutions (*) 734,452 96,163 1,061 3,133 18,272 853,081Financial assets held for trading 8,560 18,405 492 150 – 27,607Financial assets designated at fair value through profit or loss 94,607 26,583 206,182 6,985 9,734 344,091Derivative financial assets – – – – 23,049 23,049Loans and advances to customers 5,579,731 3,370,294 59,360 119,474 40,587 9,169,446Financial investments 316,271 603,038 1,767,610 1,172,354 2,053 3,861,326Investments in subsidiaries and associates – – – – 108,093 108,093Property and equipment – – – – 121,716 121,716Others 332 161 16 3 295,797 296,309
Total assets 9,622,171 4,114,644 2,034,721 1,302,099 984,743 18,058,378
Liabilities:Due to central banks – – 418 – – 418Financial liabilities designated at fair value through profit or loss 490,265 1,158 1,812 – 59,524 552,759Derivative financial liabilities – – – – 16,986 16,986Due to banks and other financial institutions (**) 1,185,047 47,784 1,739 139 1,357 1,236,066Certificates of deposit 61,549 28,822 8,815 – – 99,186Due to customers 9,108,912 3,174,854 1,593,899 53,706 270,157 14,201,528Debt securities issued 15,434 5,755 21,557 177,735 – 220,481Others – – – – 462,779 462,779
Total liabilities 10,861,207 3,258,373 1,628,240 231,580 810,803 16,790,203
Interest rate mismatch (1,239,036) 856,271 406,481 1,070,519 N/A N/A
(*) Includes reverse repurchase agreements.
(**) Includes repurchase agreements.
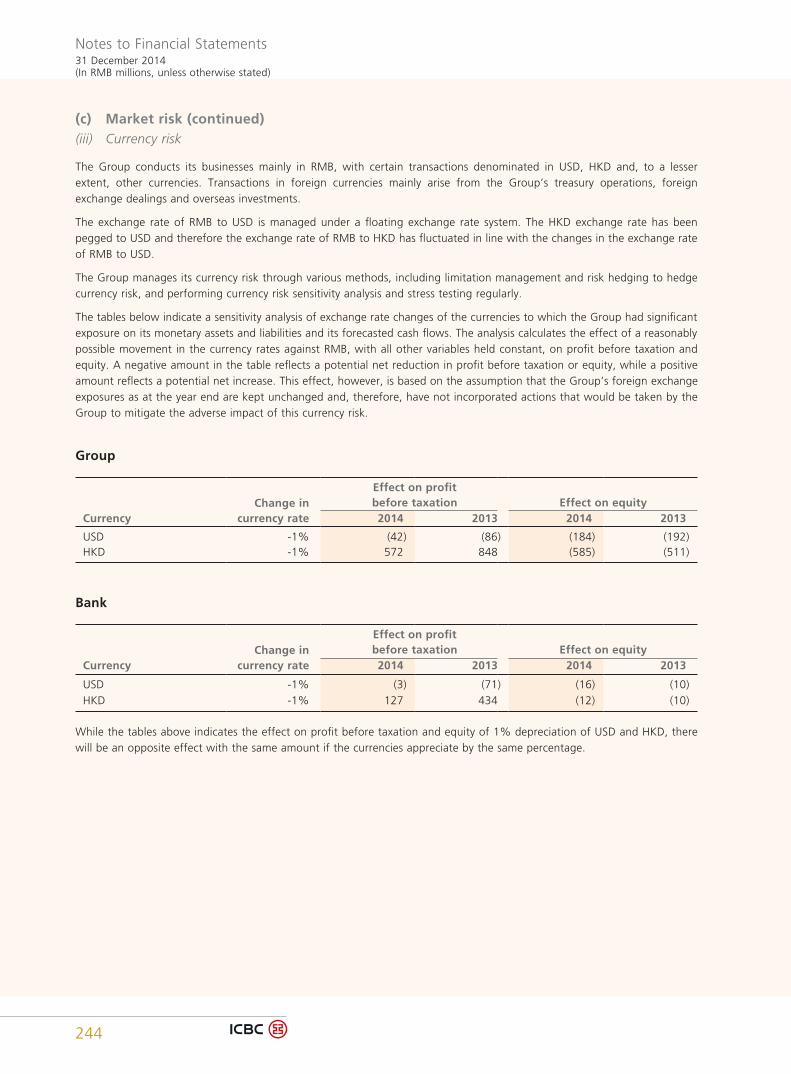
Notes to Financial Statements31 December 2014(In RMB millions, unless otherwise stated)
244
(c) Market risk (continued)(iii) Currency risk
The Group conducts its businesses mainly in RMB, with certain transactions denominated in USD, HKD and, to a lesser extent, other currencies. Transactions in foreign currencies mainly arise from the Group’s treasury operations, foreign exchange dealings and overseas investments.
The exchange rate of RMB to USD is managed under a floating exchange rate system. The HKD exchange rate has been pegged to USD and therefore the exchange rate of RMB to HKD has fluctuated in line with the changes in the exchange rate of RMB to USD.
The Group manages its currency risk through various methods, including limitation management and risk hedging to hedge currency risk, and performing currency risk sensitivity analysis and stress testing regularly.
The tables below indicate a sensitivity analysis of exchange rate changes of the currencies to which the Group had significant exposure on its monetary assets and liabilities and its forecasted cash flows. The analysis calculates the effect of a reasonably possible movement in the currency rates against RMB, with all other variables held constant, on profit before taxation and equity. A negative amount in the table reflects a potential net reduction in profit before taxation or equity, while a positive amount reflects a potential net increase. This effect, however, is based on the assumption that the Group’s foreign exchange exposures as at the year end are kept unchanged and, therefore, have not incorporated actions that would be taken by the Group to mitigate the adverse impact of this currency risk.
Group
CurrencyChange in
currency rate
Effect on profit before taxation Effect on equity2014 2013 2014 2013
USD -1% (42) (86) (184) (192)HKD -1% 572 848 (585) (511)
Bank
CurrencyChange in
currency rate
Effect on profit before taxation Effect on equity2014 2013 2014 2013
USD -1% (3) (71) (16) (10)HKD -1% 127 434 (12) (10)
While the tables above indicates the effect on profit before taxation and equity of 1% depreciation of USD and HKD, there will be an opposite effect with the same amount if the currencies appreciate by the same percentage.
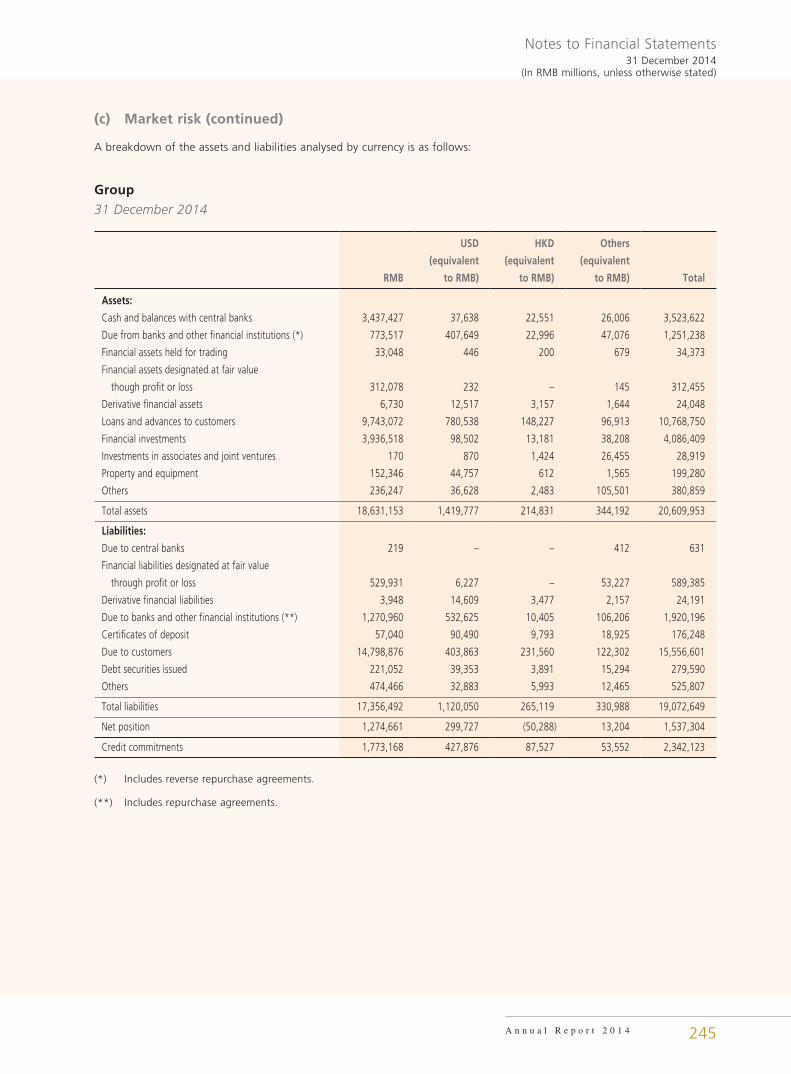
Notes to Financial Statements31 December 2014
(In RMB millions, unless otherwise stated)
A n n u a l R e p o r t 2 0 1 4 245
(c) Market risk (continued)
A breakdown of the assets and liabilities analysed by currency is as follows:
Group
31 December 2014
USD HKD Others
RMB
(equivalent
to RMB)
(equivalent
to RMB)
(equivalent
to RMB) Total
Assets:
Cash and balances with central banks 3,437,427 37,638 22,551 26,006 3,523,622
Due from banks and other financial institutions (*) 773,517 407,649 22,996 47,076 1,251,238
Financial assets held for trading 33,048 446 200 679 34,373
Financial assets designated at fair value
though profit or loss 312,078 232 – 145 312,455
Derivative financial assets 6,730 12,517 3,157 1,644 24,048
Loans and advances to customers 9,743,072 780,538 148,227 96,913 10,768,750
Financial investments 3,936,518 98,502 13,181 38,208 4,086,409
Investments in associates and joint ventures 170 870 1,424 26,455 28,919
Property and equipment 152,346 44,757 612 1,565 199,280
Others 236,247 36,628 2,483 105,501 380,859
Total assets 18,631,153 1,419,777 214,831 344,192 20,609,953
Liabilities:
Due to central banks 219 – – 412 631
Financial liabilities designated at fair value
through profit or loss 529,931 6,227 – 53,227 589,385
Derivative financial liabilities 3,948 14,609 3,477 2,157 24,191
Due to banks and other financial institutions (**) 1,270,960 532,625 10,405 106,206 1,920,196
Certificates of deposit 57,040 90,490 9,793 18,925 176,248
Due to customers 14,798,876 403,863 231,560 122,302 15,556,601
Debt securities issued 221,052 39,353 3,891 15,294 279,590
Others 474,466 32,883 5,993 12,465 525,807
Total liabilities 17,356,492 1,120,050 265,119 330,988 19,072,649
Net position 1,274,661 299,727 (50,288) 13,204 1,537,304
Credit commitments 1,773,168 427,876 87,527 53,552 2,342,123
(*) Includes reverse repurchase agreements.
(**) Includes repurchase agreements.
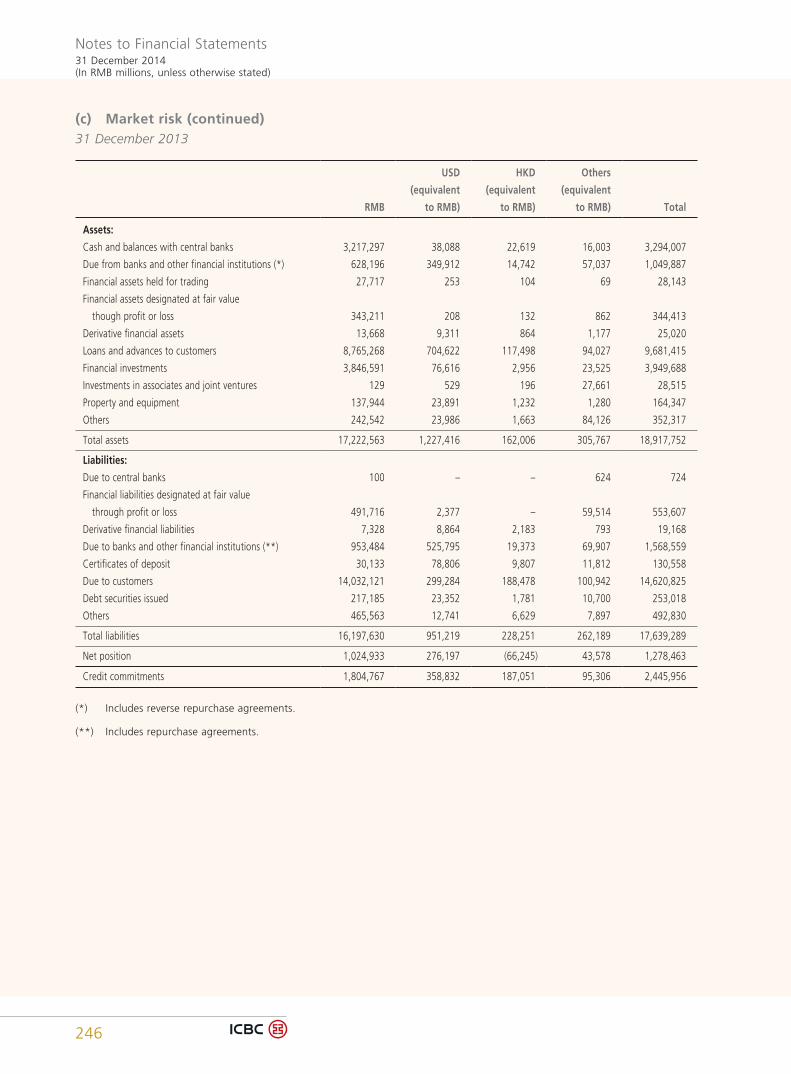
Notes to Financial Statements31 December 2014(In RMB millions, unless otherwise stated)
246
(c) Market risk (continued)31 December 2013
USD HKD Others
RMB
(equivalent
to RMB)
(equivalent
to RMB)
(equivalent
to RMB) Total
Assets:
Cash and balances with central banks 3,217,297 38,088 22,619 16,003 3,294,007
Due from banks and other financial institutions (*) 628,196 349,912 14,742 57,037 1,049,887
Financial assets held for trading 27,717 253 104 69 28,143
Financial assets designated at fair value
though profit or loss 343,211 208 132 862 344,413
Derivative financial assets 13,668 9,311 864 1,177 25,020
Loans and advances to customers 8,765,268 704,622 117,498 94,027 9,681,415
Financial investments 3,846,591 76,616 2,956 23,525 3,949,688
Investments in associates and joint ventures 129 529 196 27,661 28,515
Property and equipment 137,944 23,891 1,232 1,280 164,347
Others 242,542 23,986 1,663 84,126 352,317
Total assets 17,222,563 1,227,416 162,006 305,767 18,917,752
Liabilities:
Due to central banks 100 – – 624 724
Financial liabilities designated at fair value
through profit or loss 491,716 2,377 – 59,514 553,607
Derivative financial liabilities 7,328 8,864 2,183 793 19,168
Due to banks and other financial institutions (**) 953,484 525,795 19,373 69,907 1,568,559
Certificates of deposit 30,133 78,806 9,807 11,812 130,558
Due to customers 14,032,121 299,284 188,478 100,942 14,620,825
Debt securities issued 217,185 23,352 1,781 10,700 253,018
Others 465,563 12,741 6,629 7,897 492,830
Total liabilities 16,197,630 951,219 228,251 262,189 17,639,289
Net position 1,024,933 276,197 (66,245) 43,578 1,278,463
Credit commitments 1,804,767 358,832 187,051 95,306 2,445,956
(*) Includes reverse repurchase agreements.
(**) Includes repurchase agreements.
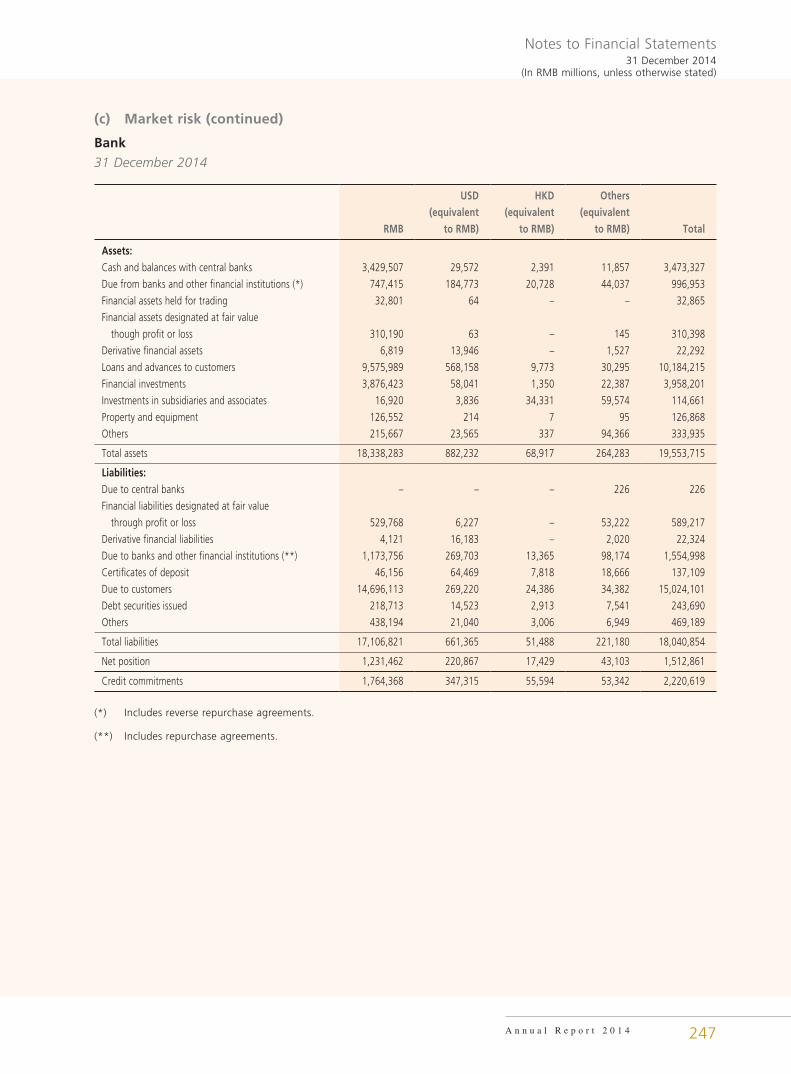
Notes to Financial Statements31 December 2014
(In RMB millions, unless otherwise stated)
A n n u a l R e p o r t 2 0 1 4 247
(c) Market risk (continued)
Bank
31 December 2014
USD HKD Others
RMB(equivalent
to RMB)(equivalent
to RMB)(equivalent
to RMB) Total
Assets:Cash and balances with central banks 3,429,507 29,572 2,391 11,857 3,473,327
Due from banks and other financial institutions (*) 747,415 184,773 20,728 44,037 996,953
Financial assets held for trading 32,801 64 – – 32,865
Financial assets designated at fair value
though profit or loss 310,190 63 – 145 310,398
Derivative financial assets 6,819 13,946 – 1,527 22,292
Loans and advances to customers 9,575,989 568,158 9,773 30,295 10,184,215
Financial investments 3,876,423 58,041 1,350 22,387 3,958,201
Investments in subsidiaries and associates 16,920 3,836 34,331 59,574 114,661
Property and equipment 126,552 214 7 95 126,868
Others 215,667 23,565 337 94,366 333,935
Total assets 18,338,283 882,232 68,917 264,283 19,553,715
Liabilities:Due to central banks – – – 226 226
Financial liabilities designated at fair value
through profit or loss 529,768 6,227 – 53,222 589,217
Derivative financial liabilities 4,121 16,183 – 2,020 22,324
Due to banks and other financial institutions (**) 1,173,756 269,703 13,365 98,174 1,554,998
Certificates of deposit 46,156 64,469 7,818 18,666 137,109
Due to customers 14,696,113 269,220 24,386 34,382 15,024,101
Debt securities issued 218,713 14,523 2,913 7,541 243,690
Others 438,194 21,040 3,006 6,949 469,189
Total liabilities 17,106,821 661,365 51,488 221,180 18,040,854
Net position 1,231,462 220,867 17,429 43,103 1,512,861
Credit commitments 1,764,368 347,315 55,594 53,342 2,220,619
(*) Includes reverse repurchase agreements.
(**) Includes repurchase agreements.
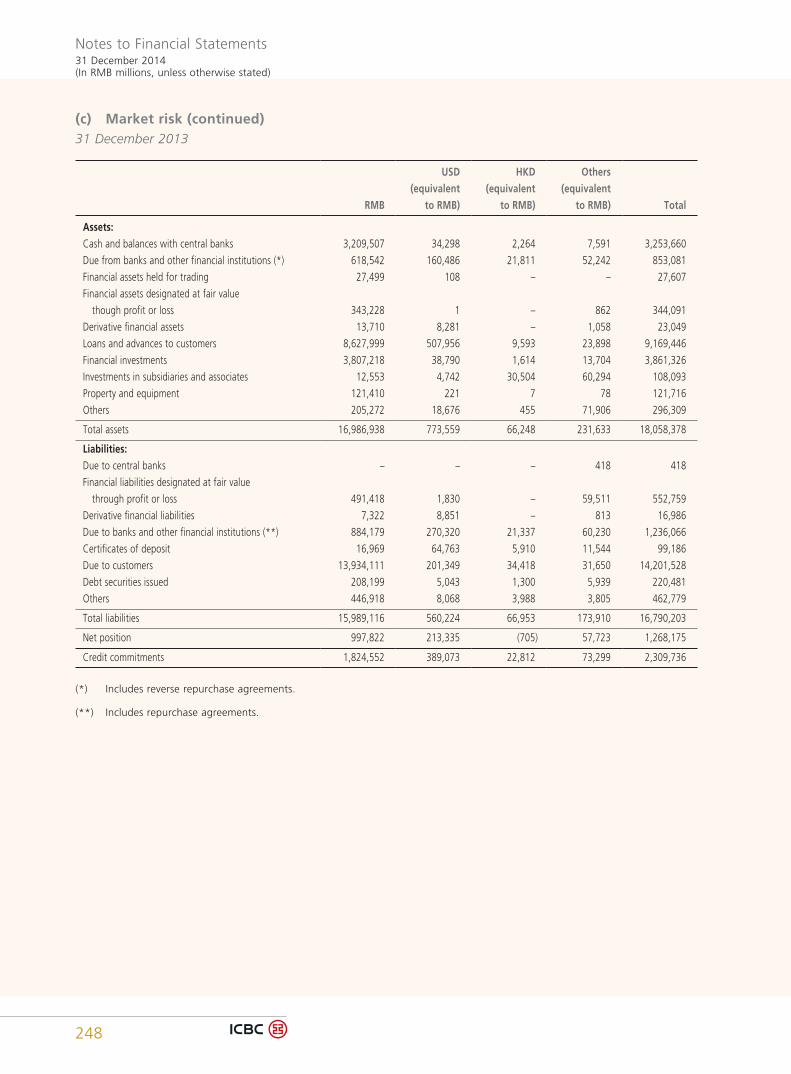
Notes to Financial Statements31 December 2014(In RMB millions, unless otherwise stated)
248
(c) Market risk (continued)31 December 2013
USD HKD Others
RMB(equivalent
to RMB)(equivalent
to RMB)(equivalent
to RMB) Total
Assets:Cash and balances with central banks 3,209,507 34,298 2,264 7,591 3,253,660
Due from banks and other financial institutions (*) 618,542 160,486 21,811 52,242 853,081
Financial assets held for trading 27,499 108 – – 27,607
Financial assets designated at fair value
though profit or loss 343,228 1 – 862 344,091
Derivative financial assets 13,710 8,281 – 1,058 23,049
Loans and advances to customers 8,627,999 507,956 9,593 23,898 9,169,446
Financial investments 3,807,218 38,790 1,614 13,704 3,861,326
Investments in subsidiaries and associates 12,553 4,742 30,504 60,294 108,093
Property and equipment 121,410 221 7 78 121,716
Others 205,272 18,676 455 71,906 296,309
Total assets 16,986,938 773,559 66,248 231,633 18,058,378
Liabilities:Due to central banks – – – 418 418
Financial liabilities designated at fair value
through profit or loss 491,418 1,830 – 59,511 552,759
Derivative financial liabilities 7,322 8,851 – 813 16,986
Due to banks and other financial institutions (**) 884,179 270,320 21,337 60,230 1,236,066
Certificates of deposit 16,969 64,763 5,910 11,544 99,186
Due to customers 13,934,111 201,349 34,418 31,650 14,201,528
Debt securities issued 208,199 5,043 1,300 5,939 220,481
Others 446,918 8,068 3,988 3,805 462,779
Total liabilities 15,989,116 560,224 66,953 173,910 16,790,203
Net position 997,822 213,335 (705) 57,723 1,268,175
Credit commitments 1,824,552 389,073 22,812 73,299 2,309,736
(*) Includes reverse repurchase agreements.
(**) Includes repurchase agreements.
Notes to Financial Statements31 December 2014
(In RMB millions, unless otherwise stated)
A n n u a l R e p o r t 2 0 1 4 249
(d) Capital management
The Group’s objectives on capital management are:
• Maintain reasonable capital adequacy ratio to continuously meet regulatory requirements on capital. Keeping stable capital base to ensure the Group’s business growth and the implementation of business development and strategic plan in order to achieve comprehensive, coordinated and sustainable development;
• Adopt the advanced measurement approaches, improve the internal capital adequacy assessment process (ICAAP), disclose information on capital management, cover all types of risks, and ensure the stable operation of the Group;
• Integrated the quantified results of various risks into daily management, establish a bank value management system with economic capital as the core tool, improve the policy, process and application management system, strengthen the capital constraint and incentive mechanism, enhance the product pricing and decision-making capabilities, and improve the capital allocation efficiency; and
• Make reasonable use of various capital instruments, continuously enhance capital strengths, refine capital structure, improve capital quality, reduce capital cost, and maximize shareholder returns.
The Group manages its capital structure and makes adjustments in light of changes in economic conditions and the risk profile of its activities. In order to maintain or adjust the capital structure, the Group may adjust its profit distribution policy, issue or repurchase own shares, other tier 1 capital instruments, qualifying tier 2 capital instruments and convertible bonds, etc.
The Group’s Management monitors the capital adequacy and the use of regulatory capital regularly based on regulations issued by the CBRC. The required information is respectively filed with the CBRC by the Group and the Bank semi-annually and quarterly.
From 1 January 2013, the Group commenced to calculate the capital adequacy ratios in accordance with Regulation Governing Capital of Commercial Banks (Provisional) and other relevant regulations promulgated by the CBRC. In April 2014, CBRC officially approved the Bank to adopt advanced capital management approaches. Within the scope of the approval, the foundation internal ratings-based (IRB) approach is adopted to corporate credit risk, the IRB approach to retail credit risk, the internal model approach (IMA) to market risk, and the standardized approach to operational risk meeting regulatory requirements.
The CBRC requires commercial banks to meet the requirements of capital adequacy ratios by the end of 2018 in accordance with Regulation Governing Capital of Commercial Banks (Provisional). For systemically important banks, CBRC requires minimum core tier 1 capital adequacy ratio, tier 1 capital adequacy ratio and capital adequacy ratio of 8.50%, 9.50% and 11.50%, respectively. For non-systemically important banks, CBRC requires corresponding minimum ratios of 7.50%, 8.50% and 10.50%, respectively. In addition, overseas entities are directly regulated by local banking regulatory commissions, and the requirements of capital adequacy ratios differ by countries.
The Group calculates the following core tier 1 capital adequacy ratio, tier 1 capital adequacy ratio and capital adequacy ratio in accordance with Regulation Governing Capital of Commercial Banks (Provisional) and relevant requirements promulgated by the CBRC. The requirements pursuant to these regulations may have certain differences comparing to those applicable in Hong Kong and other jurisdictions.
The capital adequacy ratios and related components of the Group are calculated in accordance with the statutory financial statements of the Group prepared under PRC GAAP. During the year, the Group has complied in full with all its externally imposed capital requirements.
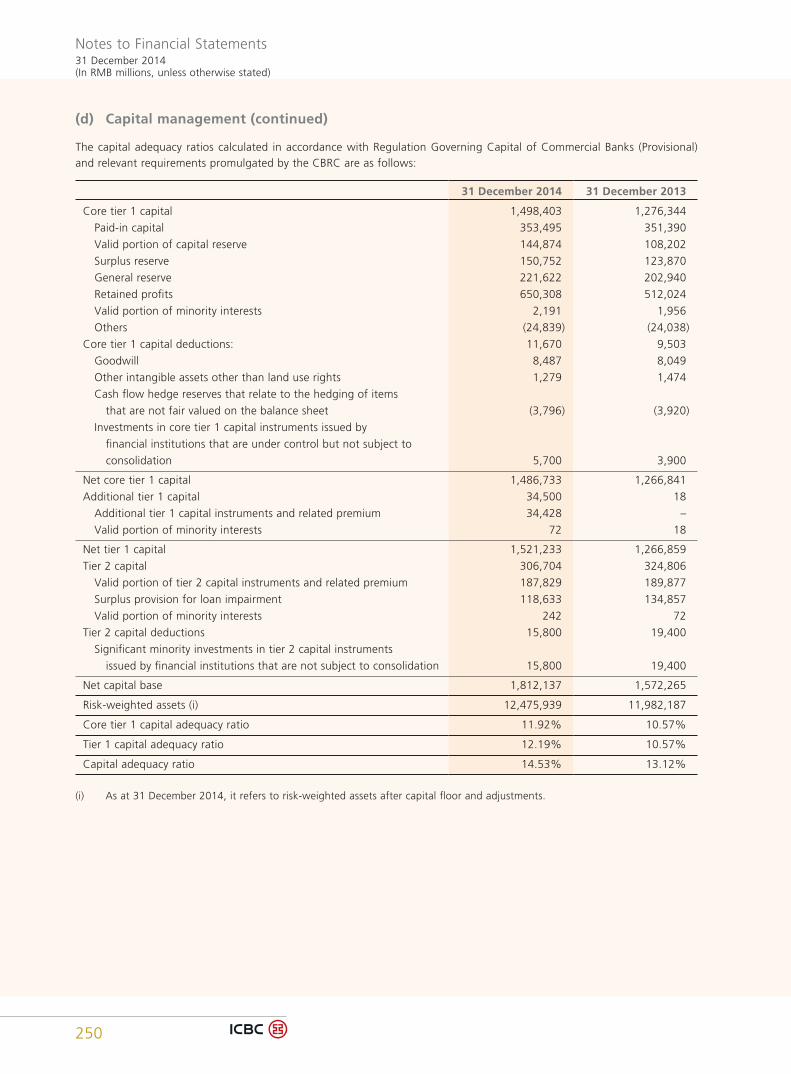
Notes to Financial Statements31 December 2014(In RMB millions, unless otherwise stated)
250
(d) Capital management (continued)
The capital adequacy ratios calculated in accordance with Regulation Governing Capital of Commercial Banks (Provisional) and relevant requirements promulgated by the CBRC are as follows:
31 December 2014 31 December 2013
Core tier 1 capital 1,498,403 1,276,344
Paid-in capital 353,495 351,390
Valid portion of capital reserve 144,874 108,202
Surplus reserve 150,752 123,870
General reserve 221,622 202,940
Retained profits 650,308 512,024
Valid portion of minority interests 2,191 1,956
Others (24,839) (24,038)
Core tier 1 capital deductions: 11,670 9,503
Goodwill 8,487 8,049
Other intangible assets other than land use rights 1,279 1,474
Cash flow hedge reserves that relate to the hedging of items
that are not fair valued on the balance sheet (3,796) (3,920)
Investments in core tier 1 capital instruments issued by
financial institutions that are under control but not subject to
consolidation 5,700 3,900
Net core tier 1 capital 1,486,733 1,266,841
Additional tier 1 capital 34,500 18
Additional tier 1 capital instruments and related premium 34,428 –
Valid portion of minority interests 72 18
Net tier 1 capital 1,521,233 1,266,859
Tier 2 capital 306,704 324,806
Valid portion of tier 2 capital instruments and related premium 187,829 189,877
Surplus provision for loan impairment 118,633 134,857
Valid portion of minority interests 242 72
Tier 2 capital deductions 15,800 19,400
Significant minority investments in tier 2 capital instruments
issued by financial institutions that are not subject to consolidation 15,800 19,400
Net capital base 1,812,137 1,572,265
Risk-weighted assets (i) 12,475,939 11,982,187
Core tier 1 capital adequacy ratio 11.92% 10.57%
Tier 1 capital adequacy ratio 12.19% 10.57%
Capital adequacy ratio 14.53% 13.12%
(i) As at 31 December 2014, it refers to risk-weighted assets after capital floor and adjustments.
Notes to Financial Statements31 December 2014
(In RMB millions, unless otherwise stated)
A n n u a l R e p o r t 2 0 1 4 251
55. FAIR VALUE OF FINANCIAL INSTRUMENTS
Fair value estimates are generally subjective in nature, and are made as of a specific point in time based on the characteristics of the financial instruments and relevant market information. The Group uses the following hierarchy for determining and disclosing the fair value of financial instruments:
Level 1: quoted (unadjusted) prices in active markets for identical assets or liabilities;
Level 2: techniques for which all inputs which have a significant effect on the recorded fair value are observable, either directly or indirectly; and
Level 3: techniques which use inputs which have a significant effect on the recorded fair value that are not based on observable market data.
The Group has established policies and internal controls with respect to the measurement of fair values, specify the framework of fair value measurement of financial instrument, fair value measurement methodologies and procedures. Fair value measurement policies specify valuation techniques, parameter selection and relevant concepts, models and parameter solutions. Operating procedures specify measurement operating procedures, valuation date, market parameter selection and corresponding allocation of responsibilities. In the process of fair value measurement, front office is responsible for daily transactions management. Financial Accounting Department plays a lead role of developing accounting policies of fair value measurement, valuation methodologies and system implementation. Risk Management Department is responsible for verifying trade details and valuation models.
The following is a description of the fair value of the financial instruments recorded at fair value which are determined using valuation techniques. These incorporate the Group’s estimate of assumptions that a market participant would make when valuing the instruments.
Financial investments
Financial investments valued using valuation techniques consist of debt securities and asset-backed securities. The Group values such securities in use of a discounted cash flow analysis which incorporates either only observable data or both observable and non-observable data. Observable inputs include assumptions regarding current interest rates; unobservable inputs include assumptions regarding expected future default rates, prepayment rates and market liquidity discounts.
A majority of the debt securities classified as level 2 are RMB bonds. The fair value of these bonds are determined based on the valuation results provided by China Central Depository & Clearing Co., Ltd., which are determined based on a valuation technique for which all significant inputs are observable market data.
Derivatives
Derivatives valued using a valuation technique with market observable inputs are mainly interest rate swaps, foreign exchange forwards, swaps and options, etc. The most frequently applied valuation techniques include discounted cash flow model and Black-Scholes model. The models incorporate various inputs including foreign exchange spot and forward rates, foreign exchange rate volatility, interest rate yield curves, etc.
Structured products are mainly valued using dealer’s quotations.
Other liabilities designated at fair value through profit or loss
For unquoted other liabilities designated at fair value through profit or loss, discounted cash flow model is used based on current yield curve appropriate for the remaining term to maturity adjusted for market liquidity and credit spreads; and Heston model is applied based on yield curves, foreign exchange forward rates, foreign exchange rate volatilities, etc., which is calibrated by active market quotes of standard European options with the same underlying.
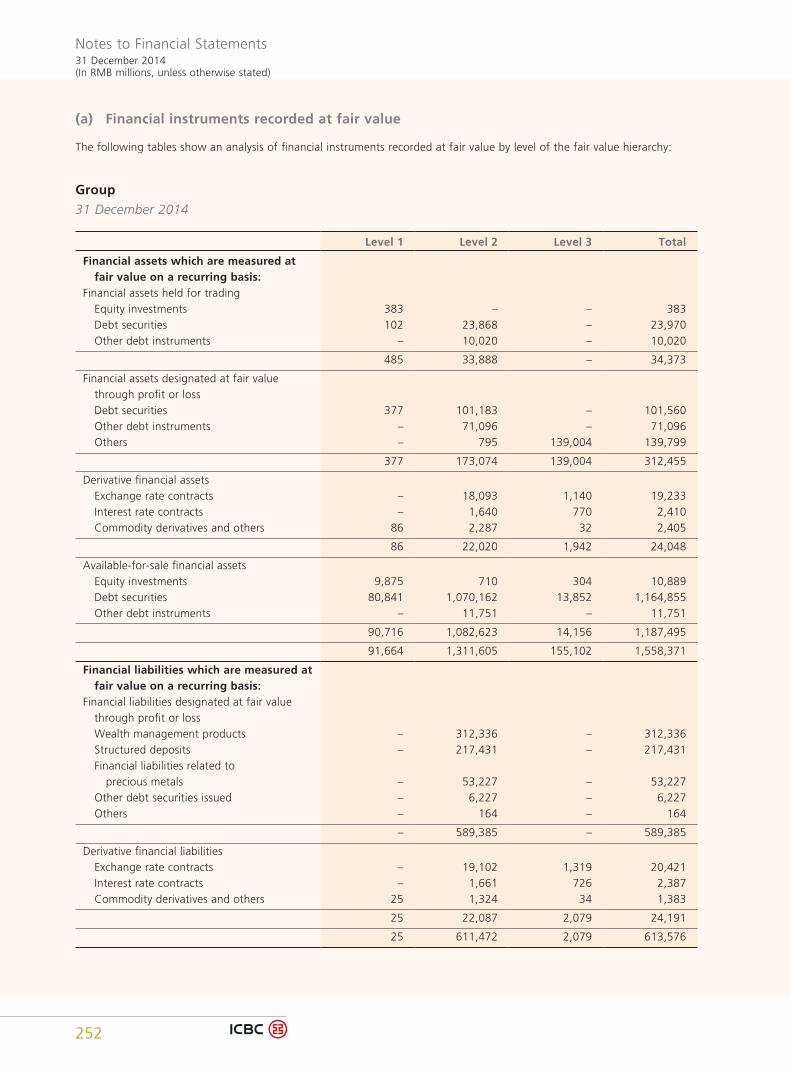
Notes to Financial Statements31 December 2014(In RMB millions, unless otherwise stated)
252
(a) Financial instruments recorded at fair value
The following tables show an analysis of financial instruments recorded at fair value by level of the fair value hierarchy:
Group
31 December 2014
Level 1 Level 2 Level 3 Total
Financial assets which are measured at fair value on a recurring basis:Financial assets held for trading Equity investments 383 – – 383 Debt securities 102 23,868 – 23,970 Other debt instruments – 10,020 – 10,020
485 33,888 – 34,373
Financial assets designated at fair value through profit or loss Debt securities 377 101,183 – 101,560 Other debt instruments – 71,096 – 71,096 Others – 795 139,004 139,799
377 173,074 139,004 312,455
Derivative financial assets Exchange rate contracts – 18,093 1,140 19,233 Interest rate contracts – 1,640 770 2,410 Commodity derivatives and others 86 2,287 32 2,405
86 22,020 1,942 24,048
Available-for-sale financial assets Equity investments 9,875 710 304 10,889 Debt securities 80,841 1,070,162 13,852 1,164,855 Other debt instruments – 11,751 – 11,751
90,716 1,082,623 14,156 1,187,495
91,664 1,311,605 155,102 1,558,371
Financial liabilities which are measured at fair value on a recurring basis:Financial liabilities designated at fair value through profit or loss Wealth management products – 312,336 – 312,336 Structured deposits – 217,431 – 217,431 Financial liabilities related to precious metals – 53,227 – 53,227 Other debt securities issued – 6,227 – 6,227 Others – 164 – 164
– 589,385 – 589,385
Derivative financial liabilities Exchange rate contracts – 19,102 1,319 20,421 Interest rate contracts – 1,661 726 2,387 Commodity derivatives and others 25 1,324 34 1,383
25 22,087 2,079 24,191
25 611,472 2,079 613,576
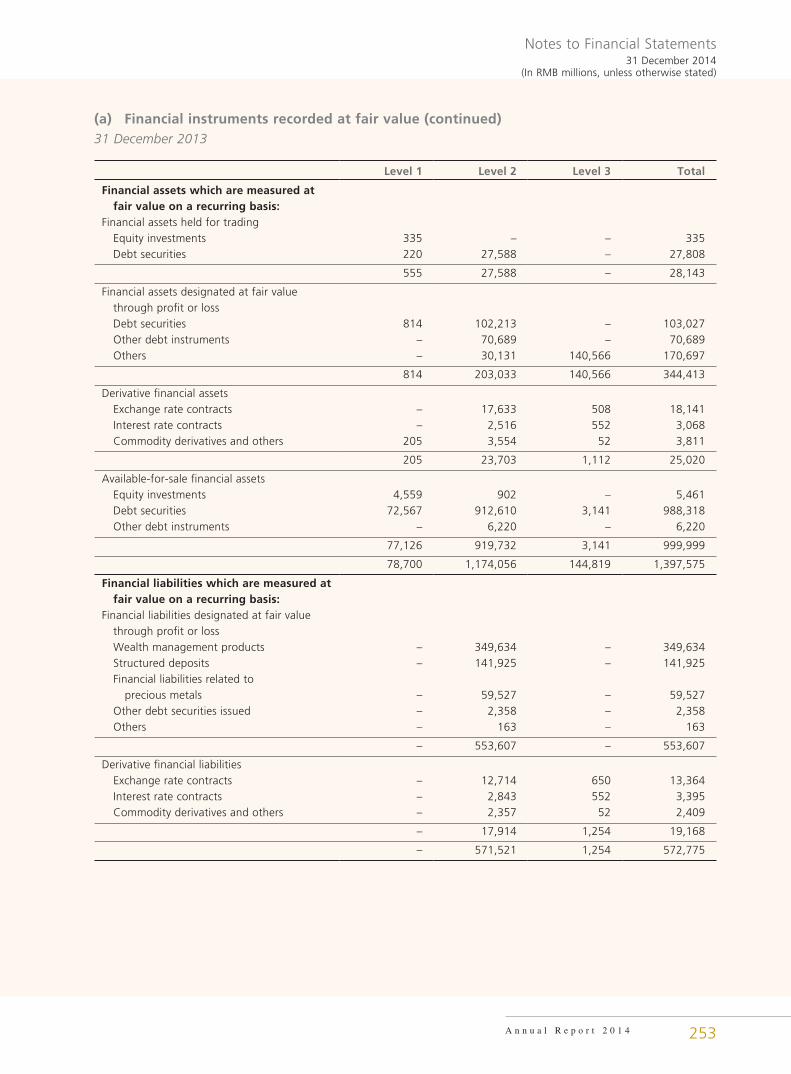
Notes to Financial Statements31 December 2014
(In RMB millions, unless otherwise stated)
A n n u a l R e p o r t 2 0 1 4 253
(a) Financial instruments recorded at fair value (continued)31 December 2013
Level 1 Level 2 Level 3 Total
Financial assets which are measured at fair value on a recurring basis:Financial assets held for trading Equity investments 335 – – 335 Debt securities 220 27,588 – 27,808
555 27,588 – 28,143
Financial assets designated at fair value through profit or loss Debt securities 814 102,213 – 103,027 Other debt instruments – 70,689 – 70,689 Others – 30,131 140,566 170,697
814 203,033 140,566 344,413
Derivative financial assets Exchange rate contracts – 17,633 508 18,141 Interest rate contracts – 2,516 552 3,068 Commodity derivatives and others 205 3,554 52 3,811
205 23,703 1,112 25,020
Available-for-sale financial assets Equity investments 4,559 902 – 5,461 Debt securities 72,567 912,610 3,141 988,318 Other debt instruments – 6,220 – 6,220
77,126 919,732 3,141 999,999
78,700 1,174,056 144,819 1,397,575
Financial liabilities which are measured at fair value on a recurring basis:Financial liabilities designated at fair value through profit or loss Wealth management products – 349,634 – 349,634 Structured deposits – 141,925 – 141,925 Financial liabilities related to precious metals – 59,527 – 59,527 Other debt securities issued – 2,358 – 2,358 Others – 163 – 163
– 553,607 – 553,607
Derivative financial liabilities Exchange rate contracts – 12,714 650 13,364 Interest rate contracts – 2,843 552 3,395 Commodity derivatives and others – 2,357 52 2,409
– 17,914 1,254 19,168
– 571,521 1,254 572,775
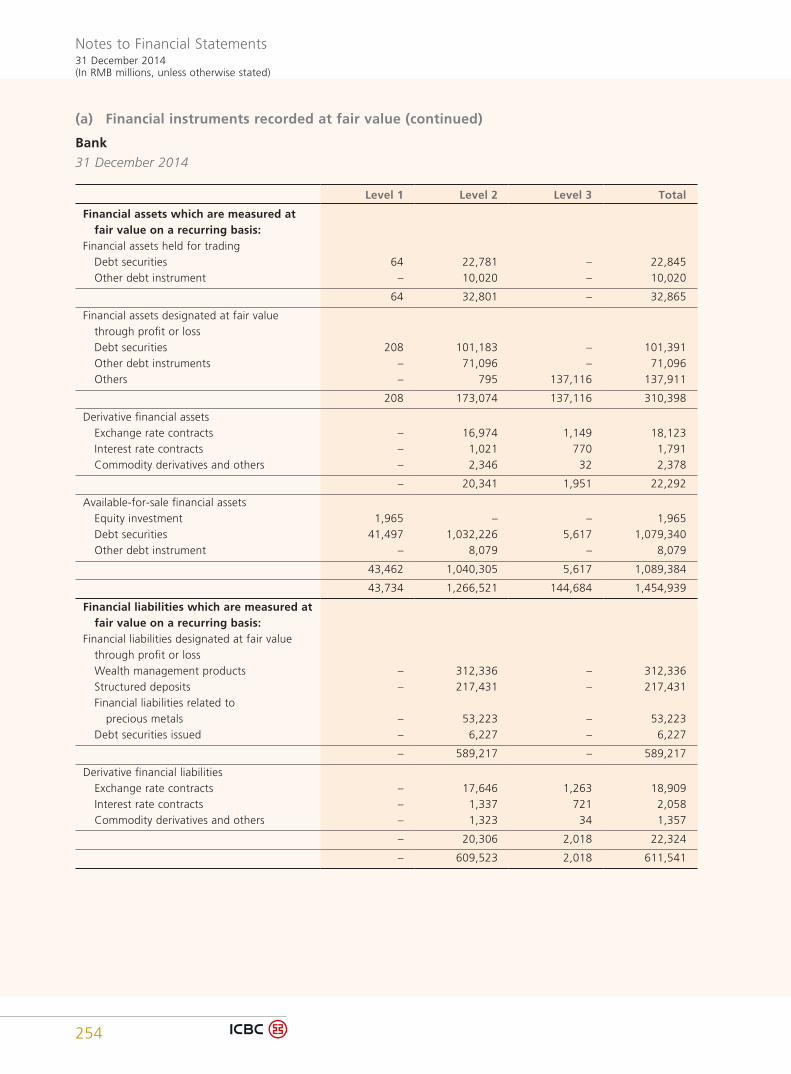
Notes to Financial Statements31 December 2014(In RMB millions, unless otherwise stated)
254
(a) Financial instruments recorded at fair value (continued)
Bank
31 December 2014
Level 1 Level 2 Level 3 Total
Financial assets which are measured at fair value on a recurring basis:Financial assets held for trading Debt securities 64 22,781 – 22,845 Other debt instrument – 10,020 – 10,020
64 32,801 – 32,865
Financial assets designated at fair value through profit or loss Debt securities 208 101,183 – 101,391 Other debt instruments – 71,096 – 71,096 Others – 795 137,116 137,911
208 173,074 137,116 310,398
Derivative financial assets Exchange rate contracts – 16,974 1,149 18,123 Interest rate contracts – 1,021 770 1,791 Commodity derivatives and others – 2,346 32 2,378
– 20,341 1,951 22,292
Available-for-sale financial assets Equity investment 1,965 – – 1,965 Debt securities 41,497 1,032,226 5,617 1,079,340 Other debt instrument – 8,079 – 8,079
43,462 1,040,305 5,617 1,089,384
43,734 1,266,521 144,684 1,454,939
Financial liabilities which are measured at fair value on a recurring basis:Financial liabilities designated at fair value through profit or loss Wealth management products – 312,336 – 312,336 Structured deposits – 217,431 – 217,431 Financial liabilities related to precious metals – 53,223 – 53,223 Debt securities issued – 6,227 – 6,227
– 589,217 – 589,217
Derivative financial liabilities Exchange rate contracts – 17,646 1,263 18,909 Interest rate contracts – 1,337 721 2,058 Commodity derivatives and others – 1,323 34 1,357
– 20,306 2,018 22,324
– 609,523 2,018 611,541
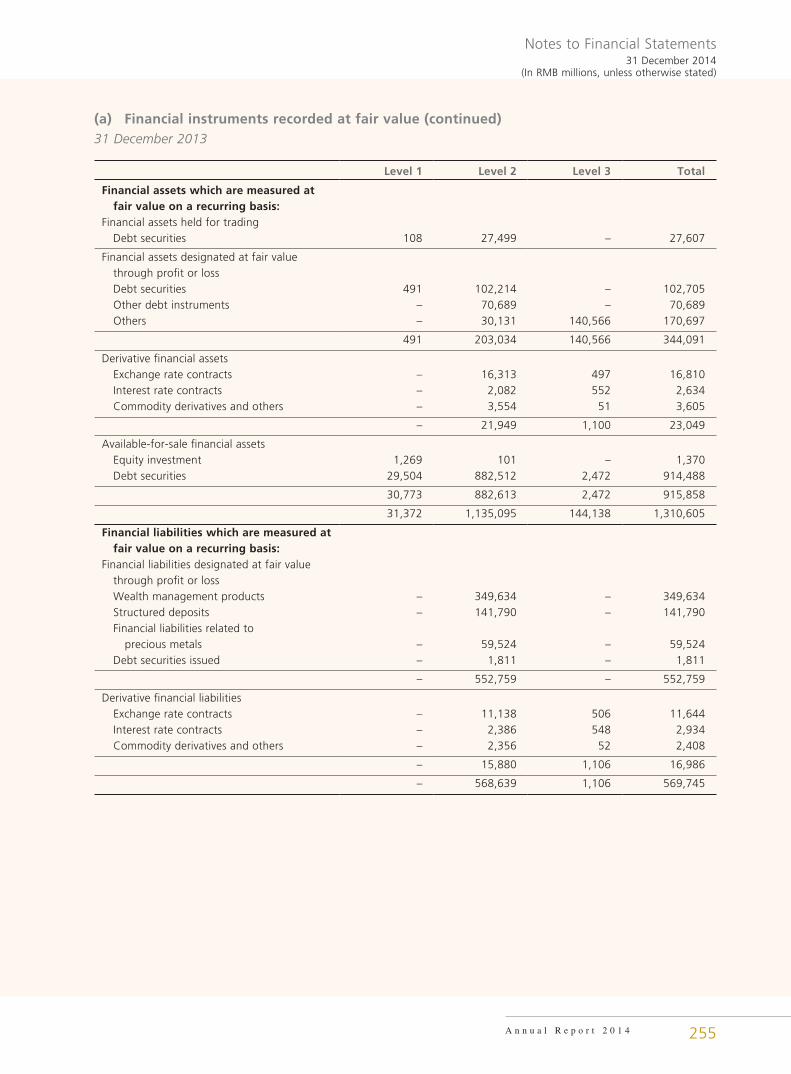
Notes to Financial Statements31 December 2014
(In RMB millions, unless otherwise stated)
A n n u a l R e p o r t 2 0 1 4 255
(a) Financial instruments recorded at fair value (continued)31 December 2013
Level 1 Level 2 Level 3 Total
Financial assets which are measured at fair value on a recurring basis:Financial assets held for trading Debt securities 108 27,499 – 27,607
Financial assets designated at fair value through profit or loss Debt securities 491 102,214 – 102,705 Other debt instruments – 70,689 – 70,689 Others – 30,131 140,566 170,697
491 203,034 140,566 344,091
Derivative financial assets Exchange rate contracts – 16,313 497 16,810 Interest rate contracts – 2,082 552 2,634 Commodity derivatives and others – 3,554 51 3,605
– 21,949 1,100 23,049
Available-for-sale financial assets Equity investment 1,269 101 – 1,370 Debt securities 29,504 882,512 2,472 914,488
30,773 882,613 2,472 915,858
31,372 1,135,095 144,138 1,310,605
Financial liabilities which are measured at fair value on a recurring basis:Financial liabilities designated at fair value through profit or loss Wealth management products – 349,634 – 349,634 Structured deposits – 141,790 – 141,790 Financial liabilities related to precious metals – 59,524 – 59,524 Debt securities issued – 1,811 – 1,811
– 552,759 – 552,759
Derivative financial liabilities Exchange rate contracts – 11,138 506 11,644 Interest rate contracts – 2,386 548 2,934 Commodity derivatives and others – 2,356 52 2,408
– 15,880 1,106 16,986
– 568,639 1,106 569,745
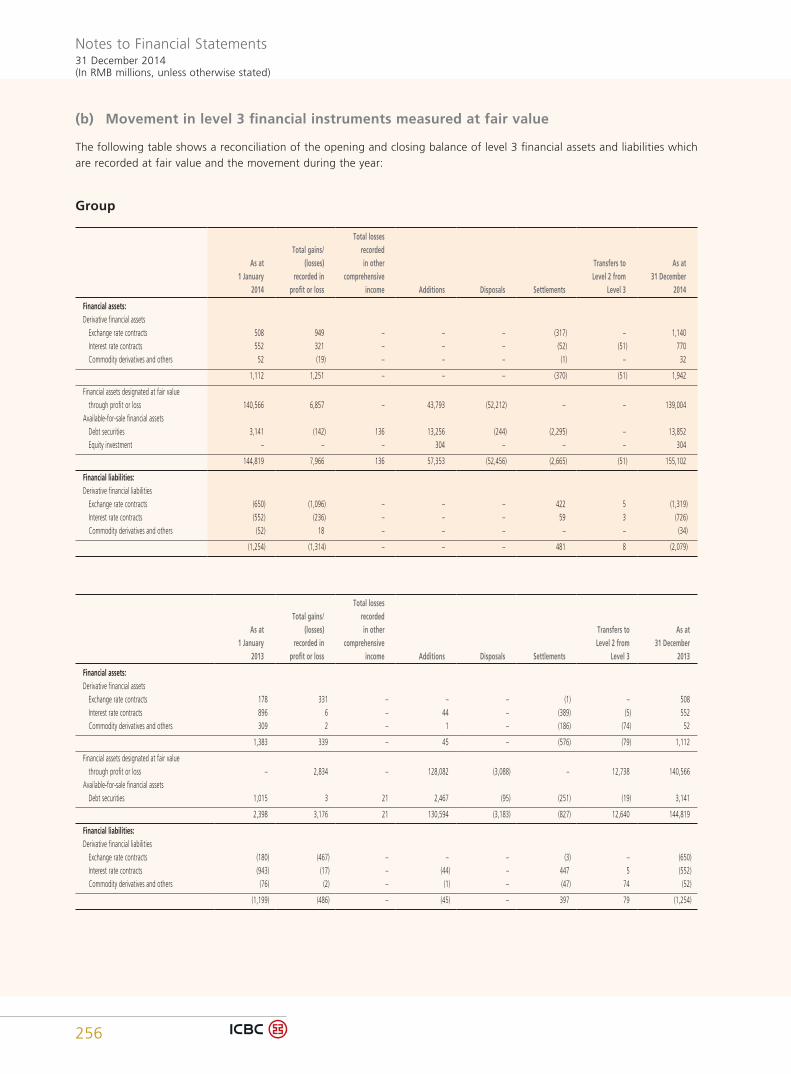
Notes to Financial Statements31 December 2014(In RMB millions, unless otherwise stated)
256
(b) Movement in level 3 financial instruments measured at fair value
The following table shows a reconciliation of the opening and closing balance of level 3 financial assets and liabilities which are recorded at fair value and the movement during the year:
Group
As at 1 January
2014
Total gains/ (losses)
recorded in profit or loss
Total losses recorded in other
comprehensive income Additions Disposals Settlements
Transfers to Level 2 from
Level 3
As at 31 December
2014
Financial assets:Derivative financial assets Exchange rate contracts 508 949 – – – (317) – 1,140 Interest rate contracts 552 321 – – – (52) (51) 770 Commodity derivatives and others 52 (19) – – – (1) – 32
1,112 1,251 – – – (370) (51) 1,942
Financial assets designated at fair value through profit or loss 140,566 6,857 – 43,793 (52,212) – – 139,004Available-for-sale financial assets Debt securities 3,141 (142) 136 13,256 (244) (2,295) – 13,852 Equity investment – – – 304 – – – 304
144,819 7,966 136 57,353 (52,456) (2,665) (51) 155,102
Financial liabilities:Derivative financial liabilities Exchange rate contracts (650) (1,096) – – – 422 5 (1,319) Interest rate contracts (552) (236) – – – 59 3 (726) Commodity derivatives and others (52) 18 – – – – – (34)
(1,254) (1,314) – – – 481 8 (2,079)
As at 1 January
2013
Total gains/ (losses)
recorded in profit or loss
Total losses recorded in other
comprehensive income Additions Disposals Settlements
Transfers to Level 2 from
Level 3
As at 31 December
2013
Financial assets:Derivative financial assets Exchange rate contracts 178 331 – – – (1) – 508 Interest rate contracts 896 6 – 44 – (389) (5) 552 Commodity derivatives and others 309 2 – 1 – (186) (74) 52
1,383 339 – 45 – (576) (79) 1,112
Financial assets designated at fair value through profit or loss – 2,834 – 128,082 (3,088) – 12,738 140,566Available-for-sale financial assets Debt securities 1,015 3 21 2,467 (95) (251) (19) 3,141
2,398 3,176 21 130,594 (3,183) (827) 12,640 144,819
Financial liabilities:Derivative financial liabilities Exchange rate contracts (180) (467) – – – (3) – (650) Interest rate contracts (943) (17) – (44) – 447 5 (552) Commodity derivatives and others (76) (2) – (1) – (47) 74 (52)
(1,199) (486) – (45) – 397 79 (1,254)
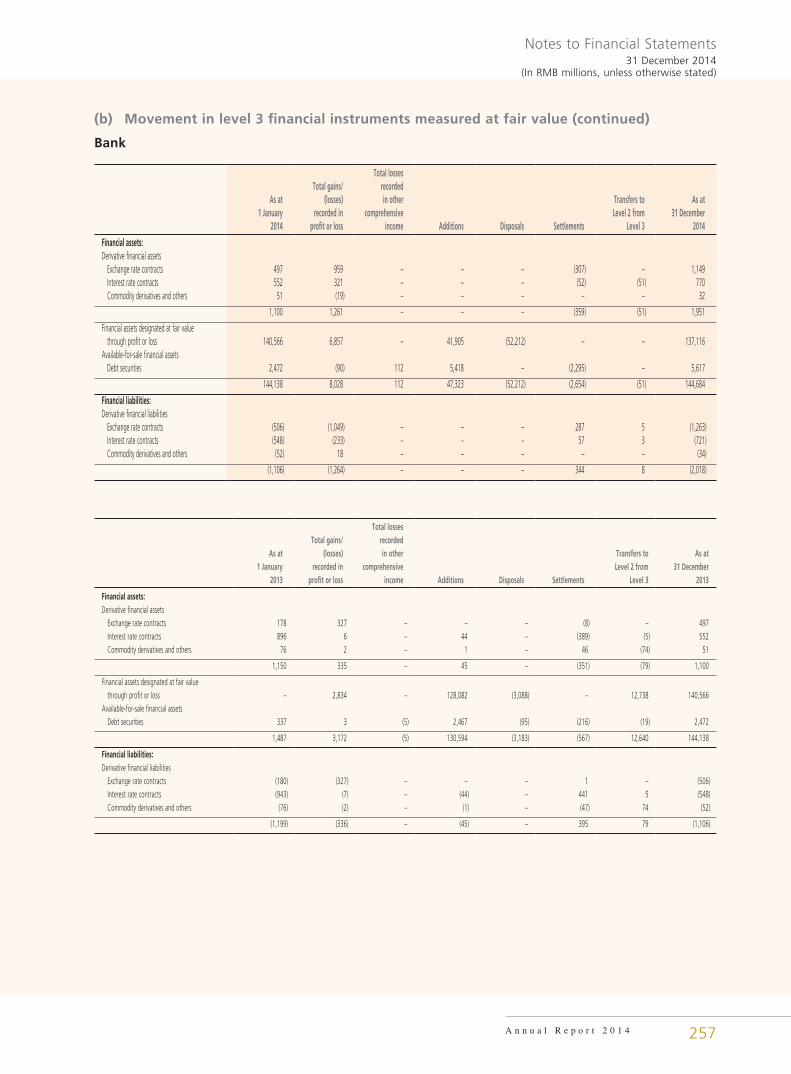
Notes to Financial Statements31 December 2014
(In RMB millions, unless otherwise stated)
A n n u a l R e p o r t 2 0 1 4 257
(b) Movement in level 3 financial instruments measured at fair value (continued)
Bank
As at 1 January
2014
Total gains/ (losses)
recorded in profit or loss
Total losses recorded in other
comprehensive income Additions Disposals Settlements
Transfers to Level 2 from
Level 3
As at 31 December
2014
Financial assets:Derivative financial assets Exchange rate contracts 497 959 – – – (307) – 1,149 Interest rate contracts 552 321 – – – (52) (51) 770 Commodity derivatives and others 51 (19) – – – – – 32
1,100 1,261 – – – (359) (51) 1,951
Financial assets designated at fair value through profit or loss 140,566 6,857 – 41,905 (52,212) – – 137,116Available-for-sale financial assets Debt securities 2,472 (90) 112 5,418 – (2,295) – 5,617
144,138 8,028 112 47,323 (52,212) (2,654) (51) 144,684
Financial liabilities:Derivative financial liabilities Exchange rate contracts (506) (1,049) – – – 287 5 (1,263) Interest rate contracts (548) (233) – – – 57 3 (721) Commodity derivatives and others (52) 18 – – – – – (34)
(1,106) (1,264) – – – 344 8 (2,018)
As at 1 January
2013
Total gains/ (losses)
recorded in profit or loss
Total losses recorded in other
comprehensive income Additions Disposals Settlements
Transfers to Level 2 from
Level 3
As at 31 December
2013
Financial assets:Derivative financial assets Exchange rate contracts 178 327 – – – (8) – 497 Interest rate contracts 896 6 – 44 – (389) (5) 552 Commodity derivatives and others 76 2 – 1 – 46 (74) 51
1,150 335 – 45 – (351) (79) 1,100
Financial assets designated at fair value through profit or loss – 2,834 – 128,082 (3,088) – 12,738 140,566Available-for-sale financial assets Debt securities 337 3 (5) 2,467 (95) (216) (19) 2,472
1,487 3,172 (5) 130,594 (3,183) (567) 12,640 144,138
Financial liabilities:Derivative financial liabilities Exchange rate contracts (180) (327) – – – 1 – (506) Interest rate contracts (943) (7) – (44) – 441 5 (548) Commodity derivatives and others (76) (2) – (1) – (47) 74 (52)
(1,199) (336) – (45) – 395 79 (1,106)
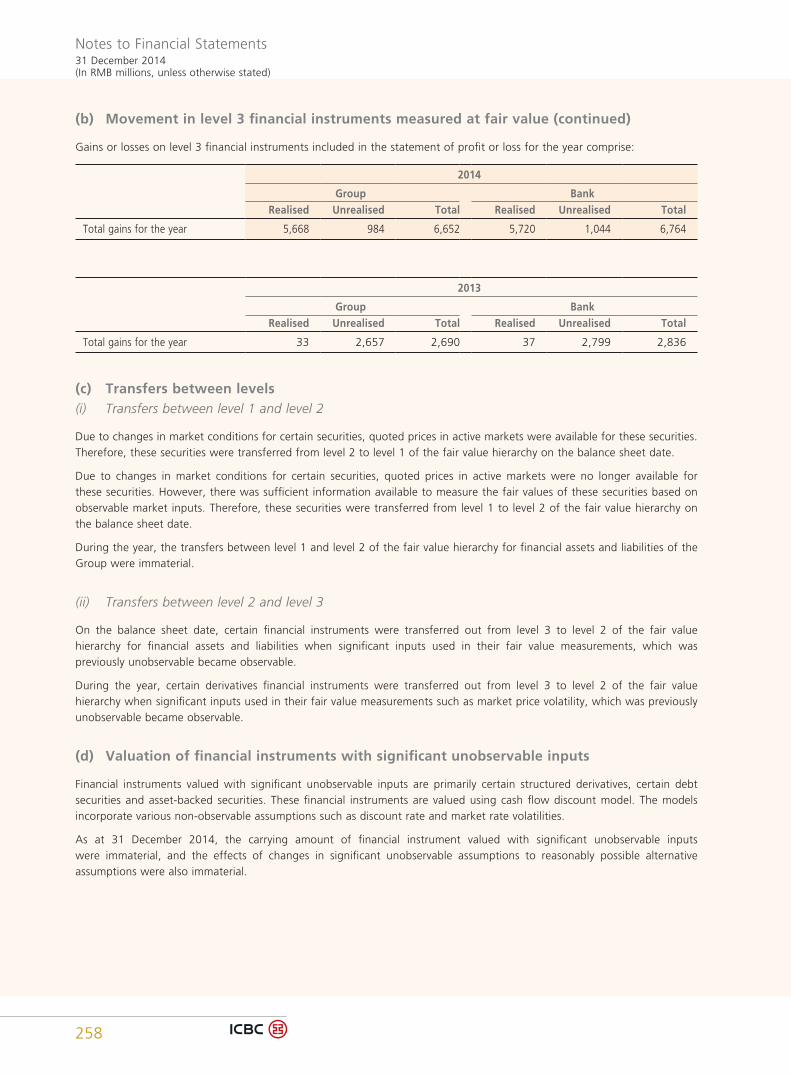
Notes to Financial Statements31 December 2014(In RMB millions, unless otherwise stated)
258
(b) Movement in level 3 financial instruments measured at fair value (continued)
Gains or losses on level 3 financial instruments included in the statement of profit or loss for the year comprise:
2014
Group BankRealised Unrealised Total Realised Unrealised Total
Total gains for the year 5,668 984 6,652 5,720 1,044 6,764
2013
Group BankRealised Unrealised Total Realised Unrealised Total
Total gains for the year 33 2,657 2,690 37 2,799 2,836
(c) Transfers between levels(i) Transfers between level 1 and level 2
Due to changes in market conditions for certain securities, quoted prices in active markets were available for these securities. Therefore, these securities were transferred from level 2 to level 1 of the fair value hierarchy on the balance sheet date.
Due to changes in market conditions for certain securities, quoted prices in active markets were no longer available for these securities. However, there was sufficient information available to measure the fair values of these securities based on observable market inputs. Therefore, these securities were transferred from level 1 to level 2 of the fair value hierarchy on the balance sheet date.
During the year, the transfers between level 1 and level 2 of the fair value hierarchy for financial assets and liabilities of the Group were immaterial.
(ii) Transfers between level 2 and level 3
On the balance sheet date, certain financial instruments were transferred out from level 3 to level 2 of the fair value hierarchy for financial assets and liabilities when significant inputs used in their fair value measurements, which was previously unobservable became observable.
During the year, certain derivatives financial instruments were transferred out from level 3 to level 2 of the fair value hierarchy when significant inputs used in their fair value measurements such as market price volatility, which was previously unobservable became observable.
(d) Valuation of financial instruments with significant unobservable inputs
Financial instruments valued with significant unobservable inputs are primarily certain structured derivatives, certain debt securities and asset-backed securities. These financial instruments are valued using cash flow discount model. The models incorporate various non-observable assumptions such as discount rate and market rate volatilities.
As at 31 December 2014, the carrying amount of financial instrument valued with significant unobservable inputs were immaterial, and the effects of changes in significant unobservable assumptions to reasonably possible alternative assumptions were also immaterial.
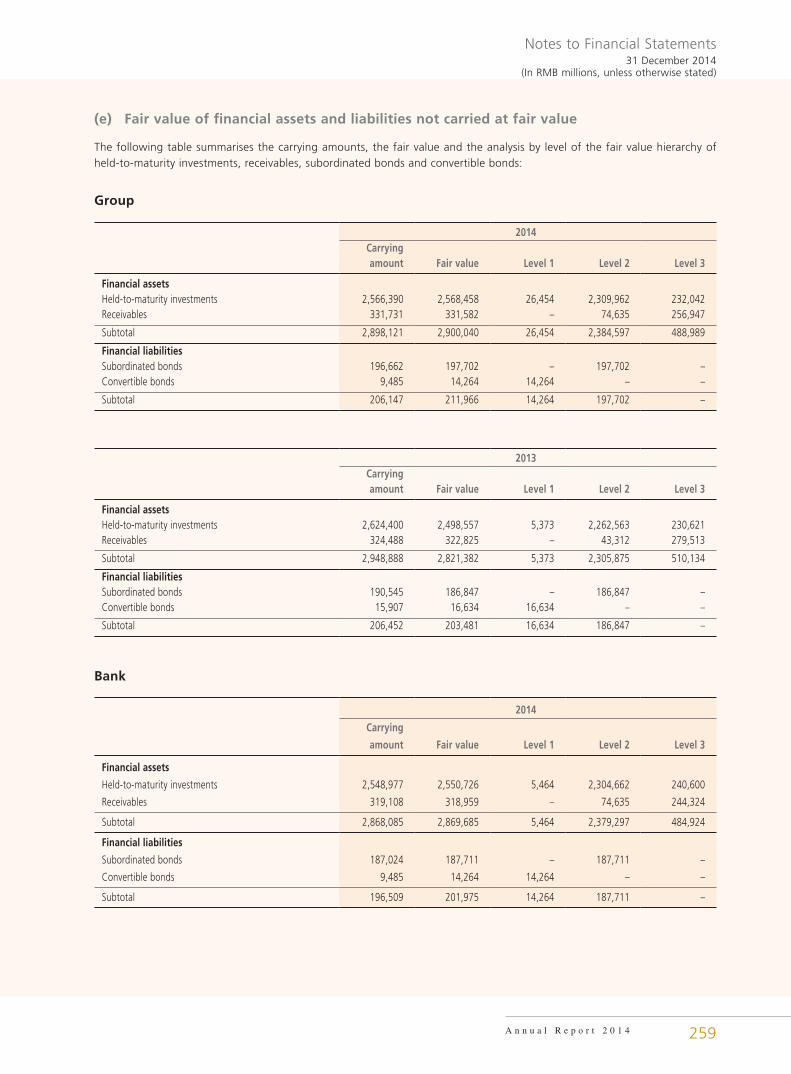
Notes to Financial Statements31 December 2014
(In RMB millions, unless otherwise stated)
A n n u a l R e p o r t 2 0 1 4 259
(e) Fair value of financial assets and liabilities not carried at fair value
The following table summarises the carrying amounts, the fair value and the analysis by level of the fair value hierarchy of held-to-maturity investments, receivables, subordinated bonds and convertible bonds:
Group
2014Carrying amount Fair value Level 1 Level 2 Level 3
Financial assetsHeld-to-maturity investments 2,566,390 2,568,458 26,454 2,309,962 232,042Receivables 331,731 331,582 – 74,635 256,947
Subtotal 2,898,121 2,900,040 26,454 2,384,597 488,989
Financial liabilitiesSubordinated bonds 196,662 197,702 – 197,702 –Convertible bonds 9,485 14,264 14,264 – –
Subtotal 206,147 211,966 14,264 197,702 –
2013Carrying amount Fair value Level 1 Level 2 Level 3
Financial assetsHeld-to-maturity investments 2,624,400 2,498,557 5,373 2,262,563 230,621Receivables 324,488 322,825 – 43,312 279,513
Subtotal 2,948,888 2,821,382 5,373 2,305,875 510,134
Financial liabilitiesSubordinated bonds 190,545 186,847 – 186,847 –Convertible bonds 15,907 16,634 16,634 – –
Subtotal 206,452 203,481 16,634 186,847 –
Bank
2014
Carrying
amount Fair value Level 1 Level 2 Level 3
Financial assets
Held-to-maturity investments 2,548,977 2,550,726 5,464 2,304,662 240,600
Receivables 319,108 318,959 – 74,635 244,324
Subtotal 2,868,085 2,869,685 5,464 2,379,297 484,924
Financial liabilities
Subordinated bonds 187,024 187,711 – 187,711 –
Convertible bonds 9,485 14,264 14,264 – –
Subtotal 196,509 201,975 14,264 187,711 –
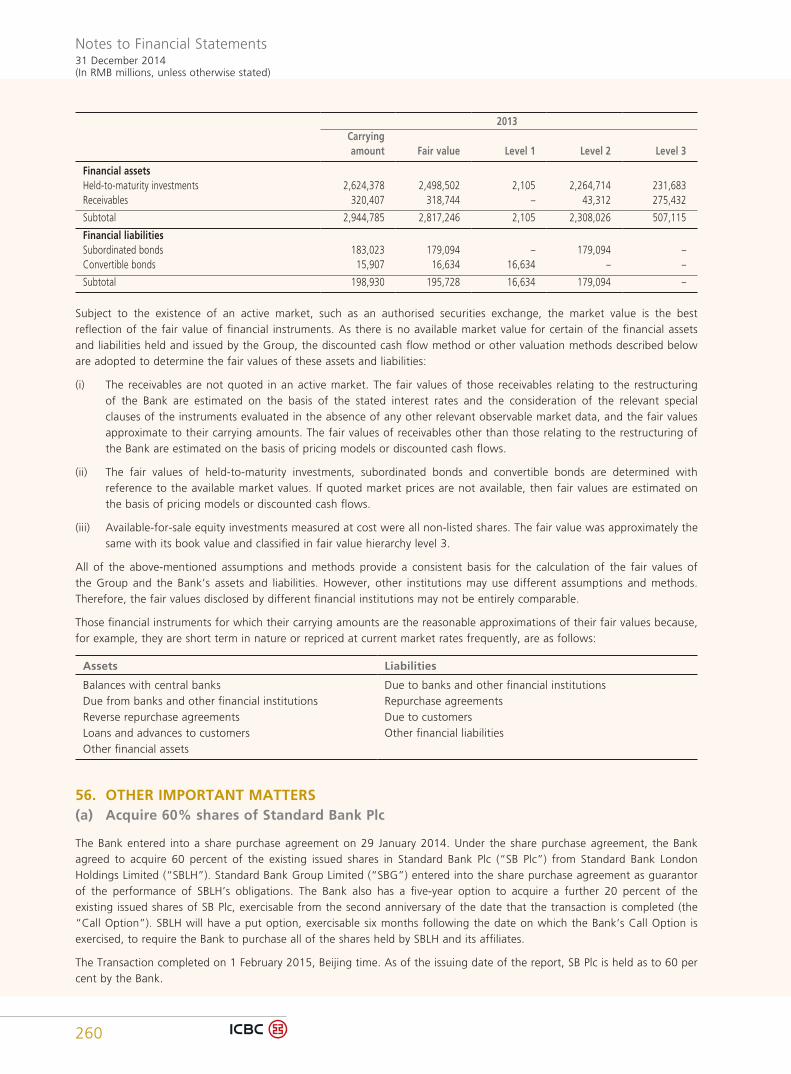
Notes to Financial Statements31 December 2014(In RMB millions, unless otherwise stated)
260
2013Carrying amount Fair value Level 1 Level 2 Level 3
Financial assetsHeld-to-maturity investments 2,624,378 2,498,502 2,105 2,264,714 231,683Receivables 320,407 318,744 – 43,312 275,432
Subtotal 2,944,785 2,817,246 2,105 2,308,026 507,115
Financial liabilitiesSubordinated bonds 183,023 179,094 – 179,094 –Convertible bonds 15,907 16,634 16,634 – –
Subtotal 198,930 195,728 16,634 179,094 –
Subject to the existence of an active market, such as an authorised securities exchange, the market value is the best reflection of the fair value of financial instruments. As there is no available market value for certain of the financial assets and liabilities held and issued by the Group, the discounted cash flow method or other valuation methods described below are adopted to determine the fair values of these assets and liabilities:
(i) The receivables are not quoted in an active market. The fair values of those receivables relating to the restructuring of the Bank are estimated on the basis of the stated interest rates and the consideration of the relevant special clauses of the instruments evaluated in the absence of any other relevant observable market data, and the fair values approximate to their carrying amounts. The fair values of receivables other than those relating to the restructuring of the Bank are estimated on the basis of pricing models or discounted cash flows.
(ii) The fair values of held-to-maturity investments, subordinated bonds and convertible bonds are determined with reference to the available market values. If quoted market prices are not available, then fair values are estimated on the basis of pricing models or discounted cash flows.
(iii) Available-for-sale equity investments measured at cost were all non-listed shares. The fair value was approximately the same with its book value and classified in fair value hierarchy level 3.
All of the above-mentioned assumptions and methods provide a consistent basis for the calculation of the fair values of the Group and the Bank’s assets and liabilities. However, other institutions may use different assumptions and methods. Therefore, the fair values disclosed by different financial institutions may not be entirely comparable.
Those financial instruments for which their carrying amounts are the reasonable approximations of their fair values because, for example, they are short term in nature or repriced at current market rates frequently, are as follows:
Assets Liabilities
Balances with central banks Due to banks and other financial institutionsDue from banks and other financial institutions Repurchase agreementsReverse repurchase agreements Due to customersLoans and advances to customers Other financial liabilitiesOther financial assets
56. OTHER IMPORTANT MATTERS(a) Acquire 60% shares of Standard Bank Plc
The Bank entered into a share purchase agreement on 29 January 2014. Under the share purchase agreement, the Bank agreed to acquire 60 percent of the existing issued shares in Standard Bank Plc (“SB Plc”) from Standard Bank London Holdings Limited (“SBLH”). Standard Bank Group Limited (“SBG”) entered into the share purchase agreement as guarantor of the performance of SBLH’s obligations. The Bank also has a five-year option to acquire a further 20 percent of the existing issued shares of SB Plc, exercisable from the second anniversary of the date that the transaction is completed (the “Call Option”). SBLH will have a put option, exercisable six months following the date on which the Bank’s Call Option is exercised, to require the Bank to purchase all of the shares held by SBLH and its affiliates.
The Transaction completed on 1 February 2015, Beijing time. As of the issuing date of the report, SB Plc is held as to 60 per cent by the Bank.
Notes to Financial Statements31 December 2014
(In RMB millions, unless otherwise stated)
A n n u a l R e p o r t 2 0 1 4 261
(b) The issuance of preference shares
The meeting of the board of directors and the shareholders’ general meeting of the Bank were held on 25 July 2014 and 19 September 2014 respectively, at which the Proposal in respect of Issuance of offshore Preference Shares by Industrial and Commercial Bank of China Limited and the Proposal in respect of Issuance of Domestic Preference Shares by Industrial and Commercial Bank of China Limited were considered and approved, with an aggregate amount of not more than RMB80 billion or its equivalent. The Bank proposes to issue domestic preference shares with an aggregate amount of not more than RMB45 billion and offshore preference shares with an aggregate amount of not more than RMB35 billion or its equivalent. The specific issuance amount was determined by shareholders’ general meeting under the authorization of the board of directors within the above limit. The funds raised through issuing domestic and offshore preferred shares will be totally used to replenish the Bank’s capital after deducting issuance fee.
The issuance of offshore preference shares has been completed on 10 December 2014. The listing of the offshore preference shares on The Stock Exchange of Hong Kong Limited has become effective on 11 December 2014. The net amount of the offshore insurance of preference shares was RMB34.4 billion or its equivalent.
The Bank has submitted the issuance of domestic preference shares to relevant regulatory authorities for approval in accordance with relevant laws and regulations. On 9 March 2015, the Bank has received the “Approval from CBRC concerning the Issuance of Domestic Preference Shares by Industrial and Commercial Bank of China Limited” (Yin Jian Fu [2015] No. 189) pursuant to which, approval was granted to the Bank by the CBRC to issue no more than 450 million domestic preference shares raising proceeds not exceeding RMB45 billion which will be counted as Additional Tier-1 Capital of the Bank in accordance with relevant regulatory requirements.
(c) Redemption of convertible bond
Given that the closing price of the A shares of the Bank from 19 November 2014 to 30 December 2014 is not less than 130% (i.e., RMB4.25 per share) of the prevailing conversion price of the ICBC Convertible Bonds (RMB3.27 per share) for 15 trading days out of 30 consecutive trading days, the redemption clause of the Convertible Bonds has been triggered according to the Prospectus in Relation to the Public Issuance of the A Share Convertible Corporate Bonds of the Bank. By a resolution of the board of directors of the Bank, it was resolved that the Bank would exercise its right of early redemption of the Convertible Bonds to redeem all outstanding ICBC Convertible Bonds which appear on the register of bonds on the Redemption Record Date. The early redemption of the Convertible Bonds was approved by the CBRC. The Redemption Price for the current redemption of the ICBC Convertible Bonds is RMB100.629 per bond (including included tax accrued interest for the current period RMB0.629 per bond), and the redemption amount was paid on 26 February 2015.The ICBC Convertible bonds (113002) and the ICBC Converted Shares (191002) have been delisted from the Shanghai Stock Exchange from 26 February 2015.
57. AFTER THE REPORTING PERIOD EVENTThe profit distribution plan
A final dividend of RMB0.2554 per share after the appropriation of statutory surplus reserve and general reserve, was approved at the board of directors’ meeting held on 26 March 2015, and is subject to the approval of the Bank’s shareholders at the forthcoming annual general meeting. Based on the number of shares issued as at 31 December 2014, the final dividend amounted to RMB91,026 million. The dividend payable was not recognised as a liability as at 31 December 2014.
58. COMPARATIVE AMOUNTS
Certain comparative amounts have been reclassified to conform with the current year’s presentation.
59. APPROVAL OF THE CONSOLIDATED FINANCIAL STATEMENTS
The financial statements were approved and authorised for issue by the board of directors on 26 March 2015.
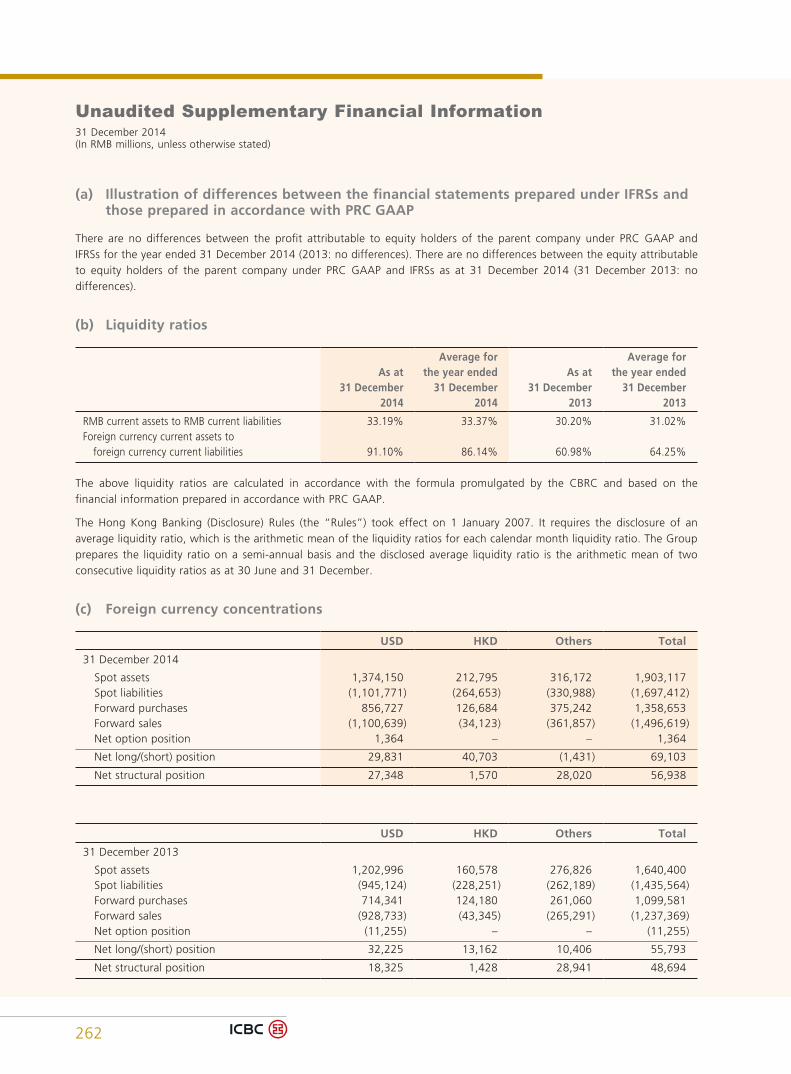
Unaudited Supplementary Financial Information31 December 2014(In RMB millions, unless otherwise stated)
262
(a) Illustration of differences between the financial statements prepared under IFRSs and those prepared in accordance with PRC GAAP
There are no differences between the profit attributable to equity holders of the parent company under PRC GAAP and IFRSs for the year ended 31 December 2014 (2013: no differences). There are no differences between the equity attributable to equity holders of the parent company under PRC GAAP and IFRSs as at 31 December 2014 (31 December 2013: no differences).
(b) Liquidity ratios
As at 31 December
2014
Average for the year ended
31 December 2014
As at 31 December
2013
Average for the year ended
31 December 2013
RMB current assets to RMB current liabilities 33.19% 33.37% 30.20% 31.02%Foreign currency current assets to foreign currency current liabilities 91.10% 86.14% 60.98% 64.25%
The above liquidity ratios are calculated in accordance with the formula promulgated by the CBRC and based on the financial information prepared in accordance with PRC GAAP.
The Hong Kong Banking (Disclosure) Rules (the “Rules”) took effect on 1 January 2007. It requires the disclosure of an average liquidity ratio, which is the arithmetic mean of the liquidity ratios for each calendar month liquidity ratio. The Group prepares the liquidity ratio on a semi-annual basis and the disclosed average liquidity ratio is the arithmetic mean of two consecutive liquidity ratios as at 30 June and 31 December.
(c) Foreign currency concentrations
USD HKD Others Total
31 December 2014
Spot assets 1,374,150 212,795 316,172 1,903,117 Spot liabilities (1,101,771) (264,653) (330,988) (1,697,412) Forward purchases 856,727 126,684 375,242 1,358,653 Forward sales (1,100,639) (34,123) (361,857) (1,496,619) Net option position 1,364 – – 1,364
Net long/(short) position 29,831 40,703 (1,431) 69,103
Net structural position 27,348 1,570 28,020 56,938
USD HKD Others Total
31 December 2013
Spot assets 1,202,996 160,578 276,826 1,640,400 Spot liabilities (945,124) (228,251) (262,189) (1,435,564) Forward purchases 714,341 124,180 261,060 1,099,581 Forward sales (928,733) (43,345) (265,291) (1,237,369) Net option position (11,255) – – (11,255)
Net long/(short) position 32,225 13,162 10,406 55,793
Net structural position 18,325 1,428 28,941 48,694
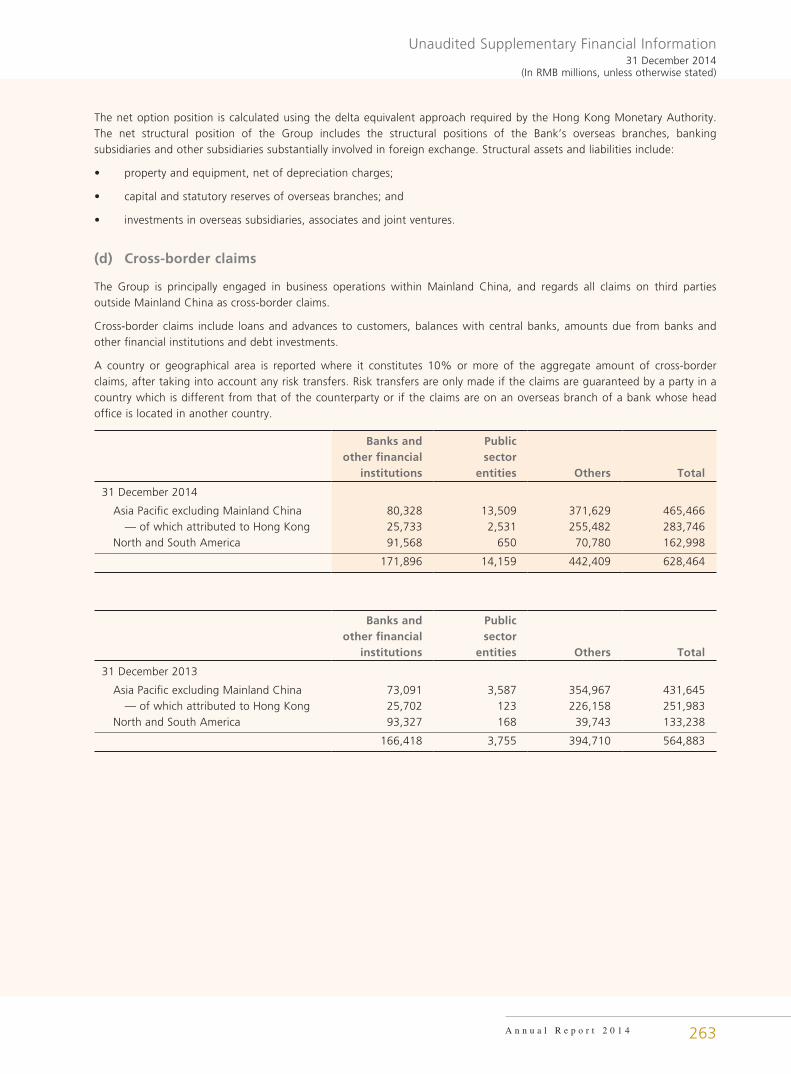
Unaudited Supplementary Financial Information31 December 2014
(In RMB millions, unless otherwise stated)
A n n u a l R e p o r t 2 0 1 4 263
The net option position is calculated using the delta equivalent approach required by the Hong Kong Monetary Authority. The net structural position of the Group includes the structural positions of the Bank’s overseas branches, banking subsidiaries and other subsidiaries substantially involved in foreign exchange. Structural assets and liabilities include:
• property and equipment, net of depreciation charges;
• capital and statutory reserves of overseas branches; and
• investments in overseas subsidiaries, associates and joint ventures.
(d) Cross-border claims
The Group is principally engaged in business operations within Mainland China, and regards all claims on third parties outside Mainland China as cross-border claims.
Cross-border claims include loans and advances to customers, balances with central banks, amounts due from banks and other financial institutions and debt investments.
A country or geographical area is reported where it constitutes 10% or more of the aggregate amount of cross-border claims, after taking into account any risk transfers. Risk transfers are only made if the claims are guaranteed by a party in a country which is different from that of the counterparty or if the claims are on an overseas branch of a bank whose head office is located in another country.
Banks and other financial
institutions
Public sector
entities Others Total
31 December 2014
Asia Pacific excluding Mainland China 80,328 13,509 371,629 465,466 — of which attributed to Hong Kong 25,733 2,531 255,482 283,746 North and South America 91,568 650 70,780 162,998
171,896 14,159 442,409 628,464
Banks and other financial
institutions
Public sector
entities Others Total
31 December 2013
Asia Pacific excluding Mainland China 73,091 3,587 354,967 431,645 — of which attributed to Hong Kong 25,702 123 226,158 251,983 North and South America 93,327 168 39,743 133,238
166,418 3,755 394,710 564,883
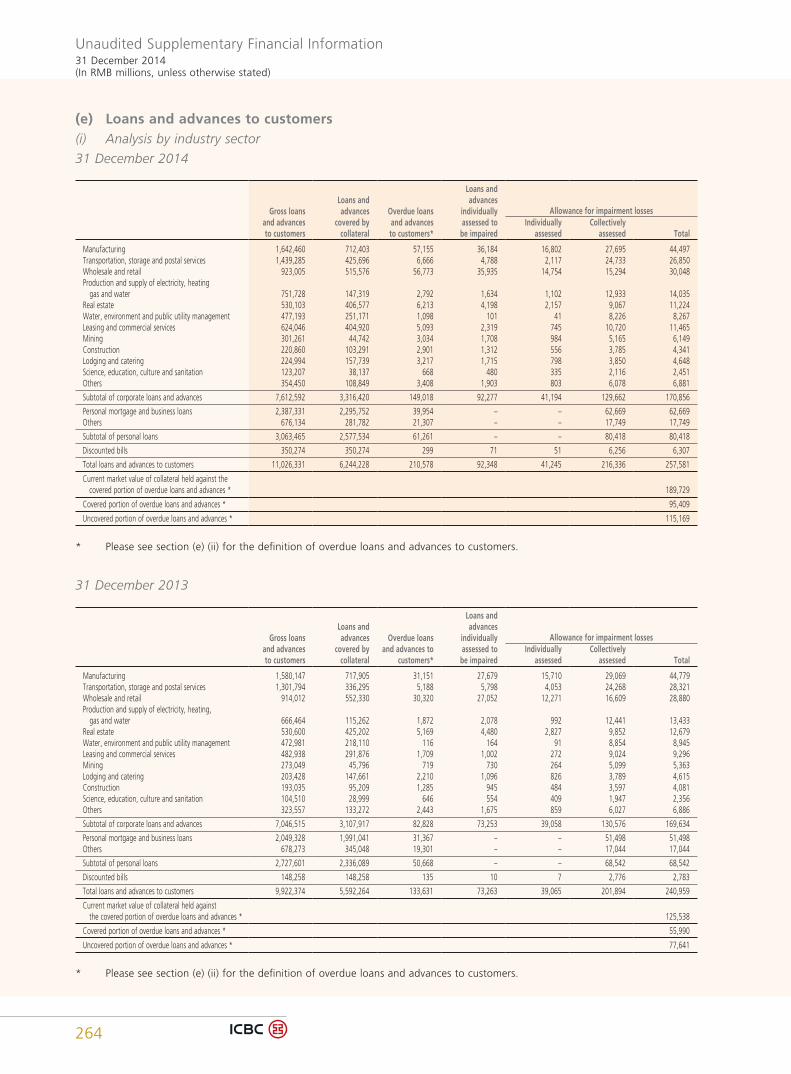
Unaudited Supplementary Financial Information31 December 2014(In RMB millions, unless otherwise stated)
264
(e) Loans and advances to customers(i) Analysis by industry sector
31 December 2014
Gross loans and advances to customers
Loans and advances
covered by collateral
Overdue loans and advances to customers*
Loans and advances
individually assessed to
be impaired
Allowance for impairment lossesIndividually
assessedCollectively
assessed Total
Manufacturing 1,642,460 712,403 57,155 36,184 16,802 27,695 44,497Transportation, storage and postal services 1,439,285 425,696 6,666 4,788 2,117 24,733 26,850Wholesale and retail 923,005 515,576 56,773 35,935 14,754 15,294 30,048Production and supply of electricity, heating gas and water 751,728 147,319 2,792 1,634 1,102 12,933 14,035Real estate 530,103 406,577 6,213 4,198 2,157 9,067 11,224Water, environment and public utility management 477,193 251,171 1,098 101 41 8,226 8,267Leasing and commercial services 624,046 404,920 5,093 2,319 745 10,720 11,465Mining 301,261 44,742 3,034 1,708 984 5,165 6,149Construction 220,860 103,291 2,901 1,312 556 3,785 4,341Lodging and catering 224,994 157,739 3,217 1,715 798 3,850 4,648Science, education, culture and sanitation 123,207 38,137 668 480 335 2,116 2,451Others 354,450 108,849 3,408 1,903 803 6,078 6,881
Subtotal of corporate loans and advances 7,612,592 3,316,420 149,018 92,277 41,194 129,662 170,856
Personal mortgage and business loans 2,387,331 2,295,752 39,954 – – 62,669 62,669Others 676,134 281,782 21,307 – – 17,749 17,749
Subtotal of personal loans 3,063,465 2,577,534 61,261 – – 80,418 80,418
Discounted bills 350,274 350,274 299 71 51 6,256 6,307
Total loans and advances to customers 11,026,331 6,244,228 210,578 92,348 41,245 216,336 257,581
Current market value of collateral held against the covered portion of overdue loans and advances * 189,729
Covered portion of overdue loans and advances * 95,409
Uncovered portion of overdue loans and advances * 115,169
* Please see section (e) (ii) for the definition of overdue loans and advances to customers.
31 December 2013
Gross loans and advances to customers
Loans and advances
covered by collateral
Overdue loans and advances to
customers*
Loans and advances
individually assessed to
be impaired
Allowance for impairment lossesIndividually
assessedCollectively
assessed Total
Manufacturing 1,580,147 717,905 31,151 27,679 15,710 29,069 44,779Transportation, storage and postal services 1,301,794 336,295 5,188 5,798 4,053 24,268 28,321Wholesale and retail 914,012 552,330 30,320 27,052 12,271 16,609 28,880Production and supply of electricity, heating, gas and water 666,464 115,262 1,872 2,078 992 12,441 13,433Real estate 530,600 425,202 5,169 4,480 2,827 9,852 12,679Water, environment and public utility management 472,981 218,110 116 164 91 8,854 8,945Leasing and commercial services 482,938 291,876 1,709 1,002 272 9,024 9,296Mining 273,049 45,796 719 730 264 5,099 5,363Lodging and catering 203,428 147,661 2,210 1,096 826 3,789 4,615Construction 193,035 95,209 1,285 945 484 3,597 4,081Science, education, culture and sanitation 104,510 28,999 646 554 409 1,947 2,356Others 323,557 133,272 2,443 1,675 859 6,027 6,886
Subtotal of corporate loans and advances 7,046,515 3,107,917 82,828 73,253 39,058 130,576 169,634
Personal mortgage and business loans 2,049,328 1,991,041 31,367 – – 51,498 51,498Others 678,273 345,048 19,301 – – 17,044 17,044
Subtotal of personal loans 2,727,601 2,336,089 50,668 – – 68,542 68,542
Discounted bills 148,258 148,258 135 10 7 2,776 2,783
Total loans and advances to customers 9,922,374 5,592,264 133,631 73,263 39,065 201,894 240,959
Current market value of collateral held against the covered portion of overdue loans and advances * 125,538
Covered portion of overdue loans and advances * 55,990
Uncovered portion of overdue loans and advances * 77,641
* Please see section (e) (ii) for the definition of overdue loans and advances to customers.
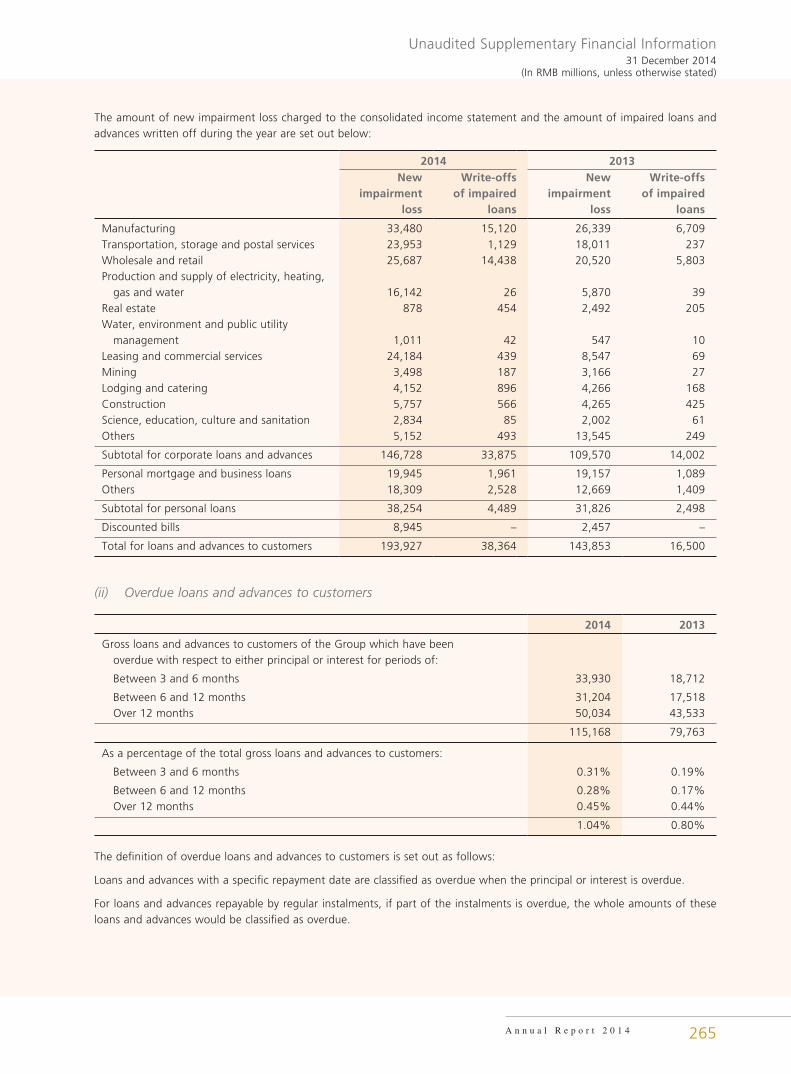
Unaudited Supplementary Financial Information31 December 2014
(In RMB millions, unless otherwise stated)
A n n u a l R e p o r t 2 0 1 4 265
The amount of new impairment loss charged to the consolidated income statement and the amount of impaired loans and advances written off during the year are set out below:
2014 2013New
impairment loss
Write-offs of impaired
loans
New impairment
loss
Write-offs of impaired
loans
Manufacturing 33,480 15,120 26,339 6,709Transportation, storage and postal services 23,953 1,129 18,011 237Wholesale and retail 25,687 14,438 20,520 5,803Production and supply of electricity, heating, gas and water 16,142 26 5,870 39Real estate 878 454 2,492 205Water, environment and public utility management 1,011 42 547 10Leasing and commercial services 24,184 439 8,547 69Mining 3,498 187 3,166 27Lodging and catering 4,152 896 4,266 168Construction 5,757 566 4,265 425Science, education, culture and sanitation 2,834 85 2,002 61Others 5,152 493 13,545 249
Subtotal for corporate loans and advances 146,728 33,875 109,570 14,002
Personal mortgage and business loans 19,945 1,961 19,157 1,089Others 18,309 2,528 12,669 1,409
Subtotal for personal loans 38,254 4,489 31,826 2,498
Discounted bills 8,945 – 2,457 –
Total for loans and advances to customers 193,927 38,364 143,853 16,500
(ii) Overdue loans and advances to customers
2014 2013
Gross loans and advances to customers of the Group which have been overdue with respect to either principal or interest for periods of:
Between 3 and 6 months 33,930 18,712
Between 6 and 12 months 31,204 17,518 Over 12 months 50,034 43,533
115,168 79,763
As a percentage of the total gross loans and advances to customers:
Between 3 and 6 months 0.31% 0.19%
Between 6 and 12 months 0.28% 0.17% Over 12 months 0.45% 0.44%
1.04% 0.80%
The definition of overdue loans and advances to customers is set out as follows:
Loans and advances with a specific repayment date are classified as overdue when the principal or interest is overdue.
For loans and advances repayable by regular instalments, if part of the instalments is overdue, the whole amounts of these loans and advances would be classified as overdue.
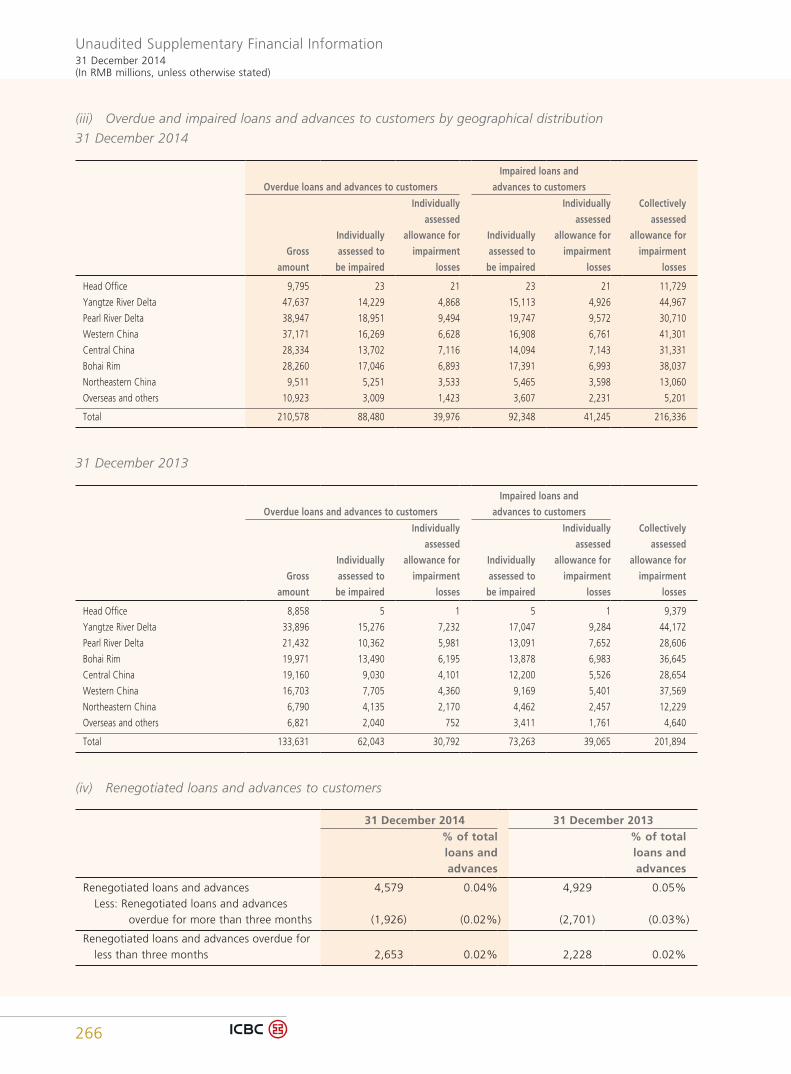
Unaudited Supplementary Financial Information31 December 2014(In RMB millions, unless otherwise stated)
266
(iii) Overdue and impaired loans and advances to customers by geographical distribution
31 December 2014
Overdue loans and advances to customers
Impaired loans and
advances to customers
Gross
amount
Individually
assessed to
be impaired
Individually
assessed
allowance for
impairment
losses
Individually
assessed to
be impaired
Individually
assessed
allowance for
impairment
losses
Collectively
assessed
allowance for
impairment
losses
Head Office 9,795 23 21 23 21 11,729
Yangtze River Delta 47,637 14,229 4,868 15,113 4,926 44,967
Pearl River Delta 38,947 18,951 9,494 19,747 9,572 30,710
Western China 37,171 16,269 6,628 16,908 6,761 41,301
Central China 28,334 13,702 7,116 14,094 7,143 31,331
Bohai Rim 28,260 17,046 6,893 17,391 6,993 38,037
Northeastern China 9,511 5,251 3,533 5,465 3,598 13,060
Overseas and others 10,923 3,009 1,423 3,607 2,231 5,201
Total 210,578 88,480 39,976 92,348 41,245 216,336
31 December 2013
Overdue loans and advances to customers
Impaired loans and
advances to customers
Gross
amount
Individually
assessed to
be impaired
Individually
assessed
allowance for
impairment
losses
Individually
assessed to
be impaired
Individually
assessed
allowance for
impairment
losses
Collectively
assessed
allowance for
impairment
losses
Head Office 8,858 5 1 5 1 9,379
Yangtze River Delta 33,896 15,276 7,232 17,047 9,284 44,172
Pearl River Delta 21,432 10,362 5,981 13,091 7,652 28,606
Bohai Rim 19,971 13,490 6,195 13,878 6,983 36,645
Central China 19,160 9,030 4,101 12,200 5,526 28,654
Western China 16,703 7,705 4,360 9,169 5,401 37,569
Northeastern China 6,790 4,135 2,170 4,462 2,457 12,229
Overseas and others 6,821 2,040 752 3,411 1,761 4,640
Total 133,631 62,043 30,792 73,263 39,065 201,894
(iv) Renegotiated loans and advances to customers
31 December 2014 31 December 2013% of total loans and advances
% of total loans and advances
Renegotiated loans and advances 4,579 0.04% 4,929 0.05% Less: Renegotiated loans and advances overdue for more than three months (1,926) (0.02%) (2,701) (0.03%)
Renegotiated loans and advances overdue for less than three months 2,653 0.02% 2,228 0.02%
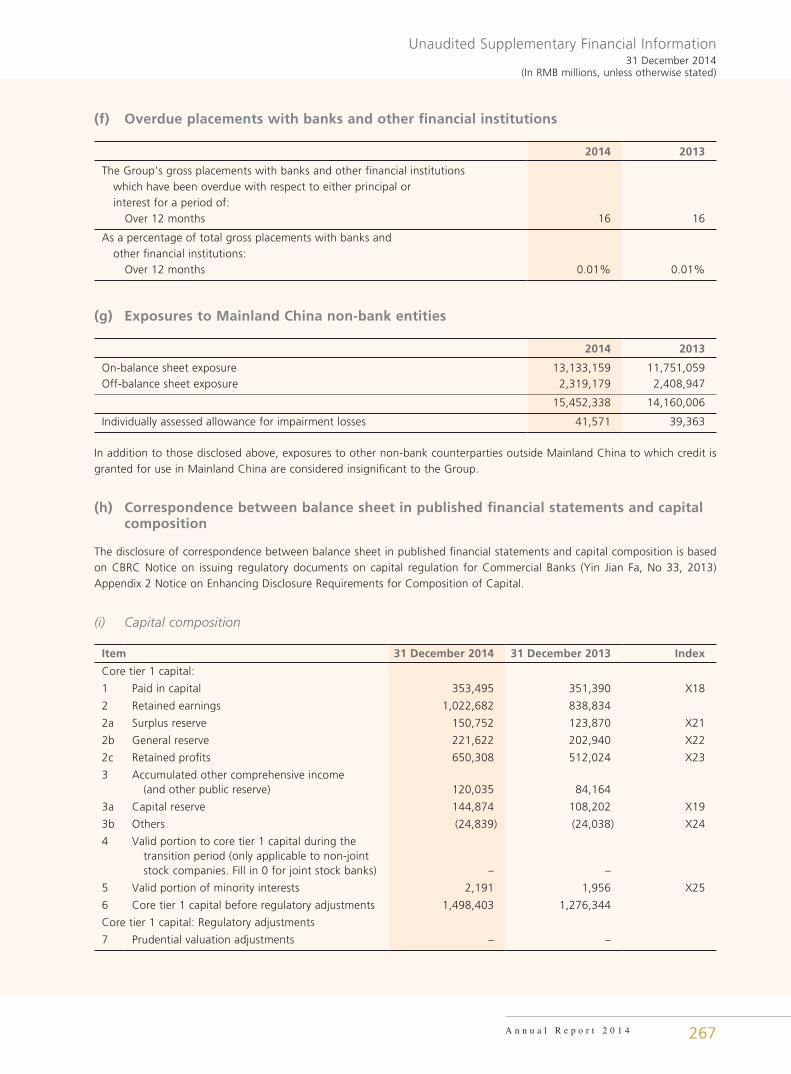
Unaudited Supplementary Financial Information31 December 2014
(In RMB millions, unless otherwise stated)
A n n u a l R e p o r t 2 0 1 4 267
(f) Overdue placements with banks and other financial institutions
2014 2013
The Group’s gross placements with banks and other financial institutions which have been overdue with respect to either principal or interest for a period of: Over 12 months 16 16
As a percentage of total gross placements with banks and other financial institutions: Over 12 months 0.01% 0.01%
(g) Exposures to Mainland China non-bank entities
2014 2013
On-balance sheet exposure 13,133,159 11,751,059Off-balance sheet exposure 2,319,179 2,408,947
15,452,338 14,160,006
Individually assessed allowance for impairment losses 41,571 39,363
In addition to those disclosed above, exposures to other non-bank counterparties outside Mainland China to which credit is granted for use in Mainland China are considered insignificant to the Group.
(h) Correspondence between balance sheet in published financial statements and capital composition
The disclosure of correspondence between balance sheet in published financial statements and capital composition is based on CBRC Notice on issuing regulatory documents on capital regulation for Commercial Banks (Yin Jian Fa, No 33, 2013) Appendix 2 Notice on Enhancing Disclosure Requirements for Composition of Capital.
(i) Capital composition
Item 31 December 2014 31 December 2013 Index
Core tier 1 capital:
1 Paid in capital 353,495 351,390 X18
2 Retained earnings 1,022,682 838,834
2a Surplus reserve 150,752 123,870 X21
2b General reserve 221,622 202,940 X22
2c Retained profits 650,308 512,024 X23
3 Accumulated other comprehensive income (and other public reserve) 120,035 84,164
3a Capital reserve 144,874 108,202 X19
3b Others (24,839) (24,038) X24
4 Valid portion to core tier 1 capital during the transition period (only applicable to non-joint stock companies. Fill in 0 for joint stock banks) – –
5 Valid portion of minority interests 2,191 1,956 X25
6 Core tier 1 capital before regulatory adjustments 1,498,403 1,276,344
Core tier 1 capital: Regulatory adjustments
7 Prudential valuation adjustments – –
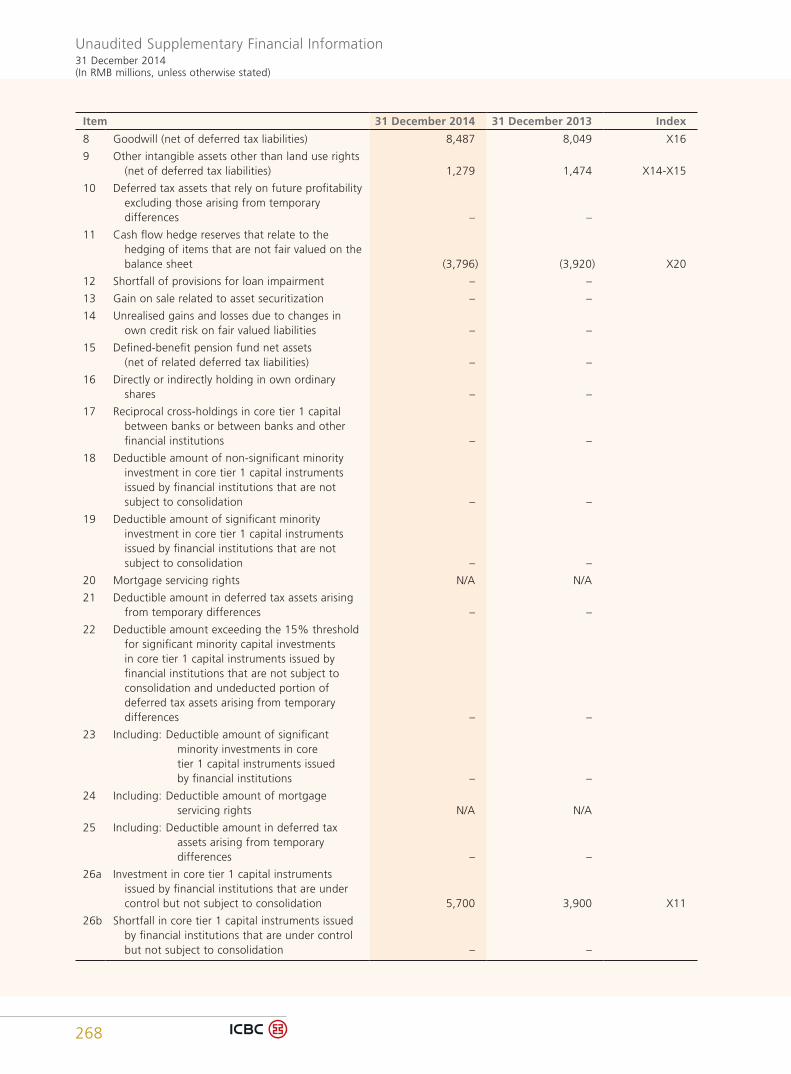
Unaudited Supplementary Financial Information31 December 2014(In RMB millions, unless otherwise stated)
268
Item 31 December 2014 31 December 2013 Index
8 Goodwill (net of deferred tax liabilities) 8,487 8,049 X16
9 Other intangible assets other than land use rights (net of deferred tax liabilities) 1,279 1,474 X14-X15
10 Deferred tax assets that rely on future profitability excluding those arising from temporary
differences – –
11 Cash flow hedge reserves that relate to the hedging of items that are not fair valued on the balance sheet (3,796) (3,920) X20
12 Shortfall of provisions for loan impairment – –
13 Gain on sale related to asset securitization – –
14 Unrealised gains and losses due to changes in own credit risk on fair valued liabilities – –
15 Defined-benefit pension fund net assets (net of related deferred tax liabilities) – –
16 Directly or indirectly holding in own ordinary shares – –
17 Reciprocal cross-holdings in core tier 1 capital between banks or between banks and other financial institutions – –
18 Deductible amount of non-significant minority investment in core tier 1 capital instruments issued by financial institutions that are not subject to consolidation – –
19 Deductible amount of significant minority investment in core tier 1 capital instruments issued by financial institutions that are not subject to consolidation – –
20 Mortgage servicing rights N/A N/A
21 Deductible amount in deferred tax assets arising from temporary differences – –
22 Deductible amount exceeding the 15% threshold for significant minority capital investments in core tier 1 capital instruments issued by financial institutions that are not subject to consolidation and undeducted portion of deferred tax assets arising from temporary differences – –
23 Including: Deductible amount of significant minority investments in core tier 1 capital instruments issued by financial institutions – –
24 Including: Deductible amount of mortgage servicing rights N/A N/A
25 Including: Deductible amount in deferred tax assets arising from temporary differences – –
26a Investment in core tier 1 capital instruments issued by financial institutions that are under control but not subject to consolidation 5,700 3,900 X11
26b Shortfall in core tier 1 capital instruments issued by financial institutions that are under control but not subject to consolidation – –
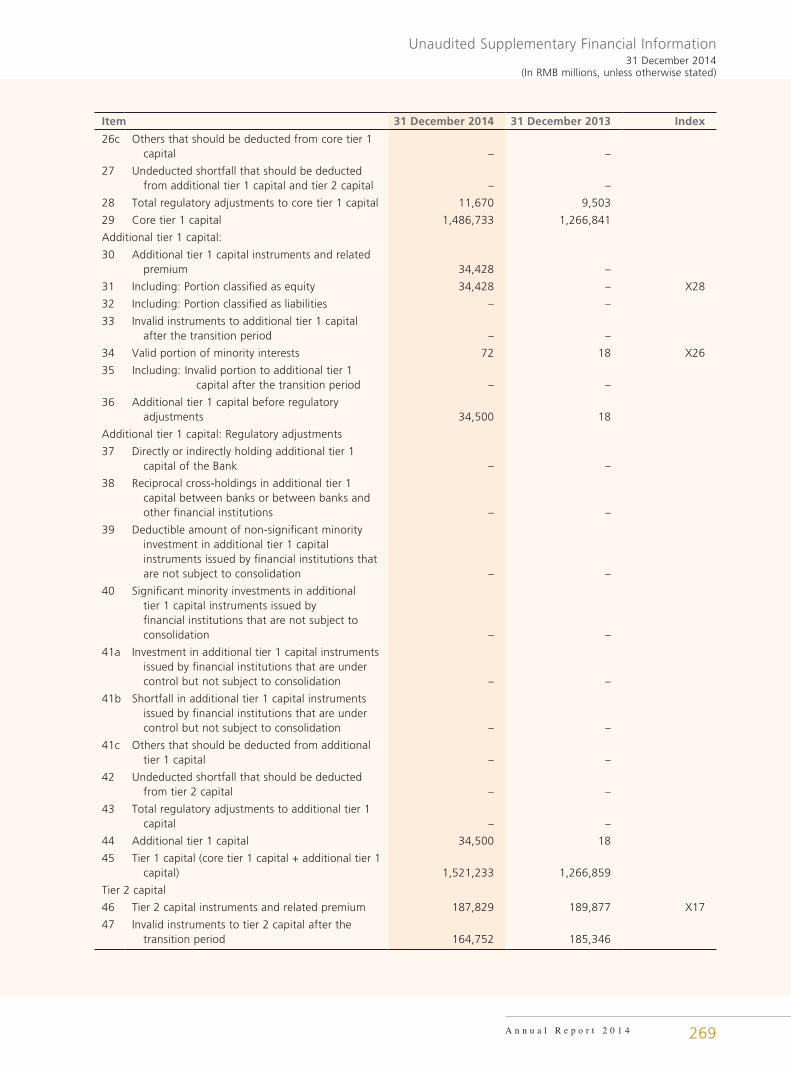
Unaudited Supplementary Financial Information31 December 2014
(In RMB millions, unless otherwise stated)
A n n u a l R e p o r t 2 0 1 4 269
Item 31 December 2014 31 December 2013 Index
26c Others that should be deducted from core tier 1 capital – –
27 Undeducted shortfall that should be deducted from additional tier 1 capital and tier 2 capital – –
28 Total regulatory adjustments to core tier 1 capital 11,670 9,503
29 Core tier 1 capital 1,486,733 1,266,841
Additional tier 1 capital:
30 Additional tier 1 capital instruments and related premium 34,428 –
31 Including: Portion classified as equity 34,428 – X28
32 Including: Portion classified as liabilities – –
33 Invalid instruments to additional tier 1 capital after the transition period – –
34 Valid portion of minority interests 72 18 X26
35 Including: Invalid portion to additional tier 1 capital after the transition period – –
36 Additional tier 1 capital before regulatory adjustments 34,500 18
Additional tier 1 capital: Regulatory adjustments
37 Directly or indirectly holding additional tier 1 capital of the Bank – –
38 Reciprocal cross-holdings in additional tier 1 capital between banks or between banks and other financial institutions – –
39 Deductible amount of non-significant minority investment in additional tier 1 capital instruments issued by financial institutions that are not subject to consolidation – –
40 Significant minority investments in additional tier 1 capital instruments issued by financial institutions that are not subject to consolidation – –
41a Investment in additional tier 1 capital instruments issued by financial institutions that are under control but not subject to consolidation – –
41b Shortfall in additional tier 1 capital instruments issued by financial institutions that are under control but not subject to consolidation – –
41c Others that should be deducted from additional tier 1 capital – –
42 Undeducted shortfall that should be deducted from tier 2 capital – –
43 Total regulatory adjustments to additional tier 1 capital – –
44 Additional tier 1 capital 34,500 18
45 Tier 1 capital (core tier 1 capital + additional tier 1 capital) 1,521,233 1,266,859
Tier 2 capital
46 Tier 2 capital instruments and related premium 187,829 189,877 X17
47 Invalid instruments to tier 2 capital after the transition period 164,752 185,346
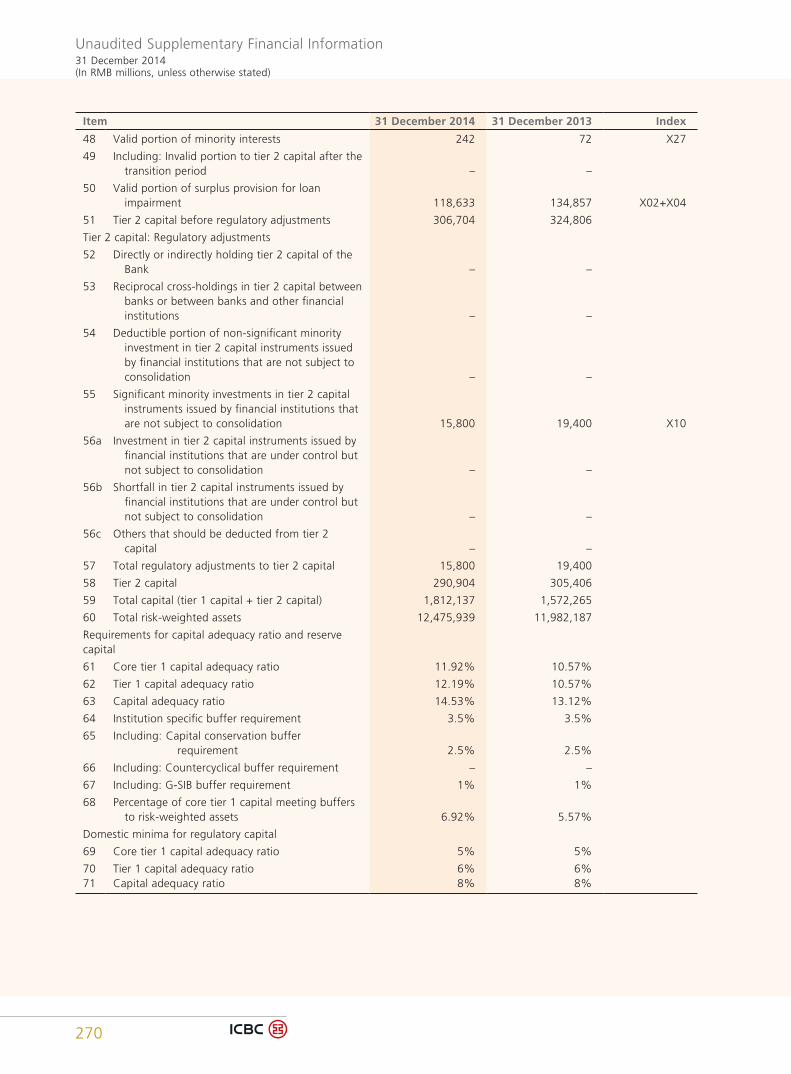
Unaudited Supplementary Financial Information31 December 2014(In RMB millions, unless otherwise stated)
270
Item 31 December 2014 31 December 2013 Index
48 Valid portion of minority interests 242 72 X27
49 Including: Invalid portion to tier 2 capital after the transition period – –
50 Valid portion of surplus provision for loan impairment 118,633 134,857 X02+X04
51 Tier 2 capital before regulatory adjustments 306,704 324,806
Tier 2 capital: Regulatory adjustments
52 Directly or indirectly holding tier 2 capital of the Bank – –
53 Reciprocal cross-holdings in tier 2 capital between banks or between banks and other financial institutions – –
54 Deductible portion of non-significant minority investment in tier 2 capital instruments issued by financial institutions that are not subject to consolidation – –
55 Significant minority investments in tier 2 capital instruments issued by financial institutions that are not subject to consolidation 15,800 19,400 X10
56a Investment in tier 2 capital instruments issued by financial institutions that are under control but not subject to consolidation – –
56b Shortfall in tier 2 capital instruments issued by financial institutions that are under control but not subject to consolidation – –
56c Others that should be deducted from tier 2 capital – –
57 Total regulatory adjustments to tier 2 capital 15,800 19,400
58 Tier 2 capital 290,904 305,406
59 Total capital (tier 1 capital + tier 2 capital) 1,812,137 1,572,265
60 Total risk-weighted assets 12,475,939 11,982,187
Requirements for capital adequacy ratio and reserve capital
61 Core tier 1 capital adequacy ratio 11.92% 10.57%
62 Tier 1 capital adequacy ratio 12.19% 10.57%
63 Capital adequacy ratio 14.53% 13.12%
64 Institution specific buffer requirement 3.5% 3.5%
65 Including: Capital conservation buffer requirement 2.5% 2.5%
66 Including: Countercyclical buffer requirement – –
67 Including: G-SIB buffer requirement 1% 1%
68 Percentage of core tier 1 capital meeting buffers to risk-weighted assets 6.92% 5.57%
Domestic minima for regulatory capital
69 Core tier 1 capital adequacy ratio 5% 5%
70 Tier 1 capital adequacy ratio 6% 6%71 Capital adequacy ratio 8% 8%
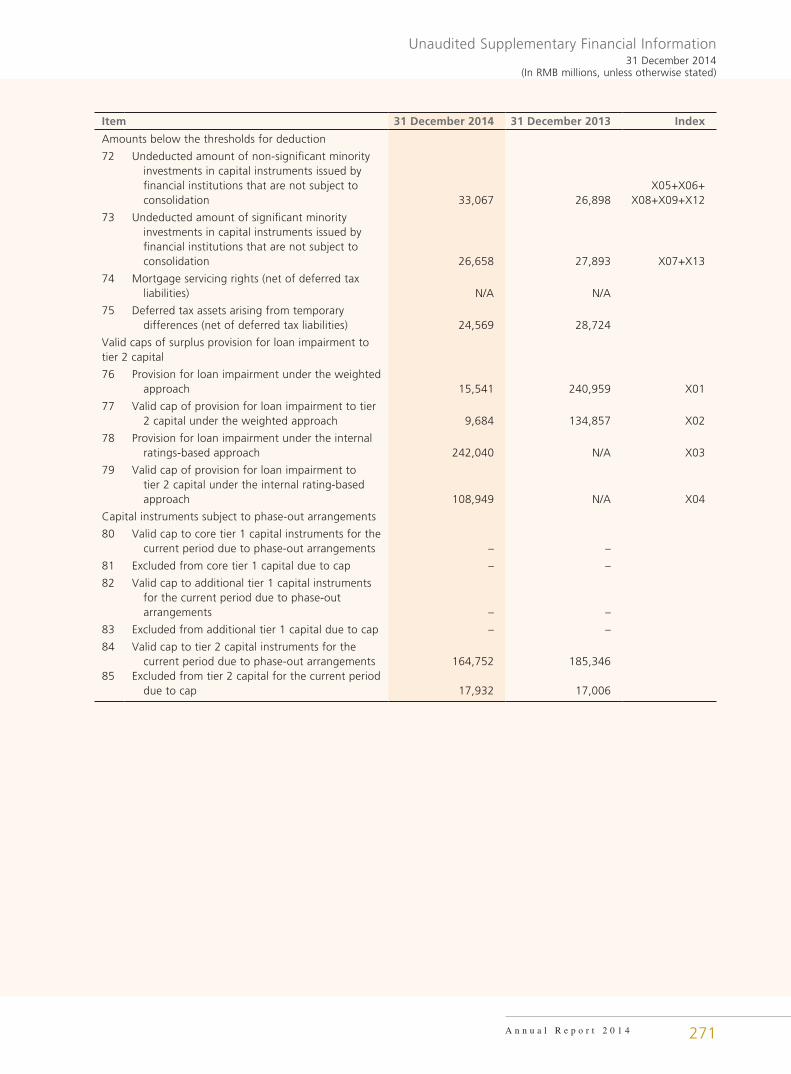
Unaudited Supplementary Financial Information31 December 2014
(In RMB millions, unless otherwise stated)
A n n u a l R e p o r t 2 0 1 4 271
Item 31 December 2014 31 December 2013 Index
Amounts below the thresholds for deduction
72 Undeducted amount of non-significant minority investments in capital instruments issued by financial institutions that are not subject to consolidation 33,067 26,898
X05+X06+ X08+X09+X12
73 Undeducted amount of significant minority investments in capital instruments issued by financial institutions that are not subject to consolidation 26,658 27,893 X07+X13
74 Mortgage servicing rights (net of deferred tax liabilities) N/A N/A
75 Deferred tax assets arising from temporary differences (net of deferred tax liabilities) 24,569 28,724
Valid caps of surplus provision for loan impairment to tier 2 capital
76 Provision for loan impairment under the weighted approach 15,541 240,959 X01
77 Valid cap of provision for loan impairment to tier 2 capital under the weighted approach 9,684 134,857 X02
78 Provision for loan impairment under the internal ratings-based approach 242,040 N/A X03
79 Valid cap of provision for loan impairment to tier 2 capital under the internal rating-based approach 108,949 N/A X04
Capital instruments subject to phase-out arrangements
80 Valid cap to core tier 1 capital instruments for the current period due to phase-out arrangements – –
81 Excluded from core tier 1 capital due to cap – –
82 Valid cap to additional tier 1 capital instruments for the current period due to phase-out arrangements – –
83 Excluded from additional tier 1 capital due to cap – –
84 Valid cap to tier 2 capital instruments for the current period due to phase-out arrangements 164,752 185,346
85 Excluded from tier 2 capital for the current period due to cap 17,932 17,006
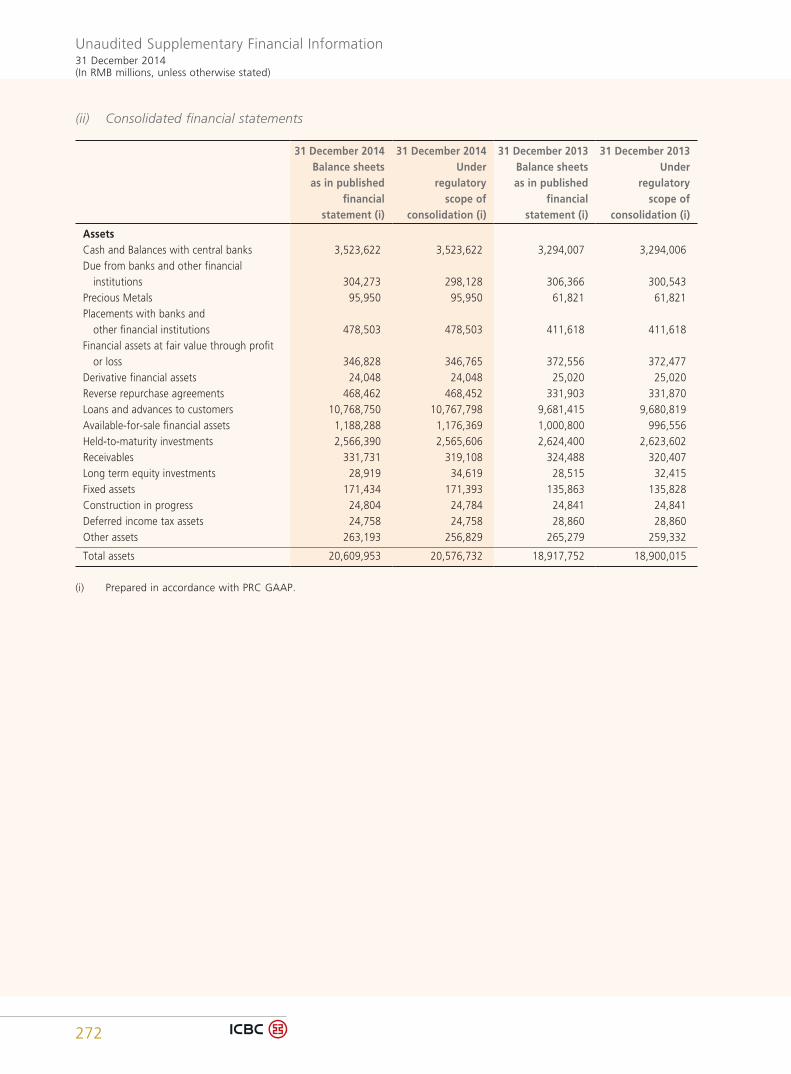
Unaudited Supplementary Financial Information31 December 2014(In RMB millions, unless otherwise stated)
272
(ii) Consolidated financial statements
31 December 2014 31 December 2014 31 December 2013 31 December 2013Balance sheets as in published
financial statement (i)
Under regulatory
scope ofconsolidation (i)
Balance sheets as in published
financial statement (i)
Under regulatory
scope ofconsolidation (i)
AssetsCash and Balances with central banks 3,523,622 3,523,622 3,294,007 3,294,006Due from banks and other financial institutions 304,273 298,128 306,366 300,543Precious Metals 95,950 95,950 61,821 61,821Placements with banks and other financial institutions 478,503 478,503 411,618 411,618Financial assets at fair value through profit or loss 346,828 346,765 372,556 372,477Derivative financial assets 24,048 24,048 25,020 25,020Reverse repurchase agreements 468,462 468,452 331,903 331,870Loans and advances to customers 10,768,750 10,767,798 9,681,415 9,680,819Available-for-sale financial assets 1,188,288 1,176,369 1,000,800 996,556Held-to-maturity investments 2,566,390 2,565,606 2,624,400 2,623,602Receivables 331,731 319,108 324,488 320,407Long term equity investments 28,919 34,619 28,515 32,415Fixed assets 171,434 171,393 135,863 135,828Construction in progress 24,804 24,784 24,841 24,841Deferred income tax assets 24,758 24,758 28,860 28,860Other assets 263,193 256,829 265,279 259,332
Total assets 20,609,953 20,576,732 18,917,752 18,900,015
(i) Prepared in accordance with PRC GAAP.
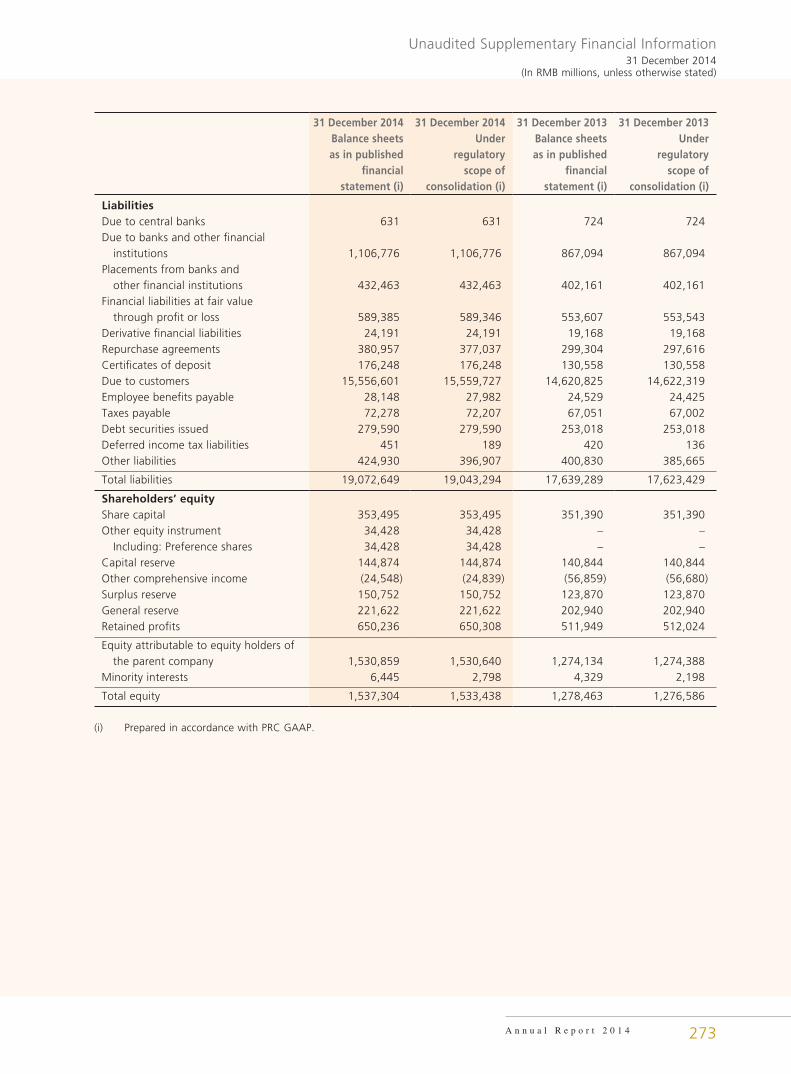
Unaudited Supplementary Financial Information31 December 2014
(In RMB millions, unless otherwise stated)
A n n u a l R e p o r t 2 0 1 4 273
31 December 2014 31 December 2014 31 December 2013 31 December 2013Balance sheets as in published
financial statement (i)
Under regulatory
scope of consolidation (i)
Balance sheets as in published
financial statement (i)
Under regulatory
scope of consolidation (i)
LiabilitiesDue to central banks 631 631 724 724Due to banks and other financial institutions 1,106,776 1,106,776 867,094 867,094Placements from banks and other financial institutions 432,463 432,463 402,161 402,161Financial liabilities at fair value through profit or loss 589,385 589,346 553,607 553,543Derivative financial liabilities 24,191 24,191 19,168 19,168Repurchase agreements 380,957 377,037 299,304 297,616Certificates of deposit 176,248 176,248 130,558 130,558Due to customers 15,556,601 15,559,727 14,620,825 14,622,319Employee benefits payable 28,148 27,982 24,529 24,425Taxes payable 72,278 72,207 67,051 67,002Debt securities issued 279,590 279,590 253,018 253,018Deferred income tax liabilities 451 189 420 136Other liabilities 424,930 396,907 400,830 385,665
Total liabilities 19,072,649 19,043,294 17,639,289 17,623,429
Shareholders’ equityShare capital 353,495 353,495 351,390 351,390Other equity instrument 34,428 34,428 – – Including: Preference shares 34,428 34,428 – –Capital reserve 144,874 144,874 140,844 140,844Other comprehensive income (24,548) (24,839) (56,859) (56,680)Surplus reserve 150,752 150,752 123,870 123,870General reserve 221,622 221,622 202,940 202,940Retained profits 650,236 650,308 511,949 512,024
Equity attributable to equity holders of the parent company 1,530,859 1,530,640 1,274,134 1,274,388Minority interests 6,445 2,798 4,329 2,198
Total equity 1,537,304 1,533,438 1,278,463 1,276,586
(i) Prepared in accordance with PRC GAAP.
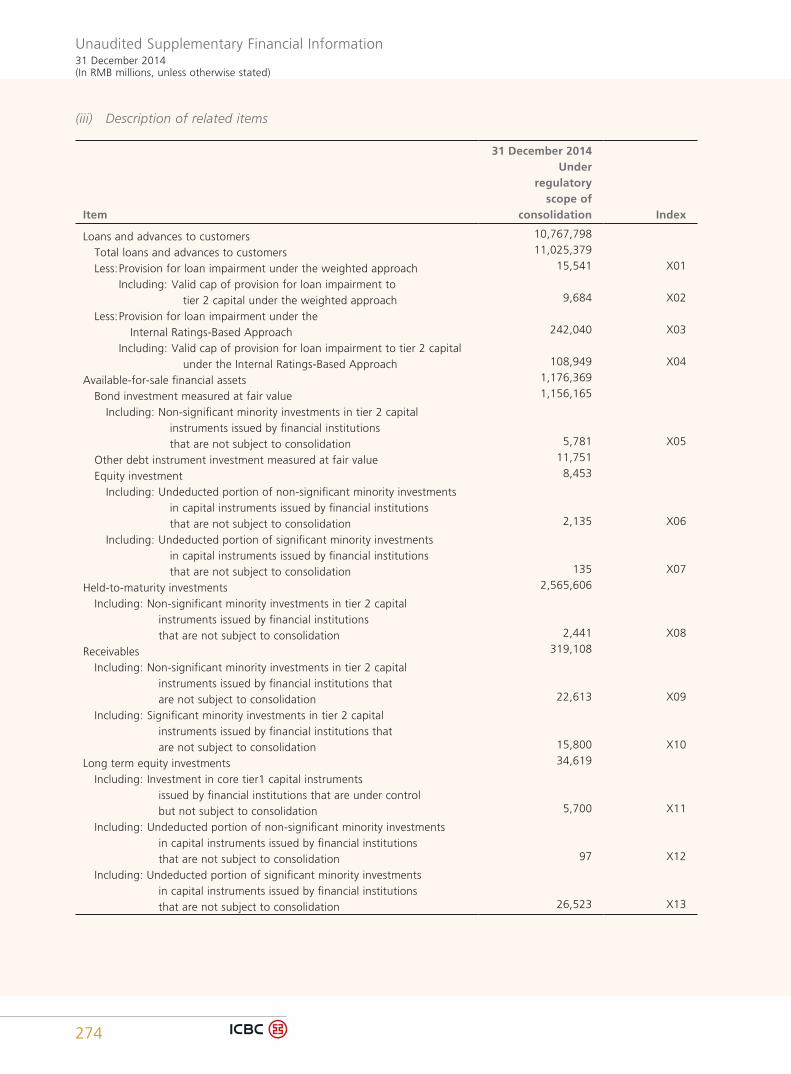
Unaudited Supplementary Financial Information31 December 2014(In RMB millions, unless otherwise stated)
274
(iii) Description of related items
Item
31 December 2014 Under
regulatory scope of
consolidation Index
Loans and advances to customers 10,767,798
Total loans and advances to customers 11,025,379
Less: Provision for loan impairment under the weighted approach 15,541 X01
Including: Valid cap of provision for loan impairment to tier 2 capital under the weighted approach 9,684 X02
Less: Provision for loan impairment under the Internal Ratings-Based Approach 242,040 X03
Including: Valid cap of provision for loan impairment to tier 2 capital under the Internal Ratings-Based Approach 108,949 X04
Available-for-sale financial assets 1,176,369
Bond investment measured at fair value 1,156,165
Including: Non-significant minority investments in tier 2 capital instruments issued by financial institutions that are not subject to consolidation 5,781 X05
Other debt instrument investment measured at fair value 11,751
Equity investment 8,453
Including: Undeducted portion of non-significant minority investments in capital instruments issued by financial institutions that are not subject to consolidation 2,135 X06
Including: Undeducted portion of significant minority investments in capital instruments issued by financial institutions that are not subject to consolidation 135 X07
Held-to-maturity investments 2,565,606
Including: Non-significant minority investments in tier 2 capital instruments issued by financial institutions that are not subject to consolidation 2,441 X08
Receivables 319,108
Including: Non-significant minority investments in tier 2 capital instruments issued by financial institutions that are not subject to consolidation 22,613 X09
Including: Significant minority investments in tier 2 capital instruments issued by financial institutions that are not subject to consolidation 15,800 X10
Long term equity investments 34,619
Including: Investment in core tier1 capital instruments issued by financial institutions that are under control but not subject to consolidation 5,700 X11
Including: Undeducted portion of non-significant minority investments in capital instruments issued by financial institutions that are not subject to consolidation 97 X12
Including: Undeducted portion of significant minority investments in capital instruments issued by financial institutions that are not subject to consolidation 26,523 X13
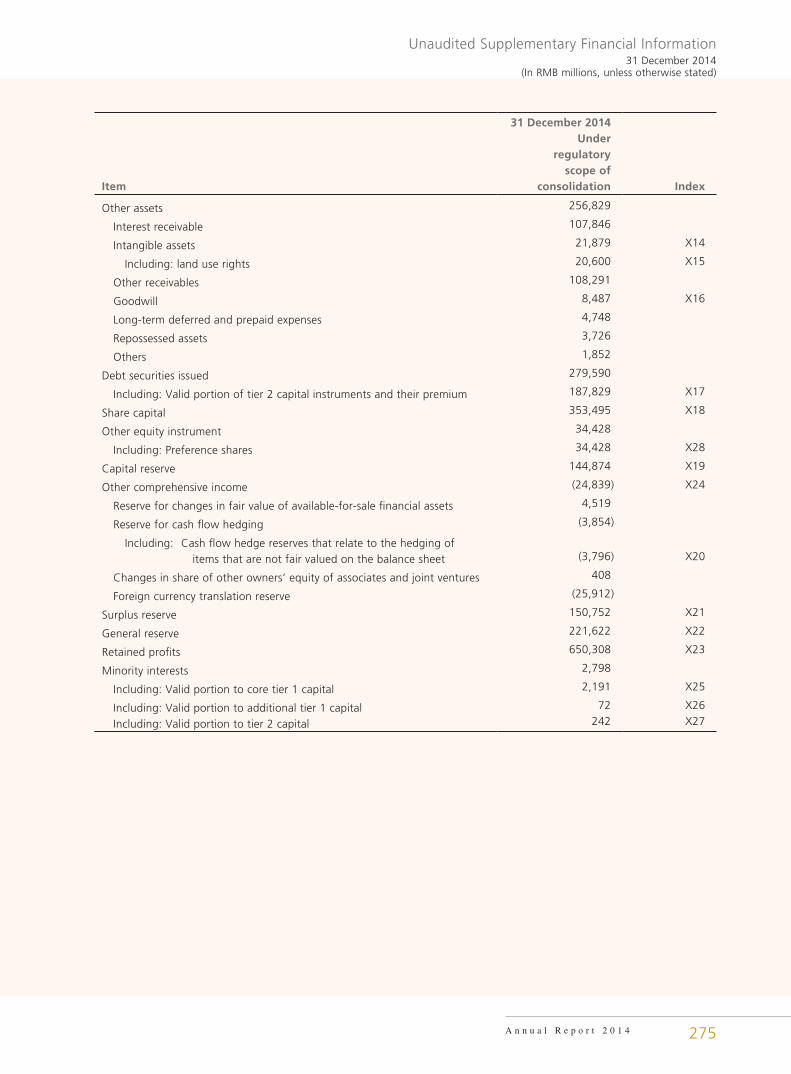
Unaudited Supplementary Financial Information31 December 2014
(In RMB millions, unless otherwise stated)
A n n u a l R e p o r t 2 0 1 4 275
Item
31 December 2014 Under
regulatory scope of
consolidation Index
Other assets 256,829
Interest receivable 107,846
Intangible assets 21,879 X14
Including: land use rights 20,600 X15
Other receivables 108,291
Goodwill 8,487 X16
Long-term deferred and prepaid expenses 4,748
Repossessed assets 3,726
Others 1,852
Debt securities issued 279,590
Including: Valid portion of tier 2 capital instruments and their premium 187,829 X17
Share capital 353,495 X18
Other equity instrument 34,428
Including: Preference shares 34,428 X28
Capital reserve 144,874 X19
Other comprehensive income (24,839) X24
Reserve for changes in fair value of available-for-sale financial assets 4,519
Reserve for cash flow hedging (3,854)
Including: Cash flow hedge reserves that relate to the hedging of items that are not fair valued on the balance sheet (3,796) X20
Changes in share of other owners’ equity of associates and joint ventures 408
Foreign currency translation reserve (25,912)
Surplus reserve 150,752 X21
General reserve 221,622 X22
Retained profits 650,308 X23
Minority interests 2,798
Including: Valid portion to core tier 1 capital 2,191 X25
Including: Valid portion to additional tier 1 capital 72 X26
Including: Valid portion to tier 2 capital 242 X27
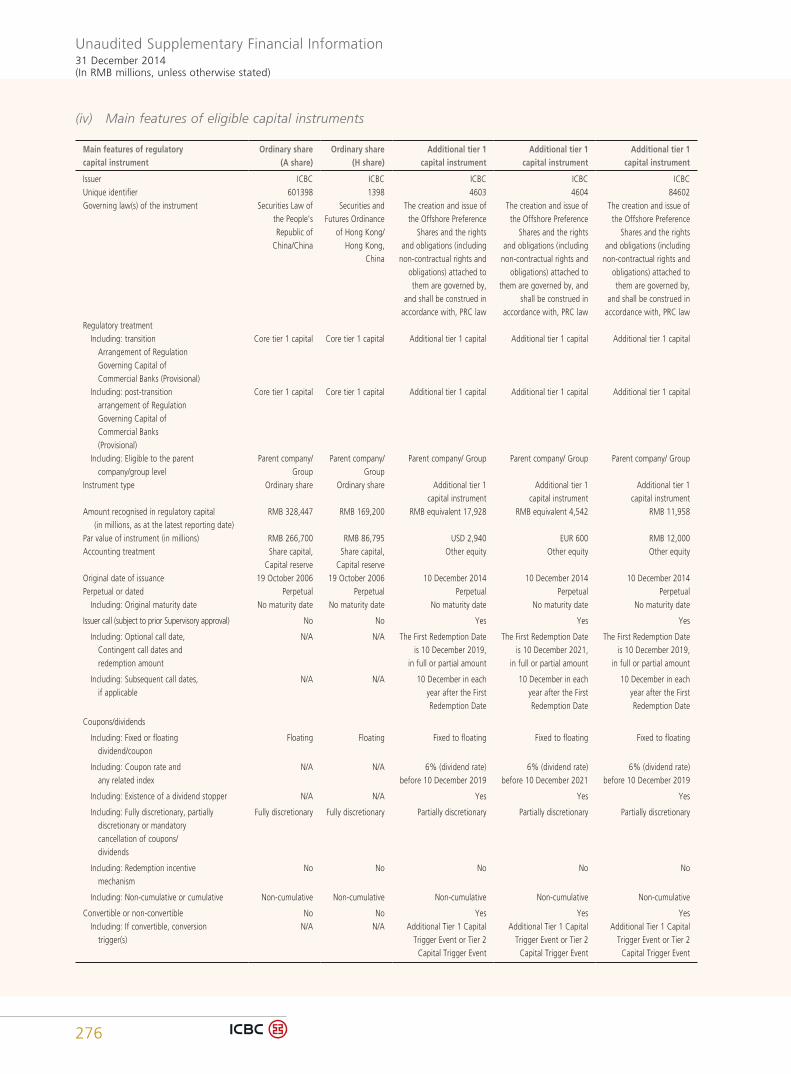
Unaudited Supplementary Financial Information31 December 2014(In RMB millions, unless otherwise stated)
276
(iv) Main features of eligible capital instruments
Main features of regulatory capital instrument
Ordinary share(A share)
Ordinary share(H share)
Additional tier 1 capital instrument
Additional tier 1 capital instrument
Additional tier 1 capital instrument
Issuer ICBC ICBC ICBC ICBC ICBCUnique identifier 601398 1398 4603 4604 84602Governing law(s) of the instrument Securities Law of
the People’sRepublic of
China/China
Securities and Futures Ordinance
of Hong Kong/ Hong Kong,
China
The creation and issue ofthe Offshore Preference
Shares and the rightsand obligations (including
non-contractual rights andobligations) attached to them are governed by,
and shall be construed in accordance with, PRC law
The creation and issue ofthe Offshore Preference
Shares and the rightsand obligations (including
non-contractual rights andobligations) attached to
them are governed by, and shall be construed in
accordance with, PRC law
The creation and issue ofthe Offshore Preference
Shares and the rightsand obligations (including
non-contractual rights andobligations) attached to them are governed by,
and shall be construed in accordance with, PRC law
Regulatory treatment Including: transition Arrangement of Regulation Governing Capital of Commercial Banks (Provisional)
Core tier 1 capital Core tier 1 capital Additional tier 1 capital Additional tier 1 capital Additional tier 1 capital
Including: post-transition arrangement of Regulation Governing Capital of Commercial Banks (Provisional)
Core tier 1 capital Core tier 1 capital Additional tier 1 capital Additional tier 1 capital Additional tier 1 capital
Including: Eligible to the parent company/group level
Parent company/ Group
Parent company/Group
Parent company/ Group Parent company/ Group Parent company/ Group
Instrument type Ordinary share Ordinary share Additional tier 1capital instrument
Additional tier 1capital instrument
Additional tier 1capital instrument
Amount recognised in regulatory capital (in millions, as at the latest reporting date)
RMB 328,447 RMB 169,200 RMB equivalent 17,928 RMB equivalent 4,542 RMB 11,958
Par value of instrument (in millions) RMB 266,700 RMB 86,795 USD 2,940 EUR 600 RMB 12,000Accounting treatment Share capital,
Capital reserveShare capital,
Capital reserveOther equity Other equity Other equity
Original date of issuance 19 October 2006 19 October 2006 10 December 2014 10 December 2014 10 December 2014Perpetual or dated Perpetual Perpetual Perpetual Perpetual Perpetual Including: Original maturity date No maturity date No maturity date No maturity date No maturity date No maturity date
Issuer call (subject to prior Supervisory approval) No No Yes Yes Yes
Including: Optional call date, Contingent call dates and redemption amount
N/A N/A The First Redemption Date is 10 December 2019,
in full or partial amount
The First Redemption Date is 10 December 2021,
in full or partial amount
The First Redemption Date is 10 December 2019,
in full or partial amount
Including: Subsequent call dates, if applicable
N/A N/A 10 December in each year after the First Redemption Date
10 December in each year after the First Redemption Date
10 December in each year after the First Redemption Date
Coupons/dividends
Including: Fixed or floating dividend/coupon
Floating Floating Fixed to floating Fixed to floating Fixed to floating
Including: Coupon rate and any related index
N/A N/A 6% (dividend rate)before 10 December 2019
6% (dividend rate)before 10 December 2021
6% (dividend rate)before 10 December 2019
Including: Existence of a dividend stopper N/A N/A Yes Yes Yes
Including: Fully discretionary, partially discretionary or mandatory cancellation of coupons/ dividends
Fully discretionary Fully discretionary Partially discretionary Partially discretionary Partially discretionary
Including: Redemption incentive mechanism
No No No No No
Including: Non-cumulative or cumulative Non-cumulative Non-cumulative Non-cumulative Non-cumulative Non-cumulative
Convertible or non-convertible No No Yes Yes Yes Including: If convertible, conversion trigger(s)
N/A N/A Additional Tier 1 CapitalTrigger Event or Tier 2
Capital Trigger Event
Additional Tier 1 CapitalTrigger Event or Tier 2
Capital Trigger Event
Additional Tier 1 CapitalTrigger Event or Tier 2
Capital Trigger Event
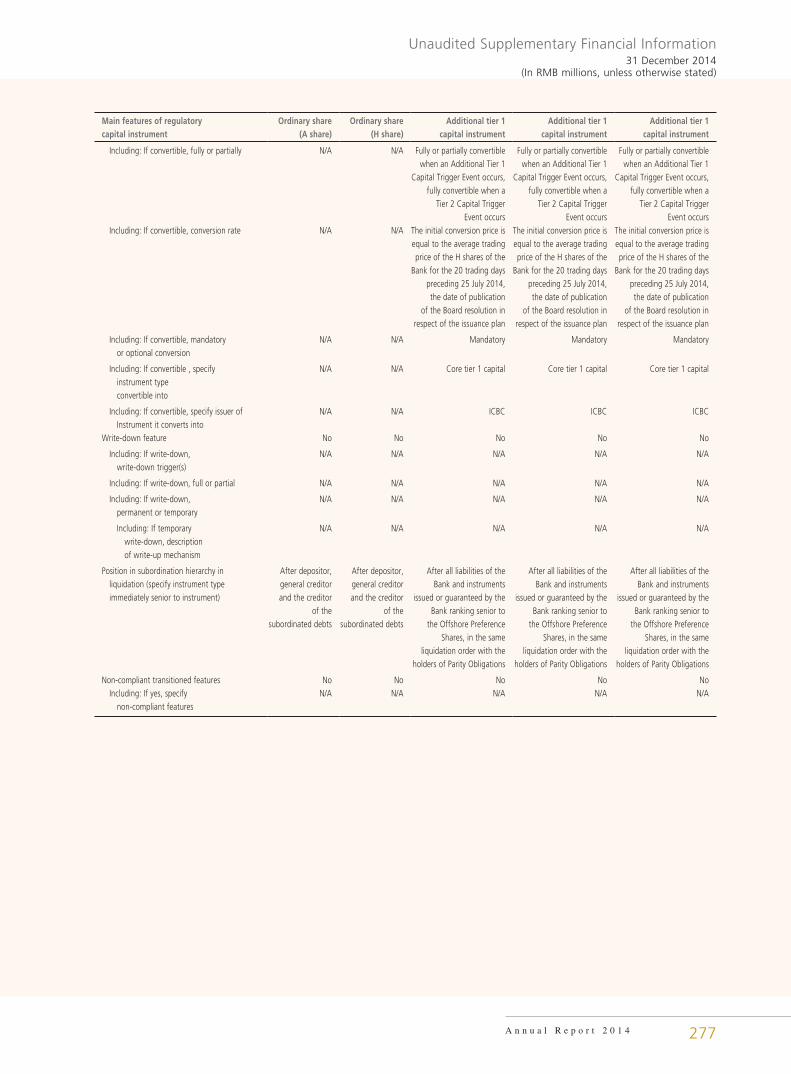
Unaudited Supplementary Financial Information31 December 2014
(In RMB millions, unless otherwise stated)
A n n u a l R e p o r t 2 0 1 4 277
Main features of regulatory capital instrument
Ordinary share(A share)
Ordinary share(H share)
Additional tier 1 capital instrument
Additional tier 1 capital instrument
Additional tier 1 capital instrument
Including: If convertible, fully or partially N/A N/A Fully or partially convertiblewhen an Additional Tier 1
Capital Trigger Event occurs,fully convertible when a
Tier 2 Capital TriggerEvent occurs
Fully or partially convertiblewhen an Additional Tier 1
Capital Trigger Event occurs,fully convertible when a
Tier 2 Capital TriggerEvent occurs
Fully or partially convertiblewhen an Additional Tier 1
Capital Trigger Event occurs,fully convertible when a
Tier 2 Capital TriggerEvent occurs
Including: If convertible, conversion rate N/A N/A The initial conversion price isequal to the average tradingprice of the H shares of the
Bank for the 20 trading dayspreceding 25 July 2014,the date of publication
of the Board resolution inrespect of the issuance plan
The initial conversion price isequal to the average tradingprice of the H shares of the
Bank for the 20 trading dayspreceding 25 July 2014,the date of publication
of the Board resolution inrespect of the issuance plan
The initial conversion price isequal to the average tradingprice of the H shares of the
Bank for the 20 trading dayspreceding 25 July 2014,the date of publication
of the Board resolution inrespect of the issuance plan
Including: If convertible, mandatory or optional conversion
N/A N/A Mandatory Mandatory Mandatory
Including: If convertible , specify instrument type convertible into
N/A N/A Core tier 1 capital Core tier 1 capital Core tier 1 capital
Including: If convertible, specify issuer of Instrument it converts into
N/A N/A ICBC ICBC ICBC
Write-down feature No No No No No
Including: If write-down, write-down trigger(s)
N/A N/A N/A N/A N/A
Including: If write-down, full or partial N/A N/A N/A N/A N/A
Including: If write-down, permanent or temporary
N/A N/A N/A N/A N/A
Including: If temporary write-down, description of write-up mechanism
N/A N/A N/A N/A N/A
Position in subordination hierarchy in liquidation (specify instrument type immediately senior to instrument)
After depositor,general creditorand the creditor
of thesubordinated debts
After depositor,general creditorand the creditor
of thesubordinated debts
After all liabilities of theBank and instruments
issued or guaranteed by theBank ranking senior to
the Offshore PreferenceShares, in the same
liquidation order with theholders of Parity Obligations
After all liabilities of theBank and instruments
issued or guaranteed by theBank ranking senior to
the Offshore PreferenceShares, in the same
liquidation order with theholders of Parity Obligations
After all liabilities of theBank and instruments
issued or guaranteed by theBank ranking senior to
the Offshore PreferenceShares, in the same
liquidation order with theholders of Parity Obligations
Non-compliant transitioned features No No No No No Including: If yes, specify non-compliant features
N/A N/A N/A N/A N/A
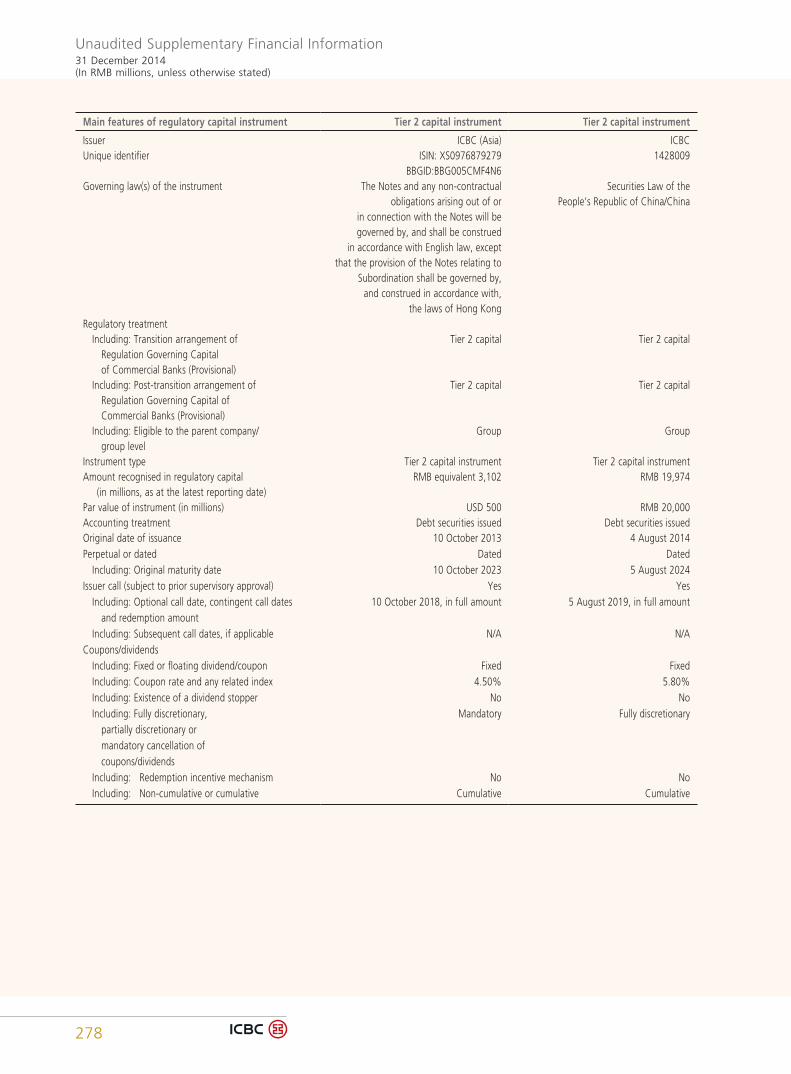
Unaudited Supplementary Financial Information31 December 2014(In RMB millions, unless otherwise stated)
278
Main features of regulatory capital instrument Tier 2 capital instrument Tier 2 capital instrument
Issuer ICBC (Asia) ICBCUnique identifier ISIN: XS0976879279
BBGID:BBG005CMF4N61428009
Governing law(s) of the instrument The Notes and any non-contractualobligations arising out of or
in connection with the Notes will be governed by, and shall be construed
in accordance with English law, except that the provision of the Notes relating to
Subordination shall be governed by, and construed in accordance with,
the laws of Hong Kong
Securities Law of thePeople’s Republic of China/China
Regulatory treatment Including: Transition arrangement of Regulation Governing Capital of Commercial Banks (Provisional)
Tier 2 capital Tier 2 capital
Including: Post-transition arrangement of Regulation Governing Capital of Commercial Banks (Provisional)
Tier 2 capital Tier 2 capital
Including: Eligible to the parent company/ group level
Group Group
Instrument type Tier 2 capital instrument Tier 2 capital instrumentAmount recognised in regulatory capital (in millions, as at the latest reporting date)
RMB equivalent 3,102 RMB 19,974
Par value of instrument (in millions) USD 500 RMB 20,000Accounting treatment Debt securities issued Debt securities issuedOriginal date of issuance 10 October 2013 4 August 2014Perpetual or dated Dated Dated Including: Original maturity date 10 October 2023 5 August 2024Issuer call (subject to prior supervisory approval) Yes Yes Including: Optional call date, contingent call dates and redemption amount
10 October 2018, in full amount 5 August 2019, in full amount
Including: Subsequent call dates, if applicable N/A N/ACoupons/dividends Including: Fixed or floating dividend/coupon Fixed Fixed Including: Coupon rate and any related index 4.50% 5.80% Including: Existence of a dividend stopper No No Including: Fully discretionary, partially discretionary or mandatory cancellation of coupons/dividends
Mandatory Fully discretionary
Including: Redemption incentive mechanism No No Including: Non-cumulative or cumulative Cumulative Cumulative
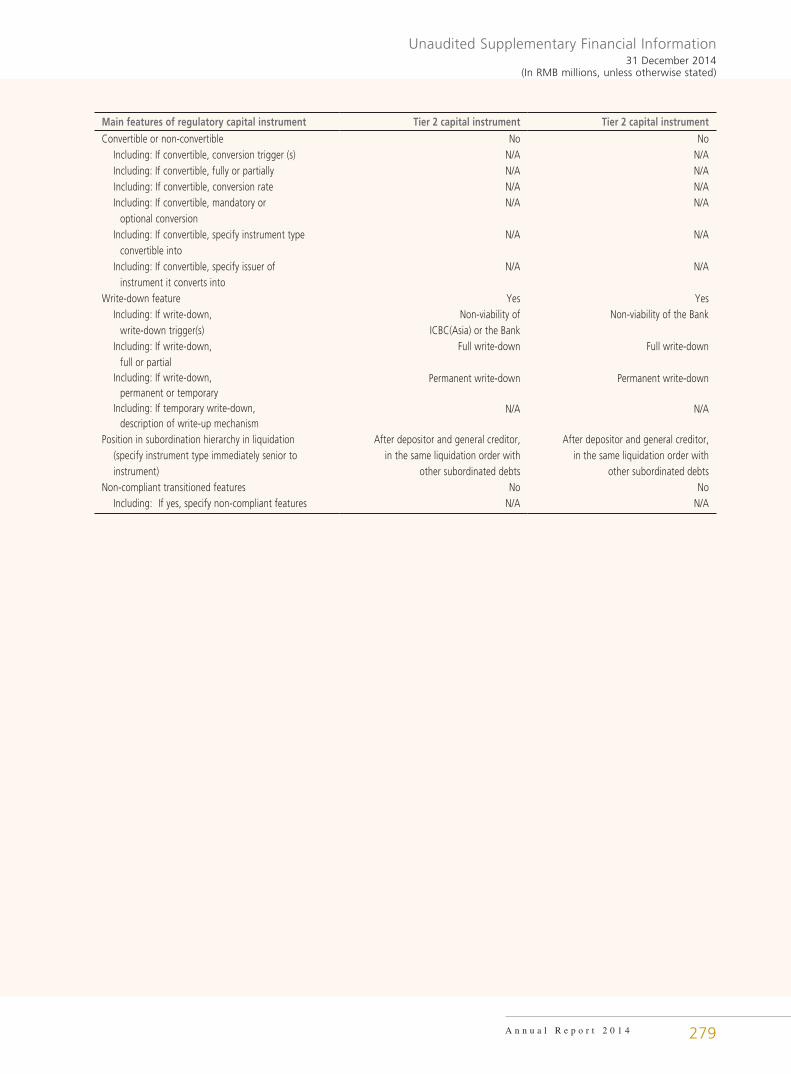
Unaudited Supplementary Financial Information31 December 2014
(In RMB millions, unless otherwise stated)
A n n u a l R e p o r t 2 0 1 4 279
Main features of regulatory capital instrument Tier 2 capital instrument Tier 2 capital instrument
Convertible or non-convertible No No Including: If convertible, conversion trigger (s) N/A N/A Including: If convertible, fully or partially N/A N/A Including: If convertible, conversion rate N/A N/A Including: If convertible, mandatory or optional conversion
N/A N/A
Including: If convertible, specify instrument type convertible into
N/A N/A
Including: If convertible, specify issuer of instrument it converts into
N/A N/A
Write-down feature Yes Yes Including: If write-down, write-down trigger(s)
Non-viability of ICBC(Asia) or the Bank
Non-viability of the Bank
Including: If write-down, full or partial
Full write-down Full write-down
Including: If write-down, permanent or temporary
Permanent write-down Permanent write-down
Including: If temporary write-down, description of write-up mechanism
N/A N/A
Position in subordination hierarchy in liquidation (specify instrument type immediately senior to instrument)
After depositor and general creditor, in the same liquidation order with
other subordinated debts
After depositor and general creditor, in the same liquidation order with
other subordinated debtsNon-compliant transitioned features No No Including: If yes, specify non-compliant features N/A N/A
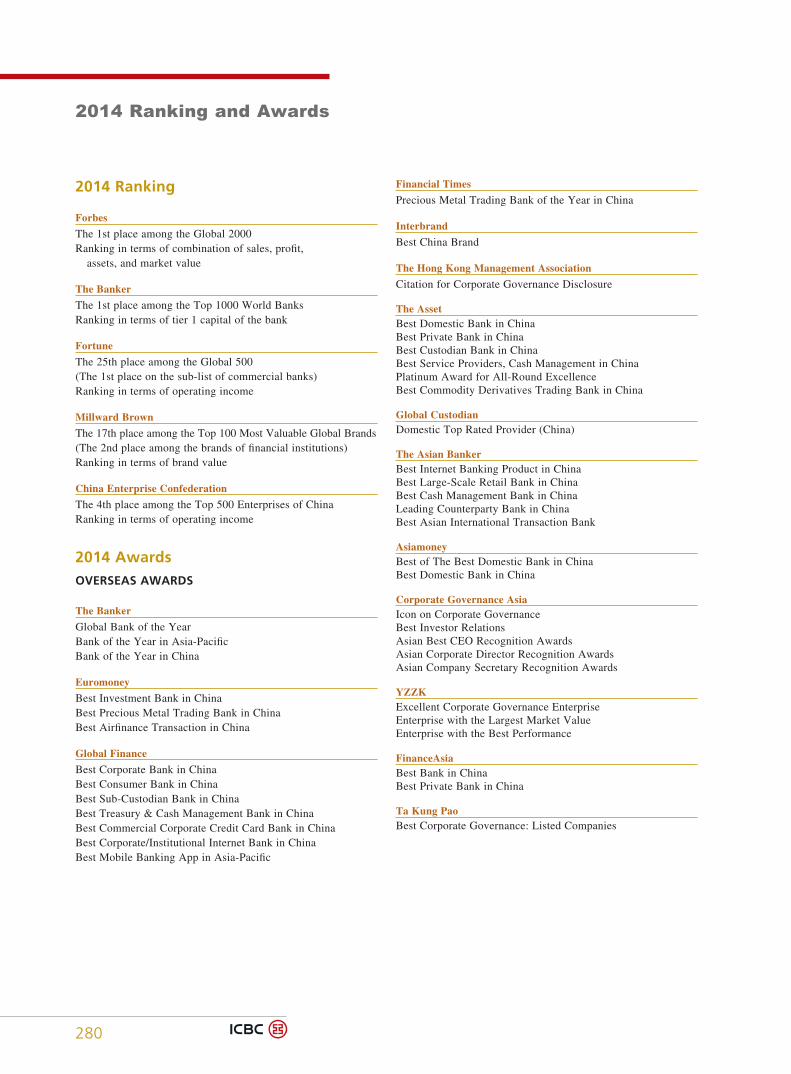
2014 Ranking and Awards
280
2014 Ranking
Forbes
The 1st place among the Global 2000Ranking in terms of combination of sales, profit, assets, and market value
The Banker
The 1st place among the Top 1000 World BanksRanking in terms of tier 1 capital of the bank
Fortune
The 25th place among the Global 500(The 1st place on the sub-list of commercial banks)Ranking in terms of operating income
Millward Brown
The 17th place among the Top 100 Most Valuable Global Brands(The 2nd place among the brands of financial institutions)Ranking in terms of brand value
China Enterprise Confederation
The 4th place among the Top 500 Enterprises of ChinaRanking in terms of operating income
2014 AwardsOVERSEAS AWARDS
The Banker
Global Bank of the YearBank of the Year in Asia-PacificBank of the Year in China
Euromoney
Best Investment Bank in ChinaBest Precious Metal Trading Bank in ChinaBest Airfinance Transaction in China
Global Finance
Best Corporate Bank in ChinaBest Consumer Bank in ChinaBest Sub-Custodian Bank in ChinaBest Treasury & Cash Management Bank in ChinaBest Commercial Corporate Credit Card Bank in ChinaBest Corporate/Institutional Internet Bank in ChinaBest Mobile Banking App in Asia-Pacific
Financial Times
Precious Metal Trading Bank of the Year in China
Interbrand
Best China Brand
The Hong Kong Management Association
Citation for Corporate Governance Disclosure
The AssetBest Domestic Bank in ChinaBest Private Bank in ChinaBest Custodian Bank in ChinaBest Service Providers, Cash Management in ChinaPlatinum Award for All-Round ExcellenceBest Commodity Derivatives Trading Bank in China
Global CustodianDomestic Top Rated Provider (China)
The Asian BankerBest Internet Banking Product in ChinaBest Large-Scale Retail Bank in ChinaBest Cash Management Bank in ChinaLeading Counterparty Bank in ChinaBest Asian International Transaction Bank
AsiamoneyBest of The Best Domestic Bank in ChinaBest Domestic Bank in China
Corporate Governance AsiaIcon on Corporate GovernanceBest Investor RelationsAsian Best CEO Recognition AwardsAsian Corporate Director Recognition AwardsAsian Company Secretary Recognition Awards
YZZKExcellent Corporate Governance EnterpriseEnterprise with the Largest Market ValueEnterprise with the Best Performance
FinanceAsiaBest Bank in ChinaBest Private Bank in China
Ta Kung PaoBest Corporate Governance: Listed Companies
281
2014 Ranking and Awards
A n n u a l R e p o r t 2 0 1 4
The American LawyerBest M&A Deal of the Year
Institutional InvestorBest Cross-border M&A Expert in China
Visa Inc.Best Risk Control in Asia-Pacific
MasterCard WorldwideLeading Enterprise in Mobile Payment InnovationBest Business Card Issuer of the YearBest Acquiring Bank in Merchant MarketingImprovement Award in Cross-border TransactionBest Traveling Innovative Payment Product
American ExpressBest ProductBest Acquirer Service PartnerBest Channel Cooperation
DOMESTIC AWARDS
MOF
1st Place among “counter-based service handling banks” by spot trading volume of book-entry treasury bond
PBC
First Award for Bank Technological Development
Ministry of Culture, PBC
Award for Excellent Achievement in Innovative Cultural and Financial Cooperation
Ministry of Industry and Information Technology
No. 1 Credit Card Brand in China
China Banking Association
Best Social Responsibility Financial Institution AwardBest Green Finance Award in Social Responsibility of the YearSocial Responsibility Leader Award of the YearExcellent Charity Project Award of the YearBest Social Responsibility Special Contribution Outlet Award of the YearBest Effect Award for “Popularizing Financial Knowledge” Series in Chinese Banking IndustryOutstanding Contribution Award in “The Month of Bank Card Internet Payment Security” of the Chinese Banking SectorOutstanding Contribution Award in Civilized and Standard Services of the Chinese Banking SectorBest Bank in Internet Trade FinanceBest Performance Award for Syndicated LoansBest Management Award for Syndicated LoansBest Transaction Award for Syndicated LoansBest Performance Award for Pension ServiceBest Growth Award for Pension ServiceMost Influential Figure in Pension SectorCustomer Service Center — Comprehensive Model AwardCustomer Service Center — Excellent Innovation AwardCustomer Service Center — Excellent Services Award
China Foreign Exchange Trade System
Best Market MakerBest Market Making AwardBest Market Maker Award in Forward and SwapBest Trading AwardBest Spot Trading AwardBest Forward and Swap Trading AwardBest Non-USD Trading AwardBest Foreign Currency Pair Trading AwardMost Popular Forward and Swap Market MakerBest Market Maker Award in Outright-traded CurrencyBest Market Maker Award in TechnologyBest Market Maker Award in Back-office SupportBest Membership Award in Foreign Currency PairTop 100 Interbank RMB Market TransactionsMember of Excellent Interbank RMB Market TransactionsBest Market Maker in Back-office Support of Interbank Foreign Exchange Market
Shanghai Clearing House
Excellent Member of Shanghai Clearing House in SettlementExcellent Member of Shanghai Clearing House in ClearingExcellent Member of Shanghai Clearing House in Foreign Exchange Clearing
China Gold Association
Best Innovation Award of the World Gold CouncilSpecial Contribution Award of the World Gold Council
Shanghai Gold Exchange
Excellent Financial Institution MemberFirst Award in Leasing Services
China UnionPay
Outstanding Contribution Award in UnionPay Card Cross-bank TransactionContribution Award in UnionPay Card PromotionContribution Award in UnionPay IC Card PromotionPolice-Bank Joint Development Contribution Award
China Advertising Association
China Advertising Great Wall Award: Advertiser
China Enterprise Confederation
Award of Innovation Achievements of National Enterprises Management Modernization
The Chinese Institute of Business Administration
Best Award in Transparency to PublicModel of Transparency to the Public
Brand Building and Promotion Society of China, China National Institute of Standardization
1st Place among enterprises of China Brand Value Assessment
Daonong Center for Enterprise
Chinese Green Companies Top 100
2014 Ranking and Awards
282
China Business Council for Sustainable Development
Excellent Corporate Social Responsibility Report: Leader Enterprise
Corporate Citizen Committee of China Association of Social Work, CCTV-2, Tencent Charity Foundation
Excellent Corporate Citizen of China
Global Compact Network China
“Caring for Climate, Ecological Civilization” Pioneer Enterprise AwardBest Practices in Contributing to Social Development and Cooperation
Chinese Foundation for Lifeline Express
Bright Merit Award
Govmade Informationization Development Research Center
Comprehensive Leadership Award
China Internet Finance Conference, China Internet Finance Association, Hexun
Top 100 Internet Finance Brands in China
China Financial Certification Authority
Best E-banking in ChinaTen 10 Marketing Cases in Financial Sector: Connections
China Internet Banking Union
E-banking Innovation Award: Best Practices in Financial Internet
China Financial Industry Call Center Development League
Operation and Management Elite Team Award
China Association of Trade in Service, China Information Industry Association
Best Customer Service Center in ChinaBest Customer Service Management Team in China
China Call-Centre & CRM Association
China Best Call Center Operations Award
Organizing Committee of Annual China E-finance Conference
Internet-based Finance Innovation Award in China
Asia Pacific Call Center Association Leaders
China Best Call Center Operations Award
Association for Safe Internet-based Payment
Excellence Award for Security Promotion
China E-Commerce Association
China Best Call Center Operations Award
Financial News
Best Commerical BankChina Financial Institutions Medal Tally: Golden Dragon Award
China Securities Journal
Golden Bull Wealth Management Bank AwardGolden Bull Award: Top 100 Listed CompaniesGolden Bull Award: Best Board Secretary
Shanghai Securities News
Best Brand Financial Institutions AwardGolden Governance Information Disclosure Enterprises: Board Secretary AwardBest Private Bank in ChinaBest Credit Card
Securities Times
Best Bank in Investment BankingBest Merger & Acquisition Advisor BankBest Equity Financing ProjectBest Structured Financing Project
China Business Journal
Brand Building Bank with Excellent CompetitivenessState-owned Commercial Bank with Excellent CompetitivenessInternational Banking with Excellent CompetitivenessInvestment Banking with Excellent Competitiveness
The Economic Observer
Excellent Financial E-commerce Platform of the YearMost Respectable Enterprise in China
China Business Network
Retail Bank of the YearCBN Corporate Social Responsibility Ranking in China: Excellent Enterprise Award
Chinese Securities Journal
Gold Board SecretaryExcellent Board Secretary Award in Investor Relations MaintenanceBest Main Board Listed Company
National Business Daily
Best Internet Marketing Bank of the YearSmall & Micro Finance Outstanding Contribution AwardGolden Tripod Award: Most Reputed Credit Card of the Year
21st Century Business Herald
Best Precious Metal BankBest Chinese-funded Private Bank
Southern Weekly
First Place in the List of Chinese State-owned Listed Companies on Corporate Social ResponsibilitiesSocial Responsibility Leader of the Year
Wisemoney
Excellent E-bankingExcellent Bank PresidentBrand Bank with Excellent Global CompetitivenessExcellent Bank Card Innovation Management FigureExcellent Bank Card
283
2014 Ranking and Awards
A n n u a l R e p o r t 2 0 1 4
China Newsweek
Most Responsible Enterprise
CCM World
Best Call Center in China
CFO WORLD
Best Corporate Wealth Management AwardBest Cash Management Brand Award
Financial Money
Gold E-banking of the YearFinancial Wealth Management Bank of the YearGold Retail Banker of the YearExcellence Award of Gold Private Bank of the YearGold Custodian Bank of the Year
China Times
Golden Shield Award for Information Disclosure of Listed CompaniesLeading Bank in Mobile Finance in China
Directors & Boards
Special Contribution Award for Golden Round Table Board BuildingGolden Round Table Most Innovative Board Secretary
China Report
Top 50 Chinese Enterprises in terms of Overseas Image
Brand Observation
Top 500 Valuable Brands in China
Treasury China
Best Treasury Management Bank of the YearBest Global Cash Management Bank of the YearBest Reliable Bank for Enterprises of the Year
Social One
Classic Socialized Marketing Cases: Connections
Taihe Consulting
2014 China Employer
Bankrate.com.cn
Financial Service Innovation AwardConsumer Satisfaction Awards: General Banking ServicesConsumer Satisfaction Awards: Internet Banking ServiceConsumer Satisfaction Awards: Personal Loans BusinessFinancial Product Innovation Award
ChinaHR
Top 50 Best Employers for University StudentsTop 50 Best Banking Employers for University Students
Zhaopin.com
Best Employer in China (Top 100)
Xinhuanet. com
Best Payment Product of the Year
People.cn
Best Corporate Social Responsibility Award
Caijing.com.cn
Best Credit Card of the Year
Finance.sina.com.cn
Best E-banking of the YearMost Popular Credit CardBest State-owned Commercial Bank
Netease
Best Banking Brand
Sohu
Best Interaction Innovation AwardBest Mobile Banking AwardBest Security Award
JRJ.com
Best Chinese-funded Bank AwardBest Internet Banking Customer Experience AwardBest E-banking Brand AwardBest Retail Bank AwardBest Social Responsibility AwardBest Wealth Management Product Brand Award
Eastmoney.com
Best Universal Bank of the YearBest Precious Metal Trading Platform
DZH
Most Popular Private Bank among Investors
Hexun
Top Ten Brand BanksExcellent Internet Banking Brand of the YearExcellent Mobile Banking Brand of the YearBest Financial Services WebsiteBest Precious Metal Business Service Bank
List of Domestic and Overseas Branches and Offices
284
Domestic Institutions
ANHUI PROVINCIAL BRANCHAddress: No. 189 Wuhu Road,
Hefei City, Anhui Province, China
Postcode: 230001Tel: 0551-62869178/62868101Fax: 0551-62868077
BEIJING MUNICIPAL BRANCHAddress: Tower B, Tianyin Mansion,
No. 2 Fuxingmen South Street, Xicheng District, Beijing, China
Postcode: 100031Tel: 010-66410579Fax: 010-66410579
CHONGQING MUNICIPAL BRANCHAddress: No. 9 Jiangnan Road,
Nan’an District, Chongqing, China
Postcode: 400060Tel: 023-62918002Fax: 023-62918059
DALIAN BRANCHAddress: No. 5 Zhongshan Square,
Dalian City, Liaoning Province, China
Postcode: 116001Tel: 0411-82378888/82819593Fax: 0411-82808377
FUJIAN PROVINCIAL BRANCHAddress: No. 108 Gutian Road,
Fuzhou City, Fujian Province, China
Postcode: 350005Tel: 0591-88087810/
88087819/88087000Fax: 0591-83353905/83347074
GANSU PROVINCIAL BRANCHAddress: No. 408 Qingyang Road,
Chengguan District, Lanzhou City, Gansu Province, China
Postcode: 730030Tel: 0931-8434172Fax: 0931-8435166
GUANGDONG PROVINCIAL BRANCHAddress: No. 123 Yanjiangxi
Road, Guangzhou City, Guangdong Province, China
Postcode: 510120Tel: 020-81308130/81308123Fax: 020-81308789
GUANGXI AUTONOMOUS REGION BRANCHAddress: No. 15-1 Jiaoyu Road,
Nanning City, Guangxi Autonomous Region, China
Postcode: 530022Tel: 0771-5316617Fax: 0771-5316617/2806043
GUIZHOU PROVINCIAL BRANCHAddress: No. 200 Zhonghua
North Road, Guiyang City, Guizhou Province, China
Postcode: 550003Tel: 0851-862000/8620018Fax: 0851-5963911/8620017
HAINAN PROVINCIAL BRANCHAddress: Tower A, No. 3 Heping
South Road, Haikou City, Hainan Province, China
Postcode: 570203Tel: 0898-65303138Fax: 0898-65303138
HEBEI PROVINCIAL BRANCHAddress: Tower B, Zhonghua
Shangwu Tower, No. 188 Zhongshan West Road, Shijiazhuang City, Hebei Province, China
Postcode: 050051Tel: 0311-66001888/66000001Fax: 0311-66001889/66000002
HENAN PROVINCIAL BRANCHAddress: No. 99 Jingsan Road,
Zhengzhou City, Henan Province, China
Postcode: 450011Tel: 0371-65776888/65776808Fax: 0371-65776889/65776988
HEILONGJIANG PROVINCIAL BRANCHAddress: No. 218 Zhongyang Street,
Daoli District, Harbin City, Heilongjiang Province, China
Postcode: 150010Tel: 0451-84668023/84668577Fax: 0451-84698115/85870962
HUBEI PROVINCIAL BRANCHAddress: No. 31 Zhongbei Road,
Wuchang District, Wuhan City, Hubei Province, China
Postcode: 430071Tel: 027-69908676/69908658Fax: 010-69908040
HUNAN PROVINCIAL BRANCHAddress: No. 619 Furong
Middle Road Yi Duan, Changsha City, Hunan Province, China
Postcode: 410011Tel: 0731 -84428833/84420000Fax: 0731-84430039
JILIN PROVINCIAL BRANCHAddress: No. 9559 Renmin Avenue,
Changchun City, Jilin Province, China
Postcode: 130022Tel: 0431-89569073/89569712Fax: 0431-88923808
JIANGSU PROVINCIAL BRANCHAddress: No. 408 Zhongshan
South Road, Nanjing City, Jiangsu Province, China
Postcode: 210006Tel: 025-52858000Fax: 025-52858111
JIANGXI PROVINCIAL BRANCHAddress: No. 233, Fuhe North Road,
Nanchang City, Jiangxi Province, China
Postcode: 330008Tel: 0791-6695117/6695018Fax: 0791-6695230
LIAONING PROVINCIAL BRANCHAddress: No. 88 Nanjing North
Road, Heping District, Shenyang City, Liaoning Province, China
Postcode: 110001Tel: 024-23491600Fax: 024-23491609
285
List of Domestic and Overseas Branches and Offices
A n n u a l R e p o r t 2 0 1 4
INNER MONGOLIA AUTONOMOUS REGION BRANCHAddress: No. 105 Xilin North Road,
Huhehot City, Inner Mongolia Autonomous Region, China
Postcode: 010050Tel: 0471-6940297Fax: 0471-6940096
NINGBO BRANCHAddress: No. 218 Zhongshan
West Road, Ningbo City, Zhejiang Province, China
Postcode: 315010Tel: 0574-87361162Fax: 0574-87361190
NINGXIA AUTONOMOUS REGION BRANCHAddress: No. 901 Huanghe East
Road, Jinfeng District, Yinchuan City, Ningxia Autonomous Region, China
Postcode: 750002Tel: 0951-5039558Fax: 0951-5042348
QINGDAO BRANCHAddress: No. 25 Shandong Road,
Shinan District, Qingdao City, Shandong Province, China
Postcode: 266071Tel: 0532-85809988-621031Fax: 0532-85814711
QINGHAI PROVINCIAL BRANCHAddress: No. 2 Shengli Road, Xining
City, Qinghai Province, China
Postcode: 810001Tel: 0971-6146733/6152326Fax: 0971-6152326
SHANDONG PROVINCIAL BRANCHAddress: No. 310 Jingsi Road, Jinan
City, Shandong Province, China
Postcode: 250001Tel: 0531-66681622Fax: 0531-87941749
SHANXI PROVINCIAL BRANCHAddress: No. 145 Yingze Street,
Taiyuan City, Shanxi Province, China
Postcode: 030001Tel: 0351-6248888/6248011Fax: 0351-6248004
SHAANXI PROVINCIAL BRANCHAddress: No. 395 Dongxin Street,
Xi’an City, Shaanxi Province, China
Postcode: 710004Tel: 029-87602608/87602630Fax: 029-87602999
SHANGHAI MUNICIPAL BRANCHAddress: No. 9 Pudong Avenue,
Pudong New District, Shanghai, China
Postcode: 200120Tel: 021-5029200Fax: 021-58886888
SHENZHEN BRANCHAddress: North Block Financial
Center, No. 5055 Shennan East Road, Luohu District, Shenzhen City, Guangdong Province, China
Postcode: 518015Tel: 0755-82246400Fax: 0755-82062761
SICHUAN PROVINCIAL BRANCHAddress: No. 35 Zongfu Road,
Jinjiang District, Chengdu City, Sichuan Province, China
Postcode: 610016Tel: 028-82866000Fax: 028-82866025
TIANJIN MUNICIPAL BRANCHAddress: No. 123 Weidi Road, Hexi
District, Tianjin, ChinaPostcode: 300074Tel: 022-28400648Fax: 022-28400123/28400647
XIAMEN BRANCHAddress: No. 17 Hubin North Road,
Xiamen City, Fujian Province, China
Postcode: 361012Tel: 0592-5292000Fax: 0592-5054663
XINJIANG AUTONOMOUS REGION BRANCHAddress: No. 231 Remin Road,
Tianshan District, Urumuqi, Xinjiang Autonomous Region, China
Postcode: 830002Tel: 0991-5981888Fax: 0991-2337527
TIBET AUTONOMOUS REGION BRANCHAddress: No. 31 Jinzhu Mid-Rd.,
Lhasa, Tibet Autonomous Region
Postcode: 850000Tel: 0891-6898019/6898002Fax: 0891-6898001
YUNNAN PROVINCIAL BRANCHAddress: Bank Mansion, No. 395
Qingnian Road, Kunming City, Yunnan Province, China
Postcode: 650021Tel: 0871-63136172/63178888Fax: 0871-63134637
ZHEJIANG PROVINCIAL BRANCHAddress: No. 150 Zhonghe Middle
Road, Hangzhou City, Zhejiang Province, China
Postcode: 310009Tel: 0571-87803888Fax: 0571-87808207
ICBC Credit Suisse Asset Management Co., Ltd.Address: Bank of Beijing Building,
17 C Financial Street, Xicheng District, Beijing, China
Postcode: 100140Tel: 010-66583333Fax: 010-66583158
ICBC Financial Leasing Co., Ltd.Address: E5AB, Finance Street,
No. 20 Plaza East Road, Economic Development Zone, Tianjin
Postcode: 300457Tel: 022-66283766/010-66105888Fax: 022-66224510/010-66105999
ICBC-AXA Assurance Co., Ltd.Address: 19/F Mirae Asset Tower,
No. 166 Lujiazui Ring Road, Pudong New Area, Shanghai
Postcode: 200120Tel: 021-5879-2288Fax: 021-5879-2299
Chongqing Bishan ICBC Rural Bank Co., Ltd.Address: No. 1 Aokang Avenue,
Bishan County, ChongqingPostcode: 402760Tel: 023-85297704Fax: 023-85297709
Zhejiang Pinghu ICBC Rural Bank Co., Ltd.Address: No. 258 Chengnan West
Road, Pinghu, Zhejiang Province
Postcode: 314200Tel: 0573-85139616Fax: 0573-85139626
List of Domestic and Overseas Branches and Offices
286
Overseas Institutions
ICBC, Hong Kong BranchAddress: 33/F, ICBC Tower,
3 Garden Road, Central, Hong Kong
Email: [email protected]: +852-25881188Fax: +852-28787784SWIFT: ICBKHKHH
ICBC, Singapore BranchAddress: 6 Raffles Quay #12-01,
Singapore 048580Email: [email protected]: +65-65381066Fax: +65-65381370SWIFT: ICBKSGSG
ICBC, Tokyo BranchAddress: 2-1 Marunouchi 1-Chome,
Chiyoda-Ku Tokyo, 100-0005,Japan
Email: [email protected]: +813-52232088Fax: +813-52198502SWIFT: ICBKJPJT
ICBC, Seoul BranchAddress: 16th Floor,
Taepyeongno Bldg., #73 Sejong-daero, Jung-gu, Seoul 100-767, Korea
Email: [email protected]: +822-37886670Fax: +822-7553748SWIFT: ICBKKRSE
ICBC, Busan BranchAddress: 1st Floor, Samsung
Fire & Marine Insurance Bldg., #184, Jungang-daero, Dong-gu, Busan 601-728, Korea
Email: [email protected]: +8251-4638868Fax: +8251-4636880SWIFT: ICBKKRSE
ICBC, Hanoi BranchAddress: 3rd Floor Daeha Business
Center, No. 360, Kim Ma Str., Ba Dinh Dist., Hanoi, Vietnam
Email: [email protected]: +84-462698888Fax: +84-462699800SWIFT: ICBKVNVN
ICBC, Vientiane BranchAddress: Lanexang Avenue, Home
No. 12, Unit 15, Ban Hatsadee, Chanthabouly District, Vientiane Capital, Lao PDR.
Email: [email protected]: +856-21258888Fax: +856-21258897SWIFT: ICBKLALA
ICBC, Phnom Penh BranchAddress: No. 15, Preah Norodom
Boulevard, Phsar Thmey I, Duan Penh, Phnom Penh, Cambodia
Tel: +855-23965280Fax: +855-23965268SWIFT: ICBKKHPP
ICBC, Doha BranchAddress: Office 1202, 12/F,
QFC Tower 1, Diplomatic Area, West Bay, Doha, Qatar
Email: [email protected],Tel: +974-44968076Fax: +974-44968080SWIFT: ICBKQAQA
ICBC, Abu Dhabi BranchAddress: 9th floor &
Mezzanine floor AKAR properties, Al Bateen Tower C6 Bainuna Street, Al Bateen Area Abu Dhabi United Arab Emirates
Email: [email protected]: +971-2-4998600Fax: +971-2-4998622SWIFT: ICBKAEAA
ICBC, Dubai (DIFC) BranchAddress: Floor 5&6,
Gate Village Building 1, Dubai International Financial Center, Dubai, United Arab Emirates
Email: [email protected]: +971-47031111Fax: +971-47031199SWIFT: ICBKAEAD
ICBC, Karachi BranchAddress: Room No.G-02 & G-03
Ground Floor, Office #803–807, 8th Floor, Parsa Towers, Plot No.31-1-A, Block 6, PECHS, Karachi, Pakistan
Tel: +92-2135208990Fax: +92-2135208930SWIFT: ICBKPKKAXXX
ICBC, Mumbai BranchAddress: Level 1, East Wing,
Wockhardt Tower, C-2, G Block, Bandra Kurla Complex, Bandra (E), Mumbai-400 051, India
Email: [email protected]: +91-2233155999Fax: +91-2233155900SWIFT: ICBKINBBXXX
287
List of Domestic and Overseas Branches and Offices
A n n u a l R e p o r t 2 0 1 4
ICBC, Sydney BranchAddress: Level 1, 220 George
Street, Sydney NSW 2000, Australia
Email: [email protected]: +612-94755588Fax: +612-92333982SWIFT: ICBKAU2S
ICBC, Luxembourg BranchAddress: 32, Boulevard Royal,
L-2449 Luxembourg B.P.278 L-2012 Luxembourg
Email: [email protected]: +352-2686661Fax: +352-26866666SWIFT: ICBKLULL
ICBC, Frankfurt BranchAddress: Bockenheimer Anlage 15,
60322 Frankfurt am Main, Germany
Email:[email protected]: +49-6950604700Fax: +49-6950604708SWIFT: ICBKDEFF
ICBC, New York BranchAddress: 725 Fifth Avenue,
20th Floor, New York, NY 10022, USA
Email: [email protected]: +1-212-838 7799Fax: +1-212-838 6688SWIFT: ICBKUS33
ICBC, London BranchAddress: 81 King William Street,
London EC4N 7BG, UKEmail: [email protected]: +44 20 7397 8888Fax: +44 20 7397 8890SWIFT: ICBKGB3L
ICBC, Kuwait BranchAddress: Mazaya Tower 2,
Floor 21, Al-Morqab, Khalid Bin Al-Waleed St. Block 3, Section 4, Kuwait City, Kuwait.
Email: [email protected],Tel: 00965-22281777Fax: 00965-22281799SWIFT: ICBKKWKW
Industrial and Commercial Bank of China (Asia) LimitedAddress: 33/F, ICBC Tower,
3 Garden Road, Central, Hong Kong
Email:[email protected]: +852-25881188Fax: +852-28787784SWIFT: UBHKHKHH
ICBC International Holdings LimitedAddress: 37/F, ICBC Tower,
3 Garden Road, Central, Hong Kong
Email:[email protected]: +852-26833888Fax: +852-26833900SWIFT: ICBHHKHH
Industrial and Commercial Bank of China (Macau) LimitedAddress: 18th Floor, ICBC Tower,
Macau Landmark, 555 Avenida da Amizade, Macau
Email: [email protected]: +853-28555222Fax: +853-28338064SWIFT: ICBKMOMX
Industrial and Commercial Bank of China (Malaysia) BerhadAddress: Level 34C, Menara Maxis,
Kuala Lumpur City Centre, 50088 Kuala Lumpur, Malaysia
Email: [email protected]: +603-23013399Fax: +603-23013388SWIFT: ICBKMYK
PT. Bank ICBC IndonesiaAddress: 32nd TCT ICBC Tower,
Jl. MH. Thamrin No. 81, Jakarta Pusat 10310, Indonesia
Email: [email protected]: +62-2123556000Fax: +62-2131996010SWIFT: ICBKIDJA
Industrial and Commercial Bank of China (Thai) Public Company LimitedAddress: 622 Emporium Tower
11th–13th Fl., Sukhumvit Road, Khlong Ton, Khlong Toei, Bangkok, Thailand
Tel: +66-26295588Fax: +66-26639888SWIFT: ICBKTHBK
Industrial and CommercialBank of China (Almaty)Joint Stock CompanyAddress: 150/230, Abai/
Turgut Ozal Street, Almaty, Kazakhstan.050046
Email: [email protected]: +7727-2377085Fax: +7727-2377070SWIFT: ICBKKZKX
List of Domestic and Overseas Branches and Offices
288
Industrial and CommercialBank of China (New Zealand) LimitedAddress: Level 11,188 Quay Street,
Auckland 1010, New Zealand
Email: [email protected]: +64-93747288Fax: +64-93747287SWIFT: ICBKNZ2A
ICBC (London) PLCAddress: 81 King William Street,
London EC4N 7BG, UKEmail:[email protected]: +44-2073978888Fax: +44-2073978899SWIFT: ICBKGB2L
Industrial and Commercial Bank of China (Europe) S.A.Address: 32,Boulevard Royal,
L-2449 LuxembourgEmail: [email protected]: +352-2686661Fax: +352-26866666SWIFT: ICBKLULU
ZAO Industrial and Commercial Bank of China (Moscow)Address: Building 29,
Serebryanicheskaya embankment, Moscow, Russia Federation 109028
Email: [email protected]: +7-495 2873099Fax: +7-495 2873098SWIFT: ICBKRUMM
Industrial and Commercial Bank of China (USA) NAAddress: 202 Canal Street,
New York, NY 10013, USAEmail: [email protected]: +1-212-238-8208Fax: +1-212-619-0315SWIFT: ICBKUS3N
Industrial and Commercial Bank of China Financial Services LLCAddress: 1633 Broadway, 28th
Floor, New York, NY, 10019, USA
Email: [email protected]: +1-212-993-7300Fax: +1-212-993-7349SWIFT: ICBKUS33FIN
Industrial and Commercial Bank of China (Canada)Address: Unit 3710, Bay Adelaide
Centre, 333 Bay Street, Toronto, Ontario, M5H 2R2, Canada
Email: [email protected]: +1416-366-5588Fax: +1416-607-2000SWIFT: ICBKCAT2
Industrial and Commercial Bank of China (Argentina) S.A.Address: Florida 99-City of Buenos
Aires, ArgentinaEmail: [email protected]: +54-11-4820-9018Fax: +54-11-4820-1901SWIFT: ICBKARBA
Industrial and Commercial Bank of China (Brasil) S.A.Address: Av.Brigadeiro Faria Lima,
3477 - Block B - 6 andar - SAO PAULO/SP - Brasil
Email: [email protected]: +5511-2395-6600Fax: +5511-2395-6600SWIFT: ICBKBRSP
ICBC PERU BANKAddress: Av.Juan de Arona 151,
Oficina 204, San Isidro, Lima27, Perú
Email:[email protected]: +51-16316801Fax: +51-16316803
Industrial and Commercial Bank of China Limited, Yangon Representative OfficeAddress: 601A, 6th Floor,
Sakura Tower, No. 339, Bogyoke Aung San Street, Kyauktada Township, Yangon, Union of Myanmar
Tel: +95-1255045Fax: +95-1255045
Industrial and Commercial Bank of China Limited, African Representative OfficeAddress: 47 Price Drive, Constantia,
Cape Town, South Africa,7806
Email: [email protected]: +27-212008006 +27-0761837882Fax: +27-212008012

2014
Stock Code: 1398USD Preference Shares Stock Code: 4603EUR Preference Shares Stock Code: 4604RMB Preference Shares Stock Code: 84602
中國北京市西城區復興門內大街55號 郵編:100140No.55 Fuxingmennei Avenue, Xicheng District, Beijing, PRC
www.icbc.com.cn, www.icbc-ltd.comPost Code: 100140
2014A
nnual Report
Annual Report


