Embed Size (px)
Citation preview

ORIGINAL PAPER
Corrosion behavior in artificial seawater of thermal-sprayedWC-CoCr coatings on mild steel by electrochemicalimpedance spectroscopy
S. Brioua & K. Belmokre & V. Debout & P. Jacquot &E. Conforto & S. Touzain & J. Creus
Received: 20 December 2010 /Revised: 22 March 2011 /Accepted: 11 April 2011 /Published online: 4 May 2011# Springer-Verlag 2011
Abstract The corrosion behavior in artificial seawater ofdifferent as-sprayed ceramic-metallic (cermet) coatingsapplied on low-alloy steel was studied. Five conditions,associated to modifications of the composition of thepowder or deposition parameters were evaluated. Thedegradation mechanisms were studied during extendedimmersion tests using conventional electrochemical mea-surement and electrochemical impedance spectroscopy. Theextended immersion tests reveal that these as-thermal-sprayed coatings present a cathodic behavior comparedwith steel. During the first hours of immersion, theelectrolyte infiltrates the defects of the coatings, whichthen result to the local degradation of the substrate
accelerated by the galvanic coupling with the cermetcoating. Optical observations and Raman analyses revealthe formation of calcium carbonates like aragonite on thecermet surface, very close to the appearance of local anodicsites. The cross-sectioned views reveal the infiltration of thecorrosive solution, and the depth penetration of thedegradation of steel substrate probably due to the acidifi-cation of the anodic sites.
Keywords WC-CoCr coatings . Thermal spray . Corrosion .
EIS . Seawater
Introduction
Ceramic-metallic (cermet) coatings are useful when highsurface hardness and resistance to wear are required. Thehard WC particles in the coating provide hardness and wearresistance while the metal binder (CoCr, NiCr, Ni, Co, etc.)gives the necessary coating toughness [1–3]. High-velocityoxy-fuel (HVOF) thermal sprayings have been designed toretain a larger fraction of WC in the coating. In this method,the hypersonic velocity of the flame shortens the time ofinteraction between the powder and the flame, and inconjunction with the relatively low temperature in the latter,limits WC decomposition [4].
WC-based hardmetals are usually applied in neutral andnear-neutral aqueous working environments. The corrosionprocess of cermet-coated metallic substrates is a verycomplex phenomenon. The properties affecting the corro-sion performance of coating on a service are the as-sprayingcoating, the binder material, and the deposition parameters[5]. Several works have underlined the importance of sprayparameters and the powder chemical composition oncorrosion behavior of HVOF coatings [6–9].
S. Brioua :K. BelmokreLCTS, Université de Skikda,Route Elhadeik, BP 26,21000 Skikda, Algeria
V. DeboutBodycote Surface Technology,10 Rue Gustave Eiffel,87240 Ambazac, France
P. JacquotBodycote,Rue Ampère,69330 Pusignan, France
E. ConfortoCCA FR-EDD, Université de la Rochelle,Avenue Michel Crépeau,17042 La Rochelle, France
S. Touzain : J. Creus (*)LEMMA, Université de la Rochelle,Avenue Michel Crépeau,17042 La Rochelle, Francee-mail: [email protected]
J Solid State Electrochem (2012) 16:633–648DOI 10.1007/s10008-011-1403-y
Different studies have been made in order to evaluate theelectrochemical behavior of the carbide particle WC and themetallic matrix, respectively. These studies are mainlyperformed in acidic HCl or H2SO4 solutions, and it wasreported that tungsten carbide particles were nobler than themetallic matrix. A uniform dissolution of the cobalt-basedmatrix was reported [10–12]. Effectively, in acidic andnear-neutral solutions, cobalt suffers from a uniformdissolution and no passivation was observed [11]. Anyway,electrochemical behaviors in near-neutral solutions ofthermal-sprayed WC-Co-based coatings reported in litera-ture were not so concordant. Perry et al. [13] had observedthat during the anodic polarization of WC-10Co4Cr insynthetic seawater, removals of carbide particles thatsuggest an initiation of corrosion at the carbide/metalinterface. As the porosity rate of HVOF coatings is verylow, less than 1%, it was assumed that interconnectedporosity was no longer the main issue in the corrosionbehavior of a coating/substrate system. Corrosion processhas been shown to be concentrated at the metallic/ceramicinterfaces. So, micro-galvanic cells occur between WCcarbide particles and the metallic matrix that lead toselective dissolution of the metallic binder [13, 14]. Suchobservations were also reported for cermet compositecoatings deposited onto low-alloy steels [8, 15–17] oraluminum [3, 18] and exposed in saline solution. The maindegradation was assigned to the metallic matrix dissolution,and the carbide particles remain unchanged.
However, non-concordant results were presented in theliterature concerning the corrosion behavior of suchthermal-sprayed composite coatings. Effectively, somestudies have reported the observations during extendedimmersion tests in aggressive solution of corrosionproducts associated to the substrate degradation [19].Open-circuit potential evolutions of the coated sampleswere reported to be quite similar to that of the substrate,indicating behavior where electrolyte easily reaches thebase substrate through open defects [2, 9, 20–22]. So,according to these studies, as-sprayed WC-Co-basedcoatings lead to an ennoblement of the corrosion potential,compared with the substrate. Indeed, corrosion potential ofWC particles and pure cobalt were respectively reported tobe around +0.19 V/SCE and −0.32 V/SCE [8]. As-sprayedWC-Co-based coatings are nobler than the substrates, andeffectively degradation can be localized at the open defectswhere electrolyte can easily infiltrates until the substrate/coating interface. In this case, galvanic corrosion between
coating and substrate may occur accelerating the localdissolution of the substrate [23–26]. Amplification of thelocalized degradation of the substrate by galvanic corro-sion was not described in literature. Galvanic corrosionwas reported to occur between the WC particles and themetallic binder, leading to an increase of the surfaceroughness and the formation of porous corrosion productsof cobalt [15]. The objective of this study is to clarify thedegradation mechanism of WC-CoCr-coated steel in salinesolution. Application development of these tribological-resistant coatings in marine environment needs to thor-oughly investigate the degradation of the coated samplesand to evaluate the evolution of industrial depositionparameters on the property modifications.
Corrosion behavior using electrochemical impedancespectroscopy (EIS) of as-sprayed WC-CoCr coatings ofapproximately 250 μm in thickness, deposited onto low-alloy steel by HVOF thermal spraying at differentdeposition parameters was investigated in artificialseawater. Examination of the corroded samples, complet-ed with analyze techniques would allow to define themechanism implied in the degradation of the coatedsamples.
Experimental
Samples preparation
WC-CoCr cermets were deposited on a commercial low-alloy steel substrate (35CrMo4 or AISI 4135) by HVOFthermal-spray technique at different deposition parametersusing two compositions of powders. Two commercialpowders A and B are used in this study; the nominalcompositions reported by suppliers are reported in Table 1.Coatings were deposited using HVOF thermal-spray tech-nique at Bodycote in a closed chamber with controlledtemperature and projection kinematic. The speed reachedby the particles is higher than 700 m/s with a flametemperature around 2,600 °C. Particles passing through theflame are then projected on the rotating substrate surfacewith the projection gun being animated by a translatorymovement. Table 2 summarizes the deposition parametersused during this study. “Standard” deposition correspondsto the conventional optimized parameters used for theindustrial deposition of WC-CoCr coatings and theseparameters cannot be detailed. The other configurations
Powder Chemical composition (wt.%) Particle sizes
A W, 81.08; C, 5.35; Co, 9.68; Cr, 3.8; Fe, 0.09 10∼38 μm
B W, 77.7–80.1; C, 5.1–5.8; Co, 8.5–9.5; Cr, 4.5–5.5; Ni, 0.8–1.2; Fe, 0.3 15∼45 μm
Table 1 Characteristics of theas-received commercial powders
634 J Solid State Electrochem (2012) 16:633–648

correspond to modification of one parameter compared withthe standard condition, for example a reduction of thetranslatory movement, lowering the flame temperature bymodifying the ratio of combustive/fuel, a reduction of thepowder flow. So, evolution of the deposition parameterswill be discussed in terms of the morphological, micro-structural, and corrosion properties of these coatings.
The coatings are made from powders containing smallparticles of tungsten carbide embedded in a metallic phase,the binder, consisting of Co, Cr, or Ni. The thickness rangeof as-sprayed coatings was 240–300 μm. The roughness isRa of 4–5 μm.
Characterization
The crystalline structures of the coatings was investigated byX-ray diffraction operating with Cu Kα (λ=0.154056 nm)radiation. The analyzed range of the diffraction angle 2θ°was between 25° and 90°. Samples were observed by anoptical LEICA DM6000M microscope in dark field orpolarized light and a scanning electron microscope (SEM).Energy dispersive X-ray spectrometer (EDS) was used tocharacterize powders and coatings with an acceleratingvoltage of 20 kV.
μ-Raman spectrophotometry was used to characterizethe nature of the corrosion products appearing during theaging of coated samples. Raman spectra were recorded witha Jobin Yvon LabRam HR spectrometer using an incidentbeam of 632.82 nm emitted by an argon laser. Laser powerwas kept constant around 0.7 mW, and detection wasachieved with a Peltier-based cooled charge coupled devicedetector. Acquisition and basic treatment of spectra were
performed with LabSpec software (Jobin Yvon–Horiba).Fourier transform infrared-attenuated total reflectance(FTIR-ATR) measurements were performed with a Ther-moNicolet FTIR Nexus spectrometer, and the micro-ATRcrystal was a diamond crystal. Spectra were acquired in therange of wavenumber from 500 to 4,000 cm−1 using theOmnic software.
Electrochemical corrosion measurements
Electrochemical impedance spectroscopy was performed atthe open-circuit potential using a potentiostat AutolabPgstat 302 N in a frequency range of 105–10−2 Hz withten points par decade using an amplitude perturbation of10 mV peak to peak. The experiments were realized during48 h of immersion in artificial seawater. A three-electrodeelectrochemical cell was used with a platinum grid counterelectrode and a saturated calomel electrode as the reference.The exposed surface area to the corrosive medium wasfixed at 2.25 cm2 using an inert resin. All the electrochem-ical tests were performed in simplified artificial seawaterprepared according to standard ASTM D-1141 whosecomposition is reported in Table 3. pH was adjusted byaddition of NaOH 0.1 mol L−1 solution at a value of 8.2,and the corrosion tests were conducted in an environmentthat is naturally ventilated, agitated, and at room tempera-ture. Reproducibility of the electrochemical tests wasensured during this study.
Results and discussion
Characterization of spray powders and coatings
Figure 1 shows the morphologies of the particles used forthe coating deposition. Both powders are composed ofspherical and agglomerated particles. A statistical approachwas developed to measure the size distribution of theagglomerated particles characteristics of powders A and B.Different SEM pictures (between 10 and 20) presentingseveral particles were obtained, at the same magnification,in order to measure a size distribution that was represen-tative from the characterized powder. Powder A had a grainsize ranging from 10 to 38 μm with an average grain size of
Ref Powder Flame temperature Powder feed rate Gun transverse velocity
Coating 1 A Standard Standard Standard
Coating 2 A Standard Standard Reduced
Coating 3 A Reduced Standard Standard
Coating 4 A Standard Reduced Standard
Coating 5 B Standard Standard Standard
Table 2 Deposition parametersof HVOF as-sprayed WC-CoCrcoatings
Table 3 Simplified artificial seawater composition according tostandard (ASTM D-1141)
Salts Concentration (mol L−1) Concentration (g L−1)
NaCl 0.42 24.5448
Na2SO4 0.0288 4.0907
MgCl2·6H2O 0.0546 11.1007
CaCl2·2H2O 0.0105 1.5437
KCl 0.00932 0.6948
NaHCO3 0.002792 0.2345
J Solid State Electrochem (2012) 16:633–648 635

27 μm and powder B had a grain size ranging from 15 to45 μm with an average grain size of about 29 μm.Distribution of particle sizes is quite similar between thesetwo powders. These values, deduced from the statisticalapproach, are in perfect agreement with the supplier datapresented in Table 1 resulting from either sieving orscalping techniques. Usual classifications of particle sizesaccording to these techniques are −38+10 μm for powderA and −45+15 μm for powder B, meaning that the particlesizes detected by these techniques range respectivelybetween 10 and 38 and 15 and 45 μm. For both powders,WC particles have angular shapes with grain size between 2and 5 μm. Distribution of the WC particles are quitehomogenous in the agglomerated spherical particles. Fewof these particles were broken permitting to assess to theinternal microstructure.
Figure 2 shows the X-ray diffraction patterns of as-sprayed WC-CoCr and WC-CoCrNi coatings deposited byHVOF process. WC is the major phase detected whereasfew diffraction peaks associated to W2C phase are alsoobserved in all deposited coatings. Presence of the W2Cpeaks indicates a very weak decarburization of WC takingplace during the coating process, as it was reported forcermet coatings developed from HVOF thermal sprayprocess [4, 27–31]. We also observed a very little peakcorresponding to brittle η-phase M12C (Co6W6C); thisphase could appear due to the dissolution of C in themetallic binder [31]. Formation of the mixed carbide couldinduce brittleness of the samples.
Although notable amount of binder phase was present inthe coating, XRD analysis do not permit to distinguish thepresence of Co, probably due to the low crystalline order ofthis phase, which organization is at very short range, oreven amorphous [32]. During the thermal-spray process,cooling rates of the sprayed particles are very high thatcould explain an amorphization of the metallic phase [15].An amorphous phase was reported to be more interestingfor corrosion resistance compared with a crystallinematerial [25, 33–36] due to the lack of microstructuraldefects that could promote localized degradation. Butformation of multiple phases within the metallic matrixdue to dissolution of carbon and tungsten could contribute
Fig. 1 SEM observations andparticle size distribution inpowder A and B
Fig. 2 XRD patterns of as-sprayed tungsten carbide-based coatings
636 J Solid State Electrochem (2012) 16:633–648

to a non-uniform degradation of the metallic binder asreported by Perry et al. [13].
Electrochemical impedance measurements
Most multilayered coating systems composed of a substrateand coating layers are sensitive to galvanically inducedlocal corrosion [33]. Galvanically induced corrosion leadsto a severe attack as soon as the coating layer is perforated.This corrosion process is extremely severe for coatedsystems due to the high current density localized at thedefect and result from a large ratio between the surfaceareas of the cathodic outer surface and the anodic defect.
Electrochemical impedance measurements were per-formed at different hours of immersion in simplifiedartificial seawater. EIS data were analyzed by using theequivalent circuits reported in the literature for coatedmetal [37].
Figure 3 shows the evolution of Nyquist and Bodediagrams after different hours of immersion for coating 1that was deposited using the standard deposition parame-ters. These results show the presence of a single capacitiveloop after 1 h of immersion, indicating a single timeconstant that can be attributed to the charge transferresistance in parallel with the double-layer capacitance.The fact that only one time constant is obtained may be dueto the short exposure time [38, 39]. We can assume that theinfiltration electrolyte has not cross over the 250 μm thickof the coating and does not reach the steel substrate. So,during the first hours of immersion, the electrochemicalcharacteristics deduced from EIS measurements could bemainly associated to a faradic process that involves thecoating reactivity. However, capacitive loop diametervalues are not so high, around few kΩ cm2. Some authorshave observed uniform dissolution of the Co matrix untilcorrosive media at pH close to that of seawater [15]. But itis also reported that incorporation of chromium effectivelypermits to reduce this phenomenon. Furthermore, some
authors have also suggested the presence of coupling effectbetween WC particles and the metallic matrix [13, 17, 18].These coupling effects induce an anodic polarization of themetallic binder that could favor the dissolution or passiv-ation of the metallic binder. According to Saha et al. [17],Nyquist diagrams in saline solution (NaCl 3.5%) ofWC-10Co4Cr coatings deposited onto low-alloy steelpresent only one capacitive loop, with a charge transferresistance around 1,500 to 1,900 Ω cm2. The importantthickness of the coatings (approximately 530 μm) delaysthe infiltration of electrolyte, and the electrochemicalcharacteristic was affected by the coating behavior [17].At the beginning of the immersion, the electrochemicalbehavior is associated to the coating oxidation and probablypassivation of the metallic binder due to the weakly alkalinepH of seawater. In fact, SEM observations of the corrodedsamples after immersion tests (not presented) have revealedthe presence of local oxidation of the binder, but theseanalyses do not suggest uniform dissolution of the metallicbinder.
After 4 h of immersion, the shape of Nyquist diagram ischanged, and two time constants occurring respectively atthe middle and low frequencies are observed. The diameterof the capacitive loop observed at the middle frequencies islarger than the latter determined at the beginning of theimmersion, and a second time constant is observed forlower frequencies which can be related to a Warburgelement. Indeed, this evolution can be directly linked to theinfiltration of electrolyte through the pores that provokeslocalized corrosion of the steel substrate. The capacitiveloop observed at middle frequencies could be mainlyassociated to the steel dissolution through the coatingdefects, the electrochemical behavior of the coatingbecoming partially masked during the displacement of thecorrosion potential when degradation progresses. As thesizes of the pores are very small and depend directly on themorphology and microstructure of the coatings, the forma-tion of steel corrosion products permits to partially seal
Fig. 3 EIS data for coating 1 atdifferent exposure time in simpli-fied artificial seawater: a Nyquistdiagram; b Bode diagram
J Solid State Electrochem (2012) 16:633–648 637

them. But, these corrosion products are very powdery, notadherent and allow the electrolyte to access the substrate.Diffusion of ionic species will provoke a partial hydrolysisof the corrosion products increasing the aggressiveness ofthe electrolyte inside the pores. So, the diameter of thecapacitive loop at the middle frequencies graduallydecreases during the immersion, as observed in Fig. 3a,indicating that the localized degradation of steel isaccelerated due to the change of electrolyte aggressivenessinside the pores combined to the galvanic coupling thatmay exist between the coating and the substrate.
Figure 4 shows the Nyquist and Bode diagrams of allcermet coatings, compared with the steel substrate, afterdifferent hours of immersion (1, 10, and 48 h) in simplifiedartificial seawater.
During the immersion, electrolyte may infiltrate insidethe pores all along the coating thickness before reaching thesubstrate. So, at the beginning of the immersion, theelectrochemical behavior is quite associated to the intrinsiccoating properties. All the composite coatings present aresistive behavior corresponding to one capacitive semi-circle. Coating 5 presents the highest resistance at thebeginning of the immersion compared with other config-urations. Coatings 1, 2, and 4 present quite similarbehaviors whereas coating 3 seems to be less protective.Indeed, coating 5 presents nickel incorporation that en-hanced the intrinsic behavior of the metallic matrix,whereas other coatings (1 to 4) have quite similarcomposition for the matrix. This may explain the highimpedance values observed for this coating. Anyway, it canbe underlined that the electrochemical parameters associat-ed to the intrinsic corrosion behavior of the coating are notso different from those of the steel substrate, so theseparation of each contribution when electrolyte reachesthe substrate is impossible.
At the beginning of immersion, the reduction of the guntraverse velocity (coating 2) or the reduction of the powderfeed rate (coating 4) during the deposition process, seems tonot affect significantly the intrinsic corrosion behavior ofthe coatings compared with coating 1 deposited withstandard parameters. However, the modification of theflame temperature during the deposition process (coating3) seems to drastically affect the coating reactivity thatcould be associated to a modification of microstructure. Itwas reported that the corrosion behavior of the compositecoatings WC-CoCr was mainly dependent on the formationof micro-galvanic cells between WC particles and the CoCrbinder [17, 18]. The distribution of WC particles inside themetallic binder plays an important role on the magnitude ofthe coating degradation. So, we can suppose that modifi-cation of the deposition parameters associated to coatings 2and 4 leads only to slight differences on the distribution ofWC particles whereas the reduction of the flame tempera-
ture would favor heterogeneous distribution of WC par-ticles that amplifies the galvanic degradation of the metallicbinder.
After 10 h of immersion, the shape of Nyquist and Bodediagrams of the coated steels are quite similar. Diagrams arecomposed of two time constants, a capacitive loop atmiddle frequencies that can be attributed to the steeldissolution through coating defects and at low frequenciesa diffusion mechanism is involved. Coatings 1 and 4present the highest resistance values compared with coat-ings 2, 3, and 5 that have quite similar behavior after 48 hof immersion. In artificial seawater, WC-CoCr coatings arenobler than steel substrate, so corrosion behavior is mainlydependent on porosity rate and interconnection of porositythrough the coatings. So differences in corrosion behaviorbetween coatings 1 to 4 are correlated to variations of poredensity and distribution. Surface morphological observa-tions (not presented) of the as-sprayed coatings haverevealed important heterogeneities of distribution of WCparticles on coatings 3 and slight heterogeneities in case ofcoating 2 whereas these distributions on coatings 1 and 4were more homogeneous. Concerning coating 5, incorpo-ration of nickel ennobles the potential of the binder phasethat worsen the galvanic coupling between steel andcoating. So even if the porosity distribution is quite similarcompared with the other configurations, the galvaniccorrosion is amplified and the resistance of coating 5 islowered.
Two different models of equivalent electrical circuit areused for the fitting of the experimental EIS data (Fig. 5).Figure 5a corresponds to the equivalent circuit thatcorrectly fits the EIS data linked to the intrinsic corrosionbehavior of the coatings in aerated and stirred seawater.This circuit is composed of the solution resistance Rs, thecharge transfer resistance of the coatings/solution interfaceRct(coating) and the double-layer capacitance Cdl(coating)
represented by a constant phase element (CPE) [40]. After4 h of immersion, the shapes of Nyquist diagrams arechanged and Fig. 5b present the equivalent electrical circuitthat correctly fits the EIS data linked to the dissolution ofsteel substrate through the coating defects. The circuit iscomposed of the solution resistance Rs, the charge transferresistance of the steel/solution interface through the coatingdefects Rct(steel), the double-layer capacitance Cdl(steel)
represented by a CPE [40] and the Warburg diffusionprocess of electrolyte and oxygen. The corrosion rate islimited by the slow diffusion of the electrolyte and theoxygen through the defects in the coating. Therefore aWarburg element (Ws) should be adopted in series with thecharge transfer resistance (Fig. 5) to account for the finitelength of the diffusion pathway. This diffusion element ischaracterized by two parameters, the diffusion resistanceRd, and the time constant for diffusion through the distance
638 J Solid State Electrochem (2012) 16:633–648

Fig. 4 EIS data for substrate and all coatings at different exposure time in simplified artificial seawater: a Nyquist diagram after 1 h; b Bodediagram after 1 h; c Nyquist diagram after 10 h; d Bode diagram after 10 h; e Nyquist diagram after 48 h; f Bode diagram after 48 h
J Solid State Electrochem (2012) 16:633–648 639

δ corresponding to the average thickness of the as-sprayedcoating : Td=δ
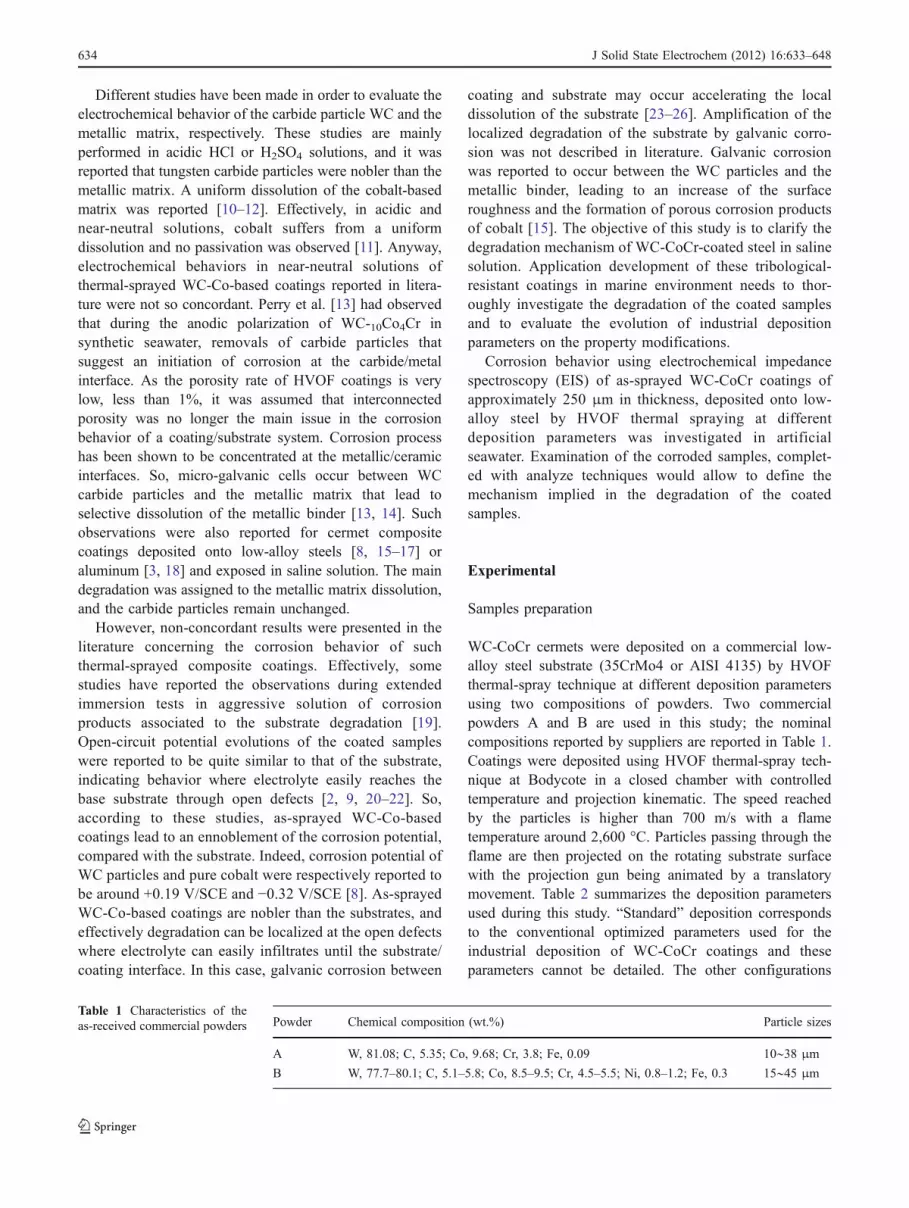
2/D. D represents the diffusion coefficient ofthe considered species. The fitting is achieved using theZview software and a good correlation was observed for allthe EIS diagrams. All the electrochemical parametersdeduced from the fitting of the experimental data usingthe equivalent electrical circuit described in Fig. 5 arepresented in Table 4. As it can be seen, the error parameterχ² is quite low for all fitting operations. Figure 6 presentsthe evolution of different electrochemical parametersdeduced from the fitting of the EIS diagrams associated tothe charge transfer reactions (Rct and time constant tF) andto the diffusion mechanism (RD and time constant tD)versus the immersion time. It must be noticed that timeconstants tF were calculated using true capacitances Cdl
obtained from Brug’s relation [40].Figure 6a, b shows the evolution of the charge transfer
resistance Rct which is inversely proportional to thecorrosion rate, deduced from EIS measurements in themiddle frequency range, as a function of immersion time.For coated steels, initial values of Rct are quite higher thanthat of steel and correspond to the intrinsic behavior of thecomposite coatings as presented in Fig. 5a. Except forcoating 5 whose composition is different from the otherconfigurations, the time constants tF (Fig. 6c) associated tothe charge transfer reaction are quite similar indicating thatsame electrochemical mechanism is involved. Up toapproximately 4 h of immersion, the slight increase of thecharge transfer resistance is attributed to the passivation ofthe metallic binder in contact with seawater. When theelectrolyte infiltration reaches the steel substrate, degrada-tion of steel becomes the predominant mechanism due tothe galvanic coupling with the coatings. Figure 6a, b showstwo different evolutions of the Rct values when theelectrolyte reaches the substrate. Up to 10 h of immersion,an increase of the transfer resistance is observed forcoatings 1 and 4. As corrosion becomes localized at thedefects of the coatings, steel corrosion products mayaccumulate and partially seal the pores. The time constantstF of these coatings increases and reach values during thisimmersion period higher than the other configuration forwhich a drastic decrease is observed. Effectively, themorphology, distribution, or interconnection of pores forcoatings 2, 3, and 5 seem to limit the sealing effect of thecorrosion products. After 10 h of immersion, the charge
transfer resistances Rct of coatings 1 and 4 drasticallydecrease as previously observed for the other configura-tions. Accumulation of metallic ions inside the pores due tothe dissolution of the steel substrate favors the diffusion ofanions like chloride, in order to restore the balance ofelectrical charges that will modify the aggressiveness of thesolutions. The ionic species diffusion that is createdbetween the confined electrolyte inside the pores and thebulk solution may favor the modification of the electrolytecomposition and chemistry inside the pores that wouldinduce local acidification. This mechanism is stronglydependent on the microstructure of the coatings (size,shape, and density of open porosity) and on the degradationamplification of the less noble material in the galvaniccoupling between two conductive materials. Comparativelyto nitride coatings or multilayer nitride based coatings [37]whose electrochemical parameters are quite separated fromsteels ones, EIS diagrams permit to evaluate the coatingproperties and the evolution of the pore electrolyte resistanceduring immersion. The electrochemical parameters of thecermet coatings, mainly dependent on the reactivity of themetallic phase are not more distinguishable in the EISdiagrams when steel localized degradation occurs. Thedecrease of Rct indicates then that the shape of the poresand/or the interconnection of porosity do not permit toconfer an effective sealing. So, Rct gradually decreasesduring the immersion to reach values close to those of thesteel substrate after 48 h of immersion.
For coating 5, initial values of Rct is effectively highercompare with the other configurations but rapidly the Rct
values decrease drastically, reaching values smaller thanthose of the steel substrate. Incorporation of nickel has adetrimental effect on the galvanic corrosion occurringbetween the substrate and the coating, so dissolution ofthe substrate is more intense through the defects of thecoating, and the corrosion products do not modify thediffusion of species through the pores as observed onFig. 6b.
Figure 6d, e shows the evolution of diffusion resistanceRD and time constant tD deduced from EIS measurementsin the low frequency range. It can be seen that a noticeabledecrease of RD can be detected after the first hours ofimmersion for coatings 2, 3, 4, and 5 while there is a slightincrease for coating 1. After 15 h, the RD values reach aconstant value for all coatings except for coating 4 where
Fig. 5 a Equivalent circuit to fitthe electrochemical impedancedata of the mild steel substrateand coatings until 4 h of expo-sure time. b Equivalent circuitused for fitting the electrochem-ical impedance data of the coat-ed samples
640 J Solid State Electrochem (2012) 16:633–648

Tab
le4
Electrochem
ical
parametersdedu
cedfrom
thefitting
sof
theEIS
experimentaldata
afterdifferentim
mersion
times
Hou
rs0.5
1.0
2.0
4.0
6.0
10.0
16.0
24.0
36.0
48.0
Steel
Rs/Ω
cm2
11.02
11.13
11.4
10.6
10.5
10.33
10.52
10.54
10.32
10.52
CPE-Y
0/m
Fcm
−2sn
−1
0.00
0301
0.00
0304
0.00
0337
0.00
0895
0.00
118
0.00
1427
0.00
1538
0.00
1615
0.00
1812
0.00
1967
7
CPE-n
0.8
0.81
20.82
70.77
80.78
90.79
155
0.80
350.81
60.82
80.82
7
Cdl/μ
Fcm
−272
8110
523
636
346
855
964
178
987
0
Rct/Ω
cm2
553
569
532
585
486
697
626
475
429
411
t F/m
s40
4656
138
176
326
350
305
338
357
χ²
0.00
091
0.00
070.00
130.00
064
0.00
088
0.00
0277
0.00
031
0.00
061
0.00
055
0.00
033
Coatin
g1
Rs/Ω
cm2
11.2
11.32
10.7
10.5
1525
23.7
18.18
25.6
41
CPE-Y
0/m
Fcm
−2sn
−1
0.00
0303
0.00
0374
0.00
0504
0.00
0334
0.00
0306
0.00
0359
0.00
042
0.00
0482
0.00
0636
0.00
0967
CPE-n
0.89
10.86
70.81
50.86
0.87
10.83
80.82
20.81
0.79
10.72
3
Cdl/μ
Fcm
−215
116
215
413
313
814
415
415
821
227
4
Rct/Ω
cm2
1,36
71,74
52,24
12,60
22,68
81,77
41,15
588
975
261
9
τ F/m
s20
628
234
534
637
025
517
814
016
017
0
W-R
D/Ω
cm2
––
–96
51,09
31,21
51,25
51,38
31,41
41,38
6
W-T/s
––
–10
.39.5
9.5
9.38
9.51
10.01
10.17
W-n
––
–0.5
0.5
0.5
0.5
0.5
0.5
0.5
χ2
0.00
110.00
349
0.00
069
0.00
022
0.00
018
0.00
633
0.00
085
0.00
079
0.00
094
0.00
0373
Coatin
g2
Rs/Ω
cm2
11.78
12.6
12.4
10.58
10.4
9.63
9.4
109.4
9.7
CPE-Y
0/m
Fcm
−2sn
−1
0.00
0343
0.00
0436
0.00
0667
0.00
0411
0.00
0324
0.00
0357
0.00
0496
0.00
066
0.00
0997
0.00
1318
CPE-n
0.88
10.88
0.82
0.83
50.86
10.83
80.79
30.75
30.71
0.67
1
Cdl/μ
Fcm
−216
321
423
214
012
9119
122
127
147
154
Rct/Ω
cm2
1,32
01,81
31,75
11,38
51,66
11,49
883
472
250
841
2
t F/m
s21
538
840
719
421
417
810
291
7563
W-R
D/Ω
cm2
––
–2,06
01,70
11,15
077
078
872
778
6
W-T/s
––
–4.1
5.88
6.49
5.4
5.85
5.65
5.7
W-n
––
–0.5
0.5
0.5
0.5
0.5
0.5
0.5
χ2
0.00
148
0.00
149
0.00
356
0.00
0653
0.00
0383
0.00
0437
0.00
0484
0.00
0353
0.00
0303
0.00
0409
Coatin
g3
Rs/Ω
cm2
10.7
11.15
9.8
9.35
9.1
8.6
8.5
8.4
8.1
8.48
CPE-Y
0/m
Fcm
−2sn
−1
0.00
0408
0.00
0593
0.00
0927
0.00
0347
0.00
0336
0.00
0396
0.00
0651
0.00
0903
0.00
119
0.00
145
CPE-n
0.88
30.85
50.75
90.86
70.86
70.84
10.77
70.73
50.70
30.67
4
Cdl/μ
Fcm
−219
825
320
814
413
813
514
615
516
617
1
Rct/Ω
cm2
1,12
81,40
41,89
91,37
81,59
11,15
765
764
354
849
4
t F/m
s22
435
539
519
822
015
696
9991
85
J Solid State Electrochem (2012) 16:633–648 641

Tab
le4
(con
tinued)
Hou
rs0.5
1.0
2.0
4.0
6.0
10.0
16.0
24.0
36.0
48.0
W-R
D/Ω
cm2
––
–1,44
11,04
992
173
074
575
282
9
W-T/s
––
–7.4
8.5
96.3
6.4
5.5
5.9
W-n
––
–0.5
0.5
0.5
0.5
0.5
0.5
0.5
χ2
0.00
2162
0.00
416
0.00
511
0.00
0729
0S.000
568
0.00
0473
0.00
0354
0.00
0147
0.00
0118
0.00
0131
Coatin
g4
Rs/Ω
cm2
11.51
11.45
9.52
1010
9.4
9.4
9.4
8.62
8.5
CPE-Y
0/m
Fcm
−2sn
−1
0.00
0306
0.00
0414
0.00
0588
0.00
035
0.00
0307
0.00
0477
0.00
0592
0.00
0768
0.00
152
0.00
219
CPE-n
0.88
10.86
30.78
40.86
40.88
60.82
50.79
70.76
0.66
20.60
5
Cdl/μ
Fcm
−214
317
714
114
414
615
115
716
116
516
1
Rct/Ω
cm2
1,79
31,87
42,57
92,66
22,50
187
377
272
864
160
2
t F/m
s25
633
136
338
236
513
212
1117
106
97
W-R
D/Ω
cm2
––
–1,64
81,20
190
798
31,13
11,23
31,57
8
W-T/s
––
–4
3.6
6.2
77
76.8
W-n
––
–0.5
0.5
0.5
0.5
0.5
0.5
0.5
χ2
0.00
053
0.00
180.00
0539
0.00
0398
0.00
0185
0.00
0583
0.00
0566
0.00
0431
0.00
0391
0.00
0219
Coatin
g5
Rs/Ω
cm2
11.5
1211
9.3
98.9
8.8
8.8
8.62
8.2
CPE-Y
0/m
Fcm
−2sn
−1
0.00
0298
0.00
0364
0.00
0563
0.00
0539
0.00
0676
0.00
0781
0.00
0956
0.00
117
0.00
181
0.00
2364
CPE-n
0.88
90.88
80.80
80.79
10.76
20.74
90.72
20.69
70.62
70.58
3
Cdl/μ
Fcm
−214
718
316
813
213
714
715
015
814
913
7
Rct/Ω
cm2
2,74
92,78
82,75
262
450
139
335
524
723
219
9
t F/m
s40
3511
462
8368
5853
3935
27
W-R
D/Ω
cm2
––
–97
863
355
758
466
561
071
4
W-T/s
––
4.5
4.5
4.5
4.5
4.5
4.4
5.7
W-n
––
–0.45
0.5
0.5
0.48
0.45
0.5
0.5
χ2
0.00
0407
0.00
120.00
0768
0.00
0402
0.00
0359
0.00
0196
0.00
0113
0.00
0209
0.00
0189
0.00
0136
Upto
4hof
immersion
,electrochemical
parametersarelin
kedto
thecompo
site
coatingcharacteristics(deduced
from
equivalent
circuit,Fig.5a)andforlong
erim
mersion
period
s,the
electrochemical
parametersareassociated
tosteeldegradationthroug
hthecoatingdefects(deduced
from
equivalent
circuit,Fig.5b
)
642 J Solid State Electrochem (2012) 16:633–648
RD values still increase. The behavior observed for coatings1 and 4 can be related to the homogeneous distribution ofchemical phases (WC particles and CoCr binder) for bothcoatings, as previously mentioned. Finally, after 48 himmersion time, it can be seen that Rct and RD values ofcoating 1 and coating 4 are higher than other coatings,probably due to a less important porosity rate than other
configurations, or by the pore geometry configuration thatfavors partial sealing during the aging of the coatedsamples. Time constant evolutions (Fig. 6e) are not sorelevant compare with the diffusion resistance evolution,because the evolution of this parameter is very dependanton the shape, interconnection paths between porosities.Anyway, tD evolutions confirm after extended immersion
Fig. 6 EIS data for substrate and coatings at different exposure timein artificial seawater: a Resistance charge transfer for substrate,coating 2, coating 3, and coating 5; b Resistance charge transfer for
substrate, coating 1 and coating 4; c time constant tF associated to thecharge transfer reactions, d Warburg diffusion resistance, and ediffusion time constant tD
J Solid State Electrochem (2012) 16:633–648 643

tests that coatings 1 and 4 present the best corrosionbehavior in seawater.
Evolution of electrochemical behavior of the coatedsteels in artificial seawater is directly link to variations ofmetallurgical states in the as-sprayed coatings. Modificationof the deposition parameters may affect the properties of theas-sprayed coatings through evolution of the density and/orporosity and detectable phases inside the coatings [41].Three parameters were reduced compare with the standarddeposition mode, as reported in Table 2.
Gun transverse velocity was reduced during the synthe-sis of coating 2. This parameter affects the number of spraypasses that are necessary for the formation of a layer. Thecoating is built through cumulative layers until reaching therequired thickness. A reduction of the transverse parameterwill mainly modify the amount of matter deposited in asingle pass without affecting the microstructure (distribu-tion of the components WC particles/metallic binder). Atthe beginning of the immersion, intrinsic corrosion behav-ior of coating 2 is normally similar to that of the referencecoating 1 since distributions of WC particles are quitesimilar. The amount of deposited matter is more importantwhen this parameter is reduced, so the number of sublayersfor a constant coating thickness is decreased and it wasreported that porous structures are then favored [41]. Fittingparameters presented in Table 4 after 4 h of immersionsuggest that the surface porosity for coating 2 is narrow thatcould explain the important value of the diffusion resis-tance. But as the number of sublayers is reduced,interconnected porosity are certainly much more importantin coating 2, increasing then the number of infiltration pathsfor electrolyte towards steel substrate and favoring thediffusion through the coating.
Flame temperature and powder feed rate were reducedduring the synthesis of coatings 3 and 4, respectively. Itwas reported that both parameters influence the particlein-flight properties [3, 42, 43]. Zhao et al. [42] hadreported that the increase of gas flow rate increasesstrongly temperature and velocity of particles. Same trendswere observed when decreasing the powder feed rate. Theamount of energy transferred to the powders are moreimportant, and the higher temperature of the particlesfavors a better melting that permits the formation of morehomogeneous and compact coatings, built through accu-mulation of thinner sublayers [3, 43]. Indeed, coatingporosity seems to decrease with increasing particletemperature, same trends were observed but in less extendwhen increasing particle velocity [42]. So, we can expectthat the reduction of the flame temperature (coating 3) willmodify the metallurgical state of the coating, maybeaffecting the composition by incorporation of un-meltedparticles for instance. Coating 3 presents effectively amore important intrinsic reactivity compare with other
configurations during the first hours of immersion thatcould be associated to composition variation leading toheterogeneous distribution of WC particles and metallicbinder. Reduction of powder feed rate (coating 4) inducesa better melting of powder particles and increases theparticle velocity that favors a homogeneous distribution ofWC particles and metallic binder. So the intrinsiccorrosion behavior is higher compared with the othercoatings deposited from powder A. Then, the reactivity ofcoating 4 is quite similar to that of the reference coating 1.However, density, shape, size, and interconnection ofporosity should be different between these both coatingsthat could explain the differences in diffusion resistanceevolution observed between 4 and 10 h of immersion.
Powder composition was also examined using a com-mercial powder containing a small amount of nickel(powder B). Powder morphology and characteristics (den-sity, particle sizes, porosity, etc.) affect the properties of theas-sprayed coatings [41]. Powders A and B present quitesimilar morphological characteristics (Fig. 1) and similarparticle size distributions. Standard deposition parameterswere used for the deposition of coating 5. Incorporation ofnickel in the composition of the particles can affect themelting temperature but also the available time for chemicalreactions inside the flame influencing the coating micro-structure. Electrochemical parameters deduced from the EISmeasurements like Rct and RD in Fig. 6a, c underline thatcoating 5, which presents the highest intrinsic corrosionresistance, suffers from the presence of an important densityof defects.
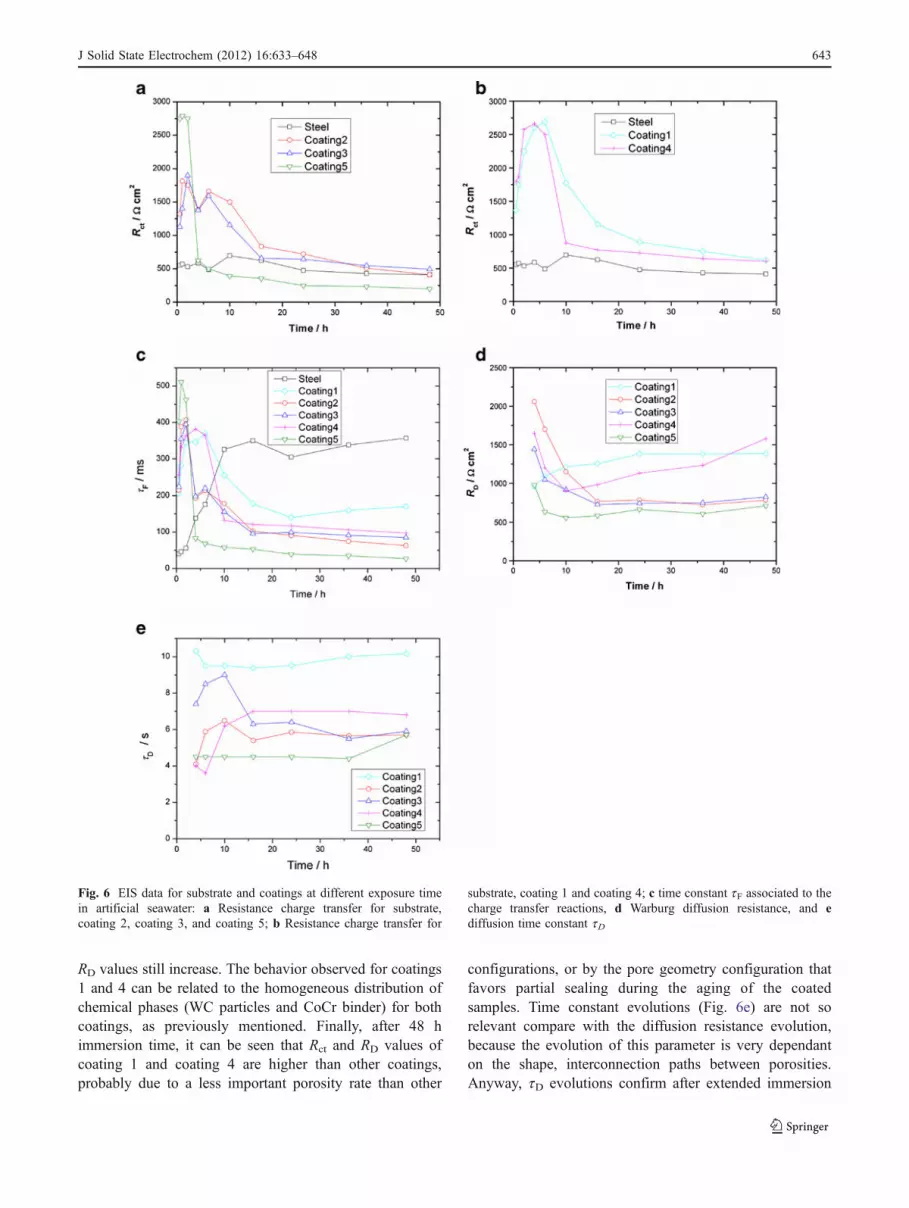
SEM cross-section and OM observations of corrodedas-sprayed coated samples
Optical microscopy (OM) studies of the corroded samplesafter EIS measurements indicate different types of defects forall coatings. Figure 7 presents optical observations inpolarized light mode respectively of the corroded surfaceof coatings 2 and 5 after extended immersion tests.Emergence of the corrosion product through few defects isobserved during immersion of the as-sprayed WC-CoCrcoatings, and it can be seen that new corroded zonesprogressively appear during immersion suggesting intercon-nection between defects through the as-sprayed coatings.Perry et al. [13] announced that low porosity rate of HVOFcoatings, reported below 3–5%, would not favor porosityinterconnection and so would not control the corrosionbehavior of the as-coated samples, but our observations arenot in agreement with that. OM observations reveal thepresence of three different types of corrosion productsemerging on or spread over the sample surface. μ-Ramanspectroscopy was used in order to characterize the nature ofthe corrosion products detected on the surface of the
644 J Solid State Electrochem (2012) 16:633–648
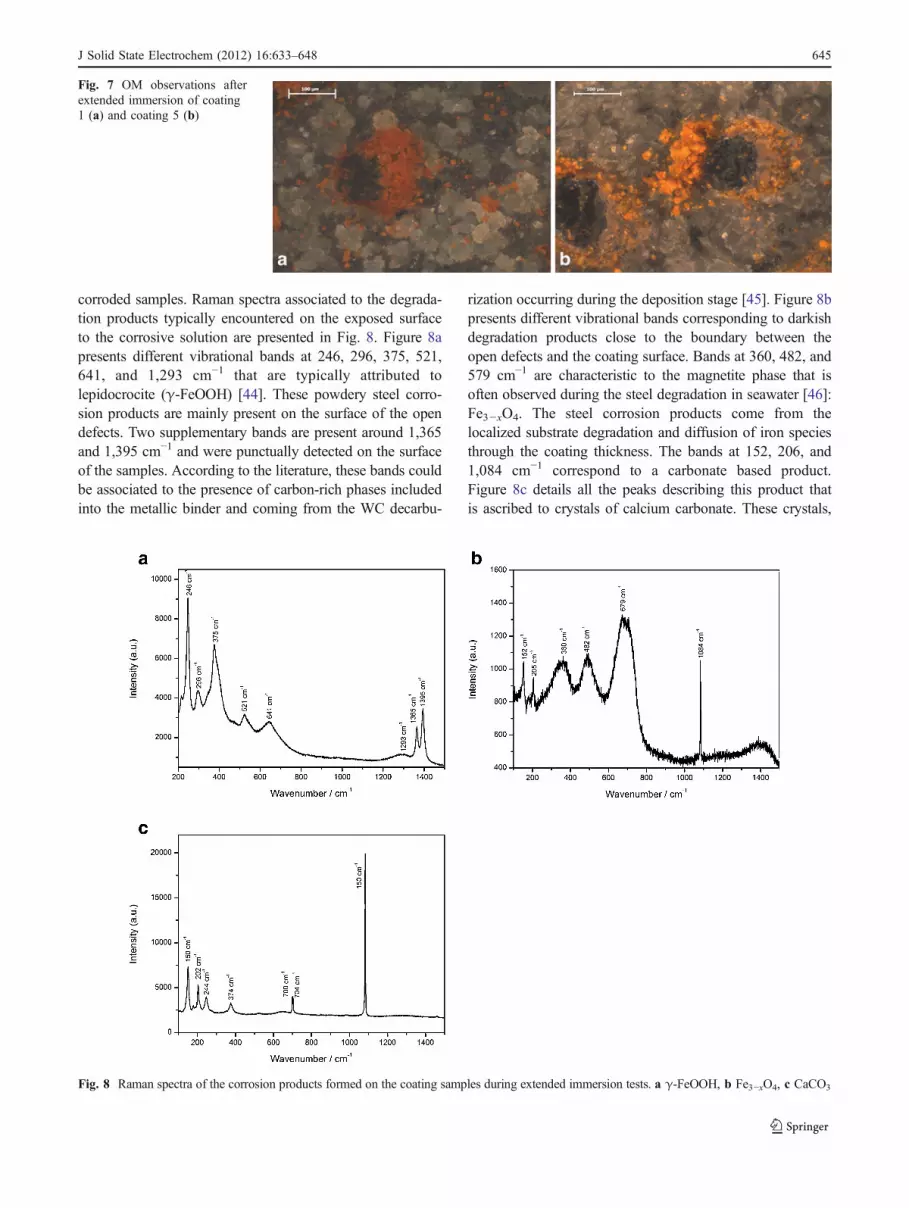
corroded samples. Raman spectra associated to the degrada-tion products typically encountered on the exposed surfaceto the corrosive solution are presented in Fig. 8. Figure 8apresents different vibrational bands at 246, 296, 375, 521,641, and 1,293 cm−1 that are typically attributed tolepidocrocite (γ-FeOOH) [44]. These powdery steel corro-sion products are mainly present on the surface of the opendefects. Two supplementary bands are present around 1,365and 1,395 cm−1 and were punctually detected on the surfaceof the samples. According to the literature, these bands couldbe associated to the presence of carbon-rich phases includedinto the metallic binder and coming from the WC decarbu-
rization occurring during the deposition stage [45]. Figure 8bpresents different vibrational bands corresponding to darkishdegradation products close to the boundary between theopen defects and the coating surface. Bands at 360, 482, and579 cm−1 are characteristic to the magnetite phase that isoften observed during the steel degradation in seawater [46]:Fe3−xO4. The steel corrosion products come from thelocalized substrate degradation and diffusion of iron speciesthrough the coating thickness. The bands at 152, 206, and1,084 cm−1 correspond to a carbonate based product.Figure 8c details all the peaks describing this product thatis ascribed to crystals of calcium carbonate. These crystals,
Fig. 7 OM observations afterextended immersion of coating1 (a) and coating 5 (b)
Fig. 8 Raman spectra of the corrosion products formed on the coating samples during extended immersion tests. a γ-FeOOH, b Fe3−xO4, c CaCO3
J Solid State Electrochem (2012) 16:633–648 645

distinctly observed on the polarized light OM pictures,appear close to open defects and they are mainly composedof aragonite crystallographic form [47–49]. Doncescu et al.[47] have demonstrated that this crystallographic form ofCaCO3 was favored in simplified artificial seawater for lowcathodic polarization due to the presence of magnesium ionsthat inhibited calcite and vaterite crystallographic forms.
FTIR-ATR measurements were performed on the cor-roded samples after extended immersion tests. Differentanalyses were done on each sample to confirm the results.The main phases detected by FTIR-ATR measurements arepresented in Fig. 9a, b. Large bands corresponding to OHgroup in the 3,080–3,250 cm−1 domain are detected.Characteristics peaks at 740, 1,020, and 1,157 cm−1 aredetected and could be associated to iron corrosion product
γ-FeOOH [50] whereas peaks at 854, 1,442, and1,644 cm−1 are mainly associated to the aragonite crystal-lographic form of CaCO3 [51, 52]. These complementaryanalyses permit to confirm the presence of iron corrosionproducts emerging from the open defects and formation onthe coating surface of calcium carbonate due to localalkalinization resulting from the cathodic reaction occurringclose to these defects.
SEM cross-section views in composition mode (back-scattered electrons image) after 48 h of immersion insimplified artificial seawater (Fig. 10) shows the electrolyteinfiltration through coating defects until reaching thesubstrate, and the formation of cavities at the substrate/coating interface. EDS analyses allowed to determine andfollow the rise path of the corrosion product towards the
Fig. 9 FTIR-ATR spectra characteristics of a γ-FeOOH and b CaCO3
Fig. 10 Cross-section SEMobservations of samples after 48 hof immersion in seawater: a coat-ing 1; b coating 3; c coating 5
646 J Solid State Electrochem (2012) 16:633–648

surface, and so to identify in the as-sprayed coatings, theinfiltration path of the solution towards the substrate.
Cross-section views of non-corroded samples, mainly insecondary electron mode, do not permit to clearly distin-guish the narrow interconnected porosity of the coatings.SEM observations in backscattered electron mode (compo-sitional view) coupled to EDS analyses were necessary toidentify electrolyte infiltration paths. The cross-sectionanalyses were performed after EIS experiments andinfiltration paths were identified following the presence ofiron based products from localized corrosion at the interfacesteel/coating until the coating surface.
Qualitatively, cross-section views are quite similar forall deposition conditions. The difference between them isthe density of paths or the interconnection betweenporosity that could vary due to morphological modifica-tions appearing during the change of deposition param-eters. These modifications are essentially related toheterogeneity in distribution of WC particles and CoCrbinder. Flame temperature and powder feed rate param-eters influence the microstructure of the coatings affect-ing the distribution and repartition of the WC particlesand metallic binders.
Diffusion parameters deduced from EIS measurements aredependent on the shape, size, and distribution of porositiesinside the coatings, so directly to the distribution of componentsinside the coatings. The infiltration paths are very thin (fewmicrometers). Furthermore, shapes of the infiltration paths arevery complex, few of them are linear path as presented inFig. 10b, but others present deviations that increase the lengthof infiltration path. So, a delay in corrosion productsemergence should be observed and could explain theappearance of new corroded zones during immersion time.Interconnection of porosity allows supplementary accessestowards the steel substrate. Diffusion of aggressive speciesremains effective even if the diffusion path is lengthenedpermitting the acceleration of the local degradation leading tothe formation of cavities. Furthermore, this corrosion processis amplified by galvanic coupling between the coating(cathode) and substrate (anode).
The formation of calcium carbonate at the vicinity of theactive open defects would partially block the cathodic areas thatdecrease the importance of the galvanic corrosion in the localdissolution of steel substrate. Anyway, evolution of theelectrolyte aggressiveness inside the pores is sufficient tomaintain an active dissolution of the substrate as it wasconfirmed by the EIS results presented after 48 h of immersion.
Conclusions
The corrosion behavior of the as-sprayed cermet coatingsdeposited onto steel has been studied through the modeling
of EIS spectra at different exposure times in artificialseawater solution. The results show that whatever themodification of deposition conditions, coated samples havethe same corrosion mechanism which is mainly dependenton the interconnected porosity of coatings.
The EIS spectra for all coatings after 4 h of immersionpresented two time constants (charge transfer and diffusion)suggesting similar corrosion. The samples developed understandard parameters (coating 1) and lower powder feedflow exhibited better corrosion resistance as compared withthe other configurations.
From typical SEM images, we observed the rise of ironcorrosion products on the surface for all samples, whereasthe surface of the coatings remains unchanged.
The OM images shows rust covered zone corresponding toiron corrosion products which are generally surrounded bycrystal of aragonite, galvanic coupling locally amplifiesdegradation. In the composite metallic matrix coatings, thepresence of porosities and essentially interconnection betweenporosities may affect the electrochemical behavior of thecoated samples, essentially in case of low-alloy steels. Finally,deposition parameters have a little effect on the electrochem-ical behavior because they mainly imply modification inmicrostructure and/or morphology and composition. What-ever the examined deposition conditions, infiltration ofelectrolyte through the defects or interconnected defectsmainly control the degradation mechanism. Homogeneousdistribution and repartition of WC particles and metallicbinder could delay the local degradation of the steel substratebut cannot avoid it. The corrosion behavior of these as-sprayed coatings should be improved by reducing theinfiltration paths (porosity) that combined to surface rough-ness of the coatings, induces important local degradation ofsteel substrate.
References
1. Zhang SH, Cho TY, Yoan JH, Wang W, Song KO, Li MX, LooYK, Lee GG (2008) Mater Charact 59:1412–1418
2. Collazo A, Novoa XR, Perez C (1999) Electrochim Acta44:4289–4296
3. Magnani M, Suegama PH, Espallargos N, Dosta S, Fugivara CS,Guilemany JM, Beneditti AV (2008) Surf Coat Technol202:4746–4757
4. Verdon C, Karimi A, Martin JL (1998) Mater Sci EngA246:11–24
5. Villalobos-Gutiérrez CJ, Gedler-Chacón GE, La Barbera-Sosa JG,Piñeiro A, Staia MH, Lesage J, Chicot D, Mesmacque G, Puchi-Cabrera ES (2008) Surf Coat Technol 202:4572–4577
6. Aw PK, Kuan Tan AL, Phong Tan T, Qiu J (2008) Thin SolidFilms 516:5710–5715
7. Bjordal M, Bardal E, Rogne T, Eggen TG (1995) Wear 186–187:508–514
8. Monticelli C, Frignani A, Zucchi F (2004) Corros Sci 46:1225–1237
J Solid State Electrochem (2012) 16:633–648 647

9. Guilemany JM, Dosta S, Miguel JR (2006) Surf Coat Technol201:1180–1190
10. HumanAM, Exner HE (1997) Int J Ref Metals HardMater 15:65–7111. Sutthiruangwong S, Mori G (2003) Int J Ref Metals Hard Mater
21:135–14512. Konadu DS, Vander Merwe J, Potgieter JH, Potgieter-Vermarsk S,
Machio CN (2010) Corros Sci 52:3118–312513. Perry JM, Neville A, Wilson VA, Hodgkiess T (2001) Surf Coat
Technol 137:43–5114. Schnyder B, Strössel-Sittig C, Kötz R, Hochstrasser-Kurz S,
Virtanen S, Jaeggi C, Eichenberger N, Siegenthaler H (2004) SurfSci 566–568:1240–1245
15. Monticelli C, Balbo A, Zucchi F (2010) Surf Coat Technol204:1452–1460
16. Guilemany JM, Cabot PL, Fernandez J, Paco JM, Sanchez J(1998) Sci Eng Compos Mater 7:205–208
17. Saha GC, Khan TI (2010) Metall Mater Trans A 41:3000–300918. Lekatou A, Zois D, Karantzalis AE, Grimanelis D (2010) Corros
Sci 52:2616–263519. Koga Y, Obata H, Noguchi M, Tarumi K, Ogi K (2004) Proc Int
Thermal Spray Conf Osaka, Japan 10–12 may 2004.20. Suegama PH, Fugivara CS, Benedetti AV, Fernandez J, Delgado J,
Guilemany JM (2002) J Appl Electrochem 32:1287–129521. Fedrizzi L, Rossi S, Cristel R, Bonora PL (2004) Electrochim
Acta 49:2803–281422. Barletta M, Bolelli G, Bonferroni B, Lusvarghi L (2010) J
Thermal Spray Technol 19:358–36723. Creus J, Idrissi H, Mazille H, Sanchette F, Jacquot P (1998) Surf
Eng 14:432–43624. Creus J, Idrissi H, Mazille H, Sanchette F, Jacquot P (1998) Surf
Coat Technol 107:183–19025. Creus J, Billard A, Sanchette F (2004) Thin Solid Films 466:1–926. Creus J, Mazille H, Idrissi H (2000) Surf Coat Technol 130:224–23227. Vinayo MH, Kassabji F, Guyamont J, Fauchais P (1985) J Vac Sci
Technol 3A:2483–248928. Li CJ, Ohmori A, Harada Y (1996) J Mater Sci 31:785–79429. Stewart DA, Shipway PH, McCartney DG (1998) Surf Coat
Technol 105:13–2430. Sahraoui T, Guessasma S, Ali Jeridane M, Hadji M (2010) Mater
Des 31:1431–143731. Thiele S, Kerstin S, Jaenicke-Roessler K, Berger-Lutz M, Spatzier
J (2010) Thermophysical and microstructural studies on thermally
sprayed Tungsten Carbide-Cobalt coatings. J Thermal SprayTechnol. doi:10.1007/s11666-010-9558-0
32. Du H, Hua W, Liu J, Gong J, Sun C, Wen L (2005) Mater Sci EngA 408:202–210
33. Creus J, Top EH, Savall C, Refait Ph, Ducros C, Sanchette F(2008) Surf Coat Technol 202:4047–4055
34. Berziou C, Remy K, Billard A, Creus J (2007) Corros Sci49:4276–4295
35. Sanchette F, Ducros C, Billard A, Rébéré C, Berziou C, ReffassM, Creus J (2009) Thin Solid Films 518:1575–1580
36. Reffass M, Berziou C, Rébéré C, Billard A, Creus J (2010) CorrosSci 52:3615–3623
37. Kaciulis S, Mezzi A, Montesperelli G, Lamastra F, Rapone M,Casadei F, Valente T, Gusmano G (2006) Surf Coat Technol201:313–319
38. William Grips VK, Barshilia HC, Selvi VE, Rajam Kalvati KS(2006) Thin Solid Films 514:204–211
39. Liu C, Bi Q, Leyland A, Mathews A (2003) Corros Sci 45:1243–1256
40. Brug GJ, Van Den Eeden ALG, Sluyters-Rehbach M, Sluyters JH(1984) J Electroanal Chem 176:275–295
41. Davis JR (2004) Handbook of thermal spray technology. ASMInternational, Ohio
42. Zhao L, Maurer M, Fischer F, Dicks R (2004) Wear 257:41–4643. Bartuli C, Valente T, Cipri F, Bemporad E, Tului M (2005) J
Thermal Spray Technol 14:187–19544. Perez FR, Barrero CA, Arnache O, Sanchez LC, Garcia KE, Hight
Walker AR (2009) Phys B Condens Matter 404:1347–135345. Gorockiewicz R, Lapinski A (2010) Vac 85:429–43346. Refait Ph, Memet JB, Bon C, Sabot R, Génin JMR (2003) Corros
Sci 45:833–84547. Doncescu A, Festy D, Gil O, Maillot V, Touzain S, Tribollet B
(1998) Mater Sci Forum 289–292:1163–118048. Dandeu A, Humbert B, Carteret C, Muhr H, Plasari E, Bossoutrot
JM (2006) Chem Eng Technol 29:221–22549. Tlili MM, Ben Amor M, Gabrielli G, Joiret S, Maurin G,
Rousseau P (2001) J Raman Spectrosc 33:10–1650. Antony H, Legrand L, Maréchal L, Perrin S, Dillmann Ph,
Chaussé A (2005) Electrochim Acta 51:745–75451. Xu X, Zhao Y, Lai Q, Hao Y (2010) J Appl Polym Sci 119:319–
32452. Sarkar A, Mahapatra S (2010) Cryst Growth Des 10:2129–2135
648 J Solid State Electrochem (2012) 16:633–648


