Embed Size (px)
Citation preview

STRUCTURAL CONTROL AND HEALTH MONITORINGStruct. Control Health Monit. (2013)Published online in Wiley Online Library (wileyonlinelibrary.com). DOI: 10.1002/stc.1586
Corrosion monitoring of post-tensioned concrete structures usingfractal analysis of guided ultrasonic waves
Ayman Moustafa, Ehsan Dehghan Niri, Alireza Farhidzadeh and Salvatore Salamone*,†
Smart Structures Research Laboratory, Department of Civil, Structural and Environmental Engineering, University at Buffalo,The State University of New York, NY 14260, USA
SUMMARY
This work presents a new approach based on fractal analysis of guided ultrasonic waves (GUWs) for monitoringthe corrosion evolutionary path in post-tensioned systems. Fractal analysis is a new scientific paradigm that hasbeen used successfully in many fields including biological and physical sciences. However, its application inthe SHM community has been modest. The proposed approach utilizes piezoelectric transducers, permanentlyattached to the steel tendon, to transmit and receive GUWs. The corrosion monitoring is performed through theexamination of the fractal dimension of GUW measurements over time. Accelerated corrosion tests were carriedout on two 7 wire steel strands embedded in two concrete blocks to validate the proposed system. Finally, anoutlier detection algorithm is proposed to enhance the sensitivity of the technique to the corrosion-induced damage.Copyright © 2013 John Wiley & Sons, Ltd.
Received 26 November 2012; Revised 14 April 2013; Accepted 18 May 2013
KEY WORDS: structural health monitoring; fractal analysis; corrosion monitoring; guided ultrasonic waves;post-tensioned structures; outlier analysis
1. INTRODUCTION
During the last years, post-tensioning has progressively become the predominant choice for pre-stressedconcrete construction ranging from commercial and residential buildings, bridges, parking structuresto pressure vessels, tanks and containment vessels for nuclear power plants. Corrosion of the steelstrands has become a concern for designers, owners and regulators. Many of these structures [1], someonly 10 years old, have suffered the failure of tendons because of corrosion. Extensive inspection andmaintenance/repair programs have been established, with attendant direct costs and significantindirect costs due to business interruption. Detecting corrosion in the tendons of post-tensioned(PT) structures is technically challenging. The general inaccessibility of the tendons makes evaluationdifficult, costly and often inconclusive [2]. Visual inspection may reveal corrosion by cracking orspalling of concrete caused by tendon failure. However, there may be no outward signs that the tendonhas broken. In addition, the location at which the tendon or wire has erupted out of the structure isusually some distance away from the location of actual failure. Exploratory concrete removalscombined with the removal of the broken tendon will be required to identify the location, natureand the possible causes of the failure. Several non-destructive evaluation techniques for evaluatingthe condition of PT tendons have been developed to address these issues in the past few years.Remanent magnetism and magnetic flux methods have met success in detecting corrosion inprestressing steel strands [3–5]. However, both methods have limitations for potential use in internal
*Correspondence to: Salvatore Salamone, Smart Structures Research Laboratory, Department of Civil, Structural andEnvironmental Engineering, University at Buffalo, The State University of New York, NY 14260, USA.†E-mail: [email protected]
Copyright © 2013 John Wiley & Sons, Ltd.

A. MOUSTAFA ET AL.
tendons because of difficulties with disturbing magnetic signals generated from non-pre-stressedreinforcement. Radiography has been effective at detecting corrosion in PT tendons, but radiationsafety concerns and expense have limited its use [6–8]. Acoustic emission has been used in some casesto report the time and location of tendon rupture by detecting the sound emanating from the rupture[9–11]. This is achieved with an array of acoustic sensors attached to the structure and connected toan on-site data-acquisition system. Although this technique can be effective, it requires continuousmonitoring of the structure to provide useful information and cannot be used to identify pre-existingbroken tendons. Importantly, it can only provide information on the final stage of the corrosionprocess (i.e., strand failure). However, it is desirable to be able to identify corrosion process at earlystages to allow for the planning and implementation of control strategies at a point where it is lessexpensive and invasive than when visible surface signs of corrosion have been observed [12,13].Techniques based on sparse arrays of sensors, which have the capability of transmitting and receivingguided ultrasonic waves (GUWs), are among the most promising candidates for corrosion detection.As opposed to the waves used in traditional impact-echo, which propagate in 3D within the PTstructure, GUWs propagate along the tendon itself by exploiting its waveguide geometry. Theadvantages of this technique over those mentioned earlier include the following: (i) the use oftransducers permanently attached to the tendon to perform real-time structural monitoring and routineinspection with the same sensing system; and (ii) the capability to detect both active and pre-existingcracks by toggling between the modes of ‘passive’ acoustic emission testing and ‘active’ ultrasonictesting. The ability of GUWs to locate cracks and notches has been demonstrated in several laboratoryworks [14–17]. However, the application of GUWs can be very challenging because of the complexityof these signals. In fact, although GUWs retain the memory of the whole propagation phenomena,sometimes, some relevant information (e.g., presence of micro-cracks) may be hidden in localfluctuations. As a result, traditional damage-sensitive features extracted from these signals (e.g.,attenuation, RMS etc.) may miss important local details. In this paper, a new approach based on fractalanalysis of GUWs is presented for monitoring the corrosion evolutionary path in PT systems.Fractal analysis is a new scientific paradigm that has been used successfully in many fields includingbiological and physical sciences [18–21], but the use of this method in GUW-based SHM systems hasnot been fully investigated [21].
This paper is organized as follows. In Section 2, we briefly provide an overview of the concept offractal analysis. Sections 3 and 4 describe the experimental study to evaluate the performance of theproposed system and the results. An outlier detection algorithm based on the fractal dimension (FD)of GUWs is presented in Section 5. The conclusions are summarized in Section 6.
2. FRACTAL DIMENSION
2.1. Fractal dimension background
The term ‘Fractal’ was first introduced by Mandelbrot [22] to indicate objects whose complexgeometry cannot be characterized by an integer dimension. A classical example to illustrate thistechnique is the ‘length’ of a coastline [23]. When measured at a given spatial scale d, the total lengthof a crooked coastline L(d) is estimated as a set of N straight line segments of length d. Because smalldetails of the coastline not recognized at lower spatial resolutions become apparent at higher spatialresolutions, the measured length L(d) increases as the scale of measurement d increases. Therefore,in fractal geometry, the Euclidean concept of ‘length’ becomes a process rather than an event, and thisprocess is controlled by a constant parameter called FD. The FD can be a non-integer number varyingdepending on the complexity of an object. For example, the FD for a curve will lie between 1 and 2,depending on how much area it fills [24]. Similarly, the FD of surfaces lies between 2 and 3 dependingon the roughness of surface [25]. The complexity of two curves or two surfaces can then be easilycompared, as the values of FD are not anymore restricted to the topological dimensions of 1 and 2.Several algorithms have been proposed for the calculation of the FD, including the box-countingalgorithm, Hurst R/S analysis, fractional Brownian motion and power spectrum method [26–28].Among them, the box-counting algorithm is the most popular [21].
Copyright © 2013 John Wiley & Sons, Ltd. Struct. Control Health Monit. (2013)DOI: 10.1002/stc

CORROSION MONITORING USING FRACTAL ANALYSIS OF GUWS
2.2. Box-counting algorithm
The box-counting method is motivated by the approach of considering the space filling properties ofthe curve as an indication of its complexity. In general, in the box-counting method, a data set (e.g.,a curve) is covered with a collection of equal-sized boxes, and the number of elements of a given sizer is counted to see how many of them are necessary to completely cover the curve. As the size of thearea element approaches zero, the total area covered by the area elements will converge to the measureof the FD [25,29,30]. This can be expressed mathematically as
D ¼ limr!0
logN rð Þlog 1=rð Þ
� �(1)
where N(r) is the number of boxes of size r required to completely cover the curve and D is the FD ofthe curve. In practice, D is estimated by fitting a straight line to the log–log plot of N(r) vs. 1/r over arange of box sizes. This can be expressed as
log N rð Þð Þ ¼ D log 1=rð Þ þ C (2)
where C is a constant. The slope of the least square fit line is taken as an estimator of the FD (D) of thecurve. Figure 1 illustrates a typical structure of a graph of log(N(r)) vs. log 1
r= Þð for the fractal analysisof a 2D object. Five regions can be identified [18]: (1) if r is much larger than the size of the object, RO
(i.e., the box always cover the object so N(r) = 1), then D = 0; (2) if r is larger than the size of structurein the object, RS (e.g., if r is large that it covers the whole area enclosed by the signal, then the boxesrequired to cover the signal will fill the whole surface), thus D= 2 as for an area; region (3) is the regionfrom which the box sizes should be selected to give the best estimation of FD; (4) in this region, thetransition from the Fractal to Euclidean regime occurs; (5) finally, if r is smaller than the discretizationsize, RD (e.g., sampling frequency), D= 0 because it will be measuring the dimension of a point.
2.3. Fractal dimension of GUWs
In general, the ‘boxes’ used to cover the data set are often squares to cover 2D data sets, or cubes tocover 3D data sets. However, time signals, including GUWs, exist in the affine space where the axeshave incompatible units, and there is no natural scaling between them; as a result, distance along thetime axis cannot be compared with distance along the amplitude axis and the classical box-countingmethod with square boxes will lead to a FD of zero (i.e., the dimension of a point) [21]. To overcomethis limitation, different solutions have been proposed in the past [29,30]. In this paper, a box-countingmethod based on rectangular boxes has been used. In general, a grid of rectangular boxes issuperimposed over a signal (e.g., GUW). Next, the number of boxes that intersect the signal, N(r), is
D = 0
D = 0
RO RS RT RD
1 2 3 4 5
log(1/r)
log
(N(r
))
Figure 1. Variation of fractal dimension versus box sizes [18].
Copyright © 2013 John Wiley & Sons, Ltd. Struct. Control Health Monit. (2013)DOI: 10.1002/stc
A. MOUSTAFA ET AL.
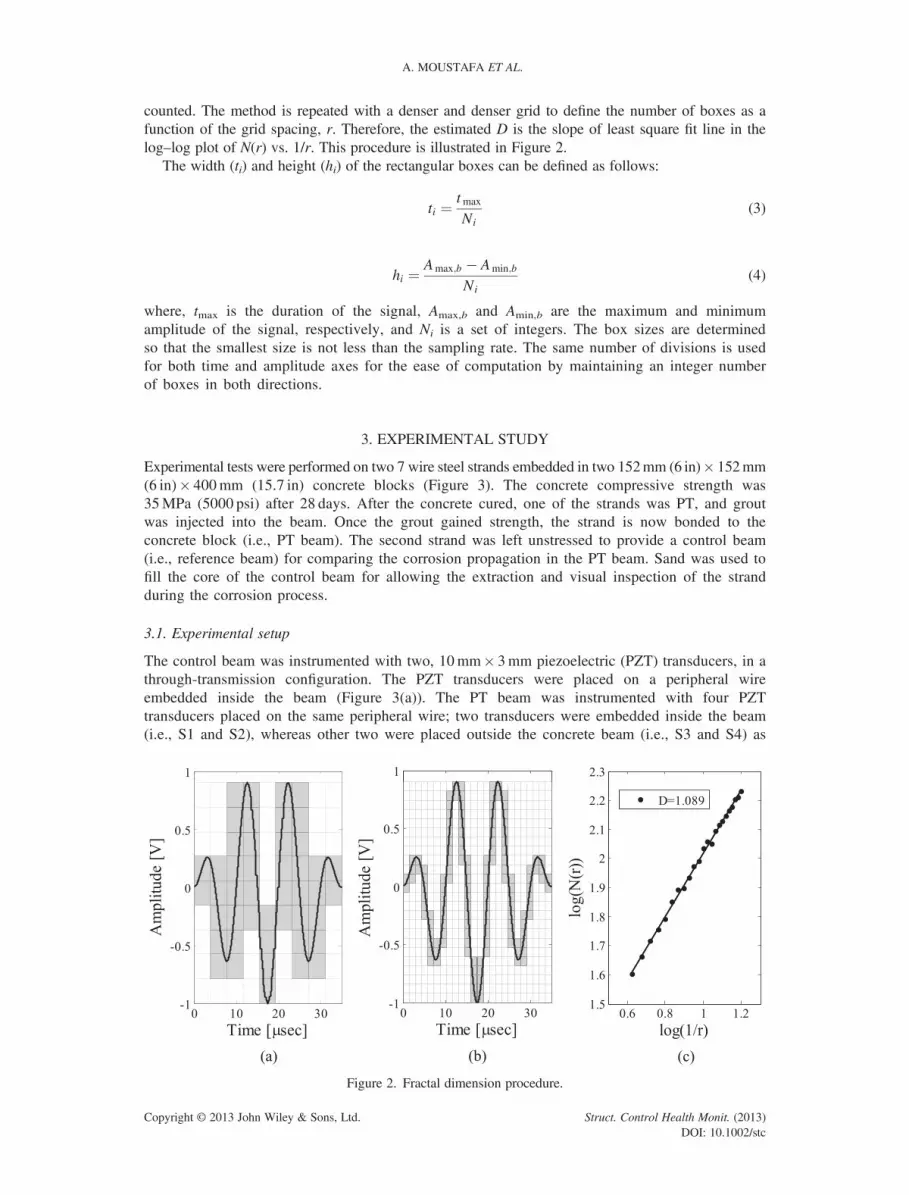
counted. The method is repeated with a denser and denser grid to define the number of boxes as afunction of the grid spacing, r. Therefore, the estimated D is the slope of least square fit line in thelog–log plot of N(r) vs. 1/r. This procedure is illustrated in Figure 2.
The width (ti) and height (hi) of the rectangular boxes can be defined as follows:
ti ¼ tmax
Ni(3)
hi ¼ Amax;b � Amin;b
Ni(4)
where, tmax is the duration of the signal, Amax,b and Amin,b are the maximum and minimumamplitude of the signal, respectively, and Ni is a set of integers. The box sizes are determinedso that the smallest size is not less than the sampling rate. The same number of divisions is usedfor both time and amplitude axes for the ease of computation by maintaining an integer numberof boxes in both directions.
3. EXPERIMENTAL STUDY
Experimental tests were performed on two 7 wire steel strands embedded in two 152mm (6 in)� 152mm(6 in)� 400mm (15.7 in) concrete blocks (Figure 3). The concrete compressive strength was35MPa (5000 psi) after 28 days. After the concrete cured, one of the strands was PT, and groutwas injected into the beam. Once the grout gained strength, the strand is now bonded to theconcrete block (i.e., PT beam). The second strand was left unstressed to provide a control beam(i.e., reference beam) for comparing the corrosion propagation in the PT beam. Sand was used tofill the core of the control beam for allowing the extraction and visual inspection of the strandduring the corrosion process.
3.1. Experimental setup
The control beam was instrumented with two, 10mm� 3mm piezoelectric (PZT) transducers, in athrough-transmission configuration. The PZT transducers were placed on a peripheral wireembedded inside the beam (Figure 3(a)). The PT beam was instrumented with four PZTtransducers placed on the same peripheral wire; two transducers were embedded inside the beam(i.e., S1 and S2), whereas other two were placed outside the concrete beam (i.e., S3 and S4) as
Figure 2. Fractal dimension procedure.
Copyright © 2013 John Wiley & Sons, Ltd. Struct. Control Health Monit. (2013)DOI: 10.1002/stc

Figure 3. Sensors layout: (a) control beam and (b) post-tensioned beam.
CORROSION MONITORING USING FRACTAL ANALYSIS OF GUWS
shown in Figure 3(b). In the PT beam, three different sensor-actuator paths were investigated:(i) S3–S1 for monitoring the corrosion at the right anchorage (A); (ii) S4–S2 for monitoringthe corrosion at the left anchorage (B); and (iii) S1–S2 for monitoring the corrosion of the steelstrand inside the beam.
Signal generation and data acquisition were achieved with a National Instruments (Austin, TX, USA),modular PXI 1042 unit. This unit included an arbitrary waveform generator card (PXI 5411) and one20-GS/s 12-bit multi-channel digitizer (PXI 5105). In addition, a high-voltage amplifier was usedto amplify the excitation to the ultrasonic transmitters. Toneburst signals, consisting of 3.5 cycles,were excited by sweeping the generation frequency from 50 to 400 kHz. LabVIEW softwaredeveloped at the University at Buffalo was used to control the sensors, and acquire and processthe data.
3.2. Accelerated corrosion tests
Accelerated corrosion tests were carried out using the impressed current method. A direct current wasapplied to the strand by using an integrated system incorporating a small rectifier power supply withan inbuilt ammeter to monitor the current and a potentiometer to control the current intensity. Theconcrete beam suffit was immersed in a 5% sodium chloride (NaCl) solution serving as the electrolyteneeded in the impressed current method, and the direction of the current was arranged so that thestrand served as the anode as a steel bar counter electrode was positioned in the tank to act as acathode. This setup ensured a uniform distribution of the current along the whole length of the strand.Figure 4 shows the accelerated corrosion test setup for the PT beam. The test was kept running for55 days, the data were recorded daily and the visual monitoring of the anchorages was performed.
Figure 4. Accelerated corrosion test setup.
Copyright © 2013 John Wiley & Sons, Ltd. Struct. Control Health Monit. (2013)DOI: 10.1002/stc

A. MOUSTAFA ET AL.
4. EXPERIMENTAL RESULTS
This section presents the results of the FD of GUWs for monitoring the corrosion-induceddamage in PT concrete beams. First, the results obtained from the control beam are presentedto show the FD variations for different ‘known’ stages of corrosion. Next, the results of the PTbeam are presented.
4.1. Control beam results
The proposed monitor system utilizes distributed actuators/sensors permanently attached to thestrand, to generate elastic waves and measure the arriving waves at sensors. When a single actuator/sensor path is considered, the corrosion monitoring is performed through the examination of the FDof the arriving waves in comparison with a ‘baseline’ condition (i.e., healthy strand). In fact,because the FD is a measure of the complexity of the signal, it may contain fundamental informationrelated to the corrosion process. Figure 5 shows the strand before the accelerated corrosion test (i.e.,pristine condition) and for three increasing levels of corrosion. In Figure 5(d), a significant loss ofstrand cross-sectional area (about 50%) can be observed and is caused by localized corrosion (i.e.,pitting corrosion).
Before the accelerated corrosion test, the FD of the wave packet (containing only the firstarrival) for the pristine condition (i.e., baseline) was calculated using the approach described inSection 2. Next, the same grids of rectangular boxes used to calculate the FD of the baselinesignals were used for computing the FD of GUWs recorded during the corrosion test (i.e., currentsignals). Figure 6 shows the FD of signals recorded at the four corrosion stages illustrated inFigure 5. In particular, Figure 6(a) illustrates the graph of log(N(r)) vs. log(1/r) for each stage,and in Figure 6(b), the FD is computed as the slope of each line shown in Figure 6(a). It canbe observed that FD decreased with the severity of the corrosion. As a result, one may infer thatGUWs signals with relatively smaller values of FD may correspond to strands with greaterlosses of mass. It should be mentioned that the deterioration of the strand (i.e., local loss ofmaterial) led to attenuation of the signal. Therefore, the FD is capable to capture this information(i.e., signal attenuation).
a) b)
c) d)
Figure 5. Corrosion stages: (a) pristine case, (b) corrosion stage 1, (c) corrosion stage 2 and (d) corrosion stage 3.
Copyright © 2013 John Wiley & Sons, Ltd. Struct. Control Health Monit. (2013)DOI: 10.1002/stc

10.5 11 11.5 12 12.5 13 13.5 14-1
0
1
2
3
4
5
6
log 1/r
log
N
Pristine caseCorrosion state 1Corrosion state 2Corrosion state 3
0 1 2 3
1.25
1.3
1.35
1.4
1.45
1.5
1.55
1.6
Corrosion Stage
Frac
tal D
imen
sion
a) b)
Figure 6. Results of the fractal dimension (FD): (a) FD for the pristine and ‘corroded’ cases and (b) the change ofFD with the corrosion stage.
CORROSION MONITORING USING FRACTAL ANALYSIS OF GUWS
4.2. PT beam results
The changes in FD as a function of time at the anchorages and inside the beam are plotted inFigures 7 and 8, respectively (i.e., S3–S1 path, S4–S2 path and S1–S2 path). The frequency of300 kHz was selected to generate these graphs. Also in this case, the same grids of rectangularboxes used to calculate the FD of the baseline signals were used for computing the FD of thecurrent signals (i.e., during the progression of corrosion). The following observations can bemade: (i) an initial stage in which the FD shows no significant change in values can be identified.The duration of this stage at the anchorage B was longer than at the anchorage A; (ii) then asudden drop occurred in day 11 for the anchorage A and in day 20 for the anchorage B; this dropmostly indicates that a significant change in the signal shape occurred because of the initiation of
Figure 7. Fractal dimension changes versus time: (a) anchorage A and (b) anchorage B.
Copyright © 2013 John Wiley & Sons, Ltd. Struct. Control Health Monit. (2013)DOI: 10.1002/stc
10 15 20 25 30 35 40 45 50 551.35
1.4
1.45
1.5
1.55
1.6
Day
Frac
tal D
imen
sion
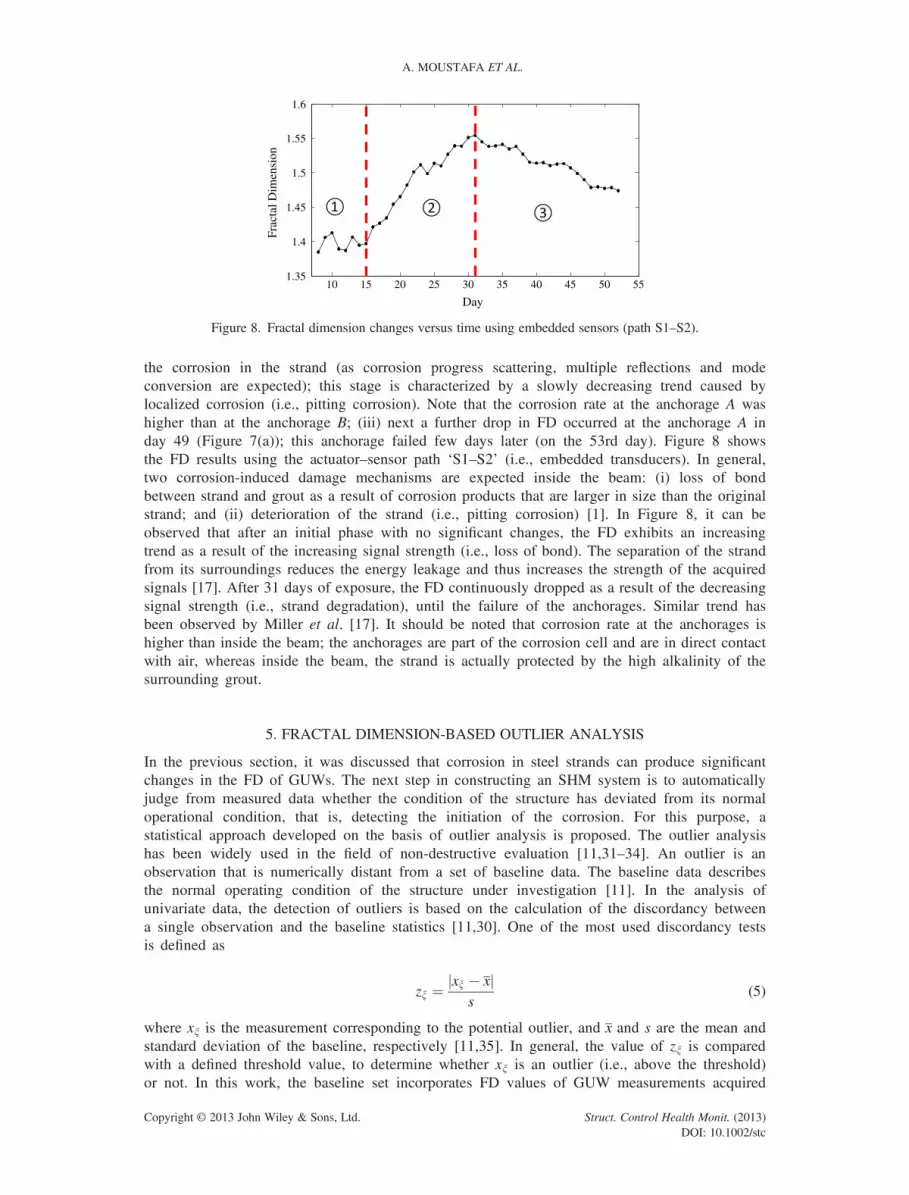
Figure 8. Fractal dimension changes versus time using embedded sensors (path S1–S2).
A. MOUSTAFA ET AL.
the corrosion in the strand (as corrosion progress scattering, multiple reflections and modeconversion are expected); this stage is characterized by a slowly decreasing trend caused bylocalized corrosion (i.e., pitting corrosion). Note that the corrosion rate at the anchorage A washigher than at the anchorage B; (iii) next a further drop in FD occurred at the anchorage A inday 49 (Figure 7(a)); this anchorage failed few days later (on the 53rd day). Figure 8 showsthe FD results using the actuator–sensor path ‘S1–S2’ (i.e., embedded transducers). In general,two corrosion-induced damage mechanisms are expected inside the beam: (i) loss of bondbetween strand and grout as a result of corrosion products that are larger in size than the originalstrand; and (ii) deterioration of the strand (i.e., pitting corrosion) [1]. In Figure 8, it can beobserved that after an initial phase with no significant changes, the FD exhibits an increasingtrend as a result of the increasing signal strength (i.e., loss of bond). The separation of the strandfrom its surroundings reduces the energy leakage and thus increases the strength of the acquiredsignals [17]. After 31 days of exposure, the FD continuously dropped as a result of the decreasingsignal strength (i.e., strand degradation), until the failure of the anchorages. Similar trend hasbeen observed by Miller et al. [17]. It should be noted that corrosion rate at the anchorages ishigher than inside the beam; the anchorages are part of the corrosion cell and are in direct contactwith air, whereas inside the beam, the strand is actually protected by the high alkalinity of thesurrounding grout.
5. FRACTAL DIMENSION-BASED OUTLIER ANALYSIS
In the previous section, it was discussed that corrosion in steel strands can produce significantchanges in the FD of GUWs. The next step in constructing an SHM system is to automaticallyjudge from measured data whether the condition of the structure has deviated from its normaloperational condition, that is, detecting the initiation of the corrosion. For this purpose, astatistical approach developed on the basis of outlier analysis is proposed. The outlier analysishas been widely used in the field of non-destructive evaluation [11,31–34]. An outlier is anobservation that is numerically distant from a set of baseline data. The baseline data describesthe normal operating condition of the structure under investigation [11]. In the analysis ofunivariate data, the detection of outliers is based on the calculation of the discordancy betweena single observation and the baseline statistics [11,30]. One of the most used discordancy testsis defined as
zx ¼ xx � xj js
(5)
where xx is the measurement corresponding to the potential outlier, and x and s are the mean andstandard deviation of the baseline, respectively [11,35]. In general, the value of zx is comparedwith a defined threshold value, to determine whether xx is an outlier (i.e., above the threshold)or not. In this work, the baseline set incorporates FD values of GUW measurements acquired
Copyright © 2013 John Wiley & Sons, Ltd. Struct. Control Health Monit. (2013)DOI: 10.1002/stc

CORROSION MONITORING USING FRACTAL ANALYSIS OF GUWS
at 300 kHz during the first week of test. For a given observation, the discordancy value zx,calculated using Equation (5), was compared with a threshold value, to classify the observationas an anomaly (i.e., outlier) or normal operating conditions of the system (inlier). A Monte Carlosimulation was employed to compute the threshold. When baseline measurements are limited, aMonte Carlo simulation is an effective method for generating a large number of random datato populate the baseline distribution [11,36].
The results of the univariate analysis are illustrated in Figure 9. The horizontal linerepresents the 99% confidence threshold calculated by the Monte Carlo simulation [36]. Itcan be seen that all observations associated to the initiation of the corrosion are successfullyclassified as outliers. The outlier analysis may play an important role in decision-makingprocesses by providing a relatively ‘early warning’ of the initiation of corrosion process (i.e., ifthe discordancy value is above the threshold) and allow the authorities for the planning andimplementation of corrosion control strategies at a point where it is less expensive and invasivethan when visible surface signs of corrosion have been observed.
10 15 20 25 30 35 40 45 50 550
5
10
15
20
25
30
35
Day
Dis
cord
ancy
(Z
)
a)
10 15 20 25 30 35 40 45 50 550
5
10
15
20
Day
Dis
cord
ancy
(Z
)
10 15 20 25 30 35 40 45 50 550
2
4
6
8
10
12
14
Day
Dis
cord
ancy
(Z
)
b)
c)
Figure 9. Univariate analysis results: (a) anchorage A, (b) anchorage B and (c) embedded transducers.
Copyright © 2013 John Wiley & Sons, Ltd. Struct. Control Health Monit. (2013)DOI: 10.1002/stc

A. MOUSTAFA ET AL.
6. CONCLUSIONS
A new approach based on the FD of GUWs was proposed for monitoring the corrosion evolutionarypath in complex structural systems such as PT systems. The proposed approach utilizes piezoelectrictransducers, permanently attached to the steel tendon, to transmit and receive GUWs. Thecorrosion monitoring was performed through the examination of the FD of GUW measurementsover time. In fact, because the FD is a measure of the complexity of the signal, it may containfundamental information related to the corrosion process. Accelerated corrosion tests were carriedon two 7 wire steel strands embedded in two concrete blocks, to validate the proposed algorithms.It was shown that the FD has the potential to monitor the progression of the corrosion-induceddamage in the strand. In particular, a decreasing trend of the FD was observed in the anchoragesas a result of the strand degradation. Inside the beam, two corrosion-induced damage mechanismswere observed: (i) loss of bond between strand and grout that caused an increasing FD; and (ii)deterioration of the strand, which resulted in a FD decreases. Moreover, an outlier detectionalgorithm based on the FD of GUWs was presented to automatically identify the initiation ofthe corrosion process. This approach may play an important role in decision-making processesby providing a relatively ‘early warning’ of the corrosion process and allow the authorities forthe planning and implementation of corrosion control strategies at a point where it is lessexpensive and invasive than when visible surface signs of corrosion have been observed.However, more theoretical investigations and formal tests need to be carried out to verify therobustness of the approach. In addition, large-scale specimens should be examined.
ACKNOWLEDGEMENTS
This project was co-sponsored by the Research and Innovative Technology Administration of the U.S.Department of Transportation through the University Transportation Centers program. The authors alsowould like to acknowledge the assistance of the technical staff of the Structural Engineering andEarthquake Simulation Laboratory (SEESL) at the University at Buffalo during the construction andpreparation of the specimens.
REFERENCES
1. Rahman A, Pernica G. Assessing New Techniques for Evaluating Post-Tensioned Buildings, Vol. 19. Institute for Researchin Construction, National Research Council of Canada, Ottawa, 1998.
2. Williams H, Hulse M. From theory to field experience with inspection of post-tensioned bridges. Construction/Repair, 1995;p. 199–202.
3. Scheel H, Hillemeier B. Capacity of the remanent magnetism method to detect fractures of steel in tendons embedded inprestressed concrete. NDT & E International 1997; 30(4):211–216.
4. Ghorbanpoor A, Borchelt R, Edwards M, Abdel Salam E. Magnetic-based NDE of prestressed and post-tensionedconcrete members – the MFL system, Final Report # FHWA-RD-00-026, Federal Highway Administration, USDOT, 2000.
5. Ghorbanpoor A, Steber GR, Shew TE. Flaw detection in reinforcing steel in concrete bridges: the magnetic field disturbance(MFD) system, Final Report No. FHWA-SA-91-026, Federal Highway Administration, Department Of Transportation,Published by the National Technical Information Service, Springfield, Virginia, 1991.
6. Shaw P, Pedersen T, Serluppens R. High energy radiography combined with the Agfa Strukturix DPS-imaging system andcomparison with other NDE-methods for inspection of thick reinforced concrete structures. Journal of NondestructiveTesting 2000; 5, http://www.ndt.net/article/v05n08/shaw/shaw.htm.
7. Corven J. Mid bay bridge post-tensioning evaluation. Final Report, Florida Department of Transportation, Florida, 2001.8. Matt P. Non-destructive evaluation and monitoring of post-tensioning tendons. in Proceedings of Workshop on Durability of
Post-Tensioning Tendons. fib bulletin, 2001.9. Youn SG, Cho SK, Kim EK. Acoustic emission technique for detection of corrosion-induced wire fracture. Key Engineering
Materials 2005; 297:2040–2045.10. Zejli H, Laksimi A, Tessier C, Gaillet L, Benmedakhene S. Detection of the broken wires in the cables’ hidden parts
(anchorings) by acoustic emission. Advanced Materials Research 2006; 13:345–350.11. Salamone S, Veletzos M, Lanza di Scalea F, Restrepo J. Detection of initial yield and onset of failure in bonded
posttensioned concrete beams. Journal of Bridge Engineering 2012; 17(6):966–974.12. Koch G, Brongers M, Thompson N, Virmani Y, Payer J. Corrosion cost and preventive strategies in the United States
(Report No. FHWA-RD-01-156). CC Technologies Laboratories, Inc./NACE International, Dublin, OH/Houston, TX,2001; p. 773.
13. Koch GH, Brongers MPH, Thompson NG, Virmani YP, Payer JH, Corrosion cost and preventive strategies in the UnitedStates, Turner-Fairbank Highway Research Center, 2002.
14. Beard M, Lowe M, Cawley P. Ultrasonic guided waves for inspection of grouted tendons and bolts. Journal of Materials inCivil Engineering 2003; 15(3):212–218.
Copyright © 2013 John Wiley & Sons, Ltd. Struct. Control Health Monit. (2013)DOI: 10.1002/stc

CORROSION MONITORING USING FRACTAL ANALYSIS OF GUWS
15. Ervin B, Bernhard J, Kuchma D, Reis H. Estimation of general corrosion damage to steel reinforced mortar usingfrequency sweeps of guided mechanical waves. Insight-Non-Destructive Testing and Condition Monitoring 2006;48(11):682–692.
16. Ervin BL, Reis H. Longitudinal guided waves for monitoring corrosion in reinforced mortar. Measurement Science andTechnology 2008; 19(5):055702.
17. Miller TH, Kundu T, Huang J, Grill JY. A new guided wave based technique for corrosion monitoring in reinforcedconcrete. Structural Health Monitoring 2013; 12(1):35–47.
18. Farhidzadeh A, Dehghan Niri E, Mustafa A, Salamone S, Whittaker A. Damage assessment of reinforced concrete structuresusing fractal analysis of residual crack patterns. Experimental Mechanics 2013. DOI 10.1007/s11340-013-9769-7
19. Lopes R, Betrouni N. Fractal and multifractal analysis: a review. Medical image analysis 2009; 13(4):634–49.20. Takayasu H. Fractals in the Physical Sciences. Manchester University Press, New York, 1990.21. Moustafa A, Salamone S. Fractal dimension-based Lamb wave tomography algorithm for damage detection in plate-like
structures. Journal of Intelligent Material Systems and Structures 2012; 23(11):1269–1276.22. Mandelbrot B. The Fractal Geometry of Nature. Freeman: New York, 1983.23. Mandelbrot BB. How long is the coast of Britain. Science 1967; 156(3775):636–638.24. Dubuc B, Quiniou JF, Roques-Carmes C, Tricot C, Zucker SW. Evaluating the fractal dimension of profiles. Physical
Review A 1989; 39(3):1500.25. Issa MA, Issa MA, Islam MS, Chudnovsky A. Fractal dimension – a measure of fracture roughness and toughness of
concrete. Engineering Fracture Mechanics 2003; 70(1):125–137.26. Esteller R, Vachtsevanos G, Echauz J, Litt B. A comparison of waveform fractal dimension algorithms. Circuits and Systems
I: Fundamental Theory and Applications, IEEE Transactions on 2001; 48(2):177–183.27. Taylor CC, Taylor SJ. Estimating the dimension of a fractal. Journal of the Royal Statistical Society. Series B
(Methodological) 1991; 53(2):353–364.28. Theiler J. Estimating fractal dimension. Journal of the Optical Society of America. A 1990; 7(6):1055–1073.29. Raghavendra BS, Narayana Dutt D. Computing fractal dimension of signals using multiresolution box-counting method.
International Journal of Information and Mathematical Sciences 2010; 6(1):50–65.30. Shoupeng S, Peiwen Q. A fractal-dimension-based signal-processing technique and its use for nondestructive testing.
Russian Journal of Nondestructive Testing 2007; 43(4):270–280.31. Bartoli I, Salamone S, Phillips R, Lanza di Scalea F, Sikorsky CS. Use of interwire ultrasonic leakage to quantify loss of
prestress in multiwire tendons. Journal of Engineering Mechanics 2011; 137(5):324–333.32. Rizzo P, Sorrivi E, Lanza di Scalea F, Viola E. Wavelet-based outlier analysis for guided wave structural monitoring:
application to multi-wire strands. Journal of Sound and Vibration 2007; 307(1–2):52–68.33. Farhidzadeh A, Salamone S, Luna B, Whittaker A. Acoustic emission monitoring of a reinforced concrete shear wall
by b-value based outlier analysis. Structural Health Monitoring 2013; 12(1):3–13.34. Salamone S, Bartoli I, Lanza di Scalea F, Coccia S. Guided-wave health monitoring of aircraft composite panels under
changing temperature. Journal of Intelligent Material Systems and Structures 2009; 20(9):1079–1090.35. Barnett V, Lewis T. Outliers in statistical data. In Applied Probability and Statistics. Wiley Series in Probability and
Mathematical Statistics, Vol. 1 (2nd edn). Wiley: Chichester, 1984.36. Worden K, Manson G, Fieller NRJ. Damage detection using outlier analysis. Journal of Sound and Vibration 2000;
229(3):647–667.
Copyright © 2013 John Wiley & Sons, Ltd. Struct. Control Health Monit. (2013)DOI: 10.1002/stc