Embed Size (px)
Citation preview
This article appeared in a journal published by Elsevier. The attachedcopy is furnished to the author for internal non-commercial researchand education use, including for instruction at the authors institution
and sharing with colleagues.
Other uses, including reproduction and distribution, or selling orlicensing copies, or posting to personal, institutional or third party
websites are prohibited.
In most cases authors are permitted to post their version of thearticle (e.g. in Word or Tex form) to their personal website orinstitutional repository. Authors requiring further information
regarding Elsevier’s archiving and manuscript policies areencouraged to visit:
http://www.elsevier.com/copyright
Author's personal copy
Corrosion–fatigue of A1N railway axle steel exposed to rainwater
S. Beretta *, M. Carboni, G. Fiore, A. Lo ContePolitecnico di Milano, Department of Mechanical Engineering, via La Masa 34, I-20156 Milano, Italy
a r t i c l e i n f o
Article history:Received 13 February 2009Received in revised form 6 August 2009Accepted 10 August 2009Available online 14 August 2009
Keywords:A1N steelRailway axlesCorrosion pitsCorrosion-fatigueRainwater
a b s t r a c t
The fatigue properties of railway axle steels have not yet been thoroughly studied even though a numberof axle failures are undoubtedly due to the combined effects of corrosion and fatigue. In this paper, theeffects of corrosion by rainwater on the fatigue behavior of A1N steel, has been studied. The analysisof the results enabled us to establish that even the presence of a mild corrosive environment eliminatesthe fatigue limit, thus causing failures in the high-cycle fatigue regime (>106 cycles). The pit-to-cracktransition and the crack propagation mechanism were then analyzed together with crack growth mea-surements on surface cracks. A modified Murtaza and Akid model was used to obtain the descriptionof corrosion–fatigue crack growth data thus allowing us to obtain a conservative prediction of the S–Ndiagram subjected to artificial rainwater.
� 2009 Elsevier Ltd. All rights reserved.
1. Introduction
In recent years, the interest for inspection intervals of railwayaxles, as a key point in safety and maintainability of criticalmechanical components, is significantly increased. Consideringthe application of damage tolerance to railway axles, Zerbst et al.[1] enumerated the critical points to be considered, while someof the present authors gave contributions about the in air crackgrowth properties of different steels [2] and their statisticaldescription [3], the determination of the stress intensity factor ofcracks in axles’ geometrical transitions [4] and the influence ofProbability of Detection curves of the adopted Non-destructiveTesting techniques [5]. However, these recent studies deal withcrack growth properties in air and the treatment of corrosion–fatigue remains an open issue, in spite of several axle failures beingrelated to corrosion phenomena [6,7]: in particular these failureswere characterized by a number of surface pits or shallow micro-cracks.
The effects of corrosion on fatigue properties [8] are character-ized by the formation of a consistent number of small cracks,whose nucleation is favored by the pits due to the aggressive envi-ronment. These small cracks are then able to cross the microstruc-tural barriers [8,9] with ease and at a much faster growth rate thanin air. These effects result in a considerable decrease in the fatigueproperties, even in less corrosive environments, resulting in the
disappearance of the ‘‘knee” of the S–N diagram. Previous researchhas provided some clues about the fatigue properties of carbonsteels exposed to mild corrosion: (i) rotating bending fatigue testsperformed by Endo and Miyao on a mild carbon (reported by Schj-ive [8]) steel immersed in tap water showed a reduction of the fa-tigue strength of the order of 50% and (ii) fatigue tests in tap waterfor an AISI 1018 steel showed fatigue strengths of 120 MPa at2 � 106 cycles (approx. 50% of the fatigue limit in air) and90 MPa at 107 cycles [10]. In a more recent paper [11], the authorsbegan to address the problem of the effects of corrosion on the fa-tigue of A1N steel by evaluating the reduction of fatigue strengthcaused by the corrosion defects on the surface of axles retired fromservice and a series of intermittent wet–dry fatigue tests in thepresence of artificial rainwater.
In this paper, fatigue tests were carried out in a corrosive envi-ronment on smooth and micro-notched cylindrical specimens witha view to discussing the corrosion–fatigue properties of A1N steel,to investigate the corrosion–fatigue mechanism (namely pit-to-crack development and crack growth rate) and to obtain a predic-tive model for fatigue crack growth assisted by the corrosion ofrainwater. In particular, the research addressed the followingphases: first and foremost, a new series of fatigue tests were car-ried out on specimens continuously exposed to artificial rainwater;then, in order to have a better understanding of the corrosion–fatigue process, we concentrated the investigation on a series ofinterrupted fatigue tests together with crack advance measure-ments on micro-holed specimens. These different experimentsallowed us to describe the corrosion–fatigue of A1N exposed tofree corrosion in the presence of artificial rainwater in terms ofan environmentally assisted growth of small cracks.
0142-1123/$ - see front matter � 2009 Elsevier Ltd. All rights reserved.doi:10.1016/j.ijfatigue.2009.08.003
* Corresponding author. Tel.: +39 02 23998246; fax: +39 02 23998202.E-mail addresses: [email protected] (S. Beretta), michele.carboni@
polimi.it (M. Carboni), [email protected] (G. Fiore), [email protected] (A. Lo Conte).
International Journal of Fatigue 32 (2010) 952–961
Contents lists available at ScienceDirect
International Journal of Fatigue
journal homepage: www.elsevier .com/locate / i j fa t igue
Author's personal copy
2. Experiments
2.1. Mechanical behavior and fatigue properties of A1N steel
A1N is a normalized 0.35% carbon steel, widely used in the man-ufacture of railway axles [12]: the matrix consists of a ferritic-pearl-itic microstructure with a 20–40 lm ferrite grain size. Its basicmechanical properties are [2]: ultimate tensile strength UTS =597 MPa and monotonic yield strength ry,monotonic = 395 MPa.Cyclic properties are as follows: 0.2% cyclic proof stress ry,cyc0.2 =357 MPa, 0.05% cyclic proof stress ry,cyc0.05 = 289 MPa. The parame-ters of the cyclic Ramberg–Osgood relationship are equal toEcyc = 209,303 MPa, n = 0.150395 and H = 907.34 MPa.
The Kitagawa–Takahashi diagram [13], i.e. the relationshipbetween fatigue limit and crack size, for A1N steel at R = �1 andthe S–N diagram is outlined in [11]. In particular, the fatigue limitof smooth specimens is Drwo = 510 MPa, while the dependence offatigue limit on defect size is described by an empirical El-Haddadequation [14]:
Drw ¼ Drwo �ffiffiffiffiffiffiffiffiffiffiffiffiffiffiffiffiffiffiffiffiffiffiffiffiffiffiffiffiffiffiffiffiffiffiffiffiffiffiffiffiffiffiffiffiffiffi
areap
offiffiffiffiffiffiffiffiffiffiffiffiffiffiffiffiffiffiffiffiffiffiffiffiffiffiffiffiffiffiffiareaþ
ffiffiffiffiffiffiffiffiffiffiareap
o
ps
ð1Þ
where the material parameterffiffiffiffiffiffiffiffiffiffiareap
o is equal to 270 lm (Eq. (1)was proposed by Beretta [15] who modified the original El-Haddadequation by expressing crack size in terms of the Murakami’s
ffiffiffiffiffiffiffiffiffiffiareap
parameter [16]). In this research, the Kitagawa diagram was used toestimate the minimum DK capable of sustaining crack growth fromcorrosion pits (the so called ‘‘pit-to-crack” transition). Fatiguethreshold DKth for long cracks at R = �1 (obtained under DK-decreasing and compression pre-cracking tests [17]) is approx.9.5 MPa
pm, while the DKth,eff obtained by tests under constant
Kmax is approx. 3.5 MPap
m.
2.2. Experiments in a corrosive environment
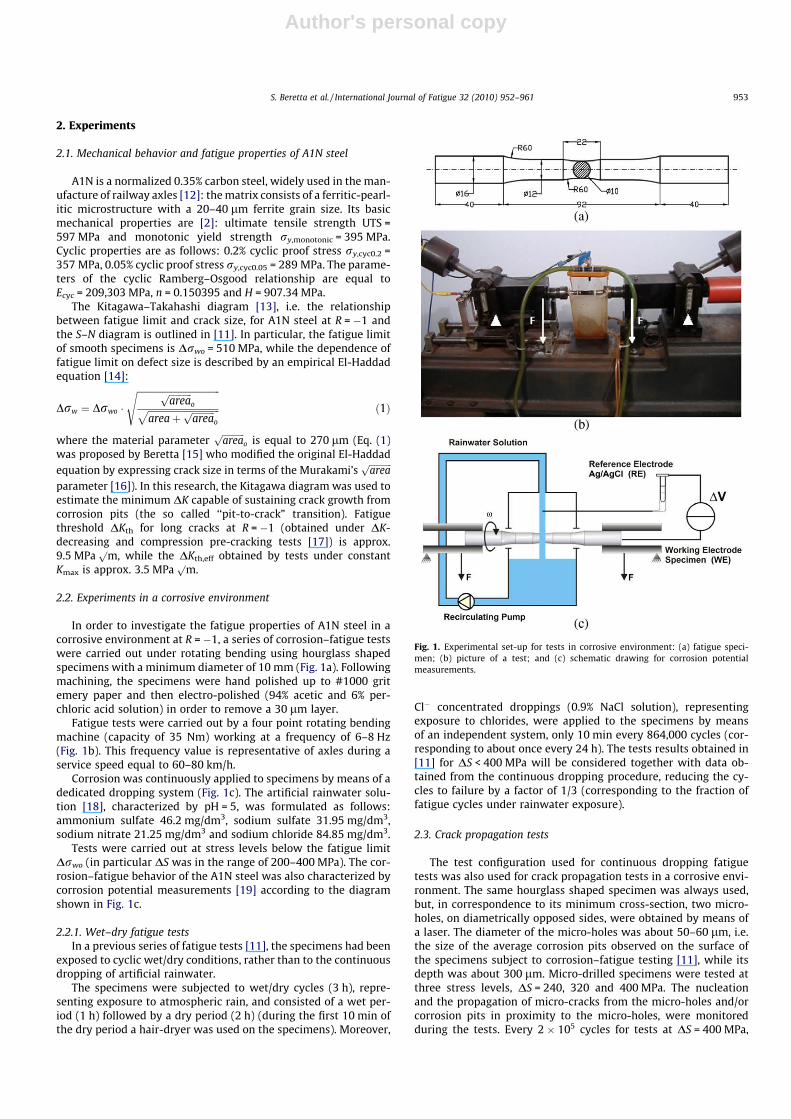
In order to investigate the fatigue properties of A1N steel in acorrosive environment at R = �1, a series of corrosion–fatigue testswere carried out under rotating bending using hourglass shapedspecimens with a minimum diameter of 10 mm (Fig. 1a). Followingmachining, the specimens were hand polished up to #1000 gritemery paper and then electro-polished (94% acetic and 6% per-chloric acid solution) in order to remove a 30 lm layer.
Fatigue tests were carried out by a four point rotating bendingmachine (capacity of 35 Nm) working at a frequency of 6–8 Hz(Fig. 1b). This frequency value is representative of axles during aservice speed equal to 60–80 km/h.
Corrosion was continuously applied to specimens by means of adedicated dropping system (Fig. 1c). The artificial rainwater solu-tion [18], characterized by pH = 5, was formulated as follows:ammonium sulfate 46.2 mg/dm3, sodium sulfate 31.95 mg/dm3,sodium nitrate 21.25 mg/dm3 and sodium chloride 84.85 mg/dm3.
Tests were carried out at stress levels below the fatigue limitDrwo (in particular DS was in the range of 200–400 MPa). The cor-rosion–fatigue behavior of the A1N steel was also characterized bycorrosion potential measurements [19] according to the diagramshown in Fig. 1c.
2.2.1. Wet–dry fatigue testsIn a previous series of fatigue tests [11], the specimens had been
exposed to cyclic wet/dry conditions, rather than to the continuousdropping of artificial rainwater.
The specimens were subjected to wet/dry cycles (3 h), repre-senting exposure to atmospheric rain, and consisted of a wet per-iod (1 h) followed by a dry period (2 h) (during the first 10 min ofthe dry period a hair-dryer was used on the specimens). Moreover,
Cl� concentrated droppings (0.9% NaCl solution), representingexposure to chlorides, were applied to the specimens by meansof an independent system, only 10 min every 864,000 cycles (cor-responding to about once every 24 h). The tests results obtained in[11] for DS < 400 MPa will be considered together with data ob-tained from the continuous dropping procedure, reducing the cy-cles to failure by a factor of 1/3 (corresponding to the fraction offatigue cycles under rainwater exposure).
2.3. Crack propagation tests
The test configuration used for continuous dropping fatiguetests was also used for crack propagation tests in a corrosive envi-ronment. The same hourglass shaped specimen was always used,but, in correspondence to its minimum cross-section, two micro-holes, on diametrically opposed sides, were obtained by means ofa laser. The diameter of the micro-holes was about 50–60 lm, i.e.the size of the average corrosion pits observed on the surface ofthe specimens subject to corrosion–fatigue testing [11], while itsdepth was about 300 lm. Micro-drilled specimens were tested atthree stress levels, DS = 240, 320 and 400 MPa. The nucleationand the propagation of micro-cracks from the micro-holes and/orcorrosion pits in proximity to the micro-holes, were monitoredduring the tests. Every 2 � 105 cycles for tests at DS = 400 MPa,
Fig. 1. Experimental set-up for tests in corrosive environment: (a) fatigue speci-men; (b) picture of a test; and (c) schematic drawing for corrosion potentialmeasurements.
S. Beretta et al. / International Journal of Fatigue 32 (2010) 952–961 953
Author's personal copy
every 5 � 105 cycles for tests at DS = 320 MPa and every 7.5 � 105
cycles for tests at DS = 240 MPa, the test was interrupted to removerust, to clean the specimen and to take plastic replicas in order tocorrelate the crack propagation (or the surface damage) with thenumber of cycles. In particular, damage was measured in termsof density and length of the cracks observed onto specimens’ sur-face (see Section 3.2). Some tests were interrupted and the speci-mens were broken under liquid nitrogen in order to measure theshape of propagating cracks.
3. Results
3.1. Fatigue tests
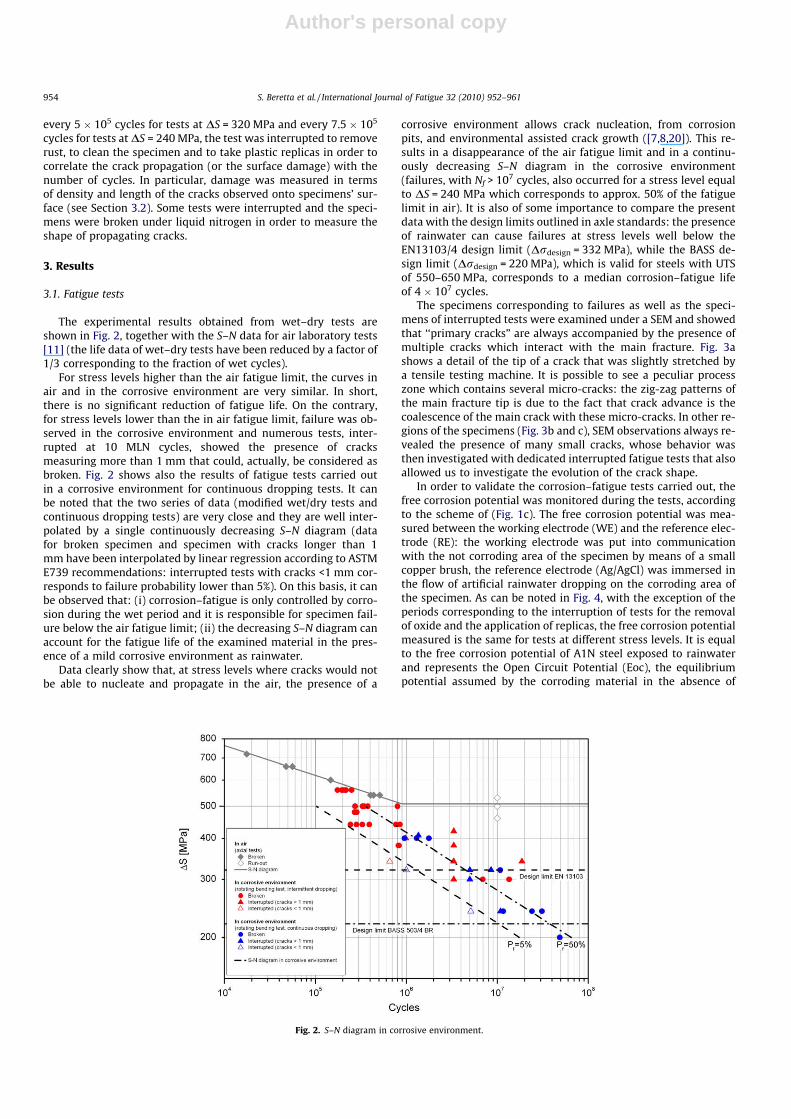
The experimental results obtained from wet–dry tests areshown in Fig. 2, together with the S–N data for air laboratory tests[11] (the life data of wet–dry tests have been reduced by a factor of1/3 corresponding to the fraction of wet cycles).
For stress levels higher than the air fatigue limit, the curves inair and in the corrosive environment are very similar. In short,there is no significant reduction of fatigue life. On the contrary,for stress levels lower than the in air fatigue limit, failure was ob-served in the corrosive environment and numerous tests, inter-rupted at 10 MLN cycles, showed the presence of cracksmeasuring more than 1 mm that could, actually, be considered asbroken. Fig. 2 shows also the results of fatigue tests carried outin a corrosive environment for continuous dropping tests. It canbe noted that the two series of data (modified wet/dry tests andcontinuous dropping tests) are very close and they are well inter-polated by a single continuously decreasing S–N diagram (datafor broken specimen and specimen with cracks longer than 1mm have been interpolated by linear regression according to ASTME739 recommendations: interrupted tests with cracks <1 mm cor-responds to failure probability lower than 5%). On this basis, it canbe observed that: (i) corrosion–fatigue is only controlled by corro-sion during the wet period and it is responsible for specimen fail-ure below the air fatigue limit; (ii) the decreasing S–N diagram canaccount for the fatigue life of the examined material in the pres-ence of a mild corrosive environment as rainwater.
Data clearly show that, at stress levels where cracks would notbe able to nucleate and propagate in the air, the presence of a
corrosive environment allows crack nucleation, from corrosionpits, and environmental assisted crack growth ([7,8,20]). This re-sults in a disappearance of the air fatigue limit and in a continu-ously decreasing S–N diagram in the corrosive environment(failures, with Nf > 107 cycles, also occurred for a stress level equalto DS = 240 MPa which corresponds to approx. 50% of the fatiguelimit in air). It is also of some importance to compare the presentdata with the design limits outlined in axle standards: the presenceof rainwater can cause failures at stress levels well below theEN13103/4 design limit (Drdesign = 332 MPa), while the BASS de-sign limit (Drdesign = 220 MPa), which is valid for steels with UTSof 550–650 MPa, corresponds to a median corrosion–fatigue lifeof 4 � 107 cycles.
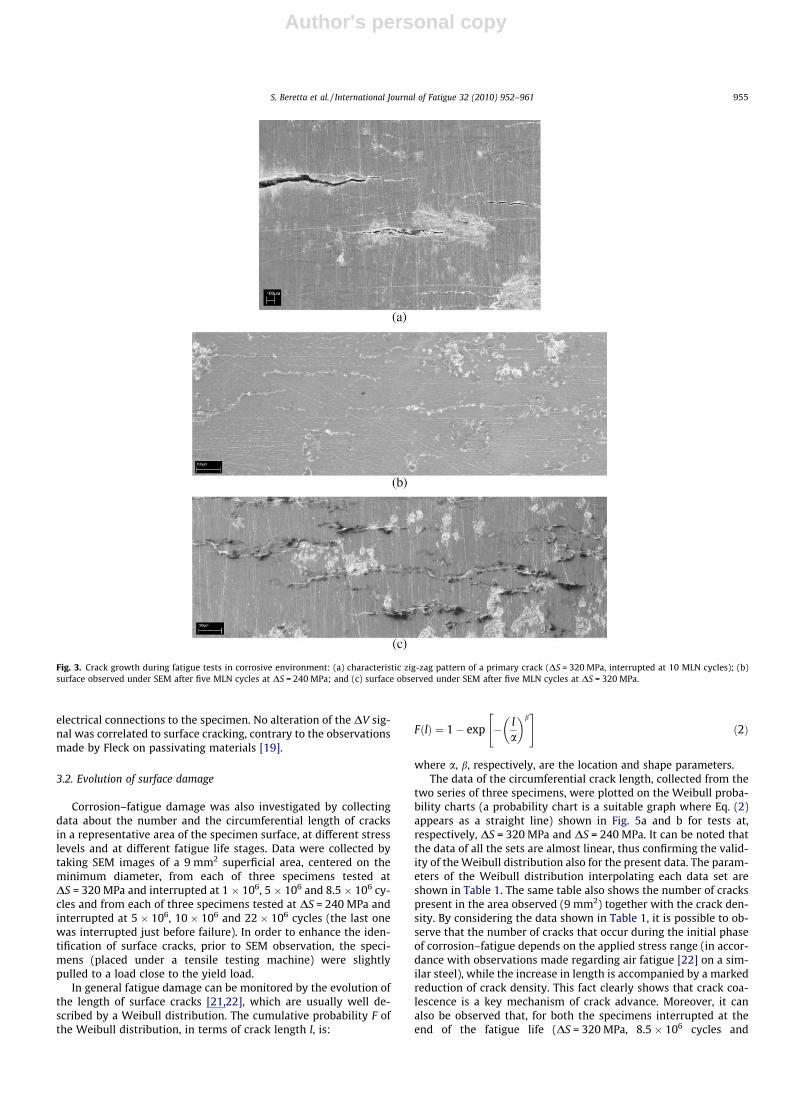
The specimens corresponding to failures as well as the speci-mens of interrupted tests were examined under a SEM and showedthat ‘‘primary cracks” are always accompanied by the presence ofmultiple cracks which interact with the main fracture. Fig. 3ashows a detail of the tip of a crack that was slightly stretched bya tensile testing machine. It is possible to see a peculiar processzone which contains several micro-cracks: the zig-zag patterns ofthe main fracture tip is due to the fact that crack advance is thecoalescence of the main crack with these micro-cracks. In other re-gions of the specimens (Fig. 3b and c), SEM observations always re-vealed the presence of many small cracks, whose behavior wasthen investigated with dedicated interrupted fatigue tests that alsoallowed us to investigate the evolution of the crack shape.
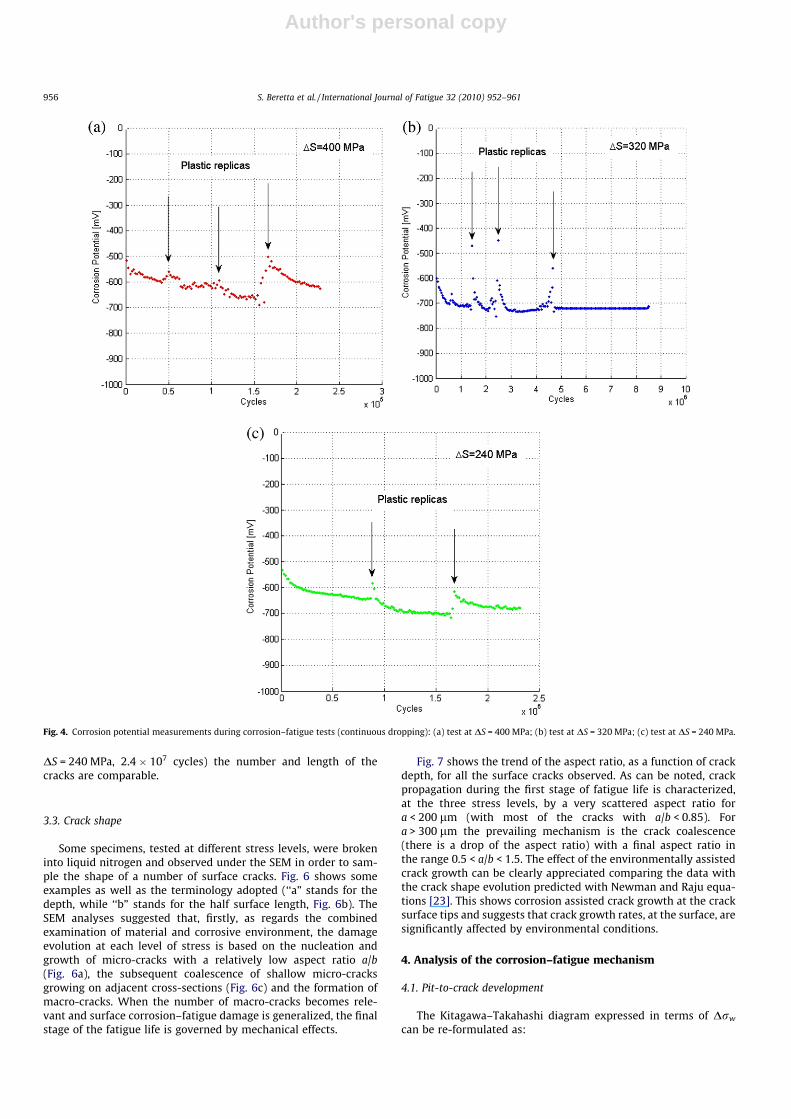
In order to validate the corrosion–fatigue tests carried out, thefree corrosion potential was monitored during the tests, accordingto the scheme of (Fig. 1c). The free corrosion potential was mea-sured between the working electrode (WE) and the reference elec-trode (RE): the working electrode was put into communicationwith the not corroding area of the specimen by means of a smallcopper brush, the reference electrode (Ag/AgCl) was immersed inthe flow of artificial rainwater dropping on the corroding area ofthe specimen. As can be noted in Fig. 4, with the exception of theperiods corresponding to the interruption of tests for the removalof oxide and the application of replicas, the free corrosion potentialmeasured is the same for tests at different stress levels. It is equalto the free corrosion potential of A1N steel exposed to rainwaterand represents the Open Circuit Potential (Eoc), the equilibriumpotential assumed by the corroding material in the absence of
Fig. 2. S–N diagram in corrosive environment.
954 S. Beretta et al. / International Journal of Fatigue 32 (2010) 952–961
Author's personal copy
electrical connections to the specimen. No alteration of the DV sig-nal was correlated to surface cracking, contrary to the observationsmade by Fleck on passivating materials [19].
3.2. Evolution of surface damage
Corrosion–fatigue damage was also investigated by collectingdata about the number and the circumferential length of cracksin a representative area of the specimen surface, at different stresslevels and at different fatigue life stages. Data were collected bytaking SEM images of a 9 mm2 superficial area, centered on theminimum diameter, from each of three specimens tested atDS = 320 MPa and interrupted at 1 � 106, 5 � 106 and 8.5 � 106 cy-cles and from each of three specimens tested at DS = 240 MPa andinterrupted at 5 � 106, 10 � 106 and 22 � 106 cycles (the last onewas interrupted just before failure). In order to enhance the iden-tification of surface cracks, prior to SEM observation, the speci-mens (placed under a tensile testing machine) were slightlypulled to a load close to the yield load.
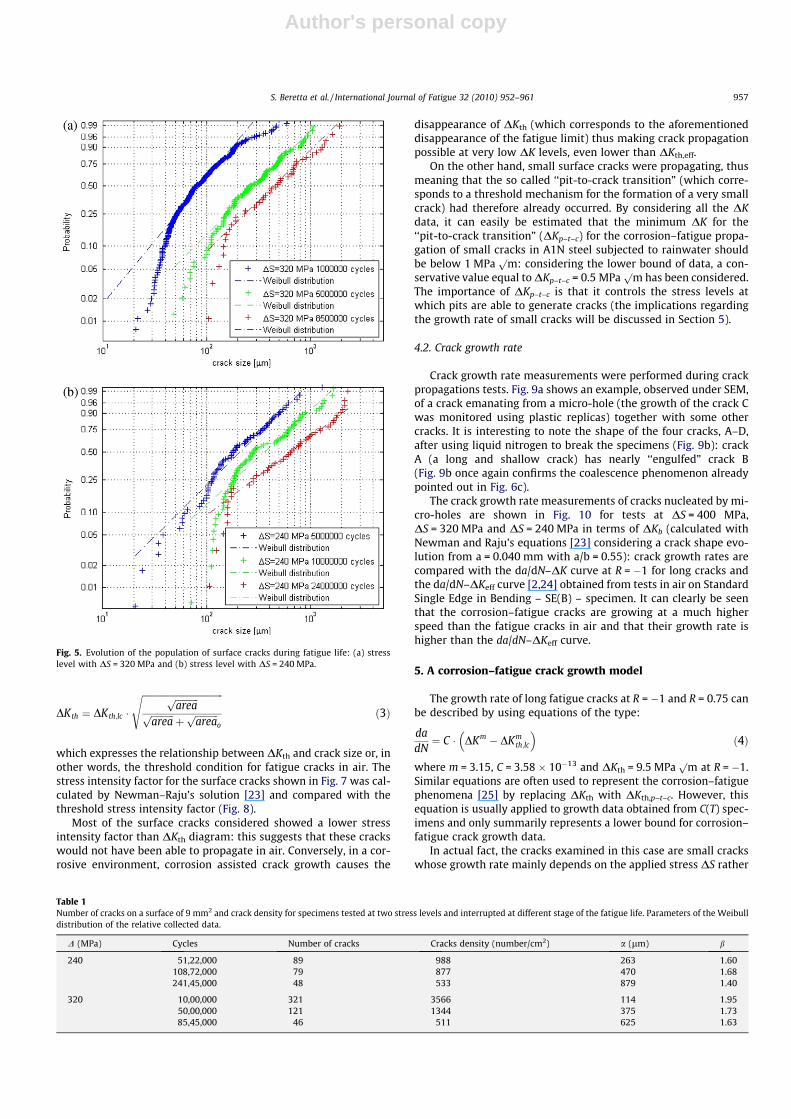
In general fatigue damage can be monitored by the evolution ofthe length of surface cracks [21,22], which are usually well de-scribed by a Weibull distribution. The cumulative probability F ofthe Weibull distribution, in terms of crack length l, is:
FðlÞ ¼ 1� exp � la
� �b" #
ð2Þ
where a, b, respectively, are the location and shape parameters.The data of the circumferential crack length, collected from the
two series of three specimens, were plotted on the Weibull proba-bility charts (a probability chart is a suitable graph where Eq. (2)appears as a straight line) shown in Fig. 5a and b for tests at,respectively, DS = 320 MPa and DS = 240 MPa. It can be noted thatthe data of all the sets are almost linear, thus confirming the valid-ity of the Weibull distribution also for the present data. The param-eters of the Weibull distribution interpolating each data set areshown in Table 1. The same table also shows the number of crackspresent in the area observed (9 mm2) together with the crack den-sity. By considering the data shown in Table 1, it is possible to ob-serve that the number of cracks that occur during the initial phaseof corrosion–fatigue depends on the applied stress range (in accor-dance with observations made regarding air fatigue [22] on a sim-ilar steel), while the increase in length is accompanied by a markedreduction of crack density. This fact clearly shows that crack coa-lescence is a key mechanism of crack advance. Moreover, it canalso be observed that, for both the specimens interrupted at theend of the fatigue life (DS = 320 MPa, 8.5 � 106 cycles and
Fig. 3. Crack growth during fatigue tests in corrosive environment: (a) characteristic zig-zag pattern of a primary crack (DS = 320 MPa, interrupted at 10 MLN cycles); (b)surface observed under SEM after five MLN cycles at DS = 240 MPa; and (c) surface observed under SEM after five MLN cycles at DS = 320 MPa.
S. Beretta et al. / International Journal of Fatigue 32 (2010) 952–961 955
Author's personal copy
DS = 240 MPa, 2.4 � 107 cycles) the number and length of thecracks are comparable.
3.3. Crack shape
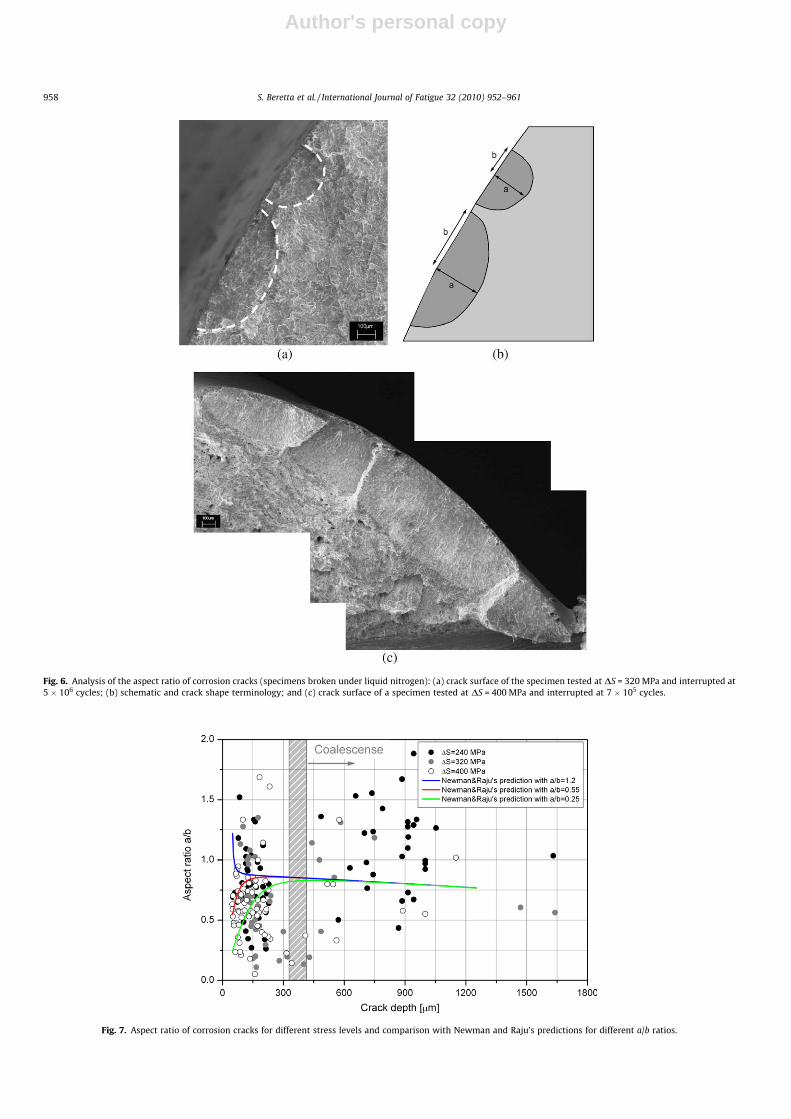
Some specimens, tested at different stress levels, were brokeninto liquid nitrogen and observed under the SEM in order to sam-ple the shape of a number of surface cracks. Fig. 6 shows someexamples as well as the terminology adopted (‘‘a” stands for thedepth, while ‘‘b” stands for the half surface length, Fig. 6b). TheSEM analyses suggested that, firstly, as regards the combinedexamination of material and corrosive environment, the damageevolution at each level of stress is based on the nucleation andgrowth of micro-cracks with a relatively low aspect ratio a/b(Fig. 6a), the subsequent coalescence of shallow micro-cracksgrowing on adjacent cross-sections (Fig. 6c) and the formation ofmacro-cracks. When the number of macro-cracks becomes rele-vant and surface corrosion–fatigue damage is generalized, the finalstage of the fatigue life is governed by mechanical effects.
Fig. 7 shows the trend of the aspect ratio, as a function of crackdepth, for all the surface cracks observed. As can be noted, crackpropagation during the first stage of fatigue life is characterized,at the three stress levels, by a very scattered aspect ratio fora < 200 lm (with most of the cracks with a/b < 0.85). Fora > 300 lm the prevailing mechanism is the crack coalescence(there is a drop of the aspect ratio) with a final aspect ratio inthe range 0.5 < a/b < 1.5. The effect of the environmentally assistedcrack growth can be clearly appreciated comparing the data withthe crack shape evolution predicted with Newman and Raju equa-tions [23]. This shows corrosion assisted crack growth at the cracksurface tips and suggests that crack growth rates, at the surface, aresignificantly affected by environmental conditions.
4. Analysis of the corrosion–fatigue mechanism
4.1. Pit-to-crack development
The Kitagawa–Takahashi diagram expressed in terms of Drw
can be re-formulated as:
Fig. 4. Corrosion potential measurements during corrosion–fatigue tests (continuous dropping): (a) test at DS = 400 MPa; (b) test at DS = 320 MPa; (c) test at DS = 240 MPa.
956 S. Beretta et al. / International Journal of Fatigue 32 (2010) 952–961
Author's personal copy
DKth ¼ DKth;lc �
ffiffiffiffiffiffiffiffiffiffiffiffiffiffiffiffiffiffiffiffiffiffiffiffiffiffiffiffiffiffiffiffiffiffiffiffiffiffiffiffiffiffiffiffiffiareapffiffiffiffiffiffiffiffiffiffi
areap
þffiffiffiffiffiffiffiffiffiffiareap
o
sð3Þ
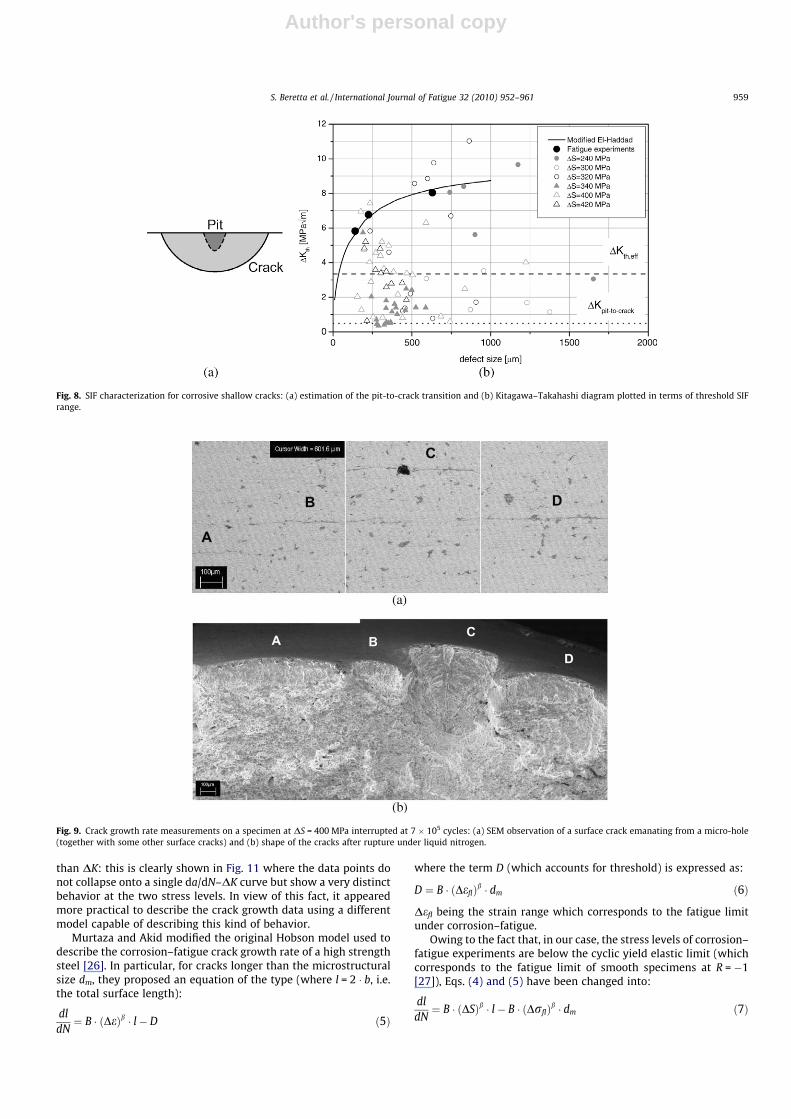
which expresses the relationship between DKth and crack size or, inother words, the threshold condition for fatigue cracks in air. Thestress intensity factor for the surface cracks shown in Fig. 7 was cal-culated by Newman–Raju’s solution [23] and compared with thethreshold stress intensity factor (Fig. 8).
Most of the surface cracks considered showed a lower stressintensity factor than DKth diagram: this suggests that these crackswould not have been able to propagate in air. Conversely, in a cor-rosive environment, corrosion assisted crack growth causes the
disappearance of DKth (which corresponds to the aforementioneddisappearance of the fatigue limit) thus making crack propagationpossible at very low DK levels, even lower than DKth,eff.
On the other hand, small surface cracks were propagating, thusmeaning that the so called ‘‘pit-to-crack transition” (which corre-sponds to a threshold mechanism for the formation of a very smallcrack) had therefore already occurred. By considering all the DKdata, it can easily be estimated that the minimum DK for the‘‘pit-to-crack transition” (DKp–t–c) for the corrosion–fatigue propa-gation of small cracks in A1N steel subjected to rainwater shouldbe below 1 MPa
pm: considering the lower bound of data, a con-
servative value equal to DKp–t–c = 0.5 MPap
m has been considered.The importance of DKp–t–c is that it controls the stress levels atwhich pits are able to generate cracks (the implications regardingthe growth rate of small cracks will be discussed in Section 5).
4.2. Crack growth rate
Crack growth rate measurements were performed during crackpropagations tests. Fig. 9a shows an example, observed under SEM,of a crack emanating from a micro-hole (the growth of the crack Cwas monitored using plastic replicas) together with some othercracks. It is interesting to note the shape of the four cracks, A–D,after using liquid nitrogen to break the specimens (Fig. 9b): crackA (a long and shallow crack) has nearly ‘‘engulfed” crack B(Fig. 9b once again confirms the coalescence phenomenon alreadypointed out in Fig. 6c).
The crack growth rate measurements of cracks nucleated by mi-cro-holes are shown in Fig. 10 for tests at DS = 400 MPa,DS = 320 MPa and DS = 240 MPa in terms of DKb (calculated withNewman and Raju’s equations [23] considering a crack shape evo-lution from a = 0.040 mm with a/b = 0.55): crack growth rates arecompared with the da/dN–DK curve at R = �1 for long cracks andthe da/dN–DKeff curve [2,24] obtained from tests in air on StandardSingle Edge in Bending – SE(B) – specimen. It can clearly be seenthat the corrosion–fatigue cracks are growing at a much higherspeed than the fatigue cracks in air and that their growth rate ishigher than the da/dN–DKeff curve.
5. A corrosion–fatigue crack growth model
The growth rate of long fatigue cracks at R = �1 and R = 0.75 canbe described by using equations of the type:
dadN¼ C � DKm � DKm
th;lc
� �ð4Þ
where m = 3.15, C = 3.58 � 10�13 and DKth = 9.5 MPap
m at R = �1.Similar equations are often used to represent the corrosion–fatiguephenomena [25] by replacing DKth with DKth,p–t–c. However, thisequation is usually applied to growth data obtained from C(T) spec-imens and only summarily represents a lower bound for corrosion–fatigue crack growth data.
In actual fact, the cracks examined in this case are small crackswhose growth rate mainly depends on the applied stress DS rather
Fig. 5. Evolution of the population of surface cracks during fatigue life: (a) stresslevel with DS = 320 MPa and (b) stress level with DS = 240 MPa.
Table 1Number of cracks on a surface of 9 mm2 and crack density for specimens tested at two stress levels and interrupted at different stage of the fatigue life. Parameters of the Weibulldistribution of the relative collected data.
D (MPa) Cycles Number of cracks Cracks density (number/cm2) a (lm) b
240 51,22,000 89 988 263 1.60108,72,000 79 877 470 1.68241,45,000 48 533 879 1.40
320 10,00,000 321 3566 114 1.9550,00,000 121 1344 375 1.7385,45,000 46 511 625 1.63
S. Beretta et al. / International Journal of Fatigue 32 (2010) 952–961 957
Author's personal copy
Fig. 6. Analysis of the aspect ratio of corrosion cracks (specimens broken under liquid nitrogen): (a) crack surface of the specimen tested at DS = 320 MPa and interrupted at5 � 106 cycles; (b) schematic and crack shape terminology; and (c) crack surface of a specimen tested at DS = 400 MPa and interrupted at 7 � 105 cycles.
Fig. 7. Aspect ratio of corrosion cracks for different stress levels and comparison with Newman and Raju’s predictions for different a/b ratios.
958 S. Beretta et al. / International Journal of Fatigue 32 (2010) 952–961
Author's personal copy
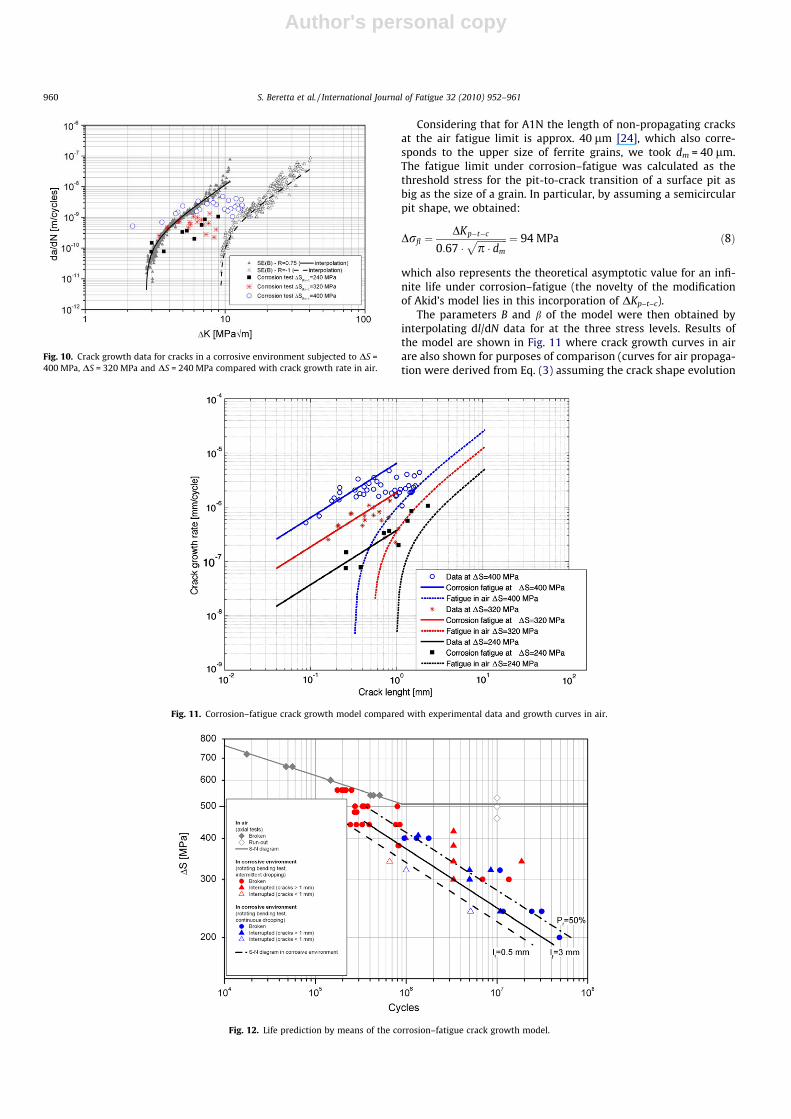
than DK: this is clearly shown in Fig. 11 where the data points donot collapse onto a single da/dN–DK curve but show a very distinctbehavior at the two stress levels. In view of this fact, it appearedmore practical to describe the crack growth data using a differentmodel capable of describing this kind of behavior.
Murtaza and Akid modified the original Hobson model used todescribe the corrosion–fatigue crack growth rate of a high strengthsteel [26]. In particular, for cracks longer than the microstructuralsize dm, they proposed an equation of the type (where l = 2 � b, i.e.the total surface length):
dldN¼ B � ðDeÞb � l� D ð5Þ
where the term D (which accounts for threshold) is expressed as:
D ¼ B � ðDeflÞb � dm ð6Þ
Defl being the strain range which corresponds to the fatigue limitunder corrosion–fatigue.
Owing to the fact that, in our case, the stress levels of corrosion–fatigue experiments are below the cyclic yield elastic limit (whichcorresponds to the fatigue limit of smooth specimens at R = �1[27]), Eqs. (4) and (5) have been changed into:
dldN¼ B � ðDSÞb � l� B � ðDrflÞb � dm ð7Þ
Fig. 8. SIF characterization for corrosive shallow cracks: (a) estimation of the pit-to-crack transition and (b) Kitagawa–Takahashi diagram plotted in terms of threshold SIFrange.
Fig. 9. Crack growth rate measurements on a specimen at DS = 400 MPa interrupted at 7 � 105 cycles: (a) SEM observation of a surface crack emanating from a micro-hole(together with some other surface cracks) and (b) shape of the cracks after rupture under liquid nitrogen.
S. Beretta et al. / International Journal of Fatigue 32 (2010) 952–961 959
Author's personal copy
Considering that for A1N the length of non-propagating cracksat the air fatigue limit is approx. 40 lm [24], which also corre-sponds to the upper size of ferrite grains, we took dm = 40 lm.The fatigue limit under corrosion–fatigue was calculated as thethreshold stress for the pit-to-crack transition of a surface pit asbig as the size of a grain. In particular, by assuming a semicircularpit shape, we obtained:
Drfl ¼DKp�t�c
0:67 �ffiffiffiffiffiffiffiffiffiffiffiffiffip � dm
p ¼ 94 MPa ð8Þ
which also represents the theoretical asymptotic value for an infi-nite life under corrosion–fatigue (the novelty of the modificationof Akid’s model lies in this incorporation of DKp–t–c).
The parameters B and b of the model were then obtained byinterpolating dl/dN data for at the three stress levels. Results ofthe model are shown in Fig. 11 where crack growth curves in airare also shown for purposes of comparison (curves for air propaga-tion were derived from Eq. (3) assuming the crack shape evolution
Fig. 11. Corrosion–fatigue crack growth model compared with experimental data and growth curves in air.
Fig. 12. Life prediction by means of the corrosion–fatigue crack growth model.
Fig. 10. Crack growth data for cracks in a corrosive environment subjected to DS =400 MPa, DS = 320 MPa and DS = 240 MPa compared with crack growth rate in air.
960 S. Beretta et al. / International Journal of Fatigue 32 (2010) 952–961
Author's personal copy
from a = 0.040 mm with a/b = 0.55). It can be seen that corrosion–fatigue causes micro-cracks to exceed the ‘‘mechanical threshold”and that when the cracks lengthen (l > 2 mm) their growth rate ap-proaches the in air model. Also worth note is the fact that dl/dNdata tend to flatten for 0.8 mm < l < 2 mm presumably because ofthe prevailing mechanisms of crack interaction and coalescence.
By adopting Eq. (7), we were also able to propose a descriptionof the S–N diagram in terms of the propagation of corrosion–fati-gue cracks from dm to lf = 3 mm. As can be seen in Fig. 12, the pre-dictions describe the median S–N diagram fairly accurately(conservatism is due to the overestimation of growth rate forl > 0.8 mm). It is also of some importance to remark that the pre-dicted corrosion–fatigue lives for a final crack lf = 0.5 mm, thatcan be taken as a reference value for the detection of surface cracksby dedicated NDT inspections (MPI, eddy currents) [28], are veryclose to the experimental S–N line for Pf = 5%.
6. Conclusions
The effects of corrosion by rainwater on the fatigue behavior ofA1N steel subjected was studied. The results can be summarized asfollows:
� fatigue tests show that the fatigue properties of A1N steel arestrongly affected (for cycles >106 cycles) by the presence of amild corrosive environment like artificial rainwater;
� the corrosion–fatigue process is characterized by the formation,under a layer of surface oxides, of a network of numerous smallcracks whose growth occurs at stress levels below the air fatiguelimit with a corrosion potential equivalent to the ‘‘free corro-sion” of the material;
� the examination of specimens from interrupted fatigue testsallowed us to show that, after an initial growth atDK > 0.5 MPa
pm, crack extension is then dominated by a coa-
lescence mechanism;� growth rate measurements, taken by means of plastic replicas
on micro-holed specimens, enabled us to describe corrosion–fatigue crack growth using a modified version of a model pro-posed by Murtaza and Akid for incorporating DKp–t–c; and
� the corrosion–fatigue crack growth model enables us to obtain afairly precise prediction of the S–N diagram of A1N steel undercorrosion–fatigue sustained by the free corrosion of thematerial.
Acknowledgements
The authors would like to thank Prof. S. Trasatti and Dr. A. Inver-nizzi, Università di Milano, Department of Chemistry Physics andElectrochemistry for their support with the corrosion potentialmeasurements.
References
[1] Zerbst U, Vormwald M, Andersch C, Mädler K, Pfuff M. The development of adamage tolerance concept for railway components and its demonstration for arailway axle. Eng Fract Mech 2005;72:209–39.
[2] Beretta S, Carboni M, Cantini S, Ghidini A. Application of fatigue crack growthalgorithms to railway axles and comparison of two steel grades. J Rail RapidTransit 2004;218:317–26.
[3] Beretta S, Carboni M. Experiments and stochastic model for propagationlifetime of railway axles. Eng Fract Mech 2006;73:2627–41.
[4] Madia M, Beretta S, Zerbst U. An investigation on the influence of rotarybending and press fitting on stress intensity factors and fatigue crack growth inrailway axles. Eng Fract Mech 2008;75:1906–20.
[5] Carboni M, Beretta S. Effect of probability of detection upon the definition ofinspection intervals of railway axles. J Rail Rapid Transit 2007;221:409–17.
[6] Hoddinot DS. Railway axle failure investigations and fatigue crack growthmonitoring of an axle. J Rail Rapid Transit 2004;218:283–92.
[7] Transportation Safety Board of Canada. Main track derailment: Canadiannational train No. G-894-31-14. Railway Investigation Report R01Q0010; 2001.
[8] Schijve J. Fatigue of structures and materials. Kluwer Academic Publishers;2004.
[9] Akid R, Miller KJ. Short fatigue crack growth behavior of a low carbon steelunder corrosion fatigue conditions. Fatigue Fract Eng Mater Struct1991;14:637–49.
[10] Ragab A, Alawi H, Sorein K. Corrosion fatigue of steel in various aqueousenvironments. Fatigue Fract Eng Mater Struct 1989;12:469–79.
[11] Beretta S, Carboni M, Lo Conte A, Palermo E. An investigation of the effects ofcorrosion on the fatigue strength of A1N steel railway axles. J Rail RapidTransit 2008;222:129–43.
[12] BS EN13261. Railway applications – wheelsets and bogies – axles – productrequirements. CEN; 2003.
[13] Kitagawa H, Takahashi S. Application of fracture mechanics to very smallcracks or the cracks in the early stage. In: Proceedings of the 2nd internationalconference on mechanical behavior of materials; 1976.
[14] El-Haddad MH, Smith KN, Topper TH. Fatigue crack propagation of short crack.J Eng Mater Tech ASME Trans 1979;101:42–6.
[15] Beretta S. Propagation of short cracks in a high strength steel for railway axles.In: Proceedings of the 14th European conference on fracture, Krakow, Poland;2002.
[16] Murakami Y. Analysis of stress intensity factors of modes I, II and III forinclined surface cracks of arbitrary shape. Eng Fract Mech 1985;22(1):101–14.
[17] Newman Jr JC, Schneider J, Daniel A, McKnight D. Compression pre-cracking togenerate near threshold fatigue-crack-growth rates in two aluminum alloys.Int J Fatigue 2005;27:1432–40.
[18] Brunoro G, Frignani A, Colledan A, Chiavari C. Organic films for protection ofcopper and bronze against acid rain corrosion. Corros Sci 2003;45:2219–31.
[19] Leinenbach C, Fleck C, Eifler D. The cyclic deformation behavior and fatigueinduced damage of the implant alloy TiAl6Nb7 in simulated physiologicalmedia. Int J Fatigue 2004;26:857–64.
[20] Ishihara S, Saka S, Nan ZY, Goshima T, Sunada S. Prediction of corrosion fatiguelives of aluminium alloy on the basis of corrosion pit growth law. Fatigue FractEng Mater Struct 2006;29:472–80.
[21] Goto M. Statistical investigations of the behavior of micro-cracks in carbonsteels. Fatigue Fract Eng Mater Struct 1991;14:833–45.
[22] Beretta S. Micro-crack propagation and micro-structural parameters of fatiguedamage. Fatigue Fract Eng Mater Struct 1996;19:1107–15.
[23] Newman Jr JC, Raju IS. An empirical stress intensity factor equation for thesurface crack. Eng Fract Mech 1981;15:185–92.
[24] Beretta S, Carboni M, Madia M. Modelling of fatigue thresholds for small cracksin a mild steel by ‘‘Strip-Yield” model. Eng Fract Mech 2009;76:1548–61.
[25] Zhou S, Turnbull A. Influence of pitting on the fatigue life of a turbine bladesteel. Fatigue Fract Eng Mater Struct 1999;22:1083–93.
[26] Murtaza G, Akid R. Empirical corrosion fatigue life prediction models of a highstrength steel. Eng Fract Mech 2000;67:461–74.
[27] Miller KJ. Material science perspective of metal fatigue resistance. Mater SciTechnol 1993;9:453–62.
[28] Benyon JA, Watson AS. The use of Monte-Carlo analysis to increase axleinspection interval. In: IWC13: proceedings of the 13th international wheelsetcongress, Roma, Italy; 2001.
S. Beretta et al. / International Journal of Fatigue 32 (2010) 952–961 961


