Embed Size (px)
Citation preview
r r
INDEPENDENT RESEARCH Cosmetics 24th November 2017 Glowing despite the challenges
Cosmetics
Finalised on 23rd November HENKEL BUY FV EUR139 Bloomberg HNKG<F Reuters HEN3<GY Price EUR113.1 High/Low 128.9/106.4 Market Cap. EUR46,558m Enterprise Val EUR48,817m PE (2017e) 19.2x EV/EBIT (2017e) 13.8x
INTERPARFUMS BUY FV EUR36 Bloomberg ITP FP Reuters IPAR.PA Price EUR33.02 High/Low 35.6/22.8363 Market Cap. EUR1,290m Enterprise Val EUR1,114m PE (2017e) 34.8x EV/EBIT (2017e) 19.9x
L'OREAL BUY FV EUR206 Bloomberg OR FP Reuters OREP.PA Price EUR186 High/Low 195.35/158.6 Market Cap. EUR104,160m Enterprise Val EUR102,315m PE (2017e) 27.9x EV/EBIT (2017e) 21.8x
BEIERSDORF NEUTRAL FV EUR95 vs. 89 Bloomberg BEI GY Reuters BEIG.DE
Price EUR97.259 High/Low 98.55/75.529
Market cap. EUR22,058m Enterprise Val EUR19,484m PE (2017e) 28.3x EV/EBIT (2017e) 17.6x
UNILEVER NEUTRAL FV EUR49 Bloomberg UNc.AS Reuters UNA.NA Price EUR186 High/Low 195,35/158,6 Market Cap. EUR140,829m Enterprise Val EUR102,315m PE (2017e) 21.8x EV/EBIT (2017e) 17.1x
Despite a relatively competitive backdrop, the global Cosmetics market is delivering robust growth (CAGR of 3.8% in the last 10 years). The drivers are numerous without speaking of e-commerce which is both a challenge and an opportunity for the industry.
The global cosmetics market, valued at around EUR200bn, is a growth sector with a 3.8% sales CAGR over the past 10 years according to L’Oréal estimates. Furthermore, it is fairly resilient, having even managed positive momentum in 2009 while the luxury goods industry was down close to 10%. Nevertheless, we view it as more and more competitive.
The two main sector growth drivers are i/ an ageing population, predominantly but not only, in mature countries (and an ageing population means higher consumption of cosmetics products per capita, at a higher price) and ii/ a growing middle class, especially in emerging markets.
Nevertheless, the industry is having to face new challenges which may even become opportunities if correctly managed: i.e. i/ retailer pricing pressure, ii/ an increasing proportion of e-commerce which currently accounts for 7% of the total market with growth of around 19% per year, and iii/ new developments in consumption with the emerging trend towards more natural products.
This report includes the five companies under our coverage, Henkel (Buy- FV: EUR139), Interparfums (Buy-FV: EUR36), L’Oréal (Buy- FV: EUR206), Beiersdorf (Neutral -FV: EUR95) and Unilever (Neutral- FV: EUR49). We view L’Oréal as the best placed to benefit from all the industry opportunities. We also argue the case for Henkel as an attractive investment, particularly thanks to its growing adhesive business, “margin story” and healthy balance sheet.
98
103
108
113
118
123
STOXX EUROPE 600 PERS & H/H GDS E STOXX EUROPE 600
23/11/17
Source Thomson Reuters
Analyst: Loïc Morvan Virginie Roumage, CFA 33(0) 1 70 36 57 24 33(0) 1.56.68.75.22 [email protected] [email protected]
Sector Analyst Team: Nikolaas Faes Clément Genelot Antoine Parison Cédric Rossi
Cosmetics
Table of contents 1. A growing market ............................................................................................................................. 3
1.1. A 3.8% CAGR over the last 10 years… ............................................................................................... 3 1.1.1. Asia and North America are the two most important regions ........................................... 4 1.1.2. Skin care is the leading product category ............................................................................... 5 1.1.3. The mass market is by far the most important channel ...................................................... 6
1.2. …Thanks to two main drivers ............................................................................................................... 8 1.2.1. An ageing population in the mature countries ...................................................................... 8 1.2.2. A booming middle class expected in the emerging markets ............................................... 9
2. Challenges and opportunities ....................................................................................................... 11 2.1. Retailer pressure ..................................................................................................................................... 11
2.1.1. Consolidation and price war in Europe................................................................................ 11 2.1.2. The shadow of a price war is overhanging .......................................................................... 12
2.2. Digital and e-commerce ........................................................................................................................ 13 2.2.1. Strong potential for online beauty ......................................................................................... 13 2.2.2. Are e-commerce giants really a threat to the beauty players? ........................................... 15
2.3. New trends of consumption ................................................................................................................ 16 3. Strengths & weaknesses ................................................................................................................ 18
3.1. L’Oréal is the best placed cosmetic group ......................................................................................... 18 3.2. L’Oréal: a true global player… ............................................................................................................. 19 3.3. Henkel: complicated positioning in the current environment ....................................................... 21 3.4. Unilever: squeezed between local competition in emerging and price competition in developed markets ............................................................................................................................................. 23 3.5. Beiersdorf is a strong niche player! ..................................................................................................... 25
4. Valuation .......................................................................................................................................... 28 4.1. Price performance .................................................................................................................................. 28 4.2. Valuation comparison............................................................................................................................ 28 4.3. DCF models ............................................................................................................................................ 29
4.3.1. Beiersdorf (Neutral- Fair Value: EUR95) ............................................................................ 29 4.3.2. Henkel (Buy- Fair Value: EUR139) ...................................................................................... 29 4.3.3. L’Oréal (Buy- Fair Value: EUR206) ...................................................................................... 31 4.3.4. Unilever (Neutral- Fair Value: EUR49) ................................................................................ 32
Beiersdorf Fair Value EUR95 vs. EUR89 NEUTRAL ................................................................. 33 A pure skin care player! ..................................................................................................................................... 33
Henkel Fair Value EUR139 BUY ..................................................................................................... 35 Confidence after a good Q3 for adhesives .................................................................................................... 35
Interparfums Fair Value EUR36 BUY............................................................................................. 37 An efficient business model ............................................................................................................................. 37
L'Oréal Fair Value EUR206 BUY .................................................................................................... 39 Ready to explore the digital opportunity! ....................................................................................................... 39
Unilever | Fair Value EUR49 NEUTRAL ..................................................................................... 41 Too busy .............................................................................................................................................................. 41
Bryan Garnier stock rating system .................................................................................................... 43
Cosmetics
3
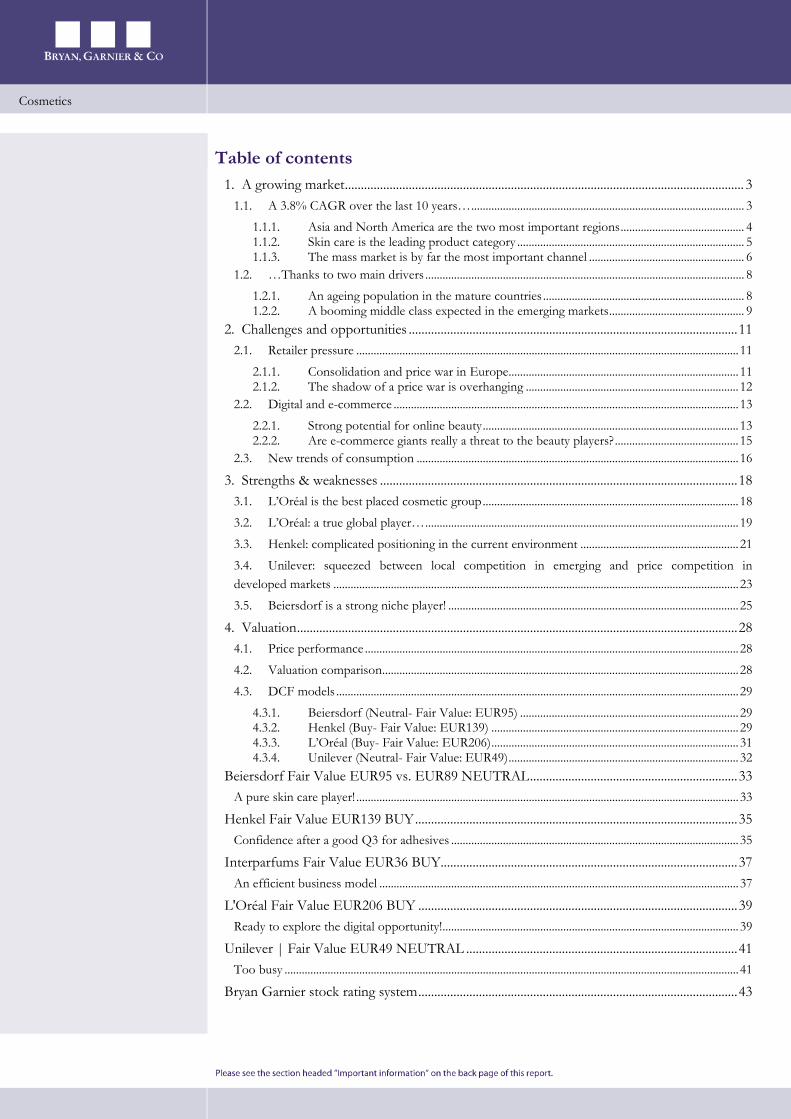
1. A growing market The fast-growing global Cosmetics market is valued by L’Oréal at around EUR200bn, having delivered a 3.8% CAGR over the last 10 years according to L’Oréal estimates. Even in 2009, a nightmare year for the world economy, this market enjoyed 1% growth followed by a strong 4.2% growth in the following year. This note highlights that the market dynamism varies depending on the region, product segment and distribution channel. Furthermore, it is driven by demographic metrics, including an ageing population in mature markets and an expanding middle class in emerging markets, especially in Asia-Pacific.
1.1. A 3.8% CAGR over the last 10 years… The cosmetic market is delivering strong growth and has even, at some points, demonstrated its resilience given, for instance, its performance in 2009. In the last 10 years, according to L’Oréal Group estimates, the global cosmetic market (excluding soaps and toothpastes) has enjoyed a 3.8% sales CAGR with close to a 4% increase over the last two years (2016 and 2017). While the luxury goods market registered some slowdown in 2016 (almost no growth, affected by a poor activity with Chinese customers), followed by a clear rebound in 2017 (close to 5% according to a Bain & Cie and Altagamma report), the global cosmetic market did not slow last year, maintaining the same momentum as in 2015 with even a slight acceleration. The 2017 trend (+4%) should remain the same as in 2016 according to L’Oréal Group management. Note that the global Cosmetics market defined by L’Oréal excludes soap and toothpaste.
For Beiersdorf management, however, its “market” has grown by 2% YTD as the German group is mainly involved in skin care, especially in the mass market with the Nivea brand which accounts for around 70% of Consumer division sales. The German group is not involved in make-up or in the selective market (or only marginally with the La Prairie brand), which were the two main cosmetics market growth drivers in 2016 and 2017. Nevertheless, the skin care segment seems to have seen a modest recovery since the beginning of 2017 according to all the industry players.
Fig. 1: Global cosmetics market % growth at constant forex
5,0%
2,9%
1,0%
4,2%4,6% 4,6%
3,8%3,6%
3,9% 4,0% 4,0%
0%
1%
2%
3%
4%
5%
6%
2007 2008 2009 2010 2011 2012 2013 2014 2015 2016 2017e
Source: L’Oréal; Bryan, Garnier & Co ests.
Cosmetics market has enjoyed a 3.8% CAGR over 10 last years
Cosmetics
4
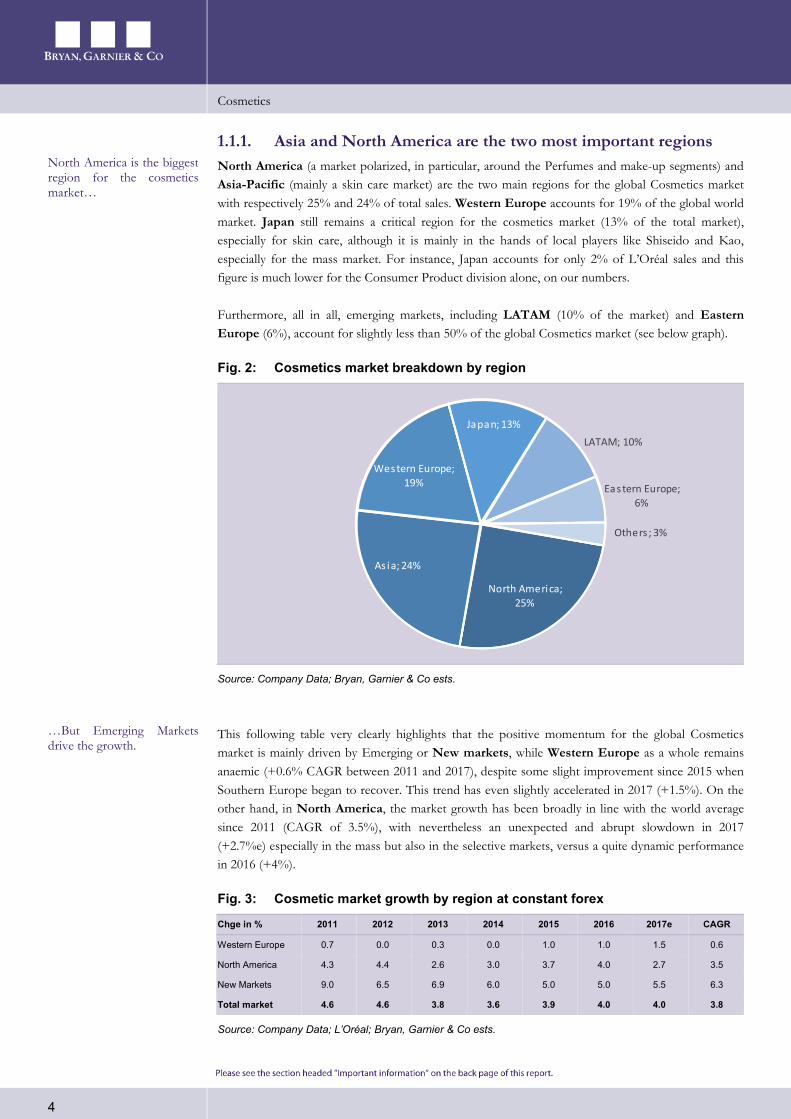
1.1.1. Asia and North America are the two most important regions North America (a market polarized, in particular, around the Perfumes and make-up segments) and Asia-Pacific (mainly a skin care market) are the two main regions for the global Cosmetics market with respectively 25% and 24% of total sales. Western Europe accounts for 19% of the global world market. Japan still remains a critical region for the cosmetics market (13% of the total market), especially for skin care, although it is mainly in the hands of local players like Shiseido and Kao, especially for the mass market. For instance, Japan accounts for only 2% of L’Oréal sales and this figure is much lower for the Consumer Product division alone, on our numbers.
Furthermore, all in all, emerging markets, including LATAM (10% of the market) and Eastern Europe (6%), account for slightly less than 50% of the global Cosmetics market (see below graph).
Fig. 2: Cosmetics market breakdown by region
North America; 25%
As ia; 24%
Western Europe; 19%
Japan; 13%LATAM; 10%
Eastern Europe; 6%
Others ; 3%
Source: Company Data; Bryan, Garnier & Co ests.
This following table very clearly highlights that the positive momentum for the global Cosmetics market is mainly driven by Emerging or New markets, while Western Europe as a whole remains anaemic (+0.6% CAGR between 2011 and 2017), despite some slight improvement since 2015 when Southern Europe began to recover. This trend has even slightly accelerated in 2017 (+1.5%). On the other hand, in North America, the market growth has been broadly in line with the world average since 2011 (CAGR of 3.5%), with nevertheless an unexpected and abrupt slowdown in 2017 (+2.7%e) especially in the mass but also in the selective markets, versus a quite dynamic performance in 2016 (+4%).
Fig. 3: Cosmetic market growth by region at constant forex
Chge in % 2011 2012 2013 2014 2015 2016 2017e CAGR
Western Europe 0.7 0.0 0.3 0.0 1.0 1.0 1.5 0.6
North America 4.3 4.4 2.6 3.0 3.7 4.0 2.7 3.5
New Markets 9.0 6.5 6.9 6.0 5.0 5.0 5.5 6.3
Total market 4.6 4.6 3.8 3.6 3.9 4.0 4.0 3.8
Source: Company Data; L’Oréal; Bryan, Garnier & Co ests.
North America is the biggest region for the cosmetics market…
…But Emerging Markets drive the growth.
Cosmetics
5
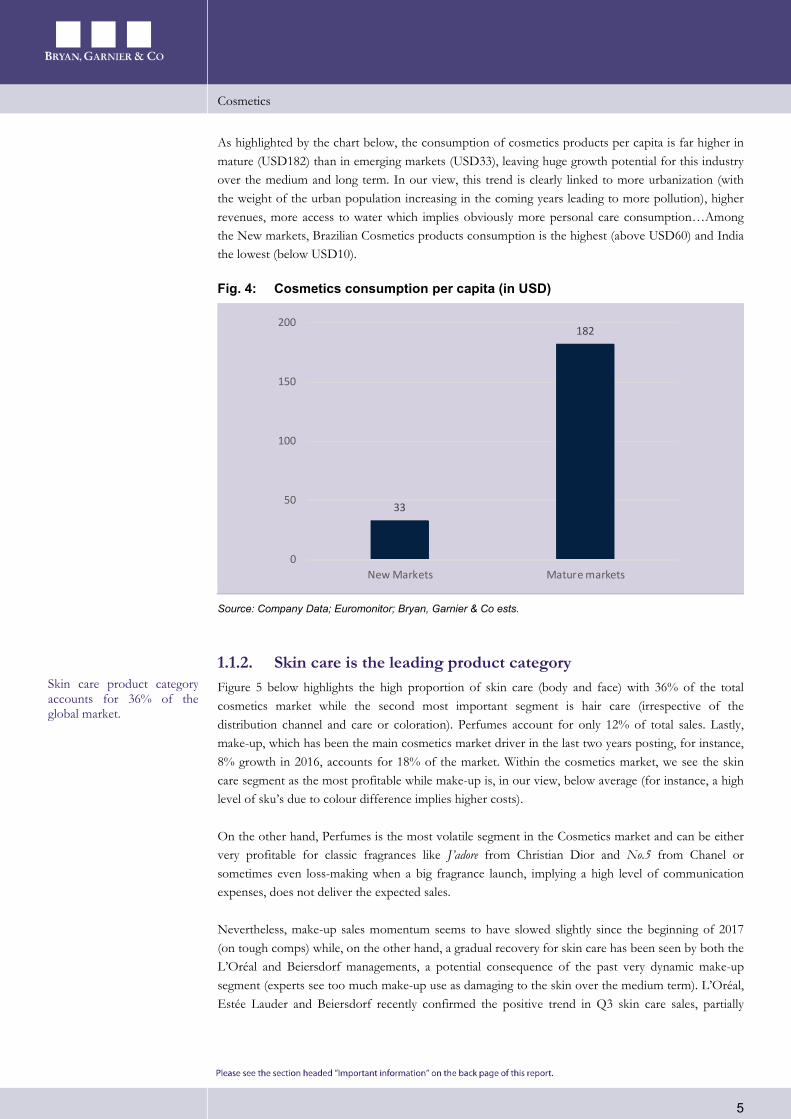
As highlighted by the chart below, the consumption of cosmetics products per capita is far higher in mature (USD182) than in emerging markets (USD33), leaving huge growth potential for this industry over the medium and long term. In our view, this trend is clearly linked to more urbanization (with the weight of the urban population increasing in the coming years leading to more pollution), higher revenues, more access to water which implies obviously more personal care consumption…Among the New markets, Brazilian Cosmetics products consumption is the highest (above USD60) and India the lowest (below USD10).
Fig. 4: Cosmetics consumption per capita (in USD)
33
182
0
50
100
150
200
New Markets Mature markets
Source: Company Data; Euromonitor; Bryan, Garnier & Co ests.
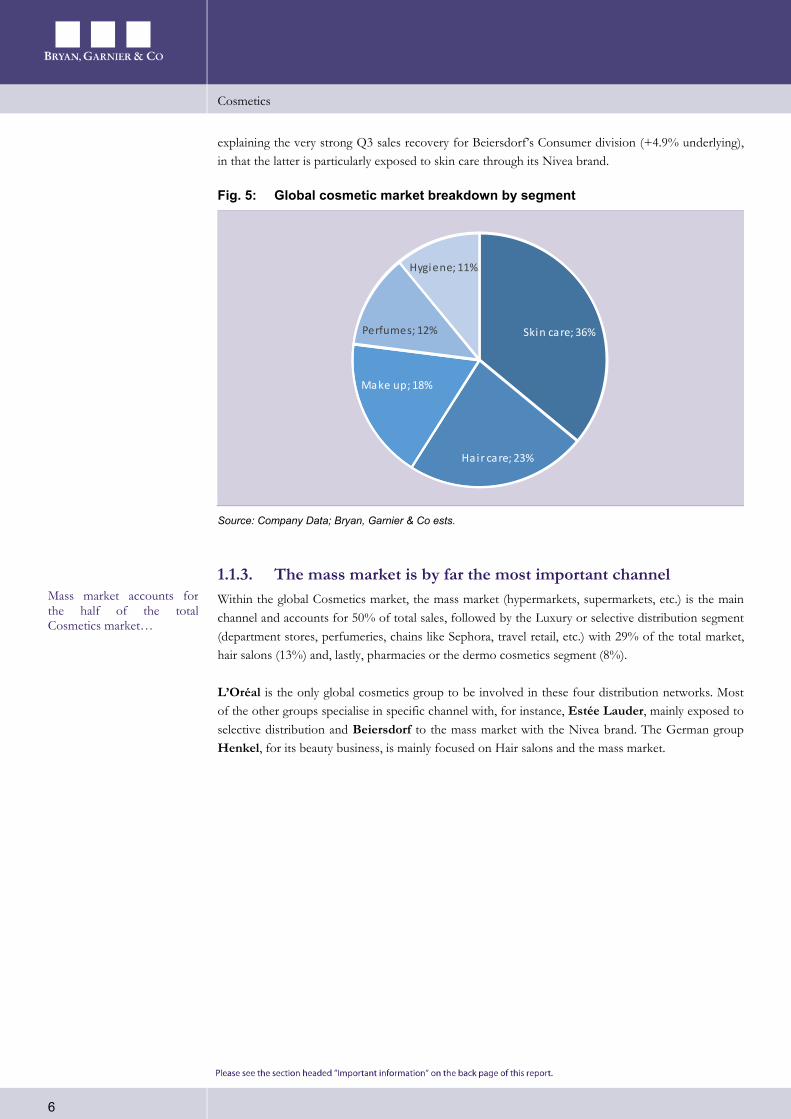
1.1.2. Skin care is the leading product category Figure 5 below highlights the high proportion of skin care (body and face) with 36% of the total cosmetics market while the second most important segment is hair care (irrespective of the distribution channel and care or coloration). Perfumes account for only 12% of total sales. Lastly, make-up, which has been the main cosmetics market driver in the last two years posting, for instance, 8% growth in 2016, accounts for 18% of the market. Within the cosmetics market, we see the skin care segment as the most profitable while make-up is, in our view, below average (for instance, a high level of sku’s due to colour difference implies higher costs).
On the other hand, Perfumes is the most volatile segment in the Cosmetics market and can be either very profitable for classic fragrances like J’adore from Christian Dior and No.5 from Chanel or sometimes even loss-making when a big fragrance launch, implying a high level of communication expenses, does not deliver the expected sales.
Nevertheless, make-up sales momentum seems to have slowed slightly since the beginning of 2017 (on tough comps) while, on the other hand, a gradual recovery for skin care has been seen by both the L’Oréal and Beiersdorf managements, a potential consequence of the past very dynamic make-up segment (experts see too much make-up use as damaging to the skin over the medium term). L’Oréal, Estée Lauder and Beiersdorf recently confirmed the positive trend in Q3 skin care sales, partially
Skin care product category accounts for 36% of the global market.
Cosmetics
6
explaining the very strong Q3 sales recovery for Beiersdorf’s Consumer division (+4.9% underlying), in that the latter is particularly exposed to skin care through its Nivea brand.
Fig. 5: Global cosmetic market breakdown by segment
Skin care; 36%
Hair care; 23%
Make up; 18%
Perfumes; 12%
Hygiene; 11%
Source: Company Data; Bryan, Garnier & Co ests.
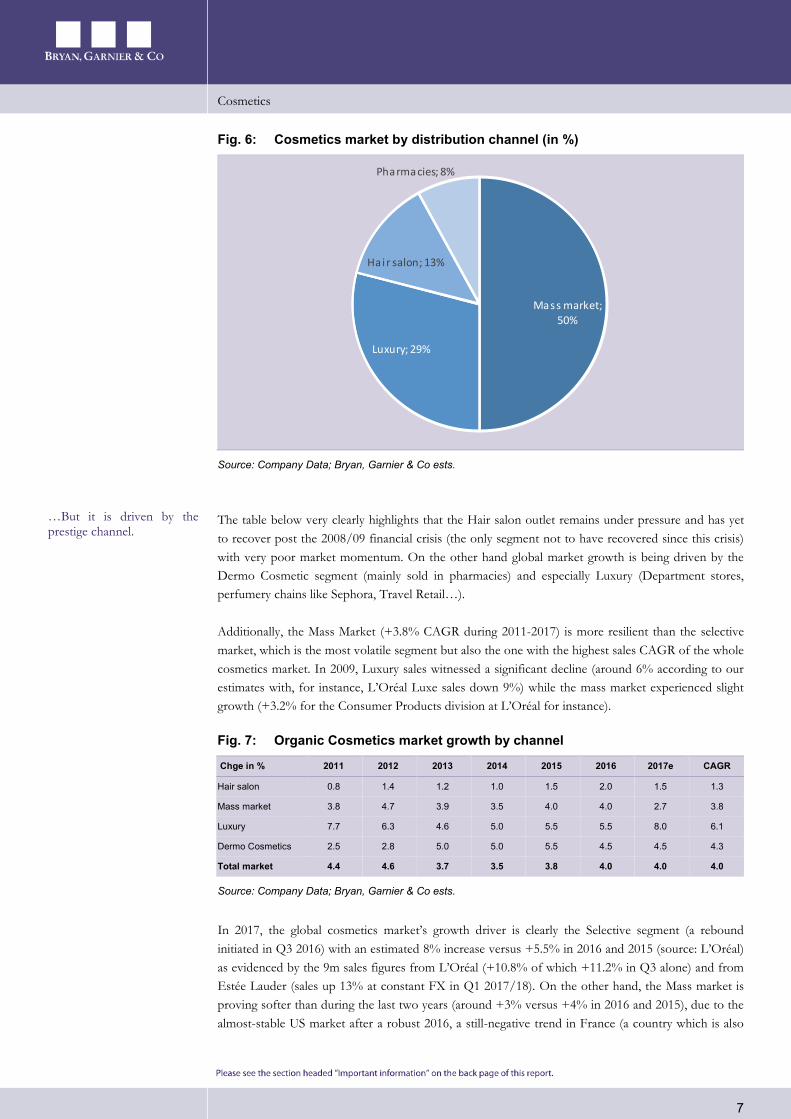
1.1.3. The mass market is by far the most important channel Within the global Cosmetics market, the mass market (hypermarkets, supermarkets, etc.) is the main channel and accounts for 50% of total sales, followed by the Luxury or selective distribution segment (department stores, perfumeries, chains like Sephora, travel retail, etc.) with 29% of the total market, hair salons (13%) and, lastly, pharmacies or the dermo cosmetics segment (8%).
L’Oréal is the only global cosmetics group to be involved in these four distribution networks. Most of the other groups specialise in specific channel with, for instance, Estée Lauder, mainly exposed to selective distribution and Beiersdorf to the mass market with the Nivea brand. The German group Henkel, for its beauty business, is mainly focused on Hair salons and the mass market.
Mass market accounts for the half of the total Cosmetics market…
Cosmetics
7
Fig. 6: Cosmetics market by distribution channel (in %)
Mass market; 50%
Luxury; 29%
Hair salon; 13%
Pharmacies; 8%
Source: Company Data; Bryan, Garnier & Co ests.
The table below very clearly highlights that the Hair salon outlet remains under pressure and has yet to recover post the 2008/09 financial crisis (the only segment not to have recovered since this crisis) with very poor market momentum. On the other hand global market growth is being driven by the Dermo Cosmetic segment (mainly sold in pharmacies) and especially Luxury (Department stores, perfumery chains like Sephora, Travel Retail…).
Additionally, the Mass Market (+3.8% CAGR during 2011-2017) is more resilient than the selective market, which is the most volatile segment but also the one with the highest sales CAGR of the whole cosmetics market. In 2009, Luxury sales witnessed a significant decline (around 6% according to our estimates with, for instance, L’Oréal Luxe sales down 9%) while the mass market experienced slight growth (+3.2% for the Consumer Products division at L’Oréal for instance).
Fig. 7: Organic Cosmetics market growth by channel
Chge in % 2011 2012 2013 2014 2015 2016 2017e CAGR
Hair salon 0.8 1.4 1.2 1.0 1.5 2.0 1.5 1.3
Mass market 3.8 4.7 3.9 3.5 4.0 4.0 2.7 3.8
Luxury 7.7 6.3 4.6 5.0 5.5 5.5 8.0 6.1
Dermo Cosmetics 2.5 2.8 5.0 5.0 5.5 4.5 4.5 4.3
Total market 4.4 4.6 3.7 3.5 3.8 4.0 4.0 4.0
Source: Company Data; Bryan, Garnier & Co ests.
In 2017, the global cosmetics market’s growth driver is clearly the Selective segment (a rebound initiated in Q3 2016) with an estimated 8% increase versus +5.5% in 2016 and 2015 (source: L’Oréal) as evidenced by the 9m sales figures from L’Oréal (+10.8% of which +11.2% in Q3 alone) and from Estée Lauder (sales up 13% at constant FX in Q1 2017/18). On the other hand, the Mass market is proving softer than during the last two years (around +3% versus +4% in 2016 and 2015), due to the almost-stable US market after a robust 2016, a still-negative trend in France (a country which is also
…But it is driven by the prestige channel.
Cosmetics
8
penalised across all channels, including Luxury) and a still-very-challenging situation in China due to the change in consumer behaviour.
1.2. …Thanks to two main drivers Among the positive factors, we see two main drivers behind the global Cosmetics industry growth: i/ an ageing population predominantly, but not only, in mature markets and ii/ a growing middle class in emerging countries.
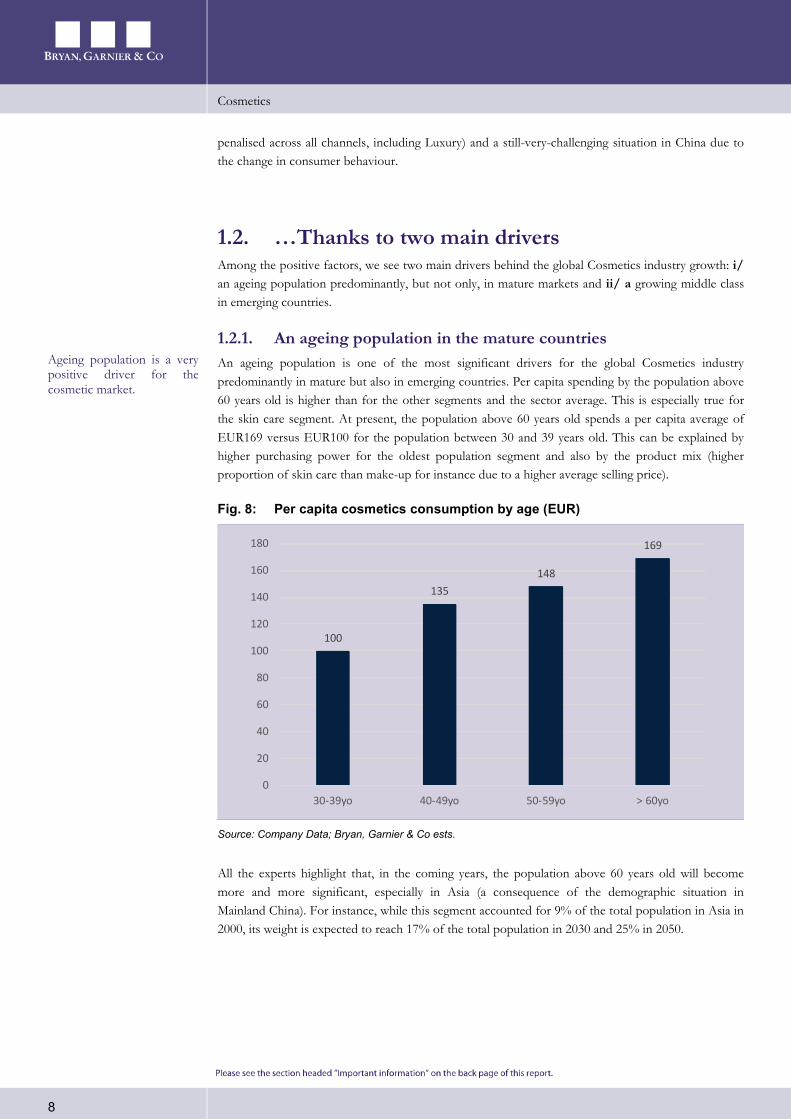
1.2.1. An ageing population in the mature countries An ageing population is one of the most significant drivers for the global Cosmetics industry predominantly in mature but also in emerging countries. Per capita spending by the population above 60 years old is higher than for the other segments and the sector average. This is especially true for the skin care segment. At present, the population above 60 years old spends a per capita average of EUR169 versus EUR100 for the population between 30 and 39 years old. This can be explained by higher purchasing power for the oldest population segment and also by the product mix (higher proportion of skin care than make-up for instance due to a higher average selling price).
Fig. 8: Per capita cosmetics consumption by age (EUR)
100
135148
169
0
20
40
60
80
100
120
140
160
180
30-39yo 40-49yo 50-59yo > 60yo
Source: Company Data; Bryan, Garnier & Co ests.
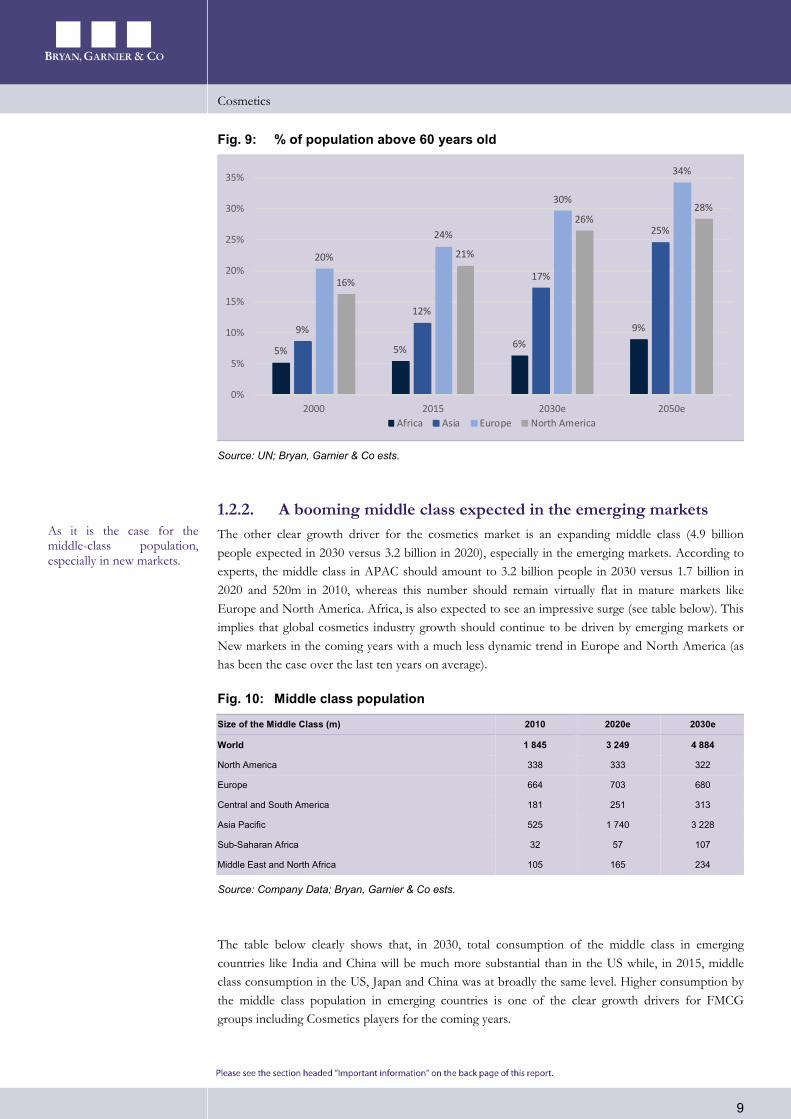
All the experts highlight that, in the coming years, the population above 60 years old will become more and more significant, especially in Asia (a consequence of the demographic situation in Mainland China). For instance, while this segment accounted for 9% of the total population in Asia in 2000, its weight is expected to reach 17% of the total population in 2030 and 25% in 2050.
Ageing population is a very positive driver for the cosmetic market.
Cosmetics
9
Fig. 9: % of population above 60 years old
5% 5% 6%9%9%
12%
17%
25%
20%
24%
30%
34%
16%
21%
26%28%
0%
5%
10%
15%
20%
25%
30%
35%
2000 2015 2030e 2050eAfrica Asia Europe North America
Source: UN; Bryan, Garnier & Co ests.
1.2.2. A booming middle class expected in the emerging markets The other clear growth driver for the cosmetics market is an expanding middle class (4.9 billion people expected in 2030 versus 3.2 billion in 2020), especially in the emerging markets. According to experts, the middle class in APAC should amount to 3.2 billion people in 2030 versus 1.7 billion in 2020 and 520m in 2010, whereas this number should remain virtually flat in mature markets like Europe and North America. Africa, is also expected to see an impressive surge (see table below). This implies that global cosmetics industry growth should continue to be driven by emerging markets or New markets in the coming years with a much less dynamic trend in Europe and North America (as has been the case over the last ten years on average).
Fig. 10: Middle class population
Size of the Middle Class (m) 2010 2020e 2030e
World 1 845 3 249 4 884
North America 338 333 322
Europe 664 703 680
Central and South America 181 251 313
Asia Pacific 525 1 740 3 228
Sub-Saharan Africa 32 57 107
Middle East and North Africa 105 165 234
Source: Company Data; Bryan, Garnier & Co ests.
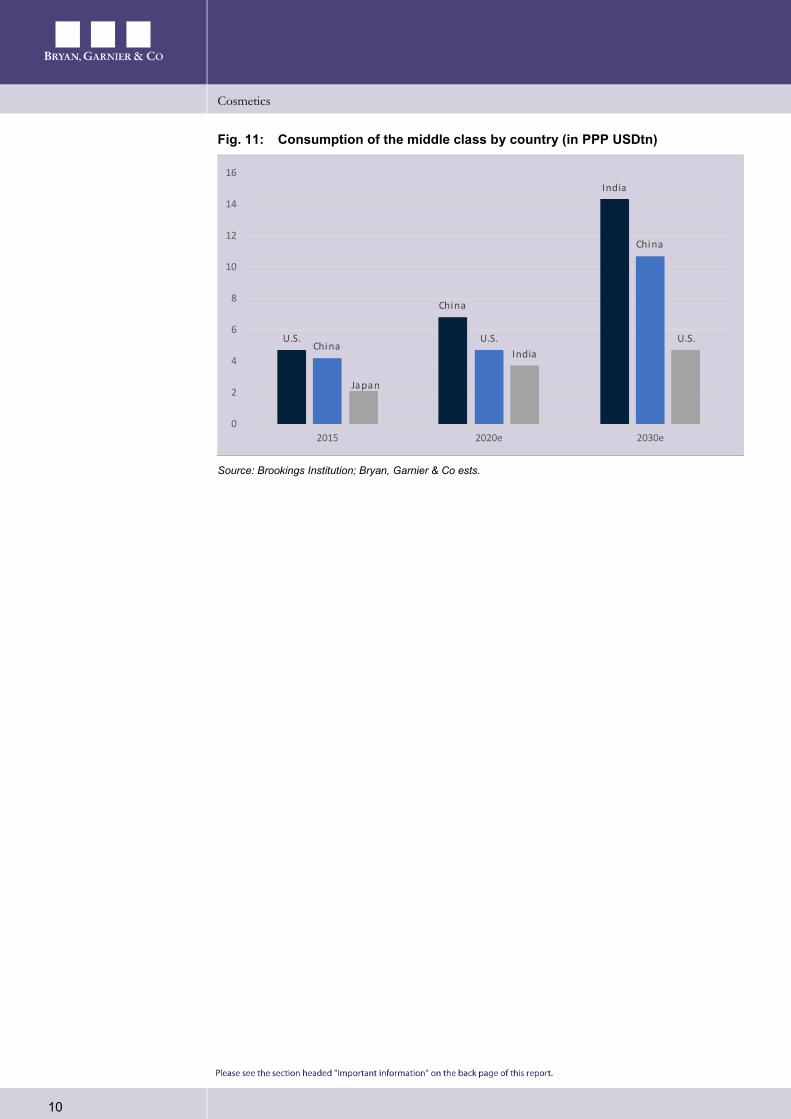
The table below clearly shows that, in 2030, total consumption of the middle class in emerging countries like India and China will be much more substantial than in the US while, in 2015, middle class consumption in the US, Japan and China was at broadly the same level. Higher consumption by the middle class population in emerging countries is one of the clear growth drivers for FMCG groups including Cosmetics players for the coming years.
As it is the case for the middle-class population, especially in new markets.
Cosmetics
10
Fig. 11: Consumption of the middle class by country (in PPP USDtn)
U.S.
China
India
ChinaU.S.
China
Japan
IndiaU.S.
0
2
4
6
8
10
12
14
16
2015 2020e 2030e
Source: Brookings Institution; Bryan, Garnier & Co ests.
Cosmetics
11
2. Challenges and opportunities The global players in the Cosmetics market are having to contend with major challenges and will continue to do so in the coming years. They should, however, also benefit from opportunities. We might even argue that some challenges could be transformed into opportunities as is the case, for instance, for e-commerce and new trends of consumption.
2.1. Retailer pressure In Europe, the concentration of retailers and purchasing banners has reshaped trade negotiations and driven a marked deterioration in the pricing environment over the past few years. The US has proven more resilient although the situation could clearly worsen with the emergence of European hard discounters and the warning signs of an impending price war between Amazon and Walmart, to the detriment of suppliers who will probably be obliged to contribute to the reduction in end sale prices.
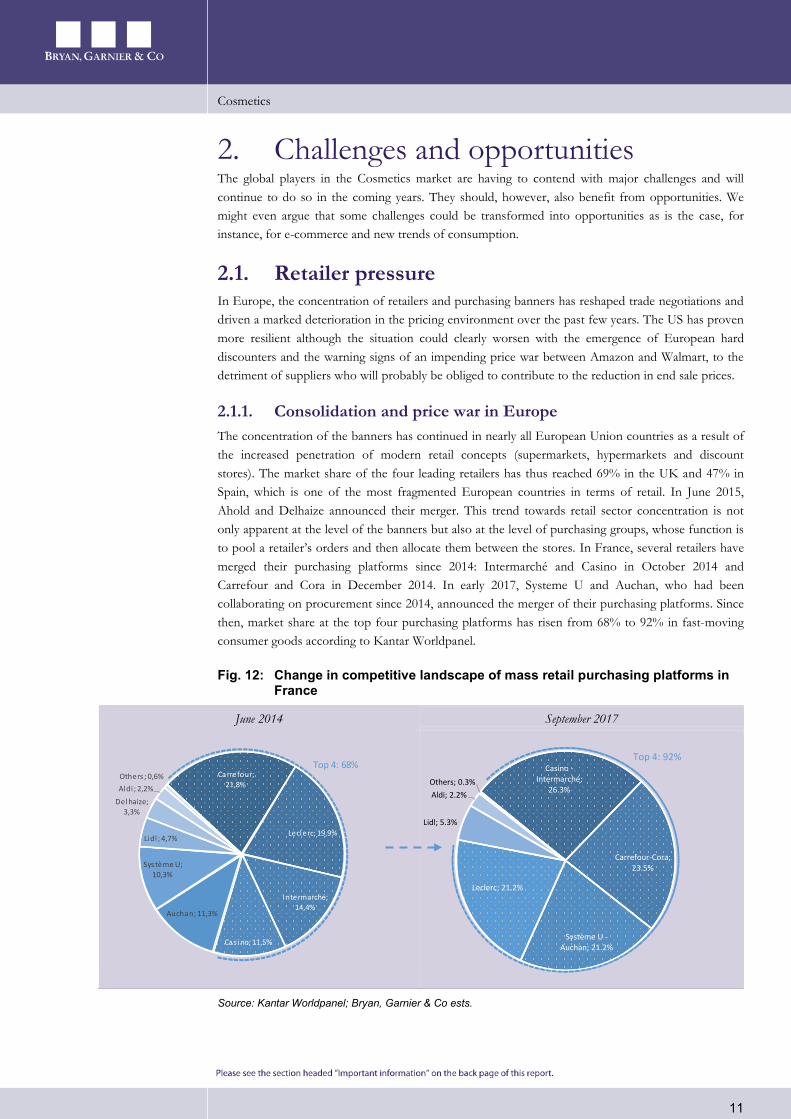
2.1.1. Consolidation and price war in Europe The concentration of the banners has continued in nearly all European Union countries as a result of the increased penetration of modern retail concepts (supermarkets, hypermarkets and discount stores). The market share of the four leading retailers has thus reached 69% in the UK and 47% in Spain, which is one of the most fragmented European countries in terms of retail. In June 2015, Ahold and Delhaize announced their merger. This trend towards retail sector concentration is not only apparent at the level of the banners but also at the level of purchasing groups, whose function is to pool a retailer’s orders and then allocate them between the stores. In France, several retailers have merged their purchasing platforms since 2014: Intermarché and Casino in October 2014 and Carrefour and Cora in December 2014. In early 2017, Systeme U and Auchan, who had been collaborating on procurement since 2014, announced the merger of their purchasing platforms. Since then, market share at the top four purchasing platforms has risen from 68% to 92% in fast-moving consumer goods according to Kantar Worldpanel.
Fig. 12: Change in competitive landscape of mass retail purchasing platforms in France
June 2014 September 2017
Carrefour; 21,8%
Leclerc; 19,9%
Intermarché; 14,4%
Cas ino; 11,5%
Auchan; 11,3%
Système U; 10,3%
Lidl ; 4,7%
Delhaize; 3,3%
Aldi ; 2,2%Others ; 0,6%
Top 4: 68%
Casino -Intermarché;
26.3%
Carrefour-Cora; 23.5%
Système U -Auchan; 21.2%
Leclerc; 21.2%
Lidl; 5.3%
Aldi; 2.2%Others; 0.3%
Top 4: 92%
Source: Kantar Worldpanel; Bryan, Garnier & Co ests.
Cosmetics
12
These moves by the French groups have acted as a catalyst for mergers on a much wider scale. There are currently seven large-scale European purchasing platforms armed with theoretical sales levels (sum of sales of each member banner, or an indicator of their weight compared with suppliers) exceeding EUR100bn.
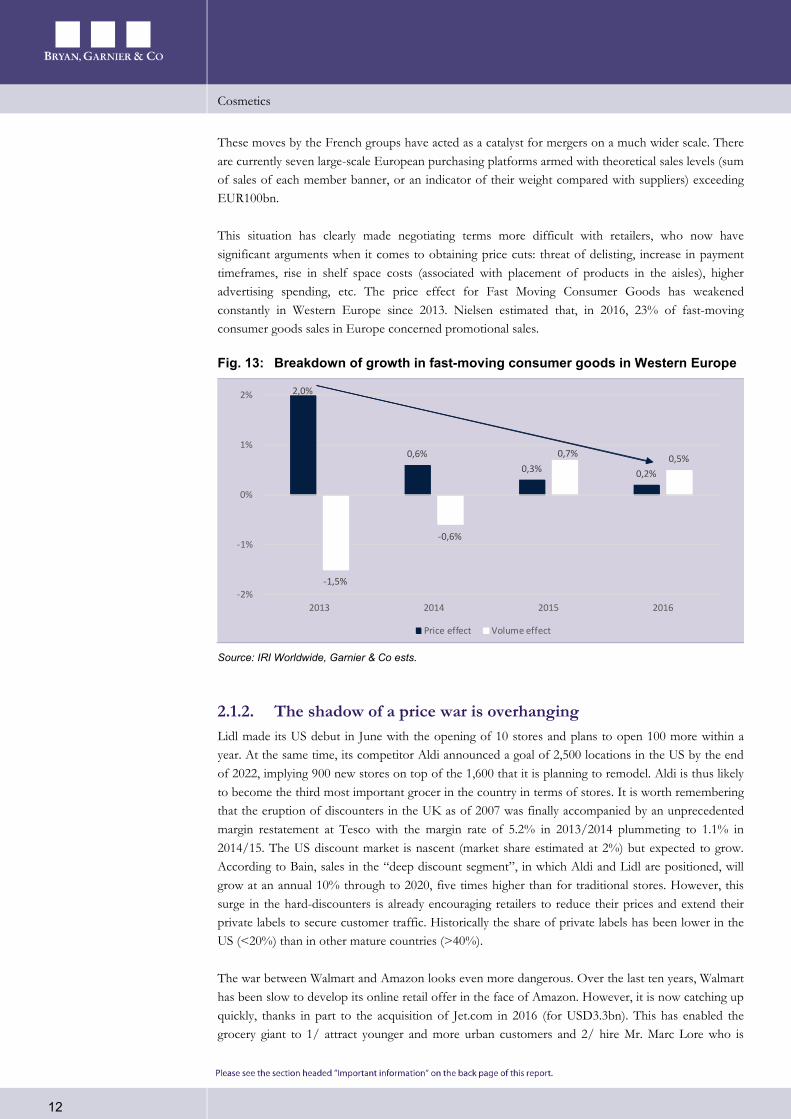
This situation has clearly made negotiating terms more difficult with retailers, who now have significant arguments when it comes to obtaining price cuts: threat of delisting, increase in payment timeframes, rise in shelf space costs (associated with placement of products in the aisles), higher advertising spending, etc. The price effect for Fast Moving Consumer Goods has weakened constantly in Western Europe since 2013. Nielsen estimated that, in 2016, 23% of fast-moving consumer goods sales in Europe concerned promotional sales.
Fig. 13: Breakdown of growth in fast-moving consumer goods in Western Europe
2,0%
0,6%0,3% 0,2%
-1,5%
-0,6%
0,7% 0,5%
-2%
-1%
0%
1%
2%
2013 2014 2015 2016
Price effect Volume effect
Source: IRI Worldwide, Garnier & Co ests.
2.1.2. The shadow of a price war is overhanging Lidl made its US debut in June with the opening of 10 stores and plans to open 100 more within a year. At the same time, its competitor Aldi announced a goal of 2,500 locations in the US by the end of 2022, implying 900 new stores on top of the 1,600 that it is planning to remodel. Aldi is thus likely to become the third most important grocer in the country in terms of stores. It is worth remembering that the eruption of discounters in the UK as of 2007 was finally accompanied by an unprecedented margin restatement at Tesco with the margin rate of 5.2% in 2013/2014 plummeting to 1.1% in 2014/15. The US discount market is nascent (market share estimated at 2%) but expected to grow. According to Bain, sales in the “deep discount segment”, in which Aldi and Lidl are positioned, will grow at an annual 10% through to 2020, five times higher than for traditional stores. However, this surge in the hard-discounters is already encouraging retailers to reduce their prices and extend their private labels to secure customer traffic. Historically the share of private labels has been lower in the US (<20%) than in other mature countries (>40%).
The war between Walmart and Amazon looks even more dangerous. Over the last ten years, Walmart has been slow to develop its online retail offer in the face of Amazon. However, it is now catching up quickly, thanks in part to the acquisition of Jet.com in 2016 (for USD3.3bn). This has enabled the grocery giant to 1/ attract younger and more urban customers and 2/ hire Mr. Marc Lore who is
Cosmetics
13
considered to be something of an a e-commerce genius and is now handling its e-activities. In 2016, Walmart spent USD1bn on e-commerce: doubling the number of warehouses in North America, increasing in the number of SKUs from 8 to 35 million, developing the drive format to strengthen its omnichannel advantage over Amazon, and lowering the free delivery threshold per basket from USD 50 to USD 35. Amazon responded by purchasing Whole Foods in June 2016 for USD13.7bn, with the strategic rationale of gaining credibility in food. From that point, events have speeded up. On 22 August, Walmart announced that thousands of its products would be sold on Google Express, the Google e-commerce platform while, just a few days later, Amazon decided to cut prices at Whole Foods (~-25% on average on a series of star products) and announced a second wave of price decreases on 15 November. Aimed at protecting its market share and countering Amazon, Walmart is likely to follow the trend and introduce price adjustments on a national level. This escalation involving the national no. 1 retailer (USD308bn of sales in the US) is thus likely to trigger a national price war in which other US retailers will have to participate whereas they had to date been used to only regional competition in prices.
2.2. Digital and e-commerce
2.2.1. Strong potential for online beauty The beauty industry has been facing a couple of challenges for several years linked to the rise of a new customer group: the millennials. This new category of consumers, who listen to youtubers rather than the conventional media, prefers products sold through a new distribution channel, namely the internet.
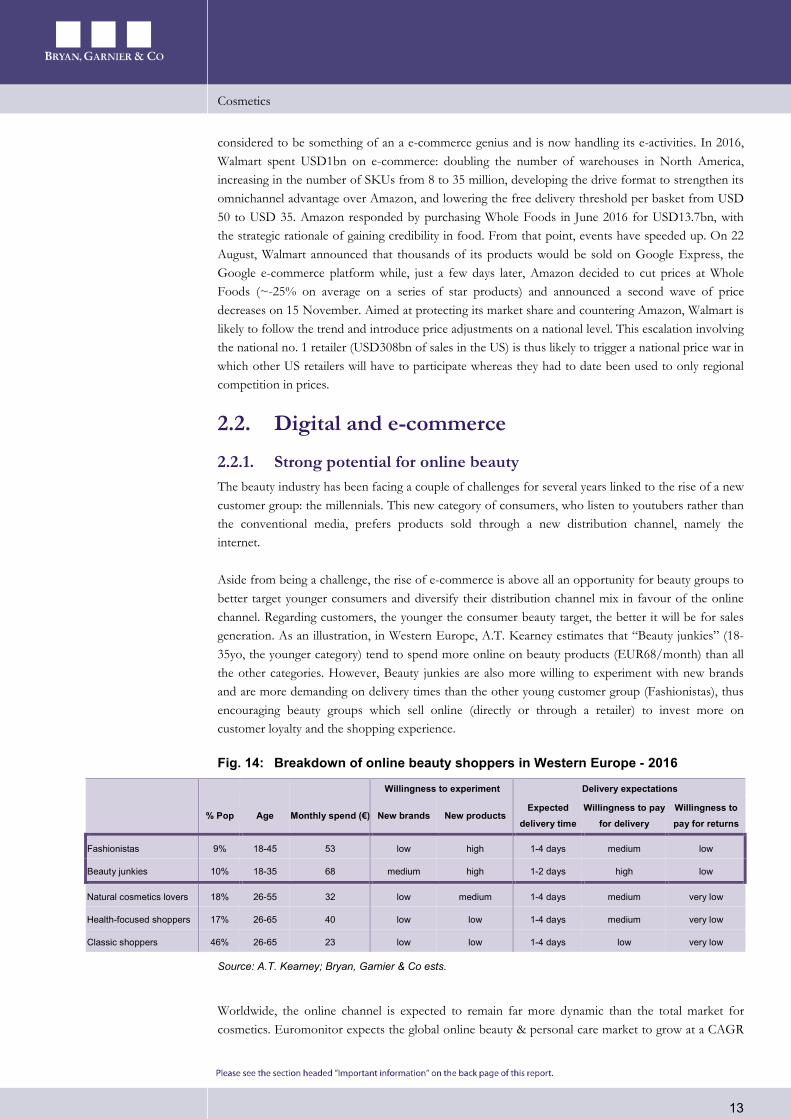
Aside from being a challenge, the rise of e-commerce is above all an opportunity for beauty groups to better target younger consumers and diversify their distribution channel mix in favour of the online channel. Regarding customers, the younger the consumer beauty target, the better it will be for sales generation. As an illustration, in Western Europe, A.T. Kearney estimates that “Beauty junkies” (18-35yo, the younger category) tend to spend more online on beauty products (EUR68/month) than all the other categories. However, Beauty junkies are also more willing to experiment with new brands and are more demanding on delivery times than the other young customer group (Fashionistas), thus encouraging beauty groups which sell online (directly or through a retailer) to invest more on customer loyalty and the shopping experience.
Fig. 14: Breakdown of online beauty shoppers in Western Europe - 2016
Willingness to experiment Delivery expectations
% Pop Age Monthly spend (€) New brands New products Expected
delivery time Willingness to pay
for delivery Willingness to pay for returns
Fashionistas 9% 18-45 53 low high 1-4 days medium low
Beauty junkies 10% 18-35 68 medium high 1-2 days high low
Natural cosmetics lovers 18% 26-55 32 low medium 1-4 days medium very low
Health-focused shoppers 17% 26-65 40 low low 1-4 days medium very low
Classic shoppers 46% 26-65 23 low low 1-4 days low very low
Source: A.T. Kearney; Bryan, Garnier & Co ests.
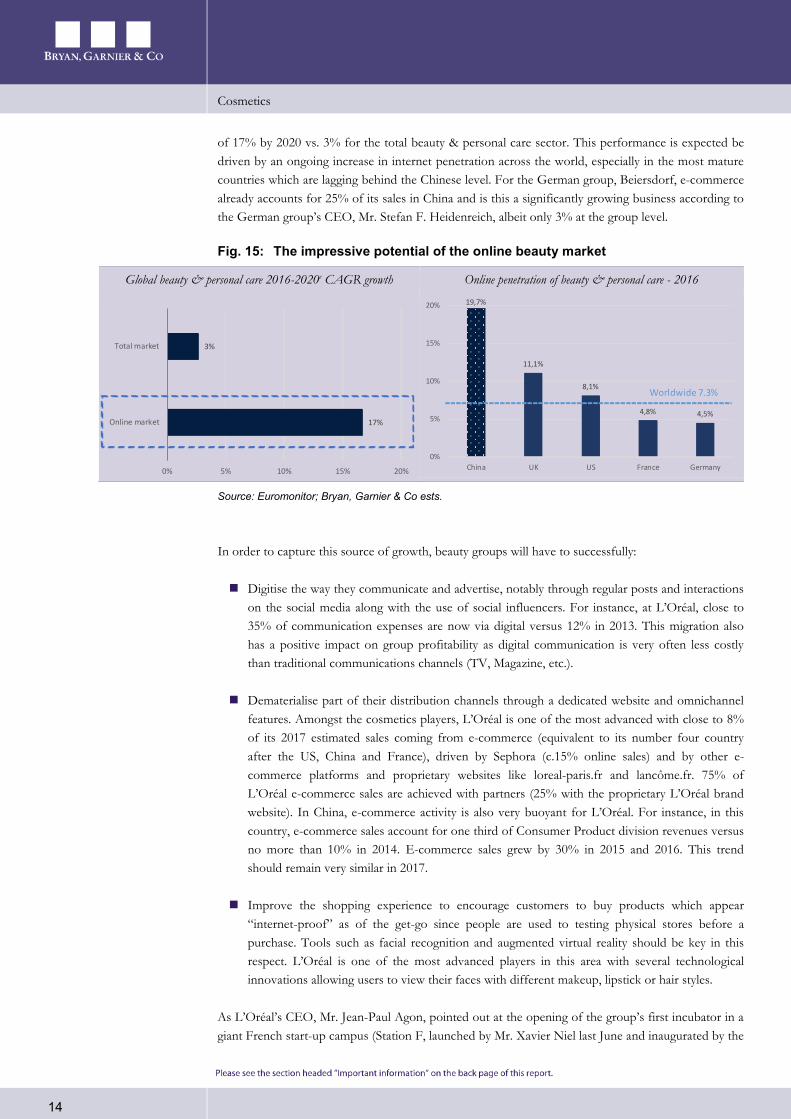
Worldwide, the online channel is expected to remain far more dynamic than the total market for cosmetics. Euromonitor expects the global online beauty & personal care market to grow at a CAGR
Cosmetics
14
of 17% by 2020 vs. 3% for the total beauty & personal care sector. This performance is expected be driven by an ongoing increase in internet penetration across the world, especially in the most mature countries which are lagging behind the Chinese level. For the German group, Beiersdorf, e-commerce already accounts for 25% of its sales in China and is this a significantly growing business according to the German group’s CEO, Mr. Stefan F. Heidenreich, albeit only 3% at the group level.
Fig. 15: The impressive potential of the online beauty market
Global beauty & personal care 2016-2020e CAGR growth Online penetration of beauty & personal care - 2016
17%
3%
0% 5% 10% 15% 20%
Online market
Total market
19,7%
11,1%
8,1%
4,8% 4,5%
0%
5%
10%
15%
20%
China UK US France Germany
Worldwide 7.3%
Source: Euromonitor; Bryan, Garnier & Co ests.
In order to capture this source of growth, beauty groups will have to successfully:
Digitise the way they communicate and advertise, notably through regular posts and interactions on the social media along with the use of social influencers. For instance, at L’Oréal, close to 35% of communication expenses are now via digital versus 12% in 2013. This migration also has a positive impact on group profitability as digital communication is very often less costly than traditional communications channels (TV, Magazine, etc.).
Dematerialise part of their distribution channels through a dedicated website and omnichannel features. Amongst the cosmetics players, L’Oréal is one of the most advanced with close to 8% of its 2017 estimated sales coming from e-commerce (equivalent to its number four country after the US, China and France), driven by Sephora (c.15% online sales) and by other e-commerce platforms and proprietary websites like loreal-paris.fr and lancôme.fr. 75% of L’Oréal e-commerce sales are achieved with partners (25% with the proprietary L’Oréal brand website). In China, e-commerce activity is also very buoyant for L’Oréal. For instance, in this country, e-commerce sales account for one third of Consumer Product division revenues versus no more than 10% in 2014. E-commerce sales grew by 30% in 2015 and 2016. This trend should remain very similar in 2017.
Improve the shopping experience to encourage customers to buy products which appear “internet-proof” as of the get-go since people are used to testing physical stores before a purchase. Tools such as facial recognition and augmented virtual reality should be key in this respect. L’Oréal is one of the most advanced players in this area with several technological innovations allowing users to view their faces with different makeup, lipstick or hair styles.
As L’Oréal’s CEO, Mr. Jean-Paul Agon, pointed out at the opening of the group’s first incubator in a giant French start-up campus (Station F, launched by Mr. Xavier Niel last June and inaugurated by the
Cosmetics
15
French President), a decentralized structure is key to being reactive and ensuing successful digitalisation in line with the latest trends and consumption behaviour. In recent years, more than 15,000 employees have been trained to be more efficient with digital and the French group has recruited nearly 1,700 employees to improve the overall digital experience. Building relations with specialized niche start-ups is also vital when it comes to remaining up to date with the latest technologies and jointly developing new projects. In this respect, L’Oréal with its new Paris incubator and Henkel and Unilever with their venture capital funds, seem very well positioned.
Fig. 16: E-commerce sales comparison
Beiersdorf Henkel L'Oréal Unilever
% of total sales 3 9 8 5
Source: Company Data; Bryan, Garnier & Co ests.
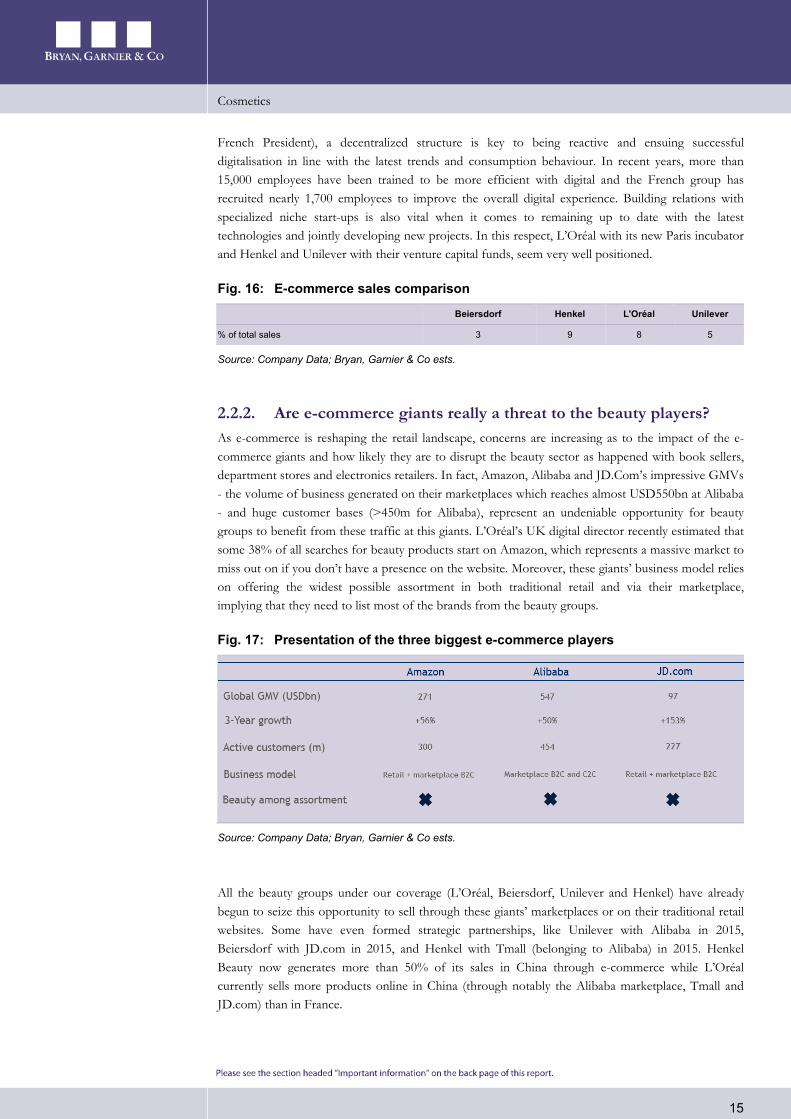
2.2.2. Are e-commerce giants really a threat to the beauty players? As e-commerce is reshaping the retail landscape, concerns are increasing as to the impact of the e-commerce giants and how likely they are to disrupt the beauty sector as happened with book sellers, department stores and electronics retailers. In fact, Amazon, Alibaba and JD.Com’s impressive GMVs - the volume of business generated on their marketplaces which reaches almost USD550bn at Alibaba - and huge customer bases (>450m for Alibaba), represent an undeniable opportunity for beauty groups to benefit from these traffic at this giants. L’Oréal’s UK digital director recently estimated that some 38% of all searches for beauty products start on Amazon, which represents a massive market to miss out on if you don’t have a presence on the website. Moreover, these giants’ business model relies on offering the widest possible assortment in both traditional retail and via their marketplace, implying that they need to list most of the brands from the beauty groups.
Fig. 17: Presentation of the three biggest e-commerce players
Source: Company Data; Bryan, Garnier & Co ests.
All the beauty groups under our coverage (L’Oréal, Beiersdorf, Unilever and Henkel) have already begun to seize this opportunity to sell through these giants’ marketplaces or on their traditional retail websites. Some have even formed strategic partnerships, like Unilever with Alibaba in 2015, Beiersdorf with JD.com in 2015, and Henkel with Tmall (belonging to Alibaba) in 2015. Henkel Beauty now generates more than 50% of its sales in China through e-commerce while L’Oréal currently sells more products online in China (through notably the Alibaba marketplace, Tmall and JD.com) than in France.
Cosmetics
16
The beauty groups mainly sell their mass market brands on these e-merchants’ websites as well as on fashion e-merchants’ platforms, as L’Oréal does with Asos. Note that the very recent diversification into beauty for the fashion e-merchants (Asos, Boohoo and Zalando) also represents an opportunity for the beauty groups to expand their digital footprints in the mass market segment. Nevertheless, L’Oréal luxury brands are not yet on Amazon.
To protect their pricing and image, cosmetics players prefer to sell their prestige brands on their own websites or through specialized retailers which offer a shopping experience in accordance with the positioning of the brand. However, a potential partnership between Amazon and the online retailer and content provider specialised in luxury beauty products, Violet Grey, as recently evoked by Wear Daily, could lend Amazon the credibility it needs to massively enter the premium segment and force groups such as L’Oréal to cooperate with Amazon in the prestige segment.
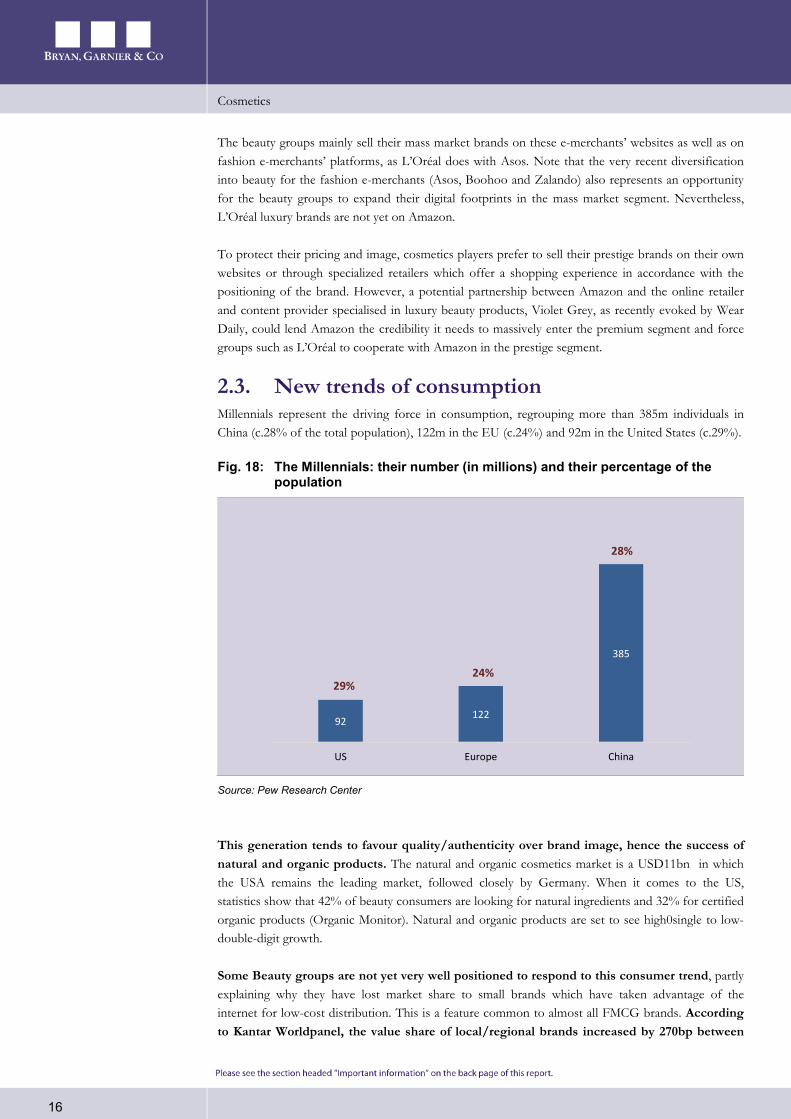
2.3. New trends of consumption Millennials represent the driving force in consumption, regrouping more than 385m individuals in China (c.28% of the total population), 122m in the EU (c.24%) and 92m in the United States (c.29%).
Fig. 18: The Millennials: their number (in millions) and their percentage of the population
92 122
385
US Europe China
28%
24%29%
Source: Pew Research Center
This generation tends to favour quality/authenticity over brand image, hence the success of natural and organic products. The natural and organic cosmetics market is a USD11bn in which the USA remains the leading market, followed closely by Germany. When it comes to the US, statistics show that 42% of beauty consumers are looking for natural ingredients and 32% for certified organic products (Organic Monitor). Natural and organic products are set to see high0single to low-double-digit growth.
Some Beauty groups are not yet very well positioned to respond to this consumer trend, partly explaining why they have lost market share to small brands which have taken advantage of the internet for low-cost distribution. This is a feature common to almost all FMCG brands. According to Kantar Worldpanel, the value share of local/regional brands increased by 270bp between
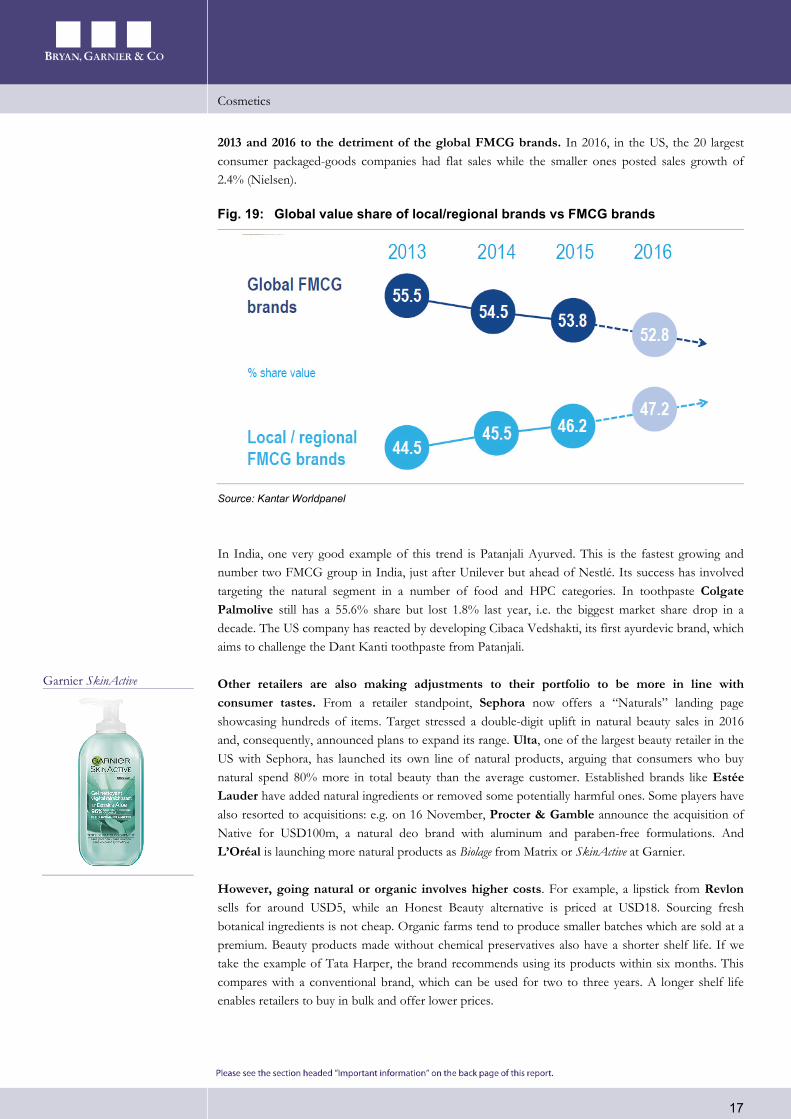
Cosmetics
17
2013 and 2016 to the detriment of the global FMCG brands. In 2016, in the US, the 20 largest consumer packaged-goods companies had flat sales while the smaller ones posted sales growth of 2.4% (Nielsen).
Fig. 19: Global value share of local/regional brands vs FMCG brands
Source: Kantar Worldpanel
In India, one very good example of this trend is Patanjali Ayurved. This is the fastest growing and number two FMCG group in India, just after Unilever but ahead of Nestlé. Its success has involved targeting the natural segment in a number of food and HPC categories. In toothpaste Colgate Palmolive still has a 55.6% share but lost 1.8% last year, i.e. the biggest market share drop in a decade. The US company has reacted by developing Cibaca Vedshakti, its first ayurdevic brand, which aims to challenge the Dant Kanti toothpaste from Patanjali.
Other retailers are also making adjustments to their portfolio to be more in line with consumer tastes. From a retailer standpoint, Sephora now offers a “Naturals” landing page showcasing hundreds of items. Target stressed a double-digit uplift in natural beauty sales in 2016 and, consequently, announced plans to expand its range. Ulta, one of the largest beauty retailer in the US with Sephora, has launched its own line of natural products, arguing that consumers who buy natural spend 80% more in total beauty than the average customer. Established brands like Estée Lauder have added natural ingredients or removed some potentially harmful ones. Some players have also resorted to acquisitions: e.g. on 16 November, Procter & Gamble announce the acquisition of Native for USD100m, a natural deo brand with aluminum and paraben-free formulations. And L’Oréal is launching more natural products as Biolage from Matrix or SkinActive at Garnier.
However, going natural or organic involves higher costs. For example, a lipstick from Revlon sells for around USD5, while an Honest Beauty alternative is priced at USD18. Sourcing fresh botanical ingredients is not cheap. Organic farms tend to produce smaller batches which are sold at a premium. Beauty products made without chemical preservatives also have a shorter shelf life. If we take the example of Tata Harper, the brand recommends using its products within six months. This compares with a conventional brand, which can be used for two to three years. A longer shelf life enables retailers to buy in bulk and offer lower prices.
Garnier SkinActive
Cosmetics
18
3. Strengths & weaknesses Below we analyse the strengths and weaknesses of each group under our coverage based on a series of criteria which are, in our view, critical for the Cosmetic sector, with their respective positioning within this industry and their different strategies.
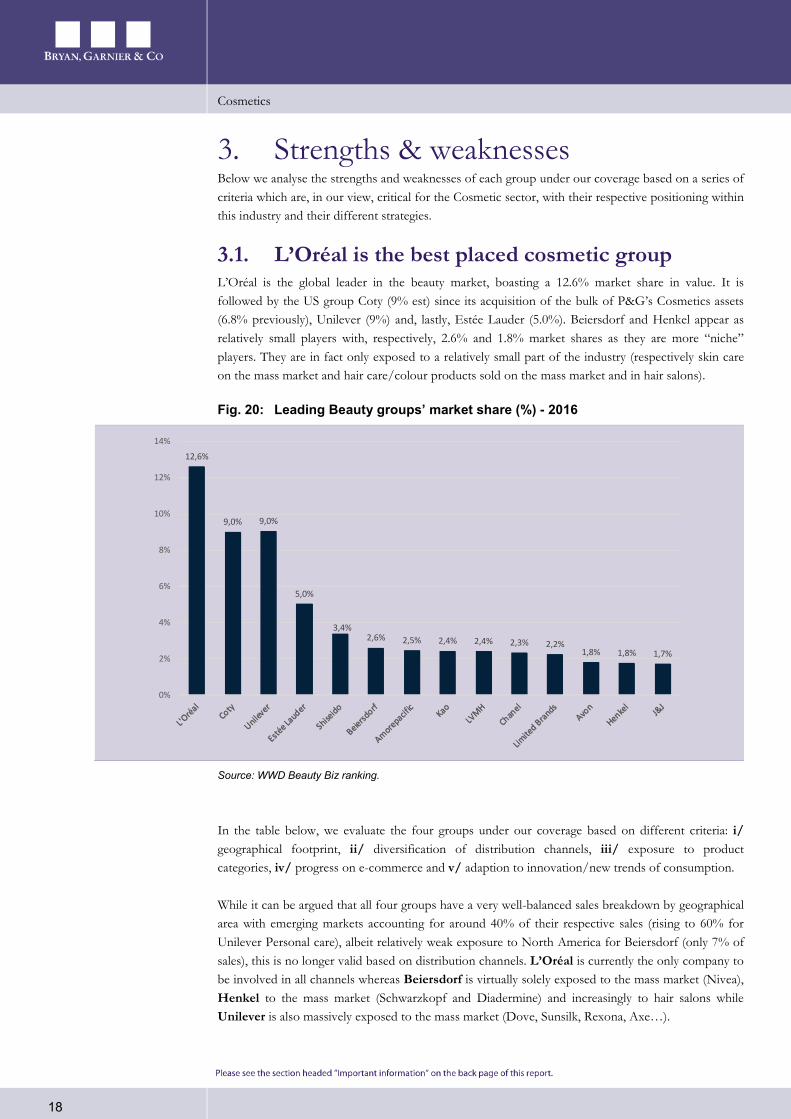
3.1. L’Oréal is the best placed cosmetic group L’Oréal is the global leader in the beauty market, boasting a 12.6% market share in value. It is followed by the US group Coty (9% est) since its acquisition of the bulk of P&G’s Cosmetics assets (6.8% previously), Unilever (9%) and, lastly, Estée Lauder (5.0%). Beiersdorf and Henkel appear as relatively small players with, respectively, 2.6% and 1.8% market shares as they are more “niche” players. They are in fact only exposed to a relatively small part of the industry (respectively skin care on the mass market and hair care/colour products sold on the mass market and in hair salons).
Fig. 20: Leading Beauty groups’ market share (%) - 2016
12,6%
9,0% 9,0%
5,0%
3,4%2,6% 2,5% 2,4% 2,4% 2,3% 2,2%
1,8% 1,8% 1,7%
0%
2%
4%
6%
8%
10%
12%
14%
Source: WWD Beauty Biz ranking.
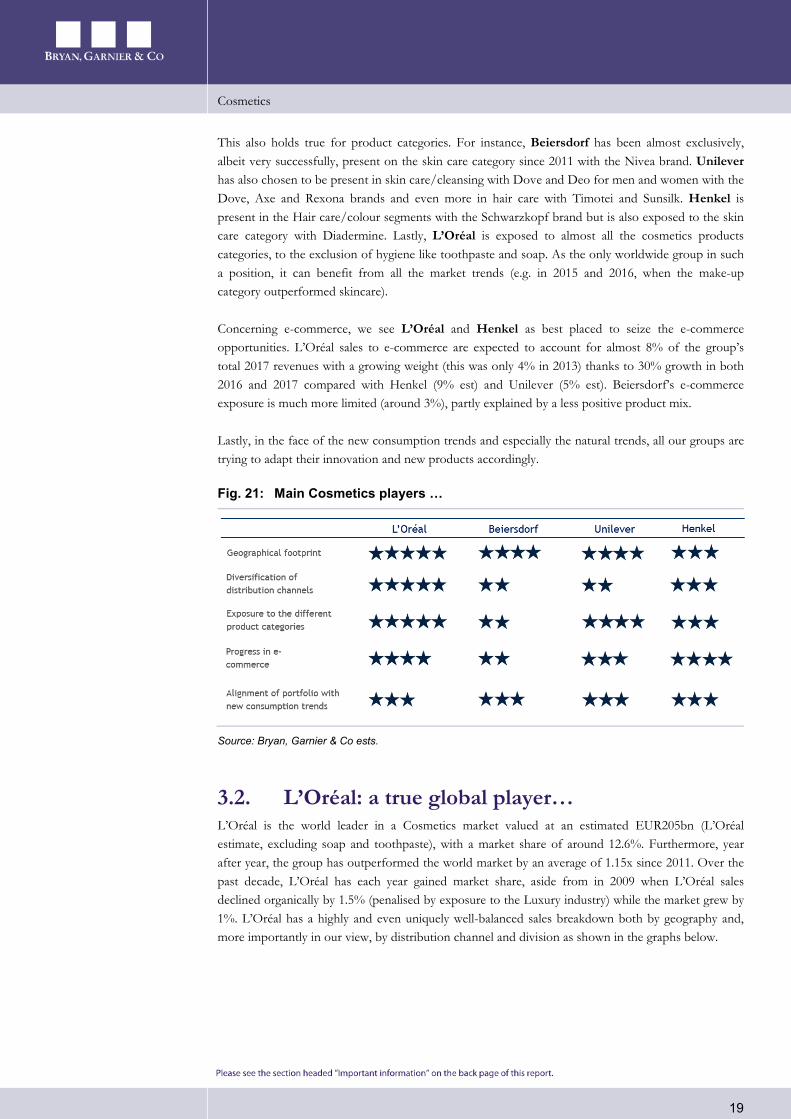
In the table below, we evaluate the four groups under our coverage based on different criteria: i/ geographical footprint, ii/ diversification of distribution channels, iii/ exposure to product categories, iv/ progress on e-commerce and v/ adaption to innovation/new trends of consumption.
While it can be argued that all four groups have a very well-balanced sales breakdown by geographical area with emerging markets accounting for around 40% of their respective sales (rising to 60% for Unilever Personal care), albeit relatively weak exposure to North America for Beiersdorf (only 7% of sales), this is no longer valid based on distribution channels. L’Oréal is currently the only company to be involved in all channels whereas Beiersdorf is virtually solely exposed to the mass market (Nivea), Henkel to the mass market (Schwarzkopf and Diadermine) and increasingly to hair salons while Unilever is also massively exposed to the mass market (Dove, Sunsilk, Rexona, Axe…).
Cosmetics
19
This also holds true for product categories. For instance, Beiersdorf has been almost exclusively, albeit very successfully, present on the skin care category since 2011 with the Nivea brand. Unilever has also chosen to be present in skin care/cleansing with Dove and Deo for men and women with the Dove, Axe and Rexona brands and even more in hair care with Timotei and Sunsilk. Henkel is present in the Hair care/colour segments with the Schwarzkopf brand but is also exposed to the skin care category with Diadermine. Lastly, L’Oréal is exposed to almost all the cosmetics products categories, to the exclusion of hygiene like toothpaste and soap. As the only worldwide group in such a position, it can benefit from all the market trends (e.g. in 2015 and 2016, when the make-up category outperformed skincare).
Concerning e-commerce, we see L’Oréal and Henkel as best placed to seize the e-commerce opportunities. L’Oréal sales to e-commerce are expected to account for almost 8% of the group’s total 2017 revenues with a growing weight (this was only 4% in 2013) thanks to 30% growth in both 2016 and 2017 compared with Henkel (9% est) and Unilever (5% est). Beiersdorf’s e-commerce exposure is much more limited (around 3%), partly explained by a less positive product mix.
Lastly, in the face of the new consumption trends and especially the natural trends, all our groups are trying to adapt their innovation and new products accordingly.
Fig. 21: Main Cosmetics players …
Source: Bryan, Garnier & Co ests.
3.2. L’Oréal: a true global player… L’Oréal is the world leader in a Cosmetics market valued at an estimated EUR205bn (L’Oréal estimate, excluding soap and toothpaste), with a market share of around 12.6%. Furthermore, year after year, the group has outperformed the world market by an average of 1.15x since 2011. Over the past decade, L’Oréal has each year gained market share, aside from in 2009 when L’Oréal sales declined organically by 1.5% (penalised by exposure to the Luxury industry) while the market grew by 1%. L’Oréal has a highly and even uniquely well-balanced sales breakdown both by geography and, more importantly in our view, by distribution channel and division as shown in the graphs below.
Cosmetics
20
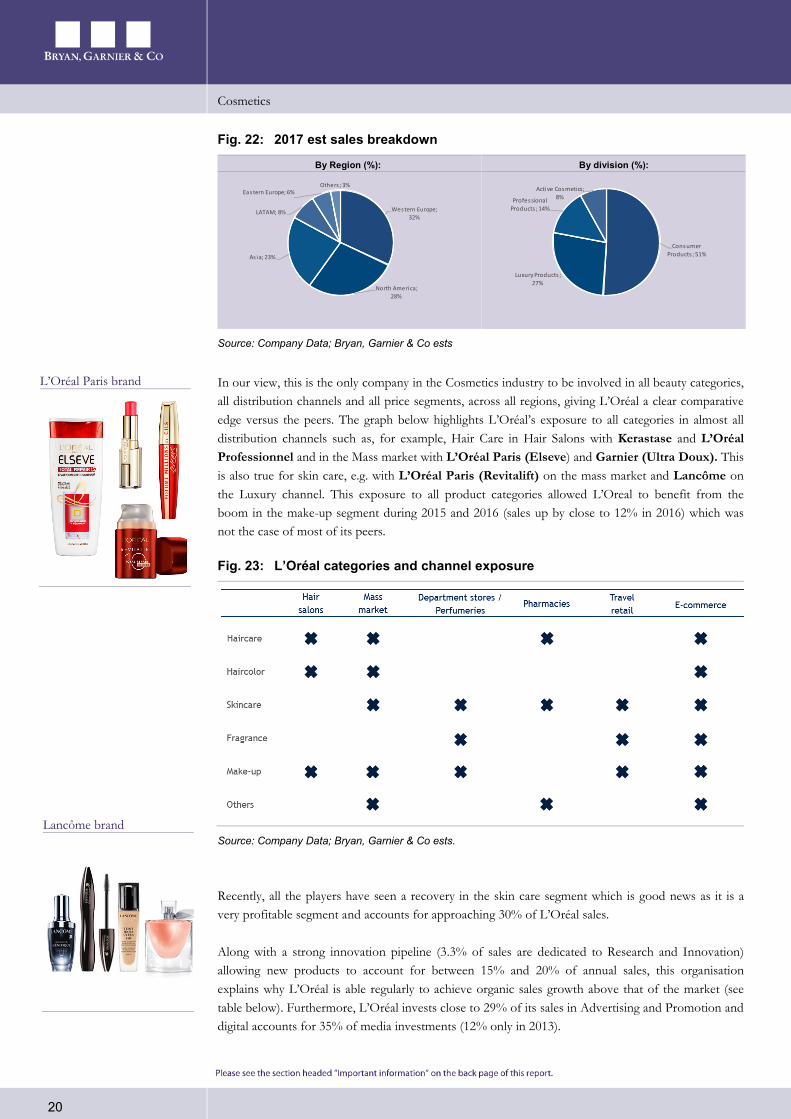
Fig. 22: 2017 est sales breakdown
By Region (%): By division (%):
Western Europe; 32%
North America; 28%
As ia; 23%
LATAM; 8%
Eastern Europe; 6%Others ; 3%
Consumer Products ; 51%
Luxury Products ; 27%
Professional Products ; 14%
Active Cosmetics; 8%
Source: Company Data; Bryan, Garnier & Co ests
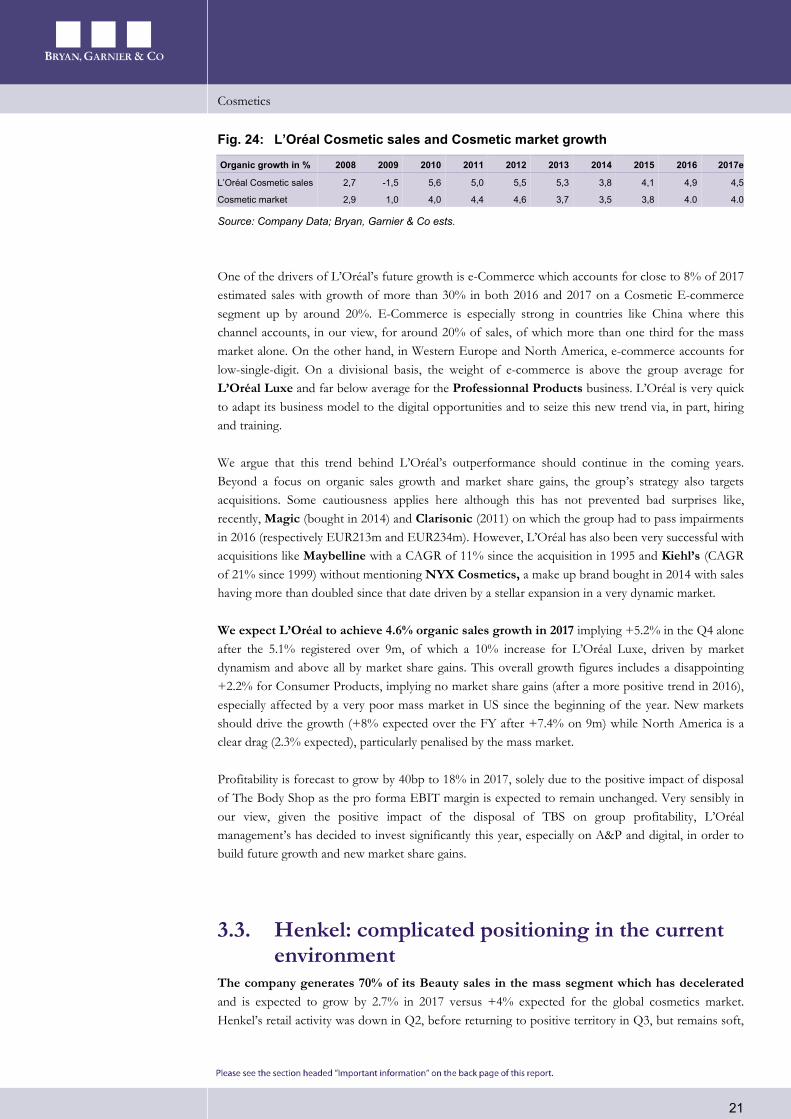
In our view, this is the only company in the Cosmetics industry to be involved in all beauty categories, all distribution channels and all price segments, across all regions, giving L’Oréal a clear comparative edge versus the peers. The graph below highlights L’Oréal’s exposure to all categories in almost all distribution channels such as, for example, Hair Care in Hair Salons with Kerastase and L’Oréal Professionnel and in the Mass market with L’Oréal Paris (Elseve) and Garnier (Ultra Doux). This is also true for skin care, e.g. with L’Oréal Paris (Revitalift) on the mass market and Lancôme on the Luxury channel. This exposure to all product categories allowed L’Oreal to benefit from the boom in the make-up segment during 2015 and 2016 (sales up by close to 12% in 2016) which was not the case of most of its peers.
Fig. 23: L’Oréal categories and channel exposure
Source: Company Data; Bryan, Garnier & Co ests.
Recently, all the players have seen a recovery in the skin care segment which is good news as it is a very profitable segment and accounts for approaching 30% of L’Oréal sales.
Along with a strong innovation pipeline (3.3% of sales are dedicated to Research and Innovation) allowing new products to account for between 15% and 20% of annual sales, this organisation explains why L’Oréal is able regularly to achieve organic sales growth above that of the market (see table below). Furthermore, L’Oréal invests close to 29% of its sales in Advertising and Promotion and digital accounts for 35% of media investments (12% only in 2013).
L’Oréal Paris brand
Lancôme brand
Cosmetics
21
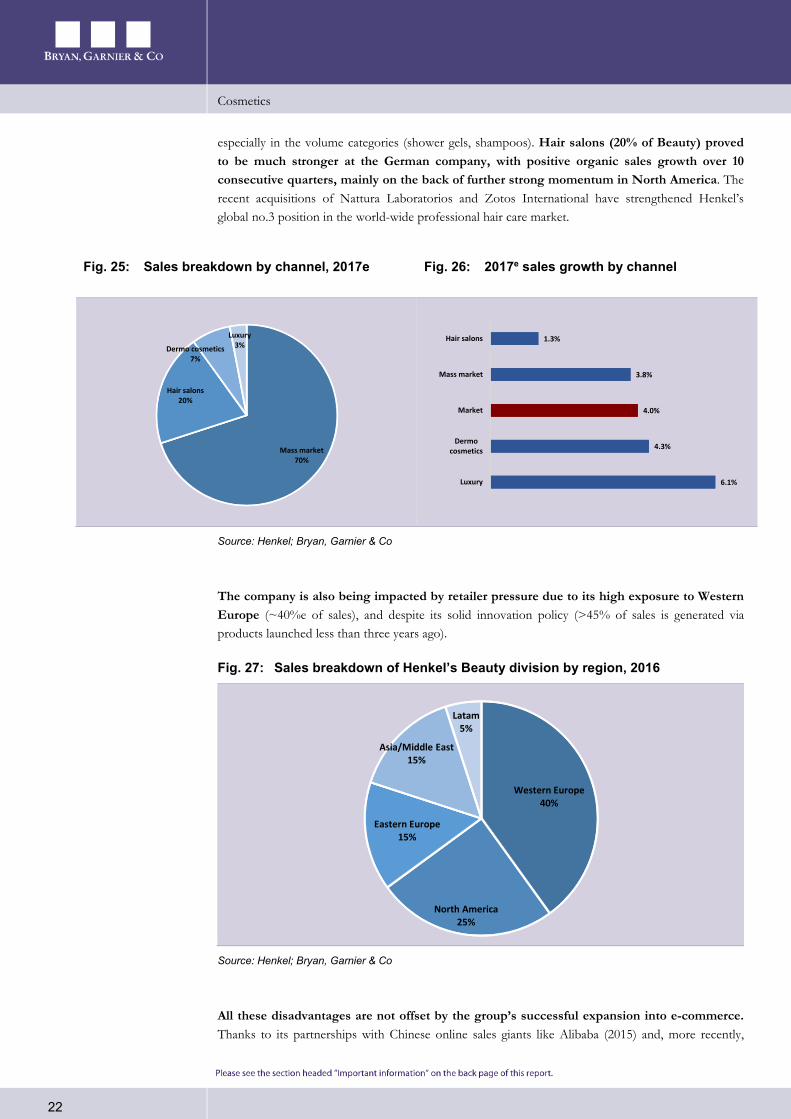
Fig. 24: L’Oréal Cosmetic sales and Cosmetic market growth
Organic growth in % 2008 2009 2010 2011 2012 2013 2014 2015 2016 2017e
L’Oréal Cosmetic sales 2,7 -1,5 5,6 5,0 5,5 5,3 3,8 4,1 4,9 4,5
Cosmetic market 2,9 1,0 4,0 4,4 4,6 3,7 3,5 3,8 4.0 4.0
Source: Company Data; Bryan, Garnier & Co ests.
One of the drivers of L’Oréal’s future growth is e-Commerce which accounts for close to 8% of 2017 estimated sales with growth of more than 30% in both 2016 and 2017 on a Cosmetic E-commerce segment up by around 20%. E-Commerce is especially strong in countries like China where this channel accounts, in our view, for around 20% of sales, of which more than one third for the mass market alone. On the other hand, in Western Europe and North America, e-commerce accounts for low-single-digit. On a divisional basis, the weight of e-commerce is above the group average for L’Oréal Luxe and far below average for the Professionnal Products business. L’Oréal is very quick to adapt its business model to the digital opportunities and to seize this new trend via, in part, hiring and training.
We argue that this trend behind L’Oréal’s outperformance should continue in the coming years. Beyond a focus on organic sales growth and market share gains, the group’s strategy also targets acquisitions. Some cautiousness applies here although this has not prevented bad surprises like, recently, Magic (bought in 2014) and Clarisonic (2011) on which the group had to pass impairments in 2016 (respectively EUR213m and EUR234m). However, L’Oréal has also been very successful with acquisitions like Maybelline with a CAGR of 11% since the acquisition in 1995 and Kiehl’s (CAGR of 21% since 1999) without mentioning NYX Cosmetics, a make up brand bought in 2014 with sales having more than doubled since that date driven by a stellar expansion in a very dynamic market.
We expect L’Oréal to achieve 4.6% organic sales growth in 2017 implying +5.2% in the Q4 alone after the 5.1% registered over 9m, of which a 10% increase for L’Oréal Luxe, driven by market dynamism and above all by market share gains. This overall growth figures includes a disappointing +2.2% for Consumer Products, implying no market share gains (after a more positive trend in 2016), especially affected by a very poor mass market in US since the beginning of the year. New markets should drive the growth (+8% expected over the FY after +7.4% on 9m) while North America is a clear drag (2.3% expected), particularly penalised by the mass market.
Profitability is forecast to grow by 40bp to 18% in 2017, solely due to the positive impact of disposal of The Body Shop as the pro forma EBIT margin is expected to remain unchanged. Very sensibly in our view, given the positive impact of the disposal of TBS on group profitability, L’Oréal management’s has decided to invest significantly this year, especially on A&P and digital, in order to build future growth and new market share gains.
3.3. Henkel: complicated positioning in the current environment
The company generates 70% of its Beauty sales in the mass segment which has decelerated and is expected to grow by 2.7% in 2017 versus +4% expected for the global cosmetics market. Henkel’s retail activity was down in Q2, before returning to positive territory in Q3, but remains soft,
Cosmetics
22
especially in the volume categories (shower gels, shampoos). Hair salons (20% of Beauty) proved to be much stronger at the German company, with positive organic sales growth over 10 consecutive quarters, mainly on the back of further strong momentum in North America. The recent acquisitions of Nattura Laboratorios and Zotos International have strengthened Henkel’s global no.3 position in the world-wide professional hair care market.
Fig. 25: Sales breakdown by channel, 2017e Fig. 26: 2017e sales growth by channel
Mass market70%
Hair salons20%
Dermo cosmetics7%
Luxury3%
6.1%
4.3%
4.0%
3.8%
1.3%
Luxury
Dermocosmetics
Market
Mass market
Hair salons
Source: Henkel; Bryan, Garnier & Co
The company is also being impacted by retailer pressure due to its high exposure to Western Europe (~40%e of sales), and despite its solid innovation policy (>45% of sales is generated via products launched less than three years ago).
Fig. 27: Sales breakdown of Henkel’s Beauty division by region, 2016
Western Europe40%
North America25%
Eastern Europe15%
Asia/Middle East15%
Latam5%
Source: Henkel; Bryan, Garnier & Co
All these disadvantages are not offset by the group’s successful expansion into e-commerce. Thanks to its partnerships with Chinese online sales giants like Alibaba (2015) and, more recently,
Cosmetics
23
JD.com., Henkel now generates 50% of its beauty sales in China through e-commerce (whereas L’Oréal only derives 33% of its mass market cosmetics sales online) and is the leader in online sales of hair care products in China.
The trend in Beauty has deteriorated in recent quarters with Q3 organic growth at +0.5%, vs. +1.1% in H1 and +2.1% over full-year 2016. In 2017, organic sales growth in the Beauty division is only expected to amount to 0.9%. Henkel has revised downwards its organic sales growth guidance for the division from 2-4% to 0-1%. We expect a gradual improvement as early as next year with organic growth of 2.0%. The roll-out of the Schwarzkopf and Gliss brands in North America should pay off, especially in the professional circuit. The potential of Gliss, introduced at the start of 2017, is increasing now that the brand has reached a distribution rate of 60% in the US. The abrupt change of direction within the division since 1 November seems to confirm that addressing Beauty Care weakness will now be a priority in the group's strategy.
Fig. 28: Beauty quarterly sales performance Fig. 29: BG growth estimates in the Beauty Care division
3.0%
2.1%
0.8%
1.7%
2.1%1.9%
2.1%2.4%
2.6%
2.1%2.6%
1.1%
2.3%
0.0%
0.5%
-1%
0%
1%
2%
3%
Q1-14 Q2-14 Q3-14 Q4-14 Q1-15 Q2-15 Q3-15 Q4-15 Q1-16 Q2-16 Q3-16 Q4-16 Q1-17 Q2-17 Q3-17
Price effect Volume effect Organic sales growth
3.1%3.0%
2.0% 2.1% 2.1%
0.9%
2.0%
2.5%
0%
1%
2%
3%
2012 2013 2014 2015 2016 2017e 2018e 2019e
Price effect Volume effect Organic sales growth
Source: Company Data; Bryan, Garnier & Co ests.
Henkel has huge firepower. Taking the highest net debt/EBITDA ratio shouldered by the group over the past 10 years as a ceiling (2.9x in 2008), we estimate that Henkel could invest around EUR13bn in a sizeable acquisition as of 2018 and EUR16bn as of 2019. In our view, the group is more likely to make a big acquisition in its beauty division, probably in hair care. This choice would be consistent with its aim of focusing on segments where it is already strong in order to maximise the yield on cash already invested whereas entering a segment such as make-up or perfumes would require huge investment to reach a vital critical mass.
3.4. Unilever: squeezed between local competition in emerging and price competition in developed markets
Personal care is Unilever’s number one division, representing 38% of sales and 48% of EBIT. The group is mainly exposed to the mass segment which has been the most impacted by the
Cosmetics
24
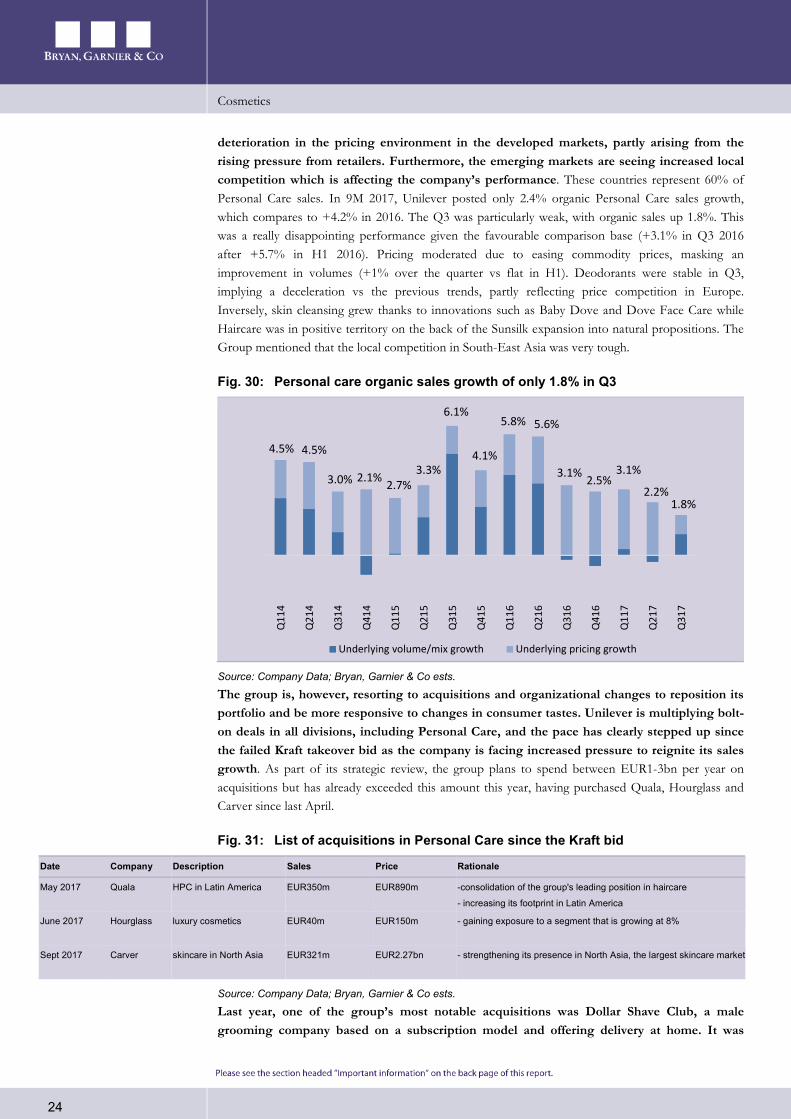
deterioration in the pricing environment in the developed markets, partly arising from the rising pressure from retailers. Furthermore, the emerging markets are seeing increased local competition which is affecting the company’s performance. These countries represent 60% of Personal Care sales. In 9M 2017, Unilever posted only 2.4% organic Personal Care sales growth, which compares to +4.2% in 2016. The Q3 was particularly weak, with organic sales up 1.8%. This was a really disappointing performance given the favourable comparison base (+3.1% in Q3 2016 after +5.7% in H1 2016). Pricing moderated due to easing commodity prices, masking an improvement in volumes (+1% over the quarter vs flat in H1). Deodorants were stable in Q3, implying a deceleration vs the previous trends, partly reflecting price competition in Europe. Inversely, skin cleansing grew thanks to innovations such as Baby Dove and Dove Face Care while Haircare was in positive territory on the back of the Sunsilk expansion into natural propositions. The Group mentioned that the local competition in South-East Asia was very tough.
Fig. 30: Personal care organic sales growth of only 1.8% in Q3
Q11
4
Q21
4
Q31
4
Q41
4
Q11
5
Q21
5
Q31
5
Q41
5
Q11
6
Q21
6
Q31
6
Q41
6
Q11
7
Q21
7
Q31
7
Underlying volume/mix growth Underlying pricing growth
4.5% 4.5%
3.0% 2.1% 2.7%3.3%
6.1%
4.1%
5.8% 5.6%
3.1% 2.5%3.1%
2.2%1.8%
Source: Company Data; Bryan, Garnier & Co ests.
The group is, however, resorting to acquisitions and organizational changes to reposition its portfolio and be more responsive to changes in consumer tastes. Unilever is multiplying bolt-on deals in all divisions, including Personal Care, and the pace has clearly stepped up since the failed Kraft takeover bid as the company is facing increased pressure to reignite its sales growth. As part of its strategic review, the group plans to spend between EUR1-3bn per year on acquisitions but has already exceeded this amount this year, having purchased Quala, Hourglass and Carver since last April.
Fig. 31: List of acquisitions in Personal Care since the Kraft bid
Date Company Description Sales Price Rationale
May 2017 Quala HPC in Latin America EUR350m EUR890m -consolidation of the group's leading position in haircare
- increasing its footprint in Latin America
June 2017 Hourglass luxury cosmetics EUR40m EUR150m - gaining exposure to a segment that is growing at 8%
Sept 2017 Carver skincare in North Asia EUR321m EUR2.27bn - strengthening its presence in North Asia, the largest skincare market
Source: Company Data; Bryan, Garnier & Co ests.
Last year, one of the group’s most notable acquisitions was Dollar Shave Club, a male grooming company based on a subscription model and offering delivery at home. It was
Cosmetics
25
illustrative of the e-commerce boom. This business grew by 50% in 2016 and was reported to be up double-digits in 9M 2017, driven by a further expansion in the subscriber base.
During its Q3 sales release, the group said that all the acquisitions carried out over the 2015-2017 period in all divisions, coupled with the disposal of spreads, should add 100bps to organic sales growth from mid-2019. More acquisitions are coming and we see prestige representing particular interest for Unilever. Currently this segment represents only EUR500m (2% of total Personal care sales) and includes the acquired businesses Kate Somerville, Murad, Living Proof, Dermalogica, REN and Hourglass but the group is looking to increase this figure to EUR1bn. The most attractive categories are skincare and haircare because there are a lot of synergies with the rest of the portfolio. In 2016 Unilever prestige brands all outperformed the market with Murad and Dermalogica seeing double-digit growth and Kate Somerville growing by high-single-digits.
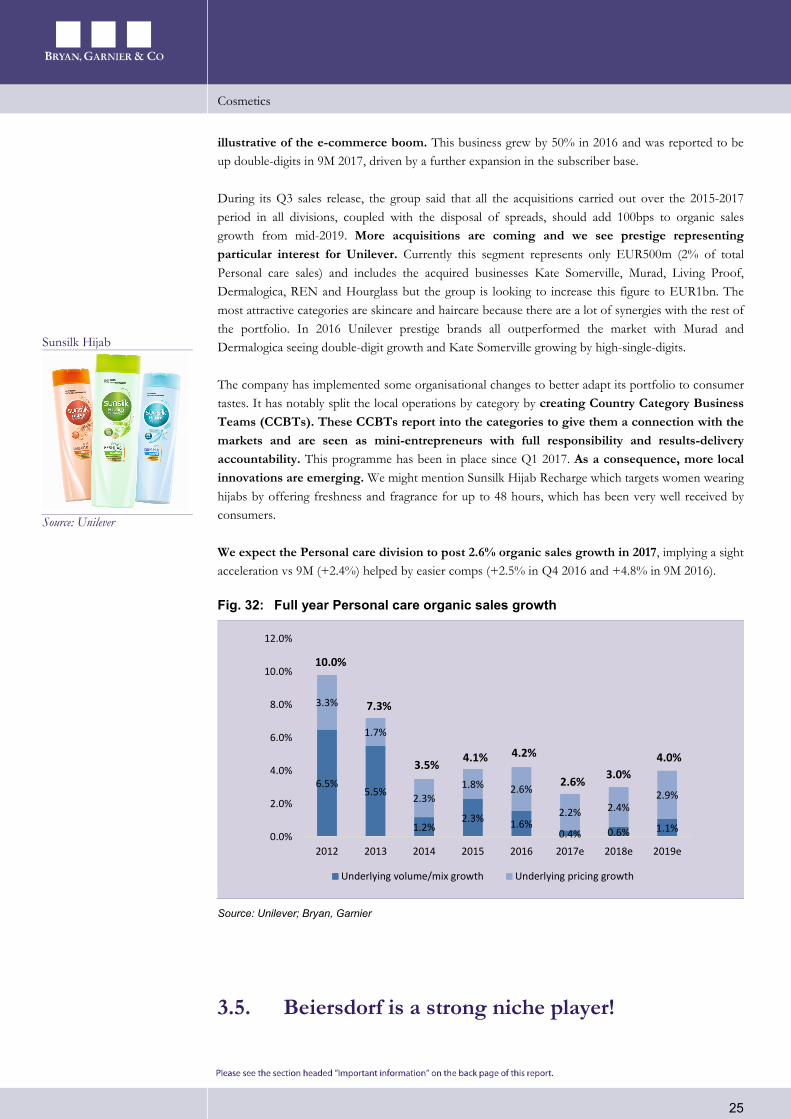
The company has implemented some organisational changes to better adapt its portfolio to consumer tastes. It has notably split the local operations by category by creating Country Category Business Teams (CCBTs). These CCBTs report into the categories to give them a connection with the markets and are seen as mini-entrepreneurs with full responsibility and results-delivery accountability. This programme has been in place since Q1 2017. As a consequence, more local innovations are emerging. We might mention Sunsilk Hijab Recharge which targets women wearing hijabs by offering freshness and fragrance for up to 48 hours, which has been very well received by consumers.
We expect the Personal care division to post 2.6% organic sales growth in 2017, implying a sight acceleration vs 9M (+2.4%) helped by easier comps (+2.5% in Q4 2016 and +4.8% in 9M 2016).
Fig. 32: Full year Personal care organic sales growth
6.5%5.5%
1.2%2.3% 1.6%
0.4% 0.6% 1.1%
3.3%
1.7%
2.3%1.8% 2.6%
2.2% 2.4%2.9%
0.0%
2.0%
4.0%
6.0%
8.0%
10.0%
12.0%
2012 2013 2014 2015 2016 2017e 2018e 2019e
Underlying volume/mix growth Underlying pricing growth
2.6% 3.0%4.0%4.2%4.1%3.5%
7.3%
10.0%
Source: Unilever; Bryan, Garnier
3.5. Beiersdorf is a strong niche player!
Sunsilk Hijab
Source: Unilever
Cosmetics
26
The German Group, which is 51% controlled by the Hertz family via the Maxingvest holding, operates in two markets, Cosmetics industry and Adhesives. The Consumer business, which regroups all the Cosmetics brands including Nivea, Eucerin and La Prairie, accounts for 82% of the group’s sales while the Adhesive business, with the Tesa brand, contributes 18% of total sales. Tesa is slightly more profitable than the Consumer division with, in 2016, respective EBIT margins of 14.8% and 15.2%. Nevertheless, we expect the gap to increase in 2017 given what has already been achieved in H1 and very dynamic Tesa top-line growth over the first 9 months.
Fig. 33: Beiersdorf sales breakdown
By division (%): By region (%):
Consumer; 82%
Tesa; 18%
Europe: 51%
AAA: 31%
Americas: 18%
Source: Company Data; Bryan, Garnier & Co ests.
The Group plans to become a strong player on pretty-much only one segment of the Cosmetics market, namely the skin care category sold only via the mass market channel with only one strong brand, Nivea! This decision was taken in 2010 by the former CEO, Thomas-B Quaas. Since his appointment in 2012, the current CEO, Stefan F. Heidenreich, has deployed the so-called Blue Agenda strategy.
Fig. 34: Group’s strategy
Source: Company Data; Bryan, Garnier & Co ests.
The group’s strategy is based on organic growth with the aim of becoming the number one skin care company in the relevant categories (e.g. body care) and markets. The CEO is looking to reach this
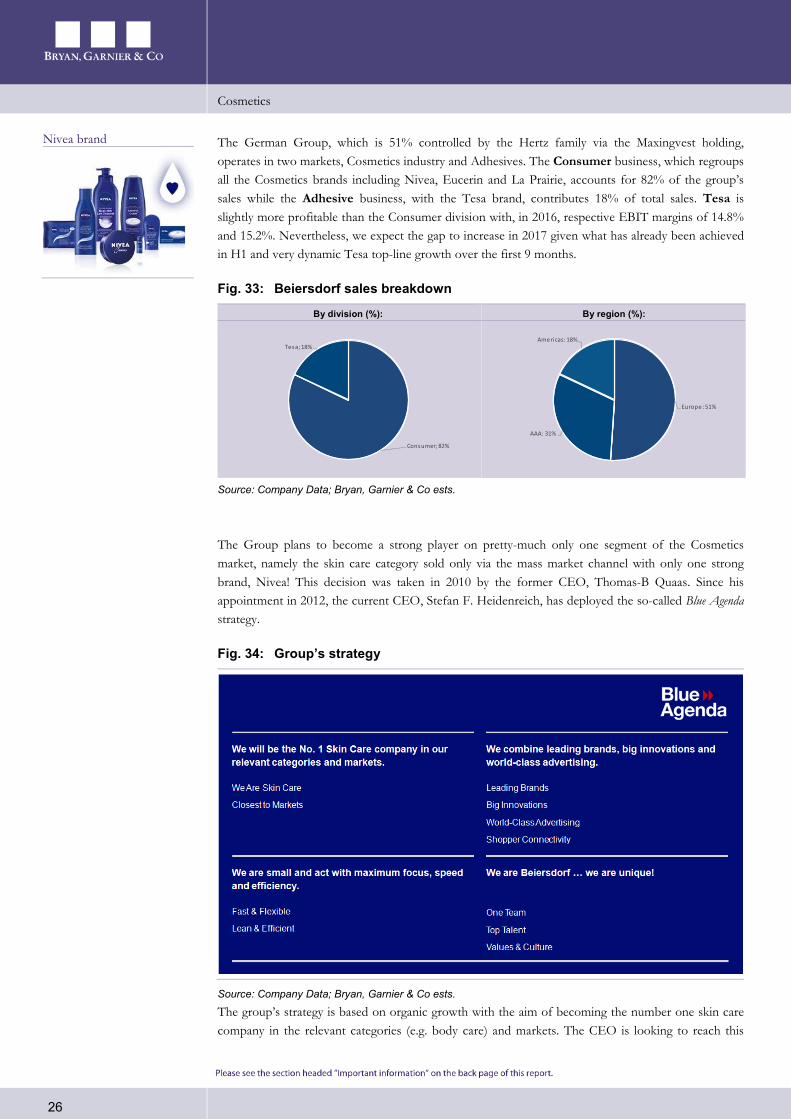
Nivea brand
Cosmetics
27
target thanks to flexibility and top-class execution. While digital is a clear priority in terms of getting closer to consumers, e-commerce accounts for around 3% of group sales, far behind the level for L’Oréal and Henkel (respectively c. 8% and 9%). Note that, for the L’Oréal and Beiersdorf CEOs, the ultimate target is to gain market share on their respective markets and it must be said that, given the weak skin care market growth, Beiersdorf is achieving this objective. The latter’s CEO recently said that, in his view, the market in which the group is present is growing by no more than 2%.
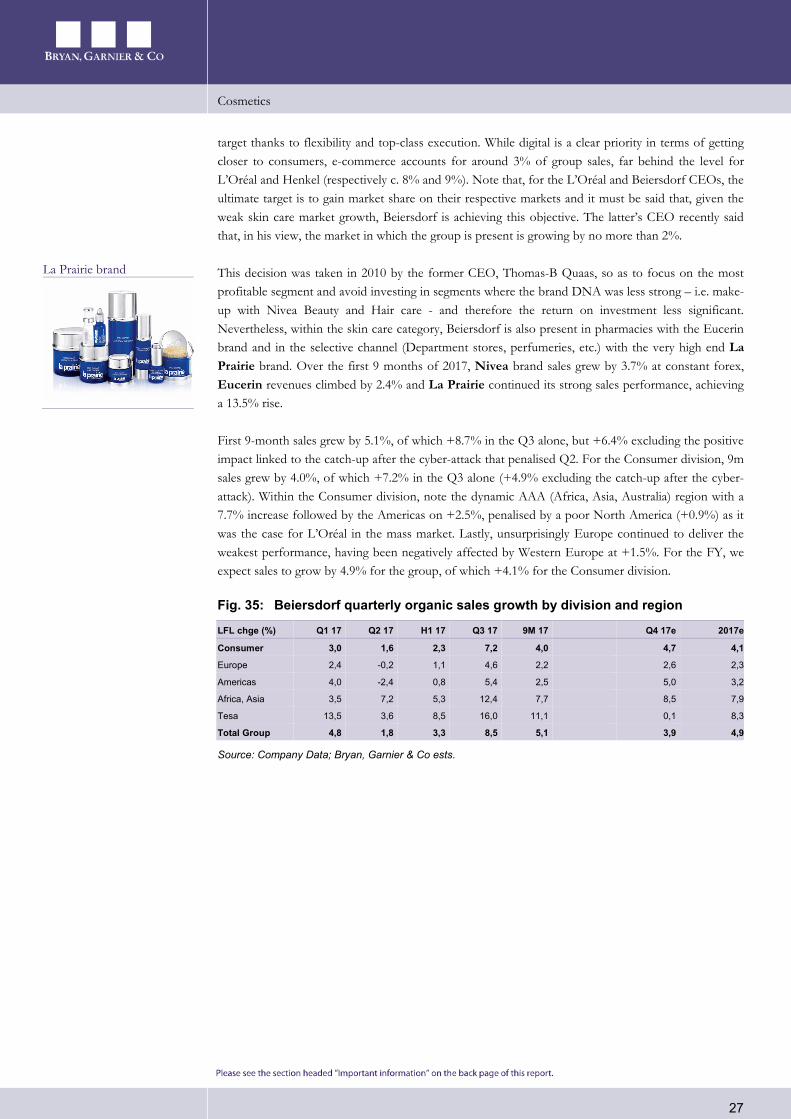
This decision was taken in 2010 by the former CEO, Thomas-B Quaas, so as to focus on the most profitable segment and avoid investing in segments where the brand DNA was less strong – i.e. make-up with Nivea Beauty and Hair care - and therefore the return on investment less significant. Nevertheless, within the skin care category, Beiersdorf is also present in pharmacies with the Eucerin brand and in the selective channel (Department stores, perfumeries, etc.) with the very high end La Prairie brand. Over the first 9 months of 2017, Nivea brand sales grew by 3.7% at constant forex, Eucerin revenues climbed by 2.4% and La Prairie continued its strong sales performance, achieving a 13.5% rise.
First 9-month sales grew by 5.1%, of which +8.7% in the Q3 alone, but +6.4% excluding the positive impact linked to the catch-up after the cyber-attack that penalised Q2. For the Consumer division, 9m sales grew by 4.0%, of which +7.2% in the Q3 alone (+4.9% excluding the catch-up after the cyber-attack). Within the Consumer division, note the dynamic AAA (Africa, Asia, Australia) region with a 7.7% increase followed by the Americas on +2.5%, penalised by a poor North America (+0.9%) as it was the case for L’Oréal in the mass market. Lastly, unsurprisingly Europe continued to deliver the weakest performance, having been negatively affected by Western Europe at +1.5%. For the FY, we expect sales to grow by 4.9% for the group, of which +4.1% for the Consumer division.
Fig. 35: Beiersdorf quarterly organic sales growth by division and region
LFL chge (%) Q1 17 Q2 17 H1 17 Q3 17 9M 17 Q4 17e 2017e
Consumer 3,0 1,6 2,3 7,2 4,0 4,7 4,1
Europe 2,4 -0,2 1,1 4,6 2,2 2,6 2,3
Americas 4,0 -2,4 0,8 5,4 2,5 5,0 3,2
Africa, Asia 3,5 7,2 5,3 12,4 7,7 8,5 7,9
Tesa 13,5 3,6 8,5 16,0 11,1 0,1 8,3
Total Group 4,8 1,8 3,3 8,5 5,1 3,9 4,9
Source: Company Data; Bryan, Garnier & Co ests.
La Prairie brand
Cosmetics
28
4. Valuation Amongst our coverage, we see L’Oréal (Buy-FV: EUR206) as the group best placed to benefit from the growing Cosmetics market thanks to its i/ portfolio of more than 30 brands, ii/ agile business model and iii/ existing position on the e-commerce market. We also argue that Henkel (Buy-FV: EUR139), given its i/ growing adhesive business, ii/ “margin story” and iii/ healthy balance sheet, also represents an attractive investment case
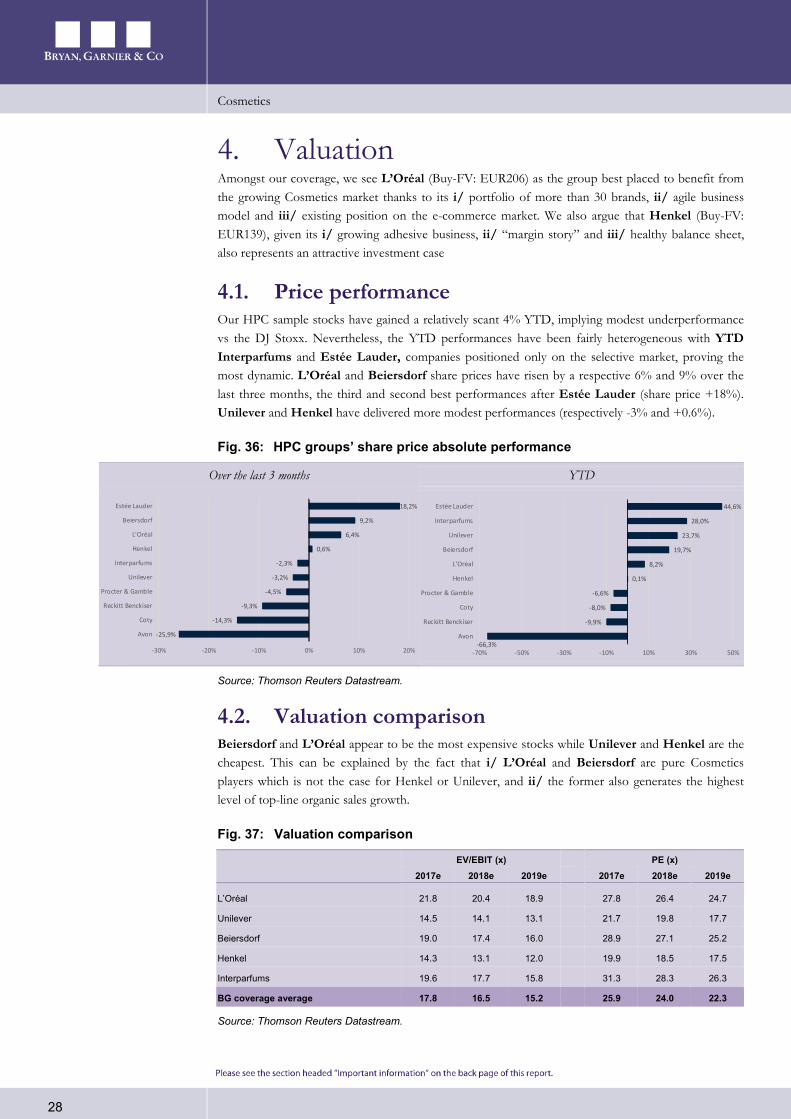
4.1. Price performance Our HPC sample stocks have gained a relatively scant 4% YTD, implying modest underperformance vs the DJ Stoxx. Nevertheless, the YTD performances have been fairly heterogeneous with YTD Interparfums and Estée Lauder, companies positioned only on the selective market, proving the most dynamic. L’Oréal and Beiersdorf share prices have risen by a respective 6% and 9% over the last three months, the third and second best performances after Estée Lauder (share price +18%). Unilever and Henkel have delivered more modest performances (respectively -3% and +0.6%).
Fig. 36: HPC groups’ share price absolute performance
Over the last 3 months YTD
-25,9%
-14,3%
-9,3%
-4,5%
-3,2%
-2,3%
0,6%
6,4%
9,2%
18,2%
-30% -20% -10% 0% 10% 20%
Avon
Coty
Reckitt Benckiser
Procter & Gamble
Unilever
Interparfums
Henkel
L'Oréal
Beiersdorf
Estée Lauder
-66,3%
-9,9%
-8,0%
-6,6%
0,1%
8,2%
19,7%
23,7%
28,0%
44,6%
-70% -50% -30% -10% 10% 30% 50%
Avon
Reckitt Benckiser
Coty
Procter & Gamble
Henkel
L'Oréal
Beiersdorf
Unilever
Interparfums
Estée Lauder
Source: Thomson Reuters Datastream.
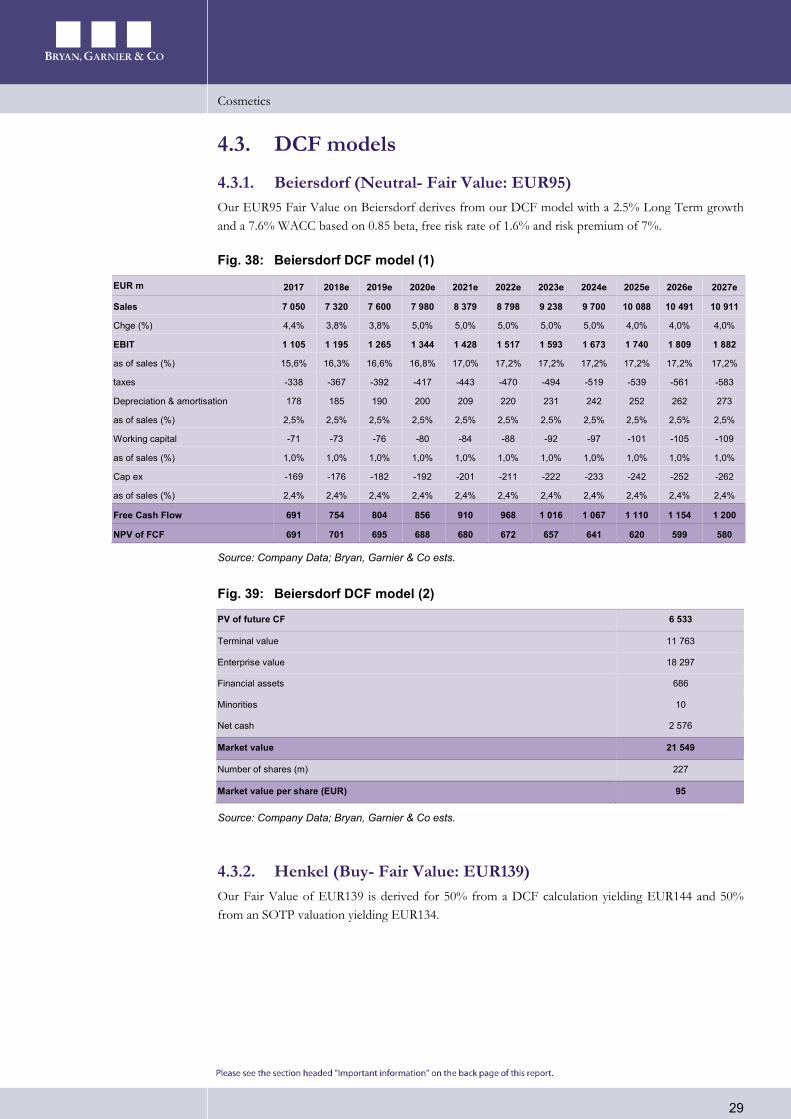
4.2. Valuation comparison Beiersdorf and L’Oréal appear to be the most expensive stocks while Unilever and Henkel are the cheapest. This can be explained by the fact that i/ L’Oréal and Beiersdorf are pure Cosmetics players which is not the case for Henkel or Unilever, and ii/ the former also generates the highest level of top-line organic sales growth.
Fig. 37: Valuation comparison
EV/EBIT (x) PE (x) 2017e 2018e 2019e 2017e 2018e 2019e
L’Oréal 21.8 20.4 18.9 27.8 26.4 24.7
Unilever 14.5 14.1 13.1 21.7 19.8 17.7
Beiersdorf 19.0 17.4 16.0 28.9 27.1 25.2
Henkel 14.3 13.1 12.0 19.9 18.5 17.5
Interparfums 19.6 17.7 15.8 31.3 28.3 26.3
BG coverage average 17.8 16.5 15.2 25.9 24.0 22.3
Source: Thomson Reuters Datastream.
Cosmetics
29
4.3. DCF models
4.3.1. Beiersdorf (Neutral- Fair Value: EUR95) Our EUR95 Fair Value on Beiersdorf derives from our DCF model with a 2.5% Long Term growth and a 7.6% WACC based on 0.85 beta, free risk rate of 1.6% and risk premium of 7%.
Fig. 38: Beiersdorf DCF model (1)
EUR m 2017 2018e 2019e 2020e 2021e 2022e 2023e 2024e 2025e 2026e 2027e
Sales 7 050 7 320 7 600 7 980 8 379 8 798 9 238 9 700 10 088 10 491 10 911
Chge (%) 4,4% 3,8% 3,8% 5,0% 5,0% 5,0% 5,0% 5,0% 4,0% 4,0% 4,0%
EBIT 1 105 1 195 1 265 1 344 1 428 1 517 1 593 1 673 1 740 1 809 1 882
as of sales (%) 15,6% 16,3% 16,6% 16,8% 17,0% 17,2% 17,2% 17,2% 17,2% 17,2% 17,2%
taxes -338 -367 -392 -417 -443 -470 -494 -519 -539 -561 -583
Depreciation & amortisation 178 185 190 200 209 220 231 242 252 262 273
as of sales (%) 2,5% 2,5% 2,5% 2,5% 2,5% 2,5% 2,5% 2,5% 2,5% 2,5% 2,5%
Working capital -71 -73 -76 -80 -84 -88 -92 -97 -101 -105 -109
as of sales (%) 1,0% 1,0% 1,0% 1,0% 1,0% 1,0% 1,0% 1,0% 1,0% 1,0% 1,0%
Cap ex -169 -176 -182 -192 -201 -211 -222 -233 -242 -252 -262
as of sales (%) 2,4% 2,4% 2,4% 2,4% 2,4% 2,4% 2,4% 2,4% 2,4% 2,4% 2,4%
Free Cash Flow 691 754 804 856 910 968 1 016 1 067 1 110 1 154 1 200
NPV of FCF 691 701 695 688 680 672 657 641 620 599 580
Source: Company Data; Bryan, Garnier & Co ests.
Fig. 39: Beiersdorf DCF model (2)
PV of future CF 6 533
Terminal value 11 763
Enterprise value 18 297
Financial assets 686
Minorities 10
Net cash 2 576
Market value 21 549
Number of shares (m) 227
Market value per share (EUR) 95
Source: Company Data; Bryan, Garnier & Co ests.
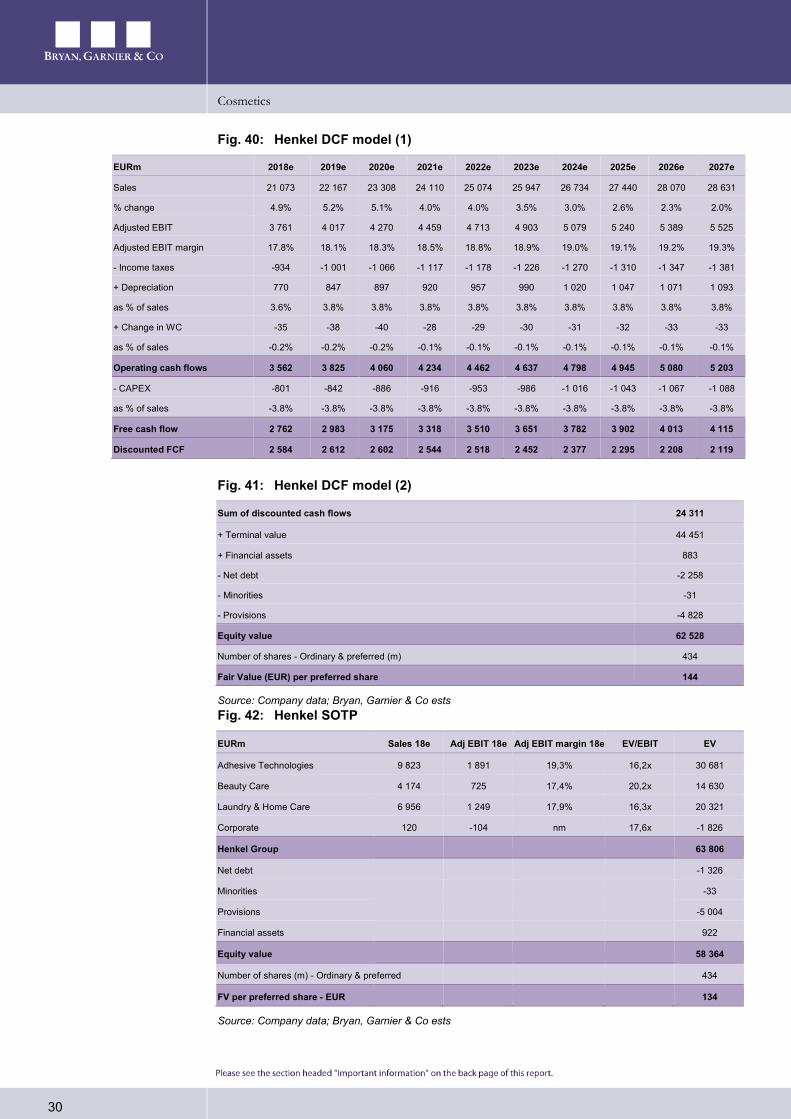
4.3.2. Henkel (Buy- Fair Value: EUR139) Our Fair Value of EUR139 is derived for 50% from a DCF calculation yielding EUR144 and 50% from an SOTP valuation yielding EUR134.
Cosmetics
30
Fig. 40: Henkel DCF model (1)
EURm 2018e 2019e 2020e 2021e 2022e 2023e 2024e 2025e 2026e 2027e
Sales 21 073 22 167 23 308 24 110 25 074 25 947 26 734 27 440 28 070 28 631
% change 4.9% 5.2% 5.1% 4.0% 4.0% 3.5% 3.0% 2.6% 2.3% 2.0%
Adjusted EBIT 3 761 4 017 4 270 4 459 4 713 4 903 5 079 5 240 5 389 5 525
Adjusted EBIT margin 17.8% 18.1% 18.3% 18.5% 18.8% 18.9% 19.0% 19.1% 19.2% 19.3%
- Income taxes -934 -1 001 -1 066 -1 117 -1 178 -1 226 -1 270 -1 310 -1 347 -1 381
+ Depreciation 770 847 897 920 957 990 1 020 1 047 1 071 1 093
as % of sales 3.6% 3.8% 3.8% 3.8% 3.8% 3.8% 3.8% 3.8% 3.8% 3.8%
+ Change in WC -35 -38 -40 -28 -29 -30 -31 -32 -33 -33
as % of sales -0.2% -0.2% -0.2% -0.1% -0.1% -0.1% -0.1% -0.1% -0.1% -0.1%
Operating cash flows 3 562 3 825 4 060 4 234 4 462 4 637 4 798 4 945 5 080 5 203
- CAPEX -801 -842 -886 -916 -953 -986 -1 016 -1 043 -1 067 -1 088
as % of sales -3.8% -3.8% -3.8% -3.8% -3.8% -3.8% -3.8% -3.8% -3.8% -3.8%
Free cash flow 2 762 2 983 3 175 3 318 3 510 3 651 3 782 3 902 4 013 4 115
Discounted FCF 2 584 2 612 2 602 2 544 2 518 2 452 2 377 2 295 2 208 2 119
Fig. 41: Henkel DCF model (2)
Sum of discounted cash flows 24 311
+ Terminal value 44 451
+ Financial assets 883
- Net debt -2 258
- Minorities -31
- Provisions -4 828
Equity value 62 528
Number of shares - Ordinary & preferred (m) 434
Fair Value (EUR) per preferred share 144
Source: Company data; Bryan, Garnier & Co ests Fig. 42: Henkel SOTP
EURm Sales 18e Adj EBIT 18e Adj EBIT margin 18e EV/EBIT EV
Adhesive Technologies 9 823 1 891 19,3% 16,2x 30 681
Beauty Care 4 174 725 17,4% 20,2x 14 630
Laundry & Home Care 6 956 1 249 17,9% 16,3x 20 321
Corporate 120 -104 nm 17,6x -1 826
Henkel Group
63 806
Net debt
-1 326
Minorities
-33
Provisions
-5 004
Financial assets
922
Equity value
58 364
Number of shares (m) - Ordinary & preferred 434
FV per preferred share - EUR 134
Source: Company data; Bryan, Garnier & Co ests
Cosmetics
31
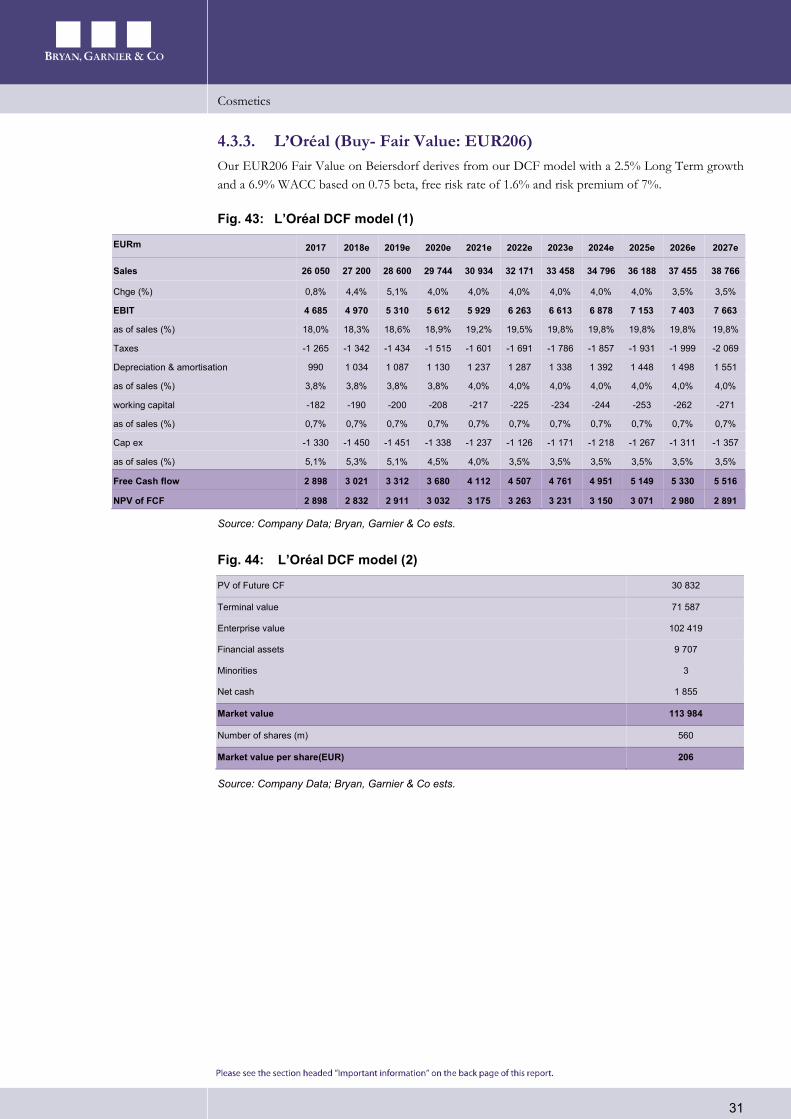
4.3.3. L’Oréal (Buy- Fair Value: EUR206) Our EUR206 Fair Value on Beiersdorf derives from our DCF model with a 2.5% Long Term growth and a 6.9% WACC based on 0.75 beta, free risk rate of 1.6% and risk premium of 7%.
Fig. 43: L’Oréal DCF model (1)
EURm 2017 2018e 2019e 2020e 2021e 2022e 2023e 2024e 2025e 2026e 2027e
Sales 26 050 27 200 28 600 29 744 30 934 32 171 33 458 34 796 36 188 37 455 38 766
Chge (%) 0,8% 4,4% 5,1% 4,0% 4,0% 4,0% 4,0% 4,0% 4,0% 3,5% 3,5%
EBIT 4 685 4 970 5 310 5 612 5 929 6 263 6 613 6 878 7 153 7 403 7 663
as of sales (%) 18,0% 18,3% 18,6% 18,9% 19,2% 19,5% 19,8% 19,8% 19,8% 19,8% 19,8%
Taxes -1 265 -1 342 -1 434 -1 515 -1 601 -1 691 -1 786 -1 857 -1 931 -1 999 -2 069
Depreciation & amortisation 990 1 034 1 087 1 130 1 237 1 287 1 338 1 392 1 448 1 498 1 551
as of sales (%) 3,8% 3,8% 3,8% 3,8% 4,0% 4,0% 4,0% 4,0% 4,0% 4,0% 4,0%
working capital -182 -190 -200 -208 -217 -225 -234 -244 -253 -262 -271
as of sales (%) 0,7% 0,7% 0,7% 0,7% 0,7% 0,7% 0,7% 0,7% 0,7% 0,7% 0,7%
Cap ex -1 330 -1 450 -1 451 -1 338 -1 237 -1 126 -1 171 -1 218 -1 267 -1 311 -1 357
as of sales (%) 5,1% 5,3% 5,1% 4,5% 4,0% 3,5% 3,5% 3,5% 3,5% 3,5% 3,5%
Free Cash flow 2 898 3 021 3 312 3 680 4 112 4 507 4 761 4 951 5 149 5 330 5 516
NPV of FCF 2 898 2 832 2 911 3 032 3 175 3 263 3 231 3 150 3 071 2 980 2 891
Source: Company Data; Bryan, Garnier & Co ests.
Fig. 44: L’Oréal DCF model (2)
PV of Future CF 30 832
Terminal value 71 587
Enterprise value 102 419
Financial assets 9 707
Minorities 3
Net cash 1 855
Market value 113 984
Number of shares (m) 560
Market value per share(EUR) 206
Source: Company Data; Bryan, Garnier & Co ests.
Cosmetics
32
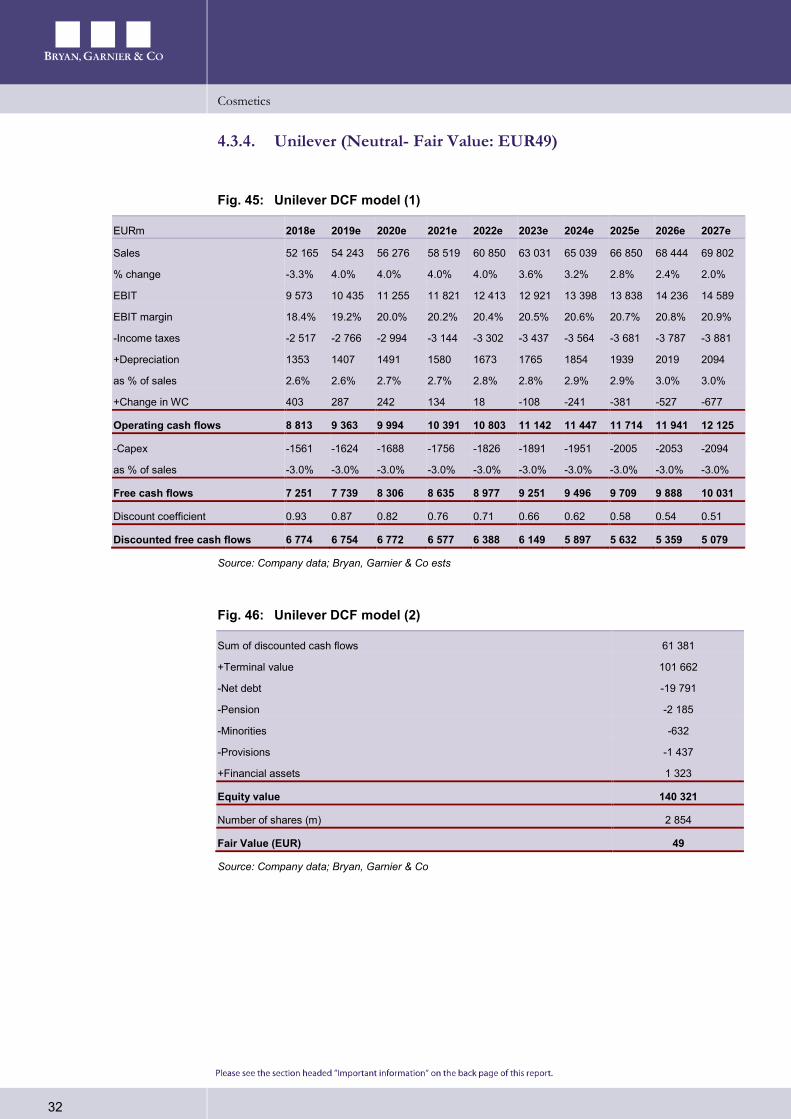
4.3.4. Unilever (Neutral- Fair Value: EUR49)
Fig. 45: Unilever DCF model (1)
EURm 2018e 2019e 2020e 2021e 2022e 2023e 2024e 2025e 2026e 2027e
Sales 52 165 54 243 56 276 58 519 60 850 63 031 65 039 66 850 68 444 69 802
% change -3.3% 4.0% 4.0% 4.0% 4.0% 3.6% 3.2% 2.8% 2.4% 2.0%
EBIT 9 573 10 435 11 255 11 821 12 413 12 921 13 398 13 838 14 236 14 589
EBIT margin 18.4% 19.2% 20.0% 20.2% 20.4% 20.5% 20.6% 20.7% 20.8% 20.9%
-Income taxes -2 517 -2 766 -2 994 -3 144 -3 302 -3 437 -3 564 -3 681 -3 787 -3 881
+Depreciation 1353 1407 1491 1580 1673 1765 1854 1939 2019 2094
as % of sales 2.6% 2.6% 2.7% 2.7% 2.8% 2.8% 2.9% 2.9% 3.0% 3.0%
+Change in WC 403 287 242 134 18 -108 -241 -381 -527 -677
Operating cash flows 8 813 9 363 9 994 10 391 10 803 11 142 11 447 11 714 11 941 12 125
-Capex -1561 -1624 -1688 -1756 -1826 -1891 -1951 -2005 -2053 -2094
as % of sales -3.0% -3.0% -3.0% -3.0% -3.0% -3.0% -3.0% -3.0% -3.0% -3.0%
Free cash flows 7 251 7 739 8 306 8 635 8 977 9 251 9 496 9 709 9 888 10 031
Discount coefficient 0.93 0.87 0.82 0.76 0.71 0.66 0.62 0.58 0.54 0.51
Discounted free cash flows 6 774 6 754 6 772 6 577 6 388 6 149 5 897 5 632 5 359 5 079
Source: Company data; Bryan, Garnier & Co ests
Fig. 46: Unilever DCF model (2)
Sum of discounted cash flows 61 381
+Terminal value 101 662
-Net debt -19 791
-Pension -2 185
-Minorities -632
-Provisions -1 437
+Financial assets 1 323
Equity value 140 321
Number of shares (m) 2 854
Fair Value (EUR) 49
Source: Company data; Bryan, Garnier & Co
r r
INDEPENDENT RESEARCH UPDATE Beiersdorf
24th November 2017 A pure skin care player! Luxury & Consumer Goods Fair Value EUR95 vs. EUR89 (price EUR97.26) NEUTRAL
Finalised on 23rd November Bloomberg BEI GY Reuters BEIG.DE 12-month High / Low (EUR) 98.6 / 75.5 Market capitalisation (EURm) 22,058 Enterprise Value (BG estimates EURm) 19,484 Avg. 6m daily volume ('000 shares) 0.60 Free Float 39.5% 3y EPS CAGR 6.9% Gearing (12/16) -39%Dividend yield (12/17e) 0.77%
Beiersdorf is a pure cosmetic skin care player, exposed almost uniquely to the mass market channel, and is growing market share on this segment which is currently not the most dynamic. Neutral recommendation maintained with a EUR95 FV.
The German group, which generates 82% of its sales in the Consumerdivision, has been focused on the profitable skin care segment (mainly soldin the mass market), notably with the Nivea brand, since the cessation ofits make-up and hair care businesses in 2010. The market segment onwhich the group operates is hardly the most dynamic currently, despite abetter recent trend. The 18% balance of the sales breakdown correspondsto the Tesa activity.
Over the first 9 months, Beiersdorf sales grew by 5.1% organically, aboveestimates, with a very strong Q3 (+8.5% but +6.4% excluding the catch-up after the cyber-attack in June), driven by both Tesa and the Consumerdivision (+4.9% excluding the cyber-attack effect). This shows thatBeiersdorf and especially its Consumer brands, including Nivea, areincreasing market share. The strong Q3 results recently led themanagement to increase its FY guidance to +4% to 5% sales growth versus the +3% to 4% previously expected.
FY 2017 sales should reach EUR7.05bn, up by 5% at constant forex (+4%est in Q4), of which +4.1% for Consumer (+4.7% est in Q4). We expectthe 2017 EBIT margin to gain 50bps to 15.5% (in line with the guidanceof a “slight” improvement), thanks to operating leverage and despite somecosts linked to the June cyber-attack.
We remain Neutral on Beiersdorf with a new EUR95 Fair Value (EUR89FV previously) due to our DCF roll over.
YE December 12/16 12/17e 12/18e 12/19e Revenue (EURm) 6,752 7,050 7,320 7,600 EBIT (EURm) 1,015 1,105 1,185 1,265 Basic EPS (EUR) 3.16 3.44 3.60 3.86 Diluted EPS (EUR) 3.16 3.44 3.60 3.86 EV/Sales 2.95x 2.76x 2.60x 2.43x EV/EBITDA 16.8x 15.3x 14.1x 12.9x EV/EBIT 19.6x 17.6x 16.0x 14.6x P/E 30.8x 28.3x 27.0x 25.2x ROCE 31.1 32.0 31.0 30.8
68.5
73.5
78.5
83.5
88.5
93.5
98.5
103.5
20/05/16 20/08/16 20/11/16 20/02/17 20/05/17 20/08/17 20/11/17
BEIERSDORF SXX EUROPE 600
Analyst: Sector Analyst Team: Loïc Morvan Nikolaas Faes 33(0) 1 70 36 57 24 Clément Genelot [email protected] Antoine Parison
Virginie Roumage, CFA Cédric Rossi
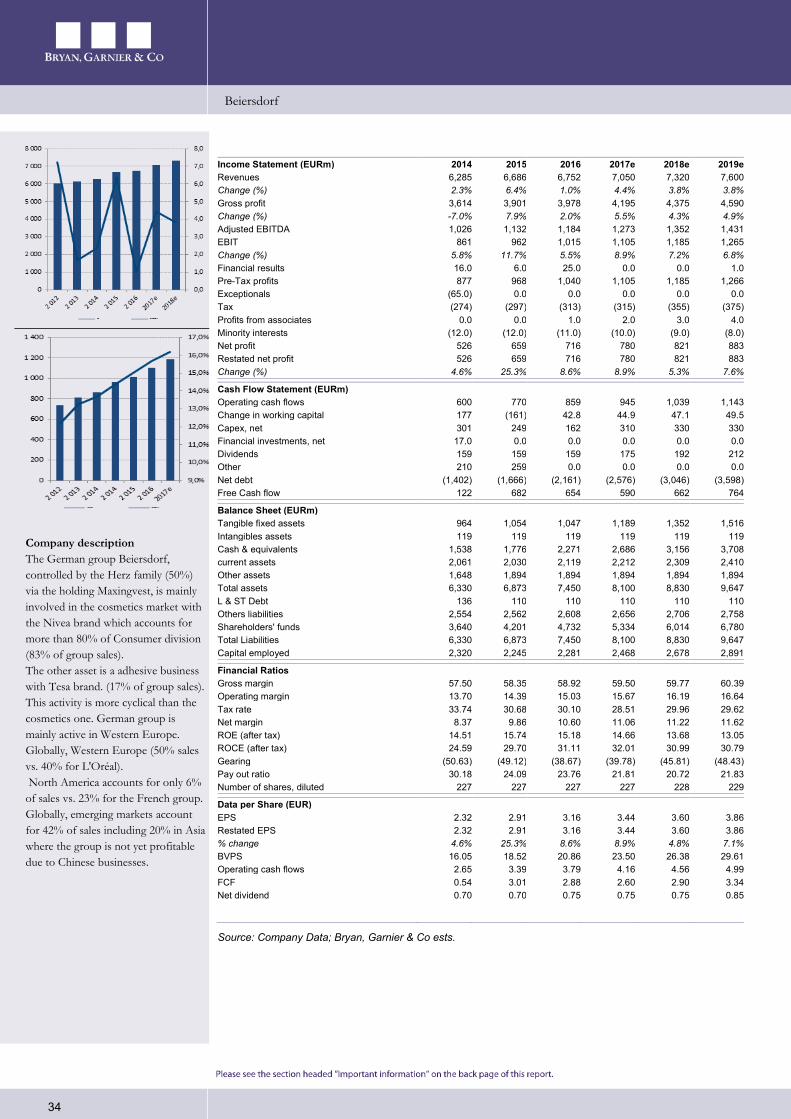
Beiersdorf
34
Income Statement (EURm) 2014 2015 2016 2017e 2018e 2019e Revenues 6,285 6,686 6,752 7,050 7,320 7,600 Change (%) 2.3% 6.4% 1.0% 4.4% 3.8% 3.8% Gross profit 3,614 3,901 3,978 4,195 4,375 4,590 Change (%) -7.0% 7.9% 2.0% 5.5% 4.3% 4.9% Adjusted EBITDA 1,026 1,132 1,184 1,273 1,352 1,431 EBIT 861 962 1,015 1,105 1,185 1,265 Change (%) 5.8% 11.7% 5.5% 8.9% 7.2% 6.8% Financial results 16.0 6.0 25.0 0.0 0.0 1.0 Pre-Tax profits 877 968 1,040 1,105 1,185 1,266 Exceptionals (65.0) 0.0 0.0 0.0 0.0 0.0 Tax (274) (297) (313) (315) (355) (375)Profits from associates 0.0 0.0 1.0 2.0 3.0 4.0 Minority interests (12.0) (12.0) (11.0) (10.0) (9.0) (8.0) Net profit 526 659 716 780 821 883 Restated net profit 526 659 716 780 821 883 Change (%) 4.6% 25.3% 8.6% 8.9% 5.3% 7.6%
Cash Flow Statement (EURm) Operating cash flows 600 770 859 945 1,039 1,143 Change in working capital 177 (161) 42.8 44.9 47.1 49.5 Capex, net 301 249 162 310 330 330 Financial investments, net 17.0 0.0 0.0 0.0 0.0 0.0 Dividends 159 159 159 175 192 212 Other 210 259 0.0 0.0 0.0 0.0 Net debt (1,402) (1,666) (2,161) (2,576) (3,046) (3,598) Free Cash flow 122 682 654 590 662 764
Balance Sheet (EURm) Tangible fixed assets 964 1,054 1,047 1,189 1,352 1,516 Intangibles assets 119 119 119 119 119 119 Cash & equivalents 1,538 1,776 2,271 2,686 3,156 3,708 current assets 2,061 2,030 2,119 2,212 2,309 2,410 Other assets 1,648 1,894 1,894 1,894 1,894 1,894 Total assets 6,330 6,873 7,450 8,100 8,830 9,647 L & ST Debt 136 110 110 110 110 110 Others liabilities 2,554 2,562 2,608 2,656 2,706 2,758 Shareholders' funds 3,640 4,201 4,732 5,334 6,014 6,780 Total Liabilities 6,330 6,873 7,450 8,100 8,830 9,647 Capital employed 2,320 2,245 2,281 2,468 2,678 2,891
Financial Ratios Gross margin 57.50 58.35 58.92 59.50 59.77 60.39 Operating margin 13.70 14.39 15.03 15.67 16.19 16.64 Tax rate 33.74 30.68 30.10 28.51 29.96 29.62 Net margin 8.37 9.86 10.60 11.06 11.22 11.62 ROE (after tax) 14.51 15.74 15.18 14.66 13.68 13.05 ROCE (after tax) 24.59 29.70 31.11 32.01 30.99 30.79 Gearing (50.63) (49.12) (38.67) (39.78) (45.81) (48.43) Pay out ratio 30.18 24.09 23.76 21.81 20.72 21.83 Number of shares, diluted 227 227 227 227 228 229
Data per Share (EUR) EPS 2.32 2.91 3.16 3.44 3.60 3.86 Restated EPS 2.32 2.91 3.16 3.44 3.60 3.86 % change 4.6% 25.3% 8.6% 8.9% 4.8% 7.1% BVPS 16.05 18.52 20.86 23.50 26.38 29.61 Operating cash flows 2.65 3.39 3.79 4.16 4.56 4.99 FCF 0.54 3.01 2.88 2.60 2.90 3.34 Net dividend 0.70 0.70 0.75 0.75 0.75 0.85
Source: Company Data; Bryan, Garnier & Co ests.
Company description The German group Beiersdorf, controlled by the Herz family (50%) via the holding Maxingvest, is mainly involved in the cosmetics market with the Nivea brand which accounts for more than 80% of Consumer division (83% of group sales). The other asset is a adhesive business with Tesa brand. (17% of group sales). This activity is more cyclical than the cosmetics one. German group is mainly active in Western Europe. Globally, Western Europe (50% sales vs. 40% for L'Oréal). North America accounts for only 6% of sales vs. 23% for the French group. Globally, emerging markets account for 42% of sales including 20% in Asia where the group is not yet profitable due to Chinese businesses.
r r
INDEPENDENT RESEARCH UPDATE Henkel
23rd November 2017 Confidence after a good Q3 for adhesives Luxury & Consumer Goods Fair Value EUR139 (price EUR113.10) BUY
Finalised on 23rd November Bloomberg HEN3 GY Reuters HNKG.F 12-month High / Low (EUR) 128.9 / 106.4 Market capitalisation (EURm) 46,558 Enterprise Value (BG estimates EURm) 48,817 Avg. 6m daily volume ('000 shares) 478.6 Free Float Pref 97.9 3y EPS CAGR 8.4% Gearing (12/16) - Dividend yield (12/17e) 1.57%
In a slowing Food and HPC sector, Henkel's very resilient growth profile stemming from a combination of defensive HPC businesses and cyclical adhesive activities gives the group safe refuge stock status. This resilience coupled with strict cost control and a very solid balance sheet explains our Buy recommendation. We reiterate our FV of EUR139.
A long-term growth profile. Henkel's dual HPC/adhesives profileensures that the group enjoys long-term resilience (+3%-4% organicgrowth) irrespective of the economic cycle in a universe where numerousFood-HPC groups have seen their organic performance more than halvedsince 2012.
Adhesives as a growth engine. Adhesives should continue to drive thegroup's growth in coming years and offset the temporary weakness in theHPC activities. Henkel's organic growth is set to run at 3.2 % in 2017,in the middle of the guidance range provided by the group (2%-4%) anddespite anaemic growth in the Beauty and Home & Laundry divisions.
The group's "margin story" is not yet over. The underlying EBITmargin should continue to widen by more than 30bps a year onaverage to reach an historical level of 18.3% in 2020, driven by ongoingcost-saving programmes, a positive mix coming from the robustAdhesives division as well as lesser dilution from the integration of SunProducts. Despite the integration of bolt-on acquisitions, Henkel's debtratio is expected to be low, thereby paving the way for sizeablepotential acquisitions as of 2018 (>EUR13bn).
Buy, Fair Value of EUR139. Henkel's 2018e P/E stands at 17.7x, vs 23xfor HPC and 22x for adhesives. The combination of a DCF calculationand an SOTP valuation points to a Fair Value of EUR139 per preferredshare, implying upside of 23%. We maintain our Buy recommendationon the stock.
YE December 12/16 12/17e 12/18e 12/19e Revenue (EURm) 18,714 20,083 21,073 22,167 EBIT (EURm) 3,172 3,475 3,761 4,017 Basic EPS (EUR) 4.74 5.13 5.53 5.93 Diluted EPS (EUR) 5.36 5.88 6.38 6.84 EV/Sales 2.61x 2.43x 2.27x 2.11x EV/EBITDA 14.6x 13.3x 11.9x 10.8x EV/EBIT 15.4x 14.0x 12.7x 11.7x P/E 21.1x 19.2x 17.7x 16.5x ROCE 16.7 13.8 14.0 14.5
88.8
93.8
98.8
103.8
108.8
113.8
118.8
123.8
128.8
133.8
20/05/16 20/08/16 20/11/16 20/02/17 20/05/17 20/08/17 20/11/17
HENKEL PREF. (XET) SXX EUROPE 600
Analyst: Sector Analyst Team: Virginie Roumage, CFA Nikolaas Faes 33(0) 1.56.68.75.22 Clément Genelot [email protected] Loic Morvan
Antoine Parison Cédric Rossi
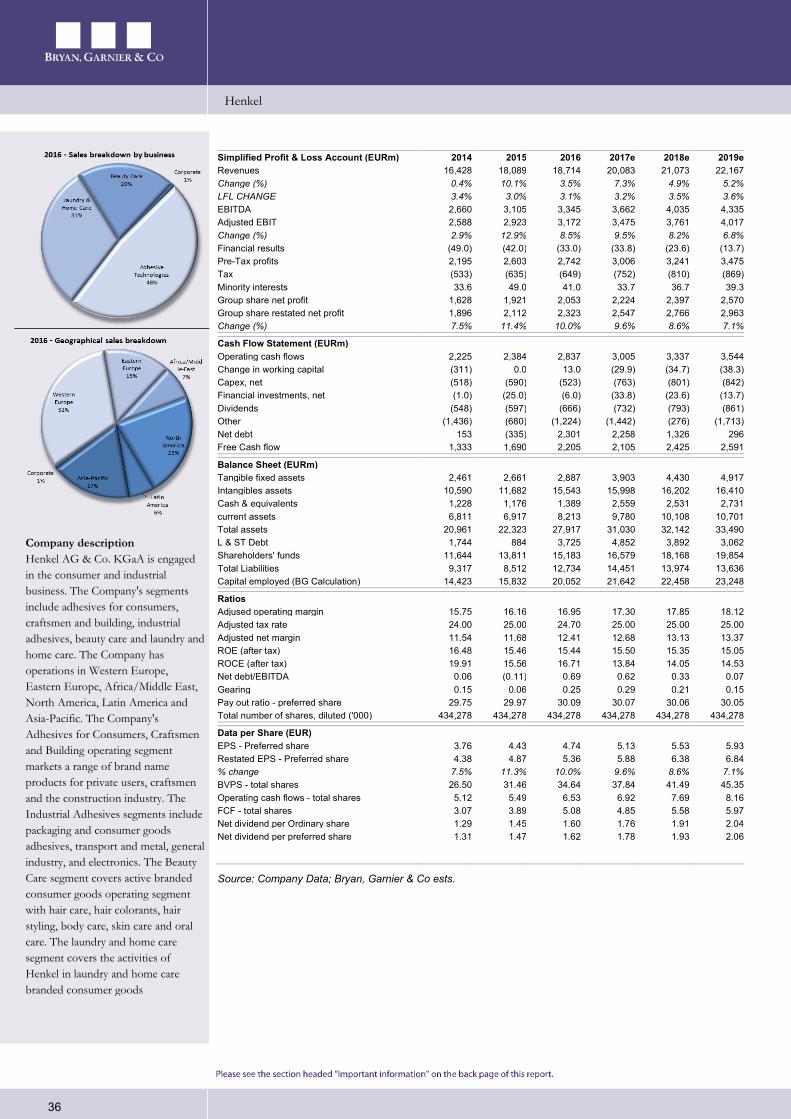
Henkel
36
Simplified Profit & Loss Account (EURm) 2014 2015 2016 2017e 2018e 2019e Revenues 16,428 18,089 18,714 20,083 21,073 22,167 Change (%) 0.4% 10.1% 3.5% 7.3% 4.9% 5.2% LFL CHANGE 3.4% 3.0% 3.1% 3.2% 3.5% 3.6% EBITDA 2,660 3,105 3,345 3,662 4,035 4,335 Adjusted EBIT 2,588 2,923 3,172 3,475 3,761 4,017 Change (%) 2.9% 12.9% 8.5% 9.5% 8.2% 6.8% Financial results (49.0) (42.0) (33.0) (33.8) (23.6) (13.7) Pre-Tax profits 2,195 2,603 2,742 3,006 3,241 3,475 Tax (533) (635) (649) (752) (810) (869)Minority interests 33.6 49.0 41.0 33.7 36.7 39.3 Group share net profit 1,628 1,921 2,053 2,224 2,397 2,570 Group share restated net profit 1,896 2,112 2,323 2,547 2,766 2,963 Change (%) 7.5% 11.4% 10.0% 9.6% 8.6% 7.1%
Cash Flow Statement (EURm) Operating cash flows 2,225 2,384 2,837 3,005 3,337 3,544 Change in working capital (311) 0.0 13.0 (29.9) (34.7) (38.3) Capex, net (518) (590) (523) (763) (801) (842)Financial investments, net (1.0) (25.0) (6.0) (33.8) (23.6) (13.7) Dividends (548) (597) (666) (732) (793) (861)Other (1,436) (680) (1,224) (1,442) (276) (1,713)Net debt 153 (335) 2,301 2,258 1,326 296 Free Cash flow 1,333 1,690 2,205 2,105 2,425 2,591
Balance Sheet (EURm) Tangible fixed assets 2,461 2,661 2,887 3,903 4,430 4,917 Intangibles assets 10,590 11,682 15,543 15,998 16,202 16,410 Cash & equivalents 1,228 1,176 1,389 2,559 2,531 2,731 current assets 6,811 6,917 8,213 9,780 10,108 10,701 Total assets 20,961 22,323 27,917 31,030 32,142 33,490 L & ST Debt 1,744 884 3,725 4,852 3,892 3,062 Shareholders' funds 11,644 13,811 15,183 16,579 18,168 19,854 Total Liabilities 9,317 8,512 12,734 14,451 13,974 13,636 Capital employed (BG Calculation) 14,423 15,832 20,052 21,642 22,458 23,248
Ratios Adjused operating margin 15.75 16.16 16.95 17.30 17.85 18.12 Adjusted tax rate 24.00 25.00 24.70 25.00 25.00 25.00 Adjusted net margin 11.54 11.68 12.41 12.68 13.13 13.37 ROE (after tax) 16.48 15.46 15.44 15.50 15.35 15.05 ROCE (after tax) 19.91 15.56 16.71 13.84 14.05 14.53 Net debt/EBITDA 0.06 (0.11) 0.69 0.62 0.33 0.07 Gearing 0.15 0.06 0.25 0.29 0.21 0.15 Pay out ratio - preferred share 29.75 29.97 30.09 30.07 30.06 30.05 Total number of shares, diluted ('000) 434,278 434,278 434,278 434,278 434,278 434,278
Data per Share (EUR) EPS - Preferred share 3.76 4.43 4.74 5.13 5.53 5.93 Restated EPS - Preferred share 4.38 4.87 5.36 5.88 6.38 6.84 % change 7.5% 11.3% 10.0% 9.6% 8.6% 7.1% BVPS - total shares 26.50 31.46 34.64 37.84 41.49 45.35 Operating cash flows - total shares 5.12 5.49 6.53 6.92 7.69 8.16 FCF - total shares 3.07 3.89 5.08 4.85 5.58 5.97 Net dividend per Ordinary share 1.29 1.45 1.60 1.76 1.91 2.04 Net dividend per preferred share 1.31 1.47 1.62 1.78 1.93 2.06
Source: Company Data; Bryan, Garnier & Co ests.
Company description Henkel AG & Co. KGaA is engaged in the consumer and industrial business. The Company's segments include adhesives for consumers, craftsmen and building, industrial adhesives, beauty care and laundry and home care. The Company has operations in Western Europe, Eastern Europe, Africa/Middle East, North America, Latin America and Asia-Pacific. The Company's Adhesives for Consumers, Craftsmen and Building operating segment markets a range of brand name products for private users, craftsmen and the construction industry. The Industrial Adhesives segments include packaging and consumer goods adhesives, transport and metal, general industry, and electronics. The Beauty Care segment covers active branded consumer goods operating segment with hair care, hair colorants, hair styling, body care, skin care and oral care. The laundry and home care segment covers the activities of Henkel in laundry and home care branded consumer goods
r r
INDEPENDENT RESEARCH UPDATE Interparfums
24th November 2017 An efficient business model Luxury & Consumer Goods Fair Value EUR36 (price EUR33.02) BUY
Finalised on 23rd November Bloomberg ITP FP Reuters IPAR.PA 12-month High / Low (EUR) 35.6 / 22.8 Market capitalisation (EURm) 1,290 Enterprise Value (BG estimates EURm) 1,114 Avg. 6m daily volume ('000 shares) 15.00 Free Float 27.0% 3y EPS CAGR 7.9% Gearing (12/16) -40%Dividend yield (12/17e) 1.82%
As an independent player, Interparfums operates in the Perfumes segment by selling only through the selective distribution channel. Its business model, mainly based on licence agreements, is efficient given the historic sales CAGR.
Unlike its peers Interparfums is not, in our view, a bona fide Cosmeticgroup in that it is only involved in the perfume market sold via the prestigechannel. Nevertheless, its business model, based on a very lightorganisation and mainly long-term licence agreements is efficient, asillustrated by the 16% sales CAGR over the past five years. Together, theMontblanc, Jimmy Choo and Lanvin brands account for 67% of thegroup’s sales.
Despite some slowdown in H2 due to the phasing of launches, we expect2017 sales to grow by 13.5% to EUR416m (2.5% above the consensusaverage), driven in particular by the Jimmy Choo (+15%), Coach andRochas (+16%) brands while the Montblanc momentum (sales virtuallystable) should be more moderate given the tough comparison base.
Given the i/ strong sales growth forecast for 2017, ii/ a stable grossmargin despite the already high level (+120bp in 2016) but thanks tohedging, and iii/ higher communication costs as a % of sales (+200bps ataround 24%), we expect the EBIT margin to remain broadly flat at 13.5%for an EBIT of EUR56m.
For 2018, sales growth should be more modest as the year will see fewerproduct launches than in 2017, hence the expected 7% uplift toEUR445m. As the group will also invest less in communications than in2017, we expect the EBIT margin to remain broadly unchanged. On theother hand, 2019 and 2020 should much more dynamic. We are forecasting9% sales growth in 2019.
We remain Buy on Interparfums with an unchanged EUR36 Fair value.
YE December 12/16 12/17e 12/18e 12/19e Revenue (EURm) 365.60 416.00 445.00 485.00 EBIT (EURm) 49.90 56.00 61.00 67.00 Basic EPS (EUR) 0.81 0.95 1.05 1.13 Diluted EPS (EUR) 0.90 0.95 1.05 1.13 EV/Sales 3.09x 2.68x 2.46x 2.21x EV/EBITDA 17.7x 15.7x 14.0x 12.6x EV/EBIT 22.6x 19.9x 17.9x 16.0x P/E 36.7x 34.8x 31.4x 29.3x ROCE 12.7 13.7 14.5 15.3
16.1
21.1
26.1
31.1
36.1
20/05/16 20/08/16 20/11/16 20/02/17 20/05/17 20/08/17 20/11/17
INTERPARFUMS SXX EUROPE 600
Analyst: Sector Analyst Team: Loïc Morvan Nikolaas Faes 33(0) 1 70 36 57 24 Clément Genelot [email protected] Antoine Parison
Virginie Roumage, CFA Cédric Rossi
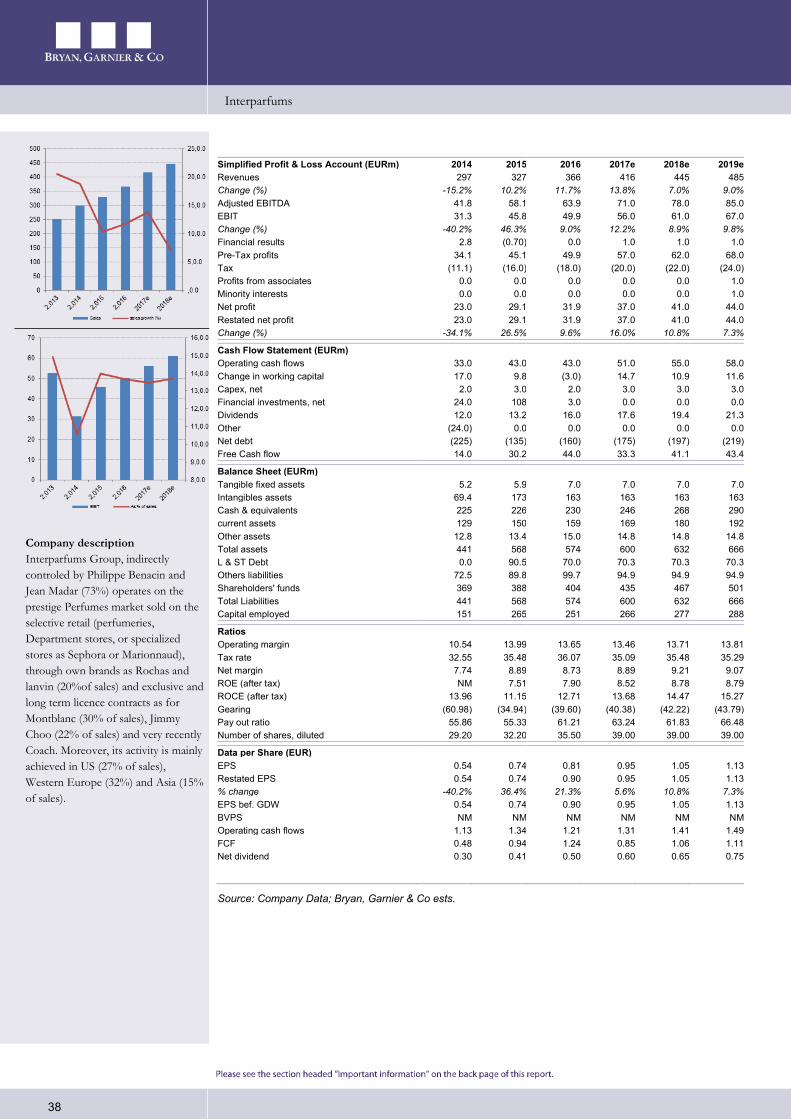
Interparfums
38
Simplified Profit & Loss Account (EURm) 2014 2015 2016 2017e 2018e 2019e Revenues 297 327 366 416 445 485 Change (%) -15.2% 10.2% 11.7% 13.8% 7.0% 9.0% Adjusted EBITDA 41.8 58.1 63.9 71.0 78.0 85.0 EBIT 31.3 45.8 49.9 56.0 61.0 67.0 Change (%) -40.2% 46.3% 9.0% 12.2% 8.9% 9.8% Financial results 2.8 (0.70) 0.0 1.0 1.0 1.0 Pre-Tax profits 34.1 45.1 49.9 57.0 62.0 68.0 Tax (11.1) (16.0) (18.0) (20.0) (22.0) (24.0) Profits from associates 0.0 0.0 0.0 0.0 0.0 1.0 Minority interests 0.0 0.0 0.0 0.0 0.0 1.0 Net profit 23.0 29.1 31.9 37.0 41.0 44.0 Restated net profit 23.0 29.1 31.9 37.0 41.0 44.0 Change (%) -34.1% 26.5% 9.6% 16.0% 10.8% 7.3%
Cash Flow Statement (EURm) Operating cash flows 33.0 43.0 43.0 51.0 55.0 58.0 Change in working capital 17.0 9.8 (3.0) 14.7 10.9 11.6 Capex, net 2.0 3.0 2.0 3.0 3.0 3.0 Financial investments, net 24.0 108 3.0 0.0 0.0 0.0 Dividends 12.0 13.2 16.0 17.6 19.4 21.3 Other (24.0) 0.0 0.0 0.0 0.0 0.0 Net debt (225) (135) (160) (175) (197) (219)Free Cash flow 14.0 30.2 44.0 33.3 41.1 43.4
Balance Sheet (EURm) Tangible fixed assets 5.2 5.9 7.0 7.0 7.0 7.0 Intangibles assets 69.4 173 163 163 163 163 Cash & equivalents 225 226 230 246 268 290 current assets 129 150 159 169 180 192 Other assets 12.8 13.4 15.0 14.8 14.8 14.8 Total assets 441 568 574 600 632 666 L & ST Debt 0.0 90.5 70.0 70.3 70.3 70.3 Others liabilities 72.5 89.8 99.7 94.9 94.9 94.9 Shareholders' funds 369 388 404 435 467 501 Total Liabilities 441 568 574 600 632 666 Capital employed 151 265 251 266 277 288
Ratios Operating margin 10.54 13.99 13.65 13.46 13.71 13.81 Tax rate 32.55 35.48 36.07 35.09 35.48 35.29 Net margin 7.74 8.89 8.73 8.89 9.21 9.07 ROE (after tax) NM 7.51 7.90 8.52 8.78 8.79 ROCE (after tax) 13.96 11.15 12.71 13.68 14.47 15.27 Gearing (60.98) (34.94) (39.60) (40.38) (42.22) (43.79) Pay out ratio 55.86 55.33 61.21 63.24 61.83 66.48 Number of shares, diluted 29.20 32.20 35.50 39.00 39.00 39.00
Data per Share (EUR) EPS 0.54 0.74 0.81 0.95 1.05 1.13 Restated EPS 0.54 0.74 0.90 0.95 1.05 1.13 % change -40.2% 36.4% 21.3% 5.6% 10.8% 7.3% EPS bef. GDW 0.54 0.74 0.90 0.95 1.05 1.13 BVPS NM NM NM NM NM NM Operating cash flows 1.13 1.34 1.21 1.31 1.41 1.49 FCF 0.48 0.94 1.24 0.85 1.06 1.11 Net dividend 0.30 0.41 0.50 0.60 0.65 0.75
Source: Company Data; Bryan, Garnier & Co ests.
Company description Interparfums Group, indirectly controled by Philippe Benacin and Jean Madar (73%) operates on the prestige Perfumes market sold on the selective retail (perfumeries, Department stores, or specialized stores as Sephora or Marionnaud), through own brands as Rochas and lanvin (20%of sales) and exclusive and long term licence contracts as for Montblanc (30% of sales), Jimmy Choo (22% of sales) and very recently Coach. Moreover, its activity is mainly achieved in US (27% of sales), Western Europe (32%) and Asia (15% of sales).
r r
INDEPENDENT RESEARCH UPDATE L'Oréal
24th November 2017 Ready to explore the digital opportunity! Luxury & Consumer Goods Fair Value EUR206 (price EUR186.00) BUY
Finalised on 23rd November Bloomberg OR FP Reuters OREP.PA 12-month High / Low (EUR) 195.4 / 158.6 Market capitalisation (EURm) 104,160 Enterprise Value (BG estimates EURm) 102,315 Avg. 6m daily volume ('000 shares) 540.9 Free Float 37.5% 3y EPS CAGR 5.9% Gearing (12/16) -2%Dividend yield (12/17e) 1.94%
L’Oréal is the world leader of the Cosmetic market and improves regularly albeit at a relatively low pace its leadership. E-commerce becomes more and more crucial for the group and is ready to seize this new opportunity!
L’Oréal is by far the world leader of Cosmetic market with a market shareof around 12.6%, with clear leadership in Western Europe (20.2%) and inNorth America (14%) with still potential of improvement especially inLATAM (8.8%) and in Asia-Pacific (9.5%). The second player is Cotysince the acquisition of Cosmetics assets of P&G.
L’Oréal is the only global Group in this Cosmetic industry to be involvedin all beauty categories, in all distribution channels, in all price segmentsand across all regions which gives him a clear comparative edge versuspeers and above all a resilient aspect and allows him to regularly gainmarket share (on average 1.15x faster than the market on average since2011).
L’Oréal will again, in 2017, improve its leadership as the world cosmeticmarket is expecting to grow by 4% (L’Oréal estimates) and we anticipate a4.5% organic sales increase for the group. This dynamic momentum isespecially fuelled by Luxury division (+10%e) and by E-commerce (+33%YTD vs +19% for the cosmetic market) which should account this yearfor close to 8% of L’Oréal sales. In 2017, L’Oréal will partly use thepositive impact of the TBS disposal on profitability to invest more and fuelfuture growth, hence an EBIT margin expected at 18% (17.6% in 2016).
Furthermore, one point seems very important for us and should attractinvestors. Thanks to a strong Cash Flow and a healthy financial situation,the group is able to increase regularly its dividend with a CAGR of 10.8%since 2006. We remain Buy on the stock with an unchanged EUR206 FairValue.
YE December 12/16 12/17e 12/18e 12/19e Revenue (EURm) 25,837 26,050 27,200 28,600 EBIT (EURm) 4,540 4,685 4,970 5,310 Basic EPS (EUR) 6.47 6.66 7.15 7.68 Diluted EPS (EUR) 6.47 6.66 7.15 7.68 EV/Sales 4.01x 3.93x 3.72x 3.50x EV/EBITDA 19.1x 18.3x 17.2x 16.0x EV/EBIT 22.8x 21.8x 20.4x 18.9x P/E 28.7x 27.9x 26.0x 24.2x ROCE 20.4 20.3 20.5 21.0
139.4
149.4
159.4
169.4
179.4
189.4
199.4
20/05/16 20/08/16 20/11/16 20/02/17 20/05/17 20/08/17 20/11/17
L'OREAL SXX EUROPE 600
Analyst: Sector Analyst Team: Loïc Morvan Nikolaas Faes 33(0) 1 70 36 57 24 Clément Genelot [email protected] Antoine Parison
Virginie Roumage, CFA Cédric Rossi
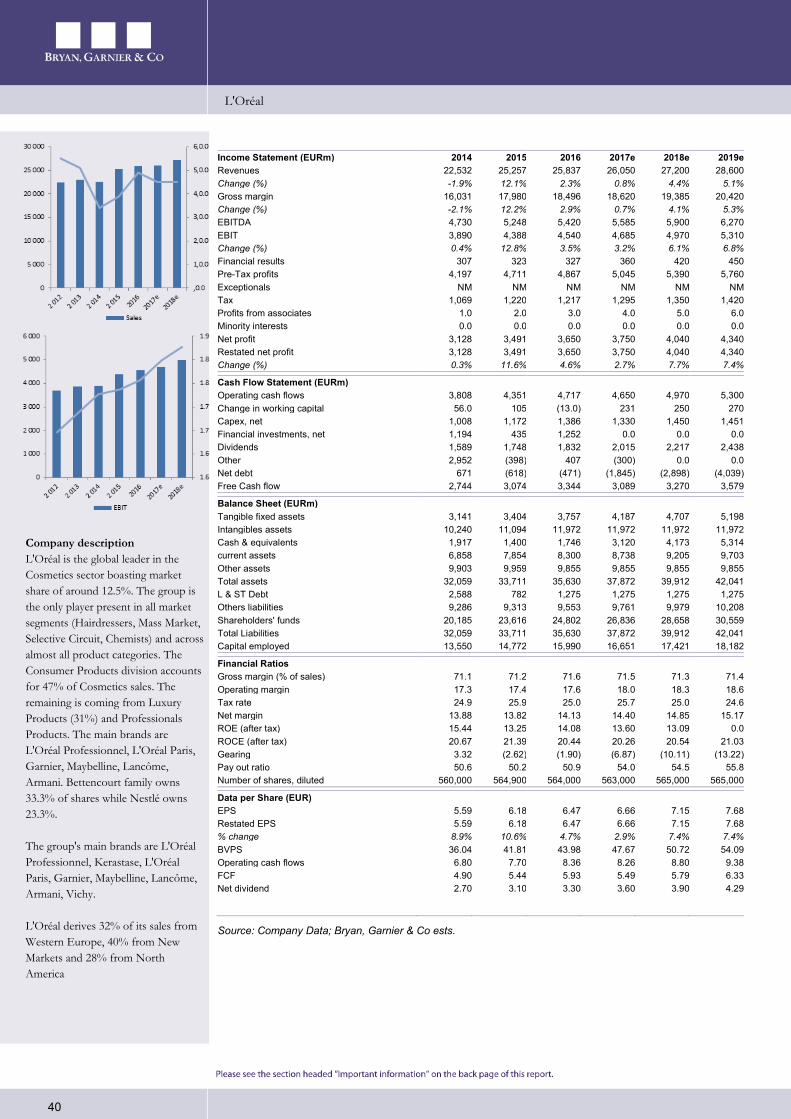
L'Oréal
40
Income Statement (EURm) 2014 2015 2016 2017e 2018e 2019e Revenues 22,532 25,257 25,837 26,050 27,200 28,600 Change (%) -1.9% 12.1% 2.3% 0.8% 4.4% 5.1% Gross margin 16,031 17,980 18,496 18,620 19,385 20,420 Change (%) -2.1% 12.2% 2.9% 0.7% 4.1% 5.3% EBITDA 4,730 5,248 5,420 5,585 5,900 6,270 EBIT 3,890 4,388 4,540 4,685 4,970 5,310 Change (%) 0.4% 12.8% 3.5% 3.2% 6.1% 6.8% Financial results 307 323 327 360 420 450 Pre-Tax profits 4,197 4,711 4,867 5,045 5,390 5,760 Exceptionals NM NM NM NM NM NM Tax 1,069 1,220 1,217 1,295 1,350 1,420 Profits from associates 1.0 2.0 3.0 4.0 5.0 6.0 Minority interests 0.0 0.0 0.0 0.0 0.0 0.0 Net profit 3,128 3,491 3,650 3,750 4,040 4,340 Restated net profit 3,128 3,491 3,650 3,750 4,040 4,340 Change (%) 0.3% 11.6% 4.6% 2.7% 7.7% 7.4%
Cash Flow Statement (EURm) Operating cash flows 3,808 4,351 4,717 4,650 4,970 5,300 Change in working capital 56.0 105 (13.0) 231 250 270 Capex, net 1,008 1,172 1,386 1,330 1,450 1,451 Financial investments, net 1,194 435 1,252 0.0 0.0 0.0 Dividends 1,589 1,748 1,832 2,015 2,217 2,438 Other 2,952 (398) 407 (300) 0.0 0.0 Net debt 671 (618) (471) (1,845) (2,898) (4,039) Free Cash flow 2,744 3,074 3,344 3,089 3,270 3,579
Balance Sheet (EURm) Tangible fixed assets 3,141 3,404 3,757 4,187 4,707 5,198 Intangibles assets 10,240 11,094 11,972 11,972 11,972 11,972 Cash & equivalents 1,917 1,400 1,746 3,120 4,173 5,314 current assets 6,858 7,854 8,300 8,738 9,205 9,703 Other assets 9,903 9,959 9,855 9,855 9,855 9,855 Total assets 32,059 33,711 35,630 37,872 39,912 42,041 L & ST Debt 2,588 782 1,275 1,275 1,275 1,275 Others liabilities 9,286 9,313 9,553 9,761 9,979 10,208 Shareholders' funds 20,185 23,616 24,802 26,836 28,658 30,559 Total Liabilities 32,059 33,711 35,630 37,872 39,912 42,041 Capital employed 13,550 14,772 15,990 16,651 17,421 18,182
Financial Ratios Gross margin (% of sales) 71.1 71.2 71.6 71.5 71.3 71.4 Operating margin 17.3 17.4 17.6 18.0 18.3 18.6 Tax rate 24.9 25.9 25.0 25.7 25.0 24.6 Net margin 13.88 13.82 14.13 14.40 14.85 15.17 ROE (after tax) 15.44 13.25 14.08 13.60 13.09 0.0 ROCE (after tax) 20.67 21.39 20.44 20.26 20.54 21.03 Gearing 3.32 (2.62) (1.90) (6.87) (10.11) (13.22) Pay out ratio 50.6 50.2 50.9 54.0 54.5 55.8 Number of shares, diluted 560,000 564,900 564,000 563,000 565,000 565,000
Data per Share (EUR) EPS 5.59 6.18 6.47 6.66 7.15 7.68 Restated EPS 5.59 6.18 6.47 6.66 7.15 7.68 % change 8.9% 10.6% 4.7% 2.9% 7.4% 7.4% BVPS 36.04 41.81 43.98 47.67 50.72 54.09 Operating cash flows 6.80 7.70 8.36 8.26 8.80 9.38 FCF 4.90 5.44 5.93 5.49 5.79 6.33 Net dividend 2.70 3.10 3.30 3.60 3.90 4.29
Source: Company Data; Bryan, Garnier & Co ests.
Company description L'Oréal is the global leader in the Cosmetics sector boasting market share of around 12.5%. The group is the only player present in all market segments (Hairdressers, Mass Market, Selective Circuit, Chemists) and across almost all product categories. The Consumer Products division accounts for 47% of Cosmetics sales. The remaining is coming from Luxury Products (31%) and Professionals Products. The main brands are L'Oréal Professionnel, L'Oréal Paris, Garnier, Maybelline, Lancôme, Armani. Bettencourt family owns 33.3% of shares while Nestlé owns 23.3%.
The group's main brands are L'Oréal Professionnel, Kerastase, L'Oréal Paris, Garnier, Maybelline, Lancôme, Armani, Vichy.
L'Oréal derives 32% of its sales from Western Europe, 40% from New Markets and 28% from North America
r r
INDEPENDENT RESEARCH UPDATE Unilever
24th November 2017 Too busy Food & Beverages Fair Value EUR49 (price EUR48.13) NEUTRAL
Bloomberg UNA NA Reuters UNc.AS 12-month High / Low (EUR) 52.3 / 36.5 Market capitalisation (EURm) 140,829 Enterprise Value (BG estimates EURm) 160,620 Avg. 6m daily volume ('000 shares) 3 692 Free Float 100% 3y EPS CAGR 8.0% Gearing (12/16) 77% Dividend yield (12/17e) 2.98%
Unilever responded vigorously to the failed Kraft takeover by increasing cost savings and shareholder return, and multiplying portfolio changes. However Q3 sales showed a steep deceleration and the group has stopped outperforming the market. We reiterate our Neutral recommendation. Our Fair Value is unchanged at EUR49.
Increased cost savings. The group is targeting an increase in underlyingoperating margin from 16.4% in 2016 to 20% by 2020. This implies animprovement of >90bps per year, which compares with the previous mid-term guidance of 40-80bps. Margin expansion at Unilever should be drivenby the increase in cumulative savings over the next three years fromEUR4bn to EUR6bn.
Active portfolio management and strong shareholder return. Thegroup has announced its decision to exit the spreads business whichrepresents 6% of total sales. It has also stepped up the pace of bolt-ondeals, acquiring eight companies since April 2017. Unilever has alsolaunched a share buy-back programme of EUR5bn and said it will increasedividends by 12% in 2017.
But a decelerating top line. Q3 2017 sales showed a deceleration,increasing by only 2.6% in organic (vs consensus: +4%). The underlyingtrend was closer to +3%, in line with the overall market (+2%-3%)whereas the group had been used to outperforming. In our view, this couldbe due to the strong decrease in brand/marketing investments in H1 andthe multiplication of projects (disposals of spreads, bolt-on). The groupmaintained its full year guidance for organic sales growth of between 3%and 5% (our estimate: +3%), implying an acceleration in Q4. We do notrule out a disappointment.
Neutral; Fair Value of EUR49. The stock has been one of the bestperformers since the beginning of the year, up 17% vs DJ Stoxx. Atyesterday’s price, the stock is trading at 16.1x EV/EBIT 2018e, globally inline with the peers’ average. We maintain our Neutral recommendation
YE December 12/16 12/17e 12/18e 12/19e Revenue (EURm) 52,713 53,920 52,165 54,243 EBIT (EURm) 8,624 9,385 9,573 10,435 Basic EPS (EUR) 2.04 2.22 2.32 2.56 Diluted EPS (EUR) 2.03 2.21 2.31 2.55 EV/Sales 2.91x 2.98x 2.96x 2.87x EV/EBITDA 16.3x 15.9x 15.0x 13.7x EV/EBIT 17.8x 17.1x 16.1x 14.9x P/E 23.7x 21.8x 20.8x 18.9x ROCE 17.9 18.4 19.1 21.3
33.9
35.9
37.9
39.9
41.9
43.9
45.9
47.9
49.9
51.9
11/03/16 11/06/16 11/09/16 11/12/16 11/03/17 11/06/17 11/09/17
UNILEVER DR SXX EUROPE 600
Analyst: Sector Analyst Team: Virginie Roumage, CFA Nikolaas Faes 33(0) 1.56.68.75.22 Clément Genelot [email protected] Loic Morvan
Antoine Parison Cédric Rossi
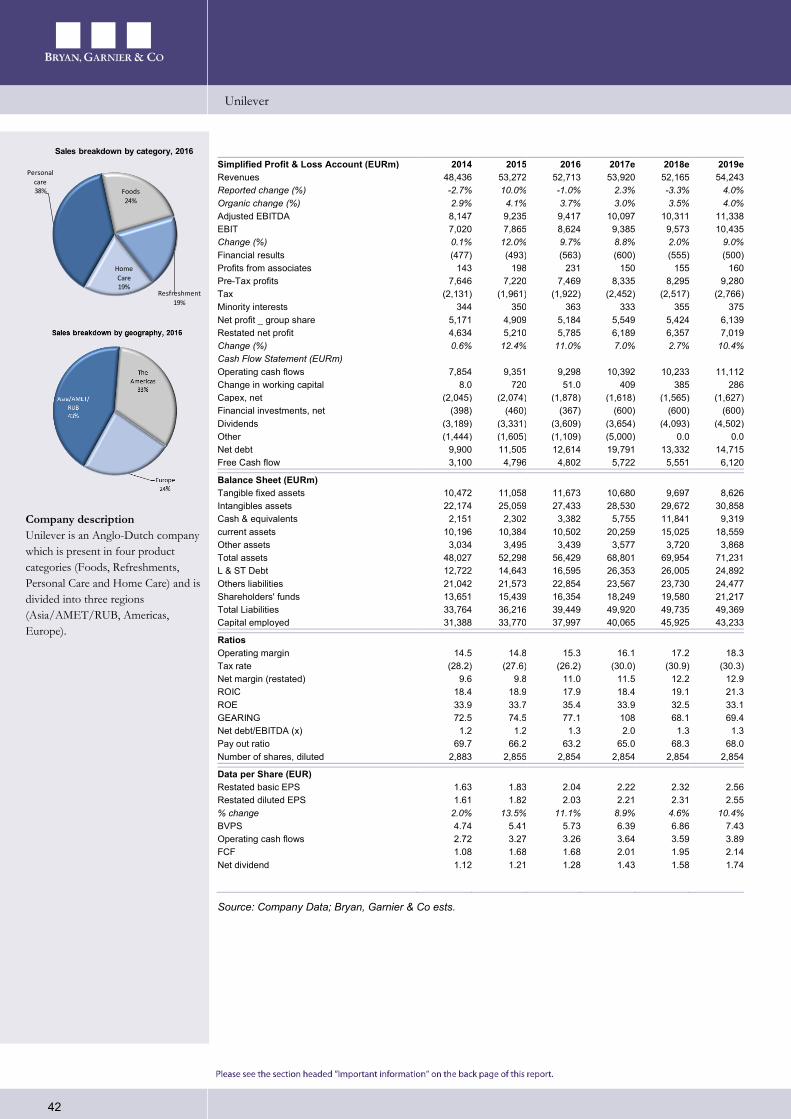
Unilever
42
Simplified Profit & Loss Account (EURm) 2014 2015 2016 2017e 2018e 2019e Revenues 48,436 53,272 52,713 53,920 52,165 54,243 Reported change (%) -2.7% 10.0% -1.0% 2.3% -3.3% 4.0% Organic change (%) 2.9% 4.1% 3.7% 3.0% 3.5% 4.0% Adjusted EBITDA 8,147 9,235 9,417 10,097 10,311 11,338 EBIT 7,020 7,865 8,624 9,385 9,573 10,435 Change (%) 0.1% 12.0% 9.7% 8.8% 2.0% 9.0% Financial results (477) (493) (563) (600) (555) (500)Profits from associates 143 198 231 150 155 160 Pre-Tax profits 7,646 7,220 7,469 8,335 8,295 9,280 Tax (2,131) (1,961) (1,922) (2,452) (2,517) (2,766) Minority interests 344 350 363 333 355 375 Net profit _ group share 5,171 4,909 5,184 5,549 5,424 6,139 Restated net profit 4,634 5,210 5,785 6,189 6,357 7,019 Change (%) 0.6% 12.4% 11.0% 7.0% 2.7% 10.4% Cash Flow Statement (EURm) Operating cash flows 7,854 9,351 9,298 10,392 10,233 11,112 Change in working capital 8.0 720 51.0 409 385 286 Capex, net (2,045) (2,074) (1,878) (1,618) (1,565) (1,627) Financial investments, net (398) (460) (367) (600) (600) (600)Dividends (3,189) (3,331) (3,609) (3,654) (4,093) (4,502)Other (1,444) (1,605) (1,109) (5,000) 0.0 0.0Net debt 9,900 11,505 12,614 19,791 13,332 14,715Free Cash flow 3,100 4,796 4,802 5,722 5,551 6,120
Balance Sheet (EURm) Tangible fixed assets 10,472 11,058 11,673 10,680 9,697 8,626 Intangibles assets 22,174 25,059 27,433 28,530 29,672 30,858 Cash & equivalents 2,151 2,302 3,382 5,755 11,841 9,319 current assets 10,196 10,384 10,502 20,259 15,025 18,559 Other assets 3,034 3,495 3,439 3,577 3,720 3,868 Total assets 48,027 52,298 56,429 68,801 69,954 71,231 L & ST Debt 12,722 14,643 16,595 26,353 26,005 24,892 Others liabilities 21,042 21,573 22,854 23,567 23,730 24,477 Shareholders' funds 13,651 15,439 16,354 18,249 19,580 21,217 Total Liabilities 33,764 36,216 39,449 49,920 49,735 49,369 Capital employed 31,388 33,770 37,997 40,065 45,925 43,233
Ratios Operating margin 14.5 14.8 15.3 16.1 17.2 18.3 Tax rate (28.2) (27.6) (26.2) (30.0) (30.9) (30.3) Net margin (restated) 9.6 9.8 11.0 11.5 12.2 12.9 ROIC 18.4 18.9 17.9 18.4 19.1 21.3 ROE 33.9 33.7 35.4 33.9 32.5 33.1 GEARING 72.5 74.5 77.1 108 68.1 69.4 Net debt/EBITDA (x) 1.2 1.2 1.3 2.0 1.3 1.3 Pay out ratio 69.7 66.2 63.2 65.0 68.3 68.0 Number of shares, diluted 2,883 2,855 2,854 2,854 2,854 2,854
Data per Share (EUR) Restated basic EPS 1.63 1.83 2.04 2.22 2.32 2.56 Restated diluted EPS 1.61 1.82 2.03 2.21 2.31 2.55 % change 2.0% 13.5% 11.1% 8.9% 4.6% 10.4% BVPS 4.74 5.41 5.73 6.39 6.86 7.43 Operating cash flows 2.72 3.27 3.26 3.64 3.59 3.89 FCF 1.08 1.68 1.68 2.01 1.95 2.14 Net dividend 1.12 1.21 1.28 1.43 1.58 1.74
Source: Company Data; Bryan, Garnier & Co ests.
Company description Unilever is an Anglo-Dutch company which is present in four product categories (Foods, Refreshments, Personal Care and Home Care) and is divided into three regions (Asia/AMET/RUB, Americas, Europe).
Personal care38% Foods
24%
Resfreshment19%
Home Care19%
Sales breakdown by category, 2016
Cosmetics
43
Bryan Garnier stock rating system For the purposes of this Report, the Bryan Garnier stock rating system is defined as follows: Stock rating
BUY Positive opinion for a stock where we expect a favourable performance in absolute terms over a period of 6 months from the publication of a recommendation. This opinion is based not only on the FV (the potential upside based on valuation), but also takes into account a number of elements that could include a SWOT analysis, momentum, technical aspects or the sector backdrop. Every subsequent published update on the stock will feature an introduction outlining the key reasons behind the opinion.
NEUTRAL Opinion recommending not to trade in a stock short-term, neither as a BUYER or a SELLER, due to a specific set of factors. This view is intended to be temporary. It may reflect different situations, but in particular those where a fair value shows no significant potential or where an upcoming binary event constitutes a high-risk that is difficult to quantify. Every subsequent published update on the stock will feature an introduction outlining the key reasons behind the opinion.
SELL Negative opinion for a stock where we expect an unfavourable performance in absolute terms over a period of 6 months from the publication of a recommendation. This opinion is based not only on the FV (the potential downside based on valuation), but also takes into account a number of elements that could include a SWOT analysis, momentum, technical aspects or the sector backdrop. Every subsequent published update on the stock will feature an introduction outlining the key reasons behind the opinion.
Distribution of stock ratings
BUY ratings 50% NEUTRAL ratings 35.2% SELL ratings 14.8%
Research Disclosure Legend 1 Bryan Garnier shareholding
in Issuer Bryan Garnier & Co Limited or another company in its group (together, the “Bryan Garnier Group”) has a shareholding that, individually or combined, exceeds 5% of the paid up and issued share capital of a company that is the subject of this Report (the “Issuer”).
No
2 Issuer shareholding in Bryan Garnier
The Issuer has a shareholding that exceeds 5% of the paid up and issued share capital of one or more members of the Bryan Garnier Group.
No
3 Financial interest A member of the Bryan Garnier Group holds one or more financial interests in relation to the Issuer which are significant in relation to this report
No
4 Market maker or liquidity provider
A member of the Bryan Garnier Group is a market maker or liquidity provider in the securities of the Issuer or in any related derivatives.
No
5 Lead/co-lead manager In the past twelve months, a member of the Bryan Garnier Group has been lead manager or co-lead manager of one or more publicly disclosed offers of securities of the Issuer or in any related derivatives.
No
6 Investment banking agreement
A member of the Bryan Garnier Group is or has in the past twelve months been party to an agreement with the Issuer relating to the provision of investment banking services, or has in that period received payment or been promised payment in respect of such services.
No
7 Research agreement A member of the Bryan Garnier Group is party to an agreement with the Issuer relating to the production of this Report.
No
8 Analyst receipt or purchase of shares in Issuer
The investment analyst or another person involved in the preparation of this Report has received or purchased shares of the Issuer prior to a public offering of those shares.
No
9 Remuneration of analyst The remuneration of the investment analyst or other persons involved in the preparation of this Report is tied to investment banking transactions performed by the Bryan Garnier Group.
No
10 Corporate finance client In the past twelve months a member of the Bryan Garnier Group has been remunerated for providing corporate finance services to the issuer or may expect to receive or intend to seek remuneration for corporate finance services from the Issuer in the next six months.
No
11 Analyst has short position The investment analyst or another person involved in the preparation of this Report has a short position in the securities or derivatives of the Issuer.
No
12 Analyst has long position The investment analyst or another person involved in the preparation of this Report has a long position in the securities or derivatives of the Issuer.
No
13 Bryan Garnier executive is an officer
A partner, director, officer, employee or agent of the Bryan Garnier Group, or a member of such person’s household, is a partner, director, officer or an employee of, or adviser to, the Issuer or one of its parents or subsidiaries. The name of such person or persons is disclosed above.
No
14 Analyst disclosure The analyst hereby certifies that neither the views expressed in the research, nor the timing of the publication of the research has been influenced by any knowledge of clients positions and that the views expressed in the report accurately reflect his/her personal views about the investment and issuer to which the report relates and that no part of his/her remuneration was, is or will be, directly or indirectly, related to the specific recommendations or views expressed in the report.
Yes
15 Other disclosures Other specific disclosures: Report sent to Issuer to verify factual accuracy (with the recommendation/rating, price target/spread and summary of conclusions removed).
No
A copy of the Bryan Garnier & Co Limited conflicts policy in relation to the production of research is available at www.bryangarnier.com
London
Beaufort House
15 St. Botolph Street
London EC3A 7BB
Tel: +44 (0) 207 332 2500
Fax: +44 (0) 207 332 2559
Authorised and regulated by the Financial
Conduct Authority (FCA)
Paris
26 Avenue des Champs Elysées
75008 Paris
Tel: +33 (0) 1 56 68 75 00
Fax: +33 (0) 1 56 68 75 01
Regulated by the
Financial Conduct Authority (FCA) and
the Autorité de Contrôle prudential et de
resolution (ACPR)
New York
750 Lexington Avenue
New York, NY 10022
Tel: +1 (0) 212 337 7000
Fax: +1 (0) 212 337 7002
FINRA and SIPC member
Munich
Widenmayerstrasse 29
80538 Munich
Germany +49 89 2422 62 11
Important information This document is classified under the FCA Handbook as being investment research (independent research). Bryan Garnier & Co Limited has in place the measures and arrangements required for investment research as set out in the FCA’s Conduct of Business Sourcebook. This report is prepared by Bryan Garnier & Co Limited, registered in England Number 03034095 and its MIFID branch registered in France Number 452 605 512. Bryan Garnier & Co Limited is authorised and regulated by the Financial Conduct Authority (Firm Reference Number 178733) and is a member of the London Stock Exchange. Registered address: Beaufort House 15 St. Botolph Street, London EC3A 7BB, United Kingdom This Report is provided for information purposes only and does not constitute an offer, or a solicitation of an offer, to buy or sell relevant securities, including securities mentioned in this Report and options, warrants or rights to or interests in any such securities. This Report is for general circulation to clients of the Firm and as such is not, and should not be construed as, investment advice or a personal recommendation. No account is taken of the investment objectives, financial situation or particular needs of any person. The information and opinions contained in this Report have been compiled from and are based upon generally available information which the Firm believes to be reliable but the accuracy of which cannot be guaranteed. All components and estimates given are statements of the Firm, or an associated company’s, opinion only and no express representation or warranty is given or should be implied from such statements. All opinions expressed in this Report are subject to change without notice. To the fullest extent permitted by law neither the Firm nor any associated company accept any liability whatsoever for any direct or consequential loss arising from the use of this Report. Information may be available to the Firm and/or associated companies which are not reflected in this Report. The Firm or an associated company may have a consulting relationship with a company which is the subject of this Report. This Report may not be reproduced, distributed or published by you for any purpose except with the Firm’s prior written permission. The Firm reserves all rights in relation to this Report. Past performance information contained in this Report is not an indication of future performance. The information in this report has not been audited or verified by an independent party and should not be seen as an indication of returns which might be received by investors. Similarly, where projections, forecasts, targeted or illustrative returns or related statements or expressions of opinion are given (“Forward Looking Information”) they should not be regarded as a guarantee, prediction or definitive statement of fact or probability. Actual events and circumstances are difficult or impossible to predict and will differ from assumptions. A number of factors, in addition to the risk factors stated in this Report, could cause actual results to differ materially from those in any Forward Looking Information. Disclosures specific to clients in the United Kingdom This Report has not been approved by Bryan Garnier & Co Limited for the purposes of section 21 of the Financial Services and Markets Act 2000 because it is being distributed in the United Kingdom only to persons who have been classified by Bryan Garnier & Co Limited as professional clients or eligible counterparties. Any recipient who is not such a person should return the Report to Bryan Garnier & Co Limited immediately and should not rely on it for any purposes whatsoever. Notice to US investors This research report (the “Report”) was prepared by Bryan Garnier & Co Limited for information purposes only. The Report is intended for distribution in the United States to “Major US Institutional Investors” as defined in SEC Rule 15a-6 and may not be furnished to any other person in the United States. Each Major US Institutional Investor which receives a copy of this Report by its acceptance hereof represents and agrees that it shall not distribute or provide this Report to any other person. Any US person that desires to effect transactions in any security discussed in this Report should call or write to our US affiliated broker, Bryan Garnier Securities, LLC. 750 Lexington Avenue, New York NY 10022. Telephone: 1-212-337-7000. This Report is based on information obtained from sources that Bryan Garnier & Co Limited believes to be reliable and, to the best of its knowledge, contains no misleading, untrue or false statements but which it has not independently verified. Neither Bryan Garnier & Co Limited and/or Bryan Garnier Securities LLC make no guarantee, representation or warranty as to its accuracy or completeness. Expressions of opinion herein are subject to change without notice. This Report is not an offer to buy or sell any security. Bryan Garnier Securities, LLC and/or its affiliate, Bryan Garnier & Co Limited may own more than 1% of the securities of the company(ies) which is (are) the subject matter of this Report, may act as a market maker in the securities of the company(ies) discussed herein, may manage or co-manage a public offering of securities for the subject company(ies), may sell such securities to or buy them from customers on a principal basis and may also perform or seek to perform investment banking services for the company(ies). Bryan Garnier Securities, LLC and/or Bryan Garnier & Co Limited are unaware of any actual, material conflict of interest of the research analyst who prepared this Report and are also not aware that the research analyst knew or had reason to know of any actual, material conflict of interest at the time this Report is distributed or made available..