Embed Size (px)
Citation preview
Count Your Smiles
The Oral Health of Michigan’s Children 2015-2016
2
Acknowledgements The 2015-2016 Count Your Smiles report is a document that shares the data collected from open mouth screenings of 3rd grade children across Michigan. Special acknowledgement goes to the following individuals who significantly contributed to this project and a special thank you to all of the schools who supported this project: Michigan Department of Health and Human Services Oral Health Program Staff Jill Moore Beth Anderson Christine Farrell Susan Deming Erin Suddeth Sandy Sutton Emily Norrix Pam Manning Jaymee Clark Jennifer Calkins Eva Winston Smiles on Wheels Kim Crabtree Betsy Southern Cheri Kasprzycki Association of State and Territorial Dental Directors Dr. Michael Manz Mott Children’s Health Center Registered Dental Hygienist Screeners and Staff Leigh Ann Albro Tamra Hover Cheryl Mukavetz Erica Augenstein Kathleen Inman Angel Nash Carrie Carr Pam Jadwin Leslie Pancheck Tymathie Douglas Blaine Johns Elizabeth Pitts Kacie Elzinga Megan LaMarche Mona Riaz Trisha Hager Jan Lehman Dawn Marie Strehl Katherine Holsworth Kari Lenon Ashley Tarzwell Missy Howington Mackenzie Moore Carol Westesson
3
Executive Summary This summary is intended to highlight important findings on dental disease and dental access for 3rd grade children in Michigan. This summary also addresses important regional concerns for oral health. Additional information is available in the full text of the Count Your Smiles Report. The data was collected from 2,647 3rd grade students in 103 schools across Michigan during the 2015-2016 school year. Oral Disease:
• One in nine 3rd grade children in Michigan, 11.4%, have immediate dental care needs with signs or symptoms of pain, infection, or swelling. Children lacking dental insurance, children of lower socioeconomic status, and children who are African American were most likely to have immediate needs.
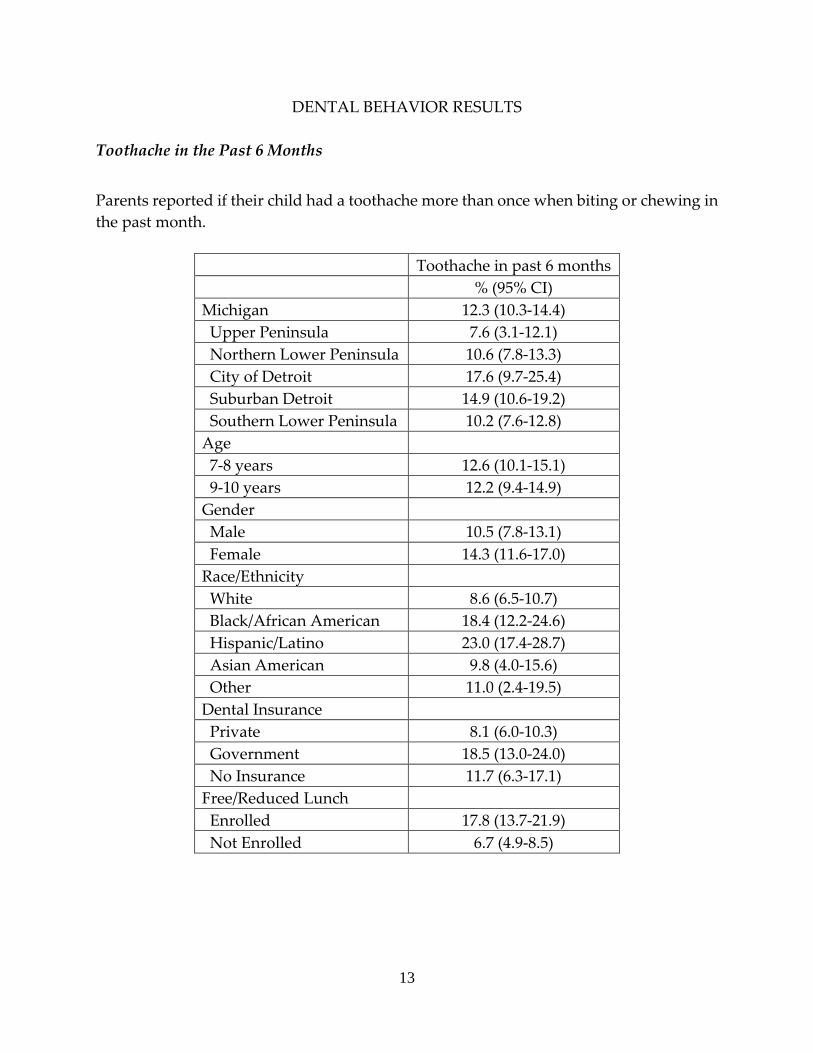
• Oral pain can impact a child’s learning, nutrition and sleeping. Nearly one in eight parents of 3rd grade children in Michigan, 12.3%, reported their child had a toothache when biting or chewing in the past six months. Toothaches were more common among minority children, children on government dental insurance and those of lower socioeconomic status.
• One in four Michigan 3rd grade children, 25.0%, have untreated dental disease. Higher proportions of untreated dental disease were seen in children with government or no dental insurance, children enrolled in the Free/Reduced Lunch program, minority children and children attending schools in the City of Detroit and the Upper Peninsula.
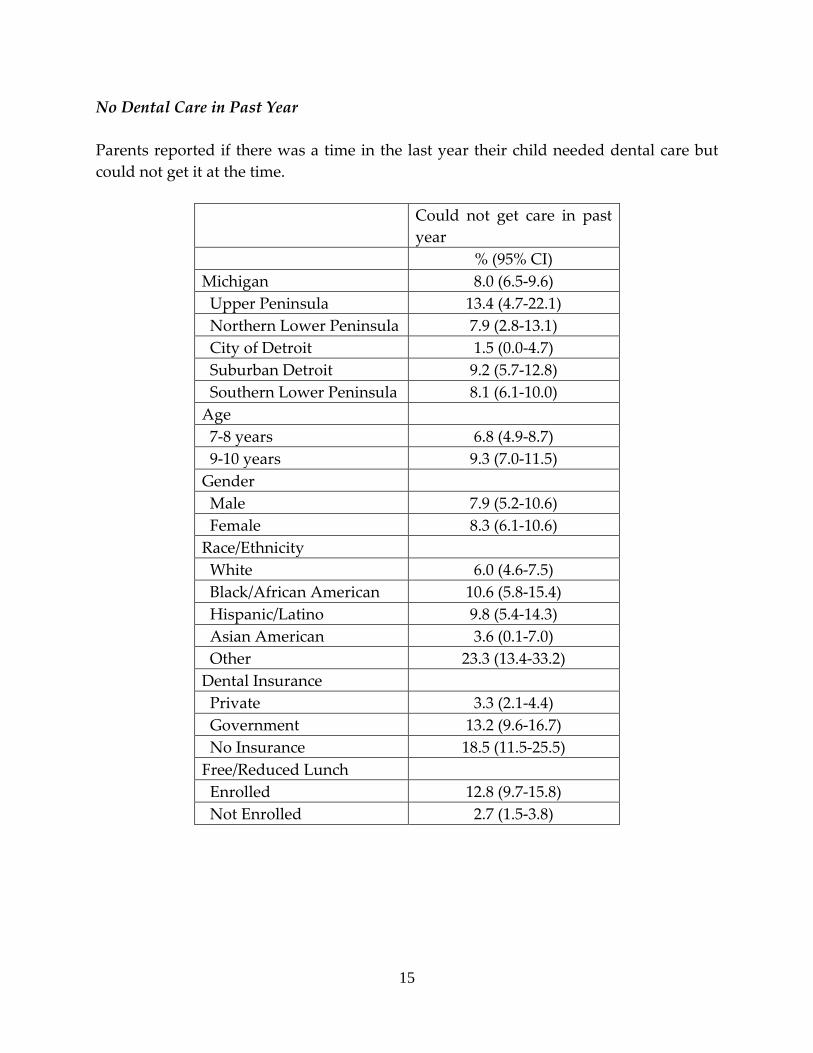
Access to Oral Health Services: • Nearly one in twelve Michigan 3rd grade children, 8.0%, encountered problems
that prevented them from getting dental care in the past year. Children attending school in the Upper Peninsula and children without dental insurance were more likely to have trouble getting dental care.
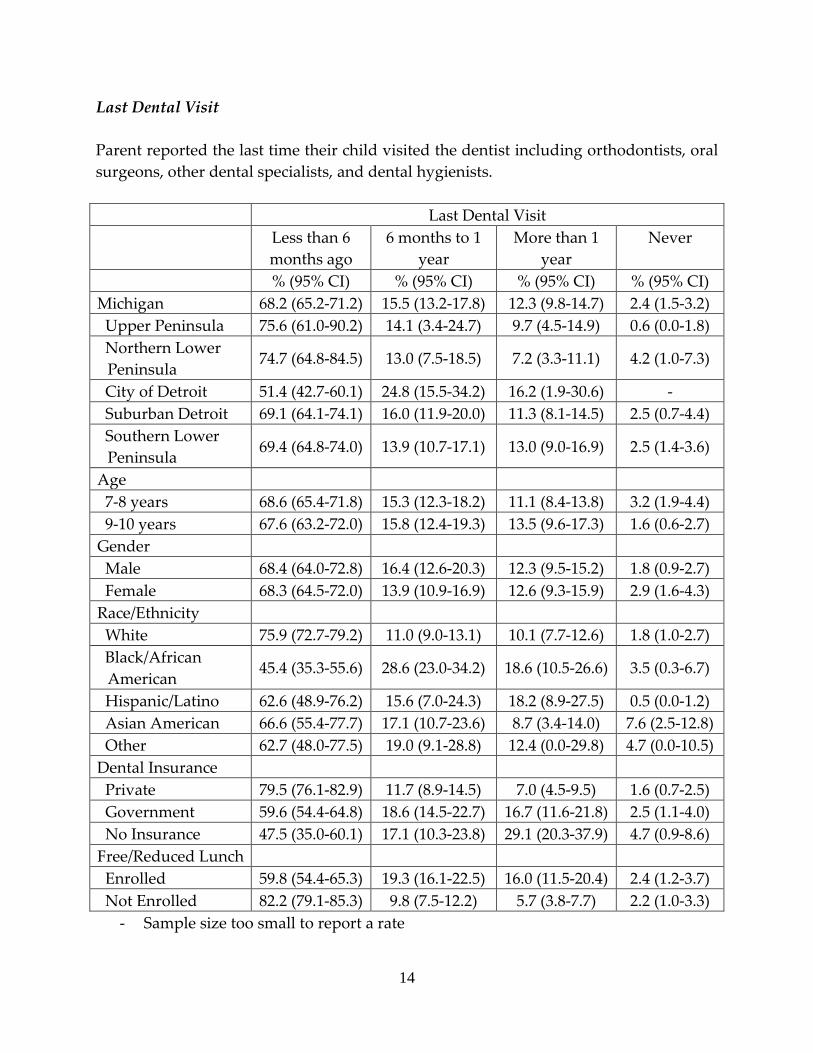
• Most children (83.7%) visited a dentist in the past year, as reported by parents.
4
Introduction
In 2000, the United States Surgeon General’s Report: Oral Health in America documented a “silent epidemic of oral disease affecting our most vulnerable citizens” (USDHHS, 2000). This report identified a substantial unmet need for dental care and disparities in oral disease. Oral health care is essential to overall health and well-being. Poor oral health can contribute to difficulties learning, nutritional deficiencies, and low self-esteem (Holt & Barzel, 2013). Routine dental visits provide opportunities to prevent or delay dental disease. However, substantial disparities exist in the access of routine preventive dental care (Flores & Lin, 2013). Additional preventive measures include the use of sealants, which are a transparent or opaque material that covers and protects the pit and fissure surfaces of teeth. Sealants, when retained, provide a cost-effective method of decay prevention (Chi, van der Goes & Ney, 2014). Often, children encounter barriers to accessing dental care and preventive dental services. These access-related barriers range from a lack of insurance to the inability to speak English (Finlayson, Gansky, Shain, & Weintraub 2014). In an effort to improve dental outcomes, several objectives aimed at preventing and treating oral disease in children as well as improving access to dental services have been included in Healthy People 2020 (HP2020). The “Count Your Smiles” (CYS) survey was designed to address dental outcomes in Michigan that pertain to Healthy People objectives. In addition, CYS provides a follow-up to statewide estimates of child dental disease in Michigan from CYS surveys conducted in 2005-2006 and 2009-2010. These surveys track trends of oral health in the state and contribute to Michigan’s overall oral health surveillance system. The CYS survey addressed health disparities among children for both dental disease and access to dental care.
Methods
SELECTION OF SCHOOLS Michigan elementary schools were randomly selected through systematic probability proportional to size (PPS) sampling from ordered lists of schools in four regions of the state: the Upper Peninsula, the Northern Lower Peninsula, the Southern Lower Peninsula, and Wayne/Oakland/Macomb counties (metropolitan Detroit). The sampling frame was based upon school enrollment information from the 2014-2015 school year. The number of schools chosen in each region was proportional to state public school 3rd
5
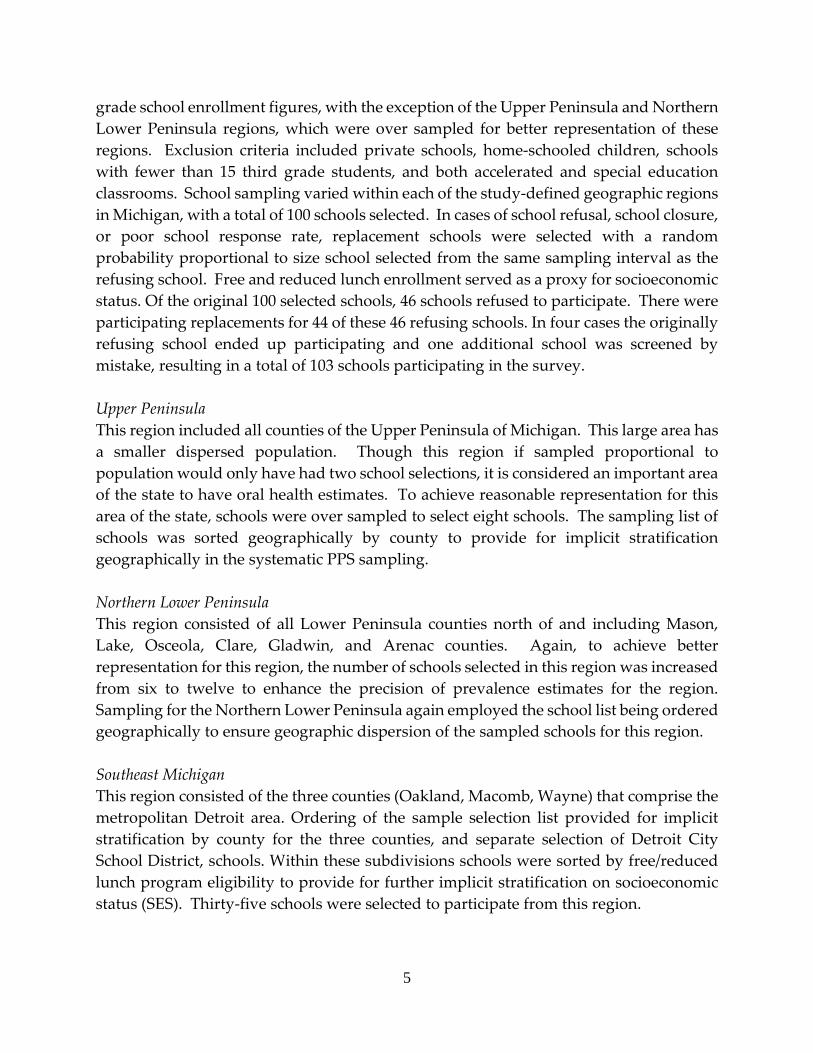
grade school enrollment figures, with the exception of the Upper Peninsula and Northern Lower Peninsula regions, which were over sampled for better representation of these regions. Exclusion criteria included private schools, home-schooled children, schools with fewer than 15 third grade students, and both accelerated and special education classrooms. School sampling varied within each of the study-defined geographic regions in Michigan, with a total of 100 schools selected. In cases of school refusal, school closure, or poor school response rate, replacement schools were selected with a random probability proportional to size school selected from the same sampling interval as the refusing school. Free and reduced lunch enrollment served as a proxy for socioeconomic status. Of the original 100 selected schools, 46 schools refused to participate. There were participating replacements for 44 of these 46 refusing schools. In four cases the originally refusing school ended up participating and one additional school was screened by mistake, resulting in a total of 103 schools participating in the survey. Upper Peninsula This region included all counties of the Upper Peninsula of Michigan. This large area has a smaller dispersed population. Though this region if sampled proportional to population would only have had two school selections, it is considered an important area of the state to have oral health estimates. To achieve reasonable representation for this area of the state, schools were over sampled to select eight schools. The sampling list of schools was sorted geographically by county to provide for implicit stratification geographically in the systematic PPS sampling. Northern Lower Peninsula This region consisted of all Lower Peninsula counties north of and including Mason, Lake, Osceola, Clare, Gladwin, and Arenac counties. Again, to achieve better representation for this region, the number of schools selected in this region was increased from six to twelve to enhance the precision of prevalence estimates for the region. Sampling for the Northern Lower Peninsula again employed the school list being ordered geographically to ensure geographic dispersion of the sampled schools for this region. Southeast Michigan This region consisted of the three counties (Oakland, Macomb, Wayne) that comprise the metropolitan Detroit area. Ordering of the sample selection list provided for implicit stratification by county for the three counties, and separate selection of Detroit City School District, schools. Within these subdivisions schools were sorted by free/reduced lunch program eligibility to provide for further implicit stratification on socioeconomic status (SES). Thirty-five schools were selected to participate from this region.
6
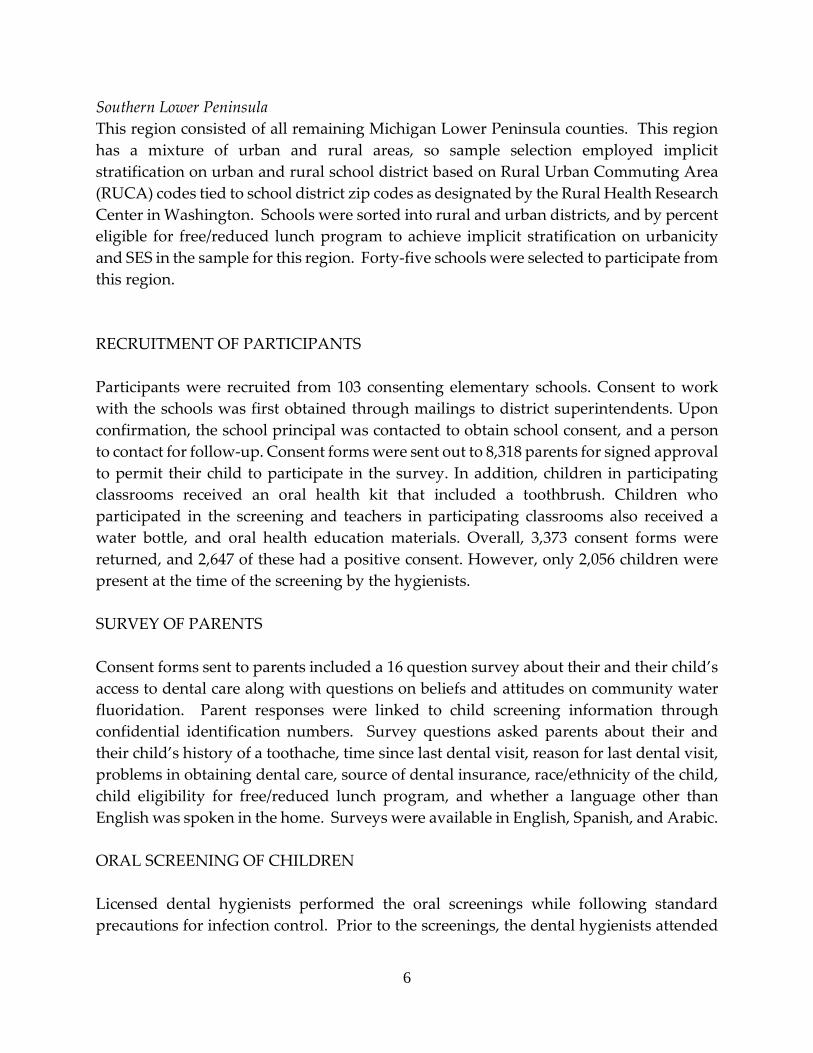
Southern Lower Peninsula This region consisted of all remaining Michigan Lower Peninsula counties. This region has a mixture of urban and rural areas, so sample selection employed implicit stratification on urban and rural school district based on Rural Urban Commuting Area (RUCA) codes tied to school district zip codes as designated by the Rural Health Research Center in Washington. Schools were sorted into rural and urban districts, and by percent eligible for free/reduced lunch program to achieve implicit stratification on urbanicity and SES in the sample for this region. Forty-five schools were selected to participate from this region. RECRUITMENT OF PARTICIPANTS Participants were recruited from 103 consenting elementary schools. Consent to work with the schools was first obtained through mailings to district superintendents. Upon confirmation, the school principal was contacted to obtain school consent, and a person to contact for follow-up. Consent forms were sent out to 8,318 parents for signed approval to permit their child to participate in the survey. In addition, children in participating classrooms received an oral health kit that included a toothbrush. Children who participated in the screening and teachers in participating classrooms also received a water bottle, and oral health education materials. Overall, 3,373 consent forms were returned, and 2,647 of these had a positive consent. However, only 2,056 children were present at the time of the screening by the hygienists. SURVEY OF PARENTS Consent forms sent to parents included a 16 question survey about their and their child’s access to dental care along with questions on beliefs and attitudes on community water fluoridation. Parent responses were linked to child screening information through confidential identification numbers. Survey questions asked parents about their and their child’s history of a toothache, time since last dental visit, reason for last dental visit, problems in obtaining dental care, source of dental insurance, race/ethnicity of the child, child eligibility for free/reduced lunch program, and whether a language other than English was spoken in the home. Surveys were available in English, Spanish, and Arabic. ORAL SCREENING OF CHILDREN Licensed dental hygienists performed the oral screenings while following standard precautions for infection control. Prior to the screenings, the dental hygienists attended
7
a training session to standardize measurement of dental disease and to facilitate the school screening.
ANALYSIS Analysis sample weights were calculated for each child in the survey based on the sampling design employed. Weight calculations were based on the stratification of schools by region, and within region sample stratification based on geography, urbanicity, and/or socio-economic status (using percentage of children on free reduced lunch as a proxy measure) depending on the region. As described in the previous section on selection of schools, sampling intervals were created based on these stratification factors. Screened children were assigned weights based on their probability of selection from children within their sampling interval. Weights therefore reflect the number of Michigan 3rd grade children that each screened child represented. These analysis weights and sample design stratification and clustering specifications were used with SAS 9.4 statistical software to generate valid population-based estimates of results. The Michigan Department of Health and Human Services Institutional Review Board reviewed this survey.
8
Results
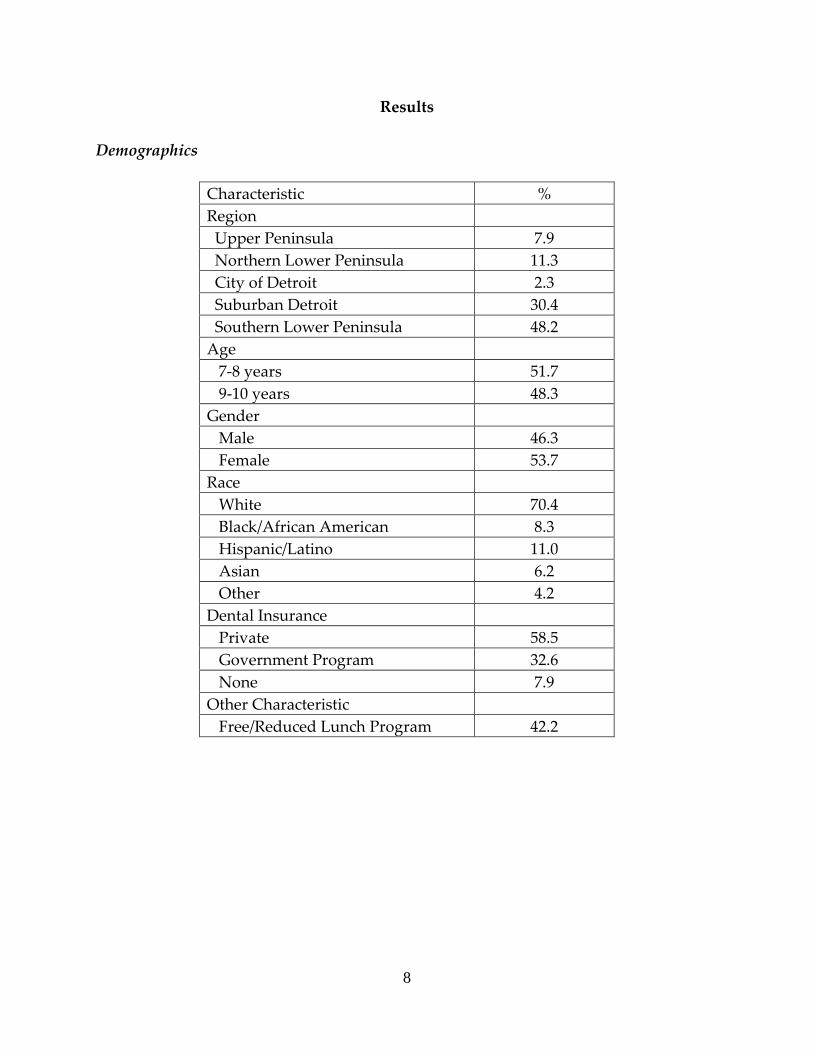
Demographics
Characteristic % Region Upper Peninsula 7.9 Northern Lower Peninsula 11.3 City of Detroit 2.3 Suburban Detroit 30.4 Southern Lower Peninsula 48.2 Age 7-8 years 51.7 9-10 years 48.3 Gender Male 46.3 Female 53.7 Race White 70.4 Black/African American 8.3 Hispanic/Latino 11.0 Asian 6.2 Other 4.2 Dental Insurance Private 58.5 Government Program 32.6 None 7.9 Other Characteristic Free/Reduced Lunch Program 42.2
9
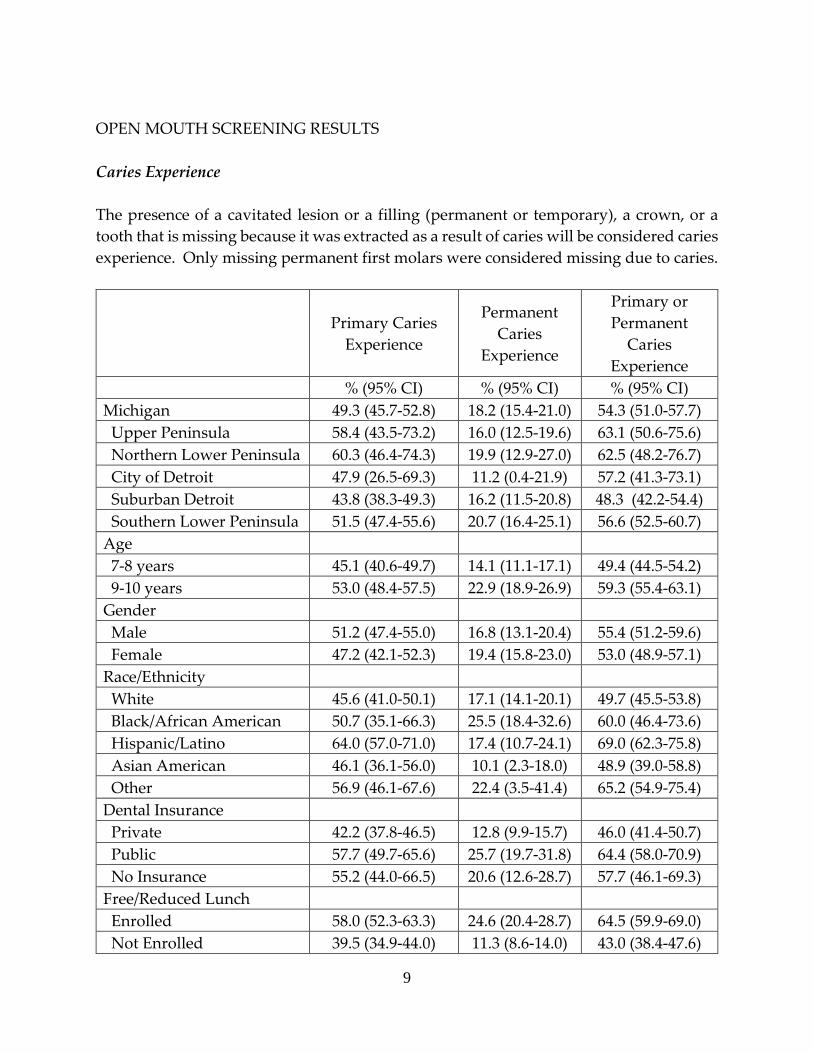
OPEN MOUTH SCREENING RESULTS Caries Experience The presence of a cavitated lesion or a filling (permanent or temporary), a crown, or a tooth that is missing because it was extracted as a result of caries will be considered caries experience. Only missing permanent first molars were considered missing due to caries.
Primary Caries Experience
Permanent Caries
Experience
Primary or Permanent
Caries Experience
% (95% CI) % (95% CI) % (95% CI) Michigan 49.3 (45.7-52.8) 18.2 (15.4-21.0) 54.3 (51.0-57.7) Upper Peninsula 58.4 (43.5-73.2) 16.0 (12.5-19.6) 63.1 (50.6-75.6) Northern Lower Peninsula 60.3 (46.4-74.3) 19.9 (12.9-27.0) 62.5 (48.2-76.7) City of Detroit 47.9 (26.5-69.3) 11.2 (0.4-21.9) 57.2 (41.3-73.1) Suburban Detroit 43.8 (38.3-49.3) 16.2 (11.5-20.8) 48.3 (42.2-54.4) Southern Lower Peninsula 51.5 (47.4-55.6) 20.7 (16.4-25.1) 56.6 (52.5-60.7) Age 7-8 years 45.1 (40.6-49.7) 14.1 (11.1-17.1) 49.4 (44.5-54.2) 9-10 years 53.0 (48.4-57.5) 22.9 (18.9-26.9) 59.3 (55.4-63.1) Gender Male 51.2 (47.4-55.0) 16.8 (13.1-20.4) 55.4 (51.2-59.6) Female 47.2 (42.1-52.3) 19.4 (15.8-23.0) 53.0 (48.9-57.1) Race/Ethnicity White 45.6 (41.0-50.1) 17.1 (14.1-20.1) 49.7 (45.5-53.8) Black/African American 50.7 (35.1-66.3) 25.5 (18.4-32.6) 60.0 (46.4-73.6) Hispanic/Latino 64.0 (57.0-71.0) 17.4 (10.7-24.1) 69.0 (62.3-75.8) Asian American 46.1 (36.1-56.0) 10.1 (2.3-18.0) 48.9 (39.0-58.8) Other 56.9 (46.1-67.6) 22.4 (3.5-41.4) 65.2 (54.9-75.4) Dental Insurance Private 42.2 (37.8-46.5) 12.8 (9.9-15.7) 46.0 (41.4-50.7) Public 57.7 (49.7-65.6) 25.7 (19.7-31.8) 64.4 (58.0-70.9) No Insurance 55.2 (44.0-66.5) 20.6 (12.6-28.7) 57.7 (46.1-69.3) Free/Reduced Lunch Enrolled 58.0 (52.3-63.3) 24.6 (20.4-28.7) 64.5 (59.9-69.0) Not Enrolled 39.5 (34.9-44.0) 11.3 (8.6-14.0) 43.0 (38.4-47.6)
10
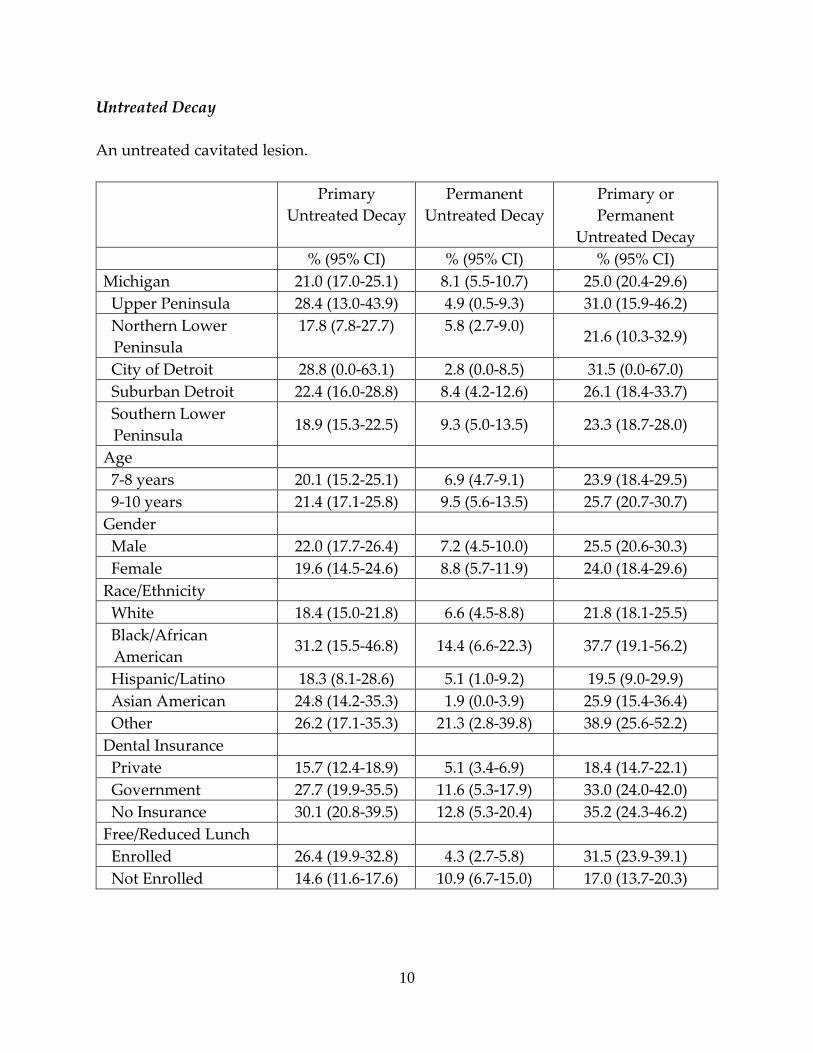
Untreated Decay An untreated cavitated lesion. Primary
Untreated Decay Permanent
Untreated Decay Primary or Permanent
Untreated Decay % (95% CI) % (95% CI) % (95% CI) Michigan 21.0 (17.0-25.1) 8.1 (5.5-10.7) 25.0 (20.4-29.6) Upper Peninsula 28.4 (13.0-43.9) 4.9 (0.5-9.3) 31.0 (15.9-46.2) Northern Lower
Peninsula 17.8 (7.8-27.7) 5.8 (2.7-9.0) 21.6 (10.3-32.9)
City of Detroit 28.8 (0.0-63.1) 2.8 (0.0-8.5) 31.5 (0.0-67.0) Suburban Detroit 22.4 (16.0-28.8) 8.4 (4.2-12.6) 26.1 (18.4-33.7) Southern Lower
Peninsula 18.9 (15.3-22.5) 9.3 (5.0-13.5) 23.3 (18.7-28.0)
Age 7-8 years 20.1 (15.2-25.1) 6.9 (4.7-9.1) 23.9 (18.4-29.5) 9-10 years 21.4 (17.1-25.8) 9.5 (5.6-13.5) 25.7 (20.7-30.7) Gender Male 22.0 (17.7-26.4) 7.2 (4.5-10.0) 25.5 (20.6-30.3) Female 19.6 (14.5-24.6) 8.8 (5.7-11.9) 24.0 (18.4-29.6) Race/Ethnicity White 18.4 (15.0-21.8) 6.6 (4.5-8.8) 21.8 (18.1-25.5) Black/African
American 31.2 (15.5-46.8) 14.4 (6.6-22.3) 37.7 (19.1-56.2)
Hispanic/Latino 18.3 (8.1-28.6) 5.1 (1.0-9.2) 19.5 (9.0-29.9) Asian American 24.8 (14.2-35.3) 1.9 (0.0-3.9) 25.9 (15.4-36.4) Other 26.2 (17.1-35.3) 21.3 (2.8-39.8) 38.9 (25.6-52.2) Dental Insurance Private 15.7 (12.4-18.9) 5.1 (3.4-6.9) 18.4 (14.7-22.1) Government 27.7 (19.9-35.5) 11.6 (5.3-17.9) 33.0 (24.0-42.0) No Insurance 30.1 (20.8-39.5) 12.8 (5.3-20.4) 35.2 (24.3-46.2) Free/Reduced Lunch Enrolled 26.4 (19.9-32.8) 4.3 (2.7-5.8) 31.5 (23.9-39.1) Not Enrolled 14.6 (11.6-17.6) 10.9 (6.7-15.0) 17.0 (13.7-20.3)
11
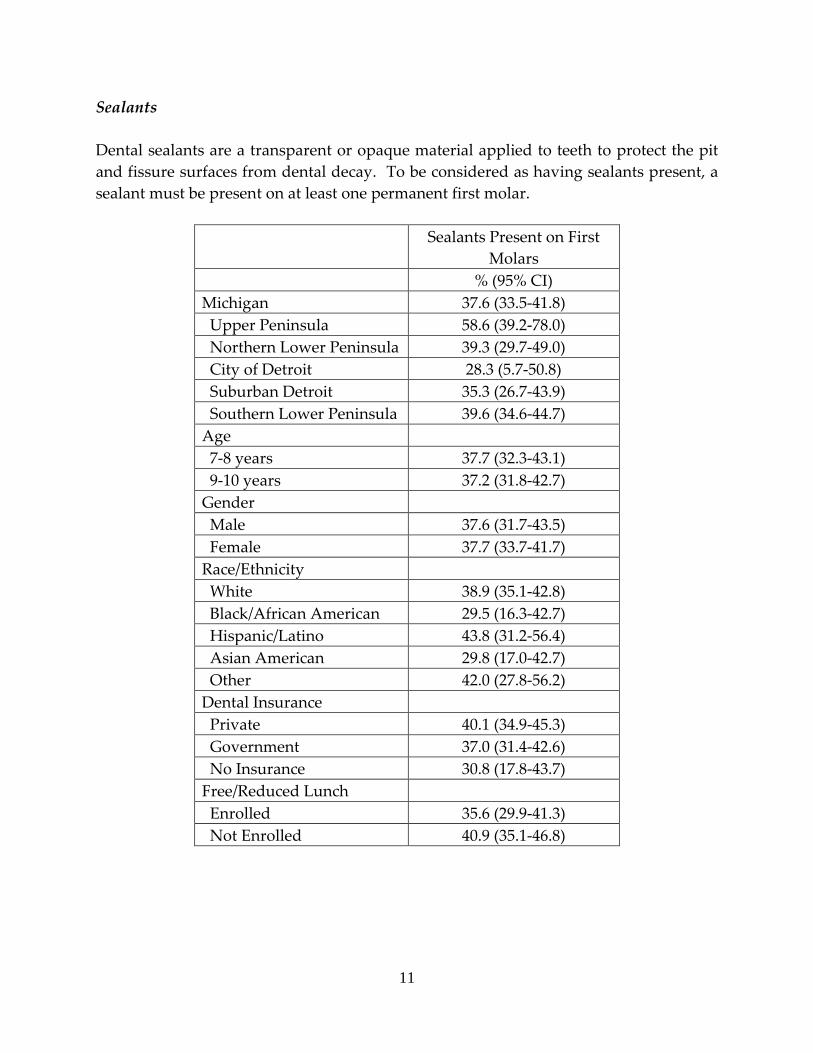
Sealants Dental sealants are a transparent or opaque material applied to teeth to protect the pit and fissure surfaces from dental decay. To be considered as having sealants present, a sealant must be present on at least one permanent first molar.
Sealants Present on First Molars
% (95% CI) Michigan 37.6 (33.5-41.8) Upper Peninsula 58.6 (39.2-78.0) Northern Lower Peninsula 39.3 (29.7-49.0) City of Detroit 28.3 (5.7-50.8) Suburban Detroit 35.3 (26.7-43.9) Southern Lower Peninsula 39.6 (34.6-44.7) Age 7-8 years 37.7 (32.3-43.1) 9-10 years 37.2 (31.8-42.7) Gender Male 37.6 (31.7-43.5) Female 37.7 (33.7-41.7) Race/Ethnicity White 38.9 (35.1-42.8) Black/African American 29.5 (16.3-42.7) Hispanic/Latino 43.8 (31.2-56.4) Asian American 29.8 (17.0-42.7) Other 42.0 (27.8-56.2) Dental Insurance Private 40.1 (34.9-45.3) Government 37.0 (31.4-42.6) No Insurance 30.8 (17.8-43.7) Free/Reduced Lunch Enrolled 35.6 (29.9-41.3) Not Enrolled 40.9 (35.1-46.8)
12
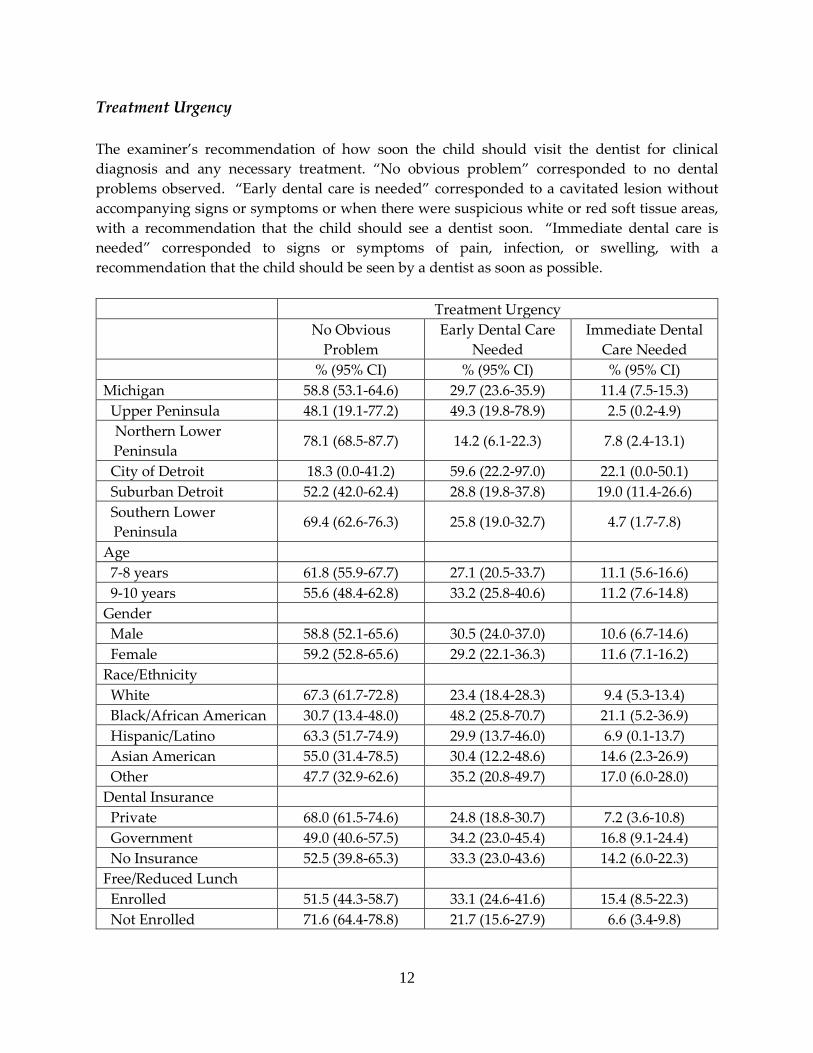
Treatment Urgency The examiner’s recommendation of how soon the child should visit the dentist for clinical diagnosis and any necessary treatment. “No obvious problem” corresponded to no dental problems observed. “Early dental care is needed” corresponded to a cavitated lesion without accompanying signs or symptoms or when there were suspicious white or red soft tissue areas, with a recommendation that the child should see a dentist soon. “Immediate dental care is needed” corresponded to signs or symptoms of pain, infection, or swelling, with a recommendation that the child should be seen by a dentist as soon as possible.
Treatment Urgency No Obvious
Problem Early Dental Care
Needed Immediate Dental
Care Needed % (95% CI) % (95% CI) % (95% CI) Michigan 58.8 (53.1-64.6) 29.7 (23.6-35.9) 11.4 (7.5-15.3) Upper Peninsula 48.1 (19.1-77.2) 49.3 (19.8-78.9) 2.5 (0.2-4.9) Northern Lower Peninsula
78.1 (68.5-87.7) 14.2 (6.1-22.3) 7.8 (2.4-13.1)
City of Detroit 18.3 (0.0-41.2) 59.6 (22.2-97.0) 22.1 (0.0-50.1) Suburban Detroit 52.2 (42.0-62.4) 28.8 (19.8-37.8) 19.0 (11.4-26.6) Southern Lower
Peninsula 69.4 (62.6-76.3) 25.8 (19.0-32.7) 4.7 (1.7-7.8)
Age 7-8 years 61.8 (55.9-67.7) 27.1 (20.5-33.7) 11.1 (5.6-16.6) 9-10 years 55.6 (48.4-62.8) 33.2 (25.8-40.6) 11.2 (7.6-14.8) Gender Male 58.8 (52.1-65.6) 30.5 (24.0-37.0) 10.6 (6.7-14.6) Female 59.2 (52.8-65.6) 29.2 (22.1-36.3) 11.6 (7.1-16.2) Race/Ethnicity White 67.3 (61.7-72.8) 23.4 (18.4-28.3) 9.4 (5.3-13.4) Black/African American 30.7 (13.4-48.0) 48.2 (25.8-70.7) 21.1 (5.2-36.9) Hispanic/Latino 63.3 (51.7-74.9) 29.9 (13.7-46.0) 6.9 (0.1-13.7) Asian American 55.0 (31.4-78.5) 30.4 (12.2-48.6) 14.6 (2.3-26.9) Other 47.7 (32.9-62.6) 35.2 (20.8-49.7) 17.0 (6.0-28.0) Dental Insurance Private 68.0 (61.5-74.6) 24.8 (18.8-30.7) 7.2 (3.6-10.8) Government 49.0 (40.6-57.5) 34.2 (23.0-45.4) 16.8 (9.1-24.4) No Insurance 52.5 (39.8-65.3) 33.3 (23.0-43.6) 14.2 (6.0-22.3) Free/Reduced Lunch Enrolled 51.5 (44.3-58.7) 33.1 (24.6-41.6) 15.4 (8.5-22.3) Not Enrolled 71.6 (64.4-78.8) 21.7 (15.6-27.9) 6.6 (3.4-9.8)
13
DENTAL BEHAVIOR RESULTS Toothache in the Past 6 Months
Parents reported if their child had a toothache more than once when biting or chewing in the past month.
Toothache in past 6 months % (95% CI) Michigan 12.3 (10.3-14.4) Upper Peninsula 7.6 (3.1-12.1) Northern Lower Peninsula 10.6 (7.8-13.3) City of Detroit 17.6 (9.7-25.4) Suburban Detroit 14.9 (10.6-19.2) Southern Lower Peninsula 10.2 (7.6-12.8) Age 7-8 years 12.6 (10.1-15.1) 9-10 years 12.2 (9.4-14.9) Gender Male 10.5 (7.8-13.1) Female 14.3 (11.6-17.0) Race/Ethnicity White 8.6 (6.5-10.7) Black/African American 18.4 (12.2-24.6) Hispanic/Latino 23.0 (17.4-28.7) Asian American 9.8 (4.0-15.6) Other 11.0 (2.4-19.5) Dental Insurance Private 8.1 (6.0-10.3) Government 18.5 (13.0-24.0) No Insurance 11.7 (6.3-17.1) Free/Reduced Lunch Enrolled 17.8 (13.7-21.9) Not Enrolled 6.7 (4.9-8.5)
14
Last Dental Visit Parent reported the last time their child visited the dentist including orthodontists, oral surgeons, other dental specialists, and dental hygienists. Last Dental Visit Less than 6
months ago 6 months to 1
year More than 1
year Never
% (95% CI) % (95% CI) % (95% CI) % (95% CI) Michigan 68.2 (65.2-71.2) 15.5 (13.2-17.8) 12.3 (9.8-14.7) 2.4 (1.5-3.2) Upper Peninsula 75.6 (61.0-90.2) 14.1 (3.4-24.7) 9.7 (4.5-14.9) 0.6 (0.0-1.8) Northern Lower
Peninsula 74.7 (64.8-84.5) 13.0 (7.5-18.5) 7.2 (3.3-11.1) 4.2 (1.0-7.3)
City of Detroit 51.4 (42.7-60.1) 24.8 (15.5-34.2) 16.2 (1.9-30.6) - Suburban Detroit 69.1 (64.1-74.1) 16.0 (11.9-20.0) 11.3 (8.1-14.5) 2.5 (0.7-4.4) Southern Lower
Peninsula 69.4 (64.8-74.0) 13.9 (10.7-17.1) 13.0 (9.0-16.9) 2.5 (1.4-3.6)
Age 7-8 years 68.6 (65.4-71.8) 15.3 (12.3-18.2) 11.1 (8.4-13.8) 3.2 (1.9-4.4) 9-10 years 67.6 (63.2-72.0) 15.8 (12.4-19.3) 13.5 (9.6-17.3) 1.6 (0.6-2.7) Gender Male 68.4 (64.0-72.8) 16.4 (12.6-20.3) 12.3 (9.5-15.2) 1.8 (0.9-2.7) Female 68.3 (64.5-72.0) 13.9 (10.9-16.9) 12.6 (9.3-15.9) 2.9 (1.6-4.3) Race/Ethnicity White 75.9 (72.7-79.2) 11.0 (9.0-13.1) 10.1 (7.7-12.6) 1.8 (1.0-2.7) Black/African
American 45.4 (35.3-55.6) 28.6 (23.0-34.2) 18.6 (10.5-26.6) 3.5 (0.3-6.7)
Hispanic/Latino 62.6 (48.9-76.2) 15.6 (7.0-24.3) 18.2 (8.9-27.5) 0.5 (0.0-1.2) Asian American 66.6 (55.4-77.7) 17.1 (10.7-23.6) 8.7 (3.4-14.0) 7.6 (2.5-12.8) Other 62.7 (48.0-77.5) 19.0 (9.1-28.8) 12.4 (0.0-29.8) 4.7 (0.0-10.5) Dental Insurance Private 79.5 (76.1-82.9) 11.7 (8.9-14.5) 7.0 (4.5-9.5) 1.6 (0.7-2.5) Government 59.6 (54.4-64.8) 18.6 (14.5-22.7) 16.7 (11.6-21.8) 2.5 (1.1-4.0) No Insurance 47.5 (35.0-60.1) 17.1 (10.3-23.8) 29.1 (20.3-37.9) 4.7 (0.9-8.6) Free/Reduced Lunch Enrolled 59.8 (54.4-65.3) 19.3 (16.1-22.5) 16.0 (11.5-20.4) 2.4 (1.2-3.7) Not Enrolled 82.2 (79.1-85.3) 9.8 (7.5-12.2) 5.7 (3.8-7.7) 2.2 (1.0-3.3)
- Sample size too small to report a rate
15
No Dental Care in Past Year Parents reported if there was a time in the last year their child needed dental care but could not get it at the time.
Could not get care in past year
% (95% CI) Michigan 8.0 (6.5-9.6) Upper Peninsula 13.4 (4.7-22.1) Northern Lower Peninsula 7.9 (2.8-13.1) City of Detroit 1.5 (0.0-4.7) Suburban Detroit 9.2 (5.7-12.8) Southern Lower Peninsula 8.1 (6.1-10.0) Age 7-8 years 6.8 (4.9-8.7) 9-10 years 9.3 (7.0-11.5) Gender Male 7.9 (5.2-10.6) Female 8.3 (6.1-10.6) Race/Ethnicity White 6.0 (4.6-7.5) Black/African American 10.6 (5.8-15.4) Hispanic/Latino 9.8 (5.4-14.3) Asian American 3.6 (0.1-7.0) Other 23.3 (13.4-33.2) Dental Insurance Private 3.3 (2.1-4.4) Government 13.2 (9.6-16.7) No Insurance 18.5 (11.5-25.5) Free/Reduced Lunch Enrolled 12.8 (9.7-15.8) Not Enrolled 2.7 (1.5-3.8)
16
References Chi, D. L., van der Goes, D. N., & Ney, J. P. (2014). Cost-Effectiveness of Pit-and-Fissure
Sealants on Primary Molars in Medicaid-Enrolled Children. American Journal of
Public Health, 104(3), 555–561. http://doi.org/10.2105/AJPH.2013.301588
Finlayson, T. L., Gansky, S. A., Shain, S. G., & Weintraub, J. A. (2014). Dental utilization
by children in Hispanic agricultural worker families in California. Journal of
Dental, Oral and Craniofacial Epidemiology, 2(1-2), 15–24.
Flores, G., & Lin, H. (2013). Trends in racial/ethnic disparities in medical and oral
health, access to care, and use of services in US children: has anything changed
over the years? International Journal for Equity in Health, 12, 10.
http://doi.org/10.1186/1475-9276-12-10
Holt K. & Barzel R. (2013). Oral health and learning: When children’s oral health suffers, so
does their ability to learn [PDF] (3rd ed.). Washington, DC: National Maternal and
Child Oral Health Resource Center. Retrieved from:
https://www.mchoralhealth.org/PDFs/learningfactsheet.pdf
US Department of Health and Human Services. (2000). Oral health in America: A report of the
Surgeon General-- Executive summary . Rockville, MD: National Institute of Dental and
Craniofacial Research, National Institutes of Health. Retrieved from:
https://www.nidcr.nih.gov/DataStatistics/SurgeonGeneral/Report/ExecutiveSummary.ht
m#foreword


