Embed Size (px)
Citation preview
Phil. Trans. R. Soc. B (2005) 360, 1959–1967
doi:10.1098/rstb.2005.1727
Critical factors for assembling a high volumeof DNA barcodes
Published online 8 September 2005
Mehrdad Hajibabaei*, Jeremy R. deWaard, Natalia V. Ivanova,
Sujeevan Ratnasingham, Robert T. Dooh, Stephanie L. Kirk,
Paula M. Mackie and Paul D. N. Hebert
One con
*Autho
Biodiversity Institute of Ontario, Department of Integrative Biology, University of Guelph,Guelph, ON, Canada N1G 2W1
Large-scale DNA barcoding projects are now moving toward activation while the creation of acomprehensive barcode library for eukaryotes will ultimately require the acquisition of some 100million barcodes. To satisfy this need, analytical facilities must adopt protocols that can support therapid, cost-effective assembly of barcodes. In this paper we discuss the prospects for establishing highvolume DNA barcoding facilities by evaluating key steps in the analytical chain from specimens tobarcodes. Alliances with members of the taxonomic community represent the most effective strategyfor provisioning the analytical chain with specimens. The optimal protocols for DNA extraction andsubsequent PCR amplification of the barcode region depend strongly on their condition, butproduction targets of 100K barcode records per year are now feasible for facilities working withcompliant specimens. The analysis of museum collections is currently challenging, but PCR cocktailsthat combine polymerases with repair enzyme(s) promise future success. Barcode analysis is already acost-effective option for species identification in some situations and this will increasingly be the caseas reference libraries are assembled and analytical protocols are simplified.
Keywords: museum specimens; DNA isolation; PCR; species identification; taxonomy; cox1
1. ASSEMBLING DNA BARCODES: THECHALLENGEDNA barcoding promises fast, accurate species identi-fications by focusing analysis on a short standardizedsegment of the genome (Hebert et al. 2003). Severalstudies have now established that sequence diversity ina w650 bp region near the 5 0 end of the mitochondrialcytochrome oxidase subunit I (cox1; also referred to asCOI) gene provides strong species-level resolution forvaried animal groups including birds (Hebert et al.2004b), fishes (Ward et al. 2005), springtails (Hogg &Hebert 2005), spiders (Barrett & Hebert 2005) andmoths (Hebert et al. 2003; Janzen et al. 2005). Theseearly results have provoked larger-scale barcodingefforts and global projects for fishes and birds havenow been initiated (Marshall 2005). These projectsrepresent the first wave in a series of initiatives whichwill demand the capability to assemble barcodesrapidly and cost-effectively. As one looks further tothe future, the need for substantial analytical capacitylooms. For example, an effort to barcode the 1.7million described species (Hawksworth 1995) wouldrequire the assembly of some 20 million barcodes,given a target of about 10 barcodes per species. Thistotal will rise fivefold if barcode coverage is desired forall 10 million eukaryote species (e.g. Hammond 1992),producing a sequence library of 65 billion base pairs,approximately twice the current size of GenBank (April
tribution of 18 to a Theme Issue ‘DNA barcoding of life’.
r for correspondence ([email protected]).
1959
2005). This task could be completed within a decadeby establishing 50 core laboratories, each producing200 000 barcode records per year. When viewed fromthe perspective of major genomic facilities, some ofwhich generate more than 50 million sequences a year,the production goals for barcode facilities may seemmodest. However the business of generating barcodesis complex; each record represents a sequence derivedfrom a specimen that had to be collected, archived anddatabased.
In the balance of this paper, we direct most of ourattention to an evaluation of how the primary steps inthe analytical chain extending from specimens tobarcode records can be optimized, scaled up andeconomized. Because the single most critical step toachieve high production involves a move from proto-cols based on single specimens to those compatiblewith 96-well format, we only consider methodscompliant with this approach.
2. SPECIMENS(a) Sourcing specimens
Specimens are the raw material for any barcode facility.This need can be met most easily by sequencing allspecimens encountered, but because of the lognormaldistribution of species abundance (May 1975), most ofthe resultant sequences will derive from a few commonspecies. Collaborations with taxonomists represent afar more effective strategy for provisioning the analyti-cal chain with specimens ( Janzen et al. 2005; Smithet al. 2005; Ward et al. 2005). With this approach, it is
q 2005 The Royal Society
1960 M. Hajibabaei and others High-volume DNA barcoding
feasible to assemble a library of sequences that providesboth broad species coverage and similar samplingintensity across species (e.g. 10 barcodes each). More-over, sample sizes can be increased in cases wherecomplexities, such as cryptic species, are encounteredin the first pass (Hebert et al. 2004a; Janzen et al. 2005).
We have adopted the TrakMates micro-plate system(Matrix Technologies, Hudson, NH, USA) to force theorganization of specimen shipments into the blocks of96 needed for the later stages of analysis. One micro-plate holds 96 vials (94 specimens, two controls), eachuniquely barcoded on the bottom of the vial. Thesebarcoded vials can be rapidly scanned, aiding thetracking of specimens as they enter the analytical chain.Aside from an organized flow of specimens to thebarcode facility, there is a critical need for the firmconnection of specimens to their collaterals. Tofacilitate this, we have developed a spreadsheet thatorganizes key specimen information. We have, as well,developed web-based software to both organize thespecimen information and to connect each barcodesequence with its source specimen (see below).
(b) Preservation/handlingWhenever possible, animal specimens should be killedand preserved in a DNA-friendly fashion (freezing,cyanide and ethanol). Even brief exposure to agentsthat damage DNA, such as ethyl acetate or formal-dehyde, should be avoided (Prendini et al. 2002).Whilefresh or freshly frozen tissues are ideal for analysis,DNA in dried specimens ordinarily remains easilyanalysed for 5 years, although degradation rises as timepasses. Specimens preserved in absolute ethanol areeasily analysed when young, but acidification soondegrades their DNA unless it is regularly replaced orbuffered. As a general principle, barcode analysisshould follow collection as soon as possible, but delaysof a few months will cause little problem.
To minimize external or cross-contamination, alltissue samples should be handled on a clean workingsurface and all instruments should be acid or flamesterilized before handling a new specimen. When using96-well plates for tissue assembly, particular care mustbe taken when adding samples to avoid cross-contamination between wells.
(c) The importance of archival specimens
Natural history museums and herbaria maintain mostof the world’s known biodiversity within their collec-tions. In some groups, species coverage may be nearlycomplete. For example, museums hold nearly 10million bird specimens (Roselaar 2003), assuringdeep coverage for most of the 10 000 known species.The analysis of museum specimens could enable rapidgrowth in barcode coverage ( Janzen et al. 2005).Unfortunately, they are generally poor targets foranalysis because of DNA degradation due to hydrolysisand oxidation (Lindahl 1993), exposure to ultravioletlight (Eglinton & Logan 1991) and preservation agentssuch as formaldehyde (Schander & Halanych 2003).Methods used to retrieve DNA from museum speci-mens typically aim to isolate DNA with high efficiency( Junqueira et al. 2002). Because many copies of themitochondrial genome are present in each cell, its
Phil. Trans. R. Soc. B (2005)
component genes, such as cox1, represent optimaltargets for analysis in archival specimens. However,because the template DNA is degraded, few ampliconslonger than 300–400 bp can be obtained from speci-mens more than a decade old (Su et al. 1999; Junqueiraet al. 2002; Rohland et al. 2004). When degradation isparticularly severe, one common strategy involves theamplification of less than 100 bp DNA fragments(Goldstein & Desalle 2003). In such cases, obtaininga DNA barcode will require the concatenation ofseveral short sequences (i.e. Su et al. 1999).
3. DNA ISOLATION(a) Different strategies
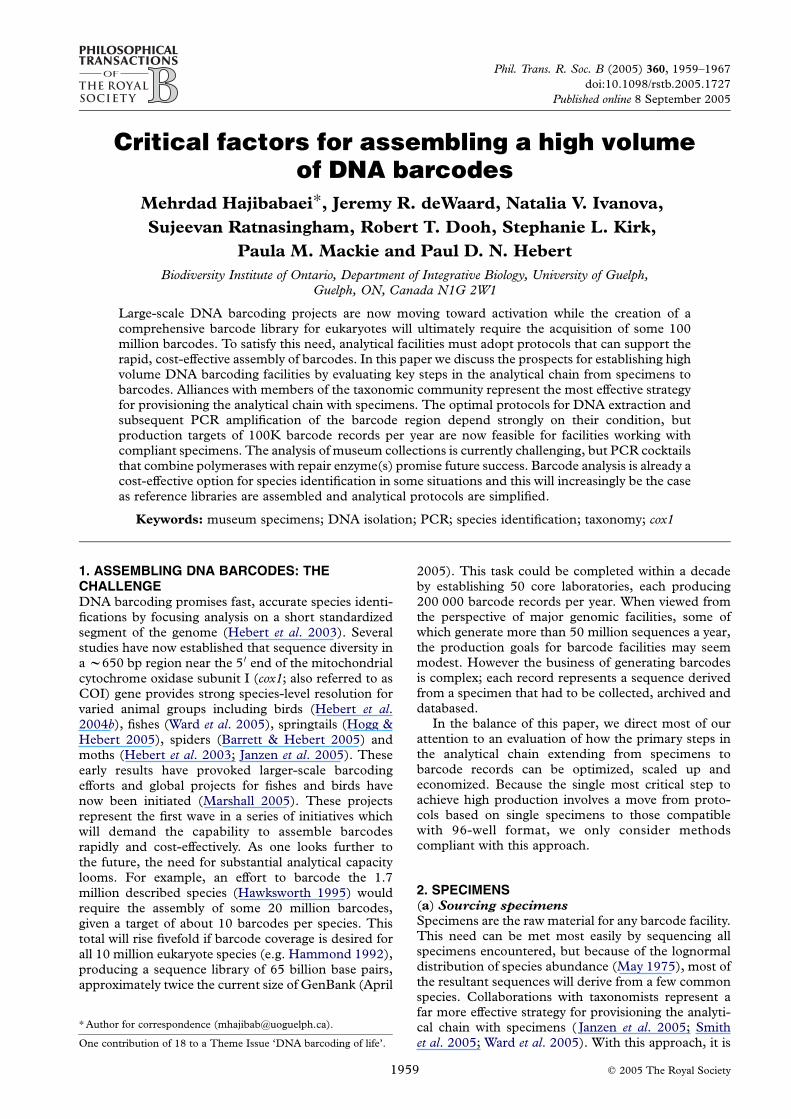
Methods for DNA isolation fall into two broadcategories: DNA release and DNA extraction. DNArelease protocols aim to rapidly release DNA intosolution, making it accessible for downstream appli-cations such as PCR. Release-based methods alsoenable DNA isolation from samples without theirphysical disruption. In this case, the entire specimencan be removed after DNA isolation, allowing theretention of a voucher in cases where this would nototherwise be possible. Release methods are, however,not very sensitive and do not produce high purity DNAsuitable for long-term storage (e.g. more than 1 year).By contrast, DNA extraction methods aim to purifyDNA, often by binding it to a membrane (e.g. silica) orby chemical fractionation. Some classical methods,such as phenol/chloroform extractions (Sambrook et al.1989), are not attractive because they are timeconsuming and involve toxic materials. The type andcondition of specimens is a key factor in selecting aDNA isolation method. For fresh or recently collectedtissue, a release-based DNA extraction usually providessufficient DNA for barcoding. However, for archivalmaterial, more sensitive approaches should be used.Because little DNA is needed for barcode analysis, theamount of tissue used in DNA isolation is usuallyminute. Figure 1 shows four typical tissue samples forbarcode analysis.
(b) Comparing DNA isolation techniques
In order to determine an optimal procedure for highvolume barcoding, we compared five DNA isolationmethods on four sets of specimens (birds, fish, recentand archival moths—see Electronic Appendix part 1Afor details). The major criterion for the inclusion ofmethods in this performance test was their capacityfor high-throughput analysis, but we also consideredcost and sensitivity. These methods included anartisanal (Zhomemade) DNA release method, calledDryRelease, which employs Chelex resin as a DNArelease agent (Walsh et al. 1991). We also examinedthree DNA extraction methods that use silica to bindDNA: Silitom, an artisanal method based on theprotocols of Elphinstone et al. (2003) and Boom et al.(1990), NucleoSpin96 tissue kit (Machery-Nagel,Duren, Germany) and DNeasy96 tissue kit (QIAGEN,Hilden, Germany). Finally, we tested a DNA extrac-tion method that uses magnetic beads to bind DNA:ChargeSwitch Forensic kit (Invitrogen, Carlsbad,
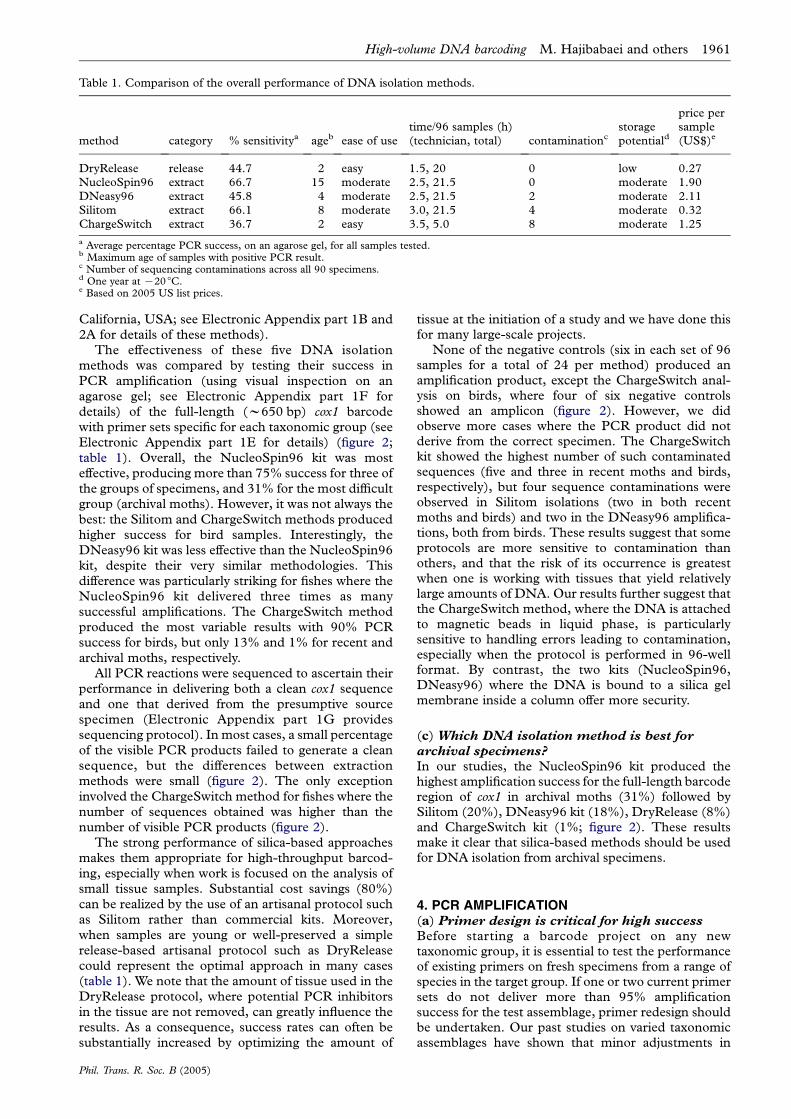
Table 1. Comparison of the overall performance of DNA isolation methods.
method category % sensitivitya ageb ease of usetime/96 samples (h)(technician, total) contaminationc
storagepotentiald
price persample(US$)e
DryRelease release 44.7 2 easy 1.5, 20 0 low 0.27NucleoSpin96 extract 66.7 15 moderate 2.5, 21.5 0 moderate 1.90DNeasy96 extract 45.8 4 moderate 2.5, 21.5 2 moderate 2.11Silitom extract 66.1 8 moderate 3.0, 21.5 4 moderate 0.32ChargeSwitch extract 36.7 2 easy 3.5, 5.0 8 moderate 1.25
a Average percentage PCR success, on an agarose gel, for all samples tested.b Maximum age of samples with positive PCR result.c Number of sequencing contaminations across all 90 specimens.d One year at K20 8C.e Based on 2005 US list prices.
High-volume DNA barcoding M. Hajibabaei and others 1961
California, USA; see Electronic Appendix part 1B and2A for details of these methods).
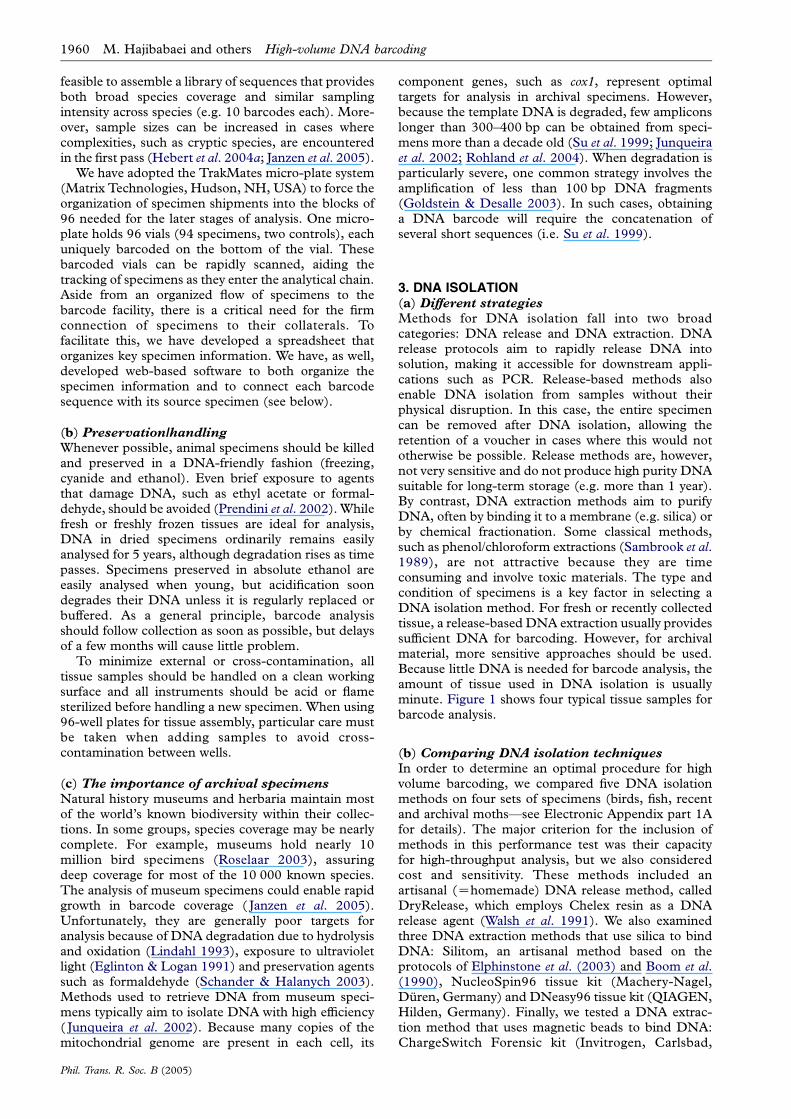
The effectiveness of these five DNA isolationmethods was compared by testing their success inPCR amplification (using visual inspection on anagarose gel; see Electronic Appendix part 1F fordetails) of the full-length (w650 bp) cox1 barcodewith primer sets specific for each taxonomic group (seeElectronic Appendix part 1E for details) (figure 2;table 1). Overall, the NucleoSpin96 kit was mosteffective, producing more than 75% success for three ofthe groups of specimens, and 31% for the most difficultgroup (archival moths). However, it was not always thebest: the Silitom and ChargeSwitch methods producedhigher success for bird samples. Interestingly, theDNeasy96 kit was less effective than the NucleoSpin96kit, despite their very similar methodologies. Thisdifference was particularly striking for fishes where theNucleoSpin96 kit delivered three times as manysuccessful amplifications. The ChargeSwitch methodproduced the most variable results with 90% PCRsuccess for birds, but only 13% and 1% for recent andarchival moths, respectively.
All PCR reactions were sequenced to ascertain theirperformance in delivering both a clean cox1 sequenceand one that derived from the presumptive sourcespecimen (Electronic Appendix part 1G providessequencing protocol). In most cases, a small percentageof the visible PCR products failed to generate a cleansequence, but the differences between extractionmethods were small (figure 2). The only exceptioninvolved the ChargeSwitch method for fishes where thenumber of sequences obtained was higher than thenumber of visible PCR products (figure 2).
The strong performance of silica-based approachesmakes them appropriate for high-throughput barcod-ing, especially when work is focused on the analysis ofsmall tissue samples. Substantial cost savings (80%)can be realized by the use of an artisanal protocol suchas Silitom rather than commercial kits. Moreover,when samples are young or well-preserved a simplerelease-based artisanal protocol such as DryReleasecould represent the optimal approach in many cases(table 1). We note that the amount of tissue used in theDryRelease protocol, where potential PCR inhibitorsin the tissue are not removed, can greatly influence theresults. As a consequence, success rates can often besubstantially increased by optimizing the amount of
Phil. Trans. R. Soc. B (2005)
tissue at the initiation of a study and we have done thisfor many large-scale projects.
None of the negative controls (six in each set of 96samples for a total of 24 per method) produced anamplification product, except the ChargeSwitch anal-ysis on birds, where four of six negative controlsshowed an amplicon (figure 2). However, we didobserve more cases where the PCR product did notderive from the correct specimen. The ChargeSwitchkit showed the highest number of such contaminatedsequences (five and three in recent moths and birds,respectively), but four sequence contaminations wereobserved in Silitom isolations (two in both recentmoths and birds) and two in the DNeasy96 amplifica-tions, both from birds. These results suggest that someprotocols are more sensitive to contamination thanothers, and that the risk of its occurrence is greatestwhen one is working with tissues that yield relativelylarge amounts of DNA. Our results further suggest thatthe ChargeSwitch method, where the DNA is attachedto magnetic beads in liquid phase, is particularlysensitive to handling errors leading to contamination,especially when the protocol is performed in 96-wellformat. By contrast, the two kits (NucleoSpin96,DNeasy96) where the DNA is bound to a silica gelmembrane inside a column offer more security.
(c) Which DNA isolation method is best for
archival specimens?
In our studies, the NucleoSpin96 kit produced thehighest amplification success for the full-length barcoderegion of cox1 in archival moths (31%) followed bySilitom (20%), DNeasy96 kit (18%), DryRelease (8%)and ChargeSwitch kit (1%; figure 2). These resultsmake it clear that silica-based methods should be usedfor DNA isolation from archival specimens.
4. PCR AMPLIFICATION(a) Primer design is critical for high success
Before starting a barcode project on any newtaxonomic group, it is essential to test the performanceof existing primers on fresh specimens from a range ofspecies in the target group. If one or two current primersets do not deliver more than 95% amplificationsuccess for the test assemblage, primer redesign shouldbe undertaken. Our past studies on varied taxonomicassemblages have shown that minor adjustments in
0
25
50
75
100
perc
enta
ge P
CR
suc
cess
birds (n=90) fish (n=90)recent moths (n=90) archival moths (n=90)
0
25
50
75
100
DryRele
ase
Nucleo
Spin96
DNeasy
96
Silitom
Charg
eSwitc
h
DNA isolation method
perc
enta
ge s
eque
ncin
g su
cces
s
(a)
(b)
4
2
22
5
3
Figure 2. Evaluation of DNA isolation methods for highvolume DNA barcoding analysis in different types of speci-mens. Five DNA isolation methods were compared for theamplification of full-length (w650 bp) cox1 barcodesequence, by examining (a), % PCR success and (b), %sequencing success. Numbers on columns indicate cases ofcontamination.
Figure 1. Typical specimen types and sizes used for DNAbarcoding analysis as compared to a pencil head. (a), alepidopteran leg; (b), a Daphnia; (c), a feather; (d ), muscletissue.
1962 M. Hajibabaei and others High-volume DNA barcoding
primer sequences can have a large impact on barcoderecovery. Primer reconfiguration begins by aligning allavailable sequences for the target taxonomic group.Subsequent adjustments in sequence to maximizematches have enabled the development of effectiveprimer sets (more than 95% amplification acrossspecies) for large taxonomic assemblages, such asLepidoptera ( Janzen et al. 2005), birds (Hebert et al.2004b) and fish (Ward et al. 2005). In most cases,effectively complete barcode recovery for all species in agroup can be achieved with two sets of non-degenerateprimers. Primers with degenerate positions or modifiedbases such as inosine (which can form base pairs withall four nucleotides) can help with recalcitrant groupswhere variable nucleotide positions across taxacompromise amplification (Candrian et al. 1991).Using primers with degenerate positions may alsoreduce the chance of preferential amplification ofnuclear pseudogenes (Sorenson et al. 1999). Manysoftware packages are available to aid primer design,but we recommend PRIMER3 (Rozen & Skaletsky 2000)for designing non-degenerate primers and CODEHOP
(Rose et al. 2003) for degenerate primers.
(b) PCR optimization
An optimized PCR for the barcode region of cox1should yield a single sharp amplicon, with nomore thanminor sub-banding when examined on an agarose gel.This can often be achieved by optimizing cyclingconditions, especially the annealing temperature, andby altering the concentration of PCR reagents such asmagnesium, dNTPs and primers through pilot studieson a few taxonomically divergent members of the targetassemblage. Optimization often also dramaticallyincreases amplification success and can eliminate theneed for PCR cleanup prior to the sequencing reaction.PCR amplification can also be enhanced with additivessuch as bovine serum albumin, betaine, DMSO (AbuAl-Soud & Radstrom 2000) and trehalose. Trehalose is
Phil. Trans. R. Soc. B (2005)
especially useful because it acts as a potent PCR
enhancer by both lowering the DNA melting tempera-
ture and stabilizing Taq polymerase (Spiess et al. 2004).Trehalose can also overcome the effect of PCR
inhibitors that are often present in crude DNA extracts
(e.g. DNA release methods). Minimalization of the
volume of each PCR reaction is also important to
reduce reagent use and cost; 10 ml reactions should be
employed.
(c) Evaluation of different polymerases
Taq DNA polymerase from Thermus aquaticus (Saiki
et al. 1988) is standard for PCR, but a wide variety of
other polymerases have higher fidelity or processivity
(e.g. Cline et al. 1996). As well, more complex PCR
cocktails that include one or more repair enzymes offer
new hope for the amplification of degraded DNA
(Di Bernardo et al. 2002; Mitchell et al. 2005).
Restorase (Sigma-Aldrich, St. Louis, MO, USA)
represents one recently introduced commercial enzyme
cocktail that couples AccuTaq, a high accuracy
polymerase, with a repair enzyme.
Taq ResAcc Dia
perc
enta
ge P
CR
suc
cess
0
25
50
75
100
658 b
p
407 b
p
155 b
p
658 b
p
407 b
p
155 b
p
recent moths archival moths
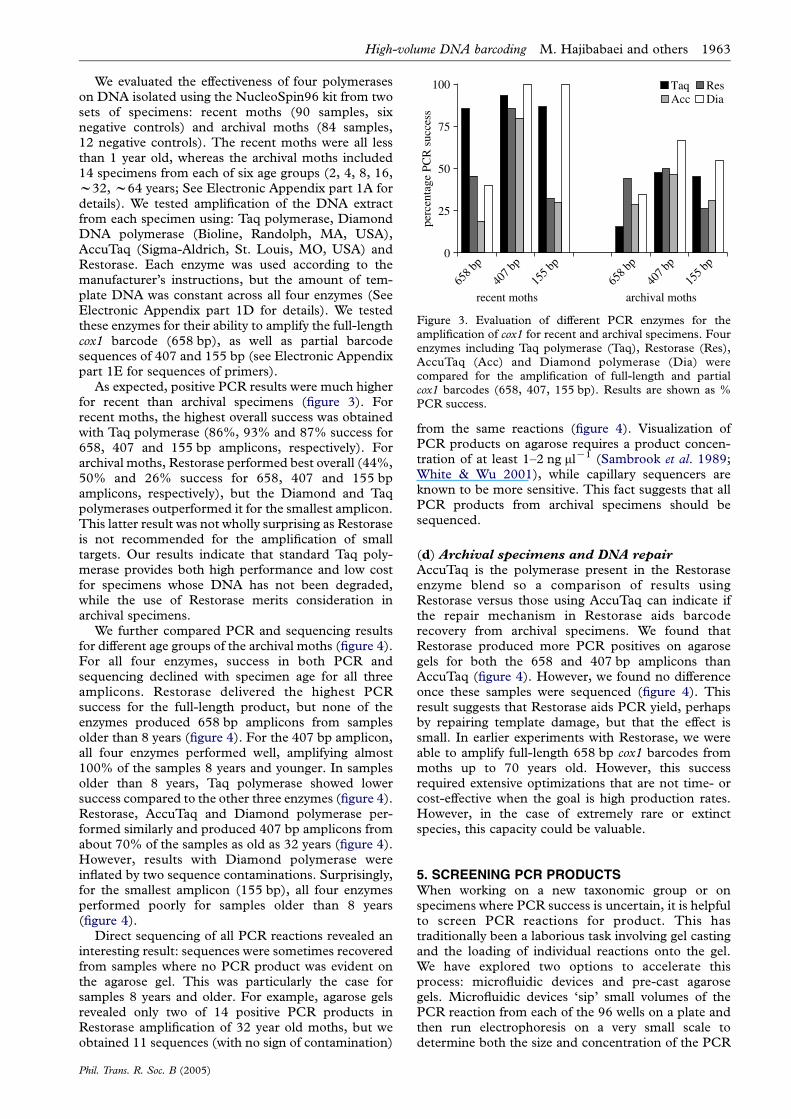
Figure 3. Evaluation of different PCR enzymes for theamplification of cox1 for recent and archival specimens. Fourenzymes including Taq polymerase (Taq), Restorase (Res),AccuTaq (Acc) and Diamond polymerase (Dia) werecompared for the amplification of full-length and partialcox1 barcodes (658, 407, 155 bp). Results are shown as %PCR success.
High-volume DNA barcoding M. Hajibabaei and others 1963
We evaluated the effectiveness of four polymeraseson DNA isolated using the NucleoSpin96 kit from twosets of specimens: recent moths (90 samples, sixnegative controls) and archival moths (84 samples,12 negative controls). The recent moths were all lessthan 1 year old, whereas the archival moths included14 specimens from each of six age groups (2, 4, 8, 16,w32, w64 years; See Electronic Appendix part 1A fordetails). We tested amplification of the DNA extractfrom each specimen using: Taq polymerase, DiamondDNA polymerase (Bioline, Randolph, MA, USA),AccuTaq (Sigma-Aldrich, St. Louis, MO, USA) andRestorase. Each enzyme was used according to themanufacturer’s instructions, but the amount of tem-plate DNA was constant across all four enzymes (SeeElectronic Appendix part 1D for details). We testedthese enzymes for their ability to amplify the full-lengthcox1 barcode (658 bp), as well as partial barcodesequences of 407 and 155 bp (see Electronic Appendixpart 1E for sequences of primers).
As expected, positive PCR results were much higherfor recent than archival specimens (figure 3). Forrecent moths, the highest overall success was obtainedwith Taq polymerase (86%, 93% and 87% success for658, 407 and 155 bp amplicons, respectively). Forarchival moths, Restorase performed best overall (44%,50% and 26% success for 658, 407 and 155 bpamplicons, respectively), but the Diamond and Taqpolymerases outperformed it for the smallest amplicon.This latter result was not wholly surprising as Restoraseis not recommended for the amplification of smalltargets. Our results indicate that standard Taq poly-merase provides both high performance and low costfor specimens whose DNA has not been degraded,while the use of Restorase merits consideration inarchival specimens.
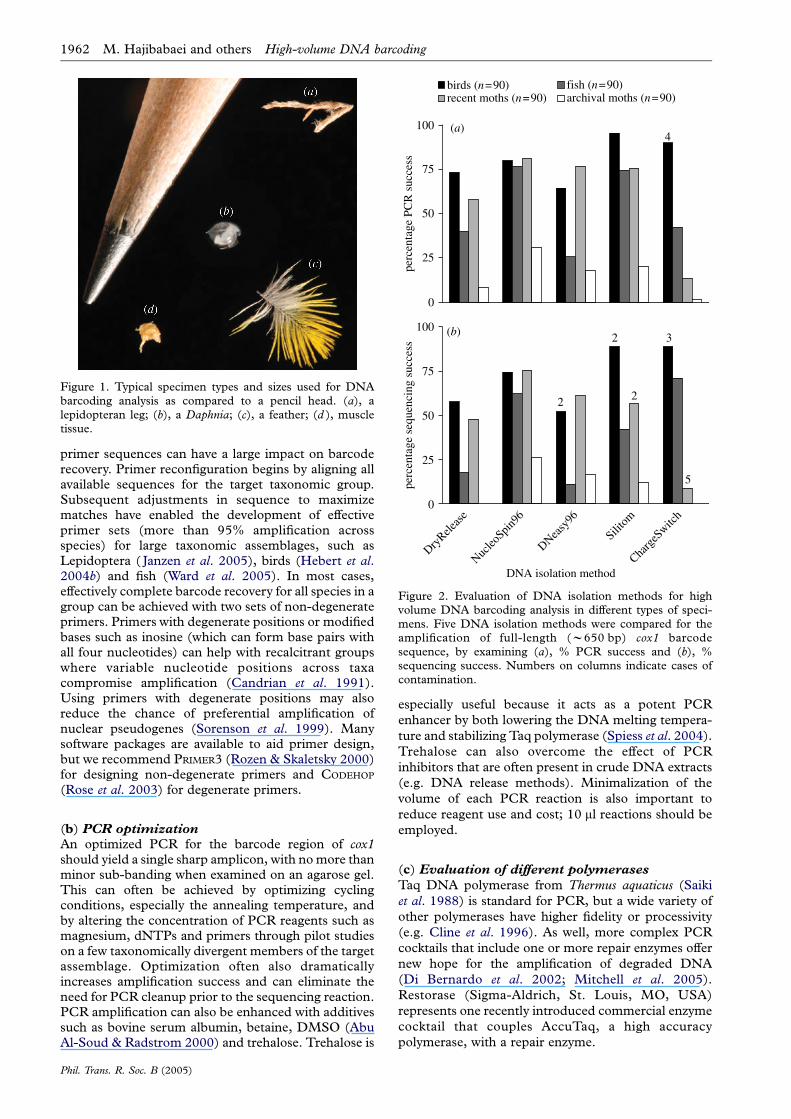
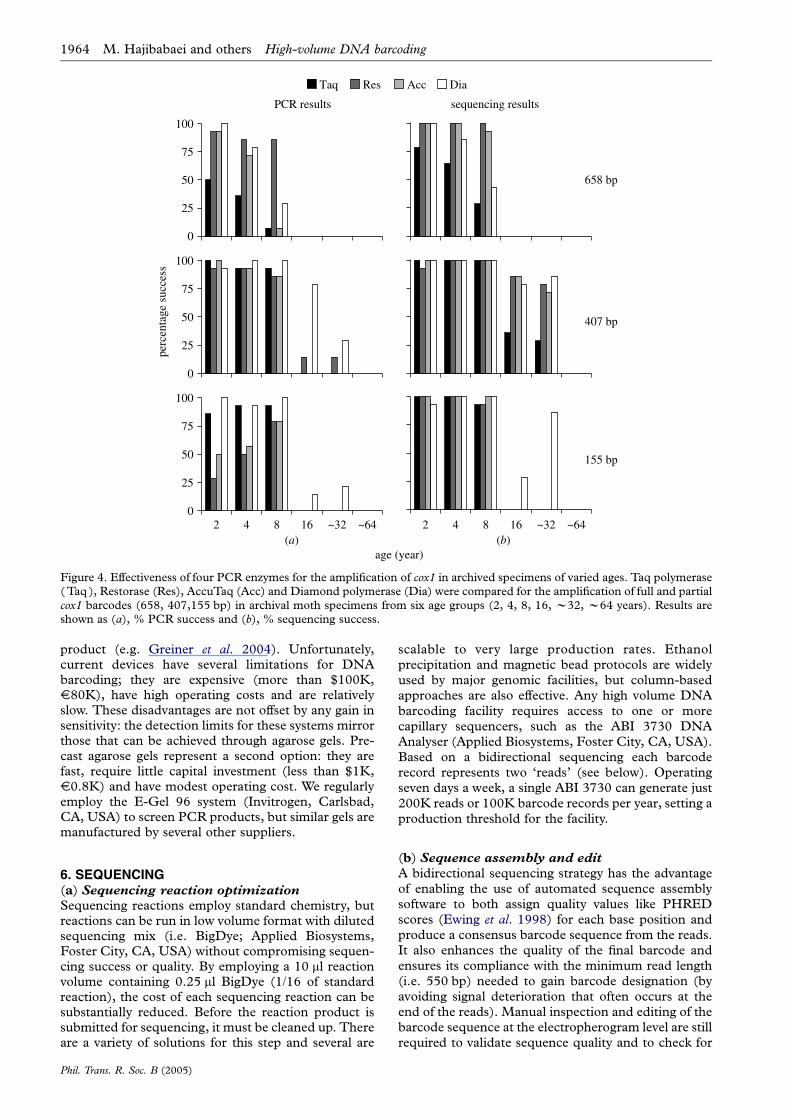
We further compared PCR and sequencing resultsfor different age groups of the archival moths (figure 4).For all four enzymes, success in both PCR andsequencing declined with specimen age for all threeamplicons. Restorase delivered the highest PCRsuccess for the full-length product, but none of theenzymes produced 658 bp amplicons from samplesolder than 8 years (figure 4). For the 407 bp amplicon,all four enzymes performed well, amplifying almost100% of the samples 8 years and younger. In samplesolder than 8 years, Taq polymerase showed lowersuccess compared to the other three enzymes (figure 4).Restorase, AccuTaq and Diamond polymerase per-formed similarly and produced 407 bp amplicons fromabout 70% of the samples as old as 32 years (figure 4).However, results with Diamond polymerase wereinflated by two sequence contaminations. Surprisingly,for the smallest amplicon (155 bp), all four enzymesperformed poorly for samples older than 8 years(figure 4).
Direct sequencing of all PCR reactions revealed aninteresting result: sequences were sometimes recoveredfrom samples where no PCR product was evident onthe agarose gel. This was particularly the case forsamples 8 years and older. For example, agarose gelsrevealed only two of 14 positive PCR products inRestorase amplification of 32 year old moths, but weobtained 11 sequences (with no sign of contamination)
Phil. Trans. R. Soc. B (2005)
from the same reactions (figure 4). Visualization ofPCR products on agarose requires a product concen-tration of at least 1–2 ng mlK1 (Sambrook et al. 1989;White & Wu 2001), while capillary sequencers areknown to be more sensitive. This fact suggests that allPCR products from archival specimens should besequenced.
(d) Archival specimens and DNA repair
AccuTaq is the polymerase present in the Restoraseenzyme blend so a comparison of results usingRestorase versus those using AccuTaq can indicate ifthe repair mechanism in Restorase aids barcoderecovery from archival specimens. We found thatRestorase produced more PCR positives on agarosegels for both the 658 and 407 bp amplicons thanAccuTaq (figure 4). However, we found no differenceonce these samples were sequenced (figure 4). Thisresult suggests that Restorase aids PCR yield, perhapsby repairing template damage, but that the effect issmall. In earlier experiments with Restorase, we wereable to amplify full-length 658 bp cox1 barcodes frommoths up to 70 years old. However, this successrequired extensive optimizations that are not time- orcost-effective when the goal is high production rates.However, in the case of extremely rare or extinctspecies, this capacity could be valuable.
5. SCREENING PCR PRODUCTSWhen working on a new taxonomic group or onspecimens where PCR success is uncertain, it is helpfulto screen PCR reactions for product. This hastraditionally been a laborious task involving gel castingand the loading of individual reactions onto the gel.We have explored two options to accelerate thisprocess: microfluidic devices and pre-cast agarosegels. Microfluidic devices ‘sip’ small volumes of thePCR reaction from each of the 96 wells on a plate andthen run electrophoresis on a very small scale todetermine both the size and concentration of the PCR
Taq Res Acc Dia
age (year)
0
25
50
75
100
0
25
50
75
100
0
25
50
75
100
perc
enta
ge s
ucce
ss
658 bp
407 bp
155 bp
PCR results sequencing results
(b)(a)2 4 8 16 ~32 ~64 2 4 8 16 ~32 ~64
Figure 4. Effectiveness of four PCR enzymes for the amplification of cox1 in archived specimens of varied ages. Taq polymerase(Taq ), Restorase (Res), AccuTaq (Acc) and Diamond polymerase (Dia) were compared for the amplification of full and partialcox1 barcodes (658, 407,155 bp) in archival moth specimens from six age groups (2, 4, 8, 16, w32, w64 years). Results areshown as (a), % PCR success and (b), % sequencing success.
1964 M. Hajibabaei and others High-volume DNA barcoding
product (e.g. Greiner et al. 2004). Unfortunately,current devices have several limitations for DNAbarcoding; they are expensive (more than $100K,V80K), have high operating costs and are relativelyslow. These disadvantages are not offset by any gain insensitivity: the detection limits for these systems mirrorthose that can be achieved through agarose gels. Pre-cast agarose gels represent a second option: they arefast, require little capital investment (less than $1K,V0.8K) and have modest operating cost. We regularlyemploy the E-Gel 96 system (Invitrogen, Carlsbad,CA, USA) to screen PCR products, but similar gels aremanufactured by several other suppliers.
6. SEQUENCING(a) Sequencing reaction optimization
Sequencing reactions employ standard chemistry, butreactions can be run in low volume format with dilutedsequencing mix (i.e. BigDye; Applied Biosystems,Foster City, CA, USA) without compromising sequen-cing success or quality. By employing a 10 ml reactionvolume containing 0.25 ml BigDye (1/16 of standardreaction), the cost of each sequencing reaction can besubstantially reduced. Before the reaction product issubmitted for sequencing, it must be cleaned up. Thereare a variety of solutions for this step and several are
Phil. Trans. R. Soc. B (2005)
scalable to very large production rates. Ethanolprecipitation and magnetic bead protocols are widelyused by major genomic facilities, but column-basedapproaches are also effective. Any high volume DNAbarcoding facility requires access to one or morecapillary sequencers, such as the ABI 3730 DNAAnalyser (Applied Biosystems, Foster City, CA, USA).Based on a bidirectional sequencing each barcoderecord represents two ‘reads’ (see below). Operatingseven days a week, a single ABI 3730 can generate just200K reads or 100K barcode records per year, setting aproduction threshold for the facility.
(b) Sequence assembly and edit
A bidirectional sequencing strategy has the advantageof enabling the use of automated sequence assemblysoftware to both assign quality values like PHREDscores (Ewing et al. 1998) for each base position andproduce a consensus barcode sequence from the reads.It also enhances the quality of the final barcode andensures its compliance with the minimum read length(i.e. 550 bp) needed to gain barcode designation (byavoiding signal deterioration that often occurs at theend of the reads). Manual inspection and editing of thebarcode sequence at the electropherogram level are stillrequired to validate sequence quality and to check for
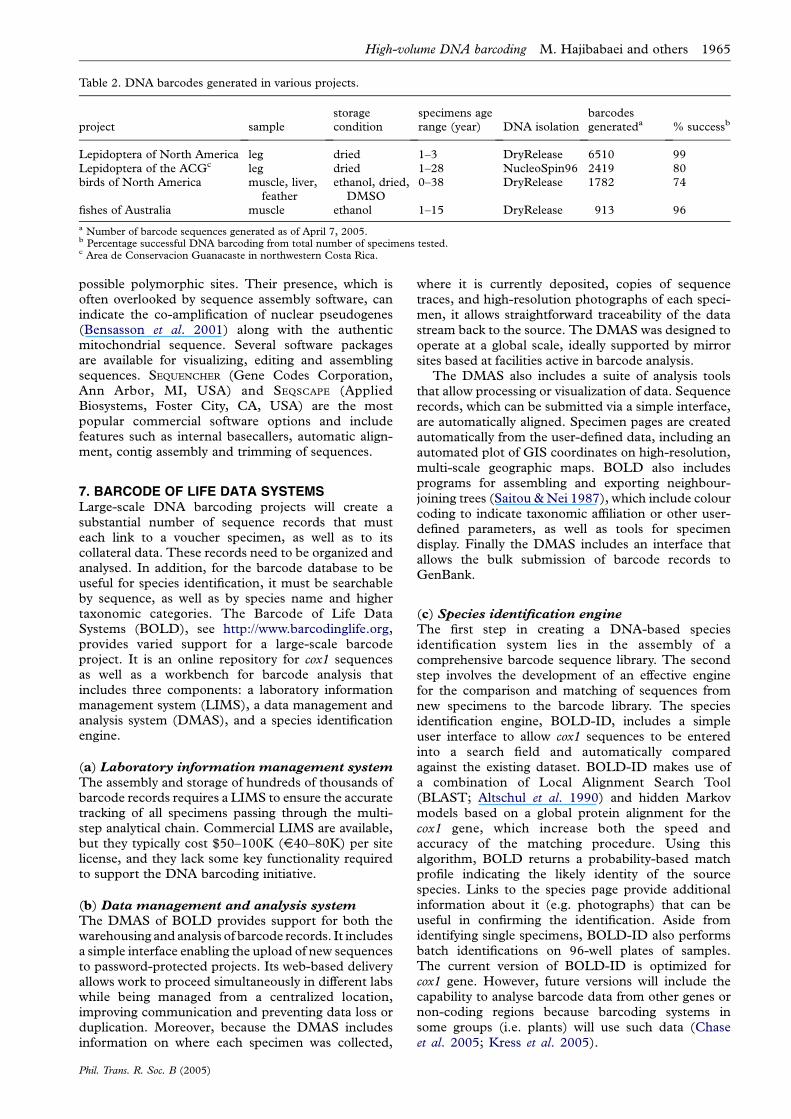
Table 2. DNA barcodes generated in various projects.
project samplestoragecondition
specimens agerange (year) DNA isolation
barcodesgenerateda % successb
Lepidoptera of North America leg dried 1–3 DryRelease 6510 99Lepidoptera of the ACGc leg dried 1–28 NucleoSpin96 2419 80birds of North America muscle, liver,
featherethanol, dried,
DMSO0–38 DryRelease 1782 74
fishes of Australia muscle ethanol 1–15 DryRelease 913 96
a Number of barcode sequences generated as of April 7, 2005.b Percentage successful DNA barcoding from total number of specimens tested.c Area de Conservacion Guanacaste in northwestern Costa Rica.
High-volume DNA barcoding M. Hajibabaei and others 1965
possible polymorphic sites. Their presence, which isoften overlooked by sequence assembly software, canindicate the co-amplification of nuclear pseudogenes(Bensasson et al. 2001) along with the authenticmitochondrial sequence. Several software packagesare available for visualizing, editing and assemblingsequences. SEQUENCHER (Gene Codes Corporation,Ann Arbor, MI, USA) and SEQSCAPE (AppliedBiosystems, Foster City, CA, USA) are the mostpopular commercial software options and includefeatures such as internal basecallers, automatic align-ment, contig assembly and trimming of sequences.
7. BARCODE OF LIFE DATA SYSTEMSLarge-scale DNA barcoding projects will create asubstantial number of sequence records that musteach link to a voucher specimen, as well as to itscollateral data. These records need to be organized andanalysed. In addition, for the barcode database to beuseful for species identification, it must be searchableby sequence, as well as by species name and highertaxonomic categories. The Barcode of Life DataSystems (BOLD), see http://www.barcodinglife.org,provides varied support for a large-scale barcodeproject. It is an online repository for cox1 sequencesas well as a workbench for barcode analysis thatincludes three components: a laboratory informationmanagement system (LIMS), a data management andanalysis system (DMAS), and a species identificationengine.
(a) Laboratory information management system
The assembly and storage of hundreds of thousands ofbarcode records requires a LIMS to ensure the accuratetracking of all specimens passing through the multi-step analytical chain. Commercial LIMS are available,but they typically cost $50–100K (V40–80K) per sitelicense, and they lack some key functionality requiredto support the DNA barcoding initiative.
(b) Data management and analysis system
The DMAS of BOLD provides support for both thewarehousing and analysis of barcode records. It includesa simple interface enabling the upload of new sequencesto password-protected projects. Its web-based deliveryallows work to proceed simultaneously in different labswhile being managed from a centralized location,improving communication and preventing data loss orduplication. Moreover, because the DMAS includesinformation on where each specimen was collected,
Phil. Trans. R. Soc. B (2005)
where it is currently deposited, copies of sequencetraces, and high-resolution photographs of each speci-men, it allows straightforward traceability of the datastream back to the source. The DMAS was designed tooperate at a global scale, ideally supported by mirrorsites based at facilities active in barcode analysis.
The DMAS also includes a suite of analysis toolsthat allow processing or visualization of data. Sequencerecords, which can be submitted via a simple interface,are automatically aligned. Specimen pages are createdautomatically from the user-defined data, including anautomated plot of GIS coordinates on high-resolution,multi-scale geographic maps. BOLD also includesprograms for assembling and exporting neighbour-joining trees (Saitou &Nei 1987), which include colourcoding to indicate taxonomic affiliation or other user-defined parameters, as well as tools for specimendisplay. Finally the DMAS includes an interface thatallows the bulk submission of barcode records toGenBank.
(c) Species identification engine
The first step in creating a DNA-based speciesidentification system lies in the assembly of acomprehensive barcode sequence library. The secondstep involves the development of an effective enginefor the comparison and matching of sequences fromnew specimens to the barcode library. The speciesidentification engine, BOLD-ID, includes a simpleuser interface to allow cox1 sequences to be enteredinto a search field and automatically comparedagainst the existing dataset. BOLD-ID makes use ofa combination of Local Alignment Search Tool(BLAST; Altschul et al. 1990) and hidden Markovmodels based on a global protein alignment for thecox1 gene, which increase both the speed andaccuracy of the matching procedure. Using thisalgorithm, BOLD returns a probability-based matchprofile indicating the likely identity of the sourcespecies. Links to the species page provide additionalinformation about it (e.g. photographs) that can beuseful in confirming the identification. Aside fromidentifying single specimens, BOLD-ID also performsbatch identifications on 96-well plates of samples.The current version of BOLD-ID is optimized forcox1 gene. However, future versions will include thecapability to analyse barcode data from other genes ornon-coding regions because barcoding systems insome groups (i.e. plants) will use such data (Chaseet al. 2005; Kress et al. 2005).
1966 M. Hajibabaei and others High-volume DNA barcoding
8. PROSPECTS FOR HIGH VOLUME DNABARCODINGFew molecular taxonomy and evolution laboratoriesprocess more than a few thousand specimens a year,but the assembly of a comprehensive barcode librarywill require, as noted earlier, 100-fold higher pro-duction rates. In one sense, the protocols described inthis paper are unproven because no barcoding facilityhas yet achieved this production target. However, weare confident, based on our own experience (table 2),that these protocols will allow the 100K goal to beachieved (see Electronic Appendix part 2 for routineprotocols). We emphasize that there is no singleoptimized protocol if varied types of specimens arebeing analysed. For example, our work on recentlycollected North American Lepidoptera employed theDryRelease protocol for DNA isolation, followed byPCR recovery of the full-length barcode. By contrast,results on Costa Rican Lepidoptera, aged from 1 to 28years, were greatly improved by using the Nucleo-Spin96 kit for DNA isolation. Moreover, when a full-length cox1 barcode could not be recovered (mainly insamples more than 10 years old), additional PCRs wereused to obtain 400 and 350 bp barcode sequences thatwere concatenated to produce the full-length sequence.These two examples provide a sense of the methodo-logical flexibility that is critical to achieve high successwhile minimizing costs. While our work has beenmainly focused on animals, we expect that barcodeanalysis of other organisms, such as plants, will requiresubstantial protocol changes, particularly in theisolation of DNA and in the choice of a target genomicbarcode region (Kress et al. 2005).
Although barcoding can be executed in adecentralized fashion, economies of scale are gainedby establishing core facilities. The capital costsinvolved in creating a facility capable of generating100K barcodes a year will range from US$0.5–0.8M(V0.4–0.6M) with the higher figure allowing theemplacement of two capillary sequencers. However,much smaller capital investments ($50K, V40K) willallow the creation of facilities capable of generating100K PCR products that might then be submittedto any sequencing facility for analysis. The gener-ation of 100K barcode records based on bidirec-tional sequencing will require an operating budget ofapproximately $0.3M (V0.2M) before salaries.Although such investments will allow an impressiveadvance on past production levels, it may beinsufficient as work moves from the construction ofbarcode libraries to the routine application of DNAbarcodes for rapid, large-scale assessments of biodi-versity in conservation biology and other ecologicalcontexts (DeSalle & Amato 2004). Fortunately thereare prospects for both further reductions in cost andincreases in production. Costs will drop as reactionvolumes shrink and microfluidic devices, whichemploy nanolitre reaction volumes for PCR andsequencing, are under development. There is alsothe potential for robotic intervention, which whencoupled with unidirectional short reads for identifi-cations (as opposed to reference barcodes) coulddrive production levels to more than 500 000specimens per year from a single sequencer. In
Phil. Trans. R. Soc. B (2005)
short, the prospects for both the assembly and use of
barcode libraries appear bright enough to expect
illumination of many key problems in biodiversity
science.
Funding for this study was provided by the Gordon and BettyMoore Foundation, the Canada Foundation for Innovation,the Ontario Innovation Trust, the Canada Research ChairsProgram and NSERC. We thank Daniel Janzen, Scott Miller,Jean-Francois Landry, John Burns, Tyler Zemlak and KevinKerr for providing specimens and Andrey Poltaraus for aidwith analytical protocols. We also thank the Sigma-Aldrich R& D group, especially Kevin Kayser, for providing Restoraseand Accutaq enzymes and for helpful discussions. AlexBorisenko aided the assembly of graphics for this paper,while Janet Topan oversaw the sequencing. We thank theConsortium for Barcoding Life for facilitating the DNAbarcoding initiative.
REFERENCESAbu Al-Soud, W. & Radstrom, P. 2000 Effects of amplifi-
cation facilitators on diagnostic PCR in the presence of
blood, feces, and meat. J. Clin. Microbiol. 38, 4463–4470.
Altschul, S. F., Gish, W., Miller, W., Myers, E. W. & Lipman,
D. J. 1990 Basic local alignment search tool. J. Mol. Biol.
215, 403–410. (doi:10.1006/jmbi.1990.9999.)
Barrett, R. & Hebert, P. D. N. 2005 Identifying spiders
through DNA barcodes. Can. J. Zool. 83, 481–491.
Bensasson, D., Zhang, D., Hartl, D. L. & Hewitt, G.M. 2001
Mitochondrial pseudogenes: evolution’s misplaced wit-
nesses. Trends Ecol. Evol. 16, 314–321. (doi:10.1016/
S0169-5347(01)02151-6.)
Boom, R., Sol, C. J., Salimans, M. M., Jansen, C. L.,
Wertheim-van Dillen, P. M. & van der Noordaa, J. 1990
Rapid and simple method for purification of nucleic acids.
J. Clin. Microbiol. 28, 495–503.
Candrian, U., Furrer, B., Hofelein, C. & Luthy, J. 1991 Use
of inosine-containing oligonucleotide primers for enzy-
matic amplification of different alleles of the gene coding
for heat-stable toxin type I of enterotoxigenic Escherichia
coli. Appl. Environ. Microbiol. 57, 955–961.
Chase, M. W., Salamin, N., Wilkinson, M., Dunwell, J. M.,
Kesanakurthi, R. P., Haidar, N. & Savolainen, V. 2005
Land plants and DNA barcodes: short-term and long-
term goals. Phil. Trans. R. Soc. B 360, 1889–1895. (doi:10.
1098/rstb.2005.1720.)
Cline, J., Braman, J. C. & Hogrefe, H. H. 1996 PCR fidelity
of pfu DNA polymerase and other thermostable DNA
polymerases. Nucleic Acids Res. 24, 3546–3551. (doi:10.
1093/nar/24.18.3546.)
DeSalle, R. & Amato, G. 2004 The expansion of conservation
genetics. Nat. Rev. Genet. 5, 702–712. (doi:10.1038/
nrg1425.)
Di Bernardo, G., Del Gaudio, S., Cammarota, M., Galderisi,
U., Cascino, A. & Cipollaro, M. 2002 Enzymatic repair of
selected cross-linked homoduplex molecules enhances
nuclear gene rescue from Pompeii and Herculaneum
remains. Nucleic Acids Res. 30, e16. (doi:10.1093/nar/
30.4.e16.)
Eglinton, G. & Logan, G. A. 1991 Molecular preservation.
Phil. Trans. R. Soc. B 333, 315–327 discussion 327–328.
Elphinstone, M. S., Hinten, G. N., Anderson, M. J. & Nock,
C. J. 2003 An inexpensive and high-throughput procedure
to extract and purify total genomic DNA for population
studies.Mol. Ecol. Notes 3, 317–320. (doi:10.1046/j.1471-
8286.2003.00397.x.)
High-volume DNA barcoding M. Hajibabaei and others 1967
Ewing, B., Hillier, L., Wendl, M. C. & Green, P. 1998 Base-
calling of automated sequencer traces using phred I.
Accuracy assessment. Genome Res. 8, 175–185.
Goldstein, P. Z. & Desalle, R. 2003 Calibrating phylogenetic
species formation in a threatened insect using DNA from
historical specimens. Mol. Ecol. 12, 1993–1998. (doi:10.
1046/j.1365-294X.2003.01860.x.)
Greiner, M., Carter, P., Korn, B. & Zink, D. 2004 New
approach to complete automation in sizing and quanti-
tation of DNA and proteins by the Automated Lab-on-a-
Chip Platform from Agilent Technologies.Nat. Methods 1,
87–89. (doi:10.1038/nmeth1004-87.)
Hammond, P. 1992 Species inventory. In Global biodiversity:
status of the earth’s living resources (ed. B. Groombridge).
London: Chapman & Hall.
Hawksworth, D. L. 1995 Global biodiversity assessment.
Cambridge: Cambridge University Press.
Hebert, P. D., Cywinska, A., Ball, S. L. & deWaard, J. R.
2003 Biological identifications through DNA barcodes.
Proc. R. Soc. B 270, 313–321. (doi:10.1098/rspb.2002.
2218.)
Hebert, P. D., Penton, E. H., Burns, J. M., Janzen, D. H. &
Hallwachs, W. 2004a Ten species in one: DNA barcoding
reveals cryptic species in the neotropical skipper butterfly
Astraptes fulgerator. Proc. Natl Acad. Sci. USA 101,
14 812–14 817. (doi:10.1073/pnas.0406166101.)
Hebert, P. D., Stoeckle, M. Y., Zemlak, T. S. & Francis,
C. M. 2004b Identification of birds through DNA
barcodes. PLoS Biol. 2, E312. (doi:10.1371/journal.pbio.
0020312.)
Hogg, I. D. &Hebert, P. D. N. 2005 Biological identifications
of springtails (Hexapoda: Collembola) from the Canadian
arctic, using mitochondrial barcodes. Can. J. Zool. 82,
749–754.
Janzen, D. H., Hajibabaei, M., Burns, J. M., Hallwachs, W.,
Remigio, E. &Hebert, P. D. N. 2005Wedding biodiversity
inventory of a large and complex Lepidoptera fauna with
DNA barcoding. Phil. Trans. R. Soc. B 360, 1835–1845.
(doi:10.1098/rstb.2005.1715.)
Junqueira, A. C., Lessinger, A. C. & Azeredo-Espin, A. M.
2002 Methods for the recovery of mitochondrial DNA
sequences from museum specimens of myiasis-causing
flies. Med. Vet. Entomol. 16, 39–45. (doi:10.1046/j.0269-
283x.2002.00336.x.)
Kress, J. W., Wurdack, K. J., Zimmer, E. A. C.,Weigt, L. A. &
Janzen, D. H. 2005 Use of DNA barcodes to identify
flowering plants. Proc. Natl Acad. Sci. USA 102,
8369–8374. (doi:10.1073/pnas.0503123102.)
Lindahl, T. 1993 Instability and decay of the primary
structure of DNA. Nature 362, 709–715. (doi:10.1038/
362709a0.)
Marshall, E. 2005 Taxonomy. Will DNA bar codes breathe
life into classification? Science 307, 1037. (doi:10.1126/
science.307.5712.1037.)
May, R.M. 1975 Patterns of species abundance and diversity.
In Ecology and evolution of communities (ed. M. Cody & J.
Diamond), pp. 81–120. Cambridge: Belknap Press of
Harvard University Press.
Mitchell, D., Willerslev, E. & Hansen, A. 2005 Damage and
repair of ancient DNA. Mutat. Res. 571, 265–276.
Prendini, L., Hanner, R. & DeSalle, R. 2002 Obtaining,
storing and archiving specimens and tissue samples for use
Phil. Trans. R. Soc. B (2005)
in molecular studies. In Techniques in molecular evolutionand systematics (ed. R. DeSalle, G. Giribet & W. C.Wheeler), pp. 176–248. Basel: Birkhaeuser Verlag AG.
Rohland, N., Siedel, H. & Hofreiter, M. 2004 Nondestruc-tive DNA extraction method for mitochondrial DNAanalyses of museum specimens. Biotechniques 36, 814–816see also pp. 818–821.
Rose, T.M., Henikoff, J. G. & Henikoff, S. 2003 CODEHOP(COnsensus-DEgenerate Hybrid Oligonucleotide Primer)PCR primer design. Nucleic Acids Res. 31, 3763–3766.(doi:10.1093/nar/gkg524.)
Roselaar, K. 2003 An inventory of major European birdcollections. Bull. Br. Ornithol. Clin. 123A, 253–337.
Rozen, S. & Skaletsky, H. 2000 Primer3 on the WWW forgeneral users and for biologist programmers.Methods Mol.Biol. 132, 365–386.
Saiki, R. K., Gelfand, D. H., Stoffel, S., Scharf, S. J., Higuchi,R., Horn, G. T., Mullis, K. B. & Erlich, H. A. 1988Primer-directed enzymatic amplification of DNA with athermostable DNA polymerase. Science 239, 487–491.
Saitou, N. & Nei, M. 1987 The neighbor-joining method: anew method for reconstructing phylogenetic trees. Mol.Biol. Evol. 4, 406–425.
Sambrook, J., Fritsch, E. F. & Maniatis, T. 1989 Molecularcloning: a laboratory manual. Cold Spring Harbor: ColdSpring Harbor Press.
Schander, C. & Halanych, K. M. 2003 DNA, PCR andformalinized animal tissue—a short review and protocols.Org. Divers. Evol. 3, 195–205.
Smith, M. A., Fisher, B. L. & Hebert, P. D. N. 2005Barcoding for effective biodiversity assessment of ahyperdiverse arthropod group: the ants of Madagascar.Phil. Trans. R. Soc. B 360, 1825–1834. (doi:10.1098/rstb.2005.1714.)
Sorenson, M. D., Ast, J. C., Dimcheff, D. E., Yuri, T. &Mindell, D. P. 1999 Primers for a PCR-based approach tomitochondrial genome sequencing in birds and othervertebrates. Mol. Phylogenet. Evol. 12, 105–114. (doi:10.1006/mpev.1998.0602.)
Spiess, A. N., Mueller, N. & Ivell, R. 2004 Trehalose is apotent PCR enhancer: lowering of DNA melting tem-perature and thermal stabilization of taq polymerase by thedisaccharide trehalose. Clin. Chem. 50, 1256–1259.(doi:10.1373/clinchem.2004.031336.)
Su, B., Wang, Y. X., Lan, H., Wang, W. & Zhang, Y. 1999Phylogenetic study of complete cytochrome b genes inmusk deer (genus Moschus) using museum samples. Mol.Phylogenet. Evol. 12, 241–249. (doi:10.1006/mpev.1999.0616.)
Walsh, P. S., Metzger, D. A. & Higuchi, R. 1991 Chelex 100as a medium for simple extraction of DNA for PCR-basedtyping from forensic material. BioTechniques 10, 506–513.
Ward, R. D., Zemlak, T. S., Innes, B. H., Last, P. R. &Hebert, P. D. N. 2005 DNA barcoding Australia’s fishspecies. Phil. Trans. R. Soc. B 360, 1847–1857. (doi:10.1098/rstb.2005.1716.)
White, H. W. & Wu, M. 2001 Factors affecting quantitationof DNA bands in gels using a charge-coupled deviceimaging system. Electrophoresis 22, 860–863. (doi:10.1002/1522-2683()22:5!860::AID-ELPS860O3.0.CO;2-D.)
The supplementary Electronic Appendix is available at http://dx.doi.org/10.1098/rstb.2005.1727 or via http://www.journals.royalsoc.ac.uk.


