Embed Size (px)
Citation preview

CROPS & MARKETS FOURTH QUARTER 2020 VOLUME 101 NO. 986

CROPS AND MARKETS
Fourth Quarter
2020
Volume 101
No. 986
Issued by the Directorate: Statistics and Economic Analysis
DEPARTMENT OF AGRICULTURE, LAND REFORM AND RURAL DEVELOPMENT

CONTENTS
SECTION A
Economic indicators and trends
1. Crop estimates and forecasts
2. Economic indicators of the South African agricultural sector
3. Economic overview
4. Indices of producer prices of agricultural products
5. Consumer price indices
6. Price indices of farming requisites
SECTION B
Fresh produce markets overview
Fresh market statistics and graphic presentations
Interesting vegetable: Potatoes
Mass, value and average price of vegetables sold on the 19 major fresh produce markets
Mass, value and average price of fruit sold on the 19 major fresh produce markets
1. Apples
2. Pears
3. Oranges
4. Lemons
5. Avocados
6. Bananas
7. Papayas
8. Pineapples
9. Potatoes
10. Sweet potatoes
11. Onions
12. Tomatoes
13. Carrots
14. Cabbage
15. Cauliflower
16. Lettuce
17. Green beans
18. Pumpkins
19. Gem squashes
20. Butternut squashes
21. Peppers
22. English cucumbers
Page No.
1
5
6
8
9
9
11
11
11
14
14
15
16
17
18
19
20
21
22
23
24
25
26
27
28
29
30
31
32
33
34
35
36
Page No.
1
1
4
5
7
8
9
12
12
12
15
15
16
17
18
19
20
21
22
23
24
25
26
27
28
29
30
31
32
33
34
35
36
37

Department of Agriculture, land reform & rural development
Crops and Markets Fourth Quarter 2020 1
SECTION A
ECONOMIC INDICATORS AND TRENDS
1. CROP ESTIMATES AND FORECASTS
Areas planted and first production forecast for summer crops for the 2021 production season
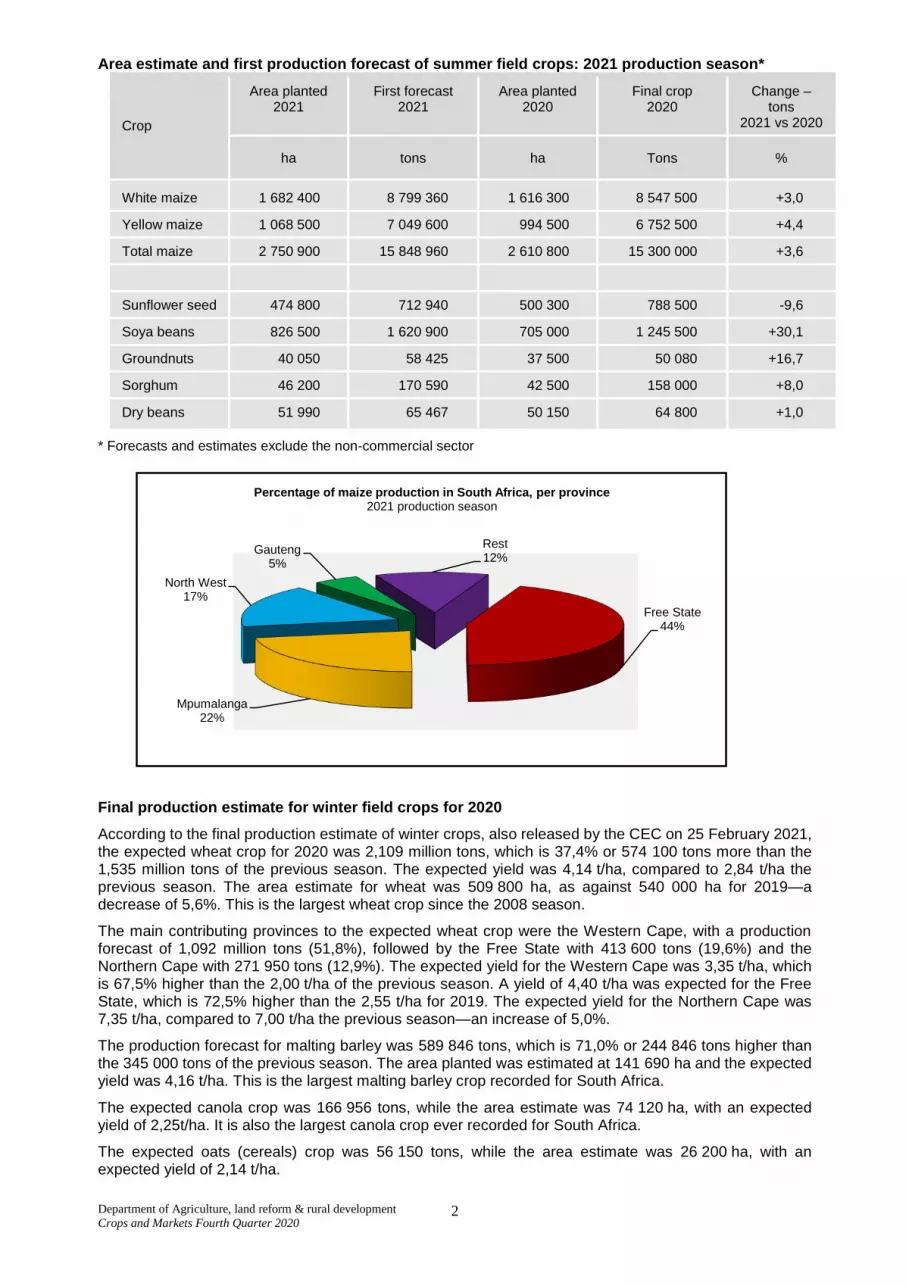
According to the first production forecast for summer crops by the Crop Estimates Committee (CEC) for the 2021 production season, the expected South African maize crop was 15,849 million tons, which was 3,6% more than the 15,300 million tons of the 2020 season and 24,4% or 3,112 million tons more than the five-year average of 12,737 million tons up to 2020. This is the second largest maize crop ever produced in South Africa.
The estimated area that South African commercial producers planted to maize during the 2021 season was 2,751 million ha. This was 5,4% or 140 100 ha more than the 2,611 million ha planted in the previous season. Of this area, 1,325 million ha (48,2%) were in the Free State, 573 000 ha (20,8%) in the North West and 525 000 ha (19,1%) in Mpumalanga.
The plantings of maize in the Free State increased by an estimated 8,6%, from 1,220 million ha in 2020 to 1,325 million ha in 2021 and in the North West, it increased by 1,4%, from 565 000 ha to 573 000 ha. Plantings in Mpumalanga increased by an estimated 2,3%, from 513 000 ha in 2020 to 525 000 ha in 2021.
The ratio of white to yellow maize plantings for 2021 is 61:39, as against 62:38 the previous season. The estimated white maize plantings were 1,682 million ha, which were 4,1% more than the previous season’s 1,616 million ha, while the yellow maize plantings were estimated to be 1,069 million ha—7,4% more than the 994 500 ha for 2020.
Most of the country’s maize crop was produced in the Free State (44,3%), Mpumalanga (22,4%) and the North West (17,0%).
The production forecast for white maize was 8,799 million tons, which was 3,0% or 251 860 tons more than the 8,548 million tons of 2020 and 2,008 million tons more than the average of the five years up to 2020. The expected yield for white maize was 5,23 t/ha, as against 5,29 t/ha the previous season.
In the case of yellow maize, the production forecast was 7,050 million tons, which was 4,4% or 297 100 tons more than the 6,752 million tons of the previous season and 1,104 million tons more than the five-year average up to 2020. The yield for yellow maize was expected to be 6,60 t/ha, as against 6,79 t/ha in 2020.
The expected sunflower seed crop was 712 940 tons, which was 9,6% less than the 788 500 tons of the previous season and 9,9% less than the average of 791 500 tons for the five years up to 2020. The area planted to sunflower seed was estimated at 474 800 ha, which was 5,1% less than the 500 300 ha planted in 2020. The expected yield was 1,50 t/ha, as against 1,58 t/ha the previous season.
The production forecast for soya beans was 1,621 million tons, which was 30,1% more than the 1,246 million tons of the previous season. This is the largest soya beans crop ever produced in South Africa. The estimated area planted was 826 500 ha, which was 17,2% or 121 500 ha more than the 705 000 ha planted in 2020. The expected yield was 1,96 t/ha, as against 1,77 t/ha in 2020.
The expected groundnut crop was 58 425 tons, which was 16,7% or 8 345 tons more than the 50 080 tons of the 2020 season and 11 183 tons more than the five-year average of 47 242 tons per annum up to 2020. The area planted to groundnuts was an estimated 40 050 ha, which was 6,8% or 2 550 ha more than the 37 500 ha planted the previous season. The expected yield was 1,46 t/ha, as against 1,34 t/ha in 2020.
The production forecast for sorghum was 170 590 tons—8,0% more than the 158 000 tons of the previous season. The area planted to sorghum was estimated to be 46 200 ha, which was 8,7% or 3 700 ha more than the 42 500 ha planted in 2020. The expected yield was 3,69 t/ha, as against 3,72 t/ha the previous season.
The production of dry beans was expected to be 65 467 tons, which was 1,0% or 667 tons more than the 64 800 tons of the previous season and 4 570 tons more than the five-year average of 60 897 tons per annum up to 2020. The estimated area planted was 51 990 ha, which was 3,7% more than the 50 150 ha planted the previous season. The expected yield was 1,26 t/ha, as against 1,29 t/ha for 2020.
Department of Agriculture, land reform & rural development
Crops and Markets Fourth Quarter 2020 2
Area estimate and first production forecast of summer field crops: 2021 production season*
Crop
Area planted 2021
First forecast 2021
Area planted 2020
Final crop 2020
Change – tons
2021 vs 2020
ha tons ha Tons %
White maize 1 682 400 8 799 360 1 616 300 8 547 500 +3,0
Yellow maize 1 068 500 7 049 600 994 500 6 752 500 +4,4
Total maize 2 750 900 15 848 960 2 610 800 15 300 000 +3,6
Sunflower seed 474 800 712 940 500 300 788 500 -9,6
Soya beans 826 500 1 620 900 705 000 1 245 500 +30,1
Groundnuts 40 050 58 425 37 500 50 080 +16,7
Sorghum 46 200 170 590 42 500 158 000 +8,0
Dry beans 51 990 65 467 50 150 64 800 +1,0
* Forecasts and estimates exclude the non-commercial sector
Final production estimate for winter field crops for 2020
According to the final production estimate of winter crops, also released by the CEC on 25 February 2021, the expected wheat crop for 2020 was 2,109 million tons, which is 37,4% or 574 100 tons more than the 1,535 million tons of the previous season. The expected yield was 4,14 t/ha, compared to 2,84 t/ha the previous season. The area estimate for wheat was 509 800 ha, as against 540 000 ha for 2019—a decrease of 5,6%. This is the largest wheat crop since the 2008 season.
The main contributing provinces to the expected wheat crop were the Western Cape, with a production forecast of 1,092 million tons (51,8%), followed by the Free State with 413 600 tons (19,6%) and the Northern Cape with 271 950 tons (12,9%). The expected yield for the Western Cape was 3,35 t/ha, which is 67,5% higher than the 2,00 t/ha of the previous season. A yield of 4,40 t/ha was expected for the Free State, which is 72,5% higher than the 2,55 t/ha for 2019. The expected yield for the Northern Cape was 7,35 t/ha, compared to 7,00 t/ha the previous season—an increase of 5,0%.
The production forecast for malting barley was 589 846 tons, which is 71,0% or 244 846 tons higher than the 345 000 tons of the previous season. The area planted was estimated at 141 690 ha and the expected yield was 4,16 t/ha. This is the largest malting barley crop recorded for South Africa.
The expected canola crop was 166 956 tons, while the area estimate was 74 120 ha, with an expected yield of 2,25t/ha. It is also the largest canola crop ever recorded for South Africa.
The expected oats (cereals) crop was 56 150 tons, while the area estimate was 26 200 ha, with an expected yield of 2,14 t/ha.
Free State44%
Mpumalanga22%
North West17%
Gauteng5%
Rest12%
Percentage of maize production in South Africa, per province2021 production season

Department of Agriculture, land reform & rural development
Crops and Markets Fourth Quarter 2020 3
Areas planted and final production estimate for winter cereals: 2020
Crop
Area planted
2020
Final estimate
2020
Area planted
2019
Final crop
2019
Change in production
2020 vs 2019
ha tons ha Tons %
Wheat 509 800 2 109 100 540 000 1 535 000 +37,4
Malting barley 141 690 589 846 131 960 345 000 +71,0
Canola 74 120 166 956 74 000 95 000 +75,7
Oats 26 200 56 150 21 000 16 500 +240,3
Updates on these figures can be found on the following websites:
www.dalrrd.gov.za/statistics and economic reports www.sagis.org.za/CEC: Crop estimates

Department of Agriculture, land reform & rural development
Crops and Markets Fourth Quarter 2020 4
2 ECONOMIC INDICATORS OF THE SOUTH AFRICAN AGRICULTURAL SECTOR
Indicator (at current prices) Jan. to Dec. 2019 Jan. to Dec. 2020 % change
Total gross farming income (R million) 282 419 327 138 +15,8
Intermediate expenditure (R million) 159 543 169 708 +6,4
Total farming cost (R million) 199 893 209 380 +4,7
Net farming income (R million) 88 675 124 388 +40,3
Domestic terms of trade (2010 = 1) 1,03 1,04 +1,0
Gross income from major products at current prices
Field crops:
Jan. to Dec. 2019 Jan. to Dec. 2020 Change
R million %
Maize 27 440 38 945 +41,9
Wheat 6 314 9 926 +57,2
Sugar cane 8 879 11 118 +25,2
Sunflower seed 3 479 4 411 +26,8
Tobacco 457 377 -17,5
All field crops 57 497 78 883 +37,2
Horticulture:
Vegetables (including potatoes) 25 776 27 702 +7,5
Deciduous and other fruit 20 212 22 482 +11,2
Citrus fruit 19 987 30 668 +53,4
Viticulture 6 161 6 613 +7,3
Subtropical fruit 4 686 4 822 +2,9
All horticultural products 86 276 101 628 +17,8
Animal products:
Poultry meat 46 971 49 365 +5,1
Cattle and calves slaughtered 35 509 37 601 +5,9
Milk 16 579 18 672 +12,6
Eggs 10 301 10 575 +2,7
Sheep slaughtered 6 779 7 784 +14,8
All animal products 138 645 146 627 +5,8

Department of Agriculture, land reform & rural development
Crops and Markets Fourth Quarter 2020 5
3. ECONOMIC OVERVIEW
This article gives an overview of the major macroeconomic trends in the agricultural sector for the period 1 January to 31 December 2020. Aggregates are compared with the period 1 January to 31 December 2019.
Gross farming income
Gross farming income refers to both the part of agricultural production that is marketed and production for own consumption, valued at basic prices.
Gross income from all agricultural products increased by 15,8% to an estimated amount of R327 138 million for the period ended 31 December 2020. This was mainly the result of the increase in income earned from field crops by 37,2%, horticulture by 17,8% and animal products by 5,8%.
The income from field crops increased significantly by 37,2% due to the increase in income obtained from groundnuts by 161,5%, grain sorghum (66,0%), wheat (57,2%), soya beans (45,9%), maize (41,9%), sunflower seed (26,8%), sugar cane (25,2%) and dry beans (8,6%).
The income from horticultural products increased by 17,8% due to the increase in income made from citrus fruit by 53,4%, deciduous and other fruit (11,2%), vegetables (7,5%), viticulture (7,3%) and subtropical fruit (2,9%).
The increase of 5,8% in income from animal products was resulted from the increase in income from sheep slaughtered by 14,8%, milk by 12,6%, cattle and calves slaughtered by 5,9%, poultry meat by 5,1% and eggs by 2,7%.
Expenditure on intermediate production inputs
Expenditure on intermediate production inputs refers to the value of the goods and services that were purchased to be consumed as inputs during the production process.
The expenditure on intermediate goods and services increased by 6,4% to R169 708 million, from R159 543 million the previous period. This was mainly the result of the increase in expenditure on seed and plants and building and fencing material by 10,0% each, packing material by 9,0%, animal health and crop protection and farm services by 6,0% each, fuel by 3,2%, fertilisers by 3,0% and maintenance and repairs of machinery and implements by 1,9% .
Farm feeds had the largest share of 28,7% as an expenditure item, followed by maintenance and repairs of machinery and implements (13,1%), farm services (12,2%), fuel (8,1%), seed and plants (7,4%), animal health and crop protection (6,2%), packing material (5,2%), fertilisers and building and fencing material (4,5% each).
Prices received and paid by farmers as well as terms of trade
The prices earned by farmers for their products increased by 4,3%, mainly as the result of the increase in prices of field crops by 8,4%, horticulture by 6,1% and animal products by 1,3%.
The weighted average price of field crops showed an increase of 8,4%, because of the increases in prices of tobacco by 31,1%, oilseeds (18,5%), dry beans (14,6%), sugar cane (13,8%), hay (13,6%), winter grains by 12,8% and summer grains by 2,5%.
The weighted average price of horticultural products increased by 6,1% due to the increases in prices of vegetables by 13,2%, fruit by 2,6% and viticulture by 2,5%.
40 000
80 000
120 000
160 000
2016 2017 2018 2019 2020
R m
illi
on
Year
Gross farming income (GFI)2015 to 2019 (January to December)
Field crops Horticulture Animal products

Department of Agriculture, land reform & rural development
Crops and Markets Fourth Quarter 2020 6
The weighted average price of animal products increased by 1,3% due to the increases in prices of milk by 13,9% and poultry meat by 1,0%. The prices of pastoral products decreased by 19,1%.
The prices paid for farming requisites, including machinery and implements, material for fixed improvements as well as intermediate goods, increased by 4,8%. The prices paid for seeds increased by 7,3%, feed by 6,0%, irrigation equipment by 4,5%, animal and crop protection and building material by 4,3%, packing material by 4,1%, fertilisers by 3,5%, maintenance and repairs of machinery by 2,7%, trucks by 2,1%, fencing material by 1,8%, tractors by 1,3% and fuel decreased by 4,6%.
The terms of trade increased by 1,0% (from 1,03% to 1,04%) due to an increase of 4,3% in prices earned from agricultural products, as opposed to an increase of 3,5% in production costs.
Net farming income and cash flow
An increase of 15,8% in gross farming income and the increase of 6,4% in expenditure on production inputs led to an increase of 40,3% in net farming income. Interest payment increased by 3,9%, while labour costs and rent payment increased by 3,3% each.
The farmers’ cash flow increased significantly by 37,3% and amounted to R122 899 million in 2020, as compared to R89 504 million in 2019.
Conclusion
An increase of 15,8% in gross farming income was mainly driven by the increase in income from field crops by 37,2%, horticulture (17,8%) and animal products (5,8%). The increase in income from these products was due to the increase in prices by 4,3% and production levels by 7,3%.
90
120
150
180
210
240
270
300
Q42017
Q12018
Q22018
Q32018
Q42018
Q12019
Q22019
Q32019
Q42019
Q12020
Q22020
Q32020
Q42020
2010 =
100
Prices paid and received by farmers4th quarter 2017 to 4th quarter 2020
Prices paid for production inputs Prices received for field crops
Prices received for horticultural products Prices received for animal products

Department of Agriculture, land reform & rural development
Crops and Markets Fourth Quarter 2020 7
4. INDICES OF PRODUCER PRICES OF AGRICULTURAL PRODUCTS
Product Weight
October November December
2019 2020 2019 2020 2019 2020
Index (2010 = 100)
Field crops 23,0 177,4 187,4 181,1 185,7 180,0 185,8
Horticulture 27,0 189,8 220,6 183,6 192,6 189,6 188,6
Animal products 50,0 181,2 177,5 181,0 179,6 180,6 178,8
Combined 100,0 180,0 182,8 181,5 182,0 180,7 183,3
Field crops
Summer grains 46,3 194,7 196,8 202,6 203,6 199,5 199,4
Winter cereals 13,1 185,1 194,7 184,0 201,8 195,8 201,8
Oilseeds 11,4 145,8 192,3 146,7 160,7 137,9 167,8
Sugar cane 16,2 157,0 162,3 154,7 162,3 152,7 167,2
Hay 10,2 150,8 172,8 155,3 150,8 156,4 155,3
Dry beans 1,2 222,3 192,8 222,3 192,8 222,3 192,8
Cotton 0,3 193,5 193,5 193,5 193,5 193,5 193,5
Tobacco 1,2 180,7 162,6 180,7 162,6 180,7 162,6
Combined 100,0 177,4 187,4 181,1 187,4 180,0 185,8
Horticulture
Viticulture 11,0 192,6 197,5 192,6 197,5 192,6 197,2
Vegetables 37,0 180,4 244,7 159,5 175,2 175,9 167,7
Fruit 52,0 196,0 208,3 198,8 204,0 198,8 201,6
Combined 100,0 189,8 220,6 183,6 192,6 189,6 188,6
Animal husbandry
Pastoral products 2,5 343,8 277,8 313,9 277,3 316,7 249,1
Stock slaughtered 34,2 192,4 192,4 195,2 195,2 193,0 193,0
Milk 14,2 140,2 148,9 140,2 148,9 140,2 148,9
Poultry 49,1 176,8 170,1 176,0 172,5 176,6 173,8
Combined 100,0 181,2 177,5 181,0 179,6 180,6 178,8
120
140
160
180
200
220
240
2010 =
100
Month
Producer price index for field crops, horticulture and animal products
Series1 Series2 Series3

Department of Agriculture, land reform & rural development
Crops and Markets Fourth Quarter 2020 8
5. CONSUMER PRICE INDICES
Item Weight October 2020 November 2020 December 2020
Index (2010 = 100)
All items 100,00 166,1 166,0 162,5
All items, excluding food 84,59 166,9 164,7 163,5
Food 15,41 186,9 187,6 189,7
Grain products 3,55 176,9 181,7 187,2
Meat 4,56 193,5 193,5 195,9
Fish and other seafood 0,37 185,3 184,4 185,4
Milk, cheese and eggs 1,74 172,3 176,6 178,1
Fats and oils 0,55 183,0 180,2 182,6
Fruit and nuts 0,23 163,4 173,0 167,0
Vegetables 1,61 191,9 178,8 173,2
Sugar 0,65 225,5 223,0 226,7
Coffee, tea and cocoa 1,21 189,0 211,3 209,8
Other 0,94 175,0 177,1 180,2
Source: Statistics South Africa

Department of Agriculture, land reform & rural development
Crops and Markets Fourth Quarter 2020 9
6. PRICE INDICES OF FARMING REQUISITES (BASE YEAR: 2010 = 100)
Period
Machinery and implements Material for fixed improvements
Tractors Trucks Imple-ments
Irrigation equipment
Combined index
Building materials
Fencing materials
Combined index
2010 100,0 100,0 100,0 100,0 100,0 100,0 100,0 100,0
2014 139,0 151,1 139,0 138,9 142,5 128,6 131,0 129,5
2015 148,6 159,8 143,7 146,5 150,2 139,5 137,8 138,9
2016 165,9 169,8 154,7 156,2 162,6 151,0 145,7 149,1
2017 171,6 179,9 159,9 159,1 169,1 157,0 153,1 155,6
January 170,8 172,9 154,3 155,9 164,8 151,7 146,9 150,0
April 172,1 175,4 155,7 153,9 166,1 165,8 159,8 163,7
2016/17 169,6 175,2 157,4 157,9 166,1 154,1 150,2 152,8
July 170,9 174,6 155,7 164,1 166,7 152,9 156,3 154,1
October 172,6 196,9 174,1 162,4 178,9 157,7 149,4 154,8
2018 178,5 192,7 165,5 164,3 177,1 165,9 161,5 164,4
January 175,7 180,0 160,8 162,3 171,1 158,1 153,6 156,5
April 176,9 183,3 157,5 155,7 170,6 172,2 166,0 170,0
2017/18 174,0 185,0 162,0 161,1 171,8 160,2 156,3 158,9
July 180,5 202,6 162,1 170,9 180,4 165,1 168,4 166,2
October 180,8 204,8 181,3 168,3 186,4 168,2 157,9 164,6
2019 184,2 198,1 172,3 169,5 183,0 173,8 168,4 171,9
January 183,5 187,9 167,2 168,9 178,3 165,5 159,8 163,5
April 183,7 188,8 164,5 161,6 176,9 182,4 175,3 179,9
2018/19 182,1 193,5 168,9 167,4 180,6 170,3 165,3 168,6
July 183,9 210,3 168,9 175,0 186,1 172,5 175,9 173,7
October 185,6 205,6 188,6 172,3 190,7 174,6 162,7 170,4
2020 186,6 202,2 176,5 177,1 187,1 181,2 171,5 177,8
January 185,5 190,0 174,0 181,2 183,0 171,3 167,2 169,9
April 185,9 190,0 168,4 165,5 179,6 177,4 170,5 174,9
2019/20 185,2 195,9 175,0 173,5 184,8 174,0 169,1 172,2
July 185,7 221,2 172,1 183,0 191,7 197,8 182,4 192,4
October 189,5 207,7 191,3 178,7 194,0 179,3 165,9 174,0

Department of Agriculture, land reform & rural development
Crops and Markets Fourth Quarter 2020 10
Period
Intermediate goods and services
All farming requisites combined
Fertilisers Fuel Feeds Animal health and
crop protection
Packing material
Maintenance and repairs
Combined index
2010 100,0 100,0 100,0 100,0 100,0 100,0 100,0 100,0
2014 124,6 141,5 146,4 139,0 144,9 139,0 142,9 142,3
2015 127,5 136,4 152,7 146,1 151,0 145,7 147,4 147,3
2016 131,4 142,9 163,6 153,9 159,1 151,6 155,7 156,2
2017 135,9 146,7 168,6 166,8 171,4 158,5 162,4 162,9
January 133,8 146,4 164,3 156,9 172,5 160,5 159,9 160,0
April 135,7 146,0 162,4 159,5 162,4 158,4 158,7 159,8
2016/17 132,7 144,6 166,0 158,0 165,9 155,3 158,7 159,3
July 137,1 144,6 167,0 169,1 175,4 159,8 163,0 163,0
October 137,2 149,7 178,7 181,8 175,5 155,4 168,2 168,8
2018 138,4 156,3 171,0 178,9 180,8 165,1 168,5 169,3
January 136,2 149,8 166,6 172,6 181,7 167,1 165,8 166,0
April 137,5 153,7 159,7 177,0 169,7 165,5 162,9 164,1
2017/18 137,0 149,4 168,5 175,1 175,6 162,0 165,0 165,5
July 139,9 158,5 174,9 175,7 186,9 167,3 170,8 171,7
October 140,0 163,1 182,8 190,1 184,8 160,3 174,7 175,6
2019 141,2 158,1 177,0 187,8 187,1 172,4 174,2 175,1
January 139,7 151,9 172,6 181,2 189,4 174,7 171,8 172,1
April 141,2 160,5 165,7 186,9 175,1 172,3 169,3 170,7
2017/18 140,2 158,5 174,0 183,5 184,1 169,5 171,8 172,6
July 142,2 157,8 180,1 184,7 189,2 173,0 175,2 176,4
October 141,6 162,2 189,6 198,5 194,6 169,7 180,6 181,2
2020 146,1 150,8 187,7 195,9 194,7 177,1 180,7 181,3
January 141,8 157,6 179,5 191,0 197,3 182,5 179,2 179,2
April 145,9 143,0 177,9 193,1 182,3 173,0 173,5 174,3
2019/20 142,9 155,2 181,8 191,8 190,9 174,6 177,1 177,8
July 147,0 151,8 193,7 190,8 196,2 178,1 183,3 184,8
October 149,5 150,8 199,6 208,8 202,8 174,6 186,8 187,1

Department of Agriculture, land reform & rural development
Crops and Markets Fourth Quarter 2020 11
150
160
170
180
190
200
Oct. '18 Jan. '19 Apr. '19 Jul. '19 Oct. '19 Jan. '20 Apr. '20 Jul. '20 Oct. '20
2010 =
100
Quarter
Price indices of farming requisites
Machinery and implements Material for fixed improvements Intermediate goods

Department of Agriculture, land reform & rural development
Crops and Markets Fourth Quarter 2020 12
SECTION B
FRESH PRODUCE MARKETS OVERVIEW
FRESH MARKET STATISTICS AND GRAPHIC PRESENTATION OF SEASONAL FLUCTUATIONS IN QUANTITIES AND PRICES OF FRUIT AND VEGETABLES SOLD ON THE MAJOR FRESH PRODUCE MARKETS
The purpose of this overview is to show the short-term price and volume trends (seasonal fluctuations) of various types of fruit and vegetables sold on major fresh produce markets and to make comparisons between the markets.
Market prices are determined by the interaction between supply and demand, which is influenced by various factors. Supply factors include climate, seasonal production, perishability of products and producers’ reaction to prices realised in preceding periods, etc. Demand factors include consumer preferences, substitution between products and per capita income. Therefore, the seasonal pattern of quantities sold and prices realised may differ considerably among the various markets.
The graphs in this overview depict the trends for fruit and vegetables sold on the Johannesburg Fresh Produce Market and give an indication of the variations in monthly volumes sold and prices received, based on the average for the five-year period 2015 to 2019.
Detailed information regarding the specific varieties of fruit and vegetables sold on the markets is available on request from:
Ms Mahlatse Makaleng
Directorate: Statistics and Economic Analysis
Tel no.: 012 319 8050
Fax: 012 319 8031
E-mail: [email protected]
Interesting vegetable: Potatoes
Common names: Potato, Papa, Oca, Cavi, Arracacha, Apio
Scientific names: Solanum tuberosum
History: The potato was first domesticated in the region of modern-day southern Peru and north-western Bolivia by pre-Columbian farmers around Lake Titicaca. It has since spread around the world and became a staple crop in many countries.
The earliest archaeologically verified potato tuber remains have been found at the coastal site of Ancon (central Peru), dating to 2500 BC.
Description: Potato is a herbaceous perennial plant in the family Solanaceae that is grown for its edible tubers. The potato plant has a branched stem and alternately arranged leaves consisting of leaflets, which are both of unequal size and shape. The leaflets can be oval to oblong in shape and the leaves can reach 10 cm to 30 cm (4 in to 12 in) in length and are 5 cm to 15 cm (2 in to 6 in) wide. The potato plant produces white or blue flowers and yellow-green berries. The potato tubers grow underground and are generally located in the top 25 cm (10 in) of the soil. The tubers can range in colour from yellow to red or purple depending on the variety. Potato plants can reach in excess of 1 m in height and are grown as annual plants, surviving only one growing season. The potato may also be referred to as a spud, Irish potato, white potato or Spanish potato and originates from South America.
Types of potatoes:
Russet potatoes

Department of Agriculture, land reform & rural development
Crops and Markets Fourth Quarter 2020 13
They are characterised by their rough brown skin and white flesh. Varieties such as Butte fall into the dry/mealy end of the texture spectrum. When baked, the thick skin crisps up to create a perfect "jacket" for the fluffy interior.
White potatoes Compared to russets, white potatoes such as Onaway and Elba have smoother, thinner and lighter-coloured skin. They are considered all-purpose potatoes and they are creamy when baked, although they hold their texture when boiled.
Yukon Gold
These are waxy potatoes made familiar by the popular Yukon Gold variety. These potatoes have fine-grained, dense flesh that holds its shape when cooked. They are ideal for potato salad, soups and stews, but can also be roasted and baked.
Colourful potatoes
Potatoes with red/pink or purple/blue flesh are as easy to grow in a garden as any other potato. All Blue potatoes have dark, purple-blue skin and lighter blue flesh. It is somewhat mealy, making it good for baking. All-Blues keep their colour best when baked, microwaved or fried; when boiled, the flesh fades to a greyish blue. Some people think it has a subtle nutty flavour.
. Russian Banana
Fingerling potatoes such as the Russian Banana, like the name implies, are shaped like fingers — these are small and elongated and thankfully have a thin, tender skin, otherwise they would be difficult to peel

Department of Agriculture, land reform & rural development
Crops and Markets Fourth Quarter 2020 14
and are fantastic roasted. Because they are so small, they can be boiled whole with the skin intact so they do not absorb as much water as potato chunks, making them great for potato salad as well.
Red Cloud
Immature potatoes that are harvested in early summer before they are fully mature (before the vines die back) are called "new potatoes." They can be of any variety. Their skin is thin and tender and they are often boiled whole and tossed with butter and fresh parsley. They have a shorter shelf life than mature potatoes.
Cultivation:
Potato seed should be planted about 30 cm apart in furrows and covered with enough soil to form a small ridge on top of the row. They should be watered regularly (at least twice a week) from the time planted until young shoots appear above the soil surface. This can be anything from one week to three weeks after planting.
Health benefits:
Regulates blood pressure:
Potatoes are high in potassium, which works in opposition to sodium to help regulate blood pressure and fluid balance. Research shows that the potassium in potatoes is just as high and as usable by the body as when consumed as a dietary supplement. Potassium is also essential for normal muscle and nerve function.
Supports the immune system:
Vitamin C is needed for normal immune system function, blood clotting and strong connective tissue and blood vessel walls. Since vitamin C cannot be stored in the body, it must be consumed through food. One baked potato provides about 19% of the daily value for vitamin C.
Repairs oxidative damage:
Potatoes also have a good concentration of antioxidant phytonutrients, including vitamin C, carotenoids, and polyphenols. These compounds can help repair cells damaged by oxidative stress, which can contribute to a number of chronic diseases.
Prevents chronic disease:
Fibre is important for digestion, blood sugar control, weight management, heart health and more. Potatoes, especially when the peel is consumed, are a good source of dietary fibre.
References: https://en.wikipedia.org/wiki/Potato https://www.gardeners.com/how-to/potato-varieties/7556.html https://plantvillage.psu.edu/topics/potato/infos https://www.verywellfit.com/are-potatoes-good-for-you-2506382

Department of Agriculture, land reform & rural development
Crops and Markets Fourth Quarter 2020 15
Mass, value and average price of vegetables sold on the 20 major fresh produce markets: October to December 2020
Code Market Rands Tons Rands/ton
TSW Tshwane (Pretoria) 649 398 267 119 485 5 435
JHB Johannesburg 1 612 446 243 287 509 5 608
BFN Bloemfontein 91 815 507 15 457 5 940
KIM Kimberley 8 604 523 1 387 6 205
CT Cape Town 349 950 850 52 701 6 640
PE Port Elizabeth 55 010 839 9 717 5 66661
EL East London 82 379 717 13 740 5 995
DBN Durban 294 677 263 52 914 5 570
PMB Pietermaritzburg 50 166 864 9 921 5 057
WLK Welkom 56 764 569 9 259 6 131
KDP Klerksdorp 82 595 482 14 640 5 642
VER Vereeniging 12 026 256 2 225 5 406
SPR Springs 117148106 23220 5045
WBK Witbank 12 517 715 2 330 5 372
NLS Nelspruit 5 408 751 908 5 957
MPL Mpumalanga 15 339 156 2 504 6 127
KEI Kei (Mthatha) 1 387 043 376 3 693
GEO George 7 390 326 1 332 5 548
MOO Mooketsi - - -
POL Polokwane - - -
Mass, value and average price of fruit sold on the 20 major fresh produce markets: October to December 2020
Code Market Rands Tons Rands/ton
TSW Tshwane (Pretoria) 359 323 204 4 3528 8 255
JHB Johannesburg 718 481 911 67 417 10 657
BFM Bloemfontein 56 155 842 6 482 8 663
KIM Kimberley 1 693 660 241 7 037
CT Cape Town 168 129 653 17 138 9 810
PE Port Elizabeth 18939273 2129 8895
EL East London 46 399 375 4 815 9 636
DBN Durban 179 773 570 18 425 9 757
PMB Pietermaritzburg 37 171 906 4 619 8 048
WLK Welkom 15 744 225 2 315 6 802
KDP Klerksdorp 29 581 215 4 672 6 327
VER Vereeniging 2 554 033 431 5 923
SPR Springs 44 945 903 5 996 7 496
WBK Witbank 1 488 637 231 6 434
NLS Nelspruit - - -
MPL Mpumalanga 35 265 6 5 593
KEI Kei (Mthatha) 267 326 41 6 498
GEO George 183 020 20 9 348
MOO Mooketsi - - -
POL Polokwane - - -

Department of Agriculture, land reform & rural development
Crops and Markets Fourth Quarter 2020 16
1. Apples
2019 Aug. Sep. Oct. Nov. Dec. 2019
Market Tons Market
TSW 3 206 3 465 3 598 2 950 1 945 TSW JHB 4 838 5 771 5 757 4 646 3 354 JHB BFN 388 468 520 491 385 BFN KIM 17 16 22 18 11 KIM CT 322 348 406 418 350 CT PE 7 7 3 4 19 PE EL 259 294 326 275 271 EL DBN 1 796 1 894 1 929 1 423 1 145 DBN PMB 429 448 511 477 394 PMB WLK 242 245 249 248 173 WLK KDP 390 425 443 636 530 KDP VER 24 36 48 46 40 VER SPR 863 1070 948 792 549 SPR UIT - - - - - UIT WBK 20 11 7 16 9 WBK NLS - - - - - NLS POL 212 267 - - - POL MPL - - - - - MPL
KEI 1 - 28 2 - KEI GEO - - - - - GEO MOO - - - - - MOO Total 13 015 14 763 14 794 12 442 9 174 Total
Market R/ton Market
TSW 6 192 6 396 7 222 8 304 8 812 TSW JHB 7 208 7 394 8 250 8 888 8 901 JHB BFN 7 563 7 571 7 934 8 073 7 916 BFN KIM 6 677 8 022 7 311 6 932 7 947 KIM CT 7 304 7 610 7 962 8 700 8 936 CT PE 5 657 5 730 9 205 10 249 7 097 PE EL 7 387 7 539 7 421 8 657 8 615 EL DBN 6 441 6 156 6 868 7 897 8 228 DBN PMB 6 036 5 874 5 684 6 609 6 068 PMB WLK 6 222 6 886 7 190 6 876 7 500 WLK KDP 6 134 6 630 6 350 4 611 4 168 KDP VER 7 165 6 818 6 906 6 904 7 119 VER SPR 6 012 5 974 6 716 7 622 7 676 SPR UIT - - - - - UIT WBK 6 677 8 440 8 509 9 408 9 119 WBK NLS - - - - - NLS POL 7 279 7 352 - - - POL MPL - - - - - MPL KEI 7 454 - 8 257 2 773 - KEI GEO - - - - - GEO MOO - - - - - MOO Average 6 699 6 834 7 515 7 273 8 243 Average
Note: A dash (–) indicates that the volume sold was less than a ton or that there were no sales. An asterisk (*)
indicates that the information on the specific market was not available at the time of printing.
4 500
5 400
6 300
7 200
8 100
9 000
1 000
2 200
3 400
4 600
5 800
7 000
J F M A M J J A S O N D
R/t
on
To
ns
Month
Sales of apples and prices received on the Johannesburg Market Five-year average (2015–2019)
Quantity Price

Department of Agriculture, land reform & rural development
Crops and Markets Fourth Quarter 2020 17
2. Pears
2019 Aug. Sep. Oct. Nov. Dec. 2019
Market Tons Market
TSW 1 896 1 440 903 307 478 TSW JHB 1 497 1 513 1 405 601 996 JHB BFN 196 200 205 82 134 BFN KIM 4 2 2 5 2 KIM CT 69 61 70 63 59 CT PE 0 1 1 0 - PE EL 129 162 161 57 87 EL DBN 574 497 422 207 230 DBN PMB 235 199 170 49 138 PMB WLK 85 87 74 43 58 WLK KDP 176 155 122 29 98 KDP VER 27 31 24 1 3 VER SPR 267 250 210 72 88 SPR UIT - - - - - UIT WBK - 1 1 0 1 WBK NLS - - 0 - - NLS POL 11 22 0 - - POL MPL - - 0 - - MPL KEI - - 4 - - KEI GEO - - - - - GEO MOO - - - - - MOO Total 5 168 4 621 3 773 1 517 2 374 Total
Market R/ton Market
TSW 3 939 5 269 8 959 10 748 11 846 TSW JHB 7 460 8 211 9 313 10 212 11 494 JHB BFN 7 313 7 451 7 814 9 365 9 221 BFN KIM 8 798 9 526 8 812 9 296 8 906 KIM CT 7 599 8 207 8 373 10 236 11 020 CT PE 1 488 10 792 5 883 - 14 428 PE EL 7 308 7 798 7 939 9 689 10 675 EL DBN 6 541 6 939 8 082 9 675 10 770 DBN PMB 5 767 6 194 6 657 7 279 7 844 PMB WLK 6 649 6 608 6 790 7 482 5 669 WLK KDP 5 313 5 752 6 569 6 605 7 218 KDP VER 7 143 7 436 8 107 9 053 6 070 VER SPR 5 902 7 214 8 083 9 878 11 002 SPR UIT - - - - - UIT WBK - 11 302 10 443 10 793 8 263 WBK NLS - - - - - NLS POL 8 499 8 807 - - - POL MPL - - - - - MPL KEI - - 6 341 - - KEI GEO - - - - - GEO MOO - - - - - MOO Average 5 816 6 855 8 595 9 801 10 890 Average
Note: A dash (–) indicates that the volume sold was less than a ton or that there were no sales. An asterisk (*)
indicates that the information on the specific market was not available at the time of printing.
1 800
3 600
5 400
7 200
9 000
10 800
100
480
860
1 240
1 620
2 000
J F M A M J J A S O N D
R/t
on
To
ns
Month
Sales of pears and prices received on the Johannesburg MarketFive-year average (2015–2019)
Quantity Price

Department of Agriculture, land reform & rural development
Crops and Markets Fourth Quarter 2020 18
3. Oranges
2019 Aug. Sep. Oct Nov Dec 2019
Market Tons Market
TSW 2 137 1 180 267 80 56 TSW JHB 5 328 2 890 1 803 1 113 497 JHB BFN 430 203 77 1 1 BFN KIM 5 11 15 - - KIM CT 463 470 483 319 323 CT PE 34 23 9 12 40 PE EL 325 187 22 15 3 EL DBN 1 702 923 541 303 35 DBN PMB 325 134 54 2 - PMB WLK 302 145 15 - 1 WLK KDP 270 160 52 - - KDP VER 35 35 1 2 - VER SPR 435 224 102 1 - SPR UIT - - - - - UIT WBK 38 2 - - - WBK NLS - - - - - NLS POL 2 2 - - - POL MPL 3 3 - - - MPL KEI 3 - 5 - - KEI GEO - - - - - GEO MOO - - - - - MOO Total 11 836 6 592 3 445 1 848 956 Total
Market R/ton Market
TSW 3 785 3 906 5 911 8 682 6 629 TSW JHB 4 775 5 420 7 106 8 922 9 680 JHB BFN 4 502 3 865 3 507 3 178 2 609 BFN KIM 4 212 4 261 2 248 - - KIM CT 3 801 3 882 4 165 4 921 7 163 CT PE 3 055 2 913 2 330 2 686 2 576 PE EL 4 546 3 543 2 050 5 924 5 477 EL DBN 4 864 4 669 4 473 5 243 5 844 DBN PMB 4 539 4 573 2 423 3 590 - PMB WLK 4 513 3 546 2 895 - 1 667 WLK KDP 4 966 3 826 3 704 1 002 - KDP VER 3 846 3 085 1 624 - - VER SPR 3 120 3 355 3 270 1 861 - SPR UIT - - - - - UIT WBK 3 386 1 995 - - - WBK NLS - - - - - NLS POL 3 566 3 580 - - - POL MPL 4 546 4 284 - - - MPL KEI 3 771 - 1 714 - - KEI GEO - - - - - GEO MOO - - - - - MOO Average 4 472 4 640 5 775 7 534 8 477 Average
Note: A dash (–) indicates that the volume sold was less than a ton or that there were no sales. An asterisk (*)
indicates that the information on the specific market was not available at the time of printing
1 000
2 500
4 000
5 500
7 000
8 500
100
1 800
3 500
5 200
6 900
8 600
J F M A M J J A S O N D
R/t
on
To
ns
Month
Sales of oranges and prices received on the Johannesburg MarketFive-year average (2015–2019)
Quantity Price

Department of Agriculture, land reform & rural development
Crops and Markets Fourth Quarter 2020 19
4. Lemons
2019 Aug. Sep. Oct Nov Dec 2019
Market Tons Market
TSW 288 302 291 245 240 TSW JHB 1 200 995 1066 963 1031 JHB BFN 37 19 35 19 36 BFN KIM - 1 0 1 - KIM CT 442 362 326 253 372 CT PE 7 10 11 7 15 PE EL 25 27 19 15 14 EL DBN 280 220 186 169 173 DBN PMB 30 23 26 22 27 PMB WLK 4 2 2 1 - WLK KDP 11 6 7 19 3 KDP VER 2 5 2 - - VER SPR 47 60 43 10 18 SPR UIT - - - - - UIT WBK - - - - - WBK NLS - - - - - NLS POL 0 - - - - POL MPL 0 0 - - 0 MPL KEI - - - - - KEI GEO - - - - - GEO MOO - - - - - MOO Total 2 372 2 033 2 014 1 724 1 928 Total
Market R/ton Market
TSW 7 570 7 494 7 867 8385 9 666 TSW JHB 6 301 6 860 6 516 7996 8 560 JHB BFN 5 949 7 029 7 788 5515 11 557 BFN KIM - 4 782 5 160 3333 - KIM CT 3 207 3 685 4 120 4927 7 165 CT PE 2 534 2 076 2 624 2531 2 502 PE EL 4 451 3 883 5 399 6372 7 494 EL DBN 6 477 5 129 5 949 8261 10 731 DBN PMB 4 655 5 663 4 482 5233 5 973 PMB WLK 10 246 11 759 10 721 6403 - WLK KDP 4 134 9 553 8 528 1634 11 615 KDP VER 7 256 6 952 4 302 - - VER SPR 5 535 5 791 4 814 5397 11 873 SPR UIT - - - - - UIT WBK 6 667 - - - - WBK NLS - - - - - NLS POL 6 706 - - - - POL MPL 4 965 4 333 - - 5 829 MPL KEI - - - - - KEI GEO - - - - - GEO MOO - - - - - MOO Average 5 825 6 108 6 209 7 439 8 622 Average
Note: A dash (–) indicates that the volume sold was less than a ton or that there were no sales. An asterisk (*)
indicates that the information on the specific market was not available at the time of printing.
1 000
3 000
5 000
7 000
9 000
100
240
380
520
660
800
J F M A M J J A S O N D
R/t
on
To
ns
Month
Sales of lemons and prices received on the Johannesburg MarketFive-year average (2015–2019)
Quantity Price

Department of Agriculture, land reform & rural development
Crops and Markets Fourth Quarter 2020 20
5. Avocados
2019 Aug. Sep. Oct Nov Dec 2019
Market Tons Market
TSW 596 480 376 189 209 TSW JHB 1 073 1 184 858 603 475 JHB BFN 63 77 117 31 25 BFN KIM 0 1 0 - - KIM CT 473 362 298 436 491 CT PE 7 4 9 9 13 PE EL 11 9 9 13 10 EL DBN 18 20 31 22 23 DBN PMB 7 13 6 2 2 PMB WLK 13 4 7 5 11 WLK KDP 58 24 18 3 7 KDP VER 0 0 - - - VER SPR 17 12 4 8 17 SPR UIT - - - - - UIT WBK 1 1 1 - - WBK NLS - - - - - NLS POL 0 - - - - POL MPL - - - - - MPL KEI - - - - - KEI GEO 1 - 2 0 6 GEO MOO - - - - - MOO Total 2 340 2 189 1 734 1 320 1 289 Total
Market R/ton Market
TSW 13 713 16 275 20 533 26 221 22 763 TSW JHB 16 453 16 402 21 361 27 231 22 007 JHB BFN 11 624 8 881 5 108 17 175 17 716 BFN KIM 9 814 9 388 2 941 - - KIM CT 16 345 23 574 24 317 18 818 16 663 CT PE 16 507 11 637 13 855 29 834 13 948 PE EL 21 839 26 623 27 420 25 577 27 145 EL DBN 13 722 17 095 14 843 22 377 23 444 DBN PMB 8 573 7 686 10 268 13 519 14 871 PMB WLK 8 398 26 322 15 881 14 859 10 570 WLK KDP 13 885 17 988 19 891 17 734 10 945 KDP VER 26 678 18 000 - - - VER SPR 17 099 14 860 21 375 16 816 18 766 SPR UIT - - - - - UIT WBK 10 353 9 628 4 540 - - WBK NLS - - - - - NLS POL 25 349 - - - - POL MPL - - - - - MPL KEI - - - - - KEI GEO 14 706 - 20 178 12 000 18 033 GEO
MOO - - - - - MOO Average 15 477 17 308 20 381 23 844 19 814 Average
Note: A dash (–) indicates that the volume sold was less than a ton or that there were no sales. An asterisk (*)
indicates that the information on the specific market was not available at the time of printing.
7 000
9 500
12 000
14 500
17 000
19 500
100
340
580
820
1 060
1 300
J F M A M J J A S O N D
R/t
on
To
ns
Month
Sales of avocados and prices received on the Johannesburg MarketFive-year average (2015–2019)
Quantity Price

Department of Agriculture, land reform & rural development
Crops and Markets Fourth Quarter 2020 21
6. Bananas
2019 Aug. Sep. Oct Nov Dec 2019
Market Tons Market
TSW 3 985 3 909 3 662 3 781 3 918 TSW JHB 4 810 4 817 4 959 5 401 5 401 JHB BFN 567 541 492 714 514 BFN KIM 74 65 0 4 2 KIM CT 1 710 1 625 1 604 1 794 1 872 CT PE 456 467 453 491 538 PE EL 822 822 801 886 855 EL DBN 2007 1832 1776 2137 2161 DBN PMB 594 636 523 496 674 PMB WLK 187 157 84 176 173 WLK KDP 438 455 390 421 473 KDP VER - 26 25 66 42 VER SPR 657 639 629 658 619 SPR UIT - - - - - UIT WBK 32 9 4 30 15 WBK NLS - - - - - NLS POL 45 44 - - - POL MPL 3 2 2 4 - MPL KEI - - - - - KEI GEO - - - - - GEO MOO - - - - - MOO Total 16 387 16 047 15 403 17 057 17 256 Total
Market R/ton Market
TSW 7 305 8 123 9 583 7 343 7 653 TSW JHB 7 397 8 353 9 238 7 406 7 875 JHB BFN 8 110 8 833 10 368 8 154 9 429 BFN KIM 8 810 9 442 12 500 8 419 8 203 KIM CT 8 174 9 391 11 070 8 877 8 623 CT PE 8 798 9 541 11 649 10 320 9 481 PE EL 8 259 9 126 10 717 8 876 9 101 EL DBN 7 856 8 696 9 476 7 697 7 916 DBN PMB 6 756 6 891 8 420 8 063 7 387 PMB WLK 7 972 8 976 10 151 8 514 7 577 WLK KDP 6 696 7 395 8 681 7 468 7 516 KDP VER - 8 051 5 761 7 635 6 963 VER SPR 6 976 7 926 8 986 6 708 7 387 SPR UIT - - - - - UIT WBK 5 583 83 69 7 501 7 556 6 317 WBK NLS - - - - - NLS POL 7 077 7 269 - - - POL MPL 6 295 5 926 5 209 5 623 - MPL KEI - - - - - KEI GEO - - - - - GEO MOO - - - - - MOO Average 7 568 8 436 9 669 7 781 8 015 Average
Note: A dash (–) indicates that the volume sold was less than a ton or that there were no sales. An asterisk (*)
indicates that the information on the specific market was not available at the time of printing.
1 000
2 400
3 800
5 200
6 600
8 000
1 000
2 400
3 800
5 200
6 600
8 000
J F M A M J J A S O N D
R/t
on
To
ns
Month
Sales of bananas and prices received on the Johannesburg Market Five-year average (2015–2019)
Quantity Price

Department of Agriculture, land reform & rural development
Crops and Markets Fourth Quarter 2020 22
7. Papayas
2019 Aug. Sep. Oct Nov Dec 2019
Market Tons Market
TSW 146 237 234 176 107 TSW JHB 365 579 564 464 275 JHB BFN 6 10 11 15 16 BFN KIM - - - - 1 KIM CT 47 58 61 61 36 CT PE 0 4 1 4 0 PE EL 2 3 3 2 1 EL DBN 22 19 30 18 20 DBN PMB 1 1 0 1 0 PMB WLK 5 6 2 3 2 WLK KDP 4 5 5 4 2 KDP VER 0 0 0 - - VER SPR 2 0 0 3 8 SPR UIT - - - - - UIT WBK - - - - - WBK NLS - - - - - NLS POL 0 - - - - POL MPL - - - - 0 MPL KEI - - - - - KEI GEO - - - - - GEO MOO - - - - - MOO Total 600 921 911 750 468 Total
Market R/ton Market
TSW 12 394 10 278 1 276 11 022 14 164 TSW
JHB 9 722 7 826 8 924 8 953 10 728 JHB BFN 13 503 9 901 10 487 10 907 6 573 BFN KIM - - - - 8 528 KIM CT 9 168 7 579 7 436 8 905 7 387 CT PE 12 233 7 568 6 302 5 607 7 000 PE EL 7 393 10 950 6 556 10 261 12 799 EL DBN 10 260 10 883 9 247 8 353 6 881 DBN PMB 11 073 8 954 6 662 5 729 5 000 PMB WLK 9 278 9 021 7 235 14 622 11 765 WLK KDP 13 686 10 992 13 956 14 684 8 088 KDP VER 14 154 7 119 8 703 - - VER SPR 17 378 2 667 13 930 9 334 4 770 SPR UIT - - - - - UIT WBK - - - - - WBK NLS - - - - - NLS POL 6 000 - - - - POL MPL - - - - 10 000 MPL KEI - - - - - KEI GEO - - - - - GEO MOO - - - - - MOO Average 10 431 8 561 9 471 9 493 10 836 Average
Note: A dash (–) indicates that the volume sold was less than a ton or that there were no sales. An asterisk (*)
indicates that the information on the specific market was not available at the time of printing.
7 000
8 000
9 000
10 000
11 000
100
200
300
400
500
600
J F M A M J J A S O N D
R/t
on
To
ns
Month
Sales of papayas and prices received on the Johannesburg MarketFive-year average (2015–2019)
Quantity Price

Department of Agriculture, land reform & rural development
Crops and Markets Fourth Quarter 2020 23
8. Pineapples
2019 Aug. Sep. Oct Nov Dec 2019
Market Tons Market
TSW 374 359 339 297 374 TSW JHB 608 726 759 709 866 JHB BFN 48 40 41 40 42 BFN KIM 12 11 13 9 12 KIM CT 182 142 105 207 386 CT PE 27 23 22 14 28 PE EL 80 63 61 63 106 EL DBN 229 223 200 169 234 DBN PMB 33 26 22 24 26 PMB WLK 23 13 14 13 16 WLK KDP 50 18 20 20 22 KDP VER 3 - - - - VER SPR 32 31 24 14 20 SPR UIT - - - - - UIT WBK - - - - - WBK NLS - - - - - NLS POL 1 - - - - POL MPL - - - - - MPL KEI - - - - - KEI GEO - - - - - GEO MOO - - - - - MOO Total 1 701 1 675 1 620 1 579 2 133 Total
Market R/ton Market
TSW 12 482 8 894 10 429 10 231 8 911 TSW JHB 11 879 8 430 10 259 10 196 10 148 JHB BFN 12 991 10 749 12 108 12 484 12 420 BFN KIM 11 848 9 695 8 281 9 540 9 587 KIM CT 11 814 8 147 12 209 12 531 11 646 CT PE 4 657 4 484 4 561 5 197 5 561 PE EL 4 923 5 679 5 675 6 224 5 850 EL DBN 11 138 7 923 8 977 9 271 8 208 DBN PMB 13 735 9 930 11 064 10 578 10 689 PMB WLK 12 277 11 602 12 334 9 539 11 684 WLK KDP 6 478 10 564 11 378 10 753 11 056 KDP VER 3 040 - - - - VER SPR 13 881 10 151 11 897 12 546 10 390 SPR UIT - - - - - UIT WBK - - - - - WBK NLS - - - - - NLS POL 3 994 - - - - POL MPL - - - - - MPL KEI - - - - - KEI GEO - - - - - GEO MOO - - - - - MOO Average 11 399 8 445 10 111 10 288 9 787 Average
Note: A dash (–) indicates that the volume sold was less than a ton or that there were no sales. An asterisk (*)
indicates that the information on the specific market was not available at the time of printing.
1 000
3 000
5 000
7 000
9 000
100
300
500
700
900
1 100
J F M A M J J A S O N D
R/t
on
To
ns
Month
Sales of pineapples and prices received on the Johannesburg MarketFive-year average (2015-2019)
Quantity Price

Department of Agriculture, land reform & rural development
Crops and Markets Fourth Quarter 2020 24
9. Potatoes
2019 Aug. Sep. Oct. Nov. Dec. 2019
Market Tons Market
TSW 14 548 15 233 16 761 16 130 18 383 TSW JHB 32 078 34 173 36 903 35 968 38 532 JHB BFN 1 987 1 793 1 953 2 481 2 674 BFN KIM 43 47 121 154 85 KIM CT 6 647 6 512 6 754 8 436 7 439 CT PE 1 899 1 753 1 355 1 490 2 330 PE EL 2 303 2 347 1 970 2 357 2 842 EL DBN 6 767 7 049 6 353 7 333 9 372 DBN PMB 2 629 2 547 1 795 1 926 2 635 PMB WLK 1 527 1 425 1 692 1 770 1 879 WLK KDP 2 355 2 359 2 742 2 720 3 014 KDP VER 831 514 605 426 533 VER SPR 3 571 3 637 4 181 4 624 4 634 SPR UIT - - - - - UIT WBK 473 473 484 435 525 WBK NLS 245 244 134 235 326 NLS POL 1193 1 080 - - - POL MPL 633 385 554 539 843 MPL KEI 224 - - - - KEI GEO 733 519 288 381 440 GEO MOO - - - - - MOO Total 80 445 82 090 84 646 87 406 96 485 Total
Market R/ton Market
TSW 5 731 6 650 7 274 5 568 5 099 TSW JHB 5 664 6 525 7 141 5 398 4 911 JHB BFN 5 606 6 859 8 048 6 278 5 577 BFN KIM 4 749 6 257 8 148 6 969 5 890 KIM CT 5 559 7 251 7 932 5 245 4 287 CT PE 5 330 6 481 7 642 5 977 4 476 PE EL 5 767 6 701 8 463 6 416 5 229 EL DBN 5 604 6 267 7 550 5 721 4 715 DBN PMB 5 481 6 145 7 395 5 260 3 852 PMB WLK 5 600 6 856 7 540 6 287 5 609 WLK KDP 5 559 6 652 7 449 5 716 4 850 KDP VER 5 821 7 172 7 605 5 513 5 119 VER SPR 5 704 6 647 7 252 5 167 4 786 SPR UIT - - - - - UIT WBK 6 007 7 140 7 867 5 964 5 838 WBK NLS 6 249 7 698 7 432 7 045 6 365 NLS POL 5 942 6 693 - - - POL MPL 6 200 7 412 8 074 6 457 6 327 MPL KEI 5 080 - - - - KEI GEO 5 048 6 195 7 396 5 617 4 441 GEO MOO - - - - - MOO Average 5 671 6 613 7 366 5 535 4 896 Average
Note: A dash (–) indicates that the volume sold was less than a ton or that there were no sales. An asterisk (*)
indicates that the information on the specific market was not available at the time of printing.
1 000
1 800
2 600
3 400
4 200
5 000
1 000
9 000
17 000
25 000
33 000
41 000
J F M A M J J A S O N D
R/t
on
To
ns
Month
Sales of potatoes and prices received on the Johannesburg Market Five-year average (2015–2019)
Quantity Price

Department of Agriculture, land reform & rural development
Crops and Markets Fourth Quarter 2020 25
10. Sweet potatoes
2019 Aug. Sep. Oct. Nov. Dec. 2019
Market Tons Market
TSW 682 417 315 227 171 TSW JHB 1 370 719 634 561 600 JHB BFN 41 14 5 7 6 BFN KIM 0 1 - - - KIM CT 411 327 201 118 92 CT PE 53 59 53 67 6 PE EL 37 26 9 11 4 EL DBN 97 65 15 20 13 DBN PMB 4 4 4 0 0 PMB WLK 27 13 2 0 - WLK KDP 19 11 5 14 3 KDP VER - - - - - VER SPR 79 29 26 25 23 SPR UIT - - - - - UIT WBK 3 - - 3 3 WBK NLS - - - - - NLS POL 42 30 - - - POL MPL 0 - - 0 0 MPL KEI 1 - - - - KEI GEO 9 18 20 8 - GEO MOO - - - - - MOO Total 2 876 1 732 1 291 1 061 921 Total
Market R/ton Market
TSW 4 468 6 226 9 318 7 279 8 357 TSW JHB 6 115 6 490 9 715 8 844 8 591 JHB BFN 4 076 7 171 9 191 9 226 7 821 BFN KIM 3 214 3 480 - - - KIM CT 4 268 4 620 9 197 9 153 11 527 CT PE 5 608 5 626 8 391 7 661 6 436 PE EL 4 040 4 636 9 958 8 504 6 938 EL DBN 4 104 2 697 8 717 6 333 9 444 DBN PMB 3 810 5 365 6 371 6 333 7 875 PMB WLK 2 487 3 594 6 578 4 250 - WLK KDP 3 705 4 062 4 887 2 549 9 467 KDP VER - - - - - VER SPR 2 968 4 499 4 466 4 432 2 367 SPR UIT - - - - - UIT WBK 4 216 - - 7 201 3 647 WBK NLS - - - - - NLS POL 4 334 2 500 - - - POL MPL 2 487 - - 9 333 8 547 MPL KEI 1 167 - - - - KEI GEO 6 155 6 696 7 510 8 076 - GEO MOO - - - - - MOO Average 5 159 5 739 9 296 8 222 8 654 Average
Note: A dash (–) indicates that the volume sold was less than a ton or that there were no sales. An asterisk (*)
indicates that the information on the specific market was not available at the time of printing.
1 000
2 200
3 400
4 600
5 800
7 000
100
460
820
1 180
1 540
1 900
J F M A M J J A S O N D
R/t
on
To
ns
Month
Sales of sweet potatoes and prices received on the Johannesburg MarketFive-year average (2015–2019)
Quantity Price
Department of Agriculture, land reform & rural development
Crops and Markets Fourth Quarter 2020 26
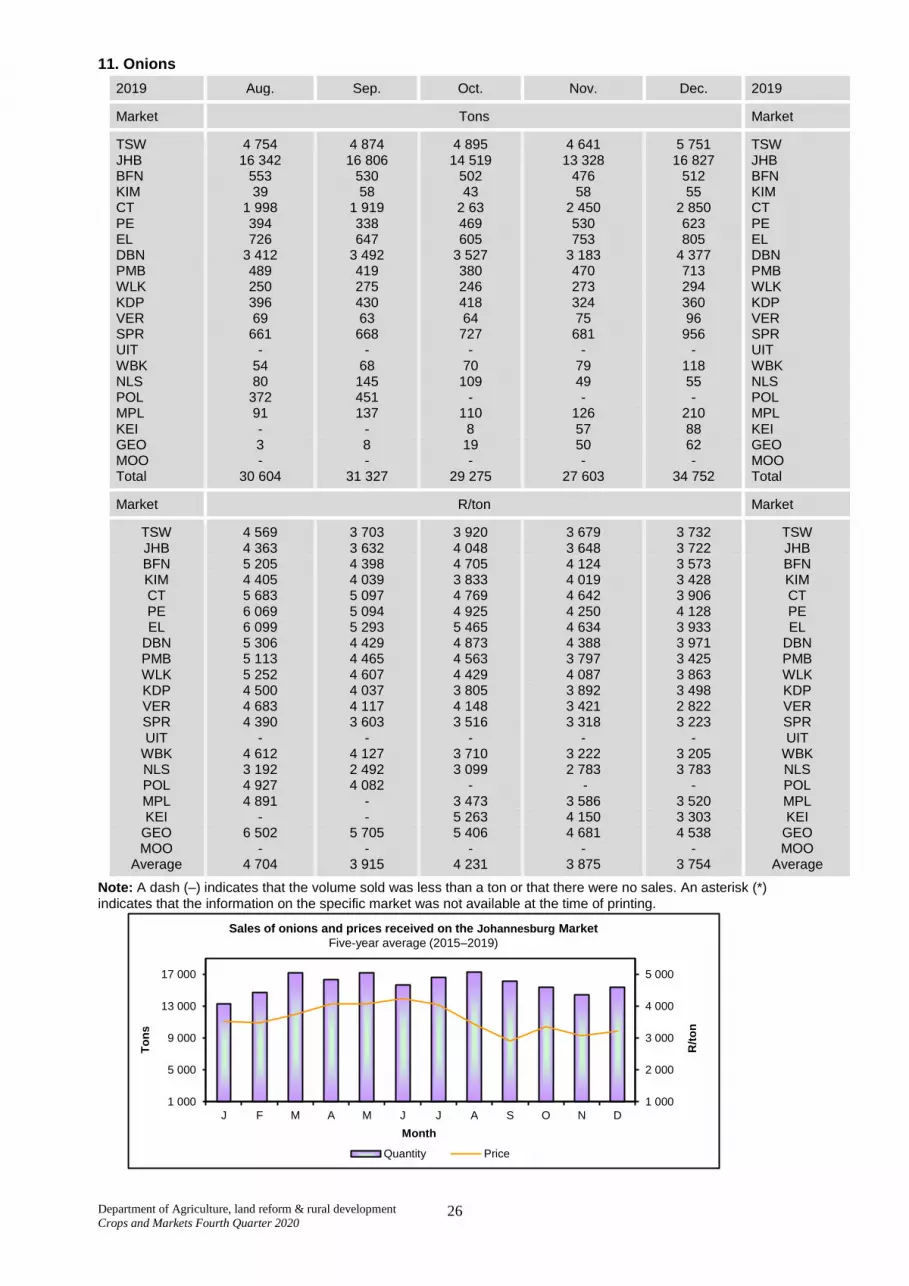
11. Onions
2019 Aug. Sep. Oct. Nov. Dec. 2019
Market Tons Market
TSW 4 754 4 874 4 895 4 641 5 751 TSW JHB 16 342 16 806 14 519 13 328 16 827 JHB BFN 553 530 502 476 512 BFN KIM 39 58 43 58 55 KIM CT 1 998 1 919 2 63 2 450 2 850 CT PE 394 338 469 530 623 PE EL 726 647 605 753 805 EL DBN 3 412 3 492 3 527 3 183 4 377 DBN PMB 489 419 380 470 713 PMB WLK 250 275 246 273 294 WLK KDP 396 430 418 324 360 KDP VER 69 63 64 75 96 VER SPR 661 668 727 681 956 SPR UIT - - - - - UIT WBK 54 68 70 79 118 WBK NLS 80 145 109 49 55 NLS POL 372 451 - - - POL MPL 91 137 110 126 210 MPL KEI - - 8 57 88 KEI GEO 3 8 19 50 62 GEO MOO - - - - - MOO Total 30 604 31 327 29 275 27 603 34 752 Total
Market R/ton Market
TSW 4 569 3 703 3 920 3 679 3 732 TSW JHB 4 363 3 632 4 048 3 648 3 722 JHB BFN 5 205 4 398 4 705 4 124 3 573 BFN KIM 4 405 4 039 3 833 4 019 3 428 KIM CT 5 683 5 097 4 769 4 642 3 906 CT PE 6 069 5 094 4 925 4 250 4 128 PE EL 6 099 5 293 5 465 4 634 3 933 EL
DBN 5 306 4 429 4 873 4 388 3 971 DBN PMB 5 113 4 465 4 563 3 797 3 425 PMB WLK 5 252 4 607 4 429 4 087 3 863 WLK KDP 4 500 4 037 3 805 3 892 3 498 KDP VER 4 683 4 117 4 148 3 421 2 822 VER SPR 4 390 3 603 3 516 3 318 3 223 SPR UIT - - - - - UIT
WBK 4 612 4 127 3 710 3 222 3 205 WBK NLS 3 192 2 492 3 099 2 783 3 783 NLS POL 4 927 4 082 - - - POL MPL 4 891 - 3 473 3 586 3 520 MPL KEI - - 5 263 4 150 3 303 KEI
GEO 6 502 5 705 5 406 4 681 4 538 GEO MOO - - - - - MOO
Average 4 704 3 915 4 231 3 875 3 754 Average
Note: A dash (–) indicates that the volume sold was less than a ton or that there were no sales. An asterisk (*)
indicates that the information on the specific market was not available at the time of printing.
1 000
2 000
3 000
4 000
5 000
1 000
5 000
9 000
13 000
17 000
J F M A M J J A S O N D
R/t
on
To
ns
Month
Sales of onions and prices received on the Johannesburg Market
Five-year average (2015–2019)
Quantity Price

Department of Agriculture, land reform & rural development
Crops and Markets Fourth Quarter 2020 27
12. Tomatoes
2019 Aug. Sep. Oct. Nov. Dec. 2019
Market Tons Market
TSW 3 807 3 523 3 389 3 400 3 589 TSW JHB 11 269 10 663 11 126 10 892 11 697 JHB BFN 638 665 572 586 670 BFN KIM 147 148 155 167 227 KIM CT 2 782 2 504 2 367 2 676 3 075 CT PE 342 277 235 319 384 PE EL 233 201 166 310 359 EL DBN 1 992 1 874 1 718 1 780 2 043 DBN PMB 172 172 112 172 213 PMB WLK 400 391 351 362 451 WLK KDP 554 520 458 417 480 KDP VER 86 88 24 30 19 VER SPR 863 773 690 883 908 SPR UIT - - - - -- UIT WBK 81 41 13 14 46 WBK NLS - - - - - NLS POL 1 333 20 32 - - - POL MPL 80 34 67 39 5 MPL KEI - - - - 3 KEI GEO - - - - - GEO MOO - - - - - MOO Total 24 780 23 905 21 444 22 047 24 168 Total
Market R/ton Market
TSW 6985 9109 10186 6729 6608 TSW JHB 6944 8635 9819 6853 6987 JHB BFN 8658 9599 11730 8645 8511 BFN KIM 7548 8516 10210 7498 6539 KIM CT 6840 10265 12361 8601 8125 CT PE 7993 9827 11765 7918 7563 PE EL 7914 9434 11267 6780 6322 EL DBN 6776 8005 10532 7364 7054 DBN PMB 7079 7869 10012 7616 6683 PMB WLK 8872 9559 11310 8998 5364 WLK KDP 7766 8765 11167 8706 8914 KDP VER 6603 7254 8769 4311 4974 VER SPR 6416 7950 9660 5857 5803 SPR UIT - - - - - UIT WBK 7101 6654 6533 5327 5496 WBK NLS - - - - - NLS POL 2927 2058 - - - POL MPL 4403 4556 4292 2915 1275 MPL KEI - - - - 5581 KEI GEO - - - - - GEO MOO - - - - - MOO Average 6803 8290 10329 7179 7130 Average
Note: A dash (–) indicates that the volume sold was less than a ton or that there were no sales. An asterisk (*) indicates that the information on the specific market was not available at the time of printing.
1 000
2 500
4 000
5 500
7 000
8 500
1 000
4 000
7 000
10 000
13 000
16 000
J F M A M J J A S O N D
R/t
on
To
ns
Month
Sales of tomatoes and prices received on the Johannesburg Market Five-year average (2015–2019)
Quantity Price

Department of Agriculture, land reform & rural development
Crops and Markets Fourth Quarter 2020 28
13. Carrots
2019 Aug. Sep. Oct. Nov. Dec. 2019
Market Tons Market
TSW 2 407 2 541 2 691 2 184 2 631 TSW JHB 5 239 5 146 5 652 4 886 6 055 JHB BFN 328 358 322 303 372 BFN KIM 19 28 18 16 38 KIM CT 657 733 698 692 723 CT PE 128 107 179 221 235 PE EL 457 497 464 552 571 EL DBN 1 039 1 307 1 429 1 380 1 767 DBN PMB 102 100 91 64 36 PMB WLK 89 92 99 122 92 WLK KDP 198 187 184 167 187 KDP VER 7 3 6 11 10 VER SPR 207 216 209 183 206 SPR UIT - - - - - UIT WBK 11 6 8 3 5 WBK NLS - - - - - NLS POL 39 54 - - - POL MPL - - - - - MPL KEI 1 - - - - KEI GEO 8 16 8 3 7 GEO MOO - - - - - MOO Total 10 938 11 391 12 058 10 787 12 934 Total
Market R/ton Market
TSW 3 107 3 483 3 478 3 544 4 438 TSW JHB 3 163 3 521 3 246 3 155 4 125 JHB BFN 4 175 4 547 4 078 3 443 4 183 BFN KIM 3 611 4 648 4 766 8 137 3 167 KIM CT 5 189 3 848 3 765 3 387 3 208 CT PE 4 486 4 675 4 448 3 687 4 438 PE EL 4 553 4 755 4 942 4 249 4 961 EL DBN 3 823 3 643 3 873 3 422 4 465 DBN PMB 3 657 3 958 4 503 4 474 4 893 PMB WLK 4 088 3 425 3 353 2 403 3 545 WLK KDP 3 349 4 163 4 083 4 056 4 357 KDP VER 3 545 4 505 4 334 2 343 3 666 VER SPR 3 281 3 679 3 462 3 597 4 217 SPR UIT - - - - - UIT WBK 3 651 4 034 4 830 4 291 5 031 WBK NLS - - - - - NLS POL 3 650 3 640 - - - POL MPL - - - - - MPL KEI 2 800 - - - - KEI GEO 5 980 - 6 162 4 586 5 248 GEO MOO - - - - - MOO Average 3 462 3 668 3 540 3 386 4 229 Average
Note: A dash (–) indicates that the volume sold was less than a ton or that there were no sales. An asterisk (*) indicates that the information on the specific market was not available at the time of printing.
1 000
2 000
3 000
4 000
5 000
6 000
1 000
2 000
3 000
4 000
5 000
6 000
J F M A M J J A S O N D
R/t
on
To
ns
Month
Sales of carrots and prices received on the Johannesburg Market Five-year average (2015–2019)
Quantity Price

Department of Agriculture, land reform & rural development
Crops and Markets Fourth Quarter 2020 29
14. Cabbage
2019 Aug. Sep. Oct. Nov. Dec. 2019
Market Tons Market
TSW 2 234 2 436 2 718 2 349 2 442 TSW JHB 3 868 4 683 5 016 4 000 5 035 JHB BFN 744 761 614 440 383 BFN KIM 76 85 76 27 48 KIM CT 506 499 613 587 360 CT PE 181 149 100 98 77 PE EL 247 256 291 233 208 EL DBN 795 750 784 858 967 DBN PMB 124 117 85 107 92 PMB WLK 287 229 154 178 163 WLK KDP 377 412 440 385 376 KDP VER 169 128 36 48 43 VER SPR 572 581 681 584 584 SPR UIT - - - - - UIT WBK 64 68 82 73 85 WBK NLS - - - - - NLS POL 105 - - - - POL MPL 0 0 1 0 1 MPL KEI 0 - 7 - 32 KEI GEO - - - 0 - GEO MOO - - - - - MOO Total 10 349 11 301 11 696 9 970 10 897 Total
Market R/ton Market
TSW 2 604 2 247 1 945 1 934 1 855 TSW JHB 3 765 2 830 2 552 2 451 1 539 JHB BFN 3 455 3 096 2 552 2 715 2 064 BFN KIM 2 280 2 097 2 438 3 442 1 926 KIM CT 4 259 4 534 3 110 2 001 1 836 CT PE 1 619 1 534 1 582 1 651 1 628 PE EL 3 163 2 976 2 481 2 331 2 309 EL DBN 2 726 2 498 2 221 1 902 1 725 DBN PMB 1 736 2 114 2 072 1 936 1 782 PMB WLK 4 274 3 938 5 366 3 925 2 824 WLK KDP 3 746 3 505 2 628 2 950 1 992 KDP VER 2 627 2 121 1 627 1 891 1 536 VER SPR 2 711 2 266 1 804 1 779 1 393 SPR UIT - - - - - UIT WBK 2 984 2 076 2 176 1 959 1 623 WBK NLS - - - - - NLS POL 2 180 1 442 - - - POL MPL 2 583 3 846 2 348 3 643 3 291 MPL KEI 2 565 - - - 1 977 KEI GEO - - - 2 400 - GEO MOO - - - - - MOO Average 3 264 2 736 2 394 2 254 1 703 Average
Note: A dash (–) indicates that the volume sold was less than a ton or that there were no sales. An asterisk (*)
indicates that the information on the specific market was not available at the time of printing
1,000
1,600
2,200
2,800
3,400
4,000
1 000
1 600
2 200
2 800
3 400
4 000
J F M A M J J A S O N D
R/t
on
To
ns
Month
Sales of cabbage and prices received on the Johannesburg Market Five-year average (2015–2019)
Quantity Price

Department of Agriculture, land reform & rural development
Crops and Markets Fourth Quarter 2020 30
15. Cauliflower
2019 Aug. Sep. Oct. Nov. Dec. 2019
Market Tons Market
TSW 74 109 96 148 111 TSW JHB 155 200 218 187 266 JHB BFN 4 4 4 4 3 BFN KIM - - - - - KIM CT 121 114 130 91 89 CT PE 10 27 27 8 3 PE EL 3 2 4 1 0 EL DBN 75 73 70 67 45 DBN PMB 21 27 18 12 10 PMB WLK 1 1 1 1 1 WLK KDP 1 2 1 4 0 KDP VER - 0 - - - VER SPR 8 6 2 1 1 SPR UIT - - - - - UIT WBK 1 0 0 0 - WBK NLS - - - - - NLS POL 0 1 - - - POL MPL - - - - - MPL KEI - - - - - KEI GEO - - - - - GEO MOO - - - - - MOO Total 475 562 570 523 530 Total
Market R/ton Market
TSW 11 592 8 016 12 875 6 880 9 847 TSW JHB 17 591 15 179 18 028 19 975 15 700 JHB BFN 10 566 10 955 13 125 15 268 14 387 BFN KIM - - - - - KIM CT 12 356 14 945 13 167 11 670 15 257 CT PE 4 489 2 751 2 973 4 699 9 308 PE EL 13 775 17 937 13 049 16 006 11 327 EL DBN 6 611 6 561 7 354 8 009 13 335 DBN PMB 5 148 3 761 4 775 3 975 7 256 PMB WLK 10 527 10 198 18 685 13 006 18 656 WLK KDP 11 157 6 515 8 510 5 393 5931 KDP VER - 7 286 - - - VER SPR 5 114 6 864 6 177 19 262 8 639 SPR UIT - - - - - UIT WBK 3 812 1 789 10 240 6 000 - WBK NLS - - - - - NLS POL 17 934 13 843 - - - POL MPL - - - - - MPL KEI - - - - - KEI GEO - - - - - GEO MOO - - - - - MOO Average 12 408 113 49 13 496 12 546 13 962 Average
Note: A dash (–) indicates that the volume sold was less than a ton or that there were no sales. An asterisk (*)
indicates that the information on the specific market was not available at the time of printing.
1 000
5 000
9 000
13 000
17 000
10
90
170
250
330
J F M A M J J A S O N D
R/t
on
To
ns
Month
Sales of cauliflower and prices received on the Johannesburg Market Five-year average (2015–2019)
Quantity Price

Department of Agriculture, land reform & rural development
Crops and Markets Fourth Quarter 2020 31
16. Lettuce
2019 Aug. Sep. Oct. Nov. Dec. 2019
Market Tons Market
TSW 274 405 525 529 593 TSW JHB 647 771 1060 868 922 JHB BFN 35 48 58 56 67 BFN KIM - - - - - KIM CT 90 108 165 158 177 CT PE 10 12 13 13 19 PE EL 6 6 6 5 6 EL DBN 170 269 341 340 413 DBN PMB 30 37 49 49 63 PMB WLK 9 12 9 7 1 WLK KDP - - - - - KDP VER 0 0 1 4 4 VER SPR 30 53 89 97 60 SPR UIT - - - - - UIT WBK 1 0 4 2 3 WBK NLS - - - - - NLS POL 5 3 - - - POL MPL - - - - - MPL KEI - - - - - KEI GEO - - - - - GEO MOO - - - - - MOO Total 1 307 1 725 2 104 2 127 2 328 Total
Market R/ton Market
TSW 13 194 8 093 5 996 7 552 11 618 TSW JHB 15 489 11 244 6 788 9 337 14 355 JHB BFN 9 595 6 601 4 790 6 447 8 518 BFN KIM - - - - - KIM CT 18 335 1 7030 9 417 7 620 12 034 CT PE 6 247 6 481 6 591 7 179 6 655 PE EL 13 231 14 665 13 830 17 137 15 177 EL DBN 6 561 5 235 3 589 5 853 8 095 DBN PMB 7 690 5 326 2 710 3 433 5 505 PMB WLK 7 347 5 806 6 224 5 397 10 808 WLK KDP - - - - - KDP VER 7 653 6 938 4 883 5 469 10 697 VER SPR 7 028 6 562 4 224 3 330 5 242 SPR UIT - - - - - UIT WBK 8 146 8 028 6 443 8 495 7 576 WBK NLS - - - - - NLS POL 6 696 17055 - - - POL MPL - - - - - MPL KEI - - - - - KEI GEO - - - - - GEO MOO - - - - - MOO Average 13 333 9 473 6 106 7 708 11 649 Average
Note: A dash (–) indicates that the volume sold was less than a ton or that there were no sales. An asterisk (*)
indicates that the information on the specific market was not available at the time of printing.
1 000
3 000
5 000
7 000
9 000
11 000
100
450
800
1 150
1 500
J F M A M J J A S O N D
R/t
on
To
ns
Month
Sales of lettuce and prices received on the Johannesburg Market Five-year average (2015–2019)
Quantity Price
Department of Agriculture, land reform & rural development
Crops and Markets Fourth Quarter 2020 32
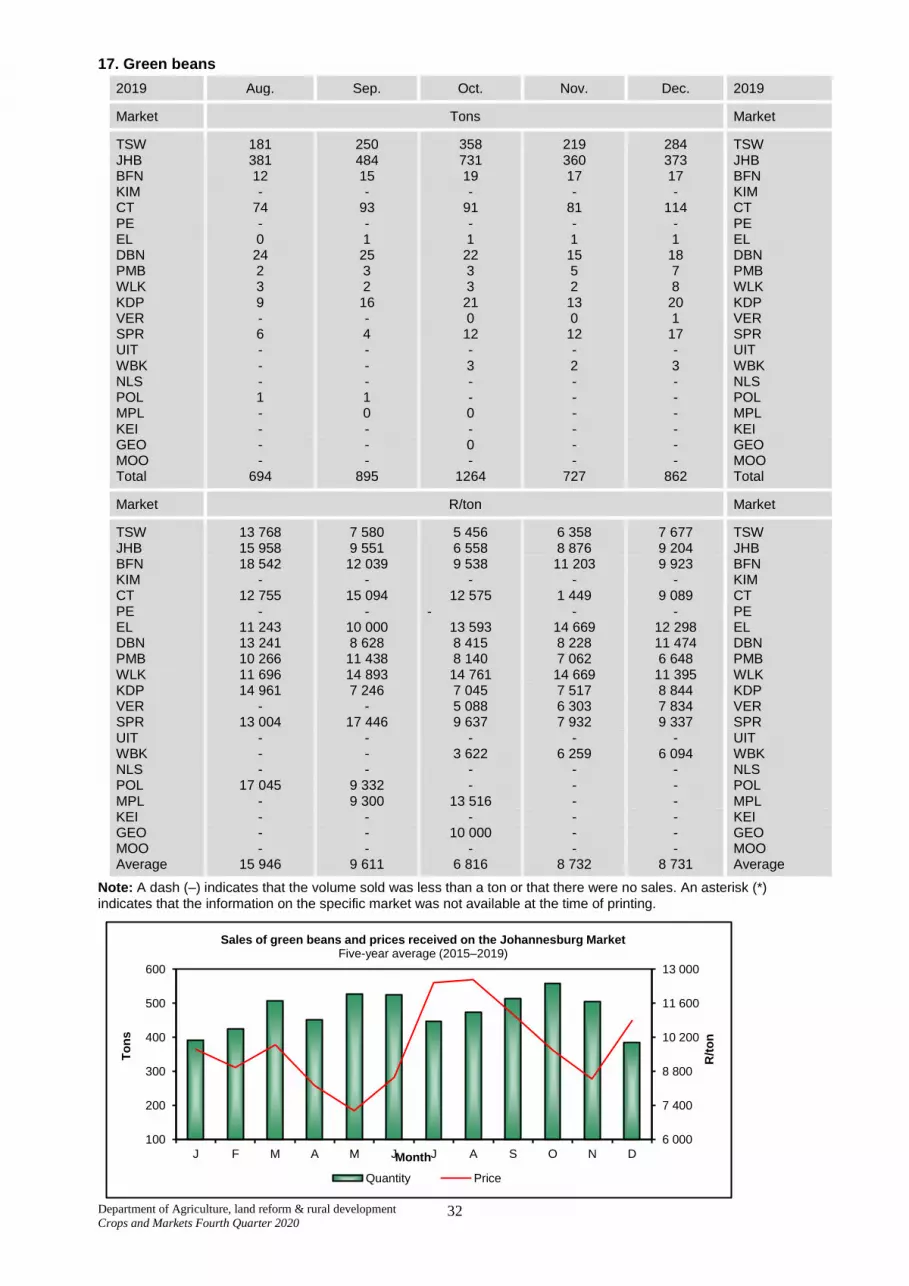
17. Green beans
2019 Aug. Sep. Oct. Nov. Dec. 2019
Market Tons Market
TSW 181 250 358 219 284 TSW JHB 381 484 731 360 373 JHB BFN 12 15 19 17 17 BFN KIM - - - - - KIM CT 74 93 91 81 114 CT PE - - - - - PE EL 0 1 1 1 1 EL DBN 24 25 22 15 18 DBN PMB 2 3 3 5 7 PMB WLK 3 2 3 2 8 WLK KDP 9 16 21 13 20 KDP VER - - 0 0 1 VER SPR 6 4 12 12 17 SPR UIT - - - - - UIT WBK - - 3 2 3 WBK NLS - - - - - NLS POL 1 1 - - - POL MPL - 0 0 - - MPL KEI - - - - - KEI GEO - - 0 - - GEO MOO - - - - - MOO Total 694 895 1264 727 862 Total
Market R/ton Market
TSW 13 768 7 580 5 456 6 358 7 677 TSW JHB 15 958 9 551 6 558 8 876 9 204 JHB BFN 18 542 12 039 9 538 11 203 9 923 BFN KIM - - - - - KIM CT 12 755 15 094 12 575 1 449 9 089 CT PE - - - - - PE EL 11 243 10 000 13 593 14 669 12 298 EL DBN 13 241 8 628 8 415 8 228 11 474 DBN PMB 10 266 11 438 8 140 7 062 6 648 PMB WLK 11 696 14 893 14 761 14 669 11 395 WLK KDP 14 961 7 246 7 045 7 517 8 844 KDP VER - - 5 088 6 303 7 834 VER SPR 13 004 17 446 9 637 7 932 9 337 SPR UIT - - - - - UIT WBK - - 3 622 6 259 6 094 WBK NLS - - - - - NLS POL 17 045 9 332 - - - POL MPL - 9 300 13 516 - - MPL KEI - - - - - KEI GEO - - 10 000 - - GEO MOO - - - - - MOO Average 15 946 9 611 6 816 8 732 8 731 Average
Note: A dash (–) indicates that the volume sold was less than a ton or that there were no sales. An asterisk (*)
indicates that the information on the specific market was not available at the time of printing.
6 000
7 400
8 800
10 200
11 600
13 000
100
200
300
400
500
600
J F M A M J J A S O N D
R/t
on
To
ns
Month
Sales of green beans and prices received on the Johannesburg MarketFive-year average (2015–2019)
Quantity Price

Department of Agriculture, land reform & rural development
Crops and Markets Fourth Quarter 2020 33
18. Pumpkins
2019 Aug. Sep. Oct. Nov. Dec. 2019
Market Tons Market
TSW 624 535 559 727 844 TSW JHB 1 477 1 365 1 914 2 473 2 436 JHB BFN 452 194 259 448 345 BFN KIM 23 71 3 23 34 KIM CT 397 257 155 426 468 CT PE 98 70 13 62 70 PE EL 37 31 24 18 42 EL DBN 14 4 19 50 61 DBN PMB 6 5 0 6 11 PMB WLK 155 113 131 173 163 WLK KDP 254 209 222 258 230 KDP VER 38 34 5 25 7 VER SPR 50 88 105 174 153 SPR UIT - - - - - UIT WBK 3 - 25 37 34 WBK NLS - - - - - NLS POL 90 - - - - POL MPL - - - - - MPL KEI 0 - 1 - - KEI GEO 43 37 1 8 12 GEO MOO - - - - - MOO Total 3 761 3 074 3 435 4 911 4 908 Total
Market R/ton Market
TSW 3 717 7 584 7 795 2 221 1 700 TSW JHB 4 333 6 669 6 672 1 911 1 391 JHB BFN 4 888 9 045 8 726 3 084 2 377 BFN KIM 5 116 7 073 7 639 3 972 2 257 KIM CT 4 746 6 581 9 361 4 198 3 154 CT PE 5 490 7 442 10 102 4 171 2 587 PE EL 5 319 6 599 7 795 7 692 2 814 EL DBN 4 891 9 214 8 216 2 704 1 941 DBN PMB 2 970 7 875 6 306 5 077 2 509 PMB WLK 5 101 8 542 8 398 2 935 2 055 WLK KDP 5 298 7 718 8 498 3 166 2 004 KDP VER 4 589 7 361 9 035 2 815 2 004 VER SPR 4 720 7 067 7 604 1 920 1 109 SPR UIT - - - - - UIT WBK 4 177 - 7 986 2 756 1 503 WBK NLS - - - - - NLS POL 3 057 6 184 - - - POL MPL - - - - - MPL KEI 4 000 - 1 870 - - KEI GEO 5 212 7 348 8 333 4 813 3 165 GEO MOO - - - - - MOO Average 4 470 7 159 7 385 2 453 1 774 Average
Note: A dash (–) indicates that the volume sold was less than a ton or that there were no sales. An asterisk (*)
indicates that the information on the specific market was not available at the time of printing.
1,000
1,500
2,000
2,500
3,000
100
550
1 000
1 450
1 900
2 350
J F M A M J J A S O N D
R/t
on
To
ns
Month
Sales of pumpkins and prices received on the Johannesburg Market Five-year average (2015–2019)
Quantity Price

Department of Agriculture, land reform & rural development
Crops and Markets Fourth Quarter 2020 34
19. Gem squashes
2019 Aug. Sep. Oct. Nov. Dec. 2019
Market Tons Market
TSW 44 111 184 176 153 TSW JHB 167 349 630 597 675 JHB BFN 1 2 4 8 13 BFN KIM - - 0 0 0 KIM CT 112 89 122 314 303 CT PE - 2 6 11 19 PE EL - 3 3 3 6 EL DBN 0 6 7 11 18 DBN PMB - 0 2 3 4 PMB WLK 2 - 0 3 2 WLK KDP - 2 6 7 5 KDP VER 1 0 0 0 2 VER SPR 0 - 4 7 19 SPR UIT - - - - - UIT WBK - - - - 1 WBK NLS - - - - - NLS POL - - - - - POL MPL - - - - - MPL KEI - - - - - KEI GEO - - - - - GEO MOO - - - - - MOO Total 327 564 969 1 142 1 218 Total
Market R/ton Market
TSW 13 999 10 027 4 577 2 058 1 674 TSW JHB 14 062 10 689 5 478 2 700 1 944 JHB BFN 13 872 11 403 8 546 4 085 2 566 BFN KIM - - 8 107 6 484 2 833 KIM CT 9 007 14 628 9 970 3 390 2 541 CT PE - 10 530 9 726 4 566 2 946 PE EL - 15 490 12 753 9 119 3 617 EL DBN 9 218 13 692 6 076 3 085 2 765 DBN PMB - 8 521 10 427 3 439 2 520 PMB WLK 3 274 - 7 765 1 485 2 198 WLK KDP - 11 416 4 368 2 421 1 492 KDP VER 1 970 - 4 189 2 109 2 072 VER SPR 5 000 5 300 4 819 2 456 1 246 SPR UIT - - - - - UIT WBK - - - - 3 382 WBK NLS - - - - - NLS POL - - - - - POL MPL - - - - - MPL KEI - -- - - - KEI GEO - - - - - GEO MOO - - - - - MOO Average 12 227 11 664 4 819 2 837 2 091 Average
Note: A dash (–) indicates that the volume sold was less than a ton or that there were no sales. An asterisk (*)
indicates that the information on the specific market was not available at the time of printing.
1 000
2 000
3 000
4 000
5 000
6 000
100
300
500
700
900
J F M A M J J A S O N D
R/t
on
To
ns
Month
Sales of gem squashes and prices received on the Johannesburg Market Five-year average (2015–2019)
Quantity Price

Department of Agriculture, land reform & rural development
Crops and Markets Fourth Quarter 2020 35
20. Butternut squashes
2019 Aug. Sep. Oct. Nov. Dec. 2019
Market Tons Market
TSW 1 857 1 341 1 121 1 846 2 007 TSW JHB 4 631 2 351 4 237 5 757 6 418 JHB BFN 80 21 37 75 137 BFN KIM 1 0 0 3 0 KIM CT 705 553 440 586 640 CT PE 71 33 26 61 99 PE EL 179 88 49 134 299 EL DBN 199 152 172 196 779 DBN PMB 55 190 11 79 240 PMB WLK 54 16 8 18 44 WLK KDP 35 1 15 32 48 KDP VER 1 1 2 5 7 VER SPR 89 38 14 70 110 SPR UIT - - - - - UIT WBK 10 0 - 2 14 WBK NLS - - - 0 - NLS POL - - - - - POL MPL 1 0 0 0 3 MPL KEI - - - - - KEI GEO 5 - 0 1 11 GEO MOO - - - - - MOO Total 7 974 4 619 6 133 8 866 10 856 Total
Market R/ton Market
TSW 4 238 7 982 9 192 3 608 2 614 TSW JHB 4 145 7 974 7 736 3 113 2 413 JHB BFN 5 524 8 698 7 579 3 921 3 263 BFN KIM 1 657 9 350 5 900 3 841 1 673 KIM CT 5 120 8 135 11 621 5 438 3 857 CT PE 5 313 6 067 10 716 5 935 4 517 PE EL 6 002 8 067 14 422 6 546 4 736 EL DBN 5 232 8 392 8 936 4 541 3 072 DBN PMB 4 939 6 339 6 056 4 888 3 344 PMB WLK 3 416 6 827 8 332 2 784 2 823 WLK KDP 3 456 7 570 7 289 3 007 2 281 KDP VER 4 747 3 337 5 061 2 010 1 290 VER SPR 4 076 6 260 7 309 3 133 1 833 SPR UIT - - - - - UIT WBK 3 950 3 318 - 3 221 2 190 WBK NLS - - - - - NLS POL - - - - - POL MPL 5 008 4 238 7 061 4 500 4 402 MPL KEI - - - - - KEI GEO 5 042 5 441 6 636 5 266 5 049 GEO MOO - - - - - MOO Average 4 343 7 972 8 374 3 494 2 695 Average
Note: A dash (–) indicates that the volume sold was less than a ton or that there were no sales. An asterisk (*)
indicates that the information on the specific market was not available at the time of printing.
1 000
2 000
3 000
4 000
5 000
1 000
1 800
2 600
3 400
4 200
5 000
J F M A M J J A S O N D
R/t
on
To
ns
Month
Sales of butternut squashes and prices received on the Johannesburg MarketFive-year average (2015–2019)
Quantity Price

Department of Agriculture, land reform & rural development
Crops and Markets Fourth Quarter 2020 36
21. Peppers
2019 Aug. Sep. Oct. Nov. Dec. 2019
Market Tons Market
TSW 1 182 1 287 1 387 1 317 1 826 TSW JHB 2 513 2 811 3 066 2 756 3 218 JHB BFN 44 34 44 58 78 BFN KIM 4 2 2 2 3 KIM CT 469 423 508 630 899 CT PE 22 22 22 35 58 PE EL 54 58 60 81 140 EL DBN 120 135 136 216 265 DBN PMB 15 14 16 23 40 PMB WLK 13 12 12 14 21 WLK KDP 57 60 62 62 74 KDP VER 5 4 5 8 13 VER SPR 41 52 49 64 101 SPR UIT - - - - - UIT WBK 2 1 1 3 12 WBK NLS - - - - - NLS POL 8 11 - - - POL MPL 1 2 1 1 0 MPL KEI - - - - - KEI GEO 0 1 0 - - GEO MOO - - - - - MOO Total 4 550 4 930 5 370 5 269 6 418 Total
Market R/ton Market
TSW 10 648 10 731 11 820 7 137 6 695 TSW JHB 12 936 12 750 15 152 9 875 8 519 JHB BFN 15 645 14 600 14 149 8 852 8 397 BFN KIM 13 010 12 025 11 337 10 650 9 807 KIM CT 17 226 17 505 18 659 11 666 9 077 CT PE 17 825 14 403 12 702 12 849 10 954 PE EL 17 964 18 421 19 263 12 886 10 244 EL DBN 15 520 14 807 15 050 9 801 11 044 DBN PMB 15 142 14 729 9 792 11 541 10 642 PMB WLK 19 003 19 696 15 553 16 265 13 871 WLK KDP 11 977 9 801 9 611 7 453 6 772 KDP VER 11 913 10 438 9 350 6 734 5 536 VER SPR 14 351 11 161 12 191 8 481 8 749 SPR UIT - - - - - UIT WBK 16 184 17 145 11 979 9 705 6 298 WBK NLS - - - - - NLS POL 12 993 8 647 - - - POL MPL 17 832 17 129 6 342 9 705 12 254 MPL KEI - - - - - KEI GEO 19 078 12 841 10 818 - 10 238 GEO MOO - - - - - MOO Average 12 995 12 744 14 534 13 810 8 329 Average
Note: A dash (–) indicates that the volume sold was less than a ton or that there were no sales. An asterisk (*)
indicates that the information on the specific market was not available at the time of printing.
6 000
7 500
9 000
10 500
12 000
13 500
100
650
1 200
1 750
2 300
2 850
J F M A M J J A S O N D
R/t
on
To
ns
Month
Sales of peppers and prices received on the Johannesburg Market Five-year average (2015–2019)
Quantity Price

Department of Agriculture, land reform & rural development
Crops and Markets Fourth Quarter 2020 37
22. English cucumbers
2019 Aug. Sep. Oct. Nov. Dec. 2019
Market Tons Market
TSW 287 368 514 494 467 TSW JHB 615 967 1 258 1 266 1 203 JHB BFN 10 18 28 43 45 BFN KIM - - - 0 0 KIM CT 135 194 358 446 552 CT PE - 5 - - - PE EL 12 - 5 5 10 EL DBN - - - - - DBN PMB 9 8 14 24 40 PMB WLK 3 6 9 10 20 WLK KDP 3 9 9 11 11 KDP VER - - 0 0 1 VER SPR 9 13 28 40 67 SPR UIT - - - - - UIT WBK - - 0 0 1 WBK NLS - - - - - NLS POL 3 4 - - - POL MPL - - - - - MPL KEI - - - - - KEI GEO - - - 0 0 GEO MOO - - - - - MOO Total 1 085 1 586 2 222 2 341 2 417 Total
Market R/ton Market
TSW 17 093 12 738 6 918 4 435 8 558 TSW JHB 23 095 12 929 8 021 3 985 7 715 JHB BFN 26 519 19 132 12 517 7 006 10 604 BFN KIM - - - 11 080 4 645 KIM CT 24 224 17 014 8 471 5 497 7 210 CT PE - - - - - PE EL 7 656 16 292 15 189 7 814 10 117 EL DBN - - - - - DBN PMB 16 489 20 438 10 991 5 273 7 854 PMB WLK 18 724 12 022 8 406 6 244 6 869 WLK KDP 21 202 17 261 17 018 10 056 14 726 KDP VER - - 10 000 8 232 13 427 VER SPR 13 165 12 162 7 727 4 118 4 016 SPR UIT - - - - - UIT WBK - - 18 000 5 000 16 795 WBK NLS - - - - - NLS POL 16 290 14 018 - - - POL MPL - - - - - MPL KEI - - - - - KEI GEO - - - 18 555 14 944 GEO MOO - - - - - MOO Average 21 477 6 593 7 963 4 489 7 758 Average
Note: A dash (–) indicates that the volume sold was less than a ton or that there were no sales. An asterisk (*)
indicates that the information on the specific market was not available at the time of printing.
4 000
6 000
8 000
10 000
12 000
14 000
100
400
700
1 000
1 300
J F M A M J J A S O N D
R/t
on
To
ns
Month
Sales of English cucumbers and prices received on the Johannesburg MarketFive-year average (2015–2019)
Quantity Price

Department of Agriculture, land reform & rural development
Crops and Markets Fourth Quarter 2020 38
2021
Published in the Republic of South Africa by the Department of Agriculture, Land Reform & Rural Development
Obtainable from the website of the Department of Agriculture, Land Reform & Rural Development
www.dalrrd.gov.za
This publication or any part thereof may be reproduced without prior permission, provided that the Directorate: Statistics and Economic Analysis of the Department of Agriculture, Land Reform & Rural
Development is acknowledged as the source.


