Embed Size (px)
Citation preview

Department of Planning and Regional Development, School of Engineering, University of Thessaly Pedion Areos, 38334 Volos, Greece, Tel: +302421074462, e-mail: [email protected], http://www.prd.uth.gr
Available online at: http://www.prd.uth.gr/research/DP/2003/uth-prd-dp-2003-02_en.pdf
Discussion Paper Series, 9(2): 17-38
Cross-Border Cooperation in Southeastern Europe: The Enterprises�s Point of View1
Dimitrov Mitko Institute of Economics, Bulgarian Academy of Sciences
Petrakos George Associate Professor, University of Thessaly
Department of Planning and Regional Development South and East European Development Center (SEED)
Pedion Areos, 38334 Volos, Greece, tel: +30 4210 74468, fax: +30 4210 74385
e-mail: [email protected] Totev Stoyan
Institute of Economics, Bulgarian Academy of Sciences Tsiapa Maria
Department of Planning and Regional Development, University of Thessaly, Greece
Abstract This paper examines the current status, the limits, the prospects and the policies of cross-border cooperation in the border zone of Albania, Bulgaria, FYROM and Greece, on the basis of a survey with a sample of 291 manufacturing firms located near the borders in all four countries. The analysis suggests that border region firms may have a higher level of interaction than the respective average national firms in all countries and that trade relations and economic cooperation eventually depend on the level of specialization and the size of the markets. It also suggests that barriers to cooperation mater and can affect negatively the performance of border region firms. Overall, firms are less concerned about the quality of infrastructure and more concerned about the general or the financial conditions prevailing in each country, indicating that the best policy of cross-border cooperation, besides infrastructure, may be the development of the economies in the region and the improvements in their economic environment.
Key words: Cross-Border Cooperation, Southeastern Europe, Trade Relations.
January 2003 1 Research work supported by the European Commission Phare ACE Program


Cross-Border Cooperation in Southeastern Europe: The Enterprises�s Point of View 19
Discussion Paper Series, 2003, 9(2)
1. Introduction
Border areas are considered traditionally as disadvantaged and low opportunity regions. The geographical coordinates of such areas are expected to shape a low competitiveness profile for one or more of the following reasons: (i) low population densities and lack of agglomeration economies; (ii) a peripheral location and an isolated position with respect to the economic and political heartland of their country, resulting to relatively high transportation costs; (iii) limitations to physical flows of commodities, truncated markets and distorted trade relations; (iv) a relatively poor infrastructure endowment because of their geographical location on extreme arteries of transport and communication networks; (v) a less developed social and business service provision and large differences in legal, administrative and social welfare systems as well as in language and cultural traditions, which altogether hamper communication and cooperation with regions across the border (Niebuhr and Stiller 2002, Nijkamp 1998, Petrakos 1996, Petrakos and Economou 2002)
The process of transition in Central and Eastern Europe has given a new momentum in the discussion and the policies of cross-border cooperation, as many regions along the East-West frontier have gradually experienced a transformation from �dead-end� or �front lines� of the sovereign states or the political blocks to socioeconomic �contact zones� for neighboring societies2. Moreover, these regions have been found in most cases unprepared for their new role and have faced serious difficulties in adapting to the new post-1989 economic and political environment (Petrakos 2001a). In any case, border regions are currently designing or implementing policies that will facilitate cross-border interaction and maximize their welfare gains from cooperation.
Although the level and the benefits of cross-border interaction has been largely affected by the �initial conditions� prevailing in each border zone and the market dynamics that they generate, it is now known that policies also play an important role. These policies take advantage of the EU INTERREG initiative and the PHARE / CARDS programs in order to improve the level of trans-frontier interaction. A large share of EU funds has been directed to infrastructure projects (especially transportation), while actions and programs related to endogenous development, agriculture, training and environmental protection were also implemented (Petrakos 1996).
Since the past and future enlargements of the EU generate new internal and external borders, an interesting policy question is related to the conditions and dynamics facilitating or discouraging the smooth integration of the new spaces into the European economy and society. 2 There is an argument that, as a result of these changes, some border regions along the East-West frontier may no longer be characterized as peripheral (Blatter 2000). For a critique of this view see Petrakos and Tsiapa (2001).

20 Dimitrov Mitko, Petrakos George, Totev Stoyan and Tsiapa Maria
UNIVERSITY OF THESSALY, Department of Planning and Regional Development
The goal of this paper is to provide empirical evidence about the factors that inhibit cross-border cooperation in Southeastern Europe and use this knowledge in order to fine-tune European, national and local policies. As cross-border policies have rarely taken into consideration the opinions and the needs of the local actors and especially the enterprises, we approach our goal by conducting an enterprise survey in the border zone of four countries (Albania, Bulgaria, FYROM and Greece). The next section presents the basic characteristics of this border zone, while section 3 reports the methodology and the characteristics of the sample of enterprises. Sections 4 and 5 present the results of the survey, while section 6 presents the conclusions of the paper.
2. The characteristics of the border zone between Albania, Bulgaria, FYROM and Greece
The region of our focus is one of the most fragmented economic, social and political spaces in Europe. After the collapse of former Yugoslavia, it hosts small states (with population varying from 2 to 11 million people) having a low level of trade interaction (Petrakos 2001b) and a mosaic of trade policies and restrictions towards each other (Kyrkilis and Nikolaidis 2001). In addition, all countries have ethnic minorities usually living in border regions that have triggered friction or conflict in the past and continue in some cases to be a source of suspicion and tension. Even their relations with the EU are different. With the exception of Greece that is an EU-15 member since 1981, the other three countries have different prospects to become members of the EU.
At the regional level, the evidence shows that the processes of integration and transition in the 1990s have been associated with increasing inequalities, as the capital regions and a few dynamic areas have gained relatively more (or lost relatively less) during this period (Petrakos 1997, Petrakos and Economou 2002).
In general, each country has a metropolitan region with the highest density, which, in several cases is the most visible part of a broader area with a higher than average concentration of population and activities3. In several cases the border zones are among the regions with the lowest densities (Map 1). This is most visible in the case of Greece, where 40 years of isolation in the post-war period have led to significant population erosion along the entire border zone. Similar low population densities can be observed
3 In that respect, these areas could be characterized as national �development axes�. For example, Attica is the most visible part of a South-North development axis in Greece, which concentrates more than 70% of the national population. In Albania, the region of Tirana is the central part of a development area in the Western coastal part of the country, while in Bulgaria a (less visible) development axis connects the region of Sofia with Varna in the Black Sea. In FYROM, a development axis connection the capital with the Greek borders starts taking shape.

Cross-Border Cooperation in Southeastern Europe: The Enterprises�s Point of View 21
Discussion Paper Series, 2003, 9(2)
in the Albanian borders with Greece4, the Bulgarian borders with Greece and FRY, the borders of FYROM with Bulgaria and the borders of FRY with Bulgaria (Petrakos and Economou 2002).
popdensity15 - 5555 - 7576 - 100101 - 250251 - 406407 - 1220
boundaries
N
EW
S
Map 1. Population density in NUTSIII level (national average=100)
Legend
4 This Albanian region is characterized by the significant presence of a Greek minority, which, after 1989 has shown a higher than average tendency to migrate to Greece on a temporary, but also on a permanent basis. Therefore, it is possible that the lower population densities in the Albanian borders with Greece have been affected by post-1989 migration flows.

22 Dimitrov Mitko, Petrakos George, Totev Stoyan and Tsiapa Maria
UNIVERSITY OF THESSALY, Department of Planning and Regional Development
Map 2. GDP per capita in NUTSIII level (national average=100)
N
EW
S
GDP/cap1 - 3031 - 5051 - 7576 - 100101 - 145146 - 171
boundaries
Legend
National border regions are in several cases characterized by lower than average levels of development. This is certainly the case for a part of the border zone of Greece (especially its western part), the Western borders of Albania with FYROM, the Eastern borders of FYROM with Albania and the Western borders of FYROM with Bulgaria and the Eastern borders of Bulgaria with FYROM. In general, regional problems tend to be more acute in border regions, either because of the presence of minorities, or because of unfavourable geography and pre-existing conditions in international relations.

Cross-Border Cooperation in Southeastern Europe: The Enterprises�s Point of View 23
Discussion Paper Series, 2003, 9(2)
However, recent evidence (Petrakos and Economou 2002), shows that interaction along an East-West frontier such as the Greek northern borderline tends to generate beneficial results for both sides of the borders, a finding which is in line with the evidence from the border zones of Central with Western Europe (Names-Nagy 2000, Petrakos 2000, Petrakos 2001a). Good economic relations at the national level, or the presence of reliable cross-border transportation infrastructure and the nearby presence of large urban areas tend to improve the relative standing and importance of border zones. The fact that the Greek � FYROM borders have improved their standing is often attributed to dramatically improved international relations and relatively good transportation infrastructure linking Thessalonica with Skopje.
3. The methodology of the survey and the characteristics of the sample
We base our analysis on a survey that was conducted within the framework of the EU Phare-ACE project P97-8196-R in the border regions of Albania, Bulgaria, FYROM and Greece in 2001. The goal of the survey was to use a multinational sample of manufacturing firms located in border regions in order to evaluate the importance of the factors affecting cross-border cooperation. We focused on manufacturing firms, as trade and investment are the most important types of economic cooperation and those that can affect in a relatively short period income, employment and welfare in a region. The survey was conducted with the use of a questionnaire, which included 30 closed questions requiring single or multiple answers about (a) the profile of the enterprise, (b) the type of existing cross-border relations and (c) the type of barriers to cross-border cooperation that exert the greater influence.
The research team collected 291 questionnaires from the border zone of the four countries as follows: (a) 53 questionnaires from the border region of Albania with Greece and FYROM, (b) 63 questionnaires from the border regions of Bulgaria with Greece and FYROM, (c) 55 questionnaires from the border regions of FYROM with Albania, Bulgaria and Greece and (d) 120 questionnaires from the border regions of Greece with Albania, FYROM and Bulgaria. Greece participates in the sample with a larger number of firms due to the fact that it has the longest borders and it is the only country sharing borders with all the others.
The vast size of the enterprise sector in these countries and the limitations of the project budget made it clear from the very beginning that we would not be able to claim a representative sample. Obtaining such a sample requires a much larger number of enterprises and a much larger budget. The research team made a significant effort, however, to collect reliable information at the enterprise level from random national
24 Dimitrov Mitko, Petrakos George, Totev Stoyan and Tsiapa Maria
UNIVERSITY OF THESSALY, Department of Planning and Regional Development
samples. This was possible in some, but not in all cases. Some interviewers met greater difficulties in convincing randomly selected firms to respond to questionnaires and felt that the validity of some responses was not assured. As a result, in some cases the interviewers decided to select a part of the enterprises participating in the sample, on the basis of their willingness to participate in the survey and the reliability and quality of their responses. As a result, most countries (Bulgaria, FYROM and Greece) participate in the survey with a sample that is both random and selective, while Albania participates with a totally random sample.
Despite the obvious constraints of such a multinational project and the difficulties in obtaining firm level information in an uncertain economic environment and a region characterized by instability, the survey was eventually successful. Although there were initially some questions about the validity of responses of the firms participating in the Albanian sample, the survey generated a database, which allows us to evaluate empirically the importance of the various factors affecting cross-border cooperation.
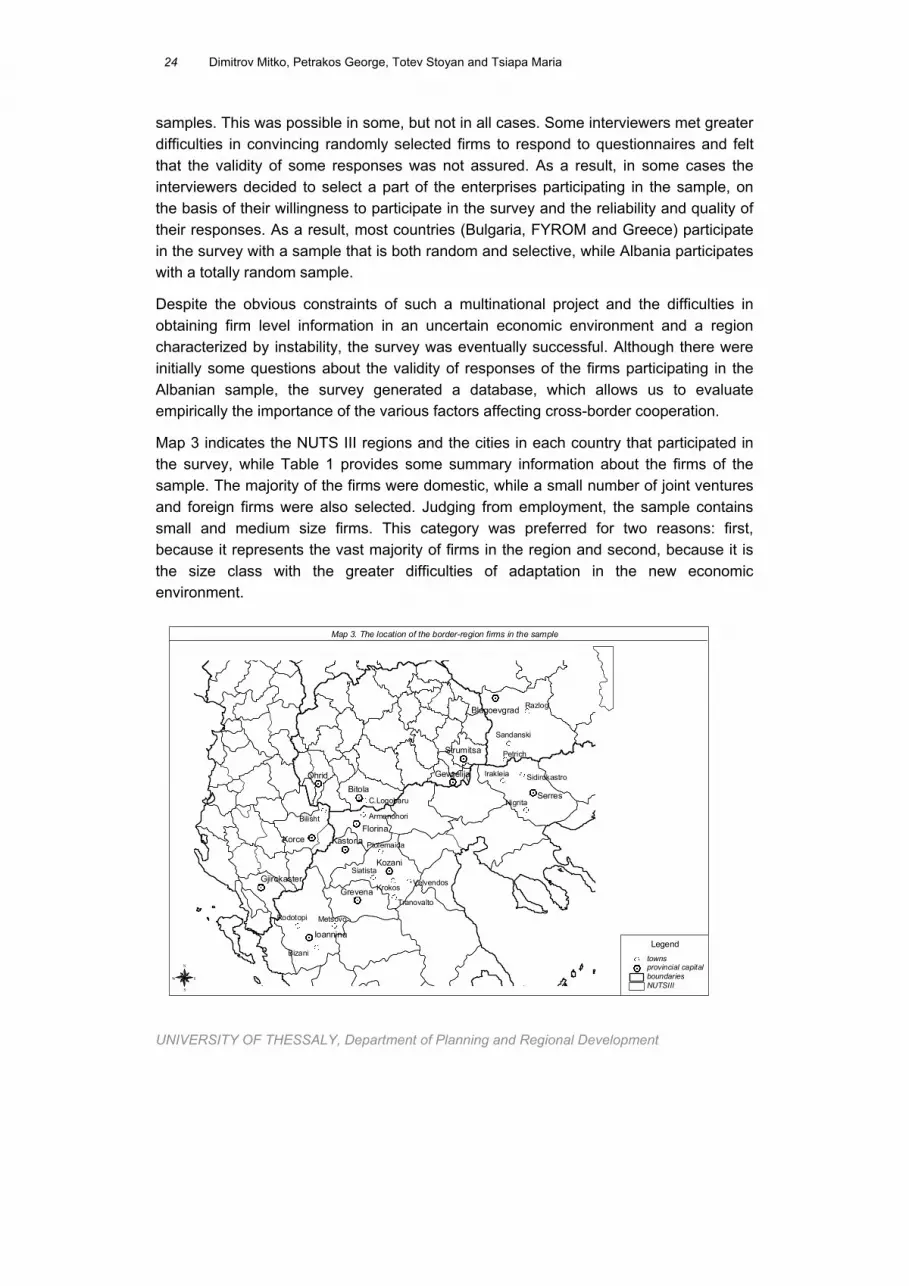
Map 3 indicates the NUTS III regions and the cities in each country that participated in the survey, while Table 1 provides some summary information about the firms of the sample. The majority of the firms were domestic, while a small number of joint ventures and foreign firms were also selected. Judging from employment, the sample contains small and medium size firms. This category was preferred for two reasons: first, because it represents the vast majority of firms in the region and second, because it is the size class with the greater difficulties of adaptation in the new economic environment.
Razlog
Krokos
Bizani
Bilisht
Petrich
Metsovo
Nigrita
Siatista
Irakleia
Sandanski
Velvendos
Tranovalto
Ptolemaida
Armenohori
Rodotopi
Sidirokastro
Korce
OhridBitola
Serres
Kozani
Grevena
FlorinaKastoria
Ioannina
Gevgelija
Strumitsa
Gjirokaster
Blagoevgrad
C.Logobaru
NUTSIIIboundariesprovincial capitaltowns
N
EW
S
Map 3. The location of the border-region firms in the sample
Legend

Cross-Border Cooperation in Southeastern Europe: The Enterprises�s Point of View 25
Discussion Paper Series, 2003, 9(2)
Table 1. The profile of enterprises of the survey Number of
firms Origin of firms (%)
Average size of annual employment
Bulgaria 63 -Domestic -Joint venture -Foreign
89 3 6 38
Albania 53 -Domestic
-Joint venture -Foreign
68 30 2 38
FYROM 55 -Domestic
-Joint venture -Foreign
71 11 18 121
Greece 120 -Domestic
-Joint venture -Foreign
98 1 0 26
Source: Survey data
4. Cross-border cooperation: current condition and prospects
Although trade relations in the post-1989 period have expanded significantly for all transition countries in Southeastern Europe, intra-regional and cross-border trade is still below the potential of the region (Chionis and Liargovas 2002). Most countries in the region maintain a low or even insignificant share of inta-Balkan trade relations (Petrakos 2001b), while the Balkan transition countries have developed the most distorted geographical pattern of trade among all transition countries (Jackson and Petrakos 2001), with a low level of interaction with neighboring countries and relatively high import dependence from developed countries.
Unfortunately, studies for the level of cross-border trade and investment at the border region level are not available. Some studies report the activities supported by the Interreg programs (Petrakos 1996) that have helped to some degree to establish entrepreneurial contacts across the border, while the general feeling is that, despite some problems of dislocation of industrial activities on the Greek side (Labrianidis 2001), interaction has increased to the benefit of all parties involved.

26 Dimitrov Mitko, Petrakos George, Totev Stoyan and Tsiapa Maria
UNIVERSITY OF THESSALY, Department of Planning and Regional Development
Table 2. Cross-border relations
Number (share) of firms exporting to neighboring countries Bulgaria Albania FYROM Greece Bulgaria 4
(6) 26 (41)
35 (55)
Albania 0 (0)
2 (4)
10 (19)
FYROM 5 (9)
9 (16)
17 (31)
Greece 36 (30)
29 (24)
36 (30)
Number (share) of firms importing from neighboring countries Bulgaria Albania FYROM Greece Bulgaria 0
(0) 6 (10)
37 (59)
Albania 1 (2)
8 (15)
45 (85)
FYROM 16 (29)
0 (0)
36 (65)
Greece 14 (12)
0 (0)
2 (2)
Source: Survey data
Table 2 provides summary information about the number of border region firms in our sample engaged in cross-border trade relations. The rows indicate origin of exports (imports) and the columns destination. For example, the first row in the upper part of the Table indicates that in our sample 6% of the Bulgarian border region firms export to Albania, 41% export to FYROM and 59% export to Greece. Similarly, the second line indicates that there are no Albanian firms in our sample exporting to Bulgaria, while there are only 2 exporting to FYROM and 10 exporting to Greece respectively. Similar, although more detailed, information is provided in Table 3, which shows also the intensity of exports and imports among countries. Overall, the examination of Tables 2 and 3 allows us to make the following observations. First, countries sharing common borders tend to have more intense trade relations. Bulgaria has greater interaction with FYROM than Albania. Also, Albania has also greater interaction with FYROM than Bulgaria.

Cross-Border Cooperation in Southeastern Europe: The Enterprises�s Point of View 27
Discussion Paper Series, 2003, 9(2)
Table 3. Cross-border relations
Number of firms exporting to neighboring countries Exports as
a share of sales
Bulgaria Albania FYROM Greece Total
0-25 4 21 14 25-50 0 4 9 50-75 0 0 2
Bulgaria
75-100 0 1 10
63
0-25 0 1 1 25-50 0 1 1 50-75 0 0 1
Albania
75-100 0 0 7
53
0-25 5 9 12 25-50 0 0 1 50-75 0 0 0
FYROM
75-100 0 0 4
55
0-25 27 26 33 25-50 4 3 3 50-75 5 0 0
Greece
75-100 0 0 0
120
Number of firms importing from neighboring countries % of sales Bulgaria Albania FYROM Greece Total
0-25 0 5 17 25-50 0 1 7 50-75 0 0 4
Bulgaria
75-100 0 0 9
63
0-25 1 4 2 25-50 0 3 9 50-75 0 1 5
Albania
75-100 0 0 29
53
0-25 11 0 17 25-50 4 0 7 50-75 0 0 1
FYROM
75-100 1 0 11
55
0-25 11 0 2 25-50 1 0 0 50-75 1 0 0
Greece
75-100 1 0 0
120
Source: Survey data
Second, it seems that countries engaged in ethnic friction and conflict over minorities, such as Albania and FYROM, tend to develop less intensive bilateral trade relations.
Third, East-West relations or cross-border relations along the Greek borders are the most important form of interaction in the region. On the export side, all transition countries have more firms exporting to Greece than to any other country in the region.

28 Dimitrov Mitko, Petrakos George, Totev Stoyan and Tsiapa Maria
UNIVERSITY OF THESSALY, Department of Planning and Regional Development
Greece also has significant export shares to all other countries. On the import side, imports from Greece are by far the most frequent type of interaction within our sample.
Forth, the intensity of interaction is also higher along the Greek borders. As Table 3 shows, high (over 50%) or very high (over 75%) shares of exports or imports in total sales are reported only for border region firms in transition countries trading with Greece.
Table 4. Planning to initialize or expand further their business in neighboring countries Share (%) of firms Bulgaria Albania FYROM Greece Bulgaria yes
yes if constraints are eliminated no no answer
17 46 33 3
56 37 8 0
65 27 8 0
Albania yes yes if constraints are eliminated no no answer
2 6 6 87
2 13 8 77
49 32 15 4
FYROM yes yes if constraints are eliminated no no answer
44 24 13 20
38 24 16 22
56 25 13 5
Greece yes yes if constraints are eliminated no no answer
42 32 20 7
30 24 39 7
42 28 26 4
Source: Survey data
Table 4 presents the attitude of sample firms towards future cooperation, irrespective of current activity. Firms were asked whether they are willing to initialize or expand further their business in neighboring countries. Looking at their responses, we can make a number of observations: First, firms in transition countries are more willing to expand business in Greece than in any other transition country in the region. The benefits of adjacency, but also the fact that Greece is more developed and the only EU member in the area make such a prospect very favorable. Second, adjacency seems to be an important factor itself, as firms in countries without common borders are in general less enthusiastic with cooperation. This is clearly the case with the attitude of Albanian firms towards cooperation with Bulgaria and the attitude of Bulgarian firms towards cooperation with Albania. Third, a significant share of sample firms declare that they will initiate or expand their activities in neighboring countries only if current constraints are eliminated.
Summarizing the evidence in this section, we may say that there are three important conclusions related to the current state of affairs of border region firms and the prospects of cross-border cooperation among Albania, Bulgaria, FYROM and Greece:

Cross-Border Cooperation in Southeastern Europe: The Enterprises�s Point of View 29
Discussion Paper Series, 2003, 9(2)
The level of interaction is affected by adjacency, friction over minorities, level of development of partner countries and is more intensive when it takes an East-West character. Second, if the sample of firms is to some degree representative, then, border firms tend to develop more intense cross-border trade relations than the national average. This finding is in line with the results of similar surveys of border region firms in Central Europe (Petrakos and Tsiapa 2001). Third, this level of interaction and trade would have been significantly higher, if current constraints in cooperation were absent.
5. Barriers to cross-border cooperation
What types of barriers exist that do not allow the full potential of cross-border relations to unfold in the region? We asked firms to respond to that question in a scale from 5 (no barrier) to 0 (barrier that cannot be overcome), classifying barriers to seven major categories:
1. The condition of infrastructure (roads, railways, public transport, telecommunications, post service)
2. The condition of border crossing (proximity of check points, visa regulations, passport and customs officers treatment)
3. Trade conditions as a barrier (tariffs, quotas, duty fees, technical requirements)
4. Financial conditions as a barrier (availability of funds, access to finance resources)
5. Lack of assistance as a barrier (by local government, national government, local business associations, national business associations, European organizations)
6. General conditions as a barrier (political stability, corruption, security, changing of the rules, income and demand prospects, inflation, exchange rate, stability of the banking system, quality of the banking system, labor protection)
7. Language as a barrier
The responses of the firms are reported in Tables 5-8. Table 5 presents the opinion of Greek firms about barriers in cross-border relations with Albania, FYROM and Bulgaria. For every type of barrier an average grade is calculated for each country5 and also an average overall grade. The lower the grade, the more serious the specific barrier to
5 This grade is the simple arithmetic average of the responses concerning the specific country given by Greek firms.

30 Dimitrov Mitko, Petrakos George, Totev Stoyan and Tsiapa Maria
UNIVERSITY OF THESSALY, Department of Planning and Regional Development
cooperation is for enterprises. Similarly, Tables 6 � 8 present the opinion of the firms in Albania, FYROM and Bulgaria respectively.
Table 5. The opinion of Greek firms about barriers to cross-border cooperation
(5=no barrier, 0=barrier that cannot be overcome) Type of barriers Albania FYROM Bulgaria average Infrastructure as a barrier 1.8 3.1 3.2 2.7 Railways 1.2 2.5 2.4 2.0 Roads 1.6 3.2 3.1 2.6 Post 2.0 3.3 3.4 2.9 Telecommunications 2.1 3.5 3.8 3.1 Public Transport 2.0 3.1 3.3 2.7 Border crossing as a barrier 3.2 3.6 3.6 3.4 Proximity of check points 3.6 3.8 4.1 3.8 Visa regulations 4.1 4.3 4.3 4.2 Passport officers treatment 2.5 3.1 3.0 2.8 Customs officers treatment 2.4 3.0 3.0 2.8 Trade conditions as a barrier 2.8 3.0 3.1 3.0 Tariffs 2.4 2.5 2.5 2.5 Quotas 3.1 3.3 3.4 3.2 Duty fees 2.5 2.5 2.6 2.6 Technical requirements 3.3 3.7 3.8 3.6 Financial conditions as a barrier 2.1 2.3 1,9 2.1 Availability of funds 2.7 2.8 2.5 2.7 Access to finance resources 1.4 1.8 1.3 1.5 Lack of assistance as a barrier 1.1 1.4 1.4 1.3 Local government 1.3 1.4 1.5 1.4 National government 0.9 1.2 1.1 1.1 Local business associations 1.8 2.1 2.2 2.0 National business associations 0.9 1.3 1.2 1.1 European organizations 0.8 1.0 1.0 0.9 General conditions as a barrier 1.4 2.1 2.6 2.2 Political stability 1.3 2.2 2.9 2.3 Corruption 1.1 1.6 1.6 1.8 Security 1.1 1.9 2.3 2.0 Changing of the rules 1.3 1.8 2.3 2.0 Income and demand prospects 1.6 2.4 2.8 2.3 Inflation 1.7 2.2 3.2 2.5 Exchange rate 1.7 2.2 3.1 2.5 Stability of the banking system 1.2 2.0 2.4 2.1 Quality of the banking system 1.1 1.8 2.0 2.0 Labor protection 1.9 2.9 3.0 2.7 Language as a barrier 2.9 3.2 3.2 3.2 Source: Survey data

Cross-Border Cooperation in Southeastern Europe: The Enterprises�s Point of View 31
Discussion Paper Series, 2003, 9(2)
Table 6. The opinion of Albanian firms about barriers to cross-border cooperation
(5=no barrier, 0=barrier that cannot be overcome) Type of barriers Greece FYROM Bulgaria average Infrastructure as a barrier 4.0 4.5 4.1 4.2 Railways 4.5 4.4 2.5 4.4 Roads 3.5 3.6 3.5 3.5 Post 4.0 4.9 5.0 4.2 Telecommunications 3.9 4.9 5.0 4.1 Public Transport 4.1 4.6 4.5 4.2 Border crossing as a barrier 3.1 3.7 4.3 3.2 Proximity of check points 3.6 4.0 4.5 3.7 Visa regulations 3.1 4.3 5.0 3.3 Passport officers treatment 3.2 3.9 4.5 3.3 Customs officers treatment 2.5 2.7 3.0 2.5 Trade conditions as a barrier 3.2 3.6 3.6 3.3 Tariffs 2.3 3.1 2.5 2.5 Quotas 3.9 4.3 4.5 4.0 Duty fees 2.9 3.1 3.0 3.0 Technical requirements 3.6 3.9 4.5 3.6 Financial conditions as a barrier 3.3 3.9 3.3 3.4 Availability of funds 3.4 3.6 2.5 3.4 Access to finance resources 3.1 4.1 4.0 3.3 Lack of assistance as a barrier 1.2 1.7 2.2 1.3 Local government 1.2 1.9 1.0 1.3 National government 0.8 1.1 1.5 0.9 Local business associations 1.9 3.0 3.5 2.1 National business associations 1.0 1.6 3.0 1.1 European organizations 0.9 0.7 2.0 1.0 General conditions as a barrier 3.0 3.6 3.3 3.0 Political stability 4.3 4.7 5.0 4.2 Corruption 2.0 2.2 2.5 2.0 Security 4.2 4.8 5.0 4.1 Changing of the rules 2.8 3.3 4.0 2.8 Income and demand prospects 3.1 3.2 3.0 3.0 Inflation 2.4 3.3 1.5 2.4 Exchange rate 2.7 3.5 3.0 2.7 Stability of the banking system 2.9 3.5 2.5 2.8 Quality of the banking system 2.8 3.5 2.5 2.7 Labor protection 3.2 4.0 3.5 3.1 Language as a barrier 4.0 4.2 4.0 3.8 Source: Survey data

32 Dimitrov Mitko, Petrakos George, Totev Stoyan and Tsiapa Maria
UNIVERSITY OF THESSALY, Department of Planning and Regional Development
Table 7. The opinion of firms in FYROM about barriers to cross-border cooperation
(5=no barrier, 0=barrier that cannot be overcome) Type of barriers Greece Albania Bulgaria average Infrastructure as a barrier 4.0 2.8 3.7 3.6 Railways 1.8 0.6 0.6 1.1 Roads 4.6 2.6 4.3 4.0 Post 4.7 4.4 4.6 4.5 Telecommunications 4.9 4.0 4.8 4.6 Public Transport 4.1 2.5 4.0 3.6 Border crossing as a barrier 3.9 3.1 3.9 3.7 Proximity of check points 4.8 3.3 3.9 4.1 Visa regulations 2.7 4.1 4.8 3.7 Passport officers treatment 4.0 2.7 3.5 3.5 Customs officers treatment 3.9 2.4 3.5 3.4 Trade conditions as a barrier 3.5 3.1 3.7 3.5 Tariffs 2.7 2.3 3.0 2.7 Quotas 4.1 3.8 4.2 4.1 Duty fees 3.5 3.1 3.6 3.4 Technical requirements 3.7 3.3 3.9 3.6 Financial conditions as a barrier 3.6 3.7 3.6 3.6 Availability of funds 3.5 3.6 3.5 3.5 Access to finance resources 3.6 3.7 3.6 3.6 Lack of assistance as a barrier 0.5 0.6 0.5 0.5 Local government 0.4 0.4 0.4 0.4 National government 0.7 0.6 0.6 0.7 Local business associations 0.3 0.5 0.5 0.4 National business associations 0.5 0.5 0.4 0.5 European organizations 0.6 0.8 0.6 0.7 General conditions as a barrier 4.1 1.3 2.7 3.1 Political stability 3.7 2.5 3.5 3.4 Corruption 3.5 1.9 2.6 3.0 Security 4.3 1.2 2.1 3.0 Changing of the rules 3.9 1.5 2.7 3.1 Income and demand prospects 4.2 1.2 2.6 3.1 Inflation 4.1 1.0 2.6 3.0 Exchange rate 4.1 1.2 2.9 3.2 Stability of the banking system 4.5 1.3 2.8 3.3 Quality of the banking system 4.5 1.1 2.6 3.2 Labor protection 4.1 0.5 2.3 2.9 Language as a barrier 3.7 2.2 4.6 3.6 Source: Survey data

Cross-Border Cooperation in Southeastern Europe: The Enterprises�s Point of View 33
Discussion Paper Series, 2003, 9(2)
Table 8. The opinion of Bulgarian firms about barriers to cross-border cooperation
(5=no barrier, 0=barrier that cannot be overcome) Type of barriers Greece Albania FYROM average Infrastructure as a barrier 4.2 1.4 3.3 3.0 Railways 3.5 1.1 2.7 2.5 Roads 4.5 1.0 3.3 3.0 Post 4.5 1.9 3.8 3.4 Telecommunications 4.6 1.9 3.9 3.5 Public Transport 3.9 1.2 3.0 2.7 Border crossing as a barrier 2.8 2.8 4.0 3.2 Proximity of check points 4.9 3.3 4.9 4.4 Visa regulations 2.0 3.7 5.0 3.4 Passport officers treatment 2.2 2.3 3.2 2.6 Customs officers treatment 2.1 2.0 2.7 2.3 Trade conditions as a barrier 2.3 3.3 3.6 3.0 Tariffs 2.3 2.9 3.2 2.8 Quotas 2.1 3.5 3.9 3.1 Duty fees 2.2 2.8 3.1 2.7 Technical requirements 2.4 3.9 4.0 3.4 Financial conditions as a barrier 1.5 2.0 2.3 1.9 Availability of funds 2.1 3.5 3.6 3.1 Access to finance resources 0.8 0.5 0.9 0.7 Lack of assistance as a barrier 2.2 1.6 2.2 2.0 Local government 1.8 1.4 1.9 1.7 National government 2.5 1.6 2.4 2.2 Local business associations 3.6 2.9 3.7 3.4 National business associations 2.4 1.8 2.4 2.2 European organizations 0.8 0.4 0.8 0.7 General conditions as a barrier 4.2 1.1 2.8 2.8 Political stability 4.5 1.0 3.0 2.9 Corruption 3.0 0.4 1.7 1.9 Security 4.0 0.6 2.5 2.6 Changing of the rules 4.0 0.9 2.5 2.6 Income and demand prospects 4.6 1.4 3.1 3.0 Inflation 4.4 1.3 2.9 2.9 Exchange rate 4.4 1.5 3.3 3.1 Stability of the banking system 4.5 0.9 2.9 2.9 Quality of the banking system 4.2 0.7 2.7 2.7 Labor protection 4.0 2.4 3.4 3.2 Language as a barrier 3.0 2.0 4.8 3.3 Source: Survey data

34 Dimitrov Mitko, Petrakos George, Totev Stoyan and Tsiapa Maria
UNIVERSITY OF THESSALY, Department of Planning and Regional Development
On the basis of the information provided in the Tables, we can make the following observations: Firstly, there is a national component in terms of difficulties faced by firms in their efforts to develop cross-border relations. Firms in Greece, FYROM and Bulgaria tend to agree that cooperation with Albania currently faces more serious difficulties, either because of lack of proximity or because in a number of categories (infrastructure, assistance, general conditions) barriers are more serious. On the other hand, firms in Albania tend to differ in their evaluation, as they consider barriers in general lees important than the firms in other countries. This raises some concern about the quality of responses, as it is widely accepted that in these categories the conditions in Albania are less favorable than in the other countries. However, we gave this puzzle a second thought and decided that the responses of the firms may not be irrational, as their major problem in cooperation is not so much the constraints they face but their own capacity. As specialization and trade is a process driven by the size and depth of the market, it is highly possible that the current level of resources development in Albania may not allow a much greater level of cross-border interaction6.
Second, the examination of the Tables shows that firms consider the general conditions prevailing in a country, the lack of assistance in developing cross-border relations and the difficult financial conditions as more serious barriers than the ones related to poor infrastructure and border crossing conditions. This may be of interest to policy makers in the specific countries, who have centered their policy to the development of infrastructure and border crossing aiming to increase cross-border interaction. Our findings show that firms are eventually more sensitive to factors related to the prospects and viability of their investment or project (such as political stability, corruption or exchange rate variations) rather than factors affecting timing, transport costs and comfort (such as roads and check points proximity). Interestingly, the firms do not consider in general the lack of a common language across the borders to be a major barrier to interaction.
Third, irrespective of the perception and the ranking of the enterprises, all barriers to cooperation eventually affect their performance. We report in Table 9 Spearman and Pearson correlation coefficients between the aggregate categories of barriers reported in Tables 5-8 on the one hand and an index of firm performance on the other7. In all cases, the coefficients are positive and significant, indicating that higher values of the barrier indices (that is smaller problems of cross-border cooperation) are associated with a better performance index.
6 The discussion above, as well as the relatively lower potential of Albanian firms to expand trade relations may also be compatible with the fact that the benefits of interaction, especially in the Albania-Greek borders, have been materialized not so much through the commodity markets but through the labor markets. Legal and illegal migration to Greece has resulted to benefits for both sides leaving less scope for benefits from trade, as the resource base of the Albanian side has been seriously weakened. 7 The index of performance (Y) is calculated a weighted index: Y = (Y1 + Y2 + Y3) / 3, where Y1 is the opinion of the firms about their performance, Y2 is their expectations about future performance and Y3 is an aggregate measure of entrepreneurial knowledge. All indices are derived from the questionnaire and are based on the responses of the firms.

Cross-Border Cooperation in Southeastern Europe: The Enterprises�s Point of View 35
Discussion Paper Series, 2003, 9(2)
Table 9. Correlation coefficients between measures of cross-border barriers and an index of enterprise performance Index of enterprise
performance (Y)
Barriers to cross-border cooperation Pearson Correlation Coefficients
Spearman Correlation Coefficients
Infrastructure as a barrier
0.239* (0.000)
0.227* (0.000)
Border crossing as a barrier
0.254* (0.000)
0.251* (0.000)
Trade conditions as a barrier
0.158* (0.007)
0.156* (0.008)
Financial conditions as a barrier
0.213* (0.000)
0.272* (0.000)
Lack of assistance as a barrier
0.220* (0.000)
0.226* (0.000)
General conditions as a barrier 0.210* (0.000)
0.211* (0.000)
* Correlation is significant at the 0.01 level (2-tailed)
6. Conclusions
In this paper we have examined the current status, the limits, the prospects and the policies of cross-border cooperation in the border zone of Albania, Bulgaria, FYROM and Greece, taking the enterprises� point of view. We have surveyed a sample of 291 manufacturing firms located near the borders in all four countries. Our analysis suggests that border region firms may have a higher level of interaction than the respective average national firms in all countries. However, this interaction is more clearly documented along the Greek frontiers, indicating that East-West trade develops faster than intra-East trade in the region. Firms are in general willing to further increase interaction in the future, especially if current constraints are removed.
However, national variations in responses may be interpreted as signs that cooperation is also facilitated or restricted by the level of development of each country. It seems that trade relations and economic cooperation eventually depend on the level of specialization and the size of the markets. This makes a lot of sense if one examines the experience of the EU. Higher and deeper interaction in internal EU border regions is not so much the result of policies but the outcome of strong market forces related to the

36 Dimitrov Mitko, Petrakos George, Totev Stoyan and Tsiapa Maria
UNIVERSITY OF THESSALY, Department of Planning and Regional Development
size and depth of the markets. Therefore, one lesson of the analysis is that it may take time for the full potential of cross-border interaction to unfold in the region. We should not be discouraged about the current level of interaction, as economic progress in the region will eventually increase the level of cross-border cooperation.
The second lesson of the analysis is that barriers to cooperation mater and can affect negatively the performance of border region firms. However, removing barriers may not produce immediate positive results. Existing policies of cooperation implemented in the region may not be able to expand cross-border activities, as firms are less concerned about the quality of infrastructure and more concerned about the general or the financial conditions prevailing in each country. Of course, policies aiming to improve the capacity and quality of transport infrastructure in the region are necessary, especially in the long term, when interaction will increase. It will be, however, wise for each country to invest at the same time in �soft� infrastructure, that is, policies that will generate or improve local mechanisms to support cross-border economic activities.
Yet, the best policy of cross-border cooperation may well prove to be the development of the economies in the region and the improvements in their record with respect to their economic environment. Certainly, EU membership (or the prospect of membership and the necessary institutional arrangements that it implies) helps. It should be clear, however, that the region as a whole has a long way to go in building institutions that will able to embed an entrepreneurial climate facilitating and promoting the expansion of cross-border activities.
Bibliography BLATTER, J. (2003) Between �spaces of place� and �spaces of flows�: institutional transformations in cross-border regions in Europe and North America, in DEFNER A., KOSTANDAKOPOULOS and PSYCHARIS G. (eds.) Culture and regional economic development, Volos: University of Thessaly Press (forthcoming). CHIONIS D. and LIARGOVAS P. (2002) An empirical investigation of Greek-Balkan bilateral trade in Eastern European Economics, 40(5):6-32. JACKSON M. and PETRAKOS G. (2001) Industrial performance under Transition: the impact of structure and geography, in PETRAKOS and TOTEV (eds.) The Development of the Balkan Region, Aldershot: Ashgate, 141-174. KYRKILIS D. and NIKOLAIDIS E (2001) Regional integration in Southeastern Europe, paper presented in the international conference Restructuring, Stability and Development in Southeastern Europe, SEED Center, Volos (http://www.seed-center.org/seed2002 /papers/papers.cfm.) LABRIANIDIS L. (2001) Delocalization of labor intensive industries: an argument in favor of triangular manufacturing between developed countries � Greece � Balkans, Proceedings of the International Conference on Restructuring, Stability and Development in Southeastern Europe, SEED Center, University of Thessaly (http://www.seed-center.org/seed2002/ papers/papers.cfm). NEMES-NAGY J. (2000) The New Regional Structure in Hungary, in PETRAKOS G., MAIER G. and GORZELAK G. (Eds.) Integration and Transition in Europe: The Economic Geography of Interaction, London: Routledge, pp. 170-186.

Cross-Border Cooperation in Southeastern Europe: The Enterprises�s Point of View 37
Discussion Paper Series, 2003, 9(2)
NIEBUHR A. and STILLER S. (2002) Integration effects in border regions � a survey of economic theory and empirical studies, discussion paper 179, HWWA, Hamburg Institute of International Economics, NIJKAMP, P. (1998) Moving frontiers: a local-global perspective, Research Memorandum 1998-22, Vrije University, Amsterdam. PETRAKOS G. (1996) The New Geography of the Balkans: Cross-Border Cooperation Between Albania, Bulgaria and Greece, University of Thessaly, Department of Planning and Regional Development. PETRAKOS G. (1997), The Regional Structure of Albania, Bulgaria and Greece: Implications for Cross-Border Cooperation and Development, European Urban and Regional Studies, 4(3):193-208. PETRAKOS G. (2000) The spatial impact of East-West integration in Europe, in PETRAKOS, MAIER and GORZELAK (eds.) Integration and Transition in Europe: The Economic Geography of Interaction, London: Routledge, pp. 38-68. PETRAKOS G. (2001a) Patterns of Regional Inequality in Transition Economies, European Planning Studies, 9(3):359-383. PETRAKOS G. (2001b) Fragmentation and conflict or integration and cooperation in the Balkans? Strategies of development for the 21st century, in Petrakos and Totev (eds.) The Development of the Balkan Region, Aldershot: Ashgate, pp.219-234. PETRAKOS G. and M. TSIAPA (2001) The Spatial Aspects of Enterprise Learning in Transition Countries, Regional Studies, 35(6):549-562.


