Embed Size (px)
Citation preview

www.elsevier.com/locate/jafrearsci
Journal of African Earth Sciences 45 (2006) 257–278
Crustal evaluation of the northern Red Sea rift and Gulf of Suez,Egypt from geophysical data: 3-dimensional modeling
Salah Saleh a,b, Thomas Jahr b, Gerhard Jentzsch b,*,Ahmed Saleh a, N.M. Abou Ashour c
a National Research Institute of Astronomy and Geophysics, 11421 Helwan, Cairo, Egyptb Institut fur Geowissenschaften, Friedrich-Schiller-Universitat, Burgweg 11, D-07749 Jena, Germany
c Ain Shams University, Faculty of Science, Geophysical Department, Cairo, Egypt
Received 8 December 2003; received in revised form 31 May 2005; accepted 6 February 2006Available online 29 March 2006
Abstract
Combined 3-D interpretations of gravity and aeromagnetic data have been used in addition to continental and marine seismic profiles,well logs and geological cross-sections. The combination of gravity and magnetic data has improved the geometry and the density dis-tribution in the 3-D calculated profiles. Results of the current work reveal possible crustal thickness and density distribution between thesedimentary cover and the upper mantle including the Moho discontinuity. The Moho depth map of the region, as obtained from the 3-Dmodeling exhibits various crustal thickness distributions. The type of crust changes gradually from continental to oceanic, from north tosouth. The zone of crustal thinning coincides mostly with zones of low-density, heated anomalous upper mantle beneath the rift floor(7 km). The eastern plateaus (the Red Sea hills) show by far the largest crustal thickness in the region (32 km).
The Moho relief, as indicated from magnetic interpretation, shows a poor flattening especially in the eastern region. This is contraryto what is given by other authors. However, the present results are in good agreement with the geothermal gradient values in the Red Sea.
The interpretation of magnetic data of the Red Sea Rift shows that the spreading rate of the part south of latitude 26.5� N agrees wellwith the theoretical model, in the order of 0.7 cm/yr. Less agreement has been obtained in the part north of latitude 27.5� N.
The magnetic anomalies along the axial portion of the rift floor, as deduced from the results of the regional and residual separationand the 3-D magnetic modeling, are mainly caused by the oceanic crustal structures beneath the graben.� 2006 Elsevier Ltd. All rights reserved.
Keywords: 3-Dimensional modeling; Bouguer and magnetic anomalies; Red Sea rift; Gulf of Suez; Egyptian off-shore
1. Introduction
The Red Sea is considered to be a typical example of anewly formed ocean; therefore, a great number of studiesdiscuss its evolution as a key for understanding continentalrifting and the initiation of sea floor spreading (Drake andGirdler, 1964; Tramontini and Davies, 1969; Makris et al.,1983; Gaulier et al., 1988; Martinez and Cochran, 1988;Cochran and Martinez, 1988; Meshref, 1990).
1464-343X/$ - see front matter � 2006 Elsevier Ltd. All rights reserved.
doi:10.1016/j.jafrearsci.2006.02.001
* Corresponding author. Fax: +49 3641 948662.E-mail address: [email protected] (G. Jentzsch).
Drake and Girdler (1964), Tramontini and Davies(1969) indicated that the recorded seismic velocities are5.8–5.9 km/s for the upper crust in the northern Red Sea,and the crust appears to be somewhat inhomogeneous inthis area. Also, it was stated that the northern part of theRed Sea appears to be characterized by oceanic type crust,lying at a mean depth of 7–8 km, whereas the Moho is at amean depth of 10–13 km, and at 32 km closest to the coast-line (Gaulier et al., 1988; Makris et al., 1991; Rihm et al.,1991).
Data presented in Cochran and Martinez (1988) and inMartinez and Cochran (1988) imply that extension in thenorthern Red Sea has recently become concentrated in a

Fig. 2. Surface geological map for the region of study (from EgyptianGeological Survey, 1994).
Fig. 1. Location map for the area of study.
258 S. Saleh et al. / Journal of African Earth Sciences 45 (2006) 257–278
well defined axial depression, which is considered to be anarrow plate boundary. Cochran and Martinez (1988) sta-ted that the northern Red Sea occupies a critical position inthe transition from continental to oceanic extension in arift. Observations of its structure and tectonics allow aqualitative model for that transition to be developed.
On land, refraction data indicate a Moho depth of 35–40 km with a velocity 8.0 km/s, in the areas which arenot affected by the rifting process and where the crust isfound to be continental (Ginzburg et al., 1981; Makriset al., 1983; Gettings et al., 1986; El-Isa et al., 1987).
In the current study integrated geophysical methods(gravity and magnetic) have been applied to determinethe sub-surface structural nature in a 3-dimensional model.All the available gravity and magnetic data (General Petro-leum Corporation, 1986; Kamel, 1990), the gravity map ofthe Sinai Peninsula (Tealeb and Riad, 1986), the recentavailable marine gravity, magnetic and well logging data(Minich, 1987; Cochran et al., 1986; Martinez and Coch-ran, 1988; Meshref, 1990; General Petroleum Corporation,1980) were all considered. This is used to construct a newmodel of the composition of the crust and its present state,continental or oceanic, especially in the areas where thetransition took place (See. Fig. 1).
2. Geological setting
The oldest known formation in the study area is of LatePrecambrian age, igneous and metamorphic rocks formingthe northern edge of the African Shield (Fig. 2). The base-
ment complex outcrops in southern Sinai and in the East-ern Desert (Red Sea mountain range).
Said (1962) and El-Gezeery and Marsouk (1974) showedthat the depth of the basement increases northwardstowards the Mediterranean Sea. The Palaeozoic rocks arecharacterized by continental clastic deposits. The marineepisodes are minor in space and time. The Palaeozoic per-iod ends with the Upper Carboniferous-Lower Permianmarine deposition that followed the Hercynian orogenicphase, and the subsequent erosional period. Predominantcontinental deposition started again in the Mesozoic. AMiddle Triassic marine transgression from the Tethysappears to be limited to the area of northern Sinai andthe Gulf of Suez. Jurassic deposits cover parts of the westside of the Gulf of Suez; it appears that the distributionof the Jurassic sediments around the Gulf is as far southas Wadi Araba. The sediments include fluvio-marine andmarine shallow-water deposits. The maximum extensionof the sea seems to have occurred during Middle Jurassictime. The Cenozoic witnessed the transformation of theTethys into the Mediterranean Sea. During the Palaeo-cene–Eocene, ‘deep sea conditions’ migrated southwardsand shallow water conditions of sedimentation or evenland masses resulted in the northern part of Egypt, whichnow corresponds to the southern Mediterranean Sea. Thedeep sea conditions in the south left thick calcareousdeposits, succeeded by Eocene limestones, which are the

S. Saleh et al. / Journal of African Earth Sciences 45 (2006) 257–278 259
most widespread marine deposits in Egypt. This limestoneextends over the central part of the country where it consti-tutes a large plateau, crossed by the River Nile over a dis-tance of 400 miles, and in the central part of Sinai. TheMiocene was a period of great transformation, leading tothe present Red Sea coast sediments and similar sedimenta-tion in the north-western part of the Gulf of Suez. After theOligocene uplift, an Early and Middle Miocene Tethystransgression began, only to be followed by late Mioceneregression related to Alpine orogeny to the north. Moreextensive marine beds were formed in the Miocene, witha maximum extent in the Middle Miocene, when theyreached to the Gulf of Suez and the Red Sea region beyondthe Egyptian border. Pliocene sediments are widely distrib-uted along the Red Sea. The Quaternary was characterizedby regression with minor transgression. Uplift and tectonicdisturbances mark the Pliocene-Quaternary boundary inthe Red Sea region. Volcanism occurred in the Red Seaaxial trough (El-Gezeery and Marsouk, 1974).
3. Gravity data
A considerable amount of gravity data are now avail-able to unravel the gross crustal structure of the Red Searegion. In the present work we utilize the following data:(1) Bouguer gravity data of the Egyptian General Petro-leum Company (EGPC, 1980) which was published as aset of Bouguer maps of Egypt at 1:500,000 scale by compil-ing all available gravity data. A simplified and redrawn ver-sion of this map is presented. (2) Gravity surveys for thestudy region were conducted by the Sahara PetroleumCompany (SAPETCO) and PHILIPS Company between1954 and 1958. These surveys covered a large area of theGulf of Suez, Sinai and the Eastern Desert. All the dataof these surveys were compiled, classified and rankedaccording to instrument sensitivity and measurement den-sity. The gravity measurements were conducted using twoWorden gravimeters. The instruments are temperaturecompensated and have a sensitivity of ±0.1 mGal1 (Kamel,1990). (3) Marine gravity data in the northern Red Seawere taken from publications (Minich, 1987; Martinezand Cochran, 1988). The underwater gravity survey wasconducted using a Bell Aerospace BGM-3 marine gravitymeter system that was installed on the R/V ‘‘Robert D.Conrad’’, north of 26� N, in 1984. The system consistedof a vertical component forced feedback accelerometerwhich is not subject to cross coupling errors, mounted ona gyro-stabilized platform. The performance of this systemis described in detailed by Bell and Watts (1986). In theRed Sea, gravity data values were obtained at 1 min inter-vals, with discrepancies at ship track intersections of lessthan about 1 mGal for the northern sections, and not morethan about 3 mGal in the worst cases. Data from previouscruises in the area were included in our contour map if dis-
1 1 mGal is equivalent to 10 lm/s2 (in SI-units).
crepancies at intersections of individual ship tracks andscatter of their discrepancies at intersections with the newdata were less than 7 mGal. Those cruises satisfying theabove criteria and their data, adjusted by adding a constantto remove the average gravity discrepancy at intersectionswith those cruises, as well as (4) Sinai Peninsula data, werecollected, from Tealeb and Riad (1986).
3.1. Gravity data analysis
Fig. 3 shows the gravity data distribution of the studyarea (dots). The distance between the consecutive observa-tion stations ranges from approximately 2–5 km. The calcu-lated Bouguer gravity anomaly is: (1) based on theinternational gravity formula of 1967, referenced tothe IGSN-1971, reduced to sea level and corrected withthe standard density of reduction, 2670 kg/m3.
For onshore stations, terrain corrections up to 50 mwere made in the field using topographic charts and Ham-mer tables (Hammer, 1939). The horizontal positions of thestations were obtained from 1:500,000 topographic sheets.The station locations were converted to the UniversalTransverse grid coordinates with the central Meridian at30� E. Elevations at each station were measured by a baro-metric altimeter and all measurements are referenced toabsolute elevation. The corrections were applied to all landstations. These corrections generally are 61 mGal, how-ever, along the mountains of the Red sea hills they reachmore than 4 mGal.
The combined errors in the Bouguer gravity valuesdepend upon the sum of errors in observation, elevationand terrain corrections. i.e.
e2B ¼pðe2
g þ e2h þ e2
p þ e2TÞ
where
eB the combined errors in Bouguer gravity measure-ments,eg error in observation,eh error in elevation,ep error in position,eT error in terrain correction.
The errors in measurement during the regional grav-ity survey in the study area were found to be within±0.1 mGal. The errors in elevation depend upon the num-ber of benchmarks, the number of quality GPS2 observa-tions, topographic relief, and variability of weather. Theerrors in elevation eh were calculated by multiplying theerrors in elevation measurement with the combined Bou-guer slab and free air correction (0.1967 mGal/m) values.The total sum of errors in the Bouguer gravity value, tak-ing into consideration the different errors mentioned above,is ±0.4 mGal in the basin and ±1 mGal on the plateaus.
2 GPS Global Positioning System.

Ras Abu Rudeis
El-Igma Plateau
Plateau of El-Tih
North Galala Plateau
SINAI PENINSULA
Safaga
Quseir
Luxor
Hurghada
GebelEl Zeit
Gebel Araba
Ayun Mousa
G. Raha
G. Ataka
Abu AlDarag
Shadwan
Sudr
Ras Zafarana
Abu Zenima
Ras Gharib
Ras Shukeir
Kareem
BelayimBakr
Lagia
El Tor
Ruahmi
Marsa Alam
32oE 33oE 34oE 35oE 36oE
Longitude
25oN
26oN
27oN
28oN
29oN
30oN
Lat
itu
de
SAUDI ARABIA
EGYPT
RIVER NILE
0 100 200
km
Fig. 3. Location map of the regional gravity profiles (the dots show the observation points).
260 S. Saleh et al. / Journal of African Earth Sciences 45 (2006) 257–278
In order to interpret the gross crustal structure of thenorthern Red Sea rift and Gulf of Suez, a new Bouguergravity anomaly map, at a constant contour interval of5 mGal was prepared (Fig. 4). The general trend of theBouguer gravity anomalies is northwest–southeast. Themap reveals a broad regional negative Bouguer anomalyover the entire Red Sea rift and the Gulf of Suez. Theanomaly increases in magnitude with a decrease in therelief of the topography and attains its maximum of+95 mGal along the axis of the Red Sea rift floor. Withthe new data coverage, this map can be divided into a num-ber of distinct areas based on anomaly size, trend and gra-dient, which can be related to regional geology.
A belt of first-, second- and third-order magnitude grav-ity anomalies extends in a northwest–southeast (Clysmic)direction in the Hurgada-Shadwan-Ras-Mohamed areas.This belt is characterised by intensive gravity variations.
It may be subdivided into the following three units (comp.Figs. 2 and 4):
(1) Northern zone of the Gulf of Suez: This zone is char-acterised by first-order gravity anomalies both inmagnitude and size. The minimum value is about�50 mGal. It is bordered by a zone of intensive grav-ity variation within which the local gravity high ofAyun Musa and the gravity anomaly of Suder-Lagiaare located.
(2) Central zone of the Gulf of Suez: This zone is alsoassociated with first-order gravity low anomalies ofabout �80 mGal. It is distinctly bordered by stripsof intensive gravity variations of the meridian trendof the Zafarana, Wadi um Arta, Abu Rudeis-Belayim-Shukheir-Gharib and Lagia-Abu Zeneimaareas. Within the axial part of the regional gravity

Ras Abu Rudeis
El-Igma Plateau
Plateau of El-Tih
North Galala Plateau
SINAI PENINSULA
Safaga
Quseir
Luxor
Hurghada
Gebel El Zeit
Gebel Araba
Ayun Mousa
G. Raha
G. Ataka
Abu AlDarag
Shadwan
Sudr
Ras Zafarana
Abu Zenima
Ras Gharib
Ras Shukeir
Kareem
BelayimBakr
Lagia
El Tor
Ruahmi
Marsa Alam
32oE 33oE 34oE 35oE 36oE
Longitude
25oN
26oN
27oN
28oN
29oN
30oN
Lat
itu
de
SAUDI ARABIA
EGYPT
RIVER NILE
0 50 100
P 26
P 29
P 15
A
B
km
Fig. 4. Measured Bouguer anomaly map of the Red Sea and surrounding region. Contour interval is 5 mGal; gravity is reduced at Sea level. Density ofreduction is 2.67 g/cm3 and the international gravity formula of 1967 has been used. The topographic reductions have been applied. This map is asimplified version of the 1:500,000 scale maps published by the GPC, Cairo, 1980.
S. Saleh et al. / Journal of African Earth Sciences 45 (2006) 257–278 261
low, local highs of clysmic trend occur at Ras Gharib,Bakr-Kareem and Gharib North. These are associ-ated with the Kareem-west Ruahmi low which mayform the Khashaba basin located to the west ofRuahmi and west Bakr.
(3) Southern zone of the Gulf of Suez: In spite of thehuge data gaps, and using available profiles we cansuggest that gravity anomalies in this zone are differ-ent from those of the other zones of the Gulf, in beingelongated in shape. They, like all others in the areabetween the Gulf and the Red Sea, follow the Clysmictrend.
The first-order local low of Abu Rudeis-El-Tor lies inthe Abu Durba area between Gebel Araba and the El-Qaa plain. The minimum values are � 50 mGal. A localhigh in the vicinity of Abu Durba is noticed in the Gebel
Araba ridge. On the western side of the Gulf lies the GebelZeit local high which is followed to the west by a pro-nounced gravity low of about �40 mGal. This low maybe attributed to the thick salt section of the subsurfaceMiocene in this part of the study area (Kamel, 1990). Fur-ther to the south, at Esh El-Mellaha range, a local gravityhigh of 5 mGal is observed. East of this positive gravityanomaly (Fig. 4), there is a gravity low with a value of�40 mGal. In the Galala plateau (elevation of 600 m) inthe Eastern Desert, where Eocene Limestone rocks cropout, Bouguer values range from �10 to �50 mGal.
The most diagnostic feature of the composite map is alinear positive anomaly (+80 mGal) centered over theRed Sea, flanked by two small anomalies over the Arabianshield (down to +10 mGal) and over the Nubian Shield(down to �40 mGal). The total width of the anomalouszone is of an order of 300 km. The large amplitude wave

262 S. Saleh et al. / Journal of African Earth Sciences 45 (2006) 257–278
length anomalies suggest crustal inhomogeneties. It is obvi-ous that such large-amplitude, long-wavelength anomaliescannot be produced solely by crustal inhomogeneities,and a subtantial contribution from subcrustal density vari-ations (asthenosphere) is inferred.
The positive axial anomaly attains its maximum value ofabout 90 mGal in the southern part of the area. A slightsystematic decrease of the amplitude occurs to the north,where the maximum amplitude is of the order 80 mGalsouth the entrance to Gulf of Aqaba.
The highest mountains in the Red Sea Ranges are over1000 m, and their negative Bouguer anomalies are onlyabout �10 to �30 mGal, aligned parallel to the Red Seaalong a NNW trend. To the west of these anomalies, from26 to 28.5 N and 31.5 to 33 E, an elongated gravity mini-mum with values between �35 and �50 mGal marks theGalala Basin, where almost 5 km thick sediments are lim-
Ras Abu Rudeis
El-Igm
Plateau o
North Galala Plateau
SINAI PE
S
Luxor
Hurghad
GebelEl Zeit
Gebel Araba
Ayun Mousa
G. Raha
G. Ataka
Abu AlDarag
Sudr
Ras Zafarana
Abu Zenima
Ras Gharib
Ras Shukeir
Kareem
BelayimBakr
Lagia
El Tor
Ruahmi
32oE 33oE 3
Lon
25oN
26oN
27oN
28oN
29oN
30oN
Lat
itu
de
EGYPT
RIVER NILE
0 50 100
km
(a)
Fig. 5. (a) Regional anomaly map with an effective cut-off wavelength of 120120 km.
ited to the east by the outcroping crystalline basement(Makris and Kebeasy, 1982). The elevation of this area isfairly smooth and only 200–400 m above sea level. TheRed Sea Mountains, with altitudes over 800 m, show Bou-guer anomalies between �10 mGal and �35 mGal, the val-ues increasing to zero gravity level at the Red Sea coast.These anomalies suggest that the crust attains its maximumthickness below the Red Sea Mountains and thins consid-erably towards the Red Sea rift. In the Red Sea, the anom-alies are positive, the anomaly increases in magnitude witha decrease in the relief of the topography and attains itsmaximum of +80 mGal along the axis of the Red Sea riftfloor.
In eastern Egypt and the Gulf of Suez, the anomalieshave a NNW–SSE trend which is associated with the Mio-cene and Post Miocene opening of the Red Sea and Gulf ofSuez.
a Plateau
f El-Tih
NINSULA
afaga
Quseir
a
Shadwan
Marsa Alam
4oE 35oE 36oE
gitude
SAUDI ARABIA
km and (b) residual anomaly map with an effective cut-off wavelength of
Ras Abu Rudeis
El-Igma Plateau
Plateau of El-Tih
North Galala Plateau
SINAI PENINSULA
Safaga
Quseir
Luxor
Hurghada
GebelEl Zeit
Gebel Araba
Ayun Mousa
G. Raha
G. Ataka
Abu AlDarag
Shadwan
Sudr
Ras Zafarana
Abu Zenima
Ras Gharib
Ras Shukeir
Kareem
BelayimBakr
Lagia
El Tor
Ruahmi
Marsa Alam
32oE 33oE 34oE 35oE 36oE
Longitude
25oN
26oN
27oN
28oN
29oN
30oN
Lat
itu
de
SAUDI ARABIA
EGYPT
RIVER NILE
0 50 100
km(b)
Fig. 5 (continued)
S. Saleh et al. / Journal of African Earth Sciences 45 (2006) 257–278 263
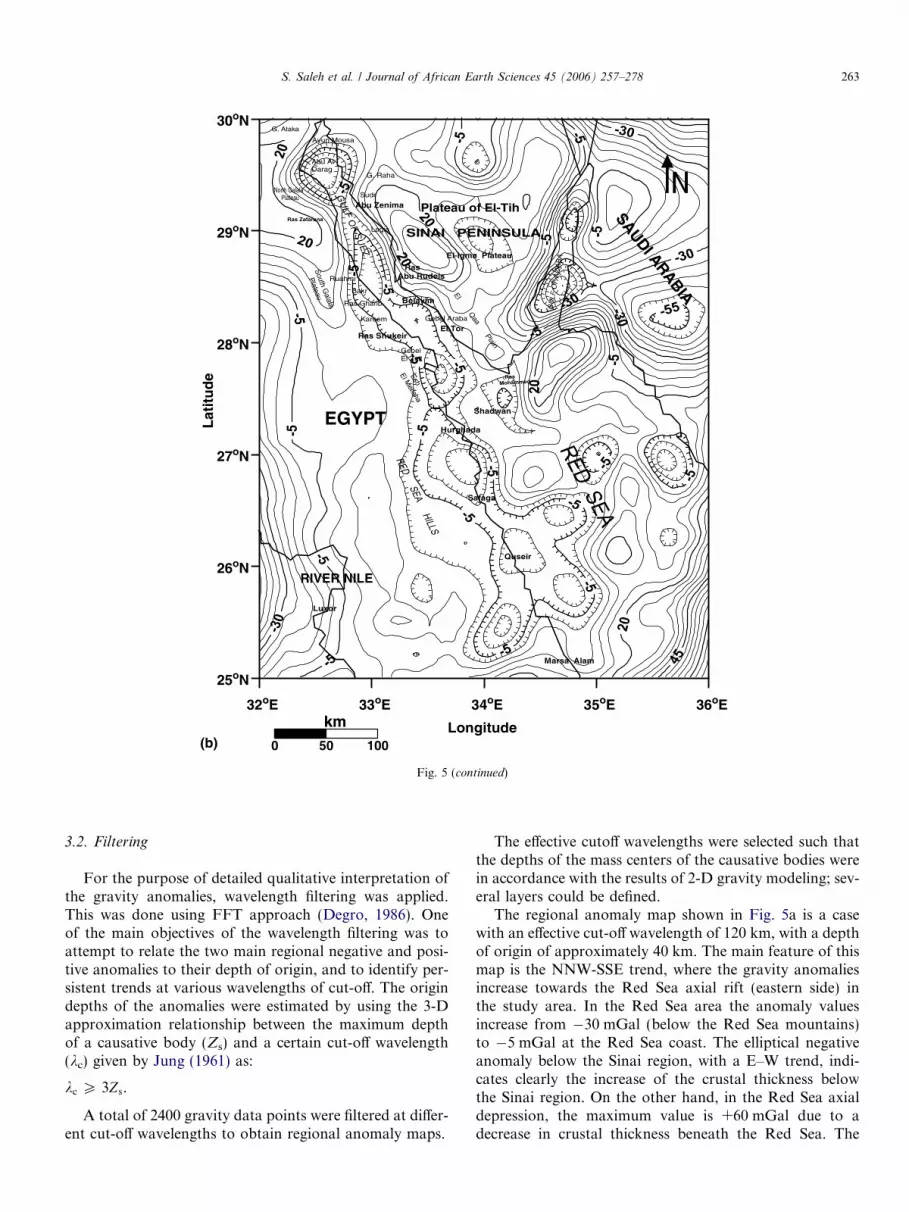
3.2. Filtering
For the purpose of detailed qualitative interpretation ofthe gravity anomalies, wavelength filtering was applied.This was done using FFT approach (Degro, 1986). Oneof the main objectives of the wavelength filtering was toattempt to relate the two main regional negative and posi-tive anomalies to their depth of origin, and to identify per-sistent trends at various wavelengths of cut-off. The origindepths of the anomalies were estimated by using the 3-Dapproximation relationship between the maximum depthof a causative body (Zs) and a certain cut-off wavelength(kc) given by Jung (1961) as:
kc P 3Zs.
A total of 2400 gravity data points were filtered at differ-ent cut-off wavelengths to obtain regional anomaly maps.
The effective cutoff wavelengths were selected such thatthe depths of the mass centers of the causative bodies werein accordance with the results of 2-D gravity modeling; sev-eral layers could be defined.
The regional anomaly map shown in Fig. 5a is a casewith an effective cut-off wavelength of 120 km, with a depthof origin of approximately 40 km. The main feature of thismap is the NNW-SSE trend, where the gravity anomaliesincrease towards the Red Sea axial rift (eastern side) inthe study area. In the Red Sea area the anomaly valuesincrease from �30 mGal (below the Red Sea mountains)to �5 mGal at the Red Sea coast. The elliptical negativeanomaly below the Sinai region, with a E–W trend, indi-cates clearly the increase of the crustal thickness belowthe Sinai region. On the other hand, in the Red Sea axialdepression, the maximum value is +60 mGal due to adecrease in crustal thickness beneath the Red Sea. The

264 S. Saleh et al. / Journal of African Earth Sciences 45 (2006) 257–278
residual field map is very similar to the unfiltered Bouguermap, as shown in Fig. 5b; in addition some isolated nega-tive anomalies can be seen along the Red Sea coast, havinga NW-SE trend and values of more than �10 mGal. Simi-lar features have been obtaind with different effective cut-off (64, 36, and 21.3 km) wavelengths.
At a cut-off wavelength of 12.8 km (Fig. 6a) the majorregional trends become less clearly defined as they arenow superimposed on each other. Small anomalies becomeclearly defined and nearly all the anomalies of the Bouguermap are represented. The sources are sedimentary layersat fairly shallow depths of approximately 4 km. Thelocal anomaly structures are absent at this shallow depth(Fig. 6b), where there is no local structure to be recognized.
In general, due to the data gaps and the distribution ofthe gravity profiles we can interpret long wavelength struc-tures, but no short wavelength information. In general, the
Ras Abu Rudeis
El-Igm
Plateau o
North Galala Plateau
SINAI PE
S
Luxor
Hurghad
GebelEl Zeit
Gebel Araba
Ayun Mousa
G. Raha
G. Ataka
Abu AlDarag
Sudr
Ras Zafarana
Abu Zenima
Ras Gharib
Ras Shukeir
Kareem
BelayimBakr
Lagia
El Tor
Ruahmi
32oE 33oE 3
Lon
25oN
26oN
27oN
28oN
29oN
30oN
Lat
itu
de
EGYPT
RIVER NILE
0 50 100
km(a)
Fig. 6. (a) Regional anomaly map with an effective cut-off wavelength of 12.812.8 km.
results of the filtering operations show that the regionaltrend of the two main positive and negative anomalies per-sists between the cut-off wavelengths of 120 km and 36 km,indicating that these anomalies are probably related toregional deep-seated structures (upper mantle and or dee-per crust) extending from approximately 12 km to a rela-tive depth of 40 km.
Filtering operations at cut-off wavelengths of 21.3 and12.8 km were conducted on the data to try and isolatesuperimposed effects, especially in the Gulf of Suez area.It was possible to eliminate short wavelength anomalieswhich are probably related to sedimentary layers at depthslower than 7 km. This trend agrees well with the geologicaldata interpretation and the seismic refraction data (Said,1962; Bayoumi, 1983; Makris and Ginzburg, 1987).Regarding the short wave anomalies we have to be carefulin areas where we do not have data. In addition to the
a Plateau
f El-Tih
NINSULA
afaga
Quseir
a
Shadwan
Marsa Alam
4oE 35oE 36oE
gitude
SAUDI ARABIA
km and (b) residual anomaly map with an effective cut-off wavelength of

Table 1The P-wave velocities of the geological units from the Red Sea region (after Gaulier et al., 1988; Marsouk, 1988)
No. Geological units Description Velocity vp (km/s) Density kg/m3
1 Recent sediments Undivided Quaternary and Pliocene sediments 2.0 22202 Evaporitic series Eocene calcareous formation, Senomanian
marls and limestones, and would correspondto Cenomanian shales and Nubian sandstones
4.1 2390
3 Igneous crust Crust mixed materials 5.6 28504 Anomalous upper – 7.5 3100
Mantle5 Miocene Thick section of gypsum and anhydrite with marly interbeds 4.2 24006 Upper crust (basement rocks) Grained quartz diorite and hornblende-biotite 6.0 27507 Lower crust 6.4 29008 Normal upper – 8.0 3250
Mantle
The different rock units used in the 3-dimensional gravity modeling and their respective densities.
Ras Abu Rudeis
El-Igma Plateau
Plateau of El-Tih
North Galala Plateau
SINAI PENINSULA
Safaga
Quseir
Luxor
Hurghada
GebelEl Zeit
Gebel Araba
Ayun Mousa
G. Raha
G. Ataka
Abu AlDarag
Shadwan
Sudr
Ras Zafarana
Abu Zenima
Ras Gharib
Ras Shukeir
Kareem
BelayimBakr
Lagia
El Tor
Ruahmi
Marsa Alam
32oE 33oE 34oE 35oE 36oE
Longitude
25oN
26oN
27oN
28oN
29oN
30oN
Lat
itu
de
SAUDI ARABIA
EGYPT
RIVER NILE
0 50 100
km(b)
Fig. 6 (continued)
S. Saleh et al. / Journal of African Earth Sciences 45 (2006) 257–278 265
separation of the Bouguer anomaly into its regional andresidual constituents, an indirect method of interpretation
(3-D forward modeling) was applied to interpret the geo-logical structure of the subsurface.
266 S. Saleh et al. / Journal of African Earth Sciences 45 (2006) 257–278
To understand the results of this method, a shortdescription of the theoretical background is given below.
3.3. Three-dimensional gravity modeling
The 3-dimensional forward gravity modeling packageIGMAS (Interactive Gravity and Magnetic Analyzing
2900 Kg/m3
3250 Kg/m3
2750 Kg/m3-10
-40
-30
-20
310
100 1412080604020
EGYPT G. o
2400 z [km]
[mGal]
60
40
20
0
-20
-40
-60
-80
80
80
60
40
20
0
-20
-40
-60
-80Egypt Coast
[mGal]
2750 Kg/m3
2390
2
2900 Kg/m3
z [km]
-10
-40
-30
-20
3250 Kg/m3
200100
2400
(a
(b
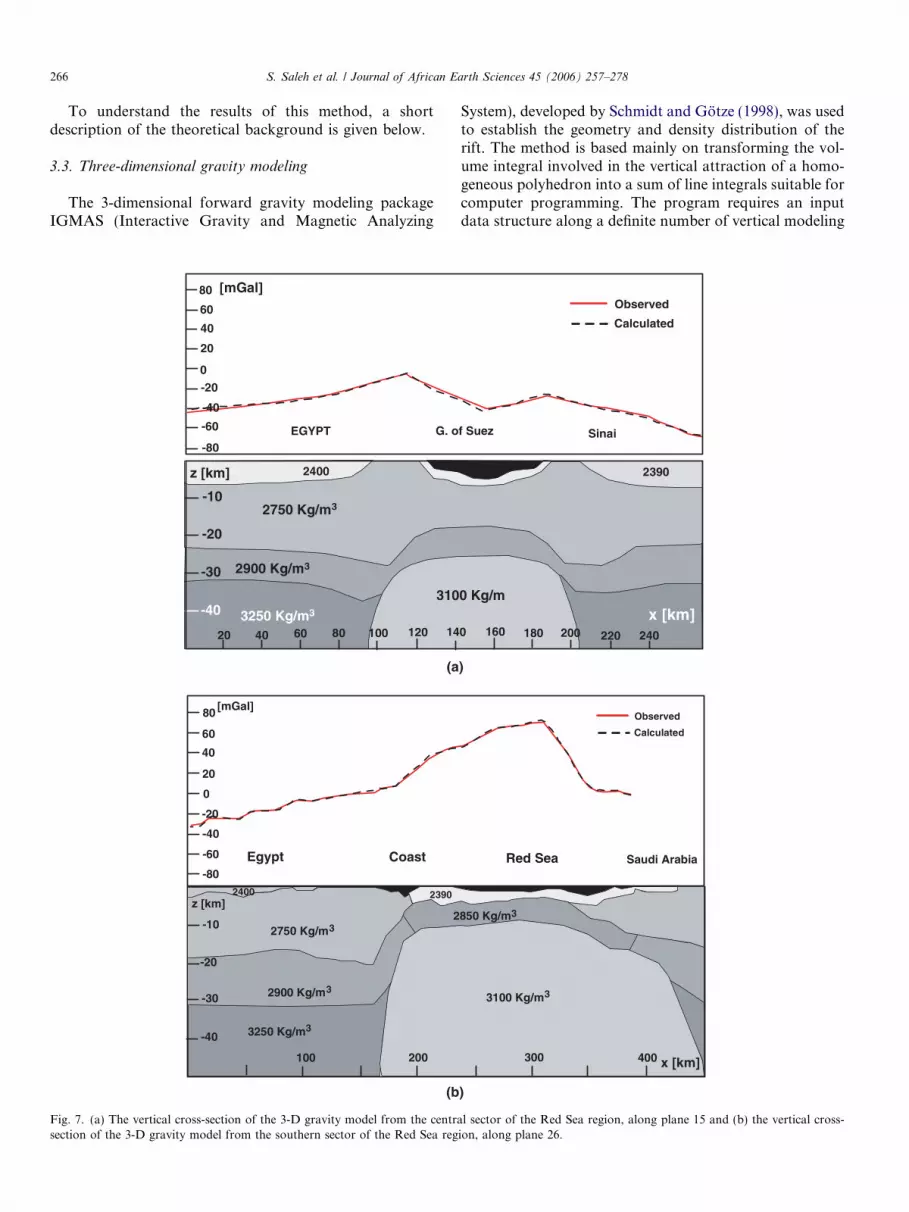
Fig. 7. (a) The vertical cross-section of the 3-D gravity model from the centrsection of the 3-D gravity model from the southern sector of the Red Sea reg
System), developed by Schmidt and Gotze (1998), was usedto establish the geometry and density distribution of therift. The method is based mainly on transforming the vol-ume integral involved in the vertical attraction of a homo-geneous polyhedron into a sum of line integrals suitable forcomputer programming. The program requires an inputdata structure along a definite number of vertical modeling
2200
0 Kg/m
200x [km]
1801600 220 240
f Suez Sinai
2390
Observed
Calculated
2200
Red Sea Saudi Arabia
850 Kg/m3
3100 Kg/m3
300 400
Observed
Calculated
x [km]
)
)
al sector of the Red Sea region, along plane 15 and (b) the vertical cross-ion, along plane 26.

Fig. 8. Moho depth map for the area of study.
G. AtaqaAyun Mousa
G. RahaAbu Al DaragSudr
N. Galala PlateauLagia
Ras Zafarana Abu Zenima
Plateau
El Ig
RuahmiBakr
Ras Abu RudiesS. Galala Plateau
Ras Gharib
Kareem
BelayimAbu Durba
G. Araba
El QaEl Tor
Ras Shukeir
G. El ZeitEsh El Mellaha
Hurghada
Safag
Q
Luxor
10700.00 10800.00 10
East
2800.00
2850.00
2900.00
2950.00
3000.00
3050.00
3100.00
3150.00
3200.00
3250.00
3300.00
No
rth
ing
(km
)
Egypt
Sinai Pe
P5
Fig. 9. Modeled Bouguer gravity map. The thin lines P2-P29 denote the loca(bold) are explained in Fig. 8a–c. Contour interval is 5 mGal.
S. Saleh et al. / Journal of African Earth Sciences 45 (2006) 257–278 267
planes perpendicular to the general geological strike. Ineach plane, the vertices of the assumed subsurface struc-tures are interconnected to form a line separating twomedia with different densities. Lines of the neighboringplanes separating identical medium densities are thenjoined to form triangles and, hence, layer boundary sur-faces. The model so developed gives a more realisticapproximation of the geologic structures (Gotze, 1976,1984; Gotze and Lahmeyer, 1988). One of the advantagesof this method is its ability to approximate a body with asmall number of polyhedrons. Consequently, any changein the shape of the body can be achieved with only a fewdata manipulations. Besides the simplicity of approxima-tion in data handling and manipulation pertaining to thechanges of shape of the body, the method takes care ofthe Earth curvature during the computation of the effectsof very large structures. The results of the gravity modelstudies of the deep structure of the Alpine area, Harzmountains and Main Ethiopian rift are amongst the bestcase histories (among others) that show the applicabilityand effectiveness of the method (Gotze, 1984; Pfister,
of El Tih
ma Plateau
a Plain
Shadwan
Ras Mohammed
a
usier
900.00 11000.00 11100.00
ing (km)
Saudi Arabia
ninsula
P29
P15
P26
P10
tions of the gravity modeling planes 2-29. The profiles P10, P15 and P26

268 S. Saleh et al. / Journal of African Earth Sciences 45 (2006) 257–278
1988; Gabriel et al., 1996, 1997; Mahatsente et al., 1999;Jentzsch et al., 2000).
As the general geological strike along the rift floor isvariable, the 3-D modeling was applied, covering an areaof 18 · 104 km2 (300 km · 600 km). The location and ori-entation of the vertical modeling planes are shown in Figs.4 and 9. The orientation of the vertical planes is perpendic-ular to the general geological strike of the rift. The verticalplanes are parallel to each other, and the distances betweenthe planes are variable along the rift floor depending on thelocation of the anomalies, on the Bouguer map, and theircorresponding causative bodies, and on the geologicalmap. The data distribution has also been taken into consid-eration during the selection and orientation of the model-ing planes along the investigated area.
3.4. Results from gravity data
The necessary information required for the 3-D gravitymodeling includes the density or velocity distribution in
G. AtaqaAyun Mousa
G. RahaAbu Al DaragSudr
N. Galala PlateauLagia
Ras Zafarana Abu Zenima
Plateau
El Ig
RuahmiBakr
Ras Abu RudiesS. Galala Plateau
Ras Gharib
Kareem
BelayimAbu Durba
G. Araba
El QaaEl Tor
Ras Shukeir
G. El ZeitEsh El Mellaha
Hurghada
Safaga
Qu
Luxor
10700.00 10800.00 10Eas
2800.00
2850.00
2900.00
2950.00
3000.00
3050.00
3100.00
3150.00
3200.00
3250.00
3300.00
No
rth
ing
(km
)
Egypt
Sinai Pe
Fig. 10. The misfit between the observed and computed Bouguer anomaly of t
the crust and upper mantle, the strike length, and the lat-eral as well as the vertical extent of the causative bodies.The better this prior information, the less ambiguous willbe the final gravity model. The initial model for the grosscrustal structure of the Red Sea and Suez rift consists ofeight bodies representing different lithological and tectonicunits.
The geometry of the initial model has been adoptedfrom the results of the 2-dimensional gravity modeling(Makris and Ginzburg, 1987) and the seismic refraction–reflection experiment surveys conducted in the investigatedarea (Gaulier et al., 1988).
Table 1 shows the P-wave velocities of the structuralunits from the Red Sea region (after Gaulier et al., 1988;Marsouk, 1988). Also shown are the estimated density val-ues used for the 3-D gravity modeling of the Red Sea rift.The density values were estimated from the seismic veloci-ties using the Nafe–Drake relation (Nafe and Drake, 1957).Also it depicts the different rock units used in the 3-D grav-ity modeling and their respective densities. The results of
of El Tih
ma Plateau
Plain
Shadwan
Ras Mohammed
sier
900.00 11000.00 11100.00ting (km)
Saudi Arabia
ninsula
he study area. Local coordinate system is used (contour interval 1 mGal).

S. Saleh et al. / Journal of African Earth Sciences 45 (2006) 257–278 269
commercial explorations in this area (after Colleta et al.,1988; Gaulier et al., 1988; Egyptian Geological Survey,1994) and the geological units considered in the gravitymodel are identified with numbers.
A section from the central sector of the Red Sea isshown in Fig. 7a (refer to Fig. 9 for the locations of themodeling planes). The long-wavelength gravity anomalyalong the axial portion of the northern Red Sea rift flooris best explained in terms of a relatively low density uppermantle (q = 3100 kg/m3). Its comparable seismic velocityequals 7.5 km/s, which was investigated along the axialRed Sea and Suez rifts (Gaulier et al., 1988). This anoma-lous layer seems to cover large parts of the main Red Seaaxial rift.
This low velocity anomalous upper mantle could reflecta change in the P-T conditions (pressure release and con-vection heat) of the Moho, and the decrease of vp couldbe estimated to be �0.1 km/s (Anderson et al., 1968). Thisresult, although it is a coarse estimation, demonstrates thatthe P-T parameters cannot explain the low mantle velocityof 7.5 km/s measured beneath the Gulf of Suez.
Attenuation of seismic waves with distance increasessharply from the coast to the axial area. This attenuation
RasAbu Rudeis
North Galala Plateau
SINAI
Safaga
Hurghada
GebelEl Zeit
Gebel Araba
Ayun Mousa
G. Raha
G. Ataka
Abu AlDarag
Shadw
Sudr
Ras ZafaranaAbu Zenima
Ras Gharib
Ras Shukeir
Kareem
BelayimBakr
Abu Durba
Lagia
El Tor
Ruahmi
0 50 100 km
32.00E 33.00E 34.00ELongitud
25.0N
26.0N
27.0N
28.0N
29.0N
30.0N
Lat
itu
de
Fig. 11. Total magnetic anomaly map reduced to the po
may be related to active fracturing and/or to higher tem-peratures which may indicate the presence of partial melt-ing at depth. Hence, the previous mechanisms must beconsidered to explain this low velocity (the possible pres-ence of partial melting in the upper mantle), or a pyroxe-nite composition for this 7.5 km/s layer, related to someunderplating event (Anderson et al., 1968).
The lateral density variations in the upper mantle seem tobe extremely intense in the coastal zone of the Red Sea; thelow-density material is confined exclusively to the rifted area.This result is very similar to the findings of Makris andGinzburg (1987) for the southern Red Sea as well as thoseof Makris et al. (1974), Berckhemer et al. (1975) in the Afar.
The gravity model also incorporates the recent sedi-ments of the rift floor, mostly surrounded by the distribu-tion of the basement outcrops on the Nubian side of theGulf of Suez-Red Sea rift, as shown in Fig. 8a and b.
It should be noted that the aerial extent and degree ofdoming of basement crystal rocks (upper igneous crust)are far greater on both sides of the Red Sea rift than thatof those bounding the Suez rift; furthermore the distribu-tion of outcropping basement rocks is limited only to thesouthern half of the Gulf of Suez.
an
35.00E 36.00Ee
P 27
P 21
-100
0
100
200
300
400
500
600
700
800
nT
le for the studying area. Contour interval is 25 nT.
270 S. Saleh et al. / Journal of African Earth Sciences 45 (2006) 257–278
This suggests that the rate of rifting in the Red Sea isgreater than that in the southern half of the Gulf of Suez,which in turn suffered more rifting than in the northern halfof the Gulf. On the other hand, it is surrounded partiallyby evaporitic series in the northern half of the Gulf of Suez(Meshref, 1990).
As mentioned before, the negative residual anomaly isattributed to the sediments of the Suez rift. This negativeresidual anomaly is well explained with a density value of2220 kg/m3, 2390 kg/m3 and 2400 kg/m3 attached to therecent, evaporitic series and anhydrite rocks, respectively.The total thickness of the sediments in the Suez rift, asobtained from the gravity modeling, is over 7 km(Fig. 7a). The thickness of the sediment, through sparselydeposited, increases towards the central part of the RedSea and Suez rifts (Fig. 7b).
The upper continental crust (crystalline basement),which is considered here at the bottom of the sedimentarylayer was modeled with a mean density value of 2750 kg/m3. Beneath the Gulf of Suez, the top interface of the crys-talline basement (upper crust) is generally marked by themaximum thickness of the sedimentary layer (over 7 km,
RasAbu Rudeis
North Galala Plateau
SINA
Safaga
Hurghada
Gebel El Zeit
Gebel Araba
Ayun Mousa
G. Raha
G. Ataka
Abu AlDarag
Shad
Sudr
Ras ZafaranaAbu Zenima
Ras Gharib
Ras Shukeir
Kareem
BelayimBakr
Abu Durba
Lagia
El Tor
Ruahmi
0 100km
32.00E 33.00E 34.00E
Longitu
25.0N
26.0N
27.0N
28.0N
29.0N
30.0N
Lat
itu
de
(a)
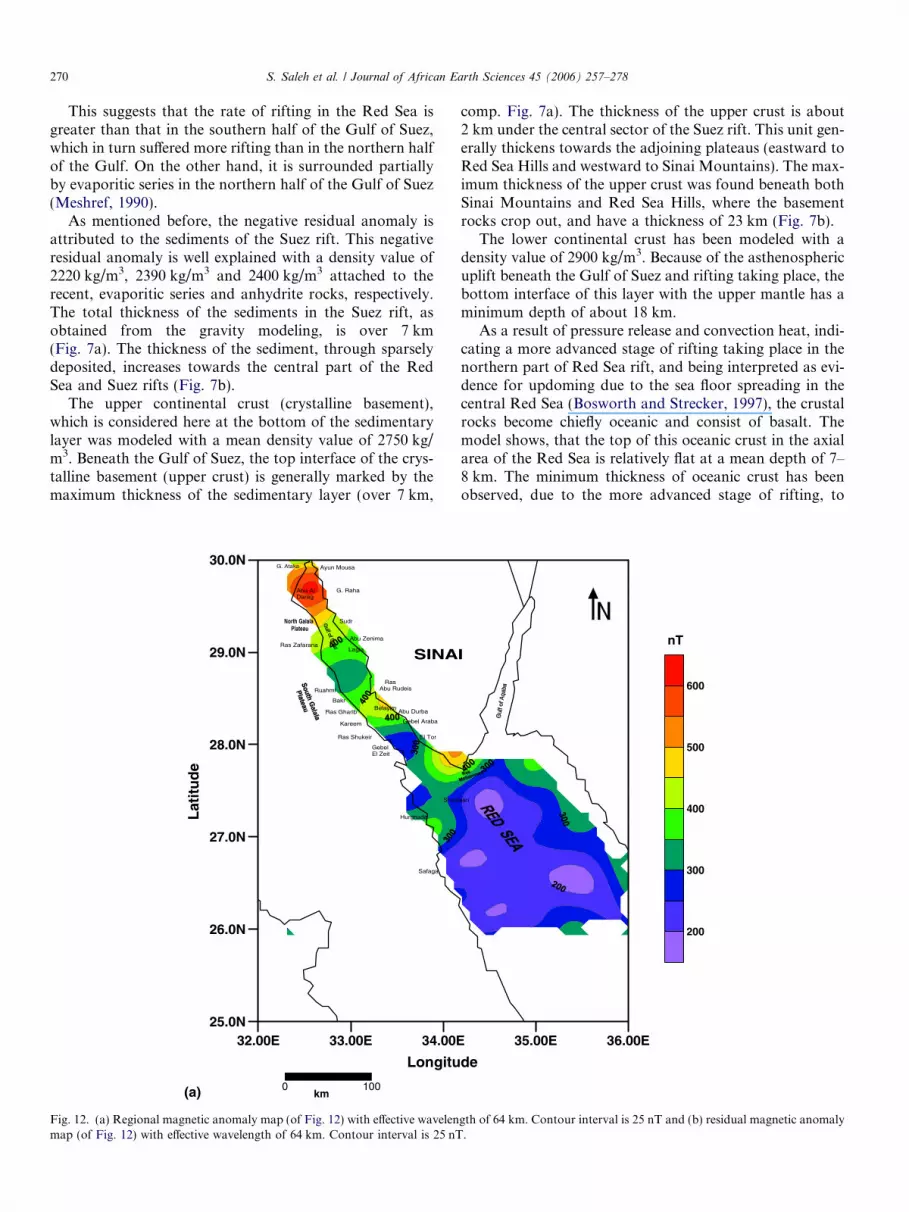
Fig. 12. (a) Regional magnetic anomaly map (of Fig. 12) with effective wavelenmap (of Fig. 12) with effective wavelength of 64 km. Contour interval is 25 nT
comp. Fig. 7a). The thickness of the upper crust is about2 km under the central sector of the Suez rift. This unit gen-erally thickens towards the adjoining plateaus (eastward toRed Sea Hills and westward to Sinai Mountains). The max-imum thickness of the upper crust was found beneath bothSinai Mountains and Red Sea Hills, where the basementrocks crop out, and have a thickness of 23 km (Fig. 7b).
The lower continental crust has been modeled with adensity value of 2900 kg/m3. Because of the asthenosphericuplift beneath the Gulf of Suez and rifting taking place, thebottom interface of this layer with the upper mantle has aminimum depth of about 18 km.
As a result of pressure release and convection heat, indi-cating a more advanced stage of rifting taking place in thenorthern part of Red Sea rift, and being interpreted as evi-dence for updoming due to the sea floor spreading in thecentral Red Sea (Bosworth and Strecker, 1997), the crustalrocks become chiefly oceanic and consist of basalt. Themodel shows, that the top of this oceanic crust in the axialarea of the Red Sea is relatively flat at a mean depth of 7–8 km. The minimum thickness of oceanic crust has beenobserved, due to the more advanced stage of rifting, to
I
wan
35.00E 36.00E
de
200
300
400
500
600
nT
gth of 64 km. Contour interval is 25 nT and (b) residual magnetic anomaly.

Ras Abu Rudeis
North Galala Plateau
SINAI
Safaga
Hurghada
Gebel El Zeit
Gebel Araba
Ayun Mousa
G. Raha
G. Ataka
Abu AlDarag
Shadwan
Sudr
Ras ZafaranaAbu Zenima
Ras Gharib
Ras Shukeir
Kareem
BelayimBakr
Abu Durba
Lagia
El Tor
Ruahmi
0 100km
32.00E 33.00E 34.00E 35.00E 36.00E
Longitude
25.0N
26.0N
27.0N
28.0N
29.0N
30.0N
Lat
itu
de
-400
-250
-100
50
200
350
500
nT
(b)
Fig. 12 (continued)
S. Saleh et al. / Journal of African Earth Sciences 45 (2006) 257–278 271
be 5 km (Fig. 7b). The model shows also the presence of asteep increase in crustal thickness towards the continentbelow the coastal plain.
The Moho depth map (Fig. 8) shows a relatively shallowdepth of 18 km beneath the Gulf of Suez, and lies at a con-stant depth of 11–13 km at the northern Red Sea axial rift,indicating thinning of the Earth’s crust in the northern RedSea. The model also reveals a maximum Moho depth ofabout 37 and 35 km beneath both the Red Sea Hills andSinai Mountains, respectively.
The first major procedure involves the fitting of the low-frequency Bouguer anomalies of the deep and large struc-tures to the observed ones. The geometries and partly thedensities of the subsurface bodies are then adjusted tillthe high-frequency parts of the observed Bouguer anoma-lies are properly modeled. The remaining discrepanciesbetween the observed and the computed Bouguer anoma-lies are then further refined either by inserting new geolog-ical units into the model or with the help of the densityinversion.
The latter procedure, however, needs proper constraints,because the densities obtained after inversion may or maynot be realistic values. In the present study, the density val-
ues were obtained from the seismic experiment and fromdrilling informations of the investigation area.
In order to assess the quality of the modeling, a Bouguermap of the final model has been computed (Fig. 9). Themap is ultimately in good agreement with the observedone, both in terms of the location and magnitude of themajor anomalies. The centre of the gravity anomaly dueto the anomalous upper oceanic mantle along the northernRed Sea rift is clearly resolved. The gravity gradients,marking the upper crust of the rift, are also well modeled.The contour map of misfit between the observed and com-puted Bouguer anomaly of the study area reveals an aver-age modeling discrepancy of ±2 mGal (Fig. 10).
However, in Sinai and Gebel El Zeit, where the base-ment complex crops out, anomalies are prominent; the dis-crepancies are in the order of ±3 mGal. In such zones, it isdifficult to get the best fit between the observed and thecomputed gravity due to small scale anomalies.
Seismically, the northern Red Sea rift is related to thenorthern Red Sea-Gulf of Suez–Cairo–Alexandria–Clys-mic–Trend, which is considered a major active trend inEgypt. It is characterized by the occurrence of shallow,micro, small, moderate and large earthquakes. The activity

272 S. Saleh et al. / Journal of African Earth Sciences 45 (2006) 257–278
along this trend which is mainly attributed to the Red Searifting as well as several active faults (Kebeasy, 1990)increased in recent years.
4. Magnetic data
A new aeromagnetic map was compiled for both theGulf of Suez and the northern Red Sea, based on Cochranet al. (1986), Meshref (1990). The total magnetic intensitydata resulting from different aeromagnetic surveys wascompiled and reduced to one set of data.
4.1. Magnetic data analysis
In the present work, the total intensity magnetic map ofthe northern Red Sea is reduced to the pole (Baranov,1957) by using a Geosoft program 1994 (magmap Fourierdomain processing system). The resulting total intensitymagnetic map reduced to the pole is shown in Fig. 11. Astrong regional magnetic effect, that should be subtractedfrom the total magnetic field in order to separate the effectof sea floor spreading, is considered to be a residual effect.
Ras Abu Rudeis
North Galala Plateau
SINAI
Safaga
Hurghada
Gebel El Zeit
Gebel Araba
Ayun Mousa
G. Raha
G. Ataka
Abu AlDarag
Shadw
Sudr
Ras ZafaranaAbu Zenima
Ras Gharib
Ras Shukeir
Kareem
BelayimBakr
Abu Durba
Lagia
El Tor
Ruahmi
0 100km
32.00E 33.00E 34.00E
Longitu
25.0N
26.0N
27.0N
28.0N
29.0N
30.0N
Lat
itu
de
(a)
Fig. 13. (a) Regional magnetic anomaly map (of Fig. 12) with effective wavanomaly map (of Fig. 12) with effective wavelength of 12.8 km. Contour inter
4.2. Filtering
For the purpose of detailed qualitative interpretation ofthe magnetic anomalies, wavelength filtering was applied.We follow the procedure used for filtering the graity anom-alies as discussed above. But, considering the different dis-tance relations (1/r2 in gravity and 1/r3 in magnetic), wemodified the factor in the formula of Jung (1961). Again,the depth of a causative body is Zs and the cut-off wave-length is kc. Then, the formula reads
kc P wZs
with the weight being 4.86 for a cut-off wavelength of12.8 km, 5.77 for 21.3 km, 6.87 for 36 km, and 8.32 for64 km, respectively. In this way reasonable depths are ob-tained taking into account the strong thermal gradient inthe area, and thus, the shallow Curie isotherm.
The regional anomaly magnetic map shown in Fig. 12ais a case with an effective cut-off wavelength of 64 km witha depth of the origin of approximately 8 km. It showsbroad and low frequency magnetic anomalies. Theirvalues increase northward towards the Gulf of Suez. It is
an
35.00E 36.00E
de
-100
0
100
200
300
400
500
600
nT
elength of 12.8 km. Contour interval is 25 nT and (b) residual magneticval is 25 nT.

Ras Abu Rudeis
North Galala Plateau
SINAI
Safaga
Hurghada
Gebel El Zeit
Gebel Araba
Ayun Mousa
G. Raha
G. Ataka
Abu AlDarag
Shadwan
Sudr
Ras ZafaranaAbu Zenima
Ras Gharib
Ras Shukeir
Kareem
BelayimBakr
Abu Durba
Lagia
El Tor
Ruahmi
0 100km
32.00E 33.00E 34.00E 35.00E 36.00E
Longitude
25.0N
26.0N
27.0N
28.0N
29.0N
30.0N
Lat
itu
de
-150
-100
-50
0
50
100
150
200
nT
(b)
Fig. 13 (continued)
S. Saleh et al. / Journal of African Earth Sciences 45 (2006) 257–278 273
suggested that the main tectonic features of these deepseated structures trend northwest–southeast.
The residual magnetic map (Fig. 12b) clearly shows twomain types of northwest-trending magnetic anomalieswithin the offshore northern Red Sea. There is a group oflinear, parallel-to-coastline magnetic anomalies, of reversedpolarity and of very high frequency and strong amplitude,(500–700 nT), which are discontinuous in nature and verysimilar to those anomalies associated with the axial troughof the central and northern Red Sea. Another group of rel-atively weak magnetic anomalies (50–150 nT) is distributed
Table 2Magnetic susceptibilities of the geological units based on the densityvalues of the different rock units (Schon, 1983)
First floor Rock type Densitykg/m3
SusceptibilitymA/m
Sediment Recent 2000 13. . .130Z � 50 m Sediments 2200Sediment Miocene 2450 2.5. . .13
Anhydrite 2670Sediment Evaporitic series (Anhydrite) 2390 2Igneous Upper crust 2750 0. . .1000Igneous Oceanic crust 2870 65. . .3800
over the western portion of the northern Red Sea. Similarfeatures have been obtained with different effective cut-off(36 and 21.3 km) wavelengths.
At an effective cut-off wavelength of 12.8 km (Fig. 13a),the major regional trends become less clearly defined asthey are now superimposed on each other. Small localanomalies dominate and nearly all the anomalies of theBouguer map are presented. The sources are at fairly shal-low depths of approximately 4 km. The local anomalystructures are absent at this shallow depth (Fig. 13b), whereno magnetic structure can be recognized.
4.3. Three-dimensional magnetic modeling
The density values were constrained as before by com-pressional velocities using the Nafe–Drake empirical func-tion for the sediments (Nafe and Drake, 1957) and theBirch relationship (Birch, 1961) for the igneous crust. Mag-netic susceptibilities were constrained by densities (Schon,1983) as shown in Table 2. The region for which the3-dimensional magnetic modeling was applied is shown inFig. 11.
Ten vertical planes representing the tectonic distributionof the Northern Red Sea rift were modeled. The magnetic
80
60
40
200
-20
-40-60
-80
Egypt CoastRed Sea Saudi Arabia
[mGal]Observed
Calculated
-100
2750 Kg/m32390 2850 Kg/m3
2900 Kg/m3
z [km]
-10
-40
-30
-20
3250 Kg/m33100 Kg/m3
200100 300
2400 2200
x [km]
Observed
Calculated
3000 mA/m2000 mA/m
20100
direction of magnetization vector, other than the geomagnetic field inclination for the region.
100 200
50 150 250
15050 250 300
-10
-20
z [km]
800
600
400
200
0 Egypt Red Sea Coast Saudi Arabia
0 mA/m
[nT]
x [km]
0 mA/m
(a)
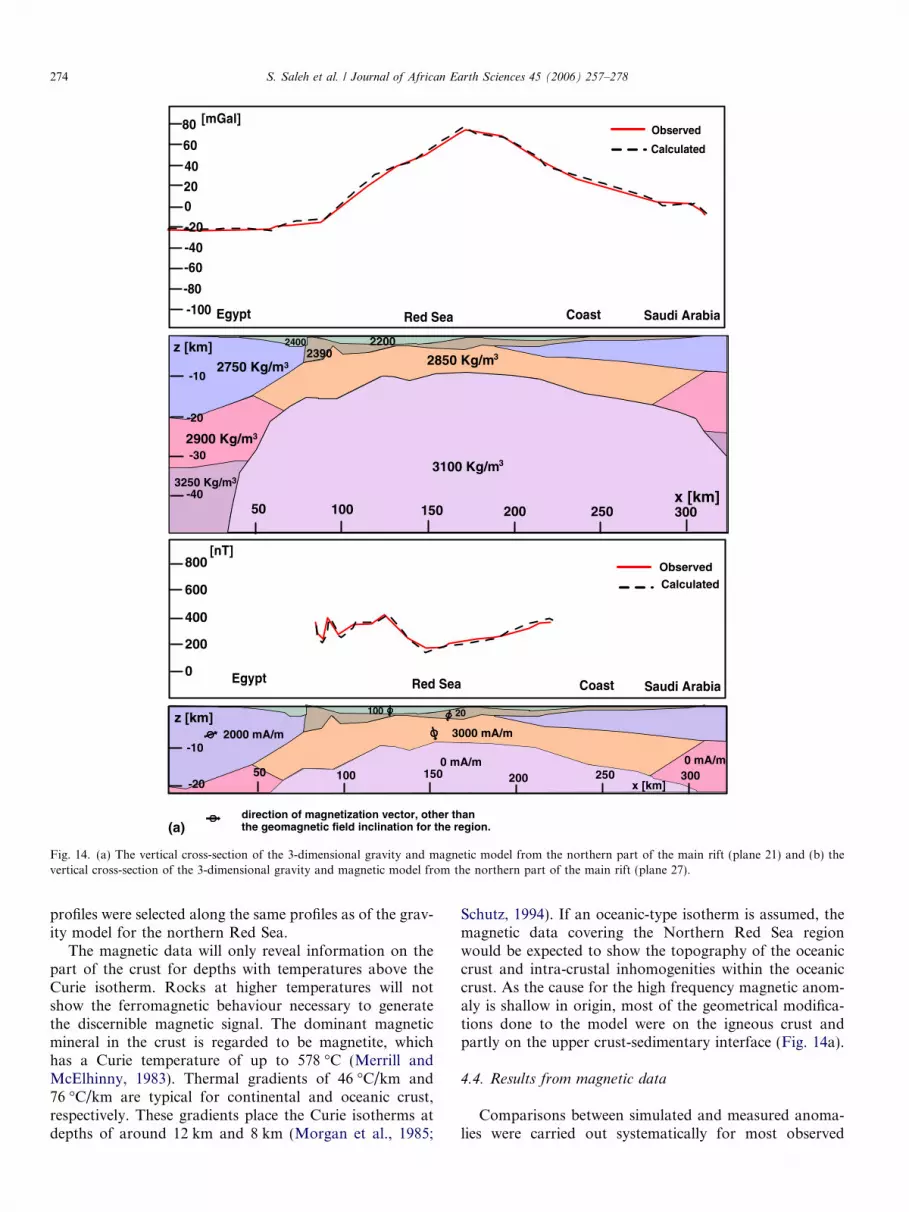
Fig. 14. (a) The vertical cross-section of the 3-dimensional gravity and magnetic model from the northern part of the main rift (plane 21) and (b) thevertical cross-section of the 3-dimensional gravity and magnetic model from the northern part of the main rift (plane 27).
274 S. Saleh et al. / Journal of African Earth Sciences 45 (2006) 257–278
profiles were selected along the same profiles as of the grav-ity model for the northern Red Sea.
The magnetic data will only reveal information on thepart of the crust for depths with temperatures above theCurie isotherm. Rocks at higher temperatures will notshow the ferromagnetic behaviour necessary to generatethe discernible magnetic signal. The dominant magneticmineral in the crust is regarded to be magnetite, whichhas a Curie temperature of up to 578 �C (Merrill andMcElhinny, 1983). Thermal gradients of 46 �C/km and76 �C/km are typical for continental and oceanic crust,respectively. These gradients place the Curie isotherms atdepths of around 12 km and 8 km (Morgan et al., 1985;
Schutz, 1994). If an oceanic-type isotherm is assumed, themagnetic data covering the Northern Red Sea regionwould be expected to show the topography of the oceaniccrust and intra-crustal inhomogenities within the oceaniccrust. As the cause for the high frequency magnetic anom-aly is shallow in origin, most of the geometrical modifica-tions done to the model were on the igneous crust andpartly on the upper crust-sedimentary interface (Fig. 14a).
4.4. Results from magnetic data
Comparisons between simulated and measured anoma-lies were carried out systematically for most observed

80
60
40
200
-20
-40-60
-80
Egypt CoastRed Sea Saudi Arabia
[mGal]Observed
Calculated
-100
2750 Kg/m32390
2850 Kg/m3
2900 Kg/m3
z [km]
-10
-40
-30
-20
3250 Kg/m33100 Kg/m3
200100 300
2400 2200
x [km]50 150 250
Observed
Calculated
3000 mA/m2000 mA/m
20 100
direction of magnetization vector, other thanthe geomagnetic field inclination for the region.
100 20015050 250 300
-10
-20
z [km]
800
600
400
200
0 Egypt Red Sea Coast Saudi Arabia
0 mA/m
[nT]
x [km]
3000 mA/m
(b)
Fig. 14 (continued)
S. Saleh et al. / Journal of African Earth Sciences 45 (2006) 257–278 275
profiles. Exceptions were those that were believed to be dis-torted by transform or transverse structures or other distur-bances. Excellent to good correlation exists for manyprofiles, which indicates that the model parameters are rea-sonable (Fig. 14a,b). For profiles showing good correlationbetween the simulated and measured profiles the maximumage and the extent of the present phase of oceanic spread-ing, as well as the rate of spreading of each flank are deter-mined and compared. Spreading rates are found to decreaseprogressively northwards, from 0.7 cm/yr at profile 29down to 0.5 cm/yr at profile 20. This is displayed in Fig. 15.
Seafloor spreading magnetic anomalies cannot bedetected all along the axial trough of the northern part of
the Red Sea. In the southern part, anomalies can be iden-tified all along the axial trough up to profile 24. Furthernorthward, anomalies can only be identified across shortsegments, being complex bipolar sets of anomalies, or veryweak, hardly correlatable anomalies. In the southern partof the area, a continuous sequence of seafloor spreadinganomalies can be identified on both sides of the axis, some-times out to anomaly 2 A as far as profiles 24, 25, 27, 28,and 29.
The phenomenon of the poleward younging of continu-ous and discontinuous spreading ridges was recorded fromthe Gulf of Aden (Tisseau, 1978; Courtillot et al., 1979;Cochran, 1981) and the northern part of the Red Sea

Theoritical0.7 cm/yr
3A 3A2A2A3 32 21
400
20050
[nT]
km
P29
P28
P26
P25
P24
P23
P22
P21
P20
Fig. 15. Tentative seafloor spreading interpretation; the axial part of a selected number of magnetic profiles projected along the main rift. Thin verticallines show correlation with Bonatti (1985) model. The selected profiles cover the northern part of the Red Sea from 26� to 28 �N.
276 S. Saleh et al. / Journal of African Earth Sciences 45 (2006) 257–278
(Bonatti, 1985), respectively. Courtillot et al. (1979)explained the phenomenon as the manifestation of a pole-ward axial propagation of a lithospheric crack. Bonatti(1985) described the phenomenon as punctiform initiationof seafloor spreading over hot areas which are related tomantle thermal waves and whose activation shows a pole-ward time progression. It is most probable that the Cour-tillot model applies to fast spreading centers (>0.7 cm/yr),whereas the Bonatti alternative applies to slow ones(<0.7 cm/yr); Hall (1979) suggested recent spreading tobe 0.5 cm/yr. The magnetic anomalies over the zonebeyond anomaly 3 are weak, hardly exceeding 100 nT(Fig. 15), and it can be considered to be a quiet zone.Due to magnetic contamination, seafloor spreading anom-alies are not likely to be generated if spreading rates fallbelow a certain threshold. Rosser (1975) found that forthe Red Sea this threshold is about 0.50 cm/yr.
5. Conclusions
Combined 3-D gravity and magnetic models whichwere constrained by seismic information from the Red
Sea rift, Sinai Peninsula and Eastern Desert plateau, arepresented in this study. The studied models reveal the exis-tence of hot upper mantle material beneath the Red Searift floor. The 3-D gravity model evaluates the density dis-tributions of the deep lithospheric structures of the RedSea rift. The magnetic data analysis reveals the topogra-phy of the oceanic crust and intra-crustal inhomogenetieswithin it. Moreover, the magnetic anomalies reflect the seafloor spreading rate. The combination of gravity and mag-netic data analysis has improved the geometry and thedensity distribution in the 3-D calculated profiles. Ourresults provide an important contribution towards theinferred nature and state of the crustal structure of the rift.The synthesized analysis leads to the following mainconclusions:
1. On the Red Sea coast, the changes in the crust, sedimentcover and upper mantle are very intense, as obtainedfrom the 3-D gravity modeling. On the Red Sea coastthe crust is still continental, only 21 km thick and atleast in some areas, covered by thick sediments. Thedensity of the upper mantle (anomalous) is very low

S. Saleh et al. / Journal of African Earth Sciences 45 (2006) 257–278 277
(q = 3100 kg/m3) and in agreement with the low veloci-ties observed along the coast. A few kilometers fartherto the east the nature of the crust changes completely.We find an oceanic crustal thickness that ranges from8 to 12 km (without the thick sediments) which seemsto cover large parts of the northern Red Sea rift. Thedistribution of the oceanic crust is not symmetric com-pared to the morphology of the Red Sea basin.
2. The relatively low-density of the anomalous upper man-tle (3100 kg/m3) of the Red Sea rift, as deduced from thegravity modeling, indicates the possible presence of par-tial melting in the upper mantle. The size of the area ofanomalous upper mantle suggests that a large scaleasthenospheric upwelling might be responsible for thesubsequent rifting of the Red Sea. As a possible resultof pressure release and convection heat, indicating amore advanced stage of rifting taking place in the north-ern part of Red Sea rift (which is interpreted as evidencefor updoming due to the sea floor spreading in the cen-tral Red Sea), the crust becomes more oceanic in its nat-ure. These results, which have been constrained byseismic measurements and confirmed by gravity andmagnetic modeling, are in agreement with Cochran’sconcept of the northern part of the Red Sea (Cochranand Martinez, 1988).
3. The interpretation of magnetic data of the Red Sea riftshows that the spreading rate of the part south of lati-tude 26.5� N agrees well with the theoretical model inthe order of 0.7 cm/yr. A lesser agreement is obtainedin the part north of latitude 27.5 �N.
4. The Moho relief as indicated from magnetic modelingshows a poor flattening especially in the eastern region.This is contrary to what is given by other authors (e.g.,Gaulier et al., 1988). However, the present results are ingood agreement with the geothermal gradient values inthe Red Sea (Cochran et al., 1986).
5. Finally, the lateral density variations in the upper man-tle seem to be extremely intense in the coastal zone ofthe Red Sea, the low density material being confinedexclusively to the rifted area. This result is based onMakris et al. (1988), and is very similar to the findingof Makris and Ginzburg (1987), Cochran and Martinez(1988), and by Martinez and Cochran (1988) for thenorthern Red Sea.
Acknowledgements
We would like to express our gratitude to the GeneralPetroleum Company, Cairo for utilizing the Bouguer grav-ity data. The authors wish to thank H.J. Gotze and SabineSchmidt for allowing us to use the 3-dimensional gravityand magnetic modeling package IGMAS. We are alsoindebted to the German Academic Exchange Service(DAAD) for supporting the principal author Salah S.Mohammed. This study was carried out at the Instituteof Geosciences, Friedrich-Schiller-University, Jena, Ger-many. Also, we would like to thank M. Hussien, Institute
of Petroleum Research, for encouragement and use of mag-netic data.
References
Anderson, O.L., Schreiber, E., Lieberman, R.C., Soga, N., 1968. Someelastic constant data on minerals relevant to geophysics. Rev.Geophys. 6 (4), 491–524.
Baranov, W., 1957. A new method for interpretation of aeromagneticmaps: pseudo-gravimetric anomalies. Geophysics 22, 359–383.
Bayoumi, A.J., 1983. Tectonic origin of the Gulf of Suez, Egypt, asdeduced from gravity data. In: Geyer, R.A., Moore, J.R. (Eds.),Handbook of Geophysical Exploration at Sea. CRC, pp. 417–432.
Bell, R.E., Watts, A.B., 1986. Evaluation of the BGM-3 sea gravity metersystem onboard R/V Conrad. Geophysics 51, 1480–1493.
Berckhemer, H., Baier B., Bartelsen H., Behle A., Burkhardt H.,Gebrande H., J., Menzel H., Miller H., Vees R., 1975. Deep seismicsoundings in the Afar region and on the highland of Ethiopia. In:Pilger, A., Roessler, A. (Eds.), Afar depression of Ethiopia, StuttgartSchweizerbart.
Birch, F., 1961. The velocity of compressional waves in rocks to10 kilobars. J. Geophys Res. 66, 2199–2224.
Bonatti, E., 1985. Punctiform initiation of seafloor spreading in the RedSea during transition from a continental to an oceanic rift. Nature 316,33–37.
Bosworth, W., Strecker, M., 1997. Stress field changes in the afro-arabianrift system during the Miocene to recent period. Tectonophysics 278,47–62.
Cochran, J.R., 1981. The Gulf of Aden: structure and evolution of ayoung ocean basin and continental margin. J. Geophys. Res. 86, 263–288.
Cochran, J.R., Martinez, F., Steckler, M.S., Hobart, M.A., 1986. Conraddeep: a new northern Red Sea deep. Origin and implications ofcontinental rifting. Earth. Planet Sci. Lett. 78, 18–32.
Cochran, J.R., Martinez, F., 1988. Evidence from the northern Red Seaon the transition from continental to oceanic rifting. Tectonophysics153, 25–53.
Colleta, B., LeQuellec, P., Letouzey, J., Moretti, I., 1988. Longitudinalevolution of the Suez rift structure (Egypt). Tectonophysics 153,221–233.
Courtillot, V., Gadeano, A., Le Mouel, J.L., 1979. Propagation of anaccreting plate boundary: a discussion of new aeromagnetic data in theGulf of Tadjourah and southern Afar. Earth Planet Sci. Lett. 47,144–160.
Degro, T., 1986. Zur Interpretation gravimetrischer und magnetischerFeldgroßen mit Hilfe von Ubertragungsfunktionen. Dissertation,Institut fur Geophysik der TU Clausthal, 139 Seiten, unpublished.
Drake, C.L., Girdler, R.W., 1964. A geophysical study of the Red Sea.Geophys. J.R. Astron. Soc. 8, 473–495.
Egyptian Geological Survey, 1994. Geological map of Sinai, ArabRepublic of Egypt, Scale 1:250 000.
El-Gezeery, M.V., Marsouk, I.M., 1974. Miocene rock stratigraphy ofEgypt. Egypt. J. Geol. 18, 1–59.
El-Isa, Z., Mechie, J., Prodehl, C., Makris, J., Rihm, P., 1987. A crustalstructure study of Jordan derived from seismic refraction data.Tectonophysics 138, 235–253.
Gabriel, G., Jahr, T., Jentzsch, G., Melzer, J., 1996. The Harz mountains,Germany: finite element modeling of the evolution based on interpre-tation of the gravity field. Phys. Chem. Earth 21 (4), 305–311.
Gabriel, G., Jahr, T., Jentzsch, G., Melzer, J., 1997. Deep structure andevolution of the Harz mountains: results of the three-dimensionalgravity and finite-element modeling. Tectonophysics 270, 279–299.
Gaulier, J.M., Le Pichon, X., Lyberis, N., Avedik, F., Geli, L., Moretti, I.,Deschamps, A., Salah, Hafez, 1988. Seismic study of the crust of thenorthern Red Sea and Gulf of Suez. Tectonophysics 153, 55–88.
General Petroleum Corporation, A.S.R.T., 1980. Bouguer gravity map ofEgypt. Scale 1:500,000.

278 S. Saleh et al. / Journal of African Earth Sciences 45 (2006) 257–278
General Petroleum Corporation, 1986. Activity of oil exploration, Egypt,the Eighth Exploration Conference.
Gettings, M.E., Blank Jr., H.R., Mooney, W.D., Healy, J.H., 1986.Crustal structure of southwestern Saudi Arabia. J. Geophys. Res. 91(B6), 6491–6512.
Ginzburg, A., Makris, J., Fuchs, K., Prodehl, C., 1981. The structure ofthe crust and upper mantle in the Dead Sea rift. Tectonophysics 80,109–119.
Gotze, H.J., 1976. Ein numerisches Verfahren zur Bereschnung dergravimetrischen und magnetischen Feldgroßen fur dreidimensionaleMoedellkorper. Dissertation, T.U. Clausthal.
Gotze, H.J., 1984. Uber den Einsatz interaktiver Comutergrafik inRahmen 3-dimensionaler Interpretationstechniken in Gravimetrieund Magnetik. Habiltationsschrift, TU Clausthal, 236pp.
Gotze, H.J., Lahmeyer, B., 1988. Application of 3-D interactive modelingin gravity and magnetics. Geophysics 53, 1096–1108.
Hall, S.A., 1979. A total intensity aeromagnetic map of the Red Sea andist interpretation . US Geol. Surv. Saudi Arabian project, report 275,260pp.
Hammer, S., 1939. Terrain corrections for gravimeter stations. Geophysics4, 184–194.
Jentzsch, G., Mahatsente, R., Jahr, T., 2000. Three dimensional inversionof gravity data from the main Ethiopian rift. Phys. Chem. Earth 25 (4),365–373.
Jung, K., 1961. Schwerkraftverfahren in der angewandten Geophysik.Akademische Verlagsgesellschaft Geest & Portig, Leipzig, 348 Seiten.
Kamel, K., 1990. Gravity map. In: Said, R. (Ed.), The Geology of Egypt.A.A. Balkema, Rotterdam, pp. 45–50.
Kebeasy, R.M., 1990. Seismicity. In: Said, R. (Ed.), The Geology ofEgypt. A.A. Balkema, Rotterdam, pp. 51–59.
Mahatsente, R., Jentzsch, G., Jahr, T., 1999. Crustal structure of the mainEthiopian rift from gravity data: 3-dimensional modeling. Tectono-physics 313, 363–382.
Makris, J., Ginzburg, A., 1987. The afar depression: transition betweencontinental rifting and sea-floor spreading. Tectonophysics 141, 199–214.
Makris, J., Kebeasy, R., 1982. South Galala Refraction Seismic Project.Paper presented at the 6th Exploration Seminar of the EgyptianGeneral Petroleum Corporation, Cairo.
Makris, J., Menzel H., Zimmermann, J., Gouin, P., 1974. Gravity fieldand crustal structure of North Ethiopia. In: A., Pilger, A., Roessler(Eds.), Afar Depression of Ethiopia, Stuttgart (Schweizerbart).
Makris, J., Allam, A., Moktar, T., Basahel, A., Dehghani, G.A., Bazari,M., 1983. Crustal structure at the northwestern region of the Arabianshield and its transition to the Red Sea. Bull. Fac. Earth Sci. K.Abdulaziz Univ. 6, 435–447.
Makris, J., Rihm, R., Allam, A., 1988. Some Geophysical aspects of theevolution and structure of the crust in Egypt. In: Greiling, S.E.-G.a.
R.O. (Ed.), The Pan-African Belt of Northeast Africa and AdjacentAreas, Tectonic Evolution and Economic Aspects of a Late Protero-zoic Orogen: Braunschweig, Friedr. Vieweg & Sohn, pp. 345–369.
Makris, J., Henke, C.H., Egloff, F., Akamaluk, T., 1991. The gravity fieldof the Red Sea and East Africa. Tectonophysics 198, 369–381.
Marsouk, I.A., 1988. Study of crustal structure of Egypt deduced fromdeep seismic and gravity data, Ph.D. dissertation thesis: University ofHamburg, 118pp.
Martinez, F., Cochran, J.R., 1988. Structure and tectonics of the northernRed Sea: catching a continental margin between rifting and drifting.Tectonophysics 150, 1–32.
Merrill, R.T., McElhinny, M.W., 1983. The Earth’s Magnetic Field.Academic Press, London, 401pp.
Meshref, W.M., 1990. Tectonic framework. In: Said, R. (Ed.), TheGeology of Egypt. A.A. Balkema, Rotterdam, pp. 113–155.
Minich, G., 1987. Gravimetrische Messungen im nordischen Roten Meer,Diplomarbeit, Institut fur Geophysik, Universitat Hamburg, 73 Seiten,unpublished.
Morgan, P., Boulos, F.K., Hennin, S.F., El-Sherif, A.A., El Sayed, A.A.,Basta, N.Z., Melek, Y.S., 1985. Heat flow in Eastern Egypt: thethermal signature of continental breakup. J. Geodyn. 4, 107–131.
Nafe, J.E., Drake, C.L., 1957. Variations with depth in shallow and deepwater marine sediments of porosity, density and the velocities ofcompressional and shear waves. Geophysics 22, 523–552.
Pfister, H., 1988. Bearbeitung des Schwerefeldes des Harzes mit modernenAuswerte- und Interpretationsmethoden. Dissertation, Freie Univer-sitat Berlin.
Rihm, R., Makris, J., Moller, L., 1991. Seismic survey in the northern RedSea: asymmetric crustal structure. Tectonophysics 198, 279–295.
Rosser, H.A., 1975. A detailed magnetic survey of the southern Red Sea.J. Biochem. 13, 131–153.
Said, R., 1962. The Geology of Egypt. Elsevier Publ. Co, Amsterdam andNew York.
Schmidt, S., Gotze, H.J., 1998. Program Documentation IGMAS. Institutfur Geologie, Geophysik und Geoinformatik der FU Berlin, unveroff-entlicht. 41 Seiten.
Schon, J., 1983. Petrophysik. Ferdinand Enke Verlag, Stuttgart, 405Seiten.
Schutz, K.I., 1994. Structure and stratigraphy of the Gulf of Suez, Egypt(abs). AAPG Bull. 81 (8), 1411.
Tealeb, A., Riad, S., 1986. Regional tectonics of Sinai Peninsulainterpreted from gravity and deep seismic data. In: Proceedings FifthAnnual Meeting of Egyptian Geophysical Society, Cairo, pp. 18–49.
Tisseau, J., 1978. Etude Structurale du Golfe d’Aden et du Somalie (OceanIndien Occidental Nord). Theses Doctoral du 3 cycle, Specialitegeophysique interne, Universite de Paris-Sud.
Tramontini, C., Davies, D., 1969. A seismic refraction survey in the RedSea. Geophys. J. R. Astron. Soc. 17, 2225–2241.


