Embed Size (px)
Citation preview
Turk J Phys
(2016) 40: 201 – 208
c⃝ TUBITAK
doi:10.3906/fiz-1509-18
Turkish Journal of Physics
http :// journa l s . tub i tak .gov . t r/phys i c s/
Research Article
Crystal dynamics of zinc chalcogenides III: an application to ZnTe
Jay Prakash DUBEY1,∗, Raj Kishore TIWARI2, Kripa Shankar UPADHYAYA3,Pramod Kumar PANDEY1
1Department of Physics, Pandit Shambhu Nath Shukla Government Post Graduate College, Shahdol Affiliated toAwadhesh Pratap Singh University, Rewa, Madhya Pradesh, India
2Department of Physics, Government New Science College, Rewa Affiliated to Awadhesh Pratap Singh University,Rewa, Madhya Pradesh, India
3Department of Physics, Nehru Gram Bharati University, Allahabad, Uttar Pradesh, India
Received: 15.09.2015 • Accepted/Published Online: 24.03.2016 • Final Version: 01.12.2016
Abstract: We report the results of a theoretical study on phonon dispersion curves (PDCs) along the three principal
symmetry directions, Debye temperature variation, combined density of states (CDS) curves, two-phonon Raman/IR
peaks, and anharmonic elastic properties (third order elastic constants and their pressure derivatives) of ZnTe. This
new van der Waals three-body force rigid shell model (VTRSM) incorporates the effect of van der Waals interactions
and three-body interactions into the rigid shell model of zinc blende structure, where the short range interactions are
operative up to the second neighbors. Our results are in good agreement with the available measured data for zinc
telluride. It is concluded that this VTRSM will be equally applicable to study the above properties of other zinc blende
structure solids.
Key words: Lattice dynamics, van der Waals interactions, Debye temperature variation, combined density of states
curve, Raman spectra, zinc telluride
PACS No: 63.20.-e, 65.40.Ba, 78.30.-j
1. Introduction
The van der Waals three-body force rigid shell model (VTRSM) has been quite successful in explaining phonon
dispersion curves, harmonic and anharmonic elastic constants, Debye temperature variation, combined density,
cohesive energy, two phonon IR and Raman spectra, and numerous other physical properties. This crystal
ZBS is promising for numerous experimental and theoretical investigations. These models, particularly neutron
scattering, reported phonon dispersion curves for IIB–VIA and theories able to explain these results correctly.
The theoretical models have been used in two categories: (i) the rigid ion model involves the ion rigidity
hypothesis and (ii) the shell model involves ionic polarizability. Both models have been utilized for studying
phonon dispersion in these compounds such as valence shell model (VSM) [1], ultrasonic pulse-echo (UPE) [2],
rigid ion model (RIM) [3], valence force field model (VFFM) [4], bond charge model (BCM) [5], and others
[6–10].
The above information encouraged us to include (i) the effect of VDWI and (ii) TBI in the framework
of RSM where short range interactions are effective up to the second neighbors. Our new VTRSM has 14
parameters, i.e. four TBI parameters, b, ρ, f(r0), and r0 f′(r0); six nearest and the next nearest neighbor
∗Correspondence: [email protected]
201
DUBEY et al./Turk J Phys
short-range repulsive interaction parameters, A12 , B12 , A11 , B11 , A22 , and B22 ; two distortion polarizabilities
of negative and positive ions, d1 and d2 ; and two shell charges of the negative and positive ions, Y1 and Y2 ,
respectively. They can be deduced with the help of measured values of elastic constants, dielectric constants,
electronic polarizabilities, and van der Waals coupling coefficients. This model has been applied to study the
lattice dynamics of zinc chalcogenides (ZnS, ZnSe, ZnTe). In this communication, we are mainly concerned with
the crystal dynamics of zinc telluride (ZnTe). Experimental data are given on ZnTe for phonon dispersion curves
[1], harmonic and anharmonic elastic constants [2], Debye temperature variation [11–15], and two-phonon Raman
[16] and IR spectra [17]. The first-order Raman spattering of ZBS-type crystal of two features corresponds to
the transverse optic (TO) and longitudinal optic (LO) zone-center phonon modes. The second order Raman
scattering of ZnTe, the total wave vector q = 0 by the combinations of phonons, provides additional information
on phonon mode frequencies at critical points near the edge of the first Brillouin zone. The formalism of our
model VTRSM has been given [18,19].
2. Computations
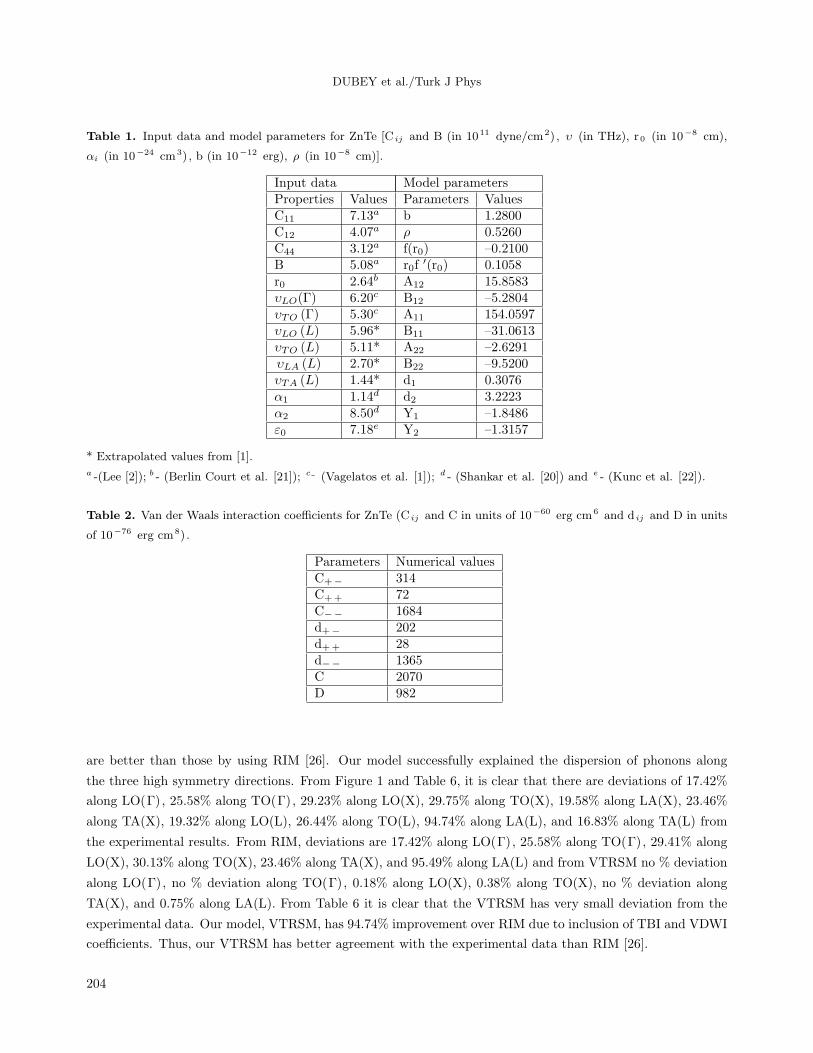
The values of the input data given by Lee [2], Jai Shankar et al. [20], Berlin Court et al. [21], and Kunc
et al. [22] and model parameters are shown in Table 1. The values of A i , B i , and C i were calculated from
the knowledge of b and ρ ; the values of various orders of derivatives are f(r0) and van der Waals coupling
coefficients [23]. The values of VDW coefficients used by us in the present study have been determined using
SKV method [24] and Lee’s [2] approach as suggested by Singh and Singh [25] and reported by Sharma and
Verma [23]. Thus our model parameters are [b, ρ , f(r0), r0 f′ (r0), A12 , A11 , A22, B12 , B11 , B22 , d1 , d2 ,
Y1 , and Y2 ]. The VDW values are shown in Table 2. Our model parameters of VTRSM used to compute
the phonon spectra for ZnTe allowed 48 nonequivalent wave vectors in the first Brillouin zone. The frequencies
along the high symmetry [q00], [qq0], and [qqq] directions were plotted against the wave vector to obtain phonon
dispersion curves (PDCs). These curves were compared with those measured by means of the coherent inelastic
neutron scattering technique [1]; especially TA modes are very different not only from ours but also from RIM
calculations of Camacho et al. [26] (Figure 1). Since the neutron scattering experiments provide us with very
few data for the symmetry directions, we also computed CDS and the Debye temperature variation for the
complete description of the frequencies for the Brillouin zone.
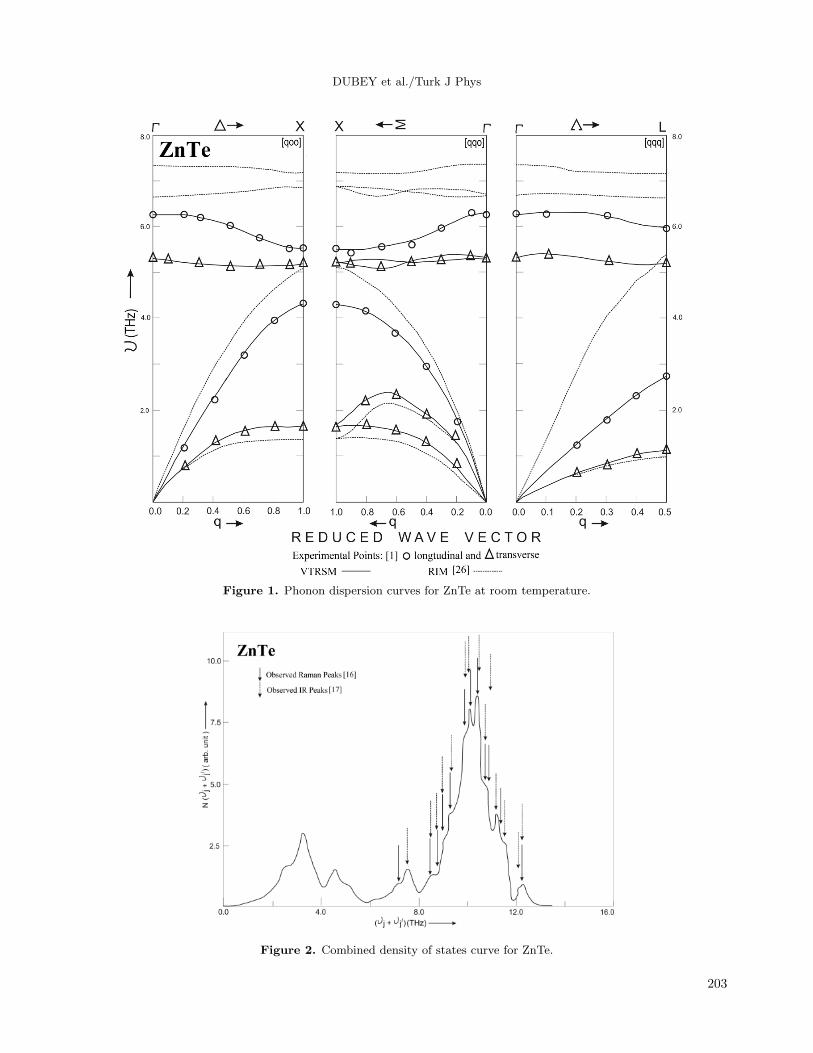
The complete phonon spectra were used to compute the combined density of states CDS, N(υj+υj′)
corresponding to the sum modes (υj+υj′) following the procedure of Smart et al. [27]. A histogram between
N(υj+υj′) and (υj+υj′) was plotted and smoothed out as shown in Figure 2. These curves show well defined
peaks that correspond to two-phonon Raman scattering and IR absorption spectra. These CDS peaks were
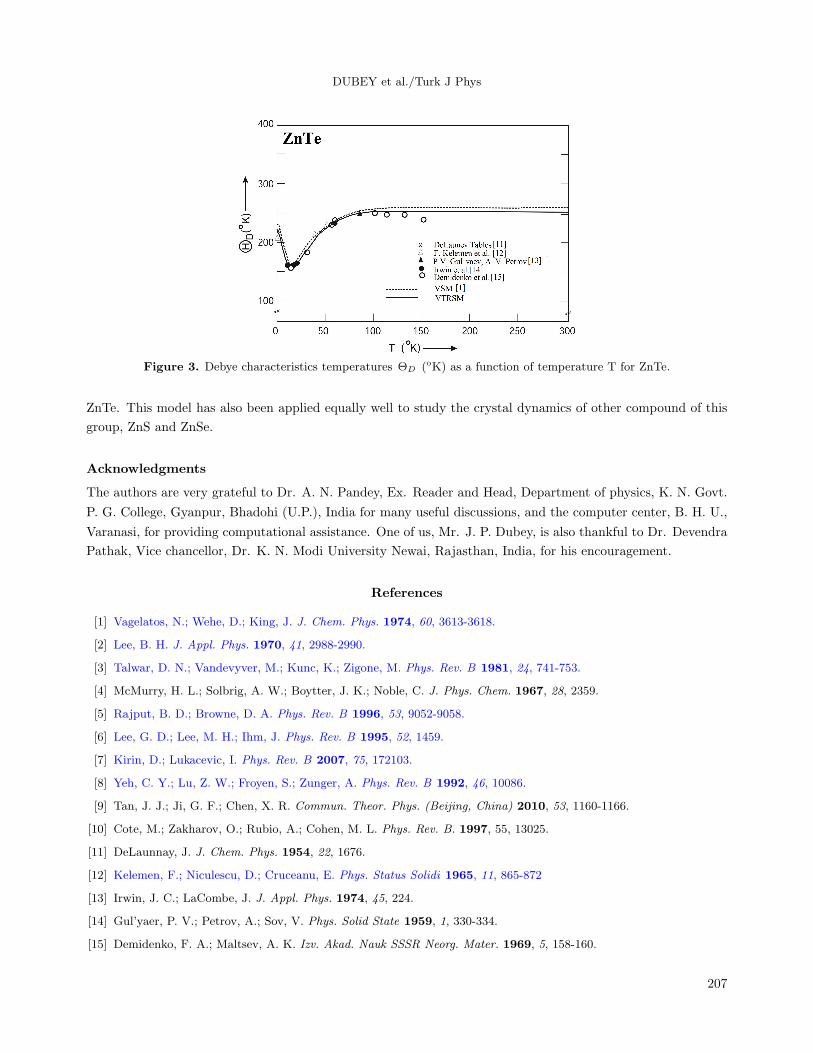
compared with the assignments calculated and are shown in Table 3. The Debye temperature variation for
ZnTe given in the literature [11–15] and those calculated by us using the VTRSM are compared in Figure 3.
The measured values of TOEC by Prasad [28] were compared with values of Sorgel and Scherz [29] and are
shown in Table 4. The pressure derivatives of SOEC were also calculated and compared with those calculated
by Dinesh et al. [30] and measured by Lee [2] (Table 5).
3. Results and discussion
3.1. Phonon dispersion curves
From Figure 1, our phonon dispersion curves for ZnTe agree well with measured data reported by Vagelatos
et al. [1] at room temperature. It is evident from the PDCs that our predictions using the present VTRSM
202
DUBEY et al./Turk J Phys
Figure 1. Phonon dispersion curves for ZnTe at room temperature.
Figure 2. Combined density of states curve for ZnTe.
203
DUBEY et al./Turk J Phys
Table 1. Input data and model parameters for ZnTe [C ij and B (in 1011 dyne/cm2) , υ (in THz), r0 (in 10−8 cm),
αi (in 10−24 cm3) , b (in 10−12 erg), ρ (in 10−8 cm)].
Input data Model parametersProperties Values Parameters ValuesC11 7.13a b 1.2800C12 4.07a ρ 0.5260C44 3.12a f(r0) –0.2100B 5.08a r0f
′(r0) 0.1058r0 2.64b A12 15.8583υLO(Γ) 6.20c B12 –5.2804υTO (Γ) 5.30c A11 154.0597υLO (L) 5.96* B11 –31.0613υTO (L) 5.11* A22 –2.6291υLA (L) 2.70* B22 –9.5200υTA (L) 1.44* d1 0.3076α1 1.14d d2 3.2223α2 8.50d Y1 –1.8486ε0 7.18e Y2 –1.3157
* Extrapolated values from [1].
a -(Lee [2]); b - (Berlin Court et al. [21]); c (Vagelatos et al. [1]); d - (Shankar et al. [20]) and e - (Kunc et al. [22]).
Table 2. Van der Waals interaction coefficients for ZnTe (C ij and C in units of 10−60 erg cm6 and d ij and D in units
of 10−76 erg cm8) .
Parameters Numerical valuesC+− 314C++ 72C−− 1684d+− 202d++ 28d−− 1365C 2070D 982
are better than those by using RIM [26]. Our model successfully explained the dispersion of phonons along
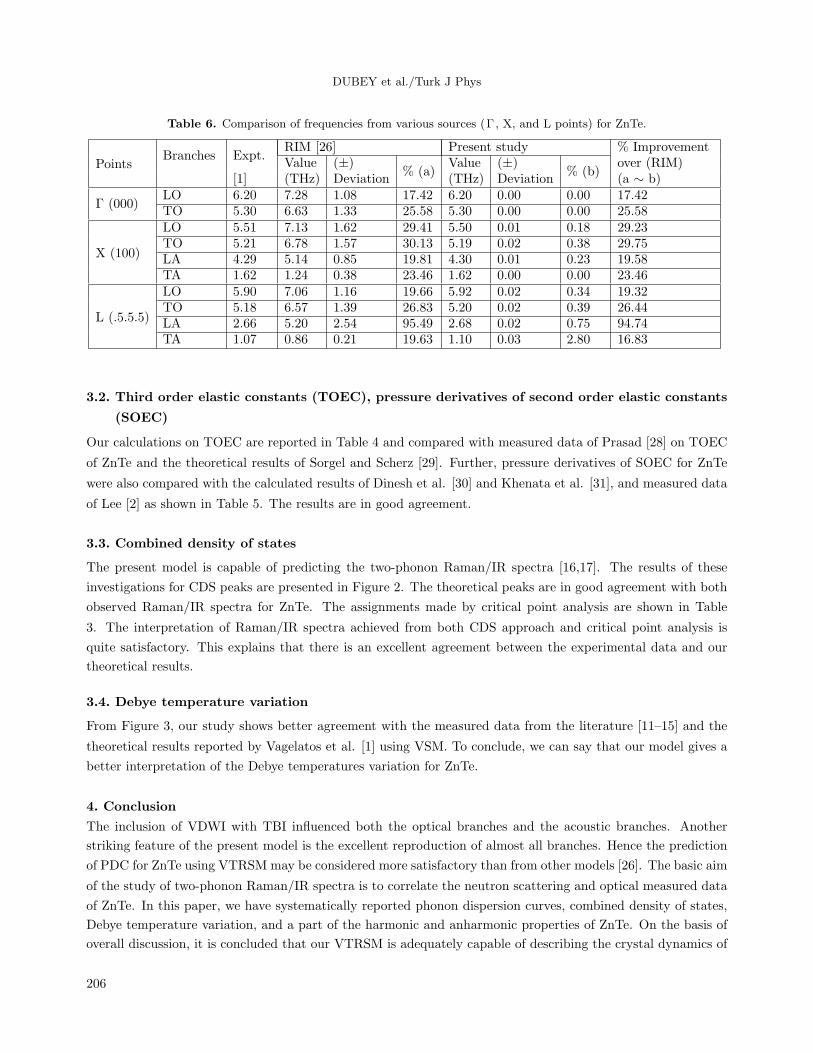
the three high symmetry directions. From Figure 1 and Table 6, it is clear that there are deviations of 17.42%
along LO(Γ), 25.58% along TO(Γ), 29.23% along LO(X), 29.75% along TO(X), 19.58% along LA(X), 23.46%
along TA(X), 19.32% along LO(L), 26.44% along TO(L), 94.74% along LA(L), and 16.83% along TA(L) from
the experimental results. From RIM, deviations are 17.42% along LO(Γ), 25.58% along TO(Γ), 29.41% along
LO(X), 30.13% along TO(X), 23.46% along TA(X), and 95.49% along LA(L) and from VTRSM no % deviation
along LO(Γ), no % deviation along TO(Γ), 0.18% along LO(X), 0.38% along TO(X), no % deviation along
TA(X), and 0.75% along LA(L). From Table 6 it is clear that the VTRSM has very small deviation from the
experimental data. Our model, VTRSM, has 94.74% improvement over RIM due to inclusion of TBI and VDWI
coefficients. Thus, our VTRSM has better agreement with the experimental data than RIM [26].
204
DUBEY et al./Turk J Phys
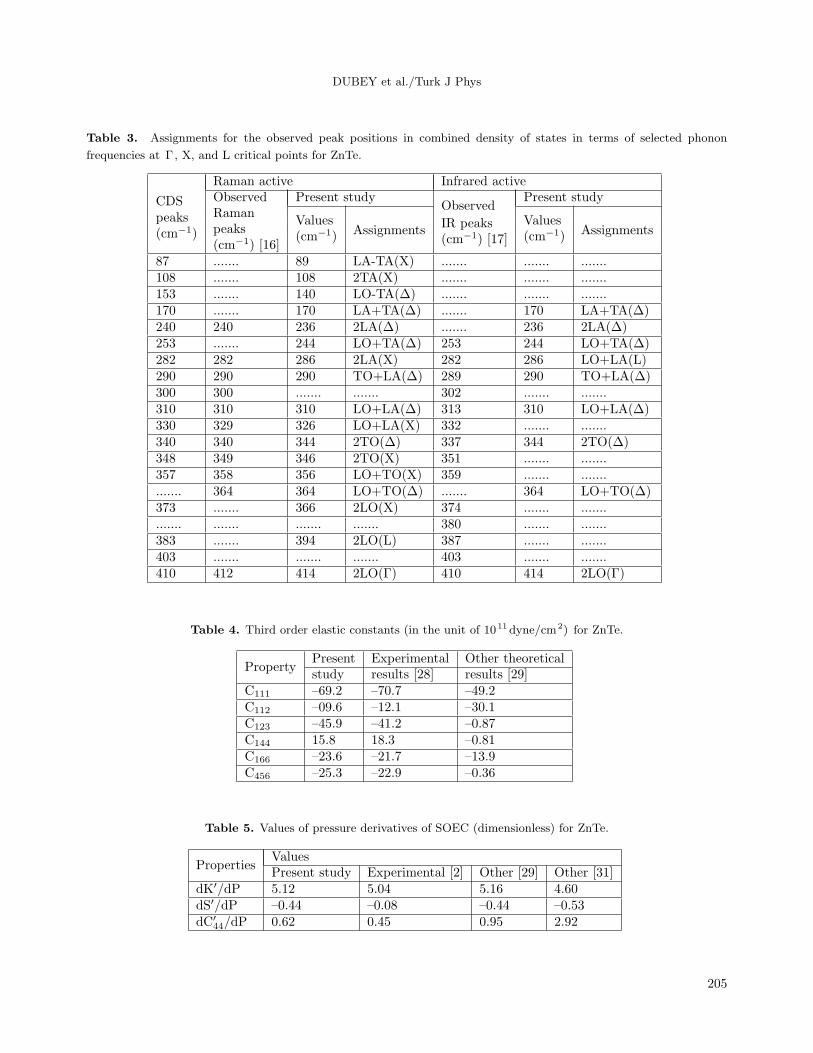
Table 3. Assignments for the observed peak positions in combined density of states in terms of selected phonon
frequencies at Γ, X, and L critical points for ZnTe.
CDS
Raman active Infrared activeObserved Present study
ObservedPresent study
Raman
Assignments Assignmentspeaks
peaksValues IR peaks Values
(cm−1)(cm−1) [16]
(cm−1) (cm−1) [17] (cm−1)
87 ....... 89 LA-TA(X) ....... ....... .......108 ....... 108 2TA(X) ....... ....... .......153 ....... 140 LO-TA(∆) ....... ....... .......170 ....... 170 LA+TA(∆) ....... 170 LA+TA(∆)240 240 236 2LA(∆) ....... 236 2LA(∆)253 ....... 244 LO+TA(∆) 253 244 LO+TA(∆)282 282 286 2LA(X) 282 286 LO+LA(L)290 290 290 TO+LA(∆) 289 290 TO+LA(∆)300 300 ....... ....... 302 ....... .......310 310 310 LO+LA(∆) 313 310 LO+LA(∆)330 329 326 LO+LA(X) 332 ....... .......340 340 344 2TO(∆) 337 344 2TO(∆)348 349 346 2TO(X) 351 ....... .......357 358 356 LO+TO(X) 359 ....... .............. 364 364 LO+TO(∆) ....... 364 LO+TO(∆)373 ....... 366 2LO(X) 374 ....... .............. ....... ....... ....... 380 ....... .......383 ....... 394 2LO(L) 387 ....... .......403 ....... ....... ....... 403 ....... .......410 412 414 2LO(Γ) 410 414 2LO(Γ)
Table 4. Third order elastic constants (in the unit of 1011dyne/cm2) for ZnTe.
PropertyPresent Experimental Other theoreticalstudy results [28] results [29]
C111 –69.2 –70.7 –49.2C112 –09.6 –12.1 –30.1C123 –45.9 –41.2 –0.87C144 15.8 18.3 –0.81C166 –23.6 –21.7 –13.9C456 –25.3 –22.9 –0.36
Table 5. Values of pressure derivatives of SOEC (dimensionless) for ZnTe.
PropertiesValuesPresent study Experimental [2] Other [29] Other [31]
dK′/dP 5.12 5.04 5.16 4.60dS′/dP –0.44 –0.08 –0.44 –0.53dC′
44/dP 0.62 0.45 0.95 2.92
205
DUBEY et al./Turk J Phys
Table 6. Comparison of frequencies from various sources (Γ, X, and L points) for ZnTe.
PointsBranches Expt.
RIM [26] Present study % ImprovementValue (±)
% (a)Value (±)
% (b)over (RIM)
[1] (THz) Deviation (THz) Deviation (a ∼ b)
Γ (000)LO 6.20 7.28 1.08 17.42 6.20 0.00 0.00 17.42TO 5.30 6.63 1.33 25.58 5.30 0.00 0.00 25.58
X (100)
LO 5.51 7.13 1.62 29.41 5.50 0.01 0.18 29.23TO 5.21 6.78 1.57 30.13 5.19 0.02 0.38 29.75LA 4.29 5.14 0.85 19.81 4.30 0.01 0.23 19.58TA 1.62 1.24 0.38 23.46 1.62 0.00 0.00 23.46
L (.5.5.5)
LO 5.90 7.06 1.16 19.66 5.92 0.02 0.34 19.32TO 5.18 6.57 1.39 26.83 5.20 0.02 0.39 26.44LA 2.66 5.20 2.54 95.49 2.68 0.02 0.75 94.74TA 1.07 0.86 0.21 19.63 1.10 0.03 2.80 16.83
3.2. Third order elastic constants (TOEC), pressure derivatives of second order elastic constants
(SOEC)
Our calculations on TOEC are reported in Table 4 and compared with measured data of Prasad [28] on TOEC
of ZnTe and the theoretical results of Sorgel and Scherz [29]. Further, pressure derivatives of SOEC for ZnTe
were also compared with the calculated results of Dinesh et al. [30] and Khenata et al. [31], and measured data
of Lee [2] as shown in Table 5. The results are in good agreement.
3.3. Combined density of states
The present model is capable of predicting the two-phonon Raman/IR spectra [16,17]. The results of these
investigations for CDS peaks are presented in Figure 2. The theoretical peaks are in good agreement with both
observed Raman/IR spectra for ZnTe. The assignments made by critical point analysis are shown in Table
3. The interpretation of Raman/IR spectra achieved from both CDS approach and critical point analysis is
quite satisfactory. This explains that there is an excellent agreement between the experimental data and our
theoretical results.
3.4. Debye temperature variation
From Figure 3, our study shows better agreement with the measured data from the literature [11–15] and the
theoretical results reported by Vagelatos et al. [1] using VSM. To conclude, we can say that our model gives a
better interpretation of the Debye temperatures variation for ZnTe.
4. Conclusion
The inclusion of VDWI with TBI influenced both the optical branches and the acoustic branches. Another
striking feature of the present model is the excellent reproduction of almost all branches. Hence the prediction
of PDC for ZnTe using VTRSM may be considered more satisfactory than from other models [26]. The basic aim
of the study of two-phonon Raman/IR spectra is to correlate the neutron scattering and optical measured data
of ZnTe. In this paper, we have systematically reported phonon dispersion curves, combined density of states,
Debye temperature variation, and a part of the harmonic and anharmonic properties of ZnTe. On the basis of
overall discussion, it is concluded that our VTRSM is adequately capable of describing the crystal dynamics of
206
DUBEY et al./Turk J Phys
Figure 3. Debye characteristics temperatures ΘD (oK) as a function of temperature T for ZnTe.
ZnTe. This model has also been applied equally well to study the crystal dynamics of other compound of this
group, ZnS and ZnSe.
Acknowledgments
The authors are very grateful to Dr. A. N. Pandey, Ex. Reader and Head, Department of physics, K. N. Govt.
P. G. College, Gyanpur, Bhadohi (U.P.), India for many useful discussions, and the computer center, B. H. U.,
Varanasi, for providing computational assistance. One of us, Mr. J. P. Dubey, is also thankful to Dr. Devendra
Pathak, Vice chancellor, Dr. K. N. Modi University Newai, Rajasthan, India, for his encouragement.
References
[1] Vagelatos, N.; Wehe, D.; King, J. J. Chem. Phys. 1974, 60, 3613-3618.
[2] Lee, B. H. J. Appl. Phys. 1970, 41, 2988-2990.
[3] Talwar, D. N.; Vandevyver, M.; Kunc, K.; Zigone, M. Phys. Rev. B 1981, 24, 741-753.
[4] McMurry, H. L.; Solbrig, A. W.; Boytter, J. K.; Noble, C. J. Phys. Chem. 1967, 28, 2359.
[5] Rajput, B. D.; Browne, D. A. Phys. Rev. B 1996, 53, 9052-9058.
[6] Lee, G. D.; Lee, M. H.; Ihm, J. Phys. Rev. B 1995, 52, 1459.
[7] Kirin, D.; Lukacevic, I. Phys. Rev. B 2007, 75, 172103.
[8] Yeh, C. Y.; Lu, Z. W.; Froyen, S.; Zunger, A. Phys. Rev. B 1992, 46, 10086.
[9] Tan, J. J.; Ji, G. F.; Chen, X. R. Commun. Theor. Phys. (Beijing, China) 2010, 53, 1160-1166.
[10] Cote, M.; Zakharov, O.; Rubio, A.; Cohen, M. L. Phys. Rev. B. 1997, 55, 13025.
[11] DeLaunnay, J. J. Chem. Phys. 1954, 22, 1676.
[12] Kelemen, F.; Niculescu, D.; Cruceanu, E. Phys. Status Solidi 1965, 11, 865-872
[13] Irwin, J. C.; LaCombe, J. J. Appl. Phys. 1974, 45, 224.
[14] Gul’yaer, P. V.; Petrov, A.; Sov, V. Phys. Solid State 1959, 1, 330-334.
[15] Demidenko, F. A.; Maltsev, A. K. Izv. Akad. Nauk SSSR Neorg. Mater. 1969, 5, 158-160.
207
DUBEY et al./Turk J Phys
[16] Irwin, J. C.; LaCombe, J. Appl. Phys. 1970, 41, 1444.
[17] Narita, S.; Harada, H.; Nagasaki, K. J. Phys. Soc. (Japan) 1967, 22, 1176.
[18] Dubey, J. P.; Tiwari, R. K.; Upadhyaya, K. S.; Pandey, P. K. Turk. J. Phys. 2015, 39, 242-253.
[19] Dubey, J. P.; Tiwari, R. K.; Upadhyaya, K. S.; Pandey, P. K. IOSR Journal of Applied Physics 2015, 7, 67-75.
[20] Shankar, J.; Sharma, J. C.; Sharma, D. P. Ind. J. Pure Appl. Phys. 1977, 5, 811-820.
[21] Berlin Court, D.; Jaffe, H.; Shiozawa, L. R. Phys. Rev. 1963, 129, 1009-1017.
[22] Kunc, K.; Balkanski, M.; Nusimovici, M. A. Phys. Status Solidi (b) 1975, 72, 249-260.
[23] Sharma, U. C.; Verma, M. P. Phys. Status Solidi (b) 1980, 102, 487-494.
[24] Slater, J. C.; Kirkwood, J. G. Phys. Rev. 1931, 37, 682-697.
[25] Singh, R. K.; Singh, S. Phys. Status Solidi (b) 1987, 140, 407-413.
[26] Camacho, J.; Loa, I.; Cantarero, A.; Syassen, K. J. Phys., Condens. Matter 2002, 14, 739-757.
[27] Smart, C.; Wilkinson, G. R.; Karo, A. M.; Hardy, J. R. In Lattice Dynamics; Wallis, R. F., Ed.; Pergamon Press:
Oxford, UK, 1965.
[28] Prasad, O. H.: PhD, Osmania University, Hyderabad, India, 1978.
[29] Sorgel, J.; Scherz, U. Eur. Phys. J. 1998, B 5, 45-52.
[30] Varshney, D.; Sharma, P.; Kaurav, N.; Singh, R. K. Bull. Mat. Sci. 2005, 28, 651-661.
[31] Khenata, R.; Bouhemadou, A.; Sahnoun, M.; Reshak, A. H.; Baltache, H.; Rabah, M. Comp. Mat. Sci. 2006, 38,
29-38.
208


