Embed Size (px)
Citation preview
P.J. le Roux Æ A.P. le Roex Æ J.-G. Schilling
Crystallization processes beneath the southern Mid-Atlantic Ridge(40–55�S), evidence for high-pressure initiation of crystallization
Received: 6 April 2001 /Accepted: 28 August 2001 / Published online: 23 October 2001� Springer-Verlag 2001
Abstract New major and trace element data are re-ported for a suite of basalts dredge sampled from thesouthern MAR (40.6–52.5�S) during cruise 9309 of theR/V Maurice Ewing and cruise 32 of the S.A. Agulhas(51–54.5�S). Samples range from aphyric to moderatelyporphyritic with plagioclase and olivine the dominantphenocryst and microphenocryst phases. Clinopyroxeneoccurs rarely as a phenocryst phase. Bulk rock andquench glass samples have major element compositionsranging from moderately primitive (Mg#=68.5) toevolved (Mg#=41.1), with a comparable range in in-compatible (Zr=54–232 ppm; Nb=0.8–21 ppm) andhighly compatible trace element (Ni=51–289 ppm;Cr=39–949 ppm) abundances. Incompatible trace ele-ment ratios (e.g., Zr/Nb=5.9–69; Y/Nb=0.88–29; (La/Sm)N=0.48–2.9) indicate both enriched and depletedMORB occurring along this section of the MAR,agreeing with along-ridge radiogenic isotope ratio vari-ations delineating compositional influences of the off-axis Discovery, and a so-called LOMU-component, andridge-centered Shona mantle plumes (Douglass et al.1999; Douglass and Schilling 2000). Major- and trace-element variations, particularly decreasing CaO/Al2O3
ratios and relatively constant Sc abundances withdecreasing Mg# suggest crystallization of olivine,
plagioclase, and clinopyroxene in most of these basaltsprior to eruption. Liquid-lines-of-descent, derived fromforward modeling of various reasonable parental mag-ma compositions at pressures between 1 atm–8 kbar,confirm clinopyroxene as an early crystallizing phase,along with olivine and plagioclase, and its pivotal role inthe compositional evolution of these basalts. Pressuresdeduced using algorithms of Grove et al. 1992 and Mi-chael and Cornell 1998 indicate crystallization beneathridge segments unaffected by mantle plumes occurredpredominately at depths of 3–6 kbar (10–20 km). Crys-tallization beneath ridge segments affected by the Dis-covery and Shona mantle plumes occurred over a largerpressure range (1 atm–�7 kbar), but predominantly atcrustal depths (1 atm–3 kbar), possibly due to moreconstant magma fluxes and higher temperatures in thecrust and lithosphere in these regions favoring the exis-tence and longevity of subaxial magma chambers.
Introduction
Crystal fractionation is one of the major processes af-fecting the compositions of magmas beneath mid-oceanridges after segregation from the melting region (i.e.,Grove et al. 1992). Much of our understanding ofcrystallization beneath mid-ocean ridges are from stud-ies of fast- and superfast spreading ridges (Michael andCornell 1998) where high heat flow and magma flux areable to sustain long-lived magma chambers. A generalconsensus of these studies is that olivine (±spinel) andplagioclase are the dominant phases that control thecompositional evolution of mid-ocean ridge basalts(MORB). Comparatively fewer studies have been un-dertaken along the major slow-spreading ridges (circum-Antarctic, Arctic and southern Mid-Atlantic Ridge)where heat flow and magma flux are lower, andephemeral magma chambers more likely to be the norm(Sinton and Detrick 1992; Michael and Cornell 1998).
The slow spreading (2 cm/year half-spreading rateover the past 80 Ma; Silver 1998) southern Mid-Atlantic
Contrib Mineral Petrol (2002) 142: 582–602DOI 10.1007/s00410-001-0312-y
P.J. le Roux (&) Æ A.P. le RoexDepartment of Geological Sciences,University of Cape Town, Rondebosch,7701, South AfricaE-mail: [email protected]: +1-202-4788821
J.-G. SchillingGraduate School of Oceanography,University of Rhode Island,Narragansett, RI 02882, USA
Present address: P.J. le RouxDepartment of Terrestrial Magnetism,Carnegie Institution of Washington,Washington, DC, 20015, USA
Editorial responsibility: T.L. Grove

Ridge (MAR) was extensively dredge sampled between40�S and 55�S during cruise 9309 of the R/V MauriceEwing (Douglass et al. 1995) and cruise 32 of the S.A.Agulhas (le Roex et al. 1987), providing an excellentopportunity to investigate crystal fractionation ofMORB beneath a major slow spreading ridge. Previousstudies on subsets of this suite of samples emphasizedsource region characteristics, focusing on radiogenicisotopes (Douglass et al. 1999; Douglass and Schilling2000), noble gasses (Moreira et al. 1995; Sarda 2000) andselected trace elements (Douglass et al. 1995), illustrat-ing the occurrence of a spectrum of basalt compositionsfrom geochemically depleted to highly enriched. Com-positions of enriched MORB along anomalously shal-low ridge segments reflect the influences of two proximalmantle plumes; off-axis Discovery (6.45�W, 44.45�S) andridge-centered Shona (51.5�S) and a so-called LOMUcomponent on the depleted asthenospheric mantle be-neath this southern end of the MAR (Moreira et al.1995; Douglass et al. 1999; Sarda 2000).
Igneous processes beneath slow spreading mid-oceanridges probably differ from those beneath fast-spreadingridges (Langmuir et al. 1992; Michael and Cornell 1998).Slow spreading ridges are likely to have low or episodicmagma flux, and melt migration after segregation fromthe melting region is rapid with minimal magma resi-dence-time at shallow-crustal levels prior to eruption(Sinton and Detrick 1992), diminishing the importanceof chemical interaction between melts and ambientmantle (Sobolev and Shimizu 1993, 1994; Niu andBatiza 1994; Kelemen et al. 1995, 1997; Reiners 1998;Suhr 1999). The new samples collected from the south-ern MAR provide an opportunity to address the influ-ence of crystal fractionation on the compositionalevolution of basalts from this major slow spreadingridge, the influence of proximal mantle plumes on thisprocess, and, in particular, evaluating the role of clino-pyroxene and the pressures of crystallization.
Sampling and analytical techniques
The majority of MORB in this study were collected from44 dredge-stations, at �25-km spacing, along thesouthern MAR (40–52.5�S) during cruise EW9309(November/December 1993) of the R/V Maurice Ewing(Douglass et al. 1995, 1999). Some samples from thesouthernmost extreme of the southern MAR (51–54.5�S), collected during cruise 32 of the S.A. Agulhas (leRoex et al. 1987), were included in the study. All sampleswere collected by dredging central valleys of segments ofmid-ocean ridges identified through multi-beam bathy-metry and magnetometry. Station locations are shown inFig. 1 in relation to the tectonics of the region and thegreater South Atlantic (Smith and Sandwell 1997).
Major element compositions of MORB glasses andassociated mineral phases were obtained using a CamecaCamebax electron microprobe (EMP) in the Depart-ment of Geological Sciences, University of Cape Town
(UCT). Operating conditions were accelerating voltage=15 kV; beam current =40 nA; 10-s counting times atpeak and background, except 30-s counting times for Niin olivine, and Na and P in glasses; beam defocused(�30 lm diameter) for glass analysis. Repeat analyses ofa single glass yielded consistent Na values. On-line datareduction was done according to Bence and Albee(1968), using factors from Albee and Ray (1970), as wellas the Cameca PAP routine.
Bulk rock compositions of selected samples wereobtained by X-ray fluorescence spectrometry in theDepartment of Geological Sciences, UCT. Samplepreparation and analytical procedures are as describedby Duncan et al. (1984); available at http://www.uc-t.ac.za/depts/geolsci/antech.html
Fig. 1 Schematic map of the geographical locations of dredge-stations along the southern Mid-Atlantic Ridge and the approx-imate present-day locations of the Discovery and Shona mantleplumes (Douglass et al. 1995; Small 1995; Douglass et al. 1999).Labels indicate dredge station numbers, with Agulhas 32 dredgestations indicated by labels with the prefix ‘‘A’’. Insert shows thebathymetry of the greater South Atlantic (Smith and Sandwell1997), with arrows indicating the section of the southern MARsampled
583

Selected trace element concentrations of quenched ig-neous glasses were determined by LA-ICP-MS, using anELAN6000 ICP-MS andCETACLSX-200 laser ablationsystem in the Department of Geological Sciences, UCT.NIST 610 and 612 reference glass standards (Pearce et al.1997) were used for calibration, with 44Ca as the internalstandard. Detection limits based on three standard devi-ations of gas blankswere<0.5ppmfor all elements exceptNi (1.06 ppm). The 2r errors were, in general, significantlybetter than 10% (le Roux et al., in preparation).
Petrography
The majority of the 104 polished-section samples fromthe southern MAR are aphyric basalts (49 containing<5%; 30 containing 5.1–10% total phenocrysts), asignificant minority are sparsely phyric (15 containing10.1–15%; 7 containing 15.1–20% total phenocrysts),and three samples (7D-3, 9D-3, 45D-2) are highlyporphyritic, with >20% total phenocrysts. Table 1 listsmodal abundances of phenocrysts present in individualthin sections, as well as the ranges of observed pla-gioclase anorthite and olivine forsterite percentages.The lavas are all olivine–plagioclase basalts as definedby Bryan (1983). Plagioclase is the dominant pheno-cryst phase (<20% in most samples, 20–40% in sam-ples 7D-3, 9D-3 and 45D-2), ranging in size fromrounded and resorbed megacrysts (An�85–90; £ 10 mm)to euhedral or skeletal microlaths (An�64–74; <250 lm).Olivine (Fo�70–89) is a common phenocryst phase(<3% in most samples, 3–10% in some Shona-influ-enced samples, e.g., 17D-1 and 19D-2), ranging in sizefrom rare, commonly anhedral and fractured, or emb-ayed, megacrysts (Fo�86–87; £ 5 mm), to euhedral orskeletal microphenocrysts ( £ 250 lm).
Olivine phenocrysts and microphenocrysts, and pla-gioclase microphenocrysts are not compositionallyzoned. Compositional zoning observed in plagioclasephenocrysts is predominantly normal, spanning a rangeof An�4–10. In rare examples of complex reverse com-positional zoning in plagioclase phenocrysts, radial out-ward-decreasing anorthite profiles are interrupted byabrupt increases of An�4–7 at the rim of phenocrysts, orcoincident with edges of distinct optical zoning bands,followed again by a gradual decrease. Where suddenincreases in anorthite content occur, it is in complexphenocrysts where resorbed cores are ‘‘mantled’’ by newcrystal growth, which might itself be resorbed and laterovergrown. Clinopyroxene phenocrysts are scarce (ob-served in only 13 of 104 samples examined). These occuras rounded, anhedral crystals. The compositional rangeobserved (Wo41–43En48–52Fs6–10, Cr2O3=0.44–1.25wt%)was based on only six analyses, including five micro-phenocrysts. The single clinopyroxene phenocryst(�500 lm) analyzed exhibited a slight normal zoning.Rare accessory phases are euhedral and cubic to anhedraland rounded Cr-spinel microphenocrysts (Mg#=0.71,
0.51–0.64 and Cr#=0.28–0.29, 0.37–0.41; 10–80 lm),observed associated with, or included in, olivine pheno-crysts in mantle plume-influenced MORB samples, andsubhedral to anhedral or circular sulfide blebs (semi-quantitative Fe=39–55 wt%, Ni=8–28 wt%, S=35–38%; £ 250 lm), confined to low-Mg# samples.
Neither plagioclase nor olivine phenocrysts or mi-crophenocrysts exhibit any systematic geographic vari-ations (e.g., in assessment of olivine equilibrium inFig. 2). Microphenocrysts have lower An and Fo con-tents relative to associated phenocrysts and the lowestAn (�59–65) and Fo (�71–73) values are from micro-phenocrysts in low-Mg# basalts (Mg# �42–47) recov-ered from mantle plume-influenced ridge segments.There is no significant latitudinal variation in modalmineralogy of basalts along this section of the southernMAR; basalts from geochemically enriched ridge seg-ments (45.2–46.6�S; 47.4–49.2�S; 50.3–54.4�S) containsimilar ranges of phenocryst varieties and abundances asbasalts from normal, geochemically depleted ridge seg-ments.
Geochemistry
Incompatible trace-element and radiogenic-isotope ra-tios (Douglass et al. 1999; le Roux et al., in preparation)subdivide MORB from the southern MAR into threegroups: (1) normal, geochemically depleted, MORB; (2)
Fig. 2 Observed olivine phenocryst (open symbols) and microphe-nocryst (filled symbols) composition (Fo%) versus Mg# (atomicMg2+/[Mg2++Fe2+]) of host glass in MORB samples from thesouthern MAR. Solid curve represents equilibrium (KD=0.3)between olivine and glass according to Roeder and Emslie (1970),dashed lines equilibrium at KD=0.27 and 0.33
584

MORB recovered from shallow ridge segments influ-enced by the off-axis (6.45�W, 44.45�S) Discoverymantle plume and associated LOMU component [twosub-groups recognized – occurring north and south ofthe Falkland-Agulhas Fracture Zone (FZ)]; and (3)MORB from shallow ridge segments associated with theridge-centered (51.5�S) Shona mantle plume. Whereappropriate, the bulk rock and quench glass geochemi-
cal data will be described here with reference to theseestablished groupings.
Major elements
Representative analyzes of 63 bulk rock samples and 272quench glasses are reported in Tables 2 and 3, respec-
Table 1 Point-counted modal mineralogy of polished thin sections, with an analyzed range of mineral compositions. Modal abundancesbased on ‡ 2,000 points counted per thin section
Samplea % Plag % Oliv % Cpx %Vesicles
An Fo Samplea % Plag % Oliv % Cpx %Vesicles
An Fo
45D-2 39 0.8 – 2.0 90–83 89–88 5D-1 – 1.7 – 0.644D-1 16 0.8 – 2.1 5D-4 – 2.0 – 0.3 8444D-3 8.3 2.4 – 0.5 85–69 85 5D-5 – 2.3 – 0.844D-12 17 1.0 – 2.9 6D-1 6.5 2.0 – 3.0 80–67 8344D-13 4.1 0.9 – 0.7 7D-1 0.8 0.8 – 2.4 79–75 8743D-1 7.4 0.3 – 2.2 84–80 84 7D-2 4.3 1.1 1.3 2.3 67–66 80–7243D-2 9.6 0.4 – 3.2 7D-3 29 2.7 – 0.7 86–72 87–8541D-1 2.1 1.6 – 1.6 8D-1 0.6 0.7 – 0.2 81–73 8641D-2 1.3 0.1 0.2 1.3 71–68 85 9D-2 3.0 – – 1.141D-7 0.7 0.5 – 1.9 9D-3 25 0.7 – 0.2 83–81 86–8440D-1 10 – – 2.1 79–72 10D-1 13 2.8 – 0.5 72–65 85–8440D-3 – – – 2.1 10D-2 9.3 1.1 – 0.6 80–68 8440D-5 – 0.3 – 4.6 10D-2b 9.1 0.8 – 1.840D-12 6.2 – – 2.2 10D-3 9.3 0.6 – 1.4 83–65 86–8339D-2 – 1.2 0.3 4.8 85 10D-8 0.2 – – 1.5 84–6737D-2 – 0.3 – 2.2 10D-9 12 0.7 – 1.0 81–67 85–8337D-3 – 0.7 – 1.2 88–85 11D-1 – 1.1 – 0.236D-2 3.7 1.4 – 0.1 11D-2 – 0.9 – 7.036D-5 5.5 1.4 – 0.3 81–72 84 11D-9 1.2 0.9 – 0.5 80–78 85–8434D-1 – 1.6 – 1.5 11D-10 – 0.9 – 0.834D-3 – 1.7 – 0.2 86 12D-1 9.7 2.7 – 0.3 84–80 86–8533D-1 – 1.0 – 0.8 12D-2 14 0.8 – 8.4 81–79 8533D-3 – 1.1 – 0.5 12D-3 6.2 1.1 – 0.5 80–72 87–8533D-4 – 1.3 – 0.5 85 13D-1 4.2 1.2 – 3.032D-1 11 2.2 – 3.7 13D-2 3.5 0.7 – – 83–76 8732D-2 11 1.2 – 1.7 84–69 85–84 14D-1 9.7 2.7 – 1.1 87–81 85–8432D-11 8.3 1.6 – 1.9 14D-2 0.9 – – 4.032D-12 9.2 3.5 – 0.9 14D-3 – – – 2.731D-1 0.6 0.2 – 1.6 86–83 14D-5 8.0 3.3 – 0.731D-2 0.6 0.3 – – 15D-1 0.9 0.2 – 1.630D-1 17 0.6 – 1.4 84–78 86–85 15D-2 3.3 0.3 – 3.9 91–89 83–8230D-2 1.1 1.9 – 0.6 15D-3 1.8 0.8 – 0.830D-5 5.9 2.0 – 3.9 15D-4 6.0 2.8 – 4.230D-6 1.9 1.0 – 1.0 17D-1 1.4 7.2 – 0.2 72–71 84–7828D-2 14 1.6 – 1.3 79–68 86 17D-2 1.2 2.7 – 2.528D-3 8.0 1.7 – 0.5 86–71 86–85 17D-3 0.3 3.2 – 0.128D-9 – 0.3 – 2.7 85 18D-1 0.4 – – 2.427D-1 14 0.4 – 0.8 86–81 87 18D-2 0.5 – – 6.827D-2 3.5 1.3 – 0.6 18D-6 5.7 – – – 88–8427D-5 6.1 1.2 – – 19D-2 0.7 9.5 – 4.8 70–65 83–7925D-1 – 4.1 – 2.9 19D-3 1.2 – – 1.9 88–8225D-8 0.6 9.0 – 0.8 87–86 19D-7 – 6.3 – 4.2 8326D-1 1.7 1.0 – 0.1 19D-9 14 0.9 – 2.3 86 87–8526D-2 3.8 1.3 – 0.9 20D-2 2.6 2.1 – 8.626D-5 1.7 0.6 – 2.8 70–64 89–81 20D-3 2.8 2.4 0.1 6.8 75–67 83–812D-1 7.3 1.6 – 0.9 20D-11 3.1 1.2 0.7 5.82D-3 12 3.1 0.8 2.4 71–64 85–83 21D-1 14 1.1 – 2.72D-10 8.9 2.9 0.8 3.1 21D-3 11 2.2 – 0.5 83–79 87–793D-1 7.4 1.6 – 4.6 86–81 87 23D-1 0.2 0.1 – 2.1 75–71 81–763D-3 2.5 0.7 – 1.6 23D-4 0.1 – – 3.84D-6 5.1 1.1 – 3.4 22D-3 2.5 1.6 – 0.24D-7 4.3 0.2 – 1.6 86–80 87–84 22D-4 3.6 1.9 – 0.2 61–59 72–71
a For full reference, the dredge and sample number xD–y should be preceded by the cruise number EW9309bDuplicate thin section
585
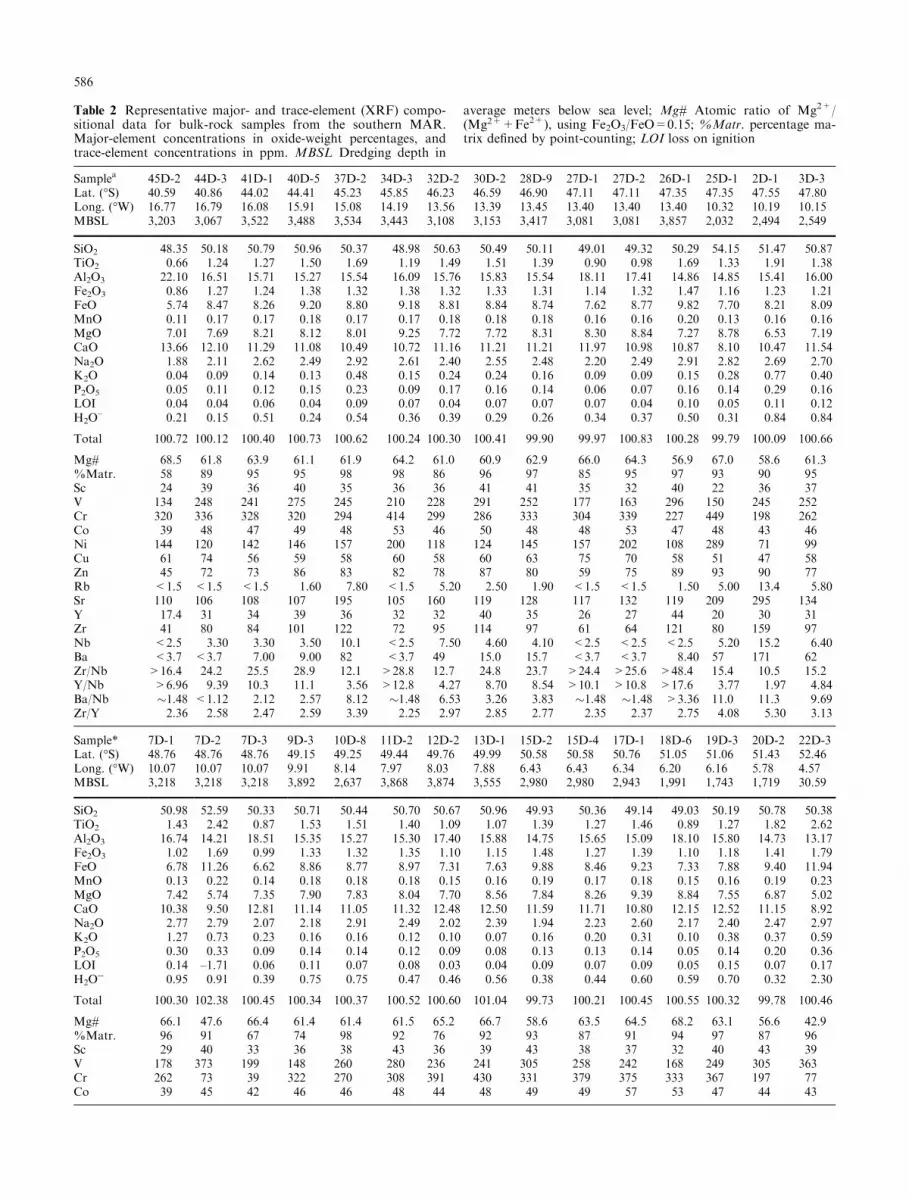
Table 2 Representative major- and trace-element (XRF) compo-sitional data for bulk-rock samples from the southern MAR.Major-element concentrations in oxide-weight percentages, andtrace-element concentrations in ppm. MBSL Dredging depth in
average meters below sea level; Mg# Atomic ratio of Mg2+/(Mg2++Fe2+), using Fe2O3/FeO=0.15; %Matr. percentage ma-trix defined by point-counting; LOI loss on ignition
Samplea 45D-2 44D-3 41D-1 40D-5 37D-2 34D-3 32D-2 30D-2 28D-9 27D-1 27D-2 26D-1 25D-1 2D-1 3D-3Lat. (�S) 40.59 40.86 44.02 44.41 45.23 45.85 46.23 46.59 46.90 47.11 47.11 47.35 47.35 47.55 47.80Long. (�W) 16.77 16.79 16.08 15.91 15.08 14.19 13.56 13.39 13.45 13.40 13.40 13.40 10.32 10.19 10.15MBSL 3,203 3,067 3,522 3,488 3,534 3,443 3,108 3,153 3,417 3,081 3,081 3,857 2,032 2,494 2,549
SiO2 48.35 50.18 50.79 50.96 50.37 48.98 50.63 50.49 50.11 49.01 49.32 50.29 54.15 51.47 50.87TiO2 0.66 1.24 1.27 1.50 1.69 1.19 1.49 1.51 1.39 0.90 0.98 1.69 1.33 1.91 1.38Al2O3 22.10 16.51 15.71 15.27 15.54 16.09 15.76 15.83 15.54 18.11 17.41 14.86 14.85 15.41 16.00Fe2O3 0.86 1.27 1.24 1.38 1.32 1.38 1.32 1.33 1.31 1.14 1.32 1.47 1.16 1.23 1.21FeO 5.74 8.47 8.26 9.20 8.80 9.18 8.81 8.84 8.74 7.62 8.77 9.82 7.70 8.21 8.09MnO 0.11 0.17 0.17 0.18 0.17 0.17 0.18 0.18 0.18 0.16 0.16 0.20 0.13 0.16 0.16MgO 7.01 7.69 8.21 8.12 8.01 9.25 7.72 7.72 8.31 8.30 8.84 7.27 8.78 6.53 7.19CaO 13.66 12.10 11.29 11.08 10.49 10.72 11.16 11.21 11.21 11.97 10.98 10.87 8.10 10.47 11.54Na2O 1.88 2.11 2.62 2.49 2.92 2.61 2.40 2.55 2.48 2.20 2.49 2.91 2.82 2.69 2.70K2O 0.04 0.09 0.14 0.13 0.48 0.15 0.24 0.24 0.16 0.09 0.09 0.15 0.28 0.77 0.40P2O5 0.05 0.11 0.12 0.15 0.23 0.09 0.17 0.16 0.14 0.06 0.07 0.16 0.14 0.29 0.16LOI 0.04 0.04 0.06 0.04 0.09 0.07 0.04 0.07 0.07 0.07 0.04 0.10 0.05 0.11 0.12H2O
– 0.21 0.15 0.51 0.24 0.54 0.36 0.39 0.29 0.26 0.34 0.37 0.50 0.31 0.84 0.84
Total 100.72 100.12 100.40 100.73 100.62 100.24 100.30 100.41 99.90 99.97 100.83 100.28 99.79 100.09 100.66
Mg# 68.5 61.8 63.9 61.1 61.9 64.2 61.0 60.9 62.9 66.0 64.3 56.9 67.0 58.6 61.3%Matr. 58 89 95 95 98 98 86 96 97 85 95 97 93 90 95Sc 24 39 36 40 35 36 36 41 41 35 32 40 22 36 37V 134 248 241 275 245 210 228 291 252 177 163 296 150 245 252Cr 320 336 328 320 294 414 299 286 333 304 339 227 449 198 262Co 39 48 47 49 48 53 46 50 48 48 53 47 48 43 46Ni 144 120 142 146 157 200 118 124 145 157 202 108 289 71 99Cu 61 74 56 59 58 60 58 60 63 75 70 58 51 47 58Zn 45 72 73 86 83 82 78 87 80 59 75 89 93 90 77Rb <1.5 <1.5 <1.5 1.60 7.80 <1.5 5.20 2.50 1.90 <1.5 <1.5 1.50 5.00 13.4 5.80Sr 110 106 108 107 195 105 160 119 128 117 132 119 209 295 134Y 17.4 31 34 39 36 32 32 40 35 26 27 44 20 30 31Zr 41 80 84 101 122 72 95 114 97 61 64 121 80 159 97Nb <2.5 3.30 3.30 3.50 10.1 <2.5 7.50 4.60 4.10 <2.5 <2.5 <2.5 5.20 15.2 6.40Ba <3.7 <3.7 7.00 9.00 82 <3.7 49 15.0 15.7 <3.7 <3.7 8.40 57 171 62Zr/Nb >16.4 24.2 25.5 28.9 12.1 >28.8 12.7 24.8 23.7 >24.4 >25.6 >48.4 15.4 10.5 15.2Y/Nb >6.96 9.39 10.3 11.1 3.56 >12.8 4.27 8.70 8.54 >10.1 >10.8 >17.6 3.77 1.97 4.84Ba/Nb �1.48 <1.12 2.12 2.57 8.12 �1.48 6.53 3.26 3.83 �1.48 �1.48 >3.36 11.0 11.3 9.69Zr/Y 2.36 2.58 2.47 2.59 3.39 2.25 2.97 2.85 2.77 2.35 2.37 2.75 4.08 5.30 3.13
Sample* 7D-1 7D-2 7D-3 9D-3 10D-8 11D-2 12D-2 13D-1 15D-2 15D-4 17D-1 18D-6 19D-3 20D-2 22D-3Lat. (�S) 48.76 48.76 48.76 49.15 49.25 49.44 49.76 49.99 50.58 50.58 50.76 51.05 51.06 51.43 52.46Long. (�W) 10.07 10.07 10.07 9.91 8.14 7.97 8.03 7.88 6.43 6.43 6.34 6.20 6.16 5.78 4.57MBSL 3,218 3,218 3,218 3,892 2,637 3,868 3,874 3,555 2,980 2,980 2,943 1,991 1,743 1,719 30.59
SiO2 50.98 52.59 50.33 50.71 50.44 50.70 50.67 50.96 49.93 50.36 49.14 49.03 50.19 50.78 50.38TiO2 1.43 2.42 0.87 1.53 1.51 1.40 1.09 1.07 1.39 1.27 1.46 0.89 1.27 1.82 2.62Al2O3 16.74 14.21 18.51 15.35 15.27 15.30 17.40 15.88 14.75 15.65 15.09 18.10 15.80 14.73 13.17Fe2O3 1.02 1.69 0.99 1.33 1.32 1.35 1.10 1.15 1.48 1.27 1.39 1.10 1.18 1.41 1.79FeO 6.78 11.26 6.62 8.86 8.77 8.97 7.31 7.63 9.88 8.46 9.23 7.33 7.88 9.40 11.94MnO 0.13 0.22 0.14 0.18 0.18 0.18 0.15 0.16 0.19 0.17 0.18 0.15 0.16 0.19 0.23MgO 7.42 5.74 7.35 7.90 7.83 8.04 7.70 8.56 7.84 8.26 9.39 8.84 7.55 6.87 5.02CaO 10.38 9.50 12.81 11.14 11.05 11.32 12.48 12.50 11.59 11.71 10.80 12.15 12.52 11.15 8.92Na2O 2.77 2.79 2.07 2.18 2.91 2.49 2.02 2.39 1.94 2.23 2.60 2.17 2.40 2.47 2.97K2O 1.27 0.73 0.23 0.16 0.16 0.12 0.10 0.07 0.16 0.20 0.31 0.10 0.38 0.37 0.59P2O5 0.30 0.33 0.09 0.14 0.14 0.12 0.09 0.08 0.13 0.13 0.14 0.05 0.14 0.20 0.36LOI 0.14 –1.71 0.06 0.11 0.07 0.08 0.03 0.04 0.09 0.07 0.09 0.05 0.15 0.07 0.17H2O
-- 0.95 0.91 0.39 0.75 0.75 0.47 0.46 0.56 0.38 0.44 0.60 0.59 0.70 0.32 2.30
Total 100.30 102.38 100.45 100.34 100.37 100.52 100.60 101.04 99.73 100.21 100.45 100.55 100.32 99.78 100.46
Mg# 66.1 47.6 66.4 61.4 61.4 61.5 65.2 66.7 58.6 63.5 64.5 68.2 63.1 56.6 42.9%Matr. 96 91 67 74 98 92 76 92 93 87 91 94 97 87 96Sc 29 40 33 36 38 43 36 39 43 38 37 32 40 43 39V 178 373 199 148 260 280 236 241 305 258 242 168 249 305 363Cr 262 73 39 322 270 308 391 430 331 379 375 333 367 197 77Co 39 45 42 46 46 48 44 48 49 49 57 53 47 44 43
586

tively. The full dataset is available from the authors orthe RidgePetDB database at http://petdb.ldeo.colum-bia.edu/petdb. Bulk rock and quench glass MgO con-centrations vary from comparatively high values of 9.6to values as low as 4.6 wt%, with Mg#’s ranging from
41.1 to 68.5. MgO concentrations decrease with in-creasing TiO2, FeO*, Na2O, K2O, and P2O5 contents,and decreasing CaO and Al2O3 (Fig. 3). SiO2 concen-trations remained fairly constant (48.5–52.2 wt%), ex-cept samples from dredge 25 (47.35�S) off-set to higher
Table 2 (Contd.)
Sample* 7D-1 7D-2 7D-3 9D-3 10D-8 11D-2 12D-2 13D-1 15D-2 15D-4 17D-1 18D-6 19D-3 20D-2 22D-3Lat. (�S) 48.76 48.76 48.76 49.15 49.25 49.44 49.76 49.99 50.58 50.58 50.76 51.05 51.06 51.43 52.46Long. (�W) 10.07 10.07 10.07 9.91 8.14 7.97 8.03 7.88 6.43 6.43 6.34 6.20 6.16 5.78 4.57MBSL 3,218 3,218 3,218 3,892 2,637 3,868 3,874 3,555 2,980 2,980 2,943 1,991 1,743 1,719 30.59
Ni 123 58 112 136 132 144 150 129 127 145 229 200 101 69 51Cu 55 43 62 72 56 61 60 69 74 65 65 93 88 62 37Zn 67 112 58 50 79 82 65 64 86 75 79 63 72 90 128Rb 22 13.7 3.50 2.40 <1.5 <1.5 <1.5 <1.5 2.70 2.10 3.20 <1.5 5.10 5.70 10.4Sr 373 142 135 139 115 109 103 96 94 105 136 114 164 181 126Y 22 53 21 24 37 35 27 27 33 30 34 21 26 33 63Zr 137 185 57 53 104 90 67 64 83 76 102 48 82 118 222Nb 20 13.5 3.30 2.60 <2.5 <2.5 <2.5 <2.5 3.90 4.20 5.20 <2.5 6.70 9.40 14.9Ba 290 152 32 22 4.30 <3.7 <3.7 <3.7 8.00 12.0 22 <3.7 40 58 109Zr/Nb 6.85 13.7 17.3 20 >42 >36 >27 >26 21 18.1 19.6 >19.2 12.2 12.6 14.9Y/Nb 1.10 3.93 6.36 9.23 >14.8 >14.0 >10.8 >10.8 8.46 7.14 6.54 >8.40 3.88 3.51 4.23Ba/Nb 14.5 11.3 9.70 8.46 >1.72 �1.48 �1.48 �1.48 2.05 2.86 4.23 �1.48 5.97 6.17 7.32Zr/Y 6.23 3.49 2.71 2.21 2.81 2.57 2.48 2.37 2.52 2.53 3.00 2.29 3.15 3.58 3.52
aFor full reference, the dredge and sample number xD–y should be preceded by the cruise number EW9309
Table 3 Representative major-element (EMP) abundances (in wt%) for quenched igneous glasses from the southern MAR. All ironreported as Fe2+. MBSL Dredging depth in average meters below sea level; Mg# atomic ratio of Mg2+/(Mg2++Fe2+), using Fe2O3/FeO=0.15
Samplea 45D-1 44D-6 42D-1 40D-5 34D-6 33D-5 32D-3 31D-1 30D-1 28D-6 27D-1 27D-2 26D-1 25D-1 2D-1Lat. (�S) 40.59 40.86 43.43 44.41 45.85 45.99 46.23 46.39 46.59 46.90 47.11 47.11 47.35 47.35 47.55Long. (�W) 16.77 16.79 16.17 15.91 14.19 14.08 13.56 13.46 13.39 13.45 13.40 13.40 13.40 10.32 10.19MBSL 3,203 3,067 3,449 3,488 3,443 3,381 3,108 2,822 3,153 3,417 3,081 3,081 3,857 2,032 2,494
SiO2 49.30 50.11 49.42 51.54 49.25 49.97 51.33 49.61 50.08 50.61 48.90 50.57 50.08 53.98 51.66TiO2 0.92 1.38 1.22 1.54 1.25 1.66 1.51 1.40 1.31 1.26 0.99 1.73 1.84 1.43 2.14Al2O3 16.77 15.31 16.97 14.72 16.39 15.65 15.49 16.56 15.85 15.63 16.79 14.19 14.63 15.79 14.92FeO 8.80 9.73 8.96 10.19 10.28 9.16 9.70 8.89 9.51 8.96 9.38 11.26 11.26 8.39 9.86MnO 0.16 0.17 0.18 0.16 0.22 0.19 0.14 0.15 0.15 0.20 0.16 0.15 0.16 0.14 0.16MgO 9.47 8.21 8.39 8.22 9.10 7.76 7.55 8.19 8.36 8.23 8.98 7.02 7.06 7.51 6.24CaO 12.32 12.11 11.21 11.12 11.10 10.41 11.19 11.25 11.55 12.11 11.83 10.86 11.07 8.69 10.42Na2O 2.35 2.70 2.75 2.76 2.81 3.34 3.05 2.94 2.89 2.79 2.57 3.15 3.09 3.41 3.35K2O 0.04 0.08 0.36 0.09 0.08 0.70 0.30 0.51 0.16 0.07 0.05 0.11 0.12 0.28 0.76P2O5 0.08 0.14 0.14 0.14 0.10 0.30 0.18 0.16 0.11 0.11 0.08 0.14 0.15 0.11 0.25Total 100.21 99.94 99.58 100.48 100.58 99.14 100.44 99.66 99.97 99.97 99.73 99.18 99.46 99.73 99.76Mg# 68.5 63.1 65.5 62.0 64.2 63.2 61.2 65.1 64.0 65.0 66.0 55.8 55.9 64.4 56.2
Sample* 3D-2 4D-3 7D-1 7D-2 9D-2 10D-2 11D-4 12D-2 13D-1 14D-5 18D-2 19D-1 19D-4 23D-1 22D-3Lat. (�S) 47.80 47.97 48.76 48.76 49.15 49.25 49.44 49.76 49.99 50.27 51.05 51.06 51.06 52.16 52.46Long. (�W) 10.15 10.08 10.07 10.07 9.91 8.14 7.97 8.03 7.88 7.06 6.20 6.16 6.16 5.34 4.57MBSL 2,549 2,895 3,218 3,218 3,892 3,860 3,868 3,874 3,555 3,347 1,991 1,743 1,743 2,609 3,059
SiO2 51.34 51.24 51.23 51.89 51.99 51.47 50.39 51.92 51.02 51.68 50.87 49.58 50.63 50.84 51.37TiO2 1.77 1.57 1.53 2.52 1.75 1.46 1.45 1.25 1.13 1.66 1.22 1.58 1.42 2.35 2.68Al2O3 14.32 15.26 16.40 13.15 15.00 15.50 15.34 14.85 15.41 13.99 14.58 15.75 15.14 13.55 13.35FeO 9.80 9.03 7.88 12.47 9.71 9.60 10.18 9.43 8.63 10.98 9.30 11.58 9.52 12.64 13.58MnO 0.14 0.14 0.14 0.15 0.14 0.15 0.15 0.15 0.16 0.14 0.14 0.16 0.19 0.15 0.16MgO 7.53 7.60 6.79 5.51 7.34 7.79 8.03 8.42 8.76 7.55 8.45 7.19 7.97 6.09 4.83CaO 10.48 11.07 10.52 9.24 10.08 11.07 11.49 12.13 12.58 11.36 12.56 9.90 12.55 9.99 9.17Na2O 3.08 2.70 3.15 3.25 3.20 3.04 2.82 2.58 2.43 2.67 2.53 3.17 2.71 3.03 3.18K2O 0.52 0.40 1.22 0.64 0.51 0.08 0.06 0.04 0.04 0.08 0.19 0.12 0.26 0.30 0.52P2O5 0.22 0.21 0.27 0.29 0.28 0.12 0.12 0.09 0.08 0.12 0.10 0.12 0.15 0.27 0.36Total 99.20 99.22 99.13 99.11 100.00 100.28 100.03 100.86 100.24 100.23 99.94 99.15 100.54 99.21 99.19Mg# 60.9 63.0 63.6 47.2 60.5 62.1 61.5 64.4 67.3 58.2 64.8 55.7 62.9 49.4 41.9
aFor full reference, the dredge and sample number xD–y should be preceded by the cruise number EW9309
587

588

SiO2 concentrations (�53–55 wt%, at 6.5–7.5 wt%MgO).
Depleted MORB from the northern (40.6–44.8�S),central (46.9–47.45�S) and southern (49.3–50.0�S) regionsare indistinguishable in their major element characteris-tics, the dominant feature being restricted and high (7.02–9.47 wt%) MgO abundances (Fig. 3; Table 3). Bulkcompositions of samples are off-set to lower TiO2, Na2Oand FeO* values, significantly higher Al2O3 and slightlyhigher CaO values relative to their quenched glass com-positions, consistent with the presence of significantmodal plagioclase phenocrysts in the bulk rocks.
MORB glass compositions from the southern (47.4–49.2�S) Discovery(+LOMU)-influenced ridge segmentsshow coherent increases of SiO2 and TiO2, and diffuseincreases of Na2O, K2O, and P2O5 with decreasing MgO.MgO concentrations of these MORB glasses (5.51–8.67 wt%) are more varied than in northern (45.2–46.6�S)Discovery(+LOMU)-influenced MORB (7.41–9.15 wt%, dashed lines in Fig. 3 indicate approximatelow-MgO extent of these samples), with the formerdominating the low MgO, high SiO2 and TiO2, and lowAl2O3 (<15.0 wt%) and CaO (9.2–<10.2 wt%) ranges.The MgO concentrations (5.74–9.25 wt%) in bulk sam-ples of Discovery(+LOMU)-influencedMORB span therange observed in northern and southern group glasses.Northern bulk samples show less variation in SiO2, TiO2,and Al2O3 than the southern group (Table 2), but aresimilar in terms of the remainingmajor elements. Relativeto their glass compositions, bulk compositions of allDiscovery(+LOMU)-influenced samples are influencedby complex variability reflecting the presence and vari-able abundance of plagioclase and mafic phenocrysts.
Quenched glass and bulk compositions of samplesfrom the ridge section influenced by the Shona plume(50.3–54.4�S) dominate the low-MgO end of observedcompositions (4.75–8.57 and 5.02–9.39 wt%, respec-tively). Major element variations with decreasing MgOabundances (Fig. 3; Tables 2 and 3) are as described forthe regional trends, and are broadly consistent withcrystal fractionation. Bulk sample compositions overlapcompositions of quenched glasses. Differences betweenbulk and glass compositions of the same Shona-influ-enced samples are consistent with influences of observedphenocryst phases, especially olivine, on bulk samplecompositions.
Trace elements
Analyzed MORB samples show considerable ranges inincompatible elements abundances extending to rela-tively high concentrations (e.g., Zr=54–220 ppm;
Nb=0.85–21 ppm; Ba=4.0–305 ppm; La=1.7–18 ppm),whereas compatible elements such as Ni (�160–20 ppm)tend to decrease systematically with decreasing Mg#(Fig. 4; Table 2). Sc abundances remain relatively con-stant (40–50 ppm; Fig. 5) over a range of Mg#, withDiscovery(+LOMU)-influenced MORB having anom-alously low abundances (<30 ppm; Fig. 5). Althoughquench glasses and bulk rock samples show similarabundance ranges for incompatible elements (Fig. 4),concentrations of Ni and Cr extend to higher values inthe bulk rock samples, reflecting the presence of minorolivine and Cr-spinel in the latter.
In general, incompatible element ratios are highlyvariable, extending from values typical of depleted (N-type) MORB, e.g., Zr/Nb=30–69, Y/Nb=11–29, (La/Sm)N=0.48–0.79, to values characteristic of geochemi-cally enriched (E-type) MORB, e.g., Zr/Nb=6–19, Y/Nb=0.9–11, (La/Sm)N‡1.0. The above geochemicalspectrum of depleted to enriched compositions variessystematically with Sr, Nd, and Pb radiogenic isotoperatios of a subset of this suite of MORB samples(Douglass et al. 1999; Douglass and Schilling 2000). Theincompatible-element enriched MORB were collectedfrom the vicinity of the two major mantle plumes in theregion: viz. the off-ridge Discovery and ridge-centeredShona mantle plumes (Douglass et al. 1999).
MORB in the three regions where the N-type pre-dominates are indistinguishable in terms of their traceelement content (Fig. 4), having incompatible elementratios as noted above, and K/Ti (0.04–0.14) consistentwith ‘‘typical’’ N-MORB values [Zr/Nb>30, Y/Nb>10, (La/Sm)N<0.75 and K/Ti<0.15 (le Roex 1987;Sun and McDonough 1989; Smith et al. 1998)]. The rareearth element (REE) patterns of representative N-MORB samples (Fig. 6) are depleted in light REE(LREE). The ranges in absolute abundances of the REEare qualitatively consistent with the effects of crystalfractionation. The presence of negative Eu anomalies inmore evolved samples reflects plagioclase fractionation,whereas the absence or small Eu anomalies in the ma-jority of samples agrees with their less evolved compo-sitions (MgO>8 wt%).
Compositions of MORB from Discovery(+LOMU)-influenced ridge segments range from predominantlygeochemically enriched to less abundant geochemicallydepleted samples. Along the section to the north ofthe Falkland–Agulhas FZ (43.4–46.6�S), dredge haulsrecovered samples with both enriched and depletedcompositions (e.g., Zr/Nb=7.9–46, Y/Nb=1.8–20, (La/Sm)N=0.60–2.0 and K/Ti=0.07–0.62), whereas in thesouthern section (47.4–49.2�S) only samples withenriched compositions (Zr/Nb=5.9–19; Y/Nb=0.9–8.4,(La/Sm)N=1.0–2.9 and K/Ti=0.22–1.15) were recov-ered. A further subset amongst samples recovered fromthis southern section shows the strongest LOMU com-ponent in their radiogenic isotope ratios (Douglass et al.1999; Douglass and Schilling 2000). Samples fromnorthern Discovery(+LOMU)-influenced ridge seg-ments have slightly lower incompatible element abun-
Fig. 3 Major element variation diagrams of MORB glass (opensymbols) and bulk-rock samples (filled symbols) from the southernMAR. Dashed lines approximate low-MgO extent of northernDiscovery(+LOMU)-influenced MORB glass samples. Relevant2r errors indicated on each diagram
b
589

dances and higher Ni and Cr concentrations comparedwith samples from southern Discovery(+LOMU)-influenced ridge segments, in accord with their slightlyless evolved compositions (Table 2).
Basalt glasses from dredge 25 and most from dredge7, both located to the south of the Falkland–AgulhasFZ, have unusually low Yb concentrations (1.4–1.6 ppm;and 1.6–1.9 ppm, respectively) accompanied by low Scabundances (<30 ppm; Fig. 5). The samples fromdredge 7 also have the highest Nb, Ba, and La concen-trations relative to other samples from this region. Thelow Yb abundances of these samples from dredges 25and 7 result in steeply orientated REE patterns, crossingthe general LREE enriched chondrite-normalized pat-terns of other Discovery(+LOMU)-influenced MORB
(Fig. 6). Crystal fractionation can qualitatively accountfor the general vertical range of REE patterns ofDiscovery(+LOMU)-influenced MORB, but not thesteeper orientation of patterns for samples from dredges25 and 7 (le Roux et al. 2001).
MORB sampled from Shona-influenced ridge seg-ments (50.3–54.4�S) include both geochemically en-riched and depleted varieties (Zr/Nb=11.3–36, Y/Nb=2.98–13.5, (La/Sm)N=0.62–1.53 and K/Ti=0.07–0.29).Although the majority are enriched in composition, theyare not as enriched as MORB from the Disco-very(+LOMU)-influenced ridge segments. Shona-influ-enced MORB extend to higher Zr abundances(�220 ppm) than Discovery(+LOMU)-influencedMORB (�180 ppm), however, they have lower Nb, Baand La content than Discovery(+LOMU)-influencedMORB at a given Zr content (Fig. 4). Similarly, thechondrite-normalized REE patterns of basalts influ-enced by the Shona mantle plume are LREE enriched,
Fig. 4 Trace element variation diagrams of MORB glass (opensymbols) and bulk-rock samples (filled symbols) from the southernMAR. Relevant 2r errors indicated on each diagram
590

but not as steep as those influenced by the Discoverymantle plume (Fig. 6).
Petrogenesis
Crystal fractionation is believed to be one of the majorprocesses that occurs beneath mid-ocean ridges, andsignificantly affects the compositional variability ofbasalts erupted at both slow and fast spreading ridges(e.g., Grove et al. 1992; Langmuir et al. 1992; le Roexet al. 1996; Michael and Cornell 1998). The MORB fromthe southern MAR described in this study encompass aconsiderable range in compositions, and, given that mosthave Mg#’s lower than expected for primary magmas,must have experienced variable extents of crystal frac-tionation prior to eruption. Of perhaps greater signifi-cance is the observation that certain compositionalindicators – e.g., CaO/Al2O3 ratio, Sc content – suggestthe involvement of clinopyroxene fractionation duringthe evolution of these basalts (Fig. 5), a characteristicoften associated with crystallization at elevated pres-sures (e.g., Fisk et al. 1982; Schilling et al. 1983; le Roexet al. 1996). The vectors in Fig. 5 indicate that the only
realistic way of causing the marked decrease in CaO/Al2O3 ratios and broadly constant Sc abundances(Discovery(+LOMU)-influenced MORB excepted) withdecreasing MgO is to invoke clinopyroxene fractiona-tion. Although mantle melting affects the CaO/Al2O3
ratios of parental melts, the variable compositions con-sidered here (discussed below), derived from the mostprimitive magmas sampled in this region and theoreticalmelting scenarios (Kinzler andGrove 1992, 1993; Kinzler1997) all necessitate clinopyroxene fractionation in orderto account for the observed variation Fig. 5. This aspectof the petrogenesis of these southern MAR basalts ispursued more quantitatively below.
Forward-modeling
Recent advances in thermodynamic understanding andimproved values for thermodynamic parameters relatingto crystallization of silicate magmas have led to a greaterability to accurately predict the course of crystallizationof silicate magmas under various conditions (e.g.,Nielsen 1988, 1989, 1990; Grove et al. 1992; Nielsen andDeLong 1992; Ariskin et al. 1993; Ghiorso et al. 1994;Sack and Ghiorso 1994a, 1994b, 1994c; Ghiorso andSack 1995; Reynolds 1995). Ideally, to develop and
Fig. 6 Representative chondrite-normalized rare-earth elementabundances in quenched MORB glasses from the southernMAR. Normalizing values from Sun and McDonough (1989)
Fig. 5 CaO/Al2O3 ratios and Sc abundances versus MgO contentin MORB glasses from the southern MAR. Schematic vectors oneach diagram qualitatively indicate the relevant compositionaleffect of fractionation of the indicated phenocryst phases, as well asthe possible influence of variable melting on compositions ofparental magmas
591

critically evaluate quantitative models describingMORB magma petrogenesis, a potentially consanguin-eous suite of samples with a wide range in composition,from a restricted geographical locality, is required.Matching modeled liquid-lines-of-descent to observedtrends can then lead to robust estimates of the compo-sitions of initial primary magmas and crystal fractiona-tion systematics (e.g., pressures, modes).
No dredge stations from the southern MAR yieldedsuch a suite of samples. Therefore, a more regional andqualitative forward-modeling approach was adoptedwith the sole aim of evaluating the presence of clino-pyroxene as a fractionating phase during petrogenesis ofthese MORB samples and not intending to result inquantitatively matching calculated fractionation trajec-tories with observed trends of sample compositions. Theresponse of crystal fractionation, and the role of clino-pyroxene to changing physical conditions (i.e., pressure)and different parental magma compositions was mod-eled using the CoMagmat program of Ariskin et al.(1993), for calculating phase saturation and liquid-lines-of-descent (shown to reproduce experimental results aswell as other available modeling algorithms; Yang et al.1996).
Two methods of estimating parental magma com-positions were employed here. Firstly, primary melts ofspinel–lherzolite mantle source-regions are inferred tohave Mg#=70 (e.g., Frey et al. 1993), although fewMORB satisfy this criteria globally (Grove et al. 1992).Consequently, a common approach is to select one ormore basalts from the relevant study area with highMg# (normally=67) as a best approximation of aprimary magma compositions for forward-modeling ofcrystallization, and correct it for olivine fractionation togive a Mg#�70 (Frey et al. 1993; le Roex et al. 1996;Reynolds and Langmuir 1997). An alternative methodis to first model melting of spinel lherzolite (Kinzler andGrove 1992; Kinzler 1997) to generate an hypothetical
primary magma and use this composition to evaluatecrystallization models. The later approach requiresassumptions for source composition and conditions ofmelting, making it no more constrained. The variousestimated hypothetical parental compositions consid-ered here, derived by both above methods, are listed inTable 4.
Variations in the degree and pressure interval ofpartial melting of spinel lherzolite, and the compositionof the mantle source, influence the CaO/Al2O3 ratio ofthe primary magma (e.g., le Roex et al. 1996); variablemantle melting, therefore, does affect the positions ofthese calculated trajectories. However, for reasonablemelting scenarios modeled for these samples (le Rouxet al. 2001), ratios typically vary between �0.63 and�0.77 and, as such, it is still difficult to account for thedecreasing CaO/Al2O3 ratio with increasing differen-tiation in southern MAR basalts (Fig. 7b) withoutinvoking clinopyroxene fractionation.
Given that MORB studied here represent a widegeographical region, and radiogenic-isotope and trace-element data indicate distinctly different mantle sourceregions beneath different sections of the southern MAR(Douglass et al. 1995, 1999; Douglass and Schilling2000), both the above approaches were used to estimatea variety of possible parental magma compositions (bothempirical and calculated). Although differences in
Table 4 Major element compositions of parental magmas consid-ered during qualitative forward-modeling of fractional crystalliza-tion. Primitive MORB glass samples were corrected for olivinefractionation, percentage listed (+ %oliv), to yield compositions
with Mg#‡70. Theoretical parental magmas derived from calcu-lated melts of depleted, HZ, and fertile, AP, mantle compositionsgiven by Kinzler (1997) between 20–10 kbar; melting rate and meanextent (Fmean) listed
+ % oliv 13D-1a 45D-1a HZ HZ AP AP
4 2 Rate (%/ kbar) 1 2 1 2
Fmean 9.5 18.1 9.5 18.1
SiO2 50.59 49.13 SiO2 47.96 47.06 47.94 46.80TiO2 1.08 0.90 TiO2 1.06 0.75 1.00 0.69Al2O3 14.79 16.43 Al2O3 16.39 15.79 16.72 16.04Cr2O3 Cr2O3 0.10 0.12 0.08 0.09FeO* 8.78 8.85 FeO* 8.38 8.64 8.85 9.28MgO 10.29 10.23 MgO 12.31 13.95 11.59 13.45CaO 12.09 12.08 CaO 11.1 12.24 10.47 11.84K2O 0.04 0.04 K2O 0.07 0.03 0.07 0.03Na2O 2.33 2.30 Na2O 2.62 1.41 3.28 1.77Mg# 70.3 70.1 Mg# 74.8 76.5 72.6 74.6CaO/Al2O3 0.82 0.73 CaO/Al2O3 0.68 0.77 0.63 0.74
aFor full reference, the dredge and sample number xD–y should be preceded by the cruise number EW9309
Fig. 7 A Major element variation diagrams of MORB glasses fromthe southern MAR, with superimposed isobaric liquid-lines-of-descent for fractional crystallization calculated following Ariskinet al. (1993). Markers on trajectories show 10% crystallizationintervals. N-MORB shown as a shaded field. Starting composition:sample 45D-1 glass plus 2% olivine, see Table 4. Crystallizingphase proportions are summarized in Table 5. B CaO/Al2O3 ratiosand Sc abundances versus Mg# (atomic Mg2+/[Mg2++Fe2+]) inMORB glasses from the southern MAR, with superimposedisobaric liquid-lines-of-descent calculated as in A
c
592

593

parental magma compositions influence finer details ofsubsequent crystallization, calculated liquid-lines-of-de-scent all have the same general orientation in composi-tional diagrams and are similarly affected by thepresence or absence of clinopyroxene in the fractionat-ing assemblage. Consequently, to illustrate subsequentarguments results from a single representative exampleare presented as a proxy for a mythical ‘‘regional’’ pa-rental magma, in this case one of the more primitivemagmas found in the region, viz. 45D-1 (Table 2), cor-rected for 2% olivine fractionation to give a Mg#�70(Table 4). To reiterate, no one parental melt composi-tion is appropriate when attempting to, or could be ex-pected to, quantitatively account for the compositionalvariations observed amongst all the MORB samplesfrom the southern MAR. The following discussion ofmodeled crystal fractionation is only intended to addressthe possible presence of clinopyroxene in the fraction-ating assemblage during petrogenesis of these samples.
The calculated liquid-lines-of-descent for 50% iso-baric crystallization of the representative parental mag-ma composition at 1 atm, and 2, 4, 6 and 8 kbar aresuperimposed on the major element data in Fig. 7a, andthe main phase relationships are summarized in Table 5.In Fig. 7a there is a broad correspondence between theorientation of the major element data and calculatedliquid-lines-of-descent across the pressure range 1 atm to8 kbar. Discovery(+LOMU)-influenced MORB areoffset to higher Na2O, and all data are offset to lowerFeO* abundances. The Na2O and FeO* content ofMORB from Discovery(+LOMU)-influenced ridgesegments are considered anomalous and caused bysource region characteristics (le Roux et al. 2001).
Olivine is the liquidus phase at all pressures con-sidered, although the interval of olivine only crystalli-zation is short, followed within ±2% by crystallizationof olivine plus plagioclase (Table 5). It is evident from
Table 5 that the interval of olivine plus plagioclasecrystallization progressively contracts with increasingpressure, and that clinopyroxene joins the fractionatingassemblage progressively earlier as pressure is increased.The point at which clinopyroxene joins the fractionat-ing assemblage is indicated by the change of slope, fromnegative to positive, in liquid-lines-of-descent in theCaO–MgO diagram. Changing the parental magma toa more MgO-rich composition (e.g., 12–14 wt% MgOas in those derived from modeled spinel–lherzolitemelting, Table 4) in an attempt to ‘‘shift’’ this inflectionpoint in the calculated 1 atm trend to fit the observeddata, simply leads to a longer interval of olivine-onlyfractionation, which effectively exacerbates the prob-lem.
To achieve the necessary decrease in CaO (and to alesser extent the subdued decrease in Al2O3) with de-creasing MgO requires fractionation of clinopyroxene,for any realistic parental magma composition. For theparental composition presented, clinopyroxene is closeto the liquidus at 8 kbar – resulting in rapid decrease inCaO – and joins the crystallizing assemblage after 20%at 6 kbar, 29% at 4 kbar and only after 37% at 1 atm.The progressively earlier appearance of clinopyroxeneon the liquidus as pressure increases results in sets ofevenly-spaced, parallel trends for three-phase crystalli-zation, spanning the various pressures (Fig. 7). Theobserved CaO–MgO trend is thus primarily caused bycrystal fractionation involving clinopyroxene, whichoccurs over a range of pressures from 2–8 kbar, eventhough the probable range of primary magma compo-sitions would impart secondary scatter to this trend.More than 50% crystallization is required to accom-modate the compositional range of MORB from Shona-influenced ridge segments and a few samples from theDiscovery(+LOMU)-influenced ridge segments(Fig. 7a).
Table 5 Calculated liquidus temperatures and crystallizing phase proportions at different F values for different pressures of fractionalcrystallization of parental magma 45D-1 (+2% olivine). Values calculated using program CoMagmat of Ariskin et al. (1992). F valuesgiven where there is a major change in phase proportions or type
Pressure: 1 atm Pressure: 2 kbar Pressure: 4 kbar
Temp.(�C)
Proportions Temp.(�C)
Proportions Temp.(�C)
Proportions
Oliv Plag Cpx Oliv Plag Cpx Oliv Plag Cpx
Liquidus 1,248 Liquidus 1,255 Liquidus 1,263F=2% 1,230 68 32 F=2% 1,241 70 30 F=2% 1,254 70 30F=5% 1,227 31 69 F=5% 1,237 29 71 F=4% 1,246 29 71F=37% 1,175 3 42 55 F=32% 1,194 9 48 43 F=27% 1,213 4 44 52
Pressure: 6 kbar Pressure: 8 kbar
Temp.(�C)
Proportions Temp.(�C)
Proportions
Oliv Plag Cpx Oliv Plag Cpx
Liquidus 1,271 Liquidus 1,279F=2% 1,254 68 32 F=2% 1,262 68 32F=5% 1,252 30 70 F=4% 1,259 33 67F=20% 1,233 9 42 49 F=9% 1,257 16 47 37
594

The importance of clinopyroxene fractionation dur-ing the evolution of southern MAR magmas is furtherillustrated in Fig. 7b where CaO/Al2O3 ratios and Scabundances are plotted versus Mg#. CaO/Al2O3 ratio issensitive, in an opposite sense, to both plagioclasefractionation (ratio increases) and clinopyroxene frac-tionation (ratio decreases). Olivine fractionation has noeffect on the ratio. Consequently, the only way to causea decrease in CaO/Al2O3 ratio with decreasing Mg# (asshown by the southern MAR data – Fig. 7b) is to in-volve significant clinopyroxene fractionation. The cal-culated fractionation trajectories shown in Fig. 7billustrate this extremely well, and it is clear that normallow pressure fractionation of MORB involving onlyolivine and plagioclase leads to a rapid increase in CaO/Al2O3 ratio. Therefore, based on the calculated liquid-lines-of-descent in Fig. 7b, the southern MAR basaltshave compositions consistent with crystal fractionationwith clinopyroxene as an important fractionating phase.
In the majority of N-MORB and MORB from Sho-na-influenced ridge segments Sc shows a limited range inabundance (40–50 ppm; Fig. 7b). Published partitioncoefficients for Sc in clinopyroxene, during basalticcrystal fractionation at pressure of 1 atm to 8 kbar,range from �1 to 3 (Hauri et al. 1994; Niu et al. 1996;Blundy et al. 1998; Hill et al. 2000), whereas Sc is in-compatible with respect to both olivine and plagioclase(Schilling et al. 1983; Niu et al. 1996). A value for thepartition coefficient of Sc in clinopyroxene of 2.5 wasused to calculate the liquid-lines-of-descent in Fig. 7b.The calculated crystallization trajectories again under-score the necessity for significant clinopyroxene frac-tionation during the evolutionary history of the majorityof these basalts. The displacement of MORB fromDiscovery(+LOMU)-influenced ridge segments to un-usually low CaO/Al2O3 ratios and Sc contents at rela-tively high Mg# (60–65) is attributed to unusual sourceconditions associated with the Discovery(+LOMU)mantle components, discussion of which is beyond thescope of the current study, leading to parental magmaswith unusually low CaO/Al2O3 ratios and Sc contents (leRoux et al. 2001).
Pressures of crystallization
Recent studies have provided mechanisms for estimatingthe pressure of crystallization of MORB magmas (Groveet al. 1992; Yang et al. 1996; Michael and Cornell 1998).All require that the magma was saturated in olivine,plagioclase, and clinopyroxene at some stage duringcrystallization, a feature that appears to be applicable tothe majority of MORB samples from the southernMAR, as discussed in the preceding section.
Based on experiments, Grove et al. (1992) calculatedlocations of the olivine–plagioclase–augite–low Ca py-roxene-melt (OPALM), olivine–plagioclase–augite-melt(OPAM) and olivine–plagioclase-melt saturationboundaries for basalts at given pressures. By plotting
glass compositions of basalts and predicted phaseboundaries, at fixed pressures, on olivine–plagioclase–clinopyroxene and quartz–olivine–clinopyroxene pseu-do-ternary diagrams, the pressure at which the basaltsexperienced crystallization can be assessed graphically(Grove et al. 1992). In order to employ this approach, allglass data were corrected for inter-laboratory differencesbetween the MIT electron microprobe, used by Groveet al. (1992), and the UCT electron microprobe. In repre-sentative quartz–olivine–clinopyroxene pseudo-ternarydiagrams (Fig. 8) the OPAM phase boundaries, deter-mined following Grove et al. (1992), are superimposedon the fields for basalts from the southern MAR. Ingeneral, southern MAR basalt compositions plot closeto the 2–8 kbar OPAM boundaries, indicating elevatedpressures of crystallization relative to that typically ad-vocated for MORB evolution (Grove et al. 1992;Langmuir et al. 1992; Michael and Cornell 1998). Indetail, N-MORB plot close to the 2 to 4 kbar OPAMboundaries, although samples from dredge 12 define twogroups – one plotting at 1–3 kbar, the other at 6–7 kbar(Fig. 8; Table 6). Samples from Shona-influenced ridgesegments (e.g., dredge 19 at 51.1�S) also show twogroups – one plotting at 1–2 kbar, the other at 7–8 kbar.The majority of MORB from the Discovery(+LOMU)-influenced ridge segments plot along OPAM boundariesat 3–4 kbar.
The second method used to investigate pressures ofcrystallization employed algorithms of Yang et al.(1996), as rearranged and discussed by Michael andCornell (1998). The PCa equation of Michael and Cor-nell (1998) was used as it was found to be the mostrobust and least sensitive to analytical uncertainties. Tominimize comparing calculated pressures of crystalliza-tion of highly-evolved basalts with much lesser-evolvedbasalts, only glasses with MgO content >6.5 wt% wereused. Glasses with MgO content >8.3 wt% were alsodiscarded to reasonably ensure clinopyroxene saturation– a slightly higher, but narrower MgO range than thatemployed by Michael and Cornell (1998). The uppervalue was set at 8.3 wt% MgO because, somewhat ob-scured within all the samples plotted on the CaO–MgOdiagrams, clear trends of decreasing CaO with MgO aredefined by samples from individual dredges with MgObelow �8.3 wt%. Calculated pressures of crystallizationobtained using this method are given in Table 6, andagree well with those deduced following Grove et al.(1992; Table 6, Fig. 9), considering that the errors onboth methods are of the order of 1 kbar (Michael andCornell 1998).
Above-mentioned algorithms yield single calculatedpressures for individual samples, when in reality crys-tallization likely follows polybaric paths in reaching thefinal erupted basalt compositions. For example, a mag-ma might crystallize plagioclase, clinopyroxene and oli-vine at high pressure, but ascend to shallower depths,prior to eruption, where clinopyroxene is no longerstable. The magma then evolve towards the low pressurecotectic by crystallization of olivine and plagioclase,
595

with dissolution of clinopyroxene. If the residence timeat shallow levels is too short to allow the magma toreach the cotectic prior to eruption, then the composi-tion of the sampled basalt yields a calculated pressure ofcrystallization intermediate between the original highpressure crystallization and later shallow level crystalli-
zation. The calculated pressures are, therefore, minimafor the onset of crystallization and maxima for thecompletion of crystallization for each sample (Michaeland Cornell 1998).
Calculated pressures of crystallization for MORBfrom the southern MAR, obtained using both the above
596

methods, are plotted against latitude in Fig. 9. Latitu-dinal variations indicate that crystallization beneath thissection of the southern MAR occurred predominantly ata pressure range of 2–6 kbar (Fig. 9). Beneath Discov-ery(+LOMU)-influenced ridge segments to the north ofthe Falkland–Agulhas FZ (at �47.4–47.2�S), crystalli-zation appears to have occurred at slightly higher pres-sures whereas, to the south of this fracture zone, basaltsexperienced crystallization at much shallower pressuresof 1 atm–4 kbar. Exceptions being basalts from dredge25, at 47.3�S – immediately south of the Falkland–Agulhas FZ, and dredge 9, the southernmost Discov-ery(+LOMU)-influenced dredge at 49.1�S, whichexperienced crystallization at pressures up to 6 kbar.MORB from Shona-influenced ridge segments span aconsiderable range of pressures of crystallization, withbasalts at the northern extreme of the Shona anomalyapparently having experienced crystallization at pres-
sures of 2–8 kbar, whereas crystallization beneath thecentral and southern zones of the Shona anomaly oc-curred at much shallower pressures of 1 atm–4 kbar.
Variations in calculated pressures of crystallizationwith MgO content of the basalt glasses (Fig. 10)suggest distinct differences between the evolution ofN-MORB and E-type MORB. The majority ofN-MORB, with few exception, form a vertical clusterat approximately 8 wt% MgO and yield pressuresbetween 3–6 kbar, indicating that crystallization be-neath ridge segments unaffected by mantle plumesoccurred primarily at depths within the sub-oceanicmantle (Grove et al. 1992), and did not proceed forsufficiently long to result in highly evolved composi-tions. If a second phase of crystallization did occur atshallow (crustal) depths, it was of insufficient magni-tude to significantly mask the compositional effects ofthe prior high pressure crystallization. If results arerestricted by more conservative estimate of the MgOabundance at which clinopyroxene saturation occurred,e.g., 7.5 wt%, the dataset is obviously smaller, con-taining less examples of N-MORB, but the relativeresults of the different groups of samples discussedbelow remain valid.
Crystallization beneath mantle plume-influencedridge segments appears to have been already active athigher pressures (�7 kbar; with two basalts from dredge19 yielding pressures of 8–9 kbar), and occurred over acontinuous range of pressures to a final depth of 1 atm–
Table 6 Calculated pressures of crystallization for each dredge.High and low pressures calculated using the methodology of Mi-chael and Cornell (1998), for samples with MgO content between
6.5–8.3 wt% (all values plotted in Fig.9); and pressure ranges de-rived according to Grove et al. (1992), if aphyric bulk analysis exist.Dredges listed in order of increasing latitude
Michael and Cornell (1998) Grove et al. (1992)
Dredge P P Dredge P P Dredge P Dredge P(kbar) (kbar) (kbar) (kbar) (kbar) (kbar)High Low High Low
45 8 4.3 2.4 45 8–7 8 4–344 4.2 2.5 9 4.7 3.1 44 4–3 9 4–3.5; 643 4.5 3.3 10 5.3 3.3 43 4–2 10 4.5–442 11 4.9 3.9 42 8 11 441 5.3 4.4 12 3.8 3.7 41 5; 4 12 1; 3; 7–640 5.3 3.6 13 40 5–4 13 4–2.539 6.9 14 5.7 1.9 39 7 14 4.5–4; 237 6.6 4.7 24 3.4 37 6–5 24 336 5.7 15 5.2 2.6 36 5 15 4.5–4; 234 17 5.9 4.1 34 8–7 17 5.5–433 6.5 4.6 18 33 7–6 18 0.00132 4.9 3.5 19 8.0 1.7 32 4; 3 19 8–7; 2–131 6.6 5.0 A-10 3.0 1.8 31 6–5 A-1030 3.4 20 1.4 0.7 30 5–4 20 1–0.00128 4.2 2.8 A-9 1.6 1.2 28 3–2; 6 A-927 2.4 21 1.8 27 8–7; 2 21 226 3.0 23 26 3; 9 23 2.5–1.525 6.0 4.3 A-7 6.0 25 A-72 1.9 0.1 22 2 1.5–0.001 22 3–23 3.5 1.3 A-6 3.1 3 4–2 A-64 3.6 1.5 A-4 3.3 4 4–2 A-45 3.2 1.6 A-3 3.6 5 4–3.5 A-36 3.2 1.9 A-2 6 4–3.5 A-27 3.3 0.5 7 4; 1
Fig. 8 Quartz (Qtz)–olivine (Oliv)–clinopyroxene (Cpx) pseudo-ternary diagrams with the predicted olivine–plagioclase–augite–lowCa-pyroxene-melt points (black circles OPALM points) at 1 atmand 2–8 kbar (as labeled), and olivine–plagioclase–augite bound-aries (black lines) where relevant (Grove et al. 1992) of represen-tative dredges (see text for discussion). The OPALM points werecalculated using related quenched igneous glass and aphyric bulk-rock pairs with homogeneous compositions. Horizontal-lined fieldsindicate composition of relevant MORB glasses, labeled withdeduced pressures of crystallization
b
597

1 kbar. Crystallization beneath Discovery(+LOMU)-influenced ridge segments occurred over a largerpressure range (1 atm–�7 kbar) compared with N-MORB-dominated ridge segments (3–6 kbar), but didnot result in highly evolved magmas (down to �7 wt%MgO compared to �8 wt% for N-MORB). The degreeof crystallization beneath Discovery(+LOMU)-influ-enced ridge segments was thus only slightly greater thanbeneath ridge segments unaffected by mantle plumes. Incontrast, MORB from Shona-influenced ridge segmentsexperienced crystallization over a similar pressure range
(1 atm–�7 kbar) to Discovery(+LOMU)-influencedridge segments, but the duration was longer leading tomore evolved compositions (down to �5 wt% MgO).The behavior of MORB from Shona-influenced ridgesegments is consistent with observations from the globalMORB data-set; i.e., multi-phase crystallization oc-curred continuously as magma bodies ascended andmagma ponding at the shallowest levels have enoughtime to evolve to higher degrees (Michael and Cornell1998).
Discussion
Variations in major and selected trace element compo-sitions of MORB from the southern MAR indicate theinfluence of fractionation of plagioclase, olivine andclinopyroxene during their evolution. The presence oflarge (>2.5 mm), high-An (An85–90), resorbed plagio-
Fig. 9 Calculated pressures of crystallization of MORB glassesfrom the southern MAR versus latitude. A Pressures calculatedfollowing Michael and Cornell (1998), as discussed in the text, forglasses with MgO content between 6.5–8.3 wt%. B Pressuresobtained using the approach of (Grove et al. 1992), as discussed inthe text and illustrated in Fig. 8. Lines indicate the range ofpressure obtained from a cluster of basalts as illustrated in Fig. 8
598

clase phenocrysts in some samples, not in equilibriumwith host compositions, indicate open system crystalli-zation, magma mixing, or rapid change in the physicalenvironment of crystallization (e.g., decreasing pressurewith rapid ascent of magmas) prior to eruption. Theresorbed habit of many olivine phenocrysts and rareclinopyroxene phenocrysts provide further support foropen system processes or rapid changes in the physicalenvironment of crystallization.
The occurrence of clinopyroxene as an early crystal-lizing phase in southern MAR basalts is consistent withconclusions reached in studies of MORB from a numberof other localities. For example, Michael and Cornell(1998), in a study of MORB from a global dataset, leRoex et al. (1996) and Stakes et al. (1984) in studies ofbasalts from the AMAR and FAMOUS Valleys, andReynolds and Langmuir (1997) in a study of Kanefracture zone basalts, have all argued for clinopyroxenesaturation in MORB magmas with MgO contents<�8.3 wt%, which agrees with the present study whereclinopyroxene appears as a crystallizing phase at�8.3 wt%.
The dominance of modal plagioclase and the generalabsence of modal clinopyroxene phenocrysts are com-mon features of MORB, which contain compositionalevidence of clinopyroxene crystallization. This so-called‘‘pyroxene paradox’’, observed in a number of studies(e.g., Stakes et al. 1984; Batiza and Niu 1992; le Roexet al. 1996), is attributed to the density contrast betweenclinopyroxene and the host magma, hindering entrain-ment of clinopyroxene by rising magma, coupled with
the increasing olivine phase volume at decreasing pres-sure, and consequent resorption of clinopyroxene enroute to the surface. Thus, the observed modal miner-alogy of a basalt does not necessarily reflect the cotecticproportions of the crystallizing phases and the qualita-tive presence of a phase is petrogenetically more signif-icant (e.g., Bryan 1983; Stakes et al. 1984). The rarity ofmodal clinopyroxene in MORB from the southernMAR does not, therefore, necessarily detract from theconclusions reached regarding the importance of clino-pyroxene fractionation.
The general crystallization sequence of olivine, fol-lowed by olivine plus plagioclase, followed by olivineplus plagioclase plus clinopyroxene, is typical forMORB (e.g., Langmuir et al. 1992). The range in theestimated pressures of crystallization is also consistentwith inferred pressures of crystallization beneath otherridges (Grove et al. 1992; le Roex et al. 1996; Reynoldsand Langmuir 1997; Michael and Cornell 1998; Smithet al. 1998) and the proposed role of magma flux indetermining the primary depth of crystallization beneathridges (Sinton and Detrick 1992; Smith and Cann 1993;Michael and Cornell 1998), as discussed below.
The crystallization of N-MORB at depths of 3–6 kbarbeneath ridge segments is consistent with low magmaflux, cold crust and upper mantle, and a deeper brittle–ductile transition (Michael and Cornell 1998). Thethicker brittle cap along these ridge segments wouldresult in the halt of ascending magma at depth beforereaching a level of neutral buoyancy (Smith and Cann1993). In contrast, increasing magma flux and highertemperatures beneath ridge segments affected by mantleplumes would have resulted in high-temperature iso-therms at shallower levels, weaker crust and mantle(Michael and Cornell 1998), and the halt of ascendingmantle at shallower levels of 1 atm–3 kbar, where neutralbuoyancy is reached (Smith and Cann 1993). Further-more, the thicker crust beneath mantle plume-influencedridge segments could induce initial crystallization atdepth, as observed especially beneath ridge segmentsfrom the northern section of the Shona anomaly, if therewas a tendency for the ascending magma to pond at thedensity contrast between the crust and the mantle (Smithand Cann 1993), prior to ascending to shallower depthsof neutral buoyancy and major crystallization.
Crystallization, especially the initial phase of olivinecrystallization, at depths within the oceanic mantlebeneath ridge segments is supported by studies ofabyssal peridotites. Abyssal peridotites have been foundto contain excess modal olivine (Dick 1989; Niu 1997,1999) because of crystallization of olivine, during meltascent through the upper oceanic mantle after segrega-tion from the melting region, as a consequence of theexpansion of the olivine phase field with decreasingpressure (Niu 1997, 1999).
Geophysical and petrogenetic studies suggest theabsence of long-lived, steady-state, shallow-level magmachambers beneath segments of slow-spreading, lowmagma flux ridges such as the southern MAR (Batiza
Fig. 10 Pressure of crystallization calculated following Michaeland Cornell (1998), versus MgO content for quenched MORBglasses from the southern MAR. Dashed lines demarcate samples ofN-MORB and respective plume-influenced MORB. Vertical line at8.3 wt% MgO indicates upper limit of reliability of pressureestimates. Samples with MgO >8.3 wt% might not have beensaturated with clinopyroxene during crystallization
599

et al. 1988; Detrick et al. 1990; Batiza and Niu 1992;Sinton and Detrick 1992; Batiza et al. 1996; Michael andCornell 1998). In the terminology of Sinton and Detrick(1992), when ascending magma beneath these low fluxridge segments is halted, the magma chambers formedare dominated by the crystal mush zone and an erup-table magma lens is unlikely to exist in any steady-statesense. The dimensions and lifetime of these bodies wouldbe highly variable because of the intermittent nature ofthe magma supply (Sinton and Detrick 1992; Smith andCann 1993). Eruptions of basalt at slow-spreading ridgesare closely linked to tectonic events and injections offresh, primitive magmas from the mantle into the highlycrystalline mush zone (Sinton and Detrick 1992; Smithand Cann 1993). Erupted magmas at ridges character-ized by low magma supply therefore frequently includecrystals from the slowly cooling mush zone and arehighly porphyritic, with large phenocrysts out of equi-librium with the magma and showing signs of resorption(Sinton and Detrick 1992).
The above physical concepts agree with the modelproposed here for the evolution of N-MORB beneathridge segments of the southern MAR, where crystalli-zation occurred at depths within the oceanic mantle(3–6 kbar) in conduits or magma chambers dominatedby a highly crystalline mush zone and the absence of amelt lens. Intermittently, the arrival of a new batch ofmagma coupled with tectonic activity induced the for-mation of conduits through which magmas containingxenocrysts incorporated from the mush zone, especiallyless dense plagioclase crystals, ascended rapidly to thesurface to be erupted without further significant crystalfractionation. At ridge segments affected by the Dis-covery or Shona mantle plumes, crystal fractionationoccurred over a greater depth range, possibly starting at�7 kbar and culminating at oceanic crustal depths(1 atm–3 kbar). Although the magma flux is higher be-neath these ridge segments, it is still too low to sustainlong lived magma bodies, but the small batches ofascending magmas are able to form small, short livedshallow-crustal magma chambers. These magma cham-bers are also predominantly composed of the mush zone,but melt lenses are present, although discontinuous andsmall. The combination of small magma volumes, longermagma-chamber residence times and slower coolingrates beneath these ridges resulted in magmas attaininghigher degrees of differentiation prior to eruption, rela-tive to magmas from ridge segments unaffected bymantle plumes (Sinton and Detrick 1992; Smith andCann 1993; Michael and Cornell 1998).
Conclusions
MORB recovered from the southern MAR (40–55�S)are predominantly olivine-normative tholeiites, with fewquartz-normative, basaltic andesites (e.g., dredge 25).Most are aphyric to moderately porphyritic, although afew contain up to 40% phenocrysts. Plagioclase is the
dominant phenocryst phase, with lesser olivine andscarce clinopyroxene, Cr-spinel, and rare sulfide.
Despite the scarcity of clinopyroxene, observed majorand selected trace element variations of quenched glassesand bulk rock samples qualitatively necessitate three-phase crystallization of olivine, plagioclase, and clino-pyroxene in most basalts at some stage prior to eruption.Forward modeling, using as starting compositions se-lected least-evolved, high-MgO quenched glasses,aphyric bulk rocks, or theoretically calculated primitivemagmas, qualitatively confirm the importance of clino-pyroxene as an early fractionating phase, along witholivine and plagioclase, during crystallization.
Pressures of crystallization beneath ridge segments ofthe southern MAR determined using the formulations ofGrove et al. (1992) and Michael and Cornell (1998),indicate the importance of moderate to high pressurecrystallization beneath this ridge system. Crystallizationbeneath ridge segments unaffected by mantle plumesoccurred predominately at depths of 3 to 6 kbar (10–20 km). Along ridge segments affected by the Discoveryand Shona mantle plumes, crystallization occurred overa larger pressure range of 1 atm to �7 kbar, but pre-dominantly at oceanic crustal depths (1 atm–4 kbar).
Acknowledgements Samples analyzed in this study were collectedduring cruise EW9309 of the R/V Maurice Ewing funded by NSFgrant OCE 9011741 to J.-G. Schilling. The Captain, Ian Young,and crew are thanked for their assistance. P. le R. and A. le R.acknowledge support from the University of Cape Town and theNational Research Foundation, South Africa.
References
Albee AL, Ray L (1970) Correction factors for electron probemicroanalyses of silicates, oxides, carbonates, phosphates andsulphates. Anal Chem 42:1408–1414
Ariskin AA, Frenkel MY, Barmina GS, Nielsen RL (1993) Co-magmat: A FORTRAN program to model magma differenti-ation processes. Comp Geosci 19:1155–1170
Batiza R, Niu Y (1992) Petrology and magma chamber processes atthe East Pacific Rise �9�30¢N. J Geophys Res 97:6779–6797
Batiza R, Melson WG, O’Hearn T (1988) Simple magma supplygeometry inferred beneath a segment of the Mid-AtlanticRidge. Nature 335:428–431
Batiza R, Niu Y, Karsten JL, Boger W, Potts E, Norby L, Butler R(1996) Steady and non-steady state magma chambers below theEast Pacific Rise. Geophys Res Lett 23:221–224
Bence AE, Albee AL (1968) Empirical correction factor for theelectron microanalysis of silicates and oxides. J Geol 76:382–403
Blundy JD, Robinson JAC, Wood BJ (1998) Heavy REE arecompatible in clinopyroxene on the spinel lherzolite solidus.Earth Planet Sci Lett 160:493–504
Bryan WB (1983) Systematics of modal phenocryst assemblages insubmarine basalts: petrologic implications. Contrib MineralPetrol 83:62–74
Detrick RS, Mutter JC, Buhl P, Kim II (1990) No evidence frommultichannel reflection data for a crustal magma chamber inthe MARK area on the Mid-Atlantic Ridge. Nature 347:61–64
Dick HJB (1989) Abyssal peridotites, very slow spreading ridgesand ocean ridge magmatism. In: Saunders AD, Norry MJ (eds)Magmatism in the Ocean Basins. Geol Soc Spec Publ 42:71–105
Douglass J, Schilling J-G (2000) Systematics of three-component,pseudo-binary mixing lines in 2D isotope ratio space repre-
600

sentations and implications for mantle plume–ridge inter-actions. Chem Geol 163:1–23
Douglass J, Schilling J-G, Kingsley RH (1995) Influence of the Dis-covery and Shona mantle plumes on the southern Mid-AtlanticRidge: rare earth evidence. Geophys Res Lett 22:2893–2896
Douglass J, Schilling J-G, Fontignie D (1999) Plume-ridge inter-actions of the Discovery and Shona mantle plumes with thesouthern Mid-Atlantic Ridge (40�–55�S). J Geophys Res104:2941–2962
Duncan AR, Erlank AJ, Betton PJ (1984) Appendix 1: analyticaltechniques and database descriptions. In: Erlank AJ (eds) Pet-rogenesis of the volcanic rocks of the Karoo Province, vol 13.Special Publication, Geological Society of South Africa,Johannesburg, pp 389–395
Fisk MR, Bence AE, Schilling J-G (1982) Major element chemistryof Galapagos Rift Zone magmas and their phenocrysts. EarthPlanet Sci Lett 61:171–189
Frey FA, Walker N, Stakes D, Hart SR, Nielsen R (1993) Geo-chemical characteristics of basaltic glasses from the AMAR andFAMOUS Axial Valleys, Mid-Atlantic Ridge (36�–37�N):Petrogenetic implications. Earth Planet Sci Lett 115:117–136
Ghiorso MS, Sack RO (1995) Chemical mass transfer in magmaticprocesses IV. A revised and internally consistent thermody-namic model for the interpolation and extrapolation of liquid–solid equilibria in magmatic systems at elevated temperaturesand pressures. Contrib Mineral Petrol 119:197–212
Ghiorso MS, Hirschmann MM, Sack RO (1994) New softwaremodels thermodynamics of magmatic systems. EOS Trans AmGeophys Union 75:571, 575, 576
Grove TL, Kinzler RJ, Bryan WB (1992) Fractionation of mid-ocean ridge basalts (MORB). In: Morgan JP, Blackman DK,Sinton JM (eds) Mantle flow and melt generation at mid-oceanridges. Geophys Monogr Am Geophys Union 71:281–310
Hauri EH, Wagner TP, Grove TL (1994) Experimental and naturalpartitioning of Th, U, Pb and other trace elements between gar-net, clinopyroxene and basaltic melts. Chem Geol 117:149–166
Hill E, Wood BJ, Blundy JD (2000) The effect of Ca-Tschermakscomponent on trace element partitioning between clinopyrox-ene and silicate melt. Lithos 53:203–215
Kelemen PB, Shimizu N, Salters VJM (1995) Extraction of mid-ocean-ridge basalt from the upwelling mantle be focused flow ofmelt in dunite channels. Nature 375:747–753
Kelemen PB, Hirth G, Shimizu N, Spiegelman M, Dick HJB (1997)A review of melt migration processes in the adiabatically up-welling mantle beneath oceanic spreading ridges. Philos TransR Soc Lond 355:283–318
Kinzler RJ (1997) Melting of mantle peridotite at pressuresapproaching the spinel to garnet transition: application tomid-ocean ridge basalt petrogenesis. J Geophys Res 102:853–874
Kinzler RJ, Grove TL (1992) Primary magmas of mid-ocean ridgebasalts 2. Applications. J Geophys Res 97:6907–6926
Kinzler RJ, Grove TL (1993) Corrections and further discussion ofthe primary magmas of mid-ocean ridge basalts, 1 and 2.J Geophys Res 98:22339–22347
Langmuir CH, Klein EM, Plank T (1992) Petrological systematicsof mid-ocean ridge basalts: constraints on melt generation be-neath ocean ridges. In: Morgan JP, Blackman DK, Sinton JM(eds) Mantle flow and melt generation at mid-ocean ridges.Geophys Monogr Am Geophys Union 71:183–280
le Roex AP (1987) Source regions of mid-ocean ridge basalts: evi-dence for enrichment processes. In: Menzies MA, HawkesworthCJ (eds) Mantle metasomatism. Academic Press, London,pp 389–422
le Roex AP, Dick HJB, Gulen L, Reid AM, Erlank AJ (1987) Localand regional heterogeneity in MORB from the Mid-AtlanticRidge between 54.5�S and 51�S: evidence for geochemical en-richment. Geochim Cosmochim Acta 51:541–555
le Roex AP, Frey FA, Richardson SH (1996) Petrogenesis of lavasfrom the AMAR Valley and Narrowgate region of the FA-MOUS Valley, 36�–37�N on the Mid-Atlantic Ridge. ContribMineral Petrol 124:167–184
le Roux PJ, le Roex AP, Schilling J-G (2001) MORB meltingprocesses beneath the southern Mid-Atlantic Ridge (40–55�S),with a role for residual garnet. J Petrol (in press)
Michael PJ, Cornell WC (1998) Influence of spreading rate andmagma supply on crystallization and assimilation beneath mid-ocean ridges: evidence from chlorine and major elementchemistry of mid-ocean ridge basalts. J Geophys Res 103:18325–18356
Moreira M, Staudacher T, Sarda P, Schilling J-G, Allegre CJ(1995) A primitive plume neon component in MORB: theShona ridge-anomaly, South Atlantic (51–52�S). Earth PlanetSci Lett 133: 367–377
Nielsen RL (1988) TRACE.FOR: a program for the calculation ofcombined major and trace-element liquid lines of descent fornatural magmatic systems. Comp Geosci 14:15–35
Nielsen RL (1989) Phase equilibria constraints on liquid lines ofdescent generated by paired assimilation and fractional crys-tallization: trace elements and Sr and Nd isotopes. J GeophysRes 94:787–794
Nielsen RL (1990) Simulation of igneous differentiation processes.In: Nicholls J, Russel JK (eds) Modern methods of igneouspetrology: understanding magmatic processes. Miner Soc Am,Rev Mineral 24:65–105
Nielsen RL, DeLong SE (1992) A numerical approach to boundarylayer fractionation: application to differentiation in naturalmagma systems. Contrib Mineral Petrol 110:355–369
Niu Y (1997) Mantle melting and melt extraction processes beneathocean ridges: evidence from abyssal peridotites. J Petrol38:1047–1074
Niu Y (1999) Comments on some misconceptions in igneous andexperimental petrology and methodology: a reply. J Petrol40:1195–1203
Niu Y, Batiza R (1994) Magmatic processes at a slow spreadingridge segment: 26�S Mid-Atlantic Ridge. J Geophys Res99:19719–19740
Niu Y, Waggoner DG, Sinton JM, Mahoney JJ (1996) Mantlesource heterogeneity and melting processes beneath seafloorspreading centers: the East Pacific Rise. 18�–19�S. J GeophysRes 101:27711–27734
Pearce NJG, Perkins WT, Westgate JA, Gorton MP, Jackson SE,Neal CR, Chenery SP (1997) A compilation of new and pub-lished major and trace element data for NIST SRM 610 andNIST SRM 612 glass reference materials. Geostand Newslett21:115-144
Reiners PW (1998) Reactive melt transport in the mantle andgeochemical signatures of mantle-derived magmas. J Petrol39:1039–1061
Reynolds JR, Langmuir CH (1997) Petrological systematics of theMid-Atlantic Ridge south of Kane: implications for ocean crustformation. J Geophys Res 102:14915–14946
Roeder PL, Emslie RF (1970) Olivine–liquid equilibrium. ContribMineral Petrol 29:275–289
Sack RO, Ghiorso MS (1994a) Thermodynamics of multicompo-nent pyroxenes: II. Phase relations in the quadrilateral. ContribMineral Petrol 116:287–300
Sack RO, Ghiorso MS (1994b) Thermodynamics of multicompo-nent pyroxenes: I. Formulation of a general model. ContribMineral Petrol 116:277–286
Sack RO, Ghiorso MS (1994c) Thermodynamics of multicompo-nent pyroxenes: III. Calibration of Fe2+(Mg)–1, TiAl2(MgSi2)
–1,TiFe2
3+(MgSi2)–1, AlFe3+(MgSi)–1, NaAl(CaMg)–1, Al2(Mg-
Si)–1 and Ca(Mg)–1 exchange reactions between pyroxenes andsilicate melts. Contrib Mineral Petrol 118:271–296
Sarda P (2000) Rare gas systematics on the southernmost Mid-Atlantic Ridge: constraints on the lower mantle and the Dupalsource. J Geophys Res 105:5973–5996
Schilling J-G, Zajac M, Evans R, Johnson T, White W, Devine JD,Kingsley R (1983) Petrologic and geochemical variations alongthe Mid-Atlantic Ridge from 29�N to 73�N. Am J Sci 283:510–586
Silver PG (1998) Coupling of South American and African platemotion and plate deformation. Science 279:60–63
601

Sinton JM, Detrick RS (1992) Mid-ocean ridge magma chambers.J Geophys Res 97:197–216
Small C (1995) Observations of ridge-hotspot interactions in theSouthern Ocean. J Geophys Res 100:17931–17946
Smith DK, Cann JR (1993) Building the crust at the Mid-AtlanticRidge. Nature 365:707–715
Smith SE, Casey JF, Bryan WB, Dmitriev L, Silantyev S, Mag-akyan R (1998) Geochemistry of basalts from the HayesTransform region of the Mid-Atlantic Ridge. J Geophys Res103:5305–5329
Smith WHF, Sandwell DT (1997) Global sea floor topographyfrom satellite altimetry and ship depth soundings. Science277:1956–1962
Sobolev AV, Shimizu N (1993) Ultra-depleted primary melt in-cluded in an olivine from the Mid-Atlantic Ridge. Nature363:151–154
Sobolev AV, Shimizu N (1994) The origin of typical NMORB: Theevidence from a melt inclusion study (Abstr). Mineral Mag58A:862–863
Stakes D, Shervais JW, Hopson CA (1984) The volcanic–tectoniccycle of the FAMOUS and AMAR valleys, Mid-AtlanticRidge (36�47¢N): evidence from basalt glass and phenocrystcompositional variations for a steady state magma chamberbeneath the valley midsections, AMAR 3. J Geophys Res89:6995–7028
Suhr G (1999) Melt migration under oceanic ridges: inferencesfrom reactive transport modelling of upper mantle hosted du-nites. J Petrol 40:575–599
Sun S, McDonough WF (1989) Chemical and isotopic systematicsof oceanic basalts: implications for mantle composition andprocesses. In: Saunders AD, Norry MJ (eds) Magmatism in theocean basins. Geol Soc Spec Publ 42:313–345
Yang H-J, Kinzler RJ, Grove TL (1996) Experiments andmodels of anhydrous, basaltic olivine–plagioclase–augite sat-urated melts from 0.001 to 10 kbar. Contrib Mineral Petrol124:1–18
602


