Embed Size (px)
Citation preview
Journal of Biotechnology 112 (2004) 225–245
Current issues for DNA microarrays: platform comparison,double linear amplification, and universal RNA reference�
Peter J. Parka,1, Yun Anna Caob,1, Sun Young Leeb, Jong-Woo Kimb,Mi Sook Changb, Rebecca Hartb, Sangdun Choib,∗
a Children’s Hospital Informatics Program and Harvard Medical School, 320 Longwood Ave, Boston, MA 02115, USAb Division of Biology 147-75, California Institute of Technology, Pasadena, CA 91125, USA
Received 23 January 2004; received in revised form 26 April 2004; accepted 12 May 2004
Abstract
DNA microarray technology has been widely used to simultaneously determine the expression levels of thousands of genes.A variety of approaches have been used, both in the implementation of this technology and in the analysis of the large amountof expression data. However, several practical issues still have not been resolved in a satisfactory manner, and among the mostcritical is the lack of agreement in the results obtained in different array platforms. In this study, we present a comparison ofseveral microarray platforms [Affymetrix oligonucleotide arrays, custom complementary DNA (cDNA) arrays, and custom oligoarrays printed with oligonucleotides from three different sources] as well as analysis of various methods used for microarraytarget preparation and the reference design. The results indicate that the pairwise correlations of expression levels betweenplatforms are relative low overall but that the log ratios of the highly expressed genes are strongly correlated, especially betweenAffymetrix and cDNA arrays. The microarray measurements were compared with quantitative real-time-polymerase chainreaction (QRT-PCR) results for 23 genes, and the varying degrees of agreement for each platform were characterized. We havealso developed and tested a double amplification method which allows the use of smaller amounts of starting material. The addedround of amplification produced reproducible results as compared to the arrays hybridized with single round amplified targets.Finally, the reliability of using a universal RNA reference for two-channel microarrays was tested and the results suggest thatcomparisons of multiple experimental conditions using the same control can be accurate.© 2004 Elsevier B.V. All rights reserved.
Keywords:DNA microarray; Platform comparison; Linear amplification; Universal RNA reference; Inkjet
� The microarray data used in this paper were depositedinto GEO (http://www.ncbi.nlm.nih.gov/geo/, Gene ExpressionOmnibus) under the accession numbers of GSM4652–4670.
∗ Corresponding author. Tel.:+1-626-395-8732;fax: +1-626-796-7066.
E-mail address:[email protected] (S. Choi).1 Contributed equally to this work.
1. Introduction
DNA microarray technology has become an im-portant tool in biological investigations by allowingresearchers to measure the expression levels of thou-sands of genes simultaneously (Brown and Botstein,1999; Choi et al., 2001; Lockhart and Winzeler, 2000;Schena et al., 1995). Generally, DNA microarrays are
0168-1656/$ – see front matter © 2004 Elsevier B.V. All rights reserved.doi:10.1016/j.jbiotec.2004.05.006

226 P.J. Park et al. / Journal of Biotechnology 112 (2004) 225–245
created in two basic forms: by DNA deposition or byin situ synthesis of oligonucleotide arrays. DepositedDNA materials can be in the form of polymerase chainreaction (PCR)-amplified complementary DNAs (cD-NAs), pre-synthesized oligonucleotides, or genomicDNAs in the form of plasmids such as bacterial artifi-cial chromosomes (BACs). Fabrication of in situ syn-thesized oligonucleotides by photolithographic maskswas pioneered by Affymetrix Inc. (Santa Clara, CA).All these platforms employing cDNA or oligonu-cleotides use unique target amplification and labelingmethods (Dorris et al., 2002; Eberwine et al., 1992;Feldman et al., 2002; Wang et al., 2000).
The availability of such multiple array platforms,which may also differ in probe preparation methodsand array surface chemistry, raises the question ofcross-platform agreement in gene expression measure-ments. Besides the many studies that have examinedin detail the performance characteristics of single plat-forms [e.g., 50-mer oligonucleotides on glass (Kaneet al., 2000) and cDNA arrays (Yue et al., 2001)],a number of comparative studies have been carriedout. In Kuo et al. (2002), corresponding measure-ments from cDNA and Affymetrix GeneChip arrayswere reported to show poor correlation for samplesfrom human cancer cell lines; inYuen et al. (2002),Affymetrix and laboratory-developed cDNA arrayswere compared and concordant results were obtainedon a number of genes with known regulation, al-though both platforms consistently underestimated thefold changes. In a comparison study between spotted70-mer oligonucleotide arrays and Affymetrix for hu-man samples, correlation coefficients of 0.8–0.9 wereobtained for differential expression ratios (Barczaket al., 2003); similarly, between unmodified 70-meroligonucleotide arrays on glass slides and cDNAs,a correlation coefficient of 0.80 (Wang et al., 2003)was observed. InLi et al. (2002), both sensitivity andspecificities for selected genes were found to be verydifferent between Affymetrix and commercial longcDNA arrays, and Affymetrix arrays appeared to per-form more reliably. InTan et al. (2003), Affymetrix,Agilent (cDNA probes) and Amersham (Codelink,30-mer oligonucleotide probes) were shown to ex-hibit considerable divergence, with correlations in therange of 0.5–0.6 for both expression measurementsand log ratios. All these reports have provided someanswers as well as adding a barrage of new questions
on the reliability of data from different microarrayplatforms.
In the present study, we systematically comparedthree different microarray platforms constructed fromthree different oligonucleotide sources (AffymetrixMG-U74A array, a custom cDNA array, and customoligo arrays printed with oligonucleotides from threedifferent sources). Quantitative real-time RT-PCR(QRT-PCR) on tens of selected genes was also per-formed to confirm the results obtained with each plat-form. We carry out an extensive analysis of the data.In addition to the correlation analysis on matchedgenes for overall agreement, our analysis includesestimation of coefficient of variations through regres-sion, examination of dynamic ranges, comparisons oflog ratios at different signal intensity levels, charac-terization of systematic under-estimation of the ratiosrelative to the RT-PCR results, and comparisons ofprobes mapping to the same gene in a given platform.In particular, the typical analysis by the Pearson cor-relation coefficient on the log ratios can be unstable,depending heavily on the details of the filtering crite-ria and simply due to the inherent properties of ratios.We therefore examine the correlations among theplatforms as a function of signal intensity. We alsosuggest how the fold ratios should be modified foreach platform based on the extent of under-estimationfor log ratios.
DNA microarray hybridization using conventionalmethods where mRNA or total RNA is labeled andhybridized without amplification is particularly chal-lenging when only a small amount of RNA is avail-able. Using conventional labeling methods, even 20�gof total RNA is often insufficient. This can ultimatelylead to diminished signal intensity and thus introducea great deal of spot to spot variation. PCR methodshave been used to amplify signals (Iscove et al., 2002;Livesey et al., 2000; Puskás et al., 2002). However, itwas not clear if the number of transcripts amplified wasproportional to the original copy numbers due to theexponential amplification nature of PCR itself. A lin-ear amplification method using T7 promoter has beendeveloped and popularly used in past years (Dorriset al., 2002; Puskás et al., 2002; Wang et al., 2000).As starting materials extracted from various experi-ments become enormously scarce such as on the tensof nanogram scale, the need for a more significant am-plification method is required. Here, we have devel-
P.J. Park et al. / Journal of Biotechnology 112 (2004) 225–245 227
oped and tested a double amplification method whichallows the use of much smaller amounts of startingmaterial.
Furthermore, a consensus has not yet been reachedregarding the type of RNA reference sample most suit-able for two color microarray experiments. Currently,a universal standard RNA reference sample, whichcombines total RNA from several cell lines, is avail-able for use from Stratagene (La Jolla, CA) or BD Bio-sciences Clontech (Palo Alto, CA). Nonbiased testingusing this universal standard reference will provideresearchers with meaningful information to incorpo-rate in future microarray experimental plans. To see ifa standard for microarray RNA reference can be ap-plied to research practice, a universal RNA referencefor microarrays was tested.
2. Materials and methods
2.1. Microarray fabrication
Amongst all arrays compared, only the AffymetrixGeneChip array is currently commercially available.The Affymetrix array used in this experiment was theMurine Genome U74A Version 2 GeneChip. Eachgene represented on the Affymetrix array containstwenty 25-mer probes encompassing 200–300 bps de-rived from the gene. The remaining arrays included inour comparisons were all custom-designed arrays. ThecDNA array is a 16K array designed by our laboratory.The cDNA clones are based on the RIKEN FAN-TOM cDNA library (http://fantom.gsc.riken.go.jp)and the PCR products were inkjet-printed by Agi-lent Technologies (Palo Alto, CA). cDNA probes are0.5–3 kb in length where about 60% of the probesrepresent full length transcripts. The 16K oligo arrayincludes 13,536 Operon (Operon Technologies Inc.,Alameda, CA) designed and synthesized probes, and2,304 Compugen (Compugen Ltd., Jamesburg, NJ)designed and Sigma–Genosys (The Woodlands, TX)synthesized probes. Oligo probes measure 70-mer(Operon) and 65-mer (Compugen) in length and weredesigned according to sequence, melting temperature,and ATGC content. This 16K oligo array was alsoinkjet-printed by Agilent Technologies. Lastly, a 10Koligonucleotide set was separately purchased fromMWG (MWG Biotech Inc., High Point, NC) and
printed on CMT-GAPS Coated Slides (Corning Inc.,Acton, MA) using a high-precision pin-spotting robot(OmniGrid: GeneMachines, San Carlos, CA) to makepin-spotted oligo arrays.
2.2. RNA samples
To evaluate the different array platforms and label-ing techniques, mouse spleen and liver total RNAswere purchased from Clontech and used as the com-mon starting material. The distribution of arrays in-volved in the study is as follows: 4 Affymetrix arrays(2 each for liver and spleen), 12 cDNA arrays (3 forliver versus spleen, single amplification; 3 for liverversus spleen, double amplification; 3 each for liverand spleen versus universal reference); and 12 oligoarrays [3 for liver versus spleen (+1 with dye swap);3 with aminoally labeling; 2 with fragmentation; and3 pin-spotted]. QRT-PCRs were done on 23 genes.
2.3. Target preparation
2.3.1. cDNA arraysFirst strand cDNA was synthesized by incubating
3�g of total RNA with 1�l of 100 pmol/�l T7-oligodT at 70◦C for 10 min followed by incubation with4�l of 5× RT buffer, 2�l of 0.1 M DTT, 1�l of10 mM dNTP, and 1�l of 200 U/�l SuperScript II(Invitrogen Life Technologies, Carlsbad, CA) at 42◦Cfor 1 h. Second strand cDNA synthesis began withthe addition of 30�l of 5× second strand buffer(Invitrogen), 3�l of 10 mM dNTP, 4�l of 10 U/�lEscherichia coliDNA polymerase I (New EnglandBiolabs Inc., Beverly, MA), 1�l of 10 U/�l E. coliDNA ligase (NEB), 1�l of 2 U/�l of RNase H (In-vitrogen), and 91�l of nuclease-free water followedby incubation at 16◦C for 2 h. After incubation, 2�lof T4 DNA polymerase (5 U/�l) (Invitrogen) wasadded to the mixture followed by 5 min incubationat 16◦C. The sample was immediately placed on iceand then centrifuged briefly prior to the addition of7.5�l of RNA digestion buffer (1 N NaOH, 2 mMEDTA pH8.0) and the subsequent 10 min incubationat 65◦C. After the sample was cooled on ice, 160�lof 25:24:1 phenol:chloroform:isoamyl alcohol wasadded to the mixture. The reaction was vortexed andimmediately transferred to a Phase Lock Gel tube(Eppendorf AG, Germany) followed by a 3 min cen-

228 P.J. Park et al. / Journal of Biotechnology 112 (2004) 225–245
trifugation at 12,000× g. After centrifugation, 75�lof 7.5 M ammonium acetate (−20◦C) and 500�l of100% ethanol (−20◦C) were mixed with the upperphase in a new 1.6 ml tube. The sample was thencentrifuged immediately at 12,000 rpm for 20 min atroom temperature. The supernatant was removed andthe pellet was washed using 80% ethanol (−20◦C)and 100% ethanol (−20◦C). The dried pellet wasthen dissolved in 22�l of nuclease-free water andstored at−20◦C.
The day following cDNA synthesis, 16�l of cDNAwas incubated with 24�l of transcription mixture(MEGAscript T7 Kit, Ambion Inc., Austin, TX);consisting of 4�l of 10× reaction buffer, 4�l ofATP solution, 4�l of CTP solution, 4�l of GTPsolution, 4�l of UTP solution, and 4�l of enzymemix, at 37◦C for 4 h. Immediately following incu-bation, 2�l of DNase I was added and the reactionmixture was incubated at 37◦C for 15 min. After invitro transcription, phenol extraction was performedby mixing 100�l of phenol:chloroform:isoamyl alco-hol (25:24:1) with 100�l of the cRNA mixture andcentrifuged for 30 s at 12,000× g. The mixture wasimmediately transferred to a pre-spin Phase Lock Geltube and centrifuged for 5 min at 12,000× g. Theupper phase was removed with care and transferredto a fresh tube. Phenol extracted cRNA was furtherpurified by using RNeasy Mini Kit (Qiagen Inc.,Valencia, CA). Fluorescent target labelling was per-formed by incubating 5�g of amplified cRNA with2�l of 3 �g/�l random hexamer primer at 70◦C for10 min. After primer denaturation, the reaction mix-ture was incubated with 6�l of 5× first strand buffer,3�l of 0.1 M DTT, 0.6�l of 50× dNTP mix, 2�l ofSuperScript II RT, and 3�l of 1 mM Cyanine 3-dUTPor 1 mM Cyanine 5-dUTP (Amersham Biosciences,Piscataway, NJ) at 42◦C for 2 h. The reaction mix-ture was then concentrated using Microcon YM-30filtering unit (Millipore, Billerica, MA).
Cyanine 3 or Cyanine 5 labelled cDNA werecombined with 2.5�l of Mouse Cot-1 DNA (Invit-rogen), 2.5�l of deposition control target (Operon),and 12.5�l of 2× hybridization buffer (Agilent).The mixture was boiled for 3 min and centrifuged at12,000 rpm for 3 min. About 24�l of the resultingmixture was applied to the array and hybridized at60◦C for 17 h. After hybridization, the array waswashed several times with solution I (0.5× SSC,
0.01% SDS, and 1 mM DTT in nuclease-free wa-ter) and solution II (0.06× SSC and 1 mM DTT innuclease-free water), respectively.
2.3.2. Oligo arraysFluorescent Linear Amplification Kit (Agilent) was
used. Briefly, both first and second strand cDNA weresynthesized by incubating 3�g of total RNA with 5�lof T7 Promoter Primer in nuclease-free water at 65◦Cfor 10 min followed by incubation with 4�l of 5× firststrand buffer, 2�l of 0.1 M DTT, 1�l of 10 mM dNTP,1�l of 200 ng/�l random hexamers, 1�l of 200 U/�lMMLV-RT, 0.5 �l of 40 U/�l RNaseOUT, and 1�l ofTriton X-100 at 40◦C for 4 h. Immediately followingcDNA synthesis, the reaction mixture was incubatedwith 4�l of 6.0 mM Cyanine-3-CTP or 4�l of 4.0 mMCyanine-5-CTP (Perkin-Elmer, Boston, MA), 20�lof transcription buffer, 8�l of NTP mixture, 6�l of0.1 M DTT, 0.5�l of RNaseOUT, 0.6�l of inorganicpyrophosphatase, 0.8�l of T7 RNA polymerase, and20.1�l of nuclease-free water at 40◦C for 3 h. Cyanine3 or Cyanine 5 labelled cRNA were combined with2.5�l of Mouse Cot-1 DNA (Invitrogen), 2.5�l ofdeposition control target (Operon), and 12.5�l of 2×hybridization buffer (Agilent). The mixture was boiledfor 3 min and centrifuged at 12,000 rpm for 3 min.About 24�l of the resulting mixture was applied tothe array and hybridized at 65◦C for 17 h. After hy-bridization, the array was washed several times withsolution I (0.5× SSC, 0.01% SDS, and 1 mM DTT innuclease-free water), solution II (0.25× SSC, 0.01%SDS, and 1 mM DTT in nuclease-free water), and so-lution III (0.06× SSC and 1 mM DTT in nuclease-freewater), respectively.
2.3.3. Affymetrix GeneChipDouble stranded cDNA was made as described in
cDNA arrays section. The cRNA labelling and hy-bridization were processed as recommended by theBioarray High Yield RNA Transcript Labelling Kit(Enzo Diagnostics Inc., Farmingdale, NY) protocoland Affymetrix. Briefly, cRNA was synthesized fromdouble stranded cDNA by incubating 10�l of cDNAwith 4�l of 10× HY reaction buffer, 4�l of 10× bi-otin labelled ribonucleotides, 4�l of 10× DTT, 4�l of10× RNase inhibitor mix, 2�l of 20× T7 RNA poly-merase, and 12�l of nuclease-free water at 37◦C for5 h. After in vitro transcription, cRNA was purified us-

P.J. Park et al. / Journal of Biotechnology 112 (2004) 225–245 229
ing RNeasy Mini Kit (Qiagen). cRNA was fragmentedby mixing 20�g of cRNA (in 32�l) with 8 �l of 5×fragmentation buffer and 40�l of RNase-free water.The mixture was then incubated at 94◦C for 35 minand subsequently placed on ice. The hybridizationmixture was prepared by mixing 10�g of fragmentedcRNA with 3.3�l of 3 nM Control Oligonucleotide B2(Affymetrix), 10�l of 20× Eukaryotic HybridizationControls (bioB, bioC, bioD, cre) (Affymetrix), 2�lof 10 mg/ml herring sperm DNA, 2�l of 50 mg/mlacetylated BSA, 100�l of 2× hybridization buffer,and lastly enough nuclease-free water to make a finalvolume of 200�l. During array equilibration, the hy-bridization mixture was heated to 99◦C for 5 min ina heat block followed by 5 min incubation at 45◦C.After incubation, the hybridization mixture was spunat maximum speed in a tabletop microcentrifuge for5 min to remove any insoluble material. Appropriatevolume of the hybridization mixture was then addedto the probe array. The probe array was subsequentlyhybridized at 45◦C, rotating at 60 rpm, for 16 h. Afterhybridization, the probe array was washed using theGeneChip Fluidics Station 400 (Affymetrix).
3. Scanning
After hybridization and washing, cDNA and oligoarrays were scanned by the Agilent Scanner G2505A(Agilent) while Affymetrix arrays were scanned bythe Agilent GeneArray Scanner (Agilent).
4. Double amplification method
Single amplification was performed as described incDNA arrays. First strand cDNA synthesis for the sec-ond cycle of amplification began by incubating theamplified cRNA with 1�l of 1 �g/�l random primerand sufficient amount of nuclease-free water at 70◦Cfor 10 min. Then, it was incubated with 4�l of 5×first strand buffer, 2�l of 0.1 M DTT, 1�l of 10 mMdNTP, and 1�l of 40 U/�l RNase inhibitor at 42◦Cfor 2 min. Immediately afterwards, 1�l of 200 U/�lSuperScript II was added to the mixture and incubatedat 42◦C for 1 h followed by incubation with 1�l of2 U/�l RNase H at 37◦C for 20 min. Before beginningsecond strand cDNA synthesis, RNase H in the reac-
tion mixture was denatured by heating to 95◦C for5 min. Second strand cDNA synthesis began by incu-bating the reaction mixture with 1�l of 100 pmol/�lT7-(dT)24 primer at 70◦C for 10 min. It was then in-cubated with 30�l of 5× second strand buffer, 3�lof 10 mM dNTP, 4�l of 10 U/ml E. coli DNA poly-merase and 91�l of nuclease-free water at 16◦C for2 h. After incubation, 2�l of T4 DNA polymerase(5 U/�l) was added to the mixture followed by 15 minincubation at 16◦C. Double stranded cDNA productwas subsequently cleaned-up by ethanol precipitation.In vitro transcription, labelling, hybridization, wash-ing, and scanning steps were performed in the samemanner described previously for the cDNA arrays.
5. Quantitative real-time RT-PCR
Quantitative real-time RT-PCR was performed us-ing GeneAmp 5700 Sequence Detector System (Ap-plied Biosystems, Foster City, CA). The measurementwas normalized to an 18S ribosomal RNA control.To measure the copy number of each transcript, PCRamplified segment of each gene was cloned intopGEM-Teasy (Promega Corp., Madison, WI) and thencRNA was linearly amplified fromNdeI-digested plas-mid using MEGAscript T7 Kit (Ambion). cRNA wasmeasured with spectrophotometer DU640 (BeckmanCoulter Inc., Fullerton, CA) and a defined amount ofcRNA was used to perform QRT-PCR. All QRT-PCRmeasurements were replicated for each experimentand the values were averaged.
6. Data analysis
The Affymetrix GeneChip information was ex-tracted and data were computationally comparedusing the Affymetrix Microarray Suite Version 5.0.Genes flagged NC/MI/MD (not changed/marginalincrease/marginal decrease) were removed. Geneswith two or more replicate values were averagedand used for the analysis. The oligo and cDNA ar-ray information were extracted using the AgilentG2566AA Extraction Software Version A.6.1.1. Sev-eral criteria were used to filter the oligo and cDNAarray data. Genes that were saturated, non-uniform,or not significantly above background (below 2.6×

230 P.J. Park et al. / Journal of Biotechnology 112 (2004) 225–245
standard deviation of background) in either channelwere removed. After removing these spots from eachreplicate, a triplicate filter was applied to the dataset. This filter involves the removal of genes that donot have at least two or more replicate values, geneswhere the replicate values differ in signs and have astandard deviation above 0.5 (in log2 scale), or geneswhere one replicate value shows more than two-foldchange while the other two replicate values show lessthan two-fold change (unless the standard deviationis less than 0.5 in log2). The remaining values wereaveraged and used for the analysis.
7. Results and discussion
7.1. Within-platform variability
A basic property of a good microarray platform ishigh reproducibility in repeated experiments. One wayto measure reproducibility within a platform is to mea-sure a correlation coefficient between the fold ratiosof all genes in replicate chips (all fold ratios or foldchanges hereafter refer to base 2 log ratios of spleenand liver comparisons). When only non-competitivelyhybridized arrays are considered, finding correlationbetween the actual expression measurements is natu-ral, but we consider the fold changes here for compar-isons with two-channel cDNA arrays. A correlationcoefficient of fold ratios can often be distorted due toinaccurate high fold ratios generated by low-expressedgenes (further discussion to follow), and so we fil-ter the genes as described inSection 2. The resultingcorrelation for within-platform reproducibility is highfor all platforms: the mean Pearson correlation coef-ficients are 0.96 for Affymetrix, 0.98 for cDNA, and0.93 for oligos arrays. The only exception is the MWGpin-spotted arrays. The pin-spotted array’s lower pre-cision seemed to be due to its spotting method generat-ing less uniform spots thus creating variations amongslides (Brody et al., 2002; Jenssen et al., 2002; Tranet al., 2002). The inkjet method, a more advanced spot-ting method, provides more consistent spots (data notshown).
To be sure that the high correlation coefficients cor-rectly reflect high reproducibility, we also examinedthe variability in the single channel measurements (be-fore taking ratios) as a function of signal intensity. A
useful measure of this is the coefficient of variation(CV), which is the standard deviation over the mean.In Fig. 1, we plot the standard deviation as a functionof the mean, and fit a curve using Locally WeightedScatterplot Smoothing (LOWESS) after a proper nor-malization for all genes. For legibility, we only plot arandom 10% of the total points. It is clear from thispicture that Affymetrix platform appears to have thesmallest variability in repeated measurements. Linearregression (without the intercept term) gives the slopeof 0.047, 0.12, and 0.29, for Affymetrix, cDNA, andoligos, respectively [this is similar to what has beenobserved in other studies; for example, a study byYueet al. (2001)has reported 12–14% CV for cDNAs].While there is a large gene-by-gene variability as seenin Fig. 1, that standard deviation is only 5–10% ofthe total signal intensity on average is reassuring. Wenote that the number of replicates was small and thatthese are rough estimates. The general trend, however,agrees with the rest of the analysis.
7.2. Inter-platform comparison
To make comparisons among different platforms,genes with the same UniGene ID across all platformswere matched. For Affymetrix and cDNA arrays, thereare many instances in which multiple probes in eachplatform map to the same UniGene ID. For exam-ple, in comparing Affymetrix and cDNA arrays, westart with, after filtering, 4545 out of 12,488 genes forAffymetrix and 12,555 out of 16,273 genes for cDNA.Between these, there are 1540 matched genes, involv-ing 1762 Affymetrix probes and 2530 cDNA probes.For multiple probes matching to the same gene, theirvalues were averaged. (The extent of agreement amongthese probes on the same chip that are supposed tomeasure the same gene can give an indication of theprobe quality; this is analyzed later). InFig. 2, we showthe boxplots of the distribution of ratios for the genesthat are shared across all the platforms. Affymetrix ap-pears to have the widest range, while cDNA and oligoshave smaller range. The overall pairwise correlationsbetween platforms are fairly low. Between Affymetrixand cDNA (1540 genes in common), the Pearson cor-relation coefficient is 0.82; between Affymetrix andoligos (668 genes), it is 0.66; and between cDNA andoligos (752 genes), it is 0.47. The pairwise scatterplotsare displayed inFig. 3.

P.J. Park et al. / Journal of Biotechnology 112 (2004) 225–245 231
Fig. 1. Standard deviation of intensity measurements as a function of mean intensity. A random 10% subset of the total points is plottedand lowess curves are fit for Affymetrix (black), cDNA (red), and oligos (green) platforms. Estimates of coefficient of variation fromlinear regression are 0.047, 0.12, and 0.29, respectively (these are rough estimates due to small sample size).
Fig. 2. Distribution of ratios for the common genes across allthe platforms (boxplots: the first and third quartiles define thebox, with another line at the median; those values farther than1.5 interquartile range (IQR) away from the box are consideredoutliers and are plotted with circles) Affymetrix has the widestdynamic range while the other two are comparable.
While these numbers appear to suggest unreliabil-ity of at least one of the three platforms, it is possiblethat these numbers are lower due to the noisy fold ra-tios generated from low-intensity genes. In fact, oneof the common mistakes in analyzing cDNA arrayshas been to compute statistics on the ratios without ac-counting for the intensities of the measurements fromwhich the ratios are derived. Low expressed genescan produce log ratios of large magnitude by chanceand the Pearson correlation can be unduly influencedby these outliers. A filtering can eliminate many ofthese non-expressed or low-expressed genes; however,unless the filtering is extremely stringent, the resultsmay still be misleading unless one accounts for the in-tensity of the genes. This is clearly illustrated inFig. 4.For each of the three pairwise comparisons, we dividethe genes into 10 bins of equal size, in the order ofincreasing averaged intensity ranks across platforms.The correlation coefficient is then computed separatelyfor each bin. InFig. 4, we see that the correlation co-efficient increases as the signal intensity increases. For

232 P.J. Park et al. / Journal of Biotechnology 112 (2004) 225–245
Fig. 3. Pairwise comparison between platforms. For each of the three pairs (Affymetrix vs. cDNA, Affymetrix vs. oligo, cDNA vs. oligo),log ratios of UniGene matched genes are plotted. The dotted line is the line with slope 1; the solid line is the linear regression line. Thecorrelation coefficient is 0.82, 0.66, and 0.47, respectively. Oligo arrays appear to show poor concordance overall.
the Affymetrix versus cDNA comparison, for exam-ple, which had a relatively high overall correlation, thecorrelation is already above 0.6 in the lower quantilesbut it steadily increases to 0.92 for top 10% quantile.More importantly, for the comparisons involving oli-gos, we see a much more noticeable increase in corre-lation, with more than 0.90 in the Affymetrix versusoligos comparison in the top 10%. This plot clearlyindicates that even though the overall correlation may
Fig. 4. Correlation coefficient as a function of intensity. For eachcomparison, the matched genes are divided into 10 bins in theorder of their average signal intensity, and correlation coefficient iscomputed in each bin. Although the overall correlation coefficientmay be low, a subset of genes with high intensity can in facthave a good agreement. Solid, dashed, and dotted lines indicateAffymetrix vs. cDNA, Affymetrix vs. oligo, and cDNA vs. oligo,respectively.
be low, the log ratios of the highly expressed genes canbe strongly correlated and are like to be more reliableestimates than is suggested by the overall correlationcoefficient.
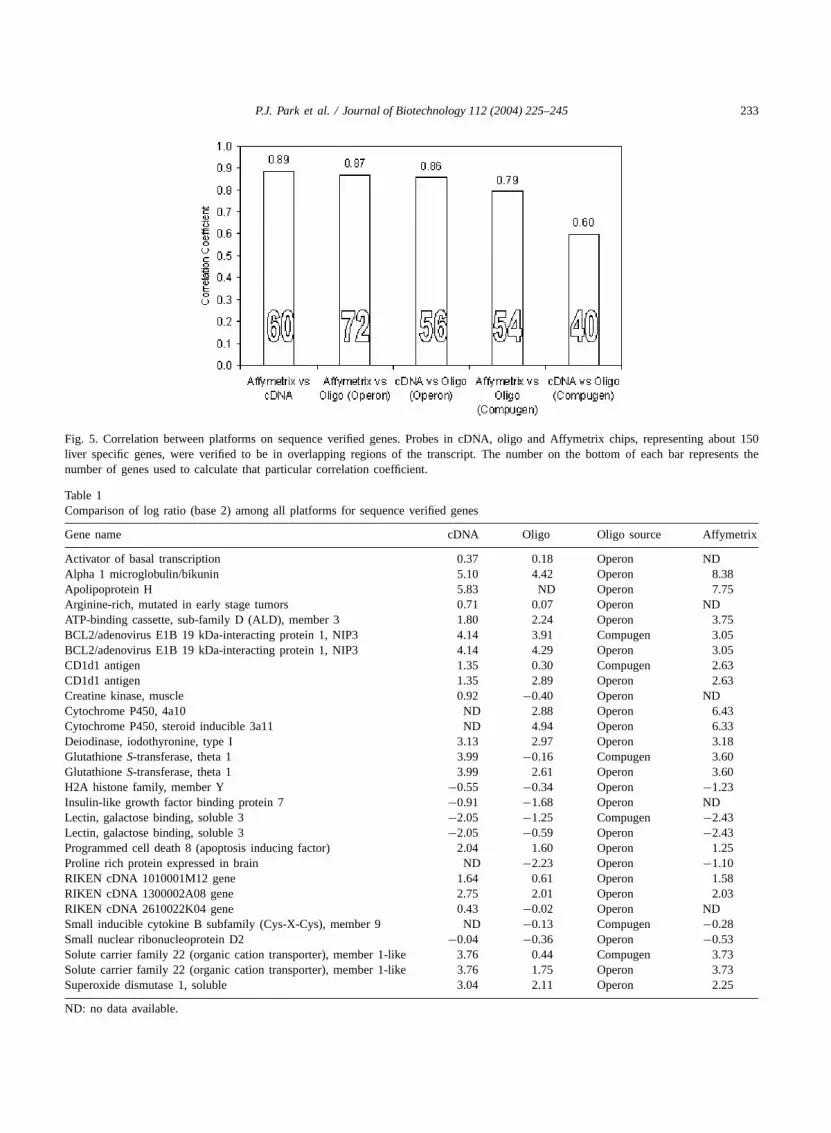
A major source in variation among the platformsis simply the location of the probe sequences withrespect to the gene. The UniGene designation isthe result of a system for automatically partition-ing GenBank sequences into a non-redundant set ofgene-oriented clusters; each UniGene cluster containsseveral to many sequences that represent a uniquegene cluster. To compensate for these differences insequences, the probe sequences of about 150 liverspecific genes from each platform were verified to bein an overlapping region of its counterpart, represent-ing the same gene in another platform. Only the genesrepresented in at least two platforms with probesthat are in overlapping regions of each other werechosen for further analysis. The MWG pin-spottedoligo set was eliminated in this comparison due tothe unavailability of its probe sequence information.As predicted, the correlations between platforms us-ing sequence-verified genes were higher (Fig. 5).Affymetrix, cDNA, and Operon manufactured oligodata were highly correlated to each other while theCompugen-designed and Sigma–Genosys synthesizedoligo data shared less correlation with other platforms.
The comparison data for sequence-verified genesin Table 1provides clues regarding platform reliabil-ity and probe quality. As shown inTable 1, compar-ison with cDNA and Affymetrix arrays showed thatthe Compugen or Operon oligos provided results thatwere dissimilar to data from the cDNA and Affymetrix
P.J. Park et al. / Journal of Biotechnology 112 (2004) 225–245 233
Fig. 5. Correlation between platforms on sequence verified genes. Probes in cDNA, oligo and Affymetrix chips, representing about 150liver specific genes, were verified to be in overlapping regions of the transcript. The number on the bottom of each bar represents thenumber of genes used to calculate that particular correlation coefficient.
Table 1Comparison of log ratio (base 2) among all platforms for sequence verified genes
Gene name cDNA Oligo Oligo source Affymetrix
Activator of basal transcription 0.37 0.18 Operon NDAlpha 1 microglobulin/bikunin 5.10 4.42 Operon 8.38Apolipoprotein H 5.83 ND Operon 7.75Arginine-rich, mutated in early stage tumors 0.71 0.07 Operon NDATP-binding cassette, sub-family D (ALD), member 3 1.80 2.24 Operon 3.75BCL2/adenovirus E1B 19 kDa-interacting protein 1, NIP3 4.14 3.91 Compugen 3.05BCL2/adenovirus E1B 19 kDa-interacting protein 1, NIP3 4.14 4.29 Operon 3.05CD1d1 antigen 1.35 0.30 Compugen 2.63CD1d1 antigen 1.35 2.89 Operon 2.63Creatine kinase, muscle 0.92 −0.40 Operon NDCytochrome P450, 4a10 ND 2.88 Operon 6.43Cytochrome P450, steroid inducible 3a11 ND 4.94 Operon 6.33Deiodinase, iodothyronine, type I 3.13 2.97 Operon 3.18GlutathioneS-transferase, theta 1 3.99 −0.16 Compugen 3.60GlutathioneS-transferase, theta 1 3.99 2.61 Operon 3.60H2A histone family, member Y −0.55 −0.34 Operon −1.23Insulin-like growth factor binding protein 7 −0.91 −1.68 Operon NDLectin, galactose binding, soluble 3 −2.05 −1.25 Compugen −2.43Lectin, galactose binding, soluble 3 −2.05 −0.59 Operon −2.43Programmed cell death 8 (apoptosis inducing factor) 2.04 1.60 Operon 1.25Proline rich protein expressed in brain ND −2.23 Operon −1.10RIKEN cDNA 1010001M12 gene 1.64 0.61 Operon 1.58RIKEN cDNA 1300002A08 gene 2.75 2.01 Operon 2.03RIKEN cDNA 2610022K04 gene 0.43 −0.02 Operon NDSmall inducible cytokine B subfamily (Cys-X-Cys), member 9 ND −0.13 Compugen −0.28Small nuclear ribonucleoprotein D2 −0.04 −0.36 Operon −0.53Solute carrier family 22 (organic cation transporter), member 1-like 3.76 0.44 Compugen 3.73Solute carrier family 22 (organic cation transporter), member 1-like 3.76 1.75 Operon 3.73Superoxide dismutase 1, soluble 3.04 2.11 Operon 2.25
ND: no data available.

234 P.J. Park et al. / Journal of Biotechnology 112 (2004) 225–245
arrays. The inconsistency found in the oligo probesreveals the importance of oligo design in obtainingaccurate gene expression readings. Further analysisshows that the average signal intensity of the Compu-gen set was lower than that of the Operon set (datanot shown). Since the same concentration (50�M) ofOperon and Compugen probes were used for spotting,a possible reason is that Compugen oligos contain anadded C6-amino group to the oligo terminus for ap-plication to negative slide surface chemistry. This maynot be optimal for the Agilent’s slide surface chem-istry used in this experiment.
Another way to test the performance of the probes isto observe the extent of agreement between the probesin a single platform that are designed to measure thesame gene. Higher quality probes would give moreconsistent measurements on each chip, as most of thevariability arises from the lack of sufficient sensitivityand specificity. InFig. 6, we show the variability inthe estimated ratios for the 10 genes with the largestnumber of probes mapping to the same gene, for eachplatform. As before, we expect the log ratios to bemore variable for the genes with low signal intensity.We account for this by plotting the log ratios on they-axis and the average intensity for that gene on thex-axis. For Affymetrix arrays, we see a good agree-ment for the two genes with the highest intensity. Sev-eral probes give relatively close estimates for the logratio. For the gene with the third highest average in-tensity, the estimates are in much less agreement, withestimates ranging from 0 to−7 in log ratios. With suchdiscrepancy, it is hard to make any conclusion aboutthat gene. In some cases, it is possible that the probesare correctly detecting the varying numbers of tran-scripts due to mechanisms such as alternative splicing.For the rest of the genes, many probes give reasonablygood cluster of points; however, there is an outlier ortwo in most cases. It appears that robust averaging,e.g. taking the median of the values rather than themean, is needed to derive best results from the data.Probes for the cDNA arrays are also variable in theirperformance. The two with the highest mean intensityshow relatively large variability in the log ratio esti-mates, while the third shows an excellent agreement.On the oligo array, there are very few genes with mul-tiple probes and it is difficult to draw conclusions, al-though there appears to be a large variability for thefew.
7.3. QRT-PCR
To confirm the microarray data, 23 sequence-verifiedgenes were selected for quantitative RT-PCR analysis(Table 2). In some cases, a particular gene was rep-resented more than once on the cDNA array. FromTable 2, we see that multiple probes representing onegene all show very similar expression levels to eachother, in spite of the fact that they were from differentcDNA fragments and derived from different clones.In Fig. 7, we compared the fold changes observedusing QRT-PCR with each of the platforms for theUniGene matched genes. When there were multipleprobes for the same gene, their values were averaged.Operon and Compugen oligos are considered sepa-rately and so few of the genes are missing in each ofthe platforms.
To examine the dynamic range and the pres-ence of any systematic bias, we fit linear regression(without the intercept term) for the data from eachplatform as a function of the QRT-PCR values.The coefficients for the QRT-PCR terms are 0.76(Affymetrix), 0.59 (cDNA), 0.42 (Oligos–Operon),and 0.22 (Oligos–Compugen). All the coefficients areless than one, which indicates that QRT-PCR may bemost sensitive in detecting relative change. In otherwords, cDNA, ink-jet printed oligo, and in situ oligoarrays underestimate the real expression change asdetected by QRT-PCR, sometimes dramatically. Thisobservation is consistent with the one described inYuen et al. (2002). As was done in that study, it ispossible to rescale the fold ratios for better estimatesby the inverse of the slopes from the linear regres-sion. The different amounts of scatter among themeasurements are also apparent inFig. 7, providinga measure of reliability for each platform. Amongthe platforms, Affymetrix array is shown to have thegreatest dynamic range followed by the cDNA arrays,as consistent withFig. 2.
The correlation of ratios between each platform andthe QRT-PCR data are also calculated for the genesin Table 2(seeTable 3). All platforms, with the ex-ception of the Compugen oligo, showed high correla-tion with the QRT-PCR result. Affymetrix most accu-rately reproduced the QRT-PCR data with the high-est correlation (0.93), while cDNA and Operon oligoarrays also showed great similarity to the QRT-PCRresults with correlation coefficients of 0.92 and 0.87,

P.J. Park et al. / Journal of Biotechnology 112 (2004) 225–245 235
Fig. 6. Variations in the log ratios among the probes that measure the same gene. In each platform, the top 10 genes with the most numberof probes mapping to the same UniGene ID are identified; their log ratios are plotted (y-axis) at their average intensity (x-axis) to accountfor intensity-dependent effects. The points along a vertical line belong to the same gene, and the tight clustering of these points indicatesgood agreement between the probes for the same gene. The error bar notes one standard deviation away from the mean in each direction.(A) Affymetrix; (B) cDNA; and (C) oligo.
respectively. The coefficient for Compugen oligos isonly 0.64.
To observe the accuracy of measurements for eachgene, we display the data from all the platforms alongwith the QRT-PCR in a matrix form inFig. 8, arrangedusing a hierarchical clustering method for clarity. InEuclidean distance metric, closest to the QRT-PCRmeasurements are those of Affymetrix, followed by
cDNA, Operon, and Compugen. Although Compugenand Operon are both oligos, Operon is closer to cDNAthan it is to Compugen (the distances have been prop-erly adjusted to account for the missing values). Thedifferences in the dynamic range can be easily seenby the range of colors in each column.
We also successfully calculated the copy numberof each transcript per mouse liver cell or spleen cell

236P.J.
Pa
rke
ta
l./
Jou
rna
lofB
iote
chn
olog
y1
12
(20
04
)2
25
–2
45
Table 2QRT-PCR confirmation of microarray data
Gene name UniGene cDNA Affy
GB ID Log ratioa Liverintensity
Spleenintensity
GB ID Log ratioa Liverintensity
Spleenintensity
Alpha 1 microglobulin/bikunin Mm.2197 AK004907 5.10 26502.8 782.1 X68680 8.38 26911.6 77.0
Diazepam binding inhibitor Mm.2785 AK018720 3.90 28451.6 1904.3 X61431 3.60 14198.0 958.0AK008576 4.14 63135.4 3600.5
RIKEN cDNA 0710008N11 gene Mm.29141 AK009660 2.52 46894.0 8187.7 AA674669 2.18 7312.8 1647.4AK003052 2.57 14050.9 2364.8
GlutathioneS-transferase, theta 1 Mm.2746 AK002338 3.99 16525.3 1045.6 X98055 3.60 4389.3 327.4
RIKEN cDNA 1810009A06 gene Mm.29135 AK007389 −0.04 6897.6 7032.9 AI837853 −0.53 2326.9 3590.6
BCL2/adenovirus E1B19 kDa-interacting protein 1, NIP3
Mm.2159 AK014223 4.14 2861.0 165.0 AF041054 3.05 1048.9 125.9
GlutathioneS-transferase, alpha 4 Mm.2662 AK019271 3.82 53665.0 3846.9 L06047 4.90 657.0 27.2AK008189 3.82 53368.1 3791.1AK008490 3.85 31636.8 2215.1AK011177 4.02 48693.2 3000.4AK010098 4.07 48687.2 2905.2AK008400 4.07 56724.2 3408.7AK011841 4.08 19011.0 1125.6AK008193 4.20 64587.9 3552.9
Suppressor of Ty 4 homolog (S.cerevisiae)
Mm.622 AK002990 −0.39 5201.7 6847.7 U96810 −1.33 266.7 620.5
Deiodinase, iodothyronine, type I Mm.2774 AK002549 3.13 939.4 112.7 U49861 3.18 125.1 15.4
Lectin, galactose binding, soluble 3 Mm.2970 AK008593 −2.05 3479.2 14487.1 X16834 −2.43 109.8 835.8
DNA-damage inducible transcript 3 Mm.7549 AV070098 −0.18 2301.3 2634.1 X67083 −3.10 48.9 399.1
Growth arrest andDNA-damage-inducible, gamma
Mm.9653 AK007410 2.67 11008.0 1727.8 AF055638 1.50 875.2 309.4
BCL2/adenovirus E1B19 kDa-interacting protein 3-like
Mm.29820 AK013467 −1.40 22116.2 58244.9 AF067395 −2.25 575.4 2736.8
AK007920 −1.56 19020.5 56002.4
Cyclin-dependent kinase inhibitor 2C(p18, inhibits CDK4)
Mm.1912 AK003933 −1.22 1421.9 3305.2 U19596 −1.25 303.9 722.8
NM 00767 −1.45 309.3 842.7
RAB17, member RAS oncogenefamily
Mm.38889 AK009707 3.21 10097.7 1094.4 X70804 2.13 216.9 49.7
NM 008998 1.13 408.3 187.1
CDC28 protein kinase 1 Mm.3049 AK004101 −1.47 1304.7 3615.1 AB025409 −2.65 195.0 1223.6AK011314 −2.05 2865.0 11866.2
Disintegrin metalloprotease (decysin) Mm.36742 AK008929 −2.65 5170.3 32428.7 AJ242912 −4.33 43.4 869.9
RNA binding motif protein, Xchromosome
Mm.28275 AK008618 −1.77 3904.2 13300.6 AJ237846 −3.50 26.4 298.7
C-type (calcium dependent,carbohydrate recognition domain)lectin, superfamily member 6
Mm.47384 AK020363 −2.74 2062.0 13808.1 AJ133533 −3.28 17.0 164.1

P.J.P
ark
et
al.
/Jo
urn
alo
fBio
tech
no
logy
11
2(2
00
4)
22
5–
24
5237
Mus musculus CD83 antigen (Cd83),mRNA
Mm.57175 AV133938 −4.29 2337.1 45590.5 AI837100 −5.05 15.7 520.1
NM 009856 −4.44 1929.2 41752.1
Regulator of G-protein signaling 2 Mm.28262 NM00906 −3.48 4956.5 55447.9 U67187 −4.88 15.3 447.5
Tnf receptor-associated factor 1 Mm.12898 BG064103 −2.89 1144.4 8504.7 L35302 −4.85 12.2 350.4
Mus musculus integrin alpha 6(Itga6), mRNA
Mm.25232 NM008397 −2.30 576.3 2836.7 X69902 −4.38 6.0 124.5
Gene name UniGene Oilgo RT-PCR
Source GB ID Log ratioa Liverintensity
Spleenintensity
Log ratioa Liverb copy(2.5 ng)
Spleenbcopy(2.5 ng)
Liver transcriptper cell
Spleen transcriptper cell
Body mapliver
From To From To
Alpha 1 microglobulin/bikunin Mm.2197 Operon D28812 4.42 47559.2 2412.3 9.61 2127917 2723 5107 8512 7 11 4
Diazepam binding inhibitor Mm.2785 Operon X61431 3.14 26591.0 3013.7 3.88 2756746 187666 6616 11027 450 751 1
RIKEN cDNA 0710008N11 gene Operon NM023374 1.98 35208.5 8904.9 2.58 142586 23846 342 570 57 95 2
GlutathioneS-transferase, theta 1 Mm.29141 Compugen NM008185 −0.16 344.1 380.9 4.51 100616 4428 241 402 11 18 1Operon X98055 2.61 3798.3 613.7
RIKEN cDNA 1810009A06 gene Mm.2746 Operon AK007389 −0.36 15916.9 20526.6 −0.99 50259 99816 121 201 240 399 1
BCL2/adenovirus E1B19 kDa-interacting protein 1, NIP3
Mm.29135 Compugen NM009760 3.91 30813.1 2210.2 4.72 400750 15208 962 1603 36 61 1
Mm.2159 Operon AF041054 4.29 28705.6 1316.2
GlutathioneS-transferase, alpha 4 Mm.2662 Operon L06047 2.78 8619.0 1166.1 3.38 65629 6310 158 263 15 25 1
Suppressor of Ty 4 homolog(S. cerevisiae)
Mm.622 Compugen NM009296 −0.19 802.1 914.2 −0.99 30687 60875 74 123 146 244 1
Deiodinase, iodothyronine, type I Mm.2774 Operon U49861 2.97 2585.5 296.9 6.84 31591 276 76 126 1 1 1
Lectin, galactose binding, soluble 3 Mm.2970 Compugen X16834 −1.25 1129.2 2682.2 −3.22 2372 22133 6 9 53 89 N/AOperon X16834 −0.59 566.0 857.2
DNA-damage inducible transcript 3 Mm.7549 Operon X67083 −0.65 245.1 389.8 −2.31 4074 20269 10 16 49 81 6
Growth arrest andDNA-damage-inducible, gamma
Mm.9653 Operon AF055638 1.39 1416.1 542.1 2.45 N/A N/A N/A N/A N/A N/A N/A
Compugen NM011817 0.14 677.0 615.7
BCL2/adenovirus E1B19 kDa-interacting protein 3-like
Mm.29820 Compugen NM009761 −0.31 478.2 593.4 −2.04 N/A N/A N/A N/A N/A N/A N/A
Operon AF067395 −1.38 2797.9 7275.9
Cyclin-dependent kinase inhibitor 2C(p18, inhibits CDK4)
Mm.1912 Operon U19596 −0.40 946.7 1247.7 −2.63 N/A N/A N/A N/A N/A N/A N/A
Compugen NM007671 −0.38 1373.0 1790.4
RAB17, member RAS oncogenefamily
Mm.38889 Operon X70804 0.73 483.2 290.4 7.91 N/A N/A N/A N/A N/A N/A N/A
Compugen NM008998 0.39 427.8 326.3
CDC28 protein kinase 1 Mm.3049 Compugen NM016904 −1.59 1920.9 5787.6 −3.51 N/A N/A N/A N/A N/A N/A N/AOperon AB025409 −1.40 1146.9 3018.2

238P.J.
Pa
rke
ta
l./
Jou
rna
lofB
iote
chn
olog
y1
12
(20
04
)2
25
–2
45
Table 2 (Continued)Gene name UniGene Oilgo RT-PCR
Source GB ID Log ratioa Liver intensity Spleenintensity
Log ratioa Liverb copy(2.5 ng)
Spleenb copy(2.5 ng)
Liver transcriptper cell
Spleen transcriptper cell
Body mapliver
From To From To
Disintegrin metalloprotease (decysin) Mm.36742 Compugen NM021475 −1.39 2103.1 5508.6 −2.75 N/A N/A N/A N/A N/A N/A N/AOperon AJ242912 −1.46 653.2 1797.1
RNA binding motif protein, Xchromosome
Mm.28275 Operon AJ237846 −0.76 538.8 912.5 −2.34 N/A N/A N/A N/A N/A N/A N/A
C-type (calcium dependent,carbohydrate recognition domain)lectin, superfamily member 6
Mm.47384 Operon AJ133533 −1.94 1226.9 4715.5 −3.40 N/A N/A N/A N/A N/A N/A N/A
Operon NM011999 −2.86 414.4 3007.7Compugen NM011999 0.22 364.9 313.0
Mus musculus CD83 antigen (Cd83),mRNA
Mm.57175 Compugen NM009856 −2.91 2554.2 19197.5 −5.46 N/A N/A N/A N/A N/A N/A N/A
Operon NM009856 −2.58 2532.6 15151.4
Regulator of G-protein signaling 2 Mm.28262 Compugen NM009061 −0.37 343.9 445.6 −3.30 N/A N/A N/A N/A N/A N/A N/AOperon U67187 −2.48 1003.2 5606.8
Tnf receptor-associated factor 1 Mm.12898 Compugen NM009421 −1.05 752.9 1558.7 −6.95 N/A N/A N/A N/A N/A N/A N/AOperon L35302 −0.65 509.3 799.3
Mus musculus integrin alpha 6(Itga6), mRNA
Mm.25232 Compugen NM008397 −0.52 367.3 527.0 −5.36 N/A N/A N/A N/A N/A N/A N/A
Note: Liver or spleen intensity displayed is an average of the three replicates’ red (liver) or green (spleen) processed intensity (after dye normalization and background subtraction).a Changes in gene expression are reported as log2 ratio.b The yield of total RNA from 1× 10⁶ cells was estimated to contain between 6 and 10�g of total RNA.

P.J. Park et al. / Journal of Biotechnology 112 (2004) 225–245 239
Table 3Correlations among platforms and QRT-PCR results using QRT-PCR confirmed genes
QRT-PCR Affymetrix cDNA Oligo (Operon) Oligo (Compugen)
QRT-PCR 0.93 0.92 0.87 0.64Affymetrix 0.93 0.96 0.94 0.66cDNA 0.92 0.96 0.96 0.71Oligo (Operon) 0.87 0.94 0.96 0.75Oligo (Compugen) 0.64 0.66 0.71 0.75
(Table 2) using the QRT-PCR approach. The lowestnumber of transcripts calculated in the spleen datawas 1 copy per cell, confirming the high sensitivityof the microarray technique. In theory, the level ofprobe binding in the array predicts the copy numberof the gene probe. We tried to find if there is a linearrelationship between the hybridization intensities andgene copy numbers calculated by QRT-PCR. How-ever, we could not find any clear relationship betweenthem. Our result also indicates that the copy number
Fig. 7. QRT-PCR measurements vs. each platform for UniGene matched genes. The dotted line is the line with slope 1; clustering aroundthis line would indicate a good agreement with the QRT-PCR. The linear regression coefficients are 0.76 (Affymetrix), 0.59 (cDNA), 0.42(Oligos-Operon), and 0.22 (Oligos-Compugen), showing that arrays generally underestimate the fold changes by varying amounts.
was better predicted by Cyanine-5 (Red–Liver) sig-nal intensity than the Cyanine-3 (Green–Spleen) sig-nal intensity (data not shown). Primer sequences usedin the QRT-PCR are shown inTable 4.
A human and mouse gene expression database,known as BodyMap (http://bodymap.ims.u-tokyo.ac.jp/), provides abundance information for each tran-script in different parts of the body (Sese et al., 2001).It is based on ESTs collected from non-biased cDNAlibraries. However, the rough estimate of the mRNA

240 P.J. Park et al. / Journal of Biotechnology 112 (2004) 225–245
Fig. 8. Gene-by-gene comparison of QRT-PCR data with data from other platforms. Affymetrix and RT-PCR show the closest agreement.Hierarchical clustering was used only for the purpose of rearrangement; white space indicates missing values.
composition of mouse liver source was quite differentfrom our QRT-PCR and array experimental results(Table 2). This emphasizes that such a study of pop-ulation by sequencing of cDNA is prone to errorsoriginating from cloning fluctuation.
7.4. RNA fragmentation
Another factor that enhances the dynamic range isRNA fragmentation. We compared arrays hybridizedwith fragmented and un-fragmented RNA probes onoligo chips and found that RNA fragmentation no-tably magnifies the binding sensitivity. Nearly 89% ofgenes, showing a two-fold regulation in the same di-rection of both fragmented and un-fragmented RNAhybridized arrays, exhibit greater dynamic range af-ter RNA fragmentation, increasing an average of 0.90log2 ratio. However, fragmented RNA hybridized ar-rays still correlate highly with un-fragmented arrays(r = 0.90), showing that RNA fragmentation affects
only the probe binding sensitivity and not the overallbinding pattern.
7.5. Double amplification
Recently,Richter et al. (2002)systematically eval-uated and compared five different principles forthe synthesis of fluorescently labeled targets formicroarray: direct labeling, T7 RNA polymeraseamplification, aminoallyl labeling, hapten-antibodyenzymatic labeling, and 3DNA. Among them, themost accurate and sensitive method was proven to bethe linear T7 RNA polymerase-mediated amplifica-tion, the major technique used for target preparationin our experiments. Although the target prepara-tion methods used here for the cDNA, oligo, andAffymetrix GeneChip arrays are slightly differentfrom one another, they all fundamentally use theT7 amplification method and all showed comparableresults.

P.J. Park et al. / Journal of Biotechnology 112 (2004) 225–245 241
Table 4Primer sequences used in the QRT-PCR
UniGene ID GenBank ID Sequence (5′→3′) Amplicon size (bps)
Mm.2197 X68680 Forward GAATATGCCATTTTCCTTACCAAGA 126Reverse CAGGGCCACATCCTTGAACT
Mm.2785 X61431 Forward CCAACTGATGAAGAGATGCTGTTC 141Reverse GGAAGTCCCTTTCAGCTTGTTC
Mm.29141 NM023374 Forward TGGATTCTACTTTAACCTTCCGAAGA 148Reverse TGTGGAAGAGGGTAGATTTTGGA
Mm.2746 X98055 Forward CATACGGGCCTTCGGAGAA 105Reverse CAACGTGGCTGCCAGTGTT
Mm.29135 AK007389 Forward ACAACACGCAAGTGCTCATTAACT 123Reverse TGGGAACCTCAGTCCACATCT
Mm.2159 AF041054 Forward GCTACTCTCAGCATGAGAAACACAA 143Reverse GTCAGACGCCTTCCAATGTAGAT
Mm.2662 L06047 Forward ATCGATGGGATGATGCTGACA 121Reverse GGGTGCCATCTGCATACATGT
Mm.622 NM 009296 Forward TGACTGCACCAGCTCTTCATTT 124Reverse ACCAGTGACGGACACAGCATAT
Mm.2774 U49861 Forward TCTCAGGACAGAAGTGCAACATCT 136Reverse GAGGCAAAGTCATCTACGAGTCTCT
Mm.2970 X16834 Forward CACAATCATGGGCACAGTGAA 138Reverse TCCTGCTTCGTGTTACACACAAT
Mm.7549 X67083 Forward TCCAGAAGGAAGTGCATCTTCATA 109Reverse CTGGACACCGTCTCCAAGGT
18S rRNA X00686 Forward GTAACCCGTTGAACCCCATT 151Reverse CCATCCAATCGGTAGTAGCG
We studied double linear amplification method andtested the precision of single versus double amplifica-tion. Single T7 amplification requires 1–3�g of totalRNA and demands about 3 days of work while dou-ble amplification requires 100 ng of total RNA andtakes about 4 days. To determine if there is any dif-ference in the size distribution of the amplified cRNApopulations from single versus double amplification,the amplified cRNA products after a single or dou-ble round of amplification were measured by AgilentBioanalyzer (Agilent) (Fig. 9). Total spleen or liverRNA was amplified using the single or double am-plification method for cDNA arrays. Results from theBioanalyzer show that double amplified cRNA con-tains a higher percentage of shorter RNA compared tothe cRNA population generated from a single ampli-fication. This phenomenon was repeatedly observedthrough several attempts (data not shown).
To determine the adequacy of the protocol, we com-pared the data from double amplification sample tothose from a single amplification sample. Using thesame filtering scheme for the triplicates as before, wefind the Pearson correlation to be 0.97, using 68% ofthe data points that passed the filter (Fig. 10). As be-fore, because the correlation is computed on the ra-tios, we may get a distorted number due to high ratiosfrom low-intensity genes. When we bin the data pointsinto three groups according to their intensity, the cor-relations are, from the low to high intensity values,0.90, 0.97, and 0.99 (Fig. 11). This demonstrates thatthe values from double amplified sample are in goodagreement with those of the single amplified sample,especially when the measurements are done with repli-cates.
It is also of interest to measure reproducibility ofthe slides within a protocol. Without a large number

242 P.J. Park et al. / Journal of Biotechnology 112 (2004) 225–245
Fig. 9. RNA quality of single and double amplification method.Total spleen and liver RNAs were amplified using 1st (single) and2nd (double) round amplification method. RNA length was mea-sured using the Bioanalyzer. Purple line shows the standard markerdisplaying the length of the RNA at each peak by nucleotides (nt).Green line represents RNA made from single amplification whilethe blue line shows the RNA made from double amplification.
Fig. 10. Single vs. double amplification. The Pearson correlationcoefficient is 0.97. The dotted line is the line with slope 1. Overall,there is good agreement between the two protocols.
of replicates, it is obviously difficult to accurately as-sess the reproducibility. As a rough estimate using thethree replicates, we find the correlation between chipsto be 0.98± 0.007 for single amplification and 0.91±0.022 for double amplification (0.93± 0.023 betweenthem). The correlations are lower in general here com-pared to before because we did not use the informationacross replicates to filter out unstable measurements.It appears that the double amplification achieves lowerreproducibility, as expected. We note again that thesenumbers are preliminary, as a single chip can distortthese numbers. Overall, the additional round of ampli-fication does lower the reproducibility of the log ra-tios, but its effect on the precision of the double ampli-fication method seems relatively small, as comparedto the single amplification method. These results sug-gest that the double amplification method may be usedwhen the amount of total RNA available is scarce.
7.6. Universal reference
A consensus has not been reached regardingthe type of RNA reference sample that is best fortwo-color microarray experiments, even though adopt-ing a standard for microarray RNA reference as wellas data format will improve research practice (Dudleyet al., 2002; Holloway et al., 2002). For standardiza-tion and annotation of expression data, the MGED(http://www.mged.org, Microarry Gene ExpressionData) project aims to address standards for data format(Spellman et al., 2002). In addition, many public geneexpression data repositories, such as Gene ExpressionOmnibus (http://www.ncbi.nlm.nih.gov/geo/) and Ar-rayExpress (http://www.ebi.ac.uk/arrayexpress/), havebeen launched for convenient public dissemination ofgene expression data.
A de facto universal reference RNA may be helpfulin interpreting results among experiments and be-tween laboratories, especially when massive microar-ray data are analyzed. There are several commercialsuppliers of RNA reference, so-called ’UniversalStandard’, including Stratagene and Clontech. Wetested Stratagene’s Universal Mouse Reference RNA,which is made up of 11 different cell lines for broadgene coverage.
To compare the direct two-dye measurement withusing the universal reference, we plot inFig. 12 theratios from the standard spleen/liver hybridization

P.J. Park et al. / Journal of Biotechnology 112 (2004) 225–245 243
Fig. 11. Single vs. double amplification as a function of intensity. The points inFig. 10 are divided into three bins according to a measureof their average intensity. The three scatter plots correspond to the three bins. For the high-intensity genes (on the right), the agreementis excellent, with less scatter around the line of slope 1.
against the ratios derived from spleen/reference andliver/reference hybridizations. We find that the corre-lation is fairly high, at 0.93. A total of 9910 (94.8%)out of 10,457 genes have a standard deviation of lessthan 0.5 (log2) while only 75 elements (0.7%) havea standard deviation of equal or above 1 (log2). Thisindicates that the hybridizations in a reference designcan give ratio estimates similar to those obtained bydirect comparisons.
We do note, however, that there appears to be asmall number of genes for which the two ratios arevery different. In particular, there is a cluster of pointsfor which the standard two-dye gives the log ratio
Fig. 12. Log ratios from direct comparison (‘standard’) comparedto those from indirect comparison using universal reference. Theagreement is fairly good, with correlation coefficient of 0.93.
(base 2) of about−3 and the common reference ap-proach gives the log ratio of about 2. We have ver-ified that this cluster is not due to the instability ofratios generated by low intensity signals. When these30 or so probes are examined, they were all found tocorrespond to hemoglobin alpha or beta or beta-likechains (Hba-a1, Hbb-b1, and Hbb-bh1) mapping toonly three UniGene clusters, along with some unan-notated ESTs. One possible explanation for this clearand strong disagreement is the dye bias effect. It iswell known that a small fraction of the probes do notget tagged by either the Cy3 or Cy5 labels, and thatdye–swapped replicates are needed to average out thiseffect. When the universal reference was used, bothspleen and liver were tagged with the same dye, thuslessening the dye bias, whereas the direct compari-son approach was done in replicates but without thedye–swap correction. We suspect that dye–swap cor-rected values for direct comparison would be more inagreement with the common reference samples. Thecommon reference design could still give a wrong ra-tio if spleen and liver both do not respond to the samedye used, but this bias is less likely to lead to false pos-itives than if different dyes are used. Hence, using thecommon reference may be advantageous in this case.
While some caution is needed, the result overall isencouraging and suggests that multiple comparisonsof experimental conditions by using a common con-trol can be accurate and can enhance sharing of arrayinformation within the research community. However,there might be unavoidable biases introduced by usingthis universal standard. Therefore, using the referencedesign may not be preferable when the experiment in-

244 P.J. Park et al. / Journal of Biotechnology 112 (2004) 225–245
volves regulation of a small portion of the genes, andthus requires a very sensitive measurement.
From this data set, we could also test a differentspeculation. Some researchers have suggested that theamount of cDNAs spotted on the array is large enough,away from the saturation point, and that it may bepossible to use cDNAs as a single channel array. Wetherefore examined the reproducibility of signal fromthe universal reference sample when the co-hybridizedsamples are different. Our analysis suggests that thespeculation may indeed be reasonable. Using all thedata points on each array, we find that the average cor-relation among the universal reference channels withthe same second channel (either spleen or liver) is0.97± 0.014. On the other hand, the average correla-tion between the pairs of arrays in which the secondchannels are different is 0.95± 0.012. The Spearmancorrelations are also high at 0.97 for both. This meansthat the second channel has a negligible effect on thesignal of the first channel in terms of correlations. Ifa filter had been applied for saturation and other ar-tifacts, the correlation would have been higher. If thesame analysis is carried out on the spleen and the liverchannel, the difference is 0.96 for the within-groupand 0.68 for between groups, as expected. The factthat the effect of the second sample hybridized on thesame array is very small indicates that the two chan-nels may be independent to a large extent. As long assaturated points are monitored and filtered out, it maybe possible to essentially perform two separate exper-iments on a single cDNA array.
7.7. Conclusions
The comparison of the three platforms gives amixed result. By most measures, the agreement be-tween Affymetrix and cDNA arrays seems to be fairlygood and reproducible. However, the oligo arrays inmany cases do not give a concordant result. We havenoted that highly expressed genes give fairly similarresults in all cases and that combining unstable logratios from low expressed genes with other genescan lead to somewhat misleading result. Probes withoverlapping sequences give a higher correlation asexpected. We also examined the differences betweenthe array data and the QRT-PCR data for a largenumber of genes. Compared to the QRT-PCR values,we found the differences to be small to substantial
for Affymetrix, cDNA, Operon oligo, and Compugenoligo arrays, in that order, both in linear correlationand in the extent of under-estimation of the log ratios.
We also examined other methods in the microar-ray experiments. The printing method is crucial inmaintaining consistent spot form from array to arrayand in minimizing variation among signal intensities:inkjet printing approaches apparently provide less spotto spot and chip to chip variability than pin-spottingmethods. The result from the double amplificationdata suggests that this method can be used reliablyfor future microarray experiments especially when theamount of total RNA is scarce. Finally, the resultsfrom the universal standard data appear to support theuse of universal reference on microarray experimentsfor enhancing the sharing of array information withinthe research communities.
Acknowledgements
We are grateful to the members of the Molecular Bi-ology Laboratory of The Alliance for Cellular Signal-ing (http://www.signaling-gateway.org/, Alliance forCellular Signaling) for their assistance. In addition, theauthors would like to thank Drs. Mel Kronick, DouglasAmorese, and Stephanie Fulmer-Smentek for provid-ing us access to the Agilent inkjet printing technologyby arranging for printing of Caltech-supplied materi-als. We also thank Drs. Melvin I. Simon, Mel Kronick,and Winston Kuo for critically reading the manuscript.This work is supported by NIH grants GM62114 andGM067825-02.
References
Barczak, A., Rodriguez, M.W., Hanspers, K., Koth, L.L., Tai,Y.C., Bolstad, B.M., Speed, T.P., Erle, D.J., 2003. Spotted longoligonucleotide arrays for human gene expression analysis.Genome Res. 13, 1775–1785.
Brody, J.P., Williams, B.A., Wold, B.J., Quake, S.R., 2002.Significance and statistical errors in the analysis of DNAmicroarray data. Proc. Natl. Acad. Sci. U.S.A. 99, 12975–12978.
Brown, P.O., Botstein, D., 1999. Exploring the new world of thegenome with DNA microarrays. Nat. Genet. 21, 33–37.
Choi, S., Hao, W., Chen, C.K., Simon, M.I., 2001. Gene expressionprofiles of light-induced apoptosis in arrestin/rhodopsin

P.J. Park et al. / Journal of Biotechnology 112 (2004) 225–245 245
kinase-deficient mouse retinas. Proc. Natl. Acad. Sci. U.S.A.98, 13096–13101.
Dorris, D.R., Ramakrishnan, R., Trakas, D., Dudzik, F., Belval, R.,Zhao, C., Nguyen, A., Domanus, M., Mazumder, A., 2002. Ahighly reproducible, linear, and automated sample preparationmethod for DNA microarrays. Genome Res. 12, 976–984.
Dudley, A.M., Aach, J., Steffen, M.A., Church, G.M., 2002.Measuring absolute expression with microarrays with acalibrated reference sample and an extended signal intensityrange. Proc. Natl. Acad. Sci. U.S.A. 99, 7554–7559.
Eberwine, J., Yeh, H., Miyashiro, K., Cao, Y., Nair, S., Finnell,R., Zettel, M., Coleman, P., 1992. Analysis of gene expressionin single live neurons. Proc. Natl. Acad. Sci. U.S.A. 89, 3010–3014.
Feldman, A.L., Costouros, N.G., Wang, E., Qian, M., Marincola,F.M., Alexander, H.R. and Libutti, S.K., 2002. Advantages ofmRNA amplification for microarray analysis. Biotechniques33, 906–912, 914.
Holloway, A.J., van Laar, R.K., Tothill, R.W., Bowtell, D.D., 2002.Options available—from start to finish—for obtaining datafrom DNA microarrays II. Nat. Genet. 32 (Suppl.), 481–489.
Iscove, N.N., Barbara, M., Gu, M., Gibson, M., Modi, C.,Winegarden, N., 2002. Representation is faithfully preservedin global cDNA amplified exponentially from sub-picogramquantities of mRNA. Nat. Biotechnol. 20, 940–943.
Jenssen, T.K., Langaas, M., Kuo, W.P., Smith-Sorensen, B.,Myklebost, O., Hovig, E., 2002. Analysis of repeatability inspotted cDNA microarrays. Nucleic Acids Res. 30, 3235–3244.
Kane, M.D., Jatkoe, T.A., Stumpf, C.R., Lu, J., Thomas,J.D., Madore, S.J., 2000. Assessment of the sensitivity andspecificity of oligonucleotide (50mer) microarrays. NucleicAcids Res. 28, 4552–4557.
Kuo, W.P., Jenssen, T.K., Butte, A.J., Ohno-Machado, L., Kohane,I.S., 2002. Analysis of matched mRNA measurements fromtwo different microarray technologies. Bioinformatics 18, 405–412.
Li, J., Pankratz, M., Johnson, J.A., 2002. Differential geneexpression patterns revealed by oligonucleotide versus longcDNA arrays. Toxicol. Sci. 69, 383–390.
Livesey, F.J., Furukawa, T., Steffen, M.A., Church, G.M., Cepko,C.L., 2000. Microarray analysis of the transcriptional networkcontrolled by the photoreceptor homeobox gene Crx. Curr.Biol. 10, 301–310.
Lockhart, D.J., Winzeler, E.A., 2000. Genomics, gene expressionand DNA arrays. Nature 405, 827–836.
Puskás, L.G., Zvara, Á., Hackler Jr., L., Van Hummelen, P., 2002.RNA amplification results in reproducible microarray data withslight ratio bias. Biotechniques 32, 1330–1340.
Richter, A., Schwager, C., Hentze, S., Ansorge, W., Hentze,M.W., Muchenthaler, M., 2002. Comparison of fluorescent tagDNA labeling methods used for expression analysis by DNAmicroarrays. Biotechniques 33, 620–628, 630.
Schena, M., Shalon, D., Davis, R.W., Brown, P.O., 1995.Quantitative monitoring of gene expression patterns with acomplementary DNA microarray. Science 270, 467–470.
Sese, J., Nikaidou, H., Kawamoto, S., Minesaki, Y., Morishita,S., Okubo, K., 2001. BodyMap incorporated PCR-basedexpression profiling data and a gene ranking system. NucleicAcids Res. 29, 156–158.
Spellman, P.T., Miller, M., Stewart, J., Troup, C., Sarkans, U.,Chervitz, S., Bernhart, D., Sherlock, G., Ball, C., Lepage,M., Swiatek, M., Marks, W.L., Goncalves, J., Markel, S.,Iordan, D., Shojatalab, M., Pizarro, A., White, J., Hubley,R., Deutsch, E., Senger, M., Aronow, B.J., Robinson, A.,Bassett, D., Stoeckert Jr., C.J., Brazma, A., 2002. Designand implementation of microarray gene expression markuplanguage (MAGE-ML). Genome Biol. 3, RESEARCH0046.
Tan, P.K., Downey, T.J., Spitznagel Jr., E.L., Xu, P., Fu, D.,Dimitrov, D.S., Lempicki, R.A., Raaka, B.M., Cam, M.C.,2003. Evaluation of gene expression measurements fromcommercial microarray platforms. Nucleic Acids Res. 31,5676–5684.
Tran, P.H., Peiffer, D.A., Shin, Y., Meek, L.M., Brody, J.P.,Cho, K.W.Y., 2002. Microarray optimizations: increasing spotaccuracy and automated identification of true microarraysignals. Nucleic Acids Res. 30, e54.
Wang, E., Miller, L.D., Ohnmacht, G.A., Liu, E.T., Marincola,F.M., 2000. High-fidelity mRNA amplification for geneprofiling. Nat. Biotechnol. 18, 457–459.
Wang, H.Y., Malek, R.L., Kwitek, A.E., Greene, A.S., Luu,T.V., Behbahani, B., Frank, B., Quackenbush, J., Lee, N.H.,2003. Assessing unmodified 70-mer oligonucleotide probeperformance on glass-slide microarrays. Genome Biol. 4, R5.
Yue, H., Eastman, P.S., Wang, B.B., Minor, J., Doctolero,M.H., Nuttall, R.L., Stack, R., Becker, J.W., Montgomery,J.R., Vainer, M., Johnston, R., 2001. An evaluation of theperformance of cDNA microarrays for detecting changes inglobal mRNA expression. Nucleic Acids Res. 29, e41.
Yuen, T., Wurmbach, E., Pfeffer, R.L., Ebersole, B.J., Sealfon, S.C.,2002. Accuracy and calibration of commercial oligonucleotideand custom cDNA microarrays. Nucleic Acids Res. 30, e48.


