Embed Size (px)
Citation preview
Customer Profitability Measurement ModelsTheir Merits and Sophistication across ContextsHolm, Morten
Document VersionFinal published version
Publication date:2012
LicenseCC BY-NC-ND
Citation for published version (APA):Holm, M. (2012). Customer Profitability Measurement Models: Their Merits and Sophistication across Contexts.Copenhagen Business School [Phd]. PhD series No. 12.2012
Link to publication in CBS Research Portal
General rightsCopyright and moral rights for the publications made accessible in the public portal are retained by the authors and/or other copyright ownersand it is a condition of accessing publications that users recognise and abide by the legal requirements associated with these rights.
Take down policyIf you believe that this document breaches copyright please contact us ([email protected]) providing details, and we will remove access tothe work immediately and investigate your claim.
Download date: 25. Jul. 2022
LIMAC PhD SchoolDepartment of Accounting and Auditing PhD Series 12-2012
PhD Series 12-2012
Customer Profi
tability Measurem
ent Models
copenhagen business schoolhandelshøjskolensolbjerg plads 3dk-2000 frederiksbergdanmark
www.cbs.dk
ISSN 0906-6934
Print ISBN: 978-87-92842-50-3Online ISBN: 978-87-92842-51-0
Morten Holm
Customer Profitability Measurement ModelsTheir Merits and Sophistication across Contexts
1
CUSTOMER PROFITABILITY MEASUREMENT MODELS
THEIR MERITS AND SOPHISTICATION ACROSS CONTEXTS
MORTEN HOLM
Supervisors:
Thomas Plenborg (CBS)
Carsten Rohde (CBS)
V. Kumar (Georgia State University)
LIMAC PhD school
Copenhagen Business School (CBS)
Morten HolmCustomer Profitability Measurement ModelsTheir Merits and Sophistication across Contexts
1st edition 2012PhD Series 12.2012
© The Author
ISSN 0906-6934
Print ISBN: 978-87-92842-50-3Online ISBN: 978-87-92842-51-0
LIMAC PhD School is a cross disciplinary PhD School connected to researchcommunities within the areas of Languages, Law, Informatics,Operations Management, Accounting, Communication and Cultural Studies.
All rights reserved.No parts of this book may be reproduced or transmitted in any form or by any means,electronic or mechanical, including photocopying, recording, or by any informationstorage or retrieval system, without permission in writing from the publisher.
3
Preface
Although only one name appears at the cover of this dissertation my PhD
project could not have been completed without the assistance of a number of
people and organizations.
First of all I want to thank my supervisors at CBS, Professors Thomas
Plenborg and Carsten Rohde. Your encouragement and guidance has been
instrumental throughout the process of completing this dissertation and I truly
appreciate the fact that your doors were always open whenever I needed help in
dealing with the many issues encountered along the way.
A warm thank also goes to my third-party supervisor from Georgia State
University, Professor V. Kumar, for sharing his vast experience and knowledge on
the topic of customer profitability management and for inviting me to come and
work with him in Atlanta.
In addition to my supervisors a number of other people have provided
valuable input on my work. I want to thank all my colleagues at the department of
Accounting & Auditing at CBS but particularly the guys who have taken the time
to give feedback on my work despite the fact that they were themselves in the
middle of a demanding PhD process. So thank you Jeppe C., Kim P. and Christian
R. for your highly appreciated feedback and comments.
Other useful input was provided by Professor Robert Scapens from
Manchester Business School, Associate Professor Denish Shah from Georgia State
University, and Professor Per Nikolaj Bukh who was discussant at my pre-
defense. I thank you for taking part in improving previous editions of my research.
During the process several organizations have provided financial support.
First of all I want to thank Quartz+Co for co-sponsoring my PhD together with the
4
Danish Ministry of Science. Thank you Hans Henrik for believing in me; thank
you Anders for your everlasting enthusiasm, support and sparring; and thank you
Kennet and Jesper for sharing all your practical input and ideas.
For my research stay abroad I want to thank the foundations that supported
me financially. I want to pay a special tribute to FSRs Studie- & Uddannelsesfond
and to the Fulbright Commission for both contributed generously to my stay.
Furthermore, I received financial support for the collection of survey data
from VISMA, LIMAC and the Marketing Science Institute (MSI). I want to thank
these organizations for their kind support which, among other things, allowed me
to engage with an American market research firm and to hire the Swedish-
speaking research assistants Narin and Jacqueline whom I also want to thank for
their persistent efforts in contacting survey participants in Sweden.
Twenty people helped pre-test the questionnaire before it was distributed.
This effort was crucial in avoiding any misunderstandings beforehand. I thank you
for that and I also thank the more than 250 survey participants from large Danish
and Swedish companies who returned a completed questionnaire.
At a personal level, my family and friends have encouraged me all the way
from the idea of pursuing a PhD to the completion of this dissertation. I thank you
all for your great support. However, a very special thanks goes to my dear wife
Maria for being by my side throughout this, at times, stormy ride. Thank you for
always believing in me, for supporting me and for being the mother of our
newborn son Frederik to whom this dissertation is dedicated.
Morten Holm
Copenhagen, March 29, 2012
5
Summary
The purpose of this dissertation is to expand our understanding of the
applicability and performance effects of different Customer Profitability
Measurement (CPM) models across contexts.
Customer profitability measurement has attracted increasing interest recently
– mainly in the marketing literature. The vast majority of this research has been
case-based. Consequently, the evidence in this field consists of a number of case
demonstrations indicating that using CPM models can be beneficial in specific
industries but only very limited cross-sectional research investigating the general
relationships between the CPM model use, context and firm financial
performance.
Researching these relationships is expected to contribute to marketing as well
as management accounting literatures but also to managers working with or
planning to start working with CPM models in practice for two reasons: First,
marketing managers are increasingly required to be accountable for the marketing
investments they expect to make. A better understanding of which CPM models
that are applicable in different contexts will contribute to more efficient resource
utilization in firms. Second, the management accounting literature on CPM
models is very scarce despite the fact that this area is a key priority in practice.
Knowledge on how CPM models are adapted to fit the environment in which the
firm operates will contribute to our understanding of how CPM models should be
designed but also to the general school of contingency-based management
accounting research.
The purpose of this dissertation is three-fold:
6
1. To compare the different kinds of CPM models in order to identify their
mutual differences and collective limitations in different customer
environments (Article #1).
2. To investigate the effect of CPM model use on firm financial performance
across industries and marketing contexts (Article #2).
3. To investigate how and why firms adapt the degree of sophistication of
CPM models to the contingency factors in the customer environment that
the firm operates under (Article #1 & Article #3).
The dissertation follows an article-based format and includes three articles in
total. In Article #1 a conceptual framework for firms’ choice of CPM models is
developed alongside a set of research propositions. The framework and the
propositions are deducted from an interdisciplinary review of the CPM literatures
in marketing and in management accounting.
Article #2 and Article #3 are both based on empirical survey data collected
from the largest firms in Denmark and Sweden. In Article #2 the relationship
between CPM model use and firm financial performance including whether this
effect is the same regardless of the degree of product focus (marketing context)
and whether it is sustainable over time.
Finally, Article #3 investigates how selected contingency factors in firms’
environments (competitive intensity and complexity) influence how sophisticated
a CPM models firms use for resource allocation purposes.
The dissertation’s methodological standpoint is positivistic and the
fundamental assumption about the social world is therefore that there is an
objective reality where causal relationships can be identified and hypotheses about
these relationships can be tested based on observations in the empirical world.
7
This world-view matches the objectives of the dissertation of investigating general
relationships between CPM models, context and performance.
The dissertation’s empirical data has been collected from primary as well as
secondary sources. Primary data was collected via the survey method where a
questionnaire was developed, tested and distributed among the 1.545 of the largest
firms (based on revenues) in Denmark and Sweden. Three follow-up rounds were
carried out by e-mail and a random sub-sample was subsequently contacted by
phone in order to maximize the response rate. All this eventually yielded a gross
response rate (total completed responses incl. responses with single missing
observations) of 17% corresponding to a gross sample of 255 observations. Non-
response bias tests showed no systematic deviations between the sample and the
total survey population.
Secondary data (annual accounts and industry classifications) were collected
from the accounting databases Greens, NNE (Denmark) and Retriever (Sweden).
Theoretically, the dissertation is anchored in the CPM research streams as
well as general contingency theory. In the CPM literature a distinction has been
made between two main categories of models: Customer Profitability Analysis
(CPA) and Customer Lifetime Value (CLV). Whereas CPA models primarily
serve the purpose of tracing all customer-related revenues and costs to the
individual customer in a historical accounting period, CLV models attempt to
estimate and discount expected future gross cash flows per customer.
Contingency theory is based on the assumption that no universal solution to
firms’ organization, strategy and system design exists. Instead, firms seek to adapt
to the relevant contingency factors they operate under. In this dissertation two
environmental factors were identified as relevant to firms’ CPM model
sophistication: Competitive intensity and customer complexity.
8
The three articles in the dissertation make four main contributions to
marketing and management accounting research:
1. The environmental factor complexity is developed into two customer-
related factors: Customer service complexity and customer behavioral
complexity (Article #1). The customer service complexity construct is
furthermore validated empirically (Article #3).
2. A contingency-based framework for explaining CPA and CLV model
sophistication based on the degree of customer service complexity and
customer behavioral complexity is developed (Article #1).
3. Additionally, the CPA sophistication construct was conceptualized and the
proposed positive association between customer service complexity and
CPA model sophistication was verified empirically although the effect of
customer service complexity on CPA sophistication is larger in non-
competitive markets (Article #3).
4. Support was found for a general positive association between the use of
CPM models and firm financial performance although the effect is less
positive when a firm’s product focus is high. Furthermore, the positive
effect diminishes over time suggesting that firms have trouble
institutionalizing the CPM models during the implementation phase and/or
that mediating institutions (e.g., consultants) capture the learning
economies of scale and transfer these improvements to later adopters
(Article #2).
9
Resumé på dansk (Summary in Danish)
Formålet med denne afhandling er, at bidrage til at øge forståelsen af i hvilke
kontekste forskellige metoder til måling og styring af kunders lønsomhed er
særligt anvendelige.
Kundelønsomhedsmåling har de senere år været genstand for stigende
interesse – primært indenfor marketinglitteraturen. Imidlertid er langt hovedparten
af den forskning, der er gennemført, case-baseret. Der er således en række
enkeltstående studier, der indikerer, at anvendelse af kundelønsomhedsmåling er
fordelagtigt i specifikke industrier, men der er til dato kun meget begrænset
forskning, der har beskæftiget sig med, hvorvidt der kan siges, at være generelle
sammenhænge imellem de kundelønsomhedsmodeller der anvendes, den kontekst
de anvendes i, samt virksomhedens performance.
Forskning indenfor disse sammenhænge forventes at kunne bidrage til såvel
marketing- som økonomistyringslitteraturen men også til ledere, der arbejder med,
eller planlægger at implementere, kundelønsomhedsmåling i praksis af to årsager:
For det første skal marketing funktionen i stigende grad stå til regnskab for de
markedsføringsinvesteringer der søges gennemført. En bedre forståelse af, hvilke
typer af kundelønsomhedsmodeller der er anvendelige i hvilke kontekste kan
bidrage til en mere effektiv ressourceanvendelse i virksomhederne. For det andet
er økonomistyringslitteraturen indenfor kundelønsomhedsmåling meget sparsom
på trods af, at dette er et højt prioriteret tema i praksis. Viden om, hvordan
kundelønsomhedsmodeller tilpasses omverdensfaktorer vil bidrage til forståelsen
af, hvordan kundelønsomhedsmodeller bør designes, men også til den generelle
forskning indenfor kontingensbaseret økonomistyringslitteratur.
Formålet med denne afhandling er tredelt:

10
1. At sammenligne forskellige kundelønsomhedsmålingsmodeller med
henblik på at identificere deres indbyrdes forskelle og fælles
begrænsninger i forskellige kunde-kontekste (behandlet i Artikel #1).
2. At undersøge effekten af kundelønsomhedsmåling på virksomheders
finansielle performance på tværs af industrier og marketingkontekste
(behandlet i Artikel #2).
3. At undersøge hvordan og hvorfor ledelsen tilpasser sofistikationen af deres
kundelønsomhedsmålingsmodeller i forhold til den kundekontekst
virksomheden opererer i (behandlet i Artikel #1 & Artikel #3).
Afhandlingen følger et artikel-baseret format og indeholder i alt tre artikler. I
Artikel #1 udvikles en konceptuelt referenceramme for virksomheders valg af
kundelønsomhedsmodel samt et sæt af propositioner, som fremtidig forskning kan
beskæftige sig med. Dette baserer sig på en gennemgang af kundelønsomheds-
målingslitteraturen indenfor både marketing og økonomistyring.
Både Artikel #2 og Artikel #3 baserer sig på empiriske spørgeskemadata
indsamlet blandt de største virksomheder i Danmark og Sverige. I Artikel #2 testes
sammenhængen mellem anvendelse af kundelønsomhedsstyringsmodeller og
virksomheders lønsomhed, herunder hvorvidt effekten varierer med
virksomhedens grad af produktfokus, samt hvorvidt virksomheder er i stand til at
opretholde en overnormal performance-effekt over tid.
Endelig undersøges i Artikel #3, hvorledes udvalgte faktorer i virksomheders
omverden (konkurrenceintensitet og kompleksitet) påvirker, hvor sofistikeret en
kundelønsomhedsmålingsmodel ledelsen anvender til ressourceallokeringsformål.
Afhandlingens videnskabsteoretiske udgangspunkt er overvejende
positivistisk og baserer sig således på en grundlæggende antagelse om, at der

11
findes en objektiv virkelighed, hvor kausale sammenhænge kan kortlægges, og
hypoteser om disse sammenhænge kan testes empirisk. Dette udgangspunkt er i
overensstemmelse med afhandlingens formål om at undersøge generelle relationer
imellem kundelønsomhedsmodeller, kontekst og virksomhedens performance.
Afhandlingens empiriske datagrundlag er indsamlet både fra primære og
sekundære datakilder. Primære data blev indsamlet via survey-metoden, hvor et
spørgeskema blev udarbejdet, testet og distribueret blandt 1.545 af de største
virksomheder (målt på omsætning) i Danmark og Sverige. Tre opfølgningsrunder
blev gennemført, og en tilfældig stikprøve blev endvidere kontaktet telefonisk, for
at maksimere svarprocenten. Dette førte i sidste ende til en brutto svarprocent
(samlede fuldendte besvarelser i alt inkl. manglende enkeltobservationer) på 17%
svarende til en brutto-stikprøve på 255 besvarelser. Test for non-response bias
afslørede ingen systematiske afvigelser mellem stikprøve og total population.
Sekundære data (regnskabsdata og industriklassifikation) blev indhentet via
regnskabsdatabaserne Greens og NNE i Danmark og Retriever i Sverige.
Afhandlingens teoretiske ståsted er forankret såvel i kundelønsomheds-
målingslitteraturen som i kontingensteori. I kundelønsomhedsmålings-litteraturen
skelner man mellem to hovedgrupper af modeller: Customer Profitability Analysis
(CPA) og Customer Lifetime Value (CLV). Hvor CPA modeller primært har til
formål at spore al kunderelateret omsætning og alle kunderelaterede omkostninger
til den enkelte kunde i en historisk regnskabsperiode, har CLV modeller til formål
at estimere og tilbagediskontere forventede fremtidige pengestrømme pr. kunde.
Kontingensteori baserer sig på antagelsen om, at der ikke findes én universel
løsning til virksomheders organisering, strategi og systemdesign. I stedet tilpasser
virksomheder sig de relevante kontingensfaktorer, de er underlagt. I afhandlingens
litteraturstudium blev virksomhedens omverden identificeret som væsentlig i

12
forhold til virksomheders design af kundelønsomhedsmodeller. To nøglefaktorer
blev efterfølgende identificeret: Konkurrenceintensitet og kunde kompleksitet.
De tre artikler i afhandlingen skaber fire hovedbidrag til forskningen indenfor
marketing og økonomistyring:
1. Omverdensfaktoren kompleksitet udvikles til to kunderelaterede faktorer:
Kundeservicekompleksitet og kundeadfærdskompleksitet (Artikel #1).
Kundeservicekompleksitet valideres endvidere empirisk. (Artikel #3)
2. Et kontingensbaseret framework til forklaring af hhv. CPA og CLV model
sofistikation baseret på graden af hhv. kundeservicekompleksitet og
kundeadfærdskompleksitet udvikles (Artikel #1).
3. Desuden blev CPA sofistikation konceptualiseret, og det blev eftervist
empirisk, at øget kundeservicekompleksitet fører til implementering af
mere sofistikerede kundelønsomhedsmodeller, men at denne sammenhæng
er stærkere i tilfælde af lav konkurrenceintensitet (Artikel #3).
4. Der påvises en generel positiv sammenhæng mellem anvendelse af
kundelønsomhedsmålingsmodeller og finansiel performance, men effekten
er mindre i produktfokuserede virksomheder. Desuden aftager effekten
over tid, hvilket enten kan skyldes at virksomheder ikke formår at
institutionalisere modellen i implementeringsfasen eller at konsulenter
opsamler læringsfordele, som de virksomheder der adopterer modellerne
på et senere tidspunkt får gavn af (Artikel #2).
13
TABLE OF CONTENTS
1.� 0BMotivation and objective ................................................................................ 15�
2.� 1BMethodological position ................................................................................. 18�
3.� 2BResearch method and data .............................................................................. 20�
8B3.1 Literature review .......................................................................................... 21�
9B3.2 Survey ........................................................................................................... 22�
12B3.2.1. Purpose and design ............................................................................... 23�
13B3.2.2. Population definition and sampling ..................................................... 24�
14B3.2.3. Questions and other method issues ...................................................... 28�
4.� 3BTheoretical position ........................................................................................ 31�
10B4.1. Customer Profitability Measurement models ............................................. 31�
15B4.1.1. Customer Profitability Analysis (CPA) ............................................... 32�
16B4.1.2. Customer Lifetime Value (CLV) ......................................................... 34�
11B4.2. Contingency thinking .................................................................................. 37�
17B4.2.1. A classification of environmental factors ............................................ 37�
18B4.2.2. The concept of contingency fit ............................................................. 39�
5.� 4BContributions to knowledge and future research directions .......................... 42�
6.� 5BReferences ...................................................................................................... 45�
7.� 6BArticles ........................................................................................................... 56�
8.� 7BAppendix A: Questionnaire .......................................................................... 180�

14
15
SYNOPSIS
1. 0BMotivation and objective
My inspiration for writing a doctoral dissertation on customer profitability
measurement (CPM) models derives from my professional background in
management consulting as well as my academic background from finance and
accounting.
I worked for four years as a management consultant on engagements mainly
concerned with the development of commercial strategies. A pivotal element
herein was always to perform segmentations of customers, segments and channels
based on profitability. Every time I participated in this type of engagement two
things puzzled me: First, I was intrigued by experiencing that most firms seemed
to be managing their sales and marketing resources without having a thorough
understanding of which customers they made money on and which customers
were loss-making. But, equally importantly, it also surprised me that the tools and
techniques for determining the financial value of customers that were available to
me as a consultant were far from adequate to solve many of the issues
encountered.
As a graduate student I was very interested in discounted cash flow valuation
of companies which was also the topic for my Master’s thesis. Subsequently,
during my time as a consultant, I started playing with the idea of incorporating the
discounted cash flow valuation technique when determining the financial worth of
a customer. This added a whole new perspective to the traditional, single-periodic
customer profitability analyses usually performed. Sadly, it also added a lot of
complexity. Based on these observations I decided that I wanted to investigate the
different methods for measuring customer profitability as well as to what extent
these models were applicable in practice
16
During the initial stage of my PhD I performed 11 semi-structured interviews
with business managers mainly from commercial functions in some of the largest
Danish companies. These interviews to some extent supported my observations
about the mixed focus on customer profitability across firms. However, it was also
clear that the benefits of using profitability-based customer management strategies
were quite different across industries. Hence, I realized that it might be rewarding
to investigate whether some general factors influencing firms’ motivation to
develop more or less sophisticated CPM models could be identified.
From a research perspective CPM models are receiving increasing attention
as a key topic – especially in the marketing literature. Two factors have
contributed to this increasing interest. First, an emerging paradigm shift from a
product/transaction orientation towards a customer relationship orientation in
marketing management has been discussed over the past two Decades (Day 2000;
Gronroos 1997; Palmer, Lindgreen, and Vanhamme 2005; Peppers, Rogers, and
Dorf 1999; Shah et al. 2006; Sheth and Parvatiyar 2002). An important element in
this shift is that customer relationships must be prioritized based on the value they
create for the firm (Payne and Frow 2005). Simultaneously, marketers are
increasingly encouraged to demonstrate the financial performance effects of
marketing investments (Rust et al. 2004; Sherrell and Bejou 2007) and the
Marketing Science Institute (MSI) has therefore identified marketing
accountability as a prioritized research topic [MSI 2008; 2010]. Consequently, a
research stream has emerged concerning how the value of customer relationships
can be determined in financial terms, and myriads of models have been developed
in the literature (see Gleaves et al. 2008; Gupta et al. 2006; McManus and
Guilding 2008; Villanueva and Hanssens 2006 for recent reviews).
In the management accounting literature CPM models have attracted much
less attention (Gleaves et al. 2008; Guilding and McManus 2002; McManus and
17
Guilding 2008). Herein lies a paradox as the measurement and management of
customer profitability has been highlighted as a top priority by management
accounting practitioners over a decade ago (Foster and Young 1997) and still is
high on the agenda in management accounting practice (CIMA 2008).
Understanding the merits and limitations of CPM as well as the way management
accountants can help develop and use CPM models alongside the rest of the
organization are therefore important research areas.
Bringing the disciplines of marketing and management accounting together is
in many ways an important next step in CPM model research which was also
highlighted in a special issue of Journal of Marketing Management in the Fall
2008 (see Roslender and Wilson 2008). These initial initiatives are promising but
at least two important areas need further development. The cost accounting
techniques and terminology developed in management accounting would be
beneficial to the development of the cost allocation aspect of marketing-based
CPM models – an aspect that has largely been ignored in the Customer Lifetime
Value stream of CPM literature (Gupta et al. 2006) but has been an integrated part
of the Customer Profitability Analysis stream (e.g., Niraj, Gupta, and Narasimhan
2001). Another important area is to study CPM model use and their contextual
dependencies via the contingency-approach deployed in management accounting.
This approach can enlighten how the customer environment in which a firm
operates influences managers’ CPM model decisions. The vast majority of CPM
research carried out in the marketing literature has been case-based
demonstrations of different CPM models. New knowledge based on cross-
sectional data could be beneficial not only to marketing theory and practice but
also as a more general contribution to contingency-based management accounting
research.
18
The objective of this dissertation is therefore to advance research in the
marketing-management accounting interface in three ways:
1. To compare CPA and CLV models in order to identify their mutual
differences and collective limitations in different customer environments
(Article #1)
2. To investigate the effect of CPA/CLV models on firm financial
performance across different industries and marketing contexts
(Article #2)
3. To investigate how and why managers adapt CPA/CLV model
sophistication to the customer environments in which they operate
(Article #1 & Article #3)
2. 1BMethodological position
The way knowledge is created is reliant on the pre-study presumptions
embedded in the different methodological views researchers carry with them to the
field of investigation (Arbnor and Bjerke 2008). This dissertation mainly relies on
the reasoning and presumptions presented in the highly interrelated functionalist
view as described by Burrell and Morgan (1979), mainstream positivist view as
described by Chua (1986), and the analytical view as described by Arbnor and
Bjerke (2008). For practical purposes I will refer to these world-views collectively
as ”positivist”.
These three closely related positivist world-views all, to some extent,
embrace a set of similar socio-philosophical assumptions about the social world
which the results presented in this dissertation should be interpreted with respect
to:
19
First, the ontological assumption is that reality is a concrete structure that
exists independently of people’s perception of it and therefore is given rather than
a product of the mind. “The phenomenon of interest is single, tangible and
fragmentable, and there is a unique, best description of any chosen aspect of the
phenomenon.” (Lincoln and Guba 1985, p. 36).
Second, the epistemological assumption is that researchers can explain and
predict what happens in the social world by searching for patterns and
relationships between entities. Knowledge is cumulative and “[t]here exist real,
uni-directional cause-effect relationships that are capable of being identified and
tested via hypothetic-deductive logic and analysis.” (Lincoln and Guba 1985, p.
36).
Finally, the methodological assumption is that of nomothetic inquiry stating
that the scientific method can be used by deducting hypotheses from theory that
are generally accepted as long as they cannot be falsified by observations in the
empirical world.
This methodological position is inevitably influenced by my personal world-
view which in many ways has been shaped by my prior academic upbringing
within the finance and financial accounting disciplines as well as my professional
experience from the management consulting profession. Hence, my
epistemological point of departure in any aspect of the research process from
identifying research questions to conducting the research was positivistic.
Consequently, this positivist perspective is reflected in the issues that are
being investigated in this dissertation in terms of general relationships between
CPM model use and sophistication, firm performance and factors in firms’
environments. Arguably, it only makes sense to test whether using CPM models is
generally performance enhancing and whether different degrees of sophistication
20
fit different customer environments if you assume that there is an objective reality
where cause-and-effect relationships and contingency patterns can be identified by
an external observer (the researcher).
The positivist world-view is furthermore consistent with most marketing
research (Hunt 2010) and it is also in line with the fundamental assumptions
underlying the contingency-approach deployed in the investigation of the
contextual factors influencing managers’ adoption of managerial information
systems such as CPM models (Chua 1986).
One limitation of this positivist world-view in the case of CPM models is that
the design and use of management systems (like CPM models) in organizations
greatly relies on the social context in which the models are implemented
(Orlikowski and Baroudi 1991). However, in order to achieve the dissertation’s
main objective of studying general relationships across contexts one has to accept
this limitation and interpret the findings with this in mind.
3. 2BResearch method and data
The survey method was selected for the empirical part of this dissertation as
the main purpose was to test general causal relationships between CPM use, firm
performance, contingency factors and CPM model sophistication across a broad
cross-section of firms. However, first a literature review was performed in order to
establish a profound understanding of the differences, overlaps and limitations
across the different approaches to measuring and managing customer profitability.
21
8B3.1 Literature review
The literature review pursued a three-step strategy first identifying the most
influential contributions to CPM and subsequently working back and forward in
time from these key papers to broaden out the perspective to more specialized
journals in the second step whereupon key words could be identified for a key
word search.
In step one, six highly rated marketing and management accounting journals
were screened from the year 2000 and onwards:
� Management Accounting Research (MAR)
� Journal of Management Accounting Research (JMAR)
� Accounting, Organizations and Society (AOS)
� Journal of Marketing (JM)
� Journal of Marketing Research (JMR)
� Journal of the Academy of Marketing Science (JAMS)
All abstracts in all volumes during this period were studied and all
conceptual, empirical and analytical papers concerned with the measurement and
management of customer’s financial value were included in the review. The
purpose of this step was to identify the key contributions within customer
profitability management that had made it to the direction-setting mainstream
outlets for marketing and management accounting research.
During the second step of the review all relevant references in the papers
selected in Step one were identified. Furthermore, Social Sciences Citation Index
was used to identify the papers that cited the papers identified in Step one. Hence,
after having highlighted some of the most influential contributions that can be
expected to be most heavily cited in the first step, the second step broadened out
the analysis to a much wider variety of journals taking the total number of journals
22
represented in the review from 6 to 27. This way relevant references in some of
the less heavily cited marketing and management accounting journals were
identified (e.g., more specialized customer management journals like Journal of
Relationship Marketing, Journal of Database Marketing & Customer Strategy
Management and Journal of Interactive Marketing).
The final step was a key word search in the EBSCO database. Three key
word searches were performed: “Customer profitability”, “Customer Lifetime
Value” and “Customer Equity”. This search was performed in order to close as
many gaps as possible mainly in terms of capturing relevant contributions outside
the marketing and management accounting research disciplines – e.g., from
operations and general management research.
9B3.2 Survey
The survey research process was planned and executed with guidance from
Van der Stede et al.’s (2005) guidelines for conducting empirical survey research
in management accounting. These guidelines were deducted from a review of 130
management accounting survey studies during the period 1982-2001 that was
structured around a legal framework that determines whether any given survey
study is admissible in court – a framework that has also been used within the
marketing discipline (see Morgan 1990).
Van der Stede et al. (2005) divides the process of conducting survey research into
three main steps0F
1: (1) Determine purpose and design; (2) Define population and
sampling; (3) Questions and other method issues.
1 The fourth and final step of presenting the results is not discussed here as this is not the part of conducting the survey
23
12B3.2.1. Purpose and design
The survey was performed to collect data for the two empirical studies in the
dissertation. The purpose of both empirical studies was to test cause-and-effect
relationships, with the first study investigating the general effect of deploying
CPM models on firm performance cross-sectionally (Article #2) and the second
study investigating how key environmental factors influence the design choices
when firm managers implement and use CPM models (Article #3). For feasibility
reasons, dictated by the restricted time frame at my disposal to conduct the
research, a cross-sectional design was adopted. A general consideration when
performing explanatory survey studies based on a cross-sectional design will
always be whether the hypothesized direction of causality is “right” – i.e., whether
A in fact causes B (as hypothesized) or it is the other way around. Merely
identifying correlations is rarely interesting from a theoretical perspective. When
investigating the relationship between environmental factors and CPM model
sophistication (Article #3) this issue is presumably not a major concern as it is
rather unlikely that individual managers’ CPM model design decisions will
influence contingency factors in their environments. However, in the study of
performance effects of CPM model use (Article #2) this issue is potentially more
critical even though the hypotheses tested were rooted in theory deducted from
prior research on CPM models’ relationship with performance. Therefore, a
robustness check in was performed in Article #2 comparing the change in
performance during a four-year period (2006-09) of firms adopting CPM in this
period with non-adopters. The results of this analysis rather convincingly
supported the hypothesized direction of causality (see Article #2).
In both empirical studies firm or business unit level phenomena are being
investigated. Ideally, a broad range of informants from each firm should be invited
to participate in the survey since individual respondents rarely possess the required
24
knowledge to cover all aspects of the topic of the enquiry (Reinartz, Krafft, and
Hoyer 2004). However, securing multiple completed and applicable responses
from each participating organization was expected to severely jeopardize the size
of the sample. Therefore, it was decided to stick with a single informant from each
firm. Senior executives were targeted in an attempt to mitigate some of the
validity issues encountered by including only a single informant per firm as these
Directors were expected to possess the most comprehensive knowledge about the
firm’s CPM capabilities and the task environment in which the firm operates.
13B3.2.2. Population definition and sampling
The target population that both empirical papers (Article #2 and #3) aim to
study consists of all managers involved with customer management decision
making. Hence, it is the commercial part of the organization where CPM models
are being used for customer prioritization decisions – not the function where the
numbers are produced (although there may be overlaps) – that is in focus. This
focus was chosen because the purpose is partly to study CPM model use and
partly to study CPM model design. Managers involved with customer
management decision making are expected to be involved with both.
Identifying the relevant commercial executives can be challenging, as the
titles of the relevant informants may vary depending on the type of firm
investigated. Based on input from the group of people who helped testing the
questionnaire the following prioritization was established:
1. Commercial Director
2. Sales & Marketing Director
3. Sales Director
4. Marketing Director
5. CEO / General Manager / Country Manager
25
A survey population of large Scandinavian companies was selected.
Originally, the idea was to collect data in the US. However, as we did not manage
to achieve support from a sponsoring organization in the US the process of gaining
access to commercial directors in large US companies proved to be too
cumbersome. Hence, neither the attempt to engage a market research bureau nor
the purchase of contact data for 3,500 large US companies and the subsequent
hiring of a research assistant yielded any usable results mainly due to legal issues
and corporate policies not allowing target respondents to participate in surveys.
Instead, Swedish and Danish companies were approached. The decision to
pool Swedish and Danish data was made in order to include more large firms in
the population. Large firms were targeted as larger firms are expected to be more
exposed to new management practices and be more inclined to experiment with
adopting these practices (Bjørnenak 1997; Malmi 1999). Hence, in order to ensure
a sufficient representation of CPM-adopters the 1.000 largest firms in Denmark
and the 1.000 largest firms in Sweden (based on revenues) were identified yielding
a total survey population of 2.000 firms.
Rather than drawing a random sample from this survey population it was
decided to contact commercial managers from the entire population of large firms.
This decision was made in order to retrieve as large and diverse a sample as
possible and due to the fact that an online questionnaire was developed so the
marginal cost of increasing the sample beyond the first contact person was
negligible. Out of the 2.000 firms in the total survey population 455 were not
approachable either due to lack of interest, a non-disclosure policy regarding e-
mail addresses or due to a corporate policy prohibiting survey participation.
Consequently, 1.545 hyperlinks to the online questionnaires were distributed
accompanied by a cover e-mail.
26
In retrospect this approach was probably not ideal. During this first round of
contact where a hyperlink to the online questionnaire was distributed by e-mail
without prior contact to potential respondents we only received 150 completed
responses corresponding to a response rate of only 10%. This low response rate
was achieved despite the fact that three rounds of follow-up e-mailings were
performed over a four week period. Therefore, a couple of months later it was
decided to pursue a more personal approach by re-contacting a random sample of
350 mangers from the survey population by phone. This strategy yielded an
additional 105 completed questionnaires taking the total gross sample to 255
observations. Hence, the personal approach in isolation secured a response rate of
30% taking the total response rate for the gross sample from 10% to 17%. In
future survey research I think it will be worthwhile to consider pursuing this more
personal approach even though it can be very time consuming.
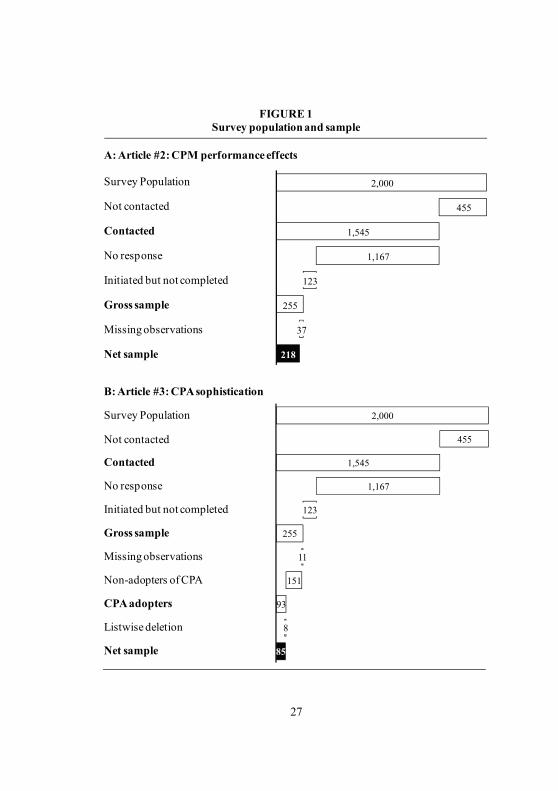
An overview of the way the gross and net samples for the two empirical
studies (Article #2 and Article #3) were established is provided in Figure 1.
A total of 378 questionnaires were initiated but only 255 informants made it
to the final question. For the CPM-performance study (Article #2) 37 responses
were ineligible due to missing observations leaving a net sample of 218
observations. For the study of environmental factors’ influence on CPM
sophistication (Article #3) 11 responses were ineligible due to missing
observations regarding the control variables and 151 observations were excluded
as these firms had not adopted CPM. This leaves 93 CPM adopters eligible for the
study (38% adoption rate) of which 8 were excluded via listwise deletion (missing
items for one or more of the focal constructs) leaving a net applicable sample of
85 observations.
27
Survey Population
Not contacted
Contacted
No response
Gross sample
2,000
455
1,545
1,167
123
255
37
218
FIGURE 1Survey population and sample
A: Article #2: CPM performance effects
Initiated but not completed
Missing observations
Net sample
B: Article #3: CPA sophistication
2,000
455
1,545
1,167
123
255
11
151
93
8
85
Survey Population
Not contacted
Contacted
No response
Gross sample
Initiated but not completed
Missing observations
Non-adopters of CPA
CPA adopters
Listwise deletion
Net sample
28
The size of the net sample applied for the first empirical study (Article #2) is
within the recommended range of 2-300 observations (Van der Stede, Young, and
Chen 2005). The size of the net sample for Article #3 is not within this range (85).
However, this sample was derived from a total sample of 245 CPM adopters and
non-adopters – a total sample that is large enough to be representative of the
survey population as a whole. Therefore, the sample of CPA-adopters is
considered representative as well although there may be some issues with gaining
sufficient statistical power with a sample of this size.
14B3.2.3. Questions and other method issues
The complete questionnaire including all questions applicable to the two
empirical papers in the dissertation is available in Appendix A. The questions in
the first section of the questionnaire are to some extent internally dependent in the
sense that some of the questions were only presented to the informants if relevant.
An overview of these internal dependencies is also provided in Appendix A
(Figure at final page of the Appendix).
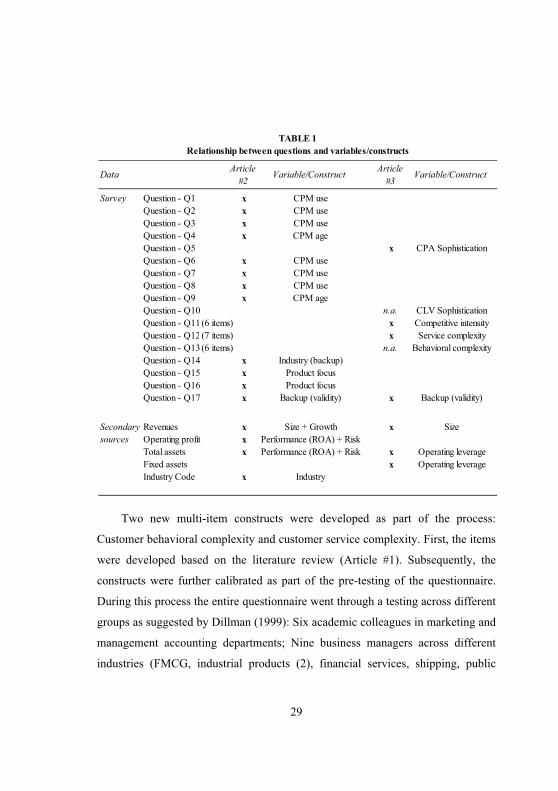
The relationship between the questions in the questionnaire and the variables
and constructs applied in the two studies is outlined in Table 1 alongside the data
that was collected from secondary sources such as annual reports and financial
accounting databases (Greens and NNE in Denmark and Retriever in Sweden). As
is evident from Table 1, the two studies draw on different parts of the
questionnaire. It is also worth noting that that Questions Q10 (CLV sophistication)
and Q13 (behavioral complexity) marked with n.a. were never used as the number
of CLV adopters in the sample (21) was too small to infer statistical
generalizations. Hence, it was not possible to accomplish the original plan of
investigating both CPA and CLV sophistication and it was therefore decided to
focus on CPA sophistication in Article #3.
29
Two new multi-item constructs were developed as part of the process:
Customer behavioral complexity and customer service complexity. First, the items
were developed based on the literature review (Article #1). Subsequently, the
constructs were further calibrated as part of the pre-testing of the questionnaire.
During this process the entire questionnaire went through a testing across different
groups as suggested by Dillman (1999): Six academic colleagues in marketing and
management accounting departments; Nine business managers across different
industries (FMCG, industrial products (2), financial services, shipping, public
Data Article #2
Variable/Construct Article #3
Variable/Construct
Survey Question - Q1 x CPM useQuestion - Q2 x CPM useQuestion - Q3 x CPM useQuestion - Q4 x CPM ageQuestion - Q5 x CPA SophisticationQuestion - Q6 x CPM useQuestion - Q7 x CPM useQuestion - Q8 x CPM useQuestion - Q9 x CPM ageQuestion - Q10 n.a. CLV SophisticationQuestion - Q11(6 items) x Competitive intensityQuestion - Q12(7 items) x Service complexityQuestion - Q13(6 items) n.a. Behavioral complexityQuestion - Q14 x Industry (backup)Question - Q15 x Product focusQuestion - Q16 x Product focusQuestion - Q17 x Backup (validity) x Backup (validity)
Secondary Revenues x Size + Growth x Sizesources Operating profit x Performance (ROA) + Risk
Total assets x Performance (ROA) + Risk x Operating leverageFixed assets x Operating leverageIndustry Code x Industry
TABLE 1Relationship between questions and variables/constructs
30
transportation, media, pharmaceuticals and real estate); and five former colleagues
from management consulting (two managers and three partners). This testing
served the dual purpose of assessing construct validity (especially for the newly
developed constructs) as well as ensuring that the other questions as well as the
questionnaire as a whole were “correctly understood and easy to answer by
respondents” (Morgan 1990, p 64) hereby increasing clarity of questions and
avoiding misunderstandings.
The third multi-item construct (competitive intensity) was adapted from
Jaworski and Kohli (1993) – a construct that has been thoroughly tested
throughout the market orientation literature (e.g., Cui, Griffith, and Cavusgil 2005;
Grewal and Tansuhaj 2001; Kumar et al. 2011) and is relevant due to the central
position of customer relationships in a market orientation (Kohli and Jaworski
1990). All multi-item constructs were measured on five-point Likert scales. Five-
point scales were chosen as this was the interval originally proposed by Jaworski
and Kohli (1993) in their empirically validated competitive intensity construct.
The response rate of 17% for the gross sample (255/1,545) is low compared
to the standards accepted in court as well as the average response rates achieved in
management accounting research (Van der Stede, Young, and Chen 2005).
However, response rates in the 10-20% range are far from uncommon in related
disciplines such as finance (e.g., Graham and Harvey 2001; Graham, Harvey, and
Rajgopal 2005) but also in marketing where Reinartz et al. (2004) recently
reported an effective response rate of ~21%, Palmatier et al. (2006) reported an
effective response rate of ~11% and Homburg et al. (2008) reported an effective
response rate of ~16% – all in highly rated journals. These different requirements
in the marketing discipline may reflect recognition that marketing executives (the
target population for this survey) are more difficult to persuade into completing
research questionnaires than their management accounting counterparts.
31
However, the data was naturally carefully analyzed for non-response bias and
no systematic patterns that suggested significant differences between participating
firms and non-participating firms were found. All the results of these non-response
analyses are reported in the research method section in Article #2 and Article #3
respectively.
Finally, objective data from secondary sources were collected for use in both
studies (see Table 1). In Article #2 the objective measure (ROA) was chosen as
the dependent measure in order to mitigate the risk of common method bias often
encountered in survey research. Furthermore, the control variables in both studies
are also from secondary sources. In Article #3 both the dependent and the
independent focus variables derive from the survey. However, as the dependent
measure in this study (CPA sophistication) is not measured on a Likert scale and is
largely objective rather than perceptual the risk of common method bias in this
study is expected to be limited as well.
4. 3BTheoretical position
The topic of this dissertation is the category of models developed to measure
the profitability of customer relationships collectively referred to as Customer
Profitability Measurement (CPM) models. The theoretical frame of reference
applied in most of the empirical work is contingency-based research.
10B4.1. Customer Profitability Measurement models
The literature review revealed that two distinct classes of CPM models have
been researched simultaneously in the CPM literature: Customer Profitability
Analysis (CPA) and Customer Lifetime Value (CLV). Although both approaches
aim at aiding resource allocation decision making (incl. pricing) across customers
they are fundamentally different in terms of their time and profitability
32
perspectives. Hence, whereas CPA models incorporate net profitability including
all customer-related costs and revenues in a single period in the past, CLV models
incorporate gross cash flows / profits from products net of direct marketing costs
from a forward-looking perspective estimating these profits over multiple future
time periods.
The following sections provide an introduction to CLV and CPA models
respectively.
15B4.1.1. Customer Profitability Analysis (CPA)
The idea of keeping track of revenues and costs at customer or segment level
is not new. Customer profitability was already a topic of interest half a century ago
(e.g., Sevin 1965) even though CPA was rarely applied in practice (Mellman
1963). Through the 1970s and the early 1980s the merits of customer profitability
analysis were outlined (Dunne and Wolk 1977; Reich and Neff 1972) and
examples of customer profitability analysis emerged – particularly in financial
services (e.g., Ahern and Bercher 1982; Dominguez and Page 1984; Dunkelberg
and Bivin 1978; Knight 1975; Lee and Masten Sr. 1978; Morgan 1978) where
increasing turbulence in the US financial sector urged banks to develop account
profitability analyses in order to ensure adequate compensating balances and that
the needs of the most profitable customers were served well (Knight 1975).
Around 1990 the concept of CPA was rejuvenated, being proposed as an
important approach to dealing with increasingly diverse cost-to-serve across
customers in many industries (Bellis-Jones 1989; Foster and Gupta 1994; Howell
and Soucy 1990; Shapiro et al. 1987; Ward 1992). Simultaneously, the advent of
Activity-Based Costing (ABC), where resource costs are consolidated in activity
cost pools and assigned to cost objects (e.g., customers) via activity cost drivers
like the number of purchase orders or the number of sales calls per customer
33
(Cooper and Kaplan 1988; Cooper and Kaplan 1991), was adopted as a useful
technique for assigning overhead costs to customer relationships. Smith and
Dikolli (1995) were among the first to suggest that some form of ABC is required
to determine many customer-related overhead costs at customer level and Goebel,
Marshall, and Locander (1998) argue that only with ABC information can
companies fully determine if market-related activities provide the desired benefits.
Empirical work on CPA is case specific. Hence, the implementation and use
of CPA for strategic resource allocation purposes has been explored in selected
industry contexts. A few approaches for assigning costs to customers that are not
based on ABC have been demonstrated (e.g., Mulhern 1999; Storbacka 1997;
Worre 1991, pp 24-27). In these models overhead costs are ignored, allocated via
a single cost driver (e.g., sales volume) in a one-stage model or attempted
measured and traced directly to customers.
Most empirically demonstrated CPA-models apply some variation of a two-
stage ABC-model. The first step in this approach traces resource expenses to
activity cost pools and the second step traces activity costs to customers via
activity cost drivers (Kaplan and Cooper 1998).
Different variations of this two-stage ABC-model have been deployed across
a number of industries including industrial products (Kaplan and Cooper 1998, pp
183-89) hotels (Noone and Griffin 1999), supply chain distributors (Niraj, Gupta,
and Narasimhan 2001), B2B order-handling industries (Helgesen 2006; Helgesen
2007), telecom (McManus 2007) and food manufacturers (Guerreiro et al. 2008).
One common finding across these CPA case demonstrations is that a small
fraction of the customer base generates the vast majority of firm profits and that
there is a ”tail” of unprofitable customers ranging from 15% (van Raaij, Vernooij,
and van Triest 2003) to 40% (Guerreiro et al. 2008) of the customer base. It is this
34
identification of attractive and unattractive customers that is highlighted as a key
merit of CPA.
The progression in the CPA model literature merely demonstrates that CPA
can provide valuable customer management insights in different industries. Apart
from the variation in the number of activity cost pools and cost drivers deployed
there are no substantial modeling differences across the identified studies. Hence,
CPA models have apparently undergone little evolution since the time when they
were first demonstrated (e.g., in terms of the type of cost drivers deployed as all
identified studies solely use transaction cost drivers). Additionally, there is only
very limited discussion of the practical issues encountered after having
implemented ABC-based CPA. ABC-models have been criticized for being too
time consuming to implement and very resource heavy to update and maintain on
a regular basis (Kaplan and Anderson 2004). Understanding how firms adopting
CPA handle these implementation issues would be useful as the inability to update
or maintain ABC-based CPA models makes the continuous measurement of
customer profitability difficult and reduces CPA to an ad hoc exercise rather than
a dynamic management tool.
16B4.1.2. Customer Lifetime Value (CLV)
The concept of estimating the financial worth of a customer over his or her
life of doing business with a firm has been used for some time in specific
industries like life insurance (see Dwyer 1989; Jackson 1989a; Jackson 1989b).
However, with the emergence of the broad Customer Equity (CE) management
concept, where CE, defined as the sum of lifetime values of extant and future
customer relationships, is measured and managed (Blattberg and Deighton 1996),
more generally applicable CLV approaches emerged (e.g., Berger and Nasr 1998).
35
Two distinct approaches to the estimation of model parameters in CLV
models have been developed: A deterministic approach where retention rates,
customer margins and other behavioral input are entered directly into
mathematical formulas and a stochastic approach where probabilistic
determination of customer choice is incorporated (Villanueva and Hanssens 2006).
The early developments towards a general approach to measuring CLV all
deploy deterministic estimation of model parameters (e.g., Berger and Nasr 1998;
Dwyer 1997). CLV-modeling is in later empirical demonstrations of deterministic
models generally aggregated at either firm-level (Gupta and Lehmann 2003; 2006)
or segment level (Berger, Weinberg, and Hanna 2003). A recent contribution has
taken the deterministic approach to the individual customer level. Ryals (2005)
demonstrates what she refers to as a “simple” approach to strategic Customer
Relationship Management (CRM) in a longitudinal case study in the key account
organization of a B2B insurer. In this study a decision calculus similar to the one
proposed by Blattberg and Deighton (1996) as a method for estimating model
parameters is applied.
Other developments of CLV-models have inaugurated more probabilistic
forecasting approaches. Pfeifer and Carraway (2000) adopted Markov Chain
Modeling as a method for stochastic modeling of switching probabilities between
recency/frequency states. This approach not only introduces flexibility in customer
relationship modeling. Its probabilistic nature also allows more individualized
CLV measurement. The MCM switching-approach has since been taken to the
micro-segment level (Libai, Narayandas, and Humby 2002) and developed further
through cases in the financial sector where new variations of the “state dimension”
such as product mix and profitability have been explored (Aeron et al. 2008;
Donkers, Verhoef, and de Jong 2007; Haenlein, Kaplan, and Beeser 2007).
36
Venkatesan and Kumar (2004) pioneered another probabilistic approach to
CLV-modeling. Based on earlier works by Reinartz and Kumar (2000; 2003) they
predict purchase frequency per individual customer in a generalized gamma-model
originally proposed by Allenby, Leone and Jen (1999) and predict contribution
margin for individual customers based on panel-data regression methods. Kumar
and colleagues have subsequently advanced this model in retailing (Kumar, Shah,
and Venkatesan 2006; Kumar and Shah 2009) and high-tech manufacturing
contexts (Kumar et al. 2008; Kumar and Shah 2009; Venkatesan, Kumar, and
Bohling 2007) and have simultaneously proposed a set of normative customer
management strategies for improving financial performance based on CLV-
management (Kumar, Ramani, and Bohling 2004; Kumar and Petersen 2005;
Kumar 2008).
CLV-based models have evolved from a basic to a highly sophisticated level
having incorporated covariates of customer behavior over and above past spending
(Kumar and George 2007), enabling the modeling of non-linear patterns of
customer lifetimes (Villanueva and Hanssens 2006) and reducing bias related to
subjective estimation of parameters as experienced in the deterministic models.
However, sophistication comes at the cost of complexity in terms of data
collection/management, and longitudinal transaction databases are a prerequisite
(Berger et al. 2006). One practical implication of the data issue is that establishing
reliable predictions of CLV with scarce data availability can be a challenge
(Villanueva and Hanssens 2006). However, a more severe implication of the sole
reliance on longitudinal transaction databases that is widely acknowledged as a
challenge in predicting future customer behavior in a CLV-context is their inside-
out scope ignoring customers’ relationships with competitors (Berger et al. 2006;
Gupta and Zeithaml 2006; Gupta et al. 2006; Lemon and Mark 2006). Taking
competitor reactions into consideration could improve CLV-models by linking
37
customer expansion potential and retention/acquisition probabilities to customer
share of wallet and/or to competitor activities.
11B4.2. Contingency thinking
Contingency thinking originates from the organization literature where it first
emerged in the early to mid-1960s (Otley 1980). The fundamental premise of
contingency thinking is that organizations tend to adopt a structure that fits the
contingencies under which the organization operates (Donaldson 2001).
Contingency-based research within customer profitability measurement
models is still in its infancy. Little is therefore known about how different
environmental, organizational and technological contingency factors are expected
to influence the implementation and use of CPM models for decision making
purposes. During the literature review I discovered that different CLV and CPA
models had been demonstrated and developed in different environmental contexts
and I specifically identified two aspects of complexity as important determinants
of CLV/CPA model sophistication. In order to prioritize my efforts I decided to
focus on complexity alongside other potential environmental contingency factors’
impact on CPM model use. Future research can build on these findings by adding
more insights on organizational and technological contingency factors hereby
gradually building a more comprehensive contingency theory of customer
accounting.
17B4.2.1. A classification of environmental factors
Dess and Beard (1984) and Sharfman and Dean (1991) were among the first
to synthesize organization research to come up with multidimensional
conceptualizations of the organizational task environment. They identify three
environmental dimensions that can be considered important for organizations to
38
consider when fitting structures within organizations: Complexity, dynamism, and
competitive threat. Sharfmann and Dean (1991) define complexity as the level of
complex knowledge that understanding the environment requires corresponding to
constructs like heterogeneity (Aldrich 1979; Thompson 1967) and diversity
(Mintzberg 1979). Dynamism is defined as the rate of unpredictable environmental
change corresponding to constructs like instability (Emery and Trist 1965; Tung
1979) and turbulence (Aldrich 1979). And competitive threat is defined as the
level of competition for available resources in the environment corresponding to
constructs like munificence (Dess and Beard 1984; March and Simon 1958) and
hostility (Mintzberg 1979).
In the marketing literature complexity, dynamism and competition have been
investigated in diverse contingency-based marketing studies examining topics
such as these factors’ influence on marketing control (e.g., Jaworski 1988),
decision making uncertainty in marketing channels (e.g., Achrol and Stern 1988)
and sales force effectiveness (e.g., Sohi 1996). However, one area that has
attracted particular interest over the past two decades is market orientation’s effect
on performance and the influence of environmental factors (e.g., Day and Wensley
1988; Grewal and Tansuhaj 2001; Jaworski and Kohli 1993; Kumar et al. 2011;
Narver and Slater 1990; Voss and Voss 2000). Within the market orientation
research stream interest has mainly been on environmental factors’ moderating
role on the performance effects of a market orientation. Competitive intensity and
Turbulence (Dynamism) in particular have been thoroughly studied empirically
albeit with mixed results (Greenley 1995; Grewal and Tansuhaj 2001; Jaworski
and Kohli 1993; Kumar et al. 2011; Slater and Narver 1994).
Market orientation is closely linked to CPM model research due to the central
role a customer focus plays within the market orientation concept (Kohli and
Jaworski 1990; Narver and Slater 1990). Therefore, the operationalization of the
39
environmental constructs in the empirical part of this dissertation were largely
inspired by this stream of research and the competitive intensity construct was
directly adapted from Jaworski and Kohli (1993).
In the management accounting literature Khandwalla’s (1977)
conceptualization of a firm’s environment has played an imperative part.
Complexity, dynamism and competition are all important elements in this
conceptualization denoted by Khandwalla as: Diversity/heterogeneity, turbulence
and hostility respectively. However, prior research on cost system sophistication
has mainly focused on complexity (diversity/heterogeneity) and competition
(hostility) as key contextual factors both in studies of the determinants of Activity-
Based Costing adoption for product costing (Bjørnenak 1997; Cagwin and
Bouwman 2002; Krumwiede 1998; Malmi 1999) as well as more recent
contributions concerning the relationship between contextual determinants of cost
system sophistication in general (Al-Omiri and Drury 2007; Drury and Tayles
2005) whereas dynamism has not been considered as a relevant environmental
factor influencing cost system sophistication.
Therefore, focus is on complexity and competition as the two key
environmental determinants of cost system sophistication.
18B4.2.2. The concept of contingency fit
The concept of fit is a central element in contingency thinking. The key
notion in contingency-based management accounting research is that specific
aspects of accounting systems must be demonstrated to fit certain circumstances in
a firm’s context (Otley 1980). Contingency thinking is therefore an approach
within which theoretical relationships between accounting system design and use
and contingency variables can be formulated and tested rather than a theory per se.
40
Contingency fit can be conceptualized in different ways (Drazin and Van de
Ven 1985; Venkatraman 1989), however two conceptualizations in particular have
dominated contingency-based management accounting research: Selection fit and
Interaction fit. According to the selection concept of fit accounting systems are
designed to fit the environment in which the firm operates (Hartmann 2005).
Hence, features of the accounting system constitute the dependent variable and the
relevant contingency factors represent a set of independent variables. Embedded in
this definition is the implicit assumption that context and accounting systems are
always in a state of equilibrium where all firms have optimal system designs and
performance given their situation (Chenhall 2003). This equilibrium is reached
through an evolutionary process where optimization occurs through the selection
of the proper accounting system features in any given context and where
performance differences are therefore not expected to be a result of accounting
system differences (Hartmann 2005).
According to the interaction concept of fit firms do not necessarily adapt their
accounting systems to fit the context in which they operate – instead certain
configurations between accounting system features and context are hypothesized
to outperform others (Hartmann 2005). Consequently, performance differences are
expected across firms within the same context depending on the kind of
accounting system deployed. In this conceptualization of fit organizational
performance is the dependent variable whereas accounting system features and
their interaction with contextual variables are the independent variables.
41
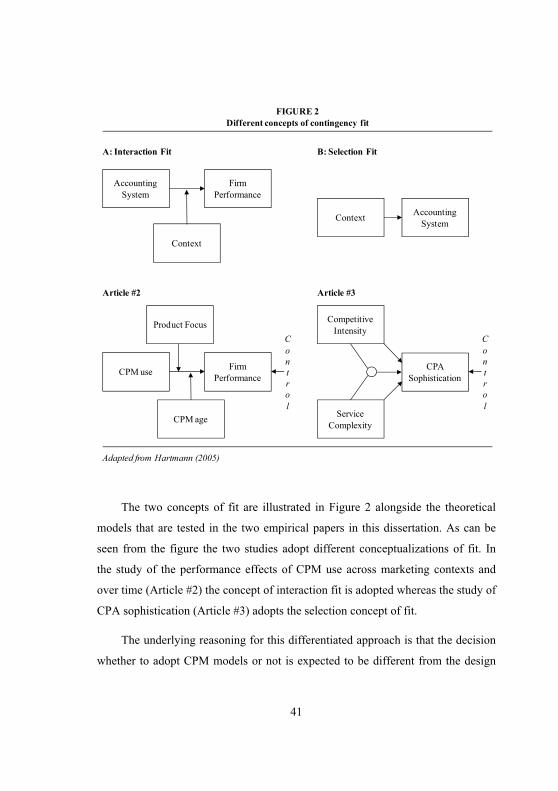
The two concepts of fit are illustrated in Figure 2 alongside the theoretical
models that are tested in the two empirical papers in this dissertation. As can be
seen from the figure the two studies adopt different conceptualizations of fit. In
the study of the performance effects of CPM use across marketing contexts and
over time (Article #2) the concept of interaction fit is adopted whereas the study of
CPA sophistication (Article #3) adopts the selection concept of fit.
The underlying reasoning for this differentiated approach is that the decision
whether to adopt CPM models or not is expected to be different from the design
FIGURE 2Different concepts of contingency fit
Accounting System
Firm Performance
Context
Context Accounting System
A: Interaction Fit B: Selection Fit
Adapted from Hartmann (2005)
CPM use
Article #2 Article #3
Firm Performance
CPM age
Product Focus
CPA Sophistication
Competitive Intensity
Service Complexity
C o n t r o l
C o n t r o l
42
decisions regarding which degree of sophistication that is to be implemented.
Adoptions of new managerial innovations in organizations are restrained by
barriers e.g., in the form of constrained financial, technological, and/or human
resources, as well as the uncertainty surrounding the future benefits of adoption
and general organizational resistance to change. Additionally, institutional or
political reasons that are inconsistent with rational economic arguments may
influence adoption decisions (Chenhall 2003). All these conditions suggest that
optimization is restrained and that managers therefore not necessarily select
systems such as CPM even though these systems may be optimal in a specific
context. Therefore, an interaction fit rather than a selection fit approach is pursued
for the CPM-performance study (Article #2) hereby expecting to find performance
differences across users and non-users of CPM with the magnitude of the
difference being influenced by certain contextual factors.
However, after the decision to adopt CPM models has been made managers
are expected to act rationally and configure CPM model sophistication with the
contextual factors under which the firm operates. Therefore, the selection concept
of fit has been chosen for the study of CPM model sophistication (Article #3).
5. 4BContributions to knowledge and future research directions
This dissertation makes four distinct contributions to marketing and
management accounting research.
First, the environmental contingency factor complexity is developed into two
customer-related constructs: Customer service complexity and customer
behavioral complexity (Article #1) and the customer service complexity construct
is furthermore validated empirically (Article #3). This way a contribution is made
to general contingency-based research and future studies centered on customer-
43
related issues within marketing and management accounting can build on the
developed constructs.
Second, a contingency framework for explaining the degree of CPA and CLV
model sophistication in different customer environments characterized by different
degrees of customer behavioral and service complexity is proposed (Article #1)
and a set of research propositions are derived from the framework. Furthermore,
suggestions for how CPA and CLV models can be improved and integrated are
proposed as well.
Third, the CPA sophistication construct is conceptualized and its association
with customer service complexity is further supported empirically (Article #3).
Additionally, competitive intensity is found to have a negative moderating effect
on this positive association suggesting that customer service complexity plays a
greater part when it comes to CPA sophistication design decisions in non-
competitive environments than in environments characterized by more fierce
competition. These findings contribute to the different branches within the general
CPM research area as well as to the general contingency-based school of
accounting research. Moreover, the contingency framework can be expanded to
include organizational contingency factors such as technology, size, organizational
structure, strategy and culture (Chenhall 2003). Field study research would be a
valuable first step to establish a profound understanding of different organizational
factors and develop propositions for their influence on CPM model sophistication.
Subsequently, these propositions can be tested empirically.
Finally, CPM models are found to be performance enhancing cross-
sectionally although the size of the effect varies across marketing contexts and
although the effect appears to diminish over time (Article #2). This demonstration
of a general effect across industries adds to the existing case-based research on the
performance enhancing effect of CPM models performed in selected industries.
44
However, the findings also emphasize the difficulties of transferring extant CPM
models to industries where brand investments and new product development are
key value drivers. Researching how CPM models are best implemented in a
product/brand focused context is therefore an interesting area for future research.
Furthermore, the findings suggest that firms are generally not successful in
implementing, maintaining, updating and using CPM models in ways that enable
them to sustain the financial benefits these models provide when first
implemented. Longitudinal case-studies investigating the CPM adoption process
from the implementation stage to the confirmation stage (Rogers 1995) would be a
beneficial way of pursuing some of the proposed explanations why the
competitive edge originally provided by the implementation of CPM models
deteriorates over time.
45
6. 5BReferences
Achrol, Ravi S. and Louis W. Stern (1988), "Environmental Determinants of Decision-Making Uncertainty in Marketing Channels," Journal of Marketing Research, 25 (February), 36-50.
Aeron, Harsha, Tarun Bhaskar, Ramasubramanian Sundararajan, Ashwani Kumar, and Janakiraman Moorthy (2008), "A Metric for Customer Lifetime Value of Credit Card Customers," Journal of Database Marketing & Customer Strategy Management, 15 (3), 153-68.
Ahern, Michael J. and Michael F. Bercher (1982), "Customer Profitability Model for use in Retail Banking," Financial Review, 17 (2), 79.
Aldrich, Howard E. (1979), Organizations and Environment. Upper Saddle River, NJ: Prentice Hall.
Allenby, Greg M., Robert P. Leone, and Lichung Jen (1999), "A Dynamic Model of Purchase Timing with Application to Direct Marketing," Journal of the American Statistical Association, 94 (June), 365-74.
Al-Omiri, Mohammed and Colin Drury (2007), "A Survey of Factors Influencing the Choice of Product Costing Systems in UK Organizations," Management Accounting Research, 18 (4), 399-424.
Arbnor, Ingemann and Björn Bjerke (2008), Methodology for Creating Business Knowledge. London, UK: Sage Publications Ltd.
Bellis-Jones, Robin (1989), "Customer Profitability Analysis," Management Accounting, 67 (2), 26-8.
Berger, Paul D., Naras Eechambadi, Morris George, Donald R. Lehmann, Ross Rizley, and Rajkumar Venkatesan (2006), "From Customer Lifetime Value to Shareholder Value: Theory, Empirical Evidence, and Issues for Future Research," Journal of Service Research, 9 (2), 156-67.
Berger, Paul D. and Nada I. Nasr (1998), "Customer Lifetime Value: Marketing Models and Applications," Journal of Interactive Marketing, 12 (1), 17-30.
Berger, Paul D., Bruce Weinberg, and Richard C. Hanna (2003), "Customer Lifetime Value Determination and Strategic Implications for a Cruise-Ship
46
Company," Journal of Database Marketing & Customer Strategy Management, 11 (1), 40-52.
Bjørnenak, Trond (1997), "Diffusion and Accounting: The Case of ABC in Norway," Management Accounting Research, 8 (1), 3-17.
Blattberg, Robert C. and John Deighton (1996), "Manage Marketing by the Customer Equity Test," Harvard Business Review, 74 (July-August), 136-44.
Burrell, Gibson and Gareth Morgan (1979), Sociological Paradigms and Organisational Analysis: Elements of the Sociology of Corporate Life. London, UK: Heinemann.
Cagwin, Douglass and Marinus J. Bouwman (2002), "The Association between Activity-Based Costing and Improvement in Financial Performance," Management Accounting Research, 13 (1), 1-39.
Chenhall, Robert H. (2003), "Management Control Systems Design within its Organizational Context: Findings from Contingency-Based Research and Directions for the Future," Accounting, Organizations & Society, 28 (2), 127-68.
Chua, Wai F. (1986), "Radical Developments in Accounting Thought," The Accounting Review, 61 (4), 601-32.
Cooper, Robin and Robert S. Kaplan (1988), "Measure Costs Right: Make the Right Decision," Harvard Business Review, 66 (5), 96-103.
----(1991), "Profit Priorities from Activity-Based Costing," Harvard Business Review, 69 (May-June), 130-5.
Cui, Anna S., David A. Griffith, and Tamer Cavusgil (2005), "The Influence of Competitive Intensity and Market Dynamism on Knowledge Management Capabilities of Multinational Corporation Subsidiaries," Journal of International Marketing, 13 (3), 32-53.
Day, George S. (2000), "Managing Market Relationships," Journal of the Academy of Marketing Science, 28 (1), 24.
Day, George S. and Robin Wensley (1988), "Assessing Advantage: A Framework for Diagnosing Competitive Superiority," Journal of Marketing, 52 (April), 1-20.
Dess, Gregory G. and Donald W. Beard (1984), "Dimensions of Organizational Task Environments," Administrative Science Quarterly, 29 (1), 52-73.
47
Dillman, D. (1999), Mail and Internet Surveys: The Tailored Design Method. New York, NY: Wiley.
Dominguez, Luis V. and Albert L. Page (1984), "Formulating a Strategic Portfolio of Profitable Retail Market Segments for Commercial Banks," Journal of Economics and Business, 36 (2), 189-206.
Donaldson, Lex (2001), The Contingency Theory of Organizations. Thousand Oaks, CA: Sage Publications Inc.
Donkers, Bas, Peter C. Verhoef, and Martijn de Jong (2007), "Modeling CLV: A Test of Competing Models in the Insurance Industry," Quantitative Marketing and Economics, 5 (2), 163-90.
Drazin, Robert and Andrew H. Van de Ven (1985), "Alternative Forms of Fit in Contingency Theory," Administrative Science Quarterly, 30 (4), 514-39.
Drury, Colin and Mike Tayles (2005), "Explicating the Design of Overhead Absorption Procedures in UK Organizations," The British Accounting Review, 37 (1), 47-84.
Dunkelberg, William C. and David G. Bivin (1978), "Bank Credit Card use and Customer Profitability," Financial Review, 13 (3), 41.
Dunne, Patrick M. and Harry I. Wolk (1977), "Marketing Cost Analysis: A Modularized Contribution Approach," Journal of Marketing, 41 (July), 83-94.
Dwyer, F. R. (1989), "Customer Lifetime Valuation to Support Marketing Decision Making," Journal of Direct Marketing, 3 (4), 8-15.
----(1997), "Customer Lifetime Valuation to Support Marketing Decision Making," Journal of Interactive Marketing, 11 (4), 6-13.
Emery, F. E. and E. L. Trist (1965), "The Causal Texture of Organizational Environments," Human Relations, 18 (1), 21-32.
Foster, George and Mahendra Gupta (1994), "Marketing, Cost Management and Management Accounting," Journal of Management Accounting Research, 6 (Fall), 43-77.
Foster, George and S. M. Young (1997), "Frontiers of Management Accounting Research," Journal of Management Accounting Research, 9, 63-77.
48
Gleaves, Robin, Jamie Burton, Jan Kitshoff, Ken Bates, and Mark Whittington (2008), "Accounting is from Mars, Marketing is from Venus: Establishing Common Ground for the Concept of Customer Profitability," Journal of Marketing Management, 24 (7), 825-45.
Goebel, Daniel J., Greg W. Marshall, and William B. Locander (1998), "Activity-Based Costing: Accounting for a Market Orientation," Industrial Marketing Management, 27 (11), 497-510.
Graham, John R. and Campbell R. Harvey (2001), "The Theory and Practice of Corporate Finance: Evidence from the Field," Journal of Financial Economics, 60 (2-3), 187-243.
Graham, John R., Campbell R. Harvey, and Shiva Rajgopal (2005), "The Economic Implications of Corporate Financial Reporting," Journal of Accounting and Economics, 40 (1-3), 3-73.
Greenley, Gordon E. (1995), "Market Orientation and Company Performance: Empirical Evidence from UK Companies," British Journal of Management, 6 (1), 1-13.
Grewal, Rajdeep and Patriya Tansuhaj (2001), "Building Organizational Capabilities for Managing Economic Crisis: The Role of Market Orientation and Strategic Flexibility," Journal of Marketing, 65 (April), 67-80.
Gronroos, Christian (1997), "From Marketing Mix to Relationship Marketing: Towards a Paradigm Shift in Marketing," Management Decision, 35 (4), 322-39.
Guerreiro, Reinaldo, Sé Bio, Elvira Vazquez, and Villamor Merschmann (2008), "Cost-to-Serve Measurement and Customer Profitability Analysis," International Journal of Logistics Management, 19 (12), 389-407.
Guilding, Chris and Lisa McManus (2002), "The Incidence, Perceived Merit and Antecedents of Customer Accounting: An Exploratory Note," Accounting, Organizations & Society, 27 (1/2), 45-59.
Gupta, Sunil, Dominique M. Hanssens, Bruce G. S. Hardie, Wiliam Kahn, V. Kumar, Nathaniel Lin, and Nalini R. S. Sriram (2006), "Modeling Customer Lifetime Value," Journal of Service Research, 9 (2), 139-55.
Gupta, Sunil and Donald R. Lehmann (2003), "Customers as Assets," Journal of Interactive Marketing, 17 (Winter), 9-24.
49
----(2006), "Customer Lifetime Value and Firm Valuation," Journal of Relationship Marketing, 5 (2/3), 87-110.
Gupta, Sunil and Valarie A. Zeithaml (2006), "Customer Metrics and their Impact on Financial Performance," Marketing Science, 25 (6), 718-39.
Haenlein, Michael, Andreas M. Kaplan, and Anemone J. Beeser (2007), "A Model to Determine Customer Lifetime Value in a Retail Banking Context," European Management Journal, 25 (3), 221-34.
Hartmann, Frank G. (2005), "The Impact of Departmental Interdependencies and Management Accounting System use on Subunit Performance: A Comment," European Accounting Review, 14 (2), 329-34.
Helgesen, Øyvind (2006), "Customer Segments Based on Customer Account Profitability," Journal of Targeting, Measurement & Analysis for Marketing, 14 (3), 225-37.
----(2007), "Customer Accounting and Customer Profitability Analysis for the Order Handling Industry - A Managerial Accounting Approach," Industrial Marketing Management, 36 (6), 757-69.
Homburg, Christian, Mathias Droll, and Dirk Totzek (2008), "Customer Prioritization: Does it Pay Off, and how should it be Implemented?" Journal of Marketing, 72 (September), 110-30.
Howell, Robert A. and Stephen R. Soucy (1990), "Customer Profitability: As Critical as Product Profitability," Management Accounting, 72 (4), 43-7.
Hunt, Shelby D. (2010), Marketing Theory: Foundations, Controversy, Strategy, Resource-Advantage Theory. Armonk, NY: M.E. Sharpe Inc.
Jackson, Donald R. (1989a), "Determining a Customer's Lifetime Value, Part 1," Direct Marketing, 51 (March), 60-2.
----(1989b), "Determining Af Customer's Lifetime Value, Part 2," Direct Marketing, 52 (May), 24-32.
Jaworski, Bernard J. (1988), "Toward a Theory of Marketing Control: Environmental Context, Control Types, and Consequences," Journal of Marketing, 52 (July), 23-39.
50
Jaworski, Bernard J. and Ajay K. Kohli (1993), "Market Orientation: Antecedents and Consequences," Journal of Marketing, 57 (July), 53-70.
Kaplan, Robert S. and Steven R. Anderson (2004), "Time-Driven Activity-Based Costing," Harvard Business Review, 82 (Nov-Dec), 131-8.
Kaplan, Robert S. and Robin Cooper (1998), Cost and Effect: Using Integrated Cost Systems to Drive Profitability and Performance. Boston, MA: Harvard Business School Press.
Khandwalla, Prahid N. (1977), The Design of Organizations. New York, NY: Harcourt Brace Jovanovich.
Knight, Robert E. (1975), "Customer Profitability Analysis - Part I: Alternative Approaches Toward Customer Profitability," Economic Review, (April), 11-20.
Kohli, Ajay K. and Bernard J. Jaworski (1990), "Market Orientation: The Construct, Research Propositions, and Managerial Implications," Journal of Marketing, 54 (April), 1-18.
Krumwiede, Kip R. (1998), "ABC: Why it's Tried and how it Succeeds," Management Accounting, 79 (9), 32-7.
Kumar, V. (2008), Managing Customers for Profit: Strategies to Increase and Build Loyalty. Upper Saddle River, NJ: Wharton School Publishing.
Kumar, V. and Morris George (2007), "Measuring and Maximizing Customer Equity: A Critical Analysis," Journal of the Academy of Marketing Science, 35 (2), 157-71.
Kumar, V., Eli Jones, Rajkumar Venkatesan, and Robert P. Leone (2011), "Is Market Orientation a Source of Sustainable Competitive Advantage Or Simply the Cost of Competing?" Journal of Marketing, 75 (January), 16-30.
Kumar, V. and J. A. Petersen (2005), "Using a Customer-Level Marketing Strategy to Enhance Firm Performance: A Review of Theoretical and Empirical Evidence," Journal of the Academy of Marketing Science, 33 (4), 504-19.
Kumar, V., Girish Ramani, and Timothy Bohling (2004), "Customer Lifetime Value Approaches and Best Practice Applications," Journal of Interactive Marketing, 18 (3), 60-72.
51
Kumar, V. and Denish Shah (2009), "Expanding the Role of Marketing: From Customer Equity to Market Capitalization," Journal of Marketing, 73 (November), 119-36.
Kumar, V., Denish Shah, and Rajkumar Venkatesan (2006), "Managing Retailer Profitability - One Customer at a Time!" Journal of Retailing, 82 (4), 277-94.
Kumar, V., Rajkumar Venkatesan, Timothy Bohling, and Denise Beckmann (2008), "The Power of CLV: Managing Customer Lifetime Value at IBM," Marketing Science, 27 (4), 585-99.
Lee, John T. and John T. Masten Sr. (1978), "Commercial Bank Customer Profitability Analysis: An Empirical Study," Financial Review, 13 (3), 90-1.
Lemon, Katherine N. and Tanya Mark (2006), "Customer Lifetime Value as the Basis of Customer Segmentation: Issues and Challenges," Journal of Relationship Marketing, 5 (2/3), 55-69.
Libai, Barak, Das Narayandas, and Clive Humby (2002), "Toward an Individual Customer Profitability Model: A Segment-Based Approach," Journal of Service Research, 5 (1), 69-76.
Lincoln, Yvonna S. and Egon G. Guba (1985), Naturalistic Inquiry. Beverly Hills, CA: Sage Publications Inc.
Malmi, Teemu (1999), "Activity-Based Costing Diffusion Across Organizations: An Exploratory Empirical Analysis of Finnish Firms," Accounting, Organizations and Society, 24 (8), 649-72.
March, James G. and Herbert A. Simon (1958), Organizations. Cambridge, MA: Blackwell Publishing.
McManus, Lisa (2007), "The Construction of a Segmental Customer Profitability Analysis," Journal of Applied Management Accounting Research, 5 (2), 59-74.
McManus, Lisa and Chris Guilding (2008), "Exploring the Potential of Customer Accounting: A Synthesis of the Accounting and Marketing Literatures," Journal of Marketing Management, 24 (7), 771-95.
Mellman, Martin (1963), "Marketing Cost Analysis - Development and Current Practices," The Accounting Review, 38 (1), 118-23.
52
Mintzberg, Henry (1979), The Structuring of Organizations. Englewood Cliffs, NJ: Prentice-Hall.
Morgan, Fred W. (1978), "Profitability Market Segmentation: Identifying the Heavy Users of Overdraft Checking," Journal of Business Research, 6 (2), 99-110.
----(1990), "Judicial Standards for Survey Research: An Update and Guidelines," Journal of Marketing, 54 (January), 59-70.
Mulhern, Francis J. (1999), "Customer Profitability Analysis: Measurement, Concentration, and Research Directions," Journal of Interactive Marketing, 13 (1), 25-40.
Narver, John C. and Stanley F. Slater (1990), "The Effect of a Market Orientation on Business Profitability," Journal of Marketing, 54 (10), 20-35.
Niraj, Rakesh, Mahendra Gupta, and Chakravarthi Narasimhan (2001), "Customer Profitability in a Supply Chain," Journal of Marketing, 65 (July), 1-16.
Noone, Breffni and Peter Griffin (1999), "Managing the Long-Term Profit Yield from Market Segments in a Hotel Environment: A Case Study on the Implementation of Customer Profitability Analysis," International Journal of Hospitality Management, 18 (2), 111-28.
Orlikowski, Wanda J. and Jack J. Baroudi (1991), "Studying Information Technology in Organizations: Research Approaches and Assumptions," Information Systems Research, 2 (1), 1-28.
Otley, David T. (1980), "The Contingency Theory of Management Accounting: Achievement and Prognosis," Accounting, Organizations & Society, 5 (10), 413-28.
Palmatier, Robert W., Srinath Gopalakrishna, and Mark B. Houston (2006), "Returns on Business-to-Business Relationship Marketing Investments: Strategies for Leveraging Profits," Marketing Science, 25 (5), 477-93.
Palmer, Roger, Adam Lindgreen, and Joëlle Vanhamme (2005), "Relationship Marketing: Schools of Thought and Future Research Directions," Marketing Intelligence & Planning, 23 (January), 313-30.
Payne, Adrian and Pennie Frow (2005), "A Strategic Framework for Customer Relationship Management," Journal of Marketing, 69 (October), 167-76.
53
Peppers, Don, Martha Rogers, and Bob Dorf (1999), "Is Your Company Ready for One-to-One Marketing?" Harvard Business Review, 77 (Jan), 151-60.
Pfeifer, Phillip E. and Robert L. Carraway (2000), "Modeling Customer Relationships as Markov Chains," Journal of Interactive Marketing, 14 (2), 43-55.
Reich, Kenneth E. and Dennis C. Neff (1972), Customer Profitability Analysis: A Tool for Improving Bank Profits. Park Ridge, Ill: Bank Administration Institute.
Reinartz, Werner, Manfred Krafft, and Wayne D. Hoyer (2004), "The Customer Relationship Management Process: Its Measurement and Impact on Performance," Journal of Marketing Research, 41 (August), 293-305.
Reinartz, Werner and V. Kumar (2000), "On the Profitability of Long-Life Customers in a Noncontractual Setting: An Empirical Investigation and Implications for Marketing," Journal of Marketing, 64 (October), 17-35.
----(2003), "The Impact of Customer Relationship Characteristics on Profitable Lifetime Duration," Journal of Marketing, 67 (January), 77-99.
Rogers, Everett (1995), Diffusion of Innovations. New York, NY: The Free Press.
Roslender, Robin and Richard M. S. Wilson (2008), "Editorial: The Marketing / Accounting Interface," Journal of Marketing Management, 24 (7), 661-8.
Rust, Roland T., Tim Ambler, Gregory S. Carpenter, V. Kumar, and Rajendra K. Srivastava (2004), "Measuring Marketing Productivity: Current Knowledge and Future Directions," Journal of Marketing, 68 (October), 76-89.
Ryals, Lynette (2005), "Making Customer Relationship Management Work: The Measurement and Profitable Management of Customer Relationships," Journal of Marketing, 69 (October), 252-61.
Sevin, Charles H. (1965), Marketing Productivity Analysis. St Louis, MO: McGraw-Hill.
Shah, Denish, Roland T. Rust, A. Parasuraman, Richard Staelin, and George S. Day (2006), "The Path to Customer Centricity," Journal of Service Research, 9 (2), 113-24.
Shapiro, Benson P., V. K. Rangan, Rowland T. Moriarty, and Elliot B. Ross (1987), "Manage Customers for Profits (Not just Sales)," Harvard Business Review, 65 (September-October), 101-8.
54
Sharfman, Mark P. and James W. Dean (1991), "Conceptualizing and Measuring the Organizational Environment: A Multidimensional Approach," Journal of Management, 17 (4), 681-700.
Sherrell, Daniel and David Bejou (2007), "Assessing the Productivity of Relationship Marketing: Moving Toward a Paradigm," Journal of Relationship Marketing, 6 (2), 3-7.
Sheth, Jagdish N. and Atul Parvatiyar (2002), "Evolving Relationship Marketing into a Discipline," Journal of Relationship Marketing, 1 (1), 3-16.
Slater, Stanley F. and John C. Narver (1994), "Does Competitive Environment Moderate the Market Orientation-Performance Relationship?" Journal of Marketing, 58 (January), 46-55.
Smith, Malcolm and Shane Dikolli (1995), "Customer Profitability Analysis: An Activity-Based Costing Approach," Managerial Auditing Journal, 10 (7), 3-7.
Sohi, Ravipreet S. (1996), "The Effects of Environmental Dynamism and Heterogeneity on Sales People's Role Perceptions, Performance and Job Satisfaction," European Journal of Marketing, 30 (7), 49-69.
Storbacka, Kaj (1997), "Segmentation Based on Customer Profitability - Retrospective Analysis of Retail Bank Customer Bases," Journal of Marketing Management, 13 (5), 479-92.
Thompson, James D. (1967), Organizations in Action: Social Science Bases of Administrative Theory. New York, NY: McGraw-Hill.
Tung, Rosalie L. (1979), "Dimensions of Organizational Environments: An Exploratory Study of their Impact on Organization Structure," Academy of Management Journal, 22 (12), 672-93.
Van der Stede, Wim A., S. M. Young, and Clara X. Chen (2005), "Assessing the Quality of Evidence in Empirical Management Accounting Research: The Case of Survey Studies," Accounting, Organizations and Society, 30 (11), 655-84.
van Raaij, Erik M., Maarten J. A. Vernooij, and Sander van Triest (2003), "The Implementation of Customer Profitability Analysis: A Case Study," Industrial Marketing Management, 32 (7), 573-83.
55
Venkatesan, Rajkumar and V. Kumar (2004), "A Customer Lifetime Value Framework for Customer Selection and Resource Allocation Strategy," Journal of Marketing, 68 (October), 106-25.
Venkatesan, Rajkumar, V. Kumar, and Timothy Bohling (2007), "Optimal Customer Relationship Management using Bayesian Decision Theory: An Application for Customer Selection," Journal of Marketing Research, 44 (November), 579-94.
Venkatraman, N. (1989), "The Concept of Fit in Strategy Research: Toward Verbal and Statistical Correspondence," Academy of Management Review, 14 (3), 423-44.
Villanueva, Julian and Dominique M. Hanssens (2006), "Customer Equity: Measurement, Management and Research Opportunities," Foundations & Trends in Marketing, 1 (1), 1-95.
Voss, Glenn B. and Zannie G. Voss (2000), "Strategic Orientation and Firm Performance in an Artistic Environment," Journal of Marketing, 64 (January), 67-83.
Ward, Keith (1992), "Accounting for Marketing Strategies," in Management Accounting Handbook, Colin Drury, ed. Oxford, UK: Butterworth-Heinemann, 228-246.
Worre, Zakken (1991), Omkostningsregnskab & Omkostningsstyring Bind 2. Copenhagen, Denmark: Civiløkonomernes Forlag.
56
7. 6BArticles
Article #1:
Measuring Customer Profitability in Complex Environments: An Interdisciplinary Contingency Framework
pp 57-97
Article #2:
Are Customer Profitability Measurement Models Always Worth the Effort? A Cross-Sectional Perspective
pp 98-141
Article #3:
A contingency-based survey of service complexity’s and competition’s influence on Customer Profitability Analysis sophistication
pp 142-179
57
Article #1
Measuring Customer Profitability in Complex Environments: An Interdisciplinary Contingency Framework
Morten Holm1, V. Kumar2 & Carsten Rohde1
1Copenhagen Business School, Department of Accounting and Auditing Solbjerg Plads 3, DK-2000 Frederiksberg, Denmark.
2Georgia State University, J. Mack Robinson College of Business Center for Excellence in Brand & Customer Management
35 Broad Street, Suite 400, Atlanta, GA 30303, USA
The article has been accepted for publication in Journal of the Academy of Marketing Science
This is a postprint of the version accepted for publication
Link to online first version: http://www.springerlink.com/content/x431u70884214262/
Abstract
Customer profitability measurement is an important element in customer
relationship management and a lever for enhanced marketing accountability. Two
distinct measurement approaches have emerged in the marketing literature:
Customer Lifetime Value (CLV) and Customer Profitability Analysis (CPA).
Myriad models have been demonstrated within these two approaches across
industries. However, limited efforts have been made to compare the approaches in
order to explain when sophisticated CLV or CPA models will be most useful. This
58
paper explores the advantages and limitations of sophisticated CLV and CPA
models and proposes that the degree of sophistication deployed when
implementing customer profitability measurement models is determined by the
type of complexity encountered in firms’ customer environments. This gives rise
to a contingency framework for customer profitability measurement model
selection and five research propositions. Additionally, the framework provides
guidance in designing customer profitability measurement models for managers
seeking to implement such models for resource allocation purposes.
Key words: Marketing Accountability; Customer Lifetime Value (CLV); Customer Profitability Analysis (CPA); Customer Relationship Management (CRM); Contingency Theory
57
1. Introduction
Marketing accountability is growing in importance as marketing managers
are increasingly expected to demonstrate the financial consequences of marketing
activities [see “MSI Research Priorities” 2008-2010 (MSI 2008); 2010-12 (MSI
2010)]. The ability to predict and measure marketing activities’ impact on cash
flows and thus ultimately firm value has also been acknowledged as an
opportunity by marketers to achieve more influence in boardrooms and a
Marketing Accountability Standards Board (MASB) has risen to support this
ambition [see “MASB Year II Overview & Report (2010)]. To succeed on this the
marketing discipline must look beyond its conventional boundaries and strive for
an integrated interdisciplinary accountability perspective across the disciplines of
marketing, finance and accounting (e.g., Srivastava, Shervani, and Fahey 1998)
where the measurement of financial outcomes is the focus (Berger et al. 2006).
One element of marketing accountability is the measurement of the financial
value of customer assets for decision making purposes. Determining the financial
value of customers facilitates the allocation of marketing resources in accordance
with customers’ contribution to firm value creation. This philosophy is not only at
the core of customer relationship management (Boulding et al. 2005; Payne and
Frow 2005) – it is also a way of identifying where marketing strategies and tactics
potentially generate the highest return on investment hereby making the financial
impact of these strategies and tactics measurable (Rust et al. 2004).
Approximating the financial value of customer assets satisfactorily thus becomes a
critical element in the chain of marketing productivity.
Two fundamentally different approaches to measuring the financial value of
customer relationships prevail: Customer Profitability Analysis (CPA) and
Customer Lifetime Value (CLV). Whereas CLV deploys a prospective perspective
on customer profitability, predicting future customer behavior and discounting
derived lifetime cash flows, CPA deploys a retrospective profitability perspective,
58
measuring costs and revenues per customer in a specific accounting period in the
past (Pfeifer, Haskins, and Conroy 2005). Despite the fact that both approaches
share a common purpose of identifying the most valuable customers for resource
allocation decision making, CPA and CLV models have been researched
remarkably autonomously in the marketing and management accounting
literatures. Although a few recent reviews have explored the marketing/accounting
interface between CPA and CLV models (Gleaves et al. 2008; McManus and
Guilding 2008) no previous study has, to the best of our knowledge, investigated
CPA and CLV models’ strengths and limitations from an integrated perspective.
This is puzzling as both the relevance of deploying CLV and CPA models for
profitability-based resource allocation across customers has been demonstrated in
a series of case studies. However, whereas most CLV models have been
investigated in direct marketing settings mainly in consumer industries (e.g.,
retailing and catalog sales), CPA models have mainly been demonstrated across
different B2B-industries (e.g., supply-chain distribution) and in settings with
intermediary channels of distribution between vendors and end-users (e.g.,
consumer product manufacturing). Furthermore, both approaches apparently have
some kind of use in financial services. These discrepancies lead to an important
unaddressed issue: In which customer environments will sophisticated CLV and
CPA models be more useful to support resource allocation decision making across
customer relationships? Recent calls have been made for exploring the boundaries
and limitations of CLV models (Gupta and Lehmann 2006; Gupta et al. 2006).
Such inquiry is important both to marketing science and practice as a contingency
theory of this kind can be used to explain as well as to prescribe the degree of
sophistication required of CPA and CLV models for resource allocation decision
making in different customer environments. This way marketers can focus on the
specific drivers of customer value that are relevant in their specific business
context. This, in turn, leads to better utilization of marketing resources and
enhanced marketing productivity.
59
We therefore seek to explore this issue by investigating extant research in
CLV and CPA measurement. We argue that selecting between sophisticated CLV
and CPA models is a matter of establishing a proper fit between CLV and CPA
model sophistication and the complexity faced in firms’ customer environments.
We hereby make two research contributions: First, we contribute to marketing
research on customer profitability measurement models (CLV/CPA) by
introducing a framework proposing how firms will adjust the degree of customer
profitability measurement model sophistication depending on the type of customer
complexity encountered in their task environments. We furthermore highlight
some collective limitations in terms of neglected tax effects and customers’
contribution to portfolio risk that may bias both CLV and CPA estimates of
customer value in certain business contexts. Second, we contribute to
contingency-based research by introducing two customer complexity constructs:
Customer behavioral complexity and customer service complexity. Both
constructs may be useful for inquiries in other areas of contingency-based
research. Additionally, we contribute to marketing practice by proposing a three-
step guideline for how customer profitability measurement models should be
developed and implemented in different business contexts based on the proposed
framework.
The rest of the paper is organized as follows: First, we define the scope of
CLV and CPA models and the determinants of CLV and CPA model
sophistication, hereby identifying these modeling approaches’ individual and
collective strengths and limitations. We then propose a contingency framework for
adapting CLV/CPA sophistication to the complexity encountered in a firm’s
customer universe and subsequently derive five research propositions from this
framework. All this leads to three avenues for future research whereupon we
discuss the managerial implications of our findings followed by a conclusion.
60
2. Customer Profitability Measurement Model Scope and Sophistication
Customer profitability measurement models are means of quantifying an
individual customer’s or a group of customers’ contribution to the financial
performance of the firm. Hence, any customer metric incorporating financial
outcomes such as profits or cash flows at customer or segment level are to be
included in this categorization.
Research on customer profitability measurement models has emerged along
the lines of the prospective Customer Lifetime Value (CLV) approach and the
retrospective Customer Profitability Analysis (CPA) approach. The CLV approach
is by definition aligned with the forward-looking nature of resource allocation
decision-making. However, as stated by Jacobs, Johnston, and Kotchetova (2001,
p. 355-56): “[T]he primary value of historical data lies in prediction, which then
aids the decision-making process about the future”. Hence, the retrospective CPA
approach is also potentially useful for decision support.
Customer profitability measurement model sophistication is not to be
interpreted as a normative guideline per se, inferring that more sophisticated
models are always better. Instead, model sophistication merely reflects the degree
to which advanced techniques are being used by managers when estimating model
parameters.
2.1 Customer Lifetime Value (CLV) Model Scope and Sophistication
Customer Lifetime Value (CLV) is conceptually defined as: the present value
of all future cash flows obtained from a customer over his or her life of
relationship with the firm (Gupta et al. 2006). A range of models for estimating
CLV have been advanced in the literature either conceptually or via case
demonstrations. Examples of these contributions are outlined in Table 1 (see
Gupta et al. 2006; Villanueva and Hanssens 2006 for CLV model reviews).
61
Table 1 shows how the techniques for estimating model parameters have
been gradually developed throughout the evolution of CLV models. This journey
has taken CLV models from their deterministic point of departure (e.g., Berger
and Nasr 1998; Berger, Weinberg, and Hanna 2003; Dwyer 1997) where retention
rates, customer margins and other input related to customer behavior are entered
directly into mathematical formulas (Villanueva and Hanssens 2006) towards
stochastic models (e.g., Haenlein, Kaplan, and Beeser 2007; Kumar, Shah, and
Venkatesan 2006) where probabilistic determination of customer choice is
incorporated (Villanueva and Hanssens 2006).
Whereas the early contributions mainly discuss how to develop a CLV model
that can be generalized later approaches have demonstrated how the
implementation of CLV models improve customer marketing strategies which in
turn may enhance firm financial performance via empirical case studies (Kumar et
al. 2008; Ryals 2005). Some studies have even taken the financial performance
link one step further and demonstrated how CLV-based analysis can predict firm
value (Gupta, Lehmann, and Stuart 2004) and that customer strategies targeted at
maximizing CLV can increase a firm’s stock price (Kumar and Shah 2009).
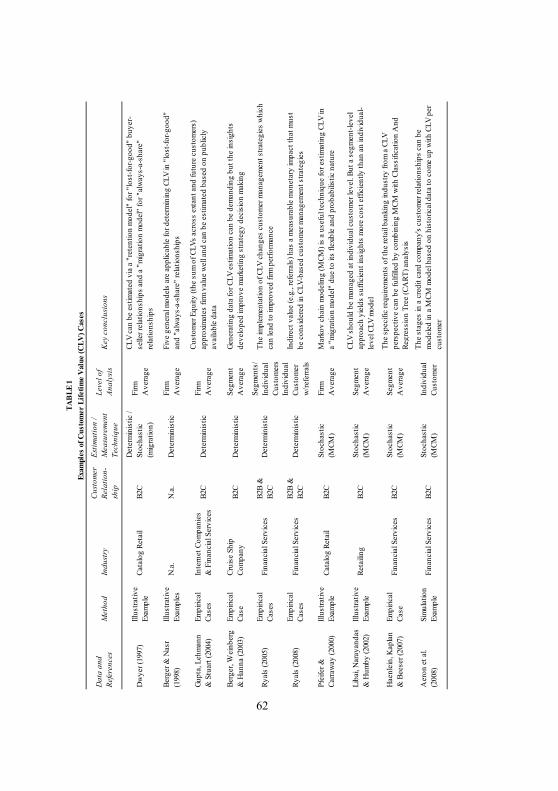
62
D
ata
and
Refe
renc
esM
etho
dIn
dust
ryC
usto
mer
Re
latio
n-sh
ip
Estim
atio
n /
Mea
sure
men
t Te
chni
que
Leve
l of
Anal
ysis
Key
con
clus
ions
Dw
yer (
1997
)Ill
ustra
tive
Exam
ple
Cata
log
Reta
ilB2
CD
eter
min
istic
/ St
ocha
stic
(m
igra
tion)
Firm
Ave
rage
CLV
can
be e
stim
ated
via
a "
rete
ntio
n m
odel
" fo
r "lo
st-fo
r-goo
d" b
uyer
-se
ller r
elat
ions
hips
and
a "
mig
ratio
n m
odel
" fo
r "al
way
s-a-
shar
e"
rela
tions
hips
Berg
er &
Nas
r (1
998)
Illus
trativ
e Ex
ampl
esN
.a.
N.a
.D
eter
min
istic
Firm
Ave
rage
Five
gen
eral
mod
els
are
appl
icab
le fo
r det
erm
inin
g CL
V in
"lo
st-fo
r-goo
d"
and
"alw
ays-
a-sh
are"
rela
tions
hips
Gupt
a, L
ehm
ann
& S
tuar
t (20
04)
Empi
rical
Ca
ses
Inte
rnet
Com
pani
es
& F
inan
cial
Ser
vice
sB2
CD
eter
min
istic
Firm
Ave
rage
Cust
omer
Equ
ity (t
he s
um o
f CLV
s ac
ross
ext
ant a
nd fu
ture
cus
tom
ers)
ap
prox
imat
es fi
rm v
alue
wel
l and
can
be
estim
ated
bas
ed o
n pu
blic
ly
avai
labl
e da
ta
Berg
er, W
einb
erg
& H
anna
(200
3)Em
piric
al
Case
Crui
se S
hip
Com
pany
B2C
Det
erm
inis
ticSe
gmen
tA
vera
geGe
nera
ting
data
for C
LV e
stim
atio
n ca
n be
dem
andi
ng b
ut th
e in
sigh
ts
deve
lope
d im
prov
e m
arke
ting
stra
tegy
dec
isio
n m
akin
g
Ryal
s (2
005)
Empi
rical
Ca
ses
Fina
ncia
l Ser
vice
sB2
B &
B2
CD
eter
min
istic
Segm
ents
/ In
divi
dual
Cu
stom
ers
The
impl
emen
tatio
n of
CLV
cha
nges
cus
tom
er m
anag
emen
t stra
tegi
es w
hich
ca
n le
ad to
impr
oved
firm
per
form
ance
Ryal
s (2
008)
Empi
rical
Ca
ses
Fina
ncia
l Ser
vice
sB2
B &
B2
CD
eter
min
istic
Indi
vidu
al
Cust
omer
w
/refe
rrals
Indi
rect
val
ue (e
.g.,
refe
rrals
) has
a m
easu
rabl
e m
onet
ary
impa
ct th
at m
ust
be c
onsi
dere
d in
CLV
-bas
ed c
usto
mer
man
agem
ent s
trate
gies
Pfei
fer &
Ca
rraw
ay (2
000)
Illus
trativ
e Ex
ampl
eCa
talo
g Re
tail
B2C
Stoc
hast
ic
(MCM
)Fi
rmA
vera
geM
arko
v ch
ain
mod
elin
g (M
CM) i
s a
usef
ul te
chni
que
for e
stim
atin
g CL
V in
a
"mig
ratio
n m
odel
" du
e to
its
flexib
le a
nd p
roba
bilis
tic n
atur
e
Liba
i, N
aray
anda
s &
Hum
by (2
002)
Illus
trativ
e Ex
ampl
eRe
taili
ngB2
CSt
ocha
stic
(M
CM)
Segm
ent
Ave
rage
CLV
shou
ld b
e m
anag
ed a
t ind
ivid
ual c
usto
mer
leve
l. Bu
t a s
egm
ent-l
evel
ap
proa
ch y
ield
s su
ffici
ent i
nsig
hts
mor
e co
st e
ffici
ently
than
an
indi
vidu
al-
leve
l CLV
mod
el
Hae
nlei
n, K
apla
n &
Bee
ser (
2007
)Em
piric
al
Case
Fina
ncia
l Ser
vice
sB2
CSt
ocha
stic
(M
CM)
Segm
ent
Ave
rage
The
spec
ific
requ
irem
ents
of t
he re
tail
bank
ing
indu
stry
from
a C
LV
pers
pect
ive
can
be fu
lfille
d by
com
bini
ng M
CM w
ith C
lass
ifica
tion
And
Re
gres
sion
Tre
e (C
ART
) ana
lysi
s
Aer
on e
t al.
(200
8)Si
mul
atio
n Ex
ampl
eFi
nanc
ial S
ervi
ces
B2C
Stoc
hast
ic
(MCM
)In
divi
dual
Cu
stom
er
The
stag
es in
a c
redi
t car
d co
mpa
ny's
cust
omer
rela
tions
hips
can
be
mod
eled
in a
MCM
mod
el b
ased
on
hist
oric
al d
ata
to c
ome
up w
ith C
LV p
er
cust
omer
TA
BL
E 1
Exam
ples
of C
usto
mer
Lif
etim
e V
alue
(CL
V) C
ases
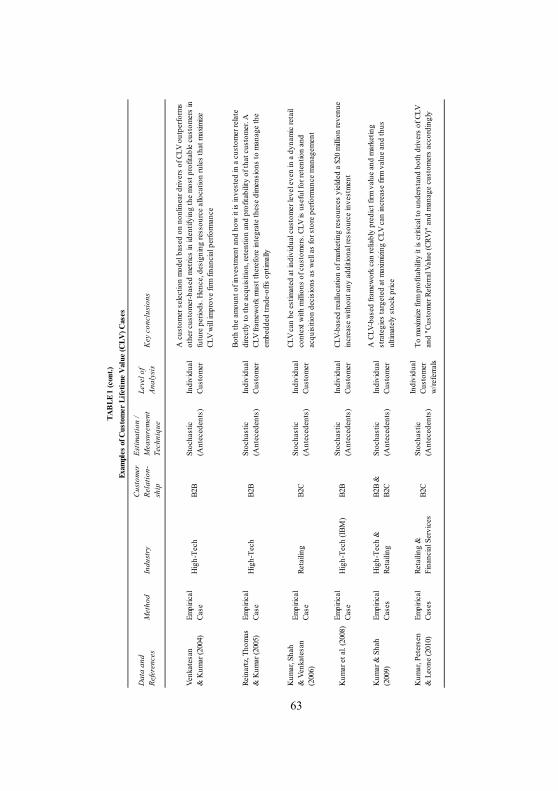
63
Dat
a an
d Re
fere
nces
Met
hod
Indu
stry
Cus
tom
er
Rela
tion-
ship
Estim
atio
n /
Mea
sure
men
t Te
chni
que
Leve
l of
Anal
ysis
Key
con
clus
ions
Venk
ates
an
& K
umar
(200
4)Em
piric
al
Case
Hig
h-Te
chB2
BSt
ocha
stic
(A
ntec
eden
ts)
Indi
vidu
al
Cust
omer
A c
usto
mer
sel
ectio
n m
odel
bas
ed o
n no
nlin
ear d
river
s of
CLV
out
perfo
rms
othe
r cus
tom
er-b
ased
met
rics
in id
entif
ying
the
mos
t pro
fitab
le c
usto
mer
s in
fu
ture
per
iods
. Hen
ce, d
esig
ning
ress
ourc
e al
loca
tion
rule
s th
at m
axim
ize
CLV
will
impr
ove
firm
fina
ncia
l per
form
ance
Rein
artz
, Tho
mas
&
Kum
ar (2
005)
Empi
rical
Ca
seH
igh-
Tech
B2B
Stoc
hast
ic
(Ant
eced
ents
)In
divi
dual
Cu
stom
er
Both
the
amou
nt o
f inv
estm
ent a
nd h
ow it
is in
vest
ed in
a c
usto
mer
rela
te
dire
ctly
to th
e ac
quis
ition
, ret
entio
n an
d pr
ofita
bilit
y of
that
cus
tom
er. A
CL
V fra
mew
ork
mus
t the
refo
re in
tegr
ate
thes
e di
men
sion
s to
man
age
the
embe
dded
trad
e-of
fs o
ptim
ally
Kum
ar, S
hah
& V
enka
tesa
n (2
006)
Empi
rical
Ca
seRe
taili
ngB2
CSt
ocha
stic
(A
ntec
eden
ts)
Indi
vidu
al
Cust
omer
CLV
can
be e
stim
ated
at i
ndiv
idua
l cus
tom
er le
vel e
ven
in a
dyn
amic
reta
il co
ntex
t with
mill
ions
of c
usto
mer
s. C
LV is
use
ful f
or re
tent
ion
and
acqu
isiti
on d
ecis
ions
as
wel
l as
for s
tore
per
form
ance
man
agem
ent
Kum
ar e
t al.
(200
8)Em
piric
al
Case
Hig
h-Te
ch (I
BM)
B2B
Stoc
hast
ic
(Ant
eced
ents
)In
divi
dual
Cu
stom
erCL
V-ba
sed
real
loca
tion
of m
arke
ting
reso
urce
s yi
elde
d a
$20
mill
ion
reve
nue
incr
ease
with
out a
ny a
dditi
onal
ress
ourc
e in
vest
men
t
Kum
ar &
Sha
h (2
009)
Empi
rical
Ca
ses
Hig
h-Te
ch &
Reta
iling
B2B
&
B2C
Stoc
hast
ic
(Ant
eced
ents
)In
divi
dual
Cu
stom
er
A C
LV-b
ased
fram
ewor
k ca
n re
liabl
y pr
edic
t firm
val
ue a
nd m
arke
ting
stra
tegi
es ta
rget
ed a
t max
imizi
ng C
LV c
an in
crea
se fi
rm v
alue
and
thus
ul
timat
ely
stoc
k pr
ice
Kum
ar, P
eter
sen
& L
eone
(201
0)Em
piric
al
Case
sRe
taili
ng &
Fina
ncia
l Ser
vice
sB2
CSt
ocha
stic
(A
ntec
eden
ts)
Indi
vidu
al
Cust
omer
w
/refe
rrals
To m
axim
ize fi
rm p
rofit
abili
ty it
is c
ritic
al to
und
erst
and
both
driv
ers
of C
LV
and
"Cus
tom
er R
efer
ral V
alue
(CRV
)" a
nd m
anag
e cu
stom
ers
acco
rdin
gly
Exam
ples
of C
usto
mer
Lif
etim
e V
alue
(CL
V) C
ases
TA
BL
E 1
(con
t.)
64
These cases are convincing but they are merely demonstrations performed in
direct marketing settings across a couple of service-oriented industries. In order to
determine whether the findings can be generalized to other business contexts it is
necessary to explore the scope of CLV models and the determinants of CLV
models sophistication.
A common trait in CLV model evolution is the strong focus on developing a
forecasting mechanism that captures the dynamics of customer behavior.
Generally, this concerns the estimation of three key drivers of CLV (Venkatesan
and Kumar 2004): (1) The propensity for a customer to purchase from the
company in the future; (2) The predicted product contribution margin from future
purchases and (3) The direct marketing resources allocated to the customer in
future periods. Hence, CLV models are means of quantifying the expected gross
cash flows generated by the firm’s offerings in future transactions with customers
after accounting for the direct marketing costs invested in generating these
transactions and cash flows. Recently, arguments have been raised for expanding
the scope of CLV measurement to incorporate the indirect value of customer
referrals and models for estimating referral value have been demonstrated (e.g.,
Kumar, Petersen, and Leone 2010; Ryals 2008). Such an expanded scope yields a
more holistic forecast of the future benefits derived from customer relationships.
An implication of their prospective forecasting focus is that CLV models will
always provide some indication of the future growth potential embedded in
servicing any given customer or segment. A less obvious implication is that CLV
models, by ignoring all other SG&A costs except direct marketing, make two
implicit assumptions: First, it is assumed that the firm’s service capacity is fixed
(and therefore cannot be adapted to customers’ potentially different demands for
service activities in future periods). Second, it is assumed that service resource
requirements are homogeneous across customer relationships. In contexts where
these assumptions are violated CLV estimates will provide a biased approximation
of customer relationship value as the cash flow component for customers that
65
draw heavily on the firm’s service capacity (e.g., due to frequent sales visits,
frequent, small-scale deliveries to distant locations, time demanding technical
service calls etc.) will be overvalued while cash flows from customers that are less
demanding to serve will be undervalued. The severity of this bias will depend on
the diversity of customer service requirements as well as the flexibility of service
capacity resources, i.e., the degree to which capacity can be adjusted to reflect the
demand for service activities in future periods.
Important determinants of CLV model sophistication are the technique used
for estimating model parameters and the level of aggregation at which the analysis
is carried out (segment or individual customers). Whereas deterministic models
rely on qualitative input via decision calculus or similar techniques (e.g., Blattberg
and Deighton 1996; Ryals 2005) for predicting the components of CLV, stochastic
models deploy quantitative statistical modeling techniques (e.g., Haenlein, Kaplan,
and Beeser 2007; Venkatesan and Kumar 2004). Consequently, deterministic
CLV-modeling introduces subjectivity that could potentially have an impact on
predictive accuracy of forecasts and potentially over-simplifies the causal
relationships between marketing efforts and customer behavior (Kumar and
George 2007). Additionally, stochastic CLV-approaches allow modeling of
complex customer relationship situations where algebraic solutions are not
possible (Pfeifer and Carraway 2000). Consequently, CLV-modeling based on
probabilistic forecasting of CLV-components can be considered more
sophisticated than deterministic CLV-modeling.
Moreover, model parameters can be estimated either at aggregate or
disaggregate level with the aggregate approach estimating retention rates,
customer margins and other behavioral input as averages across a cohort of
customers (firm-/segment-level) and the disaggregate approach estimating model
parameters at individual customer level (Kumar and George 2007). In an
aggregate approach (firm or segment) deployed in most of the earlier work on
CLV (e.g., Berger and Nasr 1998; Berger, Weinberg, and Hanna 2003; Blattberg,
66
Getz, and Thomas 2001; Dwyer 1997; Gupta and Lehmann 2003) it is assumed
that the underlying distribution of customer value across the customers in the
cohort remains unchanged in future periods (Kumar and George 2007). The
individual approach (e.g., Donkers, Verhoef, and de Jong 2007; Kumar, Shah, and
Venkatesan 2006; Kumar and Shah 2009; Reinartz, Thomas, and Kumar 2005;
Venkatesan and Kumar 2004) by definition captures such heterogeneities and can
thus be considered more sophisticated than aggregate, average firm-/segment-level
approaches.
2.2 Customer Profitability Analysis (CPA) Model Scope and Sophistication
Customer profitability is defined as: The difference between the revenues
earned from and the costs associated with a customer relationship during a
specified period (Pfeifer, Haskins, and Conroy 2005). Hence, as opposed to CLV’s
asset valuation approach focusing on future cash flows, Customer Profitability
Analysis (CPA) is based on accrual accounting profits earned in the past.
The advent of Activity-Based Costing (ABC), where resource costs are
consolidated in activity cost pools and related to cost objects (products, customers,
transactions, etc.) via activity cost drivers (Cooper and Kaplan 1988; Cooper and
Kaplan 1991), introduced a novel framework that facilitated the assignment of a
broader range of costs and assets to customers (Goebel, Marshall, and Locander
1998; Smith and Dikolli 1995). Consequently, the more recent literature on CPA
has involved the ABC technique as can be seen in the examples of CPA case
studies outlined in Table 2 (see Gleaves et al. 2008; McManus and Guilding 2008
for reviews of CPA models).
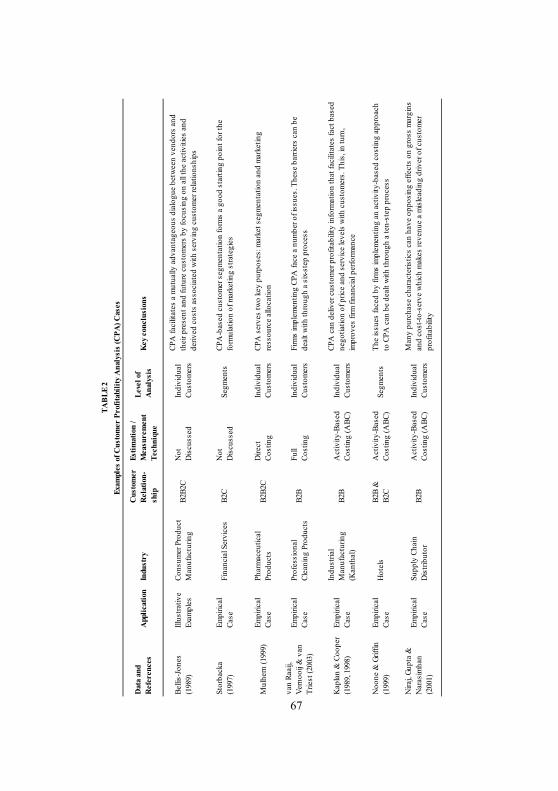
67
Dat
a an
d R
efer
ence
sA
ppli
cati
onIn
dust
ryC
usto
mer
R
elat
ion-
ship
Esti
mat
ion
/ M
easu
rem
ent
Tec
hniq
ue
Lev
el o
f A
naly
sis
Key
con
clus
ions
Belli
s-Jo
nes
(198
9)Ill
ustra
tive
Exam
ples
Cons
umer
Pro
duct
M
anuf
actu
ring
B2B2
CN
ot
Dis
cuss
edIn
divi
dual
Cu
stom
ers
CPA
faci
litat
es a
mut
ually
adv
anta
geou
s di
alog
ue b
etw
een
vend
ors
and
thei
r pre
sent
and
futu
re c
usto
mer
s by
focu
sing
on
all t
he a
ctiv
ities
and
de
rived
cos
ts a
ssoc
iate
d w
ith s
ervi
ng c
usto
mer
rela
tions
hips
Stor
back
a (1
997)
Empi
rical
Ca
seFi
nanc
ial S
ervi
ces
B2C
Not
D
iscu
ssed
Segm
ents
CPA
-bas
ed c
usto
mer
seg
men
tatio
n fo
rms
a go
od s
tarti
ng p
oint
for t
he
form
ulat
ion
of m
arke
ting
stra
tegi
es
Mul
hern
(199
9)Em
piric
al
Case
Phar
mac
eutic
al
Prod
ucts
B2B2
CD
irect
Co
stin
gIn
divi
dual
Cu
stom
ers
CPA
ser
ves
two
key
purp
oses
: mar
ket s
egm
enta
tion
and
mar
ketin
g re
ssou
rce
allo
catio
n
van
Raai
j, Ve
rnoo
ij &
van
Tr
iest
(200
3)
Empi
rical
Ca
sePr
ofes
sion
al
Clea
ning
Pro
duct
sB2
BFu
ll Co
stin
gIn
divi
dual
Cu
stom
ers
Firm
s im
plem
entin
g CP
A fa
ce a
num
ber o
f iss
ues.
The
se b
arrie
rs c
an b
e de
alt w
ith th
roug
h a
six-
step
pro
cess
Kap
lan
& C
oope
r (1
989,
199
8)Em
piric
al
Case
Indu
stria
l M
anuf
actu
ring
(Kan
thal
)B2
BA
ctiv
ity-B
ased
Co
stin
g (A
BC)
Indi
vidu
al
Cust
omer
s
CPA
can
del
iver
cus
tom
er p
rofit
abili
ty in
form
atio
n th
at fa
cilit
ates
fact
bas
ed
nego
tiatio
n of
pric
e an
d se
rvic
e le
vels
with
cus
tom
ers.
Thi
s, in
turn
, im
prov
es fi
rm fi
nanc
ial p
erfo
rman
ce
Noo
ne &
Grif
fin
(199
9)Em
piric
al
Case
Hot
els
B2B
&
B2C
Act
ivity
-Bas
ed
Cost
ing
(ABC
)Se
gmen
tsTh
e is
sues
face
d by
firm
s im
plem
entin
g an
act
ivity
-bas
ed c
ostin
g ap
proa
ch
to C
PA c
an b
e de
alt w
ith th
roug
h a
ten-
step
pro
cess
Nira
j, Gu
pta
&
Nar
asim
han
(200
1)
Empi
rical
Ca
seSu
pply
Cha
in
Dis
tribu
tor
B2B
Act
ivity
-Bas
ed
Cost
ing
(ABC
)In
divi
dual
Cu
stom
ers
Man
y pu
rcha
se c
hara
cter
istic
s ca
n ha
ve o
ppos
ing
effe
cts
on g
ross
mar
gins
an
d co
st-to
-ser
ve w
hich
mak
es re
venu
e a
mis
lead
ing
driv
er o
f cus
tom
er
prof
itabi
lity
Exam
ples
of C
usto
mer
Pro
fita
bili
ty A
naly
sis
(CP
A) C
ases
TA
BL
E 2
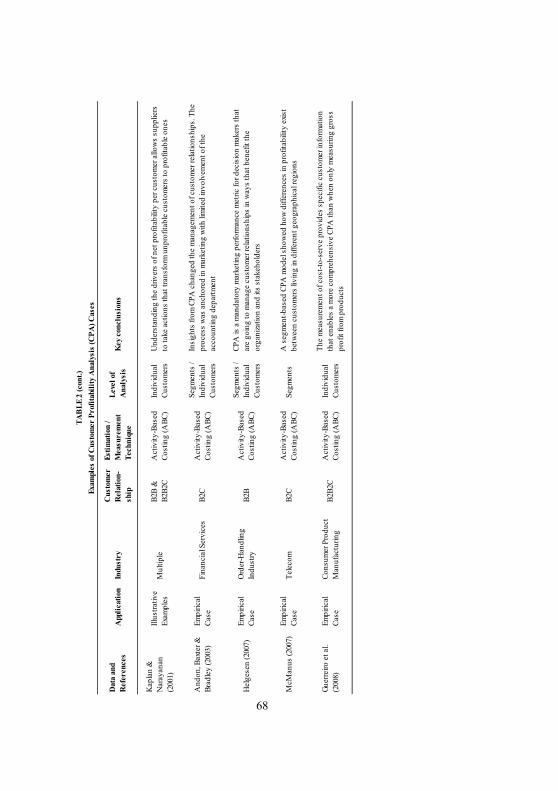
68
D
ata
and
Ref
eren
ces
App
lica
tion
Indu
stry
Cus
tom
er
Rel
atio
n-sh
ip
Esti
mat
ion
/ M
easu
rem
ent
Tec
hniq
ue
Lev
el o
f A
naly
sis
Key
con
clus
ions
Kap
lan
&
Nar
ayan
an
(200
1)
Illus
trativ
e Ex
ampl
esM
ultip
leB2
B &
B2
B2C
Act
ivity
-Bas
ed
Cost
ing
(ABC
)In
divi
dual
Cu
stom
ers
Und
erst
andi
ng th
e dr
iver
s of
net
pro
fitab
ility
per
cus
tom
er a
llow
s su
pplie
rs
to ta
ke a
ctio
ns th
at tr
ansf
orm
unp
rofit
able
cus
tom
ers
to p
rofit
able
one
s
And
on, B
axte
r &
Brad
ley
(200
3)Em
piric
al
Case
Fina
ncia
l Ser
vice
sB2
CA
ctiv
ity-B
ased
Co
stin
g (A
BC)
Segm
ents
/ In
divi
dual
Cu
stom
ers
Insi
ghts
from
CPA
cha
nged
the
man
agem
ent o
f cus
tom
er re
latio
nshi
ps. T
he
proc
ess
was
anc
hore
d in
mar
ketin
g w
ith li
mite
d in
volv
emen
t of t
he
acco
untin
g de
partm
ent
Hel
gese
n (2
007)
Empi
rical
Ca
seO
rder
-Han
dlin
g In
dust
ryB2
BA
ctiv
ity-B
ased
Co
stin
g (A
BC)
Segm
ents
/ In
divi
dual
Cu
stom
ers
CPA
is a
man
dato
ry m
arke
ting
perfo
rman
ce m
etric
for d
ecis
ion
mak
ers
that
ar
e go
ing
to m
anag
e cu
stom
er re
latio
nshi
ps in
way
s th
at b
enef
it th
e or
gani
zatio
n an
d its
sta
keho
lder
s
McM
anus
(200
7)Em
piric
al
Case
Tele
com
B2C
Act
ivity
-Bas
ed
Cost
ing
(ABC
)Se
gmen
tsA
seg
men
t-bas
ed C
PA m
odel
sho
wed
how
diff
eren
ces
in p
rofit
abili
ty e
xist
betw
een
cust
omer
s liv
ing
in d
iffer
ent g
eogr
aphi
cal r
egio
ns
Guer
reiro
et a
l. (2
008)
Empi
rical
Ca
seCo
nsum
er P
rodu
ct
Man
ufac
turin
gB2
B2C
Act
ivity
-Bas
ed
Cost
ing
(ABC
)In
divi
dual
Cu
stom
ers
The
mea
sure
men
t of c
ost-t
o-se
rve
prov
ides
spe
cific
cus
tom
er in
form
atio
n th
at e
nabl
es a
mor
e co
mpr
ehen
sive
CPA
than
whe
n on
ly m
easu
ring
gros
s pr
ofit
from
pro
duct
s
Exam
ples
of C
usto
mer
Pro
fita
bili
ty A
naly
sis
(CP
A) C
ases
TA
BL
E 2
(con
t.)
69
CPA based on the ABC technique has highlighted that substantial variation in
customer service activities (in the broadest possible sense) makes the
incorporation of cost-to-serve important when evaluating customer profitability
(Guerreiro et al. 2008; Helgesen 2007; McManus 2007; Niraj, Gupta, and
Narasimhan 2001; Noone and Griffin 1999). These insights generated by CPA
have enabled firms to improve the management of customer relationships (Andon,
Baxter, and Bradley 2003; Helgesen 2007; Kaplan and Narayanan 2001;
Storbacka 1997) leading to improved firm performance (Kaplan and Cooper
1998).
Hence, CPA modeling has demonstrated the same advantages as CLV albeit
in different industries (with the exception of financial services where both
approaches have been demonstrated as being a valuable resource allocation
mechanism). Whereas CLV has been shown to add value in service-oriented direct
marketing settings, CPA models have mainly been demonstrated in product-based
industries in a direct B2B relationship (Helgesen 2007; Kaplan and Cooper 1998;
van Raaij, Vernooij, and van Triest 2003), in supply chain distribution (Niraj,
Gupta, and Narasimhan 2001) or in a consumer product channel setting (Guerreiro
et al. 2008).
Again, this raises the issue whether some general determinants of CPA model
effectiveness can be identified and again we turn to the scope and sophistication of
the models.
As is evident from the case studies outlined in Table 2, the key idea of CPA
is that all revenues, costs, assets and liabilities relevant to servicing customers
should be assigned to the customer relationships that cause them. This wider scope
of the profitability component in CPA models vis-à-vis CLV models implies that
CPA models do capture the profitability effects of heterogeneous service capacity
requirements across customers in flexible service resource settings that CLV
models ignore. However, the retrospective nature of CPA models embeds the
implicit assumption that customer behavior does not change radically over time.
70
Hence, retention patterns are assumed to be homogeneous across customers and
purchasing amounts are assumed to be stable over time (i.e., limited expansion
potential). In contexts where customer behavior is dynamic rather than static CPA
models will provide biased approximations of customer relationship value as the
growth dimension for customers with substantial expansion potential and/or high
loyalty (as reflected in long expected retention durations) will be undervalued
whereas disloyal customers with no expansion potential will be overvalued.
By adopting a frame of reference from product costing, CPA sophistication
can be determined by the range of costs included in the estimate across the value
chain (Brierley 2008) and the level of detail deployed when accounting for cause-
and-effect relationships between customers, activities, subsequent resource
consumption and derived costs and investments at individual customer level (Al-
Omiri and Drury 2007; Drury and Tayles 2005). Hence, CPA sophistication is
mainly a function of the accuracy at which overhead resource costs that cannot be
traced entirely to customers on a one-to-one basis are assigned to the individual
customer level. The effort invested in estimating these cause-and-effect
relationships more accurately is determined by the process at which overhead
resource costs are first divided into activity cost pools and then driven to cost
objects (Al-Omiri and Drury 2007). Hence, the greater a range of total SG&A
costs, the more cost pools and cost drivers applied to account for SG&A costs at
customer level, and the more extensively resource drivers and duration drivers are
being applied in this process, the more sophisticated can the CPA model of the
firm be considered to be.
2.3 Collective limitations of CLV and CPA models
Two areas that impact firm value creation are severely underdeveloped in
CLV as well as in CPA research. First, incorporating the tax effects on customer
cash flows is beyond the scope of both approaches. Hence, firms operating under
71
heterogeneous tax regulations, as would often be the case in multinational
sales/marketing organizations, will undervalue customers in low-tax regimes and
overvalue customers in high-tax regimes. Furthermore, different tax repatriation
regulations across countries may have an impact on the timing of cash flows from
customers across these geographies. All this in turn may lead to suboptimal
resource allocation in multinational customer environments.
Second, most CLV and CPA models ignore customers’ contribution to firm
portfolio risk. All CLV models take the time value of money into consideration, as
all models discount predicted future contributions from customers at some cost of
capital. However, the treatment of risk associated with expected future cash flows
across customer relationships has received limited attention. Based on the notion
that customer level risk is determined by the volatility and vulnerability of
customer cash flows (Srivastava, Shervani, and Fahey 1998), Kumar and Shah
(2009) provide a rare attempt of incorporating customer level risk by combining
the standard deviation of CLV estimates when randomly simulating CLV model
parameters (volatility) and the average share of wallet per customer (vulnerability)
into an individual customer risk estimate. Although an important extension this
method does not account for any diversification effects across the customer
portfolio.
3. A Contingency Framework for Customer Profitability Measurment Model
Sophistication
Customer profitability measurement model sophistication addresses different
dimensions of firm value creation. Whereas CPA model sophistication is
determined by the level of detail by which service capacity resource consumption
is approximated at customer level, CLV model sophistication reflects how
advanced expected future gross cash flows from customers can be predicted.
Hence, although both CPA and CLV models can be useful for resource allocation
72
purposes, the respective models will not be equally useful to deploy in different
customer settings. This context specificity where the appropriateness of
sophisticated management techniques may be dependent on the circumstances
where they are deployed calls for a contingency approach (Tillema 2005).
Insights generated by sophisticated customer profitability measurement
models increase transparency regarding the financial attractiveness of different
customer relationships. The models will therefore be increasingly valuable as
managers’ information-processing requirements concerning customers’ behavior
and demand for service activities increases. Environments where managers face
substantial information-processing requirements can be characterized as complex
(as opposed to simple) (Duncan 1972; Pennings 1975; Tung 1979). Decision
making among high degrees of environmental complexity entails that manager
must possess more knowledge and consider more options than in simpler
environments (Sharfman and Dean 1991). Hence, a great variety of factors are
perceived as relevant by managers making decisions in complex environments
(Miller and Friesen 1983; Smart and Vertinsky 1984; Tan and Litschert 1994).
Complexity is one of three key dimensions in organizational task
environments (e.g., Castrogiovanni 2002; Dess and Beard 1984; Emery and Trist
1965; Miller and Friesen 1978; Sharfman and Dean 1991) and can formally be
defined as the level of complex knowledge that understanding the environment
requires (Sharfman and Dean 1991). Cannon and John (2007) have recently
argued that environmental complexity is a multidimensional construct composed
by (1) the number of environmental components with which the firm must interact
(following Aldrich 1979; Duncan 1972; Kabadayi, Eyuboglu, and Thomas 2007;
Tung 1979); (2) the heterogeneity, dissimilarity, or diffusion among the
environmental components (following Castrogiovanni 2002; Child 1972; Dess and
Beard 1984; Duncan 1972; Kabadayi, Eyuboglu, and Thomas 2007; Simsek,
Veiga, and Lubatkin 2007; Thompson 1967; Tung 1979); (3) the sophisticated or
technical knowledge required to interact effectively with the particular
73
components that are present in a firm’s environment (following Aldrich 1979;
Mintzberg 1979; Sharfman and Dean 1991).
Since customers constitute one of the main components that give rise to
complexity in firms’ environments (Bourgeois 1980; Duncan 1972; Kabadayi,
Eyuboglu, and Thomas 2007) customer complexity can be characterized as one
important element in the general environmental complexity faced by firms. Based
on the multidimensional conceptualization of complexity a complex customer
environment consists of many different customers with heterogeneous needs and
where high technical intricacy is required to interact effectively with the customers
and other stakeholders involved in the customer relationship management process.
In order to serve a complex customer environment firms must deploy different
customer strategies and utilize multiple channels of distribution/communication to
satisfy different customer tastes and needs across markets (Miller and Friesen
1983). It is this differentiation of efforts that in turn makes the deployment of
sophisticated managerial systems and processes necessary for managers in order
for them to cope with increasingly complex decision making environments. This
adaptation of decision making system sophistication to fit environmental
complexity has found empirical support e.g., for strategic planning systems
(Rhyne 1985), and general cost management techniques (Cagwin and Bouwman
2002).
Whereas the number of customers in a firm’s environment is a rather
unambiguous variable, customer diversity/heterogeneity and customer interaction
intricacy may have different meanings depending on which dimensions of the
customer relationship are in scope. Two distinct dimensions can be identified:
Customer behavior and customer service requirements.
Customer behavior reflects the length, depth and breadth of customer
relationships (Bolton, Lemon, and Verhoef 2004). Hence, customer behavioral
complexity can be defined as the degree of variation in retention durations
(relationship length), transaction frequency and value of transactions (relationship
74
depth) and cross-buying behavior (relationship breadth) across the total number of
customer relationships a firm serves. The larger the variation in relationship
length, depth and breadth, and the larger a customer base firms serve, the higher
customer behavioral complexity is faced by firms. Examples of industries with
high customer behavioral complexity would be retailers and mass service
providers such as telecommunication companies that serve very large and dynamic
customer bases.
Customer behavior is not necessarily correlated with customers’ service
requirements. Resource consumption in marketing, sales, order-handling,
distribution, technical service departments, customer support functions etc. is
caused by the amount and nature of activities performed to serve customers, and
these activities may or may not be related to retention duration, transaction size
and cross buying behavior. Hence, customer service complexity is the degree of
variation in service needs and requirements that invoke differential activities on
the organization across customer-facing functions in terms of the number of
activities performed as well as the time spent on each activity. The larger the
variation in customers’ service needs and requirements, and the larger a customer
base a firm serves, the higher will customer service complexity be. Examples of
industries with high customer service complexity would be manufacturers
operating full supply chains and deploying large sales forces and/or large technical
service forces.
Both customer behavioral complexity and customer service complexity
should be measured through multi-item Likert scales. However, whereas customer
service complexity can be measured as a first-order construct, customer behavioral
complexity is best measured as a second-order construct consisting of three
components: (1) Variation in relationship length; (2) Variation in relationship
depth; (3) Variation in relationship breadth. Table 3 provides a set of items for
each of the two constructs.
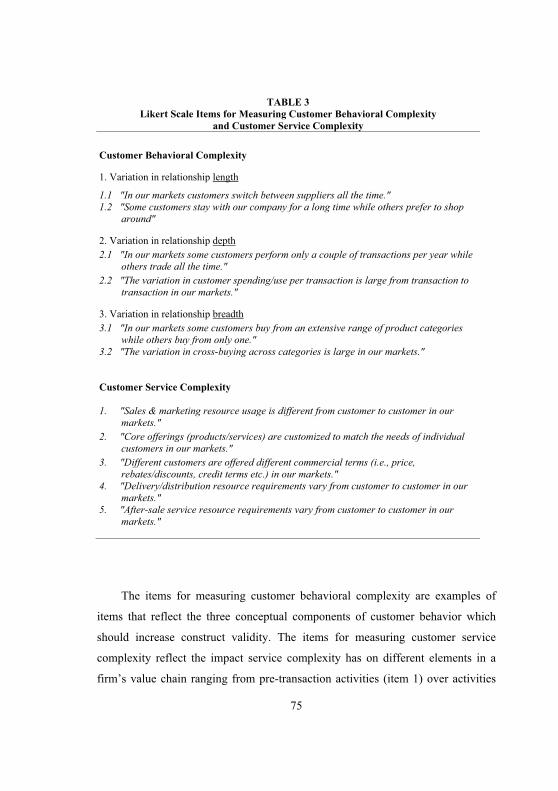
75
TABLE 3 Likert Scale Items for Measuring Customer Behavioral Complexity
and Customer Service Complexity
Customer Behavioral Complexity
1. Variation in relationship length
1.1 "In our markets customers switch between suppliers all the time." 1.2 "Some customers stay with our company for a long time while others prefer to shop
around"
2. Variation in relationship depth 2.1 "In our markets some customers perform only a couple of transactions per year while
others trade all the time." 2.2 "The variation in customer spending/use per transaction is large from transaction to
transaction in our markets."
3. Variation in relationship breadth 3.1 "In our markets some customers buy from an extensive range of product categories
while others buy from only one." 3.2 "The variation in cross-buying across categories is large in our markets."
Customer Service Complexity
1. "Sales & marketing resource usage is different from customer to customer in our markets."
2. "Core offerings (products/services) are customized to match the needs of individual customers in our markets."
3. "Different customers are offered different commercial terms (i.e., price, rebates/discounts, credit terms etc.) in our markets."
4. "Delivery/distribution resource requirements vary from customer to customer in our markets."
5. "After-sale service resource requirements vary from customer to customer in our markets."
The items for measuring customer behavioral complexity are examples of
items that reflect the three conceptual components of customer behavior which
should increase construct validity. The items for measuring customer service
complexity reflect the impact service complexity has on different elements in a
firm’s value chain ranging from pre-transaction activities (item 1) over activities
76
related to the transaction (items 2-4) to post-transaction activities (item 5). This
way all aspects of a firm’s operations that are expectedly influenced by the service
complexity encountered in customer environments are included in the measure.
Marketing managers should be able to make an informed judgment regarding all
of these items which furthermore enhances the reliability of the measures.
3.1 Framework and Propositions
By linking up the two distinct customer complexity constructs with customer
profitability measurement model sophistication we propose a contingency
framework for customer profitability measurement model selection (see Fig. 1).
The key notion is that firms will increase model sophistication only if the benefits
of this increase outweigh the costs (Cooper 1988). Hence, in a customer
environment characterized by low customer behavioral complexity and low
customer service complexity the costs of implementing sophisticated CLV/CPA
models are too high compared with the benefits that such measures produce. As
complexity increases along the two dimensions of customer complexity the
benefits of increasing sophistication will rise which in turn will motivate firms to
start implementing increasingly sophisticated customer profitability measurement
models.
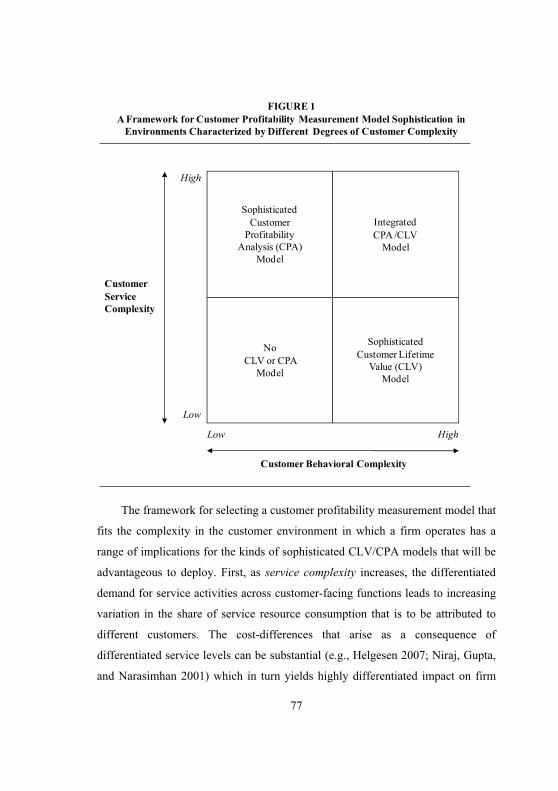
77
The framework for selecting a customer profitability measurement model that
fits the complexity in the customer environment in which a firm operates has a
range of implications for the kinds of sophisticated CLV/CPA models that will be
advantageous to deploy. First, as service complexity increases, the differentiated
demand for service activities across customer-facing functions leads to increasing
variation in the share of service resource consumption that is to be attributed to
different customers. The cost-differences that arise as a consequence of
differentiated service levels can be substantial (e.g., Helgesen 2007; Niraj, Gupta,
and Narasimhan 2001) which in turn yields highly differentiated impact on firm
Customer Service Complexity
Customer Behavioral Complexity
Low
Low
High
High
Sophisticated Customer
Profitability Analysis (CPA)
Model
Sophisticated Customer Lifetime
Value (CLV) Model
NoCLV or CPA
Model
IntegratedCPA /CLV
Model
FIGURE 1A Framework for Customer Profitability Measurement Model Sophistication in
Environments Characterized by Different Degrees of Customer Complexity
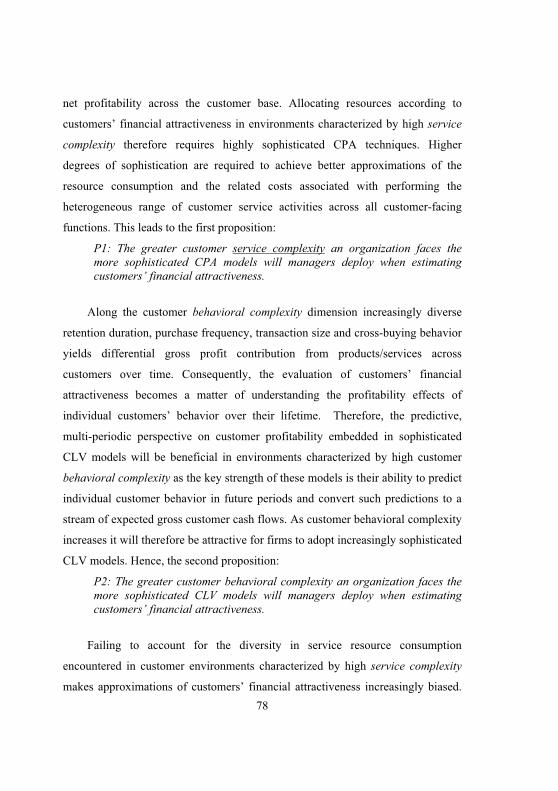
78
net profitability across the customer base. Allocating resources according to
customers’ financial attractiveness in environments characterized by high service
complexity therefore requires highly sophisticated CPA techniques. Higher
degrees of sophistication are required to achieve better approximations of the
resource consumption and the related costs associated with performing the
heterogeneous range of customer service activities across all customer-facing
functions. This leads to the first proposition:
P1: The greater customer service complexity an organization faces the more sophisticated CPA models will managers deploy when estimating customers’ financial attractiveness.
Along the customer behavioral complexity dimension increasingly diverse
retention duration, purchase frequency, transaction size and cross-buying behavior
yields differential gross profit contribution from products/services across
customers over time. Consequently, the evaluation of customers’ financial
attractiveness becomes a matter of understanding the profitability effects of
individual customers’ behavior over their lifetime. Therefore, the predictive,
multi-periodic perspective on customer profitability embedded in sophisticated
CLV models will be beneficial in environments characterized by high customer
behavioral complexity as the key strength of these models is their ability to predict
individual customer behavior in future periods and convert such predictions to a
stream of expected gross customer cash flows. As customer behavioral complexity
increases it will therefore be attractive for firms to adopt increasingly sophisticated
CLV models. Hence, the second proposition:
P2: The greater customer behavioral complexity an organization faces the more sophisticated CLV models will managers deploy when estimating customers’ financial attractiveness.
Failing to account for the diversity in service resource consumption
encountered in customer environments characterized by high service complexity
makes approximations of customers’ financial attractiveness increasingly biased.
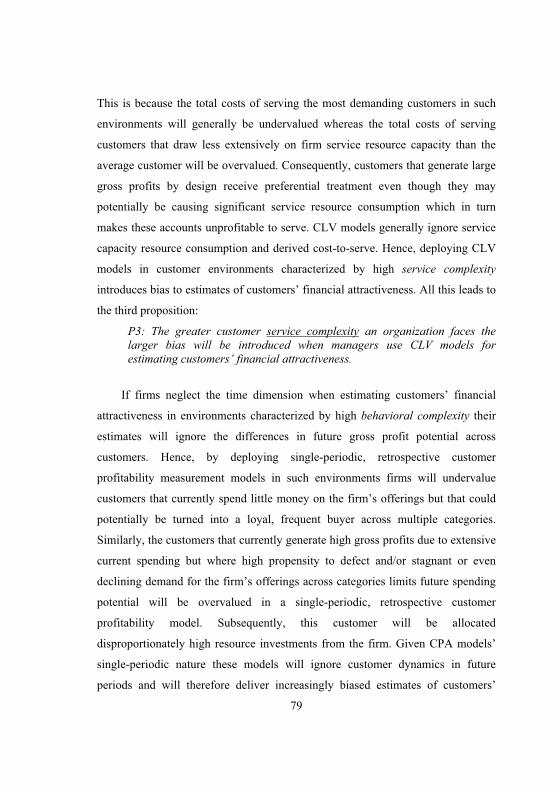
79
This is because the total costs of serving the most demanding customers in such
environments will generally be undervalued whereas the total costs of serving
customers that draw less extensively on firm service resource capacity than the
average customer will be overvalued. Consequently, customers that generate large
gross profits by design receive preferential treatment even though they may
potentially be causing significant service resource consumption which in turn
makes these accounts unprofitable to serve. CLV models generally ignore service
capacity resource consumption and derived cost-to-serve. Hence, deploying CLV
models in customer environments characterized by high service complexity
introduces bias to estimates of customers’ financial attractiveness. All this leads to
the third proposition:
P3: The greater customer service complexity an organization faces the larger bias will be introduced when managers use CLV models for estimating customers’ financial attractiveness.
If firms neglect the time dimension when estimating customers’ financial
attractiveness in environments characterized by high behavioral complexity their
estimates will ignore the differences in future gross profit potential across
customers. Hence, by deploying single-periodic, retrospective customer
profitability measurement models in such environments firms will undervalue
customers that currently spend little money on the firm’s offerings but that could
potentially be turned into a loyal, frequent buyer across multiple categories.
Similarly, the customers that currently generate high gross profits due to extensive
current spending but where high propensity to defect and/or stagnant or even
declining demand for the firm’s offerings across categories limits future spending
potential will be overvalued in a single-periodic, retrospective customer
profitability model. Subsequently, this customer will be allocated
disproportionately high resource investments from the firm. Given CPA models’
single-periodic nature these models will ignore customer dynamics in future
periods and will therefore deliver increasingly biased estimates of customers’
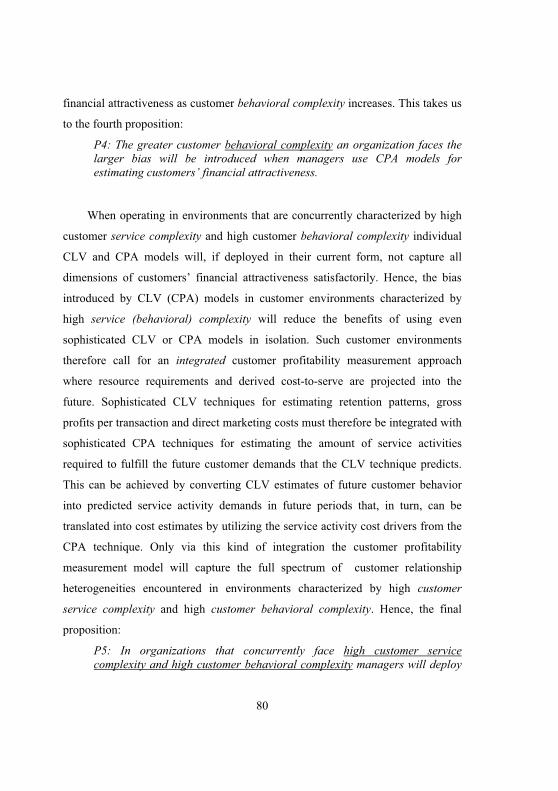
80
financial attractiveness as customer behavioral complexity increases. This takes us
to the fourth proposition:
P4: The greater customer behavioral complexity an organization faces the larger bias will be introduced when managers use CPA models for estimating customers’ financial attractiveness.
When operating in environments that are concurrently characterized by high
customer service complexity and high customer behavioral complexity individual
CLV and CPA models will, if deployed in their current form, not capture all
dimensions of customers’ financial attractiveness satisfactorily. Hence, the bias
introduced by CLV (CPA) models in customer environments characterized by
high service (behavioral) complexity will reduce the benefits of using even
sophisticated CLV or CPA models in isolation. Such customer environments
therefore call for an integrated customer profitability measurement approach
where resource requirements and derived cost-to-serve are projected into the
future. Sophisticated CLV techniques for estimating retention patterns, gross
profits per transaction and direct marketing costs must therefore be integrated with
sophisticated CPA techniques for estimating the amount of service activities
required to fulfill the future customer demands that the CLV technique predicts.
This can be achieved by converting CLV estimates of future customer behavior
into predicted service activity demands in future periods that, in turn, can be
translated into cost estimates by utilizing the service activity cost drivers from the
CPA technique. Only via this kind of integration the customer profitability
measurement model will capture the full spectrum of customer relationship
heterogeneities encountered in environments characterized by high customer
service complexity and high customer behavioral complexity. Hence, the final
proposition:
P5: In organizations that concurrently face high customer service complexity and high customer behavioral complexity managers will deploy
81
highly integrated CPA/CLV models when estimating customers’ financial attractiveness.
4. Future Research Implications
An important purpose of this article is to guide future research across the
marketing and finance/accounting disciplines in establishing a more profound
understanding of the contextual factors and boundaries affecting the sophistication
of customer profitability measurement models. Three prolific avenues for future
research can be identified: The propositions must be validated empirically, an
integrated CLV/CPA approach must be developed and the tax and risk limitations
of CLV and CPA models must be explored and potentially diminished.
4.1 Validating the contingency propositions
A theory can be defined as: ”a statement of relationships between units
observed or approximated in the empirical world” (Bacharach 1989, p. 498).
Hence, the contingency propositions must be found to be irrefutable on the basis
of empirical data in order to be validated. Whether adopting firms adapt the
sophistication of customer profitability measurement models to fit the complexity
of the customer environments in which they operate is one important issue. A key
element herein is the confirmation that the constructs customer service complexity
and customer behavioral complexity are valid empirical constructs. Cross-
sectional survey research designs similar to the ones deployed in recent studies on
the performance effects of CRM and customer prioritization strategies in general
(see e.g., Homburg, Droll, and Totzek 2008; Palmatier, Gopalakrishna, and
Houston 2006; Yim, Anderson, and Swaminathan 2004) constitute a good
approach to testing the contingency propositions.
Another important issue is the exploration of bias introduced by CLV (CPA)
models in customer environments characterized by high service (behavioral)
82
complexity. Case demonstrations similar to the ones performed on CLV efficiency
(e.g., Venkatesan and Kumar 2004) and CPA efficiency (e.g., Niraj, Gupta, and
Narasimhan 2001) could be a good design for this kind of inquiry. Hereby, the
diverging recommendations provided by CLV and CPA models can be analyzed
and the contingency explanation can be explored further.
Finally, other contingencies than complexity that may influence customer
profitability is measurement model sophistication. Otley (1980) and Chenhall
(2003) have in their review studies of contingency research in management
accounting identified six general contextual factors that have been brought up to
explain differences in the applicability of different accounting systems:
Technology (i.e., how the organization’s work processes operate), organization
structure (i.e., the formal specification of different roles to ensure that the
organization’s activities are carried out), environment (e.g., competitive intensity,
uncertainty, turbulence etc.), size, strategy and culture. Future research can begin
investigating the impact of some or all of these factors on the design of financial
customer profitability models across companies. Subsequently, later studies can
establish a more comprehensive contingency-based theory for customer
profitability measurement model sophistication.
4.2 Developing an Integrated CLV/CPA Approach
Only one customer profitability measurement model study has explored the
integration of the CLV and CPA approaches. Ryals (2005) touches upon the issue
in a case study of a B2B insurer’s implementation of a deterministic CLV model
by assigning costs associated with order-handling and key account management
activities to key accounts applying a variation of ABC. This is a promising (and
pragmatic) approach. However, the link between customer behavioral forecasting
and the prediction of service capacity costs (order-handling and key account
management) was not explored.
83
Future research can explore this link in greater detail. A first step could be to
pursue analytical research, investigating the relationship between the drivers of
customer behavior deployed in CLV models and the cost drivers deployed in CPA
models. In this context Activity-Based Budgeting (ABB) (Kaplan and Cooper
1998) and Time-Driven Activity-Based Costing (TDABC) (Kaplan and Anderson
2004) may be useful techniques to explore. Subsequently, case demonstrations
similar to the ones carried out throughout the CLV and CPA literatures can be
developed. This way a practically applicable integrated CLV/CPA model can be
developed and demonstrated.
However, one thing is to develop an integrated customer profitability
measurement model. A more daunting task is to handle the issues associated with
performing a successful implementation of such a model that offers benefits
compelling enough for decision makers in firms to use it. Generally, barriers and
resistance to change slow down the diffusion of management innovations (Ax and
Bjørnenak 2005). In the case of customer profitability measurement models a key
barrier to address is the cross-functional collaboration required across parts of the
organization like marketing and finance/accounting departments (Kumar et al.
2008) – departments that have traditionally been far apart (Gleaves et al. 2008).
Cross-functional collaboration presents two main issues. First, firms must
successfully integrate cost management systems, transaction databases, CRM
systems, other sales management software etc. into an integrated customer
profitability measurement platform that delivers insights on the drivers of
customer value that are relevant to managers across different functions. E.g.,
sales/marketing management must be able to monitor realized as well as expected
gross profit per customer across offerings as well as the sales, marketing and
service activities performed to generate these gross cash flows. Additionally,
simulation of different resource allocation strategies’ effect on customer
profitability in future periods must be facilitated. An important element herein is
84
to organize data from operational customer service functions like order-handling,
delivery and post-transaction service/support around customers.
Second, processes and competences across functions must be aligned with
the customer perspective while the overall customer responsibility is anchored in
one function. This offers an opportunity for the marketing department to take lead
on the entire organization’s value creation process. As sales/marketing
departments “own” the customer in most organizations cross-functional customer
or segment account teams are naturally headed by sales/marketing managers. Such
account teams should consist of representatives from customer-related functions
(e.g., R&D, logistics, customer service etc.), with finance/accounting departments
delivering data and controlling costs per customer. Sales/marketing managers
should be in charge of account teams and overall responsible for
customer/segment profitability. This kind of reorganization requires capability
upgrades across all customer-related departments in order to adopt, implement and
use a common financial frame for resource allocation centered on customer
profitability. Marketing managers in particular must achieve a much more in-depth
understanding of the meaning of and interrelationships between
accounting/finance terms. Similarly, accounting/finance managers need to
understand the causal relationships between marketing actions and financial
outcomes in much greater detail.
Understanding the process of breaking down such inter-functional barriers is
a crucial step towards more rapid adoption of an integrated CLV/CPA model
across companies. Longitudinal field studies may provide a good research design
for exploring the issues associated with breaking down inter-functional barriers in
one or more case companies that have adopted and implemented an integrated
customer profitability measurement model (see Roslender and Hart 2003).
85
4.3 Expanding the boundaries of CLV/CPA
CLV and CPA-based allocation of resources across multinational customer
bases may suffer from the lack of an income tax perspective in CLV and CPA
models. From a marketing perspective tax considerations are part of the macro
factors external to companies conducting global customer relationship
management practices (Ramaseshan et al. 2006). Tax rate differentials may thus
have an impact on optimization of resource allocation decisions in global CRM. If
the effective tax rate varies across countries customers with identical pre-tax cash
flows do not necessarily contribute equally to firm value creation. On a similar
note, different profit repatriation restrictions across countries may postpone the
realization of after-tax cash flows across borders hereby reducing net present value
due to the time value of money. How severe a bias that is introduced by ignoring
tax discrepancies in multinational resource allocation and how any potential bias
can be eliminated are interesting areas for future research. Again, case
demonstrations comparing the resource allocation approach with and without tax
considerations in a multinational marketing organization could be an interesting
path to pursue.
The risk perspective of customer-based resource allocation decisions is to
some extent captured in a CLV context by estimating the volatility and
vulnerability of future customer cash flows (Kumar and Shah 2009). Although this
approach is a major first step in accounting for diverse risk exposure across
different customer relationships there are still some issues that need to be
addressed to advance this thinking.
According to financial portfolio theory, investors in financial markets can
eliminate any asset-specific/idiosyncratic risk by holding a well-diversified
portfolio of financial assets due to the inter-correlation of these assets’ returns
(Markowitz 1952). Transferring this logic to a customer portfolio yields two
specific areas where the approach to measuring customer risk suggested by Kumar
86
and Shah (2009) can be expanded: First, considering customer-level risk from a
portfolio perspective rather than from the perspective of the individual customer
will allow the incorporation of any diversification effects across the customer
base. Dhar and Glazer (2003) have proposed a conceptual model for adjusting the
cost of capital at individual customer level to reflect different customers’
contribution to the volatility of portfolio cash flows. Pursuing this model via case
demonstrations would be an interesting way of exploring the impact of deploying
a customer portfolio perspective on resource allocation decisions.
Second, a related issue is the reconciliation of customer-level risk to overall
firm-level risk and the links between customer cash flow volatility/vulnerability
and the weighted average cost of capital (WACC). Given that all sales activity
derives from customer relationships the risk differences estimated at individual
customer-level provide an exciting micro-level approach to estimating firms’
exposure to fluctuations in demand across markets at the macro level.
Investigating how to merge this input into the overall estimation of the weighted
average cost of capital of the firm will not only advance CLV models but may also
provide new input to more macro-level estimation of firms’ operational risk in
corporate finance research.
5. Managerial Implications
Customer profitability measurement model design is a matter of establishing
the right fit between model sophistication and the complexity encountered in
customer environments. Customer complexity may vary across industries but may
also vary across business units within organizations in specific industries. Hence,
the determinants of customer complexity are not industry-specific. Firms serving
B2B as well as B2C customers (e.g., utilities, telecommunication firms and
financial institutions) may encounter differential customer behavior and service
requirements so that firms must measure different elements of customers’
87
financial attractiveness via more or less sophisticated measurement models.
Similarly, firms that deploy different customer service models across different
markets (e.g., by outsourcing service activities in some markets and being full-
service provider in other markets) will face different degrees of customer service
complexity.
Therefore, the first step in developing/adjusting customer profitability
measurement models is to diagnose the customer environment across business
units along the dimensions of customer service complexity and customer
behavioral complexity. This diagnosis can be performed by surveying the
sales/marketing organizations across business units using our proposed measures
(see Table 3). Subsequently, firms can use the contingency framework to identify
how sophisticated a CPA/CLV approach that best fits this environment. Finally,
firms must be aware of the limitations of CPA and CLV models in terms of the
neglected tax effects and portfolio risk implications and mitigate the bias
introduced to estimates of customers’ financial attractiveness when developing
resource allocation mechanisms wherever possible.
The next step is to develop/adjust the firm’s customer profitability
measurement model in accordance with the diagnosis of environmental customer
complexity. Hence, when facing high degrees of customer service complexity a
sophisticated cost assignment exercise must be performed. Efforts must therefore
be made to approximate cause-and-effect relationships between customer service
activities and service capacity resource requirements in order to determine cost-to-
serve per customer. Similarly, firms facing high degrees of customer behavioral
complexity must focus on performing sophisticated customer behavior forecasting
analysis to estimate retention probabilities, gross profits and direct marketing
investments per customer. And if high degrees of service and behavioral
complexity are encountered simultaneously an integrated CPA/CLV approach
must be developed in a stepwise approach. First customers’ service resource
requirements and derived cost-to-serve can be determined. Then a model
88
forecasting future customer behavior and direct marketing investment requirement
should be developed. And finally the customer behavior forecasts can be used to
estimate future customer service requirements hereby arriving at a stream of net
profits per customer that can be discounted to arrive at net value per customer.
A crucial final step is the implementation of the new/adjusted customer
profitability measurement approach. In many cases this can potentially be a matter
of shifting focus from a product perspective to a customer perspective across the
organization (Kumar et al. 2008). Two important barriers to successful
implementation include account manager motivation and feedback (Ryals 2006).
Account Managers must understand why customers are financially attractive or
unattractive and how customers’ financial attractiveness can be improved. This
can be done by focusing on the drivers of CPA (service activity time consumption
and derived resource requirements) and CLV (retention probabilities, depth and
breadth of engagements and direct marketing investment requirements) rather than
merely managing on financial customer outcomes. This also entails the
measurement of account manager performance on the drivers they can influence.
Relevant examples of elements that account managers can influence are pricing,
the product mix that customers purchase (over time), marketing budgets at
customer level, time spent on sales calls, and other service levels that account
managers promise customers in terms of e.g., promotion support, deliveries and
after-sales support. Examples of elements that are beyond account managers’
influence are efficiencies in production (reflected in cost of goods sold per unit),
logistics and technical service (reflected in cost-to-serve). However, the
implementation of sophisticated customer profitability measurement models is still
an important step in highlighting customer service processes that can be optimized
internally in firms.
89
6. Conclusion
No customer profitability measurement approach is universally superior.
Instead firms must balance the degree of CPA and CLV sophistication with the
customer service complexity and customer behavioral complexity encountered in
their task environment. How sophisticated CPA and CLV models can be
developed has been demonstrated a number of times in isolation. How the two
approaches can be integrated into a unified model is an underdeveloped area that
deserves attention in future research on customer profitability measurement.
Future research of this nature requires interdisciplinary collaboration between
marketing and management accounting scholars just as well as the implementation
of sophisticated CPA and CLV models across firms requires higher degrees of
inter-functional coordination across marketing/sales and finance/accounting
departments.
90
References
Aldrich, Howard E. (1979), Organizations and Environment. Upper Saddle River, NJ: Prentice Hall.
Al-Omiri, Mohammed and Colin Drury (2007), "A Survey of Factors Influencing the Choice of Product Costing Systems in UK Organizations," Management Accounting Research, 18 (4), 399-424.
Andon, Paul, Jane A. Baxter, and Graham Bradley (2003), "Calculating the Economic Value of Customers to an Organization," Chartered Accountants Journal of New Zealand, 82 (3), 12-28.
Ax, Christian and Trond Bjørnenak (2005), "Bundling and Diffusion of Management Accounting innovations—the Case of the Balanced Scorecard in Sweden," Management Accounting Research, 16 (1), 1-20.
Bacharach, Samuel B. (1989), "Organizational Theories: Some Criteria for Evaluation," Academy of Management Review, 14 (4), 496-515.
Berger, Paul D., Naras Eechambadi, Morris George, Donald R. Lehmann, Ross Rizley, and Rajkumar Venkatesan (2006), "From Customer Lifetime Value to Shareholder Value: Theory, Empirical Evidence, and Issues for Future Research," Journal of Service Research, 9 (2), 156-67.
Berger, Paul D. and Nada I. Nasr (1998), "Customer Lifetime Value: Marketing Models and Applications," Journal of Interactive Marketing, 12 (1), 17-30.
Berger, Paul D., Bruce Weinberg, and Richard C. Hanna (2003), "Customer Lifetime Value Determination and Strategic Implications for a Cruise-Ship Company," Journal of Database Marketing & Customer Strategy Management, 11 (1), 40-52.
Blattberg, Robert C. and John Deighton (1996), "Manage Marketing by the Customer Equity Test," Harvard Business Review, 74 (July-August), 136-44.
Blattberg, Robert C., Gary Getz, and Jacquelyn S. Thomas (2001), Customer Equity. Boston, MA: Harvard Business School Press.
Bolton, Ruth N., Katherine N. Lemon, and Peter C. Verhoef (2004), "The Theoretical Underpinnings of Customer Asset Management: A Framework and Propositions for Future Research," Journal of the Academy of Marketing Science, 32 (3), 271-92.
91
Boulding, William, Richard Staelin, Michael Ehret, and Wesley J. Johnston (2005), "A Customer Relationship Management Roadmap: What is Known, Potential Pitfalls, and Where to Go," Journal of Marketing, 69 (October), 155-66.
Bourgeois, L. J. (1980), "Strategy and Environment: A Conceptual Integration," Academy of Management Review, 5 (1), 25-39.
Brierley, John A. (2008), "Toward an Understanding of the Sophistication of Product Costing Systems," Journal of Management Accounting Research, 20 (December), 61-78.
Cagwin, Douglass and Marinus J. Bouwman (2002), "The Association between Activity-Based Costing and Improvement in Financial Performance," Management Accounting Research, 13 (1), 1-39.
Cannon, Alan R. and Caron H. St. John (2007), "Measuring Environmental Complexity: A Theoretical and Empirical Assessment," Organizational Research Methods, 10 (2), 296-321.
Castrogiovanni, Gary J. (2002), "Organization Task Environments: Have they Changed Fundamentally Over Time?" Journal of Management, 28 (2), 129-50.
Chenhall, Robert H. (2003), "Management Control Systems Design within its Organizational Context: Findings from Contingency-Based Research and Directions for the Future," Accounting, Organizations & Society, 28 (2), 127-68.
Child, John (1972), "Organizational Structure, Environment and Performance: The Role of Strategic Choice," Sociology, 6 (1), 1-22.
Cooper, Robin (1988), "The Rise of Activity-Based costing—part Two: When do I Need an Activity-Based System?" Journal of Cost Management, Summer, 41-8.
Cooper, Robin and Robert S. Kaplan (1988), "Measure Costs Right: Make the Right Decision," Harvard Business Review, 66 (5), 96-103.
----(1991), "Profit Priorities from Activity-Based Costing," Harvard Business Review, 69 (May-June), 130-5.
Dess, Gregory G. and Donald W. Beard (1984), "Dimensions of Organizational Task Environments," Administrative Science Quarterly, 29 (1), 52-73.
Dhar, Ravi and Rashi Glazer (2003), "Hedging Customers," Harvard Business Review, 81 (May-June), 86-92.
92
Donkers, Bas, Peter C. Verhoef, and Martijn de Jong (2007), "Modeling CLV: A Test of Competing Models in the Insurance Industry," Quantitative Marketing and Economics, 5 (2), 163-90.
Drury, Colin and Mike Tayles (2005), "Explicating the Design of Overhead Absorption Procedures in UK Organizations," The British Accounting Review, 37 (1), 47-84.
Duncan, Robert B. (1972), "Characteristics of Organizational Environments and Perceived Environmental Uncertainty," Administrative Science Quarterly, 17 (3), 313-27.
Dwyer, F. R. (1997), "Customer Lifetime Valuation to Support Marketing Decision Making," Journal of Interactive Marketing, 11 (4), 6-13.
Emery, F. E. and E. L. Trist (1965), "The Causal Texture of Organizational Environments," Human Relations, 18 (1), 21-32.
Gleaves, Robin, Jamie Burton, Jan Kitshoff, Ken Bates, and Mark Whittington (2008), "Accounting is from Mars, Marketing is from Venus: Establishing Common Ground for the Concept of Customer Profitability," Journal of Marketing Management, 24 (7), 825-45.
Goebel, Daniel J., Greg W. Marshall, and William B. Locander (1998), "Activity-Based Costing: Accounting for a Market Orientation," Industrial Marketing Management, 27 (11), 497-510.
Guerreiro, Reinaldo, Sé Bio, Elvira Vazquez, and Villamor Merschmann (2008), "Cost-to-Serve Measurement and Customer Profitability Analysis," International Journal of Logistics Management, 19 (12), 389-407.
Gupta, Sunil, Dominique M. Hanssens, Bruce G. S. Hardie, Wiliam Kahn, V. Kumar, Nathaniel Lin, and Nalini R. S. Sriram (2006), "Modeling Customer Lifetime Value," Journal of Service Research, 9 (2), 139-55.
Gupta, Sunil and Donald R. Lehmann (2003), "Customers as Assets," Journal of Interactive Marketing, 17 (Winter), 9-24.
----(2006), "Customer Lifetime Value and Firm Valuation," Journal of Relationship Marketing, 5 (2/3), 87-110.
Gupta, Sunil, Donald R. Lehmann, and Jennifer A. Stuart (2004), "Valuing Customers," Journal of Marketing Research, 41 (February), 7-18.
93
Haenlein, Michael, Andreas M. Kaplan, and Anemone J. Beeser (2007), "A Model to Determine Customer Lifetime Value in a Retail Banking Context," European Management Journal, 25 (3), 221-34.
Helgesen, Øyvind (2007), "Customer Accounting and Customer Profitability Analysis for the Order Handling Industry - A Managerial Accounting Approach," Industrial Marketing Management, 36 (6), 757-69.
Homburg, Christian, Mathias Droll, and Dirk Totzek (2008), "Customer Prioritization: Does it Pay Off, and how should it be Implemented?" Journal of Marketing, 72 (September), 110-30.
Jacobs, Fred A., Wesley J. Johnston, and Natalia Kotchetova (2001), "Customer Profitability Prospective Vs. Retrospective Approaches in a Business-to-Business Setting," Industrial Marketing Management, 30 (4), 353-63.
Kabadayi, Sertan, Nermin Eyuboglu, and Gloria P. Thomas (2007), "The Performance Implications of Designing Multiple Channels to Fit with Strategy and Environment," Journal of Marketing, 71 (10), 195-211.
Kaplan, Robert S. and Steven R. Anderson (2004), "Time-Driven Activity-Based Costing," Harvard Business Review, 82 (Nov-Dec), 131-8.
Kaplan, Robert S. and Robin Cooper (1998), Cost and Effect: Using Integrated Cost Systems to Drive Profitability and Performance. Boston, MA: Harvard Business School Press.
Kaplan, Robert S. and V. G. Narayanan (2001), "Measuring and Managing Customer Profitability," Journal of Cost Management, 15 (5), 5-15.
Kumar, V. and Morris George (2007), "Measuring and Maximizing Customer Equity: A Critical Analysis," Journal of the Academy of Marketing Science, 35 (2), 157-71.
Kumar, V., J. A. Petersen, and Robert P. Leone (2010), "Driving Profitability by Encouraging Customer Referrals: Who, when and how," Journal of Marketing, 74 (September), 1-17.
Kumar, V. and Denish Shah (2009), "Expanding the Role of Marketing: From Customer Equity to Market Capitalization," Journal of Marketing, 73 (November), 119-36.
Kumar, V., Denish Shah, and Rajkumar Venkatesan (2006), "Managing Retailer Profitability - One Customer at a Time!" Journal of Retailing, 82 (4), 277-94.
94
Kumar, V., Rajkumar Venkatesan, Timothy Bohling, and Denise Beckmann (2008), "The Power of CLV: Managing Customer Lifetime Value at IBM," Marketing Science, 27 (4), 585-99.
Markowitz, Harry M. (1952), "Portfolio Selection," Journal of Finance, 7 (1), 77-91.
McManus, Lisa (2007), "The Construction of a Segmental Customer Profitability Analysis," Journal of Applied Management Accounting Research, 5 (2), 59-74.
McManus, Lisa and Chris Guilding (2008), "Exploring the Potential of Customer Accounting: A Synthesis of the Accounting and Marketing Literatures," Journal of Marketing Management, 24 (7), 771-95.
Miller, Danny and Peter H. Friesen (1978), "Archetypes of Strategy Formulation," Management Science, 24 (9), 921-33.
----(1983), "Strategy-Making and Environment: The Third Link," Strategic Management Journal, 4 (3), 221-35.
Mintzberg, Henry (1979), The Structuring of Organizations. Englewood Cliffs, NJ: Prentice-Hall.
Niraj, Rakesh, Mahendra Gupta, and Chakravarthi Narasimhan (2001), "Customer Profitability in a Supply Chain," Journal of Marketing, 65 (July), 1-16.
Noone, Breffni and Peter Griffin (1999), "Managing the Long-Term Profit Yield from Market Segments in a Hotel Environment: A Case Study on the Implementation of Customer Profitability Analysis," International Journal of Hospitality Management, 18 (2), 111-28.
Otley, David T. (1980), "The Contingency Theory of Management Accounting: Achievement and Prognosis," Accounting, Organizations & Society, 5 (10), 413-28.
Palmatier, Robert W., Srinath Gopalakrishna, and Mark B. Houston (2006), "Returns on Business-to-Business Relationship Marketing Investments: Strategies for Leveraging Profits," Marketing Science, 25 (5), 477-93.
Payne, Adrian and Pennie Frow (2005), "A Strategic Framework for Customer Relationship Management," Journal of Marketing, 69 (October), 167-76.
95
Pennings, Johannes M. (1975), "The Relevance of the Structural-Contingency Model for Organizational Effectiveness," Administrative Science Quarterly, 20 (3), 393-410.
Pfeifer, Phillip E. and Robert L. Carraway (2000), "Modeling Customer Relationships as Markov Chains," Journal of Interactive Marketing, 14 (2), 43-55.
Pfeifer, Phillip E., Mark E. Haskins, and Robert M. Conroy (2005), "Customer Lifetime Value, Customer Profitability, and the Treatment of Acquisition Spending," Journal of Managerial Issues, 17 (1), 11-25.
Ramaseshan, B., David Bejou, Subhash C. Jain, Charlotte Mason, and Joseph Pancras (2006), "Issues and Perspectives in Global Customer Relationship Management," Journal of Service Research, 9 (2), 195-207.
Reinartz, Werner, Jacquelyn S. Thomas, and V. Kumar (2005), "Balancing Acquisition and Retention Resources to Maximize Customer Profitability," Journal of Marketing, 69 (January), 63-79.
Rhyne, Lawrence C. (1985), "The Relationship of Information Usage Characteristics to Planning System Sophistication: An Empirical Examination," Strategic Management Journal, 6 (4), 319-37.
Roslender, Robin and Susan J. Hart (2003), "In Search of Strategic Management Accounting: Theoretical and Field Study Perspectives," Management Accounting Research, 14 (3), 255-79.
Rust, Roland T., Tim Ambler, Gregory S. Carpenter, V. Kumar, and Rajendra K. Srivastava (2004), "Measuring Marketing Productivity: Current Knowledge and Future Directions," Journal of Marketing, 68 (October), 76-89.
Ryals, Lynette (2005), "Making Customer Relationship Management Work: The Measurement and Profitable Management of Customer Relationships," Journal of Marketing, 69 (October), 252-61.
----(2006), "Profitable Relationships with Key Customers: How Suppliers Manage Pricing and Customer Risk," Journal of Strategic Marketing, 14 (2), 101-13.
----(2008), "Determining the Indirect Value of a Customer," Journal of Marketing Management, 24 (7), 847-64.
Sharfman, Mark P. and James W. Dean (1991), "Conceptualizing and Measuring the Organizational Environment: A Multidimensional Approach," Journal of Management, 17 (4), 681-700.
96
Simsek, Zeki, John F. Veiga, and Michael H. Lubatkin (2007), "The Impact of Managerial Environmental Perceptions on Corporate Entrepreneurship: Towards Understanding Discretionary Slack's Pivotal Role," Journal of Management Studies, 44 (12), 1398-424.
Smart, Carolyne and Ilan Vertinsky (1984), "Strategy and the Environment: A Study of Corporate Responses to Crises," Strategic Management Journal, 5 (3), 199-213.
Smith, Malcolm and Shane Dikolli (1995), "Customer Profitability Analysis: An Activity-Based Costing Approach," Managerial Auditing Journal, 10 (7), 3-7.
Srivastava, Rajendra K., Tasadduq A. Shervani, and Liam Fahey (1998), "Market-Based Assets and Shareholder Value: A Framework for Analysis," Journal of Marketing, 62 (January), 2-18.
Storbacka, Kaj (1997), "Segmentation Based on Customer Profitability - Retrospective Analysis of Retail Bank Customer Bases," Journal of Marketing Management, 13 (5), 479-92.
Tan, J. J. and Robert J. Litschert (1994), "Environment-Strategy Relationship and its Performance Implications: An Empirical Study of the Chinese Electronics Industry," Strategic Management Journal, 15 (1), 1-20.
Thompson, James D. (1967), Organizations in Action: Social Science Bases of Administrative Theory. New York, NY: McGraw-Hill.
Tillema, Sandra (2005), "Towards an Integrated Contingency Framework for MAS Sophistication Case Studies on the Scope of Accounting Instruments in Dutch Power and Gas Companies," Management Accounting Research, 16 (1), 101-29.
Tung, Rosalie L. (1979), "Dimensions of Organizational Environments: An Exploratory Study of their Impact on Organization Structure," Academy of Management Journal, 22 (12), 672-93.
van Raaij, Erik M., Maarten J. A. Vernooij, and Sander van Triest (2003), "The Implementation of Customer Profitability Analysis: A Case Study," Industrial Marketing Management, 32 (7), 573-83.
Venkatesan, Rajkumar and V. Kumar (2004), "A Customer Lifetime Value Framework for Customer Selection and Resource Allocation Strategy," Journal of Marketing, 68 (October), 106-25.

97
Villanueva, Julian and Dominique M. Hanssens (2006), "Customer Equity: Measurement, Management and Research Opportunities," Foundations & Trends in Marketing, 1 (1), 1-95.
Yim, Frederick H., Rolph E. Anderson, and Srinivasan Swaminathan (2004), "Customer Relationship Management: Its Dimensions and Effect on Customer Outcomes," Journal of Personal Selling & Sales Management, 24 (4), 263-78.
98
Article #2
Are Customer Profitability Measurement Models always worth the effort? A cross-sectional perspective
Morten Holm1, V. Kumar2 & Thomas Plenborg1
1Copenhagen Business School, Department of Accounting and Auditing Solbjerg Plads 3, DK-2000 Frederiksberg, Denmark.
2Georgia State University, J. Mack Robinson College of Business Center for Excellence in Brand & Customer Management
35 Broad Street, Suite 400, Atlanta, GA 30303, USA
Abstract
Prior research on the performance effects of Customer Profitability Measurement
(CPM) models like Customer Profitability Analysis (CPA) and Customer Lifetime
Value (CLV) have generally focused on the implementation of either CPA or CLV
in a specific industry at a specific point in time. This study expands on prior
findings by investigating whether a sustainable performance effect of using CPM
models can generally be found across different marketing contexts and industries.
Based on survey data from a cross-section firms the study contributes to the
customer profitability measurement literature by demonstrating that although
using CPM models appears to be performance enhancing the link is not
straightforward. Hence, investments in CPM model implementations must be
aligned with the marketing context in which firms operate in. Furthermore,
managers must carefully consider how to continuously refine and develop the
models implemented in order to sustain the competitive edge originally obtained.
Key Words: Customer Profitability Analysis (CPA), Customer Lifetime Value (CLV), Customer Relationship Management (CRM), Marketing Strategy, Performance
99
1. Introduction
What is a customer worth and why is this worth knowing? This question is
receiving growing attention due to the ongoing shift towards a relationship
paradigm in marketing (Gronroos 1997). One important implication of this shift is
a fundamental change of focus in marketing management from “engaging in
transactions with whoever wants to buy our products” to “serving customer
relationships by highlighting products’ benefits in terms of meeting individual
customer needs” (Shah et al. 2006). Implementing a customer-centric management
approach requires the deployment of practices that facilitate the alignment of
marketing resource spending with the profits customers generate (Ramani and
Kumar 2008). Simultaneously, marketers are increasingly required to verify the
financial effects of marketing investments (Rust et al. 2004). Consequently, the
Marketing Science Institute (MSI) continuously emphasizes marketing
accountability as a key focus area for marketing research [see “MSI Research
Priorities” 2008-2010 (MSI 2008); 2010-12 (MSI 2010)]. If a positive link
between the deployment of customer profitability measurement practices and firm
performance can be demonstrated, marketers are in a better position to justify
investment decisions regarding scarce marketing resources.
The measurement and management of customer profitability is an intriguing
marketing discipline because it taps into both of the above trends in marketing
theory and practice as it represents a financial approach to customer relationship
management. Therefore, it is important to establish a more profound
understanding of customer profitability measurement models exploring both how
these models are used by managers across firms but equally importantly whether
the implementation and use of these models actually creates financial value to the
firms that adopt these practices. With this kind of empirical validation, managers
will be more confident that investing considerable resources in implementing
100
complex customer profitability measurement models will in fact be worth the
effort.
Several case studies have provided indicative evidence of a positive effect on
firm financial performance of deploying marketing strategies based on customer
profitability measurement (CPM) models. This goes for the future-oriented
Customer Lifetime Value (CLV) concept (Kumar et al. 2008; Kumar and Shah
2009; Ryals 2005; Venkatesan and Kumar 2004) as well as for the retrospective
Customer Profitability Analysis (CPA) concept (Kaplan and Cooper 1998, pp 183-
189; Nenonen and Storbacka 2008). One recent large-sample study in the high-
tech sector has backed these findings by demonstrating a positive association
between the use of marketing performance metrics and firm performance across
hith-tech firms (O'Sullivan and Abela 2007).
Although the longitudinal dimension in the above case studies strengthens the
ability to draw causal inferences from the data, the limited number of observations
makes the inference of statistical generalizations difficult. Hence, although prior
case-based research provides support for a causal relationship between CLV/CPA
use and firm performance these findings are only indicative. The large sample of
O’Sullivan and Abela’s (2007) study to some extent facilitates statistical
generalization albeit only to a target population of high-tech companies and only
at a more general marketing performance measurement level. A general causal
relationship between the deployments of CLV/CPA based customer management
strategies and firm financial performance therefore still remains to be
demonstrated. Another problem with prior case studies is that they investigate a
narrow time window during and immediately after CLV/CPA implementations.
Consequently, it is not clear whether the demonstrated improvements of financial
performance can be sustained over longer periods of time.
This paper addresses the issue whether using customer profitability
measurement models as the basis for resource allocation decisions generally leads
101
to a sustainable increase in firm financial performance across different marketing
contexts. More specifically we investigate three research questions:
1. Does CPM model use cause superior financial performance across
industries?
2. Can the positive performance effect (if any) of CPM use on firm
performance be sustained over time?
3. How does the marketing context (degree of product focus) influence the
relationship between CPM model use and firm financial performance?
Applying a survey instrument we gathered a cross-sectional data sample
consisting of responses from 218 Sales / Marketing directors in the largest Danish
and Swedish companies. This Scandinavian context was chosen as the
Scandinavian economies generally consist of very open and globally oriented
firms with a strong tradition of being at the forefront of managerial accounting
innovation and a more recent history of rapidly adopting and adapting the latest
management accounting innovations from abroad (Näsi and Rohde 2006). Hence,
we succeeded in gathering a sample of global, as well as more regional/local firms
where the share of CPM adopters was sufficiently high to be able to draw some
general conclusions about the performance effects of using CPM.
Based on an analysis of this sample we make three main contributions to
theory and practice. First, we find empirical evidence in support of the proposition
that firms that use CPM models for resource allocation purposes outperform peers
that do not. This finding provides an extension of prior case-based evidence
hereby adding to the growing body of literature on marketing accountability in
general and financial consequences of customer-based marketing metrics in
particular. Furthermore, we contribute to marketing practice by providing
102
marketing managers with a strong argument in favor of implementing CPM
models in their firms.
Second, we find a diminishing performance effect of CPM adoption over
time. This suggests that the benefits of using CPM for resource allocation
purposes are not sustainable. On a general note this finding is in line with recent
research within the market orientation literature demonstrating a diminishing
performance effect of a market orientation as competition also becomes more
market oriented and learn from early adopters (Kumar et al. 2011). How managers
can attain a sustainable competitive advantage from implementing new marketing
practices such as CPM models therefore seems to be an imperative research topic.
One element herein, is to investigate how firms can institutionalize the learnings
that new marketing practices provide across the entire organization during the
implementation phase and continuously refine and develop their marketing models
in order to sustain the benefits of using these practices.
Third, we find a negative moderating effect of product/brand investment on
the link between CPM use and firm performance. CPM is therefore not equally
efficient in all marketing contexts. This finding contributes to the ongoing
discussion about the feasibility of deploying product-/brand- vs. customer-focused
marketing metrics (e.g., Ambler et al. 2002; Leone et al. 2006; Shah et al. 2006).
Our findings suggest that it depends on the marketing context in which these
metrics are to be deployed. Marketing managers should therefore base decisions
regarding the amount of resources to invest in new CPM practices on a thorough
consideration of the marketing context in which they operate.
The remainder of the paper is organized as follows: First, we briefly review
the part of the CLV and CPA literatures where a performance link has been
explored and demonstrated. Next, we present our model and develop our
hypotheses. Subsequently, we discuss our method and data whereupon we present
103
our results. Finally, we provide a discussion and identify the managerial
implications and the limitations of our study.
2. Customer profitability measurement literature and link to performance
The customer profitability measurement literature has followed two distinct
paths to quantifying customers’ financial value: The retrospective Customer
Profitability Analysis (CPA) approach with its origin in the accrual conventions of
the accounting literature and the prospective Customer Lifetime Value (CLV)
approach, based on the net present value principle of the finance literature (Pfeifer,
Haskins, and Conroy 2005). Despite their shared purpose of estimating the
financial value of customer relationships to improve customer management
decision making their conceptual differences in terms of time and cost
perspectives justifies the distinction between the two techniques.
2.1 Customer Profitability Analysis
Customer Profitability Analysis (CPA) is the structured analysis of Customer
Profitability (CP) for the purpose of differentiating pricing and customer services
according to customers’ contribution to firm profits. CP can be defined as: The
difference between the revenues earned from and the costs associated with the
customer relationship during a specified time period (Pfeifer, Haskins, and Conroy
2005). Hence, CPA entails tracing all the different costs caused not only by
product transactions but also by the activities performed across an organization’s
customer-facing functions to customers (Ward 1992).
Although the principles of CPA are not new (Sevin (1965) presented the idea
of assigning costs and revenues to customers over forty years ago), the idea of
measuring and managing customer profitability has had a revival with the advent
104
of Activity-Based Costing (ABC). Following the ABC technique, resource costs
(e.g., sales force salaries, support staff salaries etc.) are consolidated into activity
cost pools (e.g., customer calls, order processing etc.) and driven to customers via
activity cost drivers (Cooper and Kaplan 1991). This two-step approach reduces
customer-cost distortions in the process of driving resource costs that are not
directly traceable from resources to customers by driving costs to customers based
on cause-and-effect relationships rather than more arbitrary allocation keys (Smith
and Dikolli 1995).
The ABC-based CPA approach has been demonstrated through a number of
case studies (e.g., Guerreiro et al. 2008; Helgesen 2007; McManus 2007; Niraj,
Gupta, and Narasimhan 2001; Noone and Griffin 1999). However, investigations
of the performance effects of deploying CPA for resource allocation purposes are
scarce. Kaplan and Cooper (1998, pp 183-189) report how a B2B manufacturer
managed to grow sales without investing in additional administrative, sales and
support resources, thus increasing net profit margin considerably, by
implementing specific pricing and order-handling customer differentiation
strategies based on CPA. More recently Nenonen and Storbacka (2008) investigate
three case studies in different B2B manufacturing operations and find indicative
evidence of improved performance immediately after CPA implementations.
2.2 Customer Lifetime Value
Customer Lifetime Value (CLV) can be defined as: The present value of all
future cash flows obtained from a customer over his or her life of relationship with
a firm (Gupta et al. 2006). Whereas the first generalized CLV models focused on
quantifying the lifetime value of an average customer across a broad customer
cohort (e.g., Berger and Nasr 1998; Dwyer 1997; Gupta and Lehmann 2003), later
contributions have advanced the CLV concept by developing CLV models at
105
micro-segment level (e.g., Haenlein, Kaplan, and Beeser 2007; Libai, Narayandas,
and Humby 2002) and ultimately at individual customer level (e.g., Kumar, Shah,
and Venkatesan 2006; Kumar et al. 2008; Ryals 2005; Venkatesan and Kumar
2004; Venkatesan, Kumar, and Bohling 2007).
The CLV approach is conceptually aligned with the theoretical definition of
intrinsic firm value stated as: The present value of all future cash flows generated
by the firm’s operations over the firm’s lifetime (e.g., Copeland, Koller, and
Murrin 2000; Rappaport 1998). Conceptually, the sum of CLV across all extant
and future customers (named Customer Equity) thus equals the value of the firm
and support for this relationship has been presented in case-based studies (Gupta,
Lehmann, and Stuart 2004; Rust, Lemon, and Zeithaml 2004).
Given this conceptual alignment between CLV and firm value it can be
argued that firms that pursue customer management strategies that maximize CLV
at individual customer level will consequently enhance firm value (Venkatesan
and Kumar 2004). Ryals (2005) provides qualitative evidence of a link between
CLV-based Customer Relationship Management strategies and the financial
performance of the business unit in which these strategies are implemented in two
financial services case studies. Kumar et al. (2008) demonstrate how a high tech
firm managed to increase firm revenues by $20 million via the reallocation of
marketing resources on the basis of CLV-based recommendations. Moreover, a
recent study demonstrates how a retailer and a high tech firm experienced
abnormally positive stock returns that outperformed peers as well as the general
stock market following an implementation of CLV-based resource allocation
strategies (Kumar and Shah 2009).
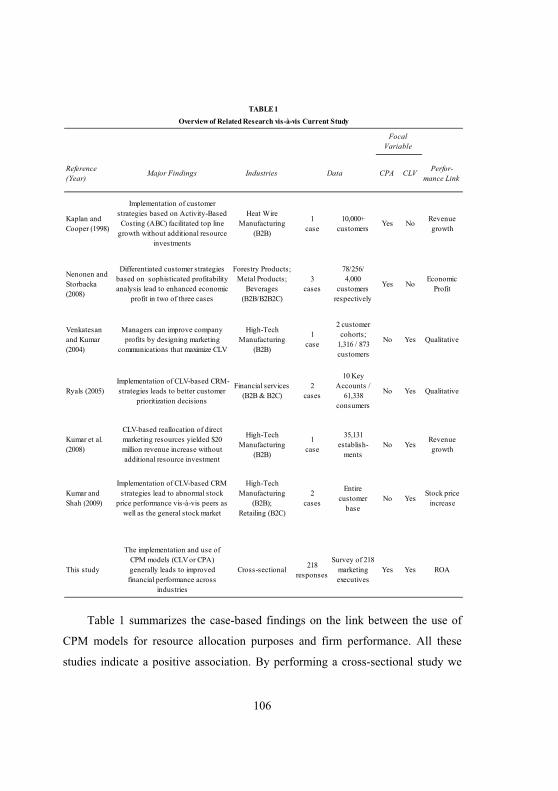
106
Table 1 summarizes the case-based findings on the link between the use of
CPM models for resource allocation purposes and firm performance. All these
studies indicate a positive association. By performing a cross-sectional study we
Reference (Year)
Major Findings Industries CPA CLV Perfor-mance Link
Kaplan and Cooper (1998)
Implementation of customer strategies based on Activity-Based Costing (ABC) facilitated top line
growth without additional resource investments
Heat Wire Manufacturing
(B2B)
1 case
10,000+ customers
Yes No Revenue growth
Nenonen and Storbacka (2008)
Differentiated customer strategies based on sophisticated profitability analysis lead to enhanced economic
profit in two of three cases
Forestry Products; Metal Products;
Beverages (B2B/B2B2C)
3cases
78/256/4,000
customers respectively
Yes NoEconomic
Profit
Venkatesan and Kumar (2004)
Managers can improve company profits by designing marketing
communications that maximize CLV
High-Tech Manufacturing
(B2B)
1case
2 customer cohorts;
1,316 / 873 customers
No Yes Qualitative
Ryals (2005)Implementation of CLV-based CRM-strategies leads to better customer
prioritization decisions
Financial services (B2B & B2C)
2 cases
10 Key Accounts /
61,338 consumers
No Yes Qualitative
Kumar et al. (2008)
CLV-based reallocation of direct marketing resources yielded $20 million revenue increase without additional resource investment
High-Tech Manufacturing
(B2B)
1case
35,131 establish-
mentsNo Yes
Revenue growth
Kumar and Shah (2009)
Implementation of CLV-based CRM strategies lead to abnormal stock
price performance vis-à-vis peers as well as the general stock market
High-Tech Manufacturing
(B2B); Retailing (B2C)
2cases
Entire customer
baseNo Yes
Stock price increase
This study
The implementation and use of CPM models (CLV or CPA) generally leads to improved financial performance across
industries
Cross-sectional 218responses
Survey of 218 marketing executives
Yes Yes ROA
TABLE 1
Overview of Related Research vis-à-vis Current Study
Focal Variable
Data
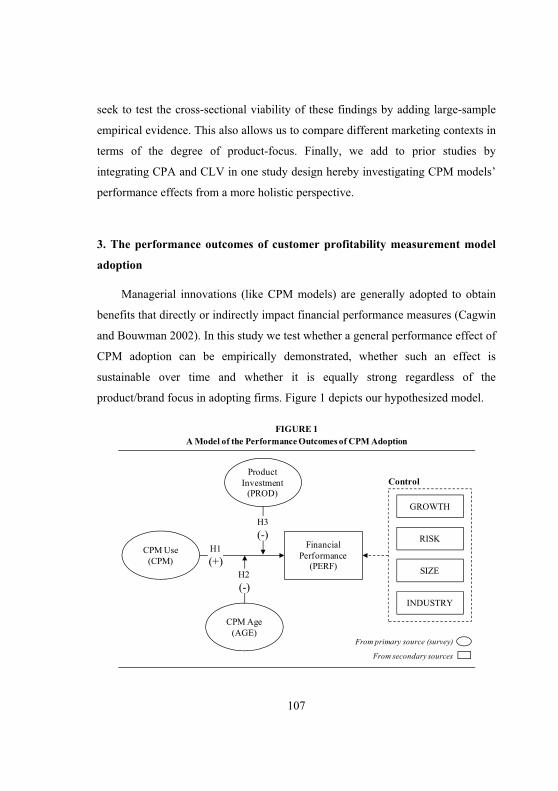
107
seek to test the cross-sectional viability of these findings by adding large-sample
empirical evidence. This also allows us to compare different marketing contexts in
terms of the degree of product-focus. Finally, we add to prior studies by
integrating CPA and CLV in one study design hereby investigating CPM models’
performance effects from a more holistic perspective.
3. The performance outcomes of customer profitability measurement model
adoption
Managerial innovations (like CPM models) are generally adopted to obtain
benefits that directly or indirectly impact financial performance measures (Cagwin
and Bouwman 2002). In this study we test whether a general performance effect of
CPM adoption can be empirically demonstrated, whether such an effect is
sustainable over time and whether it is equally strong regardless of the
product/brand focus in adopting firms. Figure 1 depicts our hypothesized model.
FIGURE 1A Model of the Performance Outcomes of CPM Adoption
FinancialPerformance
(PERF)
CPM Use (CPM)
CPM Age (AGE)
Product Investment
(PROD)Control
RISK
SIZE
INDUSTRY
H1(+)
GROWTH
From primary source (survey)
From secondary sources
H3(-)
H2(-)
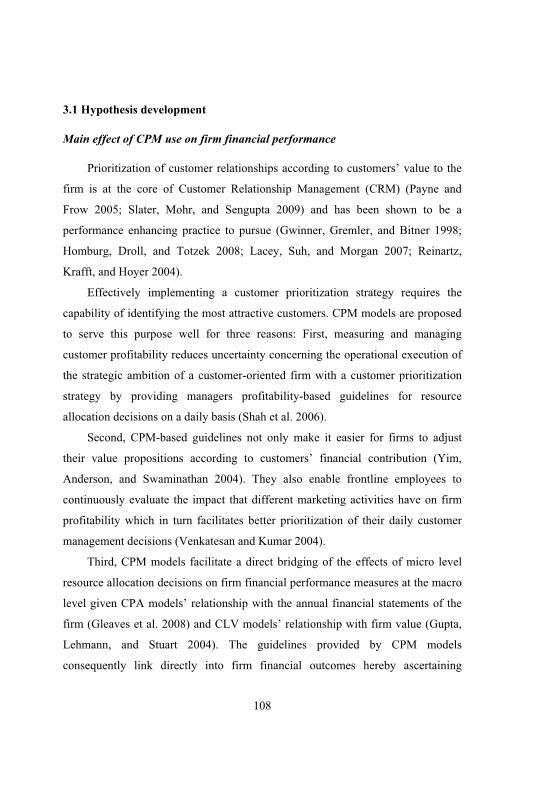
108
3.1 Hypothesis development
Main effect of CPM use on firm financial performance
Prioritization of customer relationships according to customers’ value to the
firm is at the core of Customer Relationship Management (CRM) (Payne and
Frow 2005; Slater, Mohr, and Sengupta 2009) and has been shown to be a
performance enhancing practice to pursue (Gwinner, Gremler, and Bitner 1998;
Homburg, Droll, and Totzek 2008; Lacey, Suh, and Morgan 2007; Reinartz,
Krafft, and Hoyer 2004).
Effectively implementing a customer prioritization strategy requires the
capability of identifying the most attractive customers. CPM models are proposed
to serve this purpose well for three reasons: First, measuring and managing
customer profitability reduces uncertainty concerning the operational execution of
the strategic ambition of a customer-oriented firm with a customer prioritization
strategy by providing managers profitability-based guidelines for resource
allocation decisions on a daily basis (Shah et al. 2006).
Second, CPM-based guidelines not only make it easier for firms to adjust
their value propositions according to customers’ financial contribution (Yim,
Anderson, and Swaminathan 2004). They also enable frontline employees to
continuously evaluate the impact that different marketing activities have on firm
profitability which in turn facilitates better prioritization of their daily customer
management decisions (Venkatesan and Kumar 2004).
Third, CPM models facilitate a direct bridging of the effects of micro level
resource allocation decisions on firm financial performance measures at the macro
level given CPA models’ relationship with the annual financial statements of the
firm (Gleaves et al. 2008) and CLV models’ relationship with firm value (Gupta,
Lehmann, and Stuart 2004). The guidelines provided by CPM models
consequently link directly into firm financial outcomes hereby ascertaining
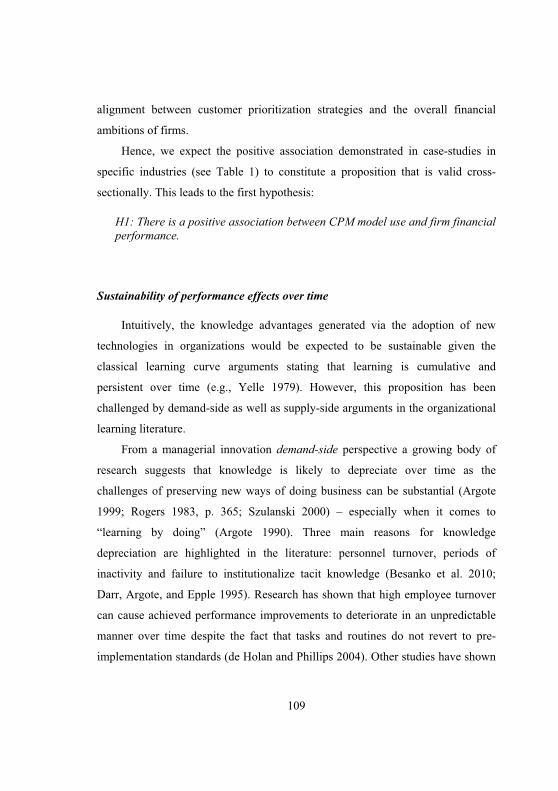
109
alignment between customer prioritization strategies and the overall financial
ambitions of firms.
Hence, we expect the positive association demonstrated in case-studies in
specific industries (see Table 1) to constitute a proposition that is valid cross-
sectionally. This leads to the first hypothesis:
H1: There is a positive association between CPM model use and firm financial performance.
Sustainability of performance effects over time
Intuitively, the knowledge advantages generated via the adoption of new
technologies in organizations would be expected to be sustainable given the
classical learning curve arguments stating that learning is cumulative and
persistent over time (e.g., Yelle 1979). However, this proposition has been
challenged by demand-side as well as supply-side arguments in the organizational
learning literature.
From a managerial innovation demand-side perspective a growing body of
research suggests that knowledge is likely to depreciate over time as the
challenges of preserving new ways of doing business can be substantial (Argote
1999; Rogers 1983, p. 365; Szulanski 2000) – especially when it comes to
“learning by doing” (Argote 1990). Three main reasons for knowledge
depreciation are highlighted in the literature: personnel turnover, periods of
inactivity and failure to institutionalize tacit knowledge (Besanko et al. 2010;
Darr, Argote, and Epple 1995). Research has shown that high employee turnover
can cause achieved performance improvements to deteriorate in an unpredictable
manner over time despite the fact that tasks and routines do not revert to pre-
implementation standards (de Holan and Phillips 2004). Other studies have shown
110
that when tasks are resumed after interruption, performance is typically inferior to
when it was interrupted but superior to when it began initially (e.g., Kolers 1976).
And Day (1994, p. 44) suggests that “Organizations without practical mechanisms
to remember what has worked and why will have to repeat their failures and
rediscover their success formulas over and over again”. So even if knowledge is
available and utilized by organizational members, knowledge created by new
innovations may still deteriorate leading to a declining performance effect over
time.
From a managerial innovation supply-side perspective the imitation and
learning from other organizations often plays an important part in the knowledge
acquisition process of firms (Ingram and Baum 1997). However, the transfer of
technological know-how across organizations often entails adaptation (or
reinvention (see Rogers 1995)) of these innovations either because it is required as
a consequence of a general immobility of technological knowledge (Attewell
1992) or because it is beneficial to supply-side actors’ (e.g., software vendors,
consultants etc.) special agendas (Ax and Bjørnenak 2005). Attewell (1992) goes
on to argue that the emergence of mediating institutions (e.g., software vendors,
consultants etc.) can reduce the learning burden on firms associated with the
implementation and reinvention of new technologies. Consequently, mediating
institutions acquire economies of scale in learning through the iterative process of
implementing and adapting new technologies across multiple firms – an effect that
is particularly important for rare events such as the implementation of new
management systems. Firms implementing managerial innovations will therefore
only benefit from these economies of scale in learning through the interaction with
mediating institutions (Attewell 1992).
When it comes to managerial innovations such as CPM models for resource
allocation decision purposes we argue that the above effects are likely to influence
the sustainability of performance effects of implementing CPM for early vs. late
111
adopters. Especially because the primary motive for adoption in the early stages of
managerial innovations’ lifecycles is efficient choice whereas imitation motives
(fashion and fad) dominate in later phases (Malmi 1999). This has two main
implications: First, early adopters will mainly be performing “learning by doing”
implementations driven by an overall ambition of improving customer
management decision making but merely guided by preliminary normative
academic research and/or heuristic know-how. Knowledge depreciation is
therefore likely to occur over time if key employees leave the firm without CPM
models having been institutionalized across these organizations and/or if CPM use
for some reason is temporarily suspended. Second, later adopters can benefit from
learning economies of scale achieved by the group of consultants, software
vendors and other CPM experts that emerge as the technology diffuses. This way
later adopters can avoid the errors encountered by peers who adopted earlier
versions of CPM and benefit from the progress made in CPM model
developments.
Based on this, our second hypothesis can be stated as follows:
H2: The positive association between CPM model use and firm financial performance decreases over time.
Moderating effect of marketing context
According to the marketing concept firms can achieve a sustainable
competitive advantage by identifying and satisfying customer needs better than
competitors (Day 1994). Consequently, market orientation is about identifying and
serving expressed customer needs (reactive market orientation) as well as latent
customer needs (proactive market orientation) (Narver, Slater, and MacLachlan
2004).
112
Focusing on customers’ expressed needs corresponds well with the logic of
CPM models because these models’ recommendations take their point of
departure in estimates based on past customer behavior. Customers that fit firms’
current value proposition well will buy more of current offerings from different
categories at attractive prices and thus be more profitable. Hence, customers’
expressed needs are translated into buying behavior that is observed and converted
to customer profitability measures whereupon resources are allocated accordingly.
This may also be an explanation why CPM models have mainly been
demonstrated to work well in service industries and other direct marketing
contexts (Gupta and Lehmann 2006).
When firms predominantly face a continuous inclination to discover and
serve latent customer needs, investments in brands and product development
(R&D) are required (product investment) for firms to remain competitive. CPM
models have limitations when it comes to incorporating product innovation and
brand building activities in estimates of customer profitability because these
activities per definition concern aspects of customers that are not reflected in their
buying behavior and will therefore not be revealed by their transaction histories.
Hence, CPM approaches will ignore brands’ potential to impact profits beyond the
current marketing environment in several ways. First, strong brands’ ability to
achieve support from channel and supply chain partners is ignored and this whole
interface with channel partners and the management of marketing activities vis-à-
vis these potential partners is generally not in scope in CPM models (Leone et al.
2006). Second, the value brands can create outside the current competitive arena
through extensions is also absent in CPM-based marketing management
approaches (Ambler et al. 2002).
In addition to these general shortcomings vis-à-vis brand investments CPA
models in particular face an additional limitation regarding the marketing context.
Brand advertising and R&D expenses are incurred to achieve future economic
113
benefits. Therefore, their incorporation in a single-periodic performance measure
like CPA will bias estimates of customer profitability and are therefore
recommended to be left out of CPA estimates (Cooper and Kaplan 1991). Firms
investing heavily in product development and/or brand advertising will therefore
not capture all the expenses incurred as a result of activities performed to
influence customer behavior across periods in their CPA models.
So in marketing contexts where identifying and serving latent customer needs
are important parts of the value creation process the required investments in
products/brands will largely be ignored by CPM models hereby making this
marketing management approach less efficient. Based on this we state our third
hypothesis as follows:
H3: The greater the investments firms make in products/brands the less positive is the association between CPM model use and firm financial performance.
3.2 Control variables
In order to mitigate omitted variable bias and to isolate the effects of CPM
model use and the moderators on firm financial performance it is necessary to
control for any factors that may correlate with both the dependent and the
independent focal variables. Growth, risk (variability in returns) and size have all
been empirically demonstrated as important firm-level determinants of financial
performance (Capon, Farley, and Hoenig 1990) and all three variables are
therefore included as control variables.
In addition to the three firm-level factors we also control for industry in line
with prior research studying the relationship between customer management
capabilities and firm financial performance (e.g., Reinartz, Krafft, and Hoyer
2004).
114
4. Research method and data collection
Given the explanatory nature of this study, testing general causal
relationships, a survey instrument has been developed for data collection purposes.
This survey instrument was deployed and cross-sectional data was collected in
Denmark and Sweden over the Fall and Winter 2010 and the Spring 20111F
2.
Development of the survey instrument and the data collection process were guided
by frameworks based on the judicial standards for survey research (Morgan 1990;
Van der Stede, Young, and Chen 2005) as well as instructions by Dillman (1999).
The level of analysis is the organization (business unit) with target
informants being Sales / Marketing decision makers (directors or managers) in
charge of marketing prioritization efforts. Even though individual informants may
not possess a comprehensive, unbiased view of the entire organization and its
environment (Reinartz, Krafft, and Hoyer 2004) we accept this risk mainly
because the information we are seeking in this survey is predominately of an
objective rather than a subjective nature. Furthermore, securing a satisfactory
response rate in this kind of study is difficult. Hence, collecting data from multiple
informants within each participating business unit would severely reduce the size
of the sample and the kind of broad cross-sectional study that we intended to
perform would not be feasible.
The target population of the study is firms’ commercial function, i.e. the part
of the organization where strategic and operational customer management
decisions are performed regularly. This is the reason why the survey population
constitutes the overall responsible commercial directors from the largest firms in
Denmark and Sweden. Large firms are expected to be more inclined to adopt
sophisticated decision tools (e.g., Bjørnenak 1997; Malmi 1999). We therefore
decided to manually collect contact information for commercial directors from the
2 No significant difference between Denmark and Sweden was expected and the inclusion of a country dummy in or regression model confirmed this expectation as the results were not affected by the incorporation of this dummy.
115
1,000 largest firms in Denmark and the 1,000 largest firms in Sweden respectively
(based on revenues). 455 firms were excluded from the population mainly because
contact information was not attainable or due to firm policy of non disclosure of
employee e-mail addresses. This left us with 1,545 informants evenly distributed
between Danish and Swedish firms to whom we sent a cover letter and a hyperlink
to the online questionnaire per e-mail.
To minimize the risk of non-sampling error in terms of response error (i.e.,
to ensure face validity and construct validity) we tested the questionnaire prior to
launch across three test-groups (Dillman 1999): Six academic colleagues from
marketing and accounting departments, nine business managers mainly from
marketing/sales, and five management consultants who with insights on a broad
range of industries helped uncover context-specific misunderstandings. To
minimize the risk of non-sampling error in terms of non-response error we
executed three rounds of follow-up e-mailings to all informants during the month
following the distribution of the questionnaire. Subsequently, we selected a
random subsample of approximately 350 non-responders who were re-contacted
personally by phone before we re-sent them the questionnaire. A follow-up
process was also carried out by phone. All in all this yielded a gross sample of 255
observations and an effective sample of 218 applicable responses (with no missing
observations) corresponding to an effective response rate of 14%. This is an
acceptable response rate for cross-sectional samples (Churchill 1991) and is within
the range that recent similar survey studies in marketing have achieved (e.g.,
Homburg, Droll, and Totzek 2008; Palmatier, Gopalakrishna, and Houston 2006;
Reinartz, Krafft, and Hoyer 2004).
A sample of this size is sufficiently large to draw statistical inferences and to
capture a broad cross-section of firms across industries. Sample sizes of 2-300
observations are also usually sufficient to achieve satisfactory face validity in
court (Morgan 1990).
116
However, it is still important to analyze the sample for non-response bias. In
order to assess any non-response error in the sample we therefore performed two
analyses. First, we compared the sample characteristics in terms of industry and
size (see Table 2). Although t-tests revealed that two industries (industrial
products and transportation) are overrepresented in the sample the sample still
consists of a broad cross-section of industries. Furthermore, the sample’s size
distribution matched well with that of the total survey population constituting all
top 2,000 firms with no significant differences between firms represented in the
sample and the rest of the total survey population. Second, we used Armstrong and
Overton’s (1977) extrapolation method comparing the mean values across focal
variables of early and late respondents. The results are summarized in Table 3.
Our t-tests revealed a significant difference between mean values for early and late
informants’ responses regarding the number of years CPM has been used as late
informants had used CPM in a shorter period of time. This indicates that firms that
have used CPM for longer periods of time may be overrepresented in our sample.
However, as we did not detect any systematic differences between early and late
responses across the other variables, and since the sample composition all in all
seems to correspond well with that of the total survey population we conclude that
non-response bias is unlikely to be a major issue in our analyses.
Objective firm performance data for our dependent variable was collected
from secondary sources partly to avoid measurement error derived from subjective
biases hereby also mitigating common method variance (Birnberg, Shields, and
Young 1990); and partly to establish a fit with our business unit level of analysis
(Van der Stede, Young, and Chen 2005). Data was obtained from company
financial reports via the Greens (Denmark), NNE (Denmark) and Retriever
(Sweden) accounting databases.
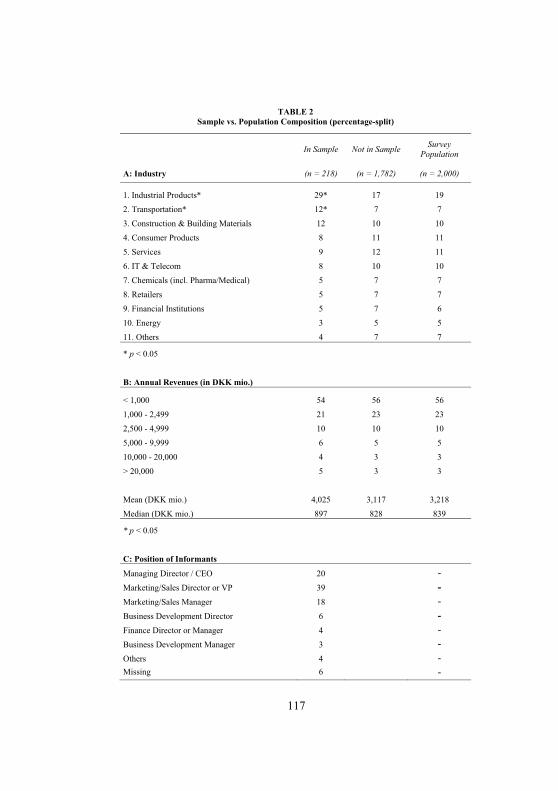
117
TABLE 2 Sample vs. Population Composition (percentage-split)
In Sample Not in Sample Survey
Population
A: Industry (n = 218) (n = 1,782) (n = 2,000)
1. Industrial Products* 29* 17 19
2. Transportation* 12* 7 7
3. Construction & Building Materials 12 10 10
4. Consumer Products 8 11 11
5. Services 9 12 11
6. IT & Telecom 8 10 10
7. Chemicals (incl. Pharma/Medical) 5 7 7
8. Retailers 5 7 7
9. Financial Institutions 5 7 6
10. Energy 3 5 5
11. Others 4 7 7
* p < 0.05 B: Annual Revenues (in DKK mio.)
< 1,000 54 56 56
1,000 - 2,499 21 23 23
2,500 - 4,999 10 10 10
5,000 - 9,999 6 5 5
10,000 - 20,000 4 3 3
> 20,000 5 3 3
Mean (DKK mio.) 4,025 3,117 3,218
Median (DKK mio.) 897 828 839
* p < 0.05 C: Position of Informants Managing Director / CEO 20 - Marketing/Sales Director or VP 39 -Marketing/Sales Manager 18 - Business Development Director 6 -Finance Director or Manager 4 - Business Development Manager 3 - Others 4 - Missing 6 -
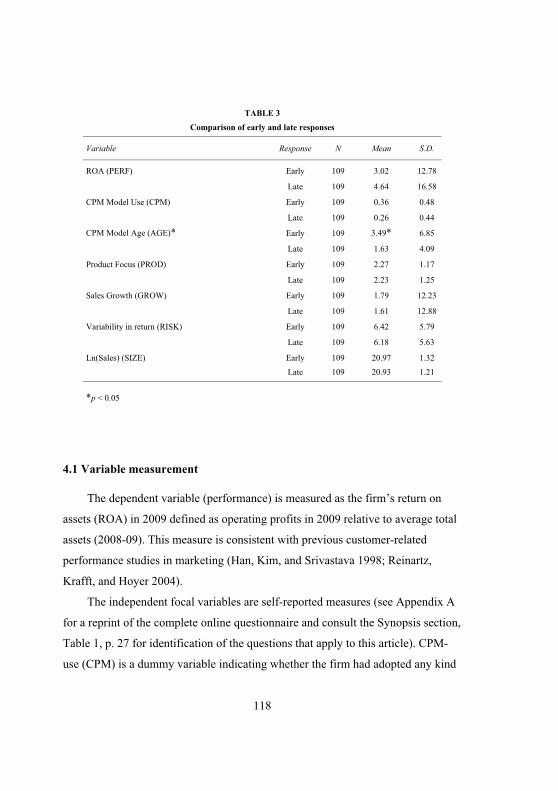
118
TABLE 3
Comparison of early and late responses
Variable Response N Mean S.D.
ROA (PERF) Early 109 3.02 12.78
Late 109 4.64 16.58
CPM Model Use (CPM) Early 109 0.36 0.48
Late 109 0.26 0.44
CPM Model Age (AGE)* Early 109 3.49* 6.85
Late 109 1.63 4.09
Product Focus (PROD) Early 109 2.27 1.17
Late 109 2.23 1.25
Sales Growth (GROW) Early 109 1.79 12.23
Late 109 1.61 12.88
Variability in return (RISK) Early 109 6.42 5.79
Late 109 6.18 5.63
Ln(Sales) (SIZE) Early 109 20.97 1.32
Late 109 20.93 1.21
*p < 0.05
4.1 Variable measurement
The dependent variable (performance) is measured as the firm’s return on
assets (ROA) in 2009 defined as operating profits in 2009 relative to average total
assets (2008-09). This measure is consistent with previous customer-related
performance studies in marketing (Han, Kim, and Srivastava 1998; Reinartz,
Krafft, and Hoyer 2004).
The independent focal variables are self-reported measures (see Appendix A
for a reprint of the complete online questionnaire and consult the Synopsis section,
Table 1, p. 27 for identification of the questions that apply to this article). CPM-
use (CPM) is a dummy variable indicating whether the firm had adopted any kind
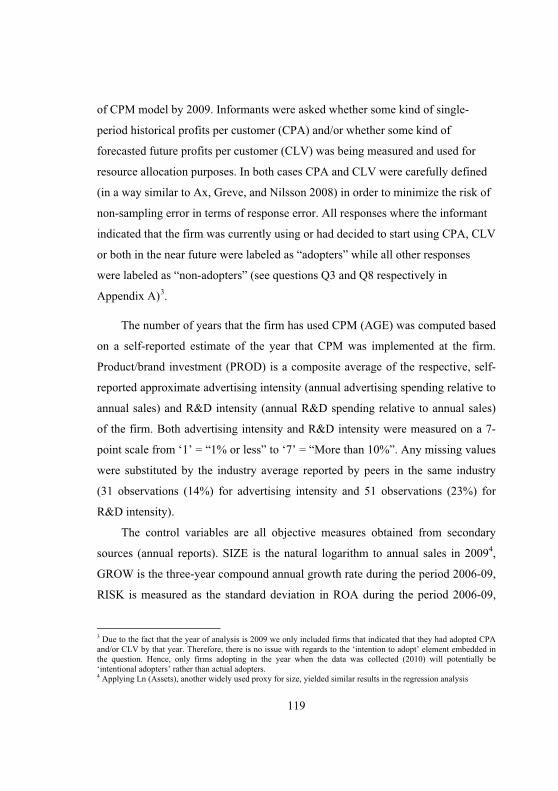
119
of CPM model by 2009. Informants were asked whether some kind of single-
period historical profits per customer (CPA) and/or whether some kind of
forecasted future profits per customer (CLV) was being measured and used for
resource allocation purposes. In both cases CPA and CLV were carefully defined
(in a way similar to Ax, Greve, and Nilsson 2008) in order to minimize the risk of
non-sampling error in terms of response error. All responses where the informant
indicated that the firm was currently using or had decided to start using CPA, CLV
or both in the near future were labeled as “adopters” while all other responses
were labeled as “non-adopters” (see questions Q3 and Q8 respectively in
Appendix A) 2F
3.
The number of years that the firm has used CPM (AGE) was computed based
on a self-reported estimate of the year that CPM was implemented at the firm.
Product/brand investment (PROD) is a composite average of the respective, self-
reported approximate advertising intensity (annual advertising spending relative to
annual sales) and R&D intensity (annual R&D spending relative to annual sales)
of the firm. Both advertising intensity and R&D intensity were measured on a 7-
point scale from ‘1’ = “1% or less” to ‘7’ = “More than 10%”. Any missing values
were substituted by the industry average reported by peers in the same industry
(31 observations (14%) for advertising intensity and 51 observations (23%) for
R&D intensity).
The control variables are all objective measures obtained from secondary
sources (annual reports). SIZE is the natural logarithm to annual sales in 20093F
4,
GROW is the three-year compound annual growth rate during the period 2006-09,
RISK is measured as the standard deviation in ROA during the period 2006-09,
3 Due to the fact that the year of analysis is 2009 we only included firms that indicated that they had adopted CPA and/or CLV by that year. Therefore, there is no issue with regards to the ‘intention to adopt’ element embedded in the question. Hence, only firms adopting in the year when the data was collected (2010) will potentially be ‘intentional adopters’ rather than actual adopters. 4 Applying Ln (Assets), another widely used proxy for size, yielded similar results in the regression analysis
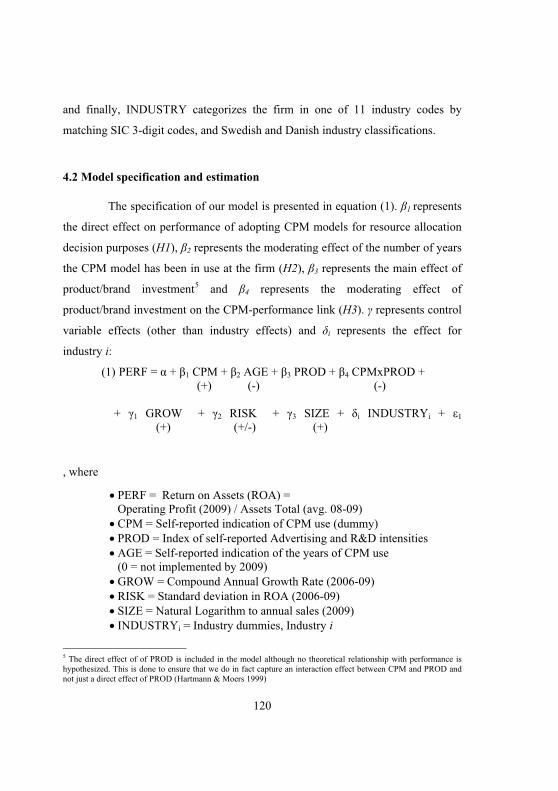
120
and finally, INDUSTRY categorizes the firm in one of 11 industry codes by
matching SIC 3-digit codes, and Swedish and Danish industry classifications.
4.2 Model specification and estimation
The specification of our model is presented in equation (1). �1 represents
the direct effect on performance of adopting CPM models for resource allocation
decision purposes (H1), �2 represents the moderating effect of the number of years
the CPM model has been in use at the firm (H2), �3 represents the main effect of
product/brand investment4F
5 and �4 represents the moderating effect of
product/brand investment on the CPM-performance link (H3). � represents control
variable effects (other than industry effects) and �i represents the effect for
industry i:
(1) PERF = � + �1 CPM + �2 AGE + �3 PROD + �4 CPMxPROD + (+) (-) (-)
+ �1 GROW + �2 RISK + �3 SIZE + �i INDUSTRYi + �1 (+) (+/-) (+)
, where
� PERF = Return on Assets (ROA) = Operating Profit (2009) / Assets Total (avg. 08-09)
� CPM = Self-reported indication of CPM use (dummy) � PROD = Index of self-reported Advertising and R&D intensities � AGE = Self-reported indication of the years of CPM use
(0 = not implemented by 2009) � GROW = Compound Annual Growth Rate (2006-09) � RISK = Standard deviation in ROA (2006-09) � SIZE = Natural Logarithm to annual sales (2009) � INDUSTRYi = Industry dummies, Industry i
5 The direct effect of of PROD is included in the model although no theoretical relationship with performance is hypothesized. This is done to ensure that we do in fact capture an interaction effect between CPM and PROD and not just a direct effect of PROD (Hartmann & Moers 1999)
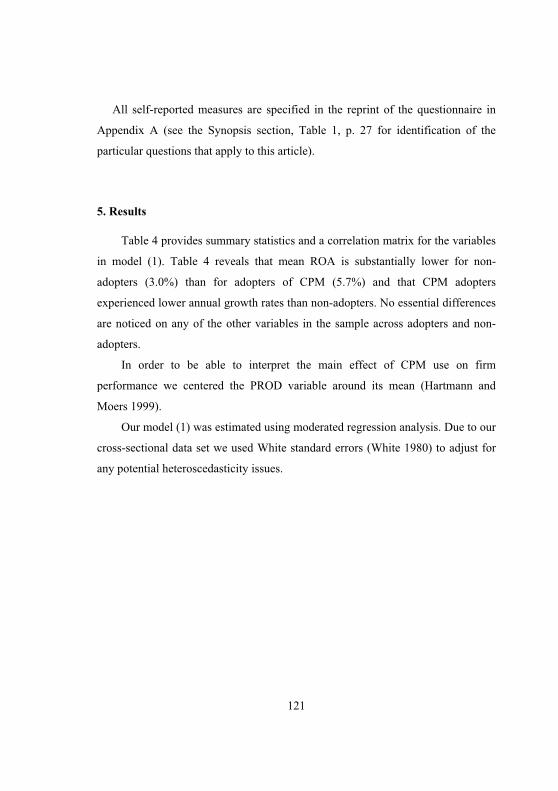
121
All self-reported measures are specified in the reprint of the questionnaire in
Appendix A (see the Synopsis section, Table 1, p. 27 for identification of the
particular questions that apply to this article).
5. Results
Table 4 provides summary statistics and a correlation matrix for the variables
in model (1). Table 4 reveals that mean ROA is substantially lower for non-
adopters (3.0%) than for adopters of CPM (5.7%) and that CPM adopters
experienced lower annual growth rates than non-adopters. No essential differences
are noticed on any of the other variables in the sample across adopters and non-
adopters.
In order to be able to interpret the main effect of CPM use on firm
performance we centered the PROD variable around its mean (Hartmann and
Moers 1999).
Our model (1) was estimated using moderated regression analysis. Due to our
cross-sectional data set we used White standard errors (White 1980) to adjust for
any potential heteroscedasticity issues.
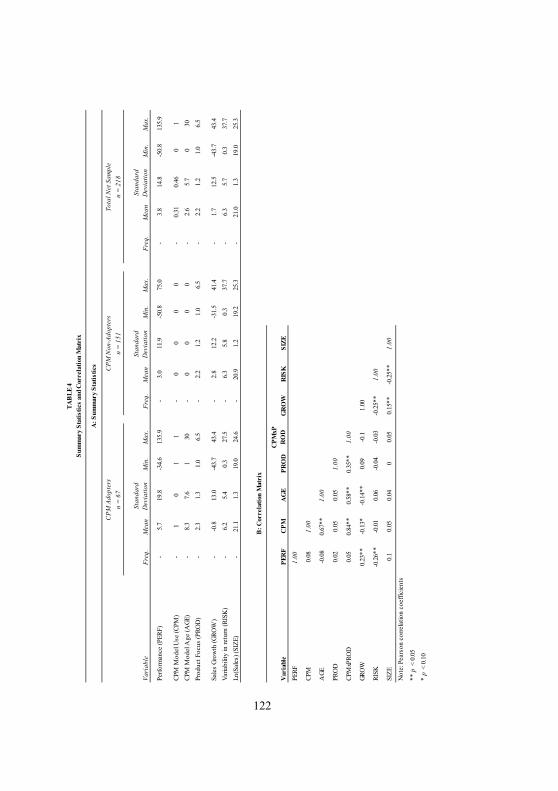
122
Vari
able
Freq
.M
ean
Stan
dard
D
evia
tion
Min
.M
ax.
Freq
.M
ean
Stan
dard
D
evia
tion
Min
.M
ax.
Freq
.M
ean
Stan
dard
D
evia
tion
Min
.M
ax.
Perfo
rman
ce (P
ERF)
-5.
719
.8-3
4.6
135.
9-
3.0
11.9
-50.
875
.0-
3.8
14.8
-50.
813
5.9
CPM
Mod
el U
se (C
PM)
-1
01
1-
00
00
-0.
310.
460
1CP
M M
odel
Age
(AGE
)-
8.3
7.6
130
-0
00
0-
2.6
5.7
030
Prod
uct F
ocus
(PRO
D)
-2.
31.
31.
06.
5-
2.2
1.2
1.0
6.5
-2.
21.
21.
06.
5
Sale
s Gr
owth
(GRO
W)
--0
.813
.0-4
3.7
43.4
-2.
812
.2-3
1.5
41.4
-1.
712
.5-4
3.7
43.4
Varia
bilit
y in
retu
rn (R
ISK
)-
6.2
5.4
0.3
27.5
-6.
35.
80.
337
.7-
6.3
5.7
0.3
37.7
Ln(S
ales
) (SI
ZE)
-21
.11.
319
.024
.6-
20.9
1.2
19.2
25.3
-21
.01.
319
.025
.3
Var
iabl
eP
ERF
CP
MA
GE
PR
OD
CP
MxP
RO
DR
ISK
SIZ
E
PERF
1.00
CPM
0.08
1.00
AGE
-0.0
80.
67**
1.00
PRO
D0.
020.
050.
051.
00
CPM
xPRO
D0.
050.
84**
0.58
**0.
35**
1.00
GRO
W0.
23**
-0.1
3*-0
.14*
*0.
09-0
.1
RISK
-0.2
6**
-0.0
10.
06-0
.04
-0.0
31.
00
SIZE
0.1
0.05
0.04
00.
05-0
.25*
*1.
00
Not
e: P
ears
on c
orre
latio
n co
effic
ient
s
** p
< 0
.05
* p
< 0
.10
GR
OW
1.00
-0.2
5**
0.15
**
TA
BL
E 4
Sum
mar
y S
tati
stic
s an
d C
orre
lati
on M
atri
x
n =
218
A: S
umm
ary
Sta
tist
ics
n =
151
CPM
Ado
pter
sC
PM N
on-A
dopt
ers
Tota
l Net
Sam
ple
n =
67
B: C
orre
lati
on M
atri
x
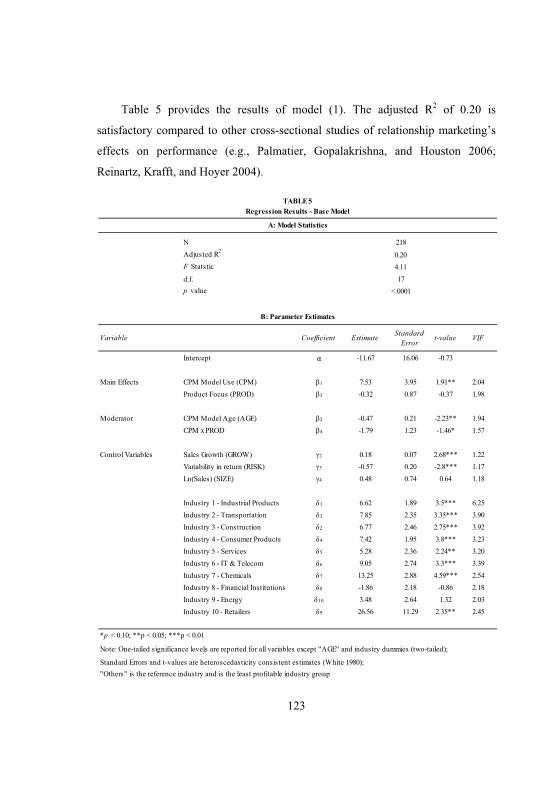
123
Table 5 provides the results of model (1). The adjusted R2 of 0.20 is
satisfactory compared to other cross-sectional studies of relationship marketing’s
effects on performance (e.g., Palmatier, Gopalakrishna, and Houston 2006;
Reinartz, Krafft, and Hoyer 2004).
NAdjusted R2
F Statstic
d.f.p value
Variable Coefficient Estimate Standard Error
t-value VIF
Intercept � -11.67 16.06 -0.73
Main Effects CPM Model Use (CPM) �1 7.53 3.95 1.91** 2.04Product Focus (PROD) �3 -0.32 0.87 -0.37 1.98
Moderator CPM Model Age (AGE) �2 -0.47 0.21 -2.23** 1.94CPM x PROD �4 -1.79 1.23 -1.46* 1.57
Control Variables Sales Growth (GROW) �2 0.18 0.07 2.68*** 1.22Variability in return (RISK) �3 -0.57 0.20 -2.8*** 1.17Ln(Sales) (SIZE) �4 0.48 0.74 0.64 1.18
Industry 1 - Industrial Products �1 6.62 1.89 3.5*** 6.25Industry 2 - Transportation �3 7.85 2.35 3.35*** 3.90Industry 3 - Construction �2 6.77 2.46 2.75*** 3.92Industry 4 - Consumer Products �4 7.42 1.95 3.8*** 3.23Industry 5 - Services �5 5.28 2.36 2.24** 3.20Industry 6 - IT & Telecom �6 9.05 2.74 3.3*** 3.39Industry 7 - Chemicals �7 13.25 2.88 4.59*** 2.54Industry 8 - Financial Institutions �8 -1.86 2.18 -0.86 2.18Industry 9 - Energy �10 3.48 2.64 1.32 2.03Industry 10 - Retailers �9 26.56 11.29 2.35** 2.45
*p < 0.10; **p < 0.05; ***p < 0.01
Note: One-tailed significance levels are reported for all variables except "AGE" and industry dummies (two-tailed);
Standard Errors and t-values are heteroscedasticity consistent estimates (White 1980);"Others" is the reference industry and is the least profitable industry group
B: Parameter Estimates
A: Model Statistics
Regression Results - Base ModelTABLE 5
218
4.1117
<.0001
0.20
124
We performed one-tailed tests for hypotheses H1 and H3 as these are
unidirectional hypotheses. However, hypothesis H2 was tested via a two-tailed test
as this hypothesis (decreasing performance effect over time) is challenging the
conventional learning curve based arguments that knowledge is cumulative and
that the positive performance effect will therefore increase over time as firms
progress along the learning curve. Our first hypothesis (H1) stated that CPM
model use for resource allocation decision purposes would have a direct, positive
effect on firm financial performance. We find a statistically significant positive
relationship between CPM use and firm ROA in 2009 (�1 = 7.53, p < 0.05). This
means that we cannot reject the hypothesis that CPM adopters generally perform
better than non-adopters of CPM models on the basis of this data set.
Our second hypothesis (H2) addressed the sustainability of the CPM-
performance association over time expecting a declining effect. This hypothesis
(H2) was also supported as we found a significant negative association between
the number of years firms had used CPM and firm ROA (�2 = -0.47, p < 0.05)
Finally, we hypothesized that firms investing more heavily in
products/brands would experience a less positive performance effect of using
CPM models for resource allocation purposes. We also found support for this
hypothesis (H3) through a statistically significant negative interaction effect
(CPMxPROD) (�3 = -1.79, p < 0.10).
All control variables (except size) and all industries (except financial
institutions and energy) showed statistically significant relationships with firm
performance.
Given Scandinavian countries’ heavy reliance on and involvement in the
global economy a significant share of the firms operating in the Scandinavian
countries are subsidiaries of global corporations. In fact 40% of our sample
constitutes subsidiaries of a foreign corporate owner.
125
Although these business units are a natural part of the Scandinavian
economies they pose potential issues to the dependent variable (PERF) in our
analysis in two important ways. First, local subsidiaries of global corporations
may operate under transfer pricing practices that arbitrarily skew reported earnings
in ways so that the underlying operational performance of the business unit is not
reflected properly. Second, the asset base of local subsidiaries may be influenced
by decisions regarding the global manufacturing setup hereby distorting the
comparability with the consolidated accounts of Danish or Swedish companies.
In order to test the robustness of our results we therefore isolated the 131
firms (60%) that were not part of an international group with an ultimate foreign
owner and repeated the moderated regression analysis on this sub-sample of
independent firms.
The results of the moderated regression analysis on this reduced sample are
outlined in Table 6. As is evident from this table the reduced sample explains
slightly more of the variation in PERF (Adjusted R2 increases from 0.20 to 0.24)
despite the lower sample size. Additionally, we observe that the relationships
between our three focus variables (CPM, AGE and CPMxPROD) and the
dependent variable (PERF) are still significant and the signs are identical with our
previous results. Hence, our three hypotheses can still not be rejected on the basis
of this reduced data sample and the corporate affiliation therefore does not seem to
be an issue.
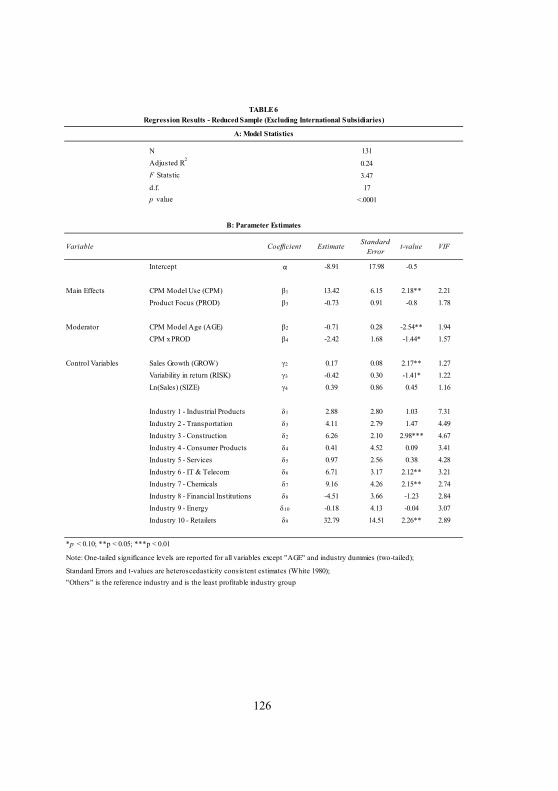
126
NAdjusted R2
F Statstic
d.f.p value
Variable Coefficient Estimate Standard Error
t-value VIF
Intercept � -8.91 17.98 -0.5
Main Effects CPM Model Use (CPM) �1 13.42 6.15 2.18** 2.21Product Focus (PROD) �3 -0.73 0.91 -0.8 1.78
Moderator CPM Model Age (AGE) �2 -0.71 0.28 -2.54** 1.94CPM x PROD �4 -2.42 1.68 -1.44* 1.57
Control Variables Sales Growth (GROW) �2 0.17 0.08 2.17** 1.27Variability in return (RISK) �3 -0.42 0.30 -1.41* 1.22Ln(Sales) (SIZE) �4 0.39 0.86 0.45 1.16
Industry 1 - Industrial Products �1 2.88 2.80 1.03 7.31Industry 2 - Transportation �3 4.11 2.79 1.47 4.49Industry 3 - Construction �2 6.26 2.10 2.98*** 4.67Industry 4 - Consumer Products �4 0.41 4.52 0.09 3.41Industry 5 - Services �5 0.97 2.56 0.38 4.28Industry 6 - IT & Telecom �6 6.71 3.17 2.12** 3.21Industry 7 - Chemicals �7 9.16 4.26 2.15** 2.74Industry 8 - Financial Institutions �8 -4.51 3.66 -1.23 2.84Industry 9 - Energy �10 -0.18 4.13 -0.04 3.07Industry 10 - Retailers �9 32.79 14.51 2.26** 2.89
*p < 0.10; **p < 0.05; ***p < 0.01
Note: One-tailed significance levels are reported for all variables except "AGE" and industry dummies (two-tailed);
Standard Errors and t-values are heteroscedasticity consistent estimates (White 1980);"Others" is the reference industry and is the least profitable industry group
17<.0001
B: Parameter Estimates
TABLE 6Regression Results - Reduced Sample (Excluding International Subsidiaries)
A: Model Statistics
131
0.243.47
127
6. Discussion and research implications
This study was performed to test the relationship between CPM model use
and firm financial performance over time as well as in different marketing
contexts. The cross-sectional data provide empirical support in favor of a general
positive association between CPM model implementation and firm performance.
This supports prior case-based findings suggesting that the structured use of CPM
models for resource allocation purposes causes superior financial performance.
However, as in any cross-sectional study the ability to draw causal inferences
is limited as the specific point in time of the analysis makes temporal priority
difficult to establish based on the empirical data per se (Pinsonneault and Kraemer
1993). Hence, although the data supports our theory-based hypotheses we cannot,
based on our model, completely rule out the notion that causality may be reversed,
i.e., that high-performing firms are more inclined to adopt managerial innovations
such as CPM models.
In order to strengthen our argumentation for the direction of causality we
therefore perform a post hoc analysis comparing the development in financial
performance during the years 2006-2009 for the cohort of firms that had not
adopted CPM by 2006. We split this cohort into two sub-samples: One sub-sample
containing firms that eventually adopted CPM either in 2007, 2008 or 2009 (24
eligible observations) and one sub-sample containing firms that did not adopt
CPM throughout this period (151 eligible observations). The results reveal a
remarkable decline in ROA from 10.9% in 2006 to 3.0% in 2009 among non-
adopters of CPM models for resource allocation purposes whereas the firms that
started implementing CPM models during the years 2007-09 experienced a slight
increase in ROA from 12.5% in 2006 to 13.6% in 2009 (see Figure 2). A t-test
confirms that the difference between these two developments in ROA is
significantly different from zero (p < 0.01).
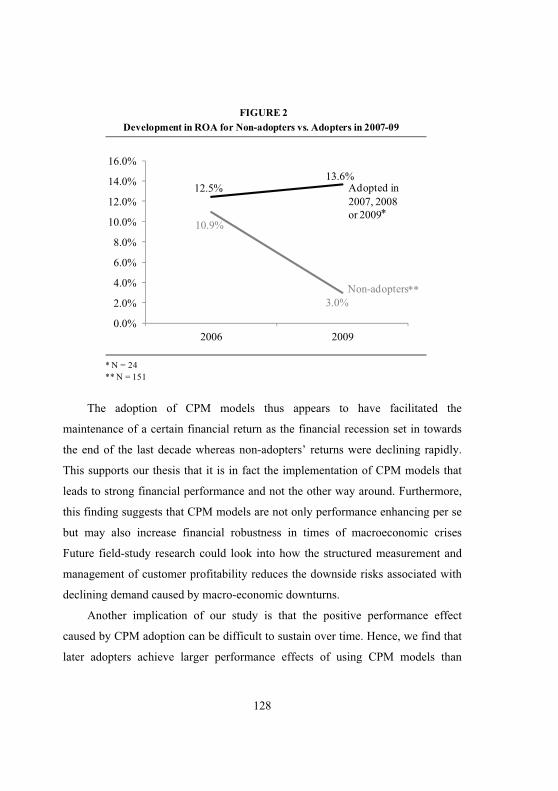
128
The adoption of CPM models thus appears to have facilitated the
maintenance of a certain financial return as the financial recession set in towards
the end of the last decade whereas non-adopters’ returns were declining rapidly.
This supports our thesis that it is in fact the implementation of CPM models that
leads to strong financial performance and not the other way around. Furthermore,
this finding suggests that CPM models are not only performance enhancing per se
but may also increase financial robustness in times of macroeconomic crises
Future field-study research could look into how the structured measurement and
management of customer profitability reduces the downside risks associated with
declining demand caused by macro-economic downturns.
Another implication of our study is that the positive performance effect
caused by CPM adoption can be difficult to sustain over time. Hence, we find that
later adopters achieve larger performance effects of using CPM models than
10.9%
3.0%
12.5%13.6%
0.0%
2.0%
4.0%
6.0%
8.0%
10.0%
12.0%
14.0%
16.0%
2006 2009
Non-adopters
Adopted in 2007, 2008 or 2009
FIGURE 2Development in ROA for Non-adopters vs. Adopters in 2007-09
* N = 24
*
**
** N = 151
129
earlier adopters. This finding simultaneously supports the deterioration of
knowledge arguments as well as arguments based on scale economies of learning
for mediating institutions regarding the transfer of technology across organizations
presented in our hypothesis development paragraph (H2). Future studies could
look into how these two factors influence the use of CPM models over time. The
way CPM models are implemented by firms in terms of the way customer
management routine changes are institutionalized is particularly interesting.
Longitudinal research designs are therefore required. Case studies comparing the
implementation of CPM models with and without the assistance of external
change agents (e.g., consultants) over longer periods of time could even
incorporate both effects in the same research design. An important derived issue
relates to how the CPM implementation approach selected subsequently affects
the sustainability of the positive performance effects achieved by using CPM
models.
Somewhat related to this is the effect of the evolutionary change of CPM
models. CPA has changed quite radically with the advent of Activity-Based
Costing (ABC) and CLV models have gone from basic deterministic frameworks
(e.g., Berger and Nasr 1998; Dwyer 1997) to more advanced stochastic simulation
models (e.g., Donkers, Verhoef, and de Jong 2007; Venkatesan, Kumar, and
Bohling 2007). If early adopters do not update marketing practices like CPM
models on a regular basis and if the data and insights provided by CPM models are
not continuously utilized via deployment of profitability-based customer
management strategies there appears to be a latent risk, that the competitive
advantage that these models originally provided, will eventually disappear. Future
research in the marketing discipline could look into what kind of precautions
marketing managers take in order to continuously refine and update their
marketing tools in order to stay aligned with the development of new, efficient
130
marketing management techniques in academia as well as in the business
environment.
In addition to the deteriorating performance effect of CPM use over time we
also find the marketing context to moderate the relationship between CPM use and
firm performance. The greater the investments in brand building and product
development activities the less positive is the financial performance effect of using
CPM models for resource allocation purposes. This finding is important in the
sense that it modifies the general perception that using CPM models is a universal
solution to marketing management. In direct marketing contexts with a non-
anonymous relationship between buyers and sellers and where brands and/or R&D
play a more marginal part in firms’ value creation process CPM may indeed be
extremely value creating. However, when firms’ brands must reach millions of
anonymous consumers through various distribution channels or when a few key
accounts must be retained and expanded through continuous product innovation
the implementation of CPM models will add less value. Linking customer value to
brand value has been suggested as a path that could potentially alleviate CPM use
in product/brand intensive business contexts (Kumar 2008; Leone et al. 2006). It
would be interesting to find out what the impact of establishing such a link would
have on the performance effect of using CPM in more product/brand focused
firms.
Despite this moderating effect of marketing context it is still puzzling from
an efficient choice perspective that CPM models are not more commonly used
given these models’ superior performance effects. In fact in our gross sample
(including all completed questionnaires with or without missing values (n=255))
only 38% of managers reported that they used some kind of CPM model (CPA,
CLV or both) for resource allocation purposes. This way, our findings correspond
well with research on the diffusion of managerial innovations across organizations
challenging the traditional rational choice perspective by proposing more social or
131
emotional explanations for adoption patterns for new management practices
(Abrahamson 1991; Ansari, Fiss, and Zajac 2010; Ax and Bjørnenak 2005; Malmi
1999; Malmi 2001; Sturdy 2004).
Ansari, Fiss and Zajac (2010) identify three forms of fit that may all
influence managerial innovation adoption: Technical fit, cultural fit and political
fit. They argue that a lack of fit on these three dimensions makes outright adoption
of a managerial innovation too costly and that managers will therefore either adapt
the managerial innovation to achieve better fit (see also Ax and Bjørnenak 2005)
or eventually abandon the idea. Future research on the diffusion of CPM models
could look into what role technical, cultural and political barriers play when
deciding whether to implement CPM models across firms as well as whether
contextual factors influence their relative importance.
7. Managerial implications
The ability to measure and manage the profitability of customer relationships
is a financially rewarding practice to implement for managers across industries.
Managers with the goal of increasing shareholder value will therefore generally
benefit from pursuing CPM model implementations. Furthermore, by
communicating around the initiation of customer profitability measurement model
implementations managers can signal to the stock market that future
improvements in financial performance are likely, which in turn should have a
positive impact on stock price.
That being said CPM models are not equally efficient across marketing
contexts. In some industries the ability to create a competitive edge via continuous
product innovation and brand building is more value creating than the
differentiation of customer service levels and direct marketing contacts.
Consequently, managers should give CPM models the kind of attention they
132
deserve depending on the relative importance of satisfying latent vs. expressed
customer needs in their industry.
Finally, our study shows that the financial benefits of managing customers
for profits can be difficult to preserve over time. Therefore, a crucial part of the
implementation and integration of CPM practices is to institutionalize tasks and
procedures as quickly as possible hereby embedding the learnings in the
organizational DNA rather than in key employees where important knowledge is
at the risk of being lost if the employee leaves the company. Simultaneously,
managers must make the necessary arrangements in an attempt to keep CPM
models technologically and conceptually up to date by monitoring the ongoing
development within this field. Further, innovations in methods and strategies have
to be monitored so that the firm can always be on the cutting-edge of
implementing the best practices available. Failing to do so may jeopardize the
competitive edge that CPM users achieve.
8. Limitations
Although our study yields some interesting findings there are a few
limitations that need to be considered. First, our analysis focused primarily on the
general performance effects of CPM use. However, despite the decent fit achieved
by our model we cannot rule out the possibility that other factors may be
correlated with both CPM use and performance. Mediating constructs (e.g.,
marketing performance) and moderating constructs (e.g., customer performance
management capabilities or the quality of top management) may play some part in
this relationship. Future studies could look into expanding our model by bringing
in mediating and/or additional moderating constructs hereby gaining further
insights on the ways CPM adoption influences firm performance.
133
Second, we focused on large Scandinavian firms. Future research could
replicate our study on samples from larger economies (e.g., USA, UK, Germany
and Japan) as well as in a true small cap setting to test whether the results hold
there as well.
Third, successful CPM is a cross-functional exercise. However, our study
focused on the customer-facing function in charge of commercial prioritization
strategies. Future studies could look into the performance effects of inter-
functional collaboration across finance, marketing and service departments. This
would provide valuable insights on the importance of including different functions
in the implementation and use of CPM models across firms.
Finally, it could be interesting for future field-study research to explore
which barriers are most significant among firms implementing CPM and how
firms deal with overcoming these barriers. Additionally, longitudinal field studies
are well suited for investigating how tasks and processes underlying managerial
innovations such as CPM evolve over time. An important element herein is to
explore the activities firms perform to monitor the development of marketing
practices and how this information can be used to upgrade existing marketing
metrics and models. This could in turn add much more knowledge on why the
competitive edge provided by CPM models is inclined to deteriorate in order to
understand how this effect is better preserved over time.
134
References
Abrahamson, Eric (1991), "Managerial Fads and Fashions: The Diffusion and Rejection of Innovations," Academy of Management Review, 16 (3), 586-612.
Ambler, Tim, C. B. Bhattacharya, Julie Edell, Kevin L. Keller, Katherine N. Lemon, and Vikas Mittal (2002), "Relating Brand and Customer Perspectives on Marketing Management," Journal of Service Research, 5 (1), 13-25.
Ansari, Shahzad M., Peer C. Fiss, and Edward J. Zajac (2010), "Made to Fit: How Practices Vary as they Diffuse," The Academy of Management Review, 35 (1), 67-92.
Argote, Linda (1990), "The Persistence and Transfer of Learning in Industrial Settings," Management Science, 36 (2), 140-54.
----(1999), Organizational Learning: Creating, Retaining, and Transferring Knowledge. New York, NY: Springer.
Armstrong, J. S. and Terry S. Overton (1977), "Estimating Nonresponse Bias in Mail Surveys," Journal of Marketing Research, 16 (August), 396-402.
Attewell, Paul (1992), "Technology Diffusion and Organizational Learning: The Case of Business Computing," Organization Science, 3 (1), 1-19.
Ax, Christian and Trond Bjørnenak (2005), "Bundling and Diffusion of Management Accounting Innovations—the Case of the Balanced Scorecard in Sweden," Management Accounting Research, 16 (1), 1-20.
Ax, Christian, Jan Greve, and Ulf Nilsson (2008), "The Impact of Competition and Uncertainty on the Adoption of Target Costing," International Journal of Production Economics, 115 (9), 92-103.
Berger, Paul D. and Nada I. Nasr (1998), "Customer Lifetime Value: Marketing Models and Applications," Journal of Interactive Marketing, 12 (1), 17-30.
Besanko, David, Ulrich Doraszelski, Yaroslav Kryukov, and Mark Satterthwaite (2010), "Learning-by-Doing, Organizational Forgetting, and Industry Dynamics," Econometrica, 78 (2), 453-508.
Birnberg, J. G., Michael D. Shields, and S. M. Young (1990), "The Case for Multiple Methods in Empirical Management Accounting Research (with an
135
Illustration from Budget Setting)," Journal of Management Accounting Research, 2 (Fall), 33-66.
Bjørnenak, Trond (1997), "Diffusion and Accounting: The Case of ABC in Norway," Management Accounting Research, 8 (1), 3-17.
Cagwin, Douglass and Marinus J. Bouwman (2002), "The Association between Activity-Based Costing and Improvement in Financial Performance," Management Accounting Research, 13 (1), 1-39.
Capon, Noel, John U. Farley, and Scott Hoenig (1990), "Determinants of Financial Performance: A Meta-Analysis," Management Science, 36 (10), 1143-59.
Churchill, Gilbert A. (1991), Marketing Research: Methodological Foundations. London, UK: Dryden Press.
Cooper, Robin and Robert S. Kaplan (1991), "Profit Priorities from Activity-Based Costing," Harvard Business Review, 69 (May-June), 130-5.
Copeland, Tom, Tim Koller, and Jack Murrin (2000), Valuation: Measuring and Managing the Value of Companies. New York, NY: John Wiley and Sons, Inc.
Darr, Eric D., Linda Argote, and Dennis Epple (1995), "The Acquisition, Transfer, and Depreciation of Knowledge in Service Organizations: Productivity in Franchises," Management Science, 41 (11), 1750-62.
Day, George S. (1994), "Continuous Learning about Markets," California Management Review, Summer, 9-31.
de Holan, Pablo M. and Nelson Phillips (2004), "Remembrance of Things Past? the Dynamics of Organizational Forgetting," Management Science, 50 (11), 1603-13.
Dillman, D. (1999), Mail and Internet Surveys: The Tailored Design Method. New York: Wiley.
Donkers, Bas, Peter C. Verhoef, and Martijn de Jong (2007), "Modeling CLV: A Test of Competing Models in the Insurance Industry," Quantitative Marketing and Economics, 5 (2), 163-90.
Dwyer, F. R. (1997), "Customer Lifetime Valuation to Support Marketing Decision Making," Journal of Interactive Marketing, 11 (4), 6-13.
136
Gleaves, Robin, Jamie Burton, Jan Kitshoff, Ken Bates, and Mark Whittington (2008), "Accounting is from Mars, Marketing is from Venus: Establishing Common Ground for the Concept of Customer Profitability," Journal of Marketing Management, 24 (7), 825-45.
Gronroos, Christian (1997), "From Marketing Mix to Relationship Marketing: Towards a Paradigm Shift in Marketing," Management Decision, 35 (4), 322-39.
Guerreiro, Reinaldo, Sé Bio, Elvira Vazquez, and Villamor Merschmann (2008), "Cost-to-Serve Measurement and Customer Profitability Analysis," International Journal of Logistics Management, 19 (12), 389-407.
Gupta, Sunil, Dominique M. Hanssens, Bruce G. S. Hardie, Wiliam Kahn, V. Kumar, Nathaniel Lin, and Nalini R. S. Sriram (2006), "Modeling Customer Lifetime Value," Journal of Service Research, 9 (2), 139-55.
Gupta, Sunil and Donald R. Lehmann (2003), "Customers as Assets," Journal of Interactive Marketing, 17 (Winter), 9-24.
----(2006), "Customer Lifetime Value and Firm Valuation," Journal of Relationship Marketing, 5 (2/3), 87-110.
Gupta, Sunil, Donald R. Lehmann, and Jennifer A. Stuart (2004), "Valuing Customers," Journal of Marketing Research, 41 (February), 7-18.
Gwinner, Kevin B., Dwayne D. Gremler, and Mary J. Bitner (1998), "Relational Benefits in Services Industries: The Customer’s Perspective," Journal of the Academy of Marketing Science, 26 (2), 101-14.
Haenlein, Michael, Andreas M. Kaplan, and Anemone J. Beeser (2007), "A Model to Determine Customer Lifetime Value in a Retail Banking Context," European Management Journal, 25 (3), 221-34.
Han, Jin K., Namwoon Kim, and Rajendra K. Srivastava (1998), "Market Orientation and Organizational Performance: Is Innovation a Missing Link?" Journal of Marketing, 62 (October), 30-45.
Hartmann, Frank G. H. and Frank Moers (1999), "Testing Contingency Hypotheses in Budgetary Research: An Evaluation of the use of Moderated Regression Analysis," Accounting, Organizations & Society, 24 (4), 291-315.
137
Helgesen, Øyvind (2007), "Customer Accounting and Customer Profitability Analysis for the Order Handling Industry - A Managerial Accounting Approach," Industrial Marketing Management, 36 (6), 757-69.
Homburg, Christian, Mathias Droll, and Dirk Totzek (2008), "Customer Prioritization: Does it Pay Off, and How Should It Be Implemented?" Journal of Marketing, 72 (September), 110-30.
Ingram, Paul and Joel A. C. Baum (1997), "Opportunity and Constraint: Organizations' Learning from the Operating and Competitive Experience of Industries," Strategic Management Journal, 18 (Summer), 75-98.
Kaplan, Robert S. and Robin Cooper (1998), Cost and Effect: Using Integrated Cost Systems to Drive Profitability and Performance. Boston, MA: Harvard Business School Press.
Kolers, Paul A. (1976), "Reading a Year Later," Journal of Experimental Psychology: Human Learning and Memory, 2 (5), 554-65.
Kumar, V. (2008), Managing Customers for Profit: Strategies to Increase and Build Loyalty. Upper Saddle River, NJ: Wharton School Publishing.
Kumar, V., Eli Jones, Rajkumar Venkatesan, and Robert P. Leone (2011), "Is Market Orientation a Source of Sustainable Competitive Advantage Or Simply the Cost of Competing?" Journal of Marketing, 75 (January), 16-30.
Kumar, V. and Denish Shah (2009), "Expanding the Role of Marketing: From Customer Equity to Market Capitalization," Journal of Marketing, 73 (November), 119-36.
Kumar, V., Denish Shah, and Rajkumar Venkatesan (2006), "Managing Retailer Profitability - One Customer at a Time!" Journal of Retailing, 82 (4), 277-94.
Kumar, V., Rajkumar Venkatesan, Timothy Bohling, and Denise Beckmann (2008), "The Power of CLV: Managing Customer Lifetime Value at IBM," Marketing Science, 27 (4), 585-99.
Lacey, Russell, Jaebeom Suh, and Robert M. Morgan (2007), "Differential Effects of Preferential Treatment Levels on Relational Outcomes," Journal of Service Research, 9 (3), 241-56.
138
Leone, Robert P., Vithala R. Rao, Kevin L. Keller, Anita M. Luo, Leigh McAlister, and Rajendra K. Srivastava (2006), "Linking Brand Equity to Customer Equity," Journal of Service Research, 9 (2), 125-38.
Libai, Barak, Das Narayandas, and Clive Humby (2002), "Toward an Individual Customer Profitability Model: A Segment-Based Approach," Journal of Service Research, 5 (1), 69-76.
Malmi, Teemu (1999), "Activity-Based Costing Diffusion Across Organizations: An Exploratory Empirical Analysis of Finnish Firms," Accounting, Organizations and Society, 24 (8), 649-72.
----(2001), "Balanced Scorecards in Finnish Companies: A Research Note," Management Accounting Research, 12 (2), 207-20.
McManus, Lisa (2007), "The Construction of a Segmental Customer Profitability Analysis," Journal of Applied Management Accounting Research, 5 (2), 59-74.
Morgan, Fred W. (1990), "Judicial Standards for Survey Research: An Update and Guidelines," Journal of Marketing, 54 (January), 59-70.
Narver, John C., Stanley F. Slater, and Douglas L. MacLachlan (2004), "Responsive and Proactive Market Orientation and New-Product Success," Journal of Product Innovation Management, 21 (5), 334-47.
Näsi, Salme and Carsten Rohde (2006), "Development of Cost and Management Accounting Ideas in the Nordic Countries," in Handbooks of Management Accounting Research, Christopher S. Chapman, Anthony G. Hopwood, and Michael D. Shields, eds. Amsterdam, The Netherlands: Elsevier, 1091-1118.
Nenonen, Suvi and Kaj Storbacka (2008), "Customer Roles in Shareholder Value Creation - an Empirical Investigation of Customer Management Strategies," Working Paper.
Niraj, Rakesh, Mahendra Gupta, and Chakravarthi Narasimhan (2001), "Customer Profitability in a Supply Chain," Journal of Marketing, 65 (July), 1-16.
Noone, Breffni and Peter Griffin (1999), "Managing the Long-Term Profit Yield from Market Segments in a Hotel Environment: A Case Study on the Implementation of Customer Profitability Analysis," International Journal of Hospitality Management, 18 (2), 111-28.
139
O'Sullivan, Don and Andrew V. Abela (2007), "Marketing Performance Measurement Ability and Firm Performance," Journal of Marketing, 71 (April), 79-93.
Palmatier, Robert W., Srinath Gopalakrishna, and Mark B. Houston (2006), "Returns on Business-to-Business Relationship Marketing Investments: Strategies for Leveraging Profits," Marketing Science, 25 (5), 477-93.
Payne, Adrian and Pennie Frow (2005), "A Strategic Framework for Customer Relationship Management," Journal of Marketing, 69 (October), 167-76.
Pfeifer, Phillip E., Mark E. Haskins, and Robert M. Conroy (2005), "Customer Lifetime Value, Customer Profitability, and the Treatment of Acquisition Spending," Journal of Managerial Issues, 17 (1), 11-25.
Pinsonneault, Alain and Kenneth L. Kraemer (1993), "Survey Research Methodology in Management Information Systems: An Assessment," Journal of Management Information Systems, 10 (2), 75-85.
Ramani, Girish and V. Kumar (2008), "Interaction Orientation and Firm Performance," Journal of Marketing, 72 (January), 27-45.
Rappaport, Alfred (1998), Creating Shareholder Value: A Guide for Managers and Investors. New York, NY: The Free Press.
Reinartz, Werner, Manfred Krafft, and Wayne D. Hoyer (2004), "The Customer Relationship Management Process: Its Measurement and Impact on Performance," Journal of Marketing Research, 41 (August), 293-305.
Rogers, Everett (1983), Diffusion of Innovations. New York, NY: The Free Press.
----(1995), Diffusion of Innovations. New York, NY: The Free Press.
Rust, Roland T., Tim Ambler, Gregory S. Carpenter, V. Kumar, and Rajendra K. Srivastava (2004), "Measuring Marketing Productivity: Current Knowledge and Future Directions," Journal of Marketing, 68 (October), 76-89.
Rust, Roland T., Katherine N. Lemon, and Valarie A. Zeithaml (2004), "Return on Marketing: Using Customer Equity to Focus Marketing Strategy," Journal of Marketing, 68 (January), 109-27.
140
Ryals, Lynette (2005), "Making Customer Relationship Management Work: The Measurement and Profitable Management of Customer Relationships," Journal of Marketing, 69 (October), 252-61.
Sevin, Charles H. (1965), Marketing Productivity Analysis. St Louis, MO: McGraw-Hill.
Shah, Denish, Roland T. Rust, A. Parasuraman, Richard Staelin, and George S. Day (2006), "The Path to Customer Centricity," Journal of Service Research, 9 (2), 113-24.
Slater, Stanley F., Jakki J. Mohr, and Sanjit Sengupta (2009), "Know Your Customers," Marketing Management, 18 (January/February), 36-44.
Smith, Malcolm and Shane Dikolli (1995), "Customer Profitability Analysis: An Activity-Based Costing Approach," Managerial Auditing Journal, 10 (7), 3-7.
Sturdy, Andrew (2004), "The Adoption of Management Ideas and Practices," Management Learning, 35 (2), 155-79.
Szulanski, Gabriel (2000), "The Process of Knowledge Transfer: A Diachronic Analysis of Stickiness," Organizational Behavior and Human Decision Processes, 82 (5), 9-27.
Van der Stede, Wim A., S. M. Young, and Clara X. Chen (2005), "Assessing the Quality of Evidence in Empirical Management Accounting Research: The Case of Survey Studies," Accounting, Organizations and Society, 30 (11), 655-84.
Venkatesan, Rajkumar and V. Kumar (2004), "A Customer Lifetime Value Framework for Customer Selection and Resource Allocation Strategy," Journal of Marketing, 68 (October), 106-25.
Venkatesan, Rajkumar, V. Kumar, and Timothy Bohling (2007), "Optimal Customer Relationship Management using Bayesian Decision Theory: An Application for Customer Selection," Journal of Marketing Research, 44 (November), 579-94.
Ward, Keith (1992), "Accounting for Marketing Strategies," in Management Accounting Handbook, Colin Drury, ed. Oxford, UK: Butterworth-Heinemann, 228-246.
White, Halbert (1980), "A Heteroskedasticity-Consistent Covariance Matrix Estimator and a Direct Test for Heteroskedasticity," Econometrica, 48 (4), 817-38.

141
Yelle, Louis E. (1979), "The Learning Curve: Historical Review and Comprehensive Survey," Decision Sciences, 10 (2), 302-28.
Yim, Frederick H., Rolph E. Anderson, and Srinivasan Swaminathan (2004), "Customer Relationship Management: Its Dimensions and Effect on Customer Outcomes," Journal of Personal Selling & Sales Management, 24 (4), 263-78.
142
Article #3
A contingency-based survey of service complexity’s and competition’s influence on Customer Profitability Analysis sophistication
Morten Holm
Copenhagen Business School, Department of Accounting and Auditing Solbjerg Plads 3, DK-2000 Frederiksberg, Denmark.
Abstract
Despite a rising focus on measuring and managing customer profitability among
management accounting practitioners, management accounting research is
remarkably silent on the topic. This paper seeks to shed more light on the use of
customer profitability measurement models in practice by investigating the
environmental factors influencing the degree of Customer Profitability Analysis
(CPA) model sophistication deployed for decision making purposes. Based on
cross-sectional survey data from CPA-adopters in Sweden and Denmark the
author finds that increasing customer service complexity leads to the application
of more sophisticated CPA models. However, competitive intensity is found to
moderate this relationship negatively. Hence, increasing customer service
complexity has a larger effect on CPA model sophistication in markets
characterized by weak/moderate competition. Additionally, the paper contributes
to the customer performance management literature by conceptualizing the CPA
sophistication construct and to general contingency-based research by validating
the service complexity construct empirically.
Key Words: Customer Accounting, Customer Profitability Analysis (CPA), Contingency Theory, Customer Service Complexity, Competition, Cost System Sophistication
143
1. Introduction
Accounting for customer relationship profitability has been a key priority for
management accounting practitioners for some time. A recent survey on customer
value management performed by the Chartered Institute of Management
Accountants (CIMA) among their members concluded that customer profitability
measurement techniques are “becoming a must have within many organizations”
and that they provide “an interesting opportunity for management accountants to
add considerable value and work alongside their colleagues in marketing, sales
and strategy” (CIMA 2008, p. 5). This point was already raised more than a
decade ago when customer profitability and satisfaction were identified as the
single most important current management priority in a survey of American and
Australian managers (Foster and Young 1997).
In the management accounting literature research on the use of customer
accounting (CA) is scarce (McManus and Guilding 2008) despite its importance to
practice and despite the fact that its potential has been repeatedly demonstrated
(e.g., Cardinaels, Roodhooft, and Warlop 2004; Kaplan and Narayanan 2001;
Niraj, Gupta, and Narasimhan 2001). In fact only one empirical management
accounting study has, to the best of the author’s knowledge, explored determinants
of CA use from a cross-sectional perspective. Guilding and McManus (2002) did a
cross-sectional survey among marketing managers and management accountants
in Top 300 listed Australian companies and found that CA practices (retrospective
Customer Profitability Analysis in particular) were actually more widely used than
first anticipated.
Little is thus known about CA practices in general and the factors that
influence their design and use in particular. This study therefore seeks to expand
the CA contingency-framework thereby contributing to contingency-based
144
research in management accounting as well as the growing research stream on
customer performance measurement in the marketing discipline in two ways.
First, the paper adds knowledge on the degree of sophistication regarding a
specific CA technique: Customer Profitabiliyt Analysis (CPA). Recent
contributions in the marketing literature have suggested a dichotomous distinction
between the retrospective CPA practice and the prospective Customer Lifetime
Value (CLV) practice (Gleaves et al. 2008; Pfeifer, Haskins, and Conroy 2005).
Focusing on one of these is necessary as the design of CPA and CLV models are
expected to be influenced differently by different contingency factors (Holm,
Kumar, and Rohde Forthcoming). Even though CLV is an interesting CA practice
that has received considerable attention in the marketing literature (see Gupta et al.
2006; Villanueva and Hanssens 2006 for recent reviews) it is considerably less
prevalent in practice (CIMA 2008; Guilding and McManus 2002). Focusing on
CPA is therefore expected to improve the prospects of gathering a reasonable
sample size as well as generating more generally relevant findings.
The paper contributes to the body of knowledge on customer performance
management techniques by offering a novel conceptualization of CPA
sophistication. Rather than merely studying the extent of use of CPA this study
investigates the degree of sophistication deployed. Recent research contributions
on the adoption of sophisticated product costing systems argue in favor of a
continuum rather than the dichotomous “adopted/not adopted” approach applied in
earlier surveys of e.g. ABC (Al-Omiri and Drury 2007; Drury and Tayles 2005)
and Malmi (2004) also suggests that CPA practices can be more or less
sophisticated. Therefore, this paper conceptualizes CPA sophistication along three
dimensions: The level of aggregation (individual accounts vs. segments), range of
costs, and number of cost pools and cost drivers. Future studies can use and
expand on this conceptualization in order to establish a more profound
145
understanding on the way customer profitability is measured and managed across
organizations.
The second contribution of the study concerns the investigation of two
important environmental constructs’ direct and interaction effects on the degree of
CPA model sophistication. The study hereby refines the environmental dimension
of the contingency perspective on the use of CA practices across companies.
Hence, the impact of the environmental constructs customer service complexity
and competition on CPA sophistication are demonstrated empirically. A direct,
positive association is found between customer service complexity and CPA
sophistication whereas no significant direct effect of competition is found. Instead
competition negatively moderates the positive association between customer
service complexity and CPA sophistication. This indicates that competition plays a
more subtle role when it comes to its impact on customer cost system rather than
product cost system sophistication. Moreover, this finding demonstrates the
potential of exploring interaction effects among contextual variables in
contingency-based research.
Management accounting researchers can build on these findings in the pursuit
of a more comprehensive contingency theory explaining the sophistication of
management accounting systems in general and customer performance
measurement models in particular. Moreover, practitioners considering
implementing CPA models can use the findings as guidance on the level of
sophistication that fits their organizational context.
In addition the empirical validation of the customer service complexity
construct also contributes to contingency-based research. This finding is useful for
future contingency-based studies regarding customer-related constructs where the
customer service complexity measure deployed in this study can be adopted.
The rest of the paper is organized as follows: Initially, CPA model
sophistication is conceptualized based on a review of the CPA literature. Next,
146
hypotheses on the relationship between CPA model sophistication and
contingency factors are developed. Subsequently, research design, variable
measurement and model specification is discussed followed by a presentation of
the results. The paper is concluded by a discussion of the study’s implications and
limitations.
2. Customer Profitability Analysis model sophistication
The development of a conceptual framework for CPA model sophistication is
based on a review of the progression of CPA research in the marketing and the
management accounting literatures. It should be noted that, sophistication is here
defined merely as an expression of how advanced techniques firms apply to
estimate customer profitability rather than a normative guideline stating that more
is always better.
In the late 1980s discussions about the merits of measuring and managing
individual customer profitability reemerged (Bellis-Jones 1989; Howell and Soucy
1990; Shapiro et al. 1987; Ward 1992). One general message embedded herein
was that one dollar of sales did not necessarily contribute equally to net profits as
customer needs were getting increasingly heterogeneous leading to increasingly
different cost-to-serve across customers. Consequently, the applicability of
customer turnover as an unbiased estimator of customers’ net financial worth to
the firm was challenged.
Creating transparency on all revenues, costs, assets and liabilities caused by
activities required for servicing customers across customer-facing functions
became the focus of attention. Simultaneously, new innovations within managerial
accounting techniques, most notably Activity-Based Costing (ABC) (Cooper
1988; Cooper and Kaplan 1991), were put forward as a viable solution to the
147
challenge of assigning cost-to-serve to the customers that cause it (Goebel,
Marshall, and Locander 1998; Smith and Dikolli 1995).
However, a full-scale ABC-model is not always necessary to support
insightful customer management strategies. Storbacka (1997) and Mulhern (1999)
demonstrate how focusing on direct costs reveals valuable insights on customer
profitability diversity in a financial services and a pharmaceuticals context
respectively. Consequently, direct costing and full costing techniques may provide
sufficient information to guide resource allocation decision making across
customers.
The initial ABC-based CPA case demonstrations emerged concurrently in the
management accounting (Noone and Griffin 1999) and the marketing (Niraj,
Gupta, and Narasimhan 2001) literatures. Both cases demonstrate how resource
expenses are assigned to customers via a two-stage approach. First, resource
expenses are split into a number of activity cost pools and subsequently costs are
assigned to customers via a set of activity cost drivers. Noone and Griffin (1999)
demonstrate the model in a service context whereas Niraj et al. (2001) demonstrate
their model for a supply chain distributor. Subsequently, a growing body of
contributions has replicated ABC-based case demonstrations in different business
contexts in management accounting (e.g., Andon, Baxter, and Bradley 2003;
McManus 2007) as well as in marketing (e.g., Guerreiro et al. 2008; Helgesen
2007).
This progression in CPA model research reflects the spectrum of design
opportunities with various degrees of sophistication available to managers
implementing CPA. Based on this spectrum a conceptualization of the different
degrees of CPA model sophistication can be developed.
Three dimensions determine CPA sophistication: First, the costs accounted
for (what to assign) range from merely accounting for cost of goods sold at the
least sophisticated end to assigning all Sales, General & Administrative (SG&A)
148
costs that are directly or indirectly caused by the marketing to and servicing of
customers across the value chain. Second, the method applied to assign overhead
costs that cannot be traced directly to customer on a one-to-one basis (how to
assign) depends on the number of cost pools and cost drivers deployed in line with
Al-Omiri and Drury (2007) and their conceptualization of product costing
sophistication. The more cost pools and cost drivers deployed to assign overhead
costs that are not directly traceable to individual customers – the more
sophisticated the CPA-model. Third, the level of aggregation that such overhead
costs are assigned at can be anything from large segments to individual accounts.
The larger the number of units for any given cost objects (e.g., customers or
segments) that cost-to-serve components must be assigned to the more
sophisticated CPA models will be required to provide unbiased approximations of
customer/segment profitability. The individual customer therefore constitutes the
ultimate endpoint in the sophisticated end of this spectrum whereas the most
aggregated customer segmentation (two segments) constitutes the other.
All this yields a three-dimensional spectrum of CPA model sophistication
(see Figure 1). The least sophisticated CPA model (bottom left hand corner of
Figure 1) is a model where customer profitability is approximated by sales or
gross profits for two segments. Expanding the range of costs by including
customer-related services in addition to product costs adds sophistication along
one dimension; increasing the number of cost pools and cost drivers when
assigning the overhead portion of these costs to customers/segments adds
sophistication along a second dimension; and increasing the number of cost
objects by assigning costs to a larger amount of customer segments adds
sophistication along a third dimension.
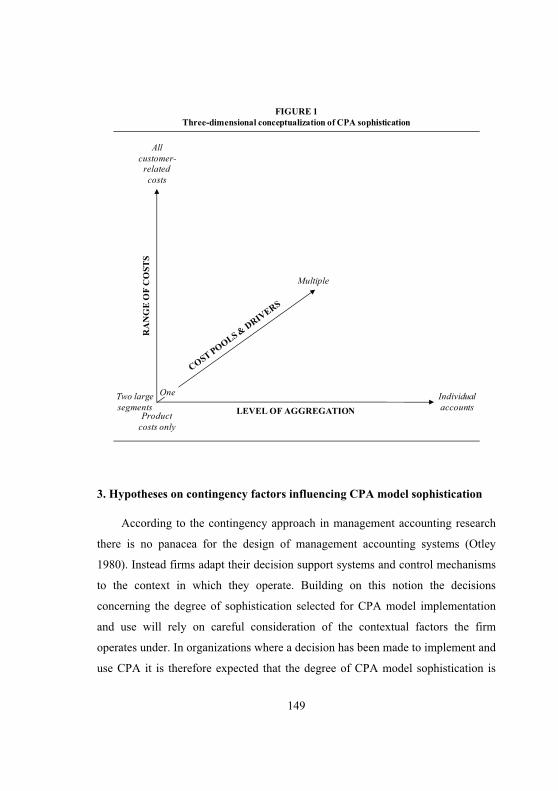
149
3. Hypotheses on contingency factors influencing CPA model sophistication
According to the contingency approach in management accounting research
there is no panacea for the design of management accounting systems (Otley
1980). Instead firms adapt their decision support systems and control mechanisms
to the context in which they operate. Building on this notion the decisions
concerning the degree of sophistication selected for CPA model implementation
and use will rely on careful consideration of the contextual factors the firm
operates under. In organizations where a decision has been made to implement and
use CPA it is therefore expected that the degree of CPA model sophistication is
RA
NG
E O
F C
OST
SAll
customer-related costs
Product costs only
One
Multiple
LEVEL OF AGGREGATION
Two large segments
Individual accounts
FIGURE 1 Three-dimensional conceptualization of CPA sophistication
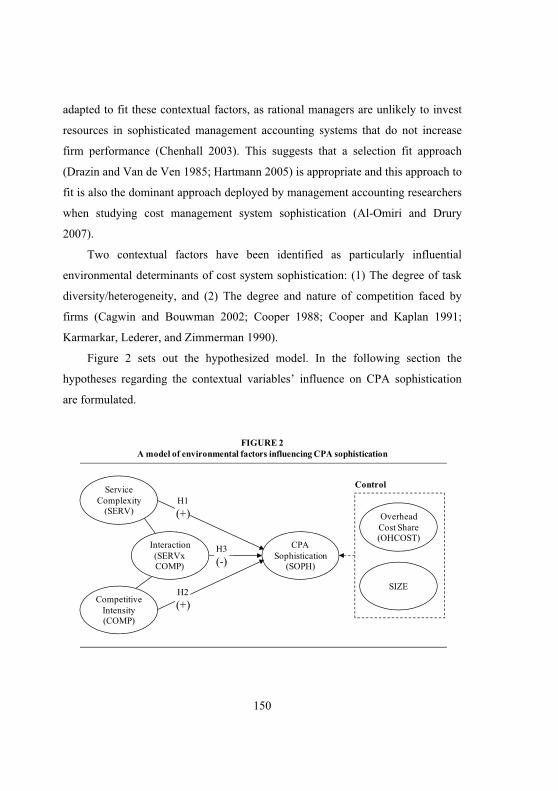
150
adapted to fit these contextual factors, as rational managers are unlikely to invest
resources in sophisticated management accounting systems that do not increase
firm performance (Chenhall 2003). This suggests that a selection fit approach
(Drazin and Van de Ven 1985; Hartmann 2005) is appropriate and this approach to
fit is also the dominant approach deployed by management accounting researchers
when studying cost management system sophistication (Al-Omiri and Drury
2007).
Two contextual factors have been identified as particularly influential
environmental determinants of cost system sophistication: (1) The degree of task
diversity/heterogeneity, and (2) The degree and nature of competition faced by
firms (Cagwin and Bouwman 2002; Cooper 1988; Cooper and Kaplan 1991;
Karmarkar, Lederer, and Zimmerman 1990).
Figure 2 sets out the hypothesized model. In the following section the
hypotheses regarding the contextual variables’ influence on CPA sophistication
are formulated.
FIGURE 2 A model of environmental factors influencing CPA sophistication
Service Complexity
(SERV)H1(+)
CPA Sophistication
(SOPH)
Competitive Intensity (COMP)
Interaction (SERVxCOMP)
H2(+)
H3(-)
OverheadCost Share(OHCOST)
SIZE
Control
151
3.1 Customer service complexity
In the marketing literature environmental diversity, heterogeneity and
complexity are used interchangeably and refer to the degree of dissimilarity of the
entities dealt with in an organization’s task environment (Achrol and Stern 1988;
Sheth, Sisodia, and Sharma 2000; Sohi 1996). From a customer perspective this
environmental complexity factor can be further divided into a customer service
complexity and a customer behavioral complexity construct in line with Holm et
al. (Forthcoming). They argue that customer service complexity and customer
behavioral complexity will impact the degree of customer profitability
measurement model sophistication differently. Customer service complexity,
defined as the degree of diversity in service needs and requirements that invoke
differential activities on an organization across customer-facing functions in terms
of the number of activities performed as well as the time spent on each activity, is
expected to mainly influence the degree of CPA model sophistication. Customer
behavioral complexity, defined as the degree of variation in retention durations
(relationship length), transaction frequency and value of transactions (relationship
depth), and cross-buying behavior (relationship breadth) across the total number of
customer relationships a firm serves, will mainly influence the degree of Customer
Lifetime Value (CLV) model sophistication deployed (Holm et al. Forthcoming).
Therefore, the customer service complexity construct is in focus for the
complexity dimension of this contingency study of CPA model sophistication.
High levels of customer service complexity compel large diversity in service
needs that must be coped with by firms. Consequently, the resources consumed
during the process of servicing customers will vary considerably in environments
characterized by high service complexity effectively yielding differences in cost-
to-serve – differences that can be substantial (see Helgesen 2007; Kaplan and
Cooper 1998; Niraj, Gupta, and Narasimhan 2001).
152
If firms do not possess sophisticated capabilities in terms of estimating the
cost-effects of different service requirements across customers they are unlikely to
be able to separate profitable from unprofitable customers in highly complex
customer service environments.
This reasoning is in line with former studies of general cost management
system sophistication. Bjørnenak (1997) argues that product diversity is the major
contributor to product cost distortions in less sophisticated product costing
systems (also referred to as “conventional costing systems”). Subsequent research
contributions have found significant positive associations between product
diversity and product costing system sophistication (Al-Omiri and Drury 2007;
Drury and Tayles 2005; Drury and Tayles 2005) as well as between product
diversity and the adoption of ABC in general (Krumwiede 1998; Malmi 1999).
By adapting these arguments and findings to a customer context it can be
hypothesized that firms adopting CPA models are expected to take customer
service complexity into consideration during the design phase and implement CPA
models that fit the level of service complexity encountered in their customer
environments. A positive direct relationship between customer service complexity
and CPA model sophistication is expected and the first hypothesis can thus be
stated as follows:
Hypothesis H1: There is a positive association between customer service complexity and CPA models sophistication.
3.2 Competitive intensity
Competitive intensity can be defined as the level of competition for available
resources in the environment (Sharfman and Dean 1991). Within this rather broad
framing, Khandwalla (1972) previously has provided a conceptualization defining
competition as a composite, three-dimensional construct determined by the level
153
of: (a) price competition; (b) promotion and distribution (marketing) competition;
and (c) competition in product quality and variety.
From a customer perspective the competitive intensity construct has been
researched as an integrated part of the vast body of research in the marketing
literature where the link between market orientation and firm performance has
been studied. In this context competition has been defined with respect to the
number of options available to customers. Weak competition means that
customers will have a limited set of options to choose from (Kohli and Jaworski
1990; Kumar et al. 2011). Consequently, there will be limited pressure on prices,
as well as on marketing activities and product quality following Khandwalla’s
(1972) different dimensions of competition. As competition increases the number
of alternative options to satisfy customers’ needs and wants increase as well
(Kohli and Jaworski 1990; Kumar et al. 2011).
Competition’s effect on management accounting system usage and
sophistication has been studied rather intensively since the entry of contingency-
based studies into management accounting research. There seems to be general
agreement that increasing competition warrants more extensive use of more
sophisticated management accounting systems for two reasons. First, costing
errors are more frequently punished by competitors in environments characterized
by fierce competition. Second, margins are generally lower in highly competitive
environments where customers have many alternative options which in turn makes
costing errors more damaging to firm profits.
Empirical evidence both supports the proposition that increasing competition
leads to more extensive use of cost management systems and that it calls for the
implementation of more sophisticated cost management systems.
Regarding the extent of use of cost management systems Khandwalla (1972,
p. 275) shows that “the greater the competition, the greater the need to control
costs, and to evaluate whether production, marketing, finance, etc. are operating
154
according to expectations.” Other studies have investigated competition’s
influence on the extent of management accounting system use as well and have
found that “Managers faced with high levels of competition may ask for more and
different types of information from their systems before making crucial decisions”
(Libby and Waterhouse 1996, p. 147) and that “[I]ncreasing intensity of market
competition is associated with increasing managerial use of the Management
Accounting System information” (Mia and Clarke 1999, p. 153).
When it comes to cost management system sophistication (e.g., the adoption
of novel cost management systems like Activity-Based Costing) the evidence is a
little less convincing. Although Malmi (1999) finds a significant positive
relationship between competition and the use of Activity-Based Costing,
Bjørnenak (1997) and Cagwin and Bouwman (2002) find non-significant
relationships. Moreover, Drury and Tayles (2005) also fail to find backing in their
data for a positive association between competition and cost system sophistication.
One possible explanation for these weak results may be the fact that all of the
above studies apply only one or two items to measure competition. This can be
problematic as the use of single-item measures for ambiguous latent constructs
may lead to reliability issues (Wanous, Reichers, and Hudy 1997). Furthermore,
two recent studies where competition was measured using multiple (4) items both
found significant positive relationships between competitive intensity and (a) cost
system sophistication (Al-Omiri and Drury 2007); and (b) the adoption of target
costing (Ax, Greve, and Nilsson 2008) respectively.
More sophisticated means of monitoring costs thus appear to be required as
competition intensifies and a greater range of different management accounting
systems are being used for decision support in order to establish as accurate cost
estimates as possible. One purpose of CPA is to monitor costs at individual
customer level. Consequently, it is hypothesized that increasing competition is
associated with the implementation of increasingly sophisticated CPA models:
155
Hypothesis H2: There is a positive association between competitive intensity and CPA model sophistication.
In addition to this direct effect of competition on CPA model sophistication
competition is also hypothesized to have a more indirect effect as a moderator of
the relationship between customer service complexity and CPA model
sophistication.
In non-competitive environments the range of options available to customers
is limited. Therefore, supplying firms are able to take advantage of heterogeneous
needs and desires by tailoring their offerings and services according to the profit
potential different customers constitute. For this purpose sophisticated means of
measuring customer profitability will be beneficial to identify highly profitable
customers from unprofitable ones. The more diverse the customer needs (i.e., the
higher the customer service complexity) the more sophisticated CPA models will
be required for these purposes.
As competition intensifies and approaches perfect competition two things
happen (Guilding and McManus 2002): First, the range of options available to
customers expands which makes competing firms’ offerings increasingly similar.
Second, firms to a greater extent become price takers making it very difficult to
build long-term relationships with customers. Both effects negate the need for a
sophisticated CPA model.
For resource allocation decision purposes the level of customer service
complexity thus becomes less relevant when designing CPA model sophistication
in highly competitive markets as firms will not be in a position to take advantage
of the insights generated by these highly sophisticated models by deploying
profitability-based customer differentiation strategies and initiatives – regardless
of the service complexity encountered due to diversity in customer needs. All this
leads to the third hypothesis:
156
Hypothesis H3: The positive association between customer service complexity and CPA model sophistication is larger in environments characterized by weak competition than in environments characterized by strong competition.
3.3 Control variables
Two additional variables are considered important to include when
investigating cost system sophistication because they have been found to explain
some of the variation in cost system sophistication: The proportion of overhead
costs in a firm’s cost structure and the size of the business.
Proportion of overhead costs is a key determinant of cost management
sophistication as a larger share of the total cost base hereby cannot be traced
directly to cost objects (Cooper and Kaplan 1991; Kaplan and Cooper 1998).
Conversely, if overhead costs make up a relatively small proportion of total costs
it may not be worthwhile investing in sophisticated accounting methods to allocate
overhead costs (Brierley 2008).
The proportion of overhead costs has been included in many empirical
studies of cost system sophistication (e.g., Al-Omiri and Drury 2007; Bjørnenak
1997; Booth and Giacobbe 1998; Clarke, Hill, and Stevens 1999; Drury and
Tayles 2005; Malmi 1999) albeit with somewhat mixed results. Due to this strong
focus on overhead cost proportion in prior research and due to its expected
relationship with cost system sophistication this variable is included as a control
variable in the model.
The influence of a business’ size on the sophistication of cost management
systems has been studied at different levels in the management accounting
literature. The general agreement across these studies is that larger firms adopt
more sophisticated management control systems and cost management systems
than smaller firms (e.g., Al-Omiri and Drury 2007; Bruns and Waterhouse 1975;
Chenhall 2003; Clarke, Hill, and Stevens 1999; Drury and Tayles 2005; Innes and
157
Mitchell 1995; Khandwalla 1977; Krumwiede 1998; Malmi 1999; Merchant
1981). Firm size is therefore also included as a control variable in the
hypothesized model.
4. Research design
A survey instrument was developed and cross-sectional data was collected
from large Danish and Swedish companies over the Fall, Winter and Spring
2010/2011. The survey development and data collection were performed with
guidance from van der Stede et al.’s (2005) survey development framework for
management accounting survey studies as well as Dillman’s (1999) general
recommendations on survey research.
The study was designed to explain how the sophistication of CPA practices is
adapted to fit the environments in which organizations operate. The level of
analysis is firm/business unit level. For feasibility reasons a single informant was
contacted from each firm. To mitigate validity issues executives from the target
population of firms’ commercial departments were targeted. With their tenure and
expected broad knowledge of the customer management practices deployed these
executives were believed to provide the most qualified responses.
To best reflect a target population of commercial departments in large firms
the survey population of the study was the Top 1,000 firms (based on revenues) in
Denmark and in Sweden respectively. Large firms were targeted in an attempt to
maximize the number of CPA adopters in the sample as firm size is expected to be
positively correlated with the adoption of sophisticated managerial innovations
(e.g., Bjørnenak 1997; Malmi 1999).
Prior to launch the questionnaire was pre-tested among six academic
colleagues and fourteen practitioners. This testing served the dual purpose of
validating the item scales of the constructs in the study and to avoid any
158
misunderstandings that could lead to non-sampling error in terms of response
error.
Contact information was retrieved for sales & marketing managers/directors
from 1,545 firms. For the remaining 455 firms in the survey population it was
either (a) impossible to retrieve contact information on relevant contact persons;
(b) considered too time consuming to participate in by potential contact persons;
or (c) in conflict with corporate policy to participate. So the 1,545 available
contacts were e-mailed a link to the online questionnaire.
After having distributed the questionnaire to the potential informants in the
population three rounds of follow-up e-mailings were performed to mitigate non-
sampling error in terms of non-response bias. However, as these three rounds of
follow-up e-mailings only resulted in a total gross sample of 150 completed
questionnaires corresponding to a response rate of less than 10% personal phone
calls were subsequently initiated to randomly selected firms from the survey
population in order to increase the sample. This added an additional 105
completed responses that brought the gross sample up to 255 informants yielding a
gross response rate of 17%. Out of the gross sample 11 responses had missing
observations leaving 244 relevant responses corresponding to a net response rate
of 16%. Of this sample 93 (38%) were using CPA. However, 8 observations were
excluded through listwise deletion due to one or more missing scale items
(SERV/COMP) yielding a net applicable sample of 85 CPA adopters to be used
for this study. Despite the fact that this net sample is well below the 2-300
observations usually recommended (Van der Stede, Young, and Chen 2005) it was
derived from a gross sample that falls within this recommended range so the small
size of the sample is not critical from a generalization perspective.
Although a response rate of 16% is within the range that is deemed
satisfactory for general management surveys (Churchill 1991) and within the 15-
20% range that management surveys usually achieve (Menon, Bharadwaj, and
159
Howell 1996) it is still very low compared to van der Stede et al.’s (2005)
recommendations for management accounting research. Therefore, the sample was
thoroughly analyzed for non-response bias in two ways.
First, the composition of the part of the gross sample with no missing
observations (n = 244) in terms of industry and size (revenues) was compared with
that of the total survey population (n = 2,000).
The results of this analysis are outlined in Table 1. Generally, the sample
provides a fairly good match with the survey population as a whole in terms of the
range of industries represented in the gross sample (panel A in Table 1). Only one
industry (industrial products) had an average representation in the sample that was
significantly different from its representation in the total survey population (p <
0.01; t = 3.73). Although this means that the number of industrial product firms
appears to be overrepresented in the data the sample still consists of firms from a
broad cross-section of industries as no significant differences were identified for
any of the other industries.
A test of the size distribution (annual revenues) across the sample (panel B in
Table 1) revealed no significant differences between the gross sample and the total
survey population as a whole so the gross sample appears to be representative of
the total survey population in terms of firm size distribution.
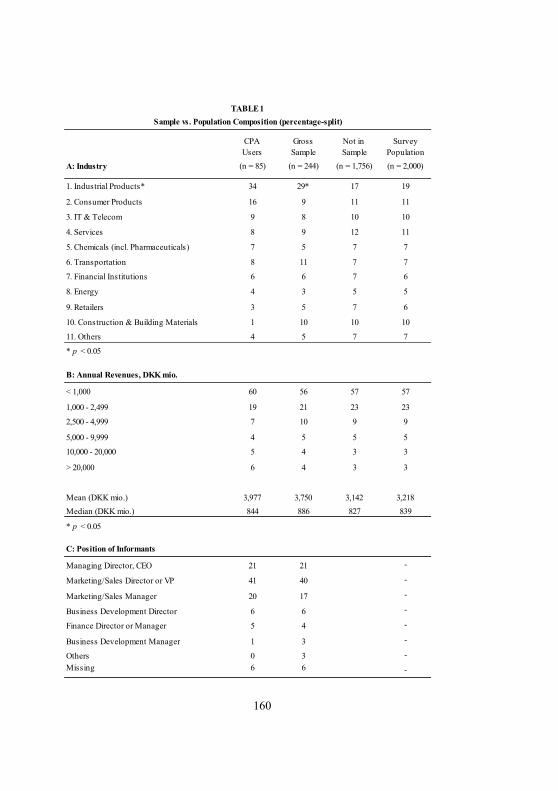
160
CPA Gross Not in SurveyUsers Sample Sample Population
A: Industry (n = 85) (n = 244) (n = 1,756) (n = 2,000)
1. Industrial Products* 34 29* 17 19
2. Consumer Products 16 9 11 11
3. IT & Telecom 9 8 10 10
4. Services 8 9 12 11
5. Chemicals (incl. Pharmaceuticals) 7 5 7 7
6. Transportation 8 11 7 7
7. Financial Institutions 6 6 7 6
8. Energy 4 3 5 5
9. Retailers 3 5 7 6
10. Construction & Building Materials 1 10 10 10
11. Others 4 5 7 7
* p < 0.05
B: Annual Revenues, DKK mio.
< 1,000 60 56 57 57
1,000 - 2,499 19 21 23 23
2,500 - 4,999 7 10 9 9
5,000 - 9,999 4 5 5 5
10,000 - 20,000 5 4 3 3
> 20,000 6 4 3 3
Mean (DKK mio.) 3,977 3,750 3,142 3,218Median (DKK mio.) 844 886 827 839
* p < 0.05
C: Position of Informants
Managing Director, CEO 21 21 -
Marketing/Sales Director or VP 41 40 -
Marketing/Sales Manager 20 17 -
Business Development Director 6 6 -
Finance Director or Manager 5 4 -
Business Development Manager 1 3 -
Others 0 3 -Missing 6 6 -
TABLE 1
Sample vs. Population Composition (percentage-split)
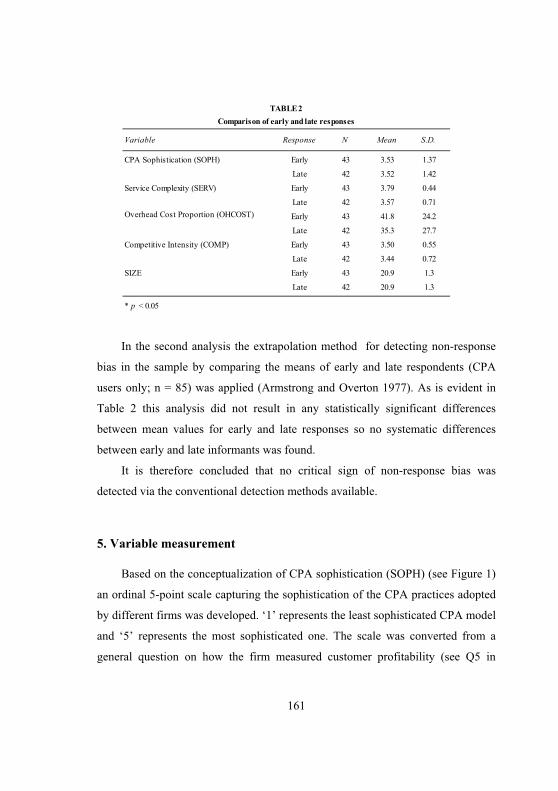
161
In the second analysis the extrapolation method for detecting non-response
bias in the sample by comparing the means of early and late respondents (CPA
users only; n = 85) was applied (Armstrong and Overton 1977). As is evident in
Table 2 this analysis did not result in any statistically significant differences
between mean values for early and late responses so no systematic differences
between early and late informants was found.
It is therefore concluded that no critical sign of non-response bias was
detected via the conventional detection methods available.
5. Variable measurement
Based on the conceptualization of CPA sophistication (SOPH) (see Figure 1)
an ordinal 5-point scale capturing the sophistication of the CPA practices adopted
by different firms was developed. ‘1’ represents the least sophisticated CPA model
and ‘5’ represents the most sophisticated one. The scale was converted from a
general question on how the firm measured customer profitability (see Q5 in
Variable Response N Mean S.D.
CPA Sophistication (SOPH) Early 43 3.53 1.37
Late 42 3.52 1.42
Service Complexity (SERV) Early 43 3.79 0.44
Late 42 3.57 0.71Overhead Cost Proportion (OHCOST) Early 43 41.8 24.2
Late 42 35.3 27.7
Competitive Intensity (COMP) Early 43 3.50 0.55
Late 42 3.44 0.72
SIZE Early 43 20.9 1.3
Late 42 20.9 1.3
* p < 0.05
TABLE 2
Comparison of early and late responses
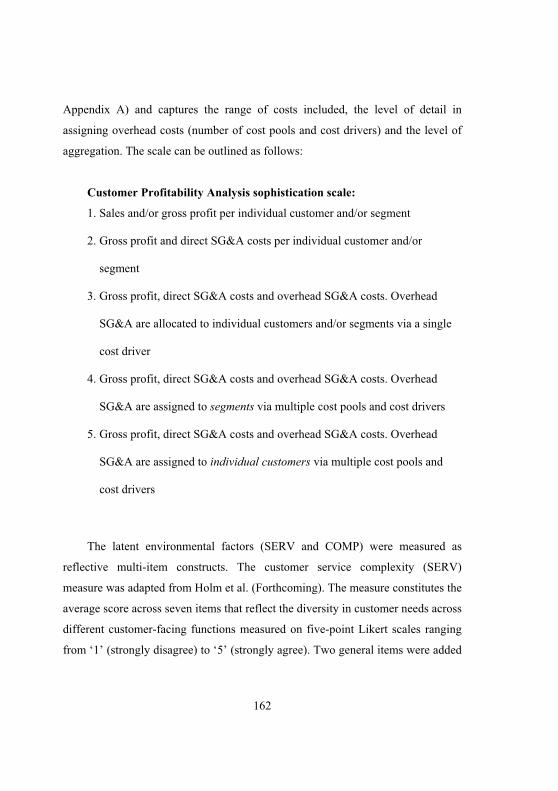
162
Appendix A) and captures the range of costs included, the level of detail in
assigning overhead costs (number of cost pools and cost drivers) and the level of
aggregation. The scale can be outlined as follows:
Customer Profitability Analysis sophistication scale:
1. Sales and/or gross profit per individual customer and/or segment
2. Gross profit and direct SG&A costs per individual customer and/or
segment
3. Gross profit, direct SG&A costs and overhead SG&A costs. Overhead
SG&A are allocated to individual customers and/or segments via a single
cost driver
4. Gross profit, direct SG&A costs and overhead SG&A costs. Overhead
SG&A are assigned to segments via multiple cost pools and cost drivers
5. Gross profit, direct SG&A costs and overhead SG&A costs. Overhead
SG&A are assigned to individual customers via multiple cost pools and
cost drivers
The latent environmental factors (SERV and COMP) were measured as
reflective multi-item constructs. The customer service complexity (SERV)
measure was adapted from Holm et al. (Forthcoming). The measure constitutes the
average score across seven items that reflect the diversity in customer needs across
different customer-facing functions measured on five-point Likert scales ranging
from ‘1’ (strongly disagree) to ‘5’ (strongly agree). Two general items were added
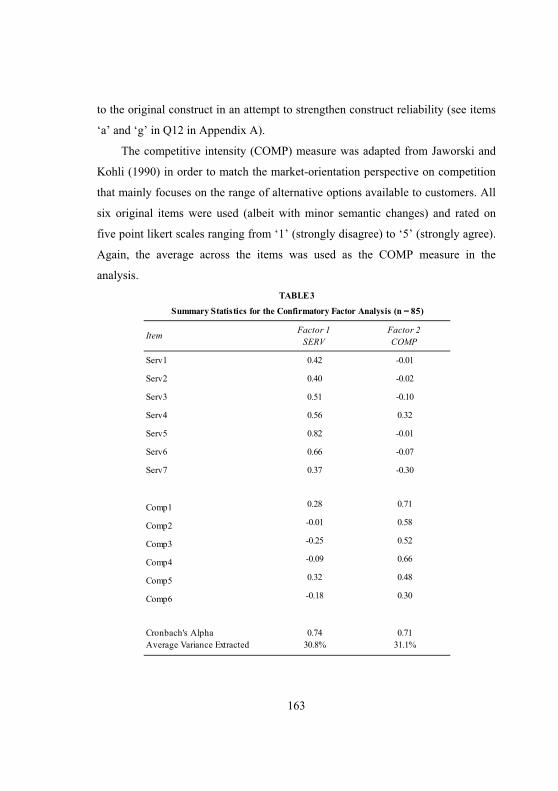
163
to the original construct in an attempt to strengthen construct reliability (see items
‘a’ and ‘g’ in Q12 in Appendix A).
The competitive intensity (COMP) measure was adapted from Jaworski and
Kohli (1990) in order to match the market-orientation perspective on competition
that mainly focuses on the range of alternative options available to customers. All
six original items were used (albeit with minor semantic changes) and rated on
five point likert scales ranging from ‘1’ (strongly disagree) to ‘5’ (strongly agree).
Again, the average across the items was used as the COMP measure in the
analysis.
Serv1
Serv2
Serv3
Serv4
Serv5
Serv6
Serv7
Comp1
Comp2
Comp3
Comp4
Comp5
Comp6
Cronbach's AlphaAverage Variance Extracted
0.48
0.7430.8%
Factor 1
0.7131.1%
0.42
0.40
0.51
0.56
0.82
0.66
0.28
-0.01
-0.25
-0.09
0.37
TABLE 3
Summary Statistics for the Confirmatory Factor Analysis (n = 85)
SERV COMPFactor 2Item
-0.18
-0.30
0.30
0.32
-0.01
-0.02
-0.10
0.32
-0.01
-0.07
0.71
0.58
0.52
0.66
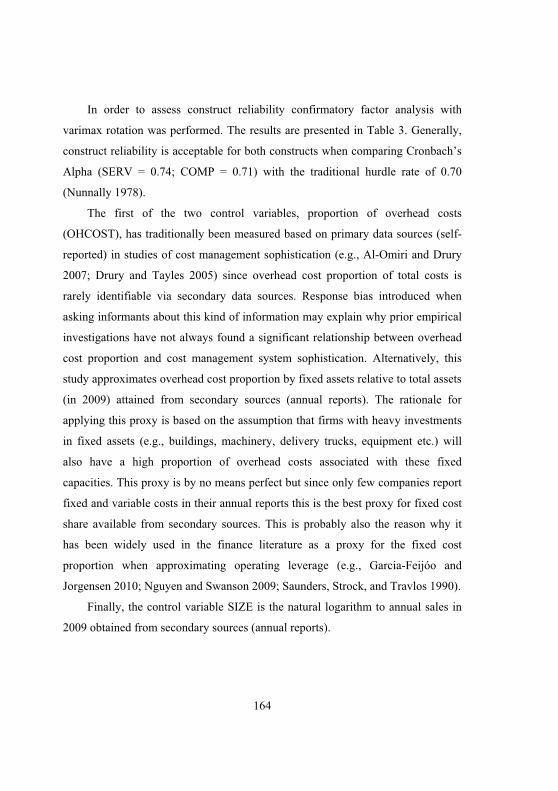
164
In order to assess construct reliability confirmatory factor analysis with
varimax rotation was performed. The results are presented in Table 3. Generally,
construct reliability is acceptable for both constructs when comparing Cronbach’s
Alpha (SERV = 0.74; COMP = 0.71) with the traditional hurdle rate of 0.70
(Nunnally 1978).
The first of the two control variables, proportion of overhead costs
(OHCOST), has traditionally been measured based on primary data sources (self-
reported) in studies of cost management sophistication (e.g., Al-Omiri and Drury
2007; Drury and Tayles 2005) since overhead cost proportion of total costs is
rarely identifiable via secondary data sources. Response bias introduced when
asking informants about this kind of information may explain why prior empirical
investigations have not always found a significant relationship between overhead
cost proportion and cost management system sophistication. Alternatively, this
study approximates overhead cost proportion by fixed assets relative to total assets
(in 2009) attained from secondary sources (annual reports). The rationale for
applying this proxy is based on the assumption that firms with heavy investments
in fixed assets (e.g., buildings, machinery, delivery trucks, equipment etc.) will
also have a high proportion of overhead costs associated with these fixed
capacities. This proxy is by no means perfect but since only few companies report
fixed and variable costs in their annual reports this is the best proxy for fixed cost
share available from secondary sources. This is probably also the reason why it
has been widely used in the finance literature as a proxy for the fixed cost
proportion when approximating operating leverage (e.g., Garcia-Feijóo and
Jorgensen 2010; Nguyen and Swanson 2009; Saunders, Strock, and Travlos 1990).
Finally, the control variable SIZE is the natural logarithm to annual sales in
2009 obtained from secondary sources (annual reports).
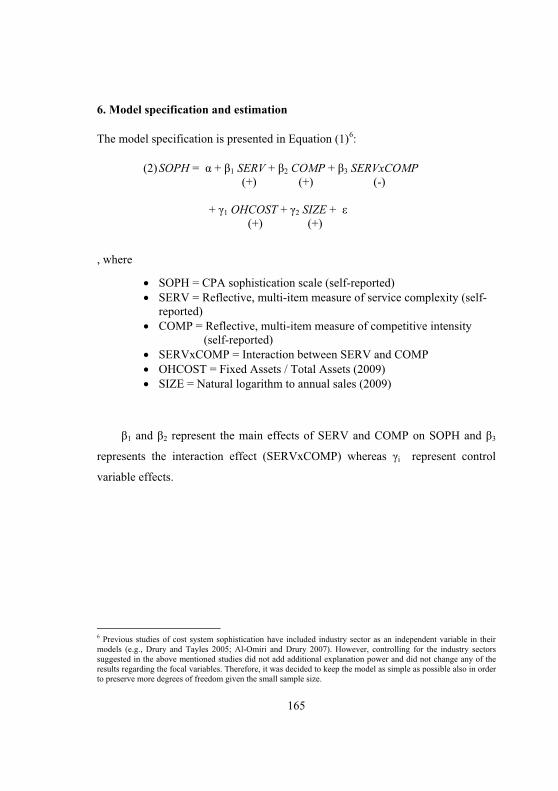
165
6. Model specification and estimation
The model specification is presented in Equation (1)5F
6:
(2)SOPH = � + �1 SERV + �2 COMP + �3 SERVxCOMP (+) (+) (-) + �1 OHCOST + �2 SIZE + � (+) (+)
, where
� SOPH = CPA sophistication scale (self-reported) � SERV = Reflective, multi-item measure of service complexity (self-
reported) � COMP = Reflective, multi-item measure of competitive intensity
(self-reported) � SERVxCOMP = Interaction between SERV and COMP � OHCOST = Fixed Assets / Total Assets (2009) � SIZE = Natural logarithm to annual sales (2009)
�1 and �2 represent the main effects of SERV and COMP on SOPH and �3
represents the interaction effect (SERVxCOMP) whereas �i represent control
variable effects.
6 Previous studies of cost system sophistication have included industry sector as an independent variable in their models (e.g., Drury and Tayles 2005; Al-Omiri and Drury 2007). However, controlling for the industry sectors suggested in the above mentioned studies did not add additional explanation power and did not change any of the results regarding the focal variables. Therefore, it was decided to keep the model as simple as possible also in order to preserve more degrees of freedom given the small sample size.
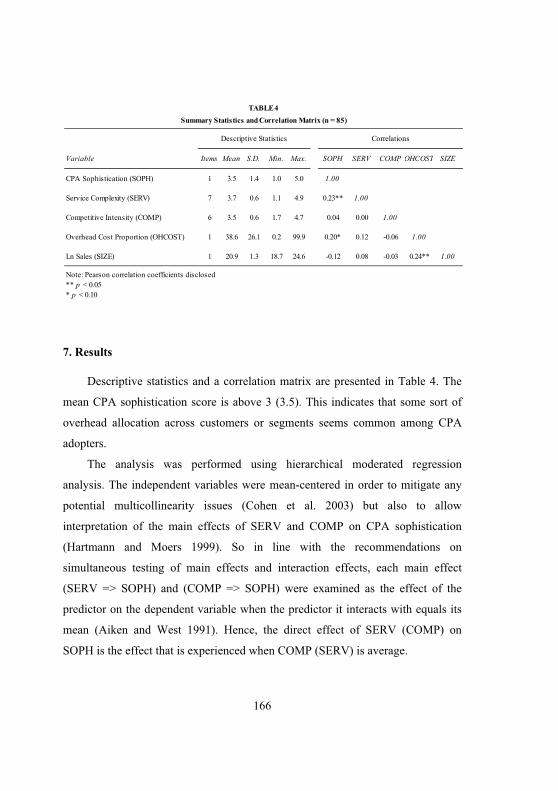
166
7. Results
Descriptive statistics and a correlation matrix are presented in Table 4. The
mean CPA sophistication score is above 3 (3.5). This indicates that some sort of
overhead allocation across customers or segments seems common among CPA
adopters.
The analysis was performed using hierarchical moderated regression
analysis. The independent variables were mean-centered in order to mitigate any
potential multicollinearity issues (Cohen et al. 2003) but also to allow
interpretation of the main effects of SERV and COMP on CPA sophistication
(Hartmann and Moers 1999). So in line with the recommendations on
simultaneous testing of main effects and interaction effects, each main effect
(SERV => SOPH) and (COMP => SOPH) were examined as the effect of the
predictor on the dependent variable when the predictor it interacts with equals its
mean (Aiken and West 1991). Hence, the direct effect of SERV (COMP) on
SOPH is the effect that is experienced when COMP (SERV) is average.
Variable Items Mean S.D. Min. Max. SOPH SERV COMP OHCOST SIZE
CPA Sophistication (SOPH) 1 3.5 1.4 1.0 5.0 1.00
Service Complexity (SERV) 7 3.7 0.6 1.1 4.9 0.23** 1.00
Competitive Intensity (COMP) 6 3.5 0.6 1.7 4.7 0.04 0.00 1.00
Overhead Cost Proportion (OHCOST) 1 38.6 26.1 0.2 99.9 0.20* 0.12 -0.06 1.00
Ln Sales (SIZE) 1 20.9 1.3 18.7 24.6 -0.12 0.08 -0.03 0.24** 1.00
Note: Pearson correlation coefficients disclosed** p < 0.05* p < 0.10
Descriptive Statistics
Summary Statistics and Correlation Matrix (n = 85)
TABLE 4
Correlations
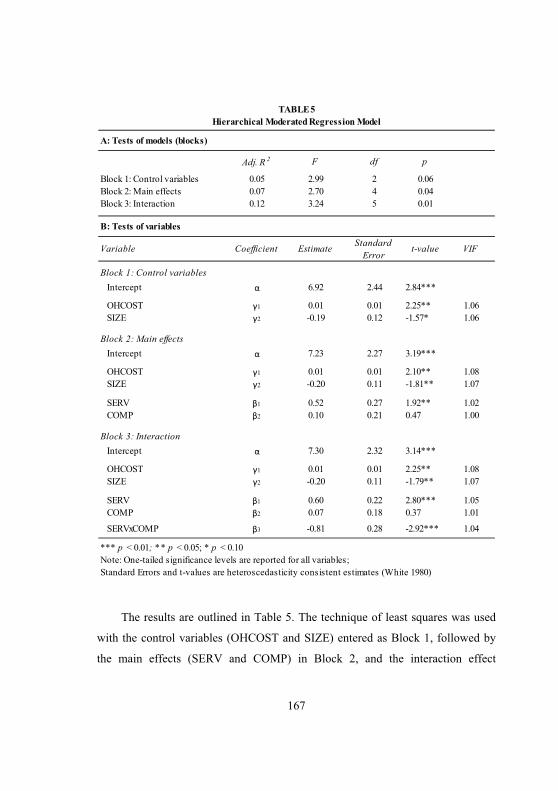
167
The results are outlined in Table 5. The technique of least squares was used
with the control variables (OHCOST and SIZE) entered as Block 1, followed by
the main effects (SERV and COMP) in Block 2, and the interaction effect
Adj. R 2 F df p
Block 1: Control variables 0.05 2.99 2 0.06Block 2: Main effects 0.07 2.70 4 0.04Block 3: Interaction 0.12 3.24 5 0.01
Variable Coefficient Estimate Standard Error
t-value VIF
Block 1: Control variables Intercept � 6.92 2.44 2.84***
OHCOST �1 0.01 0.01 2.25** 1.06 SIZE �2 -0.19 0.12 -1.57* 1.06
Block 2: Main effects Intercept � 7.23 2.27 3.19***
OHCOST �1 0.01 0.01 2.10** 1.08 SIZE �2 -0.20 0.11 -1.81** 1.07
SERV �1 0.52 0.27 1.92** 1.02 COMP �2 0.10 0.21 0.47 1.00
Block 3: Interaction Intercept � 7.30 2.32 3.14***
OHCOST �1 0.01 0.01 2.25** 1.08 SIZE �2 -0.20 0.11 -1.79** 1.07
SERV �1 0.60 0.22 2.80*** 1.05 COMP �2 0.07 0.18 0.37 1.01
SERVxCOMP �3 -0.81 0.28 -2.92*** 1.04
*** p < 0.01; * * p < 0.05; * p < 0.10Note: One-tailed significance levels are reported for all variables;Standard Errors and t-values are heteroscedasticity consistent estimates (White 1980)
B: Tests of variables
A: Tests of models (blocks)
TABLE 5Hierarchical Moderated Regression Model
168
(SERVxCOMP) in Block 3. One-tailed tests were generally performed as
directional hypotheses are being tested. In order to detect any potential
multiconllinearity issues variance inflation factors (VIF) were analyzed in parallel
with the regression results. Since all VIF’s are close to 1 in each of the three steps
multicollinearity does not seem to be an issue in our regressions.
To assess hypotheses H1 and H2 regarding the main effects of customer
service complexity (SERV) and competitive intensity (COMP) on CPA model
sophistication (SOPH) the results in Block 2 were analyzed. Both H1 and H2
suggest positive associations between the independent variable (SERV and
COMP) and SOPH. However, the results in Block 2 only provide support for H1
(�1 = 0.52, p < 0.05) whereas the positive association found between COMP and
SOPH (H2) was not significant. Model fit does not decline from Block 1 to Block
2 and the F-test turns from insignificant in Block 1 to significant in Block 2 (p <
0.05). This provides support for including SERV and COMP in the model. Finally,
the results from Block 2 turn out to be robust in Block 3 when the interaction term
is introduced. In fact the relationship between SERV and SOPH (H1) is even
stronger in Block 3 (�1 = 0.60, p < 0.01). This step also provides support for H3 as
the relationship between the interaction variable (SERVxCOMP) and SOPH is
significant (�3 = -0.81, p < 0.01). Again, the model still fits the data and r2
(adjusted) jumps from 0.07 to 0.12.
Regarding the control variables both are significant throughout the three steps
with the strongest effect in Block 3. In this final step a significant positive
relationship between overhead cost proportion (OHCOST) and SOPH is found (�1
= 0.01, p < 0.05) as expected. However, a significant negative association is found
between SIZE and SOPH (�2 = -0.20, p < 0.05) which is contrary to the expected.
Overall hypotheses H1 and H3 were supported in the hierarchical regression
analysis whereas H2 was not.
169
8. Discussion and conclusions
This study was performed to shed more light on how firms adapt their
customer-based cost management systems to the task environment in which they
operate. The purpose was to validate the customer service complexity construct
empirically and to explore its influence on CPA model sophistication in
conjunction with competitive intensity. Five main implications for research and
practice emerge.
First, a novel conceptualization of the CPA model sophistication construct is
developed. Future cross-sectional studies of customer accounting technique
sophistication can use this conceptualization when operationalizing their CPA
constructs. Furthermore, this conceptualization could provide a useful addition to
the CPA curriculum in management accounting textbooks – a curriculum that is
currently marginal both in terms of the number of textbooks covering CPA as well
as the amount of space allocated to CPA in the textbooks that do incorporate
customer profitability topics (Gleaves et al. 2008).
Second, the data provide empirical support in favor of the customer service
complexity construct being a valid and reliable construct. Hence, future studies in
management accounting as well as in marketing can adopt this customer service
complexity measure as part of contingency-based research designs investigating
customer-related relationships.
Third, the study adds to previous contingency-based research on customer
accounting practices by demonstrating how customer service complexity
influences CPA model sophistication. The findings suggest that firms adapt CPA
model sophistication to the degree of diversity in customer service requirements
they encounter. Therefore, customer service complexity constitutes an important
expansion of the original customer accounting contingency-framework proposed
by Guilding and McManus (2002), and should be incorporated in future research
170
designs investigating the determinants of customer accounting techniques.
Additionally, this finding adds further empirical support to contingency-based cost
system research where complexity/diversity has been shown to influence cost
system sophistication (e.g., Cagwin and Bouwman 2002; Drury and Tayles 2005;
Malmi 1999).
Fourth, competitive intensity seems to play a more subtle role when it comes
to the design of customer-based cost systems compared to previous research on
product cost system sophistication. Contrary to what was expected no statistically
significant relationship was found between competitive intensity and CPA model
sophistication. However, a significant negative moderating effect on the positive
association between customer service complexity and CPA model sophistication
was found. Consequently, the degree of customer service complexity encountered
matters more in non-competitive environments than in environments characterized
by intense competition. This not only has implications for future research
expanding the customer accounting contingency-framework, but also highlights
the potential of exploring interaction effects among contextual variables in
selection fit contingency studies.
Fifth, the control variables in the analysis give rise to a couple of interesting
observations. The positive association between overhead cost proportion in the
cost structure and cost system sophistication is supported. Most previous research
has suggested such a relationship but the empirical results have been weak. Future
studies could look into whether this relationship is due to higher importance of
overhead when it comes to customer-related cost components, whether the fixed
assets relative to total assets proxy provides a better proxy for the proportion of
overhead costs in firms’ cost structures than previous measures or whether other
explanations can be identified. Additionally, the negative relationship between
size and CPA model sophistication was an interesting and surprising finding
considering that prior research suggests that larger firms will adopt more
171
sophisticated cost management systems. The reasons for this deviation when it
comes to customer-based cost management systems like CPA provide an
interesting path for future research. Research from the organizational innovation
literature suggests a more ambiguous relationship between size and innovative
capabilities of organizations (Damanpour and Schneider 2006; Hitt, Hoskisson,
and Ireland 1990; Mintzberg 1979; Nord and Tucker 1987). This may provide a
productive source of inspiration to investigate the influence of latent constructs
that are expected to correlate with firm size (e.g., innovative capabilities, financial
slack, know-how of human resources, inertia, managerial conservatism, degree of
cross-functional coordination etc.) on the sophistication of customer-based cost
systems.
In addition to the traditional limitations related to survey research the
dichotomous identification of CPA adopters chosen in this study may result in
selection bias. So, even though careful consideration was given to the
identification process (three first questions in questionnaire – see Appendix A) and
to providing a broad and unambiguous definition of CPA there may still be CPA
users that were not included in the sample. Although this is probably mainly a
concern when interpreting the adoption rate a larger sample of CPA users could
perhaps have been secured by confronting all informants with a multi-item
sophistication measurement scale. Future studies related to CPA model
sophistication could apply this approach.
Another limitation of this study is the sole focus on contingency factors in the
environment. This focus was selected as a viable starting point within a relatively
undeveloped field of research. However, as contingency-based research on
customer accounting is scarce a better understanding of the organizational
contingency factors that may influence CPA sophistication is required in order to
identify relevant organizational constructs and develop theory-based propositions
about their interrelations. A deeper understanding of these conditions can be
172
achieved through case studies as has also been suggested in the product cost
sophistication literature (Al-Omiri and Drury 2007). One way could be to compare
two firms operating in similar environments regarding competition and customer
service complexity that have adopted CPA models that are substantially different
in terms of sophistication. A useful frame of reference could be Chenhall’s (2003)
review study of contingency factors in management control research which
identified five contingency dimensions in addition to the environment:
Technology, organizational structure, strategy, culture and size (which is
controlled for in this study). Case-based research could be beneficial in order to
gain more thorough knowledge of the complex intra-organizational relationships
that may influence the process of implementing and using customer profitability
measurement models in organizations. Such case-based findings could potentially
help exploring the relative importance of the above contingency factors with
regards to the design of customer profitability measurement model sophistication
as well. These insights could, in turn, provide a good starting point for developing
measures and propositions that can later be empirically tested as well as general
insights on how customer profitability measurement models are used in practice.
173
References
Achrol, Ravi S. and Louis W. Stern (1988), "Environmental Determinants of Decision-Making Uncertainty in Marketing Channels," Journal of Marketing Research, 25 (February), 36-50.
Aiken, Leona S. and Raymond R. West (1991), Multiple Regression: Testing and Interpreting Interactions. Thousand Oaks, CA: Sage Publications Inc.
Al-Omiri, Mohammed and Colin Drury (2007), "A Survey of Factors Influencing the Choice of Product Costing Systems in UK Organizations," Management Accounting Research, 18 (4), 399-424.
Andon, Paul, Jane A. Baxter, and Graham Bradley (2003), "Calculating the Economic Value of Customers to an Organization," Chartered Accountants Journal of New Zealand, 82 (3), 12-28.
Armstrong, J. S. and Terry S. Overton (1977), "Estimating Nonresponse Bias in Mail Surveys," Journal of Marketing Research, 16 (August), 396-402.
Ax, Christian, Jan Greve, and Ulf Nilsson (2008), "The Impact of Competition and Uncertainty on the Adoption of Target Costing," International Journal of Production Economics, 115 (9), 92-103.
Bellis-Jones, Robin (1989), "Customer Profitability Analysis," Management Accounting, 67 (2), 26-8.
Bjørnenak, Trond (1997), "Diffusion and Accounting: The Case of ABC in Norway," Management Accounting Research, 8 (1), 3-17.
Booth, P. and F. Giacobbe (1998), "The Impact of Demand and Supply Factors in the Diffusion of Accounting Innovations: The Adoption of Activity-Based Costing in Australian Manufacturing Firms," Management Accounting Conference, (Sydney, Australia), .
Brierley, John A. (2008), "Toward an Understanding of the Sophistication of Product Costing Systems," Journal of Management Accounting Research, 20 (December), 61-78.
Bruns, William J. and John H. Waterhouse (1975), "Budgetary Control and Organization Structure," Journal of Accounting Research, 13 (2), 177-203.
174
Cagwin, Douglass and Marinus J. Bouwman (2002), "The Association between Activity-Based Costing and Improvement in Financial Performance," Management Accounting Research, 13 (1), 1-39.
Cardinaels, Eddy, Filip Roodhooft, and Luk Warlop (2004), "Customer Profitability Analysis Reports for Resource Allocation: The Role of Complex Marketing Environments," Abacus, 40 (2), 238-58.
Chenhall, Robert H. (2003), "Management Control Systems Design within its Organizational Context: Findings from Contingency-Based Research and Directions for the Future," Accounting, Organizations & Society, 28 (2), 127-68.
Churchill, Gilbert A. (1991), Marketing Research: Methodological Foundations. London, UK: Dryden Press.
CIMA (2008), "Corporate Value Creation: Customer Value 2008 Report," .
Clarke, Peter J., Nancy T. Hill, and Kevin Stevens (1999), "Activity-Based Costing in Ireland: Barriers to, and Opportunities for, Change," Critical Perspectives on Accounting, 10 (8), 443-68.
Cohen, Jacob, Patricia Cohen, Stephen G. West, and Leona S. Aiken (2003), Applied Multiple Regression/Correlation Analysis for the Behavioral Sciences. Mahwah, NJ: Lawrence Earlbaum Associates Inc.
Cooper, Robin (1988), "The Rise of Activity-Based costing—part Two: When do I Need an Activity-Based System?" Journal of Cost Management, Summer, 41-8.
Cooper, Robin and Robert S. Kaplan (1991), "Profit Priorities from Activity-Based Costing," Harvard Business Review, 69 (May-June), 130-5.
Damanpour, Fariborz and Marguerite Schneider (2006), "Phases of the Adoption of Innovation in Organizations: Effects of Environment, Organization and Top Managers," British Journal of Management, 17 (3), 215-36.
Dillman, D. (1999), Mail and Internet Surveys: The Tailored Design Method. New York, NY: Wiley.
Drazin, Robert and Andrew H. Van de Ven (1985), "Alternative Forms of Fit in Contingency Theory," Administrative Science Quarterly, 30 (4), 514-39.
175
Drury, Colin and Mike Tayles (2005), "Explicating the Design of Overhead Absorption Procedures in UK Organizations," The British Accounting Review, 37 (1), 47-84.
Foster, George and S. M. Young (1997), "Frontiers of Management Accounting Research," Journal of Management Accounting Research, 9, 63-77.
Garcia-Feijóo, Luis and Randy D. Jorgensen (2010), "Can Operating Leverage be the Cause of the Value Premium?" Financial Management, 39 (3), 1127-54.
Gleaves, Robin, Jamie Burton, Jan Kitshoff, Ken Bates, and Mark Whittington (2008), "Accounting is from Mars, Marketing is from Venus: Establishing Common Ground for the Concept of Customer Profitability," Journal of Marketing Management, 24 (7), 825-45.
Goebel, Daniel J., Greg W. Marshall, and William B. Locander (1998), "Activity-Based Costing: Accounting for a Market Orientation," Industrial Marketing Management, 27 (11), 497-510.
Guerreiro, Reinaldo, Sé Bio, Elvira Vazquez, and Villamor Merschmann (2008), "Cost-to-Serve Measurement and Customer Profitability Analysis," International Journal of Logistics Management, 19 (12), 389-407.
Guilding, Chris and Lisa McManus (2002), "The Incidence, Perceived Merit and Antecedents of Customer Accounting: An Exploratory Note," Accounting, Organizations & Society, 27 (1/2), 45-59.
Gupta, Sunil, Dominique M. Hanssens, Bruce G. S. Hardie, Wiliam Kahn, V. Kumar, Nathaniel Lin, and Nalini R. S. Sriram (2006), "Modeling Customer Lifetime Value," Journal of Service Research, 9 (2), 139-55.
Hartmann, Frank G. (2005), "The Impact of Departmental Interdependencies and Management Accounting System use on Subunit Performance: A Comment," European Accounting Review, 14 (2), 329-34.
Hartmann, Frank G. H. and Frank Moers (1999), "Testing Contingency Hypotheses in Budgetary Research: An Evaluation of the use of Moderated Regression Analysis," Accounting, Organizations & Society, 24 (4), 291-315.
Helgesen, Øyvind (2007), "Customer Accounting and Customer Profitability Analysis for the Order Handling Industry - A Managerial Accounting Approach," Industrial Marketing Management, 36 (6), 757-69.
176
Hitt, Michael A., Robert E. Hoskisson, and R. D. Ireland (1990), "Mergers and Acquisitions and Managerial Commitment to Innovation in M-FormFirms," Strategic Management Journal, 11 (Summer), 29-47.
Holm, Morten, V. Kumar, and Carsten Rohde (Forthcoming), "Measuring Customer Profitability in Complex Environments: An Interdisciplinary Contingency Framework," Journal of the Academy of Marketing Science, .
Howell, Robert A. and Stephen R. Soucy (1990), "Customer Profitability: As Critical as Product Profitability," Management Accounting, 72 (4), 43-7.
Innes, John and Falconer Mitchell (1995), "A Survey of Activity-Based Costing in the U.K.'s Largest Companies," Management Accounting Research, 6 (2), 137-53.
Kaplan, Robert S. and Robin Cooper (1998), Cost and Effect: Using Integrated Cost Systems to Drive Profitability and Performance. Boston, MA: Harvard Business School Press.
Kaplan, Robert S. and V. G. Narayanan (2001), "Measuring and Managing Customer Profitability," Journal of Cost Management, 15 (5), 5-15.
Karmarkar, Uday S., Philip J. Lederer, and Jerold L. Zimmerman (1990), "Choosing Manufacturing Production Control and Cost Accounting Systems," in Measures for Manufacturing Excellence, Robert S. Kaplan, ed. Boston, MA: Harvard University Press, 353-396.
Khandwalla, Pradip N. (1972), "The Effect of Different Types of Competition on the use of Management Controls," Journal of Accounting Research, 10 (2), 275-85.
Khandwalla, Prahid N. (1977), The Design of Organizations. New York, NY: Harcourt Brace Jovanovich.
Kohli, Ajay K. and Bernard J. Jaworski (1990), "Market Orientation: The Construct, Research Propositions, and Managerial Implications," Journal of Marketing, 54 (April), 1-18.
Krumwiede, Kip R. (1998), "ABC: Why it's Tried and how it Succeeds," Management Accounting, 79 (9), 32-7.
Kumar, V., Eli Jones, Rajkumar Venkatesan, and Robert P. Leone (2011), "Is Market Orientation a Source of Sustainable Competitive Advantage Or Simply the Cost of Competing?" Journal of Marketing, 75 (January), 16-30.
177
Libby, Theresa and John H. Waterhouse (1996), "Predicting Change in Management Accounting Systems," Journal of Management Accounting Research, 8, 137-50.
Malmi, Teemu (1999), "Activity-Based Costing Diffusion Across Organizations: An Exploratory Empirical Analysis of Finnish Firms," Accounting, Organizations and Society, 24 (8), 649-72.
Malmi, Teemu, Mika Raulas, and Jussi Sehm (2004), "An Empirical Study on Customer Profitability Accounting, Customer Orientation and Business Unit Performance," (EAA Conference in Prague), .
McManus, Lisa (2007), "The Construction of a Segmental Customer Profitability Analysis," Journal of Applied Management Accounting Research, 5 (2), 59-74.
McManus, Lisa and Chris Guilding (2008), "Exploring the Potential of Customer Accounting: A Synthesis of the Accounting and Marketing Literatures," Journal of Marketing Management, 24 (7), 771-95.
Menon, Anil, Sundar G. Bharadwaj, and Roy Howell (1996), "The Quality and Effectiveness of Marketing Strategy: Effects of Functional and Dysfunctional Conflict in Intraorganizational Relationships," Journal of the Academy of Marketing Science, 24 (4), 299-313.
Merchant, Kenneth A. (1981), "The Design of the Corporate Budgeting System: Influences on Managerial Behavior and Performance," The Accounting Review, 56 (4), 813-29.
Mia, Lokman and Brian Clarke (1999), "Market Competition, Management Accounting Systems and Business Unit Performance," Management Accounting Research, 10 (2), 137-58.
Mintzberg, Henry (1979), The Structuring of Organizations. Englewood Cliffs, NJ: Prentice-Hall.
Mulhern, Francis J. (1999), "Customer Profitability Analysis: Measurement, Concentration, and Research Directions," Journal of Interactive Marketing, 13 (1), 25-40.
Nguyen, Giao X. and Peggy E. Swanson (2009), "Firm Characteristics, Relative Efficiency, and Equity Returns," Journal of Financial and Quantitative Analysis, 44 (1), 213-36.
178
Niraj, Rakesh, Mahendra Gupta, and Chakravarthi Narasimhan (2001), "Customer Profitability in a Supply Chain," Journal of Marketing, 65 (July), 1-16.
Noone, Breffni and Peter Griffin (1999), "Managing the Long-Term Profit Yield from Market Segments in a Hotel Environment: A Case Study on the Implementation of Customer Profitability Analysis," International Journal of Hospitality Management, 18 (2), 111-28.
Nord, Walter R. and Sharon Tucker (1987), Implementing Routine and Radical Innovations. Lexington, MA: Lexington Books.
Nunnally, Jum C. (1978), Psychometric Theory. New York, NY: McGraw-Hill.
Otley, David T. (1980), "The Contingency Theory of Management Accounting: Achievement and Prognosis," Accounting, Organizations & Society, 5 (10), 413-28.
Pfeifer, Phillip E., Mark E. Haskins, and Robert M. Conroy (2005), "Customer Lifetime Value, Customer Profitability, and the Treatment of Acquisition Spending," Journal of Managerial Issues, 17 (1), 11-25.
Saunders, Anthony, Elizabeth Strock, and Nickolaos G. Travlos (1990), "Ownership Structure, Deregulation, and Bank Risk Taking," The Journal of Finance, 45 (2), 643-54.
Shapiro, Benson P., V. K. Rangan, Rowland T. Moriarty, and Elliot B. Ross (1987), "Manage Customers for Profits (Not just Sales)," Harvard Business Review, 65 (September-October), 101-8.
Sharfman, Mark P. and James W. Dean (1991), "Conceptualizing and Measuring the Organizational Environment: A Multidimensional Approach," Journal of Management, 17 (4), 681-700.
Sheth, Jagdish N., Rajendra S. Sisodia, and Arun Sharma (2000), "The Antecedents and Consequences of Customer-Centric Marketing," Journal of the Academy of Marketing Science, 28 (1), 55-66.
Smith, Malcolm and Shane Dikolli (1995), "Customer Profitability Analysis: An Activity-Based Costing Approach," Managerial Auditing Journal, 10 (7), 3-7.
Sohi, Ravipreet S. (1996), "The Effects of Environmental Dynamism and Heterogeneity on Sales People's Role Perceptions, Performance and Job Satisfaction," European Journal of Marketing, 30 (7), 49-69.
179
Storbacka, Kaj (1997), "Segmentation Based on Customer Profitability - Retrospective Analysis of Retail Bank Customer Bases," Journal of Marketing Management, 13 (5), 479-92.
Van der Stede, Wim A., S. M. Young, and Clara X. Chen (2005), "Assessing the Quality of Evidence in Empirical Management Accounting Research: The Case of Survey Studies," Accounting, Organizations and Society, 30 (11), 655-84.
van Raaij, Erik M., Maarten J. A. Vernooij, and Sander van Triest (2003), "The Implementation of Customer Profitability Analysis: A Case Study," Industrial Marketing Management, 32 (7), 573-83.
Villanueva, Julian and Dominique M. Hanssens (2006), "Customer Equity: Measurement, Management and Research Opportunities," Foundations & Trends in Marketing, 1 (1), 1-95.
Wanous, John P., Arnon E. Reichers, and Michael J. Hudy (1997), "Overall Job Satisfaction: How Good are Single-Item Measures?" Journal of Applied Psychology, 82 (2), 247-52.
Ward, Keith (1992), "Accounting for Marketing Strategies," in Management Accounting Handbook, Colin Drury, ed. Oxford, UK: Butterworth-Heinemann, 228-246.
180
8. 7BAppendix A: Questionnaire
INTRODUCTION
Welcome!
Before you proceed please review two important general definitions that apply throughout the survey:
1. The term “firm” refers to the particular business unit in which you are employed.
2. The term “customer” refers to the buyer entity which your firm has a direct buyer-seller relationship with i.e.:
(a) Institutional customers for Business-to-Business (B2B) firms; (b) End-consumers for Business-to-Consumer (B2C) firms; (c) Intermediary channel members for Business-to-Business-to-Consumer
(B2B2C) firms that reach end-consumers through these intermediaries. You can easily navigate back and forth in the survey via the “Prev” (back) and “Next” (forward) buttons at the bottom of each screen. If you, for some reason, wish to take a break from the survey, clicking the “Exit this survey” link in the top right hand corner will allow you to re-access the survey again at any time and resume from where you left via the link in the e-mail.
Whenever you are ready to start the survey, please proceed to the first question by clicking the “Next” button below.
SECTION 1 – KNOWLEDGE AND USE OF CUSTOMER PROFITABILITY MEASUREMENT MODELS
Section 1a: Past/Current Customer Profitability (CP)
Q1. Are you aware of past/current customer profitability (CP) measurement as a tool for supporting resource allocation decisions across customers?
In responding please consider the following:
181
Past/current customer profitability (CP) measures the revenues earned from and/or the costs realized in a customer relationship during some specific time period (past or current). Hence, any measurement of past/current customer-related revenues or profits is in this survey to be considered as customer profitability (CP) measurement.
[If “yes” in Q1 – informant is redirected to Q2; If “no” in Q1 – informant is redirected to Q6]
Q2. Is your firm currently using customer profitability (CP) measurement, have you ever tried using it, or have you at some point over the past three years considered to start using it to support resource allocation decisions across customers?
[If “yes” in Q2 – informant is redirected to Q3; If “no” in Q2 – informant is redirected to Q6]
Q3. Please specify the current status on customer profitability (CP) usage at your firm:
a. We're currently considering whether to start using CP at our firm but have not reached a decision yet
b. We're currently running a CP trial which will help decide whether to implement CP at our firm
c. We currently use CP at our firm or have decided to start using it in the near future
d. We have considered to start using CP but eventually decided not to implement CP at our firm
e. We have tried using CP in the past but decided to abandon it again
[If ‘c’ in Q3 – informant is redirected to Q4; In all other cases: informant is redirected to Q6]
Q4. Please specify what year you started using customer profitability (CP) at your firm.

182
Q5. Please specify how the following P&L-components are accounted for when measuring customer profitability (CP) at your firm (you are encouraged to consult relevant colleagues (e.g., in finance/accounting) if you are not sure how CP is measured at your firm): [check all that apply]
Segment- Individual Not at level customer- all level
a. Revenues are accounted for at...
b. COGS* are accounted for at…
*COGS: Cost Of Goods Sold i.e., all costs related to producing your firm's core offerings (products/services)
c. SG&A* that are DIRECTLYMEASURABLE** are accounted for at…
*SG&A: Sales, General & Administrative costs incurred from activities not related to producing your firm's products/services
**Directly measurable: Resources are dedicated to a specific customer/segment and costs can therefore be traced directly from the dedicated resource to the customer/segment (e.g., direct mailings, customer promotions, key account managers, segment managers etc.)
183
d. Some or all SG&A* that are NOTMEASURABLE* are allocated in proportion to a SINGLE COSTDRIVER (e.g., sales volume) to..
*SG&A: Sales, General & Administrative costs incurred from activities not related to producing your firm's products/services
**Not measurable: Resources are dedicated to multiple customers/segments and costs must therefore be allocated via cost drivers (e.g., marketing research staff, sales personnel, order-handling departments, logistics setup, hotline support etc.)
e. Some or all SG&A* that are NOTMEASURABLE** are assigned based on multiple cost pools and cost drivers*(e.g. via Activity-Based Costing) to...
*SG&A: Sales, General & Administrative costs incurred from activities not related to producing your firm's products/services
**Not measurable: Resources are dedicated to multiple customers/segments and costs must therefore be allocated via cost drivers (e.g., marketing research staff, sales personnel, order-handling departments, logistics setup, hotline support etc.)
´
Section 1b: Forward-Looking Customer Lifetime Value (CLV)
Q6. Are you aware of forward-looking customer lifetime value (CLV) estimation as a tool for supporting resource allocation decisions across customers?
In responding please consider the following:
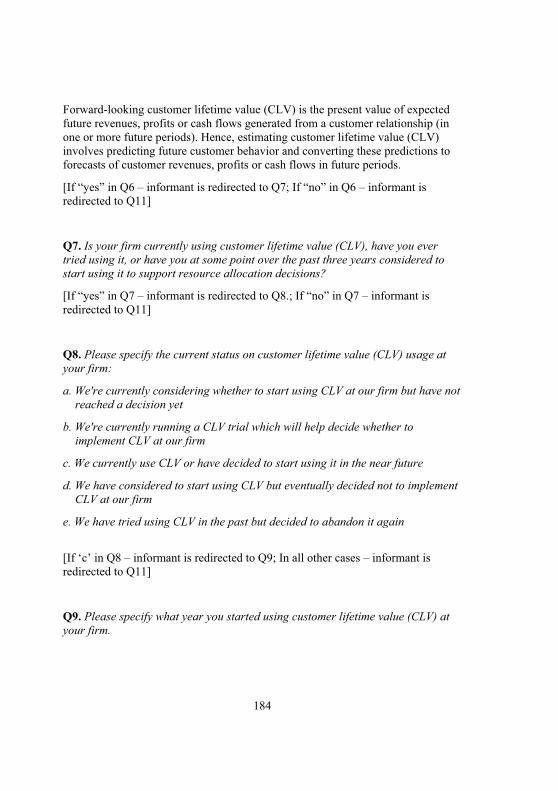
184
Forward-looking customer lifetime value (CLV) is the present value of expected future revenues, profits or cash flows generated from a customer relationship (in one or more future periods). Hence, estimating customer lifetime value (CLV) involves predicting future customer behavior and converting these predictions to forecasts of customer revenues, profits or cash flows in future periods.
[If “yes” in Q6 – informant is redirected to Q7; If “no” in Q6 – informant is redirected to Q11]
Q7. Is your firm currently using customer lifetime value (CLV), have you ever tried using it, or have you at some point over the past three years considered to start using it to support resource allocation decisions?
[If “yes” in Q7 – informant is redirected to Q8.; If “no” in Q7 – informant is redirected to Q11]
Q8. Please specify the current status on customer lifetime value (CLV) usage at your firm:
a. We're currently considering whether to start using CLV at our firm but have not reached a decision yet
b. We're currently running a CLV trial which will help decide whether to implement CLV at our firm
c. We currently use CLV or have decided to start using it in the near future
d. We have considered to start using CLV but eventually decided not to implement CLV at our firm
e. We have tried using CLV in the past but decided to abandon it again
[If ‘c’ in Q8 – informant is redirected to Q9; In all other cases – informant is redirected to Q11]
Q9. Please specify what year you started using customer lifetime value (CLV) at your firm.
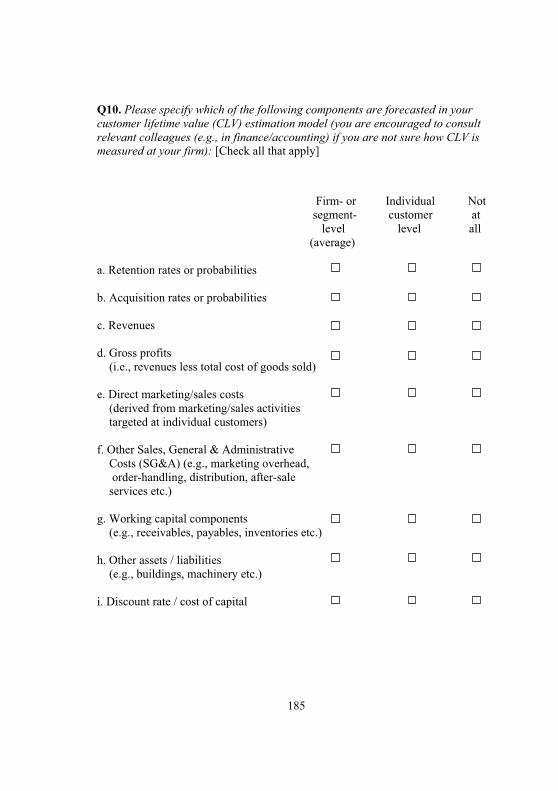
185
Q10. Please specify which of the following components are forecasted in your customer lifetime value (CLV) estimation model (you are encouraged to consult relevant colleagues (e.g., in finance/accounting) if you are not sure how CLV is measured at your firm): [Check all that apply]
Firm- or Individual Not segment- customer at level level all (average) a. Retention rates or probabilities b. Acquisition rates or probabilities c. Revenues d. Gross profits
(i.e., revenues less total cost of goods sold) e. Direct marketing/sales costs
(derived from marketing/sales activities targeted at individual customers)
f. Other Sales, General & Administrative
Costs (SG&A) (e.g., marketing overhead, order-handling, distribution, after-sale services etc.)
g. Working capital components
(e.g., receivables, payables, inventories etc.) h. Other assets / liabilities
(e.g., buildings, machinery etc.) i. Discount rate / cost of capital
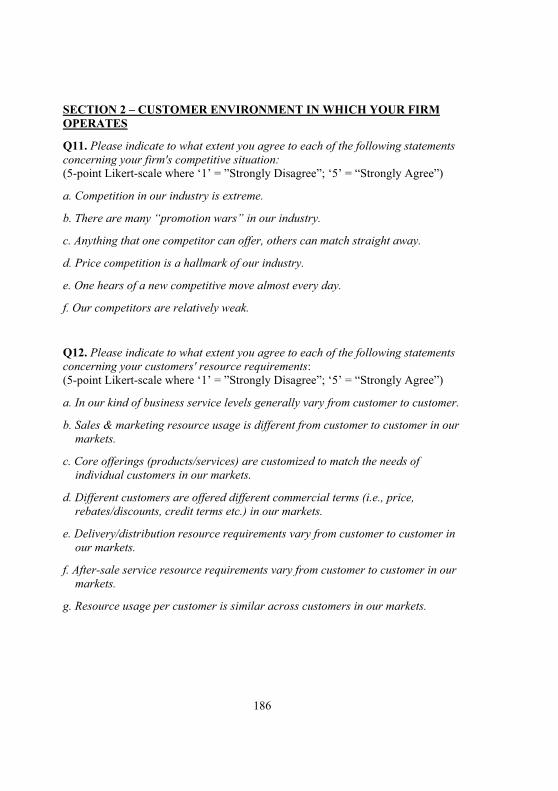
186
SECTION 2 – CUSTOMER ENVIRONMENT IN WHICH YOUR FIRM OPERATES
Q11. Please indicate to what extent you agree to each of the following statements concerning your firm's competitive situation: (5-point Likert-scale where ‘1’ = ”Strongly Disagree”; ‘5’ = “Strongly Agree”)
a. Competition in our industry is extreme.
b. There are many “promotion wars” in our industry.
c. Anything that one competitor can offer, others can match straight away.
d. Price competition is a hallmark of our industry.
e. One hears of a new competitive move almost every day.
f. Our competitors are relatively weak.
Q12. Please indicate to what extent you agree to each of the following statements concerning your customers' resource requirements: (5-point Likert-scale where ‘1’ = ”Strongly Disagree”; ‘5’ = “Strongly Agree”)
a. In our kind of business service levels generally vary from customer to customer.
b. Sales & marketing resource usage is different from customer to customer in our markets.
c. Core offerings (products/services) are customized to match the needs of individual customers in our markets.
d. Different customers are offered different commercial terms (i.e., price, rebates/discounts, credit terms etc.) in our markets.
e. Delivery/distribution resource requirements vary from customer to customer in our markets.
f. After-sale service resource requirements vary from customer to customer in our markets.
g. Resource usage per customer is similar across customers in our markets.
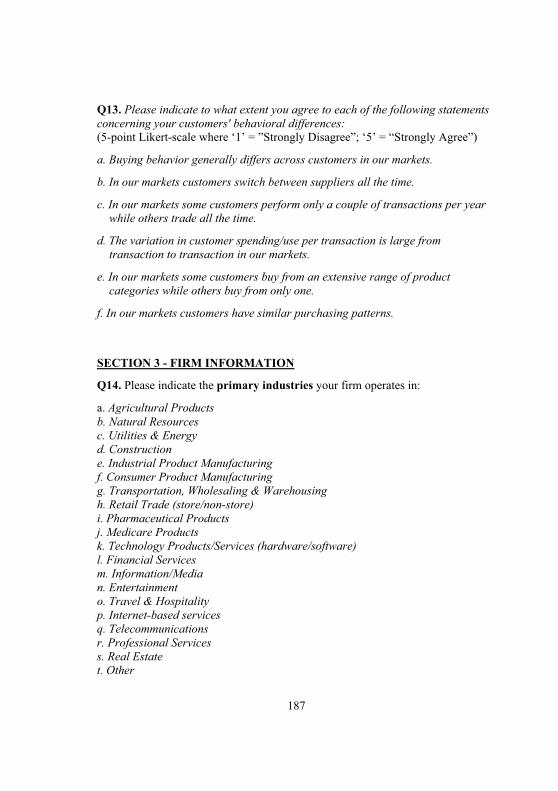
187
Q13. Please indicate to what extent you agree to each of the following statements concerning your customers' behavioral differences: (5-point Likert-scale where ‘1’ = ”Strongly Disagree”; ‘5’ = “Strongly Agree”)
a. Buying behavior generally differs across customers in our markets.
b. In our markets customers switch between suppliers all the time.
c. In our markets some customers perform only a couple of transactions per year while others trade all the time.
d. The variation in customer spending/use per transaction is large from transaction to transaction in our markets.
e. In our markets some customers buy from an extensive range of product categories while others buy from only one.
f. In our markets customers have similar purchasing patterns.
SECTION 3 - FIRM INFORMATION
Q14. Please indicate the primary industries your firm operates in:
a. Agricultural Products b. Natural Resources c. Utilities & Energy d. Construction e. Industrial Product Manufacturing f. Consumer Product Manufacturing g. Transportation, Wholesaling & Warehousing h. Retail Trade (store/non-store) i. Pharmaceutical Products j. Medicare Products k. Technology Products/Services (hardware/software) l. Financial Services m. Information/Media n. Entertainment o. Travel & Hospitality p. Internet-based services q. Telecommunications r. Professional Services s. Real Estate t. Other
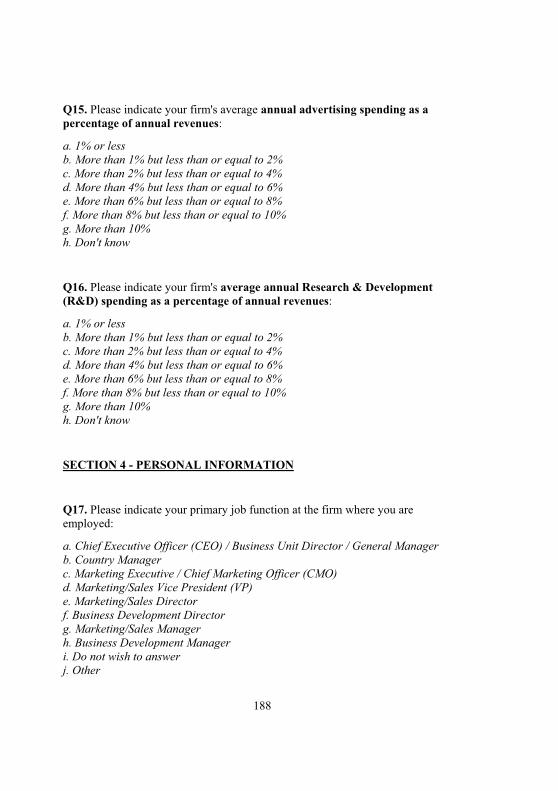
188
Q15. Please indicate your firm's average annual advertising spending as a percentage of annual revenues:
a. 1% or less b. More than 1% but less than or equal to 2% c. More than 2% but less than or equal to 4% d. More than 4% but less than or equal to 6% e. More than 6% but less than or equal to 8% f. More than 8% but less than or equal to 10% g. More than 10% h. Don't know
Q16. Please indicate your firm's average annual Research & Development (R&D) spending as a percentage of annual revenues:
a. 1% or less b. More than 1% but less than or equal to 2% c. More than 2% but less than or equal to 4% d. More than 4% but less than or equal to 6% e. More than 6% but less than or equal to 8% f. More than 8% but less than or equal to 10% g. More than 10% h. Don't know
SECTION 4 - PERSONAL INFORMATION
Q17. Please indicate your primary job function at the firm where you are employed:
a. Chief Executive Officer (CEO) / Business Unit Director / General Manager b. Country Manager c. Marketing Executive / Chief Marketing Officer (CMO) d. Marketing/Sales Vice President (VP) e. Marketing/Sales Director f. Business Development Director g. Marketing/Sales Manager h. Business Development Manager i. Do not wish to answer j. Other
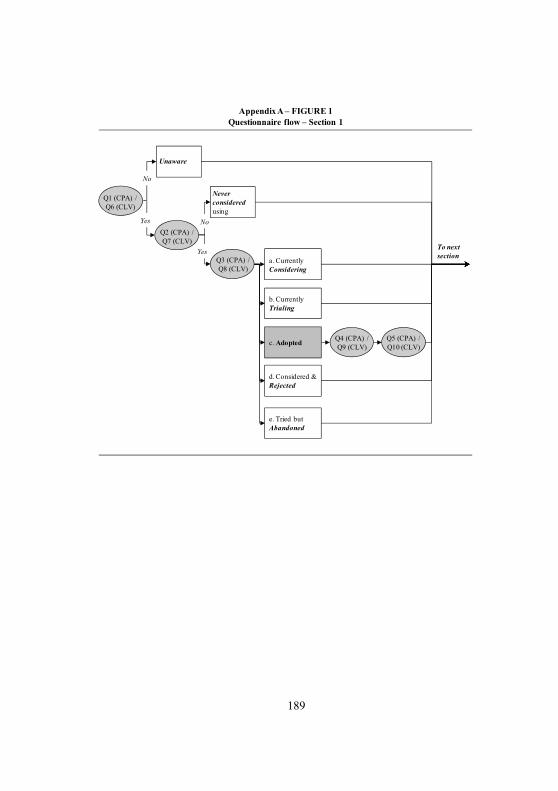
189
Appendix A – FIGURE 1Questionnaire flow – Section 1
Unaware
Never considered using
a. Currently Considering
b. Currently Trialing
c. Adopted
d. Considered & Rejected
e. Tried but Abandoned
Q1 (CPA) / Q6 (CLV)
Q4 (CPA) / Q9 (CLV)
Q5 (CPA) / Q10 (CLV)
Yes
No
No
YesQ3 (CPA) / Q8 (CLV)
Q2 (CPA) / Q7 (CLV)
To next section

190
TITLER I PH.D.SERIEN:
20041. Martin Grieger Internet-based Electronic Marketplaces and Supply Chain Management
2. Thomas Basbøll LIKENESS A Philosophical Investigation
3. Morten Knudsen Beslutningens vaklen En systemteoretisk analyse of mo-
derniseringen af et amtskommunalt sundhedsvæsen 1980-2000
4. Lars Bo Jeppesen Organizing Consumer Innovation A product development strategy that
is based on online communities and allows some firms to benefit from a distributed process of innovation by consumers
5. Barbara Dragsted SEGMENTATION IN TRANSLATION
AND TRANSLATION MEMORY SYSTEMS An empirical investigation of cognitive segmentation and effects of integra-
ting a TM system into the translation process
6. Jeanet Hardis Sociale partnerskaber Et socialkonstruktivistisk casestudie af partnerskabsaktørers virkeligheds-
opfattelse mellem identitet og legitimitet
7. Henriette Hallberg Thygesen System Dynamics in Action
8. Carsten Mejer Plath Strategisk Økonomistyring
9. Annemette Kjærgaard Knowledge Management as Internal Corporate Venturing
– a Field Study of the Rise and Fall of a Bottom-Up Process
10. Knut Arne Hovdal De profesjonelle i endring Norsk ph.d., ej til salg gennem Samfundslitteratur
11. Søren Jeppesen Environmental Practices and Greening Strategies in Small Manufacturing Enterprises in South Africa – A Critical Realist Approach
12. Lars Frode Frederiksen Industriel forskningsledelse – på sporet af mønstre og samarbejde
i danske forskningsintensive virksom-heder
13. Martin Jes Iversen The Governance of GN Great Nordic – in an age of strategic and structural transitions 1939-1988
14. Lars Pynt Andersen The Rhetorical Strategies of Danish TV Advertising A study of the first fifteen years with special emphasis on genre and irony
15. Jakob Rasmussen Business Perspectives on E-learning
16. Sof Thrane The Social and Economic Dynamics of Networks – a Weberian Analysis of Three Formalised Horizontal Networks
17. Lene Nielsen Engaging Personas and Narrative Scenarios – a study on how a user- centered approach influenced the perception of the design process in
the e-business group at AstraZeneca
18. S.J Valstad Organisationsidentitet Norsk ph.d., ej til salg gennem Samfundslitteratur

19. Thomas Lyse Hansen Six Essays on Pricing and Weather risk
in Energy Markets
20. Sabine Madsen Emerging Methods – An Interpretive Study of ISD Methods in Practice
21. Evis Sinani The Impact of Foreign Direct Inve-
stment on Efficiency, Productivity Growth and Trade: An Empirical Inve-stigation
22. Bent Meier Sørensen Making Events Work Or, How to Multiply Your Crisis
23. Pernille Schnoor Brand Ethos Om troværdige brand- og virksomhedsidentiteter i et retorisk og
diskursteoretisk perspektiv
24. Sidsel Fabech Von welchem Österreich ist hier die
Rede? Diskursive forhandlinger og magt-
kampe mellem rivaliserende nationale identitetskonstruktioner i østrigske pressediskurser
25. Klavs Odgaard Christensen Sprogpolitik og identitetsdannelse i flersprogede forbundsstater Et komparativt studie af Schweiz og Canada
26. Dana B. Minbaeva Human Resource Practices and Knowledge Transfer in Multinational Corporations
27. Holger Højlund Markedets politiske fornuft Et studie af velfærdens organisering i perioden 1990-2003
28. Christine Mølgaard Frandsen A.s erfaring Om mellemværendets praktik i en
transformation af mennesket og subjektiviteten
29. Sine Nørholm Just The Constitution of Meaning – A Meaningful Constitution? Legitimacy, identity, and public opinion
in the debate on the future of Europe
20051. Claus J. Varnes Managing product innovation through rules – The role of formal and structu-
red methods in product development
2. Helle Hedegaard Hein Mellem konflikt og konsensus – Dialogudvikling på hospitalsklinikker
3. Axel Rosenø Customer Value Driven Product Inno-
vation – A Study of Market Learning in New Product Development
4. Søren Buhl Pedersen Making space An outline of place branding
5. Camilla Funck Ellehave Differences that Matter An analysis of practices of gender and organizing in contemporary work-
places
6. Rigmor Madeleine Lond Styring af kommunale forvaltninger
7. Mette Aagaard Andreassen Supply Chain versus Supply Chain Benchmarking as a Means to Managing Supply Chains
8. Caroline Aggestam-Pontoppidan From an idea to a standard The UN and the global governance of accountants’ competence
9. Norsk ph.d.
10. Vivienne Heng Ker-ni An Experimental Field Study on the
Effectiveness of Grocer Media Advertising Measuring Ad Recall and Recognition, Purchase Intentions and Short-Term
Sales
11. Allan Mortensen Essays on the Pricing of Corporate
Bonds and Credit Derivatives
12. Remo Stefano Chiari Figure che fanno conoscere Itinerario sull’idea del valore cognitivo
e espressivo della metafora e di altri tropi da Aristotele e da Vico fino al cognitivismo contemporaneo
13. Anders McIlquham-Schmidt Strategic Planning and Corporate Performance An integrative research review and a meta-analysis of the strategic planning and corporate performance literature from 1956 to 2003
14. Jens Geersbro The TDF – PMI Case Making Sense of the Dynamics of Business Relationships and Networks
15 Mette Andersen Corporate Social Responsibility in Global Supply Chains Understanding the uniqueness of firm behaviour
16. Eva Boxenbaum Institutional Genesis: Micro – Dynamic Foundations of Institutional Change
17. Peter Lund-Thomsen Capacity Development, Environmental Justice NGOs, and Governance: The
Case of South Africa
18. Signe Jarlov Konstruktioner af offentlig ledelse
19. Lars Stæhr Jensen Vocabulary Knowledge and Listening Comprehension in English as a Foreign Language
An empirical study employing data elicited from Danish EFL learners
20. Christian Nielsen Essays on Business Reporting Production and consumption of
strategic information in the market for information
21. Marianne Thejls Fischer Egos and Ethics of Management Consultants
22. Annie Bekke Kjær Performance management i Proces- innovation – belyst i et social-konstruktivistisk perspektiv
23. Suzanne Dee Pedersen GENTAGELSENS METAMORFOSE Om organisering af den kreative gøren
i den kunstneriske arbejdspraksis
24. Benedikte Dorte Rosenbrink Revenue Management Økonomiske, konkurrencemæssige & organisatoriske konsekvenser
25. Thomas Riise Johansen Written Accounts and Verbal Accounts The Danish Case of Accounting and Accountability to Employees
26. Ann Fogelgren-Pedersen The Mobile Internet: Pioneering Users’ Adoption Decisions
27. Birgitte Rasmussen Ledelse i fællesskab – de tillidsvalgtes fornyende rolle
28. Gitte Thit Nielsen Remerger – skabende ledelseskræfter i fusion og opkøb
29. Carmine Gioia A MICROECONOMETRIC ANALYSIS OF MERGERS AND ACQUISITIONS
30. Ole Hinz Den effektive forandringsleder: pilot, pædagog eller politiker? Et studie i arbejdslederes meningstil-
skrivninger i forbindelse med vellykket gennemførelse af ledelsesinitierede forandringsprojekter
31. Kjell-Åge Gotvassli Et praksisbasert perspektiv på dynami-
ske læringsnettverk i toppidretten Norsk ph.d., ej til salg gennem Samfundslitteratur
32. Henriette Langstrup Nielsen Linking Healthcare An inquiry into the changing perfor- mances of web-based technology for asthma monitoring
33. Karin Tweddell Levinsen Virtuel Uddannelsespraksis Master i IKT og Læring – et casestudie
i hvordan proaktiv proceshåndtering kan forbedre praksis i virtuelle lærings-miljøer
34. Anika Liversage Finding a Path Labour Market Life Stories of Immigrant Professionals
35. Kasper Elmquist Jørgensen Studier i samspillet mellem stat og
erhvervsliv i Danmark under 1. verdenskrig
36. Finn Janning A DIFFERENT STORY Seduction, Conquest and Discovery
37. Patricia Ann Plackett Strategic Management of the Radical Innovation Process Leveraging Social Capital for Market Uncertainty Management
20061. Christian Vintergaard Early Phases of Corporate Venturing
2. Niels Rom-Poulsen Essays in Computational Finance
3. Tina Brandt Husman Organisational Capabilities, Competitive Advantage & Project-
Based Organisations The Case of Advertising and Creative Good Production
4. Mette Rosenkrands Johansen Practice at the top – how top managers mobilise and use non-financial performance measures
5. Eva Parum Corporate governance som strategisk kommunikations- og ledelsesværktøj
6. Susan Aagaard Petersen Culture’s Influence on Performance Management: The Case of a Danish Company in China
7. Thomas Nicolai Pedersen The Discursive Constitution of Organi-
zational Governance – Between unity and differentiation
The Case of the governance of environmental risks by World Bank
environmental staff
8. Cynthia Selin Volatile Visions: Transactons in Anticipatory Knowledge
9. Jesper Banghøj Financial Accounting Information and
Compensation in Danish Companies
10. Mikkel Lucas Overby Strategic Alliances in Emerging High-
Tech Markets: What’s the Difference and does it Matter?
11. Tine Aage External Information Acquisition of Industrial Districts and the Impact of Different Knowledge Creation Dimen-
sions
A case study of the Fashion and Design Branch of the Industrial District of Montebelluna, NE Italy
12. Mikkel Flyverbom Making the Global Information Society Governable On the Governmentality of Multi-
Stakeholder Networks
13. Anette Grønning Personen bag Tilstedevær i e-mail som inter-
aktionsform mellem kunde og med-arbejder i dansk forsikringskontekst
14. Jørn Helder One Company – One Language? The NN-case
15. Lars Bjerregaard Mikkelsen Differing perceptions of customer
value Development and application of a tool
for mapping perceptions of customer value at both ends of customer-suppli-er dyads in industrial markets
16. Lise Granerud Exploring Learning Technological learning within small manufacturers in South Africa
17. Esben Rahbek Pedersen Between Hopes and Realities: Reflections on the Promises and Practices of Corporate Social Responsibility (CSR)
18. Ramona Samson The Cultural Integration Model and European Transformation. The Case of Romania
20071. Jakob Vestergaard Discipline in The Global Economy Panopticism and the Post-Washington Consensus
2. Heidi Lund Hansen Spaces for learning and working A qualitative study of change of work, management, vehicles of power and social practices in open offices
3. Sudhanshu Rai Exploring the internal dynamics of
software development teams during user analysis
A tension enabled Institutionalization Model; ”Where process becomes the objective”
4. Norsk ph.d. Ej til salg gennem Samfundslitteratur
5. Serden Ozcan EXPLORING HETEROGENEITY IN ORGANIZATIONAL ACTIONS AND OUTCOMES A Behavioural Perspective
6. Kim Sundtoft Hald Inter-organizational Performance Measurement and Management in
Action – An Ethnography on the Construction
of Management, Identity and Relationships
7. Tobias Lindeberg Evaluative Technologies Quality and the Multiplicity of Performance
8. Merete Wedell-Wedellsborg Den globale soldat Identitetsdannelse og identitetsledelse
i multinationale militære organisatio-ner
9. Lars Frederiksen Open Innovation Business Models Innovation in firm-hosted online user communities and inter-firm project ventures in the music industry – A collection of essays
10. Jonas Gabrielsen Retorisk toposlære – fra statisk ’sted’
til persuasiv aktivitet
11. Christian Moldt-Jørgensen Fra meningsløs til meningsfuld
evaluering. Anvendelsen af studentertilfredsheds- målinger på de korte og mellemlange
videregående uddannelser set fra et psykodynamisk systemperspektiv
12. Ping Gao Extending the application of actor-network theory Cases of innovation in the tele- communications industry
13. Peter Mejlby Frihed og fængsel, en del af den
samme drøm? Et phronetisk baseret casestudie af frigørelsens og kontrollens sam-
eksistens i værdibaseret ledelse! 14. Kristina Birch Statistical Modelling in Marketing
15. Signe Poulsen Sense and sensibility: The language of emotional appeals in
insurance marketing
16. Anders Bjerre Trolle Essays on derivatives pricing and dyna-
mic asset allocation
17. Peter Feldhütter Empirical Studies of Bond and Credit
Markets
18. Jens Henrik Eggert Christensen Default and Recovery Risk Modeling
and Estimation
19. Maria Theresa Larsen Academic Enterprise: A New Mission
for Universities or a Contradiction in Terms?
Four papers on the long-term impli-cations of increasing industry involve-ment and commercialization in acade-mia
20. Morten Wellendorf Postimplementering af teknologi i den
offentlige forvaltning Analyser af en organisations konti-
nuerlige arbejde med informations-teknologi
21. Ekaterina Mhaanna Concept Relations for Terminological
Process Analysis
22. Stefan Ring Thorbjørnsen Forsvaret i forandring Et studie i officerers kapabiliteter un-
der påvirkning af omverdenens foran-dringspres mod øget styring og læring
23. Christa Breum Amhøj Det selvskabte medlemskab om ma-
nagementstaten, dens styringstekno-logier og indbyggere
24. Karoline Bromose Between Technological Turbulence and
Operational Stability – An empirical case study of corporate
venturing in TDC
25. Susanne Justesen Navigating the Paradoxes of Diversity
in Innovation Practice – A Longitudinal study of six very different innovation processes – in
practice
26. Luise Noring Henler Conceptualising successful supply
chain partnerships – Viewing supply chain partnerships
from an organisational culture per-spective
27. Mark Mau Kampen om telefonen Det danske telefonvæsen under den
tyske besættelse 1940-45
28. Jakob Halskov The semiautomatic expansion of
existing terminological ontologies using knowledge patterns discovered

on the WWW – an implementation and evaluation
29. Gergana Koleva European Policy Instruments Beyond
Networks and Structure: The Innova-tive Medicines Initiative
30. Christian Geisler Asmussen Global Strategy and International Diversity: A Double-Edged Sword?
31. Christina Holm-Petersen Stolthed og fordom Kultur- og identitetsarbejde ved ska-
belsen af en ny sengeafdeling gennem fusion
32. Hans Peter Olsen Hybrid Governance of Standardized
States Causes and Contours of the Global
Regulation of Government Auditing
33. Lars Bøge Sørensen Risk Management in the Supply Chain
34. Peter Aagaard Det unikkes dynamikker De institutionelle mulighedsbetingel-
ser bag den individuelle udforskning i professionelt og frivilligt arbejde
35. Yun Mi Antorini Brand Community Innovation An Intrinsic Case Study of the Adult
Fans of LEGO Community
36. Joachim Lynggaard Boll Labor Related Corporate Social Perfor-
mance in Denmark Organizational and Institutional Per-
spectives
20081. Frederik Christian Vinten Essays on Private Equity
2. Jesper Clement Visual Influence of Packaging Design
on In-Store Buying Decisions
3. Marius Brostrøm Kousgaard Tid til kvalitetsmåling? – Studier af indrulleringsprocesser i
forbindelse med introduktionen af kliniske kvalitetsdatabaser i speciallæ-gepraksissektoren
4. Irene Skovgaard Smith Management Consulting in Action Value creation and ambiguity in client-consultant relations
5. Anders Rom Management accounting and inte-
grated information systems How to exploit the potential for ma-
nagement accounting of information technology
6. Marina Candi Aesthetic Design as an Element of Service Innovation in New Technology-
based Firms
7. Morten Schnack Teknologi og tværfaglighed – en analyse af diskussionen omkring indførelse af EPJ på en hospitalsafde-
ling
8. Helene Balslev Clausen Juntos pero no revueltos – un estudio
sobre emigrantes norteamericanos en un pueblo mexicano
9. Lise Justesen Kunsten at skrive revisionsrapporter. En beretning om forvaltningsrevisio-
nens beretninger
10. Michael E. Hansen The politics of corporate responsibility: CSR and the governance of child labor
and core labor rights in the 1990s
11. Anne Roepstorff Holdning for handling – en etnologisk
undersøgelse af Virksomheders Sociale Ansvar/CSR
12. Claus Bajlum Essays on Credit Risk and Credit Derivatives
13. Anders Bojesen The Performative Power of Competen-
ce – an Inquiry into Subjectivity and Social Technologies at Work
14. Satu Reijonen Green and Fragile A Study on Markets and the Natural
Environment
15. Ilduara Busta Corporate Governance in Banking A European Study
16. Kristian Anders Hvass A Boolean Analysis Predicting Industry
Change: Innovation, Imitation & Busi-ness Models
The Winning Hybrid: A case study of isomorphism in the airline industry
17. Trine Paludan De uvidende og de udviklingsparate Identitet som mulighed og restriktion
blandt fabriksarbejdere på det aftaylo-riserede fabriksgulv
18. Kristian Jakobsen Foreign market entry in transition eco-
nomies: Entry timing and mode choice
19. Jakob Elming Syntactic reordering in statistical ma-
chine translation
20. Lars Brømsøe Termansen Regional Computable General Equili-
brium Models for Denmark Three papers laying the foundation for
regional CGE models with agglomera-tion characteristics
21. Mia Reinholt The Motivational Foundations of
Knowledge Sharing
22. Frederikke Krogh-Meibom The Co-Evolution of Institutions and
Technology – A Neo-Institutional Understanding of
Change Processes within the Business Press – the Case Study of Financial Times
23. Peter D. Ørberg Jensen OFFSHORING OF ADVANCED AND
HIGH-VALUE TECHNICAL SERVICES: ANTECEDENTS, PROCESS DYNAMICS AND FIRMLEVEL IMPACTS
24. Pham Thi Song Hanh Functional Upgrading, Relational Capability and Export Performance of
Vietnamese Wood Furniture Producers
25. Mads Vangkilde Why wait? An Exploration of first-mover advanta-
ges among Danish e-grocers through a resource perspective
26. Hubert Buch-Hansen Rethinking the History of European
Level Merger Control A Critical Political Economy Perspective
20091. Vivian Lindhardsen From Independent Ratings to Commu-
nal Ratings: A Study of CWA Raters’ Decision-Making Behaviours
2. Guðrið Weihe Public-Private Partnerships: Meaning
and Practice
3. Chris Nøkkentved Enabling Supply Networks with Colla-
borative Information Infrastructures An Empirical Investigation of Business
Model Innovation in Supplier Relation-ship Management
4. Sara Louise Muhr Wound, Interrupted – On the Vulner-
ability of Diversity Management

5. Christine Sestoft Forbrugeradfærd i et Stats- og Livs-
formsteoretisk perspektiv
6. Michael Pedersen Tune in, Breakdown, and Reboot: On
the production of the stress-fit self-managing employee
7. Salla Lutz Position and Reposition in Networks – Exemplified by the Transformation of
the Danish Pine Furniture Manu- facturers
8. Jens Forssbæck Essays on market discipline in commercial and central banking
9. Tine Murphy Sense from Silence – A Basis for Orga-
nised Action How do Sensemaking Processes with
Minimal Sharing Relate to the Repro-duction of Organised Action?
10. Sara Malou Strandvad Inspirations for a new sociology of art:
A sociomaterial study of development processes in the Danish film industry
11. Nicolaas Mouton On the evolution of social scientific
metaphors: A cognitive-historical enquiry into the
divergent trajectories of the idea that collective entities – states and societies, cities and corporations – are biological organisms.
12. Lars Andreas Knutsen Mobile Data Services: Shaping of user engagements
13. Nikolaos Theodoros Korfiatis Information Exchange and Behavior A Multi-method Inquiry on Online
Communities
14. Jens Albæk Forestillinger om kvalitet og tværfaglig-
hed på sygehuse – skabelse af forestillinger i læge- og
plejegrupperne angående relevans af nye idéer om kvalitetsudvikling gen-nem tolkningsprocesser
15. Maja Lotz The Business of Co-Creation – and the
Co-Creation of Business
16. Gitte P. Jakobsen Narrative Construction of Leader Iden-
tity in a Leader Development Program Context
17. Dorte Hermansen ”Living the brand” som en brandorien-
teret dialogisk praxis: Om udvikling af medarbejdernes
brandorienterede dømmekraft
18. Aseem Kinra Supply Chain (logistics) Environmental
Complexity
19. Michael Nørager How to manage SMEs through the
transformation from non innovative to innovative?
20. Kristin Wallevik Corporate Governance in Family Firms The Norwegian Maritime Sector
21. Bo Hansen Hansen Beyond the Process Enriching Software Process Improve-
ment with Knowledge Management
22. Annemette Skot-Hansen Franske adjektivisk afledte adverbier,
der tager præpositionssyntagmer ind-ledt med præpositionen à som argu-menter
En valensgrammatisk undersøgelse
23. Line Gry Knudsen Collaborative R&D Capabilities In Search of Micro-Foundations
24. Christian Scheuer Employers meet employees Essays on sorting and globalization
25. Rasmus Johnsen The Great Health of Melancholy A Study of the Pathologies of Perfor-
mativity
26. Ha Thi Van Pham Internationalization, Competitiveness
Enhancement and Export Performance of Emerging Market Firms:
Evidence from Vietnam
27. Henriette Balieu Kontrolbegrebets betydning for kausa-
tivalternationen i spansk En kognitiv-typologisk analyse
20101. Yen Tran Organizing Innovationin Turbulent
Fashion Market Four papers on how fashion firms crea-
te and appropriate innovation value
2. Anders Raastrup Kristensen Metaphysical Labour Flexibility, Performance and Commit-
ment in Work-Life Management
3. Margrét Sigrún Sigurdardottir Dependently independent Co-existence of institutional logics in
the recorded music industry
4. Ásta Dis Óladóttir Internationalization from a small do-
mestic base: An empirical analysis of Economics and
Management
5. Christine Secher E-deltagelse i praksis – politikernes og
forvaltningens medkonstruktion og konsekvenserne heraf
6. Marianne Stang Våland What we talk about when we talk
about space:
End User Participation between Proces-ses of Organizational and Architectural Design
7. Rex Degnegaard Strategic Change Management Change Management Challenges in
the Danish Police Reform
8. Ulrik Schultz Brix Værdi i rekruttering – den sikre beslut-
ning En pragmatisk analyse af perception
og synliggørelse af værdi i rekrutte-rings- og udvælgelsesarbejdet
9. Jan Ole Similä Kontraktsledelse Relasjonen mellom virksomhetsledelse
og kontraktshåndtering, belyst via fire norske virksomheter
10. Susanne Boch Waldorff Emerging Organizations: In between
local translation, institutional logics and discourse
11. Brian Kane Performance Talk Next Generation Management of
Organizational Performance
12. Lars Ohnemus Brand Thrust: Strategic Branding and
Shareholder Value An Empirical Reconciliation of two
Critical Concepts
13. Jesper Schlamovitz Håndtering af usikkerhed i film- og
byggeprojekter
14. Tommy Moesby-Jensen Det faktiske livs forbindtlighed Førsokratisk informeret, ny-aristotelisk
τηθος-tænkning hos Martin Heidegger
15. Christian Fich Two Nations Divided by Common Values French National Habitus and the Rejection of American Power
16. Peter Beyer Processer, sammenhængskraft
og fleksibilitet Et empirisk casestudie af omstillings-
forløb i fire virksomheder
17. Adam Buchhorn Markets of Good Intentions Constructing and Organizing Biogas Markets Amid Fragility
and Controversy
18. Cecilie K. Moesby-Jensen Social læring og fælles praksis Et mixed method studie, der belyser
læringskonsekvenser af et lederkursus for et praksisfællesskab af offentlige mellemledere
19. Heidi Boye Fødevarer og sundhed i sen-
modernismen – En indsigt i hyggefænomenet og
de relaterede fødevarepraksisser
20. Kristine Munkgård Pedersen Flygtige forbindelser og midlertidige
mobiliseringer Om kulturel produktion på Roskilde
Festival
21. Oliver Jacob Weber Causes of Intercompany Harmony in
Business Markets – An Empirical Inve-stigation from a Dyad Perspective
22. Susanne Ekman Authority and Autonomy Paradoxes of Modern Knowledge
Work
23. Anette Frey Larsen Kvalitetsledelse på danske hospitaler – Ledelsernes indflydelse på introduk-
tion og vedligeholdelse af kvalitetsstra-tegier i det danske sundhedsvæsen
24. Toyoko Sato Performativity and Discourse: Japanese
Advertisements on the Aesthetic Edu-cation of Desire
25. Kenneth Brinch Jensen Identifying the Last Planner System Lean management in the construction
industry
26. Javier Busquets Orchestrating Network Behavior
for Innovation
27. Luke Patey The Power of Resistance: India’s Na-
tional Oil Company and International Activism in Sudan
28. Mette Vedel Value Creation in Triadic Business Rela-
tionships. Interaction, Interconnection and Position
29. Kristian Tørning Knowledge Management Systems in
Practice – A Work Place Study
30. Qingxin Shi An Empirical Study of Thinking Aloud
Usability Testing from a Cultural Perspective
31. Tanja Juul Christiansen Corporate blogging: Medarbejderes
kommunikative handlekraft
32. Malgorzata Ciesielska Hybrid Organisations. A study of the Open Source – business
setting
33. Jens Dick-Nielsen Three Essays on Corporate Bond
Market Liquidity
34. Sabrina Speiermann Modstandens Politik Kampagnestyring i Velfærdsstaten. En diskussion af trafikkampagners sty-
ringspotentiale
35. Julie Uldam Fickle Commitment. Fostering political
engagement in 'the flighty world of online activism’
36. Annegrete Juul Nielsen Traveling technologies and
transformations in health care
37. Athur Mühlen-Schulte Organising Development Power and Organisational Reform in
the United Nations Development Programme
38. Louise Rygaard Jonas Branding på butiksgulvet Et case-studie af kultur- og identitets-
arbejdet i Kvickly
20111. Stefan Fraenkel Key Success Factors for Sales Force
Readiness during New Product Launch A Study of Product Launches in the
Swedish Pharmaceutical Industry
2. Christian Plesner Rossing International Transfer Pricing in Theory
and Practice
3. Tobias Dam Hede Samtalekunst og ledelsesdisciplin – en analyse af coachingsdiskursens
genealogi og governmentality
4. Kim Pettersson Essays on Audit Quality, Auditor Choi-
ce, and Equity Valuation
5. Henrik Merkelsen The expert-lay controversy in risk
research and management. Effects of institutional distances. Studies of risk definitions, perceptions, management and communication
6. Simon S. Torp Employee Stock Ownership: Effect on Strategic Management and
Performance
7. Mie Harder Internal Antecedents of Management
Innovation
8. Ole Helby Petersen Public-Private Partnerships: Policy and
Regulation – With Comparative and Multi-level Case Studies from Denmark and Ireland
9. Morten Krogh Petersen ’Good’ Outcomes. Handling Multipli-
city in Government Communication
10. Kristian Tangsgaard Hvelplund Allocation of cognitive resources in
translation - an eye-tracking and key-logging study
11. Moshe Yonatany The Internationalization Process of
Digital Service Providers
12. Anne Vestergaard Distance and Suffering Humanitarian Discourse in the age of
Mediatization
13. Thorsten Mikkelsen Personligsheds indflydelse på forret-
ningsrelationer
14. Jane Thostrup Jagd Hvorfor fortsætter fusionsbølgen ud-
over ”the tipping point”? – en empirisk analyse af information
og kognitioner om fusioner
15. Gregory Gimpel Value-driven Adoption and Consump-
tion of Technology: Understanding Technology Decision Making
16. Thomas Stengade Sønderskov Den nye mulighed Social innovation i en forretningsmæs-
sig kontekst
17. Jeppe Christoffersen Donor supported strategic alliances in
developing countries
18. Vibeke Vad Baunsgaard Dominant Ideological Modes of
Rationality: Cross functional
integration in the process of product innovation
19. Throstur Olaf Sigurjonsson Governance Failure and Icelands’s Financial Collapse
20. Allan Sall Tang Andersen Essays on the modeling of risks in interest-rate and inflation markets
21. Heidi Tscherning Mobile Devices in Social Contexts
22. Birgitte Gorm Hansen Adapting in the Knowledge Economy Lateral Strategies for Scientists and
Those Who Study Them
23. Kristina Vaarst Andersen Optimal Levels of Embeddedness The Contingent Value of Networked
Collaboration
24. Justine Grønbæk Pors Noisy Management A History of Danish School Governing
from 1970-2010
25. Stefan Linder Micro-foundations of Strategic
Entrepreneurship Essays on Autonomous Strategic Action
26. Xin Li Toward an Integrative Framework of
National Competitiveness An application to China
27. Rune Thorbjørn Clausen Værdifuld arkitektur Et eksplorativt studie af bygningers
rolle i virksomheders værdiskabelse
28. Monica Viken Markedsundersøkelser som bevis i
varemerke- og markedsføringsrett
29. Christian Wymann Tattooing The Economic and Artistic Constitution
of a Social Phenomenon
30. Sanne Frandsen Productive Incoherence A Case Study of Branding and
Identity Struggles in a Low-Prestige Organization
31. Mads Stenbo Nielsen Essays on Correlation Modelling
32. Ivan Häuser Følelse og sprog Etablering af en ekspressiv kategori,
eksemplificeret på russisk
33. Sebastian Schwenen Security of Supply in Electricity Markets
20121. Peter Holm Andreasen The Dynamics of Procurement
Management - A Complexity Approach
2. Martin Haulrich Data-Driven Bitext Dependency Parsing and Alignment
3. Line Kirkegaard Konsulenten i den anden nat En undersøgelse af det intense
arbejdsliv
4. Tonny Stenheim Decision usefulness of goodwill
under IFRS
5. Morten Lind Larsen Produktivitet, vækst og velfærd Industrirådet og efterkrigstidens
Danmark 1945 - 1958
6. Petter Berg Cartel Damages and Cost Asymmetries
7. Lynn Kahle Experiential Discourse in Marketing A methodical inquiry into practice
and theory
8. Anne Roelsgaard Obling Management of Emotions
in Accelerated Medical Relationships

9. Thomas Frandsen Managing Modularity of
Service Processes Architecture
10. Carina Christine Skovmøller CSR som noget særligt Et casestudie om styring og menings-
skabelse i relation til CSR ud fra en intern optik
11. Michael Tell Fradragsbeskæring af selskabers
finansieringsudgifter En skatteretlig analyse af SEL §§ 11,
11B og 11C
12. Morten Holm Customer Profitability Measurement
Models Their Merits and Sophistication
across Contexts
TITLER I ATV PH.D.-SERIEN
19921. Niels Kornum Servicesamkørsel – organisation, øko-
nomi og planlægningsmetode
19952. Verner Worm Nordiske virksomheder i Kina Kulturspecifikke interaktionsrelationer ved nordiske virksomhedsetableringer i Kina
19993. Mogens Bjerre Key Account Management of Complex Strategic Relationships An Empirical Study of the Fast Moving Consumer Goods Industry
20004. Lotte Darsø Innovation in the Making Interaction Research with heteroge-
neous Groups of Knowledge Workers creating new Knowledge and new Leads
20015. Peter Hobolt Jensen Managing Strategic Design Identities The case of the Lego Developer Net-
work
20026. Peter Lohmann The Deleuzian Other of Organizational Change – Moving Perspectives of the Human
7. Anne Marie Jess Hansen To lead from a distance: The dynamic interplay between strategy and strate-
gizing – A case study of the strategic management process
20038. Lotte Henriksen Videndeling – om organisatoriske og ledelsesmæs-
sige udfordringer ved videndeling i praksis
9. Niels Christian Nickelsen Arrangements of Knowing: Coordi-
nating Procedures Tools and Bodies in Industrial Production – a case study of the collective making of new products
200510. Carsten Ørts Hansen Konstruktion af ledelsesteknologier og effektivitet
TITLER I DBA PH.D.-SERIEN
20071. Peter Kastrup-Misir Endeavoring to Understand Market Orientation – and the concomitant co-mutation of the researched, the re searcher, the research itself and the truth
20091. Torkild Leo Thellefsen Fundamental Signs and Significance
effects A Semeiotic outline of Fundamental Signs, Significance-effects, Knowledge Profiling and their use in Knowledge Organization and Branding
2. Daniel Ronzani When Bits Learn to Walk Don’t Make Them Trip. Technological Innovation and the Role of Regulation by Law in Information Systems Research: the Case of Radio Frequency Identification (RFID)
20101. Alexander Carnera Magten over livet og livet som magt Studier i den biopolitiske ambivalens


