Embed Size (px)
Citation preview
ABSTRACT
LEOPOLD, MICHAEL CHRISTOFI. Interfacial Investigations of a Biological ElectronTransfer Model: Cytochrome c Adsorbed on Gold Electrodes Modified with Self-AssembledMonolayers. (Advised by Professor Edmond F. Bowden)
Interfacial investigations of a protein monolayer electrochemical system, cytochrome
c (cyt c) adsorbed to a carboxylic acid (COOH) terminated self-assembled monolayer (SAM)
were undertaken. Previous research suggested that anomalous peak broadening observed in
the voltammetry of cyt c may be the manifestation of surface effects at the SAM/solution
interface (heterogeneous adsorption sites). To examine this matter further, research was
directed at 1) deciphering the role of the gold substrate’s topography in both SAM formation
and cyt c voltammetry; 2) understanding the protein binding interactions at the SAM/solution
interface that influence cyt c adsorption and electrochemical response, and 3) investigating
the microscopic properties of all the surfaces involved.
Electrochemical and scanning probe microscopy techniques were used to explore the
influence of gold topography in cyt c / COOH SAM / Au systems. COOH SAMs (11-
mercaptoundecanoic acid and 14-mercaptotetradecanoic acid) were prepared and
characterized on a variety of gold surfaces including evaporated, bulk, single crystal, and
expitaxially grown on mica gold substrates. Each type of gold surface exhibited specific
topographical features and characteristic roughness. SAMs were found to have a decreasing
number of defects as the topography of the gold became smoother, as evidenced by an
increased ability to block solution probe molecules. As the SAMs become less defective on
the smoother gold, the extent of adsorption and the magnitude of the electrochemical
response of adsorbed cyt c decreased significantly. These results show cyt c adsorption and
electrochemistry to be intimately related to the density of defects in the SAM, which, in turn,
are heavily influenced by the gold topography.
Additionally, as the gold roughness decreased, the double layer capacitance of the
films was observed to increase. A physical model was proposed in which the structure and
properties of COOH SAMs are dictated by significant endgroup interactions in addition to
chain-chain interactions. The model illustrates how gold topography plays an intricate role in
determining the structure and application of COOH terminated SAMs.
Research was also performed on the SAM/solution interface by thermally healing
SAMs on gold and utilizing SAMs on Ag-UPD modified gold. Thermal healing, by reducing
the number of defects in the SAMs, was also found to affect both SAM structural properties
and cyt c adsorption. SAMs that had been thermally healed exhibited a lower density of
defects while, at the same time, supported lower electroactive cyt c coverage. Ag UPD layers
were tested as a means of creating more stable, less defective COOH SAMs for cyt c
immobilization and possibly allowing for more ideal voltammetry of the proteins.
Preliminary research has shown that SAMs with Ag-UPD layers have fewer defects and
greater inherent stability. Finally, scanning probe microscopy techniques were employed to
investigate the structure of the gold substrate, the SAM/solution interface, and adsorbed cyt c.
In addition to cyt c / SAM / Au research, results from the following investigations are
presented: electrochemistry of adsorbed cyt c at indium tin oxide electrodes and the electron
transfer (ET) properties of iron-sulfur metallodendrimers. The metallodendrimers exhibited
attenuated ET properties with increasing generations of dendritic ligands in a solventless,
polymeric media. The electrochemistry of Cu(II) in physiological pathways that may be
related to neurological and ocular diseases was also explored. Research on these systems
revealed that the reduction of Cu(II) by certain peptides and catabolites may play a vital role
in the development of these diseases.
INTERFACIAL INVESTIGATIONS OF ABIOLOGICAL ELECTRON TRANSFER MODEL:
CYTOCHROME C ADSORBED ON GOLD ELECTRODES MODIFIED WITHSELF-ASSEMBLED MONOLAYERS
by
MICHAEL CHRISTOFI LEOPOLD
A Dissertation Submitted to the Graduate Facility ofNorth Carolina State University
in Partial Fulfillment of theRequirements for the Degree of
Doctor of Philosophy
Department of ChemistryAnalytical Division
Raleigh, North CarolinaJune 27, 2000
Approved by:
_____________________________Edmond F. Bowden, Chair of Advisory Committee
_____________________________ _____________________________Christopher B. Gorman James D. Martin
_____________________________ _____________________________Charles B. Boss Graduate School Representative

ii
This accomplishment is dedicated to my family -past, present, and future…
…but especially Mom & Dad.
iii
BIOGRAPHY
Michael Christofi Leopold, the second of three children, was born on March 12, 1972, in
Newport News, Virginia to Irene and Otto Leopold. With an older brother, John, and later a younger
sister, Lauren, Michael grew up first in Newport News, later moving to Idaho Falls, Idaho, and
eventually spending most of his time in Grafton, Virginia. In Grafton, a small town near Yorktown,
Virginia, he received his primary education at Grafton Bethel Elementary School and his secondary
education at Tabb High School, where he graduated in 1990. Michael then enrolled at James
Madison University, where he would meet his longtime girlfriend and future wife, Tamara Kelsey.
Michael, commonly referred to by the nickname “Leo,” graduated from James Madison in 1994 with
a Bachelor of Science degree in Chemistry. In the summer of 1994, Michael moved to Raleigh,
North Carolina to pursue a Doctor of Philosophy degree in analytical chemistry from North Carolina
State University. Over the next five years, Michael worked on his degree, studying chemistry and
performing research under professor Edmond Bowden. In early 1999, Michael proposed to Tammy
Kelsey and married her in March of 2000. After completing his Ph.D., Michael headed to the
University of North Carolina, Chapel Hill for a postdoctoral appointment with professor Royce
Murray.
iv
ACKNOWLEDGEMENTS
This achievement is not mine alone and could have never been completed without the love
and support of my family and friends throughout the years. The people that have helped me attain
this goal are too numerous to name, but several deserve specific mention.
First and foremost, I must acknowledge my parents. My mother and father have been a
constant source of encouragement and unconditional love during, not only my years in graduate
school, but throughout my entire life. The values my parents instilled in me have enabled me to be
successful at anything in life. You did a great job Mom and Dad, I love you and thank you. I have
always been able to count on my family - Mom, Dad, John, and Lauren - you’ve always been there
for me and it never went unnoticed.
Equally important, I must sincerely thank my best friend, teammate and newest member of
my family, my long-time girlfriend and wife, Tamara Kelsey. Tammy and I met a long time ago at
JMU and have been through a lot together. Tammy has always stuck with me, through the good, the
bad and the ugly; she has had to put up with more than any woman should ever have to. Tammy,
your love, support, and encouragement were an essential part of this achievement - I love you and I
am excited about our future together.
Although they are not all still with me, my grandparents were a source of inspiration during
my years in school. I miss them. Throughout my life, I have been blessed with a large and loving
family - the part of my life for which I will always be most proud.
I must acknowledge Ed Bowden for his help, guidance, and many useful discussions about
numerous topics over the year. I really enjoyed our meetings and bouncing scientific ideas off each
other. Over the past several years, Dr. Bowden became Ed - not only my advisor, but also a trusted
friend. I look forward to continuing our relationship long after I have left N.C. State.
I would also like to thank the other members of my committee. Dr. Chris Gorman was
always supportive of my efforts and on more than one occasion gave me useful advice about graduate
school and my research. I appreciated his input very much and have a great deal of respect for him.
Dr. Gorman also has a great sense of humor which I enjoyed very much. I am equally grateful to Dr.
Jim Martin. Dr. Martin’s door was always open to me through the years. Jim was always was
willing to listen and has given me great advice both on scientific and non-scientific issues. No one
can get you excited about science like Jim – he’s simply a good man. Finally, I am extremely
appreciative of Dr. Charles Boss for his friendship over the years and the many useful discussions
about science, the department, and life in general. I very much enjoyed stopping by Dr. Boss’s
office, whether it be to talk about science, the department, the direction and voice of Phi Lamda
v
Upsilon, or just to simply sneak a piece of candy from his desk while his back was turned (damn that
mirror!).
Aside from the members of my committee, I would also like to thank Jean Sigvaldsen, Joyce
Dunn, Cynthia Martin, and the late Joyce Weatherspoon - their friendship, professionalism, and
many useful discussions were greatly appreciated. I considered these people to be the “glue” of the
department. These people always went out of their way to make things a little bit better and it meant
a lot to me.
My list of acknowledgments would not complete without mentioning the faculty at JMU.
They provided me with an unparalleled quality of scientific training that allowed me to be successful
at graduate school. I would especially like to thank Dr. Frank Palocsay - a long standing friend and
mentor from JMU; Dr. Downey - for first inspiring me to do something different and try going to
NCSU; and Dr. Roddy Amenta - my first research advisor. I will always feel a great deal of gratitude
and a fraternal bond with the people at JMU. I must also acknowledge my high school chemistry
teacher, Ms. Ester Freeman for first inspiring me to pursue chemistry as a career.
Finally, I must thank the many friends I have made and kept over the years. Drew, Booker,
Andy, and Kyle - thanks for being patient and understanding, you guys are the best. To the graduate
school class that came in with me in 1994, (Russ, Jen, Stacy, Fabio, Mark, Kathleen, Jean, Karen,
etc.) - it took awhile, but we all made it. Thanks for taking the edge off. I must specifically mention
Russ – a good friend and long time roommate – thanks for the support and, of course, the computer.
I would like to acknowledge specifically the support and friendship of my former roommates and
long time friends from JMU, Andrew and Dana, as well as, my current roommate Chris who always
manages to crack me up. I also appreciate the guys and gals of the “Saturday Basketball Crew” – for
the last four years, competitive yet friendly basketball with fellow graduate students every Saturday
morning really helped alleviate the stress of graduate school.
Lastly, I would like to especially thank Jill, my best friend here in graduate school - Jill made
graduate school and life for that matter, fun - the way it should be.
vi
TABLE OF CONTENTS
LIST OF TABLES…………………………………………………………………………..xi
LIST OF FIGURES………………………………………………………………………..xiii
LISTS OF SYMBOLS, ABBREVIATIONS, SUBSCRIPTS, AND CONSTANTS…….xx
PREFACE…………………………………………………………………………………xxiv
1. OVERVIEW AND SIGNIFICANCE OF RESEARCH………………………...……..1
1.1. COMMERCIAL BIOSENSORS…………………………………………………………...21.2. BIOCOMPATIBLE MATERIALS AND SURFACES……………………………………41.3. BIOSENSOR RESEARCH AND DEVELOPMENT……………………………………...6
1.3.1. Elements of a Biosensor………………………………………………………………61.3.2. Characteristics of an Ideal Biosensing Device………………………………………..81.3.3. Complications of Biosensor Related Research……………………………………….8
1.4. PROTEINS…………………………………………………………………………………91.4.1. Biological Electron Transfer and Proteins……………………………………………91.4.2. Protein Adsorption Processes………………………………………………………..12
1.5. ADDRESSING THE CHALLENGES OF BIOSENSOR RESEARCH………………….141.5.1. Electrochemistry……………………………………………………………………..141.5.2. Scanning Probe Microscopy…………………………………………………………151.5.3. Nanotechnology……………………………………………………………………...161.5.4. Self-Assembled Monolayers…………………………………………………...…....16
1.6. ELECTROCHEMICAL APPROACHES TO BIOSENSOR RESEARCH……...…….…171.6.1. Basic Electrochemical Biosensor Design………………………………...……….…181.6.2. Direct ET Designs…………………………………………………………………...21
1.7. SUMMARY AND PERSPECTIVE OF DISSERTATION RESEARCH………………..211.8. REFERENCES……………………………………………………………………………24
2. BACKGROUND, INTRODUCTION, AND OBJECTIVES OF RESEARCH…….27
2.1. BIOLOGICAL ET OF PROTEINS……………………………………………………….282.1.1. Homogeneous ET of Proteins………………………………………………………..282.1.2. Heterogeneous ET of Proteins……………………………………………………….30
2.2. THE STRATEGY: PROTEIN MONOLAYER ELECTROCHEMISTRY………………322.2.1. PME: Advantages and Disadvantages……………………………………………….342.2.2. Modified Electrodes and PME………………………………………………………37
2.3. THE CYT C / SAM / Au ELECTRODE SYSTEM………………………………………382.4. EQUINE (HORSE HEART) CYTOCHROME C………………………………………..40
2.4.1. Physical and Structural Properties of Cyt c………………………………………….402.4.2. Physiological Function of Cyt c……………………………………………………..42
2.5. SELF-ASSEMBLED MONOLAYERS…………………………………………………..452.5.1. General Characteristics………………………………………………………………452.5.2. The Process of Self-Assembly………………………………………………………452.5.3. Alkane Chain Length………………………………………………………………..472.5.4. SAM Endgroups (Terminal Groups)………………………………………………...492.5.5. SAM Applications…………………………………………………………………...532.5.6. Cyt c / COOH SAM / Au System (Bowden Research)…………………….………..54
vii
2.6. ELECTROCHEMISTRY – VOLTAMMETRY OF AN ADSORBED SPECIES…….…552.6.1. Laviron’s Kinetics of Adsorbed Species………………………………………….…57
2.7. DOUBLE LAYER THEORY AND CAPACITANCE…………………………………...592.7.1. The Double Layer……………………………………………………………………592.7.2. Parallel Plate Capacitors……………………………………………………………..602.7.3. Dielectric Materials………………………………………………………………….632.7.4. SAMs, Dielectrics, and Double Layer Capacitance…………………………………672.7.5. Cyclic Voltammetry and Double Layer Capacitance………………………………..69
2.8. ELECTROCHEMICAL BEHAVIOR OF CYT C / COOH SAM / Au SYSTEMS……...722.8.1. Electrochemical Properties of Cyt c…………………………………………………742.8.2. Previous Research – Testing the Heterogeneous Adsorption Site Hypothesis……...75
2.9. FOCUS OF DISSERTATION RESEARCH……………………………………………...792.9.1. Surfaces and Objectives of Research………………………………………………..792.9.2. Methodology and Approach…………………………………………………………812.9.3. Organization of Dissertation………………………………………………………...82
2.10. REFERENCES …………………………………………………………………………...84
3. THE ROLE OF GOLD TOPOGRAPHY IN CYT C / SAM / GOLDELECTROCHEMICAL SYSTEMS………………………………92
3.1. INTRODUCTION………………………………………………………………………...933.1.1. The Topography of Gold Substrates………………………………………………...953.1.2. Previous Research Into Gold Topography…………………………………………..973.1.3. Gold Topography and the Cyt c / SAM / Au System………………………………..98
3.2. EXPERIMENTAL GOLD – GENERAL CHARACTERISTICS………………………..993.2.1. Evaporated Gold Thin Films……………………………………………………….1003.2.2. Bulk Polycrystalline Gold………………………………………………………….1003.2.3. Single Crystal Gold………………………………………………………………...1023.2.4. Au Epitaxially Grown on Mica…………………………………………………….102
3.3. EXP. GOLD CHARACTERIZATION – ROUGHNESS FACTORS…………………..1033.3.1. Basis and Background of Rf………………………………………………………..1043.3.2. Experimental Results - Rf-E/C……………………………………………………….1073.3.3. Rf-E/C Results – Comparison of Various Types of Gold Substrates………………...1143.3.4. SPM Roughness Factors - Rf-SPM…………………………………………………...117
3.4. EXP. GOLD CHARACTERIZATON – CRYSTALLINITY…………………………...1173.4.1. Gold Oxide Formation and Crystallinity…………………………………………...1173.4.2. Lead Underpotential Deposition Experiments……………………………………..119
MULTIPLE GOLD SUBSTRATE STUDY (PART I)
3.5. CYT C ELECTROCHEMICAL RESPONSE ON MODIFIED GOLD………………...1223.6. X-RAY PHOTOELECTRON SPECTROSCOPY ……………………………………...1233.7. EFFECT OF INTENTIONAL ROUGHENING ON CYT C RESPONSE……………...1253.8. SQUARE WAVE VOLTAMMETRY…………………………………………………..1263.9. PROPERTIES AND STRUCTURE OF COOH SAMS………………………………...127
3.9.1. Redox Probing of SAMs…………………………………………………………...1283.9.2. Hydroxymethyl Ferrocene Redox Probing of SAMs on Experimental Gold……...129
3.10. Cdl OF THE CYT C / SAM / Au SYSTEMS……………………………………………1313.11. MIXED SAMS…………………………………………………………………………..134
3.11.1. The Structure of Mixed SAMs……………………………………………………..1353.11.2. The Effect of Mixed SAMs on Smooth Topographies and Cyt c Response……….138
viii
3.11.3. XPS of the Mixed SAM / Cyt c System……………………………………………1413.11.4. Kinetic Analysis of Cyt c Adlayers on Mixed SAMs…………………………...…141
EVAPORATED GOLD STUDY (PART II)
3.12. INITIAL RESEARCH – ROLE OF THE GOLD SUBSTRATE………………………...1443.12.1. Roughness of Evaporated Gold Substrates………………………………………...1443.12.2. SAM Desorption Linear Sweep Voltammetry……………………………………..1443.12.3. Capacitance of COOH SAMs on Evaporated Au Substrate………………………..1493.12.4. Hydroxymethyl ferrocene Redox Probing…………………………………………1503.12.5. Cyt c Response for Evaporated Gold Substrates…………………………………...1503.12.6. Effect of Intentional Roughening of Evaporated Au (HFA)……………………….1523.12.7. Mixed SAMs on Annealed Evaporated Au………………………………………...1523.12.8. The Titanium Experience – A Comment on Annealing and Contamination………152
3.13. DISCUSSION…………………………………………………………………………….1573.13.1. Carboxylic Acid SAM Structure and Gold Topography…………………………...1573.13.2. Cyt c Adsorption/Electrochemistry and Gold Topography………………………...159
3.14. FUTURE DIRECTIONS…………………………………………………………………1633.15. SPECIAL ACKNOWLEDGEMENTS…………………………………………………...1643.16. EXPERIMENTAL DETAILS……………………………………………………………165
3.16.1. Experimental Gold Substrates……………………………………………………...1653.16.2. General Materials – Solution Preparation………………………………………….1663.16.3. Electrochemistry (General – Equipment)…………………………………………..1673.16.4. Gold Substrate Pretreatments………………………………………………………1683.16.5. Scanning Probe Microscopy Imaging……………………………………………...1693.16.6. Roughness Factor Experiments…………………………………………………….1703.16.7. Lead UPD Experiments…………………………………………………………….1703.16.8. SAM Deposition Procedure………………………………………………………...1713.16.9. SAM Characterization Procedure – Redox Probing………………………………..1713.16.10. Cyt c Purification…………………………………………………………………..1723.16.11. Cyt c Adsorption and Electrochemistry…………………………………………...1813.16.12. XPS Testing Analysis……………………………………………………………...1823.16.13. Square Wave Voltammetry………………………………………………………..1833.16.14. Intentional Roughening Procedures and Mixed SAM Usage……………………..1833.16.15. SAM Deposition LSV Procedure………………………………………………….183
3.17. REFERENCES…………………………………………………………………………….184
4. THE CYT C / SAM INTERFACE: PRELIMINARY INVESTIGATION OFSAM HEALING AND SILVER UPD……………………………191
4.1. THERMAL HEALING OF SELF-ASSEMBLED MONOLAYERS……………………..1924.1.1. Mechanistic Aspects of Thermal Healing of SAMs………..………………………193
4.2. RESULTS AND DISCUSSION – THERMAL HEALING OF SAMS……………….…..1964.2.1. Cyt c Response – Thermal Healing of SAMs………..…………………………….1964.2.2. HMFc Redox Probing of Thermally Healed SAMs………………………………..1984.2.3. SAM Desorption Studies of Thermally Healed SAMs…………………………….1994.2.4. Conclusions and Future Directions for Thermal Healing………………………….200
4.3. SILVER UNDERPOTENTIAL DEPOSITION BASED SAMS (Ag-UPD)……………...2014.3.1. Underpotential Deposition – General Discussion………………………………….2014.3.2. Silver and Copper UPD Based SAMs on Gold…………………………………….202
ix
4.3.3. Methods of Depositing UPD Layers……………………………………………….2044.3.4. Results and Discussion – Ag UPD Layers…………………………………………2054.3.5. Piranha Cleaning vs. Electrochemical Cleaning – The Cyt c Response…………...2104.3.6. Future Directions – Ag/Cu UPD Layers on Au……………………………………212
4.4. FUTURE DIRECTIONS FOR THE SAM/CYT C INTERFACE………………………...2134.5. SPECIAL ACKNOWLEDGEMENTS……………………………………………………2144.6. EXPERIMENTAL DETAILS……………………………………………………………..214
4.6.1. Thermal Healing Experiments……………………………………………………...2144.6.2. Ag – UPD Experiments…………………………………………………………….215
4.7. REFERENCES…………………………………………………………………………….217
5. THE CYT C/SAM/GOLD SYSTEM ON A MOLECULAR LEVEL:A SCANNING PROBE MICROSCOPY STUDY………………………219
5.1. SPM: THE GOLD SUBSTRATE…………………………………………...…………….2215.2. SPM: SAM / SOLUTION INTERFACE………………………………………………….2335.3. SPM: PROTEINS (CYTOCHROME C)………………………………………………….235
5.3.1. SPM: Cytochrome c on Gold – Experimental Results……………………………..2365.4. SPM: THE CYT C / SAM / Au SYSTEM – CONCLUSIONS AND FUTURE
DIRECTIONS……………………………………………2425.5. SPECIAL ACKNOWLEDGEMENTS……………………………………………………2525.6. EXPERIMENTAL DETAILS……………………………………………………………..252
5.6.1. STM Experiments…….……………………………………………………………2525.6.2. AFM Experiments………………………………………………………………….253
5.7. REFERENCES…………………………………………………………………………….254
A. APPENDIX A: SOLVENTLESS ELECTROCHEMISTRY OFMETALLODENDRIMERS………………………………………259
A.1. INTRODUCTION – NANOTECHNOLOGY…………………………………………….260A.2. THE INFORMATION BEARING UNIT…………………………………………………260A.3. THE GORMAN RESEARCH PROJECT – METALLODENDRIMERS………………..261
A.3.1. Fe-S Based Dendrimers…………………………………………………………….263A.3.2. Gorman / Bowden Collaboration Project…………………………………………..268A.3.3. Research Objectives………………………………………………………………..270
A.4. PRELIMINARY EXPERIMENTS………………………………………………………..270A.4.1. Exploratory Electrochemistry in Propylene Carbonate…………………………….272
A.5. SOLVENTLESS ELECTROCHEMISTRY………………………………………………275A.5.1. Polymer Salts……………………………………………………………………….275A.5.2. Solventless Electrochemistry at Microelectrodes – Royce Murray Research……...277A.5.3. Apparent Diffusion Coefficients (Dapp)…………………………………………….278A.5.4. Dapp and Diffusion Geometry………………………………………………………279A.5.5. Relevant Experimental Results from the Murray Group…………………………...281
A.6. SOLVENTLESS ELECTROCHEMISTRY – METALLODENDRIMERS……………...284A.6.1. N.C. State versus UNC……………………………………..………………………285A.6.2. Preliminary Results – Carboxylic Acid Ferrocene / MePEG(250)………………...286A.6.3. Flexible IBUs / MePEG(250) Results……………………………………………...287
A.7. DISCUSSION……………………………………………………………………………..288A.8. CONCLUSIONS AND FUTURE DIRECTIONS………………………………………...295A.9. SPECIAL ACKNOWLEDGEMENTS……………………………………………………297A.10. EXPERIMENTAL DETAILS……………………………………………………………297
x
A.10.1. Equipment / Materials / Procedures………………………………………………..297A.10.2. SAM Experiments and LSV Desorption…………………………………………...298A.10.3. Solventless Electrochemistry……………………………………………………….299
A.11. REFERENCES……………………………………………………………………………302
B. APPENDIX B: INTERESTING ELECTROCHEMISTRY ATINDIUM OXIDE ELECTRODES……………………………………….306
B.1. INTRODUCTION………………………………………………………………………...307B.2. NEUROLOGICAL DISEASE…………………………………………………………….307B.3. METAL OXIDE ELECTRODES………………………………………………………....308B.4. THE KYNURENINE PATHWAY – A CATARACT STUDY…………………………..309B.5. THE Aβ PEPTIDE AND ALZHEIMER’S DISEASE……………………………………316B.6. CYTOCHROME C AT ITO ELECTRODES……………………………………………..319B.7. SPECIAL ACKNOWLEDGEMENTS……………………………………………………323B.8. EXPERIMENTAL DETAILS……………………………………………………………..323
B.8.1. Kynurenine Pathway Experiments…………………………………………………323B.8.2. Aβ Experiments…………………………………………………………………….324B.8.3. Cyt c / ITO Experiments…………………………………………………………...324
B.9. REFERENCES……………………………………………………………………………326
xi
LIST OF TABLES
Table 1-1. Examples of biological implants or biocompatible materials……………………………..5
Table 1-2. Protein classification and function……………………………………………………….10
Table 1-3. Sampling of genetic diseases linked to proteins and enzymes…………………………...15
Table 2-1. Scientific advantages and limitations of PME…………………………………………...35
Table 2-2. Dielectric constants and dielectric strengths for various materials………………………64
Table 2-3. Electrochemical properties of cyt c voltammetry………………………………………..76
Table 3-1. Summary of experimental gold substrate properties……………………………………101
Table 3-2. Estimated values – charge density passed for the reduction of an oxygen ad-atommonolayer of Au-oxide………………………………………………………….……...107
Table 3-3. Electrochemical and SPM roughness factors - experimental gold substrates…………..116
Table 3-4. Categories of SAM defects……………………………………………………………...128
Table 3-5. HMFc SAM defect redox probe voltammetry results on various gold substrates……...131
Table 3-6. Double layer capacitance measurements of SAMs on various gold substrates………...132
Table 3-7. HMFc redox probing for SAM defects – mixed SAMs on evaporated gold…………...139
Table 3-8. Double layer capacitance results – mixed SAMs / various gold substrates…………….140
Table 3-9. Effect of roughening and mixed SAMs on cyt c voltammetric properites……………..140
Table 3-10. Electrochemical and SPM roughness factors – evaporated gold film substrates……...145
Table 3-11. Linear scan voltammetry – SAM desorption results - evaporated gold filmsubstrates……………………………………………………………………………...148
Table 3-12. SAM double layer capacitance - evaporated gold film substrates – chainlength andpretreatment dependence……………………………………………………………….149
Table 3-13. SAMs double layer capacitance of SAMs on evaporated gold – variouspretreatments…………………………………………..……………………………….153
Table 3-14. Chemicals, solutions, and equipment for horse heart cyt c purification………………173
Table 4-1. Cyt c / C11OOH voltammetry – SAM thermal healing results……………………….....198
Table 4-2. Voltammetry cyt c / C11OOH SAM – electrochemical properties – piranha cleaning vs.Electrochemical cleaning………………………………………………………………212
Table 5-1. Comparison of known protein dimensions to experimental SPM determinedDimensions……………………………………………………………………………..237
Table A-1. Electrochemical data previously obtained for metallodendrimers……………………..267
Table A-2. Summary of solvent / electrolyte / potential window testing…………………………..272
Table A-3. Linear scan voltammetry – SAM desorption results…………………………………...274
Table A-4. Techniques for measuring very small diffusional parameters…………………………278

xii
Table A-5. Solventless electrochemical properties of metallodendrimers…………………………288
Table A-6a. IBU parameters and properties ……………………………………………………….294
Table A-6b. Microelectrode assembly parameters and properties…………………………………294
Table A-7. Dendrimer – polymer film – number of molecules electrolyzed………………………296
Table B-1. Cyt c / ITO voltammetry………………………………………………………………..321
xiii
LIST OF FIGURES
Figure 1.1. Depiction of potential in vivo biosensors with biospecific……………………………..3
Figure 1.2. Common enzymes used in biosensors………………………………………….….……4
Figure 1.3. Basic biosensor design………………………………………………………….….……7
Figure 1.4. Diagrams of chloroplasts and photosynthesis chain……………………………………12
Figure 1.5. Protein adsorption processes……………………………………………………………13
Figure 1.6. Generic model illustration of a self-assembled monolayer……………………………..17
Figure 1.7. Electrochemical designs of biosensors………………………………………………….19
Figure 1.8. Mediating species used in electrochemical based biosensor designs………….………..20
Figure 1.9. Flowchart illustrating span and diversity of biosensor and biocompatibleresearch…………………………………………………………………………………23
Figure 2.1. Illustrations and reactions schemes depicting the simplified strategy of PME versustraditional bimolecular reactions……………………………………………………….33
Figure 2.2. Illustrations showing a hypothetical structure for cyt c molecules adsorbed at a goldelectrode modified with a 16-MHDA SAM…………………………………….……...39
Figure 2.3. Crystal and space filled structures of HH cyt c – rotated 90°……………………….….41
Figure 2.4. Simulated UV-Vis spectrum of oxidized and reduced forms of HH cyt c…………...…41
Figure 2.5. Cross-sectional 3-D diagram of a eukaryotic cell……………………………….……....42
Figure 2.6. Mitochondrion structure (diagram and electron micrograph)………………………..…44
Figure 2.7. Mitochondrial ET system with four major complexes including cyt c………….…..….44
Figure 2.8. Schematics of a SAM highlighting endgroups, headgroups, alkane chains, tilt angle,substrate, and lateral interactions………………………………………………….….....46
Figure 2.9. SAM structural property trends based on SAM chain length………………………...…48
Figure 2.10. Endgroup related trends of SAM properties………………………………………...…50
Figure 2.11. Cyclic voltammogram for an ideally adsorbed, reversible electrochemical system…...56
Figure 2.12. A commonly accepted model for the electrode-solution interface known as the doublelayer…………………………………………………………………………………….60
Figure 2.13. Parallel plate capacitor as an electronic component and in a simple circuit………..….61
Figure 2.14. Dielectric effect on voltage across a capacitor…………………………………………63
Figure 2.15. Dielectric materials on a molecular level………………………………………………66
Figure 2.16. Comparison of how a SAM modified electrode can be modeled as a parallel platecapacitor with a dielectric material……………………………………………………..68
Figure 2.17. Determining Cdl from cyclic voltammograms…………………………..…………...…70
Figure 2.18. Background voltammograms taken for diagnostic Cdl measurements to track progress ofelectrochemical experiments with SAM modified electrodes……………………….....70
xiv
Figure 2.19. Reciprocal Cdl of alkanethiolate SAMs as a function of chainlength and electrolyte….72
Figure 2.20. Schematics of cyt c model system used in Bowden research: side and top view……...73
Figure 2.21. Cyclic voltammogram of typical electrochemical behavior of cyt c adsorbed onto acarboxylic acid SAM…………………………………………………………………...74
Figure 2.22. Generalized schematic diagrams depicting the experimental protocol for investigatingsub-populations of adsorbed cyt c……………………………………………………...77
Figure 2.23. Desorption plots of formal potential, full-width half maximum, and electron transferrate constant as a function of electroactive surface coverage for a cyt c / 16-MHDASAM / Au system……………………………………………………………………...78
Figure 2.24. Illustration of the cyt c / SAM / Au system and the three major surfaces to beinvestigated……………………………………………………………………………..80
Figure 3.1. Examples of SAM defects attributable to gold topography……………………………..96
Figure 3.2. Cyclic voltammetry “roughness scan” in 0.1 M H2SO4………………………………..105
Figure 3.3. Cyclic voltammetry of final electrochemical cleaning cycle and multiple cleaning cyclescans……………………………………………………………………………………109
Figure 3.4. Cyclic voltammetry roughness scans of evaporated gold as received and afterelectrochemical cleaning……………………………………………………………….110
Figure 3.5. Cyclic voltammetry roughness scans illustrating roughening effect of electrochemicalcycling on smooth gold (bulk gold example)…………………………………………..111
Figure 3.6. Illustrations of the three major stages of annealing…………………………………….112
Figure 3.7. Photomicrographs showing the effect of annealing on grain size (brass example)……112
Figure 3.8. Effect of annealing on the properties of a Zn-Cu alloy……………………………..….113
Figure 3.9. Cyclic voltammetry roughness scans illustrating the smoothing effect of HFA on bothbulk gold and evaporated gold…………………………………………………………115
Figure 3.10. Cyclic voltammetry roughness scans of various types of gold substrates andpretreatments with corresponding roughness factors.…………………...……………116
Figure 3.11. Cyclic voltammetry roughness scans of evaporated gold illustrating the link between thesurface crystallinity and the shape of Au-oxide formation peaks……………...……..118
Figure 3.12. Pb UPD stripping voltammetry showing the crystallinity of evaporated gold aftervarious pretreatments…………………………………………………………………120
Figure 3.13. Pb UPD stripping voltammograms of bulk gold after etching in aqua regia, after ovenannealing, and before/after HFA……………………………………………..………121
Figure 3.14. Cyclic voltammetry of cyt c adsorbed at C14OOH SAMs on various gold substratesincluding evaporated gold, bulk gold, Au(111), and Au on mica………..…………...122
.
xv
Figure 3.15. XPS spectra of the N(1s) region and corresponding cyclic voltammograms of cyt cadsorbed at C14OOH SAM modified bulk gold substrates that have beenelectrochemically cleaned and hydrogen flame annealed…………………………….124
Figure 3.16. Cyclic voltammetry of cyt c / C14OOH / bulk Au assemblies where the gold surface hasbeen smoothed with HFA and roughened by electrohemical cycling……………..…126
Figure 3.17. Square wave voltammetry of cyt c / C14OOH / Au / mica assemblies after initial proteinadsorption and after exposure to several rinses with 1 M KCl…………...…………..127
Figure 3.18. HMFc voltammetry at various gold substrates modified with HOOC(CH2)13SH….....131
Figure 3.19. Plot of double layer capacitance versus the overall roughness factor of various goldsubstrates……………………………………………………………………………....132
Figure 3.20. Proposed model to explain the observed trend in Cdl for SAMs on the Au substrates ofvarying roughness……………………………………………………………………..134
Figure 3.21. Illustration of the basic structure and surface distribution of a two component mixedSAM on gold…………………………………………………………………………..136
Figure 3.22. Schematics of two component mixed SAMs – hydrophobic/hydrophilic endgroup/chaininteractions…………………………………………………………………………….137
Figure 3.23. Crystallinity of Type II mixed SAMs………………………………………………....138
Figure 3.24. Cyclic voltammetry of cyt c adsorbed to a single component C14 acid SAM on annealedbulk Au compared to cyt c adsorbed to a mixed SAM on annealed bulkAu……………………………………………………………………………………..139
Figure 3.25. XPS spectra and cyclic voltammetry of cyt c on C14OOH SAMs on smoothed,roughened, and mixed SAM modified bulk gold substrates………………………….142
Figure 3.26. Cyclic voltammetry of cyt c adsorbed on C14OOH modified evaporated Au and on amixed SAM (C14OOH & C10OH) modified evaporated Au – illustrates kinetic effect ofmixed SAMs…………………………………………………………………………..143
Figure 3.27. Roughness scan voltammetry of evaporated Au as received, electrochemically cleaned,and hydrogen flame annealed…………………………………………………………145
Figure 3.28. LSV-SAM desorption scans – electrochemically cleaned and hydrogen flame annealedevaporated gold – various chain length SAMs …..…………………………………...146
Figure 3.29. LSV-SAM desorption scans electrochemically cleaned and hydrogen flame annealedevaporated gold – C14OOH SAMs………………………………….………………...148
Figure 3.30. Plot of COOH SAM chainlength (total # of carbons in chain) versus Cdl-1 for
electrochemically cleaned, oven annealed, and hydrogen flame annealed evaporated Ausubstrates………………………………………………………………………………150
Figure 3.31. HMFc redox probe voltammetry at C14OOH SAMs on electrochemically cleanedevaporated gold, HFA evaporated gold, Au/mica, and at bare evaporated Au……….151
xvi
Figure 3.32. Cyclic voltammetry of cyt c on C14OOH SAMs on electrochemically cleanedevaporated gold and HFA evaporated gold…………………………………………...151
Figure 3.33. Cyclic voltammetry with background signals illustrating the effect of surfaceroughening on the cyt c response (evaporated Au with C14OOH SAMs)………….…153
Figure 3.34. Cyclic voltammetry of cyt c adsorbed onto a HFA evaporated gold substrate modifiedwith a mixed SAM…………………………………………………………………….154
Figure 3.35. XPS survey scans of evaporated gold as received, electrochemically cleaned, ovenannealed, and hydrogen flame annealed………………………………………………154
Figure 3.36. Cross sectional diagrams of evaporated Au film substrates as received and uponannealing………………………………………………………………………………155
Figure 3.37. Computer simulations of cyt c adsorption onto SAMs……………………………….162
Figure 3.38. Schematic illustration of electrochemical cell used in this research………………….168
Figure 3.39. Apparatus for protein purification illustrating column/siphon system……………….175
Figure 3.40. Separation mechanism of the CM-52 column during ion exchange chromatographicpurification of cytochrome c………………………………………………………….177
Figure 3.41. Schematic diagram of Amicon filtration cell…………………………………………179
Figure 3.42. Experimental UV-Vis spectrum of horse heart cyt c…………………………………181
Figure 4.1. STM images illustrating example of thermal healing of SAMs……………………….195
Figure 4.2. Cyclic voltammetry of cyt c adsorbed to traditionally prepared and thermally healedSAMs………………………………………………………………………………….197
Figure 4.3. Cyclic voltammetry of HMFc redox probe at tratditionally prepared and thermally healedSAMs………………………………………………………………………………….198
Figure 4.4. Cyclic voltammetry of HMFc redox probe at methyl terminated SAMs traditionallyprepared and thermally healed…………………………………………………..…….199
Figure 4.5. Linear sweep voltammetry scans of traditionally prepared and thermally healed C11OOHSAMs on evaporated gold……………………………………………………………..200
Figure 4.6. Schematic illustration of a gold / silver or copper UPD layer / alkanethiolate SAMassembly………………………………………………………………………………202
Figure 4.7. LSV of various gold, gold-UPD, and gold-UPD-SAM systems……………………….204
Figure 4.8. Survey cyclic voltammetry illustrating UPD and bulk silver processes……………….205
Figure 4.9. Waveform of the chronocoulometry experiment for depositing Ag UPD layers……...206
Figure 4.10. Cyclic voltammetry example of Ag UPD deposition and stripping………………….207
Figure 4.11. Cyclic voltammetry of Ag-UPD experiment on piranha cleaned evaporated gold…..207
Figure 4.12. HMFc redox probe voltammetry at a n-octanethiol SAM on evaporated gold and at a n-octanethiol SAM on Ag-UPD modified evaporated gold…………………………….208
xvii
Figure 4.13. LSV SAM desorption sweep of an octane thiol SAM on Ag-UPD modified evaporatedgold……………………………………………………………………………………209
Figure 4.14. Stripping / depositing voltammetry of Ag-UPD layer on freshly prepared evaporatedgold film………………………………………………………………………………210
Figure 4.15. Cyclic voltammetry of cyt c adsorbed on SAMs formed on electrochemically cleanedand piranha cleaned evaporated gold substrates………………………………………211
Figure 4.16. Experimental apparatus for thermal healing of SAMs in the electrochemical cell…...215
Figure 5.1. Contact mode AFM images of evaporated gold before and after electrochemicalCleaning…………………………………………………………………..…………….222
Figure 5.2. Roughness analysis of an STM image of electrochemically cleaned evaporated gold...223
Figure 5.3. Roughness analysis of an STM image of evaporated gold that has been HFA………...224
Figure 5.4. Optical photomicrographs of bulk gold substrates after etching in dilute aqua regia….225
Figure 5.5. Scanning electron microscope images of bulk gold electrodes after being etched in aquaregia……….…………………………………………………………………………....226
Figure 5.6. STM images and corresponding cross sectional analyses of evaporated gold comparedto bulk gold ……………………………………………………………………………227
Figure 5.7. STM images and cross sectional analyses of a Au(111) substrate…………………….228
Figure 5.8. STM image of Au epitaxially grown on mica substrates………………………………229
Figure 5.9. Roughness analysis of an STM image of Au grown on mica………………………….230
Figure 5.10. Sectional analysis of a gold step edge on a gold on mica substrate…………………..231
Figure 5.11. Sectional analysis of another gold step edge on a gold on mica substrate……………232
Figure 5.12. STM image and cross-sectional analysis illustrating the atomic step plateau topographyof gold on mica……...………………………………………………………………...232
Figure 5.13. Illustration of how SPM techniques can skew the apparent dimensions of imagedadsorbates……………………………………………………………………………..236
Figure 5.14. STM image (survey scan) of cyt c proteins on gold on mica…………………………238
Figure 5.15. STM image of apparent single molecules of cyt c protein adsorbed onto a gold on micasurface…………………………………………………………………………………239
Figure 5.16. Sectional-analysis of two apparent cyt c molecules from an STM image……………240
Figure 5.17. STM images of individual cyt c molecules on gold on mica – top and three dimensionalviews…………………………………………………………………………….….…241
Figure 5.18. Schematic of resonant tunneling ECSTM experiment by Tao………………………..244
Figure 5.19. STM images of Fe-protoporphyrin embedded in an array of protoporphyrin referencemolecules……………………………………………………………………………...245
xviii
Figure 5.20. Sample and reference molecules from Tao’s resonant tunneling experiment………..246
Figure 5.21. STM images and corresponding cyclic voltammetry of Fe-protoporphyrin andprotoporphyrin adsorbed on graphite during resonant tunneling experiments……….246
Figure 5.22. Apparent height of imaged Fe-protoporphyrin molecules during STM resonanttunneling experiments………………………………………………………………...247
Figure 5.23. Hypothetical ECSTM resonant tunneling experiments on cyt c molecules………….249
Figure 5.24. Hypothetical sketches of potential-current plots for a two electrode resonanttunneling experiment………………………………………………………………….249
Figure 5.25. Yeast cyt c covalently bonded to a SAM via a disulfide bond between the SAM and acysteine amino acid group in position 102……………………………………………251
Figure 5.26. Microperoxidase may be used in future experiments for initial tests of resonanttunneling of proteins…………………………………………………………………..251
Figure A.1. Plot showing the miniaturization of electronic devices – past, present, and future…...260
Figure A.2. Main classes of macromolecular architectures………………………………………...262
Figure A.3. Dendritic encapsulation prevents facile ET between redox centers…………………...263
Figure A.4. The tertiary butyl thiolated iron-sulfur core – the redox center for metallodendrimerssynthesized in the Gorman Research Group…………………………………………..264
Figure A.5. Flexible IBU metallodendrimer with varying generations…………………………….265
Figure A.6. Fourth generation rigid type metallodendrimer………………………………………..266
Figure A.7. Data illustrating the effective encapsulation of the metallodendrimers and its effect onthe ET rate constant…………………………………………………………………...267
Figure A.8. Illustrative models showing the similarities between the ET systems being researched inthe Bowden and Gorman research groups…………………………………………….269
Figure A.9. LSV desorption scan of a tetradecanethiol SAM on Au in propylene carbonate……...274
Figure A.10. Experimental apparatus used by Royce Murray Group for performing solventlesselectrochemistry at a platform microelectrode….……………………………………278
Figure A.11. Solventless electrochemistry at microelectrodes – background voltammograms using avariety of polymer melts…………………….……………………………………….282
Figure A.12. Cyclic voltammetry of 5 mM carboxylic acid ferrocene / Me2PEG films at themicroelectrode assembly……………………………………………………………..283
Figure A.13. Cyclic voltammogram of background signal of Me2PEG(250)/LiClO4……….……..285
Figure A.14. Cyclic voltammogram of carboxylic acid ferrocene in Me2PEG(250) / LiClO4 atvarying scan rates…………………………………………………………………….287
Figure A.15. Cyclic voltammograms of first three generations of flexible IBU molecules inMe2PEG(250) with LiClO4…………………………………………………………..289
xix
Figure A.16. Cyclic voltammetry results comparing GO, G1, and G2 flexible IBUs……………...290
Figure A.17. Cyclic voltammogram at various scan rates of GO-flex in Me2PEG(250)/LiClO4…..291
Figure A.18. Scan rate dependence plots of GO-flex IBU in Me2PEG(250)/LiClO4………………292
Figure A.19. Hypothetical model used for charge calculations aimed at determining the number ofIBUs being electrolyzed……………………………………………………………...294
Figure A.20. In-house built experimental apparatus used for solventless electrochemistry of themetallodendrimers……………………………………………………………………300
Figure B.1. Tryptophan metabolism – kynurenine pathway……………………………………….310
Figure B.2. Electrochemical analysis by cyclic voltammetry of kynurenine pathway catabolites in thepresence of Cu(II)……………………………………………………………..………312
Figure B.3. Cyclic voltammetry of PBS background and PBS background with added H2O2….….312
Figure B.4. Cyclic voltammetry of copper (II) chloride in the presence of 3-HAA – varying potentialwindows……………………………………………………………………………….314
Figure B.5. Cyclic voltammetry copper chloride in PBS scanned in different potential windows...315
Figure B.6. Illustration of how Alzheimer’s attacks the brain……………………………………...316
Figure B.7. Model for the generation of reduced metal ions by Aβ peptides……………………...317
Figure B.8. Electrochemical characterization of a complex formed between Aβ1-42 and copper...318
Figure B.9. Cyclic voltammetry of HH cyt c adsorbed to indium tin oxide electrode……………..321
Figure B.10. Plot of scan rate versus electron transfer rate constant for HH cyt c / ITOassemblies……………………………………………………….…………………...322
Figure B.11. Plot of scan rate versus peak splitting for HH Cyt c / ITO systems………………….322

xx
LISTS OF SYMBOLS, ABBREVIATIONS, SUBSCRIPTS, AND CONSTANTS( in approximate alphabetical order)
Standard Subscripts
a anodicads adsorbedb backwardc cathodicdes desorbeddl double layeret electron transferexp experimentalf forwardOx oxidized species (oxidant)p peakr reverseRed reduced species (reductant)rxn reactionsoln solutionsurf surfacetheor theoretical∞ bulk solution
Greek Symbols
Symbol Meaning Units
α transfer coefficient noneβ adsorption coefficient none
distance decay factor CH2-1
ε extinction coefficient (molar absorbtivity) M-1 cm-1
dielectric constant noneΓ electroactive surface concentration mol/cm2, pmol/cm2
Γmono thiolate concentration comprising SAM pmol/cm2
λ wavelength nmactivation energy kJ/mol
µ ionic strength M, mMν scan rate (sweep rate) V/s, mV/s
frequency s-1
σ charge density Coul/cm2
ξ average redox center-to-center distance Å, nm, cm
xxi
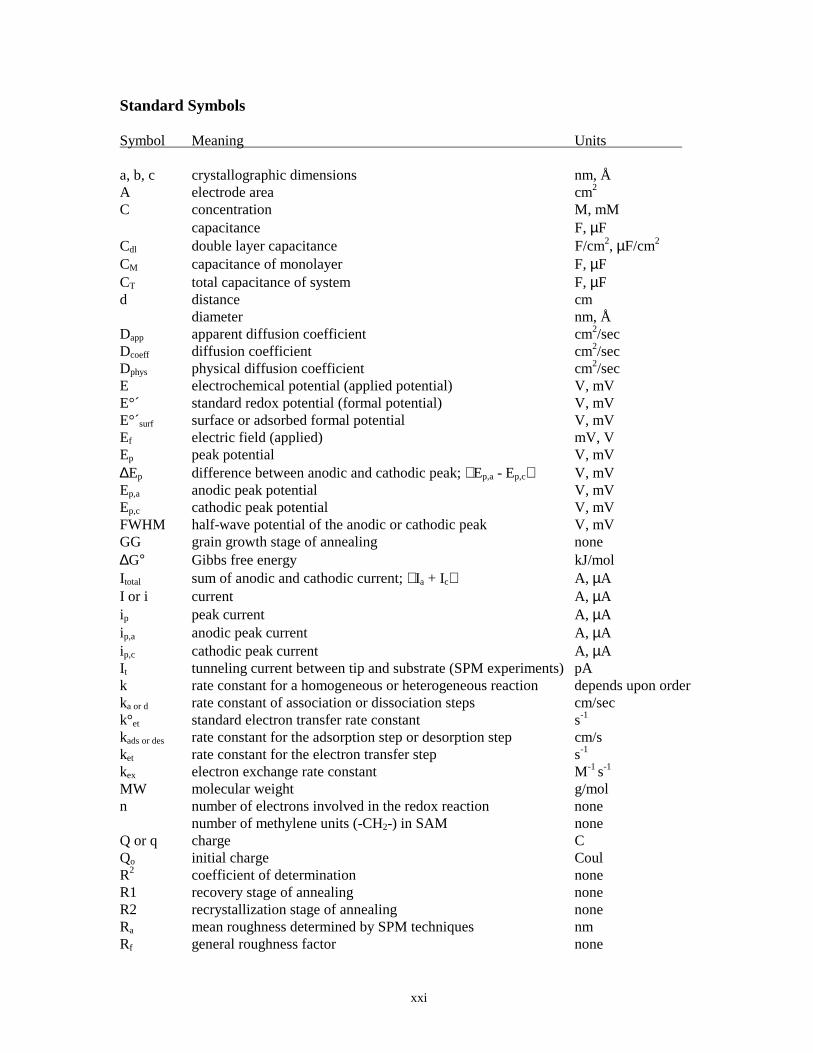
Standard Symbols
Symbol Meaning Units
a, b, c crystallographic dimensions nm, ÅA electrode area cm2
C concentration M, mMcapacitance F, µF
Cdl double layer capacitance F/cm2, µF/cm2
CM capacitance of monolayer F, µFCT total capacitance of system F, µFd distance cm
diameter nm, ÅDapp apparent diffusion coefficient cm2/secDcoeff diffusion coefficient cm2/secDphys physical diffusion coefficient cm2/secE electrochemical potential (applied potential) V, mVE°´ standard redox potential (formal potential) V, mVE°´surf surface or adsorbed formal potential V, mVEf electric field (applied) mV, VEp peak potential V, mV∆Ep difference between anodic and cathodic peak; Ep,a - Ep,c V, mVEp,a anodic peak potential V, mVEp,c cathodic peak potential V, mVFWHM half-wave potential of the anodic or cathodic peak V, mVGG grain growth stage of annealing none∆G° Gibbs free energy kJ/molItotal sum of anodic and cathodic current; Ia + Ic A, µAI or i current A, µAip peak current A, µAip,a anodic peak current A, µAip,c cathodic peak current A, µAIt tunneling current between tip and substrate (SPM experiments) pAk rate constant for a homogeneous or heterogeneous reaction depends upon orderka or d rate constant of association or dissociation steps cm/seck°et standard electron transfer rate constant s-1
kads or des rate constant for the adsorption step or desorption step cm/sket rate constant for the electron transfer step s-1
kex electron exchange rate constant M-1 s-1
MW molecular weight g/moln number of electrons involved in the redox reaction none
number of methylene units (-CH2-) in SAM noneQ or q charge CQo initial charge CoulR2 coefficient of determination noneR1 recovery stage of annealing noneR2 recrystallization stage of annealing noneRa mean roughness determined by SPM techniques nmRf general roughness factor none
xxii
Rf-E/C electrochemically determined roughness factor noneRf-SPM roughness factor determined by microscopy techniques noneRq RMS roughness nmt time secT absolute temperature KVb voltage bias between tip and substrate in SPM experiment mV, VVDI voltage applied across a dielectric material mV, VVs spatial volume Å3
X times none
Fundamental Physical Constants
F Faraday constant 96485 C/molR gas constant 8.31451 J/K⋅molh Planck’s constant 6.6261 x 10⁻³⁴ joule-secεo permitivity of free space constant 8.854187817 C2/Nm2
Main Abbreviations
A acceptor protein speciesAE auxiliary electrodeAFM atomic force microscopyATP adenosine triphosphateCAG contact angle goniometryCM carboxymethylCV cyclic voltammetrycyt c cytochrome cD donor protein species
dendritic ligandDNA deoxyribose nucleic acide- electronE/C electrochemistry or electrochemicalECSPM electrochemical scanning probe microscopyECSTM electrochemical scanning tunneling microscopyEIS electrochemical impedance spectroscopyER electroreflectance spectroscopyET electron transferFe(CN6)3- ferricyanideFWHM full width half maximumGG globular domains of vWfG1,G2… generation designation for IBU metallodendrimersHFA hydrogen flame annealed or hydrogen flame annealingHH horse heartHMFc hydroxymethyl ferrocene redox probeHOMO highest occupied molecular orbitalIBU independent binary unitIHP inner Helmholtz plane
xxiii
IR infrared spectroscopyIP ionization potentialITO indium tin oxideKE kinetic energyKPB potassium phosphate bufferLSV linear scan voltammetryLUMO lowest unoccupied molecular orbitalMe2PEG dimethyl terminated polyethylene glycol16-MHDA 16-mercaptohexadecanoic acid14-MUDA 14-mercaptoundecanoic acid6-MHA 6-mercaptohexanoic acidMS mass spectrometryMW molecular weightMX metallic saltOHP outer Helmholtz planePAR Princeton applied researchPBS phosphate buffered saline solutionPC propylene carbonatePcyt c porphyrin cytochrome cPEG polyethylene glycolPEO polyethylene oxidePES photoelectron spectroscopyPK Pelletier – Kraut ET model for cyt c and its redox partnerPME protein monolayer electrochemistryPR piranha cleaned (cleaning)QCM quartz crystal microbalanceRE reference electrodeRMS root mean squareRR fibrillar domains of vWfRT resonant tunneling-RY- polymer repeat unitSAM self-assembled monolayerSCE saturated calomel electrodeSDH succinate dehydrogenaseSEM scanning electron microscopySPM scanning probe microscopySTM scanning tunneling microcopySWV square wave voltammetryUPD underpotential depositionUV-Vis ultraviolet – visible spectroscopyVWf von Willebrand factor proteinWE working electrodeYCC yeast cytochrome c
xxiv
PREFACE
As far as my life is concerned, this dissertation represents the culmination of six years of
hard work and a variety of invaluable learning experiences. Hard work is something I believe in -
hard work and dedication. Upon undertaking any endeavor, it is these two concepts that I apply in
the hope of making a difference. A person trying to make a difference can accomplish great things.
For me, being a dedicated and hard working individual in everything that I do will always be more
valuable than shear intelligence or natural ability. If something is worth doing, it's worth doing right.
I am not the smartest chemist or even the most gifted researcher - I simply apply myself and work
hard with the understanding that anyone can learn to do anything if they simply dedicate themselves
to the objective and work at it. This is the attitude and approach with which I came to North
Carolina State University - properties of my character that were instilled in my by my parents and in
them by their parents. My ancestors were blue-collar workers and immigrants who started with very
little and gradually built good lives for themselves and their families. Hard work and dedication of
this nature have now brought me to this point in my life - the culmination of the last six years of
work in the form of a research dissertation and a Doctorate of Philosophy in Chemistry.
Research of this magnitude and on this level is not only a substantial challenge, but is also an
invaluable experience for future endeavors. The process of becoming an independent scientists
means, for me, that I can solve problems. In my opinion, a Ph.D. is really an independent problem
solver - a person capable of dedicating themselves to a problem and adept at working toward logical
solutions to that problem. The ability to do this process well is beneficial, not only for scientific
research, but also in many other aspects of life, from personal situations to society and government.
For this specific reason, I believe that Ph.D. scientists are well suited for numerous types of jobs.
What my fellow colleagues and I have been taught here at NCSU is the process of problem solving.
The research described in this dissertation addresses my experiences at learning how to solve
problems. Unfortunately, a vast amount of my learning experience here at NCSU was independent of
the work presented in this dissertation. Many other activities have helped me to this point in my life
- each with a unique importance to the overall knowledge I have gained from my time here at NCSU.
When I first entertained thoughts of joining a graduate program in chemistry, I was given the
opportunity to attend more prestigious institutions than NCSU. Upon visiting other universities,
however, it became evident that NCSU Chemistry was different. The chemistry department at NCSU
represented a dynamic, changing, atmosphere. NCSU was a program on the rise with brilliant ideas
of intermixing the different disciplines of chemistry and unique research ideas. For me, it was much
more exciting to be a part of that change rather than simply join an established program with the best
xxv
apparent "reputation." I viewed the chemistry department at NCSU as a team - an underdog - and I
always root for the underdog. The opportunity to be part of something like that was appealing and so
I went for it. After six years, I believe the decision to come to NCSU has been rewarding, with a
variety of experiences that would have never been available to me in other places.
My research experience and Ph.D. project, under the guidance of Professor Edmond
Bowden, was fruitful with learning experiences. Along with my main Ph.D. project, I was allowed to
get involved with several other research collaborations, both with Dr. Chris Gorman of NCSU's
chemistry department, and with Dr. Ashley Bush's group at the Harvard Medical School and
Massachusetts General Hospital. Cross discipline collaborations such as these really raised my level
of exposure to other areas of science. Within my own group, I was able to serve as an REU
(Research Experience for Undergraduates) mentor and have further benefited from directing two
other undergraduate researchers in projects as well. Another great opportunity for learning was Dr.
Bowden allowing me to contribute to the writing of a NSF research proposal, which was ultimately
accepted for funding. All in all, the positive research experiences over the last few years have been
extremely beneficial toward my development as a scientist and as a person.
As far as the research, graduate school in the core sciences is a unique experience, one that is
not easily understood by people outside the field. It’s hard and requires a level of dedication and
self-motivation that even medical and law graduate students cannot identify with. Over the last
several years many people (family and friends) have asked about what I do, the difficulties of
graduate school in chemistry and what it is like to do basic, fundamental research. I’ve always had
trouble with those sorts of questions, never really being able to convey to others the experience as it
really is. Fortunately, an article in the New York Times Magazine summed up the experience as
accurately as I’ve ever seen and it bears mentioning here.
Graduate study in the sciences is a very unsentimental education. It requires theintellectual evolution from an undergraduate who can ace tests of textbookknowledge to original thinker who can execute research about which the textbookshave yet to be written…At this level of achievement, there are no more A’s foreffort. As a sign in on lab had it ‘Don’t Try. Do.’…The life of a graduate studentis so uncertain…there’s no guarantee that you’re going to be able to find a job.And then you add the self-imposed pressures of the students themselves…You’redealing with people during a very difficult transition in their lives…Once theychoose a research project, graduate students essentially fend for themselves –there are no courses, no tests, no timecards, no guardrails. In scientific, thegraduate student’s journey from ignorance to expertise is like a trip without acompass…it’s completely self-motivated, and there are no landmarks in thelandscape…There are no rewards along the way, no stages when you getevaluated. It feels like there’s a long period where you don’t have any landmarkto see where you are.
xxvi
Strangely, it is this concept of graduate school that makes it so hard and, at the same time, so
rewarding and great. It is that much sweeter when you accomplish your task, aware of how difficult
it was and knowing that only a small minority of the people in the world have done likewise.
Aside from the excellent research related experiences, I have also had an opportunity to
develop interpersonal and leadership skills during my NCSU years. As a major officer in the
honorary chemical society in the department, Phi Lambda Upsilon, for three years, I gained valuable
experience with organizational skills, working with departmental personnel and faculty members,
generating substantial funding, assisting in the creation of a graduate student authored solutions
manual for a general chemistry textbook, initiating beneficial programs for fellow graduate students,
such as the thesis and travel funds that provides graduate students with financial assistance to
participate in conferences and in printing their dissertations. Eventually, in my role with Phi Lambda
Upsilon, space was secured for the Joyce Weatherspoon Graduate Student Facility, a much needed
area where graduate students can meet, enjoy their lunch, and, most importantly, interact with other
graduate students, thereby establishing the vital bond between graduates students that is essential to
any successful graduate program.
On the university level, I represented the graduate students of the chemistry department as
their Graduate Student Association representative. During my time with the GSA, I rewrote the
department's GSA constitution to allow chemistry graduate students, with their hectic schedules, to
maintain an equal representation at GSA meetings, thereby improving the chances of chemistry
graduate students getting GSA benefits. As a teaching assistant at NCSU, I gained valuable
experience teaching chemistry laboratories, effectively communicating chemistry-related ideas to
large groups of people. As an analytical teaching assistant, I was also involved in the creation and
writing of new experiments for the laboratory sessions.
Through personal initiation, I was able to develop my leadership skills. Leadership, in my
opinion, is an important quality to have as a Ph.D., a person likely to lead fellow researchers, a
research group, meetings, a business or classes at a university. NCSU's Student Leadership Center
was able to supplement my scientific education-taking place in the Chemistry Department with
courses in the Leadership Development Series. Through attending many different seminars, I
achieved the Leadership Certificate and valuable training to assist me at being an effective leader.
The foundation of a good department is its students and graduate students. I have always
believed it is important for graduate students to remain active in student organizations in order to
maintain a voice in departmental and university matters. To this end, I have served as the graduate
student member of several departmental committees aimed at improving the department in a variety
xxvii
of ways. All of this non-research-related experience were invaluable and have shaped the type of
Ph.D. I will be in the future. They are as much a part of me as the research discussed in this
dissertation.
As far as this dissertation itself is concerned, I tried to have fun with it. It is a serious
attempt at research but is written here in an original, somewhat entertaining format. Science, after
all, should be somewhat fun and interesting. Because I have this belief and based on some personal
experience with non-scientific people, like my family and friends, I have written this dissertation
with novice scientists in mind. Professors might find this style of writing, with a great deal of
explanation and detail, to be too tedious and simplistic. Graduate students and undergraduate
students may find it somewhat more informative and interesting. This is the intent. This dissertation
is intended to be a tool for future scientists doing research in this area of science. Thus, some
sections have been written with a greater degree of detail than is completely necessary. Additionally,
it is written in this manner because I was tired of coworkers responding to questions about our
research and why we do certain things with statements like, "I don't know, we just do it that way
because we've always done it that way." For my dissertation, I chose to actually explain some of
these things. Much of the detail included in these explanations was spurred on by questions and
discussions I frequently found myself having with undergraduate researchers, fellow graduate
students, friends and even members of my graduate committee during my preliminary report on this
research. One such question is "why do this research?" or "why should the general public be
interested in this work?" As an answer, the first chapter of this dissertation is dedicated to
addressing this point and placing the research in perspective with the world. In fact, before
presenting the bulk of my results, the first two chapters first delve into the background information of
this research. These chapters are useful for inexperienced researchers but may be quite boring for
people with a good understanding of the concepts involved. In this case, the person should skim
these sections and begin focusing on Chapter 3. In any event, this dissertation tells a story, as any
good research effort should. There is a beginning, middle, end, and future to this research. It is
intended to be useful and, for the most part, entertaining - I hope you find it that way.
One other thought on this dissertation that should be noted is that it is mine. I tried to have
fun with it in my own way. I realize that the traditional way for most graduate students to approach a
dissertation or thesis is to virtually copy the style and writing techniques of former graduate students.
For my dissertation, however, I did not do that. I conceived of the organization and style of this
dissertation by myself using a mental outline created only by me. Several quotes find themselves in
these pages. Some of the quotes help summarize my entire experience in graduate school, some
xxviii
reflect my feelings on a particular moment during my time here at NCSU, some were inspiring during
long nights in the laboratory, and some are just for fun. For now, I present you with one that
summarizes one of the more valuable lessons I have learned in graduate school:
ATTITUDE
The longer I live, the more I realize the impact of attitude in life. Attitude, to me, ismore important than facts. It is more important than education, than money, thancircumstances, than failures, than successes, than what people think, or say, or do.It's more important than appearance, giftedness, or skill. It will make or break acompany …a church…a home…I am convinced that life is 10 percent of whathappens to me and 90 percent how I react to it. -- Charles Swindoll
When I first joined Dr. Bowden's group in the summer of 1995, he said to me, "I want you to
get what you want out of your education here at State…" - I believe I have.
As I stated earlier, I hold myself to a standard of hard work, dedication, and making a difference - it
is my hope and belief that I have indeed made a difference here at North Carolina State University.
Michael C. Leopold
June 2000
1
OVERVIEW AND SIGNIFICANCE OF RESEARCH
CHAPTER ONE
“Some men see things as they are and saywhy. I dream things that never were and saywhy not.” – Robert Kennedy
2
1. OVERVIEW
One of the main objectives of recent bioanalytical research is the development of
versatile and clinically useful biosensors. The medical and environmental communities view
the development of useful biosensors as an achievable and essential goal of the research
world. Current interest in this type of bioanalytical research stems from the intriguing notion
that biosensors can be created, in theory, for almost any specific biological target molecule.1
The potential applications of such scientific advancement would be extremely useful,
especially the ability to monitor specific biological chemicals linked to pathogenesis. As
biotechnology advances, it is conceivable that biosenors will evolve from being useful in
vitro devices that are connected to the body externally, to self-sufficient in vivo sensors that
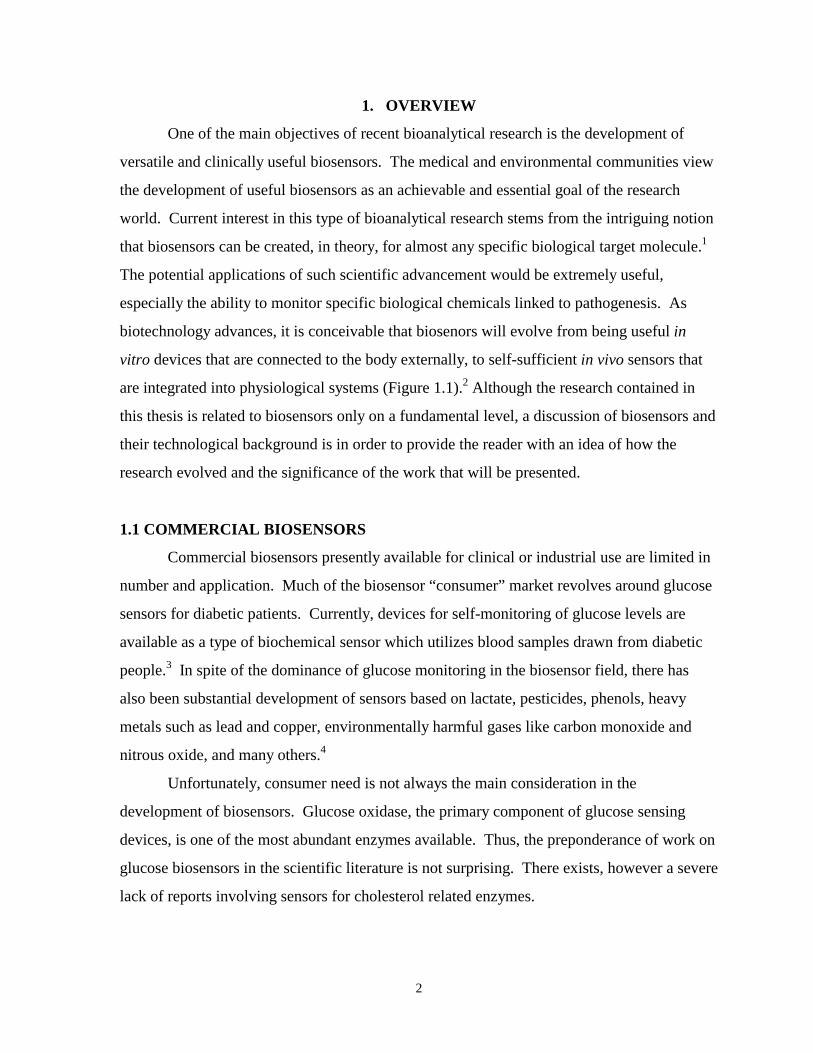
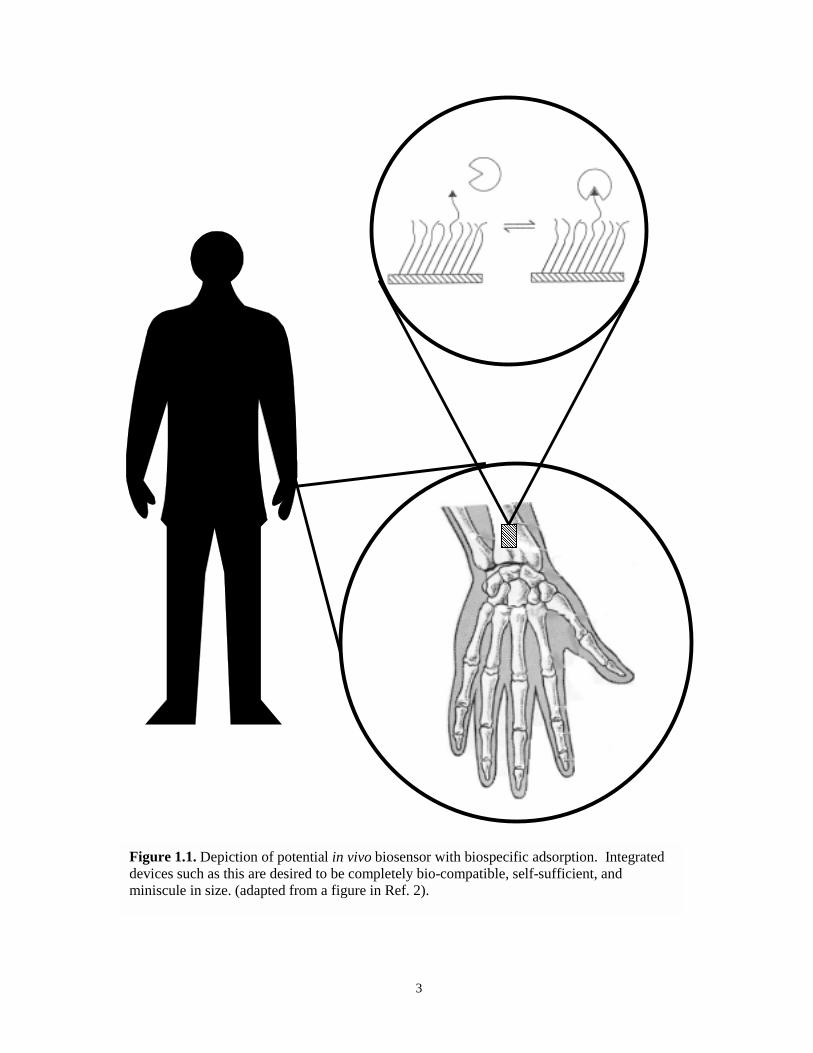
are integrated into physiological systems (Figure 1.1).2 Although the research contained in
this thesis is related to biosensors only on a fundamental level, a discussion of biosensors and
their technological background is in order to provide the reader with an idea of how the
research evolved and the significance of the work that will be presented.
1.1 COMMERCIAL BIOSENSORS
Commercial biosensors presently available for clinical or industrial use are limited in
number and application. Much of the biosensor “consumer” market revolves around glucose
sensors for diabetic patients. Currently, devices for self-monitoring of glucose levels are
available as a type of biochemical sensor which utilizes blood samples drawn from diabetic
people.3 In spite of the dominance of glucose monitoring in the biosensor field, there has
also been substantial development of sensors based on lactate, pesticides, phenols, heavy
metals such as lead and copper, environmentally harmful gases like carbon monoxide and
nitrous oxide, and many others.4
Unfortunately, consumer need is not always the main consideration in the
development of biosensors. Glucose oxidase, the primary component of glucose sensing
devices, is one of the most abundant enzymes available. Thus, the preponderance of work on
glucose biosensors in the scientific literature is not surprising. There exists, however a severe
lack of reports involving sensors for cholesterol related enzymes.
3
��������������
Figure 1.1. Depiction of potential in vivo biosensor with biospecific adsorption. Integrateddevices such as this are desired to be completely bio-compatible, self-sufficient, andminiscule in size. (adapted from a figure in Ref. 2).
4
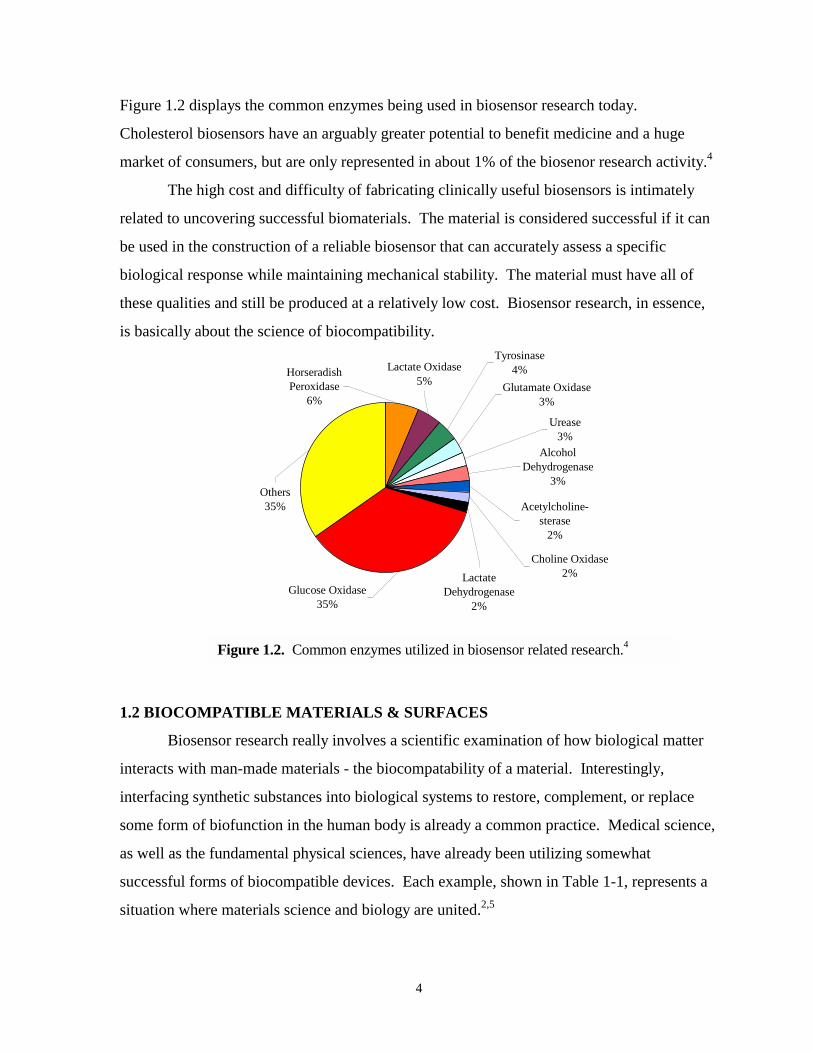
Figure 1.2 displays the common enzymes being used in biosensor research today.
Cholesterol biosensors have an arguably greater potential to benefit medicine and a huge
market of consumers, but are only represented in about 1% of the biosenor research activity.4
The high cost and difficulty of fabricating clinically useful biosensors is intimately
related to uncovering successful biomaterials. The material is considered successful if it can
be used in the construction of a reliable biosensor that can accurately assess a specific
biological response while maintaining mechanical stability. The material must have all of
these qualities and still be produced at a relatively low cost. Biosensor research, in essence,
is basically about the science of biocompatibility.
Lactate Dehydrogenase
2%Glucose Oxidase
35%
Others35%
Horseradish Peroxidase
6%
Lactate Oxidase5% Glutamate Oxidase
3%
Tyrosinase4%
Choline Oxidase2%
Acetylcholine-sterase
2%
Alcohol Dehydrogenase
3%
Urease3%
Figure 1.2. Common enzymes utilized in biosensor related research.4
1.2 BIOCOMPATIBLE MATERIALS & SURFACES
Biosensor research really involves a scientific examination of how biological matter
interacts with man-made materials - the biocompatability of a material. Interestingly,
interfacing synthetic substances into biological systems to restore, complement, or replace
some form of biofunction in the human body is already a common practice. Medical science,
as well as the fundamental physical sciences, have already been utilizing somewhat
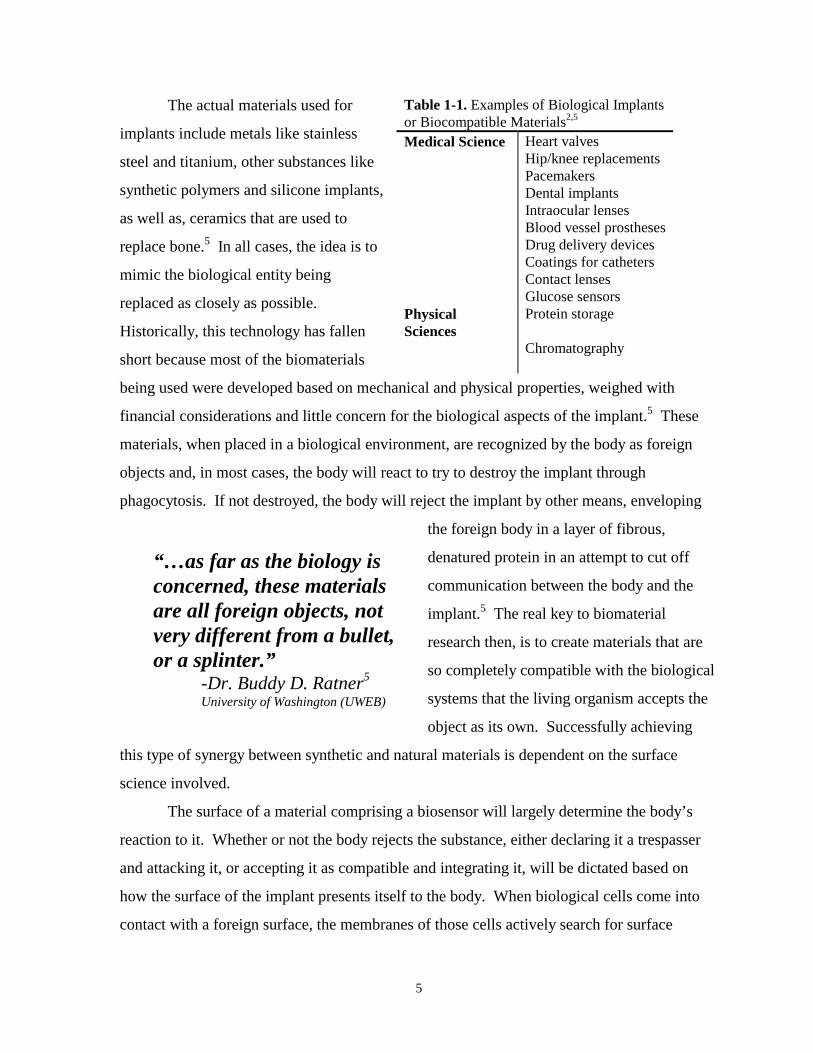
successful forms of biocompatible devices. Each example, shown in Table 1-1, represents a
situation where materials science and biology are united.2,5
5
The actual materials used for
implants include metals like stainless
steel and titanium, other substances like
synthetic polymers and silicone implants,
as well as, ceramics that are used to
replace bone.5 In all cases, the idea is to
mimic the biological entity being
replaced as closely as possible.
Historically, this technology has fallen
short because most of the biomaterials
being used were developed based on mechanical and physical properties, weighed with
financial considerations and little concern for the biological aspects of the implant.5 These
materials, when placed in a biological environment, are recognized by the body as foreign
objects and, in most cases, the body will react to try to destroy the implant through
phagocytosis. If not destroyed, the body will reject the implant by other means, enveloping
the foreign body in a layer of fibrous,
denatured protein in an attempt to cut off
communication between the body and the
implant.5 The real key to biomaterial
research then, is to create materials that are
so completely compatible with the biological
systems that the living organism accepts the
object as its own. Successfully achieving
this type of synergy between synthetic and natural materials is dependent on the surface
science involved.
The surface of a material comprising a biosensor will largely determine the body’s
reaction to it. Whether or not the body rejects the substance, either declaring it a trespasser
and attacking it, or accepting it as compatible and integrating it, will be dictated based on
how the surface of the implant presents itself to the body. When biological cells come into
contact with a foreign surface, the membranes of those cells actively search for surface
Table 1-1. Examples of Biological Implantsor Biocompatible Materials2,5
Medical Science Heart valvesHip/knee replacementsPacemakersDental implantsIntraocular lensesBlood vessel prosthesesDrug delivery devicesCoatings for cathetersContact lensesGlucose sensors
PhysicalSciences
Protein storage
Chromatography
“…as far as the biology isconcerned, these materialsare all foreign objects, notvery different from a bullet,or a splinter.”
-Dr. Buddy D. Ratner5
University of Washington (UWEB)
6
characteristics or signals that communicate whether or not the surface chemistry of the
material is compatible with the cell’s surface chemistry. Clearly, the surface of materials and
how specific biomolecules react and, in some cases, interact with it is of extreme importance
to the study of biocompatible materials and, in turn, biosensor development.
1.3 BIOSENSOR RESEARCH & DEVELOPMENT
What exactly is a biosensor? Simply put, a biosensor is an analytical device that
utilizes biological molecules that have been immobilized on a surface. The surface is
positioned near a transducer that can detect specific analyte interactions with the immobilized
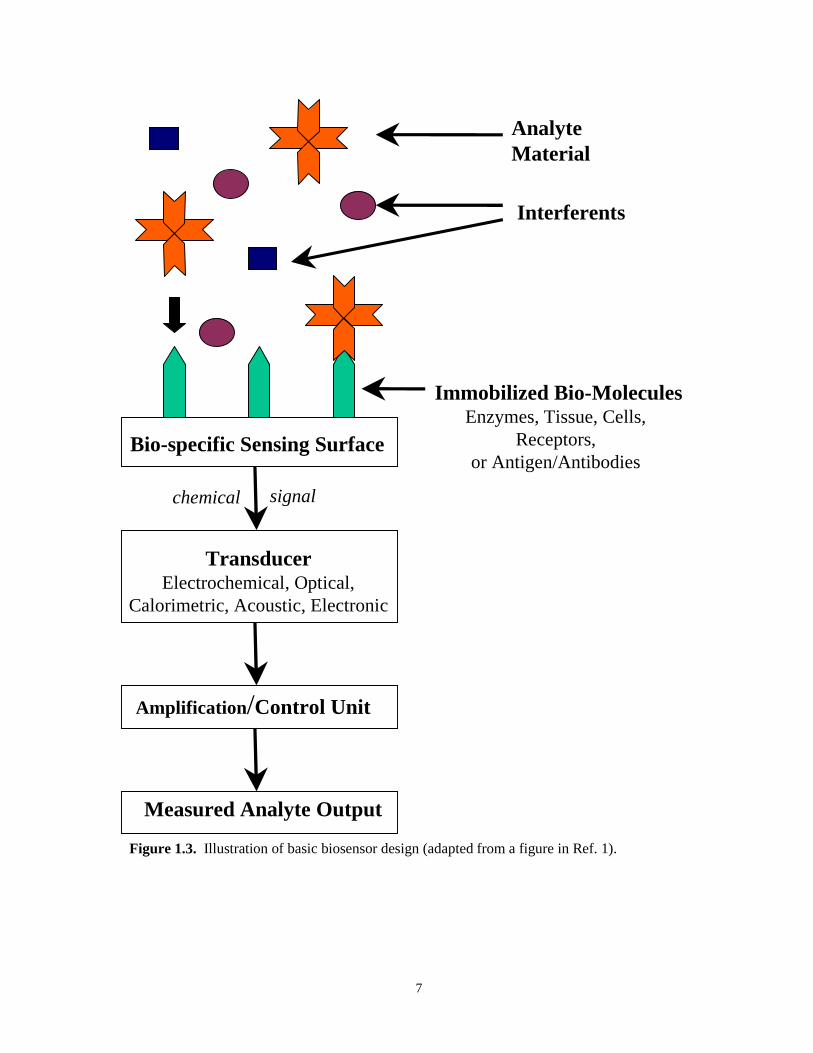
biomolecules. The interaction between the bio-substrate and the analyte results in some type
of chemical signal which can be harnessed and converted to an electronic signal (Figure 1.3).1
1.3.1. Elements of a biosensor
In many cases, the elements of a biosensor are most easily described as the following:
a substrate housing a sensing element, a transducer, and a specific method of analysis.4 In
some instances, as in the research that will be presented in this dissertation, the substrate is
synthetically designed to mimic a desired biological surface rather than employing expensive
biomolecules for immobilization on the surface.2,6 Because biological entities interacting
with the sensor will never “feel” the bulk of the sensor itself, it is clearly evident that the
interface between the target macromolecule and the receptor surface is of utmost importance
in this type of work. The mechanical and physical properties of the biosensor will reside
within the device and only the surface of the biosensor will be presented. Thus, the way the
sensing element interacts with the analyte and how the mediator element communicates the
analyte’s chemical signal are extremely important aspects of this technology and take place in
much the same way that receptor-ligand interactions occur.
7
Bio-specific Sensing Surface
AnalyteMaterial
Interferents
Immobilized Bio-MoleculesEnzymes, Tissue, Cells,
Receptors,or Antigen/Antibodies
chemical signal
TransducerElectrochemical, Optical,
Calorimetric, Acoustic, Electronic
Amplification/Control Unit
Measured Analyte Output
Figure 1.3. Illustration of basic biosensor design (adapted from a figure in Ref. 1).
8
In an attempt to simplify the interactions between the elements of the biosensor,
methods of establishing direct communication with immobilized probe molecules have been
explored. Effectively, this research is focused on sensors where the biomolecules of interest
adsorb to a surface and transmit a chemical signal that can be easily analyzed. The ability to
design a surface that effectively mimics normal tissue but that can also be selective toward
specific analytes is a crucial challenge for biosensor researchers interested in creating new
biocompatible materials targeting specific drug interactions and studying cellular
communication.4,5 Much of the research into this technology involves trying to understand
biological events on surfaces that have been chemically designed and engineered for specific
biological recognition.
1.3.2. Characteristics of an Ideal Biosensing Device
The main characteristics of an ideal biosensor are miniaturization for potential in vivo
applications, real time and selective monitoring of analyte signals, and cost efficient
production. In addition, it is desired that the analytical signal generated by the device be
large enough to accurately measure and consistent enough to be stable over a long period of
time. Real time measurements would truly benefit the current medical world which is
already highly dependent on time consuming, tedious, and very expensive laboratory
procedures that almost always involve multi-step spectroscopic and chromatographic
analyses.4 Having described what is desired and needed in bioanalytical research to this
point, it is now time to examine some of the complications that are involved with the
development of this type of biotechnology.
1.3.3. Complications of Biosensor Related Research
In general, recent work in this area of bioanalytical chemistry displays a lack of
reproducibility and has generated concern over how the orientation of the macromolecule
affects results. Mastering the ability to immobilize biomolecules to specific sites while
preserving stability and functionality may lead to more effective biosensor designs. Clearly,
however, the most significant challenge, as well as the largest drawback of biosensors and
biocompatible implants, is their inadequate selectivity.
Overall, biosensor prototypes and models being used for fundamental research suffer
greatly from extremely poor selectivity. More specifically, these devices are severely limited
9
in their ability to quantitatively determine a specific analyte in an untreated biological matrix.
Molecular recognition and subsequent selectivity of target molecules over other molecules is
the ultimate goal of analytical scientists in this field. For example, with sensors designed to
be biospecific for proteins, the surface must possess a selectivity for a particular protein while
simultaneously resisting the nonspecific adsorption of other, unwanted proteins. An obvious
part of research into this type of system is the need to understand the protein adsorption
process.
1.4 PROTEINS
Of all the biomolecules that exist in a living organism, proteins are probably the most
important macromolecules. Proteins perform a plethora of tasks for living organisms.
Numbering in the thousands, proteins play essential roles in the many different biological
processes from a cellular level to a direct functional role in vital life sustaining events. Some
of the variety of tasks that proteins perform are summarized in Table 1-2. Amazingly, all of
these proteins, with distinctive properties and functions, are formed from the same group of
twenty, naturally occurring amino acid residues. Each specific protein is its own unique
sequence of these amino acids, differing only in the order that they are joined through peptide
bonds.8 Almost all cellular activity involves at least one or more proteins to properly operate.
Many biological processes of interest involve the use of many proteins performing specific
functions in a chain of events.
1.4.1. Biological Electron Transfer & Proteins
Biological electron transfer (ET) reactions are an intrinsic part of certain biological
processes including photosynthesis, respiration, and intermediary metabolism.9 There are
two basic kinds of biological ET reactions. The first involves the redox reactions of organic
metabolites and usually incorporates short range, multiple electron movements related to
chemical bond formation and dissipation. This type of ET is sometimes referred to as inner
sphere ET because the electron donor and the electron acceptor, through altering their
coordination spheres, form a direct chemical bond between each other. The second form of
ET reaction in biology, and the eventual focus of the research that will be discussed here,
takes place over longer distances, sometimes tens of Angstroms (Å), and involves the transfer
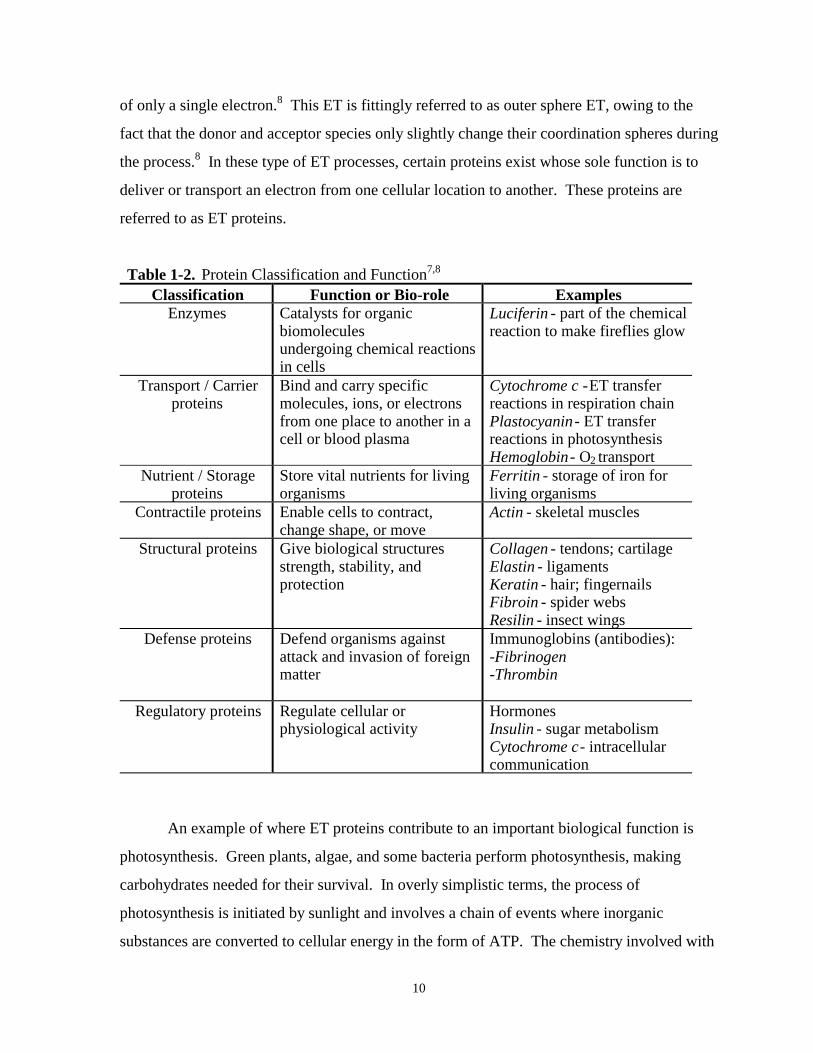
10
of only a single electron.8 This ET is fittingly referred to as outer sphere ET, owing to the
fact that the donor and acceptor species only slightly change their coordination spheres during
the process.8 In these type of ET processes, certain proteins exist whose sole function is to
deliver or transport an electron from one cellular location to another. These proteins are
referred to as ET proteins.
Table 1-2. Protein Classification and Function7,8
Classification Function or Bio-role ExamplesEnzymes Catalysts for organic
biomoleculesundergoing chemical reactionsin cells
Luciferin - part of the chemicalreaction to make fireflies glow
Transport / Carrierproteins
Bind and carry specificmolecules, ions, or electronsfrom one place to another in acell or blood plasma
Cytochrome c - ET transferreactions in respiration chainPlastocyanin - ET transferreactions in photosynthesisHemoglobin- O2 transport
Nutrient / Storageproteins
Store vital nutrients for livingorganisms
Ferritin - storage of iron forliving organisms
Contractile proteins Enable cells to contract,change shape, or move
Actin - skeletal muscles
Structural proteins Give biological structuresstrength, stability, andprotection
Collagen - tendons; cartilageElastin - ligamentsKeratin - hair; fingernailsFibroin - spider websResilin - insect wings
Defense proteins Defend organisms againstattack and invasion of foreignmatter
Immunoglobins (antibodies):-Fibrinogen-Thrombin
Regulatory proteins Regulate cellular orphysiological activity
HormonesInsulin - sugar metabolismCytochrome c - intracellularcommunication
An example of where ET proteins contribute to an important biological function is
photosynthesis. Green plants, algae, and some bacteria perform photosynthesis, making
carbohydrates needed for their survival. In overly simplistic terms, the process of
photosynthesis is initiated by sunlight and involves a chain of events where inorganic
substances are converted to cellular energy in the form of ATP. The chemistry involved with
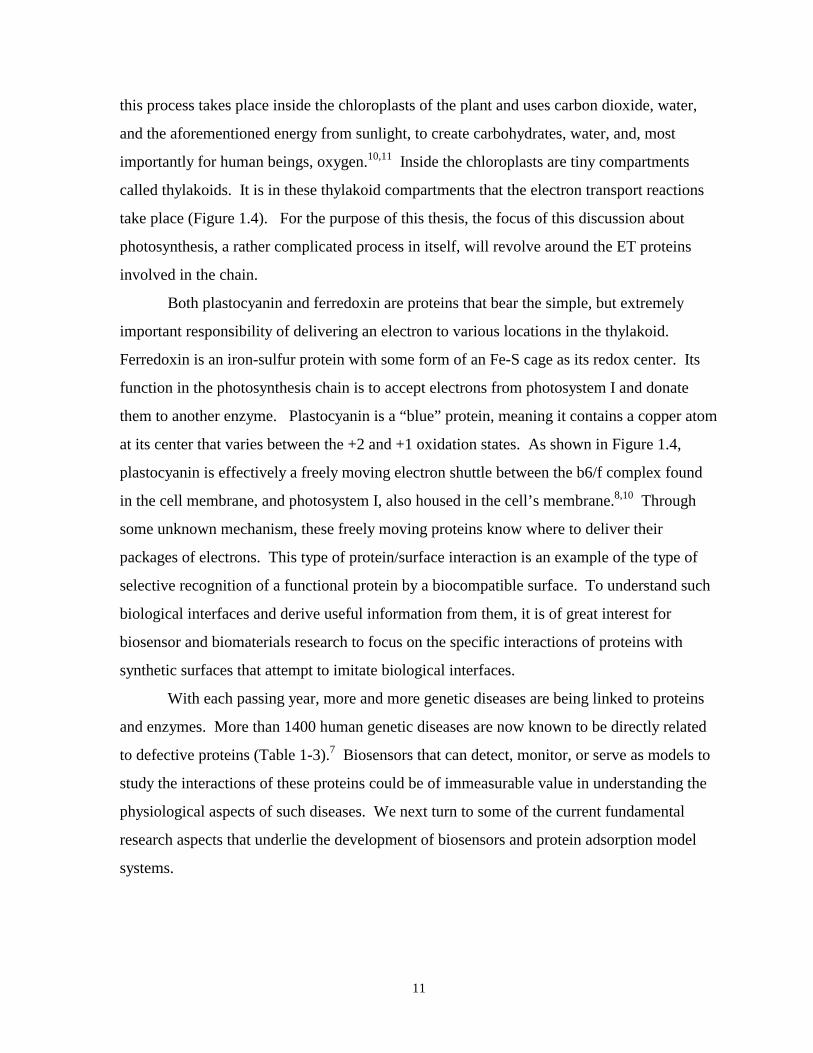
11
this process takes place inside the chloroplasts of the plant and uses carbon dioxide, water,
and the aforementioned energy from sunlight, to create carbohydrates, water, and, most
importantly for human beings, oxygen.10,11 Inside the chloroplasts are tiny compartments
called thylakoids. It is in these thylakoid compartments that the electron transport reactions
take place (Figure 1.4). For the purpose of this thesis, the focus of this discussion about
photosynthesis, a rather complicated process in itself, will revolve around the ET proteins
involved in the chain.
Both plastocyanin and ferredoxin are proteins that bear the simple, but extremely
important responsibility of delivering an electron to various locations in the thylakoid.
Ferredoxin is an iron-sulfur protein with some form of an Fe-S cage as its redox center. Its
function in the photosynthesis chain is to accept electrons from photosystem I and donate
them to another enzyme. Plastocyanin is a “blue” protein, meaning it contains a copper atom
at its center that varies between the +2 and +1 oxidation states. As shown in Figure 1.4,
plastocyanin is effectively a freely moving electron shuttle between the b6/f complex found
in the cell membrane, and photosystem I, also housed in the cell’s membrane.8,10 Through
some unknown mechanism, these freely moving proteins know where to deliver their
packages of electrons. This type of protein/surface interaction is an example of the type of
selective recognition of a functional protein by a biocompatible surface. To understand such
biological interfaces and derive useful information from them, it is of great interest for
biosensor and biomaterials research to focus on the specific interactions of proteins with
synthetic surfaces that attempt to imitate biological interfaces.
With each passing year, more and more genetic diseases are being linked to proteins
and enzymes. More than 1400 human genetic diseases are now known to be directly related
to defective proteins (Table 1-3).7 Biosensors that can detect, monitor, or serve as models to
study the interactions of these proteins could be of immeasurable value in understanding the
physiological aspects of such diseases. We next turn to some of the current fundamental
research aspects that underlie the development of biosensors and protein adsorption model
systems.
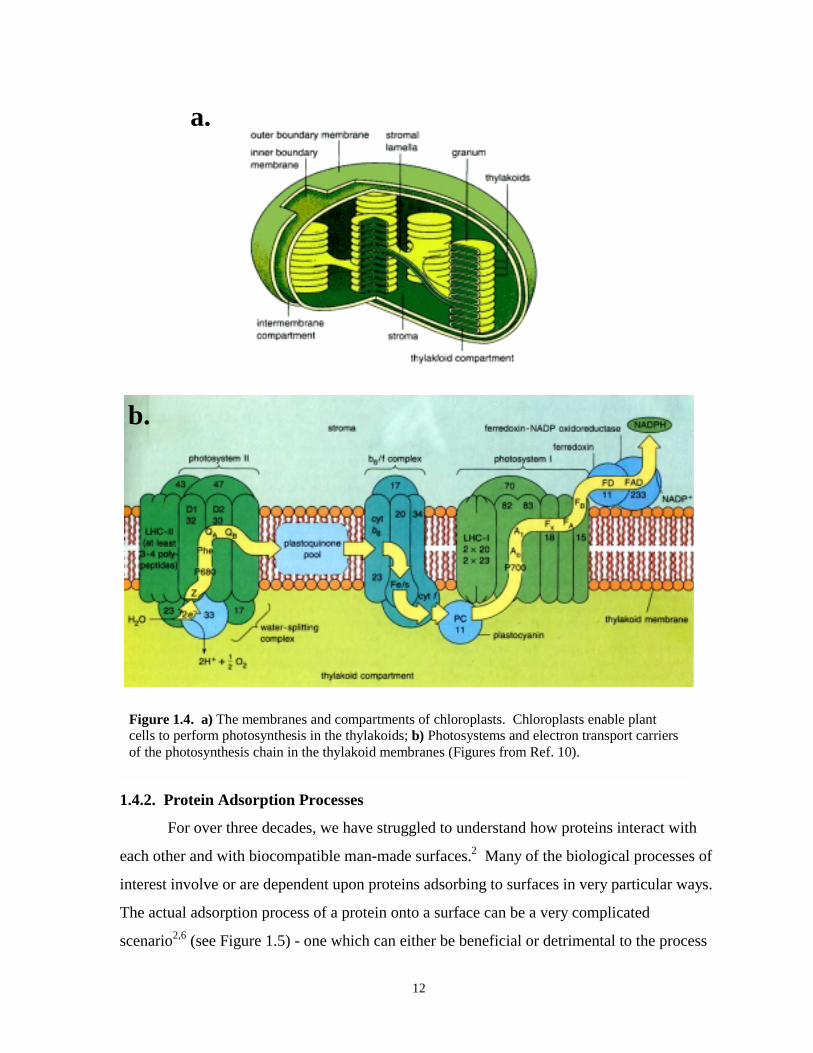
12
a.
b.
Figure 1.4. a) The membranes and compartments of chloroplasts. Chloroplasts enable plantcells to perform photosynthesis in the thylakoids; b) Photosystems and electron transport carriersof the photosynthesis chain in the thylakoid membranes (Figures from Ref. 10).
1.4.2. Protein Adsorption Processes
For over three decades, we have struggled to understand how proteins interact with
each other and with biocompatible man-made surfaces.2 Many of the biological processes of
interest involve or are dependent upon proteins adsorbing to surfaces in very particular ways.
The actual adsorption process of a protein onto a surface can be a very complicated
scenario2,6 (see Figure 1.5) - one which can either be beneficial or detrimental to the process
13
at hand or the experiment being conducted. In light of this, many researchers focus on trying
to decipher protein-surface interactions on a mechanistic level. Accomplishing this means
gaining an understanding of the factors that govern the adsorption process, including the
complex nature of a protein’s outer shell chemistry and surface structure of the substrate or
biological interface. After all, defining that chemistry and being able to predict the
interaction between the two components of the system is at the very heart of bioanalytical
research.
Figure 1.5. The complexities of protein adsorption - Several equilibrium processes must be consideredupon (a) adsorption of a protein to a surface: (b) lateral mobility of the protein; (c) dissociation of theprotein from the surface; (d) reversible denaturation and changes in conformation of the protein; (e)dissociation of the altered protein species; (f) irreversible denaturation coupled with permanentadsorption; and (g) exchange of surface bound protein with protein from solution. All of theseprocesses are further complicated by the many different conformations and chemical environments thatexist where the protein exists (Figure from Ref. 2).
A traditional method of studying protein adsorption processes is to create a model
system involving an actual protein and a specifically tailored synthetic surface that effectively
mimics the protein’s natural binding partner. The use of a model system has the advantages
of simplicity and, in some cases, allowing for the study of the protein in its natural state.
Unfortunately, these experimental models are often highly dependent on solution conditions
(pH, temperature, solvents, etc.) and, as stated earlier, suffer from poor selectivity.6 Until
recently, another major disadvantage of these models was their lack of molecular or atomic
level detail of the interactions taking place. Gradually, through technological developments
in instrumentation and innovative experimentation, research on protein adsorption models is
revealing the molecular level detail needed to provide a fundamental basis for understanding
14
protein adsorption. It is a model system of this nature that will eventually be the focus of the
research presented here.
1.5 ADDRESSING THE CHALLENGES OF BIOSENSOR RESEARCH
Having stated the desired needs and problems of this field, it is important to recognize
that plausible and fruitful techniques and scientific discoveries exist to meet each challenge.
In addition to the information presented below, fundamental research review articles on
biosensors and analytical electrochemistry are available.12
1.5.1. Electrochemistry
Electrochemistry, for reasons that will be described, lends itself as an excellent
technique to be used in this type of bioanalytical research. First of all, electrochemistry is
very inexpensive and relatively simple in practice. These are important benefits when
dealing with such potentially expensive materials and complex biological processes to
understand. Furthermore, within the realm of electrochemistry exists a technique, called
amperometry, that is capable of monitoring real time current signals. Current signals, even of
very small magnitude, are relatively easy to detect, amplify, and measure. Electrochemical
instrumentation used in amperometry is sensitive over a large range of concentrations and
would be useful in certain situations where spectroscopic techniques are ineffective. In
addition, the usage of an electrode as the substrate material in a sensor, allows the
experimenter to control the energy applied to the system. The predominance of electron
transfer reactions in biology and the demonstrated ability of electrochemistry to measure the
direct redox activity of an immobilized, electroactive enzyme are major benefits of using this
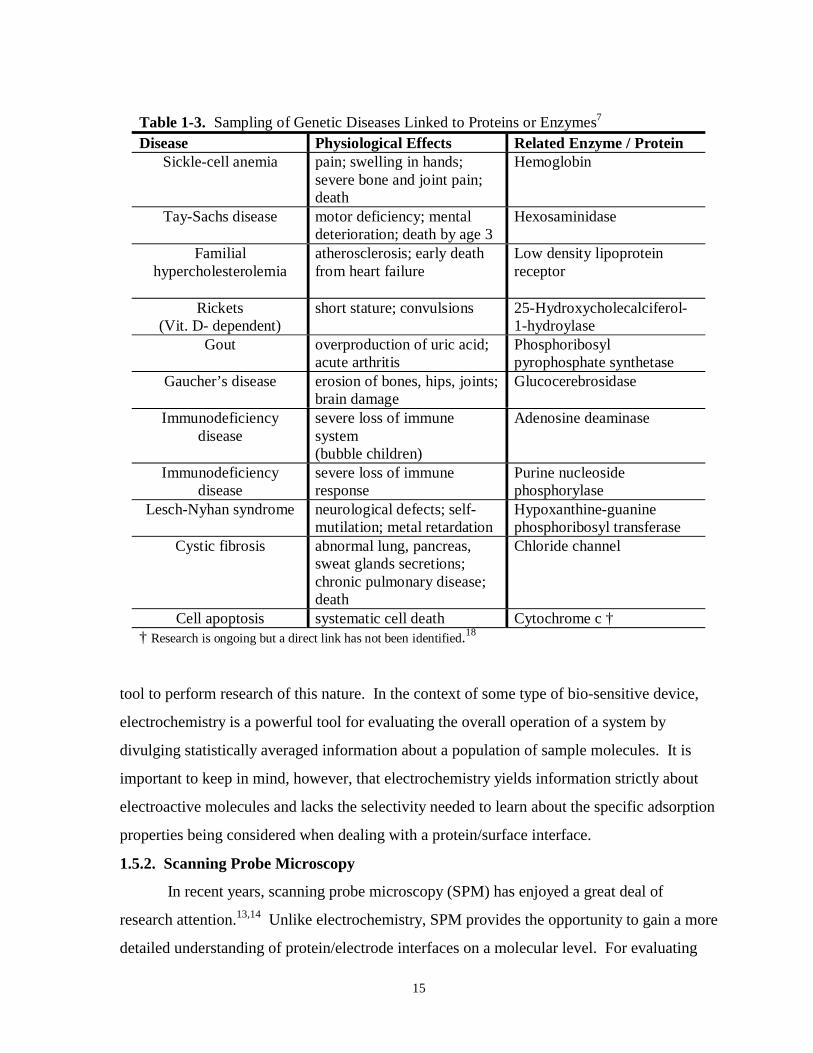
15
Table 1-3. Sampling of Genetic Diseases Linked to Proteins or Enzymes7
Disease Physiological Effects Related Enzyme / ProteinSickle-cell anemia pain; swelling in hands;
severe bone and joint pain;death
Hemoglobin
Tay-Sachs disease motor deficiency; mentaldeterioration; death by age 3
Hexosaminidase
Familialhypercholesterolemia
atherosclerosis; early deathfrom heart failure
Low density lipoproteinreceptor
Rickets(Vit. D- dependent)
short stature; convulsions 25-Hydroxycholecalciferol-1-hydroylase
Gout overproduction of uric acid;acute arthritis
Phosphoribosylpyrophosphate synthetase
Gaucher’s disease erosion of bones, hips, joints;brain damage
Glucocerebrosidase
Immunodeficiencydisease
severe loss of immunesystem(bubble children)
Adenosine deaminase
Immunodeficiencydisease
severe loss of immuneresponse
Purine nucleosidephosphorylase
Lesch-Nyhan syndrome neurological defects; self-mutilation; metal retardation
Hypoxanthine-guaninephosphoribosyl transferase
Cystic fibrosis abnormal lung, pancreas,sweat glands secretions;chronic pulmonary disease;death
Chloride channel
Cell apoptosis systematic cell death Cytochrome c †† Research is ongoing but a direct link has not been identified.18
tool to perform research of this nature. In the context of some type of bio-sensitive device,
electrochemistry is a powerful tool for evaluating the overall operation of a system by
divulging statistically averaged information about a population of sample molecules. It is
important to keep in mind, however, that electrochemistry yields information strictly about
electroactive molecules and lacks the selectivity needed to learn about the specific adsorption
properties being considered when dealing with a protein/surface interface.
1.5.2. Scanning Probe Microscopy
In recent years, scanning probe microscopy (SPM) has enjoyed a great deal of
research attention.13,14 Unlike electrochemistry, SPM provides the opportunity to gain a more
detailed understanding of protein/electrode interfaces on a molecular level. For evaluating
16
surface structure, SPM is ideal for probing localized electronic states as well as essential
topographical information. Moreover, SPM offers some exciting possibilities in the realm of
in situ studies of individual biomolecules. Through the molecular level information and
imaging, especially at solid/fluid interfaces, the potential of SPM is truly unparalleled.
1.5.3. Nanotechnology
Electrochemistry and SPM have
prospered greatly from recent scientific
discoveries taking place in electronic
technology. Electronics are being
miniaturized and nanotechnology research
is developing molecular scale, functional
electrical components like information storage units, capacitors, and wires.15,16 Not only is
hardware being made on the nanoscale, the ability of researchers to manipulate such
molecular devices is increasing.17 This type of microfabrication and control means faster
response times for transient signals, as well as, potentially very small biocompatible devices.
Size will be extremely vital if in vivo biological implants are to be realized.
1.5.4. Self-Assembled Monolayers
When considering direct contact of biomolecules with a sensing element, the nature
of the surface becomes very important. Depending on the surface characteristics, the protein
might denature or unfold upon its interaction with a substrate. Controlling the properties of a
surface has been simplified with the use of self-assembled monolayers (SAMs).2,19 SAMs
(Figure 1.6), particularly of alkanethiolates, are ideally suited for the study of biointerfacial
chemistry and they will be discussed in depth later. The advantages of SAMs in this type of
research reside in the fact that one can control the surface environment by manipulating the
components that comprise the monolayer and, thus, the surface characteristics exposed to the
incoming biomolecule. Controlling the surface to this degree allows for the study of
molecular scale interactions between the protein and a specifically tailored surface. Since the
structure and functionality of SAM can be easily manipulated, SAMs provide a marked
increase in our ability to design a surface for specific molecular recognition, a key aspect of
potential biosensing devices.20 Usually supported on coinage metals (Au, Ag, Cu) or
“Commercial success of anysensor will depend on thenature, size, and expense ofthe device.”
-Dr. H. Vaughan4
University of Paisley, UK
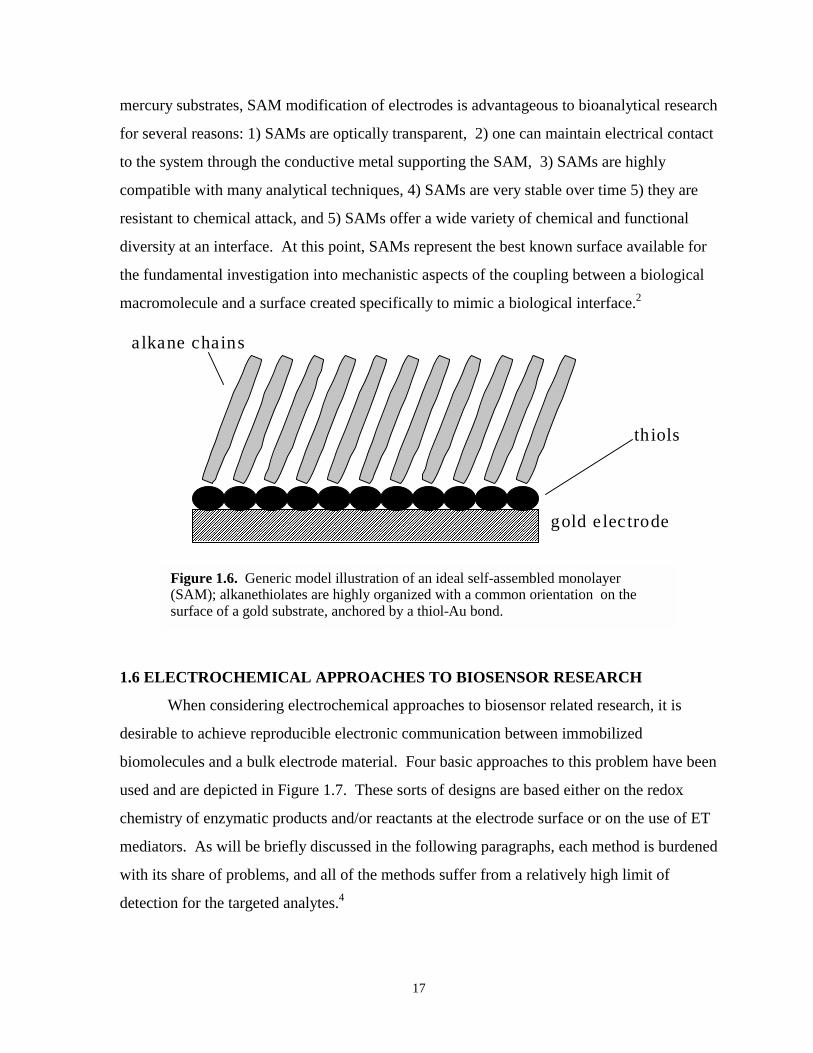
17
mercury substrates, SAM modification of electrodes is advantageous to bioanalytical research
for several reasons: 1) SAMs are optically transparent, 2) one can maintain electrical contact
to the system through the conductive metal supporting the SAM, 3) SAMs are highly
compatible with many analytical techniques, 4) SAMs are very stable over time 5) they are
resistant to chemical attack, and 5) SAMs offer a wide variety of chemical and functional
diversity at an interface. At this point, SAMs represent the best known surface available for
the fundamental investigation into mechanistic aspects of the coupling between a biological
macromolecule and a surface created specifically to mimic a biological interface.2
��������������������������������������������������������������������������������������������������������������������������������������������������������������������������������������������������������������������������������������������������������������������������������������������������������������������������������������������������������������������������������������������������������������������������������� gold e lec trode
thiols
a lkane chains
Figure 1.6. Generic model illustration of an ideal self-assembled monolayer(SAM); alkanethiolates are highly organized with a common orientation on thesurface of a gold substrate, anchored by a thiol-Au bond.
1.6 ELECTROCHEMICAL APPROACHES TO BIOSENSOR RESEARCH
When considering electrochemical approaches to biosensor related research, it is
desirable to achieve reproducible electronic communication between immobilized
biomolecules and a bulk electrode material. Four basic approaches to this problem have been
used and are depicted in Figure 1.7. These sorts of designs are based either on the redox
chemistry of enzymatic products and/or reactants at the electrode surface or on the use of ET
mediators. As will be briefly discussed in the following paragraphs, each method is burdened
with its share of problems, and all of the methods suffer from a relatively high limit of
detection for the targeted analytes.4
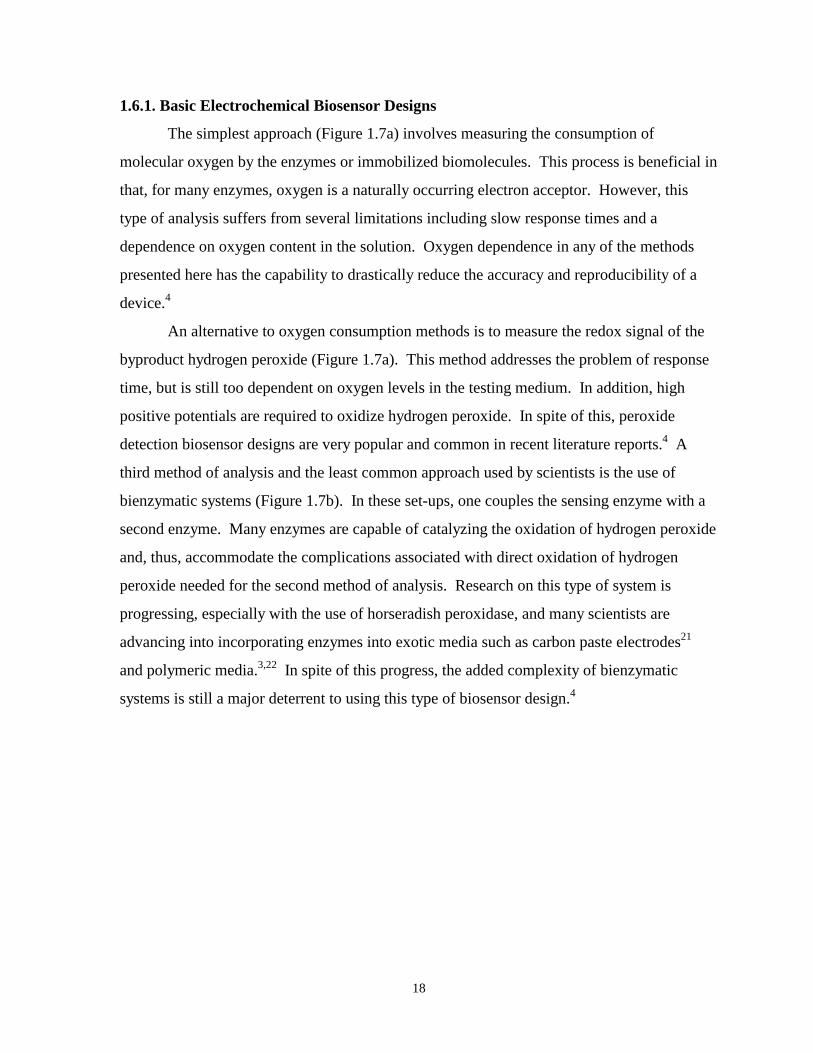
18
1.6.1. Basic Electrochemical Biosensor Designs
The simplest approach (Figure 1.7a) involves measuring the consumption of
molecular oxygen by the enzymes or immobilized biomolecules. This process is beneficial in
that, for many enzymes, oxygen is a naturally occurring electron acceptor. However, this
type of analysis suffers from several limitations including slow response times and a
dependence on oxygen content in the solution. Oxygen dependence in any of the methods
presented here has the capability to drastically reduce the accuracy and reproducibility of a
device.4
An alternative to oxygen consumption methods is to measure the redox signal of the
byproduct hydrogen peroxide (Figure 1.7a). This method addresses the problem of response
time, but is still too dependent on oxygen levels in the testing medium. In addition, high
positive potentials are required to oxidize hydrogen peroxide. In spite of this, peroxide
detection biosensor designs are very popular and common in recent literature reports.4 A
third method of analysis and the least common approach used by scientists is the use of
bienzymatic systems (Figure 1.7b). In these set-ups, one couples the sensing enzyme with a
second enzyme. Many enzymes are capable of catalyzing the oxidation of hydrogen peroxide
and, thus, accommodate the complications associated with direct oxidation of hydrogen
peroxide needed for the second method of analysis. Research on this type of system is
progressing, especially with the use of horseradish peroxidase, and many scientists are
advancing into incorporating enzymes into exotic media such as carbon paste electrodes21
and polymeric media.3,22 In spite of this progress, the added complexity of bienzymatic
systems is still a major deterrent to using this type of biosensor design.4
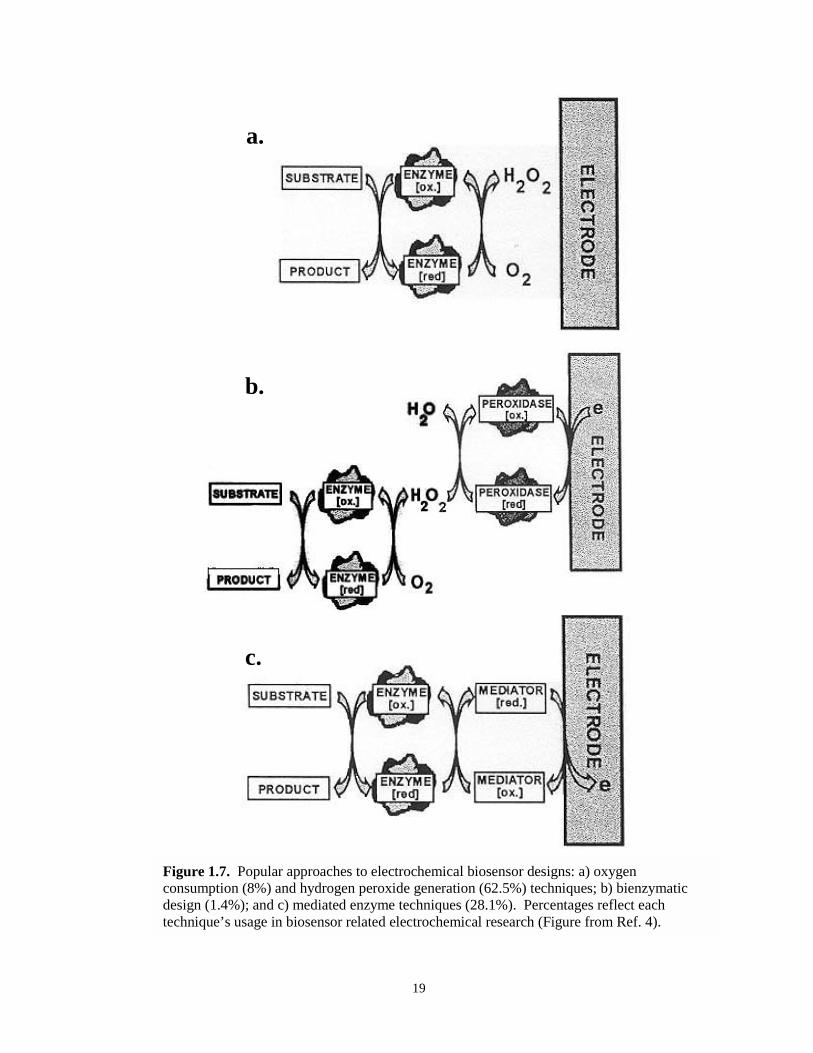
19
a.
b.
c.
Figure 1.7. Popular approaches to electrochemical biosensor designs: a) oxygenconsumption (8%) and hydrogen peroxide generation (62.5%) techniques; b) bienzymaticdesign (1.4%); and c) mediated enzyme techniques (28.1%). Percentages reflect eachtechnique’s usage in biosensor related electrochemical research (Figure from Ref. 4).
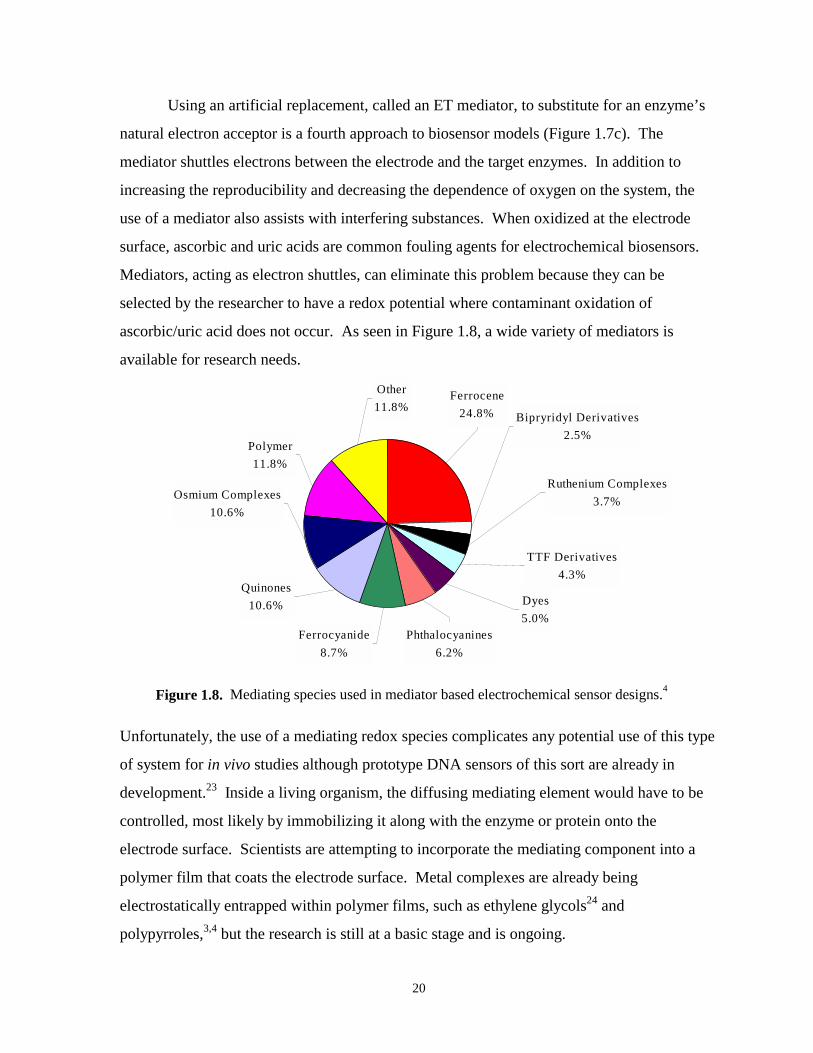
20
Using an artificial replacement, called an ET mediator, to substitute for an enzyme’s
natural electron acceptor is a fourth approach to biosensor models (Figure 1.7c). The
mediator shuttles electrons between the electrode and the target enzymes. In addition to
increasing the reproducibility and decreasing the dependence of oxygen on the system, the
use of a mediator also assists with interfering substances. When oxidized at the electrode
surface, ascorbic and uric acids are common fouling agents for electrochemical biosensors.
Mediators, acting as electron shuttles, can eliminate this problem because they can be
selected by the researcher to have a redox potential where contaminant oxidation of
ascorbic/uric acid does not occur. As seen in Figure 1.8, a wide variety of mediators is
available for research needs.
Other11.8%
Ferrocene24.8%
Polymer11.8%
Osmium Complexes10.6%
Quinones10.6%
Ferrocyanide8.7%
Phthalocyanines6.2%
Bipryridyl Derivatives2.5%
Ruthenium Complexes3.7%
TTF Derivatives 4.3%
Dyes5.0%
Figure 1.8. Mediating species used in mediator based electrochemical sensor designs.4
Unfortunately, the use of a mediating redox species complicates any potential use of this type
of system for in vivo studies although prototype DNA sensors of this sort are already in
development.23 Inside a living organism, the diffusing mediating element would have to be
controlled, most likely by immobilizing it along with the enzyme or protein onto the
electrode surface. Scientists are attempting to incorporate the mediating component into a
polymer film that coats the electrode surface. Metal complexes are already being
electrostatically entrapped within polymer films, such as ethylene glycols24 and
polypyrroles,3,4 but the research is still at a basic stage and is ongoing.
21
“Direct electricalcommunication betweenunmodified biological
molecules and electrodesdoes not normally occur,
because the redox active siteis surrounded by an
insulating protein shell.”-Dr. H. Vaughan4
University of Paisley, UK
1.6.2. Direct ET Designs
Directly linking enzymes to electrode assemblies is yet another approach that, until
recent technological advancements and innovative research, was not a major focus of
electrochemists studying biosensor designs. Recent reports summarize the research activity
involving direct electrochemical
communication with enzymes.13,25 This
is an attractive methodology due to its
mechanistic simplicity - direct ET
connection between enzyme and
electrode. With no diffusional elements
involved, the mass transport of charge
and other complications that arise with
such diffusing systems are eliminated.
As the result of this “direct wiring,”
there is maximum coupling between the components at the electrode/solution interface
making extremely fast response times achievable.1,13 It is this type of configuration that is
attractive for fundamental research into microamperometric biosensors and protein
adsorption models.
1.7 SUMMARY AND PERSPECTIVE OF THESIS RESEARCH
In summary, models of biological systems that are to be used for research purposes in
the bioanalytical field should incorporate three major components: 1) a protein or enzyme
whose properties, structure, and function are highly understood; 2) a surface with specific and
structurally well defined properties that can be easily altered and controlled to allow for
relevant biochemical interactions (electrostatic; hydrophobic, etc.); and 3) an analytical
technique that can measure protein adsorption in real time and potentially in situ.2 In light of
these requirements, the biological ET model that is the focus of the research presented within
this thesis is introduced. Cytochrome c (cyt c), an important ET protein, is chosen based on
its unique and well documented structure and properties. The protein will be directly
immobilized on a surface through the use of a specific kind of SAM. Electrochemistry will
22
be used to delineate thermodynamic, kinetic, and mechanistic information about proteins
adsorbed on self-assembled monolayers. SPM will be used to complement this approach
with an overall motivation of gaining a molecular understanding of the electronic coupling at
the protein/electrode interface. As alluded to earlier, understanding surface interactions in
biological systems is vitally important, not only to biosensor and biocompatibility research,
but also to delineating the basic process of how proteins adsorb to surfaces. Therefore, the
specific focus of this research will be on the interfaces (surfaces) involved in this model.
With the direct coupling aspect of the protein adsorbed on the self-assembled monolayer,
careful attention must be given to the surface chemistry of the interfaces. By examining the
ET kinetics and the adsorption properties of cyt c, as well as microscopic images of each
surface, this research seeks to provide a deeper understanding of how proteins bind to
surfaces and establish the interfacial electronic coupling. Thus, this dissertation, entitled
“Interfacial Investigations of a Biological Electron Transfer Model: Cytochrome c Adsorbed
on Self-Assembled Monolayers” is presented.
To place this discussion in perspective, it is important to mention here that the
research in this thesis, while related to biosensors and biocompatible devices, is of a
fundamental nature. The preceding discussions of this chapter serve only as a prelude to the
work presented here. The research within this thesis is not aimed at developing an
operational biosensor. As depicted in Figure 1.9, this research is completely fundamental,
with immediate goals of providing information about the biological processes of ET and
protein adsorption.
As with any research and development effort, fundamental studies, although not
immediately applicable to society, are a necessary and important part of scientific
advancements. Moreover, with the
recent flux of new information about
biological systems, the time is ripe for
basic research to continue
investigating the junction of man-
made materials with biomolecules. It
“Lacking the necessary biologicalperspective, we have beenmiserable failures in mimickingthe structure and function ofnatural tissue.”-Dr. David Grainger5
Colorado State University
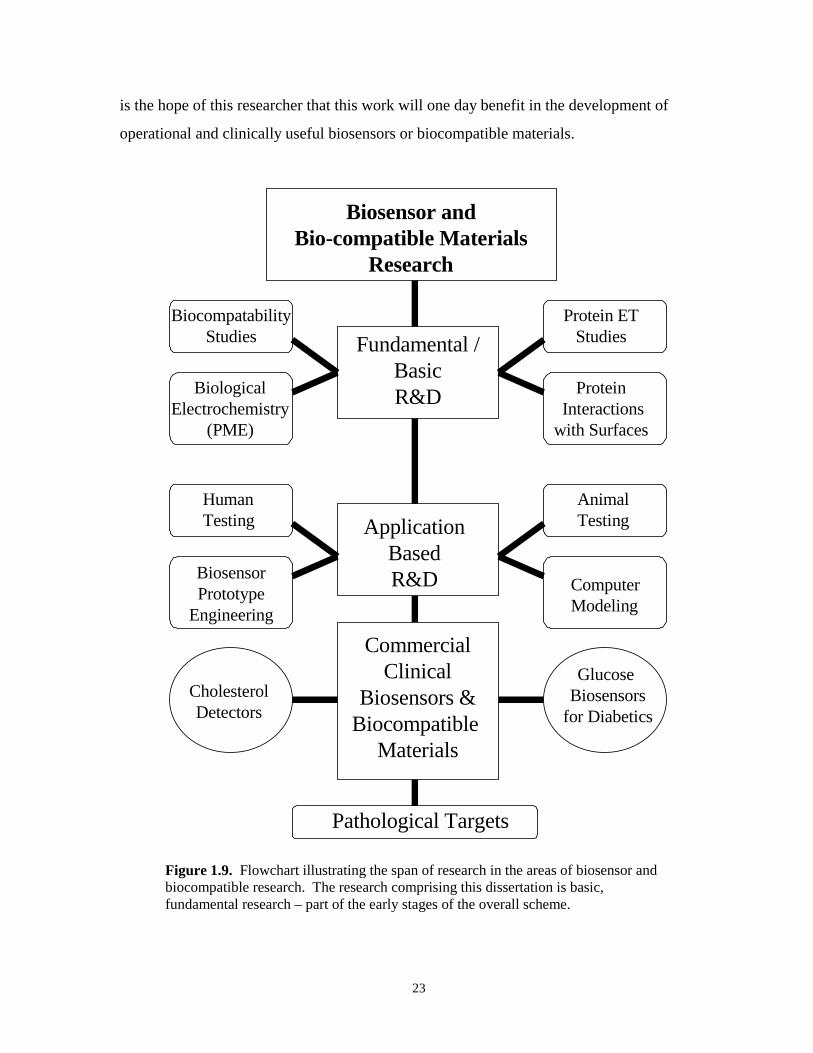
23
is the hope of this researcher that this work will one day benefit in the development of
operational and clinically useful biosensors or biocompatible materials.
Biosensor andBio-compatible Materials
Research
Fundamental /BasicR&D
BiocompatabilityStudies
BiologicalElectrochemistry
(PME)
Protein ETStudies
Protein Interactionswith Surfaces
ApplicationBasedR&D
HumanTesting
Animal Testing
ComputerModeling
BiosensorPrototype
Engineering
CommercialClinical
Biosensors &Biocompatible
Materials
Glucose Biosensors
for DiabeticsCholesterolDetectors
Pathological Targets
Figure 1.9. Flowchart illustrating the span of research in the areas of biosensor andbiocompatible research. The research comprising this dissertation is basic,fundamental research – part of the early stages of the overall scheme.
24
1.8 REFERENCES
1. W.H. Scouten, J.H.T. Luong, and R.S. Brown, “Enzyme or protein immobilization techniques forapplications in biosensor design,” Trends in Biotechnology, 1995, 13, 178-185.
2. Mrksich and G.M. Whitesides, “Using self-assembled monolayers to understand the interactions
of man made surfaces with proteins and cells,” Annual Review of Biophysics and BiomolecularStructure, 1996, 25, 55-78.
3. A. Heller, “Electrical Connection of Enzyme Redox Centers to Electrodes,” J. Phys. Chem.,1992, 96, 3579-3587.
4. J. Davis, D.H. Vaughan, and M.F. Cardosi, “Elements of biosensor construction,” Enzyme
Microb. Technol., 1995, 17, 1030-1035. 5. A. M. Rouhi, “Contemporary Biomaterials - Understanding surfaces is key to the design of
clinically useful materials,” C&E News, January 18, 1999, 51-59. 6. M. Wahlgren and T. Arnebran, “Protein adsorption to solid surfaces,” Trends in Biotechnology,
1991, 9, 201-208. 7. A.L. Lehninger, D.L. Nelson, and M.M. Cox, Principles of Biochemistry, Worth Publishers: New
York, New York, 1993. 8. J.J.R. Frausto da Silva and R.J.P. Williams, The Biological Chemistry of the Elements - The
Inorganic Chemistry of Life, Clarendon Press: Oxford, 1991. 9. F.S. Milleii, “Minireview Series: Biological Electron Transfer - Introduction,” Journal of
Bioenergetics and Biomembranes, 1995, 27(3), 261-351. 10. S.L. Wolfe, Molecular and Cellular Biology, Wadsworth Publishing Company: Belmont,
California, 1993. 11. P. Barnes-Svarney, “Chapter 5 - The Human Body and Biomedical Science,” The New York
Public Library Science Desk Reference, Stonesong Press: New York, New York, 1995. 12. a) J. Janata, M. Josowicz, P. Vanysek, and D.M. DeVaney, “Chemical Sensors,” Anal. Chem.,
1998, 70, 179R-208R. b) J.L. Anderson, L.A. Coury, and J. Leddy, “Dynamic Electrochemistry:Methodology and Application,” 1998, 70, 519R-589R. c) J.L. Anderson, E.F. Bowden, and P.G.Pickup, “Dynamic Electrochemistry: Methodology and Application,” Anal. Chem. 1996, 68,379R-444R.
13. a) Proposal to the National Science Foundation by Edmond F. Bowden, “Protein Monolayer
Electrochemistry,” 1998. b) Proposal to the National Science Foundation by Edmond F. Bowden,“Protein Monolayer Electrochemistry,” 1993.
14. a) O. Marti and M. Amrein, STM and AFM in Biology, Academic Press Inc.: New York, 1993. b)
H.J. Guntherodt and R. Wiesendanger, Eds., Scanning Tunneling Microscopy I - Springer Seriesin Surface Sciences 20, Springer-Verlag: Berlin, 1992. c) H.J. Guntherodt and R. Wiesendanger,
25
Eds., Scanning Tunneling Microscopy II - Springer Series in Surface Sciences 28, Springer-Verlag: Berlin, 1992. d) C. Bai, Scanning Tunneling Microscopy and Its Application - SpringerSeries in Surface Sciences 32, Springer-Verlag: Berlin, 1995. e) S. Magonov and M.H.Whangbo, Surface Analysis with STM and AFM: Experimental and Theoretical Aspects of ImageAnalysis, VCH: New York, 1996. f) L.A. Bottomley, J.E. Coury, and P.N. First, Anal. Chem.1996, 68, 185R-230R. g) L.A. Bottomley, “Scanning Probe Microscopy,” Anal. Chem., 1998, 70,425R-475R. h) R.J. Hamers, J. Phys. Chem. 1996, 100, 13103-13120. i) M.D. Ward and H.S.White, In Modern Techniques in Electroanalysis, P. Vanysck (Ed.), Chemical Analysis Series,John Wiley and Sons, Inc.: 1996, 139, Ch 3.
15. a) C.B. Gorman, “Encapsulated Electroactive Molecules,” Advanced Materials, 1997, 9(14),1117. b) C.B. Gorman, “Metallodendrimers: Sturctural Diversity and Functional Behavior,”Advanced Materials, 1998, 10(4), 295. c) C.B. Gorman, B.L. Parkhurst, W.Y. Su, K-Y. Chen,M.W. Hager, and I. Touzov, “A Model for Single-Molecule Information Storage,” ForthInternational Conference on Frontiers of Polymers and Advanced Materials.
16. a) D.L. Feldheim and C.D. Keating, “Self-assembly of single e- transmitters and related devices,”
Chemical Society Reviews, 1998, 27, 1. b) M. Kastner, “Technology and the single electron,”Nature, October, 16, 1997, 389. c) “Making Devices Smaller, Brighter, and More Bendy,Science, 1998, 282, 2179.
17. R. Dagani, “Putting the Nano Finger on Atoms,” Chemical and Engineering News, Dec. 2, 1996,
20. 18. a) R.S. Cotran, V. Kumar, and S.L. Robbins; F.J. Schoen (Ed.), Robbins - Pathologic Basis of
Disease, W.B. Saunders Co.: Philadelphia, Pennsylvania, 1994. b) Z. Zaheri and J.L. Tilly; R.A.Lockshin (Ed.), When Cells Die: A Comprehensive Evaluation of Apoptosis and ProgrammedCell Death, Wiley-Liss Publishing: New York, New York, 1998. c) D. Watters; M. Lavin (Ed.),Programmed Cell Death: the Cellular and Molecular Biology of Apoptosis, Harwood AcademicPublishers: Switzerland, 1993; d) I. Martinou, S. Desagher, J.-C. Martinou, “The release of cyt cfrom mitochondria during apoptosis of NGF-deprived sympathetic neurons is a reversible event,”Journal of Cell Biology, 1999, 144(5), 883; e) E.P. Holinger, T. Chittenden, R.J. Luiz, “Bak BH3
peptides antagonize Bcl-XL function and induce apoptosis through cyt c independent activationof caspases,” Journal of Biological Chemistry, 1999, 274(19), 13298; f) M. Leist, B. Sirgle, andP. Nicotora, “Nitric oxide inhibits execution of apoptosis at two distinct ATP - dependent stepsupstream and downstream of mitochondrial cyt c release,” Biochemical and BiophysicalResearch Comm., 1999, 258(1), 215; g) P. Jouvet, P. Rustin, and H. Mehmet, Trans. ofBiochemical Society, 1998, 26(4), S341; h) J. Cai, J.Yang, D.P. Jones, “Mitochondrial control ofapoptosis: the role of cyt c,” Biochimica et Biophysica Acta Bioenergetics, 1998, 1366(1/2), 139;i) R.M. Kluch, E. Bossy-Wetzel, D.D. Newmeyer, “Release of cyt c from mitochondria: aprimary site for Bcl-2 regulation of apoptosis,” Science, 1997, 275(5303), 1132.
19. H. O. Finklea, “Electrochemistry of Organized Monolayers of Thiols and Related Molecules on
Electrodes,” A.J. Bard and I. Rubinstein (Eds.), Electroanalytical Chemistry - A Series ofAdvances, Vol. 19, 108-335, Marcel Dekker: New York, New York, 1996.
20. D. Mandler and I. Turyan, “Applications of Self-Assembled Monolayers in Electroanalytical
Chemistry,” Electroanalysis 1996, 8(3), 207-213.
26
21. a) J.Wang, Q. Chen, and M. Pedrero, “Highly selective biosensing of lactate at lactate oxidasecontaining rhodium-dispersed carbon paste electrodes,” Anal. Chim. Acta, 1995, 304, 41-46. b) J.Wang, G. Rivas, and M. Cicharro, “Iridium-dispersed carbon paste enzyme electrodes,”Electroanalysis, 1996, 9, 434-437.
22. G. Kenausis, Q. Chen, and A. Heller, “Electrochemical Glucose and Lactate Sensors Based on
‘Wired’ Thermostable Soybean Peroxidase Operating Continuously and Stably at 37° C,” Anal.Chem., 1997, 69, 1054-1060.
23. a) D.H. Johnston and H.H. Thorpe, “Cyclic Voltammetry Studies of Polynucleotide Binding and
Oxidation by Metal Complexes: Homogeneous Electron-Transfer Kinetics,” J. Phys. Chem.,1996, 100, 13837-13843; b) M.E. Napier, C.R. Loomis, M.F. Sistare, J. Kim, A.E. Eckhardt, andH.H. Thorpe, “Probing Biomolecule Recognition with Electron Transfer: ElectrochemicalSensors for DNA Hybridization,” Bioconjugate Chem., 1997, 8, 906-913; c) M.E. Napier andH.H. Thorpe, “Modification of Electrodes with Dicarboxylate Self-Assembled Monolayers forAttachement and Detection of Nucleic Acids,” Langmuir, 1997, 13, 6342-6344.
24. a) T. Hatazawa, R.H. Terrill, and R.W. Murray, “Microelectrode Voltammetry and Electron
Transport in an Undiluted Room Temperature Melt of an Oligo(ethylene glycol) - TailedViologen,” Anal. Chem., 1996, 68, 597-603. b) M.L. Longmire, M. Watanabe, H. Zhang, T.T.Wooster, and R.W. Murray, “Voltammetric Measurement of Ultraslow Diffusion Rates inPolymeric Media with Microdisk Electrodes,” Anal. Chem., 1990, 62, 747-752.
25. L.H. Guo and H.A.O. Hill, Adv. Inorg. Chem. 1991, 36,341-375.
27
BACKGROUND, INTRODUCTION, AND OBJECTIVES OF RESEARCH
CHAPTER TWO
“Good judgement comes fromexperience, and experience comes frombad judgement.” – Barry LePatner
28
2. BACKGROUND, INTRODUCTION, AND OBJECTIVES OF RESEARCH
2.1 BIOLOGICAL ELECTRON TRANSFER OF PROTEINS
Biological electron transfer (ET) reactions and adsorption processes involving
proteins play a critical role in certain vital physiological functions. For decades, chemical,
physical, and biological scientists have focused their attention on understanding these ET
reactions that are such a crucial part of life sustaining processes in living organisms, most
notably photosynthesis and mitochondrial respiration. The rate and mechanistic aspects of
the ET known to occur between certain proteins, as well as, the need for an effective strategy
to study these complex reactions are at the heart of this type of research.1
During the 1980’s, research into biological ET reactions saw a significant and
unprecedented advancement in both the experimental and theoretical treatment of this
phenomenon. Of these advancements, two of the most noteworthy were the improvement of
crystallographic methods concerning the structural characterization of biological molecules2
and the theories developed based on donor-acceptor (D-A) chemistry for describing ET
reactions.3 By designating each redox partner or protein in an ET scheme as either an
electron donor (D) or as an electron acceptor (A), the door was opened for the development
of various strategies to probe ET reactions. The following sections, based on articles by
Bowden and coworkers,1,4 summarize this development and provide seminal examples of
each strategy. Strategies for studying ET reactions can be divided into two types:
homogeneous ET, where the ET occurs between two species in solution, or heterogeneous
ET, where a single redox species undergoes ET at an electrode.
2.1.1. Homogeneous Electron Transfer of Proteins
Before the 1980’s, homogeneous biomolecular strategies were the prevalent
methodology for studying ET reactions between proteins. This strategy revolved around the
intermolecular ET reaction of two independently diffusing redox proteins or redox molecules.
The ET process, as depicted in the reaction below (Rxn. 2.1), involves the reduction of the
acceptor redox partner (A) and the simultaneous oxidation of the donor partner (D).
Assuming only simple one-electron transfers, the typical net reaction taking place is as
follows:
29
D + A ⇔ D+ + A- [Rxn. 2.1]
Examining this type of reaction in greater detail, one can classify it as a diffusional ET
reaction. That is, the reaction is dependent upon redox species diffusing up to one another
and undergoing an electron exchange. Therefore, Rxn. 2.1 can be written more descriptively
as Rxn. 2.2 below, which includes several distinct steps: the association (±a) of D and A to
form the D-A complex, the ET within that complex that forms the D+A- complex, and the
subsequent dissociation (±d) of the D+A- complex:5
ka ket,f kd
D + A ⇔ DA ⇔ D+A- ⇔ D+ + A- [Rxn. 2.2] k-a ket,r k-d (1) (2) (3)
Although this approach has been used to study the ET kinetics of the ET protein cytochrome
c (cyt c) with a variety of redox partners, including other biomolecules as well as inorganic
and organic redox species,6 this strategy is not without its complications.
Kinetic analysis of the ET step (step 2) of this type of reaction (Rxn. 2.2) can be
extremely complicated due to the complexity of this three step scheme. In addition to the
forward and reverse rate constants (ket,f ; ket,r) relating to the fundamental ET, the rate of the
overall reaction can be controlled by the rate of association or dissociation (ka/-a ;
kb/-b).5 With this in mind, researchers turned to the development of diffusionless strategies
as a means of simplifying the kinetic analysis of ET reactions.
The first diffusionless strategies incorporated stable D-A complexes or protein/protein
complexes. By utilizing these kind of complexes, the complicated kinetics of Rxn. 2.2 are
dramatically simplified with the elimination of the diffusional aspects of the reaction scheme
(steps 1 & 3 in Rxn. 2.2). Thus, the ET process is rendered completely intramolecular:
ket,f
DA ⇔ D+A- [Rxn. 2.3] ket,r
This significant change in approaching fundamental ET studies laid the foundation for many
successful research efforts. Research into homogeneous intramolecular ET focused on
covalently altering proteins, metal substitutions into proteins, and stable protein/protein
complexes.3a,7 Respective examples of each endeavor include work with ruthenated cyt c and
cyt b5 ET proteins,8 Fe-Zn hybrids of hemoglobin,3a,7 and cyt c/cyt c peroxidase or cyt c/cyt
30
b5 protein complexes.9 It was during this phase of protein ET research that a remarkable
level of understanding concerning the distance dependence of ET, the importance of the
orientation of D-A docking sites, and the role of thermodynamic driving force and
reorganization energies was ultimately achieved.3a,7,10
2.1.2. Heterogeneous Electron Transfer of Proteins
Typical heterogeneous ET experiments are performed using a protein or enzyme as
either the electron acceptor (A) or as the electron donor (D), depending on the direction of the
reaction. The other redox partner is an electrode, which contributes or receives the electron
in the reaction. The ET of this reaction is direct, from protein to electrode, and does not
require the presence of a mediating species.11 Solid electrodes used to study heterogeneous
ET include metal oxides12a and pyrolytic graphite.12b This strategy came into prominence
during the 1980’s but originated in the 1970’s through research done in the laboratories of
Hill,13 Hawkridge,14 and Kuwana.12a More recently, researchers have been successful using
heterogeneous techniques to perform direct electrochemistry on complex biological systems.4
Researchers in Armstrong’s group used electrochemistry to delineate mechanistic
aspects, previously unknown to the scientific community, of succinate dehydrogenase
(SDH).15 SDH is involved in the mitochondrial respiration chain and is a rather large
biomolecule with a molecular mass of approximately 97,000 Daltons which has several redox
centers. Armstrong successfully immobilized SDH by adsorbing it onto a pyrolytic graphite
electrode. The graphite surface facilitates the binding of the enzyme through adsorption sites
that maintain the electroactivity of the SDH enzyme, an important aspect of heterogeneous
ET studies. SDH is part of an enzyme complex known as Complex II and is an important
part of the mitochondrial oxidative phophorylation chain. Bound in a membrane, Complex II
functions by oxidizing succinate to fumarate and passing electrons on to quinones that are
also membrane-bound. In the laboratory, the hydrophilic and functional portion of the
complex can be isolated and accessed on an electrode, allowing Armstrong to study the direct
catalysis of succinate oxidation, as well as, the reverse reaction. Cyclic voltammetry on this
system allowed for an unprecedented understanding of the molecular role of SDH in this
complex biological process.4
31
Another example of the potential of electrochemistry being used for the study intricate
biological events emerged from the Hawkridge research group.16 Researchers in this lab
immobilized cytochrome oxidase, another member of the respiration chain in the
mitochondrion, known as Complex IV, in a fabricated bilayer that was intended to simulate
the natural location of the complex in the cell membrane. Being extremely large,
approaching 200,000 Daltons, and very complicated, housing multiple redox sites, the
functional immobilization of this biomolecule on an electrode surface was, in itself, a
formidable accomplishment. Its biological function is to catalyze the reduction of dioxygen
and involves cytochrome oxidase exchanging electrons with its redox partner, cytochrome c.
Through his electrochemical experiments, Hawkridge was able to study the reversible ET
occurring between immobilized cyt c oxidase in this membrane and freely diffusing cyt c in
solution. This experimental arrangement bears a remarkable resemblance to what actually
takes place inside the cell, and therefore may be an excellent model for studying the process.
These two examples serve to display the immense possibilities of electrochemistry as
a tool for scientists to learn about complex biological processes. Electrochemistry, as will be
shown in this research, is especially effective on simpler ET proteins and systems. In any
event, it is clearly evident that heterogeneous ET strategies are significant and effective
means for learning about the fundamental processes of protein adsorption and ET kinetics
and thermodynamics.
Analogous to the homogeneous ET reaction scheme, mechanistic aspects of
heterogeneous ET in proteins can be written in D-A terminology. The overall net reaction
taking place during heterogeneous ET reactions is shown:
A + ne-electrode ⇔ D [Rxn. 2.4]
More specifically, the reaction is best described by including the adsorption and desorption
processes of the protein on the electrode surface:
kads ket,f kdes
Asoln ⇔ Aads + ne- ⇔ Dads ⇔ Ddes [Rxn. 2.5] k-ads ket,r k-des (1) (2) (3)
where the subscripts “soln,” “ads,” and “des” designate the status of the electroactive species
in solution, adsorbed to the electrode surface, or desorbed from the electrode’s surface,
32
respectively.17 As with the homogeneous ET scheme, clear evaluation of the ET step in this
type of reaction is not easy due to the coexisting and complicating rates of protein adsorption
and desorption. Again, the overall rate of reaction is subject to control by processes other
than the ET, rendering a fundamental ET study difficult to accomplish with any degree of
certainty. A strategy that simplifies the reaction and isolates the ET step is needed.
2.2. THE STRATEGY: PROTEIN MONOLAYER ELECTROCHEMISTRY
Over the years, various strategies have been developed to create a simplified model
for heterogeneous ET studies. Early in the 1980’s, researchers such as Niki18 and
Armstrong19-22 concentrated their efforts into establishing an electrochemical model for this
process that would alleviate the complicated kinetic analysis involved with heterogeneous
ET.1 Their work resulted in an approach known as protein monolayer electrochemistry
(PME), a diffusionless heterogeneous technique where the protein is confined to the electrode
surface. The direct adsorption of the protein to the electrode effectively eliminates the
previously competitive processes of adsorption and desorption, and provides the necessary
simplification to study fundamental ET. Adjusting Rxn. 2.5 to this simplification results in a
reaction scheme similar to the diffusionless homogeneous reaction (Rxn. 2.3) and
synonymous to the second step of Rxn. 2.5:
ket,f
Aads + ne- ⇔ Dads [Rxn. 2.6] ket,r
Thus, the ET step is totally isolated, resulting in a diffusionless, heterogeneous reaction
mechanism governed by only one rate constant, the ET rate constant (ket, f&b). The beneficial
simplification provided by the use of PME as a strategy for studying biological ET reactions
is depicted in Figure 2.1. It is thought that these protein/electrode systems can be utilized to
simulate the important protein/protein complexes in living organisms.20 A key obstacle to
employing this strategy is the successful immobilization of a protein onto a solid metal
electrode. Thus, much of the PME research being performed devotes attention to an effective
means of accomplishing the adsorption of the protein. Through studying the direct electronic
interactions taking place between the metal electrode and the protein in this type of model, a
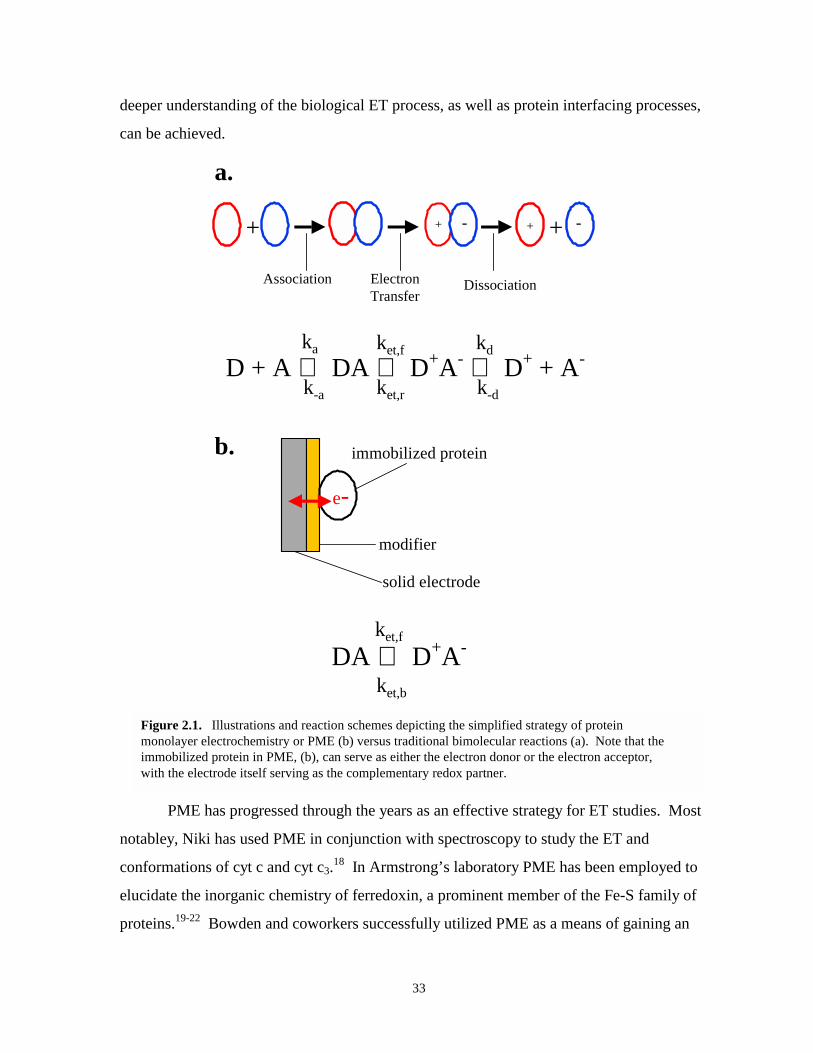
33
deeper understanding of the biological ET process, as well as protein interfacing processes,
can be achieved.
++ +
Association ElectronTransfer
Dissociation
-
ka
k-a
ket,f kd
k-d
a.
D + A ⇔ DA ⇔ D+A- ⇔ D+ + A-
ket,r
ket,b
b. immobilized protein
modifier
solid electrode
e-
ket,f
DA ⇔ D+A-
-+
Figure 2.1. Illustrations and reaction schemes depicting the simplified strategy of proteinmonolayer electrochemistry or PME (b) versus traditional bimolecular reactions (a). Note that theimmobilized protein in PME, (b), can serve as either the electron donor or the electron acceptor,with the electrode itself serving as the complementary redox partner.
PME has progressed through the years as an effective strategy for ET studies. Most
notabley, Niki has used PME in conjunction with spectroscopy to study the ET and
conformations of cyt c and cyt c3.18 In Armstrong’s laboratory PME has been employed to
elucidate the inorganic chemistry of ferredoxin, a prominent member of the Fe-S family of
proteins.19-22 Bowden and coworkers successfully utilized PME as a means of gaining an
34
unprecedented understanding of ET kinetics. In summary, PME has become an established
technique for fundamental studies of biological ET in proteins.
2.2.1. PME: Advantages & Disadvantages
What advantages does PME offer that make it so useful for studying biological ET?
Performing PME allows researchers to acquire thermodynamic and kinetic data that, when
used in conjunction with the crystal structure of the protein, prove to be extremely valuable in
efforts to understand protein ET and adsorption. The advantages and limitations of PME as a
method are briefly described here. Many advantages of this strategy have already been
mentioned and are summarized, along with additional benefits and limitations of PME, in
Table 2-1. When using PME, redox thermodynamics are readily obtained from simple cyclic
voltammetry (CV) experiments, making the technique a popular tool for biochemists wishing
to determine formal potentials of biomolecules in a variety of environments. In addition to
thermodynamic measurements, PME is also effective at illuminating a more detailed
understanding of interfacial interactions, such as the kinetics of ET and adsorption properties,
between electrodes and proteins.4
As discussed earlier, the predominant benefit PME offers in terms of kinetic analysis
is simplification. The ET is both heterogeneous and diffusionless, thus simplifying the
kinetics by excluding any possible rate limitations arising from mass transfer (diffusion) and
adsorption processes.4,23 When PME is performed on simple ET proteins, as is the case in
this thesis, the kinetic analysis is further simplified by the existence of a single redox site.
This simplification allows the PME experiment to resemble self-exchange reactions which
also have only one redox center. In self-exchange reactions, however, the electroactivity of
this redox site is traditionally difficult to measure, whereas the electrochemical determination
of heterogeneous ET rate constants are comparatively very easy. Moreover, the rate at which
an electron travels from electrode to protein or vice versa is highly dependent on two
important variables: the distance between donor and acceptor sites and the nature of the
medium between the sites.24
PME addresses these two variables nicely, considering that in some instances, the
modifying species on the electrode surfaces, such as self-assembled monolayers (SAMs), can
act as an adjustable spacer that controls the distance between electrode (D/A #1) and protein
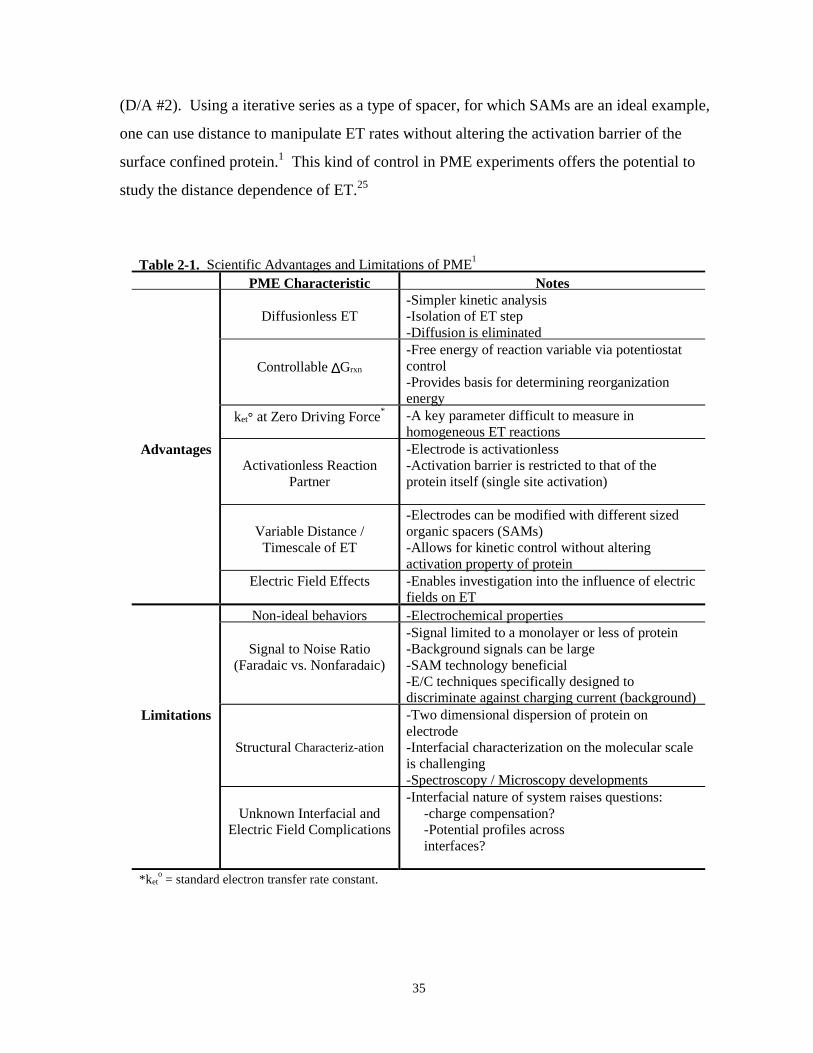
35
(D/A #2). Using a iterative series as a type of spacer, for which SAMs are an ideal example,
one can use distance to manipulate ET rates without altering the activation barrier of the
surface confined protein.1 This kind of control in PME experiments offers the potential to
study the distance dependence of ET.25
Table 2-1. Scientific Advantages and Limitations of PME1
PME Characteristic Notes
Diffusionless ET-Simpler kinetic analysis-Isolation of ET step-Diffusion is eliminated
Controllable ∆Grxn
-Free energy of reaction variable via potentiostatcontrol-Provides basis for determining reorganizationenergy
ket° at Zero Driving Force* -A key parameter difficult to measure inhomogeneous ET reactions
AdvantagesActivationless Reaction
Partner
-Electrode is activationless-Activation barrier is restricted to that of theprotein itself (single site activation)
Variable Distance /Timescale of ET
-Electrodes can be modified with different sizedorganic spacers (SAMs)-Allows for kinetic control without alteringactivation property of protein
Electric Field Effects -Enables investigation into the influence of electricfields on ET
Non-ideal behaviors -Electrochemical properties
Signal to Noise Ratio(Faradaic vs. Nonfaradaic)
-Signal limited to a monolayer or less of protein-Background signals can be large-SAM technology beneficial-E/C techniques specifically designed todiscriminate against charging current (background)
Limitations
Structural Characteriz-ation
-Two dimensional dispersion of protein onelectrode-Interfacial characterization on the molecular scaleis challenging-Spectroscopy / Microscopy developments
Unknown Interfacial andElectric Field Complications
-Interfacial nature of system raises questions: -charge compensation? -Potential profiles across interfaces?
*keto = standard electron transfer rate constant.
36
As far as the nature of the medium between the two reaction sites is concerned, PME
experiments are usually performed in aqueous solutions with supporting electrolyte.
Therefore, the environment surrounding the adsorbed protein can be altered at will and made
to simulate physiological conditions. This is especially important when attempting to study
biological molecules in their native forms. Furthermore, results obtained in physiological
environments can be directly related to the overall goal of this research, bioanalytical devices.
An additional advantage of using PME is that the driving force behind the ET
reactions, the free energy of the reaction, is infinitely variable via potentiostatic control of the
electrode. This type of experimental manipulation is not available with solution D-A
complexes, whose free energy only changes when the redox site is actually chemically
altered.26 The potentiostat controls the free energy of the electrons associated with the
working electrode, allowing the experimenter to simultaneously control the direction of the
ET reaction through an applied voltage and measure the current flow between the two
reactants (electrode and electroactive molecules).
With heterogeneous ET reactions, such as those taking place in PME, the electrode
exhibits no reorganization energy of its own and can be considered to be an activationless
(λelectrode = 0 ) entity. The only activation barrier to contend with in PME is that of the
proteins. This feature of PME allows the experimental results obtained to be directly
attributable to a protein’s specific characteristics or adsorption state, analogous to self-
exchange reactions.1
The first of several limitations involved with PME deals with signal to noise issues.
The magnitude of the current response, the analytical signal of the adsorbed ET proteins, is
limited to the amount of material actually adsorbed on the surface, usually only a monolayer
or submonolayer. The signal produced by this monolayer of proteins, sometimes called the
faradaic current, can be obscured by the non-faradaic or background signal, also called the
charging current (nonfaradaic current). When experimenting with such small signals, a large
background current can render quantitative electrochemical measurements on the system very
difficult.18a,b,e,20e,27 To combat this problem, electrochemists sought electrode modifiers that
are not only compatible and successful in confining specific proteins to a surface, but that are
also effective at differentiating between faradaic and non-faradaic current, usually by
37
attenuating the charging current. One such modifier, which will be discussed in greater detail
in a later section, is alkanethiolate self-assembled monolayers (SAMs). In addition to
altering the systems interfacial characteristics to battle this problem, techniques have been
developed that are specifically designed to address low signal to background current ratios.
Pulsed voltammetry28,29,30 and spectroelectrochemical techniques18a,b,e,31 are examples of
methods being used for this purpose.1
Another limitation found in PME is the lack of structural characterization of the
system on the molecular scale. Being a surface bound model involving minute amounts of
protein, the interfacial structures involved with PME are difficult to define. In comparison,
homogeneous solutions and solid crystals are readily characterized by a variety of techniques.
Therefore, most PME experiments are limited to proteins that have already been well
characterized and are structurally defined. It is hopeful, however, that continuing
developments in spectroscopy and especially scanning probe microscopy (SPM) will offer a
promising outlook for this particular limitation of PME.
A related problem, and a major aspect of this research, is the inherent non-ideal
properties that exist in PME results. Ideally, every protein on the surface would be adsorbed
in the exact same manner with identical orientation, stability, and binding interactions.
However, as will be discussed later, this is seldom the case. As a result, the redox properties
of the proteins, such as formal potential and rate constants, are dispersed and classically non-
ideal.1,32 This broadened distribution of electrochemical properties is the focus of much
research and will be very important in future sections.
Two positive aspects of PME is that it is a very promising strategy for obtaining ET
data and that all of its limitations can be addressed, circumvented, or minimized. Much of
the research done on PME revolves around controlling and/or understanding its limitations.
The future of the PME strategy to study biological ET will be largely dictated by how
successful the research is at overcoming these disadvantages. Success will be primarily
rooted in fundamental thermodynamic and kinetic analysis of well understood proteins, an
example of which is the research presented in this dissertation.
2.2.2. Modified Electrodes and PME
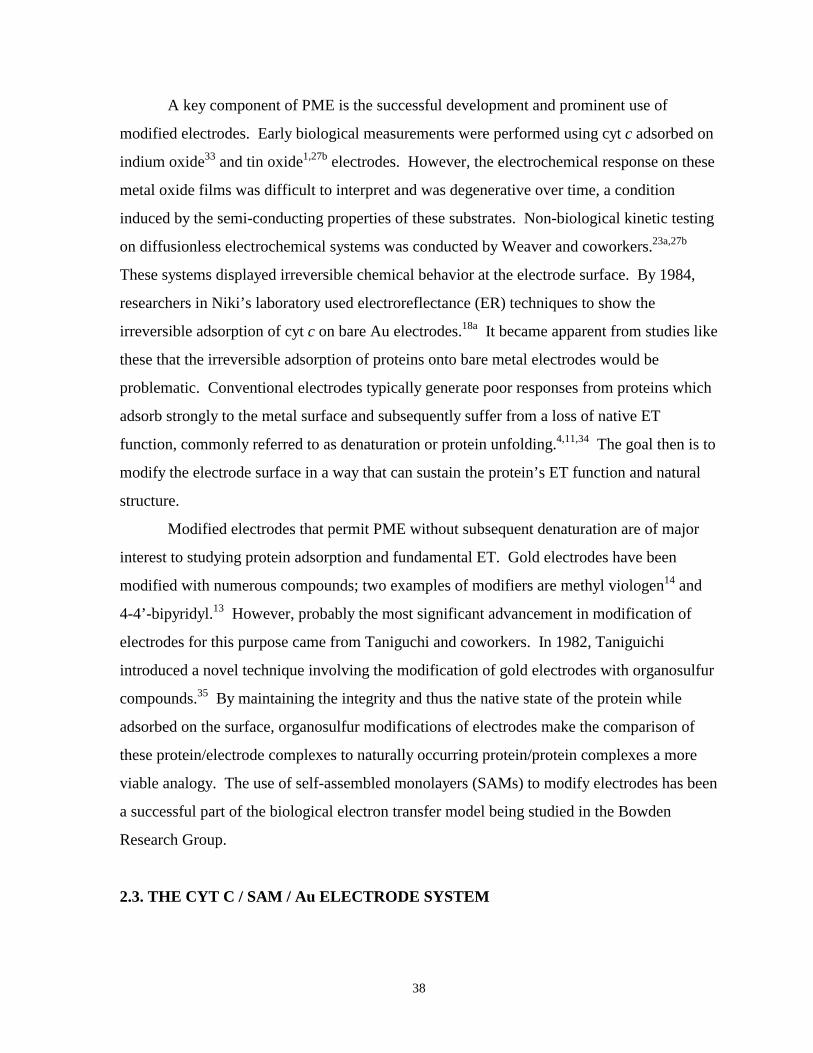
38
A key component of PME is the successful development and prominent use of
modified electrodes. Early biological measurements were performed using cyt c adsorbed on
indium oxide33 and tin oxide1,27b electrodes. However, the electrochemical response on these
metal oxide films was difficult to interpret and was degenerative over time, a condition
induced by the semi-conducting properties of these substrates. Non-biological kinetic testing
on diffusionless electrochemical systems was conducted by Weaver and coworkers.23a,27b
These systems displayed irreversible chemical behavior at the electrode surface. By 1984,
researchers in Niki’s laboratory used electroreflectance (ER) techniques to show the
irreversible adsorption of cyt c on bare Au electrodes.18a It became apparent from studies like
these that the irreversible adsorption of proteins onto bare metal electrodes would be
problematic. Conventional electrodes typically generate poor responses from proteins which
adsorb strongly to the metal surface and subsequently suffer from a loss of native ET
function, commonly referred to as denaturation or protein unfolding.4,11,34 The goal then is to
modify the electrode surface in a way that can sustain the protein’s ET function and natural
structure.
Modified electrodes that permit PME without subsequent denaturation are of major
interest to studying protein adsorption and fundamental ET. Gold electrodes have been
modified with numerous compounds; two examples of modifiers are methyl viologen14 and
4-4’-bipyridyl.13 However, probably the most significant advancement in modification of
electrodes for this purpose came from Taniguchi and coworkers. In 1982, Taniguichi
introduced a novel technique involving the modification of gold electrodes with organosulfur
compounds.35 By maintaining the integrity and thus the native state of the protein while
adsorbed on the surface, organosulfur modifications of electrodes make the comparison of
these protein/electrode complexes to naturally occurring protein/protein complexes a more
viable analogy. The use of self-assembled monolayers (SAMs) to modify electrodes has been
a successful part of the biological electron transfer model being studied in the Bowden
Research Group.
2.3. THE CYT C / SAM / Au ELECTRODE SYSTEM
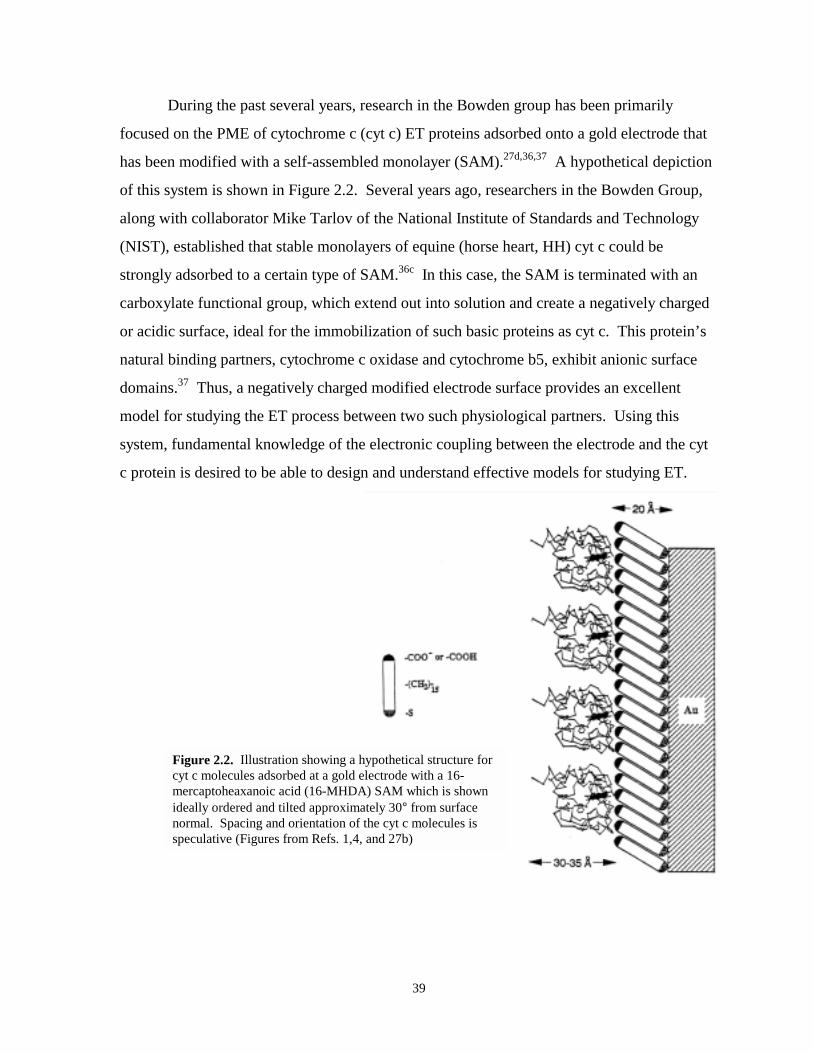
39
During the past several years, research in the Bowden group has been primarily
focused on the PME of cytochrome c (cyt c) ET proteins adsorbed onto a gold electrode that
has been modified with a self-assembled monolayer (SAM).27d,36,37 A hypothetical depiction
of this system is shown in Figure 2.2. Several years ago, researchers in the Bowden Group,
along with collaborator Mike Tarlov of the National Institute of Standards and Technology
(NIST), established that stable monolayers of equine (horse heart, HH) cyt c could be
strongly adsorbed to a certain type of SAM.36c In this case, the SAM is terminated with an
carboxylate functional group, which extend out into solution and create a negatively charged
or acidic surface, ideal for the immobilization of such basic proteins as cyt c. This protein’s
natural binding partners, cytochrome c oxidase and cytochrome b5, exhibit anionic surface
domains.37 Thus, a negatively charged modified electrode surface provides an excellent
model for studying the ET process between two such physiological partners. Using this
system, fundamental knowledge of the electronic coupling between the electrode and the cyt
c protein is desired to be able to design and understand effective models for studying ET.
Figure 2.2. Illustration showing a hypothetical structure forcyt c molecules adsorbed at a gold electrode with a 16-mercaptoheaxanoic acid (16-MHDA) SAM which is shownideally ordered and tilted approximately 30° from surfacenormal. Spacing and orientation of the cyt c molecules isspeculative (Figures from Refs. 1,4, and 27b)
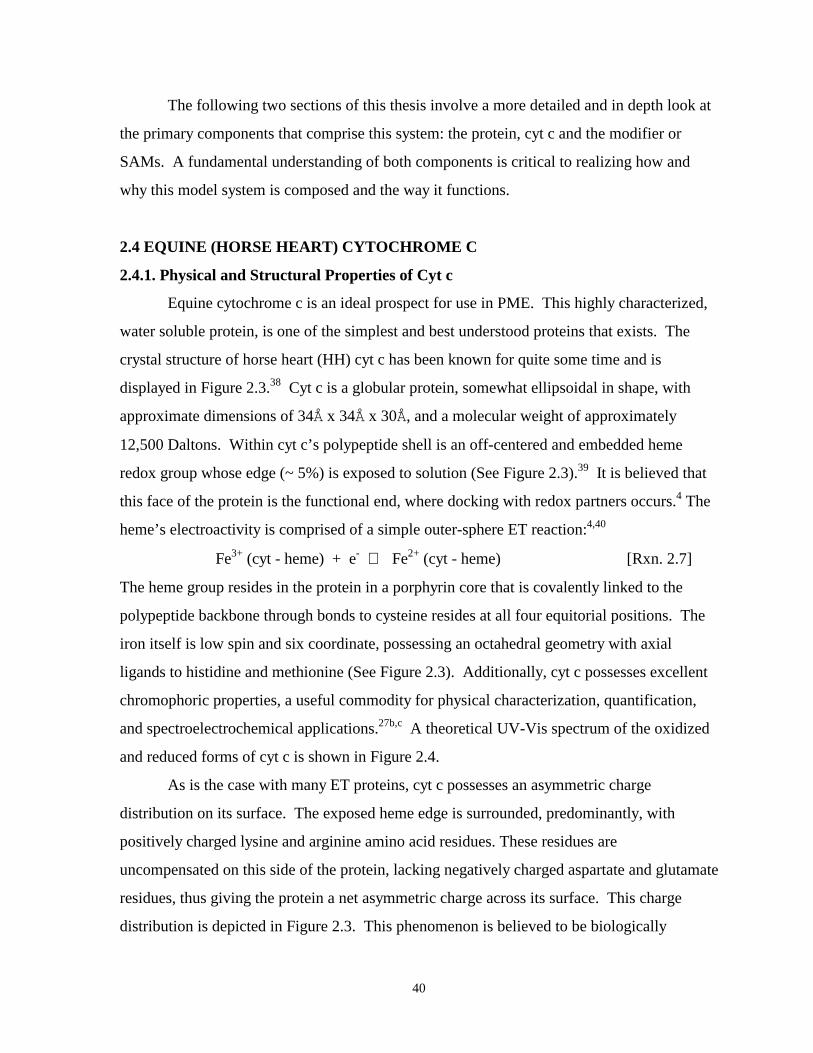
40
The following two sections of this thesis involve a more detailed and in depth look at
the primary components that comprise this system: the protein, cyt c and the modifier or
SAMs. A fundamental understanding of both components is critical to realizing how and
why this model system is composed and the way it functions.
2.4 EQUINE (HORSE HEART) CYTOCHROME C
2.4.1. Physical and Structural Properties of Cyt c
Equine cytochrome c is an ideal prospect for use in PME. This highly characterized,
water soluble protein, is one of the simplest and best understood proteins that exists. The
crystal structure of horse heart (HH) cyt c has been known for quite some time and is
displayed in Figure 2.3.38 Cyt c is a globular protein, somewhat ellipsoidal in shape, with
approximate dimensions of 34Å x 34Å x 30Å, and a molecular weight of approximately
12,500 Daltons. Within cyt c’s polypeptide shell is an off-centered and embedded heme
redox group whose edge (~ 5%) is exposed to solution (See Figure 2.3).39 It is believed that
this face of the protein is the functional end, where docking with redox partners occurs.4 The
heme’s electroactivity is comprised of a simple outer-sphere ET reaction:4,40
Fe3+ (cyt - heme) + e- ⇔ Fe2+ (cyt - heme) [Rxn. 2.7]
The heme group resides in the protein in a porphyrin core that is covalently linked to the
polypeptide backbone through bonds to cysteine resides at all four equitorial positions. The
iron itself is low spin and six coordinate, possessing an octahedral geometry with axial
ligands to histidine and methionine (See Figure 2.3). Additionally, cyt c possesses excellent
chromophoric properties, a useful commodity for physical characterization, quantification,
and spectroelectrochemical applications.27b,c A theoretical UV-Vis spectrum of the oxidized
and reduced forms of cyt c is shown in Figure 2.4.
As is the case with many ET proteins, cyt c possesses an asymmetric charge
distribution on its surface. The exposed heme edge is surrounded, predominantly, with
positively charged lysine and arginine amino acid residues. These residues are
uncompensated on this side of the protein, lacking negatively charged aspartate and glutamate
residues, thus giving the protein a net asymmetric charge across its surface. This charge
distribution is depicted in Figure 2.3. This phenomenon is believed to be biologically
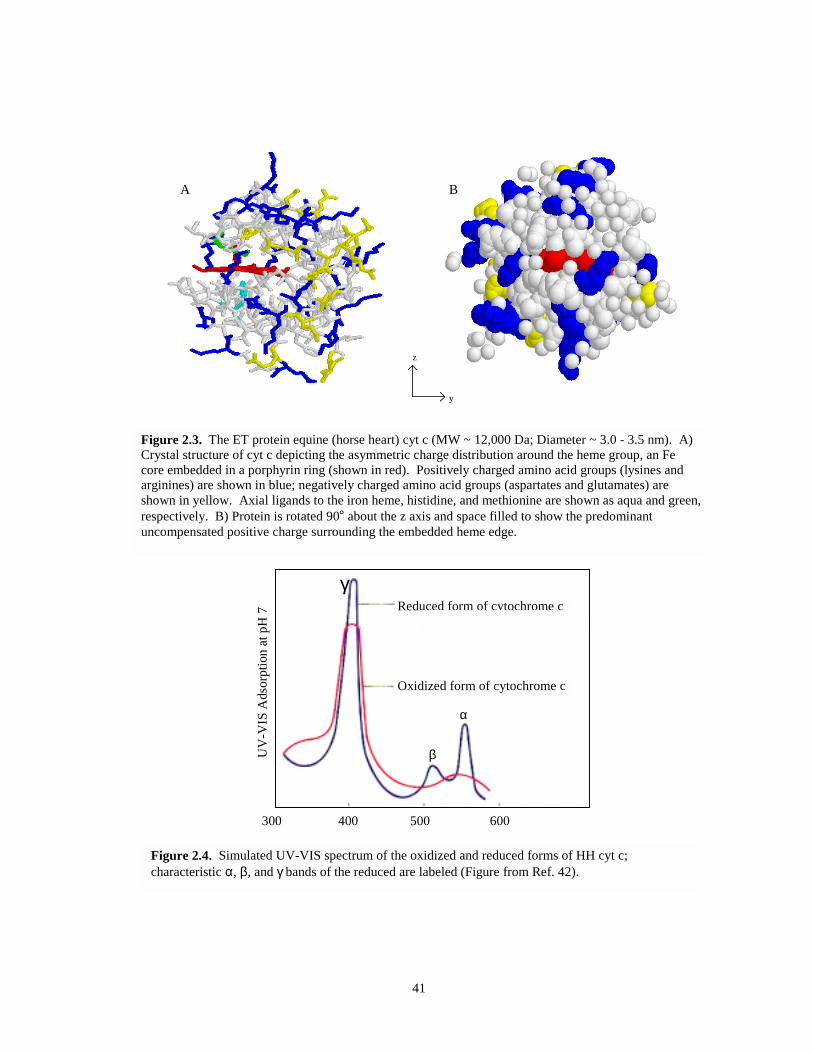
41
z
y
A B
Figure 2.3. The ET protein equine (horse heart) cyt c (MW ~ 12,000 Da; Diameter ~ 3.0 - 3.5 nm). A)Crystal structure of cyt c depicting the asymmetric charge distribution around the heme group, an Fecore embedded in a porphyrin ring (shown in red). Positively charged amino acid groups (lysines andarginines) are shown in blue; negatively charged amino acid groups (aspartates and glutamates) areshown in yellow. Axial ligands to the iron heme, histidine, and methionine are shown as aqua and green,respectively. B) Protein is rotated 90° about the z axis and space filled to show the predominantuncompensated positive charge surrounding the embedded heme edge.
300 600500400
UV
-VIS
Ads
orpt
ion
at p
H 7 Reduced form of cytochrome c
Oxidized form of cytochrome c
γ
α
β
Figure 2.4. Simulated UV-VIS spectrum of the oxidized and reduced forms of HH cyt c;characteristic α, β, and γ bands of the reduced are labeled (Figure from Ref. 42).
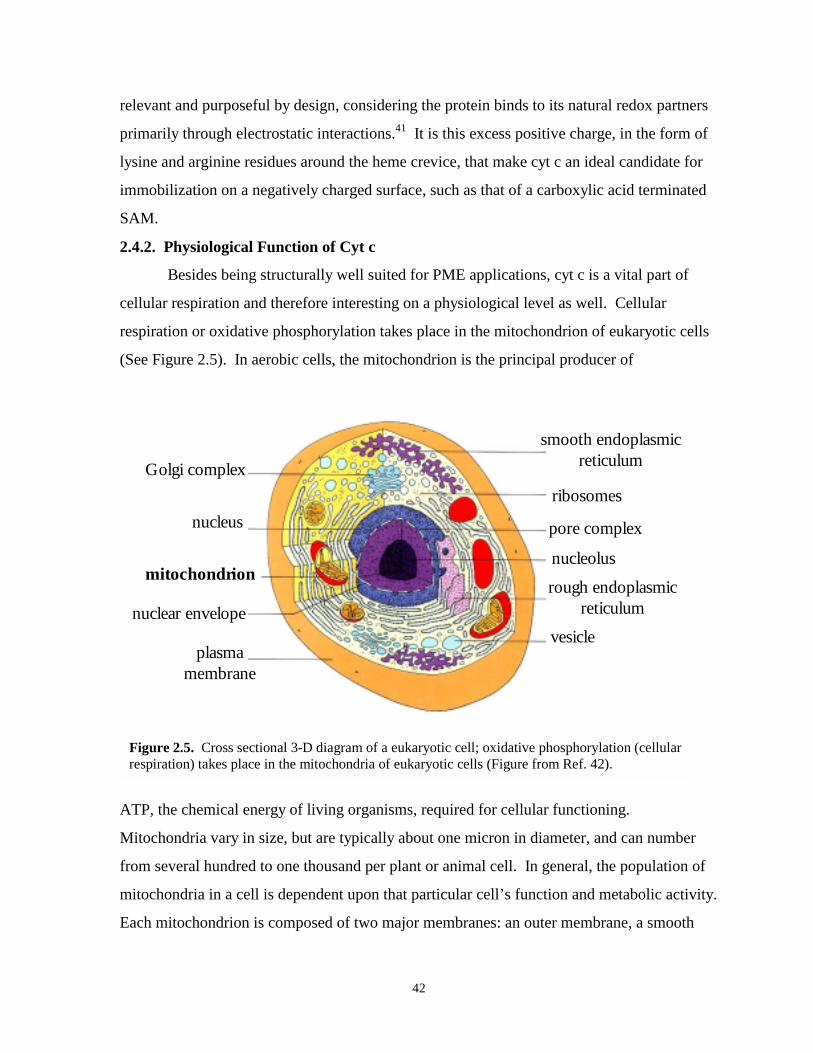
42
relevant and purposeful by design, considering the protein binds to its natural redox partners
primarily through electrostatic interactions.41 It is this excess positive charge, in the form of
lysine and arginine residues around the heme crevice, that make cyt c an ideal candidate for
immobilization on a negatively charged surface, such as that of a carboxylic acid terminated
SAM.
2.4.2. Physiological Function of Cyt c
Besides being structurally well suited for PME applications, cyt c is a vital part of
cellular respiration and therefore interesting on a physiological level as well. Cellular
respiration or oxidative phosphorylation takes place in the mitochondrion of eukaryotic cells
(See Figure 2.5). In aerobic cells, the mitochondrion is the principal producer of
smooth endoplasmicreticulum
ribosomes
pore complex
nucleolus
rough endoplasmicreticulum
vesicle
Golgi complex
nucleus
mitochondrion
nuclear envelope
plasma membrane
Figure 2.5. Cross sectional 3-D diagram of a eukaryotic cell; oxidative phosphorylation (cellularrespiration) takes place in the mitochondria of eukaryotic cells (Figure from Ref. 42).
ATP, the chemical energy of living organisms, required for cellular functioning.
Mitochondria vary in size, but are typically about one micron in diameter, and can number
from several hundred to one thousand per plant or animal cell. In general, the population of
mitochondria in a cell is dependent upon that particular cell’s function and metabolic activity.
Each mitochondrion is composed of two major membranes: an outer membrane, a smooth
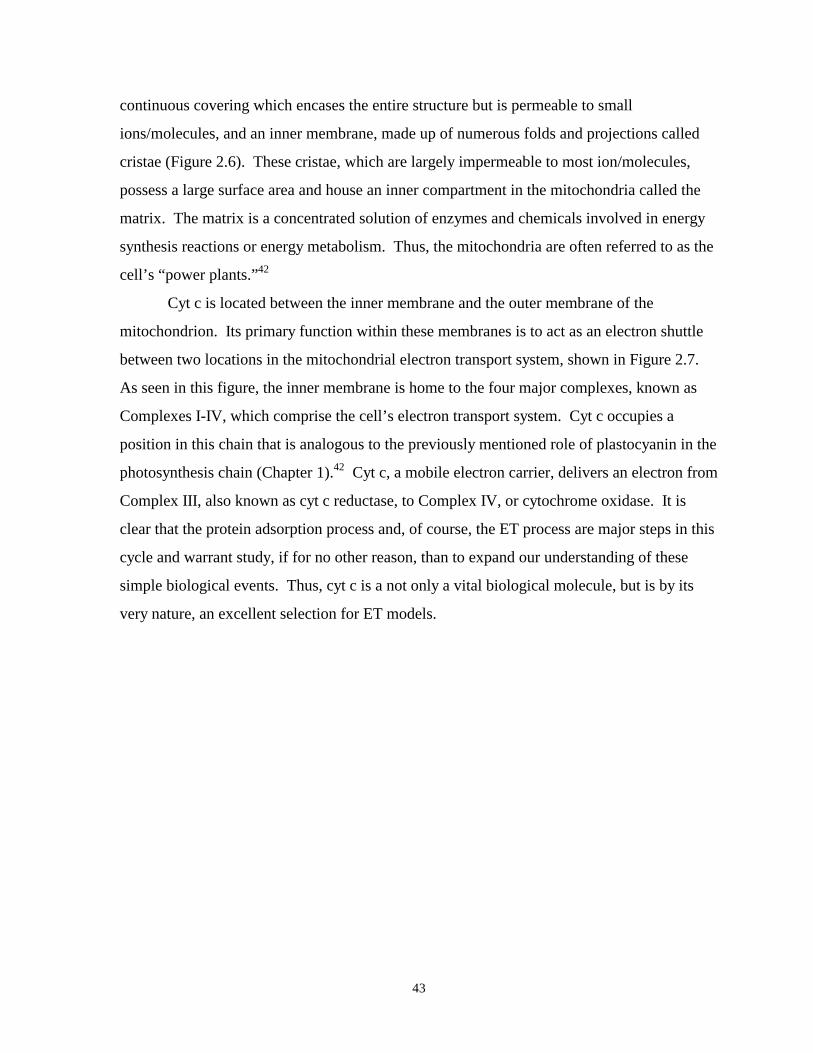
43
continuous covering which encases the entire structure but is permeable to small
ions/molecules, and an inner membrane, made up of numerous folds and projections called
cristae (Figure 2.6). These cristae, which are largely impermeable to most ion/molecules,
possess a large surface area and house an inner compartment in the mitochondria called the
matrix. The matrix is a concentrated solution of enzymes and chemicals involved in energy
synthesis reactions or energy metabolism. Thus, the mitochondria are often referred to as the
cell’s “power plants.”42
Cyt c is located between the inner membrane and the outer membrane of the
mitochondrion. Its primary function within these membranes is to act as an electron shuttle
between two locations in the mitochondrial electron transport system, shown in Figure 2.7.
As seen in this figure, the inner membrane is home to the four major complexes, known as
Complexes I-IV, which comprise the cell’s electron transport system. Cyt c occupies a
position in this chain that is analogous to the previously mentioned role of plastocyanin in the
photosynthesis chain (Chapter 1).42 Cyt c, a mobile electron carrier, delivers an electron from
Complex III, also known as cyt c reductase, to Complex IV, or cytochrome oxidase. It is
clear that the protein adsorption process and, of course, the ET process are major steps in this
cycle and warrant study, if for no other reason, than to expand our understanding of these
simple biological events. Thus, cyt c is a not only a vital biological molecule, but is by its
very nature, an excellent selection for ET models.
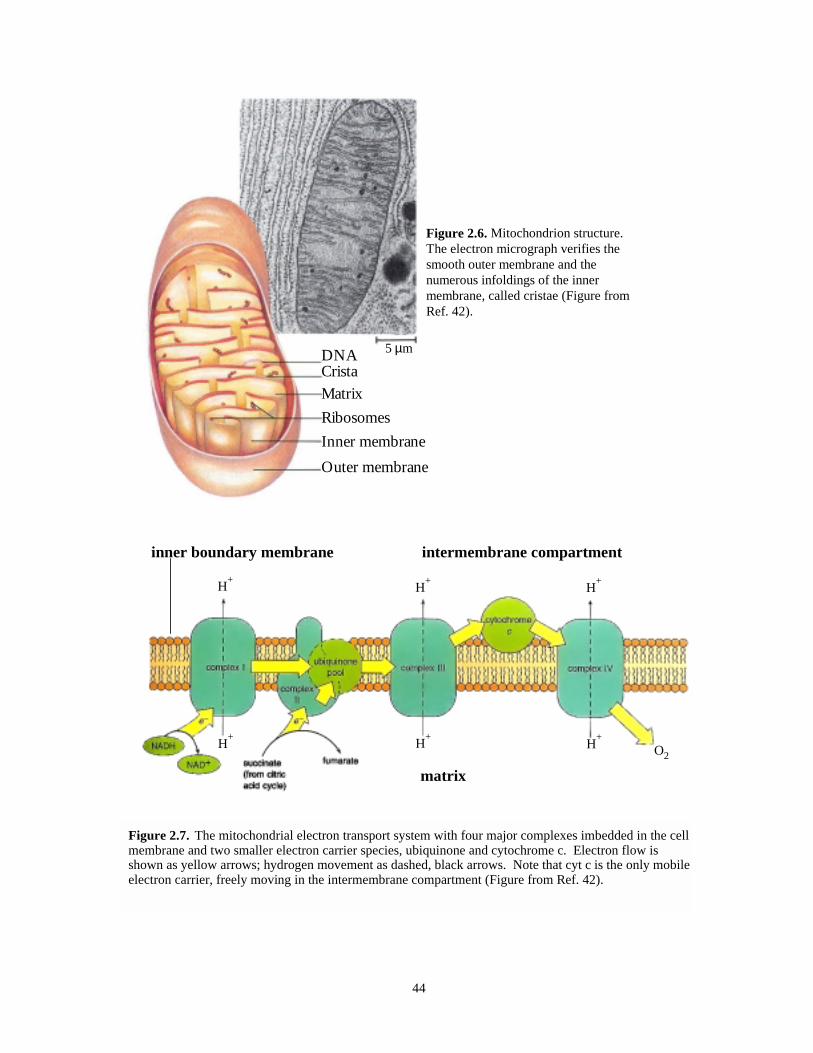
44
DNACristaMatrixRibosomesInner membraneOuter membrane
5 µm
H+H+
H+ H+
H+
H+O2
intermembrane compartment
matrix
inner boundary membrane
Figure 2.7. The mitochondrial electron transport system with four major complexes imbedded in the cellmembrane and two smaller electron carrier species, ubiquinone and cytochrome c. Electron flow isshown as yellow arrows; hydrogen movement as dashed, black arrows. Note that cyt c is the only mobileelectron carrier, freely moving in the intermembrane compartment (Figure from Ref. 42).
Figure 2.6. Mitochondrion structure.The electron micrograph verifies thesmooth outer membrane and thenumerous infoldings of the innermembrane, called cristae (Figure fromRef. 42).
45
2.5 SELF-ASSEMBLED MONOLAYERS (SAMs)
2.5.1. General Characteristics
Alkane based SAMs are a type of spontaneously formed, highly organized molecular
adlayer whose singular members share a common orientation. A generic picture of a SAM,
showing the four major components of the molecules involved in the self-assembly process
and their corresponding terminology, is shown in Figure 2.8. Each component, the metal
substrate, the headgroup, the alkane chain, and the terminal group, plays a specific role in the
formation and subsequent structure of a SAM. Therefore, this specific terminology is vital to
understanding the ensuing discussion of SAMs and their use in subsequent research studies.
The interplay of all these components give SAMs and the materials they modify certain
characteristics that make them attractive for many research purposes. The structure and
properties of SAMs have been and continue to be well characterized with a variety techniques
including the following examples: electrochemistry,43 ellipsometry (wetting), contact angle
goniometry (CAG), infrared spectroscopy,44 x-ray photoelectron spectroscopy (XPS),45 and
mass spectrometry (MS).46 The following discussion attempts to convey the results of many
of these research studies and summarize some of their major conclusions about the structure
of SAMs in aqueous solution. Here, we limit the discussion to SAMs where water serves as
the solvent, keeping in mind that any solvent, including water, can affect the properties of a
SAM. As will be seen, SAMs essentially provide scientists will a well defined and
controllable surface, an extreme advantage for surface related research. First, however, the
process of self-assembly and the roles of each component of the SAM will be examined,
starting with the interaction between the metal substrate and the headgroup.
2.5.2. The Process of Self-Assembly
The high degree of organization that is inherent in SAMs is initiated by the affinity of
the headgroup for the substrate. A major class of SAMs is derived from molecules with
sulfur based headgroups such as thiols, disulfides, and sulfides. This family of headgroups
have a high affinity to form metal-S bonds with the coinage metals (Au, Ag, Cu)47 as well as
with other metals such as platinum and mercury.48 Gold, however, is the most effective
substrate for SAM formation, and is the predominant metal seen in SAM literature.43 Several
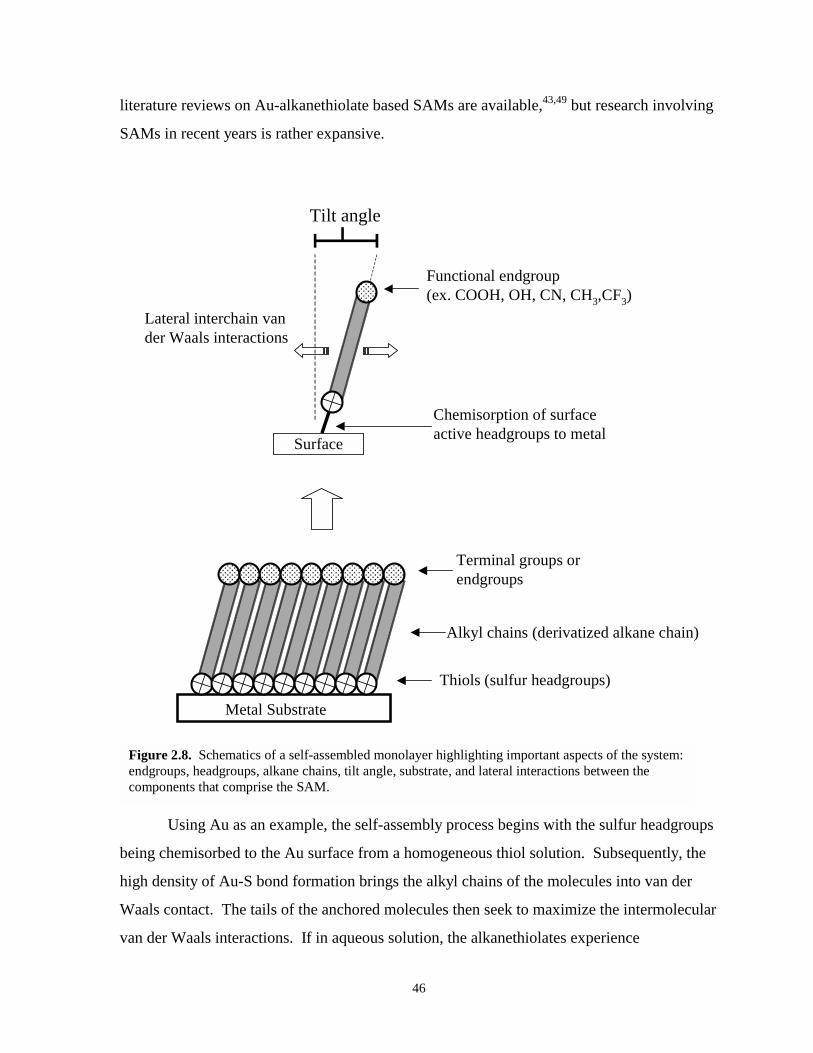
46
literature reviews on Au-alkanethiolate based SAMs are available,43,49 but research involving
SAMs in recent years is rather expansive.
��������������������
��������������������
����������������������
����������������������
��������������������
����������������������
����������������������
����������������������
����������������������
Metal Substrate
������������������������������������
Surface
Thiols (sulfur headgroups)
Alkyl chains (derivatized alkane chain)
Terminal groups orendgroups
Tilt angle
Chemisorption of surfaceactive headgroups to metal
Lateral interchain vander Waals interactions
Functional endgroup(ex. COOH, OH, CN, CH3,CF3)
Figure 2.8. Schematics of a self-assembled monolayer highlighting important aspects of the system:endgroups, headgroups, alkane chains, tilt angle, substrate, and lateral interactions between thecomponents that comprise the SAM.
Using Au as an example, the self-assembly process begins with the sulfur headgroups
being chemisorbed to the Au surface from a homogeneous thiol solution. Subsequently, the
high density of Au-S bond formation brings the alkyl chains of the molecules into van der
Waals contact. The tails of the anchored molecules then seek to maximize the intermolecular
van der Waals interactions. If in aqueous solution, the alkanethiolates experience
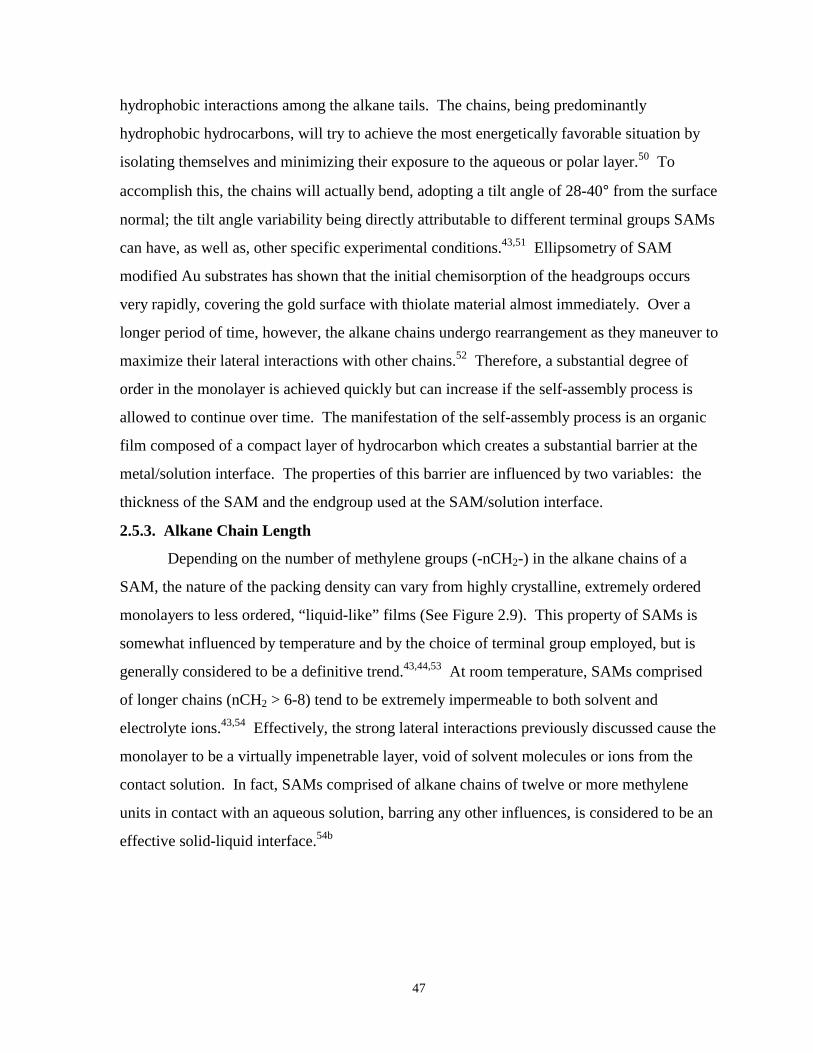
47
hydrophobic interactions among the alkane tails. The chains, being predominantly
hydrophobic hydrocarbons, will try to achieve the most energetically favorable situation by
isolating themselves and minimizing their exposure to the aqueous or polar layer.50 To
accomplish this, the chains will actually bend, adopting a tilt angle of 28-40° from the surface
normal; the tilt angle variability being directly attributable to different terminal groups SAMs
can have, as well as, other specific experimental conditions.43,51 Ellipsometry of SAM
modified Au substrates has shown that the initial chemisorption of the headgroups occurs
very rapidly, covering the gold surface with thiolate material almost immediately. Over a
longer period of time, however, the alkane chains undergo rearrangement as they maneuver to
maximize their lateral interactions with other chains.52 Therefore, a substantial degree of
order in the monolayer is achieved quickly but can increase if the self-assembly process is
allowed to continue over time. The manifestation of the self-assembly process is an organic
film composed of a compact layer of hydrocarbon which creates a substantial barrier at the
metal/solution interface. The properties of this barrier are influenced by two variables: the
thickness of the SAM and the endgroup used at the SAM/solution interface.
2.5.3. Alkane Chain Length
Depending on the number of methylene groups (-nCH2-) in the alkane chains of a
SAM, the nature of the packing density can vary from highly crystalline, extremely ordered
monolayers to less ordered, “liquid-like” films (See Figure 2.9). This property of SAMs is
somewhat influenced by temperature and by the choice of terminal group employed, but is
generally considered to be a definitive trend.43,44,53 At room temperature, SAMs comprised
of longer chains (nCH2 > 6-8) tend to be extremely impermeable to both solvent and
electrolyte ions.43,54 Effectively, the strong lateral interactions previously discussed cause the
monolayer to be a virtually impenetrable layer, void of solvent molecules or ions from the
contact solution. In fact, SAMs comprised of alkane chains of twelve or more methylene
units in contact with an aqueous solution, barring any other influences, is considered to be an
effective solid-liquid interface.54b
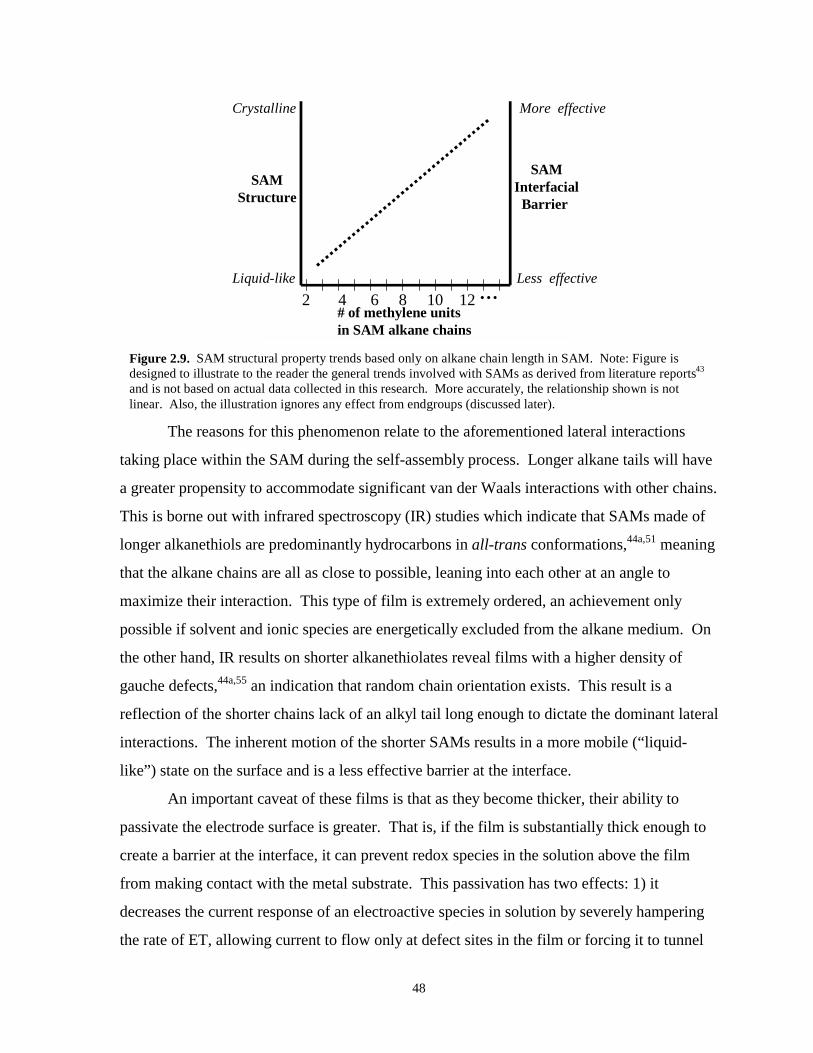
48
2 4 6 8 10 12 … # of methylene unitsin SAM alkane chains
SAMInterfacial
Barrier
SAMStructure
Crystalline
Liquid-like
More effective
Less effective
Figure 2.9. SAM structural property trends based only on alkane chain length in SAM. Note: Figure isdesigned to illustrate to the reader the general trends involved with SAMs as derived from literature reports43
and is not based on actual data collected in this research. More accurately, the relationship shown is notlinear. Also, the illustration ignores any effect from endgroups (discussed later).
The reasons for this phenomenon relate to the aforementioned lateral interactions
taking place within the SAM during the self-assembly process. Longer alkane tails will have
a greater propensity to accommodate significant van der Waals interactions with other chains.
This is borne out with infrared spectroscopy (IR) studies which indicate that SAMs made of
longer alkanethiols are predominantly hydrocarbons in all-trans conformations,44a,51 meaning
that the alkane chains are all as close to possible, leaning into each other at an angle to
maximize their interaction. This type of film is extremely ordered, an achievement only
possible if solvent and ionic species are energetically excluded from the alkane medium. On
the other hand, IR results on shorter alkanethiolates reveal films with a higher density of
gauche defects,44a,55 an indication that random chain orientation exists. This result is a
reflection of the shorter chains lack of an alkyl tail long enough to dictate the dominant lateral
interactions. The inherent motion of the shorter SAMs results in a more mobile (“liquid-
like”) state on the surface and is a less effective barrier at the interface.
An important caveat of these films is that as they become thicker, their ability to
passivate the electrode surface is greater. That is, if the film is substantially thick enough to
create a barrier at the interface, it can prevent redox species in the solution above the film
from making contact with the metal substrate. This passivation has two effects: 1) it
decreases the current response of an electroactive species in solution by severely hampering
the rate of ET, allowing current to flow only at defect sites in the film or forcing it to tunnel
49
through the hydrocarbon layer51 and 2) it decreases the background signal or charging current
of the electrode.43 The first effect is the reason that SAM research is at the heart of many
corrosion studies,56 effectively “protecting” metal surfaces from chemical attack. Many
scientist use redox active molecules in solution to detect the presence of defect sites in the
SAMs. This is a popular way of studying SAM structure and is called redox probing of
SAMs.57 The second effect, involving charging current, is brought into focus later in this
chapter. While chain length provides a definite variable that controls SAM structure, the
endgroups of the SAM can be extremely influential on the overall properties of the SAM.
2.5.4. SAM Endgroups (Terminal Groups)
The terminal group or endgroup of the SAM is probably the most important
component of a SAM, primarily because it is the component that is exposed on the surface.
Up to this point in the discussion, it has been assumed that the endgroups of the SAM were
simply methyl groups. There are however, many other possibilities. Numerous synthetic
manipulations of alkanethiolates allow for SAMs to be created with a variety of terminal
groups. These functionalities can alter the packing order, as well as the hydrophobicity and,
in some cases, the charge density of the SAM/solution interface. Thiols manipulated for
SAM purposes are often referred to as ω-substituted alkanethiolates. Examples of common
ω-substituted alkanethiols include molecules that have been terminated with methyl, hydoxyl,
carboxyl, amine, fluoronated hydrocarbons and cyano functional groups. SAMs with more
exotic endgroups, such as succinnate,54b or electroactive moieties, such as ferrocene,58 have
also been used. Instead of composed of only ω-substituted alkanethiols, aromatic based
SAMs have also been explored.57a,b The variety of ω-substituted alkanethiols utilized in
SAM studies is staggering, but for the purposes of this dissertation, this discussion will limit
itself to some of the more common, nonelectroactive functional groups just mentioned (-CH3,
CF3, -OH, -COOH, -CN, etc.).
There have been many research studies based on the characterization of SAMs with
different terminal functional groups. Ellipsometry, CAG, IR spectroscopy, XPS, and
electrochemical redox probing and capacitance measurements have all been employed at one
time or another to delineate specific SAM properties related to different endgroups.43,51,59
The following discussion attempts to summarize the major conclusions from these various
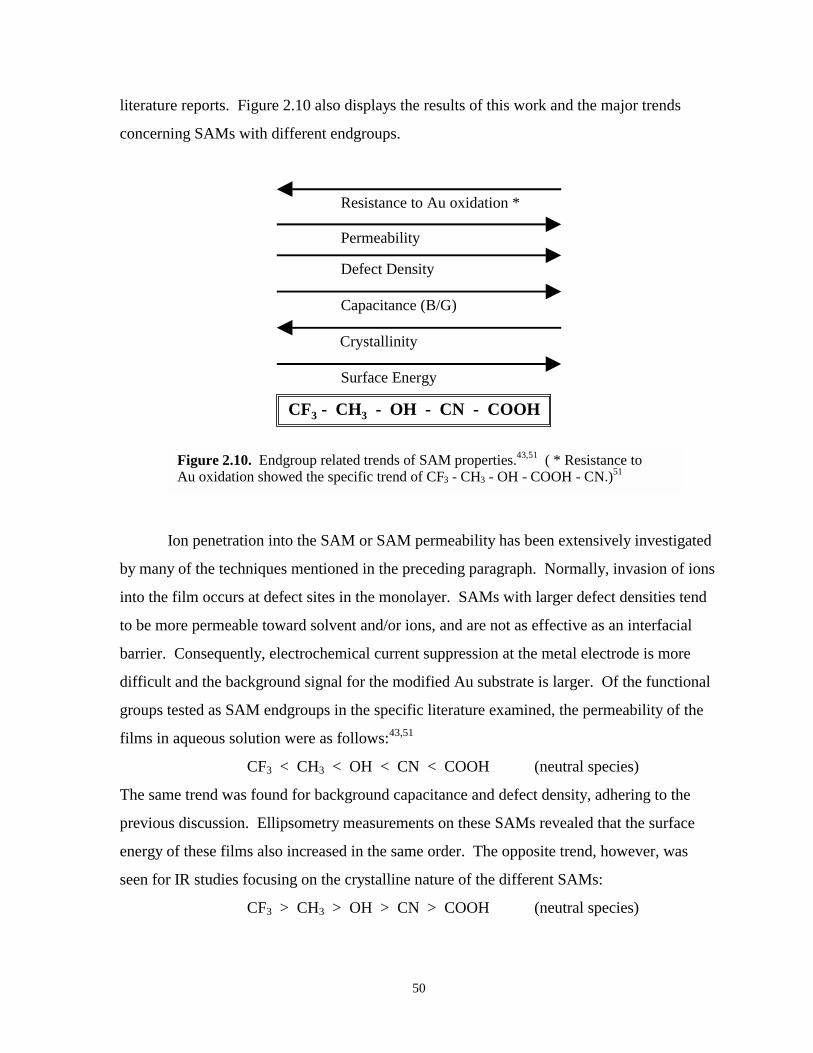
50
literature reports. Figure 2.10 also displays the results of this work and the major trends
concerning SAMs with different endgroups.
CF3 - CH3 - OH - CN - COOH
Surface Energy
Crystallinity
Capacitance (B/G)
Defect Density
Permeability
Resistance to Au oxidation *
Figure 2.10. Endgroup related trends of SAM properties.43,51 ( * Resistance toAu oxidation showed the specific trend of CF3 - CH3 - OH - COOH - CN.)51
Ion penetration into the SAM or SAM permeability has been extensively investigated
by many of the techniques mentioned in the preceding paragraph. Normally, invasion of ions
into the film occurs at defect sites in the monolayer. SAMs with larger defect densities tend
to be more permeable toward solvent and/or ions, and are not as effective as an interfacial
barrier. Consequently, electrochemical current suppression at the metal electrode is more
difficult and the background signal for the modified Au substrate is larger. Of the functional
groups tested as SAM endgroups in the specific literature examined, the permeability of the
films in aqueous solution were as follows:43,51
CF3 < CH3 < OH < CN < COOH (neutral species)
The same trend was found for background capacitance and defect density, adhering to the
previous discussion. Ellipsometry measurements on these SAMs revealed that the surface
energy of these films also increased in the same order. The opposite trend, however, was
seen for IR studies focusing on the crystalline nature of the different SAMs:
CF3 > CH3 > OH > CN > COOH (neutral species)
51
From these trends one can derive that ion penetration is not highly dependent on the
wetting properties (hydrophobicity) of the SAMs. Instead, it appears that the barrier
properties of the SAM are impacted more by the crystallinity and packing order of the
hydrocarbon portion of the film. This conclusion is drawn because the hydrophobic cyano
terminated SAMs fall in the trends between the alcohol and carboxylic acid terminated
SAMs, whose wettabilities are both very hydrophillic. Thus, these trends suggest that the
terminal can exert influence on the packing order and density of the SAM.43
A common procedure for testing the stability of a SAM modifying a Au substrate is to
electrochemically measure the film’s ability to inhibit Au oxidation.43,51 For the Au surface
to be oxidized, electrolyte solution must physically penetrate the SAM and contact the metal
surface.43 On a well formed SAM, this type of penetration usually occurs only at pinholes
and defect sites in the SAM. Therefore, the extent to which a SAM passivates the Au
oxidation process can be used as a measure of SAM structure and stability. The ability of the
different terminated SAMs to block the oxidation of Au was as follows:51
CF3 > CH3 > OH > COOH > CN
According to all of these observed trends, SAMs composed of fluorinated
alkanethiolates provide the best barrier properties and have superior overall stability. This
observation is corroborated by both IR and contact angle results on fluorinated films which
show an extremely crystalline structure coupled with very little tilt angle. Alcohol and
methyl terminated SAMs, in comparison, also have a high degree of crystallinity but possess
much more significant tilt angle in the packed chains. Nitrile SAMs have crystalline packing
to a degree but suffer from several complications that alter these SAM’s stability. The nitrile
terminated SAMs exhibited very sporadic wetting characteristics and very poor
electrochemical properties concerning the inhibition of Au oxidation and redox probing. It is
believed that these cyano based SAMs may undergo significant rearrangement when in
contact with aqueous solution and that measurements made on these films are severely
impacted by variable chain conformations inherent in these particular SAMs.51
Clearly, the ω-substituted alkanethiol based SAM with the worst blocking
characteristics is the carboxylic acid terminated SAM. All measurements made on the acid
terminated films revealed a very liquid-like structure and a very porous barrier property with
52
regard to electrolyte ions and solvent. Data collected for the COOH SAMs suggests that the
mere presence of the carboxyl group may actually disrupt the alkane packing of the SAM,
thereby severely hampering its ability to act as a barrier. The acid group at the interface of
the SAM effectively negates the lateral interactions of several methylene units. Therefore, to
achieve the same blocking characteristics as SAMs terminated with other functional groups,
carboxylic acid terminated SAMs require a significant increase in the number of methylene
units in their alkane chains. It is believed that a with long enough chains, carboxylic acid
terminated SAMs can be created that are more impermeable.51
It should be noted that if the tail groups are charged species, the situation changes.
Introducing charged groups as endgroups will have the same effect as ions penetrating the
SAM interface and decrease the SAM’s effective hydrocarbon thickness. Furthermore, the
influence of the endgroups can be altered by the solvent being used. All of the previous
comparisons were done in aqueous solution where hydrophillic endgroups will be more
susceptible to invasion of both solvent and supporting electrolyte ions.51 Likewise,
hydrophobic terminated SAMs will provide a much greater barrier toward permeation in
aqueous solutions, but will be less effective at the task in organic, nonpolar solvents. This
type of solvent can literally intermix with the hydrophobic SAM and loosen the chain
packing making it more vulnerable to ions in the solvent.60 Manipulating the compositions of
solvent mixtures by varying the percentages of organic and aqueous phases has been used to
study SAM structure.50
It has been proposed that the size of the endgroups plays a role in the spacing of the
alkane chains of a SAM.51,61 Consider, for example, the bulky functional group of a
carboxylic acid (COOH). The analogy has been made that a carboxylic acid terminated SAM
is like having beach balls on a beach of pebbles, where the acid groups are represented by the
balls and the Au atoms of the substrate are the pebbles on the beach.54b To a molecule in
solution, the surface of the SAM is dominated by the properties of the bulky endgroups. The
idea is that the endgroup-endgroup interactions, which can range from steric/electrostatic
repulsions to hydrogen bonding, are vital to the packing structure of the SAM. Even
SAM/solvent interactions, such as H-bonding between water molecules and the carboxylic
acid endgroups, can alter the properties of the SAM/solution interface. These interactions
53
can instigate different levels of order/disorder and, as previously mentioned, alter the inherent
tilt angle of the SAM chains. Hydrogen bonding among both alcohol and acid terminated
SAMs has recently been reported as a stabilizing influence on SAMs.62,59b
The ability to alter both the terminal group of the SAM and the length of the alkane
chains, thereby changing the very structural nature and interfacial properties of the film,
allows for enormous versatility in designing SAMs with tailored surfaces and specific
purposes. To summarize, the ability of molecules to form a compact and subsequently stable
SAM is dependent on three factors: 1) the strength of the binding between the headgroup and
substrate; 2) the interactive forces at work between adsorbed molecules forming the SAM
and; 3) the interaction of the molecules terminal groups with each other and with the
surrounding environment. A stable SAM will maximize all of these interactions59b,c and, as a
result, create a useful surface for a wide range of chemical applications.
2.5.5. SAM Applications
SAMs have found widespread use in a variety of applications due to their unique
properties and the relative ease with which their structural and topographical characteristics
can by altered. The insulating nature of alkanethiolates on metals make them resistive to
chemical attack, a protective coating on the surface they modify. Thus, SAMs are a used in
many corrosion related studies.56 This property of SAMs has also encouraged their use in
electrochemistry where alkanethiolate modified electrodes have a drastically reduced
magnitude of charging current, allowing for an accentuation of the electroanalytical signal.43
Furthermore, SAMs have been applied to nanotechnology research, both as a coating for
molecular electrical components,63 and as a template for well defined scanning probe
microscopy (SPM) experiments.64 On a larger scale, the ability of a SAM to quickly and
effectively coat a large area of substrate in a very specific nature, has captured the interests of
scientists studying adhesion and lubrication.54a,65 Perhaps, however, the greatest application
of SAMs resides in their ability to provide a manageable surface that can easily withstand
physiological conditions, making them attractive surfaces for bioanalytical and
biocompatability research.66
Indeed, SAMs offer exciting possibilities for both chemical sensors and biological
studies. The use of SAMs as a primary component in biosensors is already the target of many
54
researchers.4,49a,b The ability to alter the functionality at the SAM/solution interface
introduces a level of controlled selectivity to any potential sensing surface, a much desired
quality in such devices. Additionally, SAM technology can be employed in biological
models to help simulate biological entities like the lipid bilayers of cell walls.67 Because
SAMs can be specifically functionalized at their outer surface, where electron
donor/acceptors can be directly attached, SAMs are used in the construction of novel ET
models4,51 and as platforms for specific interactions with proteins.68 It is in this capacity that
SAMs are a major part of the research effort in the Bowden Group.
2.5.6. Cyt c / COOH SAM / Au System (Bowden Research)
As previously noted, carboxylic acid terminated SAMs are utilized in the biological
ET model being investigated. Carboxylic acid terminated SAMs are anchored to the Au
surface via Au-S bonds with their alkyl chains and their acid terminus extending out into
solution. As with other SAMs terminated with a single functionality, longer alkyl chains
yield more organized alkane packing and subsequent improved SAM stability. However, as
alluded to previously, COOH terminated SAMs are one of the most permeable films in
aqueous solution, possessing a higher density of defects than other SAMs.43 Their use in this
case stems from the fact that the carboxylic acid groups, depending on the pH of the
environment, can be largely unprotonated, creating a negatively charged surface. This acidic
surface is ideal for the immobilization and subsequent ET study of such basic proteins as cyt
c.
In the early 1990s, Bowden and researchers first reported the successful use of
carboxylic acid terminated SAMs on Au substrates as a binding partner for the cytochrome c
protein.36c Since that time, extensive characterization of the cyt c / SAM (COOH) / Au
system has been performed using both electrochemical and spectroscopic (electrochemical
impedance spectroscopy (EIS) and XPS) methods. Subsequent studies have employed the
same methodology on the system for specific kinetic and thermodynamic analysis of the
system’s biological ET.25-27d,36a,37,69 In recent years, research by the Bowden Group has
focused on defining specific interfacial aspects of the system, such as the electronic coupling
between the protein and SAM,36b and on examining the inherent surface effects observed in
electrochemical results.32,70
55
The acid/base properties of the carboxylic acid SAMs obviously are a major factor in
the model. Most of the electrochemistry performed on the cytochrome system is performed
at a physiological pH of 7. At this pH value, the acid groups are largely unprotonated,
facilitating the electrostatic adsorption of positively charged species. Research into the
acid/base properties of these SAMs has shown that the carboxylic acids, which normally have
a pKa value of 4-5, exhibit a considerably more basic surface pKa in the SAM. Values from
these reports show the range of the surface pKa to be between 6-8.71 Results from
electrochemical experiments on acid terminated SAMs show their background signal is
noticeably higher when they are in a neutral or basic environment.51 This reiterates that
electrostatic repulsions between negatively charged headgroups may indeed play an important
role in the packing of the SAMs and reinforces the thought that, in acidic solutions, hydrogen
bonding may be a factor. In any event, the cyt / SAM / Au electron transfer model represents
an excellent example of how SAMs interact favorably with certain proteins and, on a broader
scale, how SAMs can be tailored for specific scientific endeavors.
2.6 ELECTROCHEMISTRY – VOLTAMMETRY OF ADSORBED SPECIES
More relevant to the research in the Bowden research group and to the work presented
here, is the electrochemistry of adsorbed systems. Cyclic voltammetry on adsorbed
molecules is an example of diffusionless electrochemistry. An electroactive molecule is
considered adsorbed when it is immobilized on the electrode surface, either directly or
through some type of modifier such as a SAM. Compared to diffusing voltammetry, the
voltammograms of adsorbed systems are distinctive because of their specific peak shape.
Since the diffusional aspect of the electrochemistry is eliminated from adsorbed systems, the
response is a curve where the current proceeds back to the baseline after peaking. In an
ideally adsorbed system, both the oxidative and reductive peaks are usually symmetrical and
positioned directly on top of each other. That is, for an ideal, reversible (Nernstian) adsorbed
response, Ep,a = Ep,c = Ep. The cyclic voltammogram of an adsorbed molecule is illustrated
in Figure 2.11.
The adsorbed system, being fundamentally different than the typical diffusing
electrochemical situation, possesses its own set of equations pertaining to peak current and
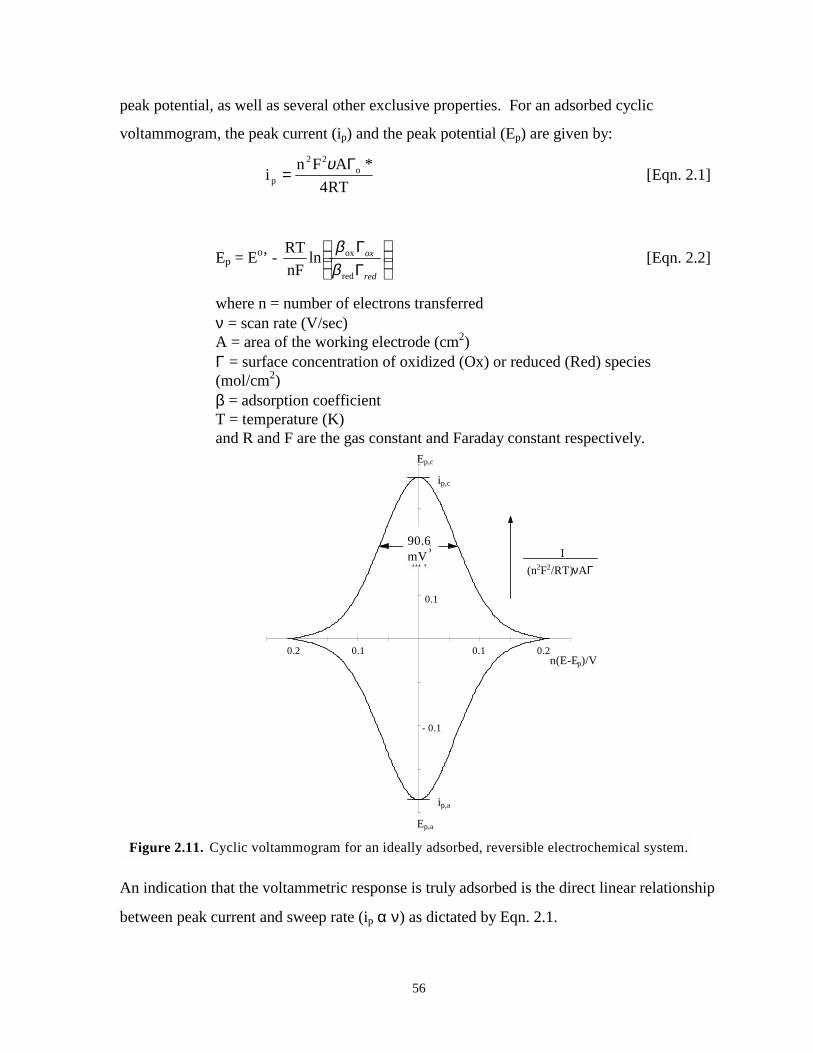
56
peak potential, as well as several other exclusive properties. For an adsorbed cyclic
voltammogram, the peak current (ip) and the peak potential (Ep) are given by:
RT4*AFn
i o22
pΓ
=υ
[Eqn. 2.1]
Ep = Eo’ -
ΓΓ
red
ox
red
oxlnnFRT
ββ
[Eqn. 2.2]
where n = number of electrons transferredν = scan rate (V/sec)A = area of the working electrode (cm2)Γ = surface concentration of oxidized (Ox) or reduced (Red) species(mol/cm2)β = adsorption coefficientT = temperature (K)and R and F are the gas constant and Faraday constant respectively.
0.1 0.20.10.2n(E-Ep)/V
0.1
90.6mV
- 0.1
I(n2F2/RT)νAΓ
Ep,c
ip,c
Ep,a
ip,a
90.6mV
Figure 2.11. Cyclic voltammogram for an ideally adsorbed, reversible electrochemical system.
An indication that the voltammetric response is truly adsorbed is the direct linear relationship
between peak current and sweep rate (ip α ν) as dictated by Eqn. 2.1.
57
The formal potential of an adsorbed molecule is defined as the surface formal potential
(Eo’surf ) and is given by the following:
Eo’surf = 2
EE cp,ap, +[Eqn. 2.3]
For the purposes of this dissertation Eo’surf will be referred to as simply Eo’.
Another electrochemical parameter typically used in the analysis of adsorbed
voltammetry is the full width at half maximum (FWHM) value, essentially a measure of the
breadth of the cathodic and anodic voltammetric peaks (See Figure 2.11). For an ideal,
reversible adsorbed system, the FWHM value for either peak should be approximately 90.6/n
mV or 62.5/α mV for an irreversible process at 25°C (where α is the transfer coefficient).73
The FWHM parameter of adsorbed cyclic voltammograms will be of extreme importance to
understanding the reasoning for performing the research presented in future chapters.
The charge (Q) passed during a cathodic or anodic wave of a cyclic voltammetry
experiment is a useful parameter for an adsorbed system. The area under a voltammetric
peak, once corrected for charging current, can be integrated to obtain a measurement of the
charge passed during an oxidation or reduction:
∫ (area under peak) = charge passed during redox process [Eqn. 2.4]
This charge, measured in coulombs, corresponds to the redox activity of a layer of adsorbed
electroactive molecules according to the following equation:
Q = nFAΓsurf [Eqn. 2.5]
where: n = number of electrons transferred,F = Faraday constantA = area of the working electrodeΓsurf = the surface coverage of electroactive molecules(mol/cm2).
Therefore, by using the above expression, a measurement of the surface concentration or
surface coverage of electroactive molecules can be derived.
2.6.1. Laviron’s Kinetics of Adsorbed Species
In general, the rate of ET for an adsorbed species is much greater than the rate of the
same species in solution.28 Moreover, because of the adsorbed nature of the analyte,
traditional kinetic analysis is unsatisfactory, requiring an alternative method for extracting
kinetic information. To calculate the ET rate constant (keto) of adsorbed species, a model
58
based on CV and Butler-Volmer kinetics was developed by Laviron.1,73 Using Laviron’s
simplest model for an adsorbed system, a mathematical expression is derived capable of
measuring keto at zero overpotential. Laviron incorporated several important assumptions
into his model: 1) both the oxidized and reduced forms of the electroactive species are
inherently stable and are strongly adsorbed to the electrode; 2) the system under consideration
is completely diffusionless, and therefore diffusional aspects of the molecules can be
excluded from the mathematical expression; and 3) the system obeys a Langmuir adsorption
isotherm. An adsorption isotherm is a predicted relationship that exists between the amount
of an adsorbed substance on a surface and its pressure or concentration at a constant
temperature.74 A chemical system adhering to a Langmuir isotherm assumes that there are no
lateral interactions between the adsorbed species, that the surface of the electrode is
completely homogeneous with no topographical structure (smooth), and that surface
saturation eventually occurs, resulting in a monolayer coverage of highly active, adsorbed
molecules. Laviron’s mathematical representation of keto is based on peak splitting (∆Ep)
and, for irreversible CV responses (where ∆Ep ≥ 200 mV), is calculated with the following
expression:
log keto = αlog(1-α) + (1-α)logα -
RT3.2EnF)1((
nFRTlog p∆−
−
αα
υ [Eqn. 2.6]
where: keto = electron transfer rate constant (sec-1),
α = transfer coefficient,T = temperature (K),ν = scan rate (mV/sec),n = number of electrons transferred,∆Ep = peak splitting between the anodic andcathodic peak potentials (mV)and R and F are the gas constant and Faraday constant, respectively.
To change the CV signal of a reversible adsorbed species so that its ∆Ep is ≥ 200 mV,
allowing the use of the above equation, the voltammetry is run at continually higher sweep
rates to increase the degree of peak splitting. This type of ET rate constant is known as the
irreversible ET rate constant but, unless otherwise denoted, will be simply referred to as keto.
The transfer coefficient (α) may also be calculated with this method by creating a
Tafel plot of the data, a plot of peak potential (Ep) versus the log of the scan rate (log ν).73
59
Theoretically, this plot should yield two straight lines with slopes equal to the following
expressions:
nF RT3.2
α− for the cathodic peak, [Eqn. 2.7]
)nF 1(RT3.2
α−− for the anodic peak, [Eqn. 2.8]
allowing a value for α to be calculated.
As stated previously, the preceding kinetic analysis is only applicable to an
irreversible response (∆Ep ≥ 200 mV), but Laviron’s model can also be applied to quasi-
reversible voltammetry (∆Ep < 200 mV) via a curve fitting algorithm.31b Unlike the
irreversible case, the quasi-reversible model does not provide for an independent
measurement of α. Therefore, when this algorithm is employed to determine keto, α is
assumed to be a value close to 0.5.73 Unless specifically noted, the kinetic analysis of this
research was performed according to the irreversible model. In situations where the quasi-
reversible model was used, the ET rate constant will be denoted as koet(Q/R). Laviron’s models
can also be applied, under certain restrictions, to linear sweep voltammetry, thin-layer
voltammetry, and coulometry.75
2.7 DOUBLE LAYER THEORY AND CAPACITANCE
A substantial part of the research contained herein will deal with the concept of
double layer capacitance as it relates to electrochemical systems and therefore a somewhat
detailed discussion of this property is warranted. Capacitance measurements are used in this
research as background quality checks, an experimental marker for the systematic progress of
an experiment, and also as an analytical measurement to learn about surface structure of the
system.
2.7.1. The Double Layer
When an electrode is placed in a solution of electrolyte and a voltage is applied to it,
the electrode will bear either a positive or negative charge, depending on the polarization of
the voltage applied to the electrode. For instance, if a negative potential is applied to the
electrode, it will have an excess negative charge at its surface. To maintain electroneutrality
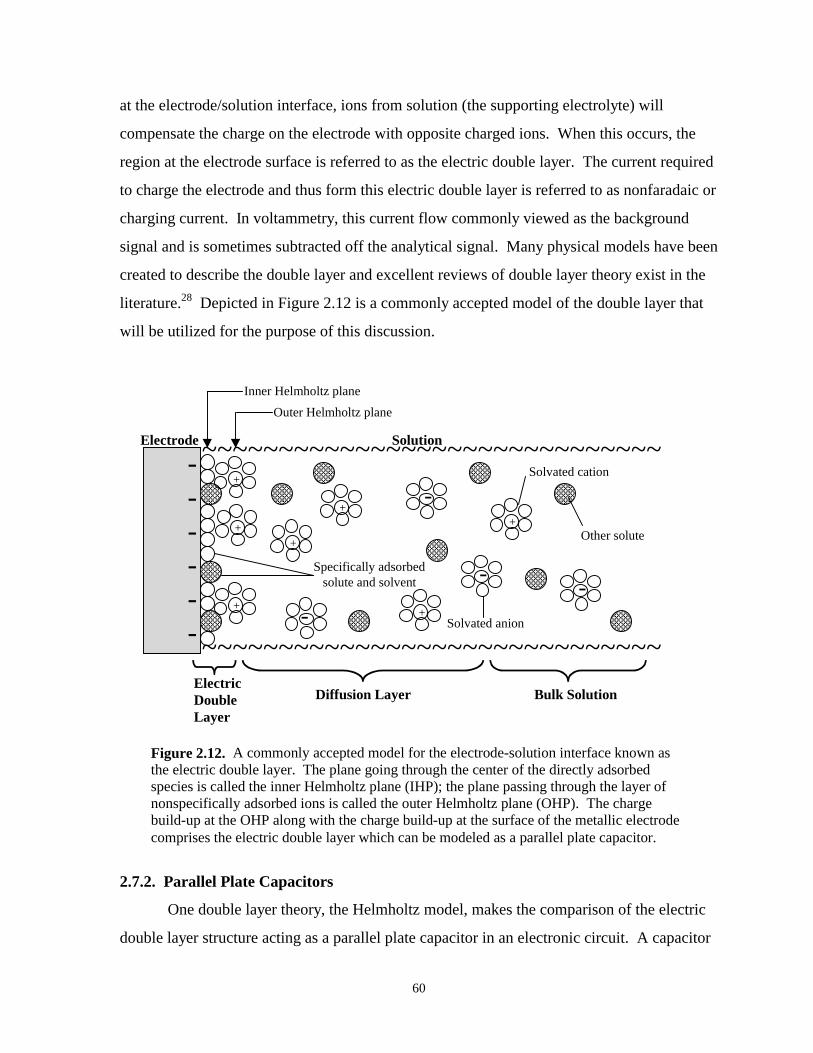
60
at the electrode/solution interface, ions from solution (the supporting electrolyte) will
compensate the charge on the electrode with opposite charged ions. When this occurs, the
region at the electrode surface is referred to as the electric double layer. The current required
to charge the electrode and thus form this electric double layer is referred to as nonfaradaic or
charging current. In voltammetry, this current flow commonly viewed as the background
signal and is sometimes subtracted off the analytical signal. Many physical models have been
created to describe the double layer and excellent reviews of double layer theory exist in the
literature.28 Depicted in Figure 2.12 is a commonly accepted model of the double layer that
will be utilized for the purpose of this discussion.
------
���������������������������������
+
���������������������������������
���������������������������������
����������������������
����������������������
������������������������
+
+
+
+
+-
-
+
����������������������
������������������������ ����������
��������������������
~~~~~~~~~~~~~~~~~~~~~~~~~~~~~~
~~~~~~~~~~~~~~~~~~~~~~~~~~~~~~Electrode Solution
Inner Helmholtz planeOuter Helmholtz plane
ElectricDouble Layer
Diffusion Layer Bulk Solution
Other solute
Solvated cation
Solvated anion
- -Specifically adsorbed
solute and solvent
������������������������
������������������
Figure 2.12. A commonly accepted model for the electrode-solution interface known asthe electric double layer. The plane going through the center of the directly adsorbedspecies is called the inner Helmholtz plane (IHP); the plane passing through the layer ofnonspecifically adsorbed ions is called the outer Helmholtz plane (OHP). The chargebuild-up at the OHP along with the charge build-up at the surface of the metallic electrodecomprises the electric double layer which can be modeled as a parallel plate capacitor.
2.7.2. Parallel Plate Capacitors
One double layer theory, the Helmholtz model, makes the comparison of the electric
double layer structure acting as a parallel plate capacitor in an electronic circuit. A capacitor
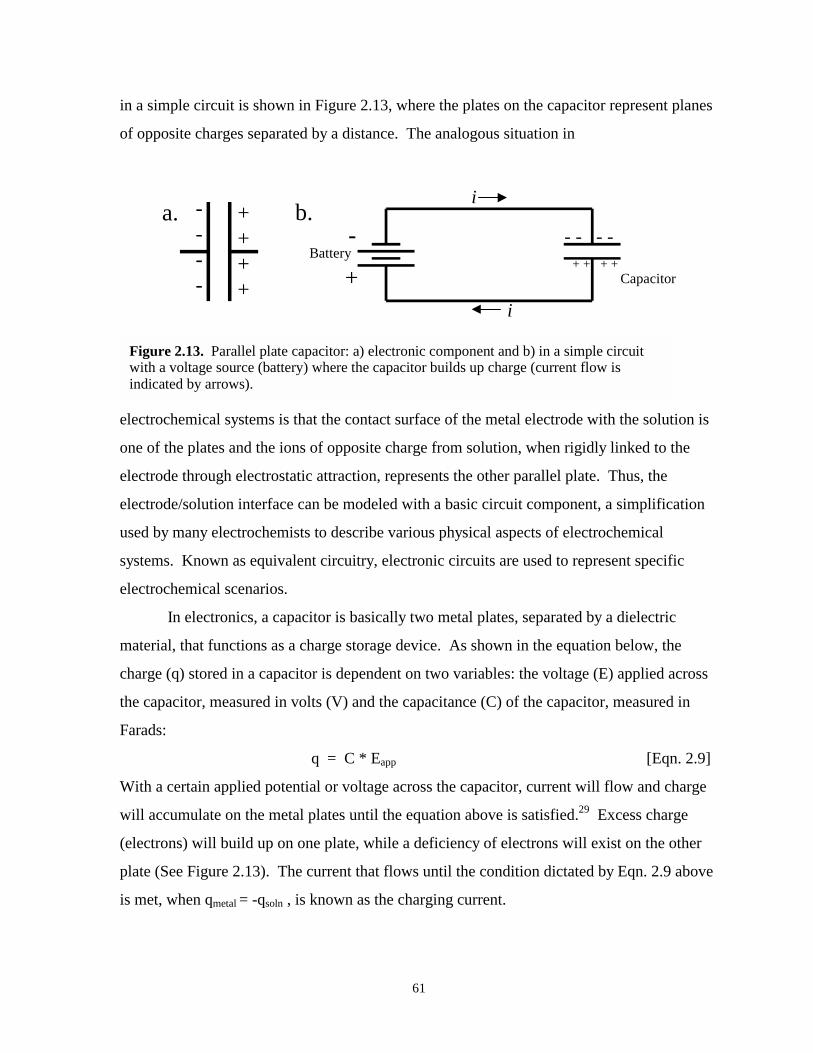
61
in a simple circuit is shown in Figure 2.13, where the plates on the capacitor represent planes
of opposite charges separated by a distance. The analogous situation in
----
++++
b.a.
+
-Battery
Capacitor
- - - -+ + + +
i
i
Figure 2.13. Parallel plate capacitor: a) electronic component and b) in a simple circuitwith a voltage source (battery) where the capacitor builds up charge (current flow isindicated by arrows).
electrochemical systems is that the contact surface of the metal electrode with the solution is
one of the plates and the ions of opposite charge from solution, when rigidly linked to the
electrode through electrostatic attraction, represents the other parallel plate. Thus, the
electrode/solution interface can be modeled with a basic circuit component, a simplification
used by many electrochemists to describe various physical aspects of electrochemical
systems. Known as equivalent circuitry, electronic circuits are used to represent specific
electrochemical scenarios.
In electronics, a capacitor is basically two metal plates, separated by a dielectric
material, that functions as a charge storage device. As shown in the equation below, the
charge (q) stored in a capacitor is dependent on two variables: the voltage (E) applied across
the capacitor, measured in volts (V) and the capacitance (C) of the capacitor, measured in
Farads:
q = C * Eapp [Eqn. 2.9]
With a certain applied potential or voltage across the capacitor, current will flow and charge
will accumulate on the metal plates until the equation above is satisfied.29 Excess charge
(electrons) will build up on one plate, while a deficiency of electrons will exist on the other
plate (See Figure 2.13). The current that flows until the condition dictated by Eqn. 2.9 above
is met, when qmetal = -qsoln , is known as the charging current.
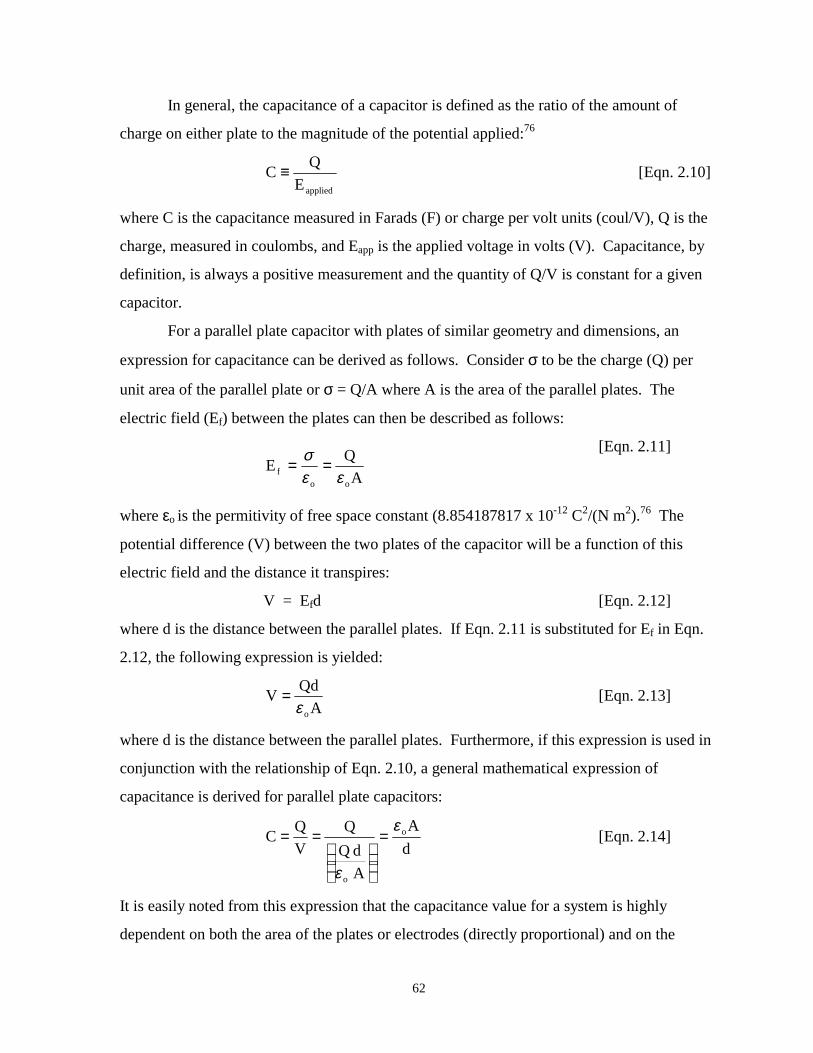
62
In general, the capacitance of a capacitor is defined as the ratio of the amount of
charge on either plate to the magnitude of the potential applied:76
appliedEQC ≡ [Eqn. 2.10]
where C is the capacitance measured in Farads (F) or charge per volt units (coul/V), Q is the
charge, measured in coulombs, and Eapp is the applied voltage in volts (V). Capacitance, by
definition, is always a positive measurement and the quantity of Q/V is constant for a given
capacitor.
For a parallel plate capacitor with plates of similar geometry and dimensions, an
expression for capacitance can be derived as follows. Consider σ to be the charge (Q) per
unit area of the parallel plate or σ = Q/A where A is the area of the parallel plates. The
electric field (Ef) between the plates can then be described as follows:
AQEoo
f εεσ ==
[Eqn. 2.11]
where εo is the permitivity of free space constant (8.854187817 x 10⁻¹² C2/(N m2).76 The
potential difference (V) between the two plates of the capacitor will be a function of this
electric field and the distance it transpires:
V = Efd [Eqn. 2.12]
where d is the distance between the parallel plates. If Eqn. 2.11 is substituted for Ef in Eqn.
2.12, the following expression is yielded:
AQdV
oε= [Eqn. 2.13]
where d is the distance between the parallel plates. Furthermore, if this expression is used in
conjunction with the relationship of Eqn. 2.10, a general mathematical expression of
capacitance is derived for parallel plate capacitors:
dA
A d Q
QVQC o
o
ε
ε
=
== [Eqn. 2.14]
It is easily noted from this expression that the capacitance value for a system is highly
dependent on both the area of the plates or electrodes (directly proportional) and on the
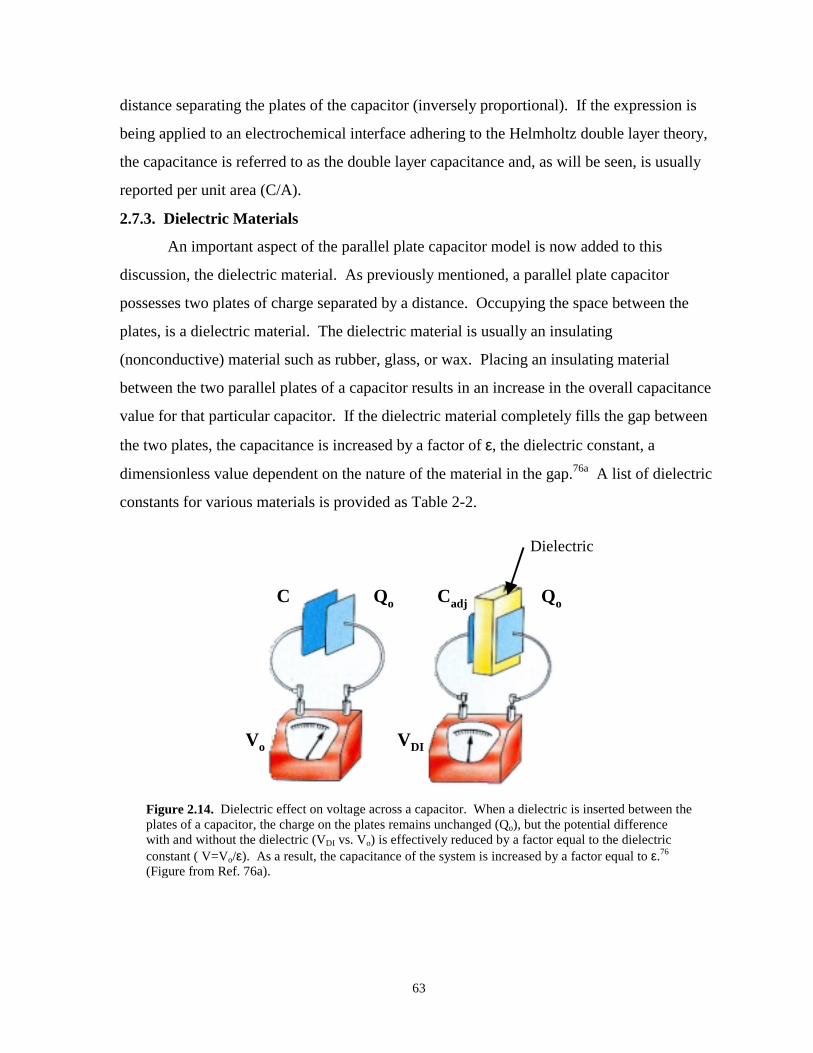
63
distance separating the plates of the capacitor (inversely proportional). If the expression is
being applied to an electrochemical interface adhering to the Helmholtz double layer theory,
the capacitance is referred to as the double layer capacitance and, as will be seen, is usually
reported per unit area (C/A).
2.7.3. Dielectric Materials
An important aspect of the parallel plate capacitor model is now added to this
discussion, the dielectric material. As previously mentioned, a parallel plate capacitor
possesses two plates of charge separated by a distance. Occupying the space between the
plates, is a dielectric material. The dielectric material is usually an insulating
(nonconductive) material such as rubber, glass, or wax. Placing an insulating material
between the two parallel plates of a capacitor results in an increase in the overall capacitance
value for that particular capacitor. If the dielectric material completely fills the gap between
the two plates, the capacitance is increased by a factor of ε, the dielectric constant, a
dimensionless value dependent on the nature of the material in the gap.76a A list of dielectric
constants for various materials is provided as Table 2-2.
Dielectric
C CadjQo Qo
Vo VDI
Figure 2.14. Dielectric effect on voltage across a capacitor. When a dielectric is inserted between theplates of a capacitor, the charge on the plates remains unchanged (Qo), but the potential differencewith and without the dielectric (VDI vs. Vo) is effectively reduced by a factor equal to the dielectricconstant ( V=Vo/ε). As a result, the capacitance of the system is increased by a factor equal to ε.76
(Figure from Ref. 76a).
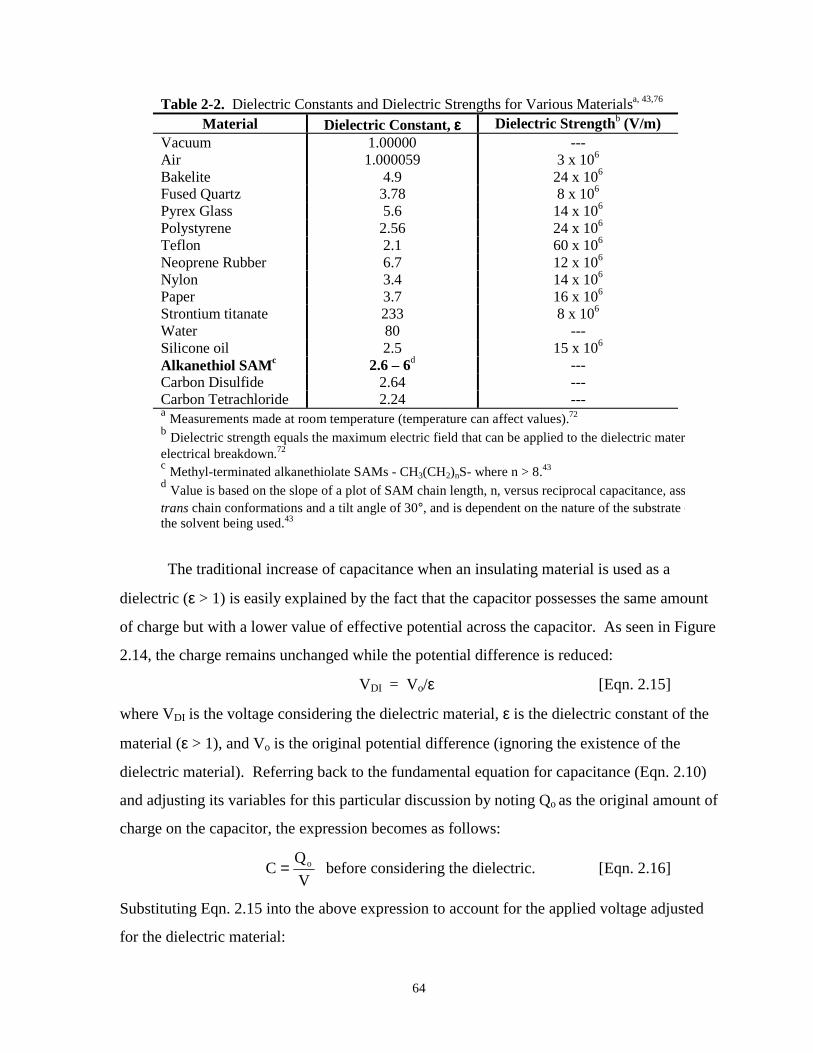
64
Table 2-2. Dielectric Constants and Dielectric Strengths for Various Materialsa, 43,76
Material Dielectric Constant, εεεε Dielectric Strengthb (V/m)Vacuum 1.00000 ---Air 1.000059 3 x 10⁶
Bakelite 4.9 24 x 106
Fused Quartz 3.78 8 x 10⁶
Pyrex Glass 5.6 14 x 106
Polystyrene 2.56 24 x 106
Teflon 2.1 60 x 106
Neoprene Rubber 6.7 12 x 106
Nylon 3.4 14 x 106
Paper 3.7 16 x 106
Strontium titanate 233 8 x 10⁶
Water 80 ---Silicone oil 2.5 15 x 106
Alkanethiol SAMc 2.6 – 6d ---Carbon Disulfide 2.64 ---Carbon Tetrachloride 2.24 ---a Measurements made at room temperature (temperature can affect values).72
b Dielectric strength equals the maximum electric field that can be applied to the dielectric materelectrical breakdown.72
c Methyl-terminated alkanethiolate SAMs - CH3(CH2)nS- where n > 8.43
d Value is based on the slope of a plot of SAM chain length, n, versus reciprocal capacitance, asstrans chain conformations and a tilt angle of 30°, and is dependent on the nature of the substrate (the solvent being used.43
The traditional increase of capacitance when an insulating material is used as a
dielectric (ε > 1) is easily explained by the fact that the capacitor possesses the same amount
of charge but with a lower value of effective potential across the capacitor. As seen in Figure
2.14, the charge remains unchanged while the potential difference is reduced:
VDI = Vo/ε [Eqn. 2.15]
where VDI is the voltage considering the dielectric material, ε is the dielectric constant of the
material (ε > 1), and Vo is the original potential difference (ignoring the existence of the
dielectric material). Referring back to the fundamental equation for capacitance (Eqn. 2.10)
and adjusting its variables for this particular discussion by noting Qo as the original amount of
charge on the capacitor, the expression becomes as follows:
VQ
C o= before considering the dielectric. [Eqn. 2.16]
Substituting Eqn. 2.15 into the above expression to account for the applied voltage adjusted
for the dielectric material:
65
o
o
o
oadj V
QVQ
Cε
ε
=
= [Eqn. 2.17]
for the capacitance of a capacitor containing a dielectric material. Thus, the original
capacitance is effectively increased by a factor equivalent to the dielectric constant (Cadj =
Coε). Therefore, considering Eqn. 2.15 in conjunction with Eqn. 2.13 and its transduction to
Eqn. 2.14, a more comprehensive expression for double layer capacitance that also
incorporates the influence of the dielectric material, can be achieved:29,76a
dA
C oεε= [Eqn. 2.18]
or per unit area as,
dACC oεε
== [Eqn. 2.19]
This is the equation that will be used throughout this work to describe the double layer
capacitance of the electric double layer at the electrode surface.29
From Eqn. 2.19, it would seem that the Cdl could be made very large by simply
decreasing the distance (d) between the plates of the capacitor. In actuality, the lowest value
of d is limited by the dielectric material’s potential to electrically discharge. That is, for a
certain distance between two plates of a capacitor, there is a maximum voltage that can be
applied to the capacitor before the dielectric material ceases to be insulating and begins to
conduct. Once this voltage is surpassed, the dielectric witnesses electrical discharge across
the plates and the capacitor fails. This voltage threshold is known as the dielectric strength of
the material. Several examples of materials and their dielectric strengths are included as part
of Table 2-2.76
Why is the applied electric field reduced by a factor of ε (V = Vo/ε)? To answer this
question, an in depth look at dielectric materials on a molecular level is necessary (See Figure
2.15).76 This phenomenon is most easily understood if one considers that the molecules
composing the dielectric material are polarizable. That is, they can be made so that their
positive and negative charges or regions of electron density, can be separated and aligned in
even the slightest amount. The degree to which the dielectric molecules align is dependent
on the dipole moment of the molecules, as well as, the temperature and magnitude of the
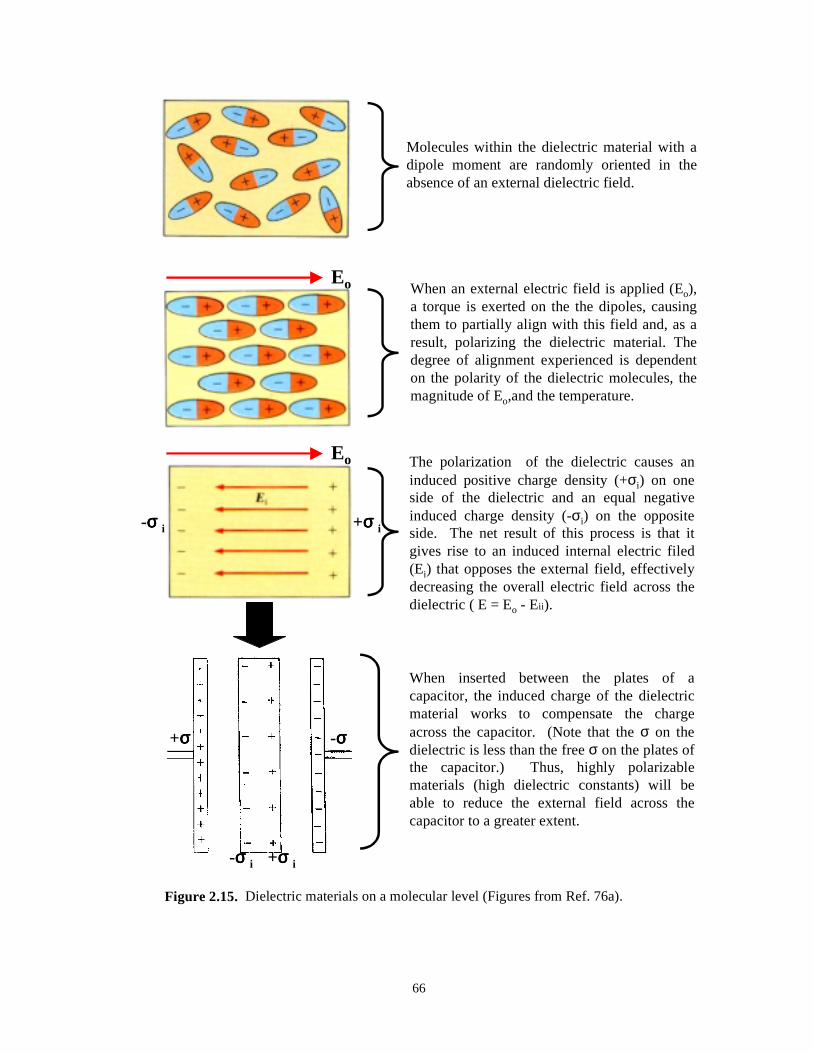
66
Eo
Eo
Molecules within the dielectric material with adipole moment are randomly oriented in theabsence of an external dielectric field.
When an external electric field is applied (Eo),a torque is exerted on the the dipoles, causingthem to partially align with this field and, as aresult, polarizing the dielectric material. Thedegree of alignment experienced is dependenton the polarity of the dielectric molecules, themagnitude of Eo,and the temperature.
-σσσσ i +σσσσ i
The polarization of the dielectric causes aninduced positive charge density (+σi) on oneside of the dielectric and an equal negativeinduced charge density (-σi) on the oppositeside. The net result of this process is that itgives rise to an induced internal electric filed(Ei) that opposes the external field, effectivelydecreasing the overall electric field across thedielectric ( E = Eo - Eii).
+σσσσ -σσσσ
+σσσσ i-σσσσ i
When inserted between the plates of acapacitor, the induced charge of the dielectricmaterial works to compensate the chargeacross the capacitor. (Note that the σ on thedielectric is less than the free σ on the plates ofthe capacitor.) Thus, highly polarizablematerials (high dielectric constants) will beable to reduce the external field across thecapacitor to a greater extent.
Figure 2.15. Dielectric materials on a molecular level (Figures from Ref. 76a).
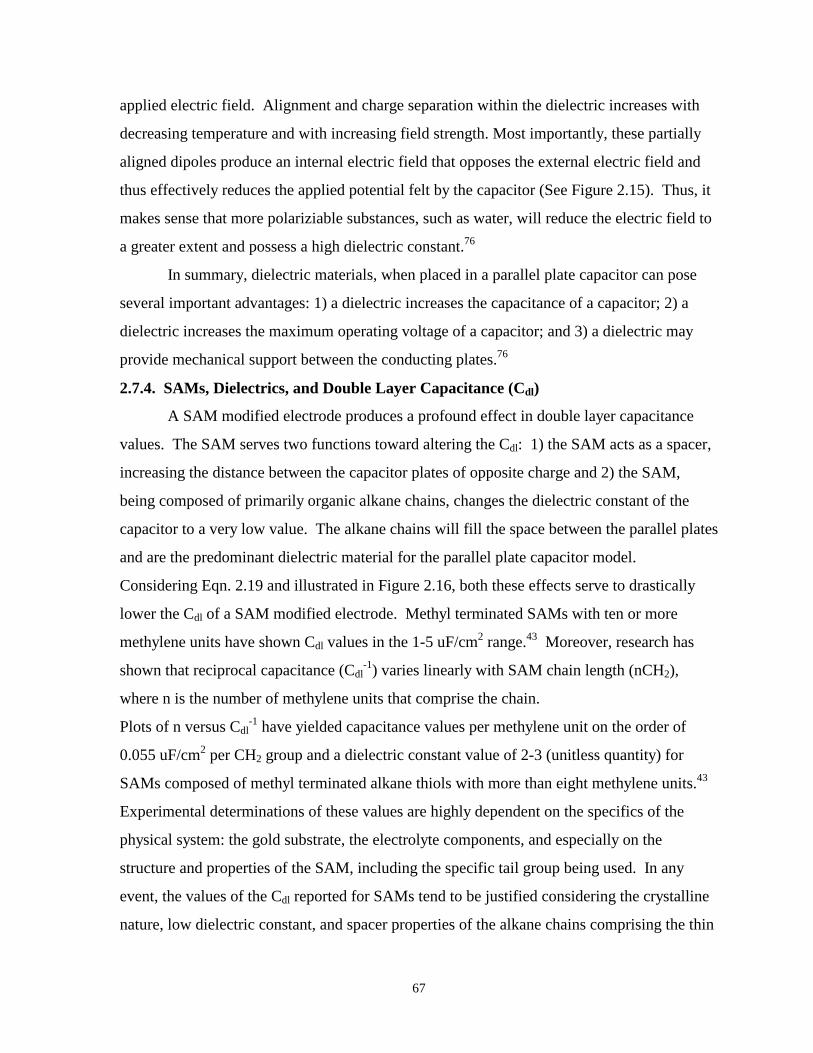
67
applied electric field. Alignment and charge separation within the dielectric increases with
decreasing temperature and with increasing field strength. Most importantly, these partially
aligned dipoles produce an internal electric field that opposes the external electric field and
thus effectively reduces the applied potential felt by the capacitor (See Figure 2.15). Thus, it
makes sense that more polariziable substances, such as water, will reduce the electric field to
a greater extent and possess a high dielectric constant.76
In summary, dielectric materials, when placed in a parallel plate capacitor can pose
several important advantages: 1) a dielectric increases the capacitance of a capacitor; 2) a
dielectric increases the maximum operating voltage of a capacitor; and 3) a dielectric may
provide mechanical support between the conducting plates.76
2.7.4. SAMs, Dielectrics, and Double Layer Capacitance (Cdl)
A SAM modified electrode produces a profound effect in double layer capacitance
values. The SAM serves two functions toward altering the Cdl: 1) the SAM acts as a spacer,
increasing the distance between the capacitor plates of opposite charge and 2) the SAM,
being composed of primarily organic alkane chains, changes the dielectric constant of the
capacitor to a very low value. The alkane chains will fill the space between the parallel plates
and are the predominant dielectric material for the parallel plate capacitor model.
Considering Eqn. 2.19 and illustrated in Figure 2.16, both these effects serve to drastically
lower the Cdl of a SAM modified electrode. Methyl terminated SAMs with ten or more
methylene units have shown Cdl values in the 1-5 uF/cm2 range.43 Moreover, research has
shown that reciprocal capacitance (Cdl-1) varies linearly with SAM chain length (nCH2),
where n is the number of methylene units that comprise the chain.
Plots of n versus Cdl-1 have yielded capacitance values per methylene unit on the order of
0.055 uF/cm2 per CH2 group and a dielectric constant value of 2-3 (unitless quantity) for
SAMs composed of methyl terminated alkane thiols with more than eight methylene units.43
Experimental determinations of these values are highly dependent on the specifics of the
physical system: the gold substrate, the electrolyte components, and especially on the
structure and properties of the SAM, including the specific tail group being used. In any
event, the values of the Cdl reported for SAMs tend to be justified considering the crystalline
nature, low dielectric constant, and spacer properties of the alkane chains comprising the thin
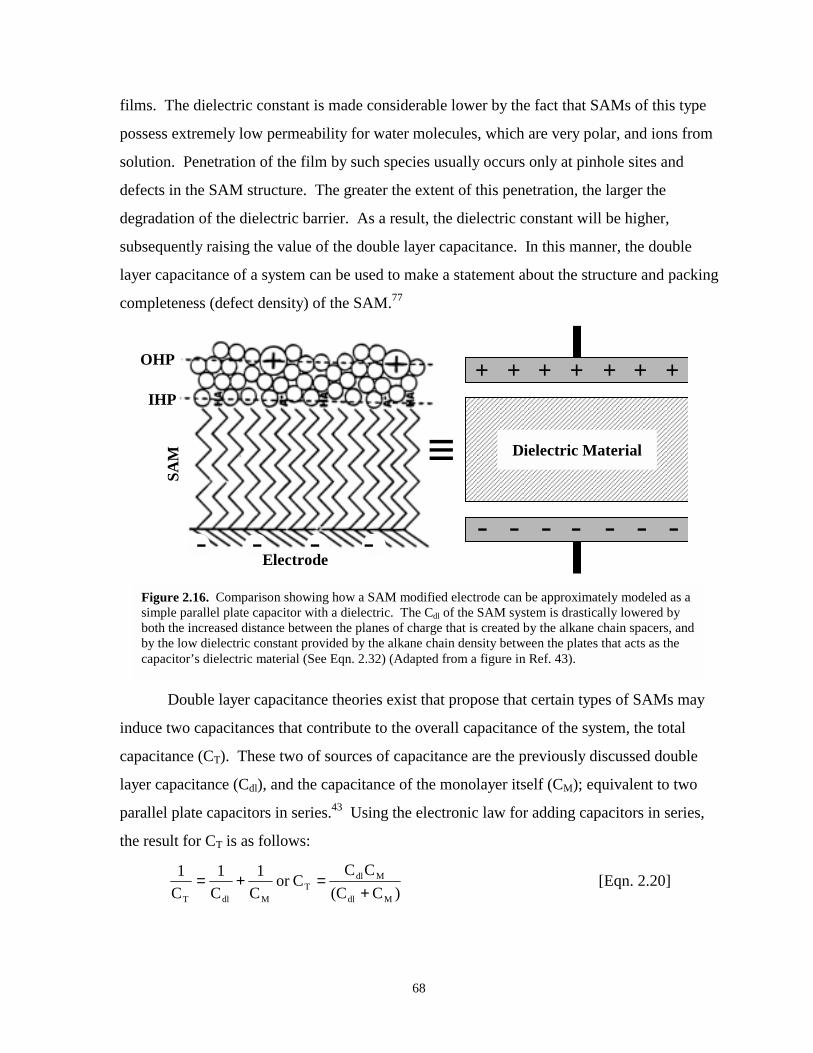
68
films. The dielectric constant is made considerable lower by the fact that SAMs of this type
possess extremely low permeability for water molecules, which are very polar, and ions from
solution. Penetration of the film by such species usually occurs only at pinhole sites and
defects in the SAM structure. The greater the extent of this penetration, the larger the
degradation of the dielectric barrier. As a result, the dielectric constant will be higher,
subsequently raising the value of the double layer capacitance. In this manner, the double
layer capacitance of a system can be used to make a statement about the structure and packing
completeness (defect density) of the SAM.77
SAM
IHP
OHP
≡
-- - -
������������������������������������������������������������������������������������������������������������������������������������������������������������������������������������������������������������������������������������������������������������������������������������������������������������������������������������������������������������������������������������������������������������������������������������������������������������������������������������������������������������������������������������������������������������������������������������������������������������������������������������������������������������������������������������������������������������������������������������������������
Dielectric Material
- - - - - - -
+ + + + + + +
Electrode
Figure 2.16. Comparison showing how a SAM modified electrode can be approximately modeled as asimple parallel plate capacitor with a dielectric. The Cdl of the SAM system is drastically lowered byboth the increased distance between the planes of charge that is created by the alkane chain spacers, andby the low dielectric constant provided by the alkane chain density between the plates that acts as thecapacitor’s dielectric material (See Eqn. 2.32) (Adapted from a figure in Ref. 43).
Double layer capacitance theories exist that propose that certain types of SAMs may
induce two capacitances that contribute to the overall capacitance of the system, the total
capacitance (CT). These two of sources of capacitance are the previously discussed double
layer capacitance (Cdl), and the capacitance of the monolayer itself (CM); equivalent to two
parallel plate capacitors in series.43 Using the electronic law for adding capacitors in series,
the result for CT is as follows:
)C(CCC
Cor C1
C1
C1
Mdl
MdlT
MdlT +=+= [Eqn. 2.20]
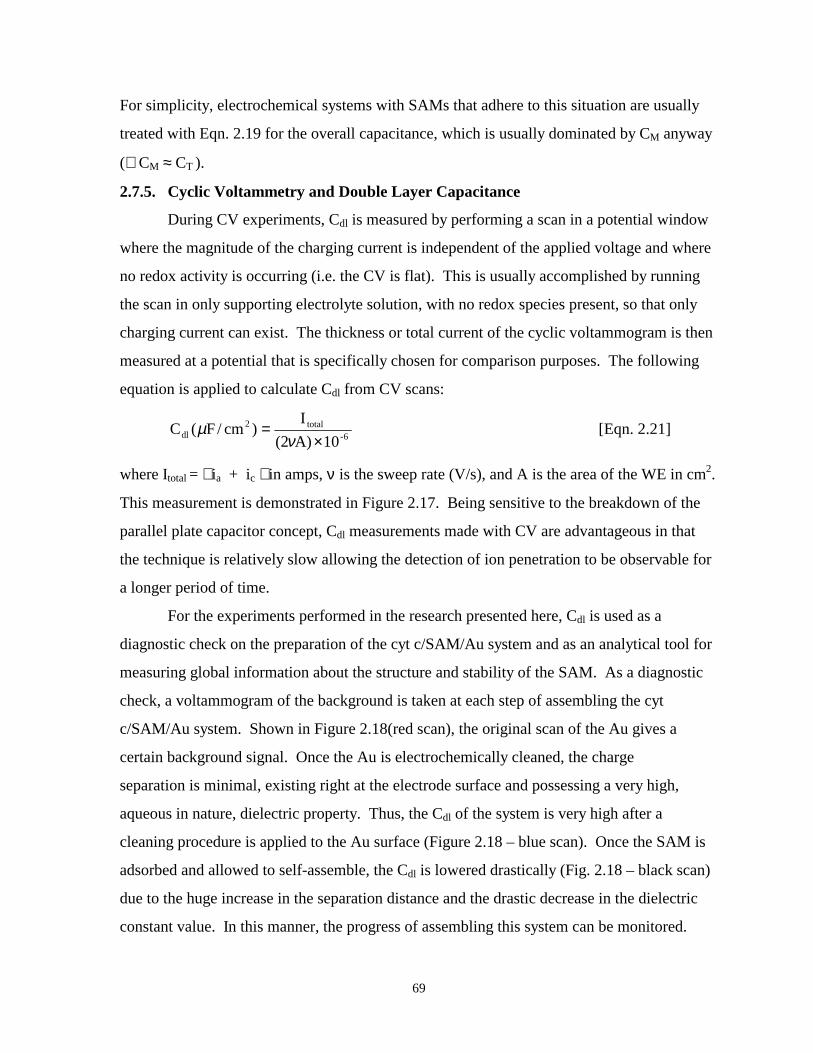
69
For simplicity, electrochemical systems with SAMs that adhere to this situation are usually
treated with Eqn. 2.19 for the overall capacitance, which is usually dominated by CM anyway
(∴ CM ≈ CT ).
2.7.5. Cyclic Voltammetry and Double Layer Capacitance
During CV experiments, Cdl is measured by performing a scan in a potential window
where the magnitude of the charging current is independent of the applied voltage and where
no redox activity is occurring (i.e. the CV is flat). This is usually accomplished by running
the scan in only supporting electrolyte solution, with no redox species present, so that only
charging current can exist. The thickness or total current of the cyclic voltammogram is then
measured at a potential that is specifically chosen for comparison purposes. The following
equation is applied to calculate Cdl from CV scans:
6-total2
dl 10 A)(2I
)cm/F(C×
=ν
µ [Eqn. 2.21]
where Itotal = ia + ic in amps, ν is the sweep rate (V/s), and A is the area of the WE in cm2.
This measurement is demonstrated in Figure 2.17. Being sensitive to the breakdown of the
parallel plate capacitor concept, Cdl measurements made with CV are advantageous in that
the technique is relatively slow allowing the detection of ion penetration to be observable for
a longer period of time.
For the experiments performed in the research presented here, Cdl is used as a
diagnostic check on the preparation of the cyt c/SAM/Au system and as an analytical tool for
measuring global information about the structure and stability of the SAM. As a diagnostic
check, a voltammogram of the background is taken at each step of assembling the cyt
c/SAM/Au system. Shown in Figure 2.18(red scan), the original scan of the Au gives a
certain background signal. Once the Au is electrochemically cleaned, the charge
separation is minimal, existing right at the electrode surface and possessing a very high,
aqueous in nature, dielectric property. Thus, the Cdl of the system is very high after a
cleaning procedure is applied to the Au surface (Figure 2.18 – blue scan). Once the SAM is
adsorbed and allowed to self-assemble, the Cdl is lowered drastically (Fig. 2.18 – black scan)
due to the huge increase in the separation distance and the drastic decrease in the dielectric
constant value. In this manner, the progress of assembling this system can be monitored.
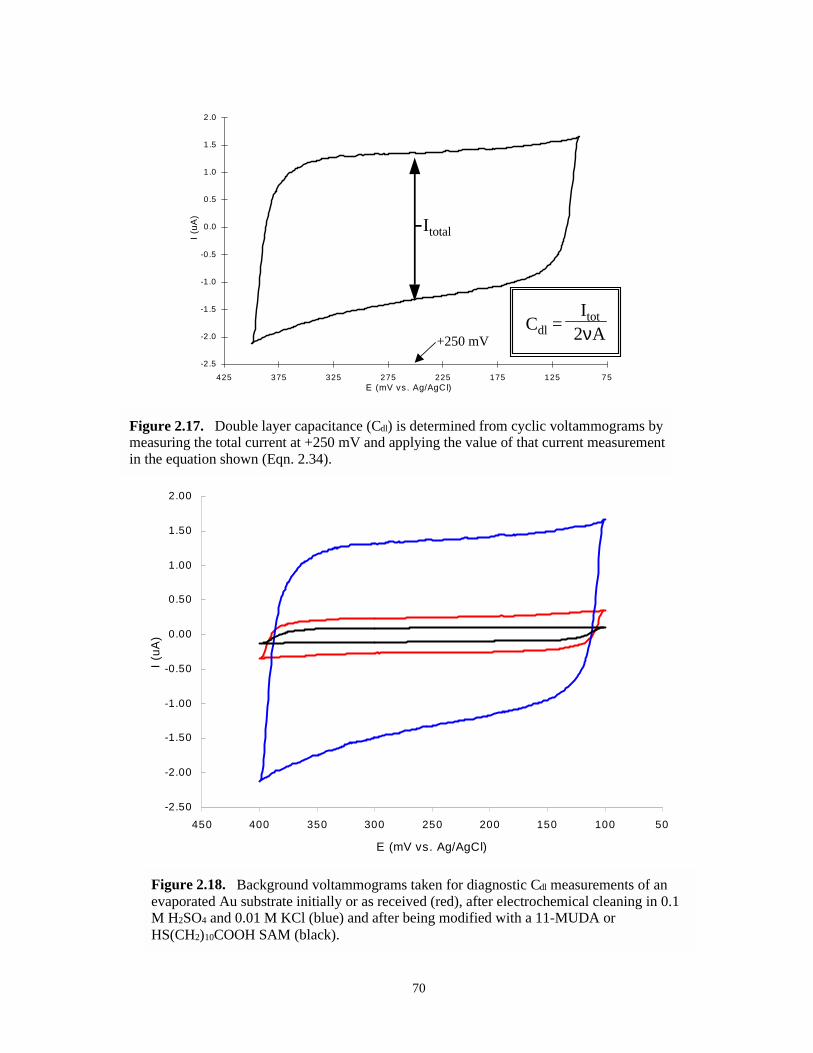
70
-2 .5
-2.0
-1.5
-1.0
-0.5
0.0
0.5
1.0
1.5
2.0
75125175225275325375425E (mV vs . Ag/AgCl)
I (uA
)
Itotal
Cdl =Itot
2νA+250 mV
Figure 2.17. Double layer capacitance (Cdl) is determined from cyclic voltammograms bymeasuring the total current at +250 mV and applying the value of that current measurementin the equation shown (Eqn. 2.34).
-2.50
-2.00
-1.50
-1.00
-0.50
0.00
0.50
1.00
1.50
2.00
50100150200250300350400450
E (mV vs. Ag/AgCl)
I (uA
)
Figure 2.18. Background voltammograms taken for diagnostic Cdl measurements of anevaporated Au substrate initially or as received (red), after electrochemical cleaning in 0.1M H2SO4 and 0.01 M KCl (blue) and after being modified with a 11-MUDA orHS(CH2)10COOH SAM (black).
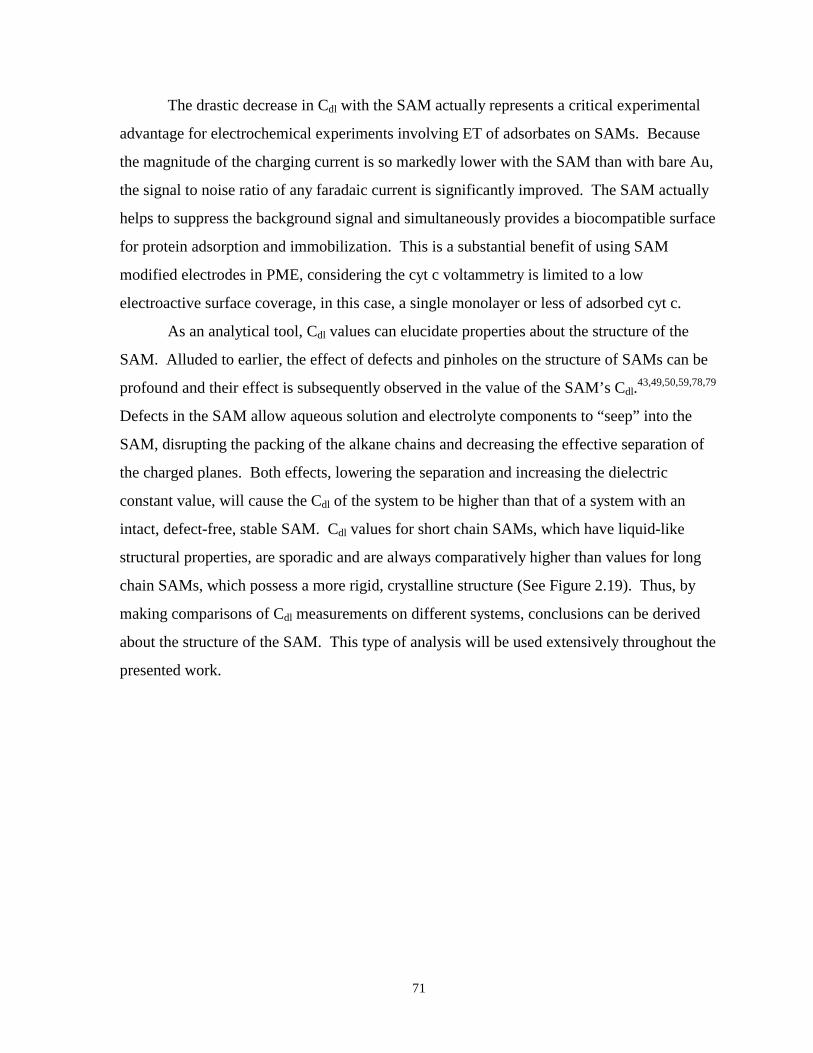
71
The drastic decrease in Cdl with the SAM actually represents a critical experimental
advantage for electrochemical experiments involving ET of adsorbates on SAMs. Because
the magnitude of the charging current is so markedly lower with the SAM than with bare Au,
the signal to noise ratio of any faradaic current is significantly improved. The SAM actually
helps to suppress the background signal and simultaneously provides a biocompatible surface
for protein adsorption and immobilization. This is a substantial benefit of using SAM
modified electrodes in PME, considering the cyt c voltammetry is limited to a low
electroactive surface coverage, in this case, a single monolayer or less of adsorbed cyt c.
As an analytical tool, Cdl values can elucidate properties about the structure of the
SAM. Alluded to earlier, the effect of defects and pinholes on the structure of SAMs can be
profound and their effect is subsequently observed in the value of the SAM’s Cdl.43,49,50,59,78,79
Defects in the SAM allow aqueous solution and electrolyte components to “seep” into the
SAM, disrupting the packing of the alkane chains and decreasing the effective separation of
the charged planes. Both effects, lowering the separation and increasing the dielectric
constant value, will cause the Cdl of the system to be higher than that of a system with an
intact, defect-free, stable SAM. Cdl values for short chain SAMs, which have liquid-like
structural properties, are sporadic and are always comparatively higher than values for long
chain SAMs, which possess a more rigid, crystalline structure (See Figure 2.19). Thus, by
making comparisons of Cdl measurements on different systems, conclusions can be derived
about the structure of the SAM. This type of analysis will be used extensively throughout the
presented work.
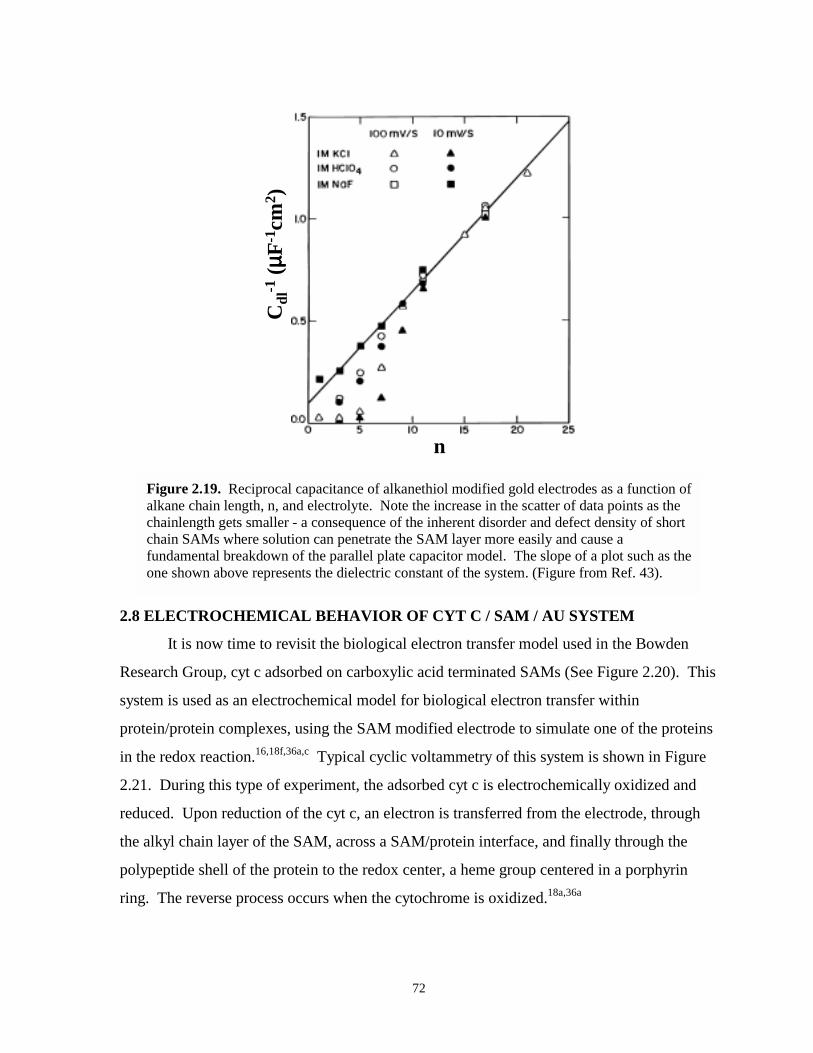
72
n
Cdl
-1 (µ µµµ
F-1cm
2 )
Figure 2.19. Reciprocal capacitance of alkanethiol modified gold electrodes as a function ofalkane chain length, n, and electrolyte. Note the increase in the scatter of data points as thechainlength gets smaller - a consequence of the inherent disorder and defect density of shortchain SAMs where solution can penetrate the SAM layer more easily and cause afundamental breakdown of the parallel plate capacitor model. The slope of a plot such as theone shown above represents the dielectric constant of the system. (Figure from Ref. 43).
2.8 ELECTROCHEMICAL BEHAVIOR OF CYT C / SAM / AU SYSTEM
It is now time to revisit the biological electron transfer model used in the Bowden
Research Group, cyt c adsorbed on carboxylic acid terminated SAMs (See Figure 2.20). This
system is used as an electrochemical model for biological electron transfer within
protein/protein complexes, using the SAM modified electrode to simulate one of the proteins
in the redox reaction.16,18f,36a,c Typical cyclic voltammetry of this system is shown in Figure
2.21. During this type of experiment, the adsorbed cyt c is electrochemically oxidized and
reduced. Upon reduction of the cyt c, an electron is transferred from the electrode, through
the alkyl chain layer of the SAM, across a SAM/protein interface, and finally through the
polypeptide shell of the protein to the redox center, a heme group centered in a porphyrin
ring. The reverse process occurs when the cytochrome is oxidized.18a,36a
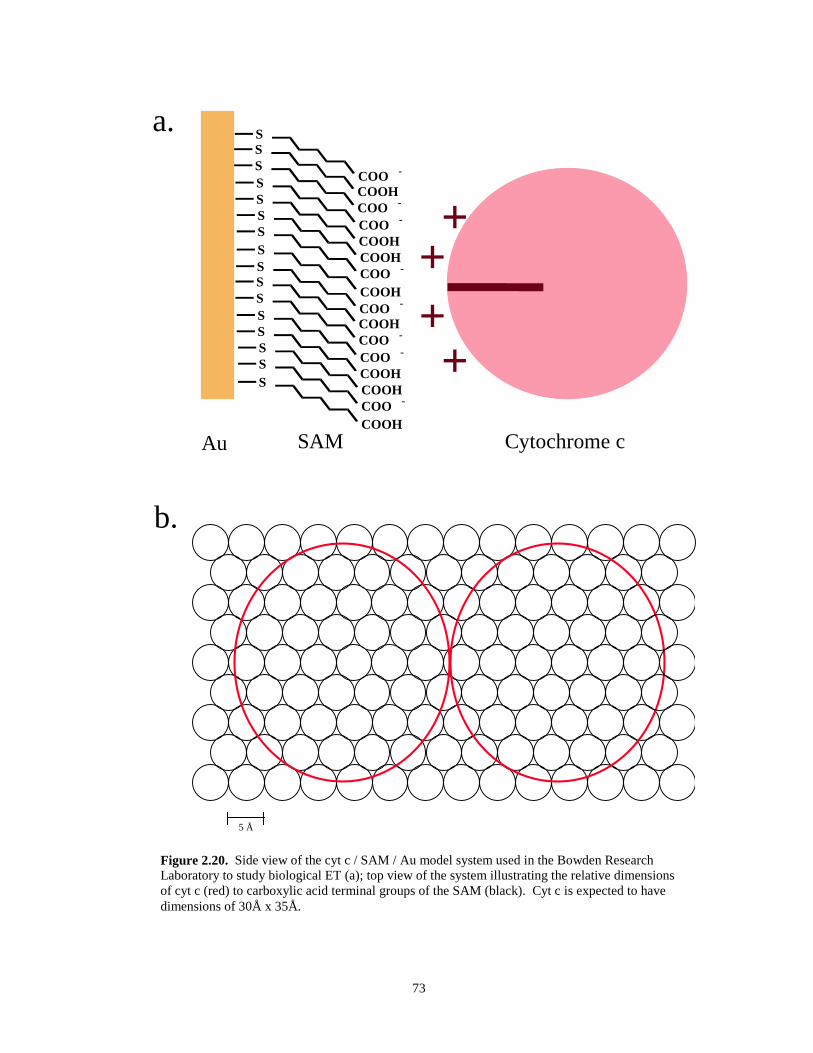
73
COO -
S
COOH
S
COO -
S
COO -
S
COOH
S
COOH
S
COO -
S
COOH
S
COO -
S
COOH
S
COO -
S
COO -
S
COOH
S
COOH
S
COO -
S
COOH
S
++++
Au SAM Cytochrome c
a.
b.
5 Å
Figure 2.20. Side view of the cyt c / SAM / Au model system used in the Bowden ResearchLaboratory to study biological ET (a); top view of the system illustrating the relative dimensionsof cyt c (red) to carboxylic acid terminal groups of the SAM (black). Cyt c is expected to havedimensions of 30Å x 35Å.
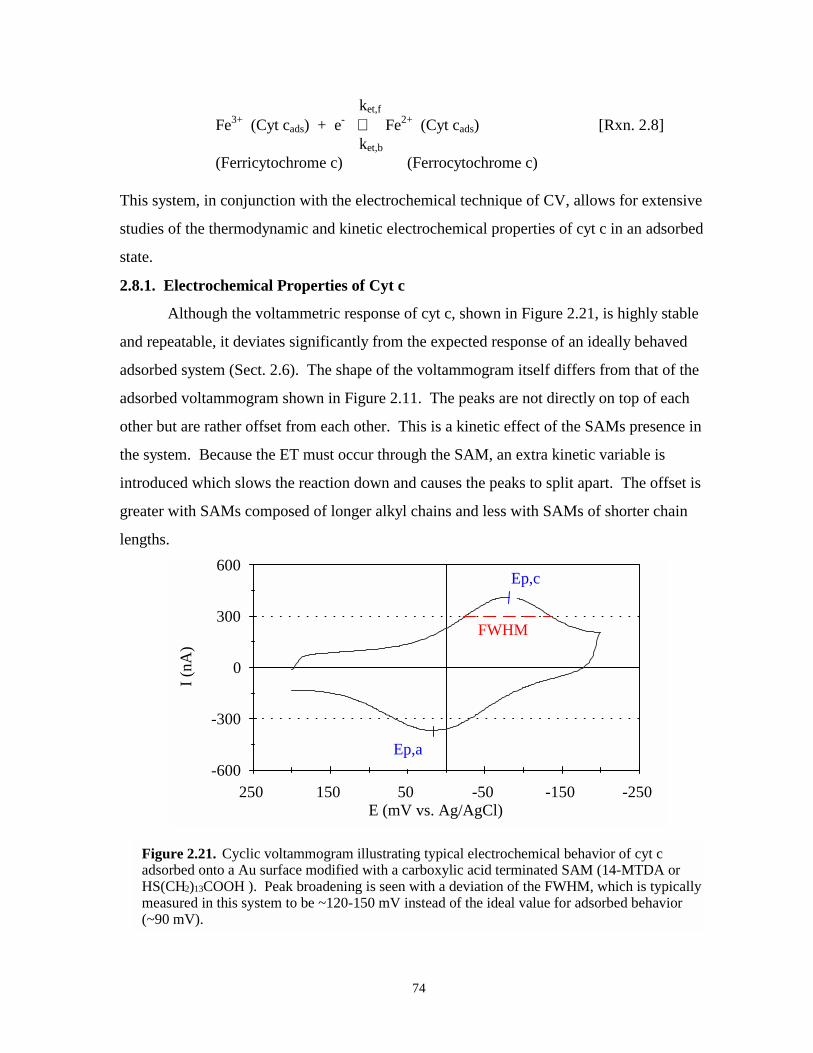
74
ket,f
Fe3+ (Cyt cads) + e- ⇔ Fe2+ (Cyt cads) [Rxn. 2.8]ket,b
(Ferricytochrome c) (Ferrocytochrome c)
This system, in conjunction with the electrochemical technique of CV, allows for extensive
studies of the thermodynamic and kinetic electrochemical properties of cyt c in an adsorbed
state.
2.8.1. Electrochemical Properties of Cyt c
Although the voltammetric response of cyt c, shown in Figure 2.21, is highly stable
and repeatable, it deviates significantly from the expected response of an ideally behaved
adsorbed system (Sect. 2.6). The shape of the voltammogram itself differs from that of the
adsorbed voltammogram shown in Figure 2.11. The peaks are not directly on top of each
other but are rather offset from each other. This is a kinetic effect of the SAMs presence in
the system. Because the ET must occur through the SAM, an extra kinetic variable is
introduced which slows the reaction down and causes the peaks to split apart. The offset is
greater with SAMs composed of longer alkyl chains and less with SAMs of shorter chain
lengths.
-600
-300
0
300
600
I (nA
)
-250 -150 -50 50 150 250 E (mV vs. Ag/AgCl)
FWHM
Ep,c
Ep,a
Figure 2.21. Cyclic voltammogram illustrating typical electrochemical behavior of cyt cadsorbed onto a Au surface modified with a carboxylic acid terminated SAM (14-MTDA orHS(CH2)13COOH ). Peak broadening is seen with a deviation of the FWHM, which is typicallymeasured in this system to be ~120-150 mV instead of the ideal value for adsorbed behavior(~90 mV).
75
Of the deviations from an ideal behavior, the most notable is the anomalous peak
broadening seen with HH cyt c. The broadening of the voltammetric peaks is most easily
illustrated by examining the full width at half maximum height (FWHM) measurements.
Ideal adsorbed behavior would result in a CV which has a FWHM of 90 mV.28,29 Commonly
observed values of FWHM for cyt c experiments, where the protein is adsorbed to SAM and
cyclic voltammetry is performed, are much larger in magnitude, sometimes ranging from 135
to 175 mV. The reason for this peak broadening is thought to be a consequence of a
dispersion of electrochemical properties such as formal potential (E°′) and ET rate constants
(k°et) for the adsorbed cyt c coverage.32 Typical values of cyt c electrochemical properties,
including the FWHM measurements, at several different sized SAMs are provided as Table
2-3. Understanding this voltammetric peak broadening is a fundamental research objective of
the Bowden Research Group.
2.8.2. Previous Research - Testing the Heterogeneous Adsorption Site Hypothesis
It has been hypothesized that these inherently non-ideal electrochemical properties are
caused by the existence of a heterogeneous adsorption surface, which, in turn, gives rise to a
variation in cyt c adsorption energies. Therefore, the voltammetric behavior displayed by cyt
c in this system can be thought of as the collective response of different subpopulations of
adsorbed proteins which, depending on their interfacial microenvironments, may exhibit non-
ideal electrochemical properties (E°′ and k°et) and culminate in broadened voltammetry
peaks.32
The heterogeneous adsorption site hypothesis was tested by a former researcher in the
Bowden group, Rose Clark. Her research into the existence of heterogeneous adsorption sites
was based on the assumption that the surface was composed of “strong” and “weak”
adsorption sites only. It was believed that this simplification would show the more strongly
retained cytochromes to exhibit specific electrochemical properties: more negative formal
potentials, faster ET rate constants, and narrow FWHM values. All of these characteristics
are highly indicative of cytochrome c molecules with excellent electronic coupling to the
surface. The weakly bound cytochromes, on the other hand, were expected to show the
opposite trend. To separately examine the electrochemical properties of the cytochromes
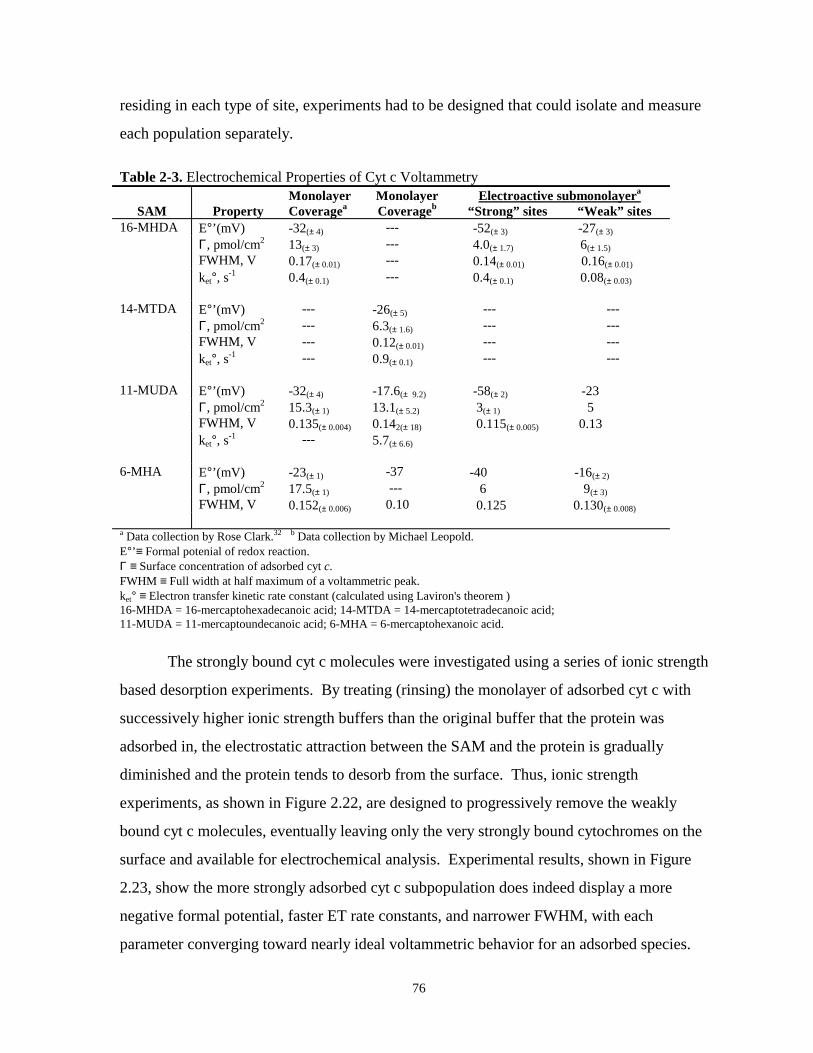
76
residing in each type of site, experiments had to be designed that could isolate and measure
each population separately.
Table 2-3. Electrochemical Properties of Cyt c Voltammetry
SAM PropertyMonolayerCoveragea
MonolayerCoverageb
Electroactive submonolayera
“Strong” sites “Weak” sites16-MHDA E°’(mV) -32(± 4) --- -52(± 3) -27(± 3)
Γ, pmol/cm2 13(± 3) --- 4.0(± 1.7) 6(± 1.5)FWHM, V 0.17(± 0.01) --- 0.14(± 0.01) 0.16(± 0.01)
ket°, s-1 0.4(± 0.1) --- 0.4(± 0.1) 0.08(± 0.03)
14-MTDA E°’(mV) --- -26(± 5) --- ---Γ, pmol/cm2 --- 6.3(± 1.6) --- ---FWHM, V --- 0.12(± 0.01) --- ---ket°, s-1 --- 0.9(± 0.1) --- ---
11-MUDA E°’(mV) -32(± 4) -17.6(± 9.2) -58(± 2) -23Γ, pmol/cm2 15.3(± 1) 13.1(± 5.2) 3(± 1) 5FWHM, V 0.135(± 0.004) 0.142(± 18) 0.115(± 0.005) 0.13ket°, s-1 --- 5.7(± 6.6)
6-MHA E°’(mV) -23(± 1) -37 -40 -16(± 2)
Γ, pmol/cm2 17.5(± 1) --- 6 9(± 3)FWHM, V 0.152(± 0.006) 0.10 0.125 0.130(± 0.008)
a Data collection by Rose Clark.32 b Data collection by Michael Leopold.E°’≡ Formal potenial of redox reaction.Γ ≡ Surface concentration of adsorbed cyt c.FWHM ≡ Full width at half maximum of a voltammetric peak.ket° ≡ Electron transfer kinetic rate constant (calculated using Laviron's theorem )16-MHDA = 16-mercaptohexadecanoic acid; 14-MTDA = 14-mercaptotetradecanoic acid;11-MUDA = 11-mercaptoundecanoic acid; 6-MHA = 6-mercaptohexanoic acid.
The strongly bound cyt c molecules were investigated using a series of ionic strength
based desorption experiments. By treating (rinsing) the monolayer of adsorbed cyt c with
successively higher ionic strength buffers than the original buffer that the protein was
adsorbed in, the electrostatic attraction between the SAM and the protein is gradually
diminished and the protein tends to desorb from the surface. Thus, ionic strength
experiments, as shown in Figure 2.22, are designed to progressively remove the weakly
bound cyt c molecules, eventually leaving only the very strongly bound cytochromes on the
surface and available for electrochemical analysis. Experimental results, shown in Figure
2.23, show the more strongly adsorbed cyt c subpopulation does indeed display a more
negative formal potential, faster ET rate constants, and narrower FWHM, with each
parameter converging toward nearly ideal voltammetric behavior for an adsorbed species.
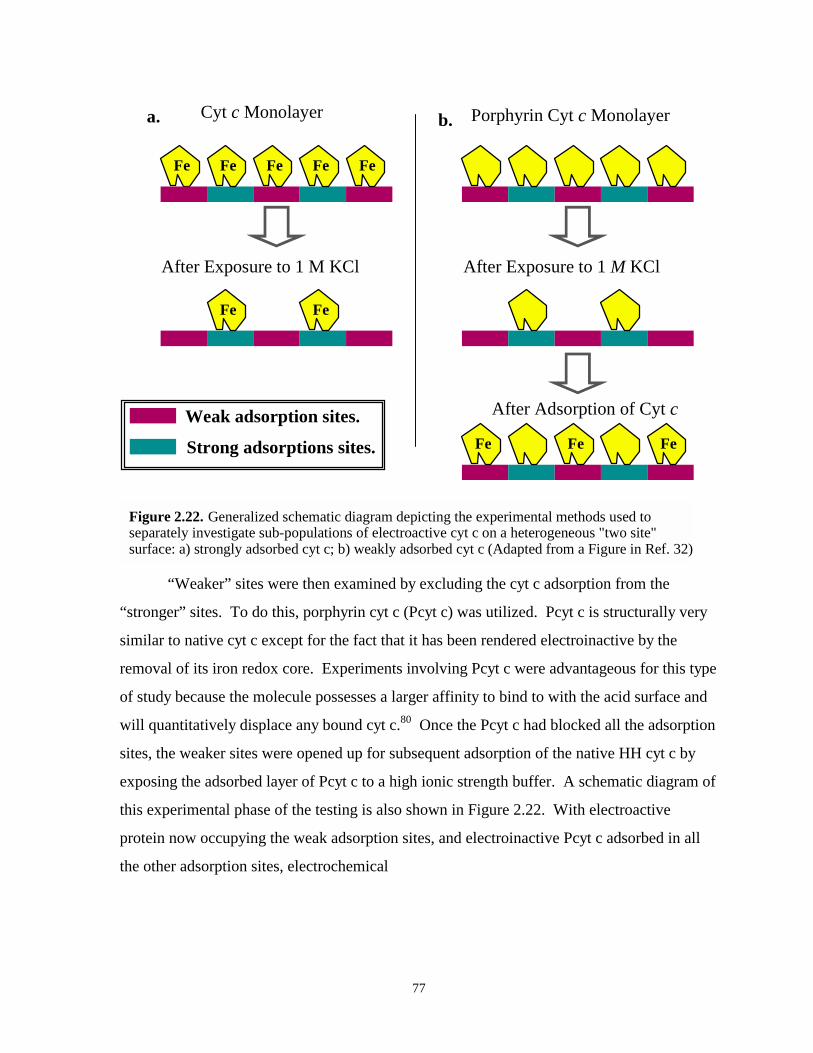
77
After Exposure to 1 M KCl
After Adsorption of Cyt c
After Exposure to 1 M KCl
Porphyrin Cyt c MonolayerCyt c Monolayer
Weak adsorption sites.
Strong adsorptions sites.
Fe Fe Fe Fe Fe
a. b.
Fe Fe
Fe Fe Fe
Figure 2.22. Generalized schematic diagram depicting the experimental methods used toseparately investigate sub-populations of electroactive cyt c on a heterogeneous "two site"surface: a) strongly adsorbed cyt c; b) weakly adsorbed cyt c (Adapted from a Figure in Ref. 32)
“Weaker” sites were then examined by excluding the cyt c adsorption from the
“stronger” sites. To do this, porphyrin cyt c (Pcyt c) was utilized. Pcyt c is structurally very
similar to native cyt c except for the fact that it has been rendered electroinactive by the
removal of its iron redox core. Experiments involving Pcyt c were advantageous for this type
of study because the molecule possesses a larger affinity to bind to with the acid surface and
will quantitatively displace any bound cyt c.80 Once the Pcyt c had blocked all the adsorption
sites, the weaker sites were opened up for subsequent adsorption of the native HH cyt c by
exposing the adsorbed layer of Pcyt c to a high ionic strength buffer. A schematic diagram of
this experimental phase of the testing is also shown in Figure 2.22. With electroactive
protein now occupying the weak adsorption sites, and electroinactive Pcyt c adsorbed in all
the other adsorption sites, electrochemical
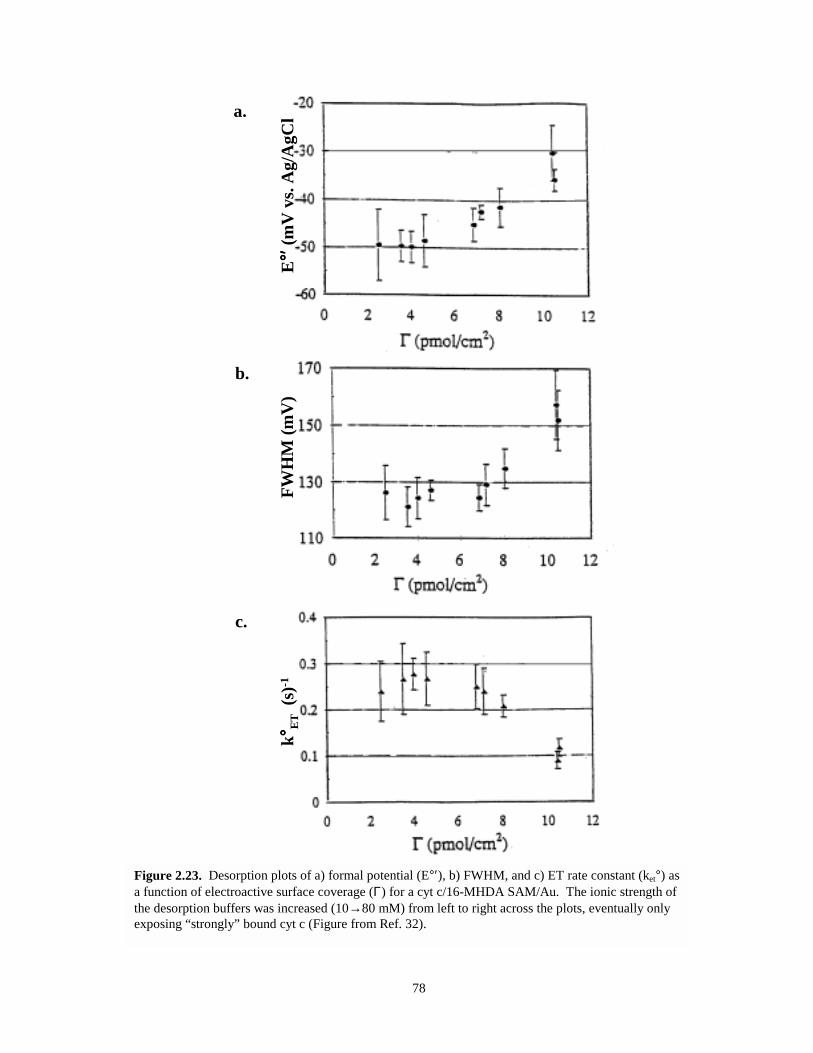
78
FWH
M (m
V)
k° °°°ET
(s)
-1E
°′ °′°′°′ (m
V v
s. A
g/A
gCla.
b.
c.
Figure 2.23. Desorption plots of a) formal potential (E°′), b) FWHM, and c) ET rate constant (ket°) asa function of electroactive surface coverage (Γ) for a cyt c/16-MHDA SAM/Au. The ionic strength ofthe desorption buffers was increased (10→80 mM) from left to right across the plots, eventually onlyexposing “strongly” bound cyt c (Figure from Ref. 32).
79
measurements accounting solely for the weakly bound cyt c could be performed. A direct
comparison of the results from these experiments is included as part of Table 2-3. The
results of these experiments support the hypothesis that heterogeneous adsorption sites exist
and may be a major reason for the observed peak broadening seen in cyt c voltammetry.
Furthermore, these results suggest that surface aspects of the cyt c adsorption process,
specifically the sources of the heterogeneity found in adsorption sites, require further
examination to better understand this system.
2.9. FOCUS OF DISSERTATION RESEARCH
Previously obtained electrochemical results, discussed in the preceding section, have
suggested that surface related phenomena may play an intrinsic role in the ET and adsorption
properties of cyt c.32 The research composing this dissertation will focus on the notion that
the sources and reasons accounting for these surface effects lie in the physical characteristics
of the surfaces involved and can be specifically identified, controlled, and understood through
strategic experimentation. Therefore, the basis of the research presented in this dissertation is
to characterize these effects and delineate their contributions to the electrochemical response
of cyt c. By gaining a thorough comprehension of the surface structure involved with the cyt
c ET system, this research may, on a molecular level, begin to substantiate an accurate
physical model for the study of biological redox chemistry.
2.9.1. Surfaces and Objectives of Research
When presented with surface studies of a system such as the cyt/SAM/Au model,
three surfaces must be considered. Depicted in Figure 2.24, these three surfaces consist of
the surface of the gold substrate itself, the surface presented by the terminal groups of the
SAM at the SAM/solution interface, and the surface of the overall system when a monolayer
of protein is adsorbed onto the SAM modified Au substrate. Each of these surfaces must be
evaluated because they all can easily exert an influence on the adsorption behavior of cyt c.
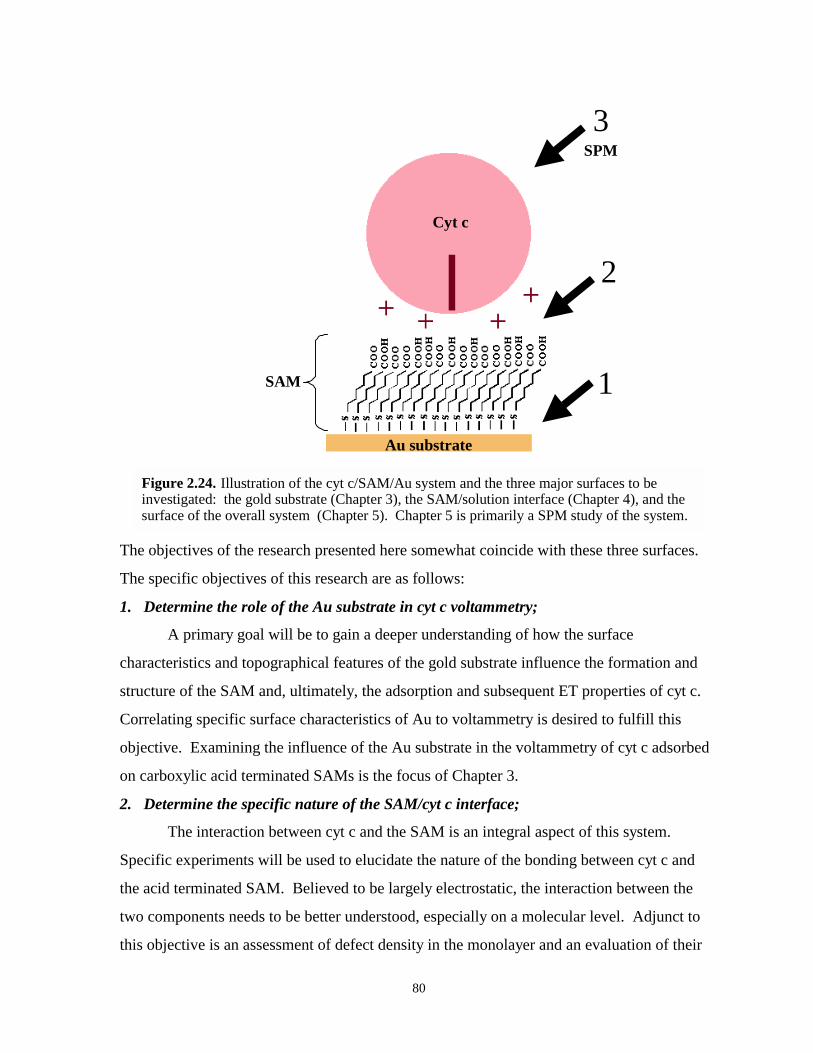
80
Au substrate
SAM
Cyt c
SPM
1
2
3
Figure 2.24. Illustration of the cyt c/SAM/Au system and the three major surfaces to beinvestigated: the gold substrate (Chapter 3), the SAM/solution interface (Chapter 4), and thesurface of the overall system (Chapter 5). Chapter 5 is primarily a SPM study of the system.
The objectives of the research presented here somewhat coincide with these three surfaces.
The specific objectives of this research are as follows:
1. Determine the role of the Au substrate in cyt c voltammetry;
A primary goal will be to gain a deeper understanding of how the surface
characteristics and topographical features of the gold substrate influence the formation and
structure of the SAM and, ultimately, the adsorption and subsequent ET properties of cyt c.
Correlating specific surface characteristics of Au to voltammetry is desired to fulfill this
objective. Examining the influence of the Au substrate in the voltammetry of cyt c adsorbed
on carboxylic acid terminated SAMs is the focus of Chapter 3.
2. Determine the specific nature of the SAM/cyt c interface;
The interaction between cyt c and the SAM is an integral aspect of this system.
Specific experiments will be used to elucidate the nature of the bonding between cyt c and
the acid terminated SAM. Believed to be largely electrostatic, the interaction between the
two components needs to be better understood, especially on a molecular level. Adjunct to
this objective is an assessment of defect density in the monolayer and an evaluation of their
81
impact on protein adsorption. SAM defect sites have the potential to play a major role in the
electrochemistry of this system. This research objective is addressed in greater detail and is
the subject matter of Chapter 4.
3. Physically characterize all of the interfaces between substrates, SAMs, and cytochrome
c on a molecular level;
Scanning probe microscopy (SPM) is used to explore the molecular aspects of the
surfaces of each component: the Au substrate topography, the SAM surface structure, and the
adsorbed cyt c molecules. Specifically, the distribution of adsorbed cyt c molecules and a
more accurate physical picture of the cyt c coverage is sought. Eventually, SPM will also be
used to explore the specific adsorption sites on the SAM. This type of exploration would
possibly allow for the direct comparison of adsorption and electrochemical properties of cyt c
adsorbed on highly ordered regions of the SAM to those proteins localized at defect sites.
Moreover, it is hopeful that SPM will be utilized to identify or differentiate between
individually adsorbed, electroactive or electroinactive cytochrome molecules. SPM and its
application to the cyt/SAM/Au system is the basis for Chapter 5.
While all three of these objectives have been addressed to some degree in this body of
work, all of them were not completely achieved. However, certain aspects of these objectives
remain part of the projected research in the Bowden Group and will be addressed in this
dissertation with a discussion about possible experiments and research directions for the
future. Accomplishing all three of these objectives to a substantial degree, should elucidate
important aspects of the surfaces involved; aspects which must be understood and applied to
PME strategies if the potential of these systems as a model for ET is to be realized.
2.9.2. Methodology and Approach
Electrochemistry (E/C) and scanning probe microscopy (SPM) are the primary modes
of experimentation that are utilized for the surface studies to be discussed. E/C is a powerful
tool for evaluating the overall operation of a system by divulging statistically averaged
information about a population of sample molecules. However, E/C yields information
strictly about the electroactive molecules and lacks the sensitivity needed to learn about the
specific surface adsorption properties being considered. SPM, on the other hand, provides
the opportunity to gain a more detailed understanding of such surface bound assemblies.
82
SPM is ideal for probing localized electronic states as well as topographical information that
is imperative to any surface science. With the recent advancements in the SPM field, one can
envision using SPM techniques to selectively probe the electrochemical behavior of
individual adsorbed molecules or, as in this case, specifically adsorbed proteins. All of the
research contain herein is conducted using this complimentary dual approach. Additionally,
other techniques are used to supplement the bulk E/C and SPM results.
A lengthy discussion about SPM and specific information about the electroanalytical
techniques is unnecessary at this point. Within each chapter, however, the techniques
employed and the experiments performed are described as needed, usually as part of the
experimental details section found at the end of each chapter.
2.9.3. Organization of Dissertation
The subsequent chapters of this dissertation focus on each of these surfaces.
Beginning with Chapter 3, where the role of the Au substrate in cyt c voltammetry is
examined in detail, there is essentially a chapter of work dedicated to each of the surfaces
involved: the Au substrate, the SAM/solution interface, and the overall system. Each chapter
begins with an introduction, experimental data and results, a discussion of those results.
Each chapter ends with experimental details, author’s notes, and finally an offering of future
directions for the research. More specifically, Chapter 3 contains two major sections: one
dedicated to preliminary results and a section devoted to more substantiated results. Chapter
4 will focus on the SAM/solution interface, where experiments were designed to specifically
alter this interface with respect to controlling how the cyt c voltammetry will respond.
Finally, SPM and the molecular scale evaluation of all aspects of the cyt c/SAM/Au system
will be the directive of Chapter 5. As alluded to earlier, not all of these surfaces and chapters
are developed to the same extent. Largely due to time and money constraints, some topics
are covered in greater detail, and some require further investigations, perhaps an opportunity
for another aspiring scientist in the Bowden Research Group.
Two appendices are included as part of this dissertation. The subject matter of the
appendices are based on research done as a collaborative effort between Professor Bowden’s
group and others. Although, for the most part, these side projects are unrelated to surface
studies of the cyt c/SAM/Au system, they represent new avenues of discovery for the Bowden
83
research group and an overall expansion of the application of electrochemistry into new areas
of research. The first appendix focuses on a materials science/nanotechnology study done in
collaboration with Professor Chris Gorman (NCSU). This project consisted of studying the
ET of dendritic polymer encapsulated molecules, precursors for viable molecular information
storage units. The second appendix consists of experiments involving the substrate indium
tin oxide (ITO). Related to the primary research system of the Bowden Group, cyt
c/SAM/Au, the electrochemistry of cyt c adorbed on these metal oxide films and the
electrochemical properties of these substrates was examined. In conjunction with Dr. Ashley
Bush (Harvard Medical School/Massachusetts General Hospital), electrochemistry at ITO
electrodes was investigated with respect to its potential usefulness in delineating drug
pathways and neurological diseases.
In summary, the research presented in this dissertation addresses a specific adsorbed
protein system that can be used to understand fundamental aspects of protein adsorption and
ET processes. The very nature of this work lends itself to being directly significant to the
advancement of protein monolayer electrochemistry as a means of simplifying complex ET
kinetic analysis. This strategy allows for extensive investigations into normally complex
redox protein behavior. Exploration of these types of processes, will not only assist in the
development of advanced ET theory, but will help lay the foundation of knowledge required
for the creation of useful bioanalytical technologies like real time amperiometric biosensors
and biocompatible implants.
84
2.10 REFERENCES
1. E.F. Bowden, R.A. Clark, J.L. Willit, and S. Song, “Protein Monolayer Electrochemistry: AStrategy for Probing Biological Electron Transfer Kinetics,” In Proceedings of the FifthInternational Symposium on Redox Mechanisms and Interfacial Properties, F. Shultz and I.Taniguchi, Eds., The Electrochemical Society: Pennington, New Jersey, 1993, 34-45.
2. a) J. Deisenhofer and H. Michel, Science, 1989, 245, 1463-1474; b) J. Deisenhofer and H.
Michel, Chemica Scripta, 1989, 29, 205-220; c) G. Feher, J.P. Allen, M.Y. Okamura, and D.C.Rees, Nature, 1989, 339, 111-116.
3. a) J.R. Bolton, N. Mataga, and G. McLendon, “Electron Transfer in Inorganic, Organic, and
Biological Systems,” In Advances in Chemistry Series 228, American Chemical Society:Washington D.C., 1991; b) B.E. Bowler, A.L. Raphael, and H.B. Gray, Progr. Inorg. Chem.,1990, 38, 259-322; c) C.C. Moser, J.M. Keske, K. Warncke, R.S. Farid, and P.L. Dutton, Nature,1992, 355, 796-802.
4. E.F. Bowden, “Wiring Mother Nature: Interfacial Electrochemistry of Proteins,” The
Electrochemical Society:Interface, 1997, 6, 40-44. 5. a) R.A. Scott, A.G. Mauk, and H.B. Gray, J. Chem. Edu., 1985, 62 932-938; b) R. Marcus and N.
Sutin, Biochim. Biophys. Acta, 1985, 811, 265-322; c) J.R. Bolton, and M.D. Archer, Adv. Chem.Ser., 1991, 228, 7.
6. a) S. Ferguson-Miller, D.L. Brautigan, and E. Margoliash, In The Porphyrins, Vol. 7B, D.
Dolphin, Ed., Academic Press: New York, 1979; b) N. Sutin, Adv. Chem. Ser., 1977, 162, 156. 7. G. Palmer, Ed., “Long-Range Electron Transfer in Biology,” In Structure and Bonding Series,
Vol. 75, Springer-Verlag: Berlin, 1991, pp. 160-174. 8. a) J.R. Winkler, H.B. Gray, Chem. Rev., 1992, 92, 369-379; b) J.R. Scott, A. Willie, M. McLean,
P.S. Stayton, S.G. Sligar, B. Durham, and F. Millett, J. Am. Chem. Soc., 1993, 115, 6820-6824. 9. a)R. Seetharaman, S.P. White, and M. Rivera, Biochemistry, 1996, 35, 12455-12463; b) S.M.
Andrew, K.A. Thomasson, and S.H. Northrup, J. Am. Chem. Soc., 1993, 115, 5516-5521; c)M.R. Mauk, L.S. Reid, A.G. Mauk, Biochemistry, 1982, 21, 1943-1846; d) F.R. Salemme, J.Mol. Biol., 1976, 102, 563-568.
10. a) A.G. Mauk, M.K. Mauk, G.R. Moore, Sh.H. Northrup, J. Bioenerg. Biomembr., 1995, 27, 311-
330; b) B. Durham, J.L. Fairris, M. McLean, F. Millett, J.R. Scott, S.G. Sligar, and A. Willie, J.Bioenergetics Biomembranes, 1995, 27, 331-340.
11. a) E.F. Bowden, F.M. Hawkridge, and H.N. Blount in Comprehensive Treatise of
Electrochemistry, Volume 10, S. Srinivasan, Y.A. Chizmadzhev, J.O.M. Bockris, B.E. Conway,and E. Yearge, Eds. Plenum Press: New York, 1985, p. 297; b) F.A. Armstrong, H.A.O. Hill,and N.J. Walton, Acc. Chem. Res. 1988, 21, 407-413.
85
12. a) P. Yeh, and T. Kuwana, Chem. Lett. 1977, 1145-1148. b) F.A. Armstrong, H.A.O. Hill, P.A.Cox, V.J. Lowe, and B.N. Oliver, J. Electroanal. Chem. 1987, 217, 331-366.
13. M.J. Eddowes and H.A.O. Hill, J. Chem. Soc. Chem. Commun. 1977, 771-772. 14. H.L. Landrum, R.T. Salmon, and F.M. Hawkridge, J. Am. Chem. Soc. 1977, 99, 3154-3158. 15. J. Hirst, A. Sucheta, B.A. C. Ackrell, and F.A. Armstrong, “Electrocatalytic Voltammetry of
Succinate Dehydrogenase: Direct Quantification of the Catalytic Properties of a ComplexElectron-Transport Enzyme,” J. Am. Chem. Soc. 1996, 118, 5031-5038.
16. J.K. Cullison, F.M. Hawkridge, N. Nakashima, and S. Yoshikawa, “A study of cytochrome c
oxidase in lipid bilayer membranes on electrode surfaces,” Langmuir 1994, 10, 877-882. 17. W.J. Albery, M.J. Eddowes, H.A.O. Hill, and A.R. Hillman, J. Am. Chem. Soc. 1981, 103, 3904. 18. a) T. Sagara, K. Niwa, A. Sone, C. Hinnin, and K. Niki, “Redox Mechanism of Cytochrome c at
Modified Gold Electrodes,” Langmuir 1990, 6, 254-262; b) C. Hinnin, and K. Niki, J.Electroanal. Chem. 1989, 264, 157-165; c) K. Niwa, M. Furukawa, and K. Niki, J. Electroanal.Chem.1988, 254, 275-285; d) K. Niki, Y. Kawasaki, Y. Kimuma, Y. Higuchi, and N. Yasuoki,Langmuir 1987, 3, 982-986; e) C. Hinnen, R. Parsons, K. Niki, J. Electroanal. Chem. 1983, 147,329-337; f) D. Zhang, G.S. Wilson, and K. Niki, Anal. Chem. 1994, 66, 3873-3881.
19. a) Butt, S.J. George, E.C. Hatchikian, A.J. Thompson, J. Breton, and F.A. Armstrong, J. Am.
Chem. Soc. 1991, 113, 6663-6670; b) F.A. Armstrong, J.N. Butt, S.J. George, E.C. Hatchikian,and A.J. Thompson, FEBS Lett. 1989, 258, 15-18.
20. a) E.A.E. Garber, E. Margoliash, Biochim. Biophys. Acta 1990, 1015, 279-287; b) J.T. Hazzard,
G. McLendon, M.A. Cusanovich, and G. Tollin, Biochem. Biophys. Res. Commun. 1988, 151,429-453; c) S.H. Northrup, J.O. Boles, J.C.L. Reynolds, Science 1988, 241, 67-70; d) J.J.Wendolkski, J.B. Mathew, P.C. Wever, F.R. Salemme, Science 1987, 238, 794-797; e) J. Willitand E.F. Bowden, J. Electroanal. Chem. 1987, 221, 265-274.
21. a) F.A. Armstrong, S.J. George, R. Cammack, E.C. Hatchikian, and A.J. Thomson, Biochem. J.
1989, 264, 265-273; b) J.N. Butt, A. Sucheta, E.C. Hatchikian, A.J. Thompson, J. Breton, andF.A. Armstrong, J. Am. Chem. Soc. 1991, 113, 8948-8950.
22. J.J.R. Frausto da Silva and R.J.P. Williams, The Biological Chemistry of the Elements - The
Inorganic Chemistry of Life, Clarendon Press: Oxford, 1991. 23. a) J.T. Hupp and M.J. Weaver, J. Electroanal. Chem. 1983, 145, 43-51; b) J.T. Hupp and M.J.
Weaver, J. Phys. Chem. 1985, 89, 2795-2804. 24. G. McLendon, Acc. Chem. Res. 1988, 21, 160-167; b) D.W. Dixon, X. Hong, S.E. Woehler, G.A.
Mauk, B.P. Sishta, J. Am. Chem. Soc. 1990, 122, 1082-1088. 25. T.M. Nahir, J.M. Wallace, and E.F. Bowden, results unpublished.
86
26. Proposal to the National Science Foundation by Edmond F. Bowden, “Protein MonolayerElectrochemistry,” 1993.
27. a) J. Willit and E.F. Bowden, in Redox Chemistry and Interfacial Behavior of Biological
Molecules, G. Dryhurst and K. Niki, Eds., Plenum Press: New York, 1988, p. 63; b) J.L. Willitand E.F. Bowden, “Adsorption and Redox Thermodynamics of Strongly Adsorbed Cytochrome con Tin Oxide Electrodes,” J. Phys. Chem. 1990, 94, 8241; c) M. Collinson and E.F. Bowden,Anal. Chem. 1992, 64, 1470; d) M. Collinson, M.J. Tarlov and E.F. Bowden, “Voltammetry ofCovalently Immobilized Cytochrome c on Self-Assembled Monolayer Electrodes,” Langmuir1992, 8, 1247-1250; e) T.T. Li and M.J. Weaver, J. Am. Chem. Soc. 1984, 106, 6107.
28. C.M.A. Brett and A.M.O. Brett, Electrochemistry - Principles, Methods, and Applications,
Oxford University Press: Oxford, 1993. 29. A.J. Bard and L.R. Faulkner, Electrochemical Methods - Fundamentals and Applications, John
Wiley and Sons, Inc.: New York, 1980. 30. a) J.H. Reeves, S. Song, and E.F. Bowden, Anal. Chem. 1993, 65, 683; b) J. Osteryoung, Acc.
Chem. Res. 1993, 26, 77. 31. a) S. Burris and E.F. Bowden, results unpublished; b) J.L. Willit, Ph.D. thesis, p. 74. 32. R.A. Clark and E.F. Bowden, “Voltamemetric Peak Broadening for Cytochrome c/Alkanethiolate
Monolayer Structures: Dispersion of Formal Potentials,” Langmuir 1996, 13, 559-565. 33. E.F.Bowden, F.M. Hawkridge, and H.N. Blount, J. Electroanal. Chem. 1984, 61, 355-376. 34. F.A. Armstrong, Struct. Bonding (Berlin) 1990, 72, 137-221. 35. a) I. Taniguchi, K. Toyosawa, H. Yamaguchi, and K. Yasukouchi, J. Chem. Soc. Chem.
Commun. 1982, 1032-1033; b) I. Taniguchi, H. Yamaguchi, and K. Yasukouchi and M. Iseki, J.Electroanal. Chem. 1984, 175, 341-348; c) I. Taniguchi, H. Yamaguchi, and K. Yasukouchi andM. Iseki, J. Electroanal. Chem. 1985, 186, 299-307.
36. a) S. Song, R.A. Clark, M.J. Tarlov and E.F. Bowden, “Characterization of Cytochrome c /
Alkanethiolate Structures Prepared by Self-Assembly on Gold,” J. Phys. Chem. 1993, 97, 6564-6572; b) A.E. Kasmi, J.M. Wallace, E.F. Bowden, S.M. Binet, and R.J. Linderman, “ControllingInterfacial ET Kinetics of Cyt c with Mixed SAMs,” J. Am. Chem. Soc. Comm. 1998, 120, 225-226; c) M.J. Tarlov and E.F. Bowden, “Electron-Transfer Reaction of Cytochrome c Adsorbedon Carboxylic Acid Terminated Alkanethiol Monolayer Electrodes,” J. Am. Chem. Soc. 1991,113, 1847-1849.
37. Proposal to the National Science Foundation by Edmond F. Bowden, “Protein Monolayer
Electrochemistry,” 1998. 38. a) R.E. Dickerson, T. Takano, D. Eisenberg, O.B. Kallai, L. Samson, A. Cooper, and E.
Margoliash, J. Biol. Chem. 1971, 246, 1511; b) R.E. Dickerson and R. Timkovich, In TheEnzymes, P.D. Boyer, Ed., Academic Press: New York, Vol. XIA, 1975, pp. 397-547; c) S.
87
Ferguson-Miller, D.L. Brautigan, and E. Margoliash, In The Porphyrins, D. Dolphin, Ed.,Academic Press: New York, Vol. VIIB, 1979, pp. 149-240.
39. E. Stellwagen, Nature 1978, 275, 73-74. 40. G.W. Pettigrew, G.R. Moore, Cytochromes c: Biological Aspects, Springer Verlag: Heidelberg,
1990. 41. D.M. Tiede, A.C. Vashista, and M.R. Gunner, Biochemistry 1993, 32, 4515-4531. 42. S.L. Wolfe, Molecular and Cellular Biology, Wadsworth Publishing Company: Belmont,
California, 1993. 43. H. O. Finklea, “Electrochemistry of Organized Monolayers of Thiols and Related Molecules on
Electrodes,” A.J. Bard and I. Rubinstein (Eds.), Electroanalytical Chemistry - A Series ofAdvances, Vol. 19, 108-335, Marcel Dekker: New York, New York, 1996.
44. a) M.D. Porter, T.B. Bright, D.L. Allara, and C.E.D. Chidsey, “Spontaneously Organized
Molecular Assemblies. 4. Structural Characterization of n-Alkyl Thiol Monolayers on Gold byOptical Ellipsometry, Infrared Spectroscopy, and Electrochemistry,” J. Am. Chem. Soc. 1987,109, 3559-3568; b) R.G. Nuzzo, L.H. Dubois, and D.L. Allara, “Fundamental Studies ofMicroscopic Wetting on Organic Surfaces. 1. Formation and Structrual Characterization of aSelf-Consistent Series,” J. Am. Chem. Soc. 1990, 112, 558-569; c) L.H. Dubois, B.R. Zegarski,and R. Nuzzo, “Fundamental Studies of Microscopic Wetting on Organic Surfaces. 2. Interactionof Secondary Adsorbates with Chemically Textured Organic Monolayers,” J. Am. Chem. Soc.1990, 112, 570-579.
45. a) T. Ishida, M. Hara, I. Kojima, S. Tsuneda, N. Nishida, H. Sasabe, and W. Knoll, “High
Resolution X-ray Photoelectron Spectroscopy Measurements of Octanethiol Self-AssembledMonolayers on Au(111),” Langmuir 1998, 14, 2092-2096; b) T. Ishida, M. Hara, S. Tsuneda, N.Nishida, H. Sasabe, and W. Knoll, “Surface-Conditioning Effect of Gold Substrates onOctadecanethiol Self-Assembled Monolayer Growth,” Langmuir 1997, 13(17), 4638-4643.
46. J.H. Griffin, et. al., Langmuir 1994, 10, 883-889. 47. a) P.E. Laibinis, G.M. Whitesides, D.L. Allara, Y-T. Tao, Atul N. Parikh, and R.G. Nuzzo,
“Comparison of the Structures and Wetting Properties of Self-Assembled Monolayers of n-Alkanethiols on the Coinage Metal Surfaces, Cu, Ag, Au,” J. Am. Chem. Soc. 1991, 113, 7152-7167; b) P.E. Laibinis and G.M. Whitesides, “ω-Terminated Alkanethiolate Monolayers onSurfaces of Copper, Silver, and Gold Have Similar Wettabilities,” J. Am. Chem. Soc. 1992, 114,1990-1995.
48. A. Demoz and D.J. Harrison, “Characterization of Extremely Low Defect Density
Hexadecanethiol Monolayers on Hg Surfaces,” Langmuir 1993, 9, 1046-1050. 49. a) M. Mrksich and G.W. Whitesides, “Using Self-Assembled Monolayers to Understand the
Interactions of Man-Made Surfaces with Proteins and Cells,” Annual Review of Biophysics andBiomolecular Structure, 1996, 25, 55-78. b) D. Mandler and I. Turyan, “Applications of Self-Assembled Monolayers in Electroanalytical Chemistry,” Electroanalysis 1996, 8(3), 207-213; c)
88
C.B. Gorman and G.M. Whitesides, “Self-Assembled Monolayers: Models for Organic SurfaceChemistry,” In Handbook of Surface Imaging and Visualization, A.T. Hubbard, Ed., CRC Press:NY, 1995.
50. a) H.O. Finklea, S. Avery, M. Lynch, “Blocked Oriented Monolayers of Alkyl Mercaptans on
Gold Electrodes,” Langmuir 1987, 3, 409-413; b) H.M. Schessler, D.S. Karpovich, and G.J.Blanchard, “Quantitating the Balance Between Enthalpic and Entropic Forces inAlkanethiol/Gold Monolayer Self Assembly,” J. Am. Chem. Soc. 1996, 118, 9645-9651.
51. a) C.E.D. Chidsey and Dominic Loiacono, “Chemical Functionality in Self-Assembled
Monolayers: Structural and Electrochemical Properties,” Langmuir 1990, 6, 682-691; b)M.H.Schoenfisch and J.E. Pemberton, “Air Stability of Alkanethiol Self-Assembled Monolayers onSilver and Gold Surfaces,” J. Am. Chem. Soc., submitted.
52. C.D. Bain, E.B. Troughton, Y.T. Tao, J. Evall, G.M. Whitesides, and R.G. Nuzzo, “Formation of
Monolayer Films by the Spontaneous Assembly of Organic Thiols from Solution onto Gold,” J.Am. Chem. Soc. 1989, 111, 321-335.
53. a) E. Delamarche, et al., Science 1997, 276, 2021; b) P. Fenter, A. Eberhardt, K.S. Liang, and P.
Eisenberger, “Epitaxy and Chainlength Dependent Strain in Self-Assembled Monolayers,” J.Chem. Phys. 1997, 106(4), 1600-1607;
54. a) E.L. Smith, C.A. Alves, J.W. Anderegg, M.D. Porter, L.M. Siperko, Langmuir 1992, 8, 2707-
2714; b) E. Delamarche and H.A. Biebuyck, Advanced Materials 1996, 8(9), 719-729. 55. G.M. Whitesides, R.G. Nuzzo, and P.E. Laibinis, J. Phys. Chem. 1992, 96, 5097-5105. 56. G.K. Jennings and P.E. Laibinis, “Underpotentially Deposited Metal Layers of Silve Provide
Enhanced Stability to Self-Assembled Alkanethiol Monolayers on Gold,” Langmuir 1996, 12,6173-6175.
57. a) E. Sabatani, J. Cohen-Boulakia, M. Bruening, and I. Rubinstein, “Thioaromatic Monolayers on
Gold: A New Family of Self-Assembling Monolayers,” Langmuir 1993, 9, 2974-2981; b) Y-Q.Wang, H-Z. Yu, J-Z. Cheng, J-W. Zhao, S-M. Cai, and Z-F. Liu, “End-Group-DominatedElectrochemical Kinetics of Axobenzene Self-Assembled Monolayers on Gold,” Langmuir 1996,12, 5466-5471; c) M. French and S.E. Creager, “Enhanced Barrier Properties of Alkanethiolate-Coated Gold Electrodes By 1-Octanol in Solution,” Langmuir 1998, 14, 2129-2133.
58. a) S.E. Creager, L.A. Hockett, and G.K. Rowe, “Consequences of Microscopic Surface
Roughness for Molecular Self-Assembly,” Langmuir 1992, 8, 854-861; b) E. Katz and I. Willner,“Kinetic Separation of Amperometric Responses of Composite Redox-Active MonolayersAssembled onto a Au Electrode: Implications to the Monolayer’s Structure and Composition,”Langmuir 1997, 13, 3364-3373.
59. a) P. Tengrall, B. Leidberg, and M. Lestelius, Langmuir 1997, 13, 5900-5908; b) C. Miller, et. al.
J. Phys. Chem. 1991, 95, 877-886; c) H.O. Finklea, D.A. Snider, and John Fedyk,“Characterization of Octadecanethiol-Coated Gold Electrodes as Microarray Electrodes byCyclic Voltammetry and AC Impedance Spectroscopy,” Langmuir 1993, 9, 3660-3667.
89
60. a) M.R. Anderson, M.N. Evaniak, and M. Zhang, “Influence of Solvent on the InterfacialStructure of Self-Assembled Alkanethiol Monolayers,” Langmuir 1996, 12(10), 2327-2331; b) O.Dannenberger, J.J. Wolff, and M. Buck, “Solvent Dependence of the Self-Assembly Process ofan Endgroup-Modified Alkanethiol,” Langmuir 1998, 14, 4679-4682.
61. E. Delamarche and B. Michel, “Structure and Stability of Self-Assembled Monolayers,” Thin
Solid Films 1996, 273, 54-60. 62. a) E. Cooper and G.J. Leggett, “Influence of Tail-Group Hydrogen Bonding on the Stabilities of
Self-Assembled Monolayers of Alkylthiols on Gold,” Langmuir 1999, 15, 1024-1032; b) R.S.Clegg and J.E. Hutchison, “Hydrogen Bonding, Self-Assembled Monolayers: Ordered MolecularFilms for Study of Through Peptide Electron Transfer,” Langmuir 1996, 12(22), 5239-5243; c)E. Delamarche, M. Sprik, B. Michel, U. Rothlisberger, M.L. Klein, H. Wolf, and H. Ringsdorf,“Structure of Hydrophillic Self-Assembled Monolayers: A Combined Scanning TunnelingMicroscopy and Computer Simulation Study,” Langmuir 1994, 10, 4116-4130;
63. S. Chen, R.S. Ingram, M.J. Hostetler, J.J. Pietron, R.W. Murray, T.G. Schaaff, J.T. Khoury,
M.M. Alvarez, and R.L. Whetten, “Gold Nanoelectrodes of Varied Size: Transition to Molecule-Like Charging,” Science 1998, 280, June 26, 2098-2101.
64. a) I. Touzov and C.B. Gorman, “Tip Induced Structural Rearrangements of Alkanethiolate Self-
Assembled Monolayers on Gold,” J. Phys. Chem. B 1997, 101(27), 5263-5276; b) I. Touzov andC.B. Gorman, “A Scanning Tunneling Microscopy Study of the Interaction of H2S with a Au(III)Surface: Characterization of Corrosion and Monolayer Structure,” Langmuir 1997, 13(18), 4850-4854.
65. T.R. Lee, R.I. Carey, H.A. Biebuyck, and G.M. Whitesides, Langmuir 1994, 10, 741-749. 66. a) J. Spinke, M. Liley, H.J. Guder, L. Angermaier, and W. Knoll, Langmuir 1993, 9, 1821; b) I.
Willner, E. Katz, A. Riklin, R. Kasher, J. Am. Chem. Soc. 1992, 114, 10965-10966; c) H.A.O.Hill, G.A. Lawerance, J. Electroanal. Chem. 1989, 270, 309-318; d) E. Katz, T. Lotzbeyer, D.D.Schlereth, W. Schuhmann, and H.L. Schmidt, Electroanal. Chem. 1994, 373, 189-200; e) K.L.Prime and G.M. Whitesides, Science 1991, 252, 1164-1167; f) I. Willner, S. Rubin, and Y.Cohen, J. Am. Chem. Soc. 1993, 115, 4937-4938; g) K. Takehara, H. Takemura, and Y. Ide, J.Electroanal. Chem. 1991, 308, 345-350; h) K.T. Kinnear and H.G. Monbouquette, Langmuir1993, 9, 2255; i) K.L. Prime and G.M. Whitesides, J. Am. Chem. Soc. 1993, 115, 10714-10721.
67. J.D. Burgess, V.W. Jones, M.D. Porter, M.C. Rhoten, and F.M. Hawkridge, “Scanning Force
Microscopy Images of Cyt c Oxidase Immobilized in an Electrode Supported Lipid BilayerMembrane,” Langmuir 1998, 14(23), 6628-6631.
68. a) D.J. Tobias, W. Mar, J.K. Blasie, and M.L. Klein, “Molecular Dynamics Simulations of a
Protein on Hydrophobic and Hydrophillic Surfaces,” Biophysical Journal 1996, 71, 2933-2941;b) M. Lestelius, B. Liedberg, and P. Tengvall, “In Vitro Plasma Protein Adsorption on ω-Functionalized Alkanethiolate Self-Assembled Monolayers,” Langmuir 1997, 13, 5900-5908; c)G.B. Sigal, C. Bamdad, A. Barberis, J. Stominger, and G.M. Whitesides, Anal. Chem. 1996, 68,490-497; d) M. Mrksich, G.B. Sigal, and G.M. Whitesides, “Surface Plasmon Resonance Permitsin Situ Measurement of Protein Adsorption on Self-Assembled Monolayers of Alkanethiolates onGold,” Langmuir 1995, 11, 4383-4385; e) C.D. Tidwell, S.I. Ertel, and B.D. Ratner, “Endothelial
90
Cell Growth and Protein Adsorption on Terminally Functionalized Self-Assembled Monolayersof Alkanethiolates on Gold,” Langmuir 1997, 13, 3404-3413; f) A.K. Gaigalas and G. Niaura,“Measurement of Electron Transfer Rates between Adsorbed Azurin and a Gold ElectrodeModified with a Hexanethiol Layer,” J. Colloid and Interface Science 1997, 193, 60-70.
69. a) TM. Nahir, R.A. Clark, and E.F. Bowden, “Linear Sweep Voltammetry of Irreversible
Electron Transfer in Surface Confined Species Using the Marcus Theory,” Anal. Chem. 1994, 66,2595-2598; b) TM. Nahir and E.F. Bowden, “The Distribution of Standard Rate Constants for ETBetween Thiol-Modified Gold Electrodes and Adsorbed Cyt c,” J. Electroanal. Chem. 1996,410, 9-13; c) TM. Nahir and E.F. Bowden, “Impedance Spectroscopy of Electroinactive ThiolateFilms Adsorbed on Gold,” Electrochim. Acta 1994, 39, 2347-2352.
70. M.C. Leopold, J.A. Black, and E.F. Bowden, “Cyt c Voltammetry - The Role of the Au
Substrate,” manuscript in preparation. 71. a) J. Wang, L.M. Frostman, and M.D. Ward, J. Phys. Chem. 1992, 96, 5224-5228; b) C.D. Bain
and G.M. Whitesides, Langmuir 1989, 5, 1370-1378; c) S.E. Creager and J. Clarke, Langmuir1994, 10, 3675-3683; d) C.P. Smith and H.S. White, Langmuir 1993, 9, 1-3; W.R. Fawcett, J.Electroanal. Chem. 1994, 378, 117-124; e) K. Hu and A. Bard, “Use of Atomic ForceMicroscopy for the Study of Surface Acid-Base Properties of Carboxylic Acid-Terminated Self-Assembled Monolayers,” Langmuir 1997, 13, 5114-5119; f) .
72. P.T. Kissinger and W.H. Heineman, Eds., In Laboratory Techniques in Electroanalytical
Chemistry, 2nd Ed., Marcel Dekker Inc.: New York, 1996. 73. E Laviron, “General Expression of the Linear Potential Sweep Voltammogram in the Case of
Diffusionless Electrochemical Systems,” J. Electroanal. Chem. 1979, 101, 19-28. 74. The Wordsworth Dictionary of Science and Technology, Wordsworth Editions Ltd.: Denmark,
1995. 75. a) E. Laviron, “Theoretical Study of a Reversible Reaction Followed by a Chemical Reaction in
Thin Layer Linear Potential Sweep Voltammetry,” J. Electroanal. Chem. 1972, 39, 1-23; b) E.Laviron, “Adsorption, Autoinhibition, and Autocatalysis in Polarography and in Linear PotentialSweep Voltammetry,” J. Electroanal. Chem. 1974, 52, 355-393; c) E. Laviron, “A Critical Studyof the Factors Causing the Appearance of Brdicka’s Adsorption Currents - Influence of theInteractions Between the Adsorbed Molecules,” J. Electroanal. Chem. 1975, 63, 245-261.
76. a) R.A. Serway, Physics for Scientists and Engineers, 3rd Edition, Saunders College Publishing:
Philadelphia, 1990; b) R.P. Feynman, R.B. Leighton, and M. Sands, The Feynman Lectures onPhysics, Mainly Electromagnetism and Matter, Volume II, Addison-Wesley Publishing Co.:Reading, Massachusetts, 1964.
77. C. Krause, V. Mirsky, and K.D. Heckmann, “Capacitive Detection of Surfactant Adsorption on
Hydrophobized Gold Electrodes,” Langmuir 1996, 12, 6059-6064. 78. H.O. Finklea, D.A. Snider and J. Fedyk, “Passivation of Pinholes in Octadecanethiol Monolayers
on Gold Electrodes by Electrochemical Polymerization of Phenol,” Langmuir 1990, 6, 371-376.
91
79. a) L. Sun and R.M. Crooks, “Indirect Visualization of Defect Structures Contained Within Self-Assembled Organomercaptan Monolayers: Combined Use of Electrochemistry and ScanningTunneling Microscopy,” Langmuir 1993, 9, 1951-1954 b) S. Creager and K.A. Groat, “Self-Assembled Monolayers in Organic Solvents: Electrochemistry at Alkanethiolate-Coated Gold inPropylene Carbonate,” Langmuir 1993, 9, 3668-3675; c) P. Krysinski and M. Brzostowska-Smolska, “Three Probe Voltammetric Characterization of Octadecanethiol Self-AssembledMonolayer Integrity on Gold Electrodes,” J. Electroanal. Chem. 1997, 424, 61-67; d) E.Saabatani and I. Rubinstein, “Organized Self-Assembling Monolayers on Electrodes. 2.Monolayer-Based Ultramicroelectrodes for the Study of Very Rapid Electrode Kinetics,” J. Phys.Chem. 1987, 91, 6663-6669.
80. J. Lyklema, Colloids Surf. 1984, 10, 33-42.
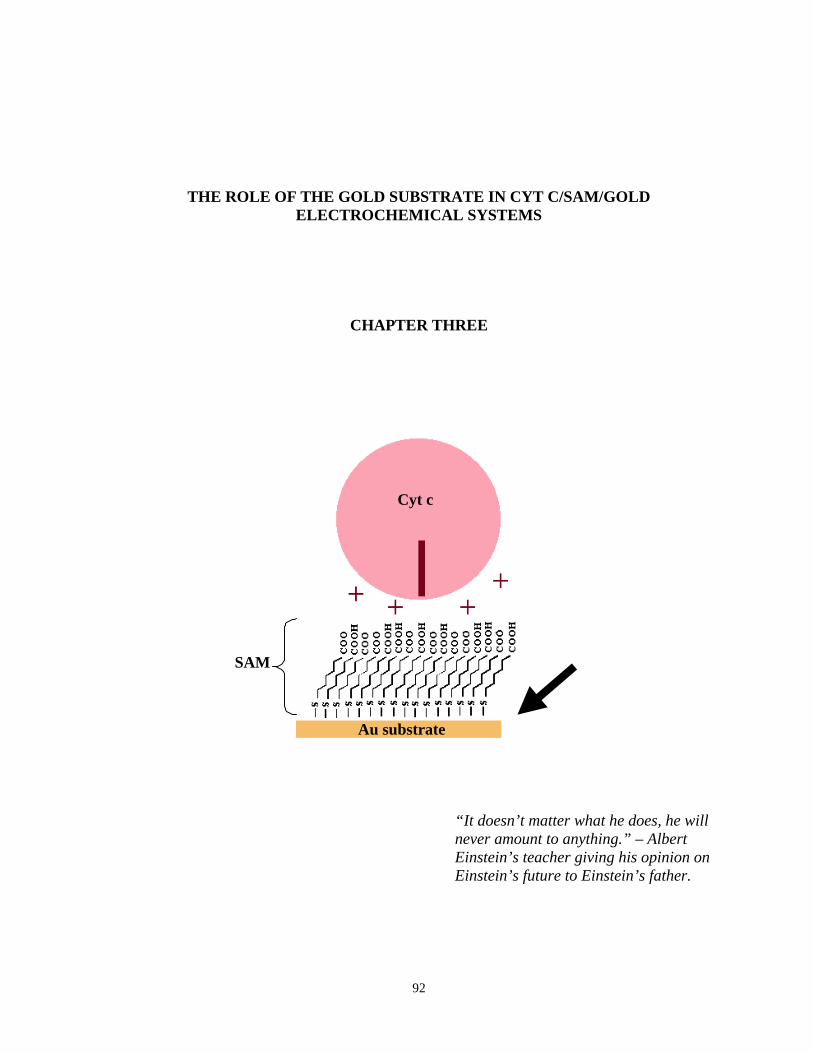
92
THE ROLE OF THE GOLD SUBSTRATE IN CYT C/SAM/GOLDELECTROCHEMICAL SYSTEMS
CHAPTER THREE
“It doesn’t matter what he does, he willnever amount to anything.” – AlbertEinstein’s teacher giving his opinion onEinstein’s future to Einstein’s father.
SAM
Cyt c
Au substrate
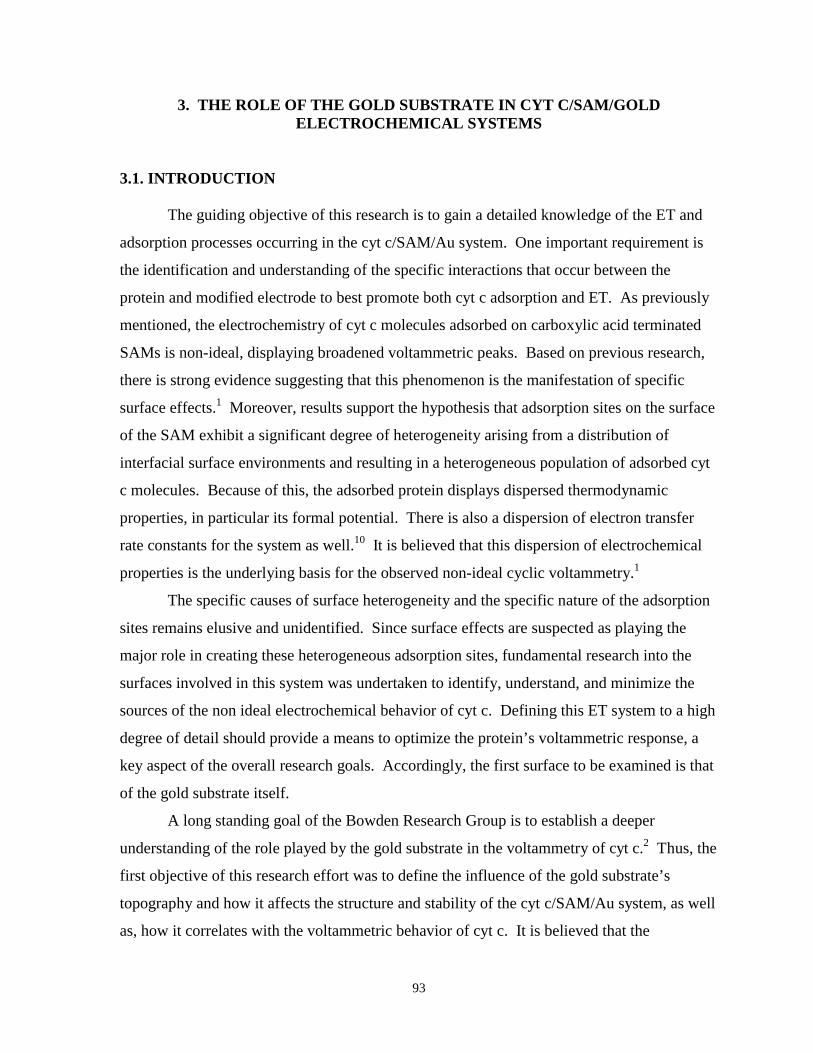
93
3. THE ROLE OF THE GOLD SUBSTRATE IN CYT C/SAM/GOLDELECTROCHEMICAL SYSTEMS
3.1. INTRODUCTION
The guiding objective of this research is to gain a detailed knowledge of the ET and
adsorption processes occurring in the cyt c/SAM/Au system. One important requirement is
the identification and understanding of the specific interactions that occur between the
protein and modified electrode to best promote both cyt c adsorption and ET. As previously
mentioned, the electrochemistry of cyt c molecules adsorbed on carboxylic acid terminated
SAMs is non-ideal, displaying broadened voltammetric peaks. Based on previous research,
there is strong evidence suggesting that this phenomenon is the manifestation of specific
surface effects.1 Moreover, results support the hypothesis that adsorption sites on the surface
of the SAM exhibit a significant degree of heterogeneity arising from a distribution of
interfacial surface environments and resulting in a heterogeneous population of adsorbed cyt
c molecules. Because of this, the adsorbed protein displays dispersed thermodynamic
properties, in particular its formal potential. There is also a dispersion of electron transfer
rate constants for the system as well.10 It is believed that this dispersion of electrochemical
properties is the underlying basis for the observed non-ideal cyclic voltammetry.1
The specific causes of surface heterogeneity and the specific nature of the adsorption
sites remains elusive and unidentified. Since surface effects are suspected as playing the
major role in creating these heterogeneous adsorption sites, fundamental research into the
surfaces involved in this system was undertaken to identify, understand, and minimize the
sources of the non ideal electrochemical behavior of cyt c. Defining this ET system to a high
degree of detail should provide a means to optimize the protein’s voltammetric response, a
key aspect of the overall research goals. Accordingly, the first surface to be examined is that
of the gold substrate itself.
A long standing goal of the Bowden Research Group is to establish a deeper
understanding of the role played by the gold substrate in the voltammetry of cyt c.2 Thus, the
first objective of this research effort was to define the influence of the gold substrate’s
topography and how it affects the structure and stability of the cyt c/SAM/Au system, as well
as, how it correlates with the voltammetric behavior of cyt c. It is believed that the
94
topography of the gold exerts a strong influence on the eventual structure of a SAM formed
on that surface. Gold surface features are sometimes characteristic of the type of gold being
employed and have been known to dictate the defectiveness, consistency, and stability of a
SAM.3 Therefore, included in this objective is an assessment of different gold substrates and
their propensity for forming SAMs with defects. The topographical features of the gold
surfaces and their impact on SAM formation, protein adsorption, and the electrochemical
response of cytochrome c is the primary focus of evaluating the surface effects on this
system.
To address this issue, experiments have been performed on the cyt c/SAM systems
with various types of gold substrates. A previous researcher performed experiments to
generally characterize different types of gold substrates as a means of assessing their use in
electrochemical experiments involving cyt c. The results of those experiments, however,
were never specifically correlated with cyt c electrochemical behavior and left the exact role
of the gold substrate largely undefined.4 Therefore, the experiments comprising this research
effort are more specifically aimed at relating specific gold surface structure to the observed
voltammetry of the cyt c.
This chapter consists of two major, independent research efforts into the role of the
gold substrate in cyt c voltammetry. The first set of experiments focused entirely on
evaporated gold substrates whereas a subsequent investigation involved multiple types of
gold surfaces covering a wide range of topography. Both endeavors produced consistent
results but are presented here as separate parts in the chapter. As will be discussed later, the
second study involving multiple types of gold was undertaken because of potential
contamination complications issues that arose from pretreatment of evaporated gold
substrates. The more recent work involving multiple substrate types and a wider range of
topography is presented first, followed by results from the earlier study of evaporated gold.
The gold substrates used in this study were specifically chosen or prepared to provide
a range of crystallinity, roughness, and topographical features, including gold with extremely
flat, plateau-like regions. After modification with a carboxylic acid terminated SAMs, cyt c
was adsorbed to each of these modified gold substrates and the electrochemical response was
monitored. Each of the gold substrate surfaces was also characterized with both
95
electrochemistry and microscopy techniques. The structure and defectiveness of the SAMs
formed on the different gold substrates were evaluated using electrochemical experiments.
At the time this work was undertaken, the prevailing view of the SAM community
was that atomically smooth surfaces make the most effective templates for creating very
ordered, low defect monolayers.5 Considering the widespread use of inherently rough
substrates in most of the cyt c electrochemistry performed in the Bowden Research Group,
the experiments discussed here were initially carried out with the idea that flat gold surfaces
that allow for the formation of low defect SAMs may minimize or eliminate the non-ideal
aspects of the voltammetry of cyt c. Extremely flat gold surfaces could possibly lead to
decreased adsorption of cyt c molecules at defect sites, thereby minimizing the ubiquitous
peak broadening. Therefore, a considerable effort was focused on the use of atomically flat
gold substrates or the alteration of existing rough gold to a smoother state.
3.1.1. The Topography of Gold Substrates
Typical topographical features of gold surfaces can be categorized according to two
prominent properties: the overall roughness of the surface and the crystal grain composition
of the surface. The roughness of a gold surface is largely influenced by how the substrate
was created and, in come cases, pretreated. Many gold substrates are created by the
formation of a gold layer on a template material, whose roughness can largely dictate the
eventual roughness of the gold overlayer. Some template materials are extremely smooth,
even atomically flat, over most of their surface, allowing for a flat gold surface to be created
whose roughness consists of only gold step edges. A gold step edge is a topographical
feature of gold where the surface “steps up” one gold atom high and, on a larger scale, can
create atomically flat plateaus. The opposite extreme of roughness occurs when the gold
surface is formed on an inherently rough template and results in a rougher terrain across the
surface, usually consisting of rolling hills and sharp peaks of gold.
The second property to consider when dealing with gold substrates is the crystallinity
of the gold at the surface. Gold can exist with one of three low index crystal planes at a
surface: Au(111), Au(110), and Au(100). The lowest energy, and therefore the most stable,
surface is the Au(111) orientation. The Au(100) orientation, on the other hand, is very
unstable and usually exhibits a predisposition to undergo a structural reconstruction to
achieve a lower energy.6 Gold surfaces can be either single crystal in nature, where there is a
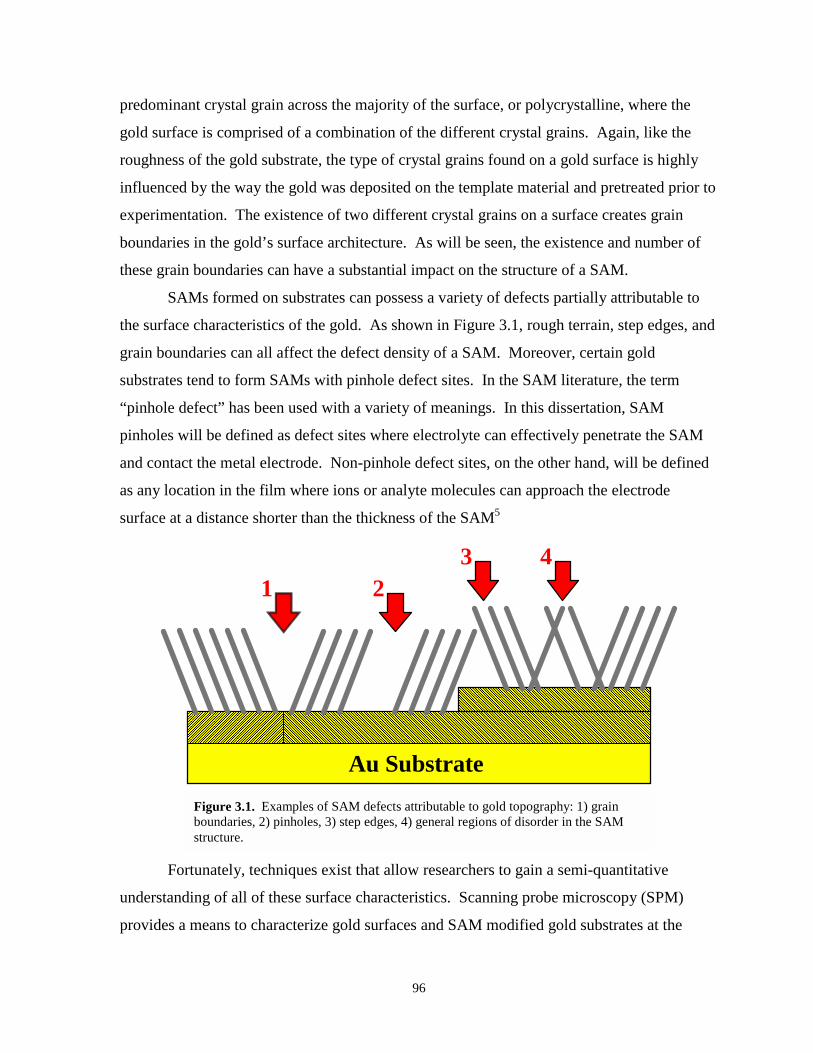
96
predominant crystal grain across the majority of the surface, or polycrystalline, where the
gold surface is comprised of a combination of the different crystal grains. Again, like the
roughness of the gold substrate, the type of crystal grains found on a gold surface is highly
influenced by the way the gold was deposited on the template material and pretreated prior to
experimentation. The existence of two different crystal grains on a surface creates grain
boundaries in the gold’s surface architecture. As will be seen, the existence and number of
these grain boundaries can have a substantial impact on the structure of a SAM.
SAMs formed on substrates can possess a variety of defects partially attributable to
the surface characteristics of the gold. As shown in Figure 3.1, rough terrain, step edges, and
grain boundaries can all affect the defect density of a SAM. Moreover, certain gold
substrates tend to form SAMs with pinhole defect sites. In the SAM literature, the term
“pinhole defect” has been used with a variety of meanings. In this dissertation, SAM
pinholes will be defined as defect sites where electrolyte can effectively penetrate the SAM
and contact the metal electrode. Non-pinhole defect sites, on the other hand, will be defined
as any location in the film where ions or analyte molecules can approach the electrode
surface at a distance shorter than the thickness of the SAM5
1
Au Substrate
���������������������������������������������������������������������������������������������������������������������
���������������������������������������������������������������������������������������������������������������������������������������������������������������������������������������������������������������������������������������������������������������������������������������������������������������������������������������������������������������������������������������������������������������������������������������������������������
��������������������������������������������������������������������������������������������������������������������������������������������������������������
23 4
Figure 3.1. Examples of SAM defects attributable to gold topography: 1) grainboundaries, 2) pinholes, 3) step edges, 4) general regions of disorder in the SAMstructure.
Fortunately, techniques exist that allow researchers to gain a semi-quantitative
understanding of all of these surface characteristics. Scanning probe microscopy (SPM)
provides a means to characterize gold surfaces and SAM modified gold substrates at the
97
molecular level. SPM techniques can assess specific topographical features such as step
edges and SAM pinholes as well as assist in delineating the overall terrain of a surface.
Likewise, specific electrochemical experiments can be designed to identify the crystallinity
of a gold surface, as well as the defectiveness of a SAM formed on a specific gold substrate.
As will be shown in subsequent sections of this chapter, the use of both electrochemistry and
microscopy techniques to substantiate the expected topographical and morphological features
of the different gold substrates is an effective approach to characterization.
3.1.2. Previous Research Into Gold Topography
In spite of the availability of an array of powerful characterization techniques, in-
depth analyses dedicated to comparative studies of gold topography are rare. Some SPM
reports do compare the microscopic features of a variety of different gold substrates and are
the subject of microscopy based reviews.7 SPM literature, however, usually addresses the
topography of gold substrates from a standpoint of what is most beneficial for microscopy
experiments. Gold preparations resulting in flat surfaces with large atomically smooth
plateaus are typically sought for imaging the atomic level surface packing of the gold itself or
for adsorbates residing on the gold surface. While research found in the literature involving
gold substrates often includes a substantial degree of surface characterization, it usually is
limited to only the specific type of gold substrate being used for that particular experiment.
A comparison of the same experiment on several different gold substrates to see if the
topography or pretreatment of the gold influences the results is rarely done. The reasons for
this lack of comparison-based studies appears to be two fold: 1) the high cost of working
with many of the specialized types of gold and 2) the notion of experimental simplicity.
Researchers often tend to settle on a type of gold substrate and surface pretreatment that is
successful for their specific systems and experiments.
Several literature reports have focused on the assembly and structure of self-
assembled monolayers on different types of gold or on gold subjected to different types of
pretreatment procedures.5 Creager and coworkers utilized polycrystalline bulk gold that was
annealed and chemically etched with aqua regia solution. Their research, which involved
studying the inhibition of interfacial ET from redox-active solute at SAMs on gold substrates
of varying roughness, lends support to the notion that SAMs with excellent blocking
characteristics can be formed on polycrystalline gold. Polycrystalline gold, it was
98
determined, is a surface that is rough on the micron scale but is also composed of smoother
planes on a smaller scale. (macroscopically rough vs. microscopically smooth). From this
work, Creager concluded that defectiveness in SAMs correlates strongly to the method used
to prepare the gold substrate for self-assembly and established the importance of surface
roughness and grain boundaries to the quality of the SAMs.3a Likewise, experiments
performed by Guo et al. with long chain methyl-terminated SAMs (HS(CH2)16CH3) on
evaporated gold on mica suggested that SAMs formed on rougher substrates had better
blocking characteristics than those on smoother gold.3b Researchers in Golan’s laboratory,3g
as well as those with Crooks3d created apparent pinhole-free SAMs with superior blocking
behavior on sputtered and evaporated films on glass and mica. Porter’s group traditionally
thermally anneals gold-on-mica films to create well ordered, low defect, SAMs and have
suggested that roughness may be less important for dictating SAM permeability than other
topographical features such as crystallinity.3c Clearly the debate on the influence of gold
topography and morphology on SAM structure is ongoing. Taking this one step further and
studying the effect that gold topography has on the SAM and subsequent adsorbates is a
unique and largely unexplored prospect for research.
3.1.3. Gold Topography and the Cyt c / SAM / Au System
In the case of the cyt c/COOH-SAM/Au system, the Bowden Research Group
established two hypotheses for the role of gold topography in the non-ideal electrochemical
response of cyt c. The first hypothesis was that grains with different crystal faces exposed
resulted in different types of adsorption sites in the SAM itself. This thought is supported by
work of Creager and coworkers that showed in microscopy images that chemically etched
gold surfaces display roughly equal proportions of Au(111) and Au(110).3a Similar results
were obtained for sputter deposited gold film electrodes used in our laboratory prior to
1994.2,4 Thus, the excessive broadness of the cyt c voltammetric peaks may represent the
collective signal of two or more unique populations of protein adsorbed on different crystal
planes. If this hypothesis proved to be correct, more ideal cyt c voltammetry should result
from the use of single crystal gold substrates.
In the second hypothesis, defect sites in the SAM were proposed to give rise to
heterogeneous adsorption and subsequent dispersion of electrochemical properties. The
source of the surface heterogeneity causing the broadened cyt c voltammetry peaks, may be
99
the manifestation of having some cyt c molecules adsorb at defects sites and others adsorb at
highly ordered, non-defective regions of the SAM. Researchers in Chidsey’s laboratory
successfully minimized the non-ideal aspects of the voltammetry of ferrocene-terminated
SAMs by purportedly exchanging electroactive molecules at defect regions with
nonelectroactive methyl-terminated alkanethiols.8 This was done by immersing the
ferrocene-terminated SAM in a solution of methyl-terminated thiol and taking advantage of
the apparently favorable thiol exchange kinetics that exist at defect sites.8,9 This hypothesis
is related to the first in that polycrystalline gold will have a larger contingency of grain
boundaries at the surface and, therefore, a greater propensity for SAM defects. It follows
then, that the defect density of a SAM may indeed have a profound effect on the
electrochemistry of adsorbed cyt c.
3.2 EXPERIMENTAL GOLD – GENERAL CHARACTERISTICS
The gold substrates selected for this study include evaporated gold films, bulk
polycrystalline gold, single crystal gold, and gold epitaxially grown on mica, each of which
is expected to possess unique surface characteristics. Each substrate’s surface characteristics
(topography, crystallinity, etc.), as well as, the typical pretreatment methods applied to them
are described in subsequent sections. Several techniques used to characterize the surfaces are
introduced in the following paragraph.
The overall roughness of each surface, a measurement describing a large area of the
surface, was characterized by an electrochemically determined roughness factor (Rf) and by a
more specific, small surface area, sampled measurement using SPM. Lead underpotential
deposition (Pb - UPD) experiments were performed to evaluate the exposed surface
crystallinity of the gold substrates. Further qualitative evidence for the crystallinity of the
substrates was obtained by evaluating the formation patterns of gold oxide during
voltammetry experiments. Each type of gold surface was also investigated with SPM to
obtain a visual description of the surface. These techniques and the results obtained will be
discussed in greater detail in future sections. The major characteristics and properties of the
four gold substrates, ranging from the molecular level terrain on the surface, to the
mechanical stability and cost of the materials, are summarized in Table 3-1.
100
The results from the SPM experiments are an important part of the description of the
gold substrate’s topography (see Table 3-1) but they are not specifically discussed in this
chapter. SPM imaging of the gold surface and other explorations into the microscopy of the
cyt c/SAM/Au system are the subject of Chapter 5.
3.2.1. Evaporated Gold Thin Films
Evaporated gold substrates have been the predominant electrode material used in the
Bowden Research Group and are used extensively throughout electrochemistry.
Polycrystalline in nature, they are manufactured by evaporating high purity gold onto a glass
mount covered by an adhesive layer of titanium or chromium. Evaporated gold films, as well
as sputter deposited films, are known to have a strong Au(111) character when deposited on a
heated mount of glass, silicon, or mica. Therefore, scientists wishing to perform “single
crystal” experiments sometimes use evaporated gold film substrates as a cheap alternative to
actual bulk Au(111) samples.5 In this lab, electrochemical pretreatment of these mirror
finished gold surfaces has been found to drastically improve the reproducibility of cyt
c/SAM/Au based experiments.10 Literature reports of SPM characterization have described
evaporated gold substrates as inherently rough with “sand-dune” topography prevalent over
most of the surface.7 This is a commonly accepted description of evaporated gold and,
because of this rough terrain, these substrates are seldom used for SPM applications, which
require large, flat areas for imaging. Evaporated gold on glass is relatively inexpensive, but
possesses poor mechanical stability. The thin layer of gold can be easily damaged with
abrasive pretreatment and can be chemically eroded away without much effort. Therefore,
the number and nature of pretreatment methods applicable to these evaporated gold films is
limited. Evaporated gold is usually employed for a single experiment and then discarded.
3.2.2. Bulk Polycrystalline Gold.
This polycrystalline gold material is often referred to as simply bulk gold, gold foil,
or gold wire. For this study, we limit the discussion to traditional gold foil substrates. The
use of this type of bulk gold in both electrochemistry and microscopy is not unfounded,3a,11
but is a rather expensive substrate to purchase. The most common pretreatments for bulk
gold foil found in the literature are polishing and/or abrasive chemical etching in a solution
such as aqua regia (HCl & HNO3 – see Experimental Details). The roughness of these
etched substrates has been described as macroscopically rough and microscopically smooth.
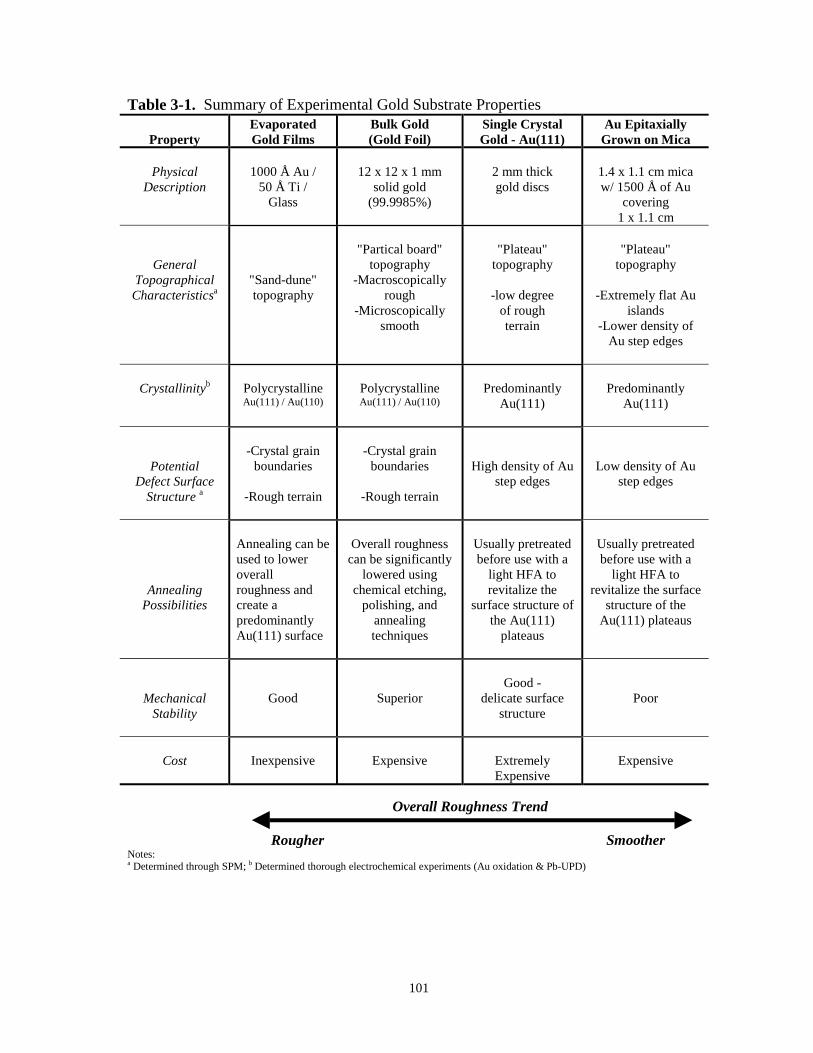
101
Table 3-1. Summary of Experimental Gold Substrate Properties
PropertyEvaporatedGold Films
Bulk Gold(Gold Foil)
Single CrystalGold - Au(111)
Au EpitaxiallyGrown on Mica
PhysicalDescription
1000 Å Au /50 Å Ti /
Glass
12 x 12 x 1 mmsolid gold
(99.9985%)
2 mm thickgold discs
1.4 x 1.1 cm micaw/ 1500 Å of Au
covering1 x 1.1 cm
GeneralTopographicalCharacteristicsa
"Sand-dune"topography
"Partical board"topography
-Macroscopicallyrough
-Microscopicallysmooth
"Plateau"topography
-low degreeof roughterrain
"Plateau"topography
-Extremely flat Auislands
-Lower density ofAu step edges
Crystallinityb PolycrystallineAu(111) / Au(110)
PolycrystallineAu(111) / Au(110)
PredominantlyAu(111)
PredominantlyAu(111)
PotentialDefect Surface
Structure a
-Crystal grainboundaries
-Rough terrain
-Crystal grainboundaries
-Rough terrain
High density of Austep edges
Low density of Austep edges
AnnealingPossibilities
Annealing can beused to loweroverallroughness andcreate apredominantlyAu(111) surface
Overall roughnesscan be significantly
lowered usingchemical etching,
polishing, andannealingtechniques
Usually pretreatedbefore use with a
light HFA torevitalize the
surface structure ofthe Au(111)
plateaus
Usually pretreatedbefore use with a
light HFA torevitalize the surface
structure of theAu(111) plateaus
MechanicalStability
Good SuperiorGood -
delicate surfacestructure
Poor
Cost Inexpensive Expensive ExtremelyExpensive
Expensive
Overall Roughness Trend
Rougher SmootherNotes:a Determined through SPM; b Determined thorough electrochemical experiments (Au oxidation & Pb-UPD)
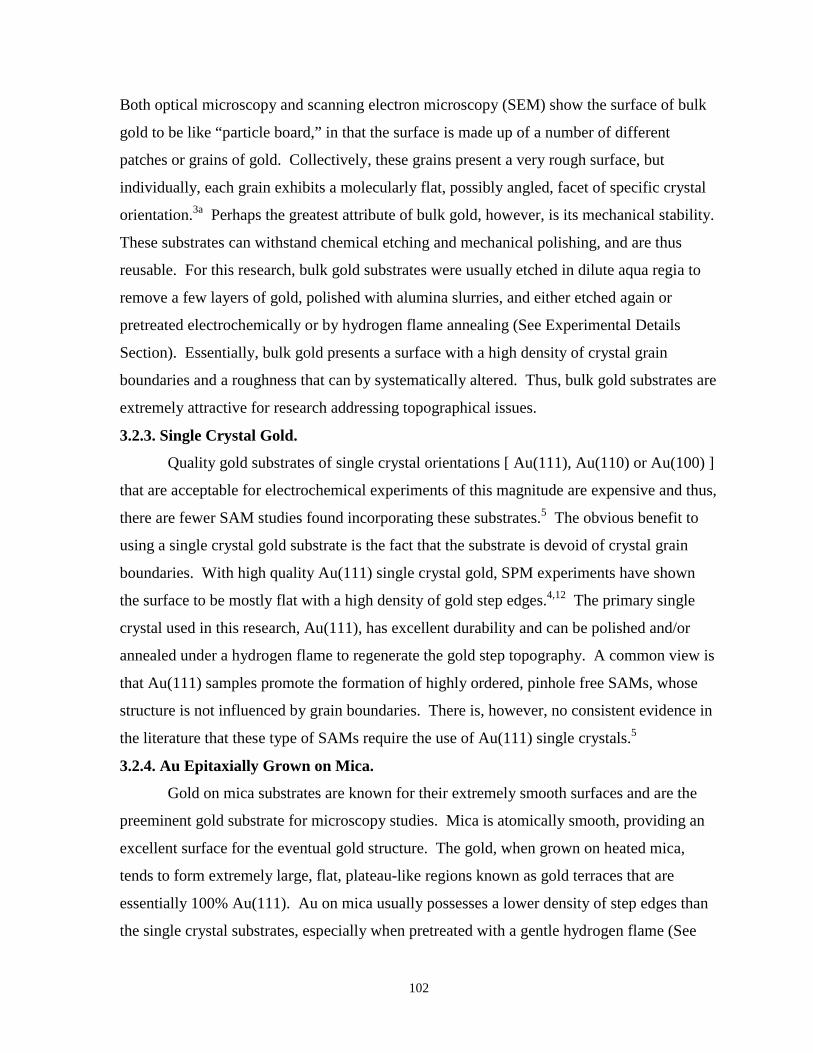
102
Both optical microscopy and scanning electron microscopy (SEM) show the surface of bulk
gold to be like “particle board,” in that the surface is made up of a number of different
patches or grains of gold. Collectively, these grains present a very rough surface, but
individually, each grain exhibits a molecularly flat, possibly angled, facet of specific crystal
orientation.3a Perhaps the greatest attribute of bulk gold, however, is its mechanical stability.
These substrates can withstand chemical etching and mechanical polishing, and are thus
reusable. For this research, bulk gold substrates were usually etched in dilute aqua regia to
remove a few layers of gold, polished with alumina slurries, and either etched again or
pretreated electrochemically or by hydrogen flame annealing (See Experimental Details
Section). Essentially, bulk gold presents a surface with a high density of crystal grain
boundaries and a roughness that can by systematically altered. Thus, bulk gold substrates are
extremely attractive for research addressing topographical issues.
3.2.3. Single Crystal Gold.
Quality gold substrates of single crystal orientations [ Au(111), Au(110) or Au(100) ]
that are acceptable for electrochemical experiments of this magnitude are expensive and thus,
there are fewer SAM studies found incorporating these substrates.5 The obvious benefit to
using a single crystal gold substrate is the fact that the substrate is devoid of crystal grain
boundaries. With high quality Au(111) single crystal gold, SPM experiments have shown
the surface to be mostly flat with a high density of gold step edges.4,12 The primary single
crystal used in this research, Au(111), has excellent durability and can be polished and/or
annealed under a hydrogen flame to regenerate the gold step topography. A common view is
that Au(111) samples promote the formation of highly ordered, pinhole free SAMs, whose
structure is not influenced by grain boundaries. There is, however, no consistent evidence in
the literature that these type of SAMs require the use of Au(111) single crystals.5
3.2.4. Au Epitaxially Grown on Mica.
Gold on mica substrates are known for their extremely smooth surfaces and are the
preeminent gold substrate for microscopy studies. Mica is atomically smooth, providing an
excellent surface for the eventual gold structure. The gold, when grown on heated mica,
tends to form extremely large, flat, plateau-like regions known as gold terraces that are
essentially 100% Au(111). Au on mica usually possesses a lower density of step edges than
the single crystal substrates, especially when pretreated with a gentle hydrogen flame (See
103
Experimental Details). The “Achilles heal” of using Au on mica is its poor mechanical
stability. Au/mica substrates are extremely fragile and can only be placed in the
electrochemical cell a single time. The gold layer tends to crack and peel away from the
brittle mica backing if removed from the cell. Thus, many comparisons of before/after
effects on Au on mica cannot be made. Additionally, Au/mica is expensive when purchased
from a supplier and, as witnessed in our own SPM experiments, usually suffers from a
significant degree of substrate-to-substrate topographical reproducibility, an artifact of the
gold deposition procedure used.25 The following section summarizes the in-house
characterization and pretreatment methods performed on these substrates.
3.3. EXP. GOLD CHARACTERIZATION - ROUGHNESS FACTORS
A general characteristic that can account for the broad spectrum of topographical and
morphological features possible on these gold surfaces is overall roughness. In this case,
roughness is defined as the ratio of the real surface area to the geometric surface area13 and
can be used to relate these unique substrates to each other. Even though the surface
geometry of an electrode, as visible to the naked eye, defines an electrode area, the actual or
real surface area may be greater due to specific topographical features (i.e. step edges, rough
terrain, etc.). Only when the real surface is perfectly flat will its area correspond exactly to
the geometric area, a ratio of one. In order to quantify the surface roughness of each type of
gold or the effect of a pretreatment, the roughness factors (Rf) of the substrates were
measured using an electrochemical technique (Rf, E/C). The Rf-E/C is not a molecularly well-
defined property but is instead an averaged surface property useful for comparative studies.
Additionally, it should be noted that electrochemistry is a population technique, measuring a
specific property over an entire surface area. Because this research is concerned with gold
topography as it relates to SAM formation and eventual cyt c adsorption and ET behavior,
the roughness of a smaller, sampled area of the surface is also of major interest. To provide
this type of information, SPM based roughness factors (Rf-SPM) were also obtained. Each
type of roughness factor and the experimental results of roughness experiments are described
in the following sections.
104
3.3.1. Basis and Background of Rf-E/C
Many different electrochemical methods exist for determining the Rf of a gold
substrate, including the use of diffusional electrochemistry,14 differential double layer
capacitance,15a,b,e,13a and measurement of charge density passed during the reduction of a
monolayer of a specific gold oxide (Au-oxide).13 All current electrochemical methods,
including these three, are subject to certain complications and pitfalls, including
interpretation. Such considerations are not the focus of this research and are not discussed
here in detail; they are, however, clearly outlined, along with other electrochemical methods
for determining Rf, in a review by Trasatti and Petrii.16
In the present work, we have used the Au-oxide reduction charge density method to
determine Rf-E/C for the gold substrates. Our implementation is derived from work by Oesch
and Janata13 and Arvia et al.,17 in which a monolayer of Au-oxide is electrochemically
formed and then reduced by cyclic voltammetry. In spite of its shortcomings, this technique
has been broadly employed to obtain Rf-E/C, for which there is presently no clear, more
accurate, or better alternative method.3h,i,4,18 To obtain the Rf –E/C, the charge density passed
during the reduction of Au-oxide, as determined by integrating the voltammetric peak area of
the reduction wave, is ratioed to a theoretical value of charge density for the reduction of a
monolayer of Au-oxide on an atomically flat surface:
red(theor)
red(exp)E/C-f Q
QR = [Eqn. 3.1]
where Q is the charge density (µC/cm2). The charge passed is assumed to be proportional to
the actual area of the electrode.13a
Stable and reproducible Au-oxide formation and stripping peaks are indicative of a
clean, well defined gold surface.5 Figure 3.2 shows the voltammetry of what is referred to as
a “roughness scan” in dilute (0.1 M) H2SO4. As indicated by this figure, the stripping peak,
with its well-defined baseline, can be easily integrated to obtain the experimental charge
density. Before integrating the stripping peaks, their relative sizes can provide a good
indication of which surface is inherently smoother or rougher. This technique can be applied
to any gold surface after any pretreatment as long as the system isn’t compromised by the
presence of chloride ions which can cause distortion of the baseline in the roughness scans.
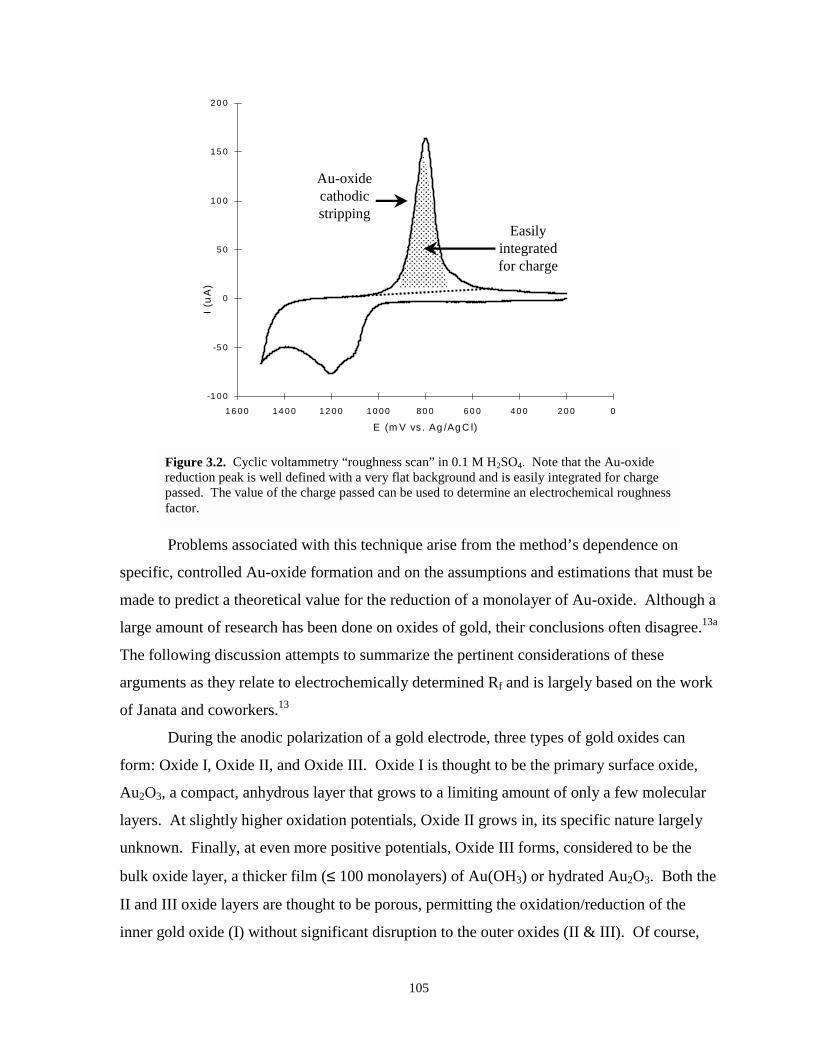
105
��������������������������������������������������������������������������������������������������������������������������������������������������������������������������������������������������������
-1 0 0
-5 0
0
5 0
1 0 0
1 5 0
2 0 0
02 0 04 0 06 0 08 0 01 0 0 01 2 0 01 4 0 01 6 0 0
E (m V vs. Ag /Ag C l)
I (u
A)
Easilyintegratedfor charge
Au-oxidecathodicstripping
Figure 3.2. Cyclic voltammetry “roughness scan” in 0.1 M H2SO4. Note that the Au-oxidereduction peak is well defined with a very flat background and is easily integrated for chargepassed. The value of the charge passed can be used to determine an electrochemical roughnessfactor.
Problems associated with this technique arise from the method’s dependence on
specific, controlled Au-oxide formation and on the assumptions and estimations that must be
made to predict a theoretical value for the reduction of a monolayer of Au-oxide. Although a
large amount of research has been done on oxides of gold, their conclusions often disagree.13a
The following discussion attempts to summarize the pertinent considerations of these
arguments as they relate to electrochemically determined Rf and is largely based on the work
of Janata and coworkers.13
During the anodic polarization of a gold electrode, three types of gold oxides can
form: Oxide I, Oxide II, and Oxide III. Oxide I is thought to be the primary surface oxide,
Au2O3, a compact, anhydrous layer that grows to a limiting amount of only a few molecular
layers. At slightly higher oxidation potentials, Oxide II grows in, its specific nature largely
unknown. Finally, at even more positive potentials, Oxide III forms, considered to be the
bulk oxide layer, a thicker film (≤ 100 monolayers) of Au(OH3) or hydrated Au2O3. Both the
II and III oxide layers are thought to be porous, permitting the oxidation/reduction of the
inner gold oxide (I) without significant disruption to the outer oxides (II & III). Of course,
106
all of these oxides and the potential and extent at which they form are dependent on solution
conditions (pH, electrolyte, etc.).13 In general, an anodic sweep on a gold electrode will first
result in the formation of Au oxide (I). The anodic current will reach a maximum and then
proceed to a minimum. This minimum is believed to signal the completion of a monolayer
of gold oxide where the atomic ratio of gold to oxygen is one. It is thought that at this
potential, just before the onset of the type II oxide, the type I oxide has not yet rearranged to
the Au2O3 structure. The size and shape of these oxidation waves are not well defined,
largely because they are influenced by the composition of the supporting electrolyte,
particularly anions, and the specific condition of the gold surface structure.13 The shape of
the oxide reduction wave, however, is unaffected by these same factors and yields the well-
defined peak utilized for Rf determinations. The charge density passed for the reduction of
this oxygen adatom layer has been used by several workers to estimate surface roughness.19
The relevance of this discussion of gold oxides to roughness factors is that the
presence of the different types of oxides complicates the measurement of Au-oxide
monolayer reduction during roughness scans. Care must be taken to have the switching
potential occur at the minimum discussed earlier, before the onset of the type II oxide. This
minimum is not always well expressed and sometimes must be estimated. Oxidation of the
gold beyond this point may inflate the Au oxide reductive current on the reverse scan
because the Au-O ratio on the surface will no longer be one. In this manner a degree of error
can be introduced into the experimental determination of Qred(exp).13
A second major source of possible error is the theoretical estimation of charge density
passed for an oxygen adlayer, Qred(theor). As alluded to earlier, this theoretical determination
is dependent upon the nature of the Au oxide layer being reduced. That is, the ratio of Au to
oxygen for a perfectly flat oxide monolayer must be estimated for a particular surface in
order to calculate the theoretical charge density (usually estimated to be 1:1). The actual
composition of the Au-oxide layer at any point, however, depends on the extent of oxidation
and is difficult to analyze.
An additional complication to using this type of Rf-E/C is the fact that the surface
concentration of Au atoms varies with the exposed crystallographic planes of the surface.13a
Surfaces are not comprised of only perfect crystal planes. It is unknown how the density of
topographical features, such as step edges, grain boundaries, etching pits, or regions of
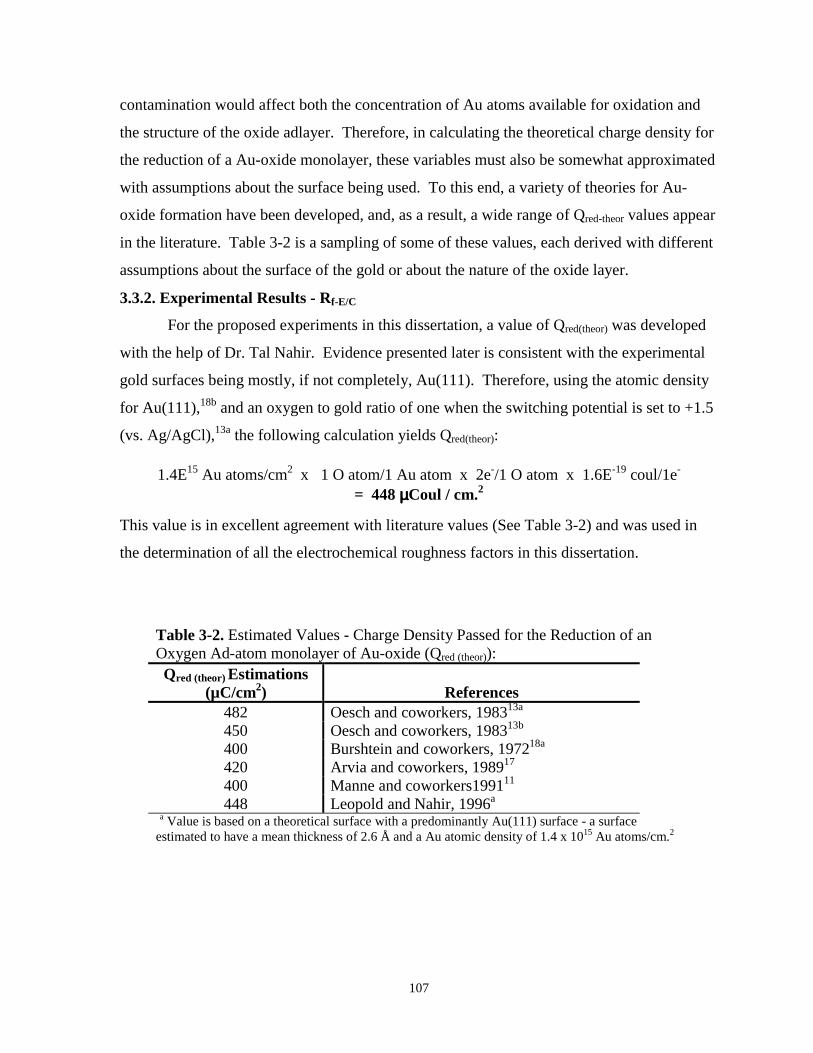
107
contamination would affect both the concentration of Au atoms available for oxidation and
the structure of the oxide adlayer. Therefore, in calculating the theoretical charge density for
the reduction of a Au-oxide monolayer, these variables must also be somewhat approximated
with assumptions about the surface being used. To this end, a variety of theories for Au-
oxide formation have been developed, and, as a result, a wide range of Qred-theor values appear
in the literature. Table 3-2 is a sampling of some of these values, each derived with different
assumptions about the surface of the gold or about the nature of the oxide layer.
3.3.2. Experimental Results - Rf-E/C
For the proposed experiments in this dissertation, a value of Qred(theor) was developed
with the help of Dr. Tal Nahir. Evidence presented later is consistent with the experimental
gold surfaces being mostly, if not completely, Au(111). Therefore, using the atomic density
for Au(111),18b and an oxygen to gold ratio of one when the switching potential is set to +1.5
(vs. Ag/AgCl),13a the following calculation yields Qred(theor):
1.4E15 Au atoms/cm2 x 1 O atom/1 Au atom x 2e-/1 O atom x 1.6E-19 coul/1e-
= 448 µµµµCoul / cm.2
This value is in excellent agreement with literature values (See Table 3-2) and was used in
the determination of all the electrochemical roughness factors in this dissertation.
Table 3-2. Estimated Values - Charge Density Passed for the Reduction of anOxygen Ad-atom monolayer of Au-oxide (Qred (theor)):Qred (theor) Estimations
(µC/cm2) References482 Oesch and coworkers, 198313a
450 Oesch and coworkers, 198313b
400 Burshtein and coworkers, 197218a
420 Arvia and coworkers, 198917
400 Manne and coworkers199111
448 Leopold and Nahir, 1996a
a Value is based on a theoretical surface with a predominantly Au(111) surface - a surfaceestimated to have a mean thickness of 2.6 Å and a Au atomic density of 1.4 x 10¹⁵ Au atoms/cm.2
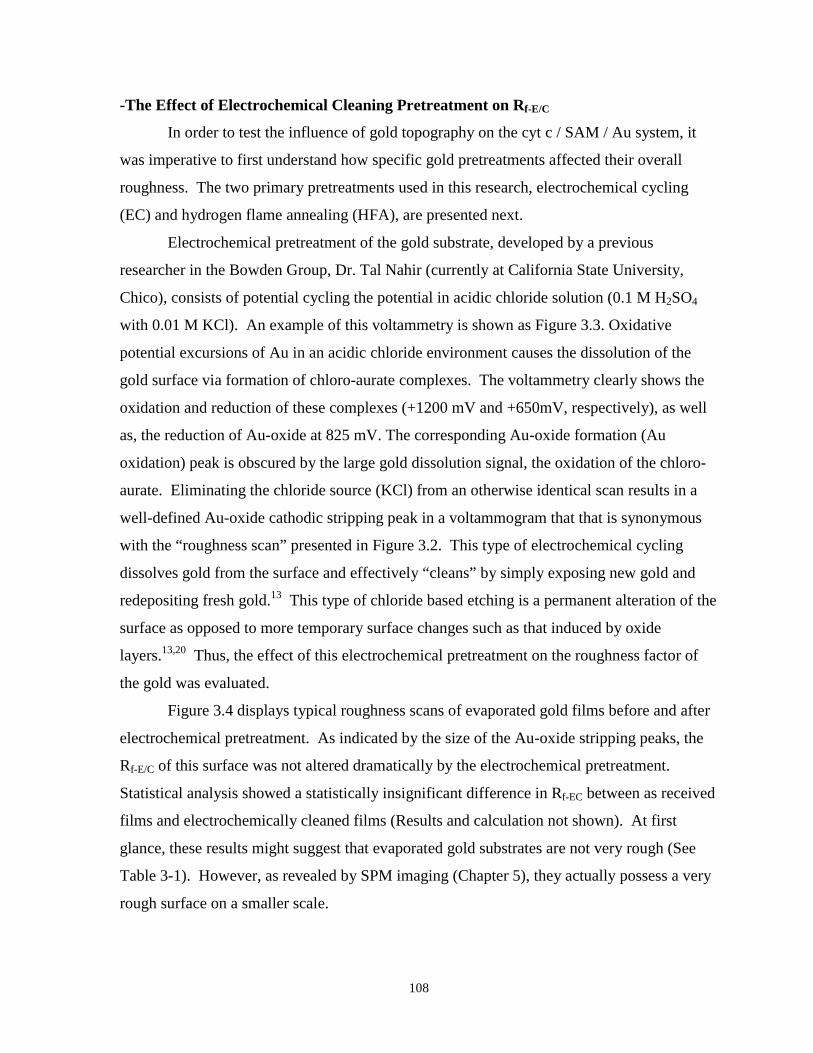
108
-The Effect of Electrochemical Cleaning Pretreatment on Rf-E/C
In order to test the influence of gold topography on the cyt c / SAM / Au system, it
was imperative to first understand how specific gold pretreatments affected their overall
roughness. The two primary pretreatments used in this research, electrochemical cycling
(EC) and hydrogen flame annealing (HFA), are presented next.
Electrochemical pretreatment of the gold substrate, developed by a previous
researcher in the Bowden Group, Dr. Tal Nahir (currently at California State University,
Chico), consists of potential cycling the potential in acidic chloride solution (0.1 M H2SO4
with 0.01 M KCl). An example of this voltammetry is shown as Figure 3.3. Oxidative
potential excursions of Au in an acidic chloride environment causes the dissolution of the
gold surface via formation of chloro-aurate complexes. The voltammetry clearly shows the
oxidation and reduction of these complexes (+1200 mV and +650mV, respectively), as well
as, the reduction of Au-oxide at 825 mV. The corresponding Au-oxide formation (Au
oxidation) peak is obscured by the large gold dissolution signal, the oxidation of the chloro-
aurate. Eliminating the chloride source (KCl) from an otherwise identical scan results in a
well-defined Au-oxide cathodic stripping peak in a voltammogram that that is synonymous
with the “roughness scan” presented in Figure 3.2. This type of electrochemical cycling
dissolves gold from the surface and effectively “cleans” by simply exposing new gold and
redepositing fresh gold.13 This type of chloride based etching is a permanent alteration of the
surface as opposed to more temporary surface changes such as that induced by oxide
layers.13,20 Thus, the effect of this electrochemical pretreatment on the roughness factor of
the gold was evaluated.
Figure 3.4 displays typical roughness scans of evaporated gold films before and after
electrochemical pretreatment. As indicated by the size of the Au-oxide stripping peaks, the
Rf-E/C of this surface was not altered dramatically by the electrochemical pretreatment.
Statistical analysis showed a statistically insignificant difference in Rf-EC between as received
films and electrochemically cleaned films (Results and calculation not shown). At first
glance, these results might suggest that evaporated gold substrates are not very rough (See
Table 3-1). However, as revealed by SPM imaging (Chapter 5), they actually possess a very
rough surface on a smaller scale.
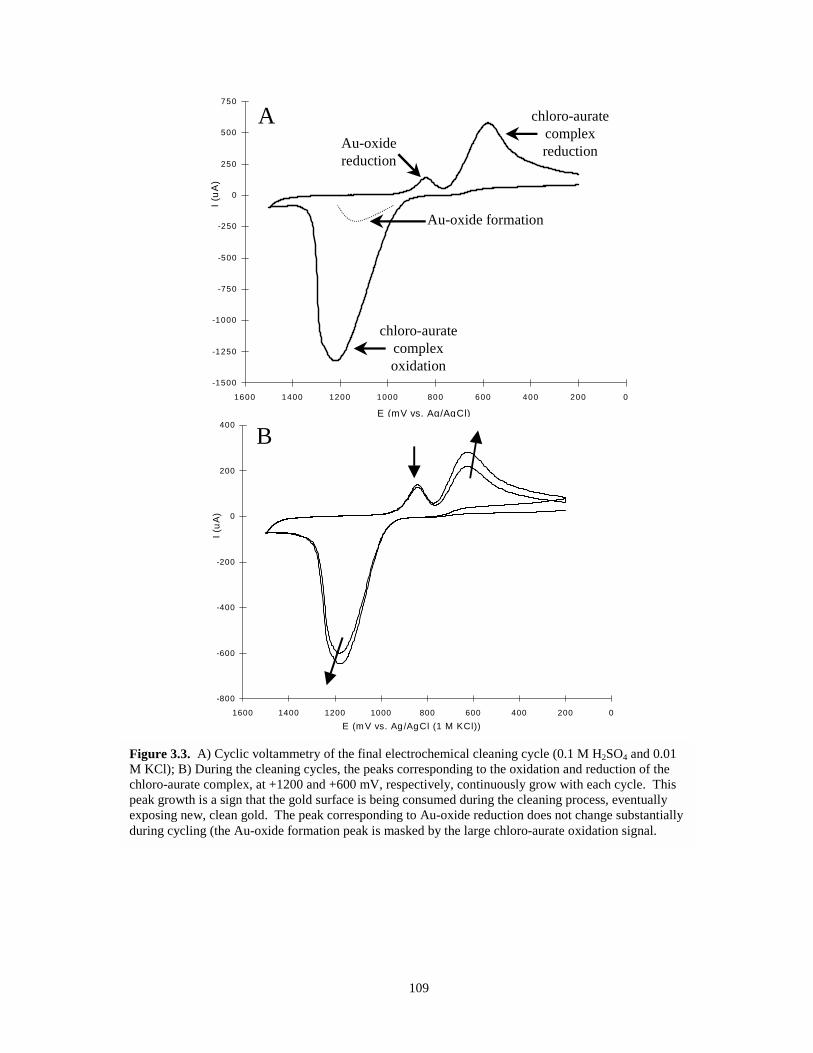
109
-1500
-1250
-1000
-750
-500
-250
0
250
500
750
02004006008001000120014001600
E (mV vs. Ag/AgCl)
I (uA
)
chloro-auratecomplexreduction
chloro-auratecomplexoxidation
Au-oxidereduction
Au-oxide formation
A
-800
-600
-400
-200
0
200
400
02004006008001000120014001600E (mV vs. Ag/AgCl (1 M KCl))
I (uA
)
B
Figure 3.3. A) Cyclic voltammetry of the final electrochemical cleaning cycle (0.1 M H2SO4 and 0.01M KCl); B) During the cleaning cycles, the peaks corresponding to the oxidation and reduction of thechloro-aurate complex, at +1200 and +600 mV, respectively, continuously grow with each cycle. Thispeak growth is a sign that the gold surface is being consumed during the cleaning process, eventuallyexposing new, clean gold. The peak corresponding to Au-oxide reduction does not change substantiallyduring cycling (the Au-oxide formation peak is masked by the large chloro-aurate oxidation signal.
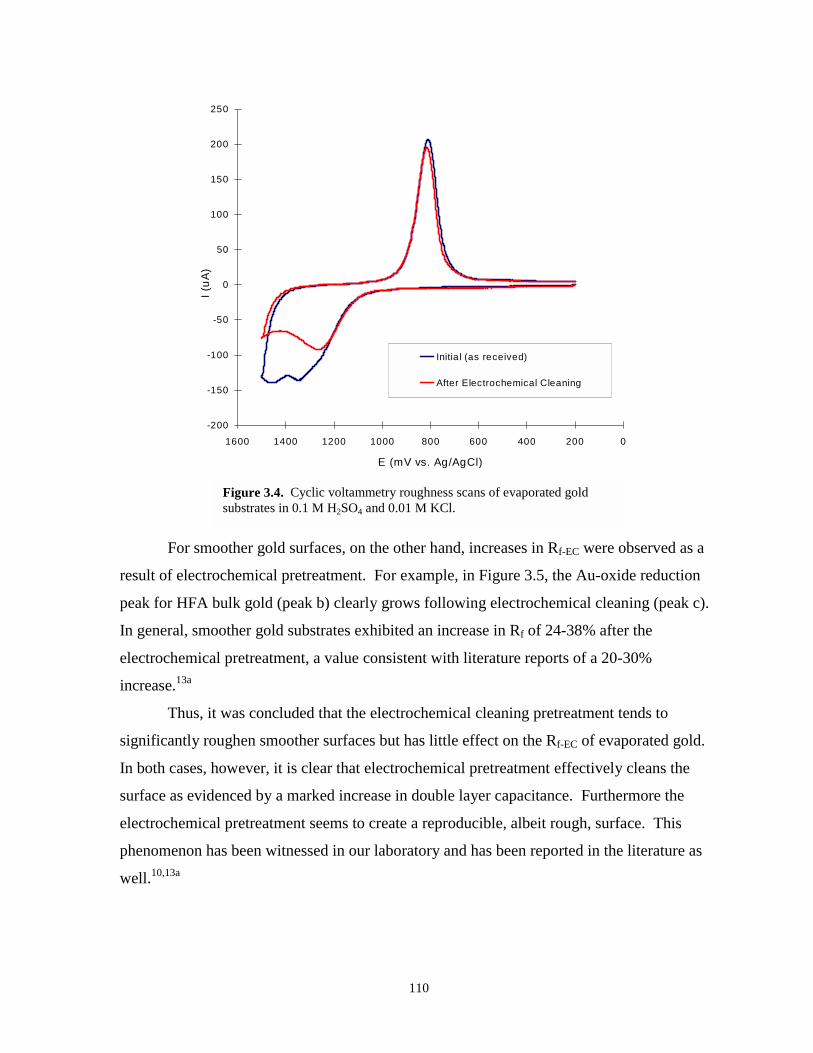
110
-200
-150
-100
-50
0
50
100
150
200
250
02004006008001000120014001600
E (mV vs. Ag/AgCl)
I (uA
)
Initial (as received)
After Electrochemical Cleaning
Figure 3.4. Cyclic voltammetry roughness scans of evaporated goldsubstrates in 0.1 M H2SO4 and 0.01 M KCl.
For smoother gold surfaces, on the other hand, increases in Rf-EC were observed as a
result of electrochemical pretreatment. For example, in Figure 3.5, the Au-oxide reduction
peak for HFA bulk gold (peak b) clearly grows following electrochemical cleaning (peak c).
In general, smoother gold substrates exhibited an increase in Rf of 24-38% after the
electrochemical pretreatment, a value consistent with literature reports of a 20-30%
increase.13a
Thus, it was concluded that the electrochemical cleaning pretreatment tends to
significantly roughen smoother surfaces but has little effect on the Rf-EC of evaporated gold.
In both cases, however, it is clear that electrochemical pretreatment effectively cleans the
surface as evidenced by a marked increase in double layer capacitance. Furthermore the
electrochemical pretreatment seems to create a reproducible, albeit rough, surface. This
phenomenon has been witnessed in our laboratory and has been reported in the literature as
well.10,13a
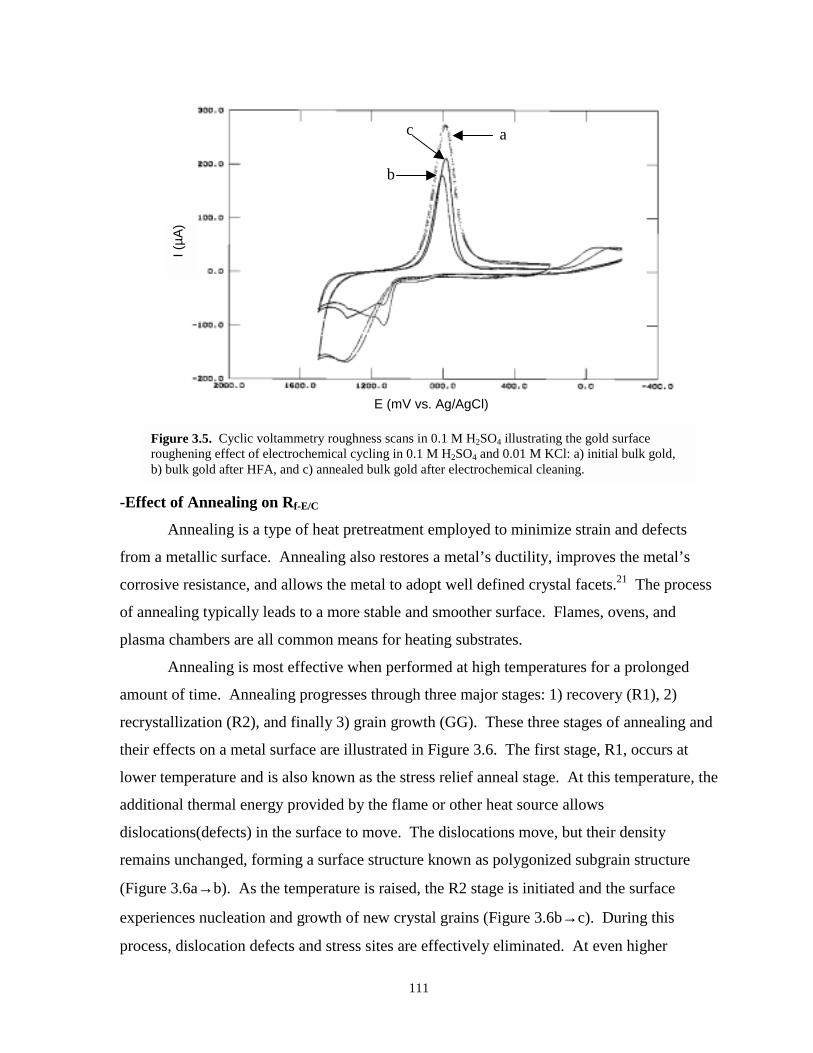
111
E (mV vs. Ag/AgCl)
a
b
c
I (µ A
)
Figure 3.5. Cyclic voltammetry roughness scans in 0.1 M H2SO4 illustrating the gold surfaceroughening effect of electrochemical cycling in 0.1 M H2SO4 and 0.01 M KCl: a) initial bulk gold,b) bulk gold after HFA, and c) annealed bulk gold after electrochemical cleaning.
-Effect of Annealing on Rf-E/C
Annealing is a type of heat pretreatment employed to minimize strain and defects
from a metallic surface. Annealing also restores a metal’s ductility, improves the metal’s
corrosive resistance, and allows the metal to adopt well defined crystal facets.21 The process
of annealing typically leads to a more stable and smoother surface. Flames, ovens, and
plasma chambers are all common means for heating substrates.
Annealing is most effective when performed at high temperatures for a prolonged
amount of time. Annealing progresses through three major stages: 1) recovery (R1), 2)
recrystallization (R2), and finally 3) grain growth (GG). These three stages of annealing and
their effects on a metal surface are illustrated in Figure 3.6. The first stage, R1, occurs at
lower temperature and is also known as the stress relief anneal stage. At this temperature, the
additional thermal energy provided by the flame or other heat source allows
dislocations(defects) in the surface to move. The dislocations move, but their density
remains unchanged, forming a surface structure known as polygonized subgrain structure
(Figure 3.6a→b). As the temperature is raised, the R2 stage is initiated and the surface
experiences nucleation and growth of new crystal grains (Figure 3.6b→c). During this
process, dislocation defects and stress sites are effectively eliminated. At even higher
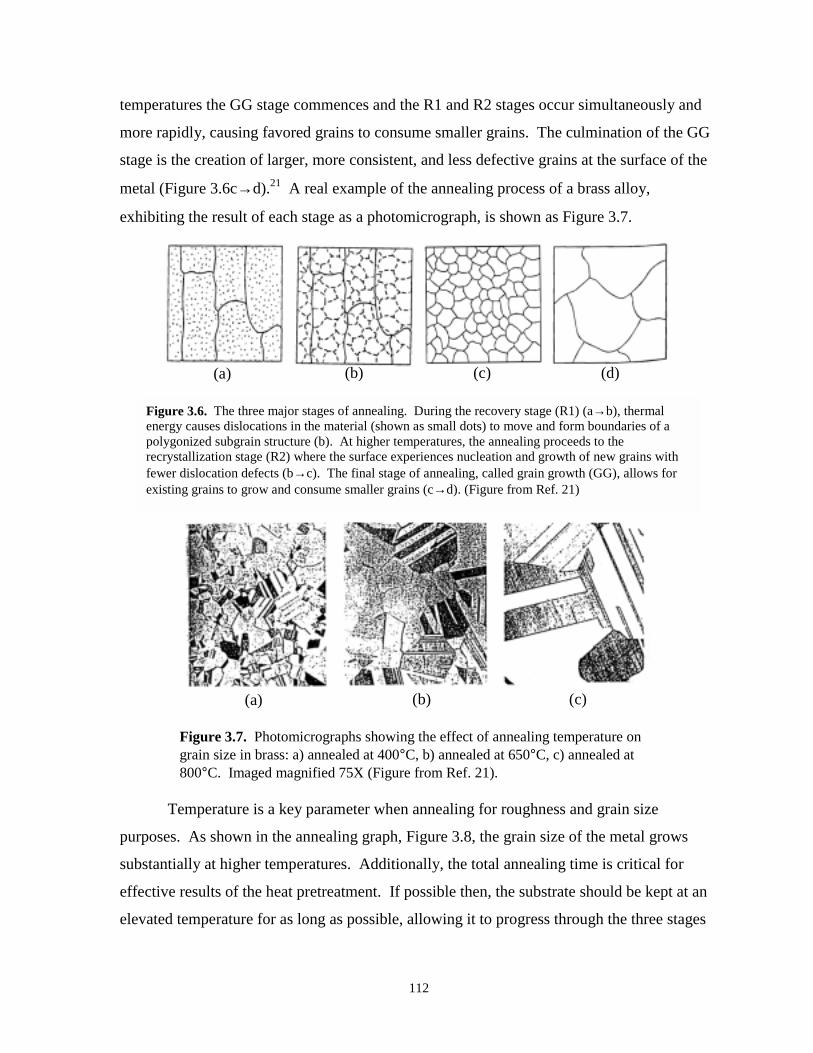
112
temperatures the GG stage commences and the R1 and R2 stages occur simultaneously and
more rapidly, causing favored grains to consume smaller grains. The culmination of the GG
stage is the creation of larger, more consistent, and less defective grains at the surface of the
metal (Figure 3.6c→d).21 A real example of the annealing process of a brass alloy,
exhibiting the result of each stage as a photomicrograph, is shown as Figure 3.7.
(a) (c)(b) (d)
Figure 3.6. The three major stages of annealing. During the recovery stage (R1) (a→b), thermalenergy causes dislocations in the material (shown as small dots) to move and form boundaries of apolygonized subgrain structure (b). At higher temperatures, the annealing proceeds to therecrystallization stage (R2) where the surface experiences nucleation and growth of new grains withfewer dislocation defects (b→c). The final stage of annealing, called grain growth (GG), allows forexisting grains to grow and consume smaller grains (c→d). (Figure from Ref. 21)
(a) (b) (c)
Figure 3.7. Photomicrographs showing the effect of annealing temperature ongrain size in brass: a) annealed at 400°C, b) annealed at 650°C, c) annealed at800°C. Imaged magnified 75X (Figure from Ref. 21).
Temperature is a key parameter when annealing for roughness and grain size
purposes. As shown in the annealing graph, Figure 3.8, the grain size of the metal grows
substantially at higher temperatures. Additionally, the total annealing time is critical for
effective results of the heat pretreatment. If possible then, the substrate should be kept at an
elevated temperature for as long as possible, allowing it to progress through the three stages
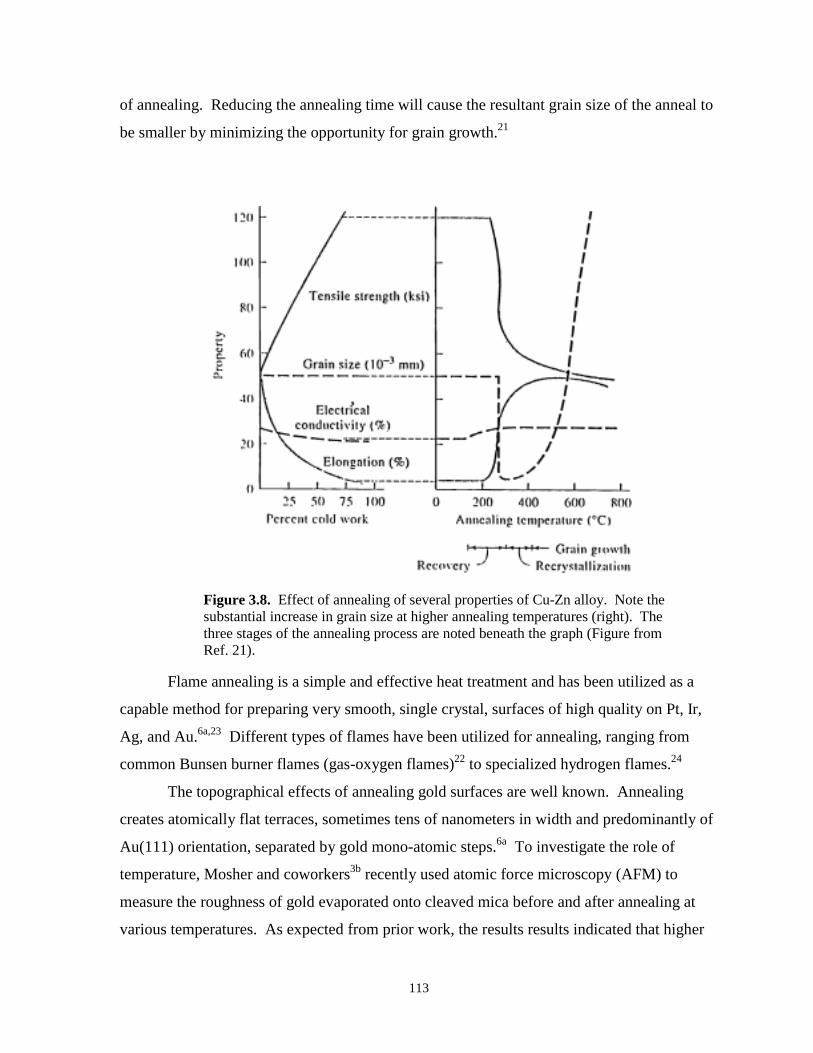
113
of annealing. Reducing the annealing time will cause the resultant grain size of the anneal to
be smaller by minimizing the opportunity for grain growth.21
Figure 3.8. Effect of annealing of several properties of Cu-Zn alloy. Note thesubstantial increase in grain size at higher annealing temperatures (right). Thethree stages of the annealing process are noted beneath the graph (Figure fromRef. 21).
Flame annealing is a simple and effective heat treatment and has been utilized as a
capable method for preparing very smooth, single crystal, surfaces of high quality on Pt, Ir,
Ag, and Au.6a,23 Different types of flames have been utilized for annealing, ranging from
common Bunsen burner flames (gas-oxygen flames)22 to specialized hydrogen flames.24
The topographical effects of annealing gold surfaces are well known. Annealing
creates atomically flat terraces, sometimes tens of nanometers in width and predominantly of
Au(111) orientation, separated by gold mono-atomic steps.6a To investigate the role of
temperature, Mosher and coworkers3b recently used atomic force microscopy (AFM) to
measure the roughness of gold evaporated onto cleaved mica before and after annealing at
various temperatures. As expected from prior work, the results results indicated that higher
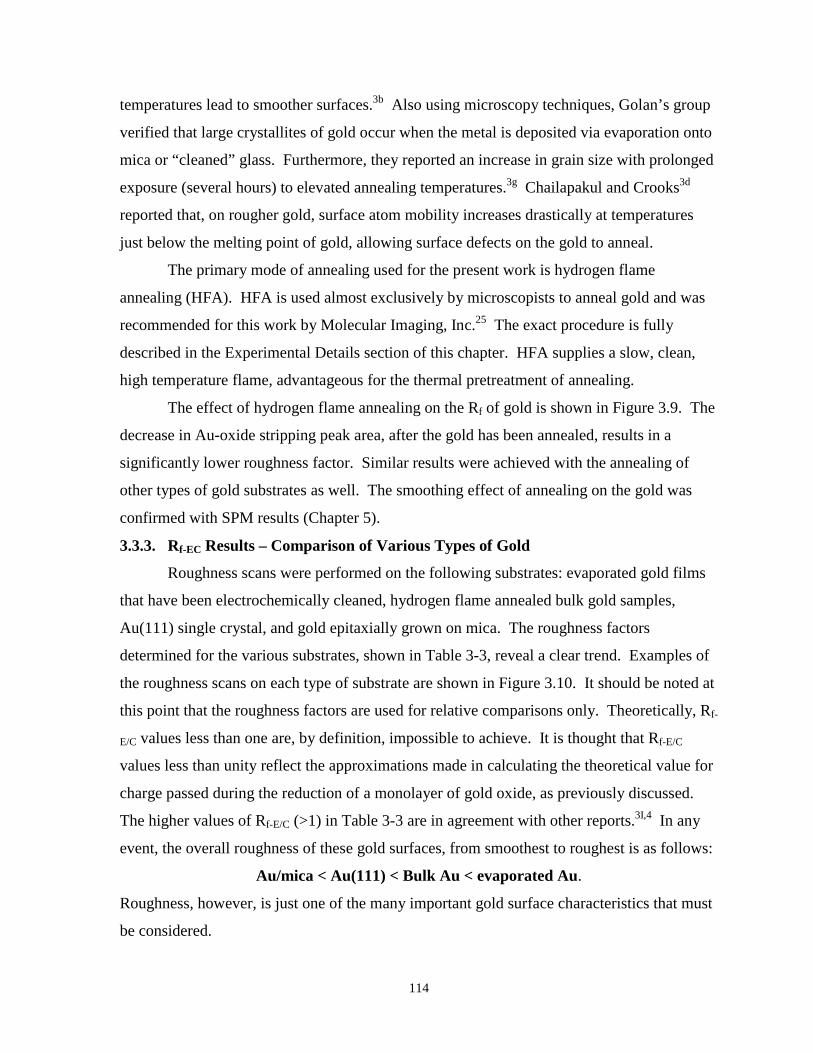
114
temperatures lead to smoother surfaces.3b Also using microscopy techniques, Golan’s group
verified that large crystallites of gold occur when the metal is deposited via evaporation onto
mica or “cleaned” glass. Furthermore, they reported an increase in grain size with prolonged
exposure (several hours) to elevated annealing temperatures.3g Chailapakul and Crooks3d
reported that, on rougher gold, surface atom mobility increases drastically at temperatures
just below the melting point of gold, allowing surface defects on the gold to anneal.
The primary mode of annealing used for the present work is hydrogen flame
annealing (HFA). HFA is used almost exclusively by microscopists to anneal gold and was
recommended for this work by Molecular Imaging, Inc.25 The exact procedure is fully
described in the Experimental Details section of this chapter. HFA supplies a slow, clean,
high temperature flame, advantageous for the thermal pretreatment of annealing.
The effect of hydrogen flame annealing on the Rf of gold is shown in Figure 3.9. The
decrease in Au-oxide stripping peak area, after the gold has been annealed, results in a
significantly lower roughness factor. Similar results were achieved with the annealing of
other types of gold substrates as well. The smoothing effect of annealing on the gold was
confirmed with SPM results (Chapter 5).
3.3.3. Rf-EC Results – Comparison of Various Types of Gold
Roughness scans were performed on the following substrates: evaporated gold films
that have been electrochemically cleaned, hydrogen flame annealed bulk gold samples,
Au(111) single crystal, and gold epitaxially grown on mica. The roughness factors
determined for the various substrates, shown in Table 3-3, reveal a clear trend. Examples of
the roughness scans on each type of substrate are shown in Figure 3.10. It should be noted at
this point that the roughness factors are used for relative comparisons only. Theoretically, Rf-
E/C values less than one are, by definition, impossible to achieve. It is thought that Rf-E/C
values less than unity reflect the approximations made in calculating the theoretical value for
charge passed during the reduction of a monolayer of gold oxide, as previously discussed.
The higher values of Rf-E/C (>1) in Table 3-3 are in agreement with other reports.3I,4 In any
event, the overall roughness of these gold surfaces, from smoothest to roughest is as follows:
Au/mica < Au(111) < Bulk Au < evaporated Au.
Roughness, however, is just one of the many important gold surface characteristics that must
be considered.
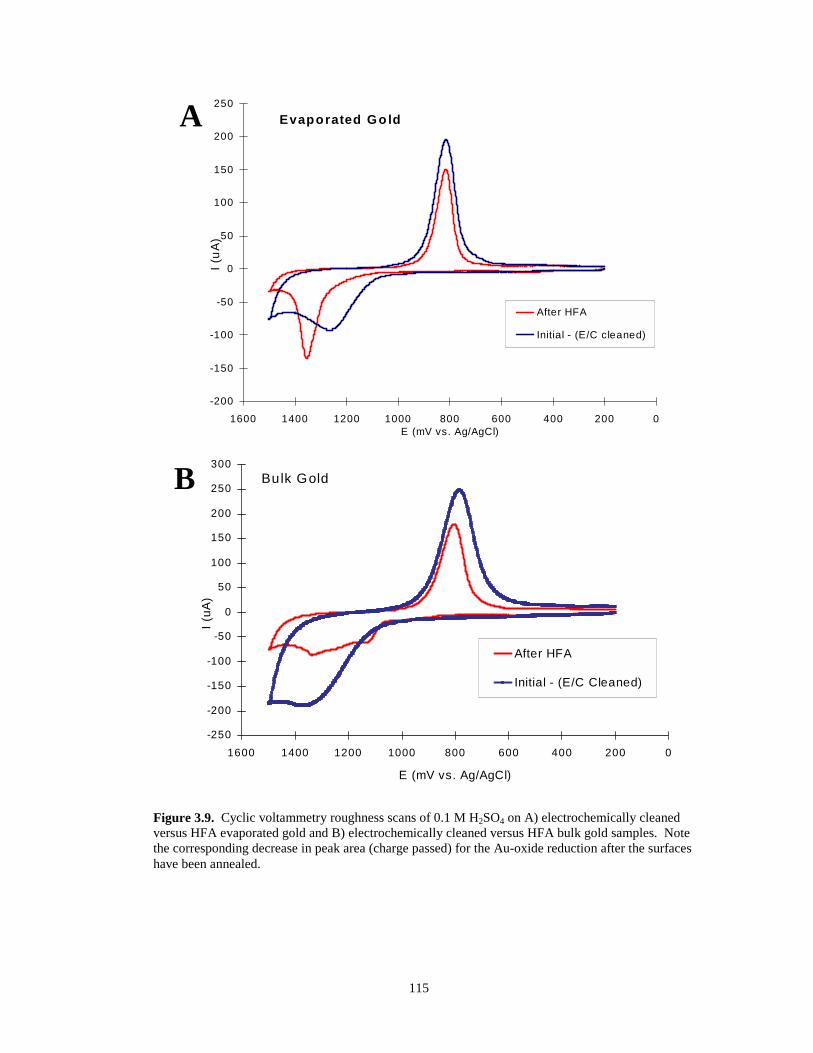
115
Evaporated Go ld
-200
-150
-100
-50
0
50
100
150
200
250
02004006008001000120014001600E (mV vs. Ag/AgCl)
I (uA
)
After HFA
Initial - (E/C cleaned)
Bulk Gold
-250
-200
-150
-100
-50
0
50
100
150
200
250
300
02004006008001000120014001600
E (mV vs. Ag/AgCl)
I (uA
)
After HFA
Initial - (E/C Cleaned)
A
B
Figure 3.9. Cyclic voltammetry roughness scans of 0.1 M H2SO4 on A) electrochemically cleanedversus HFA evaporated gold and B) electrochemically cleaned versus HFA bulk gold samples. Notethe corresponding decrease in peak area (charge passed) for the Au-oxide reduction after the surfaceshave been annealed.
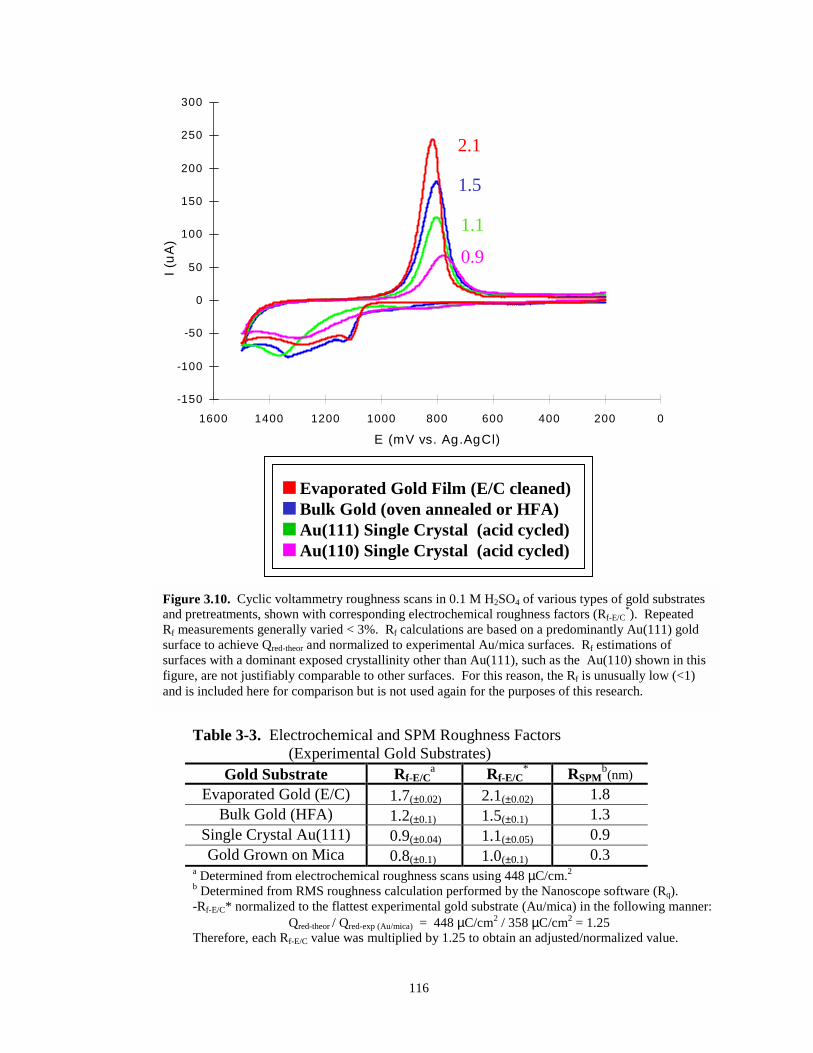
116
-150
-100
-50
0
50
100
150
200
250
300
02004006008001000120014001600
E (mV vs. Ag.AgCl)
I (uA
)2.1
1.5
1.1
0.9
■ Evaporated Gold Film (E/C cleaned)■ Bulk Gold (oven annealed or HFA)■ Au(111) Single Crystal (acid cycled)■ Au(110) Single Crystal (acid cycled)
Figure 3.10. Cyclic voltammetry roughness scans in 0.1 M H2SO4 of various types of gold substratesand pretreatments, shown with corresponding electrochemical roughness factors (Rf-E/C
*). RepeatedRf measurements generally varied < 3%. Rf calculations are based on a predominantly Au(111) goldsurface to achieve Qred-theor and normalized to experimental Au/mica surfaces. Rf estimations ofsurfaces with a dominant exposed crystallinity other than Au(111), such as the Au(110) shown in thisfigure, are not justifiably comparable to other surfaces. For this reason, the Rf is unusually low (<1)and is included here for comparison but is not used again for the purposes of this research.
Table 3-3. Electrochemical and SPM Roughness Factors(Experimental Gold Substrates)
Gold Substrate Rf-E/Ca Rf-E/C
* RSPMb(nm)
Evaporated Gold (E/C) 1.7(±0.02) 2.1(±0.02) 1.8Bulk Gold (HFA) 1.2(±0.1) 1.5(±0.1) 1.3
Single Crystal Au(111) 0.9(±0.04) 1.1(±0.05) 0.9Gold Grown on Mica 0.8(±0.1) 1.0(±0.1) 0.3
a Determined from electrochemical roughness scans using 448 µC/cm.2b Determined from RMS roughness calculation performed by the Nanoscope software (Rq).-Rf-E/C* normalized to the flattest experimental gold substrate (Au/mica) in the following manner:
Qred-theor / Qred-exp (Au/mica) = 448 µC/cm2 / 358 µC/cm2 = 1.25Therefore, each Rf-E/C value was multiplied by 1.25 to obtain an adjusted/normalized value.
117
3.3.4. SPM Roughness Factors (Rf-SPM)
Roughness factors based on microscopy images of the experimental gold surfaces are
derived from the actual current feedback of the SPM experiments. For a designated area of
the surface, the Nanoscope software will calculate a root mean square (RMS) roughness
known as Rq. RMS is a measure of the vertical standard deviation (z direction) of a plane
from the mean of that plane based on the values of each point’s z coordinate. RMS
roughness is further described by an equation for Rq given in the Experimental Details of this
chapter. For the purposes of this work, Rq is referred to as Rf-SPM. Areas of approximately
200-400 square nanometers were selected for mean roughness calculations. Examples of
some of the images and the selected areas of the surfaces used for the determination of Rf-SPM
can be found in Chapter 5. The results of these SPM based roughness factors are shown in
Table 3-3 for various gold substrates and are in agreement with the trend found for Rf-E/C.
3.4 EXPERIMENTAL GOLD CHARACTERIZATION - CRYSTALLINITY
As previously mentioned, gold typically exists in crystalline grains of three low index
surface structures: Au(111), Au(110), and Au(100). If the gold is polycrystalline, the surface
will have a significant population of grain boundaries. Grain boundaries, in turn, can serve
as loci for potential defect sites in SAMs formed on the gold. Therefore, experiments were
performed to characterize the crystallinity of the gold substrates.
3.4.1. Gold Oxide Formation and Crystallinity
Roughness scans in dilute sulfuric acid can provide a qualitative assessment of the
exposed crystal planes on the gold surface. Gold oxide forms distinctly on the three different
crystal faces of gold.17 Therefore, Au-oxide formation yields multiple peaks, it can be
inferred that the surface is polycrystalline. On the other hand, if Au oxidation yields a single,
sharp oxidation peak, a single crystal orientation dominates the surface. An example of this
behavior is shown in Figure 3.11 where multiple Au-oxide peaks appear for a polycrystalline
electrode but are replaced by a single sharp peak after annealing. Annealing is a common
technique used to induce gold rearrangement to the Au(111) orientation and, therefore, a
sharpening of the Au oxidation peak is expected. One exception to this trend, however, was
the annealed bulk gold which was resistant to a complete rearrangement to Au(111) upon
annealing (compare the Au oxidation peaks in Figure 3.11 to those of Figure 3.9). Extended
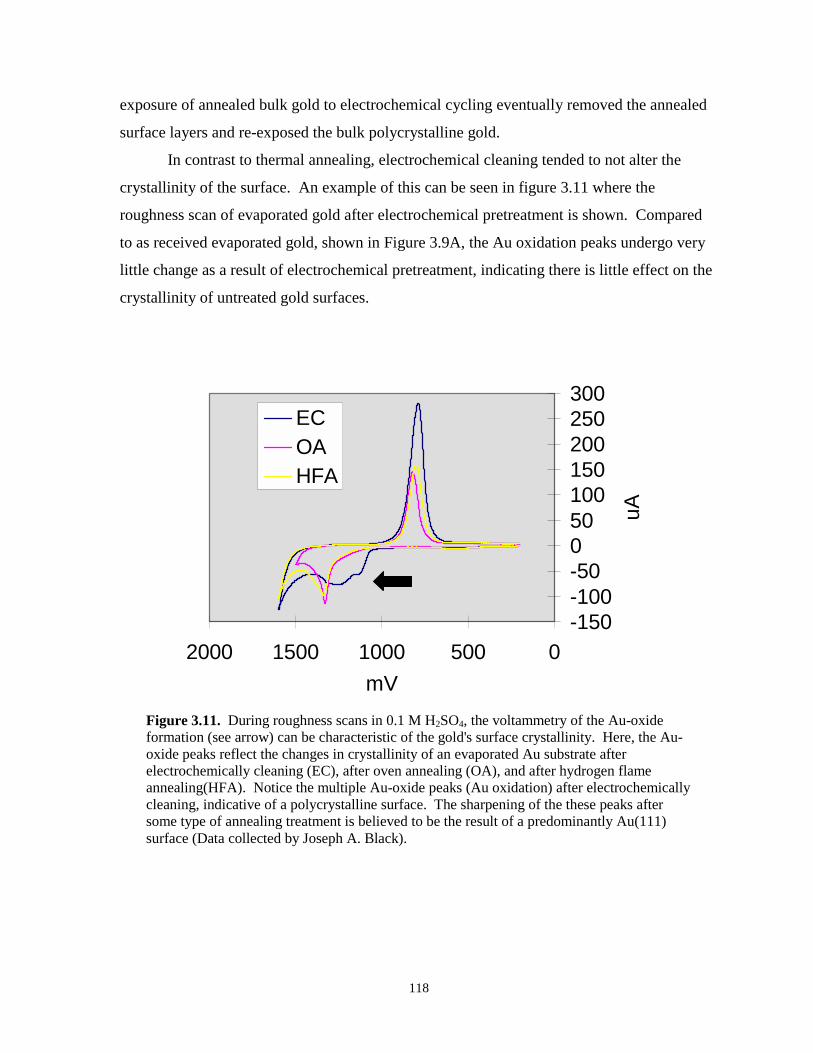
118
exposure of annealed bulk gold to electrochemical cycling eventually removed the annealed
surface layers and re-exposed the bulk polycrystalline gold.
In contrast to thermal annealing, electrochemical cleaning tended to not alter the
crystallinity of the surface. An example of this can be seen in figure 3.11 where the
roughness scan of evaporated gold after electrochemical pretreatment is shown. Compared
to as received evaporated gold, shown in Figure 3.9A, the Au oxidation peaks undergo very
little change as a result of electrochemical pretreatment, indicating there is little effect on the
crystallinity of untreated gold surfaces.
-150-100-50050100150200250300
0500100015002000mV
uA
ECOAHFA
Figure 3.11. During roughness scans in 0.1 M H2SO4, the voltammetry of the Au-oxideformation (see arrow) can be characteristic of the gold's surface crystallinity. Here, the Au-oxide peaks reflect the changes in crystallinity of an evaporated Au substrate afterelectrochemically cleaning (EC), after oven annealing (OA), and after hydrogen flameannealing(HFA). Notice the multiple Au-oxide peaks (Au oxidation) after electrochemicallycleaning, indicative of a polycrystalline surface. The sharpening of the these peaks aftersome type of annealing treatment is believed to be the result of a predominantly Au(111)surface (Data collected by Joseph A. Black).
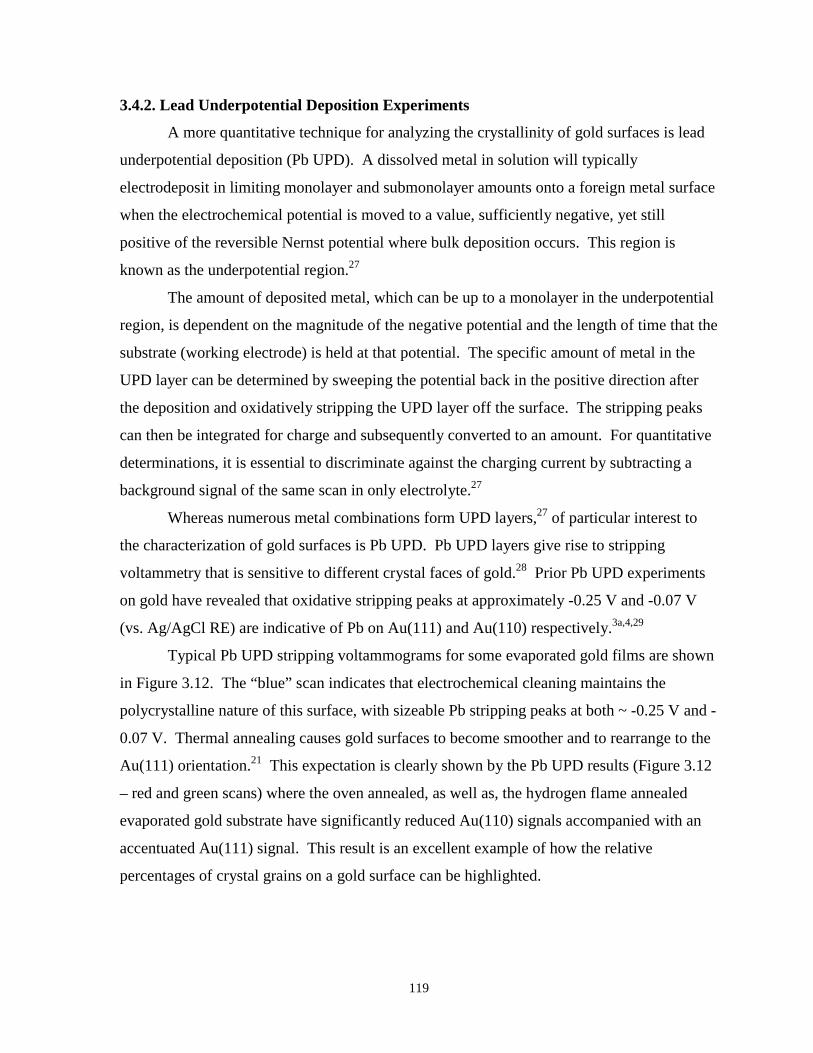
119
3.4.2. Lead Underpotential Deposition Experiments
A more quantitative technique for analyzing the crystallinity of gold surfaces is lead
underpotential deposition (Pb UPD). A dissolved metal in solution will typically
electrodeposit in limiting monolayer and submonolayer amounts onto a foreign metal surface
when the electrochemical potential is moved to a value, sufficiently negative, yet still
positive of the reversible Nernst potential where bulk deposition occurs. This region is
known as the underpotential region.27
The amount of deposited metal, which can be up to a monolayer in the underpotential
region, is dependent on the magnitude of the negative potential and the length of time that the
substrate (working electrode) is held at that potential. The specific amount of metal in the
UPD layer can be determined by sweeping the potential back in the positive direction after
the deposition and oxidatively stripping the UPD layer off the surface. The stripping peaks
can then be integrated for charge and subsequently converted to an amount. For quantitative
determinations, it is essential to discriminate against the charging current by subtracting a
background signal of the same scan in only electrolyte.27
Whereas numerous metal combinations form UPD layers,27 of particular interest to
the characterization of gold surfaces is Pb UPD. Pb UPD layers give rise to stripping
voltammetry that is sensitive to different crystal faces of gold.28 Prior Pb UPD experiments
on gold have revealed that oxidative stripping peaks at approximately -0.25 V and -0.07 V
(vs. Ag/AgCl RE) are indicative of Pb on Au(111) and Au(110) respectively.3a,4,29
Typical Pb UPD stripping voltammograms for some evaporated gold films are shown
in Figure 3.12. The “blue” scan indicates that electrochemical cleaning maintains the
polycrystalline nature of this surface, with sizeable Pb stripping peaks at both ~ -0.25 V and -
0.07 V. Thermal annealing causes gold surfaces to become smoother and to rearrange to the
Au(111) orientation.21 This expectation is clearly shown by the Pb UPD results (Figure 3.12
– red and green scans) where the oven annealed, as well as, the hydrogen flame annealed
evaporated gold substrate have significantly reduced Au(110) signals accompanied with an
accentuated Au(111) signal. This result is an excellent example of how the relative
percentages of crystal grains on a gold surface can be highlighted.
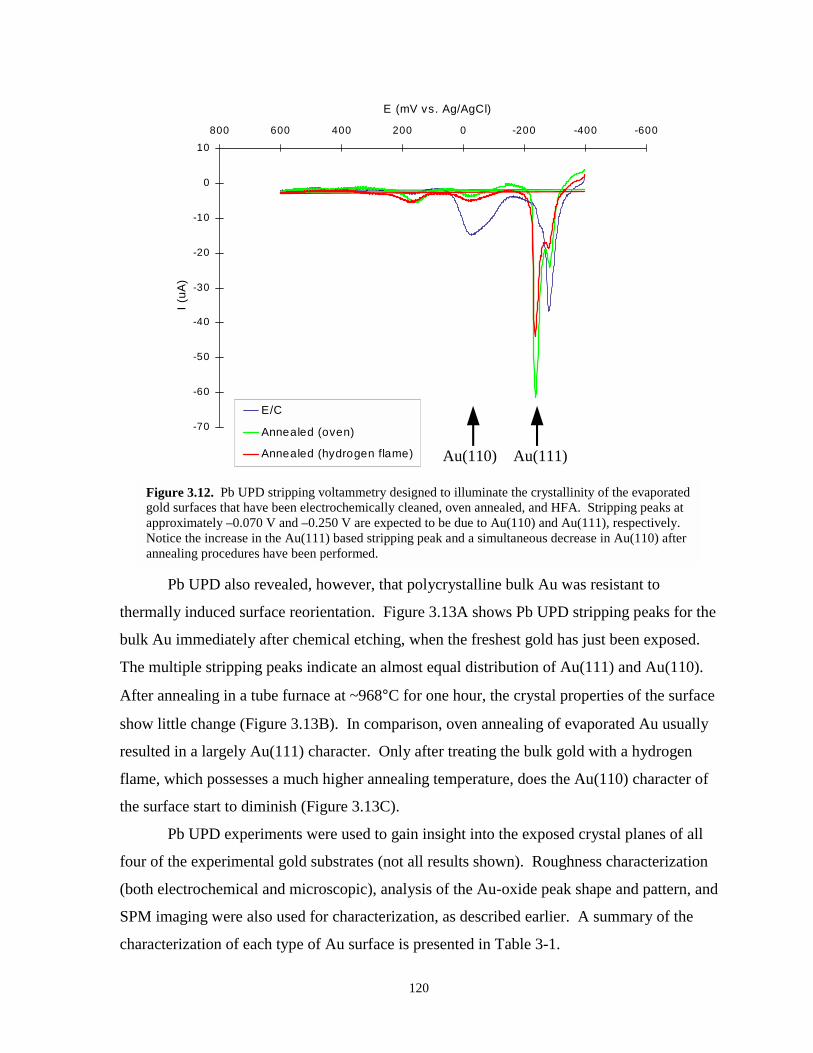
120
-70
-60
-50
-40
-30
-20
-10
0
10-600-400-2000200400600800
E (mV vs. Ag/AgCl)
I (uA
)
E/C
Annealed (oven)
Annealed (hydrogen flame) Au(110) Au(111)
Figure 3.12. Pb UPD stripping voltammetry designed to illuminate the crystallinity of the evaporatedgold surfaces that have been electrochemically cleaned, oven annealed, and HFA. Stripping peaks atapproximately –0.070 V and –0.250 V are expected to be due to Au(110) and Au(111), respectively.Notice the increase in the Au(111) based stripping peak and a simultaneous decrease in Au(110) afterannealing procedures have been performed.
Pb UPD also revealed, however, that polycrystalline bulk Au was resistant to
thermally induced surface reorientation. Figure 3.13A shows Pb UPD stripping peaks for the
bulk Au immediately after chemical etching, when the freshest gold has just been exposed.
The multiple stripping peaks indicate an almost equal distribution of Au(111) and Au(110).
After annealing in a tube furnace at ~968°C for one hour, the crystal properties of the surface
show little change (Figure 3.13B). In comparison, oven annealing of evaporated Au usually
resulted in a largely Au(111) character. Only after treating the bulk gold with a hydrogen
flame, which possesses a much higher annealing temperature, does the Au(110) character of
the surface start to diminish (Figure 3.13C).
Pb UPD experiments were used to gain insight into the exposed crystal planes of all
four of the experimental gold substrates (not all results shown). Roughness characterization
(both electrochemical and microscopic), analysis of the Au-oxide peak shape and pattern, and
SPM imaging were also used for characterization, as described earlier. A summary of the
characterization of each type of Au surface is presented in Table 3-1.
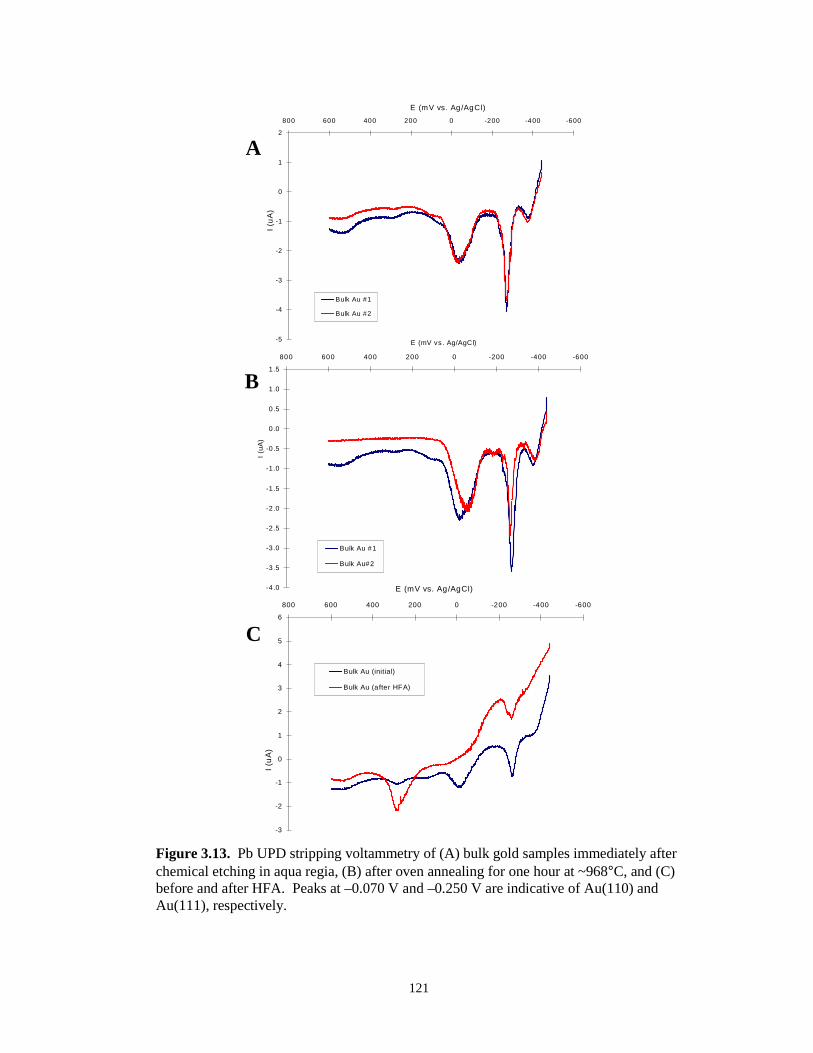
121
-5
-4
-3
-2
-1
0
1
2
-600-400-2000200400600800
E (mV vs. Ag/AgCl)
I (uA
)
Bulk Au #1
Bulk Au #2
-4.0
-3.5
-3.0
-2.5
-2.0
-1.5
-1.0
-0.5
0.0
0.5
1.0
1.5
-600-400-2000200400600800
E (mV vs. Ag/AgCl)
I (uA
)
Bulk Au #1
Bulk Au#2
-3
-2
-1
0
1
2
3
4
5
6
-600-400-2000200400600800
E (mV vs. Ag/AgCl)
I (uA
)
Bulk Au (initial)
Bulk Au (after HFA)
A
B
C
Figure 3.13. Pb UPD stripping voltammetry of (A) bulk gold samples immediately afterchemical etching in aqua regia, (B) after oven annealing for one hour at ~968°C, and (C)before and after HFA. Peaks at –0.070 V and –0.250 V are indicative of Au(110) andAu(111), respectively.
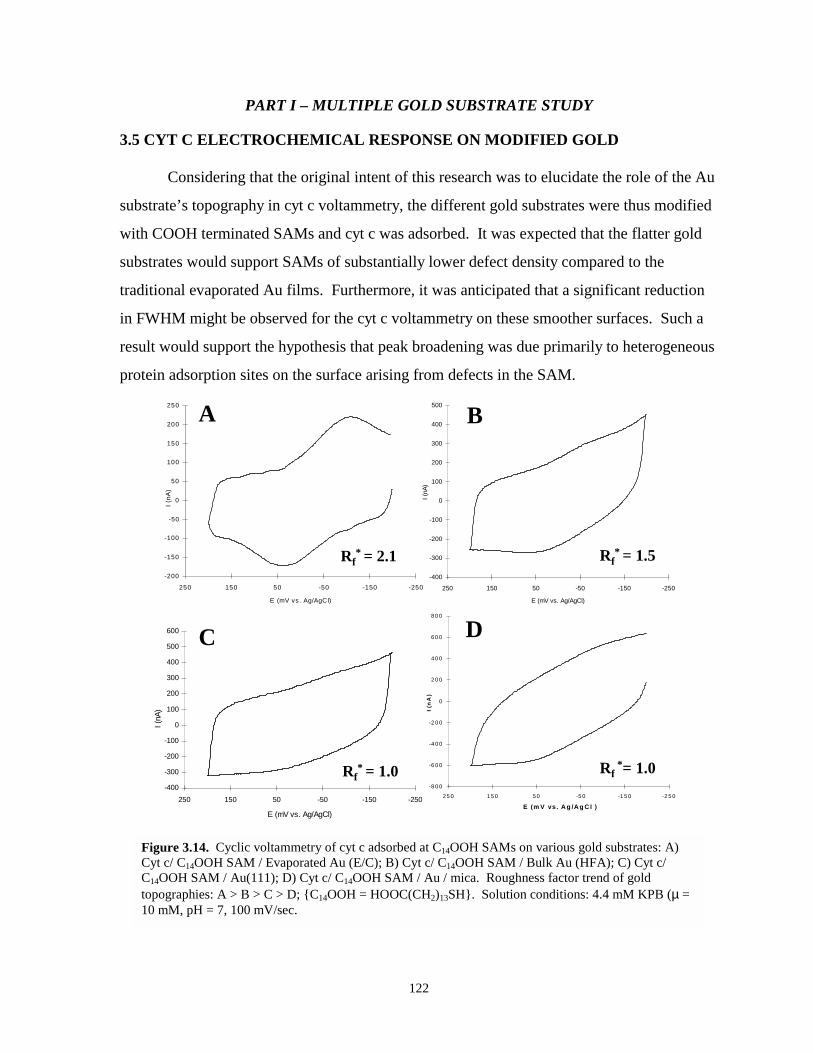
122
PART I – MULTIPLE GOLD SUBSTRATE STUDY
3.5 CYT C ELECTROCHEMICAL RESPONSE ON MODIFIED GOLD
Considering that the original intent of this research was to elucidate the role of the Au
substrate’s topography in cyt c voltammetry, the different gold substrates were thus modified
with COOH terminated SAMs and cyt c was adsorbed. It was expected that the flatter gold
substrates would support SAMs of substantially lower defect density compared to the
traditional evaporated Au films. Furthermore, it was anticipated that a significant reduction
in FWHM might be observed for the cyt c voltammetry on these smoother surfaces. Such a
result would support the hypothesis that peak broadening was due primarily to heterogeneous
protein adsorption sites on the surface arising from defects in the SAM.
-200
-150
-100
-50
0
50
100
150
200
250
-250-150-5050150250
E (mV vs. Ag/AgCl)
I (nA
)
A
-400
-300
-200
-100
0
100
200
300
400
500
-250-150-5050150250
E (mV vs. Ag/AgCl)
I (nA
)B
-400
-300
-200
-100
0
100
200
300
400
500
600
-250-150-5050150250
E (mV vs. Ag/AgCl)
I (nA
)
C
-8 0 0
-6 0 0
-4 0 0
-2 0 0
0
20 0
40 0
60 0
80 0
-2 5 0-1 5 0-5 05015 025 0
E (m V vs. A g /A g C l )
I (n
A)
D
Rf* = 2.1 Rf
* = 1.5
Rf* = 1.0 Rf
*= 1.0
Figure 3.14. Cyclic voltammetry of cyt c adsorbed at C14OOH SAMs on various gold substrates: A)Cyt c/ C14OOH SAM / Evaporated Au (E/C); B) Cyt c/ C14OOH SAM / Bulk Au (HFA); C) Cyt c/C14OOH SAM / Au(111); D) Cyt c/ C14OOH SAM / Au / mica. Roughness factor trend of goldtopographies: A > B > C > D; {C14OOH = HOOC(CH2)13SH}. Solution conditions: 4.4 mM KPB (µ =10 mM, pH = 7, 100 mV/sec.
123
Interestingly, the cyt c response on these different SAM modified gold substrates
varied significantly and unexpectedly. Examples of cyclic voltammograms of horse cyt c
adsorbed onto each of the four experimental substrates are shown in Figure 3.14. There is a
definite trend that emerges, but it is not the expected narrowing of the cyt c voltammetric
peaks. Instead, as the Au surface becomes smoother and the SAM presumably less defective,
as evidenced by the roughness and redox probe experiments, respectively, the faradaic
current response of cyt c disappears. This surprising result was highly repeatable, and
comprehending the reasons behind it became the focus of this work.
The results just described clearly show that gold substrate topography plays a
significant role in the electrochemistry of adsorbed cyt c. To account for the surprising
absence of electroactive cyt c on smoother Au substrates, two possibilities must be
considered: 1) cyt c is adsorbed on the SAM but in an electroinactive state, possibly from
improper orientation or denaturation; or 2) cyt c is not present on the surface, indicating that
the low defect SAM resists adsorption of the protein. Furthermore, a combination of these
two effects cannot be ruled out. To investigate this matter, a series of electrochemical and
spectroscopic experiments were undertaken, as described in the following sections.
3.6 X-RAY PHOTOELECTRON SPECTROSCOPY
A useful technique for determining the elemental composition of a surface and the
presence of adsorbates is x-ray photoelectron spectroscopy (XPS), which is briefly discussed
in this chapter’s Experimental Details section. Previous research from this laboratory utilized
XPS to detect the presence of cyt c adsorbed on carboxylic acid SAMs on evaporated Au
substrates. By monitoring the N(1s) signal from the amino acids comprising the
cytochrome’s protein shell, XPS revealed that a substantial amount of protein was present on
the surfaces of these SAMs.34 In that study, XPS was also used to compare the amount of
protein adsorbed to HOOC(CH2)nS- SAMs where n = 5, 10, and 15. XPS results revealed
similar cyt c coverages on all three SAMs surfaces in spite of the fact that electrochemical
experiments indicated lower values for electroactive cyt c coverage on the SAMs with
smaller chainlengths.34 In much the same manner, XPS was used in this research to
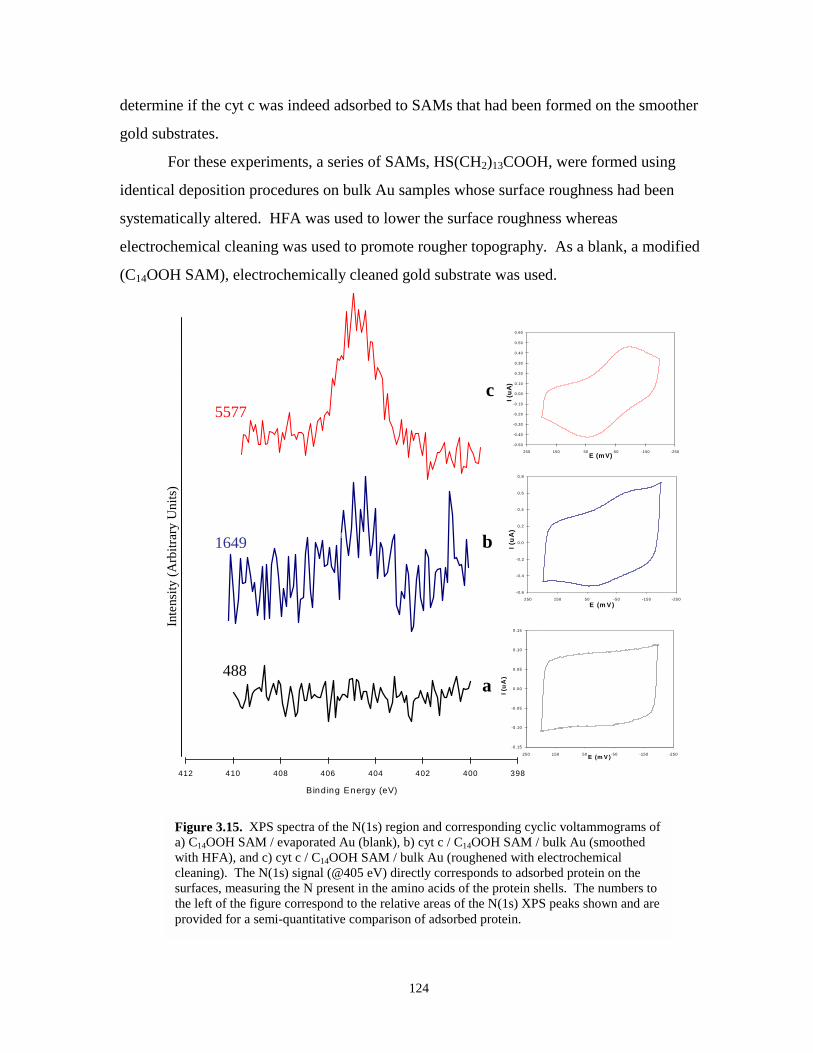
124
determine if the cyt c was indeed adsorbed to SAMs that had been formed on the smoother
gold substrates.
For these experiments, a series of SAMs, HS(CH2)13COOH, were formed using
identical deposition procedures on bulk Au samples whose surface roughness had been
systematically altered. HFA was used to lower the surface roughness whereas
electrochemical cleaning was used to promote rougher topography. As a blank, a modified
(C14OOH SAM), electrochemically cleaned gold substrate was used.
155500
157500
159500
161500
163500
165500
167500
169500
171500
398400402404406408410412
Bind ing Energy (eV)
267000
268000
269000
270000
271000
272000
273000
274000
398400402404406408410412
1 .5E+05
1.5E+05
1.5E+05
1.5E+05
1.5E+05
1.6E+05
1.6E+05
398400402404406408410412
-0.15
-0.10
-0.05
0.00
0.05
0.10
0.15
-250-150-5050150250 E (m V )
I (u
A)
-0.6
-0.4
-0.2
0.0
0.2
0.4
0.6
0.8
-250-150-5050150250E (m V)
I (u
A)
-0.50
-0.40
-0.30
-0.20
-0.10
0.00
0.10
0.20
0.30
0.40
0.50
0.60
-250-150-5050150250E (mV)
I (uA
)
5577
1649
488
Inte
nsity
(Arb
itrar
y U
nits
)
a
b
c
Figure 3.15. XPS spectra of the N(1s) region and corresponding cyclic voltammograms ofa) C14OOH SAM / evaporated Au (blank), b) cyt c / C14OOH SAM / bulk Au (smoothedwith HFA), and c) cyt c / C14OOH SAM / bulk Au (roughened with electrochemicalcleaning). The N(1s) signal (@405 eV) directly corresponds to adsorbed protein on thesurfaces, measuring the N present in the amino acids of the protein shells. The numbers tothe left of the figure correspond to the relative areas of the N(1s) XPS peaks shown and areprovided for a semi-quantitative comparison of adsorbed protein.
125
Figure 3.15 illustrates the results of the XPS testing. The XPS N(1s) signal of these
samples, when compared to the blank, clearly shows the existence of amino acids on both
surfaces. However, there seems to be a substantially larger N(1s) signal and therefore higher
coverage for cyt c adsorbed on the SAMs on rougher substrates. This result lends support to
the hypothesis that cyt c adsorption is intimately related to the density of defect sites in the
SAM. In this case, the presence of cyt c was clearly diminished on the gold surfaces that had
been pretreated with HFA.
3.7 EFFECT OF INTENTIONAL GOLD ROUGHENING ON CYT C RESPONSE
To further define the role of surface topography, experiments were designed to assess
whether intentional roughening of smooth electrodes, which had consistently yielded poor cyt
c voltammetry, would give rise to an improved response. If roughening the surface improved
the cyt c response, it would lend support to the idea that rough substrates are better suited for
protein adsorption and voltammetry.
Intentional roughening experiments were first performed on bulk Au due to its
mechanical stability and renewable surface. Bulk gold samples were first smoothed using
HFA, and the Rf value was measured. The surface was then modified with a COOH SAM
and tested for cyt c response. Subsequent electrodes were smoothed in the same manner, the
Rf value was measured, and they were then subjected to electrochemical pretreatment, which
roughens the surface as described earlier. The roughening effect was then verified by
remeasuring Rf. The new surface was then modified with a SAM, exposed to a deposition
solution of cyt c, and subsequently tested for adsorbed cyt c response. Similar experiments
were subsequently performed with other types of gold.
Figure 3.16 illustrates a typical example of how intentional roughening of a smoothed
Au surface substantially improves the adsorption and voltammetry of cyt c. The
improvement in the cyt c response was substantial enough that all electrochemical
parameters, normally measured with cyclic voltammetry, were accessible. This result was
highly repeatable and similar results were found for all of the other substrates, the results of
which are not shown for the sake of space. These results thus provide further evidence that
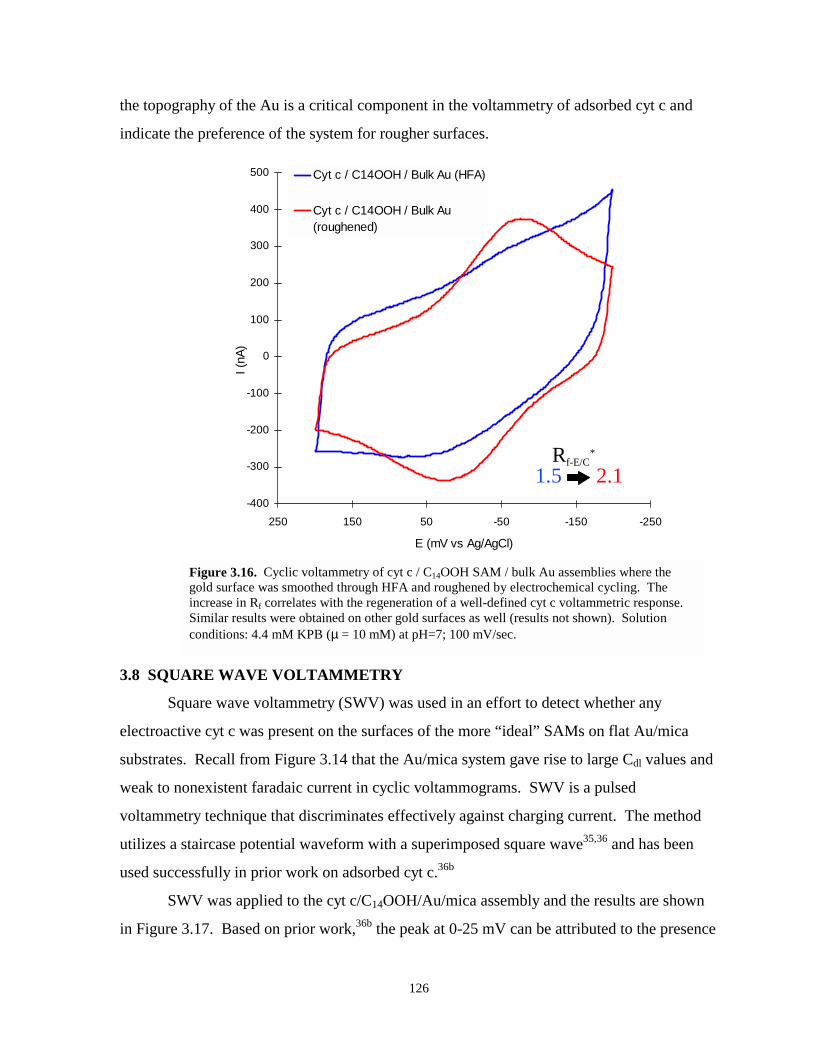
126
the topography of the Au is a critical component in the voltammetry of adsorbed cyt c and
indicate the preference of the system for rougher surfaces.
-400
-300
-200
-100
0
100
200
300
400
500
-250-150-5050150250
E (mV vs Ag/AgCl)
I (nA
)
Cyt c / C14OOH / Bulk Au (HFA)
Cyt c / C14OOH / Bulk Au(roughened)
1.5 2.1Rf-E/C
*
Figure 3.16. Cyclic voltammetry of cyt c / C14OOH SAM / bulk Au assemblies where thegold surface was smoothed through HFA and roughened by electrochemical cycling. Theincrease in Rf correlates with the regeneration of a well-defined cyt c voltammetric response.Similar results were obtained on other gold surfaces as well (results not shown). Solutionconditions: 4.4 mM KPB (µ = 10 mM) at pH=7; 100 mV/sec.
3.8 SQUARE WAVE VOLTAMMETRY
Square wave voltammetry (SWV) was used in an effort to detect whether any
electroactive cyt c was present on the surfaces of the more “ideal” SAMs on flat Au/mica
substrates. Recall from Figure 3.14 that the Au/mica system gave rise to large Cdl values and
weak to nonexistent faradaic current in cyclic voltammograms. SWV is a pulsed
voltammetry technique that discriminates effectively against charging current. The method
utilizes a staircase potential waveform with a superimposed square wave35,36 and has been
used successfully in prior work on adsorbed cyt c.36b
SWV was applied to the cyt c/C14OOH/Au/mica assembly and the results are shown
in Figure 3.17. Based on prior work,36b the peak at 0-25 mV can be attributed to the presence
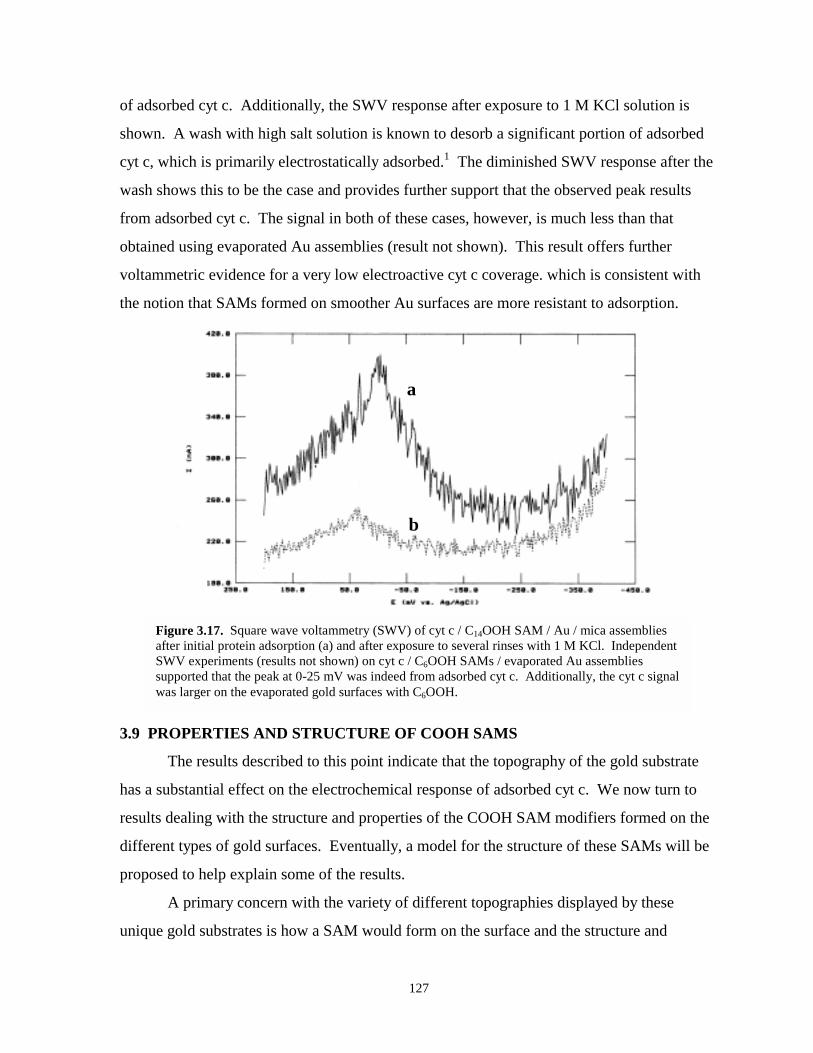
127
of adsorbed cyt c. Additionally, the SWV response after exposure to 1 M KCl solution is
shown. A wash with high salt solution is known to desorb a significant portion of adsorbed
cyt c, which is primarily electrostatically adsorbed.1 The diminished SWV response after the
wash shows this to be the case and provides further support that the observed peak results
from adsorbed cyt c. The signal in both of these cases, however, is much less than that
obtained using evaporated Au assemblies (result not shown). This result offers further
voltammetric evidence for a very low electroactive cyt c coverage. which is consistent with
the notion that SAMs formed on smoother Au surfaces are more resistant to adsorption.
a
b
Figure 3.17. Square wave voltammetry (SWV) of cyt c / C14OOH SAM / Au / mica assembliesafter initial protein adsorption (a) and after exposure to several rinses with 1 M KCl. IndependentSWV experiments (results not shown) on cyt c / C6OOH SAMs / evaporated Au assembliessupported that the peak at 0-25 mV was indeed from adsorbed cyt c. Additionally, the cyt c signalwas larger on the evaporated gold surfaces with C6OOH.
3.9 PROPERTIES AND STRUCTURE OF COOH SAMS
The results described to this point indicate that the topography of the gold substrate
has a substantial effect on the electrochemical response of adsorbed cyt c. We now turn to
results dealing with the structure and properties of the COOH SAM modifiers formed on the
different types of gold surfaces. Eventually, a model for the structure of these SAMs will be
proposed to help explain some of the results.
A primary concern with the variety of different topographies displayed by these
unique gold substrates is how a SAM would form on the surface and the structure and
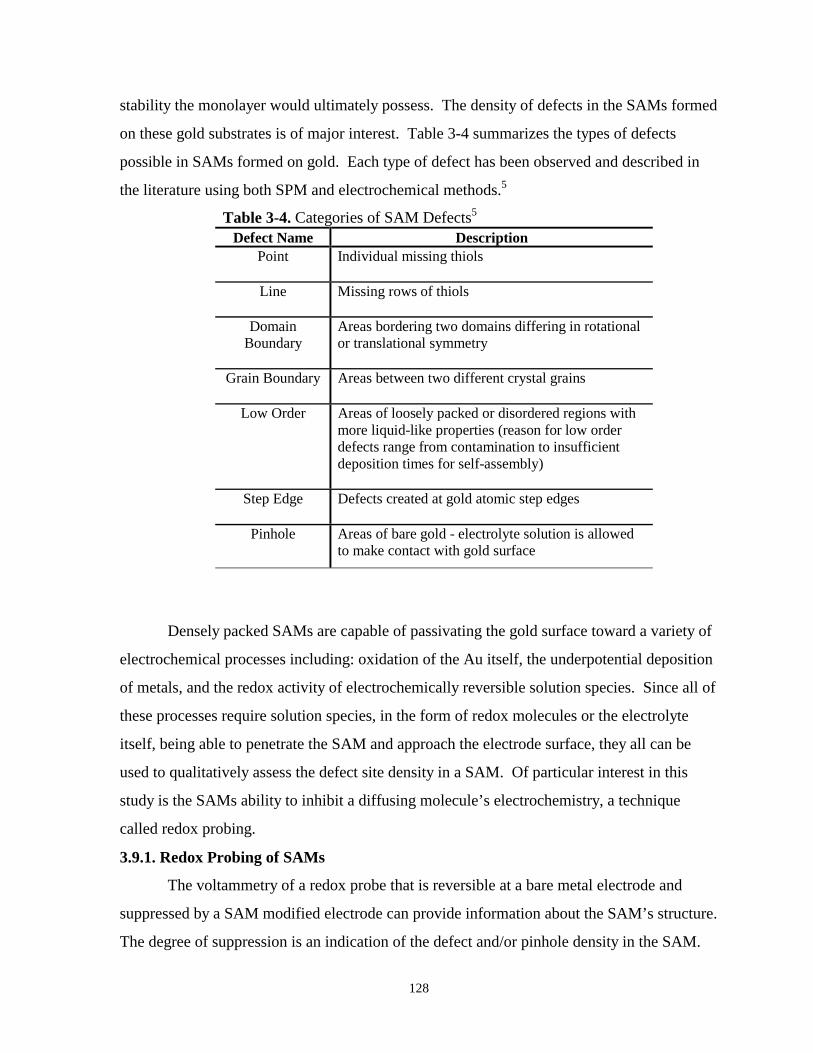
128
stability the monolayer would ultimately possess. The density of defects in the SAMs formed
on these gold substrates is of major interest. Table 3-4 summarizes the types of defects
possible in SAMs formed on gold. Each type of defect has been observed and described in
the literature using both SPM and electrochemical methods.5
Table 3-4. Categories of SAM Defects5
Defect Name DescriptionPoint Individual missing thiols
Line Missing rows of thiols
DomainBoundary
Areas bordering two domains differing in rotationalor translational symmetry
Grain Boundary Areas between two different crystal grains
Low Order Areas of loosely packed or disordered regions withmore liquid-like properties (reason for low orderdefects range from contamination to insufficientdeposition times for self-assembly)
Step Edge Defects created at gold atomic step edges
Pinhole Areas of bare gold - electrolyte solution is allowedto make contact with gold surface
Densely packed SAMs are capable of passivating the gold surface toward a variety of
electrochemical processes including: oxidation of the Au itself, the underpotential deposition
of metals, and the redox activity of electrochemically reversible solution species. Since all of
these processes require solution species, in the form of redox molecules or the electrolyte
itself, being able to penetrate the SAM and approach the electrode surface, they all can be
used to qualitatively assess the defect site density in a SAM. Of particular interest in this
study is the SAMs ability to inhibit a diffusing molecule’s electrochemistry, a technique
called redox probing.
3.9.1. Redox Probing of SAMs
The voltammetry of a redox probe that is reversible at a bare metal electrode and
suppressed by a SAM modified electrode can provide information about the SAM’s structure.
The degree of suppression is an indication of the defect and/or pinhole density in the SAM.
129
For example, if a redox probe at a SAM modified electrode exhibits reversible, mass transfer
(MT) controlled behavior, the SAM is most likely riddled with pinhole defect sites, allowing
the probe ready access to the underlying metal.
On the other hand, if the SAM has a sufficiently low level of defects, it will obstruct
the approach of the probe to the electrode and the redox reaction will be significantly
inhibited. The voltammetry, if any, will exhibit attenuated faradaic currents and slower
kinetics due to unfavorable energetics associated with polar molecules diffusing through a
layer of densely packed alkane chains. Thus, the redox probe will only gain access to the
electrode at energetically favorable defects sites in the SAM. Many experimental factors can
affect the results of redox probing experiments: solvent, electrolyte, and redox probe
hydrophobicity, charge, and mechanism of ET (inner vs. outer sphere ET).5
A major advantage of redox probing for evaluating defect density in SAMs is the
versatility provided by the method. This versatility stems from the numerous redox
molecules, with a variety of properties, that can be employed as redox probes. Redox probes
that have been utilized in SAM defect studies range from simple metal ions to more
complicated organometallic complexes. Commonly used redox probes include: iron
(Fe2+/3+),30a ferricyanide (Fe(CN)64-),30e,f,g ruthenium hexamine (Ru(NH3)6
3+/2+,30a-c,e-g phenol
((C6H5)-OH),30b benzoquinone (O=(C6H4)=O),30f and ferrocene or derivatives of
ferrocene.30c,d
3.9.2. Hydroxymethyl ferrocene Redox Probing of SAMs on Experimental Gold
Carboxylic acid SAMs were first probed with both ferricyanide and ruthenium
hexamine (results not shown), but these redox probes proved to be inadequate. The
voltammetric response of the negatively charged ferricyanide ion was essentially nonexistent
on all SAM/Au substrates, most likely due to electrostatic repulsion. Thus, ferricyanide is
not a very sensitive redox probe for COOH SAMs. Likewise, electrostatic complications
with ruthenium hexamine (RuHex) rendered it useless as a redox probe for acid terminated
SAMs. With a charge of +3, RuHex strongly adsorbed to the negatively charged surfaces
and, in fact, seemed to cause irreversible damage to the SAMs.
Of much greater usefulness is the redox probe hydroxymethyl ferrocene (HMFc), first
described in work by Creager and coworkers.3a HMFc is a sensitive redox probe for
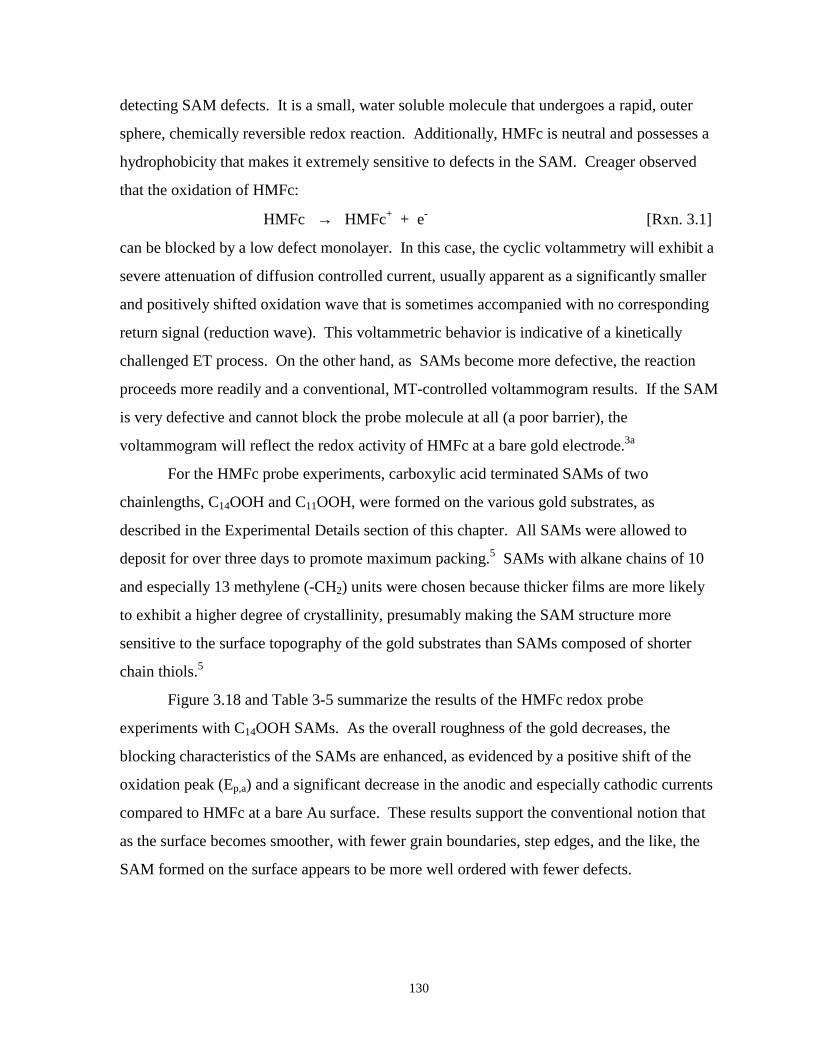
130
detecting SAM defects. It is a small, water soluble molecule that undergoes a rapid, outer
sphere, chemically reversible redox reaction. Additionally, HMFc is neutral and possesses a
hydrophobicity that makes it extremely sensitive to defects in the SAM. Creager observed
that the oxidation of HMFc:
HMFc → HMFc+ + e- [Rxn. 3.1]
can be blocked by a low defect monolayer. In this case, the cyclic voltammetry will exhibit a
severe attenuation of diffusion controlled current, usually apparent as a significantly smaller
and positively shifted oxidation wave that is sometimes accompanied with no corresponding
return signal (reduction wave). This voltammetric behavior is indicative of a kinetically
challenged ET process. On the other hand, as SAMs become more defective, the reaction
proceeds more readily and a conventional, MT-controlled voltammogram results. If the SAM
is very defective and cannot block the probe molecule at all (a poor barrier), the
voltammogram will reflect the redox activity of HMFc at a bare gold electrode.3a
For the HMFc probe experiments, carboxylic acid terminated SAMs of two
chainlengths, C14OOH and C11OOH, were formed on the various gold substrates, as
described in the Experimental Details section of this chapter. All SAMs were allowed to
deposit for over three days to promote maximum packing.5 SAMs with alkane chains of 10
and especially 13 methylene (-CH2) units were chosen because thicker films are more likely
to exhibit a higher degree of crystallinity, presumably making the SAM structure more
sensitive to the surface topography of the gold substrates than SAMs composed of shorter
chain thiols.5
Figure 3.18 and Table 3-5 summarize the results of the HMFc redox probe
experiments with C14OOH SAMs. As the overall roughness of the gold decreases, the
blocking characteristics of the SAMs are enhanced, as evidenced by a positive shift of the
oxidation peak (Ep,a) and a significant decrease in the anodic and especially cathodic currents
compared to HMFc at a bare Au surface. These results support the conventional notion that
as the surface becomes smoother, with fewer grain boundaries, step edges, and the like, the
SAM formed on the surface appears to be more well ordered with fewer defects.
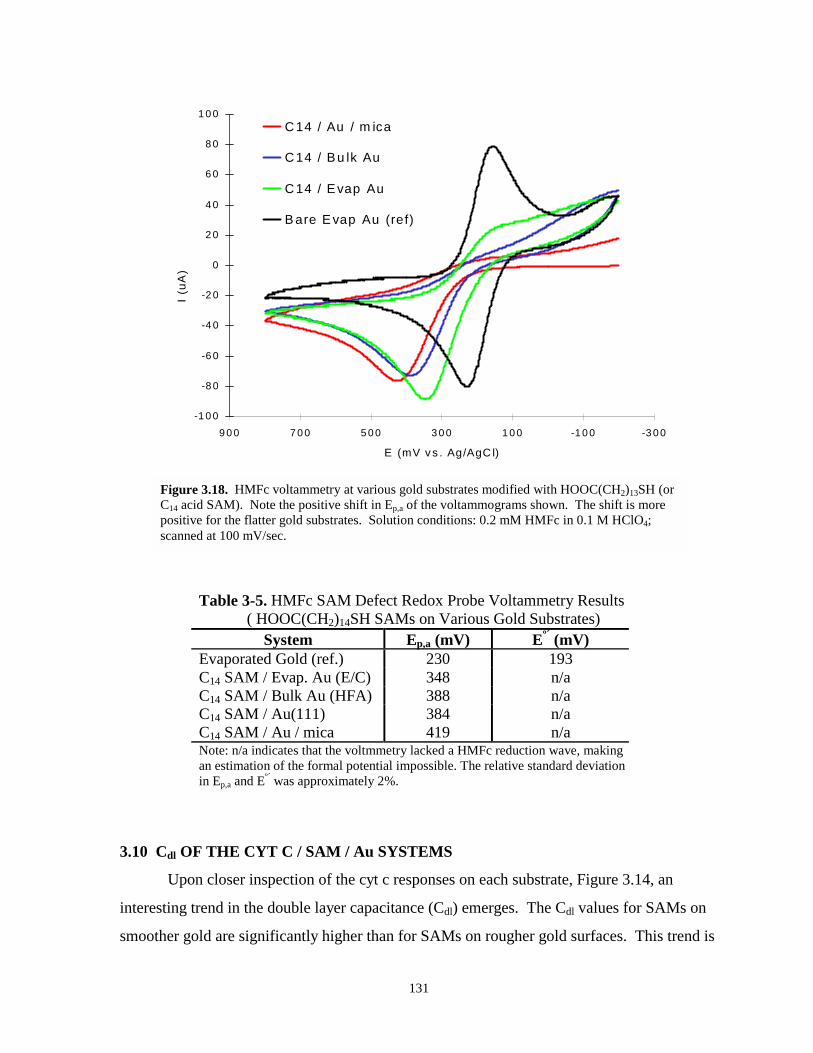
131
-1 0 0
-8 0
-6 0
-4 0
-2 0
0
2 0
4 0
6 0
8 0
1 0 0
-3 0 0-1 0 01 0 03 0 05 0 07 0 09 0 0
E (mV v s . Ag/AgC l)
I (u
A)
C 14 / Au / m ica
C 14 / Bu lk Au
C 14 / Evap Au
B are E vap Au (ref)
Figure 3.18. HMFc voltammetry at various gold substrates modified with HOOC(CH2)13SH (orC14 acid SAM). Note the positive shift in Ep,a of the voltammograms shown. The shift is morepositive for the flatter gold substrates. Solution conditions: 0.2 mM HMFc in 0.1 M HClO4;scanned at 100 mV/sec.
Table 3-5. HMFc SAM Defect Redox Probe Voltammetry Results( HOOC(CH2)14SH SAMs on Various Gold Substrates)
System Ep,a (mV) Eº´ (mV)Evaporated Gold (ref.) 230 193C14 SAM / Evap. Au (E/C) 348 n/aC14 SAM / Bulk Au (HFA) 388 n/aC14 SAM / Au(111) 384 n/aC14 SAM / Au / mica 419 n/aNote: n/a indicates that the voltmmetry lacked a HMFc reduction wave, makingan estimation of the formal potential impossible. The relative standard deviationin Ep,a and Eº´ was approximately 2%.
3.10 Cdl OF THE CYT C / SAM / Au SYSTEMS
Upon closer inspection of the cyt c responses on each substrate, Figure 3.14, an
interesting trend in the double layer capacitance (Cdl) emerges. The Cdl values for SAMs on
smoother gold are significantly higher than for SAMs on rougher gold surfaces. This trend is
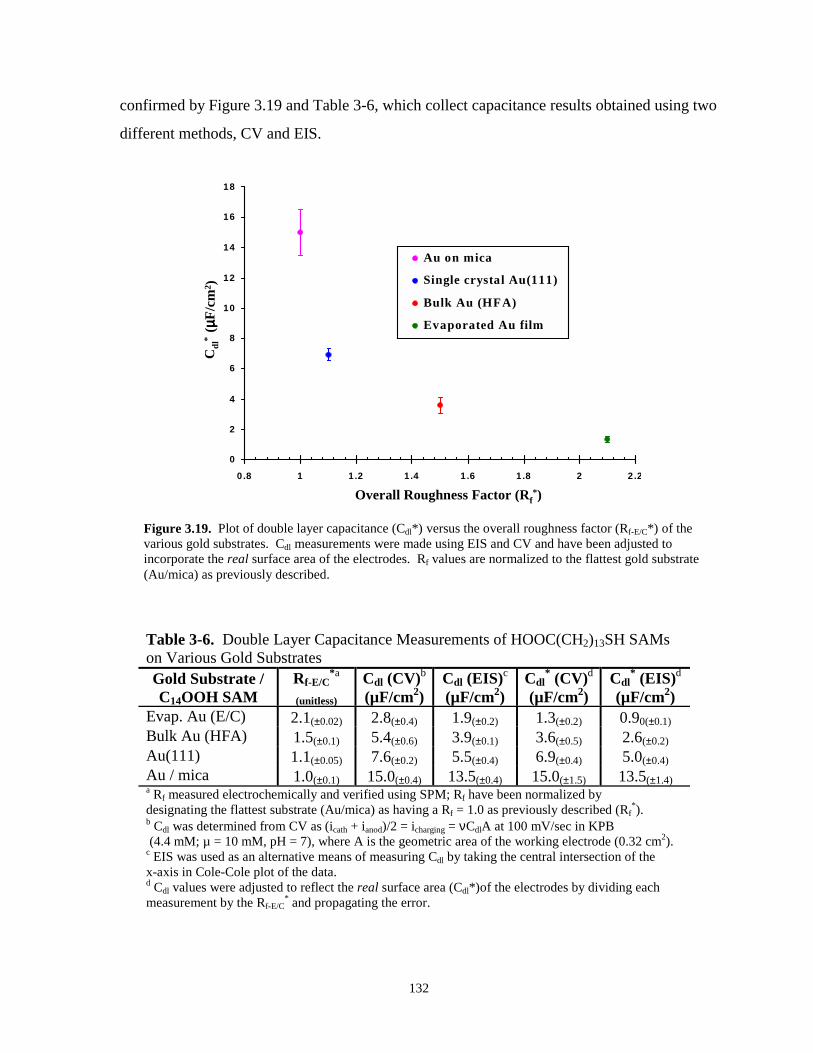
132
confirmed by Figure 3.19 and Table 3-6, which collect capacitance results obtained using two
different methods, CV and EIS.
0
2
4
6
8
10
12
14
16
18
0.8 1 1.2 1.4 1.6 1.8 2 2.2
Au on mica
Single crystal Au(111)
Bulk Au (HFA)
Evaporated Au film
Overall Roughness Factor (Rf*)
Cdl
* (µ µµµ
F/cm
2 )
Figure 3.19. Plot of double layer capacitance (Cdl*) versus the overall roughness factor (Rf-E/C*) of thevarious gold substrates. Cdl measurements were made using EIS and CV and have been adjusted toincorporate the real surface area of the electrodes. Rf values are normalized to the flattest gold substrate(Au/mica) as previously described.
Table 3-6. Double Layer Capacitance Measurements of HOOC(CH2)13SH SAMson Various Gold SubstratesGold Substrate /C14OOH SAM
Rf-E/C*a
(unitless)
Cdl (CV)b
(µF/cm2)Cdl (EIS)c
(µF/cm2)Cdl
* (CV)d
(µF/cm2)Cdl
* (EIS)d
(µF/cm2)Evap. Au (E/C) 2.1(±0.02) 2.8(±0.4) 1.9(±0.2) 1.3(±0.2) 0.90(±0.1)Bulk Au (HFA) 1.5(±0.1) 5.4(±0.6) 3.9(±0.1) 3.6(±0.5) 2.6(±0.2)Au(111) 1.1(±0.05) 7.6(±0.2) 5.5(±0.4) 6.9(±0.4) 5.0(±0.4)Au / mica 1.0(±0.1) 15.0(±0.4) 13.5(±0.4) 15.0(±1.5) 13.5(±1.4)a Rf measured electrochemically and verified using SPM; Rf have been normalized bydesignating the flattest substrate (Au/mica) as having a Rf = 1.0 as previously described (Rf
*).b Cdl was determined from CV as (icath + ianod)/2 = icharging = νCdlA at 100 mV/sec in KPB (4.4 mM; µ = 10 mM, pH = 7), where A is the geometric area of the working electrode (0.32 cm2).c EIS was used as an alternative means of measuring Cdl by taking the central intersection of thex-axis in Cole-Cole plot of the data.d Cdl values were adjusted to reflect the real surface area (Cdl*)of the electrodes by dividing eachmeasurement by the Rf-E/C
* and propagating the error.
133
The observation that Cdl increases as Rf decreases is a striking result, especially in
view of the HMFc probe results, which do not support increased Cdl as resulting from higher
pinhole defect density in the SAM. Previous work by Chidsey and Loiacono30e examined the
effects of chainlength and functional groups on Cdl, but not in conjunction with Rf. They
found that Cdl for alkythiol SAMs decreases with increasing chainlength, as would be
expected for a dielectric layer. The dependence of Cdl on functional end group was found to
obey the following trend:
CF3 < CH3 < OH < CN < COOH
In light of the present study, it should be noted that all of Chidsey and Loiacono’s
experiments were performed on only one type of gold substrate, evaporated gold on silicon
wafers.30e Considering this trend, higher relative values of Cdl with acid terminated SAMs, in
and of itself, is not surprising. The apparent dependence of Cdl on Rf shown in Figure 3.19,
however, is a newfound aspect of COOH-terminated SAMs.
Additional Cdl measurements on COOH SAMs were taken during those experiments
involving intentional roughening of gold substrates (See Section 3.7). Those results are
consistent with the Cdl-Rf trend just described, that is, rougher gold surfaces modified with
COOH SAMs consistently displayed lower Cdl values than those on smoother surfaces.
A proposed model to account for this result is introduced in Figure 3.20. It is
proposed that when the carboxylic acid groups are forced into a more uniform plane as the
gold surface becomes smoother, increased interactions among the COOH groups, i.e.,
hydrogen bonding and/or electrostatic repulsion, will increasingly dictate the overall structure
of the SAM. Thus, the alkyl chains could be restricted from dense crystalline packing if the
energy density associated with surface COOH interactions exceeded that due to chain-chain
van der Waals interactions. The consequence of this would be an increase in the average
dielectric constant of the SAM film, thus increasing Cdl:
dC o
dlεε
= [Eqn. 3.2]
On rougher surfaces, the COOH groups would tend to be more offset from
each other normal to the surface, thus leading to decreased lateral interaction among the acid
headgroups and, for a number of the components, greater conformational freedom. In this
case, the energy associated with COOH interactions would decrease, allowing the alkane
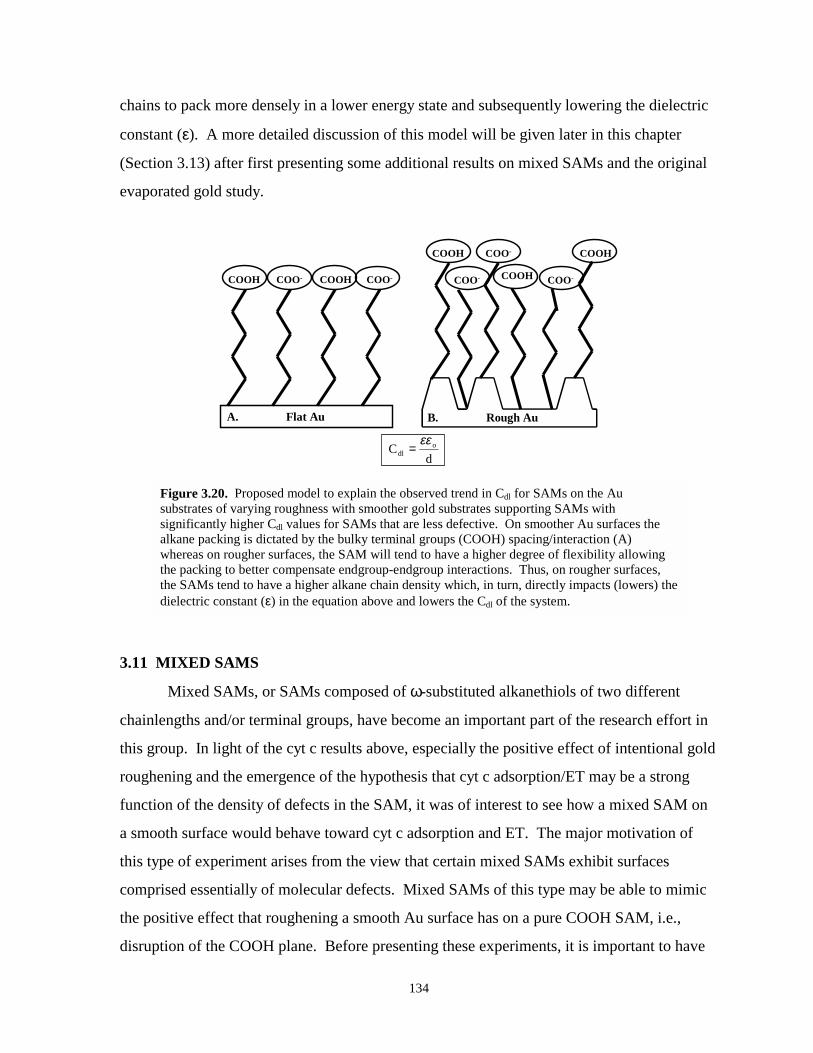
134
chains to pack more densely in a lower energy state and subsequently lowering the dielectric
constant (ε). A more detailed discussion of this model will be given later in this chapter
(Section 3.13) after first presenting some additional results on mixed SAMs and the original
evaporated gold study.
A. Flat Au
COO-
B. Rough Au
COO-COOH COO-
COO-
COO-COOH
COOH
COOH
COOH
dC o
dlεε
=
Figure 3.20. Proposed model to explain the observed trend in Cdl for SAMs on the Ausubstrates of varying roughness with smoother gold substrates supporting SAMs withsignificantly higher Cdl values for SAMs that are less defective. On smoother Au surfaces thealkane packing is dictated by the bulky terminal groups (COOH) spacing/interaction (A)whereas on rougher surfaces, the SAM will tend to have a higher degree of flexibility allowingthe packing to better compensate endgroup-endgroup interactions. Thus, on rougher surfaces,the SAMs tend to have a higher alkane chain density which, in turn, directly impacts (lowers) thedielectric constant (ε) in the equation above and lowers the Cdl of the system.
3.11 MIXED SAMS
Mixed SAMs, or SAMs composed of ω-substituted alkanethiols of two different
chainlengths and/or terminal groups, have become an important part of the research effort in
this group. In light of the cyt c results above, especially the positive effect of intentional gold
roughening and the emergence of the hypothesis that cyt c adsorption/ET may be a strong
function of the density of defects in the SAM, it was of interest to see how a mixed SAM on
a smooth surface would behave toward cyt c adsorption and ET. The major motivation of
this type of experiment arises from the view that certain mixed SAMs exhibit surfaces
comprised essentially of molecular defects. Mixed SAMs of this type may be able to mimic
the positive effect that roughening a smooth Au surface has on a pure COOH SAM, i.e.,
disruption of the COOH plane. Before presenting these experiments, it is important to have
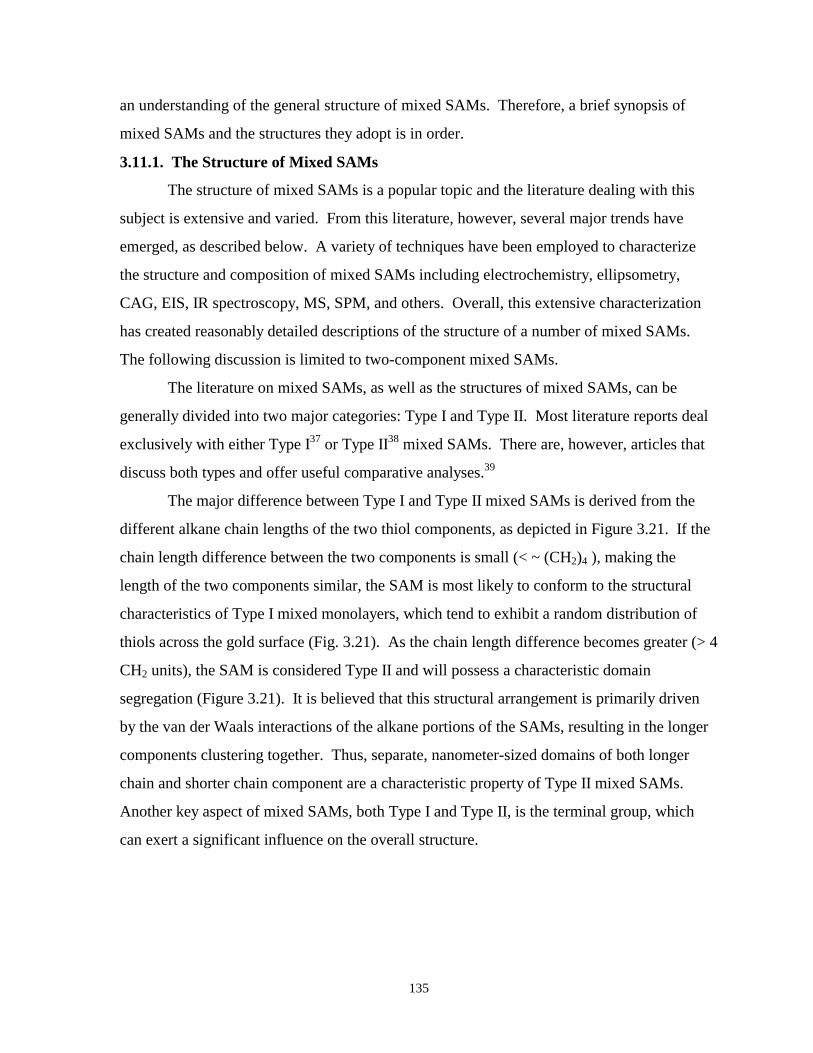
135
an understanding of the general structure of mixed SAMs. Therefore, a brief synopsis of
mixed SAMs and the structures they adopt is in order.
3.11.1. The Structure of Mixed SAMs
The structure of mixed SAMs is a popular topic and the literature dealing with this
subject is extensive and varied. From this literature, however, several major trends have
emerged, as described below. A variety of techniques have been employed to characterize
the structure and composition of mixed SAMs including electrochemistry, ellipsometry,
CAG, EIS, IR spectroscopy, MS, SPM, and others. Overall, this extensive characterization
has created reasonably detailed descriptions of the structure of a number of mixed SAMs.
The following discussion is limited to two-component mixed SAMs.
The literature on mixed SAMs, as well as the structures of mixed SAMs, can be
generally divided into two major categories: Type I and Type II. Most literature reports deal
exclusively with either Type I37 or Type II38 mixed SAMs. There are, however, articles that
discuss both types and offer useful comparative analyses.39
The major difference between Type I and Type II mixed SAMs is derived from the
different alkane chain lengths of the two thiol components, as depicted in Figure 3.21. If the
chain length difference between the two components is small (< ~ (CH2)4 ), making the
length of the two components similar, the SAM is most likely to conform to the structural
characteristics of Type I mixed monolayers, which tend to exhibit a random distribution of
thiols across the gold surface (Fig. 3.21). As the chain length difference becomes greater (> 4
CH2 units), the SAM is considered Type II and will possess a characteristic domain
segregation (Figure 3.21). It is believed that this structural arrangement is primarily driven
by the van der Waals interactions of the alkane portions of the SAMs, resulting in the longer
components clustering together. Thus, separate, nanometer-sized domains of both longer
chain and shorter chain component are a characteristic property of Type II mixed SAMs.
Another key aspect of mixed SAMs, both Type I and Type II, is the terminal group, which
can exert a significant influence on the overall structure.
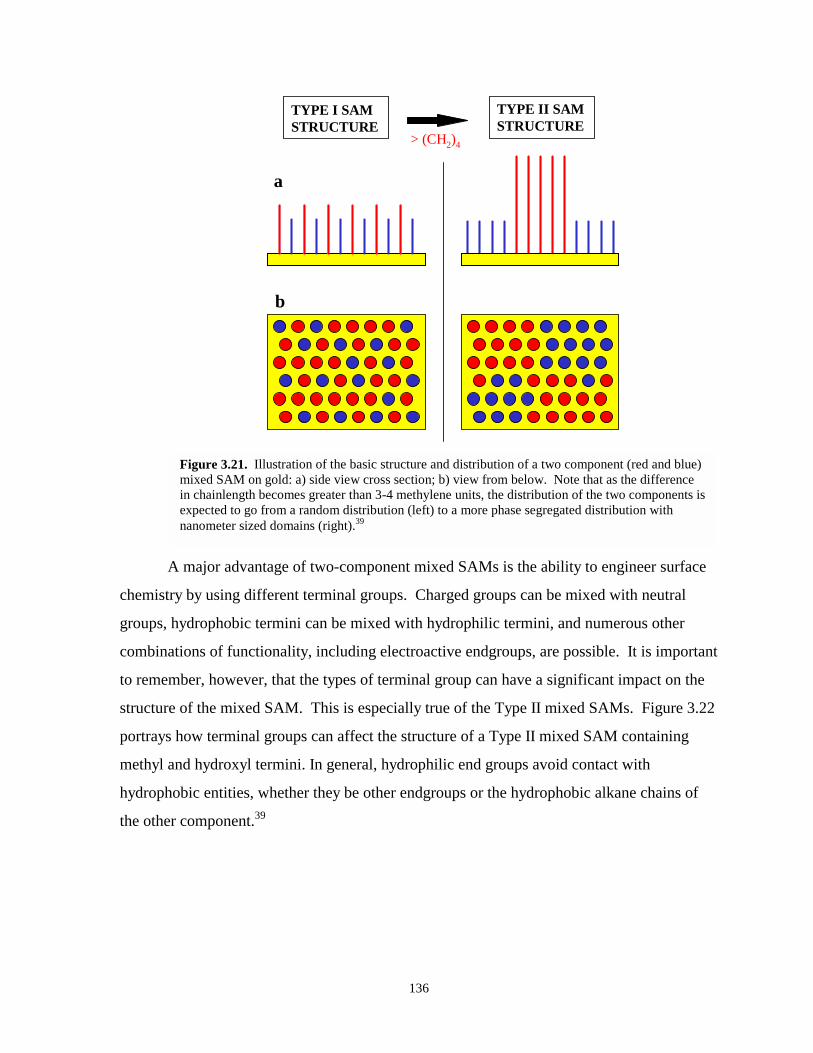
136
> (CH2)4
TYPE I SAMSTRUCTURE
TYPE II SAMSTRUCTURE
a
b
Figure 3.21. Illustration of the basic structure and distribution of a two component (red and blue)mixed SAM on gold: a) side view cross section; b) view from below. Note that as the differencein chainlength becomes greater than 3-4 methylene units, the distribution of the two components isexpected to go from a random distribution (left) to a more phase segregated distribution withnanometer sized domains (right).39
A major advantage of two-component mixed SAMs is the ability to engineer surface
chemistry by using different terminal groups. Charged groups can be mixed with neutral
groups, hydrophobic termini can be mixed with hydrophilic termini, and numerous other
combinations of functionality, including electroactive endgroups, are possible. It is important
to remember, however, that the types of terminal group can have a significant impact on the
structure of the mixed SAM. This is especially true of the Type II mixed SAMs. Figure 3.22
portrays how terminal groups can affect the structure of a Type II mixed SAM containing
methyl and hydroxyl termini. In general, hydrophilic end groups avoid contact with
hydrophobic entities, whether they be other endgroups or the hydrophobic alkane chains of
the other component.39
137
a b
c d
Figure 3.22. Two component mixed SAMs of both types (I & II) are sensitive to the influence ofendgroups and will always arrange themselves to maximize favorable interactions. Hydrophobic/hydrophilic interactions are expected to play a role in the mixed SAM structure. Several examples ofhow hydrophobic interactions may affect the structure of these mixed SAMs are illustrated above with atwo component SAM comprised of hydrophobic, methyl terminated thiols (red) and hydrophilic, hydroxyterminated thiols (green). Depending on which component is longer, it may be energetically favorable tofor the larger components to cluster together in an ordered fashion (a) avoiding unfavorable interactionsbetween hydrophobic methylene chains and the alcohol endgroups. If, instead, the longer component ishydrophilically terminated (c), the longer chains may still be phase segregated, but may also bend over tomaximize methylene chain interactions with the shorter methyl terminal groups. If the distribution ismore random, there may be different types of bending in the components (b & d).39a
The crystallinity (degree of order) in the alkane portion of mixed SAMs can also vary.
Type I mixed SAMs tend to have alkane packing similar to uniform SAMs of similar length.
Again, however, the end groups can affect this property significantly. Longer chain Type I
SAMs will usually be more ordered and crystalline in nature whereas shorter Type I SAMs
will be more liquid-like. Both long and short Type I SAMs terminated with hydrophilic end
groups typically exhibit some degree of liquid-like structure at the SAM/solution interface.
Type II mixed SAMs, on the other hand, can have a range of crystalline order within
the film. This concept is illustrated in Figure 3.23. In fact, IR spectroscopy data suggest that
the presence of the longer chain components in the Type II mixed SAM sometimes causes the
inner crystalline region to be more ordered than if it were a uniform SAM composed only of
the shorter ω-substituted thiol. The larger the difference between the lengths of the
components, the greater the effect appears to be.39 Type II mixed SAMs are largely
unexplored in the context of cyt c electrochemistry and are not the focus of the research at
hand. Nonetheless, there are many intriguing aspects of using Type II SAMs in this work that
can be envisioned.
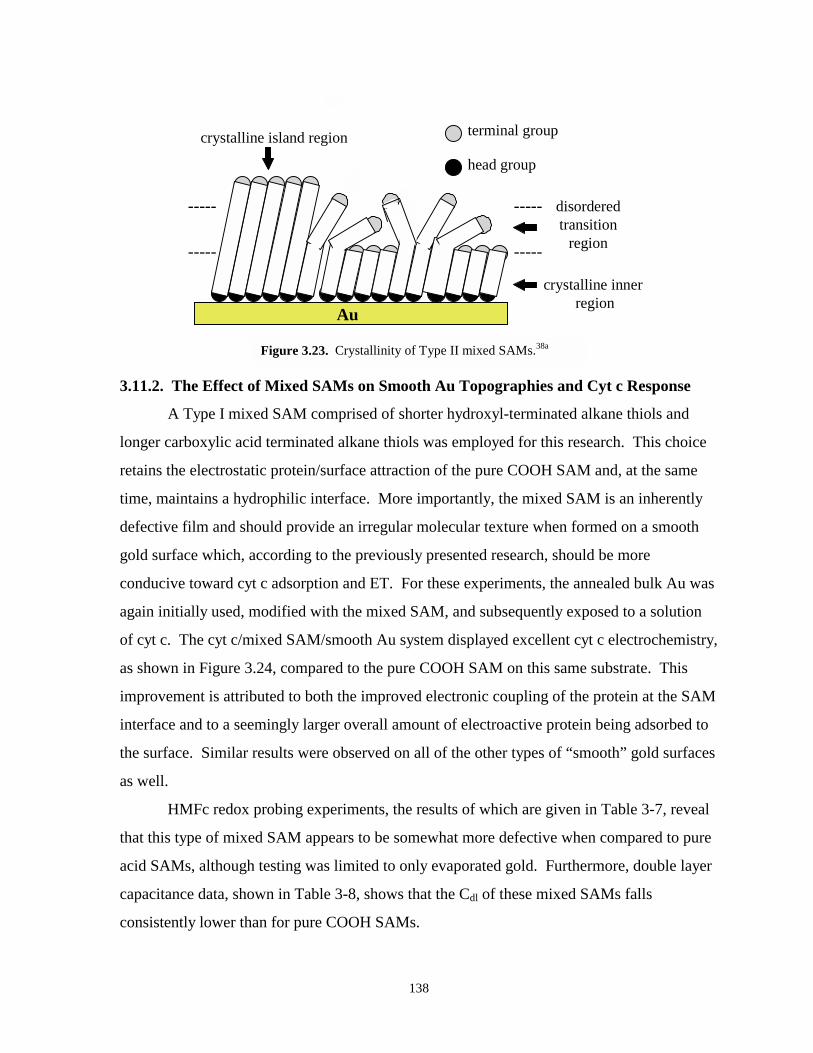
138
Au
----------
----------
crystalline island region
crystalline inner region
disorderedtransition
region
terminal group
head group
Figure 3.23. Crystallinity of Type II mixed SAMs.38a
3.11.2. The Effect of Mixed SAMs on Smooth Au Topographies and Cyt c Response
A Type I mixed SAM comprised of shorter hydroxyl-terminated alkane thiols and
longer carboxylic acid terminated alkane thiols was employed for this research. This choice
retains the electrostatic protein/surface attraction of the pure COOH SAM and, at the same
time, maintains a hydrophilic interface. More importantly, the mixed SAM is an inherently
defective film and should provide an irregular molecular texture when formed on a smooth
gold surface which, according to the previously presented research, should be more
conducive toward cyt c adsorption and ET. For these experiments, the annealed bulk Au was
again initially used, modified with the mixed SAM, and subsequently exposed to a solution
of cyt c. The cyt c/mixed SAM/smooth Au system displayed excellent cyt c electrochemistry,
as shown in Figure 3.24, compared to the pure COOH SAM on this same substrate. This
improvement is attributed to both the improved electronic coupling of the protein at the SAM
interface and to a seemingly larger overall amount of electroactive protein being adsorbed to
the surface. Similar results were observed on all of the other types of “smooth” gold surfaces
as well.
HMFc redox probing experiments, the results of which are given in Table 3-7, reveal
that this type of mixed SAM appears to be somewhat more defective when compared to pure
acid SAMs, although testing was limited to only evaporated gold. Furthermore, double layer
capacitance data, shown in Table 3-8, shows that the Cdl of these mixed SAMs falls
consistently lower than for pure COOH SAMs.
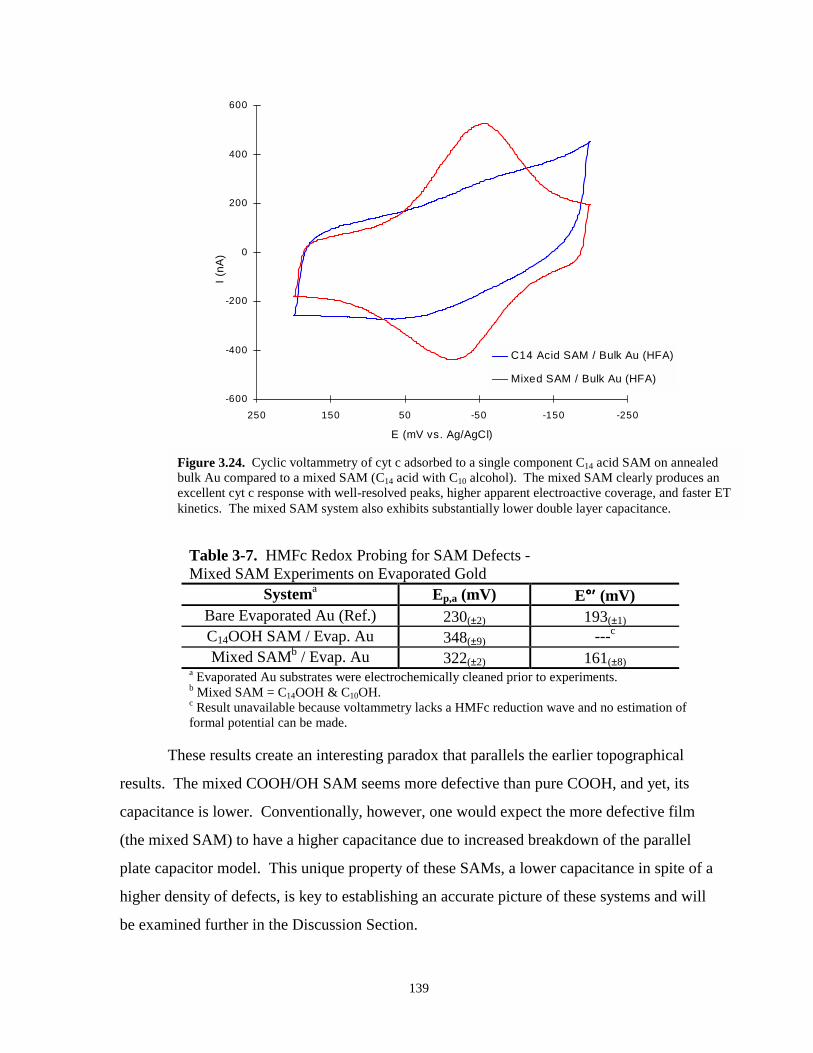
139
-600
-400
-200
0
200
400
600
-250-150-5050150250
E (mV vs. Ag/AgCl)
I (nA
)
C14 Acid SAM / Bulk Au (HFA)
Mixed SAM / Bulk Au (HFA)
Figure 3.24. Cyclic voltammetry of cyt c adsorbed to a single component C14 acid SAM on annealedbulk Au compared to a mixed SAM (C14 acid with C10 alcohol). The mixed SAM clearly produces anexcellent cyt c response with well-resolved peaks, higher apparent electroactive coverage, and faster ETkinetics. The mixed SAM system also exhibits substantially lower double layer capacitance.
Table 3-7. HMFc Redox Probing for SAM Defects -Mixed SAM Experiments on Evaporated Gold
Systema Ep,a (mV) E°°°°′′′′ (mV)Bare Evaporated Au (Ref.) 230(±2) 193(±1)C14OOH SAM / Evap. Au 348(±9) ---c
Mixed SAMb / Evap. Au 322(±2) 161(±8)a Evaporated Au substrates were electrochemically cleaned prior to experiments.b Mixed SAM = C14OOH & C10OH.c Result unavailable because voltammetry lacks a HMFc reduction wave and no estimation offormal potential can be made.
These results create an interesting paradox that parallels the earlier topographical
results. The mixed COOH/OH SAM seems more defective than pure COOH, and yet, its
capacitance is lower. Conventionally, however, one would expect the more defective film
(the mixed SAM) to have a higher capacitance due to increased breakdown of the parallel
plate capacitor model. This unique property of these SAMs, a lower capacitance in spite of a
higher density of defects, is key to establishing an accurate picture of these systems and will
be examined further in the Discussion Section.
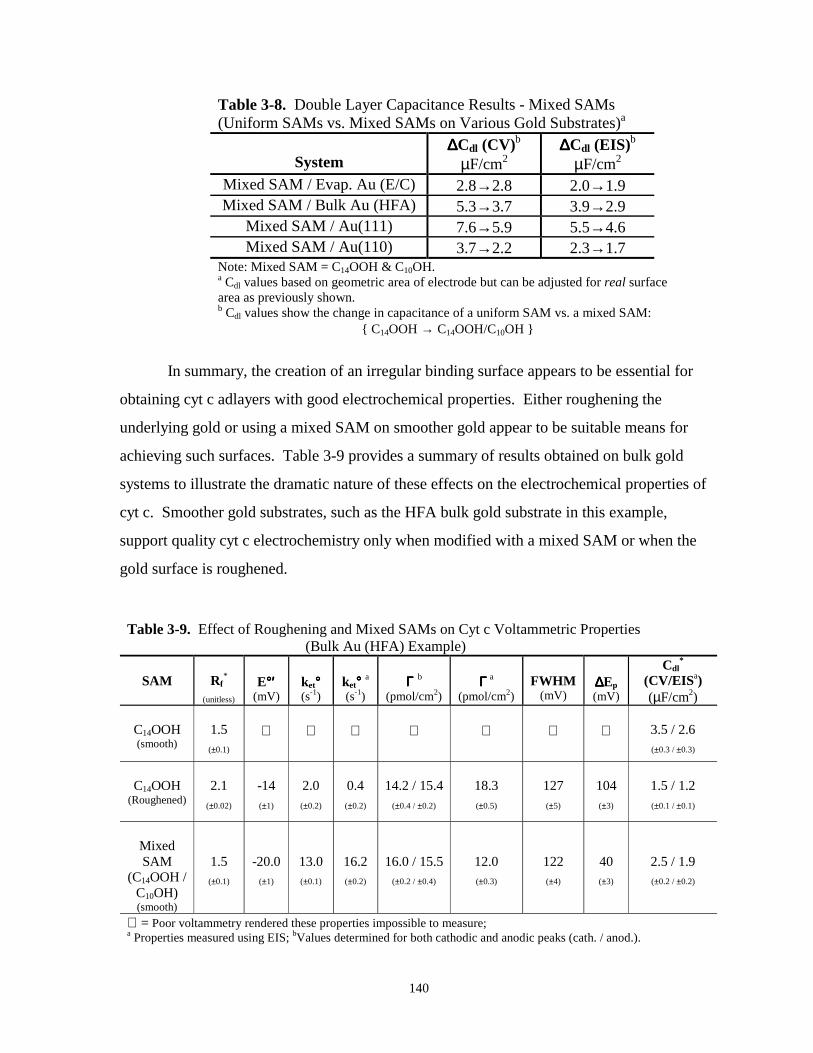
140
Table 3-8. Double Layer Capacitance Results - Mixed SAMs(Uniform SAMs vs. Mixed SAMs on Various Gold Substrates)a
System∆∆∆∆Cdl (CV)b
µF/cm2∆∆∆∆Cdl (EIS)b
µF/cm2
Mixed SAM / Evap. Au (E/C) 2.8→2.8 2.0→1.9Mixed SAM / Bulk Au (HFA) 5.3→3.7 3.9→2.9
Mixed SAM / Au(111) 7.6→5.9 5.5→4.6Mixed SAM / Au(110) 3.7→2.2 2.3→1.7
Note: Mixed SAM = C14OOH & C10OH.a Cdl values based on geometric area of electrode but can be adjusted for real surfacearea as previously shown.b Cdl values show the change in capacitance of a uniform SAM vs. a mixed SAM:
{ C14OOH → C14OOH/C10OH }
In summary, the creation of an irregular binding surface appears to be essential for
obtaining cyt c adlayers with good electrochemical properties. Either roughening the
underlying gold or using a mixed SAM on smoother gold appear to be suitable means for
achieving such surfaces. Table 3-9 provides a summary of results obtained on bulk gold
systems to illustrate the dramatic nature of these effects on the electrochemical properties of
cyt c. Smoother gold substrates, such as the HFA bulk gold substrate in this example,
support quality cyt c electrochemistry only when modified with a mixed SAM or when the
gold surface is roughened.
Table 3-9. Effect of Roughening and Mixed SAMs on Cyt c Voltammetric Properties(Bulk Au (HFA) Example)
SAM Rf*
(unitless)
E°°°°′′′′(mV)
ket°°°°(s-1)
ket°°°° a(s-1)
ΓΓΓΓ b(pmol/cm2)
ΓΓΓΓ a
(pmol/cm2)FWHM
(mV)∆∆∆∆Ep(mV)
Cdl*
(CV/EISa)(µF/cm2)
C14OOH(smooth)
1.5(±0.1)
⊗ ⊗ ⊗ ⊗ ⊗ ⊗ ⊗ 3.5 / 2.6(±0.3 / ±0.3)
C14OOH(Roughened)
2.1(±0.02)
-14(±1)
2.0(±0.2)
0.4(±0.2)
14.2 / 15.4(±0.4 / ±0.2)
18.3(±0.5)
127(±5)
104(±3)
1.5 / 1.2(±0.1 / ±0.1)
MixedSAM
(C14OOH /C10OH)(smooth)
1.5(±0.1)
-20.0(±1)
13.0(±0.1)
16.2(±0.2)
16.0 / 15.5(±0.2 / ±0.4)
12.0(±0.3)
122(±4)
40(±3)
2.5 / 1.9(±0.2 / ±0.2)
⊗ = Poor voltammetry rendered these properties impossible to measure;a Properties measured using EIS; bValues determined for both cathodic and anodic peaks (cath. / anod.).
141
3.11.3. XPS of the Mixed SAM/Cyt c System
XPS analysis was performed for cyt c adsorbed at HFA bulk gold that had been
modified with a Type I, two component mixed SAM (C10OH & C14OOH). Voltammetry
results on such systems, as seen in Figure 3.24, show, not only the regeneration of cyt c
response, but a clearly superior voltammetric signal. In most cases, the coverage of the
protein on the SAM appears to be greater when a mixed SAM of this type is used as the
modifier compared to the single component SAM on a smoothed surface. Figure 3.25 repeats
the XPS results for pure COOH SAMs (Fig. 3.15) with the addition of the N(1s) spectrum for
the mixed SAM system. The use of a mixed SAM (Fig. 3.25d) appears to substantially
increase total cyt c coverage relative to the pure SAM formed on a smooth gold surface (Fig.
3.25b), a result in agreement with the electrochemistry.
3.11.4. Kinetic Analysis of Cyt c Adlayers on Mixed SAMs
In parallel with this research, others in the Bowden Group were examining the impact
of mixed SAMs on the ET rate of adsorbed yeast cyt c (YCC).40 Those studies revealed a
substantial increase of ET rate for YCC on mixed COOH/OH SAMs relative to pure COOH
SAMs. On a Type I mixed SAM of C10COOH and C7OH, a 2500 fold increase in the ET rate
constant was observed relative to a pure C10COOH SAM. The Pelletier-Kraut (PK) model
for YCC binding to cyt c peroxidase was proposed as a possible explanation of the results.40
The PK model invokes the presence of a well-defined ET pathway between the two heme
groups when they are electrostatically bound together. Using this model as a basis, El Kasmi
et al. proposed that direct contact of extended chain termini of the SAM with the YCC’s
exposed heme edge could account for the enhanced ET rate. Thus, it seems clear that mixed
SAMs can provide the appropriate interfacial properties for optimal binding and electronic
coupling, whereas single component SAMs make this prospect a less likely possibility.40
Similar experiments on HH cyt c revealed the same general trend, although not as
substantial.40 HH cyt c ET rate constants show a 5-10 fold increase when adsorbed on a
COOH/OH SAM as compared to a similar pure COOH SAM. An example of this
comparison is shown in Figure 3.26. The change in ket° was consistent with that found in the
previous study40 and confirms that superior electronic coupling between SAM and protein
occurs when a mixed SAM (Type I) is used. These results, coupled with the gold topography
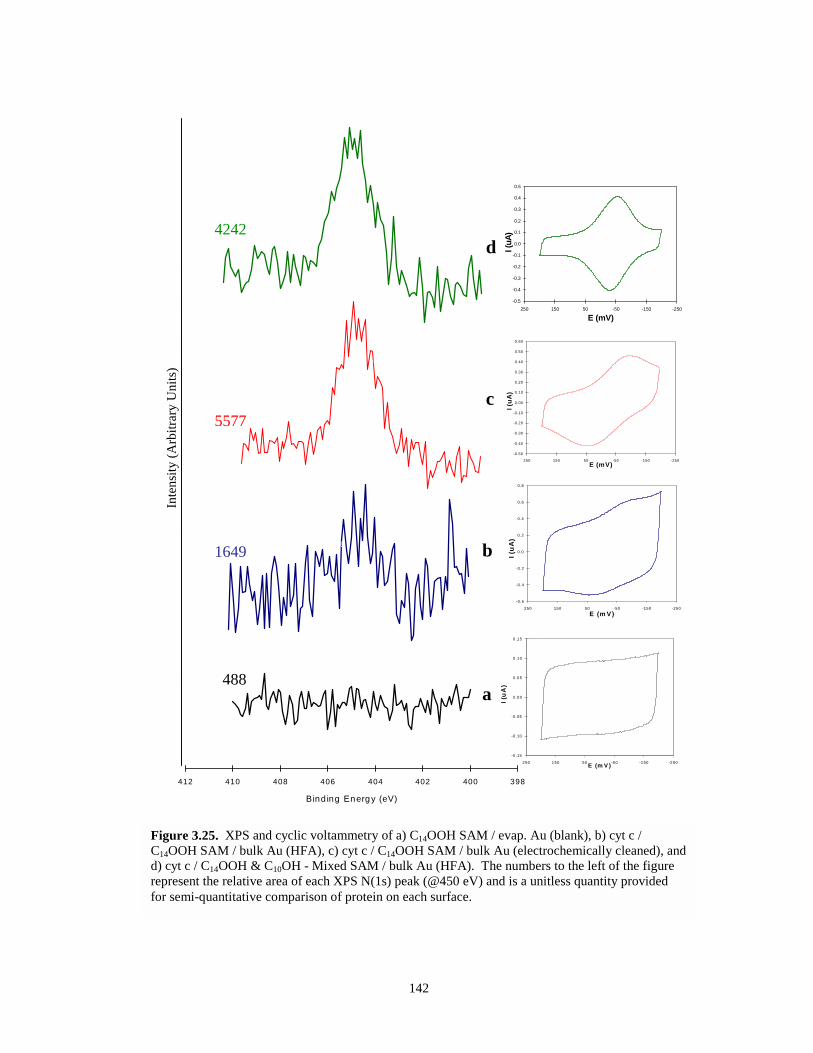
142
155500
157500
159500
161500
163500
165500
167500
169500
171500
398400402404406408410412
Bind ing Energy (eV)
267000
268000
269000
270000
271000
272000
273000
274000
398400402404406408410412
1 .5E+05
1.5E+05
1.5E+05
1.5E+05
1.5E+05
1.6E+05
1.6E+05
1.6E+05
398400402404406408410412
-0.15
-0 .10
-0 .05
0 .00
0 .05
0 .10
0 .15
-250-150-5050150250 E (m V )
I (u
A)
-0.6
-0.4
-0.2
0.0
0.2
0.4
0.6
0.8
-250-150-5050150250E (m V)
I (u
A)
-0.50
-0.40
-0.30
-0.20
-0.10
0.00
0.10
0.20
0.30
0.40
0.50
0.60
-250-150-5050150250E (mV)
I (uA
)
5577
1649
488
Inte
nsity
(Arb
itrar
y U
nits
)
a
b
c
158000
159000
160000
161000
162000
163000
164000
165000
166000
167000
168000
398.0400.0402.0404.0406.0408.0410.0412.0
4242d
-0.5
-0.4
-0.3
-0.2
-0.1
0.0
0.1
0.2
0.3
0.4
0.5
-250-150-5050150250
E (mV)
I (uA
)
Figure 3.25. XPS and cyclic voltammetry of a) C14OOH SAM / evap. Au (blank), b) cyt c /C14OOH SAM / bulk Au (HFA), c) cyt c / C14OOH SAM / bulk Au (electrochemically cleaned), andd) cyt c / C14OOH & C10OH - Mixed SAM / bulk Au (HFA). The numbers to the left of the figurerepresent the relative area of each XPS N(1s) peak (@450 eV) and is a unitless quantity providedfor semi-quantitative comparison of protein on each surface.
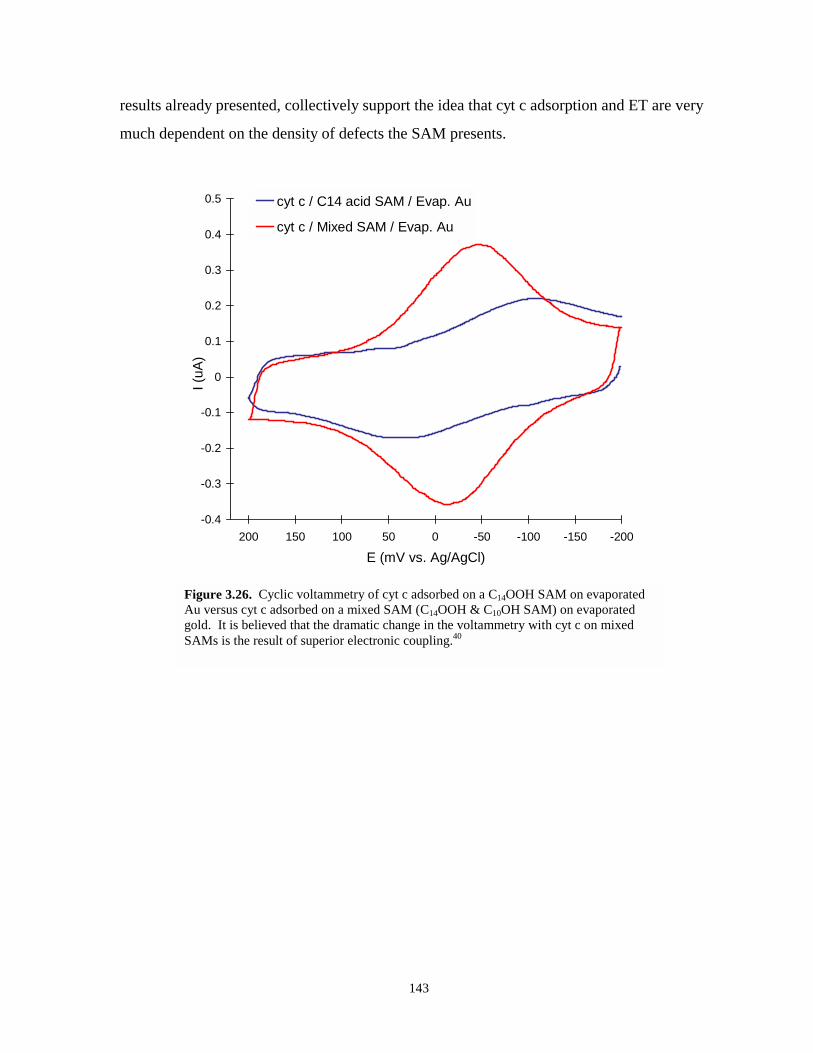
143
results already presented, collectively support the idea that cyt c adsorption and ET are very
much dependent on the density of defects the SAM presents.
-0.4
-0.3
-0.2
-0.1
0
0.1
0.2
0.3
0.4
0.5
-200-150-100-50050100150200
E (mV vs. Ag/AgCl)
I (uA
)cyt c / C14 acid SAM / Evap. Au
cyt c / Mixed SAM / Evap. Au
Figure 3.26. Cyclic voltammetry of cyt c adsorbed on a C14OOH SAM on evaporatedAu versus cyt c adsorbed on a mixed SAM (C14OOH & C10OH SAM) on evaporatedgold. It is believed that the dramatic change in the voltammetry with cyt c on mixedSAMs is the result of superior electronic coupling.40
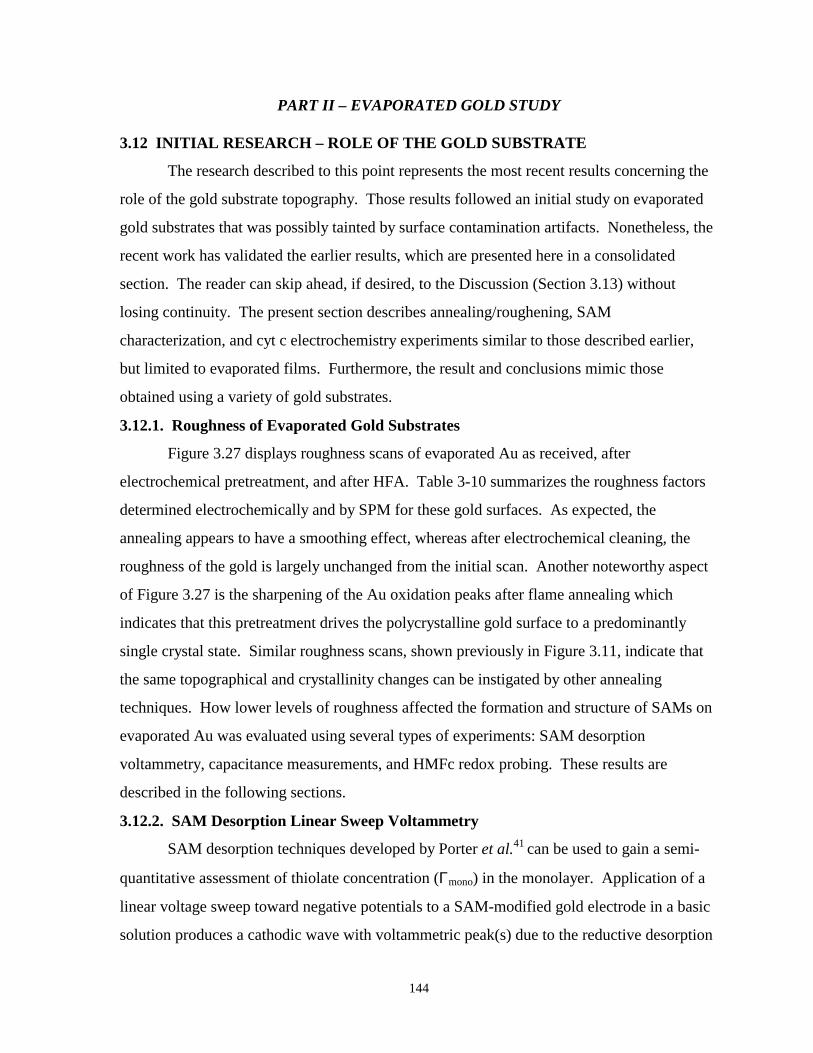
144
PART II – EVAPORATED GOLD STUDY
3.12 INITIAL RESEARCH – ROLE OF THE GOLD SUBSTRATE
The research described to this point represents the most recent results concerning the
role of the gold substrate topography. Those results followed an initial study on evaporated
gold substrates that was possibly tainted by surface contamination artifacts. Nonetheless, the
recent work has validated the earlier results, which are presented here in a consolidated
section. The reader can skip ahead, if desired, to the Discussion (Section 3.13) without
losing continuity. The present section describes annealing/roughening, SAM
characterization, and cyt c electrochemistry experiments similar to those described earlier,
but limited to evaporated films. Furthermore, the result and conclusions mimic those
obtained using a variety of gold substrates.
3.12.1. Roughness of Evaporated Gold Substrates
Figure 3.27 displays roughness scans of evaporated Au as received, after
electrochemical pretreatment, and after HFA. Table 3-10 summarizes the roughness factors
determined electrochemically and by SPM for these gold surfaces. As expected, the
annealing appears to have a smoothing effect, whereas after electrochemical cleaning, the
roughness of the gold is largely unchanged from the initial scan. Another noteworthy aspect
of Figure 3.27 is the sharpening of the Au oxidation peaks after flame annealing which
indicates that this pretreatment drives the polycrystalline gold surface to a predominantly
single crystal state. Similar roughness scans, shown previously in Figure 3.11, indicate that
the same topographical and crystallinity changes can be instigated by other annealing
techniques. How lower levels of roughness affected the formation and structure of SAMs on
evaporated Au was evaluated using several types of experiments: SAM desorption
voltammetry, capacitance measurements, and HMFc redox probing. These results are
described in the following sections.
3.12.2. SAM Desorption Linear Sweep Voltammetry
SAM desorption techniques developed by Porter et al.41 can be used to gain a semi-
quantitative assessment of thiolate concentration (Γmono) in the monolayer. Application of a
linear voltage sweep toward negative potentials to a SAM-modified gold electrode in a basic
solution produces a cathodic wave with voltammetric peak(s) due to the reductive desorption
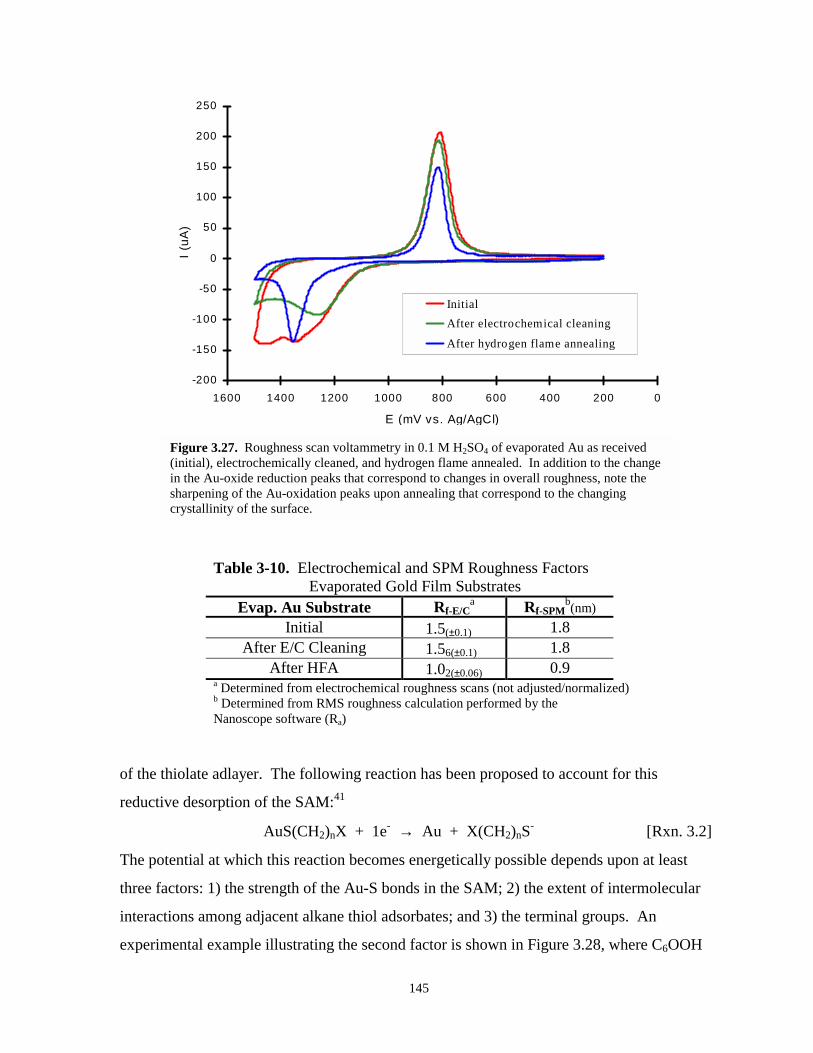
145
-200
-150
-100
-50
0
50
100
150
200
250
02004006008001000120014001600
E (mV vs. Ag/AgCl)
I (uA
)
InitialAfter electrochemical cleaning
After hydrogen flame annealing
Figure 3.27. Roughness scan voltammetry in 0.1 M H2SO4 of evaporated Au as received(initial), electrochemically cleaned, and hydrogen flame annealed. In addition to the changein the Au-oxide reduction peaks that correspond to changes in overall roughness, note thesharpening of the Au-oxidation peaks upon annealing that correspond to the changingcrystallinity of the surface.
Table 3-10. Electrochemical and SPM Roughness FactorsEvaporated Gold Film Substrates
Evap. Au Substrate Rf-E/Ca Rf-SPM
b(nm)Initial 1.5(±0.1) 1.8
After E/C Cleaning 1.56(±0.1) 1.8After HFA 1.02(±0.06) 0.9
a Determined from electrochemical roughness scans (not adjusted/normalized)b Determined from RMS roughness calculation performed by theNanoscope software (Ra)
of the thiolate adlayer. The following reaction has been proposed to account for this
reductive desorption of the SAM:41
AuS(CH2)nX + 1e- → Au + X(CH2)nS- [Rxn. 3.2]
The potential at which this reaction becomes energetically possible depends upon at least
three factors: 1) the strength of the Au-S bonds in the SAM; 2) the extent of intermolecular
interactions among adjacent alkane thiol adsorbates; and 3) the terminal groups. An
experimental example illustrating the second factor is shown in Figure 3.28, where C6OOH
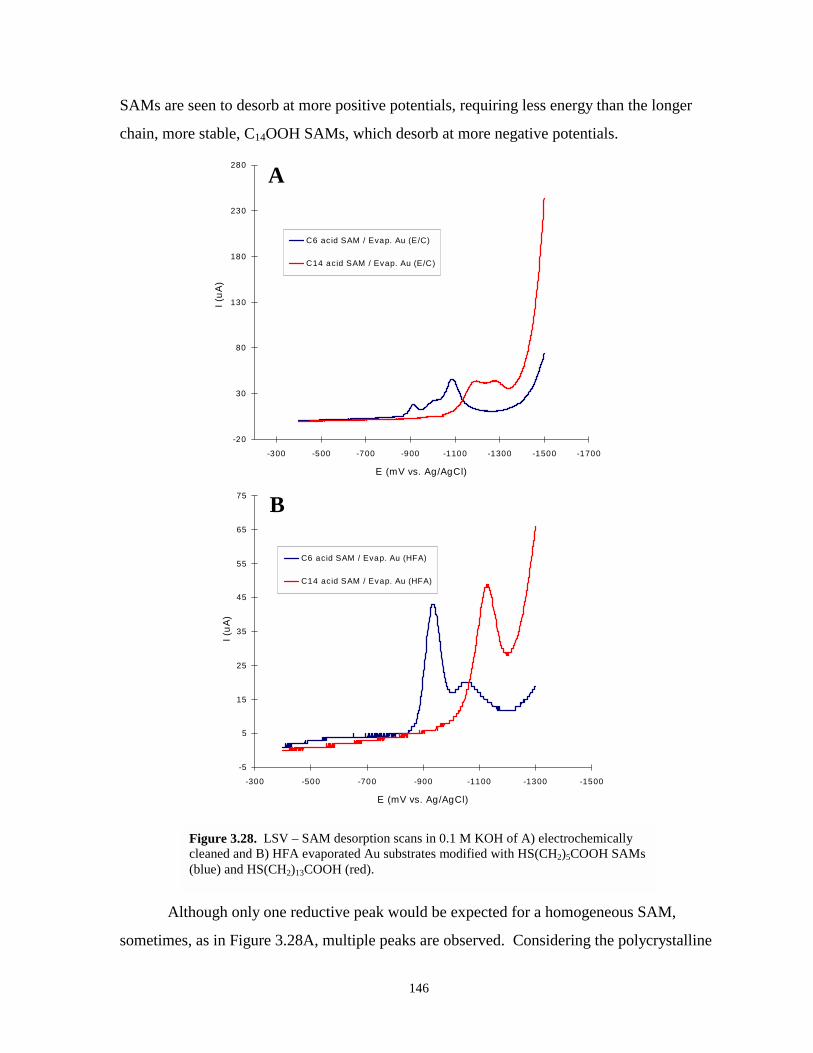
146
SAMs are seen to desorb at more positive potentials, requiring less energy than the longer
chain, more stable, C14OOH SAMs, which desorb at more negative potentials.
-20
30
80
130
180
230
280
-1700-1500-1300-1100-900-700-500-300
E (mV vs. Ag/AgCl)
I (uA
)
C6 ac id SAM / Evap. Au (E/C)
C14 acid SAM / Evap. Au (E/C)
-5
5
15
25
35
45
55
65
75
-1500-1300-1100-900-700-500-300
E (mV vs. Ag/AgCl)
I (uA
)
C6 acid SAM / Evap. Au (HFA)
C14 acid SAM / Evap. Au (HFA)
A
B
Figure 3.28. LSV – SAM desorption scans in 0.1 M KOH of A) electrochemicallycleaned and B) HFA evaporated Au substrates modified with HS(CH2)5COOH SAMs(blue) and HS(CH2)13COOH (red).
Although only one reductive peak would be expected for a homogeneous SAM,
sometimes, as in Figure 3.28A, multiple peaks are observed. Considering the polycrystalline
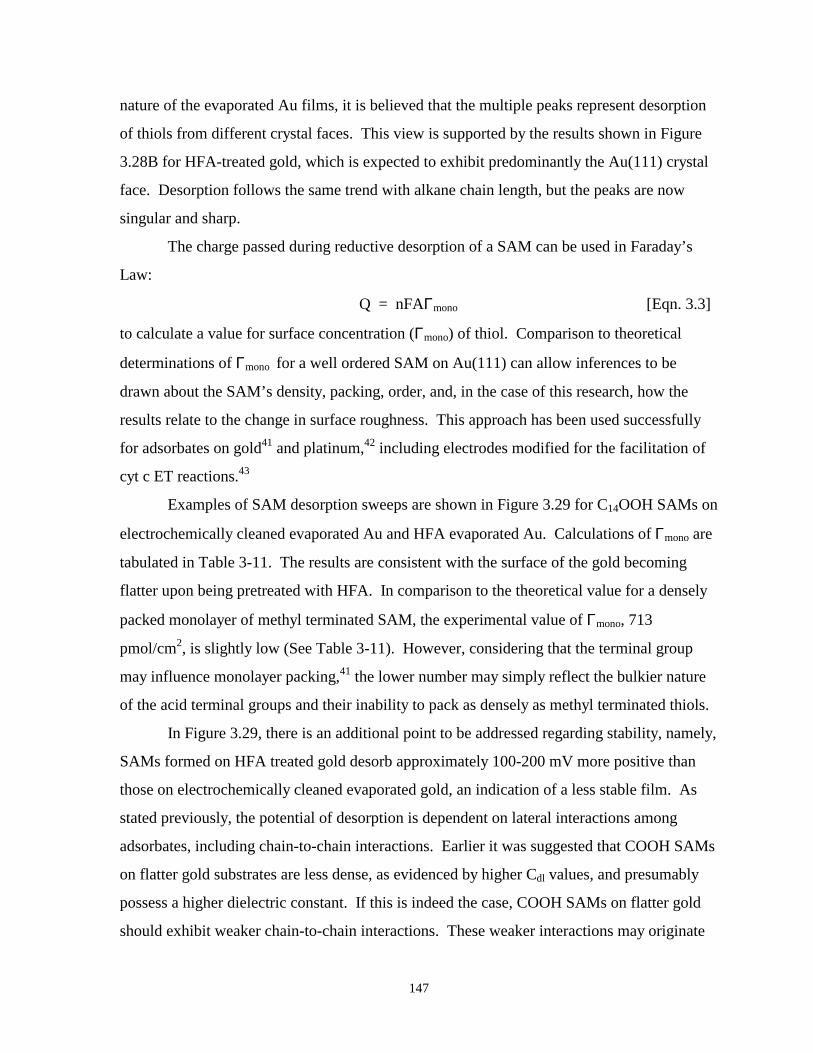
147
nature of the evaporated Au films, it is believed that the multiple peaks represent desorption
of thiols from different crystal faces. This view is supported by the results shown in Figure
3.28B for HFA-treated gold, which is expected to exhibit predominantly the Au(111) crystal
face. Desorption follows the same trend with alkane chain length, but the peaks are now
singular and sharp.
The charge passed during reductive desorption of a SAM can be used in Faraday’s
Law:
Q = nFAΓmono [Eqn. 3.3]
to calculate a value for surface concentration (Γmono) of thiol. Comparison to theoretical
determinations of Γmono for a well ordered SAM on Au(111) can allow inferences to be
drawn about the SAM’s density, packing, order, and, in the case of this research, how the
results relate to the change in surface roughness. This approach has been used successfully
for adsorbates on gold41 and platinum,42 including electrodes modified for the facilitation of
cyt c ET reactions.43
Examples of SAM desorption sweeps are shown in Figure 3.29 for C14OOH SAMs on
electrochemically cleaned evaporated Au and HFA evaporated Au. Calculations of Γmono are
tabulated in Table 3-11. The results are consistent with the surface of the gold becoming
flatter upon being pretreated with HFA. In comparison to the theoretical value for a densely
packed monolayer of methyl terminated SAM, the experimental value of Γmono, 713
pmol/cm2, is slightly low (See Table 3-11). However, considering that the terminal group
may influence monolayer packing,41 the lower number may simply reflect the bulkier nature
of the acid terminal groups and their inability to pack as densely as methyl terminated thiols.
In Figure 3.29, there is an additional point to be addressed regarding stability, namely,
SAMs formed on HFA treated gold desorb approximately 100-200 mV more positive than
those on electrochemically cleaned evaporated gold, an indication of a less stable film. As
stated previously, the potential of desorption is dependent on lateral interactions among
adsorbates, including chain-to-chain interactions. Earlier it was suggested that COOH SAMs
on flatter gold substrates are less dense, as evidenced by higher Cdl values, and presumably
possess a higher dielectric constant. If this is indeed the case, COOH SAMs on flatter gold
should exhibit weaker chain-to-chain interactions. These weaker interactions may originate
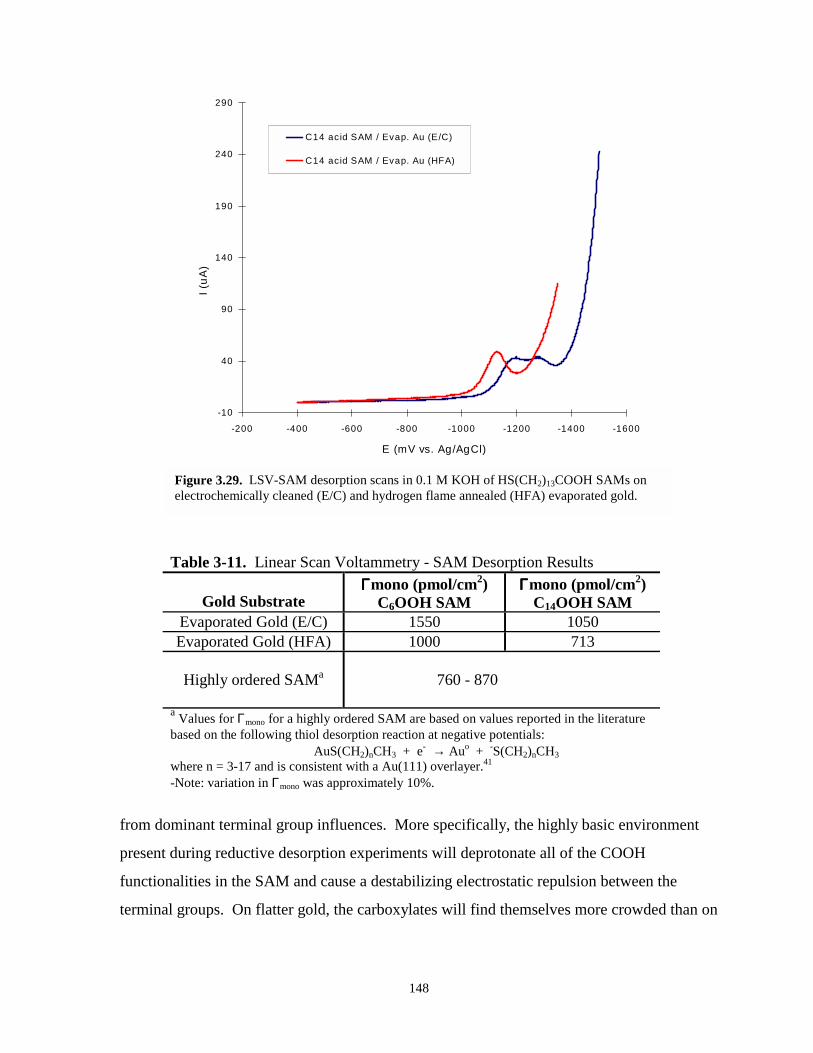
148
-10
40
90
140
190
240
290
-1600-1400-1200-1000-800-600-400-200
E (mV vs. Ag/AgCl)
I (uA
)
C14 acid SAM / Evap. Au (E/C)
C14 acid SAM / Evap. Au (HFA)
Figure 3.29. LSV-SAM desorption scans in 0.1 M KOH of HS(CH2)13COOH SAMs onelectrochemically cleaned (E/C) and hydrogen flame annealed (HFA) evaporated gold.
Table 3-11. Linear Scan Voltammetry - SAM Desorption Results
Gold SubstrateΓΓΓΓmono (pmol/cm2)
C6OOH SAMΓΓΓΓmono (pmol/cm2)
C14OOH SAMEvaporated Gold (E/C) 1550 1050Evaporated Gold (HFA) 1000 713
Highly ordered SAMa 760 - 870
a Values for Γmono for a highly ordered SAM are based on values reported in the literaturebased on the following thiol desorption reaction at negative potentials:
AuS(CH2)nCH3 + e- → Auo + -S(CH2)nCH3where n = 3-17 and is consistent with a Au(111) overlayer.41
-Note: variation in Γmono was approximately 10%.
from dominant terminal group influences. More specifically, the highly basic environment
present during reductive desorption experiments will deprotonate all of the COOH
functionalities in the SAM and cause a destabilizing electrostatic repulsion between the
terminal groups. On flatter gold, the carboxylates will find themselves more crowded than on
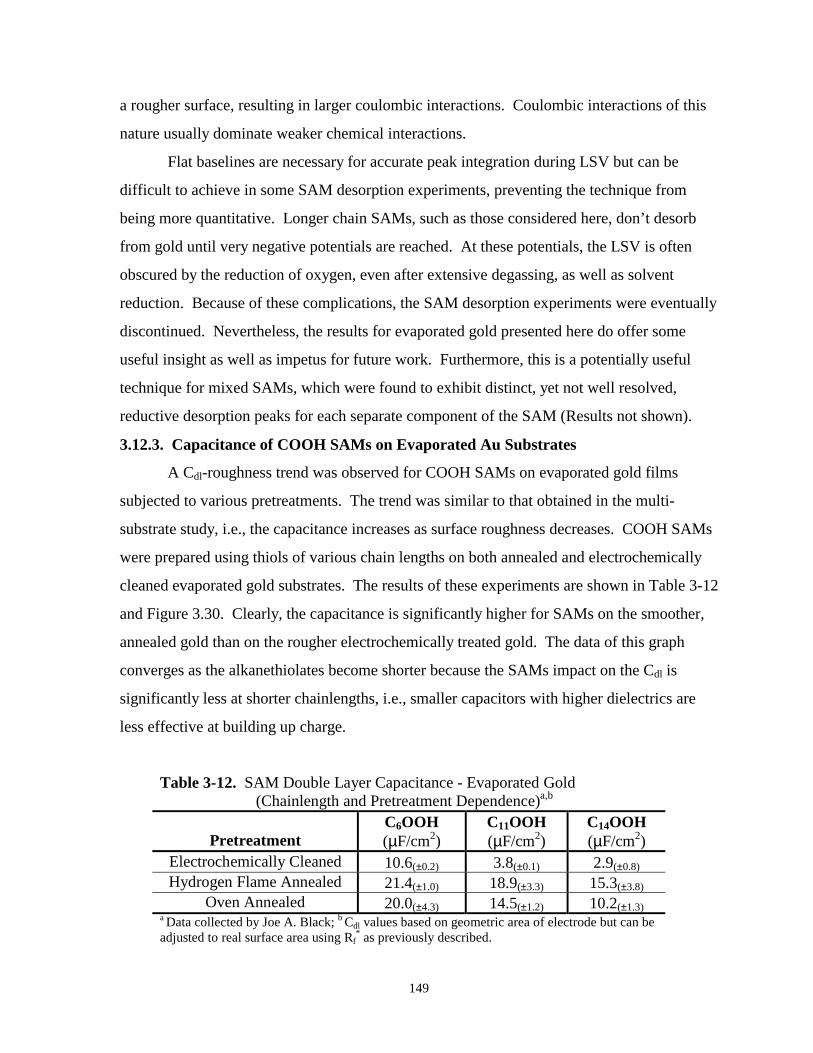
149
a rougher surface, resulting in larger coulombic interactions. Coulombic interactions of this
nature usually dominate weaker chemical interactions.
Flat baselines are necessary for accurate peak integration during LSV but can be
difficult to achieve in some SAM desorption experiments, preventing the technique from
being more quantitative. Longer chain SAMs, such as those considered here, don’t desorb
from gold until very negative potentials are reached. At these potentials, the LSV is often
obscured by the reduction of oxygen, even after extensive degassing, as well as solvent
reduction. Because of these complications, the SAM desorption experiments were eventually
discontinued. Nevertheless, the results for evaporated gold presented here do offer some
useful insight as well as impetus for future work. Furthermore, this is a potentially useful
technique for mixed SAMs, which were found to exhibit distinct, yet not well resolved,
reductive desorption peaks for each separate component of the SAM (Results not shown).
3.12.3. Capacitance of COOH SAMs on Evaporated Au Substrates
A Cdl-roughness trend was observed for COOH SAMs on evaporated gold films
subjected to various pretreatments. The trend was similar to that obtained in the multi-
substrate study, i.e., the capacitance increases as surface roughness decreases. COOH SAMs
were prepared using thiols of various chain lengths on both annealed and electrochemically
cleaned evaporated gold substrates. The results of these experiments are shown in Table 3-12
and Figure 3.30. Clearly, the capacitance is significantly higher for SAMs on the smoother,
annealed gold than on the rougher electrochemically treated gold. The data of this graph
converges as the alkanethiolates become shorter because the SAMs impact on the Cdl is
significantly less at shorter chainlengths, i.e., smaller capacitors with higher dielectrics are
less effective at building up charge.
Table 3-12. SAM Double Layer Capacitance - Evaporated Gold(Chainlength and Pretreatment Dependence)a,b
PretreatmentC6OOH(µF/cm2)
C11OOH(µF/cm2)
C14OOH(µF/cm2)
Electrochemically Cleaned 10.6(±0.2) 3.8(±0.1) 2.9(±0.8)Hydrogen Flame Annealed 21.4(±1.0) 18.9(±3.3) 15.3(±3.8)
Oven Annealed 20.0(±4.3) 14.5(±1.2) 10.2(±1.3)a Data collected by Joe A. Black; b Cdl values based on geometric area of electrode but can beadjusted to real surface area using Rf
* as previously described.
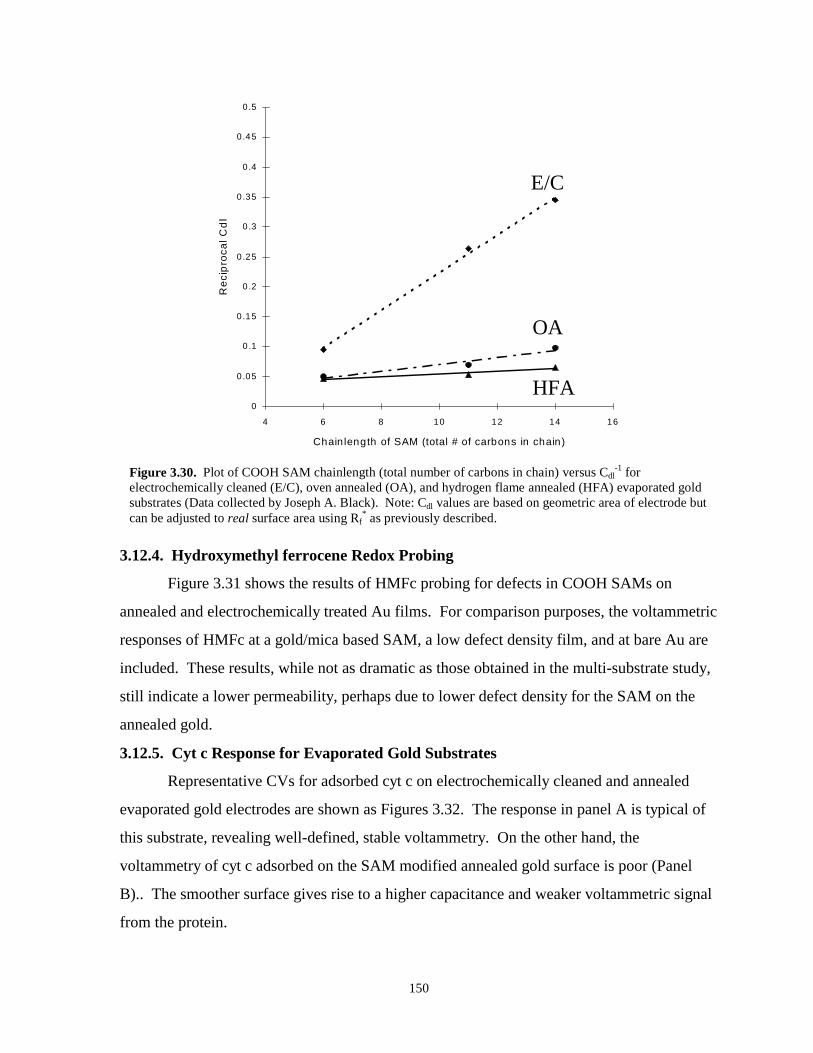
150
0
0.05
0.1
0.15
0.2
0.25
0.3
0.35
0.4
0.45
0.5
4 6 8 10 12 14 16
Chain length of SAM (total # of carbons in chain)
Rec
ipro
cal C
dl
E/C
OA
HFA
Figure 3.30. Plot of COOH SAM chainlength (total number of carbons in chain) versus Cdl-1 for
electrochemically cleaned (E/C), oven annealed (OA), and hydrogen flame annealed (HFA) evaporated goldsubstrates (Data collected by Joseph A. Black). Note: Cdl values are based on geometric area of electrode butcan be adjusted to real surface area using Rf
* as previously described.
3.12.4. Hydroxymethyl ferrocene Redox Probing
Figure 3.31 shows the results of HMFc probing for defects in COOH SAMs on
annealed and electrochemically treated Au films. For comparison purposes, the voltammetric
responses of HMFc at a gold/mica based SAM, a low defect density film, and at bare Au are
included. These results, while not as dramatic as those obtained in the multi-substrate study,
still indicate a lower permeability, perhaps due to lower defect density for the SAM on the
annealed gold.
3.12.5. Cyt c Response for Evaporated Gold Substrates
Representative CVs for adsorbed cyt c on electrochemically cleaned and annealed
evaporated gold electrodes are shown as Figures 3.32. The response in panel A is typical of
this substrate, revealing well-defined, stable voltammetry. On the other hand, the
voltammetry of cyt c adsorbed on the SAM modified annealed gold surface is poor (Panel
B).. The smoother surface gives rise to a higher capacitance and weaker voltammetric signal
from the protein.
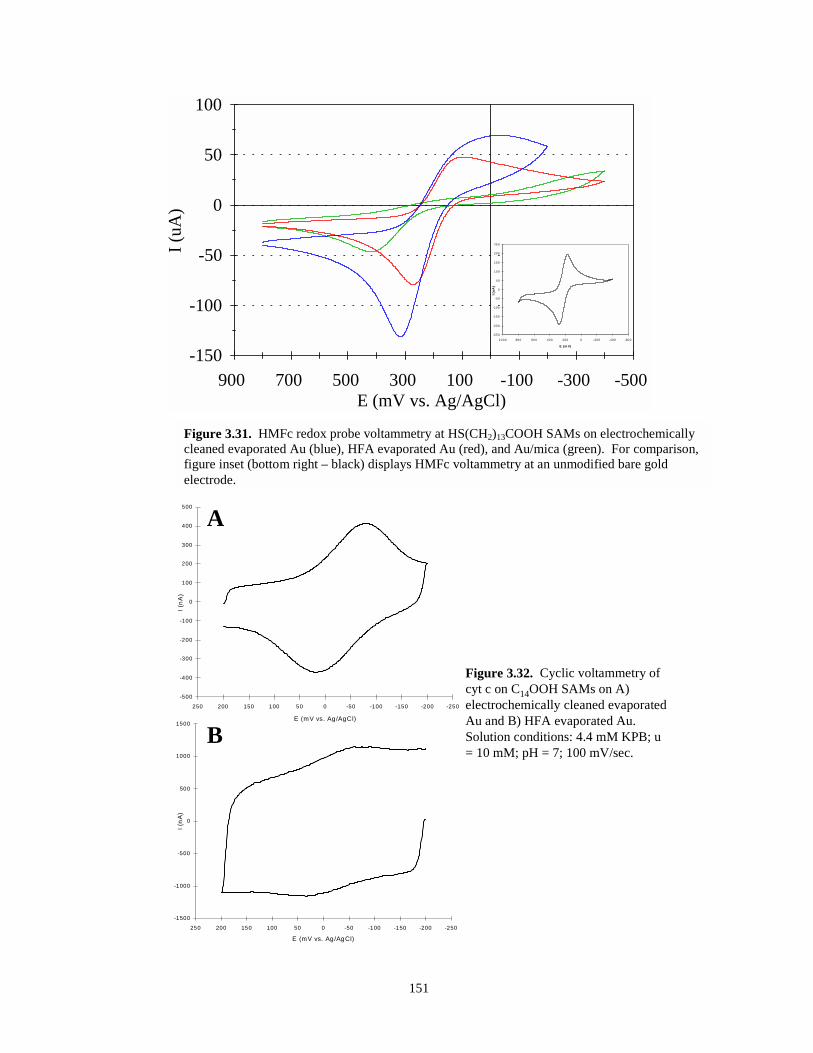
151
-150
-100
-50
0
50
100
I (uA
)
-500 -300 -100 100 300 500 700 900 E (mV vs. Ag/AgCl)
-250
-200
-150
-100
-50
0
50
100
150
200
250
-600-400-20002004006008001000
E (m V)
I (u
A)
Figure 3.31. HMFc redox probe voltammetry at HS(CH2)13COOH SAMs on electrochemicallycleaned evaporated Au (blue), HFA evaporated Au (red), and Au/mica (green). For comparison,figure inset (bottom right – black) displays HMFc voltammetry at an unmodified bare goldelectrode.
-500
-400
-300
-200
-100
0
100
200
300
400
500
-250-200-150-100-50050100150200250
E (mV vs. Ag/AgCl)
I (nA
)
-1500
-1000
-500
0
500
1000
1500
-250-200-150-100-50050100150200250
E (mV vs. Ag/AgCl)
I (nA
)
Figure 3.32. Cyclic voltammetry ofcyt c on C14OOH SAMs on A)electrochemically cleaned evaporatedAu and B) HFA evaporated Au.Solution conditions: 4.4 mM KPB; u= 10 mM; pH = 7; 100 mV/sec.
B
A
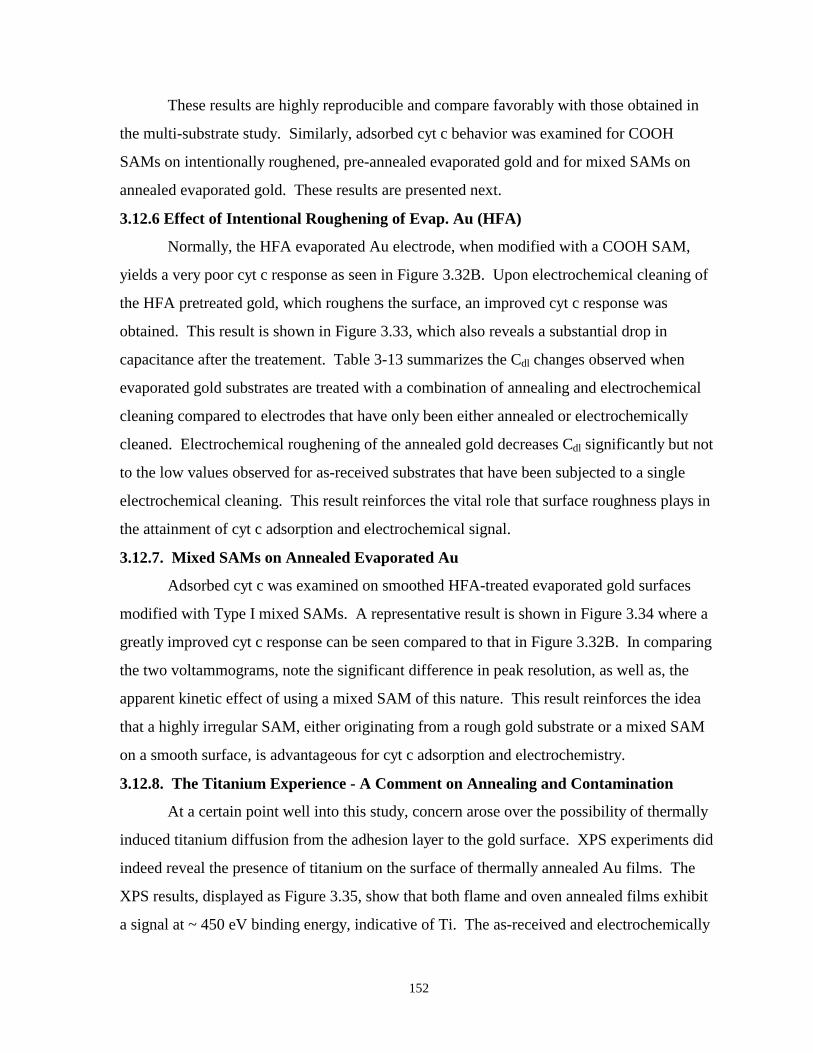
152
These results are highly reproducible and compare favorably with those obtained in
the multi-substrate study. Similarly, adsorbed cyt c behavior was examined for COOH
SAMs on intentionally roughened, pre-annealed evaporated gold and for mixed SAMs on
annealed evaporated gold. These results are presented next.
3.12.6 Effect of Intentional Roughening of Evap. Au (HFA)
Normally, the HFA evaporated Au electrode, when modified with a COOH SAM,
yields a very poor cyt c response as seen in Figure 3.32B. Upon electrochemical cleaning of
the HFA pretreated gold, which roughens the surface, an improved cyt c response was
obtained. This result is shown in Figure 3.33, which also reveals a substantial drop in
capacitance after the treatement. Table 3-13 summarizes the Cdl changes observed when
evaporated gold substrates are treated with a combination of annealing and electrochemical
cleaning compared to electrodes that have only been either annealed or electrochemically
cleaned. Electrochemical roughening of the annealed gold decreases Cdl significantly but not
to the low values observed for as-received substrates that have been subjected to a single
electrochemical cleaning. This result reinforces the vital role that surface roughness plays in
the attainment of cyt c adsorption and electrochemical signal.
3.12.7. Mixed SAMs on Annealed Evaporated Au
Adsorbed cyt c was examined on smoothed HFA-treated evaporated gold surfaces
modified with Type I mixed SAMs. A representative result is shown in Figure 3.34 where a
greatly improved cyt c response can be seen compared to that in Figure 3.32B. In comparing
the two voltammograms, note the significant difference in peak resolution, as well as, the
apparent kinetic effect of using a mixed SAM of this nature. This result reinforces the idea
that a highly irregular SAM, either originating from a rough gold substrate or a mixed SAM
on a smooth surface, is advantageous for cyt c adsorption and electrochemistry.
3.12.8. The Titanium Experience - A Comment on Annealing and Contamination
At a certain point well into this study, concern arose over the possibility of thermally
induced titanium diffusion from the adhesion layer to the gold surface. XPS experiments did
indeed reveal the presence of titanium on the surface of thermally annealed Au films. The
XPS results, displayed as Figure 3.35, show that both flame and oven annealed films exhibit
a signal at ~ 450 eV binding energy, indicative of Ti. The as-received and electrochemically
153
-600
-400
-200
0
200
400
600
800
-200-150-100-50050100150200
E (mV vs. Ag/AgCl)
nA
-500
-400
-300
-200
-100
0
100
200
300
400
500
600
-200-1000100200
E (mV vs. Ag/AgCl)
nA
A
B
Figure 3.33. Cyclic voltammetry with background signals illustrating the effect of surfaceroughening on the cyt c response: A) cyt c / C14 acid SAM / evaporated Au (HFA) and B) cyt c / C14acid SAM / evaporated Au (HFA and subsequently roughened with electrochemical cycling in 0.1M H2SO4 / 0.01 M KCl (Data collected by Joseph A. Black).
Table 3-13. SAMs Double Layer Capacitance Results Cdl of SAMs on Evap. Au w/ various pretreatmentsa,b
Pretreatment of Gold inC14OOH SAM / Evap. Au
SystemCdl
(µµµµF/cm2)E/C Cleaned 2.9(±0.8)
HFA 15.3(±3.8)
HFA then E/C Cleaned 5.2(±0.7)a Data collected by Joe A. Black; b Cdl values based on geometricarea of electrode but can be adjusted to real surface area usingRf as previously described
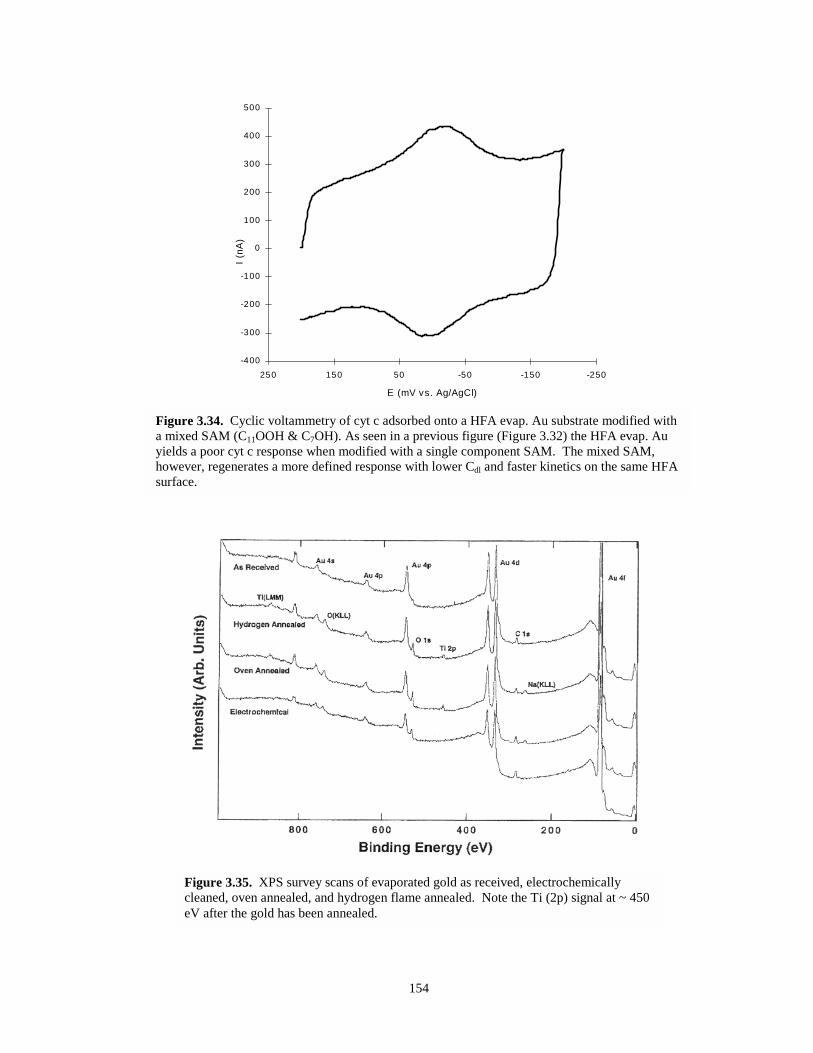
154
-400
-300
-200
-100
0
100
200
300
400
500
-250-150-5050150250
E (mV vs. Ag/AgCl)
I (nA
)
Figure 3.34. Cyclic voltammetry of cyt c adsorbed onto a HFA evap. Au substrate modified witha mixed SAM (C11OOH & C7OH). As seen in a previous figure (Figure 3.32) the HFA evap. Auyields a poor cyt c response when modified with a single component SAM. The mixed SAM,however, regenerates a more defined response with lower Cdl and faster kinetics on the same HFAsurface.
Figure 3.35. XPS survey scans of evaporated gold as received, electrochemicallycleaned, oven annealed, and hydrogen flame annealed. Note the Ti (2p) signal at ~ 450eV after the gold has been annealed.
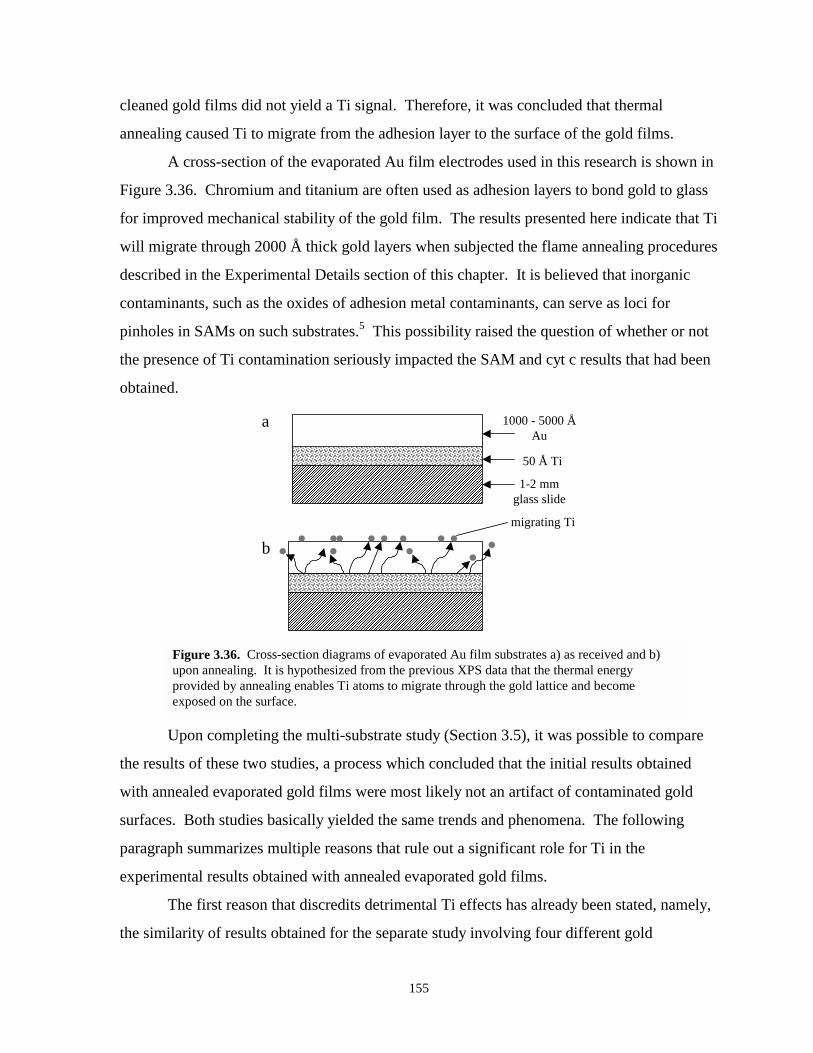
155
cleaned gold films did not yield a Ti signal. Therefore, it was concluded that thermal
annealing caused Ti to migrate from the adhesion layer to the surface of the gold films.
A cross-section of the evaporated Au film electrodes used in this research is shown in
Figure 3.36. Chromium and titanium are often used as adhesion layers to bond gold to glass
for improved mechanical stability of the gold film. The results presented here indicate that Ti
will migrate through 2000 Å thick gold layers when subjected the flame annealing procedures
described in the Experimental Details section of this chapter. It is believed that inorganic
contaminants, such as the oxides of adhesion metal contaminants, can serve as loci for
pinholes in SAMs on such substrates.5 This possibility raised the question of whether or not
the presence of Ti contamination seriously impacted the SAM and cyt c results that had been
obtained.
����������������������������������������������������������������������������������������������������������������������������������������������������������
1000 - 5000 ÅAu
50 Å Ti
1-2 mmglass slide
a
������������������������������������������������������������������������������������������������������������������������������������������������������������������������������������������������������������������������������������������������������������������������������������������������������������������������������������������������������������������������������������������������������������������������������������������������������������������������������
b
��������������������������������������������������������������������������������������������������������������������������������������������������������������������������������������������������������������������������������������������������������������������������������������������������������������������
migrating Ti
Upon completing the multi-substrate study (Section 3.5), it was possible to compare
the results of these two studies, a process which concluded that the initial results obtained
with annealed evaporated gold films were most likely not an artifact of contaminated gold
surfaces. Both studies basically yielded the same trends and phenomena. The following
paragraph summarizes multiple reasons that rule out a significant role for Ti in the
experimental results obtained with annealed evaporated gold films.
The first reason that discredits detrimental Ti effects has already been stated, namely,
the similarity of results obtained for the separate study involving four different gold
Figure 3.36. Cross-section diagrams of evaporated Au film substrates a) as received and b)upon annealing. It is hypothesized from the previous XPS data that the thermal energyprovided by annealing enables Ti atoms to migrate through the gold lattice and becomeexposed on the surface.
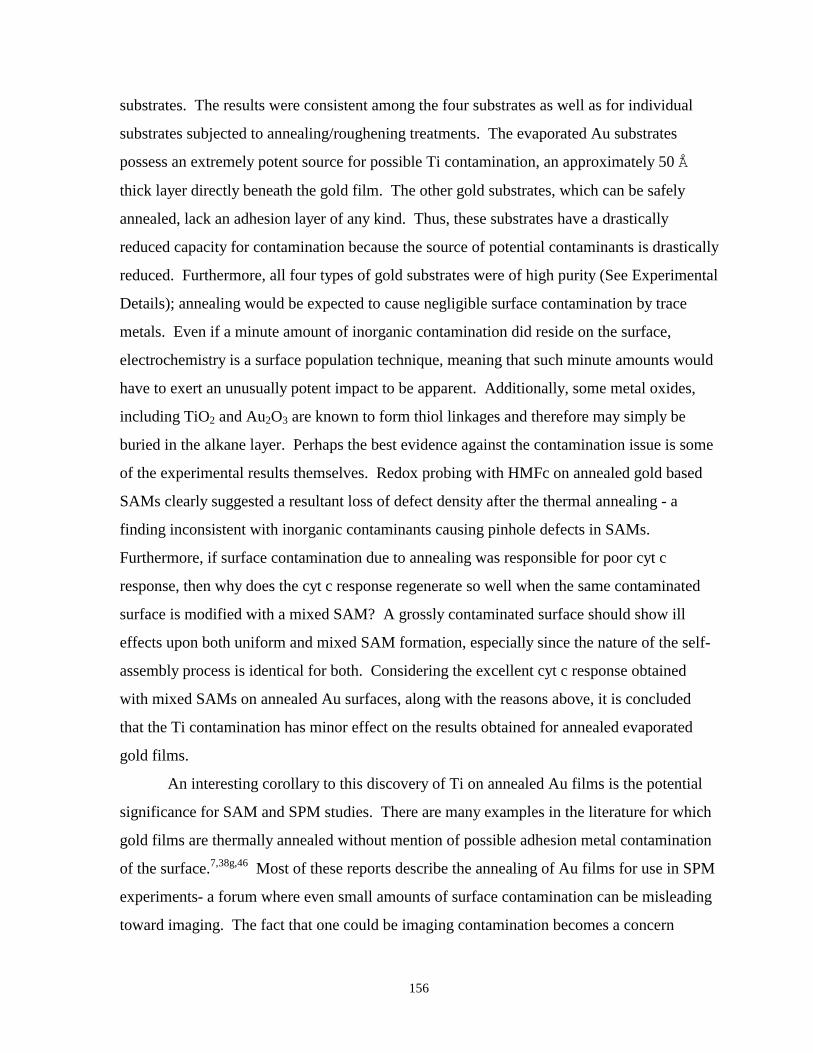
156
substrates. The results were consistent among the four substrates as well as for individual
substrates subjected to annealing/roughening treatments. The evaporated Au substrates
possess an extremely potent source for possible Ti contamination, an approximately 50 Å
thick layer directly beneath the gold film. The other gold substrates, which can be safely
annealed, lack an adhesion layer of any kind. Thus, these substrates have a drastically
reduced capacity for contamination because the source of potential contaminants is drastically
reduced. Furthermore, all four types of gold substrates were of high purity (See Experimental
Details); annealing would be expected to cause negligible surface contamination by trace
metals. Even if a minute amount of inorganic contamination did reside on the surface,
electrochemistry is a surface population technique, meaning that such minute amounts would
have to exert an unusually potent impact to be apparent. Additionally, some metal oxides,
including TiO2 and Au2O3 are known to form thiol linkages and therefore may simply be
buried in the alkane layer. Perhaps the best evidence against the contamination issue is some
of the experimental results themselves. Redox probing with HMFc on annealed gold based
SAMs clearly suggested a resultant loss of defect density after the thermal annealing - a
finding inconsistent with inorganic contaminants causing pinhole defects in SAMs.
Furthermore, if surface contamination due to annealing was responsible for poor cyt c
response, then why does the cyt c response regenerate so well when the same contaminated
surface is modified with a mixed SAM? A grossly contaminated surface should show ill
effects upon both uniform and mixed SAM formation, especially since the nature of the self-
assembly process is identical for both. Considering the excellent cyt c response obtained
with mixed SAMs on annealed Au surfaces, along with the reasons above, it is concluded
that the Ti contamination has minor effect on the results obtained for annealed evaporated
gold films.
An interesting corollary to this discovery of Ti on annealed Au films is the potential
significance for SAM and SPM studies. There are many examples in the literature for which
gold films are thermally annealed without mention of possible adhesion metal contamination
of the surface.7,38g,46 Most of these reports describe the annealing of Au films for use in SPM
experiments- a forum where even small amounts of surface contamination can be misleading
toward imaging. The fact that one could be imaging contamination becomes a concern
157
because SPM techniques are generally incapable of species identification. One paper using
annealed evaporated Au substrates with adhesion layers even states the following: “Au films
that were coated onto a quartz slide with an underlayer of Cr were much more stable
following annealing.”7
3.13. DISCUSSIONThe major finding of the research can be summarized as follows: the topography of
gold electrodes plays a very significant role in the structural properties of COOH SAMs,
which, in turn, has a substantial impact on the adsorption and electrochemistry of cyt c.
Acidic SAMs having a significant degree of defect density, arising from either rough gold
topography or from a mixed SAM, exhibit a surface texture that appears more optimal for cyt
c adsorption and electrochemical response. Additionally, the COOH SAMs with higher
defect density gave rise to consistently lower double-layer capacitance (Cdl) while at the same
time exhibiting greater permeability to diffusing redox probes. In this discussion, we will
address the major conclusions by first considering SAM structure and properties before
turning to the cyt c electrochemistry.
3.13.1. Carboxylic Acid SAM Structure and Gold Topography
A significant part of this study and a key aspect of SAM structure as a function of
gold topography is the redox probe results which define the permeability of the SAMs on
various types of gold. Expectedly, the density of defects decreases as the topography
becomes smoother and increasingly void of physical surface features that typically cause
defects in SAMs. The voltammetry of the probe molecule HMFc becomes increasingly more
restricted from access to the gold surface as the gold becomes smoother, a clear indication
that fewer defects exist in the films. At the same time, however, the SAMs on these surfaces
exhibit increasingly higher Cdl values. This paradoxical relationship is the first focus of this
discussion.
The redox probe voltammetry results and the Cdl measurements of the SAMs formed
on various gold substrates inspired the proposed model introduced in Figure 3.20 and Section
3.10. The model explains the high Cdl values found for SAMs on flatter gold in terms of a
dielectric effect caused by the unique packing found with COOH SAMs. It was proposed
that the acid termini are spatially restricted by the smoother topography to a more planar
158
arrangement which, in turn, gives rise to surface interactions that increasingly influence the
packing structure of the SAM by decreasing the relative contribution of chain-chain van der
Waals interactions. This scenario could lead to a SAM whose alkane region, while
positioned more uniformly and devoid of many major defects, is less dense, resulting in an
increased dielectric constant, which would elevate the Cdl.
Our SAM model is based on the concept that the acid termini interact attractively,
most likely through hydrogen bonding (H-bonding), to form a stabilized and more cohesive
interface that exerts substantial control over the structural properties of the SAM. The
general importance of electrostatic and steric endgoup interactions in the packing structure of
SAMs has been noted in prior work by Chidsey and Loiacono.30e Additionally, Poirier and
coworkers recently concluded that H-bonding amongst hydroxyl termini play a vital role in
determining the overall structural properties of mercaptohexanol SAMs on Au(111).49b,d
Also in support of this model, a lateral force microscopy (LFM) study of various ω-
substituted alkane thiol SAMs found acid terminated SAMs to be “stiffer” than methyl
terminated SAMs.33b If the terminal groups are attractively interacting to a significant degree,
this is not a surprising result.
The major attractive interaction between COOH end groups is undoubtedly H-
bonding. H-bonding appears to be strong enough to direct the packing and structure of the
SAM and alter its overall properties. Using SIMS, Cooper and Leggett showed that COOH
SAMs were more stable toward displacement by methyl terminated thiols and were equally as
effective in displacing methyl terminated thiols at defect sites in existing SAMs. These
tendencies were found to occur even when the methyl terminated thiols possessed
substantially longer alkane chains. Their work predicted that for an alkylthiol on gold
(SAM), the methylene chain-to-chain interactions contributes about 0.8 kcal/mol for each
methylene group in the chain whereas the carboxylic acid endgroups contribute at least 7.2
kcal/mol, the equivalent of nine methylene groups, to the enthalpy of adsorption.49b Cooper
and Leggett proposed interchain H-bonding as the primary cause of both phenomena.49b
From our results, we furthermore propose that on smoother gold, H-bonding interactions are
maximized whereas on rougher gold or with mixed SAMs, they are minimized due to
disruption of the “plane” of H-bonding. With weaker H-bonding, the SAM components
159
would have greater conformational freedom and would be expected to pack with greater
dependence on van der Waals interactions between alkane chains. With stronger H-bonding
in the COOH “plane,” the surface will exhibit a cohesiveness or surface tension. Because the
attractive energy between endgroups (H-bonding) must be overcome to disrupt or penetrate
the SAM, increased H-bonding should inhibit defect formation and minimize film
permeability.
The model proposed here may also help explain the inconsistency of pKa values that
have been reported in the literature for COOH terminated SAMs, which range from 5.2 to
11.5.57 It is proposed that the macroscopic pKa value of a COOH SAM is a gold substrate
dependent property. The work described here has shown that the surface of the gold
substantially impacts the properties and the structure of a SAM including the
microenvironment associated with individual COOH groups. COOH groups engaged in H-
bonding should be more difficult to deprotonate whereas less hindered groups that extend
further into solution should be easier to deprotonate. Likewise, COOH groups more
imbedded within the film reside in a more hydrophobic environment and will be more
resistant to deprotonation, causing higher microscopic pKa values. The latter phenomenon
has already been documented by Creager and coworkers in an investigation of mixed SAMs
composed of COOH and CH3 terminated thiols of different chainlengths. As the length of
the methyl-terminated component was progressively increased from being shorter than the
acid-terminated thiol to longer, the pKa of the COOH groups increased from 6.2 to 11.5.57a
In summary, rougher gold is predicted to yield lower pKa values for COOH SAMs and
smoother surfaces should exhibit higher pKa values in accordance with the proposed model.
3.13.2. Cyt c Adsorption/Electrochemistry and Gold Topography
The adsorption and electrochemistry of cyt c seems intimately related to the density of
defects in acidic SAMs. Topographically smoother, flatter gold substrates with fewer defect
features such as grain boundaries and step edges, should give rise to more uniform SAMs
with a lower overall density of defects. Such “ideal” surfaces have proven to be poor
platforms for cyt c adsorption and electrochemistry. On the contrary, rougher, polycrystalline
gold surfaces, supporting SAMs with a higher degree of defectiveness and disorder, have
been found to be most suitable for cyt c adsorption and electrochemistry. It is concluded that
160
SAMs with significant defect density provide an irregularly textured, disordered surface,
offering greater interfacial flexibility and conformational freedom that subsequently is better
able to promote protein adsorption and electrochemistry. Such a surface would be more
similar to that of a real protein.
Although not directly addressed by this research, it can be speculated that the cyt c
adsorption is more favorable at specific types of defect sites. That is, non-pinhole defect sites
in the SAM, such as defects formed at grain boundaries and step edges in the gold, may serve
as more favorable sites for cyt c adsorption than other types of defects, at least from an
electrochemical standpoint. Non-pinhole defects, it would seem, provide the protein with a
more optimal binding site - an irregularly textured surface that also maintains substantial
alkane density between the electrolytic solution and gold electrode, thereby lowering the
overall Cdl of the system. This type of scenario is perhaps best exemplified by the mixed
SAMs and by those assemblies prepared on intentionally roughened substrates. It may also
explain the small amounts of electroactive cyt c found on the flatter gold substrates modified
with COOH SAMs. Whereas redox probing showed these films to have very few pinhole-
type defects, they most likely still possess step edge and/or grain boundary based defects
which would be difficult to completely eliminate. Again, this concept has not yet been
specifically tested and is included here as a hypothesis to better explain the intricacies of
these systems.
One further issue to be kept in mind when visually assessing the quality of a
diffusionless protein voltammogram is the ability of these different COOH SAM modified
gold substrates to discriminate against charging current or Cdl. Cyt c voltammetry appears
most well-defined when adsorption takes place on a SAM that has a high level of
defectiveness, which, at the same time, effectively discriminates against charging current.
This situation is most evident in experiments described earlier involving mixed SAMs
composed of COOH thiols and slightly shorter OH thiols. Cyt c is most ill-defined on the
flatter SAM modified substrates which, as shown earlier, is primarily the result of lower
coverage of the protein. In addition, however, the appearance of the voltammogram is
worsened by the SAM’s inability to effectively depress charging current. Larger values of Cdl
observed for SAMs on flatter gold thus help to mask the electrochemical signal from already
161
depleted amounts of adsorbed protein. From both the XPS and SWV results, there is always
some protein adsorbed at these SAMs on flatter gold, albeit a much smaller amount than on
the higher defect density SAMs. The large charging currents on these surfaces make peak
identification and analysis more difficult than would otherwise be the case.
The results of this study clearly invalidate the “ideal” ET model system - proteins
adsorbed on highly ordered, defect free, “perfect” SAMs, as commonly depicted in literature
schematics or cartoons.34,58 Protein desorption experiments performed in our laboratory
using evaporated gold substrates have shown that there is an ionic strength dependence of
protein adsorption indicative of a predominantly electrostatic adsorption. The idea that a
highly ordered, charged, planar surface is not the optimal interface for the electrostatic
adsorption of an oppositely charged sphere has been supported on a very basic level by the
theoretical work of Stahlberg and Jonsson on a severely simplified system similar to the one
examined in this study.31 In light of the results presented here, however, other interfacial
interactions may contribute to the adsorption and ET processes as well. For instance, Klein
and coworkers have proposed from modeling studies that cyt c may partially penetrate the
surface of the COOH SAMs upon adsorption, as depicted in Figure 3.37,32 giving rise to the
possibility of hydrophobic interactions. Such an adsorption process may occur exclusively at
defects sites in the SAM and where the likelihood of additional interactive forces, such as
hydrophobic effects, may be substantial in certain microenvironments. Considering the
results presented here, however, it is also feasible that the topography influenced structure of
COOH SAMs induces a significant change in the surface pKa of the acid endgroups, raising
it to 9-10 and subsequently creating an essentially uncharged surface at the pH of the working
buffer (physiological pH = 7). Thus, the protein would have a decreased electrostatic
attraction to bind at the surface.
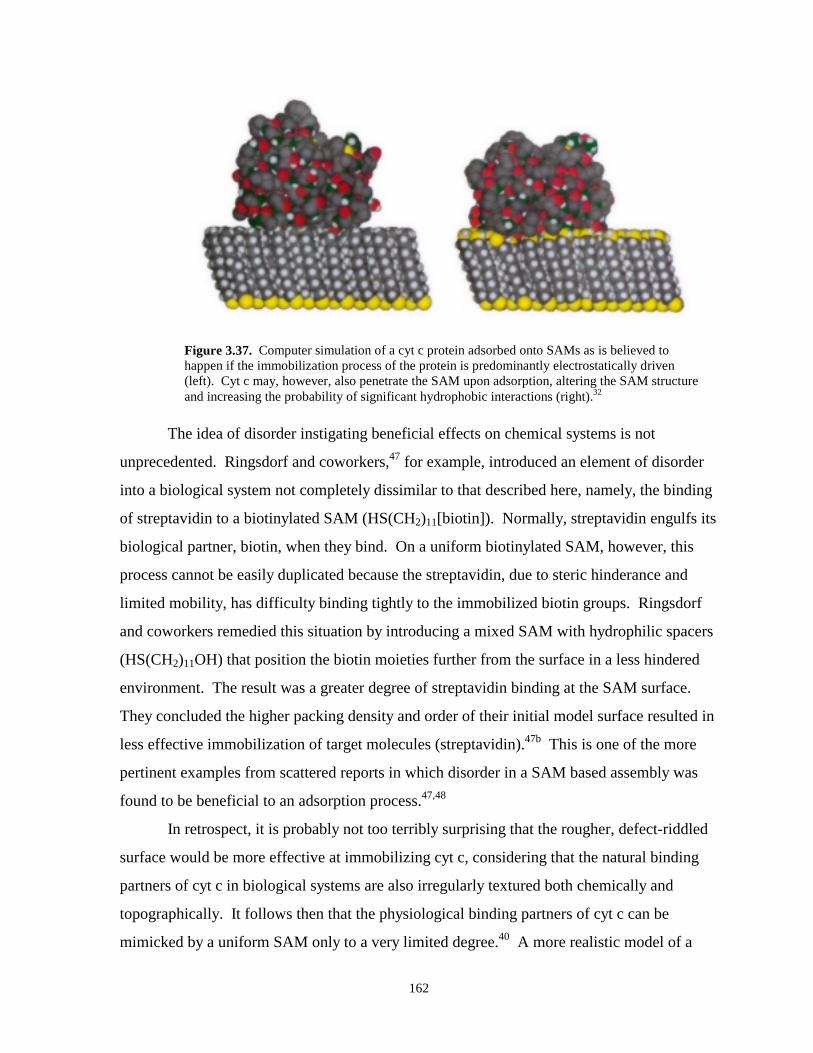
162
Figure 3.37. Computer simulation of a cyt c protein adsorbed onto SAMs as is believed tohappen if the immobilization process of the protein is predominantly electrostatically driven(left). Cyt c may, however, also penetrate the SAM upon adsorption, altering the SAM structureand increasing the probability of significant hydrophobic interactions (right).32
The idea of disorder instigating beneficial effects on chemical systems is not
unprecedented. Ringsdorf and coworkers,47 for example, introduced an element of disorder
into a biological system not completely dissimilar to that described here, namely, the binding
of streptavidin to a biotinylated SAM (HS(CH2)11[biotin]). Normally, streptavidin engulfs its
biological partner, biotin, when they bind. On a uniform biotinylated SAM, however, this
process cannot be easily duplicated because the streptavidin, due to steric hinderance and
limited mobility, has difficulty binding tightly to the immobilized biotin groups. Ringsdorf
and coworkers remedied this situation by introducing a mixed SAM with hydrophilic spacers
(HS(CH2)11OH) that position the biotin moieties further from the surface in a less hindered
environment. The result was a greater degree of streptavidin binding at the SAM surface.
They concluded the higher packing density and order of their initial model surface resulted in
less effective immobilization of target molecules (streptavidin).47b This is one of the more
pertinent examples from scattered reports in which disorder in a SAM based assembly was
found to be beneficial to an adsorption process.47,48
In retrospect, it is probably not too terribly surprising that the rougher, defect-riddled
surface would be more effective at immobilizing cyt c, considering that the natural binding
partners of cyt c in biological systems are also irregularly textured both chemically and
topographically. It follows then that the physiological binding partners of cyt c can be
mimicked by a uniform SAM only to a very limited degree.40 A more realistic model of a
163
protein binding partner would require an irregular binding surface with more appropriate
interactive forces. In any event, this research effort is viewed as having achieved its goal of
establishing a more defined role of the gold substrate in cyt c voltammetry. Surface effects
directly attributable to the topography of the gold substrate and their impact on SAM
formation may indeed account for the distribution of electrochemical properties and inherent
peak broadening commonly seen in cyt c voltammetry. In light of the research that has been
presented, the topography of the gold substrate must be carefully considered when comparing
SAM based experiments as it can substantially affect both the structure and application of a
SAM.
As a final observation, it is noted that the results of these gold topography
experiments were highly reproducible on a variety of gold substrates and by multiple
researchers in our laboratory. In addition to the results on 14-mercaptotetradecanoic acid
SAMs, the same trends have also been observed for gold substrates that were modified with
11-mercaptoundecanoic acid. The trends noted were more prominent, however, with longer
chainlengths, perhaps because the longer SAMs are more structurally sensitive, having
greater packing order than the C11OOH SAMs which, being shorter, have a greater
probability of having a more liquid-like structure, especially at the interface of the film.
3.14 FUTURE DIRECTIONS
To further elucidate the role of gold in the electrochemistry of cyt c/SAM/Au
assemblies, there is an obvious need to better define the structures and interfacial interactions
that result from different surfaces. Several examples of these type of experiments are
presented here.
An investigation of the dependence of H-bonding in COOH SAMs on the roughness
of the Au substrate is needed. As these Au surfaces become smoother, bringing carboxylate
groups into the same plane, does H-bonding between the endgroups become a significant
factor in the self-assembly process? There are literature examples dedicated to this subject
that strongly suggest that there is significant H-bonding between headgroups of acid and
alcohol terminated SAMs.49 Also, it is unknown whether there is substantial H-bonding
164
present within the mixed SAMs as well. IR measurements are commonly used to detect H-
bonding in such systems.49c,d
IR spectroscopy can also be used to help delineate the internal structure of SAMs.
This is a common practice found in the literature.50 IR measurements can provide
information about the density and packing order of the alkane chains in the SAMs. Since
results have suggested that smoother gold gives rise to better blocking SAMs but with higher
dielectric constants, it would be desirable to obtain specific chemical structural information
to further assess the model.
Another important goal is to better comprehend the structure of mixed SAMs, which
are playing an increasingly important role in this type of chemistry. IR, CAG, and SPM
should all be used to gain a better understanding of the mixed SAM structure and
characterize the distribution of thiol components across the surface and within those films.
As previously mentioned, hydrophobic interfacial interactions may play a role in the
adsorption and ET properties of cyt c on SAMs. It would be most interesting to assess the
hydrophobicity of each SAM interface as the gold surface roughness and topography are
varied. CAG may make these types of measurements feasible as a step toward better defining
the nature of these different interfaces, although the changes may be too subtle for the method
and be effective only in microenvironments at the interface.
3.15 SPECIAL ACKNOWLEDGEMENTS
I must sincerely thank Dr. Tal Nahir (currently at California State University, Chico)
for much encouragement and many useful conversations throughout the early stages of this
work. Tal also taught me a very important and, for me, difficult to learn, key to doing
successful research – don’t be afraid to spend money. My experience with Tal and his
support in the time he was here was invaluable.
I would also like to give a special acknowledgment to Mr. Joseph Andrew Black, an
REU student who worked in our group during the summer of 1997. Joe was a great worker –
dedicated and smart – too bad he was a Detroit Tigers fan (Go Yankees!). Joe did extensive
work on the evaporated Au films prior to the discovery of Ti on the surface. His work helped
to eliminate many of the contamination possibilities being considered.
165
I would like to thank Dr. Mike Tarlov of NIST and John Phillips, the microscopist in
the Analytical Instrument Facility, NCSU Centennial Campus, for performing the XPS
measurements in this study.
3.16 EXPERIMENTAL DETAILS
3.16.1. Experimental Gold Substrates
-Evaporated Gold Films. Evaporated gold film electrodes were purchased from Evaporated
Metal Films, EMF (Ithaca, NY). Each electrode is comprised of 1000 to 5000 Å of Au
evaporated on a glass slide over a 50 Å thick Ti adhesion layer. Electrodes received were
individually wrapped and usually electrochemically cleaned via the procedure outlined
below.
-Bulk Polycrystalline Gold (Au Foil). Bulk polycrystalline gold foil (Premion, 99.9985%)
was purchased from Alpha Aesar/Johnson Matthey (Ward Hill, MA). Purchased as a 25 x 25
x 1 mm piece, the gold foil was machine cut into four square pieces with approximate
dimensions of 11-12 x 11-12 x 1 mm. The bulk gold samples were usually chemically etched
for ten minutes in dilute aqua regia, a solution of concentrated HCl, concentrated HNO3, and
H2O in a 3:1:6 ratio.3a,b CAUTION: Aqua regia is a strong acidic solution and should be
handled with extreme caution. The chemical etching with dilute aqua regia acts to remove
surface gold. The bulk gold samples were polished via a Minimet polisher/grinder by
Buehler (Lake Bluff, IL) using a polishing cloth (Buehler) and alumina pastes (Buehler) of 5,
1, 0.3, and 0.05 µm. Each gold substrate was mechanically polished with successively
smaller alumina particles with the Minimet polisher (Instrument Settings: speed = 3; time =
7; half load). After each polishing sequence, the sample and the polishing cloth were rinsed
with copious amounts of M/Q H20. After the final polish with the smallest sized alumina
paste, the gold samples were rinsed thoroughly with M/Q H20 and sonicated in both Alconox
(Fisher Scientific) and M/Q H20 for 10 minutes before further treatment. At this point the
samples were either electrochemically cleaned for rougher topography or annealed for a
lower degree of roughness. After the completion of an experimental sequence with the bulk
gold samples, the samples were reused by chemical etching and repolishing.
166
-Single Crystal Gold { Au(111), Au(110). Single crystal gold samples were previously
purchased from Cornell University (Dept. of Materials Science and Engineering), Ithaca, NY.
These samples were used repeatedly in conjunction with repeated annealing in a hydrogen
flame. According to sources, a gentle anneal of these substrates after being used in an
experiment causes the surface of these single crystals to completely regenerate.25 On
occasion, especially after extensive use, the annealing of the single crystal substrate was
preceded by the mechanical polishing procedure previously discussed.
-Gold Epitaxially Grown on Mica. Gold grown on mica was purchased as Pico-Substrates
from Molecular Imaging Corporation (Phoenix, AZ). They were specially ordered to be
without an adhesion layer of Ti or Cr. The substrates has approximate dimensions of 1.4 cm
x 1.1 cm with about 1500 Å of high purity gold covering an area of about 1.0 cm x 1.1 cm.
Upon fabrication at Molecular Imaging, these substrates commonly showed atomically flat
terraces that were typically several hundred nanometers in diameter. The recommended
pretreatment was HFA which should result in even larger, atomically flat, gold terraces on the
surface. Each substrate was HFA’d at Molecular Imaging and then packed in nitrogen for
shipping. These substrates were usually HFA’d before use.
3.16.2 General Materials - Solution Preparation
Several solutions were used throughout the research project for specific experiments
and measurements (most were prepared volumetrically using chemicals purchased from
Fisher Scientific): 1.0 M KCl for the reference electrode and for high ionic strength
desorption of protein; 0.5 M NaF was used for most early measurements of double layer
capacitance/background measurements (Note: this solution was ultimately eliminated in favor
of testing double layer capacitance in the potassium phosphate buffer - see below); dilute
(0.05 M) H2SO4 was prepared by dilution from 18 M H2SO4 and used for Rf voltammetry;
0.1 M H2SO4 with 0.01 M KCl served as the electrochemical cleaning solution and was
constantly remade.
Various concentrations of potassium phosphate buffers (KPBs) with a variety of ionic
strengths were prepared by combining calculated amounts of both monobasic (NaH2PO4) and
dibasic phosphate (Na2HPO4) buffers solutions according to the following equation:
Cph = 0.437µ [Eqn. 3.4]
167
where Cph.is total phosphate concentration and µ is the ionic strength. Thus, buffers of
specific ionic strength were prepared from solutions of individual phosphate components
(mono and di), each at a concentration of 0.437µ, by combining them to a pH of 7.51 The pH
was monitored as all of the dibasic phosphate is added to a mixing flask and the monobasic is
added until the pH is buffered at 7. The amount of monobasic sodium phosphate remaining
(unmixed) was recorded for exact ionic strength calculations. All KPBs were prepared in this
manner.
To calculate the exact µ of a buffer, the number of moles of each phosphate
component, determined experimentally, were used in the following equation:
µ = ½∑CiZi2 [Eqn. 3.5]
3.16.3. Electrochemistry (General - Equipment)
Voltammetry experiments were performed at room temperature (22±2°C) using an
EG&G PAR potentiostat, Model 273 or Model 263, controlled by M270 PAR Software.
Potentiostats were typically operated in Ramp Mode, generating a potential staircase
waveform with a 0.25 mV step height and, in most cases, a 1 mV scan increment. Potential
windows varied with the particular experiment being conducted, with larger potential
windows sometimes warranting a 2 mV step increment. When operated at low scan rates (<
200 mV/sec), the current response from the potentiostat was passed through a 5.3 Hz low
pass filter; at higher scan rates the low pass filter was turned off. A minimum of three cycles
were collected for each scan, ensuring the stability of the electrochemical response. The last
cycle of each experiment was saved for display. Unless specifically stated, all
electrochemical experiments were performed at a sweep rate of 100 mV/sec. All potential
and current peak values, peak splitting, as well as surface coverage, FWHM, and formal
potentials were measured using the PAR software. Electron transfer rate constants were
calculated using other software discussed below (See Cyt c Electrochemistry Section).
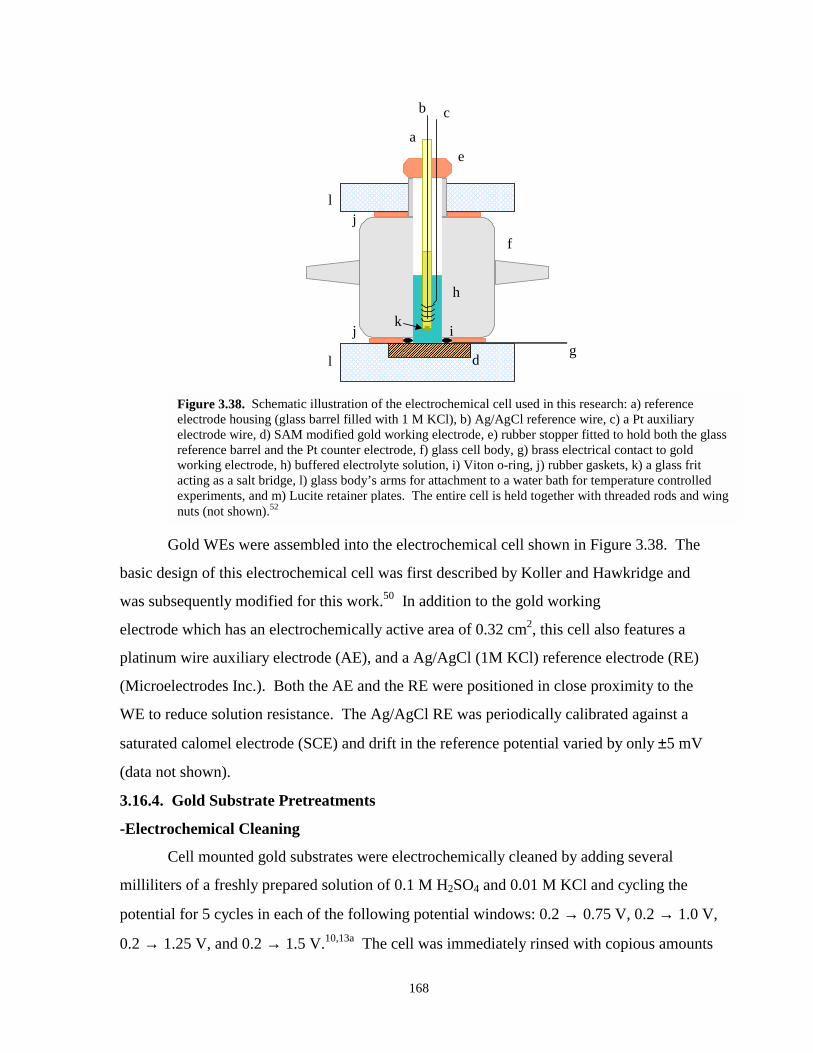
168
����������������������������������������������������������������������������������������������������������������������������������������������������������������������������������������������������������������������������������������������������������������������������������������
������������������������������������������������������������������������������������������������������������������������������������������������������������������������������������������������������������������
������������������������������������������������������������������
a
c
d
b
e
f
g
h
ij
jl
k
l
Figure 3.38. Schematic illustration of the electrochemical cell used in this research: a) referenceelectrode housing (glass barrel filled with 1 M KCl), b) Ag/AgCl reference wire, c) a Pt auxiliaryelectrode wire, d) SAM modified gold working electrode, e) rubber stopper fitted to hold both the glassreference barrel and the Pt counter electrode, f) glass cell body, g) brass electrical contact to goldworking electrode, h) buffered electrolyte solution, i) Viton o-ring, j) rubber gaskets, k) a glass fritacting as a salt bridge, l) glass body’s arms for attachment to a water bath for temperature controlledexperiments, and m) Lucite retainer plates. The entire cell is held together with threaded rods and wingnuts (not shown).52
Gold WEs were assembled into the electrochemical cell shown in Figure 3.38. The
basic design of this electrochemical cell was first described by Koller and Hawkridge and
was subsequently modified for this work.50 In addition to the gold working
electrode which has an electrochemically active area of 0.32 cm2, this cell also features a
platinum wire auxiliary electrode (AE), and a Ag/AgCl (1M KCl) reference electrode (RE)
(Microelectrodes Inc.). Both the AE and the RE were positioned in close proximity to the
WE to reduce solution resistance. The Ag/AgCl RE was periodically calibrated against a
saturated calomel electrode (SCE) and drift in the reference potential varied by only ±5 mV
(data not shown).
3.16.4. Gold Substrate Pretreatments
-Electrochemical Cleaning
Cell mounted gold substrates were electrochemically cleaned by adding several
milliliters of a freshly prepared solution of 0.1 M H2SO4 and 0.01 M KCl and cycling the
potential for 5 cycles in each of the following potential windows: 0.2 → 0.75 V, 0.2 → 1.0 V,
0.2 → 1.25 V, and 0.2 → 1.5 V.10,13a The cell was immediately rinsed with copious amounts
169
of M/Q H2O before proceeding. WARNING: The procedure actually etches the gold during
the potential cycling and can completely remove the gold film if not careful. This is
especially a concern regarding the Au/mica and evaporated Au samples.
-Hydrogen Flame Annealing
Hydrogen flame annealing (HFA) was performed via the procedure suggested by
Molecular Imaging. The Au sample was mounted on a quartz slide on a fire brick where an
additional quartz slide was sometimes required to anchor down one side of the gold substrate.
The hydrogen gas was connected with Teflon tubing directly to a quartz tube that had been
drawn to a small point and severed, i.e. a torch. The direct connection is beneficial because
the hydrogen flame produced is very clean. The hydrogen gas flow through the quartz tube
was increased until barely audible. The hydrogen torch was then ignited (usually making a
loud pop). With the lights off, the hydrogen flame was adjusted so that it was burning mostly
blue and was approximately 4 cm long. Care should be used when working with a hydrogen
flame as it can reach temperatures in the 2000-2100°C range and has a maximum burning
velocity of 300-440 cm/s.26 The quartz plate holding the gold substrate was gently heated
around the substrate to ensure even heating. This process was continued until water vapor no
longer condensed on the quartz plate. The tip of the flame was then brought into contact with
the gold surface at a 30° angle from surface normal and swept back and forth across the gold
substrate (at ~ 1 Hz) for 30 to 60 seconds. The small flame spot on the gold was maintained
as a slightly orange color, although the brightness of this orange glow may vary depending on
the room light. In a normally lit room, the spot may not appear to glow at all. Care was
taken not to overheat the sample.25
-Oven Annealing
Samples were oven annealed in Lindberg Mini-Mite Tube Furnace (Watertown, WS)
using a quartz tube and a set point temperature of ~950°C, which resulted in a chamber
temperature between 980-1000°C and a tube temperature of ~968° C. Care was taken to
control the temperature inside the tube, avoiding the melting point of gold (1064°C).
Samples were usually oven annealed for one to several hours.
3.16.5. Scanning Probe Microscopy Imaging
170
The specific procedure and equipment of the SPM imaging of these gold substrates is
included as part of the Experimental Details section of Chapter 5.
3.16.6. Roughness Factor Experiments
-Electrochemical (Rf-E/C)
Electrochemical Rfs were determined with a single cyclic voltammetry scan in the
potential window of 0.2 to 1.5 V. Cells were filled with dilute sulfuric acid solutions (0.05
M H2SO4) and scanned in this potential window at 100 mV/sec. Once the gold surface was
in contact with the H2SO4, roughness scans were performed as quickly as possible because of
concern over chloride contamination from the Ag/AgCl (1 M KCl) RE. Over time and
during continuous roughness scan potential cycling, chloride from the RE can infest the
experiment, allowing for chloroaurate complex voltammetry and obscuring the voltammetric
peak used for roughness determinations (the roughness voltammetry resembles the
electrochemical cleaning voltammetry after continuous cycling). In the future, this
complication should be avoided by using a double junction or “S” shaped RE, where the flow
of chloride contamination toward the WE can be better controlled and minimized.
-Microscopy Roughness Factors (Rf-SPM)
Microscopically determined Rfs were a product of a RMS roughness calculation
determination that is part of the Digital Instrument’s software package for the Nanoscope III
Microscope. Rf-SPM or Rq is calculated by the following equation:2/12
avgiq N
)zz(R
−= ∑ [Eqn. 3.6]
where Zi is each individual point’s distance from the mean surface level (Zavg) and N is the
total number points in the population.
3.16.7. Lead UPD Experiments
Lead UPD experiments to determine the crystallinity of the gold substrates were
performed via the following procedure. The electrochemical cell was filled with 0.1-0.17
mM Pb(NO3)2 in an electrolyte solution of 0.10 M NaClO4 and 0.10 HClO4. The potential of
the gold WE was held at -0.4 V or -0.44 V for 5 minutes, depositing Pb onto the gold surface,
and then swept positive at 5 or 50 mV/sec to 0.6 V to oxidize the Pb UPD layer off the
surface.
171
3.16.8. SAM Deposition Procedure
Following the electrochemical cleaning cycle or other pretreatment, a background
scan was acquired in 4.4 mM potassium phosphate buffer (KPB) solution (pH = 7; µ= 10
mM). Backgrounds were acquired in both the 0.1 to 0.4 V potential window and in the 0.2 to
-0.2 or similar potential window. The double layer capacitance of the background scan was
measured at +250 mV for comparison purposes. The Au substrates were prepared for SAM
modification by rinsing 10X with H2O and 10X with 95% ethanol and then repeated.
Immediately after the last rinse with EtOH, 200-250 µL of thiol in ethanol solution (~5 mM)
was added via microsyringe to the cell. In most cases, the SAM solution remained in contact
with the gold for ~72 hours (3 days) to maximize self-assembly and thiol rearrangement on
the surface. After modification, the cells were emptied and rinsed 10X with EtOH, 10X with
M/Q H2O, 10X with EtOH, and 10X with M/Q H2O again. The cells were then subsequently
filled with KPB solution, and background scans, known as monolayer checks, were acquired
in the same potential window as the background signal for bare Au.
The thiols used were previously synthesized, purified, and characterized by
Linderman and co-workers53 (i.e. 14-mercaptotetradecanoic acid) or used as received from
Aldrich Chemical Company (St. Louis, MO) (i.e. 11-mercaptoundecanoic acid). Solutions (4
mL) of 5 mM thiol were prepared volumetrically and mixed thoroughly using a vortex mixer.
3.16.9. SAM Characterization Procedure - Redox Probing
Redox probing of the SAMs with hydroxymethyl ferrocene (HMFc) was based on a
procedure by Creager and coworkers.3a A solution of 2.0 mM HMFc (Strem Chemical
Company) in acetone was prepared. The assembled cell was filled with 0.75 mL of 0.1 M
HClO4 and after which 50 µL of the 2.0 mM HMFc/acetone solution was injected via
microsyringe. The cell was capped and inverted several times to insure adequate mixing and
solubilization of the HMFc in the aqueous environment. Note: It is important to do this step
quickly to avoid concentration gradients substantial enough to cause the HMFc precipitation
on the electrode. After some initial failures, solubilization of HMFc was always achieved by
the procedure just described.
172
The HMFc probe was examined using cyclic voltammetry in the nominal potential
window of 0.8 V to -0.4 V. HMFc in HClO4 has an approximate formal potential of +0.15 V
vs. Ag/AgCl RE. The scan rate used for HMFc redox probing was always 100 mV/sec.
Redox probing with potassium ferricyanide, the results of which are not presented in
this chapter, was performed with a solution of 2.5 mM K3Fe(CN)6 in 0.5 M KCl supporting
electrolyte. The nominal potential window for ferricyanide redox probing was -0.4 V to 0.8
V and was also scanned at 100 mV/sec. The approximate formal potential for ferricyanide in
this environment is at approximately 0.227 V vs. Ag/AgCl.
3.16.10. Cyt c Purification
Horse heart (HH) or equine cyt c (Type VI) was purchased from Sigma Chemical
Company and purified via column chromatography. The procedure for this purification step
is presented here in detail for future use by researchers in the Bowden group. The entire
procedure should take place in a refrigerator at ~4°C. A listing of all the chemicals,
solutions, and equipment required for this purification procedure is provided as Table 3-14.
Beforehand, approximately 50g of “preswollen” carboxymethyl cellulose (CM52, Whatman,
Clifton, NJ) was hydrated over a 48 hour period in an excess (~200 mL) of potassium
phosphate buffer (KPB) { C = 40 mM; µ = 90mM; pH = 7 }. Proteins are often separated
using ion-exchange gels, such as cellulose, because they contain very small pores which
cannot be infiltrated by the proteins. The hydrated gel should be gently stirred on occasion.
Never use a glass stir bar to mix the gel, as this damages the gel beads and creates small
fragments called “fines.” These small fragments must be removed because, if packed into the
column, they can slow down the flow rate of the column and decrease the efficiency of the
separation. “Fines” should be removed by decanting the supernatant liquid and rehydrating
the gel several times. If the gel is being regenerated after use in a column, any brownish
colored gel beads should be removed from the mixture. This removal can be accomplished
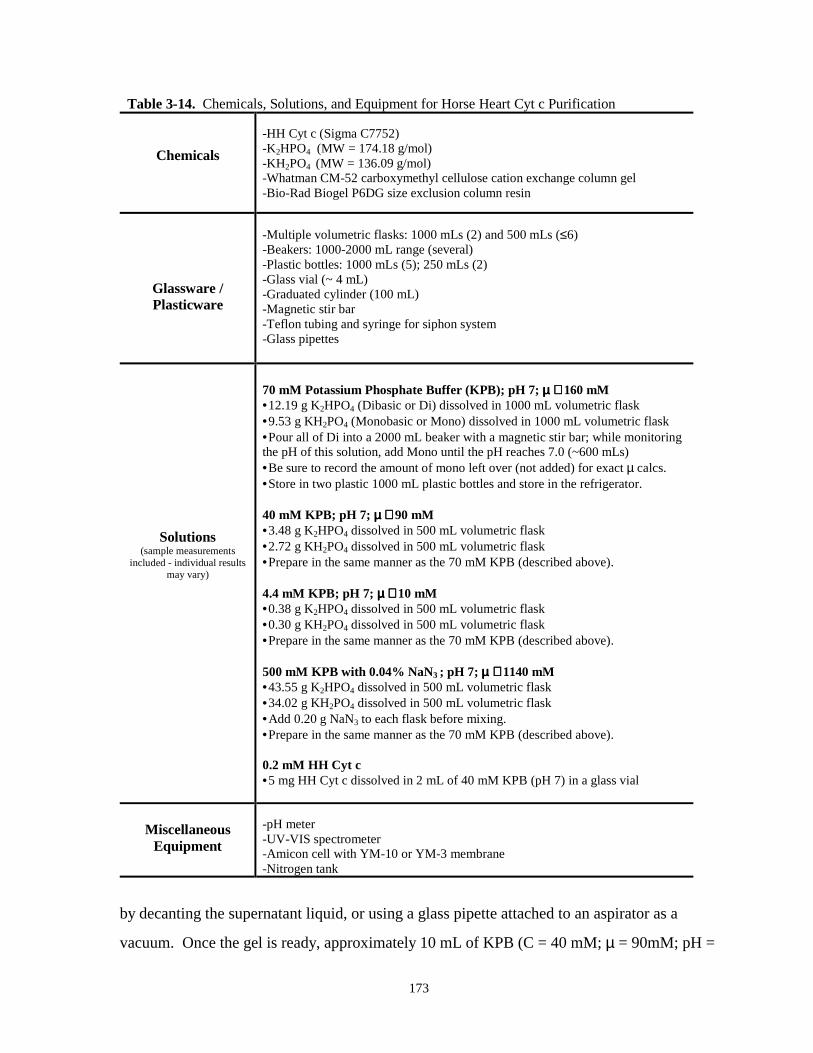
173
Table 3-14. Chemicals, Solutions, and Equipment for Horse Heart Cyt c Purification
Chemicals-HH Cyt c (Sigma C7752)-K2HPO4 (MW = 174.18 g/mol)-KH2PO4 (MW = 136.09 g/mol)-Whatman CM-52 carboxymethyl cellulose cation exchange column gel-Bio-Rad Biogel P6DG size exclusion column resin
Glassware /Plasticware
-Multiple volumetric flasks: 1000 mLs (2) and 500 mLs (≤6)-Beakers: 1000-2000 mL range (several)-Plastic bottles: 1000 mLs (5); 250 mLs (2)-Glass vial (~ 4 mL)-Graduated cylinder (100 mL)-Magnetic stir bar-Teflon tubing and syringe for siphon system-Glass pipettes
Solutions(sample measurements
included - individual resultsmay vary)
70 mM Potassium Phosphate Buffer (KPB); pH 7; µµµµ ≅≅≅≅ 160 mM•12.19 g K2HPO4 (Dibasic or Di) dissolved in 1000 mL volumetric flask•9.53 g KH2PO4 (Monobasic or Mono) dissolved in 1000 mL volumetric flask•Pour all of Di into a 2000 mL beaker with a magnetic stir bar; while monitoringthe pH of this solution, add Mono until the pH reaches 7.0 (~600 mLs)•Be sure to record the amount of mono left over (not added) for exact µ calcs.•Store in two plastic 1000 mL plastic bottles and store in the refrigerator.
40 mM KPB; pH 7; µµµµ ≅≅≅≅ 90 mM•3.48 g K2HPO4 dissolved in 500 mL volumetric flask•2.72 g KH2PO4 dissolved in 500 mL volumetric flask•Prepare in the same manner as the 70 mM KPB (described above).
4.4 mM KPB; pH 7; µµµµ ≅≅≅≅ 10 mM•0.38 g K2HPO4 dissolved in 500 mL volumetric flask•0.30 g KH2PO4 dissolved in 500 mL volumetric flask•Prepare in the same manner as the 70 mM KPB (described above).
500 mM KPB with 0.04% NaN3 ; pH 7; µµµµ ≅≅≅≅ 1140 mM•43.55 g K2HPO4 dissolved in 500 mL volumetric flask•34.02 g KH2PO4 dissolved in 500 mL volumetric flask•Add 0.20 g NaN3 to each flask before mixing.•Prepare in the same manner as the 70 mM KPB (described above).
0.2 mM HH Cyt c•5 mg HH Cyt c dissolved in 2 mL of 40 mM KPB (pH 7) in a glass vial
MiscellaneousEquipment
-pH meter-UV-VIS spectrometer-Amicon cell with YM-10 or YM-3 membrane-Nitrogen tank
by decanting the supernatant liquid, or using a glass pipette attached to an aspirator as a
vacuum. Once the gel is ready, approximately 10 mL of KPB (C = 40 mM; µ = 90mM; pH =
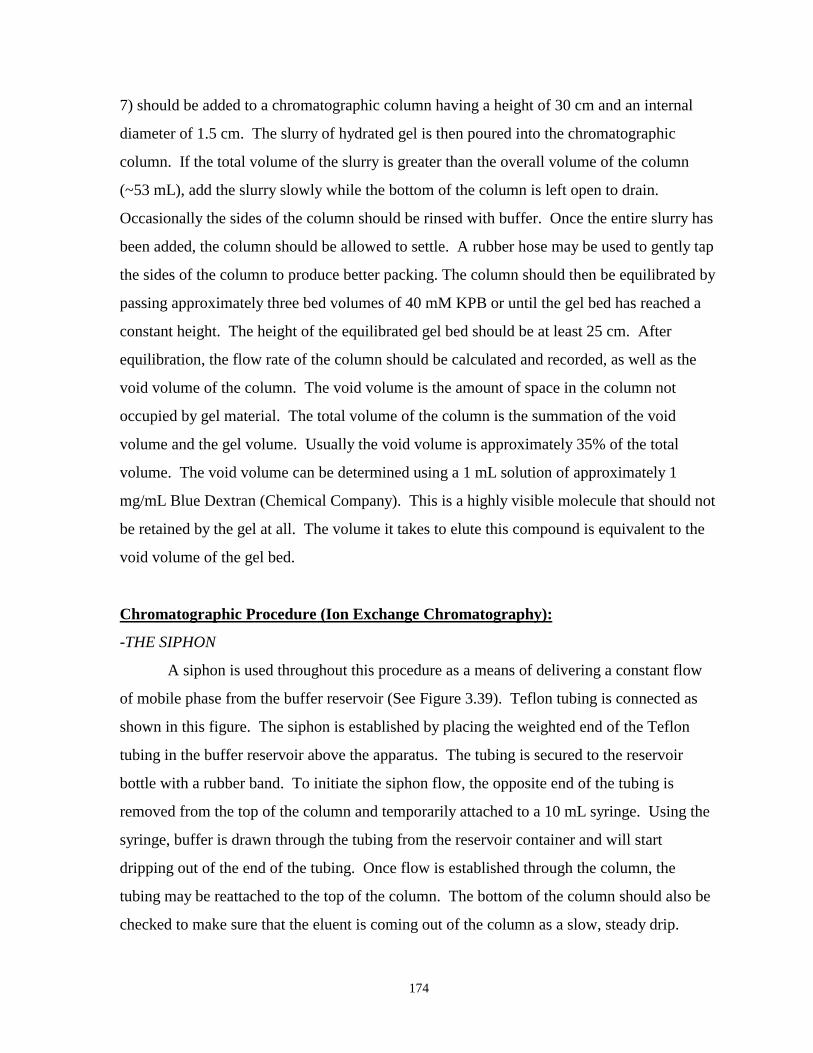
174
7) should be added to a chromatographic column having a height of 30 cm and an internal
diameter of 1.5 cm. The slurry of hydrated gel is then poured into the chromatographic
column. If the total volume of the slurry is greater than the overall volume of the column
(~53 mL), add the slurry slowly while the bottom of the column is left open to drain.
Occasionally the sides of the column should be rinsed with buffer. Once the entire slurry has
been added, the column should be allowed to settle. A rubber hose may be used to gently tap
the sides of the column to produce better packing. The column should then be equilibrated by
passing approximately three bed volumes of 40 mM KPB or until the gel bed has reached a
constant height. The height of the equilibrated gel bed should be at least 25 cm. After
equilibration, the flow rate of the column should be calculated and recorded, as well as the
void volume of the column. The void volume is the amount of space in the column not
occupied by gel material. The total volume of the column is the summation of the void
volume and the gel volume. Usually the void volume is approximately 35% of the total
volume. The void volume can be determined using a 1 mL solution of approximately 1
mg/mL Blue Dextran (Chemical Company). This is a highly visible molecule that should not
be retained by the gel at all. The volume it takes to elute this compound is equivalent to the
void volume of the gel bed.
Chromatographic Procedure (Ion Exchange Chromatography):
-THE SIPHON
A siphon is used throughout this procedure as a means of delivering a constant flow
of mobile phase from the buffer reservoir (See Figure 3.39). Teflon tubing is connected as
shown in this figure. The siphon is established by placing the weighted end of the Teflon
tubing in the buffer reservoir above the apparatus. The tubing is secured to the reservoir
bottle with a rubber band. To initiate the siphon flow, the opposite end of the tubing is
removed from the top of the column and temporarily attached to a 10 mL syringe. Using the
syringe, buffer is drawn through the tubing from the reservoir container and will start
dripping out of the end of the tubing. Once flow is established through the column, the
tubing may be reattached to the top of the column. The bottom of the column should also be
checked to make sure that the eluent is coming out of the column as a slow, steady drip.
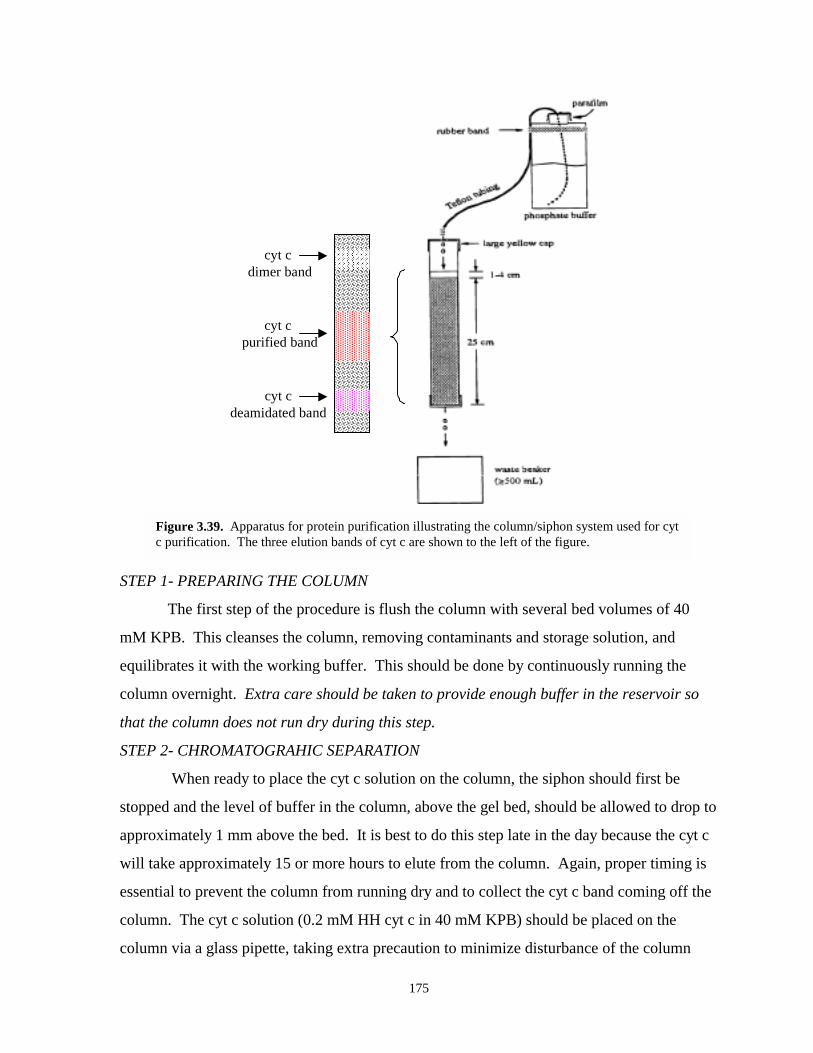
175
����������������������������������������������������������������������������������������������������������������������������������������������������������������������������������������������������������������������������������������������
��������������������������������������������������������������������
���������������������������������������������������
����������������������������������cyt c
dimer band
cyt c purified band
cyt cdeamidated band
Figure 3.39. Apparatus for protein purification illustrating the column/siphon system used for cytc purification. The three elution bands of cyt c are shown to the left of the figure.
STEP 1- PREPARING THE COLUMN
The first step of the procedure is flush the column with several bed volumes of 40
mM KPB. This cleanses the column, removing contaminants and storage solution, and
equilibrates it with the working buffer. This should be done by continuously running the
column overnight. Extra care should be taken to provide enough buffer in the reservoir so
that the column does not run dry during this step.
STEP 2- CHROMATOGRAHIC SEPARATION
When ready to place the cyt c solution on the column, the siphon should first be
stopped and the level of buffer in the column, above the gel bed, should be allowed to drop to
approximately 1 mm above the bed. It is best to do this step late in the day because the cyt c
will take approximately 15 or more hours to elute from the column. Again, proper timing is
essential to prevent the column from running dry and to collect the cyt c band coming off the
column. The cyt c solution (0.2 mM HH cyt c in 40 mM KPB) should be placed on the
column via a glass pipette, taking extra precaution to minimize disturbance of the column
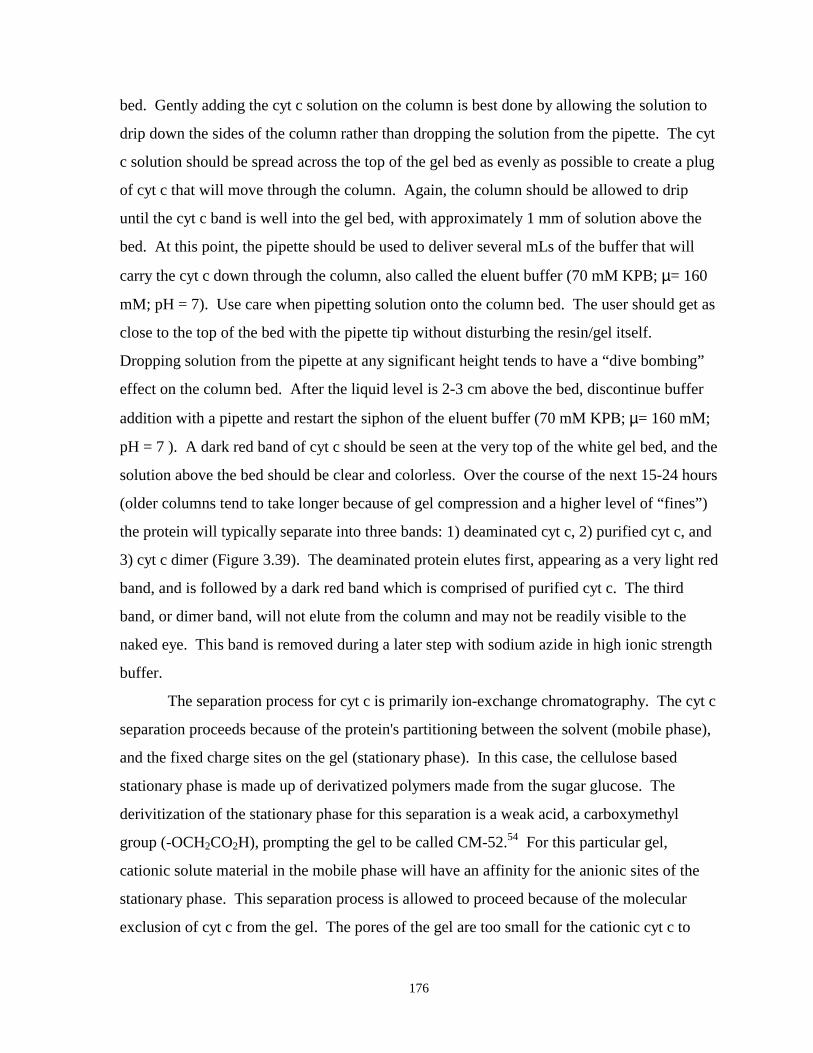
176
bed. Gently adding the cyt c solution on the column is best done by allowing the solution to
drip down the sides of the column rather than dropping the solution from the pipette. The cyt
c solution should be spread across the top of the gel bed as evenly as possible to create a plug
of cyt c that will move through the column. Again, the column should be allowed to drip
until the cyt c band is well into the gel bed, with approximately 1 mm of solution above the
bed. At this point, the pipette should be used to deliver several mLs of the buffer that will
carry the cyt c down through the column, also called the eluent buffer (70 mM KPB; µ= 160
mM; pH = 7). Use care when pipetting solution onto the column bed. The user should get as
close to the top of the bed with the pipette tip without disturbing the resin/gel itself.
Dropping solution from the pipette at any significant height tends to have a “dive bombing”
effect on the column bed. After the liquid level is 2-3 cm above the bed, discontinue buffer
addition with a pipette and restart the siphon of the eluent buffer (70 mM KPB; µ= 160 mM;
pH = 7 ). A dark red band of cyt c should be seen at the very top of the white gel bed, and the
solution above the bed should be clear and colorless. Over the course of the next 15-24 hours
(older columns tend to take longer because of gel compression and a higher level of “fines”)
the protein will typically separate into three bands: 1) deaminated cyt c, 2) purified cyt c, and
3) cyt c dimer (Figure 3.39). The deaminated protein elutes first, appearing as a very light red
band, and is followed by a dark red band which is comprised of purified cyt c. The third
band, or dimer band, will not elute from the column and may not be readily visible to the
naked eye. This band is removed during a later step with sodium azide in high ionic strength
buffer.
The separation process for cyt c is primarily ion-exchange chromatography. The cyt c
separation proceeds because of the protein's partitioning between the solvent (mobile phase),
and the fixed charge sites on the gel (stationary phase). In this case, the cellulose based
stationary phase is made up of derivatized polymers made from the sugar glucose. The
derivitization of the stationary phase for this separation is a weak acid, a carboxymethyl
group (-OCH2CO2H), prompting the gel to be called CM-52.54 For this particular gel,
cationic solute material in the mobile phase will have an affinity for the anionic sites of the
stationary phase. This separation process is allowed to proceed because of the molecular
exclusion of cyt c from the gel. The pores of the gel are too small for the cationic cyt c to
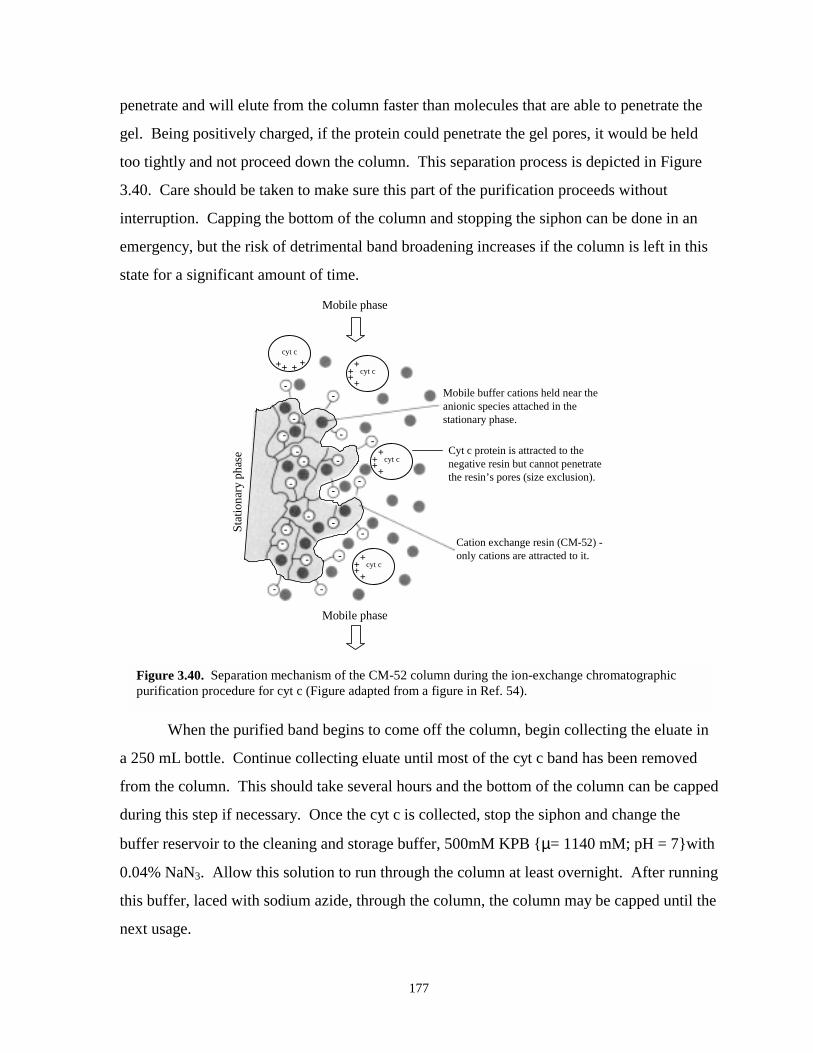
177
penetrate and will elute from the column faster than molecules that are able to penetrate the
gel. Being positively charged, if the protein could penetrate the gel pores, it would be held
too tightly and not proceed down the column. This separation process is depicted in Figure
3.40. Care should be taken to make sure this part of the purification proceeds without
interruption. Capping the bottom of the column and stopping the siphon can be done in an
emergency, but the risk of detrimental band broadening increases if the column is left in this
state for a significant amount of time.
--
-- --
-- -
--
-
--
--
-
-
-
- -
cyt c+
+++
cyt c+
+++
cyt c++++
cyt c+
+++
Mobile buffer cations held near the anionic species attached in the stationary phase.
Cation exchange resin (CM-52) -only cations are attracted to it.
Cyt c protein is attracted to the negative resin but cannot penetrate the resin’s pores (size exclusion).
Stat
iona
ry p
hase
Mobile phase
Mobile phase
Figure 3.40. Separation mechanism of the CM-52 column during the ion-exchange chromatographicpurification procedure for cyt c (Figure adapted from a figure in Ref. 54).
When the purified band begins to come off the column, begin collecting the eluate in
a 250 mL bottle. Continue collecting eluate until most of the cyt c band has been removed
from the column. This should take several hours and the bottom of the column can be capped
during this step if necessary. Once the cyt c is collected, stop the siphon and change the
buffer reservoir to the cleaning and storage buffer, 500mM KPB {µ= 1140 mM; pH = 7}with
0.04% NaN3. Allow this solution to run through the column at least overnight. After running
this buffer, laced with sodium azide, through the column, the column may be capped until the
next usage.
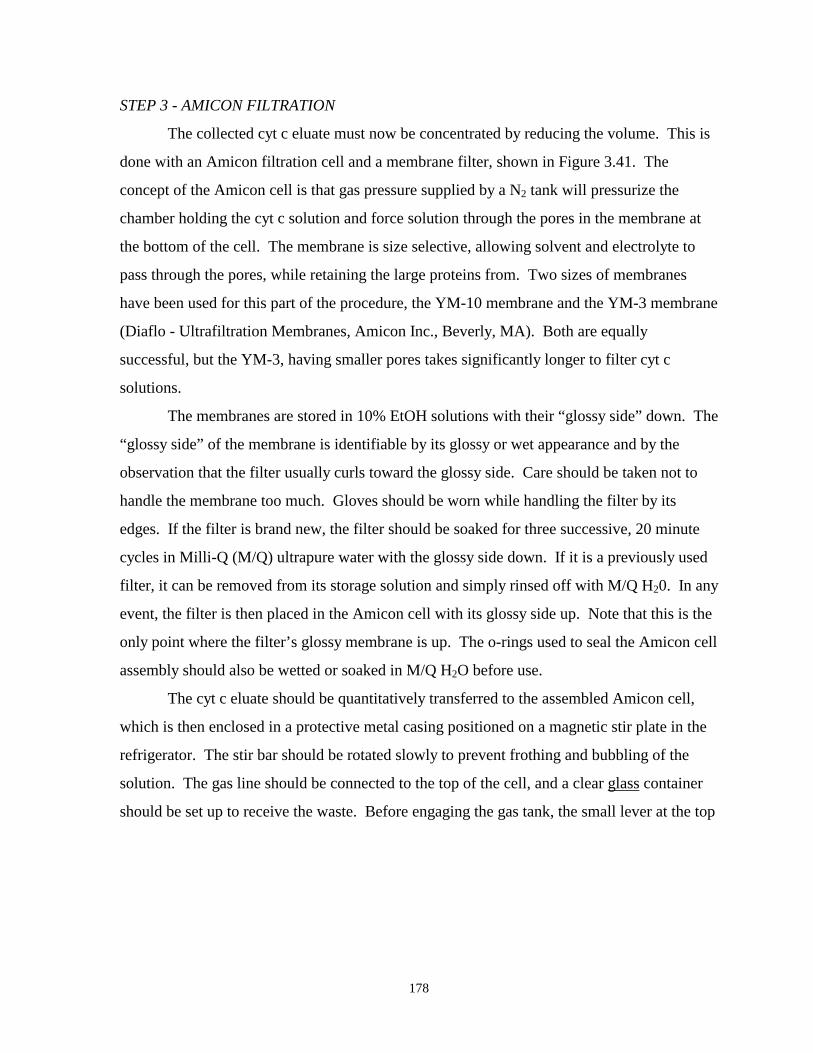
178
STEP 3 - AMICON FILTRATION
The collected cyt c eluate must now be concentrated by reducing the volume. This is
done with an Amicon filtration cell and a membrane filter, shown in Figure 3.41. The
concept of the Amicon cell is that gas pressure supplied by a N2 tank will pressurize the
chamber holding the cyt c solution and force solution through the pores in the membrane at
the bottom of the cell. The membrane is size selective, allowing solvent and electrolyte to
pass through the pores, while retaining the large proteins from. Two sizes of membranes
have been used for this part of the procedure, the YM-10 membrane and the YM-3 membrane
(Diaflo - Ultrafiltration Membranes, Amicon Inc., Beverly, MA). Both are equally
successful, but the YM-3, having smaller pores takes significantly longer to filter cyt c
solutions.
The membranes are stored in 10% EtOH solutions with their “glossy side” down. The
“glossy side” of the membrane is identifiable by its glossy or wet appearance and by the
observation that the filter usually curls toward the glossy side. Care should be taken not to
handle the membrane too much. Gloves should be worn while handling the filter by its
edges. If the filter is brand new, the filter should be soaked for three successive, 20 minute
cycles in Milli-Q (M/Q) ultrapure water with the glossy side down. If it is a previously used
filter, it can be removed from its storage solution and simply rinsed off with M/Q H20. In any
event, the filter is then placed in the Amicon cell with its glossy side up. Note that this is the
only point where the filter’s glossy membrane is up. The o-rings used to seal the Amicon cell
assembly should also be wetted or soaked in M/Q H2O before use.
The cyt c eluate should be quantitatively transferred to the assembled Amicon cell,
which is then enclosed in a protective metal casing positioned on a magnetic stir plate in the
refrigerator. The stir bar should be rotated slowly to prevent frothing and bubbling of the
solution. The gas line should be connected to the top of the cell, and a clear glass container
should be set up to receive the waste. Before engaging the gas tank, the small lever at the top
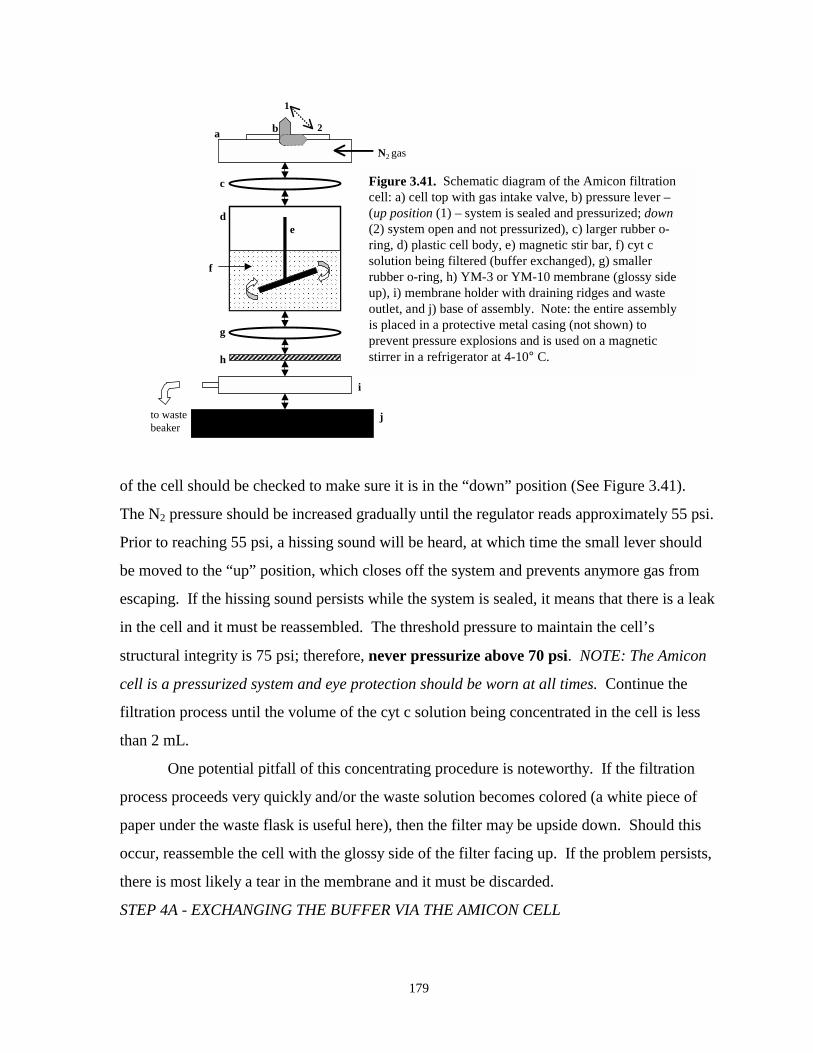
179
��������������������������������������������������������������������������������������������������������������������������������������������������������������������������������������������������������������������������������������
����������������������������������������������g
a b
1
2
c
de
f
j
h
i
to waste beaker
N2 gas
Figure 3.41. Schematic diagram of the Amicon filtrationcell: a) cell top with gas intake valve, b) pressure lever –(up position (1) – system is sealed and pressurized; down(2) system open and not pressurized), c) larger rubber o-ring, d) plastic cell body, e) magnetic stir bar, f) cyt csolution being filtered (buffer exchanged), g) smallerrubber o-ring, h) YM-3 or YM-10 membrane (glossy sideup), i) membrane holder with draining ridges and wasteoutlet, and j) base of assembly. Note: the entire assemblyis placed in a protective metal casing (not shown) toprevent pressure explosions and is used on a magneticstirrer in a refrigerator at 4-10° C.
of the cell should be checked to make sure it is in the “down” position (See Figure 3.41).
The N2 pressure should be increased gradually until the regulator reads approximately 55 psi.
Prior to reaching 55 psi, a hissing sound will be heard, at which time the small lever should
be moved to the “up” position, which closes off the system and prevents anymore gas from
escaping. If the hissing sound persists while the system is sealed, it means that there is a leak
in the cell and it must be reassembled. The threshold pressure to maintain the cell’s
structural integrity is 75 psi; therefore, never pressurize above 70 psi. NOTE: The Amicon
cell is a pressurized system and eye protection should be worn at all times. Continue the
filtration process until the volume of the cyt c solution being concentrated in the cell is less
than 2 mL.
One potential pitfall of this concentrating procedure is noteworthy. If the filtration
process proceeds very quickly and/or the waste solution becomes colored (a white piece of
paper under the waste flask is useful here), then the filter may be upside down. Should this
occur, reassemble the cell with the glossy side of the filter facing up. If the problem persists,
there is most likely a tear in the membrane and it must be discarded.
STEP 4A - EXCHANGING THE BUFFER VIA THE AMICON CELL
180
If the Amicon cell is being used to exchange the cyt c buffer to 4.4 mM KPB (µ=10
mM; pH = 7), add approximately 60 mL of the new buffer to the concentrated cyt c solution
in the cell. Following the procedure described in step 3, reduce the volume to concentrate the
cyt c again. Repeat this process three more times to ensure that the buffer has been
effectively exchanged. Using great care, remove the cyt c solution from the Amicon cell
using a hand held glass pipet and rubber bulb. Tilt the cell, using the glass pipet to draw the
solution out while taking care not to puncture the membrane. When finished, disassemble
the cell and remove the filter ( the plate holding the membrane with an o-ring may have to be
soaked in a large beaker of M/Q H2O and “floated” out). Avoid grabbing or pinching the
filter to get it out. Rinse the removed filter with M/Q H2O and soak it, glossy side down, in
M/Q H2O for at least an hour before placing it in storage solution (10% EtOH in M/Q H2O).
[Go to Step 5]
STEP 4B - EXCHANGING THE BUFFER VIA A DESALTING COLUMN
If a desalting column is used to exchange the buffer, transfer the 2 mL of concentrated
cyt c solution from the Amicon cell to the desalting column as described in step 2. The
desalting column (ht. = 50 cm; i.d.= 1 cm; bed ht.= 34 cm) should contain a approximately 40
mL of BioRad P6DG desalting gel (BioRad, Richmond, CA). The column is packed via the
procedure described above, starting with about 7 grams of the dry gel (7 mLs/g). In removing
the cyt c solution from the Amicon cell use great care not to damage the membrane. The cell
may be tilted and a glass pipette can be used to remove the cyt c solution out of the cell.
The desalting column is relatively quick compared to the CM-52 column. Once the
cyt band has been collected from the column, it will again have to be concentrated down in
the Amicon cell. When finished, disassemble the cell and remove the filter ( the plate holding
the membrane with an o-ring may have to be soaked in a large beaker of M/Q H2O and
“floated” out). Avoid grabbing or pinching the filter to get it out. Rinse the removed filter
with M/Q H2O and soak it, glossy side down, in M/Q H2O for at least an hour before placing
it in storage solution (10% EtOH in M/Q H2O). [Go to Step 5]
STEP 5 - UV-VIS SPECTROSCOPIC DETERMINATION OF CYT C CONC.
To measure the concentration of the cyt c solution, UV-Vis spectroscopy is used.
Allow the instrument’s light source to warm up for approximately 20 minutes before
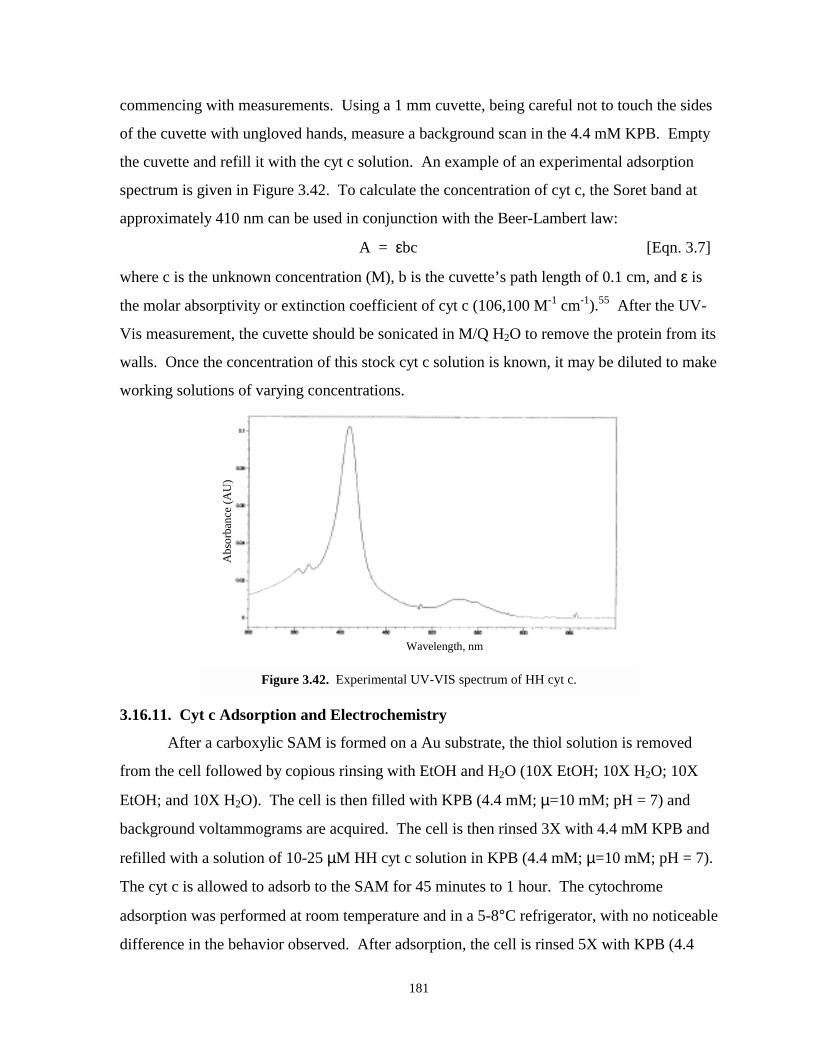
181
commencing with measurements. Using a 1 mm cuvette, being careful not to touch the sides
of the cuvette with ungloved hands, measure a background scan in the 4.4 mM KPB. Empty
the cuvette and refill it with the cyt c solution. An example of an experimental adsorption
spectrum is given in Figure 3.42. To calculate the concentration of cyt c, the Soret band at
approximately 410 nm can be used in conjunction with the Beer-Lambert law:
A = εbc [Eqn. 3.7]
where c is the unknown concentration (M), b is the cuvette’s path length of 0.1 cm, and ε is
the molar absorptivity or extinction coefficient of cyt c (106,100 M-1 cm-1).55 After the UV-
Vis measurement, the cuvette should be sonicated in M/Q H2O to remove the protein from its
walls. Once the concentration of this stock cyt c solution is known, it may be diluted to make
working solutions of varying concentrations.
Wavelength, nm
Abs
orba
nce
(AU
)
Figure 3.42. Experimental UV-VIS spectrum of HH cyt c.
3.16.11. Cyt c Adsorption and Electrochemistry
After a carboxylic SAM is formed on a Au substrate, the thiol solution is removed
from the cell followed by copious rinsing with EtOH and H2O (10X EtOH; 10X H2O; 10X
EtOH; and 10X H2O). The cell is then filled with KPB (4.4 mM; µ=10 mM; pH = 7) and
background voltammograms are acquired. The cell is then rinsed 3X with 4.4 mM KPB and
refilled with a solution of 10-25 µM HH cyt c solution in KPB (4.4 mM; µ=10 mM; pH = 7).
The cyt c is allowed to adsorb to the SAM for 45 minutes to 1 hour. The cytochrome
adsorption was performed at room temperature and in a 5-8°C refrigerator, with no noticeable
difference in the behavior observed. After adsorption, the cell is rinsed 5X with KPB (4.4
182
mM; µ=10 mM; pH = 7) and refilled with the same buffer. At this point the solution was
sometimes purged for 5-10 minutes with H2O-saturated Ar to remove oxygen. Cyt c cyclic
voltammetry experiments were typically performed using the following potential windows:
+0.2 V to -0.2 V, +0.25 V to -0.25 V, and +0.3 V to -0.3 V. Formal potentials and cyt c
surface coverage were usually determined from CVs collected at slower scan rates 1-100
mV/sec; FWHM values were determined using 100 mV/sec scans, and the ET rate constants
were primarily determined from CVs acquired at scan rates giving rise to peak splitting ≥ 200
mV. ET rate constants were calculated according to Laviron’s simplest theory for adsorbed
species using software written by former Bowden Group research Jim Willit, “CV3091.”50
Cyt c signals were stable, if the cells were refrigerated, for several days, but data were usually
collected on the same day as the cyt c was adsorbed.
3.16.12. XPS Testing Analysis
X-ray photoelectron spectroscopy (XPS) is a form of photoelectron spectroscopy
(PES) which, in general, is focused on electronic transitions involving the ejection of a single
electron out of a molecular state to a vacuum level. In PES, a sample is struck with photons
of high enough energy to displace electrons out of molecular or atomic orbitals:
Molecular/Atomic Species + hν → Molecular/Atomic Species+ + e- [Rxn. 3.3]
The energy used to eject the electron from the species is known as the binding energy of the
electron or its ionization potential (IP). During this process the system obeys a conservation
of energy known as the photoelectric effect. That is, after some of the energy of the photon is
used to displace an electron from the species, the rest of the energy becomes kinetic energy
(KE) of the ejected electron:
KE = hν - IP(e-) [Eqn. 3.8]
The KE of these ejected electrons, when measured, can be directly correlated to specific
atomic and molecular species. Each specific type of atom will require a signature amount of
energy to release an electron from its orbitals. In this manner, PES can be used to identify
and verify materials. More tightly held electrons, those in lower orbitals, will require more
energy to eject and therefore result in ejected electrons with less KE.
More specifically, XPS involves bombarding a sample with x-ray photons energetic
enough to eject core electrons, whose kinetic energies are then measured. Because
183
photoelectrons can only transverse several angstroms of material, XPS is predominantly a
surface analysis technique.56
For this research XPS testing was performed by either Mike Tarlov of NIST or by
John Phillips, the residential microscopist at the Analytical Instrumentation Facility at the
Engineering Graduate Research Center at North Carolina State University’s Centennial
Campus. Both Mr. Phillips and Dr. Tarlov performed survey scans of the surfaces being
tested. Additionally, Mr. Phillips also ran high resolution scans for N(1s), C(1s), and O(1s)
evaluation. Dr. Tarlov’s testing was aimed at determining if Ti contamination existed on the
thermally annealed gold surfaces whereas the main focus of the testing by Mr. Phillips was
the presence of nitrogen, an indication of adsorbed protein.
3.16.13. Square Wave Voltammetry
Square wave voltammetry (SWV) was performed between +0.2 V and -0.4 V with a
pulse height of 10 mV, a frequency of 5 Hz, and a scan increment of 2 mV. SWV was
performed on monolayers of cyt c as well as submonolayers that persisted following
treatment with 1 M KCl.
3.16.14. Intentional Roughening Procedures and Mixed SAM Usage
Some gold substrates were intentionally roughened by electrochemical cycling in
0.1M H2SO4 and 0.01 M KCl. Roughness scans in dilute H2SO4 were performed both before
and after the intentional roughening to verify the change in roughness factor.
Mixed SAMs were applied to the gold surfaces in the same manner as uniform SAMs.
Deposition time and concentration of the thiol solution was the same as when uniform SAMs
were utilized.
3.16.15. SAM Desorption LSV Procedure
SAM desorption experiments were performed in 0.5 M KOH according to procedures
described by Porter and coworkers.41 Typically a SAM desorption scan employed LSV
initiated at -0.2 or -0.4 V and scanned negatively until either solvent reduction current or
SAM desorption peaks were observed. The scans were run at 100 mV/sec. Care should be
taken to select a current range adequate for scaling the expected current since LSV SAM
desorption scans can only be performed once on each sample.
184
3.17 REFERENCES
1. R.A. Clark and E.F. Bowden, “Voltammetric Peak Broadening for Cytochrome c/AlkanethiolateMonolayer Structures: Dispersion of Formal Potentials,” Langmuir 1996, 13, 559-565.
2. Proposal to the National Science Foundation by Edmond F. Bowden, “Protein Monolayer
Electrochemistry,” 1993. 3. a) S.E. Creager, L.A. Hockett, and G.K. Rowe, “Consequences of Microscopic Surface
Roughness for Molecular Self-Assembly,” Langmuir 1992, 8, 854-861; b) L.H. Guo, J.S. Facci,G. McLendon, and R. Mosher, “Effect of Gold Topography and Surface Pretreatment on theSelf-Assembly of Alkanethiol Monolayers,” Langmuir 1994, 10, 4588-4593; c) C.A. Widrig, C.Chung, and M.D. Porter, J. Electroanal. Chem. 1991, 310, 335; d) O. Chailapakul and R.M.Crooks, Langmuir 1993, 9, 884; e) S. Steinberg, Y. Tor, E. Sabatani, and I. Rubinstein, J. Am.Chem. Soc. 1991, 113, 5176; f) S. Steinberg and I. Rubinstein, Langmuir 1992, 8, 1183; g) Y.Golan, L. Margulis, and I. Rubinstein, Surface Science 1992, 264, 312; h) R. Subramanian andV. Lakshminarayanan, “Effect of Surface Roughness on the Self-Assembly of OctadecanethiolMonolayers Onto Polycrystalline Noble Metal Surfaces,” Current Science 1999, 76(5), 665-669;and i) J.C. Hoogvliet, M. Dijksma, B. Kamp, and W.P. van Bennekom, “ElectrochemicalPretreatment of Gold Electrode Surfaces for Molecular Self-Assembly: A Study of BulkPolycrystalline Gold in Phosphate Buffer pH 7.4,” submitted to Analytical Chemistry, 1999.
4. Rose Anne Clark, Ph.D. Thesis, Appendix. 5. H. O. Finklea, “Electrochemistry of Organized Monolayers of Thiols and Related Molecules on
Electrodes,” A.J. Bard and I. Rubinstein (Eds.), Electroanalytical Chemistry - A Series ofAdvances, Vol. 19, 108-335, Marcel Dekker: New York, New York, 1996.
6. a) D.M. Kolb, “Reconstruction Phenomena at Metal-Electrolyte Interfaces,” Progress in Surface
Science 1996, 51(2), 109-173; b) O.M. Magnussen, J. Hotlos, R.J. Behm, N. Batina, and D.M.Kolb, “An In-Situ Scanning Tunneling Microscopy Study of Electrochemically Induced “Hex”↔ (1x1) Transitions on Au(100) Electrodes,” Surface Science 1993, 296, 310-332; c) O.M.Magnussen, J. Hotlos, R.J. Behm, R.J. Nichols, T. Twomey, and D.M. Kolb, “An In-Situ STMStudy of Potential-Induced Changes in the Surface Topography of Au(100) Electrodes,” J.Electroanal. Chem. 1990, 290, 21-31.
7. C.R. Clemmer and T.P. Beebe, “A Review of Graphite and Gold Surface Studies for Use as
Substrates in Biological Scanning Tunneling Microscopy Studies,” Scanning Microscopy 1992,6(2), 319-333.
8. C.E.D. Chidsey, C.R. Bertozzi, T.M. Putvinski, and A.M. Mujsce, J. Am. Chem. Soc. 1990, 112,
4301-4306. 9. D.M. Collard and M.A. Fox, Langmuir 1991, 7, 1192-1197. 10. T. Nahir and E.F. Bowden, “The Distribution of Standard Rate Constants for Electron Transfer
Between Thiol Modified Gold Electrodes and Adsorbed Cyt c,” J. Electroanal. Chem. 1996,410(1), 9-13.
185
11. S. Manne, J. Massie, V.B. Elings, P.K. Hansma, and A.A. Gewirth, “Electrochemistry on a GoldSurface Observed With the Atomic Force Microscope,” J. Vac. Sci. Technol. B 1991, 9(2), 950-954.
12. a) J. Wiechers, T. Twomey, R.J. Behm and D.M. Kolb, “An In-Situ Scanning Tunneling
Microscopy Study of Au(111) with Atomic Scale Resolution,” J. Electroanal. Chem. 1988, 248,451-460; b) C. Vitus and A.J. Davenport, “In-Situ Scanning Tunneling Microscopy Studies ofthe Formation and Reduction of a Gold Oxide Monolayer on Au(111),” J. Electrochem. Soc.1994, 141(5), 1291-1298; c) D.J. Trevor, C.E.D. Chidsey, and D.N. Loiacono, “In Situ Scanning-Tunneling- Microscope Observation of Roughening, Annealing, and Dissolution of Gold (111) inan Electrochemical Cell,” Physical Review Letters 1989, 62(8), 929-932.
13. a) U. Oesch and J. Janata, “Electrochemical Study of Gold Electrodes with Anodic Oxide Films -
I. Formation and Reduction Behavior of Anodic Oxides on Gold,” Electrochemica Acta 1983,28(9), 1237-1246; b) U. Oesch and J. Janata, “Electrochemical Study of Gold Electrodes withAnodic Oxide Films - II. Inhibition of Electrochemical Redox Reactions By Monolayers ofSurface Oxides,” Electrochemica Acta 1983, 28(9), 1247-1253.
14. a) R.S. Nicholson and I. Shain, Analyst. Chem. 1964, 36, 706; b) D.W. Kirk, F.R. Foulkes, and
W.F. Graydon, J. Electrochemical Society 1980, 127, 1069. 15. a) J.W. Shultze and K.J. Vetter, Ber. Bunsenges. Phys. Chem. 1975, 71, 470; b) J. Clavilier and
C.N. Van Huong, Acad. Sci. Paris 1969, 269, 736 c) A. Capon and R. Parsons, J. Electroanal.Chem. 1973, 44, 1 &239, 45, 205; d) A.H. Taylor, R.D. Pearce, and S.B. Brummer, Trans.Faraday Soc. 1971, 67, 801; C. Hinnen, J. Electroanal. Chem. 1979, 95, 131.
16. S. Trasatti and O.A. Petrii, International Union of Pure and Applied Chemistry - Physical
Chemistry Division - Commission on Electrochemistry - Chaired by K. Niki and L.R. Faulkner,“Real Surface Area Measurements in Electrochemistry,” Pure and Applied Chemistry 1991,63(5), 711-734.
17. M.E. Vela, R.C. Salvarezza, and A.J. Arvia, “The Electroreduction Kinetics of the Hydrous Gold
Oxide Layers and Growth Modes and Roughness of the Electroreduced Gold Overlayers,”Electrochimica Acta 1990, 35(1), 117-125.
18. a) A.A. Michri, A.G. Pshchenichnikov, and R.Kh. Burshtein, “Determining the Actual Area of
Smooth Gold Electrodes,” Electrokhimiya 1972, 8(3), 364-366; b) Z. Samec and J. Weber,“Study of the Oxidation of SO2 Dissolved in 0.5M H2SO4 on a Gold Electrode - I StationaryElectrode,” Electrochimica Acta 1975, 20, 403-412; c) S.B. Brummer and A.C. Makrides,“Surface Oxidation of Gold Electrodes,” J. Electrochemical Society 1964, 111(10), 1122-1128;d) D.A.J. Rand and R. Woods, “The Nature of Adsorbed Oxygen on Rh, Pd, and Au Electrodes,”J. Electroanal. Chem. 1971, 31, 29-38; e) D.A.J. Rand and R. Woods, “A Study of theDissolution of Pt, Pd, Rh, and Au Electrodes in 1M H2SO4 by Cyclic Voltammetry,” J.Electroanal. Chem. 1972, 35, 209-218; f) S.H. Cadle and Stanley Bruckenstein, “Ring-DiskElectrode Study of the Anodic Behavior of Gold in 0.2M Sulfuric Acid,” Anal. Chem. 1974,46(1), 16-20.
19. a) A.A. Michri, Soviet Electrochem. 1972, 8, 351; b) J. Weber, Z. Samec, and V. Marecek, J.
Electroanal. Chem. 1978, 89, 271; c) J.O. Besenhard, R. Parsons, and R.M. Reeves, J.
186
Electroanl. Chem. 1979, 96, 57; d) L.D. Burke and M. McRann, J. Electroanal. Chem. 1981,125, 387.
20. M. Hyland, J.A. McLaughlin, D-M. Zhou, and E.T. McAdams, “Surface Modification of Thin
Film Gold Electrodes for Improved In Vivo Performance,” Analyst 1996, 121, 705-709. 21. D. Ashland, The Science and Engineering of Materials, 3rd Edition, 1989. 22. J. Clavilier, R. Faure, G. Guinet, and R. Durand, “Preparation of Monocrystalline Pt
Microelectrodes and Electrochemical Study of the Plane Surfaces Cut in the Direction of the(111) and (110) Planes,” J. Electroanal. Chem. 1980, 107, 205-209.
23. a) J. Clavilier, K.E. Achi, M. Petit, A. Rodes, and M.A. Zamakhchari, J. Electroanal. Chem.
1990, 295, 333; b) S. Motoo, and N. Furuya, J. Electroanal. Chem. 1984, 172;167;181,339;309;301 (resp.); c) A. Hamelin, L. Doubova, D. Wagner, and H. Schirmer, J. Electroanal.Chem. 1987, 220, 155; d) N. Batina, A.S. Dakkouri, and D.M. Kolb, J. Electroanal. Chem. 1994,370, 87.
24. M. Dietterle, T. Will, and D.M. Kolb, “Step Dynamics at the Ag(111)-Electrolyte Interface,”
Surface Science Letters 1995, 327, L495-L500. 25. Personal communication with technical support at Molecular Imaging Corporation. 26. D.A. Skoog and J.J. Leary, Principles of Instrumental Analysis, 4th Ed., Saunders College
Publishing: Fort Worth, Texas, 1992. 27. D.M. Kolb, “Physical and Electrochemical Properties of Metal Monolayer on Metallic
Substrates,” in Advances in Electrochemistry and Electrochemical Engineering, Vol. 11, H.Gerischer and C.W. Tobias, Eds., 125-271, John Wiley & Sons: New York, 1978.
28. J.W. Schultze and D. Dickertmann, Surface Science 1976, 54, 489. 29. K. Engelsmann, W.J. Lorenz, E. Schmidt, J. Electroanal. Chem. 1980, 114, 1-10. 30. a) H.O. Finklea, S. Avery, M. Lynch, T. Furtsch, “Blocking Oriented Monolayers of Alkyl
Mercaptans on Gold Electrodes,” Langmuir 1987, 3, 409-413; b) H.O. Finklea, D.A. Snider andJ. Fedyk, “Passivation of Pinholes in Octadecanethiol Monolayers on Gold Electrodes byElectrochemical Polymerization of Phenol,” Langmuir 1990, 6, 371-376; c) H.O. Finklea, D.A.Snider, and John Fedyk, “Characterization of Octadecanethiol-Coated Gold Electrodes asMicroarray Electrodes by Cyclic Voltammetry and AC Impedance Spectroscopy,” Langmuir1993, 9, 3660-3667; d) S. Creager and K.A. Groat, “Self-Assembled Monolayers in OrganicSolvents: Electrochemistry at Alkanethiolate-Coated Gold in Propylene Carbonate,” Langmuir1993, 9, 3668-3675; e) C.E.D. Chidsey and Dominic Loiacono, “Chemical Functionality in Self-Assembled Monolayers: Structural and Electrochemical Properties,” Langmuir 1990, 6, 682-691;f) P. Krysinski and M. Brzostowska-Smolska, “Three Probe Voltammetric Characterization ofOctadecanethiol Self-Assembled Monolayer Integrity on Gold Electrodes,” J. Electroanal.Chem. 1997, 424, 61-67; g) E. Saabatani and I. Rubinstein, “Organized Self-AssemblingMonolayers on Electrodes. 2. Monolayer-Based Ultramicroelectrodes for the Study of VeryRapid Electrode Kinetics,” J. Phys. Chem. 1987, 91, 6663-6669.
187
31. a) C.M. Roth and A.M. Lenhoff, “Electrostatic and van der Waals Contributions to Protein
Adsorption: Computation of Equilibrium Constants,” Langmuir 1993, 9, 962-972; b) J.Stahlberg, U. Appelgren, and B. Jonsson, “Electrostatic Interactions between a Charged Sphereand a Charged Planer Surface in an Electrolyte Solution,” J. Colloid and Interfacial Science1995, 176, 1-11; c) J. Stahlberg, “Electrostatic Retention Model for Ion-ExhangeChromatography,” Anal. Chem. 1994, 66, 440-449.
32. D.J. Tobias, W. Mar, J.K. Blasie, and M.L. Klein, “Molecular Dynamics Simulations of a Protein
on Hydrophobic and Hydrophilic Surfaces,” Biophysical Journal 1996, 71, 2933-2941. 33. a) G. Bar, S. Rubin T.N. Taylor, B.I. Swanson, T.A. Zawodzinski, J.T. Chow, and J.P. Ferraris,
“Patterned Self-Assembled Monolayers of Ferrocene and Methyl Terminated Alkanethiols onGold: A Combined Electrochemical , Scanning Probe Microscopy, and Surface Science Study,”J. Vac. Sci. Tech. A 1996, 14(3), 1794-1800; b) J.L. Wilbur, H.A. Biebuyck, J.C. MacDonald,and G.M. Whitesides, “Scanning Force Microscopies Can Image Patterned Self-AssembledMonolayers,” Langmuir 1995, 11, 825-831.
34. S. Song, R.A. Clark, M.J. Tarlov, and E.F. Bowden, “Characterization of Cytochrome
c/Alkanethiolate Structures Prepared by Self-Assembly on Gold,” J. Phys. Chem. 1993, 97,6564-6572.
35. C.M.A. Brett and A.M.O. Brett, Electrochemistry - Principles, Methods, and Applications,
Oxford University Press: Oxford, 1993. 36. a) Z. Stojek and Janet Osteryoung, “Linear Scan and Staircase Voltammetry of Adsorbed
Species,” Anal. Chem. 1991, 63(8), 839-841; b) J.H. Reeves, S. Song, and E.F. Bowden,“Application of Square Wave Voltammetry to Strongly Adsorbed Quasireversible RedoxMolecules,” Anal. Chem. 1993, 65, 683-688.
37. a) C.D. Bain, J. Evall, G.M. Whitesides, “Formation of Monolayers by the Coadsorption of
Thiols on Gold: Variation in the Head Group, Tail Group, and Solvent,” J. Am. Chem. Soc. 1989,111, 7155-7164; b) L. Bertilsson and B. Liedberg, “Infrared Study of Thiol MonolayerAssemblies on Gold: Preparation, Characterization, and Functionalization of MixedMonolayers,” Langmuir 1993, 9, 141-149; c) S.J. Stanick, A.N. Parikh, Y.-T. Tao, D.L. Allara,and P.S. Weiss, “Phase Separation of Mixed-Composition Self-Assembled Monolayers intoNanometer Scale Molecular Domains,” J. Phys. Chem. 1994, 98, 7636-7646; d) G.K. Rowe andS.E. Creager, “Redox and Ion Pairing Thermodynamics in Self-Assembled Monolayers,”Langmuir 1991, 7, 2307-2312; e) K.L. Prime and G.M. Whitesides, “Self-Assembled OrganicMonolayers: Model Systems for Studying Adsorption of Proteins at Surfaces,” Science 1991,252, 1164-1167; f) C.E.D. Chidsey, C.R. Bertozzi, T.M. Putvinski, and A.M. Mujsce,“Coadsorption of Ferrocene-Terminated and Unsubstituted Alkanethiols on Gold: ElectroactiveSelf-Assembled Monolayers,” J. Am. Chem. Soc. 1990, 112, 4301-4306.
38. a) P.E. Laibinis, R.G. Nuzzo, and G.M. Whitesides, “Structure of Monolayers Formed by
Coadsorption of Two n-Alkanethiols of Different Chain Lengths on Gold and Its Relation toWetting,” J. Phys. Chem. 1992, 96, 5097-5105; b) C.D. Bain and G.M. Whitesides, “CorrelationsBetween Wettability and Structure in Monolayers of Alkanethiols Adsorbed on Gold,” J. Am.Chem. Soc. 1988, 110, 3665-3666; c) J.P. Folkers, P.E. Laibinis, J. Deutch and G.M. Whitesides,
188
“Phase Behavior of Two-Component Self-Assembled Monolayers of Alkanethiolates on Gold,”J. Phys. Chem. 1994, 98, 563-571; d) C.D. Bain and G.M. Whitesides, “Formation ofMonolayers by the Coadsorption of Thiols on Gold: Variation in the Length of the Alkyl Chain,”J. Am. Chem. Soc. 1989, 111, 7164-7175; e) J.P. Folkers, P.E. Laibinis, and G.M. Whitesides,“Self-Assembled Monolayers of Alkanethiols on Gold: Comparisons of Monolayers ContainingMixtures of Short- and Long- Chain Constituents with CH3 and CH2OH Terminal Groups,”Langmuir 1992, 8, 1330-1341; f) O. Chailapakul and R.M. Crooks, “Synthesis andCharacterization of Simple Self-Assembling, Nanoporous Monolayer Assemblies: A NewStrategy for Molecular Recognition,” Langmuir 1993, 9, 884-888; g) C. Miller, P. Cuendet, andM. Gratzel, “Adsorbed ω-Hydroxy Thiol Monolayers on Gold Electrodes: Evidence for ElectronTunneling To Redox Species in Solution,” J. Phys. Chem. 1991, 95, 877-886; h) D.A. Offord,C.M. John, and J.H. Griffin, “Contact Angle Goniometry, Ellipsometry, XPS, and TOF-SIMSAnalysis of Gold-Supported, Mixed Self-Assembled Monolayes Formed From Mixed DialkylDisulfides,” Langmuir 1994, 10, 761-766; i) D.A. Offord, C.M. John, M.R. Linford and J.H.Griffin, “Contact Angle Goniometry, Ellipsometry, and TOF-SIMS Analysis of Gold-Supported,Mixed Self-Assembled Monolayes Formed From Alkyl Mercaptans, Langmuir 1994, 10, 883-889.
39. a) S. Atre, B. Liedberg, and D.L. Allara, “Chain Length Dependence of the Structure and
Wetting Properties in Binary Composition Monolayers of OH- and CH3- TerminatedAlkanethiolates on Gold,” Langmuir 1995, 11, 3883-3893; b) K. Tamada, M. Hara, H. Sasabe,and W. Knoll, “Surface Phase Behavior of n-Alkanethiol Self-Assembled Monolayers Adsorbedon Au(111): An Atomic Force Microscope Study,” Langmuir 1997, 13, 1558-1566.
40. A.E. Kasmi, J.M. Wallace, E.F. Bowden, S.M. Binet, and R.J. Linderman, “Controlling
Interfacial Electron-Transfer Kinetics of Cytochrome c with Mixed Self-AssembledMonolayers,” J. Am. Chem. Soc. 1998, 120, 225-226.
41. a) M.M. Walczak, D.D. Popenoe, R.S. Deinhammer, B.D. Lamp, C. Chung, and M.D. Porter,
“Reductive Desorption of Alkanethiolate Monolayers at Gold: A Measure of Surface Coverage,”Langmuir 1991, 7, 2687-2693; b) M.M. Walczak, D.E. Weisshaar, and M.D. Porter,“Electrochemically Induced Transformations of Monolayers Formed by Self-Assembly ofMercaptoethanol at Gold,” Langmuir 1993, 9, 323-329.
42. a) J.Y. Gui, D.A. Stern, D.G. Frank, F. Lu, D.C. Zapien, and A.T. Hubbard, “Adsorption and
Surface Structural Chemistry of Thiophenol, Benzyl Mercaptan, and Alkyl Mercaptans.Comparative Studies at Ag(111) and Pt(111) Electrodes by Means of Auger Spectroscopy,Electron Energy Loss Spectroscopy, Low-Energy Electron Diffraction, and Electrochemistry,”Langmuir 1991, 7, 955-963; b) J.Y. Gui, D.A. Stern, C-H. Lin, P. Gao, and A.T. Hubbard,“Potential-Dependent Surface Chemistry of Hydroxypyridines Adsorbed at a Pt(111) ElectrodeStudied by Electron Energy Loss Spectroscopy, Low Energy Electron Diffraction, AugerElectron Spectroscopy, and Electrochemistry,” Langmuir 1991, 7, 3183-3189.
43. B.D. Lamp, D. Hobara, M.D. Porter, K. Niki, and T.M. Cotton, “Correlation of Structure and
Performance of Pyridinethiolate Surface Modifiers at Gold Electrodes for the Facilitation of Cytc Heterogeneous ET Reations,” Langmuir 1997, 13(4), 736-741.
44. E. Sabatani, J. Cohen-Boulakia, M. Bruening, and I. Rubinstein, “Thioaromatic Monolayers on
Gold: A New Family of Self-Assembling Monolayers,” Langmuir 1993, 9, 2974-2981.
189
45. A. Mosca, R. Paleari, P. Arosio, A. Cricenti, M.A. Scarselli, R. Generosi, S. Selci, and E.
Rovida, “Direct Observation of Human Liver Ferritin By Scanning Tunneling Microscopy,” J.Vac. Sci. Technol. B 1994, 12(3), 1486-1489.
46. a) J. Vancea, G. Reiss, F. Schneider, K. Bauer, and H. Hoffmann, “Substrate Effects on the
Surface Topography of Evaporated Au Films - An STM Investigation,” Surface Science 1989,218, 108-126; b) J. Ulstrup, Surface Science 1995, 325, 193-205.
47. a) L. Haussling, F.J. Schmitt, W. Knoll, and H. Ringsdorf, “Biotin-Functionalized Self-
Assembled Monolayers on Gold: Surface Plasmon Optical Studies of Specific RecognitionReactions,” Langmuir 1991, 7(9), 1837-1840; b) L. Haussling, B. Michel, H. Rohrer, and H.Ringsdorf, “Direct Observation of Streptavidin Specifically Adsorbed on Biotion-FunctionalizedSelf-Assembled Monolayers with the Scanning Tunneling Microscope,” Angew. Chem. Int. Engl.1991, 30(5), 569-572.
48. a) M. Niwa, T. Mori, E. Nishio, H. Nishimura, and N. Higashi, “Specific Binding of
Concanavalin A to Glycolipid Monolayers on Gold Electrodes,” J. Chem. Soc. Chem. Commun.1992, 547-549; b) D. Mandler and I. Turyan, “Applications of Self-Assembled Monolayers inElectroanalytical Chemistry,” Electroanalysis 1996, 8(3), 207-213.
49. a) E. Delamarche, M. Sprik, B. Michel, U. Rothlisberger, M.L. Klein, H. Wolf, and H.
Ringsdorf, “Structure of Hydrophilic Self-Assembled Monolayers: A Combined ScanningTunneling Microscopy and Computer Simulation Study,” Langmuir 1994, 10, 4116-4130; b) E.Cooper and G.J. Leggett, “Influence of Tail-Group Hydrogen Bonding on the Stabilities of Self-Assembled Monolayers of Alkylthiols on Gold,” Langmuir 1999, 15, 1024-1032; c) R.S. Cleggand J.E. Hutchison, “Hydrogen Bonding, Self-Assembled Monolayers: Ordered Molecular Filmsfor Study of Through Peptide Electron Transfer,” Langmuir 1996, 12(22), 5239-5243; d) G.E.Poirier, E.D. Pylant, J. White, J. Chem.Phys. 1996, 105, 2089; e) P. Tengrall, B. Liedberg, andN. Lestelius, Langmuir 1997, 13, 5900-5908.
50. a) M.D. Porter, T.B. Bright, D.L. Allara, and C.E.D. Chidsey, “Spontaneously Organized
Molecular Assemblies. 4. Structural Characterization of n-Alkyl Thiol Monolayers on Gold byOptical Ellipsometry, Infrared Spectroscopy, and Electrochemistry,” J. Am. Chem. Soc. 1987,109, 3559-3568; b) R.G. Nuzzo, L.H. Dubois, and D.L. Allara, “Fundamental Studies ofMicroscopic Wetting on Organic Surfaces. 1. Formation and Structrual Characterization of aSelf-Consistent Series,” J. Am. Chem. Soc. 1990, 112, 558-569; c) L.H. Dubois, B.R. Zegarski,and R. Nuzzo, “Fundamental Studies of Microscopic Wetting on Organic Surfaces. 2. Interactionof Secondary Adsorbates with Chemically Textured Organic Monolayers,” J. Am. Chem. Soc.1990, 112, 570-579.
51. E.F. Bowden Thesis, Virginia Commenwealth University - Appendix II. 52. J. Willit, Ph.D. Thesis, North Carolina State University, 1990. 53. T.M. Nahir, D. Tiani, D. Miller, R.J. Linderman, and E.F. Bowden, manuscript in preparation. 54. D.C. Harris, Quantitative Chemical Analysis, 3rd Ed., W.H. Freeman and Company: New York,
1991.

190
55. E. Margoliash and N. Frohwirt, Biochem. J. 1959, 71, 570. 56. Professor Chris Gorman’s class notes from CH525 - Phyical Methods in Organic Chemistry,
1996.
57. a) S.E. Creager and J. Clarke, “Contact-Angle Titrations of Mixed ω-MercaptoalkanoicAcid/Alkanethiol Monolayers on Gold. Reactive vs. Nonreactive Spreading, and Chain LengthEffects on Surface pKa Values,” Langmuir 1994, 10, 3675-3683; b) E.W. van der Vegte and G.Hadziioannou, “Acid-Base Properties and the Chemical Imaging of Surface-Bound FunctionalGroups Studied with Scanning Force Microscopy,” J. Phys. Chem. B 1997, 101, 9563-9569; c)H.S. White, J.D. Peterson, Q. Cui, and K.J. Stevenson, “Voltammetric Measurement ofInterfacial Acid/Base Reactions,” J. Phys. Chem. B 1998, 102, 2930-2934; d) T.R. Lee, R.I.Carey, H.A. Biebuyck, and G.M. Whitesides, Langmuir 1994, 10, 741; e) C.D. Bain and G.M.Whitesides, Langmuir 1988, 5, 1370; f) Y. Mo, M. Sandifer, C. Sukenik, R.J. Barriga, M.P.Soriaga, and D. Scherson, “In Situ QCM Studies of Molecular Adsorbates Containing Thiol andHydroquinone Moieties Bound to Au(111) Surfaces in Aqueous Electrolytes,” Langmuir 1995,11, 4626-4628.
58. a) E.F. Bowden, R.A. Clark, J.L. Willit, and S. Song, “Protein Monolayer Electrochemistry: AStrategy for Probing Biological Electron Transfer Kinetics,” In Proceedings of the FifthInternational Symposium on Redox Mechanisms and Interfacial Properties, F. Shultz and I.Taniguchi, Eds., The Electrochemical Society: Pennington, New Jersey, 1993, 34-45; b) E.F.Bowden, “Wiring Mother Nature: Interfacial Electrochemistry of Proteins,” The ElectrochemicalSociety:Interface, 1997, 6, 40-44; c) J.D.H. Glenn and E.F. Bowden, “DiffusionlessElectrochemistry of Cyt b5 Adsorbed on a Multilayer Film Electrode,” Chemistry Letters 1996,399-400.
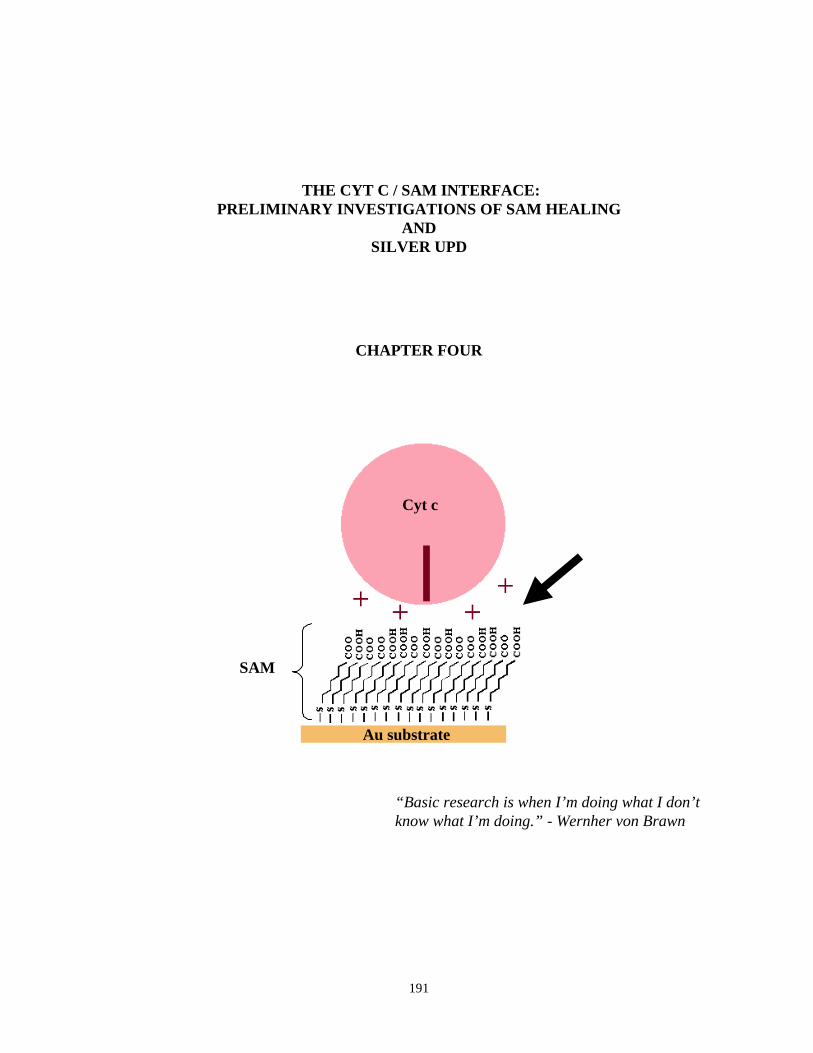
191
THE CYT C / SAM INTERFACE:PRELIMINARY INVESTIGATIONS OF SAM HEALING
ANDSILVER UPD
CHAPTER FOUR
“Basic research is when I’m doing what I don’tknow what I’m doing.” - Wernher von Brawn
Au substrate
SAM
Cyt c
192
4. PRELIMINARY INVESTIGATIONS OF SAM HEALING AND SILVER UPD
The next surface to address in the cyt c/SAM/Au system is the interface of the SAM
and the protein. More specifically, this chapter deals with the surface of the SAM and how it
relates to the adsorption and ET properties of cyt c. In contrast to the previous chapter, the
research described or proposed in this chapter will explore this interface while maintaining
the initial gold surface topography as a constant. There are numerous options for
manipulating the SAM/solution interface. In light of the results of the experiments on the
influence of the gold substrate and the conclusions made about the importance of SAM defect
density on the adsorption and ET properties of cyt c, the research in this chapter primarily
involves alternative testing of the same concepts addressed in Chapter 3. Here however,
experiments are designed to affect the density of defects in the SAM by means other than
altering the Au surface topography. Instead, physical manipulation of the SAM is
incorporated as a way of varying SAM structure by either blocking or minimizing the
occurrence of defect sites in the SAM. The SAMs are then subsequently characterized by
many of the same techniques previously described, including their responsiveness to cyt c
adsorption and ET.
Two types of experiments, in particular, comprise the bulk of this chapter. Both of
these experimental concepts involve interesting SAM manipulations, as well as, address the
need for altering the defect density of the SAM structure. Thermal healing of SAMs and
SAMs assembled on Ag UPD layers on Au both seem to serve this project well and are
included here because it is believed they would benefit the understanding of this system
greatly if pursued further. The research on these subjects in the following sections are simply
examples of the potential that these concept hold for delineating information about the cyt
c/SAM/Au ET system.
4.1 THERMAL HEALING OF SELF-ASSEMBLED MONOLAYERS
In the literature are examples of the use of temperature to dramatically reduce the
density of defects in thiol SAMs.1-3 Elevated temperatures are typically applied during the
self-assembly process, allowing for a form of thermal annealing referred to as thermal
healing. During this heat treatment, the adsorbates comprising the SAM are energetically
193
activated to rearrange and diffuse laterally across the surface for optimal positioning,
effectively “healing” many defects sites. In light of the results presented in Chapter 3, a
decrease in SAM defect density should a negative effect on cyt c’s adsorption and/or its
electrochemical response. In addition to its obvious application to the cyt c system, low
defect monolayers are of interest to many researchers involved in corrosion studies,
nanolithography, and high quality dielectric materials for microelectronics.2
4.1.1. Mechanistic Aspects of Thermal Healing of SAMs
From the detailed work of Weiss, Allara and coworkers in a recent publication and
references within that paper,2 some of the mechanistic aspects of the thermal healing process
have been elucidated. The overall effect of thermal healing of SAMs is the manifestation of
several processes that occur while the SAM is kept immersed in the self-assembly solution at
an elevated temperature for an extended amount of time. The temperature where the thermal
healing of methyl-terminated SAMs of chain lengths of 10 and 12 occurs is suggested to be
approximately 78° C.2 However, increasing the temperature to this level causes several other
events to take place. Initially, the temperature rises above room temperature where IR
spectroscopy has revealed that alkyl chain gauche defects increase substantially. At 60° C,
thiolate desorption becomes significant and X-ray diffraction studies have shown that a
melting transition occurs in the film at 50 to 70°C. Therefore, at 70° C the degree of
thermally induced disorder in the SAM is expected to be quite high. This disorder in the film
allows for greater access of the solution to the gold surface through thermally induced defect
sites.2
Because the self-assembly process is taking place during the thermal healing process,
the exchange of thiols from solution at these defect sites is presumably enhanced.
Organothiol exchange kinetics at defect regions are known to be much faster than at ordered
domains of SAMs.4 It is expected that the desorption of alkanethiols at defect sites is
accelerated by the elevated temperatures and the increased solvation of the thiolates and
thiolate-Au complexes. Chemical analysis of the thiol/ethanol solution during thermal
healing revealed a continuously increasing gold content with assembly time.1 It is
hypothesized in the article by Weiss et al. that the desorption of alkanethiolates from the
surface occurs primarily at the edges of ordered SAM domains and at other lower coverage
194
regions and is not favored at highly ordered domains.2 Futhermore, the higher temperatures
encourage increased lateral diffusion of achored thiols as well as the Au itself. All of these
processes result in for Ostwald ripening, where the size of highly ordered SAM terraces are
ultimately limited only by the properties of the underlying substrate.
The effects of thermal healing on SAMs is most evident in SPM imaging of these
surfaces.2 Most SPM images of SAMs contain topographical depressions in the self-
assembled films, or dark pits.5 There is some controversy about the exact nature of these pits
as they have been attributed to being caused by the accumulation of gauche defects in the
thiol layer, a ramification of the topography of the Au substrate, or by the chemical erosion of
gold atoms during the self-assembly process.1,5 These pits are usually circular in nature, 2-6
nm in diameter, and tend to be 0.2-1.1 nm deep. In many instances the depth of the pits
corresponds to the height of a Au step edge, approximately 0.29 nm. Depending on the
experimental conditions of self-assembly, the pits can comprise 5-30% of the surface5d and
are often lined with thiolate material rather than exposing bare gold. Pitting is considered to
be a sign of significant defect density in SAMs.
An example of a SAM with this type of pitting from Weiss and coworkers is shown in
Figure 4.1(top).2 Dark pits are evident throughout this STM image of a n-mercaptododecane
(C12) SAM formed on Au(111) grown on mica. The contrast within the SAM domains in
this image is indicative of defects in the SAM. In an identical manner, separate SAMs were
formed on gold by immersing the thiol deposition solution of approximately 1 mM in a water
bath held at 78°C for 1 hour during the self-assembly process. The image of this thermally
healed SAM is shown as Figure 4.1 (bottom). The dark depressions are no longer present in
the image, suggesting that areas of disorder and defect density has have been drastically
minimized. Similar experiments performed at various time increments during the thermal
healing process revealed that the pits seem to mobilize and coalesce, moving to the edge of
ordered domains or to step edges and grain boundaries.1 These examples, while subject to
certain criticisms inherent to the imaging process itself, suggest that thermal healing of SAMs
may be a legitimate method to be considered for controlling the defect density of the SAMs
used in cyt c electrochemistry.
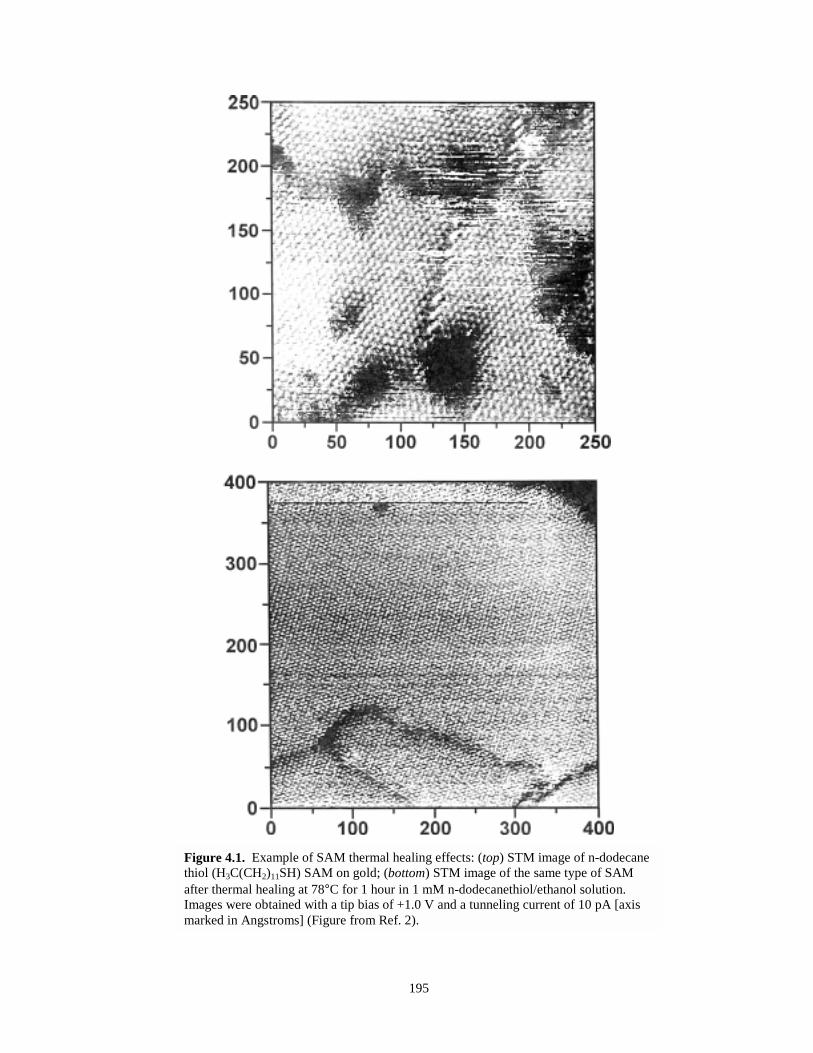
195
Figure 4.1. Example of SAM thermal healing effects: (top) STM image of n-dodecanethiol (H3C(CH2)11SH) SAM on gold; (bottom) STM image of the same type of SAMafter thermal healing at 78°C for 1 hour in 1 mM n-dodecanethiol/ethanol solution.Images were obtained with a tip bias of +1.0 V and a tunneling current of 10 pA [axismarked in Angstroms] (Figure from Ref. 2).
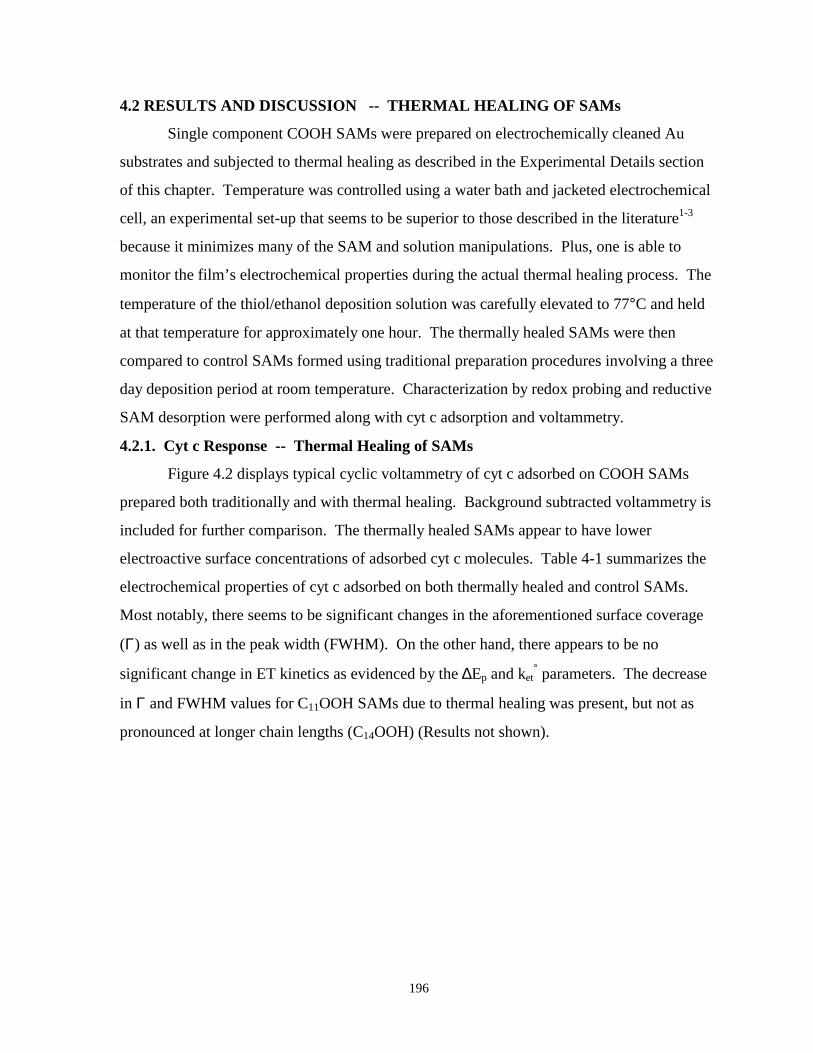
196
4.2 RESULTS AND DISCUSSION -- THERMAL HEALING OF SAMs
Single component COOH SAMs were prepared on electrochemically cleaned Au
substrates and subjected to thermal healing as described in the Experimental Details section
of this chapter. Temperature was controlled using a water bath and jacketed electrochemical
cell, an experimental set-up that seems to be superior to those described in the literature1-3
because it minimizes many of the SAM and solution manipulations. Plus, one is able to
monitor the film’s electrochemical properties during the actual thermal healing process. The
temperature of the thiol/ethanol deposition solution was carefully elevated to 77°C and held
at that temperature for approximately one hour. The thermally healed SAMs were then
compared to control SAMs formed using traditional preparation procedures involving a three
day deposition period at room temperature. Characterization by redox probing and reductive
SAM desorption were performed along with cyt c adsorption and voltammetry.
4.2.1. Cyt c Response -- Thermal Healing of SAMs
Figure 4.2 displays typical cyclic voltammetry of cyt c adsorbed on COOH SAMs
prepared both traditionally and with thermal healing. Background subtracted voltammetry is
included for further comparison. The thermally healed SAMs appear to have lower
electroactive surface concentrations of adsorbed cyt c molecules. Table 4-1 summarizes the
electrochemical properties of cyt c adsorbed on both thermally healed and control SAMs.
Most notably, there seems to be significant changes in the aforementioned surface coverage
(Γ) as well as in the peak width (FWHM). On the other hand, there appears to be no
significant change in ET kinetics as evidenced by the ∆Ep and ket° parameters. The decrease
in Γ and FWHM values for C11OOH SAMs due to thermal healing was present, but not as
pronounced at longer chain lengths (C14OOH) (Results not shown).
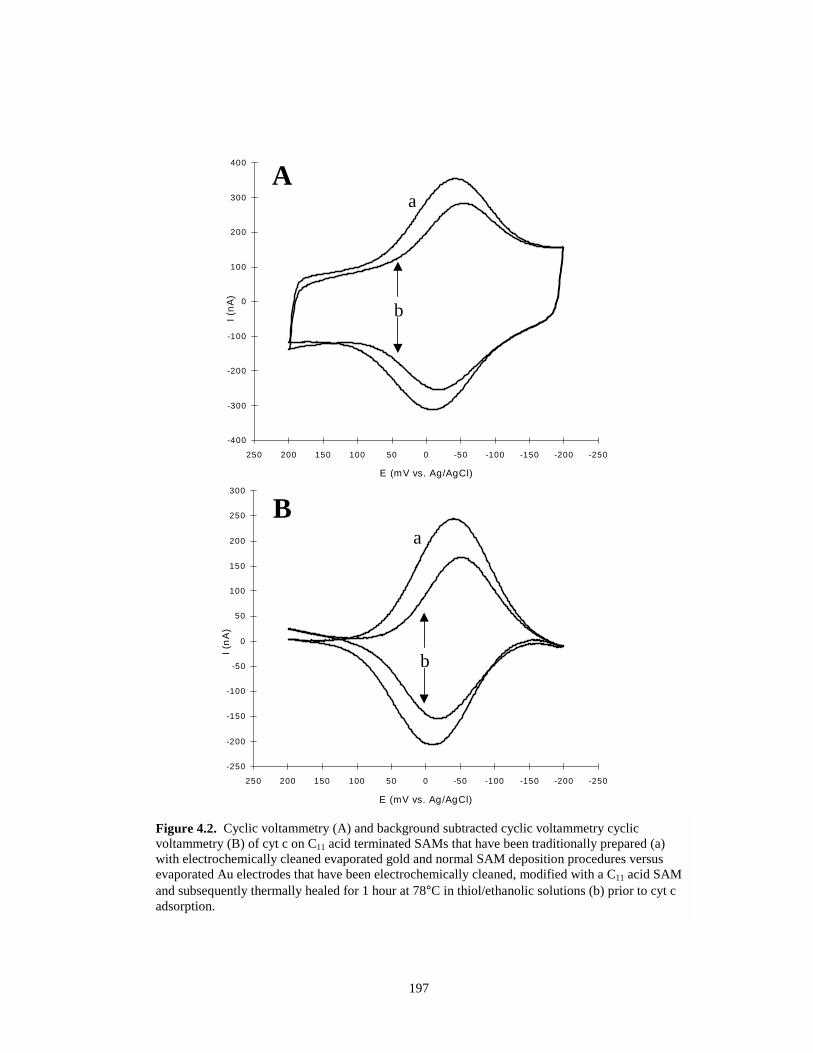
197
-400
-300
-200
-100
0
100
200
300
400
-250-200-150-100-50050100150200250
E (mV vs. Ag/AgCl)
I (nA
)
-250
-200
-150
-100
-50
0
50
100
150
200
250
300
-250-200-150-100-50050100150200250
E (mV vs. Ag/AgCl)
I (nA
)
A
B
b
a
b
a
Figure 4.2. Cyclic voltammetry (A) and background subtracted cyclic voltammetry cyclicvoltammetry (B) of cyt c on C11 acid terminated SAMs that have been traditionally prepared (a)with electrochemically cleaned evaporated gold and normal SAM deposition procedures versusevaporated Au electrodes that have been electrochemically cleaned, modified with a C11 acid SAMand subsequently thermally healed for 1 hour at 78°C in thiol/ethanolic solutions (b) prior to cyt cadsorption.
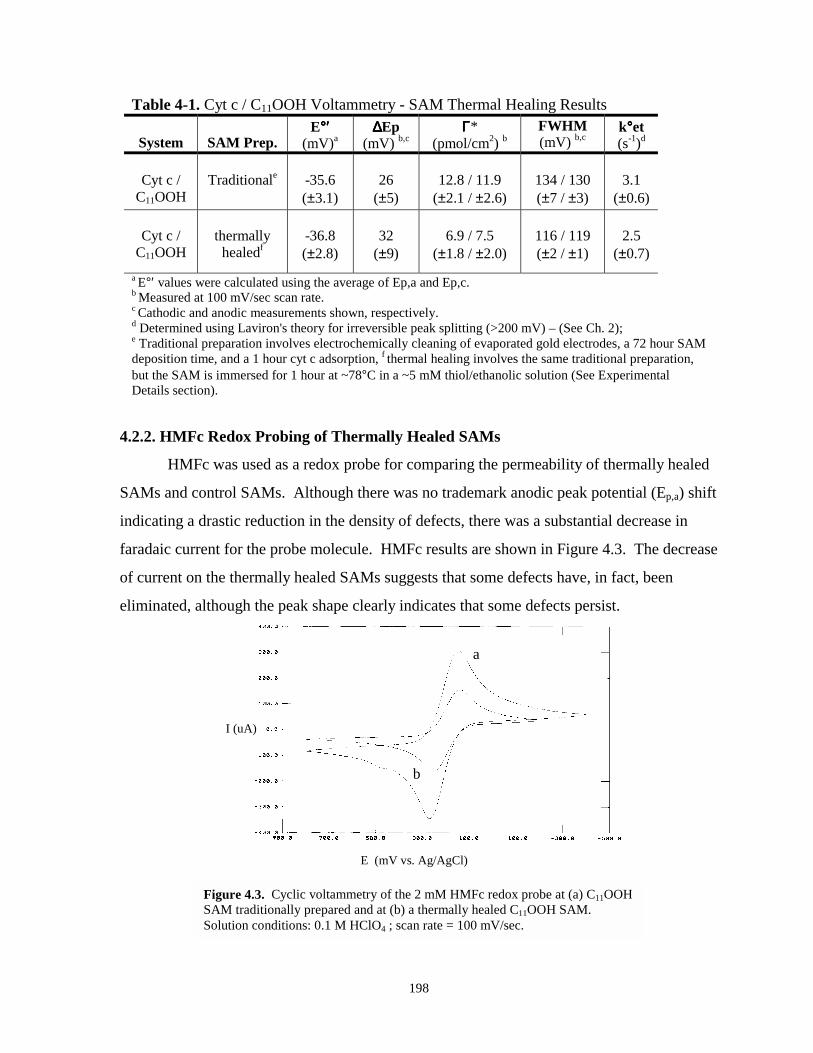
198
Table 4-1. Cyt c / C11OOH Voltammetry - SAM Thermal Healing Results
System SAM Prep.E°°°°′′′′
(mV)a∆∆∆∆Ep
(mV) b,cΓΓΓΓ*
(pmol/cm2) bFWHM(mV) b,c
k°°°°et(s-1)d
Cyt c /C11OOH
Traditionale -35.6(±3.1)
26(±5)
12.8 / 11.9(±2.1 / ±2.6)
134 / 130(±7 / ±3)
3.1(±0.6)
Cyt c /C11OOH
thermallyhealedf
-36.8(±2.8)
32(±9)
6.9 / 7.5(±1.8 / ±2.0)
116 / 119(±2 / ±1)
2.5(±0.7)
a E°′ values were calculated using the average of Ep,a and Ep,c.b Measured at 100 mV/sec scan rate.c Cathodic and anodic measurements shown, respectively.d Determined using Laviron's theory for irreversible peak splitting (>200 mV) – (See Ch. 2);e Traditional preparation involves electrochemically cleaning of evaporated gold electrodes, a 72 hour SAMdeposition time, and a 1 hour cyt c adsorption, f thermal healing involves the same traditional preparation,but the SAM is immersed for 1 hour at ~78°C in a ~5 mM thiol/ethanolic solution (See ExperimentalDetails section).
4.2.2. HMFc Redox Probing of Thermally Healed SAMs
HMFc was used as a redox probe for comparing the permeability of thermally healed
SAMs and control SAMs. Although there was no trademark anodic peak potential (Ep,a) shift
indicating a drastic reduction in the density of defects, there was a substantial decrease in
faradaic current for the probe molecule. HMFc results are shown in Figure 4.3. The decrease
of current on the thermally healed SAMs suggests that some defects have, in fact, been
eliminated, although the peak shape clearly indicates that some defects persist.
a
b
E (mV vs. Ag/AgCl)
I (uA)
Figure 4.3. Cyclic voltammetry of the 2 mM HMFc redox probe at (a) C11OOHSAM traditionally prepared and at (b) a thermally healed C11OOH SAM.Solution conditions: 0.1 M HClO4 ; scan rate = 100 mV/sec.
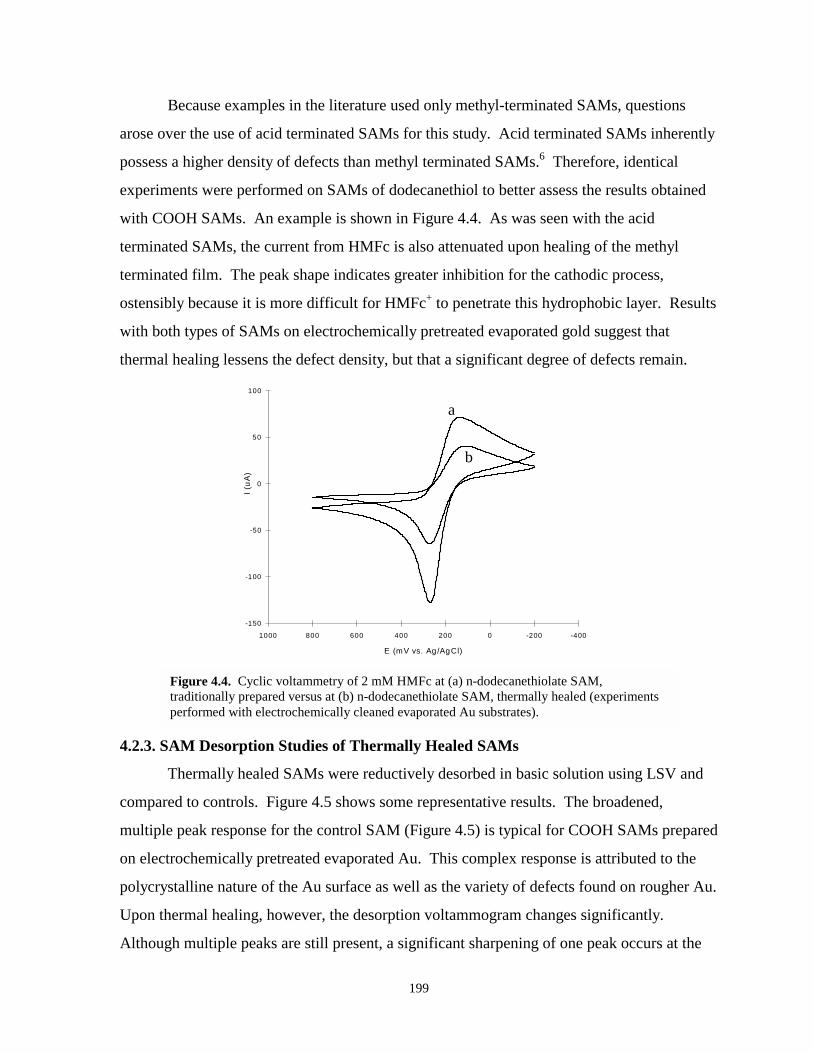
199
Because examples in the literature used only methyl-terminated SAMs, questions
arose over the use of acid terminated SAMs for this study. Acid terminated SAMs inherently
possess a higher density of defects than methyl terminated SAMs.6 Therefore, identical
experiments were performed on SAMs of dodecanethiol to better assess the results obtained
with COOH SAMs. An example is shown in Figure 4.4. As was seen with the acid
terminated SAMs, the current from HMFc is also attenuated upon healing of the methyl
terminated film. The peak shape indicates greater inhibition for the cathodic process,
ostensibly because it is more difficult for HMFc+ to penetrate this hydrophobic layer. Results
with both types of SAMs on electrochemically pretreated evaporated gold suggest that
thermal healing lessens the defect density, but that a significant degree of defects remain.
-150
-100
-50
0
50
100
-400-20002004006008001000
E (mV vs. Ag /AgCl)
I (uA
)
a
b
Figure 4.4. Cyclic voltammetry of 2 mM HMFc at (a) n-dodecanethiolate SAM,traditionally prepared versus at (b) n-dodecanethiolate SAM, thermally healed (experimentsperformed with electrochemically cleaned evaporated Au substrates).
4.2.3. SAM Desorption Studies of Thermally Healed SAMs
Thermally healed SAMs were reductively desorbed in basic solution using LSV and
compared to controls. Figure 4.5 shows some representative results. The broadened,
multiple peak response for the control SAM (Figure 4.5) is typical for COOH SAMs prepared
on electrochemically pretreated evaporated Au. This complex response is attributed to the
polycrystalline nature of the Au surface as well as the variety of defects found on rougher Au.
Upon thermal healing, however, the desorption voltammogram changes significantly.
Although multiple peaks are still present, a significant sharpening of one peak occurs at the
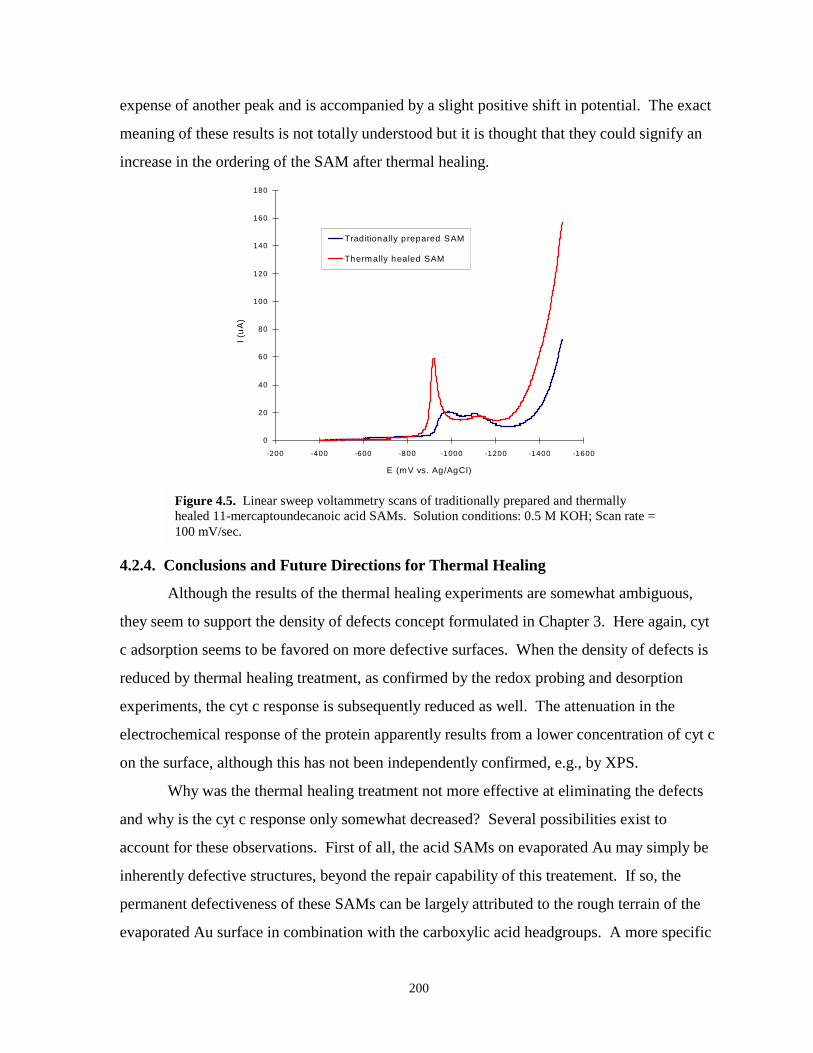
200
expense of another peak and is accompanied by a slight positive shift in potential. The exact
meaning of these results is not totally understood but it is thought that they could signify an
increase in the ordering of the SAM after thermal healing.
0
20
40
60
80
100
120
140
160
180
-1600-1400-1200-1000-800-600-400-200
E (mV vs. Ag/AgCl)
I (uA
)Trad itionally prepared SAM
Thermally healed SAM
Figure 4.5. Linear sweep voltammetry scans of traditionally prepared and thermallyhealed 11-mercaptoundecanoic acid SAMs. Solution conditions: 0.5 M KOH; Scan rate =100 mV/sec.
4.2.4. Conclusions and Future Directions for Thermal Healing
Although the results of the thermal healing experiments are somewhat ambiguous,
they seem to support the density of defects concept formulated in Chapter 3. Here again, cyt
c adsorption seems to be favored on more defective surfaces. When the density of defects is
reduced by thermal healing treatment, as confirmed by the redox probing and desorption
experiments, the cyt c response is subsequently reduced as well. The attenuation in the
electrochemical response of the protein apparently results from a lower concentration of cyt c
on the surface, although this has not been independently confirmed, e.g., by XPS.
Why was the thermal healing treatment not more effective at eliminating the defects
and why is the cyt c response only somewhat decreased? Several possibilities exist to
account for these observations. First of all, the acid SAMs on evaporated Au may simply be
inherently defective structures, beyond the repair capability of this treatement. If so, the
permanent defectiveness of these SAMs can be largely attributed to the rough terrain of the
evaporated Au surface in combination with the carboxylic acid headgroups. A more specific
201
hypothesis is that thermal healing is effective only on gauche conformational defects in the
alkyl layer and has a very limited effect on SAM defects whose origins stem from more
permanent topographical features (i.e. Au step edges and grain boundaries). Therefore, the
ability to reduce defect density in SAMs using thermal healing may very well be more
successful on SAMs that modify flatter, single crystal Au. It is recommended, therefore, that
future experiments focus on Au substrates whose SAMs present predominantly gauche
defects. In any event, the results of this study, while not definitive, are still supportive of the
density of defects dependence of cyt c adsorption.
4.3 SILVER UNDERPOTENTIAL DEPOSITION BASED SAMs (Ag - UPD)
In searching for methods to improve the stability and properties of Au/SAM
structures for protein electrochemistry, the intriguing possibility of utilizing silver and copper
UPD layers on the gold surfaces, prior to modification with ω-substituted alkanethiols, was
considered. Literature reports of describe several improved structural and functional
characteristics for SAMs deposited on the Ag and Cu UPD modified Au.8-12 The immediate
goal of this project was assess the performance of COOH SAM/Ag-UPD/gold a cyt c
adsorption platform. Unfortunately, research priorities, time constraints, and unexpected
experimental difficulties truncated this research at a relatively early stage. Still, the initial
groundwork has been completed for future pursuit of this worthy objective.
4.3.1. Underpotential Deposition - General Discussion
The electrochemical deposition of a metal adlayer onto a foreign metal substrate can
occur in one of two ways depending on the Gibbs free energy of interaction between the
adsorbate and the substrate. If this interaction is weaker than the adsorbate-adsorbate
interaction, the deposition will occur at electrochemical potentials lower, or more negative,
than the equilibrium potential for bulk deposition. In this case, the adsorbate material will
immediately begin to form three dimensional crystal structure as deposition commences. If,
on the other hand, the adsorbate-substrate interaction is stronger than the adsorbate-adsorbate
interaction, deposition will commence at a higher, or more positive potential, than that for
bulk deposition. This process is known as underpotential deposition (UPD) and results in a
single monolayer or less of deposited metal on the surface of the foreign substrate.
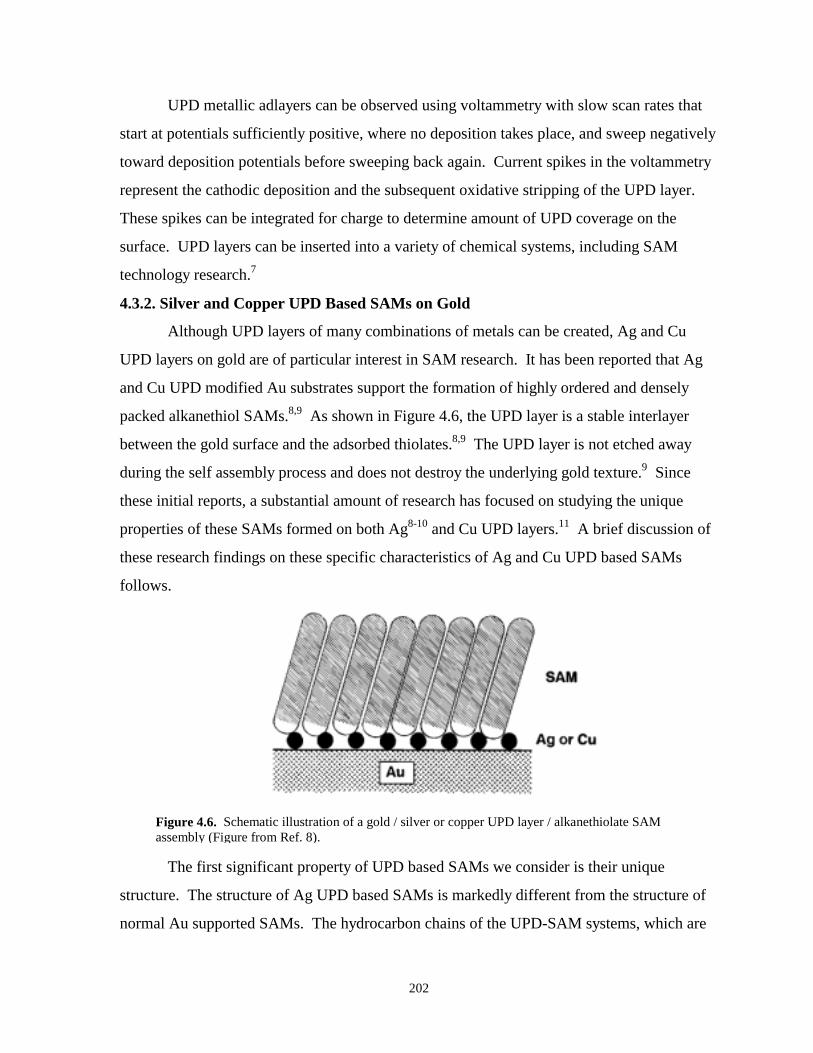
202
UPD metallic adlayers can be observed using voltammetry with slow scan rates that
start at potentials sufficiently positive, where no deposition takes place, and sweep negatively
toward deposition potentials before sweeping back again. Current spikes in the voltammetry
represent the cathodic deposition and the subsequent oxidative stripping of the UPD layer.
These spikes can be integrated for charge to determine amount of UPD coverage on the
surface. UPD layers can be inserted into a variety of chemical systems, including SAM
technology research.7
4.3.2. Silver and Copper UPD Based SAMs on Gold
Although UPD layers of many combinations of metals can be created, Ag and Cu
UPD layers on gold are of particular interest in SAM research. It has been reported that Ag
and Cu UPD modified Au substrates support the formation of highly ordered and densely
packed alkanethiol SAMs.8,9 As shown in Figure 4.6, the UPD layer is a stable interlayer
between the gold surface and the adsorbed thiolates.8,9 The UPD layer is not etched away
during the self assembly process and does not destroy the underlying gold texture.9 Since
these initial reports, a substantial amount of research has focused on studying the unique
properties of these SAMs formed on both Ag8-10 and Cu UPD layers.11 A brief discussion of
these research findings on these specific characteristics of Ag and Cu UPD based SAMs
follows.
Figure 4.6. Schematic illustration of a gold / silver or copper UPD layer / alkanethiolate SAMassembly (Figure from Ref. 8).
The first significant property of UPD based SAMs we consider is their unique
structure. The structure of Ag UPD based SAMs is markedly different from the structure of
normal Au supported SAMs. The hydrocarbon chains of the UPD-SAM systems, which are
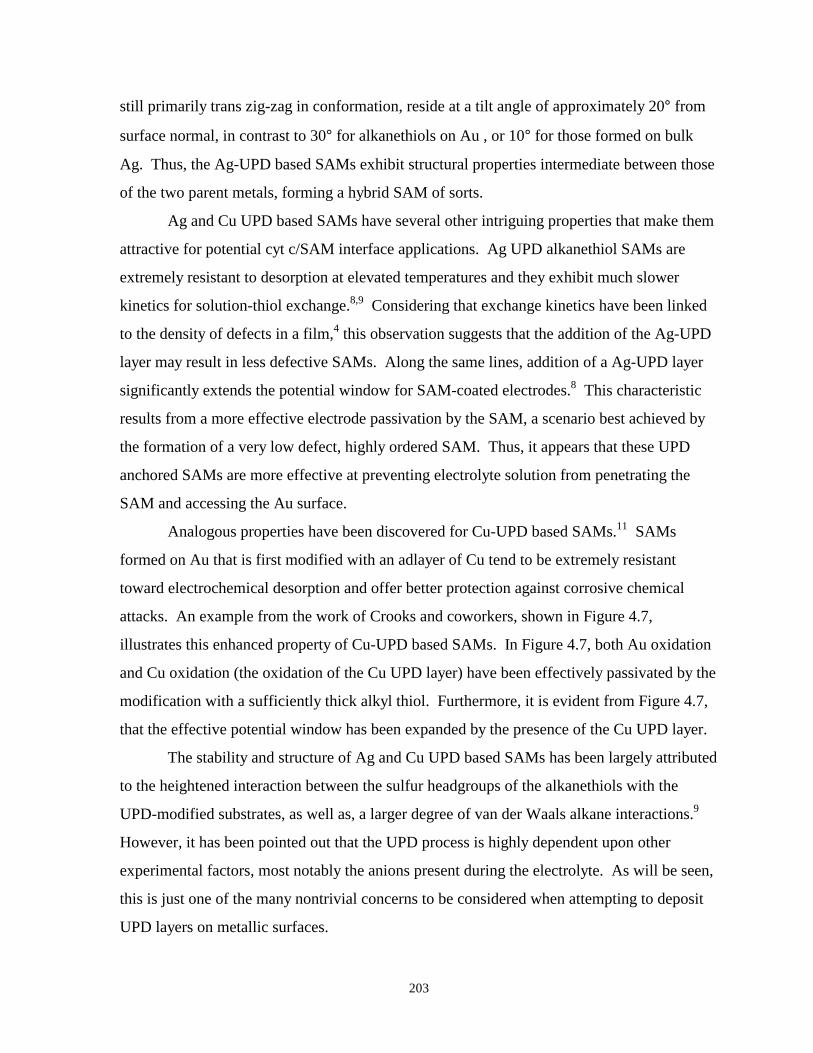
203
still primarily trans zig-zag in conformation, reside at a tilt angle of approximately 20° from
surface normal, in contrast to 30° for alkanethiols on Au , or 10° for those formed on bulk
Ag. Thus, the Ag-UPD based SAMs exhibit structural properties intermediate between those
of the two parent metals, forming a hybrid SAM of sorts.
Ag and Cu UPD based SAMs have several other intriguing properties that make them
attractive for potential cyt c/SAM interface applications. Ag UPD alkanethiol SAMs are
extremely resistant to desorption at elevated temperatures and they exhibit much slower
kinetics for solution-thiol exchange.8,9 Considering that exchange kinetics have been linked
to the density of defects in a film,4 this observation suggests that the addition of the Ag-UPD
layer may result in less defective SAMs. Along the same lines, addition of a Ag-UPD layer
significantly extends the potential window for SAM-coated electrodes.8 This characteristic
results from a more effective electrode passivation by the SAM, a scenario best achieved by
the formation of a very low defect, highly ordered SAM. Thus, it appears that these UPD
anchored SAMs are more effective at preventing electrolyte solution from penetrating the
SAM and accessing the Au surface.
Analogous properties have been discovered for Cu-UPD based SAMs.11 SAMs
formed on Au that is first modified with an adlayer of Cu tend to be extremely resistant
toward electrochemical desorption and offer better protection against corrosive chemical
attacks. An example from the work of Crooks and coworkers, shown in Figure 4.7,
illustrates this enhanced property of Cu-UPD based SAMs. In Figure 4.7, both Au oxidation
and Cu oxidation (the oxidation of the Cu UPD layer) have been effectively passivated by the
modification with a sufficiently thick alkyl thiol. Furthermore, it is evident from Figure 4.7,
that the effective potential window has been expanded by the presence of the Cu UPD layer.
The stability and structure of Ag and Cu UPD based SAMs has been largely attributed
to the heightened interaction between the sulfur headgroups of the alkanethiols with the
UPD-modified substrates, as well as, a larger degree of van der Waals alkane interactions.9
However, it has been pointed out that the UPD process is highly dependent upon other
experimental factors, most notably the anions present during the electrolyte. As will be seen,
this is just one of the many nontrivial concerns to be considered when attempting to deposit
UPD layers on metallic surfaces.
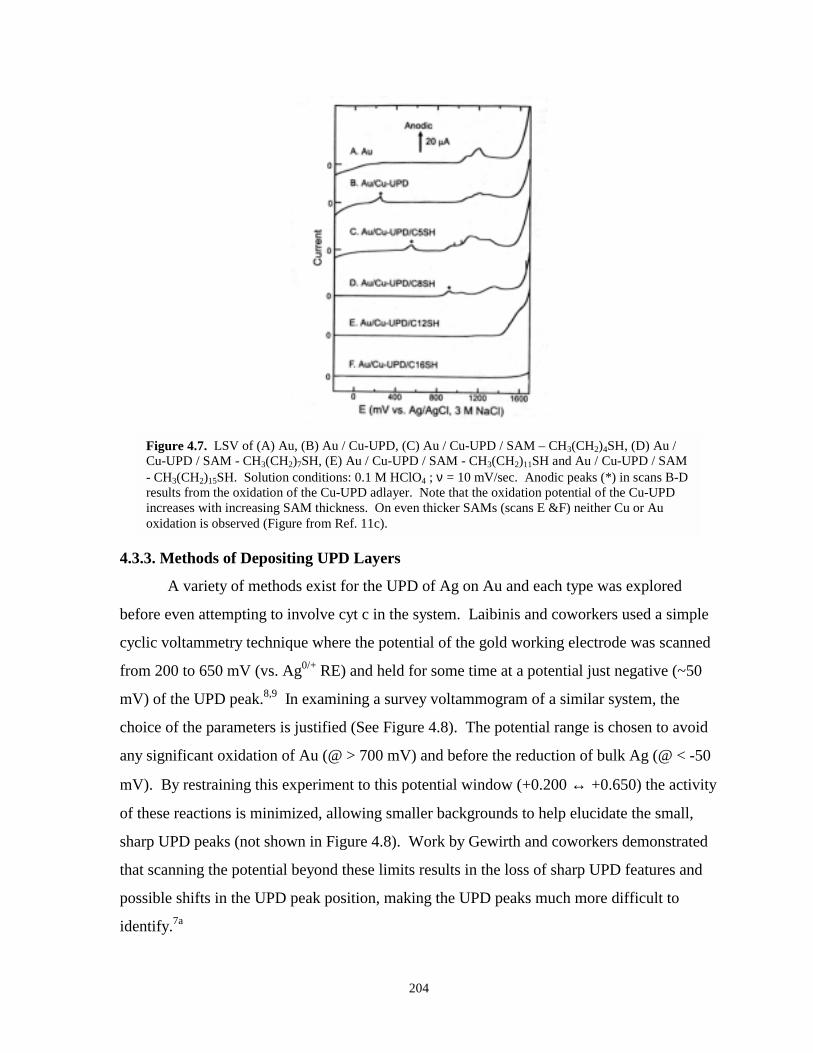
204
Figure 4.7. LSV of (A) Au, (B) Au / Cu-UPD, (C) Au / Cu-UPD / SAM – CH3(CH2)4SH, (D) Au /Cu-UPD / SAM - CH3(CH2)7SH, (E) Au / Cu-UPD / SAM - CH3(CH2)11SH and Au / Cu-UPD / SAM- CH3(CH2)15SH. Solution conditions: 0.1 M HClO4 ; ν = 10 mV/sec. Anodic peaks (*) in scans B-Dresults from the oxidation of the Cu-UPD adlayer. Note that the oxidation potential of the Cu-UPDincreases with increasing SAM thickness. On even thicker SAMs (scans E &F) neither Cu or Auoxidation is observed (Figure from Ref. 11c).
4.3.3. Methods of Depositing UPD Layers
A variety of methods exist for the UPD of Ag on Au and each type was explored
before even attempting to involve cyt c in the system. Laibinis and coworkers used a simple
cyclic voltammetry technique where the potential of the gold working electrode was scanned
from 200 to 650 mV (vs. Ag0/+ RE) and held for some time at a potential just negative (~50
mV) of the UPD peak.8,9 In examining a survey voltammogram of a similar system, the
choice of the parameters is justified (See Figure 4.8). The potential range is chosen to avoid
any significant oxidation of Au (@ > 700 mV) and before the reduction of bulk Ag (@ < -50
mV). By restraining this experiment to this potential window (+0.200 ↔ +0.650) the activity
of these reactions is minimized, allowing smaller backgrounds to help elucidate the small,
sharp UPD peaks (not shown in Figure 4.8). Work by Gewirth and coworkers demonstrated
that scanning the potential beyond these limits results in the loss of sharp UPD features and
possible shifts in the UPD peak position, making the UPD peaks much more difficult to
identify.7a
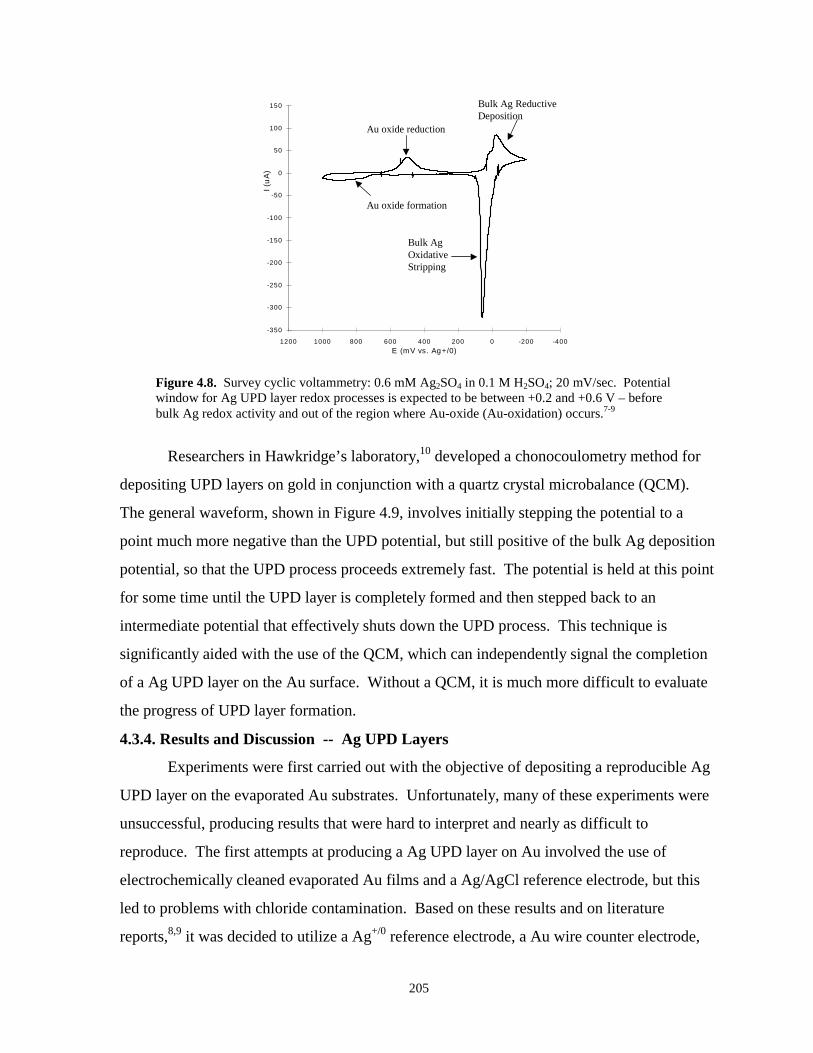
205
-350
-300
-250
-200
-150
-100
-50
0
50
100
150
-400-200020040060080010001200E (mV vs. Ag+/0)
I (uA
)
Bulk Ag Oxidative Stripping
Bulk Ag ReductiveDeposition
Au oxide reduction
Au oxide formation
Figure 4.8. Survey cyclic voltammetry: 0.6 mM Ag2SO4 in 0.1 M H2SO4; 20 mV/sec. Potentialwindow for Ag UPD layer redox processes is expected to be between +0.2 and +0.6 V – beforebulk Ag redox activity and out of the region where Au-oxide (Au-oxidation) occurs.7-9
Researchers in Hawkridge’s laboratory,10 developed a chonocoulometry method for
depositing UPD layers on gold in conjunction with a quartz crystal microbalance (QCM).
The general waveform, shown in Figure 4.9, involves initially stepping the potential to a
point much more negative than the UPD potential, but still positive of the bulk Ag deposition
potential, so that the UPD process proceeds extremely fast. The potential is held at this point
for some time until the UPD layer is completely formed and then stepped back to an
intermediate potential that effectively shuts down the UPD process. This technique is
significantly aided with the use of the QCM, which can independently signal the completion
of a Ag UPD layer on the Au surface. Without a QCM, it is much more difficult to evaluate
the progress of UPD layer formation.
4.3.4. Results and Discussion -- Ag UPD Layers
Experiments were first carried out with the objective of depositing a reproducible Ag
UPD layer on the evaporated Au substrates. Unfortunately, many of these experiments were
unsuccessful, producing results that were hard to interpret and nearly as difficult to
reproduce. The first attempts at producing a Ag UPD layer on Au involved the use of
electrochemically cleaned evaporated Au films and a Ag/AgCl reference electrode, but this
led to problems with chloride contamination. Based on these results and on literature
reports,8,9 it was decided to utilize a Ag+/0 reference electrode, a Au wire counter electrode,
206
E, mV
+500
+300
+400
Time, sec
tupd-deposition
Figure 4.9. Waveform of the chronocoulometry experiment depositing Ag-UPD layers on gold.10
For the experiments in this research, this waveform was used by stepping the potential to a value lowenough to induce the UPD process (deposition) at approximately +300 mV, holding the potential atthat magnitude for a set amount of time (tupd-deposition = 10-180 sec.), and then stepping back to anintermediate or the initial potential, +400 mV or +500 mV, respectively.
and an alternative cleaning procedure, namely piranha cleaning. The use of a Ag+/0 RE
eliminates a source of chloride contamination and the piranha cleaning provides a surface that
is free of organic contaminants, as well as choloride. Further experimental aspects are laid
out in the Experimental Details Section of this chapter.
Ag UPD is expected to appear in the 500-550 mV (vs. Ag+/0) range as sharp singular peaks,
similar to those shown in the literature example in Figure 4.10. In this project, however, the
cyclic voltammetry method of depositing Ag UPD layer produced results such as that shown
in Figure 4.11. Although cathodic and anodic peaks did appear in approximately the correct
potential range, they were inferior to those reported in the literature (Figure 4.10).
Less-than-spectacular results were also achieved using the chronocoulometry method
described by Hawkridge and coworkers.10 To deposit the UPD layer, a potential step to +500
mV was applied for 10 seconds, followed by a potential step to +300 mV for 30 seconds.
Afterward, a linear scan toward positive potentials was commenced to oxidatively remove the
Ag UPD layer. An anodic spike of current during this type of scan would support the
existence of the Ag UPD layer on the Au surface. In many instances, an anodic spike of
current was recorded and, based on its size and nature, attributed to Ag UPD oxidation
(Results not shown). However, these results were also difficult to repeat and lacked
consistency and clarity. Furthermore, the charge passed during the chronocoulometry was
noticeably lower than expected, a result also obtained by other researchers.7a,12
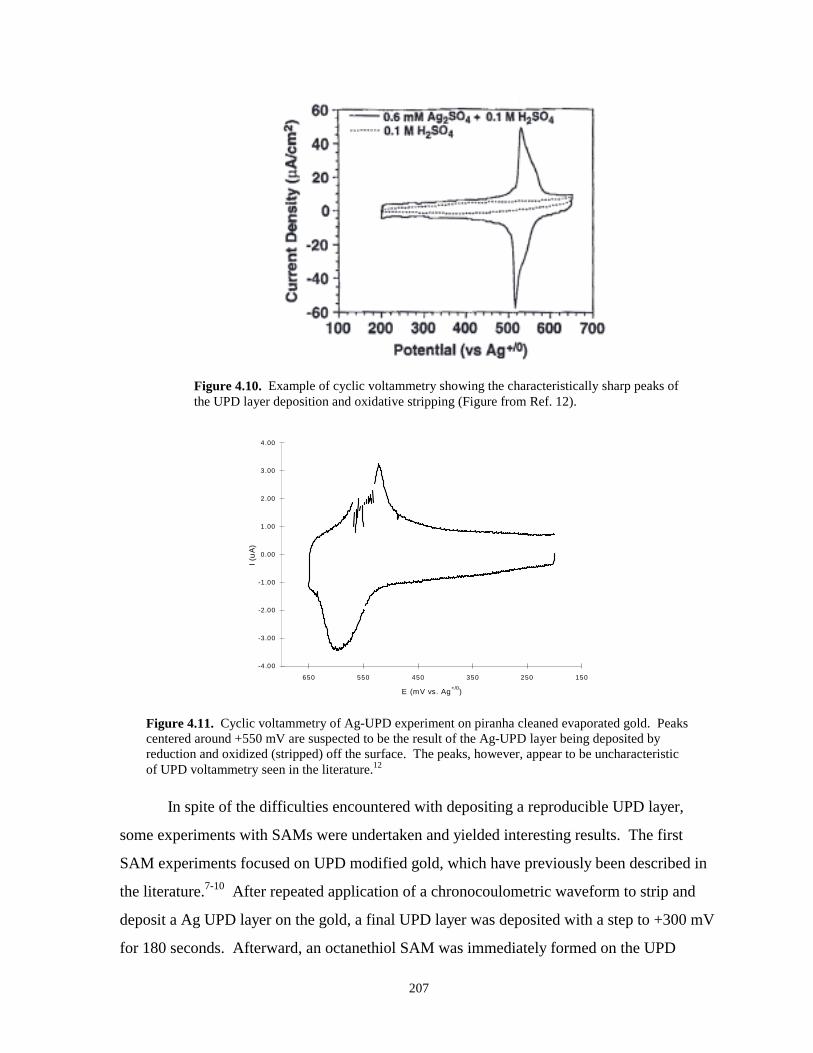
207
Figure 4.10. Example of cyclic voltammetry showing the characteristically sharp peaks ofthe UPD layer deposition and oxidative stripping (Figure from Ref. 12).
-4.00
-3.00
-2.00
-1.00
0.00
1.00
2.00
3.00
4.00
150250350450550650
E (mV vs. Ag+/0)
I (uA
)
Figure 4.11. Cyclic voltammetry of Ag-UPD experiment on piranha cleaned evaporated gold. Peakscentered around +550 mV are suspected to be the result of the Ag-UPD layer being deposited byreduction and oxidized (stripped) off the surface. The peaks, however, appear to be uncharacteristicof UPD voltammetry seen in the literature.12
In spite of the difficulties encountered with depositing a reproducible UPD layer,
some experiments with SAMs were undertaken and yielded interesting results. The first
SAM experiments focused on UPD modified gold, which have previously been described in
the literature.7-10 After repeated application of a chronocoulometric waveform to strip and
deposit a Ag UPD layer on the gold, a final UPD layer was deposited with a step to +300 mV
for 180 seconds. Afterward, an octanethiol SAM was immediately formed on the UPD
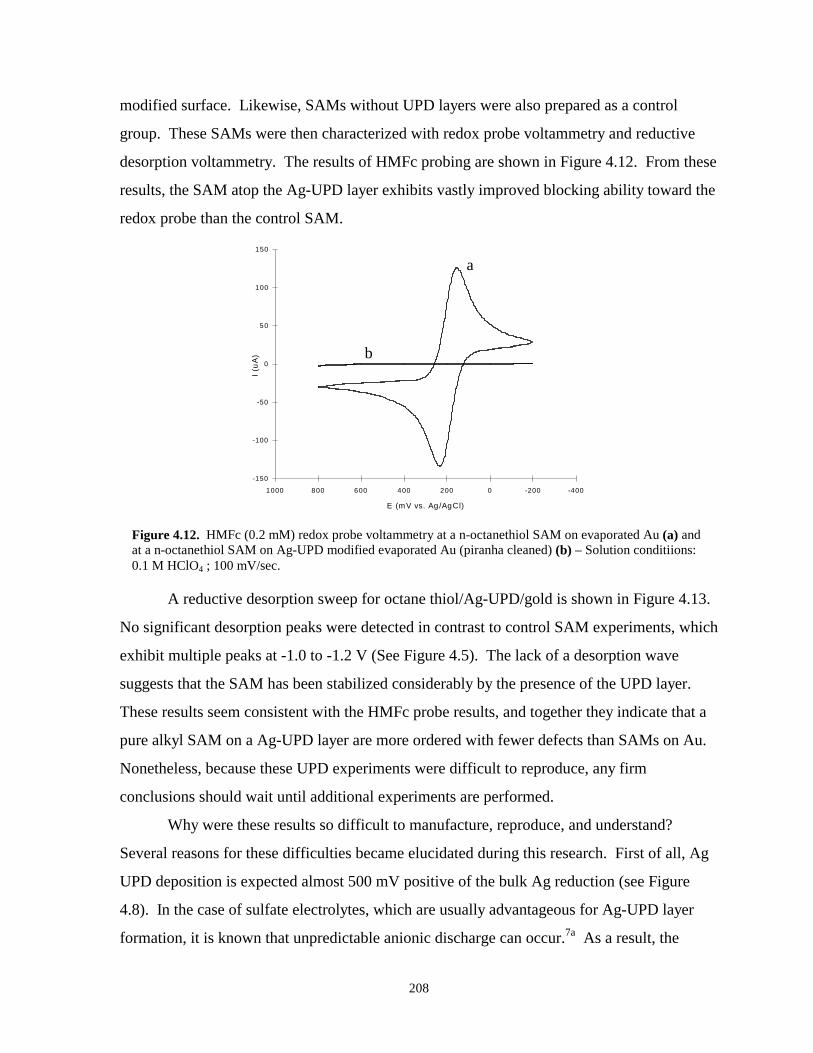
208
modified surface. Likewise, SAMs without UPD layers were also prepared as a control
group. These SAMs were then characterized with redox probe voltammetry and reductive
desorption voltammetry. The results of HMFc probing are shown in Figure 4.12. From these
results, the SAM atop the Ag-UPD layer exhibits vastly improved blocking ability toward the
redox probe than the control SAM.
-150
-100
-50
0
50
100
150
-400-20002004006008001000
E (mV vs. Ag/AgCl)
I (uA
)a
b
Figure 4.12. HMFc (0.2 mM) redox probe voltammetry at a n-octanethiol SAM on evaporated Au (a) andat a n-octanethiol SAM on Ag-UPD modified evaporated Au (piranha cleaned) (b) – Solution conditiions:0.1 M HClO4 ; 100 mV/sec.
A reductive desorption sweep for octane thiol/Ag-UPD/gold is shown in Figure 4.13.
No significant desorption peaks were detected in contrast to control SAM experiments, which
exhibit multiple peaks at -1.0 to -1.2 V (See Figure 4.5). The lack of a desorption wave
suggests that the SAM has been stabilized considerably by the presence of the UPD layer.
These results seem consistent with the HMFc probe results, and together they indicate that a
pure alkyl SAM on a Ag-UPD layer are more ordered with fewer defects than SAMs on Au.
Nonetheless, because these UPD experiments were difficult to reproduce, any firm
conclusions should wait until additional experiments are performed.
Why were these results so difficult to manufacture, reproduce, and understand?
Several reasons for these difficulties became elucidated during this research. First of all, Ag
UPD deposition is expected almost 500 mV positive of the bulk Ag reduction (see Figure
4.8). In the case of sulfate electrolytes, which are usually advantageous for Ag-UPD layer
formation, it is known that unpredictable anionic discharge can occur.7a As a result, the
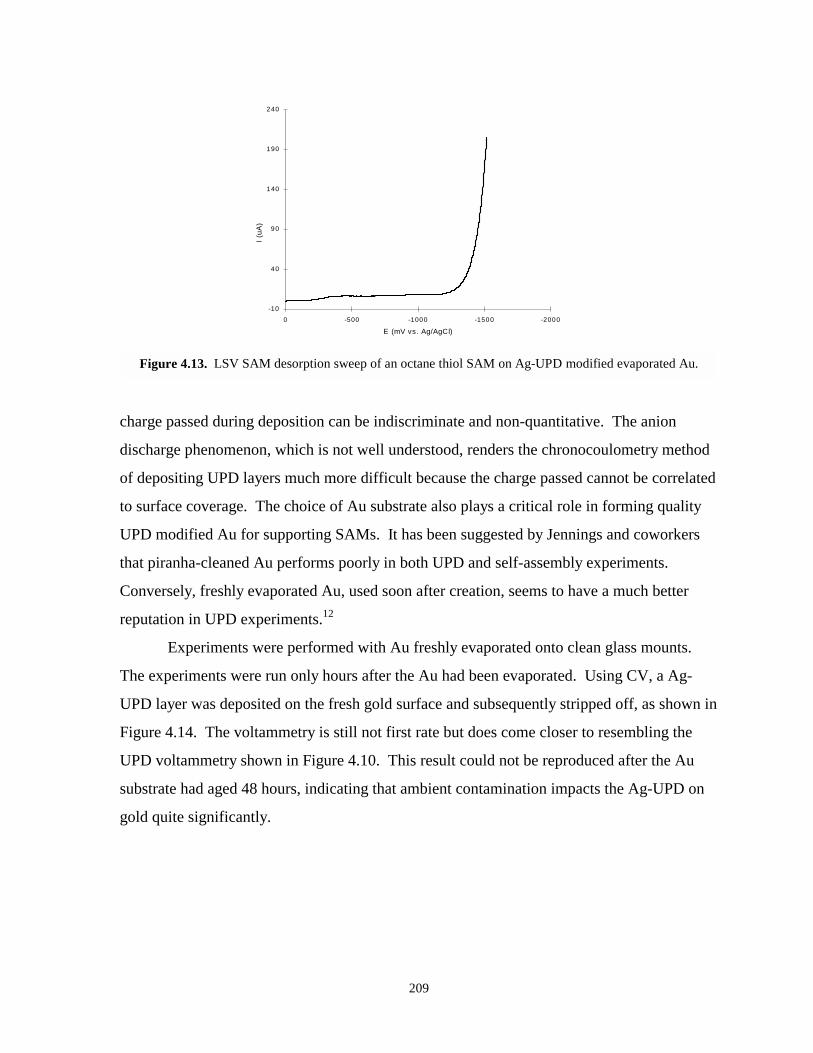
209
-10
40
90
140
190
240
-2000-1500-1000-5000
E (mV vs. Ag/AgCl)
I (uA
)
Figure 4.13. LSV SAM desorption sweep of an octane thiol SAM on Ag-UPD modified evaporated Au.
charge passed during deposition can be indiscriminate and non-quantitative. The anion
discharge phenomenon, which is not well understood, renders the chronocoulometry method
of depositing UPD layers much more difficult because the charge passed cannot be correlated
to surface coverage. The choice of Au substrate also plays a critical role in forming quality
UPD modified Au for supporting SAMs. It has been suggested by Jennings and coworkers
that piranha-cleaned Au performs poorly in both UPD and self-assembly experiments.
Conversely, freshly evaporated Au, used soon after creation, seems to have a much better
reputation in UPD experiments.12
Experiments were performed with Au freshly evaporated onto clean glass mounts.
The experiments were run only hours after the Au had been evaporated. Using CV, a Ag-
UPD layer was deposited on the fresh gold surface and subsequently stripped off, as shown in
Figure 4.14. The voltammetry is still not first rate but does come closer to resembling the
UPD voltammetry shown in Figure 4.10. This result could not be reproduced after the Au
substrate had aged 48 hours, indicating that ambient contamination impacts the Ag-UPD on
gold quite significantly.
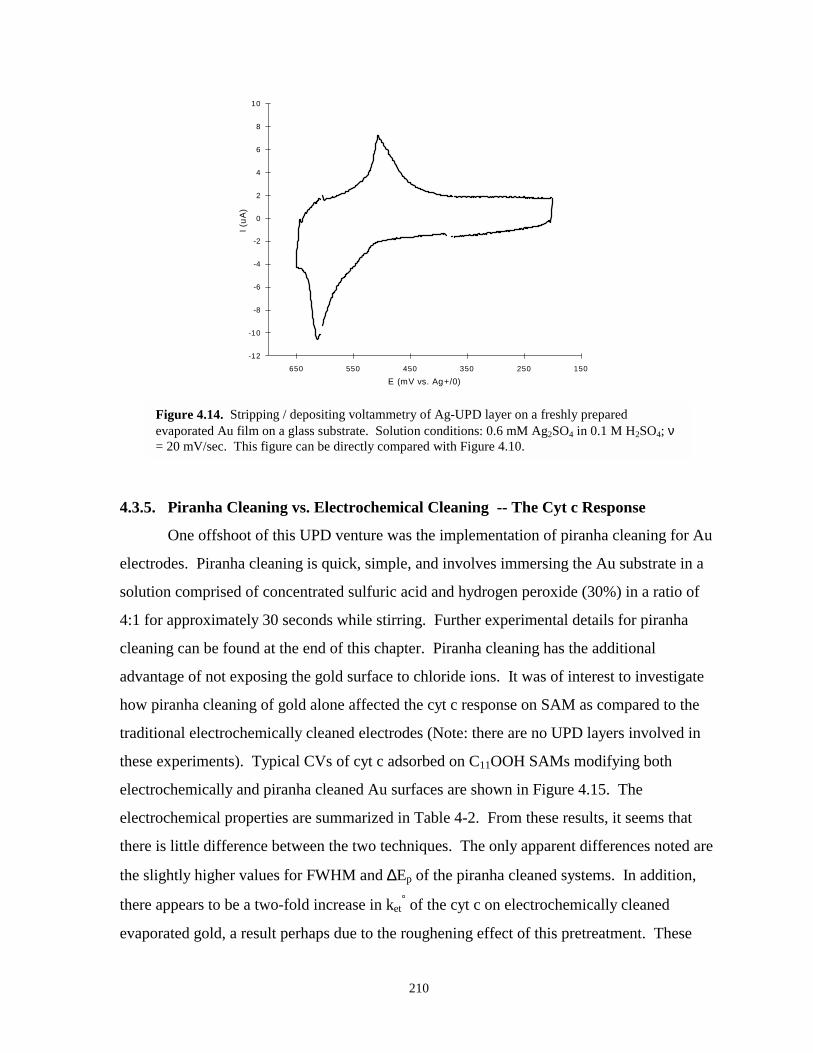
210
-12
-10
-8
-6
-4
-2
0
2
4
6
8
10
150250350450550650
E (mV vs. Ag+/0)
I (uA
)
Figure 4.14. Stripping / depositing voltammetry of Ag-UPD layer on a freshly preparedevaporated Au film on a glass substrate. Solution conditions: 0.6 mM Ag2SO4 in 0.1 M H2SO4; ν= 20 mV/sec. This figure can be directly compared with Figure 4.10.
4.3.5. Piranha Cleaning vs. Electrochemical Cleaning -- The Cyt c Response
One offshoot of this UPD venture was the implementation of piranha cleaning for Au
electrodes. Piranha cleaning is quick, simple, and involves immersing the Au substrate in a
solution comprised of concentrated sulfuric acid and hydrogen peroxide (30%) in a ratio of
4:1 for approximately 30 seconds while stirring. Further experimental details for piranha
cleaning can be found at the end of this chapter. Piranha cleaning has the additional
advantage of not exposing the gold surface to chloride ions. It was of interest to investigate
how piranha cleaning of gold alone affected the cyt c response on SAM as compared to the
traditional electrochemically cleaned electrodes (Note: there are no UPD layers involved in
these experiments). Typical CVs of cyt c adsorbed on C11OOH SAMs modifying both
electrochemically and piranha cleaned Au surfaces are shown in Figure 4.15. The
electrochemical properties are summarized in Table 4-2. From these results, it seems that
there is little difference between the two techniques. The only apparent differences noted are
the slightly higher values for FWHM and ∆Ep of the piranha cleaned systems. In addition,
there appears to be a two-fold increase in ket° of the cyt c on electrochemically cleaned
evaporated gold, a result perhaps due to the roughening effect of this pretreatment. These
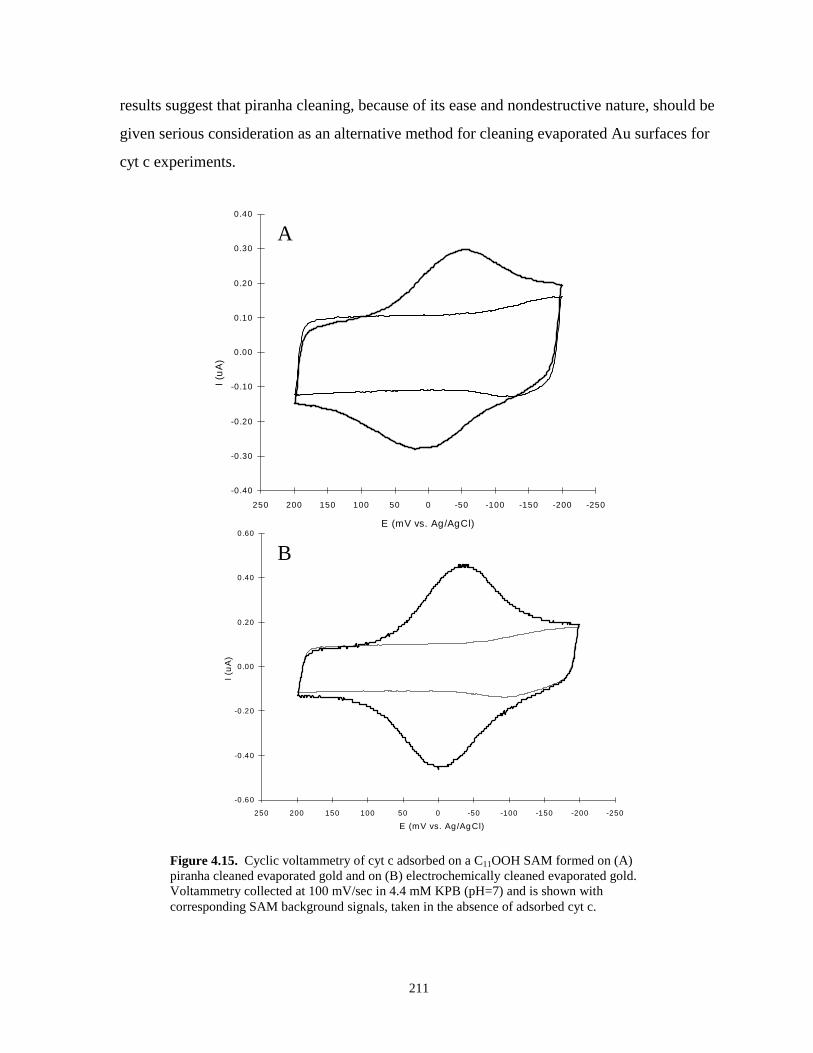
211
results suggest that piranha cleaning, because of its ease and nondestructive nature, should be
given serious consideration as an alternative method for cleaning evaporated Au surfaces for
cyt c experiments.
-0.40
-0.30
-0.20
-0.10
0.00
0.10
0.20
0.30
0.40
-250-200-150-100-50050100150200250
E (mV vs. Ag/AgCl)
I (uA
)
A
-0.60
-0.40
-0.20
0.00
0.20
0.40
0.60
-250-200-150-100-50050100150200250
E (mV vs. Ag/AgCl)
I (uA
)
B
Figure 4.15. Cyclic voltammetry of cyt c adsorbed on a C11OOH SAM formed on (A)piranha cleaned evaporated gold and on (B) electrochemically cleaned evaporated gold.Voltammetry collected at 100 mV/sec in 4.4 mM KPB (pH=7) and is shown withcorresponding SAM background signals, taken in the absence of adsorbed cyt c.
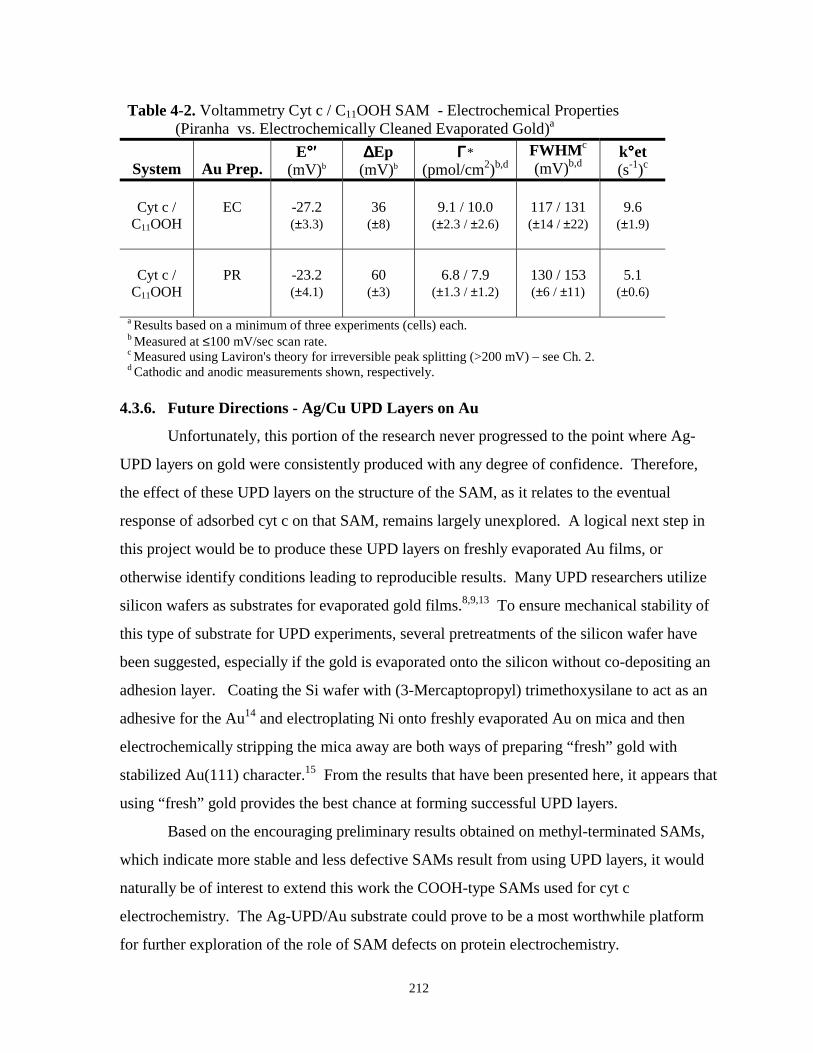
212
Table 4-2. Voltammetry Cyt c / C11OOH SAM - Electrochemical Properties(Piranha vs. Electrochemically Cleaned Evaporated Gold)a
System Au Prep.E°°°°′′′′
(mV)b∆∆∆∆Ep
(mV)bΓΓΓΓ*
(pmol/cm2)b,dFWHMc
(mV)b,dk°°°°et(s-1)c
Cyt c /C11OOH
EC -27.2(±3.3)
36(±8)
9.1 / 10.0(±2.3 / ±2.6)
117 / 131(±14 / ±22)
9.6(±1.9)
Cyt c /C11OOH
PR -23.2(±4.1)
60(±3)
6.8 / 7.9(±1.3 / ±1.2)
130 / 153(±6 / ±11)
5.1(±0.6)
a Results based on a minimum of three experiments (cells) each.b Measured at ≤100 mV/sec scan rate.c Measured using Laviron's theory for irreversible peak splitting (>200 mV) – see Ch. 2.d Cathodic and anodic measurements shown, respectively.
4.3.6. Future Directions - Ag/Cu UPD Layers on Au
Unfortunately, this portion of the research never progressed to the point where Ag-
UPD layers on gold were consistently produced with any degree of confidence. Therefore,
the effect of these UPD layers on the structure of the SAM, as it relates to the eventual
response of adsorbed cyt c on that SAM, remains largely unexplored. A logical next step in
this project would be to produce these UPD layers on freshly evaporated Au films, or
otherwise identify conditions leading to reproducible results. Many UPD researchers utilize
silicon wafers as substrates for evaporated gold films.8,9,13 To ensure mechanical stability of
this type of substrate for UPD experiments, several pretreatments of the silicon wafer have
been suggested, especially if the gold is evaporated onto the silicon without co-depositing an
adhesion layer. Coating the Si wafer with (3-Mercaptopropyl) trimethoxysilane to act as an
adhesive for the Au14 and electroplating Ni onto freshly evaporated Au on mica and then
electrochemically stripping the mica away are both ways of preparing “fresh” gold with
stabilized Au(111) character.15 From the results that have been presented here, it appears that
using “fresh” gold provides the best chance at forming successful UPD layers.
Based on the encouraging preliminary results obtained on methyl-terminated SAMs,
which indicate more stable and less defective SAMs result from using UPD layers, it would
naturally be of interest to extend this work the COOH-type SAMs used for cyt c
electrochemistry. The Ag-UPD/Au substrate could prove to be a most worthwhile platform
for further exploration of the role of SAM defects on protein electrochemistry.
213
4.4. FUTURE DIRECTIONS FOR THE SAM/CYT C INTERFACE
The possibilities for experiments that alter the SAM/solution interface are endless.
Basically, developing SAM innovations in the literature can be applied to the cyt c/SAM
interface in this research. Numerous experiments can be designed to specifically manipulate
the density of defects in SAMs or to probe specific interactions between the protein and the
surface. One of the more interesting concepts in the SAM literature dealing with defect sites
involves blocking a significant amount of the defects in the SAM with a polymer.16 This type
of experiment, when applied to the cyt c system here, may help to divulge further information
about the role of defect density in the cyt c electrochemistry. Other defect oriented future
experiments may involve the incorporation of electroactive moieties such as ferrocene
terminated alkanethiols into SAMs at defect sites.8,17
As far as the actual SAM being employed in these studies, SAMs of multiple
combinations of chain lengths and endgroups can be employed to emphasize different
degrees of hydrophobic, electrostatic, or other surface related intermolecular forces. Mixed
SAMs of both Type I and Type II structure can be used to elucidate both defect site effects
and interfacial interactions. More specifically, Type II SAMs can be formulated to create
nano-sized adsorption sites in the SAM to test cyt c behavior in highly hydrophobic
environments, thus elucidating the influence of hydrophobic forces in the system. A similar
study involving ferrocene molecules on SAMs where they are encapsulated in hydrophobic
environments has already been performed.18 Additionally, a cyt c study designed to link the
protein’s adsorption to defect density can be achieved by systematically introducing defects
into a uniform SAM as described in an article by Crooks and coworkers.19
Along the lines of manipulating defects in the SAM to see how cyt c adsorption is
affected, it is proposed that SAMs formed on mercury films should be pursued in the future.
SAMs formed on mercury have already been explored by Harrison and coworkers20 and are
of interest in this type of research because they are liquid-like and have no inherent surface
structure. Therefore, as a substrate for a SAM, there would be no surface features (step
edges, grain boundaries, etc.) to cause defects in the SAM. The electrochemical response of
cyt c at these “ideal” Hg based SAMs would be interesting. Considering the results presented
throughout this work, the response of cyt c such a platform is expected to be nonexistent, and
214
preliminary experiments have already supported this expectation.21 It is further speculated
that mixed SAMs on the same mercury films can be introduced to see if cyt c response is
regenerated upon the installation of a new, rougher, molecularly textured surface. The
interface of the SAM with the solution and how the surface of the SAM interacts with the cyt
c remains a lucrative and largely untapped area of research for the future.
4.5 SPECIAL ACKNOWLEDGEMENTS
Several people contributed greatly to getting these initial experiments started. I would
like to thank Melissa Rhoten of Professor Hawkridge’s Research Group at VCU and a fellow
JMU alumni for many informative and instructional discussions about the chronocoulometric
method for depositing Ag UPD layers. Similarly, the UPD project was assisted greatly
through repeated correspondence with both Dr. Paul Laibinis of the Massachusetts Institute
of Technology and Dr. Kane Jennings of Vanderbilt University. Dr. Jennings was extremely
helpful with advice on depositing the Ag UPD layers on gold. Appreciation is given to Mr.
Lloyd Carroll of Dr. Gorman’s Research Group for assistance with the preparation of
“freshly” evaporated Au films.
4.6 EXPERIMENTAL DETAILS
Electrochemistry was performed as previously described in Chapter 3, using the same
potentiostat, cell, solutions, and SAM deposition procedures. Specific differences in
procedures and equipment that pertain to this chapter are highlighted below.
4.6.1. Thermal Healing Experiments
Thermal healing experiments were performed on evaporated Au substrates that were
electrochemically cleaned as previously described in a cleaning solution of 0.1 M H2SO4 and
0.01 M KCl. Both 11-mercaptoundecanoic acid and 14-tetradecanoic acid SAMs were
prepared as outlined in the Experimental Details section of Chapter 3 for a fixed number of
cells. After the normal deposition period of 72 hours, half of the cells were immediately
rinsed, exposed to cyt c/KPB (10-25 µM) solution for 1 hour, and subsequently rinsed and
tested for cyt c response. These cells were used as controls. The remaining cells were
allowed to retain their thiol deposition solution ( 5mM thiol in ethanol) for the thermal

215
healing process. The cells were connected via their water jackets to a temperature controlled
water bath (see Figure 4.16), and a thermometer was used to monitor the solution temperature
just above the SAM layer. Prior to being connected to the experimental cells, the water bath
was calibrated using a dummy cell equipped with a thermometer.
H2Ofrombath
H2Oto
bath
Au
Thiol/ethanolic solution
Figure 4.17. Experimental apparatus for thermal healing of SAMs in the electrochemical cell. Awater bath is connected to the glass jacket of the cell and is allowed to circulate temperaturecontrolled water continuously. By controlling the temperature of the water bath, the temperaturewithin the cell, and subsequently around the SAM, can be manipulated and controlled as seen in Table4-3. In this manner, the electrochemical cell can be used for temperature controlled (both heating andcooling experiments on electrochemical systems.
The actual thermal healing process involved heating the deposition solution to 77-
78°C and holding the cell at that temperature for one hour. CAUTION: Care is required
because the deposition solution tends to evaporate and must be replenished from time to time
during the 1 hour procedure. After completion of the thermal healing, the cell was removed
from the water bath, rinsed in the usual way (with EtOH and M/Q H2O), exposed to cyt c
solution in buffer for 1 hour, and tested for cyt c electroactivity.
4.6.2. Ag UPD Experiments
Based on recent literature accounts,7a initial Ag UPD experiments were performed as
cyclic voltammetry in a 0.6 mM Ag2SO4 in 0.1 M H2SO4 verses an in-house built Ag+/0
reference electrode and utilized a piranha cleaned evaporated Au substrates. Survey scans
were performed in a potential window spanning from 1.0 V to -0.200 V. UPD deposition
voltammetry involved a much smaller window (+200 to +400 mV) that avoids both bulk Ag
redox processes and precedes the Au oxidation region at higher positive potentials.
The second stage of Ag-UPD experiments involved the asymmetric double potential
step, chronocoulometry technique described in literature by Hawkridge’s laboratory.10 The
actual waveform of this technique is the focus of Figure 4.9. These experiments, like the
216
previous UPD experiments, all took place on piranha cleaned evaporated Au substrates,
utilized the same Ag+/0 reference as before, as well as, the same Ag solution. The potential
was stepped to +300 mV and held there for 90-180 seconds. In some instances, voltammetry
was performed immediately after the potential step and step time to voltammetrically strip off
the deposited UPD layer. This was largely done to verify the chronocoulometry was
successful. Control SAMs and the experimental UPD SAMs were then probed with HMFc
and desorbed with LSV as described in Chapter 3.
The last round of Ag-UPD involved voltammetry scans in 0.6 mM Ag2SO4 and 0.1 M
H2SO4 at freshly evaporated gold on glass substrates. Scanned from +0.200 to +0.650 V, all
of the successful UPD experiments on these substrates were performed on the same day as
the gold was evaporated.
217
4.7 REFERENCES
1. J.P.Bucher, L. Santesson, and K. Kern, “Thermal Healing of Self-Assembled OrganicMonolayers: Hexane- and Octadecanethiol on Au(111) and Ag(111),” Langmuir 1994, 10(4),980-983.
2. L.A. Bumm, J.J. Arnold, L.F. Charles, T.D. Dunbar, D.L. Allara, and P.S. Weiss, “Creating
Molecular Terraces with Molecularly Sharp Boundaries in Organic Thin Films,” Preprintsubmitted to Science.
3. E. Delamarche, H.A. Biebuyck, B. Michel, and C. Gerber, “Golden Interfaces: The Surface of
Self-Assembled Monolayers,” Advanced Materials 1996, 8(9), 719-729. 4. a) C.E.D. Chidsey, C.R. Bertozzi, T.M. Putvinski, and A.M. Mujsce, J. Am. Chem. Soc. 1990,
112, 4301-4306; b) D.M. Collard and M.A. Fox, Langmuir 1991, 7, 1192-1197. 5. a) G.E. Poirier and E.D. Pylant, “The Self-Assembly Mechanism of Alkanethiols on Au(111),”
Science 1996, 272, 1145-1148; b) G.E. Poirier and M.J. Tarlov, “Molecular Ordering and GoldMigration Observed in Butanethiol Self-Assembled Monolayers Using Scanning ProbeMicroscopy,” J. Phys. Chem. 1995, 99, 10966-10970; c) C. Schonenberger, J.A.M. Sondag-Huethorst, J. Jorritsma, and L.G.J. Fokkink, “What Are the ‘Holes’ in Self-AssembledMonolayers of Alkanethiols on Gold?,” Langmuir 1994, 10(3), 611-614; d) C. Schonenberger,J.A.M. Sondag-Huethorst, and L.G.J. Fokkink, “Formation of Holes in Alkanetiol Monolayers onGold,” J. Phys. Chem. 1994, 98, 6826-6834.
6. H. O. Finklea, “Electrochemistry of Organized Monolayers of Thiols and Related Molecules on
Electrodes,” A.J. Bard and I. Rubinstein (Eds.), Electroanalytical Chemistry - A Series ofAdvances, Vol. 19, 108-335, Marcel Dekker: New York, New York, 1996.
7. a) C. Chen, S.M. Vesecky, and A.A. Gewirth, “In Situ Atomic Force Microscopy of
Underpotential Deposition of Ag on Au(111),” J. Am. Chem. Soc. 1992, 114, 450-458; b) W.J.Lorenz, I. Moumtzis, and E. Schmidt, J. Electroanal. Chem. 1971, 33, 121-133; c) D.P. Sandoz,R.M. Peekema, H. Freund, and C.F. Morrison, “The Deposition and Stripping of Thin Films ofSilver at Gold and Platinum Electrodes - A Study of the Multiple Deposition and StrippingCurrent Peaks,” J. Electroanal. Chem. 1970, 24, 165-174.
8. G.K. Jennings and P.E. Laibinis, “Self-Assembled n-Alkanetholate Monolayers on
Underpotentially Deposited Adlayers of Silver and Copper on Gold,” J. Am. Chem. Soc. 1997,119, 5208-5214.
9. G.K. Jennings and P.E. Laibinis, “Underpotentially Deposited Metal Layers of Silver Provide
Enhanced Stability to Self-Assembled Alkanethiol Monolayers on Gold,” Langmuir 1996, 12,6173-6175.
10. J.D. Burgess and F.M. Hawkridge, “Octadecyl Mercaptan Sub-monolayers on Silver
Electrodeposited on Gold Quartz Crystal Microbalance Electrodes,” Langmuir 1997, 13, 3781-3786.
218
11. a) M. Nishizawa, T. Sunagawa, and H. Yoneyama, “Underpotential Deposition of Copper onGold Electrodes Through Self-Assembled Monolayers of Propanethiol,” Langmuir 1997, 13,5215-5217; b) G.K. Jennings, J.C. Munro, T.-H. Yong, and P.E. Laibinis, “Effect of ChainLength on the Protection of Copper by n-Alkanethiols,” Langmuir 1998, 14, 6130-6139; c) F.P.Zamborini, J.K. Campbell, and R.M. Crooks, “Spectroscopic, Voltammetric, andElectrochemical Scanning Tunneling Microscopic Study of Underpotentially Deposited CuCorrosion and Passivation with Self-Assembled Organomercaptan Monolayers,” Langmuir 1998,14, 640-647; d) S.E. Gilbert, O. Cavalleri, and K. Kern, “Electrodeposition of Cu Nanoparticleson Decanethiol-Covered Au(111) Surfaces: An in Situ STM Investigation,” J. Phys. Chem. 1996,100(30), 12123-12130.
12. Personal correspondence with Dr. Kane Jennings, Vanderbilt University. 13. D. Stamou, D. Gourdon, M. Liley, N.A. Burnham, A. Kulik, H. Vogel, and C. Duschl,
“Uniformly Flat Gold Surfaces: Imaging the Domain Structure of Organic Monolayers UsingScanning Force Microscopy,” Langmuir 1997, 12, 2425-2428.
14. C.A. Goss, D.H. Charych, and M. Majda, “Application of (3-Mercaptopropyl) trimethoxysilane
as a Molecular Adhesive in the Fabrication of Vapor-Deposited Gold Electrodes on GlassSubstrates,” Anal. Chem. 1991, 63, 85-88.
15. P. Samori, J. Diebel, H. Lowe, and J.P. Rabe, “Template-Stripped Gold Supported on Ni as a
Substrate for SAMs,” Langmuir 1999, 15, 2592-2594. 16. H.O. Finklea, D.A. Snider and J. Fedyk, “Passivation of Pinholes in Octadecanethiol Monolayers
on Gold Electrodes by Electrochemical Polymerization of Phenol,” Langmuir 1990, 6, 371-376. 17. a) C.E.D. Chidsey, C.R. Bertozzi, T.M. Putvinski, and A.M. Mujsce, “Coadsorption of
Ferrocene-Terminated and Unsubstituted Alkanethiols on Gold: Electroactive Self-AssembledMonolayers,” J. Am. Chem. Soc. 1990, 112, 4301-4306; b) S.E. Creager, L.A. Hockett, and G.K.Rowe, “Consequences of Microscopic Surface Roughness for Molecular Self-Assembly,”Langmuir 1992, 8, 854-861.
18. S.E. Creager and G.K. Rowe, “Redox and Ion Pairing Thermodynamics in Self-Assembled
Monolayers,” Langmuir 1991, 7, 2307-2312. 19. O. Chailapakul and R.M. Crooks, “Synthesis and Characterization of Simple Self-Assembling,
Nanoporous Monolayer Assemblies: A New Strategy for Molecular Recognition,” Langmuir1993, 9, 884-888.
20. A. Demoz and D.J. Harrison, “Characterization of Extremely Low Defect Density
Hexadecanethiol Monolayers on Hg Surfaces,” Langmuir 1993, 9, 1046-1050. 21. E.F. Bowden, Jim Kelly, and J. Odea, results unpublished.
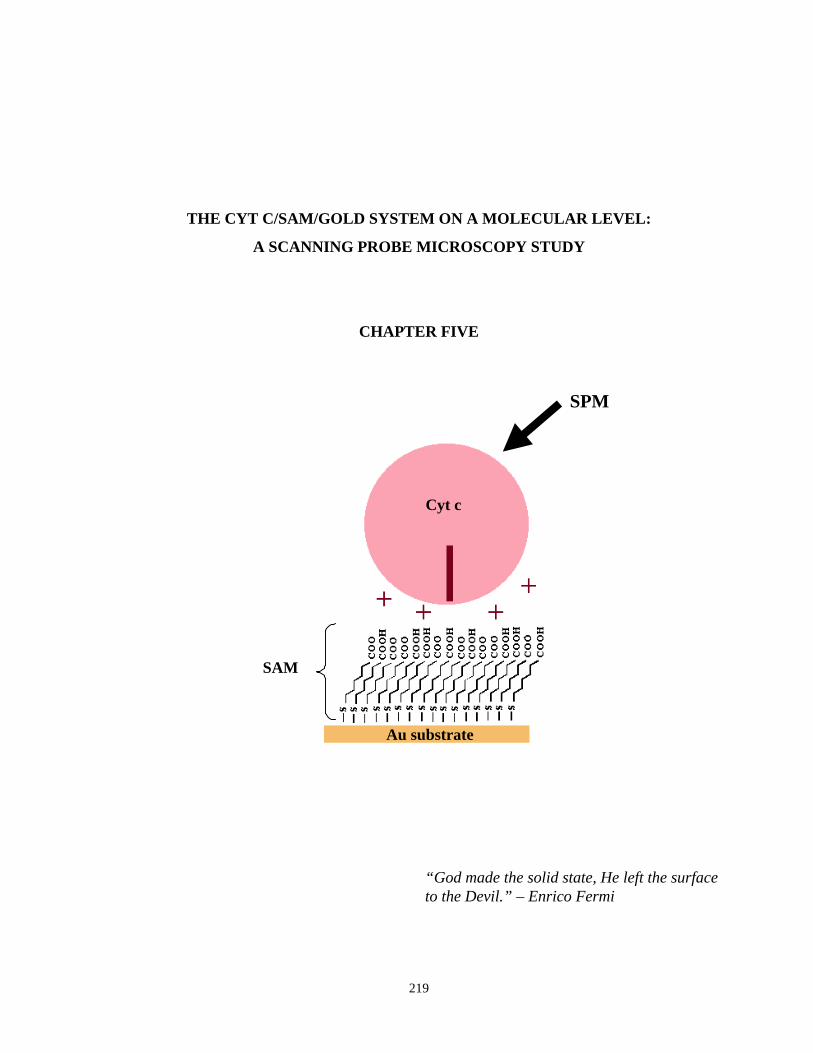
219
THE CYT C/SAM/GOLD SYSTEM ON A MOLECULAR LEVEL:
A SCANNING PROBE MICROSCOPY STUDY
CHAPTER FIVE
“God made the solid state, He left the surfaceto the Devil.” – Enrico Fermi
Au substrate
SAM
Cyt c
SPM
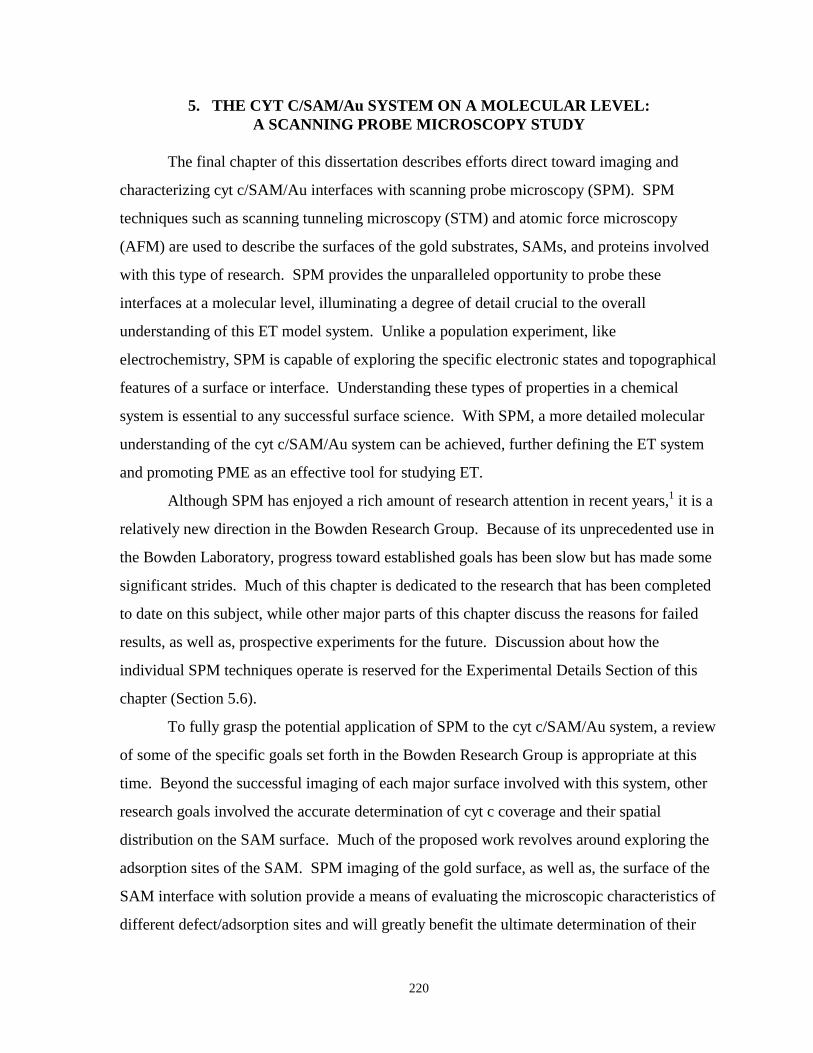
220
5. THE CYT C/SAM/Au SYSTEM ON A MOLECULAR LEVEL:A SCANNING PROBE MICROSCOPY STUDY
The final chapter of this dissertation describes efforts direct toward imaging and
characterizing cyt c/SAM/Au interfaces with scanning probe microscopy (SPM). SPM
techniques such as scanning tunneling microscopy (STM) and atomic force microscopy
(AFM) are used to describe the surfaces of the gold substrates, SAMs, and proteins involved
with this type of research. SPM provides the unparalleled opportunity to probe these
interfaces at a molecular level, illuminating a degree of detail crucial to the overall
understanding of this ET model system. Unlike a population experiment, like
electrochemistry, SPM is capable of exploring the specific electronic states and topographical
features of a surface or interface. Understanding these types of properties in a chemical
system is essential to any successful surface science. With SPM, a more detailed molecular
understanding of the cyt c/SAM/Au system can be achieved, further defining the ET system
and promoting PME as an effective tool for studying ET.
Although SPM has enjoyed a rich amount of research attention in recent years,1 it is a
relatively new direction in the Bowden Research Group. Because of its unprecedented use in
the Bowden Laboratory, progress toward established goals has been slow but has made some
significant strides. Much of this chapter is dedicated to the research that has been completed
to date on this subject, while other major parts of this chapter discuss the reasons for failed
results, as well as, prospective experiments for the future. Discussion about how the
individual SPM techniques operate is reserved for the Experimental Details Section of this
chapter (Section 5.6).
To fully grasp the potential application of SPM to the cyt c/SAM/Au system, a review
of some of the specific goals set forth in the Bowden Research Group is appropriate at this
time. Beyond the successful imaging of each major surface involved with this system, other
research goals involved the accurate determination of cyt c coverage and their spatial
distribution on the SAM surface. Much of the proposed work revolves around exploring the
adsorption sites of the SAM. SPM imaging of the gold surface, as well as, the surface of the
SAM interface with solution provide a means of evaluating the microscopic characteristics of
different defect/adsorption sites and will greatly benefit the ultimate determination of their
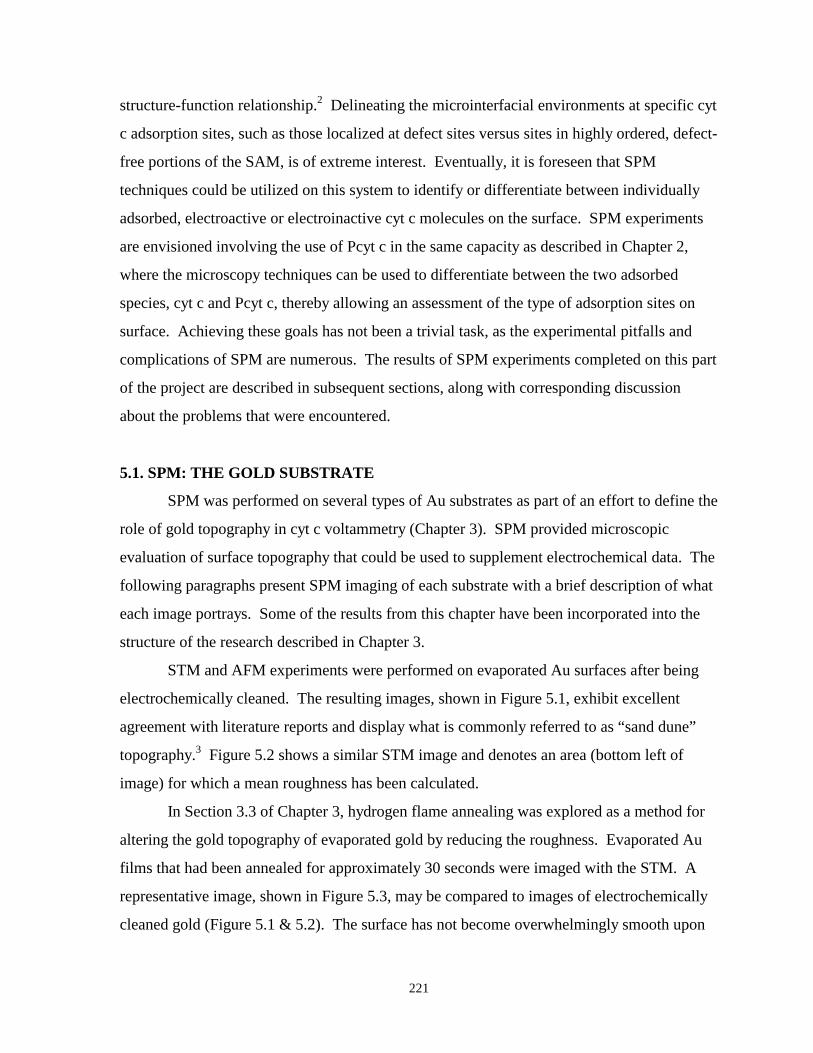
221
structure-function relationship.2 Delineating the microinterfacial environments at specific cyt
c adsorption sites, such as those localized at defect sites versus sites in highly ordered, defect-
free portions of the SAM, is of extreme interest. Eventually, it is foreseen that SPM
techniques could be utilized on this system to identify or differentiate between individually
adsorbed, electroactive or electroinactive cyt c molecules on the surface. SPM experiments
are envisioned involving the use of Pcyt c in the same capacity as described in Chapter 2,
where the microscopy techniques can be used to differentiate between the two adsorbed
species, cyt c and Pcyt c, thereby allowing an assessment of the type of adsorption sites on
surface. Achieving these goals has not been a trivial task, as the experimental pitfalls and
complications of SPM are numerous. The results of SPM experiments completed on this part
of the project are described in subsequent sections, along with corresponding discussion
about the problems that were encountered.
5.1. SPM: THE GOLD SUBSTRATE
SPM was performed on several types of Au substrates as part of an effort to define the
role of gold topography in cyt c voltammetry (Chapter 3). SPM provided microscopic
evaluation of surface topography that could be used to supplement electrochemical data. The
following paragraphs present SPM imaging of each substrate with a brief description of what
each image portrays. Some of the results from this chapter have been incorporated into the
structure of the research described in Chapter 3.
STM and AFM experiments were performed on evaporated Au surfaces after being
electrochemically cleaned. The resulting images, shown in Figure 5.1, exhibit excellent
agreement with literature reports and display what is commonly referred to as “sand dune”
topography.3 Figure 5.2 shows a similar STM image and denotes an area (bottom left of
image) for which a mean roughness has been calculated.
In Section 3.3 of Chapter 3, hydrogen flame annealing was explored as a method for
altering the gold topography of evaporated gold by reducing the roughness. Evaporated Au
films that had been annealed for approximately 30 seconds were imaged with the STM. A
representative image, shown in Figure 5.3, may be compared to images of electrochemically
cleaned gold (Figure 5.1 & 5.2). The surface has not become overwhelmingly smooth upon
222
Figure 5.1. Contact mode AFM image (1µm x 1 µm) of an evaporated Au film electrode(top). Contact mode AFM image (1µm x 1 µm) of an evaporated Au film electrode after being“cleaned” by an electrochemical cycling procedure using 0.1 M H2SO4 and 0.1 M KCl(bottom).
223
Figure 5.2. Roughness analysis of an STM image of evaporated gold that has beenelectrochemically cleaned. Note the “box statistics” for the outlined part of the image (bottom leftcorner). The instrument automatically calculates several roughness factors for the surface, includingRMS roughness or Rq as previously described in Chapter 3.
annealing, but does feature significant changes including a difference in the images
themselves where the grains are less defined and somewhat larger and a reduction in the
calculated mean roughness. In examining these images, however, it is important to
remember that, based on reason described in Chapter 3, the annealing of these type of
evaporated Au films was discontinued.
SPM images were not obtained for bulk Au samples. Instead, literature reports,4
especially from Creager’s group,4a were used to gain insight into the topography of bulk gold.
Optical photomicrographs, shown in Figure 5.4, depict a “splotchy” pattern for aqua regia
etched bulk gold, with regions of bright, shiny gold, as well as, regions of yellow and dull
orange colored gold. This “particle board” surface structure can be destroyed through
abrasive polishing and reinstated through chemical etching (i.e. aqua regia exposure). The
different regions of this surface were attributed to single grains of Au in this polycrystalline
material.4a
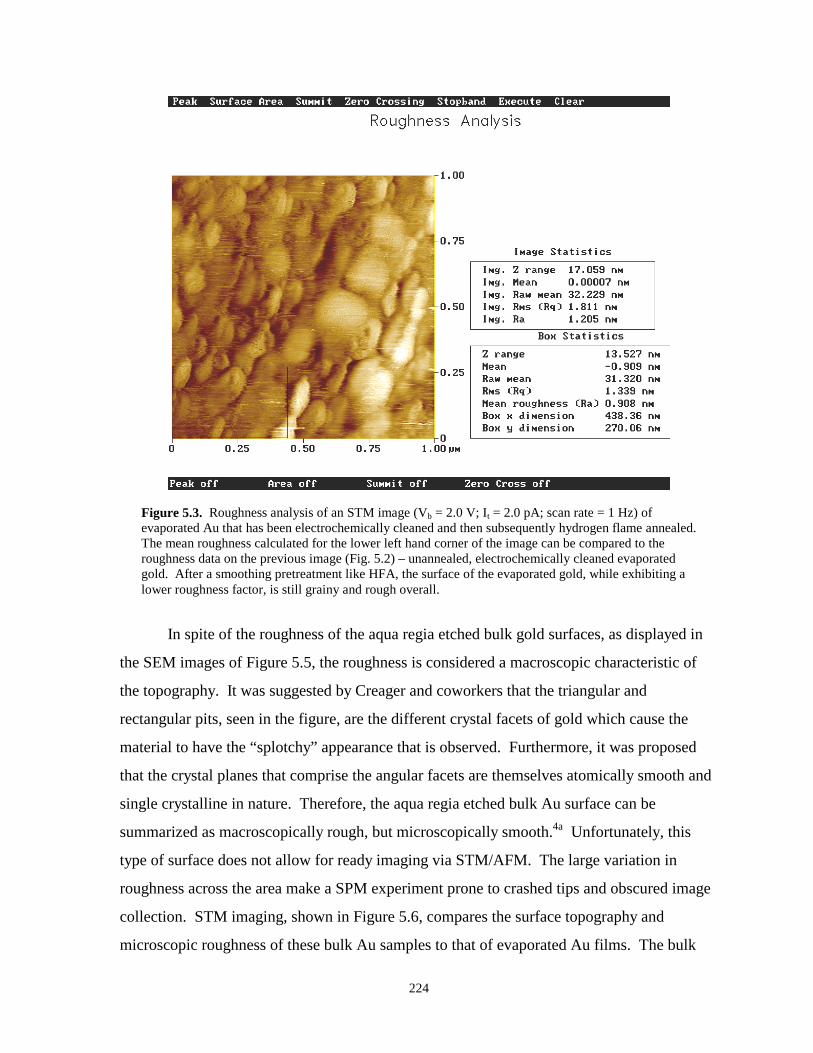
224
Figure 5.3. Roughness analysis of an STM image (Vb = 2.0 V; It = 2.0 pA; scan rate = 1 Hz) ofevaporated Au that has been electrochemically cleaned and then subsequently hydrogen flame annealed.The mean roughness calculated for the lower left hand corner of the image can be compared to theroughness data on the previous image (Fig. 5.2) – unannealed, electrochemically cleaned evaporatedgold. After a smoothing pretreatment like HFA, the surface of the evaporated gold, while exhibiting alower roughness factor, is still grainy and rough overall.
In spite of the roughness of the aqua regia etched bulk gold surfaces, as displayed in
the SEM images of Figure 5.5, the roughness is considered a macroscopic characteristic of
the topography. It was suggested by Creager and coworkers that the triangular and
rectangular pits, seen in the figure, are the different crystal facets of gold which cause the
material to have the “splotchy” appearance that is observed. Furthermore, it was proposed
that the crystal planes that comprise the angular facets are themselves atomically smooth and
single crystalline in nature. Therefore, the aqua regia etched bulk Au surface can be
summarized as macroscopically rough, but microscopically smooth.4a Unfortunately, this
type of surface does not allow for ready imaging via STM/AFM. The large variation in
roughness across the area make a SPM experiment prone to crashed tips and obscured image
collection. STM imaging, shown in Figure 5.6, compares the surface topography and
microscopic roughness of these bulk Au samples to that of evaporated Au films. The bulk
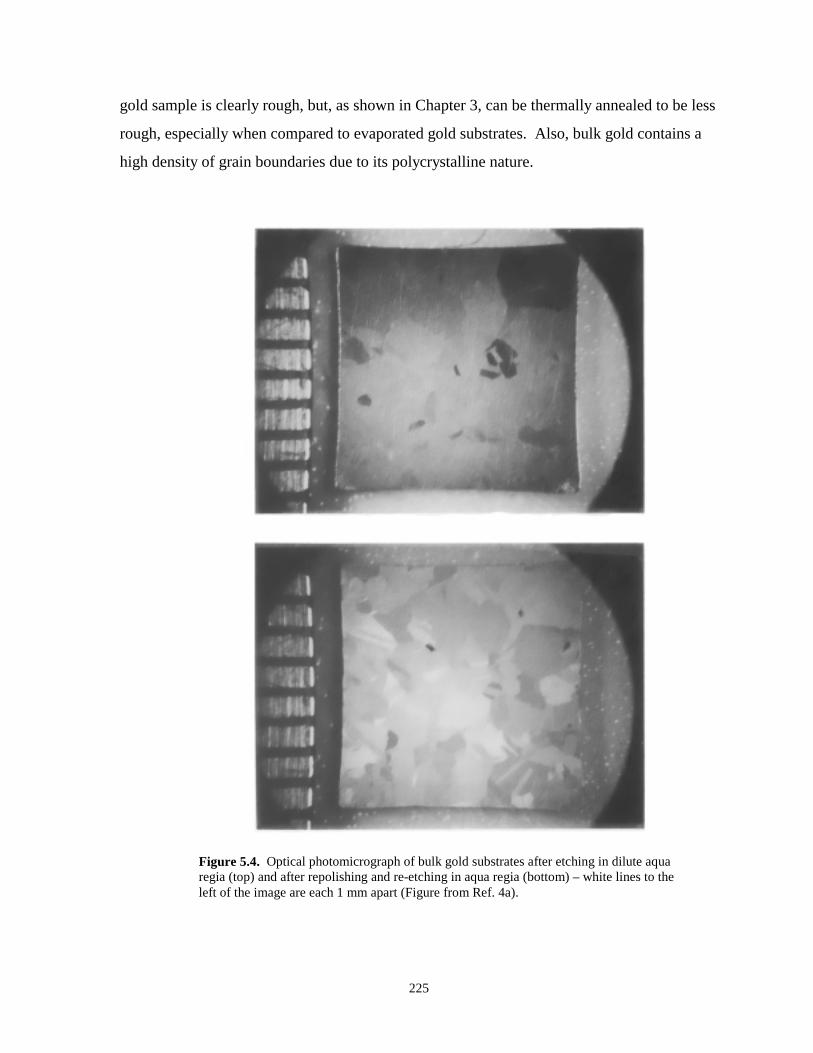
225
gold sample is clearly rough, but, as shown in Chapter 3, can be thermally annealed to be less
rough, especially when compared to evaporated gold substrates. Also, bulk gold contains a
high density of grain boundaries due to its polycrystalline nature.
Figure 5.4. Optical photomicrograph of bulk gold substrates after etching in dilute aquaregia (top) and after repolishing and re-etching in aqua regia (bottom) – white lines to theleft of the image are each 1 mm apart (Figure from Ref. 4a).
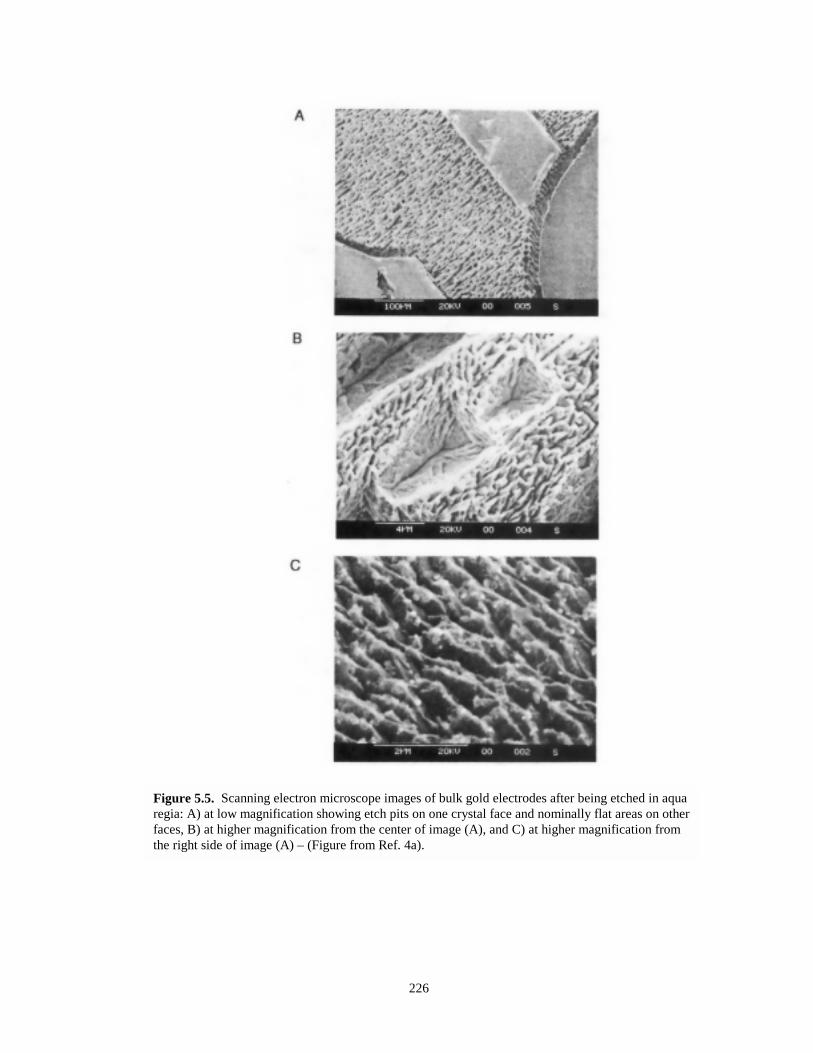
226
Figure 5.5. Scanning electron microscope images of bulk gold electrodes after being etched in aquaregia: A) at low magnification showing etch pits on one crystal face and nominally flat areas on otherfaces, B) at higher magnification from the center of image (A), and C) at higher magnification fromthe right side of image (A) – (Figure from Ref. 4a).
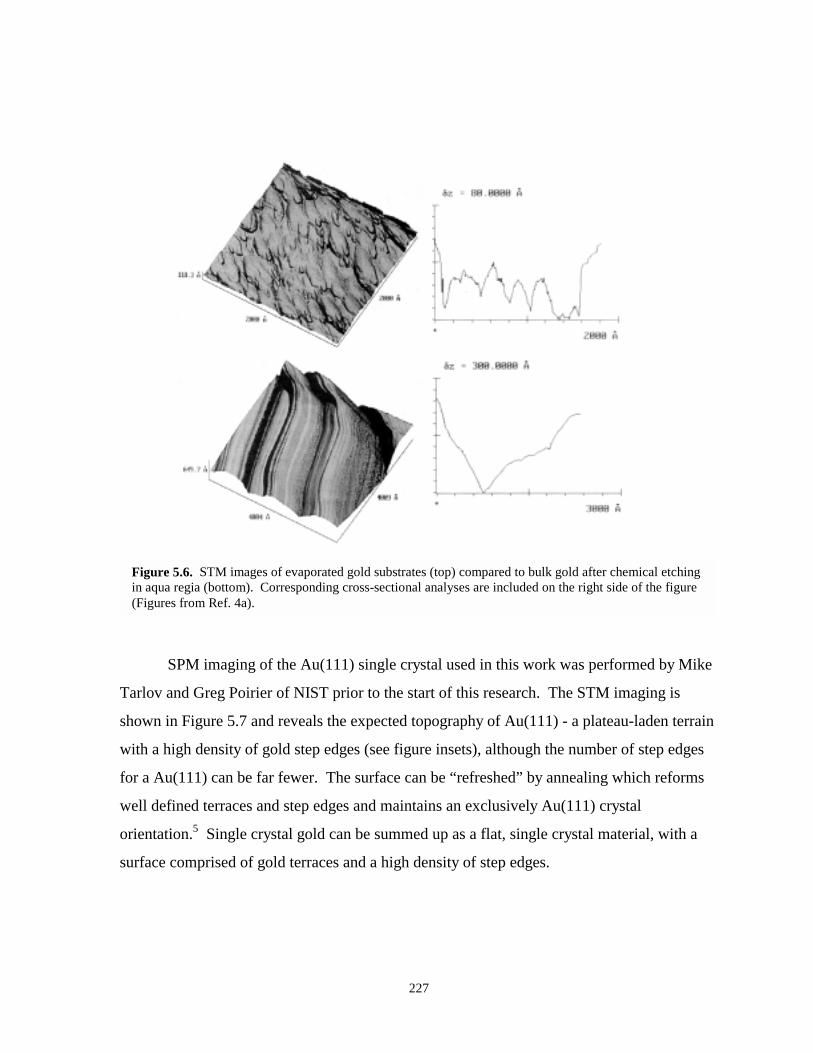
227
Figure 5.6. STM images of evaporated gold substrates (top) compared to bulk gold after chemical etchingin aqua regia (bottom). Corresponding cross-sectional analyses are included on the right side of the figure(Figures from Ref. 4a).
SPM imaging of the Au(111) single crystal used in this work was performed by Mike
Tarlov and Greg Poirier of NIST prior to the start of this research. The STM imaging is
shown in Figure 5.7 and reveals the expected topography of Au(111) - a plateau-laden terrain
with a high density of gold step edges (see figure insets), although the number of step edges
for a Au(111) can be far fewer. The surface can be “refreshed” by annealing which reforms
well defined terraces and step edges and maintains an exclusively Au(111) crystal
orientation.5 Single crystal gold can be summed up as a flat, single crystal material, with a
surface comprised of gold terraces and a high density of step edges.
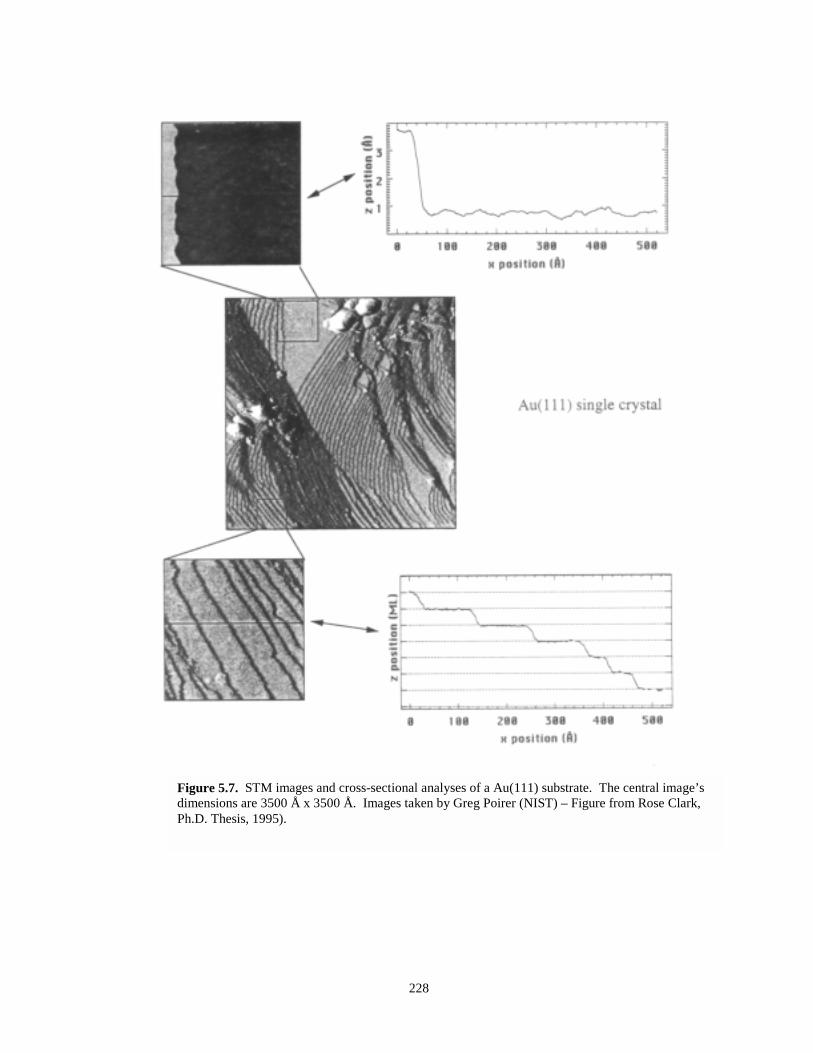
228
Figure 5.7. STM images and cross-sectional analyses of a Au(111) substrate. The central image’sdimensions are 3500 Å x 3500 Å. Images taken by Greg Poirer (NIST) – Figure from Rose Clark,Ph.D. Thesis, 1995).
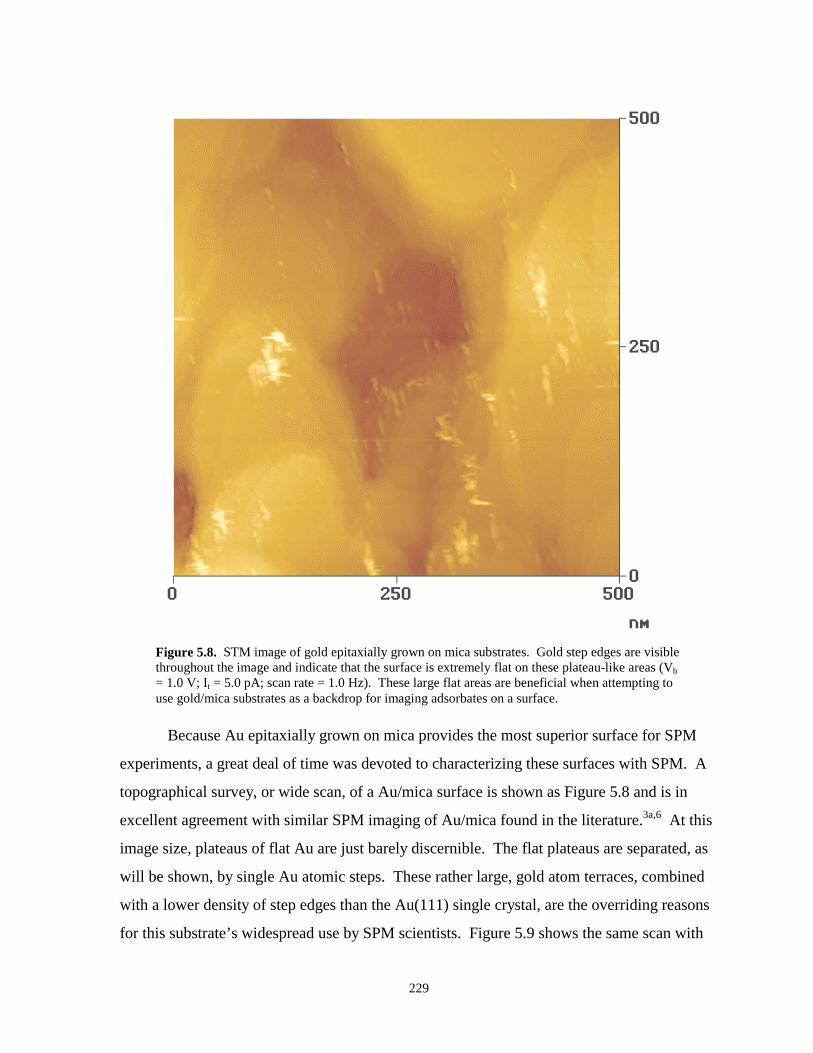
229
Figure 5.8. STM image of gold epitaxially grown on mica substrates. Gold step edges are visiblethroughout the image and indicate that the surface is extremely flat on these plateau-like areas (Vb= 1.0 V; It = 5.0 pA; scan rate = 1.0 Hz). These large flat areas are beneficial when attempting touse gold/mica substrates as a backdrop for imaging adsorbates on a surface.
Because Au epitaxially grown on mica provides the most superior surface for SPM
experiments, a great deal of time was devoted to characterizing these surfaces with SPM. A
topographical survey, or wide scan, of a Au/mica surface is shown as Figure 5.8 and is in
excellent agreement with similar SPM imaging of Au/mica found in the literature.3a,6 At this
image size, plateaus of flat Au are just barely discernible. The flat plateaus are separated, as
will be shown, by single Au atomic steps. These rather large, gold atom terraces, combined
with a lower density of step edges than the Au(111) single crystal, are the overriding reasons
for this substrate’s widespread use by SPM scientists. Figure 5.9 shows the same scan with
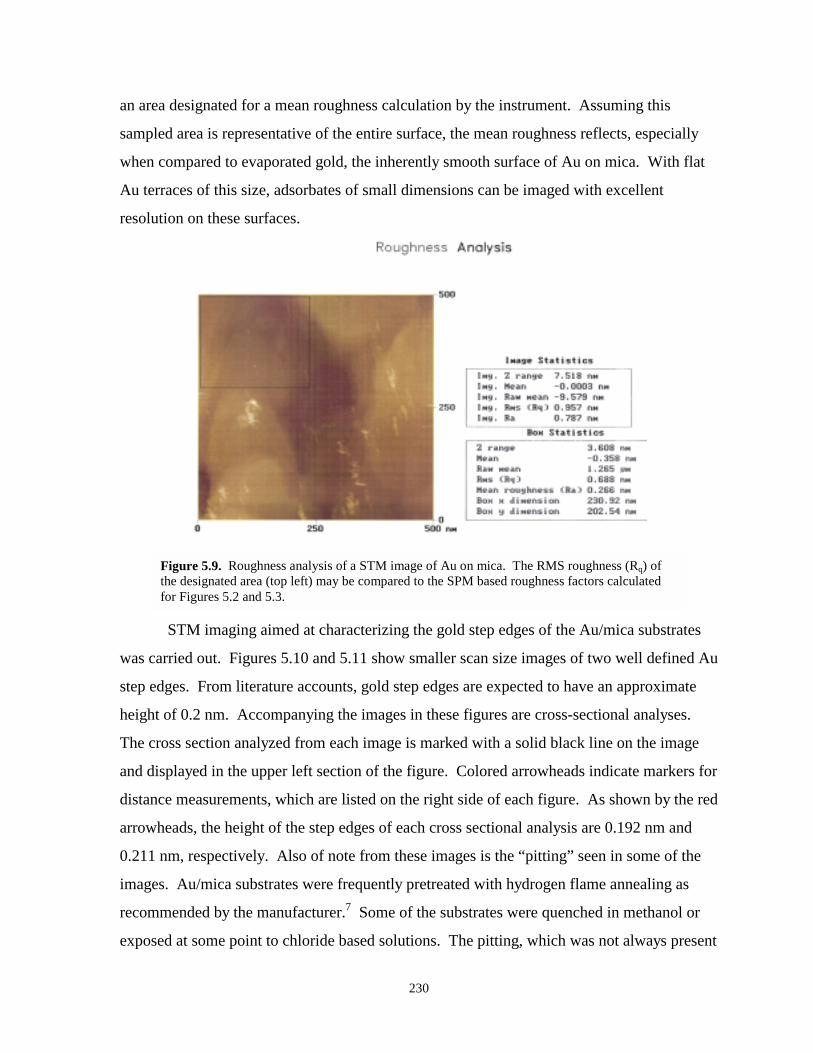
230
an area designated for a mean roughness calculation by the instrument. Assuming this
sampled area is representative of the entire surface, the mean roughness reflects, especially
when compared to evaporated gold, the inherently smooth surface of Au on mica. With flat
Au terraces of this size, adsorbates of small dimensions can be imaged with excellent
resolution on these surfaces.
Figure 5.9. Roughness analysis of a STM image of Au on mica. The RMS roughness (Rq) ofthe designated area (top left) may be compared to the SPM based roughness factors calculatedfor Figures 5.2 and 5.3.
STM imaging aimed at characterizing the gold step edges of the Au/mica substrates
was carried out. Figures 5.10 and 5.11 show smaller scan size images of two well defined Au
step edges. From literature accounts, gold step edges are expected to have an approximate
height of 0.2 nm. Accompanying the images in these figures are cross-sectional analyses.
The cross section analyzed from each image is marked with a solid black line on the image
and displayed in the upper left section of the figure. Colored arrowheads indicate markers for
distance measurements, which are listed on the right side of each figure. As shown by the red
arrowheads, the height of the step edges of each cross sectional analysis are 0.192 nm and
0.211 nm, respectively. Also of note from these images is the “pitting” seen in some of the
images. Au/mica substrates were frequently pretreated with hydrogen flame annealing as
recommended by the manufacturer.7 Some of the substrates were quenched in methanol or
exposed at some point to chloride based solutions. The pitting, which was not always present
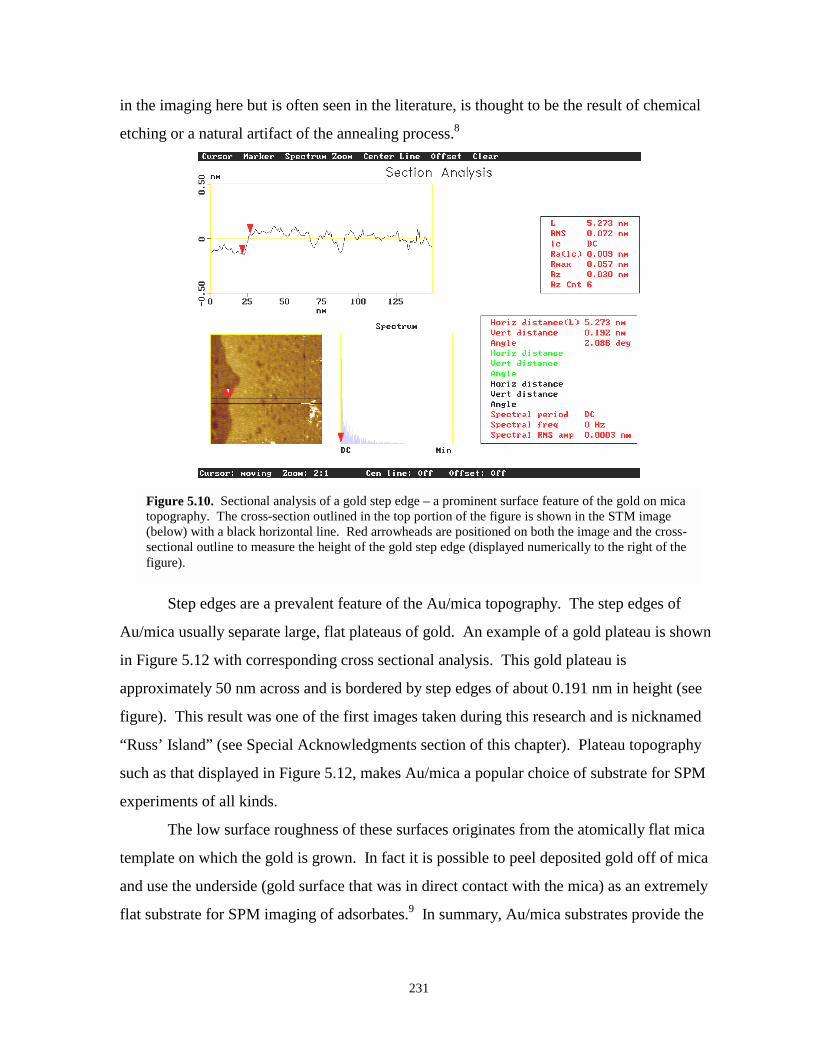
231
in the imaging here but is often seen in the literature, is thought to be the result of chemical
etching or a natural artifact of the annealing process.8
Figure 5.10. Sectional analysis of a gold step edge – a prominent surface feature of the gold on micatopography. The cross-section outlined in the top portion of the figure is shown in the STM image(below) with a black horizontal line. Red arrowheads are positioned on both the image and the cross-sectional outline to measure the height of the gold step edge (displayed numerically to the right of thefigure).
Step edges are a prevalent feature of the Au/mica topography. The step edges of
Au/mica usually separate large, flat plateaus of gold. An example of a gold plateau is shown
in Figure 5.12 with corresponding cross sectional analysis. This gold plateau is
approximately 50 nm across and is bordered by step edges of about 0.191 nm in height (see
figure). This result was one of the first images taken during this research and is nicknamed
“Russ’ Island” (see Special Acknowledgments section of this chapter). Plateau topography
such as that displayed in Figure 5.12, makes Au/mica a popular choice of substrate for SPM
experiments of all kinds.
The low surface roughness of these surfaces originates from the atomically flat mica
template on which the gold is grown. In fact it is possible to peel deposited gold off of mica
and use the underside (gold surface that was in direct contact with the mica) as an extremely
flat substrate for SPM imaging of adsorbates.9 In summary, Au/mica substrates provide the
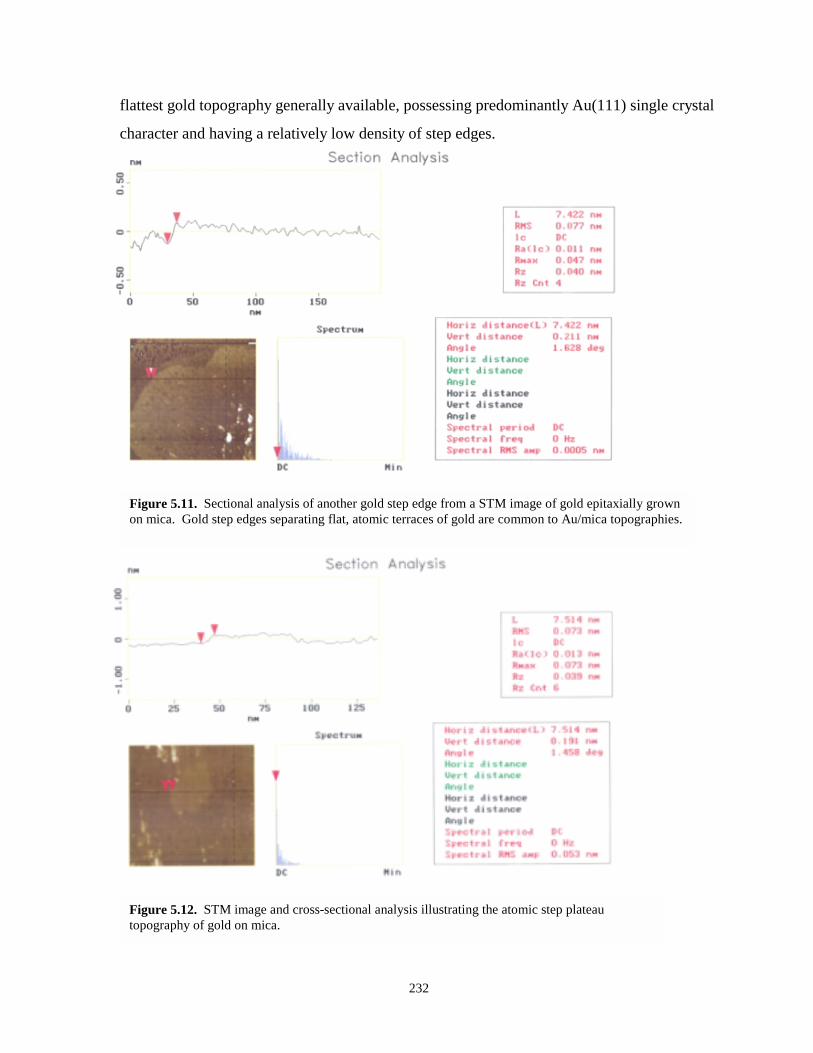
232
flattest gold topography generally available, possessing predominantly Au(111) single crystal
character and having a relatively low density of step edges.
Figure 5.11. Sectional analysis of another gold step edge from a STM image of gold epitaxially grownon mica. Gold step edges separating flat, atomic terraces of gold are common to Au/mica topographies.
Figure 5.12. STM image and cross-sectional analysis illustrating the atomic step plateautopography of gold on mica.
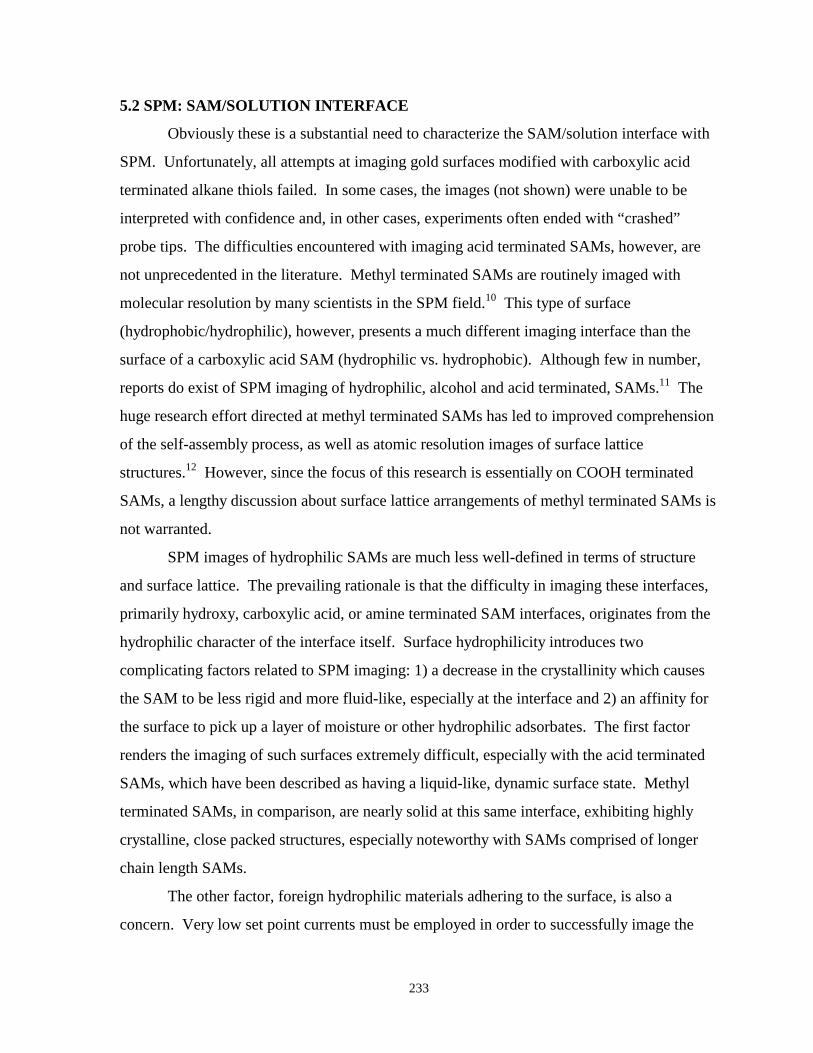
233
5.2 SPM: SAM/SOLUTION INTERFACE
Obviously these is a substantial need to characterize the SAM/solution interface with
SPM. Unfortunately, all attempts at imaging gold surfaces modified with carboxylic acid
terminated alkane thiols failed. In some cases, the images (not shown) were unable to be
interpreted with confidence and, in other cases, experiments often ended with “crashed”
probe tips. The difficulties encountered with imaging acid terminated SAMs, however, are
not unprecedented in the literature. Methyl terminated SAMs are routinely imaged with
molecular resolution by many scientists in the SPM field.10 This type of surface
(hydrophobic/hydrophilic), however, presents a much different imaging interface than the
surface of a carboxylic acid SAM (hydrophilic vs. hydrophobic). Although few in number,
reports do exist of SPM imaging of hydrophilic, alcohol and acid terminated, SAMs.11 The
huge research effort directed at methyl terminated SAMs has led to improved comprehension
of the self-assembly process, as well as atomic resolution images of surface lattice
structures.12 However, since the focus of this research is essentially on COOH terminated
SAMs, a lengthy discussion about surface lattice arrangements of methyl terminated SAMs is
not warranted.
SPM images of hydrophilic SAMs are much less well-defined in terms of structure
and surface lattice. The prevailing rationale is that the difficulty in imaging these interfaces,
primarily hydroxy, carboxylic acid, or amine terminated SAM interfaces, originates from the
hydrophilic character of the interface itself. Surface hydrophilicity introduces two
complicating factors related to SPM imaging: 1) a decrease in the crystallinity which causes
the SAM to be less rigid and more fluid-like, especially at the interface and 2) an affinity for
the surface to pick up a layer of moisture or other hydrophilic adsorbates. The first factor
renders the imaging of such surfaces extremely difficult, especially with the acid terminated
SAMs, which have been described as having a liquid-like, dynamic surface state. Methyl
terminated SAMs, in comparison, are nearly solid at this same interface, exhibiting highly
crystalline, close packed structures, especially noteworthy with SAMs comprised of longer
chain length SAMs.
The other factor, foreign hydrophilic materials adhering to the surface, is also a
concern. Very low set point currents must be employed in order to successfully image the
234
SAM/solution interface of carboxylic acid terminated SAMs. The low current is necessary in
order to increase the gap resistance, keeping the tip of the STM close enough to the surface to
maintain a tunneling current, yet far enough above the surface to prevent it from being
dragged through the SAM itself. A common mistake made in trying to image hydrophilic
SAMs is using a set point current that is too high, causing the tip to maintain a gap distance
that is too small, resulting in tip penetration of the SAM. Under these conditions the sulfur
headgroups of the thiol based films are sometimes mistakenly imaged instead of the SAM
interface. At low set point currents that place the STM probe tip just at the endgroups of the
SAM, there is a risk of tip-adsorbate interactions interfering with the imaging process. This
risk is increased if a layer of hydrophilic, foreign material is present on the surface being
imaged. This hydrophilic layer, which is sometimes simply a layer of water from the humid
atmosphere, can interfere with non-conductive methods of SPM as well. During SFM
(AFM) imaging of surfaces covered by an aqueous layer, the cantilevers (probes) can be
“snagged” by this water layer or experience shear forces disruptive to successful
imaging.11a,e,13 These complications can be combated by obtaining images in ultra high
vacuum (UHV) chambers. Unfortunately, the option of UHV is unavailable for SPM
experiments being performed in the NCSU Chemistry Department. Nevertheless, imaging of
hydrophilic SAMs, a delicate experiment requiring the experimenter to strike a balance
between set point current and gap resistance, has been accomplished in the literature with
somewhat controversial results.
-Future Directions for SPM of the COOH SAM/Solution Interface
Both -OH and NH2 SAMs have been imaged with more success than COOH
terminated SAMs, possibly because of their superior packing order. This task may best be
accomplished by first investigating methods of creating more stable acid surfaces. For
instance, perhaps the incorporation of mixed SAMs rather than uniform SAMs or the use of
Ag or Cu UPD layers beneath the SAM, as described in Chapter 4, will improve the stability
of the SAM structure to a point where the SAM interface can be reliably imaged by a SPM
technique. Once reproducible and reliable imaging of acid SAMs has been achieved, the
SPM aspect of this project can expand toward more of the cyt c/SAM/Au system related
235
goals. The future of SPM as it relates to that system will be further discussed in a subsequent
section.
SPM of mixed SAMs figures to be an important part of future experiments in this
area. With increased usage of mixed SAMs in cytochrome electrochemistry, the elucidation
of thiol distribution across the gold surface becomes an important goal. Are they phase
segregated into domains or are they randomly distributed throughout the film? SPM of
mixed films can provide the level of detail necessary to answer these types of questions, as
has already been demonstrated.14 Mixed SAMs can be homogeneously mixed or phase
segregated depending on the nature of the two components comprising the SAM. The mixed
SAMs of immediate interest here, usually consisting of components separated in length by
less then 4 methylene units (Type I structure), are thought to be randomly distributed.
5.3. SPM: PROTEINS (CYTOCHROME C)
During the past decade significant progress has been made with SPM imaging of
proteins, enzymes, and other biological entities.1a In spite of this intense effort, controversy
regarding the exact mechanism of STM imaging of proteins remains vibrant.1 AFM, an
alternative form of SPM with a better understood imaging mechanism, presents other
challenges for imaging biological structures. Some AFM methods require a greater degree of
probe-adsorbate interaction than STM, risking damage and/or translocation of adsorbates.
Furthermore, all SPM techniques require a well defined substrate where the target biological
molecule(s) can be adequately immobilized. In light of these complications, successful
imaging of proteins by SPM techniques is a nontrivial task.
Most of the published work concerning SPM imaging of proteins has addressed large
biomolecule systems1a,15 such as ferritin. The larger size provides a greater chance of
discerning some characteristic internal structure or the overall shape of the biomolecule.
More often than not, however, proteins that have appeared in SPM images resemble “fuzzy
blobs” accompanied by unrealistic dimensions and little or no scientific analysis. As seen in
some of the better biological imaging reports, an image supported by supplemental
characterization such as IR spectroscopy or XPS usually carries much greater value.
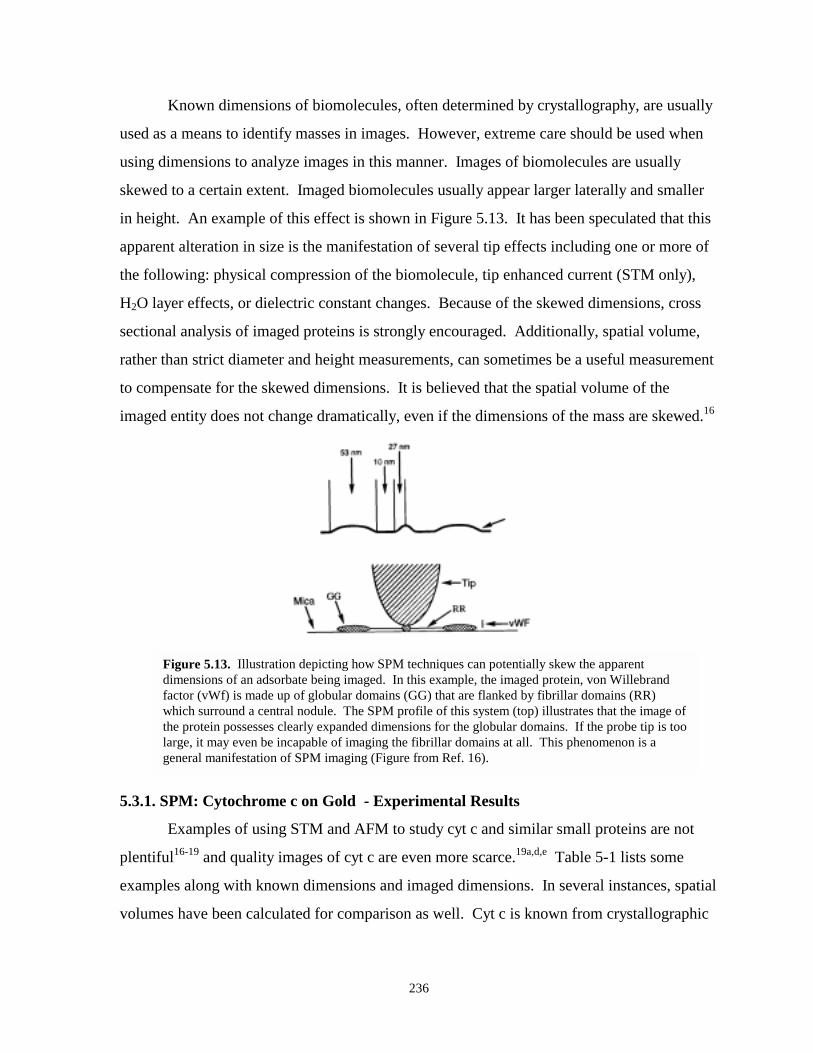
236
Known dimensions of biomolecules, often determined by crystallography, are usually
used as a means to identify masses in images. However, extreme care should be used when
using dimensions to analyze images in this manner. Images of biomolecules are usually
skewed to a certain extent. Imaged biomolecules usually appear larger laterally and smaller
in height. An example of this effect is shown in Figure 5.13. It has been speculated that this
apparent alteration in size is the manifestation of several tip effects including one or more of
the following: physical compression of the biomolecule, tip enhanced current (STM only),
H2O layer effects, or dielectric constant changes. Because of the skewed dimensions, cross
sectional analysis of imaged proteins is strongly encouraged. Additionally, spatial volume,
rather than strict diameter and height measurements, can sometimes be a useful measurement
to compensate for the skewed dimensions. It is believed that the spatial volume of the
imaged entity does not change dramatically, even if the dimensions of the mass are skewed.16
5.3.1. SPM: Cytochrome c on Gold - Experimental Results
Examples of using STM and AFM to study cyt c and similar small proteins are not
plentiful16-19 and quality images of cyt c are even more scarce.19a,d,e Table 5-1 lists some
examples along with known dimensions and imaged dimensions. In several instances, spatial
volumes have been calculated for comparison as well. Cyt c is known from crystallographic
Figure 5.13. Illustration depicting how SPM techniques can potentially skew the apparentdimensions of an adsorbate being imaged. In this example, the imaged protein, von Willebrandfactor (vWf) is made up of globular domains (GG) that are flanked by fibrillar domains (RR)which surround a central nodule. The SPM profile of this system (top) illustrates that the image ofthe protein possesses clearly expanded dimensions for the globular domains. If the probe tip is toolarge, it may even be incapable of imaging the fibrillar domains at all. This phenomenon is ageneral manifestation of SPM imaging (Figure from Ref. 16).
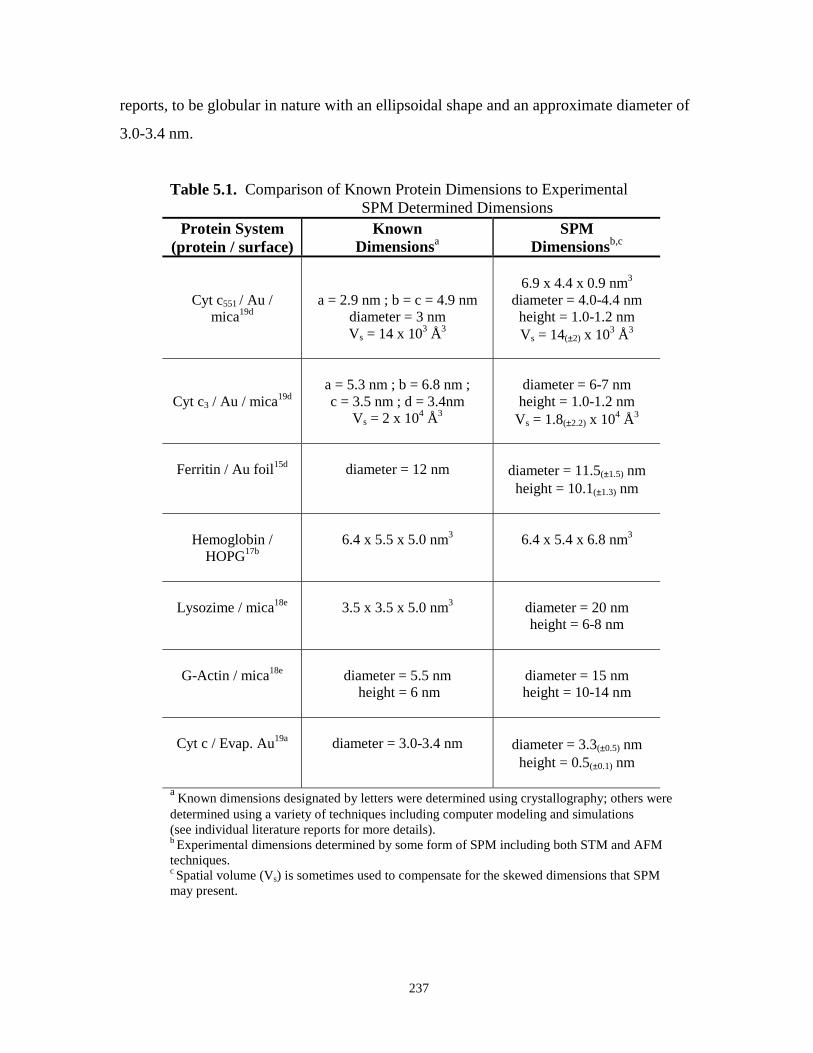
237
reports, to be globular in nature with an ellipsoidal shape and an approximate diameter of
3.0-3.4 nm.
Table 5.1. Comparison of Known Protein Dimensions to ExperimentalSPM Determined Dimensions
Protein System(protein / surface)
KnownDimensionsa
SPMDimensionsb,c
Cyt c551 / Au /mica19d
a = 2.9 nm ; b = c = 4.9 nmdiameter = 3 nmVs = 14 x 103 Å3
6.9 x 4.4 x 0.9 nm3
diameter = 4.0-4.4 nmheight = 1.0-1.2 nmVs = 14(±2) x 103 Å3
Cyt c3 / Au / mica19da = 5.3 nm ; b = 6.8 nm ;c = 3.5 nm ; d = 3.4nm
Vs = 2 x 10⁴ Å3
diameter = 6-7 nmheight = 1.0-1.2 nm
Vs = 1.8(±2.2) x 104 Å3
Ferritin / Au foil15d diameter = 12 nm diameter = 11.5(±1.5) nmheight = 10.1(±1.3) nm
Hemoglobin /HOPG17b
6.4 x 5.5 x 5.0 nm3 6.4 x 5.4 x 6.8 nm3
Lysozime / mica18e 3.5 x 3.5 x 5.0 nm3 diameter = 20 nmheight = 6-8 nm
G-Actin / mica18e diameter = 5.5 nm height = 6 nm
diameter = 15 nmheight = 10-14 nm
Cyt c / Evap. Au19a diameter = 3.0-3.4 nm diameter = 3.3(±0.5) nmheight = 0.5(±0.1) nm
a Known dimensions designated by letters were determined using crystallography; others weredetermined using a variety of techniques including computer modeling and simulations(see individual literature reports for more details).b Experimental dimensions determined by some form of SPM including both STM and AFMtechniques.c Spatial volume (Vs) is sometimes used to compensate for the skewed dimensions that SPMmay present.
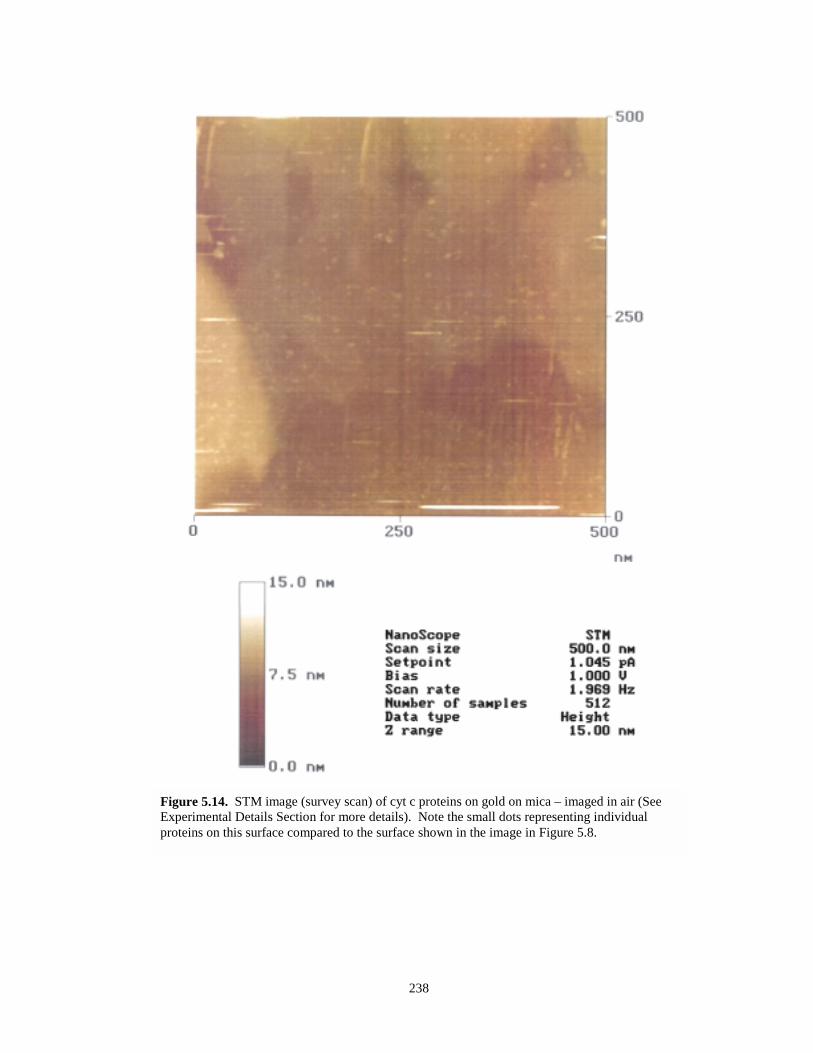
238
Figure 5.14. STM image (survey scan) of cyt c proteins on gold on mica – imaged in air (SeeExperimental Details Section for more details). Note the small dots representing individualproteins on this surface compared to the surface shown in the image in Figure 5.8.
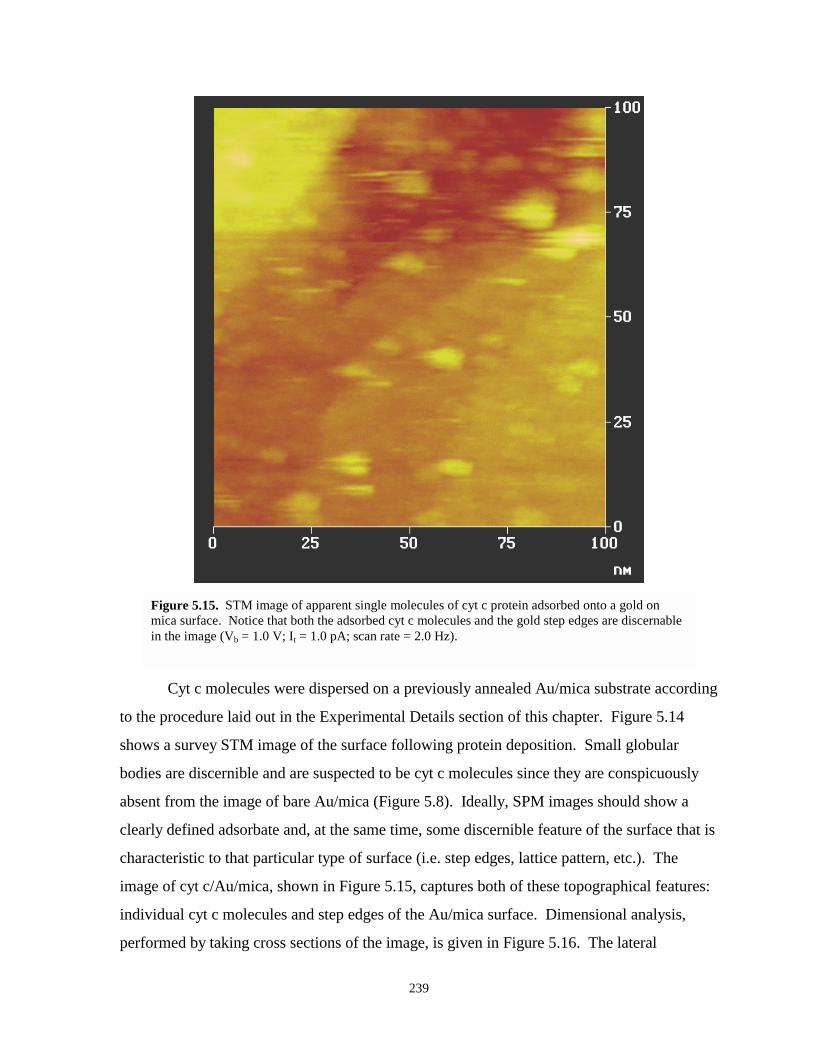
239
Figure 5.15. STM image of apparent single molecules of cyt c protein adsorbed onto a gold onmica surface. Notice that both the adsorbed cyt c molecules and the gold step edges are discernablein the image (Vb = 1.0 V; It = 1.0 pA; scan rate = 2.0 Hz).
Cyt c molecules were dispersed on a previously annealed Au/mica substrate according
to the procedure laid out in the Experimental Details section of this chapter. Figure 5.14
shows a survey STM image of the surface following protein deposition. Small globular
bodies are discernible and are suspected to be cyt c molecules since they are conspicuously
absent from the image of bare Au/mica (Figure 5.8). Ideally, SPM images should show a
clearly defined adsorbate and, at the same time, some discernible feature of the surface that is
characteristic to that particular type of surface (i.e. step edges, lattice pattern, etc.). The
image of cyt c/Au/mica, shown in Figure 5.15, captures both of these topographical features:
individual cyt c molecules and step edges of the Au/mica surface. Dimensional analysis,
performed by taking cross sections of the image, is given in Figure 5.16. The lateral
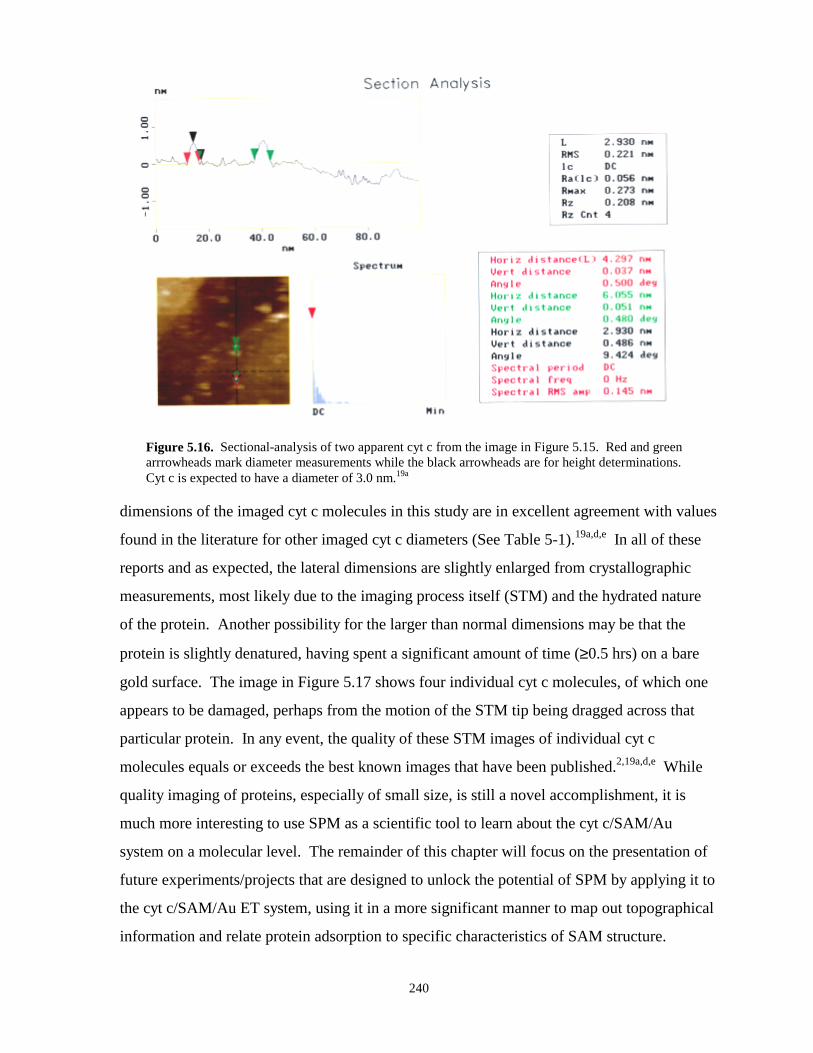
240
Figure 5.16. Sectional-analysis of two apparent cyt c from the image in Figure 5.15. Red and greenarrrowheads mark diameter measurements while the black arrowheads are for height determinations.Cyt c is expected to have a diameter of 3.0 nm.19a
dimensions of the imaged cyt c molecules in this study are in excellent agreement with values
found in the literature for other imaged cyt c diameters (See Table 5-1).19a,d,e In all of these
reports and as expected, the lateral dimensions are slightly enlarged from crystallographic
measurements, most likely due to the imaging process itself (STM) and the hydrated nature
of the protein. Another possibility for the larger than normal dimensions may be that the
protein is slightly denatured, having spent a significant amount of time (≥0.5 hrs) on a bare
gold surface. The image in Figure 5.17 shows four individual cyt c molecules, of which one
appears to be damaged, perhaps from the motion of the STM tip being dragged across that
particular protein. In any event, the quality of these STM images of individual cyt c
molecules equals or exceeds the best known images that have been published.2,19a,d,e While
quality imaging of proteins, especially of small size, is still a novel accomplishment, it is
much more interesting to use SPM as a scientific tool to learn about the cyt c/SAM/Au
system on a molecular level. The remainder of this chapter will focus on the presentation of
future experiments/projects that are designed to unlock the potential of SPM by applying it to
the cyt c/SAM/Au ET system, using it in a more significant manner to map out topographical
information and relate protein adsorption to specific characteristics of SAM structure.
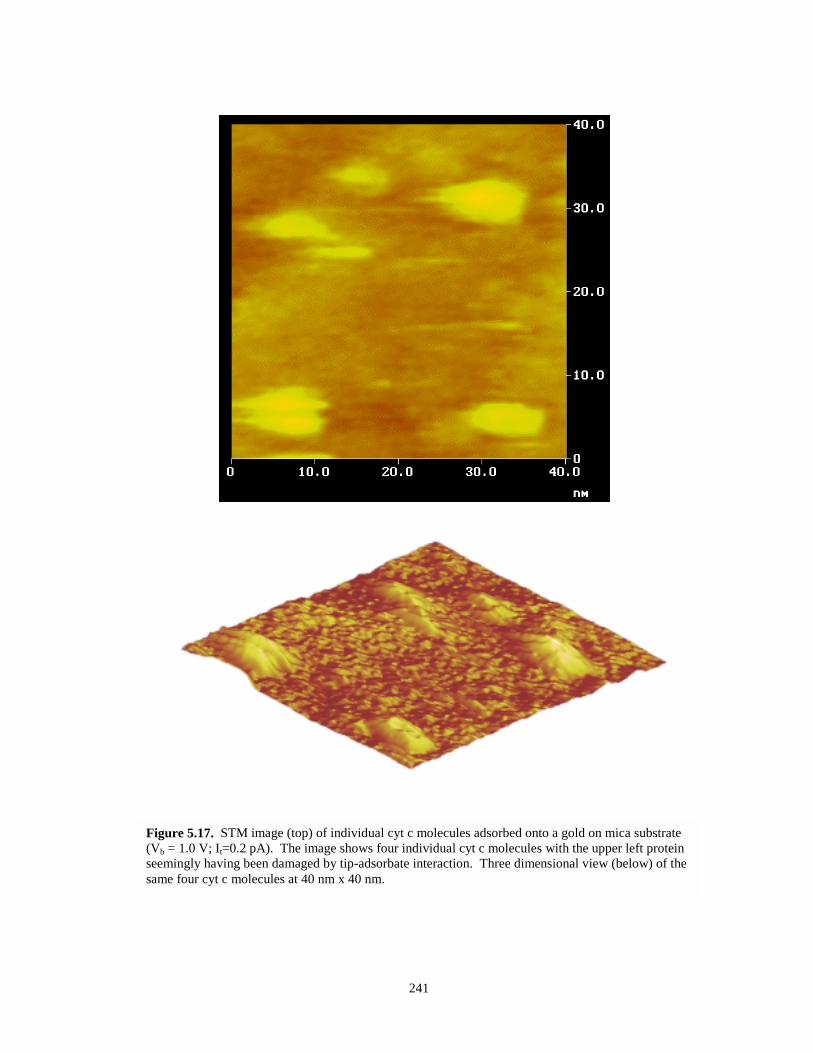
241
Figure 5.17. STM image (top) of individual cyt c molecules adsorbed onto a gold on mica substrate(Vb = 1.0 V; It=0.2 pA). The image shows four individual cyt c molecules with the upper left proteinseemingly having been damaged by tip-adsorbate interaction. Three dimensional view (below) of thesame four cyt c molecules at 40 nm x 40 nm.
242
5.4. SPM: THE CYT C/SAM/Au SYSTEM - CONCLUSIONS ANDFUTURE DIRECTIONS
SPM imaging of the complete cyt c/SAM/Au system has not been achieved yet due
largely to the difficulties associated with well resolved imaging the SAM itself. There is
much, however, that could be done using this technique. This section is devoted to possible
future experiments, including a fairly detailed description of a possible resonant tunneling
study. Of major interest is an assessment of whether cyt c adsorption sites can be correlated
with specific defect features of the SAM that could arise at step edges, crystal grain
boundaries, or etch pits.2 Based on results in Chapter 3, SPM could be a good approach to
determine whether cyt c adsorbs on atomically flat terraces. Accomplishing these tasks
would involve being able to routinely and effectively image gold substrates, SAM modified
gold substrates, and cyt c monolayers adsorbed to those gold substrates. This type of imaging
would have to be performed in careful stages and is envisioned as a primarily ex situ project.
-Electrochemical SPM (ECSPM)
In situ SPM experiments performed under potential control, also known as
electrochemical scanning probe microscopy (ECSPM),1c,20 should also be pursued because of
its potential usefulness in gaining insight into surface electrochemistry. Successful imaging
using ECSPM is expected to be challenging, but feasible. In situ ECSPM is potentially a
powerful method of identifying specific cyt c adsorption sites at active interfaces and may
possibly allow for single molecule characterization and manipulation. In situ ECSPM
experiments of this nature present several formidable obstacles that will have to be addressed,
including the need for specialized probes. For electrochemical scanning tunneling
microscopy (ECSTM), for example, high quality insulated tips are required to minimize
extraneous currents and to increase the probability that current flow arises from electron
tunneling to or from the surface bound cyt c molecules. Several procedures for preparing
coated tips of this nature are available in the literature.21
-Advanced ECSPM Experiments (Resonant Tunneling)
Successful ECSPM imaging of the cyt c/SAM/Au system would serve as the basis for
more advanced experiments that more fully utilize the potential of SPM as a scientific tool.
Even the most impressive protein images are usually subject to severe criticism due to the
nature of the imaging process. As stated previously, many SPM images show proteins simply
243
as “fuzzy blobs” with little or no supporting evidence to support interpretations. More
credible SPM papers include supplemental evidence from other techniques to bolster
interpretations made with regard to the protein images. Unfortunately, this approach usually
involves manipulating a single substrate with bioadsorbates through multiple characterization
techniques, a nontrivial task when one of the techniques is ex situ SPM which increases the
probability of natural degradation of the protein unless the environment is rigorously
controlled. One criticism of this approach is that it involves the assumption that the entire
experimental substrate is realistically portrayed by the small area imaged by SPM. It must be
assumed that the image is characteristic of the surface of the entire substrate, as well as,
nearly identical to the substrates being tested by other techniques. Considering the substrate
to substrate variation witnessed with gold surfaces, the propensity for defects in SAMs, the
variation of SAM structure that can exist, and the sensitivity of the cyt c/SAM/Au system to
different preparation and pretreatment procedures, this is not always a safe assumption to
make. When faced with this situation, a SPM technique or experiment that can perform the
imaging process while simultaneously and unambiguously distinguishing chemical identity is
an extremely attractive idea. To this end, an exciting set of experiments are proposed that not
only address this exact dilemma, but also encompass most of the objectives of this research.
Recently, the phenomenon of resonant tunneling (RT) has been used in STM
experiments to chemically identify single types of molecules adsorbed onto surfaces.20a,22
Resonant tunneling experiments are performed by having a redox species adsorbed onto a
substrate that is under potential control. Traditionally, a bipotentiostat, capable of
independently controlling the potential of two electrodes, is used for RT experiments. As a
form of ECSPM, one of the two working electrodes is the substrate, while the other is the
STM tip itself. The substrate’s Fermi level, via the bipotentiostat, is “tuned” to the reaction
potential of the adsorbed molecules. Thus, this “tuning” effectively aligns the energy levels
of the substrate with the LUMO energy levels (redox orbitals) of the adsorbed molecules.22b,d
This is most easily accomplished by adjusting the substrate’s potential to formal potential of
the adsorbed redox species as determined from electrochemistry. When this alignment is
scanned with the STM tip with a fixed tip-substrate voltage bias, the energy levels of the tip,
adsorbate, and substrate are aligned or brought into resonance with each other. This overlap
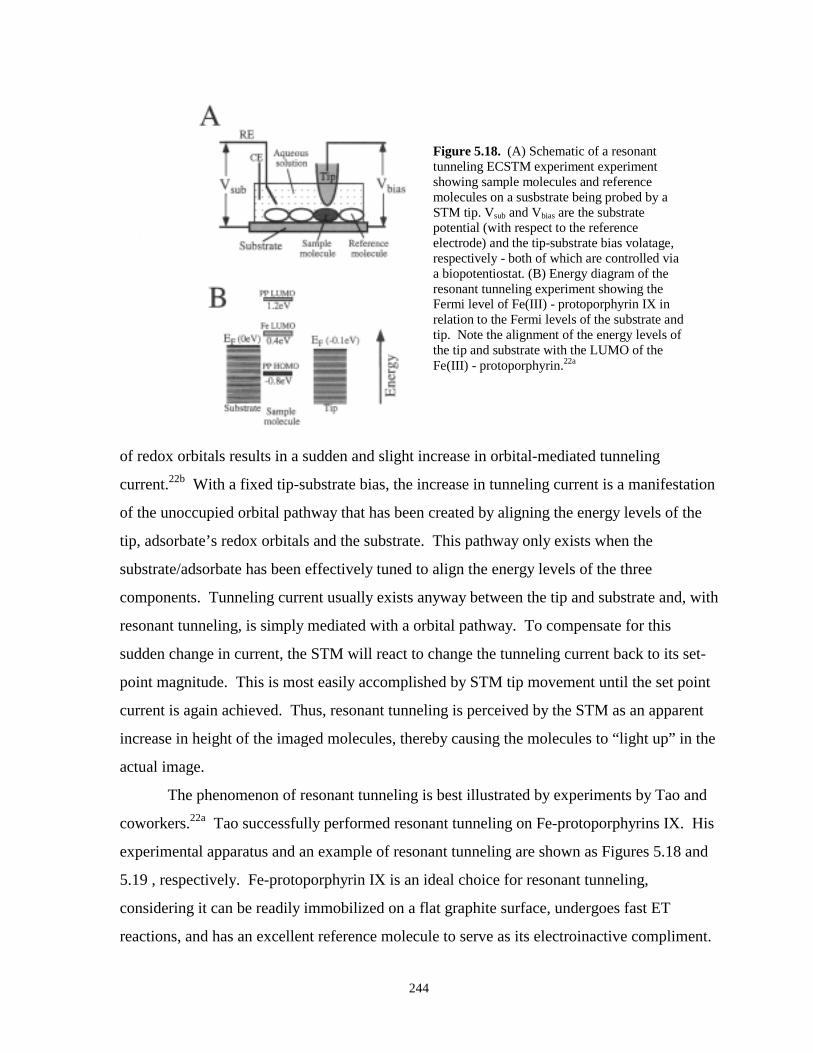
244
Figure 5.18. (A) Schematic of a resonanttunneling ECSTM experiment experimentshowing sample molecules and referencemolecules on a susbstrate being probed by aSTM tip. Vsub and Vbias are the substratepotential (with respect to the referenceelectrode) and the tip-substrate bias volatage,respectively - both of which are controlled viaa biopotentiostat. (B) Energy diagram of theresonant tunneling experiment showing theFermi level of Fe(III) - protoporphyrin IX inrelation to the Fermi levels of the substrate andtip. Note the alignment of the energy levels ofthe tip and substrate with the LUMO of theFe(III) - protoporphyrin.22a
of redox orbitals results in a sudden and slight increase in orbital-mediated tunneling
current.22b With a fixed tip-substrate bias, the increase in tunneling current is a manifestation
of the unoccupied orbital pathway that has been created by aligning the energy levels of the
tip, adsorbate’s redox orbitals and the substrate. This pathway only exists when the
substrate/adsorbate has been effectively tuned to align the energy levels of the three
components. Tunneling current usually exists anyway between the tip and substrate and, with
resonant tunneling, is simply mediated with a orbital pathway. To compensate for this
sudden change in current, the STM will react to change the tunneling current back to its set-
point magnitude. This is most easily accomplished by STM tip movement until the set point
current is again achieved. Thus, resonant tunneling is perceived by the STM as an apparent
increase in height of the imaged molecules, thereby causing the molecules to “light up” in the
actual image.
The phenomenon of resonant tunneling is best illustrated by experiments by Tao and
coworkers.22a Tao successfully performed resonant tunneling on Fe-protoporphyrins IX. His
experimental apparatus and an example of resonant tunneling are shown as Figures 5.18 and
5.19 , respectively. Fe-protoporphyrin IX is an ideal choice for resonant tunneling,
considering it can be readily immobilized on a flat graphite surface, undergoes fast ET
reactions, and has an excellent reference molecule to serve as its electroinactive compliment.
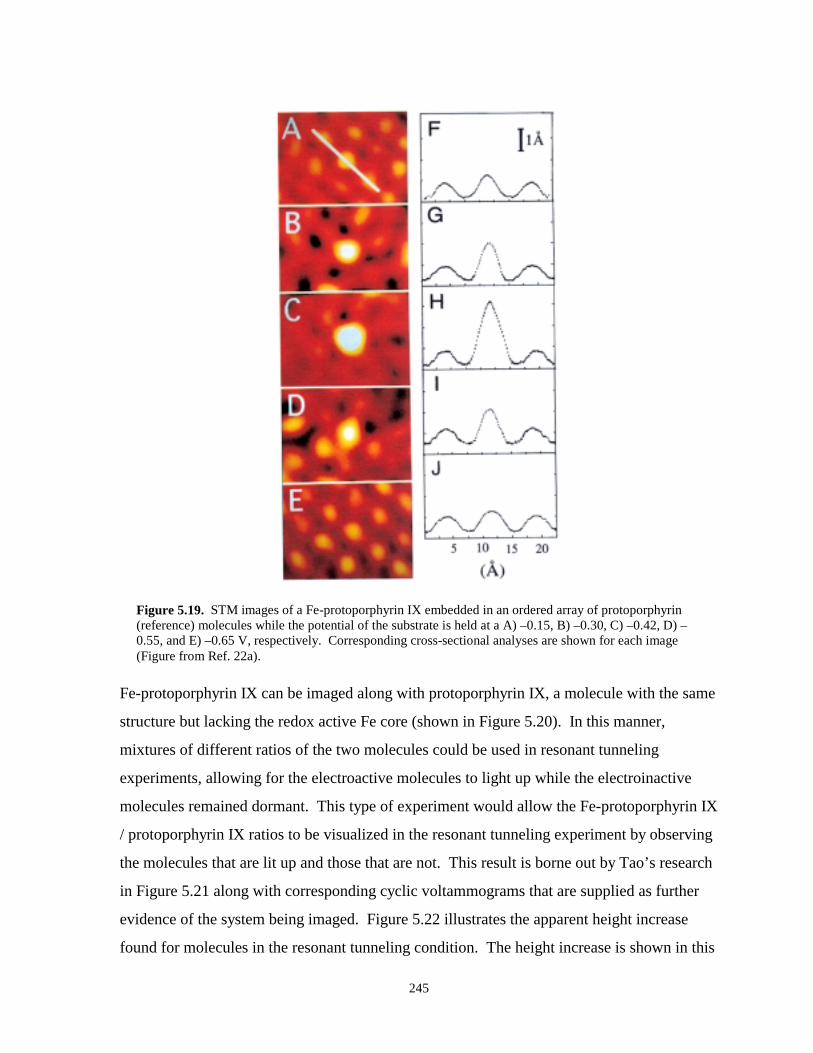
245
Figure 5.19. STM images of a Fe-protoporphyrin IX embedded in an ordered array of protoporphyrin(reference) molecules while the potential of the substrate is held at a A) –0.15, B) –0.30, C) –0.42, D) –0.55, and E) –0.65 V, respectively. Corresponding cross-sectional analyses are shown for each image(Figure from Ref. 22a).
Fe-protoporphyrin IX can be imaged along with protoporphyrin IX, a molecule with the same
structure but lacking the redox active Fe core (shown in Figure 5.20). In this manner,
mixtures of different ratios of the two molecules could be used in resonant tunneling
experiments, allowing for the electroactive molecules to light up while the electroinactive
molecules remained dormant. This type of experiment would allow the Fe-protoporphyrin IX
/ protoporphyrin IX ratios to be visualized in the resonant tunneling experiment by observing
the molecules that are lit up and those that are not. This result is borne out by Tao’s research
in Figure 5.21 along with corresponding cyclic voltammograms that are supplied as further
evidence of the system being imaged. Figure 5.22 illustrates the apparent height increase
found for molecules in the resonant tunneling condition. The height increase is shown in this
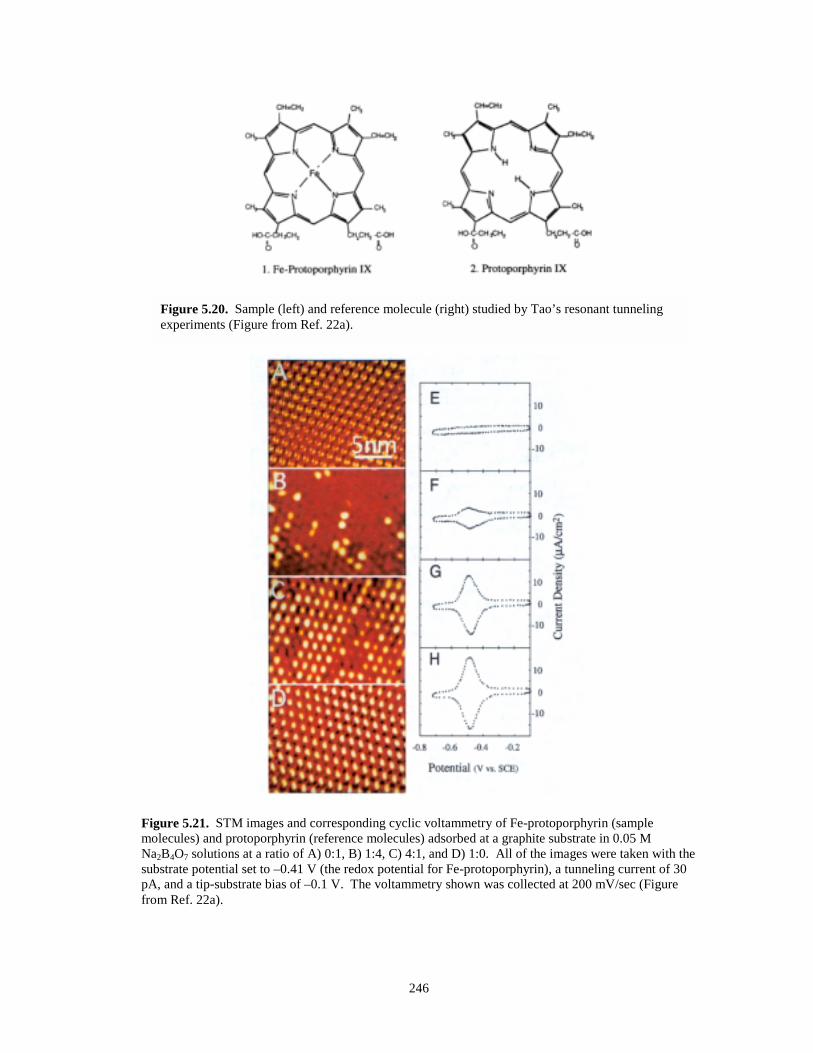
246
Figure 5.20. Sample (left) and reference molecule (right) studied by Tao’s resonant tunnelingexperiments (Figure from Ref. 22a).
Figure 5.21. STM images and corresponding cyclic voltammetry of Fe-protoporphyrin (samplemolecules) and protoporphyrin (reference molecules) adsorbed at a graphite substrate in 0.05 MNa2B4O7 solutions at a ratio of A) 0:1, B) 1:4, C) 4:1, and D) 1:0. All of the images were taken with thesubstrate potential set to –0.41 V (the redox potential for Fe-protoporphyrin), a tunneling current of 30pA, and a tip-substrate bias of –0.1 V. The voltammetry shown was collected at 200 mV/sec (Figurefrom Ref. 22a).
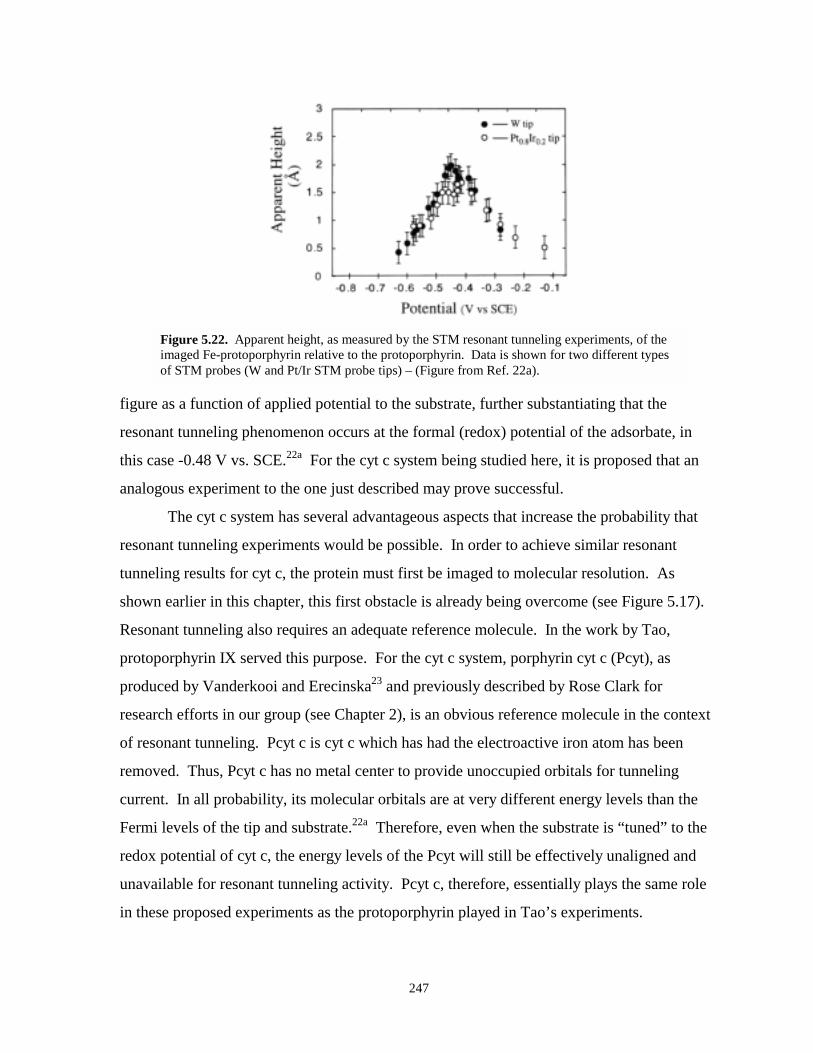
247
Figure 5.22. Apparent height, as measured by the STM resonant tunneling experiments, of theimaged Fe-protoporphyrin relative to the protoporphyrin. Data is shown for two different typesof STM probes (W and Pt/Ir STM probe tips) – (Figure from Ref. 22a).
figure as a function of applied potential to the substrate, further substantiating that the
resonant tunneling phenomenon occurs at the formal (redox) potential of the adsorbate, in
this case -0.48 V vs. SCE.22a For the cyt c system being studied here, it is proposed that an
analogous experiment to the one just described may prove successful.
The cyt c system has several advantageous aspects that increase the probability that
resonant tunneling experiments would be possible. In order to achieve similar resonant
tunneling results for cyt c, the protein must first be imaged to molecular resolution. As
shown earlier in this chapter, this first obstacle is already being overcome (see Figure 5.17).
Resonant tunneling also requires an adequate reference molecule. In the work by Tao,
protoporphyrin IX served this purpose. For the cyt c system, porphyrin cyt c (Pcyt), as
produced by Vanderkooi and Erecinska23 and previously described by Rose Clark for
research efforts in our group (see Chapter 2), is an obvious reference molecule in the context
of resonant tunneling. Pcyt c is cyt c which has had the electroactive iron atom has been
removed. Thus, Pcyt c has no metal center to provide unoccupied orbitals for tunneling
current. In all probability, its molecular orbitals are at very different energy levels than the
Fermi levels of the tip and substrate.22a Therefore, even when the substrate is “tuned” to the
redox potential of cyt c, the energy levels of the Pcyt will still be effectively unaligned and
unavailable for resonant tunneling activity. Pcyt c, therefore, essentially plays the same role
in these proposed experiments as the protoporphyrin played in Tao’s experiments.
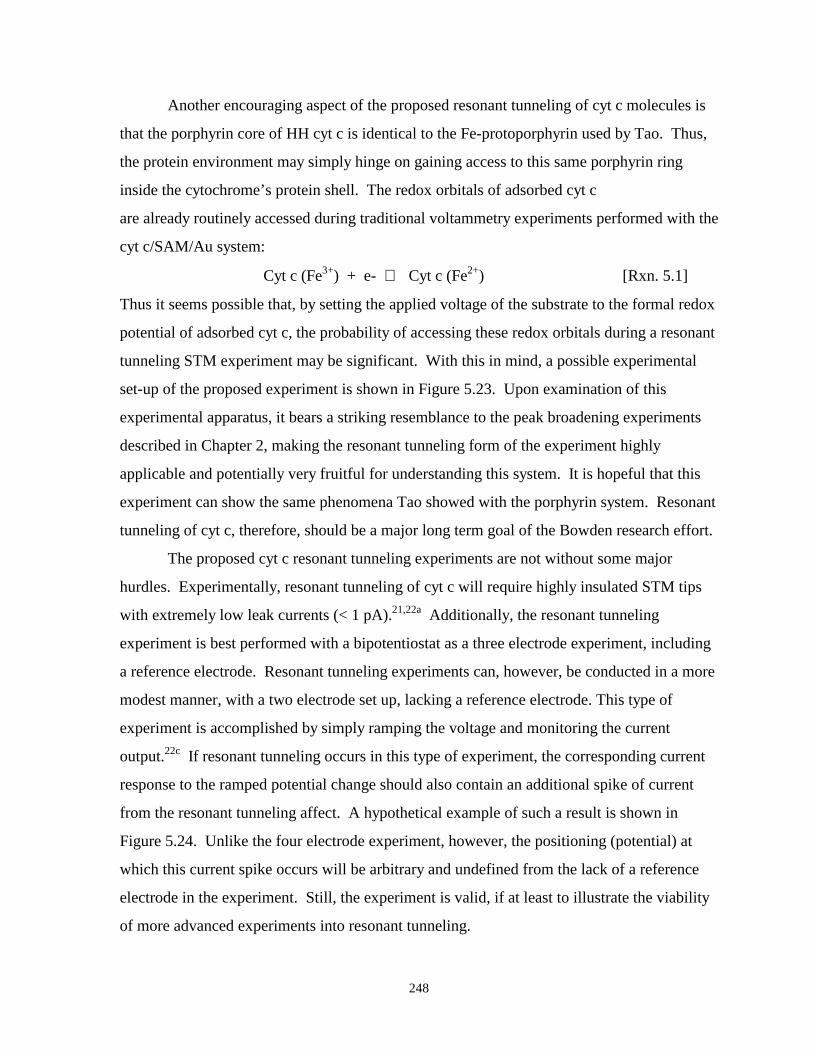
248
Another encouraging aspect of the proposed resonant tunneling of cyt c molecules is
that the porphyrin core of HH cyt c is identical to the Fe-protoporphyrin used by Tao. Thus,
the protein environment may simply hinge on gaining access to this same porphyrin ring
inside the cytochrome’s protein shell. The redox orbitals of adsorbed cyt c
are already routinely accessed during traditional voltammetry experiments performed with the
cyt c/SAM/Au system:
Cyt c (Fe3+) + e- ⇔ Cyt c (Fe2+) [Rxn. 5.1]
Thus it seems possible that, by setting the applied voltage of the substrate to the formal redox
potential of adsorbed cyt c, the probability of accessing these redox orbitals during a resonant
tunneling STM experiment may be significant. With this in mind, a possible experimental
set-up of the proposed experiment is shown in Figure 5.23. Upon examination of this
experimental apparatus, it bears a striking resemblance to the peak broadening experiments
described in Chapter 2, making the resonant tunneling form of the experiment highly
applicable and potentially very fruitful for understanding this system. It is hopeful that this
experiment can show the same phenomena Tao showed with the porphyrin system. Resonant
tunneling of cyt c, therefore, should be a major long term goal of the Bowden research effort.
The proposed cyt c resonant tunneling experiments are not without some major
hurdles. Experimentally, resonant tunneling of cyt c will require highly insulated STM tips
with extremely low leak currents (< 1 pA).21,22a Additionally, the resonant tunneling
experiment is best performed with a bipotentiostat as a three electrode experiment, including
a reference electrode. Resonant tunneling experiments can, however, be conducted in a more
modest manner, with a two electrode set up, lacking a reference electrode. This type of
experiment is accomplished by simply ramping the voltage and monitoring the current
output.22c If resonant tunneling occurs in this type of experiment, the corresponding current
response to the ramped potential change should also contain an additional spike of current
from the resonant tunneling affect. A hypothetical example of such a result is shown in
Figure 5.24. Unlike the four electrode experiment, however, the positioning (potential) at
which this current spike occurs will be arbitrary and undefined from the lack of a reference
electrode in the experiment. Still, the experiment is valid, if at least to illustrate the viability
of more advanced experiments into resonant tunneling.
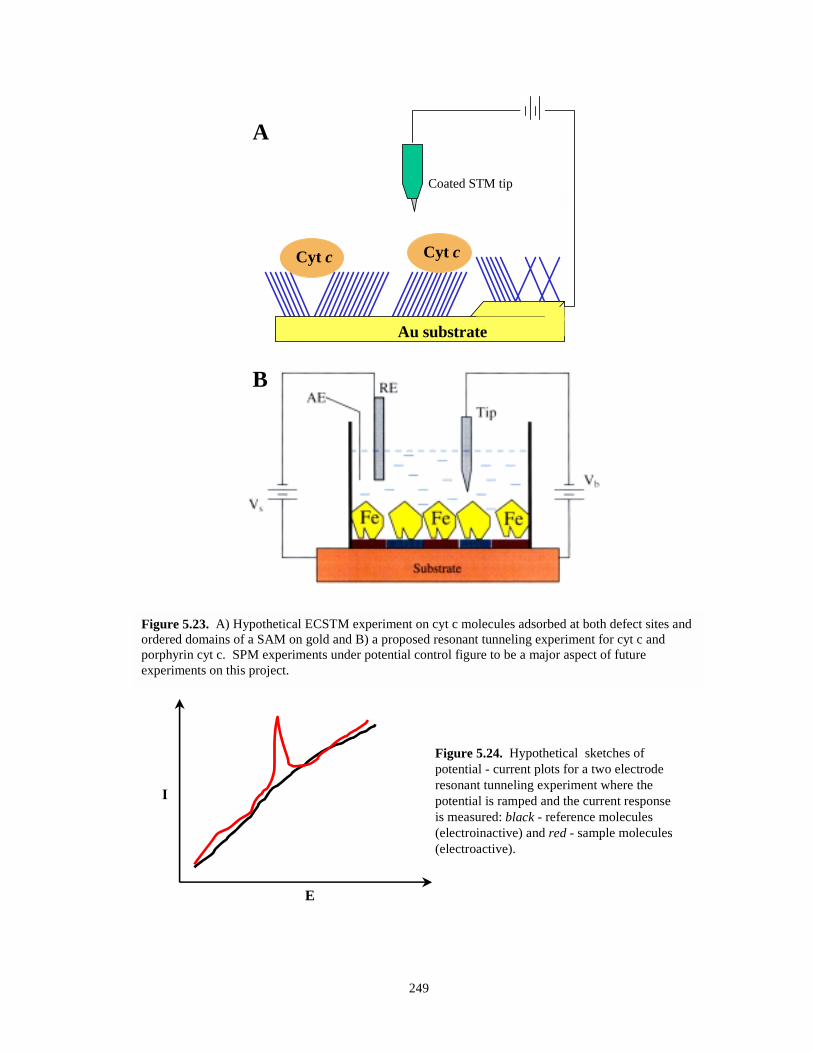
249
Au substrateAu substrate
Cyt c
Coated STM tip
Cyt c
A
B
Figure 5.23. A) Hypothetical ECSTM experiment on cyt c molecules adsorbed at both defect sites andordered domains of a SAM on gold and B) a proposed resonant tunneling experiment for cyt c andporphyrin cyt c. SPM experiments under potential control figure to be a major aspect of futureexperiments on this project.
Figure 5.24. Hypothetical sketches ofpotential - current plots for a two electroderesonant tunneling experiment where thepotential is ramped and the current responseis measured: black - reference molecules(electroinactive) and red - sample molecules(electroactive).
I
E
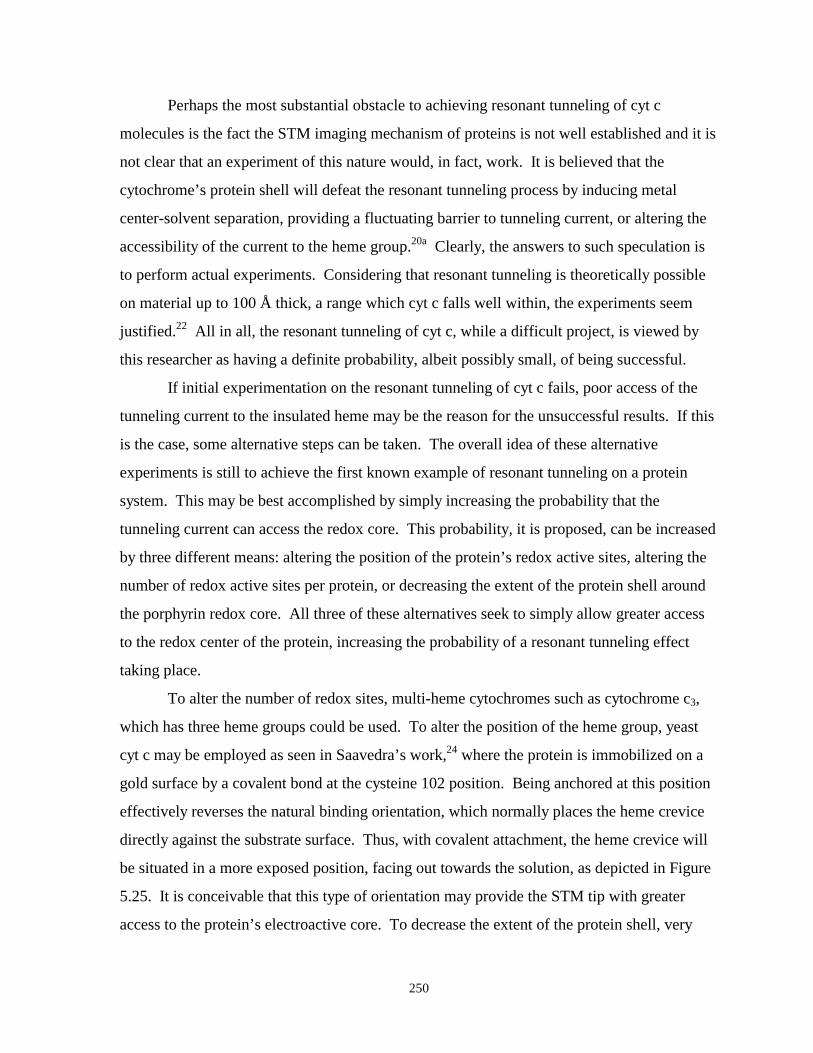
250
Perhaps the most substantial obstacle to achieving resonant tunneling of cyt c
molecules is the fact the STM imaging mechanism of proteins is not well established and it is
not clear that an experiment of this nature would, in fact, work. It is believed that the
cytochrome’s protein shell will defeat the resonant tunneling process by inducing metal
center-solvent separation, providing a fluctuating barrier to tunneling current, or altering the
accessibility of the current to the heme group.20a Clearly, the answers to such speculation is
to perform actual experiments. Considering that resonant tunneling is theoretically possible
on material up to 100 Å thick, a range which cyt c falls well within, the experiments seem
justified.22 All in all, the resonant tunneling of cyt c, while a difficult project, is viewed by
this researcher as having a definite probability, albeit possibly small, of being successful.
If initial experimentation on the resonant tunneling of cyt c fails, poor access of the
tunneling current to the insulated heme may be the reason for the unsuccessful results. If this
is the case, some alternative steps can be taken. The overall idea of these alternative
experiments is still to achieve the first known example of resonant tunneling on a protein
system. This may be best accomplished by simply increasing the probability that the
tunneling current can access the redox core. This probability, it is proposed, can be increased
by three different means: altering the position of the protein’s redox active sites, altering the
number of redox active sites per protein, or decreasing the extent of the protein shell around
the porphyrin redox core. All three of these alternatives seek to simply allow greater access
to the redox center of the protein, increasing the probability of a resonant tunneling effect
taking place.
To alter the number of redox sites, multi-heme cytochromes such as cytochrome c3,
which has three heme groups could be used. To alter the position of the heme group, yeast
cyt c may be employed as seen in Saavedra’s work,24 where the protein is immobilized on a
gold surface by a covalent bond at the cysteine 102 position. Being anchored at this position
effectively reverses the natural binding orientation, which normally places the heme crevice
directly against the substrate surface. Thus, with covalent attachment, the heme crevice will
be situated in a more exposed position, facing out towards the solution, as depicted in Figure
5.25. It is conceivable that this type of orientation may provide the STM tip with greater
access to the protein’s electroactive core. To decrease the extent of the protein shell, very
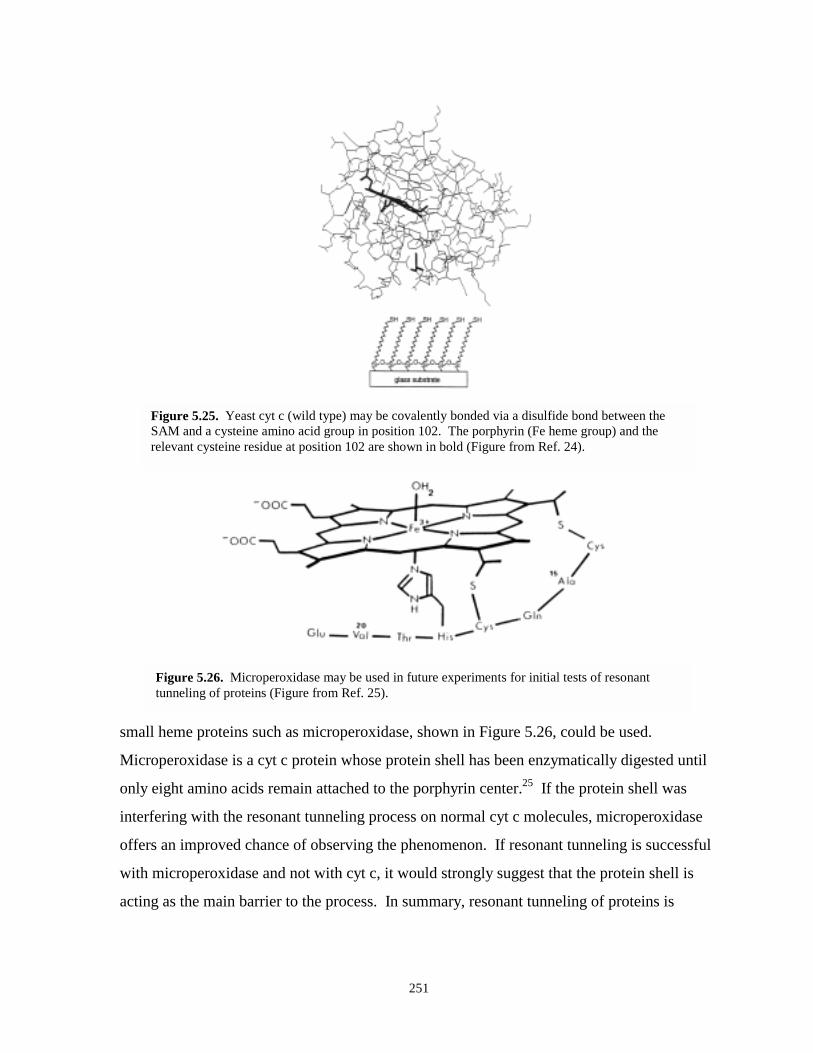
251
Figure 5.25. Yeast cyt c (wild type) may be covalently bonded via a disulfide bond between theSAM and a cysteine amino acid group in position 102. The porphyrin (Fe heme group) and therelevant cysteine residue at position 102 are shown in bold (Figure from Ref. 24).
Figure 5.26. Microperoxidase may be used in future experiments for initial tests of resonanttunneling of proteins (Figure from Ref. 25).
small heme proteins such as microperoxidase, shown in Figure 5.26, could be used.
Microperoxidase is a cyt c protein whose protein shell has been enzymatically digested until
only eight amino acids remain attached to the porphyrin center.25 If the protein shell was
interfering with the resonant tunneling process on normal cyt c molecules, microperoxidase
offers an improved chance of observing the phenomenon. If resonant tunneling is successful
with microperoxidase and not with cyt c, it would strongly suggest that the protein shell is
acting as the main barrier to the process. In summary, resonant tunneling of proteins is
252
clearly a risky venture, but one well worth consideration because of the valuable information
that can be gained from such research.
Resonant tunneling serves the ultimate objectives of this research well. Resonant
tunneling of cyt c, if successful, would provide the unprecedented ability to image cyt c
adsorbed to electrode surfaces, as well as, differentiate between native/denatured or
electroactive/electroinactive forms of the cytochrome molecules, all while maintaining
potential control at the interface. Combinations of Pcyt c and cyt c could be used to identify
strong and weak adsorption sites and correlate them with surface structure. Once molecular
comprehension of the surface aspects of protein monolayer electrochemistry become
available through research such as that described here, applied research in bioanalytical
chemistry will benefit. The availability of accurate molecular adsorption models and well-
defined ET mechanisms should lead to practical and clinically useful biosensors with
performance that is currently unattainable.
5.5. SPECIAL ACKNOWLEDGEMENTS
I am extremely grateful to the people that went out of their way to help me out with
SPM experiments. Both Professor Chris Gorman and Dr. Igor Touzov, a Gorman Research
Group postdoctoral associate, helped me out a great deal with SPM explanations, tutorials,
and suggestions on my experiments. Most of all, however, I would like to thank my good
friend and roommate of many years, Mr. Russell Miller. Without Russ, I never would have
gotten the results that have been presented in this chapter. My only regret is that I didn’t have
more time to pursue the SPM goals, which, in my opinion are very exciting, achievable, and
have the potential to be extremely insightful.
5.6. EXPERIMENTAL DETAILS
5.6.1. STM Experiments
STM experiments were conducted with a Digital Instruments Nanoscope III
Multimode Scanning Probe Microscope operating in a low current STM mode. Images were
collected at a constant current, using Pt/Ir mechanically cut STM tips (Digital Instruments).
Tip shape is an extremely important aspect of imaging as it can distort reality by obscuring
253
the dimensions of imaged adsorbates, the number of molecules in the images, and the pattern
of imaged materials (“ghost images”). To this end, many STM scientists systematically etch
W tips. For this research, however, mechanically cut Pt/Ir tips, whose tip-to-tip quality
varied significantly, were predominantly used. All measurements were carried out in a dry
atmosphere of pre-purified helium with a relative humidity of < 1% as measured by a digital
hygrometer (Fisher Scientific). Set point currents and voltage biases during imaging were
usually in the range of 1-10 pA and 1-2 V, respectively. Wherever possible, these parameters
have been included in the figures of the images or in their captions.
Gold substrates were pretreated and used as described in Chapter 3. All materials and
equipment was handled with lint-free clean room gloves and/or stainless steel forceps to
minimize contamination. Cyt c/gold samples were prepared by first hydrogen flame
annealing gold on mica (Molecular Imaging, Inc.) as described by technical support from
both Molecular Imaging and Digital Instruments.5,7 Cyt c solution (0.25 µM Horse Heart cyt
c in 4.4 mM KPB) was then dispersed in the form of several drops via a disposable glass
pipette, onto the cooled, dry gold surface. The cyt c was allowed to adsorb before the
solution was very gently blown off the surface with a steady stream of dry Ar. The substrates
were then imaged immediately over the next few hours.
5.6.2. AFM Experiments
All AFM imaging was performed with a Digital Instruments Nanoscope III
Multimode Scanning Probe Microscope. Cantilever deflections were detected optically a
typical photodiode array detections system common to AFM instrumentation. In such an
apparatus , a laser is deflected off the back of the cantilever and onto a position-sensitive
photodetector. Images of gold surfaces were collected using contact mode AFM with an
equiforce setting. This type of experiment was selected based on the stable structure of the
Au substrate. Cantilevers of silicon nitride were used as received from Digital Instruments as
100 or 200 µm isosceles triangular probes with both narrow and wide legs. The spring
constants for the 100 µm narrow and wide legs were 0.38 and 0.58 N/m, respectively, and
0.06 and 0.12 N/m for the 200 µm cantilevers.
254
5.7 REFERENCES
1. a) O. Marti and M. Amrein, STM and SFM in Biology, Academic Press Inc.: New York, 1993. b)H.J. Guntherodt, and R. Wiesendanger, Eds., Scanning Tunneling Microscopy I; Springer Seriesin Surface Sciences 20; Springer-Verlag: Berlin, 1992; c) H.J. Guntherodt, and R. Wiesendanger,Eds., Scanning Tunneling Microscopy II, Springer Series in Surface Sciences 28; Springer-Verlag: Berlin, 1992; d) C. Bai, Scanning Tunneling Microscopy and its Application, SpringerSeries in Surface Sciences 32; Springer-Verlag: Berlin, 1995; e) S. Magonov, S. and M.H.Whangbo, Surface Analysis with STM and AFM: Experimental and Theoretical Aspects of ImageAnalysis, VCH: New York, 1996; f) L.A. Bottomley, J.E. Coury, and P.N. First, Anal. Chem.1996, 68, 185R-230R; g) R.J. Hamers, “Scanned Probe Microscopies in Chemistry,” J. Phys.Chem. 1996, 100, 13103-13120; h) M.D. Ward and H.S. White, "Scanning Tunneling andAtomic Force Microscopy of Electrochemical Interfaces," In Modern Techniques inElectroanalysis; P. Vanysck, Ed., Chemical Analysis Series; John Wiley and Sons Inc.: 1996;Vol. 139, Chapter 3.
2. Supplemental Proposal to NSF Grant (CHE-9307257). 3. a) C.R. Clemmer and T.P. Beebe, “A Review of Graphite and Gold Surface Studies for Use as
Substrates in Biological Scanning Tunneling Microscopy Studies,” Scanning Microscopy 1992,6(2), 319-333; b) J. Vancea, G. Reiss, F. Schneider, and H. Hoffman, “Substrate Effects on theSurface Topography of Evaporated Gold Films - A Scanning Tunnelling MicroscopyInvestigation,” Surface Science 1989, 218, 108-126.
4. a) S.E. Creager, L.A. Hockett, and G.K. Rowe, “Consequences of Microscopic Surface
Roughness for Molecular Self-Assembly,” Langmuir 1992, 8, 854-861; b) S. Manne, J. Massie,V.B. Elings, P.K. Hansma, and A.A. Gewirth, “Electrochemistry on a Gold Surface ObservedWith the Atomic Force Microscope,” J. Vac. Sci. Technol. B 1991, 9(2), 950-954.
5. Personal correspondence with B.C. Schardt of Digital Imaging Corporation, 1996. 6. a) J. Kang and P.A. Rowntree, “Molecularly Resolved Surface Superstructure of Self-Assembled
Butanethiol Monolayers on Gold,” Langmuir 1996, 12, 2813-2819; b) D.J. Trevor, C.E.D.Chidsey, and Dominic N. Loiacono, “In Situ Scanning-Tunneling-Microscope Observation ofRoughening, Annealing, and Dissolution of Gold(111) in an Electrochemical Cell,” PhysicalReview Letters 1989, 62(8), 929-932.
7. Personal communication with technical support at Molecular Imaging Corporation. 8. a) G.E. Poirier, M.J. Tarlov, “Molecular Ordering and Gold Migration Observed in Butanethiol
Self-Assembled Monolayers Using Scanning Tunneling Microscopy,” J. Phys. Chem. 1995, 99,10966-10970; b) C. Schonenberger, J.A.M. Sondag-Huethorst, J. Jorritsma, and L.G.J. Fokkink,“What Are the ‘Holes’ in Self-Assembled Monolayers of Alkanethiols on Gold,” Langmuir1994, 10(3), 611-614; c) C. Schonenberger, J.A.M. Sondag-Huethorst, and L.G.J. Fokkink,“Formation of Holes in Alkanethiol Monolayers on Gold,” J. Phys. Chem. 1994, 98, 6826-6834.
9. a) M. Hegner, P. Wagner, and G. Semenza, “Ultralarge Atomically Flat Template-Stripped Au
Surfaces For Scanning Probe Microscopy,” Surface Science 1993, 291, 39-46; b) N.G. Woodard
255
and G.P. Lafyatis, “Fabrication and Characterization of Extremely Smooth Large Area GoldSurfaces,” J. Vac. Sci. Technol. A 1996, 14(2), 332-335.
10. a) G.E. Poirier, Langmuir 1997, 13, 2019-2026; b) M.J. Poirier and E.D. Pylant, “The Self-
Assembly Mechanism of Alkanethiols on Au(111),” Science 1996, 272, 1145-1148; c) C.A.Alves, E.L. Smith, M.D. Porter, “Atomic Scale Imaging of Alkanethiolate Monolayers at AuSurfaces with Atomic Force Microscopy,” J. Am. Chem. Soc. 1992, 114, 1222-1227; d) R.Yamada and K. Uosaki, “In-Situ, Real Time Monitoring of the Self-Assembly Process ofDecanethiol on Au(111) in Liquid Phase. A Scanning Tunneling Microscopy Investigation,”Langmuir 1997, 13, 5218-5221; e) J. Pan, N. Tao, and S.M. Lindsay, “An Atomic ForceMicroscopy Study of a Self-Assembled Octadecyl Mercaptan Monolayer Adsorbed on Gold(111) Under Potential Control,” Langmuir 1993, 9, 1556-1560; f) C.B. Ross, L. Sun, R.M.Crooks, “Scanning Probe Litography. 1. Scanning Tunneling Microscope Induced Lithography ofSelf-Assembled n-Alkanethiol Monolayer Resists,” Langmuir 1993, 9, 632-636.
11. a) M. Sprik, E. Delamarche, B. Michel, U. Rothlisberger, M.L. Klein, H. Wold, and H.
Ringsdorf, “Structure of Hydrophilic Self-Assembled Monolayers: A Combined ScanningTunneling Microscopy and Computer Simulation Study,” Langmuir 1994, 10, 4116-4130; b) K.Hu and A.J. Bard, “Use of Atomic Microscopy for the Study of Surface Acid-Base Properties ofCarboxylic Acid-Terminated Self-Assembled Monolayers, Langmuir 1997, 13, 5114-5119; c)M.P.L. Werts, E.W. van der Vegte, and G. Hadziioannou, “Surface Chemical Reactions Probedwith Scanning Force Microscopy,” Langmuir 1997, 13, 4939-4942; d) J.T. Woodward and D.K.Schwartz, “In Situ Observation of Self-Assembled Monolayer Growth,” J. Am. Chem. Soc. 1996,118, 7861-7862; e) U. Durig, O. Zuger, B. Michel, L. Haussling, and H. Ringsdorf, “Electronicand Mechanical Characterization of Self-Assembled Alkanethiol Monolayers by ScanningTunneling Microscopy Combined With Interaction Force Gradient Sensing,” Physical Review B1993, 48(3), 1711-1717; f) J.L. Wilbur, H.A. Biebuyck, J.C. MacDonald, and G.M. Whitesides,Langmuir 1995, 11, 825-831; g) M. Lestelius, B. Liedberg, and P. Tengvall, Langmuir 1997, 13,5900-5908.
12. a) N. Camillone, C.E.D. Chidsey, G. Liu, and G. Scoles, “Superlattice Structure at the Surface of
a Monolayer of Octadecanethiol Self-Assembled on Au(111),” J. Chem. Phys. 1993, 98(4), 3503-3511; b) G.E. Poirier and M.J. Tarlov, “The c(4x2) Superlattice of n-Alkanethiol MonolayersSelf-Assembled on Au(111),” Langmuir 1994, 10(9), 2853-2857; c) G.E. Poirier, H.E.Rushmeier, and M.J. Tarlov, “Two-Dimensional Liquid Phase and the p x √3 Phase ofAlkanethiol Self-Assembled Monolayers on Au(111),” Langmuir 1994, 10, 3383-3386; d) N.Camillone, P. Eisenberger, T.Y.B. Leung, P. Schwartz, and G. Scoles, “New Monolayer Phasesof n-Alkane Thiols Self-Assembled on Au(111): Preparation, Characterization, and Imaging,” J.Chem. Phys. 1994, 101, 11031-11036; e) C. Schonenberger, J. Jorritsma, J.A.M. Sondag-Huethorst, and L.G.J. Fokkink, “Domain Structure of Self-Assembled Alkanethiol Monolayerson Gold,” J. Phys. Chem. 1995, 99, 3259-3271.
13. Digital Instruments Nanoscope® III Multimode Scanning Probe Microscope, Instruction Manual,
Manual Version 1.5, November 12, 1993. 14. a) L.A. Bumm, J.J. Arnold, L.F. Charles, T.D. Dunbar, D.L. Allara, and P.S. Weiss, “Creating
Molecular Terraces With Molecularly Sharp Boundaries in Organic Thin Films,” submitted toScience; b) E. Delamarch, B. Michel, H.A. Biebuyck, and C. Gerber, “Golden Interfaces: TheSurface of Self-Assembled Monolayers**,” Adv. Mater. 1996, 8(9), 719-729; c) S.J. Stranick,
256
A.N. Parikh, T.-T. Tao, D.L. Allara, and P.S. Weiss, “Phase Separation of Mixed CompositionSelf-Assembled Monolayers Into Nanometer Scale Molecular Domains,” J. Phys. Chem. 1994,98, 7636-7646.
15. a) H. Arakawa, K. Umemura, and A. Ikai, “Protein Images Obtained by STM, AFM, and TEM,
Nature 1992, 358, 171-173; b) S. Karrasch, R. Hegerl, J.H. Hoh, W. Baumeister, and A. Engel,“Atomic Force Microscopy Produces Faithful High-Resolution Images of Protein Surfaces in anAqueous Environment,” Proc. Natl. Acad. Sci. USA 1994, 91, 836-838; c) F. Caruso, D.N.Furlong, and P. Kingshott, “Characterization of Ferritin Adsorption Onto Gold,” Journal ofColloid and Interface Science 1997, 186, 129-140; d) A. Mosca, R. Paleari, P. Arosio, A.Cricenti, M.A. Scarselli, R. Generosi, S. Selci, and E. Rovida, “Direct Observation of HumanLiver Ferritin by Scanning Tunneling Microscopy,” J. Vac. Sci. Technol. B 1994, 12(3), 1486-1489; e) S. Ohnishi, M. Hara, T. Furuno, and H. Sasabe, “Imaging the Ordered Arrays of Water-Soluble Protein Ferritin with the Atomic Force Microscope,” Biophys. J. 1992, 63, 1425-1431; f)S. Ohnishi, M. Hara, T. Furuno, and H. Sasabe, “Direct Visualization of Polypeptide Shell ofFerritin Molecule by Atomic Force Microscopy,” Biophys. J. 1993, 65, 573-577; J. Yang, K.Takeyasu, A.P. Somlyo, and Z. Shao, “Scanning Tunneling Microscopy of an Ionic Crystal:Ferritin Core,” Ultramicroscopy 1992, 45, 199-203.
16. S.J. Eppell, F.R. Zypman, and R.E. Marchant, “Probing the Resolution Limits and Tip
Interactions of Atomic Force Microscopy in the Study of Globular Proteins,” Langmuir 1993,9(9), 2281-2288.
17. a) Q. Chi, J. Zhang, S. Dong, and E. Wang, “Direct Observation of Native and Unfolded Glucose
Oxidase Structures by Scanning Tunnelling Microscopy,” J. Chem. Soc. Faraday Trans. 1994,90(14), 2057-2060; b) J.D. Zhang, Q. Chi, S.J. Dong, and E. Wang, “High Resolution Imaging ofNative Hemoglobin by Scanning Tunneling Microscopy,” J. Electroanal. Chem. 1994, 379, 535-539; c) R. Guckenberger, M. Heim, G. Cevc, H.F. Knapp, W. Wiegrabe, and A. Hillebrand,“Scanning Tunneling Microscopy of Insulators and Biological Specimens Based on LateralConductivity of Ultrathin Water Films,” Science 1994, 266, 1538-1540; d) F.-R. F. Fan and A.J.Bard, “STM on Wet Insulators: Electrochemistry or Tunneling?,” Science 1995, 270, 1849-1851;e) M.E. Welland, M.J. Miles, N. Lambert, V.J. Morris, J.H. Coombs, and J.B. Pethica, “Structureof the Globular Protein Vicilin Revealed by Scanning Tunnelling Microscopy,” Int. J. Biol.Macromol. 1989, 11, 29-32; f) D.C. Dahn, M.O. Watanabe, B.L. Blackford, M.H. Jericho, andT.J. Beveridge, “Scanning Tunneling Microscopy Imaging of Biological Structures,” J. Vac. Sci.Technol. A 1988, 6(2), 548-552; g) M.A. Voelker, S.R. Hameroff, J.E. He, R.S. McCuskey, C.W.Schneiker, T.A. Chvapil, L.S. Bell and L.B. West, “STM Imaging of Molecular Collagen andPhospholipid Membranes,” J. Mol. Biology 1988, 152(2), 557-566.
18. a) P. Wagner, P. Kernen, M. Hegner, E. Ungewickell, G. Semenza, “Covalent Anchoring of
Proteins onto Gold-Directed NHS-terminated Self-Assembled Monolayers in Aqueous Buffers:SFM Images of Clathrin Cages and Triskelia,” FEBS Letters 1994, 356, 267-271; b) A.B.Maunsbach and K. Thomsen, “Atomic Force Microscopy of Crystallized Na+/K+ - ATPase,” InThe Sodium Pump. Structure Mechanism, Hormonal Control, and its Role in Disease, E.Bamberg and W. Schoner, Eds. Steinkopff Verlag, Darmstadt 1994, 342-345; c) J.E.T. Andersen,E. Friis, L.L. Madsen, P. Moller, and J. Ulstrup, “The Behavior of P. Aeruginosa Azurin and itsSer26Cys Mutant at Gold Surfaces, Investigated by Cyclic Voltammetry and AFM,” conferenceabstract; d) J.D. Burgess, V.W. Jones, and M.D. Porter, “Tapping Mode Scanning ForceMicroscopy Images of Cytochrome c Oxidase Immobilized in an Electrode Supported Lipid
257
Bilayer Membrane,” submitted to Nature, 1998; e) M. Fritz, M. Radmacher, J.P. Cleveland,M.W. Allersma, R.J. Stewart, R. Gieselmann, P. Janmey, C.F. Schmidt, and P.K. Hansman,“Imaging Globular and Filamentous Proteins in Physiological Buffer Solutions with TappingMode Atomic Force Microscopy,” Langmuir 1995, 11, 3529-3535; f) A.P. Quist, L.P. Bjorck,C.T. Reimann, S.O. Oscarsson, B.U.R. Sundqvist, “A Scanning Force Microscopy Study ofHuman Serum Albumin and Porcine Pancreas Trypsin Adsorption on Mica Surfaces,” SurfaceScience 1995, 325, L406-L412.
19. a) J.E.T. Andersen, P. Moller, M.V. Pedersen, and J. Ulstrup, “Cytochrome c Dynamics at Gold
and Glassy Carbon Surfaces Monitored by In Situ Scanning Tunneling Microscopy,” SurfaceScience 1995, 325, 193-205; b) P. Connolly, J. Cooper, G.R. Moores, J. Shen, and G. Thompson,“Development of Molecular Patterning and Immobilization Techniques for Scanning TunnelingMicroscopy and Atomic Force Microscopy,” Nanotechnology 1991, 2, 160-163; c) P. Connollyet al., Nanobiology 1993, 2, 43-53; d) Z. Nawaz, T.R.I. Cataldi, J. Knall, R. Someleh, and J.B.Pethica, “STM Imaging of Molecules: Factors Affecting Their Reliable Imaging,” SurfaceScience 1992, 265, 139-155; e) E. Delamarche, H. Biebuyck, B. Michel, G. Sundarababu, H.Sigrist, H. Wolf, and H. Ringsdorf, In Procedures in Scanning Probe Microscopies; Colton et al.Eds.; John Wiley and Sons Inc.: Chichester, UK, 1995; f) Z. Liu, A. Manivannan, H. Inokuchi,and H. Yanagi, J. Vac. Sci. Technol. B 1993, 11(5) 1766-1773; g) Z. Liu, A. Manivannan, H.Inokuchi, M. Ashida, A. Fujishima, and H. Yanagi, Surface Science Letters 1993, 284, L411-L415; h) B. Zhang and E. Wang, “Tip Induced Dynamic Characterization of Multilayers andVariable Morphologies of Cyt c Molecules on Highly Ordered Pyrolytic Graphite Revealed by InSitu Scanning Tunneling Microscopy,” J. Chem. Soc., Faraday Trans. 1997, 93(2), 327-331; i)E.P. Friis, J.E.T. Andersen, L.L. Madsen, P. Moller, R.J. Nichols, K.G. Olesen, and J. Ulstrup,“Metalloprotein Adsorption on Au(111) and Polycrystalline Platinum Investigated by In SituScanning Tunneling Microscopy with Molecular and Submolecular Resolution,” ElectrochimicaActa 1998, 43(19-20), 2889-2897; j) J.D. Burgess, V.W. Jones, and M.D. Porter, “TappingMode-Scanning Force Microscopy Images of Cytochrome c Oxidase Immobilized in anElectrode-Supported Lipid Bilayer Membrane,” submitted to Nature.
20. a) J.E.T. Andersen, A.A. Kornyshev, A.M. Kuznetsov, L.L. Madsen, P. Moller, and J. Ulstrup,
“Electron Tunneling in Electrochemical Processes and In Situ Scanning Tunnel Microscopy ofStructurally Organized Systems,” Electrochimica Acta 1997, 42(5), 819-831; b) J.E.T. Andersen,J. Ulstrup, and P. Moller, “Electrode Surfaces in Metalloprotein Electrolytes Investigated by InSitu STM,” conference abstract.
21. a) L.A. Nagahara, T. Thundat, S.M. Lindsay, “Preparation and Characterization of STM Tips for
Electrochemical Studies,” Rev. Sci. Instrum. 1989, 60(10), 3128-3130; b) L. Libioulle, Y.Houbion, J.M. Gilles, “Very Sharp Platinum Tips for Scanning Tunneling Microscopy,” Rev. Sci.Instrum. 1995, 66(1), 97-100; c) C.E. Bach, R.J. Nichols, W. Beckmann, H. Meyer, A. Schulte,J.O. Besenhard, and P.D. Jannakoudakis, “Effective Insulation of Scanning TunnelingMicroscopy Tips for Electrochemical Studies Using an Electropainting Method,” J. Electrochem.Soc. 1993, 140(5), 1281-1284.
22. a) N.J. Tao, “Probing Potential-Tuned Resonant Tunneling Through Redox Molecules With
Scanning Tunneling Microscopy,” Physical Review Letters 1996, 76(21), 4066-4069; b) K.W.Hipps and U. Mazur, “Unoccupied Orbital Mediated Tunneling: Resonance-like Structures in theTunneling Spectra of Polyacenes,” J. Phys. Chem. 1994, 98, 5824-5829; c) J. Campbell, S. Li, D.Gust, T. Moore, A. Moore and S.M. Lindsay, “Probing Electron Transfer in Single Molecules
258
with the STM,” presented at STM 95, Snowmass, CO, July 23-28 (1995); d) K.W. Hipps and U.Mazur, “Resonant Tunneling Bands and Electrochemical Reduction Potentials,” J. Phys. Chem.1995, 99, 6684-6688; e) S.M. Lindsay, O.F. Sankey, Y. Li, C. Herbst, and A. Rupprecht,“Pressure and Resonant Effects in Scanning Tunneling Microscopy of Molecular Adsorbates,” J.Phys. Chem. 1990, 94, 4655-4660; f) S.M. Lindsay, Y. Li, J. Pan, T. Thundat, L.A. Nagahara, P.Oden, J.A. DeRose, U. Knipping, and J.W. White, “Studies of the Electrical Properties of LargeMolecular Adsorbates,” J. Vac. Sci. Technol. B 1991, 9(2), 1096-1101; g) S.M. Lindsay, L.Lyubchenko, Y. Li, N.J. Tao, J. Pan, P. Oden, and J.A. DeRose, “Scanning TunnelingMicroscopy and Atomic Force Microscopy Studies of Biomaterials at a Liquid-Solid Interface,”J. Vac. Sci. Technol. A 1993, 11(4), 808-815.
23. J.M. Vanderkooi and M. Erecinska, Eur. J. Biochem. 1975, 60, 199-207. 24. S. Saavedra, J. Am. Chem. Soc. 1997, 119, 560-576. 25. M. Adam, A.K. Brimah, R.D. Fischer, Li Xing-Fu, “Cyclic Voltammetry of
Imidazolemicroperoxidase-8: Modeling the Control of the Redox Potential of the Cytochromes,”Inorg. Chem. 1990, 29, 1597-1599.
26. R.L. Miller, “Investigating the Effects of the Incorporation of Functional Elements Into Adlayer,”
Master’s of Science Thesis, 1997. 27. a) S.N. Magonov and M.H. Whangbo, “Interpreting STM and AFM Images**,” Advanced
Materials 1994, 6(5), 355-371; b) D.M. Eigler, P.S. Weiss, N.D. Lang, and E.K. Schweizer,“Imaging Xe with a Low-Temperature Scanning Tunneling Microscope,” Physical ReviewLetters 1991, 66(9), 1189-1192; c) I.A. Rauf, “A Comparison of Scanning TunnellingMicroscopy With Conventional and Scanning Transmission Electron Microscopy Using Tin-Doped Indium Oxide Thin Films,” Surface Science 1995, 325, L413-L419; d) R. Heinz and J.P.Rabe, “Scanning Tunneling Microscopy Investigation of Sulfide and Alkanethiolate Adlayers onAg(111),” Langmuir 1995, 11, 506-511; e) J.P. Song, K.A. Morch, K. Carneiro, and A.R.Tholen, “STM Investigations of Solid Surfaces in Water and Air,” Surface Science 1993, 296,299-309; f) M.F. Crommie, C.P. Lutz, and D.M. Eigler, “Confinement of Electrons to QuantumCorrals on a Metal Surface,” Science 1993, 262, 218-220; g) Physics Today, August 1986; h)P.K. Hansma, V.B. Elings, O. Marti, and C.E. Bracker, “Scanning Tunneling Microscopy andAtomic Force Microscopy: Application to Biology and Technology,” Science 1988, 242, 209; i)Bruce Schardt, S.L. Yau, F. Rinaldi, “Atomic Resolution of Adsorbates on Metal Surfaces in Air:Iodine Adsorption on Pt(111),” Science 1989, 243, 1050-1053; j) Y. Zhang, X. Gao, and M.J.Weaver, “Scanning Tunneling Microscopy of C60 and C70 on Ordered Au(111) and Au(110):Molecular Structure and Electron Transmission,” J. Phys. Chem. 1992, 96, 510-513.
28. a) B. Drake, C.B. Prater, A.L. Weisenhorn, S.A.C. Gould, T.R. Albrecht, C.F. Quate, S. Cannell,
H.G. Hansma, P.K. Hansma, Science 1989, 243, 1586-1589; b) N.A. Burnham and R.J. Colton,“Force Microscopy,” Chapter 7 of Scanning Tunneling Microscopy and Spectroscopy, 191-249;c) M. Salmeron, G. Neubauer, A. Folch, M. Tomitori, D.F. Ogletree, and P. Sautet,, Langmuir1993, 9, 3600-3611; d) S.E. Roark, D.J. Semin, and K.L. Rowlen, Anal. Chem. 1996, 68, 473-480; e) W. Han, S.M. Lindsay, T. Jing, “A Magnetically Driven Oscillating Probe Microscopefor Operation in Liquids,” Appl. Phys. Lett. 1996, 69(26), 4111-4113; f) C.B. Prater, P.G.Maivvald, K.J. Kjoller, and M.G. Heaton, “Tapping Mode Imaging - Applications andTechnology,” Digital Instruments Brochure.
259
SOLVENTLESS ELECTROCHEMISTRY OF METALLODENDRIMERS
APPENDIX A
“For every expert, there is an equal andopposite expert.” – Late 20th Century folklore
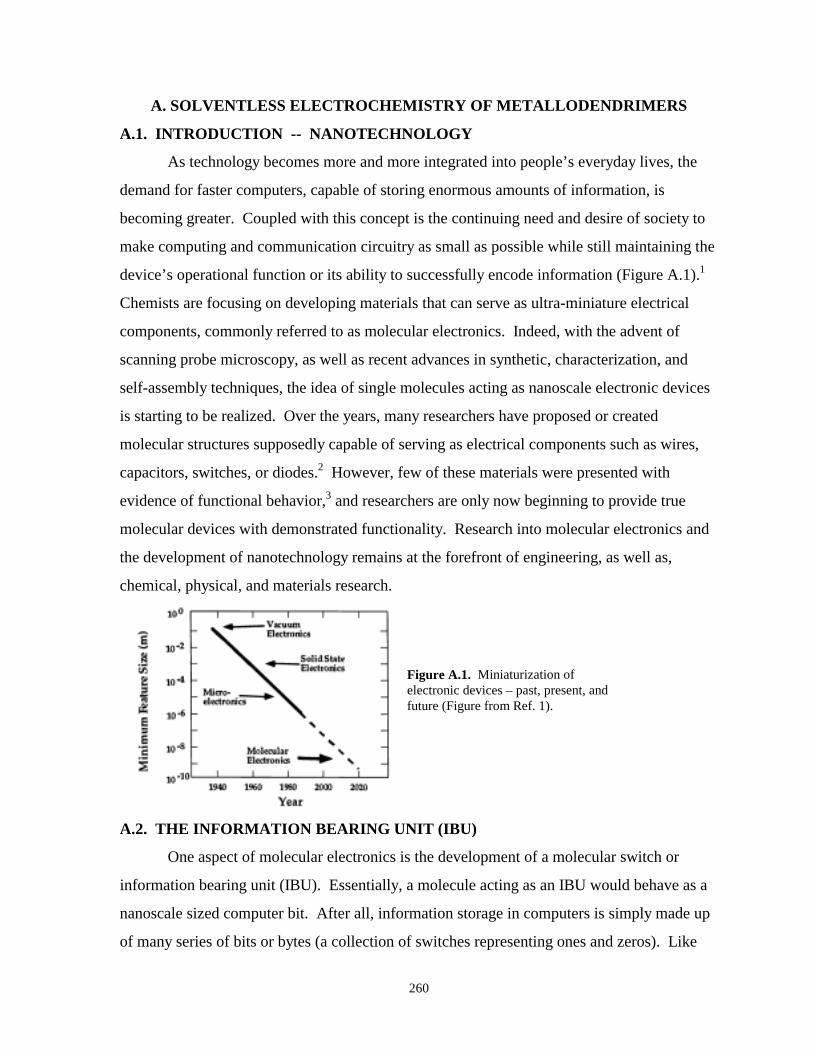
260
A. SOLVENTLESS ELECTROCHEMISTRY OF METALLODENDRIMERS
A.1. INTRODUCTION -- NANOTECHNOLOGY
As technology becomes more and more integrated into people’s everyday lives, the
demand for faster computers, capable of storing enormous amounts of information, is
becoming greater. Coupled with this concept is the continuing need and desire of society to
make computing and communication circuitry as small as possible while still maintaining the
device’s operational function or its ability to successfully encode information (Figure A.1).1
Chemists are focusing on developing materials that can serve as ultra-miniature electrical
components, commonly referred to as molecular electronics. Indeed, with the advent of
scanning probe microscopy, as well as recent advances in synthetic, characterization, and
self-assembly techniques, the idea of single molecules acting as nanoscale electronic devices
is starting to be realized. Over the years, many researchers have proposed or created
molecular structures supposedly capable of serving as electrical components such as wires,
capacitors, switches, or diodes.2 However, few of these materials were presented with
evidence of functional behavior,3 and researchers are only now beginning to provide true
molecular devices with demonstrated functionality. Research into molecular electronics and
the development of nanotechnology remains at the forefront of engineering, as well as,
chemical, physical, and materials research.
A.2. THE INFORMATION BEARING UNIT (IBU)
One aspect of molecular electronics is the development of a molecular switch or
information bearing unit (IBU). Essentially, a molecule acting as an IBU would behave as a
nanoscale sized computer bit. After all, information storage in computers is simply made up
of many series of bits or bytes (a collection of switches representing ones and zeros). Like
Figure A.1. Miniaturization ofelectronic devices – past, present, andfuture (Figure from Ref. 1).
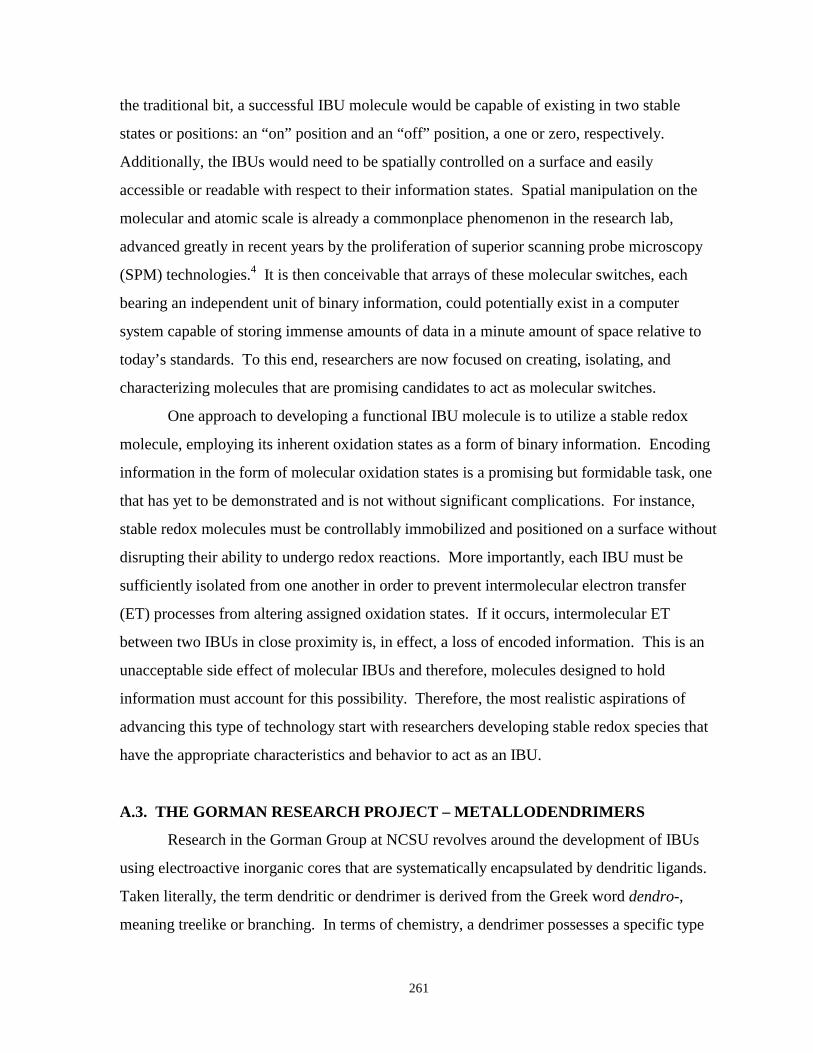
261
the traditional bit, a successful IBU molecule would be capable of existing in two stable
states or positions: an “on” position and an “off” position, a one or zero, respectively.
Additionally, the IBUs would need to be spatially controlled on a surface and easily
accessible or readable with respect to their information states. Spatial manipulation on the
molecular and atomic scale is already a commonplace phenomenon in the research lab,
advanced greatly in recent years by the proliferation of superior scanning probe microscopy
(SPM) technologies.4 It is then conceivable that arrays of these molecular switches, each
bearing an independent unit of binary information, could potentially exist in a computer
system capable of storing immense amounts of data in a minute amount of space relative to
today’s standards. To this end, researchers are now focused on creating, isolating, and
characterizing molecules that are promising candidates to act as molecular switches.
One approach to developing a functional IBU molecule is to utilize a stable redox
molecule, employing its inherent oxidation states as a form of binary information. Encoding
information in the form of molecular oxidation states is a promising but formidable task, one
that has yet to be demonstrated and is not without significant complications. For instance,
stable redox molecules must be controllably immobilized and positioned on a surface without
disrupting their ability to undergo redox reactions. More importantly, each IBU must be
sufficiently isolated from one another in order to prevent intermolecular electron transfer
(ET) processes from altering assigned oxidation states. If it occurs, intermolecular ET
between two IBUs in close proximity is, in effect, a loss of encoded information. This is an
unacceptable side effect of molecular IBUs and therefore, molecules designed to hold
information must account for this possibility. Therefore, the most realistic aspirations of
advancing this type of technology start with researchers developing stable redox species that
have the appropriate characteristics and behavior to act as an IBU.
A.3. THE GORMAN RESEARCH PROJECT – METALLODENDRIMERS
Research in the Gorman Group at NCSU revolves around the development of IBUs
using electroactive inorganic cores that are systematically encapsulated by dendritic ligands.
Taken literally, the term dendritic or dendrimer is derived from the Greek word dendro-,
meaning treelike or branching. In terms of chemistry, a dendrimer possesses a specific type
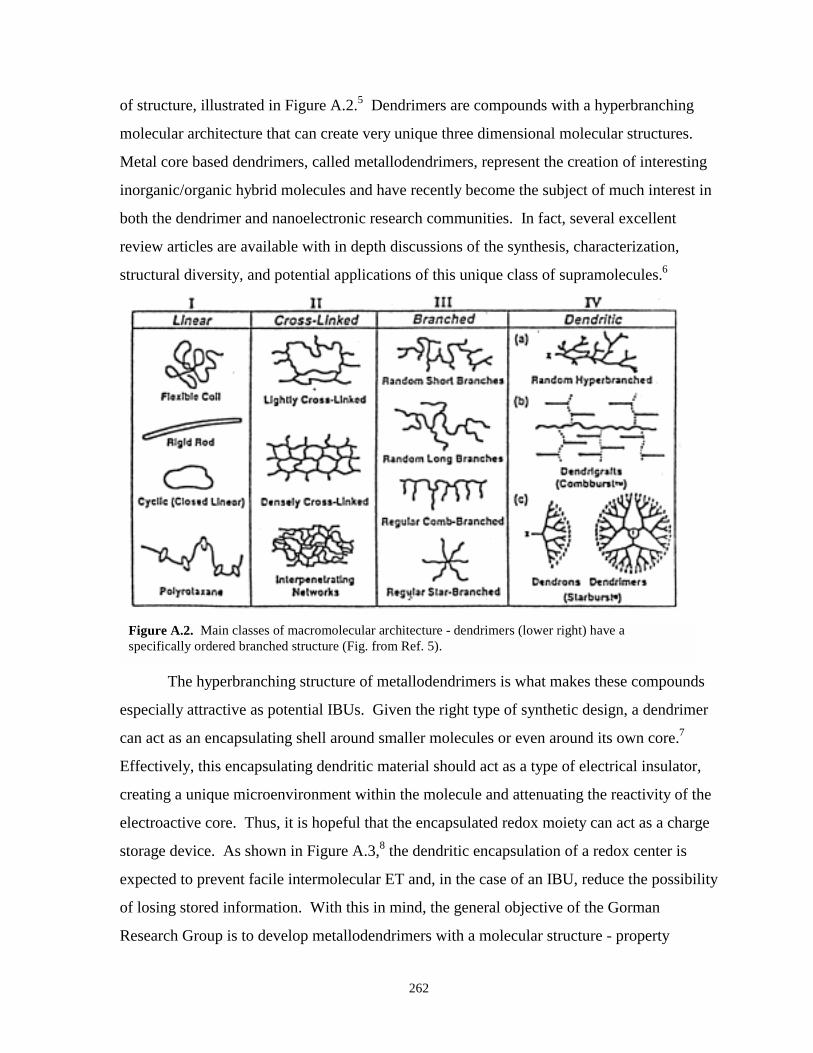
262
of structure, illustrated in Figure A.2.5 Dendrimers are compounds with a hyperbranching
molecular architecture that can create very unique three dimensional molecular structures.
Metal core based dendrimers, called metallodendrimers, represent the creation of interesting
inorganic/organic hybrid molecules and have recently become the subject of much interest in
both the dendrimer and nanoelectronic research communities. In fact, several excellent
review articles are available with in depth discussions of the synthesis, characterization,
structural diversity, and potential applications of this unique class of supramolecules.6
Figure A.2. Main classes of macromolecular architecture - dendrimers (lower right) have aspecifically ordered branched structure (Fig. from Ref. 5).
The hyperbranching structure of metallodendrimers is what makes these compounds
especially attractive as potential IBUs. Given the right type of synthetic design, a dendrimer
can act as an encapsulating shell around smaller molecules or even around its own core.7
Effectively, this encapsulating dendritic material should act as a type of electrical insulator,
creating a unique microenvironment within the molecule and attenuating the reactivity of the
electroactive core. Thus, it is hopeful that the encapsulated redox moiety can act as a charge
storage device. As shown in Figure A.3,8 the dendritic encapsulation of a redox center is
expected to prevent facile intermolecular ET and, in the case of an IBU, reduce the possibility
of losing stored information. With this in mind, the general objective of the Gorman
Research Group is to develop metallodendrimers with a molecular structure - property
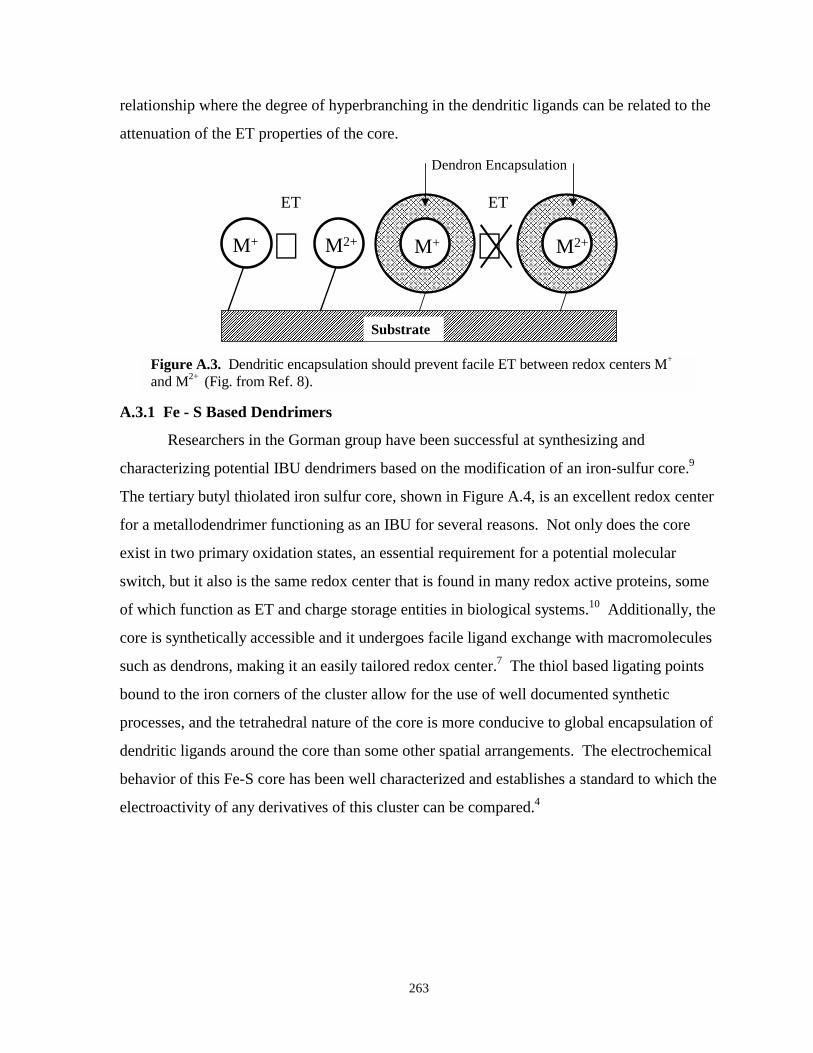
263
relationship where the degree of hyperbranching in the dendritic ligands can be related to the
attenuation of the ET properties of the core.
⇔������������������������������������������������������������������������������������������������������������������������������������������������������������������������������������������������������������������������������������������������������������������������������������������������������������������������������������������������������������������������������������������������������������������������������������������������������������������������������������������Substrate
⇔M+
������������������������������������������������������������������������������������������������������������������������������������������������������������������������������������������������������������������������������������������������������������������������������������������������������������������������������������������������
M2+
ET ET
M+
������������������������������������������������������������������������������������������������������������������������������������������������������������������������������������������������������������������������������������������������������������������������������������������������������������������������������������������������
M2+
Dendron Encapsulation
Figure A.3. Dendritic encapsulation should prevent facile ET between redox centers M+
and M2+ (Fig. from Ref. 8).
A.3.1 Fe - S Based Dendrimers
Researchers in the Gorman group have been successful at synthesizing and
characterizing potential IBU dendrimers based on the modification of an iron-sulfur core.9
The tertiary butyl thiolated iron sulfur core, shown in Figure A.4, is an excellent redox center
for a metallodendrimer functioning as an IBU for several reasons. Not only does the core
exist in two primary oxidation states, an essential requirement for a potential molecular
switch, but it also is the same redox center that is found in many redox active proteins, some
of which function as ET and charge storage entities in biological systems.10 Additionally, the
core is synthetically accessible and it undergoes facile ligand exchange with macromolecules
such as dendrons, making it an easily tailored redox center.7 The thiol based ligating points
bound to the iron corners of the cluster allow for the use of well documented synthetic
processes, and the tetrahedral nature of the core is more conducive to global encapsulation of
dendritic ligands around the core than some other spatial arrangements. The electrochemical
behavior of this Fe-S core has been well characterized and establishes a standard to which the
electroactivity of any derivatives of this cluster can be compared.4
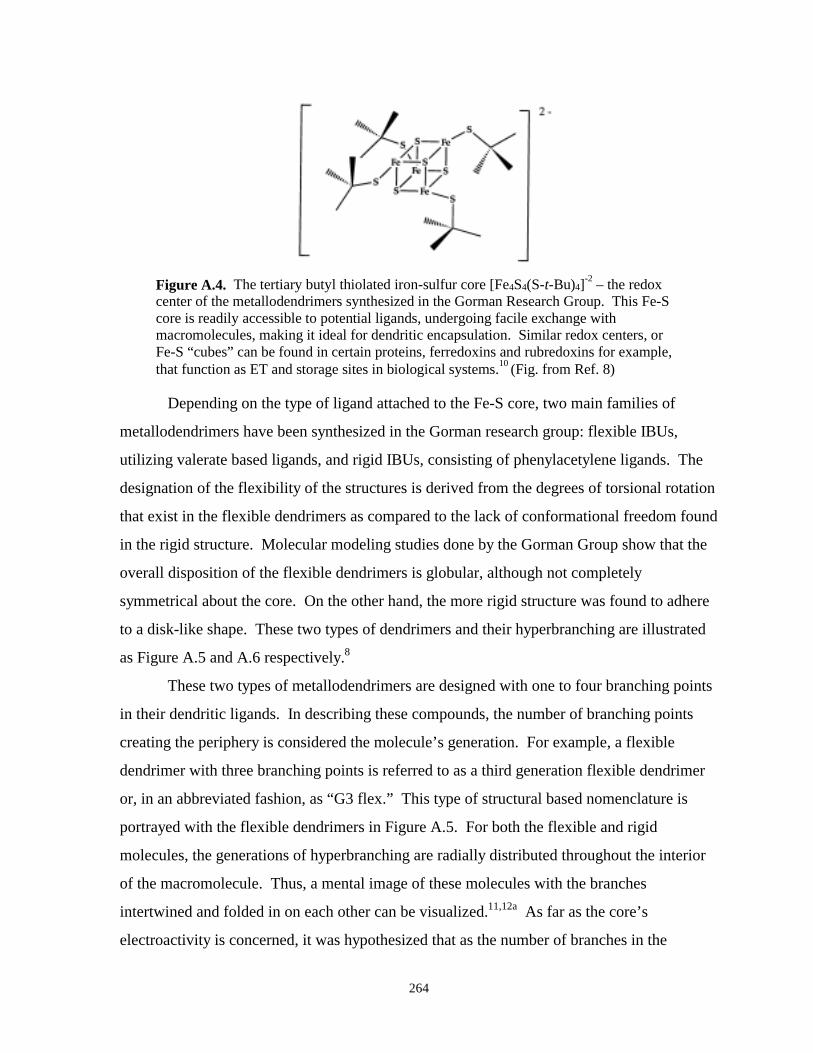
264
Figure A.4. The tertiary butyl thiolated iron-sulfur core [Fe4S4(S-t-Bu)4]-2 – the redoxcenter of the metallodendrimers synthesized in the Gorman Research Group. This Fe-Score is readily accessible to potential ligands, undergoing facile exchange withmacromolecules, making it ideal for dendritic encapsulation. Similar redox centers, orFe-S “cubes” can be found in certain proteins, ferredoxins and rubredoxins for example,that function as ET and storage sites in biological systems.10 (Fig. from Ref. 8)
Depending on the type of ligand attached to the Fe-S core, two main families of
metallodendrimers have been synthesized in the Gorman research group: flexible IBUs,
utilizing valerate based ligands, and rigid IBUs, consisting of phenylacetylene ligands. The
designation of the flexibility of the structures is derived from the degrees of torsional rotation
that exist in the flexible dendrimers as compared to the lack of conformational freedom found
in the rigid structure. Molecular modeling studies done by the Gorman Group show that the
overall disposition of the flexible dendrimers is globular, although not completely
symmetrical about the core. On the other hand, the more rigid structure was found to adhere
to a disk-like shape. These two types of dendrimers and their hyperbranching are illustrated
as Figure A.5 and A.6 respectively.8
These two types of metallodendrimers are designed with one to four branching points
in their dendritic ligands. In describing these compounds, the number of branching points
creating the periphery is considered the molecule’s generation. For example, a flexible
dendrimer with three branching points is referred to as a third generation flexible dendrimer
or, in an abbreviated fashion, as “G3 flex.” This type of structural based nomenclature is
portrayed with the flexible dendrimers in Figure A.5. For both the flexible and rigid
molecules, the generations of hyperbranching are radially distributed throughout the interior
of the macromolecule. Thus, a mental image of these molecules with the branches
intertwined and folded in on each other can be visualized.11,12a As far as the core’s
electroactivity is concerned, it was hypothesized that as the number of branches in the
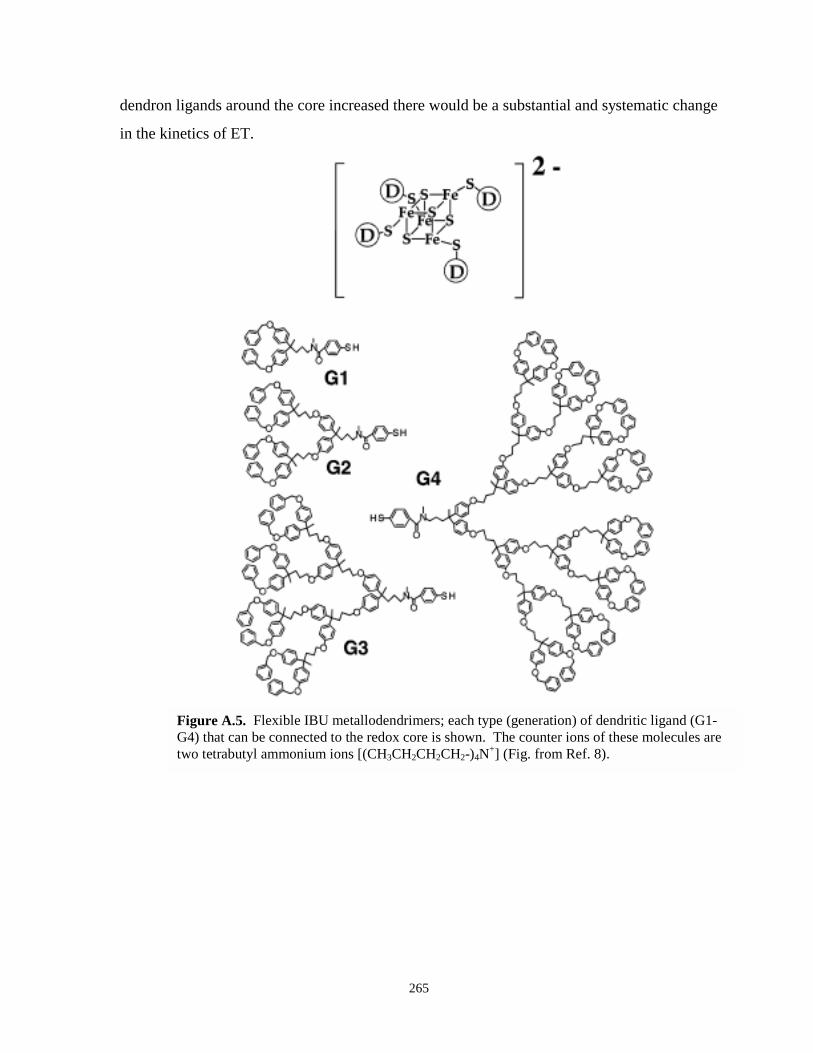
265
dendron ligands around the core increased there would be a substantial and systematic change
in the kinetics of ET.
Figure A.5. Flexible IBU metallodendrimers; each type (generation) of dendritic ligand (G1-G4) that can be connected to the redox core is shown. The counter ions of these molecules aretwo tetrabutyl ammonium ions [(CH3CH2CH2CH2-)4N+] (Fig. from Ref. 8).
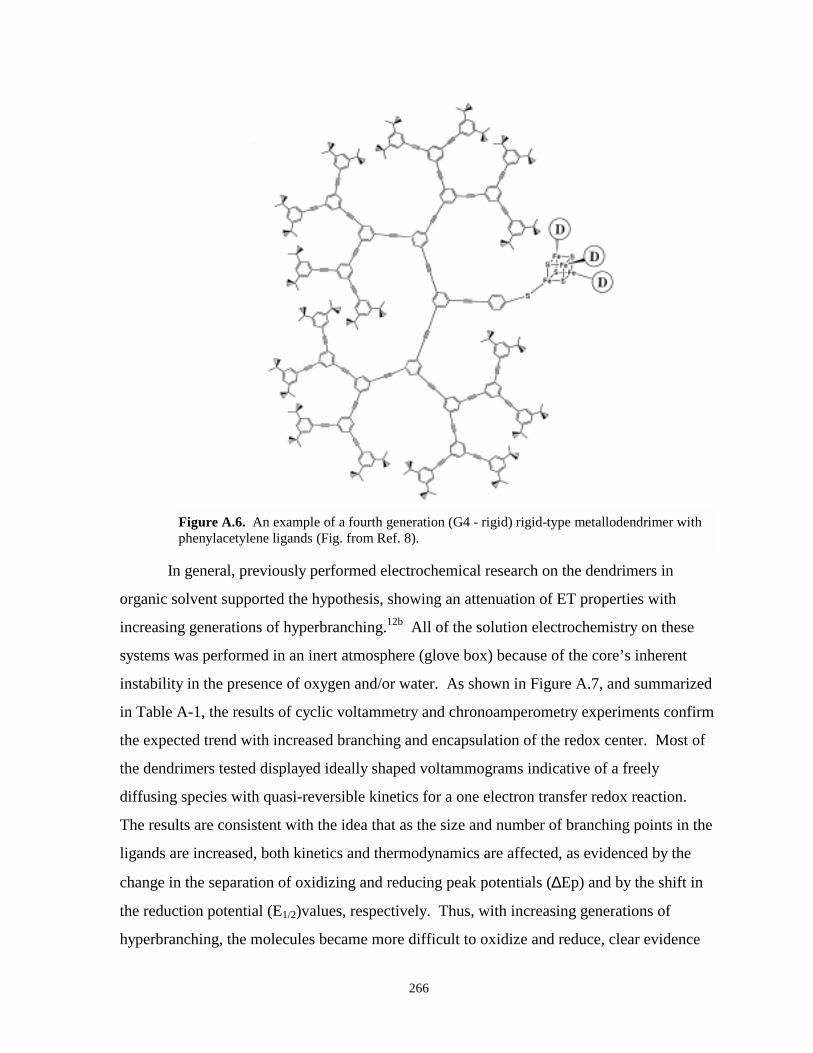
266
Figure A.6. An example of a fourth generation (G4 - rigid) rigid-type metallodendrimer withphenylacetylene ligands (Fig. from Ref. 8).
In general, previously performed electrochemical research on the dendrimers in
organic solvent supported the hypothesis, showing an attenuation of ET properties with
increasing generations of hyperbranching.12b All of the solution electrochemistry on these
systems was performed in an inert atmosphere (glove box) because of the core’s inherent
instability in the presence of oxygen and/or water. As shown in Figure A.7, and summarized
in Table A-1, the results of cyclic voltammetry and chronoamperometry experiments confirm
the expected trend with increased branching and encapsulation of the redox center. Most of
the dendrimers tested displayed ideally shaped voltammograms indicative of a freely
diffusing species with quasi-reversible kinetics for a one electron transfer redox reaction.
The results are consistent with the idea that as the size and number of branching points in the
ligands are increased, both kinetics and thermodynamics are affected, as evidenced by the
change in the separation of oxidizing and reducing peak potentials (∆Ep) and by the shift in
the reduction potential (E1/2)values, respectively. Thus, with increasing generations of
hyperbranching, the molecules became more difficult to oxidize and reduce, clear evidence
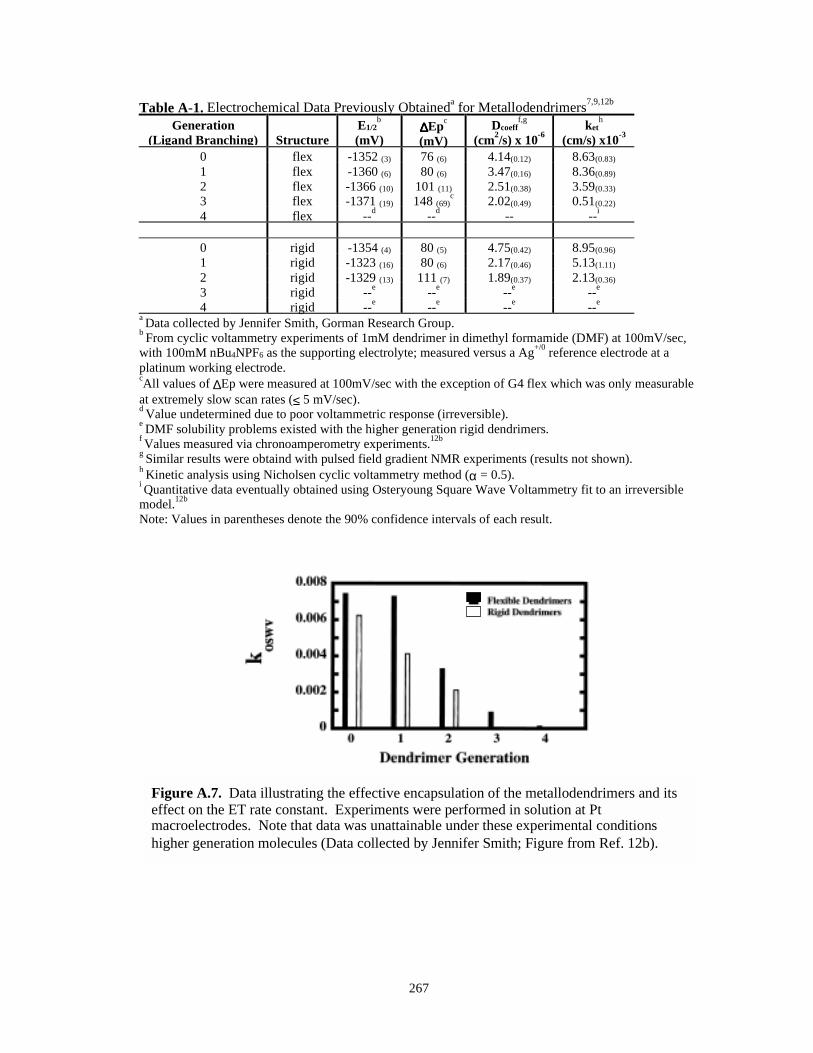
267
Table A-1. Electrochemical Data Previously Obtaineda for Metallodendrimers7,9,12b
Generation(Ligand Branching) Structure
E1/2b
(mV)∆∆∆∆Epc
(mV)Dcoeff
f,g
(cm2/s) x 10-6ket
h
(cm/s) x10-3
0 flex -1352 (3) 76 (6) 4.14(0.12) 8.63(0.83)
1 flex -1360 (6) 80 (6) 3.47(0.16) 8.36(0.89)
2 flex -1366 (10) 101 (11) 2.51(0.38) 3.59(0.33)
3 flex -1371 (19) 148 (69)c 2.02(0.49) 0.51(0.22)
4 flex --d --d -- --i
0 rigid -1354 (4) 80 (5) 4.75(0.42) 8.95(0.96)
1 rigid -1323 (16) 80 (6) 2.17(0.46) 5.13(1.11)
2 rigid -1329 (13) 111 (7) 1.89(0.37) 2.13(0.36)
3 rigid --e --e --e --e
4 rigid --e --e --e --e
a Data collected by Jennifer Smith, Gorman Research Group.b From cyclic voltammetry experiments of 1mM dendrimer in dimethyl formamide (DMF) at 100mV/sec,with 100mM nBu4NPF6 as the supporting electrolyte; measured versus a Ag+/0 reference electrode at aplatinum working electrode.cAll values of ∆Ep were measured at 100mV/sec with the exception of G4 flex which was only measurableat extremely slow scan rates (≤ 5 mV/sec).d Value undetermined due to poor voltammetric response (irreversible).e DMF solubility problems existed with the higher generation rigid dendrimers.f Values measured via chronoamperometry experiments.12b
g Similar results were obtaind with pulsed field gradient NMR experiments (results not shown).h Kinetic analysis using Nicholsen cyclic voltammetry method (α = 0.5).i Quantitative data eventually obtained using Osteryoung Square Wave Voltammetry fit to an irreversiblemodel.12b
Note: Values in parentheses denote the 90% confidence intervals of each result.
Figure A.7. Data illustrating the effective encapsulation of the metallodendrimers and itseffect on the ET rate constant. Experiments were performed in solution at Ptmacroelectrodes. Note that data was unattainable under these experimental conditionshigher generation molecules (Data collected by Jennifer Smith; Figure from Ref. 12b).
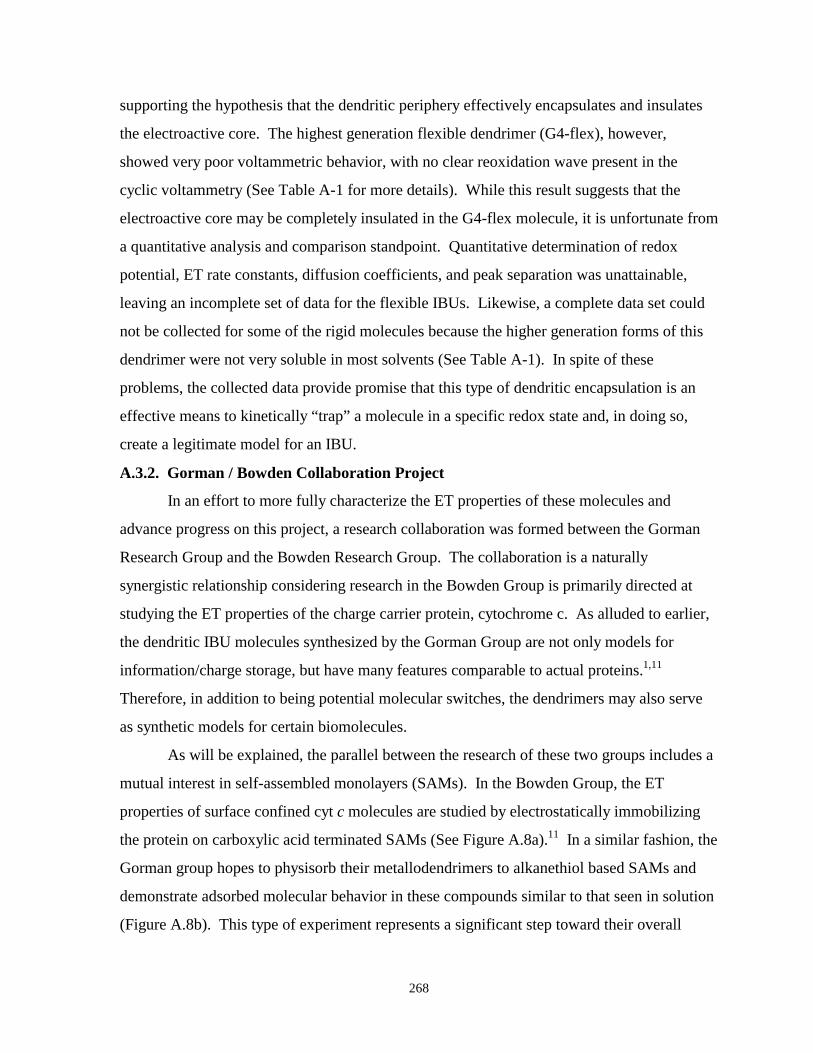
268
supporting the hypothesis that the dendritic periphery effectively encapsulates and insulates
the electroactive core. The highest generation flexible dendrimer (G4-flex), however,
showed very poor voltammetric behavior, with no clear reoxidation wave present in the
cyclic voltammetry (See Table A-1 for more details). While this result suggests that the
electroactive core may be completely insulated in the G4-flex molecule, it is unfortunate from
a quantitative analysis and comparison standpoint. Quantitative determination of redox
potential, ET rate constants, diffusion coefficients, and peak separation was unattainable,
leaving an incomplete set of data for the flexible IBUs. Likewise, a complete data set could
not be collected for some of the rigid molecules because the higher generation forms of this
dendrimer were not very soluble in most solvents (See Table A-1). In spite of these
problems, the collected data provide promise that this type of dendritic encapsulation is an
effective means to kinetically “trap” a molecule in a specific redox state and, in doing so,
create a legitimate model for an IBU.
A.3.2. Gorman / Bowden Collaboration Project
In an effort to more fully characterize the ET properties of these molecules and
advance progress on this project, a research collaboration was formed between the Gorman
Research Group and the Bowden Research Group. The collaboration is a naturally
synergistic relationship considering research in the Bowden Group is primarily directed at
studying the ET properties of the charge carrier protein, cytochrome c. As alluded to earlier,
the dendritic IBU molecules synthesized by the Gorman Group are not only models for
information/charge storage, but have many features comparable to actual proteins.1,11
Therefore, in addition to being potential molecular switches, the dendrimers may also serve
as synthetic models for certain biomolecules.
As will be explained, the parallel between the research of these two groups includes a
mutual interest in self-assembled monolayers (SAMs). In the Bowden Group, the ET
properties of surface confined cyt c molecules are studied by electrostatically immobilizing
the protein on carboxylic acid terminated SAMs (See Figure A.8a).11 In a similar fashion, the
Gorman group hopes to physisorb their metallodendrimers to alkanethiol based SAMs and
demonstrate adsorbed molecular behavior in these compounds similar to that seen in solution
(Figure A.8b). This type of experiment represents a significant step toward their overall
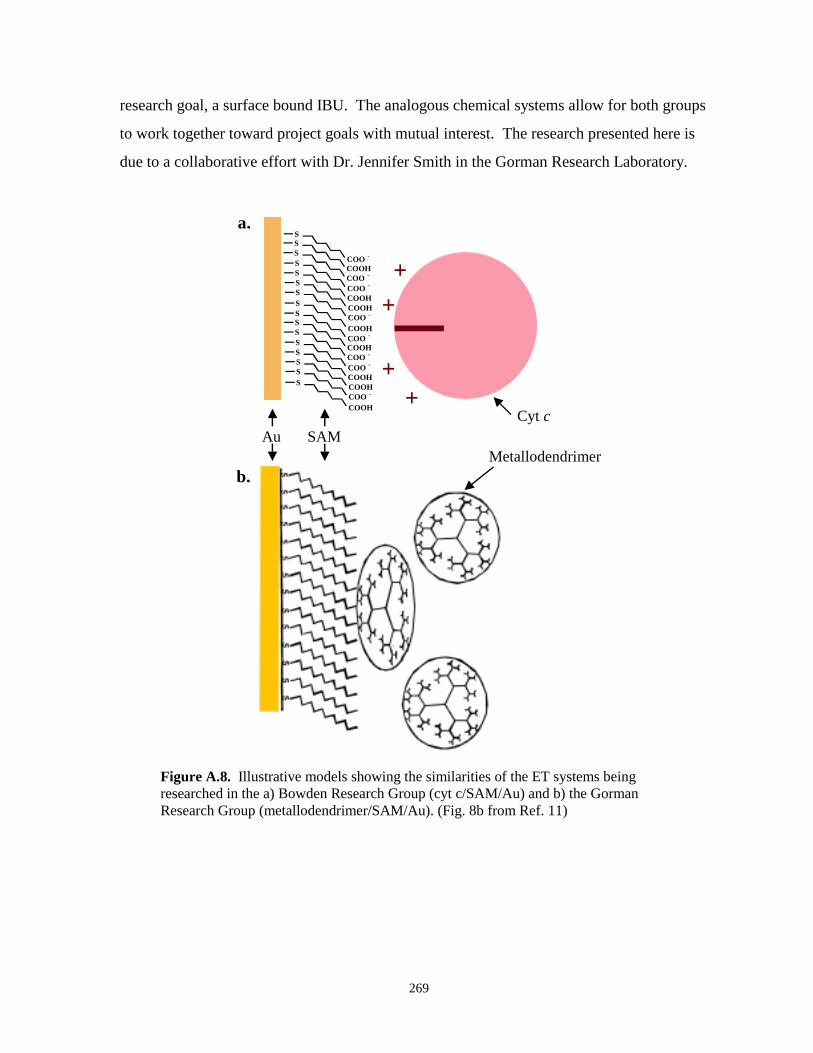
269
research goal, a surface bound IBU. The analogous chemical systems allow for both groups
to work together toward project goals with mutual interest. The research presented here is
due to a collaborative effort with Dr. Jennifer Smith in the Gorman Research Laboratory.
COO -
S
COOH
S
COO -
S
COO -
S
COOH
S
COOH
S
COO -
S
COOH
S
COO -
S
COOH
S
COO -
S
COO -
S
COOH
S
COOH
S
COO -
S
COOH
S
++
++
a.
b.
Cyt cSAMAu
Metallodendrimer
Figure A.8. Illustrative models showing the similarities of the ET systems beingresearched in the a) Bowden Research Group (cyt c/SAM/Au) and b) the GormanResearch Group (metallodendrimer/SAM/Au). (Fig. 8b from Ref. 11)
270
A.3.3. Research Objectives
Eventually, any macromolecules being considered as potential IBUs or molecular
switches will have to be specifically tailored to render the molecules switchable, addressable,
and able to be organized on a surface. A large challenge of reaching this goal is to simply
immobilize the molecule on any surface and gain the ability to control the IBU/surface
interaction. Furthermore, each IBU must be confined to a designated space and position on
that surface while maintaining the ability to effectively store charge. SAM technology, in
conjunction with lithographic techniques, seems to hold great promise with regard to
achieving this type of control over this chemical system. SAMs can be created with a variety
of structures and properties, enlisting both hybrid combinations of mixed monolayers with
different chain lengths and functional groups, as well as, micro-contact printing of patterned
SAMs. Examples of using mixed monolayers to effectively immobilize dendritic molecules
on surfaces have already been seen in the literature.13 Scanning tunneling microscopy (STM)
based lithography is not only capable of designing specifically tailored SAM surfaces, but can
also accommodate the nanometer resolution spatial manipulation required for eventually
addressing individual IBUs.4 Both SAMs and SPM allow for unprecedented order and
localized spatial definition on the molecular level, clearly beneficial for the proposed type of
work.
Most scientific research progresses in very small increments; the Gorman/Bowden
collaboration on the metallodendrimer project is no different. Before attempting work on the
advanced goals depicted in the previous paragraph, the collaborative effort of the two groups
focused on first simply finding an experimental medium conducive to testing the
electrochemical behavior of all of the dendrimers. Therefore, quantifying the electrochemical
properties of all eight IBUs is the first objective of this research. Secondly, and possibly in
conjunction with the first objective, it was desired to successfully immobilize the IBU on a
SAM and begin characterizing the ET of surface bound dendrimer assemblies.
A.4. PRELIMINARY EXPERIMENTS
Upon inspection of the properties of the dendrimers, it appears that, by taking
advantage of their relatively hydrophobic nature, they could be reasonably adsorbed to methyl
271
terminated SAMs in polar solutions. How polar the solvent had to be to facilitate this
interaction remained a focal point of the search for an adequate experimental environment.
In addition to all the dendrimers being soluble in it, the solvent used for this electrochemistry
must also be able to dissolve the supporting electrolyte and possess an adequate polarity.
Finding a solvent with all of these properties is not a minor task, especially when dealing
with organic solvents. Although aqueous experiments have been performed on the
dendrimers (data not shown or discussed in detail) and was beneficial toward the formation
and stability of the SAMs, the dendrimers used in these aqueous environments ultimately
suffered from oxygen exposure, which induced degradation of the molecules in only a brief
amount of time. Additionally, dendrimers exposed to oxygen usually showed poor
voltammetric behavior and sporadic results. All previous electrochemistry was performed in
dimethyformamide (DMF) with ammonium-borate based supporting electrolyte, usually
tetrabutylammonium hexafluoroborate (nBu4NPF6).4,9,12b With the success of this system
already established, it seemed like a logical place to begin experimentation and simply tweak
the system to find an appropriate combination of experimental conditions. One of the more
important aspects of this testing, considering the very negative redox potentials of the
dendrimers (∼ -1300 mV vs. Ag+/0 ), was to choose a solvent with a potential window far
enough negative to accommodate the redox reactions. Some solvents showed adequate
solubility toward the dendrimers and the electrolytes, but simply did not have “clean”
background electrochemistry that far into the negative potential window (CH2Cl2, toluene,
pyridine). Thus, yet another restriction had to be considered when choosing a
solvent/electrolyte combination. If, eventually, a maximum of a monolayer of physisorbed
dendrimer occupies the SAM, the background signal or noise of the system must be
sufficiently low enough to resolve the dendrimer signal. Table A-2 summarizes many of the
tested solvents and lists each solvent’s inherent problem in the proposed experimental
scheme. With all of the restrictions imposed by the desired system including the solubility of
the dendrimers and electrolyte in the solvent, the solvent’s potential window, the signal to
noise ratio, the negative thermodynamic reduction potentials of the metallodendrimers, and
their air sensitivity (See Experimental Details section), a formidable task emerged to simply
establish the experimental conditions.
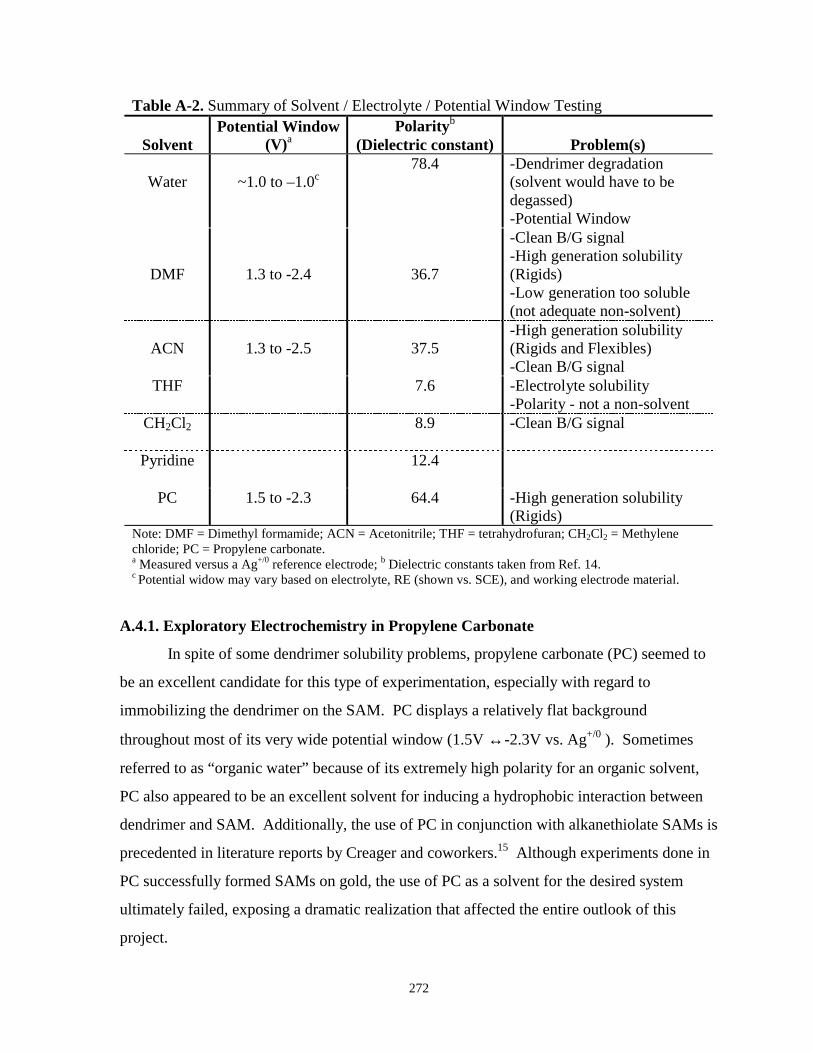
272
Table A-2. Summary of Solvent / Electrolyte / Potential Window Testing
SolventPotential Window
(V)aPolarityb
(Dielectric constant) Problem(s)
Water ~1.0 to –1.0c78.4 -Dendrimer degradation
(solvent would have to bedegassed)-Potential Window
DMF 1.3 to -2.4 36.7
-Clean B/G signal-High generation solubility(Rigids)-Low generation too soluble(not adequate non-solvent)
ACN 1.3 to -2.5 37.5-High generation solubility(Rigids and Flexibles)-Clean B/G signal
THF 7.6 -Electrolyte solubility-Polarity - not a non-solvent
CH2Cl2 8.9 -Clean B/G signal
Pyridine 12.4
PC 1.5 to -2.3 64.4 -High generation solubility(Rigids)
Note: DMF = Dimethyl formamide; ACN = Acetonitrile; THF = tetrahydrofuran; CH2Cl2 = Methylenechloride; PC = Propylene carbonate.a Measured versus a Ag+/0 reference electrode; b Dielectric constants taken from Ref. 14.c Potential widow may vary based on electrolyte, RE (shown vs. SCE), and working electrode material.
A.4.1. Exploratory Electrochemistry in Propylene Carbonate
In spite of some dendrimer solubility problems, propylene carbonate (PC) seemed to
be an excellent candidate for this type of experimentation, especially with regard to
immobilizing the dendrimer on the SAM. PC displays a relatively flat background
throughout most of its very wide potential window (1.5V ↔-2.3V vs. Ag+/0 ). Sometimes
referred to as “organic water” because of its extremely high polarity for an organic solvent,
PC also appeared to be an excellent solvent for inducing a hydrophobic interaction between
dendrimer and SAM. Additionally, the use of PC in conjunction with alkanethiolate SAMs is
precedented in literature reports by Creager and coworkers.15 Although experiments done in
PC successfully formed SAMs on gold, the use of PC as a solvent for the desired system
ultimately failed, exposing a dramatic realization that affected the entire outlook of this
project.
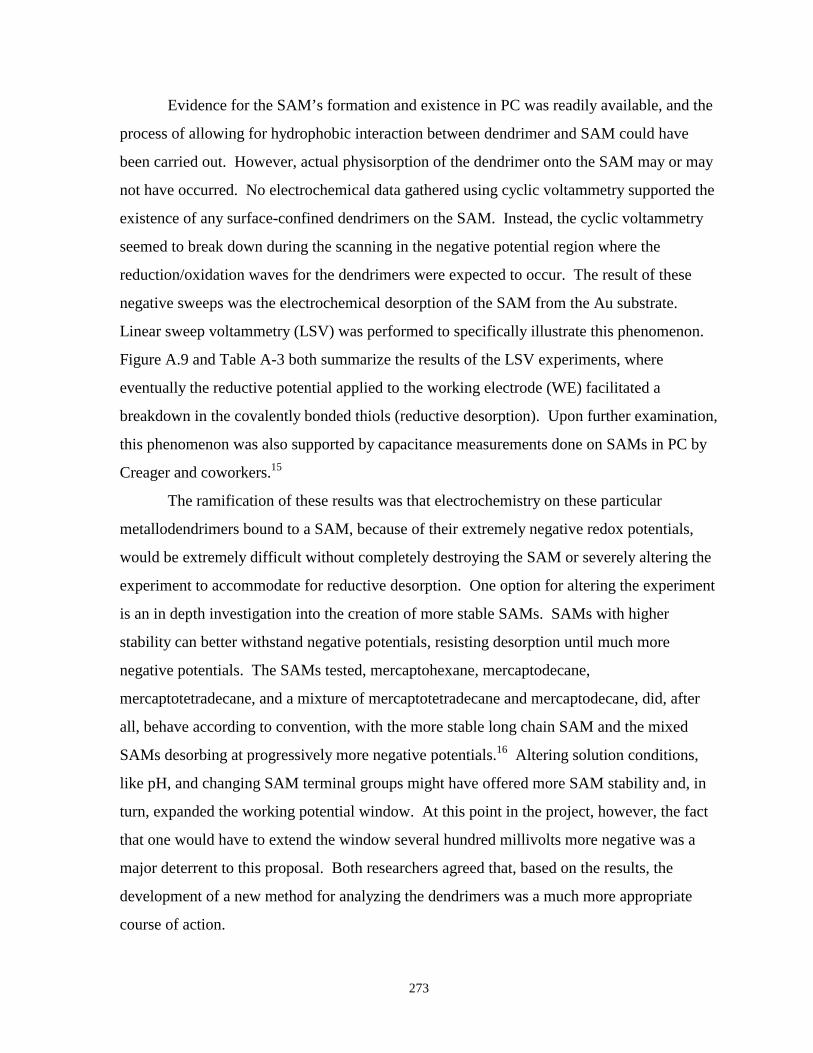
273
Evidence for the SAM’s formation and existence in PC was readily available, and the
process of allowing for hydrophobic interaction between dendrimer and SAM could have
been carried out. However, actual physisorption of the dendrimer onto the SAM may or may
not have occurred. No electrochemical data gathered using cyclic voltammetry supported the
existence of any surface-confined dendrimers on the SAM. Instead, the cyclic voltammetry
seemed to break down during the scanning in the negative potential region where the
reduction/oxidation waves for the dendrimers were expected to occur. The result of these
negative sweeps was the electrochemical desorption of the SAM from the Au substrate.
Linear sweep voltammetry (LSV) was performed to specifically illustrate this phenomenon.
Figure A.9 and Table A-3 both summarize the results of the LSV experiments, where
eventually the reductive potential applied to the working electrode (WE) facilitated a
breakdown in the covalently bonded thiols (reductive desorption). Upon further examination,
this phenomenon was also supported by capacitance measurements done on SAMs in PC by
Creager and coworkers.15
The ramification of these results was that electrochemistry on these particular
metallodendrimers bound to a SAM, because of their extremely negative redox potentials,
would be extremely difficult without completely destroying the SAM or severely altering the
experiment to accommodate for reductive desorption. One option for altering the experiment
is an in depth investigation into the creation of more stable SAMs. SAMs with higher
stability can better withstand negative potentials, resisting desorption until much more
negative potentials. The SAMs tested, mercaptohexane, mercaptodecane,
mercaptotetradecane, and a mixture of mercaptotetradecane and mercaptodecane, did, after
all, behave according to convention, with the more stable long chain SAM and the mixed
SAMs desorbing at progressively more negative potentials.16 Altering solution conditions,
like pH, and changing SAM terminal groups might have offered more SAM stability and, in
turn, expanded the working potential window. At this point in the project, however, the fact
that one would have to extend the window several hundred millivolts more negative was a
major deterrent to this proposal. Both researchers agreed that, based on the results, the
development of a new method for analyzing the dendrimers was a much more appropriate
course of action.
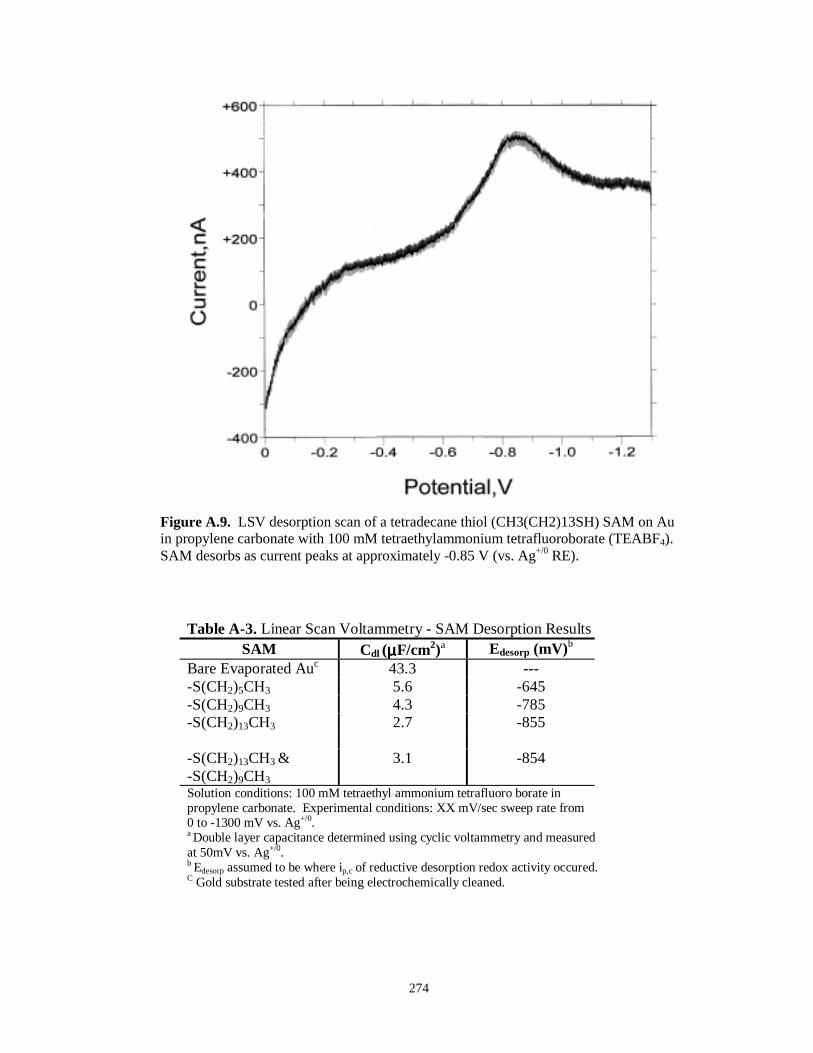
274
Figure A.9. LSV desorption scan of a tetradecane thiol (CH3(CH2)13SH) SAM on Auin propylene carbonate with 100 mM tetraethylammonium tetrafluoroborate (TEABF4).SAM desorbs as current peaks at approximately -0.85 V (vs. Ag+/0 RE).
Table A-3. Linear Scan Voltammetry - SAM Desorption ResultsSAM Cdl (µµµµF/cm2)a Edesorp (mV)b
Bare Evaporated Auc 43.3 ----S(CH2)5CH3 5.6 -645-S(CH2)9CH3 4.3 -785-S(CH2)13CH3 2.7 -855
-S(CH2)13CH3 &-S(CH2)9CH3
3.1 -854
Solution conditions: 100 mM tetraethyl ammonium tetrafluoro borate inpropylene carbonate. Experimental conditions: XX mV/sec sweep rate from0 to -1300 mV vs. Ag+/0.a Double layer capacitance determined using cyclic voltammetry and measuredat 50mV vs. Ag+/0.b Edesorp assumed to be where ip,c of reductive desorption redox activity occured.C Gold substrate tested after being electrochemically cleaned.
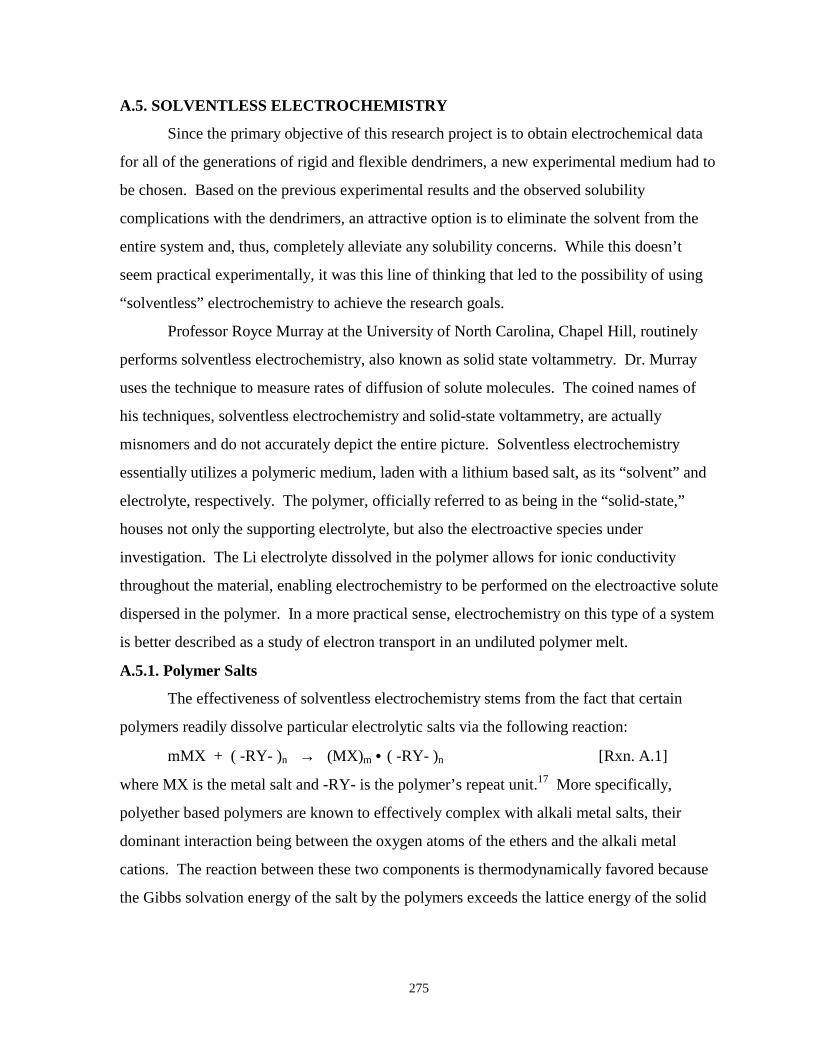
275
A.5. SOLVENTLESS ELECTROCHEMISTRY
Since the primary objective of this research project is to obtain electrochemical data
for all of the generations of rigid and flexible dendrimers, a new experimental medium had to
be chosen. Based on the previous experimental results and the observed solubility
complications with the dendrimers, an attractive option is to eliminate the solvent from the
entire system and, thus, completely alleviate any solubility concerns. While this doesn’t
seem practical experimentally, it was this line of thinking that led to the possibility of using
“solventless” electrochemistry to achieve the research goals.
Professor Royce Murray at the University of North Carolina, Chapel Hill, routinely
performs solventless electrochemistry, also known as solid state voltammetry. Dr. Murray
uses the technique to measure rates of diffusion of solute molecules. The coined names of
his techniques, solventless electrochemistry and solid-state voltammetry, are actually
misnomers and do not accurately depict the entire picture. Solventless electrochemistry
essentially utilizes a polymeric medium, laden with a lithium based salt, as its “solvent” and
electrolyte, respectively. The polymer, officially referred to as being in the “solid-state,”
houses not only the supporting electrolyte, but also the electroactive species under
investigation. The Li electrolyte dissolved in the polymer allows for ionic conductivity
throughout the material, enabling electrochemistry to be performed on the electroactive solute
dispersed in the polymer. In a more practical sense, electrochemistry on this type of a system
is better described as a study of electron transport in an undiluted polymer melt.
A.5.1. Polymer Salts
The effectiveness of solventless electrochemistry stems from the fact that certain
polymers readily dissolve particular electrolytic salts via the following reaction:
mMX + ( -RY- )n → (MX)m • ( -RY- )n [Rxn. A.1]
where MX is the metal salt and -RY- is the polymer’s repeat unit.17 More specifically,
polyether based polymers are known to effectively complex with alkali metal salts, their
dominant interaction being between the oxygen atoms of the ethers and the alkali metal
cations. The reaction between these two components is thermodynamically favored because
the Gibbs solvation energy of the salt by the polymers exceeds the lattice energy of the solid
276
salt.17 The result is a homogeneous polymer-salt blend (polymer electrolyte) that is
conductive enough to promote both ion and electron transport through the polymer.
The conductivity of the polymer melt is greatly enhanced by the excellent ion
mobility throughout the material. The ion mobility in the polymer is a consequence of the
internal movement of the poly-ether chains which, because of their inherent flexibility, are
know to undergo large amplitude motions. Increased motion in the polymer induces mobile
ions which either “hop” between energetically favorable sites in the polymer lattice or
promote the ions to experience a diffusional fluidity through the polymer.17 In both cases, the
consequences of the activity is a conductive polymer melt and a potential system for unique
electrochemical experiments.
Accordingly, as the length of the polymer chain increases, the properties of the melt
are altered. Polymeric electrolytes based on longer polymer chains tend to be more
crystalline in nature and thus have attenuated ion mobility. Subsequently, as the morphology
of the polymer changes, the formation of the cation-polymer complex is more energetically
disfavored and the resulting melts are less conductive overall. Because of this phenomenon,
short chain poly-ethers are the most common polymer used in these materials. Short chain
polymers have a greater degree of inherent motion and, therefore, have more satisfactory
conductance properties. The extent of the polymer branch motion and a high concentration
of polar or basic functional groups along the polymer chain are the two basic criteria for
creating highly conductive polymer melts.17 The most popular method to make these
polymeric electrolytes is to 1) dissolve the salt in a solvent, typically methanol (MeOH) or
acetonitrile(ACN), 2) add the selected polymer, 3) stir, and 4) remove the solvent via vacuum
evaporation to create a “solventless” mixture. These polymer electrolytes are used both as
bulk materials or as thin films placed on an electrode. Thin polymer films coated on
electrode platforms are employed for the research presented here.
Electrolytic polymers are of great interest as a component of a high energy density
battery where the electrolyte is capable of conforming to any solid electrode. Other
applications for polymer electrolytes are for the development of electrochemical devices such
as electrochromic displays or windows, solid-state photoelectrochemical cells, and
electrochemical sensors.17 In this study, however, the polymer electrolytes will be employed
277
on a much more basic level as a convenient media for novel electrochemical experiments on
the metallodendrimers.
A.5.2. Solventless Electrochemistry at Microelectrodes – Royce Murray Research
Research on these undiluted redox melts is ongoing and has already resulted in a
plethora of publications.18 Solventless electrochemistry is performed primarily with
microelectrodes.18a Microelectrodes exhibit unique advantages including favorable
background current and compatibility with highly resistive environments that would be
unsuitable for traditional macroelectrodes. With normal macroelectrodes under resistive
conditions, the uncompensated resistance effects (iR effects) are problematic for any potential
experiments. These same iR effects are effectively minimized or eliminated by using
microelectrodes, whose dimensions are minute enough to diminish the iR effects. Therefore,
microelectrodes are routinely used for varied cyclic voltammetry experiments designed to
study ET kinetics and electrode reaction mechanisms,19 including in vivo measurements in rat
brains20and in single nerve cells.21 Considering the modest conductivity of the polymeric
melts, microelectrodes, with their ability to minimize the iR effects, are a perfect tool for
solventless electrochemistry experiments.
The basic concept of the Murray experiment is to use the microelectrode as a platform
for a polymer electrolyte film. A common experimental apparatus is shown in Figure
A.10.18p A large number of experiments by Murray and coworkers use polyethylene oxide
(PEO) or polyethylene glycol (PEG) polymers with dissolved lithium perchlorate as the
electrolyte. Within this type of medium, a variety of redox species, usually some type of
ferrocene or viologen derivative, have been tested.18 As mentioned above, the supporting
electrolyte material, LiClO4, is first dissolved in MeOH and the polymer and redox species
are added afterward. This slurry of material is deposited as a thin, visible film on the
microelectrode platform which is then sealed in a vacuum cell where the MeOH can be
pumped out of the polymer (See Figure A.10).
The technique is advertised as a means of voltammetrically measuring ultraslow
diffusion coefficients (Dcoeff). Literature reports show diffusional rate coefficients on the
order of 10-12 cm2/sec being routinely measured for species in a polymeric media.18a This
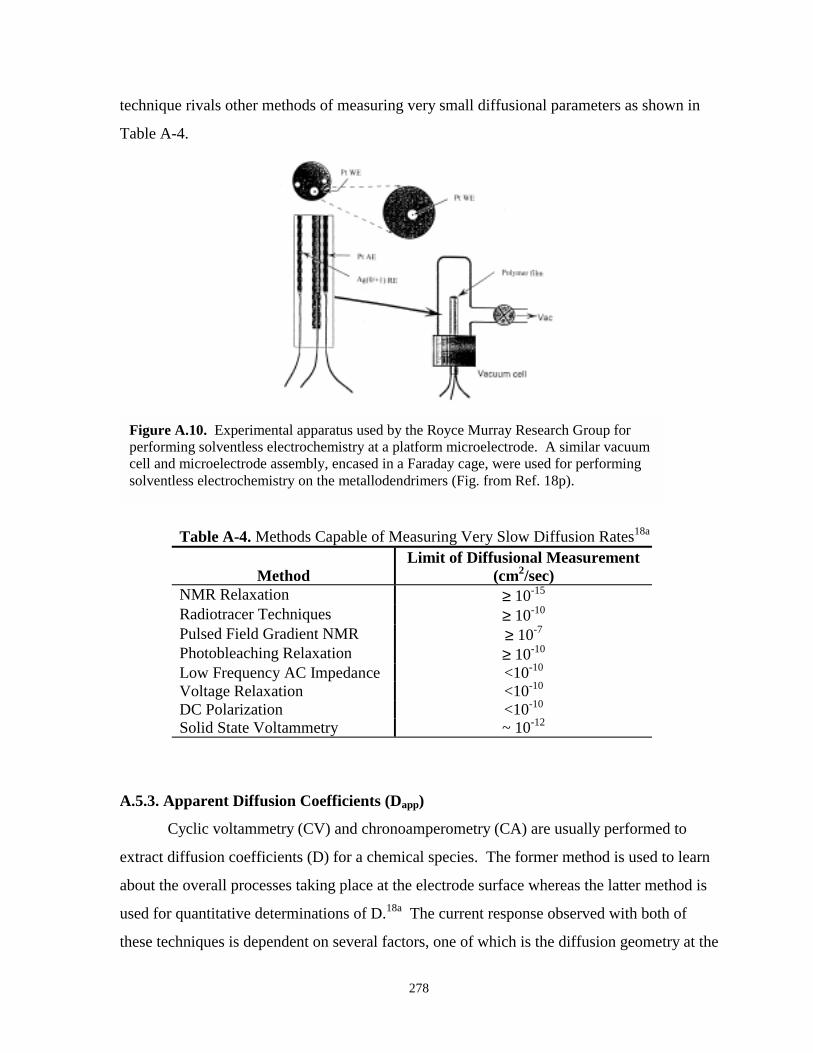
278
technique rivals other methods of measuring very small diffusional parameters as shown in
Table A-4.
Figure A.10. Experimental apparatus used by the Royce Murray Research Group forperforming solventless electrochemistry at a platform microelectrode. A similar vacuumcell and microelectrode assembly, encased in a Faraday cage, were used for performingsolventless electrochemistry on the metallodendrimers (Fig. from Ref. 18p).
Table A-4. Methods Capable of Measuring Very Slow Diffusion Rates18a
MethodLimit of Diffusional Measurement
(cm2/sec)NMR Relaxation ≥ 10-15
Radiotracer Techniques ≥ 10-10
Pulsed Field Gradient NMR ≥ 10-7
Photobleaching Relaxation ≥ 10-10
Low Frequency AC Impedance <10-10
Voltage Relaxation <10-10
DC Polarization <10-10
Solid State Voltammetry ~ 10-12
A.5.3. Apparent Diffusion Coefficients (Dapp)
Cyclic voltammetry (CV) and chronoamperometry (CA) are usually performed to
extract diffusion coefficients (D) for a chemical species. The former method is used to learn
about the overall processes taking place at the electrode surface whereas the latter method is
used for quantitative determinations of D.18a The current response observed with both of
these techniques is dependent on several factors, one of which is the diffusion geometry at the
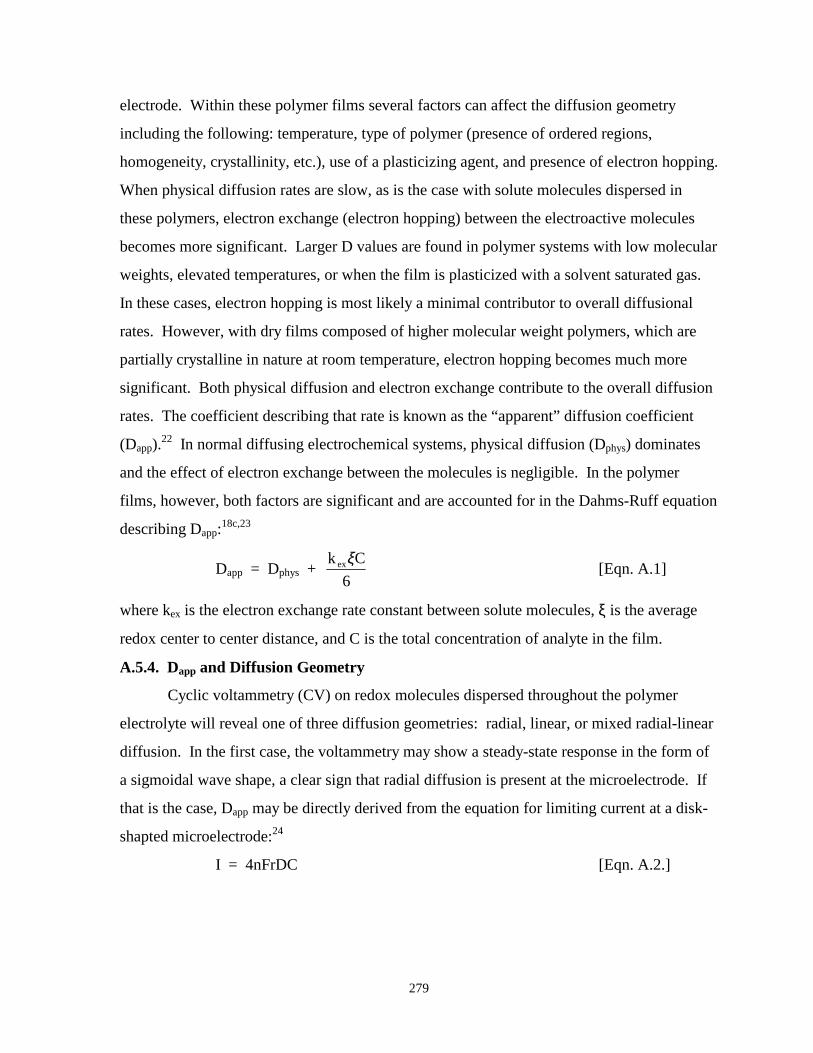
279
electrode. Within these polymer films several factors can affect the diffusion geometry
including the following: temperature, type of polymer (presence of ordered regions,
homogeneity, crystallinity, etc.), use of a plasticizing agent, and presence of electron hopping.
When physical diffusion rates are slow, as is the case with solute molecules dispersed in
these polymers, electron exchange (electron hopping) between the electroactive molecules
becomes more significant. Larger D values are found in polymer systems with low molecular
weights, elevated temperatures, or when the film is plasticized with a solvent saturated gas.
In these cases, electron hopping is most likely a minimal contributor to overall diffusional
rates. However, with dry films composed of higher molecular weight polymers, which are
partially crystalline in nature at room temperature, electron hopping becomes much more
significant. Both physical diffusion and electron exchange contribute to the overall diffusion
rates. The coefficient describing that rate is known as the “apparent” diffusion coefficient
(Dapp).22 In normal diffusing electrochemical systems, physical diffusion (Dphys) dominates
and the effect of electron exchange between the molecules is negligible. In the polymer
films, however, both factors are significant and are accounted for in the Dahms-Ruff equation
describing Dapp:18c,23
Dapp = Dphys + 6
Ck exξ [Eqn. A.1]
where kex is the electron exchange rate constant between solute molecules, ξ is the average
redox center to center distance, and C is the total concentration of analyte in the film.
A.5.4. Dapp and Diffusion Geometry
Cyclic voltammetry (CV) on redox molecules dispersed throughout the polymer
electrolyte will reveal one of three diffusion geometries: radial, linear, or mixed radial-linear
diffusion. In the first case, the voltammetry may show a steady-state response in the form of
a sigmoidal wave shape, a clear sign that radial diffusion is present at the microelectrode. If
that is the case, Dapp may be directly derived from the equation for limiting current at a disk-
shapted microelectrode:24
I = 4nFrDC [Eqn. A.2.]
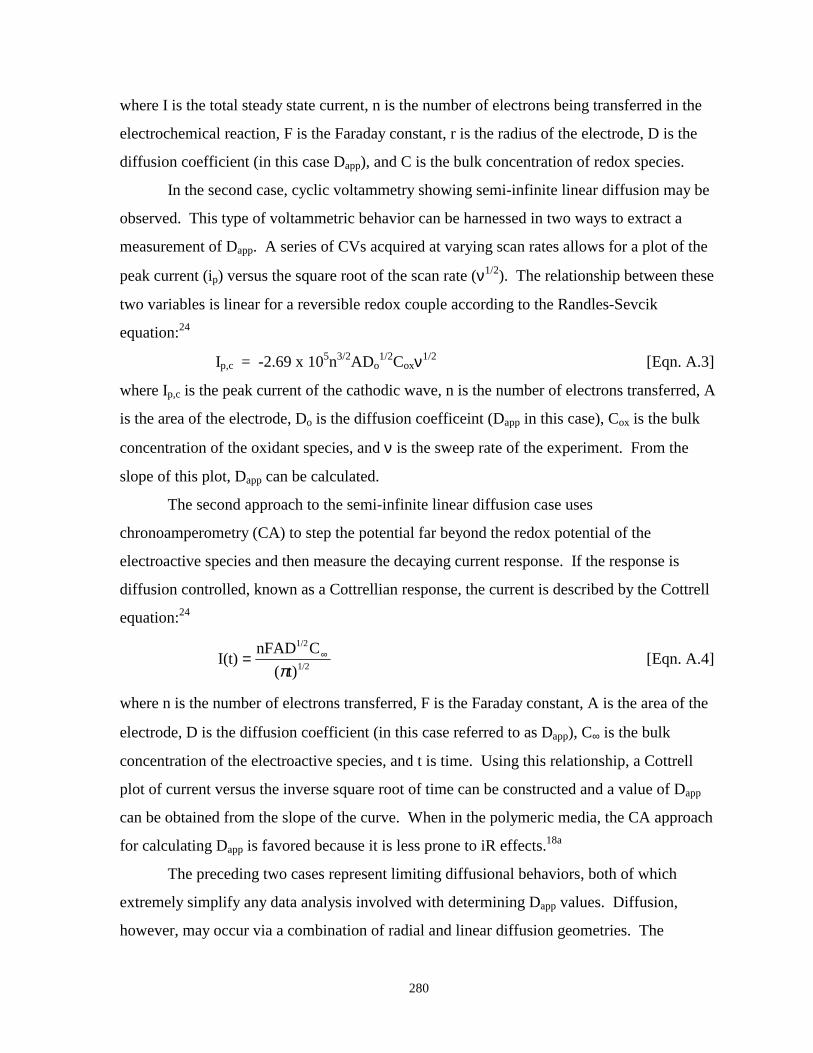
280
where I is the total steady state current, n is the number of electrons being transferred in the
electrochemical reaction, F is the Faraday constant, r is the radius of the electrode, D is the
diffusion coefficient (in this case Dapp), and C is the bulk concentration of redox species.
In the second case, cyclic voltammetry showing semi-infinite linear diffusion may be
observed. This type of voltammetric behavior can be harnessed in two ways to extract a
measurement of Dapp. A series of CVs acquired at varying scan rates allows for a plot of the
peak current (ip) versus the square root of the scan rate (ν1/2). The relationship between these
two variables is linear for a reversible redox couple according to the Randles-Sevcik
equation:24
Ip,c = -2.69 x 10⁵n3/2ADo1/2Coxν1/2 [Eqn. A.3]
where Ip,c is the peak current of the cathodic wave, n is the number of electrons transferred, A
is the area of the electrode, Do is the diffusion coefficeint (Dapp in this case), Cox is the bulk
concentration of the oxidant species, and ν is the sweep rate of the experiment. From the
slope of this plot, Dapp can be calculated.
The second approach to the semi-infinite linear diffusion case uses
chronoamperometry (CA) to step the potential far beyond the redox potential of the
electroactive species and then measure the decaying current response. If the response is
diffusion controlled, known as a Cottrellian response, the current is described by the Cottrell
equation:24
1/2
1/2
t)(CnFAD
I(t)π
∞= [Eqn. A.4]
where n is the number of electrons transferred, F is the Faraday constant, A is the area of the
electrode, D is the diffusion coefficient (in this case referred to as Dapp), C∞ is the bulk
concentration of the electroactive species, and t is time. Using this relationship, a Cottrell
plot of current versus the inverse square root of time can be constructed and a value of Dapp
can be obtained from the slope of the curve. When in the polymeric media, the CA approach
for calculating Dapp is favored because it is less prone to iR effects.18a
The preceding two cases represent limiting diffusional behaviors, both of which
extremely simplify any data analysis involved with determining Dapp values. Diffusion,
however, may occur via a combination of radial and linear diffusion geometries. The
281
analysis required for a mixed diffusion geometry is complicated and the subject of ongoing
studies in many research groups. Although it is beyond the scope of this discussion, it is
worth mentioning that the solution to the mixed diffusion geometry involves modeling the
total current at a microelectrode. Solutions presented for this purpose involve digital
simulations based on “hopscotch” algorithms25 and equations derived through a process
called convolutive forecasting.26 In spite of these efforts, most researchers using the polymer
film systems usually adjust their experimental parameters until the electrode behavior is
represented by one of the limiting cases.
A.5.5. Relevant Experimental Results from the Murray Group
Over the years, many different polymers and a vast number of redox species have
been tested and examined by Murray and coworkers. What will be discussed here, however,
are the results obtained that are relevant to the metallodendrimer project at hand. In 1992, a
paper by Murray’s group outlined some practical experimental aspects of solid state
voltammetry performed with polymeric electrolytes.18d Different polymers were tested with
respect to their molecular weight, structure, and morphology. Also considered were the
electrochemical effects of temperature and plasticization with solvent saturated vapor. For
each polymeric electrolyte, cyclic voltammetry was used to test the background signal and
establish a signature potential window. The results of these experiments, background
voltammograms of several polymer-electrolyte combinations, are presented in Figure A.11.
Of particular interest, with respect to the dendrimer research being discussed, are the first
three background scans of poly(ethylene glycol) dimethyl ethers (MePEG) with dissolved
LiClO4 (Figure A.11a-c). These scans are noteworthy because of their large negative
potential limit and low background signal, which led us to believe that these polymers might
provide adequate signal-to-noise ratios at extremely negative potentials to accommodate
electrochemistry on the metallodendrimers.
Polyethylene glycol with methyl terminated end groups (MePEG) is described basedon the following formula:18d
X - O -(-CH2CH-O-)n - X [Eqn. A.5] | Y
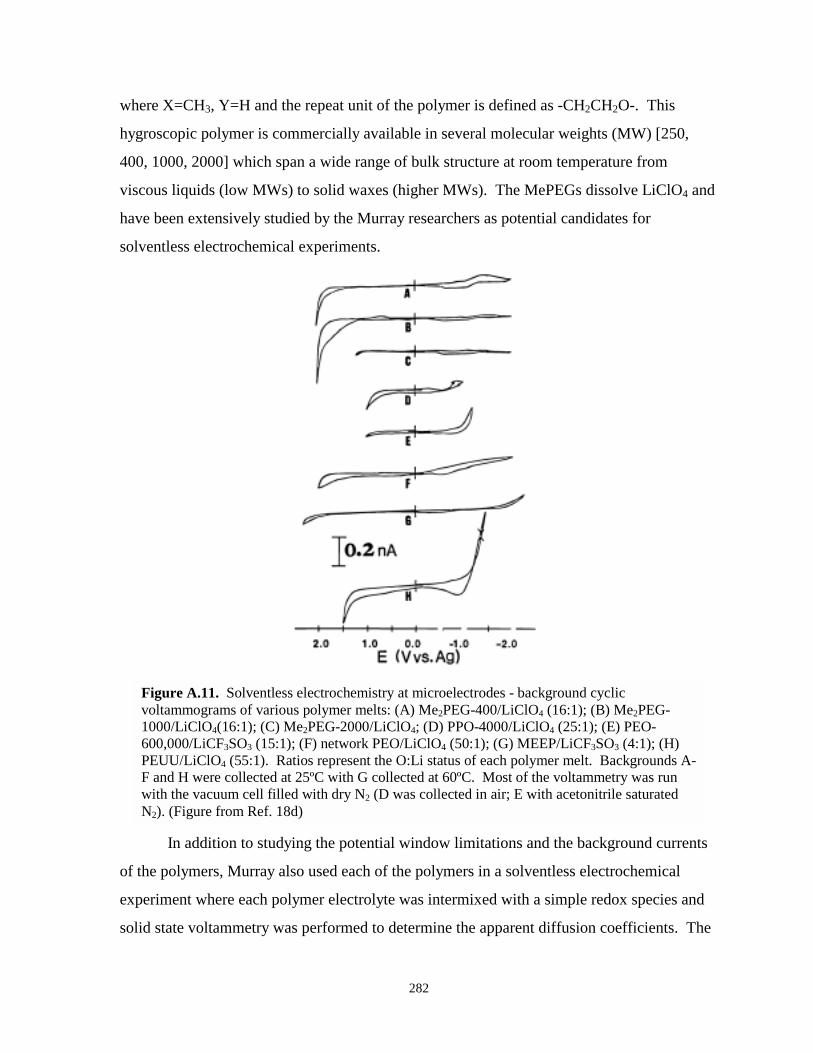
282
where X=CH3, Y=H and the repeat unit of the polymer is defined as -CH2CH2O-. This
hygroscopic polymer is commercially available in several molecular weights (MW) [250,
400, 1000, 2000] which span a wide range of bulk structure at room temperature from
viscous liquids (low MWs) to solid waxes (higher MWs). The MePEGs dissolve LiClO4 and
have been extensively studied by the Murray researchers as potential candidates for
solventless electrochemical experiments.
Figure A.11. Solventless electrochemistry at microelectrodes - background cyclicvoltammograms of various polymer melts: (A) Me2PEG-400/LiClO4 (16:1); (B) Me2PEG-1000/LiClO4(16:1); (C) Me2PEG-2000/LiClO4; (D) PPO-4000/LiClO4 (25:1); (E) PEO-600,000/LiCF3SO3 (15:1); (F) network PEO/LiClO4 (50:1); (G) MEEP/LiCF3SO3 (4:1); (H)PEUU/LiClO4 (55:1). Ratios represent the O:Li status of each polymer melt. Backgrounds A-F and H were collected at 25ºC with G collected at 60ºC. Most of the voltammetry was runwith the vacuum cell filled with dry N2 (D was collected in air; E with acetonitrile saturatedN2). (Figure from Ref. 18d)
In addition to studying the potential window limitations and the background currents
of the polymers, Murray also used each of the polymers in a solventless electrochemical
experiment where each polymer electrolyte was intermixed with a simple redox species and
solid state voltammetry was performed to determine the apparent diffusion coefficients. The
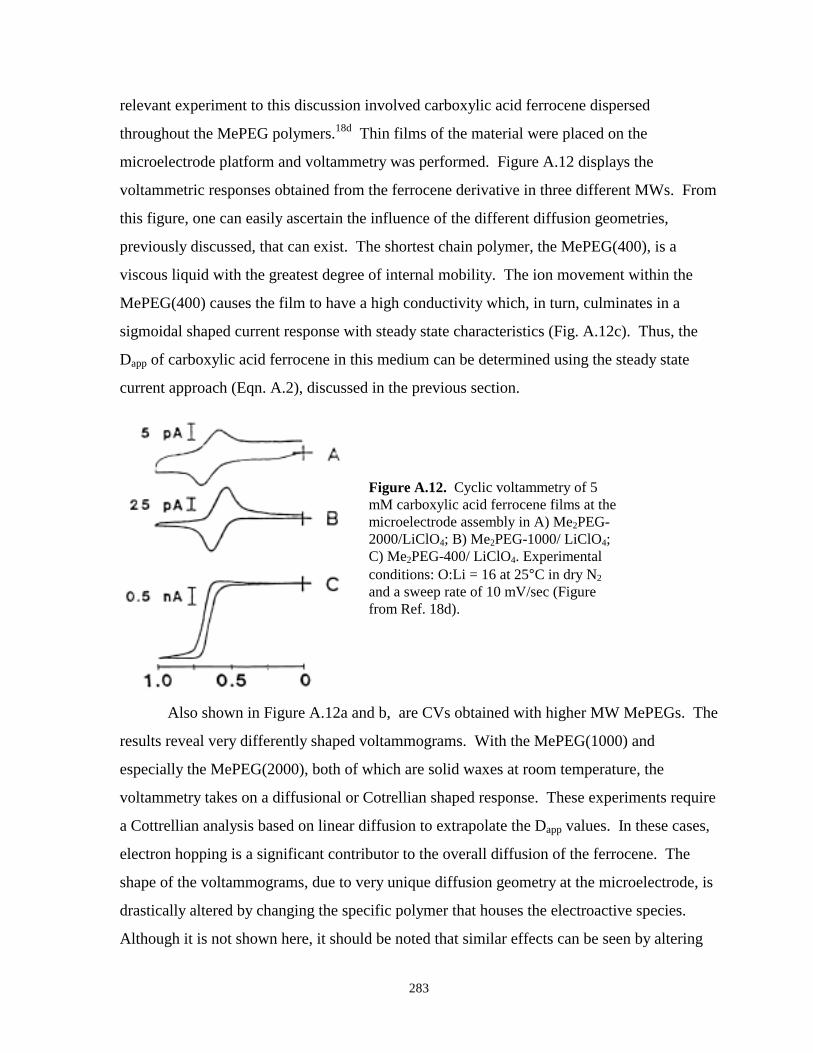
283
relevant experiment to this discussion involved carboxylic acid ferrocene dispersed
throughout the MePEG polymers.18d Thin films of the material were placed on the
microelectrode platform and voltammetry was performed. Figure A.12 displays the
voltammetric responses obtained from the ferrocene derivative in three different MWs. From
this figure, one can easily ascertain the influence of the different diffusion geometries,
previously discussed, that can exist. The shortest chain polymer, the MePEG(400), is a
viscous liquid with the greatest degree of internal mobility. The ion movement within the
MePEG(400) causes the film to have a high conductivity which, in turn, culminates in a
sigmoidal shaped current response with steady state characteristics (Fig. A.12c). Thus, the
Dapp of carboxylic acid ferrocene in this medium can be determined using the steady state
current approach (Eqn. A.2), discussed in the previous section.
Also shown in Figure A.12a and b, are CVs obtained with higher MW MePEGs. The
results reveal very differently shaped voltammograms. With the MePEG(1000) and
especially the MePEG(2000), both of which are solid waxes at room temperature, the
voltammetry takes on a diffusional or Cotrellian shaped response. These experiments require
a Cottrellian analysis based on linear diffusion to extrapolate the Dapp values. In these cases,
electron hopping is a significant contributor to the overall diffusion of the ferrocene. The
shape of the voltammograms, due to very unique diffusion geometry at the microelectrode, is
drastically altered by changing the specific polymer that houses the electroactive species.
Although it is not shown here, it should be noted that similar effects can be seen by altering
Figure A.12. Cyclic voltammetry of 5mM carboxylic acid ferrocene films at themicroelectrode assembly in A) Me2PEG-2000/LiClO4; B) Me2PEG-1000/ LiClO4;C) Me2PEG-400/ LiClO4. Experimentalconditions: O:Li = 16 at 25°C in dry N2
and a sweep rate of 10 mV/sec (Figurefrom Ref. 18d).
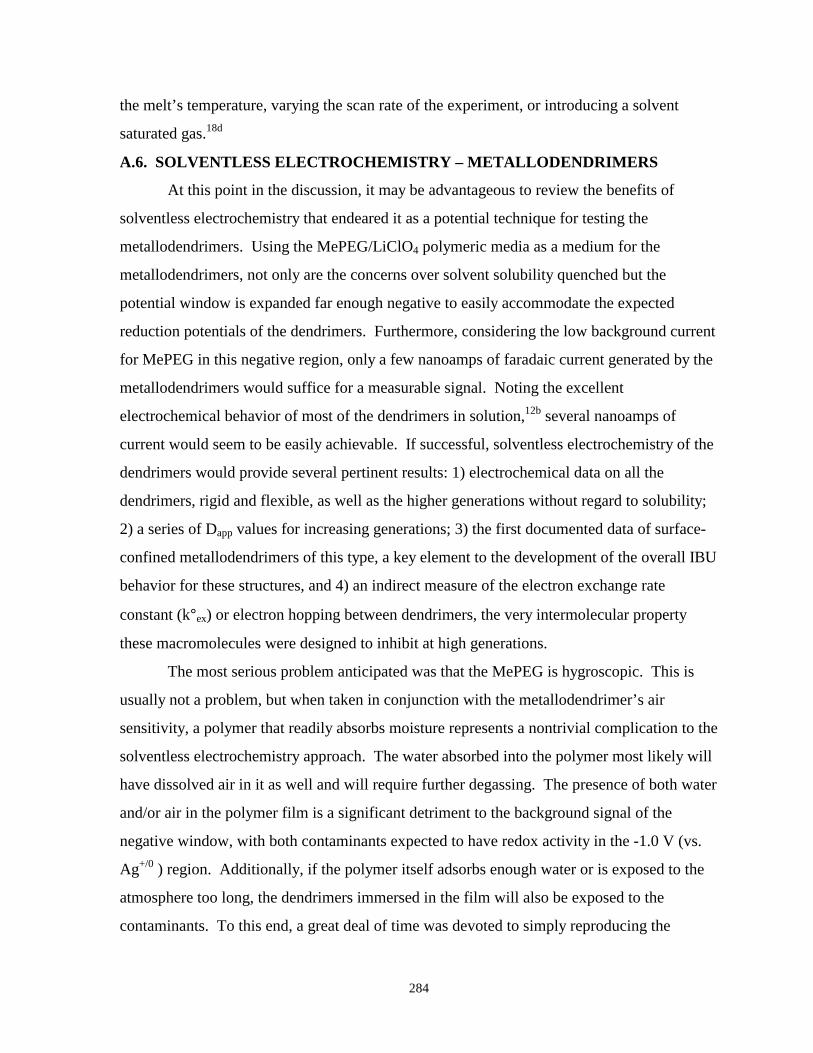
284
the melt’s temperature, varying the scan rate of the experiment, or introducing a solvent
saturated gas.18d
A.6. SOLVENTLESS ELECTROCHEMISTRY – METALLODENDRIMERS
At this point in the discussion, it may be advantageous to review the benefits of
solventless electrochemistry that endeared it as a potential technique for testing the
metallodendrimers. Using the MePEG/LiClO4 polymeric media as a medium for the
metallodendrimers, not only are the concerns over solvent solubility quenched but the
potential window is expanded far enough negative to easily accommodate the expected
reduction potentials of the dendrimers. Furthermore, considering the low background current
for MePEG in this negative region, only a few nanoamps of faradaic current generated by the
metallodendrimers would suffice for a measurable signal. Noting the excellent
electrochemical behavior of most of the dendrimers in solution,12b several nanoamps of
current would seem to be easily achievable. If successful, solventless electrochemistry of the
dendrimers would provide several pertinent results: 1) electrochemical data on all the
dendrimers, rigid and flexible, as well as the higher generations without regard to solubility;
2) a series of Dapp values for increasing generations; 3) the first documented data of surface-
confined metallodendrimers of this type, a key element to the development of the overall IBU
behavior for these structures, and 4) an indirect measure of the electron exchange rate
constant (k°ex) or electron hopping between dendrimers, the very intermolecular property
these macromolecules were designed to inhibit at high generations.
The most serious problem anticipated was that the MePEG is hygroscopic. This is
usually not a problem, but when taken in conjunction with the metallodendrimer’s air
sensitivity, a polymer that readily absorbs moisture represents a nontrivial complication to the
solventless electrochemistry approach. The water absorbed into the polymer most likely will
have dissolved air in it as well and will require further degassing. The presence of both water
and/or air in the polymer film is a significant detriment to the background signal of the
negative window, with both contaminants expected to have redox activity in the -1.0 V (vs.
Ag+/0 ) region. Additionally, if the polymer itself adsorbs enough water or is exposed to the
atmosphere too long, the dendrimers immersed in the film will also be exposed to the
contaminants. To this end, a great deal of time was devoted to simply reproducing the
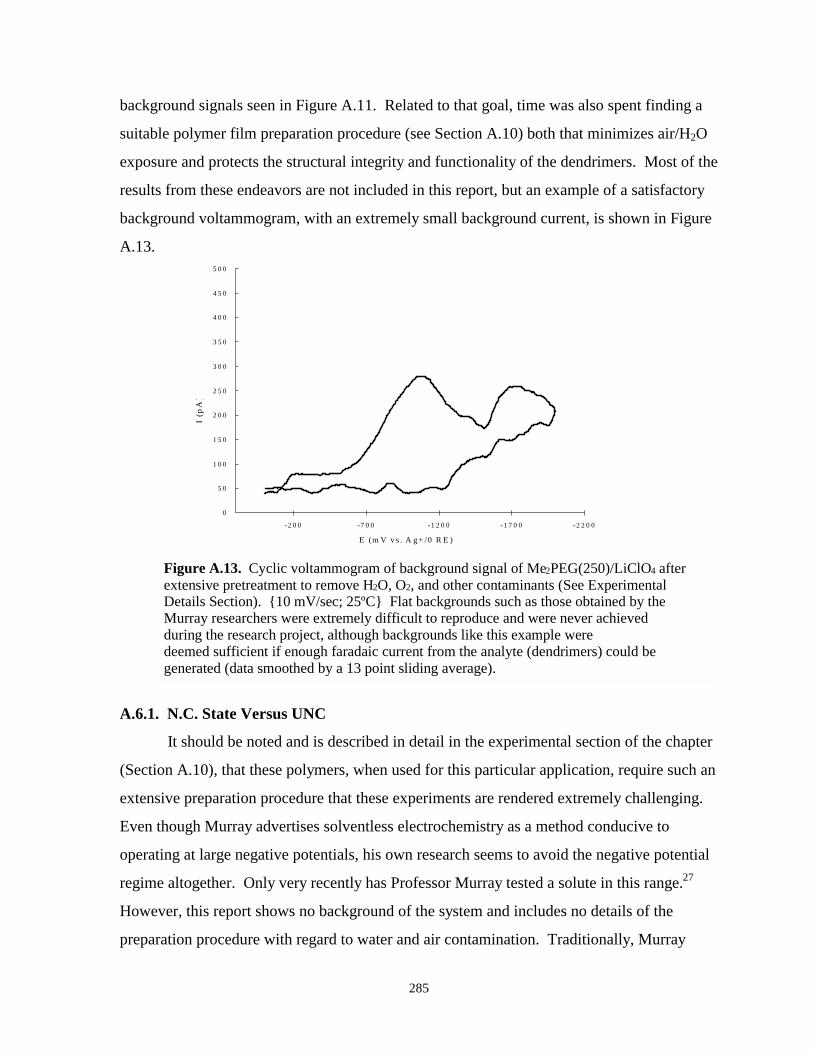
285
background signals seen in Figure A.11. Related to that goal, time was also spent finding a
suitable polymer film preparation procedure (see Section A.10) both that minimizes air/H2O
exposure and protects the structural integrity and functionality of the dendrimers. Most of the
results from these endeavors are not included in this report, but an example of a satisfactory
background voltammogram, with an extremely small background current, is shown in Figure
A.13.
0
5 0
1 0 0
1 5 0
2 0 0
2 5 0
3 0 0
3 5 0
4 0 0
4 5 0
5 0 0
-2 2 0 0-1 7 0 0-1 2 0 0-7 0 0-2 0 0
E (m V v s . A g+ /0 R E )
I (p
A)
Figure A.13. Cyclic voltammogram of background signal of Me2PEG(250)/LiClO4 afterextensive pretreatment to remove H2O, O2, and other contaminants (See ExperimentalDetails Section). {10 mV/sec; 25ºC} Flat backgrounds such as those obtained by theMurray researchers were extremely difficult to reproduce and were never achievedduring the research project, although backgrounds like this example weredeemed sufficient if enough faradaic current from the analyte (dendrimers) could begenerated (data smoothed by a 13 point sliding average).
A.6.1. N.C. State Versus UNC
It should be noted and is described in detail in the experimental section of the chapter
(Section A.10), that these polymers, when used for this particular application, require such an
extensive preparation procedure that these experiments are rendered extremely challenging.
Even though Murray advertises solventless electrochemistry as a method conducive to
operating at large negative potentials, his own research seems to avoid the negative potential
regime altogether. Only very recently has Professor Murray tested a solute in this range.27
However, this report shows no background of the system and includes no details of the
preparation procedure with regard to water and air contamination. Traditionally, Murray
286
performs his experiments on the benchtop without regard to contamination. Other
differences in the experimental protocols used by our group, as opposed to the procedures
used by Murray, are pointed out in subsequent paragraphs.
A.6.2. Preliminary Results - Carboxylic Acid Ferrocene / MePEG(250)
To test the behavior of the microelectrode assembly and ensure the viability of this
technique, the carboxylic acid ferrocene experiment was repeated. A polymer melt of
MePEG(250), a viscous liquid at room temperature, with dissolved LiClO4 was prepared via
the procedure described in the Experimental Details (Section A.10). An important difference
between the preparation procedure used in the Gorman/Bowden research collaboration and
the Murray experiments was that no solvent, either to aid in the dissolution of the Li salt or
for use as a plasitcizing agent, was ever introduced into the system. Because of this, no
solvent had to be removed from the melt after it was prepared. This experiment was
successful and results are presented as Figure A.14. Scans at different sweep rates revealed
that the electrode behaves as a microelectrode, showing a steady state response at low scan
rates and diffusion controlled response at higher scan rates.24 These results are consistent
with the results shown in Figure A.12 and validated our execution of this type of solventless
electrochemistry. The next experiments incorporated metallodendrimers into the MePEG
electrolyte films.
287
-10
-8
-6
-4
-2
0
2
4
6
020040060080010001200
E (mV vs. Ag+/0 RE)
I (nA
)
Figure A.14. Cyclic voltammetry of carboxylic acid ferrocene (5 mM) in Me2PEG(250) withLiClO4. Voltammograms shown were collected at 2 mV/sec (green), 10 mV/sec (red), and 100mV/sec (blue) and illustrate typical scan rate dependent behavior at microelectrodes, simoidalshaped voltammetry at low scan rates and diffusional shaped voltammetry at higher scan rates.
A.6.3. Flexible IBUs / MePEG(250) Results
The first solventless electrochemistry experiments on the metallodendrimers were
performed on the low generation (G0, G1, & G2), flexible series of molecules in
MePEG(250). Both the G0 flexible dendrimer and the low MW polymer, MePEG(250),
were chosen for the initial experiments because they offered the greatest chance of success.
The dendrimers, it was feared, would be too bulky and insulating to undergo facile ET of any
kind in the higher MW, long chain polymers. Although the results are not shown here,
experiments with dendrimers in higher MW polymer were attempted and showed very poor
results in accordance with this line of thought. Additionally, the longer chain polymers were
much more difficult to prepare clean and anhydrous. After a tremendous amount of effort
and repeated trials, experiments with GO were eventually successful.
Electrochemistry on the flexible IBUs required both an extensive preparation
procedure for the polymer and a specific polishing procedure for the microelectrode
assembly. Both of these procedures are outlined in the Experimental Details section at the
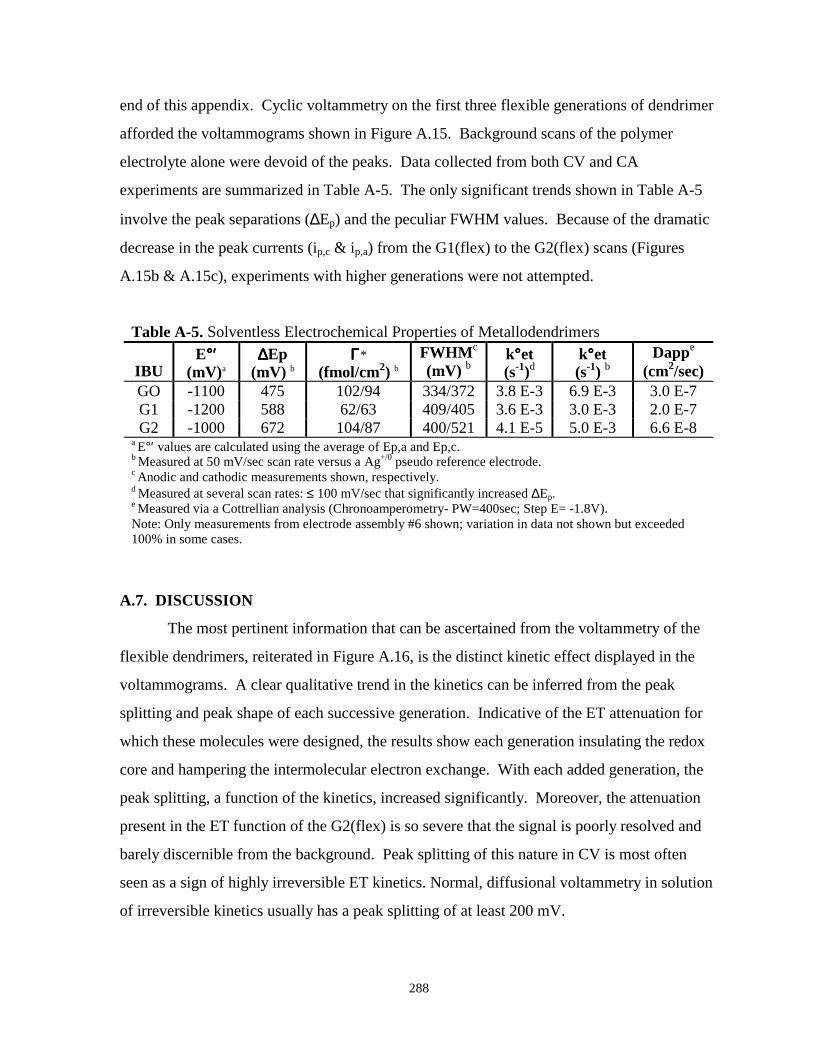
288
end of this appendix. Cyclic voltammetry on the first three flexible generations of dendrimer
afforded the voltammograms shown in Figure A.15. Background scans of the polymer
electrolyte alone were devoid of the peaks. Data collected from both CV and CA
experiments are summarized in Table A-5. The only significant trends shown in Table A-5
involve the peak separations (∆Ep) and the peculiar FWHM values. Because of the dramatic
decrease in the peak currents (ip,c & ip,a) from the G1(flex) to the G2(flex) scans (Figures
A.15b & A.15c), experiments with higher generations were not attempted.
Table A-5. Solventless Electrochemical Properties of Metallodendrimers
IBUE°°°°′′′′
(mV)a∆∆∆∆Ep
(mV) bΓΓΓΓ*
(fmol/cm2) bFWHMc
(mV) bk°°°°et(s-1)d
k°°°°et(s-1) b
Dappe
(cm2/sec)GO -1100 475 102/94 334/372 3.8 E-3 6.9 E-3 3.0 E-7G1 -1200 588 62/63 409/405 3.6 E-3 3.0 E-3 2.0 E-7G2 -1000 672 104/87 400/521 4.1 E-5 5.0 E-3 6.6 E-8
a E°′ values are calculated using the average of Ep,a and Ep,c.b Measured at 50 mV/sec scan rate versus a Ag+/0 pseudo reference electrode.c Anodic and cathodic measurements shown, respectively.d Measured at several scan rates: ≤ 100 mV/sec that significantly increased ∆Ep.e Measured via a Cottrellian analysis (Chronoamperometry- PW=400sec; Step E= -1.8V).Note: Only measurements from electrode assembly #6 shown; variation in data not shown but exceeded100% in some cases.
A.7. DISCUSSION
The most pertinent information that can be ascertained from the voltammetry of the
flexible dendrimers, reiterated in Figure A.16, is the distinct kinetic effect displayed in the
voltammograms. A clear qualitative trend in the kinetics can be inferred from the peak
splitting and peak shape of each successive generation. Indicative of the ET attenuation for
which these molecules were designed, the results show each generation insulating the redox
core and hampering the intermolecular electron exchange. With each added generation, the
peak splitting, a function of the kinetics, increased significantly. Moreover, the attenuation
present in the ET function of the G2(flex) is so severe that the signal is poorly resolved and
barely discernible from the background. Peak splitting of this nature in CV is most often
seen as a sign of highly irreversible ET kinetics. Normal, diffusional voltammetry in solution
of irreversible kinetics usually has a peak splitting of at least 200 mV.
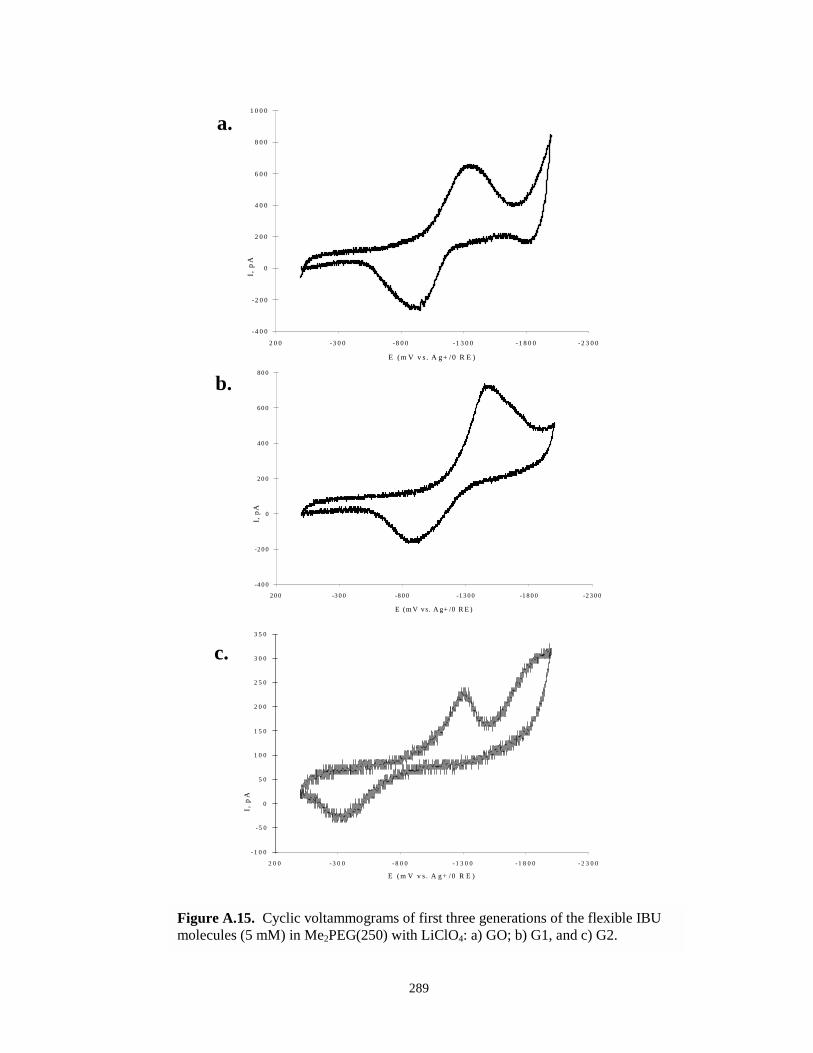
289
-4 0 0
-2 0 0
0
2 0 0
4 0 0
6 0 0
8 0 0
1 0 0 0
-2 3 0 0-1 8 0 0-1 3 0 0-8 0 0-3 0 02 0 0
E (m V v s . A g+ / 0 R E )
I, p
A
-4 0 0
-2 0 0
0
20 0
40 0
60 0
80 0
-2 3 0 0-1 8 0 0-1 3 0 0-8 0 0-3 0 020 0
E (m V vs. A g+ /0 R E )
I, p
A
- 1 0 0
- 5 0
0
5 0
1 0 0
1 5 0
2 0 0
2 5 0
3 0 0
3 5 0
- 2 3 0 0- 1 8 0 0- 1 3 0 0- 8 0 0- 3 0 02 0 0
E ( m V v s . A g + / 0 R E )
I, p
A
a.
b.
c.
Figure A.15. Cyclic voltammograms of first three generations of the flexible IBUmolecules (5 mM) in Me2PEG(250) with LiClO4: a) GO; b) G1, and c) G2.
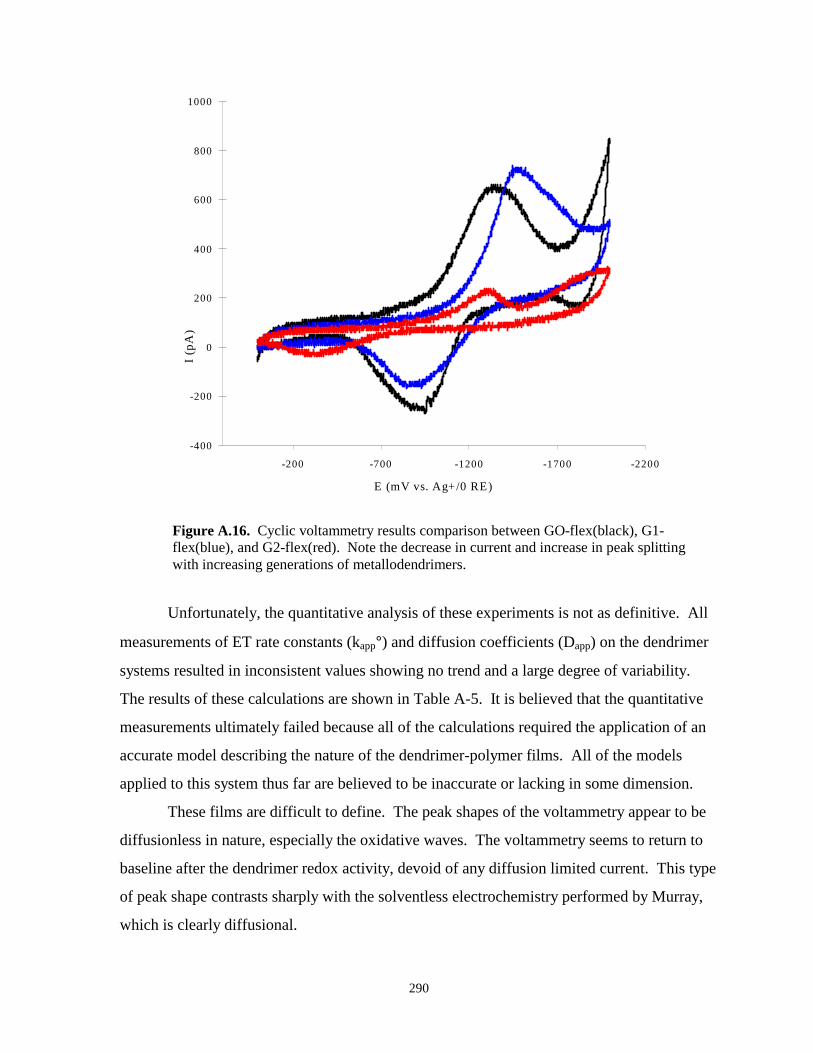
290
-400
-200
0
200
400
600
800
1000
-2200-1700-1200-700-200
E (mV vs. Ag+/0 RE)
I (p
A)
Figure A.16. Cyclic voltammetry results comparison between GO-flex(black), G1-flex(blue), and G2-flex(red). Note the decrease in current and increase in peak splittingwith increasing generations of metallodendrimers.
Unfortunately, the quantitative analysis of these experiments is not as definitive. All
measurements of ET rate constants (kapp°) and diffusion coefficients (Dapp) on the dendrimer
systems resulted in inconsistent values showing no trend and a large degree of variability.
The results of these calculations are shown in Table A-5. It is believed that the quantitative
measurements ultimately failed because all of the calculations required the application of an
accurate model describing the nature of the dendrimer-polymer films. All of the models
applied to this system thus far are believed to be inaccurate or lacking in some dimension.
These films are difficult to define. The peak shapes of the voltammetry appear to be
diffusionless in nature, especially the oxidative waves. The voltammetry seems to return to
baseline after the dendrimer redox activity, devoid of any diffusion limited current. This type
of peak shape contrasts sharply with the solventless electrochemistry performed by Murray,
which is clearly diffusional.
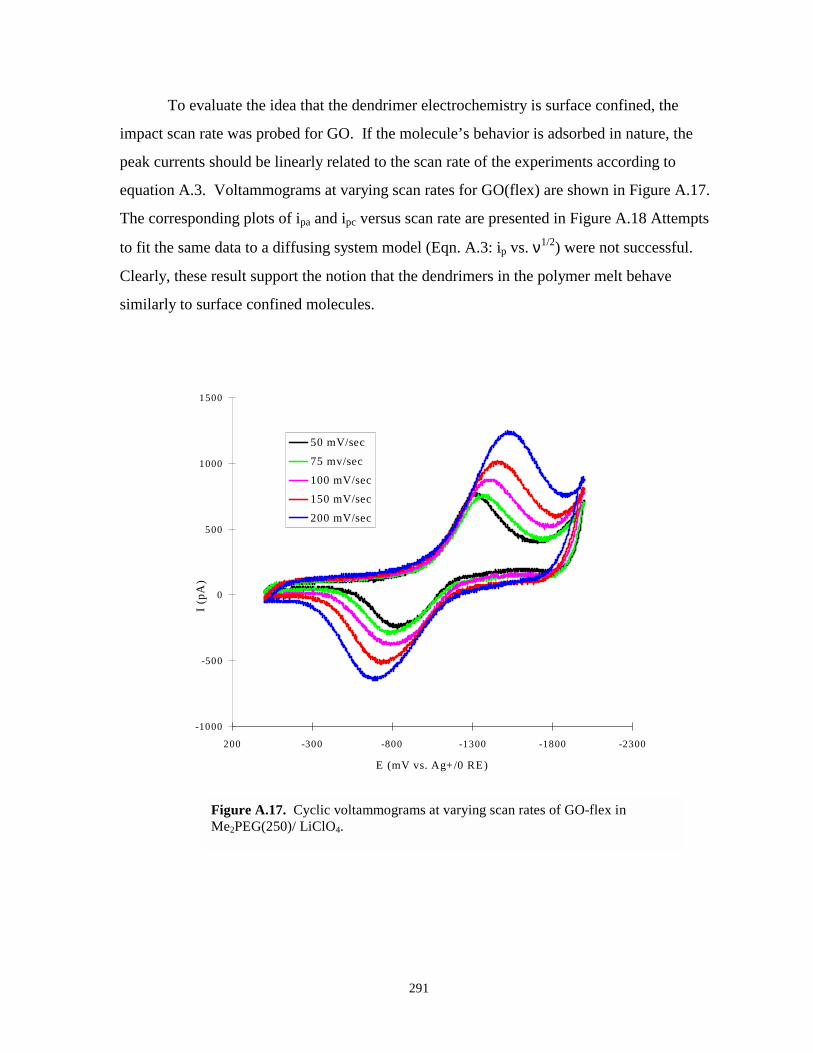
291
To evaluate the idea that the dendrimer electrochemistry is surface confined, the
impact scan rate was probed for GO. If the molecule’s behavior is adsorbed in nature, the
peak currents should be linearly related to the scan rate of the experiments according to
equation A.3. Voltammograms at varying scan rates for GO(flex) are shown in Figure A.17.
The corresponding plots of ipa and ipc versus scan rate are presented in Figure A.18 Attempts
to fit the same data to a diffusing system model (Eqn. A.3: ip vs. ν1/2) were not successful.
Clearly, these result support the notion that the dendrimers in the polymer melt behave
similarly to surface confined molecules.
-1000
-500
0
500
1000
1500
-2300-1800-1300-800-300200
E (mV vs. Ag+/0 RE)
I (p
A)
50 mV/sec
75 mv/sec
100 mV/sec
150 mV/sec
200 mV/sec
Figure A.17. Cyclic voltammograms at varying scan rates of GO-flex inMe2PEG(250)/ LiClO4.
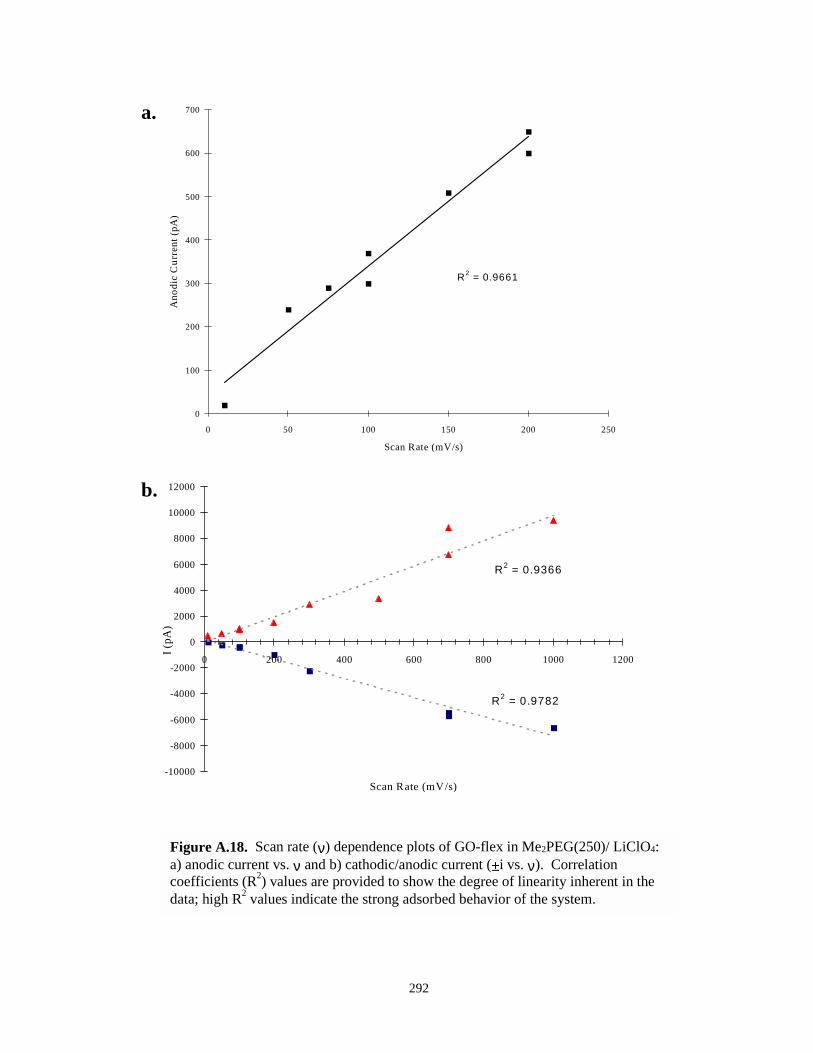
292
R2 = 0.9661
0
100
200
300
400
500
600
700
0 50 100 150 200 250
Scan Rate (mV/s)
Ano
dic
Cur
rent
(pA
)
R2 = 0.9782
R2 = 0.9366
-10000
-8000
-6000
-4000
-2000
0
2000
4000
6000
8000
10000
12000
0 200 400 600 800 1000 1200
Scan Rate (mV/s)
I (pA
)
a.
b.
Figure A.18. Scan rate (ν) dependence plots of GO-flex in Me2PEG(250)/ LiClO4:a) anodic current vs. ν and b) cathodic/anodic current (±i vs. ν). Correlationcoefficients (R2) values are provided to show the degree of linearity inherent in thedata; high R2 values indicate the strong adsorbed behavior of the system.
293
One particulary interesting property of the dendrimers’ solid-state voltammetry is the
unusually large FWHM values. Ranging from 300 to 500 mV, these FWHM values are
exceptionally large and indicative of the complex nature of this system. The reasons for the
broadened peaks are unknown, although non-diffusional broadened peaks of this magnitude
have been seen in conjunction with surface effects28 and in thin-layer voltammetry.24
If thin-layer behavior is indeed taking place, the charge passed during the scans would
be inclusive of all the electroactive molecules in the entire film. By integrating the area
under the voltammetric curves, the charge passed during the actual experiment can be directly
compared to the theoretical charge passed if the films is completely electrolyzed. To
calculate the theoretical charge passed, several assumptions about the system have to be
made. The first assumption is that the polymer electrolyte-dendrimer films are evenly
distributed across the microelectrode platform. Secondly, it is accepted that the hard sphere,
molecular radii of the dendrimers (See Table A.6a) is accurately approximated by
independent molecular modeling computer simulations. Third, it is assumed that only
dendrimers above the working electrode were able to be electrolyzed. Thus, any radial
derived current in these experiments is essentially neglected. Finally, as displayed in Figure
A.19, it is assumed that the IBU molecules are in close contact within the polymer film,
adopting a simple cubic packing order. Because both dispersion and aggregation of the
dendrimers in these films remain viable and equally plausible possibilities, this last
assumption suggests that the theoretical value calculated will be a an estimation of the upper
limit of dendrimers that may be electrolyzed. In any event, these assumptions, along with the
information in Table A-6a, Table A-6b, and the model depicted in Figure A.19, were used to
determine the theoretical upper limit of electrolyzed molecules.
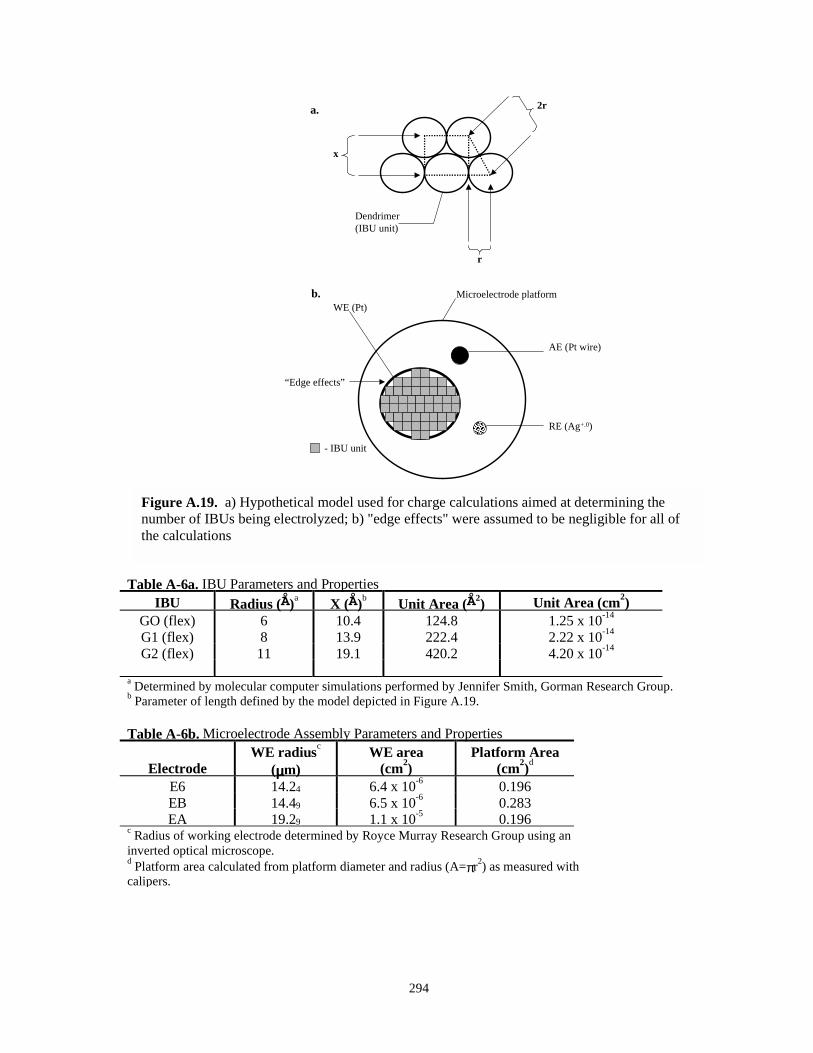
294
r
2r
x
Microelectrode platform
��������������
AE (Pt wire)
RE (Ag+.0)
WE (Pt)
- IBU unit
“Edge effects”
a.
b.
Dendrimer(IBU unit)
Figure A.19. a) Hypothetical model used for charge calculations aimed at determining thenumber of IBUs being electrolyzed; b) "edge effects" were assumed to be negligible for all ofthe calculations
Table A-6a. IBU Parameters and PropertiesIBU Radius (Å)a X (Å)b Unit Area (Å2) Unit Area (cm2)
GO (flex) 6 10.4 124.8 1.25 x 10⁻¹⁴
G1 (flex) 8 13.9 222.4 2.22 x 10⁻¹⁴
G2 (flex) 11 19.1 420.2 4.20 x 10⁻¹⁴
a Determined by molecular computer simulations performed by Jennifer Smith, Gorman Research Group.b Parameter of length defined by the model depicted in Figure A.19.
Table A-6b. Microelectrode Assembly Parameters and Properties
ElectrodeWE radiusc
(µµµµm)WE area
(cm2)Platform Area
(cm2)d
E6 14.24 6.4 x 10⁻⁶ 0.196EB 14.49 6.5 x 10⁻⁶ 0.283EA 19.29 1.1 x 10⁻⁵ 0.196
c Radius of working electrode determined by Royce Murray Research Group using aninverted optical microscope.d Platform area calculated from platform diameter and radius (A=πr2) as measured withcalipers.
295
To determine the corresponding experimental values, knowledge of the total number
of molecules deposited on the entire electrode platform is required. This amount also
requires a few significant assumptions. Considering that the film is placed on the electrode
via the inefficient and imprecise method of dropcoating from a microsyringe, the volume of
material deposited is not accurately known. Therefore, it is estimated that
the volume of material placed on the microelectrode platform was approximately 1-2 µL of
polymer. In this manner, theoretical values are reported with high and low calculations to
designate a range of possible values. The results of these calculations are shown in Tables A-
7. While not totally complete, the experimental data that can be compared to theoretical
numbers shows that, in almost all the cases, only a maximum of 33% of the dendrimer films
is being electrolyzed during the voltammetry. This result contradicts typical thin layer
behavior and leaves the specific nature of these films and their electrochemistry largely a
mystery.
A.8. CONCLUSIONS AND FUTURE DIRECTIONS
Even though the results shown here are significant, the future of solventless
electrochemistry on these metallodendrimers is uncertain at best. A positive aspect of these
results is their support, at least on a qualitative level, of the dendritic encapsulation property
of the metallodendrimers. The changing kinetics of the different generation dendrimers is the
exact structure-function relationship being sought in this project. Unfortunately, this
technique apparently can not elucidate these properties in higher order generations and has
failed to yield useful quantitative data in the lower generation molecules. There is definitely
science to be wrought here, however, as solventless electrochemistry remains a largely
untapped and potentially useful technique with many applications. In fact, it might serve as
an excellent method of recording previously unachieved data on the rigid IBUs, which were
never tested in this medium.
Solventless electrochemistry is not a side project. The extreme difficulty of the
measurements involved, as well as the time consuming nature of the required preparation
procedures, render electrochemistry of metallodendrimers a clear candidate for a full doctoral
project. Before proceeding with a full solventless electrochemistry project
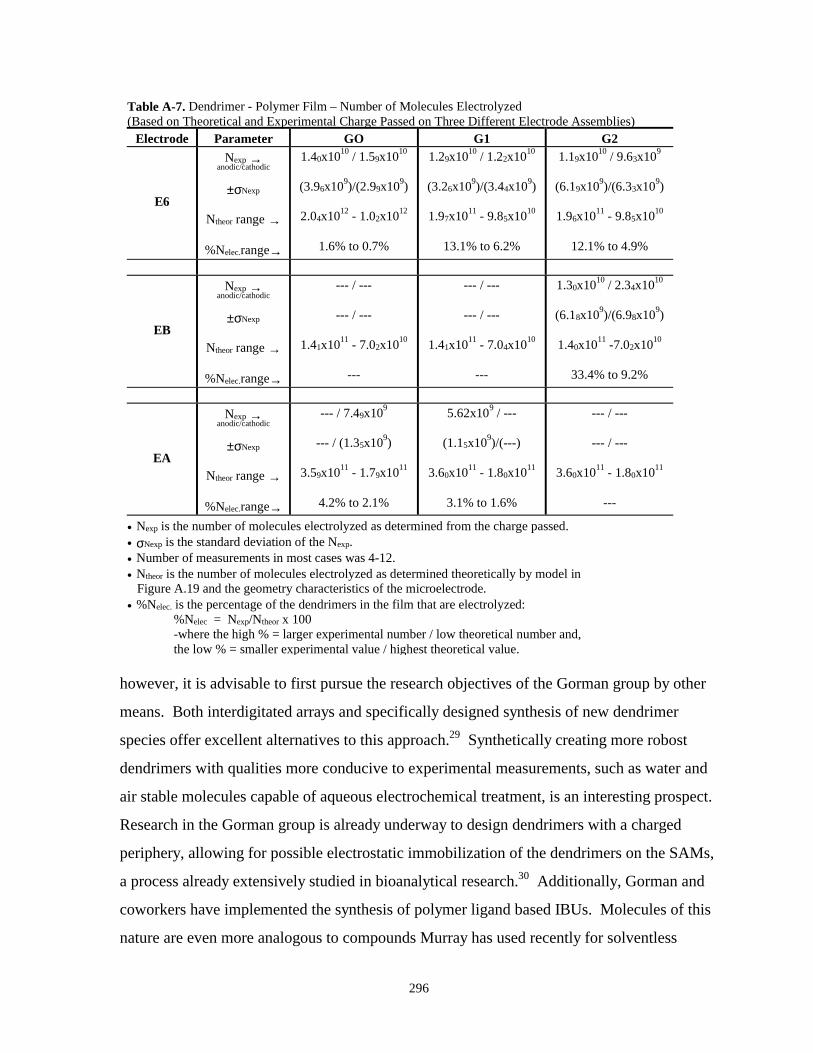
296
Table A-7. Dendrimer - Polymer Film – Number of Molecules Electrolyzed(Based on Theoretical and Experimental Charge Passed on Three Different Electrode Assemblies)
Electrode Parameter GO G1 G2
E6
Nexp →anodic/cathodic
±σNexp
Ntheor range →
%Nelec.range→
1.40x10¹⁰ / 1.59x10¹⁰
(3.96x10⁹)/(2.99x109)
2.04x10¹² - 1.02x10¹²
1.6% to 0.7%
1.29x10¹⁰ / 1.22x10¹⁰
(3.26x10⁹)/(3.44x109)
1.97x10¹¹ - 9.85x10¹⁰
13.1% to 6.2%
1.19x10¹⁰ / 9.63x10⁹
(6.19x10⁹)/(6.33x109)
1.96x10¹¹ - 9.85x10¹⁰
12.1% to 4.9%
EB
Nexp →anodic/cathodic
±σNexp
Ntheor range →
%Nelec.range→
--- / ---
--- / ---
1.41x10¹¹ - 7.02x10¹⁰
---
--- / ---
--- / ---
1.41x10¹¹ - 7.04x10¹⁰
---
1.30x10¹⁰ / 2.34x10¹⁰
(6.18x10⁹)/(6.98x109)
1.40x10¹¹ -7.02x10¹⁰
33.4% to 9.2%
EA
Nexp →anodic/cathodic
±σNexp
Ntheor range →
%Nelec.range→
--- / 7.49x10⁹
--- / (1.35x10⁹)
3.59x10¹¹ - 1.79x10¹¹
4.2% to 2.1%
5.62x10⁹ / ---
(1.15x10⁹)/(---)
3.60x10¹¹ - 1.80x10¹¹
3.1% to 1.6%
--- / ---
--- / ---
3.60x10¹¹ - 1.80x10¹¹
---
• Nexp is the number of molecules electrolyzed as determined from the charge passed.• σNexp is the standard deviation of the Nexp.• Number of measurements in most cases was 4-12.• Ntheor is the number of molecules electrolyzed as determined theoretically by model in Figure A.19 and the geometry characteristics of the microelectrode.• %Nelec. is the percentage of the dendrimers in the film that are electrolyzed:
%Nelec = Nexp/Ntheor x 100-where the high % = larger experimental number / low theoretical number and,the low % = smaller experimental value / highest theoretical value.
however, it is advisable to first pursue the research objectives of the Gorman group by other
means. Both interdigitated arrays and specifically designed synthesis of new dendrimer
species offer excellent alternatives to this approach.29 Synthetically creating more robost
dendrimers with qualities more conducive to experimental measurements, such as water and
air stable molecules capable of aqueous electrochemical treatment, is an interesting prospect.
Research in the Gorman group is already underway to design dendrimers with a charged
periphery, allowing for possible electrostatic immobilization of the dendrimers on the SAMs,
a process already extensively studied in bioanalytical research.30 Additionally, Gorman and
coworkers have implemented the synthesis of polymer ligand based IBUs. Molecules of this
nature are even more analogous to compounds Murray has used recently for solventless
297
electrochemistry experiments.29b Thus, any of these advancements in the dendrimer project
could easily resurrect solventless electrochemistry as a potential experimental technique for
elucidating ET properties of metallodendrimers. The work that has been presented here
represents the pioneering effort into the realm of solventless electrochemistry on
metallodendrimers and has been made available for possible future collaborations with the
Gorman Research Group.
A.9. SPECIAL ACKNOWLEDGEMENTS AND AUTHOR’S NOTES
This work was completed with the dedication and effort of my coworker from Dr.
Gorman’s group, Jennifer Smith - my partner in crime, a good friend and an excellent
scientist. I very much enjoyed working on this project with both Jen and Dr. Gorman. I am
appreciative of Dr. Gorman for offering me the opportunity to undertake this project and only
wish I could have completed the experiments with a greater degree of overall success. This is
a natural collaboration for researchers in the Bowden group and I would hope that future
students consider working on this project. With that said, I must also sincerely thank Dr.
Bowden for allowing me to participate in this interesting side project. This work provided
me with valuable experience in different areas of chemistry, expanded my knowledge of
science, and represents one of the more challenging episodes of my graduate career.
Additionally, I would like to thank Dr. Susan Hendrickson of the Royce Murray
group at UNC, Chapel Hill (presently an assistant professor at Davidson College) for
providing two senior graduate students with the microelectrodes used in this project, thereby
sparing us the task of making our own. I would also like to acknowledge Jan Singhaus for
making our vacuum cells, a pivotal part of the experimental apparatus.
A.10. EXPERIMENTAL DETAILS
A.10.1. Equipment / Materials / Procedures
-General
Cyclic voltammetry (CV), chronoamperometry(CA), and linear sweep
voltammetry(LSV) were performed using either an EG&G PAR 263 potentiostat or a
Bioanalytical BAS-50W voltammetric analyzer. Each instrument was used with its
298
accompanying software, the PAR 270 software being operated in Ramp Mode, generating a
staircase applied voltage waveform with a 0.5 mV step height. The current response of all
scans under 100 mV/sec were filtered with a built-in 5.3 Hz. low pass filter. To ensure
reproducibility, a minimum of 3 CV cycles were collected at any given scan rate with the
final scan being saved. CA experiments were run in duplicate for repeatability.
The metallodendrimers used for each experiment were all previously synthesized and
physically characterized with elemental analysis by members of the Gorman Research
Group.9 Atmospheric control around these molecules was maintained with a N2 purged glove
box, as well as, a variety of Schlenck flasks and vacuum lines. Exposure of the dendrimers to
the atmosphere was minimal if at all throughout the experiments.
A.10.2. SAM Experiments & LSV Desorption
-Equipment/Materials
An electrochemical cell previously described was used for all the aqueous or wet
electrochemistry. The working electrode(WE) and substrate for the SAMs was an evaporated
Au mirror electrode, 1000-4000Å Au / 50Å Ti / glass (Evaporated Metal Films, Ithaca, NY).
The predominant RE used throughout these experiments was an in house built, non-aqueous,
silver (Ag+/0) wire, pseudo reference.14 The silver wire was housed in a glass sheath that was
filled with solvent containing a small amount of dissolved AgNO3. A platinum wire was
used as the AE and wrapped around the outside of the glass barrel of the RE. The entire
apparatus was then placed in the cell as close to the gold WE as possible to minimize solution
resistance. Since organic solvents were employed with these electrochemical cells, Kalrez
o-rings were used in place of the traditional Viton o-rings. The Kalrez o-rings are more
resistant to chemical attack and degradation.
The thiols used to form the SAM on the gold surface were previously synthesized,
purified, and characterized by Linderman and co-workers31 or used as received from Aldrich
Chemical Company (11-mercaptoundecanoic acid). The thiols were generally used as 5 mM
solutions in ethanol (EtOH). The ammonium-borate salts were purchased in anhydrous form
from Aldrich Chemical Company(St. Louis, MO) and used as received after drying and
occasionally recrystallizing by standard procedures.32 All solvents were purchased
anhydrous or used directly from a still with air sensitive techniques (i.e. cantellation;
299
Schlenck flasks). Freeze-pump-thaw (F-P-T) cycles using liquid nitrogen and a heat gun
were applied as needed to the organic solvents, The small percentage of aqueous
experiments were done with Milli-Q filtered deionized water. All open transfers of materials
or chemicals took place inside the glove box under inert atmosphere.
-Procedure
Gold electrodes were cleaned with fresh Piranha solution (1:4 H2O2(30%) /
H2SO4(conc.)) by immersing the electrode into the solution and stirring for 30 seconds. After
the 30 second exposure, the Piranha solution was removed and the electrodes were rinsed
thoroughly with copious amounts of Milli-Q water. CAUTION: Piranha solution is
extremely dangerous and can react violently with organic compounds; extreme care should be
used when handling or using Piranha solution! The electrodes were then rinsed several times
with EtOH before being exposed to 900 µL of the 5 mM alkanethiol ethanolic solutions.
After several minutes, the electrodes were rinsed with pure EtOH, dried under a dry Ar gas
stream, and packed in jars with dry Ar. These jars were then pumped into the glove box
where they were assembled into the electrochemical cells.
For the actual experiments, the cells were filled with propylene carbonate (PC)
containing 100 mM tetraethylammonium tetrafluoroborate. CV scans were made for Cdl
measurements and LSV was performed from 0.0V to –1.3V to facilitate the reductive
desorption of the SAM.
A.10.3. Solventless Electrochemistry
-Materials/Equipment
Microelectrode assemblies were borrowed from Royce Murray’s Research Group and
were used in conjunction with a vacuum cell designed in this lab and built by the NCSU
glassblower. The experimental apparatus, shown in Figure A.20, was housed in a homemade
faraday cage. The microelectrodes were polished on a wheel with successively smaller grain
alumina paste micropolish (Buehler Inc.). The microelectrode was polished two times each
with each size alumina paste (1.0, 0.3, & 0.05 µm). The final polishing step was to polish the
electrode by hand using the 0.05 µm sized alumina, forming a “figure 8” with both hands.
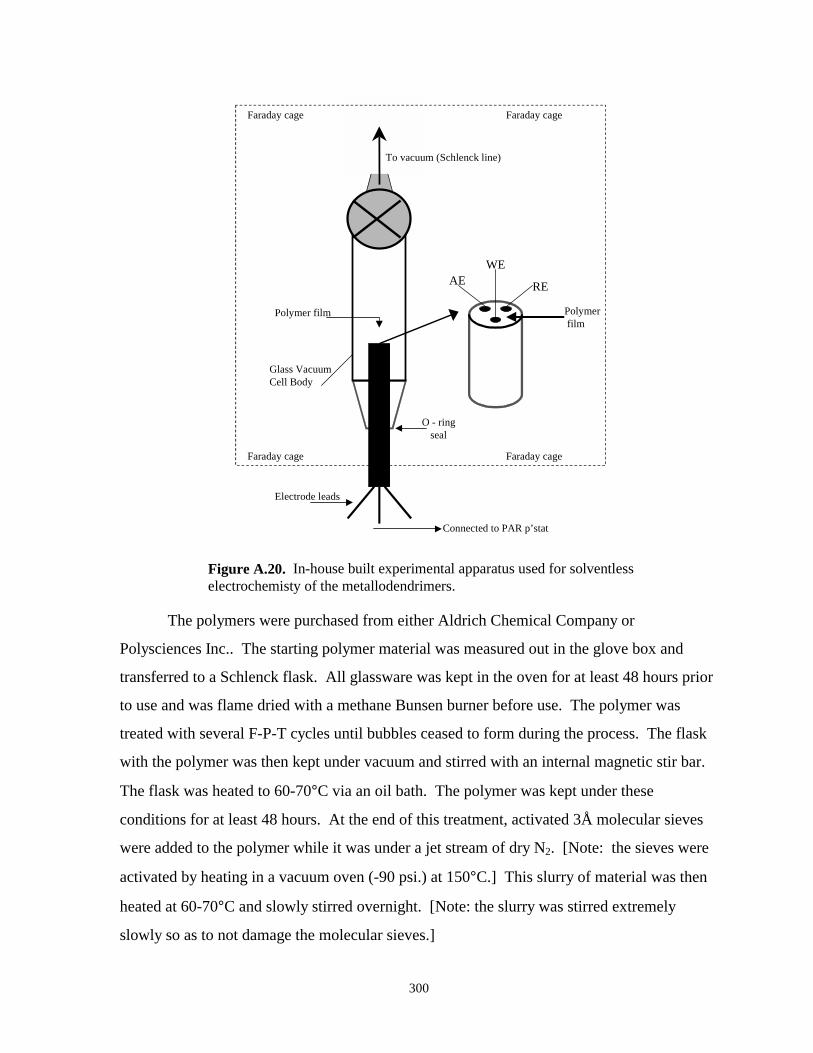
300
WE
REAE
Polymer film
Polymer film
Electrode leads
Glass VacuumCell Body
O - ringseal
To vacuum (Schlenck line)
Faraday cage Faraday cage
Faraday cage Faraday cage
Connected to PAR p’stat
Figure A.20. In-house built experimental apparatus used for solventlesselectrochemisty of the metallodendrimers.
The polymers were purchased from either Aldrich Chemical Company or
Polysciences Inc.. The starting polymer material was measured out in the glove box and
transferred to a Schlenck flask. All glassware was kept in the oven for at least 48 hours prior
to use and was flame dried with a methane Bunsen burner before use. The polymer was
treated with several F-P-T cycles until bubbles ceased to form during the process. The flask
with the polymer was then kept under vacuum and stirred with an internal magnetic stir bar.
The flask was heated to 60-70°C via an oil bath. The polymer was kept under these
conditions for at least 48 hours. At the end of this treatment, activated 3Å molecular sieves
were added to the polymer while it was under a jet stream of dry N2. [Note: the sieves were
activated by heating in a vacuum oven (-90 psi.) at 150°C.] This slurry of material was then
heated at 60-70°C and slowly stirred overnight. [Note: the slurry was stirred extremely
slowly so as to not damage the molecular sieves.]
301
Simultaneously, the LiClO4 solid was purchased as an anhydrous salt and was further
dried in a vacuum oven at >100°C for at least 3 days prior to initial use. The LiClO4 was
kept in the vacuum oven at this temperature for the duration of the solventless
electrochemistry project and used as needed. [Note: It is imperative to dry the salt before
using it since the Li salts readily adsorb moisture.17
The dried LiClO4 and the dry MePEG, which was cantilated away from the molecular sieves
into another vacuum flask, were both pumped into the glove box where they were combined.
The Li salt was quantitatively added the polymer by measuring out enough to maintain a ratio
of ether oxygen to Li of 16:1.18d The combination of these two materials, contrary to
literature reports,18 were not readily miscible. Instead the mixture required being returned to
the vacuum pump for at least overnight stirring and heating (60-70oC).
Finally, for the solventless electrochemistry experiments themselves, the polymer
electrolyte was transferred back to the glove box and mixed with the dendrimer in an
approximate concentration of 5mM IBU. Several drops of this material were placed, via a
glass microsyringe, on the microelectrode platform. The entire microelectrode tip was then
sealed into a vacuum cell and returned to the vacuum line. The thin film of material was
pumped on in this manner for at least 3 days before any testing was attempted. After the
third day of pumping, the films were tested daily until the voltammetry became consistent. It
was believed that the consistent signal was a sign that moisture had been completely removed
from the film and stabilized the signal. The films, which were very thin and uniform but
visible to the naked eye, were watched closely for any signs of “cracking,” an indication that
they were excessively dry. Overly dry films have a greater propensity for iR effects to be
present in the electrochemistry. CV experiments were performed first, followed by CA
testing. CV scans were performed from 0.0V to -2.0V (vs. Ag+/0) at varying scan rates,
typically less than 100 mV/sec. CA experiments were performed with step potentials of -1.5
to -2.0V and a pulse width of 10, 400, or 1000 seconds.
302
A.11. REFERENCES
1. C.B. Gorman, “The Need for Potentiostatic Control in Imaging and Lithography with NanoscaleElectronic Devices,” DURIP Proposal [AFOSR MURI F49620-96-1-0035], 1998.
2. a) Various Authors, “The Man Who Dared to Think Small,” Science, 1991, 28, 1300-1324. b)
J.M. Lehn, “Perspectives in Supramolecular Chemistry - From Molecular Recognition TowardsMolecular Information Processing and Self-Organization,” Angew. Chem. Int. Ed. Engl. 1990,29, 1304-1319. c) Molecular Electronics - Science and Technology; American Institute ofPhysics: New York, 1991. d) Molecular Electronics, Materials, and Methods, Kluwer AcademicPublishers; Topics in Molecular Organization and Engineering, 1991. e) J.S. Schumm, D.L.Pearson, and J.M. Tour, “Iterative Divergent / Convergent Approaches to Linear ConjugatedOligomers by Successive Doubling of Molecular Length: a Rapid Route to 128Å - Long PotentialMolecular Wire,” Angew. Chem. Int. Ed. Engl. 1994, 33, 1360-1363.
3. a) M.A. Reed, C. Zhou, C.J. 0Muller, T.P. Burgin, and J.M. Tour, “Conductance of a Molecular
Junction,” Science 1997, 278, 252. b) S. Prathapan, T.E. Johnson, J.S. Lindsay, “Building-blockSynthesis of Porphyrin Light-harvesting Arrays,” J. Am. Chem. Soc. 1993, 115, 7519. c) D.L.Klein, P.L. McEuen, J.E. Katari, R. Roth, and A.P. Alivisatos, “An Approach to ElectricalStudies of Single Nanocrystals,” Appl. Phys. Lett. 1996, 68, 2574. d) A. Credi, V. Balzani, S.J.Langford, and J.F. Stoddart, “Logic Operations at the Molecular. An XOR Gate Based on aMolecular Machine,” J. Am. Chem. Soc. 1997, 119, 2679-2681. e) P.G. Collins, A. Zettl, H.Bando, A. Thess, and R.E. Smalley, “Nanotube Nanodeveice,” Science 1997, 278, 100-103.
4. C.B. Gorman, B. Parkhurst, K. Chen, W. Su, M. Hager, and I. Touzov, “A Model for Single-
Information Storage,” in Fourth International Conference on Frontiers of Polymers andAdvanced Materials, P.N. Prasad, J.E. Mark, S.H. Kandil, and Z. Kafafi, Eds.: Plenum Press.
5. Donald Tomalia, personal communication. 6. a) C.B. Gorman, “Metallodendrimers: Structural Diversity and Functional Behavior,” Adv.
Mater. 1998, 10(4), 295-309. b) G.R. Newkome, H. He, and C.N. Moorefield,“Suprasupermolecules with Novel Properties: Metallodendrimers,” Chem. Rev. 1999, 7, 1689-1746. c) A.W. Bosman, H.M. Janssen, and E.W. Meijer, “About Dendrimers: Structure, PhysicalProperties, and Applications,” Chem. Rev. 1999, 7, 1665-1688.
7. C.B. Gorman, “Encapsulated Electroactive Molecules,” Adv. Mater. 1997, 9(14), 1117-1119. 8. Used with permission from the Gorman Research Group, North Carolina State University. 9. C.B. Gorman, B.L. Parkhurst, W.Y. Su, and K. Chen, “Encapsulated Electroactive Molecules
Based Upon an Inorganic Cluster Surrounded by Dendron Ligands,” J. Am. Chem. Soc. 1997,119, 1141-1142.
10. J.J.R. Frausto da Silva and R.J.P. Williams, The Biological Chemistry of the Elements - The
Inorganic Chemistry of Life, Clarendon Press: Oxford, 1991.
303
11. C.B. Gorman, D. Feldheim, and D.W. Brenner, “An Interdisciplinary Approach toNanotechnology: Combining Synthesis, Fabrication, and Computation to Establish FunctionalBehavior at the Nanoscale,” NSF Proposal [98-20], 1998.
12. a) C.B. Gorman and J.C. Smith, “Effect of Repeat Unit Flexibility on Dendrimer Conformation
as Studied by Atomistic Molecular Dynamic Simulation,” Polymer 2000, 41, 675-683 b) C.B.Gorman, J.C. Smith, M.W. Hager, B.L. Parkhurst, H. Sierzputowska-Gracz, and C.A. Haney,“Molecular Structure – Property Relationships for Electron-Transfer Rate Attenuation in Redox-Active Core Dendrimers,” J. Am. Chem. Soc. 1999, 121, 9958-9966.
13. H. Tokuhisa, M. Zhao, L.A. Baker, V.T. Phan, D.L. Dermody, M.E. Garcia, R.F. Peez, R.M.
Crooks, T.M. Mayer, “Preparation and Characterization of Dendrimer Monolayers andDendrimer-Alkanethiolate Mixed Monolayers Adsorbed to Gold,” J. Am. Chem. Soc. 1998, 120,4492-4501.
14. D.T. Sawyer, A. Sobkowiak, J.L. Roberts, Electrochemistry for Chemists, 2nd Ed., John Wiley
and Sons: New York, 1995. 15. K.A. Groat and S.E. Creager, “Self-Assembled Monolayers in Organic Solvents:
Electrochemistry at Alkanethiolate-Coated Gold in Propylene Carbonate,” Langmuir 1993, 9,3668-3675.
16. a) D.E. Weisshaar, M.M. Walczak, and M.D. Porter, “Electrochemically Induced
Transformations of Monolayers Formed by Self-Assembly of Mercaptoethanol at Gold,”Langmuir 1993, 9, 323-329. b) M.W. Walczak, D.D. Popenow, R.S. Deinhammer, B.D. Lamp, C.Chung, and M.D. Porter, “Reductive Desorption of Alkanethiolate Monolayers at Gold: AMeasure of Surface Coverage,” Langmuir 1991, 7, 2687-2693.
17. a) M.A. Ratner and D.F. Shriver, “Ion Transport in Solvent-Free Polymers,” Chem. Rev. 1988,
88, 109-124. b) D.F. Shriver, B.L. Papke, M.A. Ratner, R. Dupon, T. Wong, and M. Brodwin,“Structure and Ion Transport in Polymer-Salt Complexes,” Solid State Ionics 1981, 5, 83-88.
18. a) M.L. Longmire, M. Watanabe, H. Zhang, T.T. Wooster, and R.W. Murray, “Voltammetric
Measurement of Ultraslow Diffusion Rates in Polymeric Media with Microdisk Electrodes,”Anal. Chem. 1990, 62, 747-752. b) E.F. Dalton and R.W. Murray, “Viologen(2+/1+) andViologen(1+/0) Electron-Self-Exchange Reactions in a Redox Polymer,” J. Phys. Chem. 1991,95, 6383-6389. c) M. Watanabe, T.T. Wooster, and R.W. Murray, “Electron-Self-ExchangeReactions in Solid State Voltammetry. The Readical Anion of 7,7,8,8-Tetracyanoquinodimethanein Polymer Electrolytes. 1,” J. Phys. Chem., 1991, 95, 4573-4579. d) M.L. Longmire, M.Watanabe, H. Zhang, T.T. Wooster, and R.W. Murray, “Experimental Aspects of Solid-StateVoltammetry,” Anal. Chem. 1992, 64, 1132-1140. e) J.C. Brumfield, C.A. Goss, E.A. Irene, andR.W. Murray, “Preparation and Characterization of Laterally Heterogeneous Polymer ModifiedElectrodes Using in Situ Atomic Force Microscopy,” Langmuir 1992, 8, 2810-2817. f) N.A.Surridge, M.E. Zvanut, F.R. Keene, C.S. Sosnoff, M. Silver, and R.W. Murray, “Effects ofMixed-Valent Compositions and Bathing Environment on Solid-State Electron Self-Exchanges inOsmium Bipyridine Redox Polymer Films,” J. Phys. Chem. 1992, 96, 962-970. g) M. Watanabe,T.T. Wooster, and R.W. Murray, “Long Range Electron Transfers Between Very SlowlyDiffusing Tetracyanoquinodimethane and its Radical Anion in Poly(ether) Solutions,” J. Phys.Chem. 1992, 96, 5886-5893. h) H. Zhang and R.W. Murray, “Polymer Solvent Dynamic Effects
304
on an Electron Transfer Cross Reaction Rate at a Redox Polymer / Polymer Solution Interface,”J. Am. Chem. Soc. 1993, 115, 2335-2340. i) C.S. Velazquez, J.E. Hutchison, and R.W. Murray,“Electrochemical Reactions and Charge Transport in Undiluted Room Temperature Melts ofOligo(ethylene glycol) - Based Electron Carriers,” J. Am. Chem. Soc. 1993, 115, 7896-7897. j)M.G. Sullivan and R.W. Murray, “Solid-State Electron Self-Exchange Dynamics in MixedValent Poly(vinylferrocene) Films,” J. Phys. Chem. 1994, 98, 4343-4351. k) J.N. Richardson, J.Harvey, and R.W. Murray, “Heterogeneous Electron-Transfer Dynamics of Decamethylferrocenefrom 130 to 181 K,” J. Phys. Chem. 1994, 98, 13396-13402. l) M.W. Poupart, C.S. Velazquez,K. Hassett, Z. Porat, O. Haas, R.H. Terrill, and R.W. Murray, “Limit of Slow Diffusion toElectrodes: Molecular-Scale Diffusion Paths in a Redox Melt,” J. Am. Chem. Soc. 1994, 116,1165-1166. m) C.S. Velazquez and R.W. Murray, “Synthesis and Voltammetry of aTetrathiafulvalene Polymer Electrolyte Melt,” Journal of Electroanalytical Chemistry 1995, 396,349-357. n) R. Pyati and R.W. Murray, “Voltammetry and Conductivity of a Polyether-Pyridinium Room Temperature Molten Salt Electrolyte and of Its Polymer Electrolyte Solutionsin Polydimethylsiloxane,” J. Electrochemical Society, 1996, 143(2), 401-405. o) J.W. Long, C.S.Velazquez, and R.W. Murray, “Electron Self-Exchange Dynamics of an Iron BipyridineComplex Redox Polyether Hybrid in Its Room Temperature Melt,” J. Phys. Chem. 1996, 100,5492-5499. p) T. Hatazawa, R.H. Terrill, and R.W. Murray, “Microelectrode Voltammetry andElectron Transport in an Undiluted Room Temperature Melt of an Oligo(ethylene glycol) -Tailed Viologen,” Anal. Chem. 1996, 68, 597-603. q) J.W. Long, I.K. Kim, and R.W. Murray,“Hybrid Redox Polyethers: Molecular Melts of Metalloporphyrins,” J. Am. Chem. Soc. 1997,119, 11510-11515. r) F. Emmenegger, M.E. Williams, and R.W. Murray, “Redox PolyetherHybrid Copper Bipyridine Complex Molten Salts,” Inorg. Chem. 1997, 36, 3146-3151. s) M.E.Williams, H. Masui, J.W. Long, J. Malik, and R.W. Murray, “Electron and Mass Transport inHybrid Redox Polyether Melts: Co and Fe Bipyridines with Attached Polyether Chains,” J. Am.Chem. Soc. 1997, 119, 1997-2005.
19. A.C. Michael and R.M Wightman, “Microelectrodes,” in Laboratory Techniques in
Electroanalytical Chemistry, 2nd edition, P.T. Kissinger and W.R. Heineman Eds., MarcelDekker, Inc.: New York, 1996.
20. a) R.M. Wightman, L.J. May, and A.C. Michael, “Detection of Dopamine Dynamics in the
Brain,” Anal. Chem. 1988, 60, 769A. b) R.M. Wightman, D.J. Michael, “ElectrochemicalMonitoring of Biogenic Amine Neurotransmissions in Real-Time,” Journal of Pharmaceuticaland Biomedical Analysis 1999, 19(1-2), 33-42. c) R.M. Wightman and Q. Xin, “SimulataneousDetection of Catecholamine Exocytosis and Ca2+ Release From Single Bovine Chromaffin CellsUsing a Dual Microsensor,” Anal. Chem. 1998, 70(9), 1677-1681.
21. a) R.A. Wallingford and A.G. Ewing, “Capillary Zone Electrophoresis With Electrochemical
Detection in 12.7-MU-M Diameter Columns,” Anal. Chem. 1988, 60, 1975. b) P.D. Curry, R.A.Wallingford and A.G. Ewing, “Chemical Analysis of Single Cells With Capillary ZoneElectrophoresis,” Abstracts of Papers of the American Chemical Society 1988, 196:177-ANYL.
22. C.R. Martin and C.A. Foss, “Chemically Modified Electrodes,” in Laboratory Techniques in
Electroanalytical Chemistry, 2nd edition, P.T. Kissinger and W.R. Heineman Eds., MarcelDekker, Inc.: New York, 1996.
23. a) I. Ruff, “Experimental Evidence of Electronic Conduction in Aqueous Solutions,”
Electrochimica Acta 1970, 15, 1059. b) I. Ruff, V.J. Friedrich, K. Demeter, and K. Csillag,
305
“Transfer Diffusion: Kinetics of Electron Exchange Reaction Between Ferrocene andFerricinium Ion in Alcohols,” J. Phys. Chem. 1971, 75(21), 3303-3309. d) L. Botar and I. Ruff,“Effect of Exchange Reaction on Transport Processes: Fick’s Second Law for Diffusion onLattice Points,” Chemical Physics Letters 1986, 126(3,4), 348-351. e) I. Ruff and I. Korosi-Odor,“Application of Diffusion Constant Measurement to the Determination of the Rate Constant ofElectron-Exchange Reactions,” Inorganic Chemistry 1970, 9(1), 186-188. f) H. Dahms, J. Phys.Chem. 1968, 72, 362. g)E. Laviron, J. Electroanal. Chem. 1980, 112, 1.
24. C.M.A. Brett and A.M.O. Brett, Electrochemistry: Principles, Methods, and Applications,
Oxford University Press: Oxford, 1994. 25. D. Shoup and A. Szabo, “Chronoamperometric Current at a Finite Disk Electrode,” J.
Electroanal. Chem. 1982, 140, 237-245. 26. C.G. Zoski, A.M. Bond, C.L. Colyer, J.C. Myland, and K.B. Oldham, “Near Steady State Cyclic
Voltammetry at Microelectrodes,” J. Electroanal. Chem. 1989, 263, 1-21. 27. E. Dickinson, M.E. Williams, S.M. Hendrickson, H. Masui, and R.M. Murray, “Hybrid Redox
Polyether Melts Based on Polyether-Tailed Counterions,” J. Am. Chem. Soc. 1999, 121, 613-616. 28. a) R.A. Clark and E.F. Bowden, “Voltammetric Peak Broadening for Cytochrome c /
Alkanethiolate Monolayer Structures: Dipersion of Formal Potentials,” Langmuir 1996, 13, 559-565. b) M.C. Leopold and E.F. Bowden, manuscript in preparation.
29. a) H. Nishihara, F. Dalton, and R.W. Murray, “Interdigitated Array Electrode Diffusion
Measurements in Donor / Acceptor Solutions in Polyether Electrolyte Solvents,” Anal. Chem.1991, 63, 2955-2960. b) R.H. Terrill, T. Hatazawa, and R.W. Murray, “Electron Transport andFrozen Concentration Gradients in a Mixed Valent Viologen Molten Salt,” J. Phys. Chem. 1995,99, 16676-16683.
30. S. Song, R.A. Clark, M.J. Tarlov, and E.F. Bowden, “Characterization of Cytochrome c /
Alkanethiolate Structures by Self-Assembly on Gold,” J. Phys. Chem. 1993, 97(24), 6564. 31. T.M. Nahir, D. Tiani, D. Miller, R.J. Linderman, and E.F. Bowden, manuscript in preparation. 32. D.D. Perrin and W.L.F. Armarego, Purification of Laboratory Chemicals, 3rd Ed., Pergamon
Press: New York, 1988.
306
INTERESTING ELECTROCHEMISTRY AT INDIUM OXIDE ELECTRODES
APPENDIX B
“There is no crisis to which academics willnot respond with a seminar.” - Anonymous
307
B.1. INTRODUCTION
This appendix describes research performed as part of a collaboration with Dr. Ashley
Bush and coworkers in the Laboratory of Oxidation Biology in the Department of Psychiatry
and Neurology - Genetics and Aging Unit at the Harvard Medical School and Massachusetts
General Hospital. The research is focused on using electrochemistry as a complementary
technique to explore drug pathways and delineate the pathology behind age related
degradation of function and neurological disease. Although this research collaboration is in
its early stages, it appears as though electrochemistry may be useful in understanding some
of these disorders. What follows is a brief synopsis of the electrochemistry performed as part
of this research collaboration. The following discussion is not intended to be a detailed
description of the current state of neurological disease and age related illnesses. Instead, the
discussion attempts to provide a glimpse of how electrochemistry has been and can be
utilized to assist in biomedical research of this nature. The accounts of this research effort
discuss recent successful ventures using electrochemistry in biomedical studies as well as
specific complications that clearly warrant future electrochemical experiments in this area.
This appendix is provided as part of this dissertation, not only to register an account of the
research activity, but to hopefully inspire future researchers to consider work in this exciting,
new collaboration.
B.2. NEUROLOGICAL DISEASE1
Age related illnesses and neurological diseases are some of the worst ailments
affecting human beings today. Alzeimer’s disease (AD), for example, causes a progressive
loss of memory and mental capabilities in elderly people, eventually leaving people afflicted
with this disease confused and incompetent to care for themselves. The disease can render its
victims helpless to recognize and remember even their closest loved ones and friends. AD
affects 5-10% of all people over the age of 65, some 4 million persons in North America.
Other examples of the more prominent neurological diseases affecting the elderly are
Huntington’s disease (HD) and Parkinson’s Disease (PD). Huntington’s disease affects one
in ten thousand individuals, about 30,000 people in North America alone, and caused its
victims to make involuntary movements, become cognitively impaired, and eventually
308
mentally disturbed. One million people in North America suffer from PD, a condition which
eventually results in serious dementia. Not very well understood, these diseases continue to
affect people around the world and are met with non-optimal medical treatments that are only
able to slow, not halt, the degenerative process of the disease. Thus, scientists aim research
efforts at understanding the pathology of these diseases in order to develop more successful
and effective means of treating and preventing the onset of the diseases. Several hypothetical
mechanisms for these diseases have been proposed including oxidative stress, free radical
activity, excitotoxicity, accumulation of intracellular aggregates, mitochondrial dysfunction,
and apoptosis. These ideas and more are being pursued throughout the biomedical field in
search of a better understanding of how these diseases occur and, more importantly, how they
can be treated or prevented.
B.3. METAL OXIDE ELECTRODES
For this research, the pathology of several age related illnesses, neurological diseases,
and drug pathways, were investigated using voltammetry, at metal oxide electrodes. Metal
oxide electrodes have been used previously for electrochemical experiments both in the
general literature2 and in this research group.3 Metal oxides such as tin oxide and indium tin
oxide (ITO) provide stable (unreactive), conductive surfaces for electrochemical experiments.
These semi-metallic electrodes are comprised of a conductive, transparent film of tin-doped
indium oxide on a glass substrate. Their transparent nature renders these substrates useful in
spectroscopic studies and their acid/base surfaces allow for control of surface ionization with
solution pH. Although their interfacial properties are not completely understood, ITO
electrodes have been used exclusively for this research effort. ITO electrodes exhibit a very
wide potential window in aqueous solution and are less prone to fouling due to material
irreversibly adsorbing on their surface. Metal electrodes such as gold, while superior in other
electrochemical experiments, are extremely reactive toward foreign material and therefore
have a tendency to promote surface adsorption/contamination. If the material is biological in
nature, such as the case in some of this work, the materials may irreversibly adsorb to the
gold and subsequently become denatured on the surface. Most of the research involving ITO
electrodes also utilized copper solutions whose redox activity occurs at positive potentials
309
which are easily accommodated by the ITO. For these reasons, ITO was chosen to act as the
working electrode in all of the following studies.
B.4. THE KYNURENINE PATHWAY - A CATARACT STUDY
A major portion of this research focused on the amino acid tryptophan’s catabolic
reaction, or kynurenine pathway. This pathway is found throughout most of the tissue in the
human body and is illustrated in Figure B.1. In this pathway, a number of toxic intermediates
including 3-hydroxykynurenine (3HK) and 3-hydroxyanthranillic acid are produced.
Multiple research efforts have implicated the kynurenine pathway and its toxic intermediates
as playing a role in a number of neurological, inflammatory, and age related diseases
including: HD, PD, HIV infection, bladder cancer, cerebral malaria, poliomyelitis,
fetomaternal tolerance, and animal multiple sclerosis and viral pneumonia.4,5 The toxic
intermediates 3HK and 3HAA cause neuronal cell death with apoptotic features in cultures.4
The kynurenine pathway and the subsequent derivatives of the reaction are also active
in the epithelial cells of the ocular lens. In the lens, 3HK interacts with lysyl residues of the
lens proteins, such as α-crystallin, and may function as a short wavelength ultraviolet light
filter for the eye.6 Recent work performed on the kynurenine pathway component 3HK has
shown that the amount of 3HK bound to lenticular proteins increases with age and eventually
fosters protein aggregation. This aggregation is speculated to contribute to the opaque nature
of cataractous lens.4,6
Protein aggregation leading to cataract formation is also characterized by oxidative
stress damage. Numerous studies4 have shown that the process is accompanied by both a
decrease in antioxidant defense enzymes and an increase in hydrogen peroxide. Additionally,
there have been accounts of a raised level of Cu(II) in the cataractous lens, which has been
implicated as a cofactor in generating potentially damaging reactive oxygen species, such as
peroxide and superoxide, which may also foster protein aggregation.4 Taken together, these
findings suggest that oxidative stress, initiated by the combination/reaction of 3HK and other
related kynurenine catabolites with redox active copper and other metals may participate in
age related cataract formation.
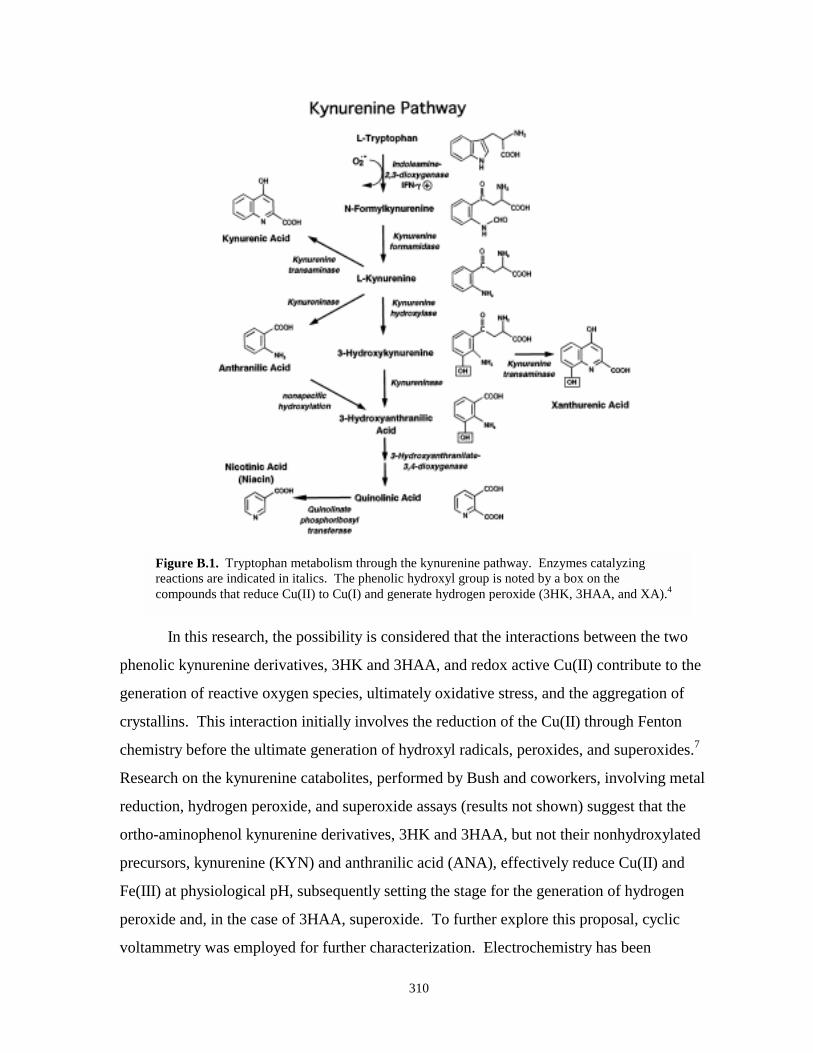
310
Figure B.1. Tryptophan metabolism through the kynurenine pathway. Enzymes catalyzingreactions are indicated in italics. The phenolic hydroxyl group is noted by a box on thecompounds that reduce Cu(II) to Cu(I) and generate hydrogen peroxide (3HK, 3HAA, and XA).4
In this research, the possibility is considered that the interactions between the two
phenolic kynurenine derivatives, 3HK and 3HAA, and redox active Cu(II) contribute to the
generation of reactive oxygen species, ultimately oxidative stress, and the aggregation of
crystallins. This interaction initially involves the reduction of the Cu(II) through Fenton
chemistry before the ultimate generation of hydroxyl radicals, peroxides, and superoxides.7
Research on the kynurenine catabolites, performed by Bush and coworkers, involving metal
reduction, hydrogen peroxide, and superoxide assays (results not shown) suggest that the
ortho-aminophenol kynurenine derivatives, 3HK and 3HAA, but not their nonhydroxylated
precursors, kynurenine (KYN) and anthranilic acid (ANA), effectively reduce Cu(II) and
Fe(III) at physiological pH, subsequently setting the stage for the generation of hydrogen
peroxide and, in the case of 3HAA, superoxide. To further explore this proposal, cyclic
voltammetry was employed for further characterization. Electrochemistry has been
311
performed previously on kynurenine catabolites,8 but their electrochemistry in the presence of
metal species is largely unexplored.
Data from the Bush laboratory indicated that 3HK and 3HAA were the strongest
Cu(II) reducing agents in the kynurenine pathway. Therefore, as a means of confirming this
apparent redox activity of 3HK and 3HAA, cyclic voltammetry was used to study the
interaction of these catabolites with Cu(II). This study, illustrated in Figure B.2,
compared 3HK and 3HAA to their non-phenolic analogs, KYN and ANA, in aqueous
solutions of Cu(II) at pH 7.41. Cyclic voltammetry of the four catabolite compounds in
the absence of Cu(II) (data not shown) revealed no significant redox activity in the +0.15 to -
0.4 V potential window compared to the phosphate buffer solution (PBS) background (scan
a). At potentials above +0.15 V, the catabolites undergo direct irreversible oxidation, a
reaction that is not considered further at this point. Cyclic voltammetry of Cu(II) in PBS
yielded a current response at approximately 100 mV due to the reduction of the metal ion
(scan b). In the presence of either KYN or ANA, the Cu(II) reduction wave remained largely
unaffected (scan c) although KYN appears to show some slight reactivity. This result
suggests that most of the Cu(II) remains uncomplexed and available for reduction in the
presence of the two catabolites. The Cu(II) reduction wave was nearly abolished (scan c) in
the presence of 3HK, and markedly decreased in the presence of 3HAA. These results
indicate that, for the experimental conditions used (see Experimental Details), loss of
electrochemically active Cu(II) by complexation and/or reduction occurs readily in the
presence of 3HK and 3HAA, but not in the presence of KYN or ANA. These findings are
consistent with the proposed reduction of Cu(II) by 3HK and 3HAA, supporting the scenario
laid out by the Bush research.
While supporting the hypothesis of the Bush laboratory, these results are not without
their own complications and clearly require further investigation to fully understand the
situation. As can be noted from Figure B.2, the scans of the catabolites KYN, 3HK, and
3HAA with copper (scan c of Figure B.2), all show an apparent rise in background cathodic
current starting at approximately -0.225 V, which may be residual dioxygen reduction or an
initial sign of a solvent related redox process. Since Bush’s group showed that the reaction
of copper with reactive metabolites in the presence of dioxygen led to hydrogen peroxide
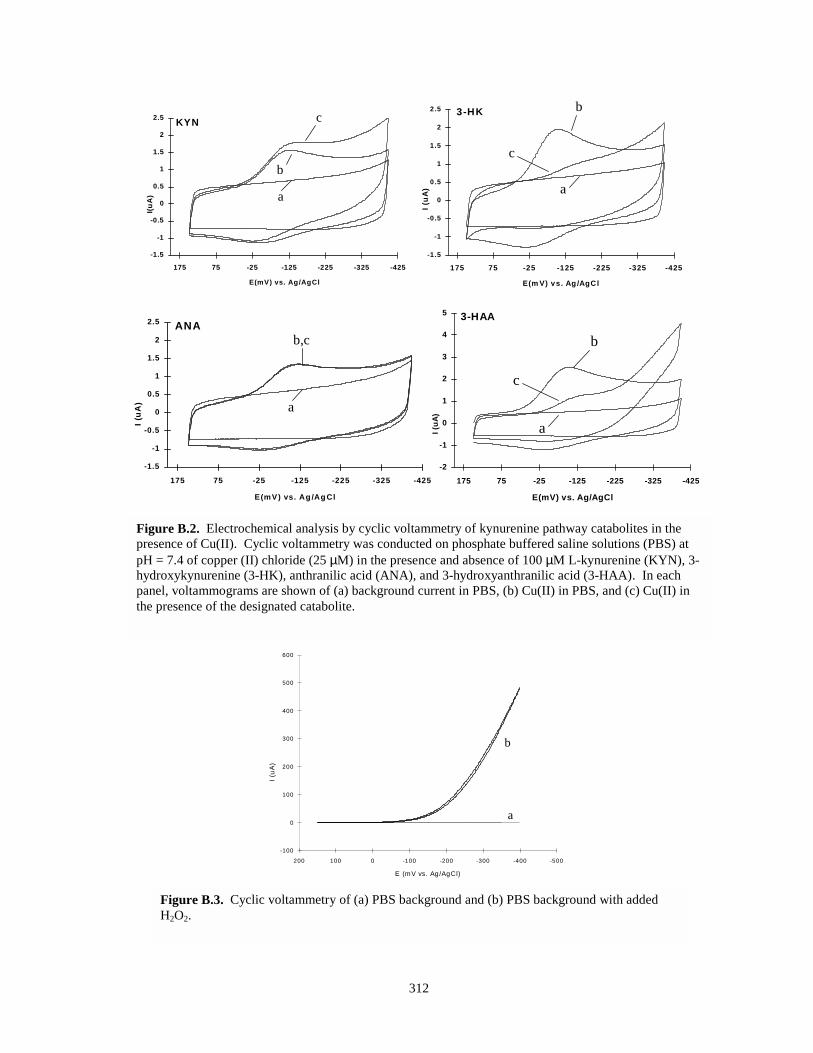
312
KYN
-1.5
-1
-0.5
0
0.5
1
1.5
2
2.5
-425-325-225-125-2575175
E(mV) vs. Ag/AgCl
I(uA
) a
b
c 3-HK
-1.5
-1
-0 .5
0
0.5
1
1.5
2
2.5
-425-325-225-125-2575175
E(m V) vs. Ag /AgCl
I (uA
)
b
a
c
ANA
-1.5
-1
-0.5
0
0.5
1
1.5
2
2.5
-425-325-225-125-2575175
E(mV) vs. Ag /Ag Cl
I (uA
)
b,c
a
3-HAA
-2
-1
0
1
2
3
4
5
-425-325-225-125-2575175
E(mV) vs. Ag/AgCl
I (uA
)
b
a
c
Figure B.2. Electrochemical analysis by cyclic voltammetry of kynurenine pathway catabolites in thepresence of Cu(II). Cyclic voltammetry was conducted on phosphate buffered saline solutions (PBS) atpH = 7.4 of copper (II) chloride (25 µM) in the presence and absence of 100 µM L-kynurenine (KYN), 3-hydroxykynurenine (3-HK), anthranilic acid (ANA), and 3-hydroxyanthranilic acid (3-HAA). In eachpanel, voltammograms are shown of (a) background current in PBS, (b) Cu(II) in PBS, and (c) Cu(II) inthe presence of the designated catabolite.
-100
0
100
200
300
400
500
600
-500-400-300-200-1000100200
E (mV vs. Ag/AgCl)
I (uA
)
b
a
Figure B.3. Cyclic voltammetry of (a) PBS background and (b) PBS background with addedH2O2.
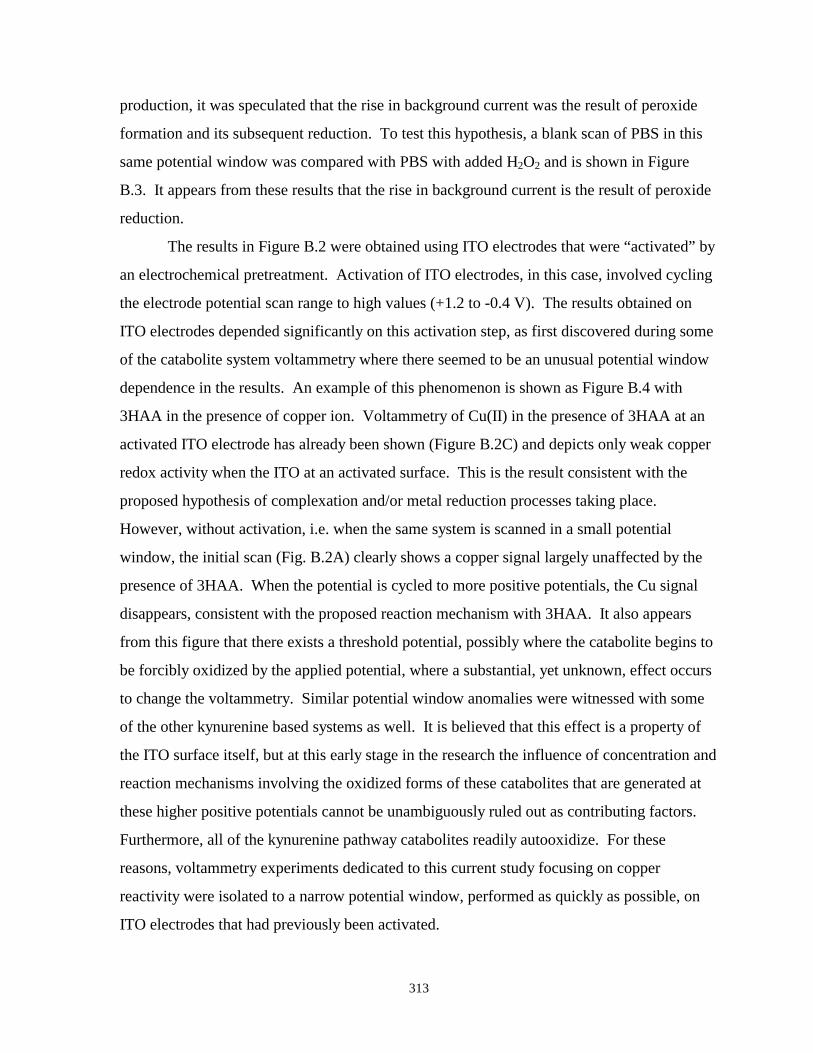
313
production, it was speculated that the rise in background current was the result of peroxide
formation and its subsequent reduction. To test this hypothesis, a blank scan of PBS in this
same potential window was compared with PBS with added H2O2 and is shown in Figure
B.3. It appears from these results that the rise in background current is the result of peroxide
reduction.
The results in Figure B.2 were obtained using ITO electrodes that were “activated” by
an electrochemical pretreatment. Activation of ITO electrodes, in this case, involved cycling
the electrode potential scan range to high values (+1.2 to -0.4 V). The results obtained on
ITO electrodes depended significantly on this activation step, as first discovered during some
of the catabolite system voltammetry where there seemed to be an unusual potential window
dependence in the results. An example of this phenomenon is shown as Figure B.4 with
3HAA in the presence of copper ion. Voltammetry of Cu(II) in the presence of 3HAA at an
activated ITO electrode has already been shown (Figure B.2C) and depicts only weak copper
redox activity when the ITO at an activated surface. This is the result consistent with the
proposed hypothesis of complexation and/or metal reduction processes taking place.
However, without activation, i.e. when the same system is scanned in a small potential
window, the initial scan (Fig. B.2A) clearly shows a copper signal largely unaffected by the
presence of 3HAA. When the potential is cycled to more positive potentials, the Cu signal
disappears, consistent with the proposed reaction mechanism with 3HAA. It also appears
from this figure that there exists a threshold potential, possibly where the catabolite begins to
be forcibly oxidized by the applied potential, where a substantial, yet unknown, effect occurs
to change the voltammetry. Similar potential window anomalies were witnessed with some
of the other kynurenine based systems as well. It is believed that this effect is a property of
the ITO surface itself, but at this early stage in the research the influence of concentration and
reaction mechanisms involving the oxidized forms of these catabolites that are generated at
these higher positive potentials cannot be unambiguously ruled out as contributing factors.
Furthermore, all of the kynurenine pathway catabolites readily autooxidize. For these
reasons, voltammetry experiments dedicated to this current study focusing on copper
reactivity were isolated to a narrow potential window, performed as quickly as possible, on
ITO electrodes that had previously been activated.
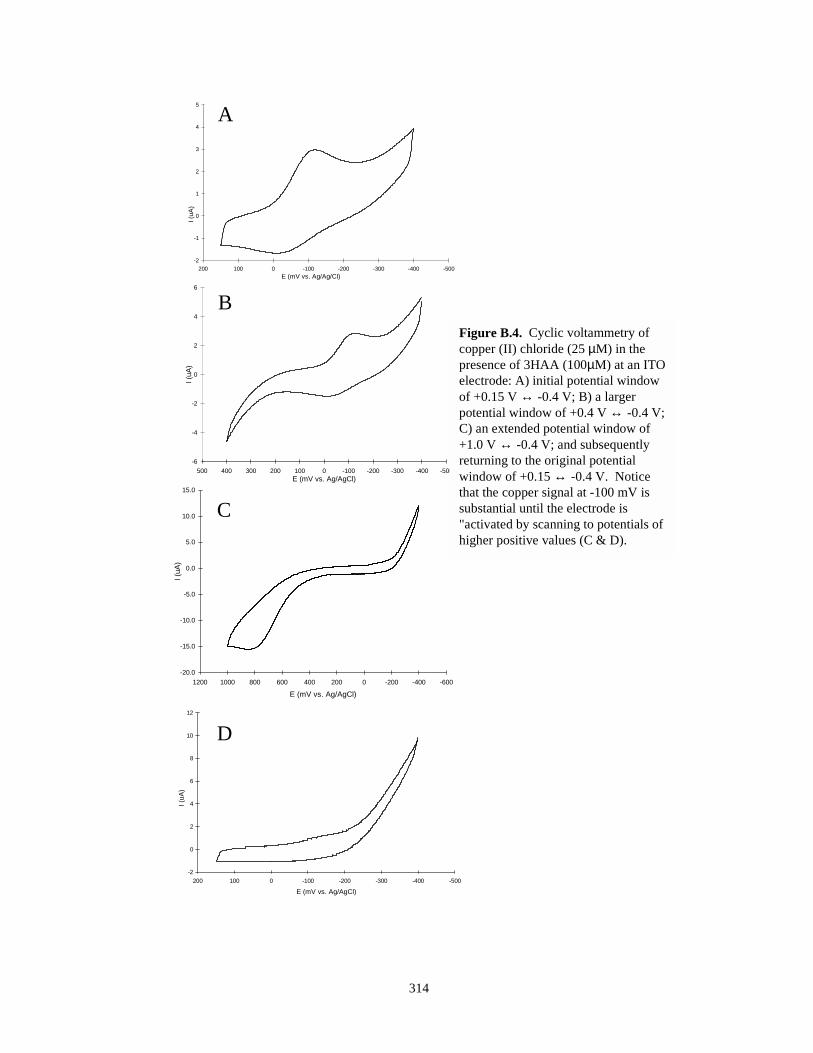
314
-2
-1
0
1
2
3
4
5
-500-400-300-200-1000100200E (mV vs. Ag/Ag/Cl)
I (uA
)
-6
-4
-2
0
2
4
6
-500-400-300-200-1000100200300400500E (mV vs. Ag/AgCl)
I (uA
)
-20.0
-15.0
-10.0
-5.0
0.0
5.0
10.0
15.0
-600-400-200020040060080010001200
E (mV vs. Ag/AgCl)
I (uA
)
-2
0
2
4
6
8
10
12
-500-400-300-200-1000100200
E (mV vs. Ag/AgCl)
I (uA
)
A
B
C
D
Figure B.4. Cyclic voltammetry ofcopper (II) chloride (25 µM) in thepresence of 3HAA (100µM) at an ITOelectrode: A) initial potential windowof +0.15 V ↔ -0.4 V; B) a largerpotential window of +0.4 V ↔ -0.4 V;C) an extended potential window of+1.0 V ↔ -0.4 V; and subsequentlyreturning to the original potentialwindow of +0.15 ↔ -0.4 V. Noticethat the copper signal at -100 mV issubstantial until the electrode is"activated by scanning to potentials ofhigher positive values (C & D).
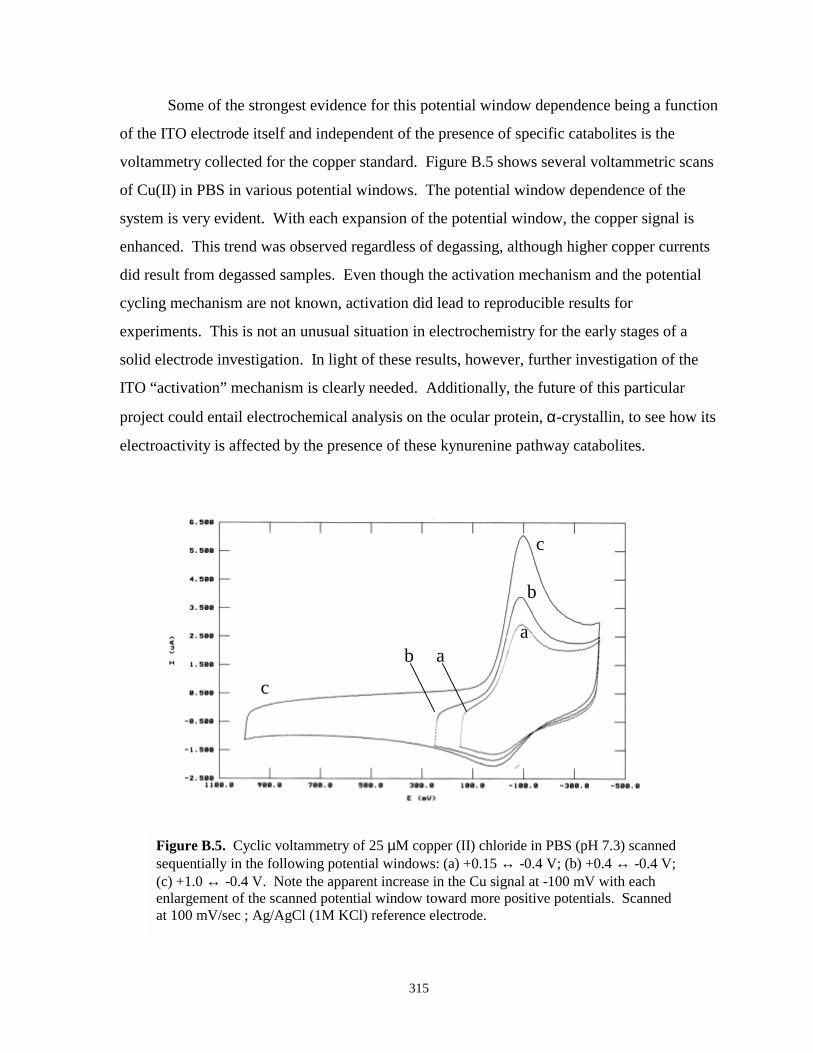
315
Some of the strongest evidence for this potential window dependence being a function
of the ITO electrode itself and independent of the presence of specific catabolites is the
voltammetry collected for the copper standard. Figure B.5 shows several voltammetric scans
of Cu(II) in PBS in various potential windows. The potential window dependence of the
system is very evident. With each expansion of the potential window, the copper signal is
enhanced. This trend was observed regardless of degassing, although higher copper currents
did result from degassed samples. Even though the activation mechanism and the potential
cycling mechanism are not known, activation did lead to reproducible results for
experiments. This is not an unusual situation in electrochemistry for the early stages of a
solid electrode investigation. In light of these results, however, further investigation of the
ITO “activation” mechanism is clearly needed. Additionally, the future of this particular
project could entail electrochemical analysis on the ocular protein, α-crystallin, to see how its
electroactivity is affected by the presence of these kynurenine pathway catabolites.
Figure B.5. Cyclic voltammetry of 25 µM copper (II) chloride in PBS (pH 7.3) scannedsequentially in the following potential windows: (a) +0.15 ↔ -0.4 V; (b) +0.4 ↔ -0.4 V;(c) +1.0 ↔ -0.4 V. Note the apparent increase in the Cu signal at -100 mV with eachenlargement of the scanned potential window toward more positive potentials. Scannedat 100 mV/sec ; Ag/AgCl (1M KCl) reference electrode.
a
b
c
c
b a
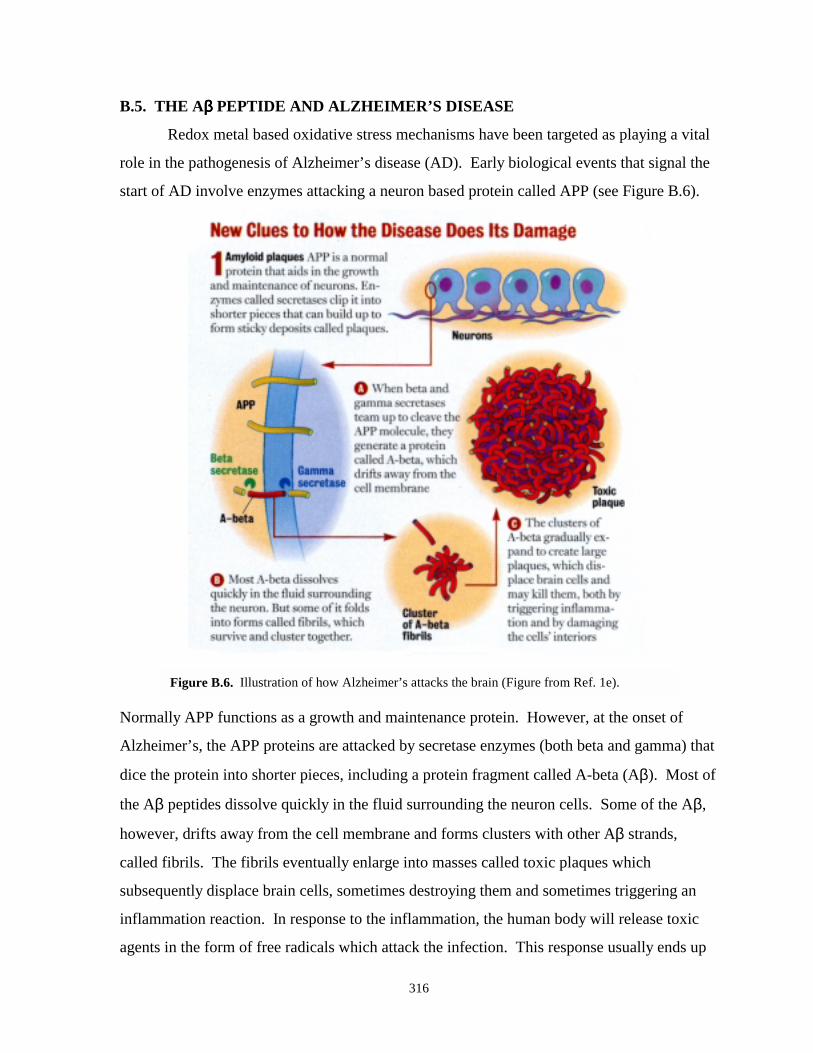
316
B.5. THE Aββββ PEPTIDE AND ALZHEIMER’S DISEASE
Redox metal based oxidative stress mechanisms have been targeted as playing a vital
role in the pathogenesis of Alzheimer’s disease (AD). Early biological events that signal the
start of AD involve enzymes attacking a neuron based protein called APP (see Figure B.6).
Figure B.6. Illustration of how Alzheimer’s attacks the brain (Figure from Ref. 1e).
Normally APP functions as a growth and maintenance protein. However, at the onset of
Alzheimer’s, the APP proteins are attacked by secretase enzymes (both beta and gamma) that
dice the protein into shorter pieces, including a protein fragment called A-beta (Aβ). Most of
the Aβ peptides dissolve quickly in the fluid surrounding the neuron cells. Some of the Aβ,
however, drifts away from the cell membrane and forms clusters with other Aβ strands,
called fibrils. The fibrils eventually enlarge into masses called toxic plaques which
subsequently displace brain cells, sometimes destroying them and sometimes triggering an
inflammation reaction. In response to the inflammation, the human body will release toxic
agents in the form of free radicals which attack the infection. This response usually ends up
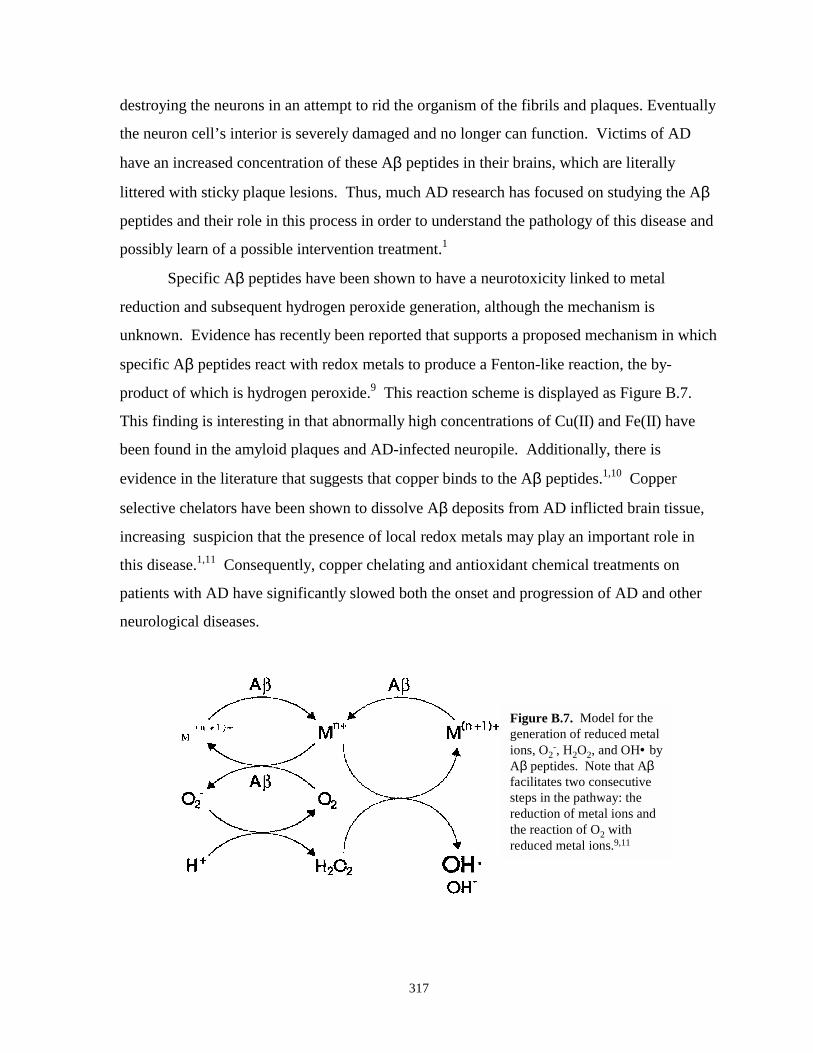
317
destroying the neurons in an attempt to rid the organism of the fibrils and plaques. Eventually
the neuron cell’s interior is severely damaged and no longer can function. Victims of AD
have an increased concentration of these Aβ peptides in their brains, which are literally
littered with sticky plaque lesions. Thus, much AD research has focused on studying the Aβ
peptides and their role in this process in order to understand the pathology of this disease and
possibly learn of a possible intervention treatment.1
Specific Aβ peptides have been shown to have a neurotoxicity linked to metal
reduction and subsequent hydrogen peroxide generation, although the mechanism is
unknown. Evidence has recently been reported that supports a proposed mechanism in which
specific Aβ peptides react with redox metals to produce a Fenton-like reaction, the by-
product of which is hydrogen peroxide.9 This reaction scheme is displayed as Figure B.7.
This finding is interesting in that abnormally high concentrations of Cu(II) and Fe(II) have
been found in the amyloid plaques and AD-infected neuropile. Additionally, there is
evidence in the literature that suggests that copper binds to the Aβ peptides.1,10 Copper
selective chelators have been shown to dissolve Aβ deposits from AD inflicted brain tissue,
increasing suspicion that the presence of local redox metals may play an important role in
this disease.1,11 Consequently, copper chelating and antioxidant chemical treatments on
patients with AD have significantly slowed both the onset and progression of AD and other
neurological diseases.
Figure B.7. Model for thegeneration of reduced metalions, O2
-, H2O2, and OH• byAβ peptides. Note that Aβfacilitates two consecutivesteps in the pathway: thereduction of metal ions andthe reaction of O2 withreduced metal ions.9,11
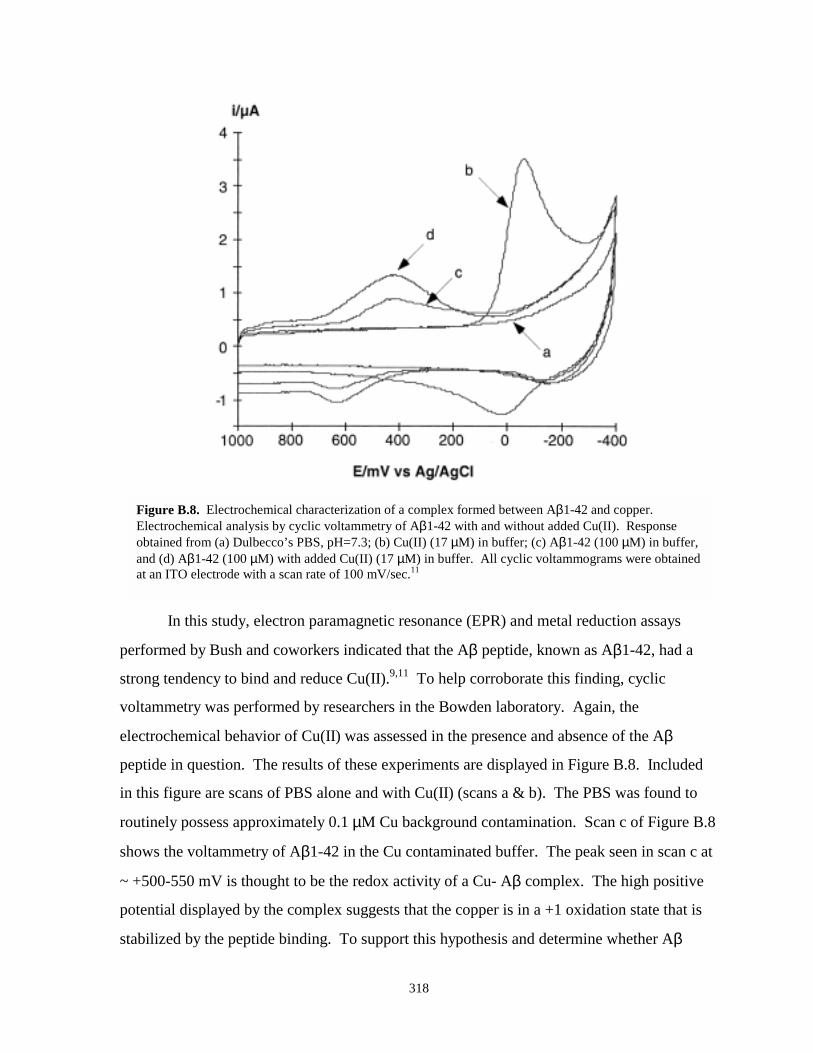
318
Figure B.8. Electrochemical characterization of a complex formed between Aβ1-42 and copper.Electrochemical analysis by cyclic voltammetry of Aβ1-42 with and without added Cu(II). Responseobtained from (a) Dulbecco’s PBS, pH=7.3; (b) Cu(II) (17 µM) in buffer; (c) Aβ1-42 (100 µM) in buffer,and (d) Aβ1-42 (100 µM) with added Cu(II) (17 µM) in buffer. All cyclic voltammograms were obtainedat an ITO electrode with a scan rate of 100 mV/sec.11
In this study, electron paramagnetic resonance (EPR) and metal reduction assays
performed by Bush and coworkers indicated that the Aβ peptide, known as Aβ1-42, had a
strong tendency to bind and reduce Cu(II).9,11 To help corroborate this finding, cyclic
voltammetry was performed by researchers in the Bowden laboratory. Again, the
electrochemical behavior of Cu(II) was assessed in the presence and absence of the Aβ
peptide in question. The results of these experiments are displayed in Figure B.8. Included
in this figure are scans of PBS alone and with Cu(II) (scans a & b). The PBS was found to
routinely possess approximately 0.1 µM Cu background contamination. Scan c of Figure B.8
shows the voltammetry of Aβ1-42 in the Cu contaminated buffer. The peak seen in scan c at
~ +500-550 mV is thought to be the redox activity of a Cu- Aβ complex. The high positive
potential displayed by the complex suggests that the copper is in a +1 oxidation state that is
stabilized by the peptide binding. To support this hypothesis and determine whether Aβ
319
interaction with Cu metal in the PBS is responsible for the electrochemical response
observed, Cu(II) in the form of CuCl2 was added to the mixture. Adding Cu(II) to the
solution increased the magnitude of the response at +500-550 mV (scan d in Figure B.8), a
response consistent with the electrochemical response being characteristic of a copper- Aβ
complex. As noted from the figure, the Cu(II) response at -80 mV (scan b) is completely
abolished in the presence of the Aβ peptide, an indication that no free copper is available
when the Aβ is present. Thus, the cyclic voltammetry results support the hypothesis that the
Aβ1-42 peptide binds and reduces Cu(II) and may be an integral part of the Fenton chemistry
that eventually leads to the production of hydrogen peroxide and ultimately to oxidative
stress, a proposed mechanism of AD.
A complete understanding of the pathology of AD remains elusive. One current focus
is a mutant form of the Aβ peptide, called the Dutch type or Q22, which has been targeted as
playing a significant role in amyloidgenic disease.12 Similar metal reduction/peroxide
formation mechanisms are thought to be responsible in this case and, thus, a key need for
exploring these possibilities is monitoring the reduction of Cu(II). A popular method of
monitoring Cu(II) reduction is through the use of a specific colorimetric ligand for Cu(I),
bathocuproine disulfonate (BC). BC’s ability to complex both Cu(II) and Cu(I), however, is
the subject of debate in the literature and welcomes future experiments aimed at delineating
the processes involved with BC-copper interactions. Perhaps, electrochemistry, having
shown promising results in these projects, can be used to clarify the exact relationship
between BC and copper species.13 In any event, applying electrochemistry to study
neurological diseases and age related illness appears to be a challenging, yet potentially
rewarding, emerging field of study.
B.6. CYTOCHROME C AT ITO ELECTRODES
As noted in a previous section, the surface ionization of ITO, due to its inherent
number of acid/base surface sites, can be adjusted via solution pH manipulation. The fact
that the surface can be made negative at near neutral pH encouraged the use of the ITO
substrate as an electrostatic binding partner for cyt c molecules. If successful, the ET of cyt c
adsorbed on ITO may be studied without the use of a surface modifier or SAM. Thus, a
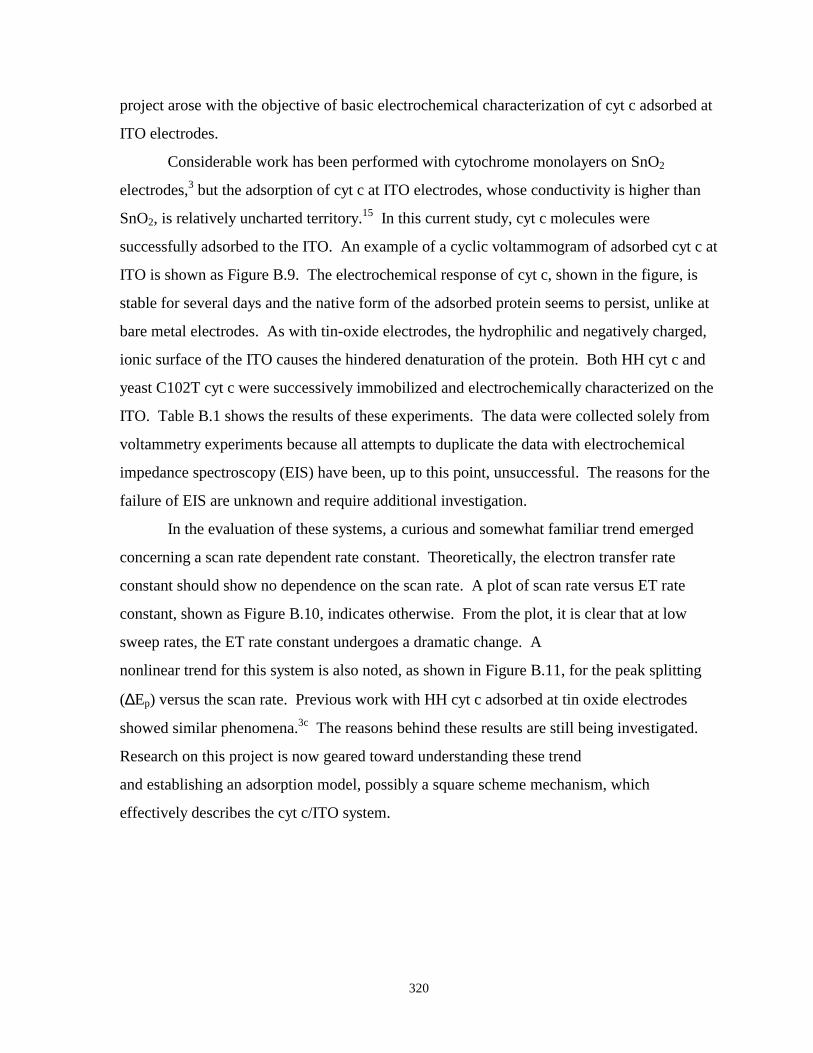
320
project arose with the objective of basic electrochemical characterization of cyt c adsorbed at
ITO electrodes.
Considerable work has been performed with cytochrome monolayers on SnO2
electrodes,3 but the adsorption of cyt c at ITO electrodes, whose conductivity is higher than
SnO2, is relatively uncharted territory.15 In this current study, cyt c molecules were
successfully adsorbed to the ITO. An example of a cyclic voltammogram of adsorbed cyt c at
ITO is shown as Figure B.9. The electrochemical response of cyt c, shown in the figure, is
stable for several days and the native form of the adsorbed protein seems to persist, unlike at
bare metal electrodes. As with tin-oxide electrodes, the hydrophilic and negatively charged,
ionic surface of the ITO causes the hindered denaturation of the protein. Both HH cyt c and
yeast C102T cyt c were successively immobilized and electrochemically characterized on the
ITO. Table B.1 shows the results of these experiments. The data were collected solely from
voltammetry experiments because all attempts to duplicate the data with electrochemical
impedance spectroscopy (EIS) have been, up to this point, unsuccessful. The reasons for the
failure of EIS are unknown and require additional investigation.
In the evaluation of these systems, a curious and somewhat familiar trend emerged
concerning a scan rate dependent rate constant. Theoretically, the electron transfer rate
constant should show no dependence on the scan rate. A plot of scan rate versus ET rate
constant, shown as Figure B.10, indicates otherwise. From the plot, it is clear that at low
sweep rates, the ET rate constant undergoes a dramatic change. A
nonlinear trend for this system is also noted, as shown in Figure B.11, for the peak splitting
(∆Ep) versus the scan rate. Previous work with HH cyt c adsorbed at tin oxide electrodes
showed similar phenomena.3c The reasons behind these results are still being investigated.
Research on this project is now geared toward understanding these trend
and establishing an adsorption model, possibly a square scheme mechanism, which
effectively describes the cyt c/ITO system.
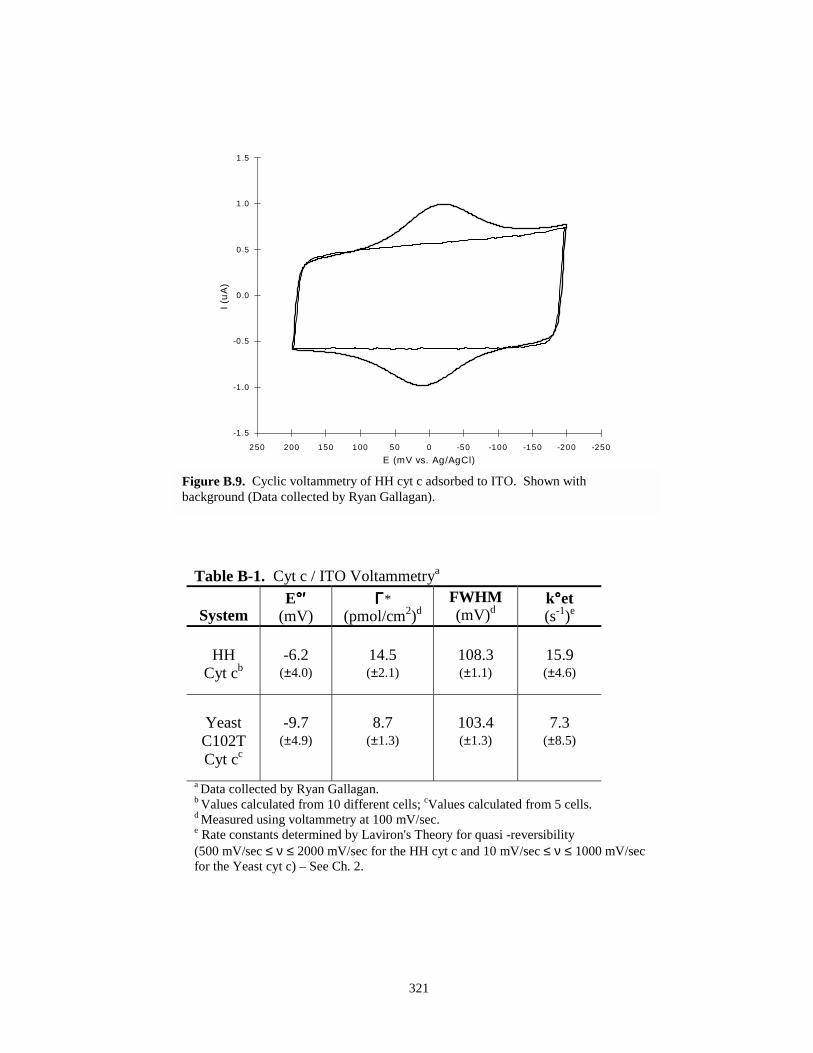
321
-1 .5
-1.0
-0.5
0.0
0.5
1.0
1.5
-250-200-150-100-50050100150200250E (mV vs. Ag/AgCl)
I (uA
)
Table B-1. Cyt c / ITO Voltammetrya
SystemE°°°°′′′′
(mV)ΓΓΓΓ*
(pmol/cm2)dFWHM(mV)d
k°°°°et(s-1)e
HHCyt cb
-6.2(±4.0)
14.5(±2.1)
108.3(±1.1)
15.9(±4.6)
YeastC102TCyt cc
-9.7(±4.9)
8.7(±1.3)
103.4(±1.3)
7.3(±8.5)
a Data collected by Ryan Gallagan.b Values calculated from 10 different cells; cValues calculated from 5 cells.d Measured using voltammetry at 100 mV/sec.e Rate constants determined by Laviron's Theory for quasi -reversibility(500 mV/sec ≤ ν ≤ 2000 mV/sec for the HH cyt c and 10 mV/sec ≤ ν ≤ 1000 mV/secfor the Yeast cyt c) – See Ch. 2.
Figure B.9. Cyclic voltammetry of HH cyt c adsorbed to ITO. Shown withbackground (Data collected by Ryan Gallagan).
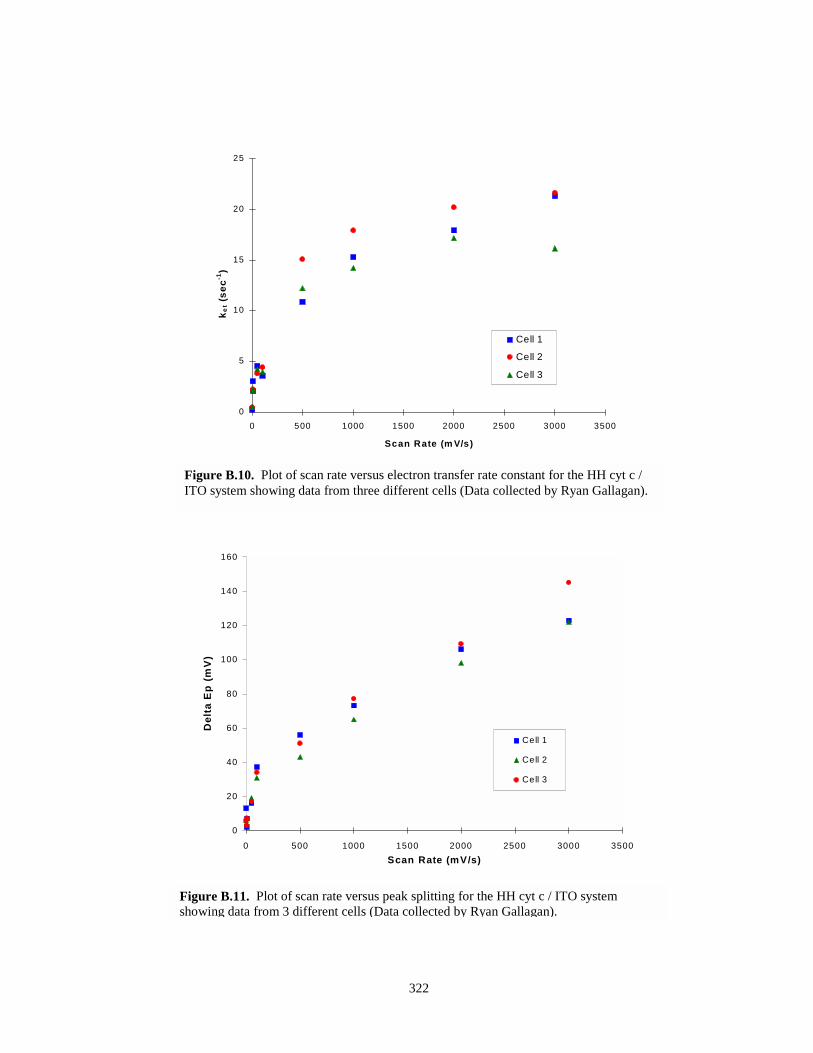
322
0
5
10
15
20
25
0 500 1000 1500 2000 2500 3000 3500
Scan Rate (m V/s)
k et (
sec-1
)
Cell 1
Cell 2
Cell 3
Figure B.10. Plot of scan rate versus electron transfer rate constant for the HH cyt c /ITO system showing data from three different cells (Data collected by Ryan Gallagan).
0
20
40
60
80
100
120
140
160
0 500 1000 1500 2000 2500 3000 3500Scan Rate (mV/s)
Del
ta E
p (m
V)
Cell 1
Cell 2
Cell 3
Figure B.11. Plot of scan rate versus peak splitting for the HH cyt c / ITO systemshowing data from 3 different cells (Data collected by Ryan Gallagan).
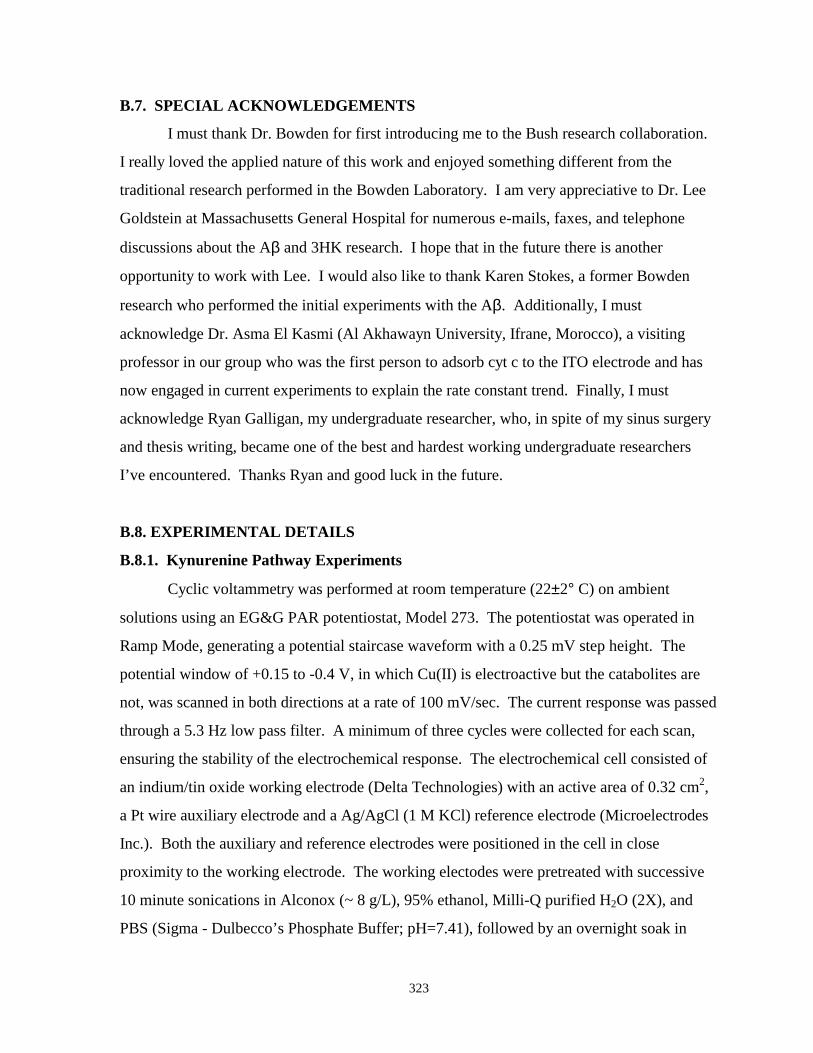
323
B.7. SPECIAL ACKNOWLEDGEMENTS
I must thank Dr. Bowden for first introducing me to the Bush research collaboration.
I really loved the applied nature of this work and enjoyed something different from the
traditional research performed in the Bowden Laboratory. I am very appreciative to Dr. Lee
Goldstein at Massachusetts General Hospital for numerous e-mails, faxes, and telephone
discussions about the Aβ and 3HK research. I hope that in the future there is another
opportunity to work with Lee. I would also like to thank Karen Stokes, a former Bowden
research who performed the initial experiments with the Aβ. Additionally, I must
acknowledge Dr. Asma El Kasmi (Al Akhawayn University, Ifrane, Morocco), a visiting
professor in our group who was the first person to adsorb cyt c to the ITO electrode and has
now engaged in current experiments to explain the rate constant trend. Finally, I must
acknowledge Ryan Galligan, my undergraduate researcher, who, in spite of my sinus surgery
and thesis writing, became one of the best and hardest working undergraduate researchers
I’ve encountered. Thanks Ryan and good luck in the future.
B.8. EXPERIMENTAL DETAILS
B.8.1. Kynurenine Pathway Experiments
Cyclic voltammetry was performed at room temperature (22±2° C) on ambient
solutions using an EG&G PAR potentiostat, Model 273. The potentiostat was operated in
Ramp Mode, generating a potential staircase waveform with a 0.25 mV step height. The
potential window of +0.15 to -0.4 V, in which Cu(II) is electroactive but the catabolites are
not, was scanned in both directions at a rate of 100 mV/sec. The current response was passed
through a 5.3 Hz low pass filter. A minimum of three cycles were collected for each scan,
ensuring the stability of the electrochemical response. The electrochemical cell consisted of
an indium/tin oxide working electrode (Delta Technologies) with an active area of 0.32 cm2,
a Pt wire auxiliary electrode and a Ag/AgCl (1 M KCl) reference electrode (Microelectrodes
Inc.). Both the auxiliary and reference electrodes were positioned in the cell in close
proximity to the working electrode. The working electodes were pretreated with successive
10 minute sonications in Alconox (~ 8 g/L), 95% ethanol, Milli-Q purified H2O (2X), and
PBS (Sigma - Dulbecco’s Phosphate Buffer; pH=7.41), followed by an overnight soak in
324
PBS (pH=7.41). The ITO electrodes were subsequently “activated” immediately prior to use
by successive cycling in PBS for three cycles in each of the following potential windows:
+0.15↔-0.4 V, +0.4↔-0.4 V, and +1.0↔-0.4 V. Cupric chloride (25µM) (Allied Chemical)
was used as the Cu(II) source. Background voltammograms were obtained on each new
electrode before testing the kynurenine pathway cataoblites, 100 µM KYN, 3HK, ANA, and
3HAA (Sigma Chemical Company), by themselves in PBS, and in the presence of Cu(II)
(25µM) in PBS. Each experiment also included a scan of Cu(II) (25µM) in PBS without
added test compound. All solutions were tested within minutes of being prepared. Each test
was repeated to ensure the reproducibility of the results.
B.8.2. Aββββ Experiments
Cyclic voltammograms were obtained at room temperature (22±2° C) on air
equilibrated solutions using an EG&G PARC potentiostat, Model 263A. The
electrochemical cell incorporated an indium/tin oxide (ITO) working electrode (Donnelly
Corporation) of 0.32 cm2 area, a platinum auxiliary electrode, and a Ag/AgCl (1 KCl)
reference electrode. The working electodes were pretreated with successive 30 minute
sonications in Alconox (~ 8 g/L), 95% ethanol, Milli-Q purified H2O, and PBS (Sigma -
Dulbecco’s Phosphate Buffer; pH=7.3), followed by an overnight soak in PBS (pH=7.3).
The peptide solution was prepared by first dissolving Aβ1-42 with sonication in deionized
water to 300 µM, after which the peptide solution was added to Dulbecco’s phosphate
buffered saline without Ca or Mg (Sigma) to a final concentration of 100 µM. Background
voltammograms were first acquired in buffer on each new electrode used, followed by
examination of Aβ1-42 (100 µM) in buffer, CuCl2 (17 µM) in buffer, and Aβ1-42 (100 µM)
with CuCl2 (17 µM) in buffer. The possibility that the formal potentials measured were for
surface adsorbed complexes cannot be excluded, and, in fact, the wave shapes (Figure B.8
lines c & d) of the copper signals are suggestive of involvement by adsorbed species. Further
investigation is warranted to resolve this issue.
B.8.3. Cyt c / ITO Experiments
Cyclic voltammetry was performed at room temperature (22±2° C) on ambient
solutions using an EG&G PAR potentiostat, Model 273. The potentiostat was operated in
Ramp Mode, generating a potential staircase waveform with a 0.25 mV step height. The
325
current response was passed through a 5.3 Hz low pass filter. A minimum of three cycles
were collected for each scan, ensuring the stability of the electrochemical response. The
electrochemical cell consisted of an indium/tin oxide working electrode (Delta Technologies)
with an active area of 0.32 cm2, a Pt wire auxiliary electrode and a Ag/AgCl (1 M KCl)
reference electrode (Microelectrodes Inc.). Both the auxiliary and reference electrodes were
positioned in the cell in close proximity to the working electrode. The working electodes
were pretreated with successive 10 minute sonications in Alconox (~ 8 g/L), 95% ethanol,
Milli-Q purified H2O (2X), and PBS (pH=7), followed by an overnight soak in PBS (pH=7).
The PBS was made (as described in Chapter 3 - Experimental Details) from mono and
dibasic potassium phosphate salts and Mill-Q purified H2O. Pre-prepared ITO electrodes
were often stored for several days at the Milli-Q water step prior to use. The storage time of
the ITO electrodes in the water seemed to have a negligible effect on the results of the
experiments. To avoid contamination of the ITO surfaces, new surface were used for each
surface and used ITO substrates were discarded.
HH Cyt c was purified based on the procedure given in the Experimental Details
section of Chapter 3 and C102T yeast cyt c was purfied via the procedure described in
reference 14. Deposition procedures and voltammetric testing was carried out as described in
Chapter 3 (Experimental Details) and were, for the most part, identical to the deposition and
testing of cyt c on SAM modified gold.
326
B.9 REFERENCES
1. a) S.M. Hurtley, “Neurodegeneration,” Science 1999, 282, 1071; b) I. Shoulson, “ExperimentalTherapeutics of Neurodegenerative Disorders: Unmet Needs,” Science 1999, 282, 1072-1074; c)J. Hardy and K. Gwinn-Hardy, “Genetic Classification of Primary Neurodegenerative Disease,”Science 1999, 282, 1075-1078; d) D.L. Price, S.S. Sisodia, and D.R. Borchelt, “GeneticNeurodegenerative Disease: The Human Illness and Transgenic Models,” Science 1999, 282,1079-1083; e) A. Underwood, “Alzheimer’s - Unlocking the Mystery,” Newsweek, January 31,2000.
2. a) M. Tominaga, T. Kumagai, S. Takita, and I. Taniguchi, “Effect of Surface Hydrophilicity of
an Indium Oxide Electrode on Direct Electron Transfer of Myoglobins,” Chemistry Letters 1993,1771-1774; b) J. Strojek and T. Kuwana, “Electrochemical Spectroscopy Using Tin-OxideCoated Optically Transparent Electrodes,” J. Electroanal. Chem. 1968, 16, 471-483.
3. a) J.L. Willit and E.F. Bowden, “Adsorption and Redox Thermodynamics of Strongly Adsorbed
Cytochrome c on Tin Oxide Electrodes,” J. Phys. Chem. 1990, 94, 8241-8246; b) M. Collinsonand E.F. Bowden, “UV-Visible Spectroscopy of Adsorbed Cytochrome c on Tin OxideElectrodes,” Anal. Chem. 1992, 64, 1470-1476; c) J.L. Willit and E.F. Bowden, J. Electroanal.Chem. 1987, 221, 265-274.
4. L.E. Goldstein, M. Hartshorn, M. Leopold, X. Huang, C. Atwood, A. Saunders, J. Lim, K. Faget,
R. Scarpa, L. Chylack, E. Bowden, and A. Bush, “3 Hydroxykynurenine and 3-Hydroxyanthranillic Acid Generate Hydrogen Peroxide and Promote α-Crystallin Crosslinkingby Metal Ion Reduction,” in press, Biochemistry.
5. a) S. Okuda, N. Nishiyama, H. Saito, and H. Katsuki, “Hydrogen Peroxide-Mediated Neuronal
Cell Death Induced by an Endogenous Neurotoxin, 3-Hydroxykynurenine,” Proc. Natl. Acad.Sci., USA, 1996, 93, 12553-12558; b) T. Ishii, H. Iwahashi, R. Sugata, and R. Kido, “Oxidationof 3HK Catalyzed by Methemoglobin with Hydrogen Peroxide,” Free Radical Biology andMedicine, 1992, 13, 17-20; c) M. Manthey, S.G. Pyne, and R.J.W. Truscott, “Mechanism ofReaction of 3HAA with Molecular Oxygen,” Biochimica et Biophysica Acta 1990, 1034, 207-212.
6. a) A.M. Wood and R.J. Truscott, “Ultraviolet Filter Compounds in Human Lenses: 3-
Hydroxykynurenine Glucoside Formation,” Vision Res. 1994, 34(11), 1369-1374; b) R.J.W.Truscott and A.M. Wood, “Gourami Lenses Convert Tryptophan Into 3HK,” Ophthalmic Res.1994, 26, 214-218; c) S.J. Atherton, J. Dillon, and E.R. Gaillard, “A Pulse Radiolysis Study ofthe Reactions of 3-Hydroxykynurenine and Kynurenine with Oxidizing and Reducing Radicals,”Electrochimica et Biophysica Acta 1993, 1158, 75-82.
7. D.T. Sawyer, Oxygen Chemistry, Oxford University Press: New York, 1991. 8. A.M. Bond, D. Dakternieks, Z. Qing, D.J. Tucker, and D.E. Rivett, “New Aspects of the
Chemistry and Mechanism of Electrochemical Reduction of Kynurenine at Mercury Electrodesin Aqueous Media,” J. Electroanal. Chem. 1991, 309, 173-197.
327
9. X. Huang, C.S. Atwood, M.A. Hartshorn, G. Multhaup, L.E. Goldstein, R.C. Scarpa, M.P.Cuajungco, D.N. Gray, J. Lim, R.D. Moir, R.E. Tanzi, and A.I. Bush, “The A-Beta Peptide ofAlzheimer’s Disease Directly Produces Hydrogen Peroxide Through Metal Ion Reduction,”Biochemistry 1999, 38(24), 7609-7616.
10. J.H. Viles, F.E. Cohen,, S.B. Prusiner, D.B. Goodin, P.E. Wright, and H.J. Dyson, “Copper
Binding to the Prion Protein: Structural Implications of Four Identical Cooperative BindingSites,” Proc. Natl. Acad. Sci. USA 1999, 96, 2042-2047.
11. X. Huang, C.S. Atwood, J.D.A. Tyndall, G. Hanson, K.C. Stokes, M.C. Leopold, M.A.
Hartshorn, G. Multhaup, L.E. Goldstein, R.C. Scarpa, A.J. Saunders, C. Glabe, C.L. Masters,D.P. Fairlie, R.E. Tanzi, M.P. Cuajungco, D.N. Gray, J. Lim, R.D. Moir, R.E. Tanzi, and A.I.Bush, “Cu(II) Potentiation of Alzheimer Aβ Neurotoxicity: Correlation with Cell-Free HydrogenPeroxide Production and Metal Reduction,” J. Biol. Chem. 1999, 274(52), 37111-37116.
12. a) C.S. Atwood, R.D. Moir, X. Huang, R.C. Scarpa, N. Michael, E. Bacarra, D.M. Ramanos, M.
Hartshorn, R.E. Tanzi, and A.I. Bush, “Dramatic Aggregation of Alzheimer Aβ by Cu(II) IsInduced by Conditions Representing Physiological Acidosis,” J. Biol. Chem. 1998, 273(21),12817-12826; b) J. Davis and W.E. Van Nortrand, “Enhanced Pathologic Properties of Dutch-Type Mutant Amyloid β- Protein,” Proc. Natl. Acad. Sci. USA 1996, 93, 2996-3000; c) E.M.Castano, F. Prelli, C. Soto, R. Beavis, Etsuro Matsubara, M. Shoji, and B. Fraggione, “TheLength of Amyloid β in Heredity Cerebral Hemorrage with Amyloidosis, Dutch Type,” J. Biol.Chem. 271(50), 32185-32191; d) P.E. Fraser, J.T. Nguyen, H. Inouye, W.K. Surewicz, D.J.Selkoe, M.B. Podlisny, D.A. Kirschner, “Fribril Formation by Primate, Rodent, and Dutch-Hemmorrhagic Analogues of Alzheimer Amyloid β Protein,” Biochemistry 1992, 31, 10716-10723.
13. a) L.M. Sayre, “Alzheimer’s Precursor Protein and the Use of Bathocuproine for Determining
Reduction of Cupper(II),” Science 1996, 274, 1933-1934; b) F. Wang and L.M. Sayre, “Kineticsand Mechanism of Aliphatic Amine Oxidation by Aqueous (batho)2CuII,” J. Am. Chem. Soc.1992, 114, 248-255; b) F. Wang and L.M. Sayre, “Oxidation of Tertiary Amine Buffers byCopper(II),” Inorganic Chemistry Communications 1989, 28(2), 169-170; c) A.G. Lappin, M.P.Youngblood, and D.W. Margerum, “Electron-Transfer Reactions of Copper(I) and Copper (III)Complexes,” Inorg. Chem. 1980, 19, 407-413.
14. J. M. Wallace, Ph.D. Thesis, North Carolina State University, 2000.
15. a) E.F. Bowden, J. Electroanal. Chem. 1984; b) E.F. Bowden and S. Song, unpublished results;c) E.A. Kasmi, R. Galligan, M.C. Leopold, and E.F. Bowden, unpublished results.


