Embed Size (px)
Citation preview

Cytoplasmic Molecular Delivery with Shock Waves:Importance of Impulse
Tetsuya Kodama, Michael R. Hamblin, and Apostolos G. DoukasWellman Laboratories of Photomedicine, Massachusetts General Hospital, and Department of Dermatology,Harvard Medical School, Boston, MA
ABSTRACT Cell permeabilization using shock waves may be a way of introducing macromolecules and small polarmolecules into the cytoplasm, and may have applications in gene therapy and anticancer drug delivery. The pressure profileof a shock wave indicates its energy content, and shock-wave propagation in tissue is associated with cellular displacement,leading to the development of cell deformation. In the present study, three different shock-wave sources were investigated;argon fluoride excimer laser, ruby laser, and shock tube. The duration of the pressure pulse of the shock tube was 100 timeslonger than the lasers. The uptake of two fluorophores, calcein (molecular weight: 622) and fluorescein isothiocyanate-dextran(molecular weight: 71,600), into HL-60 human promyelocytic leukemia cells was investigated. The intracellular fluorescencewas measured by a spectrofluorometer, and the cells were examined by confocal fluorescence microscopy. A single shockwave generated by the shock tube delivered both fluorophores into approximately 50% of the cells (p , 0.01), whereas shockwaves from the lasers did not. The cell survival fraction was .0.95. Confocal microscopy showed that, in the case of calcein,there was a uniform fluorescence throughout the cell, whereas, in the case of FITC-dextran, the fluorescence was sometimesin the nucleus and at other times not. We conclude that the impulse of the shock wave (i.e., the pressure integrated over time),rather than the peak pressure, was a dominant factor for causing fluorophore uptake into living cells, and that shock wavesmight have changed the permeability of the nuclear membrane and transferred molecules directly into the nucleus.
INTRODUCTION
There are many situations in medicine and biology when itis desired to introduce a macromolecule into the cytoplasmof mammalian cells (Hapala, 1997). One important appli-cation is gene therapy, where it is necessary to deliver agene or a synthetic oligonucleotide into the cell. Genetherapy has attracted attention as a possible solution tomany major diseases such as cancer (Fueyo et al., 1999;Gutierrez et al., 1992), cardiovascular disease (Finkel andEpstein, 1995), and inherited metabolic disorders. Achiev-ing the efficient delivery of a macromolecule to the cyto-plasm and thence to the nucleus is inherently difficult,because the natural mechanism used by cells to take upmacromolecules is endocytosis. All three variants of endo-cytosis (receptor-mediated, adsorptive, and fluid-phase)lead to the endosomal–lysosomal pathway, and exposure ofthe macromolecule to many degradative enzymes such asnucleases, proteases, etc. (Mukherjee et al., 1997). Otherimportant applications of intracellular macromolecular de-livery include the use of ribosome-inactivating proteins incancer therapy (Barbieri et al., 1993) and the elucidation ofcellular metabolic pathways by the introduction of activebiomolecules (Cockcroft, 1998).
Cells take up small polar molecules either by specifictransmembrane transporters (Cass et al., 1998), or by fluid-phase endocytosis (Connelly et al., 1993). The first processhas a high degree of structure specificity, whereas the sec-ond has a low capacity. There are applications where amethod of increasing the cellular uptake of small polarmolecules would be desirable, e.g., potentiating the effectsof cisplatin (Weiss et al., 1994) and bleomycin (Kambe etal., 1996) in cancer therapy.
Many methods have been devised to produce the transientpermeabilization of cells without concomitant cytotoxicity.These include the use of detergents such as digitonin thatalter membrane lipid structure (Schafer et al., 1987), bacte-rial toxins such as Streptolysin O (Spiller et al., 1998),virus-mediated fusogenic liposomes (Kaneda, 1999), theuse of pulsed electric fields (electroporation) (Ho and Mit-tal, 1996), the use of ultrasound (sonoporation) (Liu et al.,1998; Miller et al., 1999). Another method that may beapplicable is the use of shock waves generated by extracor-poreal lithotripters (Delius and Adams, 1999; Gambihler etal., 1994) or lasers (Lee and Doukas, 1999). The increase ofmembrane permeability due to the application of shockwaves generated by a lithotripter was first demonstrated byinducing L1210 mouse leukemia cells to take up propidiumiodide (Gambihler and Delius, 1992a) and fluorescein iso-thiocyanate dextran (FITC-D, molecular weights up to2,000,000 (Gambihler et al., 1994).
Shock waves are nonlinear and finite-amplitude waves,and the flow induced behind the shock waves cannot beignored. The duration time of the particle motion is theorder of the pulse duration,dt, of the shock wave, and thedisplacement,d, of the particle is about the order ofd 5
Received for publication 10 December 1999 and in final form 7 July 2000.
Address reprint requests to Tetsuya Kodama, Harvard Medical School,Massachusetts General Hospital, Department of Dermatology, WellmanLaboratories of Photomedicine, 55 Fruit Street - WEL 224, Boston, MA02114. Tel.: 617-724-2881; Fax: 617-726-3192; E-mail: [email protected].
© 2000 by the Biophysical Society
0006-3495/00/10/1821/12 $2.00
1821Biophysical Journal Volume 79 October 2000 1821–1832

up 3 dt, whereup is the induced speed, which is inverselyproportional to the density of the particle. A rough estimateof tissue displacement obtained with a single shock wavegenerated by a clinical lithotripter is calculated to be 1–20mm, using pressure data obtained in water (Coleman andSaunders, 1989). This value is similar to that (7–10mm)measured in rabbit liver resulting from a shock wave pro-duced by detonation of an explosive micropellet (Kodama etal., 1998). Transmembrane molecular delivery depends onthe shock wave pressure profile, but little is known aboutthe relationship between the pressure profile and the deliv-ery mechanism.
In the present paper, three different shock wave sources,excimer laser, ruby laser, and shock tube were used toinvestigate the relationship between the pressure profile andthe uptake of fluorophores into HL-60 human promyelo-cytic leukemia cells.
MATERIALS AND METHODS
Cell preparation
Human promyelocytic leukemia cells (HL-60) were obtained from theAmerican Type Culture Collection (ATCC) (Rockville, MD), and werecultured in suspension in RPMI-1640 medium (Life Technologies Inc.,Grand Island, NY) with 20% fetal bovine serum (Life Technologies Inc.)in 750-ml flasks (Fisher Scientific Co., Pittsburgh, PA) in a cell cultureincubator (Model 2720, Queue, Parkersburg, WV) at 37°C under anatmosphere of 5% CO2 in air. Total cell counts and the viability werecounted in a hemocytometer (Hausser Scientific, Horsham, PA) with thetrypan blue dye exclusion method (Tennant, 1964) before and after theshock wave experiments. Only cells in the exponential growth phase, with$95% viability, were used. In the experiments using the excimer and rubylasers, polystyrene tubes constructed from 55-mm lengths cut from 1 mlserological pipettes 3 mm in diameter (Becton Dickinson, Franklin Lakes,NJ) sealed at one end with a polystyrene plate (thickness 2.2 mm) wereused as test tubes. For the shock tube experiments, flat-top snap-capmicro-centrifuge tubes (Fisher Scientific Co., 7.5 mm outer diameter, 30.5mm length, 0.5 ml) were used. The centrifuge tube was covered with atriple layer of Parafilm (Parafilm “M”, American National Can, Chicago,IL). Both test tubes were filled with a mixture of the fluorophore solution(200 mM) and 2.03 106 cells in serum-containing medium. A cell pelletwas gently formed by centrifugation (5 min at 2333 g). Because endo-cytosis is a temperature-dependent process (Basrai et al., 1990), the testtubes were kept in an ice bath at 0.5°C except during a brief period of timeduring the application of shock waves to reduce the potential of uptake ofthe fluorophore due to endocytosis.
Fluorophores
Calcein (622 Da) (Sigma, St. Louis, MO; absorption 496 nm, emission 514nm) and fluorescein isothiocyanate-dextran (FITC-D, 71600 Da) (Sigma,absorption 494 nm, emission 514 nm) were used for evaluation of theuptake of molecules by the cells. Solutions of the fluorophore at a con-centration of 200mM were prepared in phosphate-buffered saline withoutMg21 and Ca21 (PBS). Propidium iodide (PI) (Molecular Probes, Eugene,OR; absorption 535 nm, emission 617 nm) was added to the cells to givea final concentration of 20mg/ml 5 minutes before confocal microscopy todistinguish between living and damaged cells before capturing the confocalimages.
Laser generation of shock waves
An argon fluoride (ArF) excimer laser (wavelength 193 nm, pulse durationfull width at half maximum 14 ns) (Excimer laser LPX 300cc, LambdaPhysics Inc., Acton, MA) and a Q-switched ruby laser (wavelength 694.3nm, pulse width 28 ns) (model RD-1200, Spectrum Medical TechnologiesInc., Natick, MA) were used. The laser fluence was 2.5 and 5.5 J cm22 forthe excimer laser, and 17.3, 28.8, and 40.3 J cm22 for the ruby laser. Figure1 A shows the experimental arrangement. The laser beam was delivered tothe polystyrene plate sealing the bottom of the test tube as a focused3-mm-diameter spot by way of a lens and a prism.
FIGURE 1 Schematic diagram of experimental setup. (A) Laser-gener-ated shock wave permeabilization of cells. (B) Shock tube-induced perme-abilization of cells.
1822 Kodama et al.
Biophysical Journal 79(4) 1821–1832

Shock tube
The double diaphragm shock tube (Hall, 1958) was obtained from PharmaWave (Boston, MA). It consisted of a high-pressure chamber (107 mmlong), a low-pressure channel (260 mm long, 25.4 mm inner diameter), areduction nozzle having a half-angle of 11.7° (Fig. 1B). The high-pressurechamber was separated from the low-pressure channel with two adjacentdiaphragms (thickness 0.127 mm, Part No. 44535, Precision Brand Prod-uct, Inc., Downers Grove, IL), and the low-pressure channel was separatedfrom the reduction nozzle with one diaphragm (thickness 3.18 mm, PartNo. 44550, Precision Brand Products, Inc.). A 0.5-ml microcentrifuge tubewithout the cap was covered with a plate made of terephthalate (diameter25.4 mm, thickness 7.8 mm), and both were fitted to the reduction nozzleby screwing on the end fitting. Both the high-pressure chamber and thelow-pressure channel were placed under a vacuum (4 kPa), and the formerwas filled with helium as the driver gas, whereas the later was filled withkrypton as the driven gas. The pressure in the high-pressure chamber,P2,was 1.2 MPa or 2.8 MPa. The pressure in the low-pressure channel,P1, wasfixed to 0.1 MPa. When the diaphragm placed between the high-pressurechamber and the low-pressure channel was ruptured by the pressure dif-ference, the shock wave and the following high-velocity flow propagatedfrom the diaphragm into the low-pressure channel. Based on an assumptionof one-dimensional isentropic flows (Liepman and Roshko, 1957), theshock pressure,PS, and the shock Mach number,MS, in the low-pressurechamber werePS 5 1.2 MPa andMS 5 3.1 for P2 5 2.8 MPa; andPS 50.69 MPa andMS 5 2.4 forP2 5 1.2 MPa. The traveling shock wave thenruptured the second diaphragm, and converged into the microcentrifugetube. The shock wave intensity in the microcentrifuge tube was increasedby a factor of;20 compared to the calculated pressure in the low-pressurechannel.
Pressure measurements
A PVDF needle hydrophone (model 80-0.5-4.0, Imotec Messtechnik,Warendorf, Germany) with a 0.5-mm-diameter sensitive element, whichgave an output of 0.0136mV Pa21, positioned inside the test tube, was usedto monitor the overpressure of the shock wave by changing the stand-offdistance between the polystyrene plate and the hydrophone for the exper-iment with laser beams. The sensitivity was constant up to 10 MHz, the risetime was about 100 ns and it had registrations within the limits set out inIEC Standard 61846 (IEC, 1998). For the shock tube experiment, thehydrophone was placed on the bottom of the centrifuge tube. Measureddata were stored and displayed on a digitizing oscilloscope (9360, 600MHz, 1 MV [15 pF], LeCroy Co., New York, NY).
Fluorescence measurement
Measurements were performed in a spectrofluorometer (FluoroMAX™,Spex Industries Inc., Edison, NJ). Fluorescence emission was scanned from490 to 600 nm at 20°C, after excitation at 496 nm (calcein) or 494 nm(FITC-D) with 1-nm-wide slits. The accuracy of the excitation wavelengthwas 60.5 nm. All cell samples were washed with PBS (5 ml, 33) toremove excess extracellular fluorophore and centrifuged (5 min at 2333g). After three washes, the recovery rate of the cells was between 98% and59%. The cell pellet was then resuspended in 3 ml PBS, counted with thehemocytometer, and transferred to a 10-mm square polystyrene cuvette(Fisher Scientific Co.). Each experiment consisted of 5 samples receivingfluorophore and shock wave and 5 control samples receiving fluorophorebut no shock wave. For each experiment, the mean fluorescence of thetreated samples was divided by the mean fluorescence of control samplesto give a normalized fluorescence uptake. The mean of 3–10 values ofnormalized fluorescence uptakes was calculated for each shock wavesource (ArF, ruby, and shock tube) and fluorophore (calcein and FITC-D).
Confocal fluorescence microscopy
Confocal fluorescence microscopy was performed on a confocal micro-scope (model DMRBE, Leica Microsystems, GmbH, Heidelberg, Ger-many) equipped with an 18-mW argon laser (model 2211-65ML,Uniphase, San Jose, CA). A 403 oil-immersion objective lens (PL AP0,Leica Microsystems) with a numerical aperture of 1.25 was used. Calcein,FITC-D, and PI fluorescence were excited with the 488-nm line of theargon laser. The laser excitation beam was directed to the specimenthrough a 488-nm dichroic beam splitter. Emitted fluorescence was col-lected through a 525–550-nm bandpass emission filter for the green chan-nel and a 590-nm long pass filter for the red channel. Computer-generatedimages of 1-mm optical sections were taken at the geometric center of thecell as determined by repeated optical sectioning. The percentage offluorescent cells for each sample was calculated by examining 3–6 fieldseach containing 10–100 cells. Both weakly and strongly fluorescent cellswere counted as positive. Means of 3–5 samples were calculated to givefinal percentage of fluorescent cells.
Statistical analysis
All measurements are given as mean6 standard deviation (SD). Values arethe means of 3–10 separate experiments with an average of five samplesper experiment. Differences between all samples were assessed by one-wayfactorial ANOVA. A value ofp , 0.05 was considered to be statisticallysignificant.
RESULTS
Pressure profiles
Figure 2 shows three pressure waveforms measured in wa-ter, that were generated with the excimer laser, ruby laser,and shock tube. The fluences of the excimer and ruby laserbeams were 5.5 J cm22 and 40.3 J cm22, respectively. Forthe shock tube,P2 5 2.8 MPa andP1 5 0.1 MPa. Thestandoff distance between the hydrophone and polystyreneplate was 0.5 mm for the excimer and ruby lasers. When thepolystyrene plate was exposed to the laser beam under acondition of stress confinement, stress waves were gener-ated in the polystyrene (Frenz et al., 1996; Bushnell andMcCloskey, 1968). The stress waves became bipolar whenthe polystyrene surface exposed by the laser beam was incontact with air because of the acoustic mismatch betweenpolystyrene and air (Fig. 2a). The bipolar stress wavespropagated in polystyrene and were transmitted into water.A part of the stress wave was reflected back at the interfaceof the water, was reflected again at the other side facing theair, and was transmitted to the water. The second peakpressure observed 1.86ms after the first peak pressure wasthe result of the above reflection process (Fig. 2a). Thethickness of the polystyrene was 2.2 mm. Therefore, thewave velocity in the polystyrene was calculated to be 2366m s21, which was close to 2350 m s21 reported in a data-base (Lide, 1999). The cells were mainly affected by thefirst shock wave, because the intensity of the second shockwave was negligible compared with that of the first.
For the ruby laser (Fig. 2b), the positive and negativewaves, and the reflected waves were recorded. The compo-
Drug Delivery with Shock Waves 1823
Biophysical Journal 79(4) 1821–1832

nent of the negative phase of the ruby laser was less thanthat produced by the excimer laser because the fluence ofthe laser beam was larger than that of the excimer laser bya factor of 7.3, resulting in greater ablation of the polysty-rene. The reflections of the transmitted shock wave at theinside wall were clearly observed in the case of the rubylaser, compared with the excimer laser. This was due to thedifferent pressure waveform resulting from less uniformenergy distribution over the laser focus area. The pulseduration of the shock wave generated by the shock tube was
longer than those of pulses of the excimer and ruby lasers bya factor of 100 (Fig. 2c).
Table 1 shows pressure parameters generated by threeshock-wave sources. The values of peak pressuresP1, P2,the rise time of the first positive half-cycle,tr, the durationsof the first positive and first negative half-cycles,t1 andt2,the impulse,I, integrated fort1, respectively, are given inTable 1. The rise time for the shock tube was not determinedbecause the rise profile of the waveform was nonlinear dueto the reflected waves generated in the shock tube. The
FIGURE 2 Pressure wave profilesfor the excimer laser, ruby laser, andshock tube. (a) Excimer laser, 5.5J cm22; (b) Ruby laser, 40.3 J cm22;(c) Shock tube gas pressures, P2 52.8 MPa, P1 5 0.1 MPa.
TABLE 1 Shock wave parameters
ConditionP1
(MPa)P2
(MPa)tr
(ns)t1
(ns)t2
(ns)I
(Pazs)
ArF laser 2.5 J cm22 8.36 0.0 0.966 0.1 37.86 0.8 178.86 16 217.76 3.0 0.76 0.15.5 J cm22 12.46 0.0 1.26 0.1 38.56 0.7 196.36 2.9 211.86 2.3 1.16 0.0
Ruby laser 17.3 J cm22 20.16 2.1 0.46 0.0 42.16 2.6 178.06 4.7 11.86 2.3 2.56 0.228.8 J cm22 24.16 1.2 0.45 39.06 0.7 195.56 4.3 44.5 3.16 0.140.3 J cm22 31.96 0.0 0.786 0.0 34.86 0.2 202.76 1.9 49.36 3.3 4.06 0.1
Shock tube P2 5 1.2, 3.46 1.1 0.916 0.32 — 237006 4000 357706 19350 54.16 8.9P1 5 0.1 MPaP2 5 2.8, 11.66 1.6 2.166 0.22 — 321006 7100 107006 4100 141.86 24.4P1 5 0.1 MPa
Positive and negative peak pressures,P1 andP2, rise timetr and positive and negative half cycle durations,t1 andt2, impulse,I integrated fort1, overa range of energy densities of the excimer and ruby laser beams, and the gas pressure ratio of the shock tube. The rise time was defined as the time requiredfor pressure to increase from 10% to 90% of the maximum positive value. The rise time for the shock tube was undetermined because the rise characteristicof the waveform was nonlinear due to the reflected waves generated in the shock tube. Shock-wave parameters were measured by a PVDF needlehydrophone. Values are the mean of 3 measurements and are6SD.
1824 Kodama et al.
Biophysical Journal 79(4) 1821–1832
maximum pressure measured was 31.9 MPa, which wasobtained by the ruby laser at a fluence of 40.3 J cm22.
Using one-dimensional momentum equations (Balhausand Holt, 1974), the shock Mach number,MS, the inducedparticle speed,up, and the density,r, of the water behind theshock wave with a pressure of 31.9 MPa, were determinedto be 1.03, 19.8 m s21, and 1011.4 kg m23 respectively,where the sound speed in water is 1482 m s21, the atmo-spheric pressure was 101.3 kPa, and the water temperaturewas 20°C, giving a value for density of 998.2 kg m23.Because the shock wave velocity was very close to theacoustic limit (MS 5 1.03) and the density increase wasonly 1%, both the cells and surrounding liquid were treatedas an incompressible fluid in the present paper.
Uptake of fluorophore in surviving cells
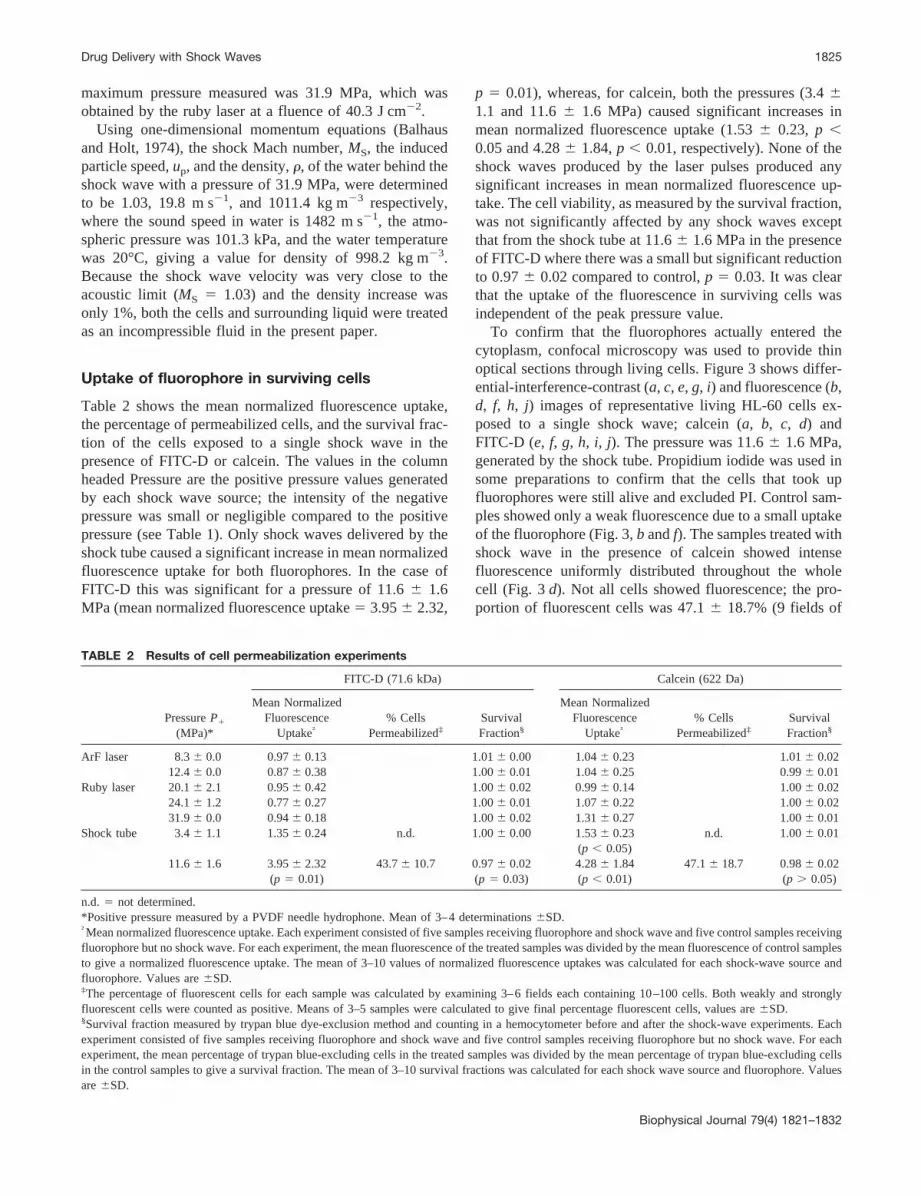
Table 2 shows the mean normalized fluorescence uptake,the percentage of permeabilized cells, and the survival frac-tion of the cells exposed to a single shock wave in thepresence of FITC-D or calcein. The values in the columnheaded Pressure are the positive pressure values generatedby each shock wave source; the intensity of the negativepressure was small or negligible compared to the positivepressure (see Table 1). Only shock waves delivered by theshock tube caused a significant increase in mean normalizedfluorescence uptake for both fluorophores. In the case ofFITC-D this was significant for a pressure of 11.66 1.6MPa (mean normalized fluorescence uptake5 3.956 2.32,
p 5 0.01), whereas, for calcein, both the pressures (3.461.1 and 11.66 1.6 MPa) caused significant increases inmean normalized fluorescence uptake (1.536 0.23, p ,0.05 and 4.286 1.84,p , 0.01, respectively). None of theshock waves produced by the laser pulses produced anysignificant increases in mean normalized fluorescence up-take. The cell viability, as measured by the survival fraction,was not significantly affected by any shock waves exceptthat from the shock tube at 11.66 1.6 MPa in the presenceof FITC-D where there was a small but significant reductionto 0.976 0.02 compared to control,p 5 0.03. It was clearthat the uptake of the fluorescence in surviving cells wasindependent of the peak pressure value.
To confirm that the fluorophores actually entered thecytoplasm, confocal microscopy was used to provide thinoptical sections through living cells. Figure 3 shows differ-ential-interference-contrast (a, c, e, g, i) and fluorescence (b,d, f, h, j) images of representative living HL-60 cells ex-posed to a single shock wave; calcein (a, b, c, d) andFITC-D (e, f, g, h, i, j). The pressure was 11.66 1.6 MPa,generated by the shock tube. Propidium iodide was used insome preparations to confirm that the cells that took upfluorophores were still alive and excluded PI. Control sam-ples showed only a weak fluorescence due to a small uptakeof the fluorophore (Fig. 3,b andf). The samples treated withshock wave in the presence of calcein showed intensefluorescence uniformly distributed throughout the wholecell (Fig. 3d). Not all cells showed fluorescence; the pro-portion of fluorescent cells was 47.16 18.7% (9 fields of
TABLE 2 Results of cell permeabilization experiments
PressureP1
(MPa)*
FITC-D (71.6 kDa) Calcein (622 Da)
Mean NormalizedFluorescence
Uptake†% Cells
Permeabilized‡SurvivalFraction§
Mean NormalizedFluorescence
Uptake†% Cells
Permeabilized‡SurvivalFraction§
ArF laser 8.36 0.0 0.976 0.13 1.016 0.00 1.046 0.23 1.016 0.0212.46 0.0 0.876 0.38 1.006 0.01 1.046 0.25 0.996 0.01
Ruby laser 20.16 2.1 0.956 0.42 1.006 0.02 0.996 0.14 1.006 0.0224.16 1.2 0.776 0.27 1.006 0.01 1.076 0.22 1.006 0.0231.96 0.0 0.946 0.18 1.006 0.02 1.316 0.27 1.006 0.01
Shock tube 3.46 1.1 1.356 0.24 n.d. 1.006 0.00 1.536 0.23 n.d. 1.006 0.01(p , 0.05)
11.66 1.6 3.956 2.32 43.76 10.7 0.976 0.02 4.286 1.84 47.16 18.7 0.986 0.02(p 5 0.01) (p 5 0.03) (p , 0.01) (p . 0.05)
n.d. 5 not determined.*Positive pressure measured by a PVDF needle hydrophone. Mean of 3–4 determinations6SD.†Mean normalized fluorescence uptake. Each experiment consisted of five samples receiving fluorophore and shock wave and five control samples receivingfluorophore but no shock wave. For each experiment, the mean fluorescence of the treated samples was divided by the mean fluorescence of control samplesto give a normalized fluorescence uptake. The mean of 3–10 values of normalized fluorescence uptakes was calculated for each shock-wave source andfluorophore. Values are6SD.‡The percentage of fluorescent cells for each sample was calculated by examining 3–6 fields each containing 10–100 cells. Both weakly and stronglyfluorescent cells were counted as positive. Means of 3–5 samples were calculated to give final percentage fluorescent cells, values are6SD.§Survival fraction measured by trypan blue dye-exclusion method and counting in a hemocytometer before and after the shock-wave experiments. Eachexperiment consisted of five samples receiving fluorophore and shock wave and five control samples receiving fluorophore but no shock wave. For eachexperiment, the mean percentage of trypan blue-excluding cells in the treated samples was divided by the mean percentage of trypan blue-excluding cellsin the control samples to give a survival fraction. The mean of 3–10 survival fractions was calculated for each shock wave source and fluorophore. Valuesare6SD.
Drug Delivery with Shock Waves 1825
Biophysical Journal 79(4) 1821–1832

cells) for calcein. For cells treated with a shock wave in thepresence of FITC-D, there were three types of fluorescenceimages obtained. The nonfluorescent cells (Fig. 3f) com-prised 56.36 10.7% of the total (17 fields of cells) (Table2). The remaining fluorescent cells could have one of twoappearances. The first shown in Fig. 3h has the nucleusdark compared to the evenly stained cytoplasm, whereas thesecond shown in Fig. 3j shows the nucleus to be interme-diately stained, whereas the nucleoli are less bright but stillhave some fluorescence. The procedure for imaging con-sisted of eight confocal sections separated by 1mm, so it isunlikely that these images were the result of the confocalmicroscope missing a dark nucleus. Observed with differ-ential-interference-contrast, fluorescence-retaining cells ex-posed to the shock wave were indistinguishable from theunshocked cells (Fig. 3,a, c, e, g, and i).
Each shock wave source generated a different shockwaveform, so it is uncertain precisely which shock waveparameters were important for uptake of the fluorophore.Because the fluorophore uptake did not depend on the peakpressures of the shock waves, we investigated uptake as afunction of the impulseI. The impulse is denoted by
I 5 E0
t1
p~t! dt, (1)
wherep(t) is the shock wave pressure, andt1 is the positivephase duration of a half-cycle of the shock wave (see Table 1).
Figure 4 shows the relationship between the mean nor-malized fluorescence uptake and the impulse. The uptake ofthe fluorophore occurred only after shock tube permeabili-
zation. No fluorophore was taken up when either the exci-mer or the ruby laser was used to generate the shock wave(see Table 2). The intensity of the intracellular fluorescenceincreased with increasing impulse. The results suggest that
FIGURE 4 Relationship between the mean normalized fluorescence up-take and the impulse of the shock wave for each shock-wave source. Thefluorophores were calcein (622 Da) and FITC-D (71.6 kDa). Each exper-iment consisted of five samples receiving fluorophore and shock wave andfive control samples receiving fluorophore but no shock wave. For eachexperiment, the mean fluorescence of the treated samples was divided bythe mean fluorescence of control samples to give a normalized fluores-cence uptake. The mean of 3–10 values of normalized fluorescence uptakeswas calculated for each shock-wave source and fluorophore. Error barsindicate SD.
FIGURE 3 Differential-interference-contrast (a, c, e, g, i) and fluorescence (b, d, f, h, j) confocal images of representative living HL-60 cells exposedto a single shock wave in the presence of 200mM; calcein (622 Da) (a, b, c, d) and FITC-dextran (71.6 kDa) (e, f, g, h, i, j). Fluorescence was excitedwith the 488-nm line of the argon laser and collected through a 525–550-nm bandpass emission filter. The sections were taken at the geometric center ofthe cell. The shock wave pressure was 11.66 1.6 MPa (n 5 4), generated by the shock tube. The samples were washed three times with PBS. Scale barindicates 10mm.
1826 Kodama et al.
Biophysical Journal 79(4) 1821–1832

there is a threshold value of the impulse for causing uptakeof fluorophore.
DISCUSSION
We have shown that shock waves are capable of deliveringlarge molecules into the cytoplasm of cells without causingsignificant cytotoxicity. It was found that the uptake of thefluorophore by the cells was closely related to the impulseof the shock wave (see Fig. 4). We shall attempt to definethe physical significance of the factors involved. Considerthe one-dimensional wave propagation in the liquid includ-ing and surrounding the cells. Because the modulus ofcompressibility of the liquid due to the shock wave pressurein the present case is negligible (see Results section, Pres-sure profiles), we can assume that the liquid and cellstogether is an incompressible fluid. Suppose that all the cellsare the same size and are uniformly distributed in the liquid.When an impulsive wave propagates into the liquid, thesudden relative displacement,d, and the difference in thekinetic energy density values,«, between the cell and liquidphases are given by (see Eq. A18 and Eq. A19)
d 5 U I
rmUm@a~b 2 1! 1 1#FS1 1
1
bDa 2 1GU, b 5rc
rf,
(2)
« 5 U2 1
2
I2
rmUm2 t1
2 @a~b 2 1! 1 1#FS1 11
bDa 2 1GU, (3)
whereI is defined in Eq. 1,rm is the average density of theliquid including cells,rf is the density of the liquid phase,rc
is the density of the cell phase,b is the ratio ofrc to rf, ais the cellular volume fraction (the fraction of the totalvolume occupied by cells) varying from 0 to 1,t1 is definedin Table 1, andUm is the wave velocity of the liquid withcells which is defined by Eq. A17.
Figure 5 shows that the relationship between the cellularvolume fraction and relative displacement for different im-pulse values given in Table 1, whereb has been chosen tohave a value of 1.1. This value was close to the value of theratio of the density of normal erythrocytes to the density ofwater found to be 1.09 (Schwartz et al., 1998). The relativedisplacement has a minimum value arounda 5 0.5, andincreases asa approaches 0 and also asa approaches 1. Thecurves increase with increasing impulse. The nonsymmetryof the curves with respect to they-axis arounda 5 0.5 isdue tob . 1.
In the experiment, HL-60 cells were centrifuged to forma cell pellet at the bottom of the tube. Assume HL-60 cellshave a constant spherical shape having a circular cross-section with a diameter of 10mm, then the cellular volumefraction of the pellet is calculated to bea 5 0.67. Inaddition, the density of each fluorophore is assumed to beequal to that of liquid, because each compound is highly
hydrophilic and characterized by good water solubility.Therefore, the molecules move in the direction of the shockwave, with the same speed and distance as those of theliquid molecules when shock waves move into the liquid. Ata 5 0.67, the displacements for the excimer (I 5 0.7, 1.1Pazs) and ruby lasers (I 5 2.5, 3.1, 4.0 Pazs) were calculatedto be less than 1mm. Whereas, for the shock tube (I 5 54.1,141.8 Pazs), the displacement was calculated to be about 20mm at I 5 54 Pazs, and about 30mm at I 5 141 Pazs (seeFig. 5), which is greater than the diameter of the cells. Theuptake of calcein occurred atI 5 54 Pazs, and the uptake ofboth calcein and FITC-D occurred atI 5 141 Pazs (seeTable 2).
Stokes radius is the effective radius of a molecule thatdepends on the molecular weight and molecular configura-tion and has been used as a determinant of transport throughbiological matrices (Bohrer et al., 1979). Stokes radii for thecalcein and FITC-D were estimated to be 0.68 nm, and 6.2nm using reported data, respectively (Curry et al., 1983; Foxand Wayland, 1979; Gambihler et al., 1994; Nugent andJain, 1984). Thus, the uptake of fluorophore depends on theimpulse and possibly also on the molecular weight. Theuptake dependency on the applied physical force was ob-served in electroporation (Mir et al., 1988), and the molec-ular size dependency was reported in the permeabilizationof cells to large molecules using a lithotripter (Gambihler etal., 1994), and also in electroporation of cells (Glogauer andMcCulloch, 1992). From Fig. 5, the relative displacementincreases whena reaches 0 or 1. Thus, we can expect thatthe uptake of fluorophore may occur if cells are widelyseparated (a3 0) or packed together (a3 1). Whena30, there are too few cells to allow efficient permeabilization.Therefore, the tightly packed state is likely to give the mosteffective permeabilization.
FIGURE 5 Relationship between the cellular volume fraction and rela-tive displacement for different impulse values,I, given in Table 1.b is theratio of the density of the cell phase to that of the liquid phase.
Drug Delivery with Shock Waves 1827
Biophysical Journal 79(4) 1821–1832

Figure 6 shows the difference in the kinetic energy den-sity between the cell and liquid phases for different impulsevalues, wherea 5 0.67 andb is varied from 1 to 1.3. Thedifference in the kinetic energy density between the rubylaser and both the excimer and shock tube was large,whereas the difference between the values of kinetic energydensity for the excimer laser and shock tube was muchsmaller. The difference in the energy density for each shocksource, however, was not found to be an important factor forthe cell uptake. That is, a waveform with a long pulseduration may have the potential to increase the efficiency ofcytoplasmic molecular delivery even though it has a lowerpressure value. Variations inb do not have a significanteffect on the kinetic energy density difference values.
In geometrically similar flows, the viscous force againsta body whose characteristic lengthL in a flow with char-acteristic velocityU is proportional tomUL where m 5coefficient of viscosity. Thus, the viscous force against cellsincreases in proportion to the difference in the velocitybetween the cell and liquid phases, which is proportional tothe increase in relative displacement between the phases(see Fig. 5). Therefore, the shear force at the cell surfacemay change the permeability of the cell membrane.
This mathematical model has the following limitations;the inertia term (v z grad)v and the viscosity termmDv wereomitted because the duration of the impulse pressure wasassumed to be infinitesimal, therefore, the local derivativev/t becomes dominant. In addition, the shape of cell wasassumed to remain constant and the flow field was assumedto be one-dimensional. Furthermore, the pressure field inthe test tube was not uniform due to the three-dimensionalshape of the test tube and subsequent wave reflections (seeFig. 2). The omitted terms will have finite values with
increasing pulse duration, resulting in viscous stress occur-ring in the moving fluid, and shear stress between the celland liquid phases. The subsequent cell deformation at dif-ferent times and positions due to varying shear stresses mayaccount for the numerical distribution of fluorescent cellsobtained in the experiment. If the impulse increases, thepercentage of fluorescent cells may increase. Because it wasreported that there was a relationship between the electricfield intensity and number of fluorescent cells in electroper-meabilization (Mir et al., 1988), there may be values of theshock wave impulse that will increase the percentage offluorescent cells.
Eucaryotic cells contain a rich array of intracellular or-ganelles with different densities and containing varyingamounts of internal membranes. The cytoskeleton providesthe mechanism to maintain the shape and control the basicmovement of cells. The behavior of a cell can be thought ofas that of a viscoelastic material (Fung, 1993). Becauseintracellular organelles may have different densities, theshock wave will cause the less dense organelles to movepreferentially, thus adding to the deformation experiencedby the cell. The cell membrane was found to be the mostsensitive to the shock wave propagation among the cellcomponents (Steinbach et al., 1992). Because each cell linemay show differences in intracellular densities and fluiditiesof membranes, the value of the shock wave-induced surfaceviscosity may be different for each cell line, leading todifferent membrane permeability.
Our confocal fluorescence micrographs showed that thesmall molecule calcein is readily taken up by the nucleus ofHL-60 cells after its introduction into the cytoplasm byshock waves. This is in agreement with data using the dyelucifer yellow (457 Da, Stokes radius5 0.59 nm) whereMir et al. (1988) showed that electropermeabilization pro-duced very similar images with uniform nuclear fluores-cence. Paine et al. (1975) have calculated that moleculeswith a radius less than 4.5 nm have no barrier to intranucleartransport. Our fluorescence micrographs with FITC-Dshowed that some of the permeabilized cells appear to havefluorophore in the nucleus while others do not. Many work-ers have investigated the permeability of the nuclear mem-brane, and have studied the size dependence of moleculartransport through the nuclear pore complexes. Peters (Pe-ters, 1984) found that FITC-D of molecular weight 20,000(Stokes radius 3.3 nm) but not 70,000 (Stokes radius 5.5nm) penetrated the nucleus. Schindler and Jiang (1986)found that 64-kDa dextran had a significant nuclear uptake.It has been proposed that the effective diameter of thenuclear pore can vary among cell types and, in the same celltype, between different stages of the cell cycle (Paine et al.,1975).
Other workers have studied the permeabilization of cellsin vitro by shock waves. Gambihler et al. (1994) have usedan extracorporeal shock wave lithotripter to permeabilizecells to macromolecular FITC-D (molecular weights up to
FIGURE 6 Difference between the kinetic energy density values of thecell and liquid phases ata 5 0.67 for different impulse values. The impulsefor the excimer laser, ruby laser, and shock tube is given in Table 1.b isthe ratio of the density of the cell phase to that of the liquid phase, whichis assumed to vary from 1 to 1.3.
1828 Kodama et al.
Biophysical Journal 79(4) 1821–1832

2,000,000) using 250 shots with a pressure of 50 MPa(Coleman and Saunders, 1989). They showed (Gambihler etal., 1994) the increase in the uptake of FITC-dextran of 35.6kDa by a factor of 4 with 250 lithotripter-induced shockwaves. The viability was about 50%. Miller et al. (1998)showed that, using FITC-dextran of 580 kDa, the percent ofthe fluorescent cells was about 50% and the survival frac-tion was about 0.2 after 1000 shock waves. In the presentpaper, we used a single shock wave, which showed theincrease in the uptake by a factor of 4, the percent of thefluorescence cells was;50% and the survival fraction isclose to 1. Recently, it was reported (Delius and Adams,1999) that the use of this procedure could permeabilizecancer cells to ribosome-inactivating protein toxins, and itwas found that the cytotoxicity in vitro increased up to40,000 fold. They also showed an in vivo tumor response inmurine fibrosarcomas after i.p. injection of toxin and localapplication of shock waves to the subcutaneous tumors. Ourlaboratory has previously used laser-generated shock wavesto permeabilize cells in vitro (Lee et al., 1996; 1997; McAu-liffe et al., 1997). It was shown (Lee et al., 1997) thaterythrocytes were permeabilized by single shock wavesfrom an ArF excimer laser. The explanation for the differ-ence between these results and the present failure of laser-generated shock waves (including ArF excimer laser) topermeabilize HL60 cells, probably lies in marked differ-ences between the membranes of the two cell types, al-though the pressure profile generated by the ArF laser(McAuliffe et al., 1997; Doukas et al., 1993, 1995) alsoshowed differences from the present measured profile.Erythrocytes are known to have higher membrane fluidity(Feinstein et al., 1975; Van Blitterswijk et al., 1984), to besusceptible to the formation of plasma membrane poresafter osmotic lysis (Lieber and Steck, 1982a, 1982b), and tohave aquaporins or “water-channels” in the membrane,which have been implicated in the shock wave-inducedpermeability (Lee et al., 1997). In a previous paper (McAu-liffe et al., 1997), we investigated the relationship betweenthe number of laser-induced shock waves and the uptake ofthymidine molecules. The uptake by two single shockwaves was double that of a single shock wave. However,there was no significant difference between 2, 3, and 5 shock-wave exposures (the laser pulses were generated at 1 Hz).Further studies will be necessary to understand the mecha-nism of shock wave-induced uptake of drugs, focusing onthe shock-wave impulse, the subsequent shear force againstthe cells, the change in membrane permeability of differingcell types, the applied number of shock waves, and the molec-ular size, ionic charge, and hydrophobicity of the drugs.
In the present paper, the survival fraction of the cellsexposed to a single shock wave of 8.3–31.9 MPa was.0.95. Extracorporeal lithotripter-generated shock waves(measured in water) consist of a positive pressure compo-nent of 9–114 MPa and a negative pressure component of2.8–9.9 MPa (Coleman and Saunders, 1989). From the
previous in vitro results using lithotripter-generated shockwaves, the LD50 varied between 250 and 400 shots atP1 524–50 MPa (Gambihler and Delius, 1992b; Miller andThomas, 1995). In addition, there was no significant differ-ence in the LD50 between normal and malignant cells(Brummer et al., 1990). Because the pressure profiles oflithotripter-generated shock waves are different from thosein the present case, and the effect of cavitation bubbles hasalso been implicated in the mechanism of lithotripter-in-duced cell damage (Kodama and Takayama, 1998; Colemanand Saunders, 1993; Delius, 1994), the present data and thelithotripsy results cannot be directly compared.
When these pressure waves propagate in human tissue,side effects such as vascular damage and perirenal andintrarenal hematomas are induced (Delius, 1994; Brummeret al., 1990). In vivo reports have shown that hemorrhageoccurs when shock waves are delivered to organs in themouse. This has been observed in murine kidney (3–10MPa, 5–200 shots) (Mayer et al., 1990; Raeman et al.,1994), in murine intestine (1–4 MPa, 100–200 shots) (Da-lecki et al., 1995; Miller and Thomas, 1995), and in murineskin (0.6–1.6 MPa, 100 shots) (Miller and Thomas, 1995).Structural and histological damage was observed in rabbitliver after one shot obtained by detonating an explosivemicropellet (,25 MPa) (Kodama et al., 1998). When ratliver was exposed to a single shock wave generated with theshock tube used in the present paper, both hemorrhage andstructural damage were observed (data not shown).
Damage in vivo may be caused by shock-wave treatmentconsisting of lower pressure or fewer shocks, than thatrequired to kill cells in vitro. That is, cells in vitro movewith the surrounding liquid in the direction of the shockwave because the ratio of the density of the cell to that ofliquid is close to one. The movement of the cell pellet in apolyethylene pipette exposed to a single shock wave wasrecorded with stroboscopic illumination (Brummer et al.,1989). Cells in vivo are fixed to neighboring cells, extra-cellular matrix, and basement membranes, and thereforeshow nonlinear, anisotropic and inhomogeneous behaviormacroscopically. The tensile strength of human tissues canvary widely, for example, from 0.057 MPa for renal paren-chyma, to 1.1–1.6 MPa for aorta, and 3.4 MPa for humancornea (Kitamura and Nangumo, 1978). Macroscopic tissuedamage with shock waves may tend to occur with decreas-ing tensile strength of the tissue.
Shock waves can be focused deep within human bodies,using a reflector or acoustic lens with a large aperture toreduce the energy density along the shock wave path and todecrease pressure attenuation caused by viscous dissipation,which becomes significant for high frequencies. This pro-cedure may have applications for localized delivery of plas-mid DNA or oligonucleotides for gene therapy, and, incancer therapy, by delivering molecules such as ribosome-inactivating protein toxins into tumors. However, it will benecessary to ensure that the shock-wave parameters needed
Drug Delivery with Shock Waves 1829
Biophysical Journal 79(4) 1821–1832
for effective cell permeabilization do not cause unaccept-able tissue damage in vivo.
APPENDIX
In this section, expressions are derived for the relative displacement and thekinetic energy density difference between the cell and liquid phases due toan impulsive pressure. The cells are assumed to be uniformly distributed inthe liquid.
The flow induced with an impulse pressure
Let the fluid be barotropic, so that the relation between the pressurep andthe densityr is given as
E dp
r5 P~p!, (A1)
whereP is the pressure function. Euler’s equation of motion is given as
DvDt
;vt
1 ~v z grad!v
5 K 2 gradP,
(A2)
whereK is the sum of external and viscous forces.When Eq. A2 is integrated over timet, from t 5 0 to a short timet, and
finding the limit whent 3 0, the integral is
v 2 v0 5 G 2 gradP, (A3)
wherev0 andv are the velocities immediately before and immediately afterthe change in the motion, and the impulsive,G, and the impulsive pressurefunction,P, are defined as (Imai, 1985)
G 5 limt30
E0
t
K dt, P 5 limt30
E0
t
P dt. (A4)
The impulsive pressure functionP approaches infinity whent 3 0, and,consequently,G can be neglected. Assume that the fluid is initially at restso thatv0 5 0. The flow induced immediately after wave propagation isgiven as
v 5 gradF, F 5 2P. (A5)
In the case of the incompressible fluid,P 5 p/r. The impulsive pressure,s, is defined as
s 5 limt30
E0
t
p dt, P 5 s/r. (A6)
Hence,
v 5 gradF, s 5 2rF. (A7)
The kinetic energy is given as,
K 51
2EES
svn dS, s 5 2rF, (A8)
where dS is the area element, andvn denotes the velocity in the directionof the unit inward normal.
The relative motion between cells and fluid dueto an impulsive pressure
Assume one-dimensional flow, and that the cells and the liquid are incom-pressible. Let the average density of the liquid including the cells berm, sothat
rm 5 arc 1 ~1 2 a!rf , (A9)
wherea is the cellular volume fraction,rc is the density of the cell phase,andrf is the density of the liquid phase.
Consider the one-dimensional motion, which is induced withs imme-diately. Letvc0 andvf0 be the immediate velocities of the single-phases ofthe cell and the liquid, respectively, which are produced by the impulsivepressures. From Eq. A7,
rcvc0 5 rfvf0 5 2grads (A10)
Suppose that the ratio of the volume of the cell phase to that of the liquidphase is given bya to 1 2 a, and each immediate velocity induced withs is vc andvf, so that
rcvc 5 2a grads, rfvf 5 2~1 2 a!grads. (A11)
Using Eqs. A10 and A11,
vc 5 avc0, vf 5 ~1 2 a!vf0 . (A12)
The impulsive relative velocity,w, between the cell and the liquid phasesis given as
w 5 vc 2 vf
5 S1 2 a
rf2
a
rcDgrad lim
t30
E0
t
p dt
< S1 2 a
rf2
a
rcD 1
Dxp#Dt, (A13)
where Dt is the finite-time interval andp# is the finite-time-averagedpressure.
Let the wave velocity of the impulsive pressure into the liquid with thecells beUm, so thatUm 5 Dx/Dt. Hence, Eq. A13 is written, using Eq. A9as
w 5p#
rmUm@a~b 2 1! 1 1#FS1 1
1
bDa 2 1G, (A14)
where,b 5 rc/rf.The difference in the kinetic energy density,«0, between the cell and the
liquid phases is given as
«0 5 21
2
p#2
rmUm2 @a~b 2 1! 1 1#FS1 1
1
bDa 2 1G. (A15)
In the present paper,p# is defined as
p# 51
t1 E0
t1
p~t! dt 5I
t1, (A16)
1830 Kodama et al.
Biophysical Journal 79(4) 1821–1832

whereI is the impulse andt1 is the duration of positive pressure half-cyclegiven in Table 1.
Assuming that the pressure and density of the liquid including the cellsare given by the Tait equation, then the wave velocity can be written as
Um2 5
n~p# 1 B!
rm. (A17)
For water at 20°C, the constantB is given a value of 3.0473 108 Pa, andthe indexn has the value 7.15 (Cole, 1948). The absolute relative displace-ment,d(5 w 3 t1), and absolute differences in the kinetic energy density,«, between the cell and the liquid phases are given as
d 5 U I
rmUm@a~b 2 1! 1 1#FS1 1
1
bDa 2 1GU (A18)
« 5 U2 1
2
I2
rmUm2 t1
2 @a~b 2 1! 1 1#FS1 11
bDa 2 1GU.(A19)
The authors wish to acknowledge J. Demirs, D. J. McAuliffe, S. Lee, andT. J. Flotte of the Wellman Laboratories of Photomedicine for their helpfuldiscussions, and I. E. Kochevar for a critical reading of the manuscript. Weare grateful to N. Michaud who recorded the confocal images.
T. Kodama was supported in part by the Cell Science Research Foundation,Japan. M. R. Hamblin was supported by the Office of Naval ResearchMedical Free Electron Laser Program (contract N 00014-94-1-0927). Thiswork was partly supported by a contract from Mile Creek Capital, limitedliability company, Boston, MA.
REFERENCES
Balhaus, W. F. J., and M. Holt. 1974. Interaction between the ocean surfaceand underwater spherical blast waves.Phys. Fluids.17:1068–1079.
Barbieri, L., M. G. Battelli, and F. Stirpe. 1993. Ribosome-inactivatingproteins from plants.Biochim. Biophys. Acta.1154:237–282.
Basrai, M. A., F. Naider, and J. M. Becker. 1990. Internalization of luciferyellow in Candida albicansby fluid phase endocytosis.J. Gen. Micro-biol. 136:1059–1065.
Bohrer, M. P., W. M. Deen, C. R. Robertson, J. L. Troy, and B. M.Brenner. 1979. Influence of molecular configuration on the passage ofmacromolecules across the glomerular capillary wall.J. Gen. Physiol.74:583–593.
Brummer, F., T. Brauner, and D. F. Hulser. 1990. Biological effects ofshock waves.World J. Urol. 8:224–232.
Brummer, F., J. Brenner, T. Brauner, and D. F. Hulser. 1989. Effect ofshock waves on suspended and immobilized L1210 cells.UltrasoundMed. Biol.15:229–239.
Bushnell, J. C., and D. J. McCloskey. 1968. Thermoelastic stress produc-tion in solids.J. Appl. Phys.39:5541–5546.
Cass, C. E., J. D. Young, and S. A. Baldwin. 1998. Recent advances in themolecular biology of nucleoside transporters of mammalian cells.Bio-chem. Cell Biol.76:761–770.
Cockcroft, S. 1998. Phosphatidylinositol transfer proteins: a requirement insignal transduction and vesicle traffic.Bioessays.20:423–432.
Cole, R. H. 1948. Underwater Explosions. Princeton University Press,Princeton, NJ. 36–45.
Coleman, A. J., and J. E. Saunders. 1989. A survey of the acoustic outputof commercial extracorporeal shock wave lithotripters.Ultrasound Med.Biol. 15:213–227.
Coleman, A. J., and J. E. Saunders. 1993. A review of the physicalproperties and biological effects of the high amplitude acoustic fieldused in extracorporeal lithotripsy.Ultrasonics.31:75–89.
Connelly, M. C., B. L. Robbins, and A. Fridland. 1993. Mechanism ofuptake of the phosphonate analog (S)-1-(3-hydroxy-2-phosphonylme-thoxypropyl)cytosine (HPMPC) in Vero cells.Biochem. Pharmacol.46:1053–1057.
Curry, F. E., V. H. Huxley, and R. H. Adamson. 1983. Permeability ofsingle capillaries to intermediate-sized colored solutes.Am. J. Physiol.Heart Circ. Physiol.245:H495–H505.
Dalecki, D., C. H. Raeman, S. Z. Child, and E. L. Carstensen. 1995.Thresholds for intestinal hemorrhage in mice exposed to a piezoelectriclithotripter. Ultrasound Med. Biol.21:1239–1246.
Delius, A., and G. Adams. 1999. Shock wave permeabilization withribosome inactivating proteins: a new approach to tumor therapy.Can-cer Res.59:5227–5232.
Delius, M. 1994. Medical applications and bioeffects of extracorporealshock waves.Shock Waves.4:55–72.
Doukas, A. G., D. J. McAuliffe, and T. J. Flotte. 1993. Biological effectsof laser-induced shock waves: structural and functional cell damage invitro. Ultrasound Med. Biol.19:137–146.
Doukas, A. G., D. J. McAuliffe, S. Lee, V. Venugopalan, and T. J. Flotte.1995. Physical factors involved in stress-wave-induced cell injury: theeffect of stress gradient.Ultrasound Med. Biol.21:961–967.
Feinstein, M. B., S. M. Fernandez, and R. I. Sha’afi. 1975. Fluidity ofnatural membranes and phosphatidylserine and ganglioside dispersions.Effect of local anesthetics, cholesterol and protein.Biochim. Biophys.Acta.413:354–370.
Finkel, T., and S. E. Epstein. 1995. Gene therapy for vascular disease.Faseb. J.9:843–851.
Fox, J. R., and H. Wayland. 1979. Interstitial diffusion of macromoleculesin the rat mesentery.Microvasc. Res.18:255–276.
Frenz, M., G. Paltauf, and H. Schmidt-Kloiber. 1996. Laser-generatedcavitation in absorbing liquid induced by acoustic diffraction.Phys. Rev.Lett. 76:3546–3549.
Fueyo, J., C. Gomez-Manzano, W. K. Yung, and A. P. Kyritsis. 1999.Targeting in gene therapy for gliomas.Arch. Neurol.56:445–448.
Fung, Y. C. 1993. Biomechanics: Mechanical Properties of Living Tissues.Springer-Verlag, New York. 23–65.
Gambihler, S., and M. Delius. 1992a. Transient increase in membranepermeability of L1210 cells upon exposure to lithotripter shock waves invitro. Naturwissenschaften.79:328–329.
Gambihler, S., and M. Delius. 1992b. In vitro interaction of lithotriptershock waves and cytotoxic drugs.Br. J. Cancer.66:69–73.
Gambihler, S., M. Delius, and J. W. Ellwart. 1994. Permeabilization of theplasma membrane of L1210 mouse leukemia cells using lithotriptershock waves.J. Membr. Biol.141:267–275.
Glogauer, M., and C. A. McCulloch. 1992. Introduction of large moleculesinto viable fibroblasts by electroporation: optimization of loading andidentification of labeled cellular compartments.Exp. Cell Res.200:227–234.
Gutierrez, A. A., N. R. Lemoine, and K. Sikora. 1992. Gene therapy forcancer.Lancet.339:715–721.
Hall, J. G. 1958. Shock tubes, Part II: Production of strong shock waves;shock tube applications, design, and instrumentation.Univ. Tor. Inst.Aerophys. Rev.12:142–163.
Hapala, I. 1997. Breaking the barrier: methods for reversible permeabili-zation of cellular membranes.Crit. Rev. Biotechnol.17:105–122.
Ho, S. Y., and G. S. Mittal. 1996. Electroporation of cell membranes: areview.Crit. Rev. Biotechnol.16:349–362.
IEC. 1998. IEC 61846, Ultrasonics—Pressure Pulse Lithotripters—Characteristics of fields. International Electrotechnical Commission, Ge-neva, Switzerland.
Imai, I. 1985. Fluid Dynamics. Vol 1. Syokabo Publishing Co., Ltd.,Tokyo, Japan. 105–107.
Kambe, M., N. Ioritani, S. Shirai, K. Kambe, M. Kuwahara, D. Arita, T.Funato, H. Shimodaira, M. Gamo, S. Orikasa, and R. Kanamaru. 1996.Enhancement of chemotherapeutic effects with focused shock waves:extracorporeal shock wave chemotherapy (ESWC).In Vivo. 10:369–375.
Drug Delivery with Shock Waves 1831
Biophysical Journal 79(4) 1821–1832

Kaneda, Y. 1999. Development of a novel fusogenic viral liposome system(HVJ-liposomes) and its applications to the treatment of acquired dis-eases.Mol. Membr. Biol.16:119–122.
Kitamura, K., and T. Nangumo. 1978. Handbook of Biomedical Engineer-ing. Corona Publishing Co. Ltd., Tokyo, Japan. 590–644.
Kodama, T., and K. Takayama. 1998. Dynamic behavior of bubbles duringextracorporeal shock-wave lithotripsy.Ultrasound Med. Biol.24:723–738.
Kodama, T., H. Uenohara, and K. Takayama. 1998. Innovative technologyfor tissue disruption by explosive-induced shock waves.UltrasoundMed. Biol.24:1459–1466.
Lee, S., T. Anderson, H. Zhang, T. J. Flotte, and A. G. Doukas. 1996.Alteration of cell membrane by stress waves in vitro.Ultrasound Med.Biol. 22:1285–1293.
Lee, S., and A. G. Doukas. 1999. Laser-generated stress waves and theireffects on the cell membrane.IEEE J. Sel. Top. Quant.5:997–1003.
Lee, S., D. J. McAuliffe, H. Zhang, Z. Xu, J. Taitelbaum, T. J. Flotte, andA. G. Doukas. 1997. Stress-wave-induced membrane permeation of redblood cells is facilitated by aquaporins.Ultrasound Med. Biol.23:1089–1094.
Lide, D. R. 1999. CRC Handbook of Chemistry and Physics. CRC PressLLC, Boca Raton, FL. 14–38.
Lieber, M. R., and T. L. Steck. 1982a. A description of the holes in humanerythrocyte membrane ghosts.J. Biol. Chem.257:11651–11659.
Lieber, M. R., and T. L. Steck. 1982b. Dynamics of the holes in humanerythrocyte membrane ghosts.J. Biol. Chem.257:11660–11666.
Liepman, H. W., and A. Roshko. 1957. Elements of Gas Dynamics. JohnWiley and Sons Inc, New York. 62–83.
Liu, J., T. N. Lewis, and M. R. Prausnitz. 1998. Non-invasive assessmentand control of ultrasound-mediated membrane permeabilization.Pharm.Res.15:918–924.
Mayer, R., E. Schenk, S. Child, S. Norton, C. Cox, C. Hartman, C. Cox,and E. Carstensen. 1990. Pressure threshold for shock wave inducedrenal hemorrhage.J. Urol. 144:1505–1509.
McAuliffe, D. J., S. Lee, T. J. Flotte, and A. G. Doukas. 1997. Stress-wave-assisted transport through the plasma membrane in vitro.LasersSurg. Med.20:216–222.
Miller, D. L., S. Bao, and J. E. Morris. 1999. Sonoporation of cultured cellsin the rotating tube exposure system.Ultrasound Med. Biol.25:143–149.
Miller, D. L., and R. M. Thomas. 1995. Thresholds for hemorrhages inmouse skin and intestine induced by lithotripter shock waves.Ultra-sound Med. Biol.21:249–257.
Miller, D. L., A. R. Williams, J. E. Morris, and W. B. Chrisler. 1998.Sonoporation of erythrocytes by lithotripter shockwaves in vitro.Ultra-sonics.36:947–952.
Mir, L. M., H. Banoun, and C. Paoletti. 1988. Introduction of definiteamounts of nonpermeant molecules into living cells afterelectropermeabilization: direct access to the cytosol.Exp. Cell. Res.175:15–25.
Mukherjee, S., R. N. Ghosh, and F. R. Maxfield. 1997. Endocytosis.Physiol. Rev.77:759–803.
Nugent, L. J., and R. K. Jain. 1984. Plasma pharmacokinetics and inter-stitial diffusion of macromolecules in a capillary bed.Am. J. Physiol.Heart Circ. Physiol.246:H129–H137.
Paine, P. L., L. C. Moore, and S. B. Horowitz. 1975. Nuclear envelopepermeability.Nature.254:109–114.
Peters, R. 1984. Nucleo-cytoplasmic flux and intracellular mobility insingle hepatocytes measured by fluorescence microphotolysis.EMBO J.3:1831–1836.
Raeman, C. H., S. Z. Child, D. Dalecki, R. Mayer, K. J. Parker, and E. L.Carstensen. 1994. Damage to murine kidney and intestine from exposureto the fields of a piezoelectric lithotripter.Ultrasound Med. Biol.20:589–594.
Schafer, T., U. O. Karli, E. K. Gratwohl, F. E. Schweizer, and M. M.Burger. 1987. Digitonin-permeabilized cells are exocytosis competent.J. Neurochem.49:1697–1707.
Schindler, M., and L. W. Jiang. 1986. Nuclear actin and myosin as controlelements in nucleocytoplasmic transport.J. Cell Biol. 102:859–862.
Schwartz, R. S., S. Musto, M. E. Fabry, and R. L. Nagel. 1998. Twodistinct pathways mediate the formation of intermediate density cellsand hyperdense cells from normal density sickle red blood cells.Blood.92:4844–4855.
Spiller, D. G., R. V. Giles, J. Grzybowski, D. M. Tidd, and R. E. Clark.1998. Improving the intracellular delivery and molecular efficacy ofantisense oligonucleotides in chronic myeloid leukemia cells: a compar-ison of streptolysin-O permeabilization, electroporation, and lipophilicconjugation.Blood.91:4738–4746.
Steinbach, P., F. Hofstadter, H. Nicolai, W. Rossler, and W. Wieland.1992. In vitro investigations on cellular damage induced by high energyshock waves.Ultrasound Med. Biol.18:691–699.
Tennant, J. R. 1964. Evaluation of the trypan blue technique for determi-nation of cell viability.Transplantation.2:685–694.
Van Blitterswijk, W. J., H. Hilkmann, and T. Hengeveld. 1984. Differencesin membrane lipid composition and fluidity of transplanted GRSL lym-phoma cells, depending on their site of growth in the mouse.Biochim.Biophys. Acta.778:521–529.
Weiss, N., M. Delius, S. Gambihler, H. Eichholtz-Wirth, P. Dirschedl, andW. Brendel. 1994. Effect of shock waves and cisplatin on cisplatin-sensitive and -resistant rodent tumors in vivo.Int. J. Cancer. 58:693–699.
1832 Kodama et al.
Biophysical Journal 79(4) 1821–1832


