Embed Size (px)
Citation preview

IEEE TRANSACTIONS ON GEOSCIENCE AND REMOTE SENSING, VOL. 47, NO. 10, OCTOBER 2009 3581
DAMA—Infrared Sea Modeling andAnalysis Software
Esra Erdem, Feza Arikan, Member, IEEE, and Cemil B. Erol
Abstract—The performance of infrared (IR) surveillance sys-tems is proportional to the ability of distinguishing the radianceof target from the background. In determining sea radiance asthe background, experimental studies are incomplete and veryexpensive. The few simulation software packages that are availableare limited to certain parameters and do not include all aspectsof sea radiance. In this paper, simulation and analysis software,namely, InfrareD SeA Modeling and Analysis (DAMA), is devel-oped to calculate the total radiance and its components seen bythe observer. The DAMA software allows the user to define allpossible parameters related to atmospheric conditions, sea sur-face conditions, and date and time of observation. The developedsoftware includes all of the three major sea surface models inthe IR band provided in the literature, namely, Cox and Munk,Mermelstein, and Shaw and Churnside models. In this sense, theDAMA software is unique in combining all possible atmosphericand surface parameters to provide components of total radiance.The DAMA software can be operated by a user-friendly graphicaluser interface to facilitate simulations and to analyze the outputs.For this paper, the software has been run for approximately 10 000simulations to understand the behavior of maritime backgroundin IR. The software is validated by the SEARAD software andmeasurement results. By this way, for the first time in the openliterature, DAMA allows one to observe the behavior of totalradiance and its components with respect to the variation of allpossible input parameters.
Index Terms—Infrared (IR), sea radiance, sea surface models,simulation.
I. INTRODUCTION
THE performance of infrared (IR) surveillance systems isproportional to the ability of distinguishing the target in
the background. If the target is on the sea, then the radiancereflected from the sea surface may dominate the target returns.Investigation of background radiance of the sea surface bycarrying out experiments might be difficult and costly, if notimpossible. Reliable and robust simulation software is thereforenecessary for examining sea background radiance with respectto all its parameters as a remedy for the expensive and incom-plete measurements.
Manuscript received April 29, 2008; revised October 28, 2008 andFebruary 18, 2009. First published July 7, 2009; current version publishedSeptember 29, 2009. This work was supported in part by TUBITAK UEKAE/ILTAREN.
E. Erdem and C. B. Erol are with the National Research Institute of Elec-tronics and Cryptology (UEKAE), Scientific and Technical Research Councilof Turkey (TUBITAK), Ankara 41470, Turkey (e-mail: [email protected]; [email protected]).
F. Arikan is with the Department of Electrical and Electronics Engineer-ing, Hacettepe University, Ankara 06532, Turkey (e-mail: [email protected]).
Digital Object Identifier 10.1109/TGRS.2009.2021767
One of the commonly used software packages to define searadiance is SEARAD [1], which is the modified version ofMODTRAN v2 [2]. In SEARAD, the sea surface is modeled bythe Cox and Munk statistical sea surface model, and emissivitycalculations are based on the Pacific Ocean measurements [3].One major disadvantage of 0SEARAD is the difficulty of userinteraction due to a lack of a graphical user interface (GUI). Theprogram also has some limitations due to the use of the earlierversion of MODTRAN. The current version of MODTRAN(v4) provides results only for the calculation of atmosphericradiance [2].
The total sea background radiance seen by an observer inthe IR band is composed of four basic components, which canbe listed as thermal sea radiance, reflected source (Sun and/orMoon) radiance, reflected sky radiance, and path radiance.Thermal sea radiance is mainly due to the thermal emissionof the sea in the direction of the observer. The reflection ofincident Sun or Moon radiance toward the observer is namedreflected source radiance. Sky radiance exists in every part ofthe atmosphere in every direction. It is due to the scatteringsunrays from the particles in the atmosphere and the thermalradiation of those particles. The last component is the reflectedsky radiance from the sea surface toward the observer. Pathradiance is the radiance of the atmospheric particles throughthe path between the observer and the sea surface seen by theobserver. Thermal sea radiance, reflected source radiance, andreflected sky radiance are modified in their propagation fromthe illuminated sea surface patch. The effect of this atmosphericpropagation is reflected by a multiplication of the atmospherictransmission constant of the path. Each of these components iscalculated spectrally and integrated over the given wavelengthband. The sum of the integrated components gives the total seabackground radiance.
In the calculation of reflected radiance, the sea surface isassumed to be the combination of small flat facets with differentslopes appearing by the effect of wind speed. The first completeset of sea surface slope statistical measurements is done byCox and Munk [4]. Cox and Munk reported measurements in1954. These measurements were obtained by taking the pho-tographs of clean and slick sea surfaces from an airplane under1–14-m/s wind speed conditions. Mermelstein et al. [5] de-veloped a sea surface model in 1994 by using analytic meth-ods for 2.5–20-m/s wind speeds. Shaw and Churnside [6]used a scanning-laser glint meter under 4–10-m/s wind speedconditions in order to develop a sea surface slope modelin 1997. All of the previously mentioned models representthe slopes of the facets by a Gaussian probability densityfunction.
0196-2892/$26.00 © 2009 IEEE

3582 IEEE TRANSACTIONS ON GEOSCIENCE AND REMOTE SENSING, VOL. 47, NO. 10, OCTOBER 2009
Salinity is also a parameter for sea radiance. The mostcomplete study in the literature is provided by measurements byQuerry et al. on six different water mediums for emissivity andreflectivity of sea surface [3]. Measurements by Querry et al.for different saline environmental mediums include 2–20-μmwavelength region of IR. For wavelengths smaller than 2 μmand greater than 20 μm, measurements by Hale and Querryfor pure water are used [7]. In [8]–[10], the dependence onwind direction is neglected, and shadowing effect is ignored.In [11] and [12], the shadowing effect is included assuming thesea surface to be 1-D. In [13]–[16], the sea surface is modeledin two dimensions with Gaussian statistics, and shadowingis also included. In [17], an anisotropic emissivity model forrough sea surfaces with non-Gaussian statistics is developed.The anisotropicity for this case was due to the dependence onwind direction. In [18], another analytical model is developedto generate sea surface images based on the statistical approachthat varies from a meter to a kilometer scale. Some of theemissivity models are developed for the purpose of retrievingthe sea surface temperature from radiometric sensors locatedon satellites in [17] and [19]. Yet, none of these analyticalemissivity models includes the salinity dependence, and theregions of the wavelength that they cover are not as wide asthose in the paper by Querry et al. [3].
The simulation and analysis software DAMA introducedin this paper is developed to calculate the total radiance andits components seen by an observer. The DAMA softwareintroduces a major improvement to the calculation of maritimebackground radiance. DAMA includes all available sea surfacestatistical models and atmospheric and sea surface conditions.The essential advantage of the DAMA software is its flexibilitydue to the independent modules to cover four basic componentsof total radiance. The modularity of the code gives the userthe chance of adapting other atmosphere radiance calculatorprograms in the IR band. For the atmospheric radiance andtransmittance calculation, MODTRAN v4 is used. The inputsof DAMA can be listed in six major groups that can be sortedas observer, medium, time, wavelength band, model selection,and output file parameters. The outputs of DAMA are thermalsea radiance, reflected sky radiance, reflected source radiance,and total radiance at the sea surface and at the observer. Thepolarized radiance outputs can also be provided separately. Theuser can run the DAMA software for multiple scenarios and canobtain the simulation outputs with respect to the variation of theinput parameters. In order to facilitate the input of a large num-ber of parameters and to observe the output of the program inan appropriate medium, a user-friendly GUI is also developed.The inputs can be entered using the menus appearing on thescreen. Alternatively, the wide range of inputs can be providedto DAMA by an input file. The outputs can be observed ingraphical mode by plots that are drawn automatically, or again,alternatively, the outputs can be provided in an output file intext format.
The DAMA software allows the user to investigate thevariation of one parameter with respect to others. In this way,the dominant components of total radiance and sensitivity toatmospheric and sea surface parameters can readily be observedby the user [20]–[23].
Fig. 1. Facet geometry.
Section II consists of sea surface radiation geometry, sea sur-face models, and wave slope probability density function. Totalsea background radiance calculation is provided in Section III.The outline of DAMA is explained in Section IV, and the resultsare given in Section V.
II. SEA SURFACE RADIATION GEOMETRY
In the literature, the sea surface in IR bands is traditionallymodeled by combination of plane facets [1]. In this paper,this standard representation is also considered as a basis forgeometrical definitions of incidence and reflection angles, winddirection, and transmission path. As in [1], the coordinatesystem shown in Fig. 1 is placed at the corner of a facet withrespect to wind direction. The origin of the coordinate systemis the point of reflection. The X-axis is pointing to the upwinddirection, and the Y -axis is pointing to the crosswind direction.The Z-axis is aligned with the local zenith. In Fig. 1, Ur andUs are the unit vectors in the direction of the observer and thesource, respectively. Un is the surface normal of the facet. ωis the angle of incidence, and 2ω is the angle between Ur andUs. θs and φs are the zenith and azimuth angles of the sourceposition, respectively. θr and φr are the zenith and azimuthangles of the observer position, respectively.
According to the surface model in [1], the facet is definedwith two slope parameters. The slope in the upwind direction,ζx, is given by the slope of the line formed at the intersectionof the facet with the X−Z plane. The slope in the crosswinddirection, ζy , is given by the slope of the line formed at theintersection of the facet with the Y −Z plane [1].
A. Sea Surface Models
The radiance reflected from the sea surface is directly relatedwith the slopes of the facets. There are three major studies,which model the facet slope distribution given in [4]–[6]. Allof these models use Gaussian probability density function anddefine the variances of slopes according to the wind speedand direction. The wave slope occurrence probability densityfunction is given in [4]–[6] as
p(ζx, ζy,W ) =1
2πσuσcexp
{−1
2
(ζ2x
σ2u
+ζ2y
σ2c
)}(1)
where W is the wind speed in meters per second. σ2u and σ2
c
denote the variances of ζx and ζy , respectively.

ERDEM et al.: DAMA—INFRARED SEA MODELING AND ANALYSIS SOFTWARE 3583
Cox and Munk in [4] collected measurements from an air-plane at an altitude of nearly 600 m and took photographs ofsunglint to obtain the sea surface slope distribution. During theperiod of measurements, the wind speed was between 1 and14 m/s, and the air–sea temperature differences were positive,namely, neutral-to-positive stability. Meteorological data weregathered from a ship nearby. Cox and Munk had taken the mea-surements during the hours when the Sun was high in the sky sothat the effects of multiple reflections and shadowing were min-imized. To study the effect of surface slicks, oil was pumped onthe water in a thin film, and measurement data were also takenunder this condition. In [4], the variances of the two slopes fora clean sea surface in the Cox and Munk model are given as
σ2u = 3.16 × 10⁻³ × W
σ2c = 0.003 + 1.92 × 10⁻³ × W. (2)
For the slick sea surface in [4], these variances aremodified as
σ2u = 0.003 + 1.92 × 10⁻³ × W
σ2c = 0.005 + 0.78 × 10⁻³ × W. (3)
The Mermelstein model in [5] defines the variances of thetwo slopes as
σu = 0.091 + 0.019 × W − 4.6 × 10⁻⁴ × W 2
σc = 0.059 + 0.021 × W − 5.5 × 10⁻⁴ × W 2. (4)
The Mermelstein model was analytically developed for windspeeds between 2.5 and 20 m/s in 1994. Relationships werederived from the wave power spectral density spectrum. Byusing detectors having wavelength bands of 3–5 and 8–12 μm,measurements were taken to validate the results. The Mermel-stein model defines a second-order relationship between thestandard deviations of the slopes and the wind speed.
The Shaw and Churnside model in [6] defines the variancesof the two slopes as
σ2u = 12.4 × 10⁻³ + 3.1 × 10⁻³ × W
σ2c = 12.4 × 10⁻³ + 3.1 × 10⁻³ × W. (5)
The Shaw and Churnside model was developed by in-vestigating the measurements taken using a scanning-laserglint meter technique. The measurements were taken under4–10 m/s wind speed conditions and at nighttimes to minimizethe effects of background radiation. According to their model,the sea slope variances are independent of wind direction. Shawand Churnside included all atmospheric stability conditions andfurther examined the negative stability condition. The conclu-sion of this study was that the mean square slope increases withnegative stability at roughly the same rate as it decreases withmoderately positive stability.
The main properties of these three models are summarizedin Table I. From Table I, it can be seen that the Mermelsteinmodel is valid for a larger wind speed interval; the Shaw andChurnside model is valid under all stability conditions. Thebackground radiation is more effective for the Cox and Munkmodel compared to the Shaw and Churnside model. All ofthese models assume a flat facet and ignore multiple reflections.
TABLE ICOMPARISON OF THE SEA SURFACE STATISTICAL
MODELS IN THE IR BAND
There is a first-order relationship between the variances of theslopes and the wind speed in the Cox and Munk model andthe Shaw and Churnside model. The standard deviation andwind speed have second-order dependence in the Mermelsteinmodel. The Shaw and Churnside model has no dependence forthe wind direction.
B. Wave Slope Probability Density Function
The wave slope interaction probability density function is animportant variable that needs to be computed in the simulationof the sea surface models. The probability of interaction of a rayand an observer according to reflection direction from a wavysurface is given by this variable [1]. The wave slope interactionprobability density function depends on wave slopes and can becalculated using the formulation for the given wind speed andobserver zenith and azimuth angles as
q(ζx, ζy) =cosωcos θn
p(ζx, ζy)∫∫ω<π/2
cosωcos θn
p(ζx, ζy)dζxdζy(6)
where θn is the zenith angle of the facet surface normal vectorand the ratio of cos ω and cos θn denotes the projection of thefacet on the observer position vector. The integration in thedenominator of (6) has to be computed for all slopes wherethe angle of incidence is less than 90◦.
III. COMPUTATION OF TOTAL SEA
BACKGROUND RADIANCE
Total radiance is composed of four components, namely,thermal sea radiance, reflected source (Sun and/or Moon) ra-diance, reflected sky radiance, and path radiance. All of thesecomponents are being calculated in the spectral domain, and to-tal radiance is obtained by the integration over the wavenumber.Total radiance (in watts per steradian per square centimeter) iscalculated by
Ntotal =
ν2∫ν1
[Npath(ν) + τ(ν)
× (Nsky(ν)+ Nsource(ν)+ Nsea(ν))] dν (7)

3584 IEEE TRANSACTIONS ON GEOSCIENCE AND REMOTE SENSING, VOL. 47, NO. 10, OCTOBER 2009
where ν1 and ν2 denote the lower and upper limits of thewavenumber band, respectively; Ntotal is the total radiance;Npath is the path radiance; Nsky is the reflected sky radiance;Nsea is the thermal sea radiance; Nsource is the reflected sourceradiance; and τ denotes the transmittance of the path [1].
Path radiance Npath(ν) is the radiance of the atmosphericparticles through the path between the observer and the sur-face seen by the observer. The transmittance (τ) of the pathis the attenuation constant depending on the particles in theatmosphere. The thermal sea radiance, reflected source radiance(Sun, Moon, or artificial source), and reflected sky radiancecomponents are multiplied by the transmittance to calculatethese components at the observer.
Thermal sea radiance is the radiance emitted by the sea, orig-inating from the temperature of the sea toward every direction.The thermal radiance emitted by the sea, Nbb(Tsea, ν), can becalculated by multiplication of the emittance of the sea withblackbody radiance. Emittance is given as ε = (1 − ρ), whereρ is reflectivity [26]. The thermal sea radiance arriving at theobserver can be calculated for the given observer zenith andazimuth angles, wind speed, and sea temperature by
Nsea(ν) = Nbb(Tsea, ν)∫∫
ω≤π/2
[1 − ρ(ω, ν)] q(ζx, ζy)dζxdζy
(8)
where Tsea is the sea temperature in kelvins and ν is thewavenumber [6]. This integration is calculated over the slopesfor a constant plane of incidence and an angle of incidencesmaller than 90◦.
Reflected source radiance is the reflected Sun or Moonradiance that is incident on the sea surface seen by the observer.Since the source radiance direction is limited, the integrationis taken over the zenith and azimuth angles of the sourceposition vector. The reflected source radiance for the givensource position, observer position, and wind speed is calculatedwith the integral for a constant plane of incidence as
Nsource(ν) =No(ν)
4
∫∫ρ(ω, ν) sec ω sec3
×θnq(ζx, ζy) sin θsdθsdφs (9)
where No(ν) is the source (Sun and Moon) radiance for thegiven source azimuth and zenith angles that are incident on thesea surface seen by the observer [1]. Integration is over sourceposition angles.
Sky radiance is the combination of radiances due to thereflection of scattering sunrays from the particles in the at-mosphere. The temperature of these particles is also a factor.Reflected sky radiance for the given observer position andwind speed is calculated by the integral over the slopes whosecorresponding angle of incidence is smaller than 90◦. For aconstant plane of incidence
Nsky(ν)=∫∫
ω≤π/2
Ns(θs, φs, ν)ρ(ω, ν)q(ζx, ζy)dζxdζy (10)
Fig. 2. Flowchart of DAMA.
where Ns(θs, φs, ν) is the sky radiance that is incident on thesea surface [1].
IV. DAMA SOFTWARE
It is very difficult and expensive to take measurements undercontrolled conditions for the sea surface. The need to computebackground sea radiance with all its possible components andparameters requires complete and reliable software. Yet, asmentioned in Section I, a simulation software package thatcovers all atmospheric and sea surface conditions and sea sur-face models is not available in the open literature. The DAMAsoftware is developed to simulate and analyze the total radianceand its components under this basic necessity [20].
The general flowchart of DAMA is shown in Fig. 2. Theinputs of the software enter in the sky, source, sea, and pathradiance modules. The outputs of these modules are processedin the total radiance algorithm. The modular structure of thesoftware allows the user to enter future developments in the seasurface and atmospheric radiance models.
DAMA is conceptualized as both simulation and analysissoftware. In spectral analysis mode, the user can obtain thevariation of the desired output parameters with respect towavelength. In multiple analysis mode, primary or secondaryanalysis with respect to various parameters can be performed.By selecting the primary multiple analysis parameter, the usercan obtain the variation of the output parameters with respectto the variation of the selected analysis parameter. The usercan also define the limits and the step size of the incrementsof the analysis parameter. In secondary analysis mode, the usercan observe the variability of the output with respect to thesecondary parameter on the same graphical interface.
The user can enter the values of the input parameters eitherfrom the developed GUI or using text files. Similarly, eitherthe output values can be obtained in graphical form using theinterface or the values of the output parameters can be writtenin a text file. The variation of the desired parameters withrespect to the selected secondary parameters can also be plottedautomatically by the GUI.

ERDEM et al.: DAMA—INFRARED SEA MODELING AND ANALYSIS SOFTWARE 3585
The input parameters of the basic algorithm can be groupedas observer, medium, time, wavelength, model selection, andoutput file parameters. The observer parameters are longi-tude, latitude, height, observation zenith angle, and observa-tion azimuth angle. The medium parameters define the at-mosphere and sea properties. These parameters can be listed assea temperature, wind speed, 24-h average wind speed, winddirection, cloud–rain model, visibility, and rain rate. Cloudmodel values refer to no cloud, cumulus, altostratus, stratus,stratus/stratocumulus, and nimbostratus cloud models, respec-tively [2]. The time parameters are the day, month, year, hour,and minute of the simulation scenario. Also, the time differencewith respect to Greenwich mean time should also be entered bythe user. The observer position and time parameters are usedto calculate the location and intensity of astronomical sources,such as Sun and Moon, automatically using [24]. The typeof the source is decided using the information on the time ofsimulation scenario and the position of the observer. If no otherinformation is provided, this source can be either Sun or Moon.If the source is the Sun, the zenith and azimuth angles arecalculated with respect to the local coordinates. If the sourceis the Moon, the phase of the Moon and zenith and azimuthangles are calculated with respect to the local coordinates. Thewavelength parameters are wavelength band and resolution.The most common IR bands can be listed as 1–3-μm band,namely, short-wavelength IR (SWIR); 3–5 μm band known asmid-wavelength IR (MWIR); and 8–12-μm band depicted aslong-wavelength IR (LWIR). In this paper, the simulations arerun within the SWIR, MWIR, and LWIR bands. In DAMA, thesea surface model and the salinity model can also be chosenby the user. All three sea surface statistical models discussed inSection II are provided as options. The selection for the salinitymodel includes the Atlantic Ocean, Florida Phosphate Mine,Dead Sea, Great Salt Lake, Pacific Ocean, and San FranciscoBay models detailed in [3]. The output file parameters consistof the name and the description of the output text file that canbe required by the user.
The standard output components computed in DAMA are theindividual radiance components detailed in Section II and thetotal radiance. The simulation results can be provided in twobasic groups. The first group consists of the computed values oftotal radiance components at the sea surface level. The secondgroup provides the components of total radiance at the observer.DAMA calculates the total radiance and its components forthe unit steradian solid angle and the unit square-meter areaat the sea surface and at the observer. These two output groupsinclude the vertically and horizontally polarized components,the polarization degrees, and also the unpolarized values of thecomponents [27].
Using the DAMA software, detailed and complete analysesof various parameters can be observed by changing the sce-narios. Approximately 10 000 simulation scenarios are run in[20] in order to investigate the dependence of total radianceand its components with respect to wind direction, salinity,cloud cover, time and date, temperature of sea surface, andobservation zenith angle for all sea surface models and for alldefined IR bands. The simulation parameters of these scenariosand the parameter values are provided in Table II. The first
TABLE IISIMULATION AND ANALYSIS PARAMETERS
column of the table indicates the scenario set case number. Thesecond column of Table II denotes the primary parameter of theanalysis. The variation of total radiance and its components isobtained with respect to the variation of the primary parameterwhose limits are given in the third column of this table. Theplots are obtained for each value of the secondary parameter.The secondary parameters and their values are given in thefourth and the fifth columns of Table II, respectively. In Table II,the values of sea surface models are given as 1–4. The Coxand Munk clear sea surface model is denoted as 1; the Cox andMunk slick sea surface model is denoted as 2; the Mermelsteinmodel is denoted as 3; and the Shaw and Churnside model isdenoted as 4 for easy reference. Similarly, the salinity modelsare also denoted with numbers 1–6 in the listed order asAtlantic Ocean, Florida Phosphate Mine, Dead Sea, Great SaltLake, Pacific Ocean, and San Francisco Bay. With the DAMAsoftware, the sunglint analysis with respect to the variation

3586 IEEE TRANSACTIONS ON GEOSCIENCE AND REMOTE SENSING, VOL. 47, NO. 10, OCTOBER 2009
Fig. 3. Example of spectral simulation output in 3–5-μm band. (a) Thermal sea radiance. (b) Reflected sky radiance. (c) Reflected Sun radiance. (d) Path radiance.(e) Transmittance. (f) Total background radiance at the observer position with respect to the variation of wavenumber.
of observation azimuth angle relative to Sun position azimuthangle, observation zenith angle, wind speed, and sea surfacemodel is also possible. This feature is an important advantagedue to lack of information on this phenomenon in the openliterature. With this study, it is the first time in the literature thatmaritime background radiation is examined in detail [20]–[23].
V. RESULTS
The simulation and analysis software DAMA can be used toexamine the behavior of maritime background total radiationin IR with respect to various atmospheric and sea surface con-ditions mentioned in Section IV. For the analysis of dominantcomponents for each scenario, approximately 10 000 simula-tions are run. A complete discussion of the results is providedin [20]. The capability of the DAMA software and the validityand reliability of the results are also summarized in part in[21]–[23]. The reliability and validity of the simulation resultsof the DAMA software, for which very limited measurementsare available in the open literature, are tested by interpretingthe results with the behavior of the theoretical models in theIR band. For the limited scenarios that can be realized withthe SEARAD software with the given sea surface and salinitymodels, the outputs of the DAMA software are comparedwith respect to SEARAD results for these cases. For the fewexperimental results that are provided in the open literature,
the DAMA software is run with the simulated scenarios thatmay best represent the given and missing parameters. All thetheoretical, simulation, and experimental results are observed tobe in excellent agreement with those from the DAMA software.
According to the theoretical models in IR physics such asthe Planck law, it is expected that the dominant component oftotal radiance in the SWIR band is the radiance of the Sun.In the DAMA software, Sun radiance is modeled as a 5900-Kblackbody radiation. When the dependence of total radianceand its components with respect to wavelength is examined, itis observed that, irrespective of all other scenario parameters,source radiance is the dominant component in the SWIR band.From the spectral analysis of radiation, it is also observedthat thermal sea radiance is the dominant component of totalradiance in the LWIR band. Sky radiance due to the temperatureof the particles in the atmosphere is also effective in this band.
In this section, specific examples will be provided to demon-strate the capability of the DAMA software in spectral andmultiple analysis modes. The results will be provided notonly for total radiance but also for all its components and thetransmittance factor.
A. Example of Spectral Analysis Capability of DAMA
In the example scenario shown in Fig. 3, the spectral analysiscapability of the DAMA software is demonstrated for the

ERDEM et al.: DAMA—INFRARED SEA MODELING AND ANALYSIS SOFTWARE 3587
Fig. 4. (a) Thermal sea radiance. (b) Reflected sky radiance. (c) Reflected Sun radiance. (d) Path radiance. (e) Transmittance. (f) Total background radiance atthe observer position with respect to the variation of zenith look angle for 10-, 100-, and 1000-m observer heights in 1–3-μm band.
MWIR band. Here, the wavelength varies from 3–5 μm with a0.01-μm step size. The scenario parameters can be specified asfollows: observer height of 100 m, observation zenith angle of0◦, wind speed of 1 m/s, Cox and Munk clear sea surface model,and Pacific Ocean salinity model. The transmittance valuesand the atmospheric windows obtained with spectral analysisin Fig. 3 are consistent with the measurement provided in[25]. The components of sea, sky, and Sun radiances shown inFig. 3(a)–(c), respectively, are multiplied by the transmittancein Fig. 3(e). The total radiance in Fig. 3(f) is obtained bythe sum of these three components and the path radiance inFig. 3(d). As it can be observed from Fig. 3, the most dominantcomponent for the given scenario is sea radiance. In [20], it isobserved that source radiance is dominant in the 1–3-μm band,and thermal sea radiance is dominant in the 8–12-μm band.
B. Variation of Zenith Look Angle and Observer Height andTheir Effects on Total Radiance and Its Components
In [20], the variation of total radiance and its componentswith respect to observation zenith angle is investigated in detail.According to the simulation results in [20], the path radianceincreases, and the transmittance and the thermal sea radiance atthe observer decreases with increasing observation zenith angle.
The reflected sky radiance at the observer increases until thezenith look angle reaches 80◦. At this angle, the path betweenthe sea surface and the observer is long. Therefore, the radiationfrom the sea surface travels a longer distance in the atmosphereuntil it reaches the observer. The behavior of the reflected Sunradiance is related to the Sun’s position, observer azimuth lookangle, and wind speed. When the observation zenith angle getscloser to the Sun’s local zenith angle, the reflected radiationfrom the surface increases.
The simulation results for the variation of height of theobserver indicate that an increase in the height of the ob-server also increases the path radiance and thus decreases thetransmittance.
In Fig. 4, an example is provided to demonstrate theaforementioned scenarios and primary and secondary analysismodes. In Fig. 4, the total radiance, its components, and trans-mittance are plotted with respect to the variation of zenith lookangle and observer height. Here, the primary analysis parameteris the observation zenith angle, while the secondary analysisparameter is the height of the observer. The wavelength variesfrom 1 to 3 μm, and the zenith look angle varies from 0◦ to80◦ with 10◦ steps. The height of the observer is set to 10,100, and 1000 m above sea level. The simulation is performedassuming the Sun zenith angle to be 0◦. Under these conditions,

3588 IEEE TRANSACTIONS ON GEOSCIENCE AND REMOTE SENSING, VOL. 47, NO. 10, OCTOBER 2009
Fig. 5. (a) Thermal sea radiance. (b) Reflected sky radiance. (c) Reflected Sun radiance. (d) Path radiance. (e) Transmittance. (f) Total background radiance atthe observer position with respect to the variation of wind direction for 1-, 5-, 10-, and 14-m/s wind speeds in 3–5-μm band.
the maximum reflected source radiance is obtained at 0◦ zenithlook angle. An increase in zenith look angle decreases the effectof the reflected source radiance. As it can be observed fromFig. 4, the most dominant component of total radiance is Sunradiance for 0◦–50◦ zenith look angle, and it is path radiancefor 50◦ to 80◦. Increasing the observer height is more effectivefor 50◦–80◦ zenith look angles than for angles lower than 50◦.
C. Variation of Wind Speed and Wind Direction and TheirEffects on Total Radiance and Its Components
Wind speed and wind direction are effective both in thedetermination of the facet geometry shown in Fig. 1 and alsoin the equations presented in Section II for the computationof slopes. In [20], a wide range of scenarios are simulatedto observe the variation of total radiance and its componentswith respect to sea surface model, wind direction, and windspeed. According to the results in [20], Sun radiance is themost sensitive component that dominates total radiance. It isalso observed that a complex relationship exists between theposition of the Sun with respect to the local facet geometry, theposition of the observer with respect to the local facet geometry,the direction of the wind that determines the facet geometry, andthe strength of the wind speed. Also, path and sky radiancesincrease, and transmittance decreases with increasing wind
speed. Depending on the local zenith angle of the Sun and theobserver, the contribution from the reflected Sun radiance mayvary significantly. For example, if the weather is calm and theSun illuminates the sea surface directly with 0◦ local zenithangle, specular reflection dominates, and the reflected radiancefrom the surface patch will not contribute to the total radiance.Yet, for the same local zenith angle of the Sun, the reflected Sunradiance increases for the upwind and downwind cases signif-icantly when compared with the crosswind case. It is observedthat the total radiance and its components are independent fromthe choice of the three surface models discussed in Section II.
In Fig. 5, an example is provided to demonstrate the variationof total radiance and its components with respect to the changesin wind speed and direction for the scenario where the Sun localzenith angle is set to 0◦. Here, the primary analysis parameteris the wind speed that varies from 2–20 m/s. The secondaryanalysis parameter is the sea surface model. In Fig. 5, theresults are obtained for the Cox and Munk model. As it can beobserved from Fig. 5, sea radiance and transmittance decrease,and sky, Sun, and path radiances increase with increasing windspeed. The component that is sensitive to wind direction isSun radiance with a relative maximum for the upwind anddownwind cases and a relative minimum for the crosswind case.The dominance of Sun radiance component can also be readilyobserved in the total radiance for the rough sea surfaces withhigh wind speeds.

ERDEM et al.: DAMA—INFRARED SEA MODELING AND ANALYSIS SOFTWARE 3589
Fig. 6. (a) Thermal sea radiance. (b) Reflected sky radiance. (c) Reflected Sun radiance. (d) Path radiance. (e) Transmittance. (f) Total background radiance atthe observer position with respect to the variation of wind direction for the Cox and Munk clear and slick, Mermelstein, and Shaw and Churnside sea surfacemodels in 8–12-μm band.
D. Variation of Sea Temperature and Its Effects on TotalRadiance and Its Components
In [20], the effect of sea temperature is also investigated forvarious scenarios. It is observed that there is a direct relation-ship between the sea temperature and the thermal sea radiance.The temperature of the sea should be taken into account whensea surface is simulated in the IR band.
E. Total Radiance and Its Components With Respect toSalinity Models
Six different salinity mediums, which are Atlantic Ocean,Florida Phosphate Mine, Dead Sea, Great Salt Lake, PacificOcean, and San Francisco Bay, are included in the DAMA soft-ware. In [20], the variation of total radiation and its componentswith respect to salinity models is investigated. It is observedthat the effect of salinity of the sea surface is very minimal inthe computation of total radiance in the IR band.
F. Total Radiance and Its Components With Respect to Cloudand Rain Models
DAMA includes the cloud and rain models of MODTRAN,which are mentioned in Section IV. The choice of the cloud
and rain model (meteorological parameters) is effective on thetransmittance and the sky radiance and path radiance com-ponents. The dependence on atmospheric conditions is moreeffective if the observer is below the cloud-base height of theselected cloud model. If the observer height is higher than thecloud-base height defined in the cloud model, the path radiancecomponent dominates the total radiance in MWIR and LWIRbands. If it is rainy, as the intensity of the rain increases, thepath radiance increases and transmittance decreases. For therainy scenarios in the SWIR band, the total radiance and itscomponents, particularly the path radiance, are very low. Thedetailed results are given in [20].
G. Total Radiance and Its Components With Respect to SeaSurface Models
The simulation results are obtained by using the DAMAsoftware for each of the sea surface models, and the outputsare examined to define the properties of the models [20]. InFig. 6, an example analysis is provided to demonstrate thechoice of the sea surface model in the scenarios. In Fig. 6,the sea surface model is the secondary analysis parameter,and the properties of the models are examined with respect
3590 IEEE TRANSACTIONS ON GEOSCIENCE AND REMOTE SENSING, VOL. 47, NO. 10, OCTOBER 2009
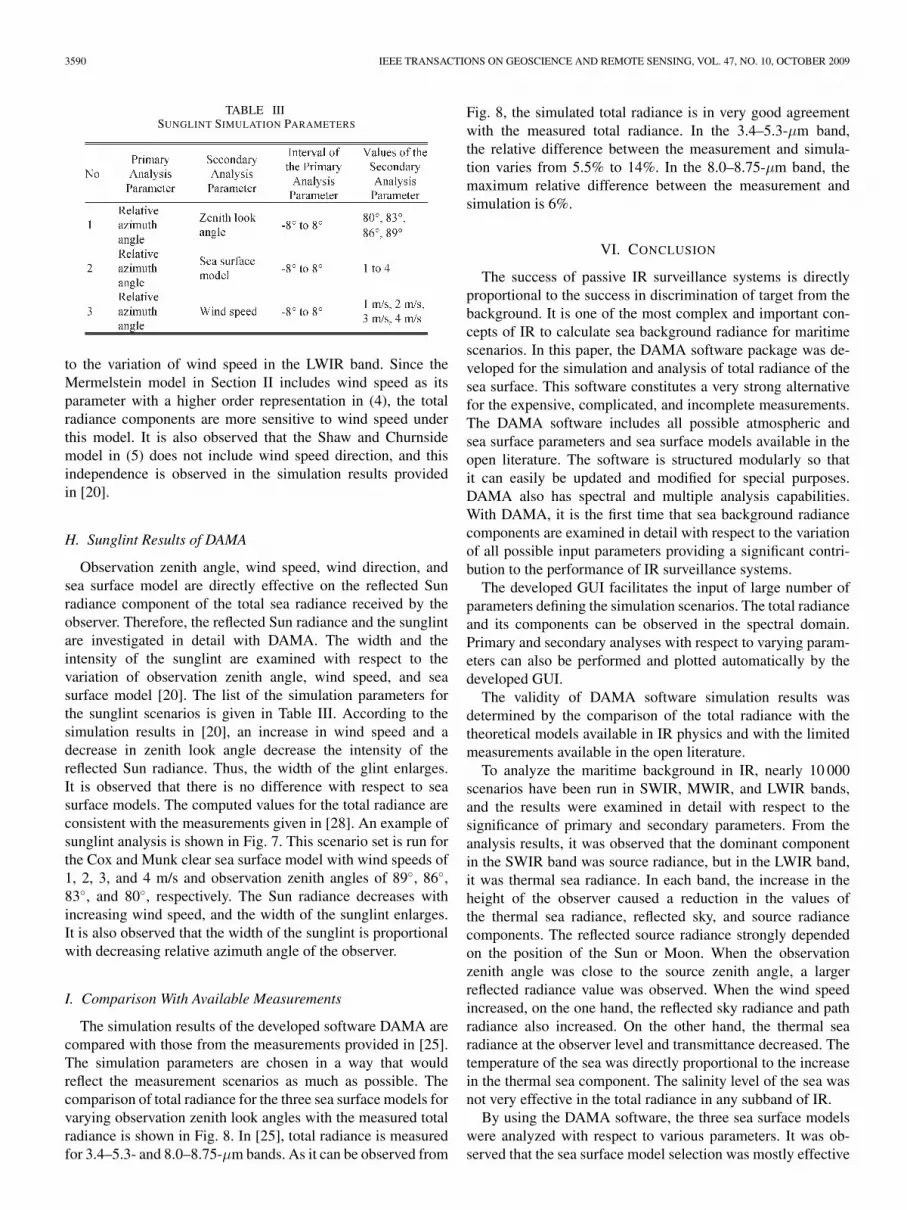
TABLE IIISUNGLINT SIMULATION PARAMETERS
to the variation of wind speed in the LWIR band. Since theMermelstein model in Section II includes wind speed as itsparameter with a higher order representation in (4), the totalradiance components are more sensitive to wind speed underthis model. It is also observed that the Shaw and Churnsidemodel in (5) does not include wind speed direction, and thisindependence is observed in the simulation results providedin [20].
H. Sunglint Results of DAMA
Observation zenith angle, wind speed, wind direction, andsea surface model are directly effective on the reflected Sunradiance component of the total sea radiance received by theobserver. Therefore, the reflected Sun radiance and the sunglintare investigated in detail with DAMA. The width and theintensity of the sunglint are examined with respect to thevariation of observation zenith angle, wind speed, and seasurface model [20]. The list of the simulation parameters forthe sunglint scenarios is given in Table III. According to thesimulation results in [20], an increase in wind speed and adecrease in zenith look angle decrease the intensity of thereflected Sun radiance. Thus, the width of the glint enlarges.It is observed that there is no difference with respect to seasurface models. The computed values for the total radiance areconsistent with the measurements given in [28]. An example ofsunglint analysis is shown in Fig. 7. This scenario set is run forthe Cox and Munk clear sea surface model with wind speeds of1, 2, 3, and 4 m/s and observation zenith angles of 89◦, 86◦,83◦, and 80◦, respectively. The Sun radiance decreases withincreasing wind speed, and the width of the sunglint enlarges.It is also observed that the width of the sunglint is proportionalwith decreasing relative azimuth angle of the observer.
I. Comparison With Available Measurements
The simulation results of the developed software DAMA arecompared with those from the measurements provided in [25].The simulation parameters are chosen in a way that wouldreflect the measurement scenarios as much as possible. Thecomparison of total radiance for the three sea surface models forvarying observation zenith look angles with the measured totalradiance is shown in Fig. 8. In [25], total radiance is measuredfor 3.4–5.3- and 8.0–8.75-μm bands. As it can be observed from
Fig. 8, the simulated total radiance is in very good agreementwith the measured total radiance. In the 3.4–5.3-μm band,the relative difference between the measurement and simula-tion varies from 5.5% to 14%. In the 8.0–8.75-μm band, themaximum relative difference between the measurement andsimulation is 6%.
VI. CONCLUSION
The success of passive IR surveillance systems is directlyproportional to the success in discrimination of target from thebackground. It is one of the most complex and important con-cepts of IR to calculate sea background radiance for maritimescenarios. In this paper, the DAMA software package was de-veloped for the simulation and analysis of total radiance of thesea surface. This software constitutes a very strong alternativefor the expensive, complicated, and incomplete measurements.The DAMA software includes all possible atmospheric andsea surface parameters and sea surface models available in theopen literature. The software is structured modularly so thatit can easily be updated and modified for special purposes.DAMA also has spectral and multiple analysis capabilities.With DAMA, it is the first time that sea background radiancecomponents are examined in detail with respect to the variationof all possible input parameters providing a significant contri-bution to the performance of IR surveillance systems.
The developed GUI facilitates the input of large number ofparameters defining the simulation scenarios. The total radianceand its components can be observed in the spectral domain.Primary and secondary analyses with respect to varying param-eters can also be performed and plotted automatically by thedeveloped GUI.
The validity of DAMA software simulation results wasdetermined by the comparison of the total radiance with thetheoretical models available in IR physics and with the limitedmeasurements available in the open literature.
To analyze the maritime background in IR, nearly 10 000scenarios have been run in SWIR, MWIR, and LWIR bands,and the results were examined in detail with respect to thesignificance of primary and secondary parameters. From theanalysis results, it was observed that the dominant componentin the SWIR band was source radiance, but in the LWIR band,it was thermal sea radiance. In each band, the increase in theheight of the observer caused a reduction in the values ofthe thermal sea radiance, reflected sky, and source radiancecomponents. The reflected source radiance strongly dependedon the position of the Sun or Moon. When the observationzenith angle was close to the source zenith angle, a largerreflected radiance value was observed. When the wind speedincreased, on the one hand, the reflected sky radiance and pathradiance also increased. On the other hand, the thermal searadiance at the observer level and transmittance decreased. Thetemperature of the sea was directly proportional to the increasein the thermal sea component. The salinity level of the sea wasnot very effective in the total radiance in any subband of IR.
By using the DAMA software, the three sea surface modelswere analyzed with respect to various parameters. It was ob-served that the sea surface model selection was mostly effective

ERDEM et al.: DAMA—INFRARED SEA MODELING AND ANALYSIS SOFTWARE 3591
Fig. 7. Example of sunglint simulation results. Reflected Sun radiance at the observer position with respect to the observer relative azimuth angle with observationzenith angles of (a) 89◦, (b) 86◦, (c) 83◦, and (d) 80◦ for 1-, 2-, 3-, and 4-m/s wind speeds.
Fig. 8. Comparison of DAMA results with the measurements in [25].(a) 3.4–5.3-μm band. (b) 8.0–8.75-μm band.
on the reflected source radiance. The maximum variation ofoutput values with respect to wind speed occurred when theuser selected the Mermelstein sea surface model. Wind direc-tion variation did not affect the outputs when the Shaw andChurnside model was selected as a sea surface model.
The DAMA software can model the sunglint path that wasmostly observed at sunrise and sunset times on the sea surface.The intensity of the glint and the width of the path can easilybe calculated, and the graphic outputs can be obtained. Thesunglint results examined during this study were also consistentwith the limited studies in the literature. It was observed fromthe results that when the wind speed increased, the path widthwidened. When the observation zenith angle increased, the pathwidth decreased, and the radiance intensity increased.
The DAMA software was tested at the boundary conditionsof the input parameters, and it was clearly observed that theresults were physically feasible. It was validated with theSEARAD software, which was obtained from MODTRAN v2.Under the same version conditions, DAMA and SEARAD gaveexactly the same results. DAMA was also validated with thelimited measurements in the literature, and it gave consistentresults. In the 3.4–5.3-μm band, the relative difference betweenthe measurement and simulation was between 5.5% and 14%.In 8.0–8.75-μm band, the maximum relative difference was 6%.

3592 IEEE TRANSACTIONS ON GEOSCIENCE AND REMOTE SENSING, VOL. 47, NO. 10, OCTOBER 2009
The modular and flexible DAMA software can be updatedand upgraded with additional parameters and future devel-opments in sea surface and atmospheric models in the IRband. Such future enhancements will include visual sea models,spectral emissivity models for wind-roughened water surfaces,and polarization and whitecap effects on the sea backgroundradiance.
ACKNOWLEDGMENT
The authors would like to thank M. Basak Turkec for her re-view of this paper and valuable suggestions. The authors wouldalso like to thank the anonymous reviewers whose valuablecomments improved the final version of this paper.
REFERENCES
[1] C. R. Zeisse, “SeaRad, a sea radiance prediction code,” Naval CommandControl Ocean Surveillance Center, San Diego, CA, Tech. Rep. 1702,1995.
[2] PcModWin Manual, Ontar Corp., North Andover, MA, 2004.MODTRAN, Ver. 4.0 v3r1 Ver., ABD.
[3] M. R. Querry, W. E. Holland, R. C. Waring, L. M. Earls, andM. D. Querry, “Relative reflectance and complex refractive index in the in-frared for saline environmental waters,” J. Geophys. Res., vol. 82, no. C9,pp. 1425–1433, Mar. 1977.
[4] C. Cox and W. Munk, “Measurement of the roughness of the sea surfacefrom photographs of the sun’s glitter,” J. Opt. Soc. Amer., vol. 44, no. 11,pp. 838–850, Nov. 1954.
[5] M. D. Mermelstein, E. P. Shettle, E. H. Takken, and R. G. Priest, “Infraredradiance and solar glint at the ocean–sky horizon,” Appl. Opt., vol. 33,no. 25, pp. 6022–6034, Sep. 1994.
[6] J. A. Shaw and J. H. Churnside, “Scanning-laser glint measurements ofsea-surface slope statistics,” Appl. Opt., vol. 36, no. 18, pp. 4202–4213,Jun. 1997.
[7] G. M. Hale and M. R. Querry, “Optical constants of water in the 200-nmto 200-μm wavelength region,” Appl. Opt., vol. 12, no. 3, pp. 555–563,1973.
[8] X. Wu and W. L. Smith, “Emissivity of rough sea surface for 8–12 μm:Modeling and verification,” Appl. Opt., vol. 36, no. 12, pp. 2609–2619,Apr. 1997.
[9] K. Masuda, T. Takashima, and Y. Takayama, “Emissivity of pure and seawaters for the model sea surface in the infrared window regions,” RemoteSens. Environ., vol. 24, no. 2, pp. 313–329, Mar. 1988.
[10] J. A. Shaw and C. Marston, “Polarized infrared emissivity for a roughwater surface,” Opt. Exp., vol. 7, no. 11, pp. 375–380, Nov. 2000.
[11] P. M. Saunders, “Shadowing on the ocean and the existence of thehorizon,” J. Geophys. Res., vol. 72, pp. 4643–4649, Sep. 1967.
[12] K. Yoshimori, K. Itoh, and Y. Ichioka, “Thermal radiative and reflectivecharacteristics of a wind-roughened water surface,” J. Opt. Soc. Amer. A,Opt. Image Sci., vol. 11, no. 6, pp. 1886–1893, Jun. 1994.
[13] K. Yoshimori, K. Itoh, and Y. Ichioka, “Optical characteristics of a wind-roughened water surface: A two-dimensional theory,” Appl. Opt., vol. 34,no. 27, pp. 6236–6247, Sep. 1995.
[14] C. Bourlier, J. Saillard, and G. Berginc, “Effect of the observation lengthon the two-dimensional shadowing function of the sea surface: Appli-cation on infrared 3–13 μm emissivity,” Appl. Opt., vol. 39, no. 20,pp. 3433–3442, Jul. 2000.
[15] C. Bourlier, G. Berginc, and J. Saillard, “Theoretical study on two-dimensional Gaussian rough sea surface emission and reflection in theinfrared frequencies with shadowing effect,” IEEE Trans. Geosci. RemoteSens., vol. 39, no. 2, pp. 379–392, Feb. 2001.
[16] C. Bourlier, “Unpolarized emissivity with shadow and multiple reflectionsfrom random rough surfaces with the geometric optics approximation:Application to Gaussian sea surfaces in the infrared band,” Appl. Opt.,vol. 45, no. 24, pp. 6241–6253, Aug. 2006.
[17] C. Bourlier, “Unpolarized infrared emissivity with shadow fromanisotropic rough sea surfaces with non-Gaussian statistics,” Appl. Opt.,vol. 44, no. 20, pp. 4335–4349, Jul. 2005.
[18] K. Caillault, S. Fauqueux, C. Boulier, P. Simoneau, and L. Labarre, “Mul-tiresolution optical characteristics of rough sea surface in the infrared,”Appl. Opt., vol. 46, no. 22, pp. 5471–5481, Aug. 2008.
[19] B. G. Henderson, J. Theiler, and P. Villeneuve, “The polarized emissivityof a wind-roughened sea surface: A Monte Carlo model,” Remote Sens.Environ., vol. 88, no. 4, pp. 453–457, Dec. 2003.
[20] E. Erdem, “Calculation of sea background radiance in the infrared band,”M.S. thesis, Elect. Electron. Eng., Hacettepe Univ., Ankara, Turkey, 2007.(in Turkish with an abstract in English).
[21] E. Erdem, F. Arikan, and C. B. Erol, “Calculation of sea radiance ininfrared band,” in Proc. SIU Conf., Antalya, Turkey, 2006. (in Turkishwith an abstract in English).
[22] E. Erdem, F. Arikan, and C. B. Erol, “Calculation of sea backgroundradiance in the infrared band,” in Proc. SIU Conf., Eskisehir, Turkey,2007. (in Turkish with an abstract in English).
[23] E. Erdem, F. Arikan, and C. B. Erol, “Infrared sea modeling and analysis,”in Proc. 3rd Int. ITBMS Workshop, Toulouse, France, 2007.
[24] J. Meeus, Astronomical Algorithms. Richmond, VA: Willmann-Bell,Inc., 1991, pp. 319–324.
[25] F. Schwenger and E. Repasi, “Sea surface simulation in the infraredmodeling and validation,” Proc. SPIE, vol. 6239, pp. 623 90J-1–623 90J-14, May 2006.
[26] R. G. Driggers, Introduction to Infrared and Electro-Optical Systems.Norwood, MA: Artech House, 1999.
[27] J. G. Dennis, S. Yu, A. W. Cooper, and E. A. Mime, “Dual-band infraredpolarization measurements of sun glint from the sea surface,” Proc. SPIE,vol. 1687, pp. 381–391, Sep. 1992.
[28] W. J. Tropf, “Definition of the sea surface sun glitter corridor,” JohnsHopkins APL Memo., F1F(0) 90-U-138, 1990.
Esra Erdem received the B.Sc. and M.Sc. de-grees in electrical and electronics engineering fromHacettepe University, Ankara, Turkey, in 2003 and2007, respectively.
She is currently with the National Research Insti-tute of Electronics and Cryptology (UEKAE), Sci-entific and Technical Research Council of Turkey(TUBITAK), Ankara. Her research interests includeinfrared technologies. Her primary focus is onbackground modeling and simulations in the infra-red band.
Feza Arikan (M’07) was born in Sivrihisar, Turkey,in 1965. She received the B.Sc. degree (with highhonors) in electrical and electronics engineeringfrom Middle East Technical University, Ankara,Turkey, in 1986 and the M.S. and Ph.D. degreesin electrical and computer engineering from North-eastern University, Boston, MA, in 1988 and 1992,respectively.
Since 1993, she has been with the Departmentof Electrical and Electronics Engineering, HacettepeUniversity, Ankara, where she is currently a Full
Professor. She is also the Director of the IONOLAB Group. Her current re-search interests include radar systems, HF propagation and communication, HFdirection finding, total electron content mapping and computerized ionospherictomography.
Prof. Arikan is a member of the American Geophysical Union and theInternational Scientific Radio Union.
Cemil B. Erol was born in Ankara, Turkey, onDecember 12, 1967. He received the B.Sc., M.Sc.,and Ph.D. degrees in physics from Middle East Tech-nical University, Ankara, in 1989, 1991, and 1996,respectively.
From 1989 to 2003, he worked in different univer-sities in Turkey as a Research Assistant, a Lecturer,and an Associate Professor. Since August 2003, hehas been with the National Research Institute ofElectronics and Cryptology (UEKAE), Scientific andTechnical Research Council of Turkey (TUBITAK),
Ankara. His current research interests include ionospheric physics and infraredmeasurement and modeling.


