Embed Size (px)
Citation preview
Dark Field Raman Microscopy
Matthew V. Schulmerich,† Rohith Reddy,† Anil K. Kodali,† Laura Jane Elgass,†
Krishnarao Tangella,‡ and Rohit Bhargava*,†
Department of Bioengineering and Beckman Institute for Advanced Science and Technology, University of Illinois atUrbana-Champaign, 405 N. Mathews Ave. Urbana, Illinois 61801, and Provena Covenant Medical Center,Department of Pathology, 1400 W. Park, Urbana, Illinois 61801
Confocal Raman microscopy is often used for opticalsectioning but is problematic when the sample plane ofinterest has a weak Raman cross-section/signal relativeto areas that are out-of-focus. This is especially true forclinical samples in pathology, which consist of a thintissue (∼5 µm) sample placed on a thick glass slide. Here,we recognize that the problem is the result of the extentof the illumination at the confocal plane being larger thanthe size of the sample and propose a dark field illumina-tion scheme to efficiently reject substrate signals. Theability of several optical configurations in rejecting out-of-plane signal is investigated for two model systems: SU-8photo resist over Teflon and SU-8 photo resist overpolystyrene. The proposed reflective dark field approach,in which excitation converged to a focal point slightlyabove the focal plane of the collection optics, was foundto be most effective in recording data from the sample.The proposed approach is validated by the rejection ofsubstrate response (fluorescence) in spectra acquiredfrom ∼4 µm of breast tissue on a glass microscope slide.The proposed approach is easy to implement on existingconfocal systems, has a straightforward optimization inacquiring data, and is not expected to result in loss oflateral resolution in mapping experiments.
Raman microscopy has now been applied in a broad range ofscientific investigations ranging from monitoring chemicalreactions1-5 to characterizing polymer films6-11 to detecting
cancer.12-16 Biological applications are especially interestingbecause images based on Raman spectra can be obtained withoutthe use of dyes or stains, thereby forming an important modalityin the emerging field of chemical imaging.17 Ex vivo examinationsof microscopic regions can provide both quantitative morphologi-cal and functional information,18 directly addressing needs in label-free, automated histopathology.19 Such investigations are alsocomplementary tools to in vivo applications, including bothepidermal20-22 and transcutaneous/deep tissue measurements,23-26
and form a critical validation step for developing in vivo spectro-scopic imaging. However, ex vivo Raman microscopy is not readilyapplicable to clinical tissue samples. The common procedure inclinical work-flow, for example for cancer diagnosis and grading,includes preparing tissue sections that are typically 2-8 µm thickand are deposited on to inexpensive glass slides used formicroscopy. Raman microscopy measurements on these samplesare especially difficult. Near infrared (NIR) illumination is needed
* To whom correspondence should be addressed. Phone: (217) 265-6596.E-mail: [email protected].
† University of Illinois at Urbana-Champaign.‡ Provena Covenant Medical Center.
(1) Clegg, I. M.; Everall, N. J.; King, B.; Melvin, H.; Norton, C. Appl. Spectrosc.2001, 55, 1138–1150.
(2) Fletcher, P. D. I.; Haswell, S. J.; Zhang, X. Electrophoresis 2003, 24, 3239–3245.
(3) Houlne, M. P.; Sjostrom, C. M.; Uibel, R. H.; Kleimeyer, J. A.; Harris, J. M.Anal. Chem. 2002, 74, 4311–4319.
(4) Lee, M.; Lee, J. -.; Rhee, H.; Choo, J.; Chai, Y. G.; Lee, E. K. J. RamanSpectrosc. 2003, 34, 737–742.
(5) Rodriıguez-Hornedo, N.; Nehm, S. J.; Seefeldt, K. F.; Pagaın-Torres, Y.;Falkiewicz, C. J. Mol. Pharmaceutics. 2006, 3, 362–367.
(6) Mcanally, G. D.; Everall, N. J.; Chalmers, J. M.; Smith, W. E. Appl. Spectrosc.2003, 57, 44–50.
(7) Everall, N. J. Appl. Spectrosc. 1998, 52, 1498–1504.(8) Lagugneı Labarthet, F.; Buffeteau, T.; Sourisseau, C. J Phys Chem B. 1998,
102, 5754–5765.(9) Mattsson, B.; Ericson, H.; Torell, L. M.; Sundholm, F. Electrochim. Acta
2000, 45, 1405–1408.
(10) Spencer, P.; Wang, Y. J. Biomed. Mater. Res. 2002, 62, 447–456.(11) Guillory, P.; Deschaines, T.; Henson, P. Mater. Today. 2009, 12, 38–39.(12) Arrasmith, C. L.; Patil, C. A.; Dickensheets, D. L.; Mahadevan-Jansen, A.
Proc. SPIE 2009, 7169.(13) Chan, J. W.; Taylor, D. S.; Zwerdling, T.; Lane, S. M.; Ihara, K.; Huser, T.
Biophys. J. 2006, 90, 648–656.(14) Feofanov, A. V.; Grichine, A. I.; Shitova, L. A.; Karmakova, T. A.;
Yakubovskaya, R. I.; Egret-Charlier, M.; Vigny, P. Biophys. J. 2000, 78,499–512.
(15) Jess, P. R. T.; Mazilu, M.; Dholakia, K.; Riches, A. C.; Herrington, C. S. Int.J. Cancer 2009, 124, 376–380.
(16) Shafer-Peltier, K. E.; Haka, A. S.; Fitzmaurice, M.; Crowe, J.; Myles, J.;Dasari, R. R.; Feld, M. S. J. Raman Spectrosc. 2002, 33, 552–563.
(17) Committee on Revealing Chemistry through Advanced Chemical Imaging& National Research Council of the National Academies. VisualizingChemistry: The Progress and Promise of Advanced Chemical Imaging; NationalAcademies Press: Washington, D.C;, 2006.
(18) Ellis, D. I.; Goodacre, R. Analyst. 2006, 131, 875–885.(19) Fernandez, D. C.; Bhargava, R.; Hewitt, S. M.; Levin, I. W. Nat. Biotechnol.
2005, 23, 469–474.(20) Gniadecka, M.; Wulf, H. C.; Mortensen, N. N.; Nielsen, O. F.; Christensen,
D. H. J. Raman Spectrosc. 1997, 28, 125–129.(21) Hata, T. R.; Scholz, T. A.; Ermakov, I. V.; McClane, R. W.; Khachik, F.;
Gellermann, W.; Pershing, L. K. J. Invest. Dermatol. 2000, 115, 441–448.(22) Nijssen, A.; Bakker Schut, T. C.; Heule, F.; Caspers, P. J.; Hayes, D. P.;
Neumann, M. H. A.; Puppels, G. J. J. Invest. Dermatol. 2002, 119, 64–69.(23) Schulmerich, M. V.; Cole, J. H.; Kreider, J. M.; Esmonde-White, F.; Dooley,
K. A.; Goldstein, S. A.; Morris, M. D. Appl. Spectrosc. 2009, 63, in press.
(24) Schulmerich, M. V.; Cole, J. H.; Dooley, K. A.; Morris, M. D.; Kreider, J. M.;Goldstein, S. A.; Srinivasan, S.; Pogue, B. W. J. Biomed. Opt. 2008, 13,1–3.
(25) Matousek, P. Chem. Soc. Rev. 2007, 36, 1292–1304.(26) Stone, N.; Baker, R.; Rogers, K.; Parker, A.; Matousek, P. Analyst. 2007,
132, 899–905.
Anal. Chem. 2010, 82, 6273–6280
10.1021/ac1014194 2010 American Chemical Society 6273Analytical Chemistry, Vol. 82, No. 14, July 15, 2010Published on Web 06/22/2010
to minimize auto fluorescence;27 unfortunately, a strong back-ground fluorescence signal in the NIR region is contributed bytrace amounts of rare-earth metals in conventional glass slides,overwhelming Raman spectra from the tissue. For Raman analysis,hence, thick sections (>20 µm) are typically placed on fused silicaor CaF2 slides as there is little competing substrate signal.28,29
Not only is this sample preparation clinically incompatible but thesubstrates are more expensive and unfamiliar to most pathologylaboratories.
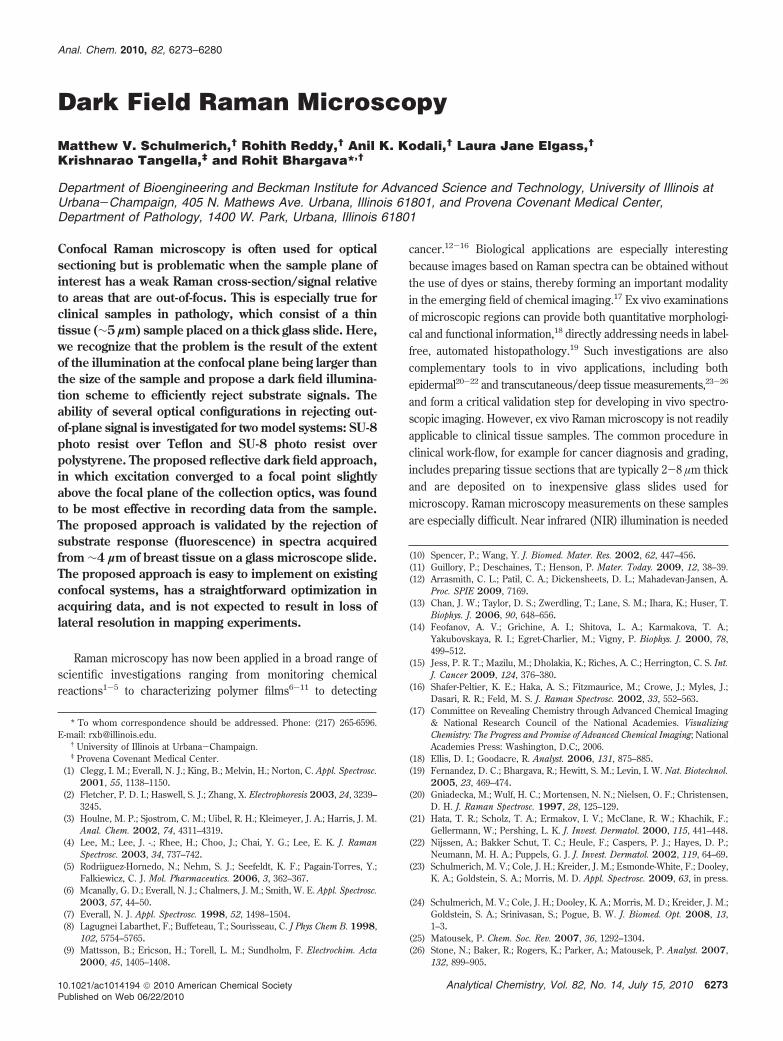
An alternative is to employ a confocal microscopy approachto optically section the sample,30,31 as illustrated in Figure 1a.Lens1 (the microscope objective) collimates light from the focalplane, which is then focused by lens2 through a pinhole apertureto a detector/spectrometer at the image plane. Any light collectedby lens1 from above or below the focal plane is not collimatedand is, consequently, rejected at the pinhole. Irrespective of thespecific optical setup for achieving depth resolution,32-36 a point
spread function (PSF) describes the distribution of light intensitycollected in the z-dimension (depth). The PSF can be experimen-tally measured by translating a thin sample across the plane offocus and plotting the intensity of a Raman band. In confocalRaman microscopy, the problem in localizing signal arises whenmedia providing weak and strong signals are adjacent, as is thecase with tissue on a glass slide. As illustrated in Figure 1b, thisproblem arises from the small tails (or wings) in the excitationPSF that can generate a detectable Raman signal from outsidethe plane of interest.37,38 For samples on a glass microscope slide,for example, the contribution of the tails creates a large fluores-cence background. While these backgrounds may be removedin software39,40 or through multiple excitation schemes41 the twoapproaches involve a reduced dynamic range for the signal andcan complicate instrumentation and data analysis. A microscopyapproach to improved signal localization would allow a largerRaman signal to be recorded directly from the region of interest,provide accurate depth profiling and straightforward mapping ofclinical samples. Hence, microscopy techniques that improve uponthe conventional confocal setup are attractive.
In this manuscript, we experimentally investigate and compareseveral optical configurations to understand sample signal localiza-tion to substrate signal rejection. In a conventional confocal Ramanmicroscope, the collimated excitation light fills the back apertureof the collection optics, nominally resulting in an overlapping ofthe illumination and collection PSFs. While this is the idealconfiguration for maximizing overall signal intensity, we demon-strate here that it is not the best configuration for rejecting out ofplane excitation, especially for the weak-strong scenario illustratedin Figure 1b. Hence, we propose a new approach, termed darkfield Raman microscopy to reject substrate signal. The approachis implemented with minor modifications on a commerciallyavailable, confocal Raman microscope. Theoretical considerationsand fluorescence rejection from breast tissue on a glass substrateare also presented for the dark field configuration. Finally, wedescribe the potential utility and limits of this approach inexamining clinical samples.
EXPERIMENTAL SECTIONInstrumentation. Raman spectra were acquired using a
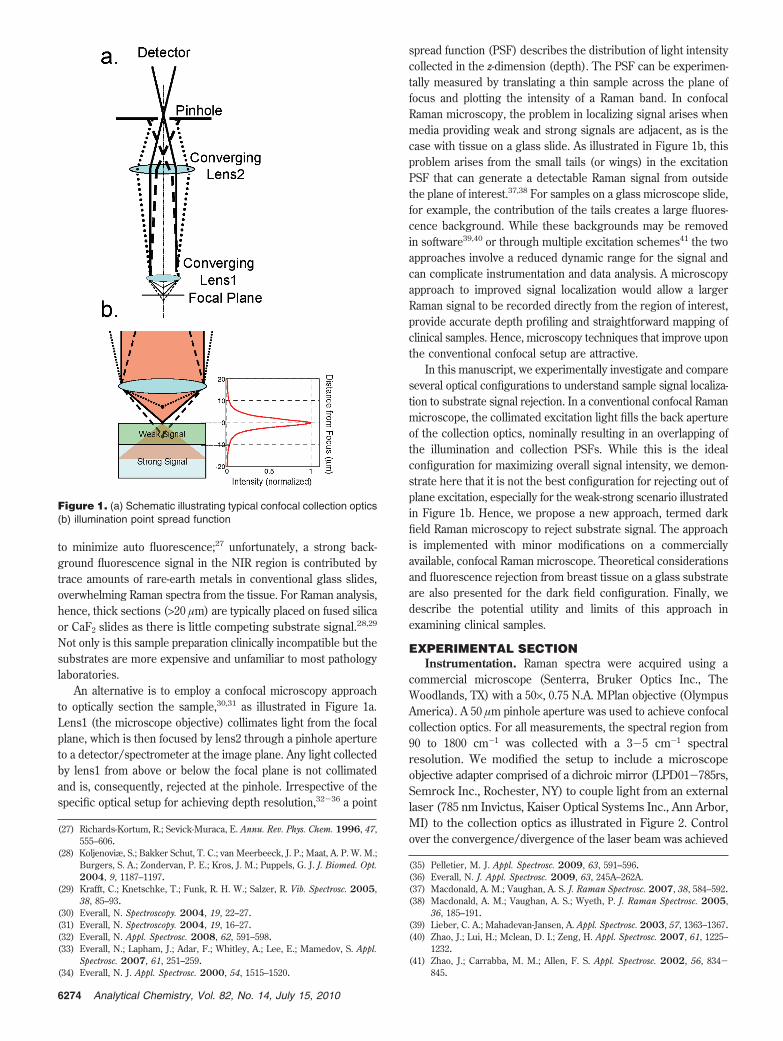
commercial microscope (Senterra, Bruker Optics Inc., TheWoodlands, TX) with a 50×, 0.75 N.A. MPlan objective (OlympusAmerica). A 50 µm pinhole aperture was used to achieve confocalcollection optics. For all measurements, the spectral region from90 to 1800 cm-1 was collected with a 3-5 cm-1 spectralresolution. We modified the setup to include a microscopeobjective adapter comprised of a dichroic mirror (LPD01-785rs,Semrock Inc., Rochester, NY) to couple light from an externallaser (785 nm Invictus, Kaiser Optical Systems Inc., Ann Arbor,MI) to the collection optics as illustrated in Figure 2. Controlover the convergence/divergence of the laser beam was achieved
(27) Richards-Kortum, R.; Sevick-Muraca, E. Annu. Rev. Phys. Chem. 1996, 47,555–606.
(28) Koljenoviæ, S.; Bakker Schut, T. C.; van Meerbeeck, J. P.; Maat, A. P. W. M.;Burgers, S. A.; Zondervan, P. E.; Kros, J. M.; Puppels, G. J. J. Biomed. Opt.2004, 9, 1187–1197.
(29) Krafft, C.; Knetschke, T.; Funk, R. H. W.; Salzer, R. Vib. Spectrosc. 2005,38, 85–93.
(30) Everall, N. Spectroscopy. 2004, 19, 22–27.(31) Everall, N. Spectroscopy. 2004, 19, 16–27.(32) Everall, N. Appl. Spectrosc. 2008, 62, 591–598.(33) Everall, N.; Lapham, J.; Adar, F.; Whitley, A.; Lee, E.; Mamedov, S. Appl.
Spectrosc. 2007, 61, 251–259.(34) Everall, N. J. Appl. Spectrosc. 2000, 54, 1515–1520.
(35) Pelletier, M. J. Appl. Spectrosc. 2009, 63, 591–596.(36) Everall, N. J. Appl. Spectrosc. 2009, 63, 245A–262A.(37) Macdonald, A. M.; Vaughan, A. S. J. Raman Spectrosc. 2007, 38, 584–592.(38) Macdonald, A. M.; Vaughan, A. S.; Wyeth, P. J. Raman Spectrosc. 2005,
36, 185–191.(39) Lieber, C. A.; Mahadevan-Jansen, A. Appl. Spectrosc. 2003, 57, 1363–1367.(40) Zhao, J.; Lui, H.; Mclean, D. I.; Zeng, H. Appl. Spectrosc. 2007, 61, 1225–
1232.(41) Zhao, J.; Carrabba, M. M.; Allen, F. S. Appl. Spectrosc. 2002, 56, 834-
845.
Figure 1. (a) Schematic illustrating typical confocal collection optics(b) illumination point spread function
6274 Analytical Chemistry, Vol. 82, No. 14, July 15, 2010
by translating the collimating optics relative to the excitation fiber.Illumination patterns were altered by placing apertures prior tointroducing the laser beam into the microscope. Three differentillumination patterns were tested. Illumination 1 is a typicalconfocal setup with collimated light filling the back aperture (6mm diameter) of the microscope objective and focused to thesame focal plane as the collection optics. Illumination 2 is the sameas illumination 1 with a 4 mm circular aperture placed in the centerof the beam. The aperture was made out of black carbon tape cutto a 4 mm circle using a skin biopsy punch and held in place witha fused silica window. Illumination 3 was the same as illumination1, except the edges of the beam were blocked with an iris closedto a 2 mm aperture, so that a 2 mm laser beam filled only thecenter portion of the microscope objective’s back aperture.
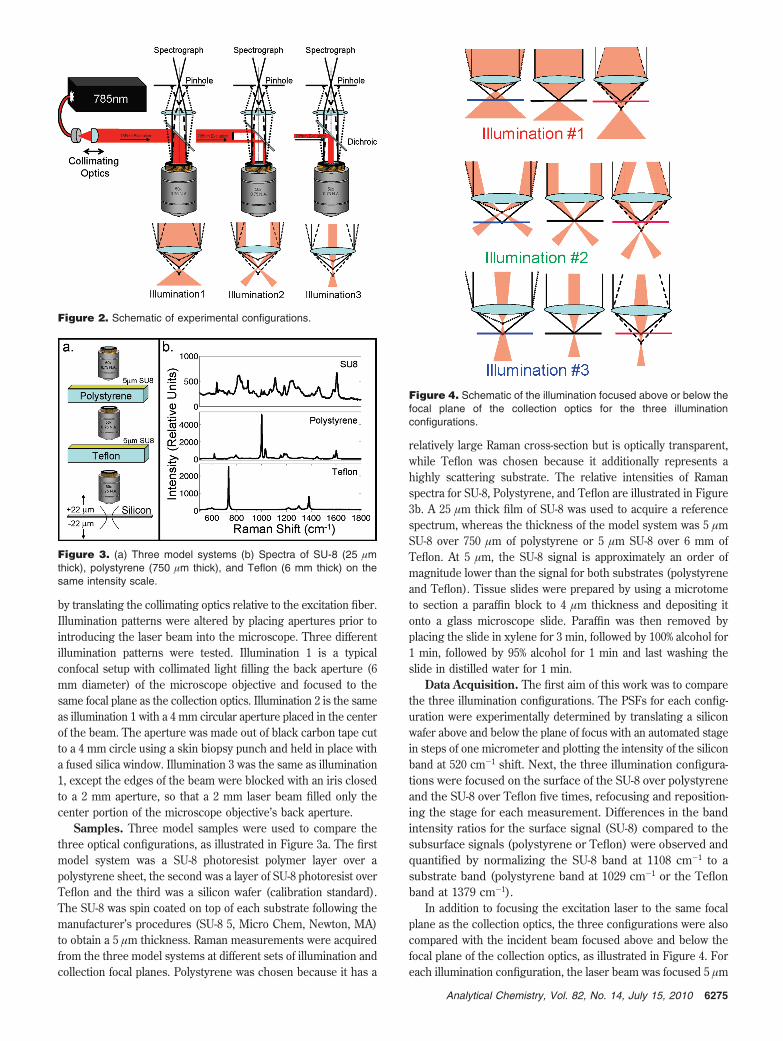
Samples. Three model samples were used to compare thethree optical configurations, as illustrated in Figure 3a. The firstmodel system was a SU-8 photoresist polymer layer over apolystyrene sheet, the second was a layer of SU-8 photoresist overTeflon and the third was a silicon wafer (calibration standard).The SU-8 was spin coated on top of each substrate following themanufacturer’s procedures (SU-8 5, Micro Chem, Newton, MA)to obtain a 5 µm thickness. Raman measurements were acquiredfrom the three model systems at different sets of illumination andcollection focal planes. Polystyrene was chosen because it has a
relatively large Raman cross-section but is optically transparent,while Teflon was chosen because it additionally represents ahighly scattering substrate. The relative intensities of Ramanspectra for SU-8, Polystyrene, and Teflon are illustrated in Figure3b. A 25 µm thick film of SU-8 was used to acquire a referencespectrum, whereas the thickness of the model system was 5 µmSU-8 over 750 µm of polystyrene or 5 µm SU-8 over 6 mm ofTeflon. At 5 µm, the SU-8 signal is approximately an order ofmagnitude lower than the signal for both substrates (polystyreneand Teflon). Tissue slides were prepared by using a microtometo section a paraffin block to 4 µm thickness and depositing itonto a glass microscope slide. Paraffin was then removed byplacing the slide in xylene for 3 min, followed by 100% alcohol for1 min, followed by 95% alcohol for 1 min and last washing theslide in distilled water for 1 min.
Data Acquisition. The first aim of this work was to comparethe three illumination configurations. The PSFs for each config-uration were experimentally determined by translating a siliconwafer above and below the plane of focus with an automated stagein steps of one micrometer and plotting the intensity of the siliconband at 520 cm-1 shift. Next, the three illumination configura-tions were focused on the surface of the SU-8 over polystyreneand the SU-8 over Teflon five times, refocusing and reposition-ing the stage for each measurement. Differences in the bandintensity ratios for the surface signal (SU-8) compared to thesubsurface signals (polystyrene or Teflon) were observed andquantified by normalizing the SU-8 band at 1108 cm-1 to asubstrate band (polystyrene band at 1029 cm-1 or the Teflonband at 1379 cm-1).
In addition to focusing the excitation laser to the same focalplane as the collection optics, the three configurations were alsocompared with the incident beam focused above and below thefocal plane of the collection optics, as illustrated in Figure 4. Foreach illumination configuration, the laser beam was focused 5 µm
Figure 2. Schematic of experimental configurations.
Figure 3. (a) Three model systems (b) Spectra of SU-8 (25 µmthick), polystyrene (750 µm thick), and Teflon (6 mm thick) on thesame intensity scale.
Figure 4. Schematic of the illumination focused above or below thefocal plane of the collection optics for the three illuminationconfigurations.
6275Analytical Chemistry, Vol. 82, No. 14, July 15, 2010
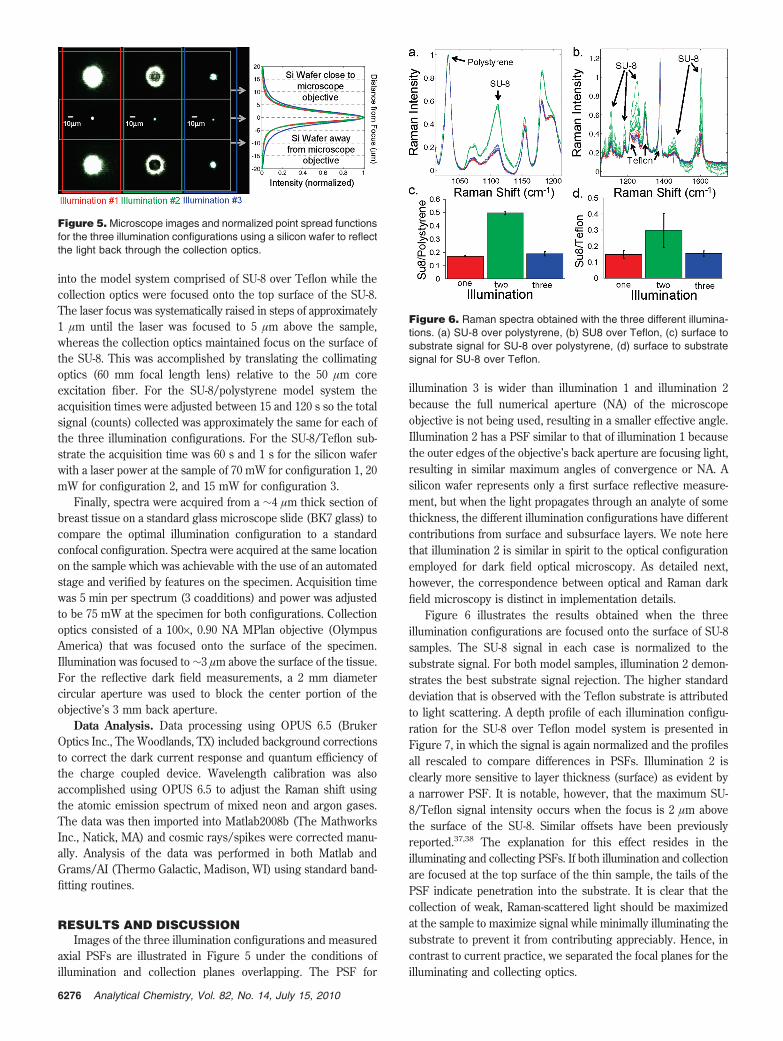
into the model system comprised of SU-8 over Teflon while thecollection optics were focused onto the top surface of the SU-8.The laser focus was systematically raised in steps of approximately1 µm until the laser was focused to 5 µm above the sample,whereas the collection optics maintained focus on the surface ofthe SU-8. This was accomplished by translating the collimatingoptics (60 mm focal length lens) relative to the 50 µm coreexcitation fiber. For the SU-8/polystyrene model system theacquisition times were adjusted between 15 and 120 s so the totalsignal (counts) collected was approximately the same for each ofthe three illumination configurations. For the SU-8/Teflon sub-strate the acquisition time was 60 s and 1 s for the silicon waferwith a laser power at the sample of 70 mW for configuration 1, 20mW for configuration 2, and 15 mW for configuration 3.
Finally, spectra were acquired from a ∼4 µm thick section ofbreast tissue on a standard glass microscope slide (BK7 glass) tocompare the optimal illumination configuration to a standardconfocal configuration. Spectra were acquired at the same locationon the sample which was achievable with the use of an automatedstage and verified by features on the specimen. Acquisition timewas 5 min per spectrum (3 coadditions) and power was adjustedto be 75 mW at the specimen for both configurations. Collectionoptics consisted of a 100×, 0.90 NA MPlan objective (OlympusAmerica) that was focused onto the surface of the specimen.Illumination was focused to ∼3 µm above the surface of the tissue.For the reflective dark field measurements, a 2 mm diametercircular aperture was used to block the center portion of theobjective’s 3 mm back aperture.
Data Analysis. Data processing using OPUS 6.5 (BrukerOptics Inc., The Woodlands, TX) included background correctionsto correct the dark current response and quantum efficiency ofthe charge coupled device. Wavelength calibration was alsoaccomplished using OPUS 6.5 to adjust the Raman shift usingthe atomic emission spectrum of mixed neon and argon gases.The data was then imported into Matlab2008b (The MathworksInc., Natick, MA) and cosmic rays/spikes were corrected manu-ally. Analysis of the data was performed in both Matlab andGrams/AI (Thermo Galactic, Madison, WI) using standard band-fitting routines.
RESULTS AND DISCUSSIONImages of the three illumination configurations and measured
axial PSFs are illustrated in Figure 5 under the conditions ofillumination and collection planes overlapping. The PSF for
illumination 3 is wider than illumination 1 and illumination 2because the full numerical aperture (NA) of the microscopeobjective is not being used, resulting in a smaller effective angle.Illumination 2 has a PSF similar to that of illumination 1 becausethe outer edges of the objective’s back aperture are focusing light,resulting in similar maximum angles of convergence or NA. Asilicon wafer represents only a first surface reflective measure-ment, but when the light propagates through an analyte of somethickness, the different illumination configurations have differentcontributions from surface and subsurface layers. We note herethat illumination 2 is similar in spirit to the optical configurationemployed for dark field optical microscopy. As detailed next,however, the correspondence between optical and Raman darkfield microscopy is distinct in implementation details.
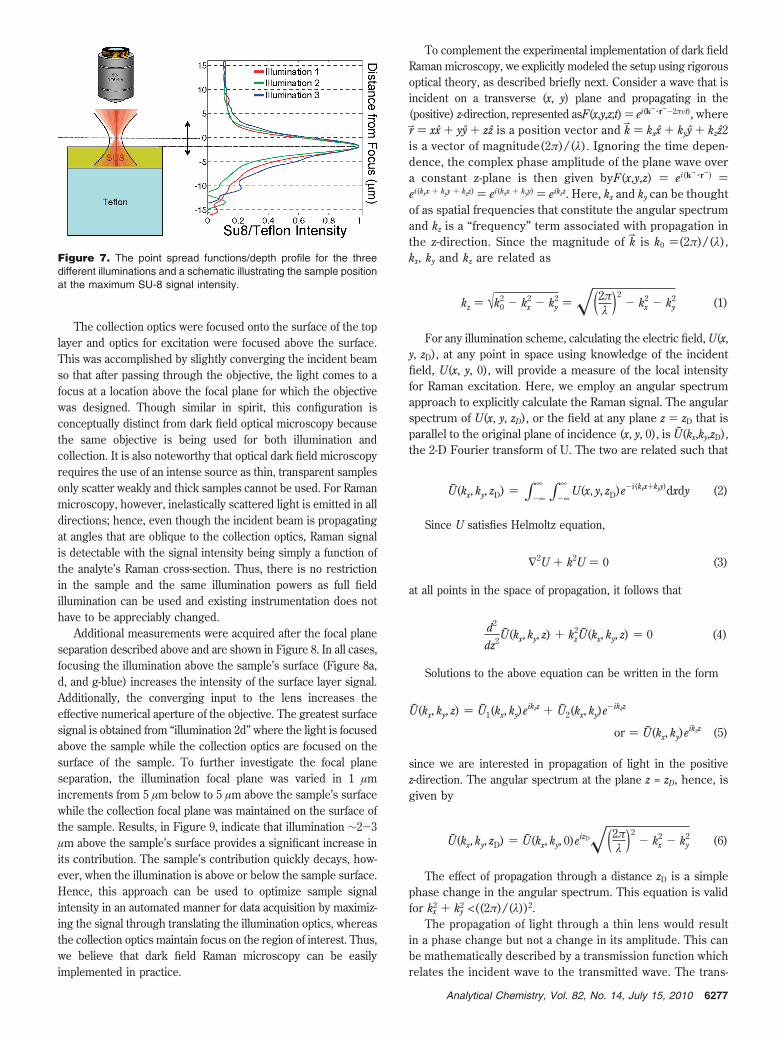
Figure 6 illustrates the results obtained when the threeillumination configurations are focused onto the surface of SU-8samples. The SU-8 signal in each case is normalized to thesubstrate signal. For both model samples, illumination 2 demon-strates the best substrate signal rejection. The higher standarddeviation that is observed with the Teflon substrate is attributedto light scattering. A depth profile of each illumination configu-ration for the SU-8 over Teflon model system is presented inFigure 7, in which the signal is again normalized and the profilesall rescaled to compare differences in PSFs. Illumination 2 isclearly more sensitive to layer thickness (surface) as evident bya narrower PSF. It is notable, however, that the maximum SU-8/Teflon signal intensity occurs when the focus is 2 µm abovethe surface of the SU-8. Similar offsets have been previouslyreported.37,38 The explanation for this effect resides in theilluminating and collecting PSFs. If both illumination and collectionare focused at the top surface of the thin sample, the tails of thePSF indicate penetration into the substrate. It is clear that thecollection of weak, Raman-scattered light should be maximizedat the sample to maximize signal while minimally illuminating thesubstrate to prevent it from contributing appreciably. Hence, incontrast to current practice, we separated the focal planes for theilluminating and collecting optics.
Figure 5. Microscope images and normalized point spread functionsfor the three illumination configurations using a silicon wafer to reflectthe light back through the collection optics.
Figure 6. Raman spectra obtained with the three different illumina-tions. (a) SU-8 over polystyrene, (b) SU8 over Teflon, (c) surface tosubstrate signal for SU-8 over polystyrene, (d) surface to substratesignal for SU-8 over Teflon.
6276 Analytical Chemistry, Vol. 82, No. 14, July 15, 2010
The collection optics were focused onto the surface of the toplayer and optics for excitation were focused above the surface.This was accomplished by slightly converging the incident beamso that after passing through the objective, the light comes to afocus at a location above the focal plane for which the objectivewas designed. Though similar in spirit, this configuration isconceptually distinct from dark field optical microscopy becausethe same objective is being used for both illumination andcollection. It is also noteworthy that optical dark field microscopyrequires the use of an intense source as thin, transparent samplesonly scatter weakly and thick samples cannot be used. For Ramanmicroscopy, however, inelastically scattered light is emitted in alldirections; hence, even though the incident beam is propagatingat angles that are oblique to the collection optics, Raman signalis detectable with the signal intensity being simply a function ofthe analyte’s Raman cross-section. Thus, there is no restrictionin the sample and the same illumination powers as full fieldillumination can be used and existing instrumentation does nothave to be appreciably changed.
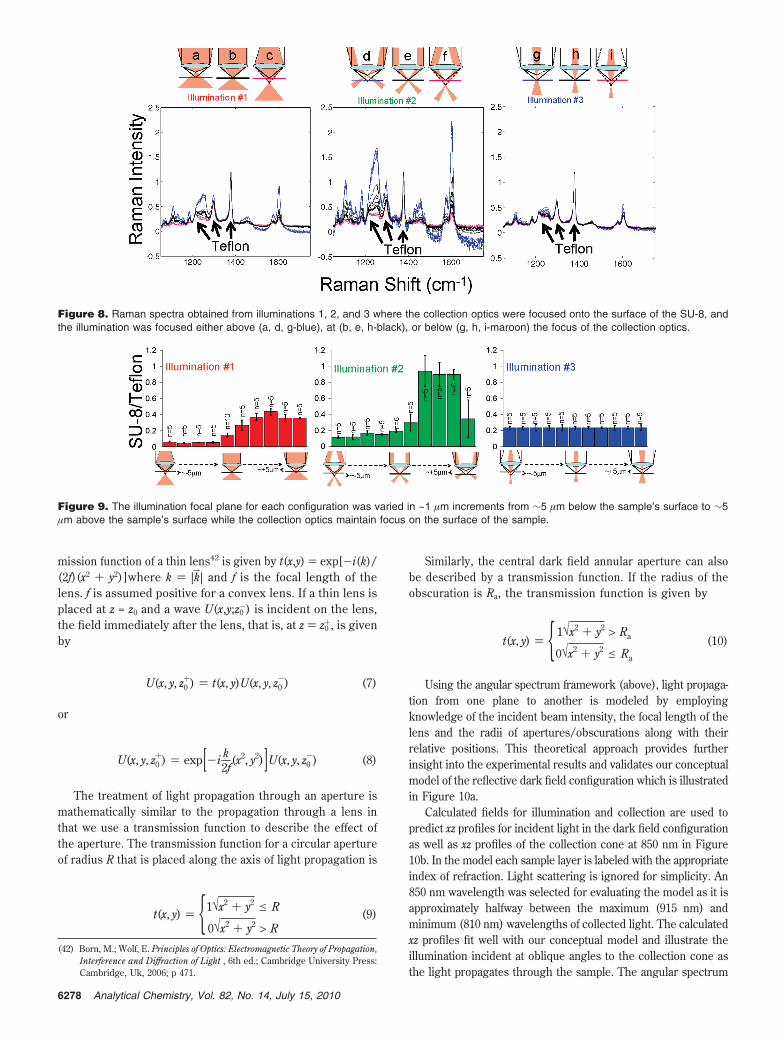
Additional measurements were acquired after the focal planeseparation described above and are shown in Figure 8. In all cases,focusing the illumination above the sample’s surface (Figure 8a,d, and g-blue) increases the intensity of the surface layer signal.Additionally, the converging input to the lens increases theeffective numerical aperture of the objective. The greatest surfacesignal is obtained from “illumination 2d” where the light is focusedabove the sample while the collection optics are focused on thesurface of the sample. To further investigate the focal planeseparation, the illumination focal plane was varied in 1 µmincrements from 5 µm below to 5 µm above the sample’s surfacewhile the collection focal plane was maintained on the surface ofthe sample. Results, in Figure 9, indicate that illumination ∼2-3µm above the sample’s surface provides a significant increase inits contribution. The sample’s contribution quickly decays, how-ever, when the illumination is above or below the sample surface.Hence, this approach can be used to optimize sample signalintensity in an automated manner for data acquisition by maximiz-ing the signal through translating the illumination optics, whereasthe collection optics maintain focus on the region of interest. Thus,we believe that dark field Raman microscopy can be easilyimplemented in practice.
To complement the experimental implementation of dark fieldRaman microscopy, we explicitly modeled the setup using rigorousoptical theory, as described briefly next. Consider a wave that isincident on a transverse (x, y) plane and propagating in the(positive) z-direction, represented asF(x,y,z;t) ) ei(kb ·rb-2πυt), whererb) xx + yy + zz is a position vector and kb ) kxx + kyy + kzz2is a vector of magnitude(2π)/(λ). Ignoring the time depen-dence, the complex phase amplitude of the plane wave overa constant z-plane is then given byF(x,y,z) ) ei(kb · rb) )ei(kxx + kyy + kzz) ) ei(kxx + kyy) ) eikzz. Here, kx and ky can be thoughtof as spatial frequencies that constitute the angular spectrumand kz is a “frequency” term associated with propagation inthe z-direction. Since the magnitude of kb is k0 )(2π)/(λ),kx, ky and kz are related as
kz ) √k02 - kx
2 - ky2 ) �(2π
λ )2- kx
2 - ky2 (1)
For any illumination scheme, calculating the electric field, U(x,y, zD), at any point in space using knowledge of the incidentfield, U(x, y, 0), will provide a measure of the local intensityfor Raman excitation. Here, we employ an angular spectrumapproach to explicitly calculate the Raman signal. The angularspectrum of U(x, y, zD), or the field at any plane z ) zD that isparallel to the original plane of incidence (x, y, 0), is U(kx,ky,zD),the 2-D Fourier transform of U. The two are related such that
U(kx, ky, zD) ) ∫-∞
∞ ∫-∞
∞U(x, y, zD)e-i(kxx+kyy)dxdy (2)
Since U satisfies Helmoltz equation,
∇2U + k2U ) 0 (3)
at all points in the space of propagation, it follows that
d2
dz2U(kx, ky, z) + kz2U(kx, ky, z) ) 0 (4)
Solutions to the above equation can be written in the form
U(kx, ky, z) ) U1(kx, ky)eikzz + U2(kx, ky)e
-ikzz
or ) U(kx, ky)eikzz (5)
since we are interested in propagation of light in the positivez-direction. The angular spectrum at the plane z = zD, hence, isgiven by
U(kx, ky, zD) ) U(kx, ky, 0)eizD�(2πλ )2
- kx2 - ky
2 (6)
The effect of propagation through a distance zD is a simplephase change in the angular spectrum. This equation is validfor kx
2 + ky2 <((2π)/(λ))2.
The propagation of light through a thin lens would resultin a phase change but not a change in its amplitude. This canbe mathematically described by a transmission function whichrelates the incident wave to the transmitted wave. The trans-
Figure 7. The point spread functions/depth profile for the threedifferent illuminations and a schematic illustrating the sample positionat the maximum SU-8 signal intensity.
6277Analytical Chemistry, Vol. 82, No. 14, July 15, 2010
mission function of a thin lens42 is given by t(x,y) ) exp[-i(k)/(2f)(x2 + y2)]where k ) |kb| and f is the focal length of thelens. f is assumed positive for a convex lens. If a thin lens isplaced at z = z0 and a wave U(x,y;z0
-) is incident on the lens,the field immediately after the lens, that is, at z ) z0
+, is givenby
U(x, y, z0+) ) t(x, y)U(x, y, z0
-) (7)
or
U(x, y, z0+) ) exp[-i k
2f(x2, y2)]U(x, y, z0
-) (8)
The treatment of light propagation through an aperture ismathematically similar to the propagation through a lens inthat we use a transmission function to describe the effect ofthe aperture. The transmission function for a circular apertureof radius R that is placed along the axis of light propagation is
t(x, y) ) {1√x2 + y2 e R
0√x2 + y2 > R(9)
Similarly, the central dark field annular aperture can alsobe described by a transmission function. If the radius of theobscuration is Ra, the transmission function is given by
t(x, y) ) {1√x2 + y2 > Ra
0√x2 + y2 e Ra
(10)
Using the angular spectrum framework (above), light propaga-tion from one plane to another is modeled by employingknowledge of the incident beam intensity, the focal length of thelens and the radii of apertures/obscurations along with theirrelative positions. This theoretical approach provides furtherinsight into the experimental results and validates our conceptualmodel of the reflective dark field configuration which is illustratedin Figure 10a.
Calculated fields for illumination and collection are used topredict xz profiles for incident light in the dark field configurationas well as xz profiles of the collection cone at 850 nm in Figure10b. In the model each sample layer is labeled with the appropriateindex of refraction. Light scattering is ignored for simplicity. An850 nm wavelength was selected for evaluating the model as it isapproximately halfway between the maximum (915 nm) andminimum (810 nm) wavelengths of collected light. The calculatedxz profiles fit well with our conceptual model and illustrate theillumination incident at oblique angles to the collection cone asthe light propagates through the sample. The angular spectrum
(42) Born, M.; Wolf, E. Principles of Optics: Electromagnetic Theory of Propagation,Interference and Diffraction of Light , 6th ed.; Cambridge University Press:Cambridge, Uk, 2006; p 471.
Figure 8. Raman spectra obtained from illuminations 1, 2, and 3 where the collection optics were focused onto the surface of the SU-8, andthe illumination was focused either above (a, d, g-blue), at (b, e, h-black), or below (g, h, i-maroon) the focus of the collection optics.
Figure 9. The illumination focal plane for each configuration was varied in ~1 µm increments from ∼5 µm below the sample’s surface to ∼5µm above the sample’s surface while the collection optics maintain focus on the surface of the sample.
6278 Analytical Chemistry, Vol. 82, No. 14, July 15, 2010
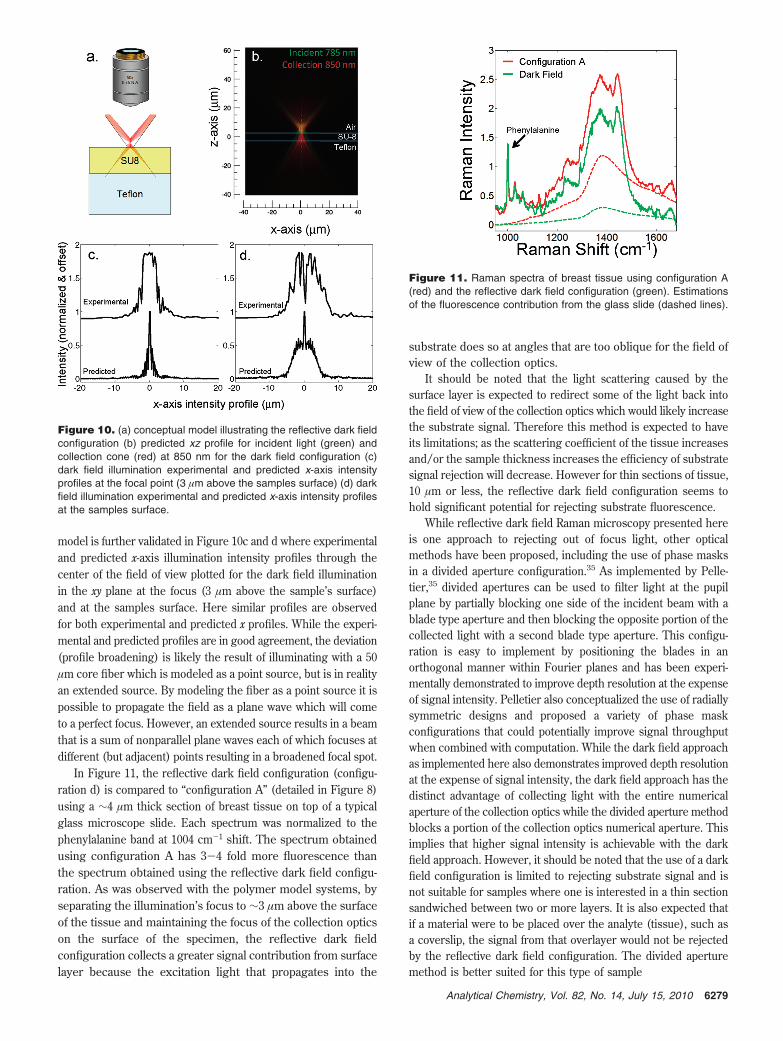
model is further validated in Figure 10c and d where experimentaland predicted x-axis illumination intensity profiles through thecenter of the field of view plotted for the dark field illuminationin the xy plane at the focus (3 µm above the sample’s surface)and at the samples surface. Here similar profiles are observedfor both experimental and predicted x profiles. While the experi-mental and predicted profiles are in good agreement, the deviation(profile broadening) is likely the result of illuminating with a 50µm core fiber which is modeled as a point source, but is in realityan extended source. By modeling the fiber as a point source it ispossible to propagate the field as a plane wave which will cometo a perfect focus. However, an extended source results in a beamthat is a sum of nonparallel plane waves each of which focuses atdifferent (but adjacent) points resulting in a broadened focal spot.
In Figure 11, the reflective dark field configuration (configu-ration d) is compared to “configuration A” (detailed in Figure 8)using a ∼4 µm thick section of breast tissue on top of a typicalglass microscope slide. Each spectrum was normalized to thephenylalanine band at 1004 cm-1 shift. The spectrum obtainedusing configuration A has 3-4 fold more fluorescence thanthe spectrum obtained using the reflective dark field configu-ration. As was observed with the polymer model systems, byseparating the illumination’s focus to ∼3 µm above the surfaceof the tissue and maintaining the focus of the collection opticson the surface of the specimen, the reflective dark fieldconfiguration collects a greater signal contribution from surfacelayer because the excitation light that propagates into the
substrate does so at angles that are too oblique for the field ofview of the collection optics.
It should be noted that the light scattering caused by thesurface layer is expected to redirect some of the light back intothe field of view of the collection optics which would likely increasethe substrate signal. Therefore this method is expected to haveits limitations; as the scattering coefficient of the tissue increasesand/or the sample thickness increases the efficiency of substratesignal rejection will decrease. However for thin sections of tissue,10 µm or less, the reflective dark field configuration seems tohold significant potential for rejecting substrate fluorescence.
While reflective dark field Raman microscopy presented hereis one approach to rejecting out of focus light, other opticalmethods have been proposed, including the use of phase masksin a divided aperture configuration.35 As implemented by Pelle-tier,35 divided apertures can be used to filter light at the pupilplane by partially blocking one side of the incident beam with ablade type aperture and then blocking the opposite portion of thecollected light with a second blade type aperture. This configu-ration is easy to implement by positioning the blades in anorthogonal manner within Fourier planes and has been experi-mentally demonstrated to improve depth resolution at the expenseof signal intensity. Pelletier also conceptualized the use of radiallysymmetric designs and proposed a variety of phase maskconfigurations that could potentially improve signal throughputwhen combined with computation. While the dark field approachas implemented here also demonstrates improved depth resolutionat the expense of signal intensity, the dark field approach has thedistinct advantage of collecting light with the entire numericalaperture of the collection optics while the divided aperture methodblocks a portion of the collection optics numerical aperture. Thisimplies that higher signal intensity is achievable with the darkfield approach. However, it should be noted that the use of a darkfield configuration is limited to rejecting substrate signal and isnot suitable for samples where one is interested in a thin sectionsandwiched between two or more layers. It is also expected thatif a material were to be placed over the analyte (tissue), such asa coverslip, the signal from that overlayer would not be rejectedby the reflective dark field configuration. The divided aperturemethod is better suited for this type of sample
Figure 10. (a) conceptual model illustrating the reflective dark fieldconfiguration (b) predicted xz profile for incident light (green) andcollection cone (red) at 850 nm for the dark field configuration (c)dark field illumination experimental and predicted x-axis intensityprofiles at the focal point (3 µm above the samples surface) (d) darkfield illumination experimental and predicted x-axis intensity profilesat the samples surface.
Figure 11. Raman spectra of breast tissue using configuration A(red) and the reflective dark field configuration (green). Estimationsof the fluorescence contribution from the glass slide (dashed lines).
6279Analytical Chemistry, Vol. 82, No. 14, July 15, 2010
Finally, gaining depth resolution in thin samples/specimenshas been demonstrated here; it is also of interest to simultaneouslyexamine the lateral resolution achieved in this configuration formapping purposes. In the reflective dark field approach, it isexpected that the lateral resolution will be equivalent to aconventional confocal measurement as the collection optics arefocused onto the surface of the sample and the lateral resolutionshould be governed by the size of the pinhole aperture. Interest-ingly, this dark field approach can be inverted to maximizesubstrate signal and, hence, image buried, subsurface samplesmore effectively. Other interesting directions from this studywould be to optimize aperture sizes and beam convergence tomaximize signals of interest. The implementation of transmission-mode dark field Raman microscopy and comparison with thereflection-mode reported here would also prove interesting. Boththeoretical and experimental efforts in these directions areunderway in our laboratories.
CONCLUSIONSMotivated by the need to analyze thin biological samples, we
proposed here a reflective dark field configuration for confocalRaman microscopy. The approach demonstrated the most promisefor rejecting substrate signal when compared to the common,
“confocal” illumination commercially available today. We alsointroduced the idea of focusing the sample excitation above thesample’s surface using a slightly converged beam while focusingthe collection optics on the sample’s surface. In sum, the darkfield illumination and asynchronous focusing of the illuminationand collection optics enabled us to acquire data from clinical tissuesamples with 3-4- fold lower fluorescence from the substrate. Itis notable that the proposed configuration can be implementedon existing Raman confocal systems with minor modifications,does not require increased illumination intensity at the sampleplane, provides the best lateral and axial resolution compared toother spatial-filtering approaches, and provides opportunities forautomated sample positioning that make its practical realizationfacile.
ACKNOWLEDGMENTWe gratefully acknowledge support for this work through the
Grainger Foundation and the Susan G. Komen for the Cure. Thework reported here is partly based upon work supported by theNational Science Foundation under Grant No.CHE0957849.
Received for review May 31, 2010. Accepted June 9, 2010.
AC1014194
6280 Analytical Chemistry, Vol. 82, No. 14, July 15, 2010


