Embed Size (px)
Citation preview

DART Research
Tel: +9122 40969700
E-mail: [email protected]
July 06, 2022
DART EARNING QUARTERLY
THE BOTTOMING OUT QUARTER!

July 06, 2022 2
Index
Sr. No Particulars Page Nos.
1 Earnings Aggregates 3
2 Aggregates Growth – DART Coverage 4
3 Quarterly Earnings – Pecking Order 10
4 Quarterly Earnings – Sector Aggregates 11
5 Bank Aggregate Earnings – Unbundled 12
6 Quarterly Aggregate Earnings – Unbundling Market Caps 13
7 Agri Inputs 14
8 AlcoBev 16
9 Autos & Auto Ancillaries 17
10 Banks 25
11 Cement 29
12 Chemicals 32
13 Consumer 35
14 Hotels 41
15 Infrastructure 42
16 IT and Digital Services 44
17 Media – Broadcasters 50
18 Metals & Mining 51
19 Pharmaceutical 52
20 Real Estate 57
21 Retail 59
22 Sugar 60
23 Telecom 61

July 06, 2022
Earnings Aggregates – Q1FY23
The Q1FY23 earnings will be most watched for 1) Impact of RM inflation on businesses 2) Demand environment where we have been observing varying trends 3) Operating levers that the corporates believe can be used to protect margins 4) Capex visibility as we set for the post Covid but geopolitically sensitive era. The markets have built in margin and demand softening to a fair extent, however if this level of realignment is good enough or does it worsen from here will be the big question we will be trying to get answers to.
Our Coverage universe (155 cos, ex banks and metals) is projected to show revenue growth of 26% yoy for Q1, while operating profits are projected to grow as 17%. The margin headwinds for sectors like autos, cement and staples are the biggest of negative impact on the operating performance.
The Q1 net earnings, as per our projections, shall growth by 19% yoy (ex banks and metals). There is wide dispersion though on this with sectors like cement (-21%) and pharma (-16%) on one end, while autos (+95%) and staples (+30%) aiding the averages higher.
The large cap universe (42 cos, Mcap USD 869 bn, ex banks & metals) is estimated for a growth of 25% on topline, (17%) on operating profit and 19% on net earnings. On the same pedestal, the mid and small cap universe (113 cos, USD 204 bn) will see 28% revenue growth but only 18% in operating profits and 22% in net earnings.
Finally, the banks universe where we expect NII to grow 16% yoy with the pre provision profit growth at -6% and net earnings to leap up by 30%.
DART EARNING QUARTERLY

July 06, 2022 4
Aggregates Growth (%) PAT % YoY
Source: DART Source: DART
Revenue % YoY EBITDA % YoY
Source: DART Source: DART
(100)
(50)
0
50
100
150
200
250
300
(30)(20)(10)
010203040506070
Q2
FY2
0
Q3
FY2
0
Q4
FY2
0
Q1
FY2
1
Q2
FY2
1
Q3
FY2
1
Q4
FY2
1
Q1
FY2
2
Q2
FY2
2
Q3
FY2
2
Q4
FY2
2E
Q1
FY2
3E
Revenue EBITDA PAT (RHS)
244.4
56.0
33.3 17.1 14.3
10
60
110
160
210
260
Q1FY22 Q2FY22 Q3FY22 Q4FY22E Q1FY23E
42.8
25.1
20.9 22.1
26.6
15
20
25
30
35
40
45
Q1FY22 Q2FY22 Q3FY22 Q4FY22E Q1FY23E
65.5
26.0
10.9 7.5
(2.0)(5)
5
15
25
35
45
55
65
75
Q1FY22 Q2FY22 Q3FY22 Q4FY22E Q1FY23E
DART Coverage – 163 Cos. (M Cap. 1,404 USD bn)

July 06, 2022 5
Aggregates Growth (%) PAT % YoY
Source: DART Source: DART
Revenue % YoY EBITDA % YoY
Source: DART Source: DART
(100)
(50)
0
50
100
150
200
250
(20)
(10)
0
10
20
30
40
50
60
Q2
FY2
0
Q3
FY2
0
Q4
FY2
0
Q1
FY2
1
Q2
FY2
1
Q3
FY2
1
Q4
FY2
1
Q1
FY2
2
Q2
FY2
2
Q3
FY2
2
Q4
FY2
2E
Q1
FY2
3E
Revenue EBITDA PAT (RHS)
230.7
52.0 39.8
25.1 19.3
10
35
60
85
110
135
160
185
210
235
260
Q1FY22 Q2FY22 Q3FY22 Q4FY22E Q1FY23E
40.0
24.0 22.5
23.5
26.4
20
25
30
35
40
45
Q1FY22 Q2FY22 Q3FY22 Q4FY22E Q1FY23E
59.9
23.8
14.9 11.7
(0.3)(5)
5
15
25
35
45
55
65
Q1FY22 Q2FY22 Q3FY22 Q4FY22E Q1FY23E
Large Cap Universe – 49 Cos. (M Cap. 1,194 USD bn)

July 06, 2022 6
Aggregates Growth (%) PAT % YoY
Source: DART Source: DART
Revenue % YoY EBITDA % YoY
Source: DART Source: DART
(100)
0
100
200
300
400
500
(40)
(20)
0
20
40
60
80
100
120
Q2
FY2
0
Q3
FY2
0
Q4
FY2
0
Q1
FY2
1
Q2
FY2
1
Q3
FY2
1
Q4
FY2
1
Q1
FY2
2
Q2
FY2
2
Q3
FY2
2
Q4
FY2
2E
Q1
FY2
3E
Revenue EBITDA PAT (RHS)
415.6
109.0
7.9
(17.1) (19.8)(50)
0
50
100
150
200
250
300
350
400
450
Q1FY22 Q2FY22 Q3FY22 Q4FY22E Q1FY23E
55.2
33.0
16.9 20.1
30.6
10
15
20
25
30
35
40
45
50
55
60
Q1FY22 Q2FY22 Q3FY22 Q4FY22E Q1FY23E
108.5
46.0
(6.0)(12.0) (16.5)(20)
0
20
40
60
80
100
120
Q1FY22 Q2FY22 Q3FY22 Q4FY22E Q1FY23E
Mid Cap Universe – 46 Cos. (M Cap. 164 USD bn)

July 06, 2022 7
Aggregates Growth (%) PAT % YoY
Source: DART Source: DART
Revenue % YoY EBITDA % YoY
Source: DART Source: DART
(80)
(60)
(40)
(20)
0
20
40
60
80
100
(40)
(20)
0
20
40
60
Q2
FY2
0
Q3
FY2
0
Q4
FY2
0
Q1
FY2
1
Q2
FY2
1
Q3
FY2
1
Q4
FY2
1
Q1
FY2
2
Q2
FY2
2
Q3
FY2
2
Q4
FY2
2E
Q1
FY2
3E
Revenue EBITDA PAT (RHS)
83.7
2.2 5.5 3.7
79.8
0
10
20
30
40
50
60
70
80
90
Q1FY22 Q2FY22 Q3FY22 Q4FY22E Q1FY23E
51.4
21.1
12.1 11.9
21.4
3
8
13
18
23
28
33
38
43
48
53
Q1FY22 Q2FY22 Q3FY22 Q4FY22E Q1FY23E
53.4
7.7
(0.7)
2.6
22.5
(9)
0
9
18
27
36
45
54
63
Q1FY22 Q2FY22 Q3FY22 Q4FY22E Q1FY23E
Small Cap Universe – 68 Cos. (M Cap. 46 USD bn)

July 06, 2022 8
Aggregates Growth (%) PAT % YoY
Source: DART Source: DART
Revenue % YoY EBITDA % YoY
Source: DART Source: DART
(100)
0
100
200
300
400
500
(30)(15)
0153045607590
105120
Q2
FY2
0
Q3
FY2
0
Q4
FY2
0
Q1
FY2
1
Q2
FY2
1
Q3
FY2
1
Q4
FY2
1
Q1
FY2
2
Q2
FY2
2
Q3
FY2
2
Q4
FY2
2E
Q1
FY2
3E
Revenue EBITDA PAT (RHS)
430.2
62.6 29.4
8.0 9.5 5
50
95
140
185
230
275
320
365
410
455
Q1FY22 Q2FY22 Q3FY22 Q4FY22E Q1FY23E
49.8
27.6
22.2 22.8
28.2
10
15
20
25
30
35
40
45
50
55
Q1FY22 Q2FY22 Q3FY22 Q4FY22E Q1FY23E
111.2
35.5
12.9 9.4
(0.5)(10)
6
22
38
54
70
86
102
118
Q1FY22 Q2FY22 Q3FY22 Q4FY22E Q1FY23E
Excl. BFSI – 150 Cos. (M Cap. 1,098 USD bn)

July 06, 2022 9
Aggregates Growth (%) PAT % YoY
Source: DART Source: DART
Revenue % YoY EBITDA % YoY
Source: DART Source: DART
(50)
0
50
100
150
(40)
(20)
0
20
40
60
80
Q2
FY2
0
Q3
FY2
0
Q4
FY2
0
Q1
FY2
1
Q2
FY2
1
Q3
FY2
1
Q4
FY2
1
Q1
FY2
2
Q2
FY2
2
Q3
FY2
2
Q4
FY2
2E
Q1
FY2
3E
Revenue EBITDA PAT (RHS)
138.9
54.5
22.6 16.6 12.7
10
30
50
70
90
110
130
150
Q1FY22 Q2FY22 Q3FY22 Q4FY22E Q1FY23E
45.4
26.1
21.6 22.1
27.1
15
20
25
30
35
40
45
50
Q1FY22 Q2FY22 Q3FY22 Q4FY22E Q1FY23E
70.4
26.4
9.9 5.4
(4.6)(5)
3
11
19
27
35
43
51
59
67
75
Q1FY22 Q2FY22 Q3FY22 Q4FY22E Q1FY23E
Excl. Telecom – 161 Cos. (M Cap. 1,355 USD bn)

July 06, 2022 10
Sector (Ex Banks) Topline
Growth YoY % Sector
EBIDTA Growth YoY (%)
Sector PAT Growth
YoY (%)
Retail 111.2 Retail 3,092.2 Auto & Auto Anc. 95.1
Consumer Discretionary# 83.0 Consumer Discretionary# 414.5 Real Estate 87.7
Auto & Auto Anc. 42.6 Auto & Auto Anc. 64.7 Telecom 42.7
Real Estate 41.9 Real Estate 30.0 Consumer Staples 29.6
Metal 33.3 Consumer Staples 29.5 Chemicals 12.7
Consumer Staples 29.7 Telecom 21.2 IT Digital Services $ 4.9
Chemicals 28.7 Chemicals 15.4 Media (1.4)
Cement 21.3 Agri Based* 10.2 Metal (6.8)
IT Digital Services $ 20.1 IT Digital Services $ 5.7 Infra & Constructions (9.1)
Telecom 18.0 Infra & Constructions 1.2 Agri Based* (12.7)
Media 10.9 Media (3.4) Pharma/Healthcare (15.8)
Agri Based* 10.7 Pharma/Healthcare (9.1) Cement (21.2)
Infra & Constructions 8.4 Cement (18.0) Retail LTP
Pharma/Healthcare 4.0 Metal (23.7) Consumer Discretionary# LTP * Including Agri Inputs & Sugar, # Including AlcoBev & Hotels, $ IT Services is EBIT fig and not EBITDA
Sector NII Growth
YoY % Sector
PPOP Growth YoY (%)
Sector PAT Growth
YoY (%)
BFSI 15.9 BFSI (5.5) BFSI 30.0 Source: DART
Quarterly Earnings – Pecking Order

July 06, 2022 11
Sector (Cos.) Sales (Rs bn) EBITDA (Rs bn) PAT (Rs bn)
Q1FY23E Q1FY22 YoY (%) Q1FY23E Q1FY22 YoY (%) Q1FY23E Q1FY22 YoY (%)
Agri Based * (7) 151 136 10.7 29 26 10.2 11 13 (12.7)
Auto & Auto Anc. (31) 1,077 756 42.6 126 77 64.7 77 39 95.1
Cement (13) 421 347 21.3 74 91 (18.0) 39 49 (21.2)
Chemicals (7) 100 78 28.7 22 19 15.4 13 12 12.7
Consumer Discretionary # (7) 73 40 83.0 14 3 414.5 7 (2) LTP
Consumer Staples (24) 771 595 29.7 170 131 29.5 116 90 29.6
Infra & Constructions (9) 115 106 8.4 15 15 1.2 6 6 (9.1)
IT and Digital Services $ (23) 1,694 1,410 20.1 312 295 5.7 250 239 4.9
Media (2) 27 25 10.9 8 8 (3.4) 6 6 (1.4)
Metal (11) 2,940 2,206 33.3 594 779 (23.7) 327 351 (6.8)
Pharmaceutical (16) 317 305 4.0 64 70 (9.1) 37 44 (15.8)
Real Estate (8) 81 57 41.9 21 16 30.0 12 6 87.7
Retail (5) 151 71 111.2 17 1 3,092.2 8 (3) LTP
Telecom (3) 579 491 18.0 304 251 21.2 74 52 42.7
Total (166) 8,498 6,623 28.3 1,770 1,782 (0.6) 984 903 9.0 * Including Agri Inputs & Sugar, # Including AlcoBev & Hotels, $ IT Services is EBIT fig and not EBITDA
Quarterly Earnings – Sector Aggregates

July 06, 2022 12
(Rs bn) Net Interest Income Pre Provision Profit PAT
Q1FY23E Q1FY22 YoY (%) Q1FY23E Q1FY22 YoY (%) Q1FY23E Q1FY22 YoY (%)
BFSI (14) 1,070 923 15.9 689 729 (5.5) 356 274 30.0
(Rs bn) Net Interest Income Pre Provision Profit PAT
Q1FY23E Q1FY22 YoY (%) Q1FY23E Q1FY22 YoY (%) Q1FY23E Q1FY22 YoY (%)
Large Cap BFSI 916 787 16.4 588 612 (4.0) 325 249 30.6
(Rs bn) Net Interest Income Pre Provision Profit PAT
Q1FY23E Q1FY22 YoY (%) Q1FY23E Q1FY22 YoY (%) Q1FY23E Q1FY22 YoY (%)
Mid/Small Cap BFSI 154 136 13.4 101 117 (13.4) 32 25 24.5
Bank Aggregate Earnings – Unbundled

July 06, 2022 13
(Rs bn) Sales EBITDA PAT
Q1FY23E Q1FY22 YoY (%) Q1FY23E Q1FY22 YoY (%) Q1FY23E Q1FY22 YoY (%)
Large Cap Ex-BFSI 6,479 5,057 28.1 1,446 1,426 1.4 814 707 15.1
Large Cap Ex-BFSI and Ex-Telecom 5,901 4,567 29.2 1,141 1,175 (2.9) 740 655 12.9
(Rs bn) Sales EBITDA PAT
Q1FY23E Q1FY22 YoY (%) Q1FY23E Q1FY22 YoY (%) Q1FY23E Q1FY22 YoY (%)
Mid/Small Cap Ex-BFSI 2,019 1,565 29.0 324 355 (8.7) 170 196 (13.3)
(Rs bn) Sales EBITDA PAT
Q1FY23E Q1FY22 YoY (%) Q1FY23E Q1FY22 YoY (%) Q1FY23E Q1FY22 YoY (%)
Large Cap Ex-Metal 5,025 4,072 23.4 1,542 1,426 8.1 871 710 22.7
Large Cap Ex-BFSI and Metal 4,109 3,284 25.1 954 814 17.2 546 461 18.5
(Rs bn) Sales EBITDA PAT
Q1FY23E Q1FY22 YoY (%) Q1FY23E Q1FY22 YoY (%) Q1FY23E Q1FY22 YoY (%)
Mid/Small Cap Ex-Metal 1,603 1,268 26.4 323 305 5.8 142 116 22.3
Mid/Small Cap Ex-BFSI and Metal 1,449 1,133 28.0 222 188 17.7 111 91 21.7
(Rs bn) Sales EBITDA PAT
Q1FY23E Q1FY22 YoY (%) Q1FY23E Q1FY22 YoY (%) Q1FY23E Q1FY22 YoY (%)
Ex Metal 5,558 4,417 25.8 1,176 1,003 17.3 657 552 19.0
Quarterly Aggregate Earnings – Unbundling Market Caps
July 06, 2022 14
Company Sales EBIDTA EBITDA Margin (%) PAT EPS (Rs)
DART Comments Q1FY23E YoY (%) Q1FY23E YoY (%) Q1FY23E YoY (bps) Q1FY23E YoY (%) Q1FY23E
Dhanuka Agri 4,002 10.0 602 (1.5) 15.0 (176) 459 (5.7) 9.8
Growth in Q1FY23 will be majorly driven by volumes. We expect gross margin to decline by 174bps to 32% owing to high technical prices
Pi Ind. 14,151 18.5 2,975 19.5 21.0 17 2,128 13.7 14.0
Domestic Business is expected to see a 5% growth YoY to Rs 4.1bn. CSM revenues are expected to grow by 25.0% to Rs 10.1bn
Rallis 7,737 4.5 1,044 (14.1) 13.5 (292) 676 (17.9) 3.5
International Business is expected to grow by 15% YoY to Rs 1.5bn. Domestic Formulation Business is expected to grow by 8% YoY to Rs 3.6bn. Seeds revenues are expected to de-grow by 5% YoY to Rs 2.6bn
Sharda Crop 7,062 13.4 1,306 14.0 18.5 10 384 1.0 4.3
Europe expected to grow by 12.0% YoY to Rs 2.8bn. NAFTA expected to grow by 15% YoY to Rs 2bn. LATAM expected to grow by 15% YoY to Rs 975mn. RoW expected to grow by 5% YoY to Rs247mn. NonAgrochemical sales expected to grow at 15% YoY to Rs 1bn
Agri Inputs
Analyst: Tejas Sonawane Tel: (+91 22) 4096 9792 Email: [email protected]

July 06, 2022 15
Company Sales EBIDTA EBITDA Margin (%) PAT EPS (Rs)
DART Comments Q1FY23E YoY (%) Q1FY23E YoY (%) Q1FY23E YoY (bps) Q1FY23E YoY (%) Q1FY23E
UPL 94,191 10.6 19,442 9.6 20.6 (19) 5,528 (27.3) 7.2
North America expected to grow by 15% YoY to Rs 14bn. India expected to grow by 12% YoY to Rs 21.4bn. Europe expected to grow by 7.0% YoY to Rs 16.3bn. Latam expected to grow by 10.0% YoY to Rs 27.6bn. Row expected to grow by 10% YoY Rs 14.9bn
Sector Aggregate 127,143 11.2 25,369 9.3 20.0 9,175 (17.9)

July 06, 2022 16
Company Sales EBIDTA EBITDA Margin (%) PAT EPS (Rs)
DART Comments Q1FY23E YoY (%) Q1FY23E YoY (%) Q1FY23E YoY (bps) Q1FY23E YoY (%) Q1FY23E
Radico 8,513 41.2 1,016 10.3 11.9 (334) 665 11.1 5.0
Volumes: +34.5% YoY (P&A +75%, Popular +20%) Realization: +11.1% YoY led by premiumisation, price hikes and mix change Gross margin: 40.3% (-725bps YoY), due to extremely high RM inflation. EBITDA margin: 11.9% (-334bps YoY)
UB 23,680 111.8 3,672 284.9 15.5 697 2,329 655.1 8.8
Volumes: +101.7% YoY Realization: +5% YoY Gross margin: 43.3% (-500bps YoY), due to extremely high RM inflation. EBITDA margin: 15.5% (+697bps YoY)
USL 22,364 38.5 3,066 66.0 13.7 227 1,705 65.1 2.3
Volumes: +22.6% YoY (P&A +30%, Popular +15%), affected by low base of Q1FY22. Realization: +13.7% YoY, led by premiumisation, price hikes and mix change. Gross margin: 40.1% (-450bps YoY), due to extremely high RM inflation. EBITDA margin: 13.7% (+227bps YoY)
Sector Aggregate 54,557 63.5 7,754 108.3 14.2 4,699 142.2
AlcoBev
VP - Research: Himanshu Shah Tel: (+91 22) 4096 9737 Email: [email protected]

July 06, 2022 17
Company Sales EBIDTA EBITDA Margin (%) PAT EPS (Rs)
DART Comments Q1FY23E YoY (%) Q1FY23E YoY (%) Q1FY23E YoY (bps) Q1FY23E YoY (%) Q1FY23E
Ashok Leyland 69,744 136.3 4,861 (446.9) 7.0 NA 1,810 (164.9) 0.6
Volume down 18% QoQ, M&HCV: LCV ratio stands at 63:37. Margin to see sharp improvement on YoY basis due to recovery in M&HCV volume
Bajaj Auto 76,618 3.7 12,106 8.1 15.8 64 10,573 (0.4) 36.5
Volume fell 7.2% YoY, Domestic: Export mix stood at 38:62. Expect OPM to contract 132bps at 15.8% due to negative operative leverage and weaker mix
Eicher 32,386 64.0 7,578 108.8 23.4 502 5,832 145.9 21.3
Volume and net ASP to remain flat QoQ. Fall in steel and other precious metal (Platinum & Palladium) prices will be positive for margin
Escorts 20,369 21.9 2,648 13.5 13.0 (95) 2,118 14.4 19.2
Tractor volume grew by 22.4 % QoQ. OPM contracted QoQ due to negative operating leverage and high discounts
Autos & Auto Ancillaries
Analyst: Abhishek Jain Tel: (+91 22) 4096 9739 Email: [email protected]

July 06, 2022 18
Company Sales EBIDTA EBITDA Margin (%) PAT EPS (Rs)
DART Comments Q1FY23E YoY (%) Q1FY23E YoY (%) Q1FY23E YoY (bps) Q1FY23E YoY (%) Q1FY23E
Hero Moto 87,652 59.7 10,781 109.4 12.3 292 7,779 112.9 39.0
Volume grew by 17% QoQ. Expect OPM to improve 115bps QoQ due to improved sales and better operating leverage
Maruti Suzuki 258,374 45.4 20,670 151.7 8.0 338 13,471 205.6 44.6
Volume down by 4.3% QoQ and we expect ASP to improve by 1% QoQ led by price hikes. Margin to see sharp improvement on YoY basis due to recovery in PV volume and better operating leverage
M&M 194,735 65.6 24,731 51.6 12.7 (117) 16,303 74.5 13.1
Tractor volume jumped by 63% QoQ, partially offset by 1.6% fall in Automotive volume. Expect OPM to expand 134 bps (QoQ) to 12.7% due to stronger mix, lower RM cost and better operating leverage
SML ISUZU 4,520 352.1 206 (221.6) 4.6 2,149 55 (116.4) 3.9
Volume jumped 31% QoQ.Expect OPM to expand on QoQ basis on account of better operating leverage

July 06, 2022 19
Company Sales EBIDTA EBITDA Margin (%) PAT EPS (Rs)
DART Comments Q1FY23E YoY (%) Q1FY23E YoY (%) Q1FY23E YoY (bps) Q1FY23E YoY (%) Q1FY23E
TVS Motor 59,139 50.3 6,150 124.6 10.4 344 3,173 280.8 6.7
Volume grew by 6% QoQ. Expect Margin to expand due to better geography mix, price hikes and operating leverages
Amara Raja Batt. 22,252 18.0 2,661 6.5 12.0 (129) 1,281 3.4 7.5
Revenue to increse 2% QoQ. OPM to expand QoQ due to favourable mix and better operating leverages
Apollo Tyres 54,983 19.9 5,993 5.7 10.9 (146) 911 (29.2) 1.6
Margin pressure to continue on negative operating leverage, increased RM basket and high energy cost in Europe
Asahi India Glass 9,557 58.4 2,479 109.4 25.9 632 1,297 267.1 5.3
Architectural glass revenue is expected to grow 8% QoQ, partially offset by 5% QoQ de-growth in Automotive division. OPM to expand led by strong margin from building glass segment

July 06, 2022 20
Company Sales EBIDTA EBITDA Margin (%) PAT EPS (Rs)
DART Comments Q1FY23E YoY (%) Q1FY23E YoY (%) Q1FY23E YoY (bps) Q1FY23E YoY (%) Q1FY23E
Balkrishna 24,180 33.4 5,368 4.7 22.2 (608) 3,660 10.5 18.9
Volumes continue to be strong, Margin to expand 116 bps QoQ due to softening freight cost
Bharat Forge 15,753 14.8 3,875 (1.0) 24.6 (393) 2,186 (4.3) 4.7
Expect revenue to de-grow QoQ due to fall in export revenue (especially muted class 8 trucks revenue). Margin is expected to contract QoQ due to weaker mix (falling revenue from International business)
CEAT 24,976 31.0 1,923 15.7 7.7 (102) 297 28.9 7.3
We expect revenue to de-grow 3.6 % QoQ due to weaker replacement demand. Margin pressure to continue due to competitive pricing in 2W tyre and elevated RM basket
Exide 32,382 30.2 3,692 41.7 11.4 92 2,090 66.7 2.5
Revenue to decrease 5% QoQ. OPM to expand due to improvement in mix, and better operating leverage

July 06, 2022 21
Company Sales EBIDTA EBITDA Margin (%) PAT EPS (Rs)
DART Comments Q1FY23E YoY (%) Q1FY23E YoY (%) Q1FY23E YoY (bps) Q1FY23E YoY (%) Q1FY23E
Jamna Auto 5,394 85.8 744 126.4 13.8 248 484 149.1 1.2
Expect 14%QoQ fall in revenue due to lower revenue from both replacement and OEMs. OPM to contract due to negative operating leverage
JBM Auto 8,656 58.3 866 53.5 10.0 (31) 360 195.7 3.0
Expect overall revenue to de-grow on QoQ basis due to lower evenue from Component, Tooling business and Bus division. OPM to be impacted due to negative operating leverage
Lumax Auto 4,049 55.4 421 160.5 10.4 419 217 535.7 3.2
Revenue to decrease by 3% QoQ due to weak 2W demand. OPM to decrease by 47bps QoQ due to rising RM cost and negative operating leverage
Lumax Inds. 4,932 57.1 481 658.6 9.8 774 234 (336.5) 25.1
Revenue to de- grow 10.2 % QoQ due to lower revenue from mold business, margin to moderate QoQ due to negative operating leverage

July 06, 2022 22
Company Sales EBIDTA EBITDA Margin (%) PAT EPS (Rs)
DART Comments Q1FY23E YoY (%) Q1FY23E YoY (%) Q1FY23E YoY (bps) Q1FY23E YoY (%) Q1FY23E
Minda Corp 8,985 60.8 857 178.3 9.5 403 449 531.7 1.9
Expect top line to reduce by 5% QoQ, due to lower volume in 2W segment, OPM to be under pressure due to high RM cost
RK Forging 5,949 42.6 1,206 25.4 20.3 (277) 323 31.3 2.0
Revenue to de-grew 13% QoQ due to fall in steel prices. Margins to remain under pressure QoQ due to weak export numbers
Sandhar Tech 6,907 68.4 635 104.5 9.2 162 230 989.9 3.8
Sales by its key clients like Hero and TVS will lead to increase in revenue. Margin under pressure due to negative operating leverage
Sterling Tools 1,316 47.8 195 50.6 14.8 28 98 118.4 4.1
Expect 5% QoQ fall in revenue led by weaker demand in the 2W segment partially offset by increase in revenue from CV and EV segment. OPM expand 211bps QoQ due to lower steel prices

July 06, 2022 23
Company Sales EBIDTA EBITDA Margin (%) PAT EPS (Rs)
DART Comments Q1FY23E YoY (%) Q1FY23E YoY (%) Q1FY23E YoY (bps) Q1FY23E YoY (%) Q1FY23E
Subros 6,402 33.3 531 98.4 8.3 272 195 526.6 3.0
Revenue to grow 33.3% YoY due to recovery in PVs volume. OPM to improve QoQ due to better operating leverage
Suprajit Eng. 6,975 92.9 969 97.0 13.9 29 618 128.3 4.4
Revenue to increase QoQ on account of higher revenue from core Automotive cable and non-Automotive business. LDC business revenue will also be added to the topline from Q1FY23 onwards. OPM to contract QoQ due to weaker mix
Varroc Eng. 15,694 (46.6) 1,067 NA 6.8 670 (71) (96.9) -0.5
Revenue to fall YoY due to sell of its VLS business, margin continue to be under pressure due to fall in volume of Bajaj Auto
NRB Bearings 2,301 14.3 311 16.1 13.5 21 148 (8.9) 1.6 Domestic and export revenue expected to fall resulting in 10% QoQ decrese in topline

July 06, 2022 24
Company Sales EBIDTA EBITDA Margin (%) PAT EPS (Rs)
DART Comments Q1FY23E YoY (%) Q1FY23E YoY (%) Q1FY23E YoY (bps) Q1FY23E YoY (%) Q1FY23E
GNA Axles 3,046 (7.4) 396 (27.3) 13.0 (356) 181 (38.4) 8.4
Revenue to increase 1.4% QoQ basis due to higher domestic revenue, partially offset by weak export revenue led by fall in demand for Class 8 trucks. Margin to decrease by 17bps on QoQ basis due to negative operating leverage
Craftsman Auto 6,090 39.9 1,431 32.8 23.5 (126) 511 112.9 24.2
Revival in M&HCV and tractor segment to improve performance in Q1. However, OPM to be under pressure due to rising RM cost
MM Forging 2,901 20.0 456 0.8 15.7 (299) 176 (23.1) 7.3
Revenue to de-grow 10% QoQ due to fall in export revenue. Margins to remain under pressure QoQ due to weaker mix
Sector Aggregate 1,077,217 42.6 126,289 64.8 11.72 76,989 95.1

July 06, 2022 25
Banks NII PPoP PAT EPS (Rs)
DART Comments Q1FY23E YoY (%) Q1FY23E YoY (%) Q1FY23E YoY (%) Q1FY23E
Axis Bank 91,490 17.9 56,646 (11.7) 34,928 61.7 11.4
Loan growth to remain healthy at 3-4% QoQ /19% YoY, with sequentially stable NIM at 3.5%. The bank could have higher MTM hit vs peers due to higher AFS duration, hurting PPoP metrics. Higher opex will also impact core PPoP. Contained slippage ratio at ~2.3-2.4% and resultant low credit costs to aid RoAs
BOB 89,437 13.3 53,751 (5.8) 13,392 10.8 2.6
Advances to grow at ~2% QoQ, but 19% YoY off a low base. NIM expected to be stable to improving QoQ at ~3%. MTM losses to impact profits for the quarter, even as core PPoP remains healthy. Slippages likely to be at 2%. Slippages from restructured/MSME book remains a monitorable
Canara 71,003 15.3 52,907 (3.5) 12,600 7.0 6.9
Loan growth expected to be at 2-3% QoQ. Slippages could be at ~3% as Future group is yet to be recognized as NPA. Delinquencies from MSME/restructured book remain monitorable. Margins expected to be stable QoQ at ~2.75-2.8%. MTM losses likely to be lowest amongst peers. Healthy income from sale of PSLC certificates will aid RoAs
CUB 5,184 15.8 3,542 (7.5) 1,870 8.1 2.5
Reported loan growth to strengthen at 15% YoY/3.5% QoQ driven by increasing WC utilization. NIM likely to be stable to declining QoQ led by stiff price competition. New customer addition remains a monitorable. Credit costs to moderate sequentially, with contained slippages at 2-2.5%
BFSI
VP - Research: Mona Khetan Tel: (+91 22) 4096 9762 Email: [email protected]

July 06, 2022 26
Banks NII PPoP PAT EPS (Rs)
DART Comments Q1FY23E YoY (%) Q1FY23E YoY (%) Q1FY23E YoY (%) Q1FY23E
CSB 3,099 15.7 1,175 (34.6) 952 56.0 5.5
Reported loan growth at 2% QoQ, 16% YoY, was led by gold portfolio (up 8% QoQ). Margins likely to remain over 5%, high MTM loss to hurt PPoP. Provisions will continue to benefit from gold recoveries, aiding negative credit costs. Slippage ratio to remain at sub 1.5%.
DCB 3,817 23.6 1,906 (5.3) 1,072 217.6 3.4
NIM to decline QoQ led by a higher base (strong recoveries in Q4 benefitted NIM). Loan growth to strengthen to 18% YoY and 3-4% QoQ. Slippages to moderate sequentially but remain slightly higher at ~3.5% owing to higher delinquencies from gold book.
Federal 15,710 10.8 8,900 (21.6) 5,705 55.3 2.7
Loan growth to improve to 15% YoY/2-3% QoQ. Expect slippages of ~1.2% for the quarter. NIM likely to be stable QoQ at ~3.1-3.2%. Impact of MTM losses is likely to be marginal for Federal, which is also offset by lower opex (family pension provisions upfronted in Q4FY22).
HDFC Bank 191,474 12.6 155,945 3.0 97,092 25.6 17.5
Reported loan growth was healthy 22% YoY and 2% QoQ. NIM should be stable QoQ at 4%, as impact of decline in C-D ratio is offset by rise in share of high yielding assets. MTM losses and elevated opex to limit PPoP growth to single digit YoY. Softer provisions to aid PAT. Slippages to rise QoQ to ~1.4-1.5% led by seasonally higher agri slippages.

July 06, 2022 27
Banks NII PPoP PAT EPS (Rs)
DART Comments Q1FY23E YoY (%) Q1FY23E YoY (%) Q1FY23E YoY (%) Q1FY23E
ICICI Bank 131,181 20.0 102,248 15.0 68,848 49.2 9.9
Expect strong growth at 4% QoQ/21% YoY. NIM to be stable QoQ at 4% as impact of higher C-D ratio is offset by a large upgrade in Q4FY22. Core PPoP expected to grow at over 20% YoY, though PPoP will be impacted by MTM losses. Slippages to be at sub 2%, with credit costs below long-term trends
Indian Bank 43,894 9.9 26,267 (24.3) 7,270 (38.5) 6.4
Factor in loan growth of 2-3% QoQ /10% YoY. NIM to remain stable QoQ. Slippages expected at ~2.5-2.7%, with lower credit costs QoQ. Slippages from restructured/MSME book remains a monitorable. MTM losses to impact RoAs, core PPoP improves QoQ as the bank up-fronted pension provisions in Q4FY22
Indusind 41,822 17.4 31,227 (2.0) 11,762 15.8 15.2
Slippages to moderate to around 3-3.5% levels, with credit costs at ~2.5%. The bank reported strong growth trends at 4.5% QoQ and 18% YoY. NIM may continue to expand to 4.25-4.3%, benefitting from higher CD ratio and increased of higher yielding assets
Kotak Mah Bank 46,520 18.0 29,860 3.3 21,488 30.9 10.8
Loan growth to remain strong at over 4% QoQ, 24% YoY. NIM may be marginally lower QoQ, impacted by lower CD ratio and rising share of TDs in deposit mix. Slippages to be at 1-1.3%, low credit costs to aid RoAs. The bank may continue write back residual COVID provisioning buffers (at Rs5.5bn currently)

July 06, 2022 28
Banks NII PPoP PAT EPS (Rs)
DART Comments Q1FY23E YoY (%) Q1FY23E YoY (%) Q1FY23E YoY (%) Q1FY23E
RBL Bank 11,109 14.6 6,259 (22.5) 2,081 NA 3.5
We build in loan growth of 2-3% QoQ and 9% YoY. NIM expected to moderate to 4.5% in the absence of one-off (in Q4FY22). Slippages to be at ~3.5%, credit costs to moderate QoQ to ~2.5%
SBI 324,228 17.3 157,921 (16.8) 77,343 18.9 8.7
Loan growth to strengthen to 14% YoY, 1.5-2% QoQ. NIMs could benefit from repricing of T-bill linked loans (at 11%). High MTM losses to hurt PPoP, though core PPoP remains stable QoQ. Slippages to be higher ~1.3-1.5% due lack of netting off with previous quarter slippages in Q1. Decline in credit costs will aid RoAs
Sector Aggregates 1,069,968 16 688,552 (6) 356,405 30
July 06, 2022 29
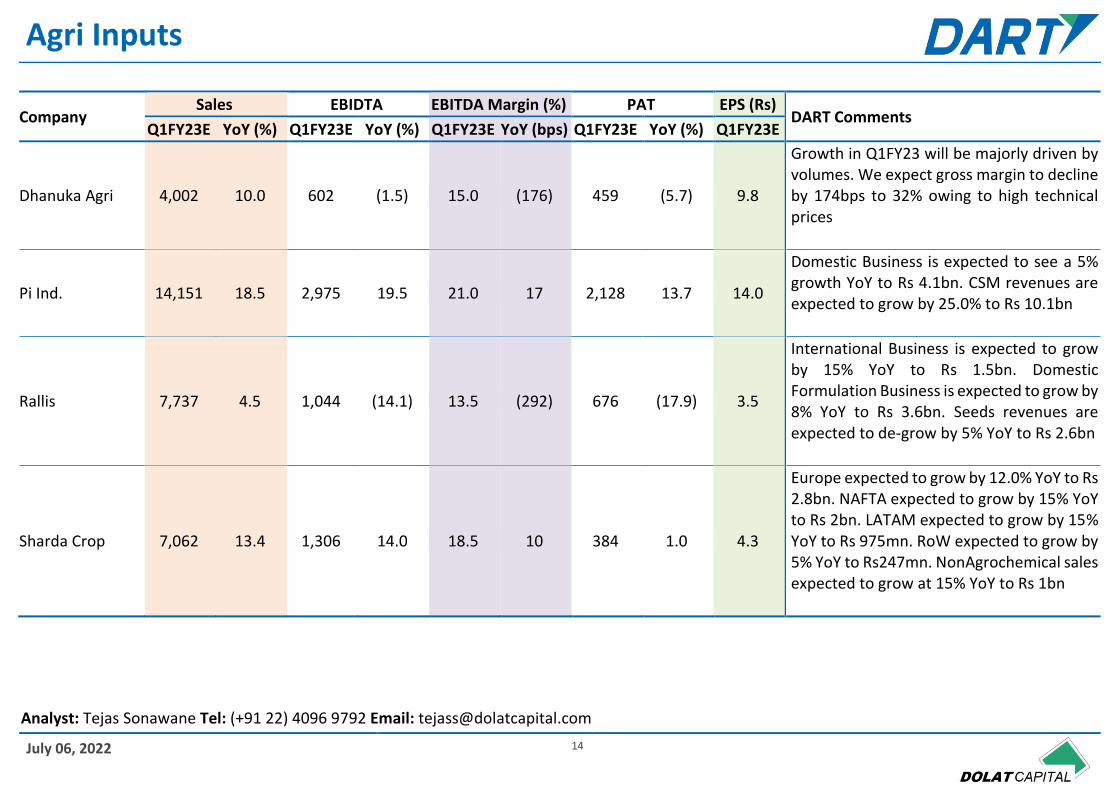
Company Sales EBIDTA EBITDA Margin (%) PAT EPS (Rs)
DART Comments Q1FY23E YoY (%) Q1FY23E YoY (%) Q1FY23E YoY (bps) Q1FY23E YoY (%) Q1FY23E
ACC *# 43,610 12.3 5,885 (32.3) 13.5 (888) 3,446 (39.5) 18.4
Volume +7.0% YoY (-5.1% QoQ), Realization +5.0% QoQ (+3.4% YoY), EBITDA/tn -36.7% YoY (-2.3% QoQ) to Rs804
Ambuja * 37,980 12.7 7,040 (26.6) 18.5 (993) 8,275 14.4 4.2
Volume +7.0% YoY (-8.3% QoQ), Realization +5.5% QoQ (+5.3% YoY), EBITDA/tn -31.4% YoY (-2.9% QoQ) to Rs1,025
Birla Corp # 21,485 22.8 2,761 (19.7) 12.8 (680) 719 (49.2) 9.3
Volume +15.0% YoY (-9.1% QoQ), Realization +5.0% QoQ (+7.8% YoY), EBITDA/tn -29.5% YoY (+9.1% QoQ) to Rs704
Dalmia Bharat # 33,751 30.5 6,079 (14.7) 18.0 (955) 1,788 (35.5) 9.5
Volume +30.0% YoY (-3.2% QoQ), Realization +3.2% QoQ (+0.4% YoY), EBITDA/tn -34.4% YoY (-8.0% QoQ) to Rs956
* Dec end, # Consolidated
Cement
VP - Research: Shravan Shah Tel: (+91 22) 4096 9749 Email: [email protected]

July 06, 2022 30
Company Sales EBIDTA EBITDA Margin (%) PAT EPS (Rs)
DART Comments Q1FY23E YoY (%) Q1FY23E YoY (%) Q1FY23E YoY (bps) Q1FY23E YoY (%) Q1FY23E
Heidelberg Cement
5,643 1.5 839 (36.0) 14.9 (872) 398 (42.0) 1.8
Volume -7.0% YoY (-10.8% QoQ), Realization +2.0% QoQ (+9.1% YoY), EBITDA/tn -31.2% YoY (-20.7% QoQ) to Rs762
JK Cement 21,623 32.4 3,884 (2.8) 18.0 (649) 1,798 (13.7) 23.3
Blended Volume +18.6% YoY (-8.9% QoQ), Blended Realization +11.6% YoY (+4.6% QoQ). Grey/ White volume +16.2%/ +43.5% YoY (-9.4%/ -4.0% QoQ). Grey/ White Realization +6.0%/ -2.5% QoQ (+11.7%/ +0.3% YoY). EBITDA/tn -18.0% YoY (+11.4% QoQ) to Rs1,084
JK Lakshmi Cement #
15,499 16.9 2,786 7.8 18.0 (151) 1,350 (0.8) 11.5
Volume +8.0% YoY (-7.3% QoQ), Realization +4.5% QoQ (+8.3% YoY), EBITDA/tn -0.1% YoY (-7.5% QoQ) to Rs913
Nuvoco vistas corporation #
25,890 17.5 3,165 (38.5) 12.2 (1,112) (168) (114.7) (0.5)
Volume +13.0% YoY (-14.3% QoQ), Pure realization +4.4% QoQ (+1.6% YoY), EBITDA/tn -45.5% YoY (-13.1% QoQ) to Rs667
* Dec end, # Consolidated

July 06, 2022 31
Company Sales EBIDTA EBITDA Margin (%) PAT EPS (Rs)
DART Comments Q1FY23E YoY (%) Q1FY23E YoY (%) Q1FY23E YoY (bps) Q1FY23E YoY (%) Q1FY23E
Sagar Cement # 5,013 27.7 555 (48.2) 11.1 (1,622) (74) (114.4) (0.6)
Volume +25.0% YoY (-2.5% QoQ), Realization +2.5% QoQ (+2.2% YoY), EBITDA/tn -58.6% YoY (-6.8% QoQ) to Rs505
Shree Cement 39,251 13.8 8,832 (12.9) 22.5 (688) 4,720 (28.7) 130.8
Volume +6.0% YoY (-9.7% QoQ), Realization +6.0% QoQ (+7.3% YoY), EBITDA/tn -17.8% YoY (+7.4% QoQ) to Rs1,218
Star Cement # 6,241 22.1 922 (0.5) 14.8 (336) 525 (22.8) 1.3
Volume +22.0% YoY (-19.5% QoQ), Realization +3.5% QoQ (+0.1% YoY), EBITDA/tn -18.4% YoY (+1.1% QoQ) to Rs995
The Ramco Cement
16,318 32.8 2,606 (28.4) 16.0 (1,366) 857 (49.3) 3.6
Volume +38.0% YoY (-7.4% QoQ), Realization +2.5% QoQ (-3.1% YoY), EBITDA/tn -48.1% YoY (-4.6% QoQ) to Rs882
Ultratech Cement #
148,791 25.8 29,027 (12.2) 19.5 (845) 14,913 (12.4) 51.7
Volume +15.6% YoY (-10.1% QoQ), Realization +5.0% QoQ (+8.8% YoY), EBITDA/tn -24.1% YoY (+5.1% QoQ) to Rs1,166
Sector Aggregate 421,095 21.3 74,380 (18.0) 17.7 38,546 (21.2)
* Dec end, # Consolidated

July 06, 2022 32
Company Sales EBIDTA EBITDA Margin (%) PAT EPS (Rs)
DART Comments Q1FY23E YoY (%) Q1FY23E YoY (%) Q1FY23E YoY (bps) Q1FY23E YoY (%) Q1FY23E
Aarti Ind 18,500 40.5 3,432 9.4 18.6 (528) 1,805 9.3 5.0
Commodity mix of 80:20. Specialty chemicals expected sales of Rs 15bn, up 22.2% YoY.Pharmaceutical expected sales: Rs 3.5bn, up 27% YoY
Atul 14,500 34.2 2,762 17.0 19.0 (281) 1,869 12.6 63.2
Life Science sales expected to grow by 13.5% YoY to Rs 4bn. Performance chemicals sales are expected to grow by 37.4% YoY to Rs 10.4bn. We expect gross margin contraction of ~252bps YoY owing to high crude oil prices. (Avg crude oil prices up by 64.4% YoY in Q1FY23)
Deepak Nitrite 18,700 22.5 4,095 (9.3) 21.9 (768) 2,670 (11.8) 19.6
Basic Chemicals expected to see a sequential dip of 5% to Rs 3.8bn. Fine & Specialty Chemicals is expected to grow by 8% QoQ to Rs 2.5bn. Performance Products sales are expected to decline by 15% sequentially to Rs 1.4bn on the back of corrrection in end product prices. Phenolics Business will remain flattish QoQ at Rs 11bn
Chemicals
Analyst: Tejas Sonawane Tel: (+91 22) 4096 9792 Email: [email protected]

July 06, 2022 33
Company Sales EBIDTA EBITDA Margin (%) PAT EPS (Rs)
DART Comments Q1FY23E YoY (%) Q1FY23E YoY (%) Q1FY23E YoY (bps) Q1FY23E YoY (%) Q1FY23E
Navin Fluorine 4,012 22.9 953 22.6 23.8 (6) 668 19.5 13.5
Referigerant gases expected to grow by 52% YoY to Rs 850mn. Inorganic Fluorides expected to grow by 19% YoY to Rs 700mn. Specialty Chemicals expected to grow by 40% YoY to Rs 1.9bn. CRAMS revenues are expected to de-grow by 10% YoY to Rs 600mn
Sudarshan Chemicals
5,181 10.0 621 0.2 12.0 (117) 248 (5.4) 3.6
Volumes for the quarter are expected to be weak owing to the ongoing shipping and logistical challenges. Gross margins are expected to decline by 204bps YoY as inflationary raw material pricing pressure continues
SRF Ltd 34,445 27.6 8,648 30.2 25.1 49 5,143 30.1 17.4
Chemicals business expected to grow by 43.7% YoY to Rs 16.0bn Packaging films expected to grow by 20.0% YoY to Rs 12.5bn Technical textiles to remain flat QoQ at ~Rs 5bn. Ref gas revenues will continue to see high growth owing to the ongoing pricing tailwinds driven by supply demand mis-match

July 06, 2022 34
Company Sales EBIDTA EBITDA Margin (%) PAT EPS (Rs)
DART Comments Q1FY23E YoY (%) Q1FY23E YoY (%) Q1FY23E YoY (bps) Q1FY23E YoY (%) Q1FY23E
Vinati Organics 5,148 33.2 1,492 46.9 29.0 270 1,026 26.8 10.0
We expect ATBS sales to improve in Q1FY23 contributing ~53% of total sales with a sequential growth of 10.0%. Iso Butyl Benzene (IBB) sales are expected to remain soft with a sequential jump of 8.0%. We expect gross margins to remain flattish YoY as Acrylonitrile prices continue to remain at elevated levels
Sector Aggregate 100,486 28.7 22,003 15.4 21.9 13,429 12.7
July 06, 2022 35
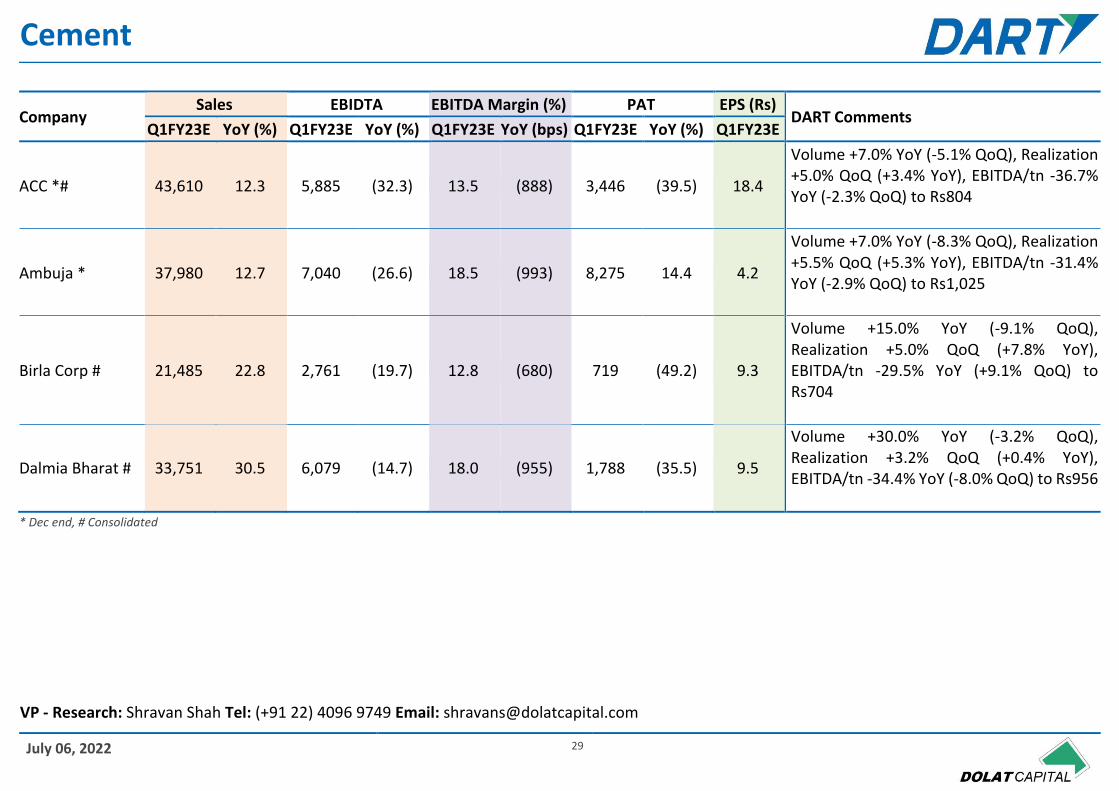
Company Sales EBIDTA EBITDA Margin (%) PAT EPS (Rs)
DART Comments Q1FY23E YoY (%) Q1FY23E YoY (%) Q1FY23E YoY (bps) Q1FY23E YoY (%) Q1FY23E
Bajaj Consumer 2,049 (4.8) 357 (31.9) 17.4 (690) 353 (27.7) 2.4
We anticipate volumes de-growth mainly due to rural slowdown and down-trading; ~7% price hikes to support revenue. Margins expected to remain under pressure due to persistent inflation in RM
Britannia 39,068 14.8 6,171 11.4 15.8 (48) 4,282 9.9 17.7
Aggressive pricing actions of ~10% to aid revenue growth in Q4 and Q1, translating to revenue growth of 15% . Volume growth is likely to remain muted. Margins to remain impacted due to 20%+ inflation in RM
Colgate 12,592 8.0 3,975 11.9 31.6 110 2,684 15.1 9.9
Expect ~5-6% price growth and low single digit volume growth. Increase in A&SP spends may impact margins. Market share gain is a key to watch
Dabur India 27,881 6.8 5,312 (3.8) 19.1 (209) 4,146 (5.2) 2.3
Domestic revenue to driven by ~4-5% volume growth. IB is likely to report high single digit CC growth. F&B is expected to report double digit growth while home and personal care would post high single digit growth. Margins to be impacted by high input cost and decline in healthcare portfolio
Consumer Staples
VP - Research: Sachin Bobade Tel: (+91 22) 4096 9731 Email: [email protected]

July 06, 2022 36
Company Sales EBIDTA EBITDA Margin (%) PAT EPS (Rs)
DART Comments Q1FY23E YoY (%) Q1FY23E YoY (%) Q1FY23E YoY (bps) Q1FY23E YoY (%) Q1FY23E
Emami 7,270 10.0 1,759 3.6 24.2 (148) 938 20.6 2.0
Expect low double digit growth in Q1. Price hikes (6-7% avg) would help mitigate RM inflation; new product launches would help incremental revenue growth
GCPL 31,094 7.4 5,091 (15.1) 16.4 (435) 3536 (14.9) 3.5
Domestic business is expected to post 10-11% growth led by 7-8% price increases. High single digit revenue degrowth expected in Indonesia. GM to remain impacted due to cost inflation. Hair Care to witness strong growth while HI likely to report muted performance
HUL 141,004 18.3 33,129 16.4 23.5 (40) 23,144 10.9 9.8
We anticipate +26/10/10% revenue growth in Home care/personal care/F&R divisions respectively. Price hikes (10%+) in select categories would restrict margin erosion
ITC 164,906 24.5 55,956 25.9 33.9 39 41,496 24.1 3.4
Cigarette business likely to witness improvement in volume growth; Agri business would post high double digit growth driven by inflation; Margins in FMCG are expected to remain muted
July 06, 2022 37
Company Sales EBIDTA EBITDA Margin (%) PAT EPS (Rs)
DART Comments Q1FY23E YoY (%) Q1FY23E YoY (%) Q1FY23E YoY (bps) Q1FY23E YoY (%) Q1FY23E
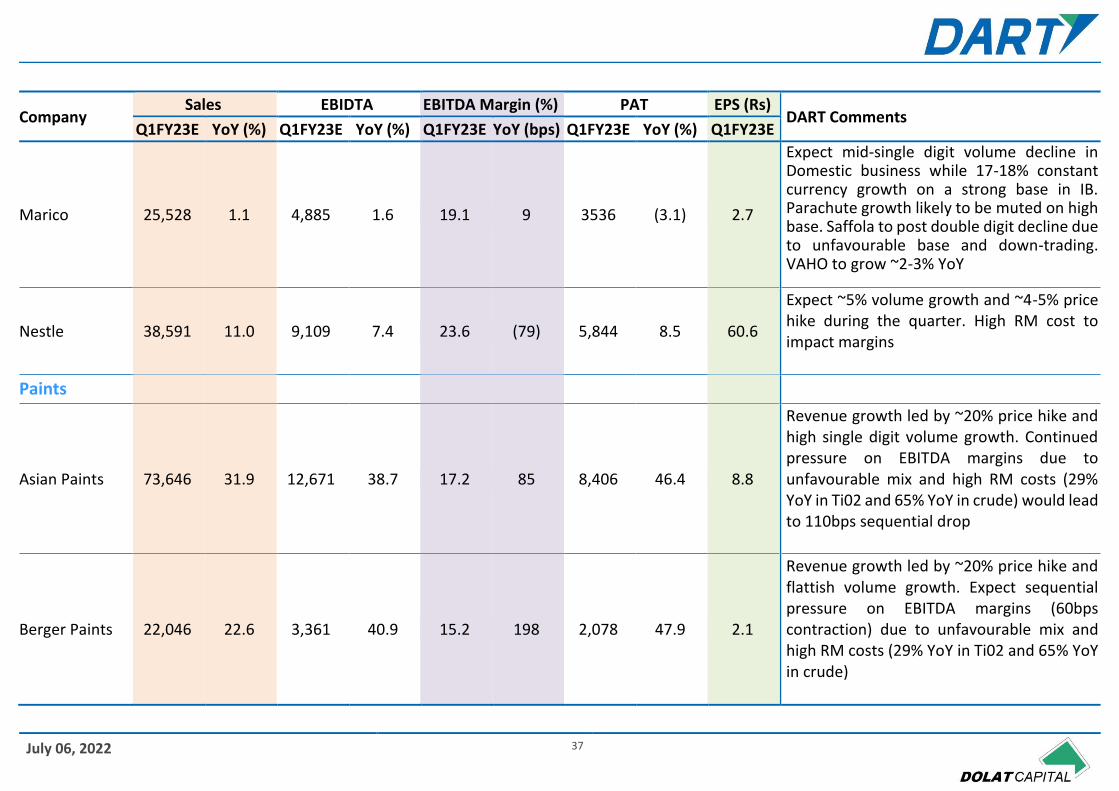
Marico 25,528 1.1 4,885 1.6 19.1 9 3536 (3.1) 2.7
Expect mid-single digit volume decline in Domestic business while 17-18% constant currency growth on a strong base in IB. Parachute growth likely to be muted on high base. Saffola to post double digit decline due to unfavourable base and down-trading. VAHO to grow ~2-3% YoY
Nestle 38,591 11.0 9,109 7.4 23.6 (79) 5,844 8.5 60.6
Expect ~5% volume growth and ~4-5% price hike during the quarter. High RM cost to impact margins
Paints
Asian Paints 73,646 31.9 12,671 38.7 17.2 85 8,406 46.4 8.8
Revenue growth led by ~20% price hike and high single digit volume growth. Continued pressure on EBITDA margins due to unfavourable mix and high RM costs (29% YoY in Ti02 and 65% YoY in crude) would lead to 110bps sequential drop
Berger Paints 22,046 22.6 3,361 40.9 15.2 198 2,078 47.9 2.1
Revenue growth led by ~20% price hike and flattish volume growth. Expect sequential pressure on EBITDA margins (60bps contraction) due to unfavourable mix and high RM costs (29% YoY in Ti02 and 65% YoY in crude)

July 06, 2022 38
Company Sales EBIDTA EBITDA Margin (%) PAT EPS (Rs)
DART Comments Q1FY23E YoY (%) Q1FY23E YoY (%) Q1FY23E YoY (bps) Q1FY23E YoY (%) Q1FY23E
Indigo Paints 1,997 28.0 284 40.9 14.2 130 168 44.5 3.5
Price hikes of ~20% and mid-single digit volume growth in Emulsion category would drive revenue growth. We are estimating 440bps sequential EBITDA margin drop due to high costs and unfavorable product mix
Kansai Nerolac 16,249 15.8 1,248 (34.5) 7.7 (590) 631 (43.4) 1.2
Revenue growth led by ~20% overall price increase. High RM costs and brand investments will continue to impact margins YoY, however, 220bps sequential margin improvement due to favorable base and increase in decorative business contribution
Pidilite 23,231 19.9 3,797 9.3 16.3 (160) 2,377 8.0 4.7
~10-15% price hike implemented to partially mitigate surge in VAM prices and support margins; we anticipate mid-single digit volume growth in Q1
Luxury
Titan 86,422 166.0 11,041 666.7 12.8 834 7832 1,183.9 8.8
Expect Jewellery/ Watches/ Eyewear to register ~+162%/+158%/+176% YoY growth respectively. Favourable base and network expansion to boost Jewellery sales. We expect Jewellery EBIT margin of ~12.5% due to better operating leverage

July 06, 2022 39
Company Sales EBIDTA EBITDA Margin (%) PAT EPS (Rs)
DART Comments Q1FY23E YoY (%) Q1FY23E YoY (%) Q1FY23E YoY (bps) Q1FY23E YoY (%) Q1FY23E
Footwear
Bata 6,943 160.0 1,611 NM 23.2 NM 615 (186.2) 4.8
Strong revenue growth on favourable base, opening of schools and offices and store expansion. Price hike of ~15% on portfolio and better operating leverage are likely to support margins
Relaxo 7,258 46.0 1,157 74.9 15.9 264 658 112.6 2.6
We anticipate ~20-25% price hike and unfavourable base to support topline. Performance of open footwear on unfavorable base is a key to watch
Innerwear
Page Industries 11,285 125.0 2,641 672.2 23.4 1,659 1861 1,599.8 166.9
Expect revenue growth to be driven by price hikes and higher sales of new launches; margins to remain muted due to high RM prices
QSR
JFL 12,130 38.0 3,075 45.4 25.4 129 1,276 87.3 9.7
We anticipate high single digit SSSG for the quarter. Dine in segment is likely to post strong growth

July 06, 2022 40
Company Sales EBIDTA EBITDA Margin (%) PAT EPS (Rs)
DART Comments Q1FY23E YoY (%) Q1FY23E YoY (%) Q1FY23E YoY (bps) Q1FY23E YoY (%) Q1FY23E
Devyani International
6,173 75.0 1,496 143.0 0 539 NA 0.4
We expect high growth on a favorable base with double digit SSSG; Margins expected to remain under pressure due to delayed price pass on
Sapphire Foods 5,152 70.0 1,004 194.5 19.5 823 296 (212.2) 0.8
We expect strong growth on favorable base; store addition would help the revenue growth; margins are expected to improve on low base
Westlife Development
4,665 80.0 629 2,416.8 13.5 1,252 142 (142.4) 0.9
We expect strong growth on favorable base; store addition would help the revenue growth; margins are expected to improve on low base
Restaurants Brands Asia (Burger King)
4,192 180.0 324 2,008.9 7.7 670 (524) 18.2 (1.1)
Expect strong tripple digit growth with Indonesia business acquisition, sustained delivery momentum and improvement in Dine-in business. Expect margin contraction mainly due to high A&SP spends
Sector Aggregate 759,383 27.7 166,734 26.9 22.0 113,811 26.8

July 06, 2022 41
Company Sales EBIDTA EBITDA Margin (%) PAT EPS (Rs)
DART Comments Q1FY23E YoY (%) Q1FY23E YoY (%) Q1FY23E YoY(bps) Q1FY23E YoY (%) Q1FY23E
Indian Hotels 11,263 226.9 3,459 (332.4) 30.7 7,390 1,704 (152.9) 1.4
Standalone Occupancy: 65.3% vs 28.4% YoY ARR: Rs 11,941 vs. Rs 7,024 (+70% YoY) RevPAR: Rs 7,800 vs. Rs1,992 (+291.6% YoY)
Lemon Tree 1,808 328.9 839 LTP 46.4 4,658 -94 (76.6) 0.12
Occupancy: 62.2% vs. 29.6% YoY ARR: Rs 4,606 vs. Rs 2,362 (+95% YoY) RevPAR: Rs 2,863 vs. Rs 699 (+309.5% YoY)
Chalet Hotels 2,558 267.9 1,079 LTP 42.2 LTP 336 LTP 1.6
Occupancy: 79.2% vs. 36% YoY and 75.1% in Q1FY20 ARR: Rs 7,270 vs. Rs 3,523 (+106.4% YoY) and Rs 8,078 (90% of Q1FY20) RevPAR: Rs 5,755 vs. Rs 1,252 (+359.7% YoY) and Rs 6,070 (95% of Q1FY20)
Mahindra Holidays
2,797 42.2 639 20.8 22.9 (405) 307 1.5 1.5
Rooms: 4,668 (+11.2% YoY) Occupancy: 83% vs. 51% YoY Member adds: ~500 QoQ
Sector Aggregate 18,419 182.1 6,010 (674.9) 32.6 2,254 (160.4) Source: DART
Hotels
VP - Research: Himanshu Shah Tel: (+91 22) 4096 9737 Email: [email protected]

July 06, 2022 42
Company Sales EBIDTA EBITDA Margin (%) PAT EPS (Rs)
DART Comments Q1FY23E YoY (%) Q1FY23E YoY (%) Q1FY23E YoY (bps) Q1FY23E YoY (%) Q1FY23E
Ahluwalia 6,675 15.1 669 10.8 10.0 (39) 381 9.5 5.7
Rs12.7 bn/ Rs7.13 bn order inflow of in FY22/ YTDFY23, 2.1x OB/revenue. Growth driven by pick up in execution
Dilip Buildcon 20,893 (2.7) 2,369 (16.2) 11.3 (184) (125) - (0.9)
Rs65.0 bn/ Rs38.1 bn order inflow in FY22/ YTDFY23, 3.1x OB/revenue. Another net loss due to higher operating expenses leading to contraction in EBITDA Margin. Improvement in execution/ margin and debt reduction are key variables to watch
GR Infra 19,289 (9.6) 2,923 (15.4) 15.2 (104) 1,514 (25.6) 15.7
Rs89.4 bn/ nil order inflow of in FY22/ YTDFY23, 2.4x OB/revenue. Sharp decline in APAT due to lower execution coupled with reduction in EBITDA margin
HG Infra 10,390 14.0 1,582 6.5 15.2 (107) 888 (0.2) 13.6
Rs43.3 bn/ Rs43.7 bn order inflow in FY22/ YTDFY23, 3.0x OB/ revenue. APAT flattish due to reduction in EBITDA margin despite better execution. Monetization of 3 HAM and pick up in execution in new projects are key variable to watch
Infrastructure
VP - Research: Shravan Shah Tel: (+91 22) 4096 9749 Email: [email protected]

July 06, 2022 43
Company Sales EBIDTA EBITDA Margin (%) PAT EPS (Rs)
DART Comments Q1FY23E YoY (%) Q1FY23E YoY (%) Q1FY23E YoY (bps) Q1FY23E YoY (%) Q1FY23E
J Kumar Infra 8,145 20.7 1,149 18.8 14.1 (22) 393 22.4 5.2
Rs36.9 bn/ Rs10.7 bn order inflow in FY22/ YTDFY23, 3.3x OB/revenue. YoY growth is driven by improved execution across projects
KNR Const 8,139 10.0 1,520 6.1 18.7 (69) 849 16.3 3.0
Rs46.4 bn/ nil order inflow in FY22/ YTDFY23, 2.4x OB/revenue. Growth led by pick up in excecution. Pick up in execution in new projects key to track
NCC 23,100 22.0 2,195 9.9 9.5 (105) 537 3.8 0.9
Rs99.2 bn/ Rs63.9 bn order inflow in FY22/ YTDFY23, 3.9x OB/revenue. Higher finance cost couple with reduction in EBITDA margin restricts APAT growth
PNC Infratech 14,750 17.9 2,192 25.0 14.9 84 1,024 9.7 4.0
Rs81.1 bn/ nil order inflow in FY22/ YTDFY23, 2.0x OB/revenue. Core EBITDA margin (adjusting early completion bonus of Rs370mn) down 135bps YoY to 12.7%
PSP Projects 4,033 27.1 494 25.3 12.2 (17) 288 14.8 9.2
Rs18.0 bn/ Rs11.6 bn order inflow in FY22/ YTDFY23, 2.7x OB/revenue. Healthy performance led by pick up in execution
Sector Aggregate 115,414 8.4 15,094 1.2 13.1 5,748 (9.1)

July 06, 2022 44
Company Sales EBIT EBIT Margin (%) PAT EPS (Rs)
DART Comments Q1FY23E YoY (%) Q1FY23E YoY (%) Q1FY23E YoY (bps) Q1FY23E YoY (%) Q1FY23E
IT Large cap
TCS 524,873 15.6 125,822 8.6 24.0 (155) 98,732 9.6 27.0
Expect 3.6% CC QoQ growth, OPM to decline by 100bps to 24%, PAT to decline by 0.5% QoQ, due to impact of wage hikes and cross currency headwinds
Infosys 338,918 21.5 70,118 6.2 20.7 (298) 56,071 7.9 13.4
Expect 2.8% QoQ in USD terms lead by strong perform. across verticals. OPM expected to decline by 85bps QoQ due to wage hike partly offset by Fx gains.PAT expected to decline by 1.4% QoQ basis on higher ETR
HCL Tech 236,062 17.6 41,324 5.1 17.5 (208) 35,905 11.7 12.3
Expect 2.6% CC growth, OPM to decline by 50bps from higher investment, PAT decline limited at 0.1% QoQ
Wipro 216,307 16.4 35,375 1.9 16.4 (233) 29,460 (8.9) 5.4
Expect revenue growth of 2.9% in CC terms QoQ inline with Qtly guidance of 1%-3%. OPM for IT Services likely to decline by 39bps to 16.4% QoQ due to re-investments in talent, travel.PAT expected to decline by 4.6% QoQ, on ETR normalization
IT and Digital Services
VP - Research: Rahul Jain Tel: (+91 22) 4096 9771 Email: [email protected]

July 06, 2022 45
Company Sales EBIT EBIT Margin (%) PAT EPS (Rs)
DART Comments Q1FY23E YoY (%) Q1FY23E YoY (%) Q1FY23E YoY (bps) Q1FY23E YoY (%) Q1FY23E
TECHM 125,904 23.5 14,857 (3.9) 11.8 (335) 12,662 (6.4) 14.2
Expect rev. growth of 2.9% QoQ in CC terms by sustained deal rampup. Expect OPM decline by ~144bps QoQ on wage hikes, Visa costs & supply side challenges. PAT expected to decline by 15.9% QoQ, on unfavourable Fx & normalised ETR of 26%
LTI 45,065 30.2 7,255 27.7 16.1 (31) 6,031 21.5 34.4
Expect 3.0% QoQ CC growth on Q1 being historically soft quarter, expect net decline of 121bps in EBIT on wage hikes, visa, offset by currency gains. PAT to decline by 5.3% QoQ
IT Mid Cap
Mphasis 34,195 27.1 5,090 19.2 14.9 (99) 3,921 15.4 20.9
Expect 3.5% QoQ growth in CC terms led by sustained traction in Direct channel. Expect OPM decline of ~26bps QoQ on increased investment in talent/travel. PAT is expected to remain flat on QoQ basis on weaker OI
Mindtree 30,025 31.0 5,474 34.7 18.2 50 4,501 31.1 27.3
Expect modest 3.2% CC growth, due to rampdown in RCM clients.Expect EBIT margins to decline by 71bps, due to return of travel &visa/normalization costs. PAT to decline by 4.9% QoQ, due to lower gains in OI.
July 06, 2022 46
Company Sales EBIT EBIT Margin (%) PAT EPS (Rs)
DART Comments Q1FY23E YoY (%) Q1FY23E YoY (%) Q1FY23E YoY (bps) Q1FY23E YoY (%) Q1FY23E
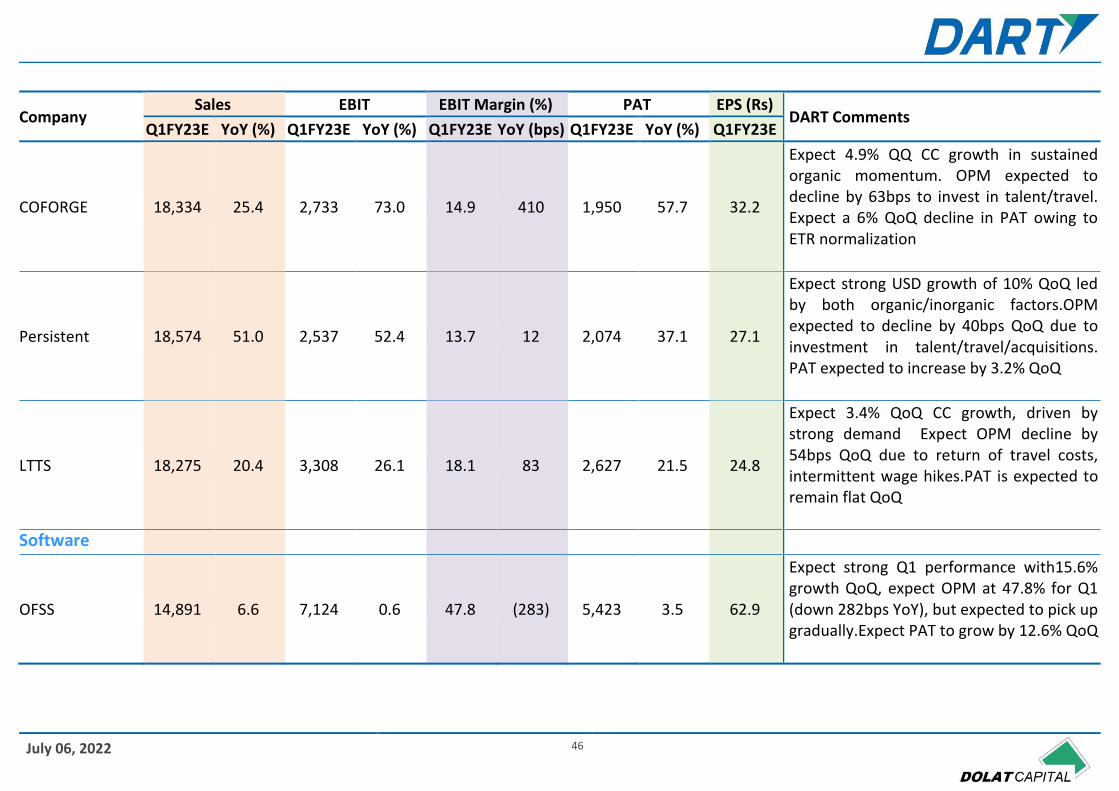
COFORGE 18,334 25.4 2,733 73.0 14.9 410 1,950 57.7 32.2
Expect 4.9% QQ CC growth in sustained organic momentum. OPM expected to decline by 63bps to invest in talent/travel. Expect a 6% QoQ decline in PAT owing to ETR normalization
Persistent 18,574 51.0 2,537 52.4 13.7 12 2,074 37.1 27.1
Expect strong USD growth of 10% QoQ led by both organic/inorganic factors.OPM expected to decline by 40bps QoQ due to investment in talent/travel/acquisitions. PAT expected to increase by 3.2% QoQ
LTTS 18,275 20.4 3,308 26.1 18.1 83 2,627 21.5 24.8
Expect 3.4% QoQ CC growth, driven by strong demand Expect OPM decline by 54bps QoQ due to return of travel costs, intermittent wage hikes.PAT is expected to remain flat QoQ
Software
OFSS 14,891 6.6 7,124 0.6 47.8 (283) 5,423 3.5 62.9
Expect strong Q1 performance with15.6% growth QoQ, expect OPM at 47.8% for Q1 (down 282bps YoY), but expected to pick up gradually.Expect PAT to grow by 12.6% QoQ

July 06, 2022 47
Company Sales EBIT EBIT Margin (%) PAT EPS (Rs)
DART Comments Q1FY23E YoY (%) Q1FY23E YoY (%) Q1FY23E YoY (bps) Q1FY23E YoY (%) Q1FY23E
Nucleus 1,497 38.0 151 (1,149.9) 10.1 1,143 165 175.2 6.0
Expect 3.1% QoQ decline as rev. run rate normalize from certain onetime gains. Expect EBIT margins at 10.1% (down 285bps QoQ) as company invests in marketing. Expect PAT to decline by 9.7% QoQ
Ramco Systems 1,307 (6.9) (269) 280.3 (20.6) (1,555) (201) 125.5 (6.6)
Expect 3.7% QoQ growth led by improved perf. from bookings across segments. EBIT loss to be lower by 239bps QoQ at (20.6%). PAT is expected to decline by 24.3% QoQ
Intellect Design 5,295 30.3 1,017 34.5 19.2 60 1,003 36.1 7.2
Expect growth of 4.3% QoQ growth in US$ rev. Expect growth in OPM by 71bps led by better rev. recognition.PAT is expected to increase by 5.3% QoQ
BPO and KPO
Firstsource 15,676 5.6 1,411 (21.6) 9.0 (312) 1,023 (24.0) 1.5
Expect 1.5% QoQ decline in $ rev. from decline in mortgage origination, further leading to seq. decline in OPM by 234bps, also challenged by supply side challenges. PAT exp. to decline by 22.8% QoQ on higher ETR of 18%

July 06, 2022 48
Company Sales EBIT EBIT Margin (%) PAT EPS (Rs)
DART Comments Q1FY23E YoY (%) Q1FY23E YoY (%) Q1FY23E YoY (bps) Q1FY23E YoY (%) Q1FY23E
NIIT 3,910 29.9 485 (16.0) 12.4 (677) 443 (13.9) 3.3
Expect 1.6% QoQ USD Rev. growth, led by 2.4% QoQ growth in CLG Biz. Exp. EBIT margin to decl. by 290bps QoQ due to ramp down in high margin RECO deal & acceleration of investments. PAT is exp to dec. by 34% QoQ, as tax rate normalizes
MPS 1,185 1.1 259 (0.4) 21.8 (33) 200 (6.4) 11.4
Expect rev. momentum to cont. for MPS with growth of 8.3% QoQ in Q1FY23. Expect OPM decline by 257bps due to ongoing supply side challenges & also increased SG&A due to return of discretionary costs. PAT is expected to decline by 9.2% QoQ
Internet
Affle India 3,285 115.4 511 71.0 15.5 (404) 656 139.2 4.9
Expect 4.3% QoQ growth as new client growth led demand continues.Expect EBIT margin of 15.5% (flat QoQ) as Jampp would not see much OpLev gains. Expect PAT decline by 5% QoQ
IRCTC 7,227 197.0 2,735 172.8 37.8 (336) 2,137 158.9 2.7
Expect 4.6% QoQ growth led by catering segment revival .EBIT Margin is expected to decline by 41bps QoQ due to biz. mix change. PAT is expected to be flat as OI is expected to be lower.

July 06, 2022 49
Company Sales EBIT EBIT Margin (%) PAT EPS (Rs)
DART Comments Q1FY23E YoY (%) Q1FY23E YoY (%) Q1FY23E YoY (bps) Q1FY23E YoY (%) Q1FY23E
Nazara 1,907 45.4 121 (28.3) 6.3 (651) 89 65.7 1.4
Expect 8.9% QoQ growth based on overall improvement. Expect EBIT Margins to improve by 542 QoQ, Nodwin perf. and Gamified e-larning op. lev. PAT is expected to improve by 54.0% on QoQ basis, aided by tax benefit
Zomato 14,995 77.6 (7,839) 90.3 (52.3) (349) (6,770) 90.1 (0.9)
Expect. Rev. growth of 23.7% QoQ. Losses expected to widen, by 1,206 bps QoQ to 52.3% (loss) due to Blinkit acquisition. Expect PAT Loss to widen to Rs.6.8Bn (loss up by 88% QoQ)
Paytm 16,330 83.3 (7,924) 92.4 (48.5) (230) (7,894) 107.6 (12.2)
Expect 6% QoQ growth, on back of continued momentum in monthly metrics and steady Take rates. Expect EBIT Margin loss decline gradually by 496bps QoQ, despite wage hike. PAT Loss expected to be higher due by 3.7% due to lower OI
Sector Aggregate 1,694,038 20.1 311,675 5.7 18.4 250,205 4.9

July 06, 2022 50
Company
Sales EBIDTA EBIDTA Margin (%) PAT EPS (Rs)
DART Comments Q1FY23E YoY (%) Q1FY23E YoY (%) Q1FY23E
YoY (bps)
Q1FY23E YoY (%) Q1FY23E
Sun TV 8,228 19.9 5,590 24.6 67.9 253 4,887 25.4 12.4
Broadcast business: Advertising: +42.4 YoY Subscription: flat YoY IPL: Rs 3,018mn vs. Rs 1,239 in Q1FY22
Zee Entertainment
19,054 7.3 2,330 (37.2) 12.2 (867) 1,414 (43.3) 1.5 Advertising: +7.4% YoY (domestic +7.5%). Subscription: +1.9% YoY (domestic +2.5%)
Sector Aggregate 27,282 10.9 7,920 (3.4) 29.0 6,301 (1.4) Source: DART
Media - Broadcasters
VP - Research: Himanshu Shah Tel: (+91 22) 4096 9737 Email: [email protected]

July 06, 2022 51
Company Sales EBIDTA EBIDTA Margin (%) PAT EPS (Rs)
DART Comments Q1FY23E YoY (%) Q1FY23E YoY (%) Q1FY23E YoY(bps) Q1FY23E YoY (%) Q1FY23E
JSW Steel 486,664 81 84,524 0 17.4 (1,397) 40,624 (3) 16.8 Realisations sharply higher, but costs also follow suit. Hence mild compression in spreads
Tata Steel 682,558 37 150,021 6 22.0 (640) 88,837 16 73.8 Realisations sharply higher, but costs also follow suit. Hence mild compression in spreads
SAIL 297,715 28 23,489 (62) 7.9 (1,853) 10,125 (72) 2.5 Realisations sharply higher, but costs also follow suit. Hence mild compression in spreads
JSPL 153,989 45 37,942 (24) 24.6 (2,221) 19,857 (26) 19.5 Realisations sharply higher, but costs not to that extent. Hence expansion in spreads
Shyam Metalics 30,750 31 6,820 9 22.2 (449) 4,477 16 17.6 Realisations sharply higher, but costs not to that extent. Hence expansion in spreads
Vedanta 378,309 34 125,735 38 33.2 95 58,578 (9) 15.7 Aluminium lower q/q, Zinc and crude higher. Volumes lower by 5% q/q broadly
Hindalco 551,063 36 66,650 18 12.1 (187) 33,405 76 15.0 Novelis Adj EBITDA/t inches up back to above US$500/t, compresssion in spreads in the Aluminium business
Nalco 34,500 22 12,753 35 37.0 351 8,504 34 4.6 Compression in EBITDA margins q/q.
NMDC 45,858 (33) 19,470 (54) 42.5 (1,950) 14,777 (48) 5.0 Realisations up marginally q/q, but volumes sharply lower
Coal India 271,880 2 64,630 1 23.8 (13) 46,229 1 7.5 Volumes healthy, e-auction realisations expected to be strong.
Maithan Alloys 6,811 36 1,976 74 29.0 623 1,630 86 56.0 Spreads compress q/q
Sector Aggregate 2,940,098 34.4 594,009 (2.3) 20.2 (759.9) 327,044 (6.6)
Metals and Mining
VP - Research: Prashant KP, CFA Tel: (+91 22) 4096 9700 Email: [email protected]

July 06, 2022 52
Company Sales EBIDTA EBITDA Margin (%) PAT EPS (Rs)
DART Comments Q1FY23E YoY (%) Q1FY23E YoY (%) Q1FY23E YoY(bps) Q1FY23E YoY (%) Q1FY23E
Aarti Drugs 6,255 7.9 769 (3.5) 12.3 (144) 455 (6.7) 4.9
We expect high single digit revenue growth driven by API & formulation sales, while higher input and freight cost to result in decline in earnings on YoY basis
Ajanta Pharma 8,173 9.3 2,043 (7.2) 25.0 (444) 1,443 (16.9) 16.6
Modest revenue growth in Domestic and Exports, while higher raw material and operating cost to restrict earnings growth on YoY basis
Alembic Pharma 12,897 (2.7) 2,321 (1.6) 18.0 21 1,475 (10.3) 7.5
Expect domestic formulation business to show degrowth on high base (benefitted from covid tailwinds in Q1FY22) and sequential decline in US sales as Q4FY22 benefitted from one-time gains. Operating margin to remain flattish on high operating and R&D cost
Alkem Labs 25,365 (7.1) 4,566 (23.0) 18.0 (371) 3,431 (26.7) 28.7
Expect domestic formulation business to show degrowth YoY on high base (benefitted from covid tailwinds in Q1FY22) and decline in US sales on account of pricing pressure in its key products. Operating margin to decline 370bps YoY on high input and operating cost
Pharmaceutical
VP - Research: Rashmi Sancheti Tel: (+91 22) 4096 9724 Email: [email protected]

July 06, 2022 53
Company Sales EBIDTA EBIDTA Margin (%) PAT EPS (Rs)
DART Comments Q1FY23E YoY (%) Q1FY23E YoY (%) Q1FY23E YoY(bps) Q1FY23E YoY (%) Q1FY23E
Cipla 55,110 0.1 11,298 -16.1 20.5 (395) 6,583 (21.6) 8.2
Expect degrowth in domestic business YoY basis on high covid base, while US to benefit YoY from volume gain in gAlbuterol, gArformoterol & g Lanreotide partially offset by base business price erosion. EBITDA margin to contract YoY on account of higher R&D, operating and input cost
Dr Reddy's Labs 55,192 12.2 11,590 28.4 21.0 265 6,991 22.5 42.1
Domestic business growth would be supported by Cidmus brand acquisition despite high Covid base. We expect US business to grow YoY on back of ramp up in prescription share of gVascepa, gVasostrict, gCiprodex and recently launched products offset by volume decline in gSuboxone. Operating margin to improve on low base YoY (impacted by inventory provision)
Granules 10,329 21.5 1,849 (8.2) 17.9 (580) 1,063 (11.5) 4.3
We expect strong sales growth across segments while higher input and freight cost to result in decline in earnings on YoY basis
July 06, 2022 54
Company Sales EBIDTA EBIDTA Margin (%) PAT EPS (Rs)
DART Comments Q1FY23E YoY (%) Q1FY23E YoY (%) Q1FY23E YoY(bps) Q1FY23E YoY (%) Q1FY23E
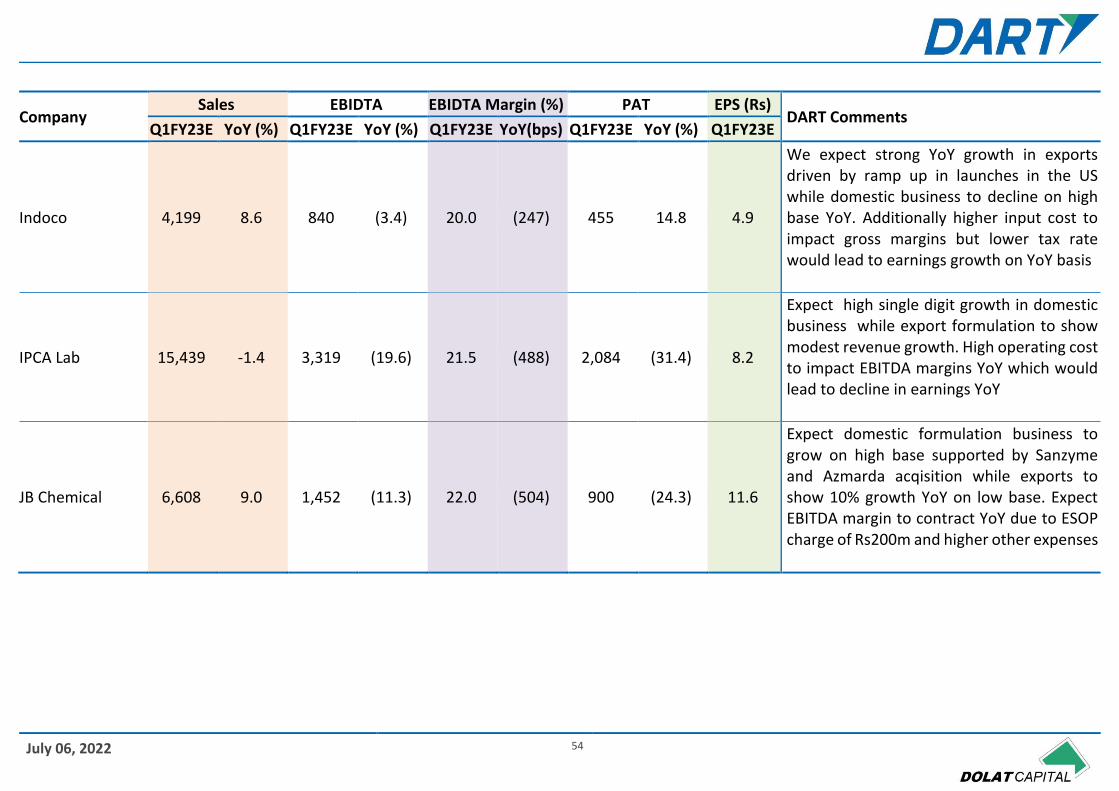
Indoco 4,199 8.6 840 (3.4) 20.0 (247) 455 14.8 4.9
We expect strong YoY growth in exports driven by ramp up in launches in the US while domestic business to decline on high base YoY. Additionally higher input cost to impact gross margins but lower tax rate would lead to earnings growth on YoY basis
IPCA Lab 15,439 -1.4 3,319 (19.6) 21.5 (488) 2,084 (31.4) 8.2
Expect high single digit growth in domestic business while export formulation to show modest revenue growth. High operating cost to impact EBITDA margins YoY which would lead to decline in earnings YoY
JB Chemical 6,608 9.0 1,452 (11.3) 22.0 (504) 900 (24.3) 11.6
Expect domestic formulation business to grow on high base supported by Sanzyme and Azmarda acqisition while exports to show 10% growth YoY on low base. Expect EBITDA margin to contract YoY due to ESOP charge of Rs200m and higher other expenses

July 06, 2022 55
Company Sales EBIDTA EBIDTA Margin (%) PAT EPS (Rs)
DART Comments Q1FY23E YoY (%) Q1FY23E YoY (%) Q1FY23E YoY(bps) Q1FY23E YoY (%) Q1FY23E
Natco Pharma 8,733 112.8 3,755 242.0 43.0 1624 2,676 256.8 14.7
Expect realization of gRevlimid sales & profit share in the US in Q1FY23 which is likely to boost earnings growth
Poly Medicure 2,576 21.5 567 2.4 22.0 (411) 378 0.6 4
Expect strong sales growth on back of steady exports and ramping up domestic business. However, high input & freight cost would lead to decline in EBITDA margin on YoY basis, though marginal improvement could be seen sequentially on back of softening of raw material cost QoQ
Suven Pharma 3,363 27.5 1,459 27.3 43.4 (5) 1,047 (0.4) 4.1
Traction in CRAMS supplies and steady margins likely to result in strong earnings growth QoQ
Torrent Pharma 22,834 7.0 6,622 (2.2) 29.0 (272) 3,309 0.3 19.6
Expect domestic, US & Brazil business to be strong while Germany to remain muted. Higher raw material and freight cost to impact operating margin on YoY basis. However, closure of Levittown facility to save operational cost leading to sequential improvement in operating margin

July 06, 2022 56
Company Sales EBIDTA EBIDTA Margin (%) PAT EPS (Rs)
DART Comments Q1FY23E YoY (%) Q1FY23E YoY (%) Q1FY23E YoY(bps) Q1FY23E YoY (%) Q1FY23E
Zydus Life Sciences
39,273 (1.1) 8,247 (6.8) 21.0 (128) 4,549 (14.7) 4.4
Expect domestic business degrowth on high Covid base and decline in US sales YoY on account of price erosion. Elevated cost and higher pricing pressure to result in decline in earnings growth on YoY basis
Sector Aggregate 277,912 4.8 56,074 -8.5 20.2 33,503 (14.4)

July 06, 2022 57
Company Sales EBIDTA EBIDTA Margin (%) PAT Presales
DART Comments Q1FY23E YoY (%) Q1FY23E YoY (%) Q1FY23E YoY (bps) Q1FY23E YoY (%) Q1FY23E
Brigade 8,000 109.0 1,809 62.6 22.6 (645.8) (1) (99.9) 8,000
Expect a healthy mix of presales from both Bengaluru (Komarla Heights, Laguna) and Chennai (Aspiro Bonito & Destino)
DLF 12,000 (3.4) 3,600 (27.7) 30.0 (1,010.2) 3,474 3.1 21,000
Delhi mid-town likely the top contributor to presaes. Expect Camellias to sustain unit sales run-rate in double digit (10-12 units) for the Q. Guidance on timeline for new lauinches will be a key monitorable
Godrej Properties
4,500 422.3 510 (180.3) 11.3 8,506.8 1,148 579.3 29,000
Strong respone to new launches in Mumbai (Horizon) and Thane (Ascend) aiding presales momentum. NCR likely to take #2 spot in overall presales contribution
Macrotech 25,000 46.0 6,312 30.7 25.2 (295.0) 3,630 125.8 28,000
Robust presales momentum sustaining across geographies (Thane, South & Central Mumbai and Pune). South & Central Mumbai leading the pack with healthy contribution from Lodha Park, World One / View and NCP (Aura). Commentary on growth plans in Bengaluru market will be a key notable
Real Estate
VP - Research: Rahul Jain, CFA Tel: (+91 22) 4096 9795 Email: [email protected]

July 06, 2022 58
Company Sales EBIDTA EBIDTA Margin (%) PAT Presales
DART Comments Q1FY23E YoY (%) Q1FY23E YoY (%) Q1FY23E YoY (bps) Q1FY23E YoY (%) Q1FY23E
Oberoi 8,506 199.3 3,800 204.3 44.7 74.5 2,481 214.2 6,500
Elysian leading presales. Two key monitorables include - 1) Update on OC for Three Sixty West and 2) Thane launch
Prestige 16,000 13.0 3,880 12.3 24.3 (14.6) 912 (15.3) 26,000
Strong momentum getting witnessed in Prestige City (Mulund, Mumbai). Channel checks indicating Jasdan Classic also gaining traction post rebranding in May '22. Other key contributors include - Prestige Green Gables (Bengaluru), Prestige Beverly Hills (Hyderabad)
Sobha 6,250 20.9 1,188 12.6 19.0 (140.2) 264 131.4 9,000
Sentosa project (Bengaluru) likely the biggest driver of presales in 1QFY23. Elsewhere, Sobha City Gurgaon is also witnessing steady traction
Sunteck 1,100 18.6 254 (33.1) 23.1 (1,784.2) (103) (442.3) 4,500
Vasai launch to aid presales. Sunteck Signature Island (BKC) may spur a positive surprise
Sector Aggregate 81,356 41.9 21,352 30.0 26.2 11,803 87.7

July 06, 2022 59
Company Sales EBIDTA EBIDTA Margin (%) PAT EPS (Rs)
DART Comments Q1FY23E YoY (%) Q1FY23E YoY (%) Q1FY23E YoY (bps) Q1FY23E YoY (%) Q1FY23E
ABFRL 22,398 189.4 3,588 (321.7) 16.0 3,692 333 (109.9) 0.3
Revenue: Madura Brand Fashions +146% YoY Pantaloons +317.5% YoY
Dmart 98,069 94.9 9,345 322.4 9.5 513 6,128 432.2 9.5 Stores: +23.5% YoY Area: +33% YoY
NYKAA 11,049 35.2 860 219.2 7.8 449 417 1,084.4 0.9
Consumers: +28.2% YoY Avg. Order Value: Rs 2,273 (+9.8% YoY) GMV: +39.1% YoY
Vmart 5,789 226.3 746 (3,906.0) 12.9 1,399 101 (135.3) 5 Stores: +38.7% YoY Area: +47.1% YoY
Trent 13,222 304.0 2,257 (809.9) 17.1 2,678 710 (184.7) 2.0
Westside Area (Mn Sq Ft): +11.4% YoY Rev/sq ft p.a. (Rs): 10,299 (+252% YoY) Rev (Rs Mn): +298.3% Zudio Area (Mn Sq Ft): +75.9% Rev/sq ft p.a. (Rs): 9,879 (+129.3%) Rev (Rs Mn): +317.3%
Sector Aggregate 150,526 111.2 16,794 3,092.2 11.2 7,688 (333.7)
Retail
VP - Research: Himanshu Shah Tel: (+91 22) 4096 9737 Email: [email protected]

July 06, 2022 60
Company Sales EBIDTA EBIDTA Margin (%) PAT EPS (Rs)
DART Comments Q1FY23E YoY (%) Q1FY23E YoY (%) Q1FY23E YoY (bps) Q1FY23E YoY (%) Q1FY23E
Balrampur Chini 11,785 3.3 1,473 9.9 12.5 75 897 16.6 4.4
Volume estimated 2.3mn quintals at blended realisation of Rs 36/kg. Distillery Sales (including ENA & Others): 4.6 crore litres at Average Realisation of Rs 56/ltr EBIT margin sequential expansion of ~80 bps driven by higher sugar realisations and higher proportion of B Heavy ethanol volumes
Triveni Engineering
11,750 13.3 1,843 23.2 15.7 125 1,155 25.1 4.8
Sugar Sales: 2.3 mn quintals valued at Rs 36/kg. Ethanol Sales: 4 crore litres at an Average realsation of Rs 55.5/ltr. Engineering business is expected to see positive growth momentum on the back of improved demand from end user industries
Sector Aggregate 23,535 8.1 3,316 16.9 14.1 2,051 21.2 Source: DART
Sugar
Analyst: Tejas Sonawane Tel: (+91 22) 4096 9792 Email: [email protected]

July 06, 2022 61
Company Sales EBIDTA EBIDTA Margin (%) PAT EPS (Rs)
DART Comments Q1FY23E YoY (%) Q1FY23E YoY (%) Q1FY23E YoY (bps) Q1FY23E YoY (%) Q1FY23E
Bharti Airtel 323,741 20.6 163,734 26.1 50.6 224 18,329 546.4 3.6
India Wireless Net adds: +3mn QoQ Subscribers: +1.7% QoQ ARPU: Rs 183.7 (+1.5% QoQ) Africa Subscribers: +2.0% QoQ ARPU: $3.2, (+1.5% QoQ)
Indus Tower 39,968 (5.1) 33,194 (5.6) 83.1 (46) 12,563 (11.2) 4.7
Towers: +3.5% YoY Tenants: +4.2% YoY Revenue/tower/month: -8.3% YoY Revenue/tenant/month: -7.6% YoY EBITDA/tower/month: +10.5% YoY EBITDA/tenant/month: +9.8% YoY
Reliance Jio 215,076 19.5 107,563 24.8 50.0 212 43,313 23.7 1.0
Net adds: +6mn QoQ Subscribers: +1.5% QoQ ARPU: Rs 173.5, +3.5% QoQ
Sector Aggregate 578,785 18.0 304,490 21.2 52.6 74,205 42.7
Telecom
VP - Research: Himanshu Shah Tel: (+91 22) 4096 9737 Email: [email protected]

July 06, 2022 62

DART RATING MATRIX
Total Return Expectation (12 Months)
Buy > 20%
Accumulate 10 to 20%
Reduce 0 to 10%
Sell < 0%
DART Team
Purvag Shah Managing Director [email protected] +9122 4096 9747
Amit Khurana, CFA Head of Equities [email protected] +9122 4096 9745
CONTACT DETAILS
Equity Sales Designation E-mail Direct Lines
Dinesh Bajaj VP - Equity Sales [email protected] +9122 4096 9709
Kapil Yadav VP - Equity Sales [email protected] +9122 4096 9735
Jubbin Shah VP - Equity Sales [email protected] +9122 4096 9779
Anjana Jhaveri VP - FII Sales [email protected] +9122 4096 9758
Ruchi Bhadra AVP - Equity Sales [email protected] +9122 4096 9784
Equity Trading Designation E-mail
P. Sridhar SVP and Head of Sales Trading [email protected] +9122 4096 9728
Chandrakant Ware VP - Sales Trading [email protected] +9122 4096 9707
Shirish Thakkar VP - Head Domestic Derivatives Sales Trading [email protected] +9122 4096 9702
Kartik Mehta Asia Head Derivatives [email protected] +9122 4096 9715
Dinesh Mehta Co - Head Asia Derivatives [email protected] +9122 4096 9765
Bhavin Mehta VP - Derivatives Strategist [email protected] +9122 4096 9705
Dolat Capital Market Private Limited. Sunshine Tower, 28th Floor, Senapati Bapat Marg, Dadar (West), Mumbai 400013

Our Research reports are also available on Reuters, Thomson Publishers, DowJones and Bloomberg (DCML <GO>)
Analyst(s) Certification The research analyst(s), with respect to each issuer and its securities covered by them in this research report, certify that: All of the views expressed in this research report accurately reflect his or her or their personal views about all of the issuers and their securities; and No part of his or her or their compensation was, is, or will be directly or indirectly related to the specific recommendations or views expressed in this research report.
I. Analyst(s) and Associate (S) holding in the Stock(s): (Nil)
II. Disclaimer: This research report has been prepared by Dolat Capital Market Private Limited. to provide information about the company(ies) and sector(s), if any, covered in the report and may be distributed by it and/or its affiliated company(ies) solely for the purpose of information of the select recipient of this report. This report and/or any part thereof, may not be duplicated in any form and/or reproduced or redistributed without the prior written consent of Dolat Capital Market Private Limited. This report has been prepared independent of the companies covered herein. Dolat Capital Market Private Limited. and its affiliated companies are part of a multi-service, integrated investment banking, brokerage and financing group. Dolat Capital Market Private Limited. and/or its affiliated company(ies) might have provided or may provide services in respect of managing offerings of securities, corporate finance, investment banking, mergers & acquisitions, financing or any other advisory services to the company(ies) covered herein. Dolat Capital Market Private Limited. and/or its affiliated company(ies) might have received or may receive compensation from the company(ies) mentioned in this report for rendering any of the above services. Research analysts and sales persons of Dolat Capital Market Private Limited. may provide important inputs to its affiliated company(ies) associated with it. While reasonable care has been taken in the preparation of this report, it does not purport to be a complete description of the securities, markets or developments referred to herein, and Dolat Capital Market Private Limited. does not warrant its accuracy or completeness. Dolat Capital Market Private Limited. may not be in any way responsible for any loss or damage that may arise to any person from any inadvertent error in the information contained in this report. This report is provided for information only and is not an investment advice and must not alone be taken as the basis for an investment decision. The investment discussed or views expressed herein may not be suitable for all investors. The user assumes the entire risk of any use made of this information. The information contained herein may be changed without notice and Dolat Capital Market Private Limited. reserves the right to make modifications and alterations to this statement as they may deem fit from time to time. Dolat Capital Market Private Limited. and its affiliated company(ies), their directors and employees may; (a) from time to time, have a long or short position in, and buy or sell the securities of the company(ies) mentioned herein or (b) be engaged in any other transaction involving such securities and earn brokerage or other compensation or act as a market maker in the financial instruments of the company(ies) discussed herein or act as an advisor or lender/borrower to such company(ies) or may have any other potential conflict of interests with respect to any recommendation and other related information and opinions. This report is neither an offer nor solicitation of an offer to buy and/or sell any securities mentioned herein and/or not an official confirmation of any transaction. This report is not directed or intended for distribution to, or use by any person or entity who is a citizen or resident of or located in any locality, state, country or other jurisdiction, where such distribution, publication, availability or use would be contrary to law, regulation or which would subject Dolat Capital Market Private Limited. and/or its affiliated company(ies) to any registration or licensing requirement within such jurisdiction. The securities described herein may or may not be eligible for sale in all jurisdictions or to a certain category of investors. Persons in whose possession this report may come, are required to inform themselves of and to observe such restrictions.
For U.S. Entity/ persons only: “This Report is considered independent third-party research and was prepared by Dolat Capital Market Private Limited, with headquarters in India. The distribution of this Research is provided pursuant to the exemption under Rule 15a-6(a) (2) and is only intended for an audience of Major U.S. Institutional Investors (MUSIIs) as defined by Rule 15a-6(b)(4). This research is not a product of StoneX Financial Inc. Dolat Capital Market Private Limited has sole control over the contents of this research report. StoneX Financial Inc. does not exercise any control over the contents of, or the views expressed in, any research reports prepared by Dolat Capital Market Private Limited and under Rule 15a-6(a) (3), any U.S. recipient of this research report wishing to affect any transaction to buy or sell securities or related financial instruments based on the information provided in this research report should do so only through StoneX Financial Inc. Please contact Gene Turok at +1 (212) 379-5463 or email [email protected]. Under no circumstances should any U.S. recipient of this research report effect any transaction to buy or sell securities or related financial instruments through the Dolat Capital Market Private Limited.”
Dolat Capital Market Private Limited.
Corporate Identity Number: U65990DD1993PTC009797 Member: BSE Limited and National Stock Exchange of India Limited.
SEBI Registration No: BSE - INZ000274132, NSE - INZ000274132, Research: INH000000685 Registered office: Unit no PO6-02A - PO6-02D, Tower A, WTC, Block 51, Zone-5, Road 5E, Gift City, Gandhinagar, Gujarat – 382355
Board: +9122 40969700 | Fax: +9122 22651278 | Email: [email protected] | www.dolatresearch.com