Embed Size (px)
Citation preview
Type of Survey Navigable Area
Field Unit NOAA Ship Fairweather
Project No. OPR-O190-FA-17
State Alaska
General Locality Southeast Alaska
Sublocality West Prince of Wales Island
LOCALITY
NOAA FORM 76-35A
U.S. DEPARTMENT OF COMMERCE
NATIONAL OCEANIC AND ATMOSPHERIC ADMINISTRATION
NATIONAL OCEAN SERVICE
DATA ACQUISITION AND
PROCESSING REPORT
1/30/2018
LIBRARY & ARCHIVES
DATE
2017
CHIEF OF PARTY
CDR Mark Van Waes, NOAA
VERSION 3
i
Table of Contents
A Equipment ......................................................................................................................................................1
A.1 Survey Vessels ..................................................................................................................................... 1A.1.1 Fairweather ...................................................................................................................................1A.1.2 Launch 2805 ................................................................................................................................ 4A.1.3 Launch 2806 ................................................................................................................................ 7A.1.4 Launch 2807 .............................................................................................................................. 10A.1.5 Launch 2808 .............................................................................................................................. 13A.1.6 AMBAR 2302 ............................................................................................................................16A.1.7 Skiff 1810 .................................................................................................................................. 18
A.2 Echo Sounding Equipment .................................................................................................................19
A.2.1 Side Scan Sonars ....................................................................................................................... 20A.2.1.1 Klein Associates Inc Klein System 5000 ......................................................................... 20
A.2.2 Multibeam Echosounders .......................................................................................................... 23A.2.2.1 Kongsberg EM 2040 .........................................................................................................23A.2.2.2 Kongsberg EM 710 ...........................................................................................................26
A.2.3 Single Beam Echosounders .......................................................................................................28A.2.3.1 CEE HydroSystems CEEPulse ......................................................................................... 28
A.2.4 Phase Measuring Bathymetric Sonars .......................................................................................30A.2.5 Other Echosounders ...................................................................................................................30
A.3 Manual Sounding Equipment .............................................................................................................31
A.3.1 Diver Depth Gauges ..................................................................................................................31A.3.2 Lead Lines ..................................................................................................................................31A.3.3 Sounding Poles .......................................................................................................................... 31A.3.4 Other Manual Sounding Equipment ..........................................................................................31
A.4 Positioning and Attitude Equipment .................................................................................................. 32
A.4.1 Applanix POS/MV .................................................................................................................... 32A.4.2 DGPS ..........................................................................................................................................35A.4.3 Trimble Backpacks .................................................................................................................... 36A.4.4 Laser Rangefinders .................................................................................................................... 39A.4.5 Other Positioning and Attitude Equipment ............................................................................... 41
A.5 Sound Speed Equipment .....................................................................................................................44
A.5.1 Sound Speed Profiles ................................................................................................................ 44A.5.1.1 CTD Profilers ....................................................................................................................45
A.5.1.1.1 Sea-Bird Scientific SBE 19plus SEACAT Profiler .................................................45A.5.1.2 Sound Speed Profilers ...................................................................................................... 46
A.5.1.2.1 Rolls-Royce Canada Limited Naval Marine / Brooke OceanTechnologies MVP-200 ........................................................................................................... 46
A.5.2 Surface Sound Speed .................................................................................................................50A.5.2.1 Teledyne Reson SVP-71 ...................................................................................................50
ii
A.5.2.2 Reson SVP 70 ................................................................................................................... 52
A.6 Horizontal and Vertical Control Equipment ...................................................................................... 52A.6.1 Horizontal Control Equipment .................................................................................................. 52
A.6.1.1 Base Station Equipment ....................................................................................................52A.6.1.2 Rover Equipment .............................................................................................................. 58
A.6.2 Vertical Control Equipment ...................................................................................................... 59
A.7 Computer Hardware and Software .....................................................................................................59A.7.1 Computer Hardware .................................................................................................................. 59A.7.2 Computer Software ....................................................................................................................60
A.8 Bottom Sampling Equipment ............................................................................................................. 65
A.8.1 Bottom Samplers ....................................................................................................................... 65A.8.1.1 Kahlsico International Corp Small Clam Shell ................................................................ 65A.8.1.2 Kahlsico International Corp Hard sediment core sampler ............................................... 66
B Quality Control ............................................................................................................................................ 67
B.1 Data Acquisition ................................................................................................................................. 67B.1.1 Bathymetry .................................................................................................................................67B.1.2 Imagery ...................................................................................................................................... 69B.1.3 Sound Speed .............................................................................................................................. 70B.1.4 Horizontal and Vertical Control ................................................................................................71B.1.5 Feature Verification ................................................................................................................... 72B.1.6 Bottom Sampling ....................................................................................................................... 73B.1.7 Backscatter ................................................................................................................................. 74B.1.8 Other .......................................................................................................................................... 74
B.2 Data Processing .................................................................................................................................. 74
B.2.1 Bathymetry .................................................................................................................................74B.2.2 Imagery ...................................................................................................................................... 77B.2.3 Sound Speed .............................................................................................................................. 78B.2.4 Horizontal and Vertical Control ................................................................................................80B.2.5 Feature Verification ................................................................................................................... 81B.2.6 Backscatter ................................................................................................................................. 82B.2.7 Other .......................................................................................................................................... 82
B.3 Quality Management .......................................................................................................................... 83
B.4 Uncertainty and Error Management ...................................................................................................84
B.4.1 Total Propagated Uncertainty (TPU) ........................................................................................ 85B.4.2 Deviations .................................................................................................................................. 89
C Corrections To Echo Soundings ..................................................................................................................89
C.1 Vessel Offsets and Layback ............................................................................................................... 90
iii
C.1.1 Vessel Offsets ............................................................................................................................ 90C.1.2 Layback ......................................................................................................................................95
C.2 Static and Dynamic Draft ...................................................................................................................95
C.2.1 Static Draft .................................................................................................................................96C.2.2 Dynamic Draft ......................................................................................................................... 101
C.3 System Alignment ............................................................................................................................ 110
C.4 Positioning and Attitude ...................................................................................................................112
C.5 Tides and Water Levels ....................................................................................................................113
C.6 Sound Speed ..................................................................................................................................... 114
C.6.1 Sound Speed Profiles ...............................................................................................................114C.6.2 Surface Sound Speed ...............................................................................................................114
List of Figures
Figure 1: NOAA Ship Fairweather........................................................................................................3Figure 2: Launch 2805 Taken During Survey of 2010............................................................................ 7Figure 3: Launch 2806 Taken During Survey of 2010.......................................................................... 10Figure 4: Launch 2807 Taken During Survey of 2010.......................................................................... 13Figure 5: Launch 2808 Taken During Survey of 2010.......................................................................... 16Figure 6: AMBAR 2302.....................................................................................................................18Figure 7: Skiff 1810...........................................................................................................................19Figure 8: Towed Heavy Weight Klein 5000 Side Scan Sonar................................................................ 21Figure 9: Hull- Mounted Heavy Weight Klein 5000 Side Scan Sonar and Kongsberg EM2040..................22Figure 10: Hull-Mounted Light Weight Klein 5000 Side Scan Sonar......................................................23Figure 11: Kongsberg EM 2040 topside processing unit........................................................................25Figure 12: Kongsberg EM 2040 projector and receiver arrays................................................................26Figure 13: EM 710 Gondola during transducer installation.................................................................... 28Figure 14: CEEPulse on a pole mount attached to FA 2303.................................................................. 30Figure 15: IMU LN 200 Unit............................................................................................................. 33Figure 16: GA830 POS Antennas on Launch Vessels........................................................................... 34Figure 17: GA830 POS Antennas........................................................................................................34Figure 18: POS MV5 components (note actual IMU and antennas are shown in separate images)..............35Figure 19: Panasonic Toughbook........................................................................................................ 38Figure 20: Panasonic Toughbook........................................................................................................ 38Figure 21: Trimble Backpack..............................................................................................................39Figure 22: Impulse LR....................................................................................................................... 40Figure 23: TruPulse 200 Laser Range finder........................................................................................ 41Figure 24: Velodyne VLP-16 Mount and Configuration........................................................................43Figure 25: Velodyne VLP-16 Dimensions............................................................................................43Figure 26: Garmin GLO GNSS Receiver.............................................................................................44Figure 31: SVP-71 Pictured on Bottom of Launch in Kongsberg Array.................................................. 51Figure 32: SVP-71............................................................................................................................. 52
iv
Figure 33: Zephyr Geodetic 2 Antenna................................................................................................54Figure 34: Trimble NetR9 Receiver.....................................................................................................55Figure 35: Trimble NetR5 receiver......................................................................................................55Figure 36: 800/900 MHz 6 dBi Omnidirectional Antenna..................................................................... 56Figure 37: Small Clam Shell Sampler..................................................................................................66Figure 38: Hard sediment core sampler............................................................................................... 67Figure 39: CEEPulse with submerged transducer on its pole mount....................................................... 69Figure 40: VLP-16 Laser Scanner work Flow...................................................................................... 73Figure 41: Coverage and Resolution....................................................................................................76Figure 42: 2805 MBES HVF values....................................................................................................91Figure 43: 2806 MBES HVF values....................................................................................................91Figure 44: 2807 MBES HVF values....................................................................................................92Figure 45: 2807 SSS HVF values........................................................................................................92Figure 46: 2808 MBES HVF values....................................................................................................92Figure 47: 2808 SSS HVF values........................................................................................................92Figure 48: S220 MBES HVF values....................................................................................................93Figure 49: 2302 SBES HVF Values.................................................................................................... 93Figure 50: 2805 Waterline Measurement ............................................................................................ 97Figure 51: 2806 Waterline Measurement ............................................................................................ 98Figure 52: 2807 Waterline Measurement ............................................................................................ 99Figure 53: 2808 Waterline Measurement .......................................................................................... 100Figure 54: S220 Waterline Measurement .......................................................................................... 101Figure 55: Chart displaying the historical averages for the ERDDM results...........................................102Figure 56: 2805 ERDDM 2016.........................................................................................................103Figure 57: 2806 ERDDM 2016.........................................................................................................104Figure 58: 2807 ERDDM 2016.........................................................................................................105Figure 59: 2808 ERDDM 2016.........................................................................................................106Figure 60: S220 ERDDM 2016.........................................................................................................107
2017 DAPR Version 3 NOAA Ship Fairweather
1
Data Acquisition and Processing Report
NOAA Ship FairweatherChief of Party: CDR Mark Van Waes, NOAA
Year: 2017Version: 3
Publish Date: 2018-01-30
A Equipment
A.1 Survey Vessels
A.1.1 Fairweather
Name Fairweather
Hull Number S220
DescriptionThe Fairweather is an ice strengthened, welded steel hulled oceanographic research vessel operated by the National Oceanic and Atmospheric Administration (NOAA)
Utilization Acquisition of mid-water multibeam and side scan sonar data
Dimensions
LOA 70.4 meters
Beam 12.8 meters
Max Draft 4.8 meters
2017 DAPR Version 3 NOAA Ship Fairweather
2
Most Recent FullStatic Survey
Date 2014-11-24
Performed By The IMTEC Group, Ltd.
Discussion
During the Fairweather 2014-2015 dry-dock period in conjunction with theinstallation of the new Kongsberg EM710 multibeam system, The IMTECGroup, Ltd. was contracted to conducta sensor alignment and orthogonalcoordinate survey. The survey wasconducted relative to a temporary threedimensional network of control pointsfixed to the ship and dry-dock and didnot reference the gravity level. The threedimensional offsets were translatedand rotated into three distinct (but fullyequivalent) reference frames by thesurveyor. These coordinate systemsare: 1. A reference frame centered onthe granite block, aligned with the keelin azimuth and pitch and aligned withthe 12 foot draft marks for roll. 2. Areference frame centered on the graniteblock and aligned with the granite blockin heading, pitch, and roll. 3. A referenceframe centered on the EM710 transmitarray and aligned with the transmit arrayin heading, pitch, and roll.
Most Recent PartialStatic Survey
Partial static survey was not performed.
Most Recent FullOffset Verification
Full offset verification was not performed.
Most Recent PartialOffset Verification
Partial offset verification was not performed.
2017 DAPR Version 3 NOAA Ship Fairweather
3
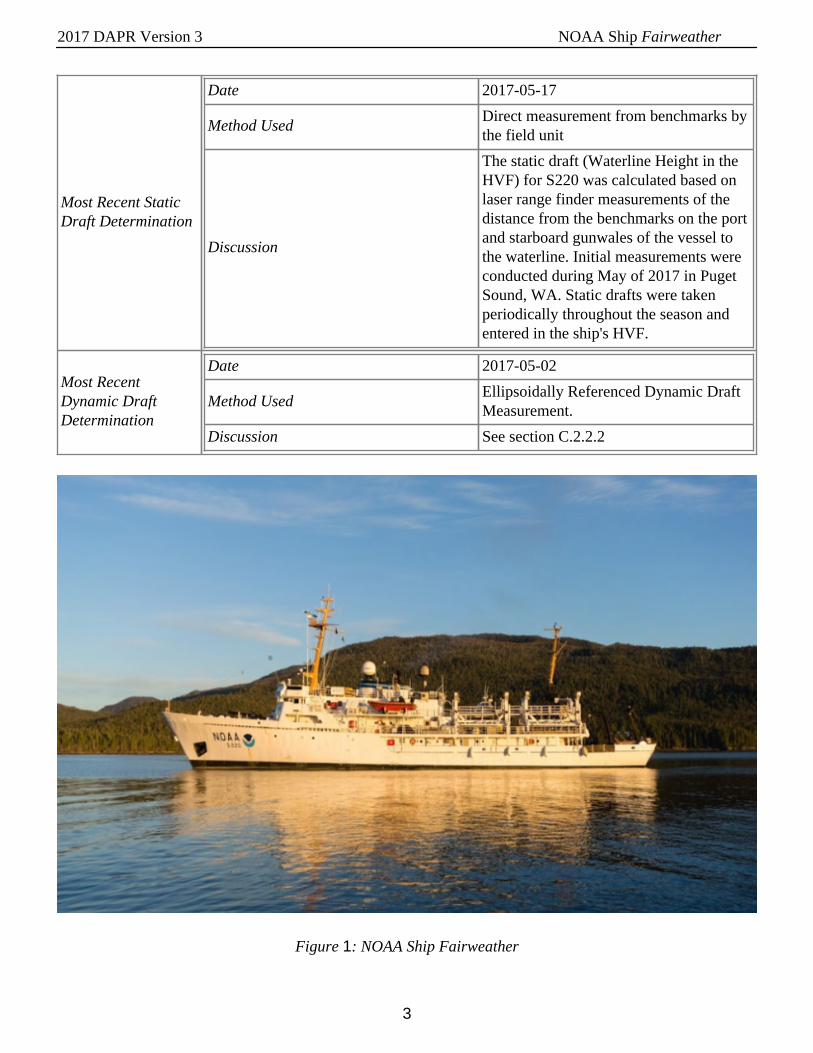
Most Recent StaticDraft Determination
Date 2017-05-17
Method UsedDirect measurement from benchmarks bythe field unit
Discussion
The static draft (Waterline Height in theHVF) for S220 was calculated based onlaser range finder measurements of thedistance from the benchmarks on the portand starboard gunwales of the vessel tothe waterline. Initial measurements wereconducted during May of 2017 in PugetSound, WA. Static drafts were takenperiodically throughout the season andentered in the ship's HVF.
Most RecentDynamic DraftDetermination
Date 2017-05-02
Method UsedEllipsoidally Referenced Dynamic DraftMeasurement.
Discussion See section C.2.2.2
Figure 1: NOAA Ship Fairweather
2017 DAPR Version 3 NOAA Ship Fairweather
4
A.1.2 Launch 2805
Name Launch 2805
Hull Number 2805
Description
Hydrographic Survey Launch 2805 is a 8.53 meter aluminum launch vessel of the NOAA Ship Fairweather. Fairweather is a scientific research vessel owned and operated by the U.S. Department of Commerce, National Oceanic and Atmospheric Administration (NOAA).
Utilization Hydrographic Survey Launch for NOAA Ship Fairweather
Dimensions
LOA 8.64 meters
Beam 3.48 meters
Max Draft 1.12 meters
2017 DAPR Version 3 NOAA Ship Fairweather
5
Most Recent FullStatic Survey
Date 2010-01-26
Performed ByNational Geodetic Survey, GeodeticServices Division
Discussion
In January of 2010 a full staticsurvey was performed by NGS/GSD. The primary purpose of thesurvey was to precisely determine thespatial relationship between varioushydrographic surveying sensors, launchbench marks, and the components of aPOS MV navigation system aboard theNOAA survey vessel 2805.
Most Recent PartialStatic Survey
Partial static survey was not performed.
Most Recent FullOffset Verification
Full offset verification was not performed.
Most Recent PartialOffset Verification
Date 2017-04-03
Method UsedDirect measurement from benchmarks bythe field unit
Discussion
As part of the 2017 HSRR, the offsetsof Fairweather's four survey launcheswere surveyed to verify the validity ofthe 2010 full survey results. The averagedifference between the results from thissurvey and the full survey conducted in2010 are within acceptable tolerancesto maintain confidence in the 2010full survey results. The values for thedifferent measurements are listed in therespective offset verification spreadsheetsincluded in this report.

2017 DAPR Version 3 NOAA Ship Fairweather
6
Most Recent StaticDraft Determination
Date 2017-04-03
Method UsedDirect measurement from benchmarks bythe field unit
Discussion
The static draft (Waterline Height in theHVF) for launch 2805 was calculatedbased on steel tape and plumb bobmeasurements of the distance frombenchmarks on the port and starboardquarter of the vessel to the waterline.Measurements were conducted duringApril of 2017 in Yaquina Bay, Newport,OR. The values and calculations for staticdraft of the various launches are listed inthe respective Waterline Measurementspreadsheets included in this report.
Most RecentDynamic DraftDetermination
Date 2016-03-10
Method UsedEllipsoidally Referenced Dynamic DraftMeasurement.
Discussion See section C.2.2.2
2017 DAPR Version 3 NOAA Ship Fairweather
7
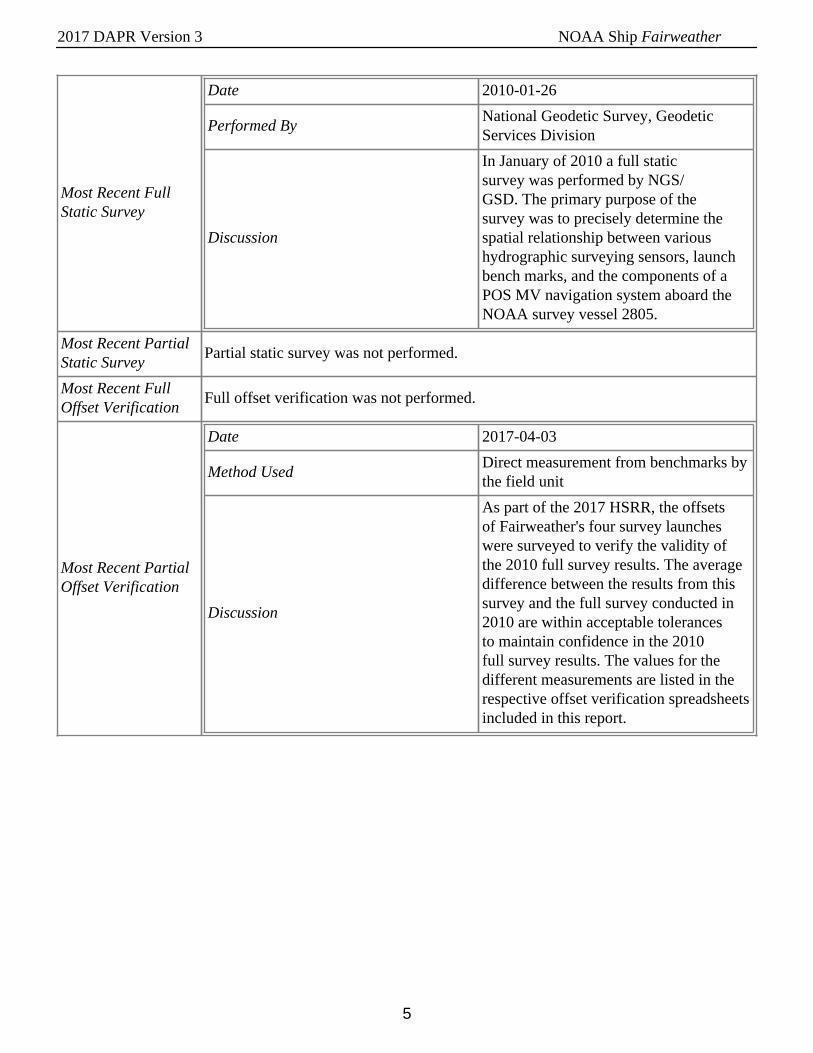
Figure 2: Launch 2805 Taken During Survey of 2010
A.1.3 Launch 2806
Name Launch 2806
Hull Number 2806
Description
Hydrographic Survey Launch 2806 is a 8.53 meter aluminum launch vessel of the NOAA Ship Fairweather. Fairweather is a scientific research vessel owned and operated by the U.S. Department of Commerce, National Oceanic and Atmospheric Administration (NOAA).
Utilization Hydrographic Survey Launch for NOAA Ship Fairweather

2017 DAPR Version 3 NOAA Ship Fairweather
8
Dimensions
LOA 8.64 meters
Beam 3.48 meters
Max Draft 1.12 meters
Most Recent FullStatic Survey
Date 2010-01-25
Performed ByNational Geodetic Survey, GeodeticServices Division.
Discussion
In January of 2010 a full staticsurvey was performed by NGS/GSD. The primary purpose of thesurvey was to precisely determine thespatial relationship between varioushydrographic surveying sensors, launchbench marks and the components of aPOS MV navigation system aboard theNOAA survey vessel 2806.
Most Recent PartialStatic Survey
Partial static survey was not performed.
Most Recent FullOffset Verification
Full offset verification was not performed.
Most Recent PartialOffset Verification
Date 2017-04-06
Method UsedDirect measurement from benchmarks bythe field unit
Discussion
As part of the 2017 HSRR, the offsetsof Fairweather's four survey launcheswere surveyed to verify the validity ofthe 2010 full survey results. The averagedifference between the results from thissurvey and the full survey conducted in2010 are within acceptable tolerancesto maintain confidence in the 2010full survey results. The values for thedifferent measurements are listed in therespective offset verification spreadsheetsincluded in this report.

2017 DAPR Version 3 NOAA Ship Fairweather
9
Most Recent StaticDraft Determination
Date 2017-04-06
Method UsedDirect measurement from benchmarks bythe field unit
Discussion
The static draft (Waterline Height in theHVF) for launch 2806 was calculatedbased on steel tape and plumb bobmeasurements of the distance frombenchmarks on the port and starboardquarter of the vessel to the waterline.Measurements were conducted duringApril of 2017 in Yaquina Bay, Newport,OR. The values and calculations for staticdraft of the various launches are listed inthe respective Waterline Measurementspreadsheets included in this report.
Most RecentDynamic DraftDetermination
Date 2016-04-13
Method UsedEllipsoidally Referenced Dynamic DraftMeasurement
Discussion See section C.2.2.2
2017 DAPR Version 3 NOAA Ship Fairweather
10
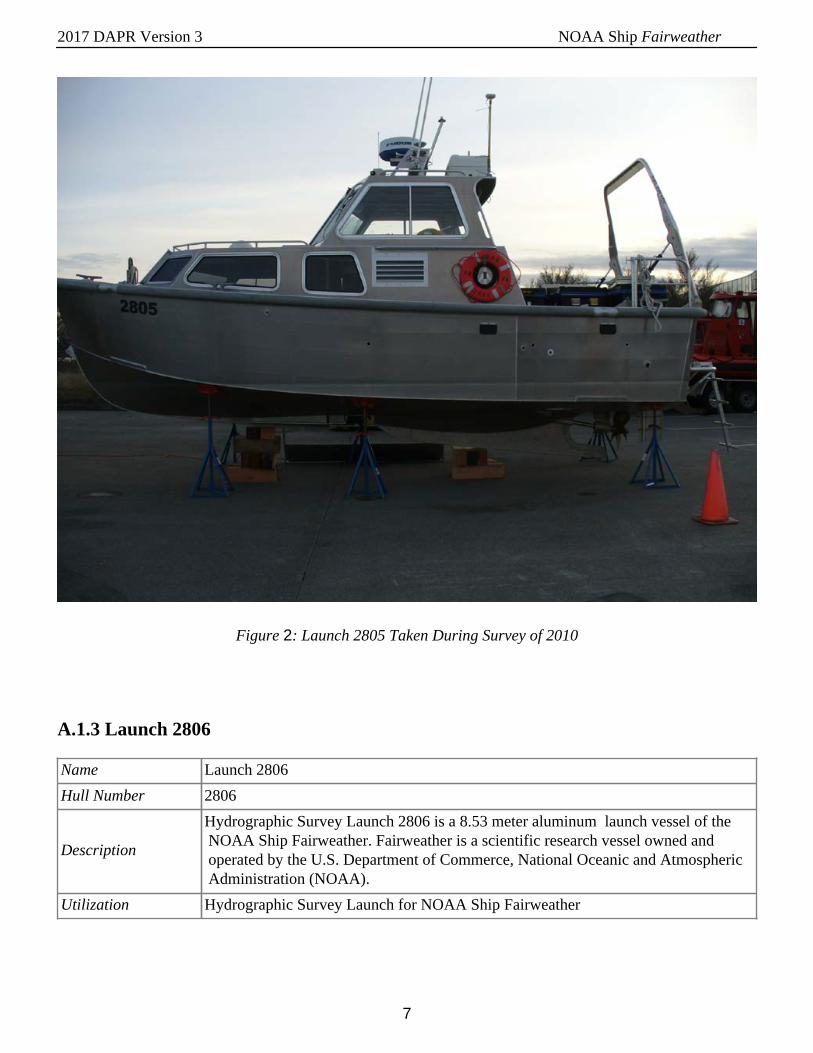
Figure 3: Launch 2806 Taken During Survey of 2010
A.1.4 Launch 2807
Name Launch 2807
Hull Number 2807
Description
Hydrographic Survey Launch 2807 is a 8.53 meter aluminum launch vessel of the NOAA Ship Fairweather. Fairweather is a scientific research vessel owned and operated by the U.S. Department of Commerce, National Oceanic and Atmospheric Administration (NOAA).
Utilization Hydrographic Survey Launch for NOAA Ship Fairweather

2017 DAPR Version 3 NOAA Ship Fairweather
11
Dimensions
LOA 8.64 meters
Beam 3.48 meters
Max Draft 1.12 meters
Most Recent FullStatic Survey
Date 2010-01-26
Performed ByNational Geodetic Survey, GeodeticServices Division.
Discussion
In January of 2010 a full staticsurvey was performed by NGS/GSD. The primary purpose of thesurvey was to precisely determine thespatial relationship between varioushydrographic surveying sensors, launchbench marks and the components of aPOS MV navigation system aboard theNOAA survey vessel 2807.
Most Recent PartialStatic Survey
Partial static survey was not performed.
Most Recent FullOffset Verification
Full offset verification was not performed.
Most Recent PartialOffset Verification
Date 2017-04-03
Method UsedDirect measurement from benchmarks bythe field unit
Discussion
As part of the 2017 HSRR, the offsetsof Fairweather's four survey launcheswere surveyed to verify the validity ofthe 2010 full survey results. The averagedifference between the results from thissurvey and the full survey conducted in2010 are within acceptable tolerancesto maintain confidence in the 2010full survey results. The values for thedifferent measurements are listed in therespective offset verification spreadsheetsincluded in this report.

2017 DAPR Version 3 NOAA Ship Fairweather
12
Most Recent StaticDraft Determination
Date 2017-04-03
Method UsedDirect measurement from benchmarks bythe field unit
Discussion
The static draft (Waterline Height in theHVF) for launch 2807 was calculatedbased on steel tape and plumb bobmeasurements of the distance frombenchmarks on the port and starboardquarter of the vessel to the waterline.Measurements were conducted duringApril of 2017 in Yaquina Bay, Newport,OR. The values and calculations for staticdraft of the various launches are listed inthe respective Waterline Measurementspreadsheets included in this report.
Most RecentDynamic DraftDetermination
Date 2016-04-08
Method UsedEllipsoidally Referenced Dynamic DraftMeasurement
Discussion See section C.2.2.2
2017 DAPR Version 3 NOAA Ship Fairweather
13
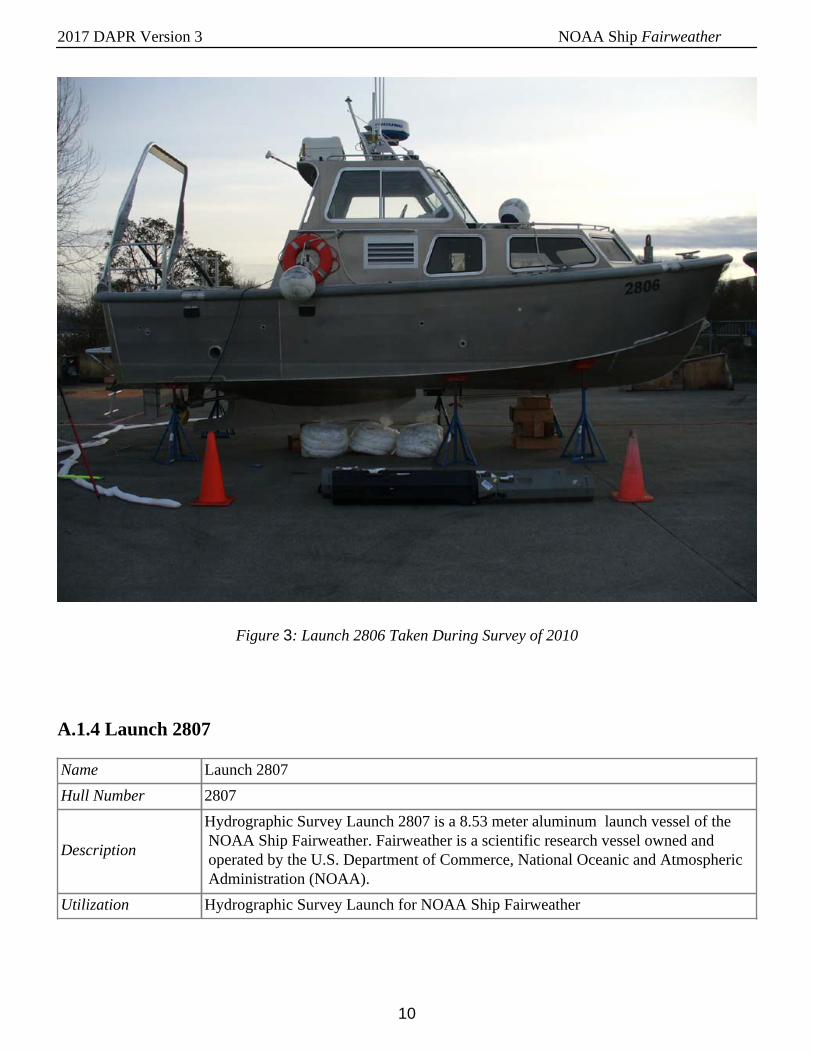
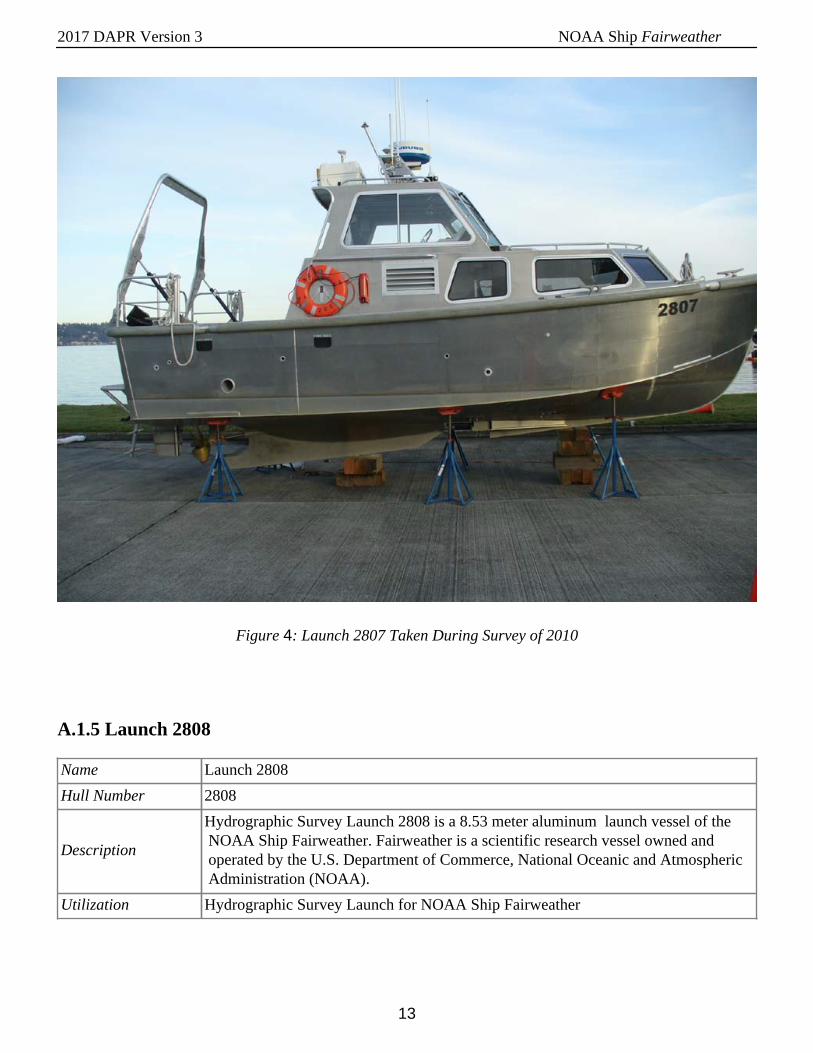
Figure 4: Launch 2807 Taken During Survey of 2010
A.1.5 Launch 2808
Name Launch 2808
Hull Number 2808
Description
Hydrographic Survey Launch 2808 is a 8.53 meter aluminum launch vessel of the NOAA Ship Fairweather. Fairweather is a scientific research vessel owned and operated by the U.S. Department of Commerce, National Oceanic and Atmospheric Administration (NOAA).
Utilization Hydrographic Survey Launch for NOAA Ship Fairweather
2017 DAPR Version 3 NOAA Ship Fairweather
14
Dimensions
LOA 8.64 meters
Beam 3.48 meters
Max Draft 1.12 meters
Most Recent FullStatic Survey
Date 2010-01-26
Performed By NGS/GSD
Discussion
In January of 2010 a full staticsurvey was performed by NGS/GSV. The primary purpose of thesurvey was to precisely determine thespatial relationship between varioushydrographic surveying sensors, launchbench marks and the components of aPOS MV navigation system aboard theNOAA survey vessel 2808.
Most Recent PartialStatic Survey
Partial static survey was not performed.
Most Recent FullOffset Verification
Full offset verification was not performed.
Most Recent PartialOffset Verification
Date 2017-04-03
Method UsedDirect measurement from benchmarks bythe field unit
Discussion
As part of the 2017 HSRR, the offsetsof Fairweather's four survey launcheswere surveyed to verify the validity ofthe 2010 full survey results. The averagedifference between the results from thissurvey and the full survey conducted in2010 are within acceptable tolerancesto maintain confidence in the 2010full survey results. The values for thedifferent measurements are listed in therespective offset verification spreadsheetsincluded in this report.
2017 DAPR Version 3 NOAA Ship Fairweather
15
Most Recent StaticDraft Determination
Date 2017-04-03
Method UsedDirect measurement from benchmarks bythe field unit
Discussion
The static draft (Waterline Height in theHVF) for launch 2808 was calculatedbased on steel tape and plumb bobmeasurements of the distance frombenchmarks on the port and starboardquarter of the vessel to the waterline.Measurements were conducted duringApril of 2017 in Yaquina Bay, Newport,OR. The values and calculations for staticdraft of the various launches are listed inthe respective Waterline Measurementspreadsheets included in this report.
Most RecentDynamic DraftDetermination
Date 2016-04-13
Method UsedEllipsoidally Referenced Dynamic DraftMeasurement
Discussion See section C.2.2.2
2017 DAPR Version 3 NOAA Ship Fairweather
16
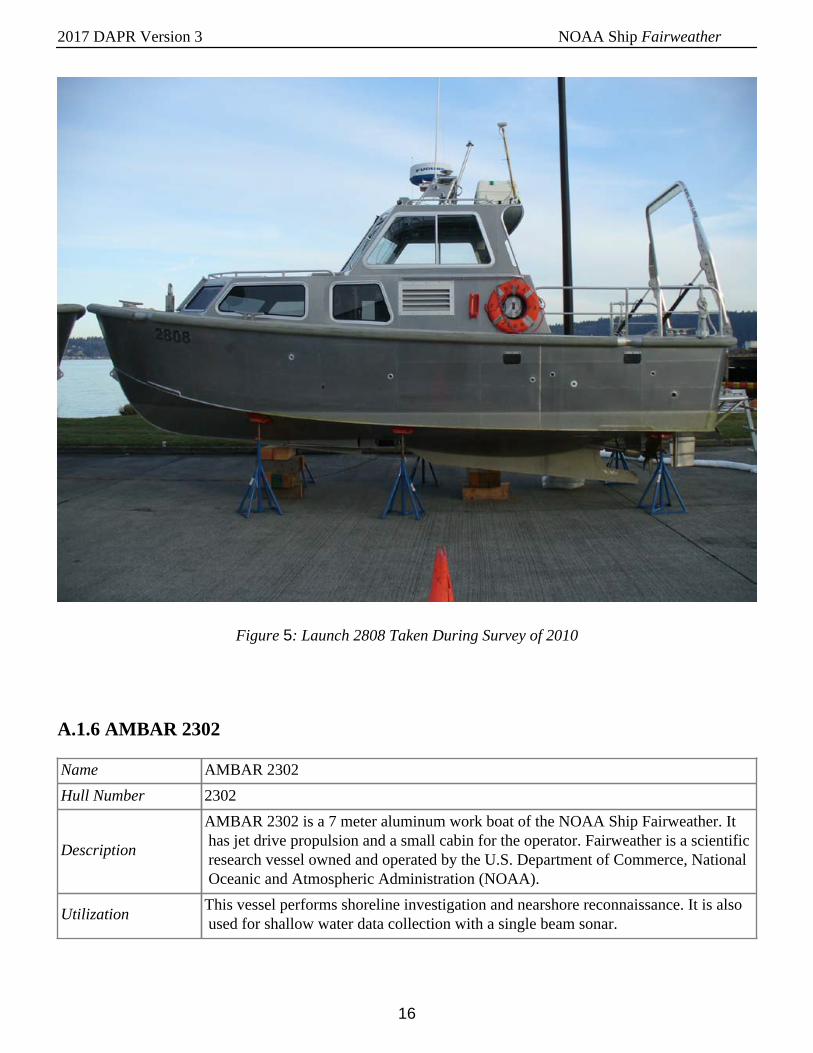
Figure 5: Launch 2808 Taken During Survey of 2010
A.1.6 AMBAR 2302
Name AMBAR 2302
Hull Number 2302
Description
AMBAR 2302 is a 7 meter aluminum work boat of the NOAA Ship Fairweather. It has jet drive propulsion and a small cabin for the operator. Fairweather is a scientific research vessel owned and operated by the U.S. Department of Commerce, National Oceanic and Atmospheric Administration (NOAA).
UtilizationThis vessel performs shoreline investigation and nearshore reconnaissance. It is also used for shallow water data collection with a single beam sonar.
2017 DAPR Version 3 NOAA Ship Fairweather
17
Dimensions
LOA 7.0 meters
Beam 2.8 meters
Max Draft 0.55 meters
Most Recent FullStatic Survey
Full static survey was not performed.
Most Recent PartialStatic Survey
Partial static survey was not performed.
Most Recent FullOffset Verification
Full offset verification was not performed.
Most Recent PartialOffset Verification
Partial offset verification was not performed.
Most Recent StaticDraft Determination
Date 2017-08-24
Method Used Direct measurement
DiscussionA steel tape was used to measure fromthe sonar head to the waterline when thesonar was deployed.
Most RecentDynamic DraftDetermination
Dynamic draft determination was not performed.
2017 DAPR Version 3 NOAA Ship Fairweather
18
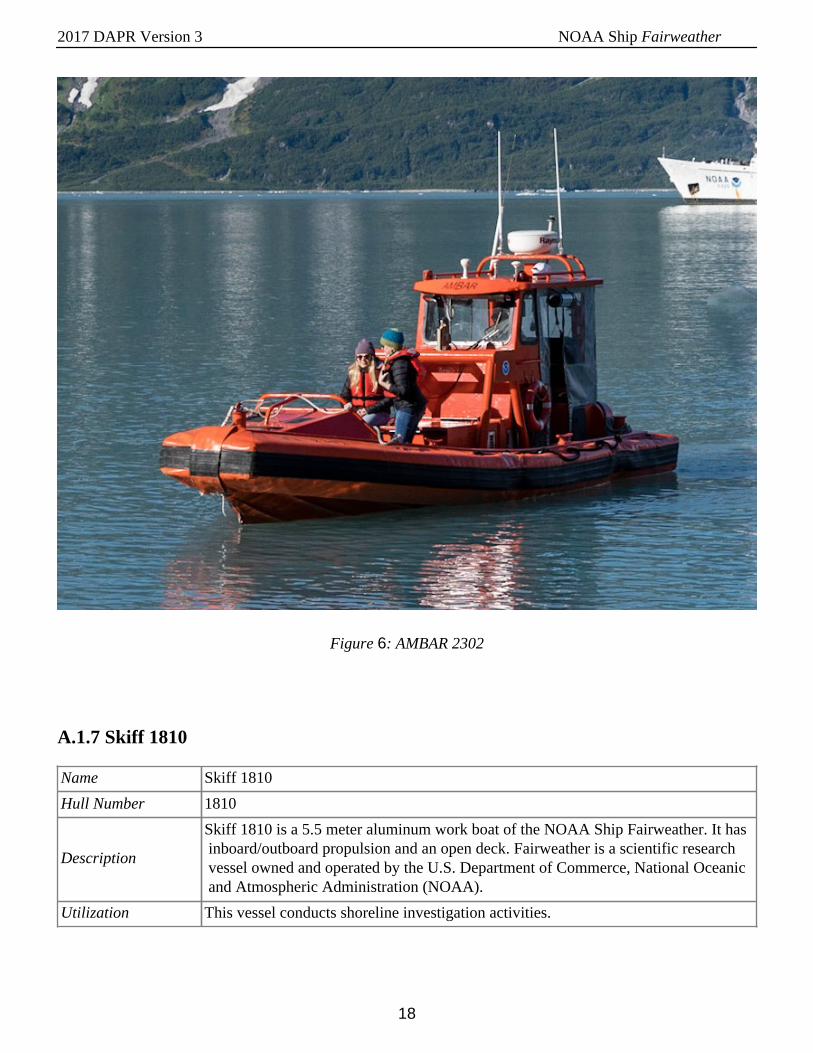
Figure 6: AMBAR 2302
A.1.7 Skiff 1810
Name Skiff 1810
Hull Number 1810
Description
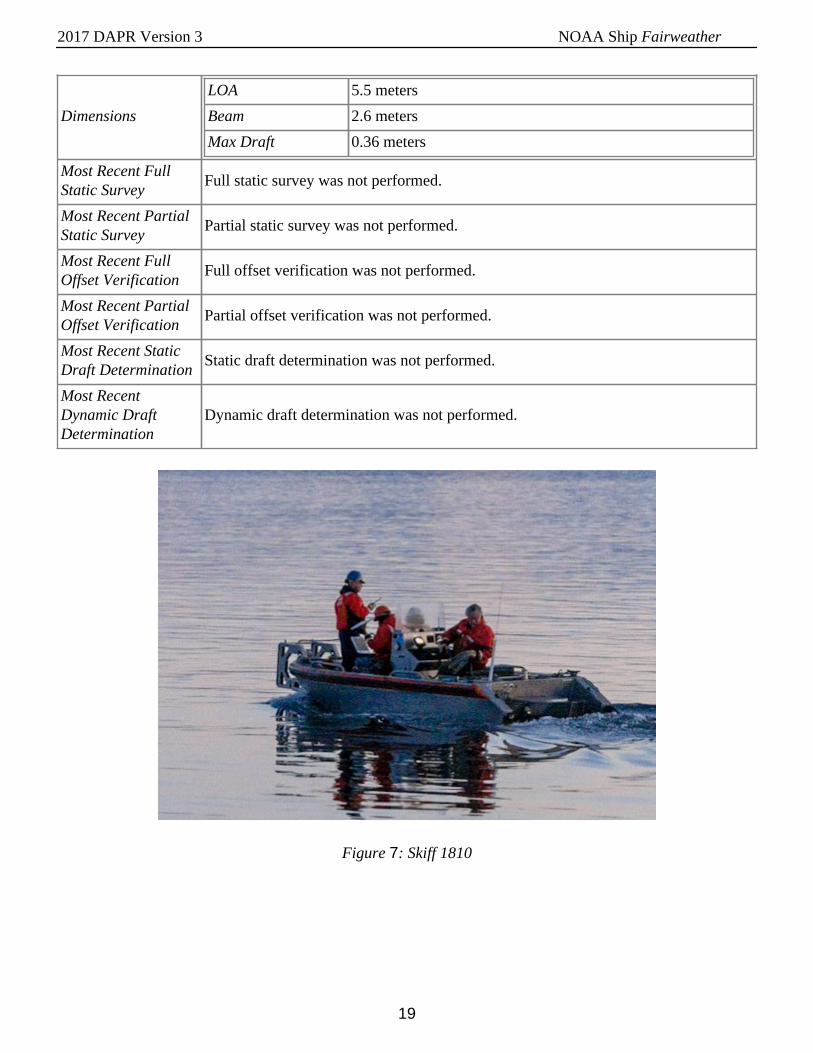
Skiff 1810 is a 5.5 meter aluminum work boat of the NOAA Ship Fairweather. It has inboard/outboard propulsion and an open deck. Fairweather is a scientific research vessel owned and operated by the U.S. Department of Commerce, National Oceanic and Atmospheric Administration (NOAA).
Utilization This vessel conducts shoreline investigation activities.
2017 DAPR Version 3 NOAA Ship Fairweather
19
Dimensions
LOA 5.5 meters
Beam 2.6 meters
Max Draft 0.36 meters
Most Recent FullStatic Survey
Full static survey was not performed.
Most Recent PartialStatic Survey
Partial static survey was not performed.
Most Recent FullOffset Verification
Full offset verification was not performed.
Most Recent PartialOffset Verification
Partial offset verification was not performed.
Most Recent StaticDraft Determination
Static draft determination was not performed.
Most RecentDynamic DraftDetermination
Dynamic draft determination was not performed.
Figure 7: Skiff 1810
2017 DAPR Version 3 NOAA Ship Fairweather
20
A.2 Echo Sounding Equipment
A.2.1 Side Scan Sonars
A.2.1.1 Klein Associates Inc Klein System 5000
Manufacturer Klein Associates Inc
Model Klein System 5000
Description
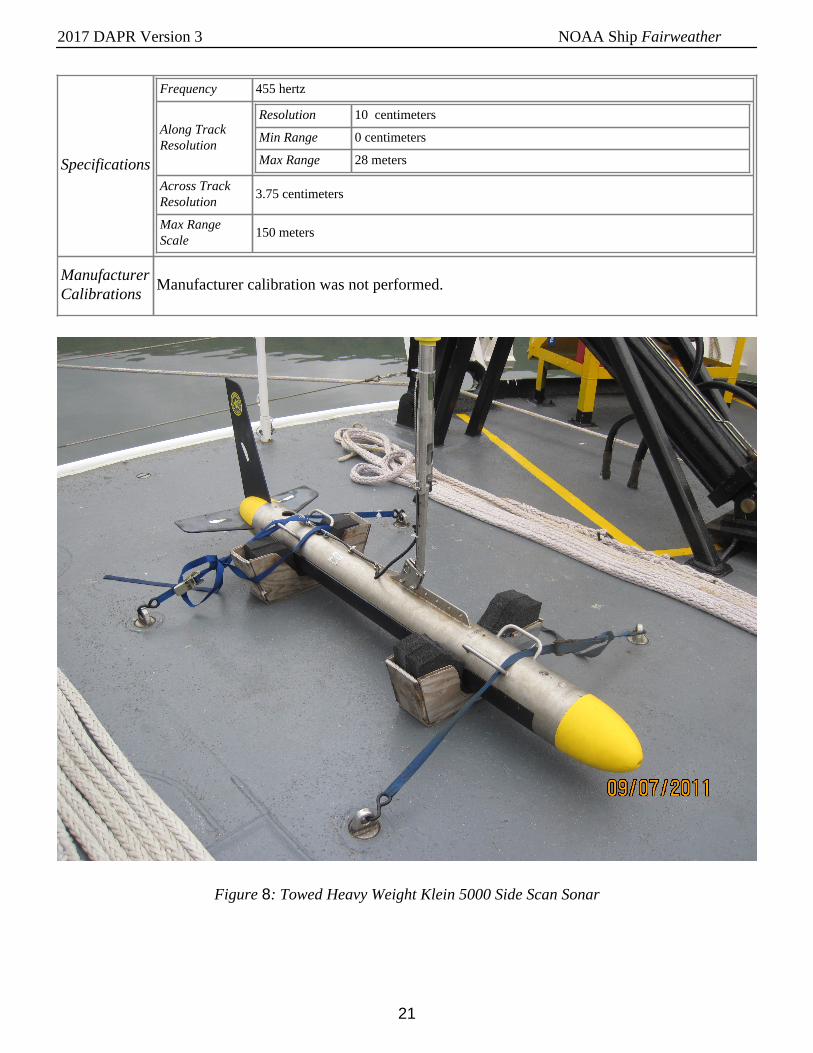
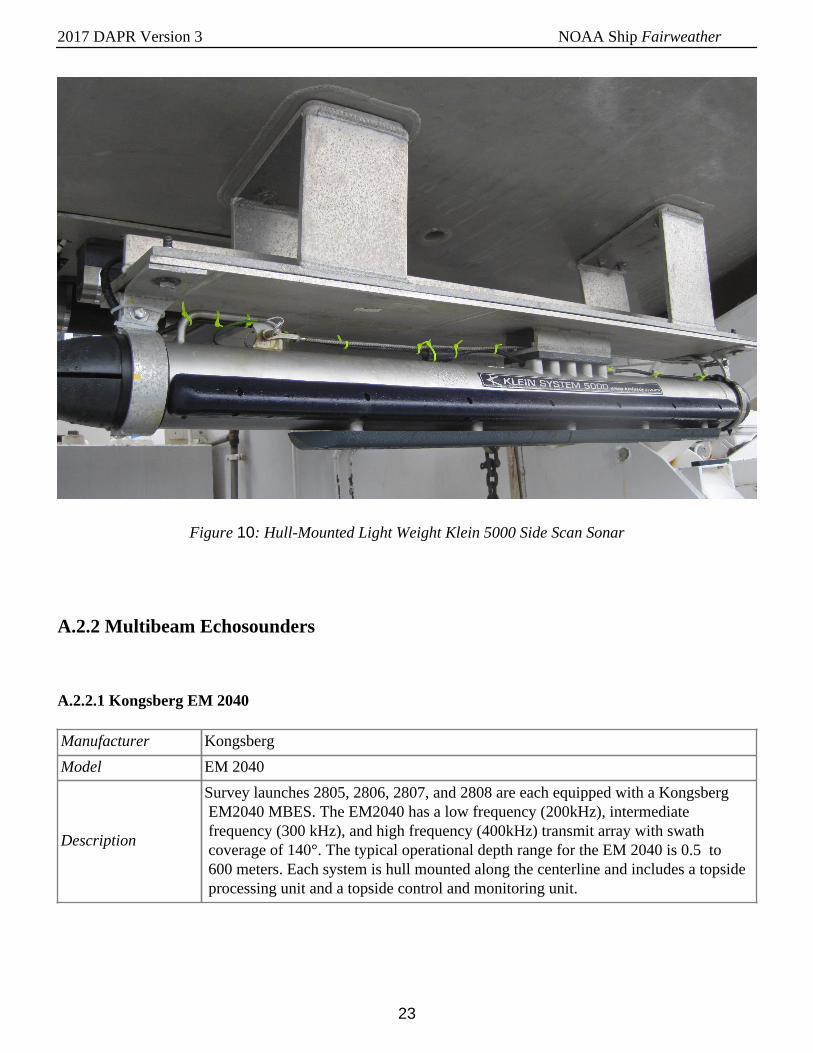
The Klein High Speed, High Resolution Side Scan (SSS) Sonar system is a beam-forming acoustic imagery device. The integrated system includes a KLEIN 5500 towfish, a Transceiver/Processing Unit (TPU), and interfaces to a computer for control and monitoring. Stern-towed units also include a tow cable telemetry assembly. The towfish operates at frequency of 455 kHz and a vertical beam angle of 40°, and can resolve up to 5 discreet received beams per transducer stave. There are two configurations for data acquisition using the KLEIN 5000 system: stern-towed and hull-mounted. S-220 uses exclusively stern towed SSS. Fairweather Launch 2807 and 2808 use a hull-mount configuration. There are also two options for the type of the towfish: the standard, and a lightweight variant. For the acquisition of data for project OPR-R365-FA-17, Launch 2807 was hull mounted with the lightweight variant, and Launch 2808 was hull-mounted with the standard variant towfish. The hull mounts on both survey launches can accommodate both standard or a light-weight towfish.
Positioning of the Towfish is calculated using CARIS SIPS, and is derived from the amount of cable out, the towfish depth (from the towfish pressure gage), the vessel's Course Made Good (CMG), and the vessel's heading. For hull mounted systems, the position is derived using a static offset from the vessel reference point. Towfish altitude is maintained between 8% and 20% of the range scale unless specifically noted in the Descriptive Report. Vessel speed is adjusted during SSS acquisition to ensure that object detection density is met. Confidence checks are performed by noting changes in linear bottom features extending to the outer edges of the digital side scan image, and by verifying aids to navigation or other known features on the side scan record. The resolution of the system is: Along Track: 10cm out to 38 meters; 20cm out to 75 meters; 36 cm out to 150 meters; Across Track: 3.75 cm.
SerialNumbers
Vessel Installed
OnS220 2807 2808
TPU s/n 166 176 177
Towfish s/n 292 321 260
2017 DAPR Version 3 NOAA Ship Fairweather
21
Specifications
Frequency 455 hertz
Along TrackResolution
Resolution 10 centimeters
Min Range 0 centimeters
Max Range 28 meters
Across TrackResolution
3.75 centimeters
Max RangeScale
150 meters
ManufacturerCalibrations
Manufacturer calibration was not performed.
Figure 8: Towed Heavy Weight Klein 5000 Side Scan Sonar
2017 DAPR Version 3 NOAA Ship Fairweather
22
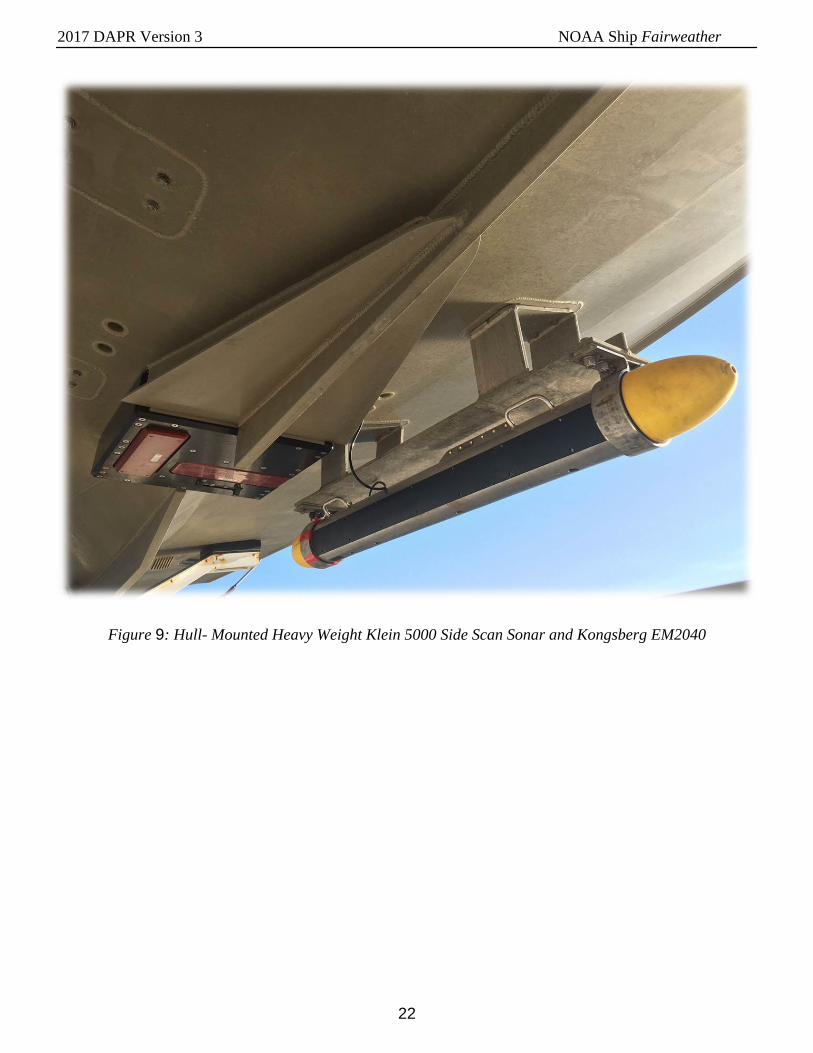
Figure 9: Hull- Mounted Heavy Weight Klein 5000 Side Scan Sonar and Kongsberg EM2040
2017 DAPR Version 3 NOAA Ship Fairweather
23
Figure 10: Hull-Mounted Light Weight Klein 5000 Side Scan Sonar
A.2.2 Multibeam Echosounders
A.2.2.1 Kongsberg EM 2040
Manufacturer Kongsberg
Model EM 2040
Description
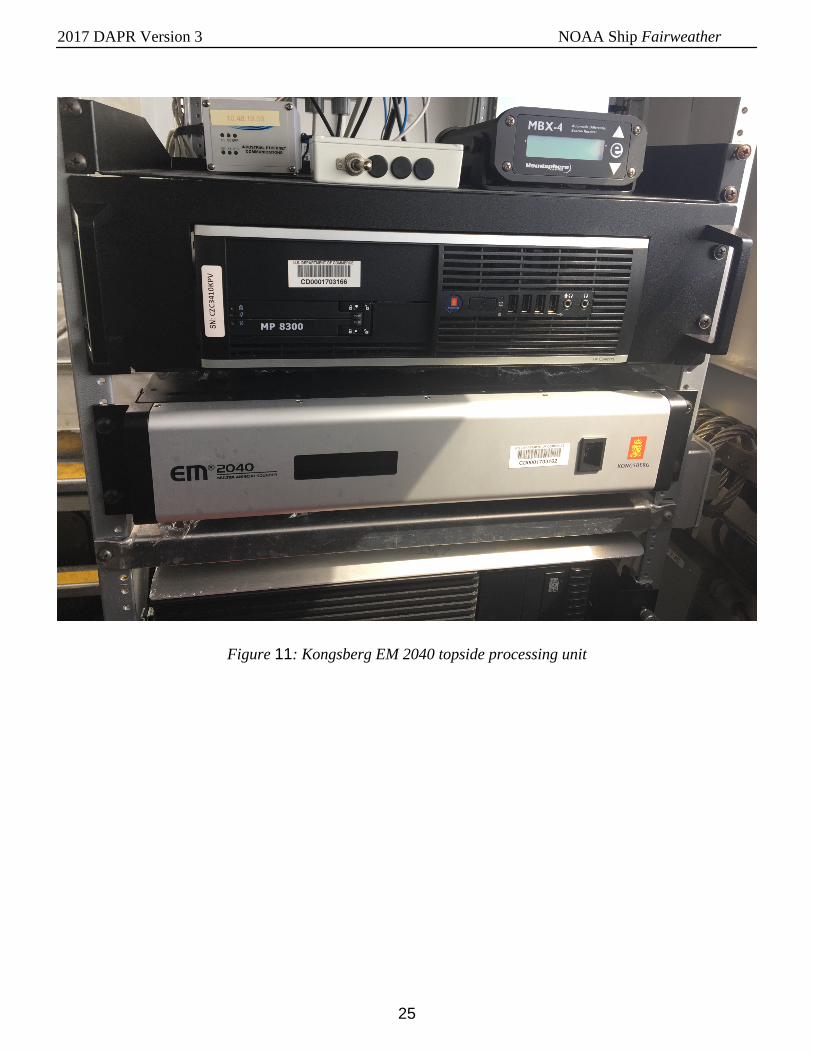
Survey launches 2805, 2806, 2807, and 2808 are each equipped with a Kongsberg EM2040 MBES. The EM2040 has a low frequency (200kHz), intermediate frequency (300 kHz), and high frequency (400kHz) transmit array with swath coverage of 140°. The typical operational depth range for the EM 2040 is 0.5 to 600 meters. Each system is hull mounted along the centerline and includes a topside processing unit and a topside control and monitoring unit.
2017 DAPR Version 3 NOAA Ship Fairweather
24
Serial Numbers
Vessel Installed On 2805 2806 2807 2808
Processor s/n 1065 CZC3410KPV CZC4310KMV CZC4310KNO
Transceiver s/n 40122 40111 40109 40117
Transducer s/n N/A N/A N/A N/A
Receiver s/n 364 356 355 351
Projector 1 s/n 255 251 249 247
Projector 2 s/n N/A N/A N/A N/A
Specifications
Frequency 200 kilohertz 300 kilohertz 400 hertz
Along Track 1.5 degreesAlong Track 1 degreesAlong Track 0.7 degreesBeamwidth
Across Track 1.51 degreesAcross Track 1 degreesAcross Track 0.7 degrees
Max Ping Rate 50 kilohertz 58.8 kilohertz 58.8 kilohertz
Beam SpacingMode
Equidistant Beam SpacingMode
Equidistant Beam SpacingMode
Equiangular
Beam SpacingNumber ofBeams
256Number ofBeams
256Number ofBeams
256
Max Swath Width 140 degrees 140 degrees 120 degrees
Depth Resolution 20 millimeters 20 millimeters 20 millimeters
ManufacturerSpecified
600 meters ManufacturerSpecified
465 meters ManufacturerSpecified
300 meters Depth Rating
Ship Usage 600 metersShip Usage 465 metersShip Usage 300 meters
ManufacturerCalibrations
Manufacturer calibration was not performed.
System AccuracyTests
Vessel Installed On 2805 / 2806 / 2807 / 2808
Methods
The reference surface used in Shilshole Bay, Seattle is a grid of 7 linesover known wreck. Each line is approximately 60 meters apart, providinggenerous overlap of soundings between lines. Reference surfaces wererun for each launch's EM 2040 system in high (400 kHz), intermediate(300 kHz), and low (200 kHz) frequency, with equidistant beam spacing.Reference surfaces of 1 meter CUBE surfaces were created for eachsystem and frequency. All surfaces were referenced to MLLW. NOAAShip Fairweather was visited on May 22-26 2017 to perform systemaccuracy tests and review configuration of her onboard Kongsberg EM2040 systems. The following systems were reviewed to assess the healthof all Fairweather Launches: The review included: • Assessment ofreceiver health at all frequencies: o Accomplished by a review of watercolumn data at each frequency with active transmit, ambient environment• Assessment of receiver stability by review of normalization history• Data analysis and performance of both bathymetry and backscatter •Review of sonar system settings • Review of sonar configuration withPOSMV and Acquisition system
Results See attached reports for details.
Snippets Sonar has snippets logging capability.
2017 DAPR Version 3 NOAA Ship Fairweather
25
Figure 11: Kongsberg EM 2040 topside processing unit
2017 DAPR Version 3 NOAA Ship Fairweather
26
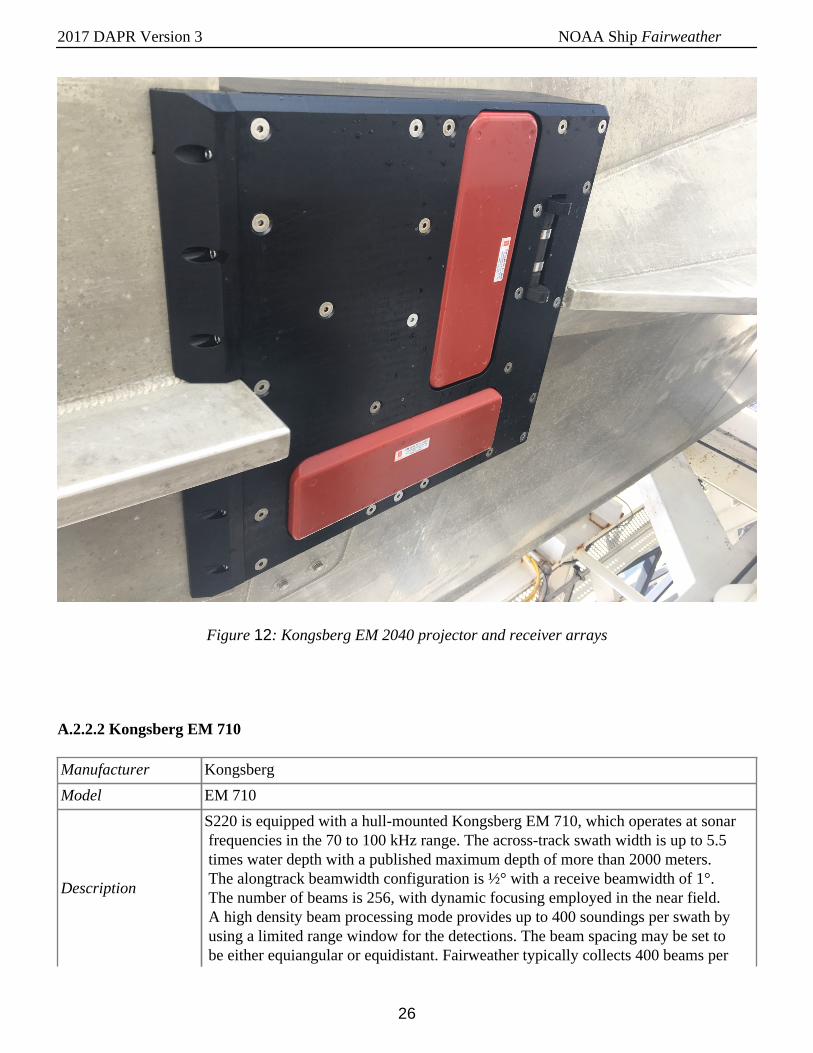
Figure 12: Kongsberg EM 2040 projector and receiver arrays
A.2.2.2 Kongsberg EM 710
Manufacturer Kongsberg
Model EM 710
Description
S220 is equipped with a hull-mounted Kongsberg EM 710, which operates at sonar frequencies in the 70 to 100 kHz range. The across-track swath width is up to 5.5 times water depth with a published maximum depth of more than 2000 meters. The alongtrack beamwidth configuration is ½° with a receive beamwidth of 1°. The number of beams is 256, with dynamic focusing employed in the near field. A high density beam processing mode provides up to 400 soundings per swath by using a limited range window for the detections. The beam spacing may be set to be either equiangular or equidistant. Fairweather typically collects 400 beams per
2017 DAPR Version 3 NOAA Ship Fairweather
27
ping in equidistant mode. The transmit fan is divided into three sectors to maximize range capability but also to suppress interference from multiples of strong bottom echoes. The sectors are transmitted sequentially within each ping, and use distinct frequencies or waveforms.
Serial Numbers
Vessel Installed On S220
Processor s/n CZC34076Z9
Transceiver s/n 232
Transducer s/n 232
Receiver s/n 232
Projector 1 s/n None
Projector 2 s/n None
Specifications
Frequency 100 kilohertz
Along Track 0.5 degreesBeamwidth
Across Track 1 degrees
Max Ping Rate 30 hertz
Beam SpacingMode
Equidistant
Beam SpacingNumber ofBeams
256
Max Swath Width 140 degrees
Depth Resolution 1 centimeters
ManufacturerSpecified
2000 meters Depth Rating
Ship Usage 2000 meters
ManufacturerCalibrations
Manufacturer calibration was not performed.
System AccuracyTests
Vessel Installed On S220
Methods Sonar Acceptance Trial
Results
Relative to the internal noise of the system, the installation has low flownoise and imperceptible direct path propulsion noise. The radiated, bottombounce propulsion noise is noticeable in shallow water, but is not speeddependent and can be minimized with shaft speed and pitch combinations.The swath width as a function of depth meets or exceeds specifications.The system bathymetry meets or exceeds specifications in all modestested.
Snippets Sonar has snippets logging capability.
2017 DAPR Version 3 NOAA Ship Fairweather
28
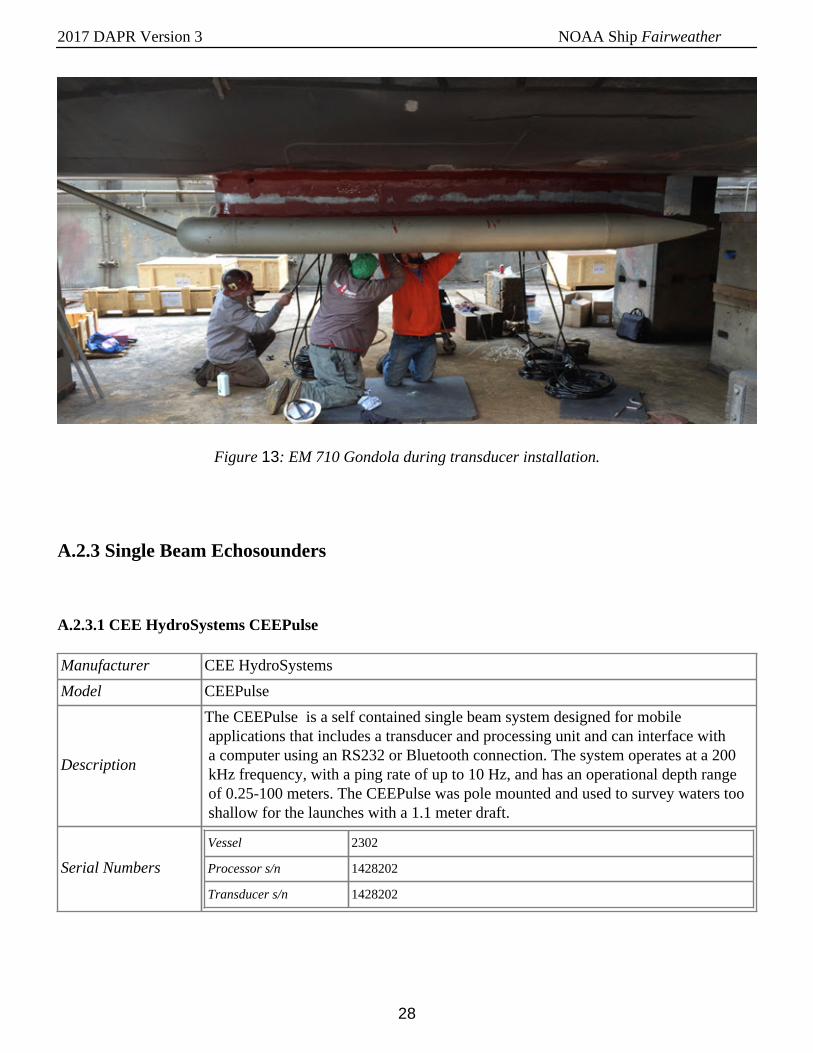
Figure 13: EM 710 Gondola during transducer installation.
A.2.3 Single Beam Echosounders
A.2.3.1 CEE HydroSystems CEEPulse
Manufacturer CEE HydroSystems
Model CEEPulse
Description
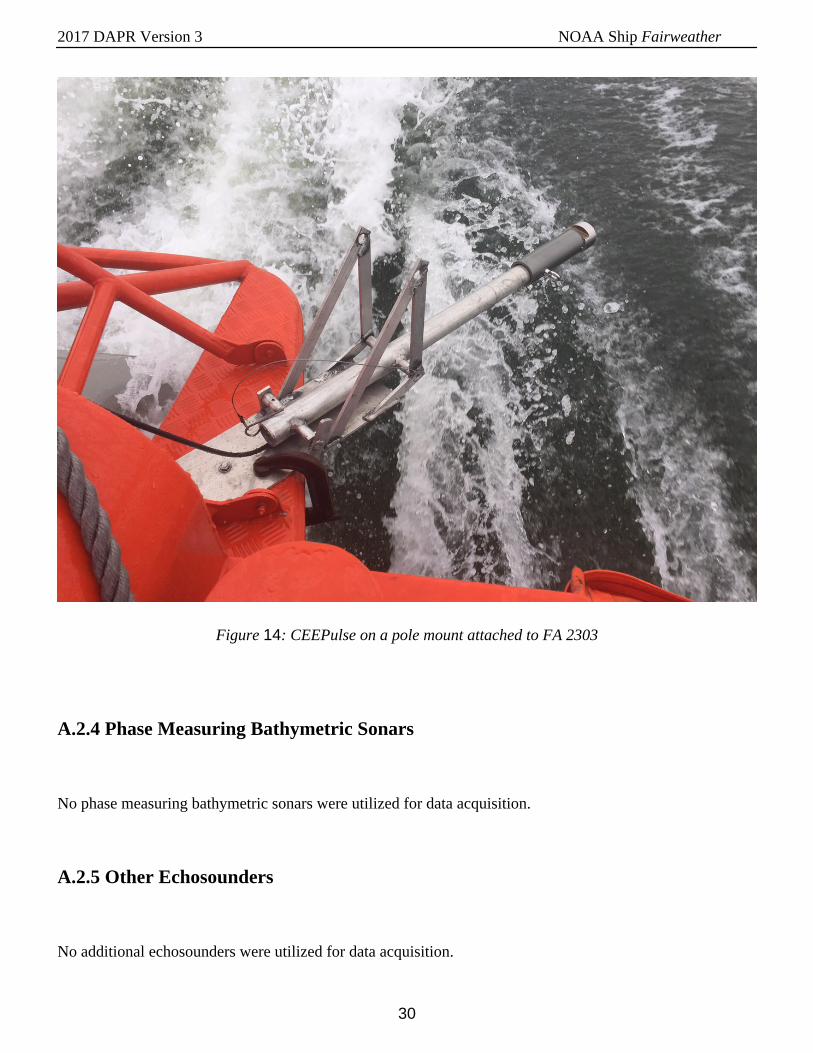
The CEEPulse is a self contained single beam system designed for mobile applications that includes a transducer and processing unit and can interface with a computer using an RS232 or Bluetooth connection. The system operates at a 200 kHz frequency, with a ping rate of up to 10 Hz, and has an operational depth range of 0.25-100 meters. The CEEPulse was pole mounted and used to survey waters too shallow for the launches with a 1.1 meter draft.
Serial Numbers
Vessel 2302
Processor s/n 1428202
Transducer s/n 1428202
2017 DAPR Version 3 NOAA Ship Fairweather
29
Specifications
Frequency 200 kilohertz
Along Track 9 degreesBeamwidth
Across Track 9 degrees
Max Ping Rate 10 hertz
Depth Resolution 1 centimeters
Manufacturer
Specified100 meters
Depth Rating
Ship Usage 100 meters
ManufacturerCalibrations
Manufacturer calibration was not performed.
System AccuracyTests
Vessel Installed On 2302
Methods
A comparison between data from the CEEPulse and calibrated MBESsystems from 2807 and 2808 was performed after processing in CARIS.Using a difference surface between the MBES data and the SBES datagridded at 4 m, statistics were generated and verified with fall withinallowable total vertical uncertainty in the relevant depths.
Results
The mean difference between the MBES and SBES surfaces was 0.09 mwith 95% of the differences falling within 0.33 m. This falls within theallowable vertical uncertainty of greater than 0.5 m as defined in HSSD5.1.3. Due to the consistency of the mean difference between two surveyareas and multiple days, the static draft was shifted by this amount as anestimate for the dynamic draft as described in Section C.2.1.
2017 DAPR Version 3 NOAA Ship Fairweather
30
Figure 14: CEEPulse on a pole mount attached to FA 2303
A.2.4 Phase Measuring Bathymetric Sonars
No phase measuring bathymetric sonars were utilized for data acquisition.
A.2.5 Other Echosounders
No additional echosounders were utilized for data acquisition.
2017 DAPR Version 3 NOAA Ship Fairweather
31
A.3 Manual Sounding Equipment
A.3.1 Diver Depth Gauges
No diver depth gauges were utilized for data acquisition.
A.3.2 Lead Lines
Manufacturer FA Personnel
Model Traditional
Description
Despite the tremendous advances in hydrographic sonar technology, the hydrographer may occasionally require a direct measurement of water depth. To this end, a calibrated lead line is still essential for field parties. The Field Procedures Manual (FPM) states: “All field units engaged in hydrographic surveys where general depths are less than 40 meters shall have one or more lead lines marked and calibrated.” The Fairweather maintains seven lead lines on board.
Serial Numbers
10_01_05
10_02_04
20_02_05
20_03_05
30_01_05
10_05_09
10_06_09
Calibrations
Serial Number 10_01_05 20_02_05 20_03_05 30_01_05 10_05_09 10_06_09
Date 2017-02-06 2017-02-06 2017-02-06 2017-02-06 2017-02-06 2017-02-06
Procedures Steel Tape Steel Tape Steel Tape Steel Tape Steel Tape Steel Tape
Accuracy Checks No accuracy checks were performed.
Correctors Correctors were not determined.
Non-StandardProcedures
Non-standard procedures were not utilized.
A.3.3 Sounding Poles
No sounding poles were utilized for data acquisition.
2017 DAPR Version 3 NOAA Ship Fairweather
32
A.3.4 Other Manual Sounding Equipment
No additional manual sounding equipment was utilized for data acquisition.
A.4 Positioning and Attitude Equipment
A.4.1 Applanix POS/MV
Manufacturer Applanix
Model POS MV V5
Description
The POS MV V5 calculates position, heading, attitude, and vertical displacement (heave) of a vessel. It consists of a rack mounted POS Computer System (PCS), a bolt down IMU-200 Inertial Measurement Unit (IMU), and two GNSS antennas corresponding to GNSS receivers in the PCS.
PCS
Manufacturer Applanix
Model POS MV5
Description
Position and Attitude POS Computer System. A rack-mounted computer
system contains the core POS processor and IMU interface electronics,
plus two GPS receivers. The PCS couples system timing, position, and
velocity aiding with GPS raw observables for use with GAMS.
Firmware Version 9.13
Software Version POS View 9.12
Serial Numbers
Vessel Installed
On2805 2806 2807 2808 S220
PCS s/n 8198 8197 8195 8196 8194
2017 DAPR Version 3 NOAA Ship Fairweather
33
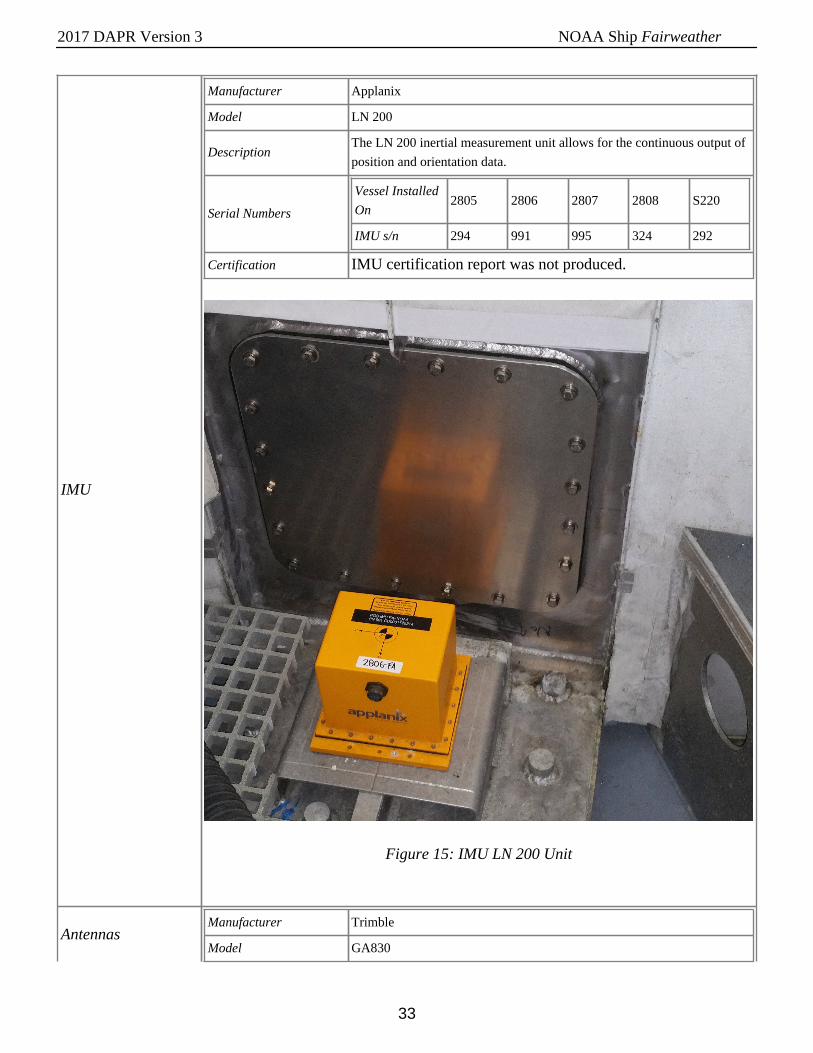
IMU
Manufacturer Applanix
Model LN 200
DescriptionThe LN 200 inertial measurement unit allows for the continuous output of
position and orientation data.
Serial Numbers
Vessel Installed
On2805 2806 2807 2808 S220
IMU s/n 294 991 995 324 292
Certification IMU certification report was not produced.
Figure 15: IMU LN 200 Unit
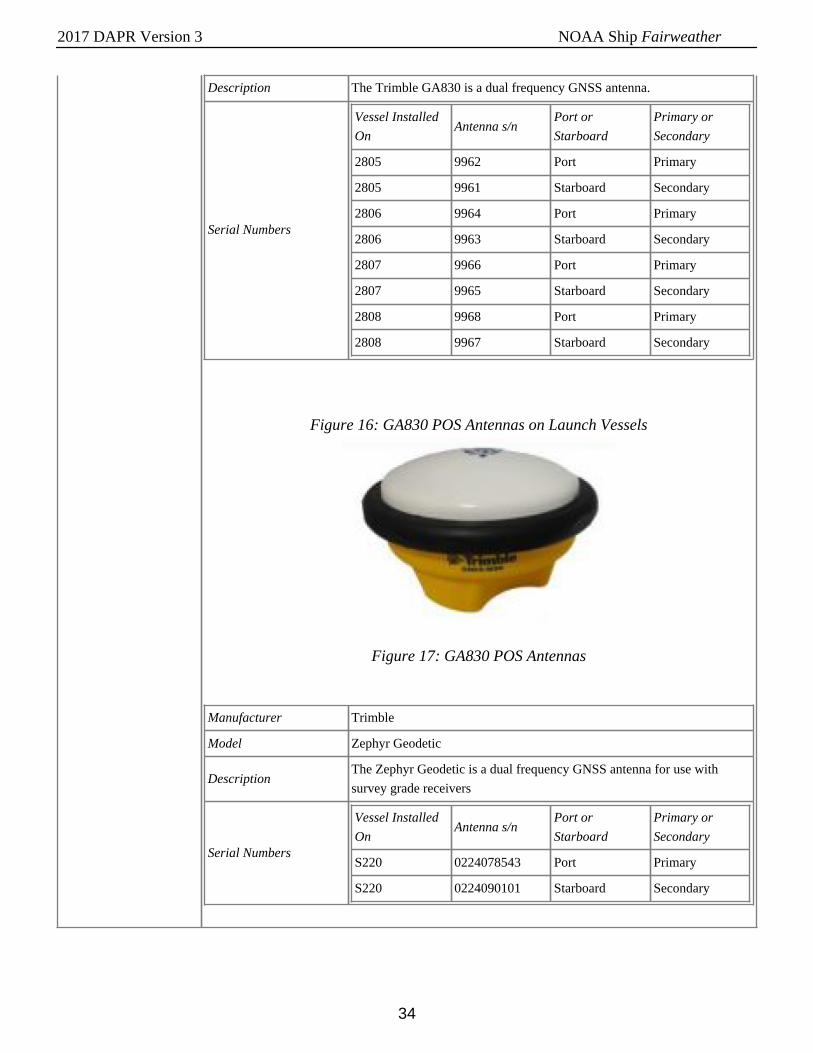
AntennasManufacturer Trimble
Model GA830
2017 DAPR Version 3 NOAA Ship Fairweather
34
Description The Trimble GA830 is a dual frequency GNSS antenna.
Serial Numbers
Vessel Installed
OnAntenna s/n
Port or
Starboard
Primary or
Secondary
2805 9962 Port Primary
2805 9961 Starboard Secondary
2806 9964 Port Primary
2806 9963 Starboard Secondary
2807 9966 Port Primary
2807 9965 Starboard Secondary
2808 9968 Port Primary
2808 9967 Starboard Secondary
Figure 16: GA830 POS Antennas on Launch Vessels
Figure 17: GA830 POS Antennas
Manufacturer Trimble
Model Zephyr Geodetic
DescriptionThe Zephyr Geodetic is a dual frequency GNSS antenna for use with
survey grade receivers
Serial Numbers
Vessel Installed
OnAntenna s/n
Port or
Starboard
Primary or
Secondary
S220 0224078543 Port Primary
S220 0224090101 Starboard Secondary
2017 DAPR Version 3 NOAA Ship Fairweather
35
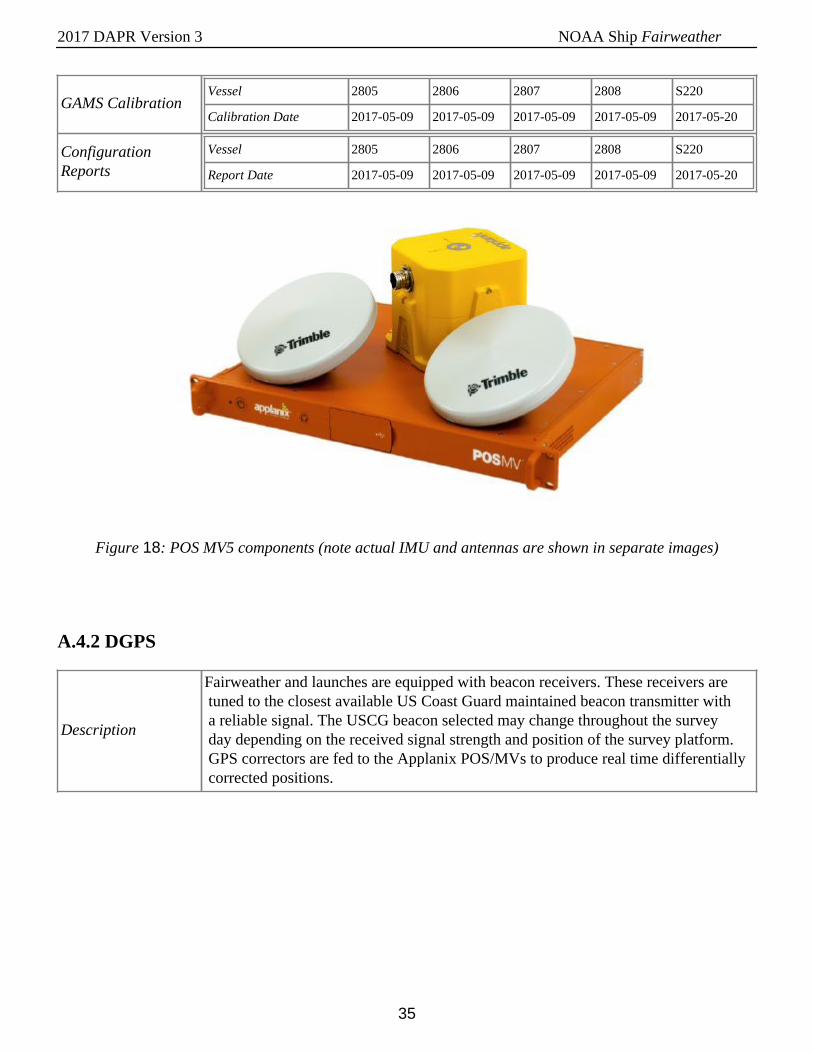
GAMS CalibrationVessel 2805 2806 2807 2808 S220
Calibration Date 2017-05-09 2017-05-09 2017-05-09 2017-05-09 2017-05-20
ConfigurationReports
Vessel 2805 2806 2807 2808 S220
Report Date 2017-05-09 2017-05-09 2017-05-09 2017-05-09 2017-05-20
Figure 18: POS MV5 components (note actual IMU and antennas are shown in separate images)
A.4.2 DGPS
Description
Fairweather and launches are equipped with beacon receivers. These receivers are tuned to the closest available US Coast Guard maintained beacon transmitter with a reliable signal. The USCG beacon selected may change throughout the survey day depending on the received signal strength and position of the survey platform. GPS correctors are fed to the Applanix POS/MVs to produce real time differentially corrected positions.
2017 DAPR Version 3 NOAA Ship Fairweather
36
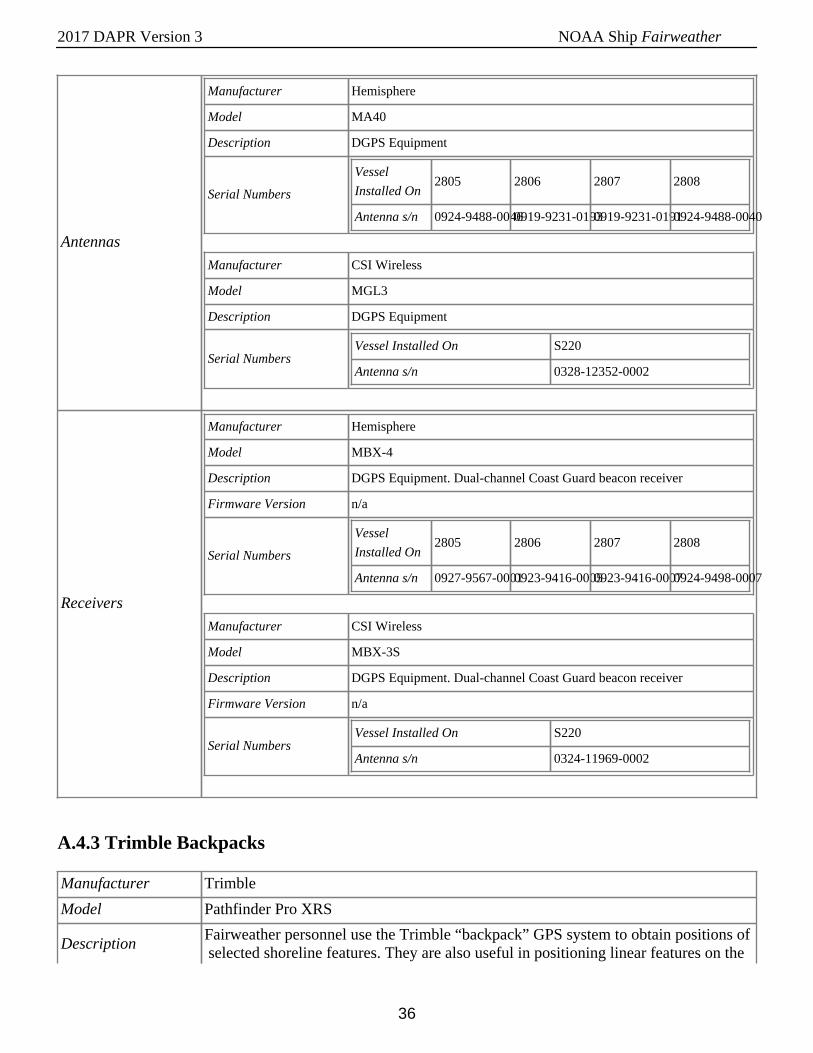
Antennas
Manufacturer Hemisphere
Model MA40
Description DGPS Equipment
Serial Numbers
Vessel
Installed On2805 2806 2807 2808
Antenna s/n 0924-9488-00460919-9231-01930919-9231-01910924-9488-0040
Manufacturer CSI Wireless
Model MGL3
Description DGPS Equipment
Serial NumbersVessel Installed On S220
Antenna s/n 0328-12352-0002
Receivers
Manufacturer Hemisphere
Model MBX-4
Description DGPS Equipment. Dual-channel Coast Guard beacon receiver
Firmware Version n/a
Serial Numbers
Vessel
Installed On2805 2806 2807 2808
Antenna s/n 0927-9567-00010923-9416-00050923-9416-00070924-9498-0007
Manufacturer CSI Wireless
Model MBX-3S
Description DGPS Equipment. Dual-channel Coast Guard beacon receiver
Firmware Version n/a
Serial NumbersVessel Installed On S220
Antenna s/n 0324-11969-0002
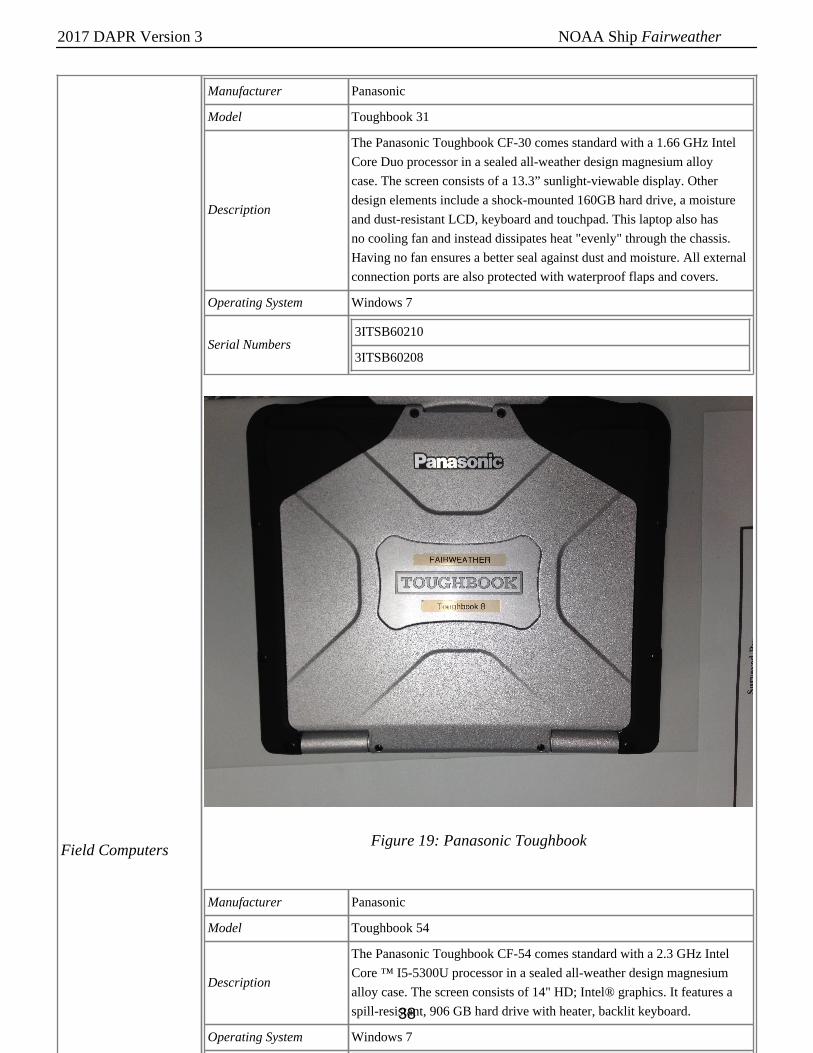
A.4.3 Trimble Backpacks
Manufacturer Trimble
Model Pathfinder Pro XRS
DescriptionFairweather personnel use the Trimble “backpack” GPS system to obtain positions of selected shoreline features. They are also useful in positioning linear features on the
2017 DAPR Version 3 NOAA Ship Fairweather
37
shore such as finger piers or roads where the user can simply go ashore and walk the boundary of the object in question while wearing the backpack. The system consists of a Pathfinder Pro XRS, a 12-channel GPS receiver that provides real-time 1-2 meter accuracy with built-in Coast Guard differential beacon reception capability. This GPS receiver is connected to a Toughbook all-weather laptop computer running Caris Notebook. Due to both the portable and weather resistant attributes of this setup, it can be used in an open skiff to augment traditional shoreline verification in a survey launch.
Serial Numbers N/A
Antennas
Manufacturer Trimble
Model GPS Pathfinder Pro XRS Antenna (part number 33580-50)
Description Integrated L1 GPS/Beacon/Satellite differential antenna
Serial Numbers0220321062
0220321059
Receivers
Manufacturer Trimble
Model Pathfinder Pro XRS
Description GPS receiver with built-in USCG beacon capabilities.
Firmware Version unknown
Serial Numbers0224090101
0224078543
2017 DAPR Version 3 NOAA Ship Fairweather
38
Field Computers
Manufacturer Panasonic
Model Toughbook 31
Description
The Panasonic Toughbook CF-30 comes standard with a 1.66 GHz Intel
Core Duo processor in a sealed all-weather design magnesium alloy
case. The screen consists of a 13.3” sunlight-viewable display. Other
design elements include a shock-mounted 160GB hard drive, a moisture
and dust-resistant LCD, keyboard and touchpad. This laptop also has
no cooling fan and instead dissipates heat "evenly" through the chassis.
Having no fan ensures a better seal against dust and moisture. All external
connection ports are also protected with waterproof flaps and covers.
Operating System Windows 7
Serial Numbers3ITSB60210
3ITSB60208
Figure 19: Panasonic Toughbook
Manufacturer Panasonic
Model Toughbook 54
Description
The Panasonic Toughbook CF-54 comes standard with a 2.3 GHz Intel
Core ™ I5-5300U processor in a sealed all-weather design magnesium
alloy case. The screen consists of 14" HD; Intel® graphics. It features a
spill-resistant, 906 GB hard drive with heater, backlit keyboard.
Operating System Windows 7
Serial Numbers5ITSA19191
5ITSA1950
Figure 20: Panasonic Toughbook
2017 DAPR Version 3 NOAA Ship Fairweather
39
DQA Tests
Date 2017-03-28
Serial Number 0224090101 & 0224090101
Methods
On March 28th, 2017 horizontal control hardware was tested on
benchmark BBCN88 at NOAA Facility MOC-P. For the Trimble
Backpacks, data were collected over the benchmark for 1 minute using
differential corrections from USCG DGPS station Fort Stevens (287.0
kHz).
ResultsThe largest error seen with differential corrected Trimble Backpack data
was 1.0 meter.
Figure 21: Trimble Backpack
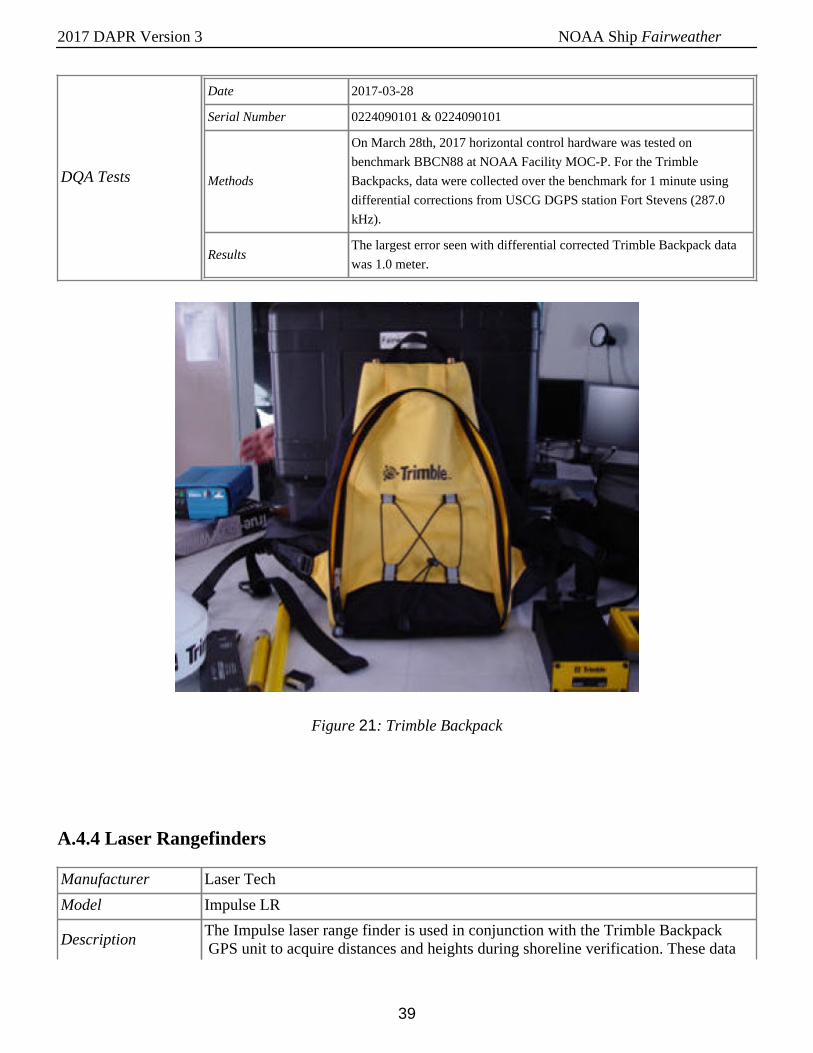
A.4.4 Laser Rangefinders
Manufacturer Laser Tech
Model Impulse LR
DescriptionThe Impulse laser range finder is used in conjunction with the Trimble Backpack GPS unit to acquire distances and heights during shoreline verification. These data
2017 DAPR Version 3 NOAA Ship Fairweather
40
are entered directly into the shoreline acquisition software and annotated on the detached position forms.
Serial Numbers i09290
DQA Tests
Date 2017-04-26
Serial Number i09290
Methods
Data quality assurance testing was conducted by Fairweather personnel
during the HSRR period. Vertical and horizontal readings were taken with
the laser range finders and compared to measurements taken with a steel
tape. The laser range finder was set up on a tripod, and a staff of known
height was measured at distances of 10, 20, 50, and 100 meters.
ResultsThree horizontal and three vertical readings were taken at each interval.
All measurements were within 0.15 meters.
Figure 22: Impulse LR
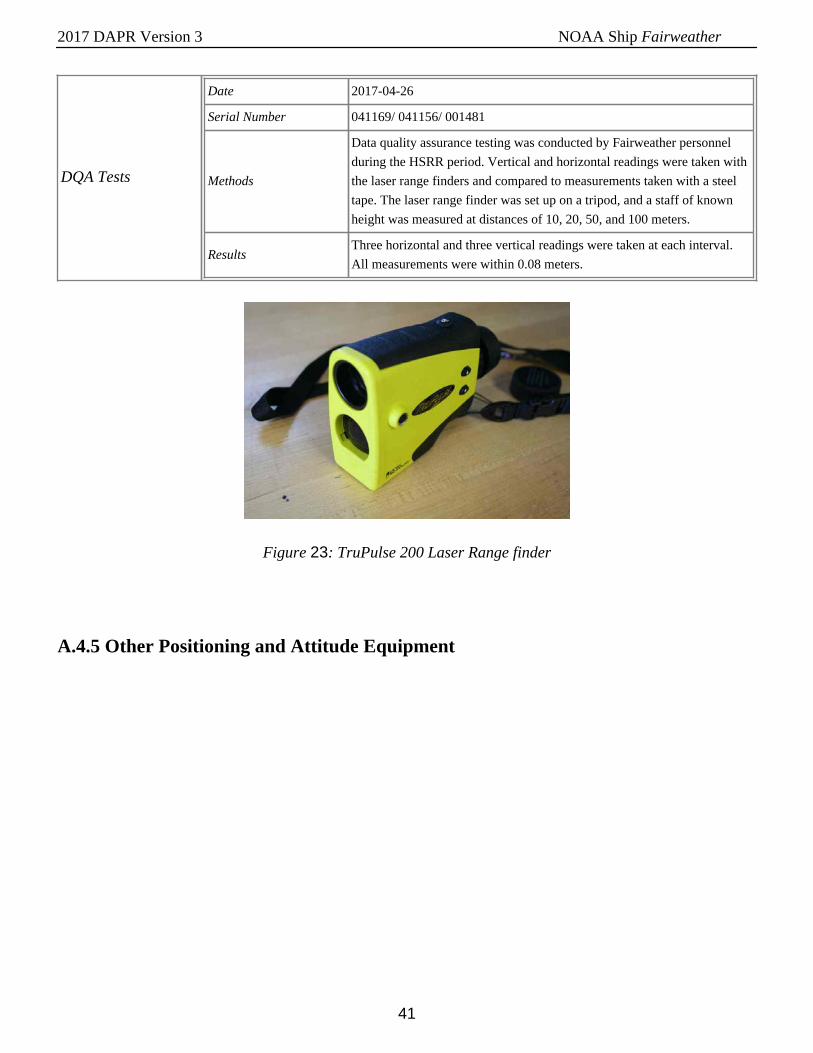
Manufacturer Laser Tech
Model TruPulse 200
Description
The TruPulse 200 laser range finders are used in conjunction with the Trimble Backpack GPS units to acquire distances and heights during shoreline verification. These data are entered directly into the shoreline acquisition software and annotated on the detached position forms. The TruPulse 200 laser rangefingers are also used to measure the static draft of S220.
Serial Numbers
041169
041156
001481
2017 DAPR Version 3 NOAA Ship Fairweather
41
DQA Tests
Date 2017-04-26
Serial Number 041169/ 041156/ 001481
Methods
Data quality assurance testing was conducted by Fairweather personnel
during the HSRR period. Vertical and horizontal readings were taken with
the laser range finders and compared to measurements taken with a steel
tape. The laser range finder was set up on a tripod, and a staff of known
height was measured at distances of 10, 20, 50, and 100 meters.
ResultsThree horizontal and three vertical readings were taken at each interval.
All measurements were within 0.08 meters.
Figure 23: TruPulse 200 Laser Range finder
A.4.5 Other Positioning and Attitude Equipment
2017 DAPR Version 3 NOAA Ship Fairweather
42
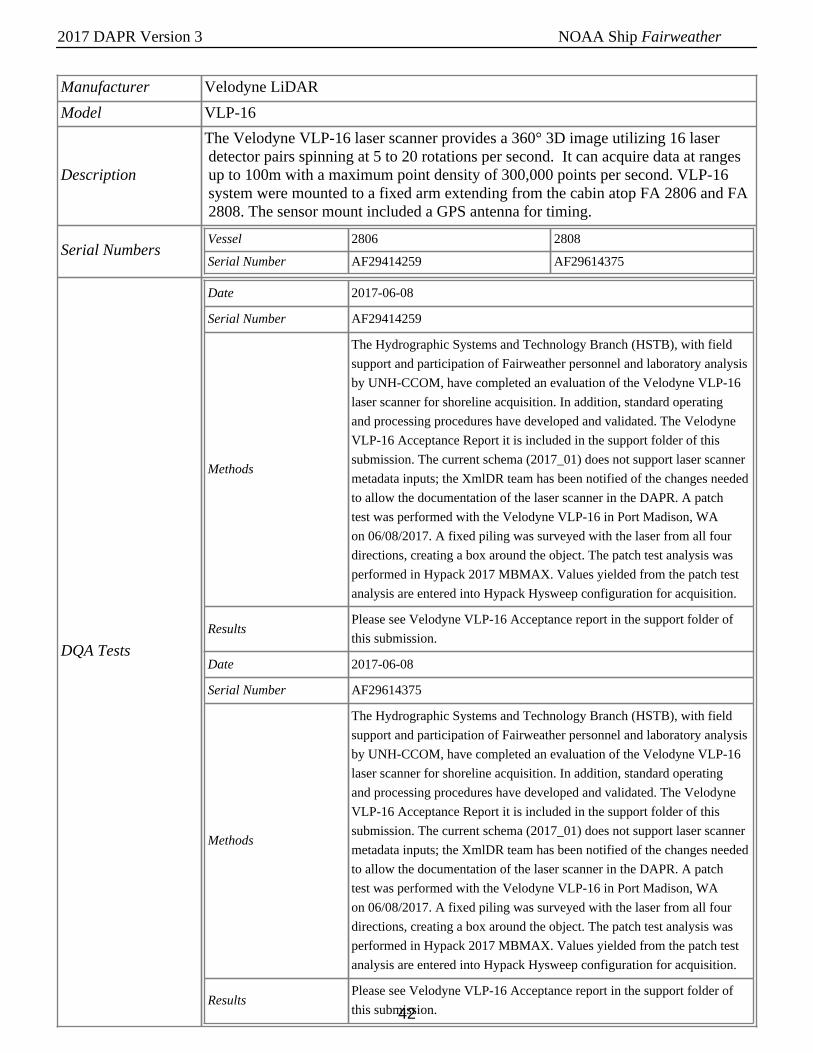
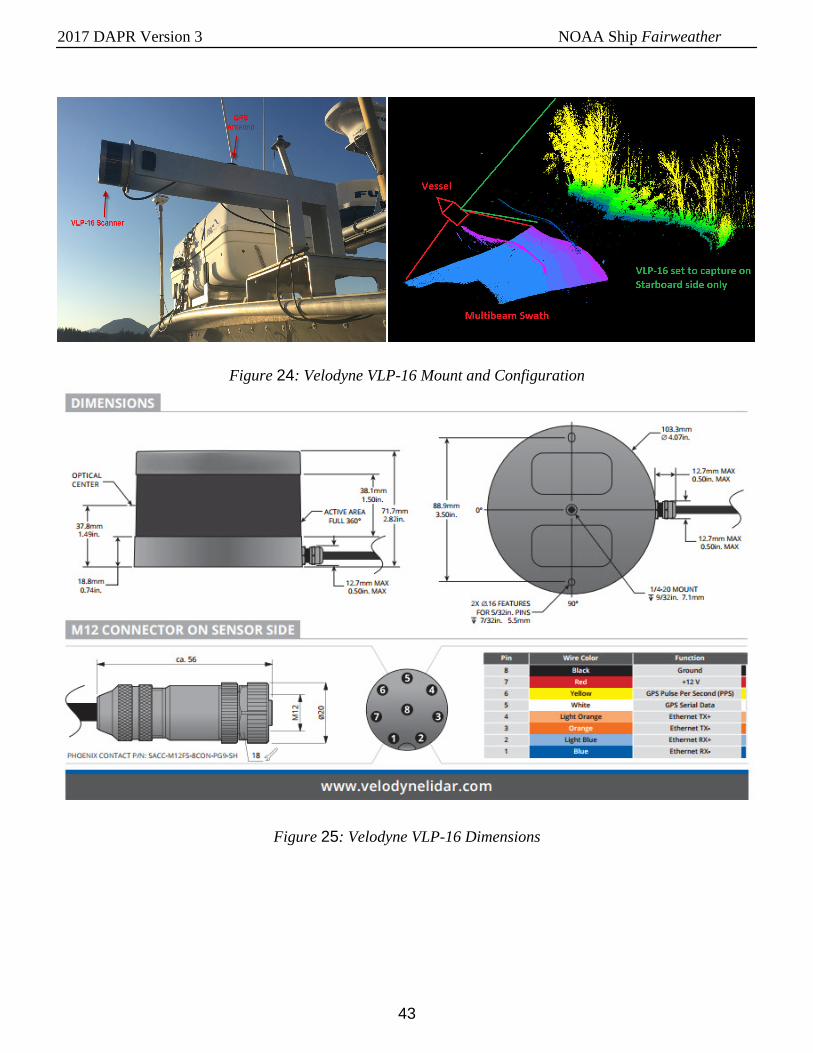
Manufacturer Velodyne LiDAR
Model VLP-16
Description
The Velodyne VLP-16 laser scanner provides a 360° 3D image utilizing 16 laser detector pairs spinning at 5 to 20 rotations per second. It can acquire data at ranges up to 100m with a maximum point density of 300,000 points per second. VLP-16 system were mounted to a fixed arm extending from the cabin atop FA 2806 and FA 2808. The sensor mount included a GPS antenna for timing.
Serial NumbersVessel 2806 2808
Serial Number AF29414259 AF29614375
DQA Tests
Date 2017-06-08
Serial Number AF29414259
Methods
The Hydrographic Systems and Technology Branch (HSTB), with field
support and participation of Fairweather personnel and laboratory analysis
by UNH-CCOM, have completed an evaluation of the Velodyne VLP-16
laser scanner for shoreline acquisition. In addition, standard operating
and processing procedures have developed and validated. The Velodyne
VLP-16 Acceptance Report it is included in the support folder of this
submission. The current schema (2017_01) does not support laser scanner
metadata inputs; the XmlDR team has been notified of the changes needed
to allow the documentation of the laser scanner in the DAPR. A patch
test was performed with the Velodyne VLP-16 in Port Madison, WA
on 06/08/2017. A fixed piling was surveyed with the laser from all four
directions, creating a box around the object. The patch test analysis was
performed in Hypack 2017 MBMAX. Values yielded from the patch test
analysis are entered into Hypack Hysweep configuration for acquisition.
ResultsPlease see Velodyne VLP-16 Acceptance report in the support folder of
this submission.
Date 2017-06-08
Serial Number AF29614375
Methods
The Hydrographic Systems and Technology Branch (HSTB), with field
support and participation of Fairweather personnel and laboratory analysis
by UNH-CCOM, have completed an evaluation of the Velodyne VLP-16
laser scanner for shoreline acquisition. In addition, standard operating
and processing procedures have developed and validated. The Velodyne
VLP-16 Acceptance Report it is included in the support folder of this
submission. The current schema (2017_01) does not support laser scanner
metadata inputs; the XmlDR team has been notified of the changes needed
to allow the documentation of the laser scanner in the DAPR. A patch
test was performed with the Velodyne VLP-16 in Port Madison, WA
on 06/08/2017. A fixed piling was surveyed with the laser from all four
directions, creating a box around the object. The patch test analysis was
performed in Hypack 2017 MBMAX. Values yielded from the patch test
analysis are entered into Hypack Hysweep configuration for acquisition.
ResultsPlease see Velodyne VLP-16 Acceptance report in the support folder of
this submission.
2017 DAPR Version 3 NOAA Ship Fairweather
43
Figure 24: Velodyne VLP-16 Mount and Configuration
Figure 25: Velodyne VLP-16 Dimensions
2017 DAPR Version 3 NOAA Ship Fairweather
44
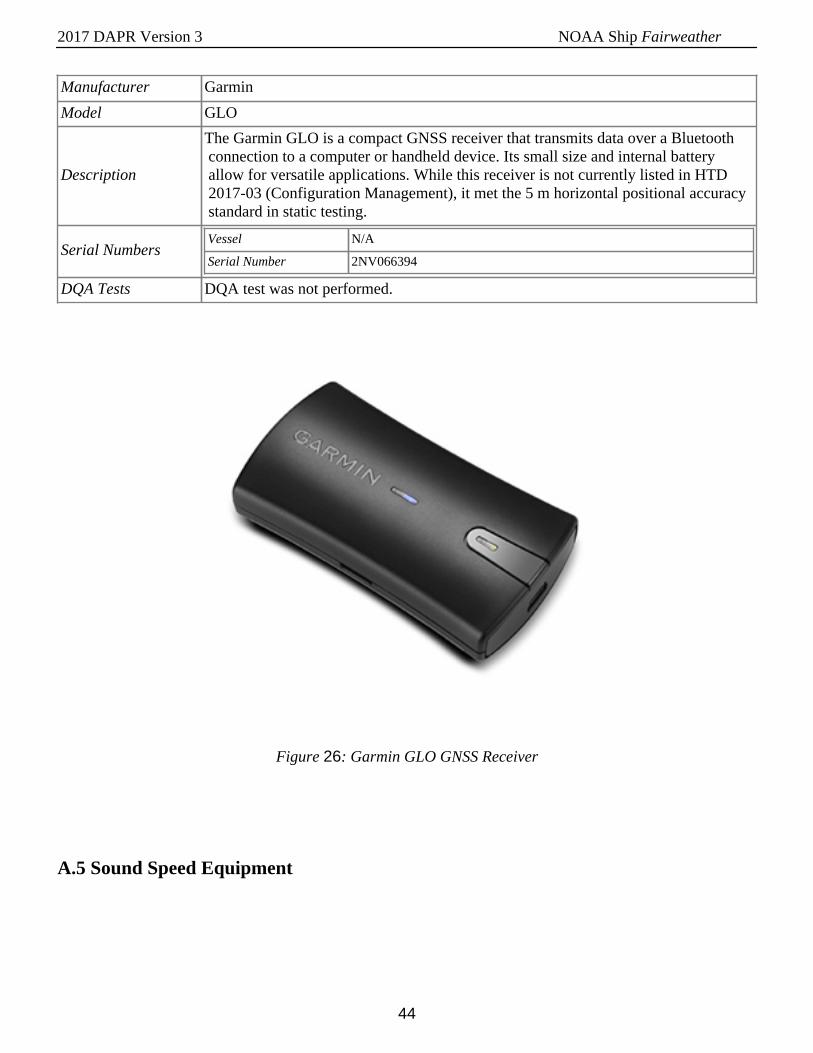
Manufacturer Garmin
Model GLO
Description
The Garmin GLO is a compact GNSS receiver that transmits data over a Bluetooth connection to a computer or handheld device. Its small size and internal battery allow for versatile applications. While this receiver is not currently listed in HTD 2017-03 (Configuration Management), it met the 5 m horizontal positional accuracy standard in static testing.
Serial NumbersVessel N/A
Serial Number 2NV066394
DQA Tests DQA test was not performed.
Figure 26: Garmin GLO GNSS Receiver
A.5 Sound Speed Equipment
2017 DAPR Version 3 NOAA Ship Fairweather
45
A.5.1 Sound Speed Profiles
A.5.1.1 CTD Profilers
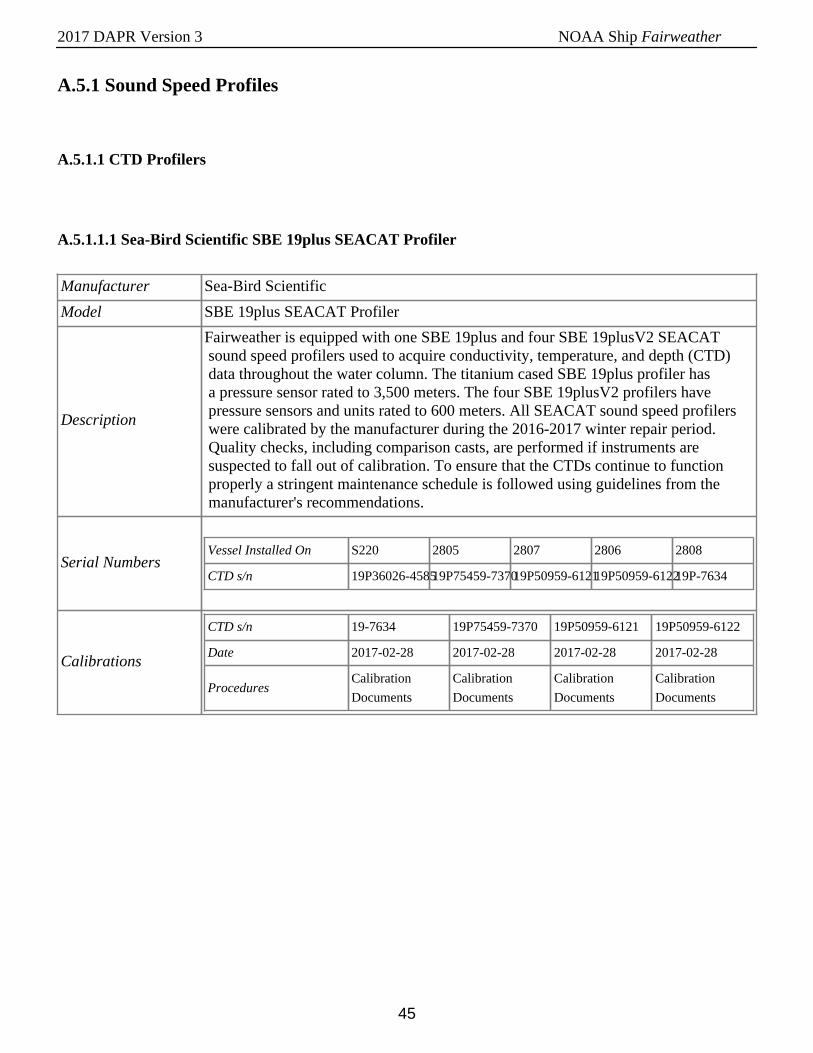
A.5.1.1.1 Sea-Bird Scientific SBE 19plus SEACAT Profiler
Manufacturer Sea-Bird Scientific
Model SBE 19plus SEACAT Profiler
Description
Fairweather is equipped with one SBE 19plus and four SBE 19plusV2 SEACAT sound speed profilers used to acquire conductivity, temperature, and depth (CTD) data throughout the water column. The titanium cased SBE 19plus profiler has a pressure sensor rated to 3,500 meters. The four SBE 19plusV2 profilers have pressure sensors and units rated to 600 meters. All SEACAT sound speed profilers were calibrated by the manufacturer during the 2016-2017 winter repair period. Quality checks, including comparison casts, are performed if instruments are suspected to fall out of calibration. To ensure that the CTDs continue to function properly a stringent maintenance schedule is followed using guidelines from the manufacturer's recommendations.
Serial NumbersVessel Installed On S220 2805 2807 2806 2808
CTD s/n 19P36026-458519P75459-737019P50959-612119P50959-612219P-7634
Calibrations
CTD s/n 19-7634 19P75459-7370 19P50959-6121 19P50959-6122
Date 2017-02-28 2017-02-28 2017-02-28 2017-02-28
ProceduresCalibration
Documents
Calibration
Documents
Calibration
Documents
Calibration
Documents
2017 DAPR Version 3 NOAA Ship Fairweather
46
Figure 27: SBE 19plus V2
A.5.1.2 Sound Speed Profilers
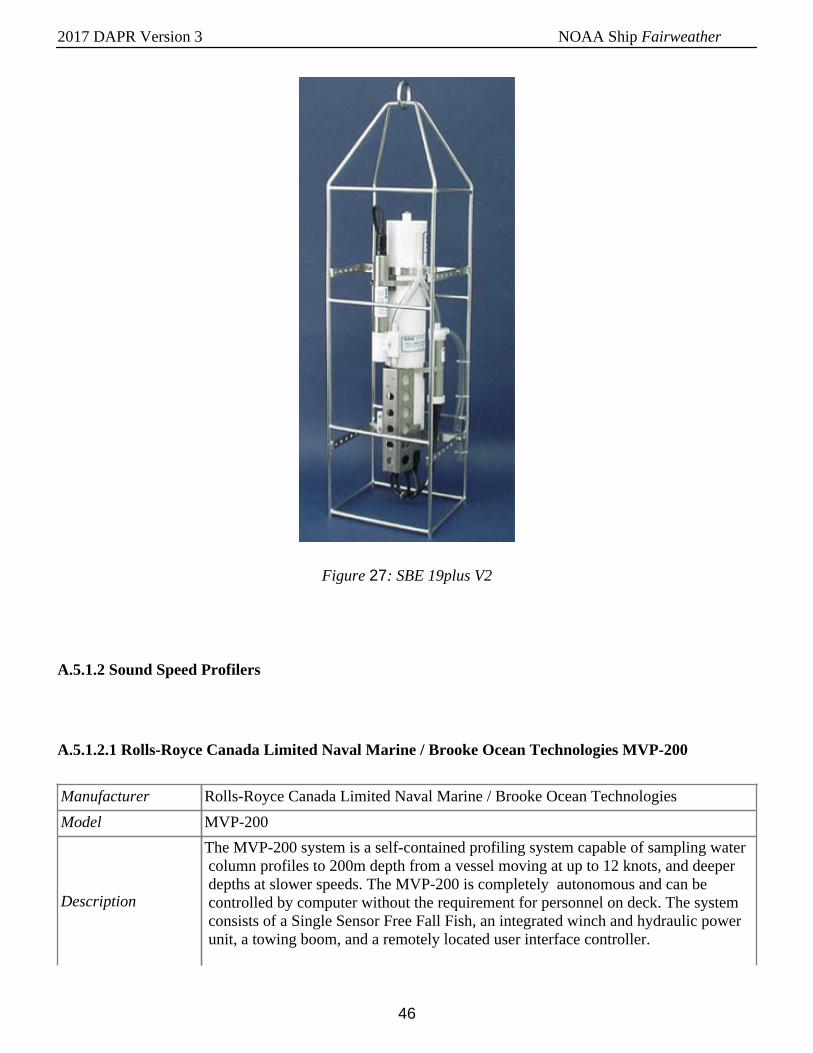
A.5.1.2.1 Rolls-Royce Canada Limited Naval Marine / Brooke Ocean Technologies MVP-200
Manufacturer Rolls-Royce Canada Limited Naval Marine / Brooke Ocean Technologies
Model MVP-200
Description
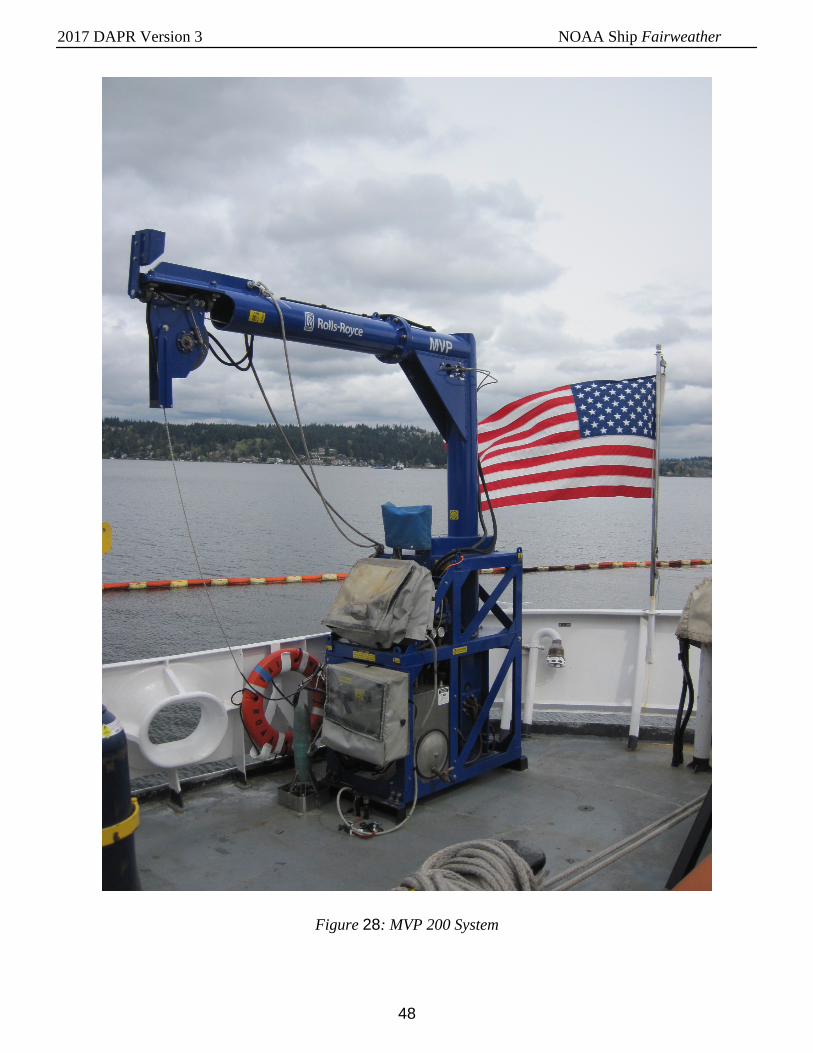
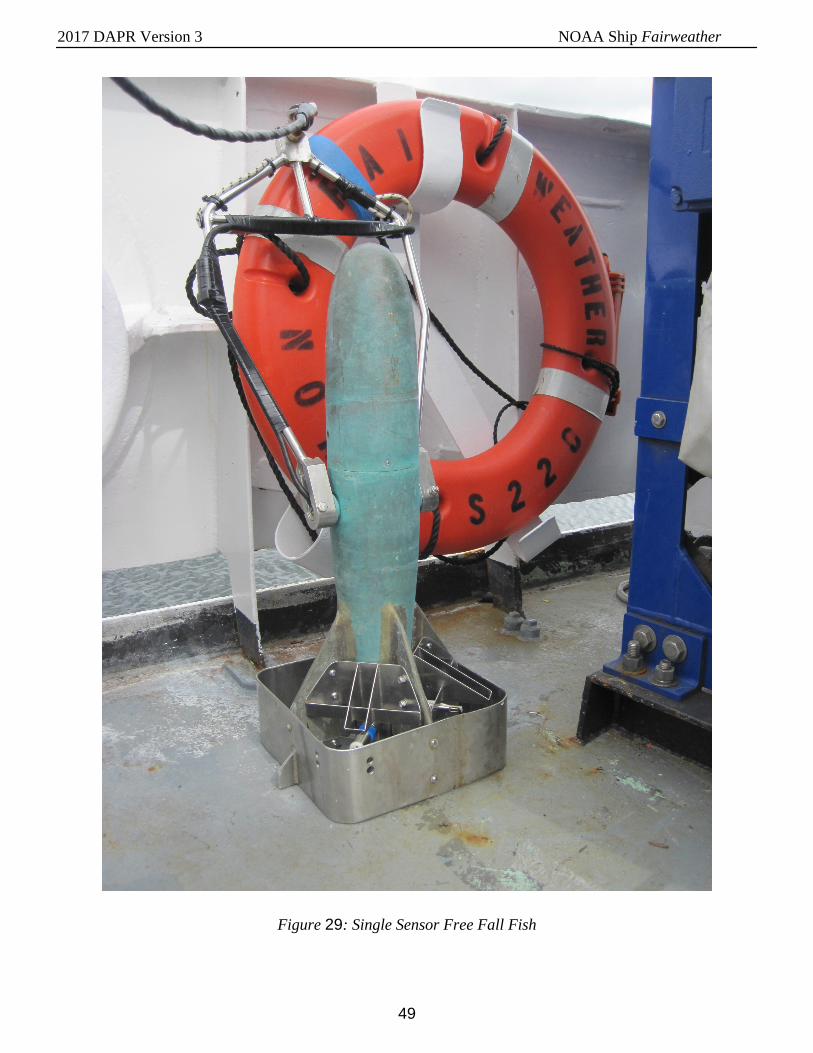
The MVP-200 system is a self-contained profiling system capable of sampling water column profiles to 200m depth from a vessel moving at up to 12 knots, and deeper depths at slower speeds. The MVP-200 is completely autonomous and can be controlled by computer without the requirement for personnel on deck. The system consists of a Single Sensor Free Fall Fish, an integrated winch and hydraulic power unit, a towing boom, and a remotely located user interface controller.
2017 DAPR Version 3 NOAA Ship Fairweather
47
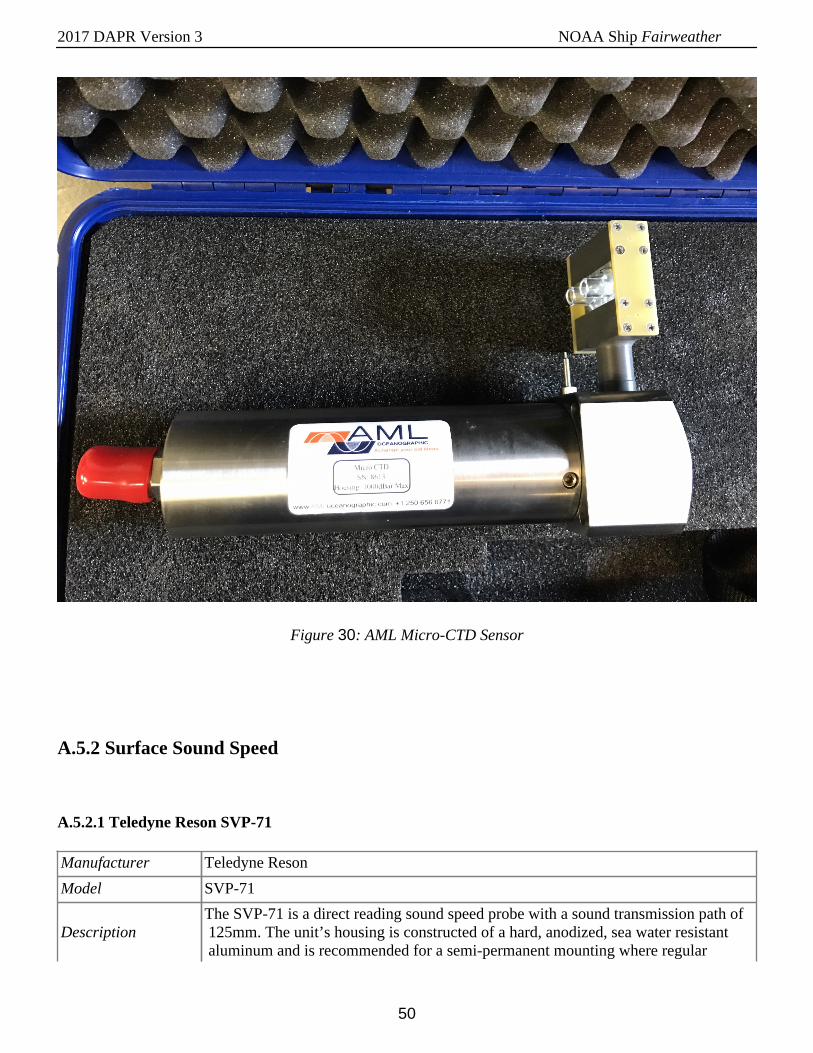
Fairweather's MVP fish is equipped with an AML Oceanographic Micro-CTD sensor capable of acquiring conductivity, temperature, and depth (CTD) data in the water column to determine the speed of sound through water, primarily to correct bathymetry data acquired with the EM 710 MBES.
Serial NumbersVessel Installed On S220
Sound Speed Profiler s/n 8808
Calibrations
Sound Speed Profiler s/n 8808
Date 2017-02-22
Procedures Calibration Documents
2017 DAPR Version 3 NOAA Ship Fairweather
48
Figure 28: MVP 200 System
2017 DAPR Version 3 NOAA Ship Fairweather
49
Figure 29: Single Sensor Free Fall Fish
2017 DAPR Version 3 NOAA Ship Fairweather
50
Figure 30: AML Micro-CTD Sensor
A.5.2 Surface Sound Speed
A.5.2.1 Teledyne Reson SVP-71
Manufacturer Teledyne Reson
Model SVP-71
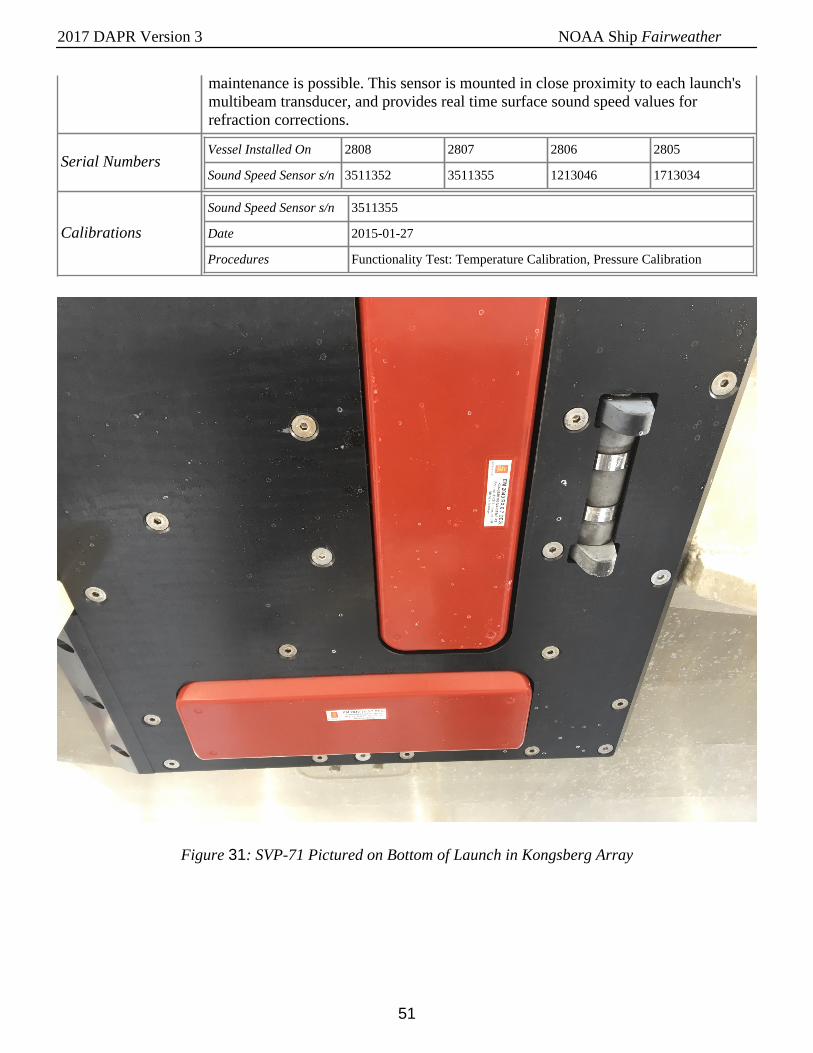
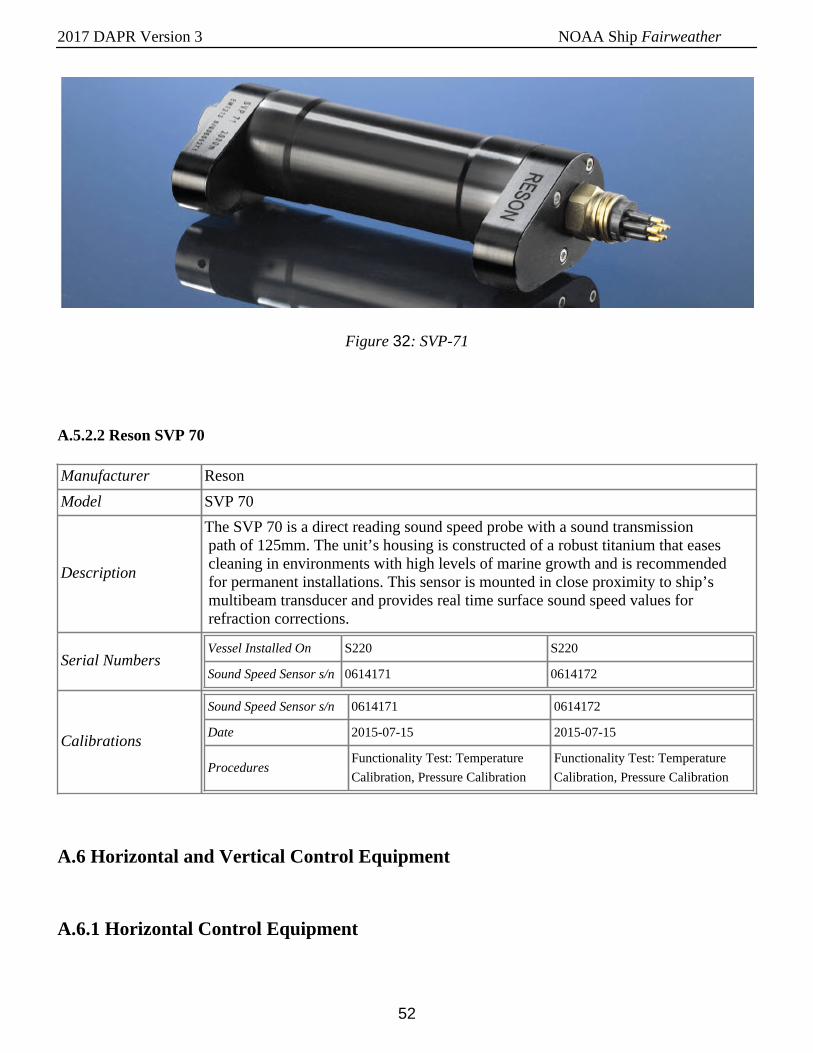
DescriptionThe SVP-71 is a direct reading sound speed probe with a sound transmission path of 125mm. The unit’s housing is constructed of a hard, anodized, sea water resistant aluminum and is recommended for a semi-permanent mounting where regular
2017 DAPR Version 3 NOAA Ship Fairweather
51
maintenance is possible. This sensor is mounted in close proximity to each launch's multibeam transducer, and provides real time surface sound speed values for refraction corrections.
Serial NumbersVessel Installed On 2808 2807 2806 2805
Sound Speed Sensor s/n 3511352 3511355 1213046 1713034
Calibrations
Sound Speed Sensor s/n 3511355
Date 2015-01-27
Procedures Functionality Test: Temperature Calibration, Pressure Calibration
Figure 31: SVP-71 Pictured on Bottom of Launch in Kongsberg Array
2017 DAPR Version 3 NOAA Ship Fairweather
52
Figure 32: SVP-71
A.5.2.2 Reson SVP 70
Manufacturer Reson
Model SVP 70
Description
The SVP 70 is a direct reading sound speed probe with a sound transmission path of 125mm. The unit’s housing is constructed of a robust titanium that eases cleaning in environments with high levels of marine growth and is recommended for permanent installations. This sensor is mounted in close proximity to ship’s multibeam transducer and provides real time surface sound speed values for refraction corrections.
Serial NumbersVessel Installed On S220 S220
Sound Speed Sensor s/n 0614171 0614172
Calibrations
Sound Speed Sensor s/n 0614171 0614172
Date 2015-07-15 2015-07-15
ProceduresFunctionality Test: Temperature
Calibration, Pressure Calibration
Functionality Test: Temperature
Calibration, Pressure Calibration
A.6 Horizontal and Vertical Control Equipment
A.6.1 Horizontal Control Equipment
2017 DAPR Version 3 NOAA Ship Fairweather
53
A.6.1.1 Base Station Equipment
Description
In the absence of a local Continuously Operating Reference Station (CORS) network, Fairweather maintains at least one GPS base station during hydrographic operations in the project area. Following the HSSD 2017, base station sites are selected to fall within 40 kilometers of all data within the project area. Each station consists of either a Trimble NetR5 or Trimble NetR9 GNSS reference receiver interfaced with a FreeWave HTP-900RE 900 MHz Ethernet radio, with all components sealed in a watertight Pelican plastic case. A Zephyr Geodetic 2 GNSS antenna is secured atop a Seco fixed-height GNSS antenna tripod and connected to the Trimble receiver through a watertight connection fitted in the side of the Pelican case. A UHF antenna on top of an extending pole supported by a standard survey tripod is connected to the FreeWave Ethernet radio and provides for remote daily download of the Trimble data. Batteries and solar panels provide power.
2017 DAPR Version 3 NOAA Ship Fairweather
54
GPS Antennas
Manufacturer Trimble Navigation Ltd.
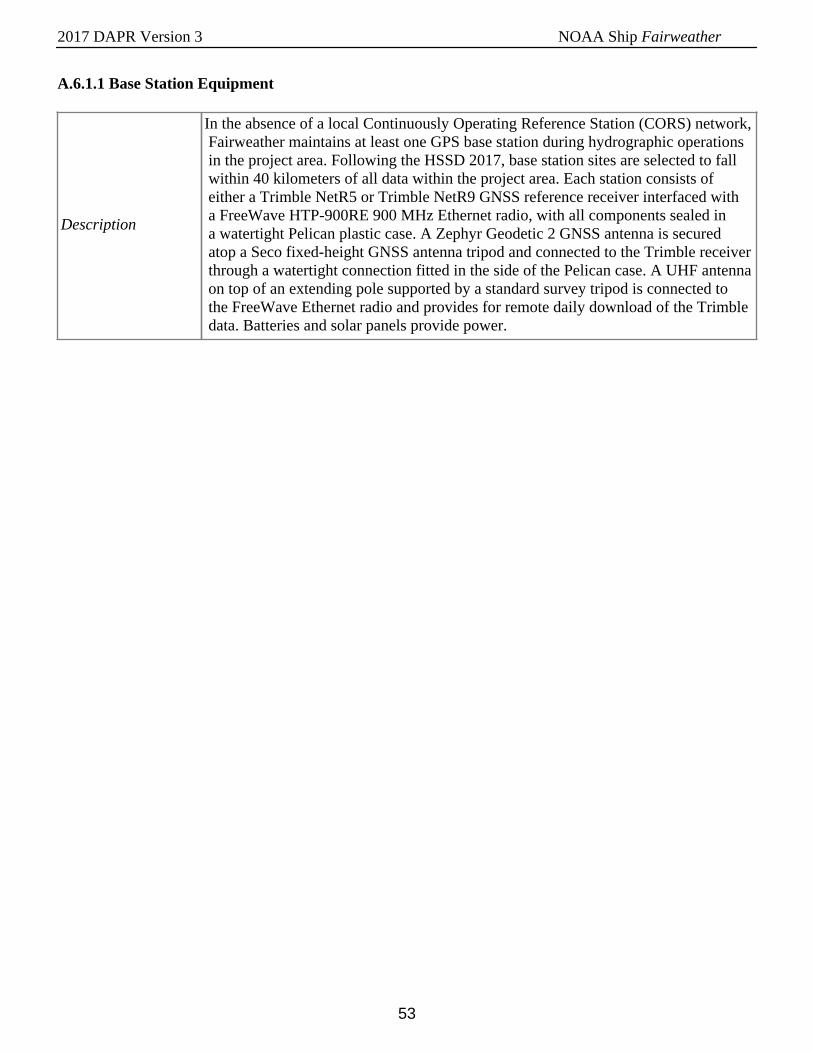
Model Zephyr Geodetic 2
Description
The Trimble Zephyr Geodetic 2 antenna is a survey grade GNSS antennawith a large ground plane for reduction of multipath. This antenna iscompatible with GNSS signals, including GPS L2C and L5, GLONASS,and Galileo.
Serial Numbers
1441031361
1441027807
6127560651
30767996
Figure 33: Zephyr Geodetic 2 Antenna
2017 DAPR Version 3 NOAA Ship Fairweather
55
GPS Receivers
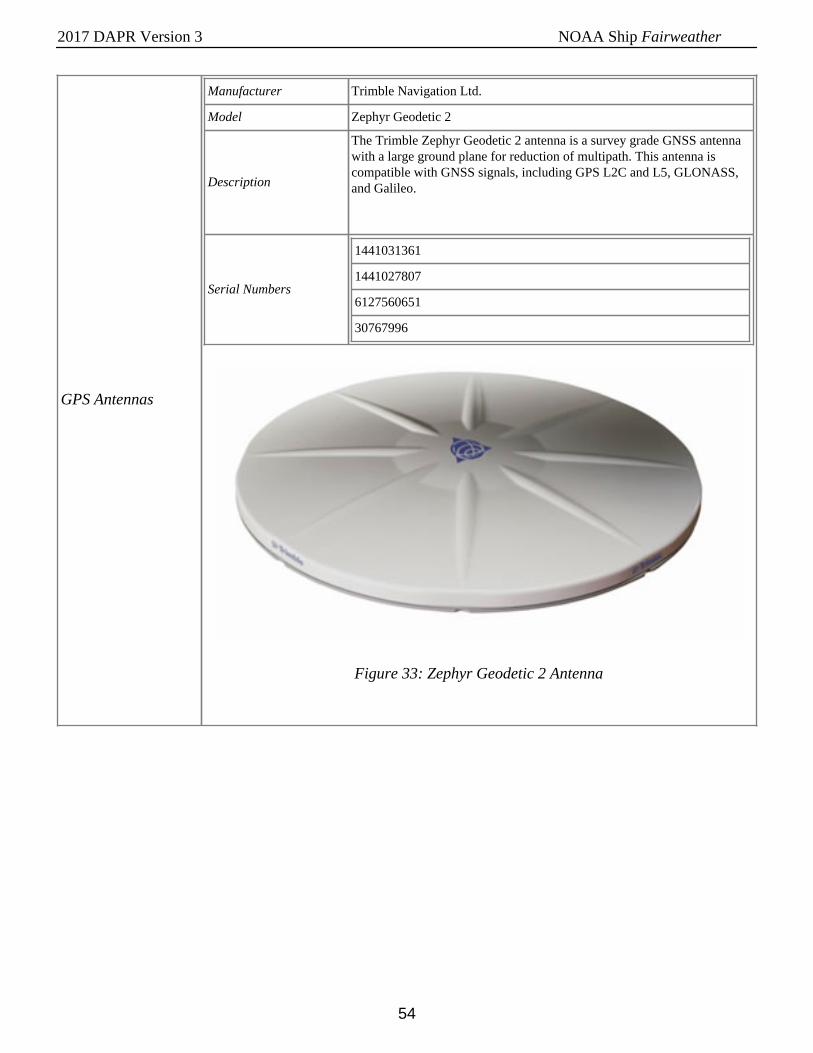
Manufacturer Trimble Navigation Limited
Model NetR9
Description
The Trimble NetR9 reference station is a multi-channel, multi-frequencyGNSS (Global Navigation Satellite System) receiver designed for use as astand-alone reference station or as part of a GNSS infrastructure solution.With 440 channels it is capable of tracking signals from GPS, GLONASS,Galileo, Compass, and QZSS constellations. Power is provided throughPower over Ethernet (PoE) or a 9.5 V to 28 V DC input on a Lemo port,while an internal 15 hour battery operates as a UPS in the event of powersource outage.
Firmware Version 4.3
Serial Numbers
5034K69677
5034K69698
5439R49375
5439R49375
Figure 34: Trimble NetR9 Receiver
Manufacturer Trimble Navigation Ltd.
Model NetR5
Description
The Trimble NetR5 reference station is a multi-channel, multi-frequencyGNSS (Global Navigation Satellite System) receiver designed for useas a stand-alone reference station or as part of a GNSS infrastructuresolution. With 76 channels it can track all GPS signals (L1/L2/L5) as wellas GLONASS (L1/L2). This receiver contains 56 MB of internal storageand has Ethernet ports compatible with HTTP and FTP protocols, also hasan USB port used for extending the storage capability. Power is providedthrough a 9.5 V to 28 V DC input on 26 pin D sub connector, while aninternal 15 hour battery operates as a UPS in the event of power sourceoutage.
Firmware Version n/a
Serial Numbers 4910K61054
Figure 35: Trimble NetR5 receiver
2017 DAPR Version 3 NOAA Ship Fairweather
56
UHF Antennas
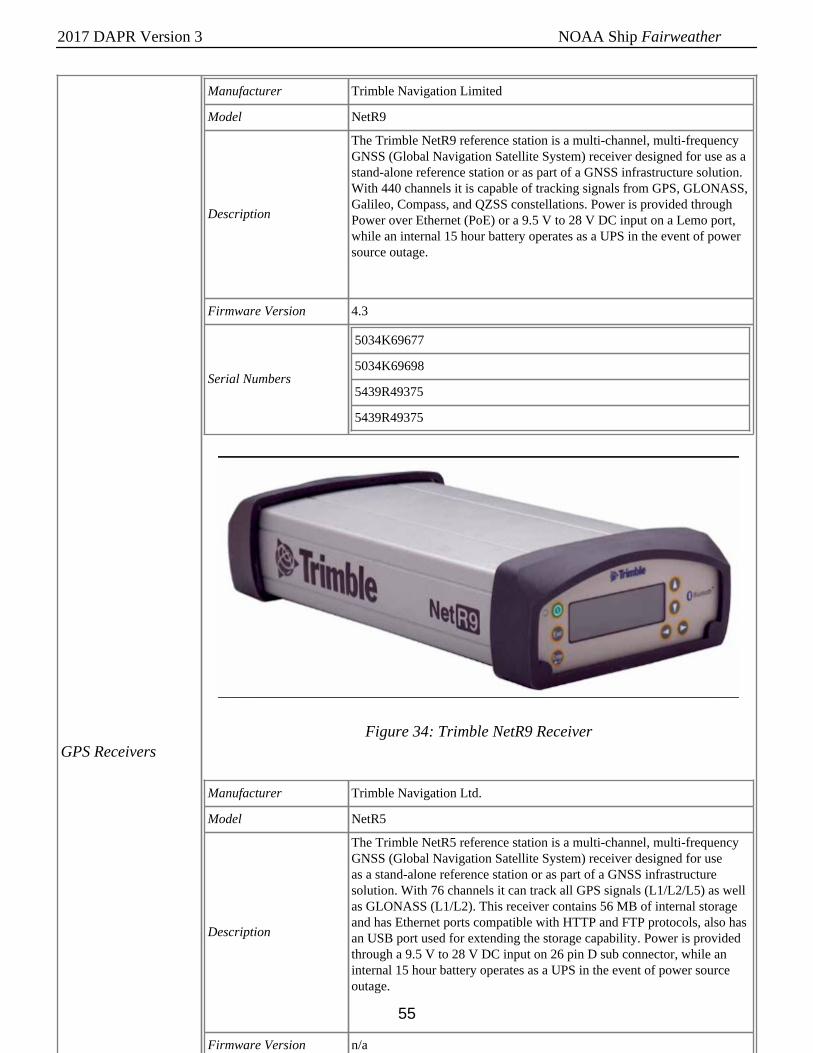
Manufacturer Hyperlink Technology
Model HGV-906U
Description
The HyperLink HGV-906U is a high performance 6 dBi gainomnidirectional antenna designed for the 800 MHz / 900 MHz ISM band.It is suited for applications where high gain and wide coverage is desired.
Serial Numbers N/A
Figure 36: 800/900 MHz 6 dBi Omnidirectional Antenna
2017 DAPR Version 3 NOAA Ship Fairweather
57
UHF Radios
Manufacturer FreeWave
Model HTP-900RE
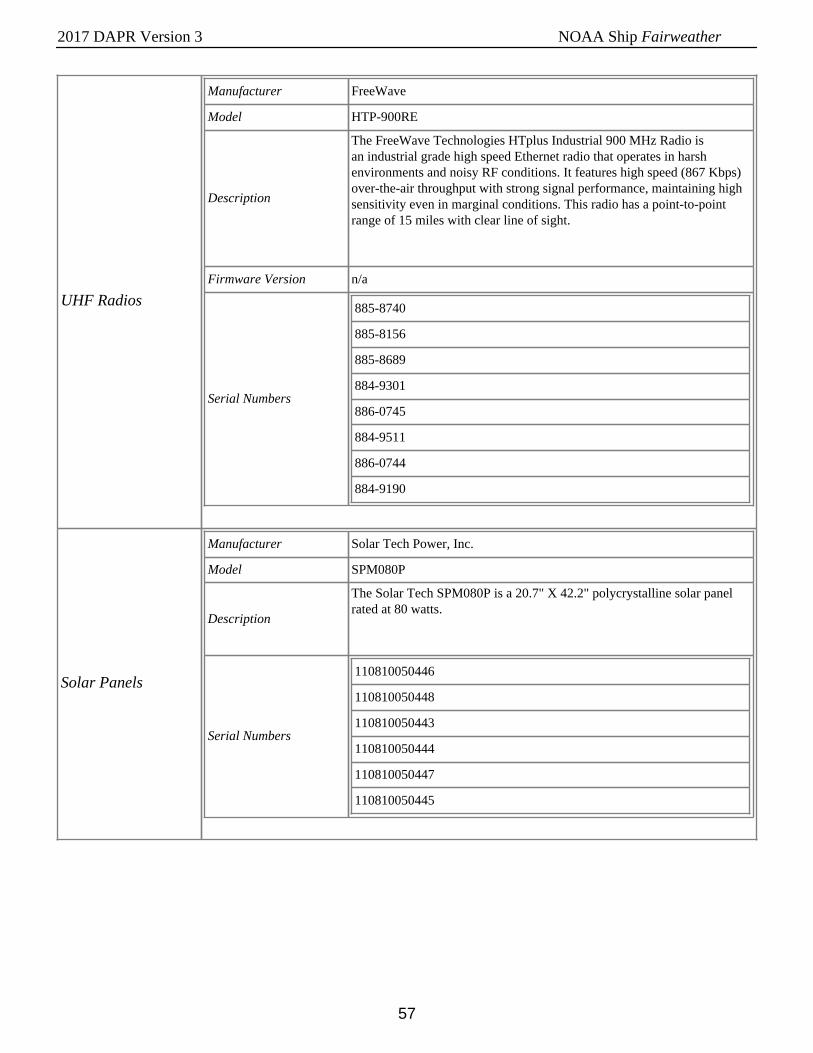
Description
The FreeWave Technologies HTplus Industrial 900 MHz Radio isan industrial grade high speed Ethernet radio that operates in harshenvironments and noisy RF conditions. It features high speed (867 Kbps)over-the-air throughput with strong signal performance, maintaining highsensitivity even in marginal conditions. This radio has a point-to-pointrange of 15 miles with clear line of sight.
Firmware Version n/a
Serial Numbers
885-8740
885-8156
885-8689
884-9301
886-0745
884-9511
886-0744
884-9190
Solar Panels
Manufacturer Solar Tech Power, Inc.
Model SPM080P
Description
The Solar Tech SPM080P is a 20.7" X 42.2" polycrystalline solar panelrated at 80 watts.
Serial Numbers
110810050446
110810050448
110810050443
110810050444
110810050447
110810050445
2017 DAPR Version 3 NOAA Ship Fairweather
58
Solar Chargers
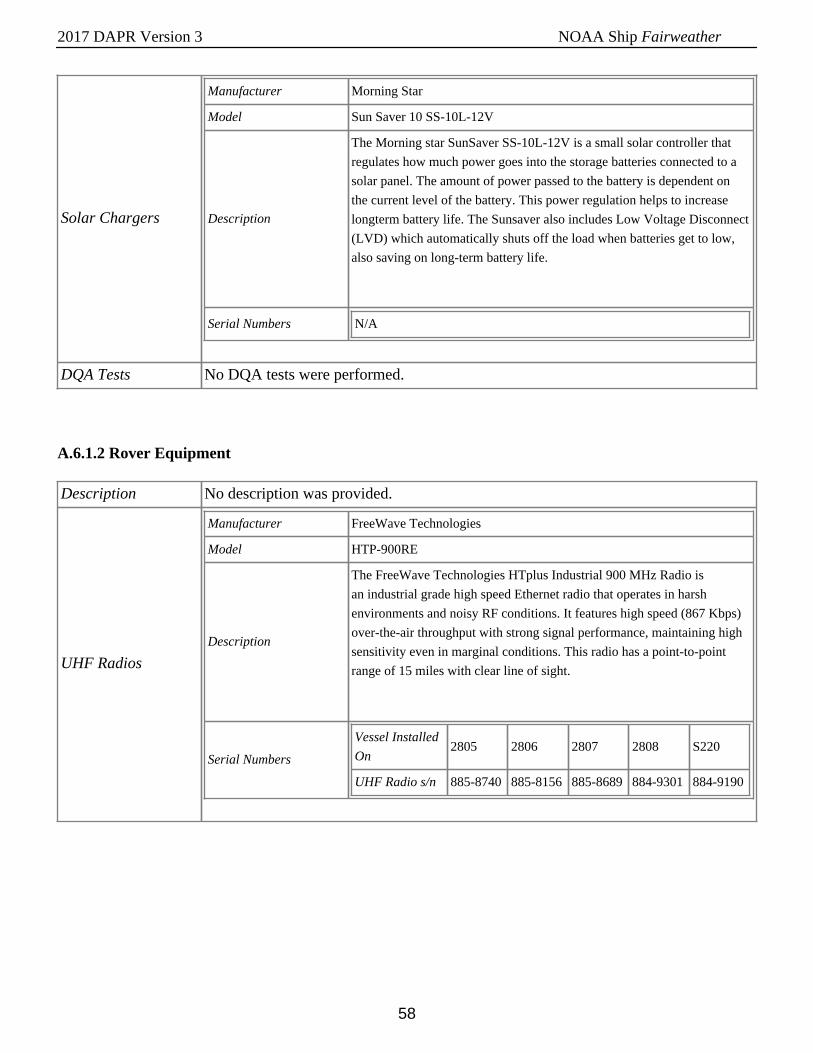
Manufacturer Morning Star
Model Sun Saver 10 SS-10L-12V
Description
The Morning star SunSaver SS-10L-12V is a small solar controller that
regulates how much power goes into the storage batteries connected to a
solar panel. The amount of power passed to the battery is dependent on
the current level of the battery. This power regulation helps to increase
longterm battery life. The Sunsaver also includes Low Voltage Disconnect
(LVD) which automatically shuts off the load when batteries get to low,
also saving on long-term battery life.
Serial Numbers N/A
DQA Tests No DQA tests were performed.
A.6.1.2 Rover Equipment
Description No description was provided.
UHF Radios
Manufacturer FreeWave Technologies
Model HTP-900RE
Description
The FreeWave Technologies HTplus Industrial 900 MHz Radio is
an industrial grade high speed Ethernet radio that operates in harsh
environments and noisy RF conditions. It features high speed (867 Kbps)
over-the-air throughput with strong signal performance, maintaining high
sensitivity even in marginal conditions. This radio has a point-to-point
range of 15 miles with clear line of sight.
Serial Numbers
Vessel Installed
On2805 2806 2807 2808 S220
UHF Radio s/n 885-8740 885-8156 885-8689 884-9301 884-9190
2017 DAPR Version 3 NOAA Ship Fairweather
59
UHF Antennas
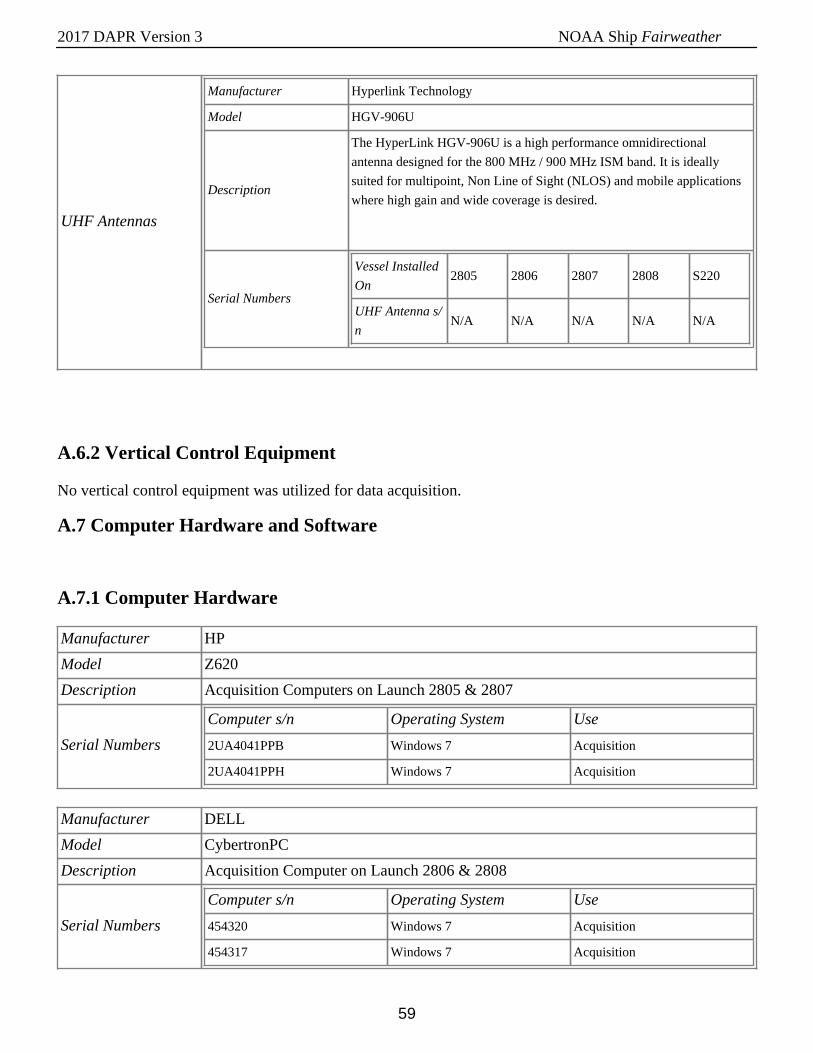
Manufacturer Hyperlink Technology
Model HGV-906U
Description
The HyperLink HGV-906U is a high performance omnidirectional
antenna designed for the 800 MHz / 900 MHz ISM band. It is ideally
suited for multipoint, Non Line of Sight (NLOS) and mobile applications
where high gain and wide coverage is desired.
Serial Numbers
Vessel Installed
On2805 2806 2807 2808 S220
UHF Antenna s/
nN/A N/A N/A N/A N/A
A.6.2 Vertical Control Equipment
No vertical control equipment was utilized for data acquisition.
A.7 Computer Hardware and Software
A.7.1 Computer Hardware
Manufacturer HP
Model Z620
Description Acquisition Computers on Launch 2805 & 2807
Serial Numbers
Computer s/n Operating System Use
2UA4041PPB Windows 7 Acquisition
2UA4041PPH Windows 7 Acquisition
Manufacturer DELL
Model CybertronPC
Description Acquisition Computer on Launch 2806 & 2808
Serial Numbers
Computer s/n Operating System Use
454320 Windows 7 Acquisition
454317 Windows 7 Acquisition
2017 DAPR Version 3 NOAA Ship Fairweather
60
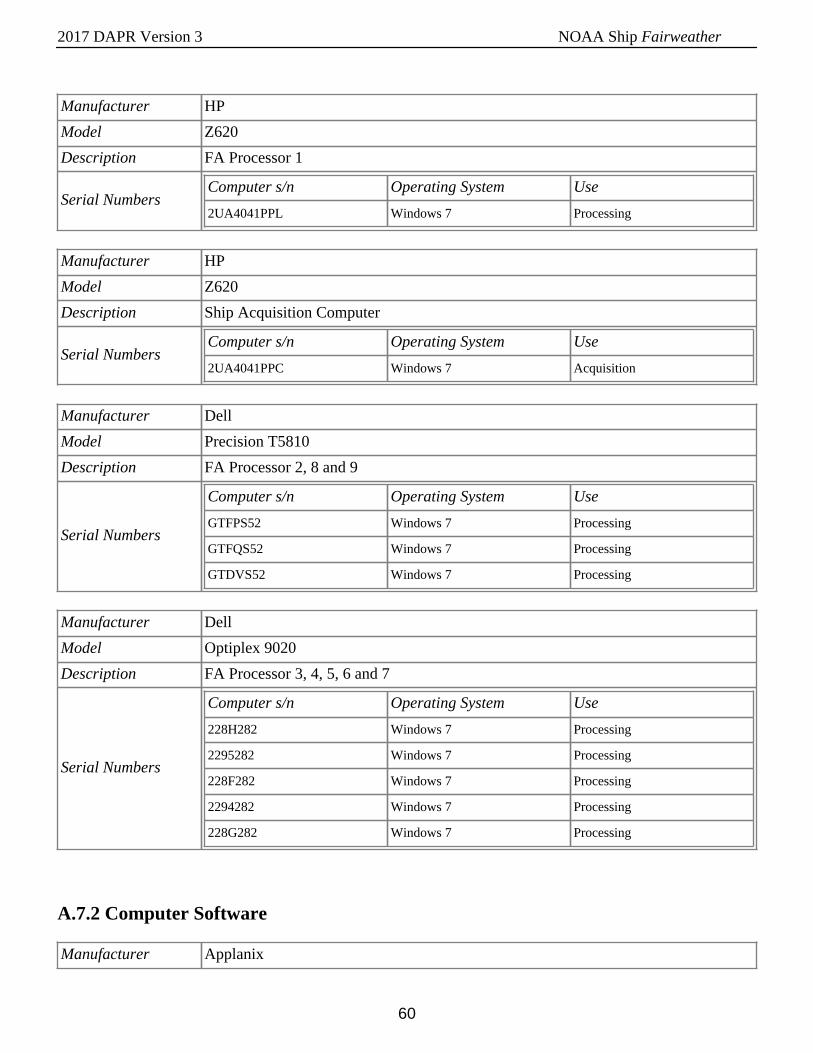
Manufacturer HP
Model Z620
Description FA Processor 1
Serial NumbersComputer s/n Operating System Use
2UA4041PPL Windows 7 Processing
Manufacturer HP
Model Z620
Description Ship Acquisition Computer
Serial NumbersComputer s/n Operating System Use
2UA4041PPC Windows 7 Acquisition
Manufacturer Dell
Model Precision T5810
Description FA Processor 2, 8 and 9
Serial Numbers
Computer s/n Operating System Use
GTFPS52 Windows 7 Processing
GTFQS52 Windows 7 Processing
GTDVS52 Windows 7 Processing
Manufacturer Dell
Model Optiplex 9020
Description FA Processor 3, 4, 5, 6 and 7
Serial Numbers
Computer s/n Operating System Use
228H282 Windows 7 Processing
2295282 Windows 7 Processing
228F282 Windows 7 Processing
2294282 Windows 7 Processing
228G282 Windows 7 Processing
A.7.2 Computer Software
Manufacturer Applanix
2017 DAPR Version 3 NOAA Ship Fairweather
61
Software Name MV-POSView
Version 9.1.2
Service Pack n/a
Hotfix n/a
Installation Date 2017-03-23
Use Acquisition
Description
The MV-POSView controller program is used to configure and operate the POS/MV attitude and positioning system. This program is also used to record the POS/MV .000 files used to produce the SBET files post-applied in CARIS to improveattitude and navigation.
Manufacturer Applanix
Software Name POSPac MMS
Version 8.1
Service Pack 0
Hotfix n/a
Installation Date 2017-07-01
Use Processing
Description
The Applanix POSPac Mobile Mapping Suite (MMS) is a post-processing softwaredesigned to maximize the accuracy potential of the POS/MV (Position andOrientation System Marine Vessels) system. Highly accurate position and orientationsolutions from the GNSS and Inertial data logged to a POS/MV system may beobtained despite periods of GNSS outages. Logged POS/MV files are imported intoPOSPac MMS for automatic analysis and quality checks. When available, data frominstalled base stations are also loaded upon receiving an OPUS solution. If thereare no user installed base stations to reference the acquired POS data to, referencestation and precise ephemeris data may be imported from the internet. This producesa SBET (Smoothed Best Estimate of Trajectory) file that may be applied in CARISto produce superior position and attitude data. Version 7.4 was used for OPR-O190-FA-17, and 8.1 for all other 2017 projects
Manufacturer CARIS
Software Name BASE Editor
Version 4.4
Service Pack n/a
Hotfix n/a
Installation Date 2017-08-01
Use Processing
2017 DAPR Version 3 NOAA Ship Fairweather
62
Description
CARIS BASE Editor allows the user to open all sources of data from historicalBASE surfaces, S-57 shoreline files, raster charts, and ENCs to the latest highdensity multibeam survey in a single space. Once opened, these data can easily besimultaneously examined for consistency. Analysis tools to compare BASE surfacesin their common areas ease junction and crossline comparisons. In addition the 3Dfly-through offers an easy way to catch data fliers.
Manufacturer Caris
Software Name HIPS/SIPS
Version 10.3.3
Service Pack n/a
Hotfix n/a
Installation Date 2017-09-01
Use Processing
Description
CARIS HIPS and SIPS is a comprehensive bathymetric, seafloor imagery, andwater column data processing software. HIPS & SIPS allows the user to convert rawhydrographic data into a usable format and then compute and apply all correctors.Data may then be visualized and manipulated by the user for analysis and cleaning.Automated data cleaning filters and algorithms assist the user in this process.
Manufacturer Caris
Software Name Notebook
Version 3.1.1
Service Pack 1
Hotfix 2
Installation Date 2014-03-01
Use Acquisition and Processing
Description
Notebook allows for the quick collection of geo-referenced hydrographic object dataand notes in the field. Both NMEA and Trimble formats are supported in CARISNotebook which allows the user to obtain data directly from a GPS receiver. NewS-57 objects can be added and proper S-57 attributes attached during collection.Field note descriptions can be attached to new marker objects as attributes. Thenewly digitized S-57 hydrographic objects can easily be brought directly into ENCproduction software.
Manufacturer HYPACK, Inc.
Software Name Hypack
Version 2017
Service Pack n/a
2017 DAPR Version 3 NOAA Ship Fairweather
63
Hotfix n/a
Installation Date 2017-06-01
Use Acquisition
Description
Hypack and the associated Hysweep software is the primary multibeam dataacquisition software aboard Fairweather. Data from sonar, GPS and attitude sensorsare logged to the hard drive while real time displays of launch position and sonarcoverage are displayed on a digital chart.
Manufacturer NOAA (HSTB)
Software Name Pydro
Version 17.06
Service Pack n/a
Hotfix n/a
Installation Date 2017-05-01
Use Processing
Description
Pydro means Python + Hydrography. Pydro represents a framework to create,distribute, and update field software tools built on a reusable code base that makesuse of an exhaustive set of Python modules and libraries. The inaugural applicationof Pydro was (released circa 2001) a specialized GIS designed for survey featuremanagement: the PydroGIS.
Manufacturer NOAA (HSTB)
Software Name Velocipy
Version 17.06
Service Pack n/a
Hotfix n/a
Installation Date 2017-05-01
Use Acquisition
Description
Velocipy is a special purpose program written by HSTP to communicate with Sea-Bird sound speed profiling equipment. With this software, CTD profilers can beinitialized and after deployment have the raw conductivity, temperature and pressuredata downloaded. These data are then processed into a form usable by CARIS inaddition to an archival NODC format.
Manufacturer NOAA (HSTB)
Software Name POSPac Automated QC
Version 17.06
Service Pack n/a
2017 DAPR Version 3 NOAA Ship Fairweather
64
Hotfix n/a
Installation Date 2017-05-01
Use Processing
Description
The POSPac Automated QC application concentrates the most important informationfrom the POSPac MMS Message Logs and Plots into a set of windowed tabs to focusthe contextual review of your ERS vessel positioning.The SBET editing is performedon the SBET QC tab. On this tab you can replace the unresolvable errors in theGNSS height and uncertainty time series data with an interpolated signal derivedfrom (known) differential heave, dynamic draft, and water level data. The abilityto discern anomalous ellipsoidal heights for editing is established in this tool viacomparisons to the smooth in situ water level and tidal datum. Hence, it is importantto include as input for each analysis run - as available: (1) a valid dynamic draftmodel in the HVF, (2) optional tide zoning data and (3) VDatum.
Manufacturer NOAA (HSTB)
Software Name QC Tools
Version 1.9.3+ and 2.0.0+
Service Pack n/a
Hotfix n/a
Installation Date 2017-05-01
Use Processing
Description
QC Tools assist in the review of various types of data occurring all throughout theping-to-chart process. Data is input as a bathymetric grid and/or feature file, and theoutput is a GIS file that alerts to the user various parts of their data that might requiremore attention.
Manufacturer Kongsberg Maritime AS
Software Name SIS
Version 4.1.5
Service Pack n/a
Hotfix n/a
Installation Date 2015-07-16
Use Acquisition
Description
Seafloor Information System (SIS) is produced by Kongsberg Maritime and issupplied as part of the EM710 multi-beam sonar system. This real time softwareis designed to be the user interface and real time data processing system for theEM710. All necessary sensor interfaces, data displays for quality control and sensorcalibration, seabed visualization, data logging, and integrated seabed acousticalimaging capability (sidescan) are standard parts of the software. It operates under the
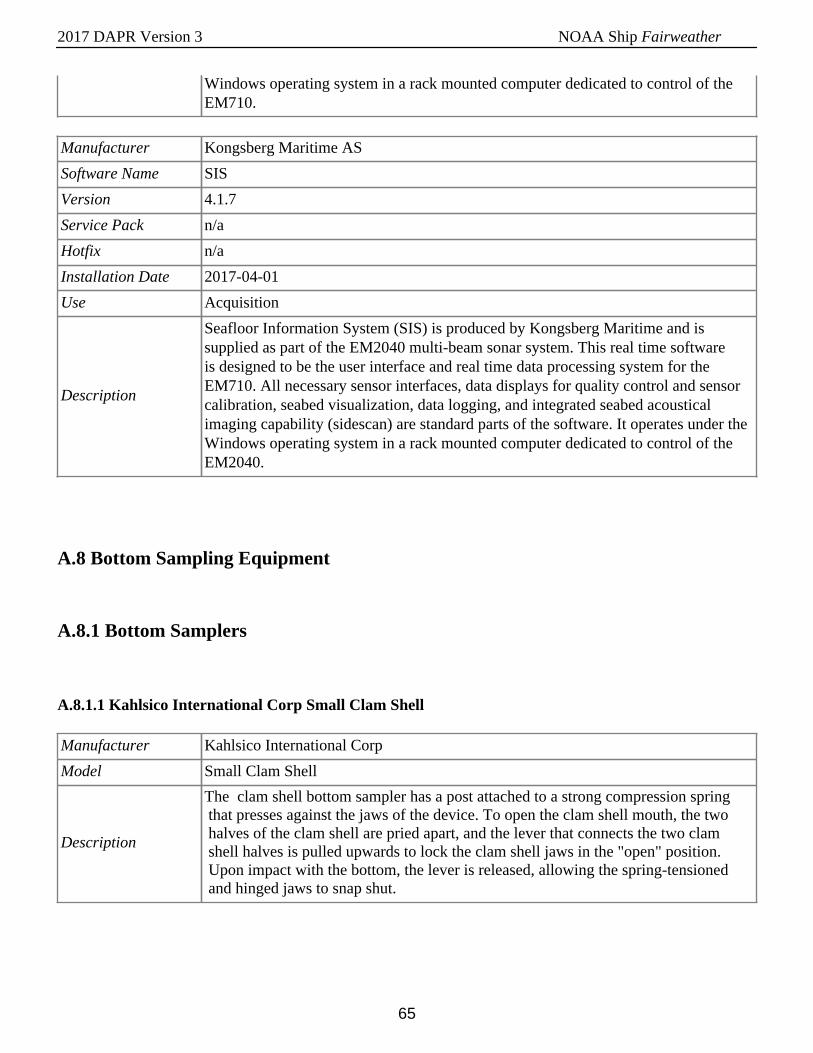
2017 DAPR Version 3 NOAA Ship Fairweather
65
Windows operating system in a rack mounted computer dedicated to control of theEM710.
Manufacturer Kongsberg Maritime AS
Software Name SIS
Version 4.1.7
Service Pack n/a
Hotfix n/a
Installation Date 2017-04-01
Use Acquisition
Description
Seafloor Information System (SIS) is produced by Kongsberg Maritime and issupplied as part of the EM2040 multi-beam sonar system. This real time softwareis designed to be the user interface and real time data processing system for theEM710. All necessary sensor interfaces, data displays for quality control and sensorcalibration, seabed visualization, data logging, and integrated seabed acousticalimaging capability (sidescan) are standard parts of the software. It operates under theWindows operating system in a rack mounted computer dedicated to control of theEM2040.
A.8 Bottom Sampling Equipment
A.8.1 Bottom Samplers
A.8.1.1 Kahlsico International Corp Small Clam Shell
Manufacturer Kahlsico International Corp
Model Small Clam Shell
Description
The clam shell bottom sampler has a post attached to a strong compression spring that presses against the jaws of the device. To open the clam shell mouth, the two halves of the clam shell are pried apart, and the lever that connects the two clam shell halves is pulled upwards to lock the clam shell jaws in the "open" position. Upon impact with the bottom, the lever is released, allowing the spring-tensioned and hinged jaws to snap shut.
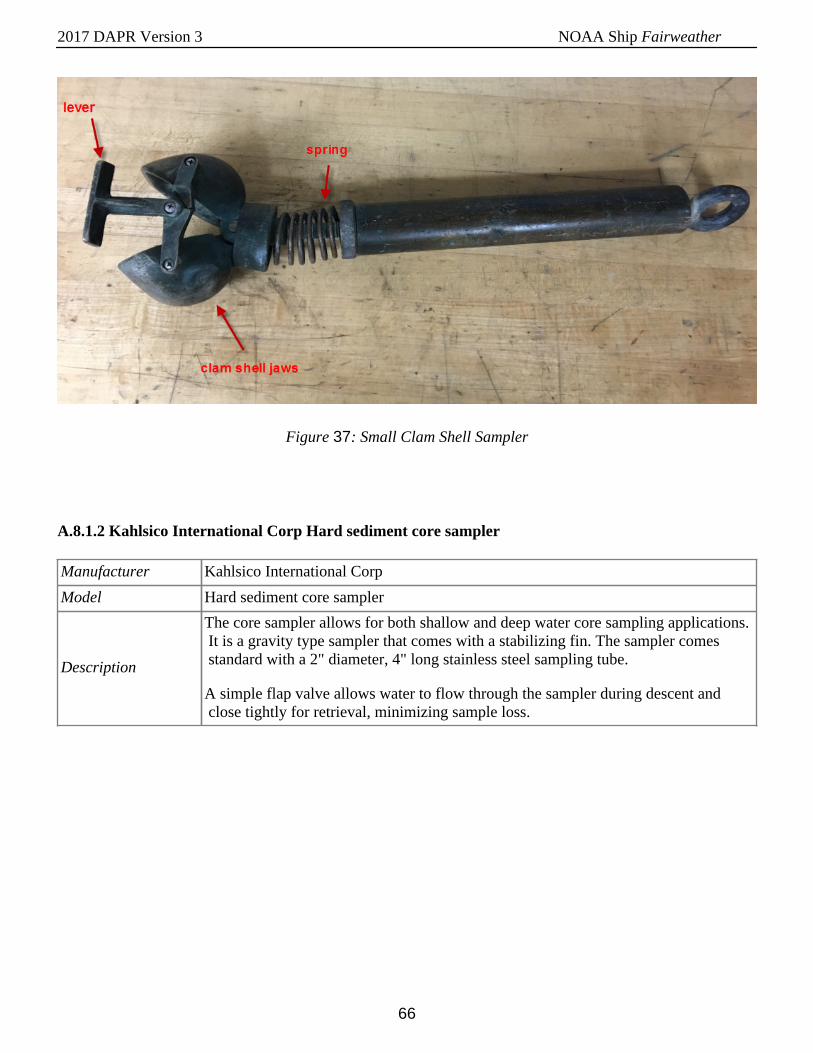
2017 DAPR Version 3 NOAA Ship Fairweather
66
Figure 37: Small Clam Shell Sampler
A.8.1.2 Kahlsico International Corp Hard sediment core sampler
Manufacturer Kahlsico International Corp
Model Hard sediment core sampler
Description
The core sampler allows for both shallow and deep water core sampling applications. It is a gravity type sampler that comes with a stabilizing fin. The sampler comes standard with a 2" diameter, 4" long stainless steel sampling tube.
A simple flap valve allows water to flow through the sampler during descent and close tightly for retrieval, minimizing sample loss.
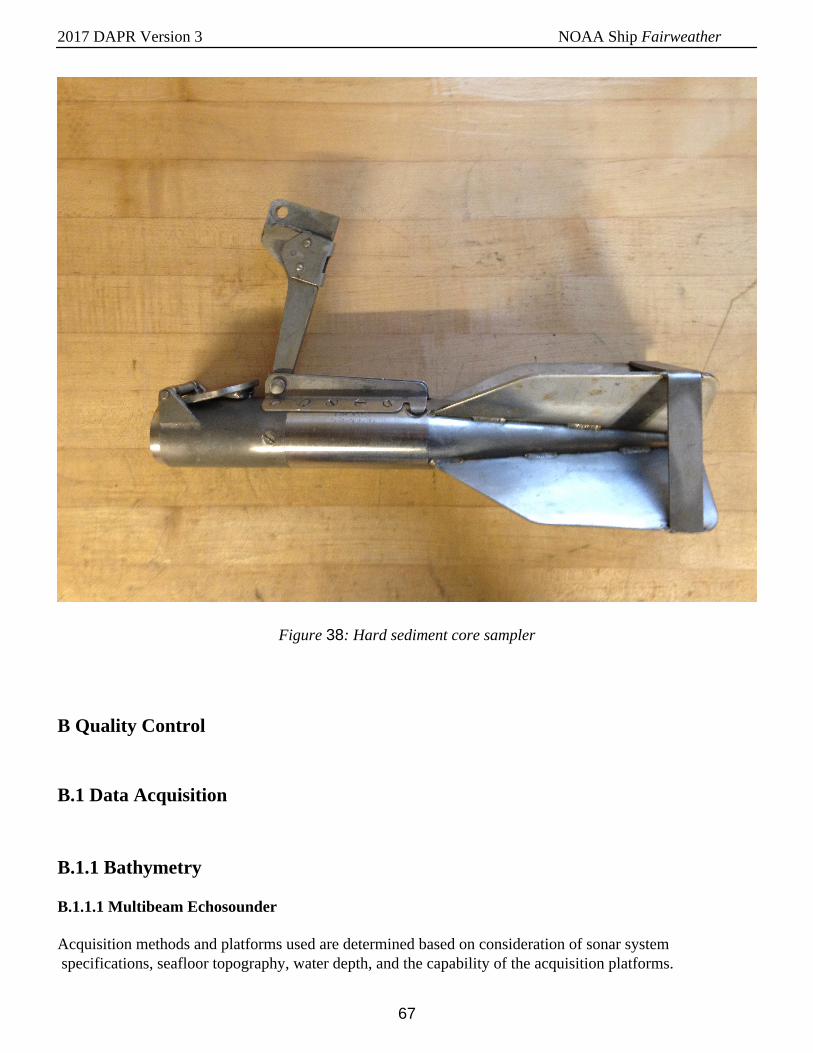
2017 DAPR Version 3 NOAA Ship Fairweather
67
Figure 38: Hard sediment core sampler
B Quality Control
B.1 Data Acquisition
B.1.1 Bathymetry
B.1.1.1 Multibeam Echosounder
Acquisition methods and platforms used are determined based on consideration of sonar system specifications, seafloor topography, water depth, and the capability of the acquisition platforms.
2017 DAPR Version 3 NOAA Ship Fairweather
68
For the Kongsberg EM 710 and EM 2040 all multibeam data is acquired in SIS (Seafloor Information System) .all format. Data were monitored in 2D, 3D and backscatter real-time display windows. A survey template define the storage location of raw and gridded (survey) data and the file naming convention. Basic parameters will determine projection, naming convention for mainscheme (H####_M) and crossline (H#####_X). During acquisition, the hydrographer often adjust parameters of the Kongsberg systems to improve data quality. Common parameters that are adjusted are the port and starboard beam angle, the force depth fields, ping mode, and yaw stabilization. Settings and specialized filters are found in the Runtime parameters tear off window of Seafloor Information Systems (SIS).
During launch acquisition mainscheme MBES lines using the Kongsberg EM2040 are generally run parallel to depth contours with appropriate overlap to ensure data density requirements for finalized BASE surface resolutions are met. For discrete item developments, 200 percent coverage is acquired to ensure least-depth determination by multibeam near-nadir beams. Hypack Hysweep realtime coverage display is used in lieu of pre-planned line files. Hysweep displays the acquired multibeam swath during acquisition and is monitored to ensure overlap and full bottom coverage.
For ship acquisition, real-time coverage is also adopted. Mainscheme MBES lines are run parallel to the contours with appropriate overlap to ensure data density requirements for finalized BASE surface resolutions are met. Hypack Hysweep realtime coverage display is used in lieu of pre-planned line files. If coverage is not adequate, additional lines are run while still in the area.
For areas where shoreline verification is not conducted before multibeam and hazards are suspected to exist, extra caution is taken by “half stepping” shoreward when operating near shore. Half stepping is done by driving along the edge of real time coverage to prevent the survey vessel from working in un-surveyed waters. Survey launch crews in the field survey to the Navigable Area Limit Line (NALL) line as defined by section 1.3.2 of the HSSD.
Seafloor backscatter data were acquired for all data during the 2017 field season, logged in the .all files. The Kongsberg systems have an internal file, BsCorr, used to correct for beam pattern and other effects to equalize backscatter between swaths, sectors, and modes. This file is populated at the factory. A modified BsCorr file was provided by HSTB for the EM 710 system, following the sonar acceptance, to optimize the quality of the backscatter data.
Navigation and motion data are acquired and monitored in POSView and logged into a POS MV file with a .000 extension. Various position and heading accuracies, as well as satellite constellations, are monitored real-time both in POSView and Hypack Hysweep. It is standard procedure not to log the POS/MV data through UTC midnight on Saturdays. At this time the GPS seconds of the week reset.
B.1.1.2 Single Beam Echosounder
The CEEPulse transducer was installed on FA 2302 using a custom built bracket that mounted to the jet guard. The transducer was mounted to a pole that submerged the transducer to a depth of approximately 50 cm below surface. The processing unit was installed in FA 2302 and powered by a 12 volt battery. The transducer was interfaced with Hypack for data acquisition on a Toughbook laptop in the cabin via RS 232
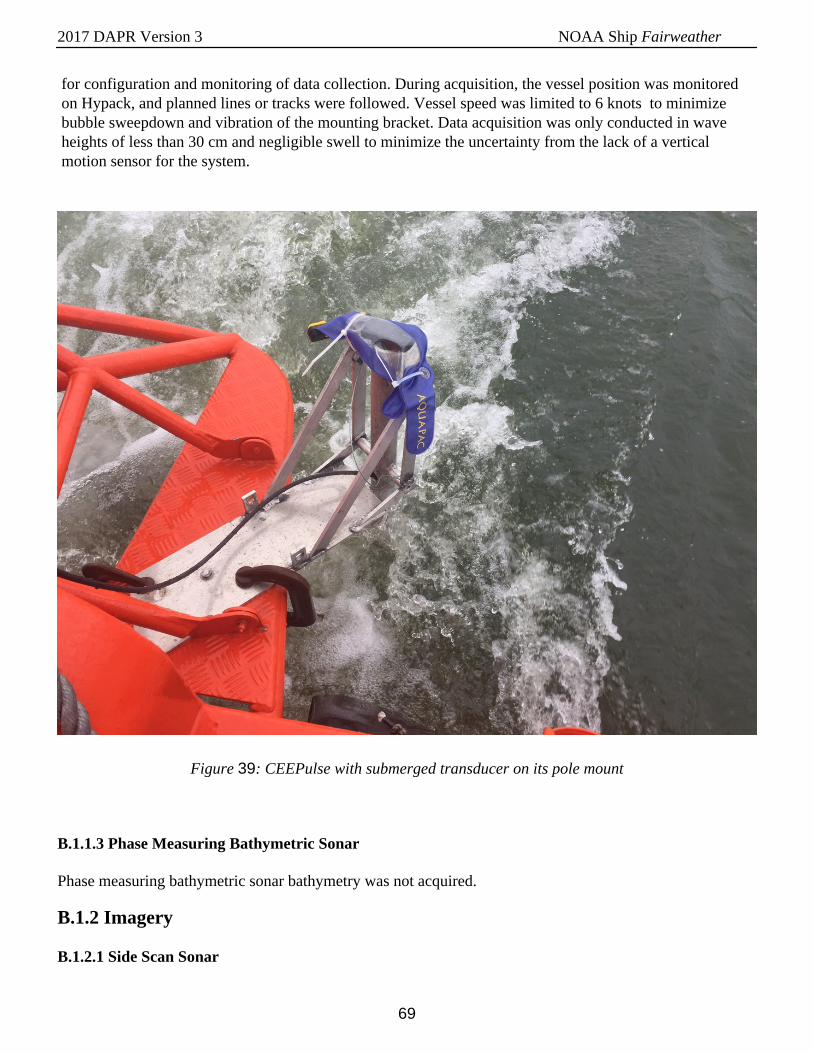
2017 DAPR Version 3 NOAA Ship Fairweather
69
for configuration and monitoring of data collection. During acquisition, the vessel position was monitored on Hypack, and planned lines or tracks were followed. Vessel speed was limited to 6 knots to minimize bubble sweepdown and vibration of the mounting bracket. Data acquisition was only conducted in wave heights of less than 30 cm and negligible swell to minimize the uncertainty from the lack of a vertical motion sensor for the system.
Figure 39: CEEPulse with submerged transducer on its pole mount
B.1.1.3 Phase Measuring Bathymetric Sonar
Phase measuring bathymetric sonar bathymetry was not acquired.
B.1.2 Imagery
B.1.2.1 Side Scan Sonar
2017 DAPR Version 3 NOAA Ship Fairweather
70
All Side Scan Sonar data is logged using Klein SonarPro, in the .SDF format. During acquisition the hydrographer:
- Monitors range, towfish height, heading, pitch, roll, latitude, longitude, speed, pressure, and temperature- If towed, the hydrographer adjusts towfish height in accordance with Field Procedures Manual- Monitors imagery for any real-time contacts, flagging contacts as necessary
During hull mounted acquisition, the bottom depth was monitored and range scale selected such that the towfish height would be between 8-20% of the range scale above the bottom as per HSSD 6.1.2.3. In some areas, waivers were requested for increased range scales, which are included with applicable survey submissions. At all times during acquisition, the outer portion of the range scale was continuously evaluated for signs that data may not be capable of meeting required object detection standards.
The hydrographic team conducts confidence checks on survey days to ensure the SSS system is functioning properly by surveying over a known object within the survey area. Confidence checks were usually performed on the S220 anchor and anchor chain. Once the vessel passes the object, the hydrographer reviews the real time data for the object's presence in the appropriate channel and at the offset from nadir. Once the object is confirmed in the outer edge of the range scale for both port and starboard channels, the confidence check is complete.
B.1.2.2 Phase Measuring Bathymetric Sonar
Phase measuring bathymetric sonar imagery was not acquired.
B.1.3 Sound Speed
B.1.3.1 Sound Speed Profiles
Sound speed casts were taken at least once every 4 hours during multibeam survey operations in accordance with section 5.2.3.3 of the HSSD. Fairweather’s launches collected sound speed casts according to changes in the water column and any changes in survey location that would influence sound speed differences in excess of the accepted 2 m/s range. The launches use the SBE 19plus and 19plus V2 SEACAT sound speed profilers, which in conjunction with Velocipy or Sound Speed Manager software, are transferred to SIS for realtime application and sonar tuning. The user is then warned for the need of a new cast by highlighting both the “SV Profile” and “SV Used” numerical displays in yellow with a difference greater than 3 m/s and red for a difference greater than 5 m/s. These casts were then compared once daily to the SVP 71 surface sound speed sensors to verify their accuracy in lieu of annual SVP 71 calibration. The results of the daily SSP sensor comparisons are logged in the Microsoft Excel acquisition log to track instrument health. Deviations from this procedure will be outlined in the individual Descriptive Report for the survey.
The Moving Vessel Profiler (MVP) is an automated winch system that deploys a fish containing a sound speed sensor by free fall. The fish is towed behind the survey vessel in a ready position that is marked by messengers attached to the tow cable. Ideally at survey speeds the fish is “flying” just above the depth of the sonar transducers. The specified depth deployed is selected by specifying a distance off the bottom (typically 10 meters). Once at the depth limit, the winch freefall is automatically stopped and the drag forces
2017 DAPR Version 3 NOAA Ship Fairweather
71
on the fish cause it to rise toward the surface due to the ship's forward motion. The cable slack is then pulled in by the winch to the towing position.
In the event of a particularly deep survey area or prior to the entire survey system being brought on-line, the MVP fish can be manually deployed while the ship is stationary using the hand-operated control box located on the winch. This method ensures that the maximum possible depth is obtained since the cable is deployed vertically. If necessary, the deep end of such a stationary cast can be added to the end of shallower casts obtained while the ship is underway.
B.1.3.2 Surface Sound Speed
Surface sound speed values are measured by an SVP 70 probe on Fairweather and SVP 71 probes on all survey launches. These sound speed values are supplied in real-time to all MBES systems to provide refraction corrections to flat-faced transducers. SIS applies a median filter to the surface sound speed values, the length of which is adjusted during acquisition to capture variability while eliminating errors due to bubble sweepdown. Surface sound speed is monitored for > 3 m/s changes to indicate when casts should be taken. SIS automatically monitors sound speed changes > 3 m/s and prompts the user when the MVP fish needs to be deployed.
B.1.4 Horizontal and Vertical Control
B.1.4.1 Horizontal Control
A complete description of horizontal control activities is included in the project’s Horizontal and Vertical Control Report (HVCR), submitted under separate cover as outlined in Section 8.1.5.2 of the HSSD and Section 5.2.3.2.3 of the FPM.
The horizontal datum for all projects is the North American Datum of 1983 (NAD83) unless otherwise noted in the individual Descriptive Reports.
Multibeam and shoreline data are differentially corrected in real time using correctors provided by Coast Guard DGPS beacons when available, or WAAS when no beacons are available. The specific beacons used for a given survey will be included in the Horizontal Control section of the survey’s descriptive report. If loss of the differential beacon resulted in any data being recorded with C/A GPS positions it will be noted in the Descriptive Report for the specific survey.
B.1.4.2 Vertical Control
2017 DAPR Version 3 NOAA Ship Fairweather
72
The Fairweather uses Mean Lower Low Water as the vertical datum and TCARI zoned tidal method for vertical control. National Water Level Observation Network (NWLON) stations provide the data that serve as datum control.
Initial reduction of acquired data to MLLW is accomplished via traditional tidal means using the Tidal Constituent And Residual Interpolation (TCARI) grid provided by HSD-OPS. Following the successful application of SBETs and computation of an Ellipsoidally Referenced Zone Tide (ERZT) separation model, ERS methods are used for reducing data to MLLW. After final tides are received, the final TCARI grids are applied to the data and used for reducing features to MLLW.
B.1.5 Feature Verification
The composite source file (CSF) in S-57/.000 format provided with the Project Instructions is the primary source for shoreline feature verification. The original project file is imported into CARIS BASE Editor, converted to a .hob file, clipped to the sheet limits for the specific survey, and named H#####_Original_Composite_Source.hob to be included with the deliverables. This file is then copied and named H#####_Feature_File.hob to be utilized during field verification. Additionally, all features to be investigated are provided to the field in the project reference file (PRF). All hob files are re-exported to S- 57/.000 format for data submission.
Fairweather personnel conduct limited shoreline verification during periods when the tide is less than 0.5m above Mean Lower-Low Water (MLLW) as directed by section 3.5.5.3 of the FPM. Detached positions (DPs) are acquired and edits to the daily field feature files are recorded in CARIS Notebook and on paper DP forms and boat sheets. An inshore limit buffer line, defined by the distance seaward from the Mean High Water (MHW) line at the scale of the largest chart in the area, is provided with the Project Instructions. This inshore limit buffer line is used in the shoreline acquisition software and on the boat sheet as a reference, and utilized as described in section 1.1.2 of the HSSD. The NALL is determined in the field as the farthest off-shore of one of the following; the MHW inshore limit buffer specified above, the 4-meter depth contour, or the inshore limit of safe navigation as defined by the HSSD. All shoreline features from the CSF seaward of the NALL are verified (including an update to depth and/or position as necessary) or disproved during operations. Features in-shore of the NALL are not addressed, or features of an ambiguous nature include remarks for further clarification. Specifically assigned features may be investigated that are inshore of the NALL in accordance with the associated instructions for a given project area.
Detached positions (DPs) acquired during shoreline verification utilizing backpacks and Laser Range Finders indicate new features, revisions to source features, or source features not found in the field. They are recorded in the shoreline acquisition software and on DP forms.
The NOAA Ship Fairweather has two vessel mounted Velodyne VLP-16 laser scanners. These Lidar systems were integrated and tested by the Hydrographic Systems and Technology Branch (HSTB) and the NOAA Ship Fairweather in January 2016. Some shoreline verification is performed used the vessel mounted Lidar systems. The laser scanners provide the position and height on features that survey launches are able to safely approach, with a maximum distance of 100 meters.
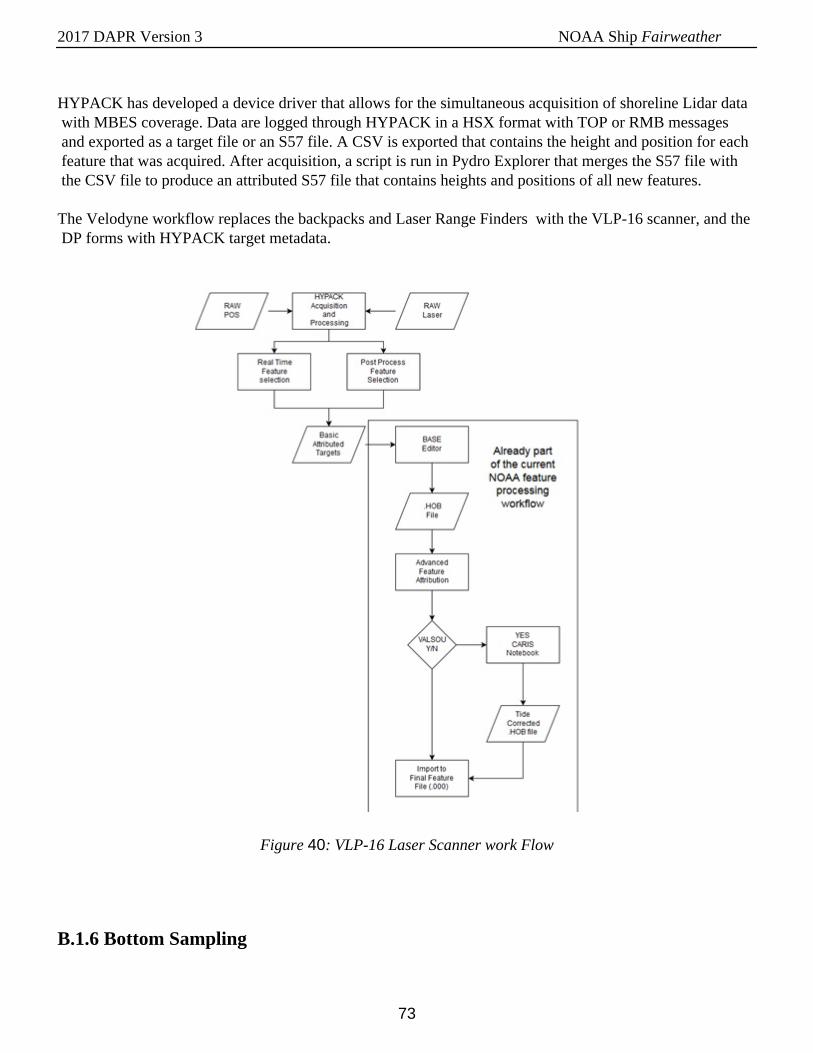
2017 DAPR Version 3 NOAA Ship Fairweather
73
HYPACK has developed a device driver that allows for the simultaneous acquisition of shoreline Lidar data with MBES coverage. Data are logged through HYPACK in a HSX format with TOP or RMB messages and exported as a target file or an S57 file. A CSV is exported that contains the height and position for each feature that was acquired. After acquisition, a script is run in Pydro Explorer that merges the S57 file with the CSV file to produce an attributed S57 file that contains heights and positions of all new features.
The Velodyne workflow replaces the backpacks and Laser Range Finders with the VLP-16 scanner, and the DP forms with HYPACK target metadata.
Figure 40: VLP-16 Laser Scanner work Flow
B.1.6 Bottom Sampling
2017 DAPR Version 3 NOAA Ship Fairweather
74
Bottom samples are acquired according to section 7.2.3 of the HSSD. Any deviations from this protocol will be outlined in the individual Descriptive Report for the survey. Samples are acquired using CARIS Notebook, HYPACK target files (.tgt), or by logging the latitude, longitude, and bottom characteristics manually. All samples are processed similarly to other shoreline features as outlined below in section B.2.5 of this report. Bottom sample results are included in the Final Feature File and are descriptively attributed as New.
B.1.7 Backscatter
Backscatter data are collected by with the Fairweather's Kongsberg system, and stored in the .all file.
B.1.8 Other
No additional data were acquired.
B.2 Data Processing
B.2.1 Bathymetry
B.2.1.1 Multibeam Echosounder
Bathymetry is processed following section 4.2 of the FPM unless otherwise noted.
Raw multibeam data is recorded as .all for ship and launch acquisition. Data is stored in a file structure created by the HSTB tool Charlene. Section 5.2.7 of this report contains a complete description of Charlene and its implementation on the Fairweather. Charlene automates night processing, which includes the creation of a data directory, file transfer, data conversion and processing in CARIS HIPS and SIPS. For the 2017 field season, Charlene was used to store, transfer, and process data. If a crew member encountered a problem while running Charlene, MBES data was then manually processed according to the procedures described below.
Data is converted to CARIS HIPS HDCS format using established and internally documented settings. After Delayed Heave, sound speed, and water level (Zoned Tides or TCARI tides) correctors are applied to all lines, the lines are merged. Once lines are merged, Total Propagated Uncertainty (TPU) is computed.
As of 2017, the final deliverable bathymetric surface for the field units is a variable resolution (VR) surface. A detailed explanation for the use of any single resolution CUBE surfaces used for the processing of each
2017 DAPR Version 3 NOAA Ship Fairweather
75
survey will be provided in the Descriptive Report for each survey. The resolution, depth range, and CUBE parameters of any single resolution CUBE surface follow the specifications outlined in 5.2.2.2 and 5.2.2.3 of the HSSD.
VR surfaces are created using the Calder-Rice Density for Estimation method, and the parameters contained in the NOAA CUBEParams2017.xml. BASE surfaces are created using the Density & Locale function of the CUBE algorithm and parameters contained in the NOAA CUBEParams_NOAA_2017.xml. The CUBEParams_NOAA.xml will be included with the HIPS Vessel Files with the individual survey data. The NOAA parameter configurations for resolutions ranging from 50 centimeters to 32 meters are used.
Multibeam data are reviewed and analyzed in CARIS HIPS subset mode and in swath editor as necessary. The CUBE surfaces are used for directed data editing at the appropriate depth range in subset editor. The surfaces and subset editor are also used to demonstrate coverage and to check for errors due to tides, sound speed, attitude, and timing.
Vessel heading, attitude, and navigation data are reviewed in HIPS navigation editor and attitude editor if deemed necessary upon review of surfaces. Where necessary, data spikes (fliers) or gaps in heading, attitude, or navigation data are manually rejected or interpolated for small periods of time. Any editing of this nature will be outlined in the Descriptive Report for the particular survey.
In depths less than 20 meters and in areas of navigational significance where the bathymetric surface does not depict the desired depth for the given area, a designated sounding may be selected. Designated soundings are selected as outlined in section 5.2.1.2.3 of the HSSD.
To check that surface junctions meet the HSD specifications that 95% or greater of grid-node comparisons are within the IHO-allowable error, the hydrographer runs the Compare Grids tool within the Pydro Explorer suite. The Compare Grids tool uses the CARIS BASE Editor batch processing engine to compute the gridded difference and IHO-allowable error between two gridded Depth/Elevation layers in surfaces. Two coverage files are loaded into the Compare Grids dialogue window and the user selects an output folder and file output names. The tool computes the simple depth difference between the two gridded layers and the allowable error fraction of surface nodes according to IHO- based HSD maximum allowable error for the Total Vertical Uncertainty of the soundings. The results automatically address the TVUmax 100-m depth switchover point using IHO Order 1a (0-100m) and IHO Order 2a (100m+). The Compare Grids tool outputs a .csar and .csar0 files for the fraction of allowable error, a plot of Node Depth vs. Allowable Error Fraction with summary statistics, a histogram showing the Comparison Distribution of the magnitude of the fractional allowable errors with summary statistics, a .csar and a .csar0 for the CSAR Difference output surface, and a distribution summary plot with statistics for the Difference CSAR layer.
NOAA allowable uncertainty surfaces are used during processing to indicate potential problem areas requiring attention on single resolution CUBE surfaces. Historically, the field unit has reported the percentage of nodes meeting or exceeding uncertainty standards in the Descriptive Report, including images of areas that failed to meet uncertainty standards. The field units are submitting a single Variable Resolution surface for the 2017 field season and may shift to only reporting the total vertical uncertainty as calculated by Pydro QC Tools in the Descriptive Report, using uncertainty layers as a tool used solely to identify "problem areas" while data processing.
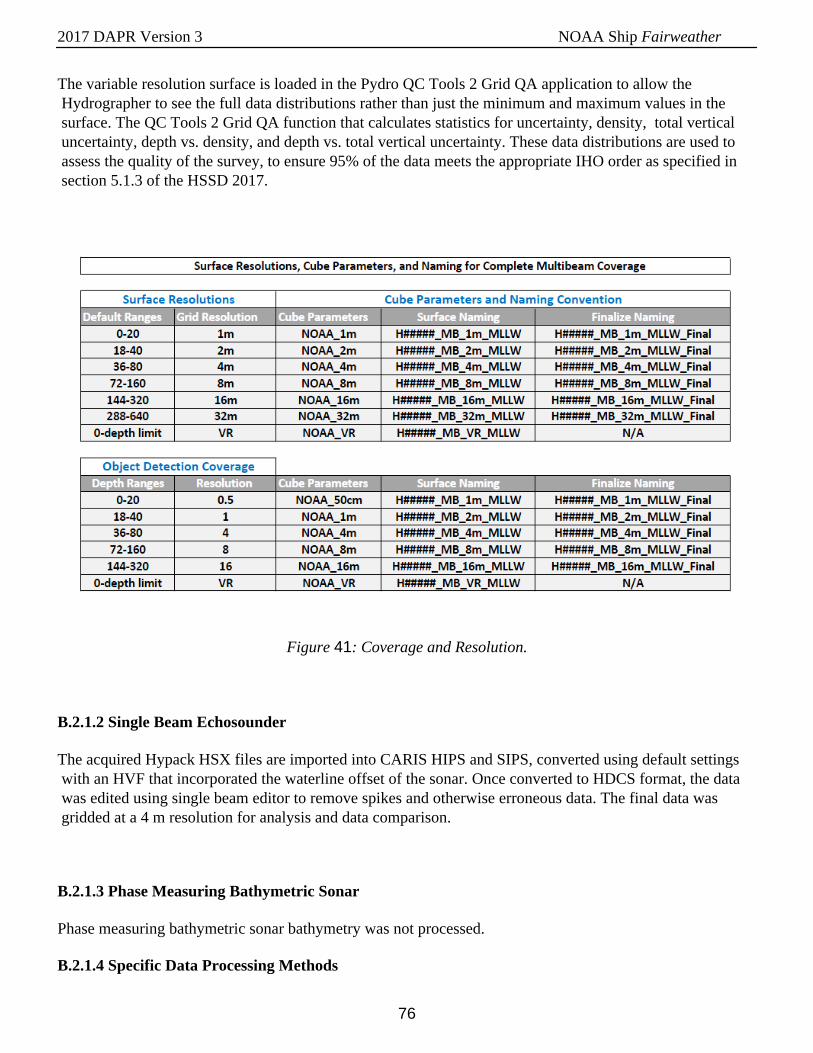
2017 DAPR Version 3 NOAA Ship Fairweather
76
The variable resolution surface is loaded in the Pydro QC Tools 2 Grid QA application to allow the Hydrographer to see the full data distributions rather than just the minimum and maximum values in the surface. The QC Tools 2 Grid QA function that calculates statistics for uncertainty, density, total vertical uncertainty, depth vs. density, and depth vs. total vertical uncertainty. These data distributions are used to assess the quality of the survey, to ensure 95% of the data meets the appropriate IHO order as specified in section 5.1.3 of the HSSD 2017.
Figure 41: Coverage and Resolution.
B.2.1.2 Single Beam Echosounder
The acquired Hypack HSX files are imported into CARIS HIPS and SIPS, converted using default settings with an HVF that incorporated the waterline offset of the sonar. Once converted to HDCS format, the data was edited using single beam editor to remove spikes and otherwise erroneous data. The final data was gridded at a 4 m resolution for analysis and data comparison.
B.2.1.3 Phase Measuring Bathymetric Sonar
Phase measuring bathymetric sonar bathymetry was not processed.
B.2.1.4 Specific Data Processing Methods
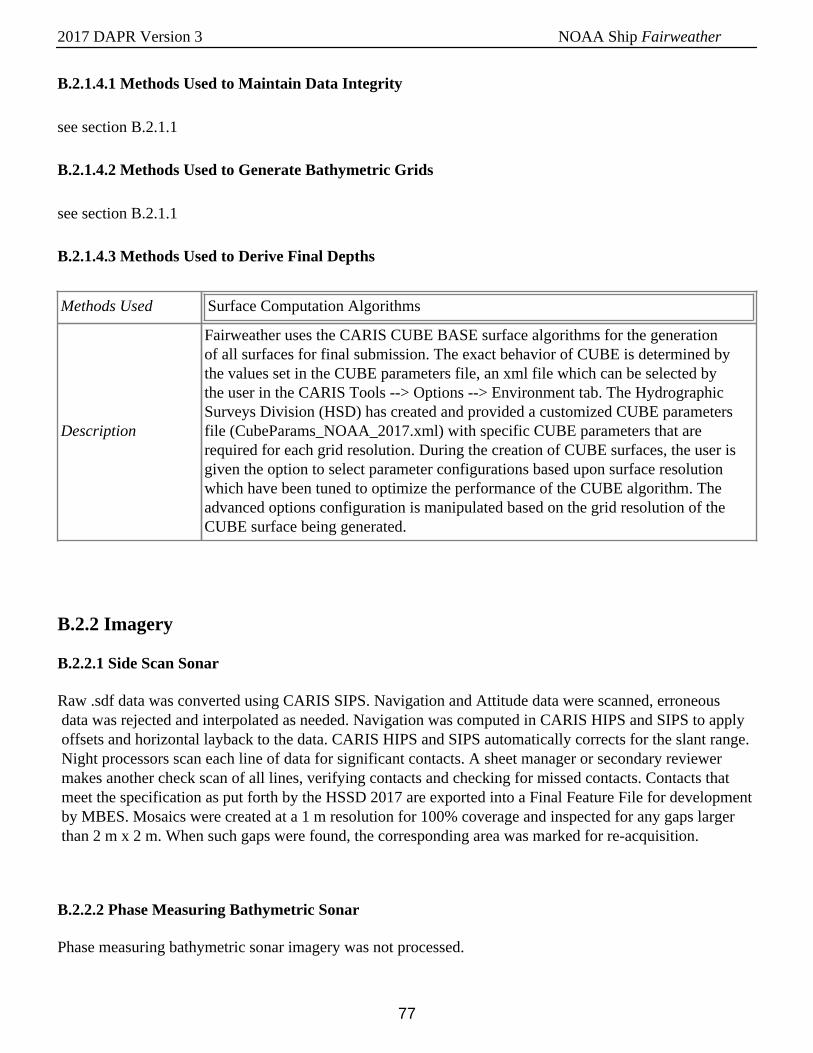
2017 DAPR Version 3 NOAA Ship Fairweather
77
B.2.1.4.1 Methods Used to Maintain Data Integrity
see section B.2.1.1
B.2.1.4.2 Methods Used to Generate Bathymetric Grids
see section B.2.1.1
B.2.1.4.3 Methods Used to Derive Final Depths
Methods Used Surface Computation Algorithms
Description
Fairweather uses the CARIS CUBE BASE surface algorithms for the generationof all surfaces for final submission. The exact behavior of CUBE is determined bythe values set in the CUBE parameters file, an xml file which can be selected bythe user in the CARIS Tools --> Options --> Environment tab. The HydrographicSurveys Division (HSD) has created and provided a customized CUBE parametersfile (CubeParams_NOAA_2017.xml) with specific CUBE parameters that arerequired for each grid resolution. During the creation of CUBE surfaces, the user isgiven the option to select parameter configurations based upon surface resolutionwhich have been tuned to optimize the performance of the CUBE algorithm. Theadvanced options configuration is manipulated based on the grid resolution of theCUBE surface being generated.
B.2.2 Imagery
B.2.2.1 Side Scan Sonar
Raw .sdf data was converted using CARIS SIPS. Navigation and Attitude data were scanned, erroneous data was rejected and interpolated as needed. Navigation was computed in CARIS HIPS and SIPS to apply offsets and horizontal layback to the data. CARIS HIPS and SIPS automatically corrects for the slant range. Night processors scan each line of data for significant contacts. A sheet manager or secondary reviewer makes another check scan of all lines, verifying contacts and checking for missed contacts. Contacts that meet the specification as put forth by the HSSD 2017 are exported into a Final Feature File for development by MBES. Mosaics were created at a 1 m resolution for 100% coverage and inspected for any gaps larger than 2 m x 2 m. When such gaps were found, the corresponding area was marked for re-acquisition.
B.2.2.2 Phase Measuring Bathymetric Sonar
Phase measuring bathymetric sonar imagery was not processed.
2017 DAPR Version 3 NOAA Ship Fairweather
78
B.2.2.3 Specific Data Processing Methods
B.2.2.3.1 Methods Used to Maintain Data Integrity
The NetApps server maintains continuous duplication and makes periodic full backups to mitigate any technological failures in addition to user error.
B.2.2.3.2 Methods Used to Achieve Object Detection and Accuracy Requirements
To verify object detection requirements, and approximately 1 m x 1 m target was constructed and placed on the seafloor. This target was then observed in processed data from all range scales to confirm visibility. Raw data was examined to ensure that the target was ensonified a minimum of three times. The 95% confidence radius of detections on the target was calculated and verified to meet the 5 m specification in FPM Section 1.5.7.1.2. Certification reports are attached in an appendix. The daily confidence checks described in B.1.2.1 assured that object detection continue to meet requirements.
During data acquisition, SSS acquisition lines were spaced at 80% of the range scale to ensure 100% coverage meeting complete coverage specifications. If refraction artifacts were observed in either acquisition or processing, the areas were re-acquired at a closer line spacing or shorter range scale.
B.2.2.3.3 Methods Used to Verify Swath Coverage
Swath coverage is verified using mosaics created by CARIS SIPS. Any gap in coverage larger than 2 m x 2 m is considered a holiday and re-acquired.
B.2.2.3.4 Criteria Used for Contact Selection
For water depths less than 20 m, any notable shadow or anomalous return of 1 m or greater in height are selected as contacts for further investigation by MBES. For water depths 20m or greater, contact heights of 10% of the water depth are considered significant. At least two reviewers inspect all data for contacts using the swath view in CARIS SIPS.
B.2.2.3.5 Compression Methods Used for Reviewing Imagery
No compression methods were used for reviewing imagery.
B.2.3 Sound Speed
B.2.3.1 Sound Speed Profiles
Downloading and processing of sound speed data is performed using Velocipy, a part of the HSTB supplied Pydro program suite. Raw and Processed SV files are retained and archived for later submission to the Pacific Hydrographic Branch (PHB).
2017 DAPR Version 3 NOAA Ship Fairweather
79
A separate submission of sound speed data is sent to the National Center for Environmental Information (NCEI) following the NetCDF template format. Velocipy is used to export a NetCDF file by selecting the NODC box upon export and specifying the export directory. Files are submitted to NCEI via email attachment to [email protected] with a courtesy copy to the HSD Project Manager.For Seacats:• After a cast, the SBE Seacat CTD is connected to the download computer with a serial cable.• After starting Velocipy, “File/ Download from SBE/Download Selected” is selected from the dropdown menu. A window showing available casts is then displayed with check boxes to select cast(s) for download.• After download the user is then required to enter cast metadata. Empty slots for Project, Survey, NOAA Unit, Instrument, User name, Process Date, Draft, and Latitude and Longitude are given. The metadata is written into the NODC output files.• After entering metadata, the sound speed, Temperature, Salinity graphs and the table with data points are reviewed for QA. The user can change the sound speed/depth units (X and Y buttons), zoom in (Magnifier tool), and take a look/edit cast points (+ button). • Casts are exported into CARIS SVP and NODC format files by selecting File/Export Selected or All Profiles. A File Export Settings window will pop up, allowing the user to point to the Caris HIPS SVP and NODC folder. The Caris HIPS SVP files are appended by checking the corresponding option in the export window. After clicking OK, the Log Window should read ‘exported sound speed profile successfully’.• To prepare for the next cast, SEACAT PreCast Setup is selected to clear all memory and initialize the profiler for the next cast.For MVP:• For the MVP, casts are typically processed continuously during acquisition.• After starting Velocipy, “File/ Load Profiles” is selected from the dropdown menu. Navigate to the *.s12 file produced by the MVP and select file/s to process.• In Velocipy right click on the loaded file to send the cast to SIS. • After the files are loaded, the user is then required to enter cast Meta data. Empty slots for Project, Survey, NOAA Unit, Instrument, User name, Process Date, and Draft are given. Unlike the SBE Seacat, Latitude and Longitude are already populated.The Meta data is written into the NODC output files.• After entering Meta data, the Sound Speed, Temperature, Salinity graphs and the table with data points are reviewed for QA. The user can change the sound speed/depth units (X and Y buttons), zoom in (Magnifier tool), and take a look/edit cast points (+ button).• Casts are exported into CARIS SVP and NODC format files by selecting File/Export Selected or All Profiles. A File Export Settings window will pop up, allowing the user to point to the Caris HIPS SVP and NODC folder. The Caris HIPS SVP files are appended by checking the corresponding option in the export window. After clicking OK, the Log Window should read ‘Exported sound speed profile successfully’.
B.2.3.1.1 Specific Data Processing Methods
B.2.3.1.1.1 Caris SVP File Concatenation Methods
Daily sound speed profiles from the AML Micro CTD, SBE 19plus and SBE 19plusV2 profilers are processed with Velocipy and concatenated into single .svp files for each vessel per survey. Individual .svp files and the concatenated vessel files for the survey are submitted with each survey.
2017 DAPR Version 3 NOAA Ship Fairweather
80
The concatenated sound speed files are applied to multibeam data in CARIS HIPS during data processing. CARIS HIPS uses one of four different methods to automatically apply a sound speed profile stored in a concatenated sound speed file. They are: “previous in time,” “nearest in time,” “nearest in distance” and “nearest in distance within time.” The method of applying sound speed for a specific day of data collection is listed in the daily logs included as Separates submitted with the individual survey data.
B.2.3.2 Surface Sound Speed
Surface sound speed data were not processed.
B.2.4 Horizontal and Vertical Control
B.2.4.1 Horizontal Control
A complete description of horizontal control will be included in the project’s Horizontal and Vertical Control Report (HVCR), submitted for each project under separate cover when necessary as outlined in section 8.1.5.2 of the HSSD and section 5.2.3.2.3 of the FPM.
Real time DGPS positioning is later replaced with a Post Processed Kinematic (PPK) Smoothed Best Estimate of Trajectory (SBET). The PPK solution is usually dependent on a local base station supported by the ship and processed in Applanix POSPac MMS software using Single Base mode. However, in areas with an adequate network of Continuously Operating Reference Stations (CORS) or public third-party base stations, Applanix POSPac SmartBase™ mode may be used. Additionally, Applanix has integrated PP-RTX technology into POSPac MMS 8.1 to provide post-processed positioning accuracies without the use of a local reference station. A global network of stations tracking GPS, GLONASS, BDS, QZSS, and Galileo provide raw data for processing to produce the PP-RTX correction, which are made available via the internet within one hour of real-time. With Single Base, SmartBase, or RTX processing, the resulting navigation from PPK is an improvement over C/A and DGPS navigation. The details of PPK use and application for a given survey will be included in the Horizontal Control section of the project’s HVCR or the survey’s Descriptive Report.
B.2.4.2 Vertical Control
All tide data is processed off of the ship by the Center for Operational Oceanographic Products and Services (CO-OPS). Although Fairweather does not process any of the tidal water level data that she collects, preliminary and final data packages are submitted to CO-OPS. All Tide & Water Level Data Packages submitted conform to the requirements of section 5.2.2.4 of the FPM and section 4 of the HSSD.
To receive final water level correctors to apply to an individual hydrographic sheet, a Request for Approved Tides/Water Levels must be submitted to the Chief of Products and Services Branch, N/OPS3. This package includes an Abstract of Times of Hydrography and digital MID MIF files of the track lines from Pydro. Once this request has been received, CO-OPS has agreed to provide final water level correctors relative
2017 DAPR Version 3 NOAA Ship Fairweather
81
to the appropriate chart datum and final tidal zoning, as soon as possible. Final approved water levels are applied to applicable data of all hydrographic surveys before data submission to PHB.
B.2.5 Feature Verification
During shoreline verification, field detached positions (DP) are acquired with CARIS Notebook or Hypack .tgt files. Tide application for features requiring tide correction is applied in CARIS Notebook when using discrete zoning.
New features and any updates to the composite source shoreline, such as ledges or reefs, are acquired or digitized with S-57 attribution and compiled from the field daily files into the H#####_Final_Feature_File.hob. Updates to source shoreline features primarily include a change in depth/height, position, or S-57 classification. If the position of a feature changes, the existing feature is deleted and a new feature created in the new location. Any changes to depth/height or S-57 classification are done so as an update to the S-57 object with the inclusion of NOAA’s object attributes.
The SORIND and SORDAT S-57 attribute fields for new features or modified source features are updated to reflect the information for the associated survey number and date (US,US,graph,H#####). All new or modified features are S-57 attributed as applicable and descriptively attributed as New or Update respectively. All unmodified source features retain their original SORIND and SORDAT values. Assigned features that are addressed but not updated are descriptively attributed as Retain and unaddressed assigned features are attributed as Not Addressed. Short descriptive comments taken from the boat sheets or DP forms along with investigation or survey methods are listed under the Remarks field.
For significant features that deserve additional discussion, the Hydrographer may include a recommendation to the cartographer in the Recommendations field, along with the Hydrographer notes and investigation methods provided in the Remarks field. Features that are disproved or that do not adequately portray the shoreline are descriptively attributed as Delete in the H#####_Final_Feature_File.hob layer. Features with the attribution of Delete retain their original SORIND and SORDAT values and include a recommendation from the Hydrographer along with an informative remark.
Investigation items are received in the Project Reference File and investigated as necessary. Investigation items are included in the H#####_Final_Feature_File.hob layer and labeled appropriately and include a remark detailing the search methods and a recommendation from the Hydrographer. Any features that are submitted as dangers to navigation (DTON) will be attributed accordingly for reporting purposes.
Images are labeled and associated with a DP/userid number or other descriptive/unique name. They are included with the survey data and stored in the Multimedia folder with the deliverables. References to the images are listed with file extension and comma delimited in the Images attribute for the specific feature.
The H#####_Final_Feature_File.hob along with CARIS HIPS BASE surface(s) are viewed to compare MBES coverage and features simultaneously. The current NOAA object catalog will be used for all CARIS software for processing and the version of such will be documented in the individual Descriptive Reports,
2017 DAPR Version 3 NOAA Ship Fairweather
82
along with any deviations in shoreline processing from those listed above. Final shoreline deliverables are two S-57 (*.000) files exported CARIS HIPS and SIPS or Base Editor, the H##### Feature File and the H##### Final Feature File, included with the processed data.
B.2.6 Backscatter
Backscatter is logged within the Kongsberg .all file and processed using Fledermaus Geocoder Toolbox Version 7.7.4. Backscatter was processed and analyzed for any discrepancies as a quality check each day after acquisition, then compiled into master mosaics once acquisition completed. For OPR-R365-FA-17 and OPR-O346-FA-17, both processed GSF files and mosaics are submitted. Additionally, any perceived changes in bottom type from the processed backscatter mosaics can be used to modify the location of assigned bottom samples to more accurately capture changes in bottom type across the survey area. Sheet managers changed bottom sample locations as necessary.
B.2.7 Other
Initial data processing at the end of each survey day is the responsibility of a few crew members that are assigned to "night processing". Daily processing produces a preliminary product in which all gross data problems have been identified and/or removed, and thus can be used by the sheet manager and the FOO to plan the next day’s operations.
New to night processing for the 2017 field season is Charlene, the automated data processor. Initial testing of the Charlene was conducted during the Sonar Acceptance Trials in May of 2017 in Seattle, WA. Charlene was integrated into the Fairweather workflow before the start of the first project for the 2017 field season and used for the entirety of the 2017 field season.
Charlene is an automated night processing and data transfer tool developed by NOAA’s Office of Coast Survey in early 2017 to reduce user interaction, user error, and processing time. Night processing includes all of those tasks in between raw data collection and a final daily product, which is usually a surface that includes all up-to-date data. Charlene allows the user to:
1. Perform verification of raw data2. Build deliverable directory structure3. Transfer and verify raw data4. Process MBES and SSS data with Caris Batch Processor5. Generate SBETs with POSPac Batch6. Use NOAA Pydro tools like AutoQC, QCTools, and TCARI
The development of Charlene was made possible when recent versions of Caris and Applanix (10.2 and 8.1 respectively) opened up machine access to the processes in these packages. This now allowed the ability to run these software packages outside of the graphical interface. Charlene leverages this to become the
2017 DAPR Version 3 NOAA Ship Fairweather
83
universal night processing tool. Charlene works across software platforms; it can transfer raw data to the appropriate submission folders, process SBETs, convert survey lines into Caris, apply sound velocity profiles, water levels, and SBETs, run in-house QC reports, and generate logs. In practice, Fairweather has set up Charlene to largely follow the current processing pipeline with the exception of now adopting the official file submission structure for data storage instead of creating it just for the data submission. Manual data processing procedures are used when the survey team runs into technical difficulties while running Charlene.
Final data processing and analysis is the responsibility of the Survey Team. While “ping-by-ping” data editing is not required, the Team will review the survey in its entirety to ensure that the final products reflect observed conditions to the standards set by the relevant OCS guidance. Bathymetric surfaces are reviewed with the best available correctors applied to ensure that all data quality problems are identified and resolved if possible, and all submerged features are accurately represented. Shoreline verification (if applicable) and feature data are reviewed in the context of this bathymetry. Survey documentation (including the Descriptive Report) is generated in conjunction with this review process.
B.3 Quality Management
Final review of the CUBE Surface is left to the Mentor or experienced Survey Manager who inspects areas with questionable shaded depth models and/or high standard deviation to ensure that no actual features were cleaned out. The use of large subset tiles is encouraged to track coverage of problems areas. Flier Finder v3, part of the QC Tools package within Pydro, is currently used to assist the search for spurious soundings following gross cleaning. Flier Finder is run multiple times for each surface, reducing the flier height value for each consecutive run. This allowed Flier Finder to very accurately and quickly identify gross fliers.
Variable resolution (VR) surfaces grid data at the resolution that corresponds to the appropriate depth range as specified by 5.2.2.2 of the HSSD. On occasion, the resolution of the surface may not be sufficient to capture the high point of a feature. In less than 20m of water, any feature where the most probable accurate sounding was shoaler than the surface by greater than one half the allowable error under IHO S-44 Order 1 was considered inadequately captured by the CUBE surface. In greater than 20m of water, this allowable error was expanded to the full Order 1 error allowance at that depth. Although this may occur on irregular shoals or rock pinnacles, man-made features such as piles and wrecks are of particular concern. These features have very slender high points that extend far above the surrounding seafloor as well as the CUBE surface. To ensure that these features are properly represented, the shoalest point is flagged “designated” in CARIS.
During the “finalization” process, the CUBE surface is forced to honor all soundings which have been flagged “designated.” In the case of a survey where the high points of many features are not being captured by the CUBE surface, (e.g. a boulder field), the hydrographer may decide to produce higher resolution CUBE surfaces to ensure that these features are being honored. Any such deviations from standard procedures will be noted in that survey’s Descriptive Report.
2017 DAPR Version 3 NOAA Ship Fairweather
84
Under ideal circumstances VR surfaces grid data at the finest resolution the data density will support, allowing the production a single BASE surface as the final deliverable. This theoretical maximum resolution was historically defined as three times the beam footprint size for a particular echo sounder and depth combination. Current guidance (HSSD 5.2.2.3) states that 95% of the nodes in a CUBE surface shall contain at least 5 soundings per node, which has experimentally been shown to be adequate to represent the depth of the seafloor while not being strongly influenced by a single erroneous sounding. To meet the required sounding density, Fairweather adheres to the table of resolutions and depth ranges as defined in HSSD which are based on practical experience in typical survey areas, and a working knowledge of bottom coverage capabilities of each echo sounding system currently in use throughout the fleet.
Although we have transitioned to VR surfaces, the Fairweather may occasionally use single resolution CUBE surfaces to address problem areas within surveys or meet particular needs that may arise on a sheet to sheet basis. The following text describes procedures for single resolution gridded surfaces.
Single resolution CUBE surfaces are based on assumed sonar system selections for each depth regime and practical data processing limitations. Deeper areas are gridded at a coarser resolution than shoaler areas with the advent of the CARIS CSAR framework and multi-threaded CUBE processing implemented in CARIS HIPS and SIPS. The CUBE surface resolutions are described for each survey in the Descriptive Report.
Each resolution-specific CUBE surface is named according to the following convention:
<Survey registry number>_<Sounding Type>_<units of resolution>_<Vertical Datum>
(EX: “H12780_MB_2m_MLLW” is the two-meter resolution surface of survey H12780 referenced to MLLW. VR will replace 2m for VR surfaces )
Once the VR surface or the collection of CUBE surfaces accurately represent the surveyed bottom and it is certain that no further edits will be made, surfaces are finalized using the resolution as defined in section 5.2.2.2 or 5.2.2.3 of the HSSD depending on whether coverage meet object detection or complete coverage specifications. The final CUBE surfaces are examined by reviewing all layers for coverage and as a final check for systematic errors such as tide, sound speed, or attitude and/or timing errors.
B.4 Uncertainty and Error Management
CARIS computes TPU based on both the static and dynamic measurements of the vessel and survey-specific information including tidal zoning uncertainty estimates and sound speed measurement uncertainties. Static offset values are entered into the CARIS *.hvf file. Real-time uncertainties provided via EM2040 MBES data, positioning errors via Applanix Delayed Heave RMS, and sound speed uncertainties are applied using the CARIS Compute TPU tool. Where TCARI tides are used, uncertainty is calculated and applied during application of TCARI tidal correctors to HDCS data. Following post-processing of the real-time vessel motion, recomputed uncertainties of vessel roll, pitch, gyro, and navigation were applied in CARIS HIPS and SIPS via a Smoothed Best Estimate of Trajectory (SBET) RMS file generated in Applanix POSPac.
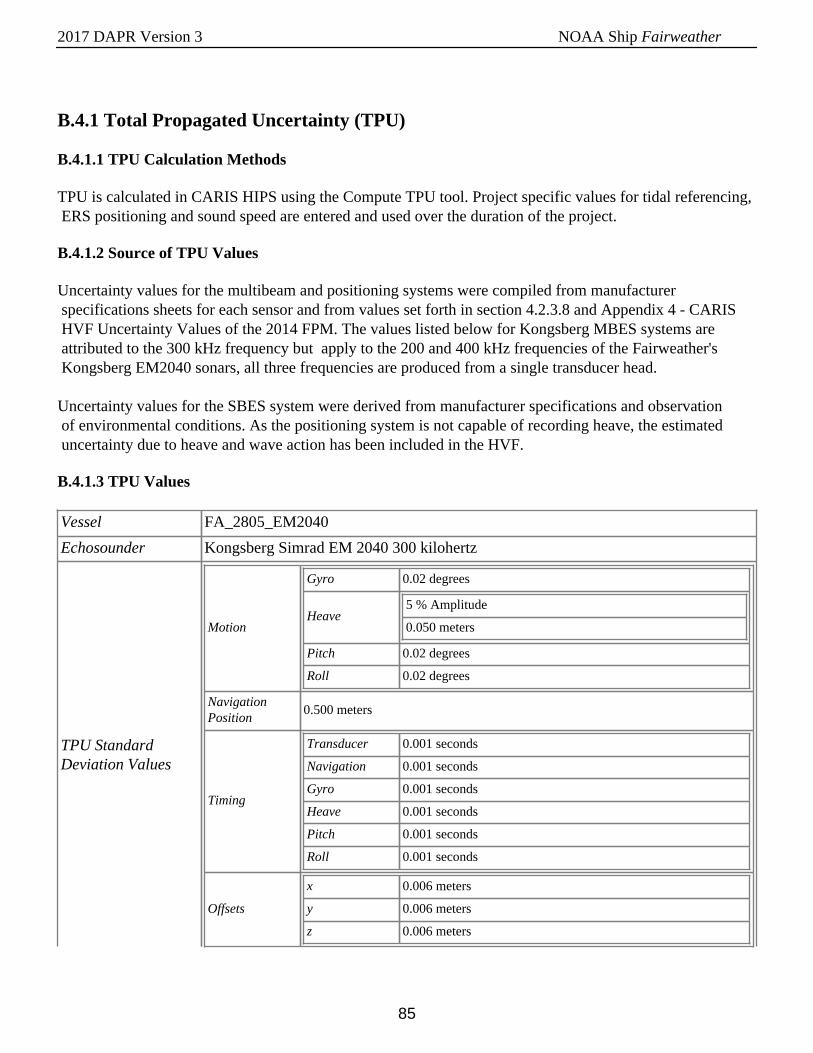
2017 DAPR Version 3 NOAA Ship Fairweather
85
B.4.1 Total Propagated Uncertainty (TPU)
B.4.1.1 TPU Calculation Methods
TPU is calculated in CARIS HIPS using the Compute TPU tool. Project specific values for tidal referencing, ERS positioning and sound speed are entered and used over the duration of the project.
B.4.1.2 Source of TPU Values
Uncertainty values for the multibeam and positioning systems were compiled from manufacturer specifications sheets for each sensor and from values set forth in section 4.2.3.8 and Appendix 4 - CARIS HVF Uncertainty Values of the 2014 FPM. The values listed below for Kongsberg MBES systems are attributed to the 300 kHz frequency but apply to the 200 and 400 kHz frequencies of the Fairweather's Kongsberg EM2040 sonars, all three frequencies are produced from a single transducer head.
Uncertainty values for the SBES system were derived from manufacturer specifications and observation of environmental conditions. As the positioning system is not capable of recording heave, the estimated uncertainty due to heave and wave action has been included in the HVF.
B.4.1.3 TPU Values
Vessel FA_2805_EM2040
Echosounder Kongsberg Simrad EM 2040 300 kilohertz
TPU StandardDeviation Values
Motion
Gyro 0.02 degrees
Heave5 % Amplitude
0.050 meters
Pitch 0.02 degrees
Roll 0.02 degrees
NavigationPosition
0.500 meters
Timing
Transducer 0.001 seconds
Navigation 0.001 seconds
Gyro 0.001 seconds
Heave 0.001 seconds
Pitch 0.001 seconds
Roll 0.001 seconds
Offsets
x 0.006 meters
y 0.006 meters
z 0.006 meters
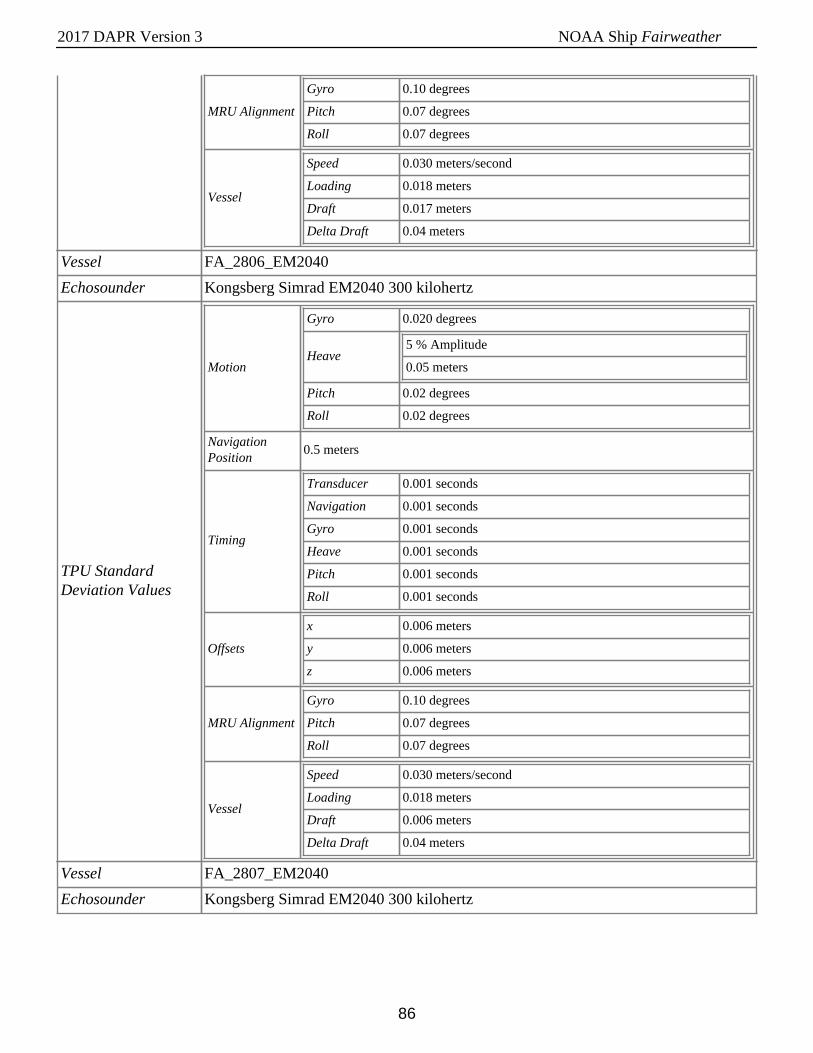
2017 DAPR Version 3 NOAA Ship Fairweather
86
MRU Alignment
Gyro 0.10 degrees
Pitch 0.07 degrees
Roll 0.07 degrees
Vessel
Speed 0.030 meters/second
Loading 0.018 meters
Draft 0.017 meters
Delta Draft 0.04 meters
Vessel FA_2806_EM2040
Echosounder Kongsberg Simrad EM2040 300 kilohertz
TPU StandardDeviation Values
Motion
Gyro 0.020 degrees
Heave5 % Amplitude
0.05 meters
Pitch 0.02 degrees
Roll 0.02 degrees
NavigationPosition
0.5 meters
Timing
Transducer 0.001 seconds
Navigation 0.001 seconds
Gyro 0.001 seconds
Heave 0.001 seconds
Pitch 0.001 seconds
Roll 0.001 seconds
Offsets
x 0.006 meters
y 0.006 meters
z 0.006 meters
MRU Alignment
Gyro 0.10 degrees
Pitch 0.07 degrees
Roll 0.07 degrees
Vessel
Speed 0.030 meters/second
Loading 0.018 meters
Draft 0.006 meters
Delta Draft 0.04 meters
Vessel FA_2807_EM2040
Echosounder Kongsberg Simrad EM2040 300 kilohertz
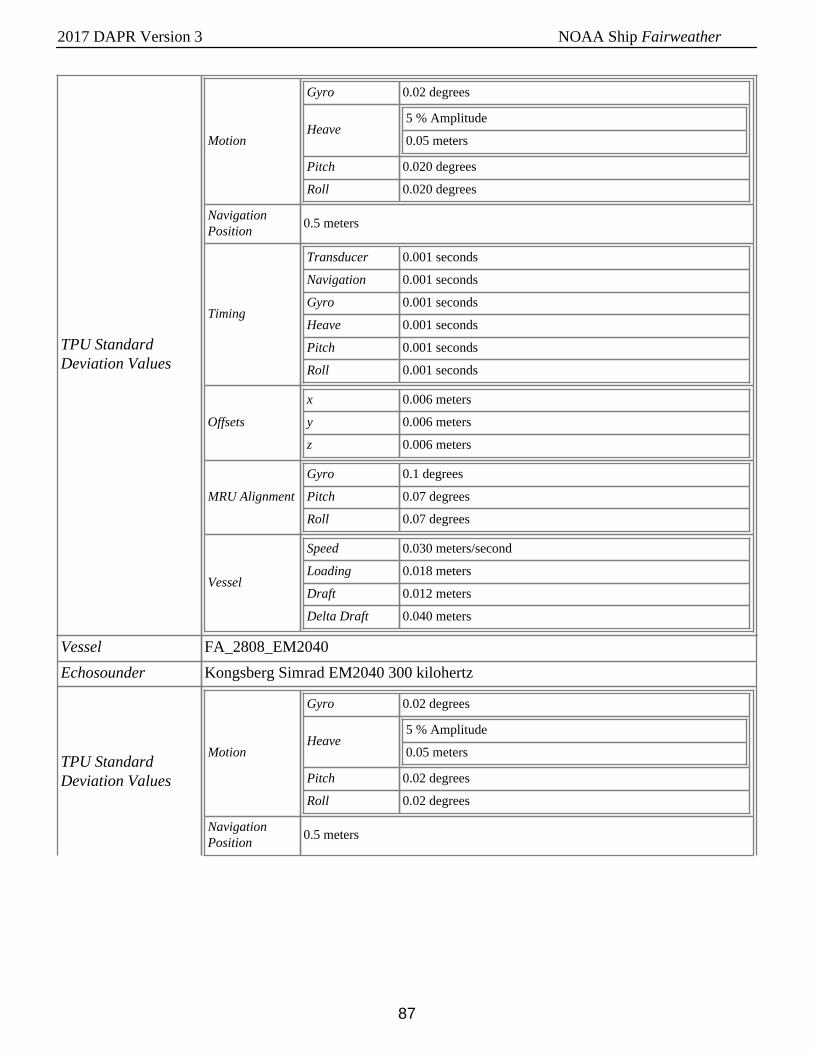
2017 DAPR Version 3 NOAA Ship Fairweather
87
TPU StandardDeviation Values
Motion
Gyro 0.02 degrees
Heave5 % Amplitude
0.05 meters
Pitch 0.020 degrees
Roll 0.020 degrees
NavigationPosition
0.5 meters
Timing
Transducer 0.001 seconds
Navigation 0.001 seconds
Gyro 0.001 seconds
Heave 0.001 seconds
Pitch 0.001 seconds
Roll 0.001 seconds
Offsets
x 0.006 meters
y 0.006 meters
z 0.006 meters
MRU Alignment
Gyro 0.1 degrees
Pitch 0.07 degrees
Roll 0.07 degrees
Vessel
Speed 0.030 meters/second
Loading 0.018 meters
Draft 0.012 meters
Delta Draft 0.040 meters
Vessel FA_2808_EM2040
Echosounder Kongsberg Simrad EM2040 300 kilohertz
TPU StandardDeviation Values
Motion
Gyro 0.02 degrees
Heave5 % Amplitude
0.05 meters
Pitch 0.02 degrees
Roll 0.02 degrees
NavigationPosition
0.5 meters
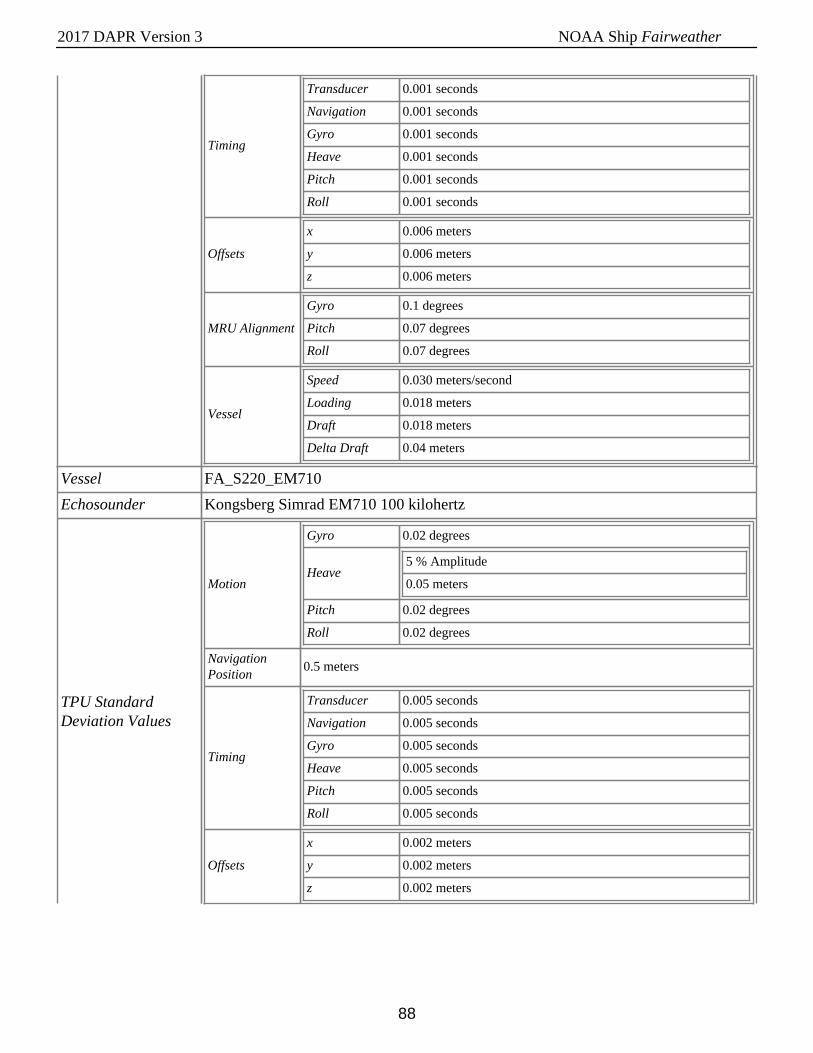
2017 DAPR Version 3 NOAA Ship Fairweather
88
Timing
Transducer 0.001 seconds
Navigation 0.001 seconds
Gyro 0.001 seconds
Heave 0.001 seconds
Pitch 0.001 seconds
Roll 0.001 seconds
Offsets
x 0.006 meters
y 0.006 meters
z 0.006 meters
MRU Alignment
Gyro 0.1 degrees
Pitch 0.07 degrees
Roll 0.07 degrees
Vessel
Speed 0.030 meters/second
Loading 0.018 meters
Draft 0.018 meters
Delta Draft 0.04 meters
Vessel FA_S220_EM710
Echosounder Kongsberg Simrad EM710 100 kilohertz
TPU StandardDeviation Values
Motion
Gyro 0.02 degrees
Heave5 % Amplitude
0.05 meters
Pitch 0.02 degrees
Roll 0.02 degrees
NavigationPosition
0.5 meters
Timing
Transducer 0.005 seconds
Navigation 0.005 seconds
Gyro 0.005 seconds
Heave 0.005 seconds
Pitch 0.005 seconds
Roll 0.005 seconds
Offsets
x 0.002 meters
y 0.002 meters
z 0.002 meters
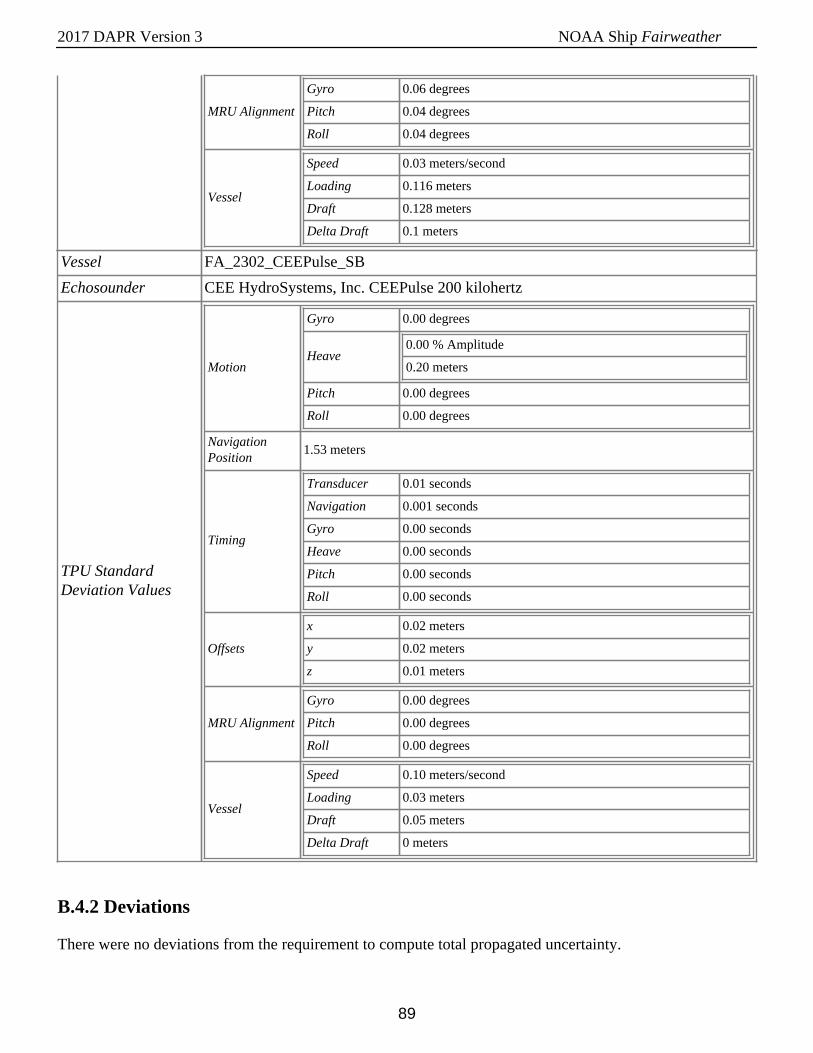
2017 DAPR Version 3 NOAA Ship Fairweather
89
MRU Alignment
Gyro 0.06 degrees
Pitch 0.04 degrees
Roll 0.04 degrees
Vessel
Speed 0.03 meters/second
Loading 0.116 meters
Draft 0.128 meters
Delta Draft 0.1 meters
Vessel FA_2302_CEEPulse_SB
Echosounder CEE HydroSystems, Inc. CEEPulse 200 kilohertz
TPU StandardDeviation Values
Motion
Gyro 0.00 degrees
Heave0.00 % Amplitude
0.20 meters
Pitch 0.00 degrees
Roll 0.00 degrees
NavigationPosition
1.53 meters
Timing
Transducer 0.01 seconds
Navigation 0.001 seconds
Gyro 0.00 seconds
Heave 0.00 seconds
Pitch 0.00 seconds
Roll 0.00 seconds
Offsets
x 0.02 meters
y 0.02 meters
z 0.01 meters
MRU Alignment
Gyro 0.00 degrees
Pitch 0.00 degrees
Roll 0.00 degrees
Vessel
Speed 0.10 meters/second
Loading 0.03 meters
Draft 0.05 meters
Delta Draft 0 meters
B.4.2 Deviations
There were no deviations from the requirement to compute total propagated uncertainty.
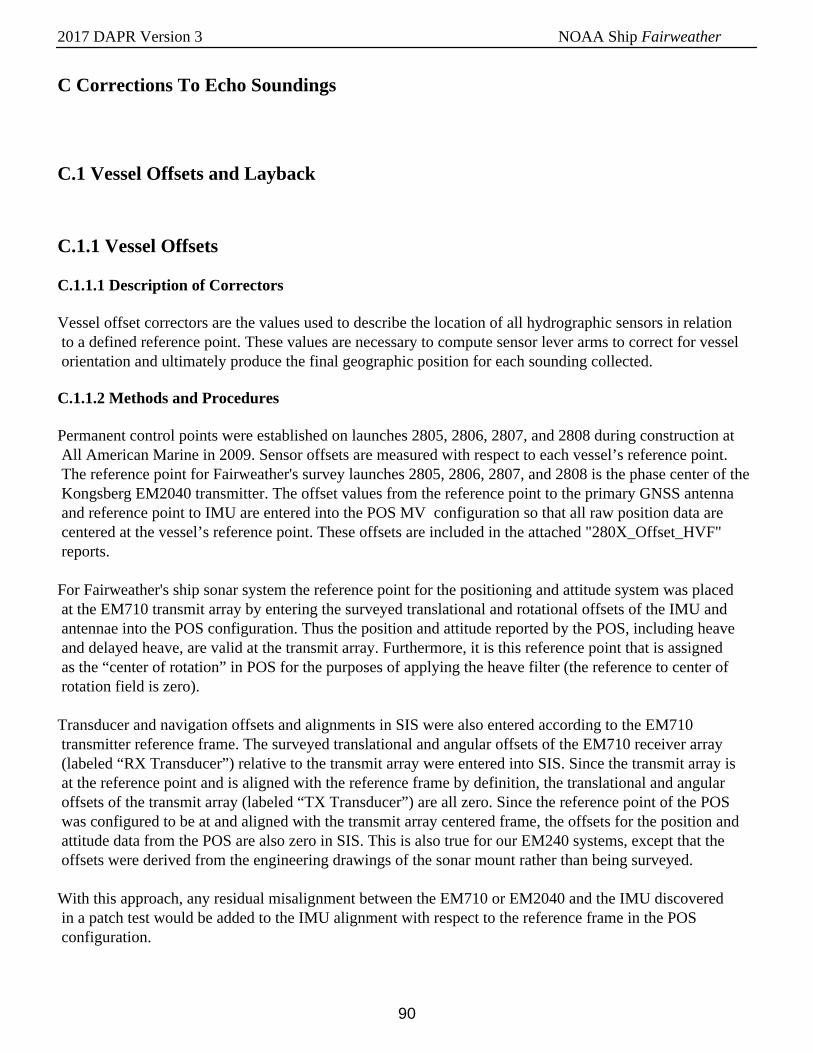
2017 DAPR Version 3 NOAA Ship Fairweather
90
C Corrections To Echo Soundings
C.1 Vessel Offsets and Layback
C.1.1 Vessel Offsets
C.1.1.1 Description of Correctors
Vessel offset correctors are the values used to describe the location of all hydrographic sensors in relation to a defined reference point. These values are necessary to compute sensor lever arms to correct for vessel orientation and ultimately produce the final geographic position for each sounding collected.
C.1.1.2 Methods and Procedures
Permanent control points were established on launches 2805, 2806, 2807, and 2808 during construction at All American Marine in 2009. Sensor offsets are measured with respect to each vessel’s reference point. The reference point for Fairweather's survey launches 2805, 2806, 2807, and 2808 is the phase center of the Kongsberg EM2040 transmitter. The offset values from the reference point to the primary GNSS antenna and reference point to IMU are entered into the POS MV configuration so that all raw position data are centered at the vessel’s reference point. These offsets are included in the attached "280X_Offset_HVF" reports.
For Fairweather's ship sonar system the reference point for the positioning and attitude system was placed at the EM710 transmit array by entering the surveyed translational and rotational offsets of the IMU and antennae into the POS configuration. Thus the position and attitude reported by the POS, including heave and delayed heave, are valid at the transmit array. Furthermore, it is this reference point that is assigned as the “center of rotation” in POS for the purposes of applying the heave filter (the reference to center of rotation field is zero).
Transducer and navigation offsets and alignments in SIS were also entered according to the EM710 transmitter reference frame. The surveyed translational and angular offsets of the EM710 receiver array (labeled “RX Transducer”) relative to the transmit array were entered into SIS. Since the transmit array is at the reference point and is aligned with the reference frame by definition, the translational and angular offsets of the transmit array (labeled “TX Transducer”) are all zero. Since the reference point of the POS was configured to be at and aligned with the transmit array centered frame, the offsets for the position and attitude data from the POS are also zero in SIS. This is also true for our EM240 systems, except that the offsets were derived from the engineering drawings of the sonar mount rather than being surveyed.
With this approach, any residual misalignment between the EM710 or EM2040 and the IMU discovered in a patch test would be added to the IMU alignment with respect to the reference frame in the POS configuration.
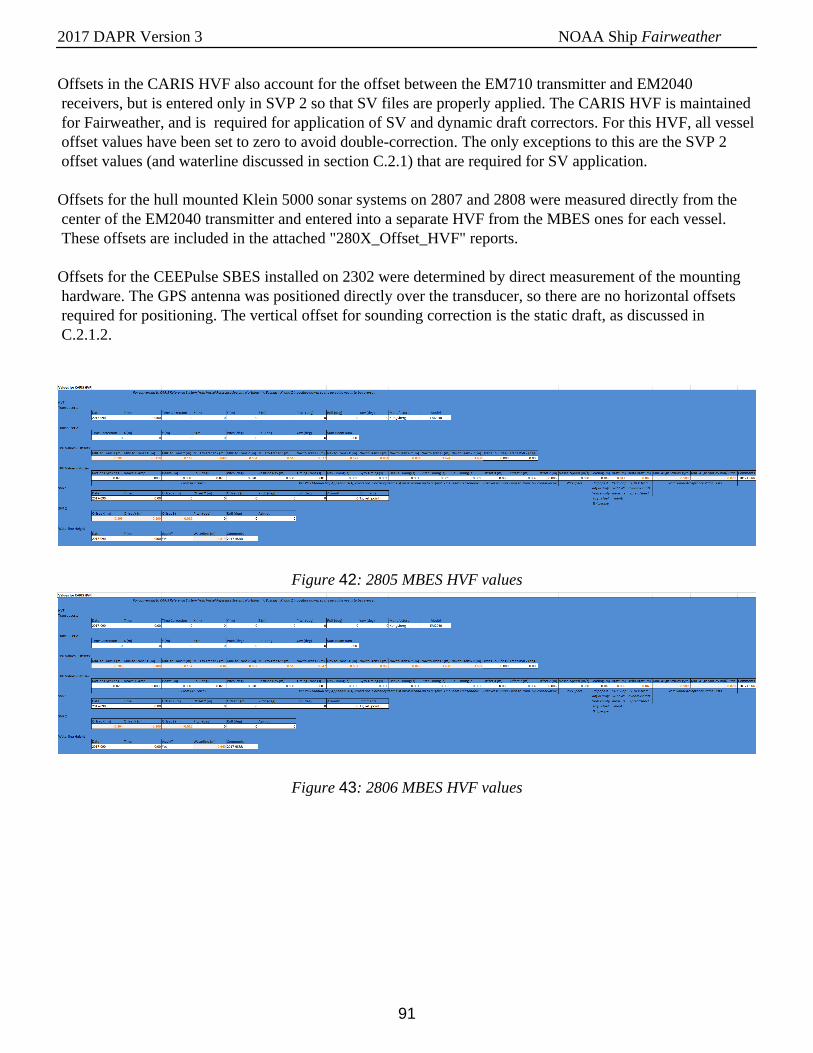
2017 DAPR Version 3 NOAA Ship Fairweather
91
Offsets in the CARIS HVF also account for the offset between the EM710 transmitter and EM2040 receivers, but is entered only in SVP 2 so that SV files are properly applied. The CARIS HVF is maintained for Fairweather, and is required for application of SV and dynamic draft correctors. For this HVF, all vessel offset values have been set to zero to avoid double-correction. The only exceptions to this are the SVP 2 offset values (and waterline discussed in section C.2.1) that are required for SV application.
Offsets for the hull mounted Klein 5000 sonar systems on 2807 and 2808 were measured directly from the center of the EM2040 transmitter and entered into a separate HVF from the MBES ones for each vessel. These offsets are included in the attached "280X_Offset_HVF" reports.
Offsets for the CEEPulse SBES installed on 2302 were determined by direct measurement of the mounting hardware. The GPS antenna was positioned directly over the transducer, so there are no horizontal offsets required for positioning. The vertical offset for sounding correction is the static draft, as discussed in C.2.1.2.
Figure 42: 2805 MBES HVF values
Figure 43: 2806 MBES HVF values
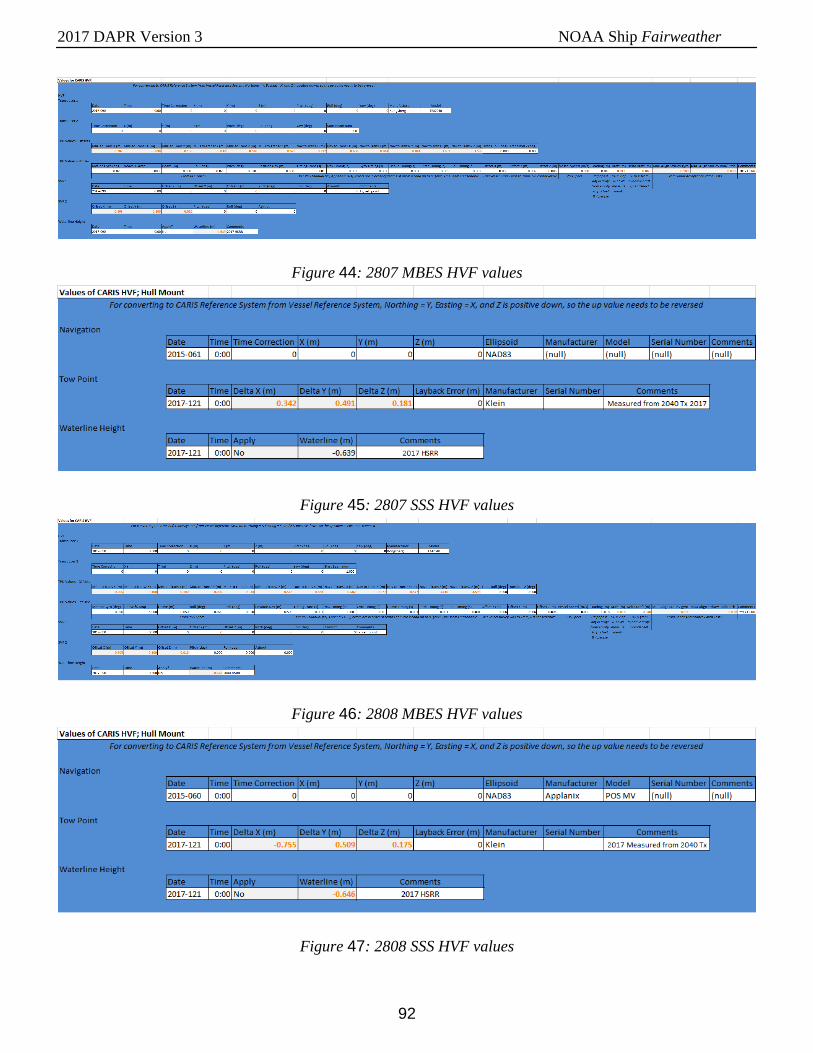
2017 DAPR Version 3 NOAA Ship Fairweather
92
Figure 44: 2807 MBES HVF values
Figure 45: 2807 SSS HVF values
Figure 46: 2808 MBES HVF values
Figure 47: 2808 SSS HVF values
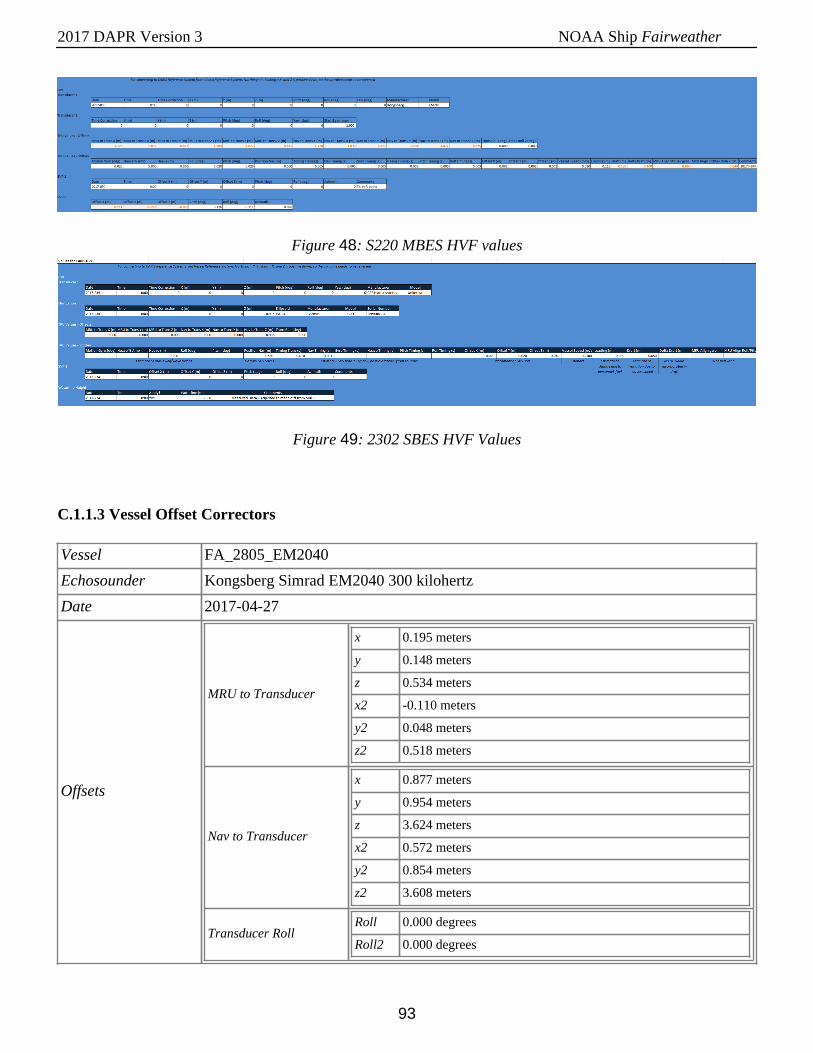
2017 DAPR Version 3 NOAA Ship Fairweather
93
Figure 48: S220 MBES HVF values
Figure 49: 2302 SBES HVF Values
C.1.1.3 Vessel Offset Correctors
Vessel FA_2805_EM2040
Echosounder Kongsberg Simrad EM2040 300 kilohertz
Date 2017-04-27
Offsets
MRU to Transducer
x 0.195 meters
y 0.148 meters
z 0.534 meters
x2 -0.110 meters
y2 0.048 meters
z2 0.518 meters
Nav to Transducer
x 0.877 meters
y 0.954 meters
z 3.624 meters
x2 0.572 meters
y2 0.854 meters
z2 3.608 meters
Transducer RollRoll 0.000 degrees
Roll2 0.000 degrees
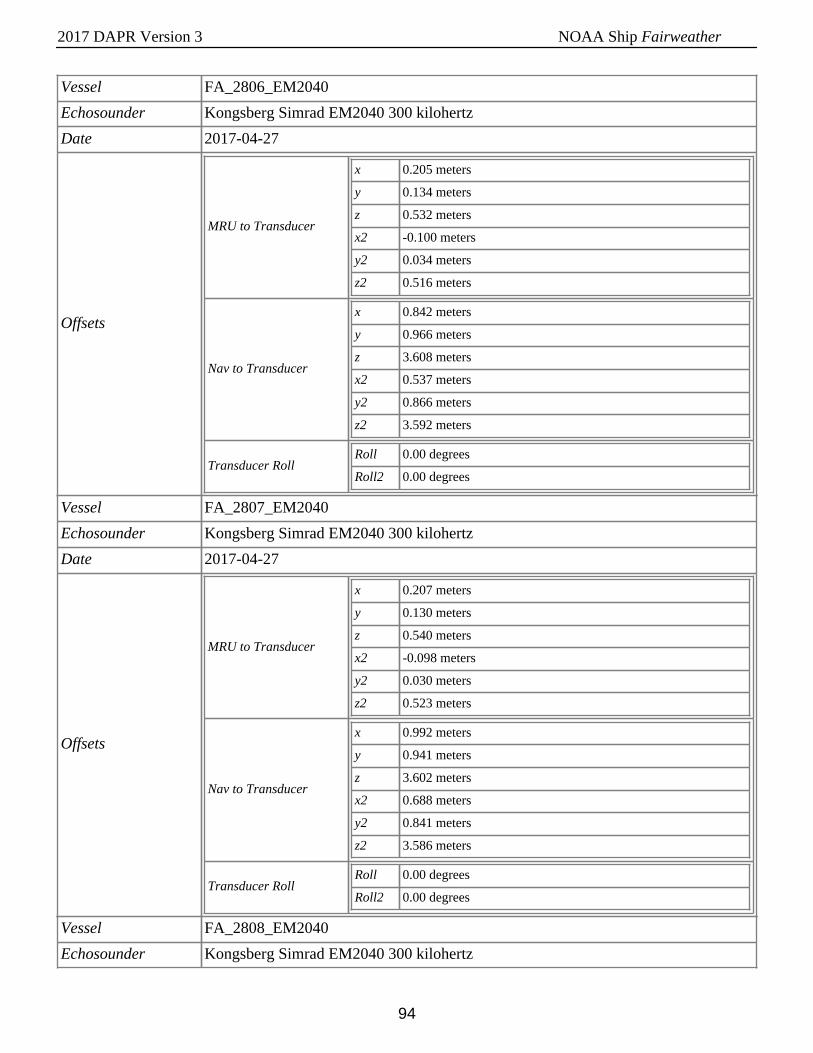
2017 DAPR Version 3 NOAA Ship Fairweather
94
Vessel FA_2806_EM2040
Echosounder Kongsberg Simrad EM2040 300 kilohertz
Date 2017-04-27
Offsets
MRU to Transducer
x 0.205 meters
y 0.134 meters
z 0.532 meters
x2 -0.100 meters
y2 0.034 meters
z2 0.516 meters
Nav to Transducer
x 0.842 meters
y 0.966 meters
z 3.608 meters
x2 0.537 meters
y2 0.866 meters
z2 3.592 meters
Transducer RollRoll 0.00 degrees
Roll2 0.00 degrees
Vessel FA_2807_EM2040
Echosounder Kongsberg Simrad EM2040 300 kilohertz
Date 2017-04-27
Offsets
MRU to Transducer
x 0.207 meters
y 0.130 meters
z 0.540 meters
x2 -0.098 meters
y2 0.030 meters
z2 0.523 meters
Nav to Transducer
x 0.992 meters
y 0.941 meters
z 3.602 meters
x2 0.688 meters
y2 0.841 meters
z2 3.586 meters
Transducer RollRoll 0.00 degrees
Roll2 0.00 degrees
Vessel FA_2808_EM2040
Echosounder Kongsberg Simrad EM2040 300 kilohertz
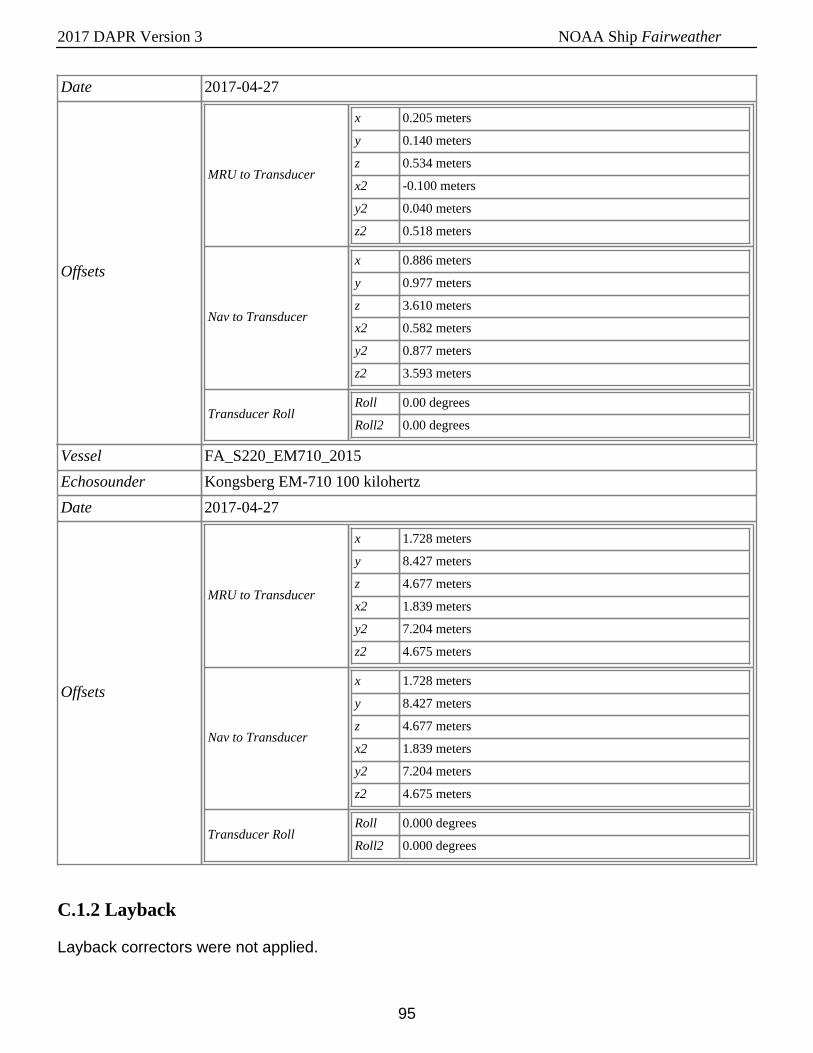
2017 DAPR Version 3 NOAA Ship Fairweather
95
Date 2017-04-27
Offsets
MRU to Transducer
x 0.205 meters
y 0.140 meters
z 0.534 meters
x2 -0.100 meters
y2 0.040 meters
z2 0.518 meters
Nav to Transducer
x 0.886 meters
y 0.977 meters
z 3.610 meters
x2 0.582 meters
y2 0.877 meters
z2 3.593 meters
Transducer RollRoll 0.00 degrees
Roll2 0.00 degrees
Vessel FA_S220_EM710_2015
Echosounder Kongsberg EM-710 100 kilohertz
Date 2017-04-27
Offsets
MRU to Transducer
x 1.728 meters
y 8.427 meters
z 4.677 meters
x2 1.839 meters
y2 7.204 meters
z2 4.675 meters
Nav to Transducer
x 1.728 meters
y 8.427 meters
z 4.677 meters
x2 1.839 meters
y2 7.204 meters
z2 4.675 meters
Transducer RollRoll 0.000 degrees
Roll2 0.000 degrees
C.1.2 Layback
Layback correctors were not applied.
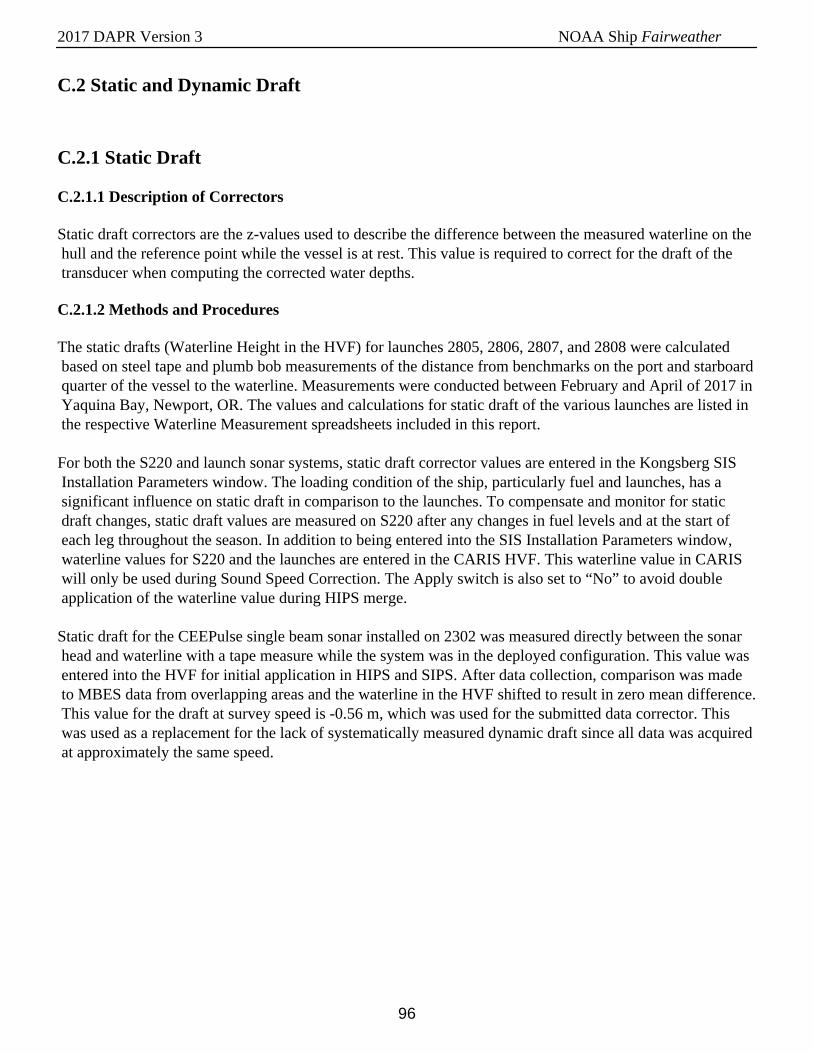
2017 DAPR Version 3 NOAA Ship Fairweather
96
C.2 Static and Dynamic Draft
C.2.1 Static Draft
C.2.1.1 Description of Correctors
Static draft correctors are the z-values used to describe the difference between the measured waterline on the hull and the reference point while the vessel is at rest. This value is required to correct for the draft of the transducer when computing the corrected water depths.
C.2.1.2 Methods and Procedures
The static drafts (Waterline Height in the HVF) for launches 2805, 2806, 2807, and 2808 were calculated based on steel tape and plumb bob measurements of the distance from benchmarks on the port and starboard quarter of the vessel to the waterline. Measurements were conducted between February and April of 2017 in Yaquina Bay, Newport, OR. The values and calculations for static draft of the various launches are listed in the respective Waterline Measurement spreadsheets included in this report.
For both the S220 and launch sonar systems, static draft corrector values are entered in the Kongsberg SIS Installation Parameters window. The loading condition of the ship, particularly fuel and launches, has a significant influence on static draft in comparison to the launches. To compensate and monitor for static draft changes, static draft values are measured on S220 after any changes in fuel levels and at the start of each leg throughout the season. In addition to being entered into the SIS Installation Parameters window, waterline values for S220 and the launches are entered in the CARIS HVF. This waterline value in CARIS will only be used during Sound Speed Correction. The Apply switch is also set to “No” to avoid double application of the waterline value during HIPS merge.
Static draft for the CEEPulse single beam sonar installed on 2302 was measured directly between the sonar head and waterline with a tape measure while the system was in the deployed configuration. This value was entered into the HVF for initial application in HIPS and SIPS. After data collection, comparison was made to MBES data from overlapping areas and the waterline in the HVF shifted to result in zero mean difference. This value for the draft at survey speed is -0.56 m, which was used for the submitted data corrector. This was used as a replacement for the lack of systematically measured dynamic draft since all data was acquired at approximately the same speed.
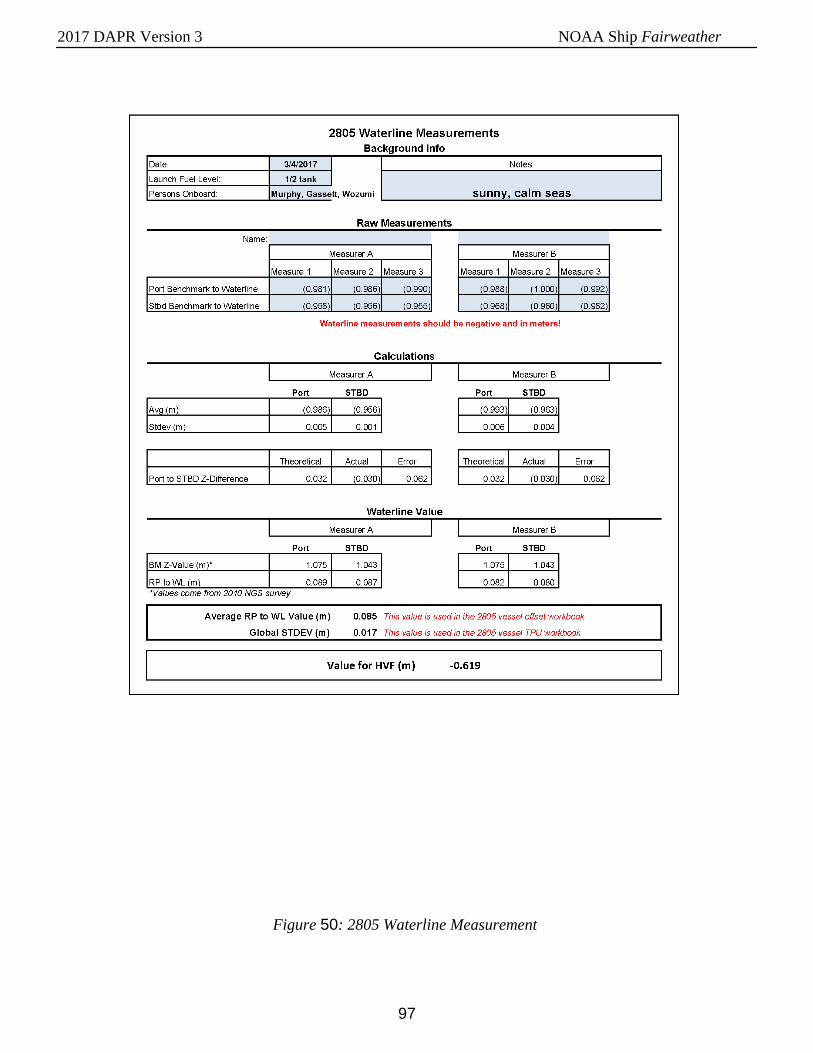
2017 DAPR Version 3 NOAA Ship Fairweather
97
Figure 50: 2805 Waterline Measurement
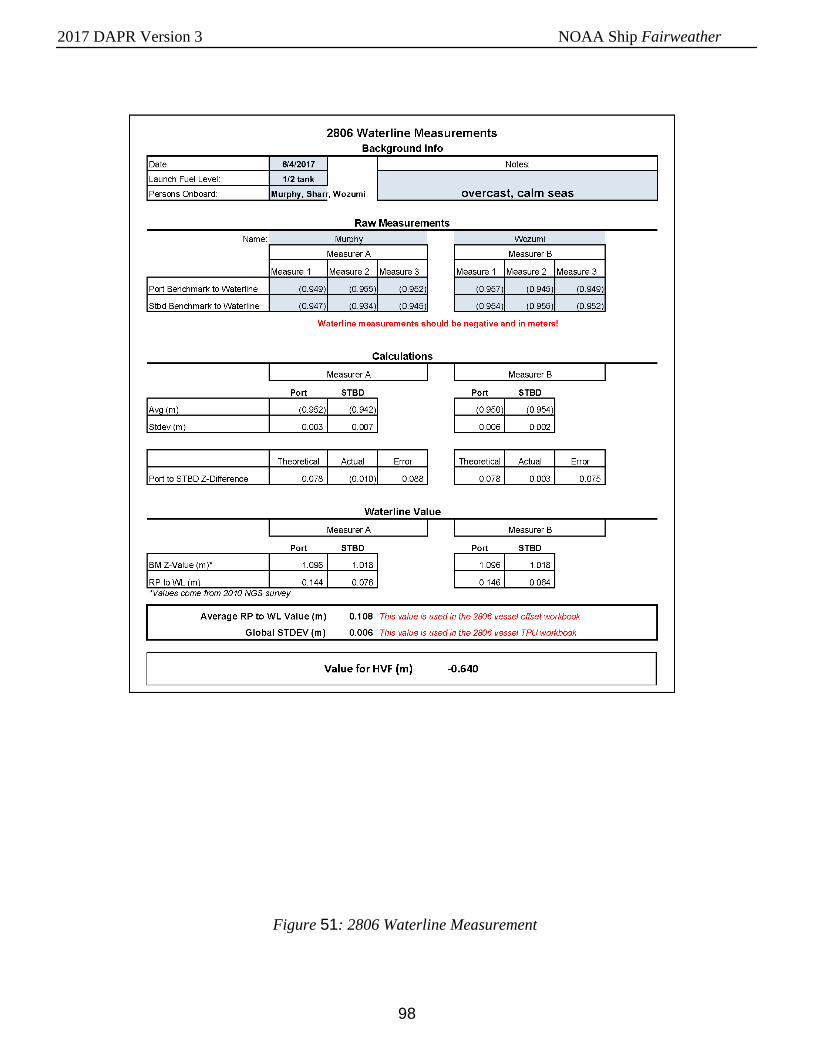
2017 DAPR Version 3 NOAA Ship Fairweather
98
Figure 51: 2806 Waterline Measurement
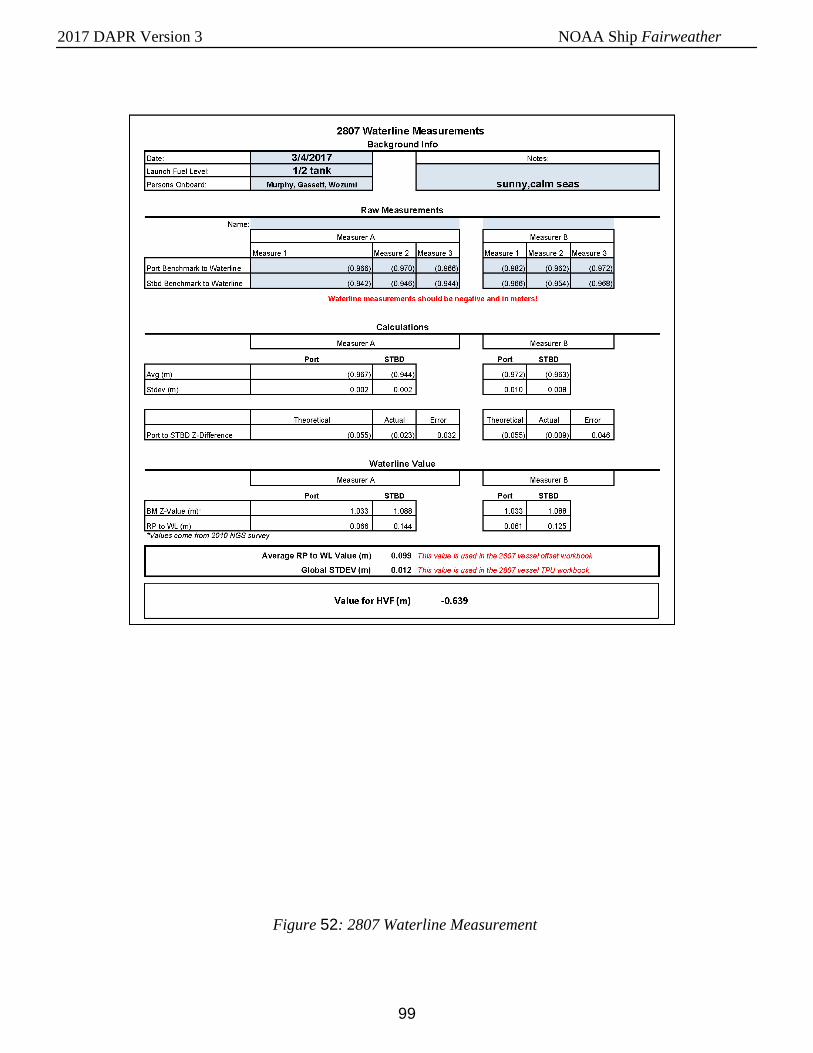
2017 DAPR Version 3 NOAA Ship Fairweather
99
Figure 52: 2807 Waterline Measurement
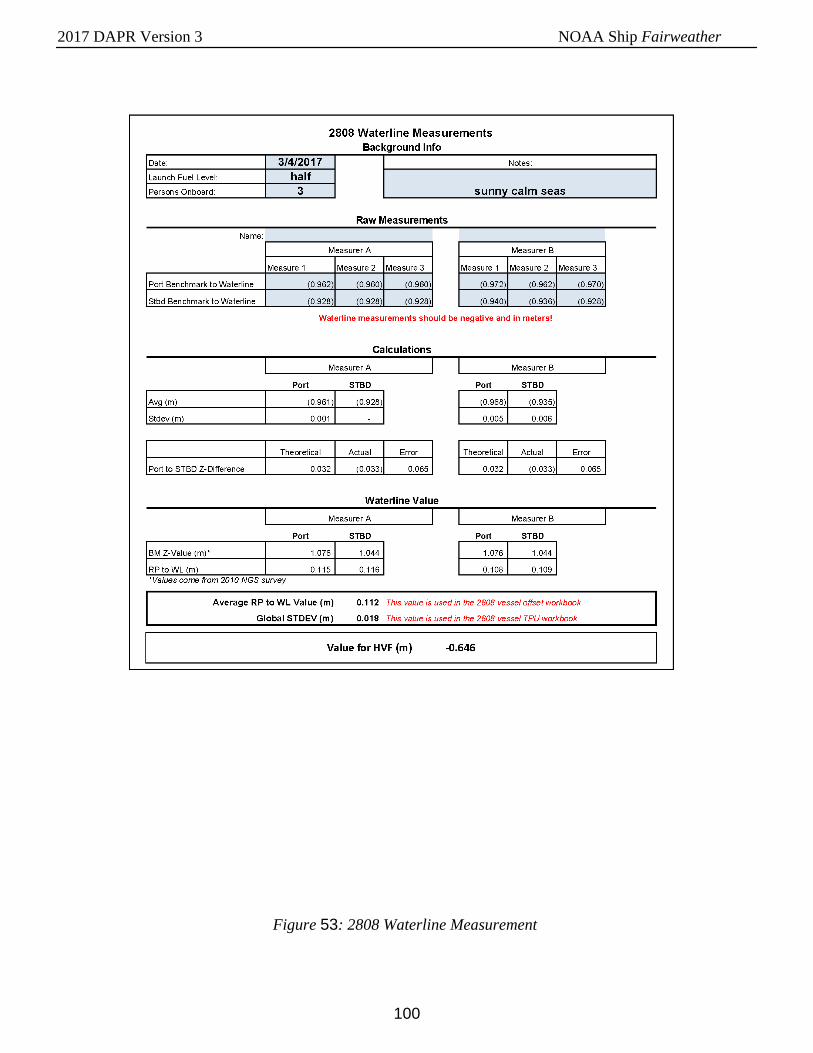
2017 DAPR Version 3 NOAA Ship Fairweather
100
Figure 53: 2808 Waterline Measurement
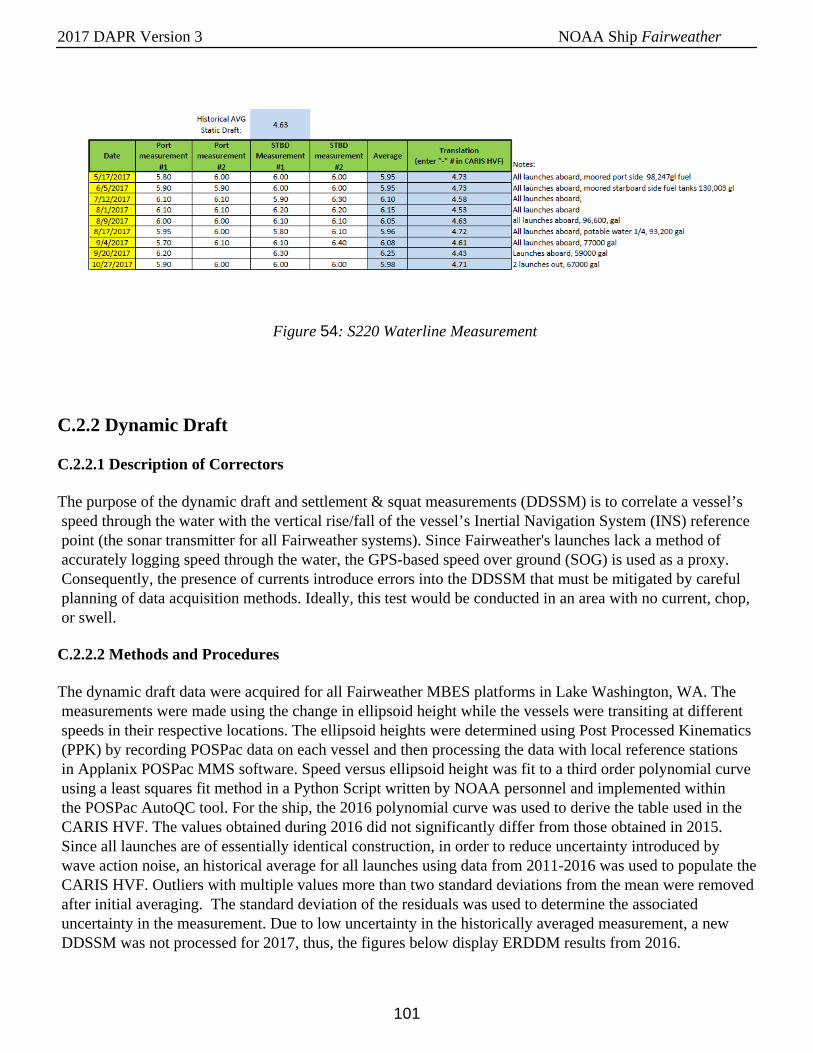
2017 DAPR Version 3 NOAA Ship Fairweather
101
Figure 54: S220 Waterline Measurement
C.2.2 Dynamic Draft
C.2.2.1 Description of Correctors
The purpose of the dynamic draft and settlement & squat measurements (DDSSM) is to correlate a vessel’s speed through the water with the vertical rise/fall of the vessel’s Inertial Navigation System (INS) reference point (the sonar transmitter for all Fairweather systems). Since Fairweather's launches lack a method of accurately logging speed through the water, the GPS-based speed over ground (SOG) is used as a proxy. Consequently, the presence of currents introduce errors into the DDSSM that must be mitigated by careful planning of data acquisition methods. Ideally, this test would be conducted in an area with no current, chop, or swell.
C.2.2.2 Methods and Procedures
The dynamic draft data were acquired for all Fairweather MBES platforms in Lake Washington, WA. The measurements were made using the change in ellipsoid height while the vessels were transiting at different speeds in their respective locations. The ellipsoid heights were determined using Post Processed Kinematics (PPK) by recording POSPac data on each vessel and then processing the data with local reference stations in Applanix POSPac MMS software. Speed versus ellipsoid height was fit to a third order polynomial curve using a least squares fit method in a Python Script written by NOAA personnel and implemented within the POSPac AutoQC tool. For the ship, the 2016 polynomial curve was used to derive the table used in the CARIS HVF. The values obtained during 2016 did not significantly differ from those obtained in 2015. Since all launches are of essentially identical construction, in order to reduce uncertainty introduced by wave action noise, an historical average for all launches using data from 2011-2016 was used to populate the CARIS HVF. Outliers with multiple values more than two standard deviations from the mean were removed after initial averaging. The standard deviation of the residuals was used to determine the associated uncertainty in the measurement. Due to low uncertainty in the historically averaged measurement, a new DDSSM was not processed for 2017, thus, the figures below display ERDDM results from 2016.
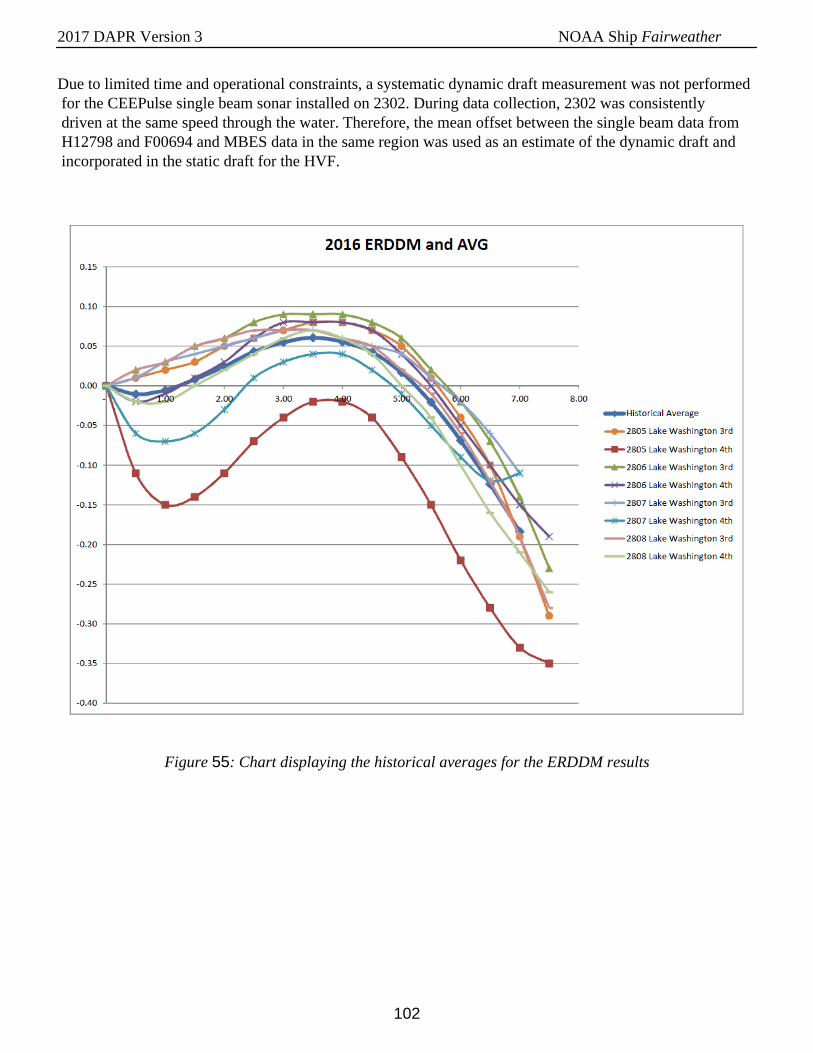
2017 DAPR Version 3 NOAA Ship Fairweather
102
Due to limited time and operational constraints, a systematic dynamic draft measurement was not performed for the CEEPulse single beam sonar installed on 2302. During data collection, 2302 was consistently driven at the same speed through the water. Therefore, the mean offset between the single beam data from H12798 and F00694 and MBES data in the same region was used as an estimate of the dynamic draft and incorporated in the static draft for the HVF.
Figure 55: Chart displaying the historical averages for the ERDDM results
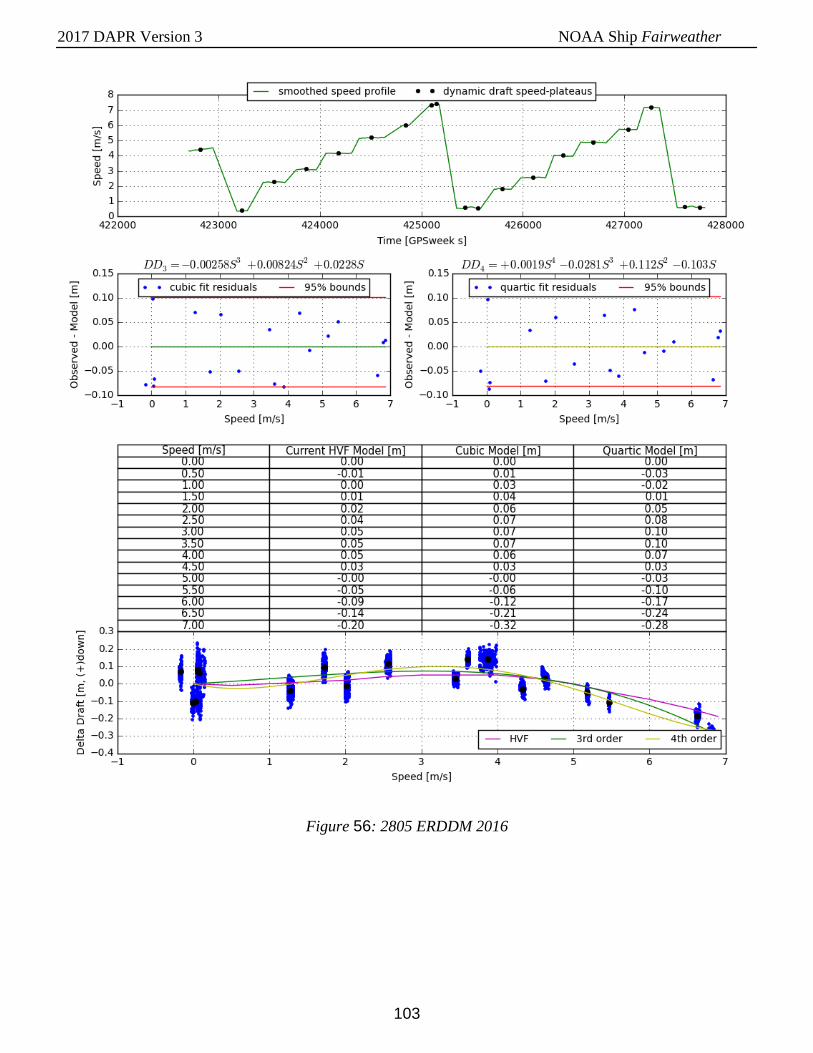
2017 DAPR Version 3 NOAA Ship Fairweather
103
Figure 56: 2805 ERDDM 2016
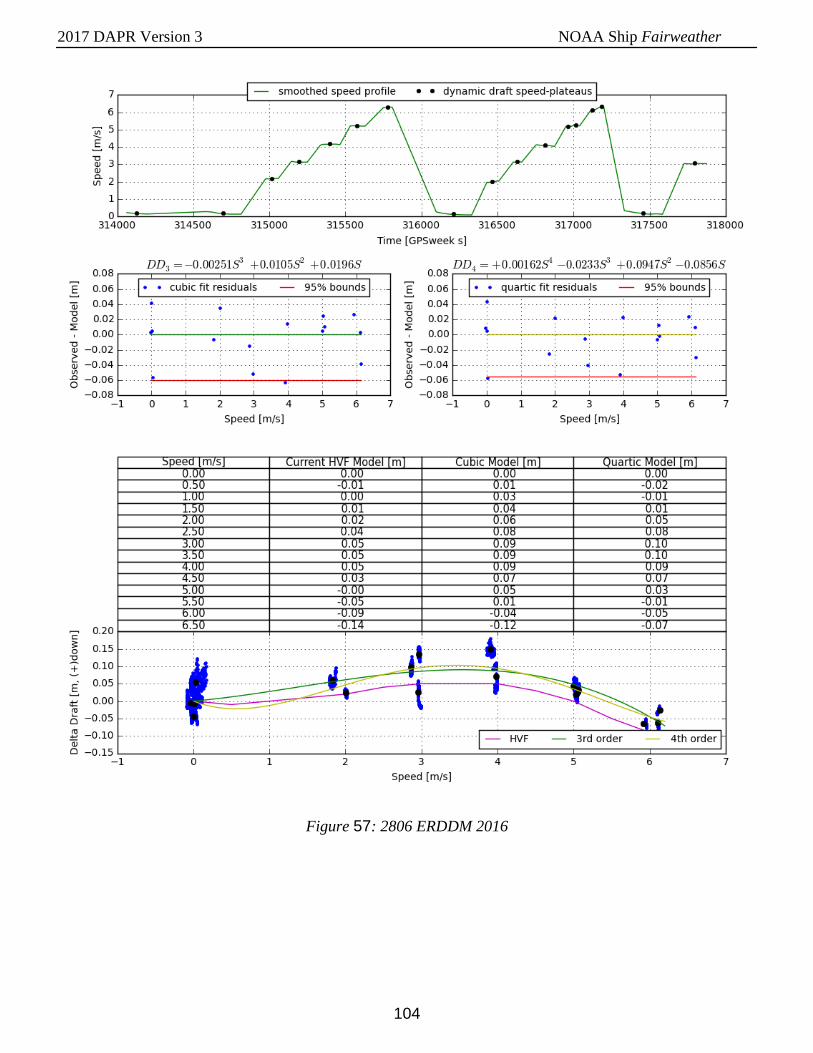
2017 DAPR Version 3 NOAA Ship Fairweather
104
Figure 57: 2806 ERDDM 2016
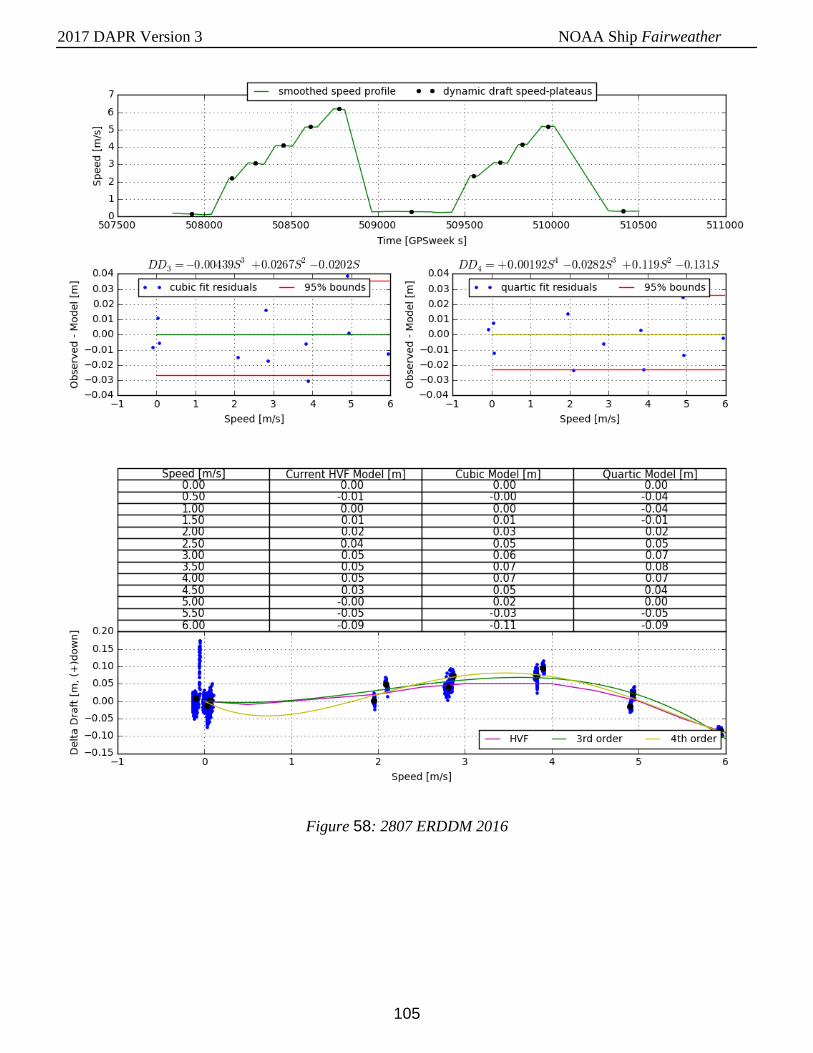
2017 DAPR Version 3 NOAA Ship Fairweather
105
Figure 58: 2807 ERDDM 2016
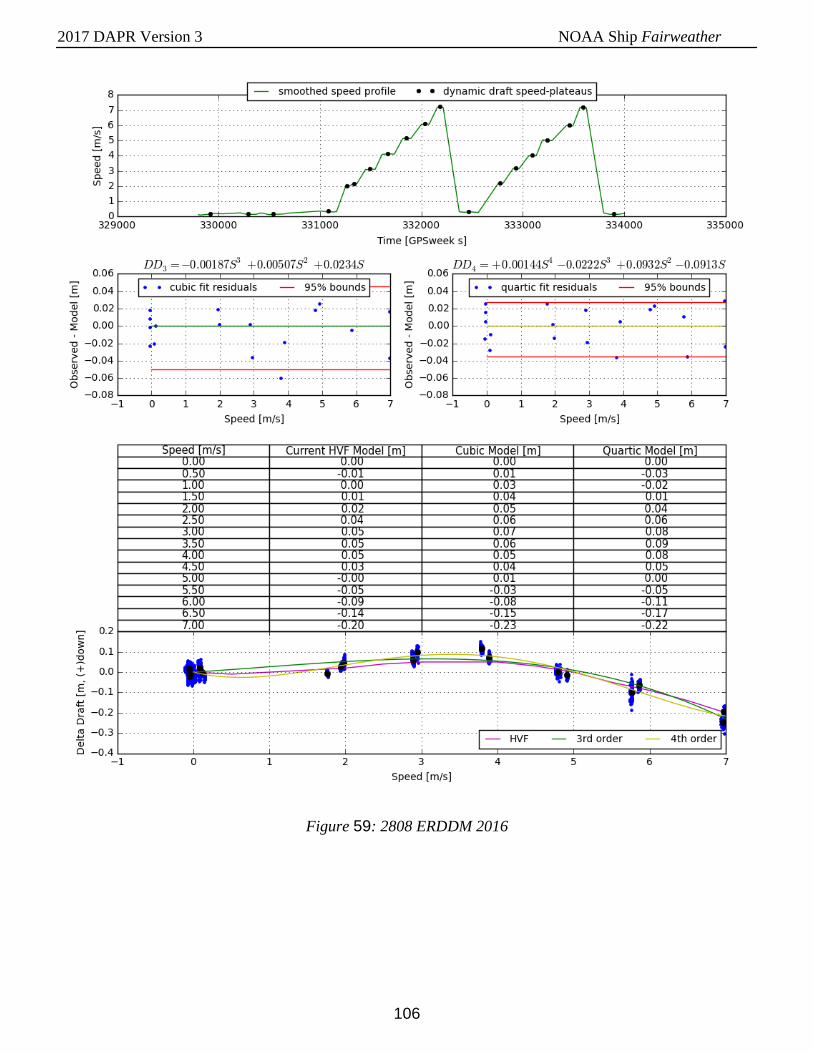
2017 DAPR Version 3 NOAA Ship Fairweather
106
Figure 59: 2808 ERDDM 2016
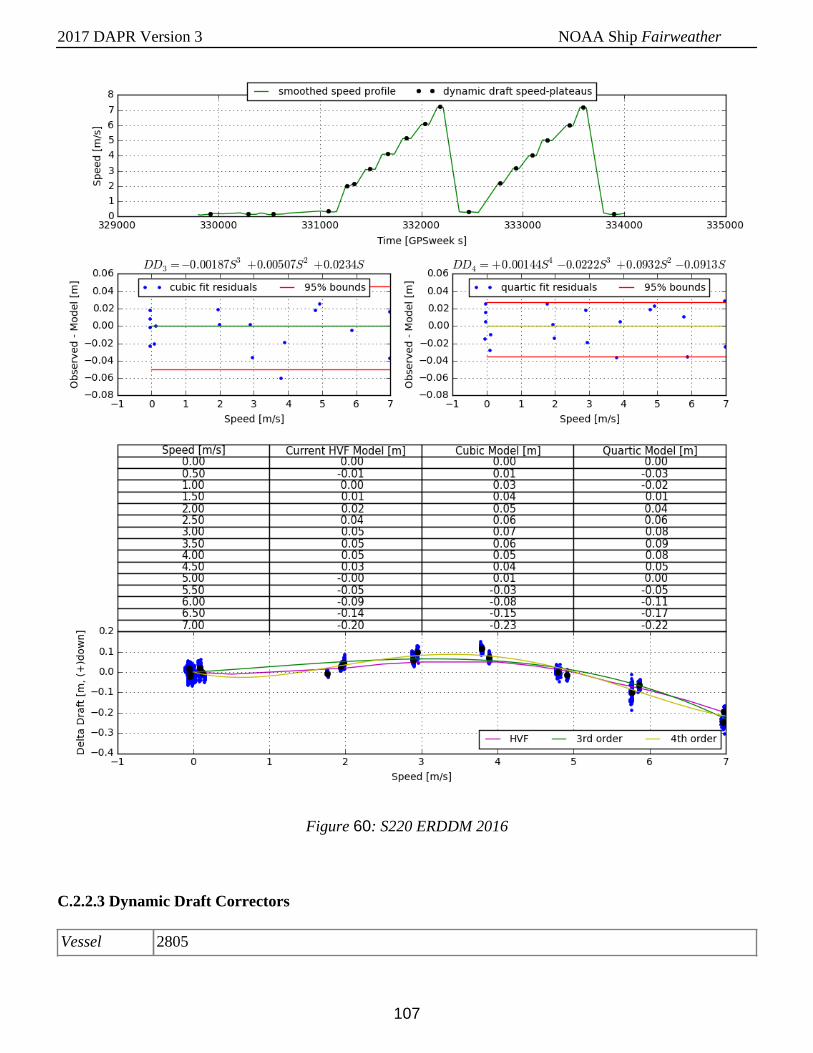
2017 DAPR Version 3 NOAA Ship Fairweather
107
Figure 60: S220 ERDDM 2016
C.2.2.3 Dynamic Draft Correctors
Vessel 2805
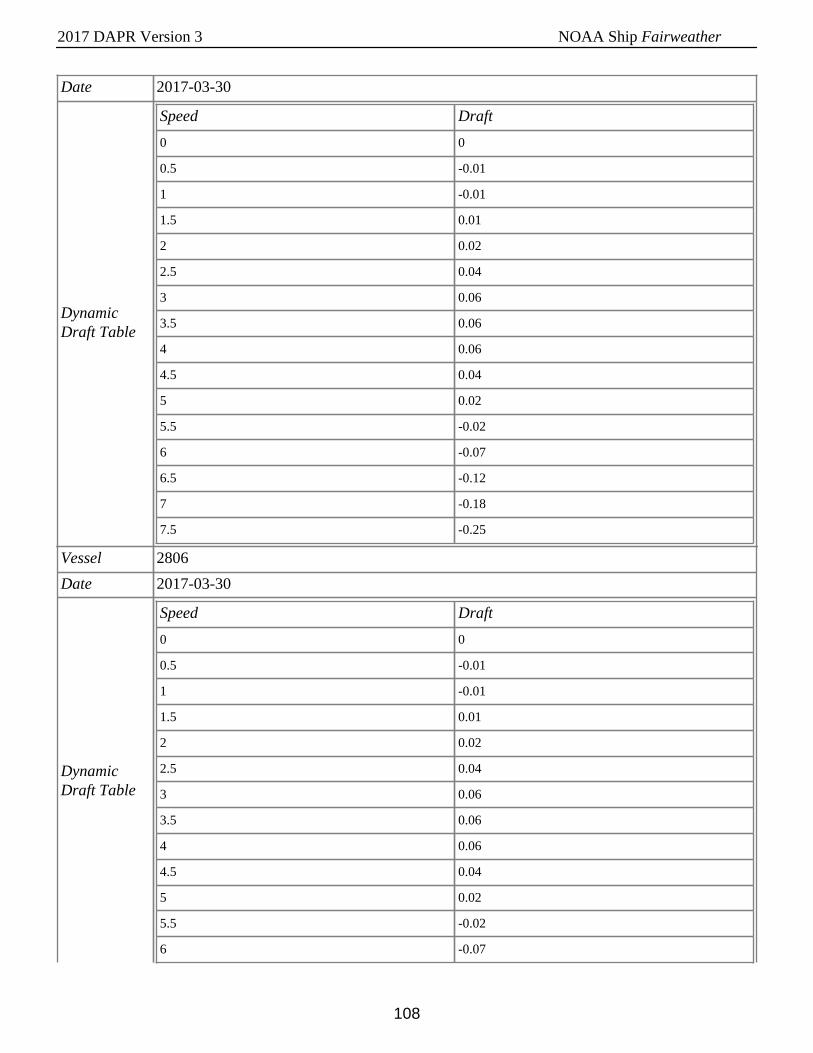
2017 DAPR Version 3 NOAA Ship Fairweather
108
Date 2017-03-30
DynamicDraft Table
Speed Draft
0 0
0.5 -0.01
1 -0.01
1.5 0.01
2 0.02
2.5 0.04
3 0.06
3.5 0.06
4 0.06
4.5 0.04
5 0.02
5.5 -0.02
6 -0.07
6.5 -0.12
7 -0.18
7.5 -0.25
Vessel 2806
Date 2017-03-30
DynamicDraft Table
Speed Draft
0 0
0.5 -0.01
1 -0.01
1.5 0.01
2 0.02
2.5 0.04
3 0.06
3.5 0.06
4 0.06
4.5 0.04
5 0.02
5.5 -0.02
6 -0.07
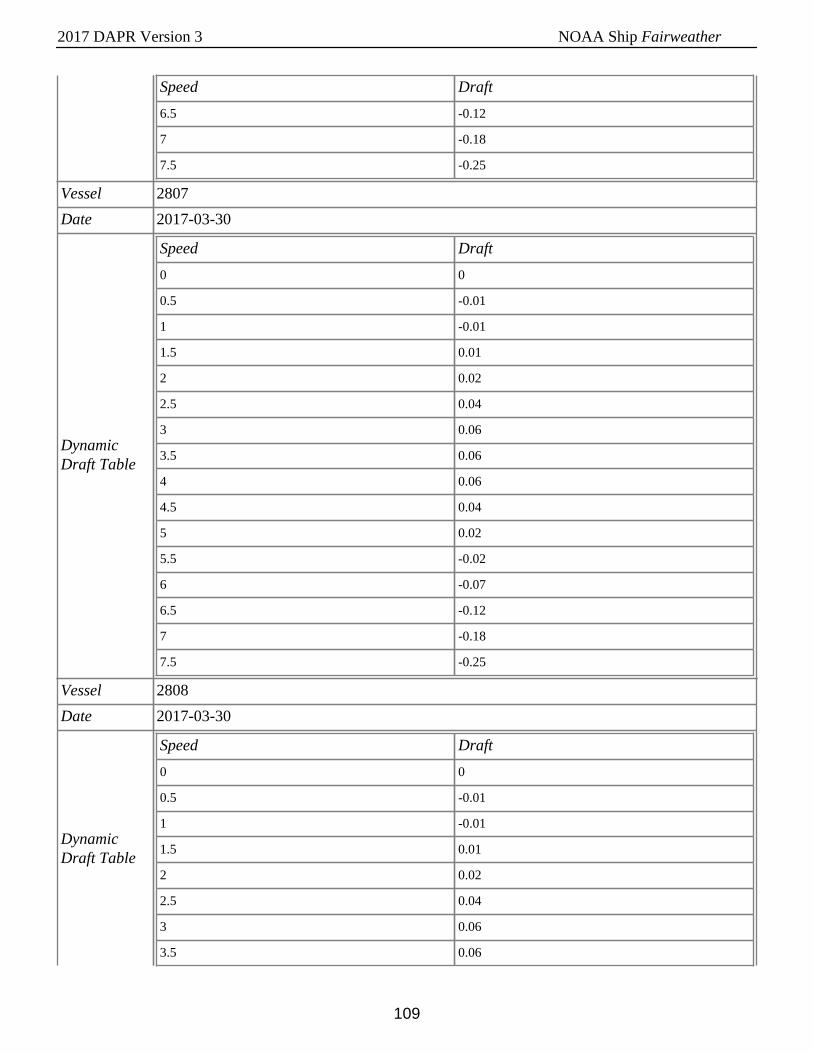
2017 DAPR Version 3 NOAA Ship Fairweather
109
Speed Draft
6.5 -0.12
7 -0.18
7.5 -0.25
Vessel 2807
Date 2017-03-30
DynamicDraft Table
Speed Draft
0 0
0.5 -0.01
1 -0.01
1.5 0.01
2 0.02
2.5 0.04
3 0.06
3.5 0.06
4 0.06
4.5 0.04
5 0.02
5.5 -0.02
6 -0.07
6.5 -0.12
7 -0.18
7.5 -0.25
Vessel 2808
Date 2017-03-30
DynamicDraft Table
Speed Draft
0 0
0.5 -0.01
1 -0.01
1.5 0.01
2 0.02
2.5 0.04
3 0.06
3.5 0.06
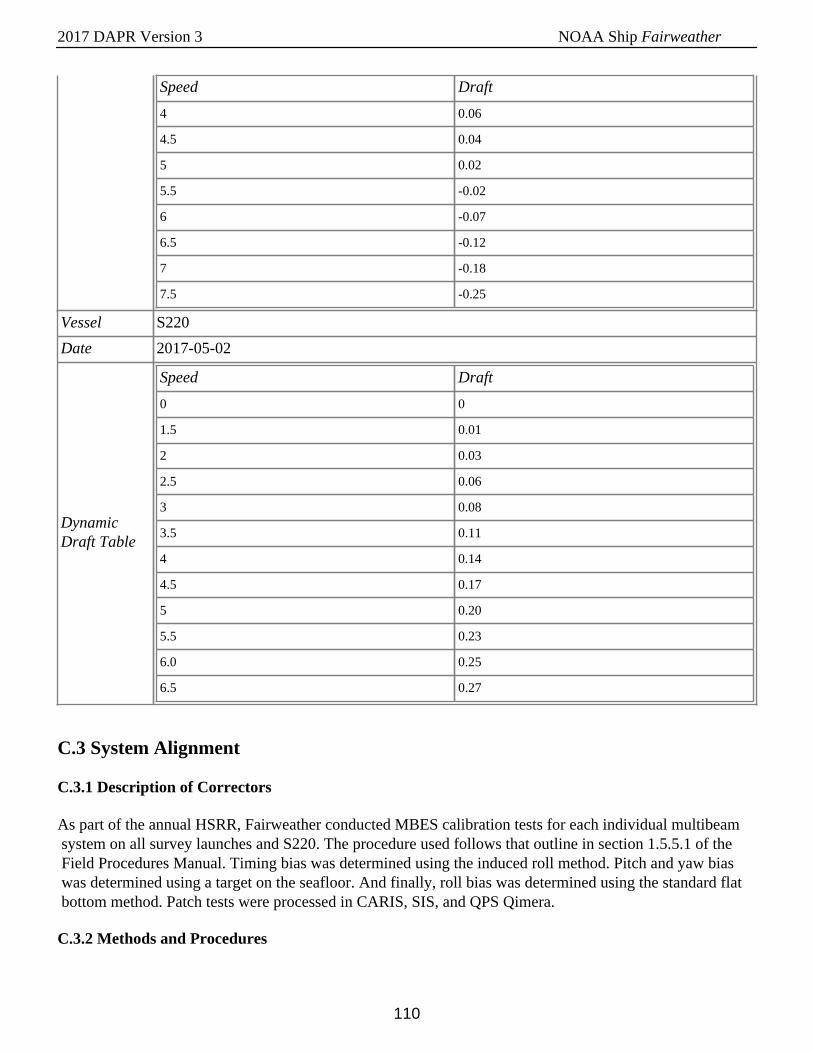
2017 DAPR Version 3 NOAA Ship Fairweather
110
Speed Draft
4 0.06
4.5 0.04
5 0.02
5.5 -0.02
6 -0.07
6.5 -0.12
7 -0.18
7.5 -0.25
Vessel S220
Date 2017-05-02
DynamicDraft Table
Speed Draft
0 0
1.5 0.01
2 0.03
2.5 0.06
3 0.08
3.5 0.11
4 0.14
4.5 0.17
5 0.20
5.5 0.23
6.0 0.25
6.5 0.27
C.3 System Alignment
C.3.1 Description of Correctors
As part of the annual HSRR, Fairweather conducted MBES calibration tests for each individual multibeam system on all survey launches and S220. The procedure used follows that outline in section 1.5.5.1 of the Field Procedures Manual. Timing bias was determined using the induced roll method. Pitch and yaw bias was determined using a target on the seafloor. And finally, roll bias was determined using the standard flat bottom method. Patch tests were processed in CARIS, SIS, and QPS Qimera.
C.3.2 Methods and Procedures
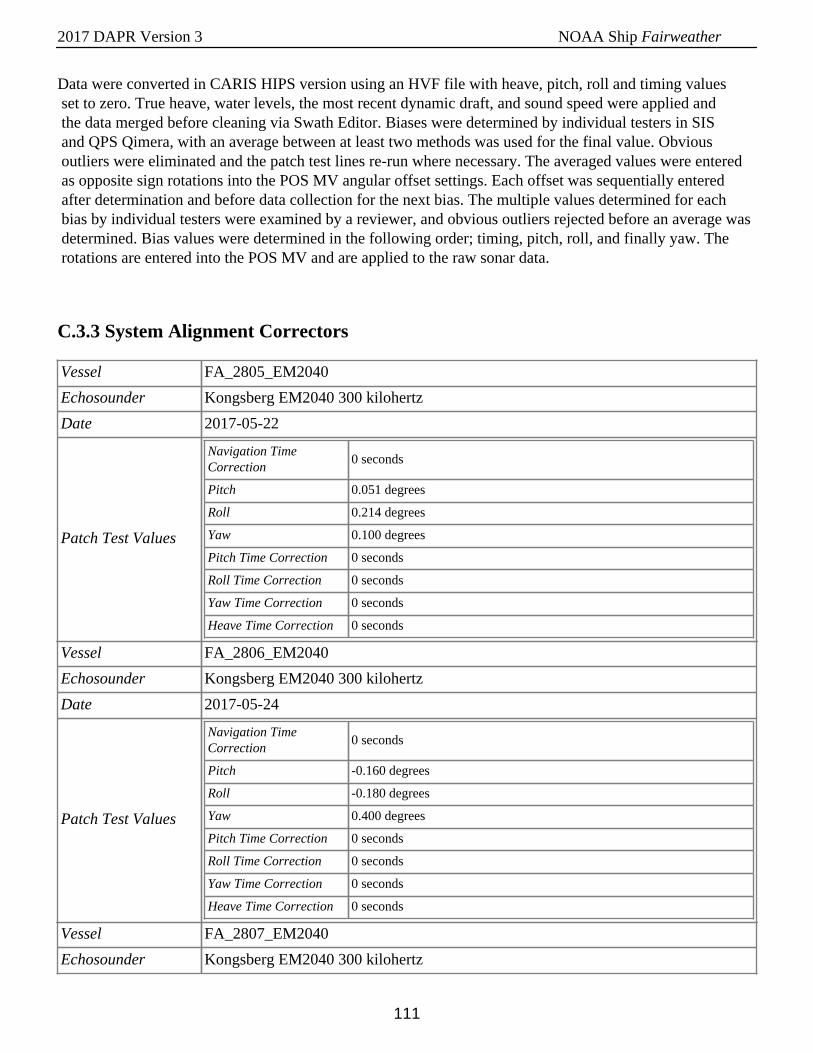
2017 DAPR Version 3 NOAA Ship Fairweather
111
Data were converted in CARIS HIPS version using an HVF file with heave, pitch, roll and timing values set to zero. True heave, water levels, the most recent dynamic draft, and sound speed were applied and the data merged before cleaning via Swath Editor. Biases were determined by individual testers in SIS and QPS Qimera, with an average between at least two methods was used for the final value. Obvious outliers were eliminated and the patch test lines re-run where necessary. The averaged values were entered as opposite sign rotations into the POS MV angular offset settings. Each offset was sequentially entered after determination and before data collection for the next bias. The multiple values determined for each bias by individual testers were examined by a reviewer, and obvious outliers rejected before an average was determined. Bias values were determined in the following order; timing, pitch, roll, and finally yaw. The rotations are entered into the POS MV and are applied to the raw sonar data.
C.3.3 System Alignment Correctors
Vessel FA_2805_EM2040
Echosounder Kongsberg EM2040 300 kilohertz
Date 2017-05-22
Patch Test Values
Navigation TimeCorrection
0 seconds
Pitch 0.051 degrees
Roll 0.214 degrees
Yaw 0.100 degrees
Pitch Time Correction 0 seconds
Roll Time Correction 0 seconds
Yaw Time Correction 0 seconds
Heave Time Correction 0 seconds
Vessel FA_2806_EM2040
Echosounder Kongsberg EM2040 300 kilohertz
Date 2017-05-24
Patch Test Values
Navigation TimeCorrection
0 seconds
Pitch -0.160 degrees
Roll -0.180 degrees
Yaw 0.400 degrees
Pitch Time Correction 0 seconds
Roll Time Correction 0 seconds
Yaw Time Correction 0 seconds
Heave Time Correction 0 seconds
Vessel FA_2807_EM2040
Echosounder Kongsberg EM2040 300 kilohertz
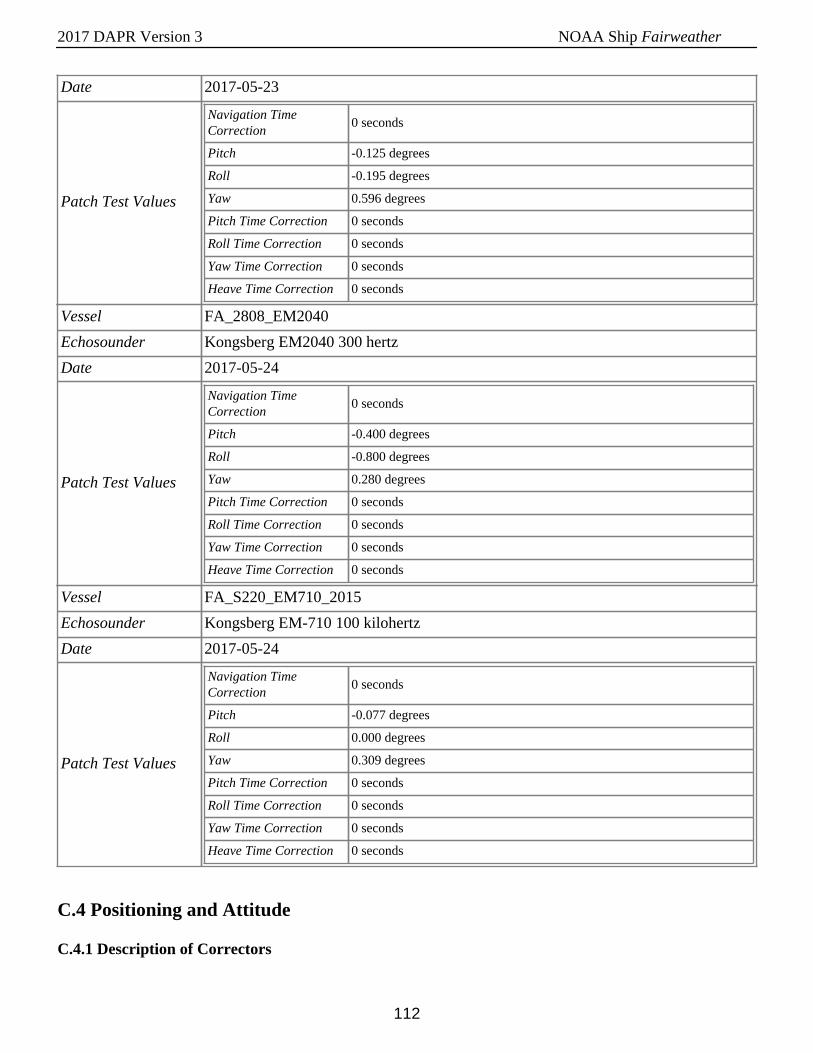
2017 DAPR Version 3 NOAA Ship Fairweather
112
Date 2017-05-23
Patch Test Values
Navigation TimeCorrection
0 seconds
Pitch -0.125 degrees
Roll -0.195 degrees
Yaw 0.596 degrees
Pitch Time Correction 0 seconds
Roll Time Correction 0 seconds
Yaw Time Correction 0 seconds
Heave Time Correction 0 seconds
Vessel FA_2808_EM2040
Echosounder Kongsberg EM2040 300 hertz
Date 2017-05-24
Patch Test Values
Navigation TimeCorrection
0 seconds
Pitch -0.400 degrees
Roll -0.800 degrees
Yaw 0.280 degrees
Pitch Time Correction 0 seconds
Roll Time Correction 0 seconds
Yaw Time Correction 0 seconds
Heave Time Correction 0 seconds
Vessel FA_S220_EM710_2015
Echosounder Kongsberg EM-710 100 kilohertz
Date 2017-05-24
Patch Test Values
Navigation TimeCorrection
0 seconds
Pitch -0.077 degrees
Roll 0.000 degrees
Yaw 0.309 degrees
Pitch Time Correction 0 seconds
Roll Time Correction 0 seconds
Yaw Time Correction 0 seconds
Heave Time Correction 0 seconds
C.4 Positioning and Attitude
C.4.1 Description of Correctors
2017 DAPR Version 3 NOAA Ship Fairweather
113
Heave, pitch, roll and heading, including attitude biases and navigation timing errors.
C.4.2 Methods and Procedures
Vessel attitude is measured by the Applanix POS MV and recorded in SIS .all files and POS MV .000 files.
Attitude correctors are applied during CARIS HIPS conversion using the raw POS MV attitude data recorded in the raw data (.all). The TrueHeave file is separately loaded into HIPS, replacing the real-time heave values recorded in the raw data. Post processed kinematic (PPK) data from the POS MV .000 file are applied to MBES data in CARIS HIPS in the form of SBET files once data acquisition is complete.
The POS MV TrueHeave™ (CARIS Delayed Heave) data is logged within the POS MV *.000 files and applied in CARIS HIPS during post processing using the “Apply Delayed Heave” function during sound speed correction. TrueHeave™ is a forward-backward filtered heave corrector providing additional robustness to the solution. To ensure proper application in CARIS HIPS, POS MV files are logged for at least five minutes before and after all MBES files are logged. The filter that produces the true heave values needs only 3 minutes of data before and after the acquisition of bathymetric data to create a baseline for the data series, but SBET processing which uses the same .000 file requires a 5 minute buffer period before and after bathymetric acquisition.
In cases where TrueHeave™ cannot be applied, real time heave correctors are used. Real time heave data are recorded and stored in the raw data file and are applied as the heave corrector for MBES data if TrueHeave™ files are unavailable. Data that do not have TrueHeave™ applied will be listed in the individual Descriptive Report for the survey.
C.5 Tides and Water Levels
C.5.1 Description of Correctors
Different methods to reference soundings to MLLW.
C.5.2 Methods and Procedures
Unless otherwise noted in the survey Descriptive Report, the vertical datum for all soundings and heights is Mean Lower Low Water (MLLW). Predicted, preliminary, and/or verified water level correctors from the primary tide station(s) listed in the Project Instructions may be downloaded from the CO-OPS website and used for water level corrections during the course of the project. These tide station files are collated to include the appropriate days of acquisition and then converted to CARIS .tid file format using FetchTides.
Water level data in the .tid files are applied to HDCS data in CARIS HIPS using the zone definition file (.zdf) or a Tidal Constituent and Residual Interpolation (TCARI) model supplied by CO-OPS. Upon receiving final approved water level data, all data are reduced to MLLW using the final approved water levels as noted in the individual survey’s Descriptive Report.
2017 DAPR Version 3 NOAA Ship Fairweather
114
If a V Datum Separation Model is provided, a comparison might be requested by Office of Coast Survey, Operations Branch. If accepted, CARIS HIPS data may be reduced to MLLW per supplied separation model instead of through traditional water level application. See the individual survey’s Descriptive Report for further information.
In Alaska, which lacks of a published VDatum Separation Model, an Ellipsoidally-Referenced Zoned Tides (ERZT) evaluation will be requested by Office of Coast Survey, Operations Branch. ERZT is done by measuring the height of the GPS antenna to the water line. Then a Separation Model is created in CARIS HIPS by adding this ellipsoidally-referenced water line measurement to the zoned water level “corrector.” If the preliminary analysis is accepted, the Separation Model is differenced from the Poor Man's VDatum and the difference surface is analyzed for any discrepancies that might have resulted from a problematic Smoothed Best Estimate of Trajectory (SBET). The mean difference value is applied to the PMVD through a vertical shift, a process referred to as "de-biasing"the PMVD. The PMVD is then applied to the data to reference it to chart datum.
A complete description of vertical control utilized for a given project can be found in the project specific Horizontal and Vertical Control Report (HVCR), submitted for each project under separate cover when necessary as outlined in section 5.2.3.2 of the FPM.
C.6 Sound Speed
C.6.1 Sound Speed Profiles
C.6.1.1 Description of Correctors
Sound speed profiles for Fairweather survey launches were acquired with SeaBird Electronics SeaCat SBE19 and SBE 19Plus Conductivity, Temperature, and Depth (CTD) profilers. For ship acquisition, sound speed profiles were acquired with the Rolls Royce Moving Vessel Profiler MVP200 micro CTD. Static casts for S220 were taken using an SBE19Plus during periods where the MVP200 was non-operational. All Fairweather launches are equipped with 24-volt electric winches attached to small swing-arm davits to deploy and recover SV CTD profilers while the vessel is at rest.
C.6.1.2 Methods and Procedures
See section B.1.3.1 and B.2.3.1
C.6.2 Surface Sound Speed
C.6.2.1 Description of Correctors
2017 DAPR Version 3 NOAA Ship Fairweather
115
Sound speed profiles are applied in real-time during MBES acquisition through Velocipy by sending the sound speed cast to SIS via the SIS data distribution window. Sound speed profiles are applied again in CARIS HIPS and SIPS during post-processing via the Nearest In Distance Within Time option.
C.6.2.2 Methods and Procedures
The Kongsberg EM 2040 systems on all launches require a sound speed probe to be interfaced with the sonar acquisition unit for use in projector beam steering computations. A Reson SVP 71 surface sound speed probe is utilized to feed real time SV values directly into the Kongsberg EM2040 acquisition computer.
The Kongsberg EM 710 multibeam systems utilized aboard requires a sound speed probe to be interfaced with the sonar acquisition unit for use in projector steering computations. A Reson SVP 70 surface sound speed probe is utilized to feed real time SV values directly into the acquisition computer for use in beam steering calculations. The MVP is also interfaced to send cast information directly to the SIS acquisition computer. SIS monitors changes in the surface sound speed vs. the value obtained with the last cast in realtime and highlights both the “SV Profile” and “SV Used” numerical displays in yellow when sound speed differences are greater than 3 m/s and red for differences greater than 5 m/s.


