Embed Size (px)
Citation preview
DATA WAREHOUSE DESIGN:
AN INVESTIGAnON OF
STAR SCHEMA
By
WEIPING LI
Bachelor of ScienceNanjing University
Nanjing, JiangsuPeople's Republic of China
1989
Master of Arts in EconomicsNanjing University
Nanjing, JiangsuPeople's Republic of China
1992
Submitted to the Faculty of theGraduate College of the
Oklahoma State Universityin partial fulfillment of
the requirements forthe Degree of
MASTER OF SCIENCEMay,200a
Thesis Approved:
I-/.
DATA WAREHOUSE DESIGN:
AN INVESTIGATION OF
STAR SCHEMA
Thesis Adviser
£
Dean of the Graduate College
11

ACKNOWLEDGEMENTS
I wish to express my sincere appreciation to my major advisor, Dr. G.E. Hedrick
for his intelligent supervision, constructive guidance, inspiration and encouragement. My
sincere appreciation extends to my other committee members Dr. Chandler and Dr. Lu,
whose guidance, assistance and support are also invaluable.
I am grateful for the help I have received from many individuals. I want to
express my sincere gratitude to all friends who provided suggestions and assistance for
this study.
Finally, I would like to give my special appreciation to my parents, whose
support, encouragement and love go through my study in US.
111
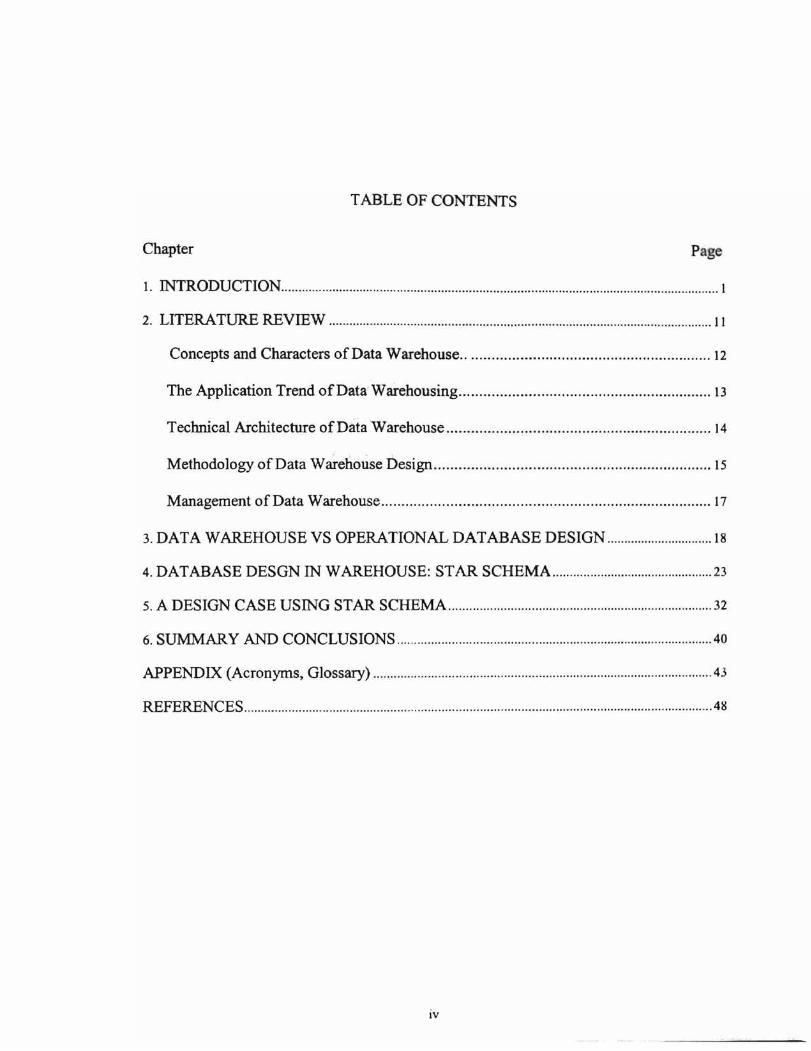
TABLE OF CONTENTS
Chapter Page
1. INTRODUCTION 1
2. LITERATURE REVIEW 11
Concepts and Characters of Data Warehouse 12
The Application Trend ofData Warehousing 13
Technical Architecture ofData Warehouse 14
Methodology ofData Warehouse Design 15
Management of Data Warehouse 17
3. DATA WAREHOUSE VS OPERATIONAL DATABASE DESIGN 18
4. DATABASE DESGN IN WAREHOUSE: STAR SCHEMA 23
5. A DESIGN CASE USING STAR SCHEMA 32
6. SUMMARY AND CONCLUSIONS 40
APPENDIX (Acronyms, Glossary) 43
REFERENCES 48
lV
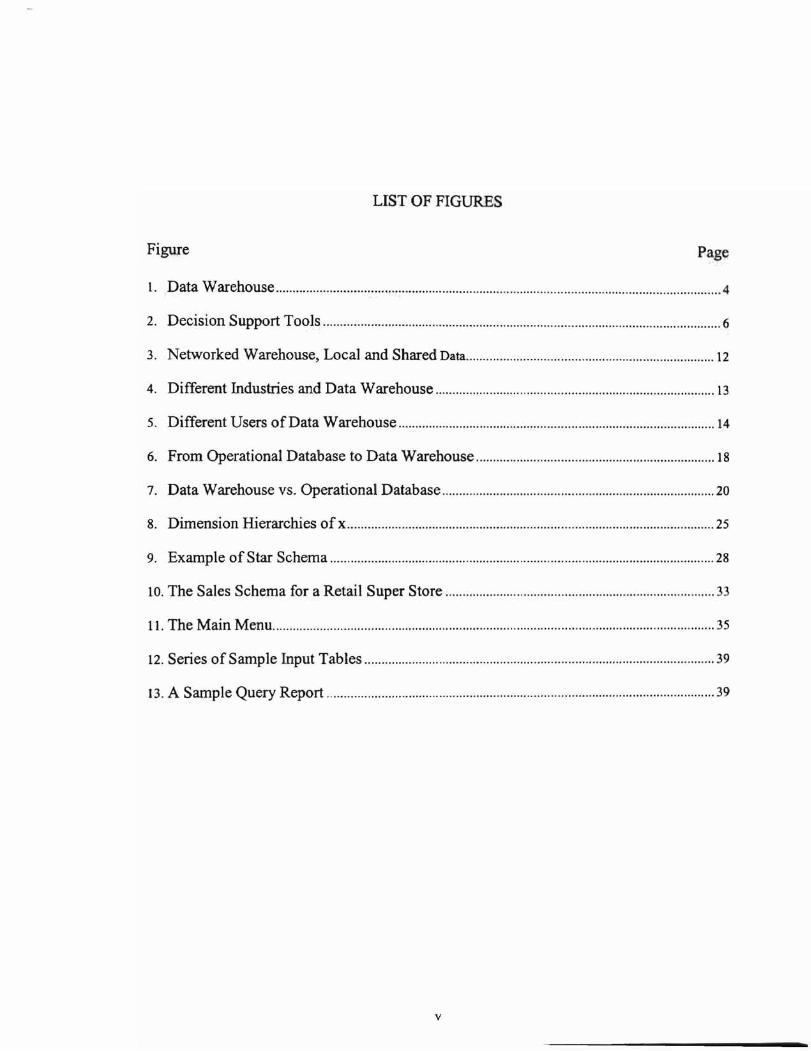
LIST OF FIGURES
Figure Page
1. Data Warehouse 4
2. Decision Support Tools 6
3. Networked Warehouse, Local and Shared Data 12
4. Different Industries and Data Warehouse 13
5. Different Users ofData Warehouse 14
6. From Operational Database to Data Warehouse 18
7. Data Warehouse ys. Operational Database 20
8. Dimension Hierarchies of x 25
9. Example of Star Schema 28
10. The Sales Schema for a Retail Super Store 33
11. The Main Menu 35
12. Series of Sample Input Tables 39
13. A Sample Query Report 39
v
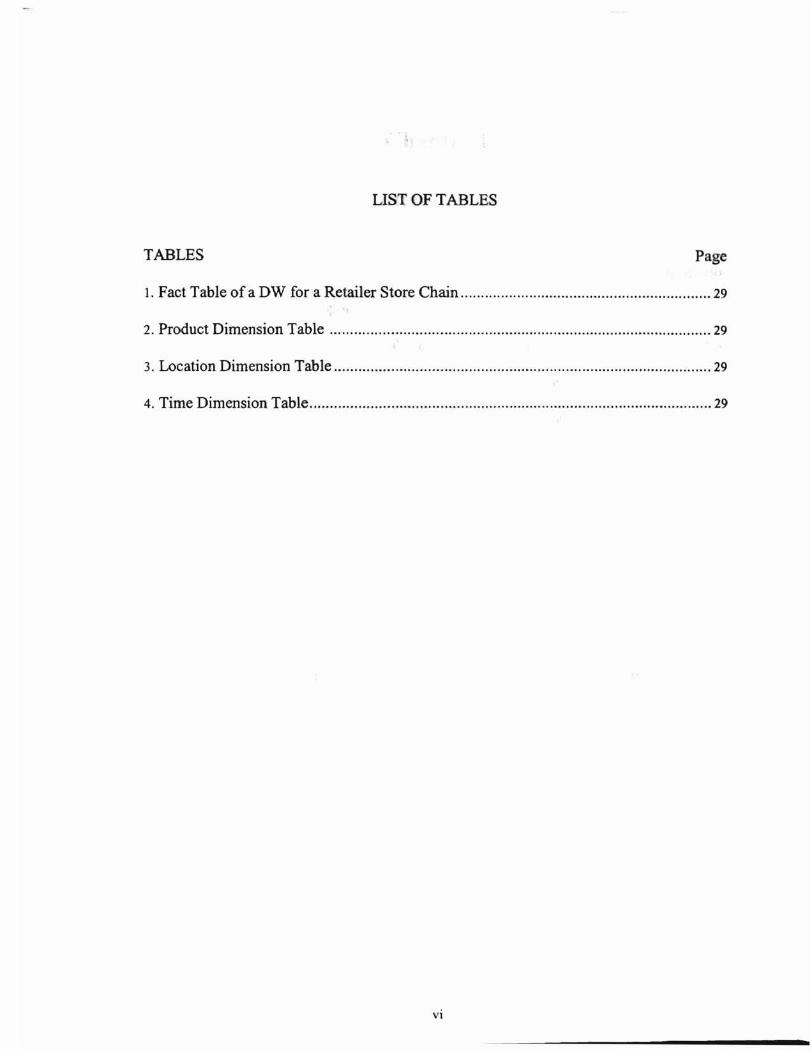
LIST OF TABLES
TABLES Page
1. Fact Table of a DW for a Retailer Store Chain 29
2. Product Dimension Table 29
3. Location Dimension Table 29
4. Time Dimension Table 29
vi
Chapter 1
Introduction
A data warehouse (D W) is a stand-alone repository of integrated information
available for decision support on-line analytical processing (OLAP) querying and
analysis [1). Unlike a traditional database that is mainly designed for online transaction
processing (OLTP) applications, a data warehouse is designed for data analysis of
knowledge management and decision support systems within a corporation. It is driven
from business analysis needs. It also can be viewed as an evolution of management
information systems.
Before the 1980s, two important technical developments--the Personal Computers
and the relational database--during this period contributed to the emergence of end-users
in a business as separate client [4]. Most business people had little exposure to
technology and looked to "someone else" such as the Information Support (IS) experts to
provide them with the information they needed as a basis for decision-making. By the
mid-1980s, with the growth of PCs and the simplification of data processing technology,
end users were provided with more tools to deal with both the business and technical
aspects of data. With the increasing power and sophistication of computer technology,
more complex processes within a business have been automated; for instance,
bookkeeping functions for bankers were automated and moved toward a real-time ATM
environment [4].
Since the competitive advantage gained from data automation trends in the same
industry are very similar, the challenge has been to "identify areas where computing
could support activities beyond the day-to-day production process [4r This trend is often
described as a move from a data processing approach to business-driven infonnation
technology strategy. Support for decision-making processes became a prime target after
the mid-1980s.
1.1 Decision Support System
Usually, end users in a business have the following characteristics: they are
familiar with business terms, driven by real business needs to solve existing problems or
to find new opportunities; aware of the value of "real" information in decision making;
at ease using technology to meet their goals; open to "do-it-yourself' solutions, but
wanting to avoid repetition; and understand the meaning of data in current applications.
Since the mid-l 980s, the success of a business in the fast-changing, competitive
environment depends on efficient decision-making, to guide either a long-teon strategy or
a short-term tactics. The best way to accelerate decision making is to build a Decision
Support System (DSS), a system that can provide the right information at the right time
and can be accessed easily by users to analyze a situation and to make decisions rapidly.
In most companies, there is no shortage of data to support decisions since their
current OLTP systems designed to run the day-to-day business have been gathering
detailed financial, operational and sales transaction data for decades. The real challenge
for decision-makers is to sift through mountains of historical data intelligently to find
answers to real world "what -if' questions [2]. According to J. Bischoff [2], these
questions might be about:
2
(I) Product trends, for example,
• Over the past 3 years,.what were the weekly sales for a selected ibrand
for total U.S.?
• How does this compare to sales for the category and average number
of products carried each week within the category for total U.S.?
(2) Competitive analysis, for example,
• What are the top 25 brands, (products, styles, etc.) for this period for
total U.S. based on sales dollars?
(3) Product mix analysis, for example,
• Within a product category, what is the percent mix, based unit sales,
of each brand within the category?-
There is a common theme to such questions: the use of data for marketing or
competitive advantages. This has led to the concept of a partitioned view of the business
data: one part is dedicated to running the business at a detailed level while the second part
focuses on managing the business at a summary level.
1.2 The Introduction of Data Warehouse
To support those decision-related queries, a large amount of computing power is
required to work and summarize millions of records. IS departments in corporations once
made several attempts to deliver necessary decision making information to end users in
companies to meet their strategic query demands7. One approach was to connect analysts
directly to operational systems, primarily mainframes. This approach failed because
mainframes are architected as excelling at capturing information rather than
disseminating it. A second approach was to create and to deploy decision support
3
systems based on specialized hardware and software. The co t of this technology is
usually very high and far exceeds the· means of most small companies. Finally. the
problem of how to cope with the vast amount of operational market data in a cost-
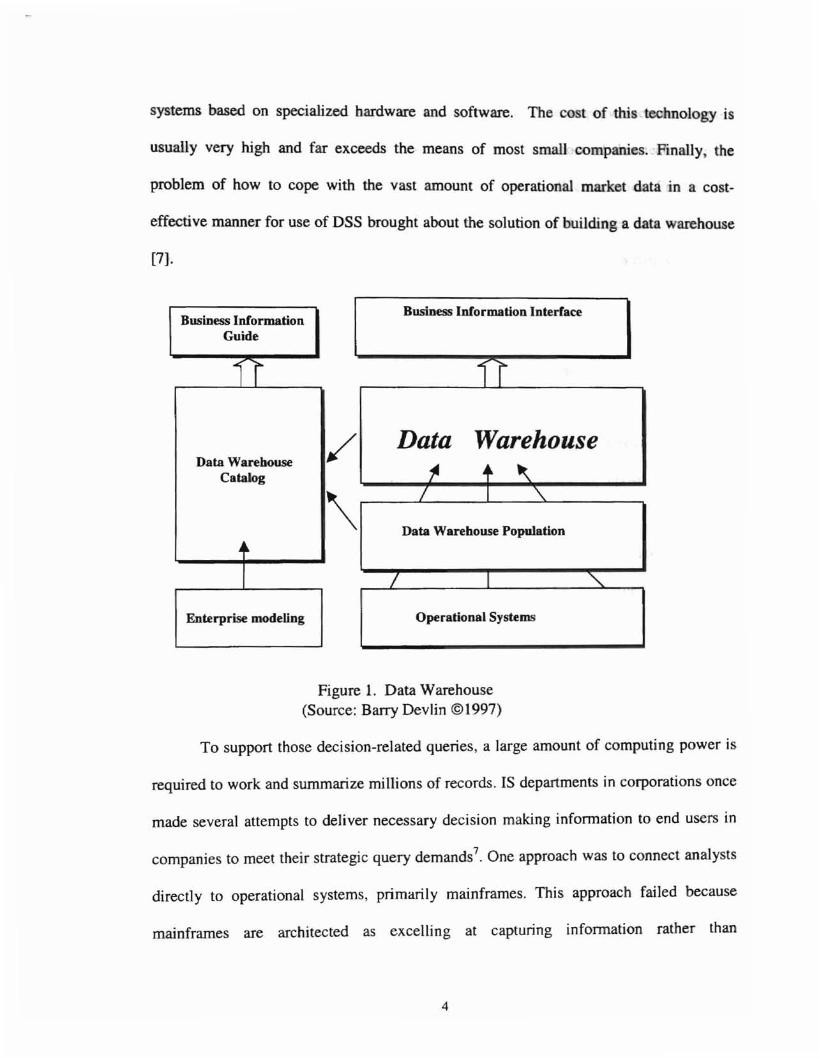
effective manner for use of DSS brought about the solution of building a data warehouse
[7].
Business Information Interface
II
Data Warehouse~ + ~
/ I "-Data Warehouse Population
/ I "'-Operational Systems
\,/
Business InformationGuide
II
Data WarehouseCatalog
J"
Enterprise modeling
Figure 1. Data Warehouse(Source: Barry Devlin © 1997)
To support those decision-related queries, a large amount of computing power is
required to work and summarize millions of records. IS departments in corporations once
made several attempts to deliver necessary decision making infonnation to end users in
companies to meet their strategic query demands? One approach was to connect analysts
directly to operational systems, primarily mainframes. This approach failed because
mainframes are architected as excelling at capturing infonnation rather than
4
disseminating it. A second approach was to create and to deploy decision support
systems based on specialized hardware and software. The cost of this technology is
usually very high and far exceeds the means of most small companies. Finally, the
problem of how to cope with the vast amount of operational market data in a cost
effective manner for use of DSS brought about the solution of building a data warehouse
[7].
A data warehouse integrates operational and other data from a variety of internal
and external sources, transforms that integrated data into consistent information, and
provides easy, flexible and fast access for users [13]. Such a data warehouse break. the
barriers of existing database offerings by giving corporations access to all their
information in any form and have consolidated them into one data repository separated
from the original sources. ~/..
A remarkable advantage of using a data warehouse is, at the data warehouse,
strategic queries can be answered and data analysis can be performed quickly and
efficiently since the information is available directly, with model and semantic
differences existing in original data sources previously resolved. Warehouse data can be
accessed without seizing the information sources; e.g., holding locks or slowing down
processing. Accessing data at the data warehouse does not incur costs that may be
associated with accessing data sources [4].
1.3 Technology of Data Warehousing
Data warehousing refers to a collection of decision support technologies to assure
the realization of the goal of decision support by Data Warehouse. A general data
warehousing technology includes back-end tools for extracting, cleaning, and loading
5
data into data warehouse, design and data modeling typical of OLAF in data warehouse,
as well as the front-end client tools for. online analytical query and data analysis. The
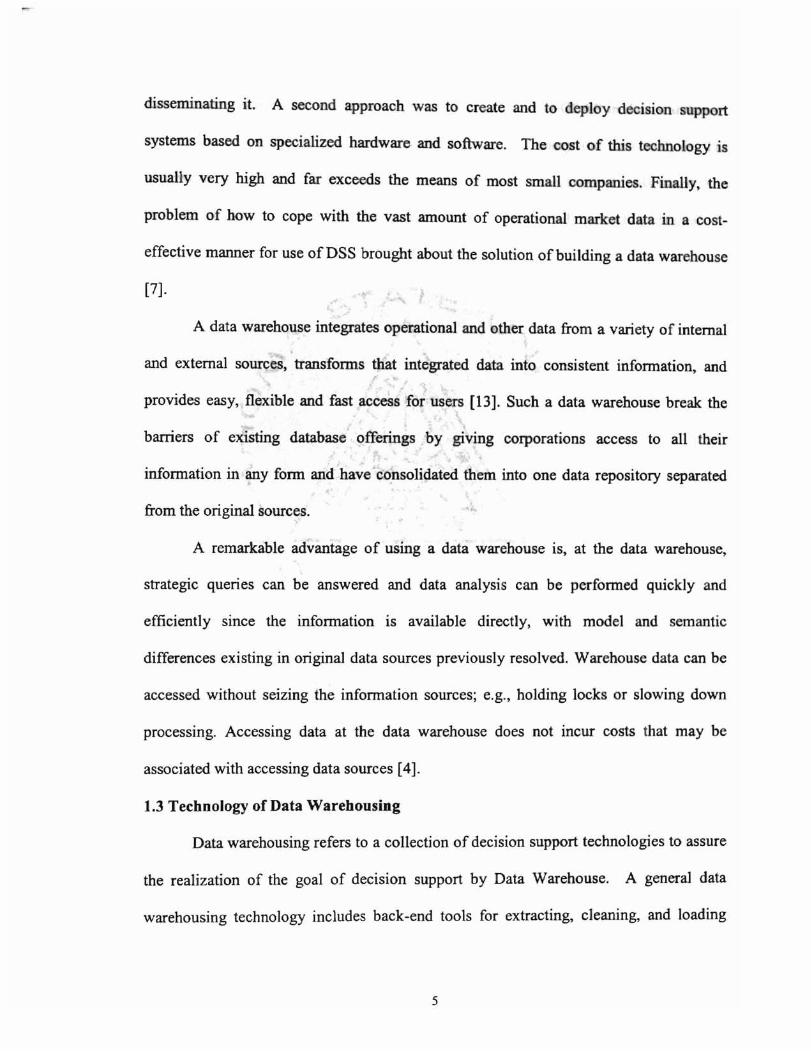
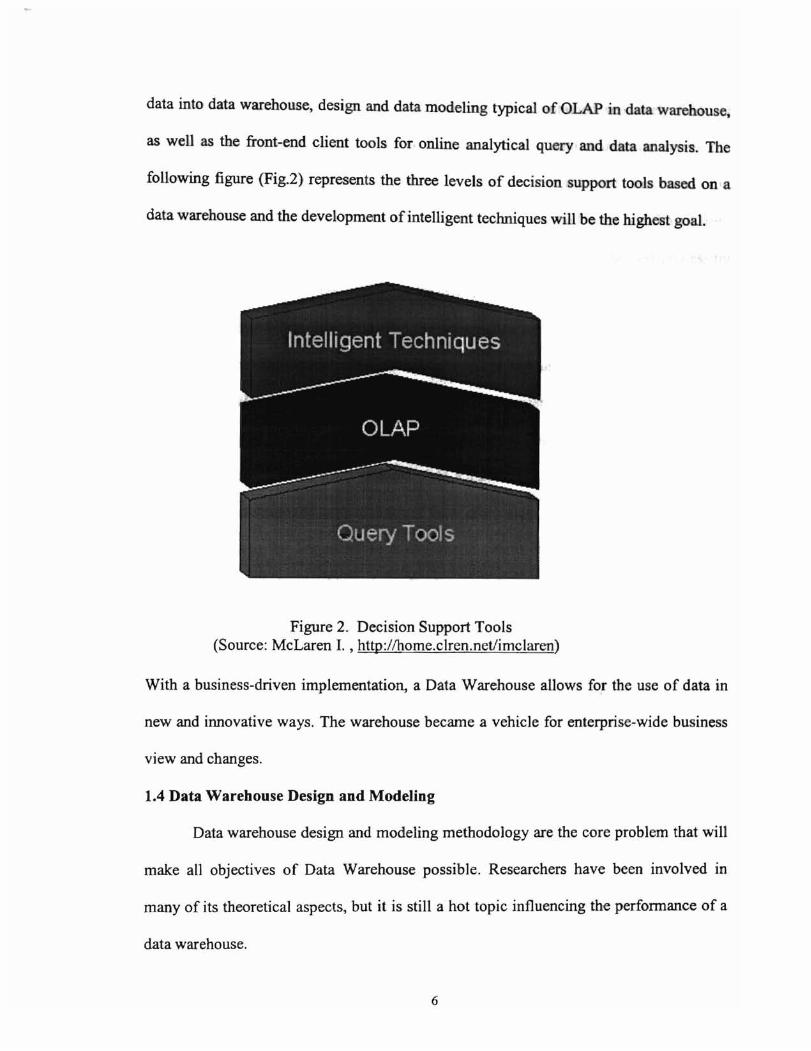
following figure (Fig.2) represents the three levels of decision support tools based on a
data warehouse and the development of intelligent techniques will be the highest goal.
Figure 2.. Decision Support Tools(Source: McLaren 1. , http://home.clren.net/imc1aren)
With a business-driven implementation, a Data Warehouse allows for the use of data in
new and innovative ways. The warehouse became a vehicle for enterprise-wide business
view and changes.
1.4 Data Warehouse Design and Modeling
Data warehouse design and modeling methodology are the core problem that will
make all objectives of Data Warehouse possible. Researchers have been involved in
many of its theoretical aspects, but it is still a hot topic influencing the performance of a
data warehouse.
6
In an organization, a typical data warehouse is maintained separately from its
operational databases as a new kind of database. Since a data warehouse serves the
specific goal of OLAP query and decision support systems, the functional and
performance requirements of its data modeling and design methodology is different from
traditional operational databases that serves the need of on-line transaction prooessing
(OLTP).
By using a data model in the star schema, data in redundant dimensions are
allowed and the dimensional information is pre-joined and aggregated for the users; thus
simplify the relationships that must be analyzed by the users. This is different from the
usual operational database that usually is normalized. For instance, for a sales data
warehouse, the time of sale, sale district, salesperson, and product can be some
meaningful dimensions of interest. Each of these dimensions is hierarchical. For example,
time of sale may be organized as a day-month-quarter-year hierarchy, product as a
product-category-industry hierarchy, district as city-state-region-country hierarchy.
Typical OLAP operations on data warehouse include roHup (increasing the level of
aggregation), and drill-down (decreasing the level of aggregation or increasing detail)
along one or more dimensions, a slice-and-dice (selection and projection), and pivot (re
orienting the multidimensional view of data). A more detailed discussion about star
schema is found in chapters 4 and 5.
To explore the use of star schema in data warehouse design, this thesis models the
retail sales problem using the star schema to detennine how and why a star schema is
used for business OLAP. Due to the complexity of building a complete data warehouse,
7
this thesis does not show the implementation of a complete data warehouse design except
the database modeling, analysis query and related problems from star schema.
While this thesis shows the fundamental theoretical aspects of a data warehouse:
its concept, its characteristics, relationship with traditional database, and major steps of
building a data warehouse, the star schema for data warehousing design is the emphasis
of investigation in this thesis.
In the following chapters of this thesis, Chapter 2 presents a review of literature
on data warehouse, including its concepts and characteristics, technical architecture of
data warehouse, methodology of design, management of data warehouse, etc. Chapter 3
will talk about the relationships between a data warehouse and the usual operational
databases. Chapter 4 investigates the use of star schema in the design of data warehouse.
Chapter 5 presents an implementation case using star schema. A summary and conclusion
are included in the last chapter.
8
Chapter 2
Literature Review
Today's industry is moving toward powerful hardware and software technologies
to process vast volumes of infonnation analytically. Any bus.iness in the infonnation age,
if not wanting to run the risk of having insufficient information needs to use new
technology to help it catch the power of infonnation. Building a data warehouse as a
repository for storing information of interest to each organization is an important start for
success of a business [4].
Many commercial products for data warehousing technology have been
developed to satisfy a rapidly expanding market. At the same time, there has been a
significant amount of research about the data warehouse with its related technology.
Research on data warehousing covers all its basic aspects: the general concept of a data
warehouse; its applications, architecture and components; its design methodology, data
warehouse building, and the management. Representative literature is in the bibliography
of this thesis.
Concepts and Characteristics of Data Warehouse
Although the concept of data warehouse was introduced in mid-1980's [13], the
development and use of the data warehouse experienced a slow period for almost ten
years since there were many different definitions of what is meant by a data warehouse
[15]. However, interest in the data warehouse peaked over the last two years, and
understandings of data warehouses increased (16]. In addition to the definition of data
9
warehouse presented at the beginning of this thesis, there are also two other defmitions of
data warehouse popular among data warehouse workers.
Bill Inmon, who is also referred to as "the father of data warehouse" [15] defined
data warehouse as a "subject-oriented, integrated, non-volatile, time-invariant collection
of data in support of management decisions." In their book of Developing the Data
Warehouse, Inmon and C. Kelly used this definition to analyze the advantages of the data
warehousing approaches, and to investigate the general architecture and suggested
functionality of data warehouses. Many data warehouse researchers follow this definition
to emphasize that the four characteristics, subject-oriented, integration, non-volatile,
time-variant are required for a data warehouse.
The other definition comes from Joseph Fong in his article Data Warehouse for
Decision Support [19]. He defmed the data warehouse as an analytical database that is
designed for large volumes of read-only data, providing intuitive access to infonnation
that will be useful in making decisions.
No definition excludes the key indicator that a collection of data is a data
warehouse, but each has a different perspective and emphasizes different points. For
example, Inmon's definition emphasizes the characteristics of data in data warehouse
while Fong's definition focuses on the analytical function of data warehouse. All
recognize the following characteristics of a data warehouse.
--- Data warehouse is the single infonnation source for the enterprise. It is built by
extracting and integrating data from any source and in any fonn.
--- Data warehouse can be comprised of a collection of subjected-oriented databases by
collecting data based on subjects instead ofprocesses.
10
--- Data warehouse provides the widespread, distributed availability of infonnation by
integrating and disseminating all kinds ofdata
-- Data warehouse provides end users with infonnation in a business context.
---The delivery of infonnation throughout the business is automated by the data
warehouse approach
---Data warehouse improves end users' confidence of the quality ofinfonnation they use
since they have ownership of their business infonnation that provide non-volatile,
validated historical data.
The Application Trends in Data Warehousing
The data warehouse helps corporations to increase the "intelligence" of a business
process and the knowledge of users involved in decision-making process. Increasingly,
corporations are realizing the great potential of the data warehouse in decision support.
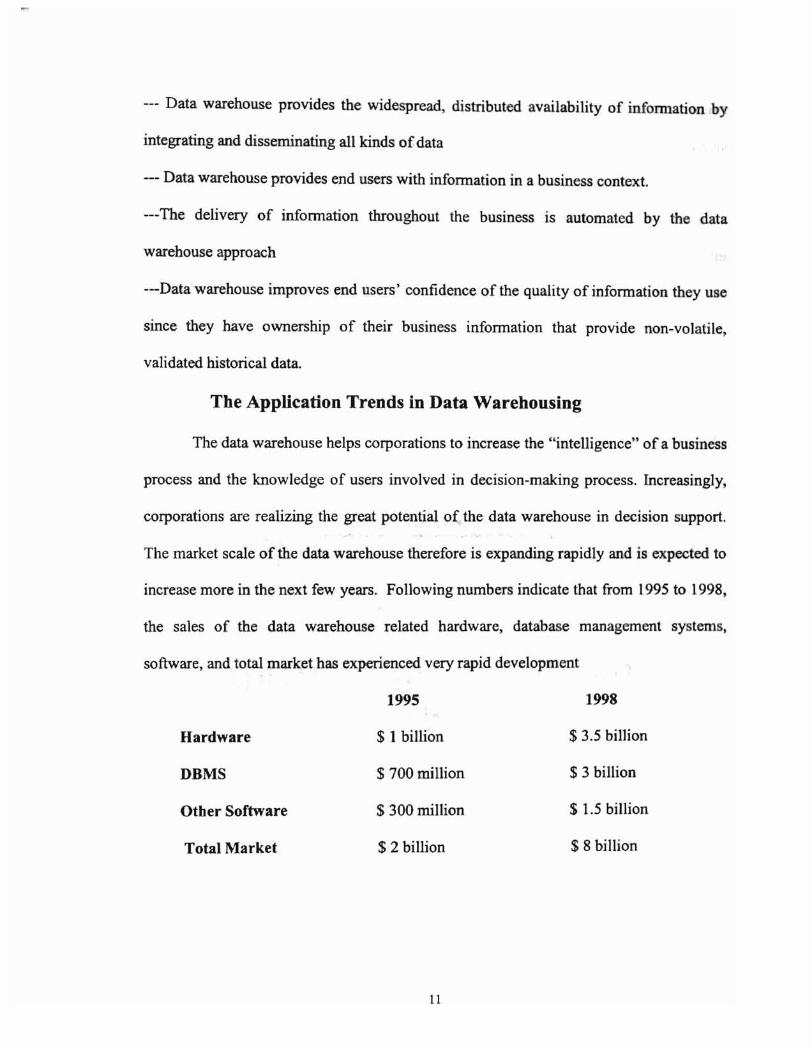
The market scale of the data warehouse therefore is expanding rapidly and is expected to
increase more in the next few years. Following numbers indicate that from 1995 to 1998,
the sales of the data warehouse related hardware, database management systems,
software, and total market has experienced very rapid development
1995 1998
Hardware $ 1 billion $ 3.5 billion
DBMS $ 700 million $ 3 billion
Other Software $ 300 million $ 1.5 billion
Total Market $ 2 billion $ 8 billion
11
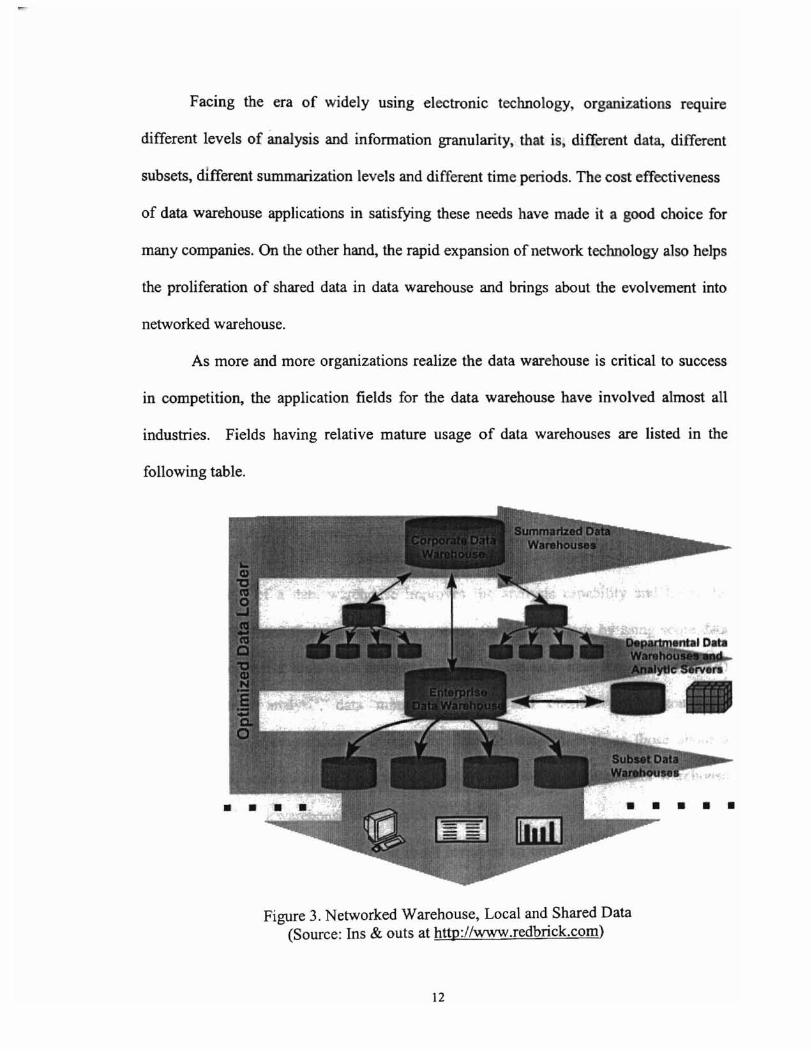
Facing the era of widely usmg electronic technology, organizations requIre
different levels of analysis and infonnation granularity, that is, different data, different
subsets, different summarization levels and different time periods. The cost effectiveness
of data warehouse applications in satisfying these needs have made it a good choice for
many companies. On the other hand, the rapid expansion of network technology also helps
the proliferation of shared data in data warehouse and brings about the evolvement into
networked warehouse.
As more and more organizations realize the data warehouse is critical to success
in competition, the application fields for the data warehouse have involved almost all
industries. Fields having relative mature usage of data warehouses are listed in the
following table.
Figure 3. Networked Warehouse, Local and Shared Data(Source: Ins & outs at http://www.redbrick.com)
12
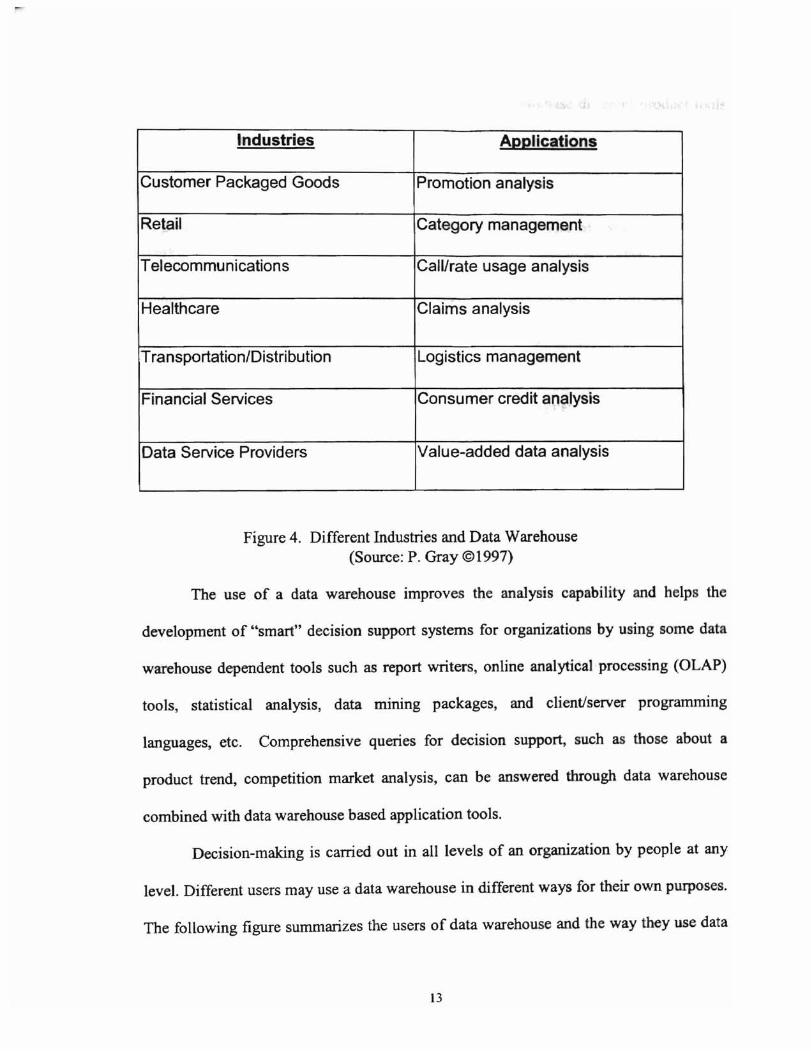
Industries Applications
Customer Packaged Goods Promotion analysis
Retail Category management
Telecommunications Call/rate usage analysis
Healthcare Claims analysis
Transportation/Distribution Logistics management
Financial Services Consumer credit analysis
Data Service Providers Value-added data analysis
Figure 4. Different Industries and Data Warehouse(Source: P. Gray ©1997)
The use of a data warehouse improves the analysis capability and helps the
development of "smart" decision support systems for organizations by using some data
warehouse dependent tools such as report writers, online analytical processing (OLAP)
tools, statistical analysis, data mining packages, and client/server programming
languages, etc. Comprehensive queries for decision support, such as those about a
product trend, competition market analysis, can be answered through data warehouse
combined with data warehouse based application tools.
Decision-making is carried out in all levels of an organization by people at any
level. Different users may use a data warehouse in different ways for their own purposes.
Th.e following figure summarizes the users of data warehouse and the way they use data
13
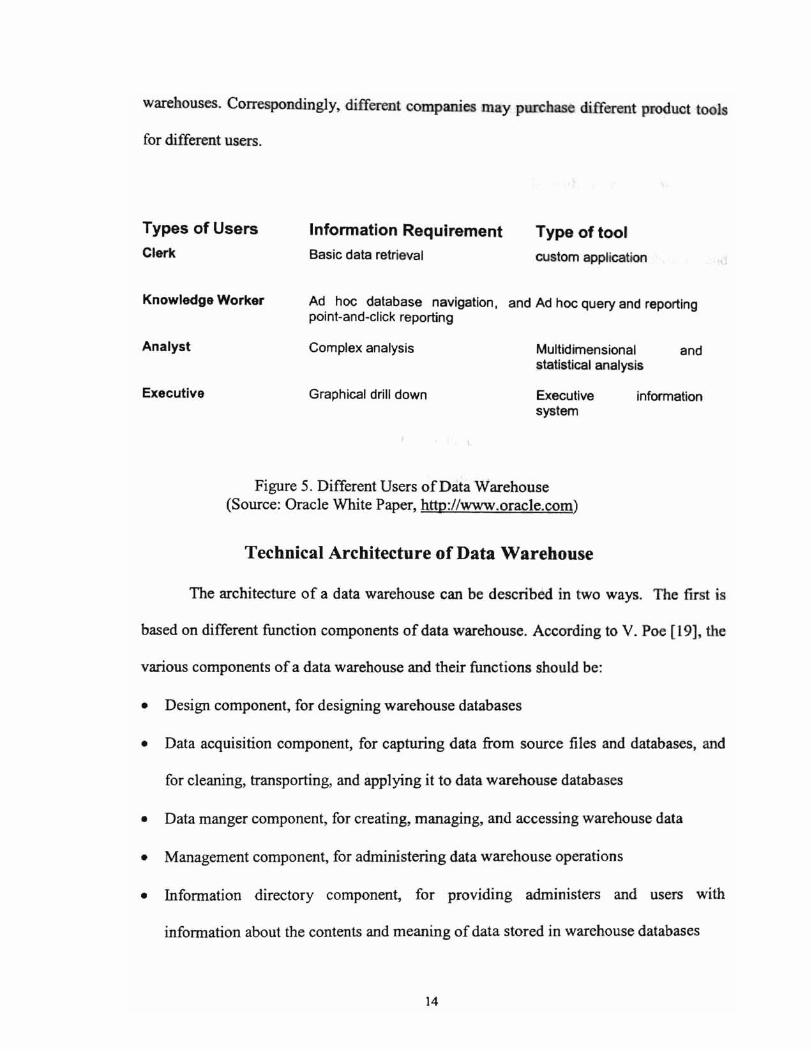
warehouses. Correspondingly, different companies may purchase different product tools
for different users.
Types of Users
Clerk
Information Requirement
Basic data retrieval
Type of tool
custom application
Knowledge Worker Ad hoc database navigation. and Ad hoc query and reportingpoint-and-click reporting
Analyst Complex analysis Multidimensionalstatistical analysis
and
Executive Graphical drill down Executivesystem
information
Figure 5. Different Users ofData Warehouse(Source: Oracle White Paper, http://www.oracle.com)
Technical Architecture of Data Warehouse
The architecture of a data warehouse can be described in two ways. The first is
based on different function components of data warehouse. According to V. Poe [19], the
various components of a data warehouse and their functions should be:
• Design component, for designing warehouse databases
• Data acquisition component, for capturing data from source files and databases, and
for cleaning, transporting, and applying it to data warehouse databases
• Data manger component, for creating, managing, and accessing warehouse data
• Management component, for administering data warehouse operations
• Information directory component, for providing administers and users with
information about the contents and meaning of data stored in warehouse databases
14
•
•
•
Data access component, for providing business end users with the tools they need for
accessing and analyzing warehouse data
Middleware component, for providing end-users tools with access to warehouse
databases
Data delivery component, for distributing warehouse data to other warehouses and
external systems
The other way describes the data warehouse architecture as based on the three
basic operation areas comprising the data warehouse. A data warehouse consists of three
functional areas: acquisition of data from legacy systems and other sources, storage in a
relational database, and the access area for analytical tools. In the first functional area, the
data are identified, copied, formatted and prepared for loading in the warehouse. In the
second area, a vendor database management system such as Oracle, SQL Server7 may be
used to house the data. In the third area, different types of decision support tools can be
used to manipulate data in data warehouse. We usually refer to the data storage part when
defining a data warehouse; however, the other two parts also are included in the general
co~cept of a data warehouse.
In a general sense, data warehouses are data stores together with operations that
can extract, integrate, manage, and analyze data from various operational systems and
then make them available for decision making. Data warehouse possesses such a
comprehensive architecture that they have great power for decision support systems. As
the Oracle white paper on data warehouses states: "in reality, a data warehouse is simply
a new approach to gathering data and generating reports from corporate information
systems" [16].
15
Methodology of Data Warehouse Design
According to W. Inmon [11], data warehouse design normally goes through the
following several steps:
(1) Planning: the creation of a project plan, including data requirement analysis and data
modeling.
(2) Analytical database design: This step will focus database design and denormalization.
In the database design, logical data model resulted from last step will be transformed
into database schema. Then denonnalization is to combine tables in a careful manner,
by breaking rules normalization and reducing nwnber of joins. Identifying keys and
creating indexing strategies will also be done in this period. Chapter Four and Five
will investigate this aspect in detail.
(3) Data mapping and transformation: The main task of this step is to determine what
data is captured. It will cover: defining the source systems, determining file layout,
developing written transformation specifications for sophisticated transfonnation,
mapping source to target data, and managing operational metadata.
(4) Data extraction and load: Developing procedures and choose data transformation
tools to transform and integrate data, load and move data into data warehouse.
(5) Automating data management procedures: This step is concerned with automating the
extraction, transformation, and the load of the data warehouse.
(6) DSS application and tool development: At this step, with goals of providing
information to users, to guarantee front end data access to the data warehouse and
develop structured navigation paths to access predefined reports become important.
16
(7) Data validation and testing: At this step, a total systematic validation and testing is
required.
Management of Data Warehouse
A data warehouse usually has heavy usage during daytime. Most data warehouses
stay on-line between 16 and 22 hours per day in read-only mode. In the early morning, it
then goes off-line for 2 to 8 hours for data loading, data indexing, data quality assurance
and data release. As mentioned before, the management of data warehouse will include
following tasks:
• Automating and scheduling the data extraction process.
• Automating and scheduling the data transformation process.
• Automating and scheduling the data load process.
• Creating backup and recovery procedures.
• Conducting a full test of all of automated procedures.
For a data warehouse that needs to be on line all the time, a back-up version in
separate memory should be managed for extracting, transformation and loading updated
data periodically.
17
Chapter 3
Data Warehouse vs. Operational Database Design
Early attempts to support decision making were based upon automation traditional
reporting. It usually is fragmented application-oriented development. With the maturation
ofData Warehouse technology, distinctions evolved between the traditional database
system the and new concept ofdata warehouse.
3.1 Relationship between DW and Operational Database
As we have seen, data warehouses and traditional operational databases are two
related database concepts. Operational databases usually are in the form of a normalized
relational database. In a general sense, data warehouses are data stores that extract,
integrate, manage, and analyze data from various operational database systems then make
them available for decision making. Different kinds of operational databases, as shown in
Database 2
ClerkEnters a sale for a bottle of(online transaction process·
Manager 1Asks revenue by month by(online analysis process -
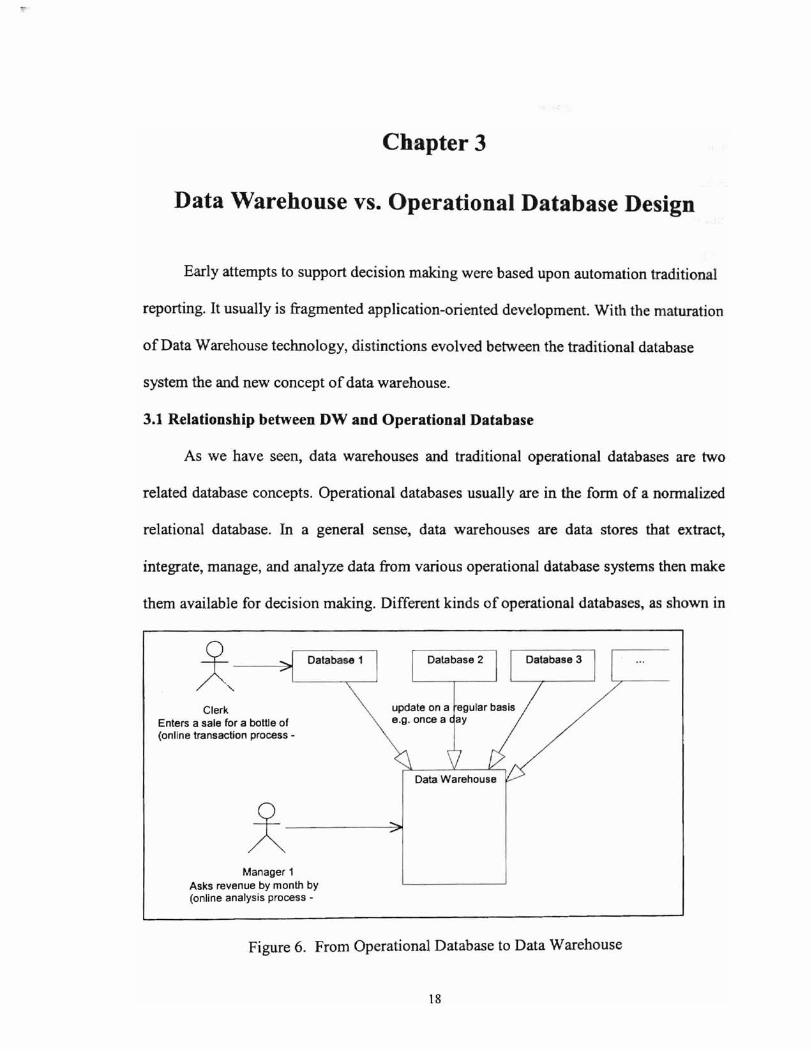
Figure 6. From Operational Database to Data Warehouse
18
Figure 6, might be data sources or legacy systems for a data warehous .
Figure 6 shows the relationship between a data warehouse and a normal database
system. In this figure, the groups of databases at the top are operational databases used
by clerks to perform data entries of daily transactions, such as the sale of a bottle ofwine.
The data warehouse at the bottom is the managerial database -a data warehouse used by
managers for decision support queries. The operational databases feed data into the data
warehouse on a regular basis. Because operational databases serve as the original data
sources for a data warehouse, we use the tenns operational database and traditional
database interchangeably.
Both kinds of databases can use a relational database management system
(RDBMS) to store and manage the data. Figure 7 below also explains the relationship
between data warehouses and operational systems. However, a data warehouse mainly
serves the goal of building decision support systems, but an operational database
originally is used in on-line transaction processing (OLTP). Diverging requirements in
meeting business needs have resulted in a functional gap between the two, and therefore
they have different characteristics [15].
3.2 Functional Differences
Typically, the differences in two types of databases can be abstracted as follows:
First, a data warehouse is critical to management decisions that may affect
company competitiveness while an operational database is critical for daily business
operations.
Second, data warehouses are analytical databases that are designed to provide
analytical infonnation to assist in making tactical and strategic decisions, and are used as
19
the foundations of DSS. Operational databases are processing systems that are designed
to handle the day-to-day business affairs.
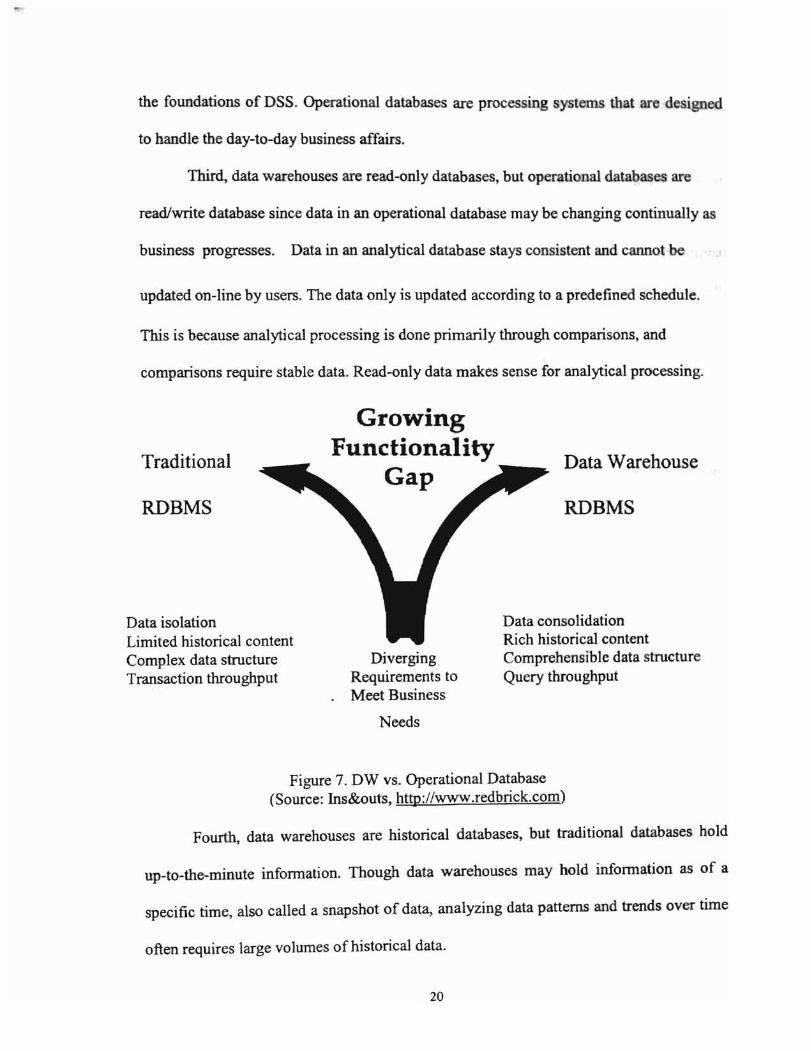
Third, data warehouses are read-only databases, but operational databases are
read/write database since data in an operational database may be changing continually as
business progresses. Data in an analytical database stays consistent and cannot be
updated on-line by users. The data only is updated according to a predefined schedule.
This is because analytical processing is done primarily through comparisons, and
comparisons require stable data. Read-only data makes sense for analytical processing.
Traditional
RDBMS
Data isolationLimited historical contentComplex data structureTransaction throughput
GrowingFunctionality
Gap
DivergingRequirements toMeet Business
Needs
Data Warehouse
RDBMS
Data consolidationRich historical contentComprehensible data structureQuery throughput
Figure 7. DW vs. Operational Database(Source: Ins&outs, http://www.redbrickcom)
Fourth, data warehouses are historical databases, but traditional databases hold
up-to-the-minute infonnation. Though data warehouses may hold infonnation as of a
specific time, also called a snapshot of data, analyzing data patterns and trends over time
often requires large volumes of historical data.
20
Fifth, a data warehouse uses data consolidation technology to integrate data into it,
but an operational database may use isolated data as its source.
Finally, a data warehouse produces decision-related query throughput, but an
operational database produces transaction throughput.
From a functional perspective, a data warehouse differs from an operational
database in two ways. One, it gives end users direct access to corporate data with
powerful graphical query and reporting tools. The other, it calls for the creation of a
separate decision support database extracted from one or more operational systems. Data
warehouses alter the way business users interact with corporate data, and the way how
companies leverage that data. End users in managing level can access data directly with a
data warehouse. They free IS departments to focus on tasks such as building various
applications by executing strategic queries and build reports on-line themselves. Use of a
data warehouse also allows end users to navigate large corporate data stores in an ad hoc,
interactive fashion without impacting critical operations.
3.3 Design Differences
One of the purposes of a database design must be to minimize the resources
required to run applications on the database. Traditional transaction processing systems,
such as bank teller machines, generate a set of simple queries of the database to return
small result sets. An example query is, ''what is my current account balance?" OLTP
systems must do this while supporting a large number of concurrent users, many
requesting changes to the data held in the database, for instance, a withdrawal of money
from a bank account. These characteristics have lead to designs that minimize the time to
do updates. The most notable solution is the normalization process that removes all
21
duplicated data from a data set, resu lting in each datum being held just once. This means
that each update must change only the data in a single location.
Similarly, the data warehouses targeted for decision support requires the database
design methodology to minimize resources used in running complex analysis and
visualization of OLAP applications. As previous figure 2 shows, decision support
applications range from simple query tools, to OLAP multidimensional analysis systems
which enable different aggregated views ofdata, to intelligent data mining solutions. The
bottom level may include database vendors or specialist query tool suppliers such as
Crystal and Brio, the second level may include MicroStrategy and Arbor Software, and
the third are like ffiM and Integral Solutions17. These query tools are characterized by
generating much more complex queries than queries used in transaction processing
systems, which rather than returning small result sets have to examine large sets of data
in order to return their results. In addition, the queries that are generated by managerial
people are largely unpredictable. Also, decision support applications tend to have fewer
users than transaction processing systems, and updates tend to be done in overnight batch
processes rather than online. These several new characteristics have lead to the
development of new database design techniques to try to minimize the amount of data
that must be transferred from hardware disks to answer a query. To realize this, data
warehouse is typically modeled multi-dimensionally, and the star schema is just a
simplified representation ofthe multidimensionality in business world.
22
Chapter 4
Database Design in Warehouse: Star Schema
A data warehouse is a consolidated database. To build a data warehouse involves
comprehensive work and several steps, as stated in Chapter 2.
The first step, in the planning stage, a team of data warehouse workers is chosen
from people who know the business and the technology; the requirements for the data
warehouse of the specific business should be analyzed; then the conceptual model of this
specific business can be detennined.
The second step is the database design stage: a logical model of the data
warehouse is formed, then transformed into a database schema based on the preceding
step, so that the basic structure of the data warehouse repository is determined to
facilitate business query.
Third, data mapping and transfonnation: in this step we decide what data to be
captured and build the mapping relationship between source and target data in the data
warehouse.
Fourth is data extraction and loading. This is a procedure to choose tools to
extract and load actual data from source data to the data warehouse.
Fifth step is to implement programs, procedures, or purchased tools to automate
the periodic data extraction and loading.
23
The sixth step is to develop DSS and query tools over the data warehouse; to
develop an unifonn interface for end users to access data warehouse and to generate
reports.
In the final step, a test of the perfonnance ofthe data warehouse is carried out.
This chapter will focus on step 2 to discuss the problems during DW design
procedure and identify the basic components ofstar schema.
4.1 Requirement for DW design
A data warehouse should be designed to satisfy the strategic needs of a
corporation; that is, a data warehouse should be able to answer strategic queries and to
provide fast, accurate reports with graphic results for decision-making. The functionality
or design ofthe data warehouse should not constraint the capabilities of strategic planners
and analysts.
End users of data warehouses are designed to be business experts instead of
computer professionals, thus the structure of data warehouse should be a good
representation of the multidimensionality of real business, easily to be understood by
business people. Output ofdata warehouse also needs to be in business-aware fonnat.
A successful design of a data warehouse needs to combine business knowledge
and technological knowledge. Considering each business is different and data warehouse
ad hoc queries often require viewing summary infonnation from the underlying database
and scanning large amounts of data, business analysis is usually necessary in data
warehouse design. There are some common strategic concern areas for business, such as
budgeting, sales, marketing, financial reporting, profitability analysis, intellectual capital,
etc.; thus, data warehouse design will usually abstract several finance related measures
24
like price, cost, investment, return of investment (ROn as main analysis objects. These
entities are major attributes in fact tables.
4.2 The essence of analytical processing
The objects for analysis can be one of those measures above of that is of interest
to business operation. It can be defined as a function (or mapping) of its corresponding
variables, and each variable represents a dimension of the domain space [21]. For
instance, suppose w is denoted as sales, and let x be the products, y be the regions, and z
the time. Then for a certain instance of (xv, Yo, zo), i.e., for product xo, in region Yo, at
time zo, we have the sales wo, denoted by Wo = f (xo,yo,zo). Along each dimension,
hierarchies can be defined.
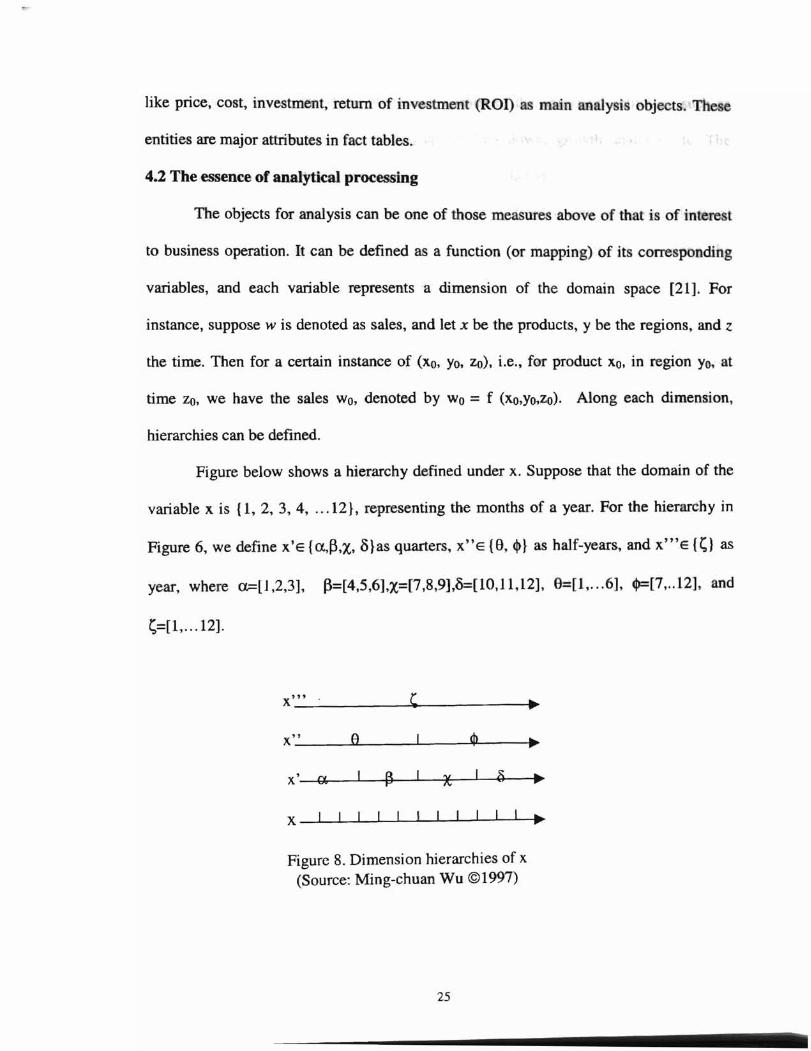
Figure below shows a hierarchy defined under x. Suppose that the domain of the
variable x is {l, 2, 3, 4, ... 12}, representing the months of a year. For the hierarchy in
Figure 6, we define X'E {a,~,x, ~}as quarters, X"E {S, Ij)} as half-years, and X"'E {~} as
year, where a=[1,2,3], ~=[4,5,6],X=[7,8,9],~[1O,11,12],8=[1, ...6], 1j)=[7,.. 12], and
S=[I, ... 12].
x'" , •x" e <Il •x' ex ~ X Q •X I I I I •Figure 8. Dimension hierarchies of x
(Source: Ming-chuan Wu ©1997)
25
----------------
The aspects of analytical processing consist of the analytical activities, such as
forecasting, comparing, ranking, rolling up, drilling down. growth analysis etc. The
primitive operations for these activities are data consolidation.
Data consolidation is the process of aggregating detailed data into single blocks of
summarized information [16]. For instance, if we want to aggregate w along the
dimension x to the level x', it can be represented as
W' = F(x', y,z)= Lf(x,y,z), where x~x'
This equation aggregates the monthly sales data to a quarterly sales summary. It is also
possible to consolidate data along multiple dimensions simultaneously, which is referred
to as multidimensional analysis [16].
4.3 Database design and modeling in DW
Any database design consists of conceptual, logical and physical designs. In the
conceptual design stage, the requirements and goals for the database, the subject of the
database and the external view of the database should be defined. In the logical design
phase, a data store schema is selected suitable for the specific conceptual needs. In the
physical design phase, the actual storage way of the data in system will be planned.
Because of the independent character of the three designs, the data model used in
the conceptual design phase need not necessarily be the data model used chosen in the
logical design phase. For example, choosing the multidimensional model for conceptual
modeling does not imply that the data warehouse should be built on a multidimensional
database system. In fact, it is common in data warehouse design that to use the
multidimensional model for the conceptual design of a data warehouse, but choose a
relational database server as the data store [16].
26
In general, a data warehouse's design point is to consolidate data from multiple
often heterogeneous, sources into a query database. This is also one of the reason why
data warehouse is rather difficult to build. The main factors include:
(1) Heterogeneity ofdata sources, which affects data conversion, quality, timeliness
(2) Use ofhistorical data, which implies that data might be "old"
(3) Tendency ofdatabases to grow very large.
The data model of a data warehouse IS the template that describes how
information will be organized within the integrated warehouse framework. It will reflect
the content and structure of the data warehouse, identifies major subjects and
relationships of the model, including keys, attributes, and attributes groupings. The data
model of data warehouse must consider its effect on the analytical query performance,
data storage requirement, and data loading performance.
4.4 Star Schema
The data warehouse needs multidimensional data for analytical processing. The
model for data warehouse should be capable of expressing multidimensionality. The two
basic data constructs provided by the multidimensional model are facts and dimensions.
These two constructs let the analysts view the data in the way they perform the actual
analysis.
A star schema is a simplified data model derived from multidimensional model and
good for representing most business application cases. It uses relational database semantics
provided by all kinds of OLTP systems, which makes it easily compatible with legacy
databases. Figure 9 below shows an example ofstar schema for business model.
A star schema contains one very large table, often referred to as the FACT table,
27
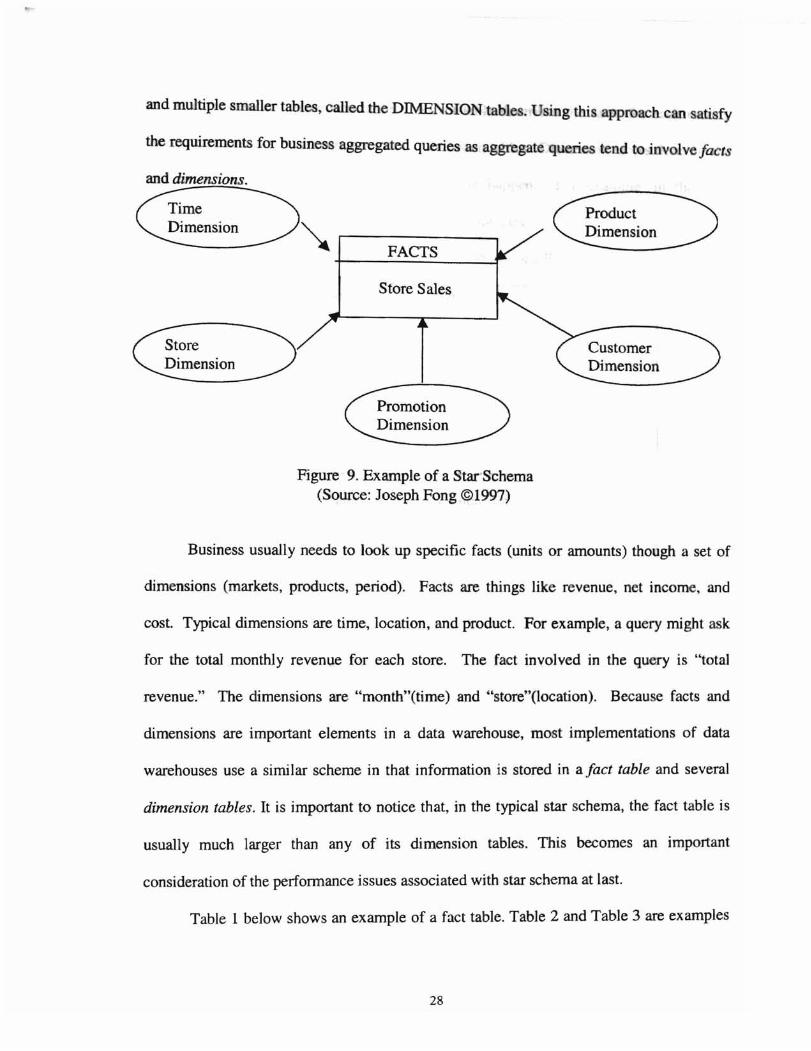
and multiple smaller tables, called the DIMENSION tables. Using this approach can satisfy
the requirements for business aggregated queries as aggregate queries tend to involve facts
and dimensions.
Store Sales
FACTS
Figure 9. Example of a Star Schema(Source: Joseph Fong ©1997)
Business usually needs to look up specific facts (units or amounts) though a set of
dimensions (markets, products, period). Facts are things like revenue, net income, and
cost. Typical dimensions are time, location, and product. For example, a query might ask
for the total monthly revenue for each store. The fact involved in the query is "total
revenue." The dimensions are "month"(time) and "store"(location). Because facts and
dimensions are important elements in a data warehouse, most implementations of data
warehouses use a similar scheme in that information is stored in a fact table and several
dimension tables. It is important to notice that, in the typical star schema, the fact table is
usually much larger than any of its dimension tables. This becomes an important
consideration of the performance issues associated with star schema at last.
Table 1 below shows an example of a fact table. Table 2 and Table 3 are examples
28
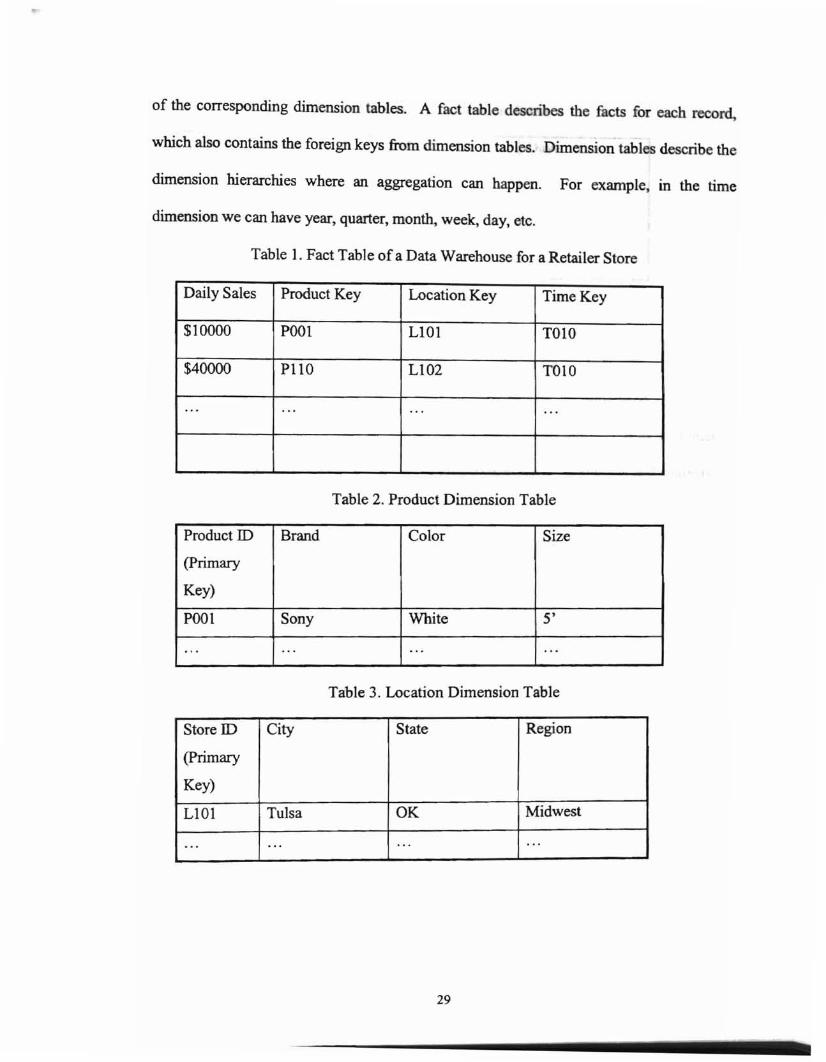
of the corresponding dimension tables. A fact table describes the facts for each record,
which also contains the foreign keys from dimension tables. Dimension tables describe the
dimension hierarchies where an aggregation can happen. For example, in the time
dimension we can have year, quarter, month, week, day, etc.
Table 1. Fact Table of a Data Warehouse for a Retailer Store
Daily Sales Product Key Location Key Time Key
$10000 POOl L101 TOlO
$40000 PllO LI02 TOIO
... ... .. . ...
Table 2. Product Dimension Table
Product ill Brand Color Size
(primary
Key)
POOl Sony White 5'
... ... ., ..' .
Table 3. Location Dimension Table
Store II) City State Region
(primary
Key)
LIDI Tulsa OK Midwest
... ...... ...
29
-----~--
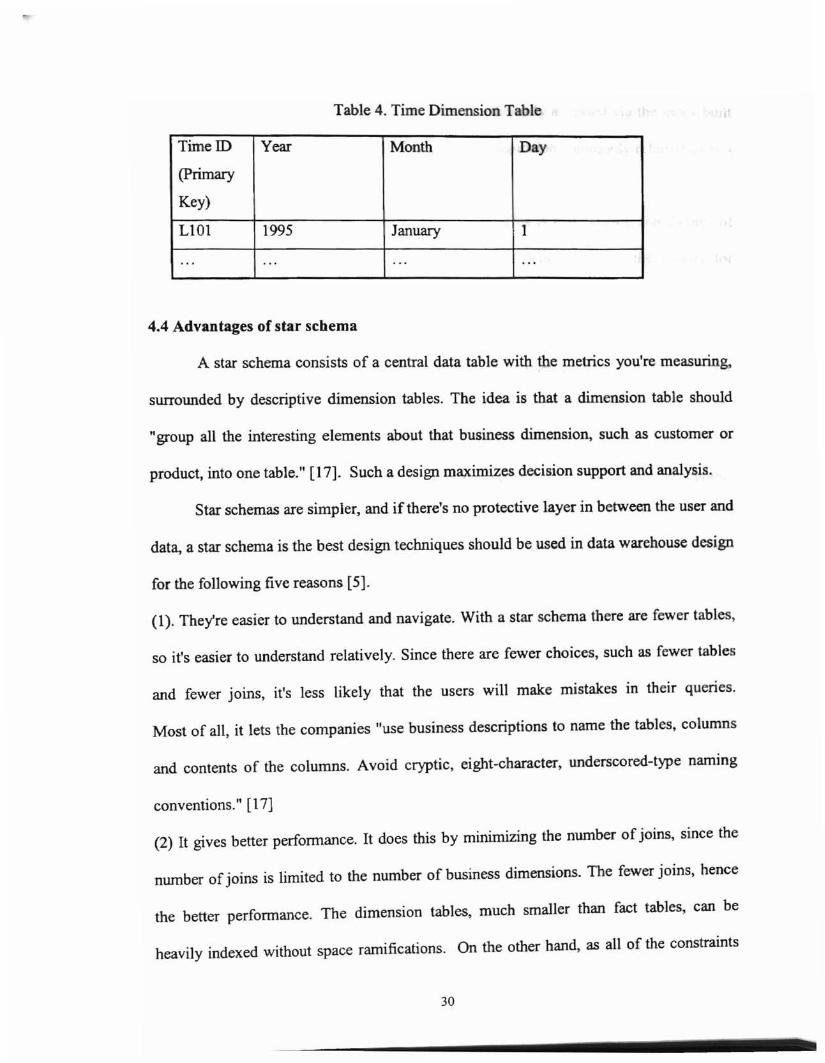
Table 4. Time Dimension Table
TimeID Year Month Day
(primary
Key)
LIOI 1995 January 1
... .., ... .,.
4.4 Advantages of star schema
A star schema consists of a central data table with the metrics you're measuring,
sUITOlUlded by descriptive dimension tables. The idea is that a dimension table should
"group all the interesting elements about that business dimension, such as customer or
product, into one table." [17]. Such a design maximizes decision support and analysis.
Star schemas are simpler, and if there's no protective layer in between the user and
data, a star schema is the best design techniques should be used in data warehouse design
for the following five reasons [5].
(1). They're easier to understand and navigate. With a star schema there are fewer tables,
so it's easier to understand relatively. Since there are fewer choices, such as fewer tables
and fewer joins. it's less likely that the users will make mistakes in their queries.
Most of all. it lets the companies "use business descriptions to name the tables, columns
and contents of the columns. Avoid cryptic. eight-character, underscored-type naming
conventions." [I7J
(2) It gives better performance. It does this by minimizing the number of joins, since the
nwnber of joins is limited to the number of business dimensions. The fewer joins. hence
the better performance. The dimension tables. much smaller than fact tables, can be
heavily indexed without space ramifications. On the other hand, as all of the constraints
30
- - - -- -- -~- --
are made on the dimension tables, the fact table is efficiently accessed via the index built
from all of the dimension table foreign keys-the configuration commonly referred to as a
"star join."
(3). Star schemas support multidimensional analysis. This is that "slicing and dicing" of
data required for the iterative analytical process. Star schemas retain the history for
comparative analysis, and identify all the business dimensions used in analysis.
(4). Extensible design supports changing business requirements. In other words, star
schemas are much easier to change and scale than other schemas, like snowflake schema.
Star schemas can easily add attributes to the dimension tables or new fact columns without
reloading tables. Such a dimension restructuring doesn't affect fact tables, as long as the
appropriate level of detail, or granularity was selected for the initial design. In another
word, with a star schema, users can easily add new "stars" to the "constellation."
(5). Star schemas are recommended for most DSS user tools. Most tools work best with a
dimensional design, while a few even require it. Typically, the more sophisticated the
tool, the more particular it will be about the design it needs.
31
Chapter 5
A Design Case Using Star Schema
In this part, a database design using the star schema is explored using a general
retail business example. Due to the limitations of time and tools, a full cycle design of
data warehouse is not included. Only data requirements analysis, data modeling, schema
design, simple table joining and query tests are presented here. Implementation uses C++
language.
5.1 Data Requirement Analyzing and Modeling
The sales' results affect pricing decisions, marketing plans, and the stock price of
public companies1• Retail sale is an important part of business since each business
depends upon product movement. Building a data warehouse to support the retail sales'
subject areas requires an understanding of the type of business, the sales cycle, and how
the sales process relates to the marketing and pricing decisions.
Retail sellers usually are concerned with effective utilization of the resources like
space, labor, and marketing dollars. Their profit comes from the maximized sales
volumes and margin profit of each unit sold. By capturing extensive, detailed sales data,
merchants can "stock the best-selling products, gain an upper hand in dealings with
producers, and optimize promotional efforts" [I].
Generally, retail sellers, including departmental stores, grocery stores, or single
commodity sellers, need to know what sells, where it sells, when it sells, and how much it
will sell. A sales data warehouse for retail should be the foundation for profitability
32
- - - ==~---- --
analysis. The pace of competition drives large retailers to create sophisticated data
warehouses to track sales.
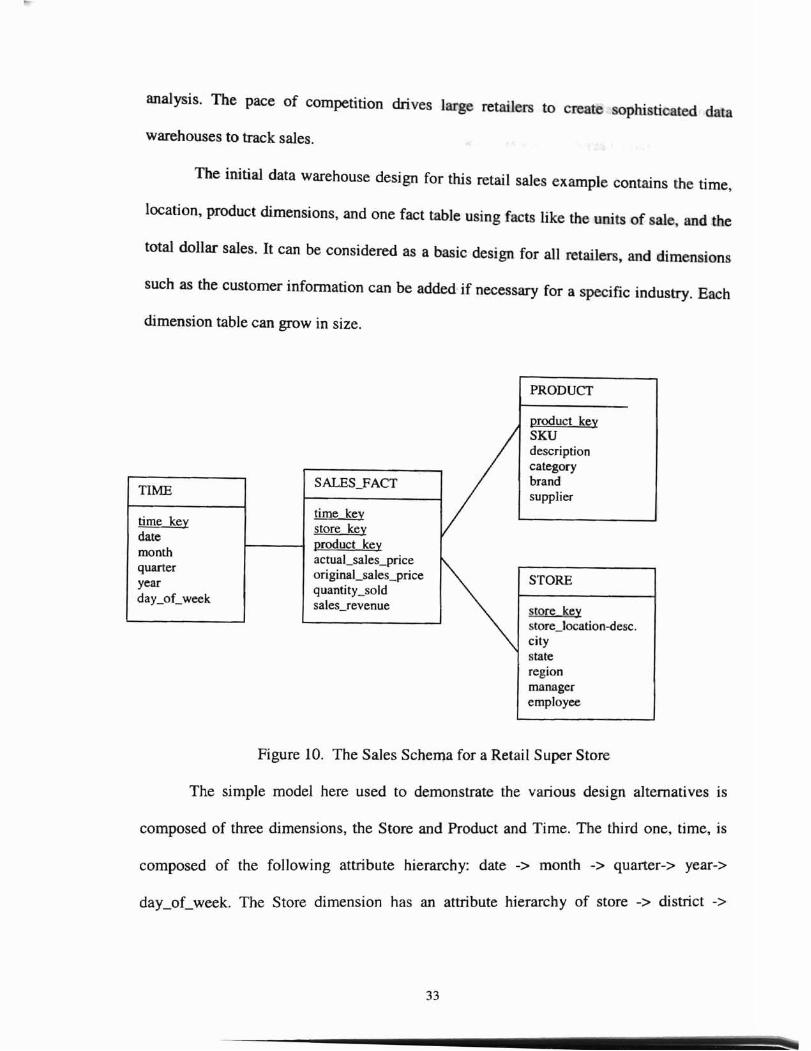
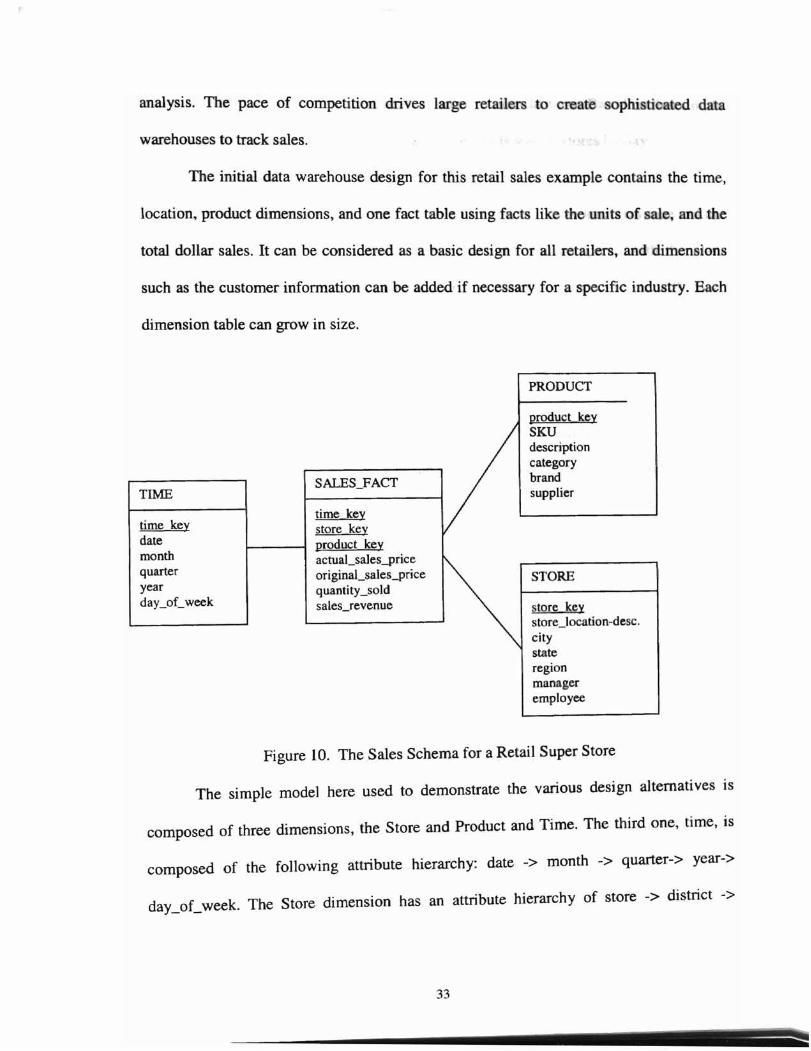
The initial data warehouse design for this retail sales example contains the time,
location, product dimensions, and one fact table using facts like the units of sale, and the
total dollar sales. It can be considered as a basic design for all retailers, and dimensions
such as the customer infonnation can be added if necessary for a specific industry. Each
dimension table can grow in size.
PRODUCT
product keySKUdescriptioncategory
I SALES_FACT brandTIME supplier
time keytime key store keydate product keymonth actual_sales_pricequarter original_sales_price STOREyear quantity_soldday_oCweek sales_revenue store key
store_location-desc.citystateregionmanageremployee
Figure 10. The Sales Schema for a Retail Super Store
The simple model here used to demonstrate the various design alternatives is
composed of three dimensions, the Store and Product and Time. The third one, time, is
composed of the following attribute hierarchy: date -> month -> quarter-> year->
day_oCweek. The Store dimension has an attribute hierarchy of store -> district ->
33
-- ---~ ~ - ~- ~
analysis. The pace of competition drives large retailers to create sophisticated da: a
warehouses to track sales.
The initial data warehouse design for this retail sales example contains the time,
location, product dimensions, and one fact table using facts like the units of sale, and the
total dollar sales. It can be considered as a basic design for all retailers, and dimensions
such as the customer information can be added if necessary for a specific industry. Each
dimension table can grow in size.
PRODUCT
product keySKUdescriptioncategory
SALESYACT brandTIME supplier
time keytime key store keydate product keymonth actuaLsales_pricequarter original_sales_price STOREyear quantity_soldday_oLweek sales_revenue store key
store_location-desc.citystateregionmanageremployee
Figure 10. The Sales Schema for a Retail Super Store
The simple model here used to demonstrate the various design alternatives is
composed of three dimensions, the Store and Product and Time. The third one, time, is
composed of the following attribute hierarchy: date -> month -> quarter-> year->
day_oCweek. The Store dimension has an attribute hierarchy of store -> district ->
33
region. Products is composed of products -> brand -> manufacturer. Based on this simple
model, we can say that the granularity of data's products sold in stores by day.
5.2 Query Features
One of the queries that motivate the design maybe like: how much revenue did th
new product generate by month, in the northeastern division compared with the plan.
Obviously, it is a four-dimensional question, and therefore need a database with four
dimensional information. By comparison, the more complex a query is, the more
dimensions may be included into the design. As this thesis is just a sample demonstration
of star schema, schema is relatively simplified from actual considerations.
With a simpler design for retail sales, reports can be generated to track how much
each products was sold in a specific location and time. Comparable results can be used to
decide what factor like time, location or product variation, has brought about the
difference of sales in each store. Consequently, corrections can be made in forecasting,
marketing, and promotion activities.
A star query strategy is used corresponding to the star schema model. In a star
query, each of the dimension tables is joined to the fact table using the primary
key/foreign key relationship. Thus, in this thesis, the product, location and the time table
would be joined with sales. Star queries only work in this simple model and in the real
world it is not an optimal choice because the Cartesian-product joins would be slow and
use too much memory. A compromise is to join relatively small dimension tables first
and then to join them with the large fact table.
34
To speed the queries of very large fact tables in the design, tables can be
aggregated in advance. That is, they only use the necessary granularity for queries, if
needed, summarizing data before queries are performed.
Query performance can be improved by deploying hardware lJpgrades or an
aggregation navigator in data summarization. Many data warehouse software vendors
provide such products [17].
5.3 Implementation
This thesis used C++ to implement a simplified retail star schema after
considering its convenience.
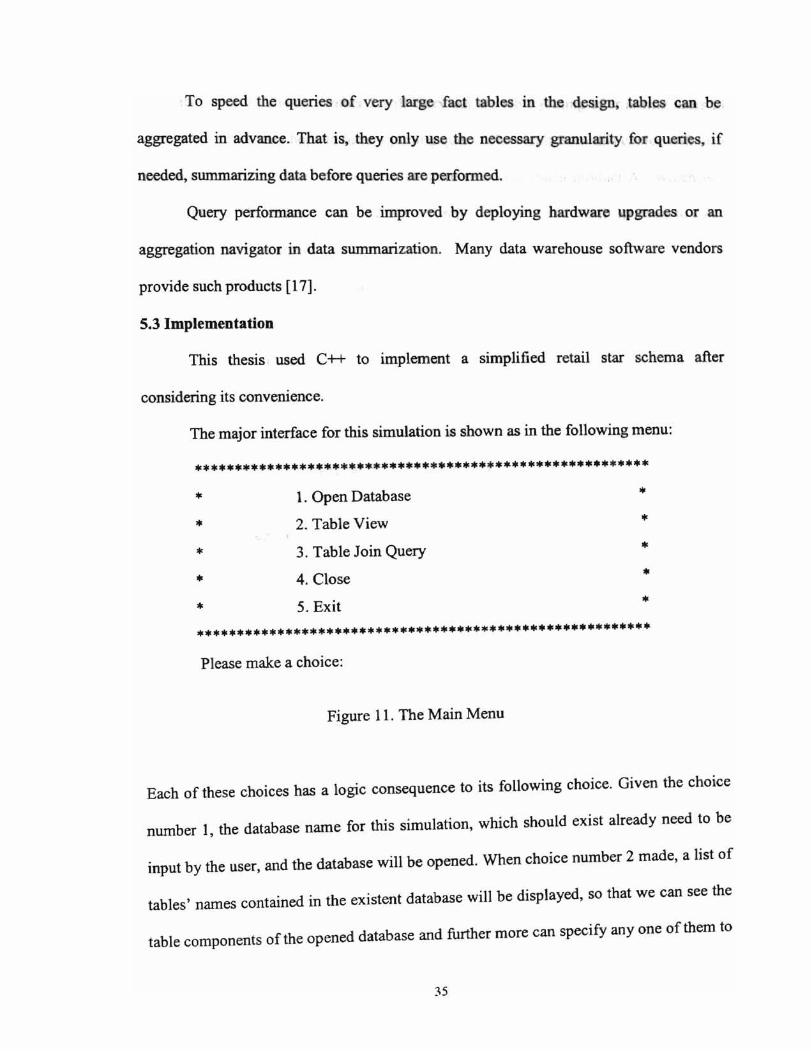
The major interface for this simulation is shown as in the following menu:
********************************************************
* 1. Open Database.,
* 2. Table View *
* 3. Table Join Query *
* 4. Close.,
* 5. Exit *********************************************************
Please make a choice:
Figure 11. The Main Menu
Each of these choices has a logic consequence to its following choice. Given the choice
number 1, the database Dame for this simulation, which should exist already need to be
input by the user, and the database will be opened. When choice number 2 made, a list of
tables' names contained in the existent database will be displayed, so that we can see the
table components of the opened database and further more can specify anyone of them to
35
show its contents. Choice number 3 will carry out the table joining after asking users to
specify the tables they hope to have a joining query. The result from this choice will be a
simple concatenation like "when in which-store sells how-much product An, which is a
query of typical business interest usually. Prompts number 4 and 5 will let users to close
the opened database and exit current program.
Data of each table for this program will be stored in file format instead of from
standard input as this is closer to the actual situation in a real data warehouse. For
simplification, data correspond to each table field is only in one string format with no
allowing ofmulti-string in this program.
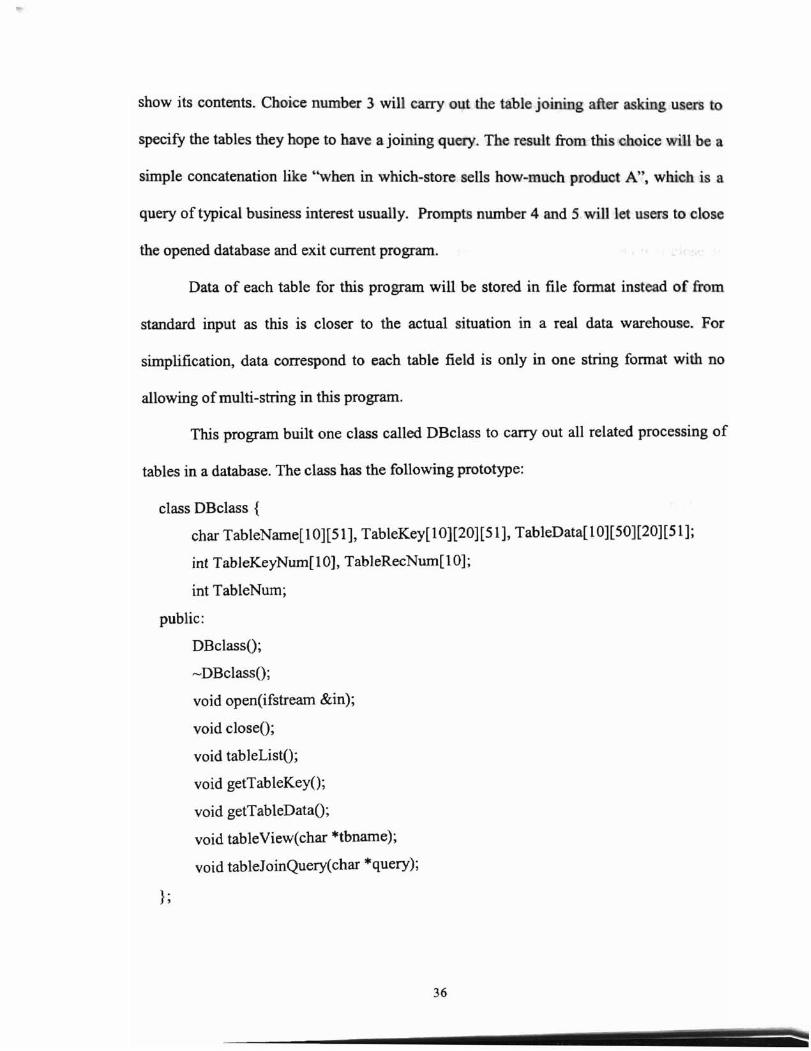
This program built one class called DBclass to carry out all related processing of
tables in a database. The class has the following prototype:
class DBclass {
char TableName[lO][51], TableKey[lO][20][51], TableData[lO][50][20][51];
int TableKeyNum[lO], TableRecNum[lO]~
int TableNum;
public:
DBclassO;
-DBclassO;
void open(ifstream &in);
void closeO;
void tableListO;
void getTableKeyO;
void getTableDataO;
void tableView(char *tbname);
void tableJoinQuery(char *query);
};
36
As this simulation is mainly for the purpose of displaying star schema and its
related query, a fixed size of database and its tables are used. For instance, tables are
assumed to have no more than twenty fields and fifty records and database contains at
most than ten tables. Functions in this class handle all database related behavior. such as
function open(ifstream&) will be in charge of open a database file; closeO will close an
opened database; tableListO show the list of tables in the database. The function
getTablekeyO will open the files that store the information ofkeys for tables. Keys are in
separate files that make changes easier. Similarly, the getTableDataO function open the
files for storing table contents and fetch them for processing. The tableView(char*)
function will show contents of a table.
The tableJoinQuery(char*) does the major work of this simulation by
implementing the table joins and output join results for a query. This method first
identifies that each of the user-input table names for joining do exist in the database and
then pick out these tables from the database. Joining start if the input joined table number
is more than two and joins go on pair by pair. For any join, first will confirm the two
tables have at least one common key and then obtain the record for joined result by
joining those with same key value into one table. To set the keyNum. keyName and
keyValue for eachjoin is the key of this method.
The table joining method uses the naive joining algorithms with traditional star
query strategy. In this way, tables can be joined pair after pair using nested loops. That is,
to join the first tables together and then joins the third to the result of the first join. But
for the real world data warehousing, it is possible to use the star schema aware processor
for speeding implementation.
37
- --~--
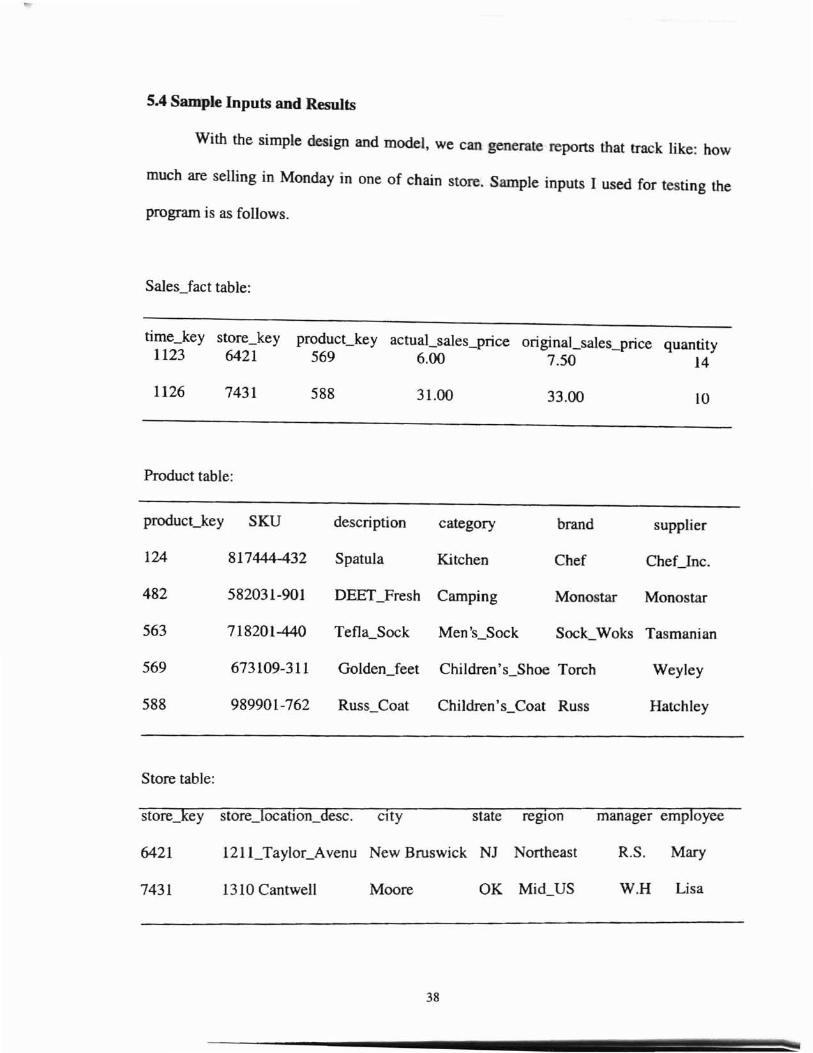
5.4 Sample Inputs and Results
With the simple design and model, we can generate reports that track like: how
much are selling in Monday in one of chain store. Sample inputs I used for testing the
program is as follows.
Sales_fact table:
time_key store_key producCkey actuaCsales_price original_sales_price quantity1123 6421 569 6.00 7.50 14
1126 7431 588 31.00 33.00 to
Product table:
producckey SKU description category brand supplier
124 817444-432 Spatula Kitchen Chef CheClnc.
482 582031-901 DEET_Fresh Camping Monostar Monostar
563 718201-440 Tefla_Sock Men's_Sock Sock_Woks Tasmanian
569 673109-311 Golden_feet Children's_Shoe Torch Weyley
588 989901-762 Russ_Coat ChiIdren 's_Coat Russ Hatchley
Store table:
store_key store_location_desc. cityi
manager employeestate regIOn
6421 121 CTaylor_Avenu New Bruswick NJ Northeast R.S. Mary
7431 1310 Cantwell Moore OK Mid_US W.H Lisa
38
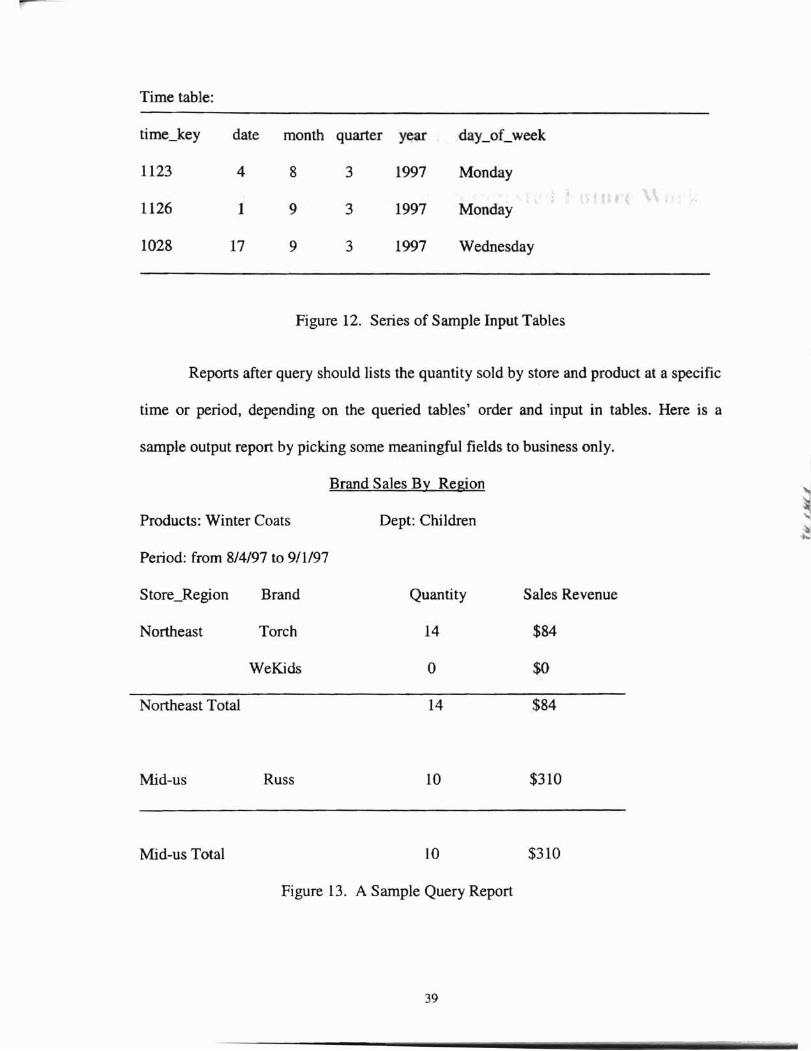
Time table:
time_key date month quarter year day_oCweek
1123 4 8 3 1997 Monday
1126 1 9 3 1997 Monday
1028 17 9 3 1997 Wednesday
Figure 12. Series of Sample Input Tables
Reports after query should lists the quantity sold by store and product at a specific
time or period, depending on the queried tables' order and input in tables. Here is a
sample output report by picking some meaningful fields to business only.
Brand Sales By Region
Products: Winter Coats Dept: Children
Period: from 8/4/97 to 9/1/97
Store_Region Brand Quantity Sales Revenue
Northeast Torch 14 $84
WeKids 0 $0
Northeast Total 14 $84
Mid-us
Mid-us Total
Russ 10
10
$310
$310
Figure 13. A Sample Query Report
39
Chapter 6
Summary, Conclusions and Suggested Future Work
6.1 A General Summary
The functions of traditional databases aim at data processing rather than data
analysis. For this reason, in the decision making environment, a single or even multiple
traditional databases hardly could meet the application requirements. However, data
warehouses can be viewed only as a complement to traditional databases even in this
sense. They cannot be a total replacement.
The methodology of building a data warehouse is different from that of a
traditional database. In its life cycle, data warehouse has some completely new steps,
such as data mapping, and data transformation, data extraction, and loading. Even in the
same steps they may have different goals and methods, for example, in the database
design step, traditional databases emphasize normalization while data warehouses
emphasize denormalization to gain fast response time and easy access.
The modeling of retail sales problem using star schema in this thesis explores the
mechanism of basic database design in warehouse, such as how the query works in star
schema, and how it makes the OLAP easier, although there are still some more problems
to be answered.
6.2 Potential performance problems and solutions with star schema
Although the star schema is a preferred modeling for data warehousing, there are
still a number of problems associated with star schema implementation, especially if a
40
- - .----- - ---- --
query-centered star schema is hosted on a traditional RDBMS optimized for OLTP. On
problem is, as the star sch.ema typically contains the entire hierarchy of attributes, index
technology is used to improve the perfonnance. However, carrying all the segments of
the compound dimension key in the fact table increase the size of the index, and
impacting both perfOlmance and scalability eventually.
The other is the pair-wise join problem.· That is, the ROBMS needs to break the
query into series of pair-wise joins and needs an optimizer to choose more efficient order
to join. But generating large intermediate result sets severely affects query performance.
Potential solutions to these problems include: using a star join that is a high-
speed, single-pass, parellizable and multi-table join. The Red Brick company has
provided such products. Another is star index, that is, use indexes that are defined on
selected columns of a table and query selectivity is limited to those colwnns. Star index is
considered as an improved technology compared to traditional B-tree or bitmap indexes.
6.3 Future Research
The use of a data warehouse broadens the database's application area, and
bringing about some new advanced research issues, such as the interoperability of data
warehouses and operational databases as well as other sources and automation of data
analysis and integration. Data warehousing technology should mature with the
development of new database technology. Those areas that need further explorations
include cubic operator implementation, materialized views, multi-way join algorithms,
etc.
Design methodologies and design tools for DWs are need with the appropriate
support for aggregation hierarchies. Future efficient operators like cubic operators will
41
include a better mapping between the multidimensional and the relational worlds. Future
operators should also take advantage of DW characteristics for allowing large table
scanning. In the future joins will support multi-way joining which is parallelized in an
optimized manner and partial results can be usable by multiple queries. As many queries
over data warehouses require summary data, and therefore use aggregates, hence,
materializing summary data or called materialized view technology can help to accelerate
common queries at last. All such problems are still open for research and need more
efforts in the future [31].
42
DB
DW
DSS
ODS
OLAP
OLTP
RDBMS
ROJ
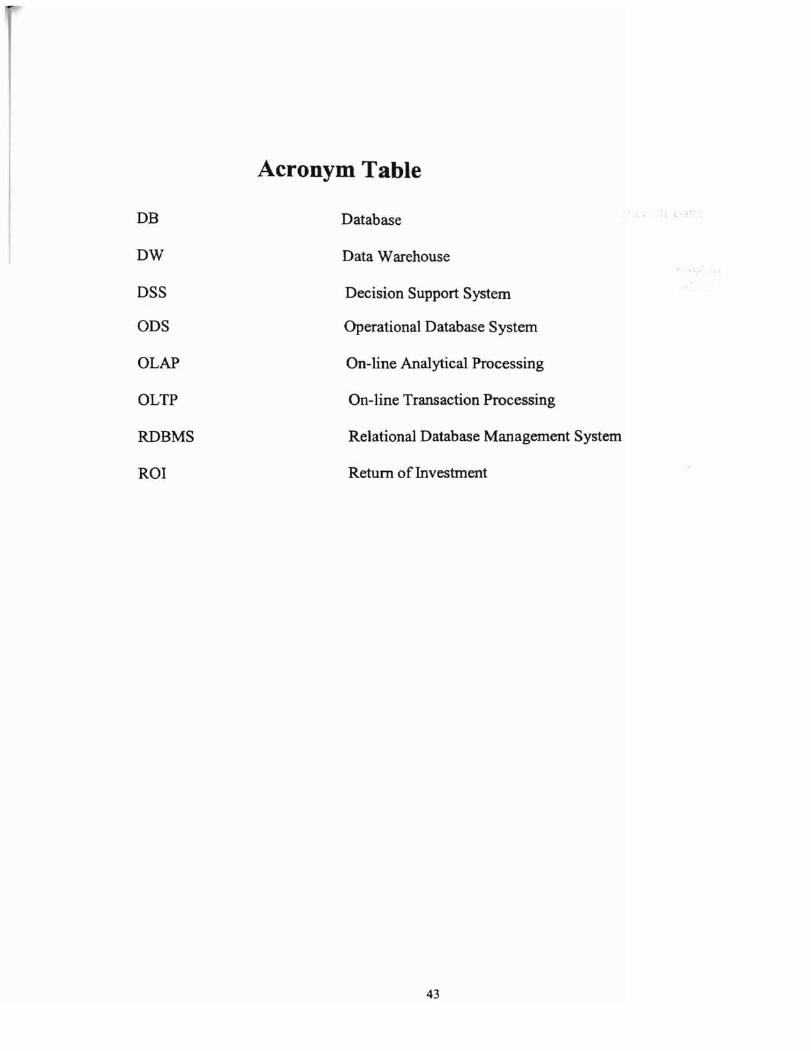
Acronym Table
Database
Data Warehouse
Decision Support System
Operational Database System
On-line Analytical Processing
On-line Transaction Processing
Relational Database Management System
Return of Investment
43
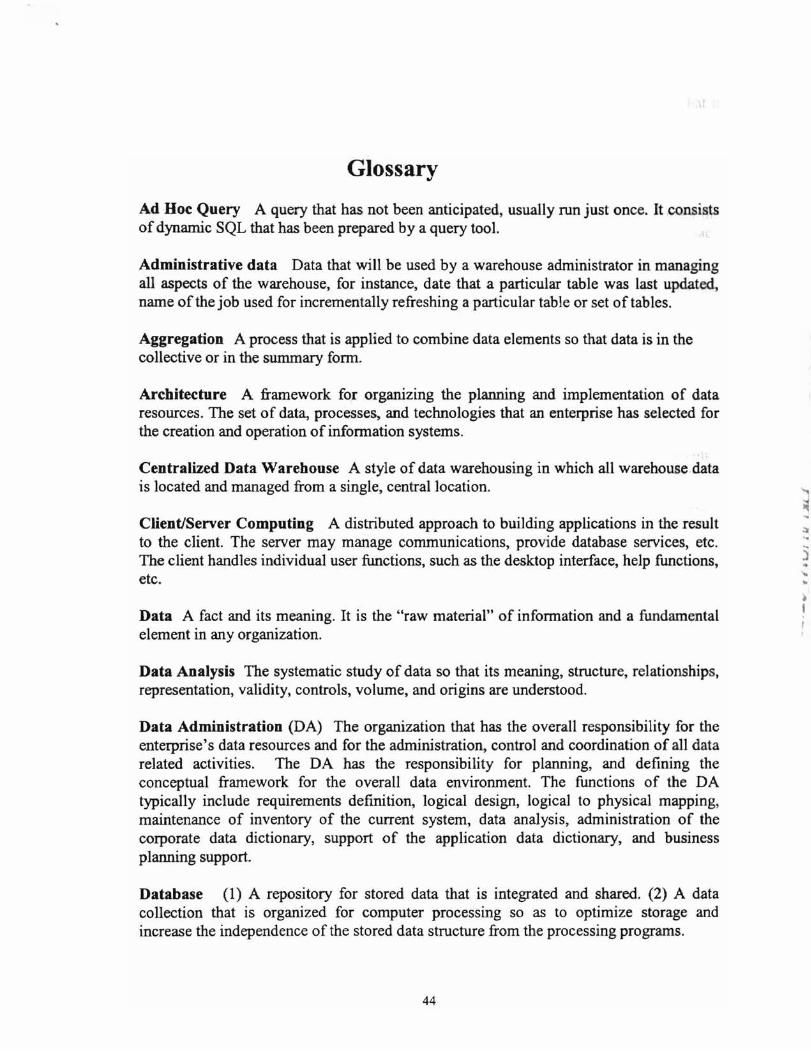
Glossary
Ad Hoc Query A query that has not been anticipated, usually run just once. It consistsof dynamic SQL that has been prepared by a query tool.
Administrative data Data that will be used by a warehouse administrator in managingall aspects of the warehouse, for instance, date that a particular table was last updated,name of the job used for incrementally refreshing a particular table or set of tables.
Aggregation A process that is applied to combine data elements so that data is in thecollective or in the summary fonn.
Architecture A framework for organizing the planning and implementation of dataresources. The set of data, processes, and technologies that an enterprise has selected forthe creation and operation of information systems.
Centralized Data Warehouse A style of data warehousing in which all warehouse datais located and managed from a single, central location.
Client/Server Computing A distributed approach to building applications in the resultto the client. The server may manage communications, provide database services, etc.The client handles individual user functions, such as the desktop interface, help functions,etc.
Data A fact and its meaning. It is the "raw material" of information and a fundamentalelement in any organization.
Data Analysis The systematic study of data so that its meaning, structure, relationships,representation, validity, controls, volume, and origins are understood.
Data Administration (DA) The organization that has the overall responsibility for theenterprise's data resources and for the administratio~ control and coordination of all datarelated activities. The DA has the responsibility for planning, and defining theconceptual framework for the overall data environment. The functions of the DAtypically include requirements definition, logical design, logical to physical mapping,maintenance of inventory of the current system, data analysis, administration of thecorporate data dictionary, support of the application data dictionary, and businessplanning support.
Database (1) A repository for stored data that is integrated and shared. (2) A datacollection that is organized for computer processing so as to optimize storage andincrease the independence of the stored data structure from the processing programs.
44
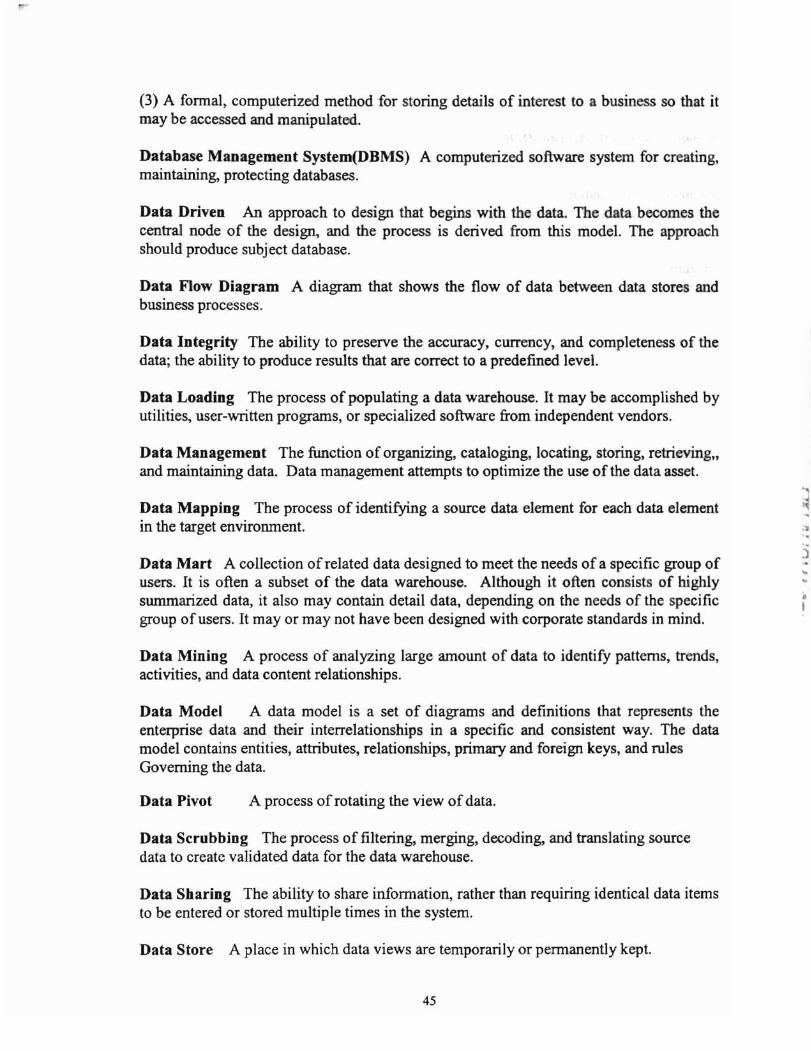
(3) A formal, computerized method for storing details of interest to a business so that itmay be accessed and manipulated.
Database Management System(DBMS) A computerized software system for creating,maintaining, protecting databases.
Data Driven An approach to design that begins with the data. The data becomes thecentra node of the design, and the process is derived from this model. The approachshould produce subj ect database.
Data Flow Diagram A diagram that shows the flow of data between data stores andbusiness processes.
Data Integrity The ability to preserve the accuracy, currency, and completeness of thedata; the ability to produce results that are correct to a predefined level.
Data Loading The process of populating a data warehouse. It may be accomplished byutilities, user-written programs, or specialized software from independent vendors.
Data Management The function of organizing, cataloging, locating, storing, retrieving"and maintaining data. Data management attempts to optimize the use of the data asset.
Data Mapping The process of identifying a source data element for each data elementin the target environment.
Data Mart A collection ofrelated data designed to meet the needs of a specific group ofusers. It is often a subset of the data warehouse. Although it often consists of highlysummarized data, it also may contain detail data, depending on the needs of the specificgroup ofusers. It mayor may not have been designed with corporate standards in mind.
Data Mining A process of analyzing large amount of data to identify patterns, trends,activities, and data content relationships.
Data Model A data model is a set of diagrams and definitions that represents theenterprise data and their interrelationships in a specific and consistent way. The datamodel contains entities, attributes, relationships, primary and foreign keys, and rulesGoverning the data.
'"..II
Data Pivot A process of rotating the view of data.
Data Scrubbing The process of filtering, merging, decoding, and translating sourcedata to create validated data for the data warehouse.
Data Sharing The ability to share information, rather than requiring identical data itemsto be entered or stored multiple times in the system.
Data Store A place in which data views are temporarily or permanently kept.
45
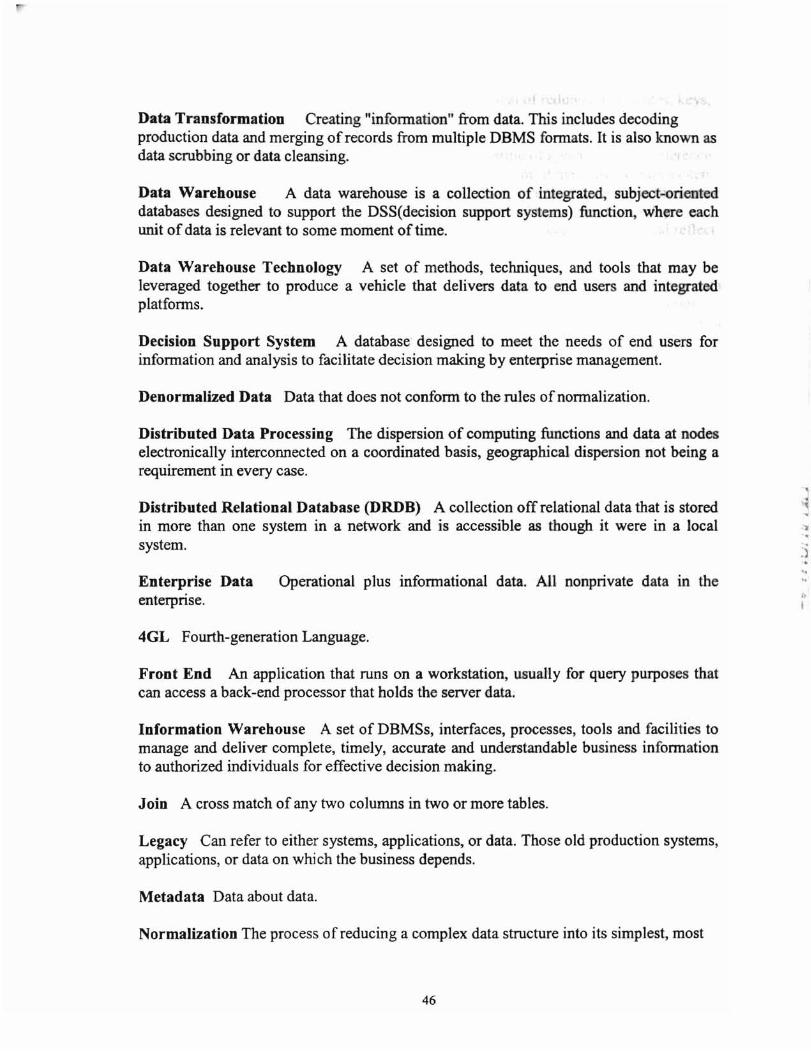
Data Transformation Creating "information" from data. This includes decodingproduction data and merging ofrecords from multiple DBMS formats. It is also known asdata scrubbing or data cleansing.
Data Warehouse A data warehouse is a collection of integrated, subject-orienteddatabases designed to support the DSS(decision support systems) function, where eachunit of data is relevant to some moment of time.
Data Warehouse Technology A set of methods, techniques, and tools that may beleveraged together to produce a vehicle that delivers data to end users and integratedplatforms.
Decision Support System A database designed to meet the needs of end users forinformation and analysis to facilitate decision making by enterprise management.
Denormalized Data Data that does not conform to the rules of normalization.
Distributed Data Processing The dispersion of computing functions and data at nodeselectronically interconnected on a coordinated basis, geographical dispersion not being arequirement in every case.
Distributed Relational Database (DRDB) A collection off relational data that is storedin more than one system in a network and is accessible as though it were in a localsystem.
Enterprise Data Operational plus informational data. All nonprivate data in theenterprise.
4GL Fourth-generation Language.
Front End An application that runs on a workstation, usually for query purposes thatcan access a back-end processor that holds the server data.
Information Warehouse A set of DBMSs, interfaces, processes, tools and facilities tomanage and deliver complete, timely, accurate and understandable business informationto authorized individuals for effective decision making.
Join A cross match of any two columns in two or more tables.
Legacy Can refer to either systems, applications, or data. Those old production systems,applications, or data on which the business depends.
Metadata Data about data.
Normalization The process of reducing a complex data structure into its simplest, most
46
:~'.
i.
i
stable structure. In general, the process entails the removal of redundant attributes, keys,and relationships from a conceptual data model.
Operational Database The database-of-record, consisting of system-specific referencedata and event data belonging to a transaction-update system. It may also contain systemcontrol data such as indicators, flags, and counters. The operational database is the sourceof data for the data warehouse. It contains detailed data used to run the day-to-dayoperations of the business. The data continually changes as updates are made, and reflectthe current value of the last transaction.
Operational Data Store A database to provide an interim step for near-real-time datato informational and operational queries. It minimizes the impact on production oroperational systems while providing as current live data as possible. Can also serve as adata staging area for processing data into the data warehouse.
OLAP A common use of a data warehouse that involves real time access and analysisof multidimensional data such as order information.
Scalability The ability to scale to support larger or smaller volumes of data and more orless users. The ability to increase or decrease size or capability in cost-effectiveincrements with minimal impact on the unit cost ofbusiness and the procurement ofadditional services.
Schema The logical and physical definition of data elements, physicalcharacteristics and inter-relationships.
Snapshot An image of a database or file at a specific point in time. Generally used forreporting purposes.
Source Database A production operational database that feeds data warehouse.
Star Scbema(or Star Join Schema) A specific organization of a database in which a facttable with a composite key is joined to a number of single-level dimension table, eachwith a single, primary key.
Subject-oriented Database A database that contains data that related to one or morelogical subjects.
47
...,).'.,'"
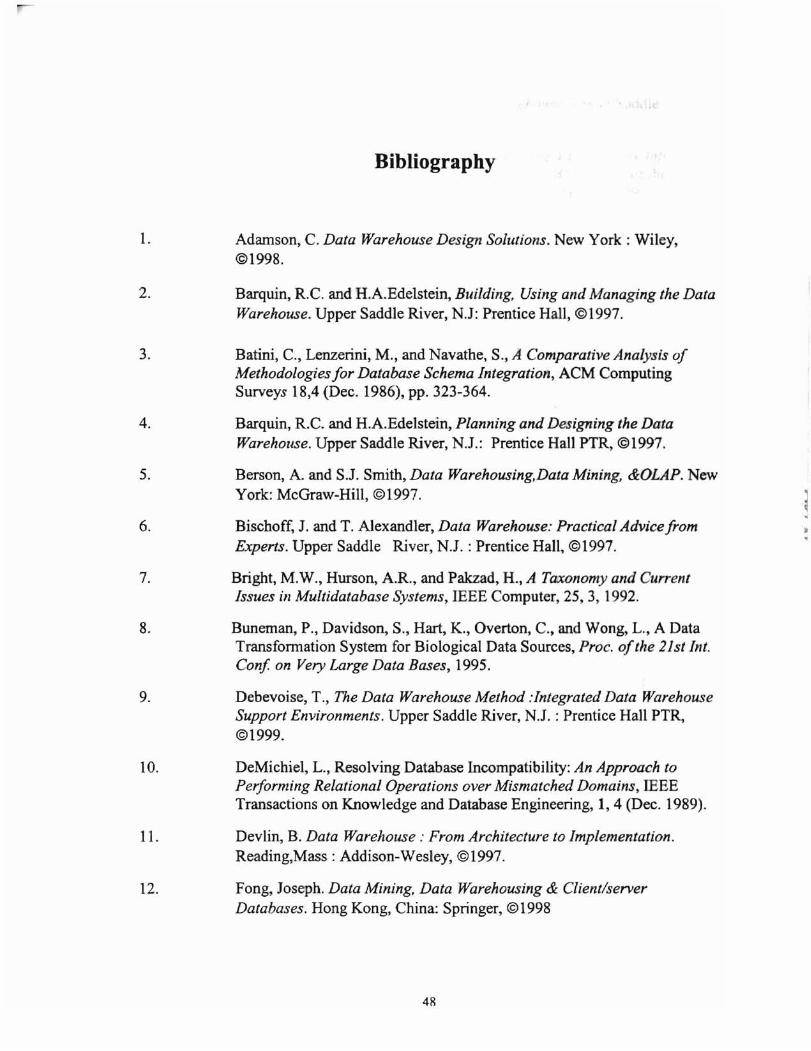
Bibliography
1. Adamson, C. Data Warehouse Design Solutions. New York: Wiley,©1998.
2. Barquin, RC. and H.A.Edelstein, Building, Using and Managing the DataWarehouse. Upper Saddle River, N.J: Prentice Hall, ©1997.
3. Batini, c., Lenzerini, M., and Navathe, S., A Comparative Analysis ofMethodologies for Database Schema Integration, ACM ComputingSurveys 18,4 (Dec. 1986), pp. 323-364.
'..
Barquin, RC. and H.A.Edelstein, Planning and Designing the DataWarehouse. Upper Saddle River, N.J.: Prentice Hall PTR, ©1997.
Berson, A. and S.J. Smith, Data Warehousing, Data Mining, &OLAP. NewYork: McGraw-Hill, ©1997.
Bischoff, J. and T. Alexandler, Data Warehouse: Practical AdvicefromExperts. Upper Saddle River, N.J. : Prentice Hall, ©1997.
7. Bright, M.W., HUTson, A.R, and Pakzad, H., A Taxonomy and CurrentIssues in Multidatabase Systems, IEEE Computer, 25, 3, 1992.
5.
4.
6.
8. Buneman, P., Davidson, S., Hart, K., Overton, C.• and Wong, L.. A DataTransformation System for Biological Data Sources, Proc. ofthe 21st Int.Con! on Very Large Data Bases, 1995.
9. Debevoise, T., The Data Warehouse Method :Integrated Data WarehouseSupport Environments. Upper Saddle River, N.J. : Prentice Hall PTR,©1999.
10. DeMichiel, L., Resolving Database Incompatibility: An Approach toPerforming Relational Operations over Mismatched Domains, IEEETransactions on Knowledge and Database Engineering, 1,4 (Dec. 1989).
11. Devlin, B. Data Warehouse: From Architecture to Implementation.Reading,Mass: Addison-Wesley. ©1997.
12. Fong, Joseph. Data Mining, Data Warehousing & Client/serverDatabases. Hong Kong, China: Springer, ©1998
48
13. Gray, P. Decision Support in the Data Warehouse. Upp r SaddleRiver, N.J.: Prentice Hall, ©1998
It,
Goodman, N., Rozen, S., and Stein, L., Building a Laboratory InformationSystem Around a C++ Based Object-Oriented DBMS, Proc. of the 20thInt. Conference on Very Large Data Bases, 1994, pp. 722-729.
http://scis.nova.eduJ~mcte/MCTE661
19.
17.
14.
22.
18.
20.
21.
15.
16. http://www.orcale.com/whitepaper
http://www.cis.upenn.eduJ-sahuguet/OLAP
http://datawarehouse.dci.comJarticles/l 998/07/28star.htrn
Inmon, William H. and C. Kelley. RdbIVMS: Developing the DataWarehouse. QED Publishing Group, Boston, Massachusetts, ©1997.
Inmon, William H. and R. Kimball. The Data Warehouse LifecycleToolkit: Expert Methods for Designing, Developing, and Deploying DataWarehouse. New York: Wiley Computer Pub., ©1998.
Inmon, William H. Building, Using, and Managing the Data Warehouse.Upper Saddle River, N.J.: Prentice Hall, ©1997.
Inmon, William H. Managing the Data Warehouse. New York:WileY,©1997.
23. Inmon, William H. Using the Data Warehouse. New York: Wiley,©1994.
23. Ins & Outs of Data Warehouse, http://www.redbrick.com
24. Kimball, R. The Data Warehouse Too/kit: Practical Techniques forBuilding Dimensional Data Warehouses. New York: John Wiley & Sons,©1996.
25. Markowitz, V.M., and Shoshani, A., Representing Extended EntityRelationship Structures in Relational Databases: A Modular Approach,ACM Transactions on Database Systems, 17,3 (September 1992).
26. McLaren I. , http://home.clren.net/imc1aren
27. Michael Corey, M. Abby, and R. Taub, Oracle White Paper on DataWarehouse. Oracle Data Warehousing, p.1-3, 7-10. Berkeley, Calif.:Osborne McGraw-Hill: Oracle Press, ©1997.
28. Morse, S. Data warehouse performance, p72-73. New York: John Wiley,©1999.
49
29. Poe, V. Building a Data Warehousefor Decision Support. Upper SaddleRiver,NJ : Prentice Hall PTR, ©1996.
30. Sarajit,C. An Overview ofData Warehouse and OLAP technology. UpperSaddle River, N.J. : Prentice Hall, ©1997.
31. Wu, M. Research Issues in Data Warehouse, p.26-27. New York: WileyComputer Pub., ©1998.
32. Zhou, G., R. Hull, R. King, and 1. Franchitti. Data integration andwarehousing using H20. Data Engineering, 18(2):29-40, June, ©1995.
32. Ullman, Jeffrey D. Principles ofDatabase Systems. Potomac, Md.:Computer Science Press, ©1980.
33. Ullman, Jeffrey D. Principles ofDatabase and Knowledge-baseSystems. Rockville, Md. : Computer Science Press, ©1988-©1989.
50
VITA
Weiping Li
Candidate for the Degree of
Master ofScience
Thesis: DATA WAREHOUSE DESIGN: AN INVESTIGATION OF STARSCHEMA
Major Field: Computer Science
Biographical:
Personal Data: Born in Jiangsu, China, the daughter of Liuqun Li and ChunfengYeo
Education: Graduated from Taixing Middle School, Taixing, Jiangsu, P.R. Chinain June 1985. Received Bachelor of Science degree in EconomicGeography and Urban Planning and a Master of Arts degree in EconomicManagement from Nanjing University, Nanjing, P.R. China in June 1989and July 1992 respectively. Completed the requirements for the Master ofScience degree with a major in Computer Science at Oklahoma StateUniversity in May, 2000.
Experience: Employed by the Finance and Economics Institute of JiangsuProvince as a researcher, Nanjing, Jiangsu, P.R. China, 1992 - 1996.Employed by the School of Public Affairs at Portland State University as aComputer Assistant and Graduate Research Assistant, 1996-1997.Employed by the Computer and Infonnation Services at Oklahoma StateUniversity as a Computer Assistant, Jan. 1998-Dec. 1998. Employed bythe Nutrition Lab at Oklahoma University as a database programmer, May1998-May 1999. Employed by Department of Computer Science ofOklahoma State University as a Teaching Assistant, August 1999 toDecember.
/1


