Embed Size (px)
Citation preview
GIS Data Structures
Identify mapped relationships among object entities. Transform the spatial information into a tabular data basestructure. Computer must be told how to handle the spatial data inbinary (base2 ) or ASCII format.
Danny M. Vaughn, Ph.D., CMS
Com puter File Structures – provides an ability to order, store, &search data. Simple list – names, addresses, w/out order. Ordered sequential lists – alphabetic or numeric listing as anordered sequential data set. Divide & conquer search strategy. Indexed files – search strategy by a key attribute, e.g. find slopes>15, & < 30 degrees.
Direct files – by a coded value for a particular record, e.g. 5 =four lane roads. Inverted files – formal index based on a search criteria, ratherthan the entity in the database, e.g. a field reflecting all recordsas good, poor, etc.
Data base A structured and stored data set. Consists of selected natural and/or societal processes.
Data base m anagem ent system - spatial and tabular data. Input, stored, captured, retrieved, updated, manipulated,deleted, analyzed, and output. Graphical and tabular format.
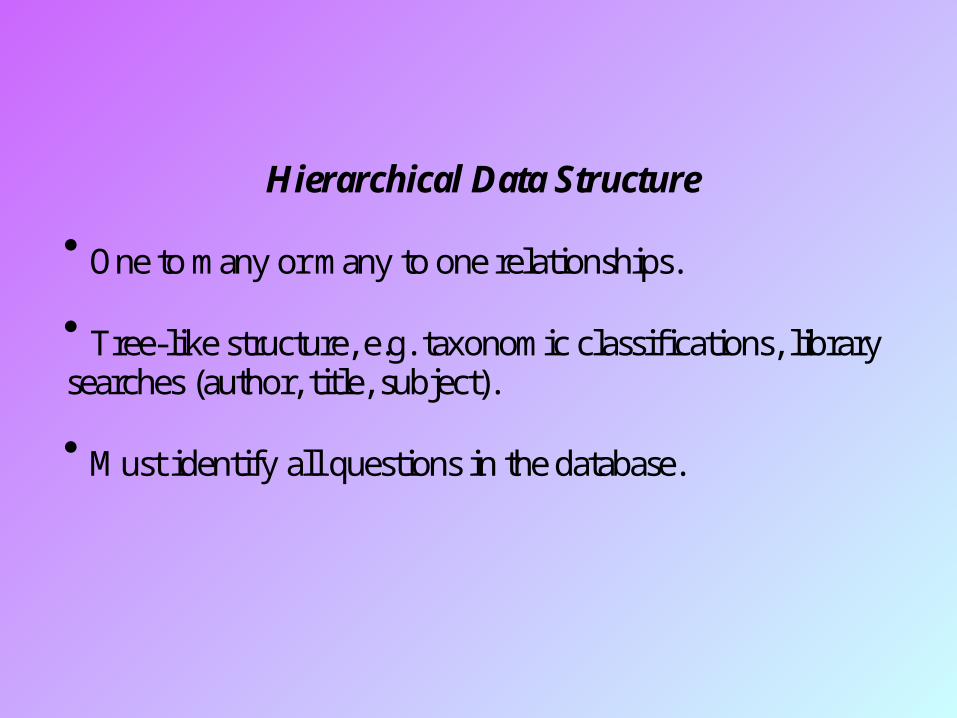
Hierarchical Data Structure One to many or many to one relationships. Tree-like structure, e.g. taxonomic classifications, librarysearches (author, title, subject). M ust identify all questions in the database.
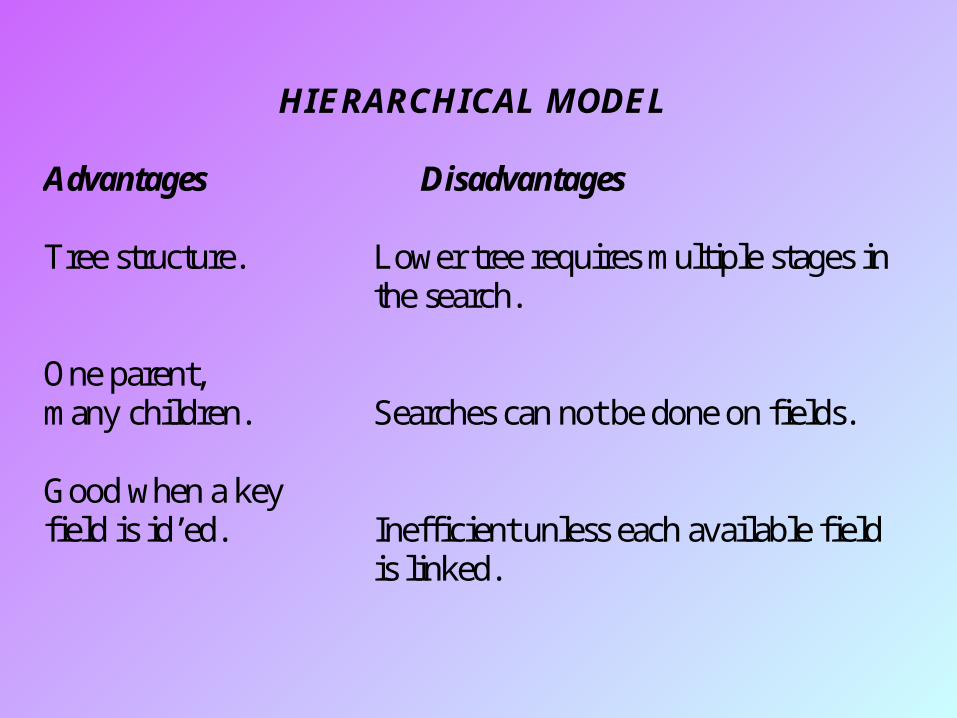
HIERARCHICAL MODEL
Advantages Disadvantages
Tree structure. Lower tree requires multiple stages inthe search.
One parent,many children. Searches can not be done on fields.
Good when a keyfield is id’ed. Inefficient unless each available field
is linked.
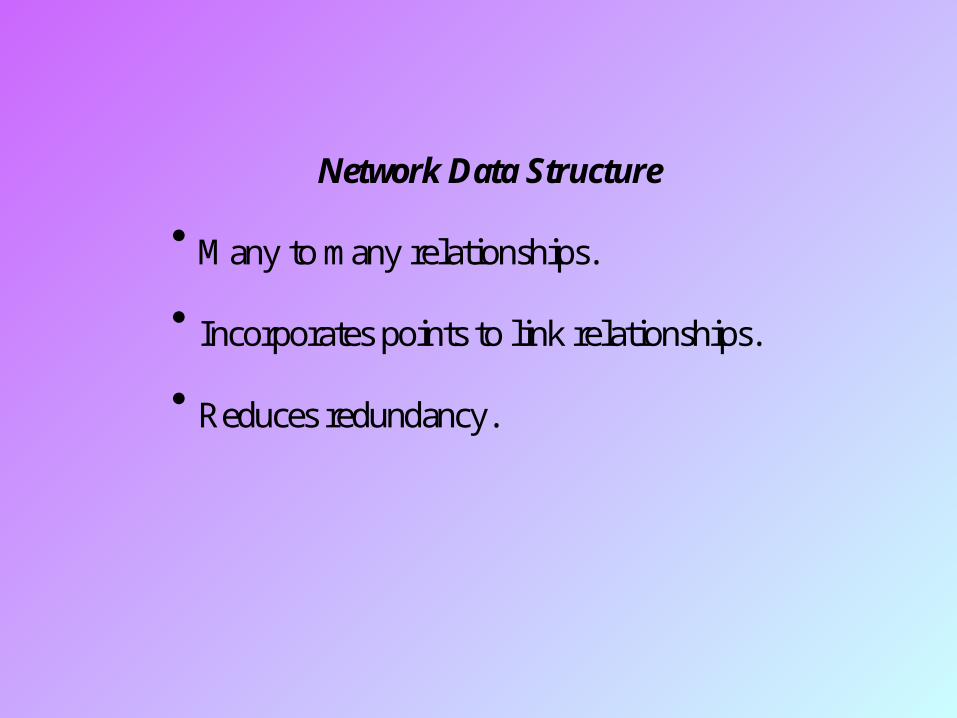
Network Data Structure
M any to many relationships. Incorporates points to link relationships. Reduces redundancy.
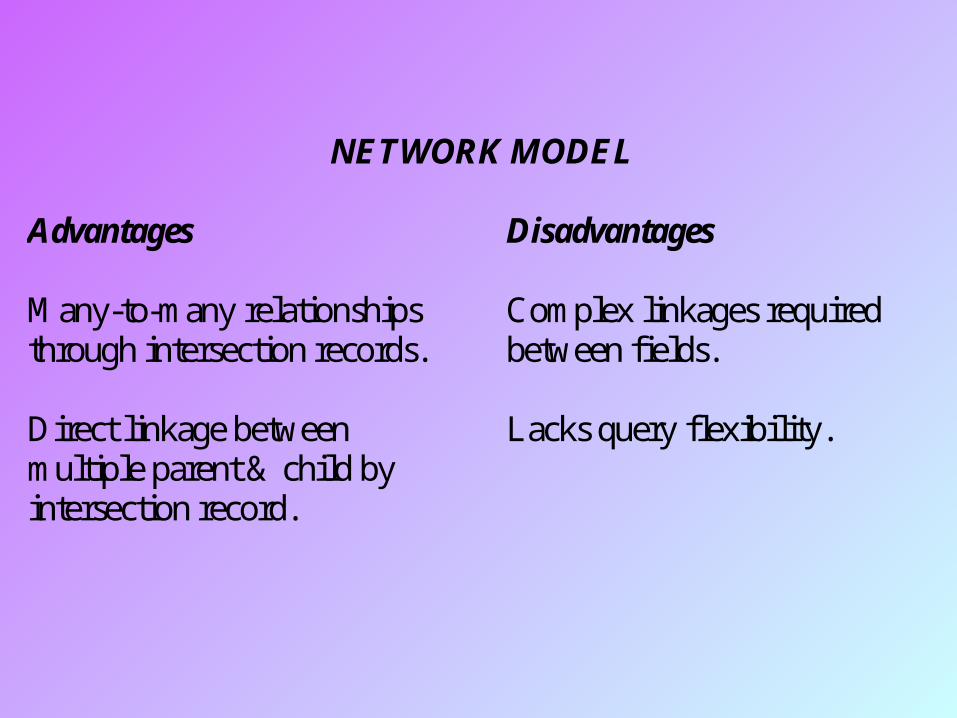
NETWORK MODEL
Advantages Disadvantages
M any-to-many relationships Complex linkages requiredthrough intersection records. between fields.
Direct linkage between Lacks query flexibility.multiple parent & child byintersection record.
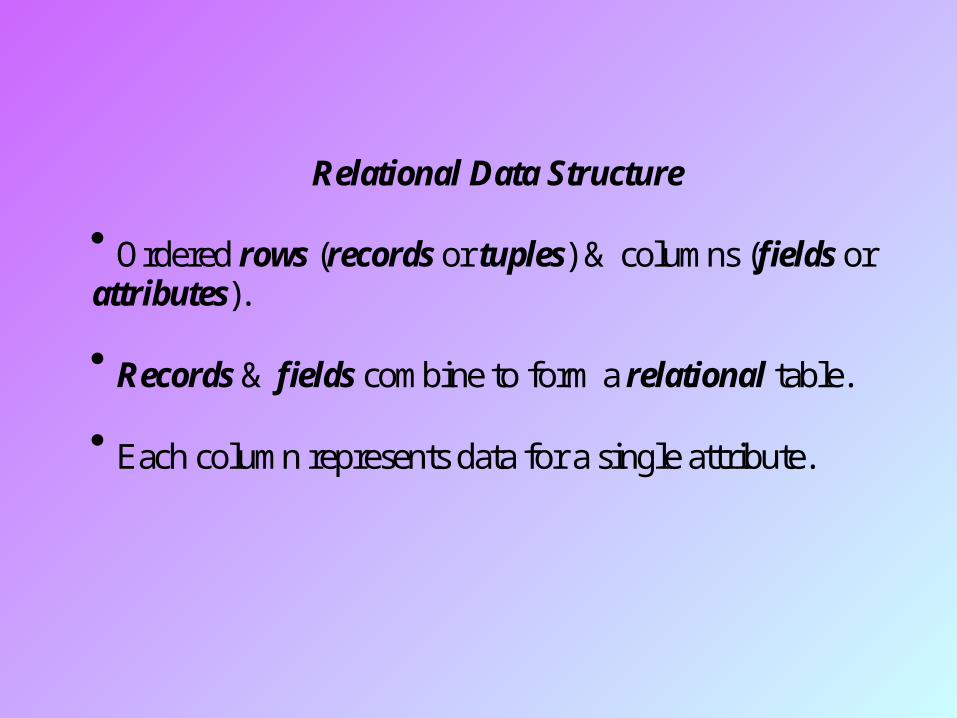
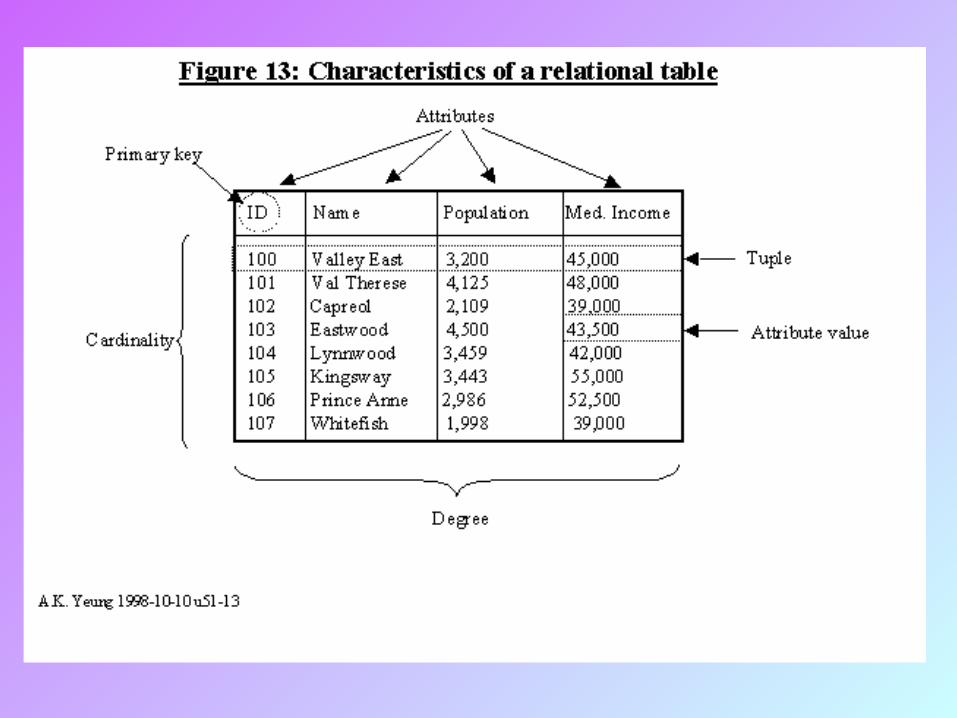
Relational Data Structure
Ordered rows (records or tuples) & columns (fields orattributes). Records & fields combine to form a relational table. Each column represents data for a single attribute.
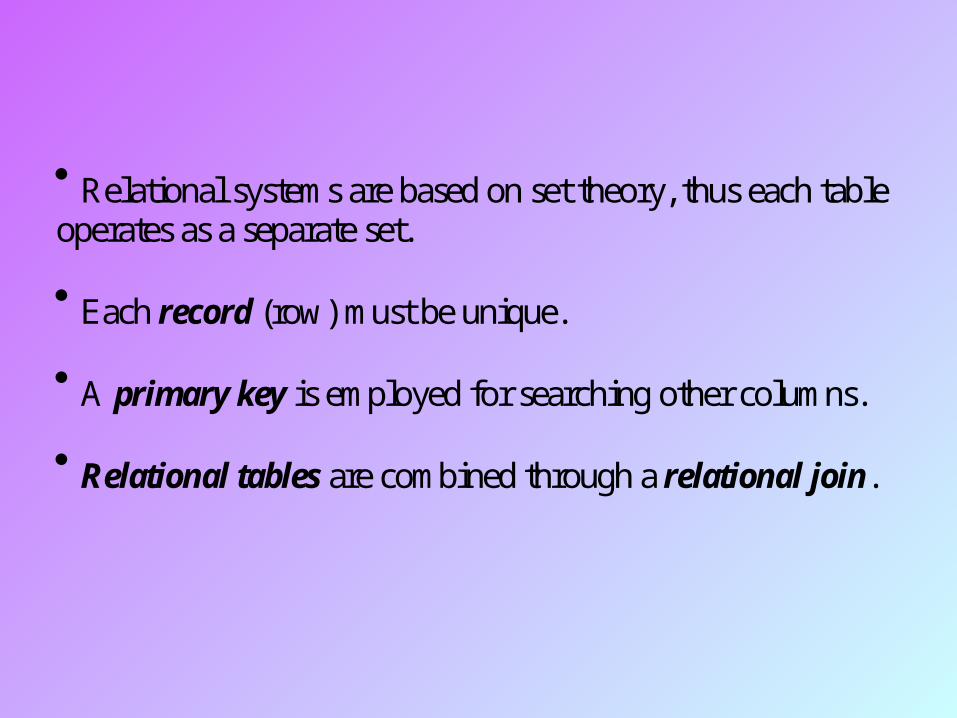
Relational systems are based on set theory, thus each tableoperates as a separate set. Each record (row) must be unique. A primary key is employed for searching other columns. Relational tables are combined through a relational join.
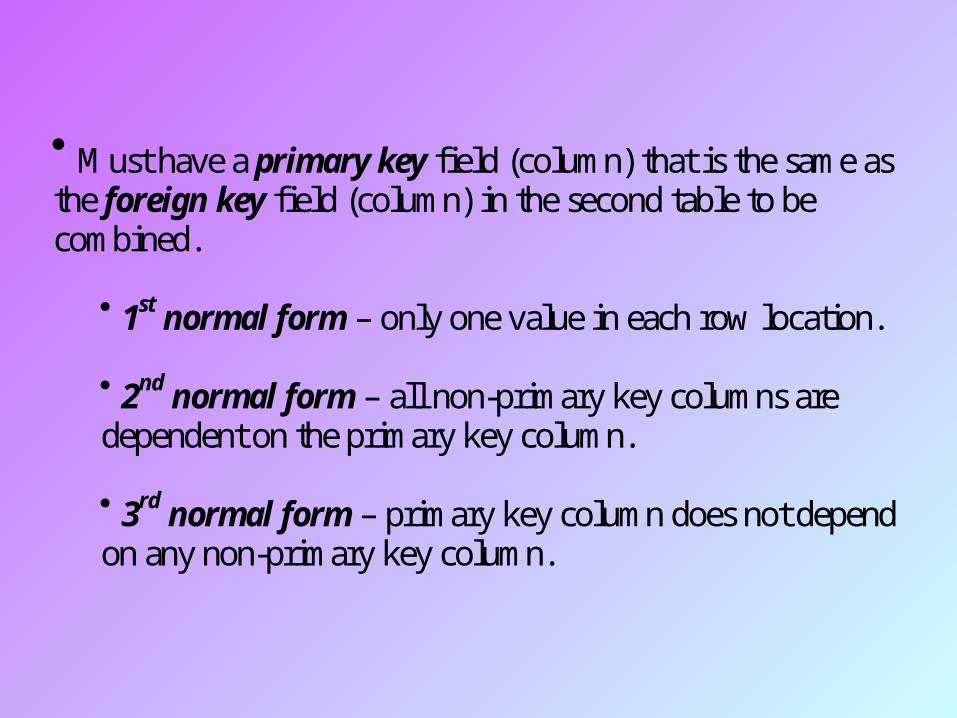
M ust have a primary key field (column) that is the same asthe foreign key field (column) in the second table to becombined.
1st normal form – only one value in each row location. 2nd normal form – all non-primary key columns aredependent on the primary key column. 3rd normal form – primary key column does not dependon any non-primary key column.
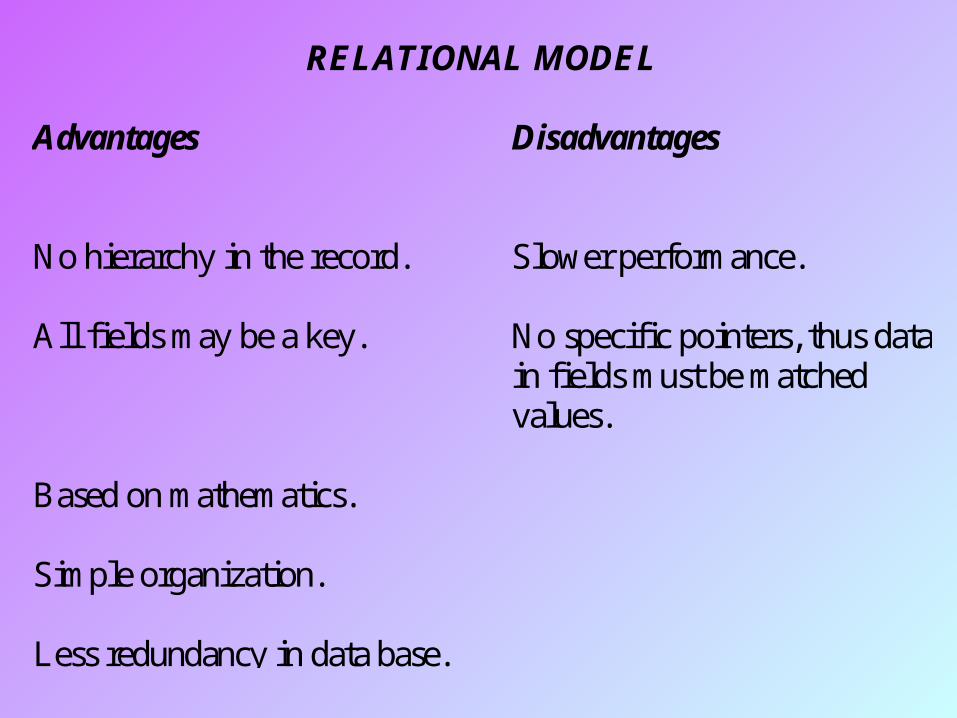
RELATIONAL MODEL
Advantages Disadvantages
No hierarchy in the record. Slower performance.
All fields may be a key. No specific pointers, thus datain fields must be matchedvalues.
Based on mathematics.
Simple organization.
Less redundancy in data base.
Graphically Representing Spatial Entities
Raster Model
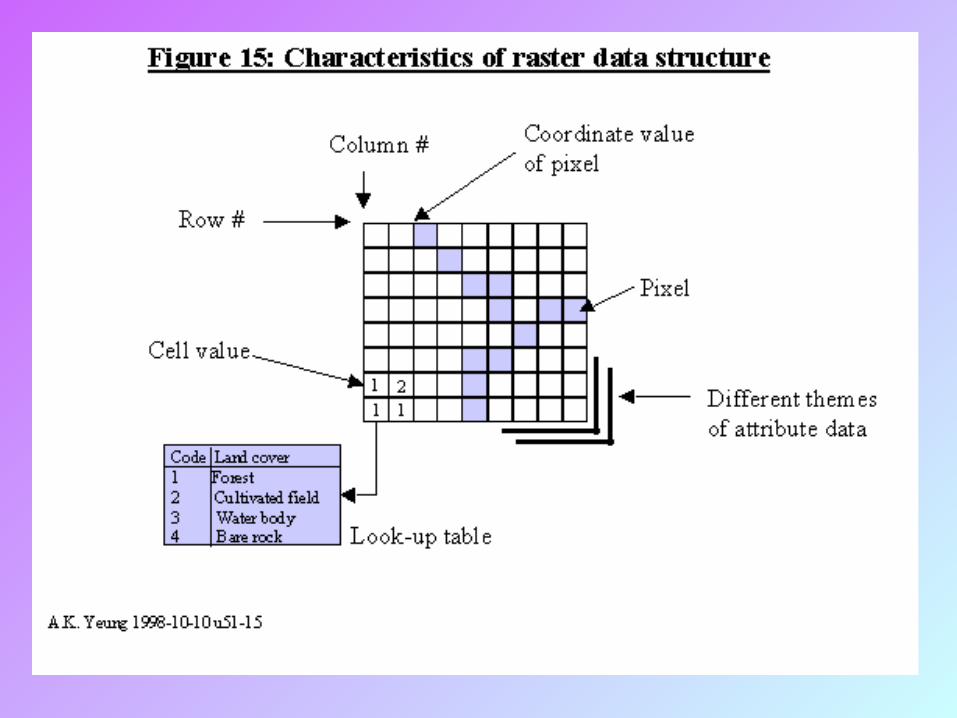
Based upon a grid of continuous cells of equivalent size. Generally a square shape, although other shapes have beenused. A simple data structure. Overlay operations are easy and efficient. Efficient representation of objects with high spatial variability. Used extensively for digital imagery.
Disadvantages of the Raster Model
Less compact & requires data compression for efficiency. Topological relationships are difficult to represent. Graphical output is aesthetically less pleasing.
Blocky boundaries. Spatial areas are less accurate. Course spatial resolution.
Vector Model
Provides a more compact data structure. Encoding of topology. M ore efficient topological operations (obtaining topologicinformation). Graphics are more representative of the drawn map. Boundaries, shape, and area are better represented.
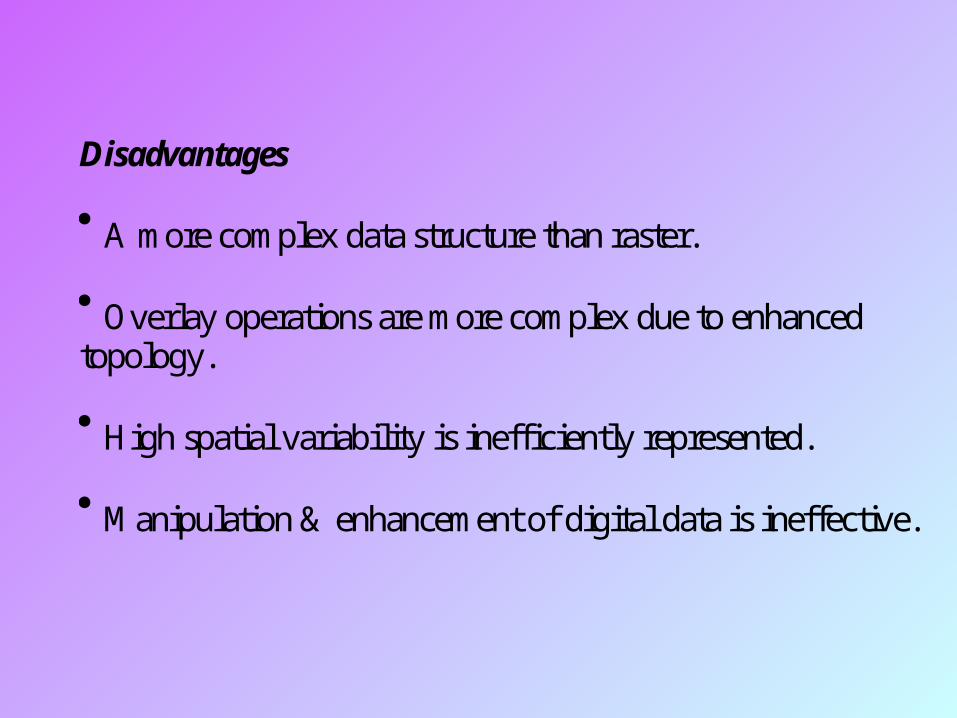
Disadvantages
A more complex data structure than raster. Overlay operations are more complex due to enhancedtopology. High spatial variability is inefficiently represented. M anipulation & enhancement of digital data is ineffective.
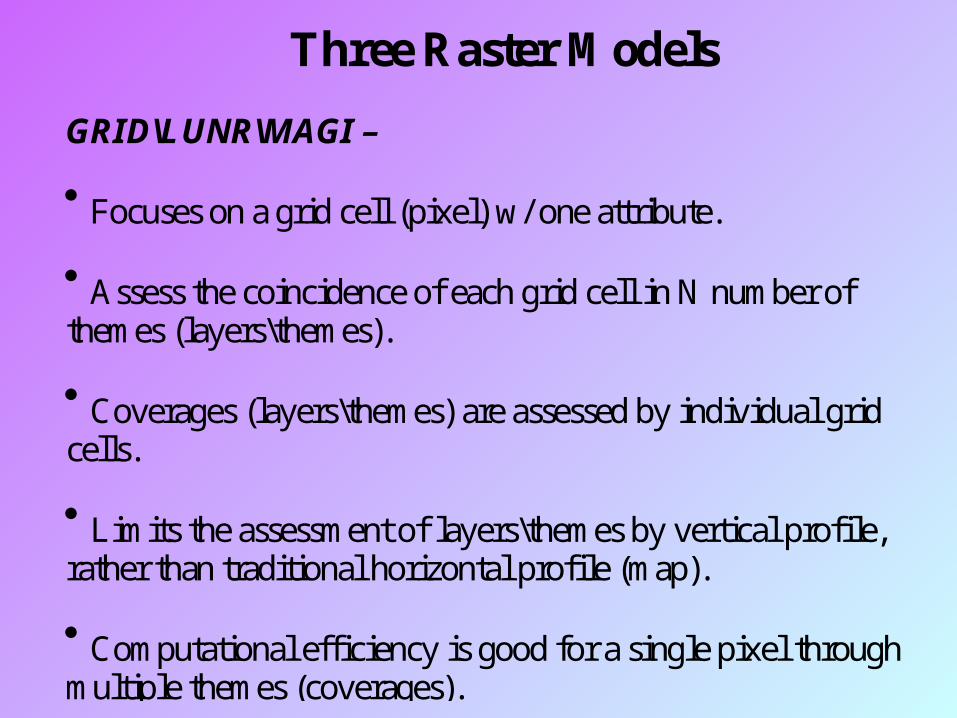
Three Raster M odelsGRID\LUNR\MAGI –
Focuses on a grid cell (pixel) w/ one attribute. Assess the coincidence of each grid cell in N number ofthemes (layers\themes). Coverages (layers\themes) are assessed by individual gridcells. Limits the assessment of layers\themes by vertical profile,rather than traditional horizontal profile (map). Computational efficiency is good for a single pixel throughmultiple themes (coverages).
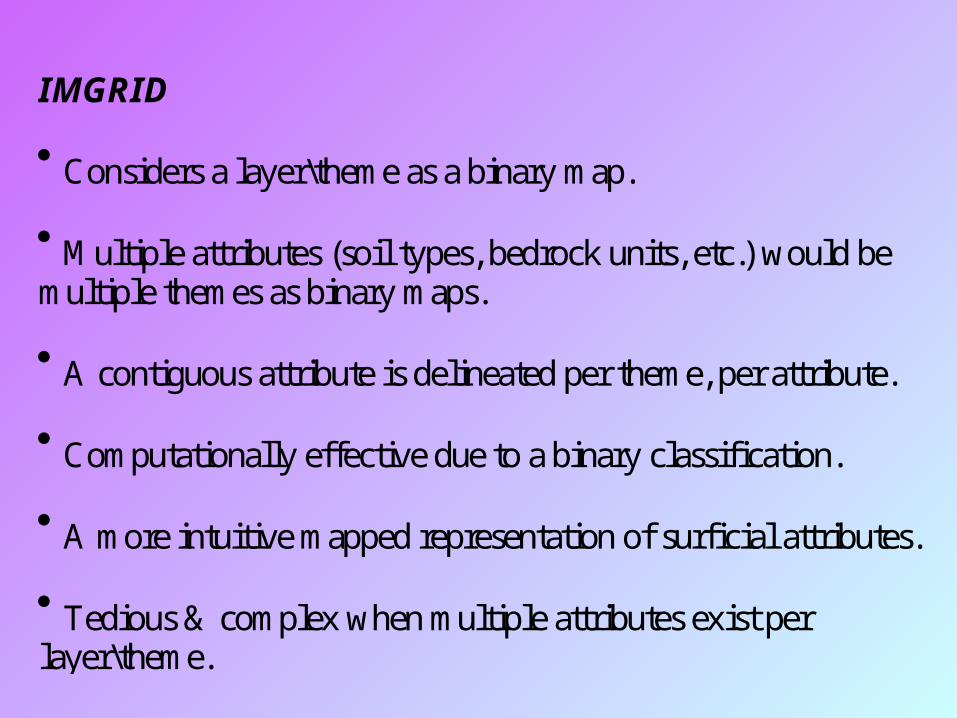
IMGRID
Considers a layer\theme as a binary map. M ultiple attributes (soil types, bedrock units, etc.) would bemultiple themes as binary maps. A contiguous attribute is delineated per theme, per attribute. Computationally effective due to a binary classification. A more intuitive mapped representation of surficial attributes. Tedious & complex when multiple attributes exist perlayer\theme.
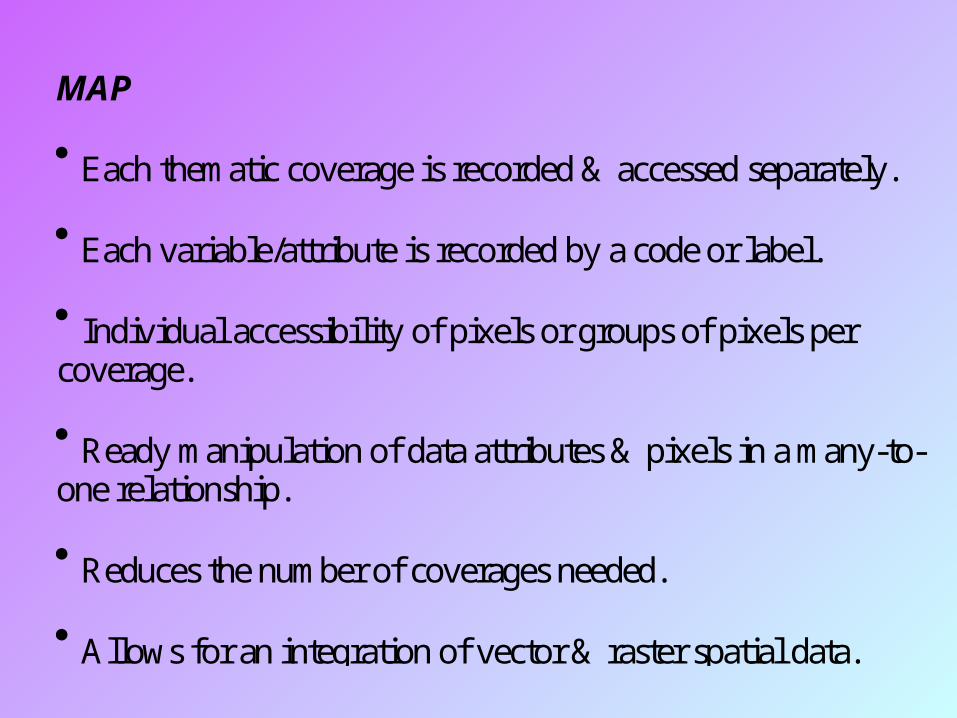
MAP
Each thematic coverage is recorded & accessed separately. Each variable/attribute is recorded by a code or label. Individual accessibility of pixels or groups of pixels percoverage. Ready manipulation of data attributes & pixels in a many-to-one relationship. Reduces the number of coverages needed. Allows for an integration of vector & raster spatial data.
Com pacting Raster DataRun-length Coding
List a value, its length (number of positions in a row), and therow designation. 10 x 10 rows\columns would have 100 individual values. W ith consecutive, redundant values, data is compressed. Inefficient with individual values, 30 x 30 max. = 900 values. Advantage when the data is consistent & redundant. Limited to row by row operations.
Raster Chain Code
Establish the regional extent of contiguous pixels with thesame value. Use cardinal positioning to establish start and end locationsdefining the outer geographic extent. Directional vectors as a number of grid cells along a trend. A second value is assigned to the pixel value for all contiguouspixels.
Block Code
Establish a block (square) of contiguous cells. Relies on square groups of cells. M ost efficient with contiguous values throughout the data set.
Quadtree Code
W orks on square groups of cells. Similar in design to the P.L.S.S (quadrants). Quadrants are subdivided by homogeneous class. Smallest unit represented is a single cell (pixel). Allows for variable resolution. Degree of coarseness by the depth of detail in the tree. Computationally difficult due to preset nesting of shapes withinthe tree.
Vector M odels
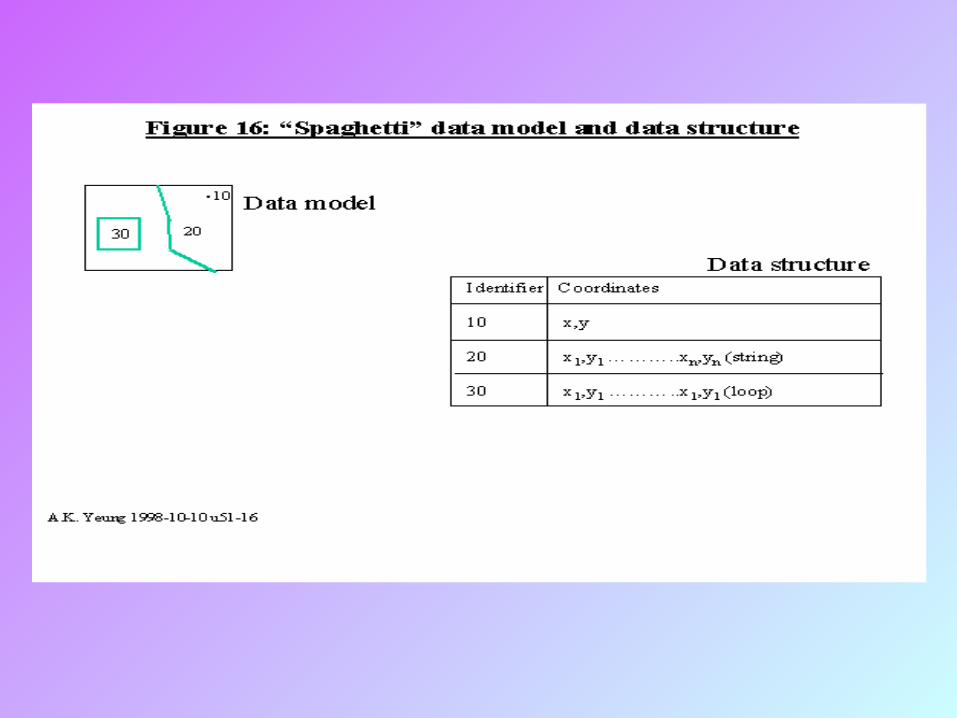
Spaghetti Model
One-to-one translation of spatial data in Cartesiancoordinates. All points, lines, & polygons are translated without topology. All relationships between & among spatial elements must becomputed. Enables quick digitizing of elements, but computationallyinefficient.
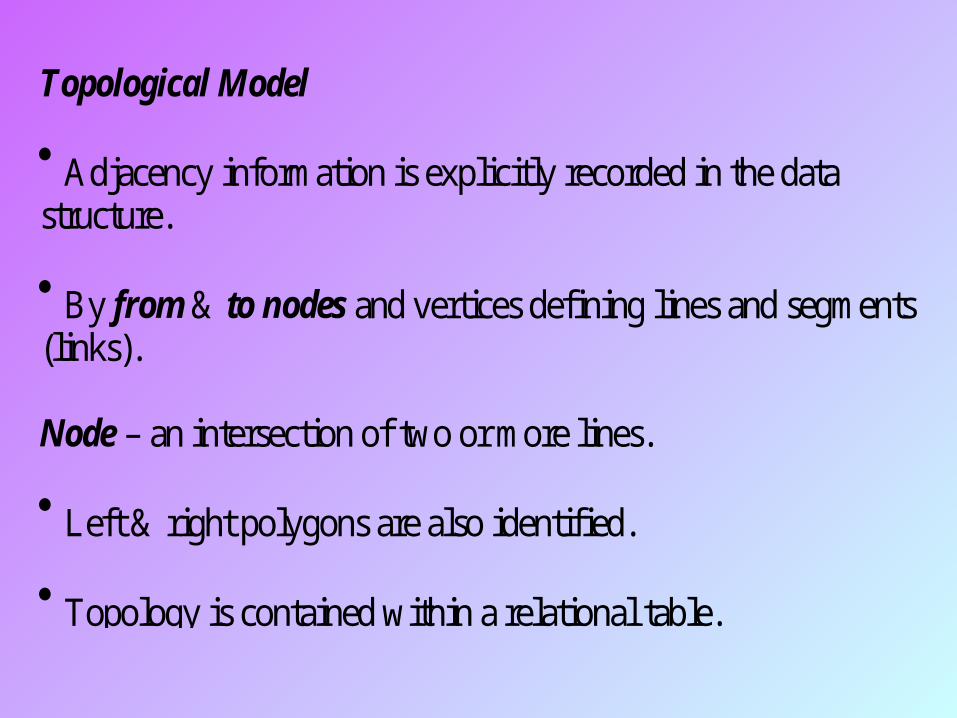
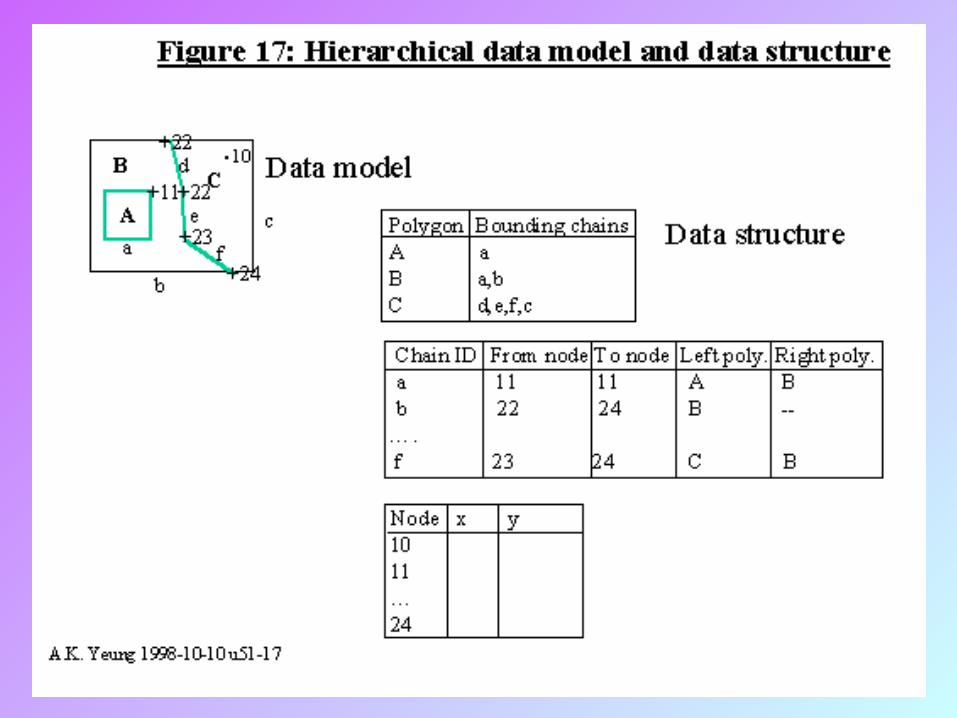
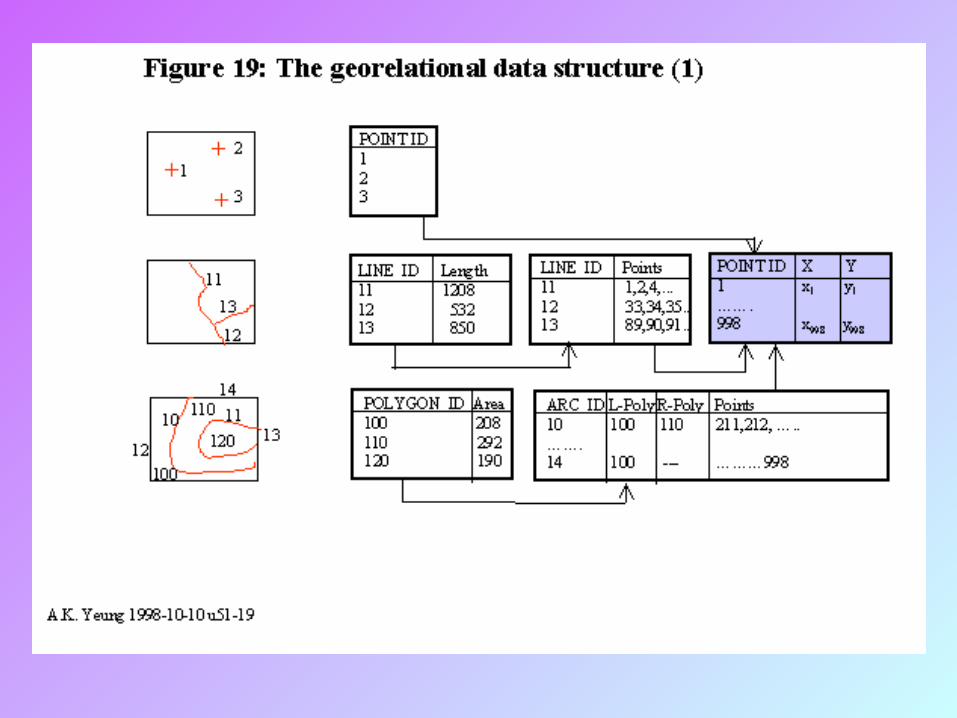
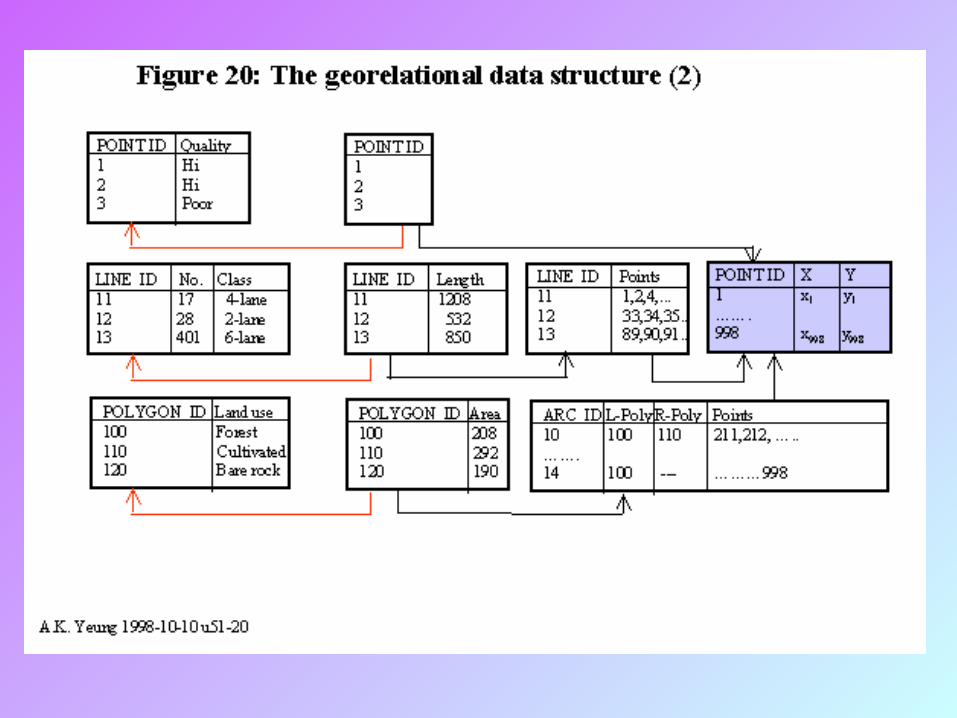
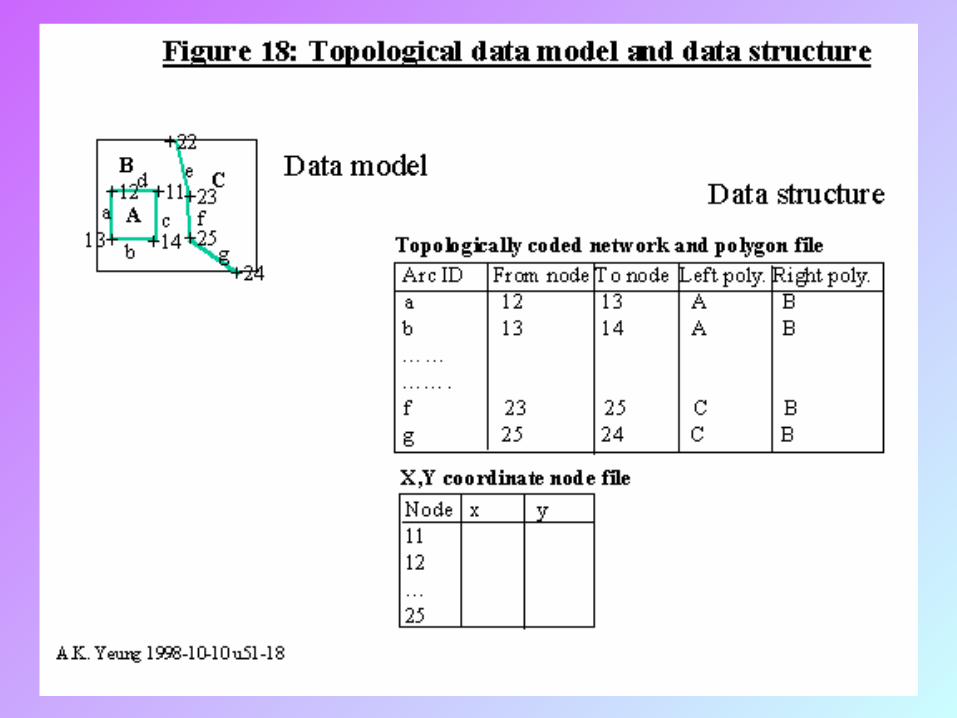
Topological Model
Adjacency information is explicitly recorded in the datastructure. By from & to nodes and vertices defining lines and segments(links).
Node – an intersection of two or more lines. Left & right polygons are also identified. Topology is contained within a relational table.
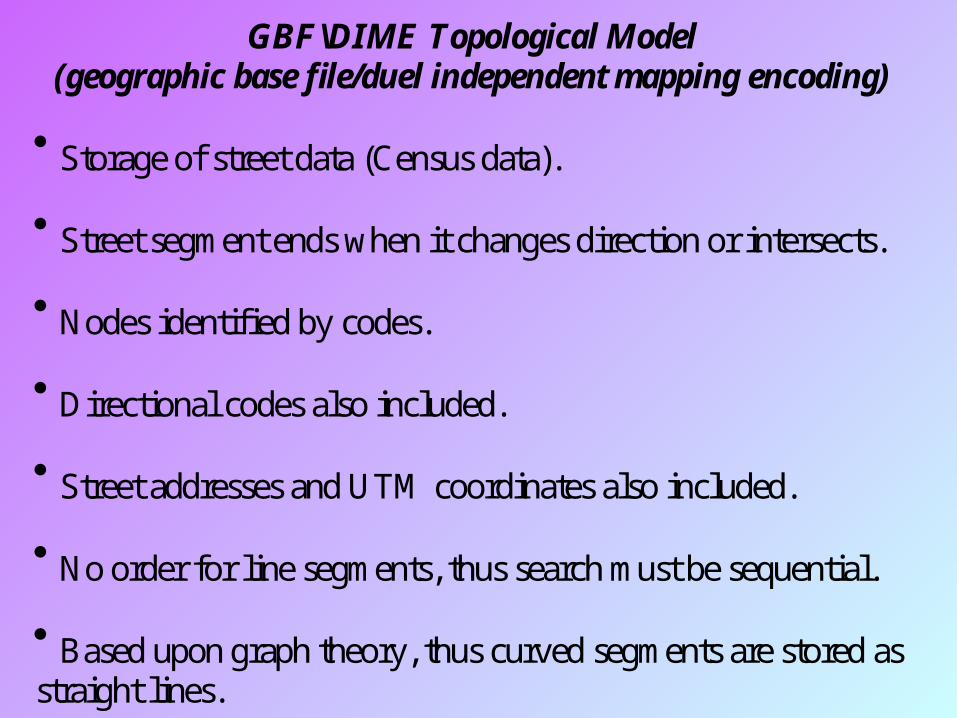
GBF \DIME Topological Model(geographic base file/duel independent mapping encoding)
Storage of street data (Census data). Street segment ends when it changes direction or intersects. Nodes identified by codes. Directional codes also included. Street addresses and UTM coordinates also included. No order for line segments, thus search must be sequential. Based upon graph theory, thus curved segments are stored asstraight lines.
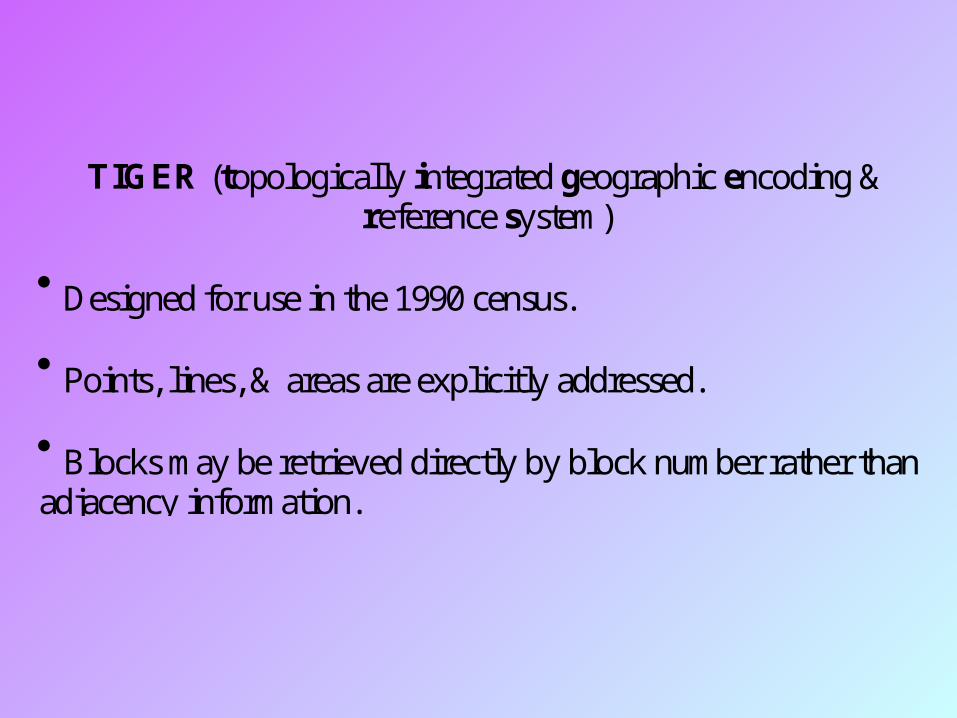
TIGER (topologically integrated geographic encoding &reference system)
Designed for use in the 1990 census. Points, lines, & areas are explicitly addressed. Blocks may be retrieved directly by block number rather thanadjacency information.
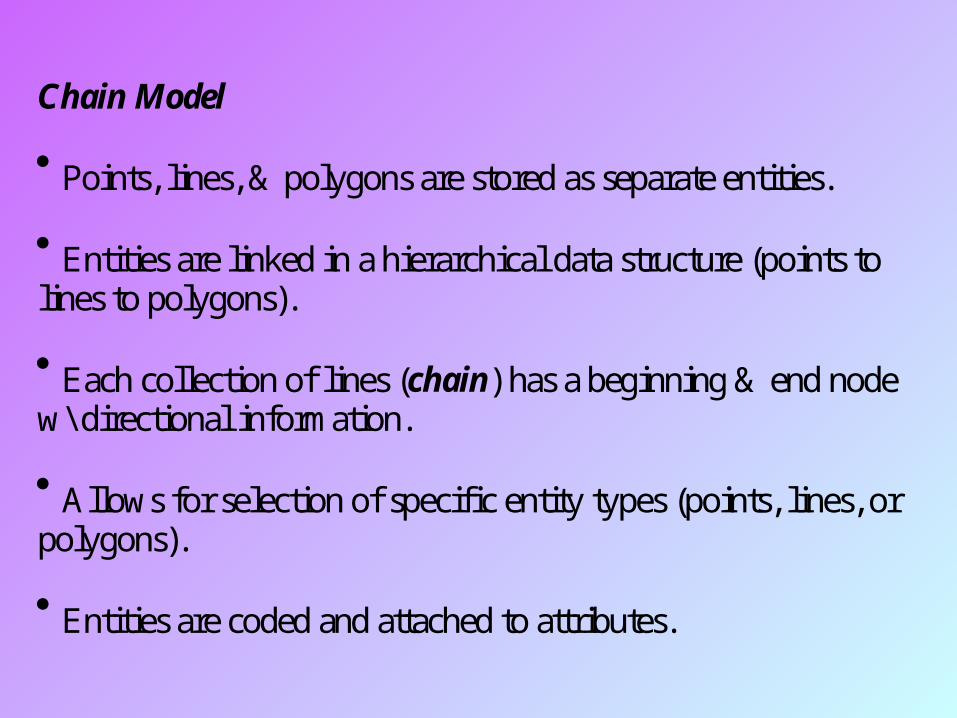
Chain Model
Points, lines, & polygons are stored as separate entities. Entities are linked in a hierarchical data structure (points tolines to polygons). Each collection of lines (chain) has a beginning & end nodew\ directional information. Allows for selection of specific entity types (points, lines, orpolygons). Entities are coded and attached to attributes.
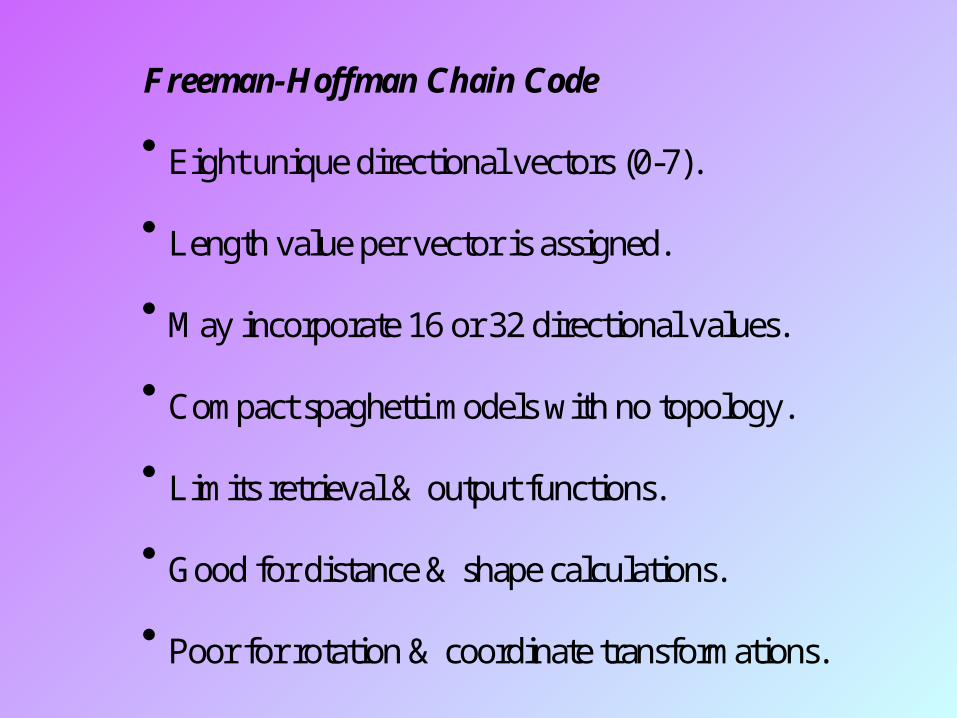
F reeman-Hoffman Chain Code
Eight unique directional vectors (0-7). Length value per vector is assigned. M ay incorporate 16 or 32 directional values. Compact spaghetti models with no topology. Limits retrieval & output functions. Good for distance & shape calculations. Poor for rotation & coordinate transformations.
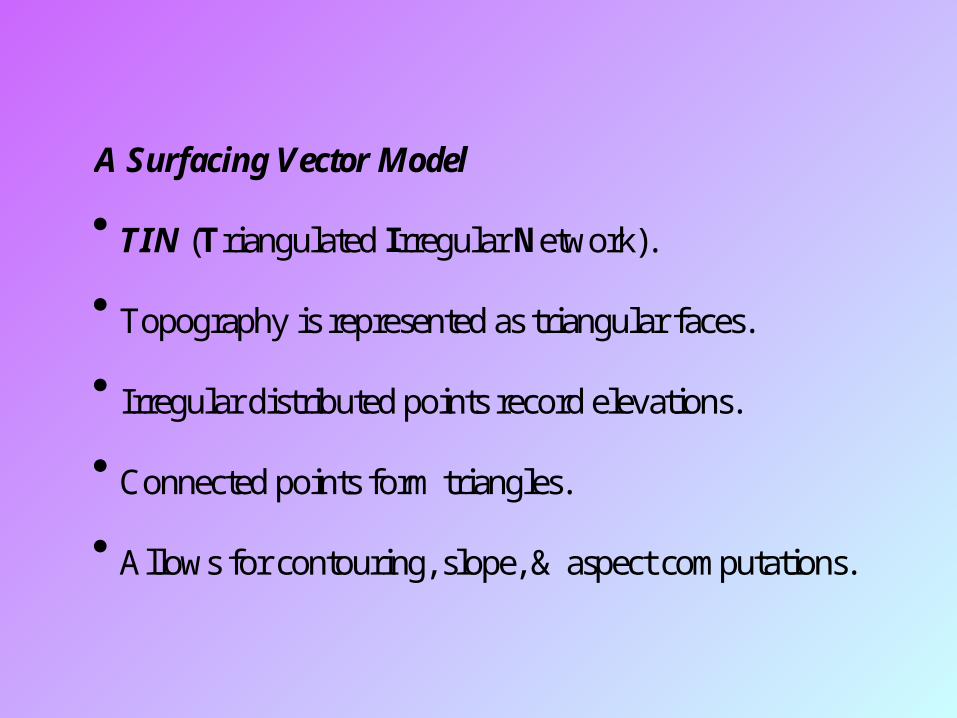
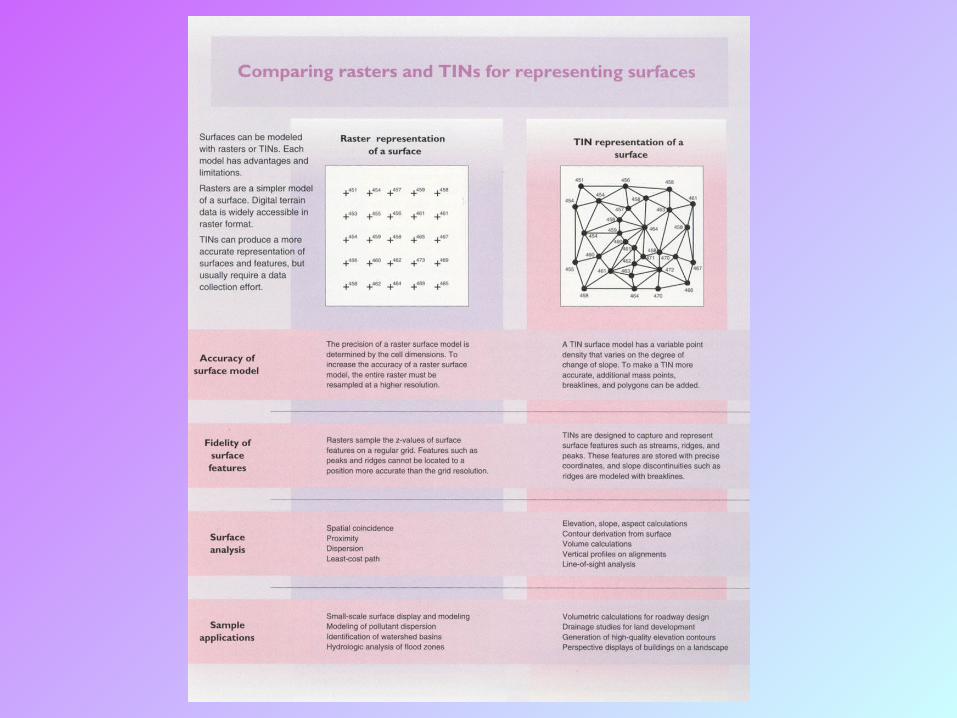
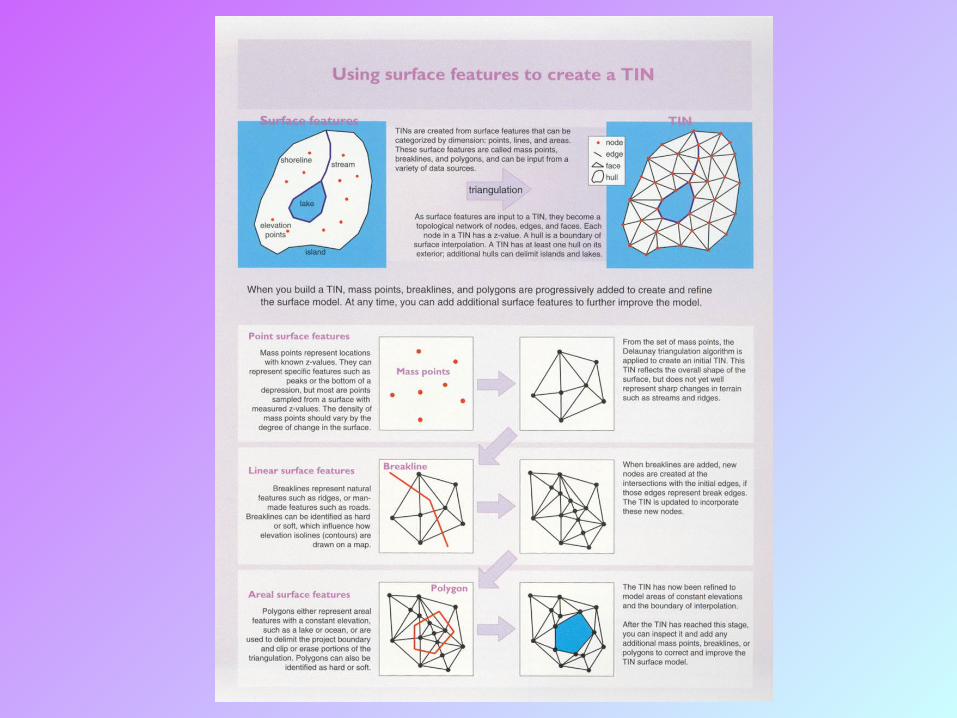
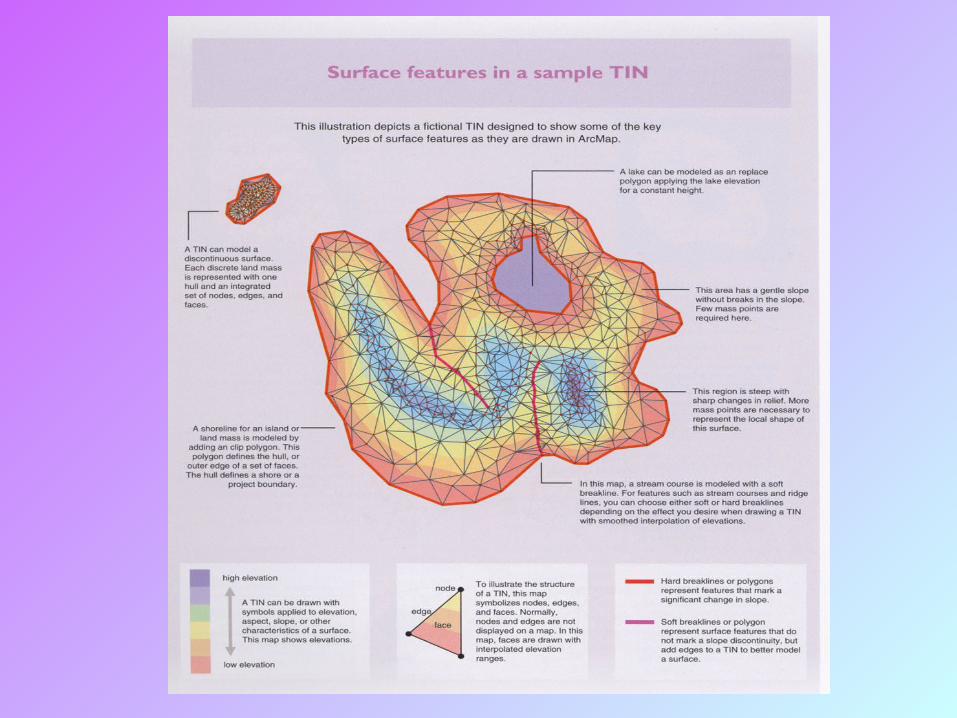
A Surfacing Vector Model
TIN (Triangulated Irregular Network). Topography is represented as triangular faces. Irregular distributed points record elevations. Connected points form triangles. Allows for contouring, slope, & aspect computations.

Topology and Shape Files
Topology – mathematical discipline concerned with linkages ofadjacent or neighborhood spatial objects. Assumes geographic features occur on a 2-D plane (planerenforcement). Lines that intersect must be broken by nodes. Topologically enforced maps have space-filling, non-overlapping polygons. An ArcInfo coverage is a topological structure.
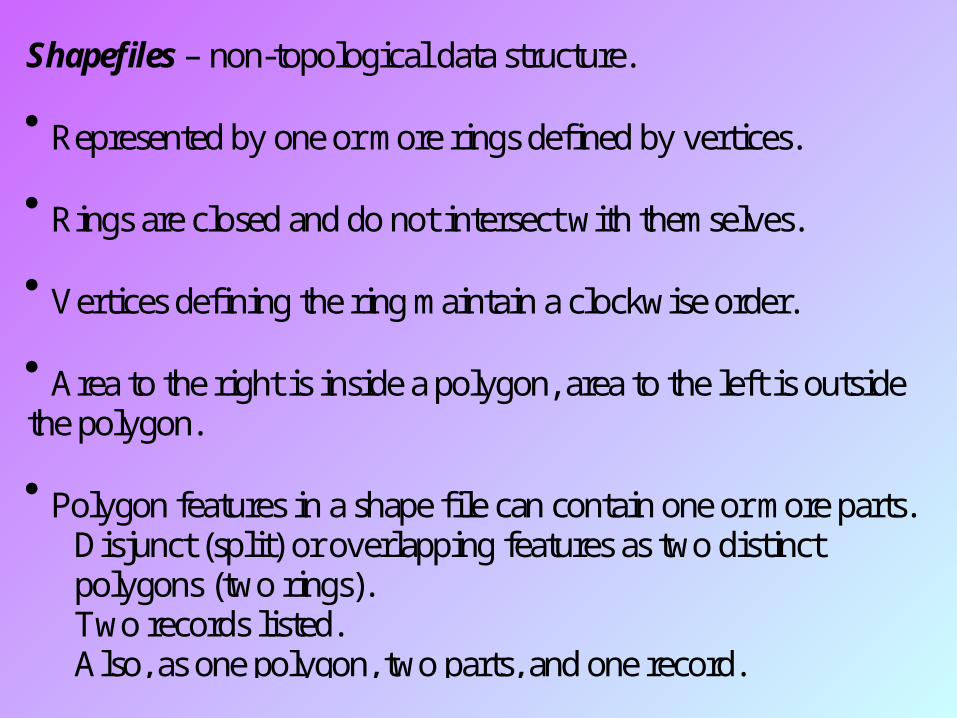
Shapefiles – non-topological data structure. Represented by one or more rings defined by vertices. Rings are closed and do not intersect with themselves. Vertices defining the ring maintain a clockwise order. Area to the right is inside a polygon, area to the left is outsidethe polygon. Polygon features in a shape file can contain one or more parts.
Disjunct (split) or overlapping features as two distinctpolygons (two rings).Two records listed.Also, as one polygon, two parts, and one record.
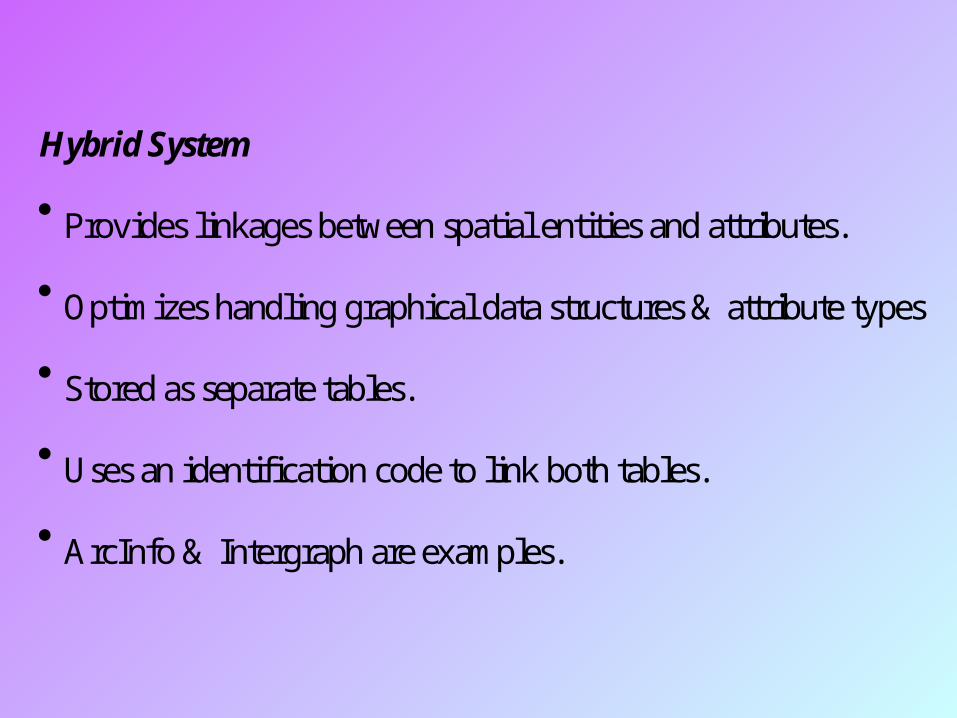
Hybrid System
Provides linkages between spatial entities and attributes. Optimizes handling graphical data structures & attribute types Stored as separate tables. Uses an identification code to link both tables. ArcInfo & Intergraph are examples.
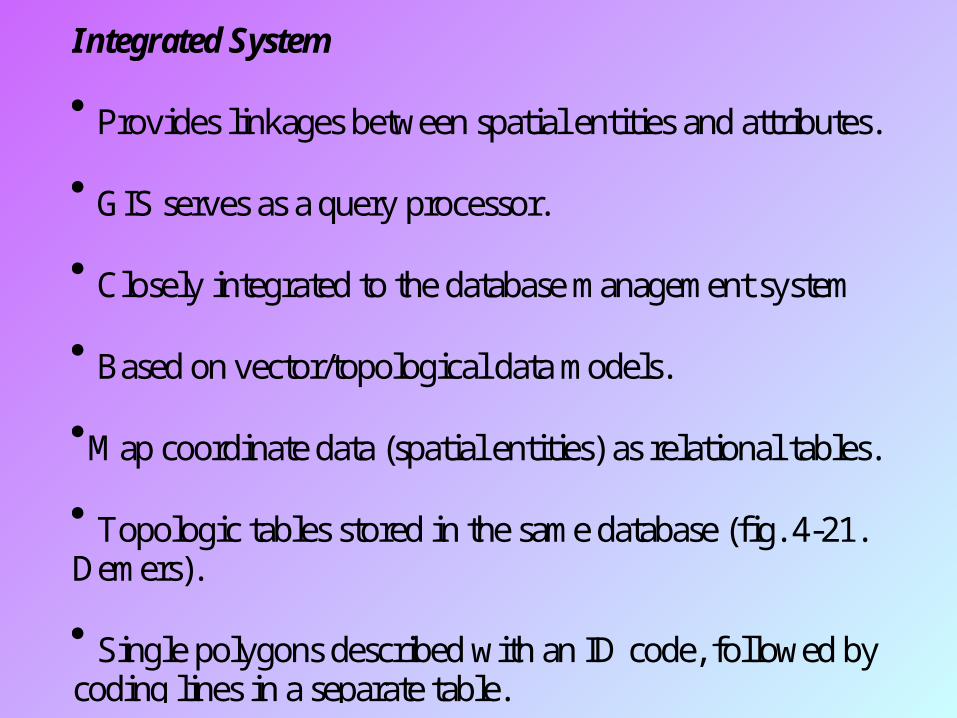
Integrated System
Provides linkages between spatial entities and attributes. GIS serves as a query processor. Closely integrated to the database management system Based on vector/topological data models.M ap coordinate data (spatial entities) as relational tables. Topologic tables stored in the same database (fig. 4-21.Demers). Single polygons described with an ID code, followed bycoding lines in a separate table.
Object-Oriented Database Management System
Recognizes the importance in accessing cartographic database,& operations to be performed. Object as an entity having a condition or state, & representedby variables & operations (entity-relationship attribute). Object-oriented as objects as members of a set (class) definedby local variables & operations. Each class belongs to a higher group. An ordered stream (line object), all 1st order streams (set\class),a specific drainage basin (polygon group). Objects are encapsulated within a defined data entity.


