Embed Size (px)
Citation preview
** This includes synthetic ETFs and a non-ETF.
db x-trackers**
Société d’investissement à capital variable
R.C.S. Luxembourg N° B-119.899
Annual Report and Audited Financial Statements
For the year ended 31 December 2014
No subscription can be accepted on the basis of the financial reports. Subscriptions are only valid if
they are made on the basis of the latest published Prospectus accompanied by the latest annual report
and the most recent semi-annual report, if published thereafter.
db x-trackers**
* This is a synthetic ETF. ** This includes synthetic ETFs and a non-ETF.
Table of contents
Page
Organisation 5
Directors’ Report 7
Independent Auditor’s Report 22
Information for Hong Kong Residents 24
Statistics 25
Statement of Net Assets as at 31 December 2014 61
Statement of Operations and Changes in Net Assets for the year ended 31 December 2014 97
Statement of Changes in Shares Issued for the year ended 31 December 2014 133
Statement of Investments as at 31 December 2014***
140
db x-trackers MSCI WORLD INDEX UCITS ETF* 140
db x-trackers MSCI EUROPE INDEX UCITS ETF (DR) 143
db x-trackers MSCI JAPAN INDEX UCITS ETF (DR) 154
db x-trackers EURO STOXX 50® UCITS ETF (DR) 161
db x-trackers DAX® UCITS ETF (DR) 163
db x-trackers FTSE MIB UCITS ETF (DR) 164
db x-trackers SMI® UCITS ETF (DR) 166
db x-trackers FTSE 100 UCITS ETF (DR) - Income 167
db x-trackers FTSE 250 UCITS ETF (DR) 170
db x-trackers FTSE ALL-SHARE UCITS ETF (DR) 177
db x-trackers MSCI EM LATAM INDEX UCITS ETF* 191
db x-trackers MSCI EM EMEA INDEX UCITS ETF* 193
db x-trackers MSCI TAIWAN INDEX UCITS ETF (DR) 194
db x-trackers MSCI BRAZIL INDEX UCITS ETF (DR) 197
db x-trackers MSCI KOREA INDEX UCITS ETF (DR) 199
db x-trackers FTSE CHINA 50 UCITS ETF (DR) 202
db x-trackers EURO STOXX® SELECT DIVIDEND 30 UCITS ETF (DR) 204
db x-trackers STOXX® GLOBAL SELECT DIVIDEND 100 UCITS ETF
* 206
db x-trackers STOXX® EUROPE 600 HEALTH CARE UCITS ETF
* 208
db x-trackers STOXX® EUROPE 600 BANKS UCITS ETF
* 210
db x-trackers DBLCI - OY BALANCED UCITS ETF* 211
db x-trackers RUSSELL 2000 UCITS ETF* 213
db x-trackers PORTFOLIO TOTAL RETURN UCITS ETF* 215
db x-trackers MSCI AC ASIA EX JAPAN INDEX UCITS ETF* 216
db x-trackers MSCI PACIFIC EX JAPAN INDEX UCITS ETF (DR) 218
db x-trackers LPX MM® PRIVATE EQUITY UCITS ETF
* 222
db x-trackers S&P/ASX 200 UCITS ETF (DR) 224
db x-trackers S&P EUROPE 350 SHARIAH UCITS ETF* 229
db x-trackers S&P JAPAN 500 SHARIAH UCITS ETF* 230
db x-trackers S&P 500 SHARIAH UCITS ETF* 231
db x-trackers DJ ISLAMIC MARKET TITANS 100 UCITS ETF* 232
db x-trackers STOXX® EUROPE 600 UCITS ETF (DR) 233
db x-trackers S&P GLOBAL INFRASTRUCTURE UCITS ETF* 247
db x-trackers CAC 40® UCITS ETF (DR) 248
db x-trackers CAC 40® SHORT DAILY UCITS ETF
* 250
db x-trackers MSCI EUROPE MID CAP INDEX UCITS ETF (DR) 251
db x-trackers MSCI EUROPE SMALL CAP INDEX UCITS ETF (DR) 257
db x-trackers DB HEDGE FUND INDEX UCITS ETF* 278
db x-trackers S&P SELECT FRONTIER UCITS ETF* 279
db x-trackers US DOLLAR CASH UCITS ETF* 280
db x-trackers DB COMMODITY BOOSTER BLOOMBERG UCITS ETF* 281
db x-trackers MSCI PAN-EURO INDEX UCITS ETF (DR) 282
db x-trackers MSCI MEXICO INDEX UCITS ETF (DR) 288
db x-trackers S&P 500 UCITS ETF* 289
db x-trackers FTSE EPRA/NAREIT DEVELOPED EUROPE REAL ESTATE UCITS ETF (DR) 291
2
db x-trackers**
* This is a synthetic ETF. ** This includes synthetic ETFs and a non-ETF.
Table of contents (continued)
Page
db x-trackers MSCI CHINA INDEX UCITS ETF (DR) 294
db x-trackers MSCI MALAYSIA INDEX UCITS ETF (DR) 298
db x-trackers MSCI THAILAND INDEX UCITS ETF (DR) 299
db x-trackers MSCI PHILIPPINES IM INDEX UCITS ETF (DR) 300
db x-trackers IBEX 35® UCITS ETF (DR) 301
db x-trackers MSCI SINGAPORE IM INDEX UCITS ETF (DR) 303
db x-trackers ATX UCITS ETF (DR) 306
db x-trackers MSCI EMU INDEX UCITS ETF (DR) 307
db x-trackers EURO STOXX 50® EX FINANCIALS UCITS ETF (DR) 313
db x-trackers DAX® UCITS ETF (DR) - Income 315
db x-trackers FTSE 100 UCITS ETF (DR) 316
db x-trackers NIKKEI 225 UCITS ETF (DR) 319
db x-trackers CUSTOM GLOBAL EQUITY 324
db x-trackers HARVEST CSI300 INDEX UCITS ETF (DR) 325
Notes to the Financial Statements 332
Information for Shareholders - unaudited 402
***
There is no Statement of Investments as at 31 December 2014 for the following Sub-Funds due to their structure
(the full collateralization of such Sub-Funds is detailed in Note 9):
db x-trackers MSCI USA INDEX UCITS ETF
*
db x-trackers MSCI EMERGING MARKETS INDEX UCITS ETF*
db x-trackers MSCI EM ASIA INDEX UCITS ETF*
db x-trackers CNX NIFTY UCITS ETF*
db x-trackers STOXX® EUROPE 600 BASIC RESOURCES UCITS ETF
*
db x-trackers STOXX® EUROPE 600 OIL & GAS UCITS ETF
*
db x-trackers STOXX® EUROPE 600 TELECOMMUNICATIONS UCITS ETF
*
db x-trackers STOXX® EUROPE 600 TECHNOLOGY UCITS ETF
*
db x-trackers STOXX® EUROPE 600 UTILITIES UCITS ETF
*
db x-trackers STOXX® EUROPE 600 INSURANCE UCITS ETF
*
db x-trackers STOXX® EUROPE 600 FOOD & BEVERAGE UCITS ETF
*
db x-trackers STOXX® EUROPE 600 INDUSTRIAL GOODS UCITS ETF
*
db x-trackers SHORTDAX® DAILY UCITS ETF
*
db x-trackers EURO STOXX 50® SHORT DAILY UCITS ETF
*
db x-trackers CURRENCY RETURNS UCITS ETF*
db x-trackers SLI® UCITS ETF
*
db x-trackers FTSE 100 SHORT DAILY UCITS ETF*
db x-trackers S&P 500 INVERSE DAILY UCITS ETF*
db x-trackers SMI® SHORT DAILY UCITS ETF
*
db x-trackers MSCI RUSSIA CAPPED INDEX UCITS ETF*
db x-trackers FTSE VIETNAM UCITS ETF*
db x-trackers STOXX® EUROPE 600 BANKS SHORT DAILY UCITS ETF
*
db x-trackers STOXX® EUROPE 600 HEALTH CARE SHORT DAILY UCITS ETF
*
db x-trackers STOXX® EUROPE 600 OIL & GAS SHORT DAILY UCITS ETF
*
db x-trackers FTSE ALL-WORLD EX UK UCITS ETF*
db x-trackers HSI SHORT DAILY UCITS ETF*
db x-trackers MSCI BRIC INDEX UCITS ETF*
db x-trackers S&P 500 2X LEVERAGED DAILY UCITS ETF*
db x-trackers SHORTDAX® X2 DAILY UCITS ETF
*
db x-trackers LEVDAX® DAILY UCITS ETF
*
db x-trackers EURO STOXX 50® LEVERAGED DAILY UCITS ETF
*
db x-trackers DB COMMODITY BOOSTER LIGHT ENERGY BENCHMARK UCITS ETF*
3
db x-trackers**
* This is a synthetic ETF. ** This includes synthetic ETFs and a non-ETF.
Table of contents (continued)
db x-trackers STOXX
® EUROPE 600 BASIC RESOURCES SHORT DAILY UCITS ETF
*
db x-trackers STOXX® EUROPE 600 INDUSTRIAL GOODS SHORT DAILY UCITS ETF
*
db x-trackers S&P 500 2X INVERSE DAILY UCITS ETF*
db x-trackers EURO STOXX 50®
DOUBLE SHORT DAILY UCITS ETF*
db x-trackers CSI300 UCITS ETF*
db x-trackers CSI300 BANKS UCITS ETF*
db x-trackers CSI300 CONSUMER DISCRETIONARY UCITS ETF*
db x-trackers CSI300 MATERIALS UCITS ETF*
db x-trackers CSI300 REAL ESTATE UCITS ETF*
db x-trackers CSI300 UTILITIES UCITS ETF*
db x-trackers CSI300 ENERGY UCITS ETF*
db x-trackers CSI300 FINANCIALS UCITS ETF*
db x-trackers CSI300 HEALTH CARE UCITS ETF*
db x-trackers CSI300 TRANSPORTATION UCITS ETF*
db x-trackers CSI300 INDUSTRIALS UCITS ETF*
db x-trackers MSCI CANADA INDEX UCITS ETF*
db x-trackers MSCI INDONESIA INDEX UCITS ETF*
db x-trackers MSCI EUROPE VALUE INDEX UCITS ETF*
db x-trackers FTSE EPRA/NAREIT GLOBAL REAL ESTATE UCITS ETF*
db x-trackers MSCI INDIA INDEX UCITS ETF*
db x-trackers MSCI EM SHORT DAILY INDEX UCITS ETF*
db x-trackers DB EQUITY STRATEGIES HEDGE FUND INDEX UCITS ETF*
db x-trackers MSCI WORLD CONSUMER DISCRETIONARY INDEX UCITS ETF*
db x-trackers MSCI WORLD CONSUMER STAPLES INDEX UCITS ETF*
db x-trackers MSCI WORLD ENERGY INDEX UCITS ETF*
db x-trackers MSCI WORLD FINANCIALS INDEX UCITS ETF*
db x-trackers MSCI WORLD HEALTH CARE INDEX UCITS ETF*
db x-trackers MSCI WORLD INDUSTRIALS INDEX UCITS ETF*
db x-trackers MSCI WORLD INFORMATION TECHNOLOGY INDEX UCITS ETF*
db x-trackers MSCI WORLD MATERIALS INDEX UCITS ETF*
db x-trackers MSCI WORLD TELECOM SERVICES INDEX UCITS ETF*
db x-trackers MSCI WORLD UTILITIES INDEX UCITS ETF*
db x-trackers RUSSELL MIDCAP UCITS ETF*
db x-trackers MSCI AC ASIA EX JAPAN HIGH DIVIDEND YIELD INDEX UCITS ETF*
db x-trackers MSCI EM CONSUMER DISCRETIONARY INDEX UCITS ETF*
db x-trackers MSCI EM CONSUMER STAPLES INDEX UCITS ETF*
db x-trackers MSCI EM ENERGY INDEX UCITS ETF*
db x-trackers MSCI EM FINANCIALS INDEX UCITS ETF*
db x-trackers MSCI EM HEALTHCARE INDEX UCITS ETF*
db x-trackers MSCI EM INDUSTRIALS INDEX UCITS ETF*
db x-trackers MSCI EM INFORMATION TECHNOLOGY INDEX UCITS ETF*
db x-trackers MSCI EM MATERIALS INDEX UCITS ETF*
db x-trackers MSCI EM TELECOMMUNICATION SERVICES INDEX UCITS ETF*
db x-trackers MSCI EM UTILITIES INDEX UCITS ETF*
db x-trackers MSCI AFRICA TOP 50 INDEX UCITS ETF*
db x-trackers MSCI EM EASTERN EUROPE INDEX UCITS ETF*
db x-trackers MSCI CHILE INDEX UCITS ETF*
db x-trackers MSCI AC ASIA PACIFIC EX JAPAN INDEX UCITS ETF*
db x-trackers MSCI BANGLADESH IM INDEX UCITS ETF*
db x-trackers MSCI PAKISTAN IM INDEX UCITS ETF*
db x-trackers S&P 500® EQUAL WEIGHT UCITS ETF
*
4
db x-trackers**
** This includes synthetic ETFs and a non-ETF.
Organisation
Registered Office
db x-trackers**
49, avenue J.F. Kennedy
L-1855 Luxembourg
Grand Duchy of Luxembourg
Board of Directors
- Werner Burg (chairman of the Board of Directors), director,
Deutsche Bank Luxembourg S.A., 2, boulevard Konrad Adenauer
L-1115 Luxembourg, Grand Duchy of Luxembourg
- Klaus-Michael Vogel, member of the Management Board,
Deutsche Bank Luxembourg S.A., 2, boulevard Konrad Adenauer
L-1115 Luxembourg, Grand Duchy of Luxembourg
- Jacques Elvinger, partner,
Elvinger, Hoss & Prussen, 2, place Winston Churchill
L-1340 Luxembourg, Grand Duchy of Luxembourg
-Manooj Mistry, head of exchange traded products and institutional passive,
Deutsche Bank AG, London branch, Winchester House, 1 Great Winchester Street
London EC2N 2DB, United Kingdom
Custodian
State Street Bank Luxembourg S.A.
49, avenue J.F. Kennedy
L-1855 Luxembourg
Grand Duchy of Luxembourg
Management Company
DB Platinum Advisors
2, boulevard Konrad Adenauer
L-1115 Luxembourg
Grand Duchy of Luxembourg
Administrative Agent, Paying Agent, Domiciliary Agent and Listing Agent
State Street Bank Luxembourg S.A.
49, avenue J.F. Kennedy
L-1855 Luxembourg
Grand Duchy of Luxembourg
Registrar and Transfer Agent
State Street Bank Luxembourg S.A.
49, avenue J.F. Kennedy
L-1855 Luxembourg
Grand Duchy of Luxembourg
Investment Manager for all Sub-Funds except for db x-trackers Harvest CSI300 Index UCITS ETF (DR)
State Street Global Advisors Limited
20 Churchill Place, Canary Wharf
London E14 5HJ
United Kingdom
5
db x-trackers**
** This includes synthetic ETFs and a non-ETF.
Organisation (continued)
Investment Manager for db x-trackers Harvest CSI300 Index UCITS ETF (DR)
Harvest Global Investments Limited
31/F One Exchange Square
8 Connaught Place, Central Hong Kong
Hong Kong
Collateral Account Bank to certain Sub-Funds (see note 9)
State Street Bank Luxembourg S.A.
49, avenue J.F. Kennedy
L-1855 Luxembourg
Grand Duchy of Luxembourg
Collateral Account Bank to certain Sub-Funds (see note 9)
The Bank of New York Mellon SA/NV, Luxembourg Branch
2-4 rue Eugène Ruppert
L-2453 Luxembourg
Grand Duchy of Luxembourg
Security Lending Agent to certain Sub-Funds (see note 8)
Deutsche Bank AG, Frankfurt head office
Taunusanlage 12
60325 Frankfurt am Main
Germany
Deutsche Bank AG, London branch
1 Great Winchester Street
London EC2N 2DB
United Kingdom
Deutsche Bank AG, New York branch
60 Wall Street
New York NY 10005
United States of America
Independent Auditor
Ernst & Young S.A.
7, rue Gabriel Lippmann
Parc d’Activité Syrdall 2
L-5365 Munsbach
Grand Duchy of Luxembourg
Legal Adviser
Elvinger, Hoss & Prussen
2, place Winston Churchill
L-1340 Luxembourg
Grand Duchy of Luxembourg
Hong Kong Representative
RBC Investor Services Trust Hong Kong Limited
51st floor, Central Plaza
18 Harbour Road
Wanchai, Hong Kong
Capitalised Terms used herein shall have the same meaning as in the current prospectus of db x-trackers** (the “Prospectus”).
6
db x-trackers**
Directors’ Report
1 All conversions into EUR were made with WM/ Reuters closing spot rates at 16:00 UK GMT.
* This is a synthetic ETF. ** This includes synthetic ETFs and a non-ETF.
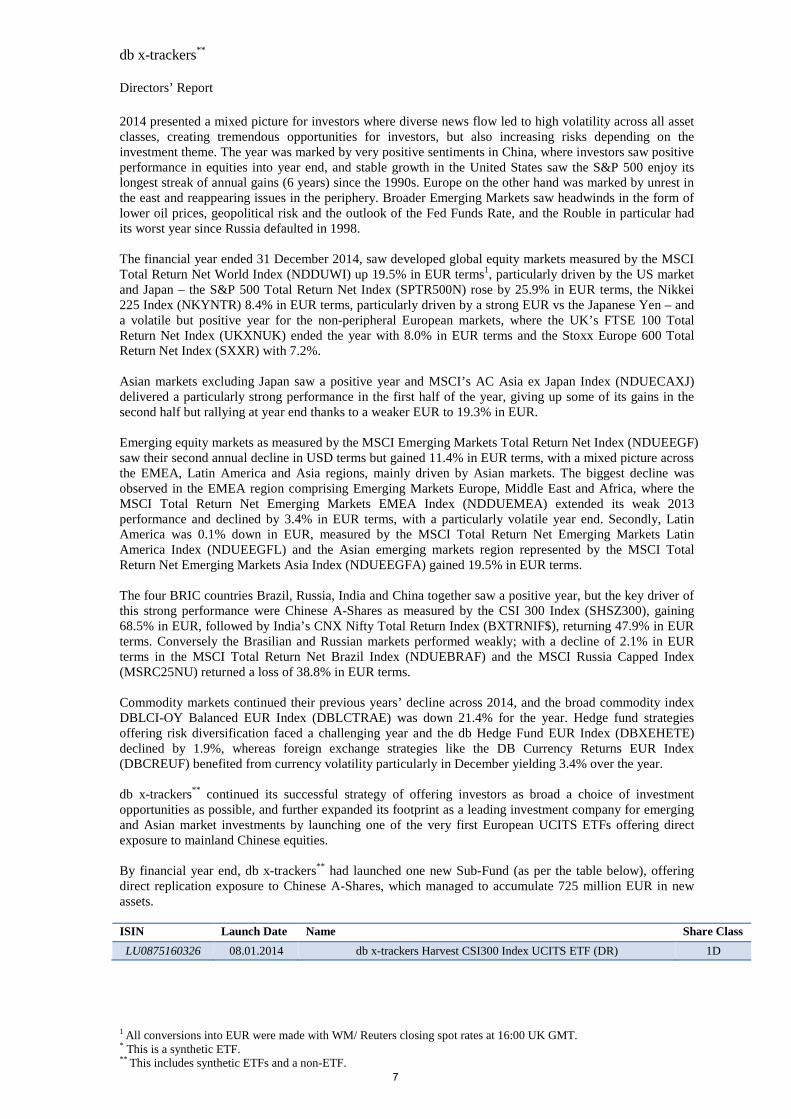
2014 presented a mixed picture for investors where diverse news flow led to high volatility across all asset classes, creating tremendous opportunities for investors, but also increasing risks depending on the investment theme. The year was marked by very positive sentiments in China, where investors saw positive performance in equities into year end, and stable growth in the United States saw the S&P 500 enjoy its longest streak of annual gains (6 years) since the 1990s. Europe on the other hand was marked by unrest in the east and reappearing issues in the periphery. Broader Emerging Markets saw headwinds in the form of lower oil prices, geopolitical risk and the outlook of the Fed Funds Rate, and the Rouble in particular had its worst year since Russia defaulted in 1998. The financial year ended 31 December 2014, saw developed global equity markets measured by the MSCI Total Return Net World Index (NDDUWI) up 19.5% in EUR terms1, particularly driven by the US market and Japan – the S&P 500 Total Return Net Index (SPTR500N) rose by 25.9% in EUR terms, the Nikkei 225 Index (NKYNTR) 8.4% in EUR terms, particularly driven by a strong EUR vs the Japanese Yen – and a volatile but positive year for the non-peripheral European markets, where the UK’s FTSE 100 Total Return Net Index (UKXNUK) ended the year with 8.0% in EUR terms and the Stoxx Europe 600 Total Return Net Index (SXXR) with 7.2%. Asian markets excluding Japan saw a positive year and MSCI’s AC Asia ex Japan Index (NDUECAXJ) delivered a particularly strong performance in the first half of the year, giving up some of its gains in the second half but rallying at year end thanks to a weaker EUR to 19.3% in EUR. Emerging equity markets as measured by the MSCI Emerging Markets Total Return Net Index (NDUEEGF) saw their second annual decline in USD terms but gained 11.4% in EUR terms, with a mixed picture across the EMEA, Latin America and Asia regions, mainly driven by Asian markets. The biggest decline was observed in the EMEA region comprising Emerging Markets Europe, Middle East and Africa, where the MSCI Total Return Net Emerging Markets EMEA Index (NDDUEMEA) extended its weak 2013 performance and declined by 3.4% in EUR terms, with a particularly volatile year end. Secondly, Latin America was 0.1% down in EUR, measured by the MSCI Total Return Net Emerging Markets Latin America Index (NDUEEGFL) and the Asian emerging markets region represented by the MSCI Total Return Net Emerging Markets Asia Index (NDUEEGFA) gained 19.5% in EUR terms. The four BRIC countries Brazil, Russia, India and China together saw a positive year, but the key driver of this strong performance were Chinese A-Shares as measured by the CSI 300 Index (SHSZ300), gaining 68.5% in EUR, followed by India’s CNX Nifty Total Return Index (BXTRNIF$), returning 47.9% in EUR terms. Conversely the Brasilian and Russian markets performed weakly; with a decline of 2.1% in EUR terms in the MSCI Total Return Net Brazil Index (NDUEBRAF) and the MSCI Russia Capped Index (MSRC25NU) returned a loss of 38.8% in EUR terms. Commodity markets continued their previous years’ decline across 2014, and the broad commodity index DBLCI-OY Balanced EUR Index (DBLCTRAE) was down 21.4% for the year. Hedge fund strategies offering risk diversification faced a challenging year and the db Hedge Fund EUR Index (DBXEHETE) declined by 1.9%, whereas foreign exchange strategies like the DB Currency Returns EUR Index (DBCREUF) benefited from currency volatility particularly in December yielding 3.4% over the year. db x-trackers** continued its successful strategy of offering investors as broad a choice of investment opportunities as possible, and further expanded its footprint as a leading investment company for emerging and Asian market investments by launching one of the very first European UCITS ETFs offering direct exposure to mainland Chinese equities. By financial year end, db x-trackers** had launched one new Sub-Fund (as per the table below), offering direct replication exposure to Chinese A-Shares, which managed to accumulate 725 million EUR in new assets. ISIN Launch Date Name Share Class
LU0875160326 08.01.2014 db x-trackers Harvest CSI300 Index UCITS ETF (DR) 1D
7
db x-trackers**
Directors’ Report (continued)
* This is a synthetic ETF. ** This includes synthetic ETFs and a non-ETF.
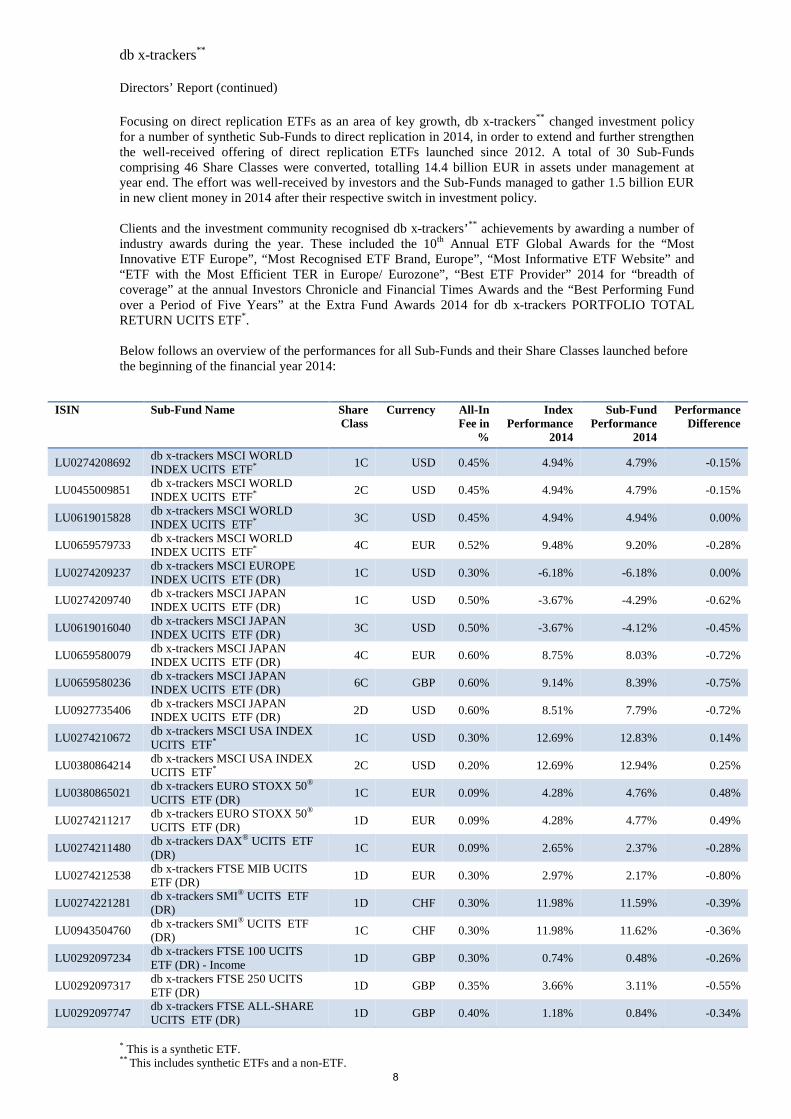
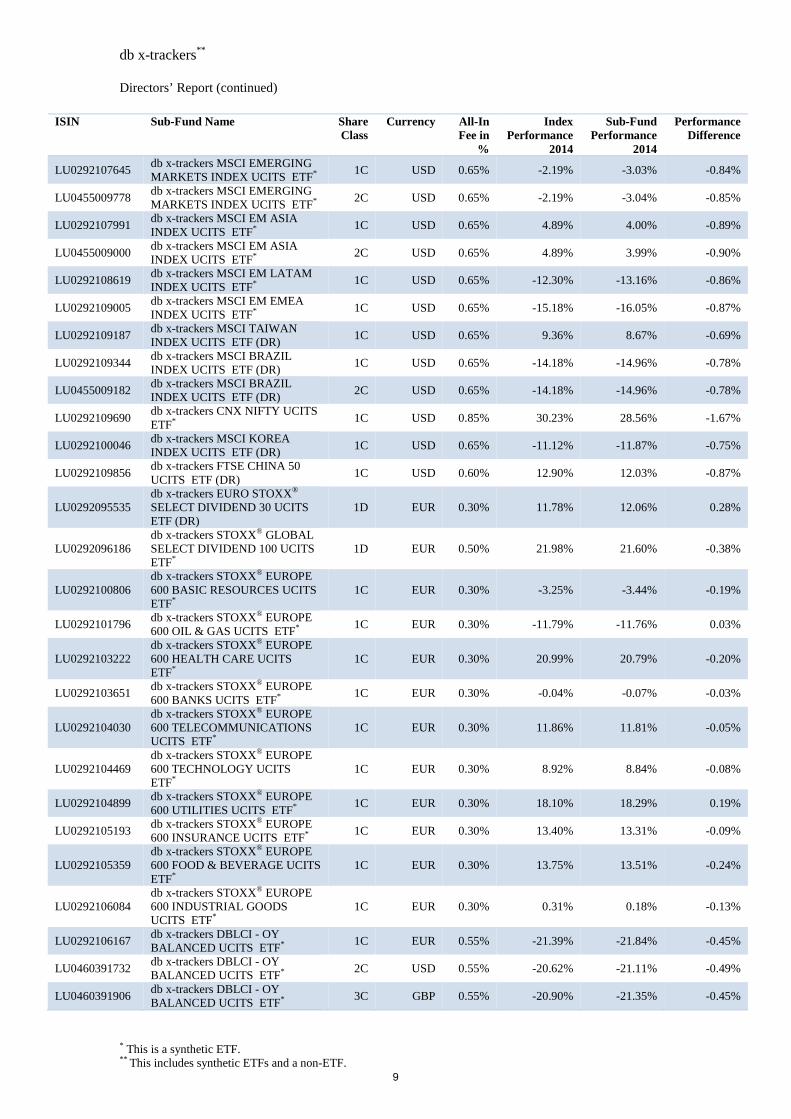
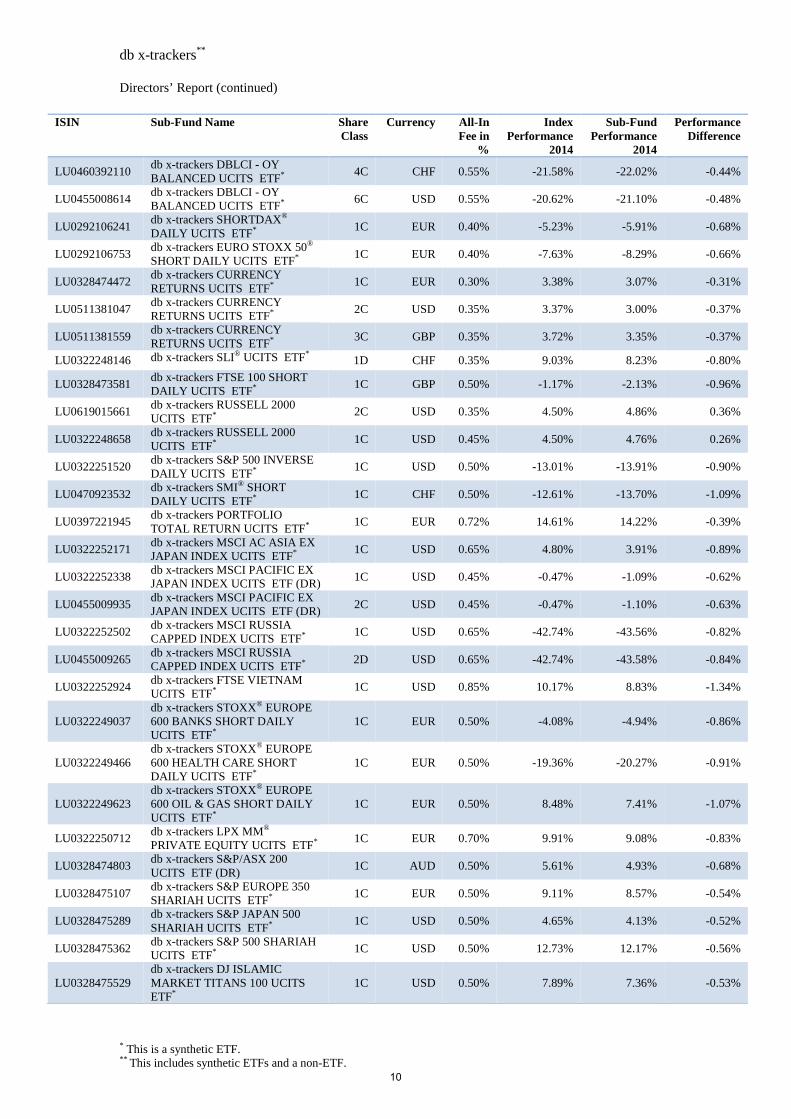
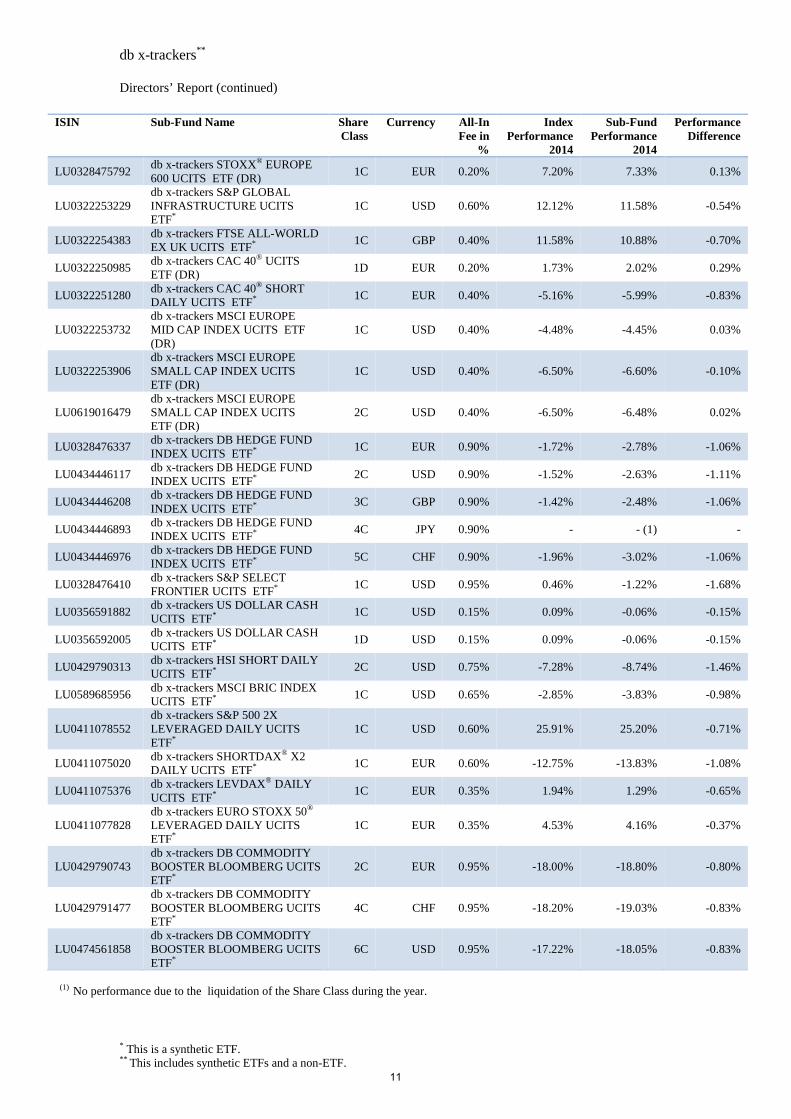
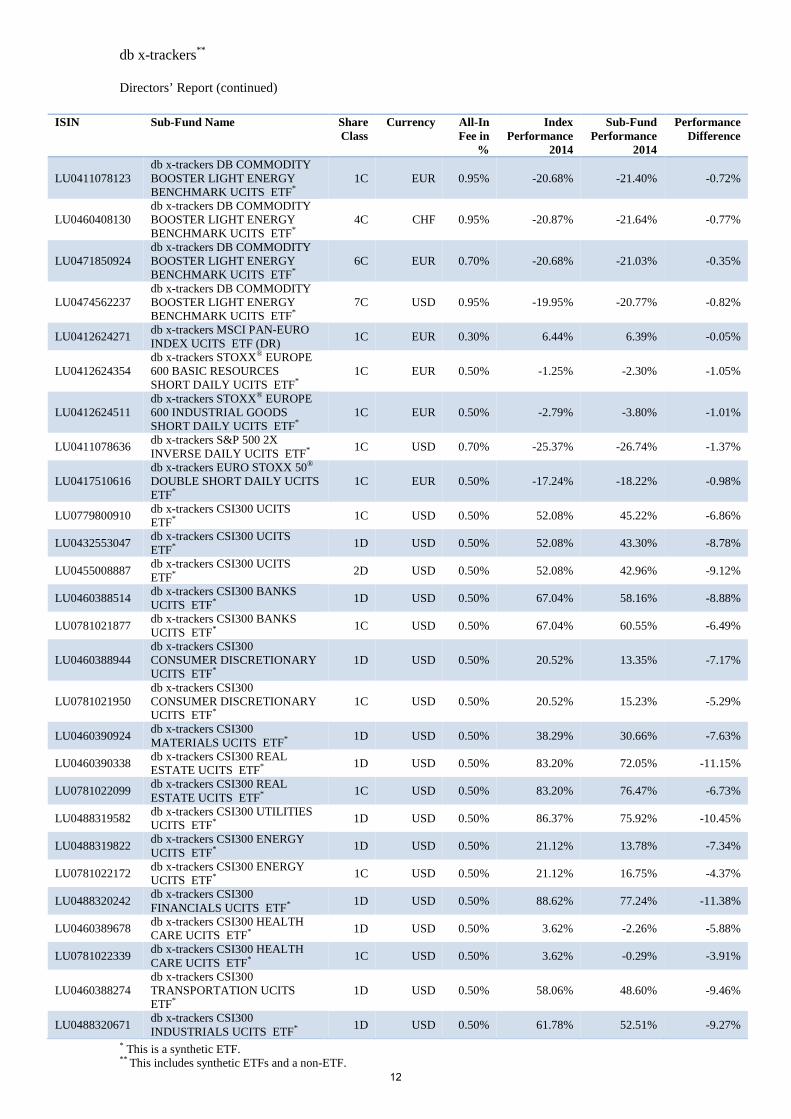
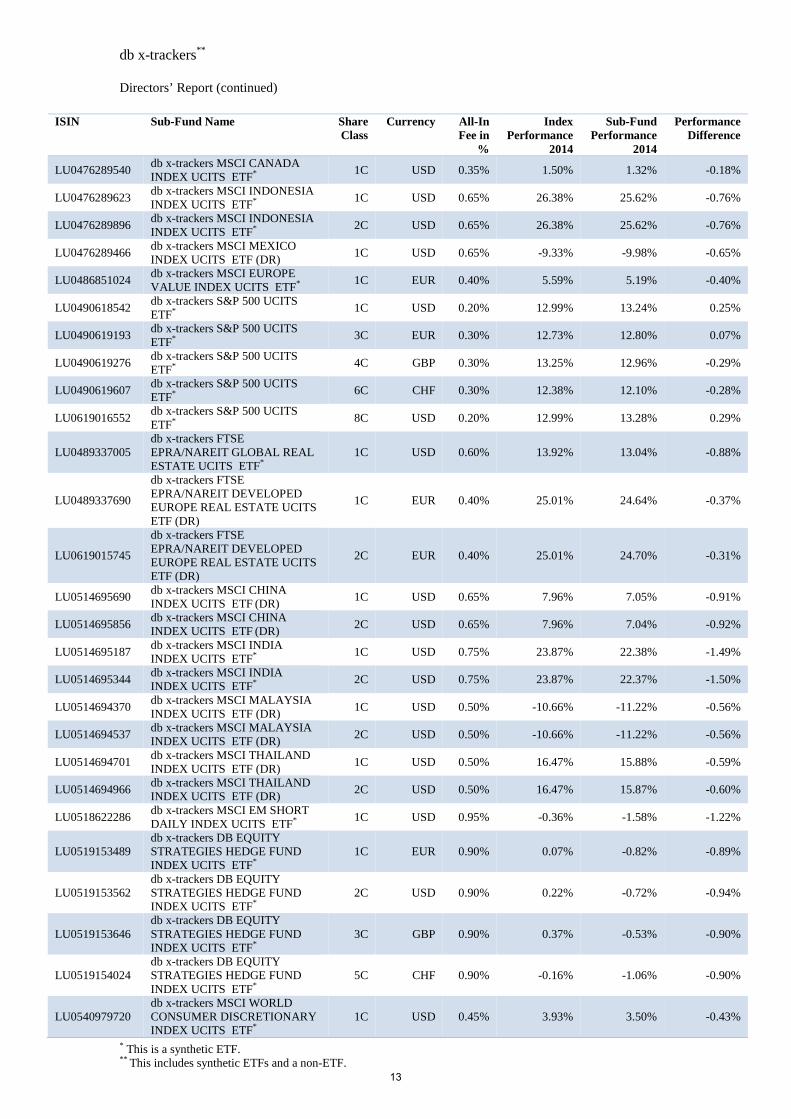
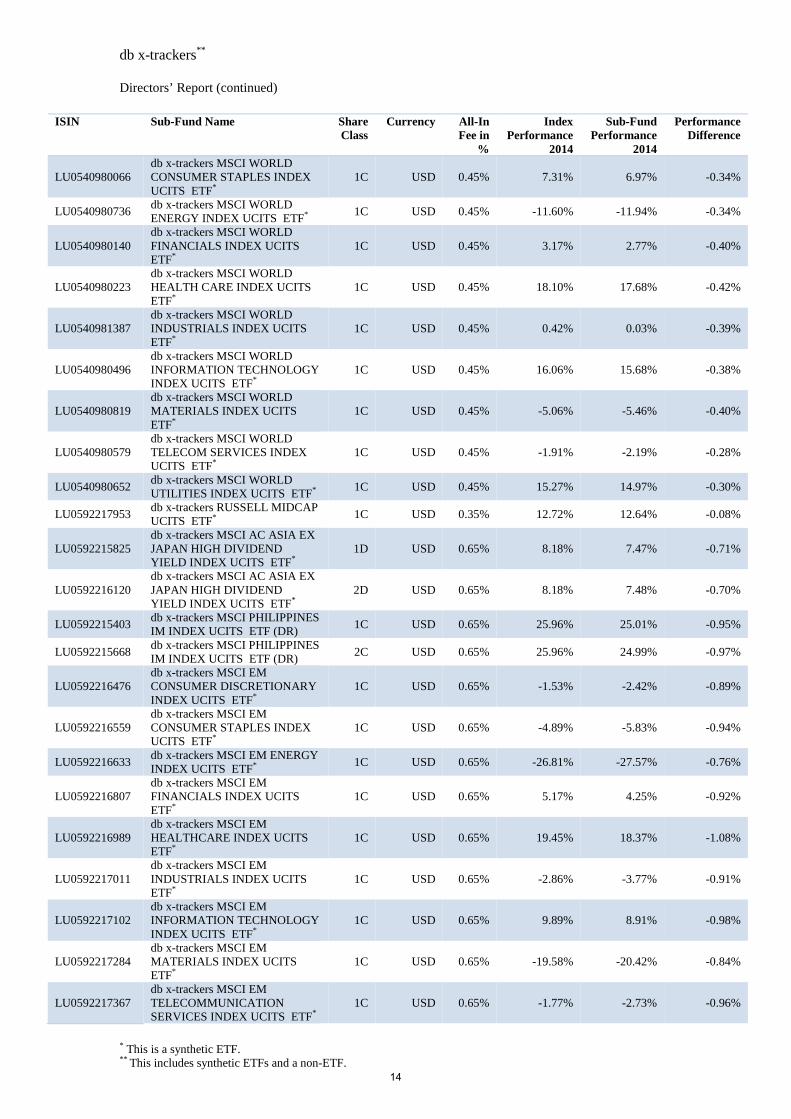
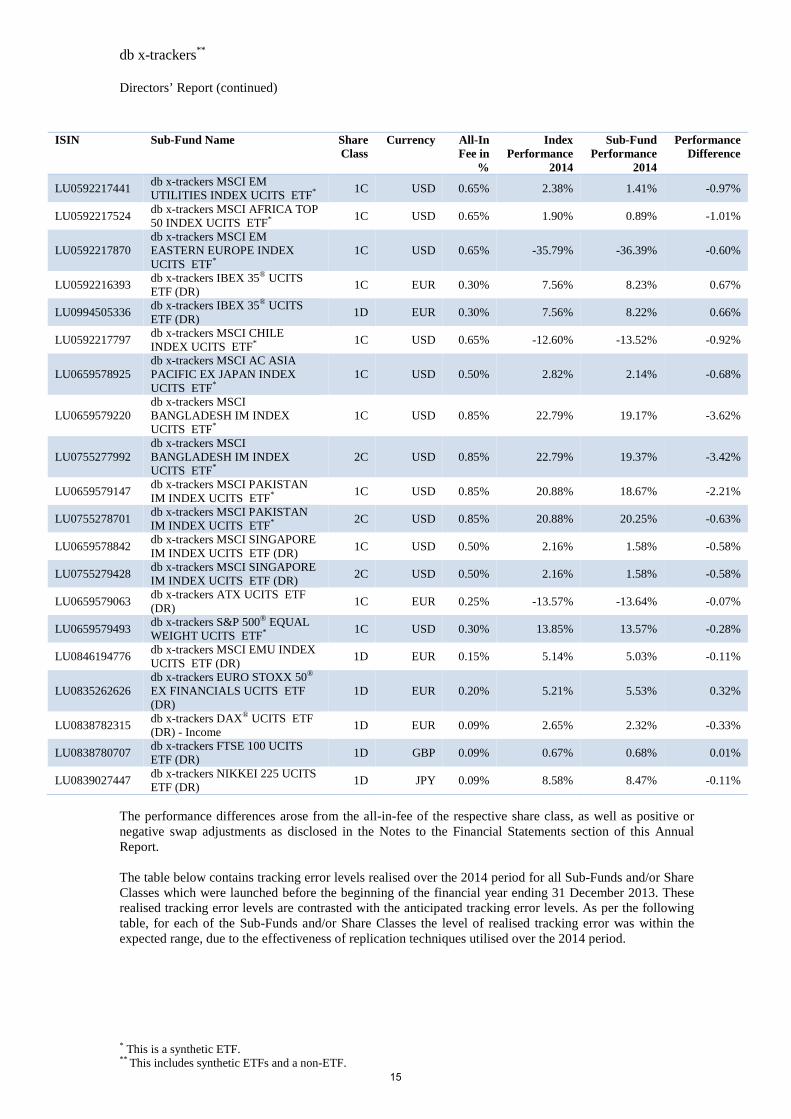
Focusing on direct replication ETFs as an area of key growth, db x-trackers** changed investment policy for a number of synthetic Sub-Funds to direct replication in 2014, in order to extend and further strengthen the well-received offering of direct replication ETFs launched since 2012. A total of 30 Sub-Funds comprising 46 Share Classes were converted, totalling 14.4 billion EUR in assets under management at year end. The effort was well-received by investors and the Sub-Funds managed to gather 1.5 billion EUR in new client money in 2014 after their respective switch in investment policy. Clients and the investment community recognised db x-trackers’** achievements by awarding a number of industry awards during the year. These included the 10th Annual ETF Global Awards for the “Most Innovative ETF Europe”, “Most Recognised ETF Brand, Europe”, “Most Informative ETF Website” and “ETF with the Most Efficient TER in Europe/ Eurozone”, “Best ETF Provider” 2014 for “breadth of coverage” at the annual Investors Chronicle and Financial Times Awards and the “Best Performing Fund over a Period of Five Years” at the Extra Fund Awards 2014 for db x-trackers PORTFOLIO TOTAL RETURN UCITS ETF*. Below follows an overview of the performances for all Sub-Funds and their Share Classes launched before the beginning of the financial year 2014:
ISIN Sub-Fund Name Share Class
Currency All-In Fee in
%
Index Performance
2014
Sub-Fund Performance
2014
Performance Difference
LU0274208692 db x-trackers MSCI WORLD INDEX UCITS ETF*
1C USD 0.45% 4.94% 4.79% -0.15%
LU0455009851 db x-trackers MSCI WORLD INDEX UCITS ETF*
2C USD 0.45% 4.94% 4.79% -0.15%
LU0619015828 db x-trackers MSCI WORLD INDEX UCITS ETF*
3C USD 0.45% 4.94% 4.94% 0.00%
LU0659579733 db x-trackers MSCI WORLD INDEX UCITS ETF*
4C EUR 0.52% 9.48% 9.20% -0.28%
LU0274209237 db x-trackers MSCI EUROPE INDEX UCITS ETF (DR)
1C USD 0.30% -6.18% -6.18% 0.00%
LU0274209740 db x-trackers MSCI JAPAN INDEX UCITS ETF (DR)
1C USD 0.50% -3.67% -4.29% -0.62%
LU0619016040 db x-trackers MSCI JAPAN INDEX UCITS ETF (DR)
3C USD 0.50% -3.67% -4.12% -0.45%
LU0659580079 db x-trackers MSCI JAPAN INDEX UCITS ETF (DR)
4C EUR 0.60% 8.75% 8.03% -0.72%
LU0659580236 db x-trackers MSCI JAPAN INDEX UCITS ETF (DR)
6C GBP 0.60% 9.14% 8.39% -0.75%
LU0927735406 db x-trackers MSCI JAPAN INDEX UCITS ETF (DR)
2D USD 0.60% 8.51% 7.79% -0.72%
LU0274210672 db x-trackers MSCI USA INDEX UCITS ETF*
1C USD 0.30% 12.69% 12.83% 0.14%
LU0380864214 db x-trackers MSCI USA INDEX UCITS ETF*
2C USD 0.20% 12.69% 12.94% 0.25%
LU0380865021 db x-trackers EURO STOXX 50® UCITS ETF (DR)
1C EUR 0.09% 4.28% 4.76% 0.48%
LU0274211217 db x-trackers EURO STOXX 50® UCITS ETF (DR)
1D EUR 0.09% 4.28% 4.77% 0.49%
LU0274211480 db x-trackers DAX® UCITS ETF (DR)
1C EUR 0.09% 2.65% 2.37% -0.28%
LU0274212538 db x-trackers FTSE MIB UCITS ETF (DR)
1D EUR 0.30% 2.97% 2.17% -0.80%
LU0274221281 db x-trackers SMI® UCITS ETF (DR)
1D CHF 0.30% 11.98% 11.59% -0.39%
LU0943504760 db x-trackers SMI® UCITS ETF (DR)
1C CHF 0.30% 11.98% 11.62% -0.36%
LU0292097234 db x-trackers FTSE 100 UCITS ETF (DR) - Income
1D GBP 0.30% 0.74% 0.48% -0.26%
LU0292097317 db x-trackers FTSE 250 UCITS ETF (DR)
1D GBP 0.35% 3.66% 3.11% -0.55%
LU0292097747 db x-trackers FTSE ALL-SHARE UCITS ETF (DR)
1D GBP 0.40% 1.18% 0.84% -0.34%
8
db x-trackers**
Directors’ Report (continued)
* This is a synthetic ETF. ** This includes synthetic ETFs and a non-ETF.
ISIN Sub-Fund Name Share Class
Currency All-In Fee in
%
Index Performance
2014
Sub-Fund Performance
2014
Performance Difference
LU0292107645 db x-trackers MSCI EMERGING MARKETS INDEX UCITS ETF*
1C USD 0.65% -2.19% -3.03% -0.84%
LU0455009778 db x-trackers MSCI EMERGING MARKETS INDEX UCITS ETF*
2C USD 0.65% -2.19% -3.04% -0.85%
LU0292107991 db x-trackers MSCI EM ASIA INDEX UCITS ETF*
1C USD 0.65% 4.89% 4.00% -0.89%
LU0455009000 db x-trackers MSCI EM ASIA INDEX UCITS ETF*
2C USD 0.65% 4.89% 3.99% -0.90%
LU0292108619 db x-trackers MSCI EM LATAM INDEX UCITS ETF*
1C USD 0.65% -12.30% -13.16% -0.86%
LU0292109005 db x-trackers MSCI EM EMEA INDEX UCITS ETF*
1C USD 0.65% -15.18% -16.05% -0.87%
LU0292109187 db x-trackers MSCI TAIWAN INDEX UCITS ETF (DR)
1C USD 0.65% 9.36% 8.67% -0.69%
LU0292109344 db x-trackers MSCI BRAZIL INDEX UCITS ETF (DR)
1C USD 0.65% -14.18% -14.96% -0.78%
LU0455009182 db x-trackers MSCI BRAZIL INDEX UCITS ETF (DR)
2C USD 0.65% -14.18% -14.96% -0.78%
LU0292109690 db x-trackers CNX NIFTY UCITS ETF*
1C USD 0.85% 30.23% 28.56% -1.67%
LU0292100046 db x-trackers MSCI KOREA INDEX UCITS ETF (DR)
1C USD 0.65% -11.12% -11.87% -0.75%
LU0292109856 db x-trackers FTSE CHINA 50 UCITS ETF (DR)
1C USD 0.60% 12.90% 12.03% -0.87%
LU0292095535 db x-trackers EURO STOXX® SELECT DIVIDEND 30 UCITS ETF (DR)
1D EUR 0.30% 11.78% 12.06% 0.28%
LU0292096186 db x-trackers STOXX® GLOBAL SELECT DIVIDEND 100 UCITS ETF*
1D EUR 0.50% 21.98% 21.60% -0.38%
LU0292100806 db x-trackers STOXX® EUROPE 600 BASIC RESOURCES UCITS ETF*
1C EUR 0.30% -3.25% -3.44% -0.19%
LU0292101796 db x-trackers STOXX® EUROPE 600 OIL & GAS UCITS ETF*
1C EUR 0.30% -11.79% -11.76% 0.03%
LU0292103222 db x-trackers STOXX® EUROPE 600 HEALTH CARE UCITS ETF*
1C EUR 0.30% 20.99% 20.79% -0.20%
LU0292103651 db x-trackers STOXX® EUROPE 600 BANKS UCITS ETF*
1C EUR 0.30% -0.04% -0.07% -0.03%
LU0292104030 db x-trackers STOXX® EUROPE 600 TELECOMMUNICATIONS UCITS ETF*
1C EUR 0.30% 11.86% 11.81% -0.05%
LU0292104469 db x-trackers STOXX® EUROPE 600 TECHNOLOGY UCITS ETF*
1C EUR 0.30% 8.92% 8.84% -0.08%
LU0292104899 db x-trackers STOXX® EUROPE 600 UTILITIES UCITS ETF*
1C EUR 0.30% 18.10% 18.29% 0.19%
LU0292105193 db x-trackers STOXX® EUROPE 600 INSURANCE UCITS ETF*
1C EUR 0.30% 13.40% 13.31% -0.09%
LU0292105359 db x-trackers STOXX® EUROPE 600 FOOD & BEVERAGE UCITS ETF*
1C EUR 0.30% 13.75% 13.51% -0.24%
LU0292106084 db x-trackers STOXX® EUROPE 600 INDUSTRIAL GOODS UCITS ETF*
1C EUR 0.30% 0.31% 0.18% -0.13%
LU0292106167 db x-trackers DBLCI - OY BALANCED UCITS ETF*
1C EUR 0.55% -21.39% -21.84% -0.45%
LU0460391732 db x-trackers DBLCI - OY BALANCED UCITS ETF*
2C USD 0.55% -20.62% -21.11% -0.49%
LU0460391906 db x-trackers DBLCI - OY BALANCED UCITS ETF*
3C GBP 0.55% -20.90% -21.35% -0.45%
9
db x-trackers**
Directors’ Report (continued)
* This is a synthetic ETF. ** This includes synthetic ETFs and a non-ETF.
ISIN Sub-Fund Name Share Class
Currency All-In Fee in
%
Index Performance
2014
Sub-Fund Performance
2014
Performance Difference
LU0460392110 db x-trackers DBLCI - OY BALANCED UCITS ETF*
4C CHF 0.55% -21.58% -22.02% -0.44%
LU0455008614 db x-trackers DBLCI - OY BALANCED UCITS ETF*
6C USD 0.55% -20.62% -21.10% -0.48%
LU0292106241 db x-trackers SHORTDAX® DAILY UCITS ETF*
1C EUR 0.40% -5.23% -5.91% -0.68%
LU0292106753 db x-trackers EURO STOXX 50® SHORT DAILY UCITS ETF*
1C EUR 0.40% -7.63% -8.29% -0.66%
LU0328474472 db x-trackers CURRENCY RETURNS UCITS ETF*
1C EUR 0.30% 3.38% 3.07% -0.31%
LU0511381047 db x-trackers CURRENCY RETURNS UCITS ETF*
2C USD 0.35% 3.37% 3.00% -0.37%
LU0511381559 db x-trackers CURRENCY RETURNS UCITS ETF*
3C GBP 0.35% 3.72% 3.35% -0.37%
LU0322248146 db x-trackers SLI® UCITS ETF* 1D CHF 0.35% 9.03% 8.23% -0.80%
LU0328473581 db x-trackers FTSE 100 SHORT DAILY UCITS ETF*
1C GBP 0.50% -1.17% -2.13% -0.96%
LU0619015661 db x-trackers RUSSELL 2000 UCITS ETF*
2C USD 0.35% 4.50% 4.86% 0.36%
LU0322248658 db x-trackers RUSSELL 2000 UCITS ETF*
1C USD 0.45% 4.50% 4.76% 0.26%
LU0322251520 db x-trackers S&P 500 INVERSE DAILY UCITS ETF*
1C USD 0.50% -13.01% -13.91% -0.90%
LU0470923532 db x-trackers SMI® SHORT DAILY UCITS ETF*
1C CHF 0.50% -12.61% -13.70% -1.09%
LU0397221945 db x-trackers PORTFOLIO TOTAL RETURN UCITS ETF*
1C EUR 0.72% 14.61% 14.22% -0.39%
LU0322252171 db x-trackers MSCI AC ASIA EX JAPAN INDEX UCITS ETF*
1C USD 0.65% 4.80% 3.91% -0.89%
LU0322252338 db x-trackers MSCI PACIFIC EX JAPAN INDEX UCITS ETF (DR)
1C USD 0.45% -0.47% -1.09% -0.62%
LU0455009935 db x-trackers MSCI PACIFIC EX JAPAN INDEX UCITS ETF (DR)
2C USD 0.45% -0.47% -1.10% -0.63%
LU0322252502 db x-trackers MSCI RUSSIA CAPPED INDEX UCITS ETF*
1C USD 0.65% -42.74% -43.56% -0.82%
LU0455009265 db x-trackers MSCI RUSSIA CAPPED INDEX UCITS ETF*
2D USD 0.65% -42.74% -43.58% -0.84%
LU0322252924 db x-trackers FTSE VIETNAM UCITS ETF*
1C USD 0.85% 10.17% 8.83% -1.34%
LU0322249037 db x-trackers STOXX® EUROPE 600 BANKS SHORT DAILY UCITS ETF*
1C EUR 0.50% -4.08% -4.94% -0.86%
LU0322249466 db x-trackers STOXX® EUROPE 600 HEALTH CARE SHORT DAILY UCITS ETF*
1C EUR 0.50% -19.36% -20.27% -0.91%
LU0322249623 db x-trackers STOXX® EUROPE 600 OIL & GAS SHORT DAILY UCITS ETF*
1C EUR 0.50% 8.48% 7.41% -1.07%
LU0322250712 db x-trackers LPX MM® PRIVATE EQUITY UCITS ETF*
1C EUR 0.70% 9.91% 9.08% -0.83%
LU0328474803 db x-trackers S&P/ASX 200 UCITS ETF (DR)
1C AUD 0.50% 5.61% 4.93% -0.68%
LU0328475107 db x-trackers S&P EUROPE 350 SHARIAH UCITS ETF*
1C EUR 0.50% 9.11% 8.57% -0.54%
LU0328475289 db x-trackers S&P JAPAN 500 SHARIAH UCITS ETF*
1C USD 0.50% 4.65% 4.13% -0.52%
LU0328475362 db x-trackers S&P 500 SHARIAH UCITS ETF*
1C USD 0.50% 12.73% 12.17% -0.56%
LU0328475529 db x-trackers DJ ISLAMIC MARKET TITANS 100 UCITS ETF*
1C USD 0.50% 7.89% 7.36% -0.53%
10
db x-trackers**
Directors’ Report (continued)
* This is a synthetic ETF. ** This includes synthetic ETFs and a non-ETF.
ISIN Sub-Fund Name Share Class
Currency All-In Fee in
%
Index Performance
2014
Sub-Fund Performance
2014
Performance Difference
LU0328475792 db x-trackers STOXX® EUROPE 600 UCITS ETF (DR)
1C EUR 0.20% 7.20% 7.33% 0.13%
LU0322253229 db x-trackers S&P GLOBAL INFRASTRUCTURE UCITS ETF*
1C USD 0.60% 12.12% 11.58% -0.54%
LU0322254383 db x-trackers FTSE ALL-WORLD EX UK UCITS ETF*
1C GBP 0.40% 11.58% 10.88% -0.70%
LU0322250985 db x-trackers CAC 40® UCITS ETF (DR)
1D EUR 0.20% 1.73% 2.02% 0.29%
LU0322251280 db x-trackers CAC 40® SHORT DAILY UCITS ETF*
1C EUR 0.40% -5.16% -5.99% -0.83%
LU0322253732 db x-trackers MSCI EUROPE MID CAP INDEX UCITS ETF (DR)
1C USD 0.40% -4.48% -4.45% 0.03%
LU0322253906 db x-trackers MSCI EUROPE SMALL CAP INDEX UCITS ETF (DR)
1C USD 0.40% -6.50% -6.60% -0.10%
LU0619016479 db x-trackers MSCI EUROPE SMALL CAP INDEX UCITS ETF (DR)
2C USD 0.40% -6.50% -6.48% 0.02%
LU0328476337 db x-trackers DB HEDGE FUND INDEX UCITS ETF*
1C EUR 0.90% -1.72% -2.78% -1.06%
LU0434446117 db x-trackers DB HEDGE FUND INDEX UCITS ETF*
2C USD 0.90% -1.52% -2.63% -1.11%
LU0434446208 db x-trackers DB HEDGE FUND INDEX UCITS ETF*
3C GBP 0.90% -1.42% -2.48% -1.06%
LU0434446893 db x-trackers DB HEDGE FUND INDEX UCITS ETF*
4C JPY 0.90% - - (1) -
LU0434446976 db x-trackers DB HEDGE FUND INDEX UCITS ETF*
5C CHF 0.90% -1.96% -3.02% -1.06%
LU0328476410 db x-trackers S&P SELECT FRONTIER UCITS ETF*
1C USD 0.95% 0.46% -1.22% -1.68%
LU0356591882 db x-trackers US DOLLAR CASH UCITS ETF*
1C USD 0.15% 0.09% -0.06% -0.15%
LU0356592005 db x-trackers US DOLLAR CASH UCITS ETF*
1D USD 0.15% 0.09% -0.06% -0.15%
LU0429790313 db x-trackers HSI SHORT DAILY UCITS ETF*
2C USD 0.75% -7.28% -8.74% -1.46%
LU0589685956 db x-trackers MSCI BRIC INDEX UCITS ETF*
1C USD 0.65% -2.85% -3.83% -0.98%
LU0411078552 db x-trackers S&P 500 2X LEVERAGED DAILY UCITS ETF*
1C USD 0.60% 25.91% 25.20% -0.71%
LU0411075020 db x-trackers SHORTDAX® X2 DAILY UCITS ETF*
1C EUR 0.60% -12.75% -13.83% -1.08%
LU0411075376 db x-trackers LEVDAX® DAILY UCITS ETF*
1C EUR 0.35% 1.94% 1.29% -0.65%
LU0411077828 db x-trackers EURO STOXX 50® LEVERAGED DAILY UCITS ETF*
1C EUR 0.35% 4.53% 4.16% -0.37%
LU0429790743 db x-trackers DB COMMODITY BOOSTER BLOOMBERG UCITS ETF*
2C EUR 0.95% -18.00% -18.80% -0.80%
LU0429791477 db x-trackers DB COMMODITY BOOSTER BLOOMBERG UCITS ETF*
4C CHF 0.95% -18.20% -19.03% -0.83%
LU0474561858 db x-trackers DB COMMODITY BOOSTER BLOOMBERG UCITS ETF*
6C USD 0.95% -17.22% -18.05% -0.83%
(1) No performance due to the liquidation of the Share Class during the year.
11
db x-trackers**
Directors’ Report (continued)
* This is a synthetic ETF. ** This includes synthetic ETFs and a non-ETF.
ISIN Sub-Fund Name Share Class
Currency All-In Fee in
%
Index Performance
2014
Sub-Fund Performance
2014
Performance Difference
LU0411078123 db x-trackers DB COMMODITY BOOSTER LIGHT ENERGY BENCHMARK UCITS ETF*
1C EUR 0.95% -20.68% -21.40% -0.72%
LU0460408130 db x-trackers DB COMMODITY BOOSTER LIGHT ENERGY BENCHMARK UCITS ETF*
4C CHF 0.95% -20.87% -21.64% -0.77%
LU0471850924 db x-trackers DB COMMODITY BOOSTER LIGHT ENERGY BENCHMARK UCITS ETF*
6C EUR 0.70% -20.68% -21.03% -0.35%
LU0474562237 db x-trackers DB COMMODITY BOOSTER LIGHT ENERGY BENCHMARK UCITS ETF*
7C USD 0.95% -19.95% -20.77% -0.82%
LU0412624271 db x-trackers MSCI PAN-EURO INDEX UCITS ETF (DR)
1C EUR 0.30% 6.44% 6.39% -0.05%
LU0412624354 db x-trackers STOXX® EUROPE 600 BASIC RESOURCES SHORT DAILY UCITS ETF*
1C EUR 0.50% -1.25% -2.30% -1.05%
LU0412624511 db x-trackers STOXX® EUROPE 600 INDUSTRIAL GOODS SHORT DAILY UCITS ETF*
1C EUR 0.50% -2.79% -3.80% -1.01%
LU0411078636 db x-trackers S&P 500 2X INVERSE DAILY UCITS ETF*
1C USD 0.70% -25.37% -26.74% -1.37%
LU0417510616 db x-trackers EURO STOXX 50® DOUBLE SHORT DAILY UCITS ETF*
1C EUR 0.50% -17.24% -18.22% -0.98%
LU0779800910 db x-trackers CSI300 UCITS ETF*
1C USD 0.50% 52.08% 45.22% -6.86%
LU0432553047 db x-trackers CSI300 UCITS ETF*
1D USD 0.50% 52.08% 43.30% -8.78%
LU0455008887 db x-trackers CSI300 UCITS ETF*
2D USD 0.50% 52.08% 42.96% -9.12%
LU0460388514 db x-trackers CSI300 BANKS UCITS ETF*
1D USD 0.50% 67.04% 58.16% -8.88%
LU0781021877 db x-trackers CSI300 BANKS UCITS ETF*
1C USD 0.50% 67.04% 60.55% -6.49%
LU0460388944 db x-trackers CSI300 CONSUMER DISCRETIONARY UCITS ETF*
1D USD 0.50% 20.52% 13.35% -7.17%
LU0781021950 db x-trackers CSI300 CONSUMER DISCRETIONARY UCITS ETF*
1C USD 0.50% 20.52% 15.23% -5.29%
LU0460390924 db x-trackers CSI300 MATERIALS UCITS ETF*
1D USD 0.50% 38.29% 30.66% -7.63%
LU0460390338 db x-trackers CSI300 REAL ESTATE UCITS ETF*
1D USD 0.50% 83.20% 72.05% -11.15%
LU0781022099 db x-trackers CSI300 REAL ESTATE UCITS ETF*
1C USD 0.50% 83.20% 76.47% -6.73%
LU0488319582 db x-trackers CSI300 UTILITIES UCITS ETF*
1D USD 0.50% 86.37% 75.92% -10.45%
LU0488319822 db x-trackers CSI300 ENERGY UCITS ETF*
1D USD 0.50% 21.12% 13.78% -7.34%
LU0781022172 db x-trackers CSI300 ENERGY UCITS ETF*
1C USD 0.50% 21.12% 16.75% -4.37%
LU0488320242 db x-trackers CSI300 FINANCIALS UCITS ETF*
1D USD 0.50% 88.62% 77.24% -11.38%
LU0460389678 db x-trackers CSI300 HEALTH CARE UCITS ETF*
1D USD 0.50% 3.62% -2.26% -5.88%
LU0781022339 db x-trackers CSI300 HEALTH CARE UCITS ETF*
1C USD 0.50% 3.62% -0.29% -3.91%
LU0460388274 db x-trackers CSI300 TRANSPORTATION UCITS ETF*
1D USD 0.50% 58.06% 48.60% -9.46%
LU0488320671 db x-trackers CSI300 INDUSTRIALS UCITS ETF*
1D USD 0.50% 61.78% 52.51% -9.27%
12
db x-trackers**
Directors’ Report (continued)
* This is a synthetic ETF. ** This includes synthetic ETFs and a non-ETF.
ISIN Sub-Fund Name Share Class
Currency All-In Fee in
%
Index Performance
2014
Sub-Fund Performance
2014
Performance Difference
LU0476289540 db x-trackers MSCI CANADA INDEX UCITS ETF*
1C USD 0.35% 1.50% 1.32% -0.18%
LU0476289623 db x-trackers MSCI INDONESIA INDEX UCITS ETF*
1C USD 0.65% 26.38% 25.62% -0.76%
LU0476289896 db x-trackers MSCI INDONESIA INDEX UCITS ETF*
2C USD 0.65% 26.38% 25.62% -0.76%
LU0476289466 db x-trackers MSCI MEXICO INDEX UCITS ETF (DR)
1C USD 0.65% -9.33% -9.98% -0.65%
LU0486851024 db x-trackers MSCI EUROPE VALUE INDEX UCITS ETF*
1C EUR 0.40% 5.59% 5.19% -0.40%
LU0490618542 db x-trackers S&P 500 UCITS ETF*
1C USD 0.20% 12.99% 13.24% 0.25%
LU0490619193 db x-trackers S&P 500 UCITS ETF*
3C EUR 0.30% 12.73% 12.80% 0.07%
LU0490619276 db x-trackers S&P 500 UCITS ETF*
4C GBP 0.30% 13.25% 12.96% -0.29%
LU0490619607 db x-trackers S&P 500 UCITS ETF*
6C CHF 0.30% 12.38% 12.10% -0.28%
LU0619016552 db x-trackers S&P 500 UCITS ETF*
8C USD 0.20% 12.99% 13.28% 0.29%
LU0489337005 db x-trackers FTSE EPRA/NAREIT GLOBAL REAL ESTATE UCITS ETF*
1C USD 0.60% 13.92% 13.04% -0.88%
LU0489337690
db x-trackers FTSE EPRA/NAREIT DEVELOPED EUROPE REAL ESTATE UCITS ETF (DR)
1C EUR 0.40% 25.01% 24.64% -0.37%
LU0619015745
db x-trackers FTSE EPRA/NAREIT DEVELOPED EUROPE REAL ESTATE UCITS ETF (DR)
2C EUR 0.40% 25.01% 24.70% -0.31%
LU0514695690 db x-trackers MSCI CHINA INDEX UCITS ETF (DR)
1C USD 0.65% 7.96% 7.05% -0.91%
LU0514695856 db x-trackers MSCI CHINA INDEX UCITS ETF (DR)
2C USD 0.65% 7.96% 7.04% -0.92%
LU0514695187 db x-trackers MSCI INDIA INDEX UCITS ETF*
1C USD 0.75% 23.87% 22.38% -1.49%
LU0514695344 db x-trackers MSCI INDIA INDEX UCITS ETF*
2C USD 0.75% 23.87% 22.37% -1.50%
LU0514694370 db x-trackers MSCI MALAYSIA INDEX UCITS ETF (DR)
1C USD 0.50% -10.66% -11.22% -0.56%
LU0514694537 db x-trackers MSCI MALAYSIA INDEX UCITS ETF (DR)
2C USD 0.50% -10.66% -11.22% -0.56%
LU0514694701 db x-trackers MSCI THAILAND INDEX UCITS ETF (DR)
1C USD 0.50% 16.47% 15.88% -0.59%
LU0514694966 db x-trackers MSCI THAILAND INDEX UCITS ETF (DR)
2C USD 0.50% 16.47% 15.87% -0.60%
LU0518622286 db x-trackers MSCI EM SHORT DAILY INDEX UCITS ETF*
1C USD 0.95% -0.36% -1.58% -1.22%
LU0519153489 db x-trackers DB EQUITY STRATEGIES HEDGE FUND INDEX UCITS ETF*
1C EUR 0.90% 0.07% -0.82% -0.89%
LU0519153562 db x-trackers DB EQUITY STRATEGIES HEDGE FUND INDEX UCITS ETF*
2C USD 0.90% 0.22% -0.72% -0.94%
LU0519153646 db x-trackers DB EQUITY STRATEGIES HEDGE FUND INDEX UCITS ETF*
3C GBP 0.90% 0.37% -0.53% -0.90%
LU0519154024 db x-trackers DB EQUITY STRATEGIES HEDGE FUND INDEX UCITS ETF*
5C CHF 0.90% -0.16% -1.06% -0.90%
LU0540979720 db x-trackers MSCI WORLD CONSUMER DISCRETIONARY INDEX UCITS ETF*
1C USD 0.45% 3.93% 3.50% -0.43%
13
db x-trackers**
Directors’ Report (continued)
* This is a synthetic ETF. ** This includes synthetic ETFs and a non-ETF.
ISIN Sub-Fund Name Share Class
Currency All-In Fee in
%
Index Performance
2014
Sub-Fund Performance
2014
Performance Difference
LU0540980066 db x-trackers MSCI WORLD CONSUMER STAPLES INDEX UCITS ETF*
1C USD 0.45% 7.31% 6.97% -0.34%
LU0540980736 db x-trackers MSCI WORLD ENERGY INDEX UCITS ETF*
1C USD 0.45% -11.60% -11.94% -0.34%
LU0540980140 db x-trackers MSCI WORLD FINANCIALS INDEX UCITS ETF*
1C USD 0.45% 3.17% 2.77% -0.40%
LU0540980223 db x-trackers MSCI WORLD HEALTH CARE INDEX UCITS ETF*
1C USD 0.45% 18.10% 17.68% -0.42%
LU0540981387 db x-trackers MSCI WORLD INDUSTRIALS INDEX UCITS ETF*
1C USD 0.45% 0.42% 0.03% -0.39%
LU0540980496 db x-trackers MSCI WORLD INFORMATION TECHNOLOGY INDEX UCITS ETF*
1C USD 0.45% 16.06% 15.68% -0.38%
LU0540980819 db x-trackers MSCI WORLD MATERIALS INDEX UCITS ETF*
1C USD 0.45% -5.06% -5.46% -0.40%
LU0540980579 db x-trackers MSCI WORLD TELECOM SERVICES INDEX UCITS ETF*
1C USD 0.45% -1.91% -2.19% -0.28%
LU0540980652 db x-trackers MSCI WORLD UTILITIES INDEX UCITS ETF*
1C USD 0.45% 15.27% 14.97% -0.30%
LU0592217953 db x-trackers RUSSELL MIDCAP UCITS ETF*
1C USD 0.35% 12.72% 12.64% -0.08%
LU0592215825 db x-trackers MSCI AC ASIA EX JAPAN HIGH DIVIDEND YIELD INDEX UCITS ETF*
1D USD 0.65% 8.18% 7.47% -0.71%
LU0592216120 db x-trackers MSCI AC ASIA EX JAPAN HIGH DIVIDEND YIELD INDEX UCITS ETF*
2D USD 0.65% 8.18% 7.48% -0.70%
LU0592215403 db x-trackers MSCI PHILIPPINES IM INDEX UCITS ETF (DR)
1C USD 0.65% 25.96% 25.01% -0.95%
LU0592215668 db x-trackers MSCI PHILIPPINES IM INDEX UCITS ETF (DR)
2C USD 0.65% 25.96% 24.99% -0.97%
LU0592216476 db x-trackers MSCI EM CONSUMER DISCRETIONARY INDEX UCITS ETF*
1C USD 0.65% -1.53% -2.42% -0.89%
LU0592216559 db x-trackers MSCI EM CONSUMER STAPLES INDEX UCITS ETF*
1C USD 0.65% -4.89% -5.83% -0.94%
LU0592216633 db x-trackers MSCI EM ENERGY INDEX UCITS ETF*
1C USD 0.65% -26.81% -27.57% -0.76%
LU0592216807 db x-trackers MSCI EM FINANCIALS INDEX UCITS ETF*
1C USD 0.65% 5.17% 4.25% -0.92%
LU0592216989 db x-trackers MSCI EM HEALTHCARE INDEX UCITS ETF*
1C USD 0.65% 19.45% 18.37% -1.08%
LU0592217011 db x-trackers MSCI EM INDUSTRIALS INDEX UCITS ETF*
1C USD 0.65% -2.86% -3.77% -0.91%
LU0592217102 db x-trackers MSCI EM INFORMATION TECHNOLOGY INDEX UCITS ETF*
1C USD 0.65% 9.89% 8.91% -0.98%
LU0592217284 db x-trackers MSCI EM MATERIALS INDEX UCITS ETF*
1C USD 0.65% -19.58% -20.42% -0.84%
LU0592217367 db x-trackers MSCI EM TELECOMMUNICATION SERVICES INDEX UCITS ETF*
1C USD 0.65% -1.77% -2.73% -0.96%
14
db x-trackers**
Directors’ Report (continued)
* This is a synthetic ETF. ** This includes synthetic ETFs and a non-ETF.
ISIN Sub-Fund Name Share
Class Currency All-In
Fee in %
Index Performance
2014
Sub-Fund Performance
2014
Performance Difference
LU0592217441 db x-trackers MSCI EM UTILITIES INDEX UCITS ETF*
1C USD 0.65% 2.38% 1.41% -0.97%
LU0592217524 db x-trackers MSCI AFRICA TOP 50 INDEX UCITS ETF*
1C USD 0.65% 1.90% 0.89% -1.01%
LU0592217870 db x-trackers MSCI EM EASTERN EUROPE INDEX UCITS ETF*
1C USD 0.65% -35.79% -36.39% -0.60%
LU0592216393 db x-trackers IBEX 35® UCITS ETF (DR)
1C EUR 0.30% 7.56% 8.23% 0.67%
LU0994505336 db x-trackers IBEX 35® UCITS ETF (DR)
1D EUR 0.30% 7.56% 8.22% 0.66%
LU0592217797 db x-trackers MSCI CHILE INDEX UCITS ETF*
1C USD 0.65% -12.60% -13.52% -0.92%
LU0659578925 db x-trackers MSCI AC ASIA PACIFIC EX JAPAN INDEX UCITS ETF*
1C USD 0.50% 2.82% 2.14% -0.68%
LU0659579220 db x-trackers MSCI BANGLADESH IM INDEX UCITS ETF*
1C USD 0.85% 22.79% 19.17% -3.62%
LU0755277992 db x-trackers MSCI BANGLADESH IM INDEX UCITS ETF*
2C USD 0.85% 22.79% 19.37% -3.42%
LU0659579147 db x-trackers MSCI PAKISTAN IM INDEX UCITS ETF*
1C USD 0.85% 20.88% 18.67% -2.21%
LU0755278701 db x-trackers MSCI PAKISTAN IM INDEX UCITS ETF*
2C USD 0.85% 20.88% 20.25% -0.63%
LU0659578842 db x-trackers MSCI SINGAPORE IM INDEX UCITS ETF (DR)
1C USD 0.50% 2.16% 1.58% -0.58%
LU0755279428 db x-trackers MSCI SINGAPORE IM INDEX UCITS ETF (DR)
2C USD 0.50% 2.16% 1.58% -0.58%
LU0659579063 db x-trackers ATX UCITS ETF (DR)
1C EUR 0.25% -13.57% -13.64% -0.07%
LU0659579493 db x-trackers S&P 500® EQUAL WEIGHT UCITS ETF*
1C USD 0.30% 13.85% 13.57% -0.28%
LU0846194776 db x-trackers MSCI EMU INDEX UCITS ETF (DR)
1D EUR 0.15% 5.14% 5.03% -0.11%
LU0835262626 db x-trackers EURO STOXX 50® EX FINANCIALS UCITS ETF (DR)
1D EUR 0.20% 5.21% 5.53% 0.32%
LU0838782315 db x-trackers DAX® UCITS ETF (DR) - Income
1D EUR 0.09% 2.65% 2.32% -0.33%
LU0838780707 db x-trackers FTSE 100 UCITS ETF (DR)
1D GBP 0.09% 0.67% 0.68% 0.01%
LU0839027447 db x-trackers NIKKEI 225 UCITS ETF (DR)
1D JPY 0.09% 8.58% 8.47% -0.11%
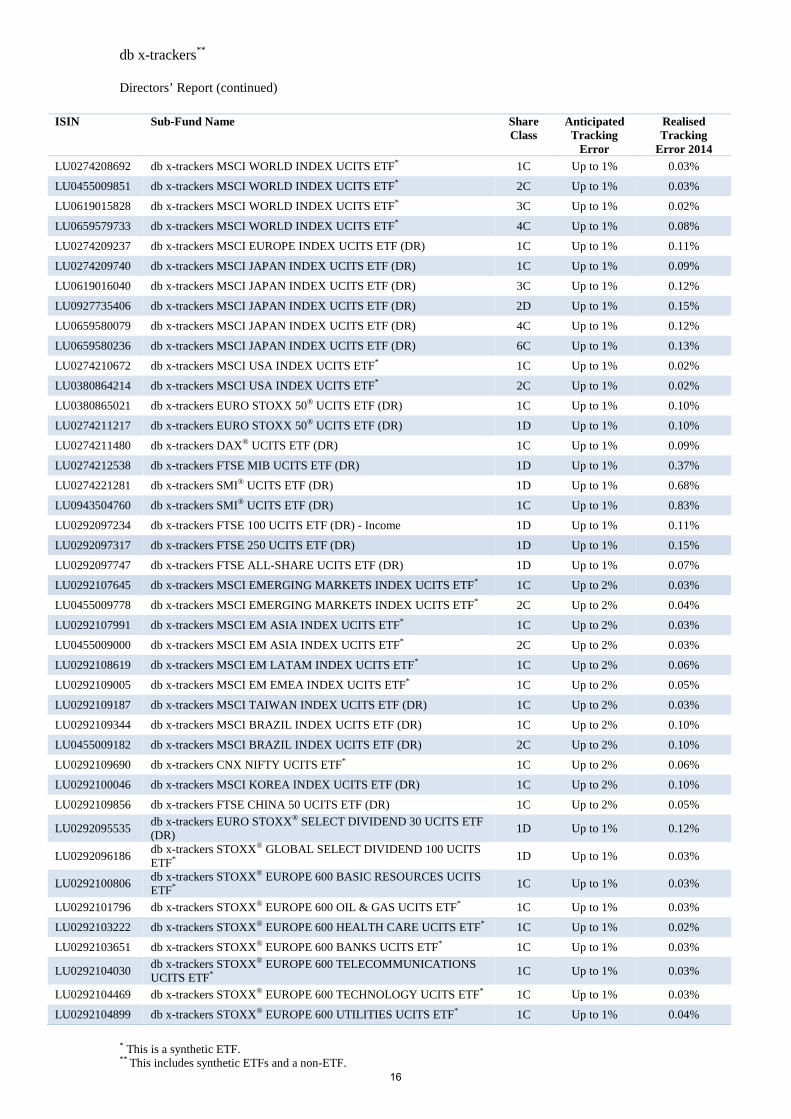
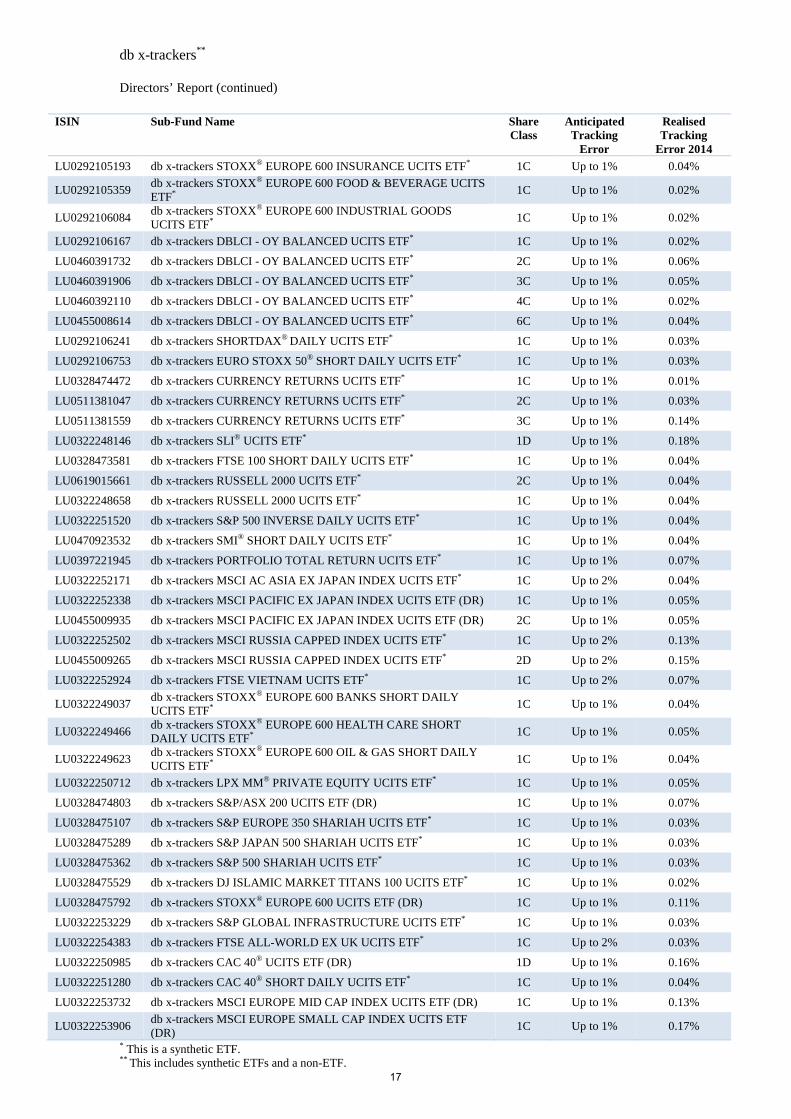
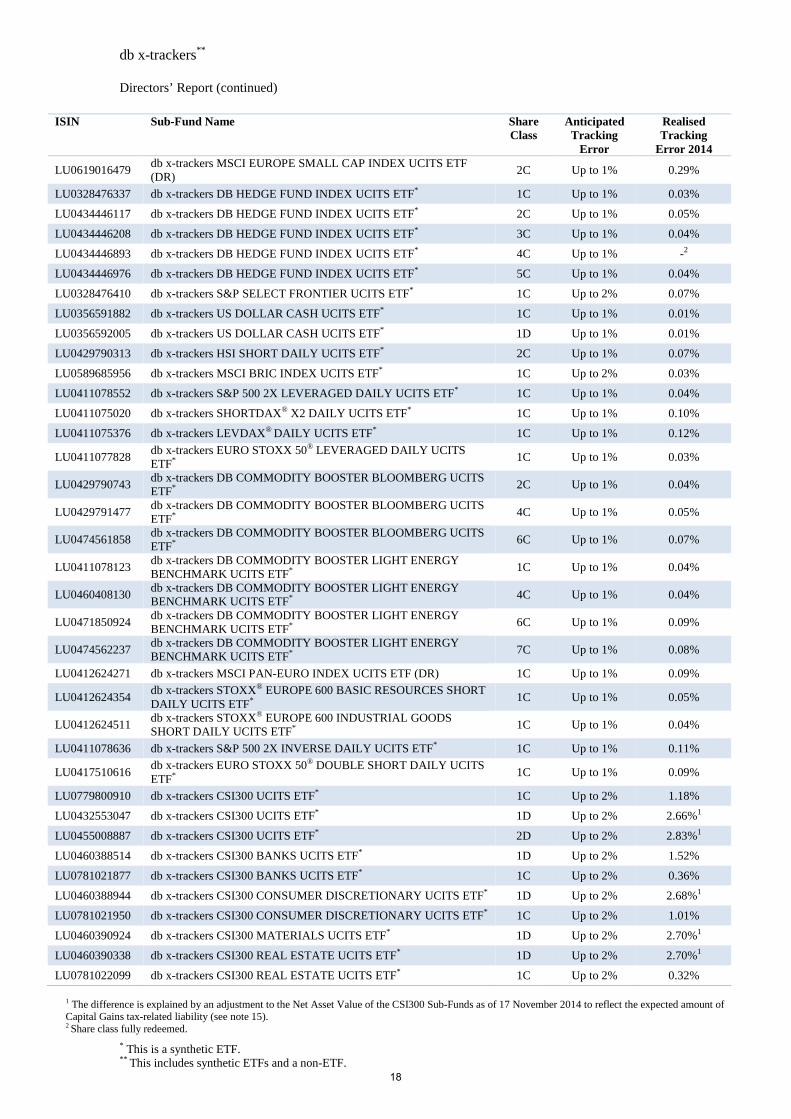
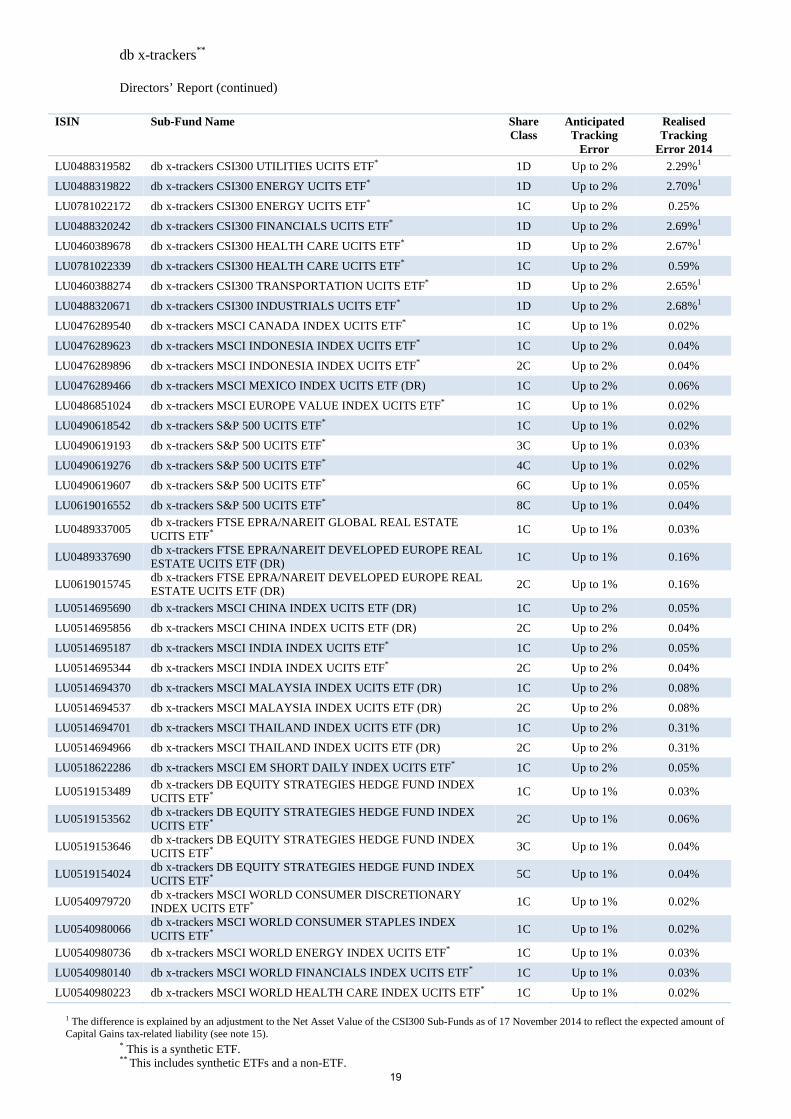
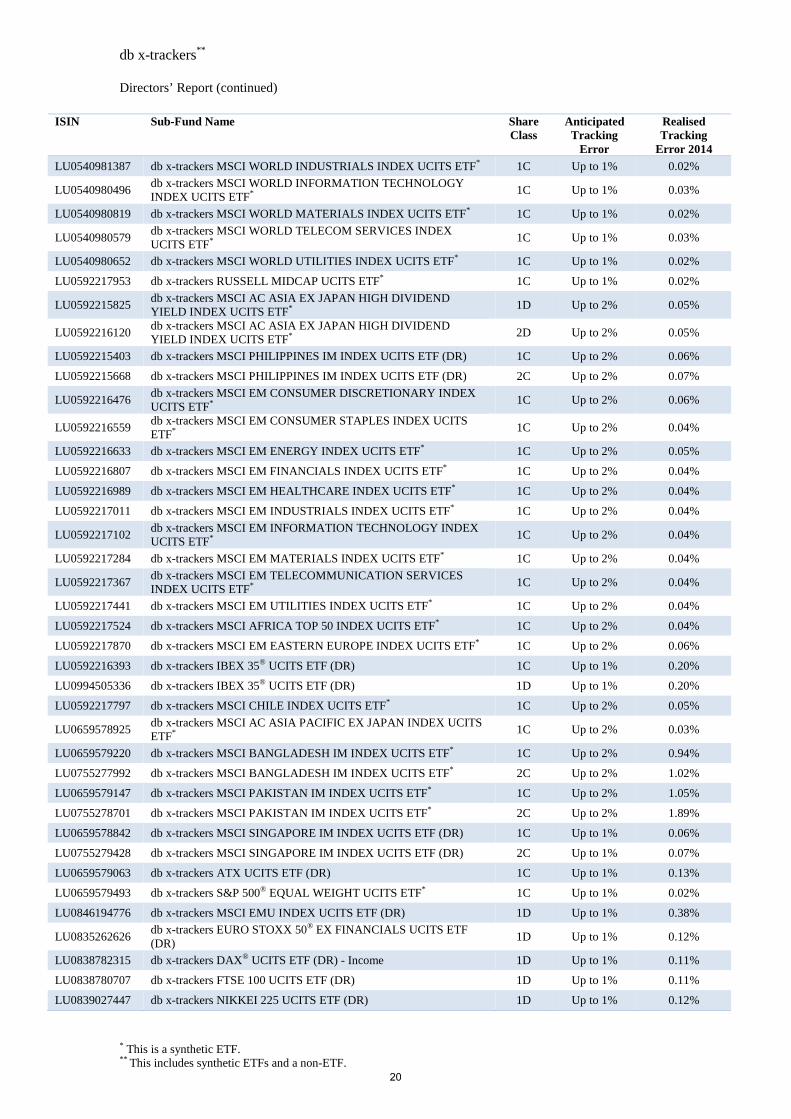
The performance differences arose from the all-in-fee of the respective share class, as well as positive or negative swap adjustments as disclosed in the Notes to the Financial Statements section of this Annual Report. The table below contains tracking error levels realised over the 2014 period for all Sub-Funds and/or Share Classes which were launched before the beginning of the financial year ending 31 December 2013. These realised tracking error levels are contrasted with the anticipated tracking error levels. As per the following table, for each of the Sub-Funds and/or Share Classes the level of realised tracking error was within the expected range, due to the effectiveness of replication techniques utilised over the 2014 period.
15
db x-trackers**
Directors’ Report (continued)
* This is a synthetic ETF. ** This includes synthetic ETFs and a non-ETF.
ISIN Sub-Fund Name Share Class
Anticipated Tracking
Error
Realised Tracking
Error 2014 LU0274208692 db x-trackers MSCI WORLD INDEX UCITS ETF* 1C Up to 1% 0.03%
LU0455009851 db x-trackers MSCI WORLD INDEX UCITS ETF* 2C Up to 1% 0.03%
LU0619015828 db x-trackers MSCI WORLD INDEX UCITS ETF* 3C Up to 1% 0.02%
LU0659579733 db x-trackers MSCI WORLD INDEX UCITS ETF* 4C Up to 1% 0.08%
LU0274209237 db x-trackers MSCI EUROPE INDEX UCITS ETF (DR) 1C Up to 1% 0.11%
LU0274209740 db x-trackers MSCI JAPAN INDEX UCITS ETF (DR) 1C Up to 1% 0.09%
LU0619016040 db x-trackers MSCI JAPAN INDEX UCITS ETF (DR) 3C Up to 1% 0.12%
LU0927735406 db x-trackers MSCI JAPAN INDEX UCITS ETF (DR) 2D Up to 1% 0.15%
LU0659580079 db x-trackers MSCI JAPAN INDEX UCITS ETF (DR) 4C Up to 1% 0.12%
LU0659580236 db x-trackers MSCI JAPAN INDEX UCITS ETF (DR) 6C Up to 1% 0.13%
LU0274210672 db x-trackers MSCI USA INDEX UCITS ETF* 1C Up to 1% 0.02%
LU0380864214 db x-trackers MSCI USA INDEX UCITS ETF* 2C Up to 1% 0.02%
LU0380865021 db x-trackers EURO STOXX 50® UCITS ETF (DR) 1C Up to 1% 0.10%
LU0274211217 db x-trackers EURO STOXX 50® UCITS ETF (DR) 1D Up to 1% 0.10%
LU0274211480 db x-trackers DAX® UCITS ETF (DR) 1C Up to 1% 0.09%
LU0274212538 db x-trackers FTSE MIB UCITS ETF (DR) 1D Up to 1% 0.37%
LU0274221281 db x-trackers SMI® UCITS ETF (DR) 1D Up to 1% 0.68%
LU0943504760 db x-trackers SMI® UCITS ETF (DR) 1C Up to 1% 0.83%
LU0292097234 db x-trackers FTSE 100 UCITS ETF (DR) - Income 1D Up to 1% 0.11%
LU0292097317 db x-trackers FTSE 250 UCITS ETF (DR) 1D Up to 1% 0.15%
LU0292097747 db x-trackers FTSE ALL-SHARE UCITS ETF (DR) 1D Up to 1% 0.07%
LU0292107645 db x-trackers MSCI EMERGING MARKETS INDEX UCITS ETF* 1C Up to 2% 0.03%
LU0455009778 db x-trackers MSCI EMERGING MARKETS INDEX UCITS ETF* 2C Up to 2% 0.04%
LU0292107991 db x-trackers MSCI EM ASIA INDEX UCITS ETF* 1C Up to 2% 0.03%
LU0455009000 db x-trackers MSCI EM ASIA INDEX UCITS ETF* 2C Up to 2% 0.03%
LU0292108619 db x-trackers MSCI EM LATAM INDEX UCITS ETF* 1C Up to 2% 0.06%
LU0292109005 db x-trackers MSCI EM EMEA INDEX UCITS ETF* 1C Up to 2% 0.05%
LU0292109187 db x-trackers MSCI TAIWAN INDEX UCITS ETF (DR) 1C Up to 2% 0.03%
LU0292109344 db x-trackers MSCI BRAZIL INDEX UCITS ETF (DR) 1C Up to 2% 0.10%
LU0455009182 db x-trackers MSCI BRAZIL INDEX UCITS ETF (DR) 2C Up to 2% 0.10%
LU0292109690 db x-trackers CNX NIFTY UCITS ETF* 1C Up to 2% 0.06%
LU0292100046 db x-trackers MSCI KOREA INDEX UCITS ETF (DR) 1C Up to 2% 0.10%
LU0292109856 db x-trackers FTSE CHINA 50 UCITS ETF (DR) 1C Up to 2% 0.05%
LU0292095535 db x-trackers EURO STOXX® SELECT DIVIDEND 30 UCITS ETF (DR)
1D Up to 1% 0.12%
LU0292096186 db x-trackers STOXX® GLOBAL SELECT DIVIDEND 100 UCITS ETF*
1D Up to 1% 0.03%
LU0292100806 db x-trackers STOXX® EUROPE 600 BASIC RESOURCES UCITS ETF*
1C Up to 1% 0.03%
LU0292101796 db x-trackers STOXX® EUROPE 600 OIL & GAS UCITS ETF* 1C Up to 1% 0.03%
LU0292103222 db x-trackers STOXX® EUROPE 600 HEALTH CARE UCITS ETF* 1C Up to 1% 0.02%
LU0292103651 db x-trackers STOXX® EUROPE 600 BANKS UCITS ETF* 1C Up to 1% 0.03%
LU0292104030 db x-trackers STOXX® EUROPE 600 TELECOMMUNICATIONS UCITS ETF*
1C Up to 1% 0.03%
LU0292104469 db x-trackers STOXX® EUROPE 600 TECHNOLOGY UCITS ETF* 1C Up to 1% 0.03%
LU0292104899 db x-trackers STOXX® EUROPE 600 UTILITIES UCITS ETF* 1C Up to 1% 0.04%
16
db x-trackers**
Directors’ Report (continued)
* This is a synthetic ETF. ** This includes synthetic ETFs and a non-ETF.
ISIN Sub-Fund Name Share Class
Anticipated Tracking
Error
Realised Tracking
Error 2014 LU0292105193 db x-trackers STOXX® EUROPE 600 INSURANCE UCITS ETF* 1C Up to 1% 0.04%
LU0292105359 db x-trackers STOXX® EUROPE 600 FOOD & BEVERAGE UCITS ETF*
1C Up to 1% 0.02%
LU0292106084 db x-trackers STOXX® EUROPE 600 INDUSTRIAL GOODS UCITS ETF* 1C Up to 1% 0.02%
LU0292106167 db x-trackers DBLCI - OY BALANCED UCITS ETF* 1C Up to 1% 0.02%
LU0460391732 db x-trackers DBLCI - OY BALANCED UCITS ETF* 2C Up to 1% 0.06%
LU0460391906 db x-trackers DBLCI - OY BALANCED UCITS ETF* 3C Up to 1% 0.05%
LU0460392110 db x-trackers DBLCI - OY BALANCED UCITS ETF* 4C Up to 1% 0.02%
LU0455008614 db x-trackers DBLCI - OY BALANCED UCITS ETF* 6C Up to 1% 0.04%
LU0292106241 db x-trackers SHORTDAX® DAILY UCITS ETF* 1C Up to 1% 0.03%
LU0292106753 db x-trackers EURO STOXX 50® SHORT DAILY UCITS ETF* 1C Up to 1% 0.03%
LU0328474472 db x-trackers CURRENCY RETURNS UCITS ETF* 1C Up to 1% 0.01%
LU0511381047 db x-trackers CURRENCY RETURNS UCITS ETF* 2C Up to 1% 0.03%
LU0511381559 db x-trackers CURRENCY RETURNS UCITS ETF* 3C Up to 1% 0.14%
LU0322248146 db x-trackers SLI® UCITS ETF* 1D Up to 1% 0.18%
LU0328473581 db x-trackers FTSE 100 SHORT DAILY UCITS ETF* 1C Up to 1% 0.04%
LU0619015661 db x-trackers RUSSELL 2000 UCITS ETF* 2C Up to 1% 0.04%
LU0322248658 db x-trackers RUSSELL 2000 UCITS ETF* 1C Up to 1% 0.04%
LU0322251520 db x-trackers S&P 500 INVERSE DAILY UCITS ETF* 1C Up to 1% 0.04%
LU0470923532 db x-trackers SMI® SHORT DAILY UCITS ETF* 1C Up to 1% 0.04%
LU0397221945 db x-trackers PORTFOLIO TOTAL RETURN UCITS ETF* 1C Up to 1% 0.07%
LU0322252171 db x-trackers MSCI AC ASIA EX JAPAN INDEX UCITS ETF* 1C Up to 2% 0.04%
LU0322252338 db x-trackers MSCI PACIFIC EX JAPAN INDEX UCITS ETF (DR) 1C Up to 1% 0.05%
LU0455009935 db x-trackers MSCI PACIFIC EX JAPAN INDEX UCITS ETF (DR) 2C Up to 1% 0.05%
LU0322252502 db x-trackers MSCI RUSSIA CAPPED INDEX UCITS ETF* 1C Up to 2% 0.13%
LU0455009265 db x-trackers MSCI RUSSIA CAPPED INDEX UCITS ETF* 2D Up to 2% 0.15%
LU0322252924 db x-trackers FTSE VIETNAM UCITS ETF* 1C Up to 2% 0.07%
LU0322249037 db x-trackers STOXX® EUROPE 600 BANKS SHORT DAILY UCITS ETF*
1C Up to 1% 0.04%
LU0322249466 db x-trackers STOXX® EUROPE 600 HEALTH CARE SHORT DAILY UCITS ETF*
1C Up to 1% 0.05%
LU0322249623 db x-trackers STOXX® EUROPE 600 OIL & GAS SHORT DAILY UCITS ETF*
1C Up to 1% 0.04%
LU0322250712 db x-trackers LPX MM® PRIVATE EQUITY UCITS ETF* 1C Up to 1% 0.05%
LU0328474803 db x-trackers S&P/ASX 200 UCITS ETF (DR) 1C Up to 1% 0.07%
LU0328475107 db x-trackers S&P EUROPE 350 SHARIAH UCITS ETF* 1C Up to 1% 0.03%
LU0328475289 db x-trackers S&P JAPAN 500 SHARIAH UCITS ETF* 1C Up to 1% 0.03%
LU0328475362 db x-trackers S&P 500 SHARIAH UCITS ETF* 1C Up to 1% 0.03%
LU0328475529 db x-trackers DJ ISLAMIC MARKET TITANS 100 UCITS ETF* 1C Up to 1% 0.02%
LU0328475792 db x-trackers STOXX® EUROPE 600 UCITS ETF (DR) 1C Up to 1% 0.11%
LU0322253229 db x-trackers S&P GLOBAL INFRASTRUCTURE UCITS ETF* 1C Up to 1% 0.03%
LU0322254383 db x-trackers FTSE ALL-WORLD EX UK UCITS ETF* 1C Up to 2% 0.03%
LU0322250985 db x-trackers CAC 40® UCITS ETF (DR) 1D Up to 1% 0.16%
LU0322251280 db x-trackers CAC 40® SHORT DAILY UCITS ETF* 1C Up to 1% 0.04%
LU0322253732 db x-trackers MSCI EUROPE MID CAP INDEX UCITS ETF (DR) 1C Up to 1% 0.13%
LU0322253906 db x-trackers MSCI EUROPE SMALL CAP INDEX UCITS ETF (DR)
1C Up to 1% 0.17%
17
db x-trackers**
Directors’ Report (continued)
* This is a synthetic ETF. ** This includes synthetic ETFs and a non-ETF.
ISIN Sub-Fund Name Share Class
Anticipated Tracking
Error
Realised Tracking
Error 2014
LU0619016479 db x-trackers MSCI EUROPE SMALL CAP INDEX UCITS ETF (DR)
2C Up to 1% 0.29%
LU0328476337 db x-trackers DB HEDGE FUND INDEX UCITS ETF* 1C Up to 1% 0.03%
LU0434446117 db x-trackers DB HEDGE FUND INDEX UCITS ETF* 2C Up to 1% 0.05%
LU0434446208 db x-trackers DB HEDGE FUND INDEX UCITS ETF* 3C Up to 1% 0.04%
LU0434446893 db x-trackers DB HEDGE FUND INDEX UCITS ETF* 4C Up to 1% -2
LU0434446976 db x-trackers DB HEDGE FUND INDEX UCITS ETF* 5C Up to 1% 0.04%
LU0328476410 db x-trackers S&P SELECT FRONTIER UCITS ETF* 1C Up to 2% 0.07%
LU0356591882 db x-trackers US DOLLAR CASH UCITS ETF* 1C Up to 1% 0.01%
LU0356592005 db x-trackers US DOLLAR CASH UCITS ETF* 1D Up to 1% 0.01%
LU0429790313 db x-trackers HSI SHORT DAILY UCITS ETF* 2C Up to 1% 0.07%
LU0589685956 db x-trackers MSCI BRIC INDEX UCITS ETF* 1C Up to 2% 0.03%
LU0411078552 db x-trackers S&P 500 2X LEVERAGED DAILY UCITS ETF* 1C Up to 1% 0.04%
LU0411075020 db x-trackers SHORTDAX® X2 DAILY UCITS ETF* 1C Up to 1% 0.10%
LU0411075376 db x-trackers LEVDAX® DAILY UCITS ETF* 1C Up to 1% 0.12%
LU0411077828 db x-trackers EURO STOXX 50® LEVERAGED DAILY UCITS ETF*
1C Up to 1% 0.03%
LU0429790743 db x-trackers DB COMMODITY BOOSTER BLOOMBERG UCITS ETF*
2C Up to 1% 0.04%
LU0429791477 db x-trackers DB COMMODITY BOOSTER BLOOMBERG UCITS ETF*
4C Up to 1% 0.05%
LU0474561858 db x-trackers DB COMMODITY BOOSTER BLOOMBERG UCITS ETF*
6C Up to 1% 0.07%
LU0411078123 db x-trackers DB COMMODITY BOOSTER LIGHT ENERGY BENCHMARK UCITS ETF*
1C Up to 1% 0.04%
LU0460408130 db x-trackers DB COMMODITY BOOSTER LIGHT ENERGY BENCHMARK UCITS ETF*
4C Up to 1% 0.04%
LU0471850924 db x-trackers DB COMMODITY BOOSTER LIGHT ENERGY BENCHMARK UCITS ETF*
6C Up to 1% 0.09%
LU0474562237 db x-trackers DB COMMODITY BOOSTER LIGHT ENERGY BENCHMARK UCITS ETF*
7C Up to 1% 0.08%
LU0412624271 db x-trackers MSCI PAN-EURO INDEX UCITS ETF (DR) 1C Up to 1% 0.09%
LU0412624354 db x-trackers STOXX® EUROPE 600 BASIC RESOURCES SHORT DAILY UCITS ETF*
1C Up to 1% 0.05%
LU0412624511 db x-trackers STOXX® EUROPE 600 INDUSTRIAL GOODS SHORT DAILY UCITS ETF*
1C Up to 1% 0.04%
LU0411078636 db x-trackers S&P 500 2X INVERSE DAILY UCITS ETF* 1C Up to 1% 0.11%
LU0417510616 db x-trackers EURO STOXX 50® DOUBLE SHORT DAILY UCITS ETF*
1C Up to 1% 0.09%
LU0779800910 db x-trackers CSI300 UCITS ETF* 1C Up to 2% 1.18%
LU0432553047 db x-trackers CSI300 UCITS ETF* 1D Up to 2% 2.66%1
LU0455008887 db x-trackers CSI300 UCITS ETF* 2D Up to 2% 2.83%1
LU0460388514 db x-trackers CSI300 BANKS UCITS ETF* 1D Up to 2% 1.52%
LU0781021877 db x-trackers CSI300 BANKS UCITS ETF* 1C Up to 2% 0.36%
LU0460388944 db x-trackers CSI300 CONSUMER DISCRETIONARY UCITS ETF* 1D Up to 2% 2.68%1
LU0781021950 db x-trackers CSI300 CONSUMER DISCRETIONARY UCITS ETF* 1C Up to 2% 1.01%
LU0460390924 db x-trackers CSI300 MATERIALS UCITS ETF* 1D Up to 2% 2.70%1
LU0460390338 db x-trackers CSI300 REAL ESTATE UCITS ETF* 1D Up to 2% 2.70%1
LU0781022099 db x-trackers CSI300 REAL ESTATE UCITS ETF* 1C Up to 2% 0.32%
1 The difference is explained by an adjustment to the Net Asset Value of the CSI300 Sub-Funds as of 17 November 2014 to reflect the expected amount of Capital Gains tax-related liability (see note 15). 2 Share class fully redeemed.
18
db x-trackers**
Directors’ Report (continued)
* This is a synthetic ETF. ** This includes synthetic ETFs and a non-ETF.
ISIN Sub-Fund Name Share Class
Anticipated Tracking
Error
Realised Tracking
Error 2014 LU0488319582 db x-trackers CSI300 UTILITIES UCITS ETF* 1D Up to 2% 2.29%1
LU0488319822 db x-trackers CSI300 ENERGY UCITS ETF* 1D Up to 2% 2.70%1
LU0781022172 db x-trackers CSI300 ENERGY UCITS ETF* 1C Up to 2% 0.25%
LU0488320242 db x-trackers CSI300 FINANCIALS UCITS ETF* 1D Up to 2% 2.69%1
LU0460389678 db x-trackers CSI300 HEALTH CARE UCITS ETF* 1D Up to 2% 2.67%1
LU0781022339 db x-trackers CSI300 HEALTH CARE UCITS ETF* 1C Up to 2% 0.59%
LU0460388274 db x-trackers CSI300 TRANSPORTATION UCITS ETF* 1D Up to 2% 2.65%1
LU0488320671 db x-trackers CSI300 INDUSTRIALS UCITS ETF* 1D Up to 2% 2.68%1
LU0476289540 db x-trackers MSCI CANADA INDEX UCITS ETF* 1C Up to 1% 0.02%
LU0476289623 db x-trackers MSCI INDONESIA INDEX UCITS ETF* 1C Up to 2% 0.04%
LU0476289896 db x-trackers MSCI INDONESIA INDEX UCITS ETF* 2C Up to 2% 0.04%
LU0476289466 db x-trackers MSCI MEXICO INDEX UCITS ETF (DR) 1C Up to 2% 0.06%
LU0486851024 db x-trackers MSCI EUROPE VALUE INDEX UCITS ETF* 1C Up to 1% 0.02%
LU0490618542 db x-trackers S&P 500 UCITS ETF* 1C Up to 1% 0.02%
LU0490619193 db x-trackers S&P 500 UCITS ETF* 3C Up to 1% 0.03%
LU0490619276 db x-trackers S&P 500 UCITS ETF* 4C Up to 1% 0.02%
LU0490619607 db x-trackers S&P 500 UCITS ETF* 6C Up to 1% 0.05%
LU0619016552 db x-trackers S&P 500 UCITS ETF* 8C Up to 1% 0.04%
LU0489337005 db x-trackers FTSE EPRA/NAREIT GLOBAL REAL ESTATE UCITS ETF*
1C Up to 1% 0.03%
LU0489337690 db x-trackers FTSE EPRA/NAREIT DEVELOPED EUROPE REAL ESTATE UCITS ETF (DR)
1C Up to 1% 0.16%
LU0619015745 db x-trackers FTSE EPRA/NAREIT DEVELOPED EUROPE REAL ESTATE UCITS ETF (DR)
2C Up to 1% 0.16%
LU0514695690 db x-trackers MSCI CHINA INDEX UCITS ETF (DR) 1C Up to 2% 0.05%
LU0514695856 db x-trackers MSCI CHINA INDEX UCITS ETF (DR) 2C Up to 2% 0.04%
LU0514695187 db x-trackers MSCI INDIA INDEX UCITS ETF* 1C Up to 2% 0.05%
LU0514695344 db x-trackers MSCI INDIA INDEX UCITS ETF* 2C Up to 2% 0.04%
LU0514694370 db x-trackers MSCI MALAYSIA INDEX UCITS ETF (DR) 1C Up to 2% 0.08%
LU0514694537 db x-trackers MSCI MALAYSIA INDEX UCITS ETF (DR) 2C Up to 2% 0.08%
LU0514694701 db x-trackers MSCI THAILAND INDEX UCITS ETF (DR) 1C Up to 2% 0.31%
LU0514694966 db x-trackers MSCI THAILAND INDEX UCITS ETF (DR) 2C Up to 2% 0.31%
LU0518622286 db x-trackers MSCI EM SHORT DAILY INDEX UCITS ETF* 1C Up to 2% 0.05%
LU0519153489 db x-trackers DB EQUITY STRATEGIES HEDGE FUND INDEX UCITS ETF*
1C Up to 1% 0.03%
LU0519153562 db x-trackers DB EQUITY STRATEGIES HEDGE FUND INDEX UCITS ETF*
2C Up to 1% 0.06%
LU0519153646 db x-trackers DB EQUITY STRATEGIES HEDGE FUND INDEX UCITS ETF*
3C Up to 1% 0.04%
LU0519154024 db x-trackers DB EQUITY STRATEGIES HEDGE FUND INDEX UCITS ETF*
5C Up to 1% 0.04%
LU0540979720 db x-trackers MSCI WORLD CONSUMER DISCRETIONARY INDEX UCITS ETF*
1C Up to 1% 0.02%
LU0540980066 db x-trackers MSCI WORLD CONSUMER STAPLES INDEX UCITS ETF*
1C Up to 1% 0.02%
LU0540980736 db x-trackers MSCI WORLD ENERGY INDEX UCITS ETF* 1C Up to 1% 0.03%
LU0540980140 db x-trackers MSCI WORLD FINANCIALS INDEX UCITS ETF* 1C Up to 1% 0.03%
LU0540980223 db x-trackers MSCI WORLD HEALTH CARE INDEX UCITS ETF* 1C Up to 1% 0.02%
1 The difference is explained by an adjustment to the Net Asset Value of the CSI300 Sub-Funds as of 17 November 2014 to reflect the expected amount of Capital Gains tax-related liability (see note 15).
19
db x-trackers**
Directors’ Report (continued)
* This is a synthetic ETF. ** This includes synthetic ETFs and a non-ETF.
ISIN Sub-Fund Name Share Class
Anticipated Tracking
Error
Realised Tracking
Error 2014 LU0540981387 db x-trackers MSCI WORLD INDUSTRIALS INDEX UCITS ETF* 1C Up to 1% 0.02%
LU0540980496 db x-trackers MSCI WORLD INFORMATION TECHNOLOGY INDEX UCITS ETF*
1C Up to 1% 0.03%
LU0540980819 db x-trackers MSCI WORLD MATERIALS INDEX UCITS ETF* 1C Up to 1% 0.02%
LU0540980579 db x-trackers MSCI WORLD TELECOM SERVICES INDEX UCITS ETF*
1C Up to 1% 0.03%
LU0540980652 db x-trackers MSCI WORLD UTILITIES INDEX UCITS ETF* 1C Up to 1% 0.02%
LU0592217953 db x-trackers RUSSELL MIDCAP UCITS ETF* 1C Up to 1% 0.02%
LU0592215825 db x-trackers MSCI AC ASIA EX JAPAN HIGH DIVIDEND YIELD INDEX UCITS ETF*
1D Up to 2% 0.05%
LU0592216120 db x-trackers MSCI AC ASIA EX JAPAN HIGH DIVIDEND YIELD INDEX UCITS ETF*
2D Up to 2% 0.05%
LU0592215403 db x-trackers MSCI PHILIPPINES IM INDEX UCITS ETF (DR) 1C Up to 2% 0.06%
LU0592215668 db x-trackers MSCI PHILIPPINES IM INDEX UCITS ETF (DR) 2C Up to 2% 0.07%
LU0592216476 db x-trackers MSCI EM CONSUMER DISCRETIONARY INDEX UCITS ETF*
1C Up to 2% 0.06%
LU0592216559 db x-trackers MSCI EM CONSUMER STAPLES INDEX UCITS ETF* 1C Up to 2% 0.04%
LU0592216633 db x-trackers MSCI EM ENERGY INDEX UCITS ETF* 1C Up to 2% 0.05%
LU0592216807 db x-trackers MSCI EM FINANCIALS INDEX UCITS ETF* 1C Up to 2% 0.04%
LU0592216989 db x-trackers MSCI EM HEALTHCARE INDEX UCITS ETF* 1C Up to 2% 0.04%
LU0592217011 db x-trackers MSCI EM INDUSTRIALS INDEX UCITS ETF* 1C Up to 2% 0.04%
LU0592217102 db x-trackers MSCI EM INFORMATION TECHNOLOGY INDEX UCITS ETF*
1C Up to 2% 0.04%
LU0592217284 db x-trackers MSCI EM MATERIALS INDEX UCITS ETF* 1C Up to 2% 0.04%
LU0592217367 db x-trackers MSCI EM TELECOMMUNICATION SERVICES INDEX UCITS ETF*
1C Up to 2% 0.04%
LU0592217441 db x-trackers MSCI EM UTILITIES INDEX UCITS ETF* 1C Up to 2% 0.04%
LU0592217524 db x-trackers MSCI AFRICA TOP 50 INDEX UCITS ETF* 1C Up to 2% 0.04%
LU0592217870 db x-trackers MSCI EM EASTERN EUROPE INDEX UCITS ETF* 1C Up to 2% 0.06%
LU0592216393 db x-trackers IBEX 35® UCITS ETF (DR) 1C Up to 1% 0.20%
LU0994505336 db x-trackers IBEX 35® UCITS ETF (DR) 1D Up to 1% 0.20%
LU0592217797 db x-trackers MSCI CHILE INDEX UCITS ETF* 1C Up to 2% 0.05%
LU0659578925 db x-trackers MSCI AC ASIA PACIFIC EX JAPAN INDEX UCITS ETF*
1C Up to 2% 0.03%
LU0659579220 db x-trackers MSCI BANGLADESH IM INDEX UCITS ETF* 1C Up to 2% 0.94%
LU0755277992 db x-trackers MSCI BANGLADESH IM INDEX UCITS ETF* 2C Up to 2% 1.02%
LU0659579147 db x-trackers MSCI PAKISTAN IM INDEX UCITS ETF* 1C Up to 2% 1.05%
LU0755278701 db x-trackers MSCI PAKISTAN IM INDEX UCITS ETF* 2C Up to 2% 1.89%
LU0659578842 db x-trackers MSCI SINGAPORE IM INDEX UCITS ETF (DR) 1C Up to 1% 0.06%
LU0755279428 db x-trackers MSCI SINGAPORE IM INDEX UCITS ETF (DR) 2C Up to 1% 0.07%
LU0659579063 db x-trackers ATX UCITS ETF (DR) 1C Up to 1% 0.13%
LU0659579493 db x-trackers S&P 500® EQUAL WEIGHT UCITS ETF* 1C Up to 1% 0.02%
LU0846194776 db x-trackers MSCI EMU INDEX UCITS ETF (DR) 1D Up to 1% 0.38%
LU0835262626 db x-trackers EURO STOXX 50® EX FINANCIALS UCITS ETF
(DR) 1D Up to 1% 0.12%
LU0838782315 db x-trackers DAX® UCITS ETF (DR) - Income 1D Up to 1% 0.11%
LU0838780707 db x-trackers FTSE 100 UCITS ETF (DR) 1D Up to 1% 0.11%
LU0839027447 db x-trackers NIKKEI 225 UCITS ETF (DR) 1D Up to 1% 0.12%
20
db x-trackers**
Directors’ Report (continued)
* This is a synthetic ETF. ** This includes synthetic ETFs and a non-ETF.
The Board of Directors of the Company expects to expand its market share through the innovative extension of its product range and specifically db x-trackers’** range of direct replication Sub-Funds by both launching new Sub-Funds as well as amending the investment policy of a number of the existing synthetic Sub-Funds’ such that they will become direct replication ETFs. The Company continues its effort to enhance secondary market liquidity by means of a broad range of liquidity providers in the marketplace and provides investors with a vastly diversified choice of ETFs offering access to asset classes and regions worldwide for the further diversification of their asset allocation. Luxembourg, 11 March 2015 While every effort is made to ensure the accuracy of this report, should there be any material differences with the data expressed in the Prospectus and/or relevant Product Annex, the latter will prevail. Past performance is no indication of future returns.
21
yø
Ernst & YoungSociété anonyme
Eyr 7, rue Gabriel LippmannParc d’Activité Syrdall 2[-5365 Munsbach B.P. 780
[-2017 Luxembourg
Building a better Tel: +352 42 124 1R.C.S. Luxembourg B 47 771
working world www.ey.com/luxembourg TVA LU 16063074
Independent Auditor’s Report
To the Shareholders of db x-trackers,49, avenue J.F. KennedyL-1855 Luxembourg
Following our appointment by the annual general meeting of the Shareholders of 28 March 2014, we have audited theaccompanying financial statements of db x-trackers (the “SICAV”) and of each of its Sub-Funds, which comprise theStatement of Net Assets and the Statement of Investments as at 31 December 2014 and the Statement of Operations andChanges in Net Assets for the year then ended, and a summary of significant accounting policies and other explanatorynotes to the financial statements.
Responsibility ofthe Board ofDirectors ofthe SICA Vfor the financial statements
The Board of Directors of the SICAV is responsible for the preparation and fair presentation of these financialstatements in accordance with Luxembourg legal and regulatory requirements relating to the preparation andpresentation of the financial statements and for such internal control as the Board of Directors of the SICAV determinesis necessary to enable the preparation and presentation of financial statements that are free from material misstatement,whether due to fraud or error.
Responsibility ofthe “réviseur d ntreprises agréé”
Our responsibility is to express an opinion on these financial statements based on our audit. We conducted our audit inaccordance with International Standards on Auditing as adopted for Luxembourg by the Commission de Surveillancedu Secteur Financier”. Those standards require that we comply with ethical requirements and plan and perform theaudit to obtain reasonable assurance about whether the financial statements are free from material misstatement.
An audit involves performing procedures to obtain audit evidence about the amounts and disclosures in the financialstatements. The procedures selected depend on the judgment of the “réviseur d’entreprises agréé”. including theassessment of the risks of material misstatement of the financial statements, whether due to fraud or error. In makingthose risk assessments. the “réviseur d’entreprises agréé’ considers internal control relevant to the entity’s preparationand fair presentation of the financial statements in order to design audit procedures that are appropriate in thecircumstances. but not for the purpose ofexpressing an opinion on the effectiveness ofthe entity’s internal control. Anaudit also includes evaluating the appropriateness of accounting policies used and the reasonableness of accountingestimates made by the Board of Directors of the SICAV, as well as evaluating the overall presentation of the financialstatements.
We believe that the audit evidence we have obtained is sufficient and appropriate to provide a basis for our auditopinion.
22
A member firm of Ernst & Young Global Limited
EYBuilding a betterworking world
Opinion
In our opinion, the financial statements give a true and fair view of the financial position of db x-trackers and of each ofits Sub-Funds as of 31 December 2014, and of the results of their operations and changes in their net assets for the yearthen ended in accordance with Luxembourg legal and regulatory requirements relating to the preparation andpresentation of the financial statements.
Other matter
Supplementary information included in the annual report has been reviewed in the context of our mandate but has notbeen subject to specific audit procedures carried out in accordance with the standards described above. Consequently,we express no opinion on such information. However, we have no observation to make concerning such information inthe context of the financial statements taken as a whole.
Luxembourg, 11 March 2015
23
Ernst & YoungSociëtë Anonyme
Bernard Lhoest
A member firm of Ernst & Young Global Limited
db x-trackers**
* This is a synthetic ETF. ** This includes synthetic ETFs and a non-ETF.
Information for Hong Kong Residents
Sub-Funds authorised in Hong Kong
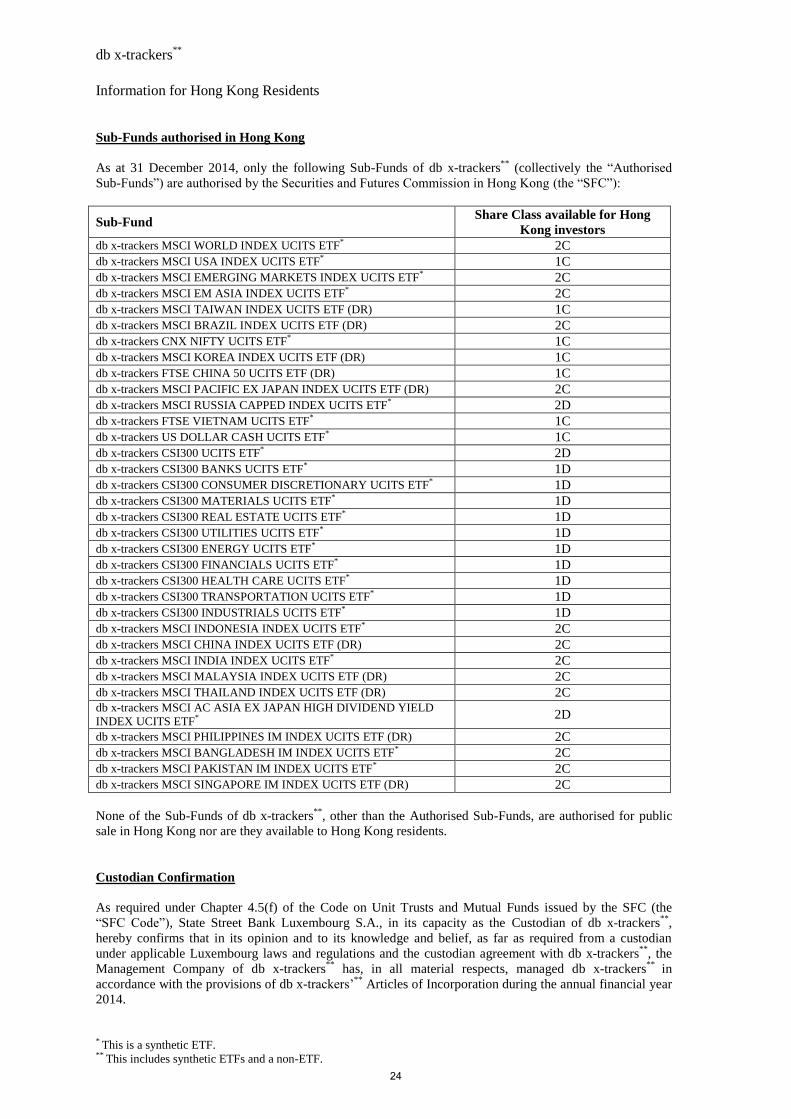
As at 31 December 2014, only the following Sub-Funds of db x-trackers**
(collectively the “Authorised
Sub-Funds”) are authorised by the Securities and Futures Commission in Hong Kong (the “SFC”):
Sub-Fund Share Class available for Hong
Kong investors
db x-trackers MSCI WORLD INDEX UCITS ETF* 2C
db x-trackers MSCI USA INDEX UCITS ETF* 1C
db x-trackers MSCI EMERGING MARKETS INDEX UCITS ETF* 2C
db x-trackers MSCI EM ASIA INDEX UCITS ETF* 2C
db x-trackers MSCI TAIWAN INDEX UCITS ETF (DR) 1C
db x-trackers MSCI BRAZIL INDEX UCITS ETF (DR) 2C
db x-trackers CNX NIFTY UCITS ETF* 1C
db x-trackers MSCI KOREA INDEX UCITS ETF (DR) 1C
db x-trackers FTSE CHINA 50 UCITS ETF (DR) 1C
db x-trackers MSCI PACIFIC EX JAPAN INDEX UCITS ETF (DR) 2C
db x-trackers MSCI RUSSIA CAPPED INDEX UCITS ETF* 2D
db x-trackers FTSE VIETNAM UCITS ETF* 1C
db x-trackers US DOLLAR CASH UCITS ETF* 1C
db x-trackers CSI300 UCITS ETF* 2D
db x-trackers CSI300 BANKS UCITS ETF* 1D
db x-trackers CSI300 CONSUMER DISCRETIONARY UCITS ETF* 1D
db x-trackers CSI300 MATERIALS UCITS ETF* 1D
db x-trackers CSI300 REAL ESTATE UCITS ETF* 1D
db x-trackers CSI300 UTILITIES UCITS ETF* 1D
db x-trackers CSI300 ENERGY UCITS ETF* 1D
db x-trackers CSI300 FINANCIALS UCITS ETF* 1D
db x-trackers CSI300 HEALTH CARE UCITS ETF* 1D
db x-trackers CSI300 TRANSPORTATION UCITS ETF* 1D
db x-trackers CSI300 INDUSTRIALS UCITS ETF* 1D
db x-trackers MSCI INDONESIA INDEX UCITS ETF* 2C
db x-trackers MSCI CHINA INDEX UCITS ETF (DR) 2C
db x-trackers MSCI INDIA INDEX UCITS ETF* 2C
db x-trackers MSCI MALAYSIA INDEX UCITS ETF (DR) 2C
db x-trackers MSCI THAILAND INDEX UCITS ETF (DR) 2C db x-trackers MSCI AC ASIA EX JAPAN HIGH DIVIDEND YIELD
INDEX UCITS ETF* 2D
db x-trackers MSCI PHILIPPINES IM INDEX UCITS ETF (DR) 2C
db x-trackers MSCI BANGLADESH IM INDEX UCITS ETF* 2C
db x-trackers MSCI PAKISTAN IM INDEX UCITS ETF* 2C
db x-trackers MSCI SINGAPORE IM INDEX UCITS ETF (DR) 2C
None of the Sub-Funds of db x-trackers**
, other than the Authorised Sub-Funds, are authorised for public
sale in Hong Kong nor are they available to Hong Kong residents.
Custodian Confirmation
As required under Chapter 4.5(f) of the Code on Unit Trusts and Mutual Funds issued by the SFC (the
“SFC Code”), State Street Bank Luxembourg S.A., in its capacity as the Custodian of db x-trackers**
,
hereby confirms that in its opinion and to its knowledge and belief, as far as required from a custodian
under applicable Luxembourg laws and regulations and the custodian agreement with db x-trackers**
, the
Management Company of db x-trackers**
has, in all material respects, managed db x-trackers**
in
accordance with the provisions of db x-trackers’**
Articles of Incorporation during the annual financial year
2014.
24
db x-trackers**
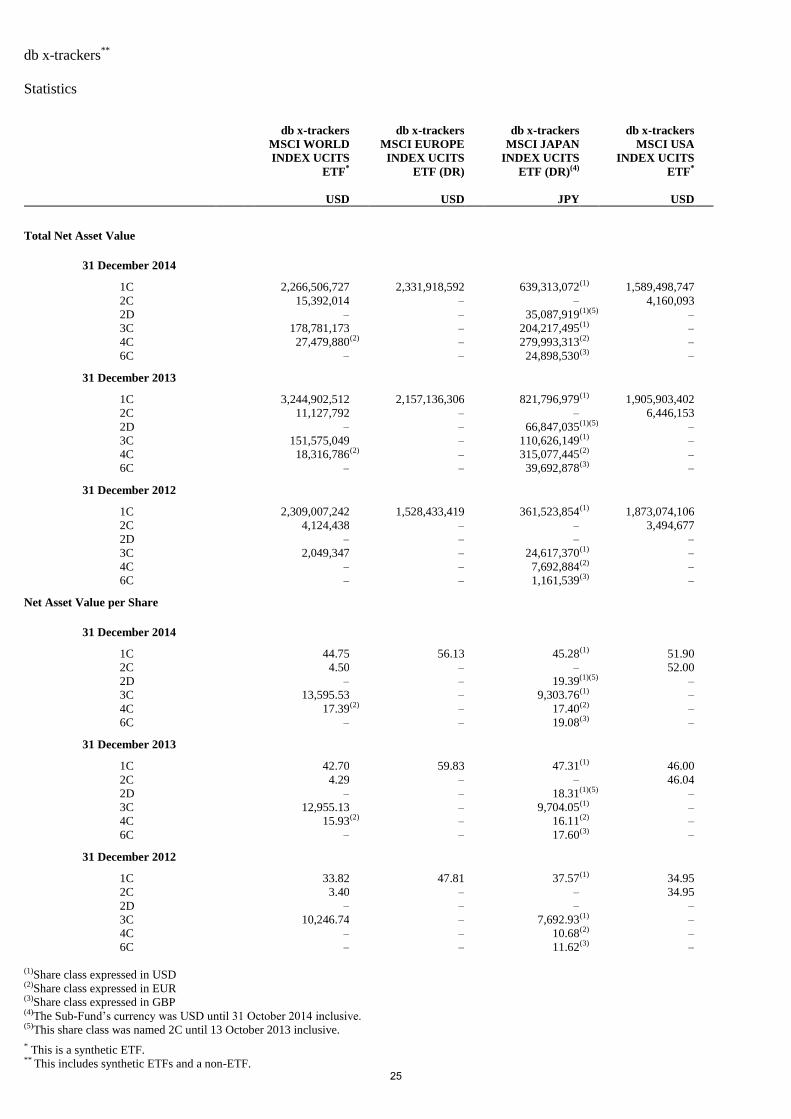
Statistics
* This is a synthetic ETF. **
This includes synthetic ETFs and a non-ETF.
db x-trackers
MSCI WORLD
INDEX UCITS
ETF*
db x-trackers
MSCI EUROPE
INDEX UCITS
ETF (DR)
db x-trackers
MSCI JAPAN
INDEX UCITS
ETF (DR)(4)
db x-trackers
MSCI USA
INDEX UCITS
ETF*
USD USD JPY USD
Total Net Asset Value
31 December 2014
1C 2,266,506,727 2,331,918,592 639,313,072 (1) 1,589,498,747
2C 15,392,014 – – 4,160,093
2D – – 35,087,919 (1)(5) –
3C 178,781,173 – 204,217,495 (1) –
4C 27,479,880 (2) – 279,993,313 (2) –
6C – – 24,898,530 (3) –
31 December 2013
1C 3,244,902,512 2,157,136,306 821,796,979 (1) 1,905,903,402
2C 11,127,792 – – 6,446,153
2D – – 66,847,035 (1)(5) –
3C 151,575,049 – 110,626,149 (1) –
4C 18,316,786 (2) – 315,077,445 (2) –
6C – – 39,692,878 (3) –
31 December 2012
1C 2,309,007,242 1,528,433,419 361,523,854 (1) 1,873,074,106
2C 4,124,438 – – 3,494,677
2D – – – –
3C 2,049,347 – 24,617,370 (1) –
4C – – 7,692,884 (2) –
6C – – 1,161,539 (3) –
Net Asset Value per Share
31 December 2014
1C 44.75 56.13 45.28 (1) 51.90
2C 4.50 – – 52.00
2D – – 19.39 (1)(5) –
3C 13,595.53 – 9,303.76 (1) –
4C 17.39 (2) – 17.40 (2) –
6C – – 19.08 (3) –
31 December 2013
1C 42.70 59.83 47.31 (1) 46.00
2C 4.29 – – 46.04
2D – – 18.31 (1)(5) –
3C 12,955.13 – 9,704.05 (1) –
4C 15.93 (2) – 16.11 (2) –
6C – – 17.60 (3) –
31 December 2012
1C 33.82 47.81 37.57 (1) 34.95
2C 3.40 – – 34.95
2D – – – –
3C 10,246.74 – 7,692.93 (1) –
4C – – 10.68 (2) –
6C – – 11.62 (3) –
(1)Share class expressed in USD (2)Share class expressed in EUR (3)Share class expressed in GBP (4)The Sub-Fund’s currency was USD until 31 October 2014 inclusive. (5)This share class was named 2C until 13 October 2013 inclusive.
25
db x-trackers**
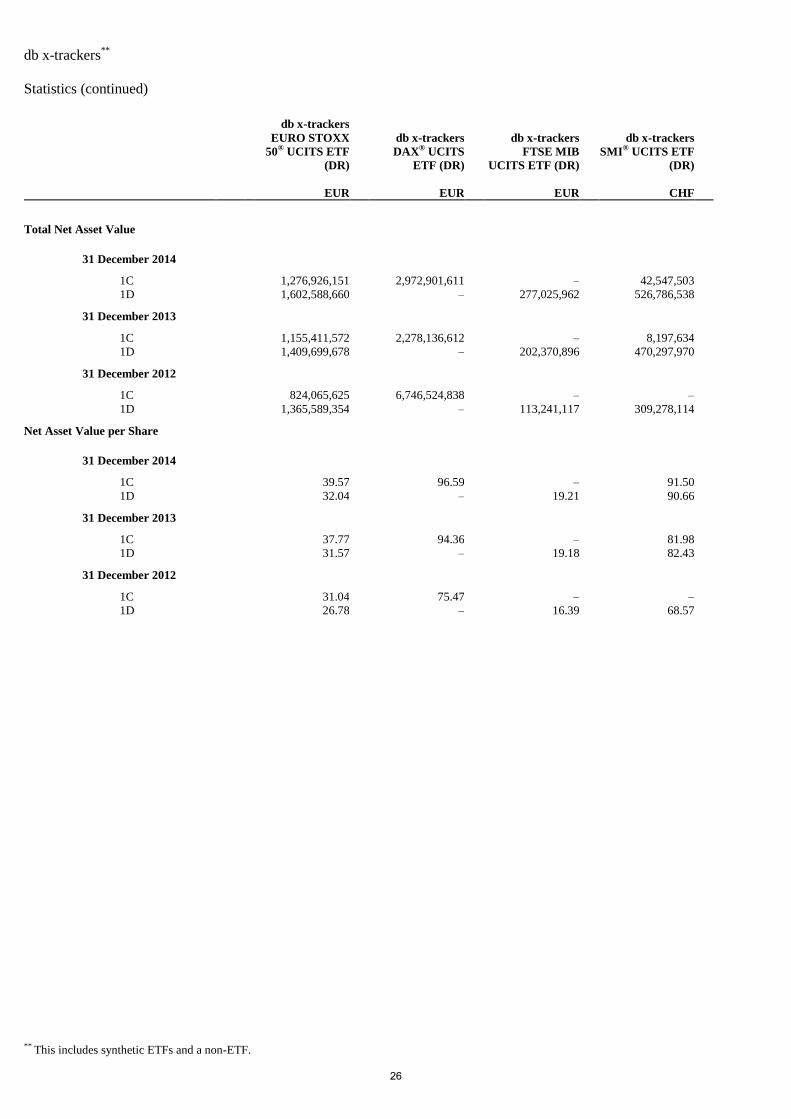
Statistics (continued)
** This includes synthetic ETFs and a non-ETF.
db x-trackers
EURO STOXX
50® UCITS ETF
(DR)
db x-trackers
DAX® UCITS
ETF (DR)
db x-trackers
FTSE MIB
UCITS ETF (DR)
db x-trackers
SMI® UCITS ETF
(DR)
EUR EUR EUR CHF
Total Net Asset Value
31 December 2014
1C 1,276,926,151 2,972,901,611 – 42,547,503
1D 1,602,588,660 – 277,025,962 526,786,538
31 December 2013
1C 1,155,411,572 2,278,136,612 – 8,197,634
1D 1,409,699,678 – 202,370,896 470,297,970
31 December 2012
1C 824,065,625 6,746,524,838 – –
1D 1,365,589,354 – 113,241,117 309,278,114
Net Asset Value per Share
31 December 2014
1C 39.57 96.59 – 91.50
1D 32.04 – 19.21 90.66
31 December 2013
1C 37.77 94.36 – 81.98
1D 31.57 – 19.18 82.43
31 December 2012
1C 31.04 75.47 – –
1D 26.78 – 16.39 68.57
26
db x-trackers**
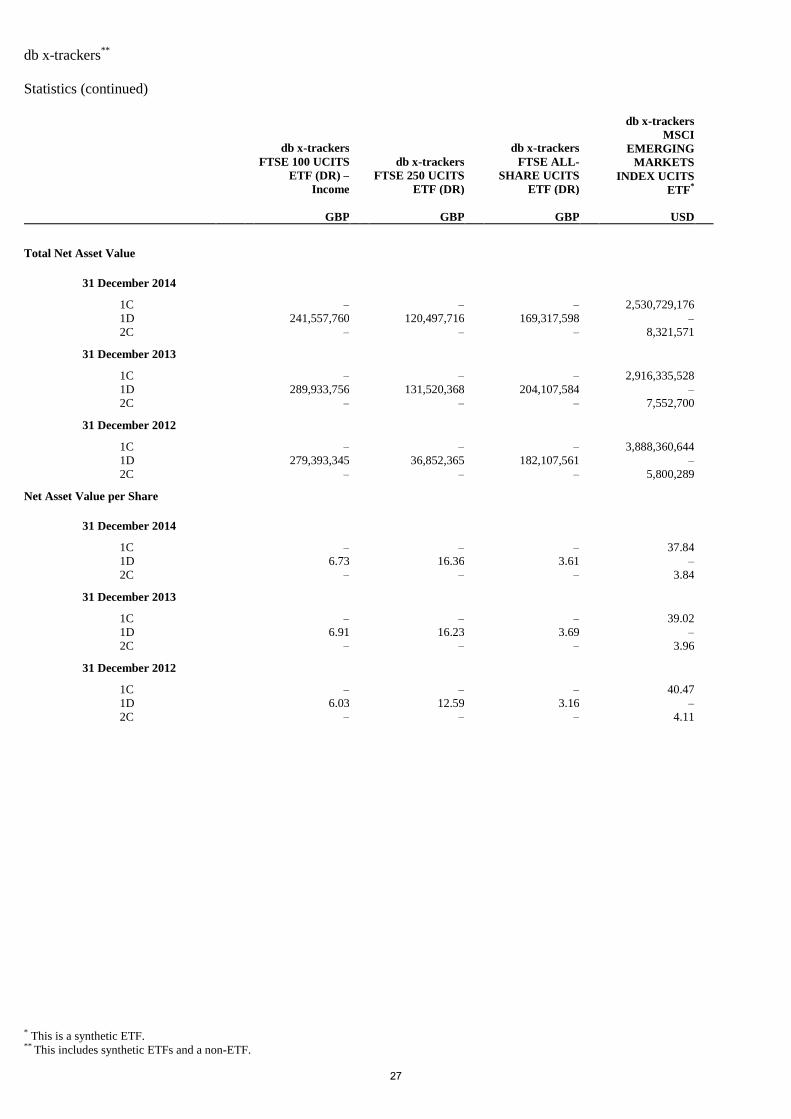
Statistics (continued)
* This is a synthetic ETF. **
This includes synthetic ETFs and a non-ETF.
db x-trackers
FTSE 100 UCITS
ETF (DR) –
Income
db x-trackers
FTSE 250 UCITS
ETF (DR)
db x-trackers
FTSE ALL-
SHARE UCITS
ETF (DR)
db x-trackers
MSCI
EMERGING
MARKETS
INDEX UCITS
ETF*
GBP GBP GBP USD
Total Net Asset Value
31 December 2014
1C – – – 2,530,729,176
1D 241,557,760 120,497,716 169,317,598 –
2C – – – 8,321,571
31 December 2013
1C – – – 2,916,335,528
1D 289,933,756 131,520,368 204,107,584 –
2C – – – 7,552,700
31 December 2012
1C – – – 3,888,360,644
1D 279,393,345 36,852,365 182,107,561 –
2C – – – 5,800,289
Net Asset Value per Share
31 December 2014
1C – – – 37.84
1D 6.73 16.36 3.61 –
2C – – – 3.84
31 December 2013
1C – – – 39.02
1D 6.91 16.23 3.69 –
2C – – – 3.96
31 December 2012
1C – – – 40.47
1D 6.03 12.59 3.16 –
2C – – – 4.11
27
db x-trackers**
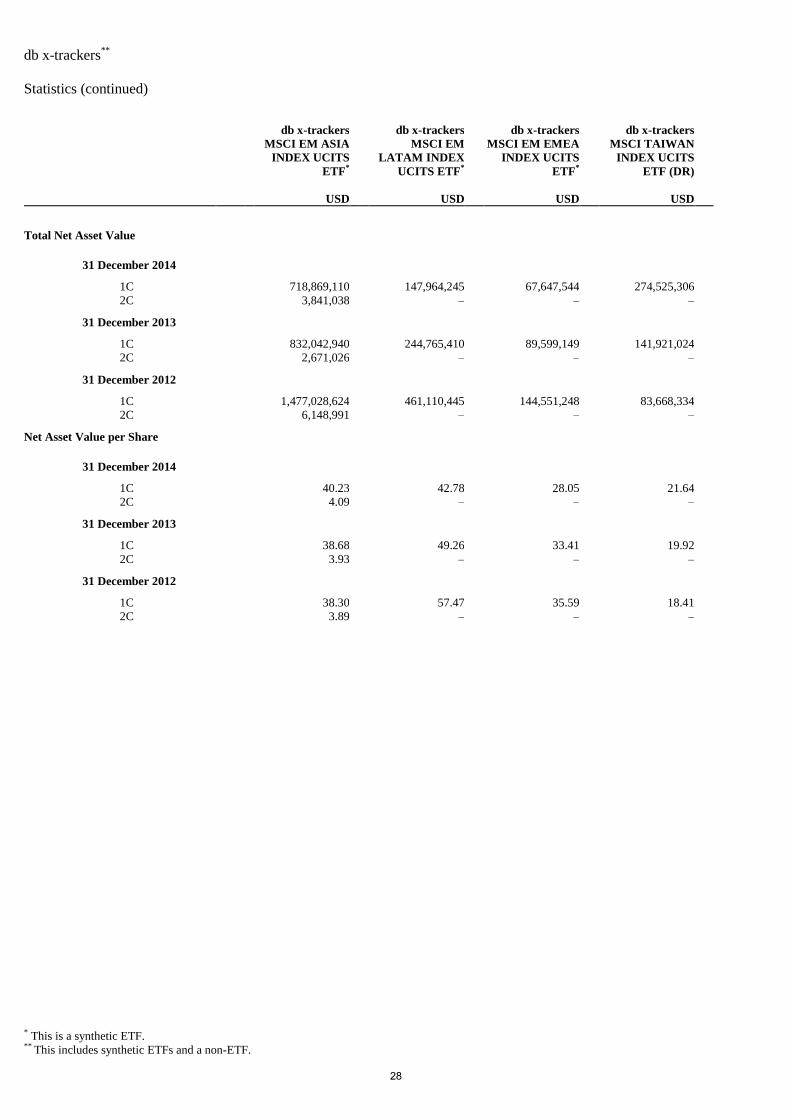
Statistics (continued)
* This is a synthetic ETF. **
This includes synthetic ETFs and a non-ETF.
db x-trackers
MSCI EM ASIA
INDEX UCITS
ETF*
db x-trackers
MSCI EM
LATAM INDEX
UCITS ETF*
db x-trackers
MSCI EM EMEA
INDEX UCITS
ETF*
db x-trackers
MSCI TAIWAN
INDEX UCITS
ETF (DR)
USD USD USD USD
Total Net Asset Value
31 December 2014
1C 718,869,110 147,964,245 67,647,544 274,525,306
2C 3,841,038 – – –
31 December 2013
1C 832,042,940 244,765,410 89,599,149 141,921,024
2C 2,671,026 – – –
31 December 2012
1C 1,477,028,624 461,110,445 144,551,248 83,668,334
2C 6,148,991 – – –
Net Asset Value per Share
31 December 2014
1C 40.23 42.78 28.05 21.64
2C 4.09 – – –
31 December 2013
1C 38.68 49.26 33.41 19.92
2C 3.93 – – –
31 December 2012
1C 38.30 57.47 35.59 18.41
2C 3.89 – – –
28
db x-trackers**
Statistics (continued)
* This is a synthetic ETF. **
This includes synthetic ETFs and a non-ETF.
db x-trackers
MSCI BRAZIL
INDEX UCITS
ETF (DR)
db x-trackers
CNX NIFTY
UCITS ETF*
db x-trackers
MSCI KOREA
INDEX UCITS
ETF (DR)
db x-trackers
FTSE CHINA 50
UCITS ETF (DR)
USD USD USD USD
Total Net Asset Value
31 December 2014
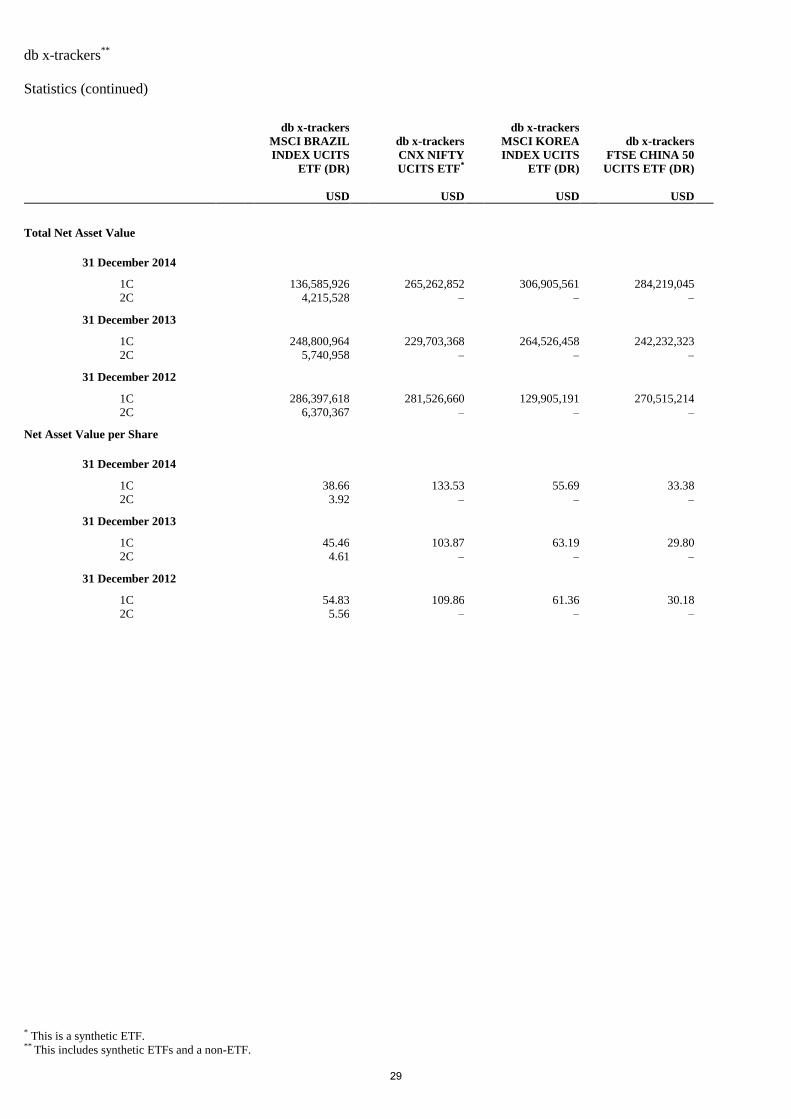
1C 136,585,926 265,262,852 306,905,561 284,219,045
2C 4,215,528 – – –
31 December 2013
1C 248,800,964 229,703,368 264,526,458 242,232,323
2C 5,740,958 – – –
31 December 2012
1C 286,397,618 281,526,660 129,905,191 270,515,214
2C 6,370,367 – – –
Net Asset Value per Share
31 December 2014
1C 38.66 133.53 55.69 33.38
2C 3.92 – – –
31 December 2013
1C 45.46 103.87 63.19 29.80
2C 4.61 – – –
31 December 2012
1C 54.83 109.86 61.36 30.18
2C 5.56 – – –
29
db x-trackers**
Statistics (continued)
* This is a synthetic ETF. **
This includes synthetic ETFs and a non-ETF.
db x-trackers
EURO STOXX®
SELECT
DIVIDEND 30
UCITS ETF (DR)
db x-trackers
STOXX®
GLOBAL
SELECT
DIVIDEND 100
UCITS ETF*
db x-trackers
STOXX®
EUROPE 600
BASIC
RESOURCES
UCITS ETF*
db x-trackers
STOXX®
EUROPE 600
OIL & GAS
UCITS ETF*
EUR EUR EUR EUR
Total Net Asset Value
31 December 2014
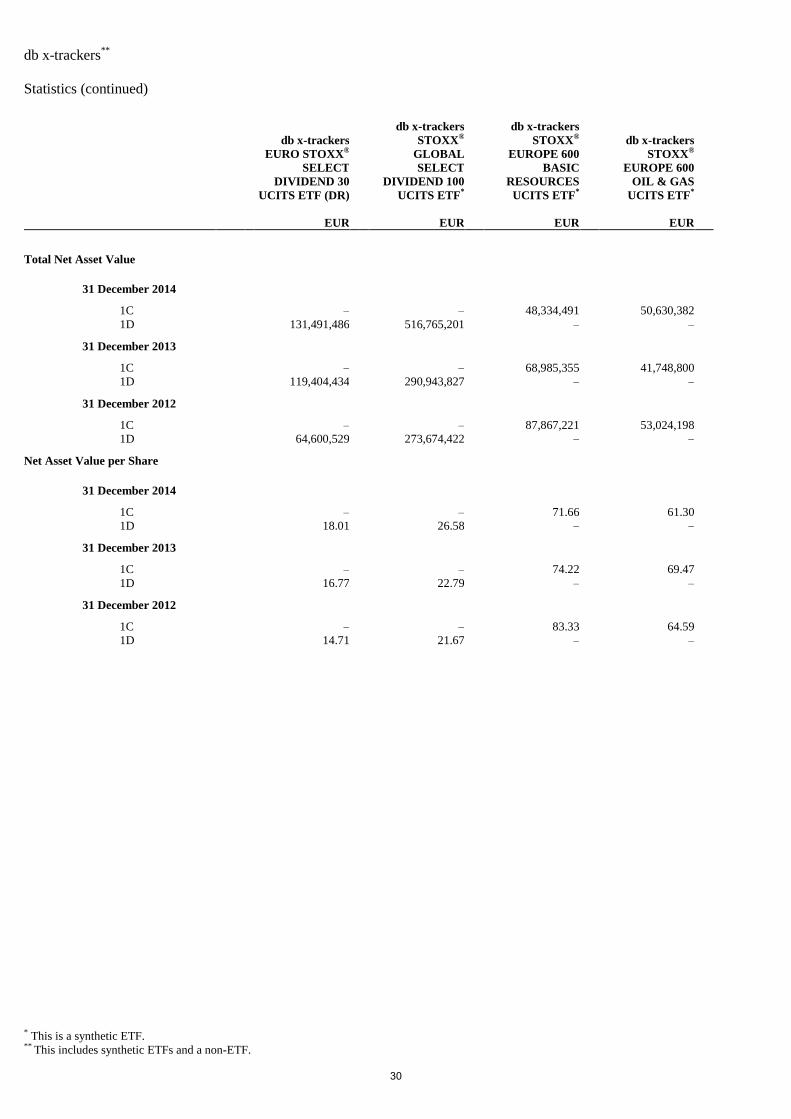
1C – – 48,334,491 50,630,382
1D 131,491,486 516,765,201 – –
31 December 2013
1C – – 68,985,355 41,748,800
1D 119,404,434 290,943,827 – –
31 December 2012
1C – – 87,867,221 53,024,198
1D 64,600,529 273,674,422 – –
Net Asset Value per Share
31 December 2014
1C – – 71.66 61.30
1D 18.01 26.58 – –
31 December 2013
1C – – 74.22 69.47
1D 16.77 22.79 – –
31 December 2012
1C – – 83.33 64.59
1D 14.71 21.67 – –
30
db x-trackers**
Statistics (continued)
* This is a synthetic ETF. **
This includes synthetic ETFs and a non-ETF.
db x-trackers
STOXX®
EUROPE 600
HEALTH CARE
UCITS ETF*
db x-trackers
STOXX®
EUROPE 600
BANKS UCITS
ETF*
db x-trackers
STOXX®
EUROPE 600
TELECOMMU-
NICATIONS
UCITS ETF*
db x-trackers
STOXX®
EUROPE 600
TECHNOLOGY
UCITS ETF*
EUR EUR EUR EUR
Total Net Asset Value
31 December 2014
1C 193,058,047 140,300,535 19,946,614 33,815,050
31 December 2013
1C 140,265,112 140,003,911 49,128,038 23,003,372
31 December 2012
1C 114,250,539 162,140,852 22,872,104 13,886,536
Net Asset Value per Share
31 December 2014
1C 109.93 39.54 70.67 43.89
31 December 2013
1C 91.01 39.57 63.21 40.32
31 December 2012
1C 73.89 32.38 46.00 31.52
31
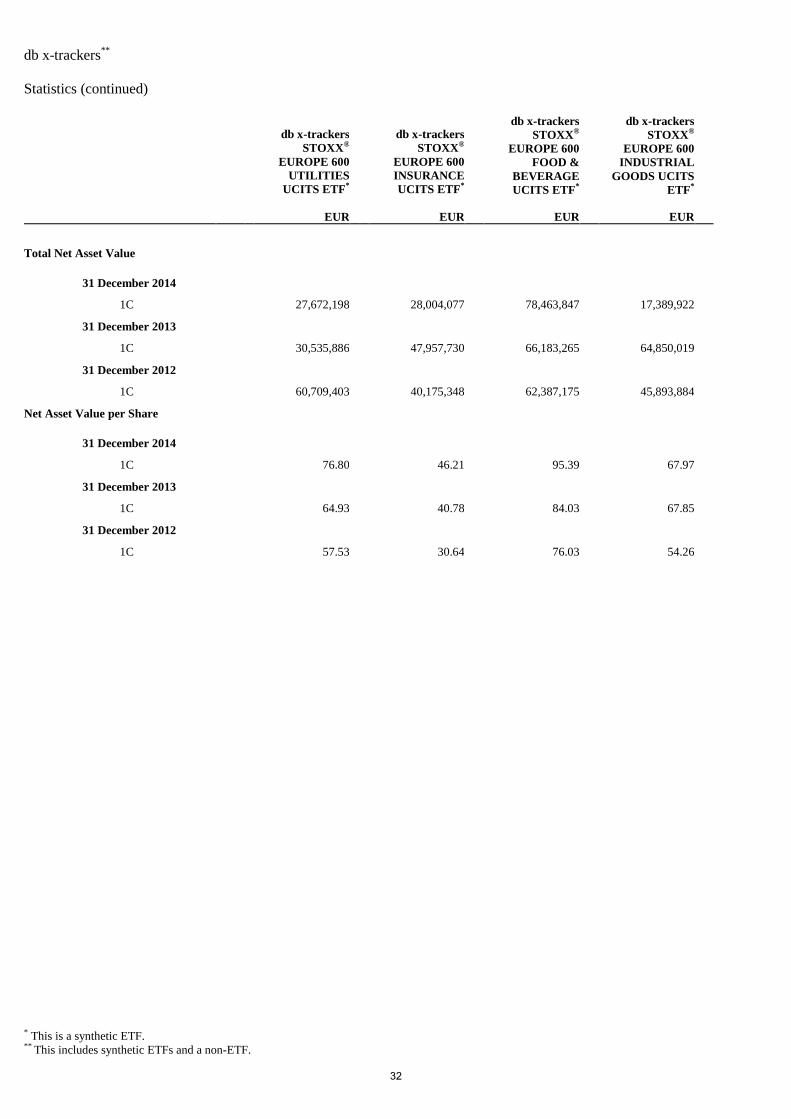
db x-trackers**
Statistics (continued)
* This is a synthetic ETF. **
This includes synthetic ETFs and a non-ETF.
db x-trackers
STOXX®
EUROPE 600
UTILITIES
UCITS ETF*
db x-trackers
STOXX®
EUROPE 600
INSURANCE
UCITS ETF*
db x-trackers
STOXX®
EUROPE 600
FOOD &
BEVERAGE
UCITS ETF*
db x-trackers
STOXX®
EUROPE 600
INDUSTRIAL
GOODS UCITS
ETF*
EUR EUR EUR EUR
Total Net Asset Value
31 December 2014
1C 27,672,198 28,004,077 78,463,847 17,389,922
31 December 2013
1C 30,535,886 47,957,730 66,183,265 64,850,019
31 December 2012
1C 60,709,403 40,175,348 62,387,175 45,893,884
Net Asset Value per Share
31 December 2014
1C 76.80 46.21 95.39 67.97
31 December 2013
1C 64.93 40.78 84.03 67.85
31 December 2012
1C 57.53 30.64 76.03 54.26
32
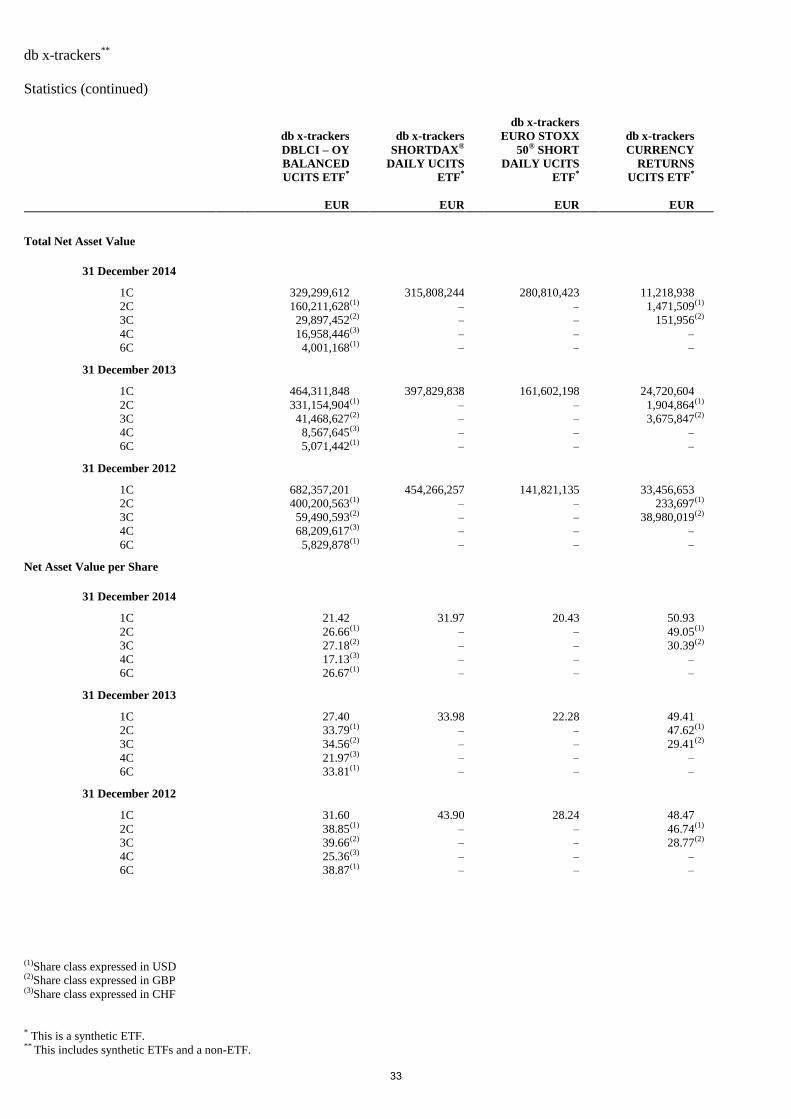
db x-trackers**
Statistics (continued)
* This is a synthetic ETF. **
This includes synthetic ETFs and a non-ETF.
db x-trackers
DBLCI – OY
BALANCED
UCITS ETF*
db x-trackers
SHORTDAX®
DAILY UCITS
ETF*
db x-trackers
EURO STOXX
50® SHORT
DAILY UCITS
ETF*
db x-trackers
CURRENCY
RETURNS
UCITS ETF*
EUR EUR EUR EUR
Total Net Asset Value
31 December 2014
1C 329,299,612 315,808,244 280,810,423 11,218,938
2C 160,211,628 (1) – – 1,471,509 (1)
3C 29,897,452 (2) – – 151,956 (2)
4C 16,958,446 (3) – – –
6C 4,001,168 (1) – – –
31 December 2013
1C 464,311,848 397,829,838 161,602,198 24,720,604
2C 331,154,904 (1) – – 1,904,864 (1)
3C 41,468,627 (2) – – 3,675,847 (2)
4C 8,567,645 (3) – – –
6C 5,071,442 (1) – – –
31 December 2012
1C 682,357,201 454,266,257 141,821,135 33,456,653
2C 400,200,563 (1) – – 233,697 (1)
3C 59,490,593 (2) – – 38,980,019 (2)
4C 68,209,617 (3) – – –
6C 5,829,878 (1) – – –
Net Asset Value per Share
31 December 2014
1C 21.42 31.97 20.43 50.93
2C 26.66 (1) – – 49.05 (1)
3C 27.18 (2) – – 30.39 (2)
4C 17.13 (3) – – –
6C 26.67 (1) – – –
31 December 2013
1C 27.40 33.98 22.28 49.41
2C 33.79 (1) – – 47.62 (1)
3C 34.56 (2) – – 29.41 (2)
4C 21.97 (3) – – –
6C 33.81 (1) – – –
31 December 2012
1C 31.60 43.90 28.24 48.47
2C 38.85 (1) – – 46.74 (1)
3C 39.66 (2) – – 28.77 (2)
4C 25.36 (3) – – –
6C 38.87 (1) – – –
(1)Share class expressed in USD (2)Share class expressed in GBP (3)Share class expressed in CHF
33
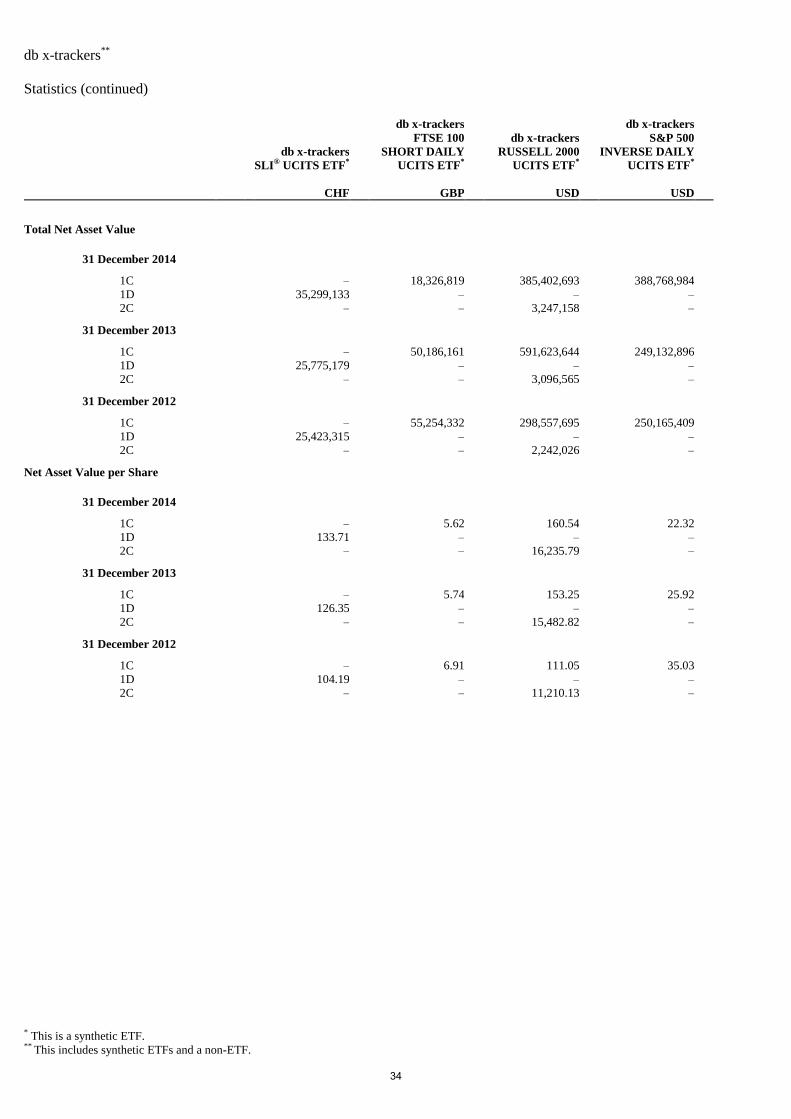
db x-trackers**
Statistics (continued)
* This is a synthetic ETF. **
This includes synthetic ETFs and a non-ETF.
db x-trackers
SLI® UCITS ETF*
db x-trackers
FTSE 100
SHORT DAILY
UCITS ETF*
db x-trackers
RUSSELL 2000
UCITS ETF*
db x-trackers
S&P 500
INVERSE DAILY
UCITS ETF*
CHF GBP USD USD
Total Net Asset Value
31 December 2014
1C – 18,326,819 385,402,693 388,768,984
1D 35,299,133 – – –
2C – – 3,247,158 –
31 December 2013
1C – 50,186,161 591,623,644 249,132,896
1D 25,775,179 – – –
2C – – 3,096,565 –
31 December 2012
1C – 55,254,332 298,557,695 250,165,409
1D 25,423,315 – – –
2C – – 2,242,026 –
Net Asset Value per Share
31 December 2014
1C – 5.62 160.54 22.32
1D 133.71 – – –
2C – – 16,235.79 –
31 December 2013
1C – 5.74 153.25 25.92
1D 126.35 – – –
2C – – 15,482.82 –
31 December 2012
1C – 6.91 111.05 35.03
1D 104.19 – – –
2C – – 11,210.13 –
34
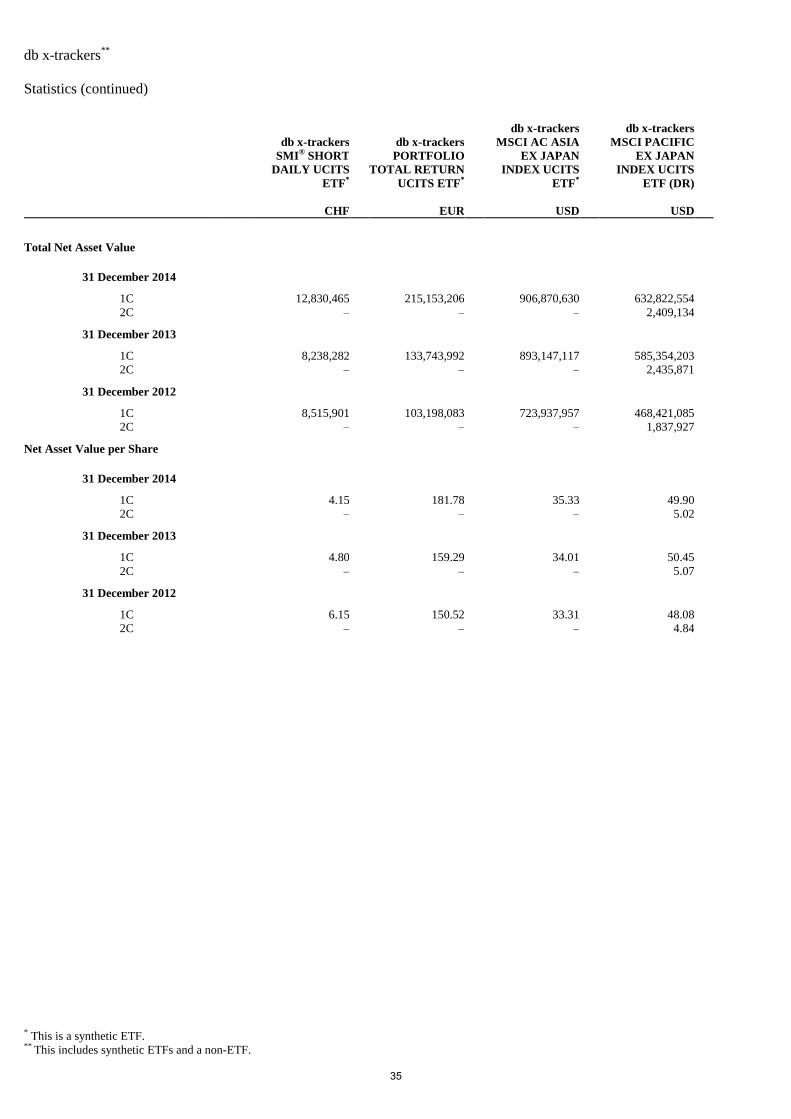
db x-trackers**
Statistics (continued)
* This is a synthetic ETF. **
This includes synthetic ETFs and a non-ETF.
db x-trackers
SMI® SHORT
DAILY UCITS
ETF*
db x-trackers
PORTFOLIO
TOTAL RETURN
UCITS ETF*
db x-trackers
MSCI AC ASIA
EX JAPAN
INDEX UCITS
ETF*
db x-trackers
MSCI PACIFIC
EX JAPAN
INDEX UCITS
ETF (DR)
CHF EUR USD USD
Total Net Asset Value
31 December 2014
1C 12,830,465 215,153,206 906,870,630 632,822,554
2C – – – 2,409,134
31 December 2013
1C 8,238,282 133,743,992 893,147,117 585,354,203
2C – – – 2,435,871
31 December 2012
1C 8,515,901 103,198,083 723,937,957 468,421,085
2C – – – 1,837,927
Net Asset Value per Share
31 December 2014
1C 4.15 181.78 35.33 49.90
2C – – – 5.02
31 December 2013
1C 4.80 159.29 34.01 50.45
2C – – – 5.07
31 December 2012
1C 6.15 150.52 33.31 48.08
2C – – – 4.84
35
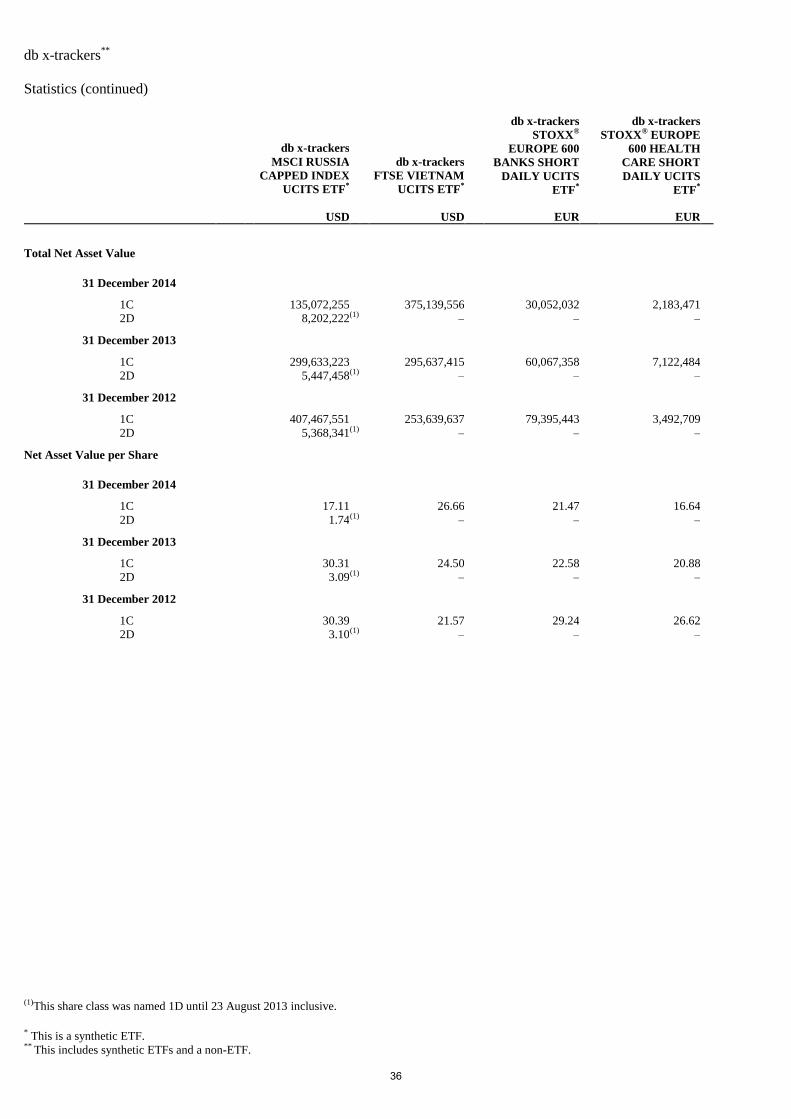
db x-trackers**
Statistics (continued)
* This is a synthetic ETF. **
This includes synthetic ETFs and a non-ETF.
db x-trackers
MSCI RUSSIA
CAPPED INDEX
UCITS ETF*
db x-trackers
FTSE VIETNAM
UCITS ETF*
db x-trackers
STOXX®
EUROPE 600
BANKS SHORT
DAILY UCITS
ETF*
db x-trackers
STOXX® EUROPE
600 HEALTH
CARE SHORT
DAILY UCITS
ETF*
USD USD EUR EUR
Total Net Asset Value
31 December 2014
1C 135,072,255 375,139,556 30,052,032 2,183,471
2D 8,202,222 (1) – – –
31 December 2013
1C 299,633,223 295,637,415 60,067,358 7,122,484
2D 5,447,458 (1) – – –
31 December 2012
1C 407,467,551 253,639,637 79,395,443 3,492,709
2D 5,368,341 (1) – – –
Net Asset Value per Share
31 December 2014
1C 17.11 26.66 21.47 16.64
2D 1.74 (1) – – –
31 December 2013
1C 30.31 24.50 22.58 20.88
2D 3.09 (1) – – –
31 December 2012
1C 30.39 21.57 29.24 26.62
2D 3.10 (1) – – –
(1)This share class was named 1D until 23 August 2013 inclusive.
36
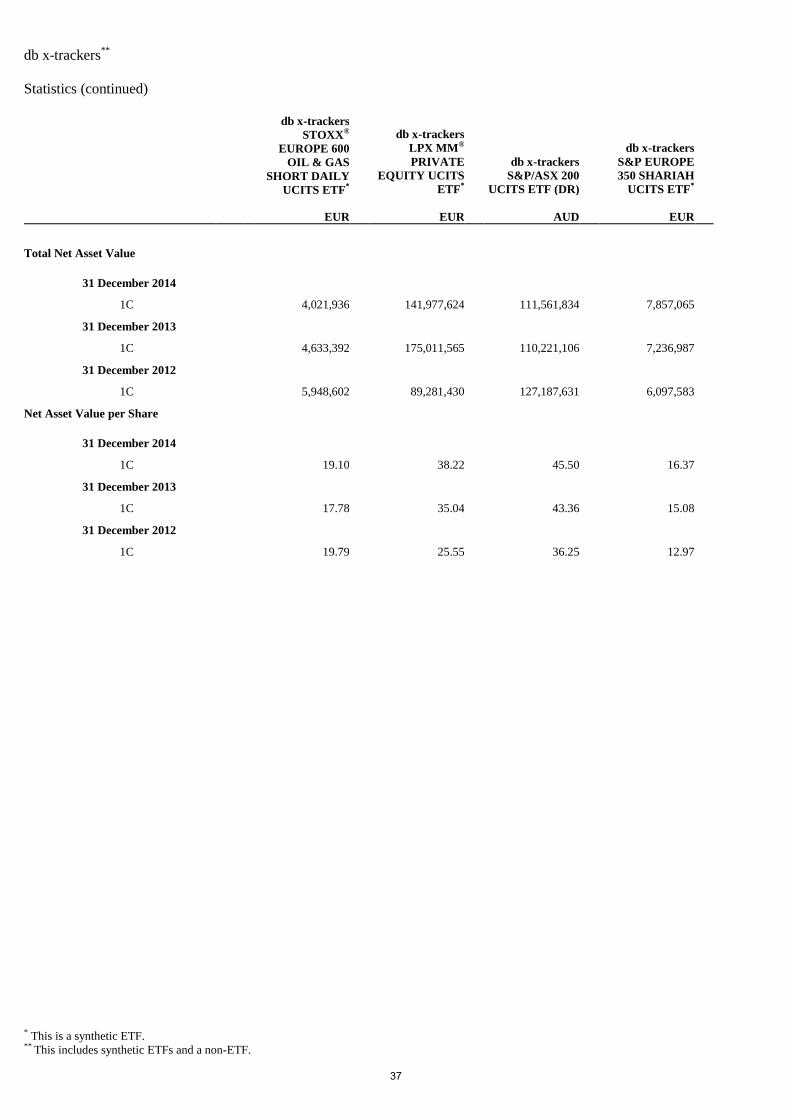
db x-trackers**
Statistics (continued)
* This is a synthetic ETF. **
This includes synthetic ETFs and a non-ETF.
db x-trackers
STOXX®
EUROPE 600
OIL & GAS
SHORT DAILY
UCITS ETF*
db x-trackers
LPX MM®
PRIVATE
EQUITY UCITS
ETF*
db x-trackers
S&P/ASX 200
UCITS ETF (DR)
db x-trackers
S&P EUROPE
350 SHARIAH
UCITS ETF*
EUR EUR AUD EUR
Total Net Asset Value
31 December 2014
1C 4,021,936 141,977,624 111,561,834 7,857,065
31 December 2013
1C 4,633,392 175,011,565 110,221,106 7,236,987
31 December 2012
1C 5,948,602 89,281,430 127,187,631 6,097,583
Net Asset Value per Share
31 December 2014
1C 19.10 38.22 45.50 16.37
31 December 2013
1C 17.78 35.04 43.36 15.08
31 December 2012
1C 19.79 25.55 36.25 12.97
37
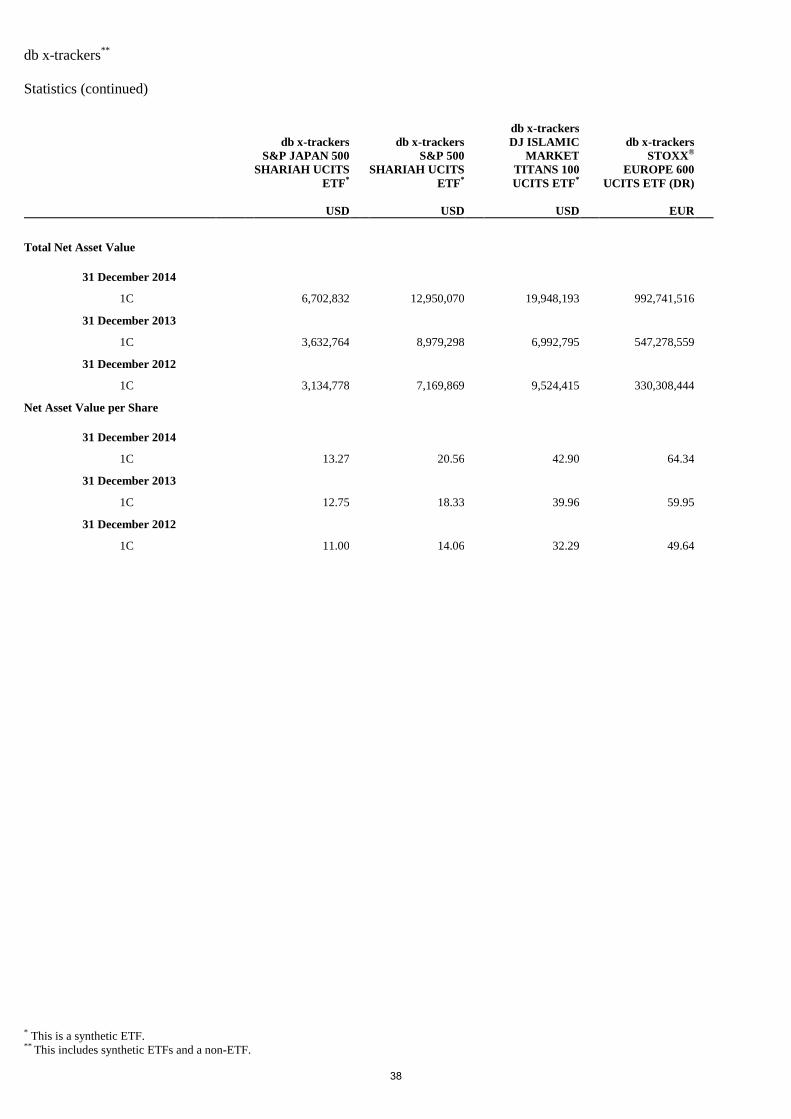
db x-trackers**
Statistics (continued)
* This is a synthetic ETF. **
This includes synthetic ETFs and a non-ETF.
db x-trackers
S&P JAPAN 500
SHARIAH UCITS
ETF*
db x-trackers
S&P 500
SHARIAH UCITS
ETF*
db x-trackers
DJ ISLAMIC
MARKET
TITANS 100
UCITS ETF*
db x-trackers
STOXX®
EUROPE 600
UCITS ETF (DR)
USD USD USD EUR
Total Net Asset Value
31 December 2014
1C 6,702,832 12,950,070 19,948,193 992,741,516
31 December 2013
1C 3,632,764 8,979,298 6,992,795 547,278,559
31 December 2012
1C 3,134,778 7,169,869 9,524,415 330,308,444
Net Asset Value per Share
31 December 2014
1C 13.27 20.56 42.90 64.34
31 December 2013
1C 12.75 18.33 39.96 59.95
31 December 2012
1C 11.00 14.06 32.29 49.64
38
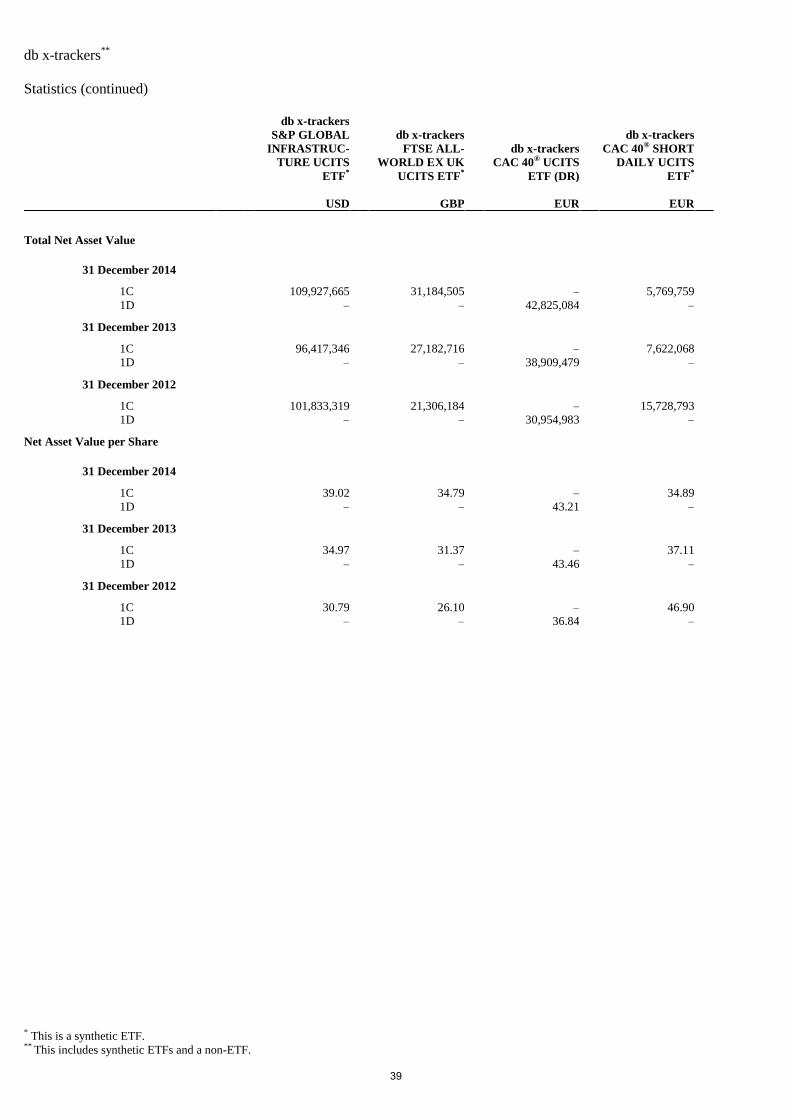
db x-trackers**
Statistics (continued)
* This is a synthetic ETF. **
This includes synthetic ETFs and a non-ETF.
db x-trackers
S&P GLOBAL
INFRASTRUC-
TURE UCITS
ETF*
db x-trackers
FTSE ALL-
WORLD EX UK
UCITS ETF*
db x-trackers
CAC 40® UCITS
ETF (DR)
db x-trackers
CAC 40® SHORT
DAILY UCITS
ETF*
USD GBP EUR EUR
Total Net Asset Value
31 December 2014
1C 109,927,665 31,184,505 – 5,769,759
1D – – 42,825,084 –
31 December 2013
1C 96,417,346 27,182,716 – 7,622,068
1D – – 38,909,479 –
31 December 2012
1C 101,833,319 21,306,184 – 15,728,793
1D – – 30,954,983 –
Net Asset Value per Share
31 December 2014
1C 39.02 34.79 – 34.89
1D – – 43.21 –
31 December 2013
1C 34.97 31.37 – 37.11
1D – – 43.46 –
31 December 2012
1C 30.79 26.10 – 46.90
1D – – 36.84 –
39
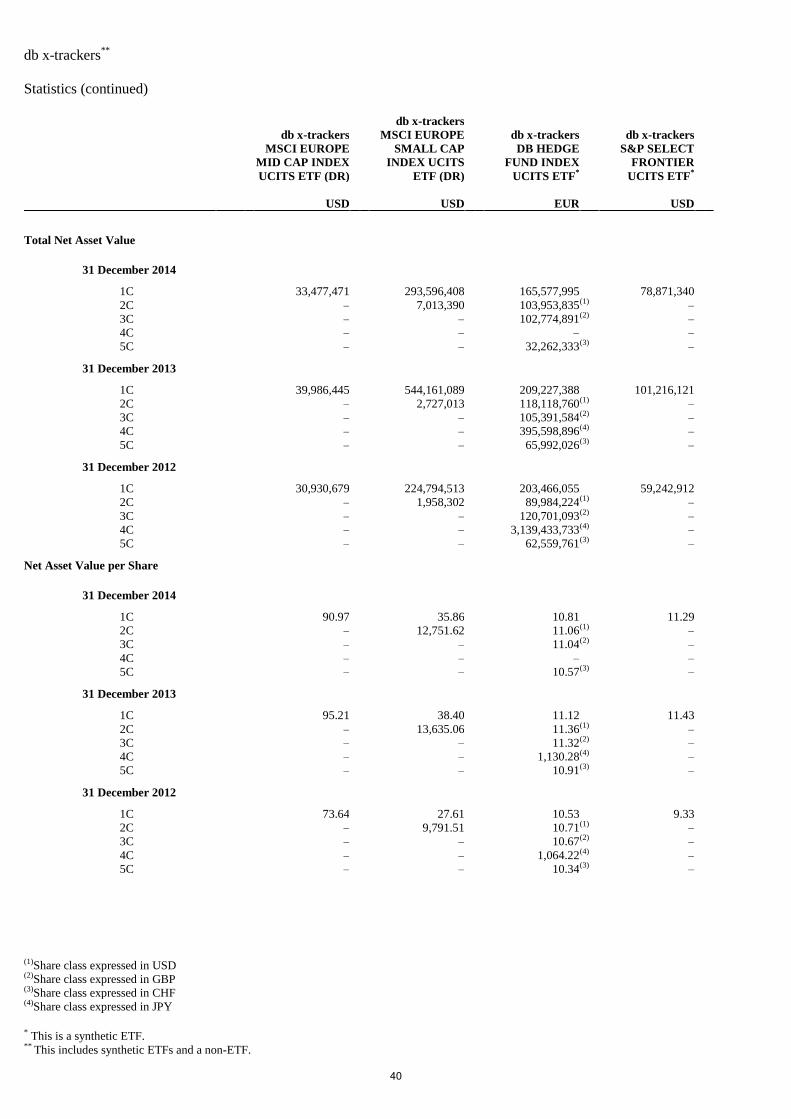
db x-trackers**
Statistics (continued)
* This is a synthetic ETF. **
This includes synthetic ETFs and a non-ETF.
db x-trackers
MSCI EUROPE
MID CAP INDEX
UCITS ETF (DR)
db x-trackers
MSCI EUROPE
SMALL CAP
INDEX UCITS
ETF (DR)
db x-trackers
DB HEDGE
FUND INDEX
UCITS ETF*
db x-trackers
S&P SELECT
FRONTIER
UCITS ETF*
USD USD EUR USD
Total Net Asset Value
31 December 2014
1C 33,477,471 293,596,408 165,577,995 78,871,340
2C – 7,013,390 103,953,835 (1) –
3C – – 102,774,891 (2) –
4C – – – –
5C – – 32,262,333 (3) –
31 December 2013
1C 39,986,445 544,161,089 209,227,388 101,216,121
2C – 2,727,013 118,118,760 (1) –
3C – – 105,391,584 (2) –
4C – – 395,598,896 (4) –
5C – – 65,992,026 (3) –
31 December 2012
1C 30,930,679 224,794,513 203,466,055 59,242,912
2C – 1,958,302 89,984,224 (1) –
3C – – 120,701,093 (2) –
4C – – 3,139,433,733 (4) –
5C – – 62,559,761 (3) –
Net Asset Value per Share
31 December 2014
1C 90.97 35.86 10.81 11.29
2C – 12,751.62 11.06 (1) –
3C – – 11.04 (2) –
4C – – – –
5C – – 10.57 (3) –
31 December 2013
1C 95.21 38.40 11.12 11.43
2C – 13,635.06 11.36 (1) –
3C – – 11.32 (2) –
4C – – 1,130.28 (4) –
5C – – 10.91 (3) –
31 December 2012
1C 73.64 27.61 10.53 9.33
2C – 9,791.51 10.71 (1) –
3C – – 10.67 (2) –
4C – – 1,064.22 (4) –
5C – – 10.34 (3) –
(1)Share class expressed in USD (2)Share class expressed in GBP (3)Share class expressed in CHF (4)Share class expressed in JPY
40
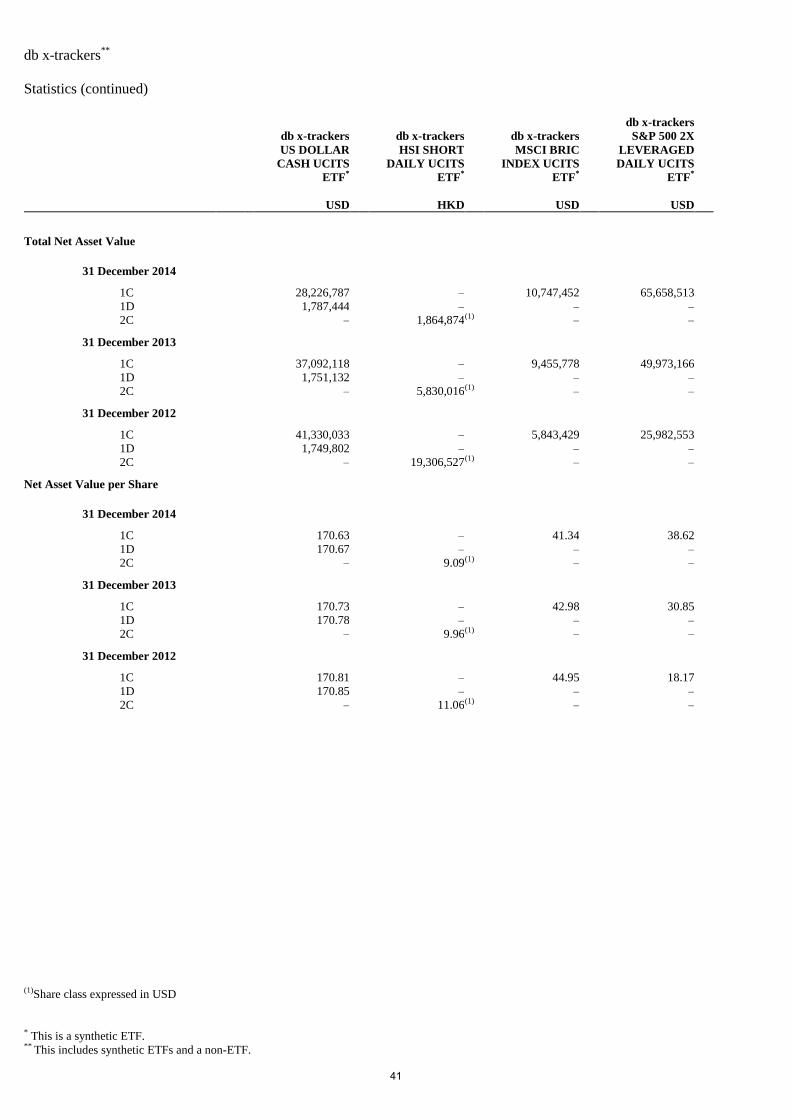
db x-trackers**
Statistics (continued)
* This is a synthetic ETF. **
This includes synthetic ETFs and a non-ETF.
db x-trackers
US DOLLAR
CASH UCITS
ETF*
db x-trackers
HSI SHORT
DAILY UCITS
ETF*
db x-trackers
MSCI BRIC
INDEX UCITS
ETF*
db x-trackers
S&P 500 2X
LEVERAGED
DAILY UCITS
ETF*
USD HKD USD USD
Total Net Asset Value
31 December 2014
1C 28,226,787 – 10,747,452 65,658,513
1D 1,787,444 – – –
2C – 1,864,874 (1) – –
31 December 2013
1C 37,092,118 – 9,455,778 49,973,166
1D 1,751,132 – – –
2C – 5,830,016 (1) – –
31 December 2012
1C 41,330,033 – 5,843,429 25,982,553
1D 1,749,802 – – –
2C – 19,306,527 (1) – –
Net Asset Value per Share
31 December 2014
1C 170.63 – 41.34 38.62
1D 170.67 – – –
2C – 9.09 (1) – –
31 December 2013
1C 170.73 – 42.98 30.85
1D 170.78 – – –
2C – 9.96 (1) – –
31 December 2012
1C 170.81 – 44.95 18.17
1D 170.85 – – –
2C – 11.06 (1) – –
(1)Share class expressed in USD
41
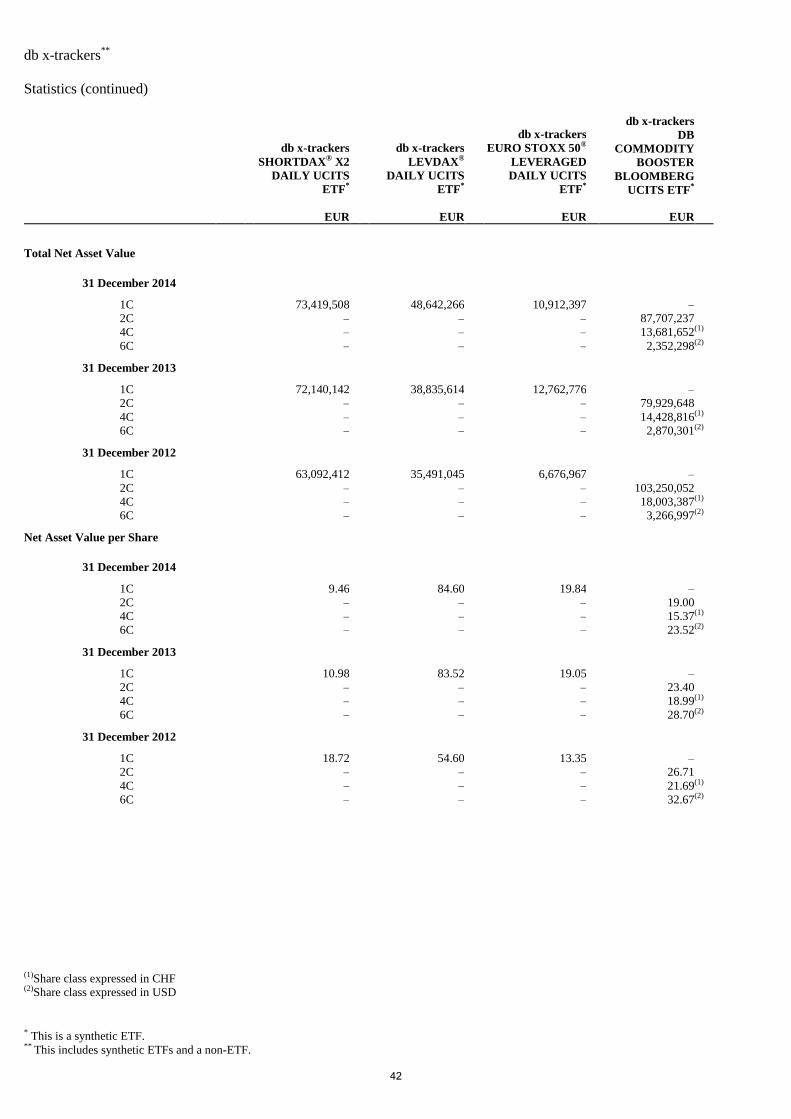
db x-trackers**
Statistics (continued)
* This is a synthetic ETF. **
This includes synthetic ETFs and a non-ETF.
db x-trackers
SHORTDAX® X2
DAILY UCITS
ETF*
db x-trackers
LEVDAX®
DAILY UCITS
ETF*
db x-trackers
EURO STOXX 50®
LEVERAGED
DAILY UCITS
ETF*
db x-trackers
DB
COMMODITY
BOOSTER
BLOOMBERG
UCITS ETF*
EUR EUR EUR EUR
Total Net Asset Value
31 December 2014
1C 73,419,508 48,642,266 10,912,397 –
2C – – – 87,707,237
4C – – – 13,681,652 (1)
6C – – – 2,352,298 (2)
31 December 2013
1C 72,140,142 38,835,614 12,762,776 –
2C – – – 79,929,648
4C – – – 14,428,816 (1)
6C – – – 2,870,301 (2)
31 December 2012
1C 63,092,412 35,491,045 6,676,967 –
2C – – – 103,250,052
4C – – – 18,003,387 (1)
6C – – – 3,266,997 (2)
Net Asset Value per Share
31 December 2014
1C 9.46 84.60 19.84 –
2C – – – 19.00
4C – – – 15.37 (1)
6C – – – 23.52 (2)
31 December 2013
1C 10.98 83.52 19.05 –
2C – – – 23.40
4C – – – 18.99 (1)
6C – – – 28.70 (2)
31 December 2012
1C 18.72 54.60 13.35 –
2C – – – 26.71
4C – – – 21.69 (1)
6C – – – 32.67 (2)
(1)Share class expressed in CHF (2)Share class expressed in USD
42
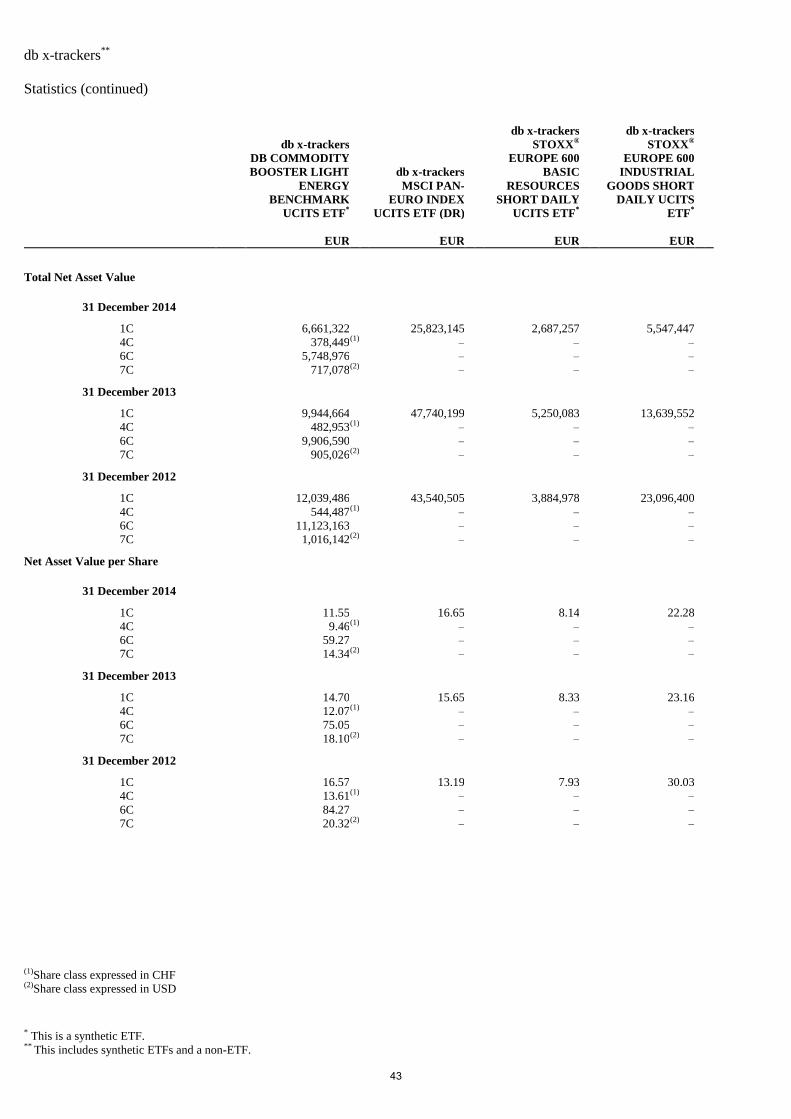
db x-trackers**
Statistics (continued)
* This is a synthetic ETF. **
This includes synthetic ETFs and a non-ETF.
db x-trackers
DB COMMODITY
BOOSTER LIGHT
ENERGY
BENCHMARK
UCITS ETF*
db x-trackers
MSCI PAN-
EURO INDEX
UCITS ETF (DR)
db x-trackers
STOXX®
EUROPE 600
BASIC
RESOURCES
SHORT DAILY
UCITS ETF*
db x-trackers
STOXX®
EUROPE 600
INDUSTRIAL
GOODS SHORT
DAILY UCITS
ETF*
EUR EUR EUR EUR
Total Net Asset Value
31 December 2014
1C 6,661,322 25,823,145 2,687,257 5,547,447
4C 378,449 (1) – – –
6C 5,748,976 – – –
7C 717,078 (2) – – –
31 December 2013
1C 9,944,664 47,740,199 5,250,083 13,639,552
4C 482,953 (1) – – –
6C 9,906,590 – – –
7C 905,026 (2) – – –
31 December 2012
1C 12,039,486 43,540,505 3,884,978 23,096,400
4C 544,487 (1) – – –
6C 11,123,163 – – –
7C 1,016,142 (2) – – –
Net Asset Value per Share
31 December 2014
1C 11.55 16.65 8.14 22.28
4C 9.46 (1) – – –
6C 59.27 – – –
7C 14.34 (2) – – –
31 December 2013
1C 14.70 15.65 8.33 23.16
4C 12.07 (1) – – –
6C 75.05 – – –
7C 18.10 (2) – – –
31 December 2012
1C 16.57 13.19 7.93 30.03
4C 13.61 (1) – – –
6C 84.27 – – –
7C 20.32 (2) – – –
(1)Share class expressed in CHF (2)Share class expressed in USD
43
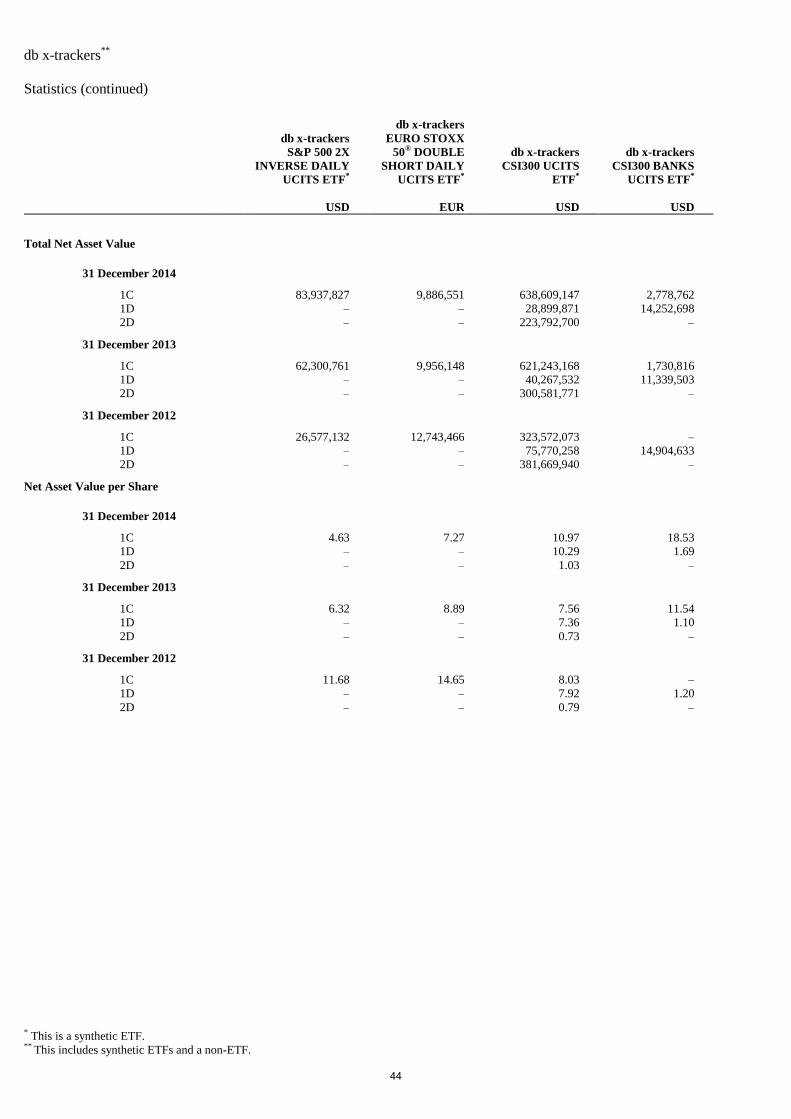
db x-trackers**
Statistics (continued)
* This is a synthetic ETF. **
This includes synthetic ETFs and a non-ETF.
db x-trackers
S&P 500 2X
INVERSE DAILY
UCITS ETF*
db x-trackers
EURO STOXX
50® DOUBLE
SHORT DAILY
UCITS ETF*
db x-trackers
CSI300 UCITS
ETF*
db x-trackers
CSI300 BANKS
UCITS ETF*
USD EUR USD USD
Total Net Asset Value
31 December 2014
1C 83,937,827 9,886,551 638,609,147 2,778,762
1D – – 28,899,871 14,252,698
2D – – 223,792,700 –
31 December 2013
1C 62,300,761 9,956,148 621,243,168 1,730,816
1D – – 40,267,532 11,339,503
2D – – 300,581,771 –
31 December 2012
1C 26,577,132 12,743,466 323,572,073 –
1D – – 75,770,258 14,904,633
2D – – 381,669,940 –
Net Asset Value per Share
31 December 2014
1C 4.63 7.27 10.97 18.53
1D – – 10.29 1.69
2D – – 1.03 –
31 December 2013
1C 6.32 8.89 7.56 11.54
1D – – 7.36 1.10
2D – – 0.73 –
31 December 2012
1C 11.68 14.65 8.03 –
1D – – 7.92 1.20
2D – – 0.79 –
44
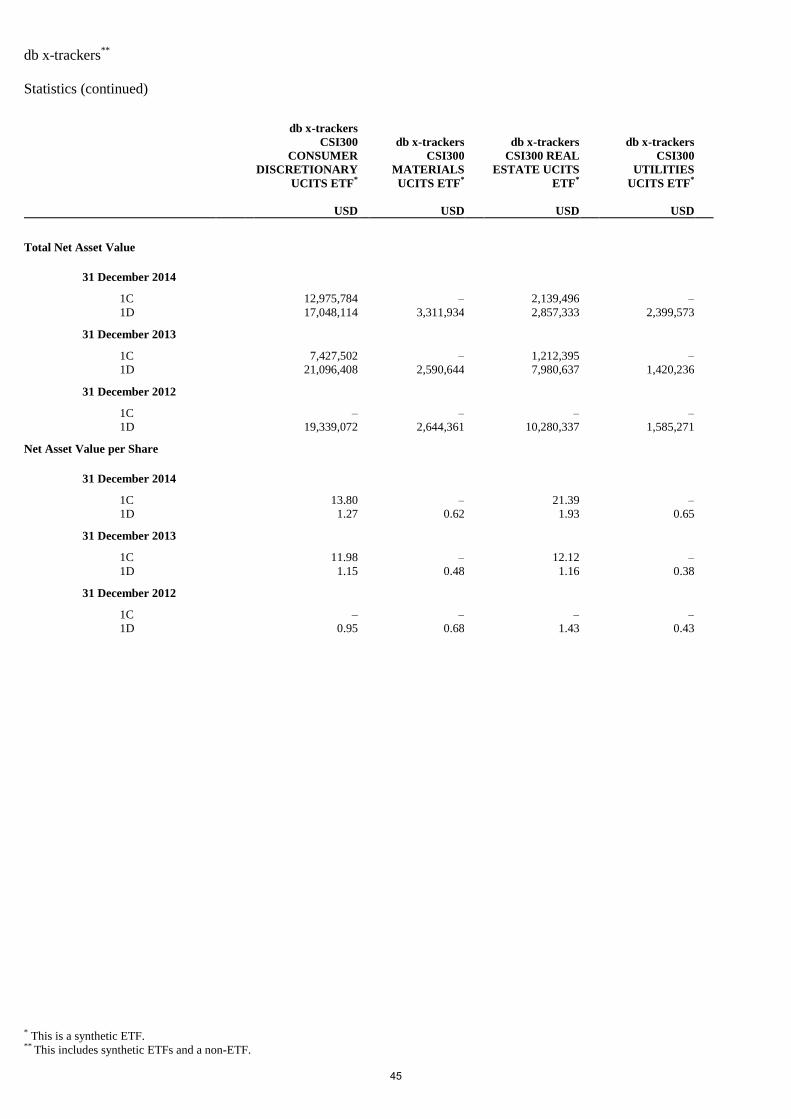
db x-trackers**
Statistics (continued)
* This is a synthetic ETF. **
This includes synthetic ETFs and a non-ETF.
db x-trackers
CSI300
CONSUMER
DISCRETIONARY
UCITS ETF*
db x-trackers
CSI300
MATERIALS
UCITS ETF*
db x-trackers
CSI300 REAL
ESTATE UCITS
ETF*
db x-trackers
CSI300
UTILITIES
UCITS ETF*
USD USD USD USD
Total Net Asset Value
31 December 2014
1C 12,975,784 – 2,139,496 –
1D 17,048,114 3,311,934 2,857,333 2,399,573
31 December 2013
1C 7,427,502 – 1,212,395 –
1D 21,096,408 2,590,644 7,980,637 1,420,236
31 December 2012
1C – – – –
1D 19,339,072 2,644,361 10,280,337 1,585,271
Net Asset Value per Share
31 December 2014
1C 13.80 – 21.39 –
1D 1.27 0.62 1.93 0.65
31 December 2013
1C 11.98 – 12.12 –
1D 1.15 0.48 1.16 0.38
31 December 2012
1C – – – –
1D 0.95 0.68 1.43 0.43
45
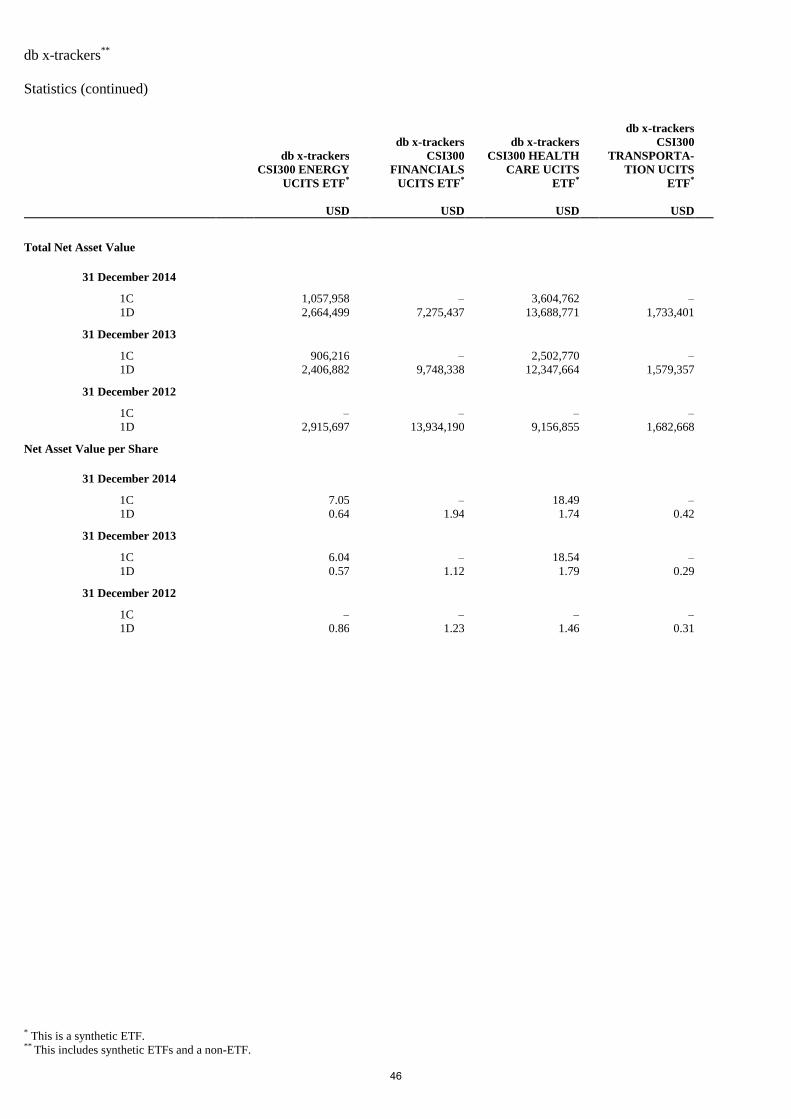
db x-trackers**
Statistics (continued)
* This is a synthetic ETF. **
This includes synthetic ETFs and a non-ETF.
db x-trackers
CSI300 ENERGY
UCITS ETF*
db x-trackers
CSI300
FINANCIALS
UCITS ETF*
db x-trackers
CSI300 HEALTH
CARE UCITS
ETF*
db x-trackers
CSI300
TRANSPORTA-
TION UCITS
ETF*
USD USD USD USD
Total Net Asset Value
31 December 2014
1C 1,057,958 – 3,604,762 –
1D 2,664,499 7,275,437 13,688,771 1,733,401
31 December 2013
1C 906,216 – 2,502,770 –
1D 2,406,882 9,748,338 12,347,664 1,579,357
31 December 2012
1C – – – –
1D 2,915,697 13,934,190 9,156,855 1,682,668
Net Asset Value per Share
31 December 2014
1C 7.05 – 18.49 –
1D 0.64 1.94 1.74 0.42
31 December 2013
1C 6.04 – 18.54 –
1D 0.57 1.12 1.79 0.29
31 December 2012
1C – – – –
1D 0.86 1.23 1.46 0.31
46
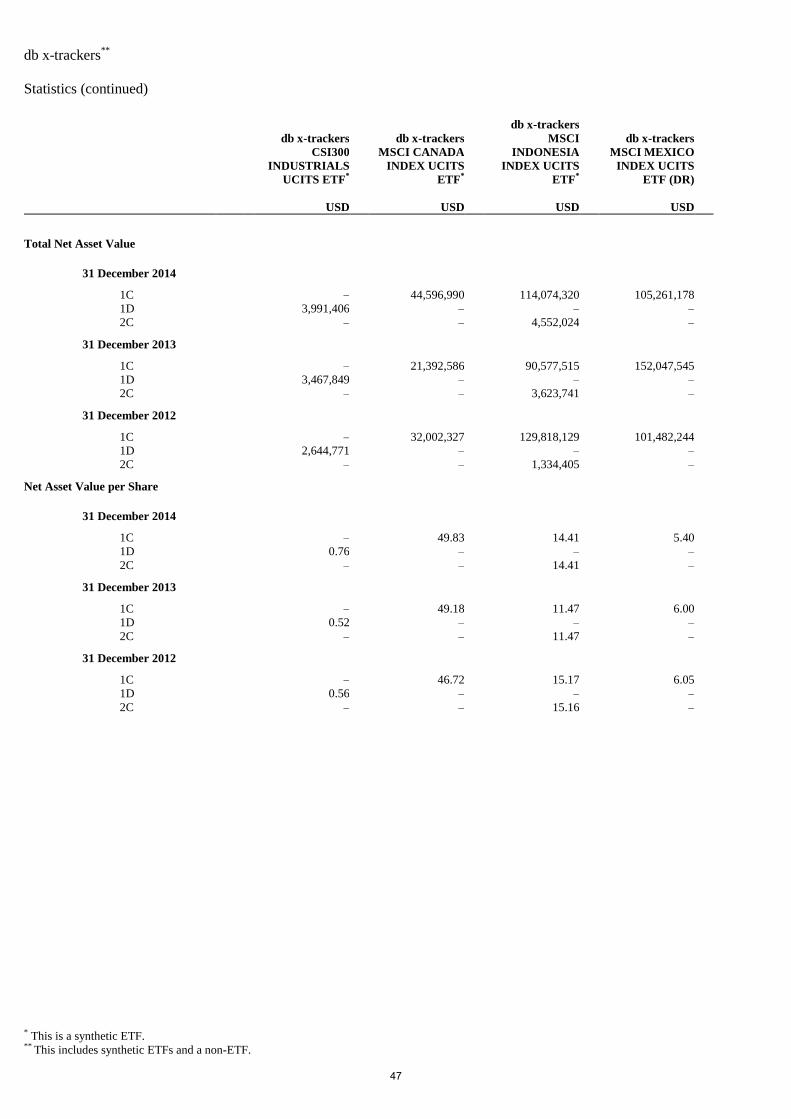
db x-trackers**
Statistics (continued)
* This is a synthetic ETF. **
This includes synthetic ETFs and a non-ETF.
db x-trackers
CSI300
INDUSTRIALS
UCITS ETF*
db x-trackers
MSCI CANADA
INDEX UCITS
ETF*
db x-trackers
MSCI
INDONESIA
INDEX UCITS
ETF*
db x-trackers
MSCI MEXICO
INDEX UCITS
ETF (DR)
USD USD USD USD
Total Net Asset Value
31 December 2014
1C – 44,596,990 114,074,320 105,261,178
1D 3,991,406 – – –
2C – – 4,552,024 –
31 December 2013
1C – 21,392,586 90,577,515 152,047,545
1D 3,467,849 – – –
2C – – 3,623,741 –
31 December 2012
1C – 32,002,327 129,818,129 101,482,244
1D 2,644,771 – – –
2C – – 1,334,405 –
Net Asset Value per Share
31 December 2014
1C – 49.83 14.41 5.40
1D 0.76 – – –
2C – – 14.41 –
31 December 2013
1C – 49.18 11.47 6.00
1D 0.52 – – –
2C – – 11.47 –
31 December 2012
1C – 46.72 15.17 6.05
1D 0.56 – – –
2C – – 15.16 –
47
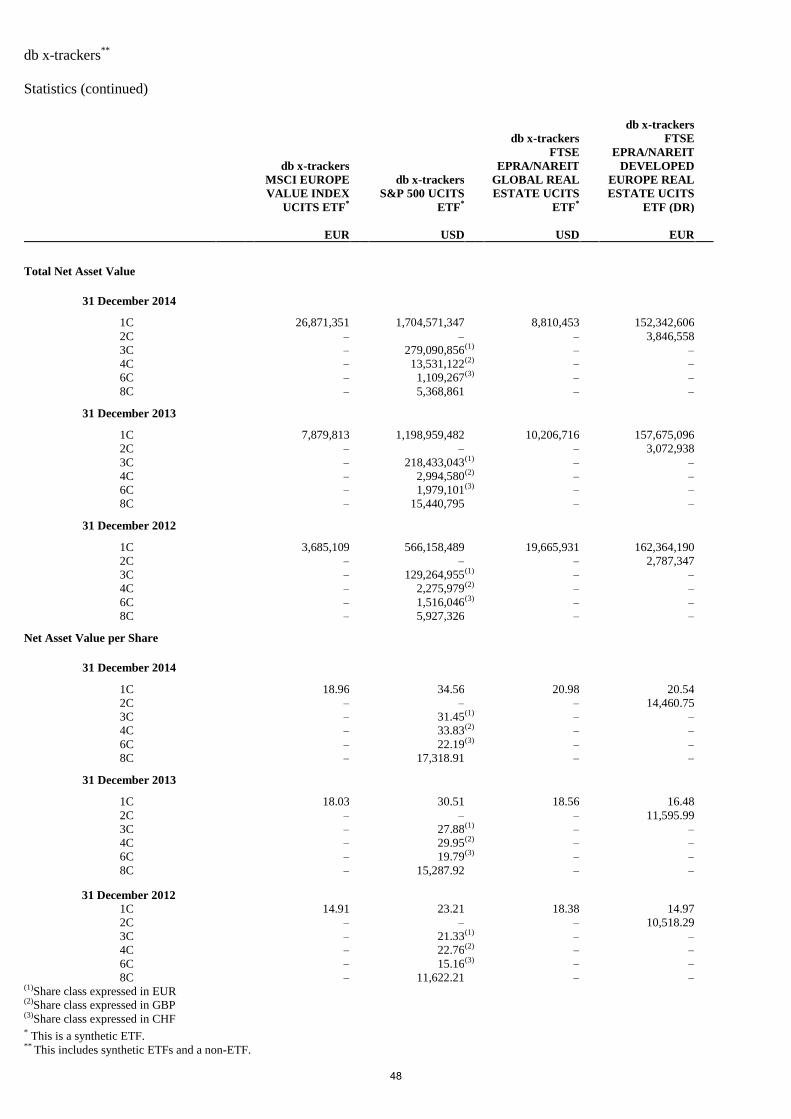
db x-trackers**
Statistics (continued)
* This is a synthetic ETF. **
This includes synthetic ETFs and a non-ETF.
db x-trackers
MSCI EUROPE
VALUE INDEX
UCITS ETF*
db x-trackers
S&P 500 UCITS
ETF*
db x-trackers
FTSE
EPRA/NAREIT
GLOBAL REAL
ESTATE UCITS
ETF*
db x-trackers
FTSE
EPRA/NAREIT
DEVELOPED
EUROPE REAL
ESTATE UCITS
ETF (DR)
EUR USD USD EUR
Total Net Asset Value
31 December 2014
1C 26,871,351 1,704,571,347 8,810,453 152,342,606
2C – – – 3,846,558
3C – 279,090,856 (1) – –
4C – 13,531,122 (2) – –
6C – 1,109,267 (3) – –
8C – 5,368,861 – –
31 December 2013
1C 7,879,813 1,198,959,482 10,206,716 157,675,096
2C – – – 3,072,938
3C – 218,433,043 (1) – –
4C – 2,994,580 (2) – –
6C – 1,979,101 (3) – –
8C – 15,440,795 – –
31 December 2012
1C 3,685,109 566,158,489 19,665,931 162,364,190
2C – – – 2,787,347
3C – 129,264,955 (1) – –
4C – 2,275,979 (2) – –
6C – 1,516,046 (3) – –
8C – 5,927,326 – –
Net Asset Value per Share
31 December 2014
1C 18.96 34.56 20.98 20.54
2C – – – 14,460.75
3C – 31.45 (1) – –
4C – 33.83 (2) – –
6C – 22.19 (3) – –
8C – 17,318.91 – –
31 December 2013
1C 18.03 30.51 18.56 16.48
2C – – – 11,595.99
3C – 27.88 (1) – –
4C – 29.95 (2) – –
6C – 19.79 (3) – –
8C – 15,287.92 – –
31 December 2012
1C 14.91 23.21 18.38 14.97
2C – – – 10,518.29
3C – 21.33 (1) – –
4C – 22.76 (2) – –
6C – 15.16 (3) – –
8C – 11,622.21 – – (1)Share class expressed in EUR (2)Share class expressed in GBP (3)Share class expressed in CHF
48
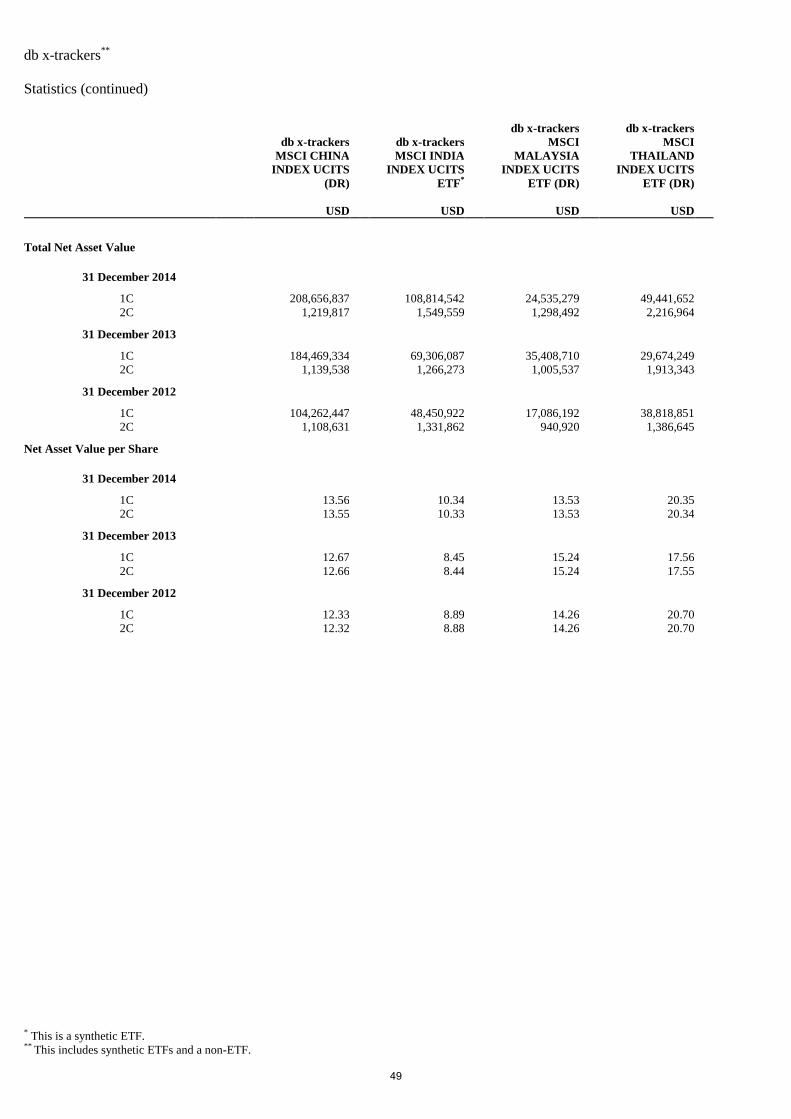
db x-trackers**
Statistics (continued)
* This is a synthetic ETF. **
This includes synthetic ETFs and a non-ETF.
db x-trackers
MSCI CHINA
INDEX UCITS
(DR)
db x-trackers
MSCI INDIA
INDEX UCITS
ETF*
db x-trackers
MSCI
MALAYSIA
INDEX UCITS
ETF (DR)
db x-trackers
MSCI
THAILAND
INDEX UCITS
ETF (DR)
USD USD USD USD
Total Net Asset Value
31 December 2014
1C 208,656,837 108,814,542 24,535,279 49,441,652
2C 1,219,817 1,549,559 1,298,492 2,216,964
31 December 2013
1C 184,469,334 69,306,087 35,408,710 29,674,249
2C 1,139,538 1,266,273 1,005,537 1,913,343
31 December 2012
1C 104,262,447 48,450,922 17,086,192 38,818,851
2C 1,108,631 1,331,862 940,920 1,386,645
Net Asset Value per Share
31 December 2014
1C 13.56 10.34 13.53 20.35
2C 13.55 10.33 13.53 20.34
31 December 2013
1C 12.67 8.45 15.24 17.56
2C 12.66 8.44 15.24 17.55
31 December 2012
1C 12.33 8.89 14.26 20.70
2C 12.32 8.88 14.26 20.70
49
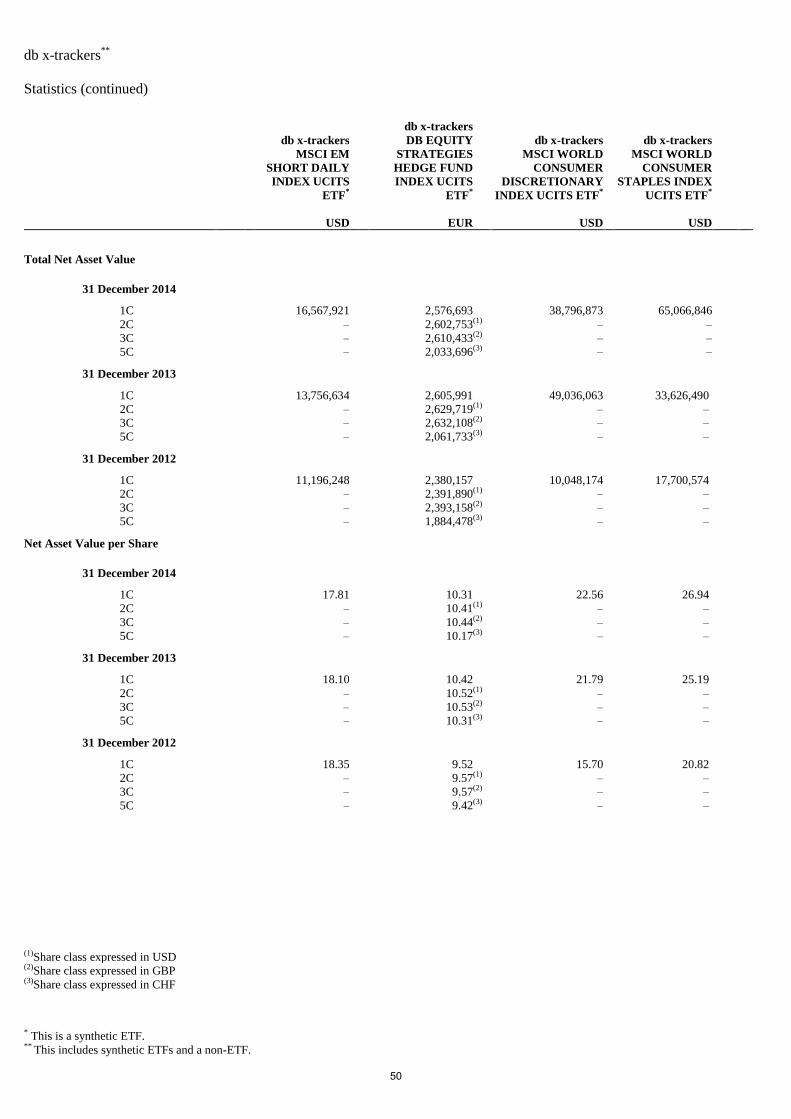
db x-trackers**
Statistics (continued)
* This is a synthetic ETF. **
This includes synthetic ETFs and a non-ETF.
db x-trackers
MSCI EM
SHORT DAILY
INDEX UCITS
ETF*
db x-trackers
DB EQUITY
STRATEGIES
HEDGE FUND
INDEX UCITS
ETF*
db x-trackers
MSCI WORLD
CONSUMER
DISCRETIONARY
INDEX UCITS ETF*
db x-trackers
MSCI WORLD
CONSUMER
STAPLES INDEX
UCITS ETF*
USD EUR USD USD
Total Net Asset Value
31 December 2014
1C 16,567,921 2,576,693 38,796,873 65,066,846
2C – 2,602,753 (1) – –
3C – 2,610,433 (2) – –
5C – 2,033,696 (3) – –
31 December 2013
1C 13,756,634 2,605,991 49,036,063 33,626,490
2C – 2,629,719 (1) – –
3C – 2,632,108 (2) – –
5C – 2,061,733 (3) – –
31 December 2012
1C 11,196,248 2,380,157 10,048,174 17,700,574
2C – 2,391,890 (1) – –
3C – 2,393,158 (2) – –
5C – 1,884,478 (3) – –
Net Asset Value per Share
31 December 2014
1C 17.81 10.31 22.56 26.94
2C – 10.41 (1) – –
3C – 10.44 (2) – –
5C – 10.17 (3) – –
31 December 2013
1C 18.10 10.42 21.79 25.19
2C – 10.52 (1) – –
3C – 10.53 (2) – –
5C – 10.31 (3) – –
31 December 2012
1C 18.35 9.52 15.70 20.82
2C – 9.57 (1) – –
3C – 9.57 (2) – –
5C – 9.42 (3) – –
(1)Share class expressed in USD (2)Share class expressed in GBP (3)Share class expressed in CHF
50
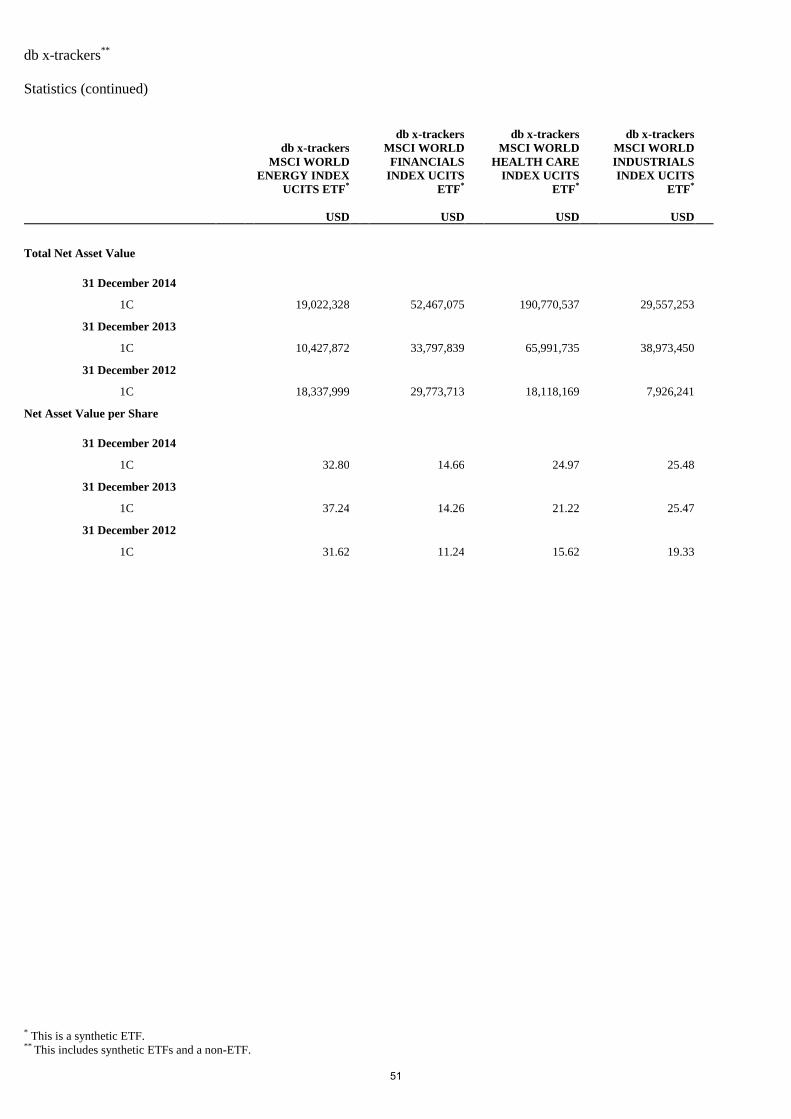
db x-trackers**
Statistics (continued)
* This is a synthetic ETF. **
This includes synthetic ETFs and a non-ETF.
db x-trackers
MSCI WORLD
ENERGY INDEX
UCITS ETF*
db x-trackers
MSCI WORLD
FINANCIALS
INDEX UCITS
ETF*
db x-trackers
MSCI WORLD
HEALTH CARE
INDEX UCITS
ETF*
db x-trackers
MSCI WORLD
INDUSTRIALS
INDEX UCITS
ETF*
USD USD USD USD
Total Net Asset Value
31 December 2014
1C 19,022,328 52,467,075 190,770,537 29,557,253
31 December 2013
1C 10,427,872 33,797,839 65,991,735 38,973,450
31 December 2012
1C 18,337,999 29,773,713 18,118,169 7,926,241
Net Asset Value per Share
31 December 2014
1C 32.80 14.66 24.97 25.48
31 December 2013
1C 37.24 14.26 21.22 25.47
31 December 2012
1C 31.62 11.24 15.62 19.33
51

db x-trackers**
Statistics (continued)
* This is a synthetic ETF. **
This includes synthetic ETFs and a non-ETF.
db x-trackers
MSCI WORLD
INFORMATION
TECHNOLOGY
INDEX UCITS
ETF*
db x-trackers
MSCI WORLD
MATERIALS
INDEX UCITS
ETF*
db x-trackers
MSCI WORLD
TELECOM
SERVICES
INDEX UCITS
ETF*
db x-trackers
MSCI WORLD
UTILITIES
INDEX UCITS
ETF*
USD USD USD USD
Total Net Asset Value
31 December 2014
1C 153,251,995 13,579,656 7,408,501 10,979,830
31 December 2013
1C 60,207,353 9,680,105 3,675,711 4,688,448
31 December 2012
1C 36,999,321 4,543,245 7,056,430 4,631,353
Net Asset Value per Share
31 December 2014
1C 15.51 29.52 10.89 19.96
31 December 2013
1C 13.41 31.23 11.14 17.36
31 December 2012
1C 10.45 30.29 8.50 15.44
52
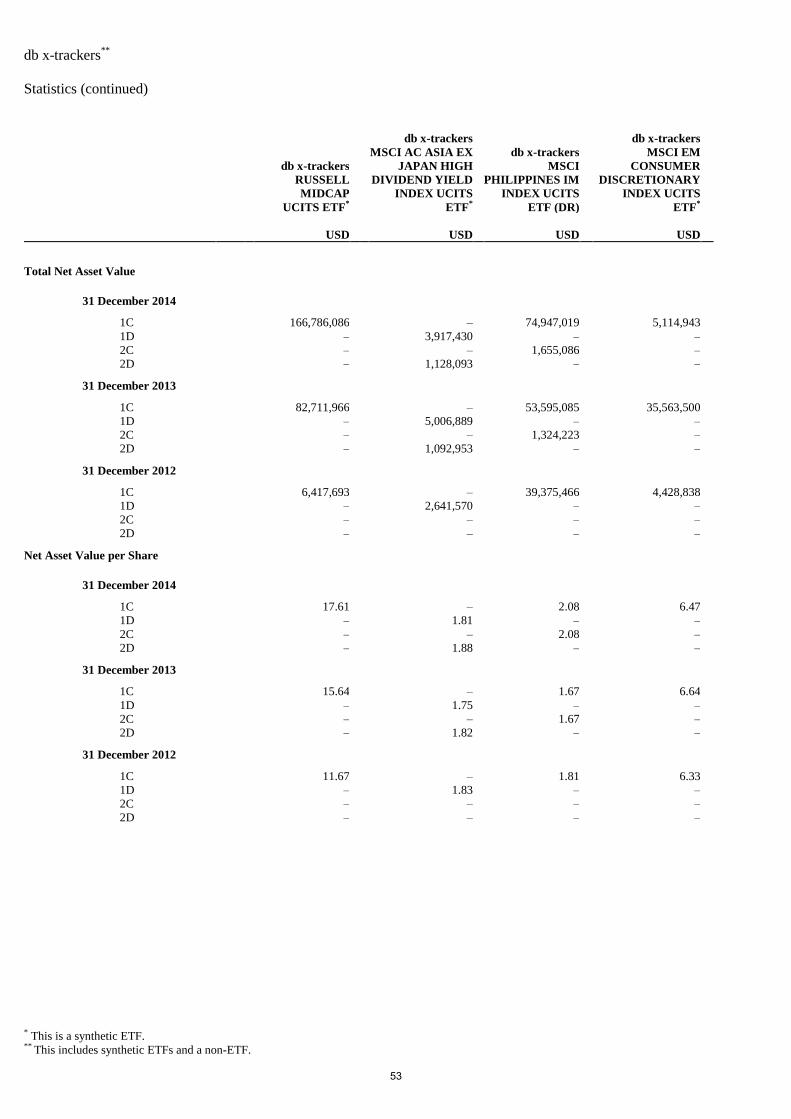
db x-trackers**
Statistics (continued)
* This is a synthetic ETF. **
This includes synthetic ETFs and a non-ETF.
db x-trackers
RUSSELL
MIDCAP
UCITS ETF*
db x-trackers
MSCI AC ASIA EX
JAPAN HIGH
DIVIDEND YIELD
INDEX UCITS
ETF*
db x-trackers
MSCI
PHILIPPINES IM
INDEX UCITS
ETF (DR)
db x-trackers
MSCI EM
CONSUMER
DISCRETIONARY
INDEX UCITS
ETF*
USD USD USD USD
Total Net Asset Value
31 December 2014
1C 166,786,086 – 74,947,019 5,114,943
1D – 3,917,430 – –
2C – – 1,655,086 –
2D – 1,128,093 – –
31 December 2013
1C 82,711,966 – 53,595,085 35,563,500
1D – 5,006,889 – –
2C – – 1,324,223 –
2D – 1,092,953 – –
31 December 2012
1C 6,417,693 – 39,375,466 4,428,838
1D – 2,641,570 – –
2C – – – –
2D – – – –
Net Asset Value per Share
31 December 2014
1C 17.61 – 2.08 6.47
1D – 1.81 – –
2C – – 2.08 –
2D – 1.88 – –
31 December 2013
1C 15.64 – 1.67 6.64
1D – 1.75 – –
2C – – 1.67 –
2D – 1.82 – –
31 December 2012
1C 11.67 – 1.81 6.33
1D – 1.83 – –
2C – – – –
2D – – – –
53
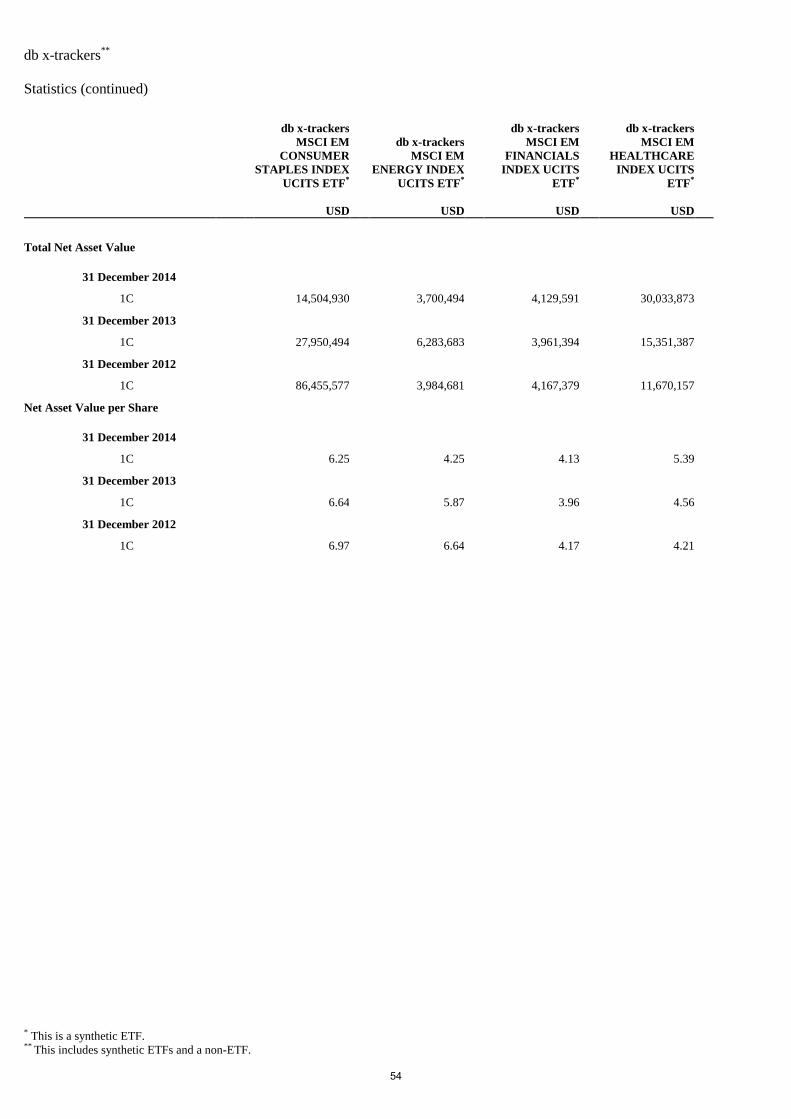
db x-trackers**
Statistics (continued)
* This is a synthetic ETF. **
This includes synthetic ETFs and a non-ETF.
db x-trackers
MSCI EM
CONSUMER
STAPLES INDEX
UCITS ETF*
db x-trackers
MSCI EM
ENERGY INDEX
UCITS ETF*
db x-trackers
MSCI EM
FINANCIALS
INDEX UCITS
ETF*
db x-trackers
MSCI EM
HEALTHCARE
INDEX UCITS
ETF*
USD USD USD USD
Total Net Asset Value
31 December 2014
1C 14,504,930 3,700,494 4,129,591 30,033,873
31 December 2013
1C 27,950,494 6,283,683 3,961,394 15,351,387
31 December 2012
1C 86,455,577 3,984,681 4,167,379 11,670,157
Net Asset Value per Share
31 December 2014
1C 6.25 4.25 4.13 5.39
31 December 2013
1C 6.64 5.87 3.96 4.56
31 December 2012
1C 6.97 6.64 4.17 4.21
54
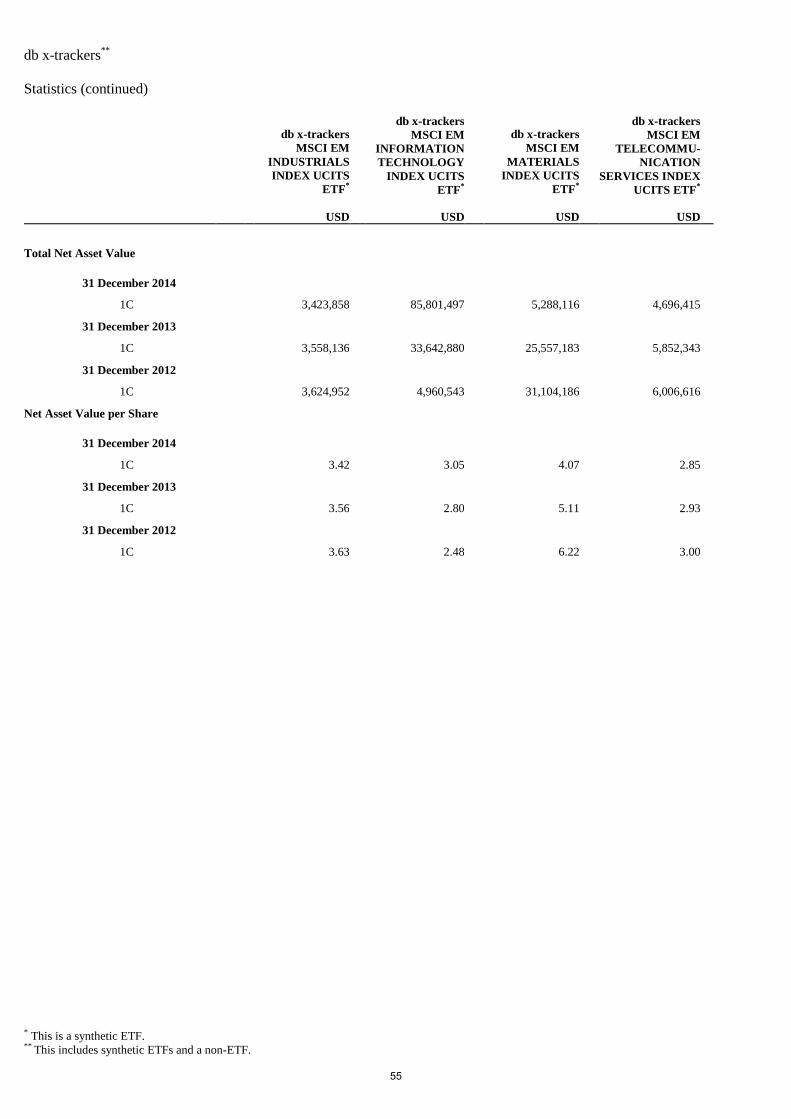
db x-trackers**
Statistics (continued)
* This is a synthetic ETF. **
This includes synthetic ETFs and a non-ETF.
db x-trackers
MSCI EM
INDUSTRIALS
INDEX UCITS
ETF*
db x-trackers
MSCI EM
INFORMATION
TECHNOLOGY
INDEX UCITS
ETF*
db x-trackers
MSCI EM
MATERIALS
INDEX UCITS
ETF*
db x-trackers
MSCI EM
TELECOMMU-
NICATION
SERVICES INDEX
UCITS ETF*
USD USD USD USD
Total Net Asset Value
31 December 2014
1C 3,423,858 85,801,497 5,288,116 4,696,415
31 December 2013
1C 3,558,136 33,642,880 25,557,183 5,852,343
31 December 2012
1C 3,624,952 4,960,543 31,104,186 6,006,616
Net Asset Value per Share
31 December 2014
1C 3.42 3.05 4.07 2.85
31 December 2013
1C 3.56 2.80 5.11 2.93
31 December 2012
1C 3.63 2.48 6.22 3.00
55
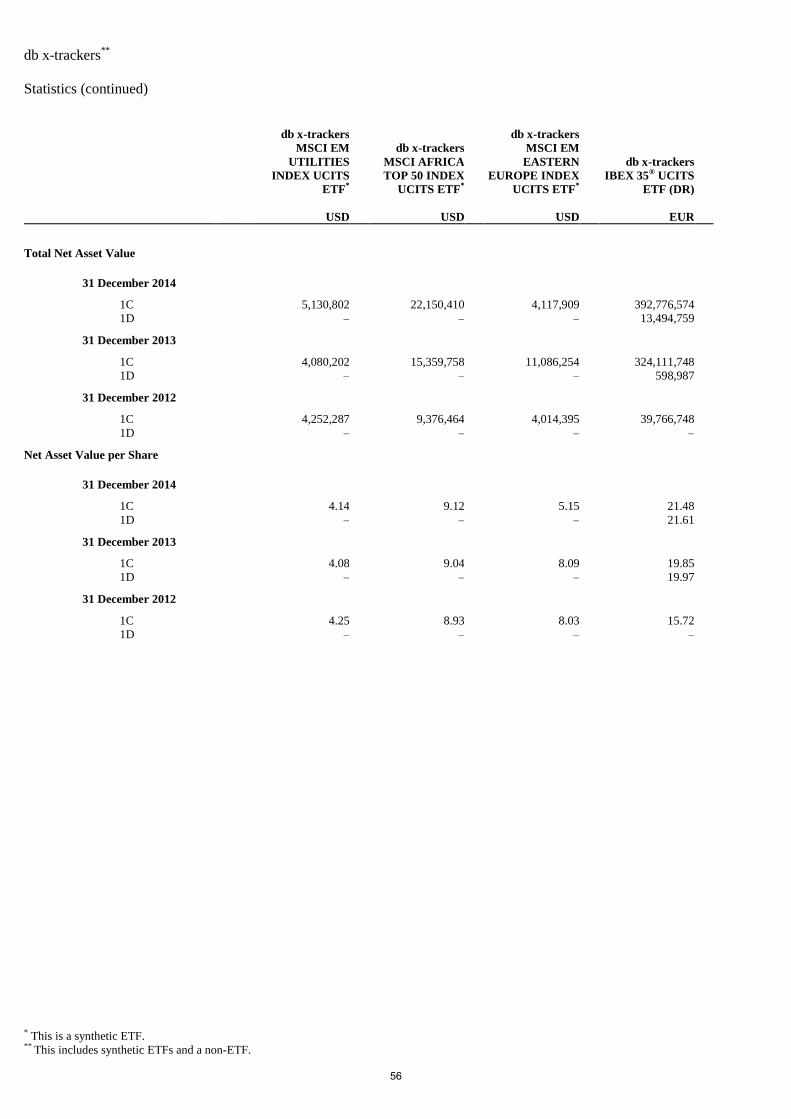
db x-trackers**
Statistics (continued)
* This is a synthetic ETF. **
This includes synthetic ETFs and a non-ETF.
db x-trackers
MSCI EM
UTILITIES
INDEX UCITS
ETF*
db x-trackers
MSCI AFRICA
TOP 50 INDEX
UCITS ETF*
db x-trackers
MSCI EM
EASTERN
EUROPE INDEX
UCITS ETF*
db x-trackers
IBEX 35® UCITS
ETF (DR)
USD USD USD EUR
Total Net Asset Value
31 December 2014
1C 5,130,802 22,150,410 4,117,909 392,776,574
1D – – – 13,494,759
31 December 2013
1C 4,080,202 15,359,758 11,086,254 324,111,748
1D – – – 598,987
31 December 2012
1C 4,252,287 9,376,464 4,014,395 39,766,748
1D – – – –
Net Asset Value per Share
31 December 2014
1C 4.14 9.12 5.15 21.48
1D – – – 21.61
31 December 2013
1C 4.08 9.04 8.09 19.85
1D – – – 19.97
31 December 2012
1C 4.25 8.93 8.03 15.72
1D – – – –
56
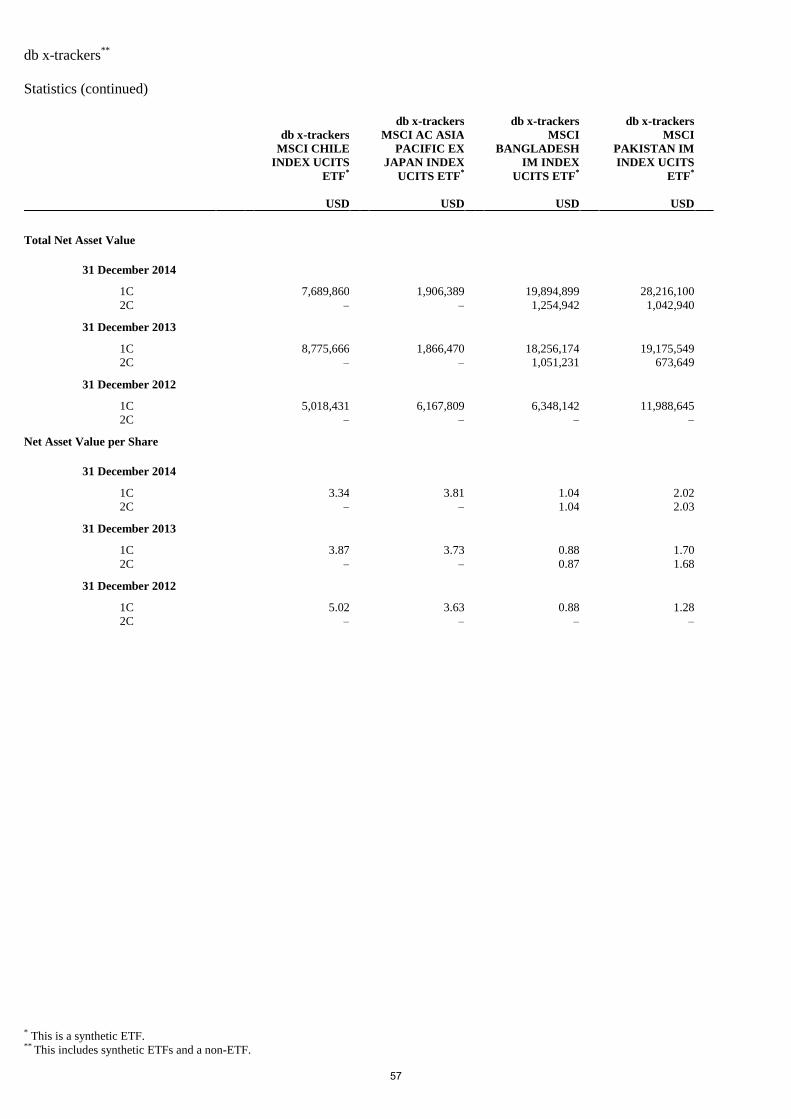
db x-trackers**
Statistics (continued)
* This is a synthetic ETF. **
This includes synthetic ETFs and a non-ETF.
db x-trackers
MSCI CHILE
INDEX UCITS
ETF*
db x-trackers
MSCI AC ASIA
PACIFIC EX
JAPAN INDEX
UCITS ETF*
db x-trackers
MSCI
BANGLADESH
IM INDEX
UCITS ETF*
db x-trackers
MSCI
PAKISTAN IM
INDEX UCITS
ETF*
USD USD USD USD
Total Net Asset Value
31 December 2014
1C 7,689,860 1,906,389 19,894,899 28,216,100
2C – – 1,254,942 1,042,940
31 December 2013
1C 8,775,666 1,866,470 18,256,174 19,175,549
2C – – 1,051,231 673,649
31 December 2012
1C 5,018,431 6,167,809 6,348,142 11,988,645
2C – – – –
Net Asset Value per Share
31 December 2014
1C 3.34 3.81 1.04 2.02
2C – – 1.04 2.03
31 December 2013
1C 3.87 3.73 0.88 1.70
2C – – 0.87 1.68
31 December 2012
1C 5.02 3.63 0.88 1.28
2C – – – –
57
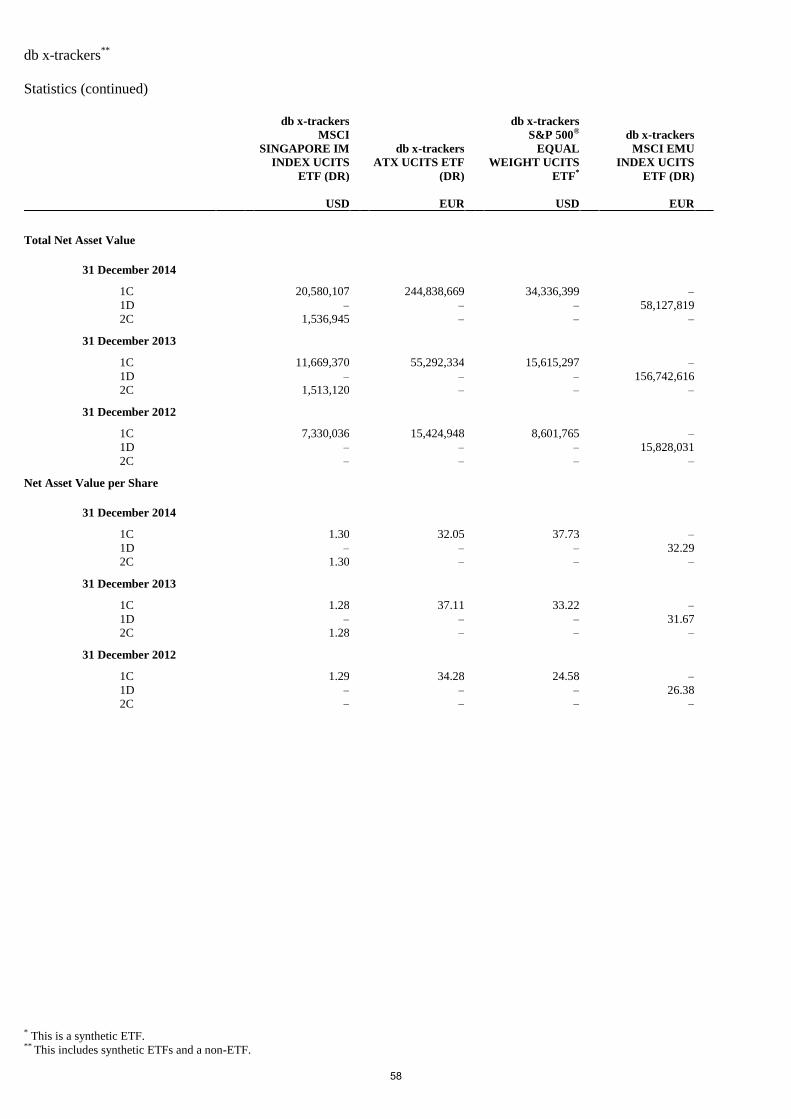
db x-trackers**
Statistics (continued)
* This is a synthetic ETF. **
This includes synthetic ETFs and a non-ETF.
db x-trackers
MSCI
SINGAPORE IM
INDEX UCITS
ETF (DR)
db x-trackers
ATX UCITS ETF
(DR)
db x-trackers
S&P 500®
EQUAL
WEIGHT UCITS
ETF*
db x-trackers
MSCI EMU
INDEX UCITS
ETF (DR)
USD EUR USD EUR
Total Net Asset Value
31 December 2014
1C 20,580,107 244,838,669 34,336,399 –
1D – – – 58,127,819
2C 1,536,945 – – –
31 December 2013
1C 11,669,370 55,292,334 15,615,297 –
1D – – – 156,742,616
2C 1,513,120 – – –
31 December 2012
1C 7,330,036 15,424,948 8,601,765 –
1D – – – 15,828,031
2C – – – –
Net Asset Value per Share
31 December 2014
1C 1.30 32.05 37.73 –
1D – – – 32.29
2C 1.30 – – –
31 December 2013
1C 1.28 37.11 33.22 –
1D – – – 31.67
2C 1.28 – – –
31 December 2012
1C 1.29 34.28 24.58 –
1D – – – 26.38
2C – – – –
58
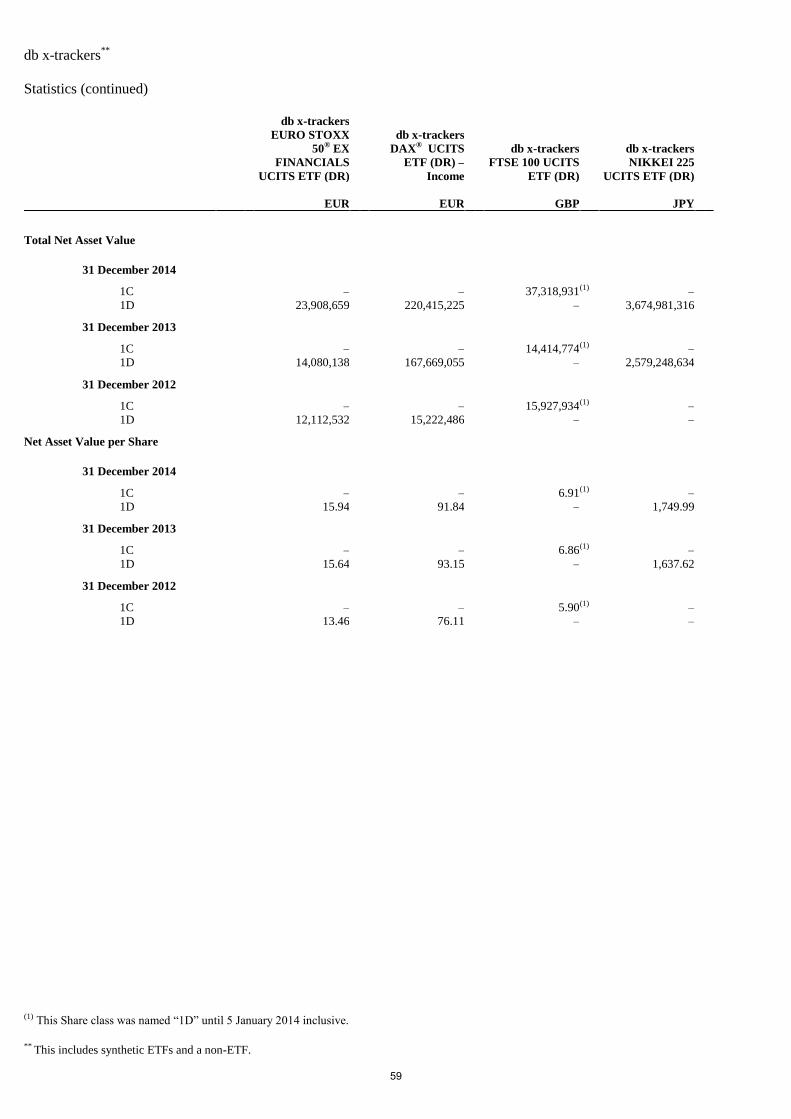
db x-trackers**
Statistics (continued)
**
This includes synthetic ETFs and a non-ETF.
db x-trackers
EURO STOXX
50® EX
FINANCIALS
UCITS ETF (DR)
db x-trackers
DAX® UCITS
ETF (DR) –
Income
db x-trackers
FTSE 100 UCITS
ETF (DR)
db x-trackers
NIKKEI 225
UCITS ETF (DR)
EUR EUR GBP JPY
Total Net Asset Value
31 December 2014
1C – – 37,318,931 (1) –
1D 23,908,659 220,415,225 – 3,674,981,316
31 December 2013
1C – – 14,414,774 (1) –
1D 14,080,138 167,669,055 – 2,579,248,634
31 December 2012
1C – – 15,927,934 (1) –
1D 12,112,532 15,222,486 – –
Net Asset Value per Share
31 December 2014
1C – – 6.91 (1) –
1D 15.94 91.84 – 1,749.99
31 December 2013
1C – – 6.86 (1) –
1D 15.64 93.15 – 1,637.62
31 December 2012
1C – – 5.90 (1) –
1D 13.46 76.11 – –
(1) This Share class was named “1D” until 5 January 2014 inclusive.
59
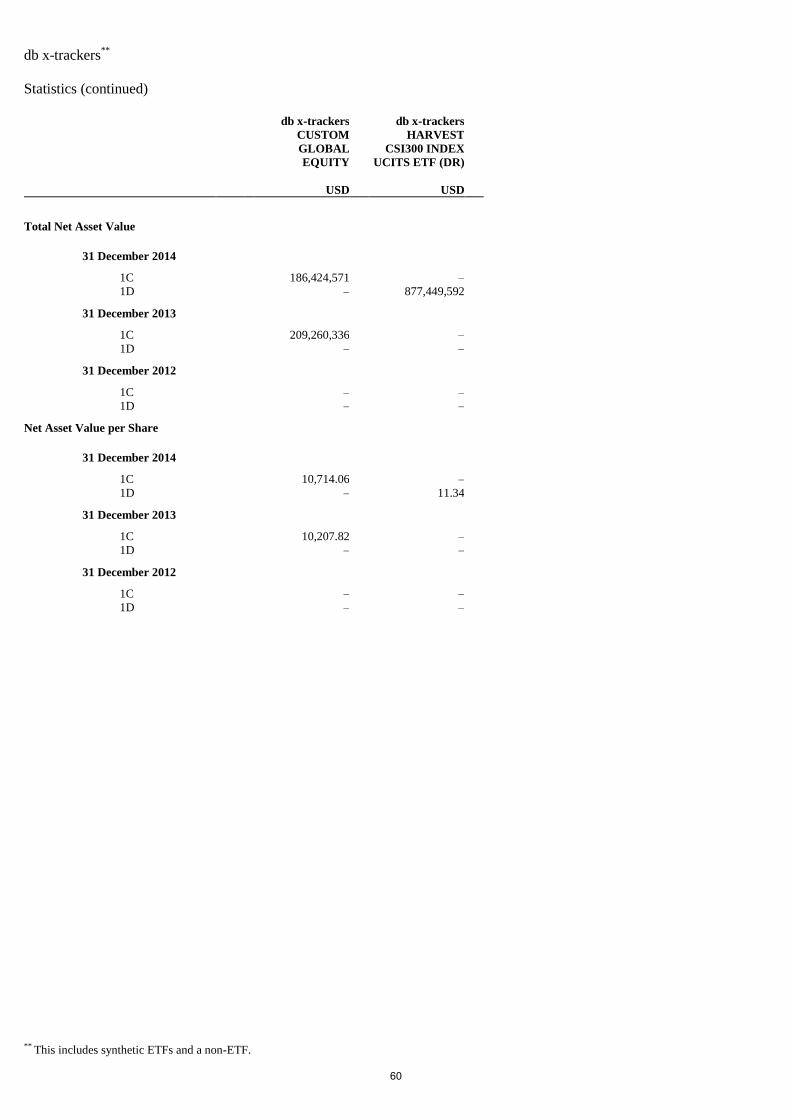
db x-trackers**
Statistics (continued)
**
This includes synthetic ETFs and a non-ETF.
db x-trackers
CUSTOM
GLOBAL
EQUITY
db x-trackers
HARVEST
CSI300 INDEX
UCITS ETF (DR)
USD USD
Total Net Asset Value
31 December 2014
1C 186,424,571 –
1D – 877,449,592
31 December 2013
1C 209,260,336 –
1D – –
31 December 2012
1C – –
1D – –
Net Asset Value per Share
31 December 2014
1C 10,714.06 –
1D – 11.34
31 December 2013
1C 10,207.82 –
1D – –
31 December 2012
1C – –
1D – –
60
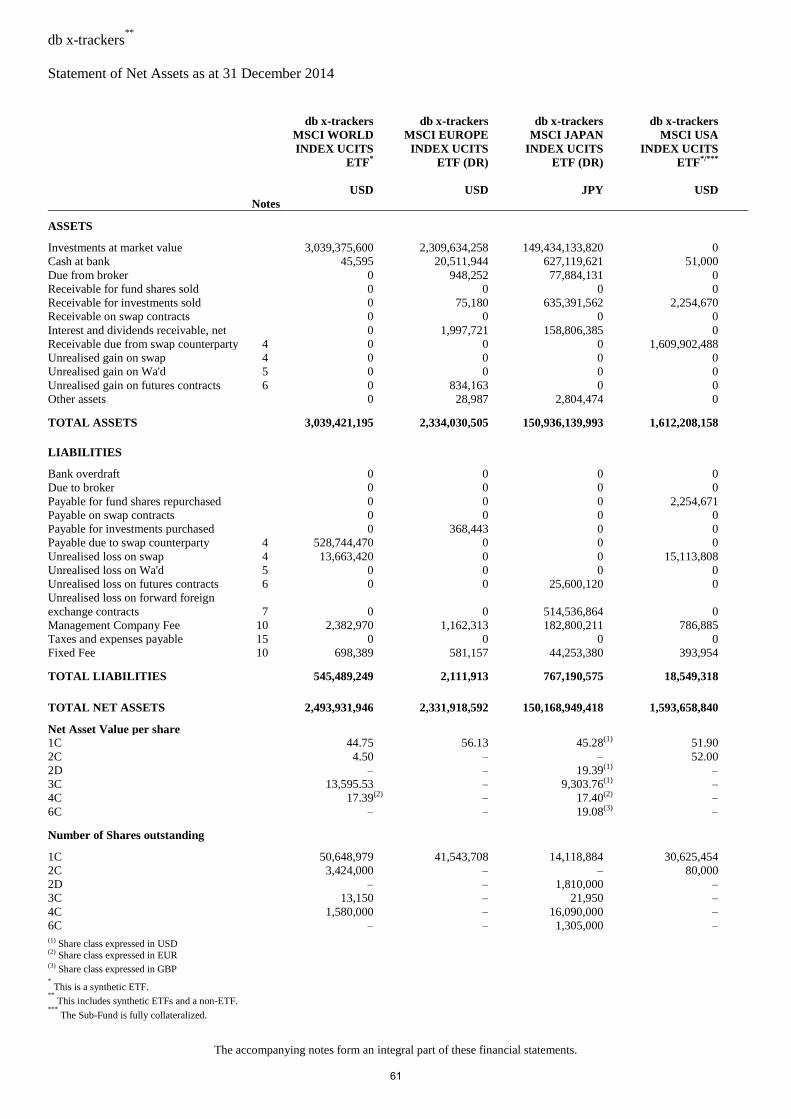
db x-trackers**
Statement of Net Assets as at 31 December 2014
The accompanying notes form an integral part of these financial statements.
db x-trackers
MSCI WORLD
INDEX UCITS
ETF*
db x-trackers
MSCI EUROPE
INDEX UCITS
ETF (DR)
db x-trackers
MSCI JAPAN
INDEX UCITS
ETF (DR)
db x-trackers
MSCI USA
INDEX UCITS
ETF*/***
USD USD JPY USD
Notes
ASSETS
Investments at market value 3,039,375,600 2,309,634,258 149,434,133,820 0
Cash at bank 45,595 20,511,944 627,119,621 51,000
Due from broker 0 948,252 77,884,131 0
Receivable for fund shares sold 0 0 0 0
Receivable for investments sold 0 75,180 635,391,562 2,254,670
Receivable on swap contracts 0 0 0 0
Interest and dividends receivable, net 0 1,997,721 158,806,385 0
Receivable due from swap counterparty 4 0 0 0 1,609,902,488
Unrealised gain on swap 4 0 0 0 0
Unrealised gain on Wa'd 5 0 0 0 0
Unrealised gain on futures contracts 6 0 834,163 0 0
Other assets 0 28,987 2,804,474 0
TOTAL ASSETS 3,039,421,195 2,334,030,505 150,936,139,993 1,612,208,158
LIABILITIES
Bank overdraft 0 0 0 0
Due to broker 0 0 0 0
Payable for fund shares repurchased 0 0 0 2,254,671
Payable on swap contracts 0 0 0 0
Payable for investments purchased 0 368,443 0 0
Payable due to swap counterparty 4 528,744,470 0 0 0
Unrealised loss on swap 4 13,663,420 0 0 15,113,808
Unrealised loss on Wa'd 5 0 0 0 0
Unrealised loss on futures contracts 6 0 0 25,600,120 0
Unrealised loss on forward foreign
exchange contracts 7
0 0 514,536,864 0
Management Company Fee 10 2,382,970 1,162,313 182,800,211 786,885
Taxes and expenses payable 15 0 0 0 0
Fixed Fee 10 698,389 581,157 44,253,380 393,954
TOTAL LIABILITIES 545,489,249 2,111,913 767,190,575 18,549,318
TOTAL NET ASSETS 2,493,931,946 2,331,918,592 150,168,949,418 1,593,658,840
Net Asset Value per share
1C 44.75 56.13 45.28 (1) 51.90
2C 4.50 – – 52.00
2D – – 19.39 (1) –
3C 13,595.53 – 9,303.76 (1) –
4C 17.39 (2) – 17.40 (2) –
6C – – 19.08 (3) –
Number of Shares outstanding
1C 50,648,979 41,543,708 14,118,884 30,625,454
2C 3,424,000 – – 80,000
2D – – 1,810,000 –
3C 13,150 – 21,950 –
4C 1,580,000 – 16,090,000 –
6C – – 1,305,000 – (1)
Share class expressed in USD (2)
Share class expressed in EUR (3)
Share class expressed in GBP
* This is a synthetic ETF.
** This includes synthetic ETFs and a non-ETF.
*** The Sub-Fund is fully collateralized.
61
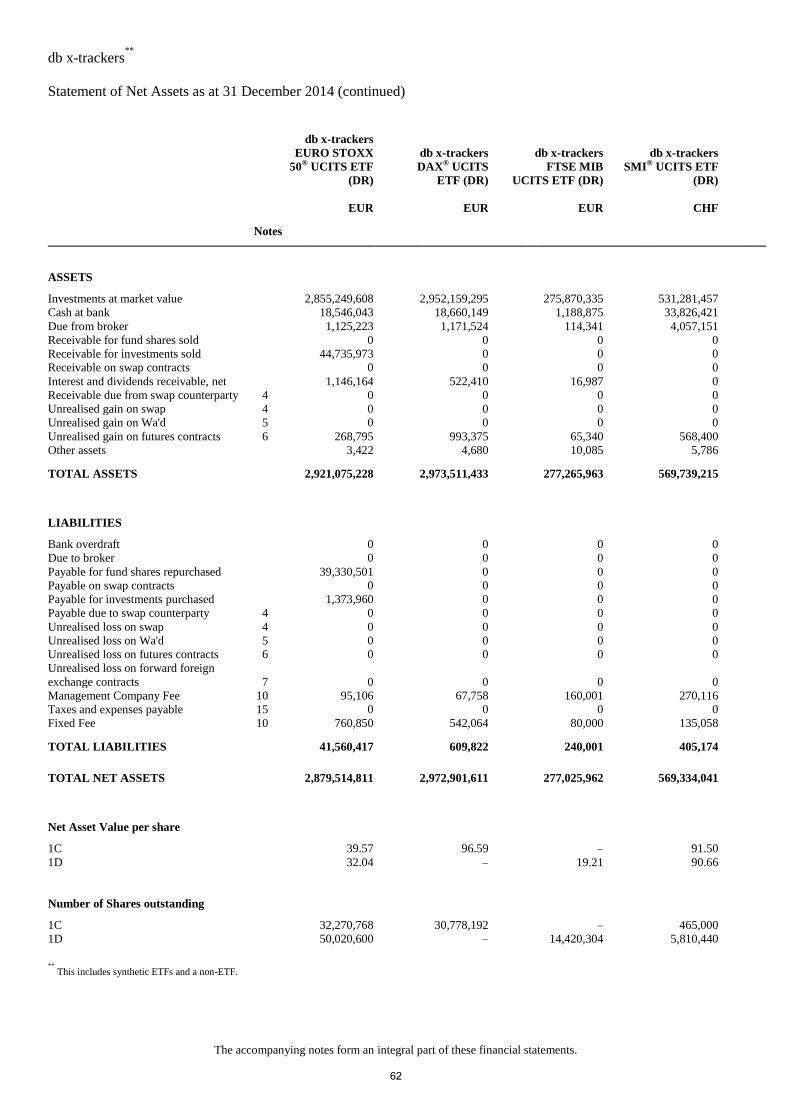
db x-trackers**
Statement of Net Assets as at 31 December 2014 (continued)
The accompanying notes form an integral part of these financial statements.
db x-trackers
EURO STOXX
50® UCITS ETF
(DR)
db x-trackers
DAX® UCITS
ETF (DR)
db x-trackers
FTSE MIB
UCITS ETF (DR)
db x-trackers
SMI® UCITS ETF
(DR)
EUR EUR EUR CHF
Notes
ASSETS
Investments at market value 2,855,249,608 2,952,159,295 275,870,335 531,281,457
Cash at bank 18,546,043 18,660,149 1,188,875 33,826,421
Due from broker 1,125,223 1,171,524 114,341 4,057,151
Receivable for fund shares sold 0 0 0 0
Receivable for investments sold 44,735,973 0 0 0
Receivable on swap contracts 0 0 0 0
Interest and dividends receivable, net 1,146,164 522,410 16,987 0
Receivable due from swap counterparty 4 0 0 0 0
Unrealised gain on swap 4 0 0 0 0
Unrealised gain on Wa'd 5 0 0 0 0
Unrealised gain on futures contracts 6 268,795 993,375 65,340 568,400
Other assets 3,422 4,680 10,085 5,786
TOTAL ASSETS 2,921,075,228 2,973,511,433 277,265,963 569,739,215
LIABILITIES
Bank overdraft 0 0 0 0
Due to broker 0 0 0 0
Payable for fund shares repurchased 39,330,501 0 0 0
Payable on swap contracts 0 0 0 0
Payable for investments purchased 1,373,960 0 0 0
Payable due to swap counterparty 4 0 0 0 0
Unrealised loss on swap 4 0 0 0 0
Unrealised loss on Wa'd 5 0 0 0 0
Unrealised loss on futures contracts 6 0 0 0 0
Unrealised loss on forward foreign
exchange contracts 7
0 0 0 0
Management Company Fee 10 95,106 67,758 160,001 270,116
Taxes and expenses payable 15 0 0 0 0
Fixed Fee 10 760,850 542,064 80,000 135,058
TOTAL LIABILITIES 41,560,417 609,822 240,001 405,174
TOTAL NET ASSETS 2,879,514,811 2,972,901,611 277,025,962 569,334,041
Net Asset Value per share
1C 39.57 96.59 – 91.50
1D 32.04 – 19.21 90.66
Number of Shares outstanding
1C 32,270,768 30,778,192 – 465,000
1D 50,020,600 – 14,420,304 5,810,440
**
This includes synthetic ETFs and a non-ETF.
62
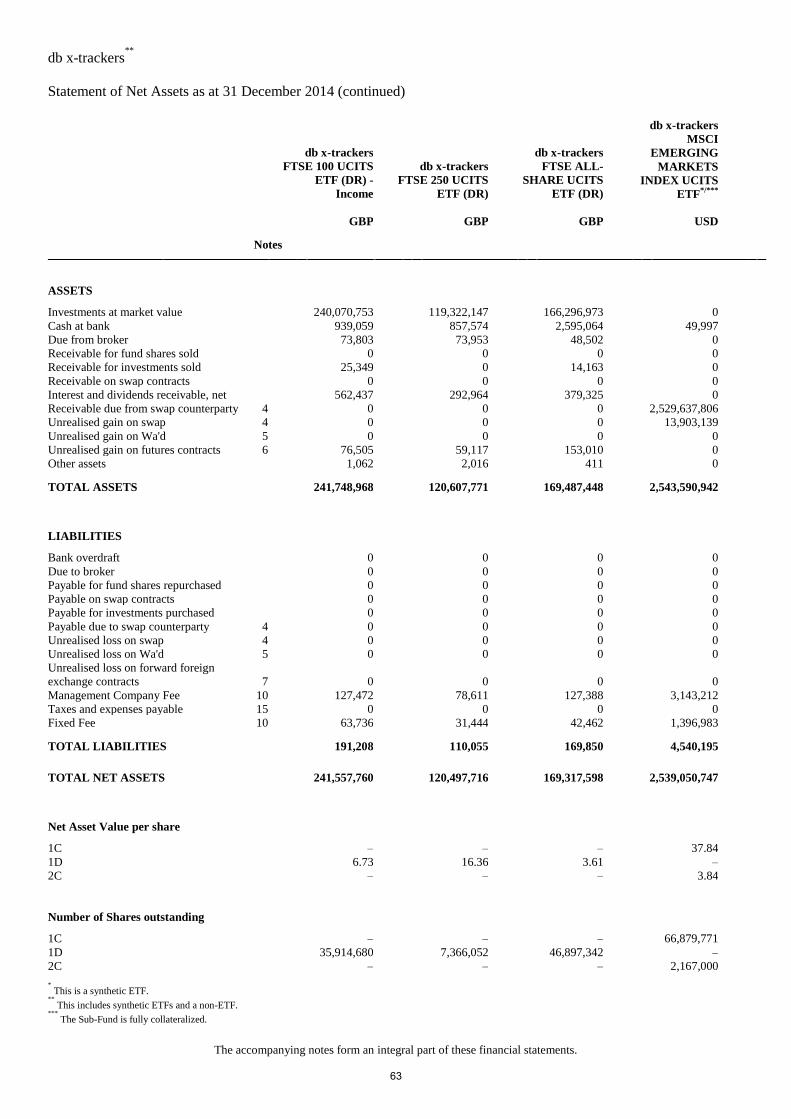
db x-trackers**
Statement of Net Assets as at 31 December 2014 (continued)
The accompanying notes form an integral part of these financial statements.
db x-trackers
FTSE 100 UCITS
ETF (DR) -
Income
db x-trackers
FTSE 250 UCITS
ETF (DR)
db x-trackers
FTSE ALL-
SHARE UCITS
ETF (DR)
db x-trackers
MSCI
EMERGING
MARKETS
INDEX UCITS
ETF*/***
GBP GBP GBP USD
Notes
ASSETS
Investments at market value 240,070,753 119,322,147 166,296,973 0
Cash at bank 939,059 857,574 2,595,064 49,997
Due from broker 73,803 73,953 48,502 0
Receivable for fund shares sold 0 0 0 0
Receivable for investments sold 25,349 0 14,163 0
Receivable on swap contracts 0 0 0 0
Interest and dividends receivable, net 562,437 292,964 379,325 0
Receivable due from swap counterparty 4 0 0 0 2,529,637,806
Unrealised gain on swap 4 0 0 0 13,903,139
Unrealised gain on Wa'd 5 0 0 0 0
Unrealised gain on futures contracts 6 76,505 59,117 153,010 0
Other assets 1,062 2,016 411 0
TOTAL ASSETS 241,748,968 120,607,771 169,487,448 2,543,590,942
LIABILITIES
Bank overdraft 0 0 0 0
Due to broker 0 0 0 0
Payable for fund shares repurchased 0 0 0 0
Payable on swap contracts 0 0 0 0
Payable for investments purchased 0 0 0 0
Payable due to swap counterparty 4 0 0 0 0
Unrealised loss on swap 4 0 0 0 0
Unrealised loss on Wa'd 5 0 0 0 0
Unrealised loss on forward foreign
exchange contracts 7
0 0 0 0
Management Company Fee 10 127,472 78,611 127,388 3,143,212
Taxes and expenses payable 15 0 0 0 0
Fixed Fee 10 63,736 31,444 42,462 1,396,983
TOTAL LIABILITIES 191,208 110,055 169,850 4,540,195
TOTAL NET ASSETS 241,557,760 120,497,716 169,317,598 2,539,050,747
Net Asset Value per share
1C – – – 37.84
1D 6.73 16.36 3.61 –
2C – – – 3.84
Number of Shares outstanding
1C – – – 66,879,771
1D 35,914,680 7,366,052 46,897,342 –
2C – – – 2,167,000
* This is a synthetic ETF.
** This includes synthetic ETFs and a non-ETF.
*** The Sub-Fund is fully collateralized.
63
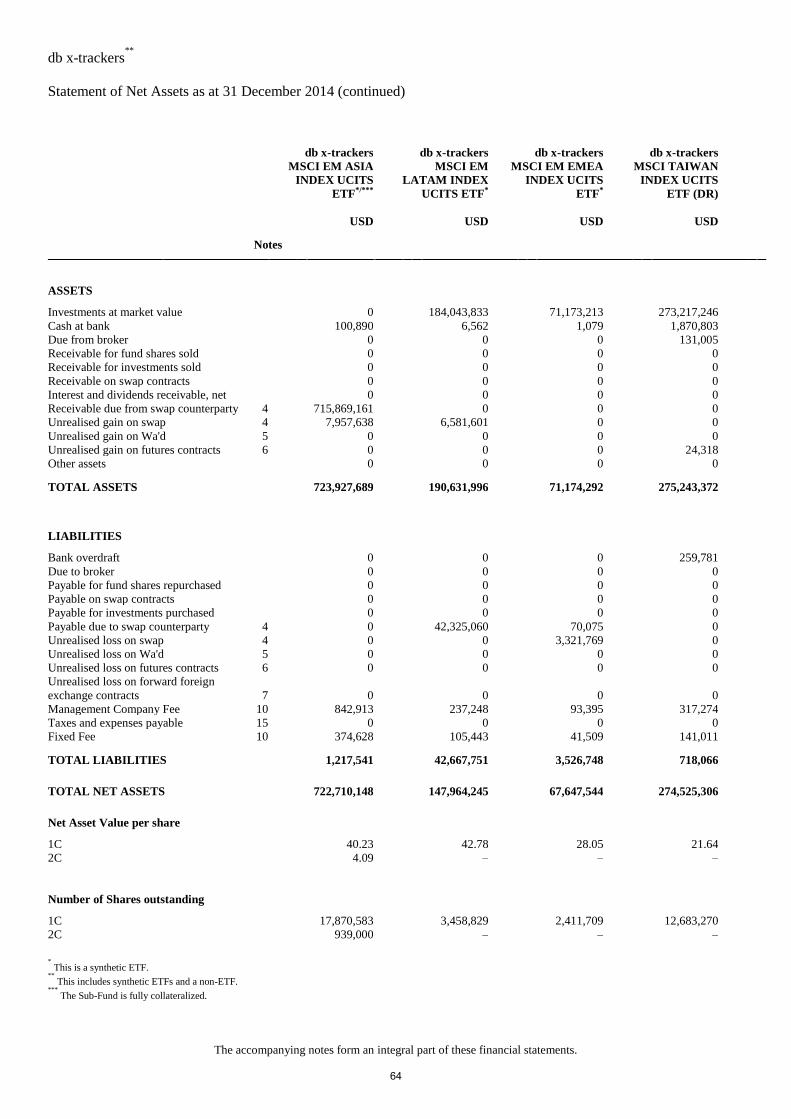
db x-trackers**
Statement of Net Assets as at 31 December 2014 (continued)
The accompanying notes form an integral part of these financial statements.
db x-trackers
MSCI EM ASIA
INDEX UCITS
ETF*/***
db x-trackers
MSCI EM
LATAM INDEX
UCITS ETF*
db x-trackers
MSCI EM EMEA
INDEX UCITS
ETF*
db x-trackers
MSCI TAIWAN
INDEX UCITS
ETF (DR)
USD USD USD USD
Notes
ASSETS
Investments at market value 0 184,043,833 71,173,213 273,217,246
Cash at bank 100,890 6,562 1,079 1,870,803
Due from broker 0 0 0 131,005
Receivable for fund shares sold 0 0 0 0
Receivable for investments sold 0 0 0 0
Receivable on swap contracts 0 0 0 0
Interest and dividends receivable, net 0 0 0 0
Receivable due from swap counterparty 4 715,869,161 0 0 0
Unrealised gain on swap 4 7,957,638 6,581,601 0 0
Unrealised gain on Wa'd 5 0 0 0 0
Unrealised gain on futures contracts 6 0 0 0 24,318
Other assets 0 0 0 0
TOTAL ASSETS 723,927,689 190,631,996 71,174,292 275,243,372
LIABILITIES
Bank overdraft 0 0 0 259,781
Due to broker 0 0 0 0
Payable for fund shares repurchased 0 0 0 0
Payable on swap contracts 0 0 0 0
Payable for investments purchased 0 0 0 0
Payable due to swap counterparty 4 0 42,325,060 70,075 0
Unrealised loss on swap 4 0 0 3,321,769 0
Unrealised loss on Wa'd 5 0 0 0 0
Unrealised loss on futures contracts 6 0 0 0 0
Unrealised loss on forward foreign
exchange contracts 7
0 0 0 0
Management Company Fee 10 842,913 237,248 93,395 317,274
Taxes and expenses payable 15 0 0 0 0
Fixed Fee 10 374,628 105,443 41,509 141,011
TOTAL LIABILITIES 1,217,541 42,667,751 3,526,748 718,066
TOTAL NET ASSETS 722,710,148 147,964,245 67,647,544 274,525,306
Net Asset Value per share
1C 40.23 42.78 28.05 21.64
2C 4.09 – – –
Number of Shares outstanding
1C 17,870,583 3,458,829 2,411,709 12,683,270
2C 939,000 – – –
* This is a synthetic ETF.
** This includes synthetic ETFs and a non-ETF.
*** The Sub-Fund is fully collateralized.
64
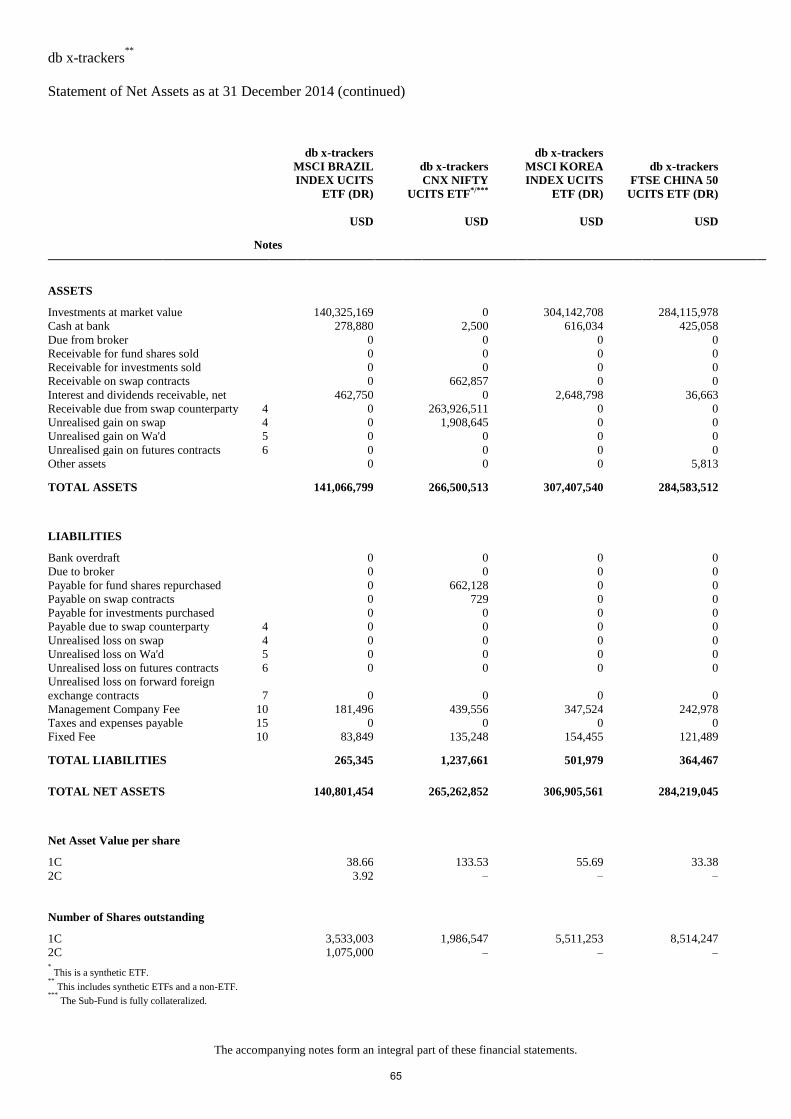
db x-trackers**
Statement of Net Assets as at 31 December 2014 (continued)
The accompanying notes form an integral part of these financial statements.
db x-trackers
MSCI BRAZIL
INDEX UCITS
ETF (DR)
db x-trackers
CNX NIFTY
UCITS ETF*/***
db x-trackers
MSCI KOREA
INDEX UCITS
ETF (DR)
db x-trackers
FTSE CHINA 50
UCITS ETF (DR)
USD USD USD USD
Notes
ASSETS
Investments at market value 140,325,169 0 304,142,708 284,115,978
Cash at bank 278,880 2,500 616,034 425,058
Due from broker 0 0 0 0
Receivable for fund shares sold 0 0 0 0
Receivable for investments sold 0 0 0 0
Receivable on swap contracts 0 662,857 0 0
Interest and dividends receivable, net 462,750 0 2,648,798 36,663
Receivable due from swap counterparty 4 0 263,926,511 0 0
Unrealised gain on swap 4 0 1,908,645 0 0
Unrealised gain on Wa'd 5 0 0 0 0
Unrealised gain on futures contracts 6 0 0 0 0
Other assets 0 0 0 5,813
TOTAL ASSETS 141,066,799 266,500,513 307,407,540 284,583,512
LIABILITIES
Bank overdraft 0 0 0 0
Due to broker 0 0 0 0
Payable for fund shares repurchased 0 662,128 0 0
Payable on swap contracts 0 729 0 0
Payable for investments purchased 0 0 0 0
Payable due to swap counterparty 4 0 0 0 0
Unrealised loss on swap 4 0 0 0 0
Unrealised loss on Wa'd 5 0 0 0 0
Unrealised loss on futures contracts 6 0 0 0 0
Unrealised loss on forward foreign
exchange contracts 7
0 0 0 0
Management Company Fee 10 181,496 439,556 347,524 242,978
Taxes and expenses payable 15 0 0 0 0
Fixed Fee 10 83,849 135,248 154,455 121,489
TOTAL LIABILITIES 265,345 1,237,661 501,979 364,467
TOTAL NET ASSETS 140,801,454 265,262,852 306,905,561 284,219,045
Net Asset Value per share
1C 38.66 133.53 55.69 33.38
2C 3.92 – – –
Number of Shares outstanding
1C 3,533,003 1,986,547 5,511,253 8,514,247
2C 1,075,000 – – – * This is a synthetic ETF.
** This includes synthetic ETFs and a non-ETF.
*** The Sub-Fund is fully collateralized.
65
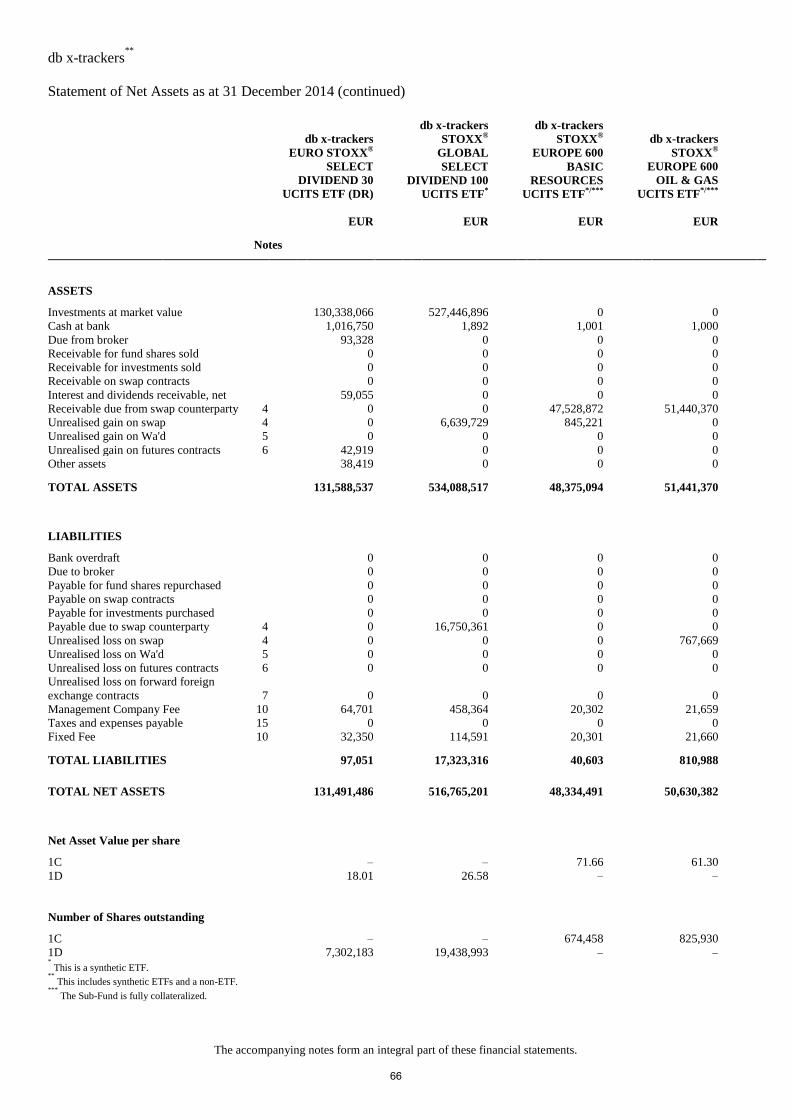
db x-trackers**
Statement of Net Assets as at 31 December 2014 (continued)
The accompanying notes form an integral part of these financial statements.
db x-trackers
EURO STOXX®
SELECT
DIVIDEND 30
UCITS ETF (DR)
db x-trackers
STOXX®
GLOBAL
SELECT
DIVIDEND 100
UCITS ETF*
db x-trackers
STOXX®
EUROPE 600
BASIC
RESOURCES
UCITS ETF*/***
db x-trackers
STOXX®
EUROPE 600
OIL & GAS
UCITS ETF*/***
EUR EUR EUR EUR
Notes
ASSETS
Investments at market value 130,338,066 527,446,896 0 0
Cash at bank 1,016,750 1,892 1,001 1,000
Due from broker 93,328 0 0 0
Receivable for fund shares sold 0 0 0 0
Receivable for investments sold 0 0 0 0
Receivable on swap contracts 0 0 0 0
Interest and dividends receivable, net 59,055 0 0 0
Receivable due from swap counterparty 4 0 0 47,528,872 51,440,370
Unrealised gain on swap 4 0 6,639,729 845,221 0
Unrealised gain on Wa'd 5 0 0 0 0
Unrealised gain on futures contracts 6 42,919 0 0 0
Other assets 38,419 0 0 0
TOTAL ASSETS 131,588,537 534,088,517 48,375,094 51,441,370
LIABILITIES
Bank overdraft 0 0 0 0
Due to broker 0 0 0 0
Payable for fund shares repurchased 0 0 0 0
Payable on swap contracts 0 0 0 0
Payable for investments purchased 0 0 0 0
Payable due to swap counterparty 4 0 16,750,361 0 0
Unrealised loss on swap 4 0 0 0 767,669
Unrealised loss on Wa'd 5 0 0 0 0
Unrealised loss on futures contracts 6 0 0 0 0
Unrealised loss on forward foreign
exchange contracts 7
0 0 0 0
Management Company Fee 10 64,701 458,364 20,302 21,659
Taxes and expenses payable 15 0 0 0 0
Fixed Fee 10 32,350 114,591 20,301 21,660
TOTAL LIABILITIES 97,051 17,323,316 40,603 810,988
TOTAL NET ASSETS 131,491,486 516,765,201 48,334,491 50,630,382
Net Asset Value per share
1C – – 71.66 61.30
1D 18.01 26.58 – –
Number of Shares outstanding
1C – – 674,458 825,930
1D 7,302,183 19,438,993 – – * This is a synthetic ETF.
** This includes synthetic ETFs and a non-ETF.
*** The Sub-Fund is fully collateralized.
66
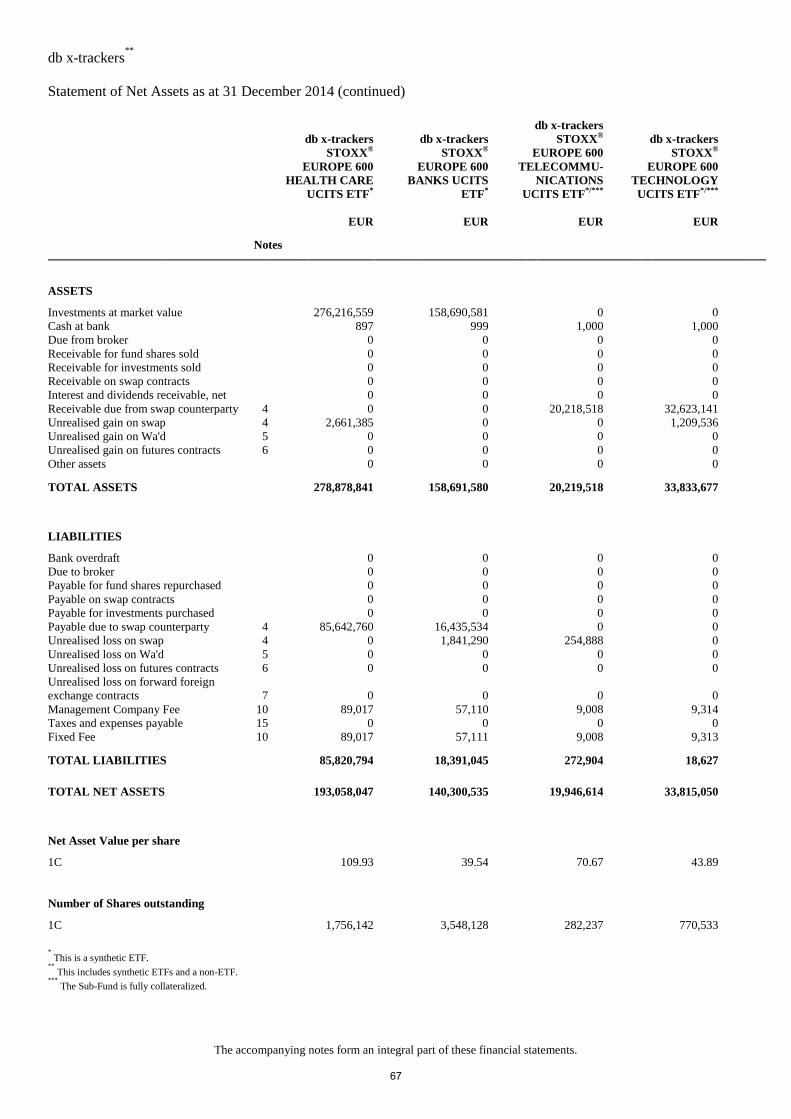
db x-trackers**
Statement of Net Assets as at 31 December 2014 (continued)
The accompanying notes form an integral part of these financial statements.
db x-trackers
STOXX®
EUROPE 600
HEALTH CARE
UCITS ETF*
db x-trackers
STOXX®
EUROPE 600
BANKS UCITS
ETF*
db x-trackers
STOXX®
EUROPE 600
TELECOMMU-
NICATIONS
UCITS ETF*/***
db x-trackers
STOXX®
EUROPE 600
TECHNOLOGY
UCITS ETF*/***
EUR EUR EUR EUR
Notes
ASSETS
Investments at market value 276,216,559 158,690,581 0 0
Cash at bank 897 999 1,000 1,000
Due from broker 0 0 0 0
Receivable for fund shares sold 0 0 0 0
Receivable for investments sold 0 0 0 0
Receivable on swap contracts 0 0 0 0
Interest and dividends receivable, net 0 0 0 0
Receivable due from swap counterparty 4 0 0 20,218,518 32,623,141
Unrealised gain on swap 4 2,661,385 0 0 1,209,536
Unrealised gain on Wa'd 5 0 0 0 0
Unrealised gain on futures contracts 6 0 0 0 0
Other assets 0 0 0 0
TOTAL ASSETS 278,878,841 158,691,580 20,219,518 33,833,677
LIABILITIES
Bank overdraft 0 0 0 0
Due to broker 0 0 0 0
Payable for fund shares repurchased 0 0 0 0
Payable on swap contracts 0 0 0 0
Payable for investments purchased 0 0 0 0
Payable due to swap counterparty 4 85,642,760 16,435,534 0 0
Unrealised loss on swap 4 0 1,841,290 254,888 0
Unrealised loss on Wa'd 5 0 0 0 0
Unrealised loss on futures contracts 6 0 0 0 0
Unrealised loss on forward foreign
exchange contracts 7
0 0 0 0
Management Company Fee 10 89,017 57,110 9,008 9,314
Taxes and expenses payable 15 0 0 0 0
Fixed Fee 10 89,017 57,111 9,008 9,313
TOTAL LIABILITIES 85,820,794 18,391,045 272,904 18,627
TOTAL NET ASSETS 193,058,047 140,300,535 19,946,614 33,815,050
Net Asset Value per share
1C 109.93 39.54 70.67 43.89
Number of Shares outstanding
1C 1,756,142 3,548,128 282,237 770,533
* This is a synthetic ETF.
** This includes synthetic ETFs and a non-ETF.
*** The Sub-Fund is fully collateralized.
67
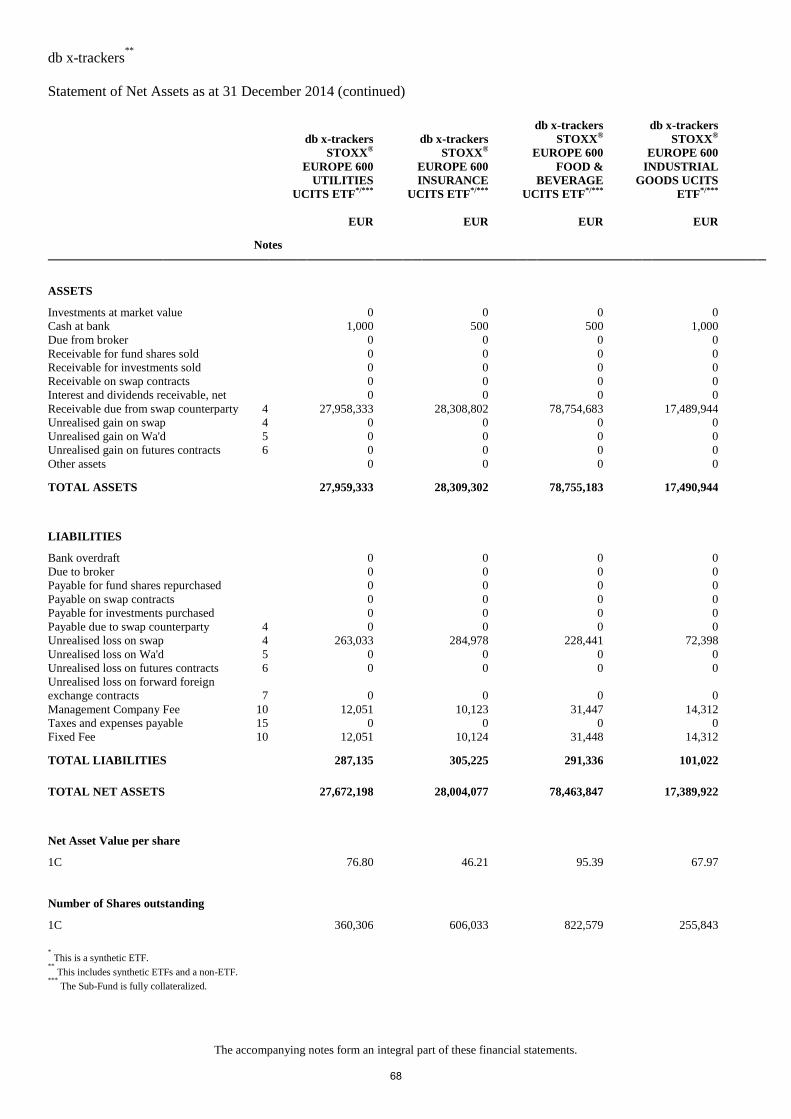
db x-trackers**
Statement of Net Assets as at 31 December 2014 (continued)
The accompanying notes form an integral part of these financial statements.
db x-trackers
STOXX®
EUROPE 600
UTILITIES
UCITS ETF*/***
db x-trackers
STOXX®
EUROPE 600
INSURANCE
UCITS ETF*/***
db x-trackers
STOXX®
EUROPE 600
FOOD &
BEVERAGE
UCITS ETF*/***
db x-trackers
STOXX®
EUROPE 600
INDUSTRIAL
GOODS UCITS
ETF*/***
EUR EUR EUR EUR
Notes
ASSETS
Investments at market value 0 0 0 0
Cash at bank 1,000 500 500 1,000
Due from broker 0 0 0 0
Receivable for fund shares sold 0 0 0 0
Receivable for investments sold 0 0 0 0
Receivable on swap contracts 0 0 0 0
Interest and dividends receivable, net 0 0 0 0
Receivable due from swap counterparty 4 27,958,333 28,308,802 78,754,683 17,489,944
Unrealised gain on swap 4 0 0 0 0
Unrealised gain on Wa'd 5 0 0 0 0
Unrealised gain on futures contracts 6 0 0 0 0
Other assets 0 0 0 0
TOTAL ASSETS 27,959,333 28,309,302 78,755,183 17,490,944
LIABILITIES
Bank overdraft 0 0 0 0
Due to broker 0 0 0 0
Payable for fund shares repurchased 0 0 0 0
Payable on swap contracts 0 0 0 0
Payable for investments purchased 0 0 0 0
Payable due to swap counterparty 4 0 0 0 0
Unrealised loss on swap 4 263,033 284,978 228,441 72,398
Unrealised loss on Wa'd 5 0 0 0 0
Unrealised loss on futures contracts 6 0 0 0 0
Unrealised loss on forward foreign
exchange contracts 7
0 0 0 0
Management Company Fee 10 12,051 10,123 31,447 14,312
Taxes and expenses payable 15 0 0 0 0
Fixed Fee 10 12,051 10,124 31,448 14,312
TOTAL LIABILITIES 287,135 305,225 291,336 101,022
TOTAL NET ASSETS 27,672,198 28,004,077 78,463,847 17,389,922
Net Asset Value per share
1C 76.80 46.21 95.39 67.97
Number of Shares outstanding
1C 360,306 606,033 822,579 255,843
* This is a synthetic ETF.
** This includes synthetic ETFs and a non-ETF.
*** The Sub-Fund is fully collateralized.
68
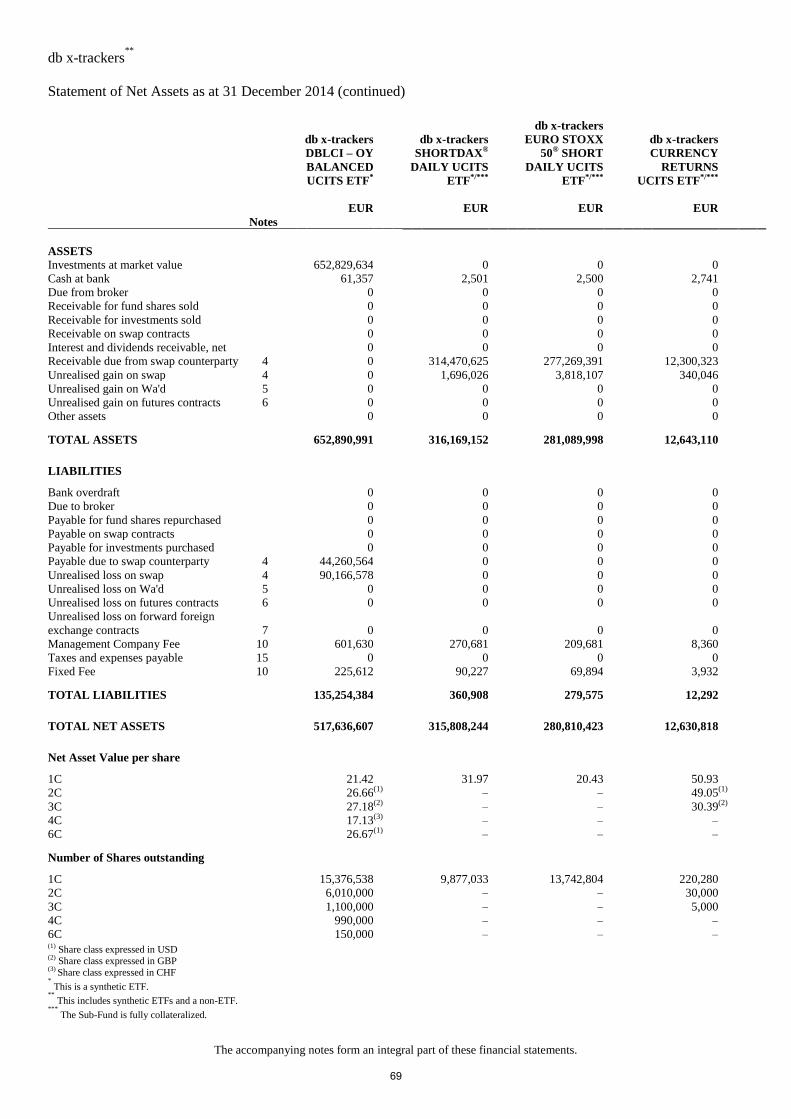
db x-trackers**
Statement of Net Assets as at 31 December 2014 (continued)
The accompanying notes form an integral part of these financial statements.
db x-trackers
DBLCI – OY
BALANCED
UCITS ETF*
db x-trackers
SHORTDAX®
DAILY UCITS
ETF*/***
db x-trackers
EURO STOXX
50® SHORT
DAILY UCITS
ETF*/***
db x-trackers
CURRENCY
RETURNS
UCITS ETF*/***
EUR EUR EUR EUR
Notes
ASSETS
Investments at market value 652,829,634 0 0 0
Cash at bank 61,357 2,501 2,500 2,741
Due from broker 0 0 0 0
Receivable for fund shares sold 0 0 0 0
Receivable for investments sold 0 0 0 0
Receivable on swap contracts 0 0 0 0
Interest and dividends receivable, net 0 0 0 0
Receivable due from swap counterparty 4 0 314,470,625 277,269,391 12,300,323
Unrealised gain on swap 4 0 1,696,026 3,818,107 340,046
Unrealised gain on Wa'd 5 0 0 0 0
Unrealised gain on futures contracts 6 0 0 0 0
Other assets 0 0 0 0
TOTAL ASSETS 652,890,991 316,169,152 281,089,998 12,643,110
LIABILITIES
Bank overdraft 0 0 0 0
Due to broker 0 0 0 0
Payable for fund shares repurchased 0 0 0 0
Payable on swap contracts 0 0 0 0
Payable for investments purchased 0 0 0 0
Payable due to swap counterparty 4 44,260,564 0 0 0
Unrealised loss on swap 4 90,166,578 0 0 0
Unrealised loss on Wa'd 5 0 0 0 0
Unrealised loss on futures contracts 6 0 0 0 0
Unrealised loss on forward foreign
exchange contracts 7
0 0 0 0
Management Company Fee 10 601,630 270,681 209,681 8,360
Taxes and expenses payable 15 0 0 0 0
Fixed Fee 10 225,612 90,227 69,894 3,932
TOTAL LIABILITIES 135,254,384 360,908 279,575 12,292
TOTAL NET ASSETS 517,636,607 315,808,244 280,810,423 12,630,818
Net Asset Value per share
1C 21.42 31.97 20.43 50.93
2C 26.66 (1) – – 49.05 (1)
3C 27.18 (2) – – 30.39 (2)
4C 17.13 (3) – – –
6C 26.67 (1) – – –
Number of Shares outstanding
1C 15,376,538 9,877,033 13,742,804 220,280
2C 6,010,000 – – 30,000
3C 1,100,000 – – 5,000
4C 990,000 – – –
6C 150,000 – – – (1)
Share class expressed in USD (2)
Share class expressed in GBP (3)
Share class expressed in CHF * This is a synthetic ETF.
** This includes synthetic ETFs and a non-ETF.
*** The Sub-Fund is fully collateralized.
69
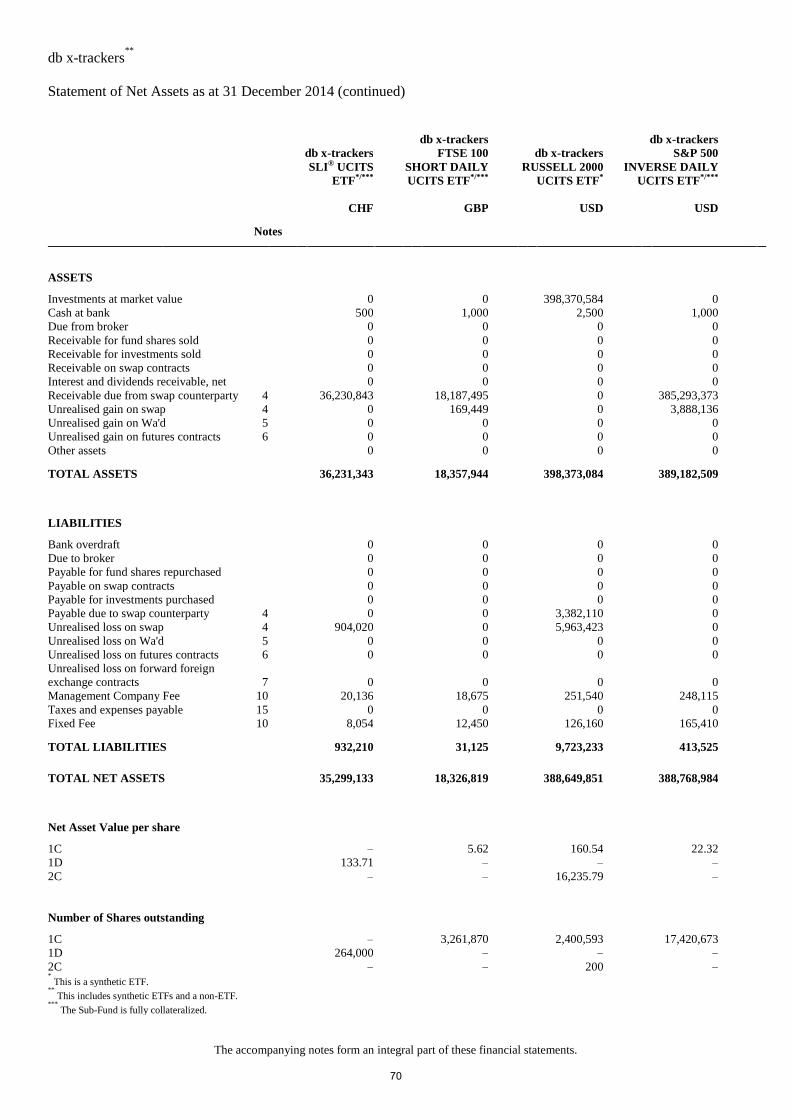
db x-trackers**
Statement of Net Assets as at 31 December 2014 (continued)
The accompanying notes form an integral part of these financial statements.
db x-trackers
SLI® UCITS
ETF*/***
db x-trackers
FTSE 100
SHORT DAILY
UCITS ETF*/***
db x-trackers
RUSSELL 2000
UCITS ETF*
db x-trackers
S&P 500
INVERSE DAILY
UCITS ETF*/***
CHF GBP USD USD
Notes
ASSETS
Investments at market value 0 0 398,370,584 0
Cash at bank 500 1,000 2,500 1,000
Due from broker 0 0 0 0
Receivable for fund shares sold 0 0 0 0
Receivable for investments sold 0 0 0 0
Receivable on swap contracts 0 0 0 0
Interest and dividends receivable, net 0 0 0 0
Receivable due from swap counterparty 4 36,230,843 18,187,495 0 385,293,373
Unrealised gain on swap 4 0 169,449 0 3,888,136
Unrealised gain on Wa'd 5 0 0 0 0
Unrealised gain on futures contracts 6 0 0 0 0
Other assets 0 0 0 0
TOTAL ASSETS 36,231,343 18,357,944 398,373,084 389,182,509
LIABILITIES
Bank overdraft 0 0 0 0
Due to broker 0 0 0 0
Payable for fund shares repurchased 0 0 0 0
Payable on swap contracts 0 0 0 0
Payable for investments purchased 0 0 0 0
Payable due to swap counterparty 4 0 0 3,382,110 0
Unrealised loss on swap 4 904,020 0 5,963,423 0
Unrealised loss on Wa'd 5 0 0 0 0
Unrealised loss on futures contracts 6 0 0 0 0
Unrealised loss on forward foreign
exchange contracts 7
0 0 0 0
Management Company Fee 10 20,136 18,675 251,540 248,115
Taxes and expenses payable 15 0 0 0 0
Fixed Fee 10 8,054 12,450 126,160 165,410
TOTAL LIABILITIES 932,210 31,125 9,723,233 413,525
TOTAL NET ASSETS 35,299,133 18,326,819 388,649,851 388,768,984
Net Asset Value per share
1C – 5.62 160.54 22.32
1D 133.71 – – –
2C – – 16,235.79 –
Number of Shares outstanding
1C – 3,261,870 2,400,593 17,420,673
1D 264,000 – – –
2C – – 200 – * This is a synthetic ETF.
** This includes synthetic ETFs and a non-ETF.
*** The Sub-Fund is fully collateralized.
70
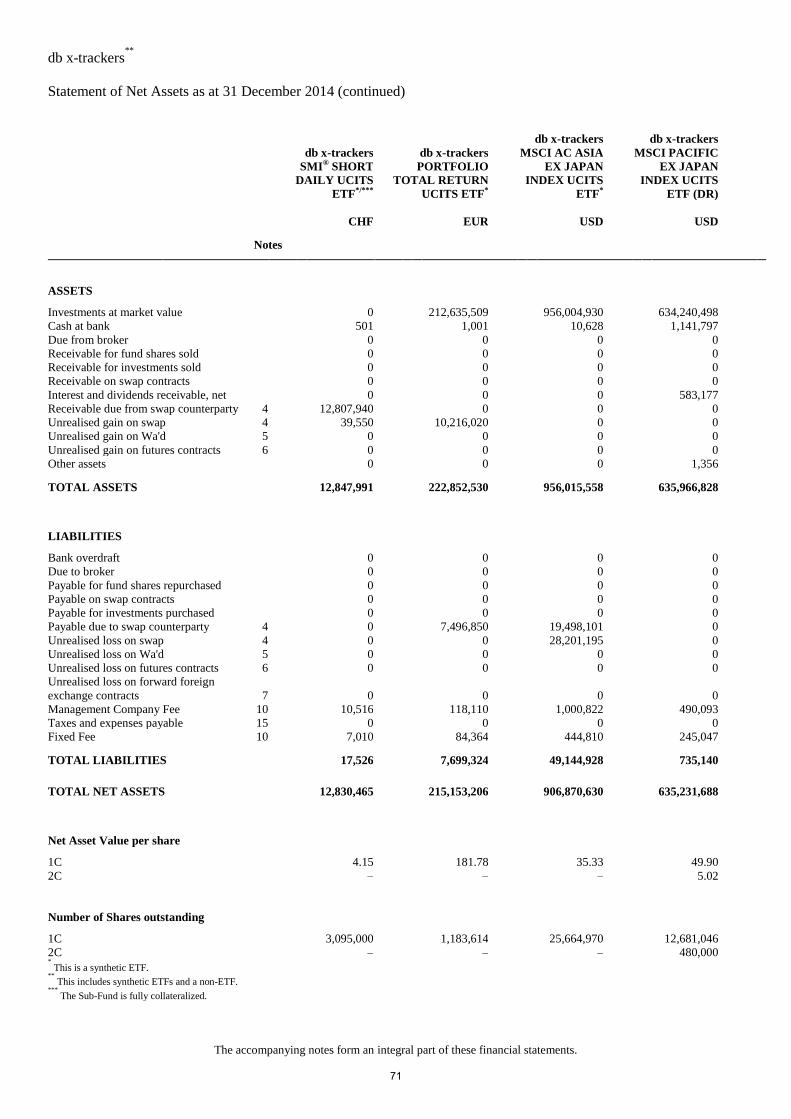
db x-trackers**
Statement of Net Assets as at 31 December 2014 (continued)
The accompanying notes form an integral part of these financial statements.
db x-trackers
SMI® SHORT
DAILY UCITS
ETF*/***
db x-trackers
PORTFOLIO
TOTAL RETURN
UCITS ETF*
db x-trackers
MSCI AC ASIA
EX JAPAN
INDEX UCITS
ETF*
db x-trackers
MSCI PACIFIC
EX JAPAN
INDEX UCITS
ETF (DR)
CHF EUR USD USD
Notes
ASSETS
Investments at market value 0 212,635,509 956,004,930 634,240,498
Cash at bank 501 1,001 10,628 1,141,797
Due from broker 0 0 0 0
Receivable for fund shares sold 0 0 0 0
Receivable for investments sold 0 0 0 0
Receivable on swap contracts 0 0 0 0
Interest and dividends receivable, net 0 0 0 583,177
Receivable due from swap counterparty 4 12,807,940 0 0 0
Unrealised gain on swap 4 39,550 10,216,020 0 0
Unrealised gain on Wa'd 5 0 0 0 0
Unrealised gain on futures contracts 6 0 0 0 0
Other assets 0 0 0 1,356
TOTAL ASSETS 12,847,991 222,852,530 956,015,558 635,966,828
LIABILITIES
Bank overdraft 0 0 0 0
Due to broker 0 0 0 0
Payable for fund shares repurchased 0 0 0 0
Payable on swap contracts 0 0 0 0
Payable for investments purchased 0 0 0 0
Payable due to swap counterparty 4 0 7,496,850 19,498,101 0
Unrealised loss on swap 4 0 0 28,201,195 0
Unrealised loss on Wa'd 5 0 0 0 0
Unrealised loss on futures contracts 6 0 0 0 0
Unrealised loss on forward foreign
exchange contracts 7
0 0 0 0
Management Company Fee 10 10,516 118,110 1,000,822 490,093
Taxes and expenses payable 15 0 0 0 0
Fixed Fee 10 7,010 84,364 444,810 245,047
TOTAL LIABILITIES 17,526 7,699,324 49,144,928 735,140
TOTAL NET ASSETS 12,830,465 215,153,206 906,870,630 635,231,688
Net Asset Value per share
1C 4.15 181.78 35.33 49.90
2C – – – 5.02
Number of Shares outstanding
1C 3,095,000 1,183,614 25,664,970 12,681,046
2C – – – 480,000 * This is a synthetic ETF.
** This includes synthetic ETFs and a non-ETF.
*** The Sub-Fund is fully collateralized.
71
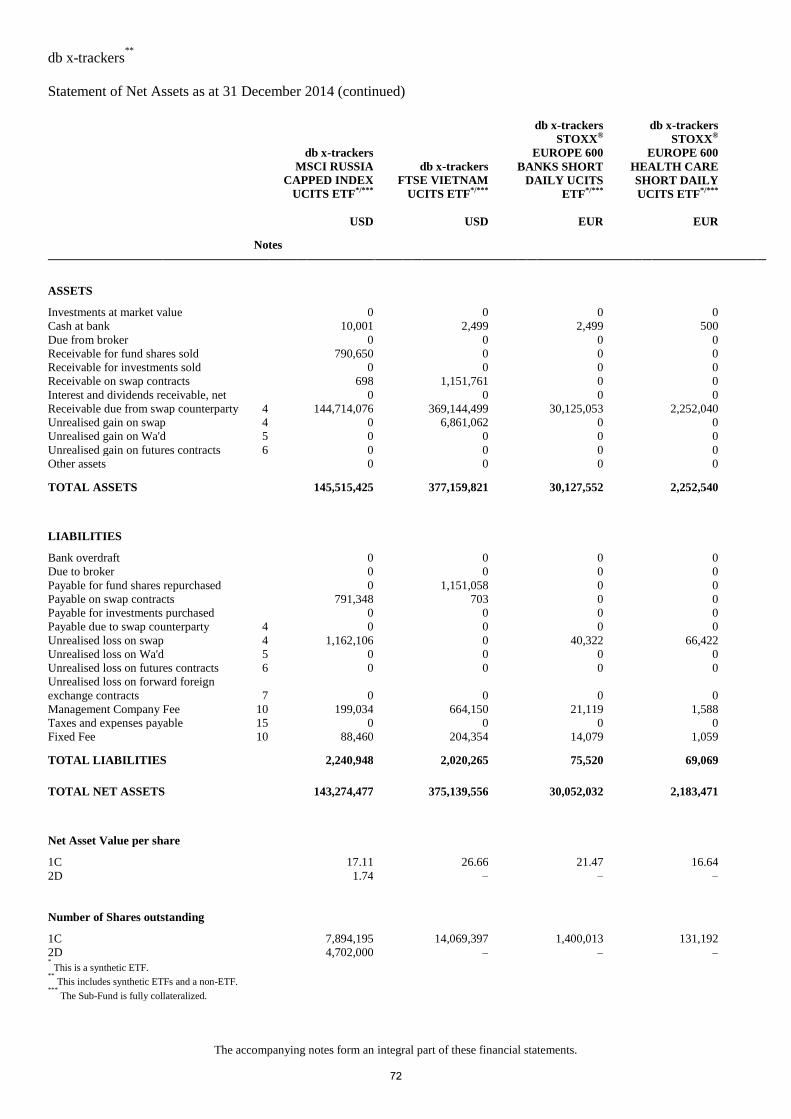
db x-trackers**
Statement of Net Assets as at 31 December 2014 (continued)
The accompanying notes form an integral part of these financial statements.
db x-trackers
MSCI RUSSIA
CAPPED INDEX
UCITS ETF*/***
db x-trackers
FTSE VIETNAM
UCITS ETF*/***
db x-trackers
STOXX®
EUROPE 600
BANKS SHORT
DAILY UCITS
ETF*/***
db x-trackers
STOXX®
EUROPE 600
HEALTH CARE
SHORT DAILY
UCITS ETF*/***
USD USD EUR EUR
Notes
ASSETS
Investments at market value 0 0 0 0
Cash at bank 10,001 2,499 2,499 500
Due from broker 0 0 0 0
Receivable for fund shares sold 790,650 0 0 0
Receivable for investments sold 0 0 0 0
Receivable on swap contracts 698 1,151,761 0 0
Interest and dividends receivable, net 0 0 0 0
Receivable due from swap counterparty 4 144,714,076 369,144,499 30,125,053 2,252,040
Unrealised gain on swap 4 0 6,861,062 0 0
Unrealised gain on Wa'd 5 0 0 0 0
Unrealised gain on futures contracts 6 0 0 0 0
Other assets 0 0 0 0
TOTAL ASSETS 145,515,425 377,159,821 30,127,552 2,252,540
LIABILITIES
Bank overdraft 0 0 0 0
Due to broker 0 0 0 0
Payable for fund shares repurchased 0 1,151,058 0 0
Payable on swap contracts 791,348 703 0 0
Payable for investments purchased 0 0 0 0
Payable due to swap counterparty 4 0 0 0 0
Unrealised loss on swap 4 1,162,106 0 40,322 66,422
Unrealised loss on Wa'd 5 0 0 0 0
Unrealised loss on futures contracts 6 0 0 0 0
Unrealised loss on forward foreign
exchange contracts 7
0 0 0 0
Management Company Fee 10 199,034 664,150 21,119 1,588
Taxes and expenses payable 15 0 0 0 0
Fixed Fee 10 88,460 204,354 14,079 1,059
TOTAL LIABILITIES 2,240,948 2,020,265 75,520 69,069
TOTAL NET ASSETS 143,274,477 375,139,556 30,052,032 2,183,471
Net Asset Value per share
1C 17.11 26.66 21.47 16.64
2D 1.74 – – –
Number of Shares outstanding
1C 7,894,195 14,069,397 1,400,013 131,192
2D 4,702,000 – – – * This is a synthetic ETF.
** This includes synthetic ETFs and a non-ETF.
*** The Sub-Fund is fully collateralized.
72
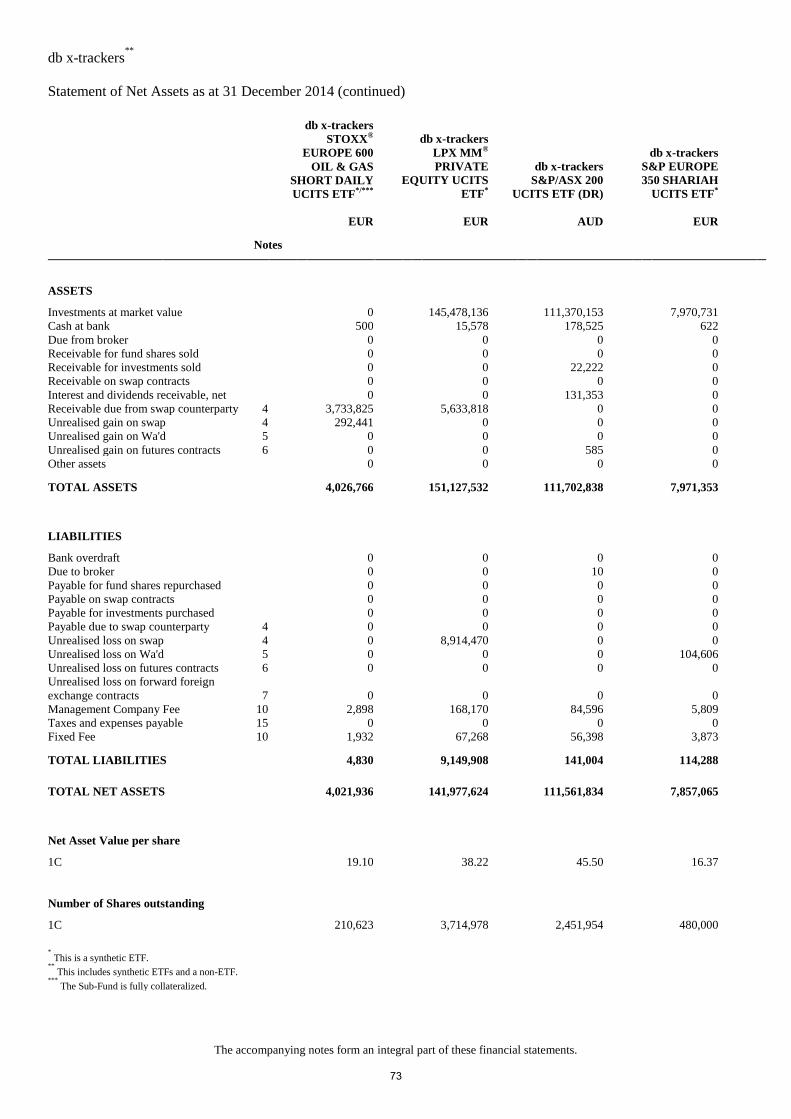
db x-trackers**
Statement of Net Assets as at 31 December 2014 (continued)
The accompanying notes form an integral part of these financial statements.
db x-trackers
STOXX®
EUROPE 600
OIL & GAS
SHORT DAILY
UCITS ETF*/***
db x-trackers
LPX MM®
PRIVATE
EQUITY UCITS
ETF*
db x-trackers
S&P/ASX 200
UCITS ETF (DR)
db x-trackers
S&P EUROPE
350 SHARIAH
UCITS ETF*
EUR EUR AUD EUR
Notes
ASSETS
Investments at market value 0 145,478,136 111,370,153 7,970,731
Cash at bank 500 15,578 178,525 622
Due from broker 0 0 0 0
Receivable for fund shares sold 0 0 0 0
Receivable for investments sold 0 0 22,222 0
Receivable on swap contracts 0 0 0 0
Interest and dividends receivable, net 0 0 131,353 0
Receivable due from swap counterparty 4 3,733,825 5,633,818 0 0
Unrealised gain on swap 4 292,441 0 0 0
Unrealised gain on Wa'd 5 0 0 0 0
Unrealised gain on futures contracts 6 0 0 585 0
Other assets 0 0 0 0
TOTAL ASSETS 4,026,766 151,127,532 111,702,838 7,971,353
LIABILITIES
Bank overdraft 0 0 0 0
Due to broker 0 0 10 0
Payable for fund shares repurchased 0 0 0 0
Payable on swap contracts 0 0 0 0
Payable for investments purchased 0 0 0 0
Payable due to swap counterparty 4 0 0 0 0
Unrealised loss on swap 4 0 8,914,470 0 0
Unrealised loss on Wa'd 5 0 0 0 104,606
Unrealised loss on futures contracts 6 0 0 0 0
Unrealised loss on forward foreign
exchange contracts 7
0 0 0 0
Management Company Fee 10 2,898 168,170 84,596 5,809
Taxes and expenses payable 15 0 0 0 0
Fixed Fee 10 1,932 67,268 56,398 3,873
TOTAL LIABILITIES 4,830 9,149,908 141,004 114,288
TOTAL NET ASSETS 4,021,936 141,977,624 111,561,834 7,857,065
Net Asset Value per share
1C 19.10 38.22 45.50 16.37
Number of Shares outstanding
1C 210,623 3,714,978 2,451,954 480,000
* This is a synthetic ETF.
** This includes synthetic ETFs and a non-ETF.
*** The Sub-Fund is fully collateralized.
73
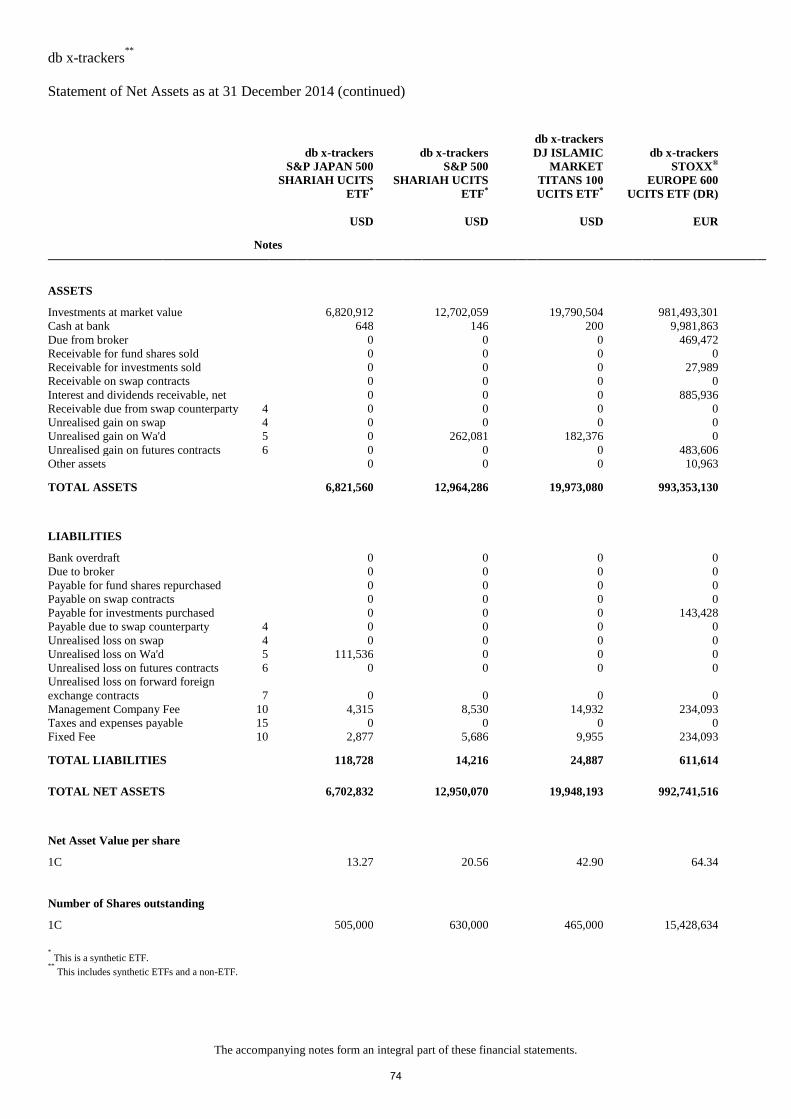
db x-trackers**
Statement of Net Assets as at 31 December 2014 (continued)
The accompanying notes form an integral part of these financial statements.
db x-trackers
S&P JAPAN 500
SHARIAH UCITS
ETF*
db x-trackers
S&P 500
SHARIAH UCITS
ETF*
db x-trackers
DJ ISLAMIC
MARKET
TITANS 100
UCITS ETF*
db x-trackers
STOXX®
EUROPE 600
UCITS ETF (DR)
USD USD USD EUR
Notes
ASSETS
Investments at market value 6,820,912 12,702,059 19,790,504 981,493,301
Cash at bank 648 146 200 9,981,863
Due from broker 0 0 0 469,472
Receivable for fund shares sold 0 0 0 0
Receivable for investments sold 0 0 0 27,989
Receivable on swap contracts 0 0 0 0
Interest and dividends receivable, net 0 0 0 885,936
Receivable due from swap counterparty 4 0 0 0 0
Unrealised gain on swap 4 0 0 0 0
Unrealised gain on Wa'd 5 0 262,081 182,376 0
Unrealised gain on futures contracts 6 0 0 0 483,606
Other assets 0 0 0 10,963
TOTAL ASSETS 6,821,560 12,964,286 19,973,080 993,353,130
LIABILITIES
Bank overdraft 0 0 0 0
Due to broker 0 0 0 0
Payable for fund shares repurchased 0 0 0 0
Payable on swap contracts 0 0 0 0
Payable for investments purchased 0 0 0 143,428
Payable due to swap counterparty 4 0 0 0 0
Unrealised loss on swap 4 0 0 0 0
Unrealised loss on Wa'd 5 111,536 0 0 0
Unrealised loss on futures contracts 6 0 0 0 0
Unrealised loss on forward foreign
exchange contracts 7
0 0 0 0
Management Company Fee 10 4,315 8,530 14,932 234,093
Taxes and expenses payable 15 0 0 0 0
Fixed Fee 10 2,877 5,686 9,955 234,093
TOTAL LIABILITIES 118,728 14,216 24,887 611,614
TOTAL NET ASSETS 6,702,832 12,950,070 19,948,193 992,741,516
Net Asset Value per share
1C 13.27 20.56 42.90 64.34
Number of Shares outstanding
1C 505,000 630,000 465,000 15,428,634
* This is a synthetic ETF.
** This includes synthetic ETFs and a non-ETF.
74
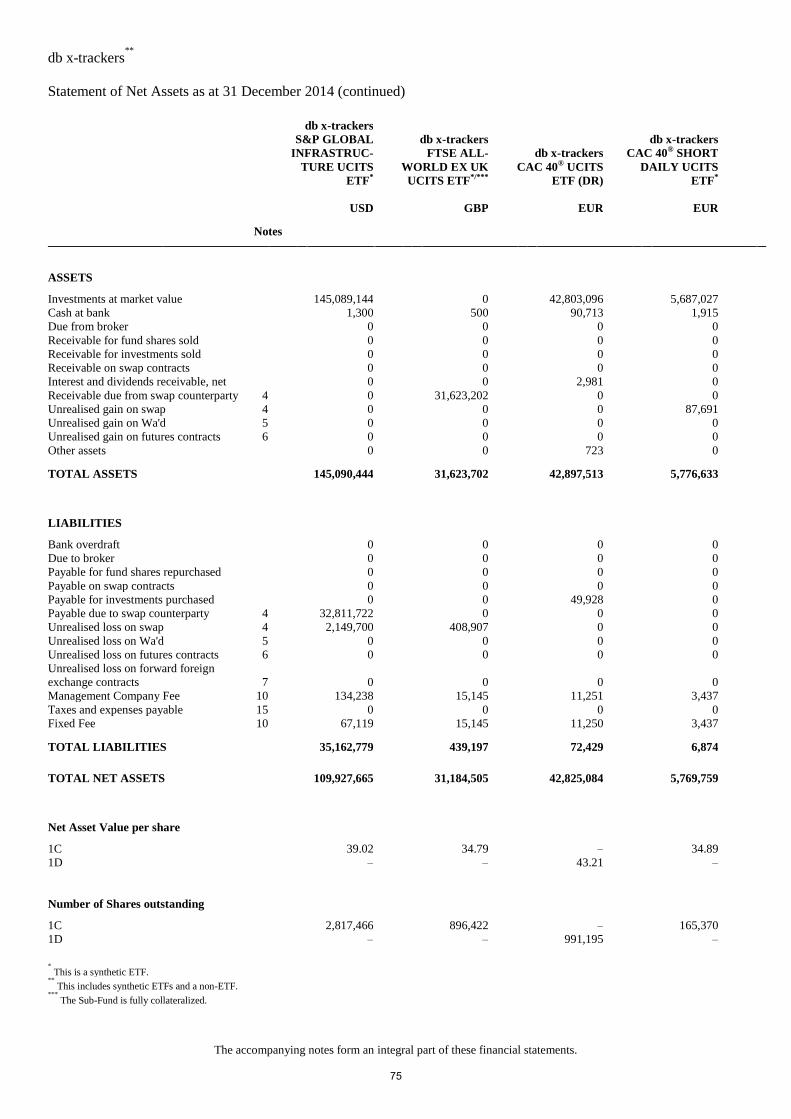
db x-trackers**
Statement of Net Assets as at 31 December 2014 (continued)
The accompanying notes form an integral part of these financial statements.
db x-trackers
S&P GLOBAL
INFRASTRUC-
TURE UCITS
ETF*
db x-trackers
FTSE ALL-
WORLD EX UK
UCITS ETF*/***
db x-trackers
CAC 40® UCITS
ETF (DR)
db x-trackers
CAC 40® SHORT
DAILY UCITS
ETF*
USD GBP EUR EUR
Notes
ASSETS
Investments at market value 145,089,144 0 42,803,096 5,687,027
Cash at bank 1,300 500 90,713 1,915
Due from broker 0 0 0 0
Receivable for fund shares sold 0 0 0 0
Receivable for investments sold 0 0 0 0
Receivable on swap contracts 0 0 0 0
Interest and dividends receivable, net 0 0 2,981 0
Receivable due from swap counterparty 4 0 31,623,202 0 0
Unrealised gain on swap 4 0 0 0 87,691
Unrealised gain on Wa'd 5 0 0 0 0
Unrealised gain on futures contracts 6 0 0 0 0
Other assets 0 0 723 0
TOTAL ASSETS 145,090,444 31,623,702 42,897,513 5,776,633
LIABILITIES
Bank overdraft 0 0 0 0
Due to broker 0 0 0 0
Payable for fund shares repurchased 0 0 0 0
Payable on swap contracts 0 0 0 0
Payable for investments purchased 0 0 49,928 0
Payable due to swap counterparty 4 32,811,722 0 0 0
Unrealised loss on swap 4 2,149,700 408,907 0 0
Unrealised loss on Wa'd 5 0 0 0 0
Unrealised loss on futures contracts 6 0 0 0 0
Unrealised loss on forward foreign
exchange contracts 7
0 0 0 0
Management Company Fee 10 134,238 15,145 11,251 3,437
Taxes and expenses payable 15 0 0 0 0
Fixed Fee 10 67,119 15,145 11,250 3,437
TOTAL LIABILITIES 35,162,779 439,197 72,429 6,874
TOTAL NET ASSETS 109,927,665 31,184,505 42,825,084 5,769,759
Net Asset Value per share
1C 39.02 34.79 – 34.89
1D – – 43.21 –
Number of Shares outstanding
1C 2,817,466 896,422 – 165,370
1D – – 991,195 –
* This is a synthetic ETF.
** This includes synthetic ETFs and a non-ETF.
*** The Sub-Fund is fully collateralized.
75
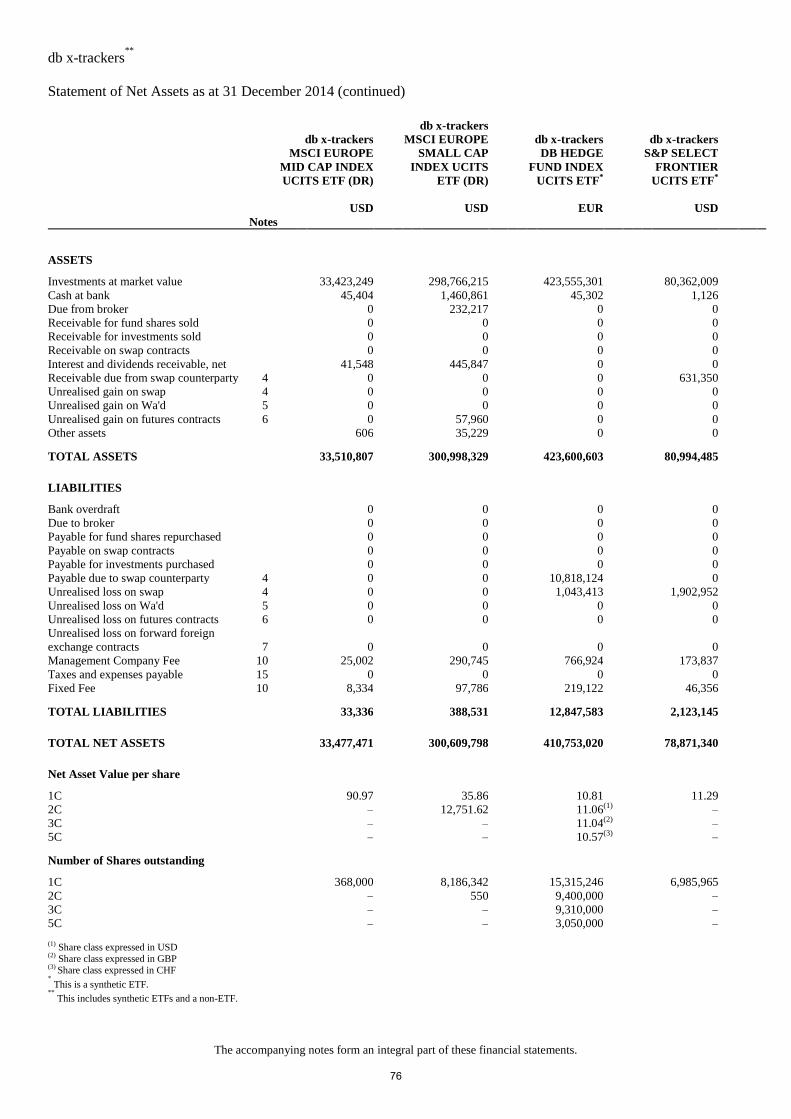
db x-trackers**
Statement of Net Assets as at 31 December 2014 (continued)
The accompanying notes form an integral part of these financial statements.
db x-trackers
MSCI EUROPE
MID CAP INDEX
UCITS ETF (DR)
db x-trackers
MSCI EUROPE
SMALL CAP
INDEX UCITS
ETF (DR)
db x-trackers
DB HEDGE
FUND INDEX
UCITS ETF*
db x-trackers
S&P SELECT
FRONTIER
UCITS ETF*
USD USD EUR USD
Notes
ASSETS
Investments at market value 33,423,249 298,766,215 423,555,301 80,362,009
Cash at bank 45,404 1,460,861 45,302 1,126
Due from broker 0 232,217 0 0
Receivable for fund shares sold 0 0 0 0
Receivable for investments sold 0 0 0 0
Receivable on swap contracts 0 0 0 0
Interest and dividends receivable, net 41,548 445,847 0 0
Receivable due from swap counterparty 4 0 0 0 631,350
Unrealised gain on swap 4 0 0 0 0
Unrealised gain on Wa'd 5 0 0 0 0
Unrealised gain on futures contracts 6 0 57,960 0 0
Other assets 606 35,229 0 0
TOTAL ASSETS 33,510,807 300,998,329 423,600,603 80,994,485
LIABILITIES
Bank overdraft 0 0 0 0
Due to broker 0 0 0 0
Payable for fund shares repurchased 0 0 0 0
Payable on swap contracts 0 0 0 0
Payable for investments purchased 0 0 0 0
Payable due to swap counterparty 4 0 0 10,818,124 0
Unrealised loss on swap 4 0 0 1,043,413 1,902,952
Unrealised loss on Wa'd 5 0 0 0 0
Unrealised loss on futures contracts 6 0 0 0 0
Unrealised loss on forward foreign
exchange contracts 7
0 0 0 0
Management Company Fee 10 25,002 290,745 766,924 173,837
Taxes and expenses payable 15 0 0 0 0
Fixed Fee 10 8,334 97,786 219,122 46,356
TOTAL LIABILITIES 33,336 388,531 12,847,583 2,123,145
TOTAL NET ASSETS 33,477,471 300,609,798 410,753,020 78,871,340
Net Asset Value per share
1C 90.97 35.86 10.81 11.29
2C – 12,751.62 11.06 (1) –
3C – – 11.04 (2) –
5C – – 10.57 (3) –
Number of Shares outstanding
1C 368,000 8,186,342 15,315,246 6,985,965
2C – 550 9,400,000 –
3C – – 9,310,000 –
5C – – 3,050,000 –
(1) Share class expressed in USD
(2) Share class expressed in GBP
(3) Share class expressed in CHF
* This is a synthetic ETF.
** This includes synthetic ETFs and a non-ETF.
76
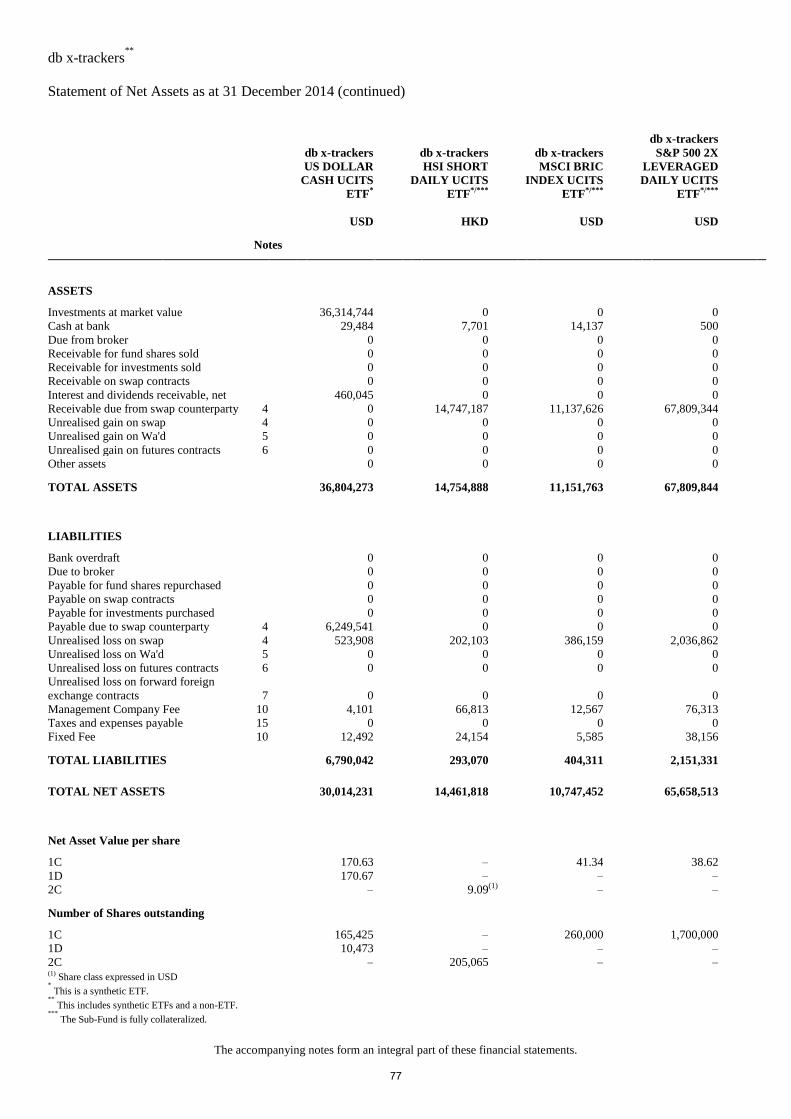
db x-trackers**
Statement of Net Assets as at 31 December 2014 (continued)
The accompanying notes form an integral part of these financial statements.
db x-trackers
US DOLLAR
CASH UCITS
ETF*
db x-trackers
HSI SHORT
DAILY UCITS
ETF*/***
db x-trackers
MSCI BRIC
INDEX UCITS
ETF*/***
db x-trackers
S&P 500 2X
LEVERAGED
DAILY UCITS
ETF*/***
USD HKD USD USD
Notes
ASSETS
Investments at market value 36,314,744 0 0 0
Cash at bank 29,484 7,701 14,137 500
Due from broker 0 0 0 0
Receivable for fund shares sold 0 0 0 0
Receivable for investments sold 0 0 0 0
Receivable on swap contracts 0 0 0 0
Interest and dividends receivable, net 460,045 0 0 0
Receivable due from swap counterparty 4 0 14,747,187 11,137,626 67,809,344
Unrealised gain on swap 4 0 0 0 0
Unrealised gain on Wa'd 5 0 0 0 0
Unrealised gain on futures contracts 6 0 0 0 0
Other assets 0 0 0 0
TOTAL ASSETS 36,804,273 14,754,888 11,151,763 67,809,844
LIABILITIES
Bank overdraft 0 0 0 0
Due to broker 0 0 0 0
Payable for fund shares repurchased 0 0 0 0
Payable on swap contracts 0 0 0 0
Payable for investments purchased 0 0 0 0
Payable due to swap counterparty 4 6,249,541 0 0 0
Unrealised loss on swap 4 523,908 202,103 386,159 2,036,862
Unrealised loss on Wa'd 5 0 0 0 0
Unrealised loss on futures contracts 6 0 0 0 0
Unrealised loss on forward foreign
exchange contracts 7
0 0 0 0
Management Company Fee 10 4,101 66,813 12,567 76,313
Taxes and expenses payable 15 0 0 0 0
Fixed Fee 10 12,492 24,154 5,585 38,156
TOTAL LIABILITIES 6,790,042 293,070 404,311 2,151,331
TOTAL NET ASSETS 30,014,231 14,461,818 10,747,452 65,658,513
Net Asset Value per share
1C 170.63 – 41.34 38.62
1D 170.67 – – –
2C – 9.09 (1) – –
Number of Shares outstanding
1C 165,425 – 260,000 1,700,000
1D 10,473 – – –
2C – 205,065 – – (1)
Share class expressed in USD * This is a synthetic ETF.
** This includes synthetic ETFs and a non-ETF.
*** The Sub-Fund is fully collateralized.
77
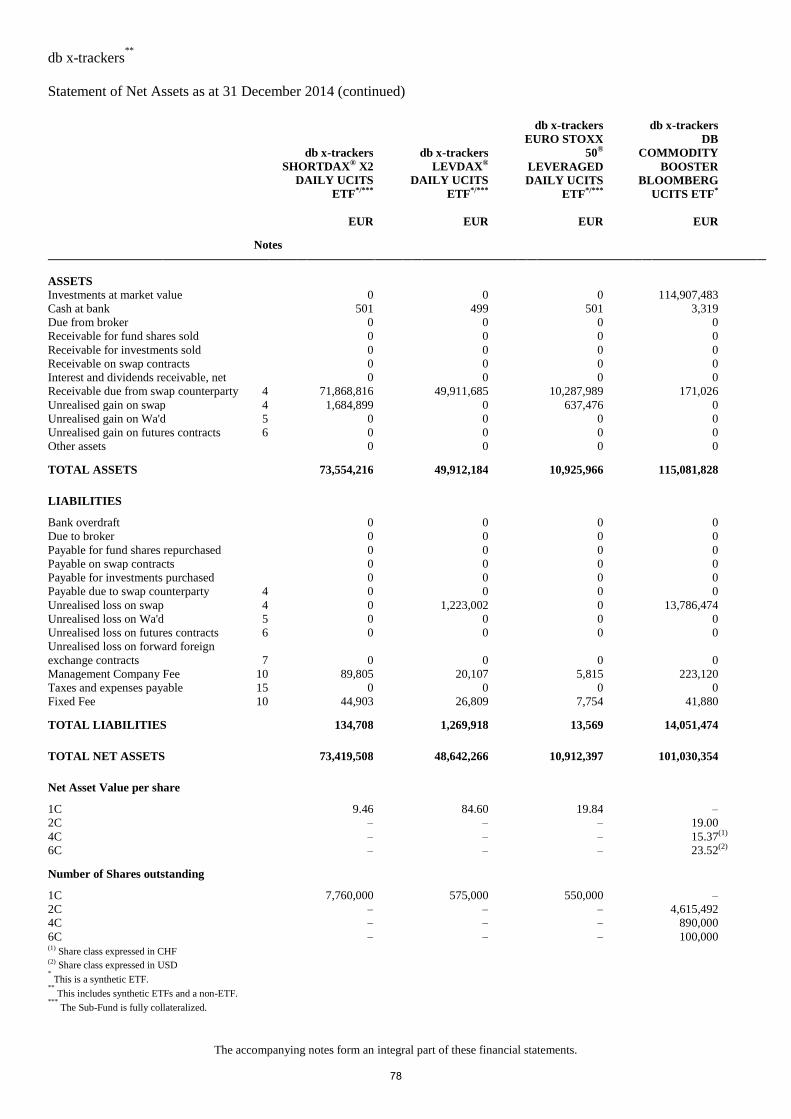
db x-trackers**
Statement of Net Assets as at 31 December 2014 (continued)
The accompanying notes form an integral part of these financial statements.
db x-trackers
SHORTDAX® X2
DAILY UCITS
ETF*/***
db x-trackers
LEVDAX®
DAILY UCITS
ETF*/***
db x-trackers
EURO STOXX
50®
LEVERAGED
DAILY UCITS
ETF*/***
db x-trackers
DB
COMMODITY
BOOSTER
BLOOMBERG
UCITS ETF*
EUR EUR EUR EUR
Notes
ASSETS
Investments at market value 0 0 0 114,907,483
Cash at bank 501 499 501 3,319
Due from broker 0 0 0 0
Receivable for fund shares sold 0 0 0 0
Receivable for investments sold 0 0 0 0
Receivable on swap contracts 0 0 0 0
Interest and dividends receivable, net 0 0 0 0
Receivable due from swap counterparty 4 71,868,816 49,911,685 10,287,989 171,026
Unrealised gain on swap 4 1,684,899 0 637,476 0
Unrealised gain on Wa'd 5 0 0 0 0
Unrealised gain on futures contracts 6 0 0 0 0
Other assets 0 0 0 0
TOTAL ASSETS 73,554,216 49,912,184 10,925,966 115,081,828
LIABILITIES
Bank overdraft 0 0 0 0
Due to broker 0 0 0 0
Payable for fund shares repurchased 0 0 0 0
Payable on swap contracts 0 0 0 0
Payable for investments purchased 0 0 0 0
Payable due to swap counterparty 4 0 0 0 0
Unrealised loss on swap 4 0 1,223,002 0 13,786,474
Unrealised loss on Wa'd 5 0 0 0 0
Unrealised loss on futures contracts 6 0 0 0 0
Unrealised loss on forward foreign
exchange contracts 7
0 0 0 0
Management Company Fee 10 89,805 20,107 5,815 223,120
Taxes and expenses payable 15 0 0 0 0
Fixed Fee 10 44,903 26,809 7,754 41,880
TOTAL LIABILITIES 134,708 1,269,918 13,569 14,051,474
TOTAL NET ASSETS 73,419,508 48,642,266 10,912,397 101,030,354
Net Asset Value per share
1C 9.46 84.60 19.84 –
2C – – – 19.00
4C – – – 15.37 (1)
6C – – – 23.52 (2)
Number of Shares outstanding
1C 7,760,000 575,000 550,000 –
2C – – – 4,615,492
4C – – – 890,000
6C – – – 100,000 (1)
Share class expressed in CHF
(2)
Share class expressed in USD
* This is a synthetic ETF.
** This includes synthetic ETFs and a non-ETF.
*** The Sub-Fund is fully collateralized.
78
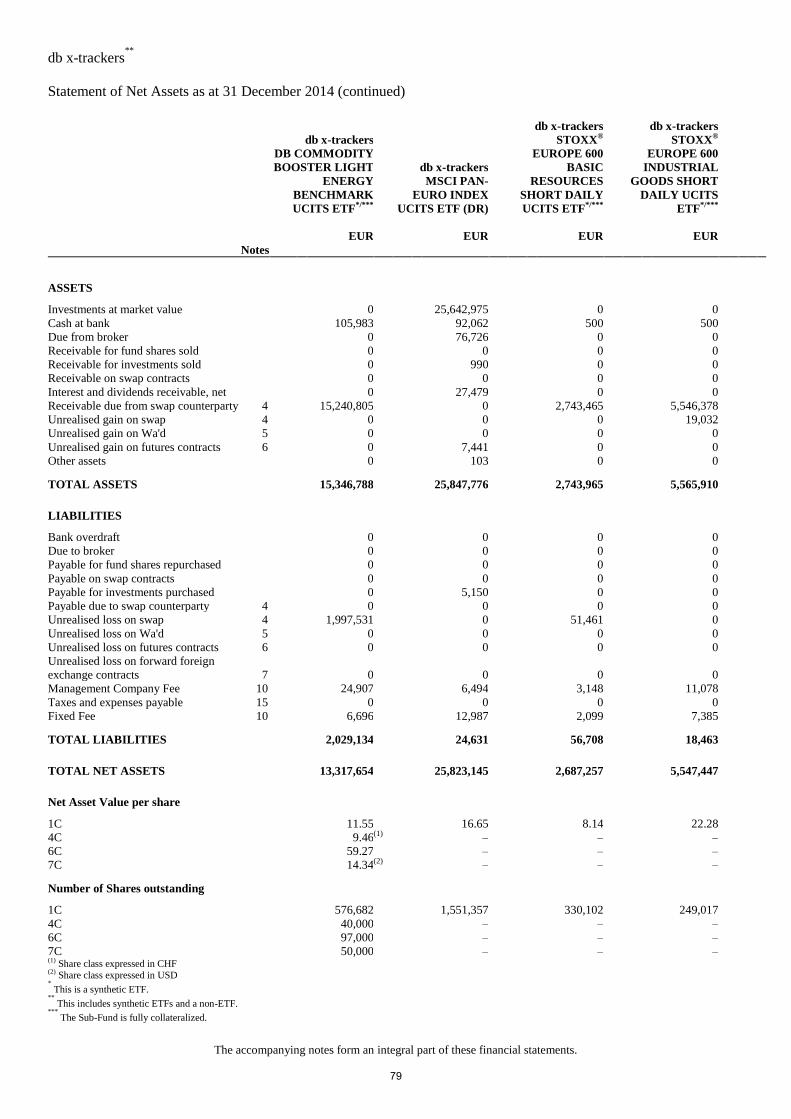
db x-trackers**
Statement of Net Assets as at 31 December 2014 (continued)
The accompanying notes form an integral part of these financial statements.
db x-trackers
DB COMMODITY
BOOSTER LIGHT
ENERGY
BENCHMARK
UCITS ETF*/***
db x-trackers
MSCI PAN-
EURO INDEX
UCITS ETF (DR)
db x-trackers
STOXX®
EUROPE 600
BASIC
RESOURCES
SHORT DAILY
UCITS ETF*/***
db x-trackers
STOXX®
EUROPE 600
INDUSTRIAL
GOODS SHORT
DAILY UCITS
ETF*/***
EUR EUR EUR EUR
Notes
ASSETS
Investments at market value 0 25,642,975 0 0
Cash at bank 105,983 92,062 500 500
Due from broker 0 76,726 0 0
Receivable for fund shares sold 0 0 0 0
Receivable for investments sold 0 990 0 0
Receivable on swap contracts 0 0 0 0
Interest and dividends receivable, net 0 27,479 0 0
Receivable due from swap counterparty 4 15,240,805 0 2,743,465 5,546,378
Unrealised gain on swap 4 0 0 0 19,032
Unrealised gain on Wa'd 5 0 0 0 0
Unrealised gain on futures contracts 6 0 7,441 0 0
Other assets 0 103 0 0
TOTAL ASSETS 15,346,788 25,847,776 2,743,965 5,565,910
LIABILITIES
Bank overdraft 0 0 0 0
Due to broker 0 0 0 0
Payable for fund shares repurchased 0 0 0 0
Payable on swap contracts 0 0 0 0
Payable for investments purchased 0 5,150 0 0
Payable due to swap counterparty 4 0 0 0 0
Unrealised loss on swap 4 1,997,531 0 51,461 0
Unrealised loss on Wa'd 5 0 0 0 0
Unrealised loss on futures contracts 6 0 0 0 0
Unrealised loss on forward foreign
exchange contracts 7
0 0 0 0
Management Company Fee 10 24,907 6,494 3,148 11,078
Taxes and expenses payable 15 0 0 0 0
Fixed Fee 10 6,696 12,987 2,099 7,385
TOTAL LIABILITIES 2,029,134 24,631 56,708 18,463
TOTAL NET ASSETS 13,317,654 25,823,145 2,687,257 5,547,447
Net Asset Value per share
1C 11.55 16.65 8.14 22.28
4C 9.46 (1) – – –
6C 59.27 – – –
7C 14.34 (2) – – –
Number of Shares outstanding
1C 576,682 1,551,357 330,102 249,017
4C 40,000 – – –
6C 97,000 – – –
7C 50,000 – – – (1)
Share class expressed in CHF (2)
Share class expressed in USD * This is a synthetic ETF.
** This includes synthetic ETFs and a non-ETF.
*** The Sub-Fund is fully collateralized.
79
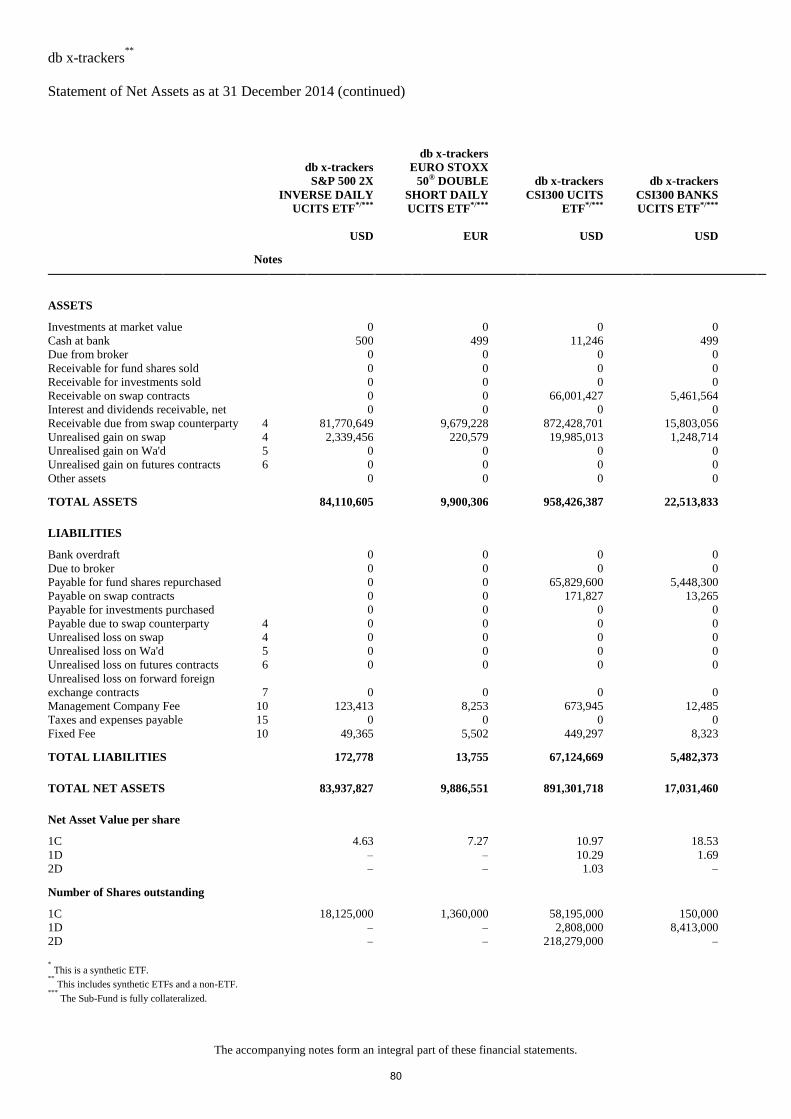
db x-trackers**
Statement of Net Assets as at 31 December 2014 (continued)
The accompanying notes form an integral part of these financial statements.
db x-trackers
S&P 500 2X
INVERSE DAILY
UCITS ETF*/***
db x-trackers
EURO STOXX
50® DOUBLE
SHORT DAILY
UCITS ETF*/***
db x-trackers
CSI300 UCITS
ETF*/***
db x-trackers
CSI300 BANKS
UCITS ETF*/***
USD EUR USD USD
Notes
ASSETS
Investments at market value 0 0 0 0
Cash at bank 500 499 11,246 499
Due from broker 0 0 0 0
Receivable for fund shares sold 0 0 0 0
Receivable for investments sold 0 0 0 0
Receivable on swap contracts 0 0 66,001,427 5,461,564
Interest and dividends receivable, net 0 0 0 0
Receivable due from swap counterparty 4 81,770,649 9,679,228 872,428,701 15,803,056
Unrealised gain on swap 4 2,339,456 220,579 19,985,013 1,248,714
Unrealised gain on Wa'd 5 0 0 0 0
Unrealised gain on futures contracts 6 0 0 0 0
Other assets 0 0 0 0
TOTAL ASSETS 84,110,605 9,900,306 958,426,387 22,513,833
LIABILITIES
Bank overdraft 0 0 0 0
Due to broker 0 0 0 0
Payable for fund shares repurchased 0 0 65,829,600 5,448,300
Payable on swap contracts 0 0 171,827 13,265
Payable for investments purchased 0 0 0 0
Payable due to swap counterparty 4 0 0 0 0
Unrealised loss on swap 4 0 0 0 0
Unrealised loss on Wa'd 5 0 0 0 0
Unrealised loss on futures contracts 6 0 0 0 0
Unrealised loss on forward foreign
exchange contracts 7
0 0 0 0
Management Company Fee 10 123,413 8,253 673,945 12,485
Taxes and expenses payable 15 0 0 0 0
Fixed Fee 10 49,365 5,502 449,297 8,323
TOTAL LIABILITIES 172,778 13,755 67,124,669 5,482,373
TOTAL NET ASSETS 83,937,827 9,886,551 891,301,718 17,031,460
Net Asset Value per share
1C 4.63 7.27 10.97 18.53
1D – – 10.29 1.69
2D – – 1.03 –
Number of Shares outstanding
1C 18,125,000 1,360,000 58,195,000 150,000
1D – – 2,808,000 8,413,000
2D – – 218,279,000 –
* This is a synthetic ETF.
** This includes synthetic ETFs and a non-ETF.
*** The Sub-Fund is fully collateralized.
80
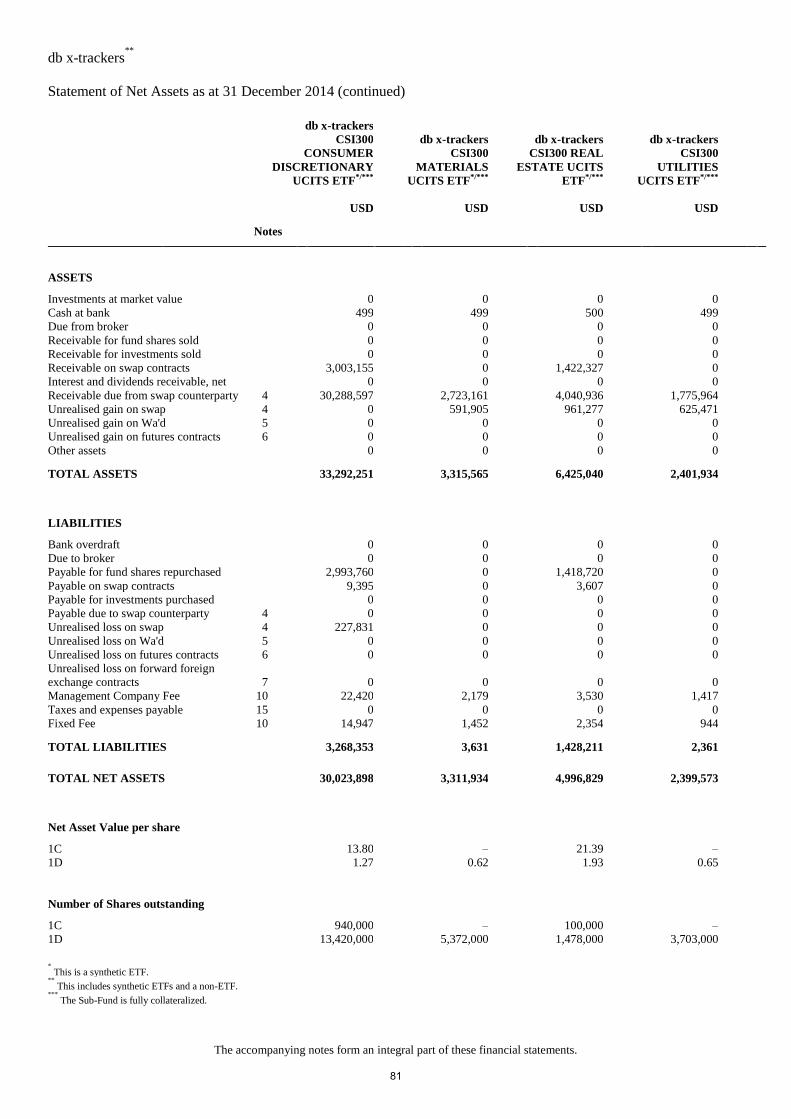
db x-trackers**
Statement of Net Assets as at 31 December 2014 (continued)
The accompanying notes form an integral part of these financial statements.
db x-trackers
CSI300
CONSUMER
DISCRETIONARY
UCITS ETF*/***
db x-trackers
CSI300
MATERIALS
UCITS ETF*/***
db x-trackers
CSI300 REAL
ESTATE UCITS
ETF*/***
db x-trackers
CSI300
UTILITIES
UCITS ETF*/***
USD USD USD USD
Notes
ASSETS
Investments at market value 0 0 0 0
Cash at bank 499 499 500 499
Due from broker 0 0 0 0
Receivable for fund shares sold 0 0 0 0
Receivable for investments sold 0 0 0 0
Receivable on swap contracts 3,003,155 0 1,422,327 0
Interest and dividends receivable, net 0 0 0 0
Receivable due from swap counterparty 4 30,288,597 2,723,161 4,040,936 1,775,964
Unrealised gain on swap 4 0 591,905 961,277 625,471
Unrealised gain on Wa'd 5 0 0 0 0
Unrealised gain on futures contracts 6 0 0 0 0
Other assets 0 0 0 0
TOTAL ASSETS 33,292,251 3,315,565 6,425,040 2,401,934
LIABILITIES
Bank overdraft 0 0 0 0
Due to broker 0 0 0 0
Payable for fund shares repurchased 2,993,760 0 1,418,720 0
Payable on swap contracts 9,395 0 3,607 0
Payable for investments purchased 0 0 0 0
Payable due to swap counterparty 4 0 0 0 0
Unrealised loss on swap 4 227,831 0 0 0
Unrealised loss on Wa'd 5 0 0 0 0
Unrealised loss on futures contracts 6 0 0 0 0
Unrealised loss on forward foreign
exchange contracts 7
0 0 0 0
Management Company Fee 10 22,420 2,179 3,530 1,417
Taxes and expenses payable 15 0 0 0 0
Fixed Fee 10 14,947 1,452 2,354 944
TOTAL LIABILITIES 3,268,353 3,631 1,428,211 2,361
TOTAL NET ASSETS 30,023,898 3,311,934 4,996,829 2,399,573
Net Asset Value per share
1C 13.80 – 21.39 –
1D 1.27 0.62 1.93 0.65
Number of Shares outstanding
1C 940,000 – 100,000 –
1D 13,420,000 5,372,000 1,478,000 3,703,000
* This is a synthetic ETF.
** This includes synthetic ETFs and a non-ETF.
*** The Sub-Fund is fully collateralized.
81
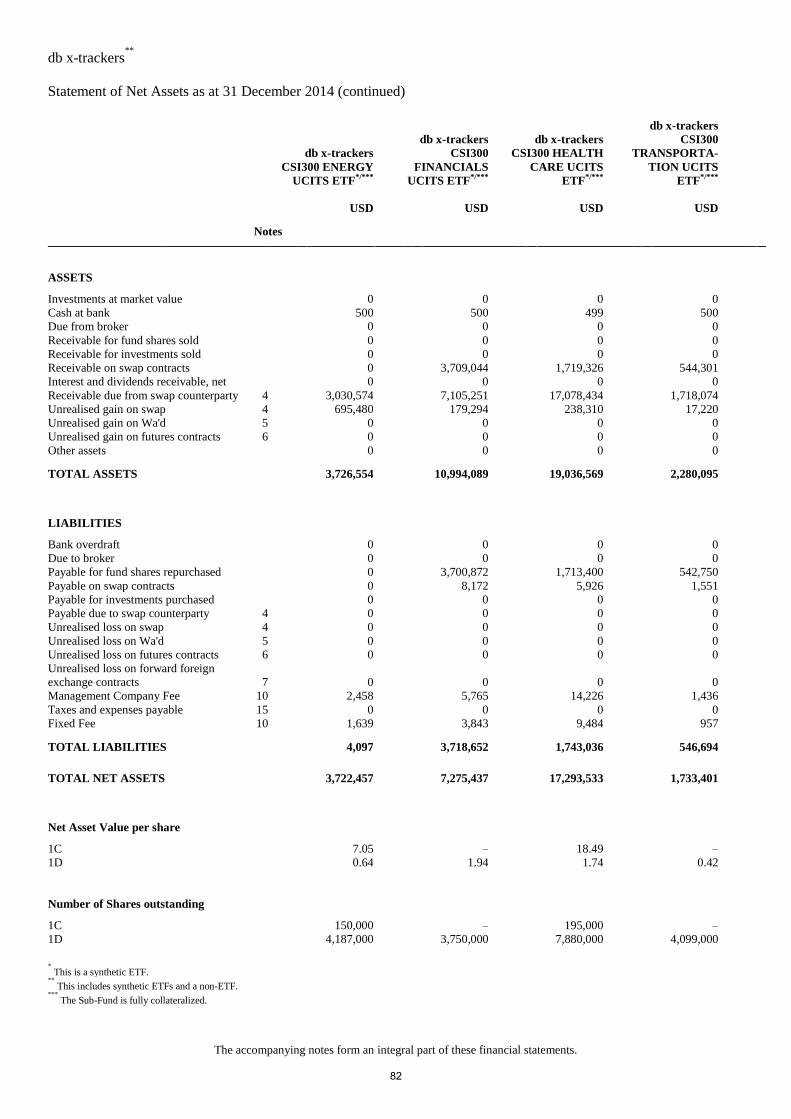
db x-trackers**
Statement of Net Assets as at 31 December 2014 (continued)
The accompanying notes form an integral part of these financial statements.
db x-trackers
CSI300 ENERGY
UCITS ETF*/***
db x-trackers
CSI300
FINANCIALS
UCITS ETF*/***
db x-trackers
CSI300 HEALTH
CARE UCITS
ETF*/***
db x-trackers
CSI300
TRANSPORTA-
TION UCITS
ETF*/***
USD USD USD USD
Notes
ASSETS
Investments at market value 0 0 0 0
Cash at bank 500 500 499 500
Due from broker 0 0 0 0
Receivable for fund shares sold 0 0 0 0
Receivable for investments sold 0 0 0 0
Receivable on swap contracts 0 3,709,044 1,719,326 544,301
Interest and dividends receivable, net 0 0 0 0
Receivable due from swap counterparty 4 3,030,574 7,105,251 17,078,434 1,718,074
Unrealised gain on swap 4 695,480 179,294 238,310 17,220
Unrealised gain on Wa'd 5 0 0 0 0
Unrealised gain on futures contracts 6 0 0 0 0
Other assets 0 0 0 0
TOTAL ASSETS 3,726,554 10,994,089 19,036,569 2,280,095
LIABILITIES
Bank overdraft 0 0 0 0
Due to broker 0 0 0 0
Payable for fund shares repurchased 0 3,700,872 1,713,400 542,750
Payable on swap contracts 0 8,172 5,926 1,551
Payable for investments purchased 0 0 0 0
Payable due to swap counterparty 4 0 0 0 0
Unrealised loss on swap 4 0 0 0 0
Unrealised loss on Wa'd 5 0 0 0 0
Unrealised loss on futures contracts 6 0 0 0 0
Unrealised loss on forward foreign
exchange contracts 7
0 0 0 0
Management Company Fee 10 2,458 5,765 14,226 1,436
Taxes and expenses payable 15 0 0 0 0
Fixed Fee 10 1,639 3,843 9,484 957
TOTAL LIABILITIES 4,097 3,718,652 1,743,036 546,694
TOTAL NET ASSETS 3,722,457 7,275,437 17,293,533 1,733,401
Net Asset Value per share
1C 7.05 – 18.49 –
1D 0.64 1.94 1.74 0.42
Number of Shares outstanding
1C 150,000 – 195,000 –
1D 4,187,000 3,750,000 7,880,000 4,099,000
* This is a synthetic ETF.
** This includes synthetic ETFs and a non-ETF.
*** The Sub-Fund is fully collateralized.
82
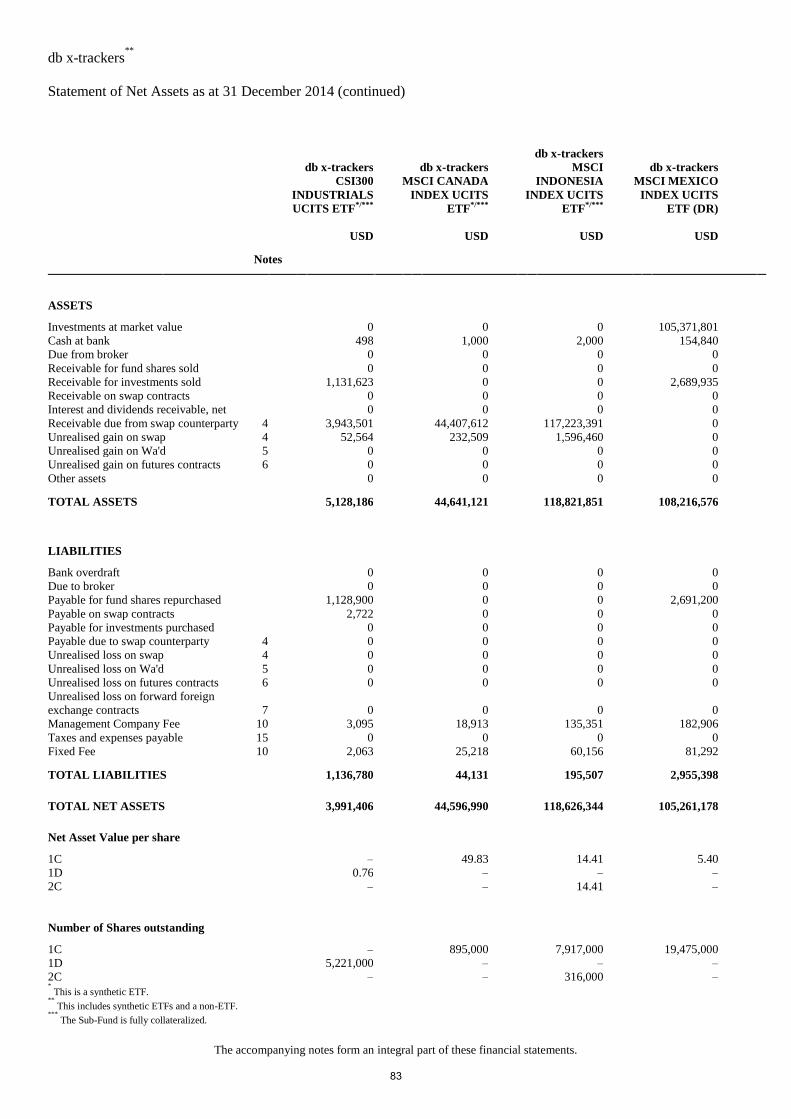
db x-trackers**
Statement of Net Assets as at 31 December 2014 (continued)
The accompanying notes form an integral part of these financial statements.
db x-trackers
CSI300
INDUSTRIALS
UCITS ETF*/***
db x-trackers
MSCI CANADA
INDEX UCITS
ETF*/***
db x-trackers
MSCI
INDONESIA
INDEX UCITS
ETF*/***
db x-trackers
MSCI MEXICO
INDEX UCITS
ETF (DR)
USD USD USD USD
Notes
ASSETS
Investments at market value 0 0 0 105,371,801
Cash at bank 498 1,000 2,000 154,840
Due from broker 0 0 0 0
Receivable for fund shares sold 0 0 0 0
Receivable for investments sold 1,131,623 0 0 2,689,935
Receivable on swap contracts 0 0 0 0
Interest and dividends receivable, net 0 0 0 0
Receivable due from swap counterparty 4 3,943,501 44,407,612 117,223,391 0
Unrealised gain on swap 4 52,564 232,509 1,596,460 0
Unrealised gain on Wa'd 5 0 0 0 0
Unrealised gain on futures contracts 6 0 0 0 0
Other assets 0 0 0 0
TOTAL ASSETS 5,128,186 44,641,121 118,821,851 108,216,576
LIABILITIES
Bank overdraft 0 0 0 0
Due to broker 0 0 0 0
Payable for fund shares repurchased 1,128,900 0 0 2,691,200
Payable on swap contracts 2,722 0 0 0
Payable for investments purchased 0 0 0 0
Payable due to swap counterparty 4 0 0 0 0
Unrealised loss on swap 4 0 0 0 0
Unrealised loss on Wa'd 5 0 0 0 0
Unrealised loss on futures contracts 6 0 0 0 0
Unrealised loss on forward foreign
exchange contracts 7
0 0 0 0
Management Company Fee 10 3,095 18,913 135,351 182,906
Taxes and expenses payable 15 0 0 0 0
Fixed Fee 10 2,063 25,218 60,156 81,292
TOTAL LIABILITIES 1,136,780 44,131 195,507 2,955,398
TOTAL NET ASSETS 3,991,406 44,596,990 118,626,344 105,261,178
Net Asset Value per share
1C – 49.83 14.41 5.40
1D 0.76 – – –
2C – – 14.41 –
Number of Shares outstanding
1C – 895,000 7,917,000 19,475,000
1D 5,221,000 – – –
2C – – 316,000 – * This is a synthetic ETF.
** This includes synthetic ETFs and a non-ETF.
*** The Sub-Fund is fully collateralized.
83
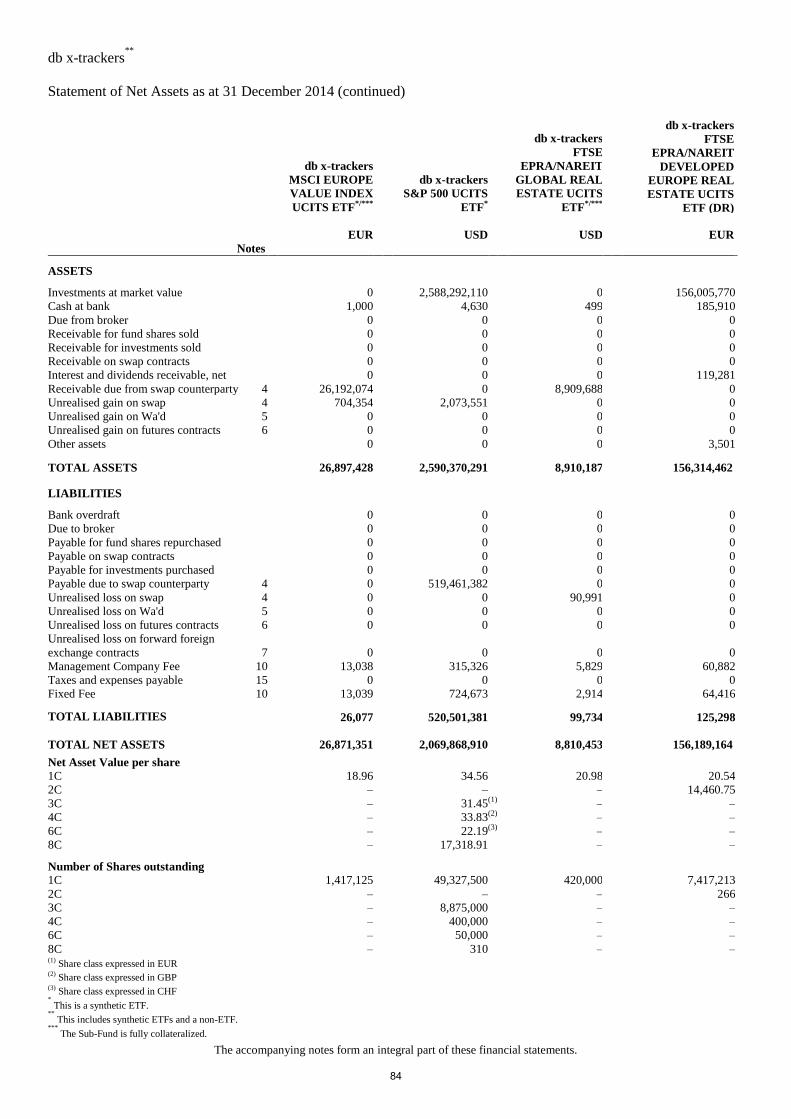
db x-trackers**
Statement of Net Assets as at 31 December 2014 (continued)
The accompanying notes form an integral part of these financial statements.
db x-trackers
MSCI EUROPE
VALUE INDEX
UCITS ETF*/***
db x-trackers
S&P 500 UCITS
ETF*
db x-trackers
FTSE
EPRA/NAREIT
GLOBAL REAL
ESTATE UCITS
ETF*/***
db x-trackers
FTSE
EPRA/NAREIT
DEVELOPED
EUROPE REAL
ESTATE UCITS
ETF (DR)
EUR USD USD EUR
Notes
ASSETS
Investments at market value 0 2,588,292,110 0 156,005,770
Cash at bank 1,000 4,630 499 185,910
Due from broker 0 0 0 0
Receivable for fund shares sold 0 0 0 0
Receivable for investments sold 0 0 0 0
Receivable on swap contracts 0 0 0 0
Interest and dividends receivable, net 0 0 0 119,281
Receivable due from swap counterparty 4 26,192,074 0 8,909,688 0
Unrealised gain on swap 4 704,354 2,073,551 0 0
Unrealised gain on Wa'd 5 0 0 0 0
Unrealised gain on futures contracts 6 0 0 0 0
Other assets 0 0 0 3,501
TOTAL ASSETS 26,897,428 2,590,370,291 8,910,187 156,314,462
LIABILITIES
Bank overdraft 0 0 0 0
Due to broker 0 0 0 0
Payable for fund shares repurchased 0 0 0 0
Payable on swap contracts 0 0 0 0
Payable for investments purchased 0 0 0 0
Payable due to swap counterparty 4 0 519,461,382 0 0
Unrealised loss on swap 4 0 0 90,991 0
Unrealised loss on Wa'd 5 0 0 0 0
Unrealised loss on futures contracts 6 0 0 0 0
Unrealised loss on forward foreign
exchange contracts 7
0 0 0 0
Management Company Fee 10 13,038 315,326 5,829 60,882
Taxes and expenses payable 15 0 0 0 0
Fixed Fee 10 13,039 724,673 2,914 64,416
TOTAL LIABILITIES
26,077 520,501,381
99,734 125,298
TOTAL NET ASSETS 26,871,351 2,069,868,910 8,810,453 156,189,164
Net Asset Value per share
1C 18.96 34.56 20.98 20.54
2C – – – 14,460.75
3C – 31.45 (1) – –
4C – 33.83 (2) – –
6C – 22.19 (3) – –
8C – 17,318.91 – –
Number of Shares outstanding
1C 1,417,125 49,327,500 420,000 7,417,213
2C – – – 266
3C – 8,875,000 – –
4C – 400,000 – –
6C – 50,000 – –
8C – 310 – – (1)
Share class expressed in EUR (2)
Share class expressed in GBP
(3) Share class expressed in CHF
* This is a synthetic ETF.
** This includes synthetic ETFs and a non-ETF.
*** The Sub-Fund is fully collateralized.
84
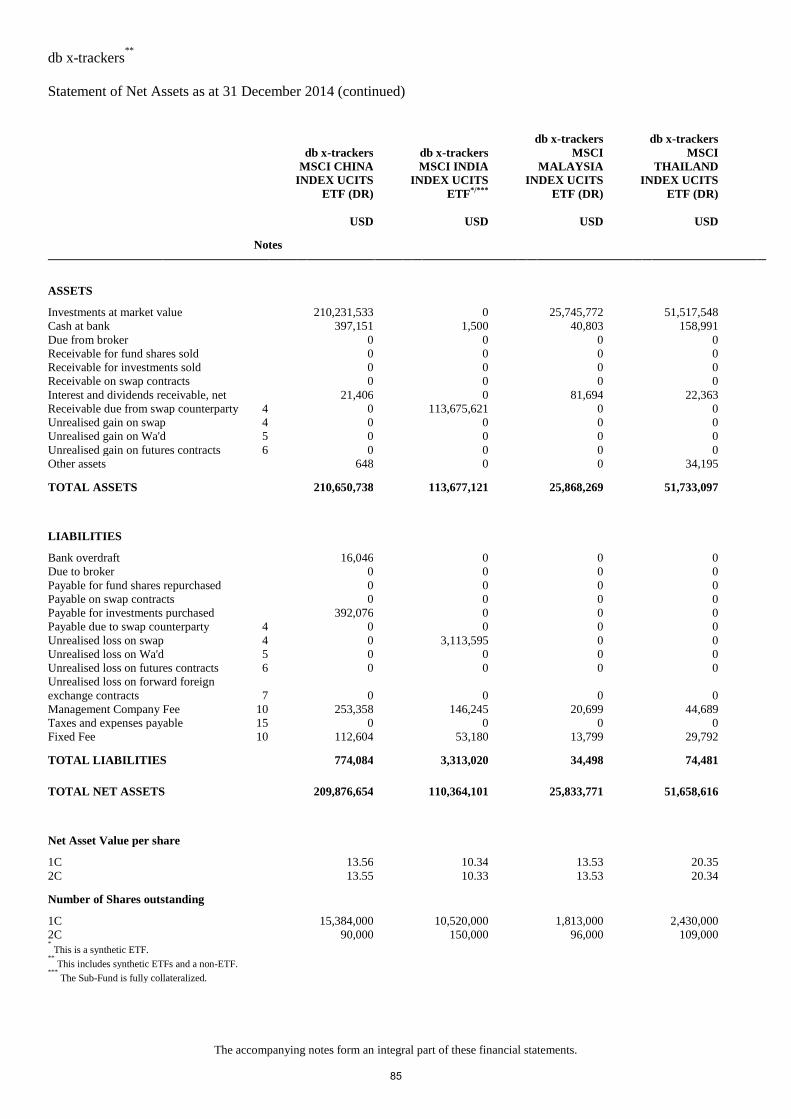
db x-trackers**
Statement of Net Assets as at 31 December 2014 (continued)
The accompanying notes form an integral part of these financial statements.
db x-trackers
MSCI CHINA
INDEX UCITS
ETF (DR)
db x-trackers
MSCI INDIA
INDEX UCITS
ETF*/***
db x-trackers
MSCI
MALAYSIA
INDEX UCITS
ETF (DR)
db x-trackers
MSCI
THAILAND
INDEX UCITS
ETF (DR)
USD USD USD USD
Notes
ASSETS
Investments at market value 210,231,533 0 25,745,772 51,517,548
Cash at bank 397,151 1,500 40,803 158,991
Due from broker 0 0 0 0
Receivable for fund shares sold 0 0 0 0
Receivable for investments sold 0 0 0 0
Receivable on swap contracts 0 0 0 0
Interest and dividends receivable, net 21,406 0 81,694 22,363
Receivable due from swap counterparty 4 0 113,675,621 0 0
Unrealised gain on swap 4 0 0 0 0
Unrealised gain on Wa'd 5 0 0 0 0
Unrealised gain on futures contracts 6 0 0 0 0
Other assets 648 0 0 34,195
TOTAL ASSETS 210,650,738 113,677,121 25,868,269 51,733,097
LIABILITIES
Bank overdraft 16,046 0 0 0
Due to broker 0 0 0 0
Payable for fund shares repurchased 0 0 0 0
Payable on swap contracts 0 0 0 0
Payable for investments purchased 392,076 0 0 0
Payable due to swap counterparty 4 0 0 0 0
Unrealised loss on swap 4 0 3,113,595 0 0
Unrealised loss on Wa'd 5 0 0 0 0
Unrealised loss on futures contracts 6 0 0 0 0
Unrealised loss on forward foreign
exchange contracts 7
0 0 0 0
Management Company Fee 10 253,358 146,245 20,699 44,689
Taxes and expenses payable 15 0 0 0 0
Fixed Fee 10 112,604 53,180 13,799 29,792
TOTAL LIABILITIES 774,084 3,313,020 34,498 74,481
TOTAL NET ASSETS 209,876,654 110,364,101 25,833,771 51,658,616
Net Asset Value per share
1C 13.56 10.34 13.53 20.35
2C 13.55 10.33 13.53 20.34
Number of Shares outstanding
1C 15,384,000 10,520,000 1,813,000 2,430,000
2C 90,000 150,000 96,000 109,000 * This is a synthetic ETF.
** This includes synthetic ETFs and a non-ETF.
*** The Sub-Fund is fully collateralized.
85
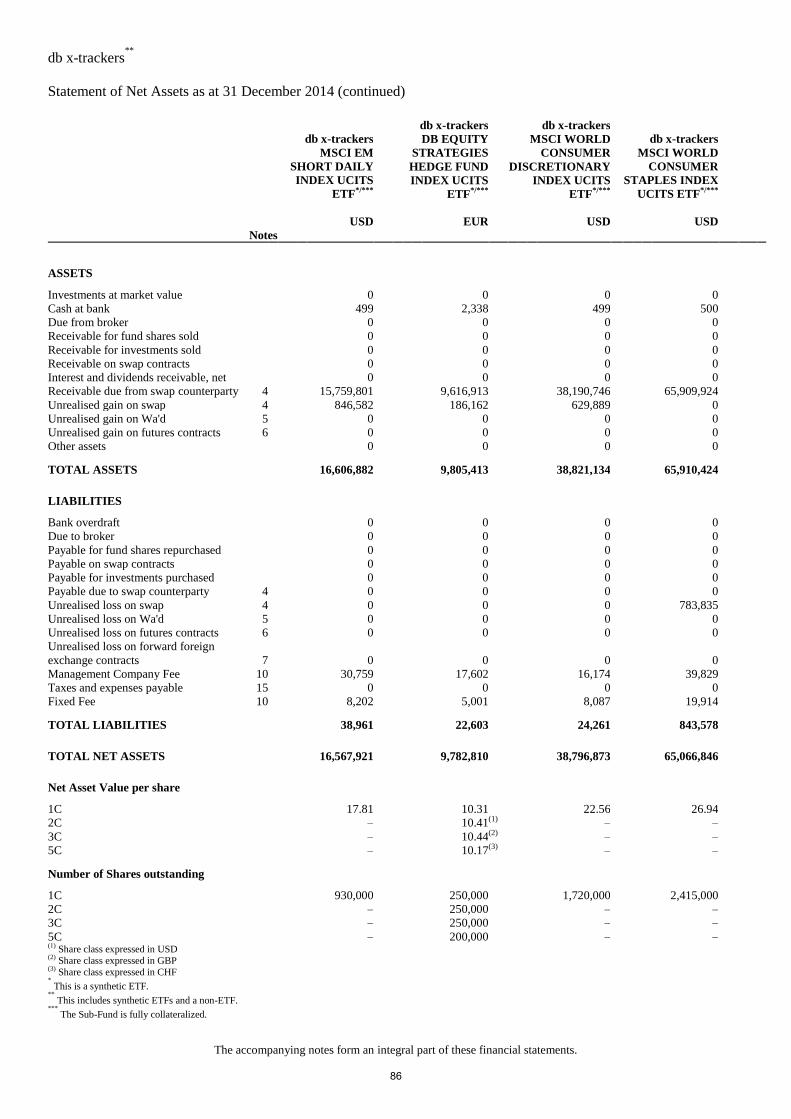
db x-trackers**
Statement of Net Assets as at 31 December 2014 (continued)
The accompanying notes form an integral part of these financial statements.
db x-trackers
MSCI EM
SHORT DAILY
INDEX UCITS
ETF*/***
db x-trackers
DB EQUITY
STRATEGIES
HEDGE FUND
INDEX UCITS
ETF*/***
db x-trackers
MSCI WORLD
CONSUMER
DISCRETIONARY
INDEX UCITS
ETF*/***
db x-trackers
MSCI WORLD
CONSUMER
STAPLES INDEX
UCITS ETF*/***
USD EUR USD USD
Notes
ASSETS
Investments at market value 0 0 0 0
Cash at bank 499 2,338 499 500
Due from broker 0 0 0 0
Receivable for fund shares sold 0 0 0 0
Receivable for investments sold 0 0 0 0
Receivable on swap contracts 0 0 0 0
Interest and dividends receivable, net 0 0 0 0
Receivable due from swap counterparty 4 15,759,801 9,616,913 38,190,746 65,909,924
Unrealised gain on swap 4 846,582 186,162 629,889 0
Unrealised gain on Wa'd 5 0 0 0 0
Unrealised gain on futures contracts 6 0 0 0 0
Other assets 0 0 0 0
TOTAL ASSETS 16,606,882 9,805,413 38,821,134 65,910,424
LIABILITIES
Bank overdraft 0 0 0 0
Due to broker 0 0 0 0
Payable for fund shares repurchased 0 0 0 0
Payable on swap contracts 0 0 0 0
Payable for investments purchased 0 0 0 0
Payable due to swap counterparty 4 0 0 0 0
Unrealised loss on swap 4 0 0 0 783,835
Unrealised loss on Wa'd 5 0 0 0 0
Unrealised loss on futures contracts 6 0 0 0 0
Unrealised loss on forward foreign
exchange contracts 7
0 0 0 0
Management Company Fee 10 30,759 17,602 16,174 39,829
Taxes and expenses payable 15 0 0 0 0
Fixed Fee 10 8,202 5,001 8,087 19,914
TOTAL LIABILITIES 38,961 22,603 24,261 843,578
TOTAL NET ASSETS 16,567,921 9,782,810 38,796,873 65,066,846
Net Asset Value per share
1C 17.81 10.31 22.56 26.94
2C – 10.41 (1) – –
3C – 10.44 (2) – –
5C – 10.17 (3) – –
Number of Shares outstanding
1C 930,000 250,000 1,720,000 2,415,000
2C – 250,000 – –
3C – 250,000 – –
5C – 200,000 – – (1)
Share class expressed in USD (2)
Share class expressed in GBP (3)
Share class expressed in CHF * This is a synthetic ETF.
** This includes synthetic ETFs and a non-ETF.
*** The Sub-Fund is fully collateralized.
86
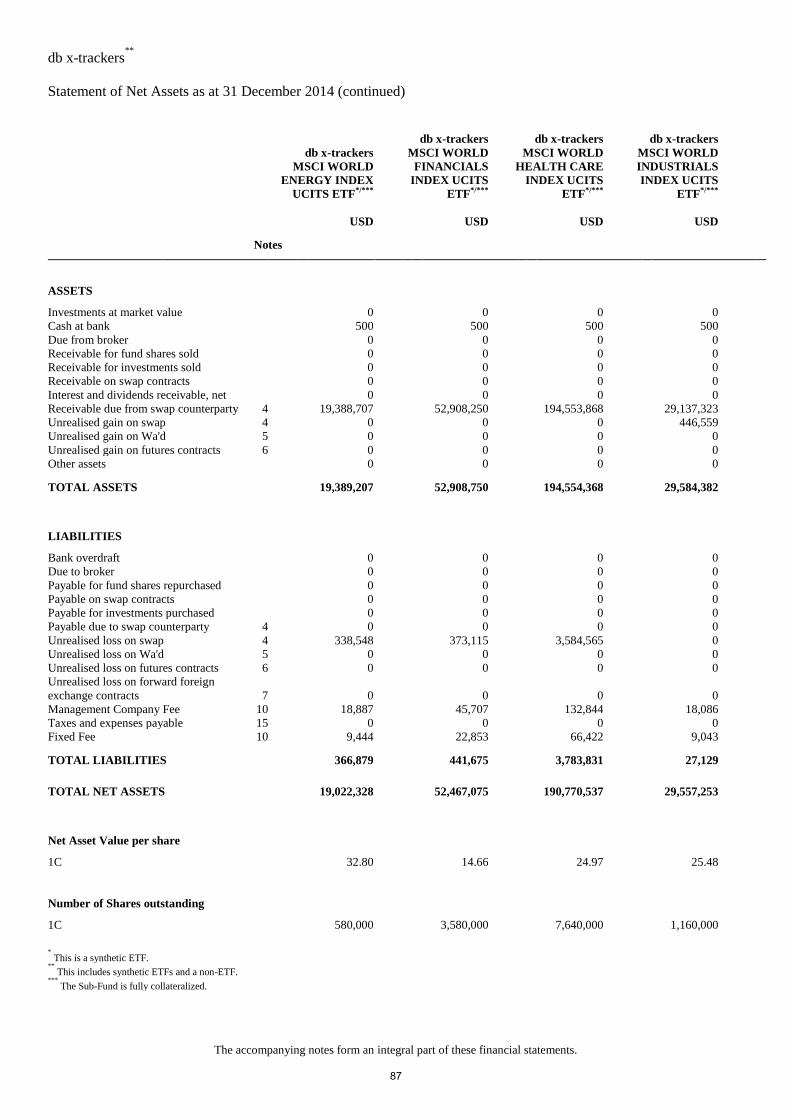
db x-trackers**
Statement of Net Assets as at 31 December 2014 (continued)
The accompanying notes form an integral part of these financial statements.
db x-trackers
MSCI WORLD
ENERGY INDEX
UCITS ETF*/***
db x-trackers
MSCI WORLD
FINANCIALS
INDEX UCITS
ETF*/***
db x-trackers
MSCI WORLD
HEALTH CARE
INDEX UCITS
ETF*/***
db x-trackers
MSCI WORLD
INDUSTRIALS
INDEX UCITS
ETF*/***
USD USD USD USD
Notes
ASSETS
Investments at market value 0 0 0 0
Cash at bank 500 500 500 500
Due from broker 0 0 0 0
Receivable for fund shares sold 0 0 0 0
Receivable for investments sold 0 0 0 0
Receivable on swap contracts 0 0 0 0
Interest and dividends receivable, net 0 0 0 0
Receivable due from swap counterparty 4 19,388,707 52,908,250 194,553,868 29,137,323
Unrealised gain on swap 4 0 0 0 446,559
Unrealised gain on Wa'd 5 0 0 0 0
Unrealised gain on futures contracts 6 0 0 0 0
Other assets 0 0 0 0
TOTAL ASSETS 19,389,207 52,908,750 194,554,368 29,584,382
LIABILITIES
Bank overdraft 0 0 0 0
Due to broker 0 0 0 0
Payable for fund shares repurchased 0 0 0 0
Payable on swap contracts 0 0 0 0
Payable for investments purchased 0 0 0 0
Payable due to swap counterparty 4 0 0 0 0
Unrealised loss on swap 4 338,548 373,115 3,584,565 0
Unrealised loss on Wa'd 5 0 0 0 0
Unrealised loss on futures contracts 6 0 0 0 0
Unrealised loss on forward foreign
exchange contracts 7
0 0 0 0
Management Company Fee 10 18,887 45,707 132,844 18,086
Taxes and expenses payable 15 0 0 0 0
Fixed Fee 10 9,444 22,853 66,422 9,043
TOTAL LIABILITIES 366,879 441,675 3,783,831 27,129
TOTAL NET ASSETS 19,022,328 52,467,075 190,770,537 29,557,253
Net Asset Value per share
1C 32.80 14.66 24.97 25.48
Number of Shares outstanding
1C 580,000 3,580,000 7,640,000 1,160,000
* This is a synthetic ETF.
** This includes synthetic ETFs and a non-ETF.
*** The Sub-Fund is fully collateralized.
87
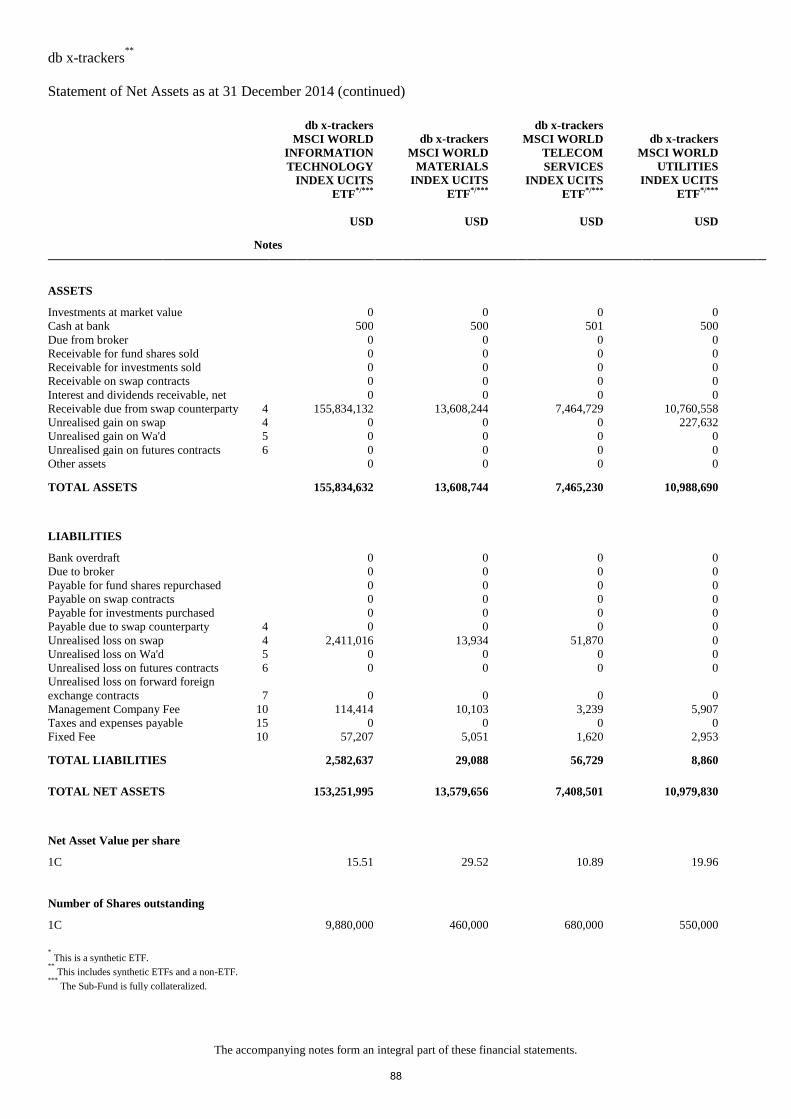
db x-trackers**
Statement of Net Assets as at 31 December 2014 (continued)
The accompanying notes form an integral part of these financial statements.
db x-trackers
MSCI WORLD
INFORMATION
TECHNOLOGY
INDEX UCITS
ETF*/***
db x-trackers
MSCI WORLD
MATERIALS
INDEX UCITS
ETF*/***
db x-trackers
MSCI WORLD
TELECOM
SERVICES
INDEX UCITS
ETF*/***
db x-trackers
MSCI WORLD
UTILITIES
INDEX UCITS
ETF*/***
USD USD USD USD
Notes
ASSETS
Investments at market value 0 0 0 0
Cash at bank 500 500 501 500
Due from broker 0 0 0 0
Receivable for fund shares sold 0 0 0 0
Receivable for investments sold 0 0 0 0
Receivable on swap contracts 0 0 0 0
Interest and dividends receivable, net 0 0 0 0
Receivable due from swap counterparty 4 155,834,132 13,608,244 7,464,729 10,760,558
Unrealised gain on swap 4 0 0 0 227,632
Unrealised gain on Wa'd 5 0 0 0 0
Unrealised gain on futures contracts 6 0 0 0 0
Other assets 0 0 0 0
TOTAL ASSETS 155,834,632 13,608,744 7,465,230 10,988,690
LIABILITIES
Bank overdraft 0 0 0 0
Due to broker 0 0 0 0
Payable for fund shares repurchased 0 0 0 0
Payable on swap contracts 0 0 0 0
Payable for investments purchased 0 0 0 0
Payable due to swap counterparty 4 0 0 0 0
Unrealised loss on swap 4 2,411,016 13,934 51,870 0
Unrealised loss on Wa'd 5 0 0 0 0
Unrealised loss on futures contracts 6 0 0 0 0
Unrealised loss on forward foreign
exchange contracts 7
0 0 0 0
Management Company Fee 10 114,414 10,103 3,239 5,907
Taxes and expenses payable 15 0 0 0 0
Fixed Fee 10 57,207 5,051 1,620 2,953
TOTAL LIABILITIES 2,582,637 29,088 56,729 8,860
TOTAL NET ASSETS 153,251,995 13,579,656 7,408,501 10,979,830
Net Asset Value per share
1C 15.51 29.52 10.89 19.96
Number of Shares outstanding
1C 9,880,000 460,000 680,000 550,000
* This is a synthetic ETF.
** This includes synthetic ETFs and a non-ETF.
*** The Sub-Fund is fully collateralized.
88
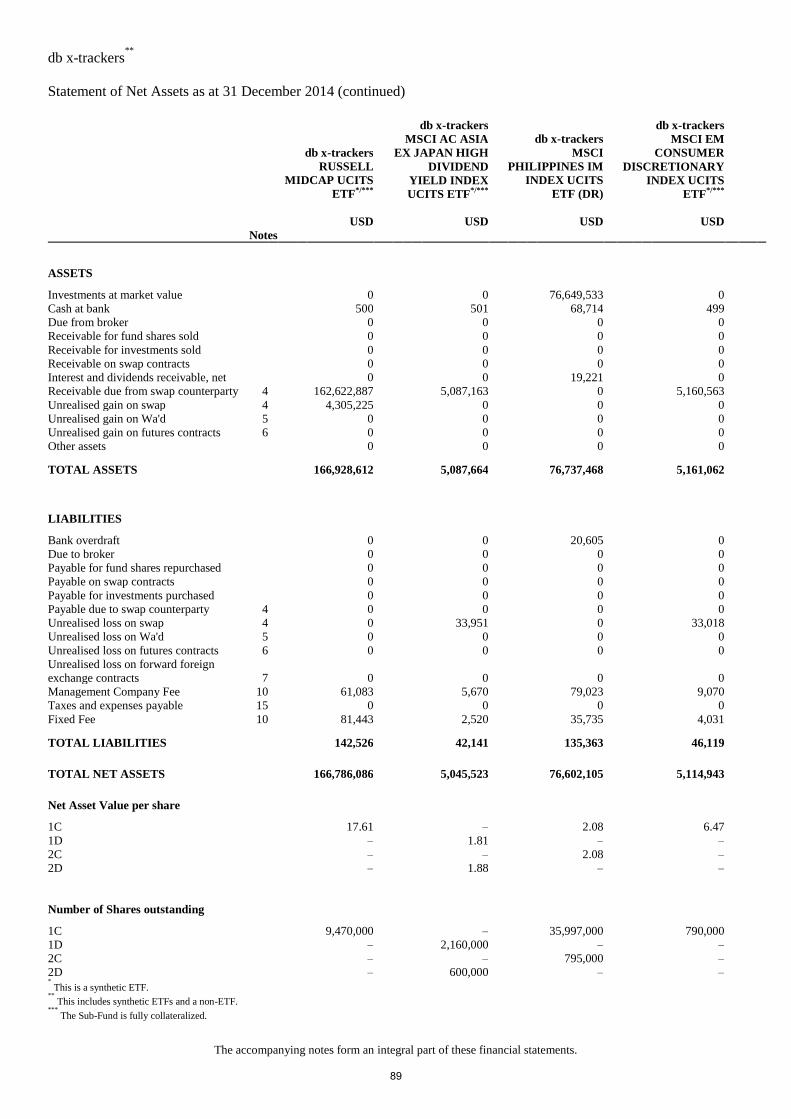
db x-trackers**
Statement of Net Assets as at 31 December 2014 (continued)
The accompanying notes form an integral part of these financial statements.
db x-trackers
RUSSELL
MIDCAP UCITS
ETF*/***
db x-trackers
MSCI AC ASIA
EX JAPAN HIGH
DIVIDEND
YIELD INDEX
UCITS ETF*/***
db x-trackers
MSCI
PHILIPPINES IM
INDEX UCITS
ETF (DR)
db x-trackers
MSCI EM
CONSUMER
DISCRETIONARY
INDEX UCITS
ETF*/***
USD USD USD USD
Notes
ASSETS
Investments at market value 0 0 76,649,533 0
Cash at bank 500 501 68,714 499
Due from broker 0 0 0 0
Receivable for fund shares sold 0 0 0 0
Receivable for investments sold 0 0 0 0
Receivable on swap contracts 0 0 0 0
Interest and dividends receivable, net 0 0 19,221 0
Receivable due from swap counterparty 4 162,622,887 5,087,163 0 5,160,563
Unrealised gain on swap 4 4,305,225 0 0 0
Unrealised gain on Wa'd 5 0 0 0 0
Unrealised gain on futures contracts 6 0 0 0 0
Other assets 0 0 0 0
TOTAL ASSETS 166,928,612 5,087,664 76,737,468 5,161,062
LIABILITIES
Bank overdraft 0 0 20,605 0
Due to broker 0 0 0 0
Payable for fund shares repurchased 0 0 0 0
Payable on swap contracts 0 0 0 0
Payable for investments purchased 0 0 0 0
Payable due to swap counterparty 4 0 0 0 0
Unrealised loss on swap 4 0 33,951 0 33,018
Unrealised loss on Wa'd 5 0 0 0 0
Unrealised loss on futures contracts 6 0 0 0 0
Unrealised loss on forward foreign
exchange contracts 7
0 0 0 0
Management Company Fee 10 61,083 5,670 79,023 9,070
Taxes and expenses payable 15 0 0 0 0
Fixed Fee 10 81,443 2,520 35,735 4,031
TOTAL LIABILITIES 142,526 42,141 135,363 46,119
TOTAL NET ASSETS 166,786,086 5,045,523 76,602,105 5,114,943
Net Asset Value per share
1C 17.61 – 2.08 6.47
1D – 1.81 – –
2C – – 2.08 –
2D – 1.88 – –
Number of Shares outstanding
1C 9,470,000 – 35,997,000 790,000
1D – 2,160,000 – –
2C – – 795,000 –
2D – 600,000 – – * This is a synthetic ETF.
** This includes synthetic ETFs and a non-ETF.
*** The Sub-Fund is fully collateralized.
89
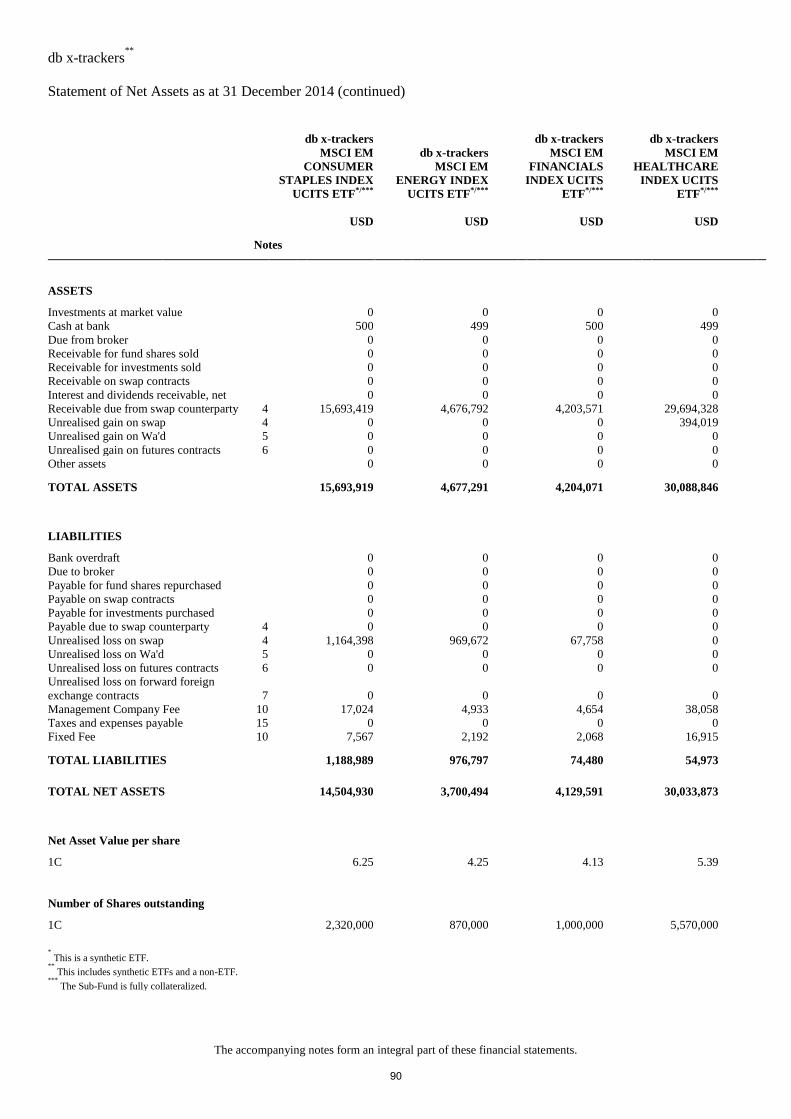
db x-trackers**
Statement of Net Assets as at 31 December 2014 (continued)
The accompanying notes form an integral part of these financial statements.
db x-trackers
MSCI EM
CONSUMER
STAPLES INDEX
UCITS ETF*/***
db x-trackers
MSCI EM
ENERGY INDEX
UCITS ETF*/***
db x-trackers
MSCI EM
FINANCIALS
INDEX UCITS
ETF*/***
db x-trackers
MSCI EM
HEALTHCARE
INDEX UCITS
ETF*/***
USD USD USD USD
Notes
ASSETS
Investments at market value 0 0 0 0
Cash at bank 500 499 500 499
Due from broker 0 0 0 0
Receivable for fund shares sold 0 0 0 0
Receivable for investments sold 0 0 0 0
Receivable on swap contracts 0 0 0 0
Interest and dividends receivable, net 0 0 0 0
Receivable due from swap counterparty 4 15,693,419 4,676,792 4,203,571 29,694,328
Unrealised gain on swap 4 0 0 0 394,019
Unrealised gain on Wa'd 5 0 0 0 0
Unrealised gain on futures contracts 6 0 0 0 0
Other assets 0 0 0 0
TOTAL ASSETS 15,693,919 4,677,291 4,204,071 30,088,846
LIABILITIES
Bank overdraft 0 0 0 0
Due to broker 0 0 0 0
Payable for fund shares repurchased 0 0 0 0
Payable on swap contracts 0 0 0 0
Payable for investments purchased 0 0 0 0
Payable due to swap counterparty 4 0 0 0 0
Unrealised loss on swap 4 1,164,398 969,672 67,758 0
Unrealised loss on Wa'd 5 0 0 0 0
Unrealised loss on futures contracts 6 0 0 0 0
Unrealised loss on forward foreign
exchange contracts 7
0 0 0 0
Management Company Fee 10 17,024 4,933 4,654 38,058
Taxes and expenses payable 15 0 0 0 0
Fixed Fee 10 7,567 2,192 2,068 16,915
TOTAL LIABILITIES 1,188,989 976,797 74,480 54,973
TOTAL NET ASSETS 14,504,930 3,700,494 4,129,591 30,033,873
Net Asset Value per share
1C 6.25 4.25 4.13 5.39
Number of Shares outstanding
1C 2,320,000 870,000 1,000,000 5,570,000
* This is a synthetic ETF.
** This includes synthetic ETFs and a non-ETF.
*** The Sub-Fund is fully collateralized.
90
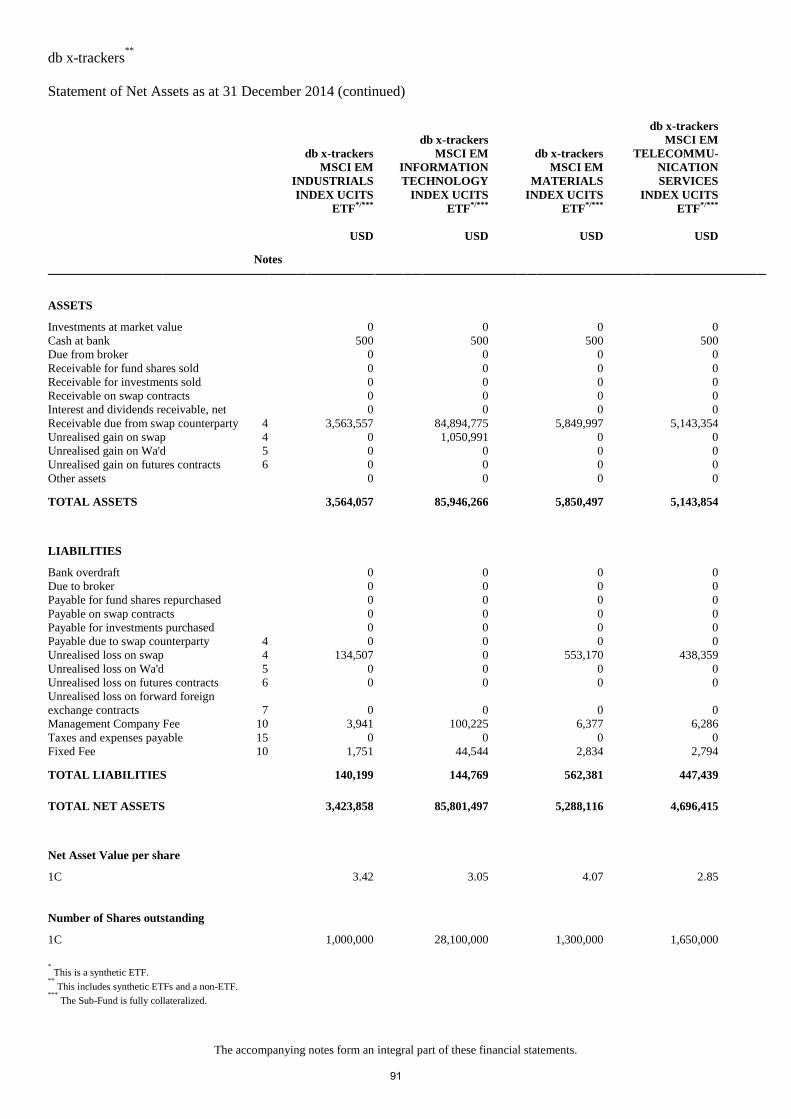
db x-trackers**
Statement of Net Assets as at 31 December 2014 (continued)
The accompanying notes form an integral part of these financial statements.
db x-trackers
MSCI EM
INDUSTRIALS
INDEX UCITS
ETF*/***
db x-trackers
MSCI EM
INFORMATION
TECHNOLOGY
INDEX UCITS
ETF*/***
db x-trackers
MSCI EM
MATERIALS
INDEX UCITS
ETF*/***
db x-trackers
MSCI EM
TELECOMMU-
NICATION
SERVICES
INDEX UCITS
ETF*/***
USD USD USD USD
Notes
ASSETS
Investments at market value 0 0 0 0
Cash at bank 500 500 500 500
Due from broker 0 0 0 0
Receivable for fund shares sold 0 0 0 0
Receivable for investments sold 0 0 0 0
Receivable on swap contracts 0 0 0 0
Interest and dividends receivable, net 0 0 0 0
Receivable due from swap counterparty 4 3,563,557 84,894,775 5,849,997 5,143,354
Unrealised gain on swap 4 0 1,050,991 0 0
Unrealised gain on Wa'd 5 0 0 0 0
Unrealised gain on futures contracts 6 0 0 0 0
Other assets 0 0 0 0
TOTAL ASSETS 3,564,057 85,946,266 5,850,497 5,143,854
LIABILITIES
Bank overdraft 0 0 0 0
Due to broker 0 0 0 0
Payable for fund shares repurchased 0 0 0 0
Payable on swap contracts 0 0 0 0
Payable for investments purchased 0 0 0 0
Payable due to swap counterparty 4 0 0 0 0
Unrealised loss on swap 4 134,507 0 553,170 438,359
Unrealised loss on Wa'd 5 0 0 0 0
Unrealised loss on futures contracts 6 0 0 0 0
Unrealised loss on forward foreign
exchange contracts 7
0 0 0 0
Management Company Fee 10 3,941 100,225 6,377 6,286
Taxes and expenses payable 15 0 0 0 0
Fixed Fee 10 1,751 44,544 2,834 2,794
TOTAL LIABILITIES 140,199 144,769 562,381 447,439
TOTAL NET ASSETS 3,423,858 85,801,497 5,288,116 4,696,415
Net Asset Value per share
1C 3.42 3.05 4.07 2.85
Number of Shares outstanding
1C 1,000,000 28,100,000 1,300,000 1,650,000
* This is a synthetic ETF.
** This includes synthetic ETFs and a non-ETF.
*** The Sub-Fund is fully collateralized.
91
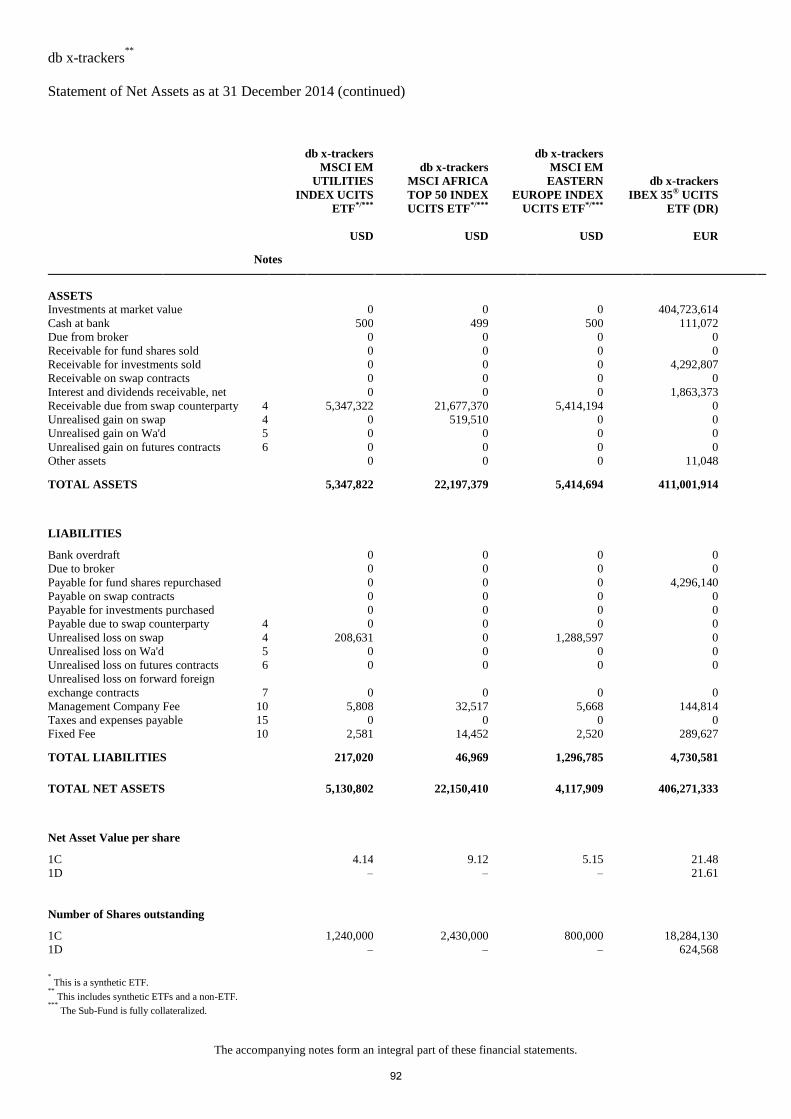
db x-trackers**
Statement of Net Assets as at 31 December 2014 (continued)
The accompanying notes form an integral part of these financial statements.
db x-trackers
MSCI EM
UTILITIES
INDEX UCITS
ETF*/***
db x-trackers
MSCI AFRICA
TOP 50 INDEX
UCITS ETF*/***
db x-trackers
MSCI EM
EASTERN
EUROPE INDEX
UCITS ETF*/***
db x-trackers
IBEX 35® UCITS
ETF (DR)
USD USD USD EUR
Notes
ASSETS
Investments at market value 0 0 0 404,723,614
Cash at bank 500 499 500 111,072
Due from broker 0 0 0 0
Receivable for fund shares sold 0 0 0 0
Receivable for investments sold 0 0 0 4,292,807
Receivable on swap contracts 0 0 0 0
Interest and dividends receivable, net 0 0 0 1,863,373
Receivable due from swap counterparty 4 5,347,322 21,677,370 5,414,194 0
Unrealised gain on swap 4 0 519,510 0 0
Unrealised gain on Wa'd 5 0 0 0 0
Unrealised gain on futures contracts 6 0 0 0 0
Other assets 0 0 0 11,048
TOTAL ASSETS 5,347,822 22,197,379 5,414,694 411,001,914
LIABILITIES
Bank overdraft 0 0 0 0
Due to broker 0 0 0 0
Payable for fund shares repurchased 0 0 0 4,296,140
Payable on swap contracts 0 0 0 0
Payable for investments purchased 0 0 0 0
Payable due to swap counterparty 4 0 0 0 0
Unrealised loss on swap 4 208,631 0 1,288,597 0
Unrealised loss on Wa'd 5 0 0 0 0
Unrealised loss on futures contracts 6 0 0 0 0
Unrealised loss on forward foreign
exchange contracts 7
0 0 0 0
Management Company Fee 10 5,808 32,517 5,668 144,814
Taxes and expenses payable 15 0 0 0 0
Fixed Fee 10 2,581 14,452 2,520 289,627
TOTAL LIABILITIES 217,020 46,969 1,296,785 4,730,581
TOTAL NET ASSETS 5,130,802 22,150,410 4,117,909 406,271,333
Net Asset Value per share
1C 4.14 9.12 5.15 21.48
1D – – – 21.61
Number of Shares outstanding
1C 1,240,000 2,430,000 800,000 18,284,130
1D – – – 624,568
* This is a synthetic ETF.
** This includes synthetic ETFs and a non-ETF.
*** The Sub-Fund is fully collateralized.
92
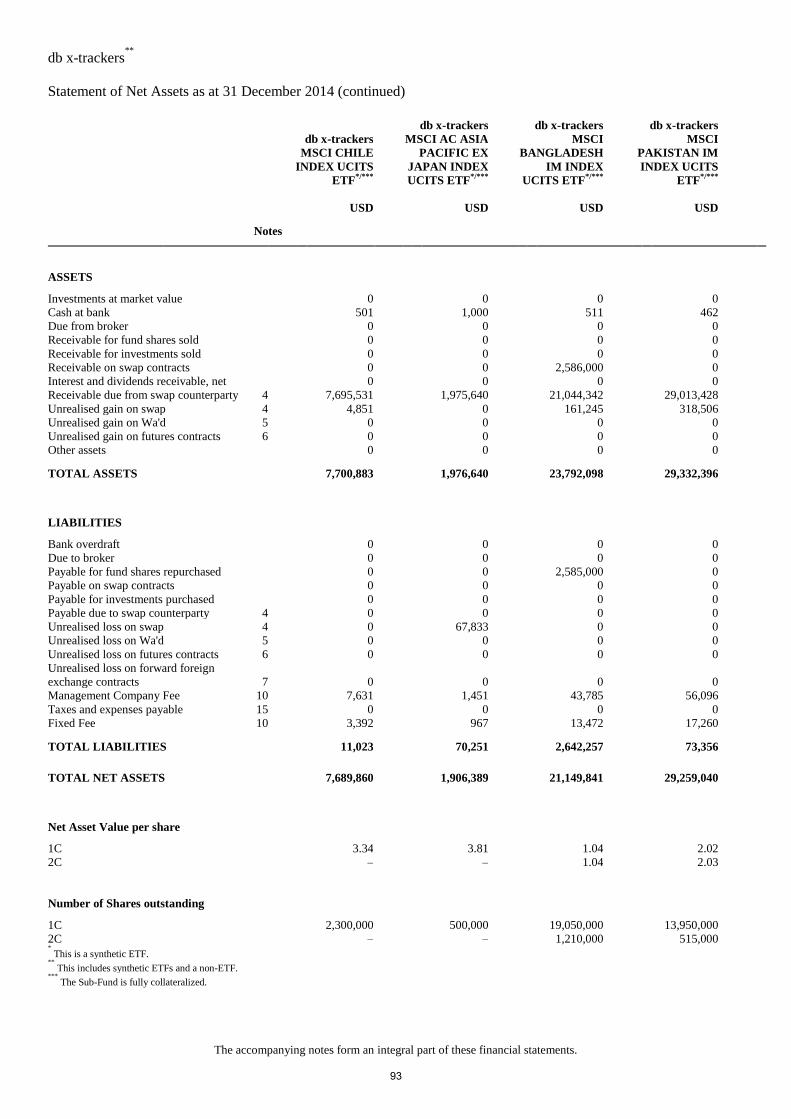
db x-trackers**
Statement of Net Assets as at 31 December 2014 (continued)
The accompanying notes form an integral part of these financial statements.
db x-trackers
MSCI CHILE
INDEX UCITS
ETF*/***
db x-trackers
MSCI AC ASIA
PACIFIC EX
JAPAN INDEX
UCITS ETF*/***
db x-trackers
MSCI
BANGLADESH
IM INDEX
UCITS ETF*/***
db x-trackers
MSCI
PAKISTAN IM
INDEX UCITS
ETF*/***
USD USD USD USD
Notes
ASSETS
Investments at market value 0 0 0 0
Cash at bank 501 1,000 511 462
Due from broker 0 0 0 0
Receivable for fund shares sold 0 0 0 0
Receivable for investments sold 0 0 0 0
Receivable on swap contracts 0 0 2,586,000 0
Interest and dividends receivable, net 0 0 0 0
Receivable due from swap counterparty 4 7,695,531 1,975,640 21,044,342 29,013,428
Unrealised gain on swap 4 4,851 0 161,245 318,506
Unrealised gain on Wa'd 5 0 0 0 0
Unrealised gain on futures contracts 6 0 0 0 0
Other assets 0 0 0 0
TOTAL ASSETS 7,700,883 1,976,640 23,792,098 29,332,396
LIABILITIES
Bank overdraft 0 0 0 0
Due to broker 0 0 0 0
Payable for fund shares repurchased 0 0 2,585,000 0
Payable on swap contracts 0 0 0 0
Payable for investments purchased 0 0 0 0
Payable due to swap counterparty 4 0 0 0 0
Unrealised loss on swap 4 0 67,833 0 0
Unrealised loss on Wa'd 5 0 0 0 0
Unrealised loss on futures contracts 6 0 0 0 0
Unrealised loss on forward foreign
exchange contracts 7
0 0 0 0
Management Company Fee 10 7,631 1,451 43,785 56,096
Taxes and expenses payable 15 0 0 0 0
Fixed Fee 10 3,392 967 13,472 17,260
TOTAL LIABILITIES 11,023 70,251 2,642,257 73,356
TOTAL NET ASSETS 7,689,860 1,906,389 21,149,841 29,259,040
Net Asset Value per share
1C 3.34 3.81 1.04 2.02
2C – – 1.04 2.03
Number of Shares outstanding
1C 2,300,000 500,000 19,050,000 13,950,000
2C – – 1,210,000 515,000 * This is a synthetic ETF.
** This includes synthetic ETFs and a non-ETF.
*** The Sub-Fund is fully collateralized.
93
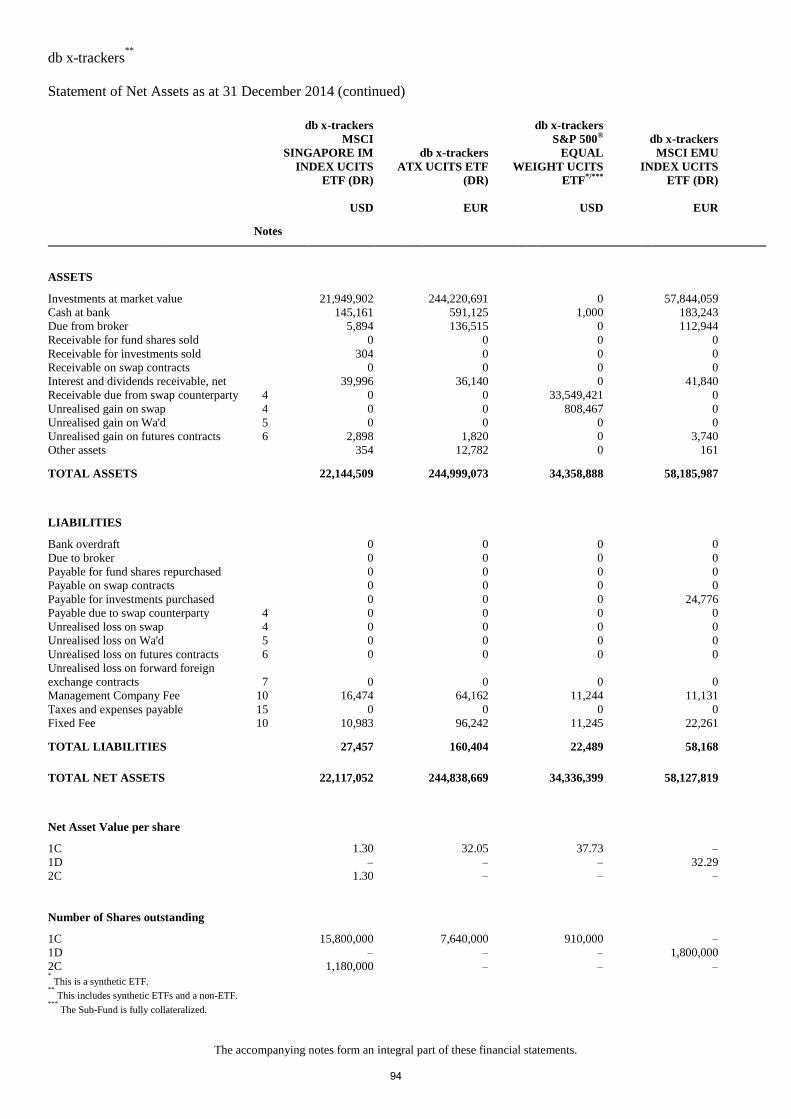
db x-trackers**
Statement of Net Assets as at 31 December 2014 (continued)
The accompanying notes form an integral part of these financial statements.
db x-trackers
MSCI
SINGAPORE IM
INDEX UCITS
ETF (DR)
db x-trackers
ATX UCITS ETF
(DR)
db x-trackers
S&P 500®
EQUAL
WEIGHT UCITS
ETF*/***
db x-trackers
MSCI EMU
INDEX UCITS
ETF (DR)
USD EUR USD EUR
Notes
ASSETS
Investments at market value 21,949,902 244,220,691 0 57,844,059
Cash at bank 145,161 591,125 1,000 183,243
Due from broker 5,894 136,515 0 112,944
Receivable for fund shares sold 0 0 0 0
Receivable for investments sold 304 0 0 0
Receivable on swap contracts 0 0 0 0
Interest and dividends receivable, net 39,996 36,140 0 41,840
Receivable due from swap counterparty 4 0 0 33,549,421 0
Unrealised gain on swap 4 0 0 808,467 0
Unrealised gain on Wa'd 5 0 0 0 0
Unrealised gain on futures contracts 6 2,898 1,820 0 3,740
Other assets 354 12,782 0 161
TOTAL ASSETS 22,144,509 244,999,073 34,358,888 58,185,987
LIABILITIES
Bank overdraft 0 0 0 0
Due to broker 0 0 0 0
Payable for fund shares repurchased 0 0 0 0
Payable on swap contracts 0 0 0 0
Payable for investments purchased 0 0 0 24,776
Payable due to swap counterparty 4 0 0 0 0
Unrealised loss on swap 4 0 0 0 0
Unrealised loss on Wa'd 5 0 0 0 0
Unrealised loss on futures contracts 6 0 0 0 0
Unrealised loss on forward foreign
exchange contracts 7
0 0 0 0
Management Company Fee 10 16,474 64,162 11,244 11,131
Taxes and expenses payable 15 0 0 0 0
Fixed Fee 10 10,983 96,242 11,245 22,261
TOTAL LIABILITIES 27,457 160,404 22,489 58,168
TOTAL NET ASSETS 22,117,052 244,838,669 34,336,399 58,127,819
Net Asset Value per share
1C 1.30 32.05 37.73 –
1D – – – 32.29
2C 1.30 – – –
Number of Shares outstanding
1C 15,800,000 7,640,000 910,000 –
1D – – – 1,800,000
2C 1,180,000 – – – * This is a synthetic ETF.
** This includes synthetic ETFs and a non-ETF.
*** The Sub-Fund is fully collateralized.
94
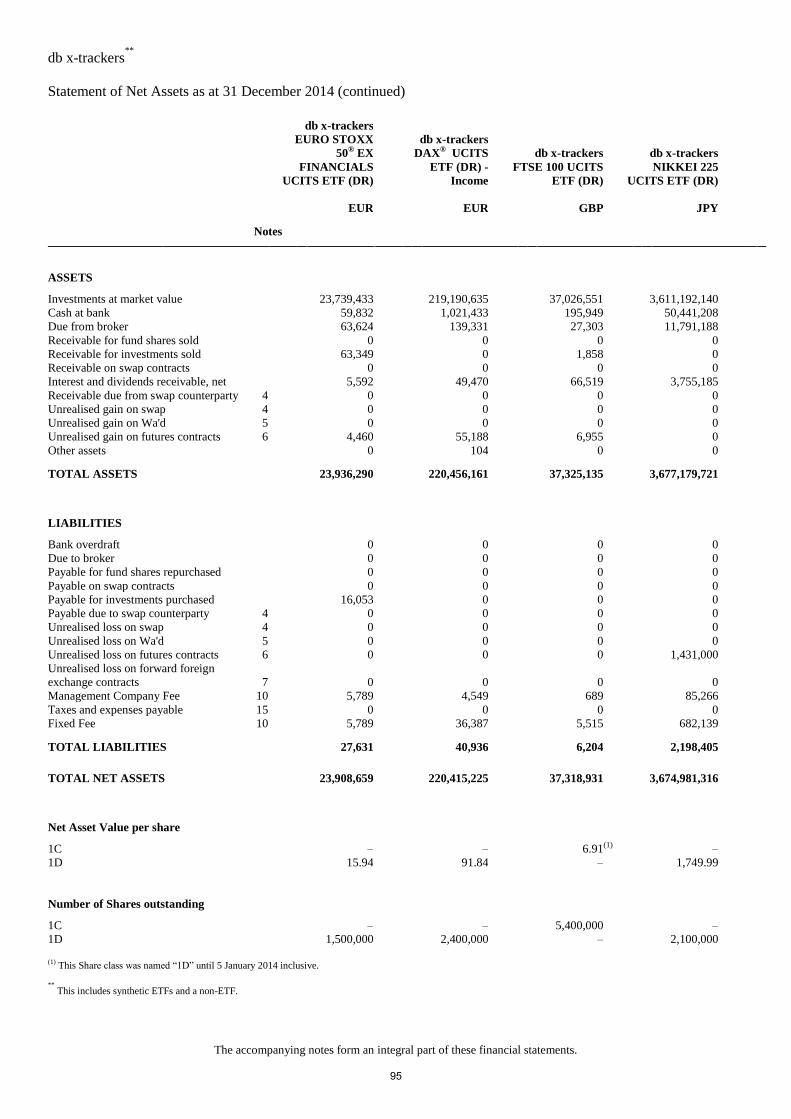
db x-trackers**
Statement of Net Assets as at 31 December 2014 (continued)
The accompanying notes form an integral part of these financial statements.
db x-trackers
EURO STOXX
50® EX
FINANCIALS
UCITS ETF (DR)
db x-trackers
DAX® UCITS
ETF (DR) -
Income
db x-trackers
FTSE 100 UCITS
ETF (DR)
db x-trackers
NIKKEI 225
UCITS ETF (DR)
EUR EUR GBP JPY
Notes
ASSETS
Investments at market value 23,739,433 219,190,635 37,026,551 3,611,192,140
Cash at bank 59,832 1,021,433 195,949 50,441,208
Due from broker 63,624 139,331 27,303 11,791,188
Receivable for fund shares sold 0 0 0 0
Receivable for investments sold 63,349 0 1,858 0
Receivable on swap contracts 0 0 0 0
Interest and dividends receivable, net 5,592 49,470 66,519 3,755,185
Receivable due from swap counterparty 4 0 0 0 0
Unrealised gain on swap 4 0 0 0 0
Unrealised gain on Wa'd 5 0 0 0 0
Unrealised gain on futures contracts 6 4,460 55,188 6,955 0
Other assets 0 104 0 0
TOTAL ASSETS 23,936,290 220,456,161 37,325,135 3,677,179,721
LIABILITIES
Bank overdraft 0 0 0 0
Due to broker 0 0 0 0
Payable for fund shares repurchased 0 0 0 0
Payable on swap contracts 0 0 0 0
Payable for investments purchased 16,053 0 0 0
Payable due to swap counterparty 4 0 0 0 0
Unrealised loss on swap 4 0 0 0 0
Unrealised loss on Wa'd 5 0 0 0 0
Unrealised loss on futures contracts 6 0 0 0 1,431,000
Unrealised loss on forward foreign
exchange contracts 7
0 0 0 0
Management Company Fee 10 5,789 4,549 689 85,266
Taxes and expenses payable 15 0 0 0 0
Fixed Fee 10 5,789 36,387 5,515 682,139
TOTAL LIABILITIES 27,631 40,936 6,204 2,198,405
TOTAL NET ASSETS 23,908,659 220,415,225 37,318,931 3,674,981,316
Net Asset Value per share
1C – – 6.91 (1) –
1D 15.94 91.84 – 1,749.99
Number of Shares outstanding
1C – – 5,400,000 –
1D 1,500,000 2,400,000 – 2,100,000
(1)
This Share class was named “1D” until 5 January 2014 inclusive. **
This includes synthetic ETFs and a non-ETF.
95
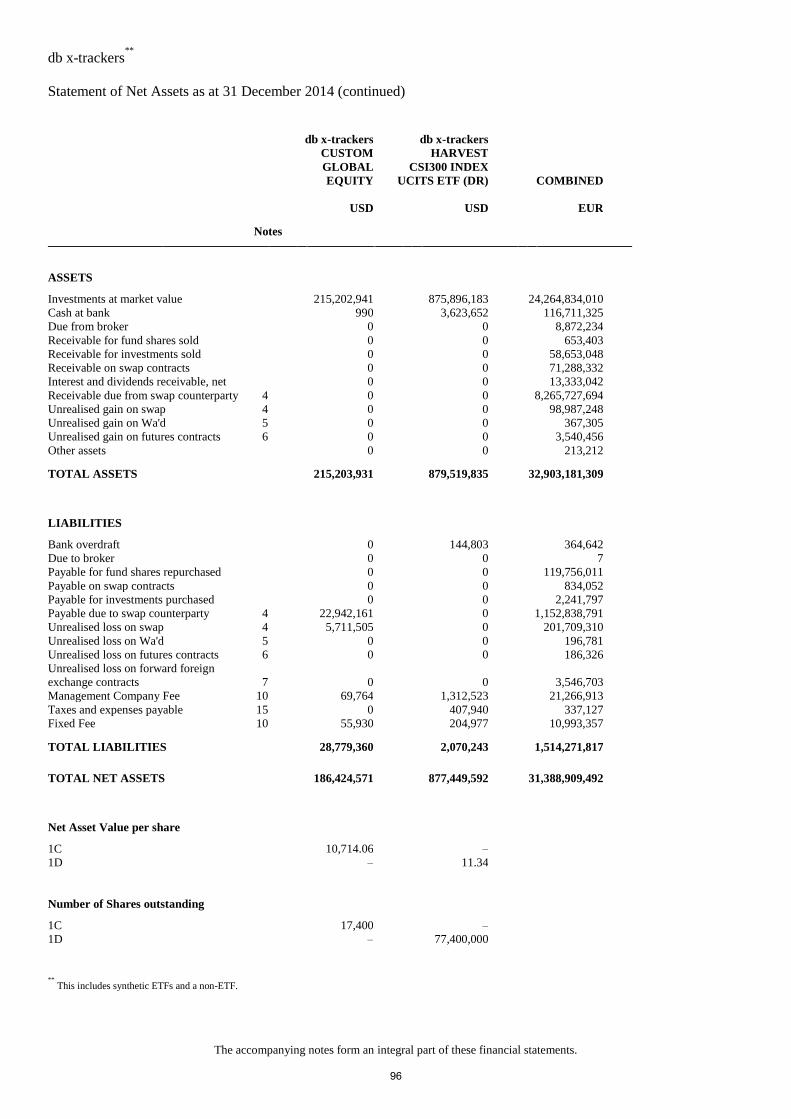
db x-trackers**
Statement of Net Assets as at 31 December 2014 (continued)
The accompanying notes form an integral part of these financial statements.
db x-trackers
CUSTOM
GLOBAL
EQUITY
db x-trackers
HARVEST
CSI300 INDEX
UCITS ETF (DR) COMBINED
USD USD EUR
Notes
ASSETS
Investments at market value 215,202,941 875,896,183 24,264,834,010
Cash at bank 990 3,623,652 116,711,325
Due from broker 0 0 8,872,234
Receivable for fund shares sold 0 0 653,403
Receivable for investments sold 0 0 58,653,048
Receivable on swap contracts 0 0 71,288,332
Interest and dividends receivable, net 0 0 13,333,042
Receivable due from swap counterparty 4 0 0 8,265,727,694
Unrealised gain on swap 4 0 0 98,987,248
Unrealised gain on Wa'd 5 0 0 367,305
Unrealised gain on futures contracts 6 0 0 3,540,456
Other assets 0 0 213,212
TOTAL ASSETS 215,203,931 879,519,835 32,903,181,309
LIABILITIES
Bank overdraft 0 144,803 364,642
Due to broker 0 0 7
Payable for fund shares repurchased 0 0 119,756,011
Payable on swap contracts 0 0 834,052
Payable for investments purchased 0 0 2,241,797
Payable due to swap counterparty 4 22,942,161 0 1,152,838,791
Unrealised loss on swap 4 5,711,505 0 201,709,310
Unrealised loss on Wa'd 5 0 0 196,781
Unrealised loss on futures contracts 6 0 0 186,326
Unrealised loss on forward foreign
exchange contracts 7
0 0 3,546,703
Management Company Fee 10 69,764 1,312,523 21,266,913
Taxes and expenses payable 15 0 407,940 337,127
Fixed Fee 10 55,930 204,977 10,993,357
TOTAL LIABILITIES 28,779,360 2,070,243 1,514,271,817
TOTAL NET ASSETS 186,424,571 877,449,592 31,388,909,492
Net Asset Value per share
1C 10,714.06 –
1D – 11.34
Number of Shares outstanding
1C 17,400 –
1D – 77,400,000
**
This includes synthetic ETFs and a non-ETF.
96
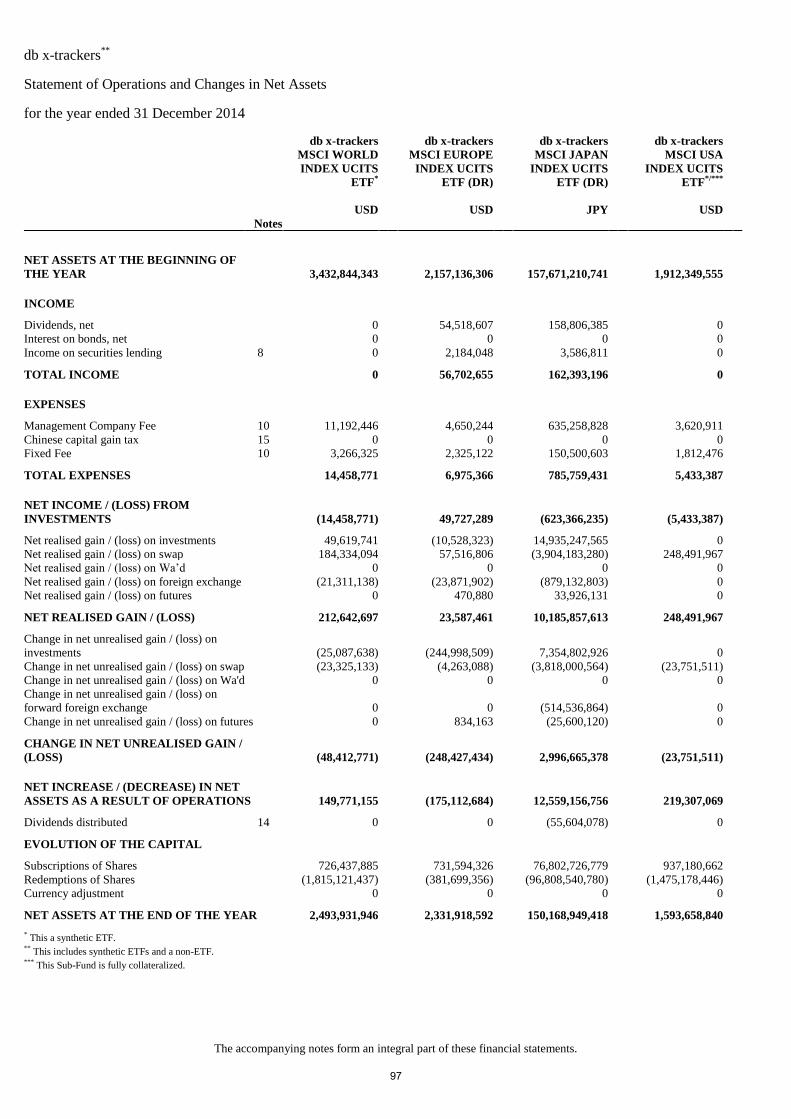
db x-trackers**
Statement of Operations and Changes in Net Assets
for the year ended 31 December 2014
The accompanying notes form an integral part of these financial statements.
db x-trackers
MSCI WORLD
INDEX UCITS
ETF*
db x-trackers
MSCI EUROPE
INDEX UCITS
ETF (DR)
db x-trackers
MSCI JAPAN
INDEX UCITS
ETF (DR)
db x-trackers
MSCI USA
INDEX UCITS
ETF*/***
USD USD JPY USD
Notes
NET ASSETS AT THE BEGINNING OF
THE YEAR 3,432,844,343 2,157,136,306 157,671,210,741 1,912,349,555
INCOME
Dividends, net 0 54,518,607 158,806,385 0
Interest on bonds, net 0 0 0 0
Income on securities lending 8 0 2,184,048 3,586,811 0
TOTAL INCOME 0 56,702,655 162,393,196 0
EXPENSES
Management Company Fee 10 11,192,446 4,650,244 635,258,828 3,620,911
Chinese capital gain tax 15 0 0 0 0
Fixed Fee 10 3,266,325 2,325,122 150,500,603 1,812,476
TOTAL EXPENSES 14,458,771 6,975,366 785,759,431 5,433,387
NET INCOME / (LOSS) FROM
INVESTMENTS (14,458,771) 49,727,289 (623,366,235) (5,433,387)
Net realised gain / (loss) on investments 49,619,741 (10,528,323) 14,935,247,565 0
Net realised gain / (loss) on swap 184,334,094 57,516,806 (3,904,183,280) 248,491,967
Net realised gain / (loss) on Wa’d 0 0 0 0
Net realised gain / (loss) on foreign exchange (21,311,138) (23,871,902) (879,132,803) 0
Net realised gain / (loss) on futures 0 470,880 33,926,131 0
NET REALISED GAIN / (LOSS) 212,642,697 23,587,461 10,185,857,613 248,491,967
Change in net unrealised gain / (loss) on
investments
(25,087,638) (244,998,509) 7,354,802,926 0
Change in net unrealised gain / (loss) on swap (23,325,133) (4,263,088) (3,818,000,564) (23,751,511)
Change in net unrealised gain / (loss) on Wa'd 0 0 0 0
Change in net unrealised gain / (loss) on
forward foreign exchange
0 0 (514,536,864) 0
Change in net unrealised gain / (loss) on futures 0 834,163 (25,600,120) 0
CHANGE IN NET UNREALISED GAIN /
(LOSS) (48,412,771) (248,427,434) 2,996,665,378 (23,751,511)
NET INCREASE / (DECREASE) IN NET
ASSETS AS A RESULT OF OPERATIONS 149,771,155 (175,112,684) 12,559,156,756 219,307,069
Dividends distributed 14 0 0 (55,604,078) 0
EVOLUTION OF THE CAPITAL
Subscriptions of Shares 726,437,885 731,594,326 76,802,726,779 937,180,662
Redemptions of Shares (1,815,121,437) (381,699,356) (96,808,540,780) (1,475,178,446)
Currency adjustment 0 0 0 0
NET ASSETS AT THE END OF THE YEAR 2,493,931,946 2,331,918,592 150,168,949,418 1,593,658,840
* This a synthetic ETF.
** This includes synthetic ETFs and a non-ETF.
*** This Sub-Fund is fully collateralized.
97
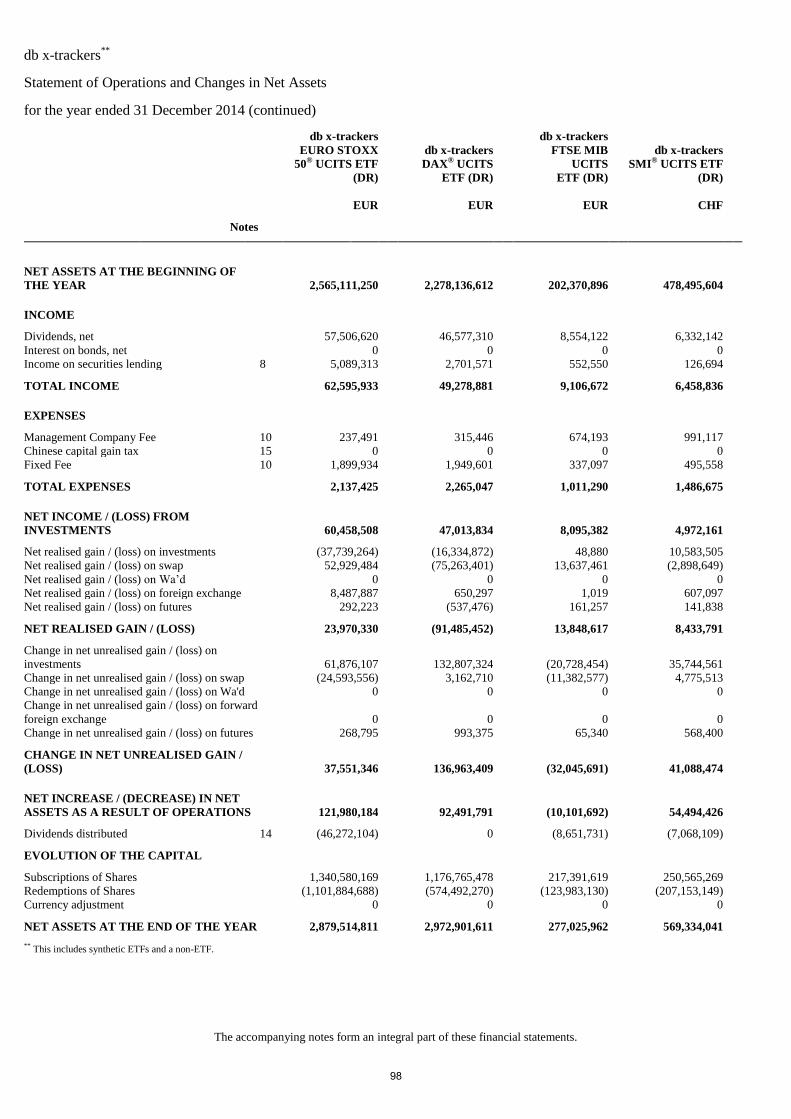
db x-trackers**
Statement of Operations and Changes in Net Assets
for the year ended 31 December 2014 (continued)
The accompanying notes form an integral part of these financial statements.
db x-trackers
EURO STOXX
50® UCITS ETF
(DR)
db x-trackers
DAX® UCITS
ETF (DR)
db x-trackers
FTSE MIB
UCITS
ETF (DR)
db x-trackers
SMI® UCITS ETF
(DR)
EUR EUR EUR CHF
Notes
NET ASSETS AT THE BEGINNING OF
THE YEAR 2,565,111,250 2,278,136,612 202,370,896 478,495,604
INCOME
Dividends, net 57,506,620 46,577,310 8,554,122 6,332,142
Interest on bonds, net 0 0 0 0
Income on securities lending 8 5,089,313 2,701,571 552,550 126,694
TOTAL INCOME 62,595,933 49,278,881 9,106,672 6,458,836
EXPENSES
Management Company Fee 10 237,491 315,446 674,193 991,117
Chinese capital gain tax 15 0 0 0 0
Fixed Fee 10 1,899,934 1,949,601 337,097 495,558
TOTAL EXPENSES 2,137,425 2,265,047 1,011,290 1,486,675
NET INCOME / (LOSS) FROM
INVESTMENTS 60,458,508 47,013,834 8,095,382 4,972,161
Net realised gain / (loss) on investments (37,739,264) (16,334,872) 48,880 10,583,505
Net realised gain / (loss) on swap 52,929,484 (75,263,401) 13,637,461 (2,898,649)
Net realised gain / (loss) on Wa’d 0 0 0 0
Net realised gain / (loss) on foreign exchange 8,487,887 650,297 1,019 607,097
Net realised gain / (loss) on futures 292,223 (537,476) 161,257 141,838
NET REALISED GAIN / (LOSS) 23,970,330 (91,485,452) 13,848,617 8,433,791
Change in net unrealised gain / (loss) on
investments
61,876,107 132,807,324 (20,728,454) 35,744,561
Change in net unrealised gain / (loss) on swap (24,593,556) 3,162,710 (11,382,577) 4,775,513
Change in net unrealised gain / (loss) on Wa'd 0 0 0 0
Change in net unrealised gain / (loss) on forward
foreign exchange
0 0 0 0
Change in net unrealised gain / (loss) on futures 268,795 993,375 65,340 568,400
CHANGE IN NET UNREALISED GAIN /
(LOSS) 37,551,346 136,963,409 (32,045,691) 41,088,474
NET INCREASE / (DECREASE) IN NET
ASSETS AS A RESULT OF OPERATIONS 121,980,184 92,491,791 (10,101,692) 54,494,426
Dividends distributed 14 (46,272,104) 0 (8,651,731) (7,068,109)
EVOLUTION OF THE CAPITAL
Subscriptions of Shares 1,340,580,169 1,176,765,478 217,391,619 250,565,269
Redemptions of Shares (1,101,884,688) (574,492,270) (123,983,130) (207,153,149)
Currency adjustment 0 0 0 0
NET ASSETS AT THE END OF THE YEAR 2,879,514,811 2,972,901,611 277,025,962 569,334,041
** This includes synthetic ETFs and a non-ETF.
98
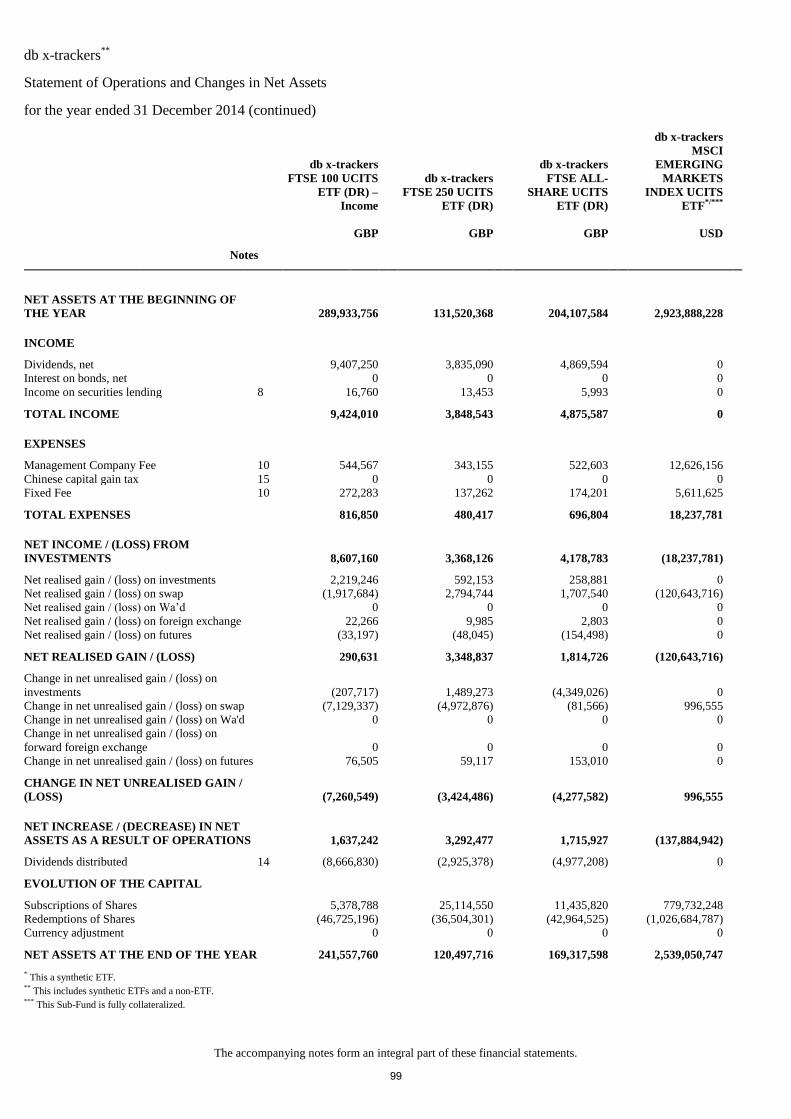
db x-trackers**
Statement of Operations and Changes in Net Assets
for the year ended 31 December 2014 (continued)
The accompanying notes form an integral part of these financial statements.
db x-trackers
FTSE 100 UCITS
ETF (DR) –
Income
db x-trackers
FTSE 250 UCITS
ETF (DR)
db x-trackers
FTSE ALL-
SHARE UCITS
ETF (DR)
db x-trackers
MSCI
EMERGING
MARKETS
INDEX UCITS
ETF*/***
GBP GBP GBP USD
Notes
NET ASSETS AT THE BEGINNING OF
THE YEAR 289,933,756 131,520,368 204,107,584 2,923,888,228
INCOME
Dividends, net 9,407,250 3,835,090 4,869,594 0
Interest on bonds, net 0 0 0 0
Income on securities lending 8 16,760 13,453 5,993 0
TOTAL INCOME 9,424,010 3,848,543 4,875,587 0
EXPENSES
Management Company Fee 10 544,567 343,155 522,603 12,626,156
Chinese capital gain tax 15 0 0 0 0
Fixed Fee 10 272,283 137,262 174,201 5,611,625
TOTAL EXPENSES 816,850 480,417 696,804 18,237,781
NET INCOME / (LOSS) FROM
INVESTMENTS 8,607,160 3,368,126 4,178,783 (18,237,781)
Net realised gain / (loss) on investments 2,219,246 592,153 258,881 0
Net realised gain / (loss) on swap (1,917,684) 2,794,744 1,707,540 (120,643,716)
Net realised gain / (loss) on Wa’d 0 0 0 0
Net realised gain / (loss) on foreign exchange 22,266 9,985 2,803 0
Net realised gain / (loss) on futures (33,197) (48,045) (154,498) 0
NET REALISED GAIN / (LOSS) 290,631 3,348,837 1,814,726 (120,643,716)
Change in net unrealised gain / (loss) on
investments
(207,717) 1,489,273 (4,349,026) 0
Change in net unrealised gain / (loss) on swap (7,129,337) (4,972,876) (81,566) 996,555
Change in net unrealised gain / (loss) on Wa'd 0 0 0 0
Change in net unrealised gain / (loss) on
forward foreign exchange
0 0 0 0
Change in net unrealised gain / (loss) on futures 76,505 59,117 153,010 0
CHANGE IN NET UNREALISED GAIN /
(LOSS) (7,260,549) (3,424,486) (4,277,582) 996,555
NET INCREASE / (DECREASE) IN NET
ASSETS AS A RESULT OF OPERATIONS 1,637,242 3,292,477 1,715,927 (137,884,942)
Dividends distributed 14 (8,666,830) (2,925,378) (4,977,208) 0
EVOLUTION OF THE CAPITAL
Subscriptions of Shares 5,378,788 25,114,550 11,435,820 779,732,248
Redemptions of Shares (46,725,196) (36,504,301) (42,964,525) (1,026,684,787)
Currency adjustment 0 0 0 0
NET ASSETS AT THE END OF THE YEAR 241,557,760 120,497,716 169,317,598 2,539,050,747
* This a synthetic ETF.
** This includes synthetic ETFs and a non-ETF.
*** This Sub-Fund is fully collateralized.
99
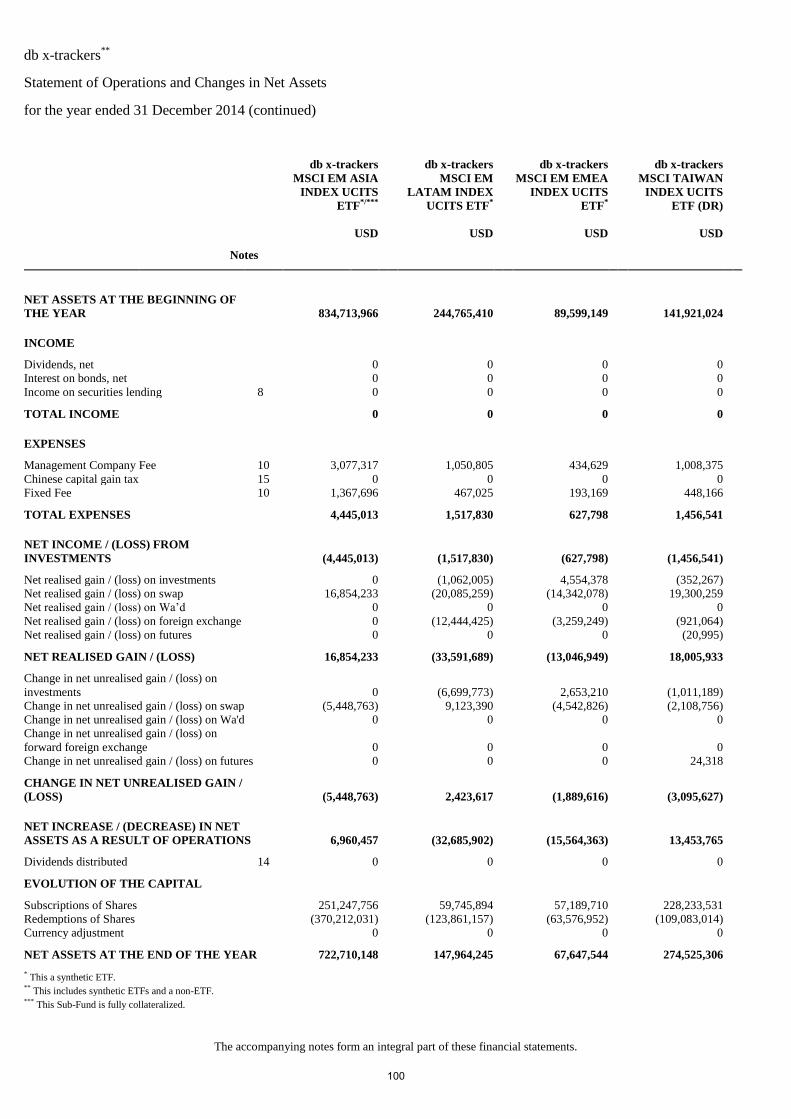
db x-trackers**
Statement of Operations and Changes in Net Assets
for the year ended 31 December 2014 (continued)
The accompanying notes form an integral part of these financial statements.
db x-trackers
MSCI EM ASIA
INDEX UCITS
ETF*/***
db x-trackers
MSCI EM
LATAM INDEX
UCITS ETF*
db x-trackers
MSCI EM EMEA
INDEX UCITS
ETF*
db x-trackers
MSCI TAIWAN
INDEX UCITS
ETF (DR)
USD USD USD USD
Notes
NET ASSETS AT THE BEGINNING OF
THE YEAR 834,713,966 244,765,410 89,599,149 141,921,024
INCOME
Dividends, net 0 0 0 0
Interest on bonds, net 0 0 0 0
Income on securities lending 8 0 0 0 0
TOTAL INCOME 0 0 0 0
EXPENSES
Management Company Fee 10 3,077,317 1,050,805 434,629 1,008,375
Chinese capital gain tax 15 0 0 0 0
Fixed Fee 10 1,367,696 467,025 193,169 448,166
TOTAL EXPENSES 4,445,013 1,517,830 627,798 1,456,541
NET INCOME / (LOSS) FROM
INVESTMENTS (4,445,013) (1,517,830) (627,798) (1,456,541)
Net realised gain / (loss) on investments 0 (1,062,005) 4,554,378 (352,267)
Net realised gain / (loss) on swap 16,854,233 (20,085,259) (14,342,078) 19,300,259
Net realised gain / (loss) on Wa’d 0 0 0 0
Net realised gain / (loss) on foreign exchange 0 (12,444,425) (3,259,249) (921,064)
Net realised gain / (loss) on futures 0 0 0 (20,995)
NET REALISED GAIN / (LOSS) 16,854,233 (33,591,689) (13,046,949) 18,005,933
Change in net unrealised gain / (loss) on
investments
0 (6,699,773) 2,653,210 (1,011,189)
Change in net unrealised gain / (loss) on swap (5,448,763) 9,123,390 (4,542,826) (2,108,756)
Change in net unrealised gain / (loss) on Wa'd 0 0 0 0
Change in net unrealised gain / (loss) on
forward foreign exchange
0 0 0 0
Change in net unrealised gain / (loss) on futures 0 0 0 24,318
CHANGE IN NET UNREALISED GAIN /
(LOSS) (5,448,763) 2,423,617 (1,889,616) (3,095,627)
NET INCREASE / (DECREASE) IN NET
ASSETS AS A RESULT OF OPERATIONS 6,960,457 (32,685,902) (15,564,363) 13,453,765
Dividends distributed 14 0 0 0 0
EVOLUTION OF THE CAPITAL
Subscriptions of Shares 251,247,756 59,745,894 57,189,710 228,233,531
Redemptions of Shares (370,212,031) (123,861,157) (63,576,952) (109,083,014)
Currency adjustment 0 0 0 0
NET ASSETS AT THE END OF THE YEAR 722,710,148 147,964,245 67,647,544 274,525,306
* This a synthetic ETF.
** This includes synthetic ETFs and a non-ETF.
*** This Sub-Fund is fully collateralized.
100
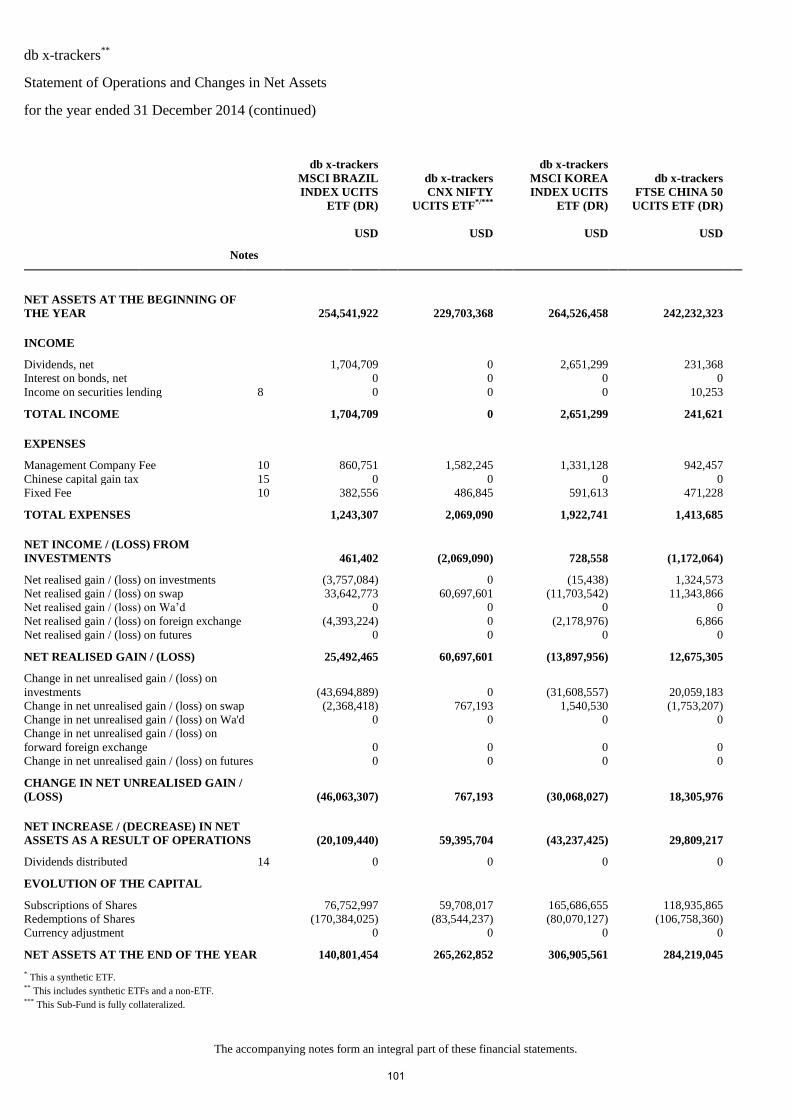
db x-trackers**
Statement of Operations and Changes in Net Assets
for the year ended 31 December 2014 (continued)
The accompanying notes form an integral part of these financial statements.
db x-trackers
MSCI BRAZIL
INDEX UCITS
ETF (DR)
db x-trackers
CNX NIFTY
UCITS ETF*/***
db x-trackers
MSCI KOREA
INDEX UCITS
ETF (DR)
db x-trackers
FTSE CHINA 50
UCITS ETF (DR)
USD USD USD USD
Notes
NET ASSETS AT THE BEGINNING OF
THE YEAR 254,541,922 229,703,368 264,526,458 242,232,323
INCOME
Dividends, net 1,704,709 0 2,651,299 231,368
Interest on bonds, net 0 0 0 0
Income on securities lending 8 0 0 0 10,253
TOTAL INCOME 1,704,709 0 2,651,299 241,621
EXPENSES
Management Company Fee 10 860,751 1,582,245 1,331,128 942,457
Chinese capital gain tax 15 0 0 0 0
Fixed Fee 10 382,556 486,845 591,613 471,228
TOTAL EXPENSES 1,243,307 2,069,090 1,922,741 1,413,685
NET INCOME / (LOSS) FROM
INVESTMENTS 461,402 (2,069,090) 728,558 (1,172,064)
Net realised gain / (loss) on investments (3,757,084) 0 (15,438) 1,324,573
Net realised gain / (loss) on swap 33,642,773 60,697,601 (11,703,542) 11,343,866
Net realised gain / (loss) on Wa’d 0 0 0 0
Net realised gain / (loss) on foreign exchange (4,393,224) 0 (2,178,976) 6,866
Net realised gain / (loss) on futures 0 0 0 0
NET REALISED GAIN / (LOSS) 25,492,465 60,697,601 (13,897,956) 12,675,305
Change in net unrealised gain / (loss) on
investments
(43,694,889) 0 (31,608,557) 20,059,183
Change in net unrealised gain / (loss) on swap (2,368,418) 767,193 1,540,530 (1,753,207)
Change in net unrealised gain / (loss) on Wa'd 0 0 0 0
Change in net unrealised gain / (loss) on
forward foreign exchange
0 0 0 0
Change in net unrealised gain / (loss) on futures 0 0 0 0
CHANGE IN NET UNREALISED GAIN /
(LOSS) (46,063,307) 767,193 (30,068,027) 18,305,976
NET INCREASE / (DECREASE) IN NET
ASSETS AS A RESULT OF OPERATIONS (20,109,440) 59,395,704 (43,237,425) 29,809,217
Dividends distributed 14 0 0 0 0
EVOLUTION OF THE CAPITAL
Subscriptions of Shares 76,752,997 59,708,017 165,686,655 118,935,865
Redemptions of Shares (170,384,025) (83,544,237) (80,070,127) (106,758,360)
Currency adjustment 0 0 0 0
NET ASSETS AT THE END OF THE YEAR 140,801,454 265,262,852 306,905,561 284,219,045
* This a synthetic ETF.
** This includes synthetic ETFs and a non-ETF.
*** This Sub-Fund is fully collateralized.
101
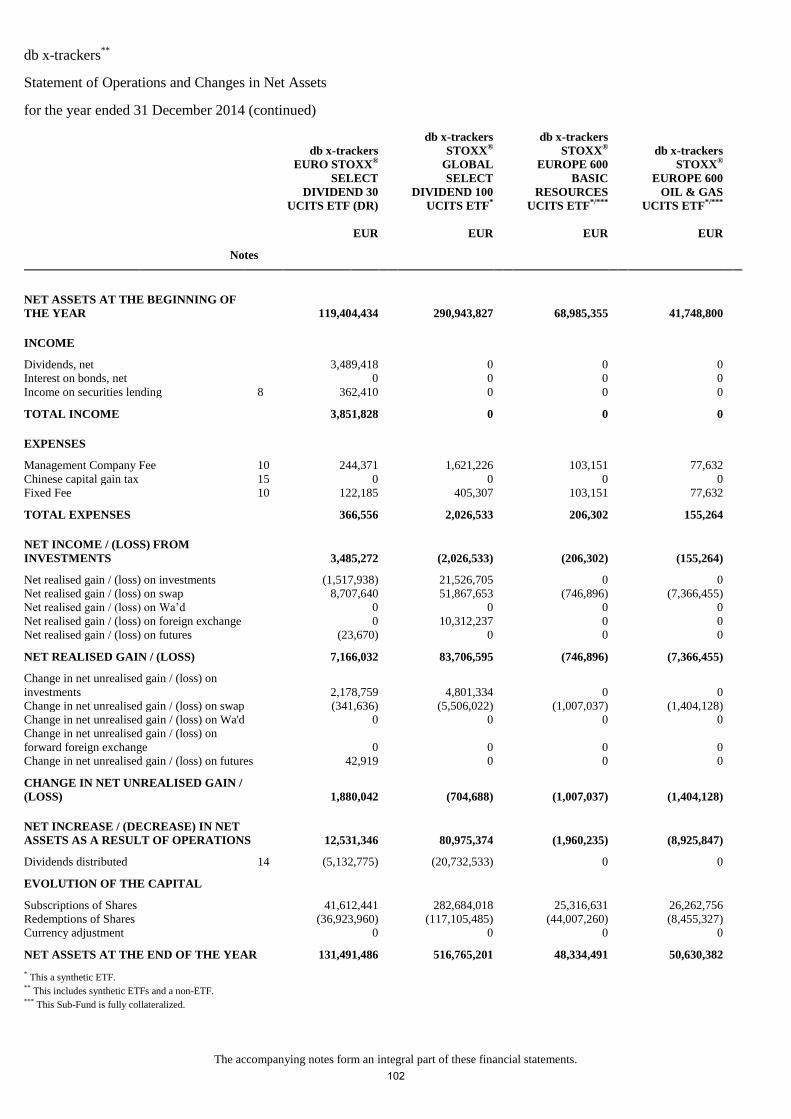
db x-trackers**
Statement of Operations and Changes in Net Assets
for the year ended 31 December 2014 (continued)
The accompanying notes form an integral part of these financial statements.
db x-trackers
EURO STOXX®
SELECT
DIVIDEND 30
UCITS ETF (DR)
db x-trackers
STOXX®
GLOBAL
SELECT
DIVIDEND 100
UCITS ETF*
db x-trackers
STOXX®
EUROPE 600
BASIC
RESOURCES
UCITS ETF*/***
db x-trackers
STOXX®
EUROPE 600
OIL & GAS
UCITS ETF*/***
EUR EUR EUR EUR
Notes
NET ASSETS AT THE BEGINNING OF
THE YEAR 119,404,434 290,943,827 68,985,355 41,748,800
INCOME
Dividends, net 3,489,418 0 0 0
Interest on bonds, net 0 0 0 0
Income on securities lending 8 362,410 0 0 0
TOTAL INCOME 3,851,828 0 0 0
EXPENSES
Management Company Fee 10 244,371 1,621,226 103,151 77,632
Chinese capital gain tax 15 0 0 0 0
Fixed Fee 10 122,185 405,307 103,151 77,632
TOTAL EXPENSES 366,556 2,026,533 206,302 155,264
NET INCOME / (LOSS) FROM
INVESTMENTS 3,485,272 (2,026,533) (206,302) (155,264)
Net realised gain / (loss) on investments (1,517,938) 21,526,705 0 0
Net realised gain / (loss) on swap 8,707,640 51,867,653 (746,896) (7,366,455)
Net realised gain / (loss) on Wa’d 0 0 0 0
Net realised gain / (loss) on foreign exchange 0 10,312,237 0 0
Net realised gain / (loss) on futures (23,670) 0 0 0
NET REALISED GAIN / (LOSS) 7,166,032 83,706,595 (746,896) (7,366,455)
Change in net unrealised gain / (loss) on
investments
2,178,759 4,801,334 0 0
Change in net unrealised gain / (loss) on swap (341,636) (5,506,022) (1,007,037) (1,404,128)
Change in net unrealised gain / (loss) on Wa'd 0 0 0 0
Change in net unrealised gain / (loss) on
forward foreign exchange
0 0 0 0
Change in net unrealised gain / (loss) on futures 42,919 0 0 0
CHANGE IN NET UNREALISED GAIN /
(LOSS) 1,880,042 (704,688) (1,007,037) (1,404,128)
NET INCREASE / (DECREASE) IN NET
ASSETS AS A RESULT OF OPERATIONS 12,531,346 80,975,374 (1,960,235) (8,925,847)
Dividends distributed 14 (5,132,775) (20,732,533) 0 0
EVOLUTION OF THE CAPITAL
Subscriptions of Shares 41,612,441 282,684,018 25,316,631 26,262,756
Redemptions of Shares (36,923,960) (117,105,485) (44,007,260) (8,455,327)
Currency adjustment 0 0 0 0
NET ASSETS AT THE END OF THE YEAR 131,491,486 516,765,201 48,334,491 50,630,382
* This a synthetic ETF.
** This includes synthetic ETFs and a non-ETF.
*** This Sub-Fund is fully collateralized.
102

db x-trackers**
Statement of Operations and Changes in Net Assets
for the year ended 31 December 2014 (continued)
The accompanying notes form an integral part of these financial statements.
db x-trackers
STOXX®
EUROPE 600
HEALTH CARE
UCITS ETF*
db x-trackers
STOXX®
EUROPE 600
BANKS UCITS
ETF*
db x-trackers
STOXX®
EUROPE 600
TELECOMMU-
NICATIONS
UCITS ETF*/***
db x-trackers
STOXX®
EUROPE 600
TECHNOLOGY
UCITS ETF*/***
EUR EUR EUR EUR
Notes
NET ASSETS AT THE BEGINNING OF
THE YEAR 140,265,112 140,003,911 49,128,038 23,003,372
INCOME
Dividends, net 0 0 0 0
Interest on bonds, net 0 0 0 0
Income on securities lending 8 0 0 0 0
TOTAL INCOME 0 0 0 0
EXPENSES
Management Company Fee 10 297,035 225,633 43,169 25,437
Chinese capital gain tax 15 0 0 0 0
Fixed Fee 10 297,035 225,633 43,169 25,437
TOTAL EXPENSES 594,070 451,266 86,338 50,874
NET INCOME / (LOSS) FROM
INVESTMENTS (594,070) (451,266) (86,338) (50,874)
Net realised gain / (loss) on investments (1,553,340) 0 0 0
Net realised gain / (loss) on swap 35,841,517 4,676,685 5,678,059 2,026,728
Net realised gain / (loss) on Wa’d 0 0 0 0
Net realised gain / (loss) on foreign exchange 1,140,351 0 0 0
Net realised gain / (loss) on futures 0 0 0 0
NET REALISED GAIN / (LOSS) 35,428,528 4,676,685 5,678,059 2,026,728
Change in net unrealised gain / (loss) on
investments
(1,946,349) 549,326 0 0
Change in net unrealised gain / (loss) on swap 514,954 (5,133,904) (2,222,614) 638,938
Change in net unrealised gain / (loss) on Wa'd 0 0 0 0
Change in net unrealised gain / (loss) on
forward foreign exchange
0 0 0 0
Change in net unrealised gain / (loss) on futures 0 0 0 0
CHANGE IN NET UNREALISED GAIN /
(LOSS) (1,431,395) (4,584,578) (2,222,614) 638,938
NET INCREASE / (DECREASE) IN NET
ASSETS AS A RESULT OF OPERATIONS 33,403,063 (359,159) 3,369,107 2,614,792
Dividends distributed 14 0 0 0 0
EVOLUTION OF THE CAPITAL
Subscriptions of Shares 165,922,646 87,509,430 19,549,338 23,814,147
Redemptions of Shares (146,532,774) (86,853,647) (52,099,869) (15,617,261)
Currency adjustment 0 0 0 0
NET ASSETS AT THE END OF THE YEAR 193,058,047 140,300,535 19,946,614 33,815,050
* This a synthetic ETF.
** This includes synthetic ETFs and a non-ETF.
*** This Sub-Fund is fully collateralized.
103
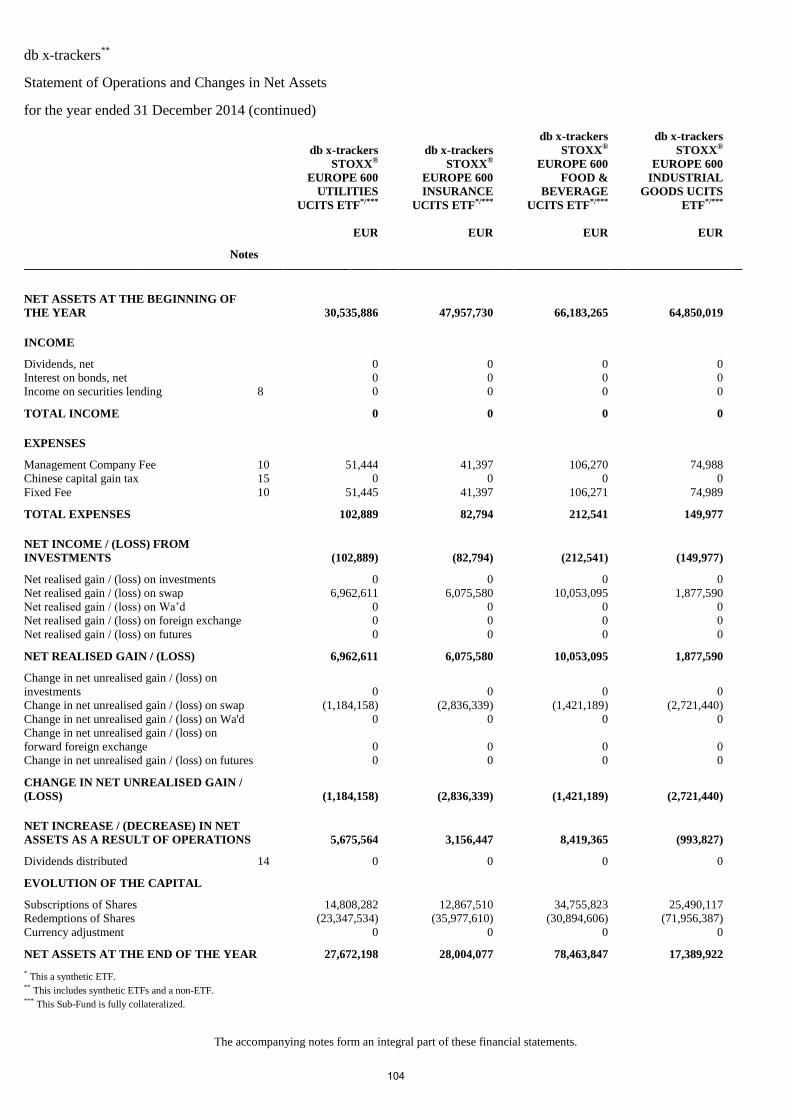
db x-trackers**
Statement of Operations and Changes in Net Assets
for the year ended 31 December 2014 (continued)
The accompanying notes form an integral part of these financial statements.
db x-trackers
STOXX®
EUROPE 600
UTILITIES
UCITS ETF*/***
db x-trackers
STOXX®
EUROPE 600
INSURANCE
UCITS ETF*/***
db x-trackers
STOXX®
EUROPE 600
FOOD &
BEVERAGE
UCITS ETF*/***
db x-trackers
STOXX®
EUROPE 600
INDUSTRIAL
GOODS UCITS
ETF*/***
EUR EUR EUR EUR
Notes
NET ASSETS AT THE BEGINNING OF
THE YEAR 30,535,886 47,957,730 66,183,265 64,850,019
INCOME
Dividends, net 0 0 0 0
Interest on bonds, net 0 0 0 0
Income on securities lending 8 0 0 0 0
TOTAL INCOME 0 0 0 0
EXPENSES
Management Company Fee 10 51,444 41,397 106,270 74,988
Chinese capital gain tax 15 0 0 0 0
Fixed Fee 10 51,445 41,397 106,271 74,989
TOTAL EXPENSES 102,889 82,794 212,541 149,977
NET INCOME / (LOSS) FROM
INVESTMENTS (102,889) (82,794) (212,541) (149,977)
Net realised gain / (loss) on investments 0 0 0 0
Net realised gain / (loss) on swap 6,962,611 6,075,580 10,053,095 1,877,590
Net realised gain / (loss) on Wa’d 0 0 0 0
Net realised gain / (loss) on foreign exchange 0 0 0 0
Net realised gain / (loss) on futures 0 0 0 0
NET REALISED GAIN / (LOSS) 6,962,611 6,075,580 10,053,095 1,877,590
Change in net unrealised gain / (loss) on
investments
0 0 0 0
Change in net unrealised gain / (loss) on swap (1,184,158) (2,836,339) (1,421,189) (2,721,440)
Change in net unrealised gain / (loss) on Wa'd 0 0 0 0
Change in net unrealised gain / (loss) on
forward foreign exchange
0 0 0 0
Change in net unrealised gain / (loss) on futures 0 0 0 0
CHANGE IN NET UNREALISED GAIN /
(LOSS) (1,184,158) (2,836,339) (1,421,189) (2,721,440)
NET INCREASE / (DECREASE) IN NET
ASSETS AS A RESULT OF OPERATIONS 5,675,564 3,156,447 8,419,365 (993,827)
Dividends distributed 14 0 0 0 0
EVOLUTION OF THE CAPITAL
Subscriptions of Shares 14,808,282 12,867,510 34,755,823 25,490,117
Redemptions of Shares (23,347,534) (35,977,610) (30,894,606) (71,956,387)
Currency adjustment 0 0 0 0
NET ASSETS AT THE END OF THE YEAR 27,672,198 28,004,077 78,463,847 17,389,922
* This a synthetic ETF.
** This includes synthetic ETFs and a non-ETF.
*** This Sub-Fund is fully collateralized.
104
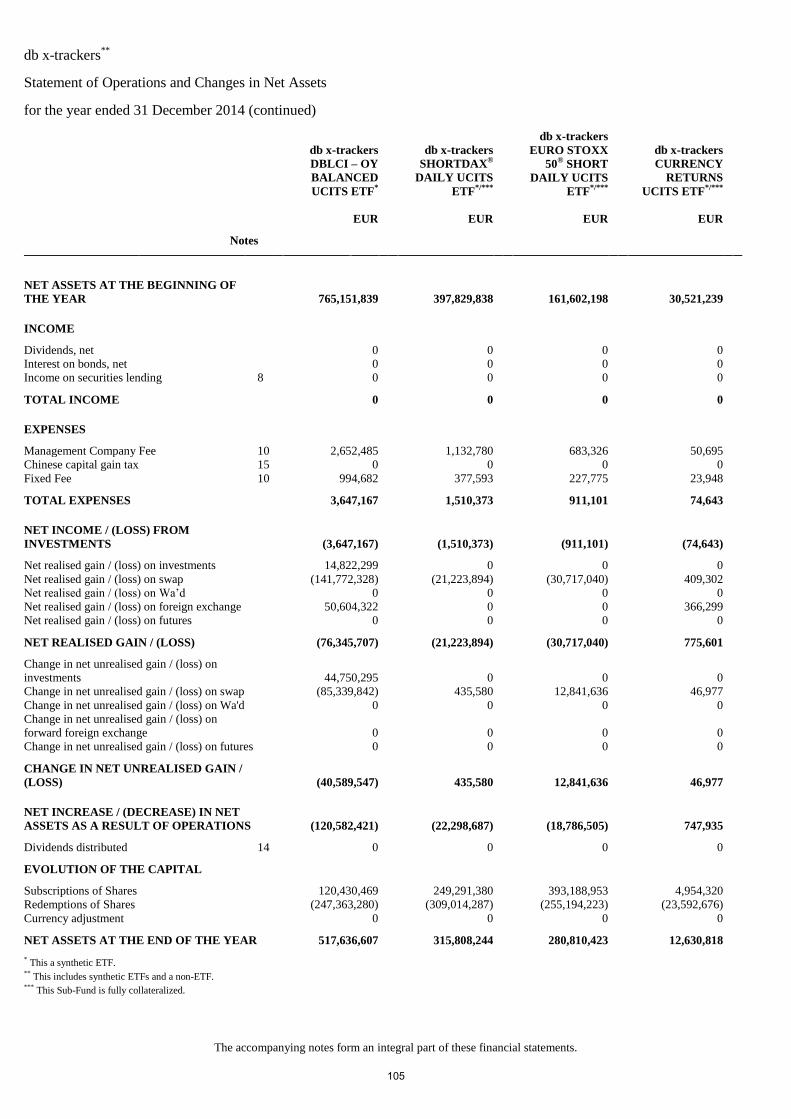
db x-trackers**
Statement of Operations and Changes in Net Assets
for the year ended 31 December 2014 (continued)
The accompanying notes form an integral part of these financial statements.
db x-trackers
DBLCI – OY
BALANCED
UCITS ETF*
db x-trackers
SHORTDAX®
DAILY UCITS
ETF*/***
db x-trackers
EURO STOXX
50® SHORT
DAILY UCITS
ETF*/***
db x-trackers
CURRENCY
RETURNS
UCITS ETF*/***
EUR EUR EUR EUR
Notes
NET ASSETS AT THE BEGINNING OF
THE YEAR 765,151,839 397,829,838 161,602,198 30,521,239
INCOME
Dividends, net 0 0 0 0
Interest on bonds, net 0 0 0 0
Income on securities lending 8 0 0 0 0
TOTAL INCOME 0 0 0 0
EXPENSES
Management Company Fee 10 2,652,485 1,132,780 683,326 50,695
Chinese capital gain tax 15 0 0 0 0
Fixed Fee 10 994,682 377,593 227,775 23,948
TOTAL EXPENSES 3,647,167 1,510,373 911,101 74,643
NET INCOME / (LOSS) FROM
INVESTMENTS (3,647,167) (1,510,373) (911,101) (74,643)
Net realised gain / (loss) on investments 14,822,299 0 0 0
Net realised gain / (loss) on swap (141,772,328) (21,223,894) (30,717,040) 409,302
Net realised gain / (loss) on Wa’d 0 0 0 0
Net realised gain / (loss) on foreign exchange 50,604,322 0 0 366,299
Net realised gain / (loss) on futures 0 0 0 0
NET REALISED GAIN / (LOSS) (76,345,707) (21,223,894) (30,717,040) 775,601
Change in net unrealised gain / (loss) on
investments
44,750,295 0 0 0
Change in net unrealised gain / (loss) on swap (85,339,842) 435,580 12,841,636 46,977
Change in net unrealised gain / (loss) on Wa'd 0 0 0 0
Change in net unrealised gain / (loss) on
forward foreign exchange
0 0 0 0
Change in net unrealised gain / (loss) on futures 0 0 0 0
CHANGE IN NET UNREALISED GAIN /
(LOSS) (40,589,547) 435,580 12,841,636 46,977
NET INCREASE / (DECREASE) IN NET
ASSETS AS A RESULT OF OPERATIONS (120,582,421) (22,298,687) (18,786,505) 747,935
Dividends distributed 14 0 0 0 0
EVOLUTION OF THE CAPITAL
Subscriptions of Shares 120,430,469 249,291,380 393,188,953 4,954,320
Redemptions of Shares (247,363,280) (309,014,287) (255,194,223) (23,592,676)
Currency adjustment 0 0 0 0
NET ASSETS AT THE END OF THE YEAR 517,636,607 315,808,244 280,810,423 12,630,818
* This a synthetic ETF.
** This includes synthetic ETFs and a non-ETF.
*** This Sub-Fund is fully collateralized.
105
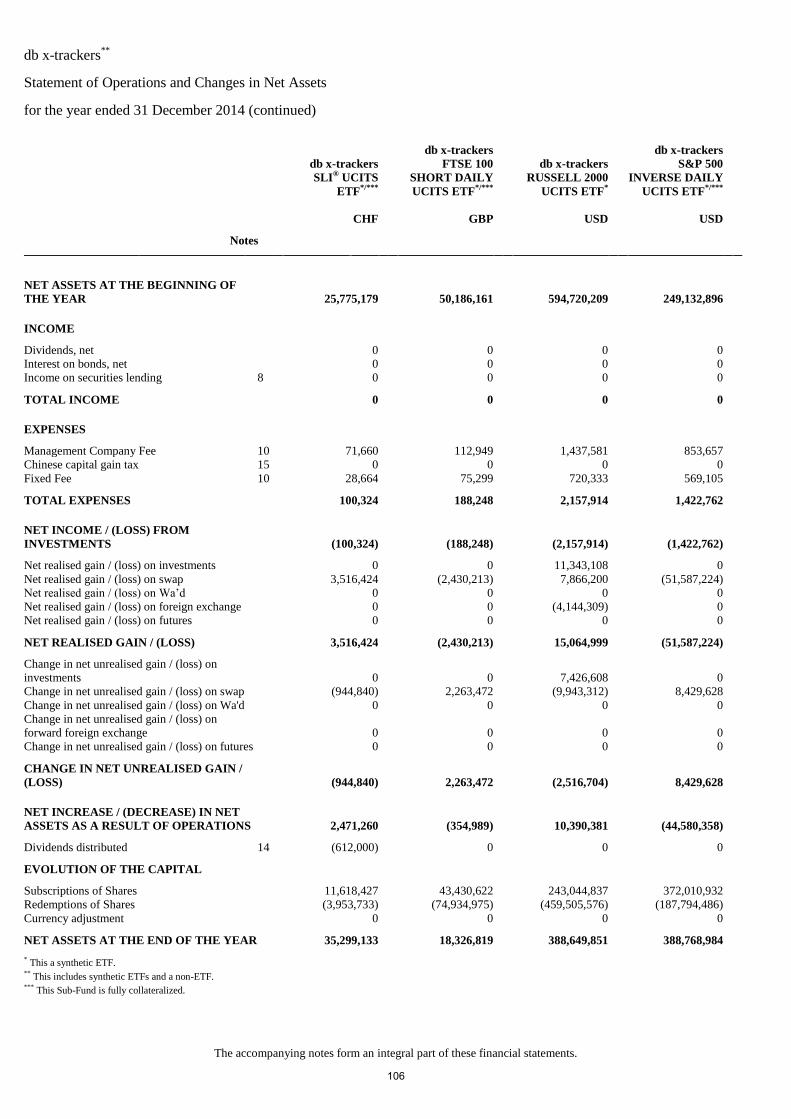
db x-trackers**
Statement of Operations and Changes in Net Assets
for the year ended 31 December 2014 (continued)
The accompanying notes form an integral part of these financial statements.
db x-trackers
SLI® UCITS
ETF*/***
db x-trackers
FTSE 100
SHORT DAILY
UCITS ETF*/***
db x-trackers
RUSSELL 2000
UCITS ETF*
db x-trackers
S&P 500
INVERSE DAILY
UCITS ETF*/***
CHF GBP USD USD
Notes
NET ASSETS AT THE BEGINNING OF
THE YEAR 25,775,179 50,186,161 594,720,209 249,132,896
INCOME
Dividends, net 0 0 0 0
Interest on bonds, net 0 0 0 0
Income on securities lending 8 0 0 0 0
TOTAL INCOME 0 0 0 0
EXPENSES
Management Company Fee 10 71,660 112,949 1,437,581 853,657
Chinese capital gain tax 15 0 0 0 0
Fixed Fee 10 28,664 75,299 720,333 569,105
TOTAL EXPENSES 100,324 188,248 2,157,914 1,422,762
NET INCOME / (LOSS) FROM
INVESTMENTS (100,324) (188,248) (2,157,914) (1,422,762)
Net realised gain / (loss) on investments 0 0 11,343,108 0
Net realised gain / (loss) on swap 3,516,424 (2,430,213) 7,866,200 (51,587,224)
Net realised gain / (loss) on Wa’d 0 0 0 0
Net realised gain / (loss) on foreign exchange 0 0 (4,144,309) 0
Net realised gain / (loss) on futures 0 0 0 0
NET REALISED GAIN / (LOSS) 3,516,424 (2,430,213) 15,064,999 (51,587,224)
Change in net unrealised gain / (loss) on
investments
0 0 7,426,608 0
Change in net unrealised gain / (loss) on swap (944,840) 2,263,472 (9,943,312) 8,429,628
Change in net unrealised gain / (loss) on Wa'd 0 0 0 0
Change in net unrealised gain / (loss) on
forward foreign exchange
0 0 0 0
Change in net unrealised gain / (loss) on futures 0 0 0 0
CHANGE IN NET UNREALISED GAIN /
(LOSS) (944,840) 2,263,472 (2,516,704) 8,429,628
NET INCREASE / (DECREASE) IN NET
ASSETS AS A RESULT OF OPERATIONS 2,471,260 (354,989) 10,390,381 (44,580,358)
Dividends distributed 14 (612,000) 0 0 0
EVOLUTION OF THE CAPITAL
Subscriptions of Shares 11,618,427 43,430,622 243,044,837 372,010,932
Redemptions of Shares (3,953,733) (74,934,975) (459,505,576) (187,794,486)
Currency adjustment 0 0 0 0
NET ASSETS AT THE END OF THE YEAR 35,299,133 18,326,819 388,649,851 388,768,984
* This a synthetic ETF.
** This includes synthetic ETFs and a non-ETF.
*** This Sub-Fund is fully collateralized.
106
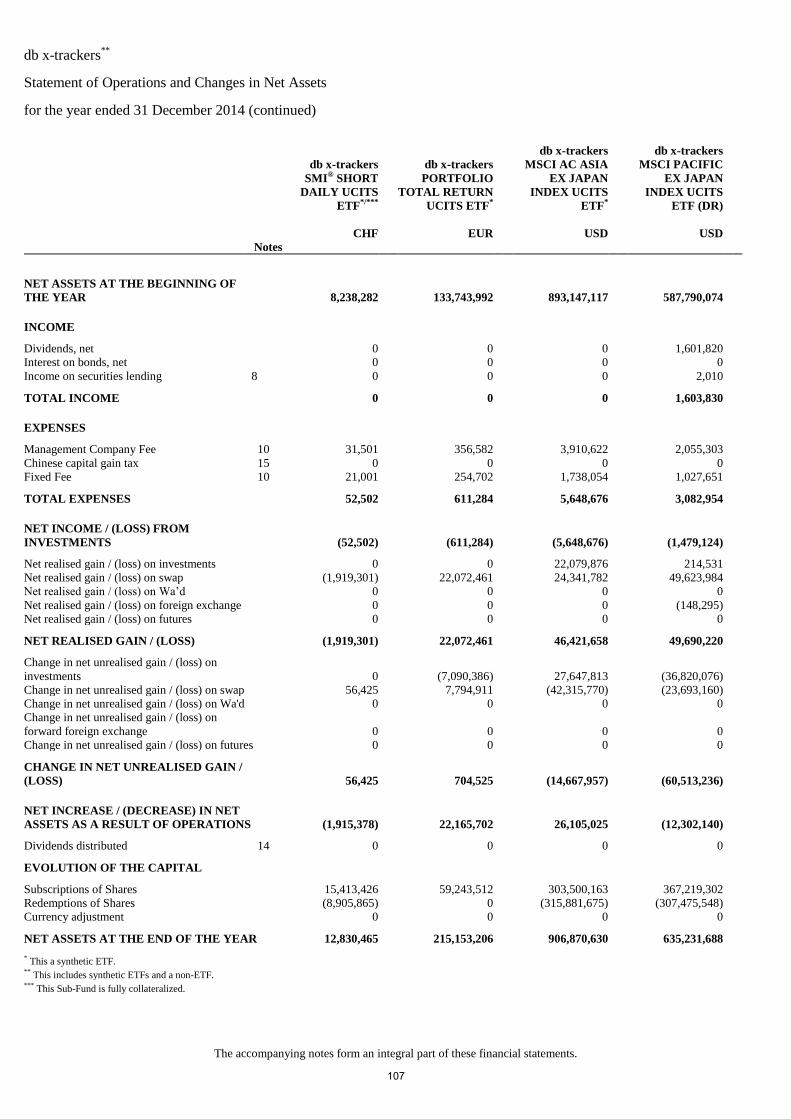
db x-trackers**
Statement of Operations and Changes in Net Assets
for the year ended 31 December 2014 (continued)
The accompanying notes form an integral part of these financial statements.
db x-trackers
SMI® SHORT
DAILY UCITS
ETF*/***
db x-trackers
PORTFOLIO
TOTAL RETURN
UCITS ETF*
db x-trackers
MSCI AC ASIA
EX JAPAN
INDEX UCITS
ETF*
db x-trackers
MSCI PACIFIC
EX JAPAN
INDEX UCITS
ETF (DR)
CHF EUR USD USD
Notes
NET ASSETS AT THE BEGINNING OF
THE YEAR 8,238,282 133,743,992 893,147,117 587,790,074
INCOME
Dividends, net 0 0 0 1,601,820
Interest on bonds, net 0 0 0 0
Income on securities lending 8 0 0 0 2,010
TOTAL INCOME 0 0 0 1,603,830
EXPENSES
Management Company Fee 10 31,501 356,582 3,910,622 2,055,303
Chinese capital gain tax 15 0 0 0 0
Fixed Fee 10 21,001 254,702 1,738,054 1,027,651
TOTAL EXPENSES 52,502 611,284 5,648,676 3,082,954
NET INCOME / (LOSS) FROM
INVESTMENTS (52,502) (611,284) (5,648,676) (1,479,124)
Net realised gain / (loss) on investments 0 0 22,079,876 214,531
Net realised gain / (loss) on swap (1,919,301) 22,072,461 24,341,782 49,623,984
Net realised gain / (loss) on Wa’d 0 0 0 0
Net realised gain / (loss) on foreign exchange 0 0 0 (148,295)
Net realised gain / (loss) on futures 0 0 0 0
NET REALISED GAIN / (LOSS) (1,919,301) 22,072,461 46,421,658 49,690,220
Change in net unrealised gain / (loss) on
investments
0 (7,090,386) 27,647,813 (36,820,076)
Change in net unrealised gain / (loss) on swap 56,425 7,794,911 (42,315,770) (23,693,160)
Change in net unrealised gain / (loss) on Wa'd 0 0 0 0
Change in net unrealised gain / (loss) on
forward foreign exchange
0 0 0 0
Change in net unrealised gain / (loss) on futures 0 0 0 0
CHANGE IN NET UNREALISED GAIN /
(LOSS) 56,425 704,525 (14,667,957) (60,513,236)
NET INCREASE / (DECREASE) IN NET
ASSETS AS A RESULT OF OPERATIONS (1,915,378) 22,165,702 26,105,025 (12,302,140)
Dividends distributed 14 0 0 0 0
EVOLUTION OF THE CAPITAL
Subscriptions of Shares 15,413,426 59,243,512 303,500,163 367,219,302
Redemptions of Shares (8,905,865) 0 (315,881,675) (307,475,548)
Currency adjustment 0 0 0 0
NET ASSETS AT THE END OF THE YEAR 12,830,465 215,153,206 906,870,630 635,231,688
* This a synthetic ETF.
** This includes synthetic ETFs and a non-ETF.
*** This Sub-Fund is fully collateralized.
107
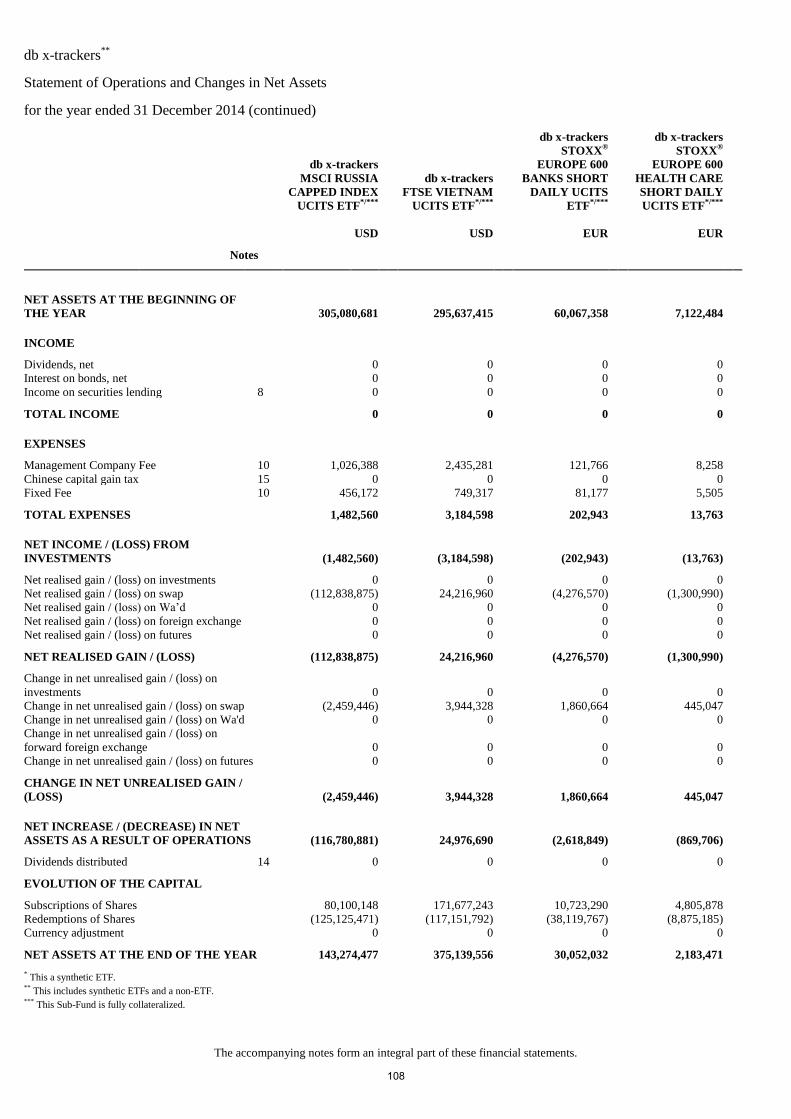
db x-trackers**
Statement of Operations and Changes in Net Assets
for the year ended 31 December 2014 (continued)
The accompanying notes form an integral part of these financial statements.
db x-trackers
MSCI RUSSIA
CAPPED INDEX
UCITS ETF*/***
db x-trackers
FTSE VIETNAM
UCITS ETF*/***
db x-trackers
STOXX®
EUROPE 600
BANKS SHORT
DAILY UCITS
ETF*/***
db x-trackers
STOXX®
EUROPE 600
HEALTH CARE
SHORT DAILY
UCITS ETF*/***
USD USD EUR EUR
Notes
NET ASSETS AT THE BEGINNING OF
THE YEAR 305,080,681 295,637,415 60,067,358 7,122,484
INCOME
Dividends, net 0 0 0 0
Interest on bonds, net 0 0 0 0
Income on securities lending 8 0 0 0 0
TOTAL INCOME 0 0 0 0
EXPENSES
Management Company Fee 10 1,026,388 2,435,281 121,766 8,258
Chinese capital gain tax 15 0 0 0 0
Fixed Fee 10 456,172 749,317 81,177 5,505
TOTAL EXPENSES 1,482,560 3,184,598 202,943 13,763
NET INCOME / (LOSS) FROM
INVESTMENTS (1,482,560) (3,184,598) (202,943) (13,763)
Net realised gain / (loss) on investments 0 0 0 0
Net realised gain / (loss) on swap (112,838,875) 24,216,960 (4,276,570) (1,300,990)
Net realised gain / (loss) on Wa’d 0 0 0 0
Net realised gain / (loss) on foreign exchange 0 0 0 0
Net realised gain / (loss) on futures 0 0 0 0
NET REALISED GAIN / (LOSS) (112,838,875) 24,216,960 (4,276,570) (1,300,990)
Change in net unrealised gain / (loss) on
investments
0 0 0 0
Change in net unrealised gain / (loss) on swap (2,459,446) 3,944,328 1,860,664 445,047
Change in net unrealised gain / (loss) on Wa'd 0 0 0 0
Change in net unrealised gain / (loss) on
forward foreign exchange
0 0 0 0
Change in net unrealised gain / (loss) on futures 0 0 0 0
CHANGE IN NET UNREALISED GAIN /
(LOSS) (2,459,446) 3,944,328 1,860,664 445,047
NET INCREASE / (DECREASE) IN NET
ASSETS AS A RESULT OF OPERATIONS (116,780,881) 24,976,690 (2,618,849) (869,706)
Dividends distributed 14 0 0 0 0
EVOLUTION OF THE CAPITAL
Subscriptions of Shares 80,100,148 171,677,243 10,723,290 4,805,878
Redemptions of Shares (125,125,471) (117,151,792) (38,119,767) (8,875,185)
Currency adjustment 0 0 0 0
NET ASSETS AT THE END OF THE YEAR 143,274,477 375,139,556 30,052,032 2,183,471
* This a synthetic ETF.
** This includes synthetic ETFs and a non-ETF.
*** This Sub-Fund is fully collateralized.
108
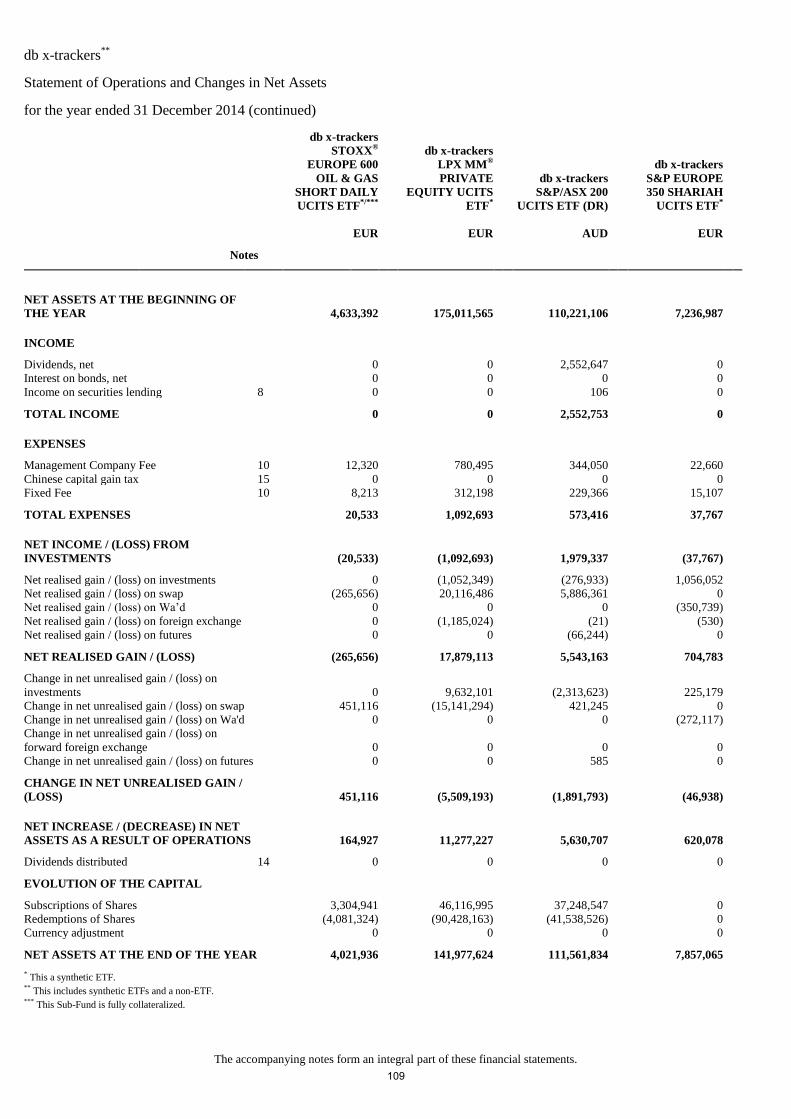
db x-trackers**
Statement of Operations and Changes in Net Assets
for the year ended 31 December 2014 (continued)
The accompanying notes form an integral part of these financial statements.
db x-trackers
STOXX®
EUROPE 600
OIL & GAS
SHORT DAILY
UCITS ETF*/***
db x-trackers
LPX MM®
PRIVATE
EQUITY UCITS
ETF*
db x-trackers
S&P/ASX 200
UCITS ETF (DR)
db x-trackers
S&P EUROPE
350 SHARIAH
UCITS ETF*
EUR EUR AUD EUR
Notes
NET ASSETS AT THE BEGINNING OF
THE YEAR 4,633,392 175,011,565 110,221,106 7,236,987
INCOME
Dividends, net 0 0 2,552,647 0
Interest on bonds, net 0 0 0 0
Income on securities lending 8 0 0 106 0
TOTAL INCOME 0 0 2,552,753 0
EXPENSES
Management Company Fee 10 12,320 780,495 344,050 22,660
Chinese capital gain tax 15 0 0 0 0
Fixed Fee 10 8,213 312,198 229,366 15,107
TOTAL EXPENSES 20,533 1,092,693 573,416 37,767
NET INCOME / (LOSS) FROM
INVESTMENTS (20,533) (1,092,693) 1,979,337 (37,767)
Net realised gain / (loss) on investments 0 (1,052,349) (276,933) 1,056,052
Net realised gain / (loss) on swap (265,656) 20,116,486 5,886,361 0
Net realised gain / (loss) on Wa’d 0 0 0 (350,739)
Net realised gain / (loss) on foreign exchange 0 (1,185,024) (21) (530)
Net realised gain / (loss) on futures 0 0 (66,244) 0
NET REALISED GAIN / (LOSS) (265,656) 17,879,113 5,543,163 704,783
Change in net unrealised gain / (loss) on
investments
0 9,632,101 (2,313,623) 225,179
Change in net unrealised gain / (loss) on swap 451,116 (15,141,294) 421,245 0
Change in net unrealised gain / (loss) on Wa'd 0 0 0 (272,117)
Change in net unrealised gain / (loss) on
forward foreign exchange
0 0 0 0
Change in net unrealised gain / (loss) on futures 0 0 585 0
CHANGE IN NET UNREALISED GAIN /
(LOSS) 451,116 (5,509,193) (1,891,793) (46,938)
NET INCREASE / (DECREASE) IN NET
ASSETS AS A RESULT OF OPERATIONS 164,927 11,277,227 5,630,707 620,078
Dividends distributed 14 0 0 0 0
EVOLUTION OF THE CAPITAL
Subscriptions of Shares 3,304,941 46,116,995 37,248,547 0
Redemptions of Shares (4,081,324) (90,428,163) (41,538,526) 0
Currency adjustment 0 0 0 0
NET ASSETS AT THE END OF THE YEAR 4,021,936 141,977,624 111,561,834 7,857,065
* This a synthetic ETF.
** This includes synthetic ETFs and a non-ETF.
*** This Sub-Fund is fully collateralized.
109
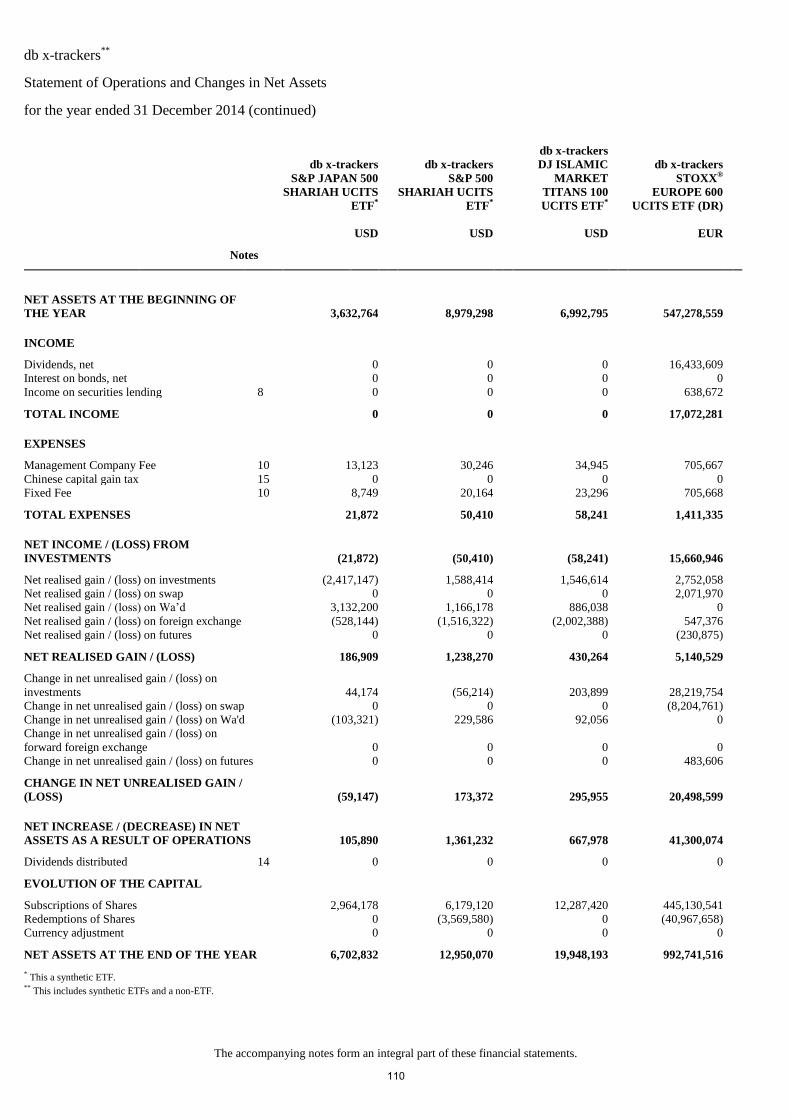
db x-trackers**
Statement of Operations and Changes in Net Assets
for the year ended 31 December 2014 (continued)
The accompanying notes form an integral part of these financial statements.
db x-trackers
S&P JAPAN 500
SHARIAH UCITS
ETF*
db x-trackers
S&P 500
SHARIAH UCITS
ETF*
db x-trackers
DJ ISLAMIC
MARKET
TITANS 100
UCITS ETF*
db x-trackers
STOXX®
EUROPE 600
UCITS ETF (DR)
USD USD USD EUR
Notes
NET ASSETS AT THE BEGINNING OF
THE YEAR 3,632,764 8,979,298 6,992,795 547,278,559
INCOME
Dividends, net 0 0 0 16,433,609
Interest on bonds, net 0 0 0 0
Income on securities lending 8 0 0 0 638,672
TOTAL INCOME 0 0 0 17,072,281
EXPENSES
Management Company Fee 10 13,123 30,246 34,945 705,667
Chinese capital gain tax 15 0 0 0 0
Fixed Fee 10 8,749 20,164 23,296 705,668
TOTAL EXPENSES 21,872 50,410 58,241 1,411,335
NET INCOME / (LOSS) FROM
INVESTMENTS (21,872) (50,410) (58,241) 15,660,946
Net realised gain / (loss) on investments (2,417,147) 1,588,414 1,546,614 2,752,058
Net realised gain / (loss) on swap 0 0 0 2,071,970
Net realised gain / (loss) on Wa’d 3,132,200 1,166,178 886,038 0
Net realised gain / (loss) on foreign exchange (528,144) (1,516,322) (2,002,388) 547,376
Net realised gain / (loss) on futures 0 0 0 (230,875)
NET REALISED GAIN / (LOSS) 186,909 1,238,270 430,264 5,140,529
Change in net unrealised gain / (loss) on
investments
44,174 (56,214) 203,899 28,219,754
Change in net unrealised gain / (loss) on swap 0 0 0 (8,204,761)
Change in net unrealised gain / (loss) on Wa'd (103,321) 229,586 92,056 0
Change in net unrealised gain / (loss) on
forward foreign exchange
0 0 0 0
Change in net unrealised gain / (loss) on futures 0 0 0 483,606
CHANGE IN NET UNREALISED GAIN /
(LOSS) (59,147) 173,372 295,955 20,498,599
NET INCREASE / (DECREASE) IN NET
ASSETS AS A RESULT OF OPERATIONS 105,890 1,361,232 667,978 41,300,074
Dividends distributed 14 0 0 0 0
EVOLUTION OF THE CAPITAL
Subscriptions of Shares 2,964,178 6,179,120 12,287,420 445,130,541
Redemptions of Shares 0 (3,569,580) 0 (40,967,658)
Currency adjustment 0 0 0 0
NET ASSETS AT THE END OF THE YEAR 6,702,832 12,950,070 19,948,193 992,741,516
* This a synthetic ETF.
** This includes synthetic ETFs and a non-ETF.
110
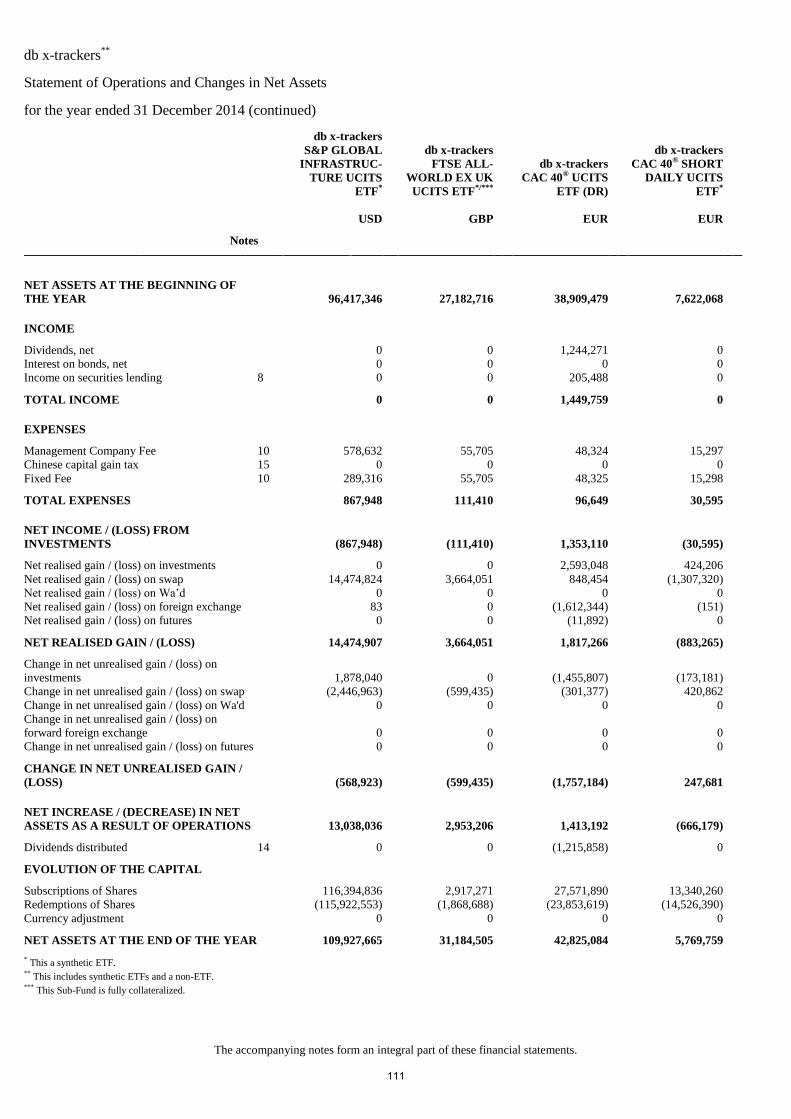
db x-trackers**
Statement of Operations and Changes in Net Assets
for the year ended 31 December 2014 (continued)
The accompanying notes form an integral part of these financial statements.
db x-trackers
S&P GLOBAL
INFRASTRUC-
TURE UCITS
ETF*
db x-trackers
FTSE ALL-
WORLD EX UK
UCITS ETF*/***
db x-trackers
CAC 40® UCITS
ETF (DR)
db x-trackers
CAC 40® SHORT
DAILY UCITS
ETF*
USD GBP EUR EUR
Notes
NET ASSETS AT THE BEGINNING OF
THE YEAR 96,417,346 27,182,716 38,909,479 7,622,068
INCOME
Dividends, net 0 0 1,244,271 0
Interest on bonds, net 0 0 0 0
Income on securities lending 8 0 0 205,488 0
TOTAL INCOME 0 0 1,449,759 0
EXPENSES
Management Company Fee 10 578,632 55,705 48,324 15,297
Chinese capital gain tax 15 0 0 0 0
Fixed Fee 10 289,316 55,705 48,325 15,298
TOTAL EXPENSES 867,948 111,410 96,649 30,595
NET INCOME / (LOSS) FROM
INVESTMENTS (867,948) (111,410) 1,353,110 (30,595)
Net realised gain / (loss) on investments 0 0 2,593,048 424,206
Net realised gain / (loss) on swap 14,474,824 3,664,051 848,454 (1,307,320)
Net realised gain / (loss) on Wa’d 0 0 0 0
Net realised gain / (loss) on foreign exchange 83 0 (1,612,344) (151)
Net realised gain / (loss) on futures 0 0 (11,892) 0
NET REALISED GAIN / (LOSS) 14,474,907 3,664,051 1,817,266 (883,265)
Change in net unrealised gain / (loss) on
investments
1,878,040 0 (1,455,807) (173,181)
Change in net unrealised gain / (loss) on swap (2,446,963) (599,435) (301,377) 420,862
Change in net unrealised gain / (loss) on Wa'd 0 0 0 0
Change in net unrealised gain / (loss) on
forward foreign exchange
0 0 0 0
Change in net unrealised gain / (loss) on futures 0 0 0 0
CHANGE IN NET UNREALISED GAIN /
(LOSS) (568,923) (599,435) (1,757,184) 247,681
NET INCREASE / (DECREASE) IN NET
ASSETS AS A RESULT OF OPERATIONS 13,038,036 2,953,206 1,413,192 (666,179)
Dividends distributed 14 0 0 (1,215,858) 0
EVOLUTION OF THE CAPITAL
Subscriptions of Shares 116,394,836 2,917,271 27,571,890 13,340,260
Redemptions of Shares (115,922,553) (1,868,688) (23,853,619) (14,526,390)
Currency adjustment 0 0 0 0
NET ASSETS AT THE END OF THE YEAR 109,927,665 31,184,505 42,825,084 5,769,759
* This a synthetic ETF.
** This includes synthetic ETFs and a non-ETF.
*** This Sub-Fund is fully collateralized.
111
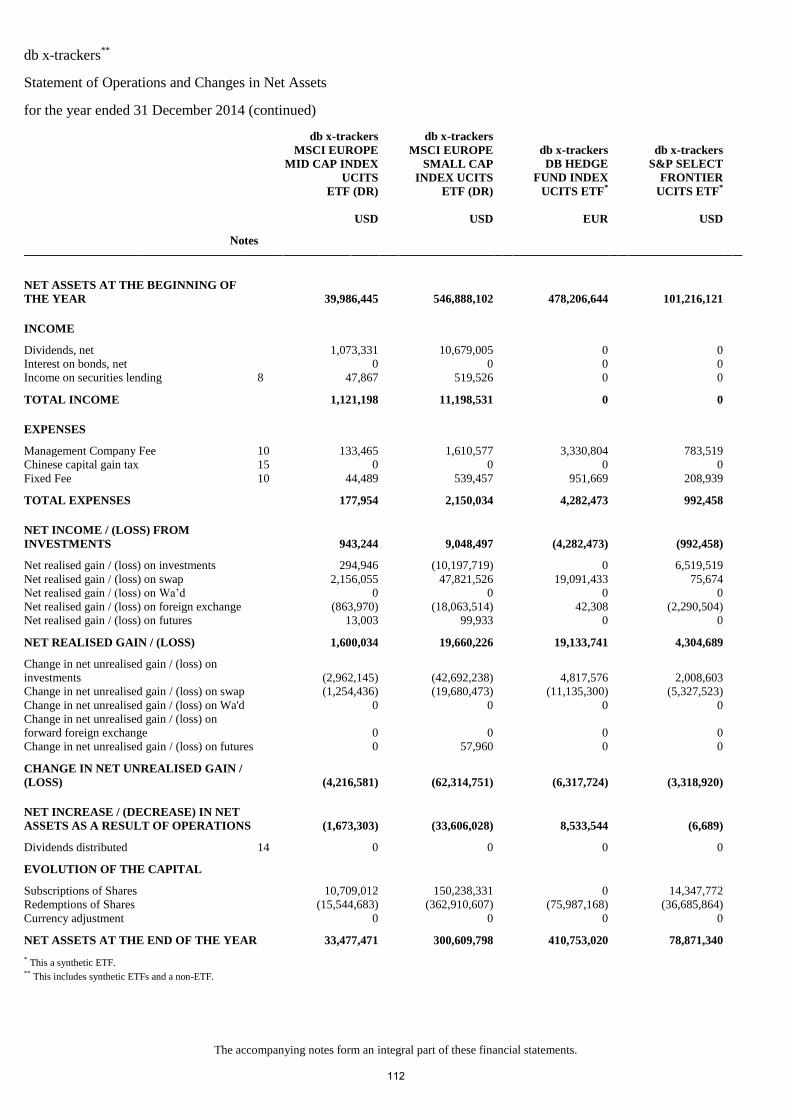
db x-trackers**
Statement of Operations and Changes in Net Assets
for the year ended 31 December 2014 (continued)
The accompanying notes form an integral part of these financial statements.
db x-trackers
MSCI EUROPE
MID CAP INDEX
UCITS
ETF (DR)
db x-trackers
MSCI EUROPE
SMALL CAP
INDEX UCITS
ETF (DR)
db x-trackers
DB HEDGE
FUND INDEX
UCITS ETF*
db x-trackers
S&P SELECT
FRONTIER
UCITS ETF*
USD USD EUR USD
Notes
NET ASSETS AT THE BEGINNING OF
THE YEAR 39,986,445 546,888,102 478,206,644 101,216,121
INCOME
Dividends, net 1,073,331 10,679,005 0 0
Interest on bonds, net 0 0 0 0
Income on securities lending 8 47,867 519,526 0 0
TOTAL INCOME 1,121,198 11,198,531 0 0
EXPENSES
Management Company Fee 10 133,465 1,610,577 3,330,804 783,519
Chinese capital gain tax 15 0 0 0 0
Fixed Fee 10 44,489 539,457 951,669 208,939
TOTAL EXPENSES 177,954 2,150,034 4,282,473 992,458
NET INCOME / (LOSS) FROM
INVESTMENTS 943,244 9,048,497 (4,282,473) (992,458)
Net realised gain / (loss) on investments 294,946 (10,197,719) 0 6,519,519
Net realised gain / (loss) on swap 2,156,055 47,821,526 19,091,433 75,674
Net realised gain / (loss) on Wa’d 0 0 0 0
Net realised gain / (loss) on foreign exchange (863,970) (18,063,514) 42,308 (2,290,504)
Net realised gain / (loss) on futures 13,003 99,933 0 0
NET REALISED GAIN / (LOSS) 1,600,034 19,660,226 19,133,741 4,304,689
Change in net unrealised gain / (loss) on
investments
(2,962,145) (42,692,238) 4,817,576 2,008,603
Change in net unrealised gain / (loss) on swap (1,254,436) (19,680,473) (11,135,300) (5,327,523)
Change in net unrealised gain / (loss) on Wa'd 0 0 0 0
Change in net unrealised gain / (loss) on
forward foreign exchange
0 0 0 0
Change in net unrealised gain / (loss) on futures 0 57,960 0 0
CHANGE IN NET UNREALISED GAIN /
(LOSS) (4,216,581) (62,314,751) (6,317,724) (3,318,920)
NET INCREASE / (DECREASE) IN NET
ASSETS AS A RESULT OF OPERATIONS (1,673,303) (33,606,028) 8,533,544 (6,689)
Dividends distributed 14 0 0 0 0
EVOLUTION OF THE CAPITAL
Subscriptions of Shares 10,709,012 150,238,331 0 14,347,772
Redemptions of Shares (15,544,683) (362,910,607) (75,987,168) (36,685,864)
Currency adjustment 0 0 0 0
NET ASSETS AT THE END OF THE YEAR 33,477,471 300,609,798 410,753,020 78,871,340
* This a synthetic ETF.
** This includes synthetic ETFs and a non-ETF.
112

db x-trackers**
Statement of Operations and Changes in Net Assets
for the year ended 31 December 2014 (continued)
The accompanying notes form an integral part of these financial statements.
db x-trackers
US DOLLAR
CASH UCITS
ETF*
db x-trackers
HSI SHORT
DAILY UCITS
ETF*/***
db x-trackers
MSCI BRIC
INDEX UCITS
ETF*/***
db x-trackers
S&P 500 2X
LEVERAGED
DAILY UCITS
ETF*/***
USD HKD USD USD
Notes
NET ASSETS AT THE BEGINNING OF
THE YEAR 38,843,250 45,204,488 9,455,778 49,973,166
INCOME
Dividends, net 0 0 0 0
Interest on bonds, net 1,270,137 0 0 0
Income on securities lending 8 0 0 0 0
TOTAL INCOME 1,270,137 0 0 0
EXPENSES
Management Company Fee 10 18,021 282,515 52,125 236,306
Chinese capital gain tax 15 0 0 0 0
Fixed Fee 10 36,041 102,734 23,166 118,153
TOTAL EXPENSES 54,062 385,249 75,291 354,459
NET INCOME / (LOSS) FROM
INVESTMENTS 1,216,075 (385,249) (75,291) (354,459)
Net realised gain / (loss) on investments 704,216 0 0 0
Net realised gain / (loss) on swap (864,617) (5,931,477) 142,384 16,709,184
Net realised gain / (loss) on Wa’d 0 0 0 0
Net realised gain / (loss) on foreign exchange (573,503) 32,536 0 0
Net realised gain / (loss) on futures 0 0 0 0
NET REALISED GAIN / (LOSS) (733,904) (5,898,941) 142,384 16,709,184
Change in net unrealised gain / (loss) on
investments
269,786 0 0 0
Change in net unrealised gain / (loss) on swap (773,952) 1,051,989 (360,199) (2,420,854)
Change in net unrealised gain / (loss) on Wa'd 0 0 0 0
Change in net unrealised gain / (loss) on
forward foreign exchange
0 0 0 0
Change in net unrealised gain / (loss) on futures 0 0 0 0
CHANGE IN NET UNREALISED GAIN /
(LOSS) (504,166) 1,051,989 (360,199) (2,420,854)
NET INCREASE / (DECREASE) IN NET
ASSETS AS A RESULT OF OPERATIONS (21,995) (5,232,201) (293,106) 13,933,871
Dividends distributed 14 0 0 0 0
EVOLUTION OF THE CAPITAL
Subscriptions of Shares 15,084,748 24,495,273 3,377,376 70,868,689
Redemptions of Shares (23,891,772) (50,005,742) (1,792,596) (69,117,213)
Currency adjustment 0 0 0 0
NET ASSETS AT THE END OF THE YEAR 30,014,231 14,461,818 10,747,452 65,658,513
* This a synthetic ETF.
** This includes synthetic ETFs and a non-ETF.
*** This Sub-Fund is fully collateralized.
113
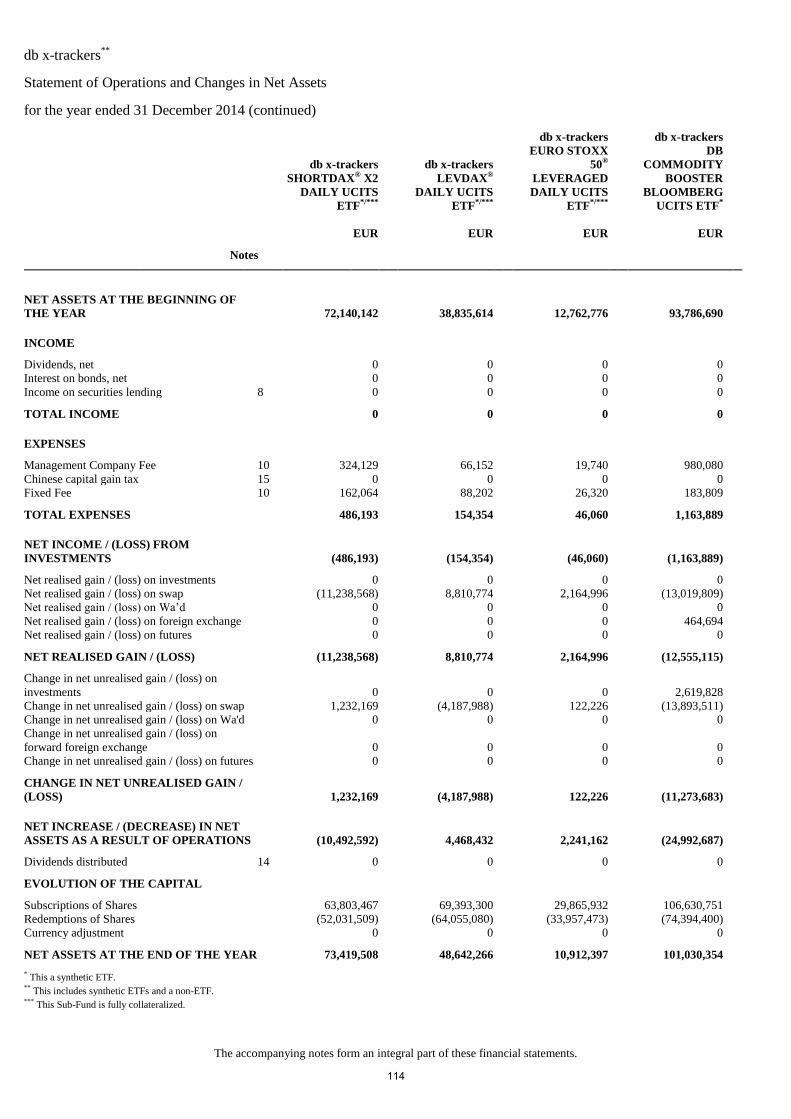
db x-trackers**
Statement of Operations and Changes in Net Assets
for the year ended 31 December 2014 (continued)
The accompanying notes form an integral part of these financial statements.
db x-trackers
SHORTDAX® X2
DAILY UCITS
ETF*/***
db x-trackers
LEVDAX®
DAILY UCITS
ETF*/***
db x-trackers
EURO STOXX
50®
LEVERAGED
DAILY UCITS
ETF*/***
db x-trackers
DB
COMMODITY
BOOSTER
BLOOMBERG
UCITS ETF*
EUR EUR EUR EUR
Notes
NET ASSETS AT THE BEGINNING OF
THE YEAR 72,140,142 38,835,614 12,762,776 93,786,690
INCOME
Dividends, net 0 0 0 0
Interest on bonds, net 0 0 0 0
Income on securities lending 8 0 0 0 0
TOTAL INCOME 0 0 0 0
EXPENSES
Management Company Fee 10 324,129 66,152 19,740 980,080
Chinese capital gain tax 15 0 0 0 0
Fixed Fee 10 162,064 88,202 26,320 183,809
TOTAL EXPENSES 486,193 154,354 46,060 1,163,889
NET INCOME / (LOSS) FROM
INVESTMENTS (486,193) (154,354) (46,060) (1,163,889)
Net realised gain / (loss) on investments 0 0 0 0
Net realised gain / (loss) on swap (11,238,568) 8,810,774 2,164,996 (13,019,809)
Net realised gain / (loss) on Wa’d 0 0 0 0
Net realised gain / (loss) on foreign exchange 0 0 0 464,694
Net realised gain / (loss) on futures 0 0 0 0
NET REALISED GAIN / (LOSS) (11,238,568) 8,810,774 2,164,996 (12,555,115)
Change in net unrealised gain / (loss) on
investments
0 0 0 2,619,828
Change in net unrealised gain / (loss) on swap 1,232,169 (4,187,988) 122,226 (13,893,511)
Change in net unrealised gain / (loss) on Wa'd 0 0 0 0
Change in net unrealised gain / (loss) on
forward foreign exchange
0 0 0 0
Change in net unrealised gain / (loss) on futures 0 0 0 0
CHANGE IN NET UNREALISED GAIN /
(LOSS) 1,232,169 (4,187,988) 122,226 (11,273,683)
NET INCREASE / (DECREASE) IN NET
ASSETS AS A RESULT OF OPERATIONS (10,492,592) 4,468,432 2,241,162 (24,992,687)
Dividends distributed 14 0 0 0 0
EVOLUTION OF THE CAPITAL
Subscriptions of Shares 63,803,467 69,393,300 29,865,932 106,630,751
Redemptions of Shares (52,031,509) (64,055,080) (33,957,473) (74,394,400)
Currency adjustment 0 0 0 0
NET ASSETS AT THE END OF THE YEAR 73,419,508 48,642,266 10,912,397 101,030,354
* This a synthetic ETF.
** This includes synthetic ETFs and a non-ETF.
*** This Sub-Fund is fully collateralized.
114
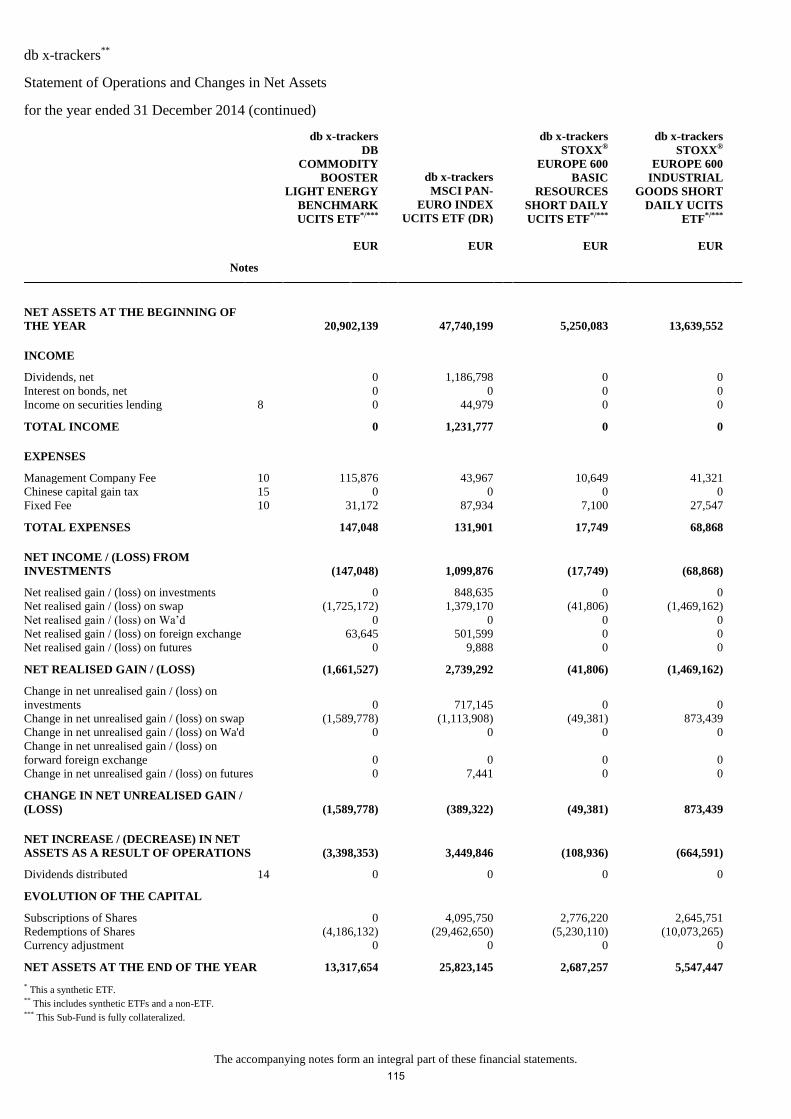
db x-trackers**
Statement of Operations and Changes in Net Assets
for the year ended 31 December 2014 (continued)
The accompanying notes form an integral part of these financial statements.
db x-trackers
DB
COMMODITY
BOOSTER
LIGHT ENERGY
BENCHMARK
UCITS ETF*/***
db x-trackers
MSCI PAN-
EURO INDEX
UCITS ETF (DR)
db x-trackers
STOXX®
EUROPE 600
BASIC
RESOURCES
SHORT DAILY
UCITS ETF*/***
db x-trackers
STOXX®
EUROPE 600
INDUSTRIAL
GOODS SHORT
DAILY UCITS
ETF*/***
EUR EUR EUR EUR
Notes
NET ASSETS AT THE BEGINNING OF
THE YEAR 20,902,139 47,740,199 5,250,083 13,639,552
INCOME
Dividends, net 0 1,186,798 0 0
Interest on bonds, net 0 0 0 0
Income on securities lending 8 0 44,979 0 0
TOTAL INCOME 0 1,231,777 0 0
EXPENSES
Management Company Fee 10 115,876 43,967 10,649 41,321
Chinese capital gain tax 15 0 0 0 0
Fixed Fee 10 31,172 87,934 7,100 27,547
TOTAL EXPENSES 147,048 131,901 17,749 68,868
NET INCOME / (LOSS) FROM
INVESTMENTS (147,048) 1,099,876 (17,749) (68,868)
Net realised gain / (loss) on investments 0 848,635 0 0
Net realised gain / (loss) on swap (1,725,172) 1,379,170 (41,806) (1,469,162)
Net realised gain / (loss) on Wa’d 0 0 0 0
Net realised gain / (loss) on foreign exchange 63,645 501,599 0 0
Net realised gain / (loss) on futures 0 9,888 0 0
NET REALISED GAIN / (LOSS) (1,661,527) 2,739,292 (41,806) (1,469,162)
Change in net unrealised gain / (loss) on
investments
0 717,145 0 0
Change in net unrealised gain / (loss) on swap (1,589,778) (1,113,908) (49,381) 873,439
Change in net unrealised gain / (loss) on Wa'd 0 0 0 0
Change in net unrealised gain / (loss) on
forward foreign exchange
0 0 0 0
Change in net unrealised gain / (loss) on futures 0 7,441 0 0
CHANGE IN NET UNREALISED GAIN /
(LOSS) (1,589,778) (389,322) (49,381) 873,439
NET INCREASE / (DECREASE) IN NET
ASSETS AS A RESULT OF OPERATIONS (3,398,353) 3,449,846 (108,936) (664,591)
Dividends distributed 14 0 0 0 0
EVOLUTION OF THE CAPITAL
Subscriptions of Shares 0 4,095,750 2,776,220 2,645,751
Redemptions of Shares (4,186,132) (29,462,650) (5,230,110) (10,073,265)
Currency adjustment 0 0 0 0
NET ASSETS AT THE END OF THE YEAR 13,317,654 25,823,145 2,687,257 5,547,447
* This a synthetic ETF.
** This includes synthetic ETFs and a non-ETF.
*** This Sub-Fund is fully collateralized.
115
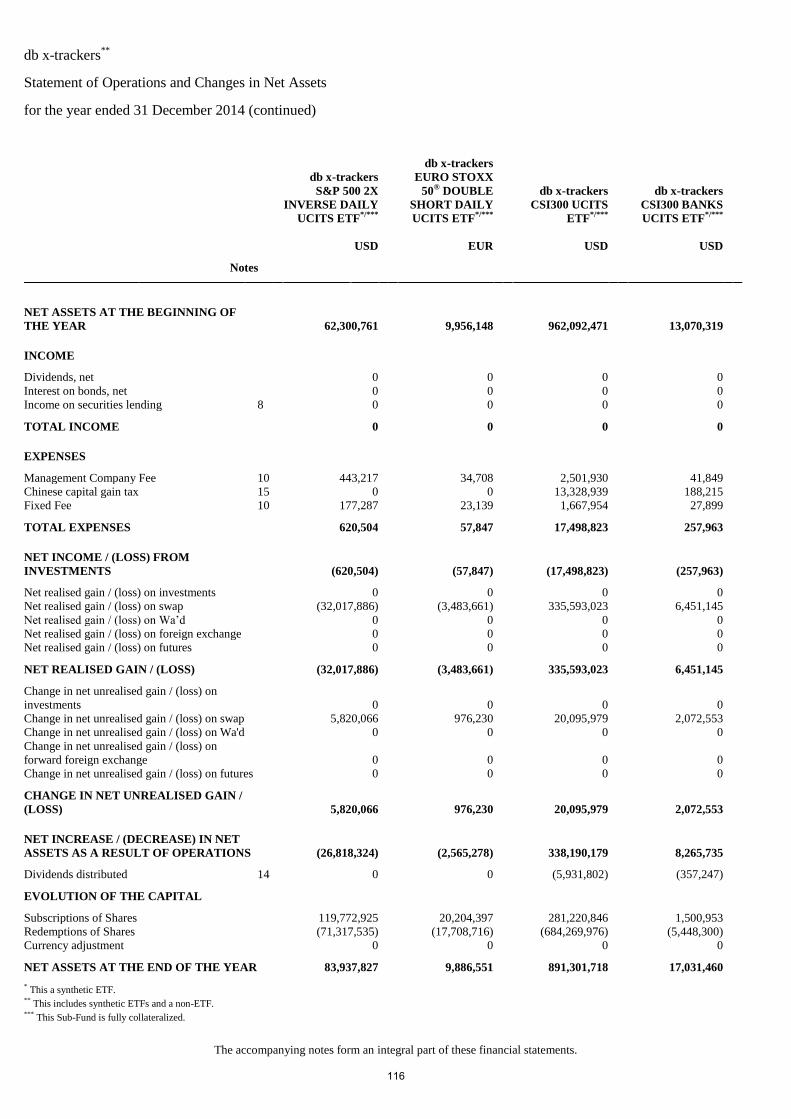
db x-trackers**
Statement of Operations and Changes in Net Assets
for the year ended 31 December 2014 (continued)
The accompanying notes form an integral part of these financial statements.
db x-trackers
S&P 500 2X
INVERSE DAILY
UCITS ETF*/***
db x-trackers
EURO STOXX
50® DOUBLE
SHORT DAILY
UCITS ETF*/***
db x-trackers
CSI300 UCITS
ETF*/***
db x-trackers
CSI300 BANKS
UCITS ETF*/***
USD EUR USD USD
Notes
NET ASSETS AT THE BEGINNING OF
THE YEAR 62,300,761 9,956,148 962,092,471 13,070,319
INCOME
Dividends, net 0 0 0 0
Interest on bonds, net 0 0 0 0
Income on securities lending 8 0 0 0 0
TOTAL INCOME 0 0 0 0
EXPENSES
Management Company Fee 10 443,217 34,708 2,501,930 41,849
Chinese capital gain tax 15 0 0 13,328,939 188,215
Fixed Fee 10 177,287 23,139 1,667,954 27,899
TOTAL EXPENSES 620,504 57,847 17,498,823 257,963
NET INCOME / (LOSS) FROM
INVESTMENTS (620,504) (57,847) (17,498,823) (257,963)
Net realised gain / (loss) on investments 0 0 0 0
Net realised gain / (loss) on swap (32,017,886) (3,483,661) 335,593,023 6,451,145
Net realised gain / (loss) on Wa’d 0 0 0 0
Net realised gain / (loss) on foreign exchange 0 0 0 0
Net realised gain / (loss) on futures 0 0 0 0
NET REALISED GAIN / (LOSS) (32,017,886) (3,483,661) 335,593,023 6,451,145
Change in net unrealised gain / (loss) on
investments
0 0 0 0
Change in net unrealised gain / (loss) on swap 5,820,066 976,230 20,095,979 2,072,553
Change in net unrealised gain / (loss) on Wa'd 0 0 0 0
Change in net unrealised gain / (loss) on
forward foreign exchange
0 0 0 0
Change in net unrealised gain / (loss) on futures 0 0 0 0
CHANGE IN NET UNREALISED GAIN /
(LOSS) 5,820,066 976,230 20,095,979 2,072,553
NET INCREASE / (DECREASE) IN NET
ASSETS AS A RESULT OF OPERATIONS (26,818,324) (2,565,278) 338,190,179 8,265,735
Dividends distributed 14 0 0 (5,931,802) (357,247)
EVOLUTION OF THE CAPITAL
Subscriptions of Shares 119,772,925 20,204,397 281,220,846 1,500,953
Redemptions of Shares (71,317,535) (17,708,716) (684,269,976) (5,448,300)
Currency adjustment 0 0 0 0
NET ASSETS AT THE END OF THE YEAR 83,937,827 9,886,551 891,301,718 17,031,460
* This a synthetic ETF.
** This includes synthetic ETFs and a non-ETF.
*** This Sub-Fund is fully collateralized.
116
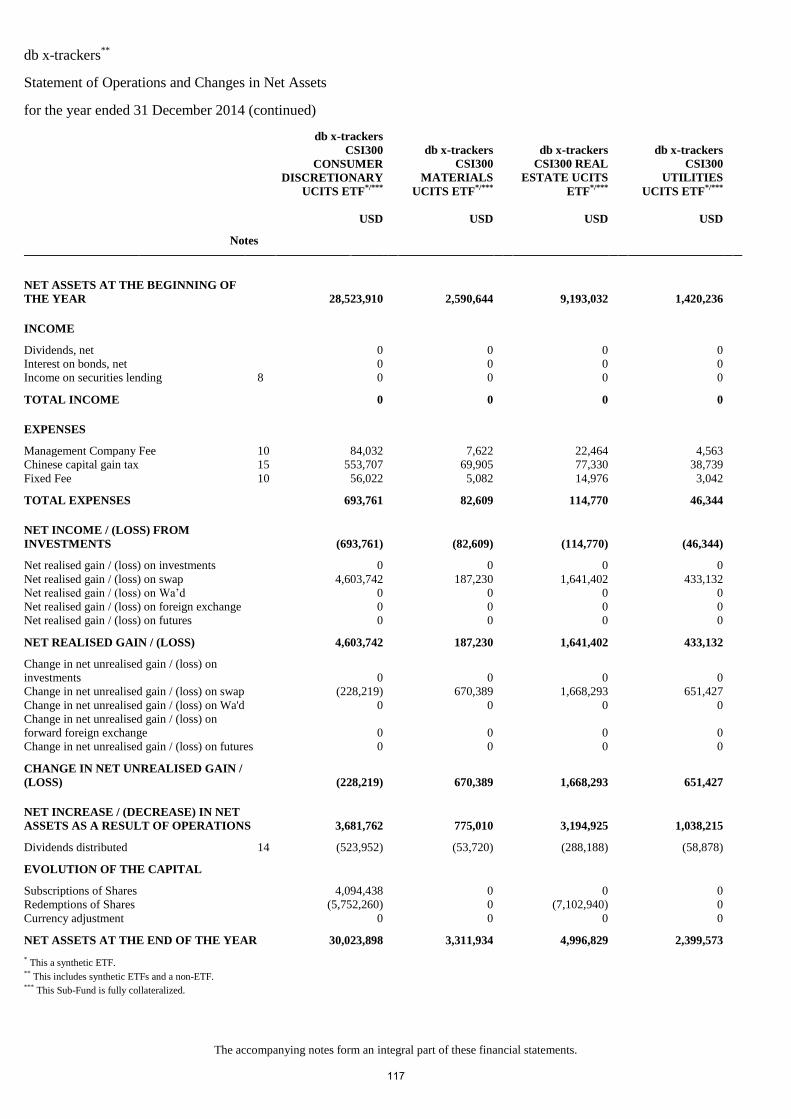
db x-trackers**
Statement of Operations and Changes in Net Assets
for the year ended 31 December 2014 (continued)
The accompanying notes form an integral part of these financial statements.
db x-trackers
CSI300
CONSUMER
DISCRETIONARY
UCITS ETF*/***
db x-trackers
CSI300
MATERIALS
UCITS ETF*/***
db x-trackers
CSI300 REAL
ESTATE UCITS
ETF*/***
db x-trackers
CSI300
UTILITIES
UCITS ETF*/***
USD USD USD USD
Notes
NET ASSETS AT THE BEGINNING OF
THE YEAR 28,523,910 2,590,644 9,193,032 1,420,236
INCOME
Dividends, net 0 0 0 0
Interest on bonds, net 0 0 0 0
Income on securities lending 8 0 0 0 0
TOTAL INCOME 0 0 0 0
EXPENSES
Management Company Fee 10 84,032 7,622 22,464 4,563
Chinese capital gain tax 15 553,707 69,905 77,330 38,739
Fixed Fee 10 56,022 5,082 14,976 3,042
TOTAL EXPENSES 693,761 82,609 114,770 46,344
NET INCOME / (LOSS) FROM
INVESTMENTS (693,761) (82,609) (114,770) (46,344)
Net realised gain / (loss) on investments 0 0 0 0
Net realised gain / (loss) on swap 4,603,742 187,230 1,641,402 433,132
Net realised gain / (loss) on Wa’d 0 0 0 0
Net realised gain / (loss) on foreign exchange 0 0 0 0
Net realised gain / (loss) on futures 0 0 0 0
NET REALISED GAIN / (LOSS) 4,603,742 187,230 1,641,402 433,132
Change in net unrealised gain / (loss) on
investments
0 0 0 0
Change in net unrealised gain / (loss) on swap (228,219) 670,389 1,668,293 651,427
Change in net unrealised gain / (loss) on Wa'd 0 0 0 0
Change in net unrealised gain / (loss) on
forward foreign exchange
0 0 0 0
Change in net unrealised gain / (loss) on futures 0 0 0 0
CHANGE IN NET UNREALISED GAIN /
(LOSS) (228,219) 670,389 1,668,293 651,427
NET INCREASE / (DECREASE) IN NET
ASSETS AS A RESULT OF OPERATIONS 3,681,762 775,010 3,194,925 1,038,215
Dividends distributed 14 (523,952) (53,720) (288,188) (58,878)
EVOLUTION OF THE CAPITAL
Subscriptions of Shares 4,094,438 0 0 0
Redemptions of Shares (5,752,260) 0 (7,102,940) 0
Currency adjustment 0 0 0 0
NET ASSETS AT THE END OF THE YEAR 30,023,898 3,311,934 4,996,829 2,399,573
* This a synthetic ETF.
** This includes synthetic ETFs and a non-ETF.
*** This Sub-Fund is fully collateralized.
117
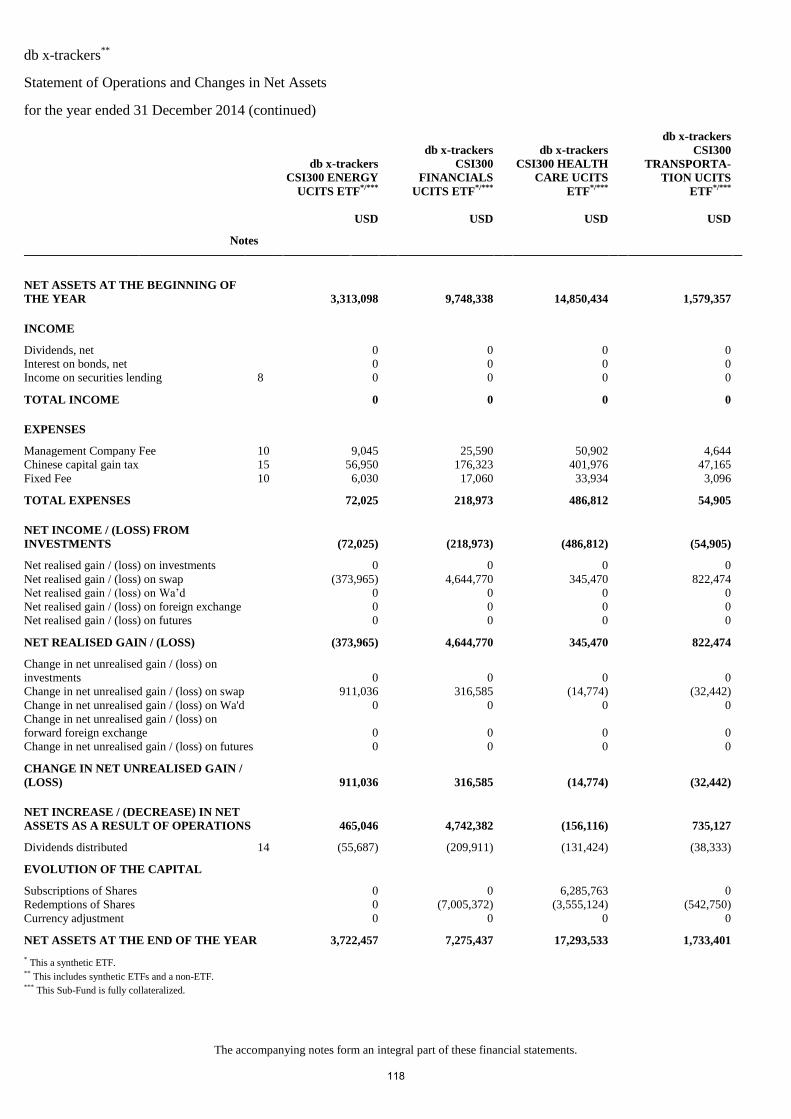
db x-trackers**
Statement of Operations and Changes in Net Assets
for the year ended 31 December 2014 (continued)
The accompanying notes form an integral part of these financial statements.
db x-trackers
CSI300 ENERGY
UCITS ETF*/***
db x-trackers
CSI300
FINANCIALS
UCITS ETF*/***
db x-trackers
CSI300 HEALTH
CARE UCITS
ETF*/***
db x-trackers
CSI300
TRANSPORTA-
TION UCITS
ETF*/***
USD USD USD USD
Notes
NET ASSETS AT THE BEGINNING OF
THE YEAR 3,313,098 9,748,338 14,850,434 1,579,357
INCOME
Dividends, net 0 0 0 0
Interest on bonds, net 0 0 0 0
Income on securities lending 8 0 0 0 0
TOTAL INCOME 0 0 0 0
EXPENSES
Management Company Fee 10 9,045 25,590 50,902 4,644
Chinese capital gain tax 15 56,950 176,323 401,976 47,165
Fixed Fee 10 6,030 17,060 33,934 3,096
TOTAL EXPENSES 72,025 218,973 486,812 54,905
NET INCOME / (LOSS) FROM
INVESTMENTS (72,025) (218,973) (486,812) (54,905)
Net realised gain / (loss) on investments 0 0 0 0
Net realised gain / (loss) on swap (373,965) 4,644,770 345,470 822,474
Net realised gain / (loss) on Wa’d 0 0 0 0
Net realised gain / (loss) on foreign exchange 0 0 0 0
Net realised gain / (loss) on futures 0 0 0 0
NET REALISED GAIN / (LOSS) (373,965) 4,644,770 345,470 822,474
Change in net unrealised gain / (loss) on
investments
0 0 0 0
Change in net unrealised gain / (loss) on swap 911,036 316,585 (14,774) (32,442)
Change in net unrealised gain / (loss) on Wa'd 0 0 0 0
Change in net unrealised gain / (loss) on
forward foreign exchange
0 0 0 0
Change in net unrealised gain / (loss) on futures 0 0 0 0
CHANGE IN NET UNREALISED GAIN /
(LOSS) 911,036 316,585 (14,774) (32,442)
NET INCREASE / (DECREASE) IN NET
ASSETS AS A RESULT OF OPERATIONS 465,046 4,742,382 (156,116) 735,127
Dividends distributed 14 (55,687) (209,911) (131,424) (38,333)
EVOLUTION OF THE CAPITAL
Subscriptions of Shares 0 0 6,285,763 0
Redemptions of Shares 0 (7,005,372) (3,555,124) (542,750)
Currency adjustment 0 0 0 0
NET ASSETS AT THE END OF THE YEAR 3,722,457 7,275,437 17,293,533 1,733,401
* This a synthetic ETF.
** This includes synthetic ETFs and a non-ETF.
*** This Sub-Fund is fully collateralized.
118
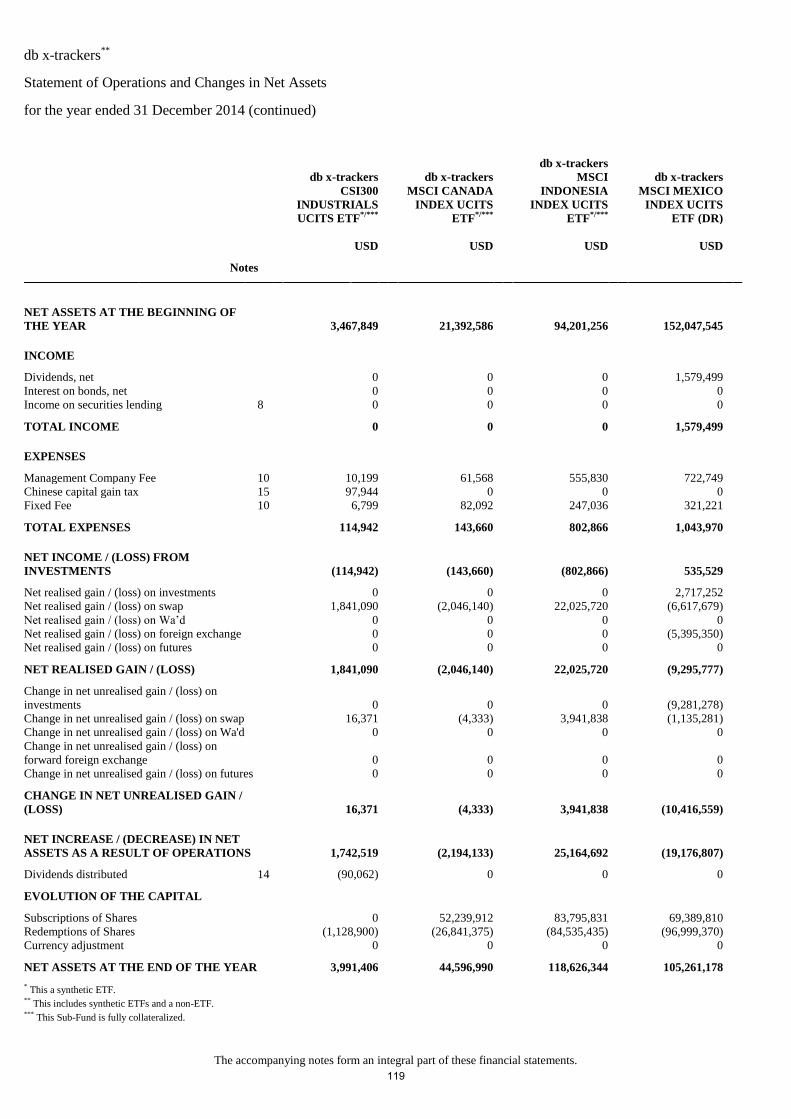
db x-trackers**
Statement of Operations and Changes in Net Assets
for the year ended 31 December 2014 (continued)
The accompanying notes form an integral part of these financial statements.
db x-trackers
CSI300
INDUSTRIALS
UCITS ETF*/***
db x-trackers
MSCI CANADA
INDEX UCITS
ETF*/***
db x-trackers
MSCI
INDONESIA
INDEX UCITS
ETF*/***
db x-trackers
MSCI MEXICO
INDEX UCITS
ETF (DR)
USD USD USD USD
Notes
NET ASSETS AT THE BEGINNING OF
THE YEAR 3,467,849 21,392,586 94,201,256 152,047,545
INCOME
Dividends, net 0 0 0 1,579,499
Interest on bonds, net 0 0 0 0
Income on securities lending 8 0 0 0 0
TOTAL INCOME 0 0 0 1,579,499
EXPENSES
Management Company Fee 10 10,199 61,568 555,830 722,749
Chinese capital gain tax 15 97,944 0 0 0
Fixed Fee 10 6,799 82,092 247,036 321,221
TOTAL EXPENSES 114,942 143,660 802,866 1,043,970
NET INCOME / (LOSS) FROM
INVESTMENTS (114,942) (143,660) (802,866) 535,529
Net realised gain / (loss) on investments 0 0 0 2,717,252
Net realised gain / (loss) on swap 1,841,090 (2,046,140) 22,025,720 (6,617,679)
Net realised gain / (loss) on Wa’d 0 0 0 0
Net realised gain / (loss) on foreign exchange 0 0 0 (5,395,350)
Net realised gain / (loss) on futures 0 0 0 0
NET REALISED GAIN / (LOSS) 1,841,090 (2,046,140) 22,025,720 (9,295,777)
Change in net unrealised gain / (loss) on
investments
0 0 0 (9,281,278)
Change in net unrealised gain / (loss) on swap 16,371 (4,333) 3,941,838 (1,135,281)
Change in net unrealised gain / (loss) on Wa'd 0 0 0 0
Change in net unrealised gain / (loss) on
forward foreign exchange
0 0 0 0
Change in net unrealised gain / (loss) on futures 0 0 0 0
CHANGE IN NET UNREALISED GAIN /
(LOSS) 16,371 (4,333) 3,941,838 (10,416,559)
NET INCREASE / (DECREASE) IN NET
ASSETS AS A RESULT OF OPERATIONS 1,742,519 (2,194,133) 25,164,692 (19,176,807)
Dividends distributed 14 (90,062) 0 0 0
EVOLUTION OF THE CAPITAL
Subscriptions of Shares 0 52,239,912 83,795,831 69,389,810
Redemptions of Shares (1,128,900) (26,841,375) (84,535,435) (96,999,370)
Currency adjustment 0 0 0 0
NET ASSETS AT THE END OF THE YEAR 3,991,406 44,596,990 118,626,344 105,261,178
* This a synthetic ETF.
** This includes synthetic ETFs and a non-ETF.
*** This Sub-Fund is fully collateralized.
119
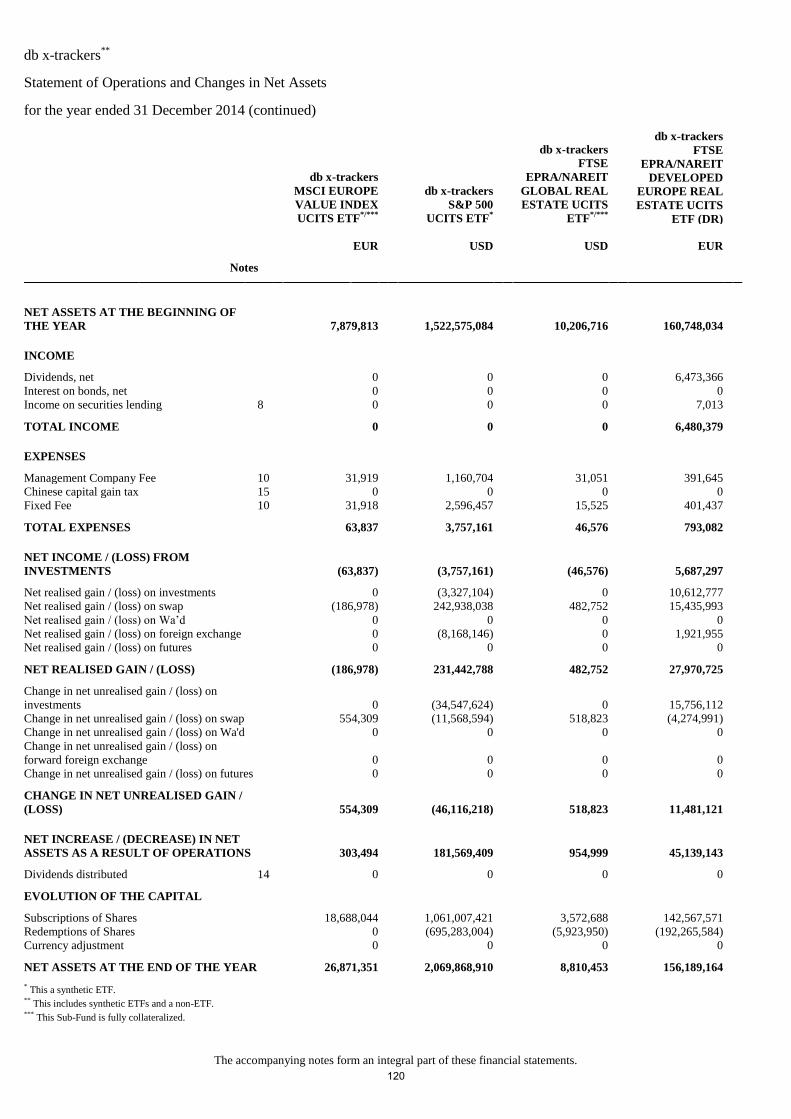
db x-trackers**
Statement of Operations and Changes in Net Assets
for the year ended 31 December 2014 (continued)
The accompanying notes form an integral part of these financial statements.
db x-trackers
MSCI EUROPE
VALUE INDEX
UCITS ETF*/***
db x-trackers
S&P 500
UCITS ETF*
db x-trackers
FTSE
EPRA/NAREIT
GLOBAL REAL
ESTATE UCITS
ETF*/***
db x-trackers
FTSE
EPRA/NAREIT
DEVELOPED
EUROPE REAL
ESTATE UCITS
ETF (DR)
EUR USD USD EUR
Notes
NET ASSETS AT THE BEGINNING OF
THE YEAR 7,879,813 1,522,575,084 10,206,716 160,748,034
INCOME
Dividends, net 0 0 0 6,473,366
Interest on bonds, net 0 0 0 0
Income on securities lending 8 0 0 0 7,013
TOTAL INCOME 0 0 0 6,480,379
EXPENSES
Management Company Fee 10 31,919 1,160,704 31,051 391,645
Chinese capital gain tax 15 0 0 0 0
Fixed Fee 10 31,918 2,596,457 15,525 401,437
TOTAL EXPENSES 63,837 3,757,161 46,576 793,082
NET INCOME / (LOSS) FROM
INVESTMENTS (63,837) (3,757,161) (46,576) 5,687,297
Net realised gain / (loss) on investments 0 (3,327,104) 0 10,612,777
Net realised gain / (loss) on swap (186,978) 242,938,038 482,752 15,435,993
Net realised gain / (loss) on Wa’d 0 0 0 0
Net realised gain / (loss) on foreign exchange 0 (8,168,146) 0 1,921,955
Net realised gain / (loss) on futures 0 0 0 0
NET REALISED GAIN / (LOSS) (186,978) 231,442,788 482,752 27,970,725
Change in net unrealised gain / (loss) on
investments
0 (34,547,624) 0 15,756,112
Change in net unrealised gain / (loss) on swap 554,309 (11,568,594) 518,823 (4,274,991)
Change in net unrealised gain / (loss) on Wa'd 0 0 0 0
Change in net unrealised gain / (loss) on
forward foreign exchange
0 0 0 0
Change in net unrealised gain / (loss) on futures 0 0 0 0
CHANGE IN NET UNREALISED GAIN /
(LOSS) 554,309 (46,116,218) 518,823 11,481,121
NET INCREASE / (DECREASE) IN NET
ASSETS AS A RESULT OF OPERATIONS 303,494 181,569,409 954,999 45,139,143
Dividends distributed 14 0 0 0 0
EVOLUTION OF THE CAPITAL
Subscriptions of Shares 18,688,044 1,061,007,421 3,572,688 142,567,571
Redemptions of Shares 0 (695,283,004) (5,923,950) (192,265,584)
Currency adjustment 0 0 0 0
NET ASSETS AT THE END OF THE YEAR 26,871,351 2,069,868,910 8,810,453 156,189,164
* This a synthetic ETF.
** This includes synthetic ETFs and a non-ETF.
*** This Sub-Fund is fully collateralized.
120
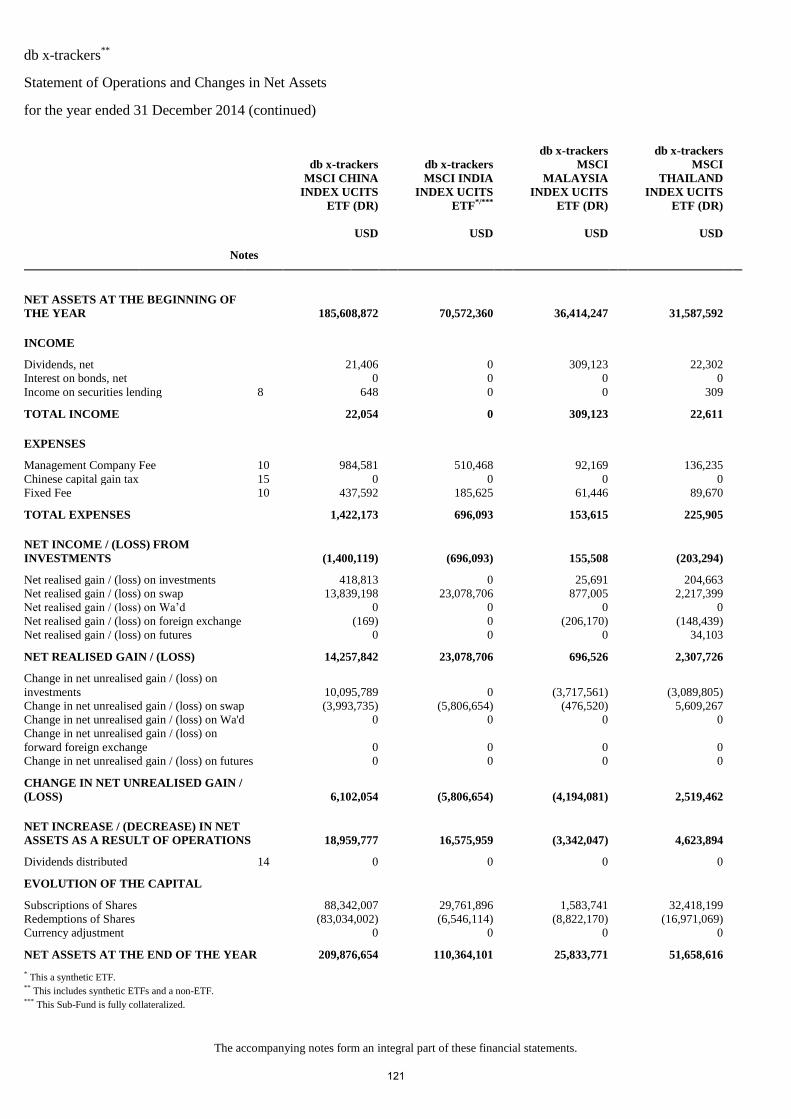
db x-trackers**
Statement of Operations and Changes in Net Assets
for the year ended 31 December 2014 (continued)
The accompanying notes form an integral part of these financial statements.
db x-trackers
MSCI CHINA
INDEX UCITS
ETF (DR)
db x-trackers
MSCI INDIA
INDEX UCITS
ETF*/***
db x-trackers
MSCI
MALAYSIA
INDEX UCITS
ETF (DR)
db x-trackers
MSCI
THAILAND
INDEX UCITS
ETF (DR)
USD USD USD USD
Notes
NET ASSETS AT THE BEGINNING OF
THE YEAR 185,608,872 70,572,360 36,414,247 31,587,592
INCOME
Dividends, net 21,406 0 309,123 22,302
Interest on bonds, net 0 0 0 0
Income on securities lending 8 648 0 0 309
TOTAL INCOME 22,054 0 309,123 22,611
EXPENSES
Management Company Fee 10 984,581 510,468 92,169 136,235
Chinese capital gain tax 15 0 0 0 0
Fixed Fee 10 437,592 185,625 61,446 89,670
TOTAL EXPENSES 1,422,173 696,093 153,615 225,905
NET INCOME / (LOSS) FROM
INVESTMENTS (1,400,119) (696,093) 155,508 (203,294)
Net realised gain / (loss) on investments 418,813 0 25,691 204,663
Net realised gain / (loss) on swap 13,839,198 23,078,706 877,005 2,217,399
Net realised gain / (loss) on Wa’d 0 0 0 0
Net realised gain / (loss) on foreign exchange (169) 0 (206,170) (148,439)
Net realised gain / (loss) on futures 0 0 0 34,103
NET REALISED GAIN / (LOSS) 14,257,842 23,078,706 696,526 2,307,726
Change in net unrealised gain / (loss) on
investments
10,095,789 0 (3,717,561) (3,089,805)
Change in net unrealised gain / (loss) on swap (3,993,735) (5,806,654) (476,520) 5,609,267
Change in net unrealised gain / (loss) on Wa'd 0 0 0 0
Change in net unrealised gain / (loss) on
forward foreign exchange
0 0 0 0
Change in net unrealised gain / (loss) on futures 0 0 0 0
CHANGE IN NET UNREALISED GAIN /
(LOSS) 6,102,054 (5,806,654) (4,194,081) 2,519,462
NET INCREASE / (DECREASE) IN NET
ASSETS AS A RESULT OF OPERATIONS 18,959,777 16,575,959 (3,342,047) 4,623,894
Dividends distributed 14 0 0 0 0
EVOLUTION OF THE CAPITAL
Subscriptions of Shares 88,342,007 29,761,896 1,583,741 32,418,199
Redemptions of Shares (83,034,002) (6,546,114) (8,822,170) (16,971,069)
Currency adjustment 0 0 0 0
NET ASSETS AT THE END OF THE YEAR 209,876,654 110,364,101 25,833,771 51,658,616
* This a synthetic ETF.
** This includes synthetic ETFs and a non-ETF.
*** This Sub-Fund is fully collateralized.
121
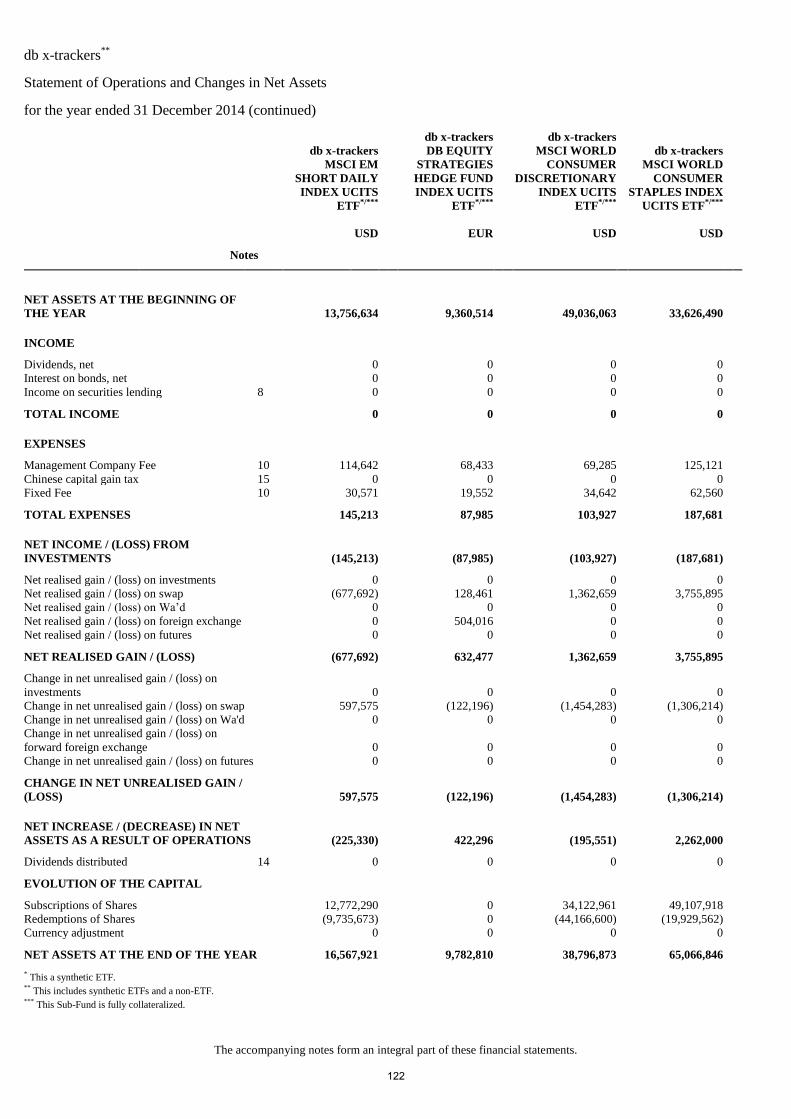
db x-trackers**
Statement of Operations and Changes in Net Assets
for the year ended 31 December 2014 (continued)
The accompanying notes form an integral part of these financial statements.
db x-trackers
MSCI EM
SHORT DAILY
INDEX UCITS
ETF*/***
db x-trackers
DB EQUITY
STRATEGIES
HEDGE FUND
INDEX UCITS
ETF*/***
db x-trackers
MSCI WORLD
CONSUMER
DISCRETIONARY
INDEX UCITS
ETF*/***
db x-trackers
MSCI WORLD
CONSUMER
STAPLES INDEX
UCITS ETF*/***
USD EUR USD USD
Notes
NET ASSETS AT THE BEGINNING OF
THE YEAR 13,756,634 9,360,514 49,036,063 33,626,490
INCOME
Dividends, net 0 0 0 0
Interest on bonds, net 0 0 0 0
Income on securities lending 8 0 0 0 0
TOTAL INCOME 0 0 0 0
EXPENSES
Management Company Fee 10 114,642 68,433 69,285 125,121
Chinese capital gain tax 15 0 0 0 0
Fixed Fee 10 30,571 19,552 34,642 62,560
TOTAL EXPENSES 145,213 87,985 103,927 187,681
NET INCOME / (LOSS) FROM
INVESTMENTS (145,213) (87,985) (103,927) (187,681)
Net realised gain / (loss) on investments 0 0 0 0
Net realised gain / (loss) on swap (677,692) 128,461 1,362,659 3,755,895
Net realised gain / (loss) on Wa’d 0 0 0 0
Net realised gain / (loss) on foreign exchange 0 504,016 0 0
Net realised gain / (loss) on futures 0 0 0 0
NET REALISED GAIN / (LOSS) (677,692) 632,477 1,362,659 3,755,895
Change in net unrealised gain / (loss) on
investments
0 0 0 0
Change in net unrealised gain / (loss) on swap 597,575 (122,196) (1,454,283) (1,306,214)
Change in net unrealised gain / (loss) on Wa'd 0 0 0 0
Change in net unrealised gain / (loss) on
forward foreign exchange
0 0 0 0
Change in net unrealised gain / (loss) on futures 0 0 0 0
CHANGE IN NET UNREALISED GAIN /
(LOSS) 597,575 (122,196) (1,454,283) (1,306,214)
NET INCREASE / (DECREASE) IN NET
ASSETS AS A RESULT OF OPERATIONS (225,330) 422,296 (195,551) 2,262,000
Dividends distributed 14 0 0 0 0
EVOLUTION OF THE CAPITAL
Subscriptions of Shares 12,772,290 0 34,122,961 49,107,918
Redemptions of Shares (9,735,673) 0 (44,166,600) (19,929,562)
Currency adjustment 0 0 0 0
NET ASSETS AT THE END OF THE YEAR 16,567,921 9,782,810 38,796,873 65,066,846
* This a synthetic ETF.
** This includes synthetic ETFs and a non-ETF.
*** This Sub-Fund is fully collateralized.
122
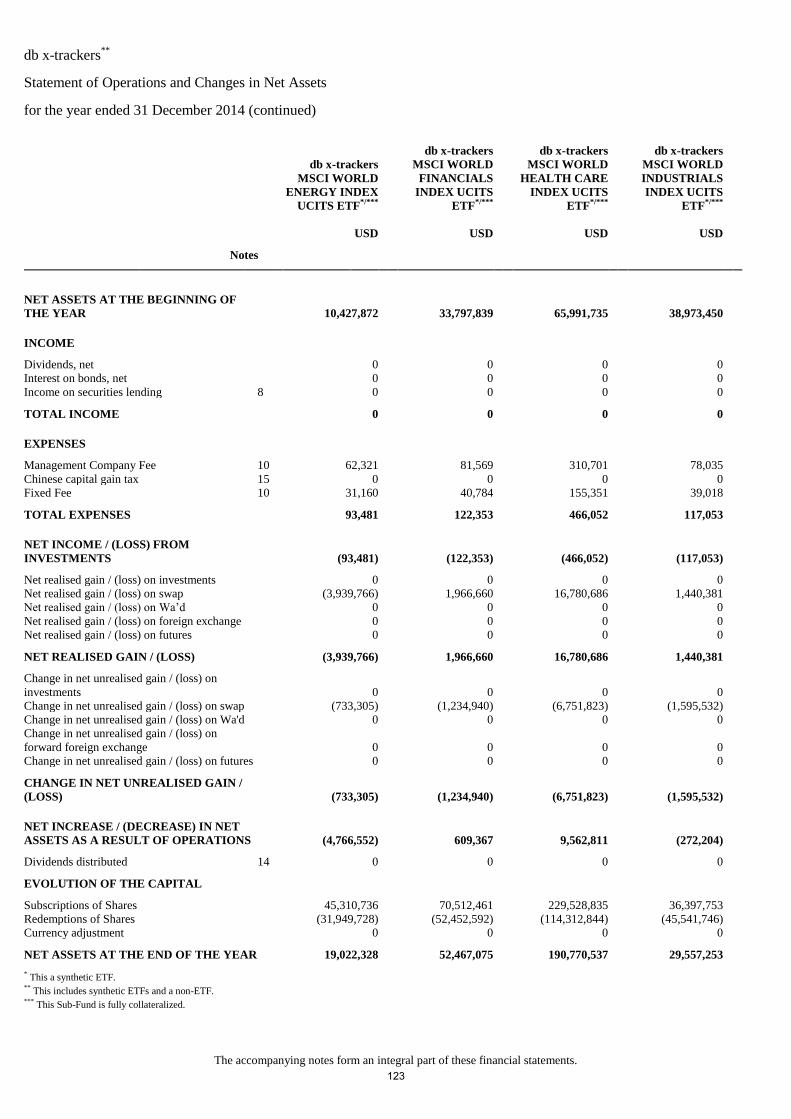
db x-trackers**
Statement of Operations and Changes in Net Assets
for the year ended 31 December 2014 (continued)
The accompanying notes form an integral part of these financial statements.
db x-trackers
MSCI WORLD
ENERGY INDEX
UCITS ETF*/***
db x-trackers
MSCI WORLD
FINANCIALS
INDEX UCITS
ETF*/***
db x-trackers
MSCI WORLD
HEALTH CARE
INDEX UCITS
ETF*/***
db x-trackers
MSCI WORLD
INDUSTRIALS
INDEX UCITS
ETF*/***
USD USD USD USD
Notes
NET ASSETS AT THE BEGINNING OF
THE YEAR 10,427,872 33,797,839 65,991,735 38,973,450
INCOME
Dividends, net 0 0 0 0
Interest on bonds, net 0 0 0 0
Income on securities lending 8 0 0 0 0
TOTAL INCOME 0 0 0 0
EXPENSES
Management Company Fee 10 62,321 81,569 310,701 78,035
Chinese capital gain tax 15 0 0 0 0
Fixed Fee 10 31,160 40,784 155,351 39,018
TOTAL EXPENSES 93,481 122,353 466,052 117,053
NET INCOME / (LOSS) FROM
INVESTMENTS (93,481) (122,353) (466,052) (117,053)
Net realised gain / (loss) on investments 0 0 0 0
Net realised gain / (loss) on swap (3,939,766) 1,966,660 16,780,686 1,440,381
Net realised gain / (loss) on Wa’d 0 0 0 0
Net realised gain / (loss) on foreign exchange 0 0 0 0
Net realised gain / (loss) on futures 0 0 0 0
NET REALISED GAIN / (LOSS) (3,939,766) 1,966,660 16,780,686 1,440,381
Change in net unrealised gain / (loss) on
investments
0 0 0 0
Change in net unrealised gain / (loss) on swap (733,305) (1,234,940) (6,751,823) (1,595,532)
Change in net unrealised gain / (loss) on Wa'd 0 0 0 0
Change in net unrealised gain / (loss) on
forward foreign exchange
0 0 0 0
Change in net unrealised gain / (loss) on futures 0 0 0 0
CHANGE IN NET UNREALISED GAIN /
(LOSS) (733,305) (1,234,940) (6,751,823) (1,595,532)
NET INCREASE / (DECREASE) IN NET
ASSETS AS A RESULT OF OPERATIONS (4,766,552) 609,367 9,562,811 (272,204)
Dividends distributed 14 0 0 0 0
EVOLUTION OF THE CAPITAL
Subscriptions of Shares 45,310,736 70,512,461 229,528,835 36,397,753
Redemptions of Shares (31,949,728) (52,452,592) (114,312,844) (45,541,746)
Currency adjustment 0 0 0 0
NET ASSETS AT THE END OF THE YEAR 19,022,328 52,467,075 190,770,537 29,557,253
* This a synthetic ETF.
** This includes synthetic ETFs and a non-ETF.
*** This Sub-Fund is fully collateralized.
123
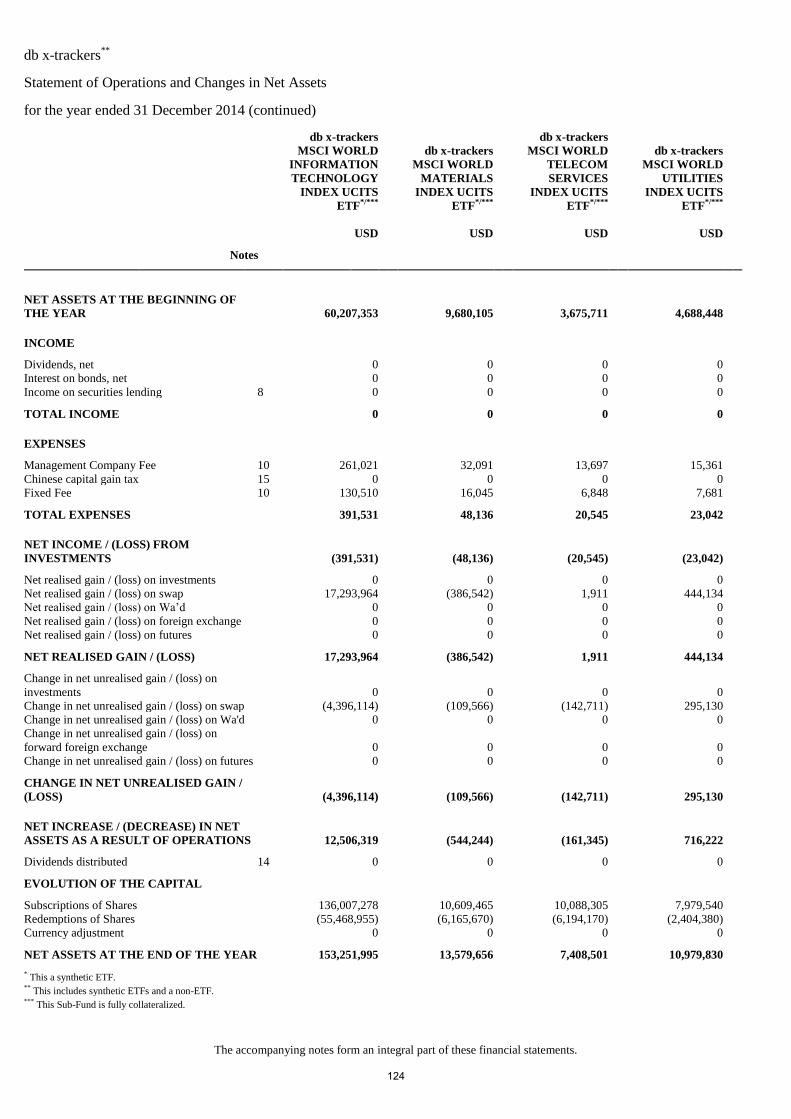
db x-trackers**
Statement of Operations and Changes in Net Assets
for the year ended 31 December 2014 (continued)
The accompanying notes form an integral part of these financial statements.
db x-trackers
MSCI WORLD
INFORMATION
TECHNOLOGY
INDEX UCITS
ETF*/***
db x-trackers
MSCI WORLD
MATERIALS
INDEX UCITS
ETF*/***
db x-trackers
MSCI WORLD
TELECOM
SERVICES
INDEX UCITS
ETF*/***
db x-trackers
MSCI WORLD
UTILITIES
INDEX UCITS
ETF*/***
USD USD USD USD
Notes
NET ASSETS AT THE BEGINNING OF
THE YEAR 60,207,353 9,680,105 3,675,711 4,688,448
INCOME
Dividends, net 0 0 0 0
Interest on bonds, net 0 0 0 0
Income on securities lending 8 0 0 0 0
TOTAL INCOME 0 0 0 0
EXPENSES
Management Company Fee 10 261,021 32,091 13,697 15,361
Chinese capital gain tax 15 0 0 0 0
Fixed Fee 10 130,510 16,045 6,848 7,681
TOTAL EXPENSES 391,531 48,136 20,545 23,042
NET INCOME / (LOSS) FROM
INVESTMENTS (391,531) (48,136) (20,545) (23,042)
Net realised gain / (loss) on investments 0 0 0 0
Net realised gain / (loss) on swap 17,293,964 (386,542) 1,911 444,134
Net realised gain / (loss) on Wa’d 0 0 0 0
Net realised gain / (loss) on foreign exchange 0 0 0 0
Net realised gain / (loss) on futures 0 0 0 0
NET REALISED GAIN / (LOSS) 17,293,964 (386,542) 1,911 444,134
Change in net unrealised gain / (loss) on
investments
0 0 0 0
Change in net unrealised gain / (loss) on swap (4,396,114) (109,566) (142,711) 295,130
Change in net unrealised gain / (loss) on Wa'd 0 0 0 0
Change in net unrealised gain / (loss) on
forward foreign exchange
0 0 0 0
Change in net unrealised gain / (loss) on futures 0 0 0 0
CHANGE IN NET UNREALISED GAIN /
(LOSS) (4,396,114) (109,566) (142,711) 295,130
NET INCREASE / (DECREASE) IN NET
ASSETS AS A RESULT OF OPERATIONS 12,506,319 (544,244) (161,345) 716,222
Dividends distributed 14 0 0 0 0
EVOLUTION OF THE CAPITAL
Subscriptions of Shares 136,007,278 10,609,465 10,088,305 7,979,540
Redemptions of Shares (55,468,955) (6,165,670) (6,194,170) (2,404,380)
Currency adjustment 0 0 0 0
NET ASSETS AT THE END OF THE YEAR 153,251,995 13,579,656 7,408,501 10,979,830
* This a synthetic ETF.
** This includes synthetic ETFs and a non-ETF.
*** This Sub-Fund is fully collateralized.
124
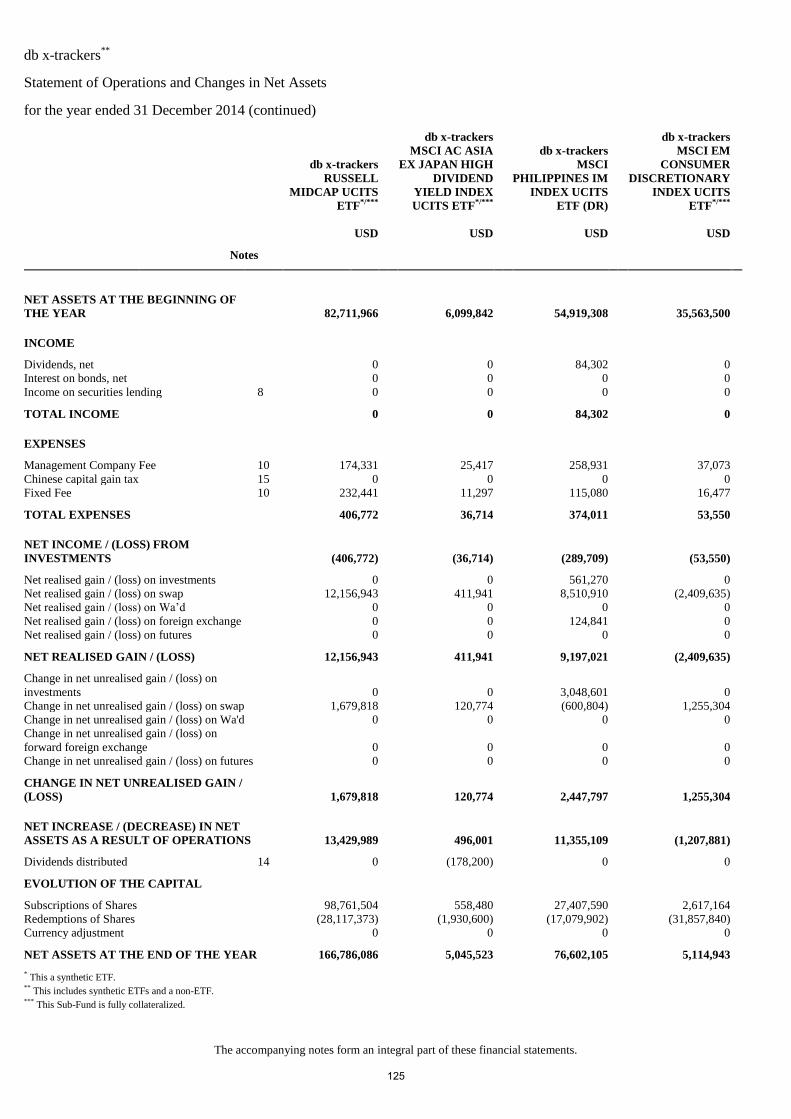
db x-trackers**
Statement of Operations and Changes in Net Assets
for the year ended 31 December 2014 (continued)
The accompanying notes form an integral part of these financial statements.
db x-trackers
RUSSELL
MIDCAP UCITS
ETF*/***
db x-trackers
MSCI AC ASIA
EX JAPAN HIGH
DIVIDEND
YIELD INDEX
UCITS ETF*/***
db x-trackers
MSCI
PHILIPPINES IM
INDEX UCITS
ETF (DR)
db x-trackers
MSCI EM
CONSUMER
DISCRETIONARY
INDEX UCITS
ETF*/***
USD USD USD USD
Notes
NET ASSETS AT THE BEGINNING OF
THE YEAR 82,711,966 6,099,842 54,919,308 35,563,500
INCOME
Dividends, net 0 0 84,302 0
Interest on bonds, net 0 0 0 0
Income on securities lending 8 0 0 0 0
TOTAL INCOME 0 0 84,302 0
EXPENSES
Management Company Fee 10 174,331 25,417 258,931 37,073
Chinese capital gain tax 15 0 0 0 0
Fixed Fee 10 232,441 11,297 115,080 16,477
TOTAL EXPENSES 406,772 36,714 374,011 53,550
NET INCOME / (LOSS) FROM
INVESTMENTS (406,772) (36,714) (289,709) (53,550)
Net realised gain / (loss) on investments 0 0 561,270 0
Net realised gain / (loss) on swap 12,156,943 411,941 8,510,910 (2,409,635)
Net realised gain / (loss) on Wa’d 0 0 0 0
Net realised gain / (loss) on foreign exchange 0 0 124,841 0
Net realised gain / (loss) on futures 0 0 0 0
NET REALISED GAIN / (LOSS) 12,156,943 411,941 9,197,021 (2,409,635)
Change in net unrealised gain / (loss) on
investments
0 0 3,048,601 0
Change in net unrealised gain / (loss) on swap 1,679,818 120,774 (600,804) 1,255,304
Change in net unrealised gain / (loss) on Wa'd 0 0 0 0
Change in net unrealised gain / (loss) on
forward foreign exchange
0 0 0 0
Change in net unrealised gain / (loss) on futures 0 0 0 0
CHANGE IN NET UNREALISED GAIN /
(LOSS) 1,679,818 120,774 2,447,797 1,255,304
NET INCREASE / (DECREASE) IN NET
ASSETS AS A RESULT OF OPERATIONS 13,429,989 496,001 11,355,109 (1,207,881)
Dividends distributed 14 0 (178,200) 0 0
EVOLUTION OF THE CAPITAL
Subscriptions of Shares 98,761,504 558,480 27,407,590 2,617,164
Redemptions of Shares (28,117,373) (1,930,600) (17,079,902) (31,857,840)
Currency adjustment 0 0 0 0
NET ASSETS AT THE END OF THE YEAR 166,786,086 5,045,523 76,602,105 5,114,943
* This a synthetic ETF.
** This includes synthetic ETFs and a non-ETF.
*** This Sub-Fund is fully collateralized.
125
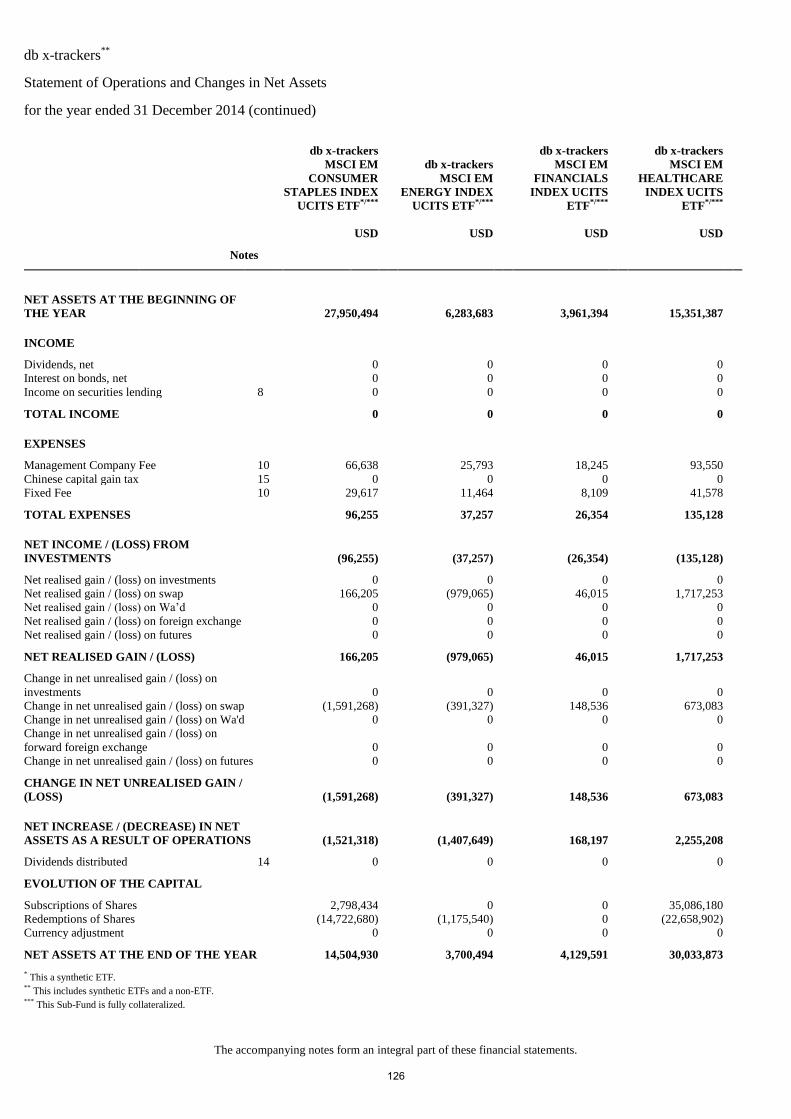
db x-trackers**
Statement of Operations and Changes in Net Assets
for the year ended 31 December 2014 (continued)
The accompanying notes form an integral part of these financial statements.
db x-trackers
MSCI EM
CONSUMER
STAPLES INDEX
UCITS ETF*/***
db x-trackers
MSCI EM
ENERGY INDEX
UCITS ETF*/***
db x-trackers
MSCI EM
FINANCIALS
INDEX UCITS
ETF*/***
db x-trackers
MSCI EM
HEALTHCARE
INDEX UCITS
ETF*/***
USD USD USD USD
Notes
NET ASSETS AT THE BEGINNING OF
THE YEAR 27,950,494 6,283,683 3,961,394 15,351,387
INCOME
Dividends, net 0 0 0 0
Interest on bonds, net 0 0 0 0
Income on securities lending 8 0 0 0 0
TOTAL INCOME 0 0 0 0
EXPENSES
Management Company Fee 10 66,638 25,793 18,245 93,550
Chinese capital gain tax 15 0 0 0 0
Fixed Fee 10 29,617 11,464 8,109 41,578
TOTAL EXPENSES 96,255 37,257 26,354 135,128
NET INCOME / (LOSS) FROM
INVESTMENTS (96,255) (37,257) (26,354) (135,128)
Net realised gain / (loss) on investments 0 0 0 0
Net realised gain / (loss) on swap 166,205 (979,065) 46,015 1,717,253
Net realised gain / (loss) on Wa’d 0 0 0 0
Net realised gain / (loss) on foreign exchange 0 0 0 0
Net realised gain / (loss) on futures 0 0 0 0
NET REALISED GAIN / (LOSS) 166,205 (979,065) 46,015 1,717,253
Change in net unrealised gain / (loss) on
investments
0 0 0 0
Change in net unrealised gain / (loss) on swap (1,591,268) (391,327) 148,536 673,083
Change in net unrealised gain / (loss) on Wa'd 0 0 0 0
Change in net unrealised gain / (loss) on
forward foreign exchange
0 0 0 0
Change in net unrealised gain / (loss) on futures 0 0 0 0
CHANGE IN NET UNREALISED GAIN /
(LOSS) (1,591,268) (391,327) 148,536 673,083
NET INCREASE / (DECREASE) IN NET
ASSETS AS A RESULT OF OPERATIONS (1,521,318) (1,407,649) 168,197 2,255,208
Dividends distributed 14 0 0 0 0
EVOLUTION OF THE CAPITAL
Subscriptions of Shares 2,798,434 0 0 35,086,180
Redemptions of Shares (14,722,680) (1,175,540) 0 (22,658,902)
Currency adjustment 0 0 0 0
NET ASSETS AT THE END OF THE YEAR 14,504,930 3,700,494 4,129,591 30,033,873
* This a synthetic ETF.
** This includes synthetic ETFs and a non-ETF.
*** This Sub-Fund is fully collateralized.
126
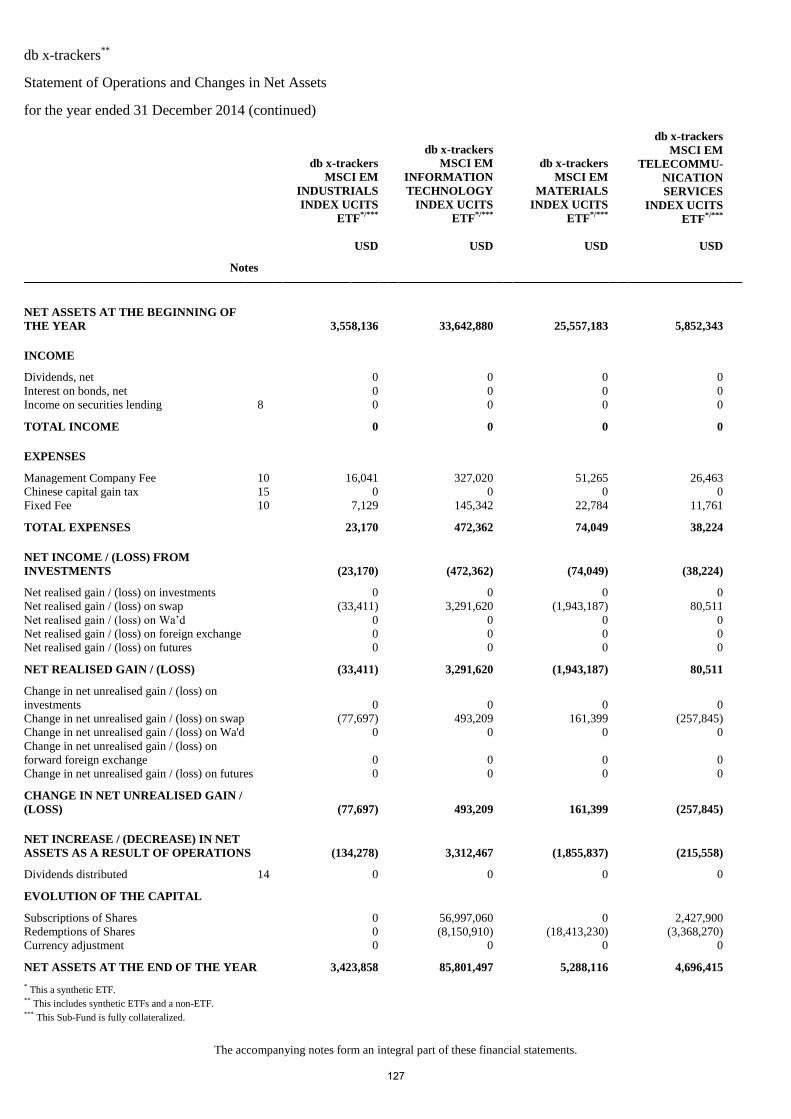
db x-trackers**
Statement of Operations and Changes in Net Assets
for the year ended 31 December 2014 (continued)
The accompanying notes form an integral part of these financial statements.
db x-trackers
MSCI EM
INDUSTRIALS
INDEX UCITS
ETF*/***
db x-trackers
MSCI EM
INFORMATION
TECHNOLOGY
INDEX UCITS
ETF*/***
db x-trackers
MSCI EM
MATERIALS
INDEX UCITS
ETF*/***
db x-trackers
MSCI EM
TELECOMMU-
NICATION
SERVICES
INDEX UCITS
ETF*/***
USD USD USD USD
Notes
NET ASSETS AT THE BEGINNING OF
THE YEAR 3,558,136 33,642,880 25,557,183 5,852,343
INCOME
Dividends, net 0 0 0 0
Interest on bonds, net 0 0 0 0
Income on securities lending 8 0 0 0 0
TOTAL INCOME 0 0 0 0
EXPENSES
Management Company Fee 10 16,041 327,020 51,265 26,463
Chinese capital gain tax 15 0 0 0 0
Fixed Fee 10 7,129 145,342 22,784 11,761
TOTAL EXPENSES 23,170 472,362 74,049 38,224
NET INCOME / (LOSS) FROM
INVESTMENTS (23,170) (472,362) (74,049) (38,224)
Net realised gain / (loss) on investments 0 0 0 0
Net realised gain / (loss) on swap (33,411) 3,291,620 (1,943,187) 80,511
Net realised gain / (loss) on Wa’d 0 0 0 0
Net realised gain / (loss) on foreign exchange 0 0 0 0
Net realised gain / (loss) on futures 0 0 0 0
NET REALISED GAIN / (LOSS) (33,411) 3,291,620 (1,943,187) 80,511
Change in net unrealised gain / (loss) on
investments
0 0 0 0
Change in net unrealised gain / (loss) on swap (77,697) 493,209 161,399 (257,845)
Change in net unrealised gain / (loss) on Wa'd 0 0 0 0
Change in net unrealised gain / (loss) on
forward foreign exchange
0 0 0 0
Change in net unrealised gain / (loss) on futures 0 0 0 0
CHANGE IN NET UNREALISED GAIN /
(LOSS) (77,697) 493,209 161,399 (257,845)
NET INCREASE / (DECREASE) IN NET
ASSETS AS A RESULT OF OPERATIONS (134,278) 3,312,467 (1,855,837) (215,558)
Dividends distributed 14 0 0 0 0
EVOLUTION OF THE CAPITAL
Subscriptions of Shares 0 56,997,060 0 2,427,900
Redemptions of Shares 0 (8,150,910) (18,413,230) (3,368,270)
Currency adjustment 0 0 0 0
NET ASSETS AT THE END OF THE YEAR 3,423,858 85,801,497 5,288,116 4,696,415
* This a synthetic ETF.
** This includes synthetic ETFs and a non-ETF.
*** This Sub-Fund is fully collateralized.
127
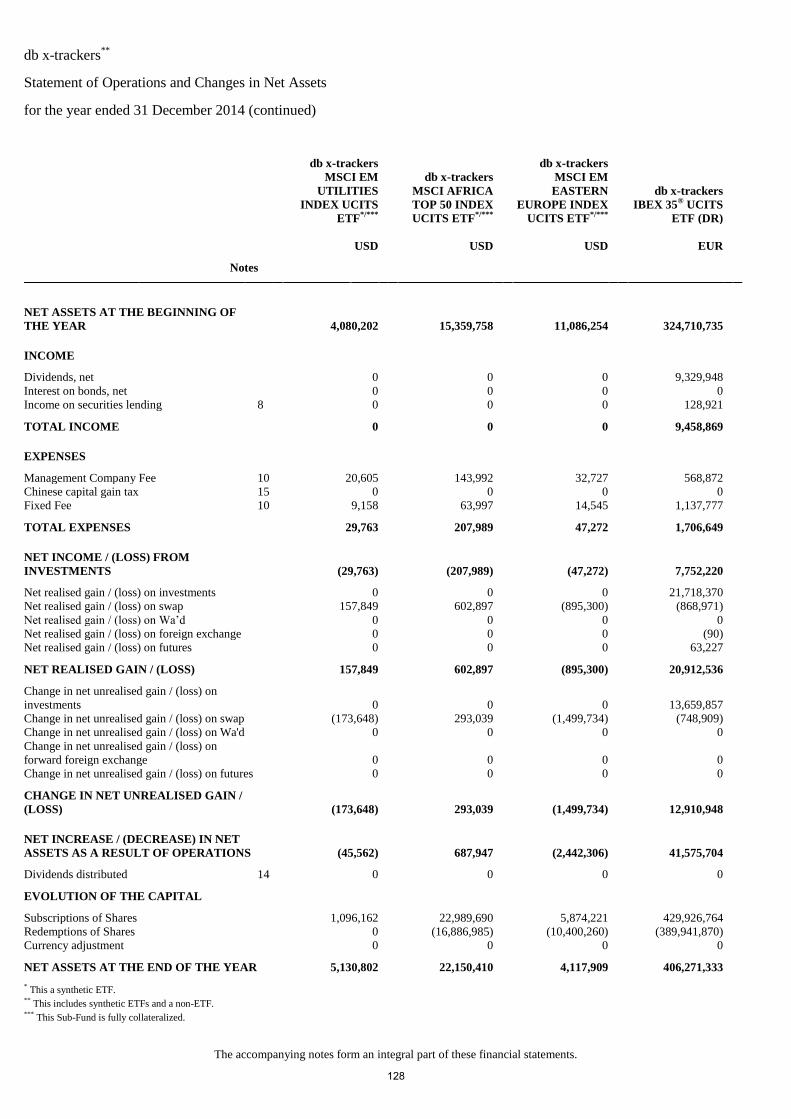
db x-trackers**
Statement of Operations and Changes in Net Assets
for the year ended 31 December 2014 (continued)
The accompanying notes form an integral part of these financial statements.
db x-trackers
MSCI EM
UTILITIES
INDEX UCITS
ETF*/***
db x-trackers
MSCI AFRICA
TOP 50 INDEX
UCITS ETF*/***
db x-trackers
MSCI EM
EASTERN
EUROPE INDEX
UCITS ETF*/***
db x-trackers
IBEX 35® UCITS
ETF (DR)
USD USD USD EUR
Notes
NET ASSETS AT THE BEGINNING OF
THE YEAR 4,080,202 15,359,758 11,086,254 324,710,735
INCOME
Dividends, net 0 0 0 9,329,948
Interest on bonds, net 0 0 0 0
Income on securities lending 8 0 0 0 128,921
TOTAL INCOME 0 0 0 9,458,869
EXPENSES
Management Company Fee 10 20,605 143,992 32,727 568,872
Chinese capital gain tax 15 0 0 0 0
Fixed Fee 10 9,158 63,997 14,545 1,137,777
TOTAL EXPENSES 29,763 207,989 47,272 1,706,649
NET INCOME / (LOSS) FROM
INVESTMENTS (29,763) (207,989) (47,272) 7,752,220
Net realised gain / (loss) on investments 0 0 0 21,718,370
Net realised gain / (loss) on swap 157,849 602,897 (895,300) (868,971)
Net realised gain / (loss) on Wa’d 0 0 0 0
Net realised gain / (loss) on foreign exchange 0 0 0 (90)
Net realised gain / (loss) on futures 0 0 0 63,227
NET REALISED GAIN / (LOSS) 157,849 602,897 (895,300) 20,912,536
Change in net unrealised gain / (loss) on
investments
0 0 0 13,659,857
Change in net unrealised gain / (loss) on swap (173,648) 293,039 (1,499,734) (748,909)
Change in net unrealised gain / (loss) on Wa'd 0 0 0 0
Change in net unrealised gain / (loss) on
forward foreign exchange
0 0 0 0
Change in net unrealised gain / (loss) on futures 0 0 0 0
CHANGE IN NET UNREALISED GAIN /
(LOSS) (173,648) 293,039 (1,499,734) 12,910,948
NET INCREASE / (DECREASE) IN NET
ASSETS AS A RESULT OF OPERATIONS (45,562) 687,947 (2,442,306) 41,575,704
Dividends distributed 14 0 0 0 0
EVOLUTION OF THE CAPITAL
Subscriptions of Shares 1,096,162 22,989,690 5,874,221 429,926,764
Redemptions of Shares 0 (16,886,985) (10,400,260) (389,941,870)
Currency adjustment 0 0 0 0
NET ASSETS AT THE END OF THE YEAR 5,130,802 22,150,410 4,117,909 406,271,333
* This a synthetic ETF.
** This includes synthetic ETFs and a non-ETF.
*** This Sub-Fund is fully collateralized.
128
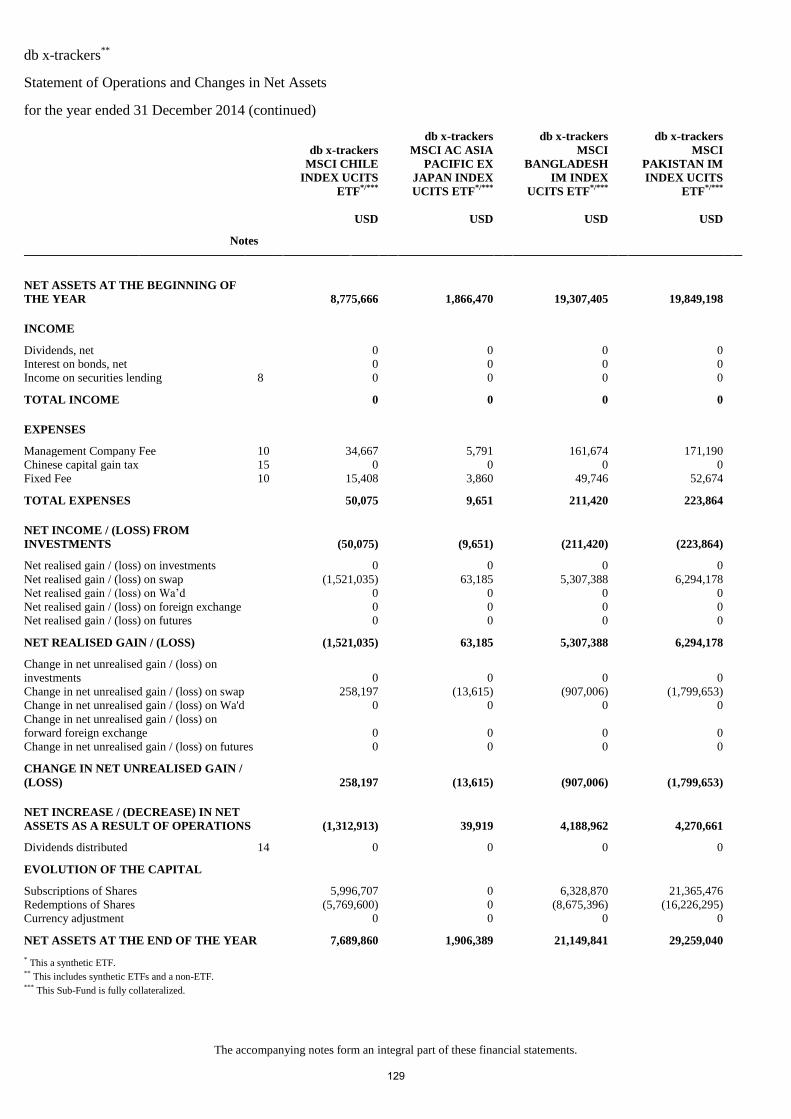
db x-trackers**
Statement of Operations and Changes in Net Assets
for the year ended 31 December 2014 (continued)
The accompanying notes form an integral part of these financial statements.
db x-trackers
MSCI CHILE
INDEX UCITS
ETF*/***
db x-trackers
MSCI AC ASIA
PACIFIC EX
JAPAN INDEX
UCITS ETF*/***
db x-trackers
MSCI
BANGLADESH
IM INDEX
UCITS ETF*/***
db x-trackers
MSCI
PAKISTAN IM
INDEX UCITS
ETF*/***
USD USD USD USD
Notes
NET ASSETS AT THE BEGINNING OF
THE YEAR 8,775,666 1,866,470 19,307,405 19,849,198
INCOME
Dividends, net 0 0 0 0
Interest on bonds, net 0 0 0 0
Income on securities lending 8 0 0 0 0
TOTAL INCOME 0 0 0 0
EXPENSES
Management Company Fee 10 34,667 5,791 161,674 171,190
Chinese capital gain tax 15 0 0 0 0
Fixed Fee 10 15,408 3,860 49,746 52,674
TOTAL EXPENSES 50,075 9,651 211,420 223,864
NET INCOME / (LOSS) FROM
INVESTMENTS (50,075) (9,651) (211,420) (223,864)
Net realised gain / (loss) on investments 0 0 0 0
Net realised gain / (loss) on swap (1,521,035) 63,185 5,307,388 6,294,178
Net realised gain / (loss) on Wa’d 0 0 0 0
Net realised gain / (loss) on foreign exchange 0 0 0 0
Net realised gain / (loss) on futures 0 0 0 0
NET REALISED GAIN / (LOSS) (1,521,035) 63,185 5,307,388 6,294,178
Change in net unrealised gain / (loss) on
investments
0 0 0 0
Change in net unrealised gain / (loss) on swap 258,197 (13,615) (907,006) (1,799,653)
Change in net unrealised gain / (loss) on Wa'd 0 0 0 0
Change in net unrealised gain / (loss) on
forward foreign exchange
0 0 0 0
Change in net unrealised gain / (loss) on futures 0 0 0 0
CHANGE IN NET UNREALISED GAIN /
(LOSS) 258,197 (13,615) (907,006) (1,799,653)
NET INCREASE / (DECREASE) IN NET
ASSETS AS A RESULT OF OPERATIONS (1,312,913) 39,919 4,188,962 4,270,661
Dividends distributed 14 0 0 0 0
EVOLUTION OF THE CAPITAL
Subscriptions of Shares 5,996,707 0 6,328,870 21,365,476
Redemptions of Shares (5,769,600) 0 (8,675,396) (16,226,295)
Currency adjustment 0 0 0 0
NET ASSETS AT THE END OF THE YEAR 7,689,860 1,906,389 21,149,841 29,259,040
* This a synthetic ETF.
** This includes synthetic ETFs and a non-ETF.
*** This Sub-Fund is fully collateralized.
129
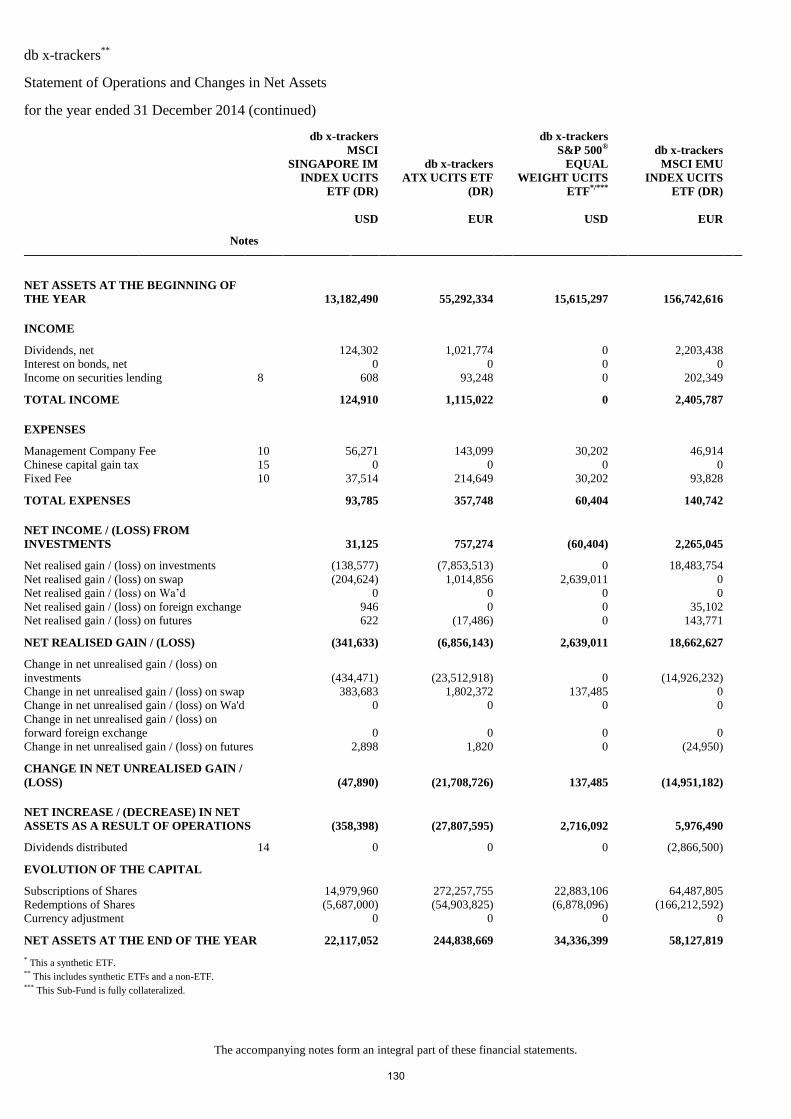
db x-trackers**
Statement of Operations and Changes in Net Assets
for the year ended 31 December 2014 (continued)
The accompanying notes form an integral part of these financial statements.
db x-trackers
MSCI
SINGAPORE IM
INDEX UCITS
ETF (DR)
db x-trackers
ATX UCITS ETF
(DR)
db x-trackers
S&P 500®
EQUAL
WEIGHT UCITS
ETF*/***
db x-trackers
MSCI EMU
INDEX UCITS
ETF (DR)
USD EUR USD EUR
Notes
NET ASSETS AT THE BEGINNING OF
THE YEAR 13,182,490 55,292,334 15,615,297 156,742,616
INCOME
Dividends, net 124,302 1,021,774 0 2,203,438
Interest on bonds, net 0 0 0 0
Income on securities lending 8 608 93,248 0 202,349
TOTAL INCOME 124,910 1,115,022 0 2,405,787
EXPENSES
Management Company Fee 10 56,271 143,099 30,202 46,914
Chinese capital gain tax 15 0 0 0 0
Fixed Fee 10 37,514 214,649 30,202 93,828
TOTAL EXPENSES 93,785 357,748 60,404 140,742
NET INCOME / (LOSS) FROM
INVESTMENTS 31,125 757,274 (60,404) 2,265,045
Net realised gain / (loss) on investments (138,577) (7,853,513) 0 18,483,754
Net realised gain / (loss) on swap (204,624) 1,014,856 2,639,011 0
Net realised gain / (loss) on Wa’d 0 0 0 0
Net realised gain / (loss) on foreign exchange 946 0 0 35,102
Net realised gain / (loss) on futures 622 (17,486) 0 143,771
NET REALISED GAIN / (LOSS) (341,633) (6,856,143) 2,639,011 18,662,627
Change in net unrealised gain / (loss) on
investments
(434,471) (23,512,918) 0 (14,926,232)
Change in net unrealised gain / (loss) on swap 383,683 1,802,372 137,485 0
Change in net unrealised gain / (loss) on Wa'd 0 0 0 0
Change in net unrealised gain / (loss) on
forward foreign exchange
0 0 0 0
Change in net unrealised gain / (loss) on futures 2,898 1,820 0 (24,950)
CHANGE IN NET UNREALISED GAIN /
(LOSS) (47,890) (21,708,726) 137,485 (14,951,182)
NET INCREASE / (DECREASE) IN NET
ASSETS AS A RESULT OF OPERATIONS (358,398) (27,807,595) 2,716,092 5,976,490
Dividends distributed 14 0 0 0 (2,866,500)
EVOLUTION OF THE CAPITAL
Subscriptions of Shares 14,979,960 272,257,755 22,883,106 64,487,805
Redemptions of Shares (5,687,000) (54,903,825) (6,878,096) (166,212,592)
Currency adjustment 0 0 0 0
NET ASSETS AT THE END OF THE YEAR 22,117,052 244,838,669 34,336,399 58,127,819
* This a synthetic ETF.
** This includes synthetic ETFs and a non-ETF.
*** This Sub-Fund is fully collateralized.
130
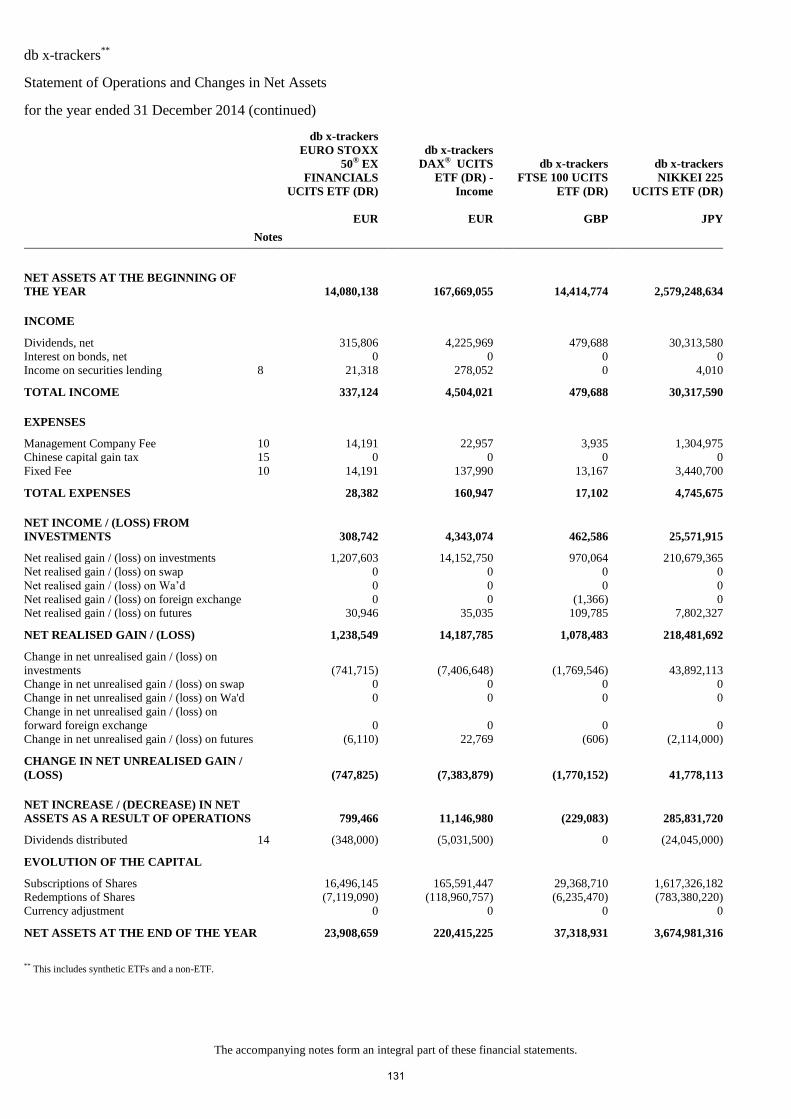
db x-trackers**
Statement of Operations and Changes in Net Assets
for the year ended 31 December 2014 (continued)
The accompanying notes form an integral part of these financial statements.
db x-trackers
EURO STOXX
50® EX
FINANCIALS
UCITS ETF (DR)
db x-trackers
DAX® UCITS
ETF (DR) -
Income
db x-trackers
FTSE 100 UCITS
ETF (DR)
db x-trackers
NIKKEI 225
UCITS ETF (DR)
EUR EUR GBP JPY
Notes
NET ASSETS AT THE BEGINNING OF
THE YEAR 14,080,138 167,669,055 14,414,774 2,579,248,634
INCOME
Dividends, net 315,806 4,225,969 479,688 30,313,580
Interest on bonds, net 0 0 0 0
Income on securities lending 8 21,318 278,052 0 4,010
TOTAL INCOME 337,124 4,504,021 479,688 30,317,590
EXPENSES
Management Company Fee 10 14,191 22,957 3,935 1,304,975
Chinese capital gain tax 15 0 0 0 0
Fixed Fee 10 14,191 137,990 13,167 3,440,700
TOTAL EXPENSES 28,382 160,947 17,102 4,745,675
NET INCOME / (LOSS) FROM
INVESTMENTS 308,742 4,343,074 462,586 25,571,915
Net realised gain / (loss) on investments 1,207,603 14,152,750 970,064 210,679,365
Net realised gain / (loss) on swap 0 0 0 0
Net realised gain / (loss) on Wa’d 0 0 0 0
Net realised gain / (loss) on foreign exchange 0 0 (1,366) 0
Net realised gain / (loss) on futures 30,946 35,035 109,785 7,802,327
NET REALISED GAIN / (LOSS) 1,238,549 14,187,785 1,078,483 218,481,692
Change in net unrealised gain / (loss) on
investments
(741,715) (7,406,648) (1,769,546) 43,892,113
Change in net unrealised gain / (loss) on swap 0 0 0 0
Change in net unrealised gain / (loss) on Wa'd 0 0 0 0
Change in net unrealised gain / (loss) on
forward foreign exchange
0 0 0 0
Change in net unrealised gain / (loss) on futures (6,110) 22,769 (606) (2,114,000)
CHANGE IN NET UNREALISED GAIN /
(LOSS) (747,825) (7,383,879) (1,770,152) 41,778,113
NET INCREASE / (DECREASE) IN NET
ASSETS AS A RESULT OF OPERATIONS 799,466 11,146,980 (229,083) 285,831,720
Dividends distributed 14 (348,000) (5,031,500) 0 (24,045,000)
EVOLUTION OF THE CAPITAL
Subscriptions of Shares 16,496,145 165,591,447 29,368,710 1,617,326,182
Redemptions of Shares (7,119,090) (118,960,757) (6,235,470) (783,380,220)
Currency adjustment 0 0 0 0
NET ASSETS AT THE END OF THE YEAR 23,908,659 220,415,225 37,318,931 3,674,981,316
**
This includes synthetic ETFs and a non-ETF.
131
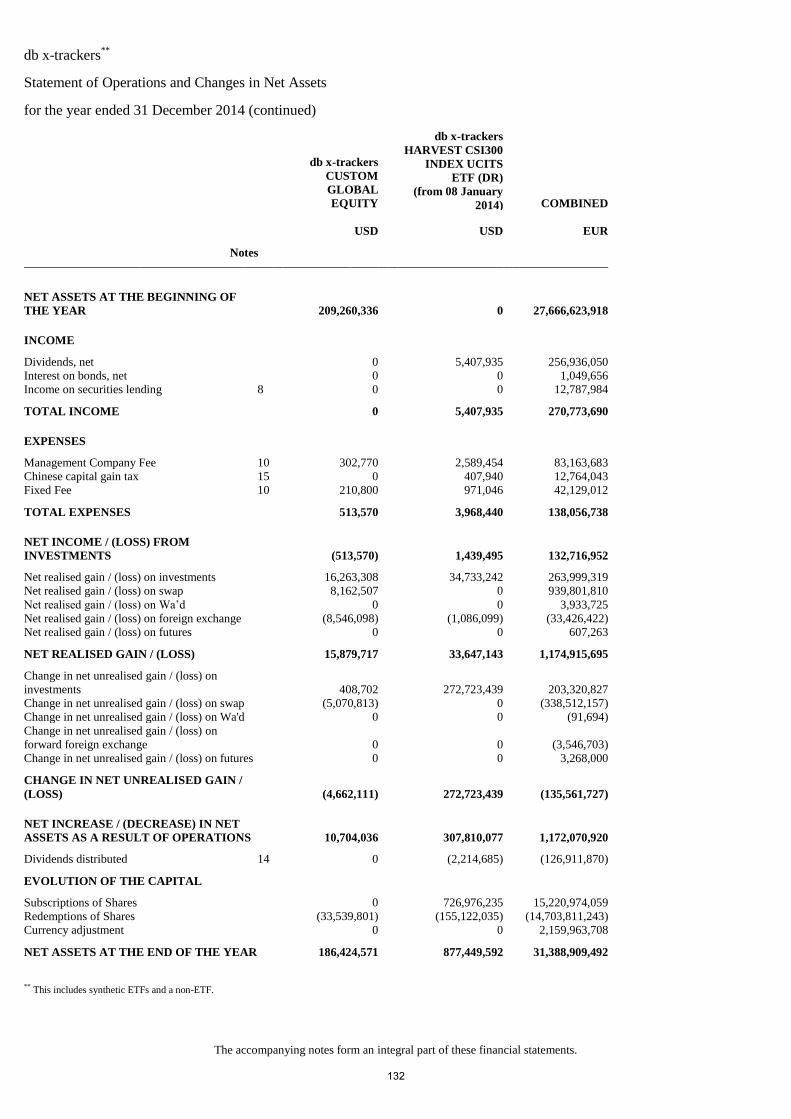
db x-trackers**
Statement of Operations and Changes in Net Assets
for the year ended 31 December 2014 (continued)
The accompanying notes form an integral part of these financial statements.
db x-trackers
CUSTOM
GLOBAL
EQUITY
db x-trackers
HARVEST CSI300
INDEX UCITS
ETF (DR)
(from 08 January
2014) COMBINED
USD USD EUR
Notes
NET ASSETS AT THE BEGINNING OF
THE YEAR 209,260,336 0 27,666,623,918
INCOME
Dividends, net 0 5,407,935 256,936,050
Interest on bonds, net 0 0 1,049,656
Income on securities lending 8 0 0 12,787,984
TOTAL INCOME 0 5,407,935 270,773,690
EXPENSES
Management Company Fee 10 302,770 2,589,454 83,163,683
Chinese capital gain tax 15 0 407,940 12,764,043
Fixed Fee 10 210,800 971,046 42,129,012
TOTAL EXPENSES 513,570 3,968,440 138,056,738
NET INCOME / (LOSS) FROM
INVESTMENTS (513,570) 1,439,495 132,716,952
Net realised gain / (loss) on investments 16,263,308 34,733,242 263,999,319
Net realised gain / (loss) on swap 8,162,507 0 939,801,810
Net realised gain / (loss) on Wa’d 0 0 3,933,725
Net realised gain / (loss) on foreign exchange (8,546,098) (1,086,099) (33,426,422)
Net realised gain / (loss) on futures 0 0 607,263
NET REALISED GAIN / (LOSS) 15,879,717 33,647,143 1,174,915,695
Change in net unrealised gain / (loss) on
investments
408,702 272,723,439 203,320,827
Change in net unrealised gain / (loss) on swap (5,070,813) 0 (338,512,157)
Change in net unrealised gain / (loss) on Wa'd 0 0 (91,694)
Change in net unrealised gain / (loss) on
forward foreign exchange
0 0 (3,546,703)
Change in net unrealised gain / (loss) on futures 0 0 3,268,000
CHANGE IN NET UNREALISED GAIN /
(LOSS) (4,662,111) 272,723,439 (135,561,727)
NET INCREASE / (DECREASE) IN NET
ASSETS AS A RESULT OF OPERATIONS 10,704,036 307,810,077 1,172,070,920
Dividends distributed 14 0 (2,214,685) (126,911,870)
EVOLUTION OF THE CAPITAL
Subscriptions of Shares 0 726,976,235 15,220,974,059
Redemptions of Shares (33,539,801) (155,122,035) (14,703,811,243)
Currency adjustment 0 0 2,159,963,708
NET ASSETS AT THE END OF THE YEAR 186,424,571 877,449,592 31,388,909,492
**
This includes synthetic ETFs and a non-ETF.
132
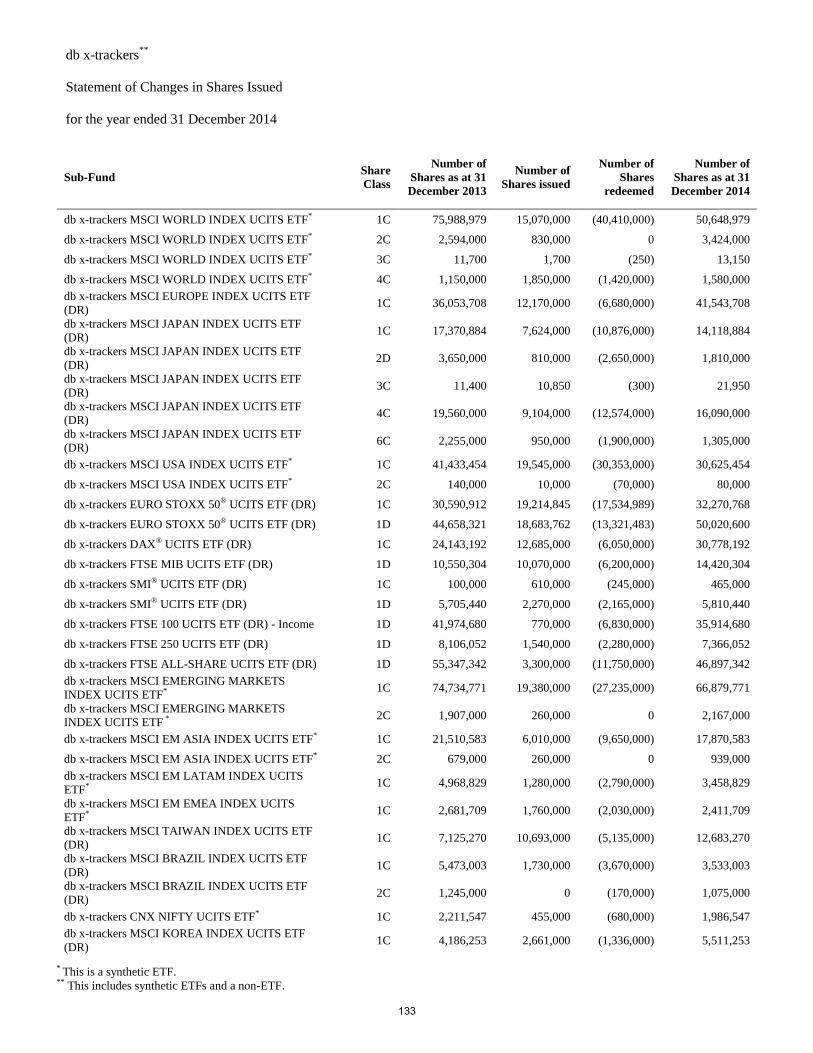
db x-trackers**
Statement of Changes in Shares Issued
for the year ended 31 December 2014
* This is a synthetic ETF. ** This includes synthetic ETFs and a non-ETF.
Sub-Fund Share
Class
Number of
Shares as at 31
December 2013
Number of
Shares issued
Number of
Shares
redeemed
Number of
Shares as at 31
December 2014
db x-trackers MSCI WORLD INDEX UCITS ETF* 1C 75,988,979 15,070,000 (40,410,000) 50,648,979
db x-trackers MSCI WORLD INDEX UCITS ETF* 2C 2,594,000 830,000 0 3,424,000
db x-trackers MSCI WORLD INDEX UCITS ETF* 3C 11,700 1,700 (250) 13,150
db x-trackers MSCI WORLD INDEX UCITS ETF* 4C 1,150,000 1,850,000 (1,420,000) 1,580,000
db x-trackers MSCI EUROPE INDEX UCITS ETF
(DR) 1C 36,053,708 12,170,000 (6,680,000) 41,543,708
db x-trackers MSCI JAPAN INDEX UCITS ETF
(DR) 1C 17,370,884 7,624,000 (10,876,000) 14,118,884
db x-trackers MSCI JAPAN INDEX UCITS ETF
(DR) 2D 3,650,000 810,000 (2,650,000) 1,810,000
db x-trackers MSCI JAPAN INDEX UCITS ETF
(DR) 3C 11,400 10,850 (300) 21,950
db x-trackers MSCI JAPAN INDEX UCITS ETF
(DR) 4C 19,560,000 9,104,000 (12,574,000) 16,090,000
db x-trackers MSCI JAPAN INDEX UCITS ETF
(DR) 6C 2,255,000 950,000 (1,900,000) 1,305,000
db x-trackers MSCI USA INDEX UCITS ETF* 1C 41,433,454 19,545,000 (30,353,000) 30,625,454
db x-trackers MSCI USA INDEX UCITS ETF* 2C 140,000 10,000 (70,000) 80,000
db x-trackers EURO STOXX 50® UCITS ETF (DR) 1C 30,590,912 19,214,845 (17,534,989) 32,270,768
db x-trackers EURO STOXX 50® UCITS ETF (DR) 1D 44,658,321 18,683,762 (13,321,483) 50,020,600
db x-trackers DAX® UCITS ETF (DR) 1C 24,143,192 12,685,000 (6,050,000) 30,778,192
db x-trackers FTSE MIB UCITS ETF (DR) 1D 10,550,304 10,070,000 (6,200,000) 14,420,304
db x-trackers SMI® UCITS ETF (DR) 1C 100,000 610,000 (245,000) 465,000
db x-trackers SMI® UCITS ETF (DR) 1D 5,705,440 2,270,000 (2,165,000) 5,810,440
db x-trackers FTSE 100 UCITS ETF (DR) - Income 1D 41,974,680 770,000 (6,830,000) 35,914,680
db x-trackers FTSE 250 UCITS ETF (DR) 1D 8,106,052 1,540,000 (2,280,000) 7,366,052
db x-trackers FTSE ALL-SHARE UCITS ETF (DR) 1D 55,347,342 3,300,000 (11,750,000) 46,897,342
db x-trackers MSCI EMERGING MARKETS
INDEX UCITS ETF* 1C 74,734,771 19,380,000 (27,235,000) 66,879,771
db x-trackers MSCI EMERGING MARKETS
INDEX UCITS ETF * 2C 1,907,000 260,000 0 2,167,000
db x-trackers MSCI EM ASIA INDEX UCITS ETF* 1C 21,510,583 6,010,000 (9,650,000) 17,870,583
db x-trackers MSCI EM ASIA INDEX UCITS ETF* 2C 679,000 260,000 0 939,000
db x-trackers MSCI EM LATAM INDEX UCITS
ETF* 1C 4,968,829 1,280,000 (2,790,000) 3,458,829
db x-trackers MSCI EM EMEA INDEX UCITS
ETF* 1C 2,681,709 1,760,000 (2,030,000) 2,411,709
db x-trackers MSCI TAIWAN INDEX UCITS ETF
(DR) 1C 7,125,270 10,693,000 (5,135,000) 12,683,270
db x-trackers MSCI BRAZIL INDEX UCITS ETF
(DR) 1C 5,473,003 1,730,000 (3,670,000) 3,533,003
db x-trackers MSCI BRAZIL INDEX UCITS ETF
(DR) 2C 1,245,000 0 (170,000) 1,075,000
db x-trackers CNX NIFTY UCITS ETF* 1C 2,211,547 455,000 (680,000) 1,986,547
db x-trackers MSCI KOREA INDEX UCITS ETF
(DR) 1C 4,186,253 2,661,000 (1,336,000) 5,511,253
133
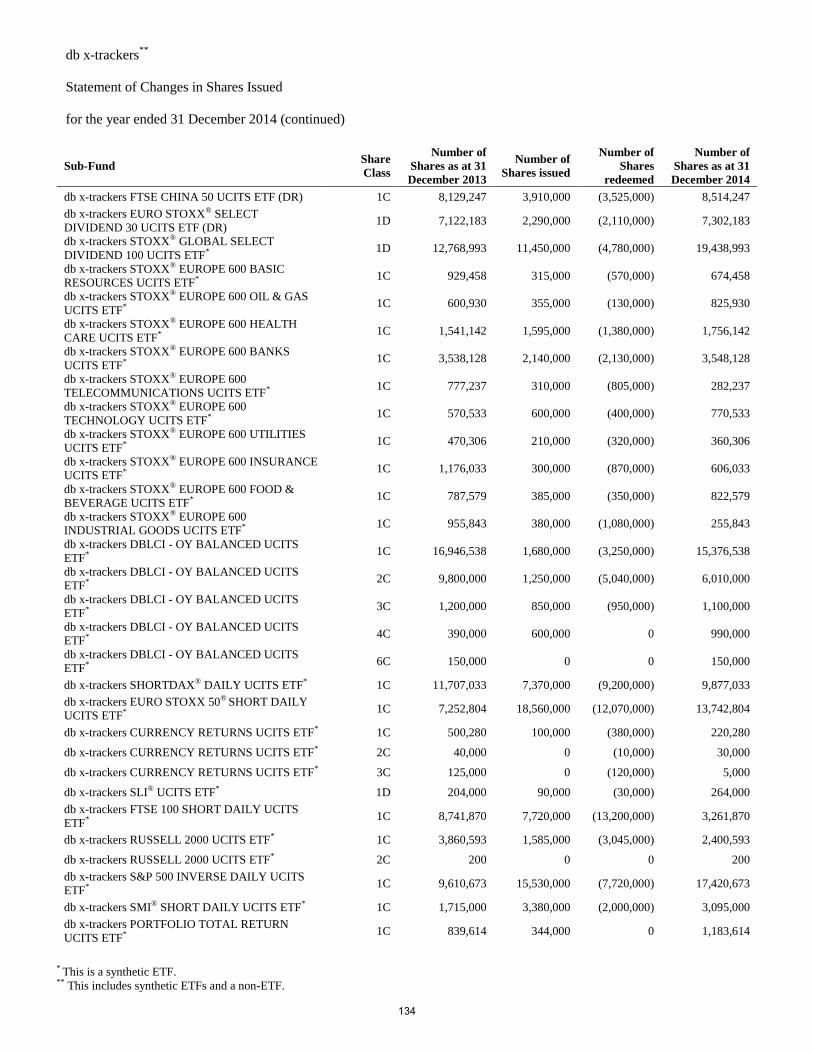
db x-trackers**
Statement of Changes in Shares Issued
for the year ended 31 December 2014 (continued)
* This is a synthetic ETF. ** This includes synthetic ETFs and a non-ETF.
Sub-Fund Share
Class
Number of
Shares as at 31
December 2013
Number of
Shares issued
Number of
Shares
redeemed
Number of
Shares as at 31
December 2014
db x-trackers FTSE CHINA 50 UCITS ETF (DR) 1C 8,129,247 3,910,000 (3,525,000) 8,514,247
db x-trackers EURO STOXX® SELECT
DIVIDEND 30 UCITS ETF (DR) 1D 7,122,183 2,290,000 (2,110,000) 7,302,183
db x-trackers STOXX® GLOBAL SELECT
DIVIDEND 100 UCITS ETF* 1D 12,768,993 11,450,000 (4,780,000) 19,438,993
db x-trackers STOXX® EUROPE 600 BASIC
RESOURCES UCITS ETF* 1C 929,458 315,000 (570,000) 674,458
db x-trackers STOXX® EUROPE 600 OIL & GAS
UCITS ETF* 1C 600,930 355,000 (130,000) 825,930
db x-trackers STOXX® EUROPE 600 HEALTH
CARE UCITS ETF* 1C 1,541,142 1,595,000 (1,380,000) 1,756,142
db x-trackers STOXX® EUROPE 600 BANKS
UCITS ETF* 1C 3,538,128 2,140,000 (2,130,000) 3,548,128
db x-trackers STOXX® EUROPE 600
TELECOMMUNICATIONS UCITS ETF* 1C 777,237 310,000 (805,000) 282,237
db x-trackers STOXX® EUROPE 600
TECHNOLOGY UCITS ETF* 1C 570,533 600,000 (400,000) 770,533
db x-trackers STOXX® EUROPE 600 UTILITIES
UCITS ETF* 1C 470,306 210,000 (320,000) 360,306
db x-trackers STOXX® EUROPE 600 INSURANCE
UCITS ETF* 1C 1,176,033 300,000 (870,000) 606,033
db x-trackers STOXX® EUROPE 600 FOOD &
BEVERAGE UCITS ETF* 1C 787,579 385,000 (350,000) 822,579
db x-trackers STOXX® EUROPE 600
INDUSTRIAL GOODS UCITS ETF* 1C 955,843 380,000 (1,080,000) 255,843
db x-trackers DBLCI - OY BALANCED UCITS
ETF* 1C 16,946,538 1,680,000 (3,250,000) 15,376,538
db x-trackers DBLCI - OY BALANCED UCITS
ETF* 2C 9,800,000 1,250,000 (5,040,000) 6,010,000
db x-trackers DBLCI - OY BALANCED UCITS
ETF* 3C 1,200,000 850,000 (950,000) 1,100,000
db x-trackers DBLCI - OY BALANCED UCITS
ETF* 4C 390,000 600,000 0 990,000
db x-trackers DBLCI - OY BALANCED UCITS
ETF* 6C 150,000 0 0 150,000
db x-trackers SHORTDAX® DAILY UCITS ETF* 1C 11,707,033 7,370,000 (9,200,000) 9,877,033
db x-trackers EURO STOXX 50® SHORT DAILY
UCITS ETF* 1C 7,252,804 18,560,000 (12,070,000) 13,742,804
db x-trackers CURRENCY RETURNS UCITS ETF* 1C 500,280 100,000 (380,000) 220,280
db x-trackers CURRENCY RETURNS UCITS ETF* 2C 40,000 0 (10,000) 30,000
db x-trackers CURRENCY RETURNS UCITS ETF* 3C 125,000 0 (120,000) 5,000
db x-trackers SLI® UCITS ETF* 1D 204,000 90,000 (30,000) 264,000
db x-trackers FTSE 100 SHORT DAILY UCITS
ETF* 1C 8,741,870 7,720,000 (13,200,000) 3,261,870
db x-trackers RUSSELL 2000 UCITS ETF* 1C 3,860,593 1,585,000 (3,045,000) 2,400,593
db x-trackers RUSSELL 2000 UCITS ETF* 2C 200 0 0 200
db x-trackers S&P 500 INVERSE DAILY UCITS
ETF* 1C 9,610,673 15,530,000 (7,720,000) 17,420,673
db x-trackers SMI® SHORT DAILY UCITS ETF* 1C 1,715,000 3,380,000 (2,000,000) 3,095,000
db x-trackers PORTFOLIO TOTAL RETURN
UCITS ETF* 1C 839,614 344,000 0 1,183,614
134
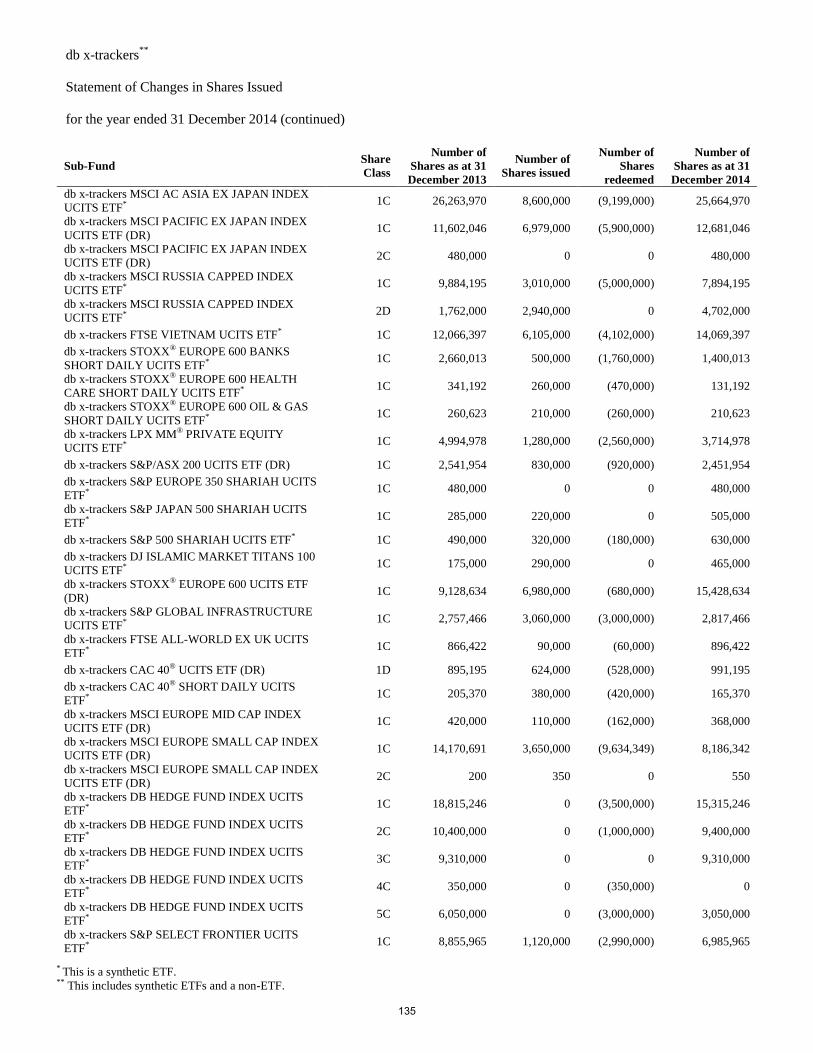
db x-trackers**
Statement of Changes in Shares Issued
for the year ended 31 December 2014 (continued)
* This is a synthetic ETF. ** This includes synthetic ETFs and a non-ETF.
Sub-Fund Share
Class
Number of
Shares as at 31
December 2013
Number of
Shares issued
Number of
Shares
redeemed
Number of
Shares as at 31
December 2014
db x-trackers MSCI AC ASIA EX JAPAN INDEX
UCITS ETF* 1C 26,263,970 8,600,000 (9,199,000) 25,664,970
db x-trackers MSCI PACIFIC EX JAPAN INDEX
UCITS ETF (DR) 1C 11,602,046 6,979,000 (5,900,000) 12,681,046
db x-trackers MSCI PACIFIC EX JAPAN INDEX
UCITS ETF (DR) 2C 480,000 0 0 480,000
db x-trackers MSCI RUSSIA CAPPED INDEX
UCITS ETF* 1C 9,884,195 3,010,000 (5,000,000) 7,894,195
db x-trackers MSCI RUSSIA CAPPED INDEX
UCITS ETF* 2D 1,762,000 2,940,000 0 4,702,000
db x-trackers FTSE VIETNAM UCITS ETF* 1C 12,066,397 6,105,000 (4,102,000) 14,069,397
db x-trackers STOXX® EUROPE 600 BANKS
SHORT DAILY UCITS ETF* 1C 2,660,013 500,000 (1,760,000) 1,400,013
db x-trackers STOXX® EUROPE 600 HEALTH
CARE SHORT DAILY UCITS ETF* 1C 341,192 260,000 (470,000) 131,192
db x-trackers STOXX® EUROPE 600 OIL & GAS
SHORT DAILY UCITS ETF* 1C 260,623 210,000 (260,000) 210,623
db x-trackers LPX MM® PRIVATE EQUITY
UCITS ETF* 1C 4,994,978 1,280,000 (2,560,000) 3,714,978
db x-trackers S&P/ASX 200 UCITS ETF (DR) 1C 2,541,954 830,000 (920,000) 2,451,954
db x-trackers S&P EUROPE 350 SHARIAH UCITS
ETF* 1C 480,000 0 0 480,000
db x-trackers S&P JAPAN 500 SHARIAH UCITS
ETF* 1C 285,000 220,000 0 505,000
db x-trackers S&P 500 SHARIAH UCITS ETF* 1C 490,000 320,000 (180,000) 630,000
db x-trackers DJ ISLAMIC MARKET TITANS 100
UCITS ETF* 1C 175,000 290,000 0 465,000
db x-trackers STOXX® EUROPE 600 UCITS ETF
(DR) 1C 9,128,634 6,980,000 (680,000) 15,428,634
db x-trackers S&P GLOBAL INFRASTRUCTURE
UCITS ETF* 1C 2,757,466 3,060,000 (3,000,000) 2,817,466
db x-trackers FTSE ALL-WORLD EX UK UCITS
ETF* 1C 866,422 90,000 (60,000) 896,422
db x-trackers CAC 40® UCITS ETF (DR) 1D 895,195 624,000 (528,000) 991,195
db x-trackers CAC 40® SHORT DAILY UCITS
ETF* 1C 205,370 380,000 (420,000) 165,370
db x-trackers MSCI EUROPE MID CAP INDEX
UCITS ETF (DR) 1C 420,000 110,000 (162,000) 368,000
db x-trackers MSCI EUROPE SMALL CAP INDEX
UCITS ETF (DR) 1C 14,170,691 3,650,000 (9,634,349) 8,186,342
db x-trackers MSCI EUROPE SMALL CAP INDEX
UCITS ETF (DR) 2C 200 350 0 550
db x-trackers DB HEDGE FUND INDEX UCITS
ETF* 1C 18,815,246 0 (3,500,000) 15,315,246
db x-trackers DB HEDGE FUND INDEX UCITS
ETF* 2C 10,400,000 0 (1,000,000) 9,400,000
db x-trackers DB HEDGE FUND INDEX UCITS
ETF* 3C 9,310,000 0 0 9,310,000
db x-trackers DB HEDGE FUND INDEX UCITS
ETF* 4C 350,000 0 (350,000) 0
db x-trackers DB HEDGE FUND INDEX UCITS
ETF* 5C 6,050,000 0 (3,000,000) 3,050,000
db x-trackers S&P SELECT FRONTIER UCITS
ETF* 1C 8,855,965 1,120,000 (2,990,000) 6,985,965
135
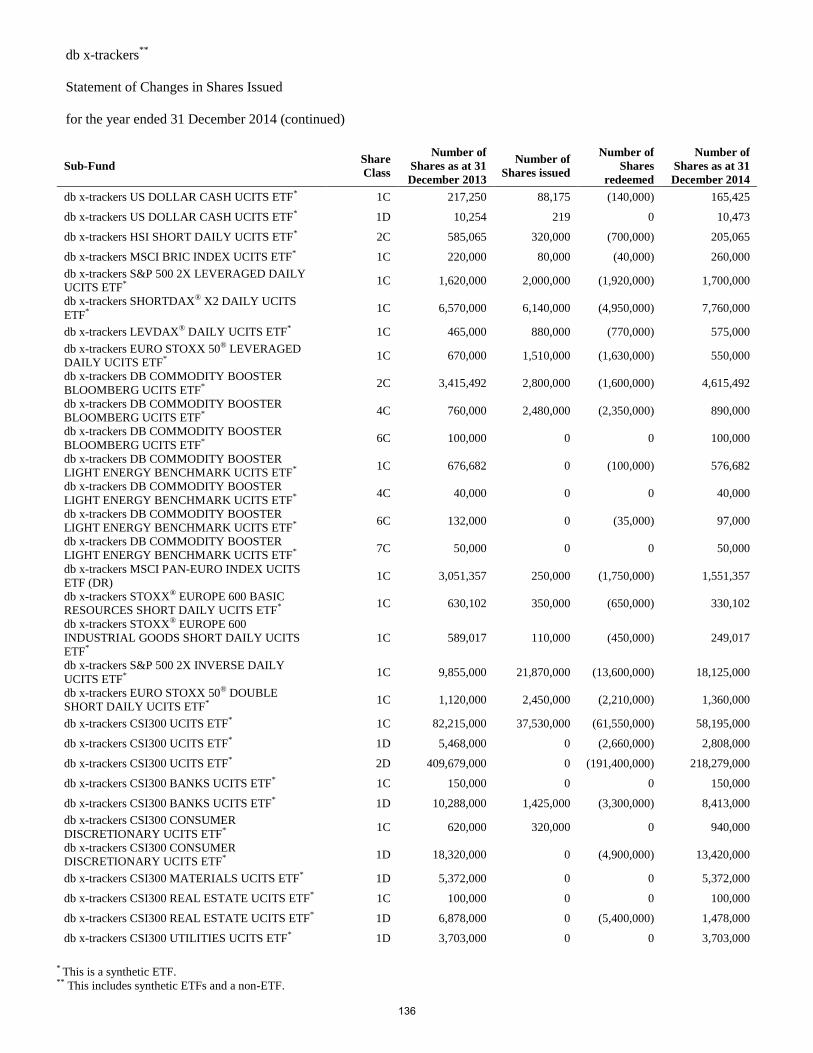
db x-trackers**
Statement of Changes in Shares Issued
for the year ended 31 December 2014 (continued)
* This is a synthetic ETF. ** This includes synthetic ETFs and a non-ETF.
Sub-Fund Share
Class
Number of
Shares as at 31
December 2013
Number of
Shares issued
Number of
Shares
redeemed
Number of
Shares as at 31
December 2014
db x-trackers US DOLLAR CASH UCITS ETF* 1C 217,250 88,175 (140,000) 165,425
db x-trackers US DOLLAR CASH UCITS ETF* 1D 10,254 219 0 10,473
db x-trackers HSI SHORT DAILY UCITS ETF* 2C 585,065 320,000 (700,000) 205,065
db x-trackers MSCI BRIC INDEX UCITS ETF* 1C 220,000 80,000 (40,000) 260,000
db x-trackers S&P 500 2X LEVERAGED DAILY
UCITS ETF* 1C 1,620,000 2,000,000 (1,920,000) 1,700,000
db x-trackers SHORTDAX® X2 DAILY UCITS
ETF* 1C 6,570,000 6,140,000 (4,950,000) 7,760,000
db x-trackers LEVDAX® DAILY UCITS ETF* 1C 465,000 880,000 (770,000) 575,000
db x-trackers EURO STOXX 50® LEVERAGED
DAILY UCITS ETF* 1C 670,000 1,510,000 (1,630,000) 550,000
db x-trackers DB COMMODITY BOOSTER
BLOOMBERG UCITS ETF* 2C 3,415,492 2,800,000 (1,600,000) 4,615,492
db x-trackers DB COMMODITY BOOSTER
BLOOMBERG UCITS ETF* 4C 760,000 2,480,000 (2,350,000) 890,000
db x-trackers DB COMMODITY BOOSTER
BLOOMBERG UCITS ETF* 6C 100,000 0 0 100,000
db x-trackers DB COMMODITY BOOSTER
LIGHT ENERGY BENCHMARK UCITS ETF* 1C 676,682 0 (100,000) 576,682
db x-trackers DB COMMODITY BOOSTER
LIGHT ENERGY BENCHMARK UCITS ETF* 4C 40,000 0 0 40,000
db x-trackers DB COMMODITY BOOSTER
LIGHT ENERGY BENCHMARK UCITS ETF* 6C 132,000 0 (35,000) 97,000
db x-trackers DB COMMODITY BOOSTER
LIGHT ENERGY BENCHMARK UCITS ETF* 7C 50,000 0 0 50,000
db x-trackers MSCI PAN-EURO INDEX UCITS
ETF (DR) 1C 3,051,357 250,000 (1,750,000) 1,551,357
db x-trackers STOXX® EUROPE 600 BASIC
RESOURCES SHORT DAILY UCITS ETF* 1C 630,102 350,000 (650,000) 330,102
db x-trackers STOXX® EUROPE 600
INDUSTRIAL GOODS SHORT DAILY UCITS
ETF*
1C 589,017 110,000 (450,000) 249,017
db x-trackers S&P 500 2X INVERSE DAILY
UCITS ETF* 1C 9,855,000 21,870,000 (13,600,000) 18,125,000
db x-trackers EURO STOXX 50® DOUBLE
SHORT DAILY UCITS ETF* 1C 1,120,000 2,450,000 (2,210,000) 1,360,000
db x-trackers CSI300 UCITS ETF* 1C 82,215,000 37,530,000 (61,550,000) 58,195,000
db x-trackers CSI300 UCITS ETF* 1D 5,468,000 0 (2,660,000) 2,808,000
db x-trackers CSI300 UCITS ETF* 2D 409,679,000 0 (191,400,000) 218,279,000
db x-trackers CSI300 BANKS UCITS ETF* 1C 150,000 0 0 150,000
db x-trackers CSI300 BANKS UCITS ETF* 1D 10,288,000 1,425,000 (3,300,000) 8,413,000
db x-trackers CSI300 CONSUMER
DISCRETIONARY UCITS ETF* 1C 620,000 320,000 0 940,000
db x-trackers CSI300 CONSUMER
DISCRETIONARY UCITS ETF* 1D 18,320,000 0 (4,900,000) 13,420,000
db x-trackers CSI300 MATERIALS UCITS ETF* 1D 5,372,000 0 0 5,372,000
db x-trackers CSI300 REAL ESTATE UCITS ETF* 1C 100,000 0 0 100,000
db x-trackers CSI300 REAL ESTATE UCITS ETF* 1D 6,878,000 0 (5,400,000) 1,478,000
db x-trackers CSI300 UTILITIES UCITS ETF* 1D 3,703,000 0 0 3,703,000
136
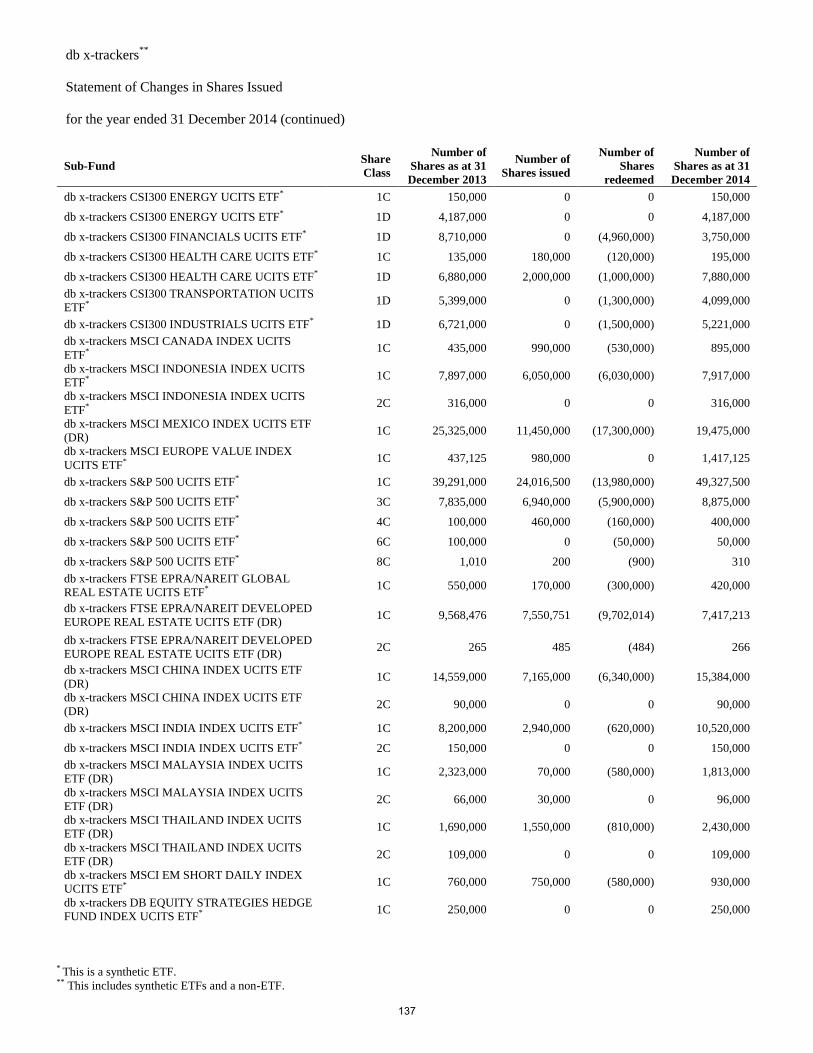
db x-trackers**
Statement of Changes in Shares Issued
for the year ended 31 December 2014 (continued)
* This is a synthetic ETF. ** This includes synthetic ETFs and a non-ETF.
Sub-Fund Share
Class
Number of
Shares as at 31
December 2013
Number of
Shares issued
Number of
Shares
redeemed
Number of
Shares as at 31
December 2014
db x-trackers CSI300 ENERGY UCITS ETF* 1C 150,000 0 0 150,000
db x-trackers CSI300 ENERGY UCITS ETF* 1D 4,187,000 0 0 4,187,000
db x-trackers CSI300 FINANCIALS UCITS ETF* 1D 8,710,000 0 (4,960,000) 3,750,000
db x-trackers CSI300 HEALTH CARE UCITS ETF* 1C 135,000 180,000 (120,000) 195,000
db x-trackers CSI300 HEALTH CARE UCITS ETF* 1D 6,880,000 2,000,000 (1,000,000) 7,880,000
db x-trackers CSI300 TRANSPORTATION UCITS
ETF* 1D 5,399,000 0 (1,300,000) 4,099,000
db x-trackers CSI300 INDUSTRIALS UCITS ETF* 1D 6,721,000 0 (1,500,000) 5,221,000
db x-trackers MSCI CANADA INDEX UCITS
ETF* 1C 435,000 990,000 (530,000) 895,000
db x-trackers MSCI INDONESIA INDEX UCITS
ETF* 1C 7,897,000 6,050,000 (6,030,000) 7,917,000
db x-trackers MSCI INDONESIA INDEX UCITS
ETF* 2C 316,000 0 0 316,000
db x-trackers MSCI MEXICO INDEX UCITS ETF
(DR) 1C 25,325,000 11,450,000 (17,300,000) 19,475,000
db x-trackers MSCI EUROPE VALUE INDEX
UCITS ETF* 1C 437,125 980,000 0 1,417,125
db x-trackers S&P 500 UCITS ETF* 1C 39,291,000 24,016,500 (13,980,000) 49,327,500
db x-trackers S&P 500 UCITS ETF* 3C 7,835,000 6,940,000 (5,900,000) 8,875,000
db x-trackers S&P 500 UCITS ETF* 4C 100,000 460,000 (160,000) 400,000
db x-trackers S&P 500 UCITS ETF* 6C 100,000 0 (50,000) 50,000
db x-trackers S&P 500 UCITS ETF* 8C 1,010 200 (900) 310
db x-trackers FTSE EPRA/NAREIT GLOBAL
REAL ESTATE UCITS ETF* 1C 550,000 170,000 (300,000) 420,000
db x-trackers FTSE EPRA/NAREIT DEVELOPED
EUROPE REAL ESTATE UCITS ETF (DR) 1C 9,568,476 7,550,751 (9,702,014) 7,417,213
db x-trackers FTSE EPRA/NAREIT DEVELOPED
EUROPE REAL ESTATE UCITS ETF (DR) 2C 265 485 (484) 266
db x-trackers MSCI CHINA INDEX UCITS ETF
(DR) 1C 14,559,000 7,165,000 (6,340,000) 15,384,000
db x-trackers MSCI CHINA INDEX UCITS ETF
(DR) 2C 90,000 0 0 90,000
db x-trackers MSCI INDIA INDEX UCITS ETF* 1C 8,200,000 2,940,000 (620,000) 10,520,000
db x-trackers MSCI INDIA INDEX UCITS ETF* 2C 150,000 0 0 150,000
db x-trackers MSCI MALAYSIA INDEX UCITS
ETF (DR) 1C 2,323,000 70,000 (580,000) 1,813,000
db x-trackers MSCI MALAYSIA INDEX UCITS
ETF (DR) 2C 66,000 30,000 0 96,000
db x-trackers MSCI THAILAND INDEX UCITS
ETF (DR) 1C 1,690,000 1,550,000 (810,000) 2,430,000
db x-trackers MSCI THAILAND INDEX UCITS
ETF (DR) 2C 109,000 0 0 109,000
db x-trackers MSCI EM SHORT DAILY INDEX
UCITS ETF* 1C 760,000 750,000 (580,000) 930,000
db x-trackers DB EQUITY STRATEGIES HEDGE
FUND INDEX UCITS ETF* 1C 250,000 0 0 250,000
137
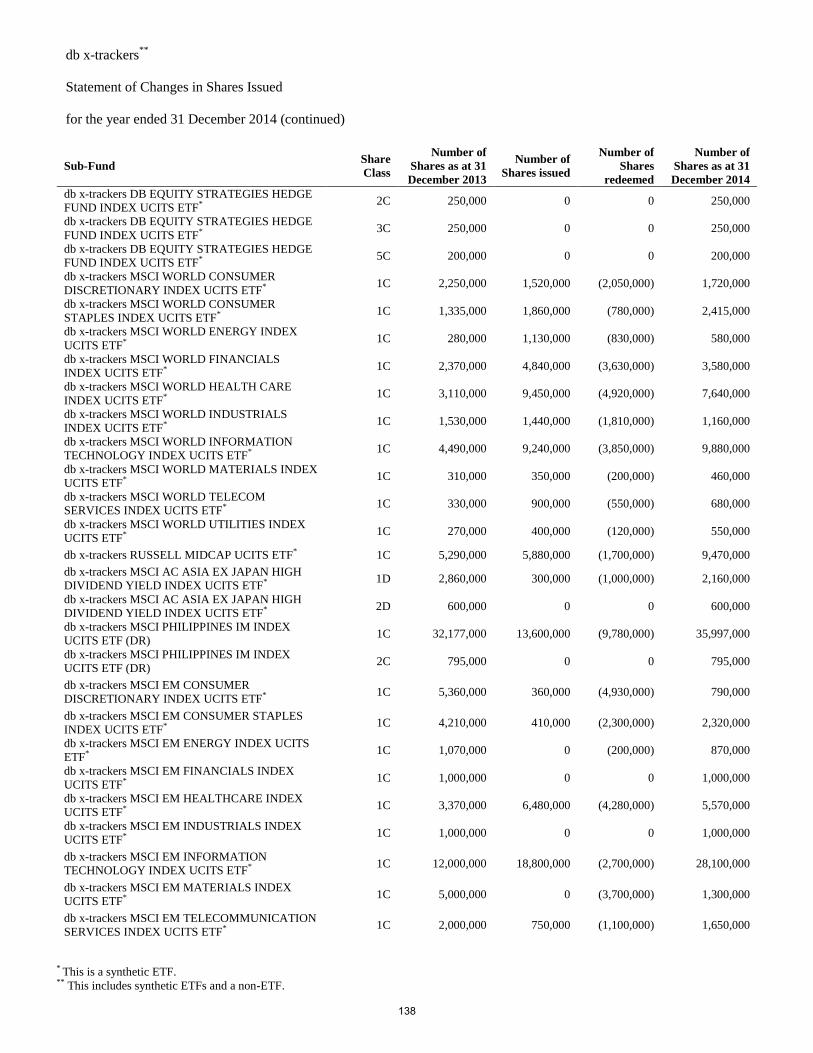
db x-trackers**
Statement of Changes in Shares Issued
for the year ended 31 December 2014 (continued)
* This is a synthetic ETF. ** This includes synthetic ETFs and a non-ETF.
Sub-Fund Share
Class
Number of
Shares as at 31
December 2013
Number of
Shares issued
Number of
Shares
redeemed
Number of
Shares as at 31
December 2014
db x-trackers DB EQUITY STRATEGIES HEDGE
FUND INDEX UCITS ETF* 2C 250,000 0 0 250,000
db x-trackers DB EQUITY STRATEGIES HEDGE
FUND INDEX UCITS ETF* 3C 250,000 0 0 250,000
db x-trackers DB EQUITY STRATEGIES HEDGE
FUND INDEX UCITS ETF* 5C 200,000 0 0 200,000
db x-trackers MSCI WORLD CONSUMER
DISCRETIONARY INDEX UCITS ETF* 1C 2,250,000 1,520,000 (2,050,000) 1,720,000
db x-trackers MSCI WORLD CONSUMER
STAPLES INDEX UCITS ETF* 1C 1,335,000 1,860,000 (780,000) 2,415,000
db x-trackers MSCI WORLD ENERGY INDEX
UCITS ETF* 1C 280,000 1,130,000 (830,000) 580,000
db x-trackers MSCI WORLD FINANCIALS
INDEX UCITS ETF* 1C 2,370,000 4,840,000 (3,630,000) 3,580,000
db x-trackers MSCI WORLD HEALTH CARE
INDEX UCITS ETF* 1C 3,110,000 9,450,000 (4,920,000) 7,640,000
db x-trackers MSCI WORLD INDUSTRIALS
INDEX UCITS ETF* 1C 1,530,000 1,440,000 (1,810,000) 1,160,000
db x-trackers MSCI WORLD INFORMATION
TECHNOLOGY INDEX UCITS ETF* 1C 4,490,000 9,240,000 (3,850,000) 9,880,000
db x-trackers MSCI WORLD MATERIALS INDEX
UCITS ETF* 1C 310,000 350,000 (200,000) 460,000
db x-trackers MSCI WORLD TELECOM
SERVICES INDEX UCITS ETF* 1C 330,000 900,000 (550,000) 680,000
db x-trackers MSCI WORLD UTILITIES INDEX
UCITS ETF* 1C 270,000 400,000 (120,000) 550,000
db x-trackers RUSSELL MIDCAP UCITS ETF* 1C 5,290,000 5,880,000 (1,700,000) 9,470,000
db x-trackers MSCI AC ASIA EX JAPAN HIGH
DIVIDEND YIELD INDEX UCITS ETF* 1D 2,860,000 300,000 (1,000,000) 2,160,000
db x-trackers MSCI AC ASIA EX JAPAN HIGH
DIVIDEND YIELD INDEX UCITS ETF* 2D 600,000 0 0 600,000
db x-trackers MSCI PHILIPPINES IM INDEX
UCITS ETF (DR) 1C 32,177,000 13,600,000 (9,780,000) 35,997,000
db x-trackers MSCI PHILIPPINES IM INDEX
UCITS ETF (DR) 2C 795,000 0 0 795,000
db x-trackers MSCI EM CONSUMER
DISCRETIONARY INDEX UCITS ETF* 1C 5,360,000 360,000 (4,930,000) 790,000
db x-trackers MSCI EM CONSUMER STAPLES
INDEX UCITS ETF* 1C 4,210,000 410,000 (2,300,000) 2,320,000
db x-trackers MSCI EM ENERGY INDEX UCITS
ETF* 1C 1,070,000 0 (200,000) 870,000
db x-trackers MSCI EM FINANCIALS INDEX
UCITS ETF* 1C 1,000,000 0 0 1,000,000
db x-trackers MSCI EM HEALTHCARE INDEX
UCITS ETF* 1C 3,370,000 6,480,000 (4,280,000) 5,570,000
db x-trackers MSCI EM INDUSTRIALS INDEX
UCITS ETF* 1C 1,000,000 0 0 1,000,000
db x-trackers MSCI EM INFORMATION
TECHNOLOGY INDEX UCITS ETF* 1C 12,000,000 18,800,000 (2,700,000) 28,100,000
db x-trackers MSCI EM MATERIALS INDEX
UCITS ETF* 1C 5,000,000 0 (3,700,000) 1,300,000
db x-trackers MSCI EM TELECOMMUNICATION
SERVICES INDEX UCITS ETF* 1C 2,000,000 750,000 (1,100,000) 1,650,000
138
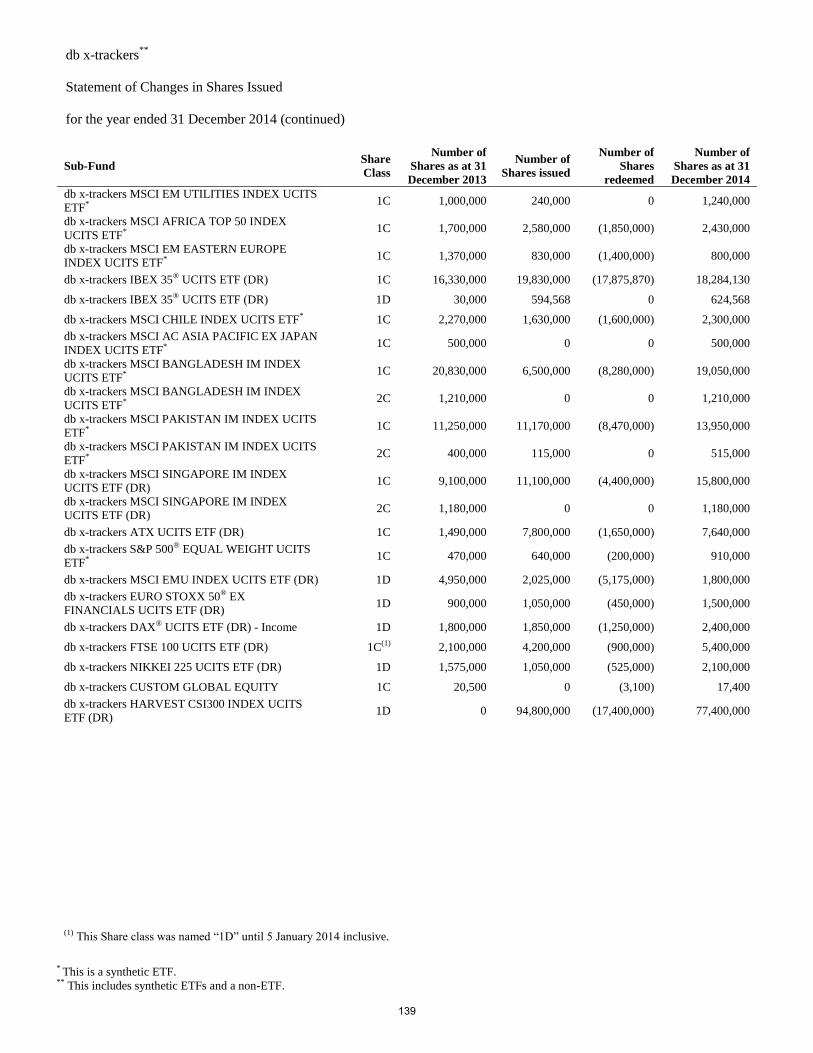
db x-trackers**
Statement of Changes in Shares Issued
for the year ended 31 December 2014 (continued)
* This is a synthetic ETF. ** This includes synthetic ETFs and a non-ETF.
Sub-Fund Share
Class
Number of
Shares as at 31
December 2013
Number of
Shares issued
Number of
Shares
redeemed
Number of
Shares as at 31
December 2014
db x-trackers MSCI EM UTILITIES INDEX UCITS
ETF* 1C 1,000,000 240,000 0 1,240,000
db x-trackers MSCI AFRICA TOP 50 INDEX
UCITS ETF* 1C 1,700,000 2,580,000 (1,850,000) 2,430,000
db x-trackers MSCI EM EASTERN EUROPE
INDEX UCITS ETF* 1C 1,370,000 830,000 (1,400,000) 800,000
db x-trackers IBEX 35® UCITS ETF (DR) 1C 16,330,000 19,830,000 (17,875,870) 18,284,130
db x-trackers IBEX 35® UCITS ETF (DR) 1D 30,000 594,568 0 624,568
db x-trackers MSCI CHILE INDEX UCITS ETF* 1C 2,270,000 1,630,000 (1,600,000) 2,300,000
db x-trackers MSCI AC ASIA PACIFIC EX JAPAN
INDEX UCITS ETF* 1C 500,000 0 0 500,000
db x-trackers MSCI BANGLADESH IM INDEX
UCITS ETF* 1C 20,830,000 6,500,000 (8,280,000) 19,050,000
db x-trackers MSCI BANGLADESH IM INDEX
UCITS ETF* 2C 1,210,000 0 0 1,210,000
db x-trackers MSCI PAKISTAN IM INDEX UCITS
ETF* 1C 11,250,000 11,170,000 (8,470,000) 13,950,000
db x-trackers MSCI PAKISTAN IM INDEX UCITS
ETF* 2C 400,000 115,000 0 515,000
db x-trackers MSCI SINGAPORE IM INDEX
UCITS ETF (DR) 1C 9,100,000 11,100,000 (4,400,000) 15,800,000
db x-trackers MSCI SINGAPORE IM INDEX
UCITS ETF (DR) 2C 1,180,000 0 0 1,180,000
db x-trackers ATX UCITS ETF (DR) 1C 1,490,000 7,800,000 (1,650,000) 7,640,000
db x-trackers S&P 500® EQUAL WEIGHT UCITS
ETF* 1C 470,000 640,000 (200,000) 910,000
db x-trackers MSCI EMU INDEX UCITS ETF (DR) 1D 4,950,000 2,025,000 (5,175,000) 1,800,000
db x-trackers EURO STOXX 50® EX
FINANCIALS UCITS ETF (DR) 1D 900,000 1,050,000 (450,000) 1,500,000
db x-trackers DAX® UCITS ETF (DR) - Income 1D 1,800,000 1,850,000 (1,250,000) 2,400,000
db x-trackers FTSE 100 UCITS ETF (DR) 1C(1) 2,100,000 4,200,000 (900,000) 5,400,000
db x-trackers NIKKEI 225 UCITS ETF (DR) 1D 1,575,000 1,050,000 (525,000) 2,100,000
db x-trackers CUSTOM GLOBAL EQUITY 1C 20,500 0 (3,100) 17,400
db x-trackers HARVEST CSI300 INDEX UCITS
ETF (DR) 1D 0 94,800,000 (17,400,000) 77,400,000
(1) This Share class was named “1D” until 5 January 2014 inclusive.
139
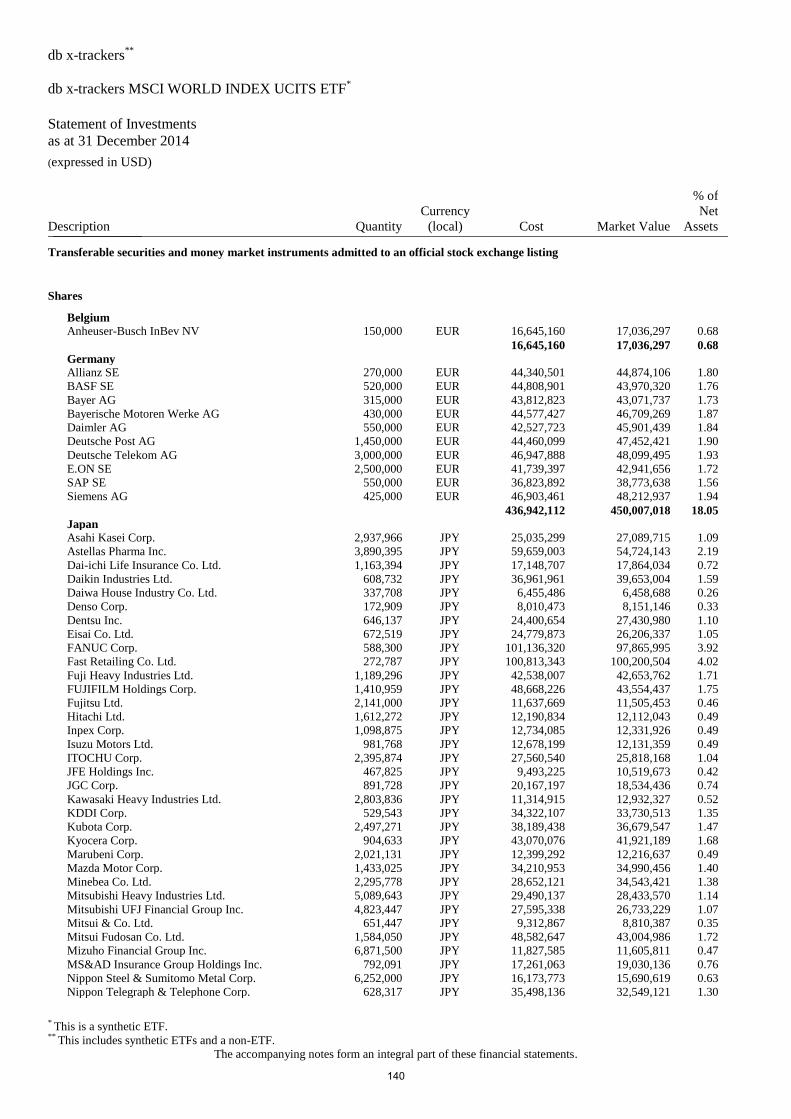
db x-trackers**
db x-trackers MSCI WORLD INDEX UCITS ETF*
Statement of Investments
as at 31 December 2014 (expressed in USD)
* This is a synthetic ETF. ** This includes synthetic ETFs and a non-ETF.
The accompanying notes form an integral part of these financial statements.
Description Quantity
Currency
(local) Cost Market Value
% of
Net
Assets _______________
Transferable securities and money market instruments admitted to an official stock exchange listing
Shares
Belgium
Anheuser-Busch InBev NV 150,000 EUR 16,645,160 17,036,297 0.68
16,645,160 17,036,297 0.68
Germany
Allianz SE 270,000 EUR 44,340,501 44,874,106 1.80
BASF SE 520,000 EUR 44,808,901 43,970,320 1.76
Bayer AG 315,000 EUR 43,812,823 43,071,737 1.73
Bayerische Motoren Werke AG 430,000 EUR 44,577,427 46,709,269 1.87
Daimler AG 550,000 EUR 42,527,723 45,901,439 1.84
Deutsche Post AG 1,450,000 EUR 44,460,099 47,452,421 1.90
Deutsche Telekom AG 3,000,000 EUR 46,947,888 48,099,495 1.93
E.ON SE 2,500,000 EUR 41,739,397 42,941,656 1.72
SAP SE 550,000 EUR 36,823,892 38,773,638 1.56
Siemens AG 425,000 EUR 46,903,461 48,212,937 1.94
436,942,112 450,007,018 18.05
Japan
Asahi Kasei Corp. 2,937,966 JPY 25,035,299 27,089,715 1.09
Astellas Pharma Inc. 3,890,395 JPY 59,659,003 54,724,143 2.19
Dai-ichi Life Insurance Co. Ltd. 1,163,394 JPY 17,148,707 17,864,034 0.72
Daikin Industries Ltd. 608,732 JPY 36,961,961 39,653,004 1.59
Daiwa House Industry Co. Ltd. 337,708 JPY 6,455,486 6,458,688 0.26
Denso Corp. 172,909 JPY 8,010,473 8,151,146 0.33
Dentsu Inc. 646,137 JPY 24,400,654 27,430,980 1.10
Eisai Co. Ltd. 672,519 JPY 24,779,873 26,206,337 1.05
FANUC Corp. 588,300 JPY 101,136,320 97,865,995 3.92
Fast Retailing Co. Ltd. 272,787 JPY 100,813,343 100,200,504 4.02
Fuji Heavy Industries Ltd. 1,189,296 JPY 42,538,007 42,653,762 1.71
FUJIFILM Holdings Corp. 1,410,959 JPY 48,668,226 43,554,437 1.75
Fujitsu Ltd. 2,141,000 JPY 11,637,669 11,505,453 0.46
Hitachi Ltd. 1,612,272 JPY 12,190,834 12,112,043 0.49
Inpex Corp. 1,098,875 JPY 12,734,085 12,331,926 0.49
Isuzu Motors Ltd. 981,768 JPY 12,678,199 12,131,359 0.49
ITOCHU Corp. 2,395,874 JPY 27,560,540 25,818,168 1.04
JFE Holdings Inc. 467,825 JPY 9,493,225 10,519,673 0.42
JGC Corp. 891,728 JPY 20,167,197 18,534,436 0.74
Kawasaki Heavy Industries Ltd. 2,803,836 JPY 11,314,915 12,932,327 0.52
KDDI Corp. 529,543 JPY 34,322,107 33,730,513 1.35
Kubota Corp. 2,497,271 JPY 38,189,438 36,679,547 1.47
Kyocera Corp. 904,633 JPY 43,070,076 41,921,189 1.68
Marubeni Corp. 2,021,131 JPY 12,399,292 12,216,637 0.49
Mazda Motor Corp. 1,433,025 JPY 34,210,953 34,990,456 1.40
Minebea Co. Ltd. 2,295,778 JPY 28,652,121 34,543,421 1.38
Mitsubishi Heavy Industries Ltd. 5,089,643 JPY 29,490,137 28,433,570 1.14
Mitsubishi UFJ Financial Group Inc. 4,823,447 JPY 27,595,338 26,733,229 1.07
Mitsui & Co. Ltd. 651,447 JPY 9,312,867 8,810,387 0.35
Mitsui Fudosan Co. Ltd. 1,584,050 JPY 48,582,647 43,004,986 1.72
Mizuho Financial Group Inc. 6,871,500 JPY 11,827,585 11,605,811 0.47
MS&AD Insurance Group Holdings Inc. 792,091 JPY 17,261,063 19,030,136 0.76
Nippon Steel & Sumitomo Metal Corp. 6,252,000 JPY 16,173,773 15,690,619 0.63
Nippon Telegraph & Telephone Corp. 628,317 JPY 35,498,136 32,549,121 1.30
140
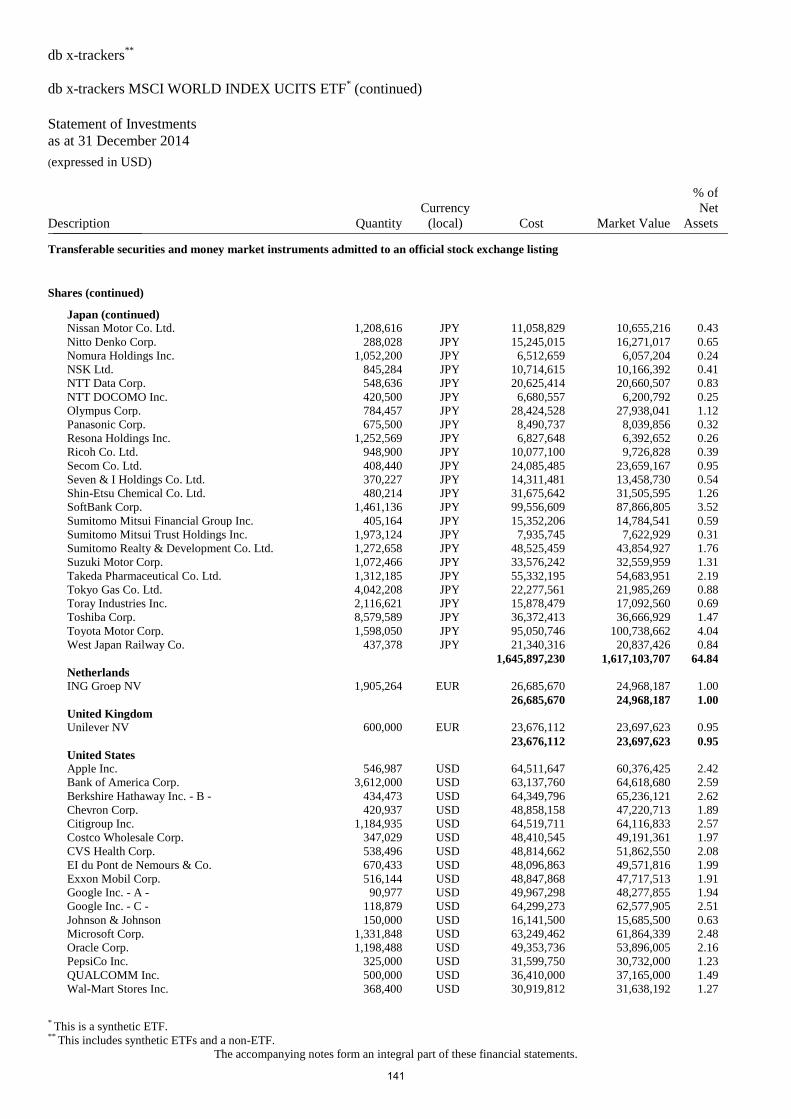
db x-trackers**
db x-trackers MSCI WORLD INDEX UCITS ETF* (continued)
Statement of Investments
as at 31 December 2014 (expressed in USD)
* This is a synthetic ETF. ** This includes synthetic ETFs and a non-ETF.
The accompanying notes form an integral part of these financial statements.
Description Quantity
Currency
(local) Cost Market Value
% of
Net
Assets _______________
Transferable securities and money market instruments admitted to an official stock exchange listing
Shares (continued)
Japan (continued)
Nissan Motor Co. Ltd. 1,208,616 JPY 11,058,829 10,655,216 0.43
Nitto Denko Corp. 288,028 JPY 15,245,015 16,271,017 0.65
Nomura Holdings Inc. 1,052,200 JPY 6,512,659 6,057,204 0.24
NSK Ltd. 845,284 JPY 10,714,615 10,166,392 0.41
NTT Data Corp. 548,636 JPY 20,625,414 20,660,507 0.83
NTT DOCOMO Inc. 420,500 JPY 6,680,557 6,200,792 0.25
Olympus Corp. 784,457 JPY 28,424,528 27,938,041 1.12
Panasonic Corp. 675,500 JPY 8,490,737 8,039,856 0.32
Resona Holdings Inc. 1,252,569 JPY 6,827,648 6,392,652 0.26
Ricoh Co. Ltd. 948,900 JPY 10,077,100 9,726,828 0.39
Secom Co. Ltd. 408,440 JPY 24,085,485 23,659,167 0.95
Seven & I Holdings Co. Ltd. 370,227 JPY 14,311,481 13,458,730 0.54
Shin-Etsu Chemical Co. Ltd. 480,214 JPY 31,675,642 31,505,595 1.26
SoftBank Corp. 1,461,136 JPY 99,556,609 87,866,805 3.52
Sumitomo Mitsui Financial Group Inc. 405,164 JPY 15,352,206 14,784,541 0.59
Sumitomo Mitsui Trust Holdings Inc. 1,973,124 JPY 7,935,745 7,622,929 0.31
Sumitomo Realty & Development Co. Ltd. 1,272,658 JPY 48,525,459 43,854,927 1.76
Suzuki Motor Corp. 1,072,466 JPY 33,576,242 32,559,959 1.31
Takeda Pharmaceutical Co. Ltd. 1,312,185 JPY 55,332,195 54,683,951 2.19
Tokyo Gas Co. Ltd. 4,042,208 JPY 22,277,561 21,985,269 0.88
Toray Industries Inc. 2,116,621 JPY 15,878,479 17,092,560 0.69
Toshiba Corp. 8,579,589 JPY 36,372,413 36,666,929 1.47
Toyota Motor Corp. 1,598,050 JPY 95,050,746 100,738,662 4.04
West Japan Railway Co. 437,378 JPY 21,340,316 20,837,426 0.84
1,645,897,230 1,617,103,707 64.84
Netherlands
ING Groep NV 1,905,264 EUR 26,685,670 24,968,187 1.00
26,685,670 24,968,187 1.00
United Kingdom
Unilever NV 600,000 EUR 23,676,112 23,697,623 0.95
23,676,112 23,697,623 0.95
United States
Apple Inc. 546,987 USD 64,511,647 60,376,425 2.42
Bank of America Corp. 3,612,000 USD 63,137,760 64,618,680 2.59
Berkshire Hathaway Inc. - B - 434,473 USD 64,349,796 65,236,121 2.62
Chevron Corp. 420,937 USD 48,858,158 47,220,713 1.89
Citigroup Inc. 1,184,935 USD 64,519,711 64,116,833 2.57
Costco Wholesale Corp. 347,029 USD 48,410,545 49,191,361 1.97
CVS Health Corp. 538,496 USD 48,814,662 51,862,550 2.08
EI du Pont de Nemours & Co. 670,433 USD 48,096,863 49,571,816 1.99
Exxon Mobil Corp. 516,144 USD 48,847,868 47,717,513 1.91
Google Inc. - A - 90,977 USD 49,967,298 48,277,855 1.94
Google Inc. - C - 118,879 USD 64,299,273 62,577,905 2.51
Johnson & Johnson 150,000 USD 16,141,500 15,685,500 0.63
Microsoft Corp. 1,331,848 USD 63,249,462 61,864,339 2.48
Oracle Corp. 1,198,488 USD 49,353,736 53,896,005 2.16
PepsiCo Inc. 325,000 USD 31,599,750 30,732,000 1.23
QUALCOMM Inc. 500,000 USD 36,410,000 37,165,000 1.49
Wal-Mart Stores Inc. 368,400 USD 30,919,812 31,638,192 1.27
141
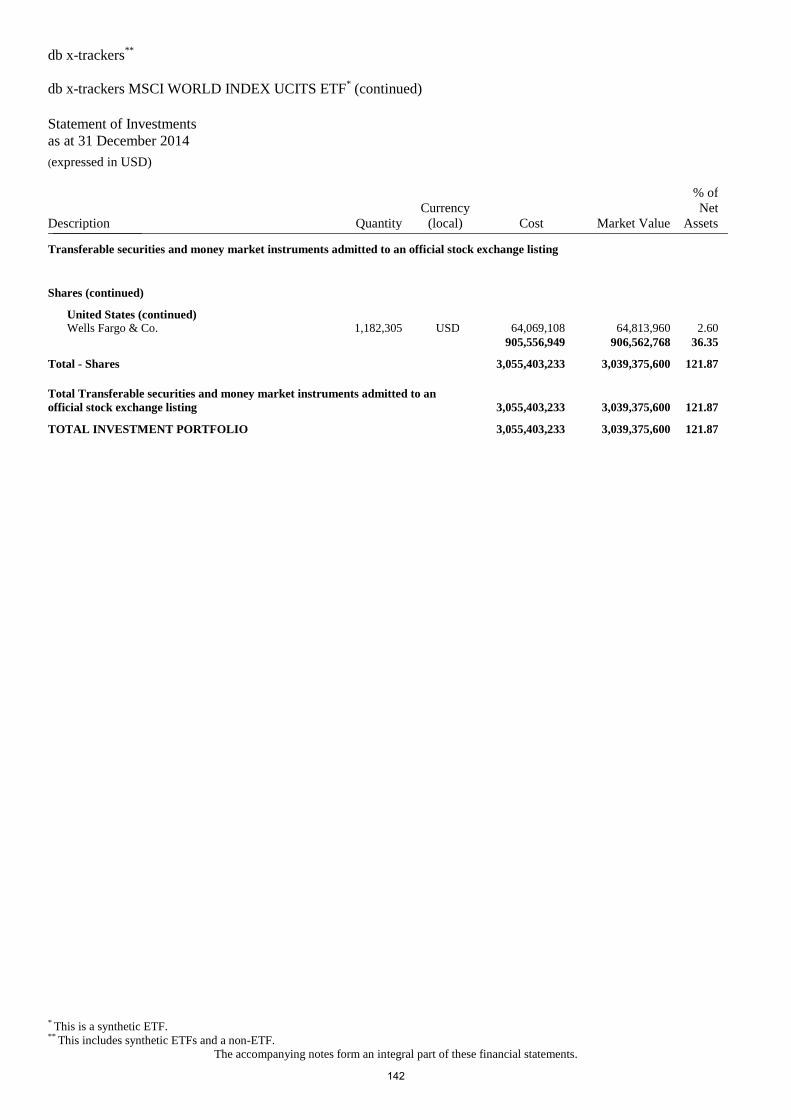
db x-trackers**
db x-trackers MSCI WORLD INDEX UCITS ETF* (continued)
Statement of Investments
as at 31 December 2014 (expressed in USD)
* This is a synthetic ETF. ** This includes synthetic ETFs and a non-ETF.
The accompanying notes form an integral part of these financial statements.
Description Quantity
Currency
(local) Cost Market Value
% of
Net
Assets _______________
Transferable securities and money market instruments admitted to an official stock exchange listing
Shares (continued)
United States (continued)
Wells Fargo & Co. 1,182,305 USD 64,069,108 64,813,960 2.60
905,556,949 906,562,768 36.35
Total - Shares 3,055,403,233 3,039,375,600 121.87
Total Transferable securities and money market instruments admitted to an
official stock exchange listing 3,055,403,233 3,039,375,600 121.87
TOTAL INVESTMENT PORTFOLIO 3,055,403,233 3,039,375,600 121.87
142
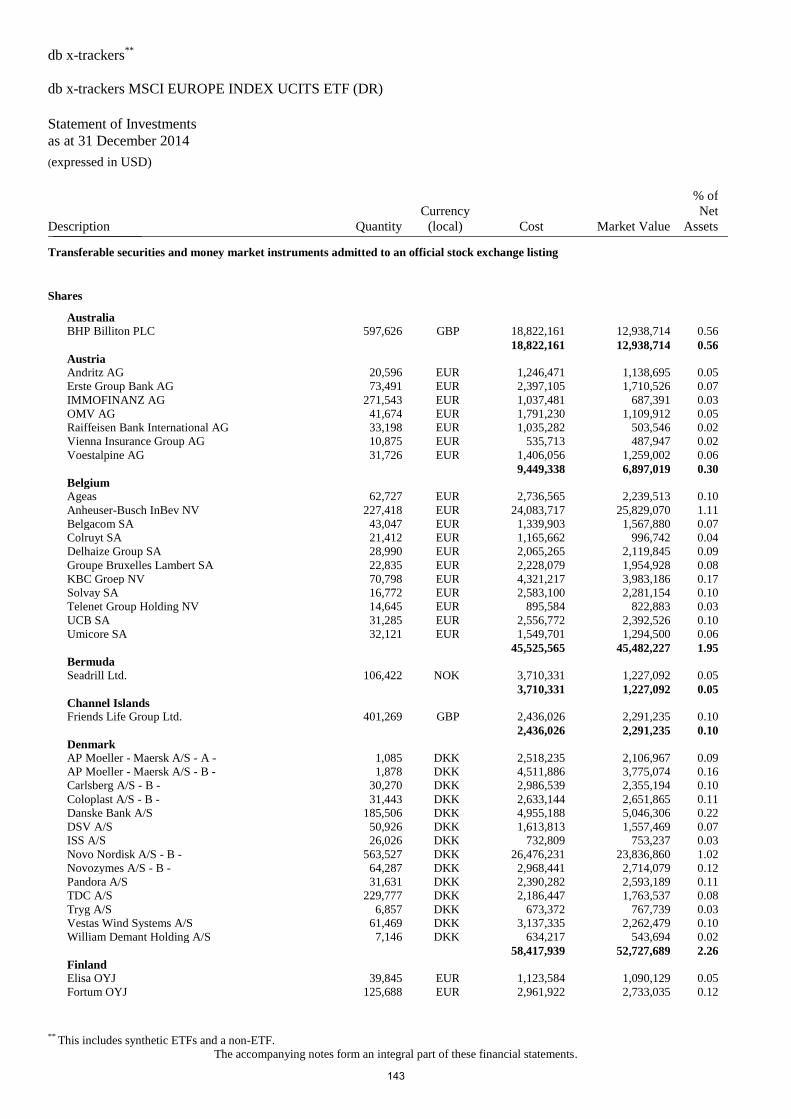
db x-trackers**
db x-trackers MSCI EUROPE INDEX UCITS ETF (DR)
Statement of Investments
as at 31 December 2014 (expressed in USD)
** This includes synthetic ETFs and a non-ETF.
The accompanying notes form an integral part of these financial statements.
Description Quantity
Currency
(local) Cost Market Value
% of
Net
Assets _______________
Transferable securities and money market instruments admitted to an official stock exchange listing
Shares
Australia
BHP Billiton PLC 597,626 GBP 18,822,161 12,938,714 0.56
18,822,161 12,938,714 0.56
Austria
Andritz AG 20,596 EUR 1,246,471 1,138,695 0.05
Erste Group Bank AG 73,491 EUR 2,397,105 1,710,526 0.07
IMMOFINANZ AG 271,543 EUR 1,037,481 687,391 0.03
OMV AG 41,674 EUR 1,791,230 1,109,912 0.05
Raiffeisen Bank International AG 33,198 EUR 1,035,282 503,546 0.02
Vienna Insurance Group AG 10,875 EUR 535,713 487,947 0.02
Voestalpine AG 31,726 EUR 1,406,056 1,259,002 0.06
9,449,338 6,897,019 0.30
Belgium
Ageas 62,727 EUR 2,736,565 2,239,513 0.10
Anheuser-Busch InBev NV 227,418 EUR 24,083,717 25,829,070 1.11
Belgacom SA 43,047 EUR 1,339,903 1,567,880 0.07
Colruyt SA 21,412 EUR 1,165,662 996,742 0.04
Delhaize Group SA 28,990 EUR 2,065,265 2,119,845 0.09
Groupe Bruxelles Lambert SA 22,835 EUR 2,228,079 1,954,928 0.08
KBC Groep NV 70,798 EUR 4,321,217 3,983,186 0.17
Solvay SA 16,772 EUR 2,583,100 2,281,154 0.10
Telenet Group Holding NV 14,645 EUR 895,584 822,883 0.03
UCB SA 31,285 EUR 2,556,772 2,392,526 0.10
Umicore SA 32,121 EUR 1,549,701 1,294,500 0.06
45,525,565 45,482,227 1.95
Bermuda
Seadrill Ltd. 106,422 NOK 3,710,331 1,227,092 0.05
3,710,331 1,227,092 0.05
Channel Islands
Friends Life Group Ltd. 401,269 GBP 2,436,026 2,291,235 0.10
2,436,026 2,291,235 0.10
Denmark
AP Moeller - Maersk A/S - A - 1,085 DKK 2,518,235 2,106,967 0.09
AP Moeller - Maersk A/S - B - 1,878 DKK 4,511,886 3,775,074 0.16
Carlsberg A/S - B - 30,270 DKK 2,986,539 2,355,194 0.10
Coloplast A/S - B - 31,443 DKK 2,633,144 2,651,865 0.11
Danske Bank A/S 185,506 DKK 4,955,188 5,046,306 0.22
DSV A/S 50,926 DKK 1,613,813 1,557,469 0.07
ISS A/S 26,026 DKK 732,809 753,237 0.03
Novo Nordisk A/S - B - 563,527 DKK 26,476,231 23,836,860 1.02
Novozymes A/S - B - 64,287 DKK 2,968,441 2,714,079 0.12
Pandora A/S 31,631 DKK 2,390,282 2,593,189 0.11
TDC A/S 229,777 DKK 2,186,447 1,763,537 0.08
Tryg A/S 6,857 DKK 673,372 767,739 0.03
Vestas Wind Systems A/S 61,469 DKK 3,137,335 2,262,479 0.10
William Demant Holding A/S 7,146 DKK 634,217 543,694 0.02
58,417,939 52,727,689 2.26
Finland
Elisa OYJ 39,845 EUR 1,123,584 1,090,129 0.05
Fortum OYJ 125,688 EUR 2,961,922 2,733,035 0.12
143
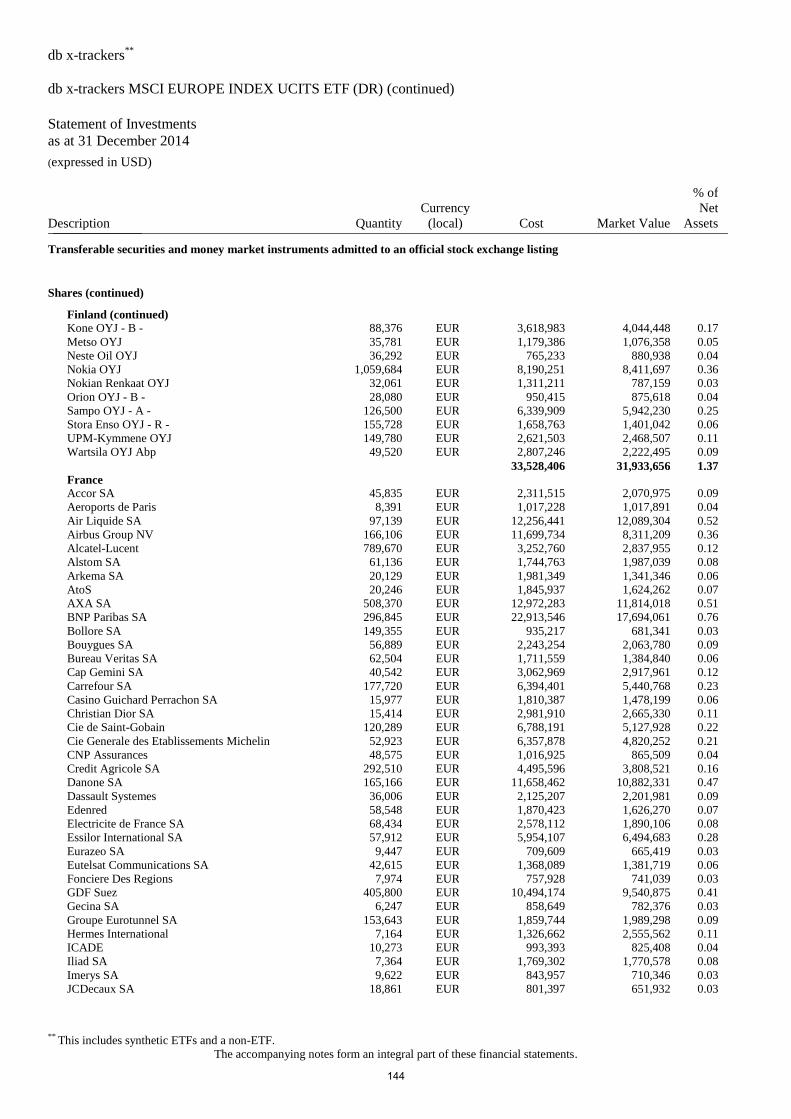
db x-trackers**
db x-trackers MSCI EUROPE INDEX UCITS ETF (DR) (continued)
Statement of Investments
as at 31 December 2014 (expressed in USD)
** This includes synthetic ETFs and a non-ETF.
The accompanying notes form an integral part of these financial statements.
Description Quantity
Currency
(local) Cost Market Value
% of
Net
Assets _______________
Transferable securities and money market instruments admitted to an official stock exchange listing
Shares (continued)
Finland (continued)
Kone OYJ - B - 88,376 EUR 3,618,983 4,044,448 0.17
Metso OYJ 35,781 EUR 1,179,386 1,076,358 0.05
Neste Oil OYJ 36,292 EUR 765,233 880,938 0.04
Nokia OYJ 1,059,684 EUR 8,190,251 8,411,697 0.36
Nokian Renkaat OYJ 32,061 EUR 1,311,211 787,159 0.03
Orion OYJ - B - 28,080 EUR 950,415 875,618 0.04
Sampo OYJ - A - 126,500 EUR 6,339,909 5,942,230 0.25
Stora Enso OYJ - R - 155,728 EUR 1,658,763 1,401,042 0.06
UPM-Kymmene OYJ 149,780 EUR 2,621,503 2,468,507 0.11
Wartsila OYJ Abp 49,520 EUR 2,807,246 2,222,495 0.09
33,528,406 31,933,656 1.37
France
Accor SA 45,835 EUR 2,311,515 2,070,975 0.09
Aeroports de Paris 8,391 EUR 1,017,228 1,017,891 0.04
Air Liquide SA 97,139 EUR 12,256,441 12,089,304 0.52
Airbus Group NV 166,106 EUR 11,699,734 8,311,209 0.36
Alcatel-Lucent 789,670 EUR 3,252,760 2,837,955 0.12
Alstom SA 61,136 EUR 1,744,763 1,987,039 0.08
Arkema SA 20,129 EUR 1,981,349 1,341,346 0.06
AtoS 20,246 EUR 1,845,937 1,624,262 0.07
AXA SA 508,370 EUR 12,972,283 11,814,018 0.51
BNP Paribas SA 296,845 EUR 22,913,546 17,694,061 0.76
Bollore SA 149,355 EUR 935,217 681,341 0.03
Bouygues SA 56,889 EUR 2,243,254 2,063,780 0.09
Bureau Veritas SA 62,504 EUR 1,711,559 1,384,840 0.06
Cap Gemini SA 40,542 EUR 3,062,969 2,917,961 0.12
Carrefour SA 177,720 EUR 6,394,401 5,440,768 0.23
Casino Guichard Perrachon SA 15,977 EUR 1,810,387 1,478,199 0.06
Christian Dior SA 15,414 EUR 2,981,910 2,665,330 0.11
Cie de Saint-Gobain 120,289 EUR 6,788,191 5,127,928 0.22
Cie Generale des Etablissements Michelin 52,923 EUR 6,357,878 4,820,252 0.21
CNP Assurances 48,575 EUR 1,016,925 865,509 0.04
Credit Agricole SA 292,510 EUR 4,495,596 3,808,521 0.16
Danone SA 165,166 EUR 11,658,462 10,882,331 0.47
Dassault Systemes 36,006 EUR 2,125,207 2,201,981 0.09
Edenred 58,548 EUR 1,870,423 1,626,270 0.07
Electricite de France SA 68,434 EUR 2,578,112 1,890,106 0.08
Essilor International SA 57,912 EUR 5,954,107 6,494,683 0.28
Eurazeo SA 9,447 EUR 709,609 665,419 0.03
Eutelsat Communications SA 42,615 EUR 1,368,089 1,381,719 0.06
Fonciere Des Regions 7,974 EUR 757,928 741,039 0.03
GDF Suez 405,800 EUR 10,494,174 9,540,875 0.41
Gecina SA 6,247 EUR 858,649 782,376 0.03
Groupe Eurotunnel SA 153,643 EUR 1,859,744 1,989,298 0.09
Hermes International 7,164 EUR 1,326,662 2,555,562 0.11
ICADE 10,273 EUR 993,393 825,408 0.04
Iliad SA 7,364 EUR 1,769,302 1,770,578 0.08
Imerys SA 9,622 EUR 843,957 710,346 0.03
JCDecaux SA 18,861 EUR 801,397 651,932 0.03
144
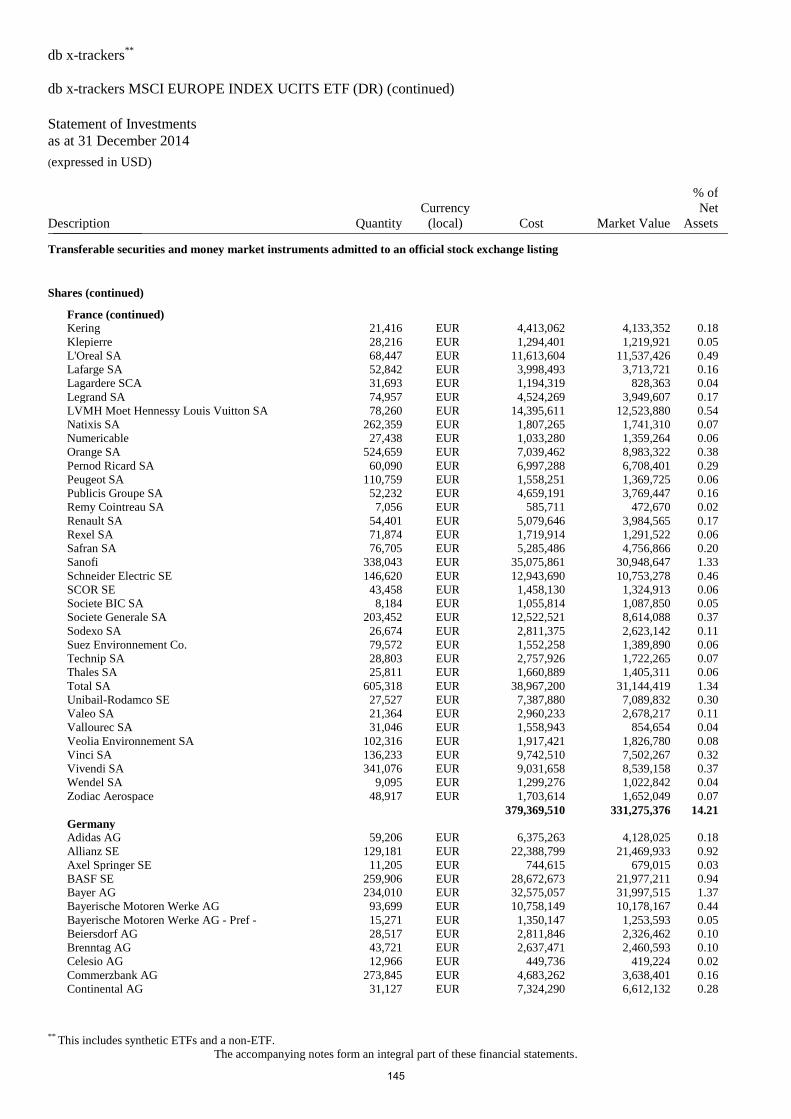
db x-trackers**
db x-trackers MSCI EUROPE INDEX UCITS ETF (DR) (continued)
Statement of Investments
as at 31 December 2014 (expressed in USD)
** This includes synthetic ETFs and a non-ETF.
The accompanying notes form an integral part of these financial statements.
Description Quantity
Currency
(local) Cost Market Value
% of
Net
Assets _______________
Transferable securities and money market instruments admitted to an official stock exchange listing
Shares (continued)
France (continued)
Kering 21,416 EUR 4,413,062 4,133,352 0.18
Klepierre 28,216 EUR 1,294,401 1,219,921 0.05
L'Oreal SA 68,447 EUR 11,613,604 11,537,426 0.49
Lafarge SA 52,842 EUR 3,998,493 3,713,721 0.16
Lagardere SCA 31,693 EUR 1,194,319 828,363 0.04
Legrand SA 74,957 EUR 4,524,269 3,949,607 0.17
LVMH Moet Hennessy Louis Vuitton SA 78,260 EUR 14,395,611 12,523,880 0.54
Natixis SA 262,359 EUR 1,807,265 1,741,310 0.07
Numericable 27,438 EUR 1,033,280 1,359,264 0.06
Orange SA 524,659 EUR 7,039,462 8,983,322 0.38
Pernod Ricard SA 60,090 EUR 6,997,288 6,708,401 0.29
Peugeot SA 110,759 EUR 1,558,251 1,369,725 0.06
Publicis Groupe SA 52,232 EUR 4,659,191 3,769,447 0.16
Remy Cointreau SA 7,056 EUR 585,711 472,670 0.02
Renault SA 54,401 EUR 5,079,646 3,984,565 0.17
Rexel SA 71,874 EUR 1,719,914 1,291,522 0.06
Safran SA 76,705 EUR 5,285,486 4,756,866 0.20
Sanofi 338,043 EUR 35,075,861 30,948,647 1.33
Schneider Electric SE 146,620 EUR 12,943,690 10,753,278 0.46
SCOR SE 43,458 EUR 1,458,130 1,324,913 0.06
Societe BIC SA 8,184 EUR 1,055,814 1,087,850 0.05
Societe Generale SA 203,452 EUR 12,522,521 8,614,088 0.37
Sodexo SA 26,674 EUR 2,811,375 2,623,142 0.11
Suez Environnement Co. 79,572 EUR 1,552,258 1,389,890 0.06
Technip SA 28,803 EUR 2,757,926 1,722,265 0.07
Thales SA 25,811 EUR 1,660,889 1,405,311 0.06
Total SA 605,318 EUR 38,967,200 31,144,419 1.34
Unibail-Rodamco SE 27,527 EUR 7,387,880 7,089,832 0.30
Valeo SA 21,364 EUR 2,960,233 2,678,217 0.11
Vallourec SA 31,046 EUR 1,558,943 854,654 0.04
Veolia Environnement SA 102,316 EUR 1,917,421 1,826,780 0.08
Vinci SA 136,233 EUR 9,742,510 7,502,267 0.32
Vivendi SA 341,076 EUR 9,031,658 8,539,158 0.37
Wendel SA 9,095 EUR 1,299,276 1,022,842 0.04
Zodiac Aerospace 48,917 EUR 1,703,614 1,652,049 0.07
379,369,510 331,275,376 14.21
Germany
Adidas AG 59,206 EUR 6,375,263 4,128,025 0.18
Allianz SE 129,181 EUR 22,388,799 21,469,933 0.92
Axel Springer SE 11,205 EUR 744,615 679,015 0.03
BASF SE 259,906 EUR 28,672,673 21,977,211 0.94
Bayer AG 234,010 EUR 32,575,057 31,997,515 1.37
Bayerische Motoren Werke AG 93,699 EUR 10,758,149 10,178,167 0.44
Bayerische Motoren Werke AG - Pref - 15,271 EUR 1,350,147 1,253,593 0.05
Beiersdorf AG 28,517 EUR 2,811,846 2,326,462 0.10
Brenntag AG 43,721 EUR 2,637,471 2,460,593 0.10
Celesio AG 12,966 EUR 449,736 419,224 0.02
Commerzbank AG 273,845 EUR 4,683,262 3,638,401 0.16
Continental AG 31,127 EUR 7,324,290 6,612,132 0.28
145
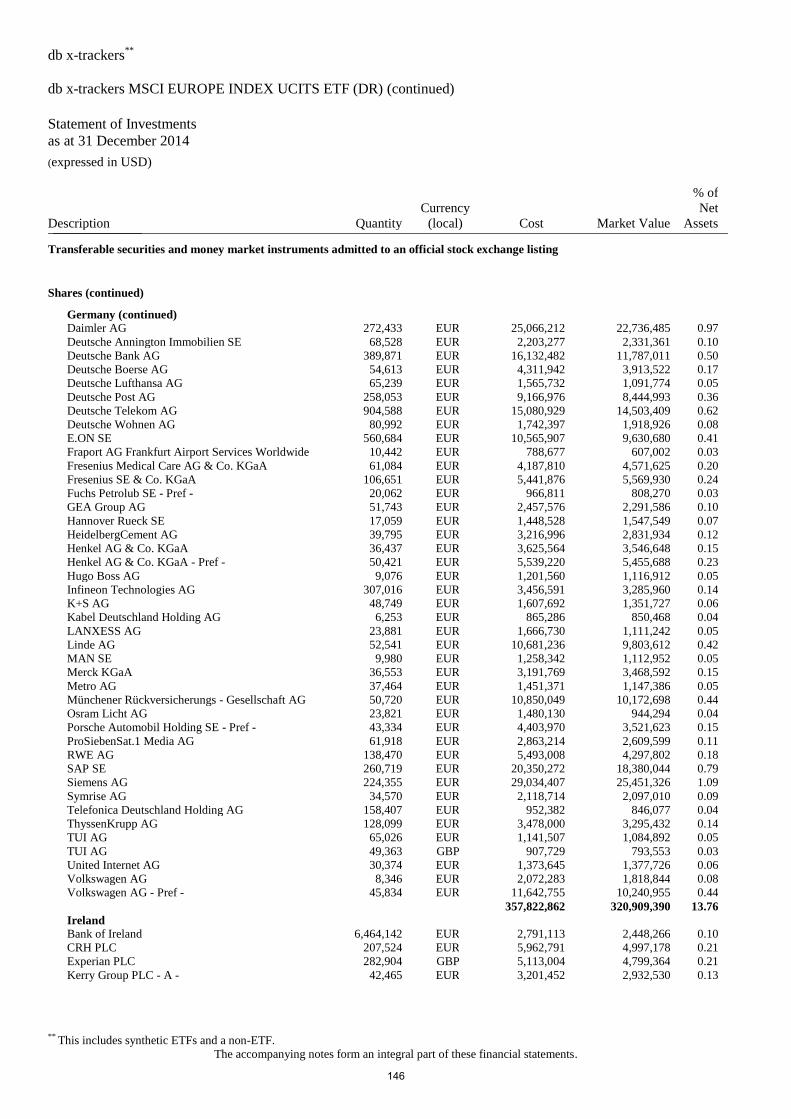
db x-trackers**
db x-trackers MSCI EUROPE INDEX UCITS ETF (DR) (continued)
Statement of Investments
as at 31 December 2014 (expressed in USD)
** This includes synthetic ETFs and a non-ETF.
The accompanying notes form an integral part of these financial statements.
Description Quantity
Currency
(local) Cost Market Value
% of
Net
Assets _______________
Transferable securities and money market instruments admitted to an official stock exchange listing
Shares (continued)
Germany (continued)
Daimler AG 272,433 EUR 25,066,212 22,736,485 0.97
Deutsche Annington Immobilien SE 68,528 EUR 2,203,277 2,331,361 0.10
Deutsche Bank AG 389,871 EUR 16,132,482 11,787,011 0.50
Deutsche Boerse AG 54,613 EUR 4,311,942 3,913,522 0.17
Deutsche Lufthansa AG 65,239 EUR 1,565,732 1,091,774 0.05
Deutsche Post AG 258,053 EUR 9,166,976 8,444,993 0.36
Deutsche Telekom AG 904,588 EUR 15,080,929 14,503,409 0.62
Deutsche Wohnen AG 80,992 EUR 1,742,397 1,918,926 0.08
E.ON SE 560,684 EUR 10,565,907 9,630,680 0.41
Fraport AG Frankfurt Airport Services Worldwide 10,442 EUR 788,677 607,002 0.03
Fresenius Medical Care AG & Co. KGaA 61,084 EUR 4,187,810 4,571,625 0.20
Fresenius SE & Co. KGaA 106,651 EUR 5,441,876 5,569,930 0.24
Fuchs Petrolub SE - Pref - 20,062 EUR 966,811 808,270 0.03
GEA Group AG 51,743 EUR 2,457,576 2,291,586 0.10
Hannover Rueck SE 17,059 EUR 1,448,528 1,547,549 0.07
HeidelbergCement AG 39,795 EUR 3,216,996 2,831,934 0.12
Henkel AG & Co. KGaA 36,437 EUR 3,625,564 3,546,648 0.15
Henkel AG & Co. KGaA - Pref - 50,421 EUR 5,539,220 5,455,688 0.23
Hugo Boss AG 9,076 EUR 1,201,560 1,116,912 0.05
Infineon Technologies AG 307,016 EUR 3,456,591 3,285,960 0.14
K+S AG 48,749 EUR 1,607,692 1,351,727 0.06
Kabel Deutschland Holding AG 6,253 EUR 865,286 850,468 0.04
LANXESS AG 23,881 EUR 1,666,730 1,111,242 0.05
Linde AG 52,541 EUR 10,681,236 9,803,612 0.42
MAN SE 9,980 EUR 1,258,342 1,112,952 0.05
Merck KGaA 36,553 EUR 3,191,769 3,468,592 0.15
Metro AG 37,464 EUR 1,451,371 1,147,386 0.05
Münchener Rückversicherungs - Gesellschaft AG 50,720 EUR 10,850,049 10,172,698 0.44
Osram Licht AG 23,821 EUR 1,480,130 944,294 0.04
Porsche Automobil Holding SE - Pref - 43,334 EUR 4,403,970 3,521,623 0.15
ProSiebenSat.1 Media AG 61,918 EUR 2,863,214 2,609,599 0.11
RWE AG 138,470 EUR 5,493,008 4,297,802 0.18
SAP SE 260,719 EUR 20,350,272 18,380,044 0.79
Siemens AG 224,355 EUR 29,034,407 25,451,326 1.09
Symrise AG 34,570 EUR 2,118,714 2,097,010 0.09
Telefonica Deutschland Holding AG 158,407 EUR 952,382 846,077 0.04
ThyssenKrupp AG 128,099 EUR 3,478,000 3,295,432 0.14
TUI AG 65,026 EUR 1,141,507 1,084,892 0.05
TUI AG 49,363 GBP 907,729 793,553 0.03
United Internet AG 30,374 EUR 1,373,645 1,377,726 0.06
Volkswagen AG 8,346 EUR 2,072,283 1,818,844 0.08
Volkswagen AG - Pref - 45,834 EUR 11,642,755 10,240,955 0.44
357,822,862 320,909,390 13.76
Ireland
Bank of Ireland 6,464,142 EUR 2,791,113 2,448,266 0.10
CRH PLC 207,524 EUR 5,962,791 4,997,178 0.21
Experian PLC 282,904 GBP 5,113,004 4,799,364 0.21
Kerry Group PLC - A - 42,465 EUR 3,201,452 2,932,530 0.13
146
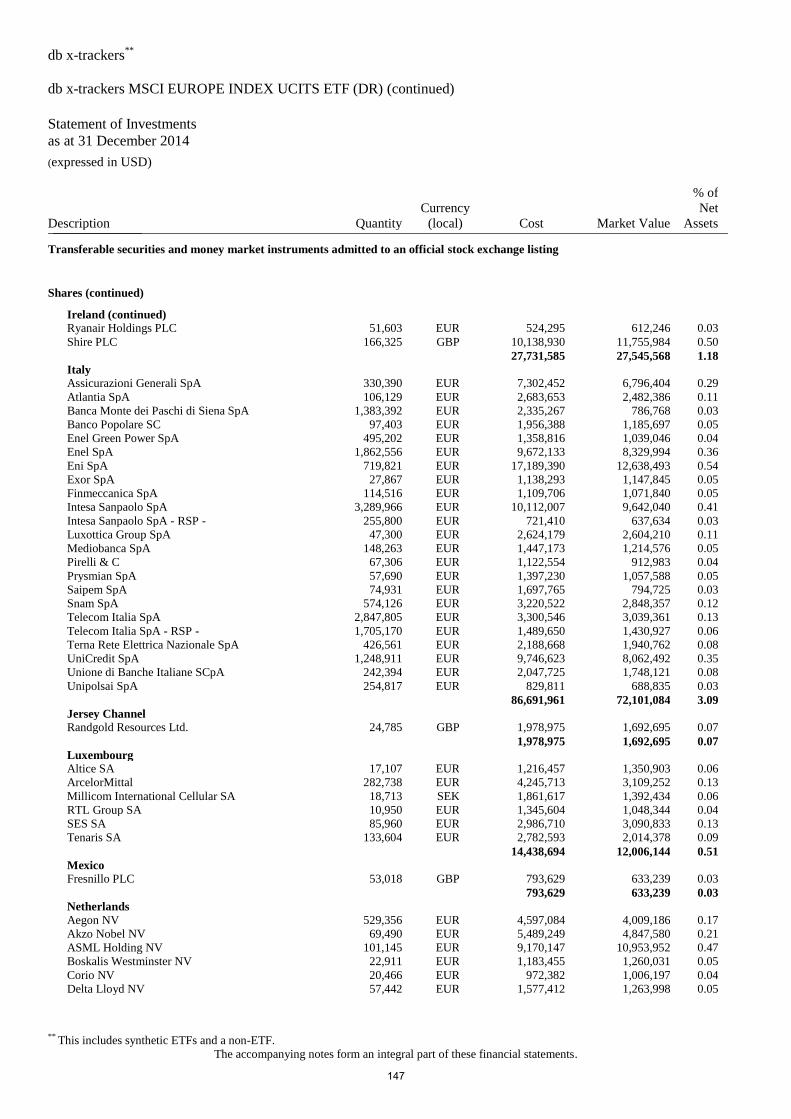
db x-trackers**
db x-trackers MSCI EUROPE INDEX UCITS ETF (DR) (continued)
Statement of Investments
as at 31 December 2014 (expressed in USD)
** This includes synthetic ETFs and a non-ETF.
The accompanying notes form an integral part of these financial statements.
Description Quantity
Currency
(local) Cost Market Value
% of
Net
Assets _______________
Transferable securities and money market instruments admitted to an official stock exchange listing
Shares (continued)
Ireland (continued)
Ryanair Holdings PLC 51,603 EUR 524,295 612,246 0.03
Shire PLC 166,325 GBP 10,138,930 11,755,984 0.50
27,731,585 27,545,568 1.18
Italy
Assicurazioni Generali SpA 330,390 EUR 7,302,452 6,796,404 0.29
Atlantia SpA 106,129 EUR 2,683,653 2,482,386 0.11
Banca Monte dei Paschi di Siena SpA 1,383,392 EUR 2,335,267 786,768 0.03
Banco Popolare SC 97,403 EUR 1,956,388 1,185,697 0.05
Enel Green Power SpA 495,202 EUR 1,358,816 1,039,046 0.04
Enel SpA 1,862,556 EUR 9,672,133 8,329,994 0.36
Eni SpA 719,821 EUR 17,189,390 12,638,493 0.54
Exor SpA 27,867 EUR 1,138,293 1,147,845 0.05
Finmeccanica SpA 114,516 EUR 1,109,706 1,071,840 0.05
Intesa Sanpaolo SpA 3,289,966 EUR 10,112,007 9,642,040 0.41
Intesa Sanpaolo SpA - RSP - 255,800 EUR 721,410 637,634 0.03
Luxottica Group SpA 47,300 EUR 2,624,179 2,604,210 0.11
Mediobanca SpA 148,263 EUR 1,447,173 1,214,576 0.05
Pirelli & C 67,306 EUR 1,122,554 912,983 0.04
Prysmian SpA 57,690 EUR 1,397,230 1,057,588 0.05
Saipem SpA 74,931 EUR 1,697,765 794,725 0.03
Snam SpA 574,126 EUR 3,220,522 2,848,357 0.12
Telecom Italia SpA 2,847,805 EUR 3,300,546 3,039,361 0.13
Telecom Italia SpA - RSP - 1,705,170 EUR 1,489,650 1,430,927 0.06
Terna Rete Elettrica Nazionale SpA 426,561 EUR 2,188,668 1,940,762 0.08
UniCredit SpA 1,248,911 EUR 9,746,623 8,062,492 0.35
Unione di Banche Italiane SCpA 242,394 EUR 2,047,725 1,748,121 0.08
Unipolsai SpA 254,817 EUR 829,811 688,835 0.03
86,691,961 72,101,084 3.09
Jersey Channel
Randgold Resources Ltd. 24,785 GBP 1,978,975 1,692,695 0.07
1,978,975 1,692,695 0.07
Luxembourg
Altice SA 17,107 EUR 1,216,457 1,350,903 0.06
ArcelorMittal 282,738 EUR 4,245,713 3,109,252 0.13
Millicom International Cellular SA 18,713 SEK 1,861,617 1,392,434 0.06
RTL Group SA 10,950 EUR 1,345,604 1,048,344 0.04
SES SA 85,960 EUR 2,986,710 3,090,833 0.13
Tenaris SA 133,604 EUR 2,782,593 2,014,378 0.09
14,438,694 12,006,144 0.51
Mexico
Fresnillo PLC 53,018 GBP 793,629 633,239 0.03
793,629 633,239 0.03
Netherlands
Aegon NV 529,356 EUR 4,597,084 4,009,186 0.17
Akzo Nobel NV 69,490 EUR 5,489,249 4,847,580 0.21
ASML Holding NV 101,145 EUR 9,170,147 10,953,952 0.47
Boskalis Westminster NV 22,911 EUR 1,183,455 1,260,031 0.05
Corio NV 20,466 EUR 972,382 1,006,197 0.04
Delta Lloyd NV 57,442 EUR 1,577,412 1,263,998 0.05
147
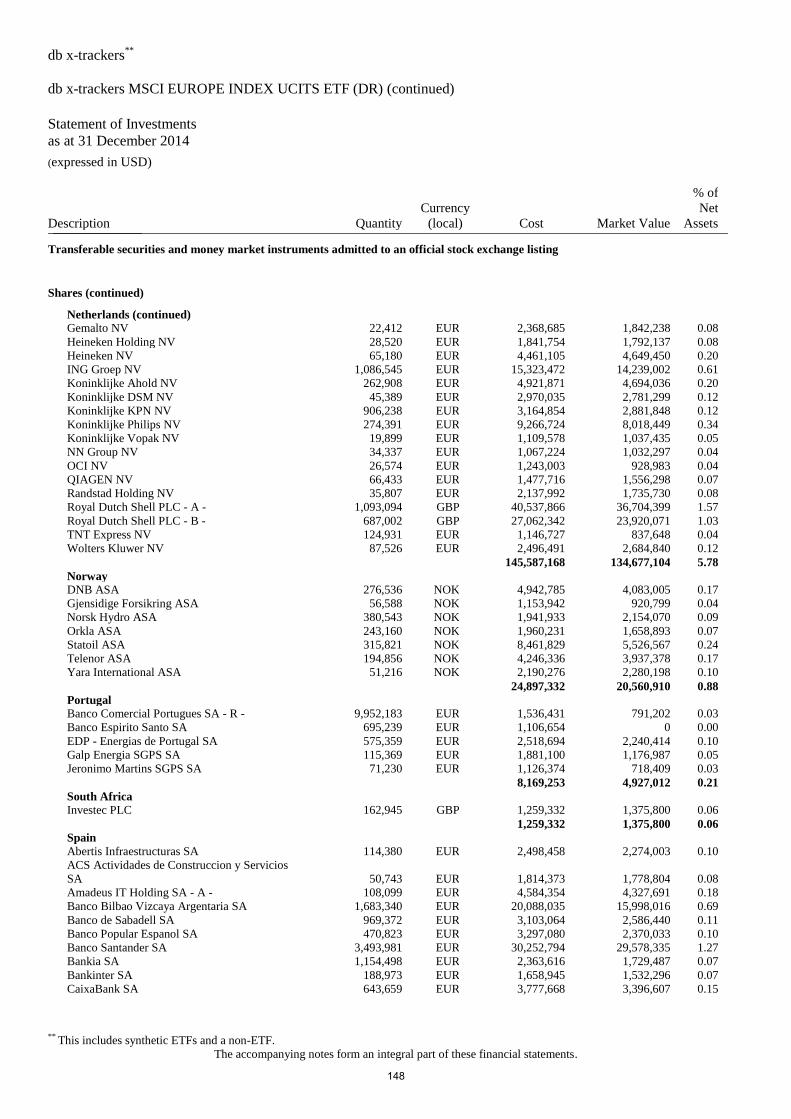
db x-trackers**
db x-trackers MSCI EUROPE INDEX UCITS ETF (DR) (continued)
Statement of Investments
as at 31 December 2014 (expressed in USD)
** This includes synthetic ETFs and a non-ETF.
The accompanying notes form an integral part of these financial statements.
Description Quantity
Currency
(local) Cost Market Value
% of
Net
Assets _______________
Transferable securities and money market instruments admitted to an official stock exchange listing
Shares (continued)
Netherlands (continued)
Gemalto NV 22,412 EUR 2,368,685 1,842,238 0.08
Heineken Holding NV 28,520 EUR 1,841,754 1,792,137 0.08
Heineken NV 65,180 EUR 4,461,105 4,649,450 0.20
ING Groep NV 1,086,545 EUR 15,323,472 14,239,002 0.61
Koninklijke Ahold NV 262,908 EUR 4,921,871 4,694,036 0.20
Koninklijke DSM NV 45,389 EUR 2,970,035 2,781,299 0.12
Koninklijke KPN NV 906,238 EUR 3,164,854 2,881,848 0.12
Koninklijke Philips NV 274,391 EUR 9,266,724 8,018,449 0.34
Koninklijke Vopak NV 19,899 EUR 1,109,578 1,037,435 0.05
NN Group NV 34,337 EUR 1,067,224 1,032,297 0.04
OCI NV 26,574 EUR 1,243,003 928,983 0.04
QIAGEN NV 66,433 EUR 1,477,716 1,556,298 0.07
Randstad Holding NV 35,807 EUR 2,137,992 1,735,730 0.08
Royal Dutch Shell PLC - A - 1,093,094 GBP 40,537,866 36,704,399 1.57
Royal Dutch Shell PLC - B - 687,002 GBP 27,062,342 23,920,071 1.03
TNT Express NV 124,931 EUR 1,146,727 837,648 0.04
Wolters Kluwer NV 87,526 EUR 2,496,491 2,684,840 0.12
145,587,168 134,677,104 5.78
Norway
DNB ASA 276,536 NOK 4,942,785 4,083,005 0.17
Gjensidige Forsikring ASA 56,588 NOK 1,153,942 920,799 0.04
Norsk Hydro ASA 380,543 NOK 1,941,933 2,154,070 0.09
Orkla ASA 243,160 NOK 1,960,231 1,658,893 0.07
Statoil ASA 315,821 NOK 8,461,829 5,526,567 0.24
Telenor ASA 194,856 NOK 4,246,336 3,937,378 0.17
Yara International ASA 51,216 NOK 2,190,276 2,280,198 0.10
24,897,332 20,560,910 0.88
Portugal
Banco Comercial Portugues SA - R - 9,952,183 EUR 1,536,431 791,202 0.03
Banco Espirito Santo SA 695,239 EUR 1,106,654 0 0.00
EDP - Energias de Portugal SA 575,359 EUR 2,518,694 2,240,414 0.10
Galp Energia SGPS SA 115,369 EUR 1,881,100 1,176,987 0.05
Jeronimo Martins SGPS SA 71,230 EUR 1,126,374 718,409 0.03
8,169,253 4,927,012 0.21
South Africa
Investec PLC 162,945 GBP 1,259,332 1,375,800 0.06
1,259,332 1,375,800 0.06
Spain
Abertis Infraestructuras SA 114,380 EUR 2,498,458 2,274,003 0.10
ACS Actividades de Construccion y Servicios
SA
50,743 EUR 1,814,373 1,778,804 0.08
Amadeus IT Holding SA - A - 108,099 EUR 4,584,354 4,327,691 0.18
Banco Bilbao Vizcaya Argentaria SA 1,683,340 EUR 20,088,035 15,998,016 0.69
Banco de Sabadell SA 969,372 EUR 3,103,064 2,586,440 0.11
Banco Popular Espanol SA 470,823 EUR 3,297,080 2,370,033 0.10
Banco Santander SA 3,493,981 EUR 30,252,794 29,578,335 1.27
Bankia SA 1,154,498 EUR 2,363,616 1,729,487 0.07
Bankinter SA 188,973 EUR 1,658,945 1,532,296 0.07
CaixaBank SA 643,659 EUR 3,777,668 3,396,607 0.15
148
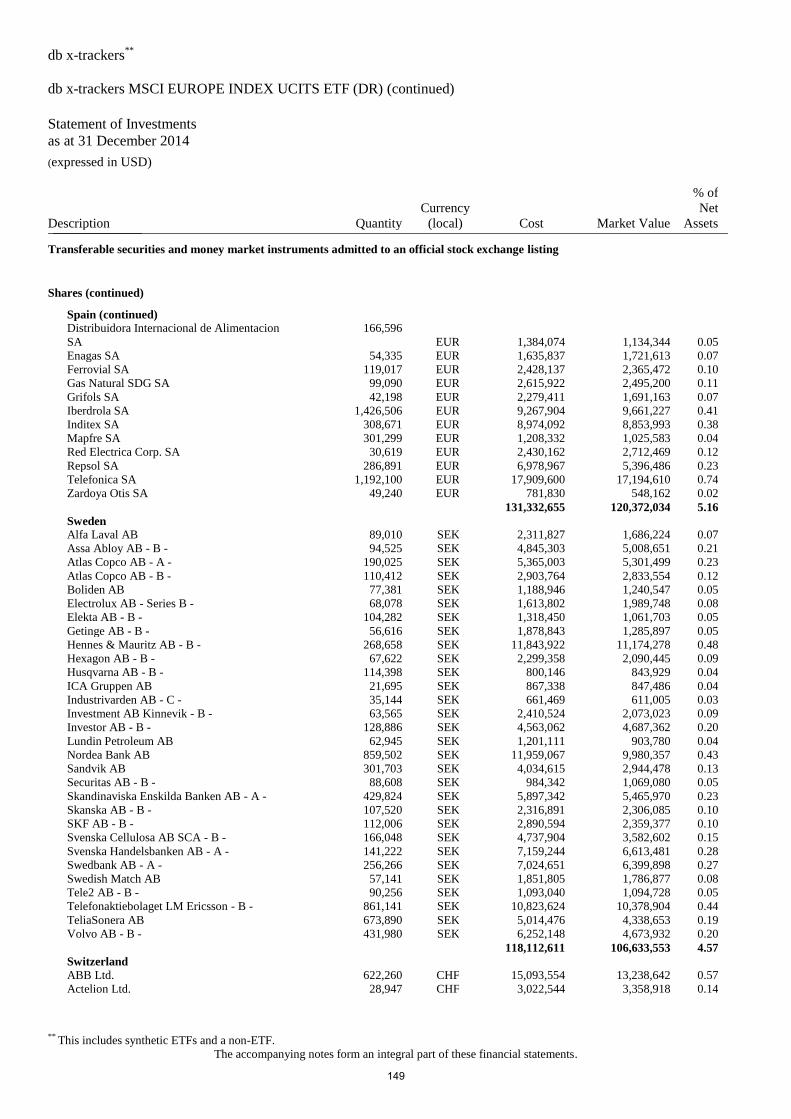
db x-trackers**
db x-trackers MSCI EUROPE INDEX UCITS ETF (DR) (continued)
Statement of Investments
as at 31 December 2014 (expressed in USD)
** This includes synthetic ETFs and a non-ETF.
The accompanying notes form an integral part of these financial statements.
Description Quantity
Currency
(local) Cost Market Value
% of
Net
Assets _______________
Transferable securities and money market instruments admitted to an official stock exchange listing
Shares (continued)
Spain (continued)
Distribuidora Internacional de Alimentacion
SA
166,596
EUR 1,384,074 1,134,344 0.05
Enagas SA 54,335 EUR 1,635,837 1,721,613 0.07
Ferrovial SA 119,017 EUR 2,428,137 2,365,472 0.10
Gas Natural SDG SA 99,090 EUR 2,615,922 2,495,200 0.11
Grifols SA 42,198 EUR 2,279,411 1,691,163 0.07
Iberdrola SA 1,426,506 EUR 9,267,904 9,661,227 0.41
Inditex SA 308,671 EUR 8,974,092 8,853,993 0.38
Mapfre SA 301,299 EUR 1,208,332 1,025,583 0.04
Red Electrica Corp. SA 30,619 EUR 2,430,162 2,712,469 0.12
Repsol SA 286,891 EUR 6,978,967 5,396,486 0.23
Telefonica SA 1,192,100 EUR 17,909,600 17,194,610 0.74
Zardoya Otis SA 49,240 EUR 781,830 548,162 0.02
131,332,655 120,372,034 5.16
Sweden
Alfa Laval AB 89,010 SEK 2,311,827 1,686,224 0.07
Assa Abloy AB - B - 94,525 SEK 4,845,303 5,008,651 0.21
Atlas Copco AB - A - 190,025 SEK 5,365,003 5,301,499 0.23
Atlas Copco AB - B - 110,412 SEK 2,903,764 2,833,554 0.12
Boliden AB 77,381 SEK 1,188,946 1,240,547 0.05
Electrolux AB - Series B - 68,078 SEK 1,613,802 1,989,748 0.08
Elekta AB - B - 104,282 SEK 1,318,450 1,061,703 0.05
Getinge AB - B - 56,616 SEK 1,878,843 1,285,897 0.05
Hennes & Mauritz AB - B - 268,658 SEK 11,843,922 11,174,278 0.48
Hexagon AB - B - 67,622 SEK 2,299,358 2,090,445 0.09
Husqvarna AB - B - 114,398 SEK 800,146 843,929 0.04
ICA Gruppen AB 21,695 SEK 867,338 847,486 0.04
Industrivarden AB - C - 35,144 SEK 661,469 611,005 0.03
Investment AB Kinnevik - B - 63,565 SEK 2,410,524 2,073,023 0.09
Investor AB - B - 128,886 SEK 4,563,062 4,687,362 0.20
Lundin Petroleum AB 62,945 SEK 1,201,111 903,780 0.04
Nordea Bank AB 859,502 SEK 11,959,067 9,980,357 0.43
Sandvik AB 301,703 SEK 4,034,615 2,944,478 0.13
Securitas AB - B - 88,608 SEK 984,342 1,069,080 0.05
Skandinaviska Enskilda Banken AB - A - 429,824 SEK 5,897,342 5,465,970 0.23
Skanska AB - B - 107,520 SEK 2,316,891 2,306,085 0.10
SKF AB - B - 112,006 SEK 2,890,594 2,359,377 0.10
Svenska Cellulosa AB SCA - B - 166,048 SEK 4,737,904 3,582,602 0.15
Svenska Handelsbanken AB - A - 141,222 SEK 7,159,244 6,613,481 0.28
Swedbank AB - A - 256,266 SEK 7,024,651 6,399,898 0.27
Swedish Match AB 57,141 SEK 1,851,805 1,786,877 0.08
Tele2 AB - B - 90,256 SEK 1,093,040 1,094,728 0.05
Telefonaktiebolaget LM Ericsson - B - 861,141 SEK 10,823,624 10,378,904 0.44
TeliaSonera AB 673,890 SEK 5,014,476 4,338,653 0.19
Volvo AB - B - 431,980 SEK 6,252,148 4,673,932 0.20
118,112,611 106,633,553 4.57
Switzerland
ABB Ltd. 622,260 CHF 15,093,554 13,238,642 0.57
Actelion Ltd. 28,947 CHF 3,022,544 3,358,918 0.14
149
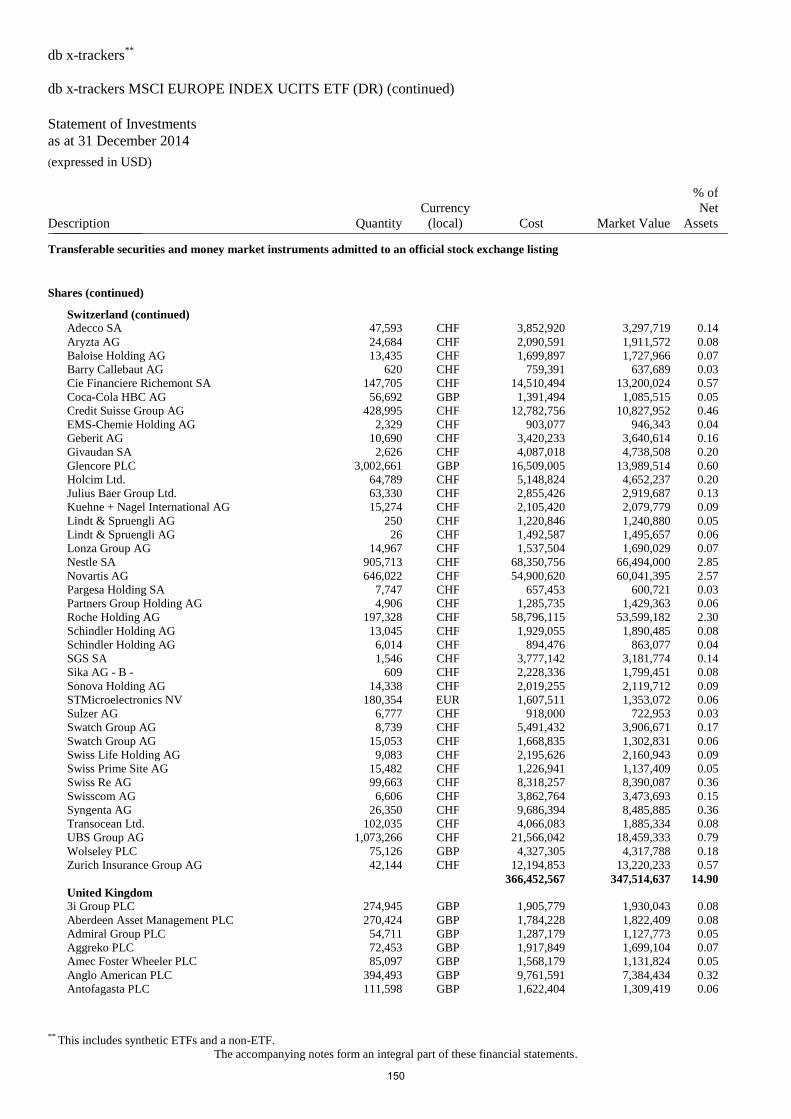
db x-trackers**
db x-trackers MSCI EUROPE INDEX UCITS ETF (DR) (continued)
Statement of Investments
as at 31 December 2014 (expressed in USD)
** This includes synthetic ETFs and a non-ETF.
The accompanying notes form an integral part of these financial statements.
Description Quantity
Currency
(local) Cost Market Value
% of
Net
Assets _______________
Transferable securities and money market instruments admitted to an official stock exchange listing
Shares (continued)
Switzerland (continued)
Adecco SA 47,593 CHF 3,852,920 3,297,719 0.14
Aryzta AG 24,684 CHF 2,090,591 1,911,572 0.08
Baloise Holding AG 13,435 CHF 1,699,897 1,727,966 0.07
Barry Callebaut AG 620 CHF 759,391 637,689 0.03
Cie Financiere Richemont SA 147,705 CHF 14,510,494 13,200,024 0.57
Coca-Cola HBC AG 56,692 GBP 1,391,494 1,085,515 0.05
Credit Suisse Group AG 428,995 CHF 12,782,756 10,827,952 0.46
EMS-Chemie Holding AG 2,329 CHF 903,077 946,343 0.04
Geberit AG 10,690 CHF 3,420,233 3,640,614 0.16
Givaudan SA 2,626 CHF 4,087,018 4,738,508 0.20
Glencore PLC 3,002,661 GBP 16,509,005 13,989,514 0.60
Holcim Ltd. 64,789 CHF 5,148,824 4,652,237 0.20
Julius Baer Group Ltd. 63,330 CHF 2,855,426 2,919,687 0.13
Kuehne + Nagel International AG 15,274 CHF 2,105,420 2,079,779 0.09
Lindt & Spruengli AG 250 CHF 1,220,846 1,240,880 0.05
Lindt & Spruengli AG 26 CHF 1,492,587 1,495,657 0.06
Lonza Group AG 14,967 CHF 1,537,504 1,690,029 0.07
Nestle SA 905,713 CHF 68,350,756 66,494,000 2.85
Novartis AG 646,022 CHF 54,900,620 60,041,395 2.57
Pargesa Holding SA 7,747 CHF 657,453 600,721 0.03
Partners Group Holding AG 4,906 CHF 1,285,735 1,429,363 0.06
Roche Holding AG 197,328 CHF 58,796,115 53,599,182 2.30
Schindler Holding AG 13,045 CHF 1,929,055 1,890,485 0.08
Schindler Holding AG 6,014 CHF 894,476 863,077 0.04
SGS SA 1,546 CHF 3,777,142 3,181,774 0.14
Sika AG - B - 609 CHF 2,228,336 1,799,451 0.08
Sonova Holding AG 14,338 CHF 2,019,255 2,119,712 0.09
STMicroelectronics NV 180,354 EUR 1,607,511 1,353,072 0.06
Sulzer AG 6,777 CHF 918,000 722,953 0.03
Swatch Group AG 8,739 CHF 5,491,432 3,906,671 0.17
Swatch Group AG 15,053 CHF 1,668,835 1,302,831 0.06
Swiss Life Holding AG 9,083 CHF 2,195,626 2,160,943 0.09
Swiss Prime Site AG 15,482 CHF 1,226,941 1,137,409 0.05
Swiss Re AG 99,663 CHF 8,318,257 8,390,087 0.36
Swisscom AG 6,606 CHF 3,862,764 3,473,693 0.15
Syngenta AG 26,350 CHF 9,686,394 8,485,885 0.36
Transocean Ltd. 102,035 CHF 4,066,083 1,885,334 0.08
UBS Group AG 1,073,266 CHF 21,566,042 18,459,333 0.79
Wolseley PLC 75,126 GBP 4,327,305 4,317,788 0.18
Zurich Insurance Group AG 42,144 CHF 12,194,853 13,220,233 0.57
366,452,567 347,514,637 14.90
United Kingdom
3i Group PLC 274,945 GBP 1,905,779 1,930,043 0.08
Aberdeen Asset Management PLC 270,424 GBP 1,784,228 1,822,409 0.08
Admiral Group PLC 54,711 GBP 1,287,179 1,127,773 0.05
Aggreko PLC 72,453 GBP 1,917,849 1,699,104 0.07
Amec Foster Wheeler PLC 85,097 GBP 1,568,179 1,131,824 0.05
Anglo American PLC 394,493 GBP 9,761,591 7,384,434 0.32
Antofagasta PLC 111,598 GBP 1,622,404 1,309,419 0.06
150
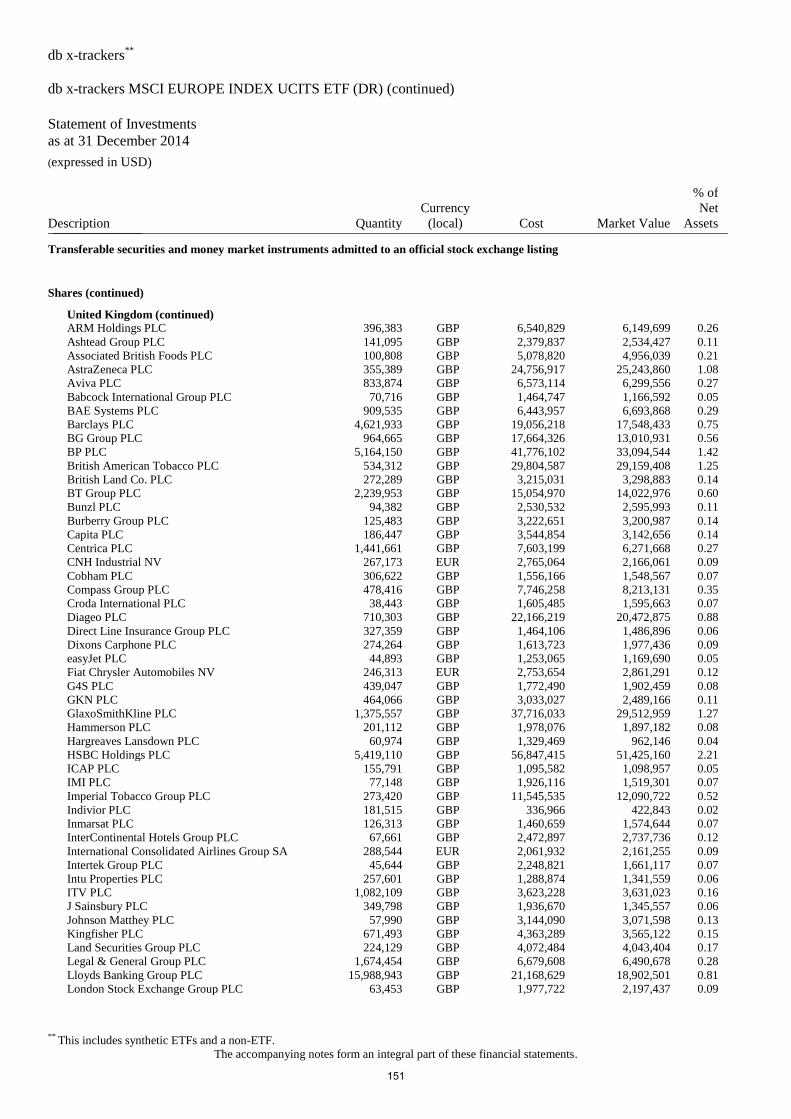
db x-trackers**
db x-trackers MSCI EUROPE INDEX UCITS ETF (DR) (continued)
Statement of Investments
as at 31 December 2014 (expressed in USD)
** This includes synthetic ETFs and a non-ETF.
The accompanying notes form an integral part of these financial statements.
Description Quantity
Currency
(local) Cost Market Value
% of
Net
Assets _______________
Transferable securities and money market instruments admitted to an official stock exchange listing
Shares (continued)
United Kingdom (continued)
ARM Holdings PLC 396,383 GBP 6,540,829 6,149,699 0.26
Ashtead Group PLC 141,095 GBP 2,379,837 2,534,427 0.11
Associated British Foods PLC 100,808 GBP 5,078,820 4,956,039 0.21
AstraZeneca PLC 355,389 GBP 24,756,917 25,243,860 1.08
Aviva PLC 833,874 GBP 6,573,114 6,299,556 0.27
Babcock International Group PLC 70,716 GBP 1,464,747 1,166,592 0.05
BAE Systems PLC 909,535 GBP 6,443,957 6,693,868 0.29
Barclays PLC 4,621,933 GBP 19,056,218 17,548,433 0.75
BG Group PLC 964,665 GBP 17,664,326 13,010,931 0.56
BP PLC 5,164,150 GBP 41,776,102 33,094,544 1.42
British American Tobacco PLC 534,312 GBP 29,804,587 29,159,408 1.25
British Land Co. PLC 272,289 GBP 3,215,031 3,298,883 0.14
BT Group PLC 2,239,953 GBP 15,054,970 14,022,976 0.60
Bunzl PLC 94,382 GBP 2,530,532 2,595,993 0.11
Burberry Group PLC 125,483 GBP 3,222,651 3,200,987 0.14
Capita PLC 186,447 GBP 3,544,854 3,142,656 0.14
Centrica PLC 1,441,661 GBP 7,603,199 6,271,668 0.27
CNH Industrial NV 267,173 EUR 2,765,064 2,166,061 0.09
Cobham PLC 306,622 GBP 1,556,166 1,548,567 0.07
Compass Group PLC 478,416 GBP 7,746,258 8,213,131 0.35
Croda International PLC 38,443 GBP 1,605,485 1,595,663 0.07
Diageo PLC 710,303 GBP 22,166,219 20,472,875 0.88
Direct Line Insurance Group PLC 327,359 GBP 1,464,106 1,486,896 0.06
Dixons Carphone PLC 274,264 GBP 1,613,723 1,977,436 0.09
easyJet PLC 44,893 GBP 1,253,065 1,169,690 0.05
Fiat Chrysler Automobiles NV 246,313 EUR 2,753,654 2,861,291 0.12
G4S PLC 439,047 GBP 1,772,490 1,902,459 0.08
GKN PLC 464,066 GBP 3,033,027 2,489,166 0.11
GlaxoSmithKline PLC 1,375,557 GBP 37,716,033 29,512,959 1.27
Hammerson PLC 201,112 GBP 1,978,076 1,897,182 0.08
Hargreaves Lansdown PLC 60,974 GBP 1,329,469 962,146 0.04
HSBC Holdings PLC 5,419,110 GBP 56,847,415 51,425,160 2.21
ICAP PLC 155,791 GBP 1,095,582 1,098,957 0.05
IMI PLC 77,148 GBP 1,926,116 1,519,301 0.07
Imperial Tobacco Group PLC 273,420 GBP 11,545,535 12,090,722 0.52
Indivior PLC 181,515 GBP 336,966 422,843 0.02
Inmarsat PLC 126,313 GBP 1,460,659 1,574,644 0.07
InterContinental Hotels Group PLC 67,661 GBP 2,472,897 2,737,736 0.12
International Consolidated Airlines Group SA 288,544 EUR 2,061,932 2,161,255 0.09
Intertek Group PLC 45,644 GBP 2,248,821 1,661,117 0.07
Intu Properties PLC 257,601 GBP 1,288,874 1,341,559 0.06
ITV PLC 1,082,109 GBP 3,623,228 3,631,023 0.16
J Sainsbury PLC 349,798 GBP 1,936,670 1,345,557 0.06
Johnson Matthey PLC 57,990 GBP 3,144,090 3,071,598 0.13
Kingfisher PLC 671,493 GBP 4,363,289 3,565,122 0.15
Land Securities Group PLC 224,129 GBP 4,072,484 4,043,404 0.17
Legal & General Group PLC 1,674,454 GBP 6,679,608 6,490,678 0.28
Lloyds Banking Group PLC 15,988,943 GBP 21,168,629 18,902,501 0.81
London Stock Exchange Group PLC 63,453 GBP 1,977,722 2,197,437 0.09
151
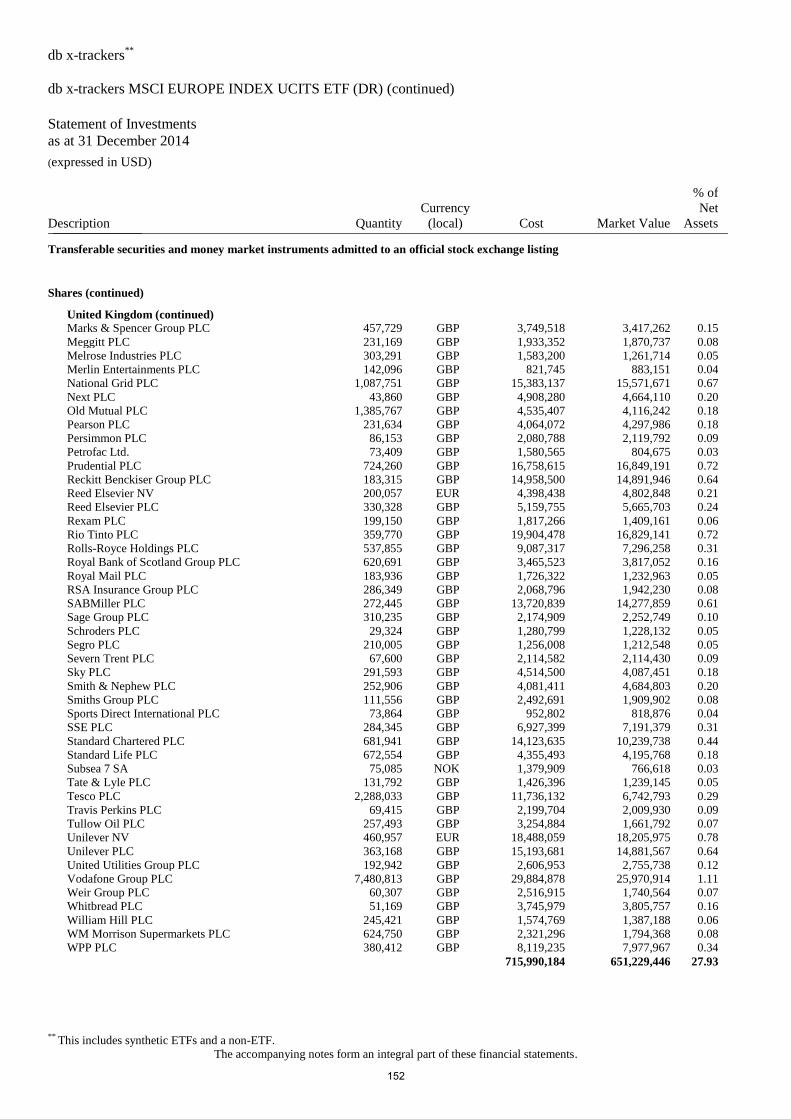
db x-trackers**
db x-trackers MSCI EUROPE INDEX UCITS ETF (DR) (continued)
Statement of Investments
as at 31 December 2014 (expressed in USD)
** This includes synthetic ETFs and a non-ETF.
The accompanying notes form an integral part of these financial statements.
Description Quantity
Currency
(local) Cost Market Value
% of
Net
Assets _______________
Transferable securities and money market instruments admitted to an official stock exchange listing
Shares (continued)
United Kingdom (continued)
Marks & Spencer Group PLC 457,729 GBP 3,749,518 3,417,262 0.15
Meggitt PLC 231,169 GBP 1,933,352 1,870,737 0.08
Melrose Industries PLC 303,291 GBP 1,583,200 1,261,714 0.05
Merlin Entertainments PLC 142,096 GBP 821,745 883,151 0.04
National Grid PLC 1,087,751 GBP 15,383,137 15,571,671 0.67
Next PLC 43,860 GBP 4,908,280 4,664,110 0.20
Old Mutual PLC 1,385,767 GBP 4,535,407 4,116,242 0.18
Pearson PLC 231,634 GBP 4,064,072 4,297,986 0.18
Persimmon PLC 86,153 GBP 2,080,788 2,119,792 0.09
Petrofac Ltd. 73,409 GBP 1,580,565 804,675 0.03
Prudential PLC 724,260 GBP 16,758,615 16,849,191 0.72
Reckitt Benckiser Group PLC 183,315 GBP 14,958,500 14,891,946 0.64
Reed Elsevier NV 200,057 EUR 4,398,438 4,802,848 0.21
Reed Elsevier PLC 330,328 GBP 5,159,755 5,665,703 0.24
Rexam PLC 199,150 GBP 1,817,266 1,409,161 0.06
Rio Tinto PLC 359,770 GBP 19,904,478 16,829,141 0.72
Rolls-Royce Holdings PLC 537,855 GBP 9,087,317 7,296,258 0.31
Royal Bank of Scotland Group PLC 620,691 GBP 3,465,523 3,817,052 0.16
Royal Mail PLC 183,936 GBP 1,726,322 1,232,963 0.05
RSA Insurance Group PLC 286,349 GBP 2,068,796 1,942,230 0.08
SABMiller PLC 272,445 GBP 13,720,839 14,277,859 0.61
Sage Group PLC 310,235 GBP 2,174,909 2,252,749 0.10
Schroders PLC 29,324 GBP 1,280,799 1,228,132 0.05
Segro PLC 210,005 GBP 1,256,008 1,212,548 0.05
Severn Trent PLC 67,600 GBP 2,114,582 2,114,430 0.09
Sky PLC 291,593 GBP 4,514,500 4,087,451 0.18
Smith & Nephew PLC 252,906 GBP 4,081,411 4,684,803 0.20
Smiths Group PLC 111,556 GBP 2,492,691 1,909,902 0.08
Sports Direct International PLC 73,864 GBP 952,802 818,876 0.04
SSE PLC 284,345 GBP 6,927,399 7,191,379 0.31
Standard Chartered PLC 681,941 GBP 14,123,635 10,239,738 0.44
Standard Life PLC 672,554 GBP 4,355,493 4,195,768 0.18
Subsea 7 SA 75,085 NOK 1,379,909 766,618 0.03
Tate & Lyle PLC 131,792 GBP 1,426,396 1,239,145 0.05
Tesco PLC 2,288,033 GBP 11,736,132 6,742,793 0.29
Travis Perkins PLC 69,415 GBP 2,199,704 2,009,930 0.09
Tullow Oil PLC 257,493 GBP 3,254,884 1,661,792 0.07
Unilever NV 460,957 EUR 18,488,059 18,205,975 0.78
Unilever PLC 363,168 GBP 15,193,681 14,881,567 0.64
United Utilities Group PLC 192,942 GBP 2,606,953 2,755,738 0.12
Vodafone Group PLC 7,480,813 GBP 29,884,878 25,970,914 1.11
Weir Group PLC 60,307 GBP 2,516,915 1,740,564 0.07
Whitbread PLC 51,169 GBP 3,745,979 3,805,757 0.16
William Hill PLC 245,421 GBP 1,574,769 1,387,188 0.06
WM Morrison Supermarkets PLC 624,750 GBP 2,321,296 1,794,368 0.08
WPP PLC 380,412 GBP 8,119,235 7,977,967 0.34
715,990,184 651,229,446 27.93
152
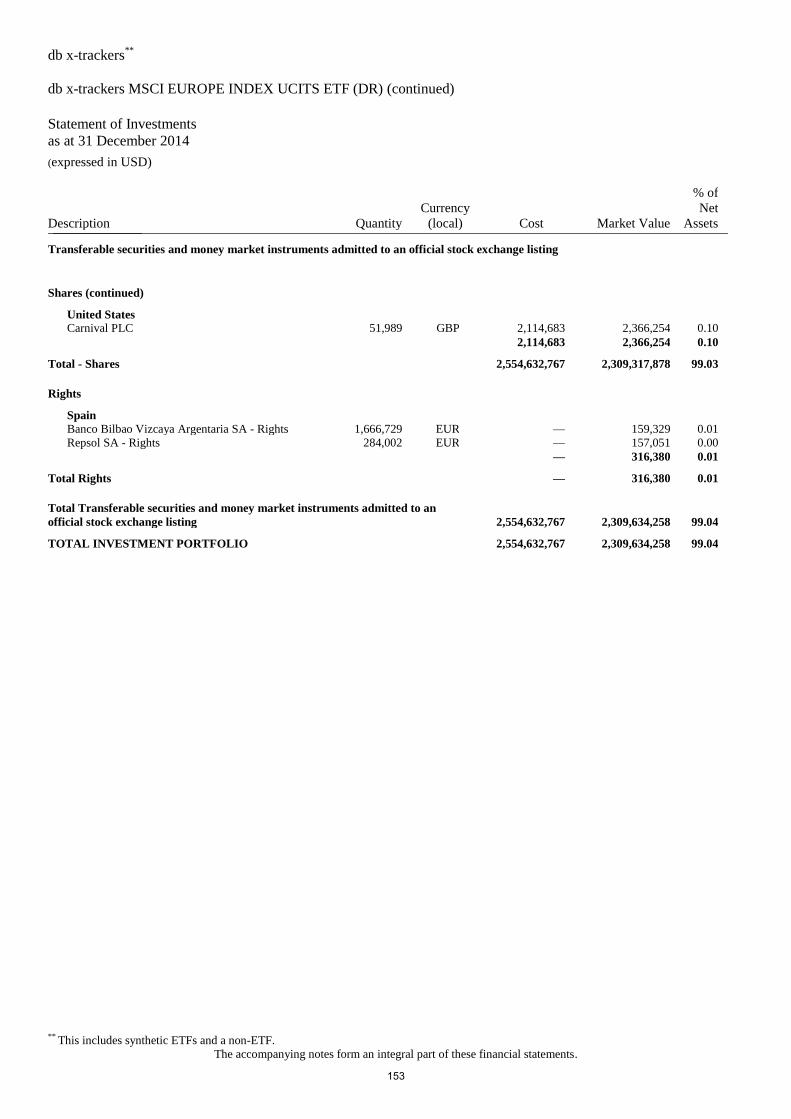
db x-trackers**
db x-trackers MSCI EUROPE INDEX UCITS ETF (DR) (continued)
Statement of Investments
as at 31 December 2014 (expressed in USD)
** This includes synthetic ETFs and a non-ETF.
The accompanying notes form an integral part of these financial statements.
Description Quantity
Currency
(local) Cost Market Value
% of
Net
Assets _______________
Transferable securities and money market instruments admitted to an official stock exchange listing
Shares (continued)
United States
Carnival PLC 51,989 GBP 2,114,683 2,366,254 0.10
2,114,683 2,366,254 0.10
Total - Shares 2,554,632,767 2,309,317,878 99.03
Rights
Spain
Banco Bilbao Vizcaya Argentaria SA - Rights 1,666,729 EUR — 159,329 0.01
Repsol SA - Rights 284,002 EUR — 157,051 0.00
— 316,380 0.01
Total Rights — 316,380 0.01
Total Transferable securities and money market instruments admitted to an
official stock exchange listing 2,554,632,767 2,309,634,258 99.04
TOTAL INVESTMENT PORTFOLIO 2,554,632,767 2,309,634,258 99.04
153
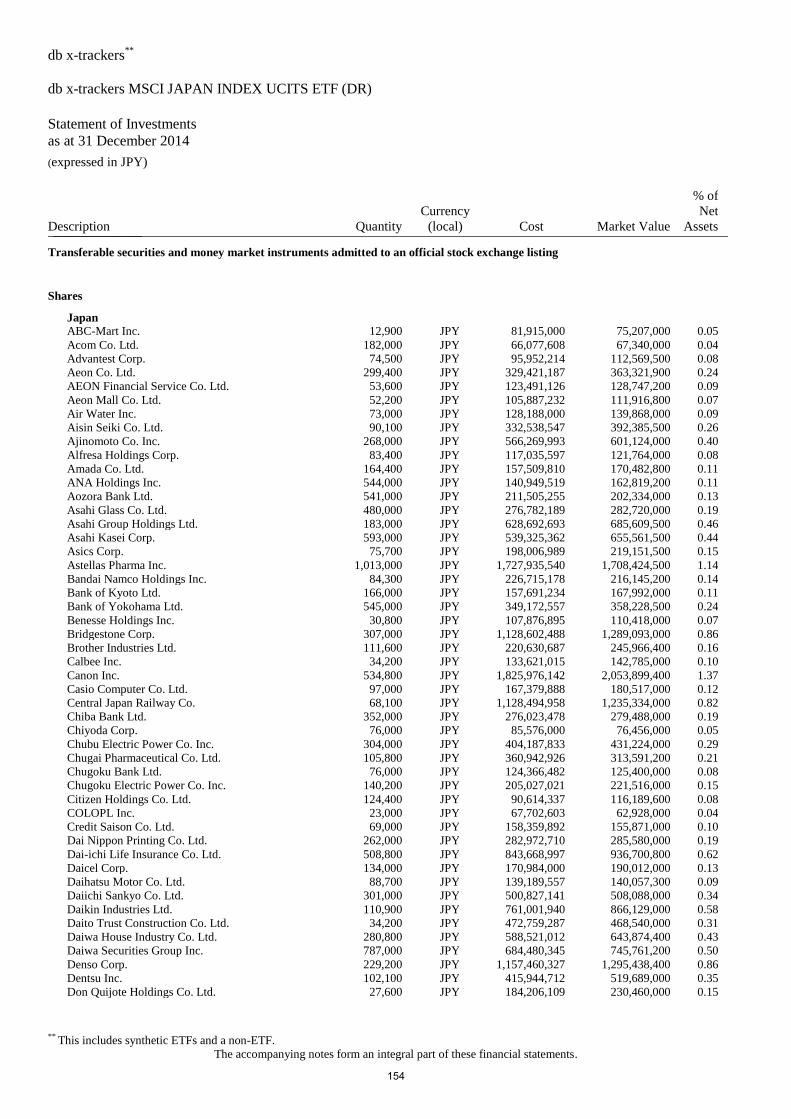
db x-trackers**
db x-trackers MSCI JAPAN INDEX UCITS ETF (DR)
Statement of Investments
as at 31 December 2014 (expressed in JPY)
** This includes synthetic ETFs and a non-ETF.
The accompanying notes form an integral part of these financial statements.
Description Quantity
Currency
(local) Cost Market Value
% of
Net
Assets _______________
Transferable securities and money market instruments admitted to an official stock exchange listing
Shares
Japan
ABC-Mart Inc. 12,900 JPY 81,915,000 75,207,000 0.05
Acom Co. Ltd. 182,000 JPY 66,077,608 67,340,000 0.04
Advantest Corp. 74,500 JPY 95,952,214 112,569,500 0.08
Aeon Co. Ltd. 299,400 JPY 329,421,187 363,321,900 0.24
AEON Financial Service Co. Ltd. 53,600 JPY 123,491,126 128,747,200 0.09
Aeon Mall Co. Ltd. 52,200 JPY 105,887,232 111,916,800 0.07
Air Water Inc. 73,000 JPY 128,188,000 139,868,000 0.09
Aisin Seiki Co. Ltd. 90,100 JPY 332,538,547 392,385,500 0.26
Ajinomoto Co. Inc. 268,000 JPY 566,269,993 601,124,000 0.40
Alfresa Holdings Corp. 83,400 JPY 117,035,597 121,764,000 0.08
Amada Co. Ltd. 164,400 JPY 157,509,810 170,482,800 0.11
ANA Holdings Inc. 544,000 JPY 140,949,519 162,819,200 0.11
Aozora Bank Ltd. 541,000 JPY 211,505,255 202,334,000 0.13
Asahi Glass Co. Ltd. 480,000 JPY 276,782,189 282,720,000 0.19
Asahi Group Holdings Ltd. 183,000 JPY 628,692,693 685,609,500 0.46
Asahi Kasei Corp. 593,000 JPY 539,325,362 655,561,500 0.44
Asics Corp. 75,700 JPY 198,006,989 219,151,500 0.15
Astellas Pharma Inc. 1,013,000 JPY 1,727,935,540 1,708,424,500 1.14
Bandai Namco Holdings Inc. 84,300 JPY 226,715,178 216,145,200 0.14
Bank of Kyoto Ltd. 166,000 JPY 157,691,234 167,992,000 0.11
Bank of Yokohama Ltd. 545,000 JPY 349,172,557 358,228,500 0.24
Benesse Holdings Inc. 30,800 JPY 107,876,895 110,418,000 0.07
Bridgestone Corp. 307,000 JPY 1,128,602,488 1,289,093,000 0.86
Brother Industries Ltd. 111,600 JPY 220,630,687 245,966,400 0.16
Calbee Inc. 34,200 JPY 133,621,015 142,785,000 0.10
Canon Inc. 534,800 JPY 1,825,976,142 2,053,899,400 1.37
Casio Computer Co. Ltd. 97,000 JPY 167,379,888 180,517,000 0.12
Central Japan Railway Co. 68,100 JPY 1,128,494,958 1,235,334,000 0.82
Chiba Bank Ltd. 352,000 JPY 276,023,478 279,488,000 0.19
Chiyoda Corp. 76,000 JPY 85,576,000 76,456,000 0.05
Chubu Electric Power Co. Inc. 304,000 JPY 404,187,833 431,224,000 0.29
Chugai Pharmaceutical Co. Ltd. 105,800 JPY 360,942,926 313,591,200 0.21
Chugoku Bank Ltd. 76,000 JPY 124,366,482 125,400,000 0.08
Chugoku Electric Power Co. Inc. 140,200 JPY 205,027,021 221,516,000 0.15
Citizen Holdings Co. Ltd. 124,400 JPY 90,614,337 116,189,600 0.08
COLOPL Inc. 23,000 JPY 67,702,603 62,928,000 0.04
Credit Saison Co. Ltd. 69,000 JPY 158,359,892 155,871,000 0.10
Dai Nippon Printing Co. Ltd. 262,000 JPY 282,972,710 285,580,000 0.19
Dai-ichi Life Insurance Co. Ltd. 508,800 JPY 843,668,997 936,700,800 0.62
Daicel Corp. 134,000 JPY 170,984,000 190,012,000 0.13
Daihatsu Motor Co. Ltd. 88,700 JPY 139,189,557 140,057,300 0.09
Daiichi Sankyo Co. Ltd. 301,000 JPY 500,827,141 508,088,000 0.34
Daikin Industries Ltd. 110,900 JPY 761,001,940 866,129,000 0.58
Daito Trust Construction Co. Ltd. 34,200 JPY 472,759,287 468,540,000 0.31
Daiwa House Industry Co. Ltd. 280,800 JPY 588,521,012 643,874,400 0.43
Daiwa Securities Group Inc. 787,000 JPY 684,480,345 745,761,200 0.50
Denso Corp. 229,200 JPY 1,157,460,327 1,295,438,400 0.86
Dentsu Inc. 102,100 JPY 415,944,712 519,689,000 0.35
Don Quijote Holdings Co. Ltd. 27,600 JPY 184,206,109 230,460,000 0.15
154
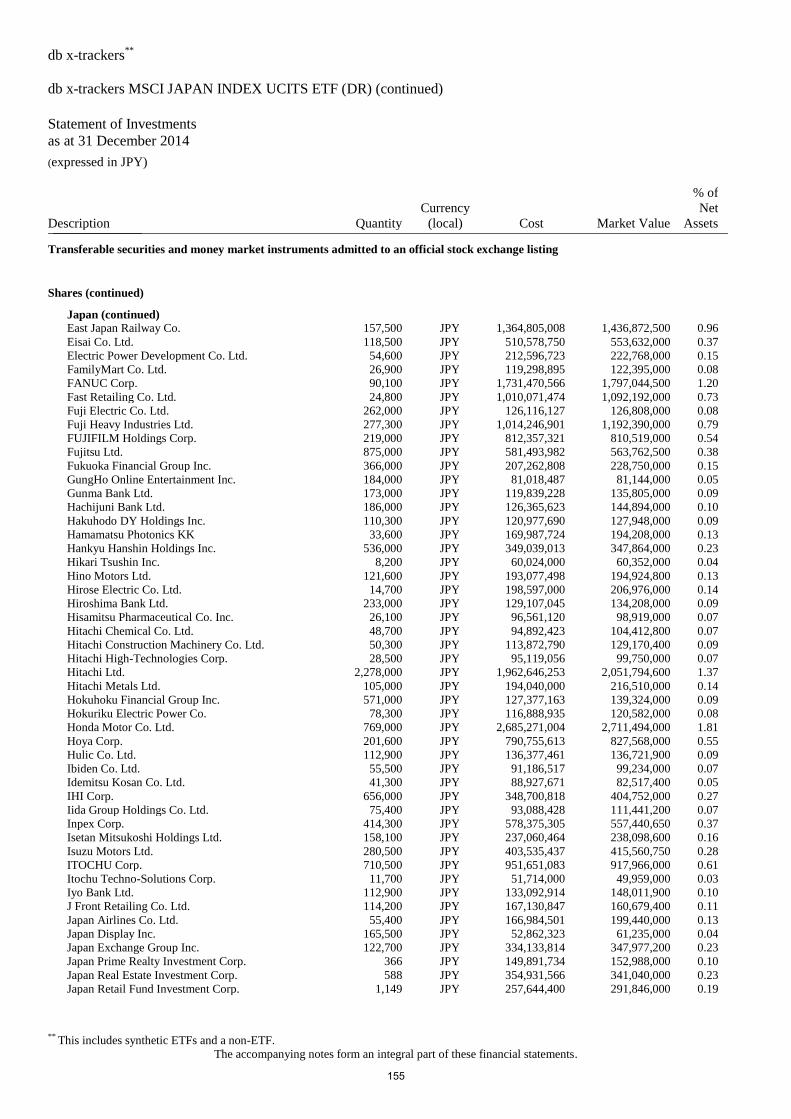
db x-trackers**
db x-trackers MSCI JAPAN INDEX UCITS ETF (DR) (continued)
Statement of Investments
as at 31 December 2014 (expressed in JPY)
** This includes synthetic ETFs and a non-ETF.
The accompanying notes form an integral part of these financial statements.
Description Quantity
Currency
(local) Cost Market Value
% of
Net
Assets _______________
Transferable securities and money market instruments admitted to an official stock exchange listing
Shares (continued)
Japan (continued)
East Japan Railway Co. 157,500 JPY 1,364,805,008 1,436,872,500 0.96
Eisai Co. Ltd. 118,500 JPY 510,578,750 553,632,000 0.37
Electric Power Development Co. Ltd. 54,600 JPY 212,596,723 222,768,000 0.15
FamilyMart Co. Ltd. 26,900 JPY 119,298,895 122,395,000 0.08
FANUC Corp. 90,100 JPY 1,731,470,566 1,797,044,500 1.20
Fast Retailing Co. Ltd. 24,800 JPY 1,010,071,474 1,092,192,000 0.73
Fuji Electric Co. Ltd. 262,000 JPY 126,116,127 126,808,000 0.08
Fuji Heavy Industries Ltd. 277,300 JPY 1,014,246,901 1,192,390,000 0.79
FUJIFILM Holdings Corp. 219,000 JPY 812,357,321 810,519,000 0.54
Fujitsu Ltd. 875,000 JPY 581,493,982 563,762,500 0.38
Fukuoka Financial Group Inc. 366,000 JPY 207,262,808 228,750,000 0.15
GungHo Online Entertainment Inc. 184,000 JPY 81,018,487 81,144,000 0.05
Gunma Bank Ltd. 173,000 JPY 119,839,228 135,805,000 0.09
Hachijuni Bank Ltd. 186,000 JPY 126,365,623 144,894,000 0.10
Hakuhodo DY Holdings Inc. 110,300 JPY 120,977,690 127,948,000 0.09
Hamamatsu Photonics KK 33,600 JPY 169,987,724 194,208,000 0.13
Hankyu Hanshin Holdings Inc. 536,000 JPY 349,039,013 347,864,000 0.23
Hikari Tsushin Inc. 8,200 JPY 60,024,000 60,352,000 0.04
Hino Motors Ltd. 121,600 JPY 193,077,498 194,924,800 0.13
Hirose Electric Co. Ltd. 14,700 JPY 198,597,000 206,976,000 0.14
Hiroshima Bank Ltd. 233,000 JPY 129,107,045 134,208,000 0.09
Hisamitsu Pharmaceutical Co. Inc. 26,100 JPY 96,561,120 98,919,000 0.07
Hitachi Chemical Co. Ltd. 48,700 JPY 94,892,423 104,412,800 0.07
Hitachi Construction Machinery Co. Ltd. 50,300 JPY 113,872,790 129,170,400 0.09
Hitachi High-Technologies Corp. 28,500 JPY 95,119,056 99,750,000 0.07
Hitachi Ltd. 2,278,000 JPY 1,962,646,253 2,051,794,600 1.37
Hitachi Metals Ltd. 105,000 JPY 194,040,000 216,510,000 0.14
Hokuhoku Financial Group Inc. 571,000 JPY 127,377,163 139,324,000 0.09
Hokuriku Electric Power Co. 78,300 JPY 116,888,935 120,582,000 0.08
Honda Motor Co. Ltd. 769,000 JPY 2,685,271,004 2,711,494,000 1.81
Hoya Corp. 201,600 JPY 790,755,613 827,568,000 0.55
Hulic Co. Ltd. 112,900 JPY 136,377,461 136,721,900 0.09
Ibiden Co. Ltd. 55,500 JPY 91,186,517 99,234,000 0.07
Idemitsu Kosan Co. Ltd. 41,300 JPY 88,927,671 82,517,400 0.05
IHI Corp. 656,000 JPY 348,700,818 404,752,000 0.27
Iida Group Holdings Co. Ltd. 75,400 JPY 93,088,428 111,441,200 0.07
Inpex Corp. 414,300 JPY 578,375,305 557,440,650 0.37
Isetan Mitsukoshi Holdings Ltd. 158,100 JPY 237,060,464 238,098,600 0.16
Isuzu Motors Ltd. 280,500 JPY 403,535,437 415,560,750 0.28
ITOCHU Corp. 710,500 JPY 951,651,083 917,966,000 0.61
Itochu Techno-Solutions Corp. 11,700 JPY 51,714,000 49,959,000 0.03
Iyo Bank Ltd. 112,900 JPY 133,092,914 148,011,900 0.10
J Front Retailing Co. Ltd. 114,200 JPY 167,130,847 160,679,400 0.11
Japan Airlines Co. Ltd. 55,400 JPY 166,984,501 199,440,000 0.13
Japan Display Inc. 165,500 JPY 52,862,323 61,235,000 0.04
Japan Exchange Group Inc. 122,700 JPY 334,133,814 347,977,200 0.23
Japan Prime Realty Investment Corp. 366 JPY 149,891,734 152,988,000 0.10
Japan Real Estate Investment Corp. 588 JPY 354,931,566 341,040,000 0.23
Japan Retail Fund Investment Corp. 1,149 JPY 257,644,400 291,846,000 0.19
155
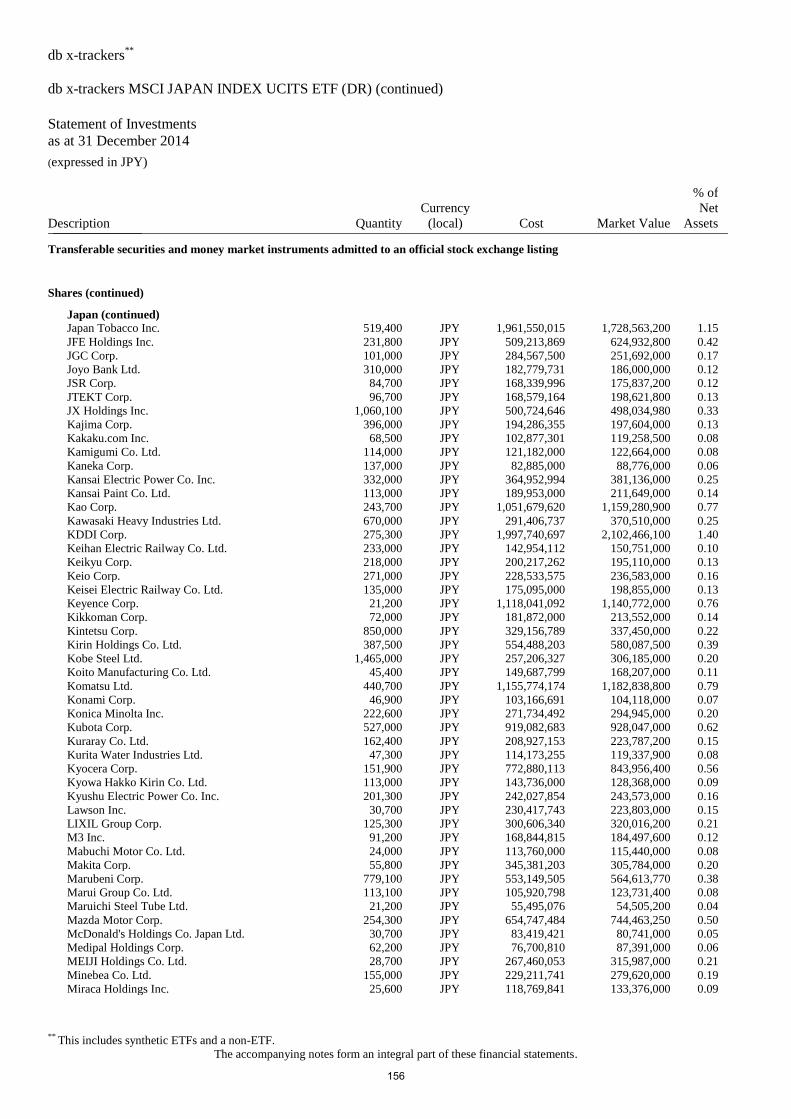
db x-trackers**
db x-trackers MSCI JAPAN INDEX UCITS ETF (DR) (continued)
Statement of Investments
as at 31 December 2014 (expressed in JPY)
** This includes synthetic ETFs and a non-ETF.
The accompanying notes form an integral part of these financial statements.
Description Quantity
Currency
(local) Cost Market Value
% of
Net
Assets _______________
Transferable securities and money market instruments admitted to an official stock exchange listing
Shares (continued)
Japan (continued)
Japan Tobacco Inc. 519,400 JPY 1,961,550,015 1,728,563,200 1.15
JFE Holdings Inc. 231,800 JPY 509,213,869 624,932,800 0.42
JGC Corp. 101,000 JPY 284,567,500 251,692,000 0.17
Joyo Bank Ltd. 310,000 JPY 182,779,731 186,000,000 0.12
JSR Corp. 84,700 JPY 168,339,996 175,837,200 0.12
JTEKT Corp. 96,700 JPY 168,579,164 198,621,800 0.13
JX Holdings Inc. 1,060,100 JPY 500,724,646 498,034,980 0.33
Kajima Corp. 396,000 JPY 194,286,355 197,604,000 0.13
Kakaku.com Inc. 68,500 JPY 102,877,301 119,258,500 0.08
Kamigumi Co. Ltd. 114,000 JPY 121,182,000 122,664,000 0.08
Kaneka Corp. 137,000 JPY 82,885,000 88,776,000 0.06
Kansai Electric Power Co. Inc. 332,000 JPY 364,952,994 381,136,000 0.25
Kansai Paint Co. Ltd. 113,000 JPY 189,953,000 211,649,000 0.14
Kao Corp. 243,700 JPY 1,051,679,620 1,159,280,900 0.77
Kawasaki Heavy Industries Ltd. 670,000 JPY 291,406,737 370,510,000 0.25
KDDI Corp. 275,300 JPY 1,997,740,697 2,102,466,100 1.40
Keihan Electric Railway Co. Ltd. 233,000 JPY 142,954,112 150,751,000 0.10
Keikyu Corp. 218,000 JPY 200,217,262 195,110,000 0.13
Keio Corp. 271,000 JPY 228,533,575 236,583,000 0.16
Keisei Electric Railway Co. Ltd. 135,000 JPY 175,095,000 198,855,000 0.13
Keyence Corp. 21,200 JPY 1,118,041,092 1,140,772,000 0.76
Kikkoman Corp. 72,000 JPY 181,872,000 213,552,000 0.14
Kintetsu Corp. 850,000 JPY 329,156,789 337,450,000 0.22
Kirin Holdings Co. Ltd. 387,500 JPY 554,488,203 580,087,500 0.39
Kobe Steel Ltd. 1,465,000 JPY 257,206,327 306,185,000 0.20
Koito Manufacturing Co. Ltd. 45,400 JPY 149,687,799 168,207,000 0.11
Komatsu Ltd. 440,700 JPY 1,155,774,174 1,182,838,800 0.79
Konami Corp. 46,900 JPY 103,166,691 104,118,000 0.07
Konica Minolta Inc. 222,600 JPY 271,734,492 294,945,000 0.20
Kubota Corp. 527,000 JPY 919,082,683 928,047,000 0.62
Kuraray Co. Ltd. 162,400 JPY 208,927,153 223,787,200 0.15
Kurita Water Industries Ltd. 47,300 JPY 114,173,255 119,337,900 0.08
Kyocera Corp. 151,900 JPY 772,880,113 843,956,400 0.56
Kyowa Hakko Kirin Co. Ltd. 113,000 JPY 143,736,000 128,368,000 0.09
Kyushu Electric Power Co. Inc. 201,300 JPY 242,027,854 243,573,000 0.16
Lawson Inc. 30,700 JPY 230,417,743 223,803,000 0.15
LIXIL Group Corp. 125,300 JPY 300,606,340 320,016,200 0.21
M3 Inc. 91,200 JPY 168,844,815 184,497,600 0.12
Mabuchi Motor Co. Ltd. 24,000 JPY 113,760,000 115,440,000 0.08
Makita Corp. 55,800 JPY 345,381,203 305,784,000 0.20
Marubeni Corp. 779,100 JPY 553,149,505 564,613,770 0.38
Marui Group Co. Ltd. 113,100 JPY 105,920,798 123,731,400 0.08
Maruichi Steel Tube Ltd. 21,200 JPY 55,495,076 54,505,200 0.04
Mazda Motor Corp. 254,300 JPY 654,747,484 744,463,250 0.50
McDonald's Holdings Co. Japan Ltd. 30,700 JPY 83,419,421 80,741,000 0.05
Medipal Holdings Corp. 62,200 JPY 76,700,810 87,391,000 0.06
MEIJI Holdings Co. Ltd. 28,700 JPY 267,460,053 315,987,000 0.21
Minebea Co. Ltd. 155,000 JPY 229,211,741 279,620,000 0.19
Miraca Holdings Inc. 25,600 JPY 118,769,841 133,376,000 0.09
156
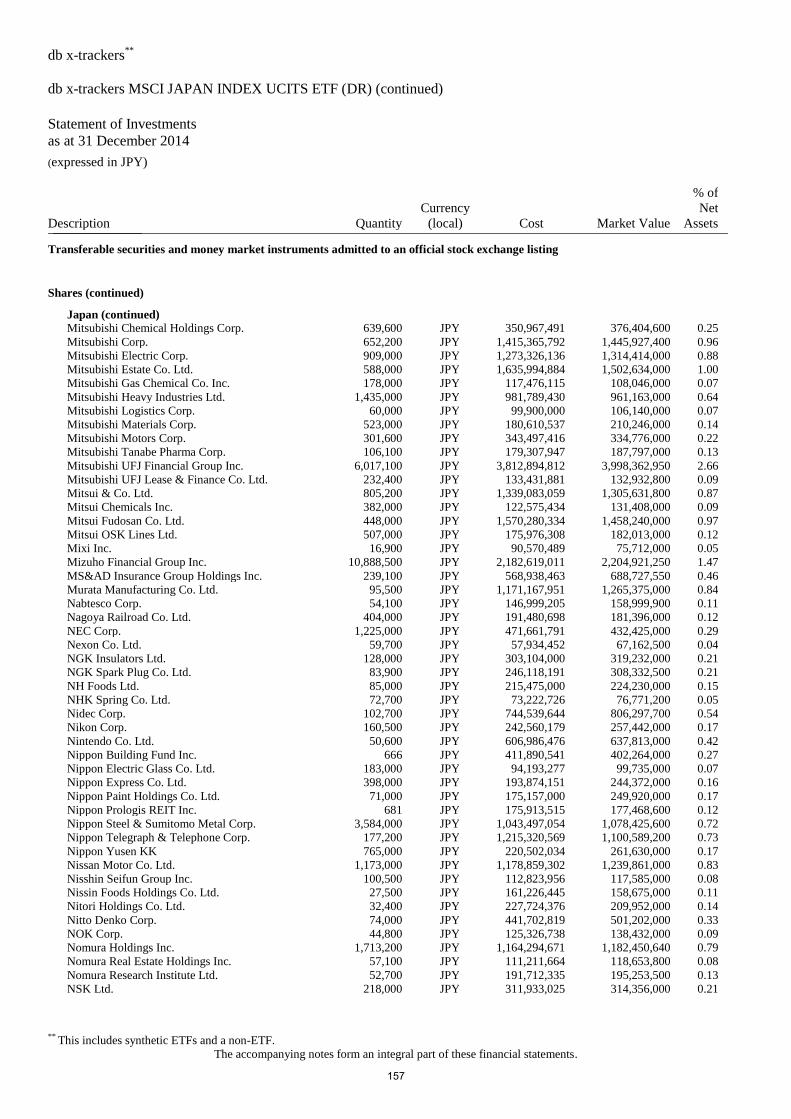
db x-trackers**
db x-trackers MSCI JAPAN INDEX UCITS ETF (DR) (continued)
Statement of Investments
as at 31 December 2014 (expressed in JPY)
** This includes synthetic ETFs and a non-ETF.
The accompanying notes form an integral part of these financial statements.
Description Quantity
Currency
(local) Cost Market Value
% of
Net
Assets _______________
Transferable securities and money market instruments admitted to an official stock exchange listing
Shares (continued)
Japan (continued)
Mitsubishi Chemical Holdings Corp. 639,600 JPY 350,967,491 376,404,600 0.25
Mitsubishi Corp. 652,200 JPY 1,415,365,792 1,445,927,400 0.96
Mitsubishi Electric Corp. 909,000 JPY 1,273,326,136 1,314,414,000 0.88
Mitsubishi Estate Co. Ltd. 588,000 JPY 1,635,994,884 1,502,634,000 1.00
Mitsubishi Gas Chemical Co. Inc. 178,000 JPY 117,476,115 108,046,000 0.07
Mitsubishi Heavy Industries Ltd. 1,435,000 JPY 981,789,430 961,163,000 0.64
Mitsubishi Logistics Corp. 60,000 JPY 99,900,000 106,140,000 0.07
Mitsubishi Materials Corp. 523,000 JPY 180,610,537 210,246,000 0.14
Mitsubishi Motors Corp. 301,600 JPY 343,497,416 334,776,000 0.22
Mitsubishi Tanabe Pharma Corp. 106,100 JPY 179,307,947 187,797,000 0.13
Mitsubishi UFJ Financial Group Inc. 6,017,100 JPY 3,812,894,812 3,998,362,950 2.66
Mitsubishi UFJ Lease & Finance Co. Ltd. 232,400 JPY 133,431,881 132,932,800 0.09
Mitsui & Co. Ltd. 805,200 JPY 1,339,083,059 1,305,631,800 0.87
Mitsui Chemicals Inc. 382,000 JPY 122,575,434 131,408,000 0.09
Mitsui Fudosan Co. Ltd. 448,000 JPY 1,570,280,334 1,458,240,000 0.97
Mitsui OSK Lines Ltd. 507,000 JPY 175,976,308 182,013,000 0.12
Mixi Inc. 16,900 JPY 90,570,489 75,712,000 0.05
Mizuho Financial Group Inc. 10,888,500 JPY 2,182,619,011 2,204,921,250 1.47
MS&AD Insurance Group Holdings Inc. 239,100 JPY 568,938,463 688,727,550 0.46
Murata Manufacturing Co. Ltd. 95,500 JPY 1,171,167,951 1,265,375,000 0.84
Nabtesco Corp. 54,100 JPY 146,999,205 158,999,900 0.11
Nagoya Railroad Co. Ltd. 404,000 JPY 191,480,698 181,396,000 0.12
NEC Corp. 1,225,000 JPY 471,661,791 432,425,000 0.29
Nexon Co. Ltd. 59,700 JPY 57,934,452 67,162,500 0.04
NGK Insulators Ltd. 128,000 JPY 303,104,000 319,232,000 0.21
NGK Spark Plug Co. Ltd. 83,900 JPY 246,118,191 308,332,500 0.21
NH Foods Ltd. 85,000 JPY 215,475,000 224,230,000 0.15
NHK Spring Co. Ltd. 72,700 JPY 73,222,726 76,771,200 0.05
Nidec Corp. 102,700 JPY 744,539,644 806,297,700 0.54
Nikon Corp. 160,500 JPY 242,560,179 257,442,000 0.17
Nintendo Co. Ltd. 50,600 JPY 606,986,476 637,813,000 0.42
Nippon Building Fund Inc. 666 JPY 411,890,541 402,264,000 0.27
Nippon Electric Glass Co. Ltd. 183,000 JPY 94,193,277 99,735,000 0.07
Nippon Express Co. Ltd. 398,000 JPY 193,874,151 244,372,000 0.16
Nippon Paint Holdings Co. Ltd. 71,000 JPY 175,157,000 249,920,000 0.17
Nippon Prologis REIT Inc. 681 JPY 175,913,515 177,468,600 0.12
Nippon Steel & Sumitomo Metal Corp. 3,584,000 JPY 1,043,497,054 1,078,425,600 0.72
Nippon Telegraph & Telephone Corp. 177,200 JPY 1,215,320,569 1,100,589,200 0.73
Nippon Yusen KK 765,000 JPY 220,502,034 261,630,000 0.17
Nissan Motor Co. Ltd. 1,173,000 JPY 1,178,859,302 1,239,861,000 0.83
Nisshin Seifun Group Inc. 100,500 JPY 112,823,956 117,585,000 0.08
Nissin Foods Holdings Co. Ltd. 27,500 JPY 161,226,445 158,675,000 0.11
Nitori Holdings Co. Ltd. 32,400 JPY 227,724,376 209,952,000 0.14
Nitto Denko Corp. 74,000 JPY 441,702,819 501,202,000 0.33
NOK Corp. 44,800 JPY 125,326,738 138,432,000 0.09
Nomura Holdings Inc. 1,713,200 JPY 1,164,294,671 1,182,450,640 0.79
Nomura Real Estate Holdings Inc. 57,100 JPY 111,211,664 118,653,800 0.08
Nomura Research Institute Ltd. 52,700 JPY 191,712,335 195,253,500 0.13
NSK Ltd. 218,000 JPY 311,933,025 314,356,000 0.21
157
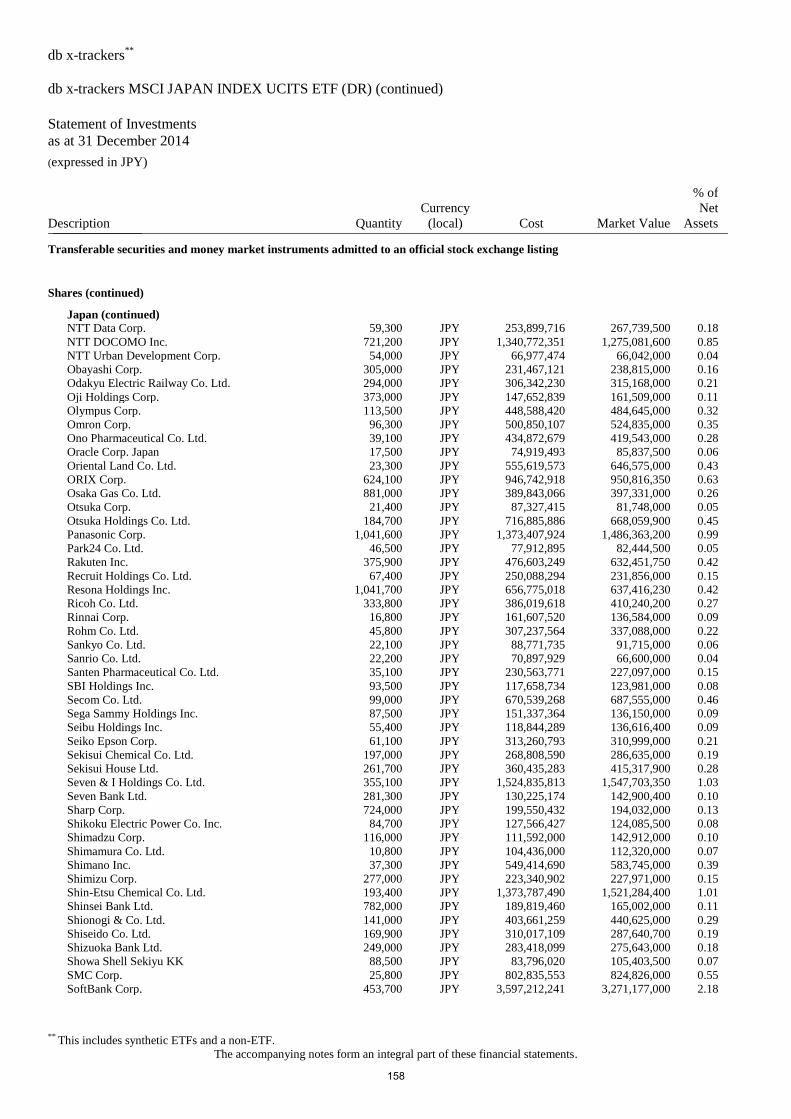
db x-trackers**
db x-trackers MSCI JAPAN INDEX UCITS ETF (DR) (continued)
Statement of Investments
as at 31 December 2014 (expressed in JPY)
** This includes synthetic ETFs and a non-ETF.
The accompanying notes form an integral part of these financial statements.
Description Quantity
Currency
(local) Cost Market Value
% of
Net
Assets _______________
Transferable securities and money market instruments admitted to an official stock exchange listing
Shares (continued)
Japan (continued)
NTT Data Corp. 59,300 JPY 253,899,716 267,739,500 0.18
NTT DOCOMO Inc. 721,200 JPY 1,340,772,351 1,275,081,600 0.85
NTT Urban Development Corp. 54,000 JPY 66,977,474 66,042,000 0.04
Obayashi Corp. 305,000 JPY 231,467,121 238,815,000 0.16
Odakyu Electric Railway Co. Ltd. 294,000 JPY 306,342,230 315,168,000 0.21
Oji Holdings Corp. 373,000 JPY 147,652,839 161,509,000 0.11
Olympus Corp. 113,500 JPY 448,588,420 484,645,000 0.32
Omron Corp. 96,300 JPY 500,850,107 524,835,000 0.35
Ono Pharmaceutical Co. Ltd. 39,100 JPY 434,872,679 419,543,000 0.28
Oracle Corp. Japan 17,500 JPY 74,919,493 85,837,500 0.06
Oriental Land Co. Ltd. 23,300 JPY 555,619,573 646,575,000 0.43
ORIX Corp. 624,100 JPY 946,742,918 950,816,350 0.63
Osaka Gas Co. Ltd. 881,000 JPY 389,843,066 397,331,000 0.26
Otsuka Corp. 21,400 JPY 87,327,415 81,748,000 0.05
Otsuka Holdings Co. Ltd. 184,700 JPY 716,885,886 668,059,900 0.45
Panasonic Corp. 1,041,600 JPY 1,373,407,924 1,486,363,200 0.99
Park24 Co. Ltd. 46,500 JPY 77,912,895 82,444,500 0.05
Rakuten Inc. 375,900 JPY 476,603,249 632,451,750 0.42
Recruit Holdings Co. Ltd. 67,400 JPY 250,088,294 231,856,000 0.15
Resona Holdings Inc. 1,041,700 JPY 656,775,018 637,416,230 0.42
Ricoh Co. Ltd. 333,800 JPY 386,019,618 410,240,200 0.27
Rinnai Corp. 16,800 JPY 161,607,520 136,584,000 0.09
Rohm Co. Ltd. 45,800 JPY 307,237,564 337,088,000 0.22
Sankyo Co. Ltd. 22,100 JPY 88,771,735 91,715,000 0.06
Sanrio Co. Ltd. 22,200 JPY 70,897,929 66,600,000 0.04
Santen Pharmaceutical Co. Ltd. 35,100 JPY 230,563,771 227,097,000 0.15
SBI Holdings Inc. 93,500 JPY 117,658,734 123,981,000 0.08
Secom Co. Ltd. 99,000 JPY 670,539,268 687,555,000 0.46
Sega Sammy Holdings Inc. 87,500 JPY 151,337,364 136,150,000 0.09
Seibu Holdings Inc. 55,400 JPY 118,844,289 136,616,400 0.09
Seiko Epson Corp. 61,100 JPY 313,260,793 310,999,000 0.21
Sekisui Chemical Co. Ltd. 197,000 JPY 268,808,590 286,635,000 0.19
Sekisui House Ltd. 261,700 JPY 360,435,283 415,317,900 0.28
Seven & I Holdings Co. Ltd. 355,100 JPY 1,524,835,813 1,547,703,350 1.03
Seven Bank Ltd. 281,300 JPY 130,225,174 142,900,400 0.10
Sharp Corp. 724,000 JPY 199,550,432 194,032,000 0.13
Shikoku Electric Power Co. Inc. 84,700 JPY 127,566,427 124,085,500 0.08
Shimadzu Corp. 116,000 JPY 111,592,000 142,912,000 0.10
Shimamura Co. Ltd. 10,800 JPY 104,436,000 112,320,000 0.07
Shimano Inc. 37,300 JPY 549,414,690 583,745,000 0.39
Shimizu Corp. 277,000 JPY 223,340,902 227,971,000 0.15
Shin-Etsu Chemical Co. Ltd. 193,400 JPY 1,373,787,490 1,521,284,400 1.01
Shinsei Bank Ltd. 782,000 JPY 189,819,460 165,002,000 0.11
Shionogi & Co. Ltd. 141,000 JPY 403,661,259 440,625,000 0.29
Shiseido Co. Ltd. 169,900 JPY 310,017,109 287,640,700 0.19
Shizuoka Bank Ltd. 249,000 JPY 283,418,099 275,643,000 0.18
Showa Shell Sekiyu KK 88,500 JPY 83,796,020 105,403,500 0.07
SMC Corp. 25,800 JPY 802,835,553 824,826,000 0.55
SoftBank Corp. 453,700 JPY 3,597,212,241 3,271,177,000 2.18
158
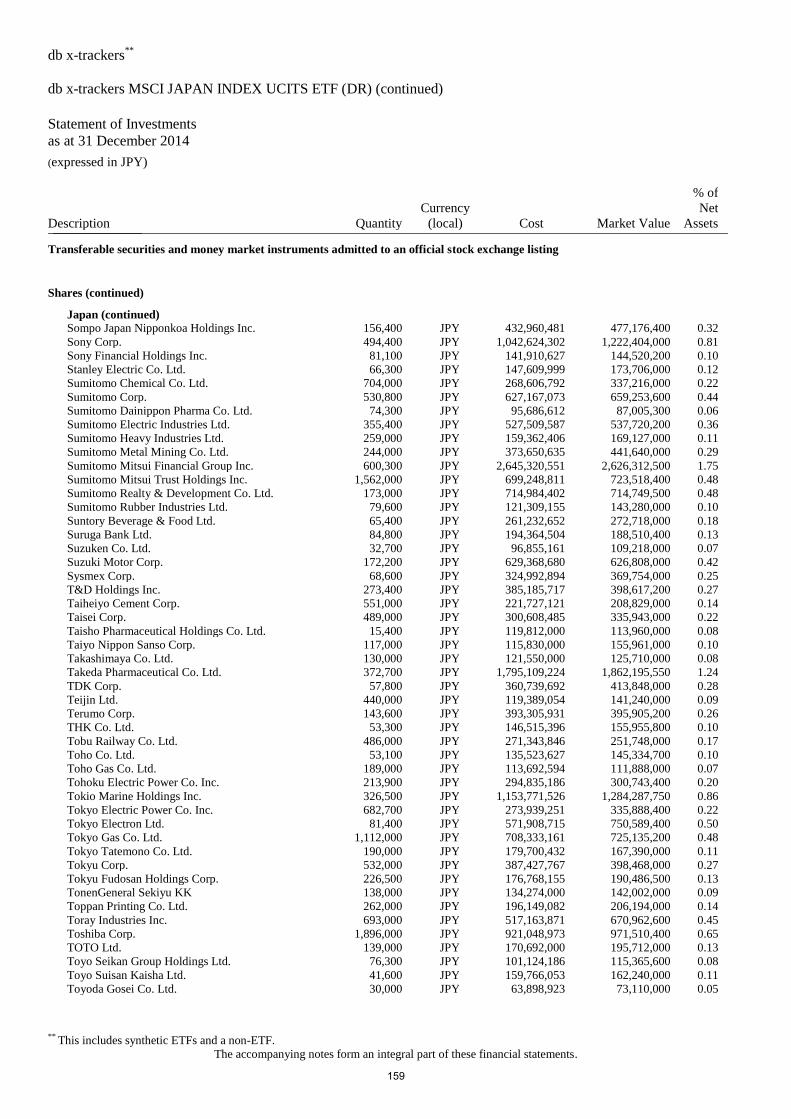
db x-trackers**
db x-trackers MSCI JAPAN INDEX UCITS ETF (DR) (continued)
Statement of Investments
as at 31 December 2014 (expressed in JPY)
** This includes synthetic ETFs and a non-ETF.
The accompanying notes form an integral part of these financial statements.
Description Quantity
Currency
(local) Cost Market Value
% of
Net
Assets _______________
Transferable securities and money market instruments admitted to an official stock exchange listing
Shares (continued)
Japan (continued)
Sompo Japan Nipponkoa Holdings Inc. 156,400 JPY 432,960,481 477,176,400 0.32
Sony Corp. 494,400 JPY 1,042,624,302 1,222,404,000 0.81
Sony Financial Holdings Inc. 81,100 JPY 141,910,627 144,520,200 0.10
Stanley Electric Co. Ltd. 66,300 JPY 147,609,999 173,706,000 0.12
Sumitomo Chemical Co. Ltd. 704,000 JPY 268,606,792 337,216,000 0.22
Sumitomo Corp. 530,800 JPY 627,167,073 659,253,600 0.44
Sumitomo Dainippon Pharma Co. Ltd. 74,300 JPY 95,686,612 87,005,300 0.06
Sumitomo Electric Industries Ltd. 355,400 JPY 527,509,587 537,720,200 0.36
Sumitomo Heavy Industries Ltd. 259,000 JPY 159,362,406 169,127,000 0.11
Sumitomo Metal Mining Co. Ltd. 244,000 JPY 373,650,635 441,640,000 0.29
Sumitomo Mitsui Financial Group Inc. 600,300 JPY 2,645,320,551 2,626,312,500 1.75
Sumitomo Mitsui Trust Holdings Inc. 1,562,000 JPY 699,248,811 723,518,400 0.48
Sumitomo Realty & Development Co. Ltd. 173,000 JPY 714,984,402 714,749,500 0.48
Sumitomo Rubber Industries Ltd. 79,600 JPY 121,309,155 143,280,000 0.10
Suntory Beverage & Food Ltd. 65,400 JPY 261,232,652 272,718,000 0.18
Suruga Bank Ltd. 84,800 JPY 194,364,504 188,510,400 0.13
Suzuken Co. Ltd. 32,700 JPY 96,855,161 109,218,000 0.07
Suzuki Motor Corp. 172,200 JPY 629,368,680 626,808,000 0.42
Sysmex Corp. 68,600 JPY 324,992,894 369,754,000 0.25
T&D Holdings Inc. 273,400 JPY 385,185,717 398,617,200 0.27
Taiheiyo Cement Corp. 551,000 JPY 221,727,121 208,829,000 0.14
Taisei Corp. 489,000 JPY 300,608,485 335,943,000 0.22
Taisho Pharmaceutical Holdings Co. Ltd. 15,400 JPY 119,812,000 113,960,000 0.08
Taiyo Nippon Sanso Corp. 117,000 JPY 115,830,000 155,961,000 0.10
Takashimaya Co. Ltd. 130,000 JPY 121,550,000 125,710,000 0.08
Takeda Pharmaceutical Co. Ltd. 372,700 JPY 1,795,109,224 1,862,195,550 1.24
TDK Corp. 57,800 JPY 360,739,692 413,848,000 0.28
Teijin Ltd. 440,000 JPY 119,389,054 141,240,000 0.09
Terumo Corp. 143,600 JPY 393,305,931 395,905,200 0.26
THK Co. Ltd. 53,300 JPY 146,515,396 155,955,800 0.10
Tobu Railway Co. Ltd. 486,000 JPY 271,343,846 251,748,000 0.17
Toho Co. Ltd. 53,100 JPY 135,523,627 145,334,700 0.10
Toho Gas Co. Ltd. 189,000 JPY 113,692,594 111,888,000 0.07
Tohoku Electric Power Co. Inc. 213,900 JPY 294,835,186 300,743,400 0.20
Tokio Marine Holdings Inc. 326,500 JPY 1,153,771,526 1,284,287,750 0.86
Tokyo Electric Power Co. Inc. 682,700 JPY 273,939,251 335,888,400 0.22
Tokyo Electron Ltd. 81,400 JPY 571,908,715 750,589,400 0.50
Tokyo Gas Co. Ltd. 1,112,000 JPY 708,333,161 725,135,200 0.48
Tokyo Tatemono Co. Ltd. 190,000 JPY 179,700,432 167,390,000 0.11
Tokyu Corp. 532,000 JPY 387,427,767 398,468,000 0.27
Tokyu Fudosan Holdings Corp. 226,500 JPY 176,768,155 190,486,500 0.13
TonenGeneral Sekiyu KK 138,000 JPY 134,274,000 142,002,000 0.09
Toppan Printing Co. Ltd. 262,000 JPY 196,149,082 206,194,000 0.14
Toray Industries Inc. 693,000 JPY 517,163,871 670,962,600 0.45
Toshiba Corp. 1,896,000 JPY 921,048,973 971,510,400 0.65
TOTO Ltd. 139,000 JPY 170,692,000 195,712,000 0.13
Toyo Seikan Group Holdings Ltd. 76,300 JPY 101,124,186 115,365,600 0.08
Toyo Suisan Kaisha Ltd. 41,600 JPY 159,766,053 162,240,000 0.11
Toyoda Gosei Co. Ltd. 30,000 JPY 63,898,923 73,110,000 0.05
159
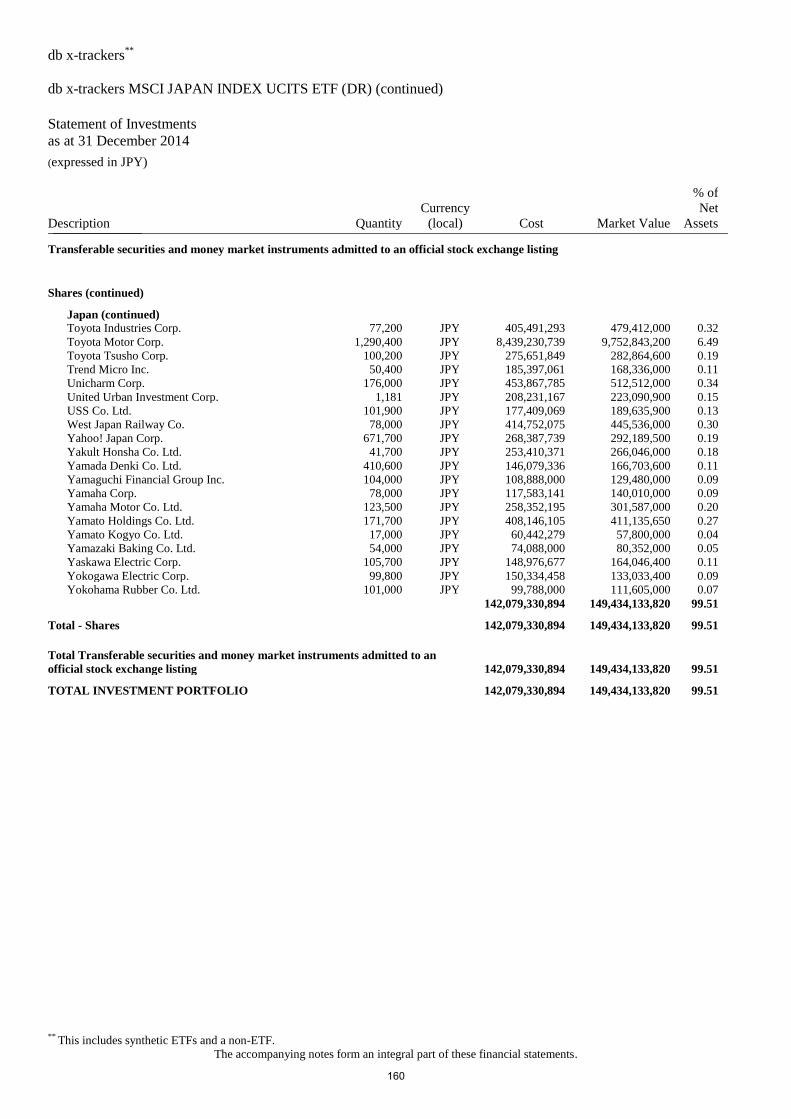
db x-trackers**
db x-trackers MSCI JAPAN INDEX UCITS ETF (DR) (continued)
Statement of Investments
as at 31 December 2014 (expressed in JPY)
** This includes synthetic ETFs and a non-ETF.
The accompanying notes form an integral part of these financial statements.
Description Quantity
Currency
(local) Cost Market Value
% of
Net
Assets _______________
Transferable securities and money market instruments admitted to an official stock exchange listing
Shares (continued)
Japan (continued)
Toyota Industries Corp. 77,200 JPY 405,491,293 479,412,000 0.32
Toyota Motor Corp. 1,290,400 JPY 8,439,230,739 9,752,843,200 6.49
Toyota Tsusho Corp. 100,200 JPY 275,651,849 282,864,600 0.19
Trend Micro Inc. 50,400 JPY 185,397,061 168,336,000 0.11
Unicharm Corp. 176,000 JPY 453,867,785 512,512,000 0.34
United Urban Investment Corp. 1,181 JPY 208,231,167 223,090,900 0.15
USS Co. Ltd. 101,900 JPY 177,409,069 189,635,900 0.13
West Japan Railway Co. 78,000 JPY 414,752,075 445,536,000 0.30
Yahoo! Japan Corp. 671,700 JPY 268,387,739 292,189,500 0.19
Yakult Honsha Co. Ltd. 41,700 JPY 253,410,371 266,046,000 0.18
Yamada Denki Co. Ltd. 410,600 JPY 146,079,336 166,703,600 0.11
Yamaguchi Financial Group Inc. 104,000 JPY 108,888,000 129,480,000 0.09
Yamaha Corp. 78,000 JPY 117,583,141 140,010,000 0.09
Yamaha Motor Co. Ltd. 123,500 JPY 258,352,195 301,587,000 0.20
Yamato Holdings Co. Ltd. 171,700 JPY 408,146,105 411,135,650 0.27
Yamato Kogyo Co. Ltd. 17,000 JPY 60,442,279 57,800,000 0.04
Yamazaki Baking Co. Ltd. 54,000 JPY 74,088,000 80,352,000 0.05
Yaskawa Electric Corp. 105,700 JPY 148,976,677 164,046,400 0.11
Yokogawa Electric Corp. 99,800 JPY 150,334,458 133,033,400 0.09
Yokohama Rubber Co. Ltd. 101,000 JPY 99,788,000 111,605,000 0.07
142,079,330,894 149,434,133,820 99.51
Total - Shares 142,079,330,894 149,434,133,820 99.51
Total Transferable securities and money market instruments admitted to an
official stock exchange listing 142,079,330,894 149,434,133,820 99.51
TOTAL INVESTMENT PORTFOLIO 142,079,330,894 149,434,133,820 99.51
160
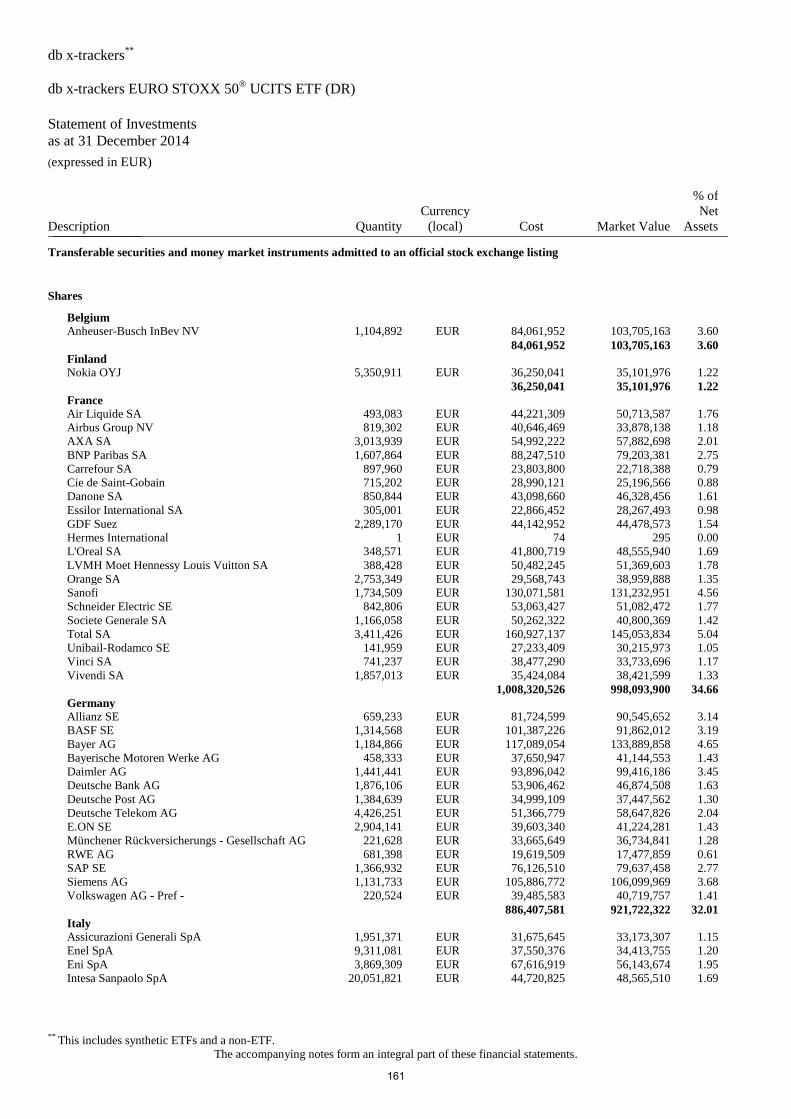
db x-trackers**
db x-trackers EURO STOXX 50® UCITS ETF (DR)
Statement of Investments
as at 31 December 2014 (expressed in EUR)
** This includes synthetic ETFs and a non-ETF.
The accompanying notes form an integral part of these financial statements.
Description Quantity
Currency
(local) Cost Market Value
% of
Net
Assets _______________
Transferable securities and money market instruments admitted to an official stock exchange listing
Shares
Belgium
Anheuser-Busch InBev NV 1,104,892 EUR 84,061,952 103,705,163 3.60
84,061,952 103,705,163 3.60
Finland
Nokia OYJ 5,350,911 EUR 36,250,041 35,101,976 1.22
36,250,041 35,101,976 1.22
France
Air Liquide SA 493,083 EUR 44,221,309 50,713,587 1.76
Airbus Group NV 819,302 EUR 40,646,469 33,878,138 1.18
AXA SA 3,013,939 EUR 54,992,222 57,882,698 2.01
BNP Paribas SA 1,607,864 EUR 88,247,510 79,203,381 2.75
Carrefour SA 897,960 EUR 23,803,800 22,718,388 0.79
Cie de Saint-Gobain 715,202 EUR 28,990,121 25,196,566 0.88
Danone SA 850,844 EUR 43,098,660 46,328,456 1.61
Essilor International SA 305,001 EUR 22,866,452 28,267,493 0.98
GDF Suez 2,289,170 EUR 44,142,952 44,478,573 1.54
Hermes International 1 EUR 74 295 0.00
L'Oreal SA 348,571 EUR 41,800,719 48,555,940 1.69
LVMH Moet Hennessy Louis Vuitton SA 388,428 EUR 50,482,245 51,369,603 1.78
Orange SA 2,753,349 EUR 29,568,743 38,959,888 1.35
Sanofi 1,734,509 EUR 130,071,581 131,232,951 4.56
Schneider Electric SE 842,806 EUR 53,063,427 51,082,472 1.77
Societe Generale SA 1,166,058 EUR 50,262,322 40,800,369 1.42
Total SA 3,411,426 EUR 160,927,137 145,053,834 5.04
Unibail-Rodamco SE 141,959 EUR 27,233,409 30,215,973 1.05
Vinci SA 741,237 EUR 38,477,290 33,733,696 1.17
Vivendi SA 1,857,013 EUR 35,424,084 38,421,599 1.33
1,008,320,526 998,093,900 34.66
Germany
Allianz SE 659,233 EUR 81,724,599 90,545,652 3.14
BASF SE 1,314,568 EUR 101,387,226 91,862,012 3.19
Bayer AG 1,184,866 EUR 117,089,054 133,889,858 4.65
Bayerische Motoren Werke AG 458,333 EUR 37,650,947 41,144,553 1.43
Daimler AG 1,441,441 EUR 93,896,042 99,416,186 3.45
Deutsche Bank AG 1,876,106 EUR 53,906,462 46,874,508 1.63
Deutsche Post AG 1,384,639 EUR 34,999,109 37,447,562 1.30
Deutsche Telekom AG 4,426,251 EUR 51,366,779 58,647,826 2.04
E.ON SE 2,904,141 EUR 39,603,340 41,224,281 1.43
Münchener Rückversicherungs - Gesellschaft AG 221,628 EUR 33,665,649 36,734,841 1.28
RWE AG 681,398 EUR 19,619,509 17,477,859 0.61
SAP SE 1,366,932 EUR 76,126,510 79,637,458 2.77
Siemens AG 1,131,733 EUR 105,886,772 106,099,969 3.68
Volkswagen AG - Pref - 220,524 EUR 39,485,583 40,719,757 1.41
886,407,581 921,722,322 32.01
Italy
Assicurazioni Generali SpA 1,951,371 EUR 31,675,645 33,173,307 1.15
Enel SpA 9,311,081 EUR 37,550,376 34,413,755 1.20
Eni SpA 3,869,309 EUR 67,616,919 56,143,674 1.95
Intesa Sanpaolo SpA 20,051,821 EUR 44,720,825 48,565,510 1.69
161
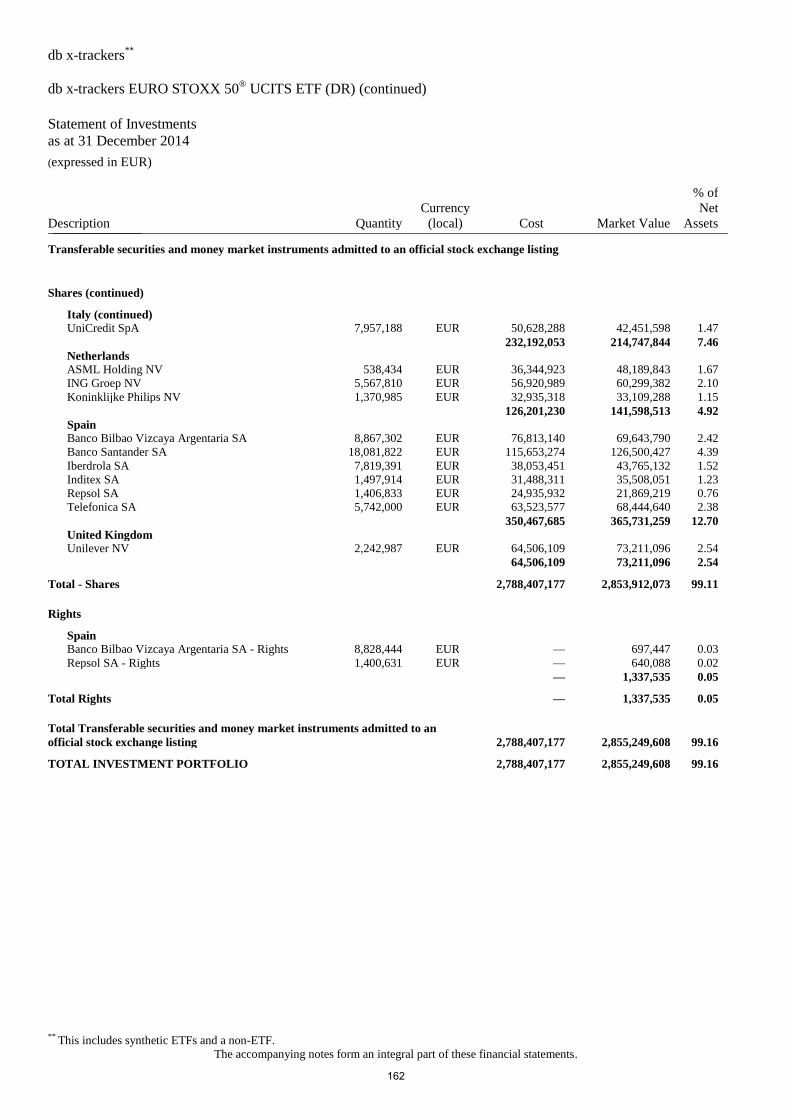
db x-trackers**
db x-trackers EURO STOXX 50® UCITS ETF (DR) (continued)
Statement of Investments
as at 31 December 2014 (expressed in EUR)
** This includes synthetic ETFs and a non-ETF.
The accompanying notes form an integral part of these financial statements.
Description Quantity
Currency
(local) Cost Market Value
% of
Net
Assets _______________
Transferable securities and money market instruments admitted to an official stock exchange listing
Shares (continued)
Italy (continued)
UniCredit SpA 7,957,188 EUR 50,628,288 42,451,598 1.47
232,192,053 214,747,844 7.46
Netherlands
ASML Holding NV 538,434 EUR 36,344,923 48,189,843 1.67
ING Groep NV 5,567,810 EUR 56,920,989 60,299,382 2.10
Koninklijke Philips NV 1,370,985 EUR 32,935,318 33,109,288 1.15
126,201,230 141,598,513 4.92
Spain
Banco Bilbao Vizcaya Argentaria SA 8,867,302 EUR 76,813,140 69,643,790 2.42
Banco Santander SA 18,081,822 EUR 115,653,274 126,500,427 4.39
Iberdrola SA 7,819,391 EUR 38,053,451 43,765,132 1.52
Inditex SA 1,497,914 EUR 31,488,311 35,508,051 1.23
Repsol SA 1,406,833 EUR 24,935,932 21,869,219 0.76
Telefonica SA 5,742,000 EUR 63,523,577 68,444,640 2.38
350,467,685 365,731,259 12.70
United Kingdom
Unilever NV 2,242,987 EUR 64,506,109 73,211,096 2.54
64,506,109 73,211,096 2.54
Total - Shares 2,788,407,177 2,853,912,073 99.11
Rights
Spain
Banco Bilbao Vizcaya Argentaria SA - Rights 8,828,444 EUR — 697,447 0.03
Repsol SA - Rights 1,400,631 EUR — 640,088 0.02
— 1,337,535 0.05
Total Rights — 1,337,535 0.05
Total Transferable securities and money market instruments admitted to an
official stock exchange listing 2,788,407,177 2,855,249,608 99.16
TOTAL INVESTMENT PORTFOLIO 2,788,407,177 2,855,249,608 99.16
162
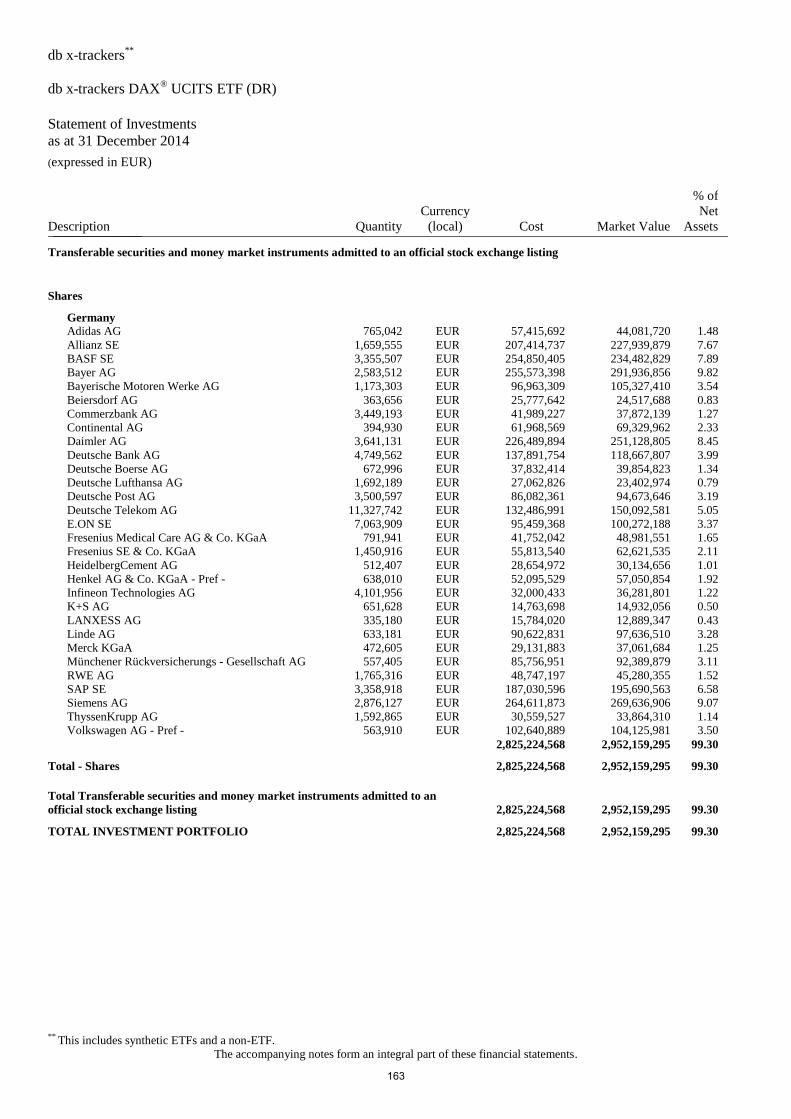
db x-trackers**
db x-trackers DAX® UCITS ETF (DR)
Statement of Investments
as at 31 December 2014 (expressed in EUR)
** This includes synthetic ETFs and a non-ETF.
The accompanying notes form an integral part of these financial statements.
Description Quantity
Currency
(local) Cost Market Value
% of
Net
Assets _______________
Transferable securities and money market instruments admitted to an official stock exchange listing
Shares
Germany
Adidas AG 765,042 EUR 57,415,692 44,081,720 1.48
Allianz SE 1,659,555 EUR 207,414,737 227,939,879 7.67
BASF SE 3,355,507 EUR 254,850,405 234,482,829 7.89
Bayer AG 2,583,512 EUR 255,573,398 291,936,856 9.82
Bayerische Motoren Werke AG 1,173,303 EUR 96,963,309 105,327,410 3.54
Beiersdorf AG 363,656 EUR 25,777,642 24,517,688 0.83
Commerzbank AG 3,449,193 EUR 41,989,227 37,872,139 1.27
Continental AG 394,930 EUR 61,968,569 69,329,962 2.33
Daimler AG 3,641,131 EUR 226,489,894 251,128,805 8.45
Deutsche Bank AG 4,749,562 EUR 137,891,754 118,667,807 3.99
Deutsche Boerse AG 672,996 EUR 37,832,414 39,854,823 1.34
Deutsche Lufthansa AG 1,692,189 EUR 27,062,826 23,402,974 0.79
Deutsche Post AG 3,500,597 EUR 86,082,361 94,673,646 3.19
Deutsche Telekom AG 11,327,742 EUR 132,486,991 150,092,581 5.05
E.ON SE 7,063,909 EUR 95,459,368 100,272,188 3.37
Fresenius Medical Care AG & Co. KGaA 791,941 EUR 41,752,042 48,981,551 1.65
Fresenius SE & Co. KGaA 1,450,916 EUR 55,813,540 62,621,535 2.11
HeidelbergCement AG 512,407 EUR 28,654,972 30,134,656 1.01
Henkel AG & Co. KGaA - Pref - 638,010 EUR 52,095,529 57,050,854 1.92
Infineon Technologies AG 4,101,956 EUR 32,000,433 36,281,801 1.22
K+S AG 651,628 EUR 14,763,698 14,932,056 0.50
LANXESS AG 335,180 EUR 15,784,020 12,889,347 0.43
Linde AG 633,181 EUR 90,622,831 97,636,510 3.28
Merck KGaA 472,605 EUR 29,131,883 37,061,684 1.25
Münchener Rückversicherungs - Gesellschaft AG 557,405 EUR 85,756,951 92,389,879 3.11
RWE AG 1,765,316 EUR 48,747,197 45,280,355 1.52
SAP SE 3,358,918 EUR 187,030,596 195,690,563 6.58
Siemens AG 2,876,127 EUR 264,611,873 269,636,906 9.07
ThyssenKrupp AG 1,592,865 EUR 30,559,527 33,864,310 1.14
Volkswagen AG - Pref - 563,910 EUR 102,640,889 104,125,981 3.50
2,825,224,568 2,952,159,295 99.30
Total - Shares 2,825,224,568 2,952,159,295 99.30
Total Transferable securities and money market instruments admitted to an
official stock exchange listing 2,825,224,568 2,952,159,295 99.30
TOTAL INVESTMENT PORTFOLIO 2,825,224,568 2,952,159,295 99.30
163
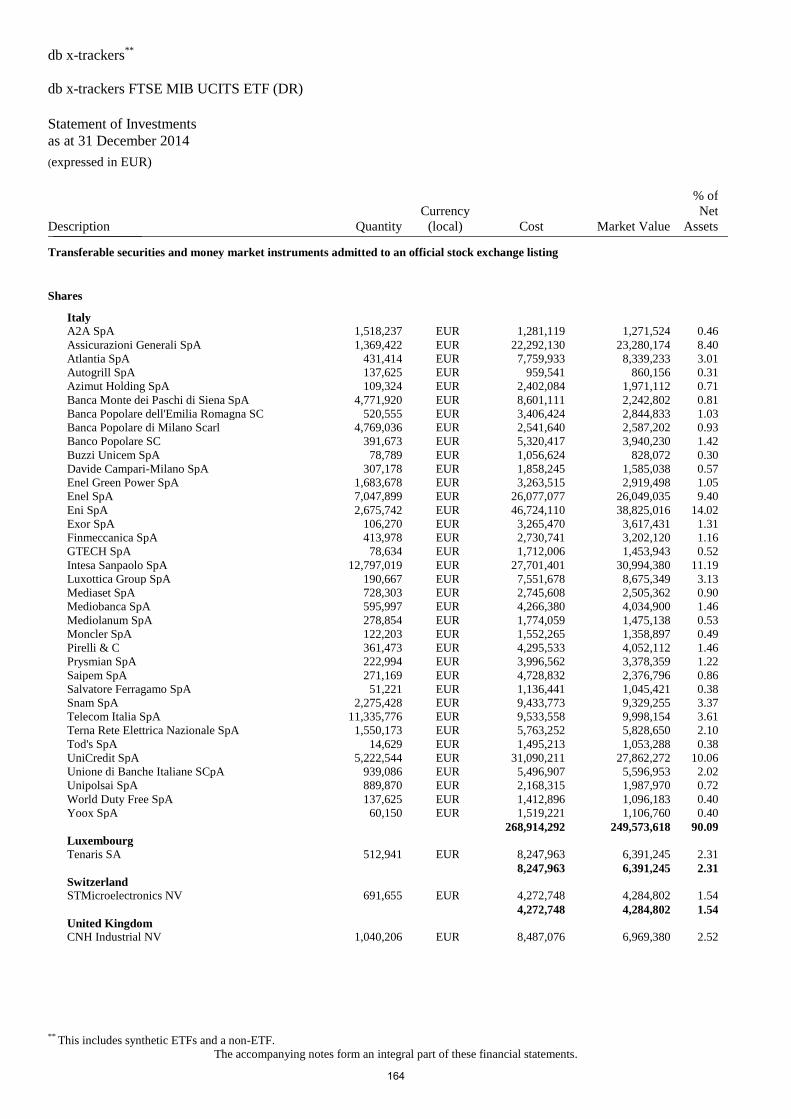
db x-trackers**
db x-trackers FTSE MIB UCITS ETF (DR)
Statement of Investments
as at 31 December 2014 (expressed in EUR)
** This includes synthetic ETFs and a non-ETF.
The accompanying notes form an integral part of these financial statements.
Description Quantity
Currency
(local) Cost Market Value
% of
Net
Assets _______________
Transferable securities and money market instruments admitted to an official stock exchange listing
Shares
Italy
A2A SpA 1,518,237 EUR 1,281,119 1,271,524 0.46
Assicurazioni Generali SpA 1,369,422 EUR 22,292,130 23,280,174 8.40
Atlantia SpA 431,414 EUR 7,759,933 8,339,233 3.01
Autogrill SpA 137,625 EUR 959,541 860,156 0.31
Azimut Holding SpA 109,324 EUR 2,402,084 1,971,112 0.71
Banca Monte dei Paschi di Siena SpA 4,771,920 EUR 8,601,111 2,242,802 0.81
Banca Popolare dell'Emilia Romagna SC 520,555 EUR 3,406,424 2,844,833 1.03
Banca Popolare di Milano Scarl 4,769,036 EUR 2,541,640 2,587,202 0.93
Banco Popolare SC 391,673 EUR 5,320,417 3,940,230 1.42
Buzzi Unicem SpA 78,789 EUR 1,056,624 828,072 0.30
Davide Campari-Milano SpA 307,178 EUR 1,858,245 1,585,038 0.57
Enel Green Power SpA 1,683,678 EUR 3,263,515 2,919,498 1.05
Enel SpA 7,047,899 EUR 26,077,077 26,049,035 9.40
Eni SpA 2,675,742 EUR 46,724,110 38,825,016 14.02
Exor SpA 106,270 EUR 3,265,470 3,617,431 1.31
Finmeccanica SpA 413,978 EUR 2,730,741 3,202,120 1.16
GTECH SpA 78,634 EUR 1,712,006 1,453,943 0.52
Intesa Sanpaolo SpA 12,797,019 EUR 27,701,401 30,994,380 11.19
Luxottica Group SpA 190,667 EUR 7,551,678 8,675,349 3.13
Mediaset SpA 728,303 EUR 2,745,608 2,505,362 0.90
Mediobanca SpA 595,997 EUR 4,266,380 4,034,900 1.46
Mediolanum SpA 278,854 EUR 1,774,059 1,475,138 0.53
Moncler SpA 122,203 EUR 1,552,265 1,358,897 0.49
Pirelli & C 361,473 EUR 4,295,533 4,052,112 1.46
Prysmian SpA 222,994 EUR 3,996,562 3,378,359 1.22
Saipem SpA 271,169 EUR 4,728,832 2,376,796 0.86
Salvatore Ferragamo SpA 51,221 EUR 1,136,441 1,045,421 0.38
Snam SpA 2,275,428 EUR 9,433,773 9,329,255 3.37
Telecom Italia SpA 11,335,776 EUR 9,533,558 9,998,154 3.61
Terna Rete Elettrica Nazionale SpA 1,550,173 EUR 5,763,252 5,828,650 2.10
Tod's SpA 14,629 EUR 1,495,213 1,053,288 0.38
UniCredit SpA 5,222,544 EUR 31,090,211 27,862,272 10.06
Unione di Banche Italiane SCpA 939,086 EUR 5,496,907 5,596,953 2.02
Unipolsai SpA 889,870 EUR 2,168,315 1,987,970 0.72
World Duty Free SpA 137,625 EUR 1,412,896 1,096,183 0.40
Yoox SpA 60,150 EUR 1,519,221 1,106,760 0.40
268,914,292 249,573,618 90.09
Luxembourg
Tenaris SA 512,941 EUR 8,247,963 6,391,245 2.31
8,247,963 6,391,245 2.31
Switzerland
STMicroelectronics NV 691,655 EUR 4,272,748 4,284,802 1.54
4,272,748 4,284,802 1.54
United Kingdom
CNH Industrial NV 1,040,206 EUR 8,487,076 6,969,380 2.52
164
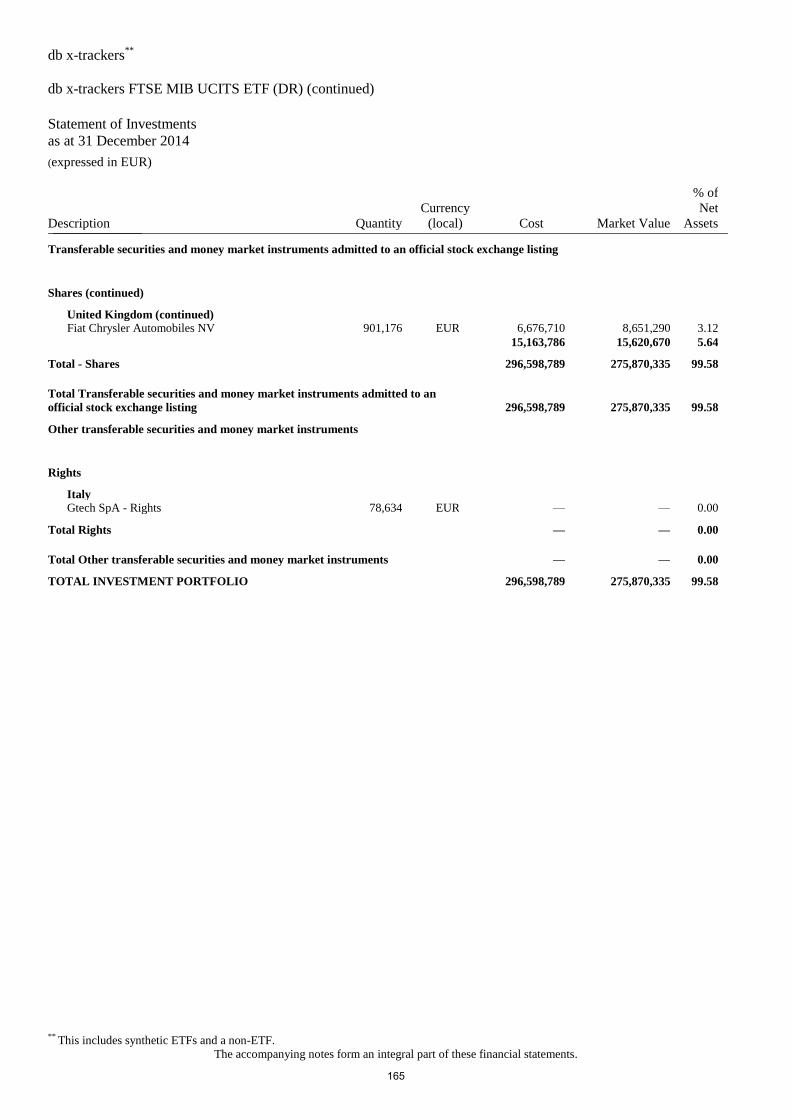
db x-trackers**
db x-trackers FTSE MIB UCITS ETF (DR) (continued)
Statement of Investments
as at 31 December 2014 (expressed in EUR)
** This includes synthetic ETFs and a non-ETF.
The accompanying notes form an integral part of these financial statements.
Description Quantity
Currency
(local) Cost Market Value
% of
Net
Assets _______________
Transferable securities and money market instruments admitted to an official stock exchange listing
Shares (continued)
United Kingdom (continued)
Fiat Chrysler Automobiles NV 901,176 EUR 6,676,710 8,651,290 3.12
15,163,786 15,620,670 5.64
Total - Shares 296,598,789 275,870,335 99.58
Total Transferable securities and money market instruments admitted to an
official stock exchange listing 296,598,789 275,870,335 99.58
Other transferable securities and money market instruments
Rights
Italy
Gtech SpA - Rights 78,634 EUR — — 0.00
Total Rights — — 0.00
Total Other transferable securities and money market instruments — — 0.00
TOTAL INVESTMENT PORTFOLIO 296,598,789 275,870,335 99.58
165
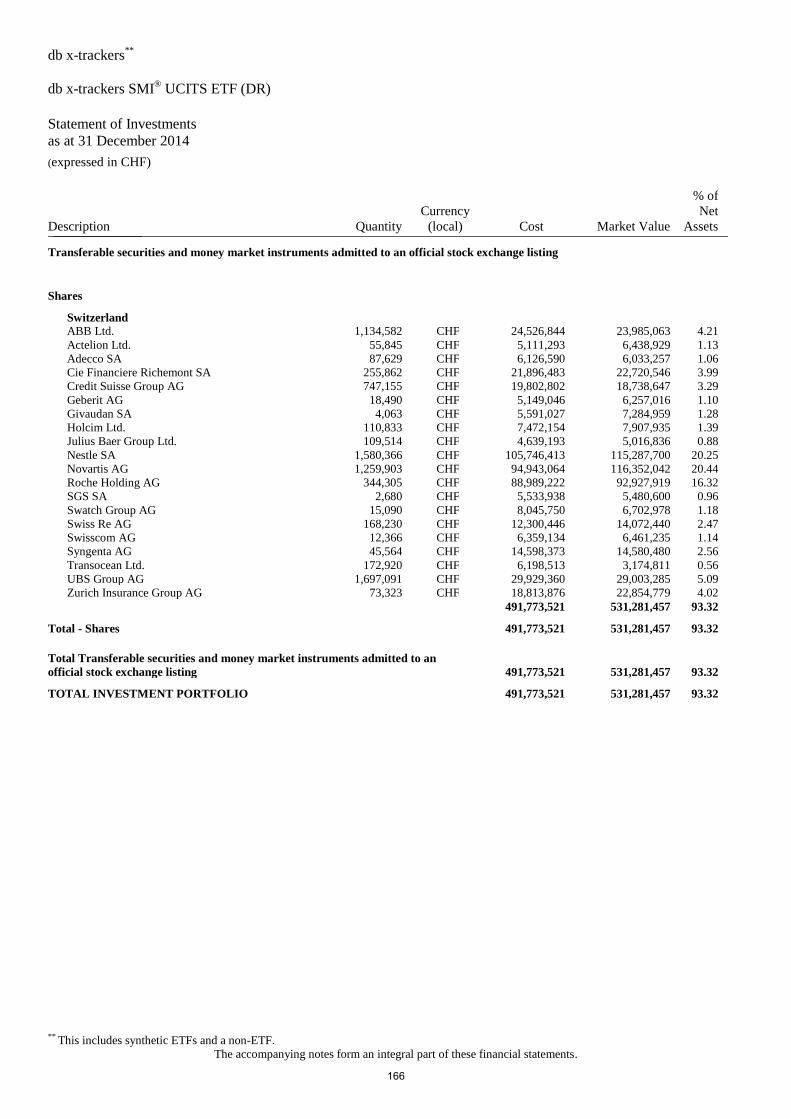
db x-trackers**
db x-trackers SMI® UCITS ETF (DR)
Statement of Investments
as at 31 December 2014 (expressed in CHF)
** This includes synthetic ETFs and a non-ETF.
The accompanying notes form an integral part of these financial statements.
Description Quantity
Currency
(local) Cost Market Value
% of
Net
Assets _______________
Transferable securities and money market instruments admitted to an official stock exchange listing
Shares
Switzerland
ABB Ltd. 1,134,582 CHF 24,526,844 23,985,063 4.21
Actelion Ltd. 55,845 CHF 5,111,293 6,438,929 1.13
Adecco SA 87,629 CHF 6,126,590 6,033,257 1.06
Cie Financiere Richemont SA 255,862 CHF 21,896,483 22,720,546 3.99
Credit Suisse Group AG 747,155 CHF 19,802,802 18,738,647 3.29
Geberit AG 18,490 CHF 5,149,046 6,257,016 1.10
Givaudan SA 4,063 CHF 5,591,027 7,284,959 1.28
Holcim Ltd. 110,833 CHF 7,472,154 7,907,935 1.39
Julius Baer Group Ltd. 109,514 CHF 4,639,193 5,016,836 0.88
Nestle SA 1,580,366 CHF 105,746,413 115,287,700 20.25
Novartis AG 1,259,903 CHF 94,943,064 116,352,042 20.44
Roche Holding AG 344,305 CHF 88,989,222 92,927,919 16.32
SGS SA 2,680 CHF 5,533,938 5,480,600 0.96
Swatch Group AG 15,090 CHF 8,045,750 6,702,978 1.18
Swiss Re AG 168,230 CHF 12,300,446 14,072,440 2.47
Swisscom AG 12,366 CHF 6,359,134 6,461,235 1.14
Syngenta AG 45,564 CHF 14,598,373 14,580,480 2.56
Transocean Ltd. 172,920 CHF 6,198,513 3,174,811 0.56
UBS Group AG 1,697,091 CHF 29,929,360 29,003,285 5.09
Zurich Insurance Group AG 73,323 CHF 18,813,876 22,854,779 4.02
491,773,521 531,281,457 93.32
Total - Shares 491,773,521 531,281,457 93.32
Total Transferable securities and money market instruments admitted to an
official stock exchange listing 491,773,521 531,281,457 93.32
TOTAL INVESTMENT PORTFOLIO 491,773,521 531,281,457 93.32
166
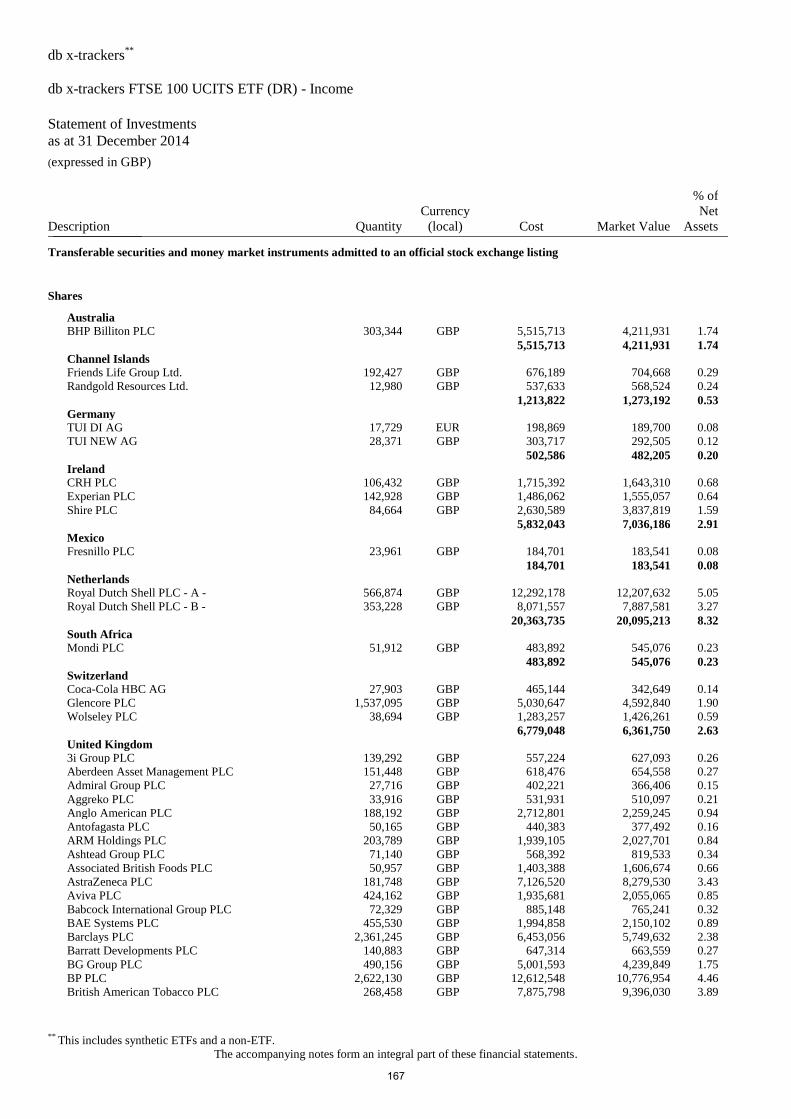
db x-trackers**
db x-trackers FTSE 100 UCITS ETF (DR) - Income
Statement of Investments
as at 31 December 2014 (expressed in GBP)
** This includes synthetic ETFs and a non-ETF.
The accompanying notes form an integral part of these financial statements.
Description Quantity
Currency
(local) Cost Market Value
% of
Net
Assets _______________
Transferable securities and money market instruments admitted to an official stock exchange listing
Shares
Australia
BHP Billiton PLC 303,344 GBP 5,515,713 4,211,931 1.74
5,515,713 4,211,931 1.74
Channel Islands
Friends Life Group Ltd. 192,427 GBP 676,189 704,668 0.29
Randgold Resources Ltd. 12,980 GBP 537,633 568,524 0.24
1,213,822 1,273,192 0.53
Germany
TUI DI AG 17,729 EUR 198,869 189,700 0.08
TUI NEW AG 28,371 GBP 303,717 292,505 0.12
502,586 482,205 0.20
Ireland
CRH PLC 106,432 GBP 1,715,392 1,643,310 0.68
Experian PLC 142,928 GBP 1,486,062 1,555,057 0.64
Shire PLC 84,664 GBP 2,630,589 3,837,819 1.59
5,832,043 7,036,186 2.91
Mexico
Fresnillo PLC 23,961 GBP 184,701 183,541 0.08
184,701 183,541 0.08
Netherlands
Royal Dutch Shell PLC - A - 566,874 GBP 12,292,178 12,207,632 5.05
Royal Dutch Shell PLC - B - 353,228 GBP 8,071,557 7,887,581 3.27
20,363,735 20,095,213 8.32
South Africa
Mondi PLC 51,912 GBP 483,892 545,076 0.23
483,892 545,076 0.23
Switzerland
Coca-Cola HBC AG 27,903 GBP 465,144 342,649 0.14
Glencore PLC 1,537,095 GBP 5,030,647 4,592,840 1.90
Wolseley PLC 38,694 GBP 1,283,257 1,426,261 0.59
6,779,048 6,361,750 2.63
United Kingdom
3i Group PLC 139,292 GBP 557,224 627,093 0.26
Aberdeen Asset Management PLC 151,448 GBP 618,476 654,558 0.27
Admiral Group PLC 27,716 GBP 402,221 366,406 0.15
Aggreko PLC 33,916 GBP 531,931 510,097 0.21
Anglo American PLC 188,192 GBP 2,712,801 2,259,245 0.94
Antofagasta PLC 50,165 GBP 440,383 377,492 0.16
ARM Holdings PLC 203,789 GBP 1,939,105 2,027,701 0.84
Ashtead Group PLC 71,140 GBP 568,392 819,533 0.34
Associated British Foods PLC 50,957 GBP 1,403,388 1,606,674 0.66
AstraZeneca PLC 181,748 GBP 7,126,520 8,279,530 3.43
Aviva PLC 424,162 GBP 1,935,681 2,055,065 0.85
Babcock International Group PLC 72,329 GBP 885,148 765,241 0.32
BAE Systems PLC 455,530 GBP 1,994,858 2,150,102 0.89
Barclays PLC 2,361,245 GBP 6,453,056 5,749,632 2.38
Barratt Developments PLC 140,883 GBP 647,314 663,559 0.27
BG Group PLC 490,156 GBP 5,001,593 4,239,849 1.75
BP PLC 2,622,130 GBP 12,612,548 10,776,954 4.46
British American Tobacco PLC 268,458 GBP 7,875,798 9,396,030 3.89
167

db x-trackers**
db x-trackers FTSE 100 UCITS ETF (DR) - Income (continued)
Statement of Investments
as at 31 December 2014 (expressed in GBP)
** This includes synthetic ETFs and a non-ETF.
The accompanying notes form an integral part of these financial statements.
Description Quantity
Currency
(local) Cost Market Value
% of
Net
Assets _______________
Transferable securities and money market instruments admitted to an official stock exchange listing
Shares (continued)
United Kingdom (continued)
British Land Co. PLC 145,782 GBP 981,615 1,132,726 0.47
BT Group PLC 1,170,050 GBP 4,385,960 4,697,751 1.94
Bunzl PLC 46,932 GBP 659,862 827,880 0.34
Burberry Group PLC 64,060 GBP 910,004 1,048,022 0.43
Capita PLC 95,082 GBP 958,151 1,027,836 0.43
Centrica PLC 724,820 GBP 2,299,868 2,022,248 0.84
Compass Group PLC 239,620 GBP 2,214,744 2,638,216 1.09
Diageo PLC 362,755 GBP 6,645,555 6,705,526 2.78
Direct Line Insurance Group PLC 212,076 GBP 639,586 617,777 0.26
Dixons Carphone PLC 132,582 GBP 495,808 613,059 0.25
easyJet PLC 35,115 GBP 577,708 586,772 0.24
G4S PLC 219,318 GBP 523,926 609,485 0.25
GKN PLC 235,506 GBP 942,117 810,141 0.34
GlaxoSmithKline PLC 700,203 GBP 11,098,525 9,634,793 3.99
Hammerson PLC 111,290 GBP 596,197 673,305 0.28
Hargreaves Lansdown PLC 30,843 GBP 469,299 312,131 0.13
HSBC Holdings PLC 2,738,911 GBP 17,305,023 16,669,012 6.90
Imperial Tobacco Group PLC 138,751 GBP 3,079,604 3,934,978 1.63
InterContinental Hotels Group PLC 33,864 GBP 731,116 878,771 0.36
International Consolidated Airlines Group SA 298,110 GBP 1,251,131 1,449,113 0.60
Intertek Group PLC 22,722 GBP 645,564 530,331 0.22
Intu Properties PLC 129,761 GBP 397,941 433,402 0.18
ITV PLC 541,109 GBP 1,097,860 1,164,467 0.48
J Sainsbury PLC 203,395 GBP 709,444 501,775 0.21
Johnson Matthey PLC 29,628 GBP 977,839 1,006,463 0.42
Kingfisher PLC 346,766 GBP 1,283,163 1,180,738 0.49
Land Securities Group PLC 116,200 GBP 1,210,740 1,344,434 0.56
Legal & General Group PLC 853,943 GBP 1,871,759 2,122,902 0.88
Lloyds Banking Group PLC 7,784,448 GBP 6,452,562 5,902,168 2.44
London Stock Exchange Group PLC 34,451 GBP 613,197 765,157 0.32
Marks & Spencer Group PLC 235,234 GBP 1,125,369 1,126,300 0.47
Meggitt PLC 115,880 GBP 597,853 601,417 0.25
National Grid PLC 543,258 GBP 4,316,905 4,987,652 2.06
Next PLC 21,208 GBP 1,333,586 1,446,386 0.60
Old Mutual PLC 715,701 GBP 1,253,660 1,363,410 0.56
Pearson PLC 119,062 GBP 1,333,556 1,416,838 0.59
Persimmon PLC 44,049 GBP 573,702 695,093 0.29
Prudential PLC 367,499 GBP 4,610,282 5,483,085 2.27
Reckitt Benckiser Group PLC 92,915 GBP 4,169,756 4,840,871 2.00
Reed Elsevier PLC 165,354 GBP 1,487,887 1,818,894 0.75
Rio Tinto PLC 179,688 GBP 5,847,059 5,390,640 2.23
Rolls-Royce Holdings PLC 269,574 GBP 3,106,086 2,345,294 0.97
Royal Bank of Scotland Group PLC 307,259 GBP 1,073,313 1,211,829 0.50
Royal Mail PLC 87,639 GBP 530,226 376,760 0.16
RSA Insurance Group PLC 142,077 GBP 625,904 618,035 0.26
SABMiller PLC 136,157 GBP 3,799,158 4,576,237 1.89
Sage Group PLC 155,233 GBP 656,019 722,920 0.30
Schroders PLC 15,976 GBP 398,668 429,115 0.18
Severn Trent PLC 33,654 GBP 585,803 675,099 0.28
168
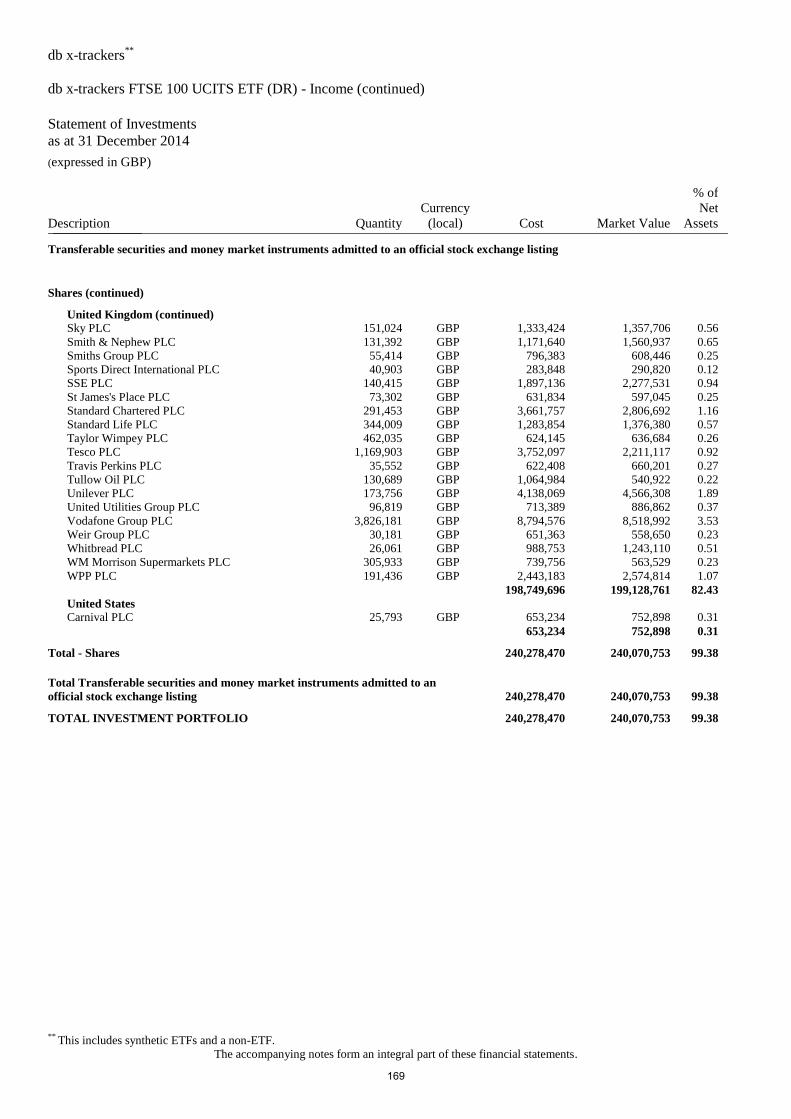
db x-trackers**
db x-trackers FTSE 100 UCITS ETF (DR) - Income (continued)
Statement of Investments
as at 31 December 2014 (expressed in GBP)
** This includes synthetic ETFs and a non-ETF.
The accompanying notes form an integral part of these financial statements.
Description Quantity
Currency
(local) Cost Market Value
% of
Net
Assets _______________
Transferable securities and money market instruments admitted to an official stock exchange listing
Shares (continued)
United Kingdom (continued)
Sky PLC 151,024 GBP 1,333,424 1,357,706 0.56
Smith & Nephew PLC 131,392 GBP 1,171,640 1,560,937 0.65
Smiths Group PLC 55,414 GBP 796,383 608,446 0.25
Sports Direct International PLC 40,903 GBP 283,848 290,820 0.12
SSE PLC 140,415 GBP 1,897,136 2,277,531 0.94
St James's Place PLC 73,302 GBP 631,834 597,045 0.25
Standard Chartered PLC 291,453 GBP 3,661,757 2,806,692 1.16
Standard Life PLC 344,009 GBP 1,283,854 1,376,380 0.57
Taylor Wimpey PLC 462,035 GBP 624,145 636,684 0.26
Tesco PLC 1,169,903 GBP 3,752,097 2,211,117 0.92
Travis Perkins PLC 35,552 GBP 622,408 660,201 0.27
Tullow Oil PLC 130,689 GBP 1,064,984 540,922 0.22
Unilever PLC 173,756 GBP 4,138,069 4,566,308 1.89
United Utilities Group PLC 96,819 GBP 713,389 886,862 0.37
Vodafone Group PLC 3,826,181 GBP 8,794,576 8,518,992 3.53
Weir Group PLC 30,181 GBP 651,363 558,650 0.23
Whitbread PLC 26,061 GBP 988,753 1,243,110 0.51
WM Morrison Supermarkets PLC 305,933 GBP 739,756 563,529 0.23
WPP PLC 191,436 GBP 2,443,183 2,574,814 1.07
198,749,696 199,128,761 82.43
United States
Carnival PLC 25,793 GBP 653,234 752,898 0.31
653,234 752,898 0.31
Total - Shares 240,278,470 240,070,753 99.38
Total Transferable securities and money market instruments admitted to an
official stock exchange listing 240,278,470 240,070,753 99.38
TOTAL INVESTMENT PORTFOLIO 240,278,470 240,070,753 99.38
169
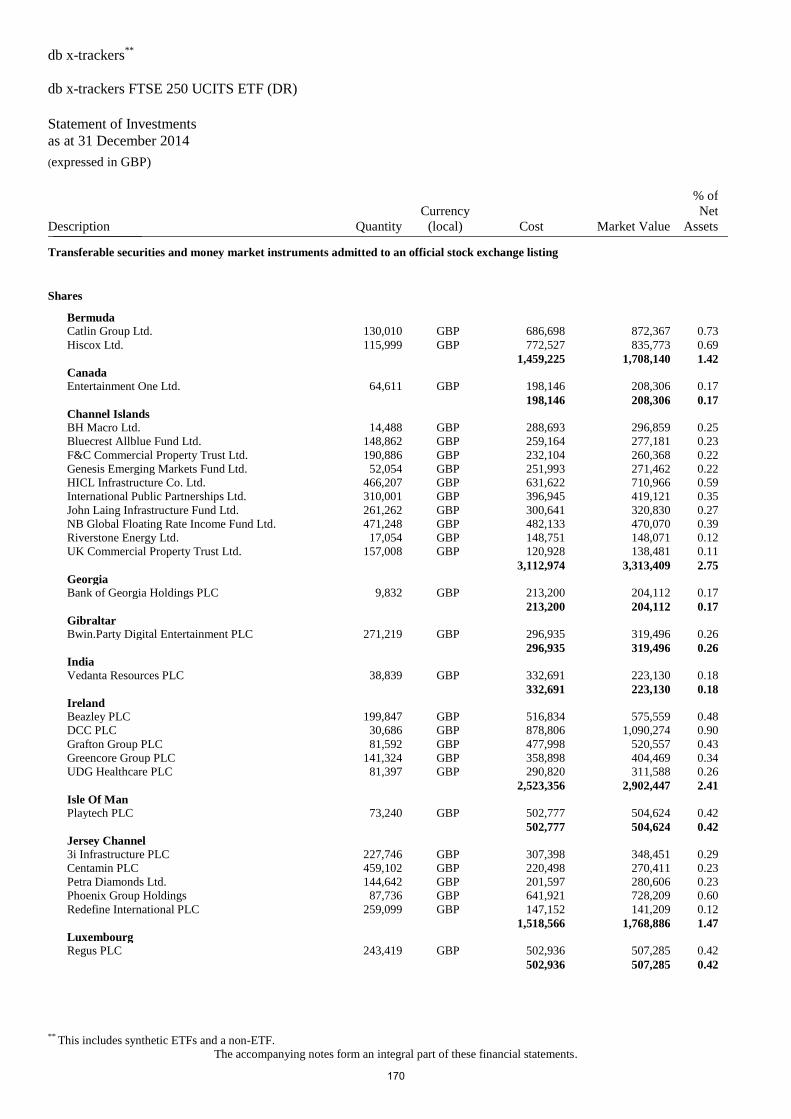
db x-trackers**
db x-trackers FTSE 250 UCITS ETF (DR)
Statement of Investments
as at 31 December 2014 (expressed in GBP)
** This includes synthetic ETFs and a non-ETF.
The accompanying notes form an integral part of these financial statements.
Description Quantity
Currency
(local) Cost Market Value
% of
Net
Assets _______________
Transferable securities and money market instruments admitted to an official stock exchange listing
Shares
Bermuda
Catlin Group Ltd. 130,010 GBP 686,698 872,367 0.73
Hiscox Ltd. 115,999 GBP 772,527 835,773 0.69
1,459,225 1,708,140 1.42
Canada
Entertainment One Ltd. 64,611 GBP 198,146 208,306 0.17
198,146 208,306 0.17
Channel Islands
BH Macro Ltd. 14,488 GBP 288,693 296,859 0.25
Bluecrest Allblue Fund Ltd. 148,862 GBP 259,164 277,181 0.23
F&C Commercial Property Trust Ltd. 190,886 GBP 232,104 260,368 0.22
Genesis Emerging Markets Fund Ltd. 52,054 GBP 251,993 271,462 0.22
HICL Infrastructure Co. Ltd. 466,207 GBP 631,622 710,966 0.59
International Public Partnerships Ltd. 310,001 GBP 396,945 419,121 0.35
John Laing Infrastructure Fund Ltd. 261,262 GBP 300,641 320,830 0.27
NB Global Floating Rate Income Fund Ltd. 471,248 GBP 482,133 470,070 0.39
Riverstone Energy Ltd. 17,054 GBP 148,751 148,071 0.12
UK Commercial Property Trust Ltd. 157,008 GBP 120,928 138,481 0.11
3,112,974 3,313,409 2.75
Georgia
Bank of Georgia Holdings PLC 9,832 GBP 213,200 204,112 0.17
213,200 204,112 0.17
Gibraltar
Bwin.Party Digital Entertainment PLC 271,219 GBP 296,935 319,496 0.26
296,935 319,496 0.26
India
Vedanta Resources PLC 38,839 GBP 332,691 223,130 0.18
332,691 223,130 0.18
Ireland
Beazley PLC 199,847 GBP 516,834 575,559 0.48
DCC PLC 30,686 GBP 878,806 1,090,274 0.90
Grafton Group PLC 81,592 GBP 477,998 520,557 0.43
Greencore Group PLC 141,324 GBP 358,898 404,469 0.34
UDG Healthcare PLC 81,397 GBP 290,820 311,588 0.26
2,523,356 2,902,447 2.41
Isle Of Man
Playtech PLC 73,240 GBP 502,777 504,624 0.42
502,777 504,624 0.42
Jersey Channel
3i Infrastructure PLC 227,746 GBP 307,398 348,451 0.29
Centamin PLC 459,102 GBP 220,498 270,411 0.23
Petra Diamonds Ltd. 144,642 GBP 201,597 280,606 0.23
Phoenix Group Holdings 87,736 GBP 641,921 728,209 0.60
Redefine International PLC 259,099 GBP 147,152 141,209 0.12
1,518,566 1,768,886 1.47
Luxembourg
Regus PLC 243,419 GBP 502,936 507,285 0.42
502,936 507,285 0.42
170
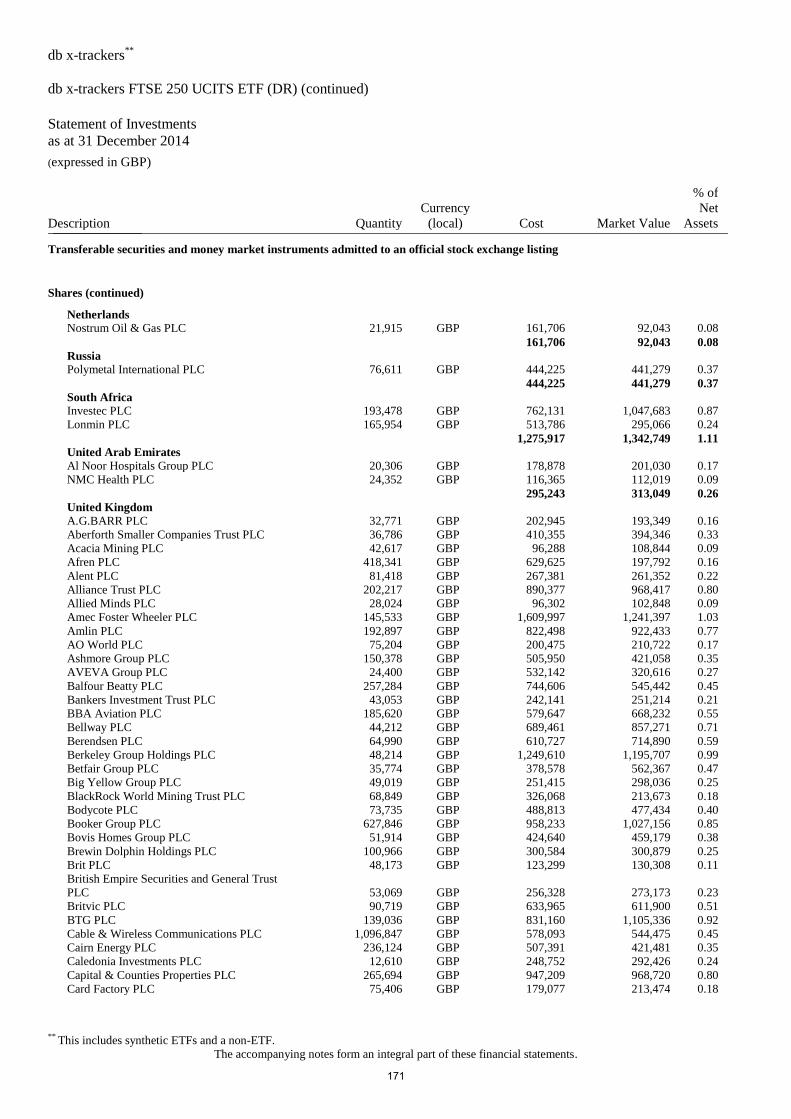
db x-trackers**
db x-trackers FTSE 250 UCITS ETF (DR) (continued)
Statement of Investments
as at 31 December 2014 (expressed in GBP)
** This includes synthetic ETFs and a non-ETF.
The accompanying notes form an integral part of these financial statements.
Description Quantity
Currency
(local) Cost Market Value
% of
Net
Assets _______________
Transferable securities and money market instruments admitted to an official stock exchange listing
Shares (continued)
Netherlands
Nostrum Oil & Gas PLC 21,915 GBP 161,706 92,043 0.08
161,706 92,043 0.08
Russia
Polymetal International PLC 76,611 GBP 444,225 441,279 0.37
444,225 441,279 0.37
South Africa
Investec PLC 193,478 GBP 762,131 1,047,683 0.87
Lonmin PLC 165,954 GBP 513,786 295,066 0.24
1,275,917 1,342,749 1.11
United Arab Emirates
Al Noor Hospitals Group PLC 20,306 GBP 178,878 201,030 0.17
NMC Health PLC 24,352 GBP 116,365 112,019 0.09
295,243 313,049 0.26
United Kingdom
A.G.BARR PLC 32,771 GBP 202,945 193,349 0.16
Aberforth Smaller Companies Trust PLC 36,786 GBP 410,355 394,346 0.33
Acacia Mining PLC 42,617 GBP 96,288 108,844 0.09
Afren PLC 418,341 GBP 629,625 197,792 0.16
Alent PLC 81,418 GBP 267,381 261,352 0.22
Alliance Trust PLC 202,217 GBP 890,377 968,417 0.80
Allied Minds PLC 28,024 GBP 96,302 102,848 0.09
Amec Foster Wheeler PLC 145,533 GBP 1,609,997 1,241,397 1.03
Amlin PLC 192,897 GBP 822,498 922,433 0.77
AO World PLC 75,204 GBP 200,475 210,722 0.17
Ashmore Group PLC 150,378 GBP 505,950 421,058 0.35
AVEVA Group PLC 24,400 GBP 532,142 320,616 0.27
Balfour Beatty PLC 257,284 GBP 744,606 545,442 0.45
Bankers Investment Trust PLC 43,053 GBP 242,141 251,214 0.21
BBA Aviation PLC 185,620 GBP 579,647 668,232 0.55
Bellway PLC 44,212 GBP 689,461 857,271 0.71
Berendsen PLC 64,990 GBP 610,727 714,890 0.59
Berkeley Group Holdings PLC 48,214 GBP 1,249,610 1,195,707 0.99
Betfair Group PLC 35,774 GBP 378,578 562,367 0.47
Big Yellow Group PLC 49,019 GBP 251,415 298,036 0.25
BlackRock World Mining Trust PLC 68,849 GBP 326,068 213,673 0.18
Bodycote PLC 73,735 GBP 488,813 477,434 0.40
Booker Group PLC 627,846 GBP 958,233 1,027,156 0.85
Bovis Homes Group PLC 51,914 GBP 424,640 459,179 0.38
Brewin Dolphin Holdings PLC 100,966 GBP 300,584 300,879 0.25
Brit PLC 48,173 GBP 123,299 130,308 0.11
British Empire Securities and General Trust
PLC
53,069 GBP 256,328 273,173 0.23
Britvic PLC 90,719 GBP 633,965 611,900 0.51
BTG PLC 139,036 GBP 831,160 1,105,336 0.92
Cable & Wireless Communications PLC 1,096,847 GBP 578,093 544,475 0.45
Cairn Energy PLC 236,124 GBP 507,391 421,481 0.35
Caledonia Investments PLC 12,610 GBP 248,752 292,426 0.24
Capital & Counties Properties PLC 265,694 GBP 947,209 968,720 0.80
Card Factory PLC 75,406 GBP 179,077 213,474 0.18
171
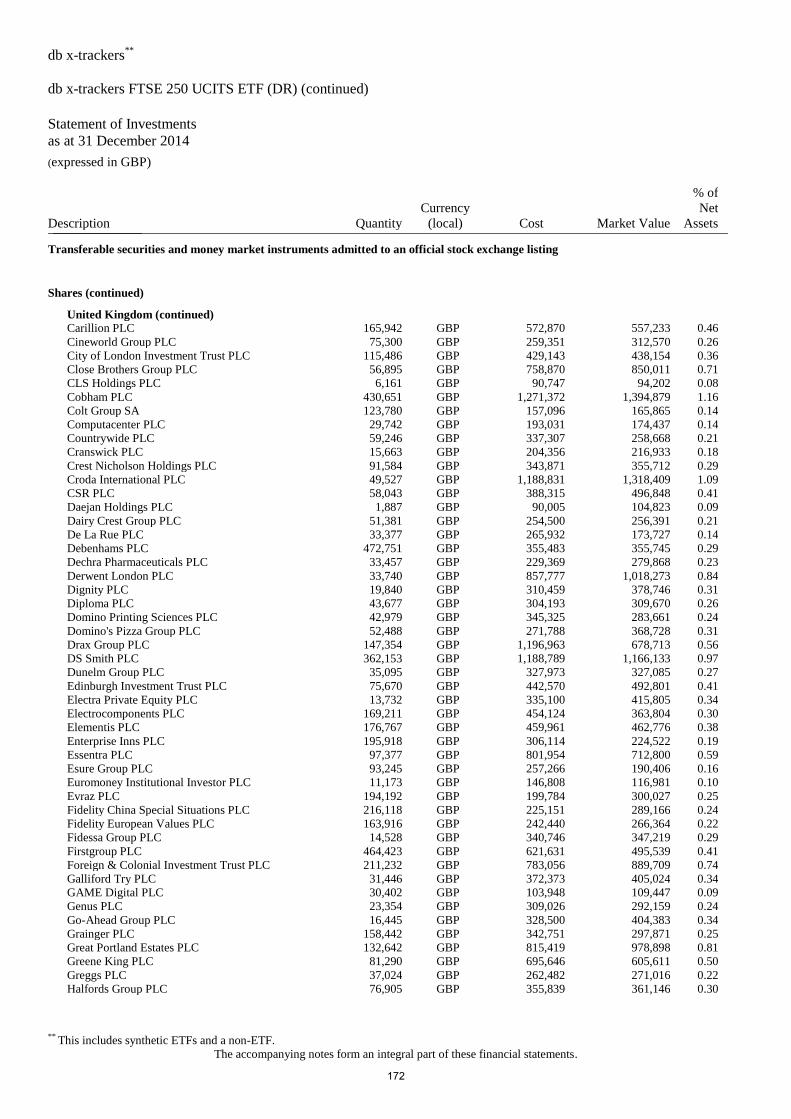
db x-trackers**
db x-trackers FTSE 250 UCITS ETF (DR) (continued)
Statement of Investments
as at 31 December 2014 (expressed in GBP)
** This includes synthetic ETFs and a non-ETF.
The accompanying notes form an integral part of these financial statements.
Description Quantity
Currency
(local) Cost Market Value
% of
Net
Assets _______________
Transferable securities and money market instruments admitted to an official stock exchange listing
Shares (continued)
United Kingdom (continued)
Carillion PLC 165,942 GBP 572,870 557,233 0.46
Cineworld Group PLC 75,300 GBP 259,351 312,570 0.26
City of London Investment Trust PLC 115,486 GBP 429,143 438,154 0.36
Close Brothers Group PLC 56,895 GBP 758,870 850,011 0.71
CLS Holdings PLC 6,161 GBP 90,747 94,202 0.08
Cobham PLC 430,651 GBP 1,271,372 1,394,879 1.16
Colt Group SA 123,780 GBP 157,096 165,865 0.14
Computacenter PLC 29,742 GBP 193,031 174,437 0.14
Countrywide PLC 59,246 GBP 337,307 258,668 0.21
Cranswick PLC 15,663 GBP 204,356 216,933 0.18
Crest Nicholson Holdings PLC 91,584 GBP 343,871 355,712 0.29
Croda International PLC 49,527 GBP 1,188,831 1,318,409 1.09
CSR PLC 58,043 GBP 388,315 496,848 0.41
Daejan Holdings PLC 1,887 GBP 90,005 104,823 0.09
Dairy Crest Group PLC 51,381 GBP 254,500 256,391 0.21
De La Rue PLC 33,377 GBP 265,932 173,727 0.14
Debenhams PLC 472,751 GBP 355,483 355,745 0.29
Dechra Pharmaceuticals PLC 33,457 GBP 229,369 279,868 0.23
Derwent London PLC 33,740 GBP 857,777 1,018,273 0.84
Dignity PLC 19,840 GBP 310,459 378,746 0.31
Diploma PLC 43,677 GBP 304,193 309,670 0.26
Domino Printing Sciences PLC 42,979 GBP 345,325 283,661 0.24
Domino's Pizza Group PLC 52,488 GBP 271,788 368,728 0.31
Drax Group PLC 147,354 GBP 1,196,963 678,713 0.56
DS Smith PLC 362,153 GBP 1,188,789 1,166,133 0.97
Dunelm Group PLC 35,095 GBP 327,973 327,085 0.27
Edinburgh Investment Trust PLC 75,670 GBP 442,570 492,801 0.41
Electra Private Equity PLC 13,732 GBP 335,100 415,805 0.34
Electrocomponents PLC 169,211 GBP 454,124 363,804 0.30
Elementis PLC 176,767 GBP 459,961 462,776 0.38
Enterprise Inns PLC 195,918 GBP 306,114 224,522 0.19
Essentra PLC 97,377 GBP 801,954 712,800 0.59
Esure Group PLC 93,245 GBP 257,266 190,406 0.16
Euromoney Institutional Investor PLC 11,173 GBP 146,808 116,981 0.10
Evraz PLC 194,192 GBP 199,784 300,027 0.25
Fidelity China Special Situations PLC 216,118 GBP 225,151 289,166 0.24
Fidelity European Values PLC 163,916 GBP 242,440 266,364 0.22
Fidessa Group PLC 14,528 GBP 340,746 347,219 0.29
Firstgroup PLC 464,423 GBP 621,631 495,539 0.41
Foreign & Colonial Investment Trust PLC 211,232 GBP 783,056 889,709 0.74
Galliford Try PLC 31,446 GBP 372,373 405,024 0.34
GAME Digital PLC 30,402 GBP 103,948 109,447 0.09
Genus PLC 23,354 GBP 309,026 292,159 0.24
Go-Ahead Group PLC 16,445 GBP 328,500 404,383 0.34
Grainger PLC 158,442 GBP 342,751 297,871 0.25
Great Portland Estates PLC 132,642 GBP 815,419 978,898 0.81
Greene King PLC 81,290 GBP 695,646 605,611 0.50
Greggs PLC 37,024 GBP 262,482 271,016 0.22
Halfords Group PLC 76,905 GBP 355,839 361,146 0.30
172
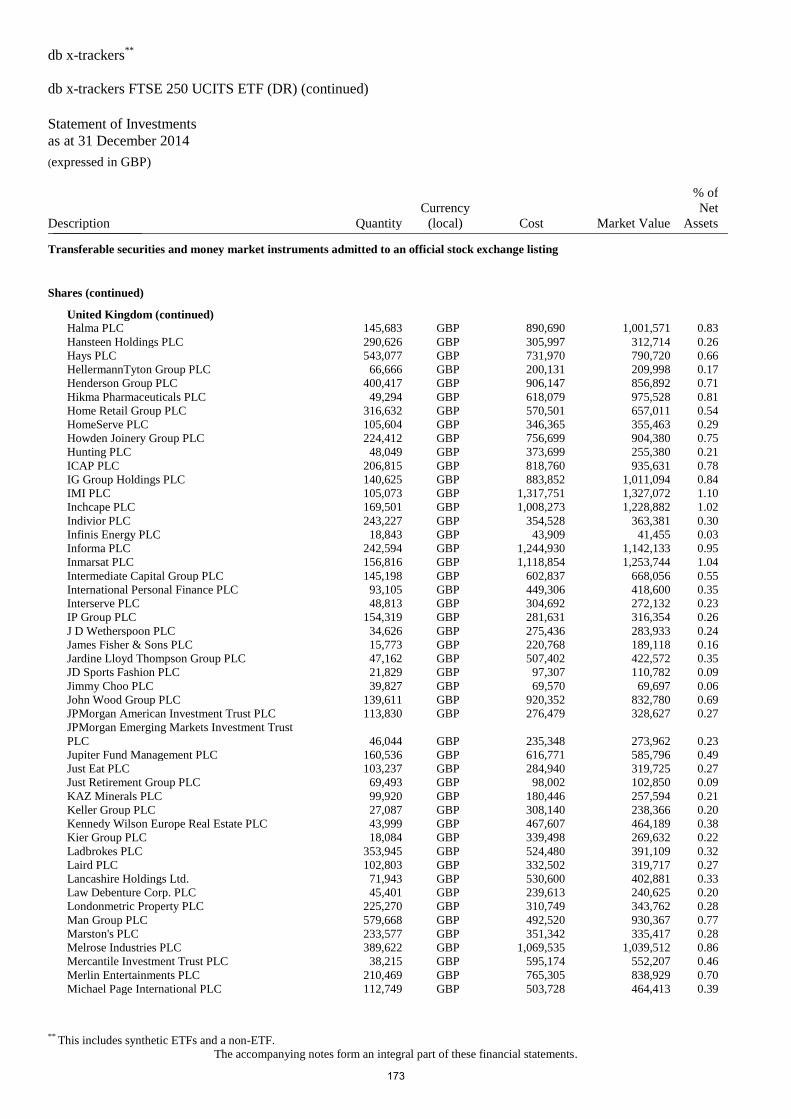
db x-trackers**
db x-trackers FTSE 250 UCITS ETF (DR) (continued)
Statement of Investments
as at 31 December 2014 (expressed in GBP)
** This includes synthetic ETFs and a non-ETF.
The accompanying notes form an integral part of these financial statements.
Description Quantity
Currency
(local) Cost Market Value
% of
Net
Assets _______________
Transferable securities and money market instruments admitted to an official stock exchange listing
Shares (continued)
United Kingdom (continued)
Halma PLC 145,683 GBP 890,690 1,001,571 0.83
Hansteen Holdings PLC 290,626 GBP 305,997 312,714 0.26
Hays PLC 543,077 GBP 731,970 790,720 0.66
HellermannTyton Group PLC 66,666 GBP 200,131 209,998 0.17
Henderson Group PLC 400,417 GBP 906,147 856,892 0.71
Hikma Pharmaceuticals PLC 49,294 GBP 618,079 975,528 0.81
Home Retail Group PLC 316,632 GBP 570,501 657,011 0.54
HomeServe PLC 105,604 GBP 346,365 355,463 0.29
Howden Joinery Group PLC 224,412 GBP 756,699 904,380 0.75
Hunting PLC 48,049 GBP 373,699 255,380 0.21
ICAP PLC 206,815 GBP 818,760 935,631 0.78
IG Group Holdings PLC 140,625 GBP 883,852 1,011,094 0.84
IMI PLC 105,073 GBP 1,317,751 1,327,072 1.10
Inchcape PLC 169,501 GBP 1,008,273 1,228,882 1.02
Indivior PLC 243,227 GBP 354,528 363,381 0.30
Infinis Energy PLC 18,843 GBP 43,909 41,455 0.03
Informa PLC 242,594 GBP 1,244,930 1,142,133 0.95
Inmarsat PLC 156,816 GBP 1,118,854 1,253,744 1.04
Intermediate Capital Group PLC 145,198 GBP 602,837 668,056 0.55
International Personal Finance PLC 93,105 GBP 449,306 418,600 0.35
Interserve PLC 48,813 GBP 304,692 272,132 0.23
IP Group PLC 154,319 GBP 281,631 316,354 0.26
J D Wetherspoon PLC 34,626 GBP 275,436 283,933 0.24
James Fisher & Sons PLC 15,773 GBP 220,768 189,118 0.16
Jardine Lloyd Thompson Group PLC 47,162 GBP 507,402 422,572 0.35
JD Sports Fashion PLC 21,829 GBP 97,307 110,782 0.09
Jimmy Choo PLC 39,827 GBP 69,570 69,697 0.06
John Wood Group PLC 139,611 GBP 920,352 832,780 0.69
JPMorgan American Investment Trust PLC 113,830 GBP 276,479 328,627 0.27
JPMorgan Emerging Markets Investment Trust
PLC
46,044 GBP 235,348 273,962 0.23
Jupiter Fund Management PLC 160,536 GBP 616,771 585,796 0.49
Just Eat PLC 103,237 GBP 284,940 319,725 0.27
Just Retirement Group PLC 69,493 GBP 98,002 102,850 0.09
KAZ Minerals PLC 99,920 GBP 180,446 257,594 0.21
Keller Group PLC 27,087 GBP 308,140 238,366 0.20
Kennedy Wilson Europe Real Estate PLC 43,999 GBP 467,607 464,189 0.38
Kier Group PLC 18,084 GBP 339,498 269,632 0.22
Ladbrokes PLC 353,945 GBP 524,480 391,109 0.32
Laird PLC 102,803 GBP 332,502 319,717 0.27
Lancashire Holdings Ltd. 71,943 GBP 530,600 402,881 0.33
Law Debenture Corp. PLC 45,401 GBP 239,613 240,625 0.20
Londonmetric Property PLC 225,270 GBP 310,749 343,762 0.28
Man Group PLC 579,668 GBP 492,520 930,367 0.77
Marston's PLC 233,577 GBP 351,342 335,417 0.28
Melrose Industries PLC 389,622 GBP 1,069,535 1,039,512 0.86
Mercantile Investment Trust PLC 38,215 GBP 595,174 552,207 0.46
Merlin Entertainments PLC 210,469 GBP 765,305 838,929 0.70
Michael Page International PLC 112,749 GBP 503,728 464,413 0.39
173
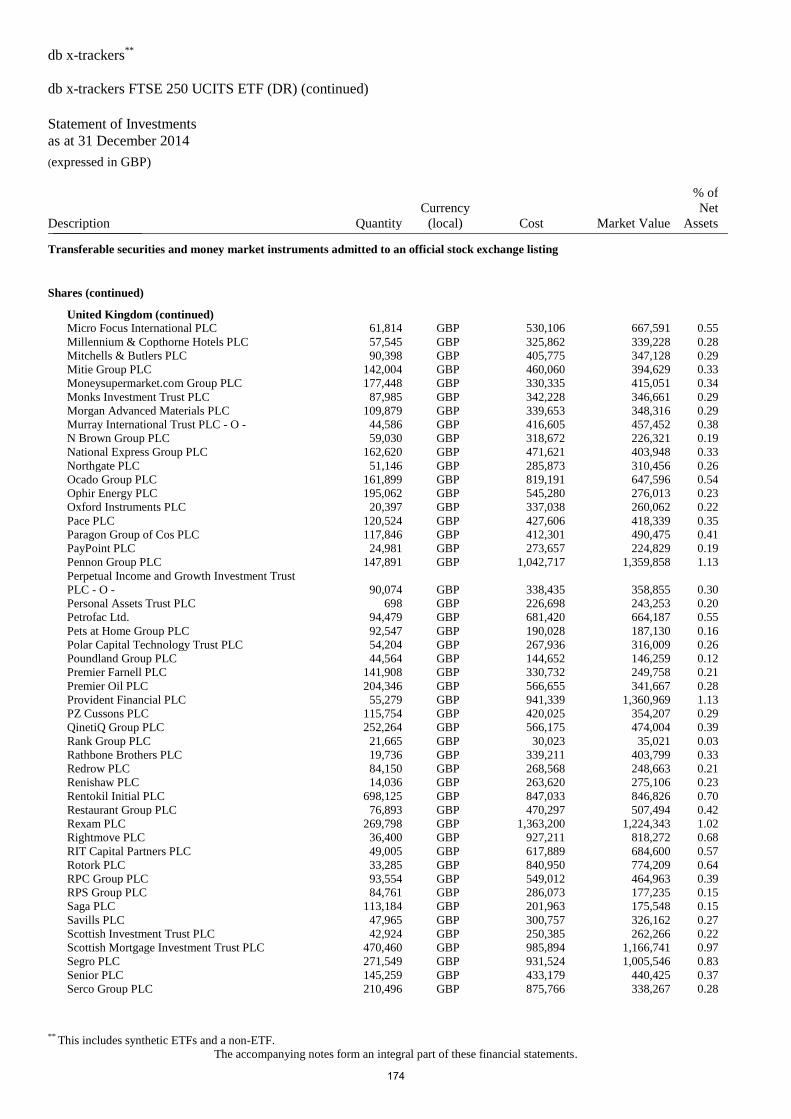
db x-trackers**
db x-trackers FTSE 250 UCITS ETF (DR) (continued)
Statement of Investments
as at 31 December 2014 (expressed in GBP)
** This includes synthetic ETFs and a non-ETF.
The accompanying notes form an integral part of these financial statements.
Description Quantity
Currency
(local) Cost Market Value
% of
Net
Assets _______________
Transferable securities and money market instruments admitted to an official stock exchange listing
Shares (continued)
United Kingdom (continued)
Micro Focus International PLC 61,814 GBP 530,106 667,591 0.55
Millennium & Copthorne Hotels PLC 57,545 GBP 325,862 339,228 0.28
Mitchells & Butlers PLC 90,398 GBP 405,775 347,128 0.29
Mitie Group PLC 142,004 GBP 460,060 394,629 0.33
Moneysupermarket.com Group PLC 177,448 GBP 330,335 415,051 0.34
Monks Investment Trust PLC 87,985 GBP 342,228 346,661 0.29
Morgan Advanced Materials PLC 109,879 GBP 339,653 348,316 0.29
Murray International Trust PLC - O - 44,586 GBP 416,605 457,452 0.38
N Brown Group PLC 59,030 GBP 318,672 226,321 0.19
National Express Group PLC 162,620 GBP 471,621 403,948 0.33
Northgate PLC 51,146 GBP 285,873 310,456 0.26
Ocado Group PLC 161,899 GBP 819,191 647,596 0.54
Ophir Energy PLC 195,062 GBP 545,280 276,013 0.23
Oxford Instruments PLC 20,397 GBP 337,038 260,062 0.22
Pace PLC 120,524 GBP 427,606 418,339 0.35
Paragon Group of Cos PLC 117,846 GBP 412,301 490,475 0.41
PayPoint PLC 24,981 GBP 273,657 224,829 0.19
Pennon Group PLC 147,891 GBP 1,042,717 1,359,858 1.13
Perpetual Income and Growth Investment Trust
PLC - O -
90,074 GBP 338,435 358,855 0.30
Personal Assets Trust PLC 698 GBP 226,698 243,253 0.20
Petrofac Ltd. 94,479 GBP 681,420 664,187 0.55
Pets at Home Group PLC 92,547 GBP 190,028 187,130 0.16
Polar Capital Technology Trust PLC 54,204 GBP 267,936 316,009 0.26
Poundland Group PLC 44,564 GBP 144,652 146,259 0.12
Premier Farnell PLC 141,908 GBP 330,732 249,758 0.21
Premier Oil PLC 204,346 GBP 566,655 341,667 0.28
Provident Financial PLC 55,279 GBP 941,339 1,360,969 1.13
PZ Cussons PLC 115,754 GBP 420,025 354,207 0.29
QinetiQ Group PLC 252,264 GBP 566,175 474,004 0.39
Rank Group PLC 21,665 GBP 30,023 35,021 0.03
Rathbone Brothers PLC 19,736 GBP 339,211 403,799 0.33
Redrow PLC 84,150 GBP 268,568 248,663 0.21
Renishaw PLC 14,036 GBP 263,620 275,106 0.23
Rentokil Initial PLC 698,125 GBP 847,033 846,826 0.70
Restaurant Group PLC 76,893 GBP 470,297 507,494 0.42
Rexam PLC 269,798 GBP 1,363,200 1,224,343 1.02
Rightmove PLC 36,400 GBP 927,211 818,272 0.68
RIT Capital Partners PLC 49,005 GBP 617,889 684,600 0.57
Rotork PLC 33,285 GBP 840,950 774,209 0.64
RPC Group PLC 93,554 GBP 549,012 464,963 0.39
RPS Group PLC 84,761 GBP 286,073 177,235 0.15
Saga PLC 113,184 GBP 201,963 175,548 0.15
Savills PLC 47,965 GBP 300,757 326,162 0.27
Scottish Investment Trust PLC 42,924 GBP 250,385 262,266 0.22
Scottish Mortgage Investment Trust PLC 470,460 GBP 985,894 1,166,741 0.97
Segro PLC 271,549 GBP 931,524 1,005,546 0.83
Senior PLC 145,259 GBP 433,179 440,425 0.37
Serco Group PLC 210,496 GBP 875,766 338,267 0.28
174
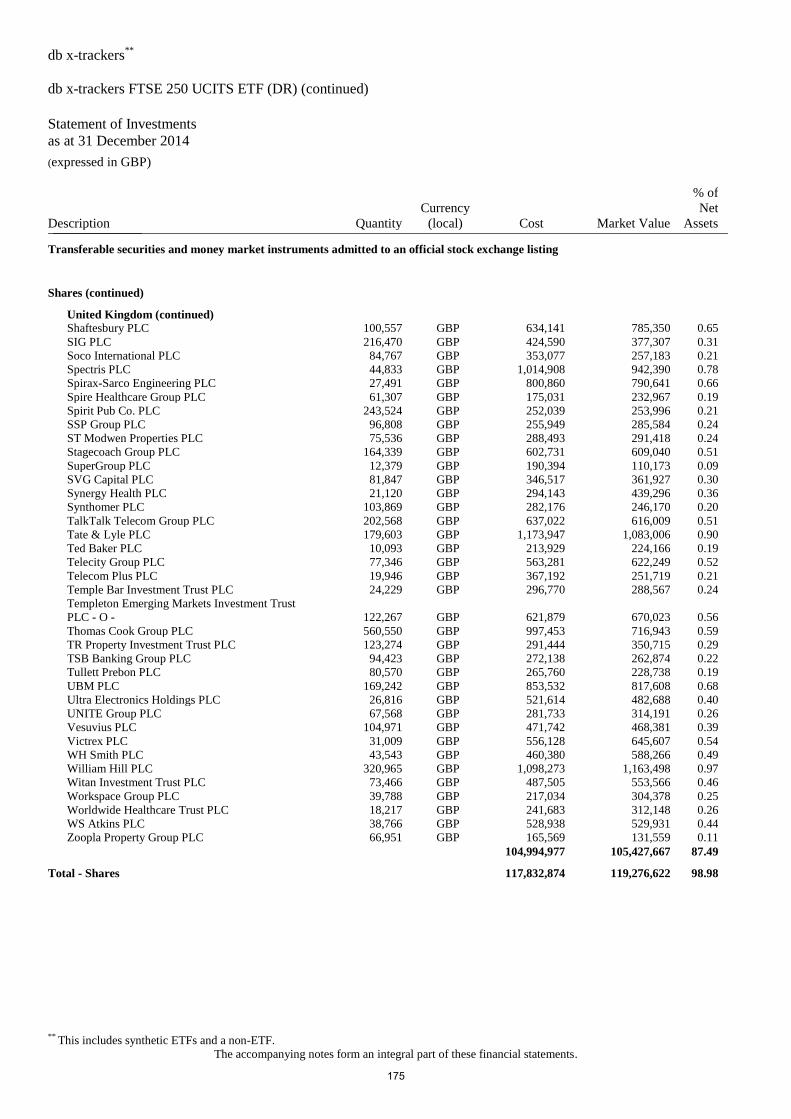
db x-trackers**
db x-trackers FTSE 250 UCITS ETF (DR) (continued)
Statement of Investments
as at 31 December 2014 (expressed in GBP)
** This includes synthetic ETFs and a non-ETF.
The accompanying notes form an integral part of these financial statements.
Description Quantity
Currency
(local) Cost Market Value
% of
Net
Assets _______________
Transferable securities and money market instruments admitted to an official stock exchange listing
Shares (continued)
United Kingdom (continued)
Shaftesbury PLC 100,557 GBP 634,141 785,350 0.65
SIG PLC 216,470 GBP 424,590 377,307 0.31
Soco International PLC 84,767 GBP 353,077 257,183 0.21
Spectris PLC 44,833 GBP 1,014,908 942,390 0.78
Spirax-Sarco Engineering PLC 27,491 GBP 800,860 790,641 0.66
Spire Healthcare Group PLC 61,307 GBP 175,031 232,967 0.19
Spirit Pub Co. PLC 243,524 GBP 252,039 253,996 0.21
SSP Group PLC 96,808 GBP 255,949 285,584 0.24
ST Modwen Properties PLC 75,536 GBP 288,493 291,418 0.24
Stagecoach Group PLC 164,339 GBP 602,731 609,040 0.51
SuperGroup PLC 12,379 GBP 190,394 110,173 0.09
SVG Capital PLC 81,847 GBP 346,517 361,927 0.30
Synergy Health PLC 21,120 GBP 294,143 439,296 0.36
Synthomer PLC 103,869 GBP 282,176 246,170 0.20
TalkTalk Telecom Group PLC 202,568 GBP 637,022 616,009 0.51
Tate & Lyle PLC 179,603 GBP 1,173,947 1,083,006 0.90
Ted Baker PLC 10,093 GBP 213,929 224,166 0.19
Telecity Group PLC 77,346 GBP 563,281 622,249 0.52
Telecom Plus PLC 19,946 GBP 367,192 251,719 0.21
Temple Bar Investment Trust PLC 24,229 GBP 296,770 288,567 0.24
Templeton Emerging Markets Investment Trust
PLC - O -
122,267 GBP 621,879 670,023 0.56
Thomas Cook Group PLC 560,550 GBP 997,453 716,943 0.59
TR Property Investment Trust PLC 123,274 GBP 291,444 350,715 0.29
TSB Banking Group PLC 94,423 GBP 272,138 262,874 0.22
Tullett Prebon PLC 80,570 GBP 265,760 228,738 0.19
UBM PLC 169,242 GBP 853,532 817,608 0.68
Ultra Electronics Holdings PLC 26,816 GBP 521,614 482,688 0.40
UNITE Group PLC 67,568 GBP 281,733 314,191 0.26
Vesuvius PLC 104,971 GBP 471,742 468,381 0.39
Victrex PLC 31,009 GBP 556,128 645,607 0.54
WH Smith PLC 43,543 GBP 460,380 588,266 0.49
William Hill PLC 320,965 GBP 1,098,273 1,163,498 0.97
Witan Investment Trust PLC 73,466 GBP 487,505 553,566 0.46
Workspace Group PLC 39,788 GBP 217,034 304,378 0.25
Worldwide Healthcare Trust PLC 18,217 GBP 241,683 312,148 0.26
WS Atkins PLC 38,766 GBP 528,938 529,931 0.44
Zoopla Property Group PLC 66,951 GBP 165,569 131,559 0.11
104,994,977 105,427,667 87.49
Total - Shares 117,832,874 119,276,622 98.98
175
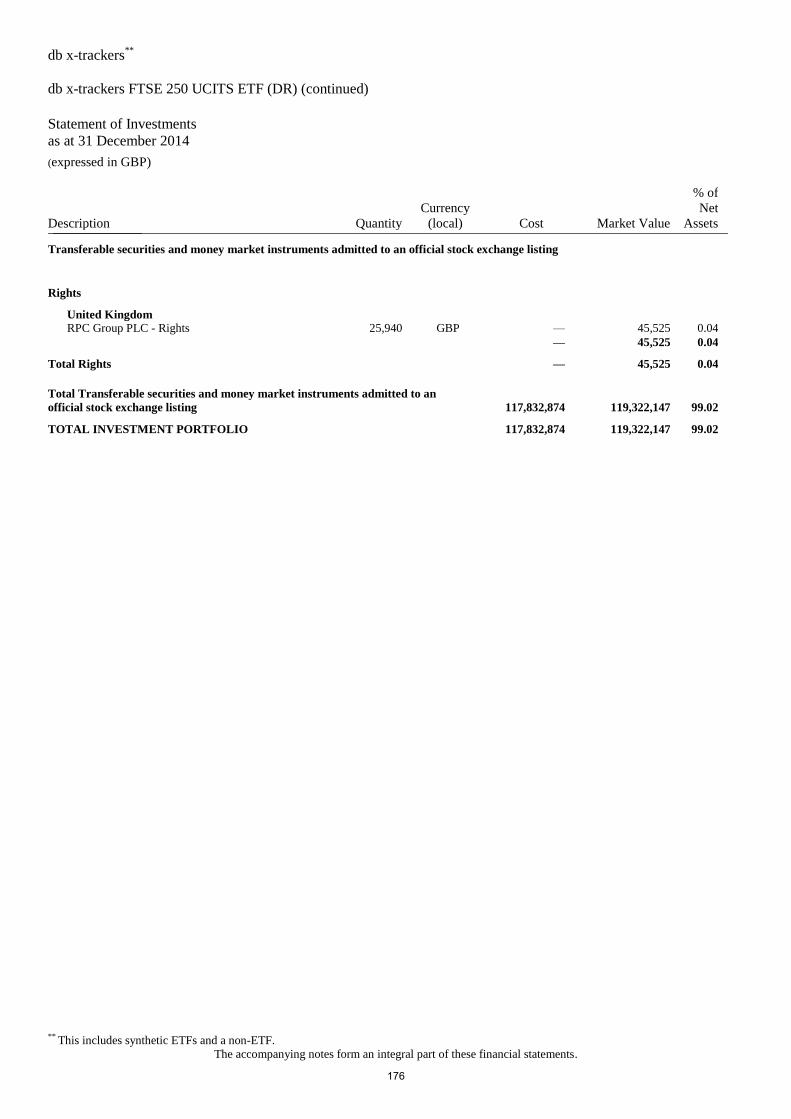
db x-trackers**
db x-trackers FTSE 250 UCITS ETF (DR) (continued)
Statement of Investments
as at 31 December 2014 (expressed in GBP)
** This includes synthetic ETFs and a non-ETF.
The accompanying notes form an integral part of these financial statements.
Description Quantity
Currency
(local) Cost Market Value
% of
Net
Assets _______________
Transferable securities and money market instruments admitted to an official stock exchange listing
Rights
United Kingdom
RPC Group PLC - Rights 25,940 GBP — 45,525 0.04
— 45,525 0.04
Total Rights — 45,525 0.04
Total Transferable securities and money market instruments admitted to an
official stock exchange listing 117,832,874 119,322,147 99.02
TOTAL INVESTMENT PORTFOLIO 117,832,874 119,322,147 99.02
176
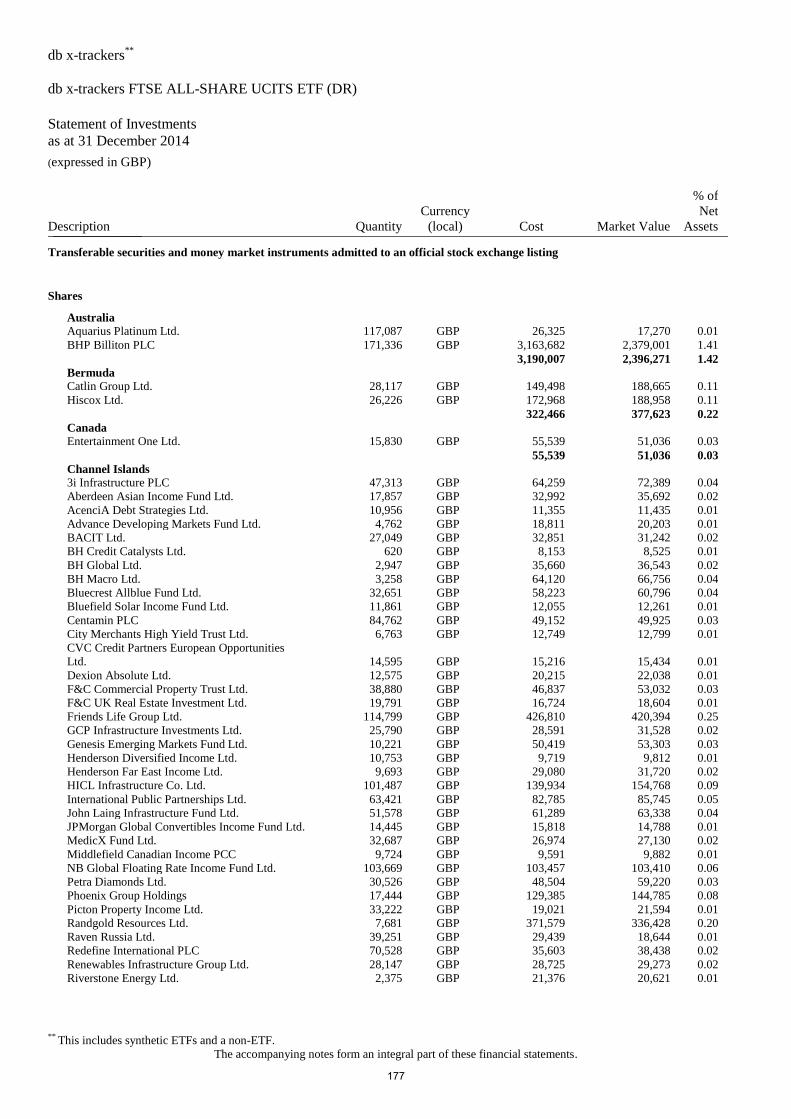
db x-trackers**
db x-trackers FTSE ALL-SHARE UCITS ETF (DR)
Statement of Investments
as at 31 December 2014 (expressed in GBP)
** This includes synthetic ETFs and a non-ETF.
The accompanying notes form an integral part of these financial statements.
Description Quantity
Currency
(local) Cost Market Value
% of
Net
Assets _______________
Transferable securities and money market instruments admitted to an official stock exchange listing
Shares
Australia
Aquarius Platinum Ltd. 117,087 GBP 26,325 17,270 0.01
BHP Billiton PLC 171,336 GBP 3,163,682 2,379,001 1.41
3,190,007 2,396,271 1.42
Bermuda
Catlin Group Ltd. 28,117 GBP 149,498 188,665 0.11
Hiscox Ltd. 26,226 GBP 172,968 188,958 0.11
322,466 377,623 0.22
Canada
Entertainment One Ltd. 15,830 GBP 55,539 51,036 0.03
55,539 51,036 0.03
Channel Islands
3i Infrastructure PLC 47,313 GBP 64,259 72,389 0.04
Aberdeen Asian Income Fund Ltd. 17,857 GBP 32,992 35,692 0.02
AcenciA Debt Strategies Ltd. 10,956 GBP 11,355 11,435 0.01
Advance Developing Markets Fund Ltd. 4,762 GBP 18,811 20,203 0.01
BACIT Ltd. 27,049 GBP 32,851 31,242 0.02
BH Credit Catalysts Ltd. 620 GBP 8,153 8,525 0.01
BH Global Ltd. 2,947 GBP 35,660 36,543 0.02
BH Macro Ltd. 3,258 GBP 64,120 66,756 0.04
Bluecrest Allblue Fund Ltd. 32,651 GBP 58,223 60,796 0.04
Bluefield Solar Income Fund Ltd. 11,861 GBP 12,055 12,261 0.01
Centamin PLC 84,762 GBP 49,152 49,925 0.03
City Merchants High Yield Trust Ltd. 6,763 GBP 12,749 12,799 0.01
CVC Credit Partners European Opportunities
Ltd. 14,595 GBP 15,216 15,434 0.01
Dexion Absolute Ltd. 12,575 GBP 20,215 22,038 0.01
F&C Commercial Property Trust Ltd. 38,880 GBP 46,837 53,032 0.03
F&C UK Real Estate Investment Ltd. 19,791 GBP 16,724 18,604 0.01
Friends Life Group Ltd. 114,799 GBP 426,810 420,394 0.25
GCP Infrastructure Investments Ltd. 25,790 GBP 28,591 31,528 0.02
Genesis Emerging Markets Fund Ltd. 10,221 GBP 50,419 53,303 0.03
Henderson Diversified Income Ltd. 10,753 GBP 9,719 9,812 0.01
Henderson Far East Income Ltd. 9,693 GBP 29,080 31,720 0.02
HICL Infrastructure Co. Ltd. 101,487 GBP 139,934 154,768 0.09
International Public Partnerships Ltd. 63,421 GBP 82,785 85,745 0.05
John Laing Infrastructure Fund Ltd. 51,578 GBP 61,289 63,338 0.04
JPMorgan Global Convertibles Income Fund Ltd. 14,445 GBP 15,818 14,788 0.01
MedicX Fund Ltd. 32,687 GBP 26,974 27,130 0.02
Middlefield Canadian Income PCC 9,724 GBP 9,591 9,882 0.01
NB Global Floating Rate Income Fund Ltd. 103,669 GBP 103,457 103,410 0.06
Petra Diamonds Ltd. 30,526 GBP 48,504 59,220 0.03
Phoenix Group Holdings 17,444 GBP 129,385 144,785 0.08
Picton Property Income Ltd. 33,222 GBP 19,021 21,594 0.01
Randgold Resources Ltd. 7,681 GBP 371,579 336,428 0.20
Raven Russia Ltd. 39,251 GBP 29,439 18,644 0.01
Redefine International PLC 70,528 GBP 35,603 38,438 0.02
Renewables Infrastructure Group Ltd. 28,147 GBP 28,725 29,273 0.02
Riverstone Energy Ltd. 2,375 GBP 21,376 20,621 0.01
177
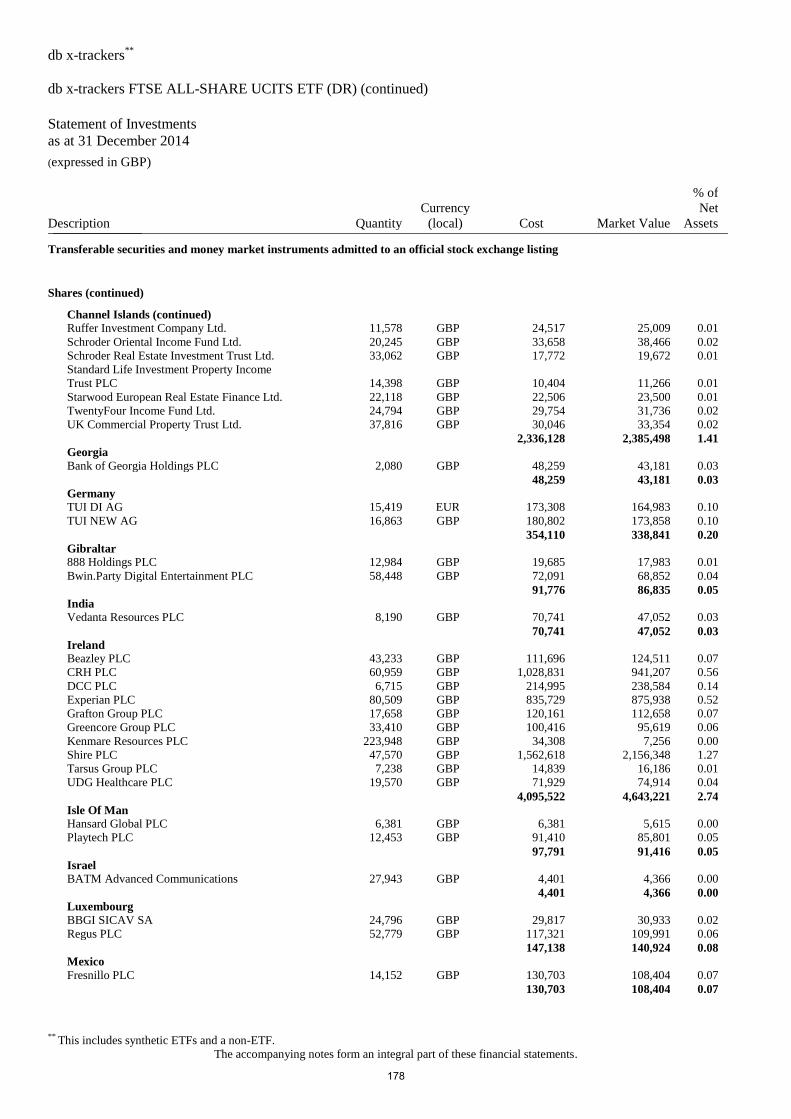
db x-trackers**
db x-trackers FTSE ALL-SHARE UCITS ETF (DR) (continued)
Statement of Investments
as at 31 December 2014 (expressed in GBP)
** This includes synthetic ETFs and a non-ETF.
The accompanying notes form an integral part of these financial statements.
Description Quantity
Currency
(local) Cost Market Value
% of
Net
Assets _______________
Transferable securities and money market instruments admitted to an official stock exchange listing
Shares (continued)
Channel Islands (continued)
Ruffer Investment Company Ltd. 11,578 GBP 24,517 25,009 0.01
Schroder Oriental Income Fund Ltd. 20,245 GBP 33,658 38,466 0.02
Schroder Real Estate Investment Trust Ltd. 33,062 GBP 17,772 19,672 0.01
Standard Life Investment Property Income
Trust PLC 14,398 GBP 10,404 11,266 0.01
Starwood European Real Estate Finance Ltd. 22,118 GBP 22,506 23,500 0.01
TwentyFour Income Fund Ltd. 24,794 GBP 29,754 31,736 0.02
UK Commercial Property Trust Ltd. 37,816 GBP 30,046 33,354 0.02
2,336,128 2,385,498 1.41
Georgia
Bank of Georgia Holdings PLC 2,080 GBP 48,259 43,181 0.03
48,259 43,181 0.03
Germany
TUI DI AG 15,419 EUR 173,308 164,983 0.10
TUI NEW AG 16,863 GBP 180,802 173,858 0.10
354,110 338,841 0.20
Gibraltar
888 Holdings PLC 12,984 GBP 19,685 17,983 0.01
Bwin.Party Digital Entertainment PLC 58,448 GBP 72,091 68,852 0.04
91,776 86,835 0.05
India
Vedanta Resources PLC 8,190 GBP 70,741 47,052 0.03
70,741 47,052 0.03
Ireland
Beazley PLC 43,233 GBP 111,696 124,511 0.07
CRH PLC 60,959 GBP 1,028,831 941,207 0.56
DCC PLC 6,715 GBP 214,995 238,584 0.14
Experian PLC 80,509 GBP 835,729 875,938 0.52
Grafton Group PLC 17,658 GBP 120,161 112,658 0.07
Greencore Group PLC 33,410 GBP 100,416 95,619 0.06
Kenmare Resources PLC 223,948 GBP 34,308 7,256 0.00
Shire PLC 47,570 GBP 1,562,618 2,156,348 1.27
Tarsus Group PLC 7,238 GBP 14,839 16,186 0.01
UDG Healthcare PLC 19,570 GBP 71,929 74,914 0.04
4,095,522 4,643,221 2.74
Isle Of Man
Hansard Global PLC 6,381 GBP 6,381 5,615 0.00
Playtech PLC 12,453 GBP 91,410 85,801 0.05
97,791 91,416 0.05
Israel
BATM Advanced Communications 27,943 GBP 4,401 4,366 0.00
4,401 4,366 0.00
Luxembourg
BBGI SICAV SA 24,796 GBP 29,817 30,933 0.02
Regus PLC 52,779 GBP 117,321 109,991 0.06
147,138 140,924 0.08
Mexico
Fresnillo PLC 14,152 GBP 130,703 108,404 0.07
130,703 108,404 0.07
178
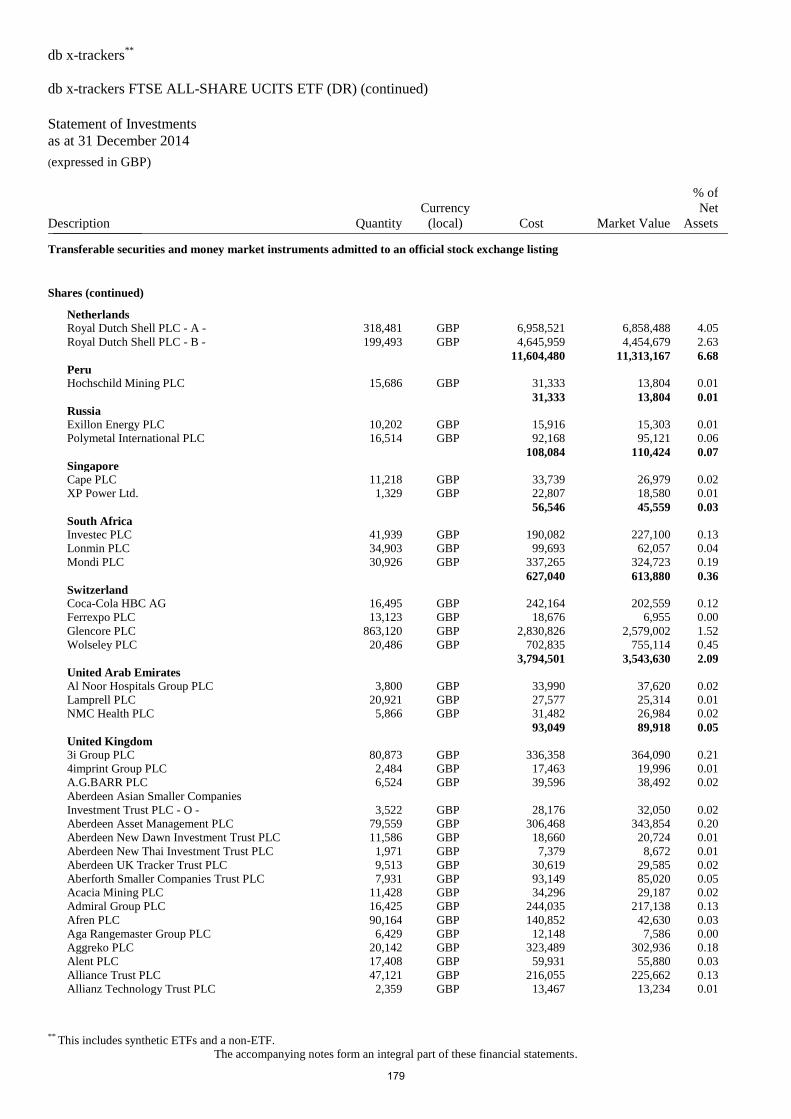
db x-trackers**
db x-trackers FTSE ALL-SHARE UCITS ETF (DR) (continued)
Statement of Investments
as at 31 December 2014 (expressed in GBP)
** This includes synthetic ETFs and a non-ETF.
The accompanying notes form an integral part of these financial statements.
Description Quantity
Currency
(local) Cost Market Value
% of
Net
Assets _______________
Transferable securities and money market instruments admitted to an official stock exchange listing
Shares (continued)
Netherlands
Royal Dutch Shell PLC - A - 318,481 GBP 6,958,521 6,858,488 4.05
Royal Dutch Shell PLC - B - 199,493 GBP 4,645,959 4,454,679 2.63
11,604,480 11,313,167 6.68
Peru
Hochschild Mining PLC 15,686 GBP 31,333 13,804 0.01
31,333 13,804 0.01
Russia
Exillon Energy PLC 10,202 GBP 15,916 15,303 0.01
Polymetal International PLC 16,514 GBP 92,168 95,121 0.06
108,084 110,424 0.07
Singapore
Cape PLC 11,218 GBP 33,739 26,979 0.02
XP Power Ltd. 1,329 GBP 22,807 18,580 0.01
56,546 45,559 0.03
South Africa
Investec PLC 41,939 GBP 190,082 227,100 0.13
Lonmin PLC 34,903 GBP 99,693 62,057 0.04
Mondi PLC 30,926 GBP 337,265 324,723 0.19
627,040 613,880 0.36
Switzerland
Coca-Cola HBC AG 16,495 GBP 242,164 202,559 0.12
Ferrexpo PLC 13,123 GBP 18,676 6,955 0.00
Glencore PLC 863,120 GBP 2,830,826 2,579,002 1.52
Wolseley PLC 20,486 GBP 702,835 755,114 0.45
3,794,501 3,543,630 2.09
United Arab Emirates
Al Noor Hospitals Group PLC 3,800 GBP 33,990 37,620 0.02
Lamprell PLC 20,921 GBP 27,577 25,314 0.01
NMC Health PLC 5,866 GBP 31,482 26,984 0.02
93,049 89,918 0.05
United Kingdom
3i Group PLC 80,873 GBP 336,358 364,090 0.21
4imprint Group PLC 2,484 GBP 17,463 19,996 0.01
A.G.BARR PLC 6,524 GBP 39,596 38,492 0.02
Aberdeen Asian Smaller Companies
Investment Trust PLC - O - 3,522 GBP 28,176 32,050 0.02
Aberdeen Asset Management PLC 79,559 GBP 306,468 343,854 0.20
Aberdeen New Dawn Investment Trust PLC 11,586 GBP 18,660 20,724 0.01
Aberdeen New Thai Investment Trust PLC 1,971 GBP 7,379 8,672 0.01
Aberdeen UK Tracker Trust PLC 9,513 GBP 30,619 29,585 0.02
Aberforth Smaller Companies Trust PLC 7,931 GBP 93,149 85,020 0.05
Acacia Mining PLC 11,428 GBP 34,296 29,187 0.02
Admiral Group PLC 16,425 GBP 244,035 217,138 0.13
Afren PLC 90,164 GBP 140,852 42,630 0.03
Aga Rangemaster Group PLC 6,429 GBP 12,148 7,586 0.00
Aggreko PLC 20,142 GBP 323,489 302,936 0.18
Alent PLC 17,408 GBP 59,931 55,880 0.03
Alliance Trust PLC 47,121 GBP 216,055 225,662 0.13
Allianz Technology Trust PLC 2,359 GBP 13,467 13,234 0.01
179
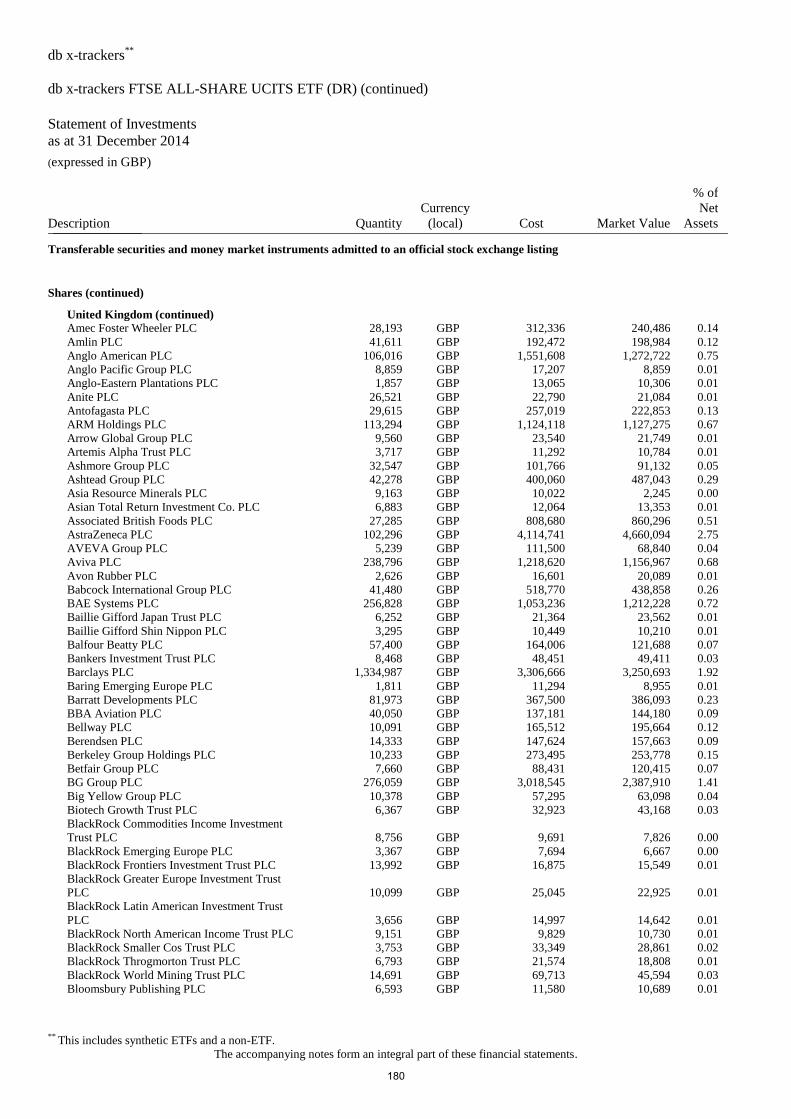
db x-trackers**
db x-trackers FTSE ALL-SHARE UCITS ETF (DR) (continued)
Statement of Investments
as at 31 December 2014 (expressed in GBP)
** This includes synthetic ETFs and a non-ETF.
The accompanying notes form an integral part of these financial statements.
Description Quantity
Currency
(local) Cost Market Value
% of
Net
Assets _______________
Transferable securities and money market instruments admitted to an official stock exchange listing
Shares (continued)
United Kingdom (continued)
Amec Foster Wheeler PLC 28,193 GBP 312,336 240,486 0.14
Amlin PLC 41,611 GBP 192,472 198,984 0.12
Anglo American PLC 106,016 GBP 1,551,608 1,272,722 0.75
Anglo Pacific Group PLC 8,859 GBP 17,207 8,859 0.01
Anglo-Eastern Plantations PLC 1,857 GBP 13,065 10,306 0.01
Anite PLC 26,521 GBP 22,790 21,084 0.01
Antofagasta PLC 29,615 GBP 257,019 222,853 0.13
ARM Holdings PLC 113,294 GBP 1,124,118 1,127,275 0.67
Arrow Global Group PLC 9,560 GBP 23,540 21,749 0.01
Artemis Alpha Trust PLC 3,717 GBP 11,292 10,784 0.01
Ashmore Group PLC 32,547 GBP 101,766 91,132 0.05
Ashtead Group PLC 42,278 GBP 400,060 487,043 0.29
Asia Resource Minerals PLC 9,163 GBP 10,022 2,245 0.00
Asian Total Return Investment Co. PLC 6,883 GBP 12,064 13,353 0.01
Associated British Foods PLC 27,285 GBP 808,680 860,296 0.51
AstraZeneca PLC 102,296 GBP 4,114,741 4,660,094 2.75
AVEVA Group PLC 5,239 GBP 111,500 68,840 0.04
Aviva PLC 238,796 GBP 1,218,620 1,156,967 0.68
Avon Rubber PLC 2,626 GBP 16,601 20,089 0.01
Babcock International Group PLC 41,480 GBP 518,770 438,858 0.26
BAE Systems PLC 256,828 GBP 1,053,236 1,212,228 0.72
Baillie Gifford Japan Trust PLC 6,252 GBP 21,364 23,562 0.01
Baillie Gifford Shin Nippon PLC 3,295 GBP 10,449 10,210 0.01
Balfour Beatty PLC 57,400 GBP 164,006 121,688 0.07
Bankers Investment Trust PLC 8,468 GBP 48,451 49,411 0.03
Barclays PLC 1,334,987 GBP 3,306,666 3,250,693 1.92
Baring Emerging Europe PLC 1,811 GBP 11,294 8,955 0.01
Barratt Developments PLC 81,973 GBP 367,500 386,093 0.23
BBA Aviation PLC 40,050 GBP 137,181 144,180 0.09
Bellway PLC 10,091 GBP 165,512 195,664 0.12
Berendsen PLC 14,333 GBP 147,624 157,663 0.09
Berkeley Group Holdings PLC 10,233 GBP 273,495 253,778 0.15
Betfair Group PLC 7,660 GBP 88,431 120,415 0.07
BG Group PLC 276,059 GBP 3,018,545 2,387,910 1.41
Big Yellow Group PLC 10,378 GBP 57,295 63,098 0.04
Biotech Growth Trust PLC 6,367 GBP 32,923 43,168 0.03
BlackRock Commodities Income Investment
Trust PLC 8,756 GBP 9,691 7,826 0.00
BlackRock Emerging Europe PLC 3,367 GBP 7,694 6,667 0.00
BlackRock Frontiers Investment Trust PLC 13,992 GBP 16,875 15,549 0.01
BlackRock Greater Europe Investment Trust
PLC 10,099 GBP 25,045 22,925 0.01
BlackRock Latin American Investment Trust
PLC 3,656 GBP 14,997 14,642 0.01
BlackRock North American Income Trust PLC 9,151 GBP 9,829 10,730 0.01
BlackRock Smaller Cos Trust PLC 3,753 GBP 33,349 28,861 0.02
BlackRock Throgmorton Trust PLC 6,793 GBP 21,574 18,808 0.01
BlackRock World Mining Trust PLC 14,691 GBP 69,713 45,594 0.03
Bloomsbury Publishing PLC 6,593 GBP 11,580 10,689 0.01
180
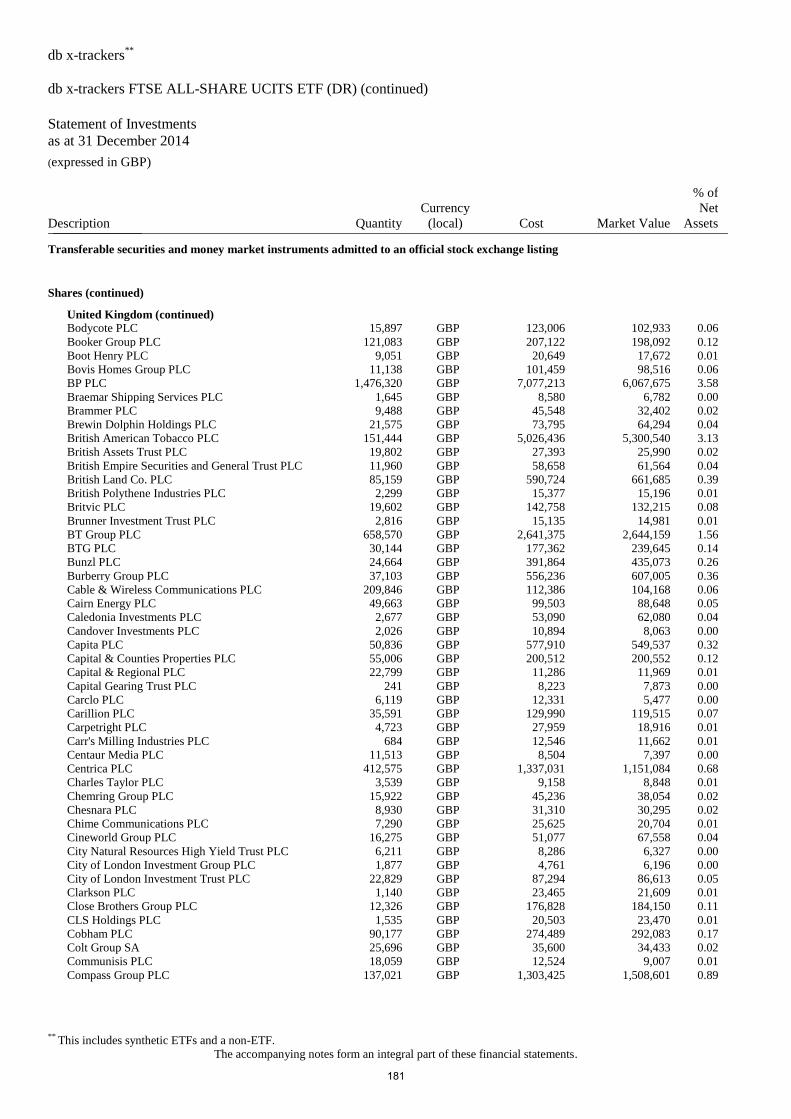
db x-trackers**
db x-trackers FTSE ALL-SHARE UCITS ETF (DR) (continued)
Statement of Investments
as at 31 December 2014 (expressed in GBP)
** This includes synthetic ETFs and a non-ETF.
The accompanying notes form an integral part of these financial statements.
Description Quantity
Currency
(local) Cost Market Value
% of
Net
Assets _______________
Transferable securities and money market instruments admitted to an official stock exchange listing
Shares (continued)
United Kingdom (continued)
Bodycote PLC 15,897 GBP 123,006 102,933 0.06
Booker Group PLC 121,083 GBP 207,122 198,092 0.12
Boot Henry PLC 9,051 GBP 20,649 17,672 0.01
Bovis Homes Group PLC 11,138 GBP 101,459 98,516 0.06
BP PLC 1,476,320 GBP 7,077,213 6,067,675 3.58
Braemar Shipping Services PLC 1,645 GBP 8,580 6,782 0.00
Brammer PLC 9,488 GBP 45,548 32,402 0.02
Brewin Dolphin Holdings PLC 21,575 GBP 73,795 64,294 0.04
British American Tobacco PLC 151,444 GBP 5,026,436 5,300,540 3.13
British Assets Trust PLC 19,802 GBP 27,393 25,990 0.02
British Empire Securities and General Trust PLC 11,960 GBP 58,658 61,564 0.04
British Land Co. PLC 85,159 GBP 590,724 661,685 0.39
British Polythene Industries PLC 2,299 GBP 15,377 15,196 0.01
Britvic PLC 19,602 GBP 142,758 132,215 0.08
Brunner Investment Trust PLC 2,816 GBP 15,135 14,981 0.01
BT Group PLC 658,570 GBP 2,641,375 2,644,159 1.56
BTG PLC 30,144 GBP 177,362 239,645 0.14
Bunzl PLC 24,664 GBP 391,864 435,073 0.26
Burberry Group PLC 37,103 GBP 556,236 607,005 0.36
Cable & Wireless Communications PLC 209,846 GBP 112,386 104,168 0.06
Cairn Energy PLC 49,663 GBP 99,503 88,648 0.05
Caledonia Investments PLC 2,677 GBP 53,090 62,080 0.04
Candover Investments PLC 2,026 GBP 10,894 8,063 0.00
Capita PLC 50,836 GBP 577,910 549,537 0.32
Capital & Counties Properties PLC 55,006 GBP 200,512 200,552 0.12
Capital & Regional PLC 22,799 GBP 11,286 11,969 0.01
Capital Gearing Trust PLC 241 GBP 8,223 7,873 0.00
Carclo PLC 6,119 GBP 12,331 5,477 0.00
Carillion PLC 35,591 GBP 129,990 119,515 0.07
Carpetright PLC 4,723 GBP 27,959 18,916 0.01
Carr's Milling Industries PLC 684 GBP 12,546 11,662 0.01
Centaur Media PLC 11,513 GBP 8,504 7,397 0.00
Centrica PLC 412,575 GBP 1,337,031 1,151,084 0.68
Charles Taylor PLC 3,539 GBP 9,158 8,848 0.01
Chemring Group PLC 15,922 GBP 45,236 38,054 0.02
Chesnara PLC 8,930 GBP 31,310 30,295 0.02
Chime Communications PLC 7,290 GBP 25,625 20,704 0.01
Cineworld Group PLC 16,275 GBP 51,077 67,558 0.04
City Natural Resources High Yield Trust PLC 6,211 GBP 8,286 6,327 0.00
City of London Investment Group PLC 1,877 GBP 4,761 6,196 0.00
City of London Investment Trust PLC 22,829 GBP 87,294 86,613 0.05
Clarkson PLC 1,140 GBP 23,465 21,609 0.01
Close Brothers Group PLC 12,326 GBP 176,828 184,150 0.11
CLS Holdings PLC 1,535 GBP 20,503 23,470 0.01
Cobham PLC 90,177 GBP 274,489 292,083 0.17
Colt Group SA 25,696 GBP 35,600 34,433 0.02
Communisis PLC 18,059 GBP 12,524 9,007 0.01
Compass Group PLC 137,021 GBP 1,303,425 1,508,601 0.89
181
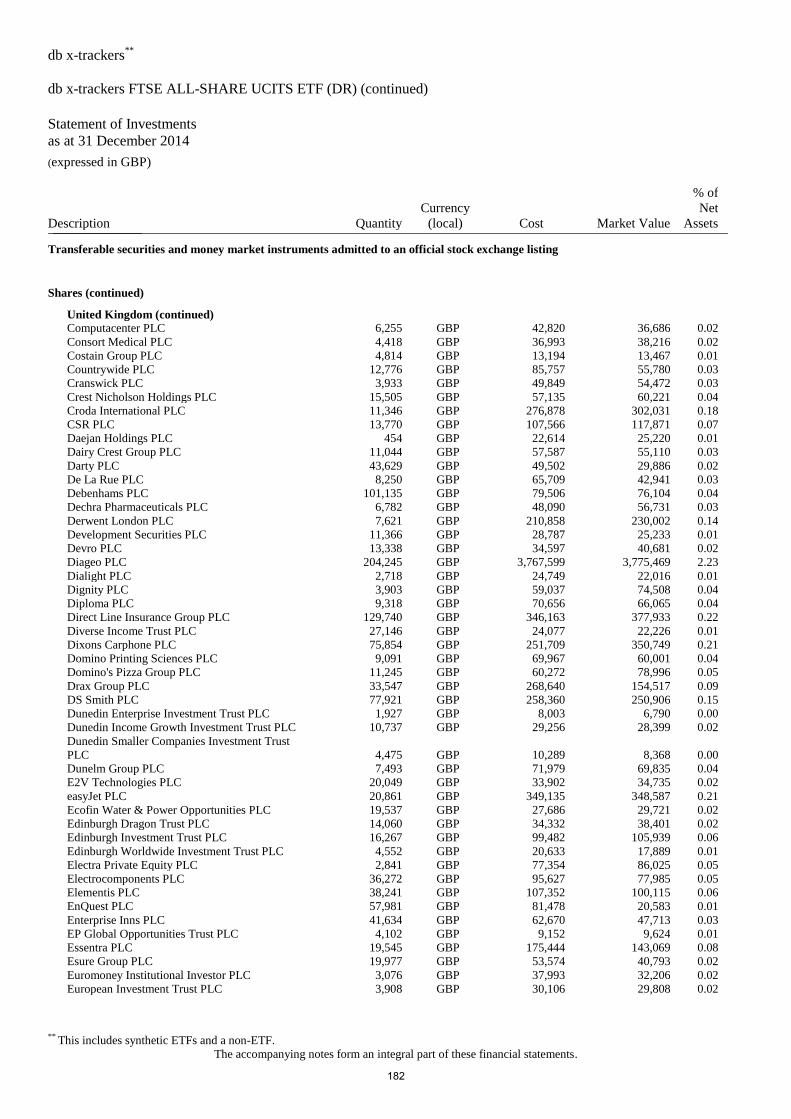
db x-trackers**
db x-trackers FTSE ALL-SHARE UCITS ETF (DR) (continued)
Statement of Investments
as at 31 December 2014 (expressed in GBP)
** This includes synthetic ETFs and a non-ETF.
The accompanying notes form an integral part of these financial statements.
Description Quantity
Currency
(local) Cost Market Value
% of
Net
Assets _______________
Transferable securities and money market instruments admitted to an official stock exchange listing
Shares (continued)
United Kingdom (continued)
Computacenter PLC 6,255 GBP 42,820 36,686 0.02
Consort Medical PLC 4,418 GBP 36,993 38,216 0.02
Costain Group PLC 4,814 GBP 13,194 13,467 0.01
Countrywide PLC 12,776 GBP 85,757 55,780 0.03
Cranswick PLC 3,933 GBP 49,849 54,472 0.03
Crest Nicholson Holdings PLC 15,505 GBP 57,135 60,221 0.04
Croda International PLC 11,346 GBP 276,878 302,031 0.18
CSR PLC 13,770 GBP 107,566 117,871 0.07
Daejan Holdings PLC 454 GBP 22,614 25,220 0.01
Dairy Crest Group PLC 11,044 GBP 57,587 55,110 0.03
Darty PLC 43,629 GBP 49,502 29,886 0.02
De La Rue PLC 8,250 GBP 65,709 42,941 0.03
Debenhams PLC 101,135 GBP 79,506 76,104 0.04
Dechra Pharmaceuticals PLC 6,782 GBP 48,090 56,731 0.03
Derwent London PLC 7,621 GBP 210,858 230,002 0.14
Development Securities PLC 11,366 GBP 28,787 25,233 0.01
Devro PLC 13,338 GBP 34,597 40,681 0.02
Diageo PLC 204,245 GBP 3,767,599 3,775,469 2.23
Dialight PLC 2,718 GBP 24,749 22,016 0.01
Dignity PLC 3,903 GBP 59,037 74,508 0.04
Diploma PLC 9,318 GBP 70,656 66,065 0.04
Direct Line Insurance Group PLC 129,740 GBP 346,163 377,933 0.22
Diverse Income Trust PLC 27,146 GBP 24,077 22,226 0.01
Dixons Carphone PLC 75,854 GBP 251,709 350,749 0.21
Domino Printing Sciences PLC 9,091 GBP 69,967 60,001 0.04
Domino's Pizza Group PLC 11,245 GBP 60,272 78,996 0.05
Drax Group PLC 33,547 GBP 268,640 154,517 0.09
DS Smith PLC 77,921 GBP 258,360 250,906 0.15
Dunedin Enterprise Investment Trust PLC 1,927 GBP 8,003 6,790 0.00
Dunedin Income Growth Investment Trust PLC 10,737 GBP 29,256 28,399 0.02
Dunedin Smaller Companies Investment Trust
PLC 4,475 GBP 10,289 8,368 0.00
Dunelm Group PLC 7,493 GBP 71,979 69,835 0.04
E2V Technologies PLC 20,049 GBP 33,902 34,735 0.02
easyJet PLC 20,861 GBP 349,135 348,587 0.21
Ecofin Water & Power Opportunities PLC 19,537 GBP 27,686 29,721 0.02
Edinburgh Dragon Trust PLC 14,060 GBP 34,332 38,401 0.02
Edinburgh Investment Trust PLC 16,267 GBP 99,482 105,939 0.06
Edinburgh Worldwide Investment Trust PLC 4,552 GBP 20,633 17,889 0.01
Electra Private Equity PLC 2,841 GBP 77,354 86,025 0.05
Electrocomponents PLC 36,272 GBP 95,627 77,985 0.05
Elementis PLC 38,241 GBP 107,352 100,115 0.06
EnQuest PLC 57,981 GBP 81,478 20,583 0.01
Enterprise Inns PLC 41,634 GBP 62,670 47,713 0.03
EP Global Opportunities Trust PLC 4,102 GBP 9,152 9,624 0.01
Essentra PLC 19,545 GBP 175,444 143,069 0.08
Esure Group PLC 19,977 GBP 53,574 40,793 0.02
Euromoney Institutional Investor PLC 3,076 GBP 37,993 32,206 0.02
European Investment Trust PLC 3,908 GBP 30,106 29,808 0.02
182
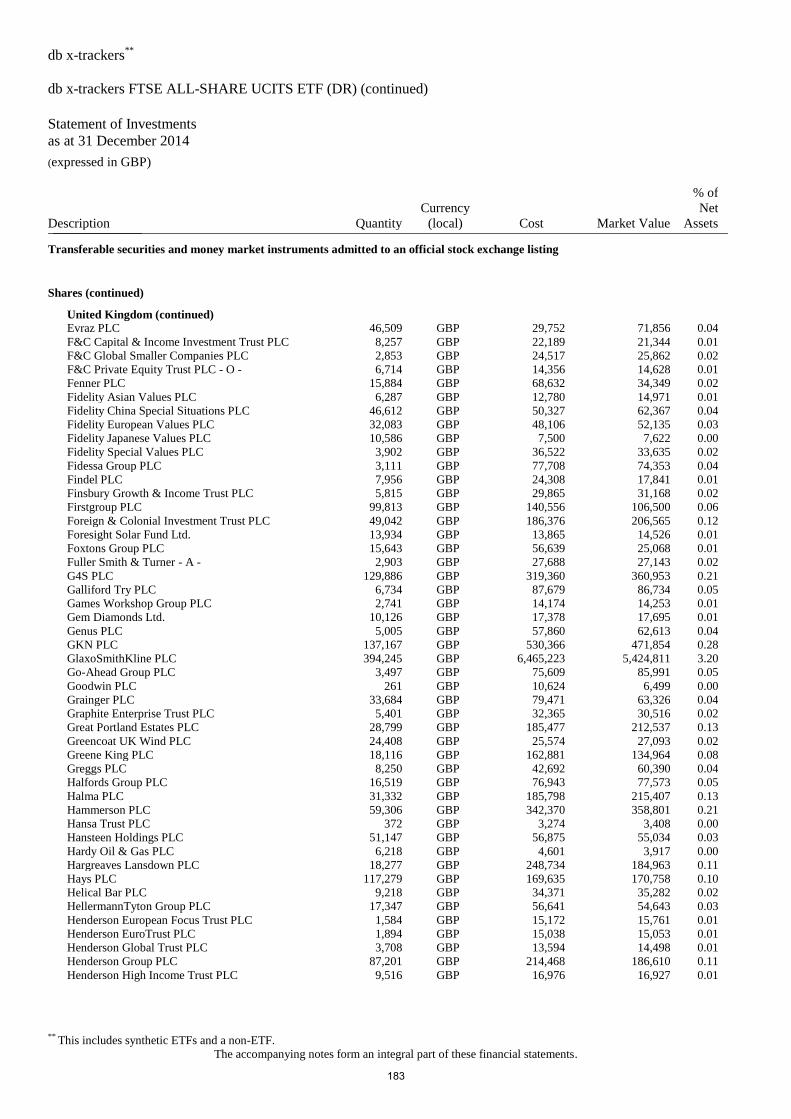
db x-trackers**
db x-trackers FTSE ALL-SHARE UCITS ETF (DR) (continued)
Statement of Investments
as at 31 December 2014 (expressed in GBP)
** This includes synthetic ETFs and a non-ETF.
The accompanying notes form an integral part of these financial statements.
Description Quantity
Currency
(local) Cost Market Value
% of
Net
Assets _______________
Transferable securities and money market instruments admitted to an official stock exchange listing
Shares (continued)
United Kingdom (continued)
Evraz PLC 46,509 GBP 29,752 71,856 0.04
F&C Capital & Income Investment Trust PLC 8,257 GBP 22,189 21,344 0.01
F&C Global Smaller Companies PLC 2,853 GBP 24,517 25,862 0.02
F&C Private Equity Trust PLC - O - 6,714 GBP 14,356 14,628 0.01
Fenner PLC 15,884 GBP 68,632 34,349 0.02
Fidelity Asian Values PLC 6,287 GBP 12,780 14,971 0.01
Fidelity China Special Situations PLC 46,612 GBP 50,327 62,367 0.04
Fidelity European Values PLC 32,083 GBP 48,106 52,135 0.03
Fidelity Japanese Values PLC 10,586 GBP 7,500 7,622 0.00
Fidelity Special Values PLC 3,902 GBP 36,522 33,635 0.02
Fidessa Group PLC 3,111 GBP 77,708 74,353 0.04
Findel PLC 7,956 GBP 24,308 17,841 0.01
Finsbury Growth & Income Trust PLC 5,815 GBP 29,865 31,168 0.02
Firstgroup PLC 99,813 GBP 140,556 106,500 0.06
Foreign & Colonial Investment Trust PLC 49,042 GBP 186,376 206,565 0.12
Foresight Solar Fund Ltd. 13,934 GBP 13,865 14,526 0.01
Foxtons Group PLC 15,643 GBP 56,639 25,068 0.01
Fuller Smith & Turner - A - 2,903 GBP 27,688 27,143 0.02
G4S PLC 129,886 GBP 319,360 360,953 0.21
Galliford Try PLC 6,734 GBP 87,679 86,734 0.05
Games Workshop Group PLC 2,741 GBP 14,174 14,253 0.01
Gem Diamonds Ltd. 10,126 GBP 17,378 17,695 0.01
Genus PLC 5,005 GBP 57,860 62,613 0.04
GKN PLC 137,167 GBP 530,366 471,854 0.28
GlaxoSmithKline PLC 394,245 GBP 6,465,223 5,424,811 3.20
Go-Ahead Group PLC 3,497 GBP 75,609 85,991 0.05
Goodwin PLC 261 GBP 10,624 6,499 0.00
Grainger PLC 33,684 GBP 79,471 63,326 0.04
Graphite Enterprise Trust PLC 5,401 GBP 32,365 30,516 0.02
Great Portland Estates PLC 28,799 GBP 185,477 212,537 0.13
Greencoat UK Wind PLC 24,408 GBP 25,574 27,093 0.02
Greene King PLC 18,116 GBP 162,881 134,964 0.08
Greggs PLC 8,250 GBP 42,692 60,390 0.04
Halfords Group PLC 16,519 GBP 76,943 77,573 0.05
Halma PLC 31,332 GBP 185,798 215,407 0.13
Hammerson PLC 59,306 GBP 342,370 358,801 0.21
Hansa Trust PLC 372 GBP 3,274 3,408 0.00
Hansteen Holdings PLC 51,147 GBP 56,875 55,034 0.03
Hardy Oil & Gas PLC 6,218 GBP 4,601 3,917 0.00
Hargreaves Lansdown PLC 18,277 GBP 248,734 184,963 0.11
Hays PLC 117,279 GBP 169,635 170,758 0.10
Helical Bar PLC 9,218 GBP 34,371 35,282 0.02
HellermannTyton Group PLC 17,347 GBP 56,641 54,643 0.03
Henderson European Focus Trust PLC 1,584 GBP 15,172 15,761 0.01
Henderson EuroTrust PLC 1,894 GBP 15,038 15,053 0.01
Henderson Global Trust PLC 3,708 GBP 13,594 14,498 0.01
Henderson Group PLC 87,201 GBP 214,468 186,610 0.11
Henderson High Income Trust PLC 9,516 GBP 16,976 16,927 0.01
183
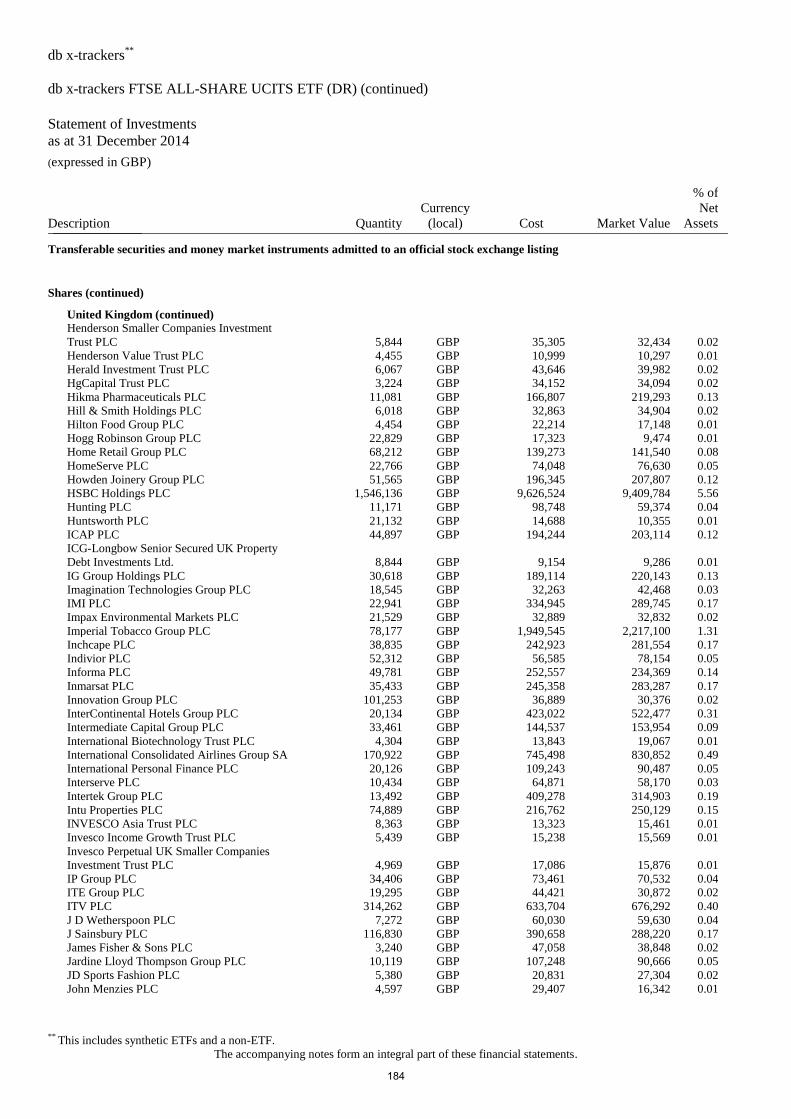
db x-trackers**
db x-trackers FTSE ALL-SHARE UCITS ETF (DR) (continued)
Statement of Investments
as at 31 December 2014 (expressed in GBP)
** This includes synthetic ETFs and a non-ETF.
The accompanying notes form an integral part of these financial statements.
Description Quantity
Currency
(local) Cost Market Value
% of
Net
Assets _______________
Transferable securities and money market instruments admitted to an official stock exchange listing
Shares (continued)
United Kingdom (continued)
Henderson Smaller Companies Investment
Trust PLC 5,844 GBP 35,305 32,434 0.02
Henderson Value Trust PLC 4,455 GBP 10,999 10,297 0.01
Herald Investment Trust PLC 6,067 GBP 43,646 39,982 0.02
HgCapital Trust PLC 3,224 GBP 34,152 34,094 0.02
Hikma Pharmaceuticals PLC 11,081 GBP 166,807 219,293 0.13
Hill & Smith Holdings PLC 6,018 GBP 32,863 34,904 0.02
Hilton Food Group PLC 4,454 GBP 22,214 17,148 0.01
Hogg Robinson Group PLC 22,829 GBP 17,323 9,474 0.01
Home Retail Group PLC 68,212 GBP 139,273 141,540 0.08
HomeServe PLC 22,766 GBP 74,048 76,630 0.05
Howden Joinery Group PLC 51,565 GBP 196,345 207,807 0.12
HSBC Holdings PLC 1,546,136 GBP 9,626,524 9,409,784 5.56
Hunting PLC 11,171 GBP 98,748 59,374 0.04
Huntsworth PLC 21,132 GBP 14,688 10,355 0.01
ICAP PLC 44,897 GBP 194,244 203,114 0.12
ICG-Longbow Senior Secured UK Property
Debt Investments Ltd. 8,844 GBP 9,154 9,286 0.01
IG Group Holdings PLC 30,618 GBP 189,114 220,143 0.13
Imagination Technologies Group PLC 18,545 GBP 32,263 42,468 0.03
IMI PLC 22,941 GBP 334,945 289,745 0.17
Impax Environmental Markets PLC 21,529 GBP 32,889 32,832 0.02
Imperial Tobacco Group PLC 78,177 GBP 1,949,545 2,217,100 1.31
Inchcape PLC 38,835 GBP 242,923 281,554 0.17
Indivior PLC 52,312 GBP 56,585 78,154 0.05
Informa PLC 49,781 GBP 252,557 234,369 0.14
Inmarsat PLC 35,433 GBP 245,358 283,287 0.17
Innovation Group PLC 101,253 GBP 36,889 30,376 0.02
InterContinental Hotels Group PLC 20,134 GBP 423,022 522,477 0.31
Intermediate Capital Group PLC 33,461 GBP 144,537 153,954 0.09
International Biotechnology Trust PLC 4,304 GBP 13,843 19,067 0.01
International Consolidated Airlines Group SA 170,922 GBP 745,498 830,852 0.49
International Personal Finance PLC 20,126 GBP 109,243 90,487 0.05
Interserve PLC 10,434 GBP 64,871 58,170 0.03
Intertek Group PLC 13,492 GBP 409,278 314,903 0.19
Intu Properties PLC 74,889 GBP 216,762 250,129 0.15
INVESCO Asia Trust PLC 8,363 GBP 13,323 15,461 0.01
Invesco Income Growth Trust PLC 5,439 GBP 15,238 15,569 0.01
Invesco Perpetual UK Smaller Companies
Investment Trust PLC 4,969 GBP 17,086 15,876 0.01
IP Group PLC 34,406 GBP 73,461 70,532 0.04
ITE Group PLC 19,295 GBP 44,421 30,872 0.02
ITV PLC 314,262 GBP 633,704 676,292 0.40
J D Wetherspoon PLC 7,272 GBP 60,030 59,630 0.04
J Sainsbury PLC 116,830 GBP 390,658 288,220 0.17
James Fisher & Sons PLC 3,240 GBP 47,058 38,848 0.02
Jardine Lloyd Thompson Group PLC 10,119 GBP 107,248 90,666 0.05
JD Sports Fashion PLC 5,380 GBP 20,831 27,304 0.02
John Menzies PLC 4,597 GBP 29,407 16,342 0.01
184
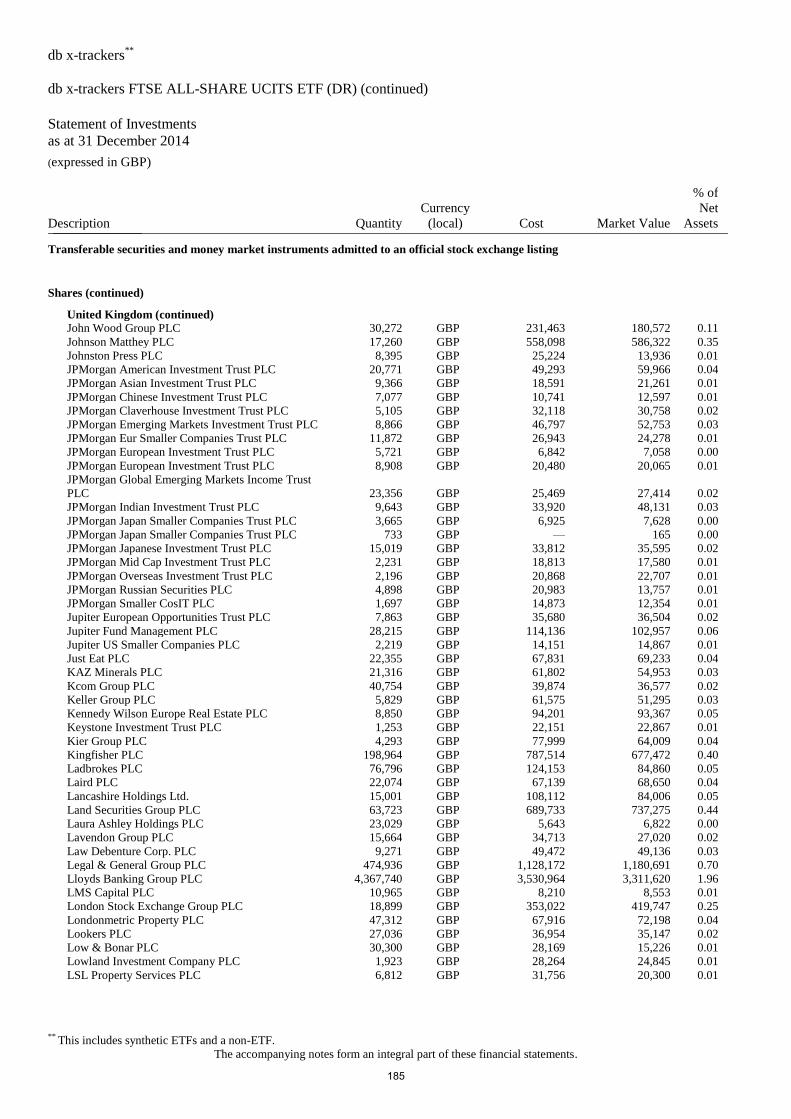
db x-trackers**
db x-trackers FTSE ALL-SHARE UCITS ETF (DR) (continued)
Statement of Investments
as at 31 December 2014 (expressed in GBP)
** This includes synthetic ETFs and a non-ETF.
The accompanying notes form an integral part of these financial statements.
Description Quantity
Currency
(local) Cost Market Value
% of
Net
Assets _______________
Transferable securities and money market instruments admitted to an official stock exchange listing
Shares (continued)
United Kingdom (continued)
John Wood Group PLC 30,272 GBP 231,463 180,572 0.11
Johnson Matthey PLC 17,260 GBP 558,098 586,322 0.35
Johnston Press PLC 8,395 GBP 25,224 13,936 0.01
JPMorgan American Investment Trust PLC 20,771 GBP 49,293 59,966 0.04
JPMorgan Asian Investment Trust PLC 9,366 GBP 18,591 21,261 0.01
JPMorgan Chinese Investment Trust PLC 7,077 GBP 10,741 12,597 0.01
JPMorgan Claverhouse Investment Trust PLC 5,105 GBP 32,118 30,758 0.02
JPMorgan Emerging Markets Investment Trust PLC 8,866 GBP 46,797 52,753 0.03
JPMorgan Eur Smaller Companies Trust PLC 11,872 GBP 26,943 24,278 0.01
JPMorgan European Investment Trust PLC 5,721 GBP 6,842 7,058 0.00
JPMorgan European Investment Trust PLC 8,908 GBP 20,480 20,065 0.01
JPMorgan Global Emerging Markets Income Trust
PLC 23,356 GBP 25,469 27,414 0.02
JPMorgan Indian Investment Trust PLC 9,643 GBP 33,920 48,131 0.03
JPMorgan Japan Smaller Companies Trust PLC 3,665 GBP 6,925 7,628 0.00
JPMorgan Japan Smaller Companies Trust PLC 733 GBP — 165 0.00
JPMorgan Japanese Investment Trust PLC 15,019 GBP 33,812 35,595 0.02
JPMorgan Mid Cap Investment Trust PLC 2,231 GBP 18,813 17,580 0.01
JPMorgan Overseas Investment Trust PLC 2,196 GBP 20,868 22,707 0.01
JPMorgan Russian Securities PLC 4,898 GBP 20,983 13,757 0.01
JPMorgan Smaller CosIT PLC 1,697 GBP 14,873 12,354 0.01
Jupiter European Opportunities Trust PLC 7,863 GBP 35,680 36,504 0.02
Jupiter Fund Management PLC 28,215 GBP 114,136 102,957 0.06
Jupiter US Smaller Companies PLC 2,219 GBP 14,151 14,867 0.01
Just Eat PLC 22,355 GBP 67,831 69,233 0.04
KAZ Minerals PLC 21,316 GBP 61,802 54,953 0.03
Kcom Group PLC 40,754 GBP 39,874 36,577 0.02
Keller Group PLC 5,829 GBP 61,575 51,295 0.03
Kennedy Wilson Europe Real Estate PLC 8,850 GBP 94,201 93,367 0.05
Keystone Investment Trust PLC 1,253 GBP 22,151 22,867 0.01
Kier Group PLC 4,293 GBP 77,999 64,009 0.04
Kingfisher PLC 198,964 GBP 787,514 677,472 0.40
Ladbrokes PLC 76,796 GBP 124,153 84,860 0.05
Laird PLC 22,074 GBP 67,139 68,650 0.04
Lancashire Holdings Ltd. 15,001 GBP 108,112 84,006 0.05
Land Securities Group PLC 63,723 GBP 689,733 737,275 0.44
Laura Ashley Holdings PLC 23,029 GBP 5,643 6,822 0.00
Lavendon Group PLC 15,664 GBP 34,713 27,020 0.02
Law Debenture Corp. PLC 9,271 GBP 49,472 49,136 0.03
Legal & General Group PLC 474,936 GBP 1,128,172 1,180,691 0.70
Lloyds Banking Group PLC 4,367,740 GBP 3,530,964 3,311,620 1.96
LMS Capital PLC 10,965 GBP 8,210 8,553 0.01
London Stock Exchange Group PLC 18,899 GBP 353,022 419,747 0.25
Londonmetric Property PLC 47,312 GBP 67,916 72,198 0.04
Lookers PLC 27,036 GBP 36,954 35,147 0.02
Low & Bonar PLC 30,300 GBP 28,169 15,226 0.01
Lowland Investment Company PLC 1,923 GBP 28,264 24,845 0.01
LSL Property Services PLC 6,812 GBP 31,756 20,300 0.01
185
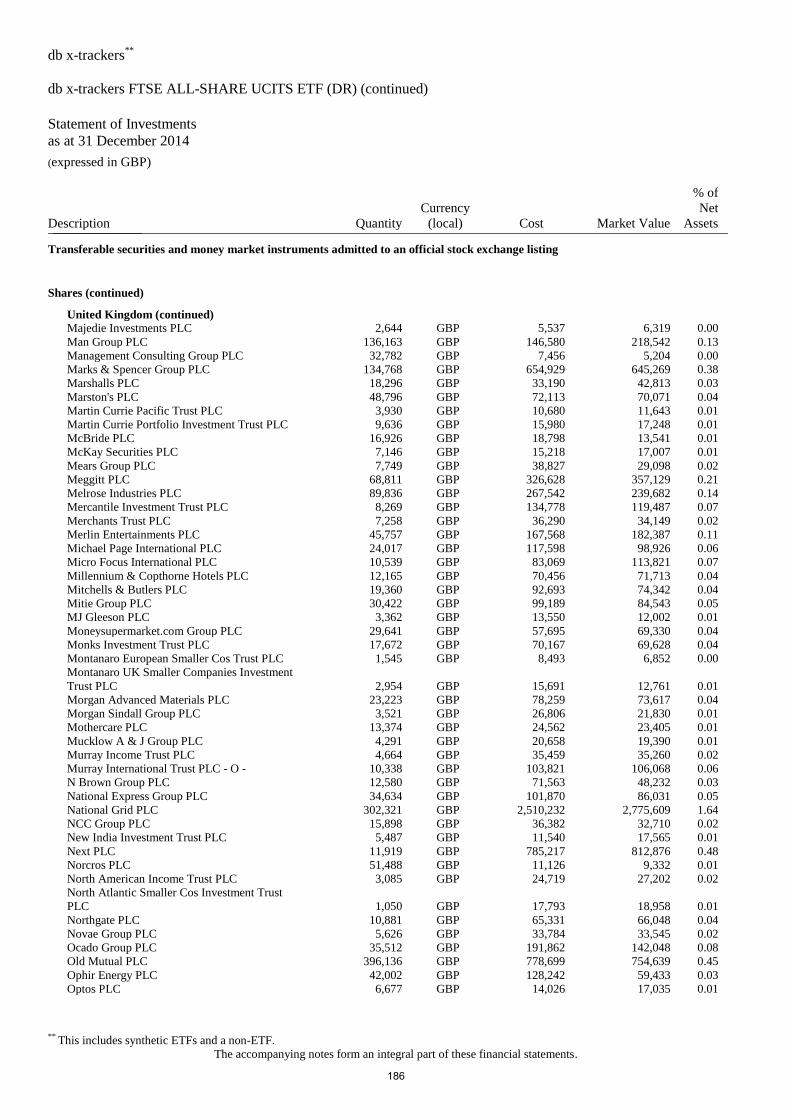
db x-trackers**
db x-trackers FTSE ALL-SHARE UCITS ETF (DR) (continued)
Statement of Investments
as at 31 December 2014 (expressed in GBP)
** This includes synthetic ETFs and a non-ETF.
The accompanying notes form an integral part of these financial statements.
Description Quantity
Currency
(local) Cost Market Value
% of
Net
Assets _______________
Transferable securities and money market instruments admitted to an official stock exchange listing
Shares (continued)
United Kingdom (continued)
Majedie Investments PLC 2,644 GBP 5,537 6,319 0.00
Man Group PLC 136,163 GBP 146,580 218,542 0.13
Management Consulting Group PLC 32,782 GBP 7,456 5,204 0.00
Marks & Spencer Group PLC 134,768 GBP 654,929 645,269 0.38
Marshalls PLC 18,296 GBP 33,190 42,813 0.03
Marston's PLC 48,796 GBP 72,113 70,071 0.04
Martin Currie Pacific Trust PLC 3,930 GBP 10,680 11,643 0.01
Martin Currie Portfolio Investment Trust PLC 9,636 GBP 15,980 17,248 0.01
McBride PLC 16,926 GBP 18,798 13,541 0.01
McKay Securities PLC 7,146 GBP 15,218 17,007 0.01
Mears Group PLC 7,749 GBP 38,827 29,098 0.02
Meggitt PLC 68,811 GBP 326,628 357,129 0.21
Melrose Industries PLC 89,836 GBP 267,542 239,682 0.14
Mercantile Investment Trust PLC 8,269 GBP 134,778 119,487 0.07
Merchants Trust PLC 7,258 GBP 36,290 34,149 0.02
Merlin Entertainments PLC 45,757 GBP 167,568 182,387 0.11
Michael Page International PLC 24,017 GBP 117,598 98,926 0.06
Micro Focus International PLC 10,539 GBP 83,069 113,821 0.07
Millennium & Copthorne Hotels PLC 12,165 GBP 70,456 71,713 0.04
Mitchells & Butlers PLC 19,360 GBP 92,693 74,342 0.04
Mitie Group PLC 30,422 GBP 99,189 84,543 0.05
MJ Gleeson PLC 3,362 GBP 13,550 12,002 0.01
Moneysupermarket.com Group PLC 29,641 GBP 57,695 69,330 0.04
Monks Investment Trust PLC 17,672 GBP 70,167 69,628 0.04
Montanaro European Smaller Cos Trust PLC 1,545 GBP 8,493 6,852 0.00
Montanaro UK Smaller Companies Investment
Trust PLC 2,954 GBP 15,691 12,761 0.01
Morgan Advanced Materials PLC 23,223 GBP 78,259 73,617 0.04
Morgan Sindall Group PLC 3,521 GBP 26,806 21,830 0.01
Mothercare PLC 13,374 GBP 24,562 23,405 0.01
Mucklow A & J Group PLC 4,291 GBP 20,658 19,390 0.01
Murray Income Trust PLC 4,664 GBP 35,459 35,260 0.02
Murray International Trust PLC - O - 10,338 GBP 103,821 106,068 0.06
N Brown Group PLC 12,580 GBP 71,563 48,232 0.03
National Express Group PLC 34,634 GBP 101,870 86,031 0.05
National Grid PLC 302,321 GBP 2,510,232 2,775,609 1.64
NCC Group PLC 15,898 GBP 36,382 32,710 0.02
New India Investment Trust PLC 5,487 GBP 11,540 17,565 0.01
Next PLC 11,919 GBP 785,217 812,876 0.48
Norcros PLC 51,488 GBP 11,126 9,332 0.01
North American Income Trust PLC 3,085 GBP 24,719 27,202 0.02
North Atlantic Smaller Cos Investment Trust
PLC 1,050 GBP 17,793 18,958 0.01
Northgate PLC 10,881 GBP 65,331 66,048 0.04
Novae Group PLC 5,626 GBP 33,784 33,545 0.02
Ocado Group PLC 35,512 GBP 191,862 142,048 0.08
Old Mutual PLC 396,136 GBP 778,699 754,639 0.45
Ophir Energy PLC 42,002 GBP 128,242 59,433 0.03
Optos PLC 6,677 GBP 14,026 17,035 0.01
186
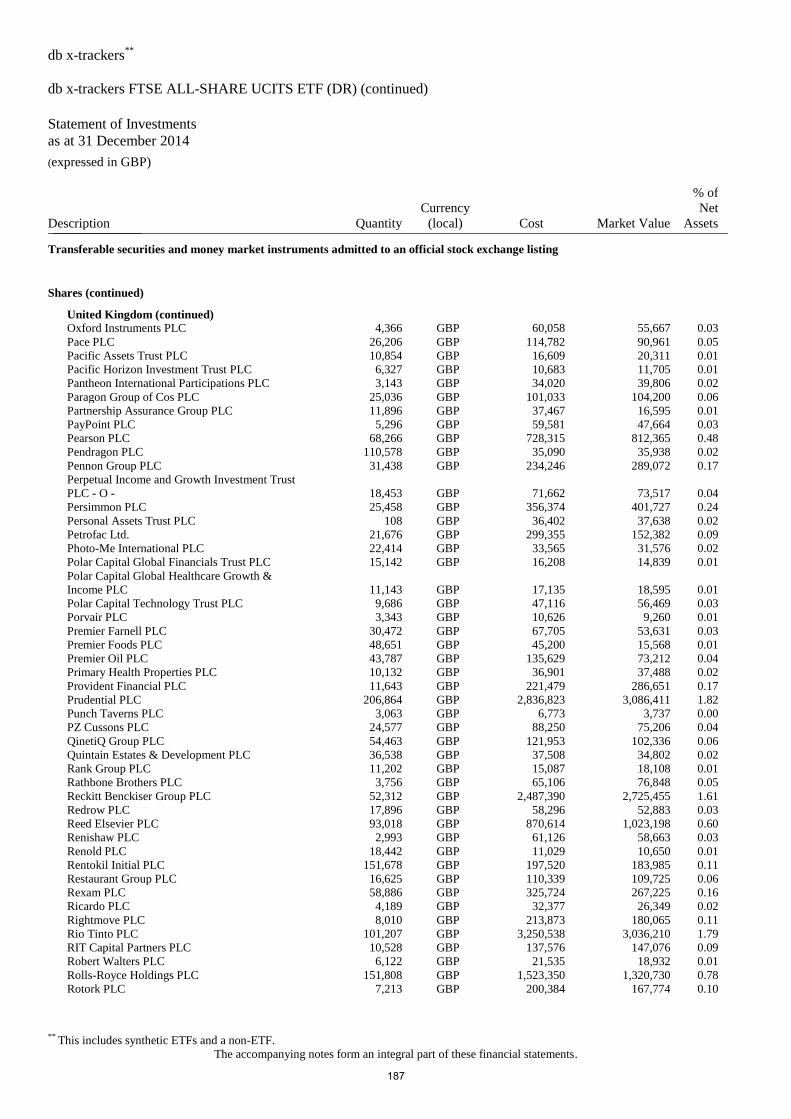
db x-trackers**
db x-trackers FTSE ALL-SHARE UCITS ETF (DR) (continued)
Statement of Investments
as at 31 December 2014 (expressed in GBP)
** This includes synthetic ETFs and a non-ETF.
The accompanying notes form an integral part of these financial statements.
Description Quantity
Currency
(local) Cost Market Value
% of
Net
Assets _______________
Transferable securities and money market instruments admitted to an official stock exchange listing
Shares (continued)
United Kingdom (continued)
Oxford Instruments PLC 4,366 GBP 60,058 55,667 0.03
Pace PLC 26,206 GBP 114,782 90,961 0.05
Pacific Assets Trust PLC 10,854 GBP 16,609 20,311 0.01
Pacific Horizon Investment Trust PLC 6,327 GBP 10,683 11,705 0.01
Pantheon International Participations PLC 3,143 GBP 34,020 39,806 0.02
Paragon Group of Cos PLC 25,036 GBP 101,033 104,200 0.06
Partnership Assurance Group PLC 11,896 GBP 37,467 16,595 0.01
PayPoint PLC 5,296 GBP 59,581 47,664 0.03
Pearson PLC 68,266 GBP 728,315 812,365 0.48
Pendragon PLC 110,578 GBP 35,090 35,938 0.02
Pennon Group PLC 31,438 GBP 234,246 289,072 0.17
Perpetual Income and Growth Investment Trust
PLC - O - 18,453 GBP 71,662 73,517 0.04
Persimmon PLC 25,458 GBP 356,374 401,727 0.24
Personal Assets Trust PLC 108 GBP 36,402 37,638 0.02
Petrofac Ltd. 21,676 GBP 299,355 152,382 0.09
Photo-Me International PLC 22,414 GBP 33,565 31,576 0.02
Polar Capital Global Financials Trust PLC 15,142 GBP 16,208 14,839 0.01
Polar Capital Global Healthcare Growth &
Income PLC 11,143 GBP 17,135 18,595 0.01
Polar Capital Technology Trust PLC 9,686 GBP 47,116 56,469 0.03
Porvair PLC 3,343 GBP 10,626 9,260 0.01
Premier Farnell PLC 30,472 GBP 67,705 53,631 0.03
Premier Foods PLC 48,651 GBP 45,200 15,568 0.01
Premier Oil PLC 43,787 GBP 135,629 73,212 0.04
Primary Health Properties PLC 10,132 GBP 36,901 37,488 0.02
Provident Financial PLC 11,643 GBP 221,479 286,651 0.17
Prudential PLC 206,864 GBP 2,836,823 3,086,411 1.82
Punch Taverns PLC 3,063 GBP 6,773 3,737 0.00
PZ Cussons PLC 24,577 GBP 88,250 75,206 0.04
QinetiQ Group PLC 54,463 GBP 121,953 102,336 0.06
Quintain Estates & Development PLC 36,538 GBP 37,508 34,802 0.02
Rank Group PLC 11,202 GBP 15,087 18,108 0.01
Rathbone Brothers PLC 3,756 GBP 65,106 76,848 0.05
Reckitt Benckiser Group PLC 52,312 GBP 2,487,390 2,725,455 1.61
Redrow PLC 17,896 GBP 58,296 52,883 0.03
Reed Elsevier PLC 93,018 GBP 870,614 1,023,198 0.60
Renishaw PLC 2,993 GBP 61,126 58,663 0.03
Renold PLC 18,442 GBP 11,029 10,650 0.01
Rentokil Initial PLC 151,678 GBP 197,520 183,985 0.11
Restaurant Group PLC 16,625 GBP 110,339 109,725 0.06
Rexam PLC 58,886 GBP 325,724 267,225 0.16
Ricardo PLC 4,189 GBP 32,377 26,349 0.02
Rightmove PLC 8,010 GBP 213,873 180,065 0.11
Rio Tinto PLC 101,207 GBP 3,250,538 3,036,210 1.79
RIT Capital Partners PLC 10,528 GBP 137,576 147,076 0.09
Robert Walters PLC 6,122 GBP 21,535 18,932 0.01
Rolls-Royce Holdings PLC 151,808 GBP 1,523,350 1,320,730 0.78
Rotork PLC 7,213 GBP 200,384 167,774 0.10
187
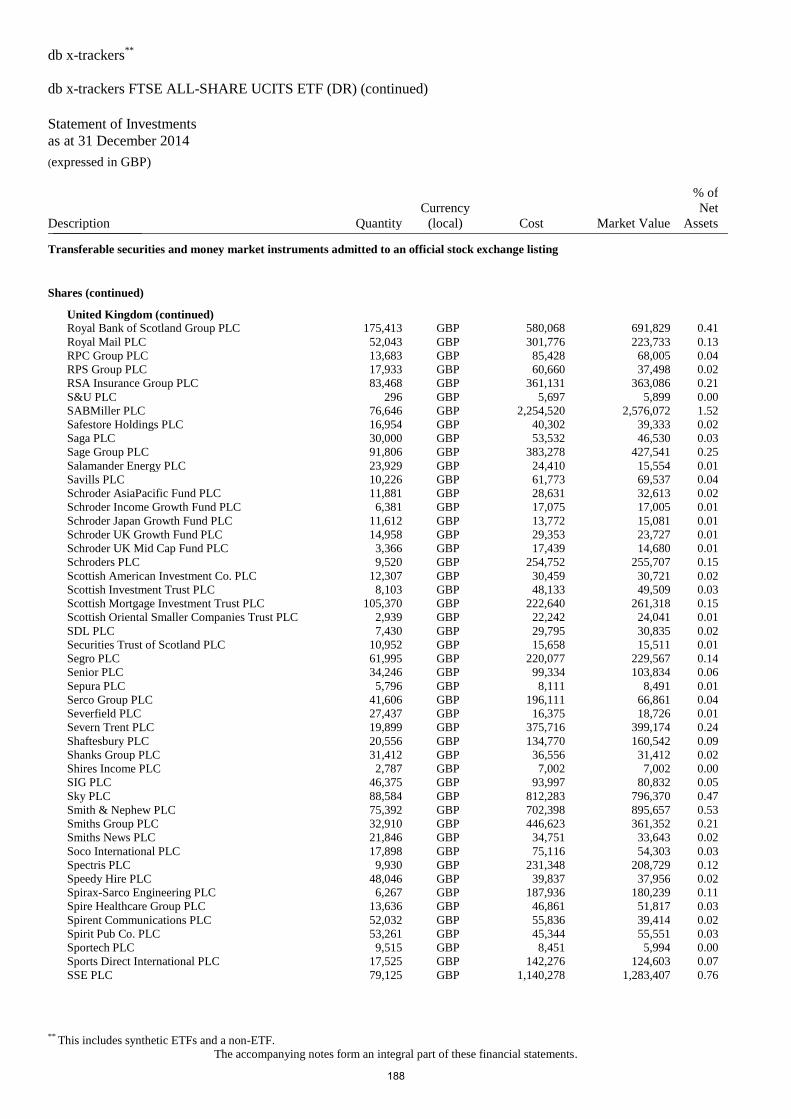
db x-trackers**
db x-trackers FTSE ALL-SHARE UCITS ETF (DR) (continued)
Statement of Investments
as at 31 December 2014 (expressed in GBP)
** This includes synthetic ETFs and a non-ETF.
The accompanying notes form an integral part of these financial statements.
Description Quantity
Currency
(local) Cost Market Value
% of
Net
Assets _______________
Transferable securities and money market instruments admitted to an official stock exchange listing
Shares (continued)
United Kingdom (continued)
Royal Bank of Scotland Group PLC 175,413 GBP 580,068 691,829 0.41
Royal Mail PLC 52,043 GBP 301,776 223,733 0.13
RPC Group PLC 13,683 GBP 85,428 68,005 0.04
RPS Group PLC 17,933 GBP 60,660 37,498 0.02
RSA Insurance Group PLC 83,468 GBP 361,131 363,086 0.21
S&U PLC 296 GBP 5,697 5,899 0.00
SABMiller PLC 76,646 GBP 2,254,520 2,576,072 1.52
Safestore Holdings PLC 16,954 GBP 40,302 39,333 0.02
Saga PLC 30,000 GBP 53,532 46,530 0.03
Sage Group PLC 91,806 GBP 383,278 427,541 0.25
Salamander Energy PLC 23,929 GBP 24,410 15,554 0.01
Savills PLC 10,226 GBP 61,773 69,537 0.04
Schroder AsiaPacific Fund PLC 11,881 GBP 28,631 32,613 0.02
Schroder Income Growth Fund PLC 6,381 GBP 17,075 17,005 0.01
Schroder Japan Growth Fund PLC 11,612 GBP 13,772 15,081 0.01
Schroder UK Growth Fund PLC 14,958 GBP 29,353 23,727 0.01
Schroder UK Mid Cap Fund PLC 3,366 GBP 17,439 14,680 0.01
Schroders PLC 9,520 GBP 254,752 255,707 0.15
Scottish American Investment Co. PLC 12,307 GBP 30,459 30,721 0.02
Scottish Investment Trust PLC 8,103 GBP 48,133 49,509 0.03
Scottish Mortgage Investment Trust PLC 105,370 GBP 222,640 261,318 0.15
Scottish Oriental Smaller Companies Trust PLC 2,939 GBP 22,242 24,041 0.01
SDL PLC 7,430 GBP 29,795 30,835 0.02
Securities Trust of Scotland PLC 10,952 GBP 15,658 15,511 0.01
Segro PLC 61,995 GBP 220,077 229,567 0.14
Senior PLC 34,246 GBP 99,334 103,834 0.06
Sepura PLC 5,796 GBP 8,111 8,491 0.01
Serco Group PLC 41,606 GBP 196,111 66,861 0.04
Severfield PLC 27,437 GBP 16,375 18,726 0.01
Severn Trent PLC 19,899 GBP 375,716 399,174 0.24
Shaftesbury PLC 20,556 GBP 134,770 160,542 0.09
Shanks Group PLC 31,412 GBP 36,556 31,412 0.02
Shires Income PLC 2,787 GBP 7,002 7,002 0.00
SIG PLC 46,375 GBP 93,997 80,832 0.05
Sky PLC 88,584 GBP 812,283 796,370 0.47
Smith & Nephew PLC 75,392 GBP 702,398 895,657 0.53
Smiths Group PLC 32,910 GBP 446,623 361,352 0.21
Smiths News PLC 21,846 GBP 34,751 33,643 0.02
Soco International PLC 17,898 GBP 75,116 54,303 0.03
Spectris PLC 9,930 GBP 231,348 208,729 0.12
Speedy Hire PLC 48,046 GBP 39,837 37,956 0.02
Spirax-Sarco Engineering PLC 6,267 GBP 187,936 180,239 0.11
Spire Healthcare Group PLC 13,636 GBP 46,861 51,817 0.03
Spirent Communications PLC 52,032 GBP 55,836 39,414 0.02
Spirit Pub Co. PLC 53,261 GBP 45,344 55,551 0.03
Sportech PLC 9,515 GBP 8,451 5,994 0.00
Sports Direct International PLC 17,525 GBP 142,276 124,603 0.07
SSE PLC 79,125 GBP 1,140,278 1,283,407 0.76
188
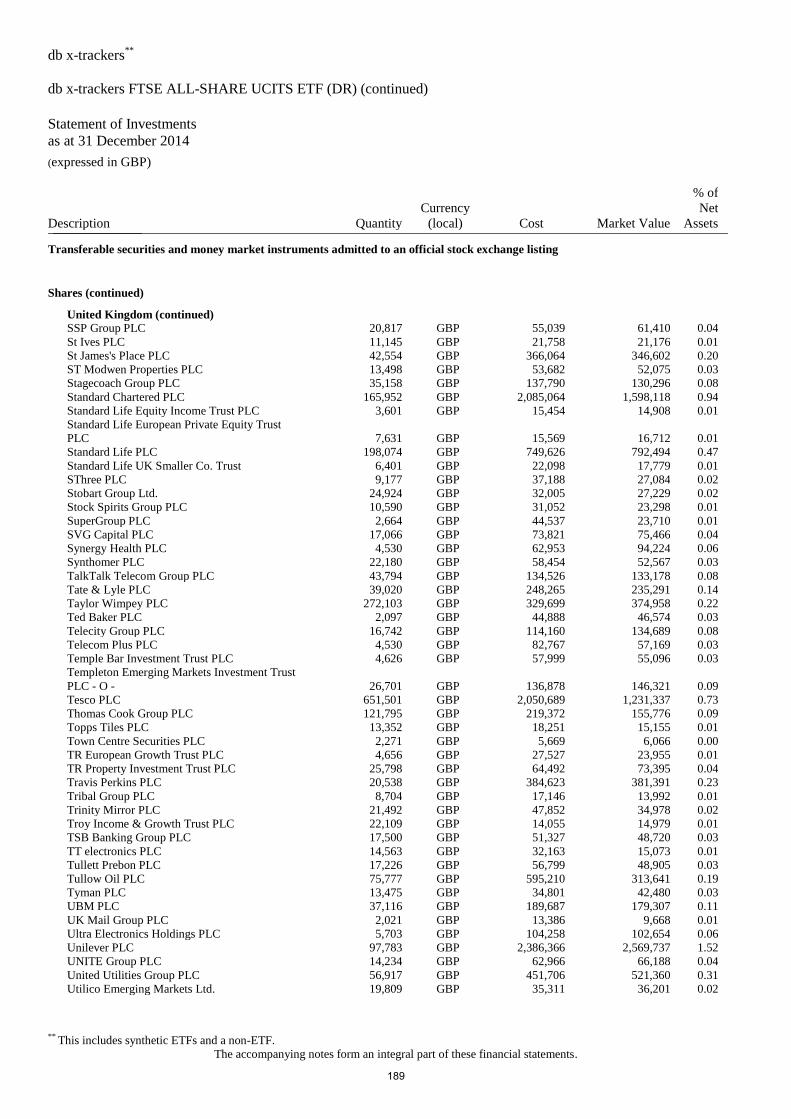
db x-trackers**
db x-trackers FTSE ALL-SHARE UCITS ETF (DR) (continued)
Statement of Investments
as at 31 December 2014 (expressed in GBP)
** This includes synthetic ETFs and a non-ETF.
The accompanying notes form an integral part of these financial statements.
Description Quantity
Currency
(local) Cost Market Value
% of
Net
Assets _______________
Transferable securities and money market instruments admitted to an official stock exchange listing
Shares (continued)
United Kingdom (continued)
SSP Group PLC 20,817 GBP 55,039 61,410 0.04
St Ives PLC 11,145 GBP 21,758 21,176 0.01
St James's Place PLC 42,554 GBP 366,064 346,602 0.20
ST Modwen Properties PLC 13,498 GBP 53,682 52,075 0.03
Stagecoach Group PLC 35,158 GBP 137,790 130,296 0.08
Standard Chartered PLC 165,952 GBP 2,085,064 1,598,118 0.94
Standard Life Equity Income Trust PLC 3,601 GBP 15,454 14,908 0.01
Standard Life European Private Equity Trust
PLC 7,631 GBP 15,569 16,712 0.01
Standard Life PLC 198,074 GBP 749,626 792,494 0.47
Standard Life UK Smaller Co. Trust 6,401 GBP 22,098 17,779 0.01
SThree PLC 9,177 GBP 37,188 27,084 0.02
Stobart Group Ltd. 24,924 GBP 32,005 27,229 0.02
Stock Spirits Group PLC 10,590 GBP 31,052 23,298 0.01
SuperGroup PLC 2,664 GBP 44,537 23,710 0.01
SVG Capital PLC 17,066 GBP 73,821 75,466 0.04
Synergy Health PLC 4,530 GBP 62,953 94,224 0.06
Synthomer PLC 22,180 GBP 58,454 52,567 0.03
TalkTalk Telecom Group PLC 43,794 GBP 134,526 133,178 0.08
Tate & Lyle PLC 39,020 GBP 248,265 235,291 0.14
Taylor Wimpey PLC 272,103 GBP 329,699 374,958 0.22
Ted Baker PLC 2,097 GBP 44,888 46,574 0.03
Telecity Group PLC 16,742 GBP 114,160 134,689 0.08
Telecom Plus PLC 4,530 GBP 82,767 57,169 0.03
Temple Bar Investment Trust PLC 4,626 GBP 57,999 55,096 0.03
Templeton Emerging Markets Investment Trust
PLC - O - 26,701 GBP 136,878 146,321 0.09
Tesco PLC 651,501 GBP 2,050,689 1,231,337 0.73
Thomas Cook Group PLC 121,795 GBP 219,372 155,776 0.09
Topps Tiles PLC 13,352 GBP 18,251 15,155 0.01
Town Centre Securities PLC 2,271 GBP 5,669 6,066 0.00
TR European Growth Trust PLC 4,656 GBP 27,527 23,955 0.01
TR Property Investment Trust PLC 25,798 GBP 64,492 73,395 0.04
Travis Perkins PLC 20,538 GBP 384,623 381,391 0.23
Tribal Group PLC 8,704 GBP 17,146 13,992 0.01
Trinity Mirror PLC 21,492 GBP 47,852 34,978 0.02
Troy Income & Growth Trust PLC 22,109 GBP 14,055 14,979 0.01
TSB Banking Group PLC 17,500 GBP 51,327 48,720 0.03
TT electronics PLC 14,563 GBP 32,163 15,073 0.01
Tullett Prebon PLC 17,226 GBP 56,799 48,905 0.03
Tullow Oil PLC 75,777 GBP 595,210 313,641 0.19
Tyman PLC 13,475 GBP 34,801 42,480 0.03
UBM PLC 37,116 GBP 189,687 179,307 0.11
UK Mail Group PLC 2,021 GBP 13,386 9,668 0.01
Ultra Electronics Holdings PLC 5,703 GBP 104,258 102,654 0.06
Unilever PLC 97,783 GBP 2,386,366 2,569,737 1.52
UNITE Group PLC 14,234 GBP 62,966 66,188 0.04
United Utilities Group PLC 56,917 GBP 451,706 521,360 0.31
Utilico Emerging Markets Ltd. 19,809 GBP 35,311 36,201 0.02
189
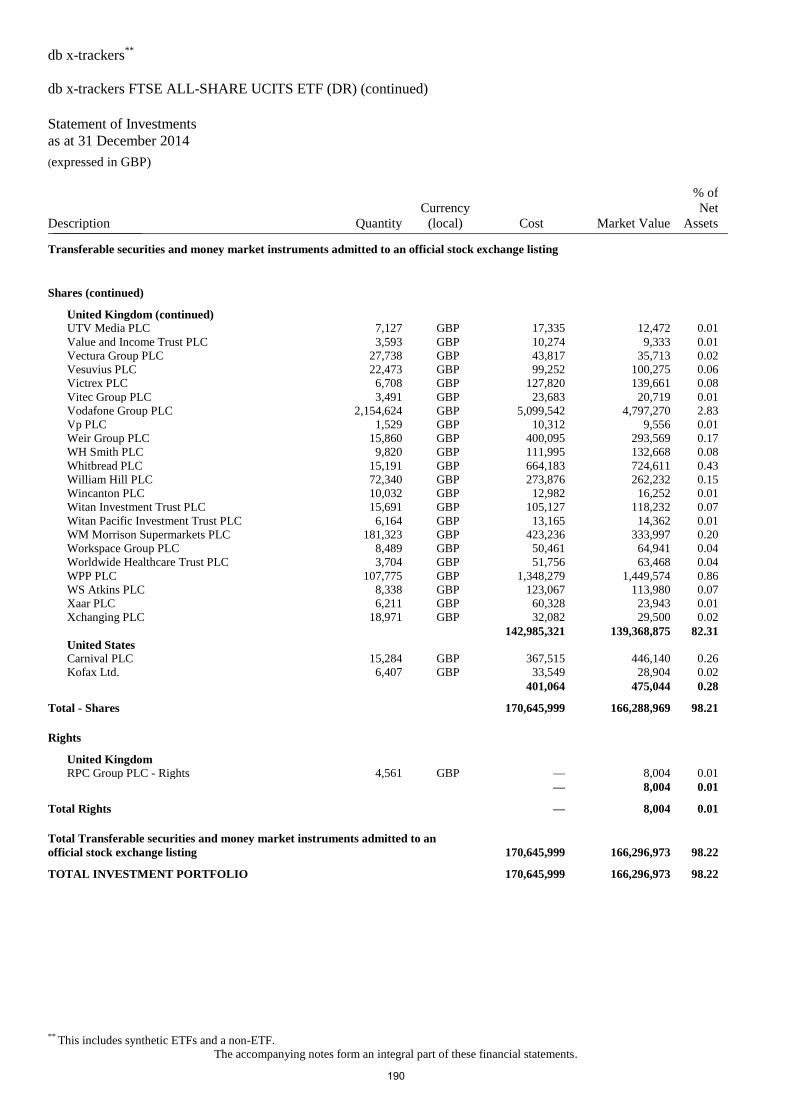
db x-trackers**
db x-trackers FTSE ALL-SHARE UCITS ETF (DR) (continued)
Statement of Investments
as at 31 December 2014 (expressed in GBP)
** This includes synthetic ETFs and a non-ETF.
The accompanying notes form an integral part of these financial statements.
Description Quantity
Currency
(local) Cost Market Value
% of
Net
Assets _______________
Transferable securities and money market instruments admitted to an official stock exchange listing
Shares (continued)
United Kingdom (continued)
UTV Media PLC 7,127 GBP 17,335 12,472 0.01
Value and Income Trust PLC 3,593 GBP 10,274 9,333 0.01
Vectura Group PLC 27,738 GBP 43,817 35,713 0.02
Vesuvius PLC 22,473 GBP 99,252 100,275 0.06
Victrex PLC 6,708 GBP 127,820 139,661 0.08
Vitec Group PLC 3,491 GBP 23,683 20,719 0.01
Vodafone Group PLC 2,154,624 GBP 5,099,542 4,797,270 2.83
Vp PLC 1,529 GBP 10,312 9,556 0.01
Weir Group PLC 15,860 GBP 400,095 293,569 0.17
WH Smith PLC 9,820 GBP 111,995 132,668 0.08
Whitbread PLC 15,191 GBP 664,183 724,611 0.43
William Hill PLC 72,340 GBP 273,876 262,232 0.15
Wincanton PLC 10,032 GBP 12,982 16,252 0.01
Witan Investment Trust PLC 15,691 GBP 105,127 118,232 0.07
Witan Pacific Investment Trust PLC 6,164 GBP 13,165 14,362 0.01
WM Morrison Supermarkets PLC 181,323 GBP 423,236 333,997 0.20
Workspace Group PLC 8,489 GBP 50,461 64,941 0.04
Worldwide Healthcare Trust PLC 3,704 GBP 51,756 63,468 0.04
WPP PLC 107,775 GBP 1,348,279 1,449,574 0.86
WS Atkins PLC 8,338 GBP 123,067 113,980 0.07
Xaar PLC 6,211 GBP 60,328 23,943 0.01
Xchanging PLC 18,971 GBP 32,082 29,500 0.02
142,985,321 139,368,875 82.31
United States
Carnival PLC 15,284 GBP 367,515 446,140 0.26
Kofax Ltd. 6,407 GBP 33,549 28,904 0.02
401,064 475,044 0.28
Total - Shares 170,645,999 166,288,969 98.21
Rights
United Kingdom
RPC Group PLC - Rights 4,561 GBP — 8,004 0.01
— 8,004 0.01
Total Rights — 8,004 0.01
Total Transferable securities and money market instruments admitted to an
official stock exchange listing 170,645,999 166,296,973 98.22
TOTAL INVESTMENT PORTFOLIO 170,645,999 166,296,973 98.22
190
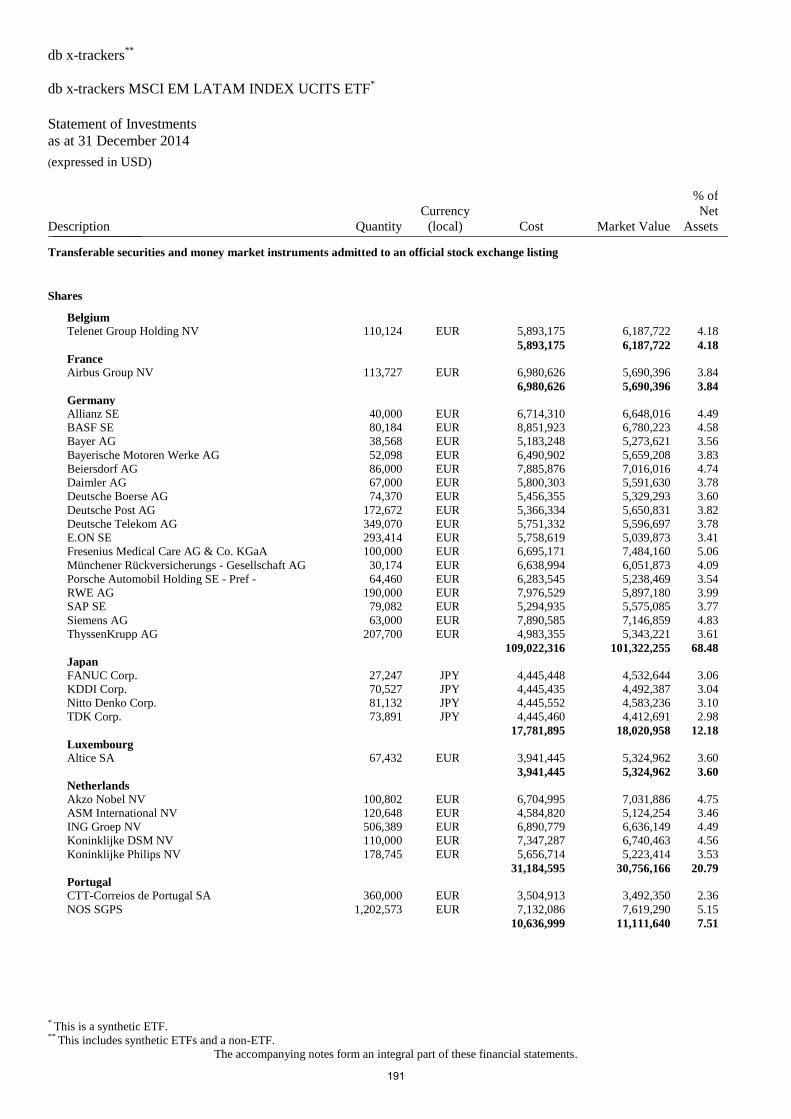
db x-trackers**
db x-trackers MSCI EM LATAM INDEX UCITS ETF*
Statement of Investments
as at 31 December 2014 (expressed in USD)
* This is a synthetic ETF. ** This includes synthetic ETFs and a non-ETF.
The accompanying notes form an integral part of these financial statements.
Description Quantity
Currency
(local) Cost Market Value
% of
Net
Assets _______________
Transferable securities and money market instruments admitted to an official stock exchange listing
Shares
Belgium
Telenet Group Holding NV 110,124 EUR 5,893,175 6,187,722 4.18
5,893,175 6,187,722 4.18
France
Airbus Group NV 113,727 EUR 6,980,626 5,690,396 3.84
6,980,626 5,690,396 3.84
Germany
Allianz SE 40,000 EUR 6,714,310 6,648,016 4.49
BASF SE 80,184 EUR 8,851,923 6,780,223 4.58
Bayer AG 38,568 EUR 5,183,248 5,273,621 3.56
Bayerische Motoren Werke AG 52,098 EUR 6,490,902 5,659,208 3.83
Beiersdorf AG 86,000 EUR 7,885,876 7,016,016 4.74
Daimler AG 67,000 EUR 5,800,303 5,591,630 3.78
Deutsche Boerse AG 74,370 EUR 5,456,355 5,329,293 3.60
Deutsche Post AG 172,672 EUR 5,366,334 5,650,831 3.82
Deutsche Telekom AG 349,070 EUR 5,751,332 5,596,697 3.78
E.ON SE 293,414 EUR 5,758,619 5,039,873 3.41
Fresenius Medical Care AG & Co. KGaA 100,000 EUR 6,695,171 7,484,160 5.06
Münchener Rückversicherungs - Gesellschaft AG 30,174 EUR 6,638,994 6,051,873 4.09
Porsche Automobil Holding SE - Pref - 64,460 EUR 6,283,545 5,238,469 3.54
RWE AG 190,000 EUR 7,976,529 5,897,180 3.99
SAP SE 79,082 EUR 5,294,935 5,575,085 3.77
Siemens AG 63,000 EUR 7,890,585 7,146,859 4.83
ThyssenKrupp AG 207,700 EUR 4,983,355 5,343,221 3.61
109,022,316 101,322,255 68.48
Japan
FANUC Corp. 27,247 JPY 4,445,448 4,532,644 3.06
KDDI Corp. 70,527 JPY 4,445,435 4,492,387 3.04
Nitto Denko Corp. 81,132 JPY 4,445,552 4,583,236 3.10
TDK Corp. 73,891 JPY 4,445,460 4,412,691 2.98
17,781,895 18,020,958 12.18
Luxembourg
Altice SA 67,432 EUR 3,941,445 5,324,962 3.60
3,941,445 5,324,962 3.60
Netherlands
Akzo Nobel NV 100,802 EUR 6,704,995 7,031,886 4.75
ASM International NV 120,648 EUR 4,584,820 5,124,254 3.46
ING Groep NV 506,389 EUR 6,890,779 6,636,149 4.49
Koninklijke DSM NV 110,000 EUR 7,347,287 6,740,463 4.56
Koninklijke Philips NV 178,745 EUR 5,656,714 5,223,414 3.53
31,184,595 30,756,166 20.79
Portugal
CTT-Correios de Portugal SA 360,000 EUR 3,504,913 3,492,350 2.36
NOS SGPS 1,202,573 EUR 7,132,086 7,619,290 5.15
10,636,999 11,111,640 7.51
191
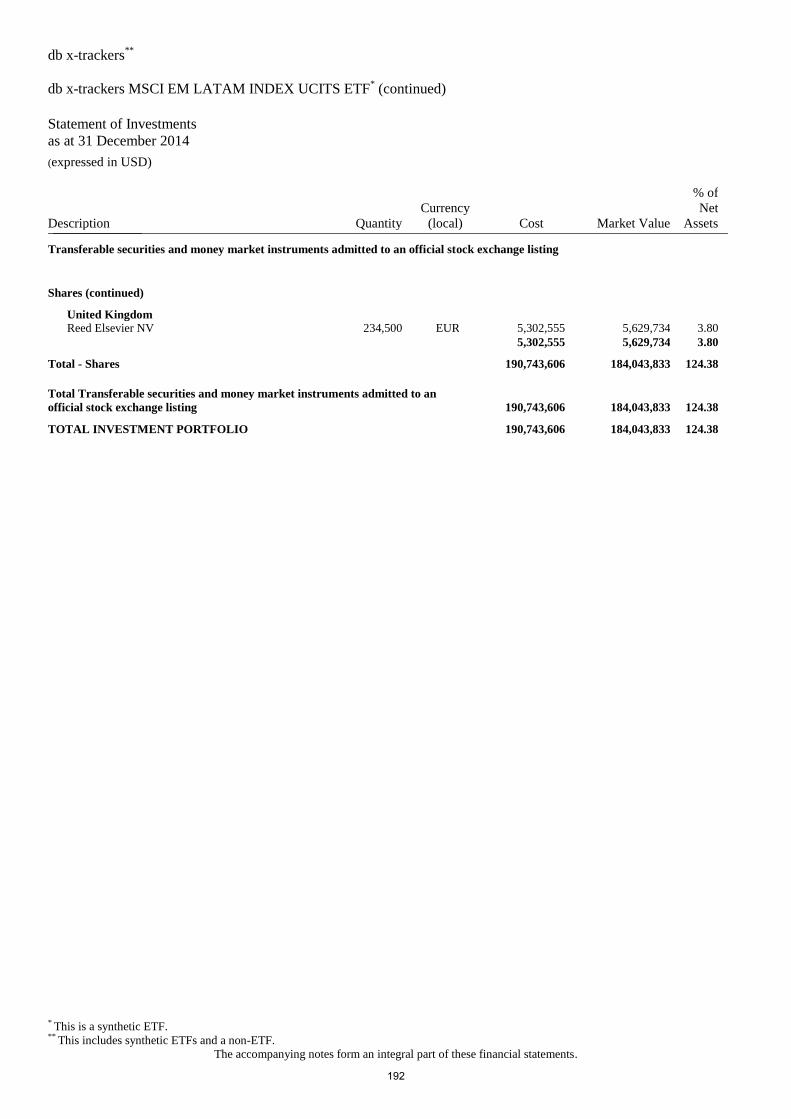
db x-trackers**
db x-trackers MSCI EM LATAM INDEX UCITS ETF* (continued)
Statement of Investments
as at 31 December 2014 (expressed in USD)
* This is a synthetic ETF. ** This includes synthetic ETFs and a non-ETF.
The accompanying notes form an integral part of these financial statements.
Description Quantity
Currency
(local) Cost Market Value
% of
Net
Assets _______________
Transferable securities and money market instruments admitted to an official stock exchange listing
Shares (continued)
United Kingdom
Reed Elsevier NV 234,500 EUR 5,302,555 5,629,734 3.80
5,302,555 5,629,734 3.80
Total - Shares 190,743,606 184,043,833 124.38
Total Transferable securities and money market instruments admitted to an
official stock exchange listing 190,743,606 184,043,833 124.38
TOTAL INVESTMENT PORTFOLIO 190,743,606 184,043,833 124.38
192
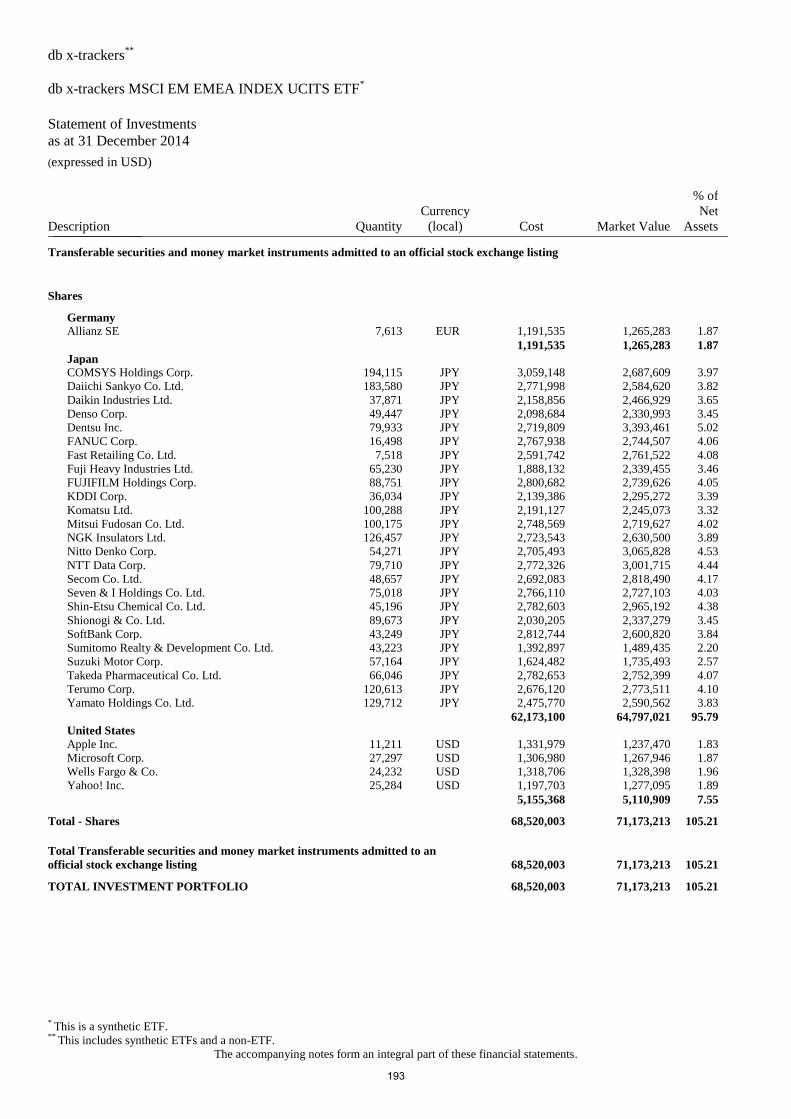
db x-trackers**
db x-trackers MSCI EM EMEA INDEX UCITS ETF*
Statement of Investments
as at 31 December 2014 (expressed in USD)
* This is a synthetic ETF. ** This includes synthetic ETFs and a non-ETF.
The accompanying notes form an integral part of these financial statements.
Description Quantity
Currency
(local) Cost Market Value
% of
Net
Assets _______________
Transferable securities and money market instruments admitted to an official stock exchange listing
Shares
Germany
Allianz SE 7,613 EUR 1,191,535 1,265,283 1.87
1,191,535 1,265,283 1.87
Japan
COMSYS Holdings Corp. 194,115 JPY 3,059,148 2,687,609 3.97
Daiichi Sankyo Co. Ltd. 183,580 JPY 2,771,998 2,584,620 3.82
Daikin Industries Ltd. 37,871 JPY 2,158,856 2,466,929 3.65
Denso Corp. 49,447 JPY 2,098,684 2,330,993 3.45
Dentsu Inc. 79,933 JPY 2,719,809 3,393,461 5.02
FANUC Corp. 16,498 JPY 2,767,938 2,744,507 4.06
Fast Retailing Co. Ltd. 7,518 JPY 2,591,742 2,761,522 4.08
Fuji Heavy Industries Ltd. 65,230 JPY 1,888,132 2,339,455 3.46
FUJIFILM Holdings Corp. 88,751 JPY 2,800,682 2,739,626 4.05
KDDI Corp. 36,034 JPY 2,139,386 2,295,272 3.39
Komatsu Ltd. 100,288 JPY 2,191,127 2,245,073 3.32
Mitsui Fudosan Co. Ltd. 100,175 JPY 2,748,569 2,719,627 4.02
NGK Insulators Ltd. 126,457 JPY 2,723,543 2,630,500 3.89
Nitto Denko Corp. 54,271 JPY 2,705,493 3,065,828 4.53
NTT Data Corp. 79,710 JPY 2,772,326 3,001,715 4.44
Secom Co. Ltd. 48,657 JPY 2,692,083 2,818,490 4.17
Seven & I Holdings Co. Ltd. 75,018 JPY 2,766,110 2,727,103 4.03
Shin-Etsu Chemical Co. Ltd. 45,196 JPY 2,782,603 2,965,192 4.38
Shionogi & Co. Ltd. 89,673 JPY 2,030,205 2,337,279 3.45
SoftBank Corp. 43,249 JPY 2,812,744 2,600,820 3.84
Sumitomo Realty & Development Co. Ltd. 43,223 JPY 1,392,897 1,489,435 2.20
Suzuki Motor Corp. 57,164 JPY 1,624,482 1,735,493 2.57
Takeda Pharmaceutical Co. Ltd. 66,046 JPY 2,782,653 2,752,399 4.07
Terumo Corp. 120,613 JPY 2,676,120 2,773,511 4.10
Yamato Holdings Co. Ltd. 129,712 JPY 2,475,770 2,590,562 3.83
62,173,100 64,797,021 95.79
United States
Apple Inc. 11,211 USD 1,331,979 1,237,470 1.83
Microsoft Corp. 27,297 USD 1,306,980 1,267,946 1.87
Wells Fargo & Co. 24,232 USD 1,318,706 1,328,398 1.96
Yahoo! Inc. 25,284 USD 1,197,703 1,277,095 1.89
5,155,368 5,110,909 7.55
Total - Shares 68,520,003 71,173,213 105.21
Total Transferable securities and money market instruments admitted to an
official stock exchange listing 68,520,003 71,173,213 105.21
TOTAL INVESTMENT PORTFOLIO 68,520,003 71,173,213 105.21
193
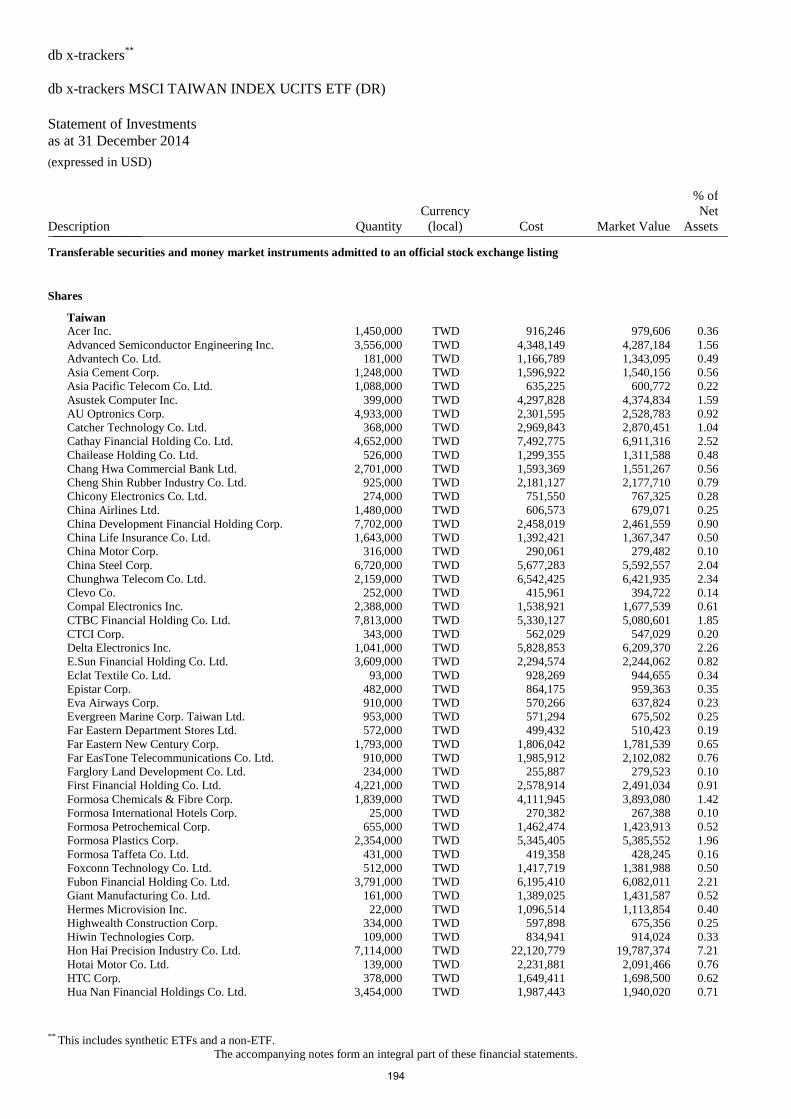
db x-trackers**
db x-trackers MSCI TAIWAN INDEX UCITS ETF (DR)
Statement of Investments
as at 31 December 2014 (expressed in USD)
** This includes synthetic ETFs and a non-ETF.
The accompanying notes form an integral part of these financial statements.
Description Quantity
Currency
(local) Cost Market Value
% of
Net
Assets _______________
Transferable securities and money market instruments admitted to an official stock exchange listing
Shares
Taiwan
Acer Inc. 1,450,000 TWD 916,246 979,606 0.36
Advanced Semiconductor Engineering Inc. 3,556,000 TWD 4,348,149 4,287,184 1.56
Advantech Co. Ltd. 181,000 TWD 1,166,789 1,343,095 0.49
Asia Cement Corp. 1,248,000 TWD 1,596,922 1,540,156 0.56
Asia Pacific Telecom Co. Ltd. 1,088,000 TWD 635,225 600,772 0.22
Asustek Computer Inc. 399,000 TWD 4,297,828 4,374,834 1.59
AU Optronics Corp. 4,933,000 TWD 2,301,595 2,528,783 0.92
Catcher Technology Co. Ltd. 368,000 TWD 2,969,843 2,870,451 1.04
Cathay Financial Holding Co. Ltd. 4,652,000 TWD 7,492,775 6,911,316 2.52
Chailease Holding Co. Ltd. 526,000 TWD 1,299,355 1,311,588 0.48
Chang Hwa Commercial Bank Ltd. 2,701,000 TWD 1,593,369 1,551,267 0.56
Cheng Shin Rubber Industry Co. Ltd. 925,000 TWD 2,181,127 2,177,710 0.79
Chicony Electronics Co. Ltd. 274,000 TWD 751,550 767,325 0.28
China Airlines Ltd. 1,480,000 TWD 606,573 679,071 0.25
China Development Financial Holding Corp. 7,702,000 TWD 2,458,019 2,461,559 0.90
China Life Insurance Co. Ltd. 1,643,000 TWD 1,392,421 1,367,347 0.50
China Motor Corp. 316,000 TWD 290,061 279,482 0.10
China Steel Corp. 6,720,000 TWD 5,677,283 5,592,557 2.04
Chunghwa Telecom Co. Ltd. 2,159,000 TWD 6,542,425 6,421,935 2.34
Clevo Co. 252,000 TWD 415,961 394,722 0.14
Compal Electronics Inc. 2,388,000 TWD 1,538,921 1,677,539 0.61
CTBC Financial Holding Co. Ltd. 7,813,000 TWD 5,330,127 5,080,601 1.85
CTCI Corp. 343,000 TWD 562,029 547,029 0.20
Delta Electronics Inc. 1,041,000 TWD 5,828,853 6,209,370 2.26
E.Sun Financial Holding Co. Ltd. 3,609,000 TWD 2,294,574 2,244,062 0.82
Eclat Textile Co. Ltd. 93,000 TWD 928,269 944,655 0.34
Epistar Corp. 482,000 TWD 864,175 959,363 0.35
Eva Airways Corp. 910,000 TWD 570,266 637,824 0.23
Evergreen Marine Corp. Taiwan Ltd. 953,000 TWD 571,294 675,502 0.25
Far Eastern Department Stores Ltd. 572,000 TWD 499,432 510,423 0.19
Far Eastern New Century Corp. 1,793,000 TWD 1,806,042 1,781,539 0.65
Far EasTone Telecommunications Co. Ltd. 910,000 TWD 1,985,912 2,102,082 0.76
Farglory Land Development Co. Ltd. 234,000 TWD 255,887 279,523 0.10
First Financial Holding Co. Ltd. 4,221,000 TWD 2,578,914 2,491,034 0.91
Formosa Chemicals & Fibre Corp. 1,839,000 TWD 4,111,945 3,893,080 1.42
Formosa International Hotels Corp. 25,000 TWD 270,382 267,388 0.10
Formosa Petrochemical Corp. 655,000 TWD 1,462,474 1,423,913 0.52
Formosa Plastics Corp. 2,354,000 TWD 5,345,405 5,385,552 1.96
Formosa Taffeta Co. Ltd. 431,000 TWD 419,358 428,245 0.16
Foxconn Technology Co. Ltd. 512,000 TWD 1,417,719 1,381,988 0.50
Fubon Financial Holding Co. Ltd. 3,791,000 TWD 6,195,410 6,082,011 2.21
Giant Manufacturing Co. Ltd. 161,000 TWD 1,389,025 1,431,587 0.52
Hermes Microvision Inc. 22,000 TWD 1,096,514 1,113,854 0.40
Highwealth Construction Corp. 334,000 TWD 597,898 675,356 0.25
Hiwin Technologies Corp. 109,000 TWD 834,941 914,024 0.33
Hon Hai Precision Industry Co. Ltd. 7,114,000 TWD 22,120,779 19,787,374 7.21
Hotai Motor Co. Ltd. 139,000 TWD 2,231,881 2,091,466 0.76
HTC Corp. 378,000 TWD 1,649,411 1,698,500 0.62
Hua Nan Financial Holdings Co. Ltd. 3,454,000 TWD 1,987,443 1,940,020 0.71
194
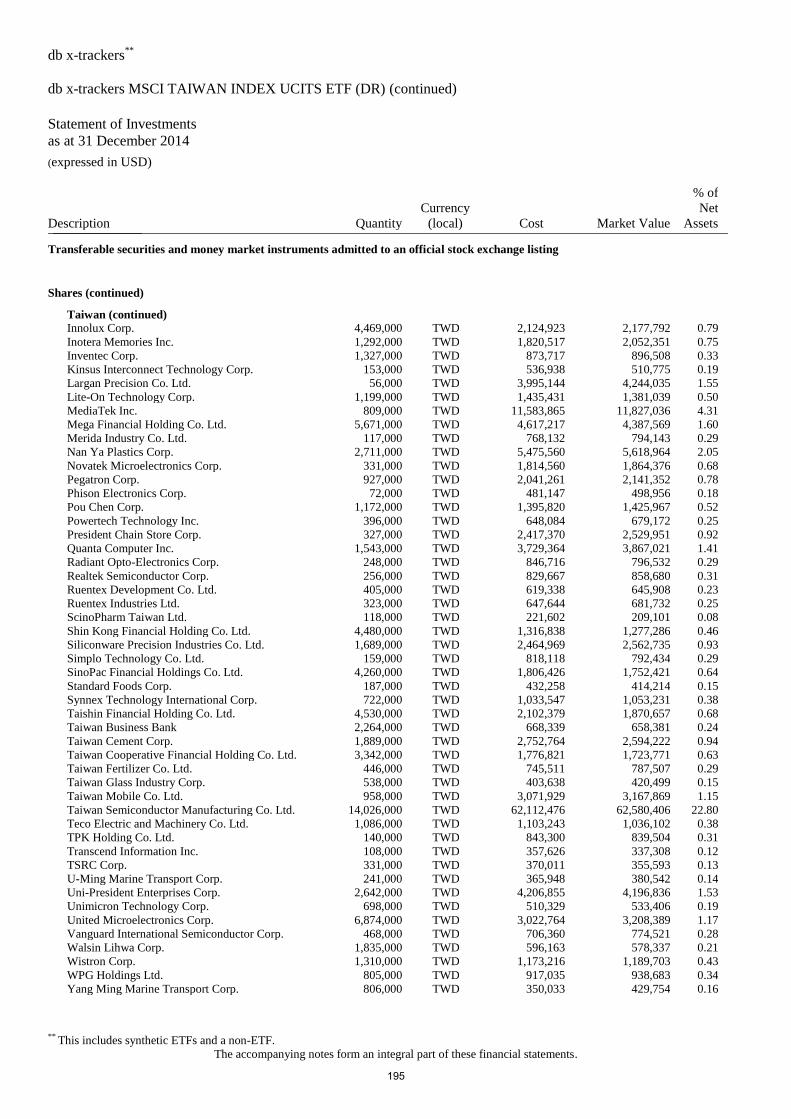
db x-trackers**
db x-trackers MSCI TAIWAN INDEX UCITS ETF (DR) (continued)
Statement of Investments
as at 31 December 2014 (expressed in USD)
** This includes synthetic ETFs and a non-ETF.
The accompanying notes form an integral part of these financial statements.
Description Quantity
Currency
(local) Cost Market Value
% of
Net
Assets _______________
Transferable securities and money market instruments admitted to an official stock exchange listing
Shares (continued)
Taiwan (continued)
Innolux Corp. 4,469,000 TWD 2,124,923 2,177,792 0.79
Inotera Memories Inc. 1,292,000 TWD 1,820,517 2,052,351 0.75
Inventec Corp. 1,327,000 TWD 873,717 896,508 0.33
Kinsus Interconnect Technology Corp. 153,000 TWD 536,938 510,775 0.19
Largan Precision Co. Ltd. 56,000 TWD 3,995,144 4,244,035 1.55
Lite-On Technology Corp. 1,199,000 TWD 1,435,431 1,381,039 0.50
MediaTek Inc. 809,000 TWD 11,583,865 11,827,036 4.31
Mega Financial Holding Co. Ltd. 5,671,000 TWD 4,617,217 4,387,569 1.60
Merida Industry Co. Ltd. 117,000 TWD 768,132 794,143 0.29
Nan Ya Plastics Corp. 2,711,000 TWD 5,475,560 5,618,964 2.05
Novatek Microelectronics Corp. 331,000 TWD 1,814,560 1,864,376 0.68
Pegatron Corp. 927,000 TWD 2,041,261 2,141,352 0.78
Phison Electronics Corp. 72,000 TWD 481,147 498,956 0.18
Pou Chen Corp. 1,172,000 TWD 1,395,820 1,425,967 0.52
Powertech Technology Inc. 396,000 TWD 648,084 679,172 0.25
President Chain Store Corp. 327,000 TWD 2,417,370 2,529,951 0.92
Quanta Computer Inc. 1,543,000 TWD 3,729,364 3,867,021 1.41
Radiant Opto-Electronics Corp. 248,000 TWD 846,716 796,532 0.29
Realtek Semiconductor Corp. 256,000 TWD 829,667 858,680 0.31
Ruentex Development Co. Ltd. 405,000 TWD 619,338 645,908 0.23
Ruentex Industries Ltd. 323,000 TWD 647,644 681,732 0.25
ScinoPharm Taiwan Ltd. 118,000 TWD 221,602 209,101 0.08
Shin Kong Financial Holding Co. Ltd. 4,480,000 TWD 1,316,838 1,277,286 0.46
Siliconware Precision Industries Co. Ltd. 1,689,000 TWD 2,464,969 2,562,735 0.93
Simplo Technology Co. Ltd. 159,000 TWD 818,118 792,434 0.29
SinoPac Financial Holdings Co. Ltd. 4,260,000 TWD 1,806,426 1,752,421 0.64
Standard Foods Corp. 187,000 TWD 432,258 414,214 0.15
Synnex Technology International Corp. 722,000 TWD 1,033,547 1,053,231 0.38
Taishin Financial Holding Co. Ltd. 4,530,000 TWD 2,102,379 1,870,657 0.68
Taiwan Business Bank 2,264,000 TWD 668,339 658,381 0.24
Taiwan Cement Corp. 1,889,000 TWD 2,752,764 2,594,222 0.94
Taiwan Cooperative Financial Holding Co. Ltd. 3,342,000 TWD 1,776,821 1,723,771 0.63
Taiwan Fertilizer Co. Ltd. 446,000 TWD 745,511 787,507 0.29
Taiwan Glass Industry Corp. 538,000 TWD 403,638 420,499 0.15
Taiwan Mobile Co. Ltd. 958,000 TWD 3,071,929 3,167,869 1.15
Taiwan Semiconductor Manufacturing Co. Ltd. 14,026,000 TWD 62,112,476 62,580,406 22.80
Teco Electric and Machinery Co. Ltd. 1,086,000 TWD 1,103,243 1,036,102 0.38
TPK Holding Co. Ltd. 140,000 TWD 843,300 839,504 0.31
Transcend Information Inc. 108,000 TWD 357,626 337,308 0.12
TSRC Corp. 331,000 TWD 370,011 355,593 0.13
U-Ming Marine Transport Corp. 241,000 TWD 365,948 380,542 0.14
Uni-President Enterprises Corp. 2,642,000 TWD 4,206,855 4,196,836 1.53
Unimicron Technology Corp. 698,000 TWD 510,329 533,406 0.19
United Microelectronics Corp. 6,874,000 TWD 3,022,764 3,208,389 1.17
Vanguard International Semiconductor Corp. 468,000 TWD 706,360 774,521 0.28
Walsin Lihwa Corp. 1,835,000 TWD 596,163 578,337 0.21
Wistron Corp. 1,310,000 TWD 1,173,216 1,189,703 0.43
WPG Holdings Ltd. 805,000 TWD 917,035 938,683 0.34
Yang Ming Marine Transport Corp. 806,000 TWD 350,033 429,754 0.16
195
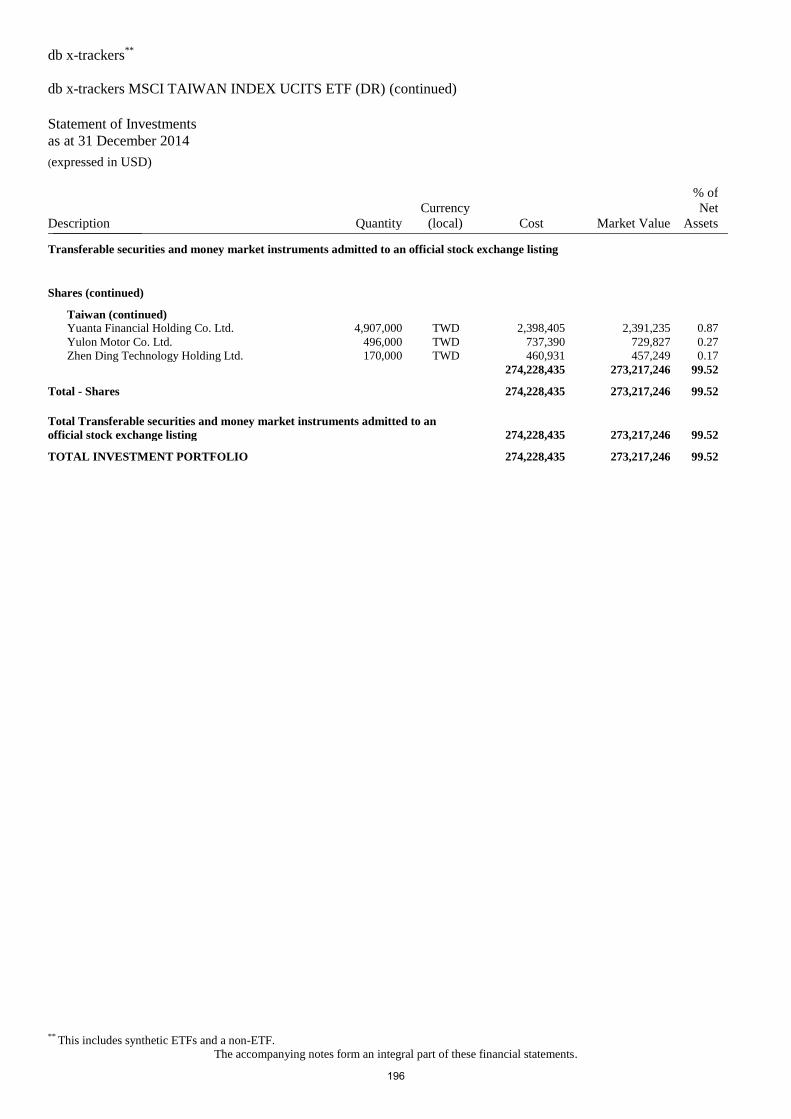
db x-trackers**
db x-trackers MSCI TAIWAN INDEX UCITS ETF (DR) (continued)
Statement of Investments
as at 31 December 2014 (expressed in USD)
** This includes synthetic ETFs and a non-ETF.
The accompanying notes form an integral part of these financial statements.
Description Quantity
Currency
(local) Cost Market Value
% of
Net
Assets _______________
Transferable securities and money market instruments admitted to an official stock exchange listing
Shares (continued)
Taiwan (continued)
Yuanta Financial Holding Co. Ltd. 4,907,000 TWD 2,398,405 2,391,235 0.87
Yulon Motor Co. Ltd. 496,000 TWD 737,390 729,827 0.27
Zhen Ding Technology Holding Ltd. 170,000 TWD 460,931 457,249 0.17
274,228,435 273,217,246 99.52
Total - Shares 274,228,435 273,217,246 99.52
Total Transferable securities and money market instruments admitted to an
official stock exchange listing 274,228,435 273,217,246 99.52
TOTAL INVESTMENT PORTFOLIO 274,228,435 273,217,246 99.52
196
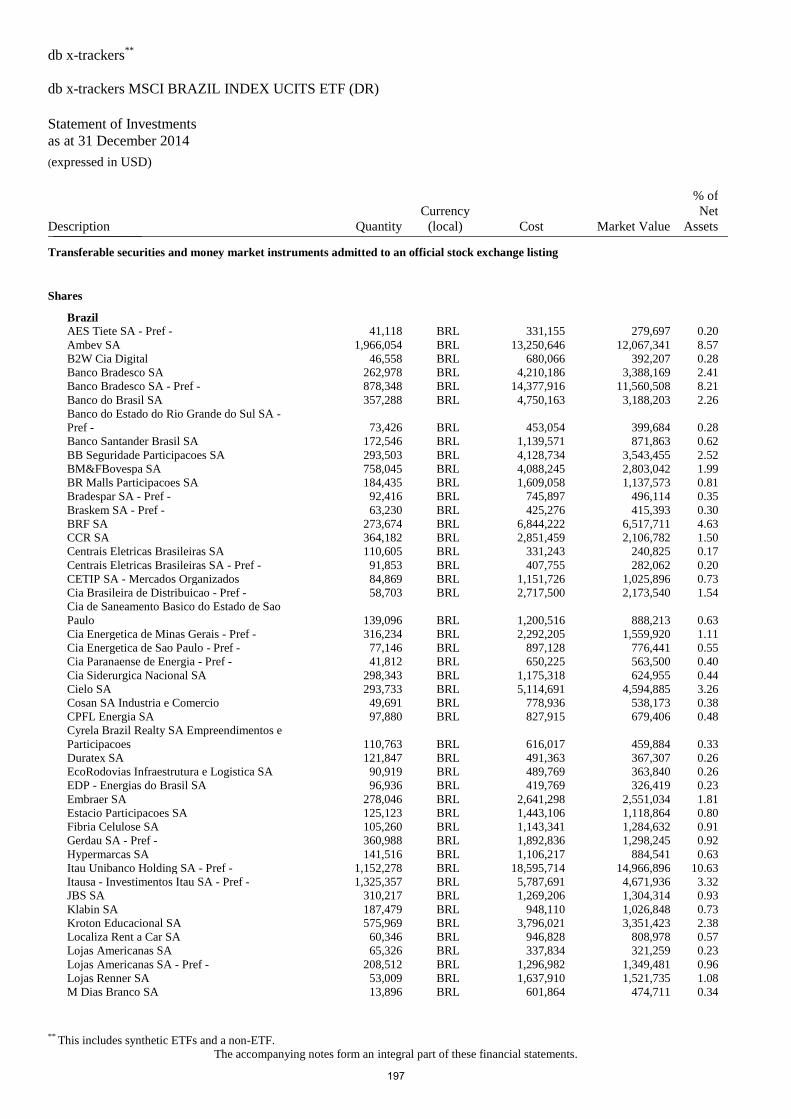
db x-trackers**
db x-trackers MSCI BRAZIL INDEX UCITS ETF (DR)
Statement of Investments
as at 31 December 2014 (expressed in USD)
** This includes synthetic ETFs and a non-ETF.
The accompanying notes form an integral part of these financial statements.
Description Quantity
Currency
(local) Cost Market Value
% of
Net
Assets _______________
Transferable securities and money market instruments admitted to an official stock exchange listing
Shares
Brazil
AES Tiete SA - Pref - 41,118 BRL 331,155 279,697 0.20
Ambev SA 1,966,054 BRL 13,250,646 12,067,341 8.57
B2W Cia Digital 46,558 BRL 680,066 392,207 0.28
Banco Bradesco SA 262,978 BRL 4,210,186 3,388,169 2.41
Banco Bradesco SA - Pref - 878,348 BRL 14,377,916 11,560,508 8.21
Banco do Brasil SA 357,288 BRL 4,750,163 3,188,203 2.26
Banco do Estado do Rio Grande do Sul SA -
Pref - 73,426 BRL 453,054 399,684 0.28
Banco Santander Brasil SA 172,546 BRL 1,139,571 871,863 0.62
BB Seguridade Participacoes SA 293,503 BRL 4,128,734 3,543,455 2.52
BM&FBovespa SA 758,045 BRL 4,088,245 2,803,042 1.99
BR Malls Participacoes SA 184,435 BRL 1,609,058 1,137,573 0.81
Bradespar SA - Pref - 92,416 BRL 745,897 496,114 0.35
Braskem SA - Pref - 63,230 BRL 425,276 415,393 0.30
BRF SA 273,674 BRL 6,844,222 6,517,711 4.63
CCR SA 364,182 BRL 2,851,459 2,106,782 1.50
Centrais Eletricas Brasileiras SA 110,605 BRL 331,243 240,825 0.17
Centrais Eletricas Brasileiras SA - Pref - 91,853 BRL 407,755 282,062 0.20
CETIP SA - Mercados Organizados 84,869 BRL 1,151,726 1,025,896 0.73
Cia Brasileira de Distribuicao - Pref - 58,703 BRL 2,717,500 2,173,540 1.54
Cia de Saneamento Basico do Estado de Sao
Paulo 139,096 BRL 1,200,516 888,213 0.63
Cia Energetica de Minas Gerais - Pref - 316,234 BRL 2,292,205 1,559,920 1.11
Cia Energetica de Sao Paulo - Pref - 77,146 BRL 897,128 776,441 0.55
Cia Paranaense de Energia - Pref - 41,812 BRL 650,225 563,500 0.40
Cia Siderurgica Nacional SA 298,343 BRL 1,175,318 624,955 0.44
Cielo SA 293,733 BRL 5,114,691 4,594,885 3.26
Cosan SA Industria e Comercio 49,691 BRL 778,936 538,173 0.38
CPFL Energia SA 97,880 BRL 827,915 679,406 0.48
Cyrela Brazil Realty SA Empreendimentos e
Participacoes 110,763 BRL 616,017 459,884 0.33
Duratex SA 121,847 BRL 491,363 367,307 0.26
EcoRodovias Infraestrutura e Logistica SA 90,919 BRL 489,769 363,840 0.26
EDP - Energias do Brasil SA 96,936 BRL 419,769 326,419 0.23
Embraer SA 278,046 BRL 2,641,298 2,551,034 1.81
Estacio Participacoes SA 125,123 BRL 1,443,106 1,118,864 0.80
Fibria Celulose SA 105,260 BRL 1,143,341 1,284,632 0.91
Gerdau SA - Pref - 360,988 BRL 1,892,836 1,298,245 0.92
Hypermarcas SA 141,516 BRL 1,106,217 884,541 0.63
Itau Unibanco Holding SA - Pref - 1,152,278 BRL 18,595,714 14,966,896 10.63
Itausa - Investimentos Itau SA - Pref - 1,325,357 BRL 5,787,691 4,671,936 3.32
JBS SA 310,217 BRL 1,269,206 1,304,314 0.93
Klabin SA 187,479 BRL 948,110 1,026,848 0.73
Kroton Educacional SA 575,969 BRL 3,796,021 3,351,423 2.38
Localiza Rent a Car SA 60,346 BRL 946,828 808,978 0.57
Lojas Americanas SA 65,326 BRL 337,834 321,259 0.23
Lojas Americanas SA - Pref - 208,512 BRL 1,296,982 1,349,481 0.96
Lojas Renner SA 53,009 BRL 1,637,910 1,521,735 1.08
M Dias Branco SA 13,896 BRL 601,864 474,711 0.34
197
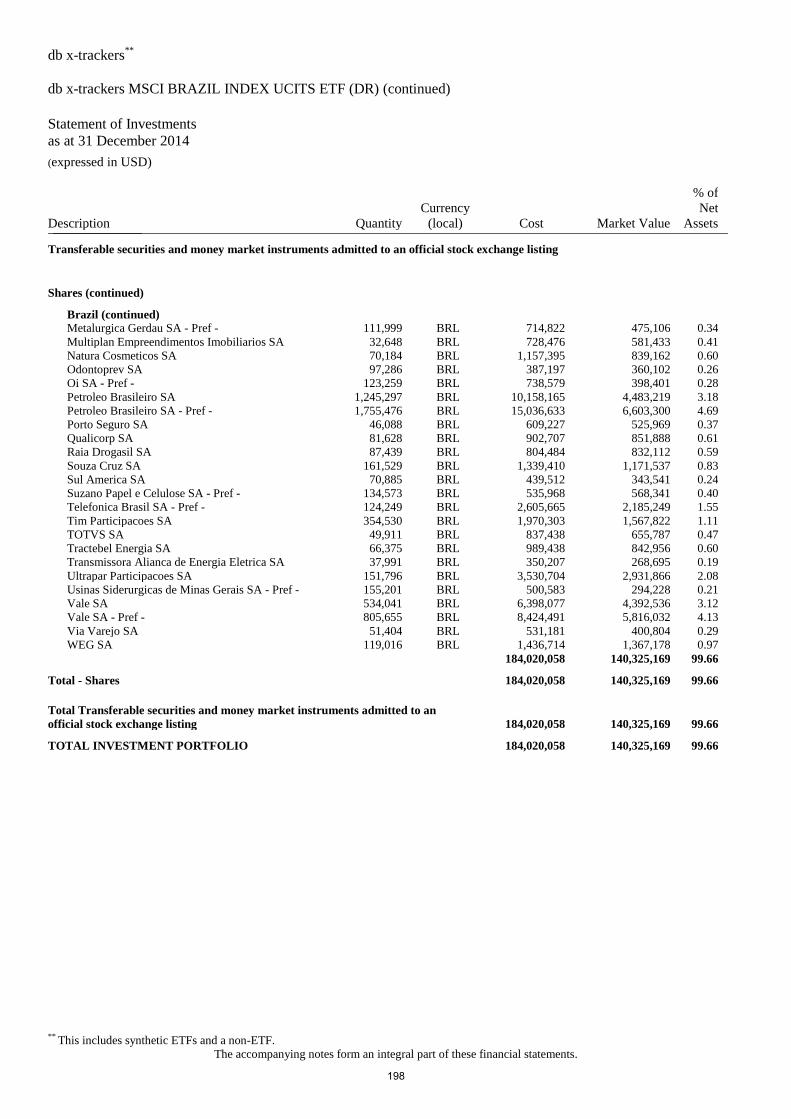
db x-trackers**
db x-trackers MSCI BRAZIL INDEX UCITS ETF (DR) (continued)
Statement of Investments
as at 31 December 2014 (expressed in USD)
** This includes synthetic ETFs and a non-ETF.
The accompanying notes form an integral part of these financial statements.
Description Quantity
Currency
(local) Cost Market Value
% of
Net
Assets _______________
Transferable securities and money market instruments admitted to an official stock exchange listing
Shares (continued)
Brazil (continued)
Metalurgica Gerdau SA - Pref - 111,999 BRL 714,822 475,106 0.34
Multiplan Empreendimentos Imobiliarios SA 32,648 BRL 728,476 581,433 0.41
Natura Cosmeticos SA 70,184 BRL 1,157,395 839,162 0.60
Odontoprev SA 97,286 BRL 387,197 360,102 0.26
Oi SA - Pref - 123,259 BRL 738,579 398,401 0.28
Petroleo Brasileiro SA 1,245,297 BRL 10,158,165 4,483,219 3.18
Petroleo Brasileiro SA - Pref - 1,755,476 BRL 15,036,633 6,603,300 4.69
Porto Seguro SA 46,088 BRL 609,227 525,969 0.37
Qualicorp SA 81,628 BRL 902,707 851,888 0.61
Raia Drogasil SA 87,439 BRL 804,484 832,112 0.59
Souza Cruz SA 161,529 BRL 1,339,410 1,171,537 0.83
Sul America SA 70,885 BRL 439,512 343,541 0.24
Suzano Papel e Celulose SA - Pref - 134,573 BRL 535,968 568,341 0.40
Telefonica Brasil SA - Pref - 124,249 BRL 2,605,665 2,185,249 1.55
Tim Participacoes SA 354,530 BRL 1,970,303 1,567,822 1.11
TOTVS SA 49,911 BRL 837,438 655,787 0.47
Tractebel Energia SA 66,375 BRL 989,438 842,956 0.60
Transmissora Alianca de Energia Eletrica SA 37,991 BRL 350,207 268,695 0.19
Ultrapar Participacoes SA 151,796 BRL 3,530,704 2,931,866 2.08
Usinas Siderurgicas de Minas Gerais SA - Pref - 155,201 BRL 500,583 294,228 0.21
Vale SA 534,041 BRL 6,398,077 4,392,536 3.12
Vale SA - Pref - 805,655 BRL 8,424,491 5,816,032 4.13
Via Varejo SA 51,404 BRL 531,181 400,804 0.29
WEG SA 119,016 BRL 1,436,714 1,367,178 0.97
184,020,058 140,325,169 99.66
Total - Shares 184,020,058 140,325,169 99.66
Total Transferable securities and money market instruments admitted to an
official stock exchange listing 184,020,058 140,325,169 99.66
TOTAL INVESTMENT PORTFOLIO 184,020,058 140,325,169 99.66
198
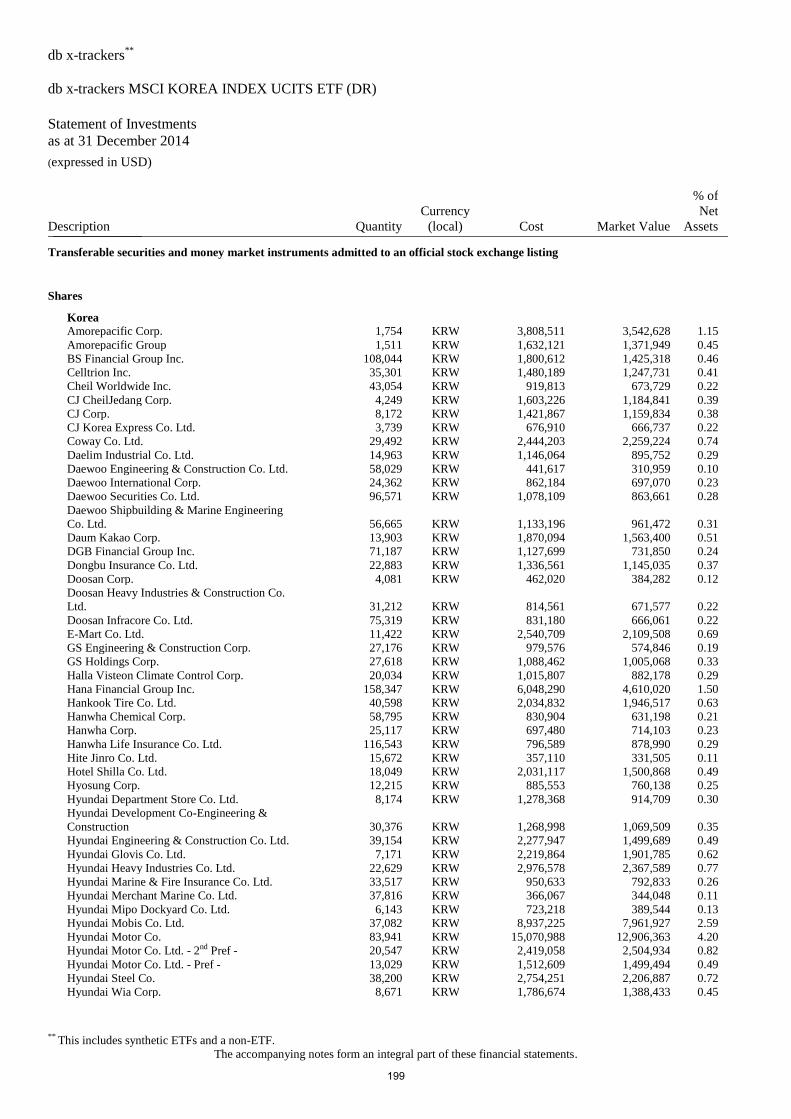
db x-trackers**
db x-trackers MSCI KOREA INDEX UCITS ETF (DR)
Statement of Investments
as at 31 December 2014 (expressed in USD)
** This includes synthetic ETFs and a non-ETF.
The accompanying notes form an integral part of these financial statements.
Description Quantity
Currency
(local) Cost Market Value
% of
Net
Assets _______________
Transferable securities and money market instruments admitted to an official stock exchange listing
Shares
Korea
Amorepacific Corp. 1,754 KRW 3,808,511 3,542,628 1.15
Amorepacific Group 1,511 KRW 1,632,121 1,371,949 0.45
BS Financial Group Inc. 108,044 KRW 1,800,612 1,425,318 0.46
Celltrion Inc. 35,301 KRW 1,480,189 1,247,731 0.41
Cheil Worldwide Inc. 43,054 KRW 919,813 673,729 0.22
CJ CheilJedang Corp. 4,249 KRW 1,603,226 1,184,841 0.39
CJ Corp. 8,172 KRW 1,421,867 1,159,834 0.38
CJ Korea Express Co. Ltd. 3,739 KRW 676,910 666,737 0.22
Coway Co. Ltd. 29,492 KRW 2,444,203 2,259,224 0.74
Daelim Industrial Co. Ltd. 14,963 KRW 1,146,064 895,752 0.29
Daewoo Engineering & Construction Co. Ltd. 58,029 KRW 441,617 310,959 0.10
Daewoo International Corp. 24,362 KRW 862,184 697,070 0.23
Daewoo Securities Co. Ltd. 96,571 KRW 1,078,109 863,661 0.28
Daewoo Shipbuilding & Marine Engineering
Co. Ltd. 56,665 KRW 1,133,196 961,472 0.31
Daum Kakao Corp. 13,903 KRW 1,870,094 1,563,400 0.51
DGB Financial Group Inc. 71,187 KRW 1,127,699 731,850 0.24
Dongbu Insurance Co. Ltd. 22,883 KRW 1,336,561 1,145,035 0.37
Doosan Corp. 4,081 KRW 462,020 384,282 0.12
Doosan Heavy Industries & Construction Co.
Ltd. 31,212 KRW 814,561 671,577 0.22
Doosan Infracore Co. Ltd. 75,319 KRW 831,180 666,061 0.22
E-Mart Co. Ltd. 11,422 KRW 2,540,709 2,109,508 0.69
GS Engineering & Construction Corp. 27,176 KRW 979,576 574,846 0.19
GS Holdings Corp. 27,618 KRW 1,088,462 1,005,068 0.33
Halla Visteon Climate Control Corp. 20,034 KRW 1,015,807 882,178 0.29
Hana Financial Group Inc. 158,347 KRW 6,048,290 4,610,020 1.50
Hankook Tire Co. Ltd. 40,598 KRW 2,034,832 1,946,517 0.63
Hanwha Chemical Corp. 58,795 KRW 830,904 631,198 0.21
Hanwha Corp. 25,117 KRW 697,480 714,103 0.23
Hanwha Life Insurance Co. Ltd. 116,543 KRW 796,589 878,990 0.29
Hite Jinro Co. Ltd. 15,672 KRW 357,110 331,505 0.11
Hotel Shilla Co. Ltd. 18,049 KRW 2,031,117 1,500,868 0.49
Hyosung Corp. 12,215 KRW 885,553 760,138 0.25
Hyundai Department Store Co. Ltd. 8,174 KRW 1,278,368 914,709 0.30
Hyundai Development Co-Engineering &
Construction 30,376 KRW 1,268,998 1,069,509 0.35
Hyundai Engineering & Construction Co. Ltd. 39,154 KRW 2,277,947 1,499,689 0.49
Hyundai Glovis Co. Ltd. 7,171 KRW 2,219,864 1,901,785 0.62
Hyundai Heavy Industries Co. Ltd. 22,629 KRW 2,976,578 2,367,589 0.77
Hyundai Marine & Fire Insurance Co. Ltd. 33,517 KRW 950,633 792,833 0.26
Hyundai Merchant Marine Co. Ltd. 37,816 KRW 366,067 344,048 0.11
Hyundai Mipo Dockyard Co. Ltd. 6,143 KRW 723,218 389,544 0.13
Hyundai Mobis Co. Ltd. 37,082 KRW 8,937,225 7,961,927 2.59
Hyundai Motor Co. 83,941 KRW 15,070,988 12,906,363 4.20
Hyundai Motor Co. Ltd. - 2nd Pref - 20,547 KRW 2,419,058 2,504,934 0.82
Hyundai Motor Co. Ltd. - Pref - 13,029 KRW 1,512,609 1,499,494 0.49
Hyundai Steel Co. 38,200 KRW 2,754,251 2,206,887 0.72
Hyundai Wia Corp. 8,671 KRW 1,786,674 1,388,433 0.45
199
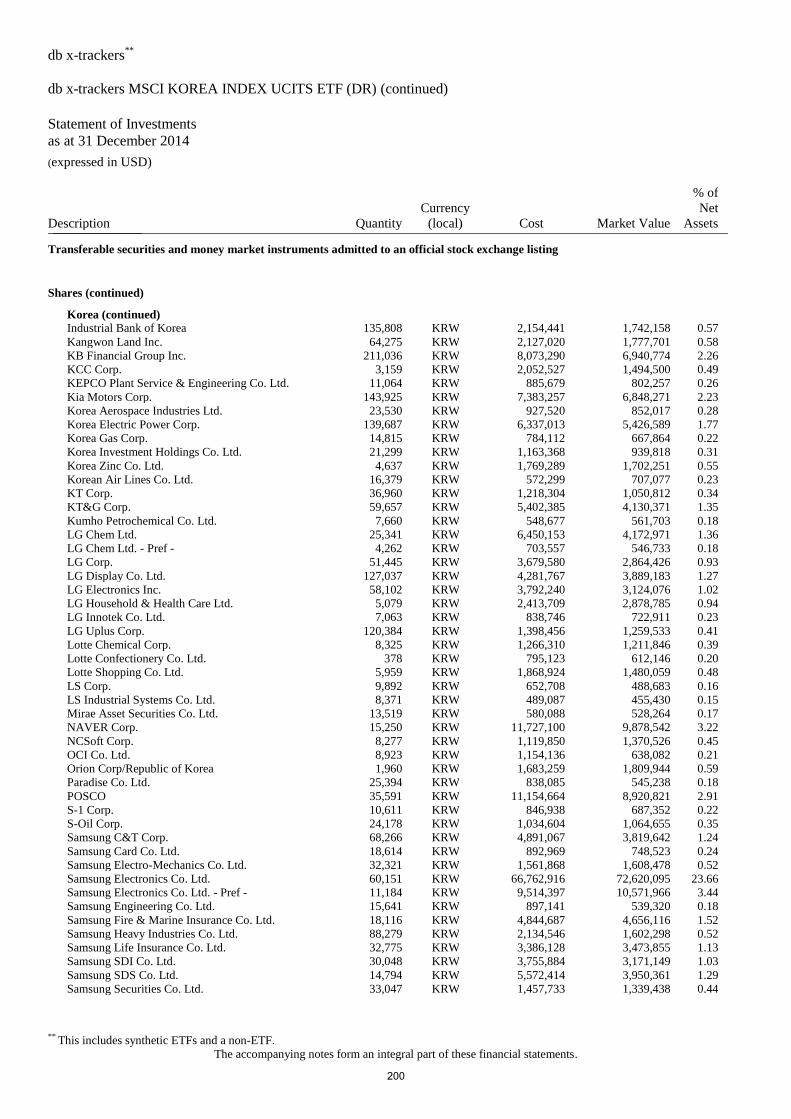
db x-trackers**
db x-trackers MSCI KOREA INDEX UCITS ETF (DR) (continued)
Statement of Investments
as at 31 December 2014 (expressed in USD)
** This includes synthetic ETFs and a non-ETF.
The accompanying notes form an integral part of these financial statements.
Description Quantity
Currency
(local) Cost Market Value
% of
Net
Assets _______________
Transferable securities and money market instruments admitted to an official stock exchange listing
Shares (continued)
Korea (continued)
Industrial Bank of Korea 135,808 KRW 2,154,441 1,742,158 0.57
Kangwon Land Inc. 64,275 KRW 2,127,020 1,777,701 0.58
KB Financial Group Inc. 211,036 KRW 8,073,290 6,940,774 2.26
KCC Corp. 3,159 KRW 2,052,527 1,494,500 0.49
KEPCO Plant Service & Engineering Co. Ltd. 11,064 KRW 885,679 802,257 0.26
Kia Motors Corp. 143,925 KRW 7,383,257 6,848,271 2.23
Korea Aerospace Industries Ltd. 23,530 KRW 927,520 852,017 0.28
Korea Electric Power Corp. 139,687 KRW 6,337,013 5,426,589 1.77
Korea Gas Corp. 14,815 KRW 784,112 667,864 0.22
Korea Investment Holdings Co. Ltd. 21,299 KRW 1,163,368 939,818 0.31
Korea Zinc Co. Ltd. 4,637 KRW 1,769,289 1,702,251 0.55
Korean Air Lines Co. Ltd. 16,379 KRW 572,299 707,077 0.23
KT Corp. 36,960 KRW 1,218,304 1,050,812 0.34
KT&G Corp. 59,657 KRW 5,402,385 4,130,371 1.35
Kumho Petrochemical Co. Ltd. 7,660 KRW 548,677 561,703 0.18
LG Chem Ltd. 25,341 KRW 6,450,153 4,172,971 1.36
LG Chem Ltd. - Pref - 4,262 KRW 703,557 546,733 0.18
LG Corp. 51,445 KRW 3,679,580 2,864,426 0.93
LG Display Co. Ltd. 127,037 KRW 4,281,767 3,889,183 1.27
LG Electronics Inc. 58,102 KRW 3,792,240 3,124,076 1.02
LG Household & Health Care Ltd. 5,079 KRW 2,413,709 2,878,785 0.94
LG Innotek Co. Ltd. 7,063 KRW 838,746 722,911 0.23
LG Uplus Corp. 120,384 KRW 1,398,456 1,259,533 0.41
Lotte Chemical Corp. 8,325 KRW 1,266,310 1,211,846 0.39
Lotte Confectionery Co. Ltd. 378 KRW 795,123 612,146 0.20
Lotte Shopping Co. Ltd. 5,959 KRW 1,868,924 1,480,059 0.48
LS Corp. 9,892 KRW 652,708 488,683 0.16
LS Industrial Systems Co. Ltd. 8,371 KRW 489,087 455,430 0.15
Mirae Asset Securities Co. Ltd. 13,519 KRW 580,088 528,264 0.17
NAVER Corp. 15,250 KRW 11,727,100 9,878,542 3.22
NCSoft Corp. 8,277 KRW 1,119,850 1,370,526 0.45
OCI Co. Ltd. 8,923 KRW 1,154,136 638,082 0.21
Orion Corp/Republic of Korea 1,960 KRW 1,683,259 1,809,944 0.59
Paradise Co. Ltd. 25,394 KRW 838,085 545,238 0.18
POSCO 35,591 KRW 11,154,664 8,920,821 2.91
S-1 Corp. 10,611 KRW 846,938 687,352 0.22
S-Oil Corp. 24,178 KRW 1,034,604 1,064,655 0.35
Samsung C&T Corp. 68,266 KRW 4,891,067 3,819,642 1.24
Samsung Card Co. Ltd. 18,614 KRW 892,969 748,523 0.24
Samsung Electro-Mechanics Co. Ltd. 32,321 KRW 1,561,868 1,608,478 0.52
Samsung Electronics Co. Ltd. 60,151 KRW 66,762,916 72,620,095 23.66
Samsung Electronics Co. Ltd. - Pref - 11,184 KRW 9,514,397 10,571,966 3.44
Samsung Engineering Co. Ltd. 15,641 KRW 897,141 539,320 0.18
Samsung Fire & Marine Insurance Co. Ltd. 18,116 KRW 4,844,687 4,656,116 1.52
Samsung Heavy Industries Co. Ltd. 88,279 KRW 2,134,546 1,602,298 0.52
Samsung Life Insurance Co. Ltd. 32,775 KRW 3,386,128 3,473,855 1.13
Samsung SDI Co. Ltd. 30,048 KRW 3,755,884 3,171,149 1.03
Samsung SDS Co. Ltd. 14,794 KRW 5,572,414 3,950,361 1.29
Samsung Securities Co. Ltd. 33,047 KRW 1,457,733 1,339,438 0.44
200
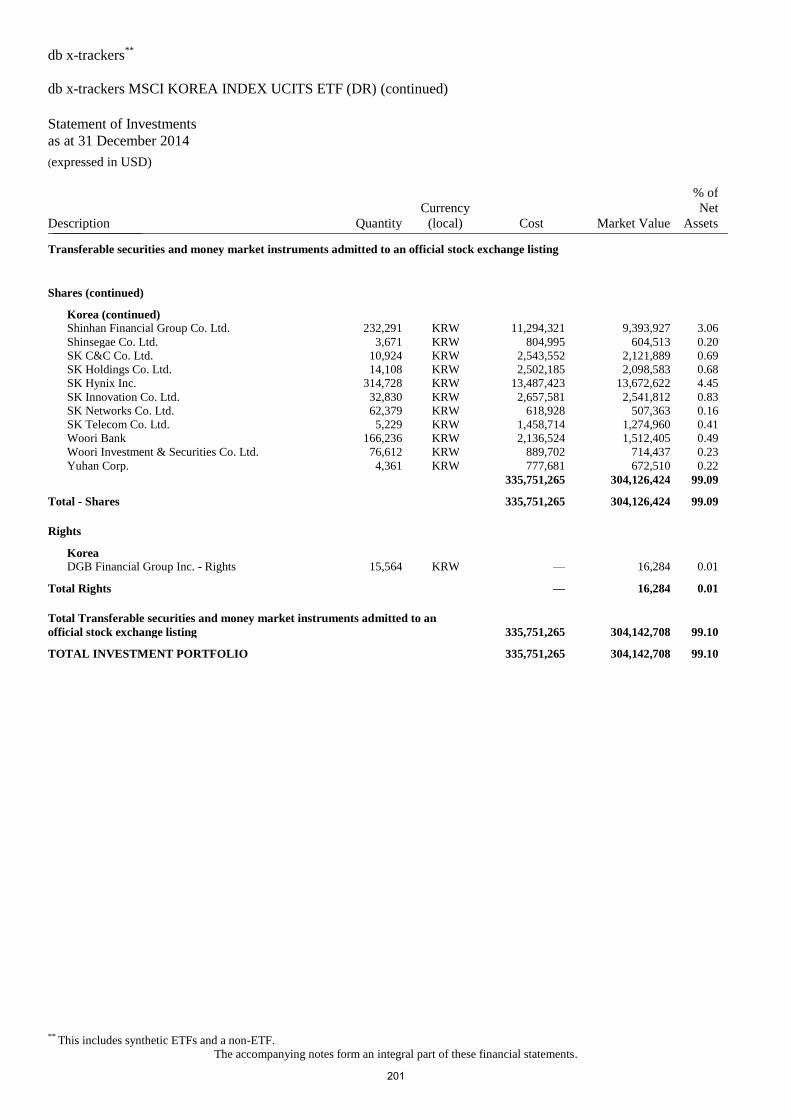
db x-trackers**
db x-trackers MSCI KOREA INDEX UCITS ETF (DR) (continued)
Statement of Investments
as at 31 December 2014 (expressed in USD)
** This includes synthetic ETFs and a non-ETF.
The accompanying notes form an integral part of these financial statements.
Description Quantity
Currency
(local) Cost Market Value
% of
Net
Assets _______________
Transferable securities and money market instruments admitted to an official stock exchange listing
Shares (continued)
Korea (continued)
Shinhan Financial Group Co. Ltd. 232,291 KRW 11,294,321 9,393,927 3.06
Shinsegae Co. Ltd. 3,671 KRW 804,995 604,513 0.20
SK C&C Co. Ltd. 10,924 KRW 2,543,552 2,121,889 0.69
SK Holdings Co. Ltd. 14,108 KRW 2,502,185 2,098,583 0.68
SK Hynix Inc. 314,728 KRW 13,487,423 13,672,622 4.45
SK Innovation Co. Ltd. 32,830 KRW 2,657,581 2,541,812 0.83
SK Networks Co. Ltd. 62,379 KRW 618,928 507,363 0.16
SK Telecom Co. Ltd. 5,229 KRW 1,458,714 1,274,960 0.41
Woori Bank 166,236 KRW 2,136,524 1,512,405 0.49
Woori Investment & Securities Co. Ltd. 76,612 KRW 889,702 714,437 0.23
Yuhan Corp. 4,361 KRW 777,681 672,510 0.22
335,751,265 304,126,424 99.09
Total - Shares 335,751,265 304,126,424 99.09
Rights
Korea
DGB Financial Group Inc. - Rights 15,564 KRW — 16,284 0.01
Total Rights — 16,284 0.01
Total Transferable securities and money market instruments admitted to an
official stock exchange listing 335,751,265 304,142,708 99.10
TOTAL INVESTMENT PORTFOLIO 335,751,265 304,142,708 99.10
201
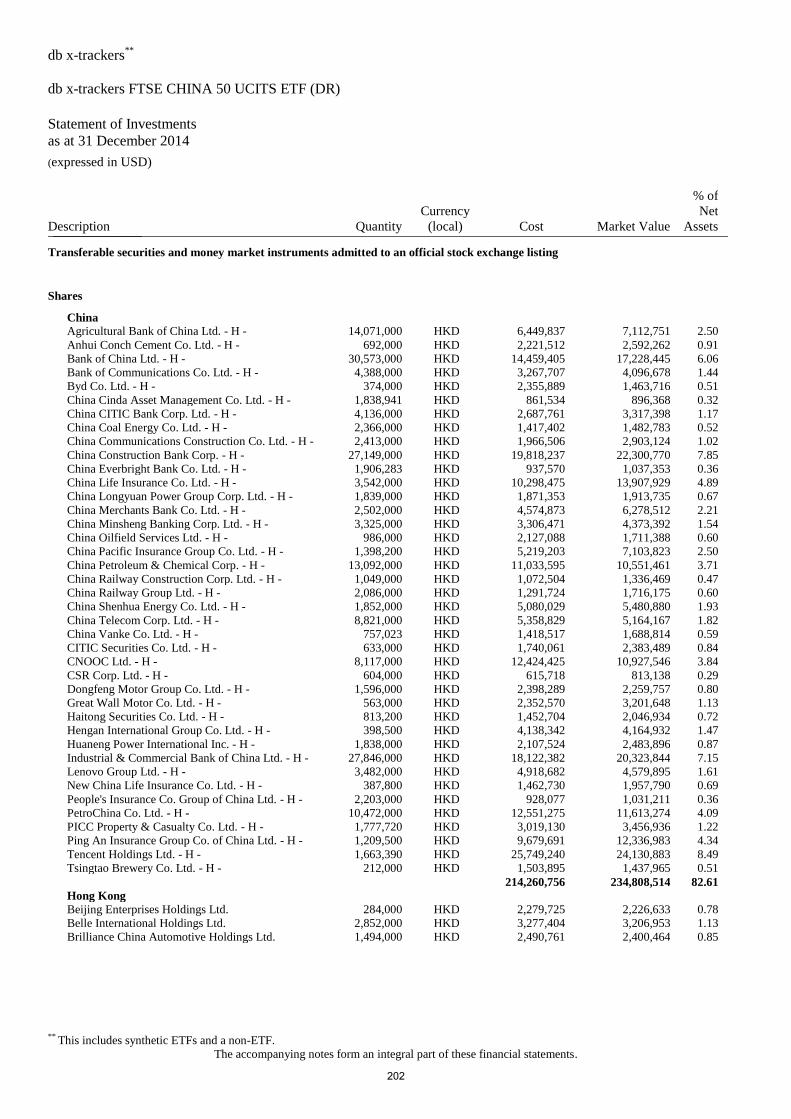
db x-trackers**
db x-trackers FTSE CHINA 50 UCITS ETF (DR)
Statement of Investments
as at 31 December 2014 (expressed in USD)
** This includes synthetic ETFs and a non-ETF.
The accompanying notes form an integral part of these financial statements.
Description Quantity
Currency
(local) Cost Market Value
% of
Net
Assets _______________
Transferable securities and money market instruments admitted to an official stock exchange listing
Shares
China
Agricultural Bank of China Ltd. - H - 14,071,000 HKD 6,449,837 7,112,751 2.50
Anhui Conch Cement Co. Ltd. - H - 692,000 HKD 2,221,512 2,592,262 0.91
Bank of China Ltd. - H - 30,573,000 HKD 14,459,405 17,228,445 6.06
Bank of Communications Co. Ltd. - H - 4,388,000 HKD 3,267,707 4,096,678 1.44
Byd Co. Ltd. - H - 374,000 HKD 2,355,889 1,463,716 0.51
China Cinda Asset Management Co. Ltd. - H - 1,838,941 HKD 861,534 896,368 0.32
China CITIC Bank Corp. Ltd. - H - 4,136,000 HKD 2,687,761 3,317,398 1.17
China Coal Energy Co. Ltd. - H - 2,366,000 HKD 1,417,402 1,482,783 0.52
China Communications Construction Co. Ltd. - H - 2,413,000 HKD 1,966,506 2,903,124 1.02
China Construction Bank Corp. - H - 27,149,000 HKD 19,818,237 22,300,770 7.85
China Everbright Bank Co. Ltd. - H - 1,906,283 HKD 937,570 1,037,353 0.36
China Life Insurance Co. Ltd. - H - 3,542,000 HKD 10,298,475 13,907,929 4.89
China Longyuan Power Group Corp. Ltd. - H - 1,839,000 HKD 1,871,353 1,913,735 0.67
China Merchants Bank Co. Ltd. - H - 2,502,000 HKD 4,574,873 6,278,512 2.21
China Minsheng Banking Corp. Ltd. - H - 3,325,000 HKD 3,306,471 4,373,392 1.54
China Oilfield Services Ltd. - H - 986,000 HKD 2,127,088 1,711,388 0.60
China Pacific Insurance Group Co. Ltd. - H - 1,398,200 HKD 5,219,203 7,103,823 2.50
China Petroleum & Chemical Corp. - H - 13,092,000 HKD 11,033,595 10,551,461 3.71
China Railway Construction Corp. Ltd. - H - 1,049,000 HKD 1,072,504 1,336,469 0.47
China Railway Group Ltd. - H - 2,086,000 HKD 1,291,724 1,716,175 0.60
China Shenhua Energy Co. Ltd. - H - 1,852,000 HKD 5,080,029 5,480,880 1.93
China Telecom Corp. Ltd. - H - 8,821,000 HKD 5,358,829 5,164,167 1.82
China Vanke Co. Ltd. - H - 757,023 HKD 1,418,517 1,688,814 0.59
CITIC Securities Co. Ltd. - H - 633,000 HKD 1,740,061 2,383,489 0.84
CNOOC Ltd. - H - 8,117,000 HKD 12,424,425 10,927,546 3.84
CSR Corp. Ltd. - H - 604,000 HKD 615,718 813,138 0.29
Dongfeng Motor Group Co. Ltd. - H - 1,596,000 HKD 2,398,289 2,259,757 0.80
Great Wall Motor Co. Ltd. - H - 563,000 HKD 2,352,570 3,201,648 1.13
Haitong Securities Co. Ltd. - H - 813,200 HKD 1,452,704 2,046,934 0.72
Hengan International Group Co. Ltd. - H - 398,500 HKD 4,138,342 4,164,932 1.47
Huaneng Power International Inc. - H - 1,838,000 HKD 2,107,524 2,483,896 0.87
Industrial & Commercial Bank of China Ltd. - H - 27,846,000 HKD 18,122,382 20,323,844 7.15
Lenovo Group Ltd. - H - 3,482,000 HKD 4,918,682 4,579,895 1.61
New China Life Insurance Co. Ltd. - H - 387,800 HKD 1,462,730 1,957,790 0.69
People's Insurance Co. Group of China Ltd. - H - 2,203,000 HKD 928,077 1,031,211 0.36
PetroChina Co. Ltd. - H - 10,472,000 HKD 12,551,275 11,613,274 4.09
PICC Property & Casualty Co. Ltd. - H - 1,777,720 HKD 3,019,130 3,456,936 1.22
Ping An Insurance Group Co. of China Ltd. - H - 1,209,500 HKD 9,679,691 12,336,983 4.34
Tencent Holdings Ltd. - H - 1,663,390 HKD 25,749,240 24,130,883 8.49
Tsingtao Brewery Co. Ltd. - H - 212,000 HKD 1,503,895 1,437,965 0.51
214,260,756 234,808,514 82.61
Hong Kong
Beijing Enterprises Holdings Ltd. 284,000 HKD 2,279,725 2,226,633 0.78
Belle International Holdings Ltd. 2,852,000 HKD 3,277,404 3,206,953 1.13
Brilliance China Automotive Holdings Ltd. 1,494,000 HKD 2,490,761 2,400,464 0.85
202
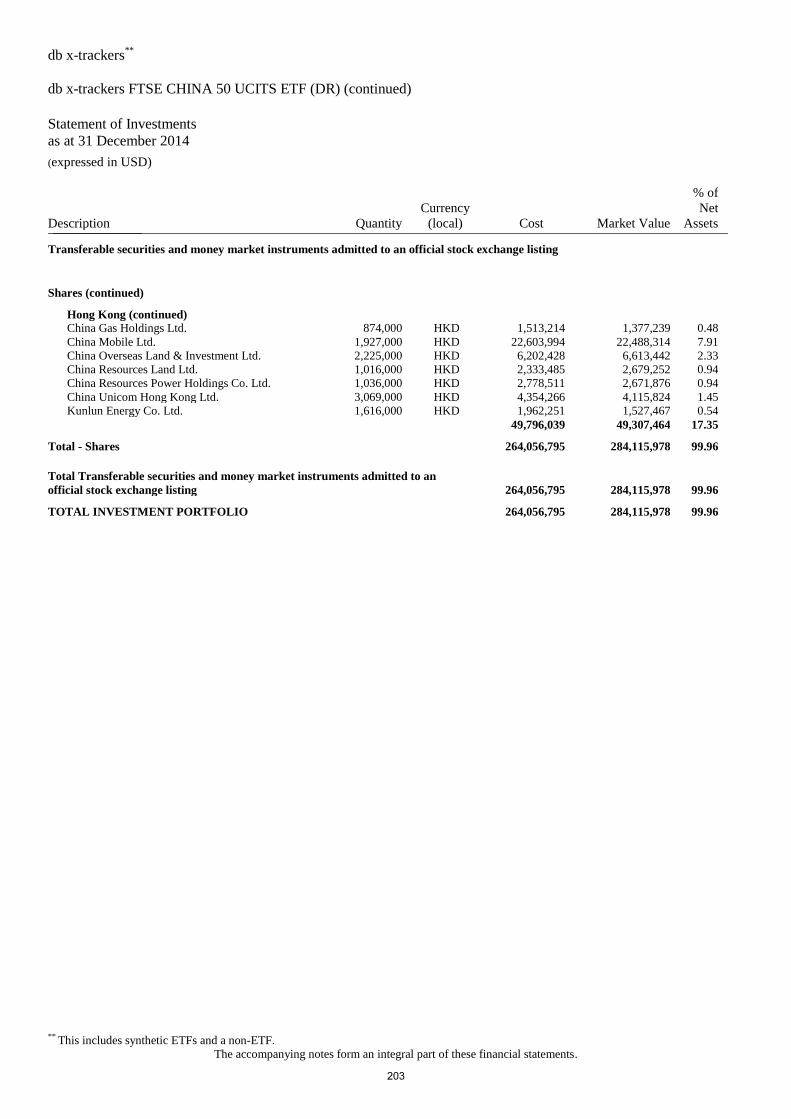
db x-trackers**
db x-trackers FTSE CHINA 50 UCITS ETF (DR) (continued)
Statement of Investments
as at 31 December 2014 (expressed in USD)
** This includes synthetic ETFs and a non-ETF.
The accompanying notes form an integral part of these financial statements.
Description Quantity
Currency
(local) Cost Market Value
% of
Net
Assets _______________
Transferable securities and money market instruments admitted to an official stock exchange listing
Shares (continued)
Hong Kong (continued)
China Gas Holdings Ltd. 874,000 HKD 1,513,214 1,377,239 0.48
China Mobile Ltd. 1,927,000 HKD 22,603,994 22,488,314 7.91
China Overseas Land & Investment Ltd. 2,225,000 HKD 6,202,428 6,613,442 2.33
China Resources Land Ltd. 1,016,000 HKD 2,333,485 2,679,252 0.94
China Resources Power Holdings Co. Ltd. 1,036,000 HKD 2,778,511 2,671,876 0.94
China Unicom Hong Kong Ltd. 3,069,000 HKD 4,354,266 4,115,824 1.45
Kunlun Energy Co. Ltd. 1,616,000 HKD 1,962,251 1,527,467 0.54
49,796,039 49,307,464 17.35
Total - Shares 264,056,795 284,115,978 99.96
Total Transferable securities and money market instruments admitted to an
official stock exchange listing 264,056,795 284,115,978 99.96
TOTAL INVESTMENT PORTFOLIO 264,056,795 284,115,978 99.96
203
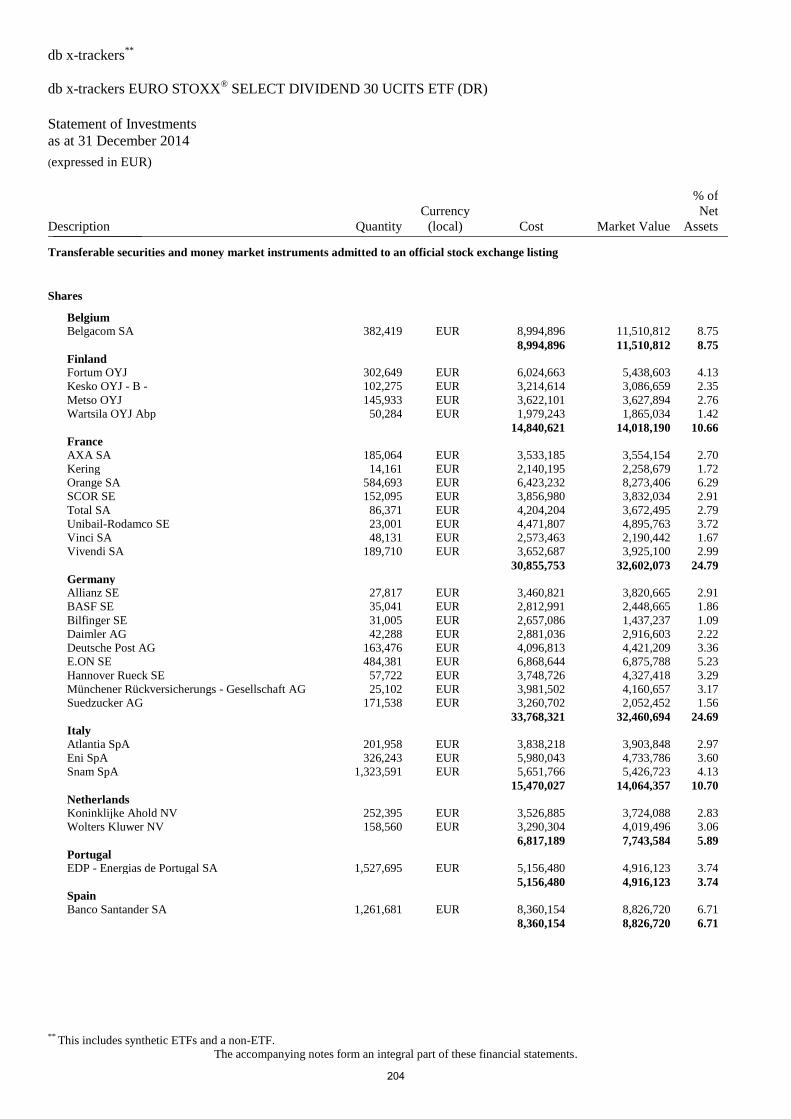
db x-trackers**
db x-trackers EURO STOXX® SELECT DIVIDEND 30 UCITS ETF (DR)
Statement of Investments
as at 31 December 2014 (expressed in EUR)
** This includes synthetic ETFs and a non-ETF.
The accompanying notes form an integral part of these financial statements.
Description Quantity
Currency
(local) Cost Market Value
% of
Net
Assets _______________
Transferable securities and money market instruments admitted to an official stock exchange listing
Shares
Belgium
Belgacom SA 382,419 EUR 8,994,896 11,510,812 8.75
8,994,896 11,510,812 8.75
Finland
Fortum OYJ 302,649 EUR 6,024,663 5,438,603 4.13
Kesko OYJ - B - 102,275 EUR 3,214,614 3,086,659 2.35
Metso OYJ 145,933 EUR 3,622,101 3,627,894 2.76
Wartsila OYJ Abp 50,284 EUR 1,979,243 1,865,034 1.42
14,840,621 14,018,190 10.66
France
AXA SA 185,064 EUR 3,533,185 3,554,154 2.70
Kering 14,161 EUR 2,140,195 2,258,679 1.72
Orange SA 584,693 EUR 6,423,232 8,273,406 6.29
SCOR SE 152,095 EUR 3,856,980 3,832,034 2.91
Total SA 86,371 EUR 4,204,204 3,672,495 2.79
Unibail-Rodamco SE 23,001 EUR 4,471,807 4,895,763 3.72
Vinci SA 48,131 EUR 2,573,463 2,190,442 1.67
Vivendi SA 189,710 EUR 3,652,687 3,925,100 2.99
30,855,753 32,602,073 24.79
Germany
Allianz SE 27,817 EUR 3,460,821 3,820,665 2.91
BASF SE 35,041 EUR 2,812,991 2,448,665 1.86
Bilfinger SE 31,005 EUR 2,657,086 1,437,237 1.09
Daimler AG 42,288 EUR 2,881,036 2,916,603 2.22
Deutsche Post AG 163,476 EUR 4,096,813 4,421,209 3.36
E.ON SE 484,381 EUR 6,868,644 6,875,788 5.23
Hannover Rueck SE 57,722 EUR 3,748,726 4,327,418 3.29
Münchener Rückversicherungs - Gesellschaft AG 25,102 EUR 3,981,502 4,160,657 3.17
Suedzucker AG 171,538 EUR 3,260,702 2,052,452 1.56
33,768,321 32,460,694 24.69
Italy
Atlantia SpA 201,958 EUR 3,838,218 3,903,848 2.97
Eni SpA 326,243 EUR 5,980,043 4,733,786 3.60
Snam SpA 1,323,591 EUR 5,651,766 5,426,723 4.13
15,470,027 14,064,357 10.70
Netherlands
Koninklijke Ahold NV 252,395 EUR 3,526,885 3,724,088 2.83
Wolters Kluwer NV 158,560 EUR 3,290,304 4,019,496 3.06
6,817,189 7,743,584 5.89
Portugal
EDP - Energias de Portugal SA 1,527,695 EUR 5,156,480 4,916,123 3.74
5,156,480 4,916,123 3.74
Spain
Banco Santander SA 1,261,681 EUR 8,360,154 8,826,720 6.71
8,360,154 8,826,720 6.71
204
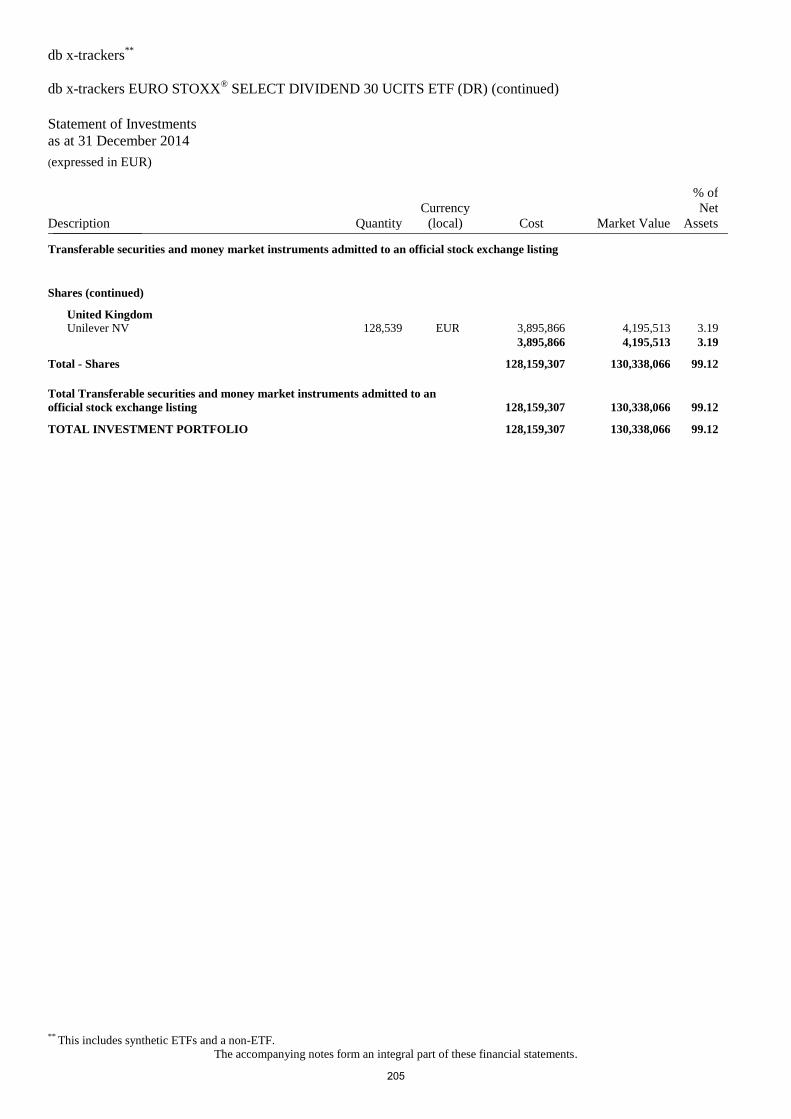
db x-trackers**
db x-trackers EURO STOXX® SELECT DIVIDEND 30 UCITS ETF (DR) (continued)
Statement of Investments
as at 31 December 2014 (expressed in EUR)
** This includes synthetic ETFs and a non-ETF.
The accompanying notes form an integral part of these financial statements.
Description Quantity
Currency
(local) Cost Market Value
% of
Net
Assets _______________
Transferable securities and money market instruments admitted to an official stock exchange listing
Shares (continued)
United Kingdom
Unilever NV 128,539 EUR 3,895,866 4,195,513 3.19
3,895,866 4,195,513 3.19
Total - Shares 128,159,307 130,338,066 99.12
Total Transferable securities and money market instruments admitted to an
official stock exchange listing 128,159,307 130,338,066 99.12
TOTAL INVESTMENT PORTFOLIO 128,159,307 130,338,066 99.12
205
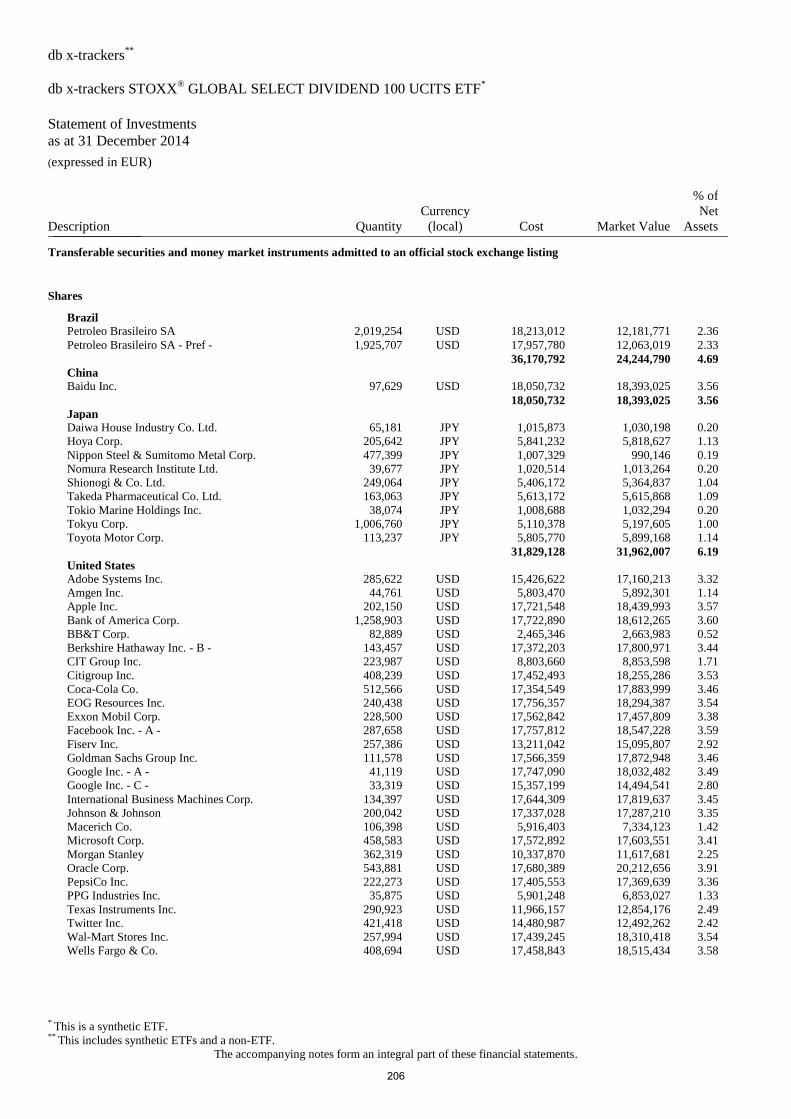
db x-trackers**
db x-trackers STOXX® GLOBAL SELECT DIVIDEND 100 UCITS ETF
*
Statement of Investments
as at 31 December 2014 (expressed in EUR)
* This is a synthetic ETF. ** This includes synthetic ETFs and a non-ETF.
The accompanying notes form an integral part of these financial statements.
Description Quantity
Currency
(local) Cost Market Value
% of
Net
Assets _______________
Transferable securities and money market instruments admitted to an official stock exchange listing
Shares
Brazil
Petroleo Brasileiro SA 2,019,254 USD 18,213,012 12,181,771 2.36
Petroleo Brasileiro SA - Pref - 1,925,707 USD 17,957,780 12,063,019 2.33
36,170,792 24,244,790 4.69
China
Baidu Inc. 97,629 USD 18,050,732 18,393,025 3.56
18,050,732 18,393,025 3.56
Japan
Daiwa House Industry Co. Ltd. 65,181 JPY 1,015,873 1,030,198 0.20
Hoya Corp. 205,642 JPY 5,841,232 5,818,627 1.13
Nippon Steel & Sumitomo Metal Corp. 477,399 JPY 1,007,329 990,146 0.19
Nomura Research Institute Ltd. 39,677 JPY 1,020,514 1,013,264 0.20
Shionogi & Co. Ltd. 249,064 JPY 5,406,172 5,364,837 1.04
Takeda Pharmaceutical Co. Ltd. 163,063 JPY 5,613,172 5,615,868 1.09
Tokio Marine Holdings Inc. 38,074 JPY 1,008,688 1,032,294 0.20
Tokyu Corp. 1,006,760 JPY 5,110,378 5,197,605 1.00
Toyota Motor Corp. 113,237 JPY 5,805,770 5,899,168 1.14
31,829,128 31,962,007 6.19
United States
Adobe Systems Inc. 285,622 USD 15,426,622 17,160,213 3.32
Amgen Inc. 44,761 USD 5,803,470 5,892,301 1.14
Apple Inc. 202,150 USD 17,721,548 18,439,993 3.57
Bank of America Corp. 1,258,903 USD 17,722,890 18,612,265 3.60
BB&T Corp. 82,889 USD 2,465,346 2,663,983 0.52
Berkshire Hathaway Inc. - B - 143,457 USD 17,372,203 17,800,971 3.44
CIT Group Inc. 223,987 USD 8,803,660 8,853,598 1.71
Citigroup Inc. 408,239 USD 17,452,493 18,255,286 3.53
Coca-Cola Co. 512,566 USD 17,354,549 17,883,999 3.46
EOG Resources Inc. 240,438 USD 17,756,357 18,294,387 3.54
Exxon Mobil Corp. 228,500 USD 17,562,842 17,457,809 3.38
Facebook Inc. - A - 287,658 USD 17,757,812 18,547,228 3.59
Fiserv Inc. 257,386 USD 13,211,042 15,095,807 2.92
Goldman Sachs Group Inc. 111,578 USD 17,566,359 17,872,948 3.46
Google Inc. - A - 41,119 USD 17,747,090 18,032,482 3.49
Google Inc. - C - 33,319 USD 15,357,199 14,494,541 2.80
International Business Machines Corp. 134,397 USD 17,644,309 17,819,637 3.45
Johnson & Johnson 200,042 USD 17,337,028 17,287,210 3.35
Macerich Co. 106,398 USD 5,916,403 7,334,123 1.42
Microsoft Corp. 458,583 USD 17,572,892 17,603,551 3.41
Morgan Stanley 362,319 USD 10,337,870 11,617,681 2.25
Oracle Corp. 543,881 USD 17,680,389 20,212,656 3.91
PepsiCo Inc. 222,273 USD 17,405,553 17,369,639 3.36
PPG Industries Inc. 35,875 USD 5,901,248 6,853,027 1.33
Texas Instruments Inc. 290,923 USD 11,966,157 12,854,176 2.49
Twitter Inc. 421,418 USD 14,480,987 12,492,262 2.42
Wal-Mart Stores Inc. 257,994 USD 17,439,245 18,310,418 3.54
Wells Fargo & Co. 408,694 USD 17,458,843 18,515,434 3.58
206
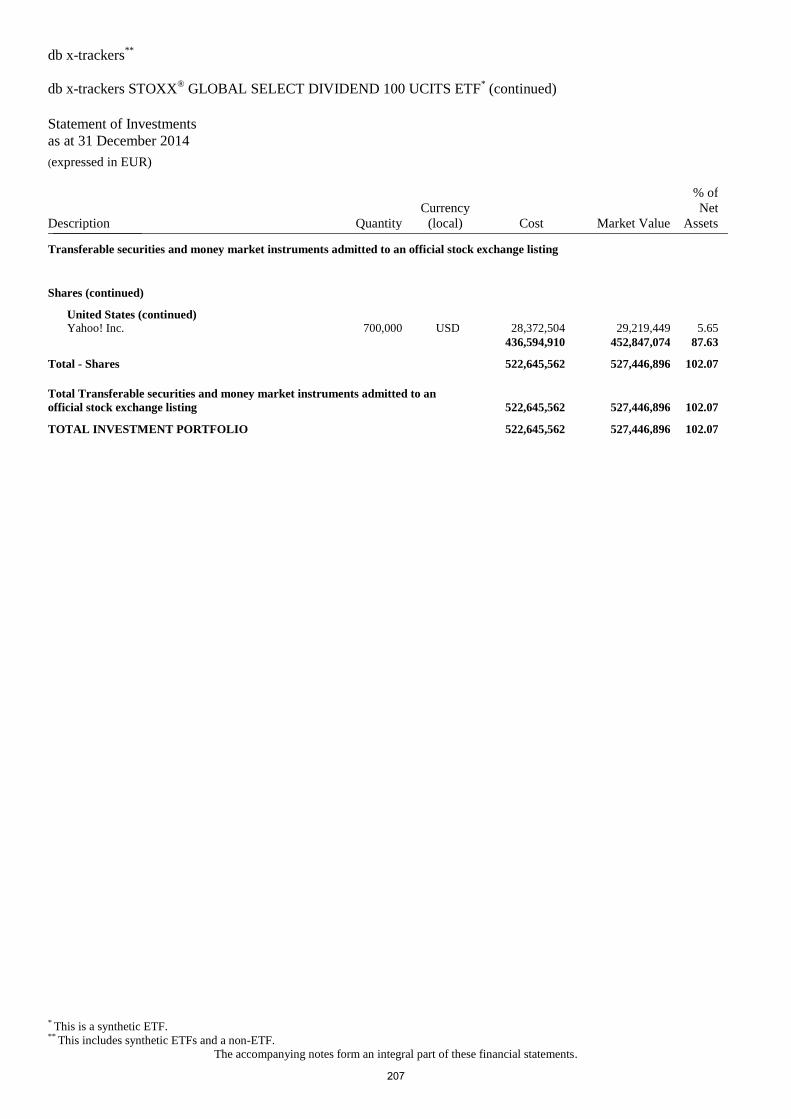
db x-trackers**
db x-trackers STOXX® GLOBAL SELECT DIVIDEND 100 UCITS ETF
* (continued)
Statement of Investments
as at 31 December 2014 (expressed in EUR)
* This is a synthetic ETF. ** This includes synthetic ETFs and a non-ETF.
The accompanying notes form an integral part of these financial statements.
Description Quantity
Currency
(local) Cost Market Value
% of
Net
Assets _______________
Transferable securities and money market instruments admitted to an official stock exchange listing
Shares (continued)
United States (continued)
Yahoo! Inc. 700,000 USD 28,372,504 29,219,449 5.65
436,594,910 452,847,074 87.63
Total - Shares 522,645,562 527,446,896 102.07
Total Transferable securities and money market instruments admitted to an
official stock exchange listing 522,645,562 527,446,896 102.07
TOTAL INVESTMENT PORTFOLIO 522,645,562 527,446,896 102.07
207
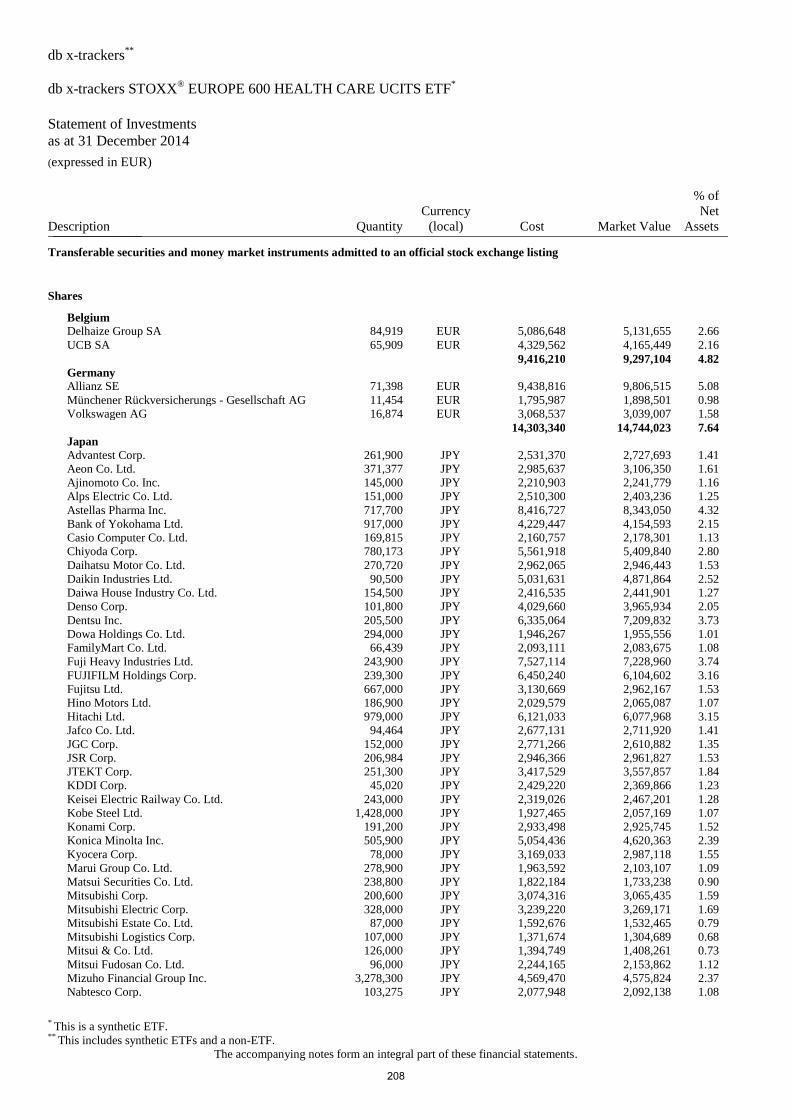
db x-trackers**
db x-trackers STOXX® EUROPE 600 HEALTH CARE UCITS ETF
*
Statement of Investments
as at 31 December 2014 (expressed in EUR)
* This is a synthetic ETF. ** This includes synthetic ETFs and a non-ETF.
The accompanying notes form an integral part of these financial statements.
Description Quantity
Currency
(local) Cost Market Value
% of
Net
Assets _______________
Transferable securities and money market instruments admitted to an official stock exchange listing
Shares
Belgium
Delhaize Group SA 84,919 EUR 5,086,648 5,131,655 2.66
UCB SA 65,909 EUR 4,329,562 4,165,449 2.16
9,416,210 9,297,104 4.82
Germany
Allianz SE 71,398 EUR 9,438,816 9,806,515 5.08
Münchener Rückversicherungs - Gesellschaft AG 11,454 EUR 1,795,987 1,898,501 0.98
Volkswagen AG 16,874 EUR 3,068,537 3,039,007 1.58
14,303,340 14,744,023 7.64
Japan
Advantest Corp. 261,900 JPY 2,531,370 2,727,693 1.41
Aeon Co. Ltd. 371,377 JPY 2,985,637 3,106,350 1.61
Ajinomoto Co. Inc. 145,000 JPY 2,210,903 2,241,779 1.16
Alps Electric Co. Ltd. 151,000 JPY 2,510,300 2,403,236 1.25
Astellas Pharma Inc. 717,700 JPY 8,416,727 8,343,050 4.32
Bank of Yokohama Ltd. 917,000 JPY 4,229,447 4,154,593 2.15
Casio Computer Co. Ltd. 169,815 JPY 2,160,757 2,178,301 1.13
Chiyoda Corp. 780,173 JPY 5,561,918 5,409,840 2.80
Daihatsu Motor Co. Ltd. 270,720 JPY 2,962,065 2,946,443 1.53
Daikin Industries Ltd. 90,500 JPY 5,031,631 4,871,864 2.52
Daiwa House Industry Co. Ltd. 154,500 JPY 2,416,535 2,441,901 1.27
Denso Corp. 101,800 JPY 4,029,660 3,965,934 2.05
Dentsu Inc. 205,500 JPY 6,335,064 7,209,832 3.73
Dowa Holdings Co. Ltd. 294,000 JPY 1,946,267 1,955,556 1.01
FamilyMart Co. Ltd. 66,439 JPY 2,093,111 2,083,675 1.08
Fuji Heavy Industries Ltd. 243,900 JPY 7,527,114 7,228,960 3.74
FUJIFILM Holdings Corp. 239,300 JPY 6,450,240 6,104,602 3.16
Fujitsu Ltd. 667,000 JPY 3,130,669 2,962,167 1.53
Hino Motors Ltd. 186,900 JPY 2,029,579 2,065,087 1.07
Hitachi Ltd. 979,000 JPY 6,121,033 6,077,968 3.15
Jafco Co. Ltd. 94,464 JPY 2,677,131 2,711,920 1.41
JGC Corp. 152,000 JPY 2,771,266 2,610,882 1.35
JSR Corp. 206,984 JPY 2,946,366 2,961,827 1.53
JTEKT Corp. 251,300 JPY 3,417,529 3,557,857 1.84
KDDI Corp. 45,020 JPY 2,429,220 2,369,866 1.23
Keisei Electric Railway Co. Ltd. 243,000 JPY 2,319,026 2,467,201 1.28
Kobe Steel Ltd. 1,428,000 JPY 1,927,465 2,057,169 1.07
Konami Corp. 191,200 JPY 2,933,498 2,925,745 1.52
Konica Minolta Inc. 505,900 JPY 5,054,436 4,620,363 2.39
Kyocera Corp. 78,000 JPY 3,169,033 2,987,118 1.55
Marui Group Co. Ltd. 278,900 JPY 1,963,592 2,103,107 1.09
Matsui Securities Co. Ltd. 238,800 JPY 1,822,184 1,733,238 0.90
Mitsubishi Corp. 200,600 JPY 3,074,316 3,065,435 1.59
Mitsubishi Electric Corp. 328,000 JPY 3,239,220 3,269,171 1.69
Mitsubishi Estate Co. Ltd. 87,000 JPY 1,592,676 1,532,465 0.79
Mitsubishi Logistics Corp. 107,000 JPY 1,371,674 1,304,689 0.68
Mitsui & Co. Ltd. 126,000 JPY 1,394,749 1,408,261 0.73
Mitsui Fudosan Co. Ltd. 96,000 JPY 2,244,165 2,153,862 1.12
Mizuho Financial Group Inc. 3,278,300 JPY 4,569,470 4,575,824 2.37
Nabtesco Corp. 103,275 JPY 2,077,948 2,092,138 1.08
208
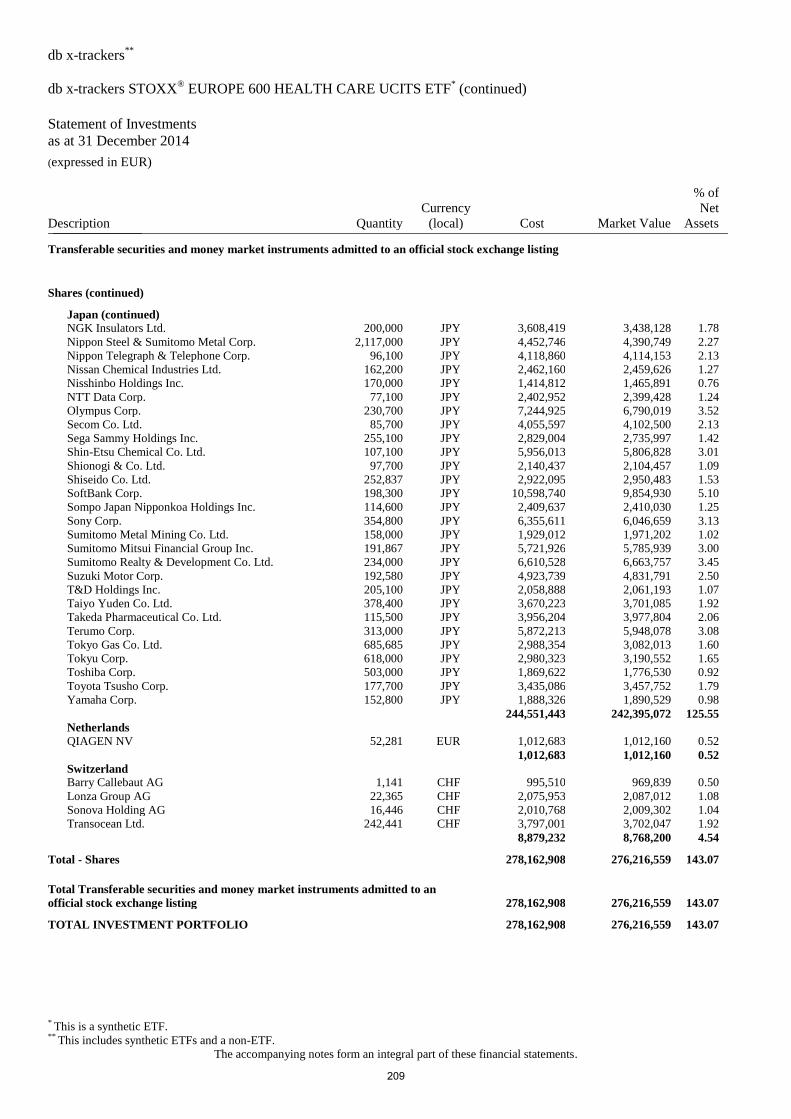
db x-trackers**
db x-trackers STOXX® EUROPE 600 HEALTH CARE UCITS ETF
* (continued)
Statement of Investments
as at 31 December 2014 (expressed in EUR)
* This is a synthetic ETF. ** This includes synthetic ETFs and a non-ETF.
The accompanying notes form an integral part of these financial statements.
Description Quantity
Currency
(local) Cost Market Value
% of
Net
Assets _______________
Transferable securities and money market instruments admitted to an official stock exchange listing
Shares (continued)
Japan (continued)
NGK Insulators Ltd. 200,000 JPY 3,608,419 3,438,128 1.78
Nippon Steel & Sumitomo Metal Corp. 2,117,000 JPY 4,452,746 4,390,749 2.27
Nippon Telegraph & Telephone Corp. 96,100 JPY 4,118,860 4,114,153 2.13
Nissan Chemical Industries Ltd. 162,200 JPY 2,462,160 2,459,626 1.27
Nisshinbo Holdings Inc. 170,000 JPY 1,414,812 1,465,891 0.76
NTT Data Corp. 77,100 JPY 2,402,952 2,399,428 1.24
Olympus Corp. 230,700 JPY 7,244,925 6,790,019 3.52
Secom Co. Ltd. 85,700 JPY 4,055,597 4,102,500 2.13
Sega Sammy Holdings Inc. 255,100 JPY 2,829,004 2,735,997 1.42
Shin-Etsu Chemical Co. Ltd. 107,100 JPY 5,956,013 5,806,828 3.01
Shionogi & Co. Ltd. 97,700 JPY 2,140,437 2,104,457 1.09
Shiseido Co. Ltd. 252,837 JPY 2,922,095 2,950,483 1.53
SoftBank Corp. 198,300 JPY 10,598,740 9,854,930 5.10
Sompo Japan Nipponkoa Holdings Inc. 114,600 JPY 2,409,637 2,410,030 1.25
Sony Corp. 354,800 JPY 6,355,611 6,046,659 3.13
Sumitomo Metal Mining Co. Ltd. 158,000 JPY 1,929,012 1,971,202 1.02
Sumitomo Mitsui Financial Group Inc. 191,867 JPY 5,721,926 5,785,939 3.00
Sumitomo Realty & Development Co. Ltd. 234,000 JPY 6,610,528 6,663,757 3.45
Suzuki Motor Corp. 192,580 JPY 4,923,739 4,831,791 2.50
T&D Holdings Inc. 205,100 JPY 2,058,888 2,061,193 1.07
Taiyo Yuden Co. Ltd. 378,400 JPY 3,670,223 3,701,085 1.92
Takeda Pharmaceutical Co. Ltd. 115,500 JPY 3,956,204 3,977,804 2.06
Terumo Corp. 313,000 JPY 5,872,213 5,948,078 3.08
Tokyo Gas Co. Ltd. 685,685 JPY 2,988,354 3,082,013 1.60
Tokyu Corp. 618,000 JPY 2,980,323 3,190,552 1.65
Toshiba Corp. 503,000 JPY 1,869,622 1,776,530 0.92
Toyota Tsusho Corp. 177,700 JPY 3,435,086 3,457,752 1.79
Yamaha Corp. 152,800 JPY 1,888,326 1,890,529 0.98
244,551,443 242,395,072 125.55
Netherlands
QIAGEN NV 52,281 EUR 1,012,683 1,012,160 0.52
1,012,683 1,012,160 0.52
Switzerland
Barry Callebaut AG 1,141 CHF 995,510 969,839 0.50
Lonza Group AG 22,365 CHF 2,075,953 2,087,012 1.08
Sonova Holding AG 16,446 CHF 2,010,768 2,009,302 1.04
Transocean Ltd. 242,441 CHF 3,797,001 3,702,047 1.92
8,879,232 8,768,200 4.54
Total - Shares 278,162,908 276,216,559 143.07
Total Transferable securities and money market instruments admitted to an
official stock exchange listing 278,162,908 276,216,559 143.07
TOTAL INVESTMENT PORTFOLIO 278,162,908 276,216,559 143.07
209
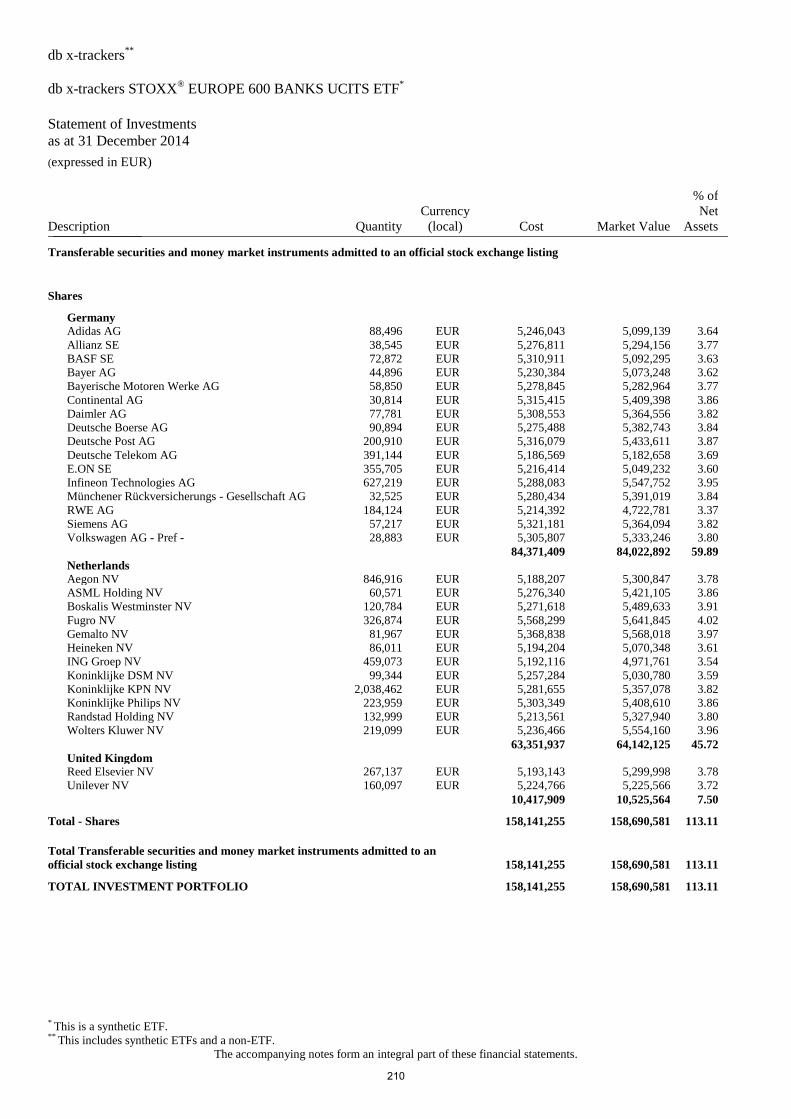
db x-trackers**
db x-trackers STOXX® EUROPE 600 BANKS UCITS ETF
*
Statement of Investments
as at 31 December 2014 (expressed in EUR)
* This is a synthetic ETF. ** This includes synthetic ETFs and a non-ETF.
The accompanying notes form an integral part of these financial statements.
Description Quantity
Currency
(local) Cost Market Value
% of
Net
Assets _______________
Transferable securities and money market instruments admitted to an official stock exchange listing
Shares
Germany
Adidas AG 88,496 EUR 5,246,043 5,099,139 3.64
Allianz SE 38,545 EUR 5,276,811 5,294,156 3.77
BASF SE 72,872 EUR 5,310,911 5,092,295 3.63
Bayer AG 44,896 EUR 5,230,384 5,073,248 3.62
Bayerische Motoren Werke AG 58,850 EUR 5,278,845 5,282,964 3.77
Continental AG 30,814 EUR 5,315,415 5,409,398 3.86
Daimler AG 77,781 EUR 5,308,553 5,364,556 3.82
Deutsche Boerse AG 90,894 EUR 5,275,488 5,382,743 3.84
Deutsche Post AG 200,910 EUR 5,316,079 5,433,611 3.87
Deutsche Telekom AG 391,144 EUR 5,186,569 5,182,658 3.69
E.ON SE 355,705 EUR 5,216,414 5,049,232 3.60
Infineon Technologies AG 627,219 EUR 5,288,083 5,547,752 3.95
Münchener Rückversicherungs - Gesellschaft AG 32,525 EUR 5,280,434 5,391,019 3.84
RWE AG 184,124 EUR 5,214,392 4,722,781 3.37
Siemens AG 57,217 EUR 5,321,181 5,364,094 3.82
Volkswagen AG - Pref - 28,883 EUR 5,305,807 5,333,246 3.80
84,371,409 84,022,892 59.89
Netherlands
Aegon NV 846,916 EUR 5,188,207 5,300,847 3.78
ASML Holding NV 60,571 EUR 5,276,340 5,421,105 3.86
Boskalis Westminster NV 120,784 EUR 5,271,618 5,489,633 3.91
Fugro NV 326,874 EUR 5,568,299 5,641,845 4.02
Gemalto NV 81,967 EUR 5,368,838 5,568,018 3.97
Heineken NV 86,011 EUR 5,194,204 5,070,348 3.61
ING Groep NV 459,073 EUR 5,192,116 4,971,761 3.54
Koninklijke DSM NV 99,344 EUR 5,257,284 5,030,780 3.59
Koninklijke KPN NV 2,038,462 EUR 5,281,655 5,357,078 3.82
Koninklijke Philips NV 223,959 EUR 5,303,349 5,408,610 3.86
Randstad Holding NV 132,999 EUR 5,213,561 5,327,940 3.80
Wolters Kluwer NV 219,099 EUR 5,236,466 5,554,160 3.96
63,351,937 64,142,125 45.72
United Kingdom
Reed Elsevier NV 267,137 EUR 5,193,143 5,299,998 3.78
Unilever NV 160,097 EUR 5,224,766 5,225,566 3.72
10,417,909 10,525,564 7.50
Total - Shares 158,141,255 158,690,581 113.11
Total Transferable securities and money market instruments admitted to an
official stock exchange listing 158,141,255 158,690,581 113.11
TOTAL INVESTMENT PORTFOLIO 158,141,255 158,690,581 113.11
210
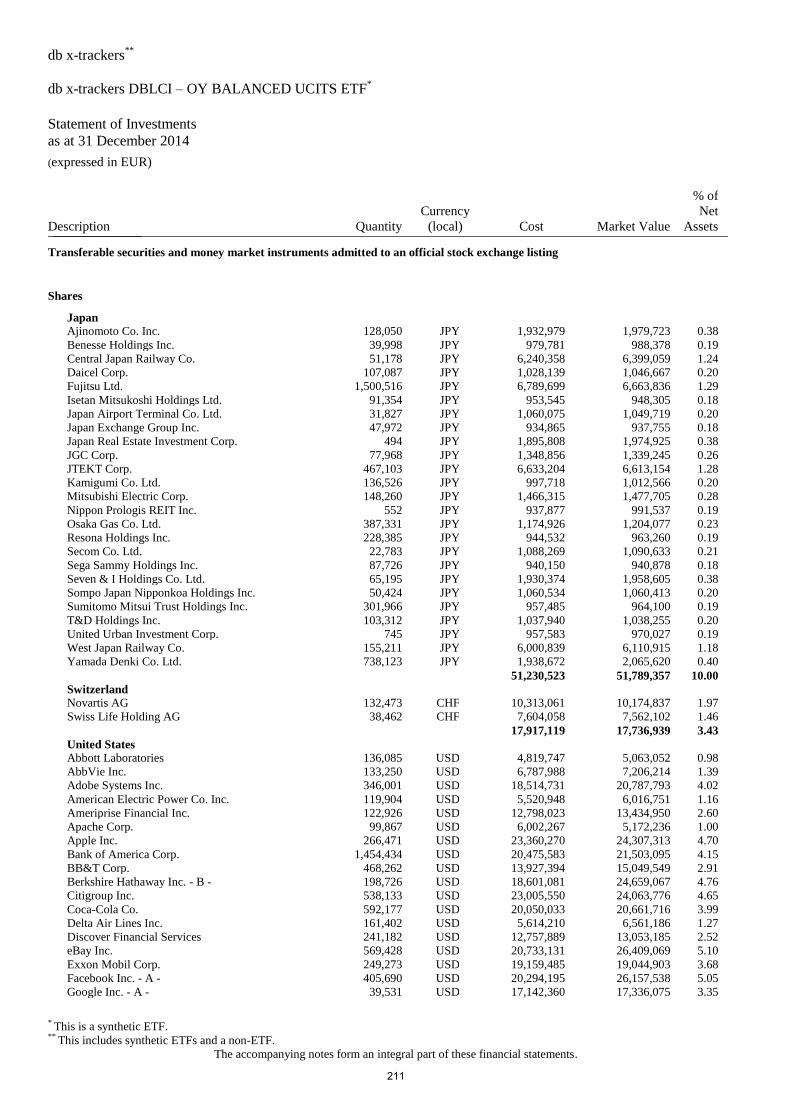
db x-trackers**
db x-trackers DBLCI – OY BALANCED UCITS ETF*
Statement of Investments
as at 31 December 2014 (expressed in EUR)
* This is a synthetic ETF. ** This includes synthetic ETFs and a non-ETF.
The accompanying notes form an integral part of these financial statements.
Description Quantity
Currency
(local) Cost Market Value
% of
Net
Assets _______________
Transferable securities and money market instruments admitted to an official stock exchange listing
Shares
Japan
Ajinomoto Co. Inc. 128,050 JPY 1,932,979 1,979,723 0.38
Benesse Holdings Inc. 39,998 JPY 979,781 988,378 0.19
Central Japan Railway Co. 51,178 JPY 6,240,358 6,399,059 1.24
Daicel Corp. 107,087 JPY 1,028,139 1,046,667 0.20
Fujitsu Ltd. 1,500,516 JPY 6,789,699 6,663,836 1.29
Isetan Mitsukoshi Holdings Ltd. 91,354 JPY 953,545 948,305 0.18
Japan Airport Terminal Co. Ltd. 31,827 JPY 1,060,075 1,049,719 0.20
Japan Exchange Group Inc. 47,972 JPY 934,865 937,755 0.18
Japan Real Estate Investment Corp. 494 JPY 1,895,808 1,974,925 0.38
JGC Corp. 77,968 JPY 1,348,856 1,339,245 0.26
JTEKT Corp. 467,103 JPY 6,633,204 6,613,154 1.28
Kamigumi Co. Ltd. 136,526 JPY 997,718 1,012,566 0.20
Mitsubishi Electric Corp. 148,260 JPY 1,466,315 1,477,705 0.28
Nippon Prologis REIT Inc. 552 JPY 937,877 991,537 0.19
Osaka Gas Co. Ltd. 387,331 JPY 1,174,926 1,204,077 0.23
Resona Holdings Inc. 228,385 JPY 944,532 963,260 0.19
Secom Co. Ltd. 22,783 JPY 1,088,269 1,090,633 0.21
Sega Sammy Holdings Inc. 87,726 JPY 940,150 940,878 0.18
Seven & I Holdings Co. Ltd. 65,195 JPY 1,930,374 1,958,605 0.38
Sompo Japan Nipponkoa Holdings Inc. 50,424 JPY 1,060,534 1,060,413 0.20
Sumitomo Mitsui Trust Holdings Inc. 301,966 JPY 957,485 964,100 0.19
T&D Holdings Inc. 103,312 JPY 1,037,940 1,038,255 0.20
United Urban Investment Corp. 745 JPY 957,583 970,027 0.19
West Japan Railway Co. 155,211 JPY 6,000,839 6,110,915 1.18
Yamada Denki Co. Ltd. 738,123 JPY 1,938,672 2,065,620 0.40
51,230,523 51,789,357 10.00
Switzerland
Novartis AG 132,473 CHF 10,313,061 10,174,837 1.97
Swiss Life Holding AG 38,462 CHF 7,604,058 7,562,102 1.46
17,917,119 17,736,939 3.43
United States
Abbott Laboratories 136,085 USD 4,819,747 5,063,052 0.98
AbbVie Inc. 133,250 USD 6,787,988 7,206,214 1.39
Adobe Systems Inc. 346,001 USD 18,514,731 20,787,793 4.02
American Electric Power Co. Inc. 119,904 USD 5,520,948 6,016,751 1.16
Ameriprise Financial Inc. 122,926 USD 12,798,023 13,434,950 2.60
Apache Corp. 99,867 USD 6,002,267 5,172,236 1.00
Apple Inc. 266,471 USD 23,360,270 24,307,313 4.70
Bank of America Corp. 1,454,434 USD 20,475,583 21,503,095 4.15
BB&T Corp. 468,262 USD 13,927,394 15,049,549 2.91
Berkshire Hathaway Inc. - B - 198,726 USD 18,601,081 24,659,067 4.76
Citigroup Inc. 538,133 USD 23,005,550 24,063,776 4.65
Coca-Cola Co. 592,177 USD 20,050,033 20,661,716 3.99
Delta Air Lines Inc. 161,402 USD 5,614,210 6,561,186 1.27
Discover Financial Services 241,182 USD 12,757,889 13,053,185 2.52
eBay Inc. 569,428 USD 20,733,131 26,409,069 5.10
Exxon Mobil Corp. 249,273 USD 19,159,485 19,044,903 3.68
Facebook Inc. - A - 405,690 USD 20,294,195 26,157,538 5.05
Google Inc. - A - 39,531 USD 17,142,360 17,336,075 3.35
211
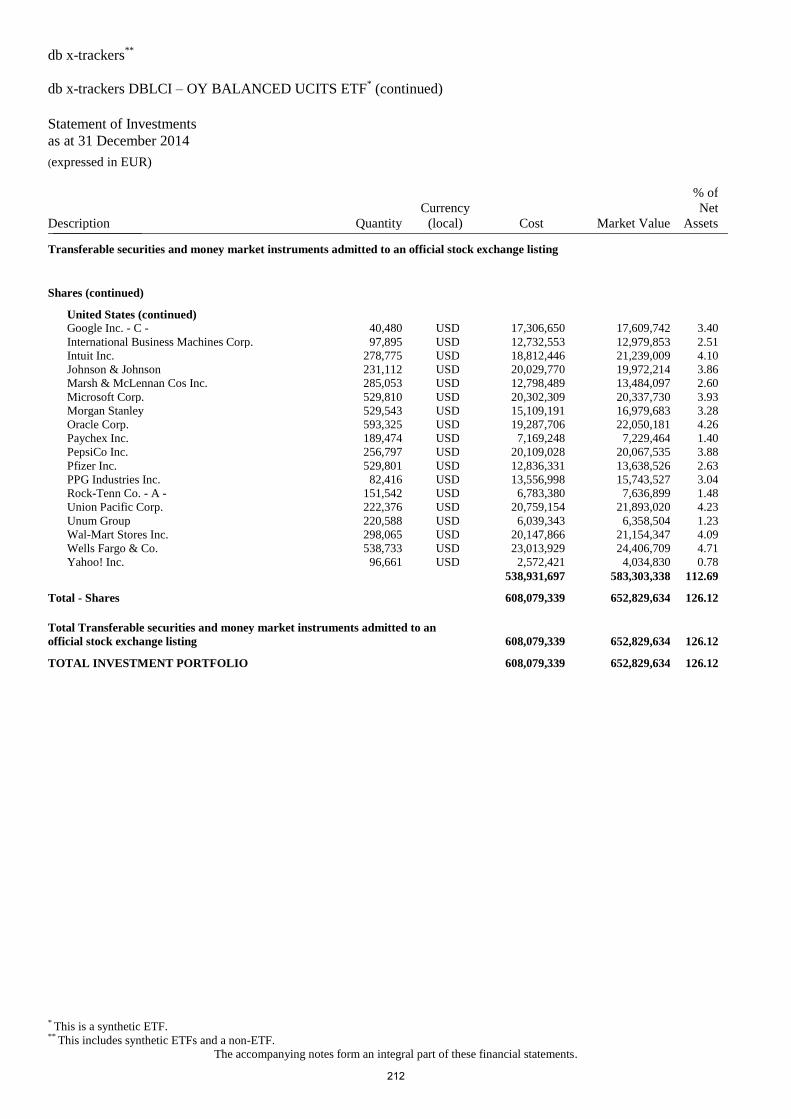
db x-trackers**
db x-trackers DBLCI – OY BALANCED UCITS ETF* (continued)
Statement of Investments
as at 31 December 2014 (expressed in EUR)
* This is a synthetic ETF. ** This includes synthetic ETFs and a non-ETF.
The accompanying notes form an integral part of these financial statements.
Description Quantity
Currency
(local) Cost Market Value
% of
Net
Assets _______________
Transferable securities and money market instruments admitted to an official stock exchange listing
Shares (continued)
United States (continued)
Google Inc. - C - 40,480 USD 17,306,650 17,609,742 3.40
International Business Machines Corp. 97,895 USD 12,732,553 12,979,853 2.51
Intuit Inc. 278,775 USD 18,812,446 21,239,009 4.10
Johnson & Johnson 231,112 USD 20,029,770 19,972,214 3.86
Marsh & McLennan Cos Inc. 285,053 USD 12,798,489 13,484,097 2.60
Microsoft Corp. 529,810 USD 20,302,309 20,337,730 3.93
Morgan Stanley 529,543 USD 15,109,191 16,979,683 3.28
Oracle Corp. 593,325 USD 19,287,706 22,050,181 4.26
Paychex Inc. 189,474 USD 7,169,248 7,229,464 1.40
PepsiCo Inc. 256,797 USD 20,109,028 20,067,535 3.88
Pfizer Inc. 529,801 USD 12,836,331 13,638,526 2.63
PPG Industries Inc. 82,416 USD 13,556,998 15,743,527 3.04
Rock-Tenn Co. - A - 151,542 USD 6,783,380 7,636,899 1.48
Union Pacific Corp. 222,376 USD 20,759,154 21,893,020 4.23
Unum Group 220,588 USD 6,039,343 6,358,504 1.23
Wal-Mart Stores Inc. 298,065 USD 20,147,866 21,154,347 4.09
Wells Fargo & Co. 538,733 USD 23,013,929 24,406,709 4.71
Yahoo! Inc. 96,661 USD 2,572,421 4,034,830 0.78
538,931,697 583,303,338 112.69
Total - Shares 608,079,339 652,829,634 126.12
Total Transferable securities and money market instruments admitted to an
official stock exchange listing 608,079,339 652,829,634 126.12
TOTAL INVESTMENT PORTFOLIO 608,079,339 652,829,634 126.12
212
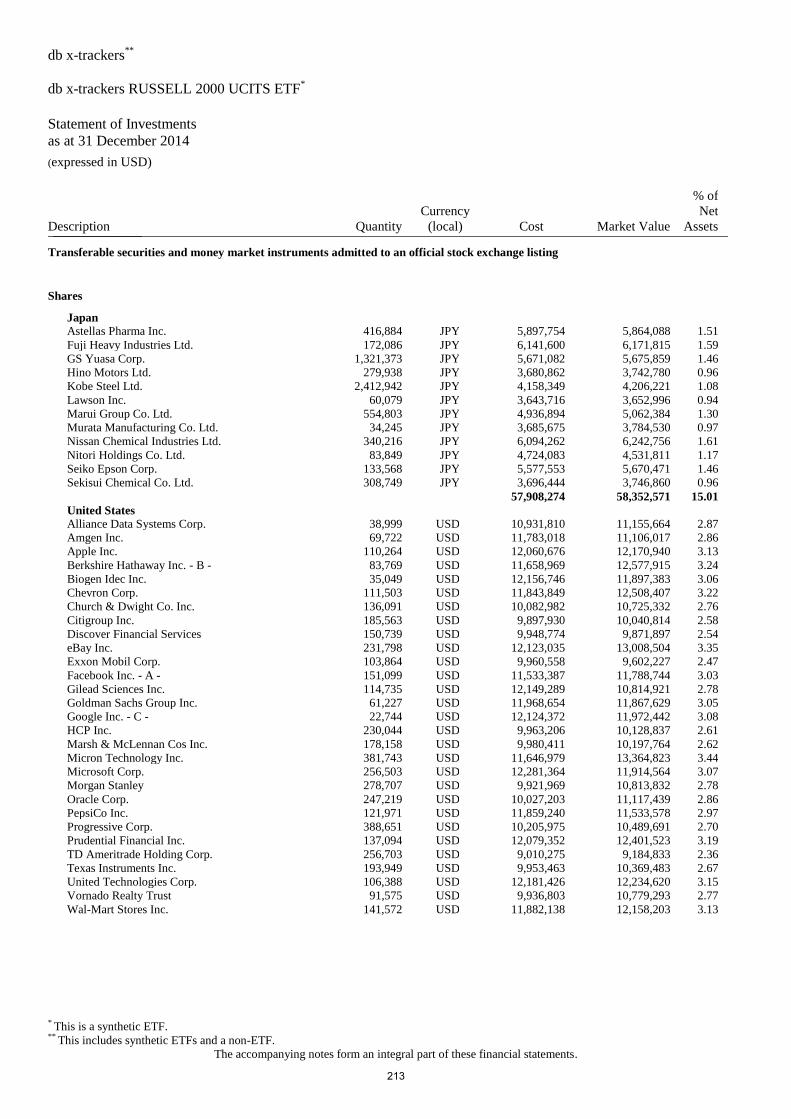
db x-trackers**
db x-trackers RUSSELL 2000 UCITS ETF*
Statement of Investments
as at 31 December 2014 (expressed in USD)
* This is a synthetic ETF. ** This includes synthetic ETFs and a non-ETF.
The accompanying notes form an integral part of these financial statements.
Description Quantity
Currency
(local) Cost Market Value
% of
Net
Assets _______________
Transferable securities and money market instruments admitted to an official stock exchange listing
Shares
Japan
Astellas Pharma Inc. 416,884 JPY 5,897,754 5,864,088 1.51
Fuji Heavy Industries Ltd. 172,086 JPY 6,141,600 6,171,815 1.59
GS Yuasa Corp. 1,321,373 JPY 5,671,082 5,675,859 1.46
Hino Motors Ltd. 279,938 JPY 3,680,862 3,742,780 0.96
Kobe Steel Ltd. 2,412,942 JPY 4,158,349 4,206,221 1.08
Lawson Inc. 60,079 JPY 3,643,716 3,652,996 0.94
Marui Group Co. Ltd. 554,803 JPY 4,936,894 5,062,384 1.30
Murata Manufacturing Co. Ltd. 34,245 JPY 3,685,675 3,784,530 0.97
Nissan Chemical Industries Ltd. 340,216 JPY 6,094,262 6,242,756 1.61
Nitori Holdings Co. Ltd. 83,849 JPY 4,724,083 4,531,811 1.17
Seiko Epson Corp. 133,568 JPY 5,577,553 5,670,471 1.46
Sekisui Chemical Co. Ltd. 308,749 JPY 3,696,444 3,746,860 0.96
57,908,274 58,352,571 15.01
United States
Alliance Data Systems Corp. 38,999 USD 10,931,810 11,155,664 2.87
Amgen Inc. 69,722 USD 11,783,018 11,106,017 2.86
Apple Inc. 110,264 USD 12,060,676 12,170,940 3.13
Berkshire Hathaway Inc. - B - 83,769 USD 11,658,969 12,577,915 3.24
Biogen Idec Inc. 35,049 USD 12,156,746 11,897,383 3.06
Chevron Corp. 111,503 USD 11,843,849 12,508,407 3.22
Church & Dwight Co. Inc. 136,091 USD 10,082,982 10,725,332 2.76
Citigroup Inc. 185,563 USD 9,897,930 10,040,814 2.58
Discover Financial Services 150,739 USD 9,948,774 9,871,897 2.54
eBay Inc. 231,798 USD 12,123,035 13,008,504 3.35
Exxon Mobil Corp. 103,864 USD 9,960,558 9,602,227 2.47
Facebook Inc. - A - 151,099 USD 11,533,387 11,788,744 3.03
Gilead Sciences Inc. 114,735 USD 12,149,289 10,814,921 2.78
Goldman Sachs Group Inc. 61,227 USD 11,968,654 11,867,629 3.05
Google Inc. - C - 22,744 USD 12,124,372 11,972,442 3.08
HCP Inc. 230,044 USD 9,963,206 10,128,837 2.61
Marsh & McLennan Cos Inc. 178,158 USD 9,980,411 10,197,764 2.62
Micron Technology Inc. 381,743 USD 11,646,979 13,364,823 3.44
Microsoft Corp. 256,503 USD 12,281,364 11,914,564 3.07
Morgan Stanley 278,707 USD 9,921,969 10,813,832 2.78
Oracle Corp. 247,219 USD 10,027,203 11,117,439 2.86
PepsiCo Inc. 121,971 USD 11,859,240 11,533,578 2.97
Progressive Corp. 388,651 USD 10,205,975 10,489,691 2.70
Prudential Financial Inc. 137,094 USD 12,079,352 12,401,523 3.19
TD Ameritrade Holding Corp. 256,703 USD 9,010,275 9,184,833 2.36
Texas Instruments Inc. 193,949 USD 9,953,463 10,369,483 2.67
United Technologies Corp. 106,388 USD 12,181,426 12,234,620 3.15
Vornado Realty Trust 91,575 USD 9,936,803 10,779,293 2.77
Wal-Mart Stores Inc. 141,572 USD 11,882,138 12,158,203 3.13
213

db x-trackers**
db x-trackers RUSSELL 2000 UCITS ETF* (continued)
Statement of Investments
as at 31 December 2014 (expressed in USD)
* This is a synthetic ETF. ** This includes synthetic ETFs and a non-ETF.
The accompanying notes form an integral part of these financial statements.
Description Quantity
Currency
(local) Cost Market Value
% of
Net
Assets _______________
Transferable securities and money market instruments admitted to an official stock exchange listing
Shares (continued)
United States (continued)
Wells Fargo & Co. 222,924 USD 11,881,849 12,220,694 3.15
333,035,702 340,018,013 87.49
Total - Shares 390,943,976 398,370,584 102.50
Total Transferable securities and money market instruments admitted to an
official stock exchange listing 390,943,976 398,370,584 102.50
TOTAL INVESTMENT PORTFOLIO 390,943,976 398,370,584 102.50
214
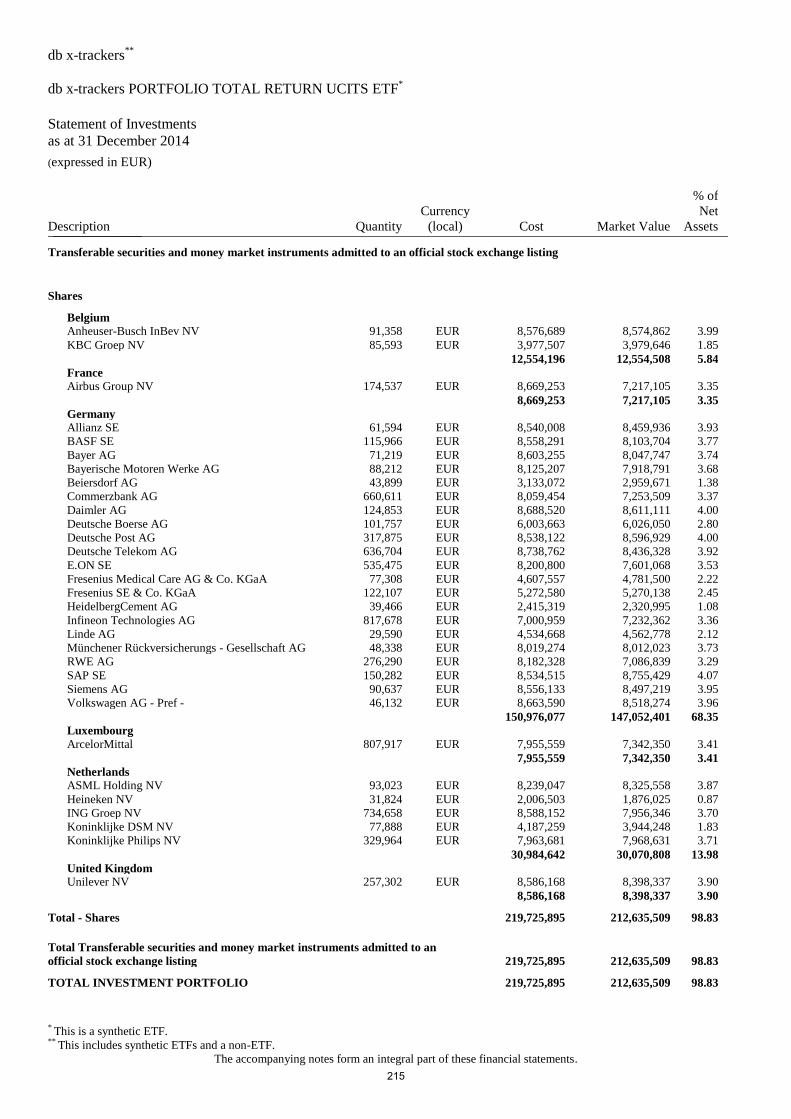
db x-trackers**
db x-trackers PORTFOLIO TOTAL RETURN UCITS ETF*
Statement of Investments
as at 31 December 2014 (expressed in EUR)
* This is a synthetic ETF. ** This includes synthetic ETFs and a non-ETF.
The accompanying notes form an integral part of these financial statements.
Description Quantity
Currency
(local) Cost Market Value
% of
Net
Assets _______________
Transferable securities and money market instruments admitted to an official stock exchange listing
Shares
Belgium
Anheuser-Busch InBev NV 91,358 EUR 8,576,689 8,574,862 3.99
KBC Groep NV 85,593 EUR 3,977,507 3,979,646 1.85
12,554,196 12,554,508 5.84
France
Airbus Group NV 174,537 EUR 8,669,253 7,217,105 3.35
8,669,253 7,217,105 3.35
Germany
Allianz SE 61,594 EUR 8,540,008 8,459,936 3.93
BASF SE 115,966 EUR 8,558,291 8,103,704 3.77
Bayer AG 71,219 EUR 8,603,255 8,047,747 3.74
Bayerische Motoren Werke AG 88,212 EUR 8,125,207 7,918,791 3.68
Beiersdorf AG 43,899 EUR 3,133,072 2,959,671 1.38
Commerzbank AG 660,611 EUR 8,059,454 7,253,509 3.37
Daimler AG 124,853 EUR 8,688,520 8,611,111 4.00
Deutsche Boerse AG 101,757 EUR 6,003,663 6,026,050 2.80
Deutsche Post AG 317,875 EUR 8,538,122 8,596,929 4.00
Deutsche Telekom AG 636,704 EUR 8,738,762 8,436,328 3.92
E.ON SE 535,475 EUR 8,200,800 7,601,068 3.53
Fresenius Medical Care AG & Co. KGaA 77,308 EUR 4,607,557 4,781,500 2.22
Fresenius SE & Co. KGaA 122,107 EUR 5,272,580 5,270,138 2.45
HeidelbergCement AG 39,466 EUR 2,415,319 2,320,995 1.08
Infineon Technologies AG 817,678 EUR 7,000,959 7,232,362 3.36
Linde AG 29,590 EUR 4,534,668 4,562,778 2.12
Münchener Rückversicherungs - Gesellschaft AG 48,338 EUR 8,019,274 8,012,023 3.73
RWE AG 276,290 EUR 8,182,328 7,086,839 3.29
SAP SE 150,282 EUR 8,534,515 8,755,429 4.07
Siemens AG 90,637 EUR 8,556,133 8,497,219 3.95
Volkswagen AG - Pref - 46,132 EUR 8,663,590 8,518,274 3.96
150,976,077 147,052,401 68.35
Luxembourg
ArcelorMittal 807,917 EUR 7,955,559 7,342,350 3.41
7,955,559 7,342,350 3.41
Netherlands
ASML Holding NV 93,023 EUR 8,239,047 8,325,558 3.87
Heineken NV 31,824 EUR 2,006,503 1,876,025 0.87
ING Groep NV 734,658 EUR 8,588,152 7,956,346 3.70
Koninklijke DSM NV 77,888 EUR 4,187,259 3,944,248 1.83
Koninklijke Philips NV 329,964 EUR 7,963,681 7,968,631 3.71
30,984,642 30,070,808 13.98
United Kingdom
Unilever NV 257,302 EUR 8,586,168 8,398,337 3.90
8,586,168 8,398,337 3.90
Total - Shares 219,725,895 212,635,509 98.83
Total Transferable securities and money market instruments admitted to an
official stock exchange listing 219,725,895 212,635,509 98.83
TOTAL INVESTMENT PORTFOLIO 219,725,895 212,635,509 98.83
215
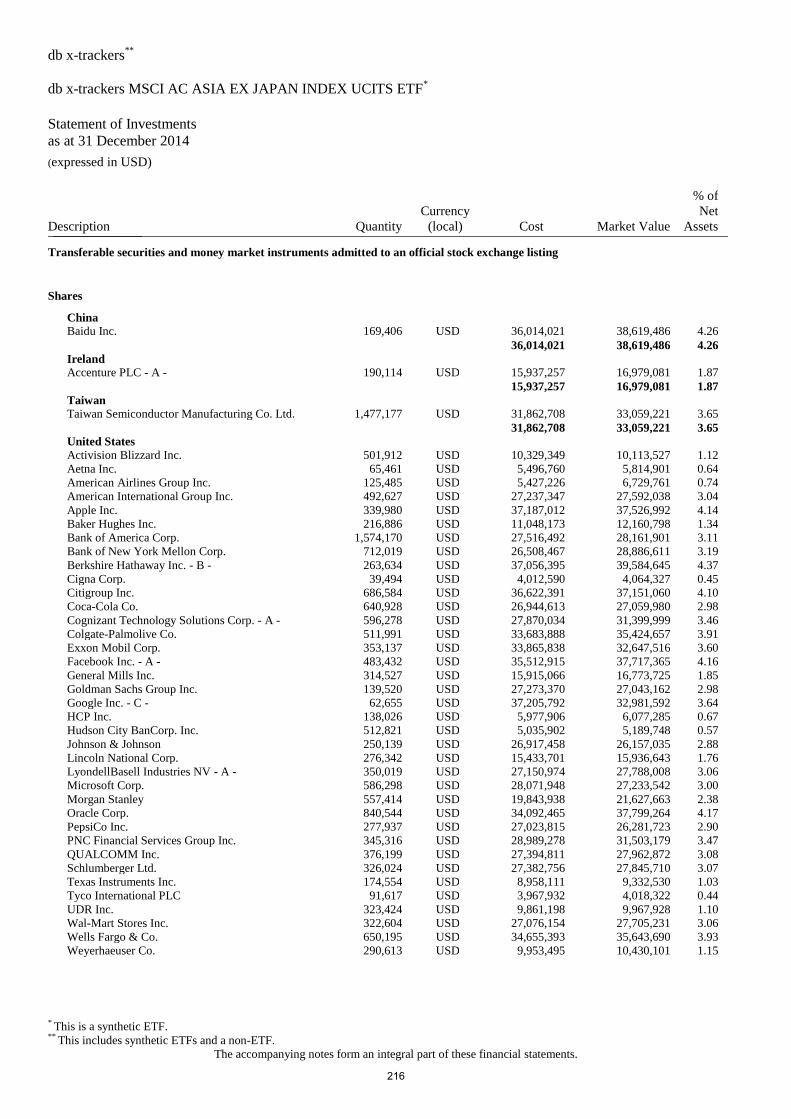
db x-trackers**
db x-trackers MSCI AC ASIA EX JAPAN INDEX UCITS ETF*
Statement of Investments
as at 31 December 2014 (expressed in USD)
* This is a synthetic ETF. ** This includes synthetic ETFs and a non-ETF.
The accompanying notes form an integral part of these financial statements.
Description Quantity
Currency
(local) Cost Market Value
% of
Net
Assets _______________
Transferable securities and money market instruments admitted to an official stock exchange listing
Shares
China
Baidu Inc. 169,406 USD 36,014,021 38,619,486 4.26
36,014,021 38,619,486 4.26
Ireland
Accenture PLC - A - 190,114 USD 15,937,257 16,979,081 1.87
15,937,257 16,979,081 1.87
Taiwan
Taiwan Semiconductor Manufacturing Co. Ltd. 1,477,177 USD 31,862,708 33,059,221 3.65
31,862,708 33,059,221 3.65
United States
Activision Blizzard Inc. 501,912 USD 10,329,349 10,113,527 1.12
Aetna Inc. 65,461 USD 5,496,760 5,814,901 0.64
American Airlines Group Inc. 125,485 USD 5,427,226 6,729,761 0.74
American International Group Inc. 492,627 USD 27,237,347 27,592,038 3.04
Apple Inc. 339,980 USD 37,187,012 37,526,992 4.14
Baker Hughes Inc. 216,886 USD 11,048,173 12,160,798 1.34
Bank of America Corp. 1,574,170 USD 27,516,492 28,161,901 3.11
Bank of New York Mellon Corp. 712,019 USD 26,508,467 28,886,611 3.19
Berkshire Hathaway Inc. - B - 263,634 USD 37,056,395 39,584,645 4.37
Cigna Corp. 39,494 USD 4,012,590 4,064,327 0.45
Citigroup Inc. 686,584 USD 36,622,391 37,151,060 4.10
Coca-Cola Co. 640,928 USD 26,944,613 27,059,980 2.98
Cognizant Technology Solutions Corp. - A - 596,278 USD 27,870,034 31,399,999 3.46
Colgate-Palmolive Co. 511,991 USD 33,683,888 35,424,657 3.91
Exxon Mobil Corp. 353,137 USD 33,865,838 32,647,516 3.60
Facebook Inc. - A - 483,432 USD 35,512,915 37,717,365 4.16
General Mills Inc. 314,527 USD 15,915,066 16,773,725 1.85
Goldman Sachs Group Inc. 139,520 USD 27,273,370 27,043,162 2.98
Google Inc. - C - 62,655 USD 37,205,792 32,981,592 3.64
HCP Inc. 138,026 USD 5,977,906 6,077,285 0.67
Hudson City BanCorp. Inc. 512,821 USD 5,035,902 5,189,748 0.57
Johnson & Johnson 250,139 USD 26,917,458 26,157,035 2.88
Lincoln National Corp. 276,342 USD 15,433,701 15,936,643 1.76
LyondellBasell Industries NV - A - 350,019 USD 27,150,974 27,788,008 3.06
Microsoft Corp. 586,298 USD 28,071,948 27,233,542 3.00
Morgan Stanley 557,414 USD 19,843,938 21,627,663 2.38
Oracle Corp. 840,544 USD 34,092,465 37,799,264 4.17
PepsiCo Inc. 277,937 USD 27,023,815 26,281,723 2.90
PNC Financial Services Group Inc. 345,316 USD 28,989,278 31,503,179 3.47
QUALCOMM Inc. 376,199 USD 27,394,811 27,962,872 3.08
Schlumberger Ltd. 326,024 USD 27,382,756 27,845,710 3.07
Texas Instruments Inc. 174,554 USD 8,958,111 9,332,530 1.03
Tyco International PLC 91,617 USD 3,967,932 4,018,322 0.44
UDR Inc. 323,424 USD 9,861,198 9,967,928 1.10
Wal-Mart Stores Inc. 322,604 USD 27,076,154 27,705,231 3.06
Wells Fargo & Co. 650,195 USD 34,655,393 35,643,690 3.93
Weyerhaeuser Co. 290,613 USD 9,953,495 10,430,101 1.15
216
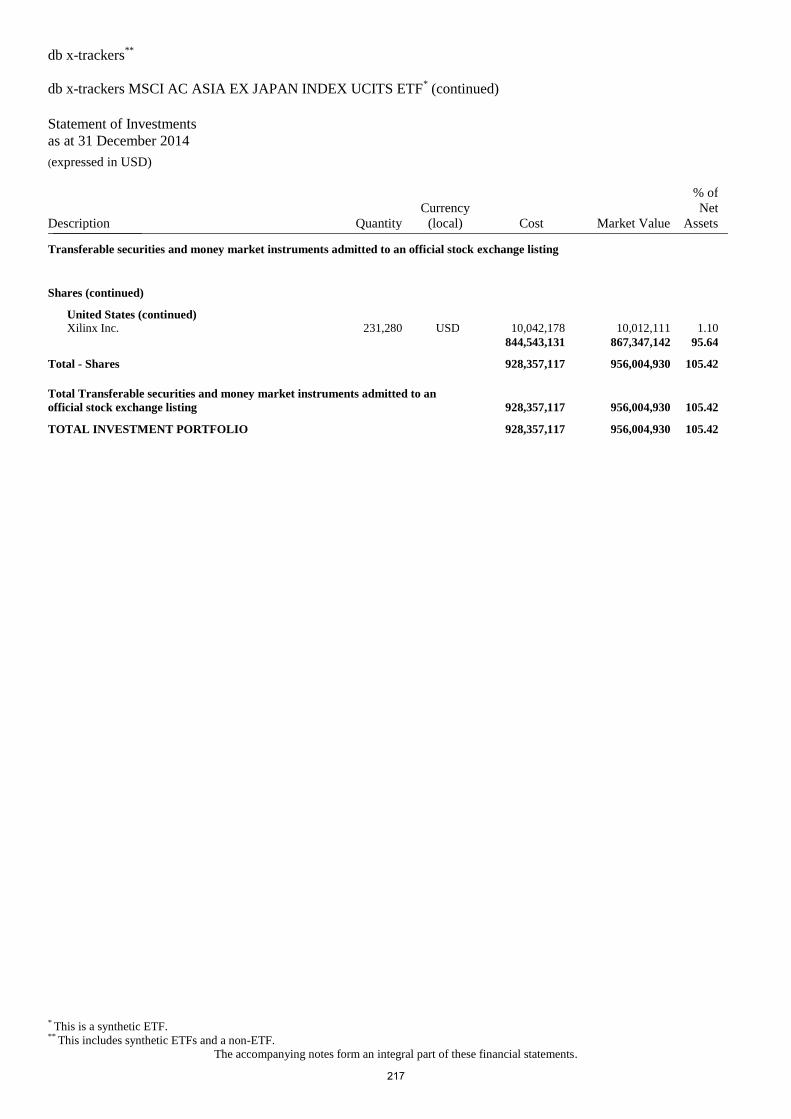
db x-trackers**
db x-trackers MSCI AC ASIA EX JAPAN INDEX UCITS ETF* (continued)
Statement of Investments
as at 31 December 2014 (expressed in USD)
* This is a synthetic ETF. ** This includes synthetic ETFs and a non-ETF.
The accompanying notes form an integral part of these financial statements.
Description Quantity
Currency
(local) Cost Market Value
% of
Net
Assets _______________
Transferable securities and money market instruments admitted to an official stock exchange listing
Shares (continued)
United States (continued)
Xilinx Inc. 231,280 USD 10,042,178 10,012,111 1.10
844,543,131 867,347,142 95.64
Total - Shares 928,357,117 956,004,930 105.42
Total Transferable securities and money market instruments admitted to an
official stock exchange listing 928,357,117 956,004,930 105.42
TOTAL INVESTMENT PORTFOLIO 928,357,117 956,004,930 105.42
217
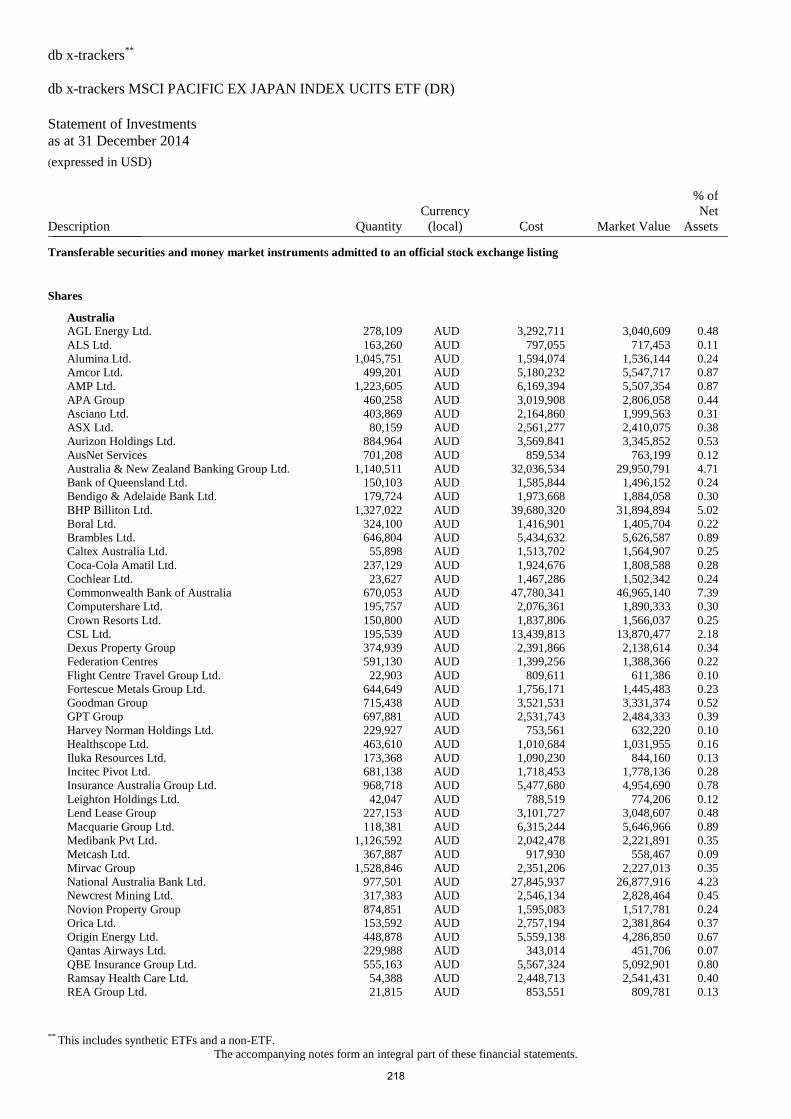
db x-trackers**
db x-trackers MSCI PACIFIC EX JAPAN INDEX UCITS ETF (DR)
Statement of Investments
as at 31 December 2014 (expressed in USD)
** This includes synthetic ETFs and a non-ETF.
The accompanying notes form an integral part of these financial statements.
Description Quantity
Currency
(local) Cost Market Value
% of
Net
Assets _______________
Transferable securities and money market instruments admitted to an official stock exchange listing
Shares
Australia
AGL Energy Ltd. 278,109 AUD 3,292,711 3,040,609 0.48
ALS Ltd. 163,260 AUD 797,055 717,453 0.11
Alumina Ltd. 1,045,751 AUD 1,594,074 1,536,144 0.24
Amcor Ltd. 499,201 AUD 5,180,232 5,547,717 0.87
AMP Ltd. 1,223,605 AUD 6,169,394 5,507,354 0.87
APA Group 460,258 AUD 3,019,908 2,806,058 0.44
Asciano Ltd. 403,869 AUD 2,164,860 1,999,563 0.31
ASX Ltd. 80,159 AUD 2,561,277 2,410,075 0.38
Aurizon Holdings Ltd. 884,964 AUD 3,569,841 3,345,852 0.53
AusNet Services 701,208 AUD 859,534 763,199 0.12
Australia & New Zealand Banking Group Ltd. 1,140,511 AUD 32,036,534 29,950,791 4.71
Bank of Queensland Ltd. 150,103 AUD 1,585,844 1,496,152 0.24
Bendigo & Adelaide Bank Ltd. 179,724 AUD 1,973,668 1,884,058 0.30
BHP Billiton Ltd. 1,327,022 AUD 39,680,320 31,894,894 5.02
Boral Ltd. 324,100 AUD 1,416,901 1,405,704 0.22
Brambles Ltd. 646,804 AUD 5,434,632 5,626,587 0.89
Caltex Australia Ltd. 55,898 AUD 1,513,702 1,564,907 0.25
Coca-Cola Amatil Ltd. 237,129 AUD 1,924,676 1,808,588 0.28
Cochlear Ltd. 23,627 AUD 1,467,286 1,502,342 0.24
Commonwealth Bank of Australia 670,053 AUD 47,780,341 46,965,140 7.39
Computershare Ltd. 195,757 AUD 2,076,361 1,890,333 0.30
Crown Resorts Ltd. 150,800 AUD 1,837,806 1,566,037 0.25
CSL Ltd. 195,539 AUD 13,439,813 13,870,477 2.18
Dexus Property Group 374,939 AUD 2,391,866 2,138,614 0.34
Federation Centres 591,130 AUD 1,399,256 1,388,366 0.22
Flight Centre Travel Group Ltd. 22,903 AUD 809,611 611,386 0.10
Fortescue Metals Group Ltd. 644,649 AUD 1,756,171 1,445,483 0.23
Goodman Group 715,438 AUD 3,521,531 3,331,374 0.52
GPT Group 697,881 AUD 2,531,743 2,484,333 0.39
Harvey Norman Holdings Ltd. 229,927 AUD 753,561 632,220 0.10
Healthscope Ltd. 463,610 AUD 1,010,684 1,031,955 0.16
Iluka Resources Ltd. 173,368 AUD 1,090,230 844,160 0.13
Incitec Pivot Ltd. 681,138 AUD 1,718,453 1,778,136 0.28
Insurance Australia Group Ltd. 968,718 AUD 5,477,680 4,954,690 0.78
Leighton Holdings Ltd. 42,047 AUD 788,519 774,206 0.12
Lend Lease Group 227,153 AUD 3,101,727 3,048,607 0.48
Macquarie Group Ltd. 118,381 AUD 6,315,244 5,646,966 0.89
Medibank Pvt Ltd. 1,126,592 AUD 2,042,478 2,221,891 0.35
Metcash Ltd. 367,887 AUD 917,930 558,467 0.09
Mirvac Group 1,528,846 AUD 2,351,206 2,227,013 0.35
National Australia Bank Ltd. 977,501 AUD 27,845,937 26,877,916 4.23
Newcrest Mining Ltd. 317,383 AUD 2,546,134 2,828,464 0.45
Novion Property Group 874,851 AUD 1,595,083 1,517,781 0.24
Orica Ltd. 153,592 AUD 2,757,194 2,381,864 0.37
Origin Energy Ltd. 448,878 AUD 5,559,138 4,286,850 0.67
Qantas Airways Ltd. 229,988 AUD 343,014 451,706 0.07
QBE Insurance Group Ltd. 555,163 AUD 5,567,324 5,092,901 0.80
Ramsay Health Care Ltd. 54,388 AUD 2,448,713 2,541,431 0.40
REA Group Ltd. 21,815 AUD 853,551 809,781 0.13
218
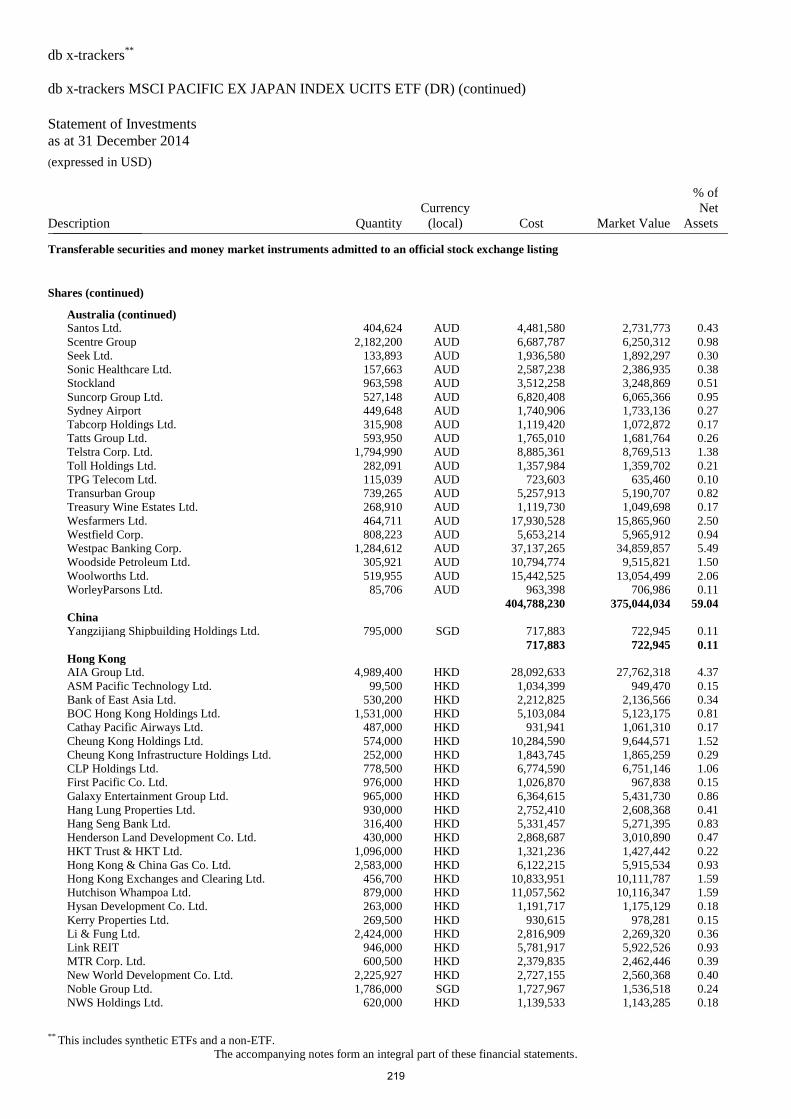
db x-trackers**
db x-trackers MSCI PACIFIC EX JAPAN INDEX UCITS ETF (DR) (continued)
Statement of Investments
as at 31 December 2014 (expressed in USD)
** This includes synthetic ETFs and a non-ETF.
The accompanying notes form an integral part of these financial statements.
Description Quantity
Currency
(local) Cost Market Value
% of
Net
Assets _______________
Transferable securities and money market instruments admitted to an official stock exchange listing
Shares (continued)
Australia (continued)
Santos Ltd. 404,624 AUD 4,481,580 2,731,773 0.43
Scentre Group 2,182,200 AUD 6,687,787 6,250,312 0.98
Seek Ltd. 133,893 AUD 1,936,580 1,892,297 0.30
Sonic Healthcare Ltd. 157,663 AUD 2,587,238 2,386,935 0.38
Stockland 963,598 AUD 3,512,258 3,248,869 0.51
Suncorp Group Ltd. 527,148 AUD 6,820,408 6,065,366 0.95
Sydney Airport 449,648 AUD 1,740,906 1,733,136 0.27
Tabcorp Holdings Ltd. 315,908 AUD 1,119,420 1,072,872 0.17
Tatts Group Ltd. 593,950 AUD 1,765,010 1,681,764 0.26
Telstra Corp. Ltd. 1,794,990 AUD 8,885,361 8,769,513 1.38
Toll Holdings Ltd. 282,091 AUD 1,357,984 1,359,702 0.21
TPG Telecom Ltd. 115,039 AUD 723,603 635,460 0.10
Transurban Group 739,265 AUD 5,257,913 5,190,707 0.82
Treasury Wine Estates Ltd. 268,910 AUD 1,119,730 1,049,698 0.17
Wesfarmers Ltd. 464,711 AUD 17,930,528 15,865,960 2.50
Westfield Corp. 808,223 AUD 5,653,214 5,965,912 0.94
Westpac Banking Corp. 1,284,612 AUD 37,137,265 34,859,857 5.49
Woodside Petroleum Ltd. 305,921 AUD 10,794,774 9,515,821 1.50
Woolworths Ltd. 519,955 AUD 15,442,525 13,054,499 2.06
WorleyParsons Ltd. 85,706 AUD 963,398 706,986 0.11
404,788,230 375,044,034 59.04
China
Yangzijiang Shipbuilding Holdings Ltd. 795,000 SGD 717,883 722,945 0.11
717,883 722,945 0.11
Hong Kong
AIA Group Ltd. 4,989,400 HKD 28,092,633 27,762,318 4.37
ASM Pacific Technology Ltd. 99,500 HKD 1,034,399 949,470 0.15
Bank of East Asia Ltd. 530,200 HKD 2,212,825 2,136,566 0.34
BOC Hong Kong Holdings Ltd. 1,531,000 HKD 5,103,084 5,123,175 0.81
Cathay Pacific Airways Ltd. 487,000 HKD 931,941 1,061,310 0.17
Cheung Kong Holdings Ltd. 574,000 HKD 10,284,590 9,644,571 1.52
Cheung Kong Infrastructure Holdings Ltd. 252,000 HKD 1,843,745 1,865,259 0.29
CLP Holdings Ltd. 778,500 HKD 6,774,590 6,751,146 1.06
First Pacific Co. Ltd. 976,000 HKD 1,026,870 967,838 0.15
Galaxy Entertainment Group Ltd. 965,000 HKD 6,364,615 5,431,730 0.86
Hang Lung Properties Ltd. 930,000 HKD 2,752,410 2,608,368 0.41
Hang Seng Bank Ltd. 316,400 HKD 5,331,457 5,271,395 0.83
Henderson Land Development Co. Ltd. 430,000 HKD 2,868,687 3,010,890 0.47
HKT Trust & HKT Ltd. 1,096,000 HKD 1,321,236 1,427,442 0.22
Hong Kong & China Gas Co. Ltd. 2,583,000 HKD 6,122,215 5,915,534 0.93
Hong Kong Exchanges and Clearing Ltd. 456,700 HKD 10,833,951 10,111,787 1.59
Hutchison Whampoa Ltd. 879,000 HKD 11,057,562 10,116,347 1.59
Hysan Development Co. Ltd. 263,000 HKD 1,191,717 1,175,129 0.18
Kerry Properties Ltd. 269,500 HKD 930,615 978,281 0.15
Li & Fung Ltd. 2,424,000 HKD 2,816,909 2,269,320 0.36
Link REIT 946,000 HKD 5,781,917 5,922,526 0.93
MTR Corp. Ltd. 600,500 HKD 2,379,835 2,462,446 0.39
New World Development Co. Ltd. 2,225,927 HKD 2,727,155 2,560,368 0.40
Noble Group Ltd. 1,786,000 SGD 1,727,967 1,536,518 0.24
NWS Holdings Ltd. 620,000 HKD 1,139,533 1,143,285 0.18
219
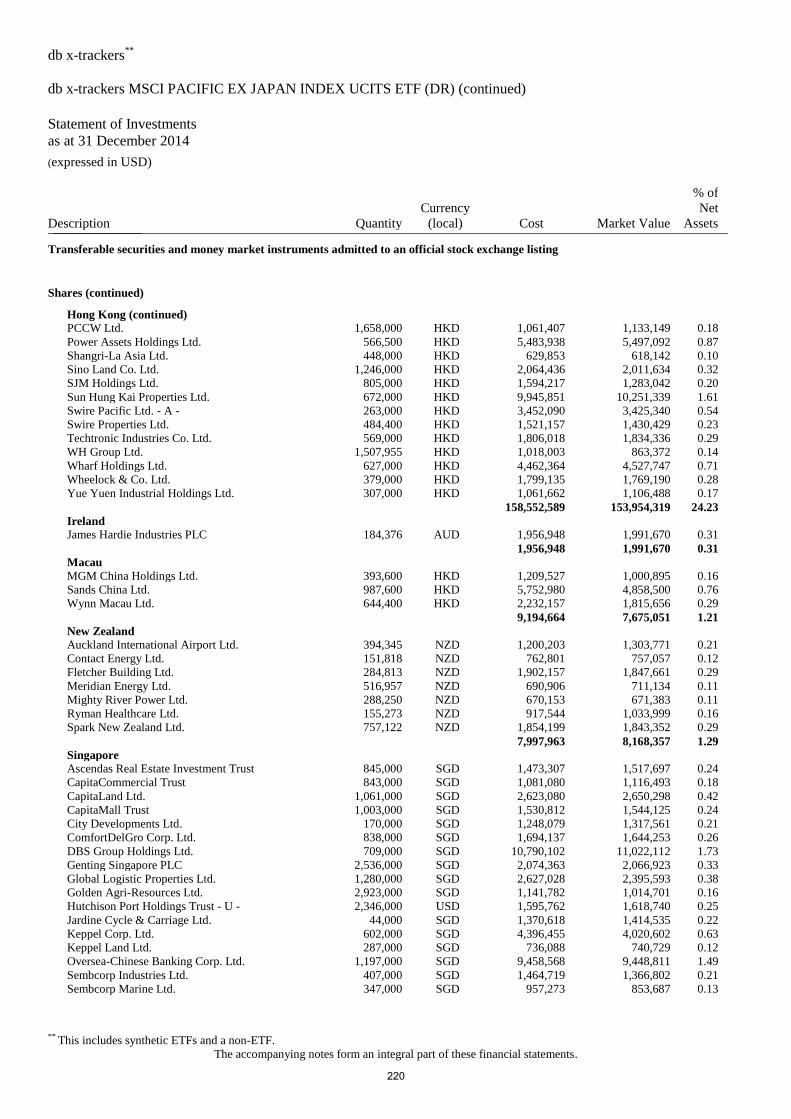
db x-trackers**
db x-trackers MSCI PACIFIC EX JAPAN INDEX UCITS ETF (DR) (continued)
Statement of Investments
as at 31 December 2014 (expressed in USD)
** This includes synthetic ETFs and a non-ETF.
The accompanying notes form an integral part of these financial statements.
Description Quantity
Currency
(local) Cost Market Value
% of
Net
Assets _______________
Transferable securities and money market instruments admitted to an official stock exchange listing
Shares (continued)
Hong Kong (continued)
PCCW Ltd. 1,658,000 HKD 1,061,407 1,133,149 0.18
Power Assets Holdings Ltd. 566,500 HKD 5,483,938 5,497,092 0.87
Shangri-La Asia Ltd. 448,000 HKD 629,853 618,142 0.10
Sino Land Co. Ltd. 1,246,000 HKD 2,064,436 2,011,634 0.32
SJM Holdings Ltd. 805,000 HKD 1,594,217 1,283,042 0.20
Sun Hung Kai Properties Ltd. 672,000 HKD 9,945,851 10,251,339 1.61
Swire Pacific Ltd. - A - 263,000 HKD 3,452,090 3,425,340 0.54
Swire Properties Ltd. 484,400 HKD 1,521,157 1,430,429 0.23
Techtronic Industries Co. Ltd. 569,000 HKD 1,806,018 1,834,336 0.29
WH Group Ltd. 1,507,955 HKD 1,018,003 863,372 0.14
Wharf Holdings Ltd. 627,000 HKD 4,462,364 4,527,747 0.71
Wheelock & Co. Ltd. 379,000 HKD 1,799,135 1,769,190 0.28
Yue Yuen Industrial Holdings Ltd. 307,000 HKD 1,061,662 1,106,488 0.17
158,552,589 153,954,319 24.23
Ireland
James Hardie Industries PLC 184,376 AUD 1,956,948 1,991,670 0.31
1,956,948 1,991,670 0.31
Macau
MGM China Holdings Ltd. 393,600 HKD 1,209,527 1,000,895 0.16
Sands China Ltd. 987,600 HKD 5,752,980 4,858,500 0.76
Wynn Macau Ltd. 644,400 HKD 2,232,157 1,815,656 0.29
9,194,664 7,675,051 1.21
New Zealand
Auckland International Airport Ltd. 394,345 NZD 1,200,203 1,303,771 0.21
Contact Energy Ltd. 151,818 NZD 762,801 757,057 0.12
Fletcher Building Ltd. 284,813 NZD 1,902,157 1,847,661 0.29
Meridian Energy Ltd. 516,957 NZD 690,906 711,134 0.11
Mighty River Power Ltd. 288,250 NZD 670,153 671,383 0.11
Ryman Healthcare Ltd. 155,273 NZD 917,544 1,033,999 0.16
Spark New Zealand Ltd. 757,122 NZD 1,854,199 1,843,352 0.29
7,997,963 8,168,357 1.29
Singapore
Ascendas Real Estate Investment Trust 845,000 SGD 1,473,307 1,517,697 0.24
CapitaCommercial Trust 843,000 SGD 1,081,080 1,116,493 0.18
CapitaLand Ltd. 1,061,000 SGD 2,623,080 2,650,298 0.42
CapitaMall Trust 1,003,000 SGD 1,530,812 1,544,125 0.24
City Developments Ltd. 170,000 SGD 1,248,079 1,317,561 0.21
ComfortDelGro Corp. Ltd. 838,000 SGD 1,694,137 1,644,253 0.26
DBS Group Holdings Ltd. 709,000 SGD 10,790,102 11,022,112 1.73
Genting Singapore PLC 2,536,000 SGD 2,074,363 2,066,923 0.33
Global Logistic Properties Ltd. 1,280,000 SGD 2,627,028 2,395,593 0.38
Golden Agri-Resources Ltd. 2,923,000 SGD 1,141,782 1,014,701 0.16
Hutchison Port Holdings Trust - U - 2,346,000 USD 1,595,762 1,618,740 0.25
Jardine Cycle & Carriage Ltd. 44,000 SGD 1,370,618 1,414,535 0.22
Keppel Corp. Ltd. 602,000 SGD 4,396,455 4,020,602 0.63
Keppel Land Ltd. 287,000 SGD 736,088 740,729 0.12
Oversea-Chinese Banking Corp. Ltd. 1,197,000 SGD 9,458,568 9,448,811 1.49
Sembcorp Industries Ltd. 407,000 SGD 1,464,719 1,366,802 0.21
Sembcorp Marine Ltd. 347,000 SGD 957,273 853,687 0.13
220
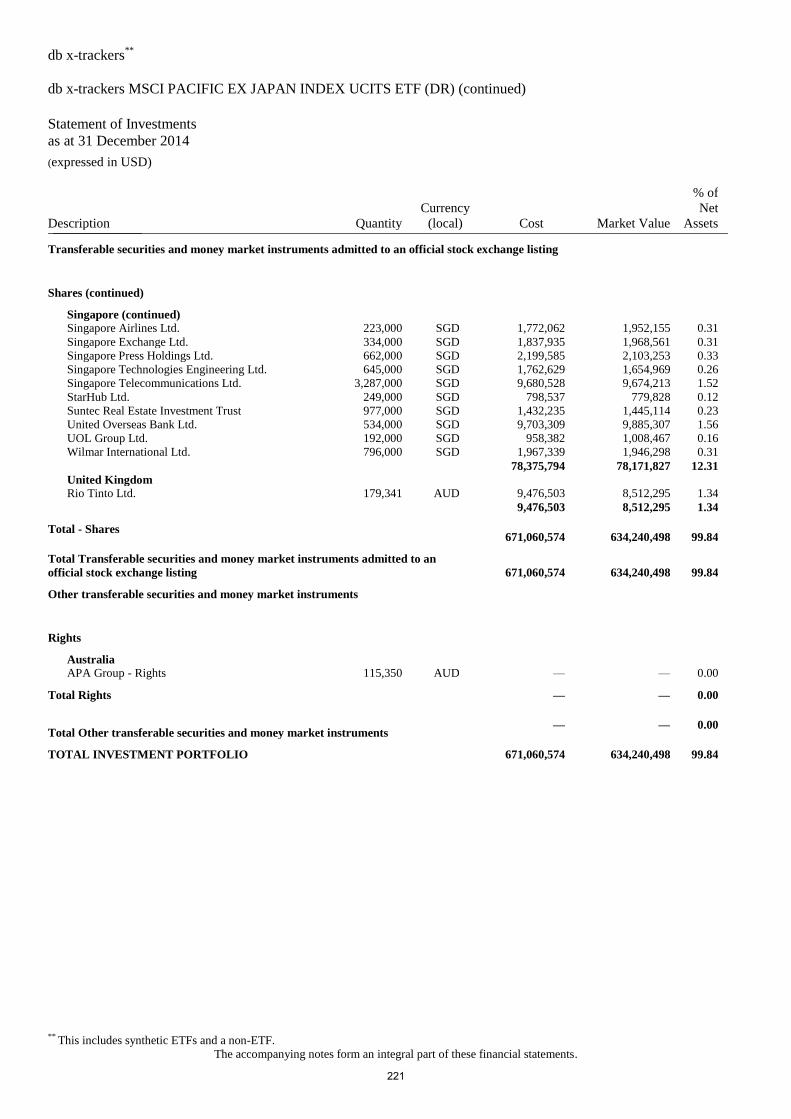
db x-trackers**
db x-trackers MSCI PACIFIC EX JAPAN INDEX UCITS ETF (DR) (continued)
Statement of Investments
as at 31 December 2014 (expressed in USD)
** This includes synthetic ETFs and a non-ETF.
The accompanying notes form an integral part of these financial statements.
Description Quantity
Currency
(local) Cost Market Value
% of
Net
Assets _______________
Transferable securities and money market instruments admitted to an official stock exchange listing
Shares (continued)
Singapore (continued)
Singapore Airlines Ltd. 223,000 SGD 1,772,062 1,952,155 0.31
Singapore Exchange Ltd. 334,000 SGD 1,837,935 1,968,561 0.31
Singapore Press Holdings Ltd. 662,000 SGD 2,199,585 2,103,253 0.33
Singapore Technologies Engineering Ltd. 645,000 SGD 1,762,629 1,654,969 0.26
Singapore Telecommunications Ltd. 3,287,000 SGD 9,680,528 9,674,213 1.52
StarHub Ltd. 249,000 SGD 798,537 779,828 0.12
Suntec Real Estate Investment Trust 977,000 SGD 1,432,235 1,445,114 0.23
United Overseas Bank Ltd. 534,000 SGD 9,703,309 9,885,307 1.56
UOL Group Ltd. 192,000 SGD 958,382 1,008,467 0.16
Wilmar International Ltd. 796,000 SGD 1,967,339 1,946,298 0.31
78,375,794 78,171,827 12.31
United Kingdom
Rio Tinto Ltd. 179,341 AUD 9,476,503 8,512,295 1.34
9,476,503 8,512,295 1.34
Total - Shares 671,060,574 634,240,498 99.84
Total Transferable securities and money market instruments admitted to an
official stock exchange listing 671,060,574 634,240,498 99.84
Other transferable securities and money market instruments
Rights
Australia
APA Group - Rights 115,350 AUD — — 0.00
Total Rights — — 0.00
Total Other transferable securities and money market instruments — — 0.00
TOTAL INVESTMENT PORTFOLIO 671,060,574 634,240,498 99.84
221
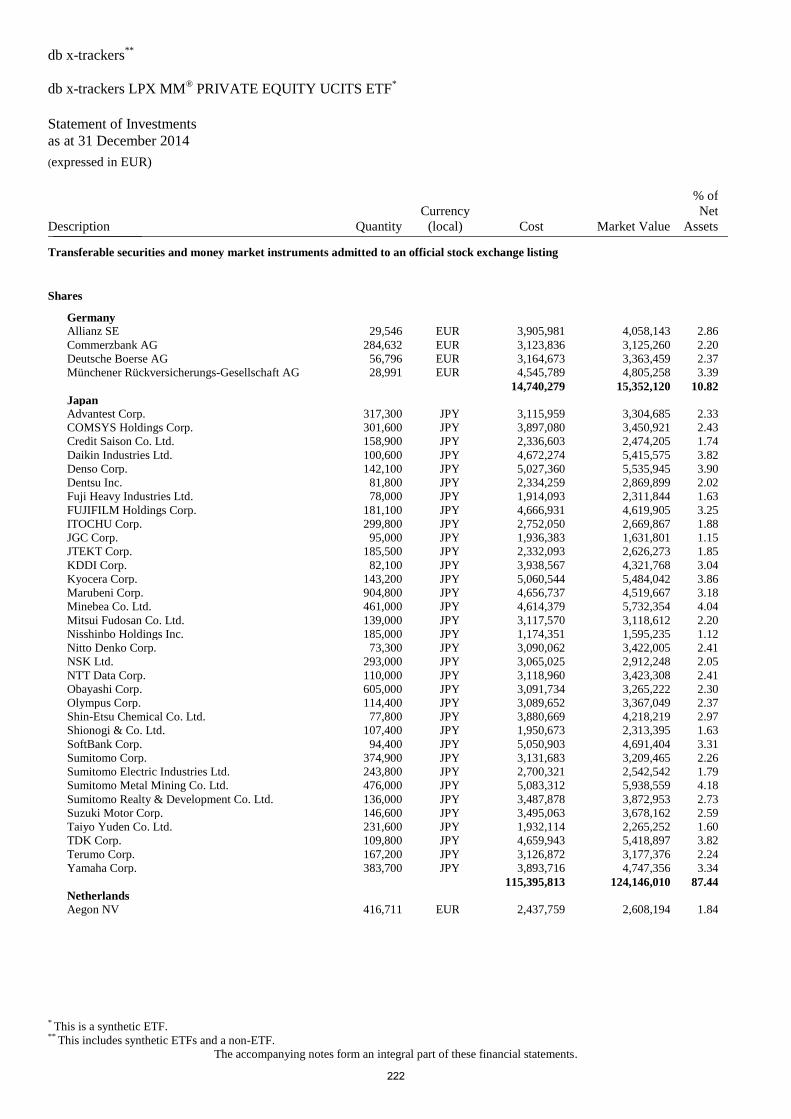
db x-trackers**
db x-trackers LPX MM® PRIVATE EQUITY UCITS ETF
*
Statement of Investments
as at 31 December 2014 (expressed in EUR)
* This is a synthetic ETF. ** This includes synthetic ETFs and a non-ETF.
The accompanying notes form an integral part of these financial statements.
Description Quantity
Currency
(local) Cost Market Value
% of
Net
Assets _______________
Transferable securities and money market instruments admitted to an official stock exchange listing
Shares
Germany
Allianz SE 29,546 EUR 3,905,981 4,058,143 2.86
Commerzbank AG 284,632 EUR 3,123,836 3,125,260 2.20
Deutsche Boerse AG 56,796 EUR 3,164,673 3,363,459 2.37
Münchener Rückversicherungs-Gesellschaft AG 28,991 EUR 4,545,789 4,805,258 3.39
14,740,279 15,352,120 10.82
Japan
Advantest Corp. 317,300 JPY 3,115,959 3,304,685 2.33
COMSYS Holdings Corp. 301,600 JPY 3,897,080 3,450,921 2.43
Credit Saison Co. Ltd. 158,900 JPY 2,336,603 2,474,205 1.74
Daikin Industries Ltd. 100,600 JPY 4,672,274 5,415,575 3.82
Denso Corp. 142,100 JPY 5,027,360 5,535,945 3.90
Dentsu Inc. 81,800 JPY 2,334,259 2,869,899 2.02
Fuji Heavy Industries Ltd. 78,000 JPY 1,914,093 2,311,844 1.63
FUJIFILM Holdings Corp. 181,100 JPY 4,666,931 4,619,905 3.25
ITOCHU Corp. 299,800 JPY 2,752,050 2,669,867 1.88
JGC Corp. 95,000 JPY 1,936,383 1,631,801 1.15
JTEKT Corp. 185,500 JPY 2,332,093 2,626,273 1.85
KDDI Corp. 82,100 JPY 3,938,567 4,321,768 3.04
Kyocera Corp. 143,200 JPY 5,060,544 5,484,042 3.86
Marubeni Corp. 904,800 JPY 4,656,737 4,519,667 3.18
Minebea Co. Ltd. 461,000 JPY 4,614,379 5,732,354 4.04
Mitsui Fudosan Co. Ltd. 139,000 JPY 3,117,570 3,118,612 2.20
Nisshinbo Holdings Inc. 185,000 JPY 1,174,351 1,595,235 1.12
Nitto Denko Corp. 73,300 JPY 3,090,062 3,422,005 2.41
NSK Ltd. 293,000 JPY 3,065,025 2,912,248 2.05
NTT Data Corp. 110,000 JPY 3,118,960 3,423,308 2.41
Obayashi Corp. 605,000 JPY 3,091,734 3,265,222 2.30
Olympus Corp. 114,400 JPY 3,089,652 3,367,049 2.37
Shin-Etsu Chemical Co. Ltd. 77,800 JPY 3,880,669 4,218,219 2.97
Shionogi & Co. Ltd. 107,400 JPY 1,950,673 2,313,395 1.63
SoftBank Corp. 94,400 JPY 5,050,903 4,691,404 3.31
Sumitomo Corp. 374,900 JPY 3,131,683 3,209,465 2.26
Sumitomo Electric Industries Ltd. 243,800 JPY 2,700,321 2,542,542 1.79
Sumitomo Metal Mining Co. Ltd. 476,000 JPY 5,083,312 5,938,559 4.18
Sumitomo Realty & Development Co. Ltd. 136,000 JPY 3,487,878 3,872,953 2.73
Suzuki Motor Corp. 146,600 JPY 3,495,063 3,678,162 2.59
Taiyo Yuden Co. Ltd. 231,600 JPY 1,932,114 2,265,252 1.60
TDK Corp. 109,800 JPY 4,659,943 5,418,897 3.82
Terumo Corp. 167,200 JPY 3,126,872 3,177,376 2.24
Yamaha Corp. 383,700 JPY 3,893,716 4,747,356 3.34
115,395,813 124,146,010 87.44
Netherlands
Aegon NV 416,711 EUR 2,437,759 2,608,194 1.84
222
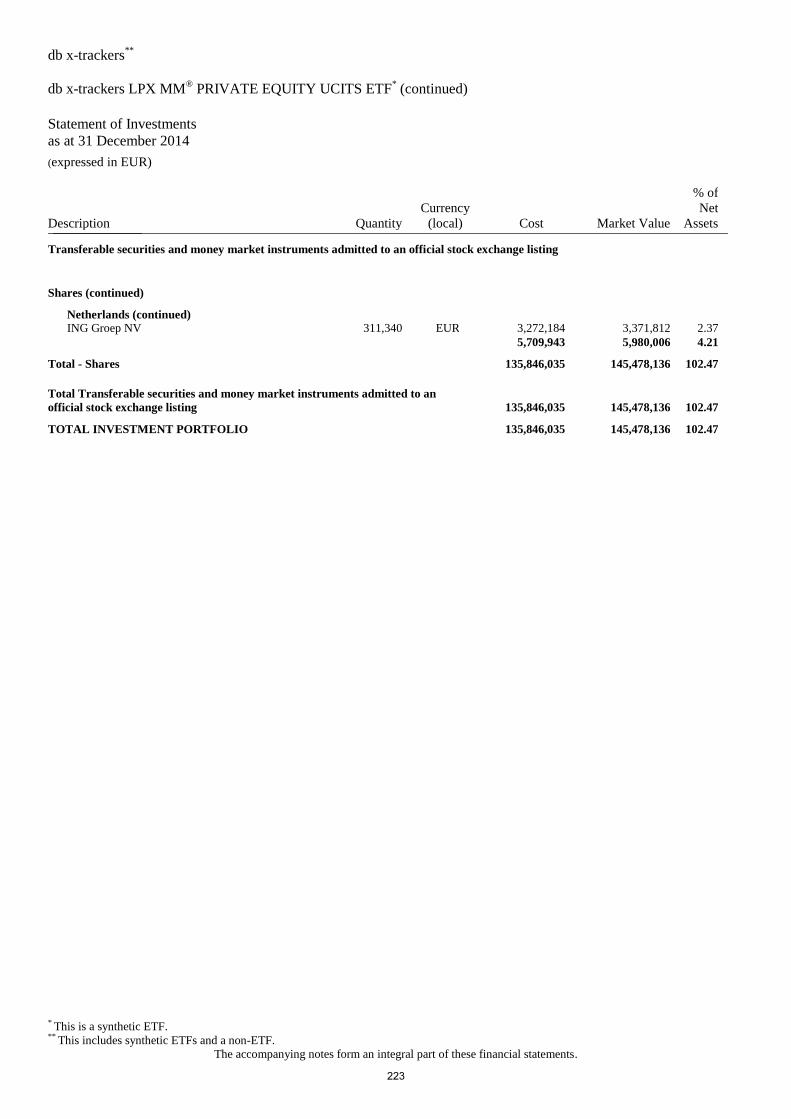
db x-trackers**
db x-trackers LPX MM® PRIVATE EQUITY UCITS ETF
* (continued)
Statement of Investments
as at 31 December 2014 (expressed in EUR)
* This is a synthetic ETF. ** This includes synthetic ETFs and a non-ETF.
The accompanying notes form an integral part of these financial statements.
Description Quantity
Currency
(local) Cost Market Value
% of
Net
Assets _______________
Transferable securities and money market instruments admitted to an official stock exchange listing
Shares (continued)
Netherlands (continued)
ING Groep NV 311,340 EUR 3,272,184 3,371,812 2.37
5,709,943 5,980,006 4.21
Total - Shares 135,846,035 145,478,136 102.47
Total Transferable securities and money market instruments admitted to an
official stock exchange listing 135,846,035 145,478,136 102.47
TOTAL INVESTMENT PORTFOLIO 135,846,035 145,478,136 102.47
223
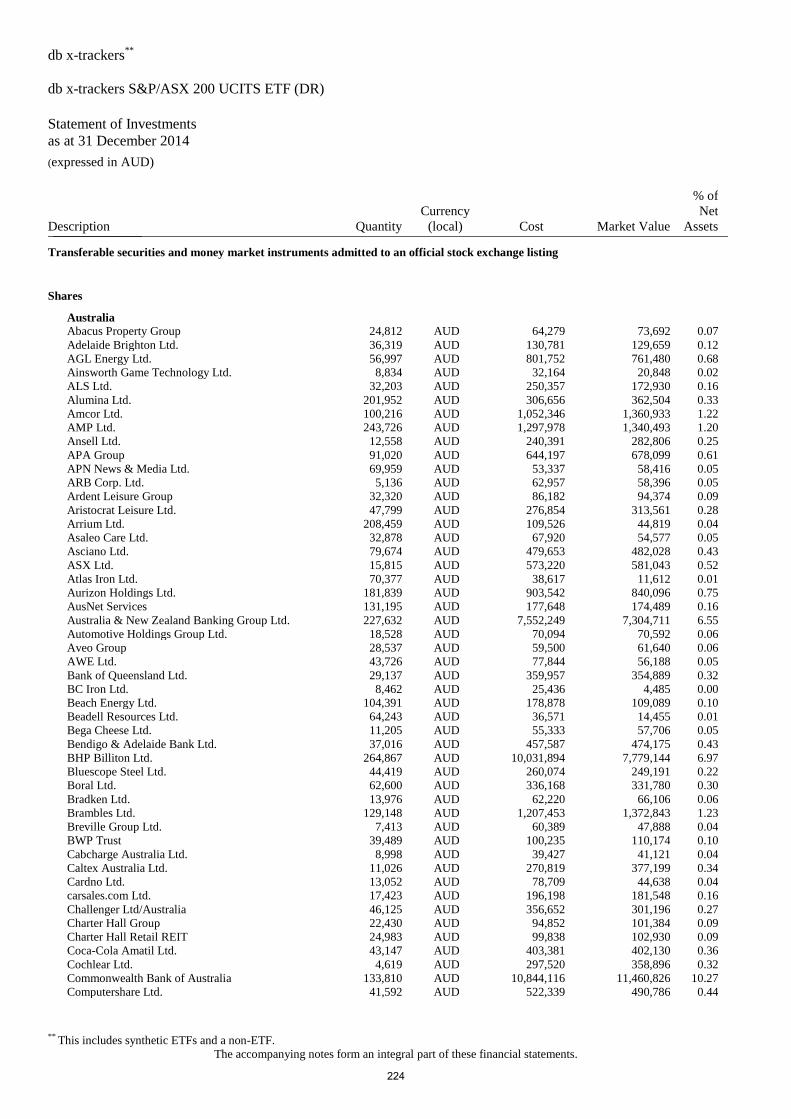
db x-trackers**
db x-trackers S&P/ASX 200 UCITS ETF (DR)
Statement of Investments
as at 31 December 2014 (expressed in AUD)
** This includes synthetic ETFs and a non-ETF.
The accompanying notes form an integral part of these financial statements.
Description Quantity
Currency
(local) Cost Market Value
% of
Net
Assets _______________
Transferable securities and money market instruments admitted to an official stock exchange listing
Shares
Australia
Abacus Property Group 24,812 AUD 64,279 73,692 0.07
Adelaide Brighton Ltd. 36,319 AUD 130,781 129,659 0.12
AGL Energy Ltd. 56,997 AUD 801,752 761,480 0.68
Ainsworth Game Technology Ltd. 8,834 AUD 32,164 20,848 0.02
ALS Ltd. 32,203 AUD 250,357 172,930 0.16
Alumina Ltd. 201,952 AUD 306,656 362,504 0.33
Amcor Ltd. 100,216 AUD 1,052,346 1,360,933 1.22
AMP Ltd. 243,726 AUD 1,297,978 1,340,493 1.20
Ansell Ltd. 12,558 AUD 240,391 282,806 0.25
APA Group 91,020 AUD 644,197 678,099 0.61
APN News & Media Ltd. 69,959 AUD 53,337 58,416 0.05
ARB Corp. Ltd. 5,136 AUD 62,957 58,396 0.05
Ardent Leisure Group 32,320 AUD 86,182 94,374 0.09
Aristocrat Leisure Ltd. 47,799 AUD 276,854 313,561 0.28
Arrium Ltd. 208,459 AUD 109,526 44,819 0.04
Asaleo Care Ltd. 32,878 AUD 67,920 54,577 0.05
Asciano Ltd. 79,674 AUD 479,653 482,028 0.43
ASX Ltd. 15,815 AUD 573,220 581,043 0.52
Atlas Iron Ltd. 70,377 AUD 38,617 11,612 0.01
Aurizon Holdings Ltd. 181,839 AUD 903,542 840,096 0.75
AusNet Services 131,195 AUD 177,648 174,489 0.16
Australia & New Zealand Banking Group Ltd. 227,632 AUD 7,552,249 7,304,711 6.55
Automotive Holdings Group Ltd. 18,528 AUD 70,094 70,592 0.06
Aveo Group 28,537 AUD 59,500 61,640 0.06
AWE Ltd. 43,726 AUD 77,844 56,188 0.05
Bank of Queensland Ltd. 29,137 AUD 359,957 354,889 0.32
BC Iron Ltd. 8,462 AUD 25,436 4,485 0.00
Beach Energy Ltd. 104,391 AUD 178,878 109,089 0.10
Beadell Resources Ltd. 64,243 AUD 36,571 14,455 0.01
Bega Cheese Ltd. 11,205 AUD 55,333 57,706 0.05
Bendigo & Adelaide Bank Ltd. 37,016 AUD 457,587 474,175 0.43
BHP Billiton Ltd. 264,867 AUD 10,031,894 7,779,144 6.97
Bluescope Steel Ltd. 44,419 AUD 260,074 249,191 0.22
Boral Ltd. 62,600 AUD 336,168 331,780 0.30
Bradken Ltd. 13,976 AUD 62,220 66,106 0.06
Brambles Ltd. 129,148 AUD 1,207,453 1,372,843 1.23
Breville Group Ltd. 7,413 AUD 60,389 47,888 0.04
BWP Trust 39,489 AUD 100,235 110,174 0.10
Cabcharge Australia Ltd. 8,998 AUD 39,427 41,121 0.04
Caltex Australia Ltd. 11,026 AUD 270,819 377,199 0.34
Cardno Ltd. 13,052 AUD 78,709 44,638 0.04
carsales.com Ltd. 17,423 AUD 196,198 181,548 0.16
Challenger Ltd/Australia 46,125 AUD 356,652 301,196 0.27
Charter Hall Group 22,430 AUD 94,852 101,384 0.09
Charter Hall Retail REIT 24,983 AUD 99,838 102,930 0.09
Coca-Cola Amatil Ltd. 43,147 AUD 403,381 402,130 0.36
Cochlear Ltd. 4,619 AUD 297,520 358,896 0.32
Commonwealth Bank of Australia 133,810 AUD 10,844,116 11,460,826 10.27
Computershare Ltd. 41,592 AUD 522,339 490,786 0.44
224
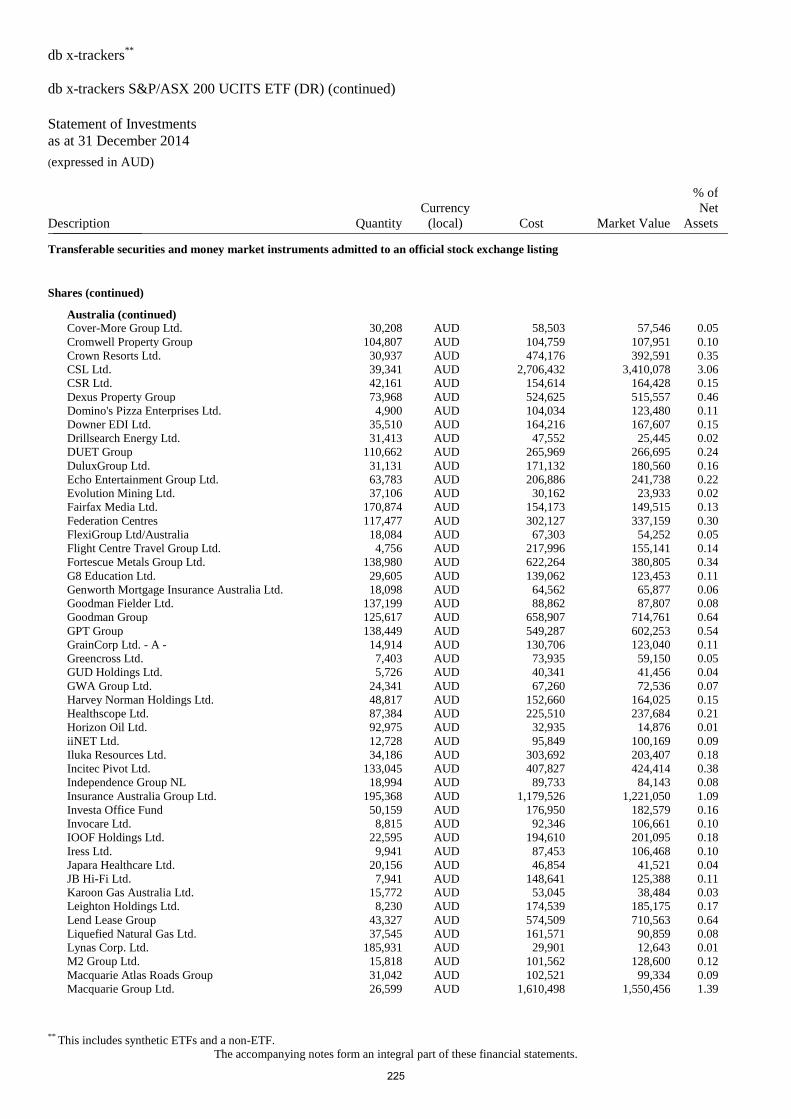
db x-trackers**
db x-trackers S&P/ASX 200 UCITS ETF (DR) (continued)
Statement of Investments
as at 31 December 2014 (expressed in AUD)
** This includes synthetic ETFs and a non-ETF.
The accompanying notes form an integral part of these financial statements.
Description Quantity
Currency
(local) Cost Market Value
% of
Net
Assets _______________
Transferable securities and money market instruments admitted to an official stock exchange listing
Shares (continued)
Australia (continued)
Cover-More Group Ltd. 30,208 AUD 58,503 57,546 0.05
Cromwell Property Group 104,807 AUD 104,759 107,951 0.10
Crown Resorts Ltd. 30,937 AUD 474,176 392,591 0.35
CSL Ltd. 39,341 AUD 2,706,432 3,410,078 3.06
CSR Ltd. 42,161 AUD 154,614 164,428 0.15
Dexus Property Group 73,968 AUD 524,625 515,557 0.46
Domino's Pizza Enterprises Ltd. 4,900 AUD 104,034 123,480 0.11
Downer EDI Ltd. 35,510 AUD 164,216 167,607 0.15
Drillsearch Energy Ltd. 31,413 AUD 47,552 25,445 0.02
DUET Group 110,662 AUD 265,969 266,695 0.24
DuluxGroup Ltd. 31,131 AUD 171,132 180,560 0.16
Echo Entertainment Group Ltd. 63,783 AUD 206,886 241,738 0.22
Evolution Mining Ltd. 37,106 AUD 30,162 23,933 0.02
Fairfax Media Ltd. 170,874 AUD 154,173 149,515 0.13
Federation Centres 117,477 AUD 302,127 337,159 0.30
FlexiGroup Ltd/Australia 18,084 AUD 67,303 54,252 0.05
Flight Centre Travel Group Ltd. 4,756 AUD 217,996 155,141 0.14
Fortescue Metals Group Ltd. 138,980 AUD 622,264 380,805 0.34
G8 Education Ltd. 29,605 AUD 139,062 123,453 0.11
Genworth Mortgage Insurance Australia Ltd. 18,098 AUD 64,562 65,877 0.06
Goodman Fielder Ltd. 137,199 AUD 88,862 87,807 0.08
Goodman Group 125,617 AUD 658,907 714,761 0.64
GPT Group 138,449 AUD 549,287 602,253 0.54
GrainCorp Ltd. - A - 14,914 AUD 130,706 123,040 0.11
Greencross Ltd. 7,403 AUD 73,935 59,150 0.05
GUD Holdings Ltd. 5,726 AUD 40,341 41,456 0.04
GWA Group Ltd. 24,341 AUD 67,260 72,536 0.07
Harvey Norman Holdings Ltd. 48,817 AUD 152,660 164,025 0.15
Healthscope Ltd. 87,384 AUD 225,510 237,684 0.21
Horizon Oil Ltd. 92,975 AUD 32,935 14,876 0.01
iiNET Ltd. 12,728 AUD 95,849 100,169 0.09
Iluka Resources Ltd. 34,186 AUD 303,692 203,407 0.18
Incitec Pivot Ltd. 133,045 AUD 407,827 424,414 0.38
Independence Group NL 18,994 AUD 89,733 84,143 0.08
Insurance Australia Group Ltd. 195,368 AUD 1,179,526 1,221,050 1.09
Investa Office Fund 50,159 AUD 176,950 182,579 0.16
Invocare Ltd. 8,815 AUD 92,346 106,661 0.10
IOOF Holdings Ltd. 22,595 AUD 194,610 201,095 0.18
Iress Ltd. 9,941 AUD 87,453 106,468 0.10
Japara Healthcare Ltd. 20,156 AUD 46,854 41,521 0.04
JB Hi-Fi Ltd. 7,941 AUD 148,641 125,388 0.11
Karoon Gas Australia Ltd. 15,772 AUD 53,045 38,484 0.03
Leighton Holdings Ltd. 8,230 AUD 174,539 185,175 0.17
Lend Lease Group 43,327 AUD 574,509 710,563 0.64
Liquefied Natural Gas Ltd. 37,545 AUD 161,571 90,859 0.08
Lynas Corp. Ltd. 185,931 AUD 29,901 12,643 0.01
M2 Group Ltd. 15,818 AUD 101,562 128,600 0.12
Macquarie Atlas Roads Group 31,042 AUD 102,521 99,334 0.09
Macquarie Group Ltd. 26,599 AUD 1,610,498 1,550,456 1.39
225
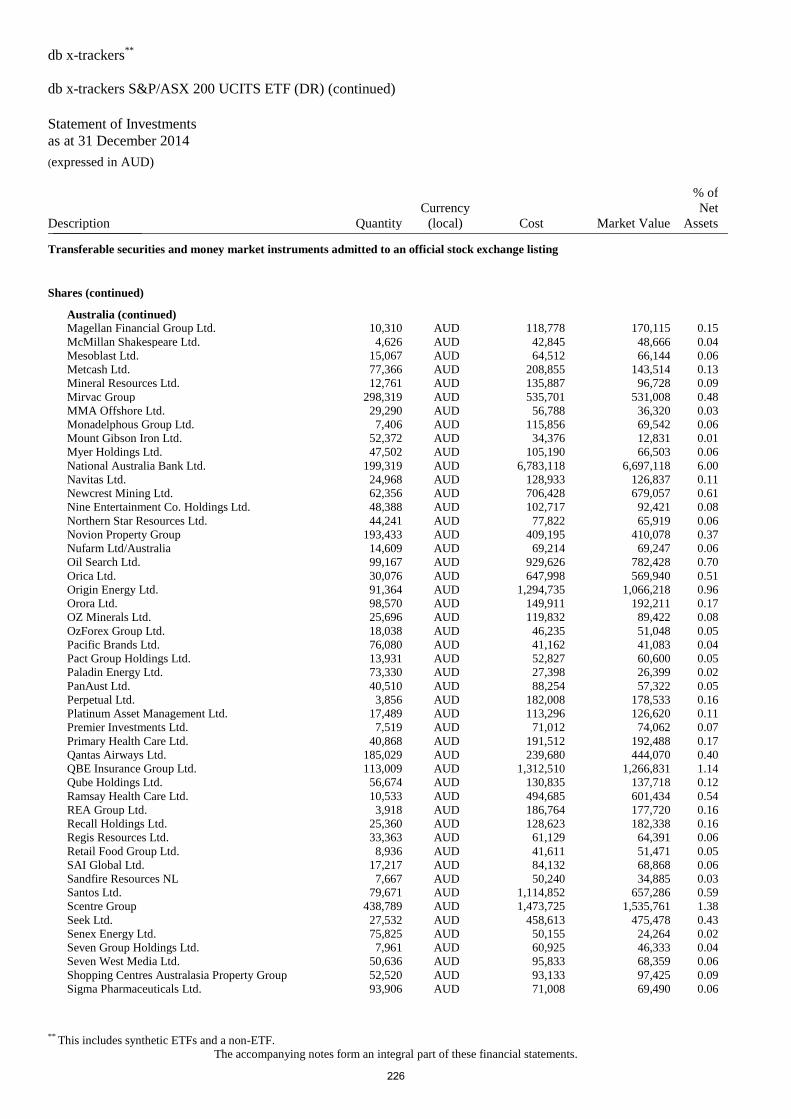
db x-trackers**
db x-trackers S&P/ASX 200 UCITS ETF (DR) (continued)
Statement of Investments
as at 31 December 2014 (expressed in AUD)
** This includes synthetic ETFs and a non-ETF.
The accompanying notes form an integral part of these financial statements.
Description Quantity
Currency
(local) Cost Market Value
% of
Net
Assets _______________
Transferable securities and money market instruments admitted to an official stock exchange listing
Shares (continued)
Australia (continued)
Magellan Financial Group Ltd. 10,310 AUD 118,778 170,115 0.15
McMillan Shakespeare Ltd. 4,626 AUD 42,845 48,666 0.04
Mesoblast Ltd. 15,067 AUD 64,512 66,144 0.06
Metcash Ltd. 77,366 AUD 208,855 143,514 0.13
Mineral Resources Ltd. 12,761 AUD 135,887 96,728 0.09
Mirvac Group 298,319 AUD 535,701 531,008 0.48
MMA Offshore Ltd. 29,290 AUD 56,788 36,320 0.03
Monadelphous Group Ltd. 7,406 AUD 115,856 69,542 0.06
Mount Gibson Iron Ltd. 52,372 AUD 34,376 12,831 0.01
Myer Holdings Ltd. 47,502 AUD 105,190 66,503 0.06
National Australia Bank Ltd. 199,319 AUD 6,783,118 6,697,118 6.00
Navitas Ltd. 24,968 AUD 128,933 126,837 0.11
Newcrest Mining Ltd. 62,356 AUD 706,428 679,057 0.61
Nine Entertainment Co. Holdings Ltd. 48,388 AUD 102,717 92,421 0.08
Northern Star Resources Ltd. 44,241 AUD 77,822 65,919 0.06
Novion Property Group 193,433 AUD 409,195 410,078 0.37
Nufarm Ltd/Australia 14,609 AUD 69,214 69,247 0.06
Oil Search Ltd. 99,167 AUD 929,626 782,428 0.70
Orica Ltd. 30,076 AUD 647,998 569,940 0.51
Origin Energy Ltd. 91,364 AUD 1,294,735 1,066,218 0.96
Orora Ltd. 98,570 AUD 149,911 192,211 0.17
OZ Minerals Ltd. 25,696 AUD 119,832 89,422 0.08
OzForex Group Ltd. 18,038 AUD 46,235 51,048 0.05
Pacific Brands Ltd. 76,080 AUD 41,162 41,083 0.04
Pact Group Holdings Ltd. 13,931 AUD 52,827 60,600 0.05
Paladin Energy Ltd. 73,330 AUD 27,398 26,399 0.02
PanAust Ltd. 40,510 AUD 88,254 57,322 0.05
Perpetual Ltd. 3,856 AUD 182,008 178,533 0.16
Platinum Asset Management Ltd. 17,489 AUD 113,296 126,620 0.11
Premier Investments Ltd. 7,519 AUD 71,012 74,062 0.07
Primary Health Care Ltd. 40,868 AUD 191,512 192,488 0.17
Qantas Airways Ltd. 185,029 AUD 239,680 444,070 0.40
QBE Insurance Group Ltd. 113,009 AUD 1,312,510 1,266,831 1.14
Qube Holdings Ltd. 56,674 AUD 130,835 137,718 0.12
Ramsay Health Care Ltd. 10,533 AUD 494,685 601,434 0.54
REA Group Ltd. 3,918 AUD 186,764 177,720 0.16
Recall Holdings Ltd. 25,360 AUD 128,623 182,338 0.16
Regis Resources Ltd. 33,363 AUD 61,129 64,391 0.06
Retail Food Group Ltd. 8,936 AUD 41,611 51,471 0.05
SAI Global Ltd. 17,217 AUD 84,132 68,868 0.06
Sandfire Resources NL 7,667 AUD 50,240 34,885 0.03
Santos Ltd. 79,671 AUD 1,114,852 657,286 0.59
Scentre Group 438,789 AUD 1,473,725 1,535,761 1.38
Seek Ltd. 27,532 AUD 458,613 475,478 0.43
Senex Energy Ltd. 75,825 AUD 50,155 24,264 0.02
Seven Group Holdings Ltd. 7,961 AUD 60,925 46,333 0.04
Seven West Media Ltd. 50,636 AUD 95,833 68,359 0.06
Shopping Centres Australasia Property Group 52,520 AUD 93,133 97,425 0.09
Sigma Pharmaceuticals Ltd. 93,906 AUD 71,008 69,490 0.06
226
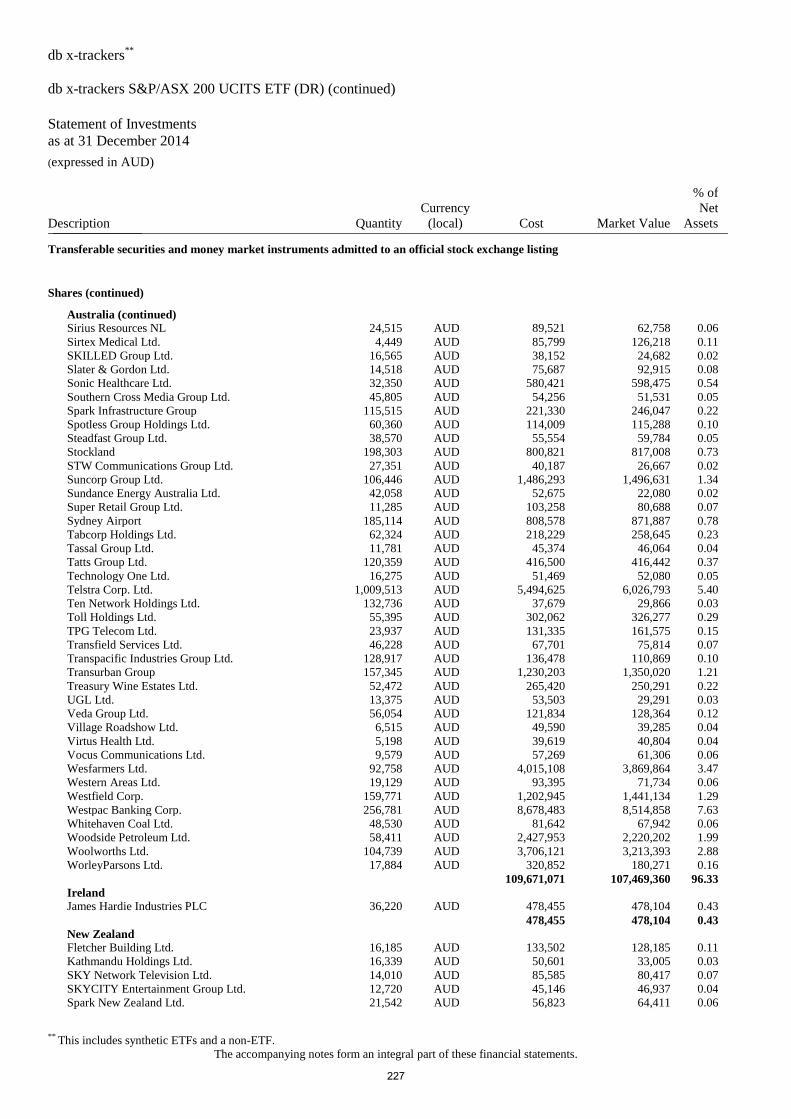
db x-trackers**
db x-trackers S&P/ASX 200 UCITS ETF (DR) (continued)
Statement of Investments
as at 31 December 2014 (expressed in AUD)
** This includes synthetic ETFs and a non-ETF.
The accompanying notes form an integral part of these financial statements.
Description Quantity
Currency
(local) Cost Market Value
% of
Net
Assets _______________
Transferable securities and money market instruments admitted to an official stock exchange listing
Shares (continued)
Australia (continued)
Sirius Resources NL 24,515 AUD 89,521 62,758 0.06
Sirtex Medical Ltd. 4,449 AUD 85,799 126,218 0.11
SKILLED Group Ltd. 16,565 AUD 38,152 24,682 0.02
Slater & Gordon Ltd. 14,518 AUD 75,687 92,915 0.08
Sonic Healthcare Ltd. 32,350 AUD 580,421 598,475 0.54
Southern Cross Media Group Ltd. 45,805 AUD 54,256 51,531 0.05
Spark Infrastructure Group 115,515 AUD 221,330 246,047 0.22
Spotless Group Holdings Ltd. 60,360 AUD 114,009 115,288 0.10
Steadfast Group Ltd. 38,570 AUD 55,554 59,784 0.05
Stockland 198,303 AUD 800,821 817,008 0.73
STW Communications Group Ltd. 27,351 AUD 40,187 26,667 0.02
Suncorp Group Ltd. 106,446 AUD 1,486,293 1,496,631 1.34
Sundance Energy Australia Ltd. 42,058 AUD 52,675 22,080 0.02
Super Retail Group Ltd. 11,285 AUD 103,258 80,688 0.07
Sydney Airport 185,114 AUD 808,578 871,887 0.78
Tabcorp Holdings Ltd. 62,324 AUD 218,229 258,645 0.23
Tassal Group Ltd. 11,781 AUD 45,374 46,064 0.04
Tatts Group Ltd. 120,359 AUD 416,500 416,442 0.37
Technology One Ltd. 16,275 AUD 51,469 52,080 0.05
Telstra Corp. Ltd. 1,009,513 AUD 5,494,625 6,026,793 5.40
Ten Network Holdings Ltd. 132,736 AUD 37,679 29,866 0.03
Toll Holdings Ltd. 55,395 AUD 302,062 326,277 0.29
TPG Telecom Ltd. 23,937 AUD 131,335 161,575 0.15
Transfield Services Ltd. 46,228 AUD 67,701 75,814 0.07
Transpacific Industries Group Ltd. 128,917 AUD 136,478 110,869 0.10
Transurban Group 157,345 AUD 1,230,203 1,350,020 1.21
Treasury Wine Estates Ltd. 52,472 AUD 265,420 250,291 0.22
UGL Ltd. 13,375 AUD 53,503 29,291 0.03
Veda Group Ltd. 56,054 AUD 121,834 128,364 0.12
Village Roadshow Ltd. 6,515 AUD 49,590 39,285 0.04
Virtus Health Ltd. 5,198 AUD 39,619 40,804 0.04
Vocus Communications Ltd. 9,579 AUD 57,269 61,306 0.06
Wesfarmers Ltd. 92,758 AUD 4,015,108 3,869,864 3.47
Western Areas Ltd. 19,129 AUD 93,395 71,734 0.06
Westfield Corp. 159,771 AUD 1,202,945 1,441,134 1.29
Westpac Banking Corp. 256,781 AUD 8,678,483 8,514,858 7.63
Whitehaven Coal Ltd. 48,530 AUD 81,642 67,942 0.06
Woodside Petroleum Ltd. 58,411 AUD 2,427,953 2,220,202 1.99
Woolworths Ltd. 104,739 AUD 3,706,121 3,213,393 2.88
WorleyParsons Ltd. 17,884 AUD 320,852 180,271 0.16
109,671,071 107,469,360 96.33
Ireland
James Hardie Industries PLC 36,220 AUD 478,455 478,104 0.43
478,455 478,104 0.43
New Zealand
Fletcher Building Ltd. 16,185 AUD 133,502 128,185 0.11
Kathmandu Holdings Ltd. 16,339 AUD 50,601 33,005 0.03
SKY Network Television Ltd. 14,010 AUD 85,585 80,417 0.07
SKYCITY Entertainment Group Ltd. 12,720 AUD 45,146 46,937 0.04
Spark New Zealand Ltd. 21,542 AUD 56,823 64,411 0.06
227
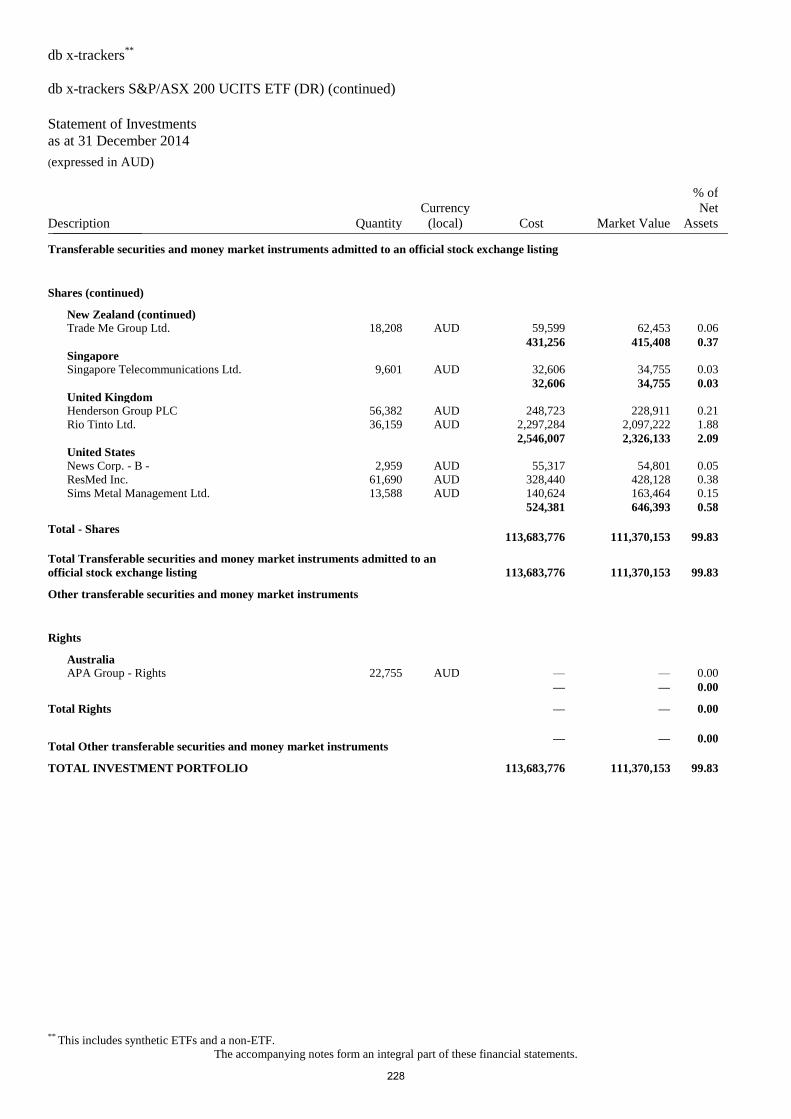
db x-trackers**
db x-trackers S&P/ASX 200 UCITS ETF (DR) (continued)
Statement of Investments
as at 31 December 2014 (expressed in AUD)
** This includes synthetic ETFs and a non-ETF.
The accompanying notes form an integral part of these financial statements.
Description Quantity
Currency
(local) Cost Market Value
% of
Net
Assets _______________
Transferable securities and money market instruments admitted to an official stock exchange listing
Shares (continued)
New Zealand (continued)
Trade Me Group Ltd. 18,208 AUD 59,599 62,453 0.06
431,256 415,408 0.37
Singapore
Singapore Telecommunications Ltd. 9,601 AUD 32,606 34,755 0.03
32,606 34,755 0.03
United Kingdom
Henderson Group PLC 56,382 AUD 248,723 228,911 0.21
Rio Tinto Ltd. 36,159 AUD 2,297,284 2,097,222 1.88
2,546,007 2,326,133 2.09
United States
News Corp. - B - 2,959 AUD 55,317 54,801 0.05
ResMed Inc. 61,690 AUD 328,440 428,128 0.38
Sims Metal Management Ltd. 13,588 AUD 140,624 163,464 0.15
524,381 646,393 0.58
Total - Shares 113,683,776 111,370,153 99.83
Total Transferable securities and money market instruments admitted to an
official stock exchange listing 113,683,776 111,370,153 99.83
Other transferable securities and money market instruments
Rights
Australia
APA Group - Rights 22,755 AUD — — 0.00
— — 0.00
Total Rights — — 0.00
Total Other transferable securities and money market instruments — — 0.00
TOTAL INVESTMENT PORTFOLIO 113,683,776 111,370,153 99.83
228
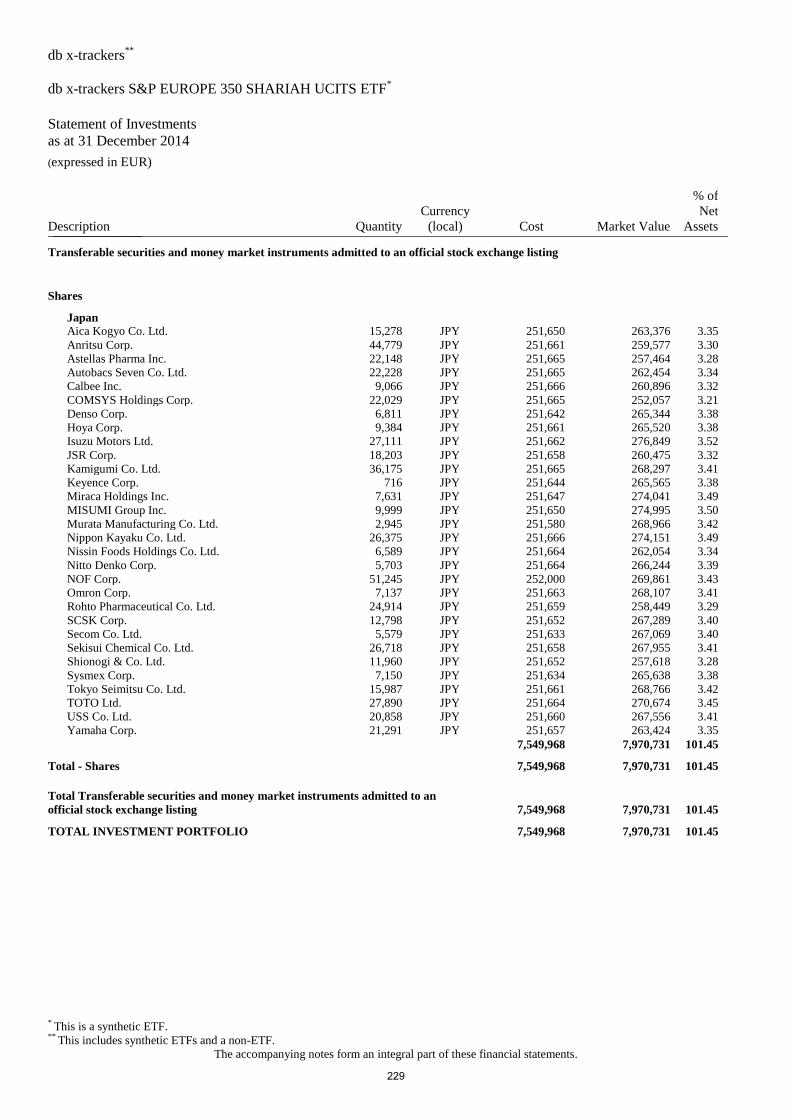
db x-trackers**
db x-trackers S&P EUROPE 350 SHARIAH UCITS ETF*
Statement of Investments
as at 31 December 2014 (expressed in EUR)
* This is a synthetic ETF. ** This includes synthetic ETFs and a non-ETF.
The accompanying notes form an integral part of these financial statements.
Description Quantity
Currency
(local) Cost Market Value
% of
Net
Assets _______________
Transferable securities and money market instruments admitted to an official stock exchange listing
Shares
Japan
Aica Kogyo Co. Ltd. 15,278 JPY 251,650 263,376 3.35
Anritsu Corp. 44,779 JPY 251,661 259,577 3.30
Astellas Pharma Inc. 22,148 JPY 251,665 257,464 3.28
Autobacs Seven Co. Ltd. 22,228 JPY 251,665 262,454 3.34
Calbee Inc. 9,066 JPY 251,666 260,896 3.32
COMSYS Holdings Corp. 22,029 JPY 251,665 252,057 3.21
Denso Corp. 6,811 JPY 251,642 265,344 3.38
Hoya Corp. 9,384 JPY 251,661 265,520 3.38
Isuzu Motors Ltd. 27,111 JPY 251,662 276,849 3.52
JSR Corp. 18,203 JPY 251,658 260,475 3.32
Kamigumi Co. Ltd. 36,175 JPY 251,665 268,297 3.41
Keyence Corp. 716 JPY 251,644 265,565 3.38
Miraca Holdings Inc. 7,631 JPY 251,647 274,041 3.49
MISUMI Group Inc. 9,999 JPY 251,650 274,995 3.50
Murata Manufacturing Co. Ltd. 2,945 JPY 251,580 268,966 3.42
Nippon Kayaku Co. Ltd. 26,375 JPY 251,666 274,151 3.49
Nissin Foods Holdings Co. Ltd. 6,589 JPY 251,664 262,054 3.34
Nitto Denko Corp. 5,703 JPY 251,664 266,244 3.39
NOF Corp. 51,245 JPY 252,000 269,861 3.43
Omron Corp. 7,137 JPY 251,663 268,107 3.41
Rohto Pharmaceutical Co. Ltd. 24,914 JPY 251,659 258,449 3.29
SCSK Corp. 12,798 JPY 251,652 267,289 3.40
Secom Co. Ltd. 5,579 JPY 251,633 267,069 3.40
Sekisui Chemical Co. Ltd. 26,718 JPY 251,658 267,955 3.41
Shionogi & Co. Ltd. 11,960 JPY 251,652 257,618 3.28
Sysmex Corp. 7,150 JPY 251,634 265,638 3.38
Tokyo Seimitsu Co. Ltd. 15,987 JPY 251,661 268,766 3.42
TOTO Ltd. 27,890 JPY 251,664 270,674 3.45
USS Co. Ltd. 20,858 JPY 251,660 267,556 3.41
Yamaha Corp. 21,291 JPY 251,657 263,424 3.35
7,549,968 7,970,731 101.45
Total - Shares 7,549,968 7,970,731 101.45
Total Transferable securities and money market instruments admitted to an
official stock exchange listing 7,549,968 7,970,731 101.45
TOTAL INVESTMENT PORTFOLIO 7,549,968 7,970,731 101.45
229
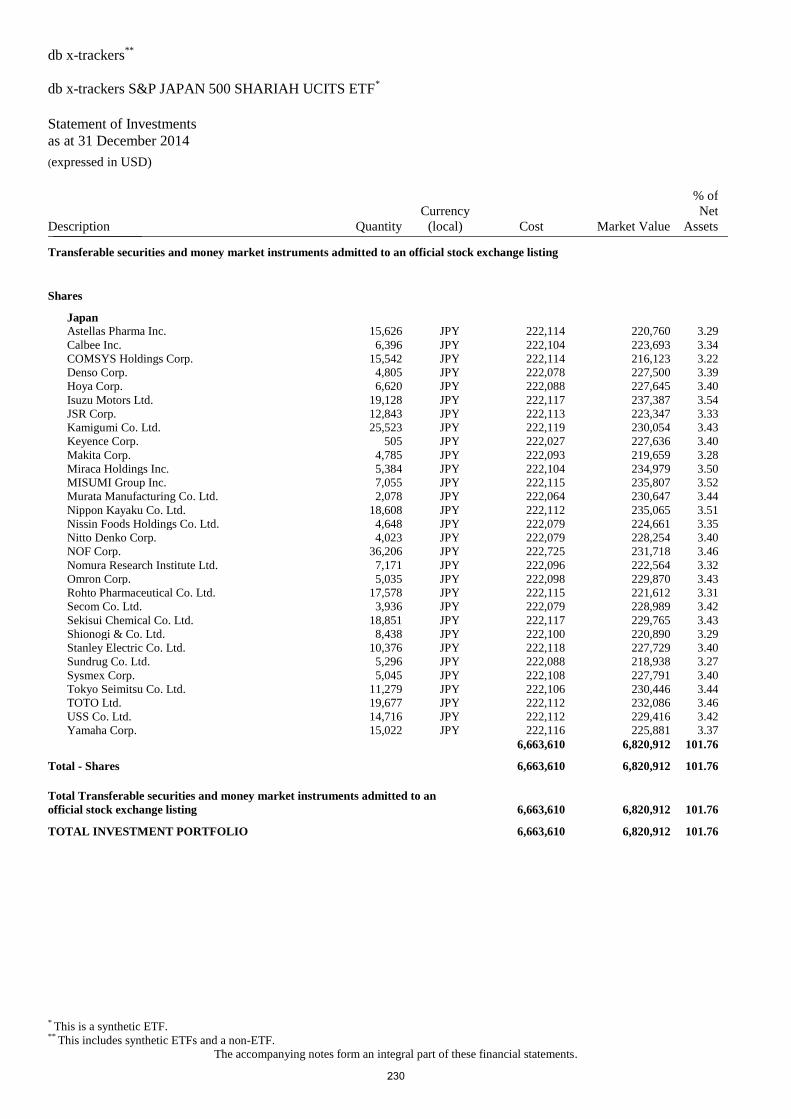
db x-trackers**
db x-trackers S&P JAPAN 500 SHARIAH UCITS ETF*
Statement of Investments
as at 31 December 2014 (expressed in USD)
* This is a synthetic ETF. ** This includes synthetic ETFs and a non-ETF.
The accompanying notes form an integral part of these financial statements.
Description Quantity
Currency
(local) Cost Market Value
% of
Net
Assets _______________
Transferable securities and money market instruments admitted to an official stock exchange listing
Shares
Japan
Astellas Pharma Inc. 15,626 JPY 222,114 220,760 3.29
Calbee Inc. 6,396 JPY 222,104 223,693 3.34
COMSYS Holdings Corp. 15,542 JPY 222,114 216,123 3.22
Denso Corp. 4,805 JPY 222,078 227,500 3.39
Hoya Corp. 6,620 JPY 222,088 227,645 3.40
Isuzu Motors Ltd. 19,128 JPY 222,117 237,387 3.54
JSR Corp. 12,843 JPY 222,113 223,347 3.33
Kamigumi Co. Ltd. 25,523 JPY 222,119 230,054 3.43
Keyence Corp. 505 JPY 222,027 227,636 3.40
Makita Corp. 4,785 JPY 222,093 219,659 3.28
Miraca Holdings Inc. 5,384 JPY 222,104 234,979 3.50
MISUMI Group Inc. 7,055 JPY 222,115 235,807 3.52
Murata Manufacturing Co. Ltd. 2,078 JPY 222,064 230,647 3.44
Nippon Kayaku Co. Ltd. 18,608 JPY 222,112 235,065 3.51
Nissin Foods Holdings Co. Ltd. 4,648 JPY 222,079 224,661 3.35
Nitto Denko Corp. 4,023 JPY 222,079 228,254 3.40
NOF Corp. 36,206 JPY 222,725 231,718 3.46
Nomura Research Institute Ltd. 7,171 JPY 222,096 222,564 3.32
Omron Corp. 5,035 JPY 222,098 229,870 3.43
Rohto Pharmaceutical Co. Ltd. 17,578 JPY 222,115 221,612 3.31
Secom Co. Ltd. 3,936 JPY 222,079 228,989 3.42
Sekisui Chemical Co. Ltd. 18,851 JPY 222,117 229,765 3.43
Shionogi & Co. Ltd. 8,438 JPY 222,100 220,890 3.29
Stanley Electric Co. Ltd. 10,376 JPY 222,118 227,729 3.40
Sundrug Co. Ltd. 5,296 JPY 222,088 218,938 3.27
Sysmex Corp. 5,045 JPY 222,108 227,791 3.40
Tokyo Seimitsu Co. Ltd. 11,279 JPY 222,106 230,446 3.44
TOTO Ltd. 19,677 JPY 222,112 232,086 3.46
USS Co. Ltd. 14,716 JPY 222,112 229,416 3.42
Yamaha Corp. 15,022 JPY 222,116 225,881 3.37
6,663,610 6,820,912 101.76
Total - Shares 6,663,610 6,820,912 101.76
Total Transferable securities and money market instruments admitted to an
official stock exchange listing 6,663,610 6,820,912 101.76
TOTAL INVESTMENT PORTFOLIO 6,663,610 6,820,912 101.76
230
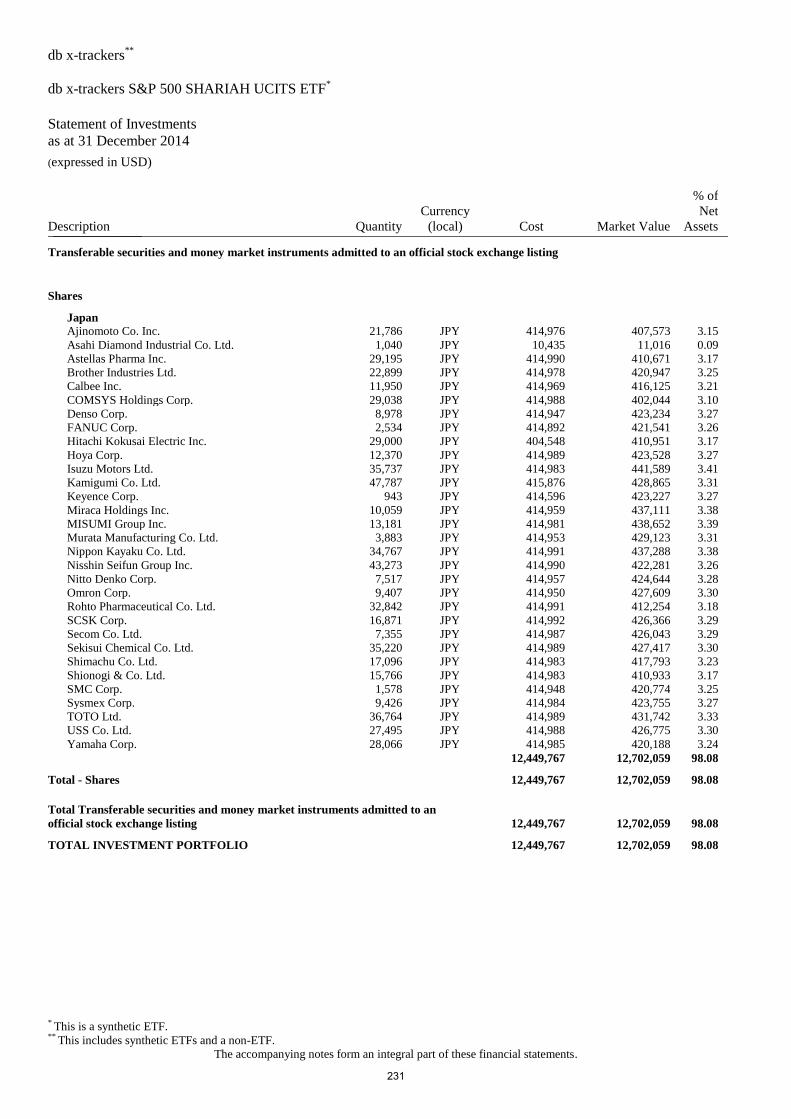
db x-trackers**
db x-trackers S&P 500 SHARIAH UCITS ETF*
Statement of Investments
as at 31 December 2014 (expressed in USD)
* This is a synthetic ETF. ** This includes synthetic ETFs and a non-ETF.
The accompanying notes form an integral part of these financial statements.
Description Quantity
Currency
(local) Cost Market Value
% of
Net
Assets _______________
Transferable securities and money market instruments admitted to an official stock exchange listing
Shares
Japan
Ajinomoto Co. Inc. 21,786 JPY 414,976 407,573 3.15
Asahi Diamond Industrial Co. Ltd. 1,040 JPY 10,435 11,016 0.09
Astellas Pharma Inc. 29,195 JPY 414,990 410,671 3.17
Brother Industries Ltd. 22,899 JPY 414,978 420,947 3.25
Calbee Inc. 11,950 JPY 414,969 416,125 3.21
COMSYS Holdings Corp. 29,038 JPY 414,988 402,044 3.10
Denso Corp. 8,978 JPY 414,947 423,234 3.27
FANUC Corp. 2,534 JPY 414,892 421,541 3.26
Hitachi Kokusai Electric Inc. 29,000 JPY 404,548 410,951 3.17
Hoya Corp. 12,370 JPY 414,989 423,528 3.27
Isuzu Motors Ltd. 35,737 JPY 414,983 441,589 3.41
Kamigumi Co. Ltd. 47,787 JPY 415,876 428,865 3.31
Keyence Corp. 943 JPY 414,596 423,227 3.27
Miraca Holdings Inc. 10,059 JPY 414,959 437,111 3.38
MISUMI Group Inc. 13,181 JPY 414,981 438,652 3.39
Murata Manufacturing Co. Ltd. 3,883 JPY 414,953 429,123 3.31
Nippon Kayaku Co. Ltd. 34,767 JPY 414,991 437,288 3.38
Nisshin Seifun Group Inc. 43,273 JPY 414,990 422,281 3.26
Nitto Denko Corp. 7,517 JPY 414,957 424,644 3.28
Omron Corp. 9,407 JPY 414,950 427,609 3.30
Rohto Pharmaceutical Co. Ltd. 32,842 JPY 414,991 412,254 3.18
SCSK Corp. 16,871 JPY 414,992 426,366 3.29
Secom Co. Ltd. 7,355 JPY 414,987 426,043 3.29
Sekisui Chemical Co. Ltd. 35,220 JPY 414,989 427,417 3.30
Shimachu Co. Ltd. 17,096 JPY 414,983 417,793 3.23
Shionogi & Co. Ltd. 15,766 JPY 414,983 410,933 3.17
SMC Corp. 1,578 JPY 414,948 420,774 3.25
Sysmex Corp. 9,426 JPY 414,984 423,755 3.27
TOTO Ltd. 36,764 JPY 414,989 431,742 3.33
USS Co. Ltd. 27,495 JPY 414,988 426,775 3.30
Yamaha Corp. 28,066 JPY 414,985 420,188 3.24
12,449,767 12,702,059 98.08
Total - Shares 12,449,767 12,702,059 98.08
Total Transferable securities and money market instruments admitted to an
official stock exchange listing 12,449,767 12,702,059 98.08
TOTAL INVESTMENT PORTFOLIO 12,449,767 12,702,059 98.08
231
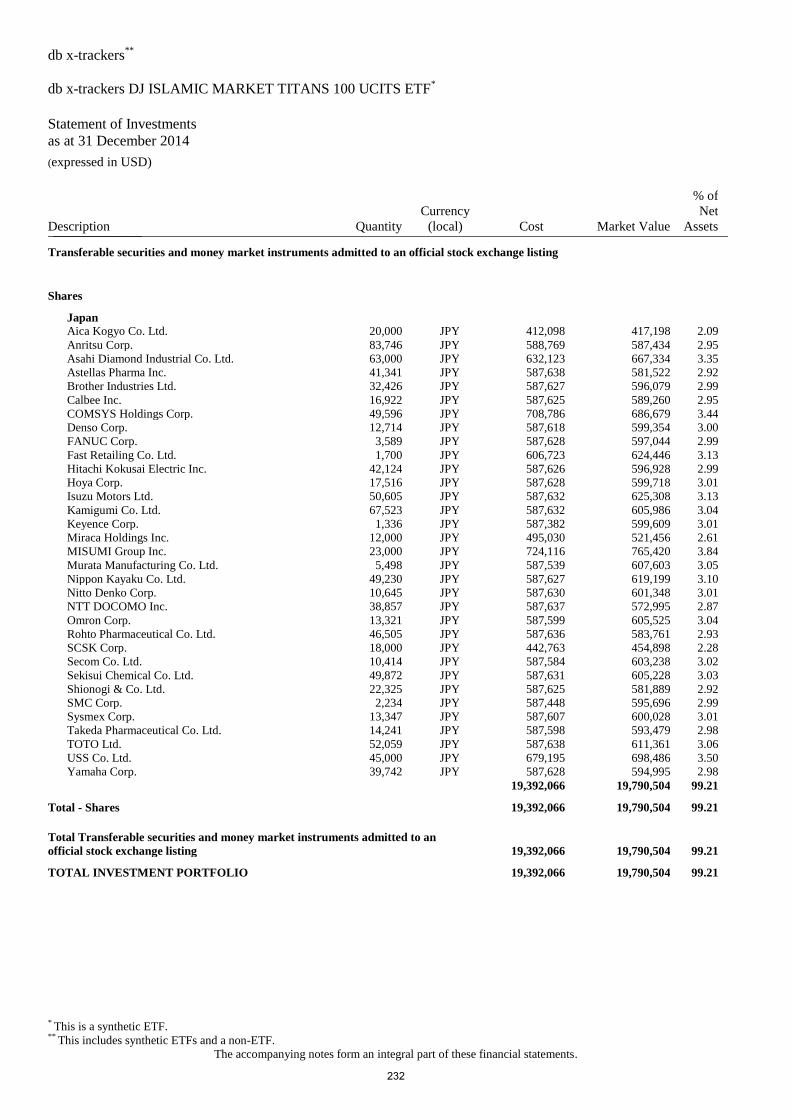
db x-trackers**
db x-trackers DJ ISLAMIC MARKET TITANS 100 UCITS ETF*
Statement of Investments
as at 31 December 2014 (expressed in USD)
* This is a synthetic ETF. ** This includes synthetic ETFs and a non-ETF.
The accompanying notes form an integral part of these financial statements.
Description Quantity
Currency
(local) Cost Market Value
% of
Net
Assets _______________
Transferable securities and money market instruments admitted to an official stock exchange listing
Shares
Japan
Aica Kogyo Co. Ltd. 20,000 JPY 412,098 417,198 2.09
Anritsu Corp. 83,746 JPY 588,769 587,434 2.95
Asahi Diamond Industrial Co. Ltd. 63,000 JPY 632,123 667,334 3.35
Astellas Pharma Inc. 41,341 JPY 587,638 581,522 2.92
Brother Industries Ltd. 32,426 JPY 587,627 596,079 2.99
Calbee Inc. 16,922 JPY 587,625 589,260 2.95
COMSYS Holdings Corp. 49,596 JPY 708,786 686,679 3.44
Denso Corp. 12,714 JPY 587,618 599,354 3.00
FANUC Corp. 3,589 JPY 587,628 597,044 2.99
Fast Retailing Co. Ltd. 1,700 JPY 606,723 624,446 3.13
Hitachi Kokusai Electric Inc. 42,124 JPY 587,626 596,928 2.99
Hoya Corp. 17,516 JPY 587,628 599,718 3.01
Isuzu Motors Ltd. 50,605 JPY 587,632 625,308 3.13
Kamigumi Co. Ltd. 67,523 JPY 587,632 605,986 3.04
Keyence Corp. 1,336 JPY 587,382 599,609 3.01
Miraca Holdings Inc. 12,000 JPY 495,030 521,456 2.61
MISUMI Group Inc. 23,000 JPY 724,116 765,420 3.84
Murata Manufacturing Co. Ltd. 5,498 JPY 587,539 607,603 3.05
Nippon Kayaku Co. Ltd. 49,230 JPY 587,627 619,199 3.10
Nitto Denko Corp. 10,645 JPY 587,630 601,348 3.01
NTT DOCOMO Inc. 38,857 JPY 587,637 572,995 2.87
Omron Corp. 13,321 JPY 587,599 605,525 3.04
Rohto Pharmaceutical Co. Ltd. 46,505 JPY 587,636 583,761 2.93
SCSK Corp. 18,000 JPY 442,763 454,898 2.28
Secom Co. Ltd. 10,414 JPY 587,584 603,238 3.02
Sekisui Chemical Co. Ltd. 49,872 JPY 587,631 605,228 3.03
Shionogi & Co. Ltd. 22,325 JPY 587,625 581,889 2.92
SMC Corp. 2,234 JPY 587,448 595,696 2.99
Sysmex Corp. 13,347 JPY 587,607 600,028 3.01
Takeda Pharmaceutical Co. Ltd. 14,241 JPY 587,598 593,479 2.98
TOTO Ltd. 52,059 JPY 587,638 611,361 3.06
USS Co. Ltd. 45,000 JPY 679,195 698,486 3.50
Yamaha Corp. 39,742 JPY 587,628 594,995 2.98
19,392,066 19,790,504 99.21
Total - Shares 19,392,066 19,790,504 99.21
Total Transferable securities and money market instruments admitted to an
official stock exchange listing 19,392,066 19,790,504 99.21
TOTAL INVESTMENT PORTFOLIO 19,392,066 19,790,504 99.21
232
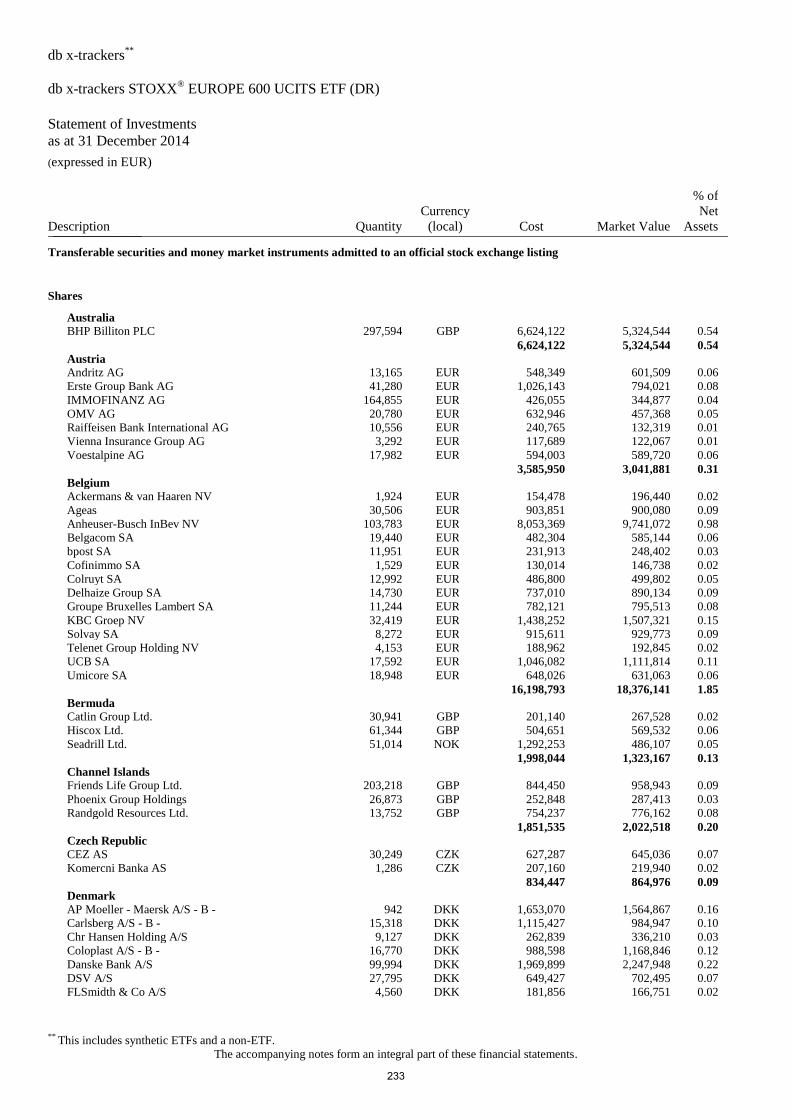
db x-trackers**
db x-trackers STOXX® EUROPE 600 UCITS ETF (DR)
Statement of Investments
as at 31 December 2014 (expressed in EUR)
** This includes synthetic ETFs and a non-ETF.
The accompanying notes form an integral part of these financial statements.
Description Quantity
Currency
(local) Cost Market Value
% of
Net
Assets _______________
Transferable securities and money market instruments admitted to an official stock exchange listing
Shares
Australia
BHP Billiton PLC 297,594 GBP 6,624,122 5,324,544 0.54
6,624,122 5,324,544 0.54
Austria
Andritz AG 13,165 EUR 548,349 601,509 0.06
Erste Group Bank AG 41,280 EUR 1,026,143 794,021 0.08
IMMOFINANZ AG 164,855 EUR 426,055 344,877 0.04
OMV AG 20,780 EUR 632,946 457,368 0.05
Raiffeisen Bank International AG 10,556 EUR 240,765 132,319 0.01
Vienna Insurance Group AG 3,292 EUR 117,689 122,067 0.01
Voestalpine AG 17,982 EUR 594,003 589,720 0.06
3,585,950 3,041,881 0.31
Belgium
Ackermans & van Haaren NV 1,924 EUR 154,478 196,440 0.02
Ageas 30,506 EUR 903,851 900,080 0.09
Anheuser-Busch InBev NV 103,783 EUR 8,053,369 9,741,072 0.98
Belgacom SA 19,440 EUR 482,304 585,144 0.06
bpost SA 11,951 EUR 231,913 248,402 0.03
Cofinimmo SA 1,529 EUR 130,014 146,738 0.02
Colruyt SA 12,992 EUR 486,800 499,802 0.05
Delhaize Group SA 14,730 EUR 737,010 890,134 0.09
Groupe Bruxelles Lambert SA 11,244 EUR 782,121 795,513 0.08
KBC Groep NV 32,419 EUR 1,438,252 1,507,321 0.15
Solvay SA 8,272 EUR 915,611 929,773 0.09
Telenet Group Holding NV 4,153 EUR 188,962 192,845 0.02
UCB SA 17,592 EUR 1,046,082 1,111,814 0.11
Umicore SA 18,948 EUR 648,026 631,063 0.06
16,198,793 18,376,141 1.85
Bermuda
Catlin Group Ltd. 30,941 GBP 201,140 267,528 0.02
Hiscox Ltd. 61,344 GBP 504,651 569,532 0.06
Seadrill Ltd. 51,014 NOK 1,292,253 486,107 0.05
1,998,044 1,323,167 0.13
Channel Islands
Friends Life Group Ltd. 203,218 GBP 844,450 958,943 0.09
Phoenix Group Holdings 26,873 GBP 252,848 287,413 0.03
Randgold Resources Ltd. 13,752 GBP 754,237 776,162 0.08
1,851,535 2,022,518 0.20
Czech Republic
CEZ AS 30,249 CZK 627,287 645,036 0.07
Komercni Banka AS 1,286 CZK 207,160 219,940 0.02
834,447 864,976 0.09
Denmark
AP Moeller - Maersk A/S - B - 942 DKK 1,653,070 1,564,867 0.16
Carlsberg A/S - B - 15,318 DKK 1,115,427 984,947 0.10
Chr Hansen Holding A/S 9,127 DKK 262,839 336,210 0.03
Coloplast A/S - B - 16,770 DKK 988,598 1,168,846 0.12
Danske Bank A/S 99,994 DKK 1,969,899 2,247,948 0.22
DSV A/S 27,795 DKK 649,427 702,495 0.07
FLSmidth & Co A/S 4,560 DKK 181,856 166,751 0.02
233
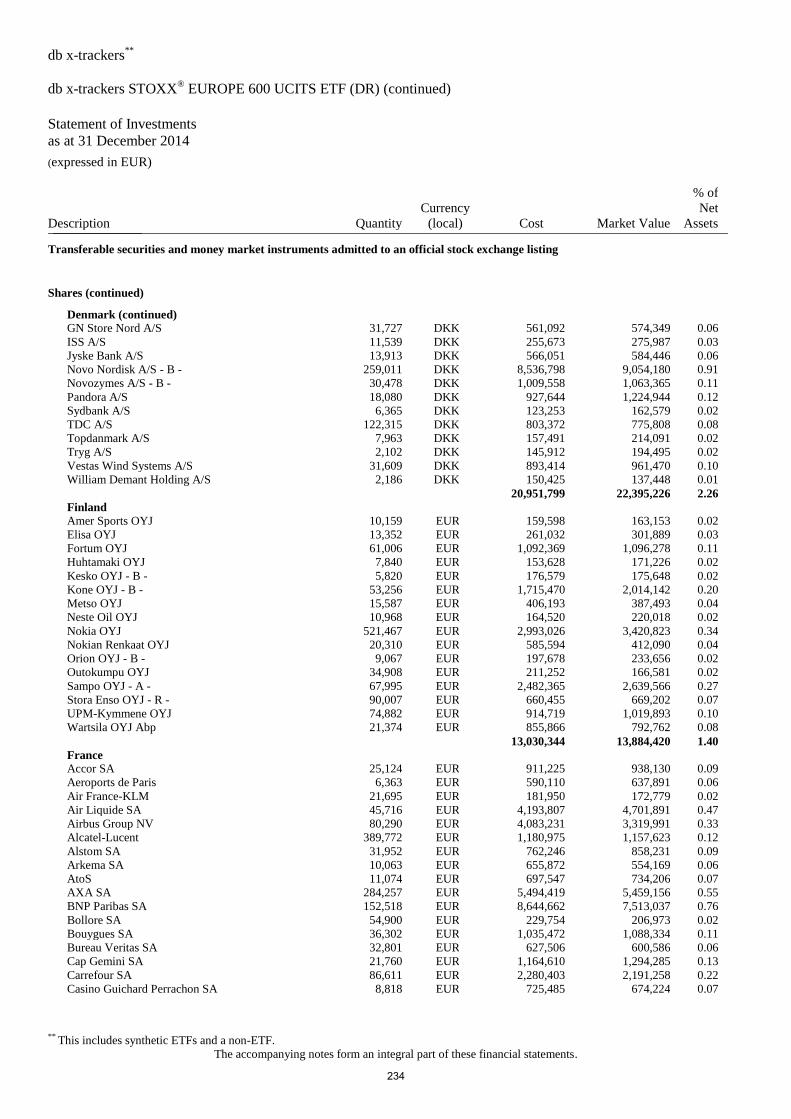
db x-trackers**
db x-trackers STOXX® EUROPE 600 UCITS ETF (DR) (continued)
Statement of Investments
as at 31 December 2014 (expressed in EUR)
** This includes synthetic ETFs and a non-ETF.
The accompanying notes form an integral part of these financial statements.
Description Quantity
Currency
(local) Cost Market Value
% of
Net
Assets _______________
Transferable securities and money market instruments admitted to an official stock exchange listing
Shares (continued)
Denmark (continued)
GN Store Nord A/S 31,727 DKK 561,092 574,349 0.06
ISS A/S 11,539 DKK 255,673 275,987 0.03
Jyske Bank A/S 13,913 DKK 566,051 584,446 0.06
Novo Nordisk A/S - B - 259,011 DKK 8,536,798 9,054,180 0.91
Novozymes A/S - B - 30,478 DKK 1,009,558 1,063,365 0.11
Pandora A/S 18,080 DKK 927,644 1,224,944 0.12
Sydbank A/S 6,365 DKK 123,253 162,579 0.02
TDC A/S 122,315 DKK 803,372 775,808 0.08
Topdanmark A/S 7,963 DKK 157,491 214,091 0.02
Tryg A/S 2,102 DKK 145,912 194,495 0.02
Vestas Wind Systems A/S 31,609 DKK 893,414 961,470 0.10
William Demant Holding A/S 2,186 DKK 150,425 137,448 0.01
20,951,799 22,395,226 2.26
Finland
Amer Sports OYJ 10,159 EUR 159,598 163,153 0.02
Elisa OYJ 13,352 EUR 261,032 301,889 0.03
Fortum OYJ 61,006 EUR 1,092,369 1,096,278 0.11
Huhtamaki OYJ 7,840 EUR 153,628 171,226 0.02
Kesko OYJ - B - 5,820 EUR 176,579 175,648 0.02
Kone OYJ - B - 53,256 EUR 1,715,470 2,014,142 0.20
Metso OYJ 15,587 EUR 406,193 387,493 0.04
Neste Oil OYJ 10,968 EUR 164,520 220,018 0.02
Nokia OYJ 521,467 EUR 2,993,026 3,420,823 0.34
Nokian Renkaat OYJ 20,310 EUR 585,594 412,090 0.04
Orion OYJ - B - 9,067 EUR 197,678 233,656 0.02
Outokumpu OYJ 34,908 EUR 211,252 166,581 0.02
Sampo OYJ - A - 67,995 EUR 2,482,365 2,639,566 0.27
Stora Enso OYJ - R - 90,007 EUR 660,455 669,202 0.07
UPM-Kymmene OYJ 74,882 EUR 914,719 1,019,893 0.10
Wartsila OYJ Abp 21,374 EUR 855,866 792,762 0.08
13,030,344 13,884,420 1.40
France
Accor SA 25,124 EUR 911,225 938,130 0.09
Aeroports de Paris 6,363 EUR 590,110 637,891 0.06
Air France-KLM 21,695 EUR 181,950 172,779 0.02
Air Liquide SA 45,716 EUR 4,193,807 4,701,891 0.47
Airbus Group NV 80,290 EUR 4,083,231 3,319,991 0.33
Alcatel-Lucent 389,772 EUR 1,180,975 1,157,623 0.12
Alstom SA 31,952 EUR 762,246 858,231 0.09
Arkema SA 10,063 EUR 655,872 554,169 0.06
AtoS 11,074 EUR 697,547 734,206 0.07
AXA SA 284,257 EUR 5,494,419 5,459,156 0.55
BNP Paribas SA 152,518 EUR 8,644,662 7,513,037 0.76
Bollore SA 54,900 EUR 229,754 206,973 0.02
Bouygues SA 36,302 EUR 1,035,472 1,088,334 0.11
Bureau Veritas SA 32,801 EUR 627,506 600,586 0.06
Cap Gemini SA 21,760 EUR 1,164,610 1,294,285 0.13
Carrefour SA 86,611 EUR 2,280,403 2,191,258 0.22
Casino Guichard Perrachon SA 8,818 EUR 725,485 674,224 0.07
234
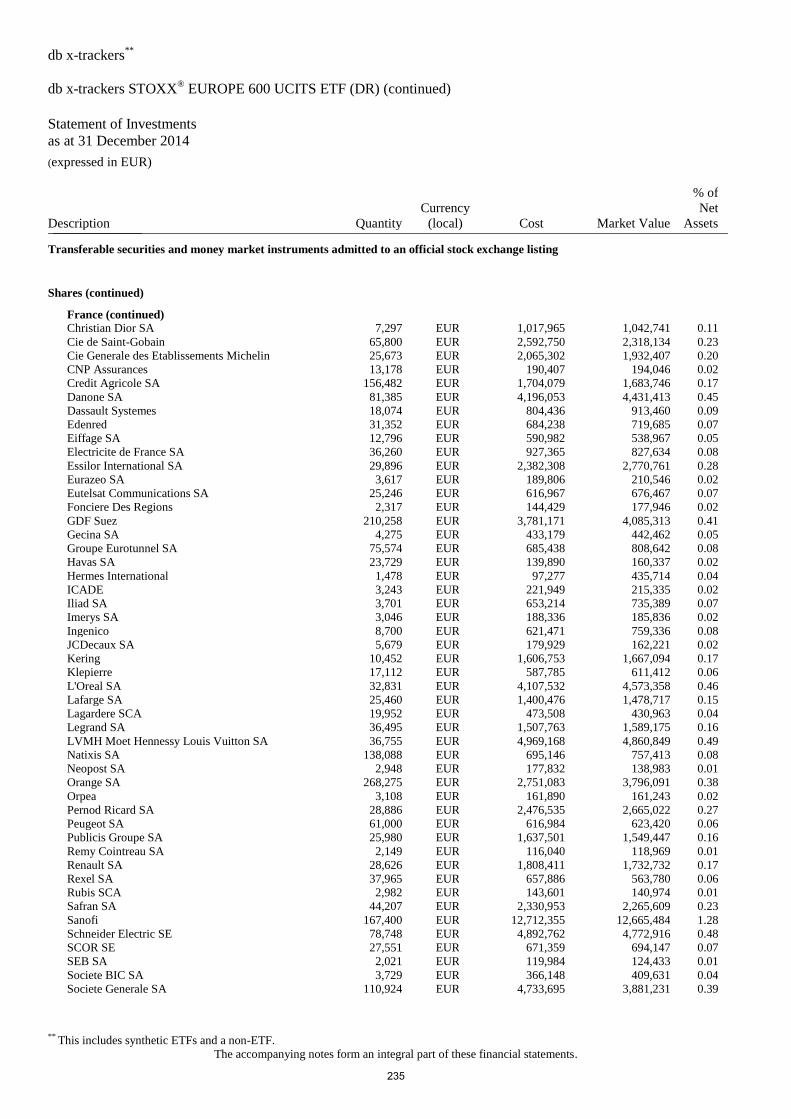
db x-trackers**
db x-trackers STOXX® EUROPE 600 UCITS ETF (DR) (continued)
Statement of Investments
as at 31 December 2014 (expressed in EUR)
** This includes synthetic ETFs and a non-ETF.
The accompanying notes form an integral part of these financial statements.
Description Quantity
Currency
(local) Cost Market Value
% of
Net
Assets _______________
Transferable securities and money market instruments admitted to an official stock exchange listing
Shares (continued)
France (continued)
Christian Dior SA 7,297 EUR 1,017,965 1,042,741 0.11
Cie de Saint-Gobain 65,800 EUR 2,592,750 2,318,134 0.23
Cie Generale des Etablissements Michelin 25,673 EUR 2,065,302 1,932,407 0.20
CNP Assurances 13,178 EUR 190,407 194,046 0.02
Credit Agricole SA 156,482 EUR 1,704,079 1,683,746 0.17
Danone SA 81,385 EUR 4,196,053 4,431,413 0.45
Dassault Systemes 18,074 EUR 804,436 913,460 0.09
Edenred 31,352 EUR 684,238 719,685 0.07
Eiffage SA 12,796 EUR 590,982 538,967 0.05
Electricite de France SA 36,260 EUR 927,365 827,634 0.08
Essilor International SA 29,896 EUR 2,382,308 2,770,761 0.28
Eurazeo SA 3,617 EUR 189,806 210,546 0.02
Eutelsat Communications SA 25,246 EUR 616,967 676,467 0.07
Fonciere Des Regions 2,317 EUR 144,429 177,946 0.02
GDF Suez 210,258 EUR 3,781,171 4,085,313 0.41
Gecina SA 4,275 EUR 433,179 442,462 0.05
Groupe Eurotunnel SA 75,574 EUR 685,438 808,642 0.08
Havas SA 23,729 EUR 139,890 160,337 0.02
Hermes International 1,478 EUR 97,277 435,714 0.04
ICADE 3,243 EUR 221,949 215,335 0.02
Iliad SA 3,701 EUR 653,214 735,389 0.07
Imerys SA 3,046 EUR 188,336 185,836 0.02
Ingenico 8,700 EUR 621,471 759,336 0.08
JCDecaux SA 5,679 EUR 179,929 162,221 0.02
Kering 10,452 EUR 1,606,753 1,667,094 0.17
Klepierre 17,112 EUR 587,785 611,412 0.06
L'Oreal SA 32,831 EUR 4,107,532 4,573,358 0.46
Lafarge SA 25,460 EUR 1,400,476 1,478,717 0.15
Lagardere SCA 19,952 EUR 473,508 430,963 0.04
Legrand SA 36,495 EUR 1,507,763 1,589,175 0.16
LVMH Moet Hennessy Louis Vuitton SA 36,755 EUR 4,969,168 4,860,849 0.49
Natixis SA 138,088 EUR 695,146 757,413 0.08
Neopost SA 2,948 EUR 177,832 138,983 0.01
Orange SA 268,275 EUR 2,751,083 3,796,091 0.38
Orpea 3,108 EUR 161,890 161,243 0.02
Pernod Ricard SA 28,886 EUR 2,476,535 2,665,022 0.27
Peugeot SA 61,000 EUR 616,984 623,420 0.06
Publicis Groupe SA 25,980 EUR 1,637,501 1,549,447 0.16
Remy Cointreau SA 2,149 EUR 116,040 118,969 0.01
Renault SA 28,626 EUR 1,808,411 1,732,732 0.17
Rexel SA 37,965 EUR 657,886 563,780 0.06
Rubis SCA 2,982 EUR 143,601 140,974 0.01
Safran SA 44,207 EUR 2,330,953 2,265,609 0.23
Sanofi 167,400 EUR 12,712,355 12,665,484 1.28
Schneider Electric SE 78,748 EUR 4,892,762 4,772,916 0.48
SCOR SE 27,551 EUR 671,359 694,147 0.07
SEB SA 2,021 EUR 119,984 124,433 0.01
Societe BIC SA 3,729 EUR 366,148 409,631 0.04
Societe Generale SA 110,924 EUR 4,733,695 3,881,231 0.39
235
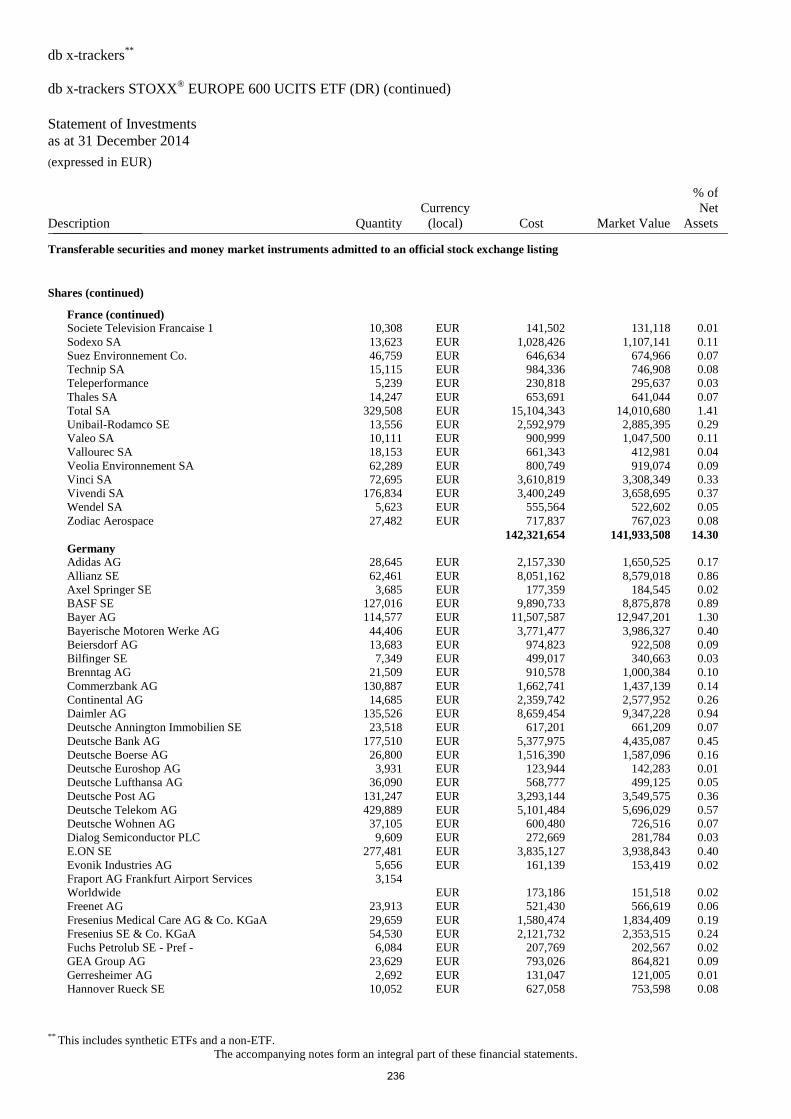
db x-trackers**
db x-trackers STOXX® EUROPE 600 UCITS ETF (DR) (continued)
Statement of Investments
as at 31 December 2014 (expressed in EUR)
** This includes synthetic ETFs and a non-ETF.
The accompanying notes form an integral part of these financial statements.
Description Quantity
Currency
(local) Cost Market Value
% of
Net
Assets _______________
Transferable securities and money market instruments admitted to an official stock exchange listing
Shares (continued)
France (continued)
Societe Television Francaise 1 10,308 EUR 141,502 131,118 0.01
Sodexo SA 13,623 EUR 1,028,426 1,107,141 0.11
Suez Environnement Co. 46,759 EUR 646,634 674,966 0.07
Technip SA 15,115 EUR 984,336 746,908 0.08
Teleperformance 5,239 EUR 230,818 295,637 0.03
Thales SA 14,247 EUR 653,691 641,044 0.07
Total SA 329,508 EUR 15,104,343 14,010,680 1.41
Unibail-Rodamco SE 13,556 EUR 2,592,979 2,885,395 0.29
Valeo SA 10,111 EUR 900,999 1,047,500 0.11
Vallourec SA 18,153 EUR 661,343 412,981 0.04
Veolia Environnement SA 62,289 EUR 800,749 919,074 0.09
Vinci SA 72,695 EUR 3,610,819 3,308,349 0.33
Vivendi SA 176,834 EUR 3,400,249 3,658,695 0.37
Wendel SA 5,623 EUR 555,564 522,602 0.05
Zodiac Aerospace 27,482 EUR 717,837 767,023 0.08
142,321,654 141,933,508 14.30
Germany
Adidas AG 28,645 EUR 2,157,330 1,650,525 0.17
Allianz SE 62,461 EUR 8,051,162 8,579,018 0.86
Axel Springer SE 3,685 EUR 177,359 184,545 0.02
BASF SE 127,016 EUR 9,890,733 8,875,878 0.89
Bayer AG 114,577 EUR 11,507,587 12,947,201 1.30
Bayerische Motoren Werke AG 44,406 EUR 3,771,477 3,986,327 0.40
Beiersdorf AG 13,683 EUR 974,823 922,508 0.09
Bilfinger SE 7,349 EUR 499,017 340,663 0.03
Brenntag AG 21,509 EUR 910,578 1,000,384 0.10
Commerzbank AG 130,887 EUR 1,662,741 1,437,139 0.14
Continental AG 14,685 EUR 2,359,742 2,577,952 0.26
Daimler AG 135,526 EUR 8,659,454 9,347,228 0.94
Deutsche Annington Immobilien SE 23,518 EUR 617,201 661,209 0.07
Deutsche Bank AG 177,510 EUR 5,377,975 4,435,087 0.45
Deutsche Boerse AG 26,800 EUR 1,516,390 1,587,096 0.16
Deutsche Euroshop AG 3,931 EUR 123,944 142,283 0.01
Deutsche Lufthansa AG 36,090 EUR 568,777 499,125 0.05
Deutsche Post AG 131,247 EUR 3,293,144 3,549,575 0.36
Deutsche Telekom AG 429,889 EUR 5,101,484 5,696,029 0.57
Deutsche Wohnen AG 37,105 EUR 600,480 726,516 0.07
Dialog Semiconductor PLC 9,609 EUR 272,669 281,784 0.03
E.ON SE 277,481 EUR 3,835,127 3,938,843 0.40
Evonik Industries AG 5,656 EUR 161,139 153,419 0.02
Fraport AG Frankfurt Airport Services
Worldwide
3,154
EUR 173,186 151,518 0.02
Freenet AG 23,913 EUR 521,430 566,619 0.06
Fresenius Medical Care AG & Co. KGaA 29,659 EUR 1,580,474 1,834,409 0.19
Fresenius SE & Co. KGaA 54,530 EUR 2,121,732 2,353,515 0.24
Fuchs Petrolub SE - Pref - 6,084 EUR 207,769 202,567 0.02
GEA Group AG 23,629 EUR 793,026 864,821 0.09
Gerresheimer AG 2,692 EUR 131,047 121,005 0.01
Hannover Rueck SE 10,052 EUR 627,058 753,598 0.08
236
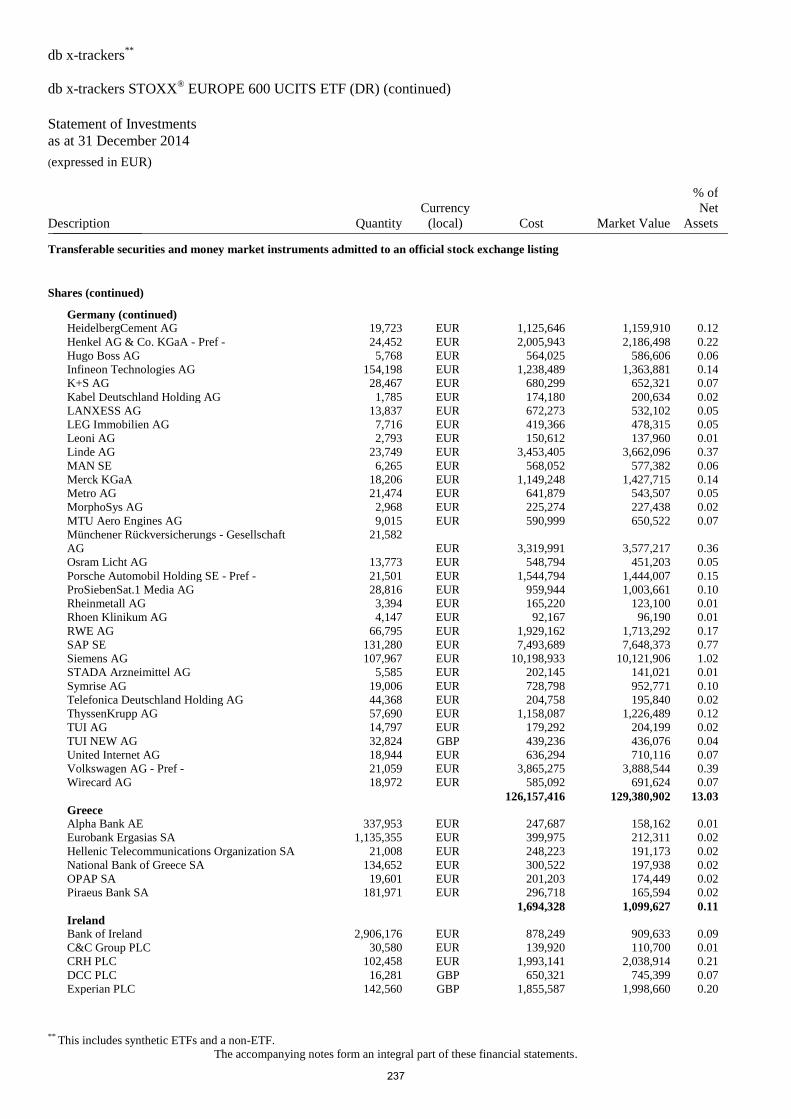
db x-trackers**
db x-trackers STOXX® EUROPE 600 UCITS ETF (DR) (continued)
Statement of Investments
as at 31 December 2014 (expressed in EUR)
** This includes synthetic ETFs and a non-ETF.
The accompanying notes form an integral part of these financial statements.
Description Quantity
Currency
(local) Cost Market Value
% of
Net
Assets _______________
Transferable securities and money market instruments admitted to an official stock exchange listing
Shares (continued)
Germany (continued)
HeidelbergCement AG 19,723 EUR 1,125,646 1,159,910 0.12
Henkel AG & Co. KGaA - Pref - 24,452 EUR 2,005,943 2,186,498 0.22
Hugo Boss AG 5,768 EUR 564,025 586,606 0.06
Infineon Technologies AG 154,198 EUR 1,238,489 1,363,881 0.14
K+S AG 28,467 EUR 680,299 652,321 0.07
Kabel Deutschland Holding AG 1,785 EUR 174,180 200,634 0.02
LANXESS AG 13,837 EUR 672,273 532,102 0.05
LEG Immobilien AG 7,716 EUR 419,366 478,315 0.05
Leoni AG 2,793 EUR 150,612 137,960 0.01
Linde AG 23,749 EUR 3,453,405 3,662,096 0.37
MAN SE 6,265 EUR 568,052 577,382 0.06
Merck KGaA 18,206 EUR 1,149,248 1,427,715 0.14
Metro AG 21,474 EUR 641,879 543,507 0.05
MorphoSys AG 2,968 EUR 225,274 227,438 0.02
MTU Aero Engines AG 9,015 EUR 590,999 650,522 0.07
Münchener Rückversicherungs - Gesellschaft
AG
21,582
EUR 3,319,991 3,577,217 0.36
Osram Licht AG 13,773 EUR 548,794 451,203 0.05
Porsche Automobil Holding SE - Pref - 21,501 EUR 1,544,794 1,444,007 0.15
ProSiebenSat.1 Media AG 28,816 EUR 959,944 1,003,661 0.10
Rheinmetall AG 3,394 EUR 165,220 123,100 0.01
Rhoen Klinikum AG 4,147 EUR 92,167 96,190 0.01
RWE AG 66,795 EUR 1,929,162 1,713,292 0.17
SAP SE 131,280 EUR 7,493,689 7,648,373 0.77
Siemens AG 107,967 EUR 10,198,933 10,121,906 1.02
STADA Arzneimittel AG 5,585 EUR 202,145 141,021 0.01
Symrise AG 19,006 EUR 728,798 952,771 0.10
Telefonica Deutschland Holding AG 44,368 EUR 204,758 195,840 0.02
ThyssenKrupp AG 57,690 EUR 1,158,087 1,226,489 0.12
TUI AG 14,797 EUR 179,292 204,199 0.02
TUI NEW AG 32,824 GBP 439,236 436,076 0.04
United Internet AG 18,944 EUR 636,294 710,116 0.07
Volkswagen AG - Pref - 21,059 EUR 3,865,275 3,888,544 0.39
Wirecard AG 18,972 EUR 585,092 691,624 0.07
126,157,416 129,380,902 13.03
Greece
Alpha Bank AE 337,953 EUR 247,687 158,162 0.01
Eurobank Ergasias SA 1,135,355 EUR 399,975 212,311 0.02
Hellenic Telecommunications Organization SA 21,008 EUR 248,223 191,173 0.02
National Bank of Greece SA 134,652 EUR 300,522 197,938 0.02
OPAP SA 19,601 EUR 201,203 174,449 0.02
Piraeus Bank SA 181,971 EUR 296,718 165,594 0.02
1,694,328 1,099,627 0.11
Ireland
Bank of Ireland 2,906,176 EUR 878,249 909,633 0.09
C&C Group PLC 30,580 EUR 139,920 110,700 0.01
CRH PLC 102,458 EUR 1,993,141 2,038,914 0.21
DCC PLC 16,281 GBP 650,321 745,399 0.07
Experian PLC 142,560 GBP 1,855,587 1,998,660 0.20
237
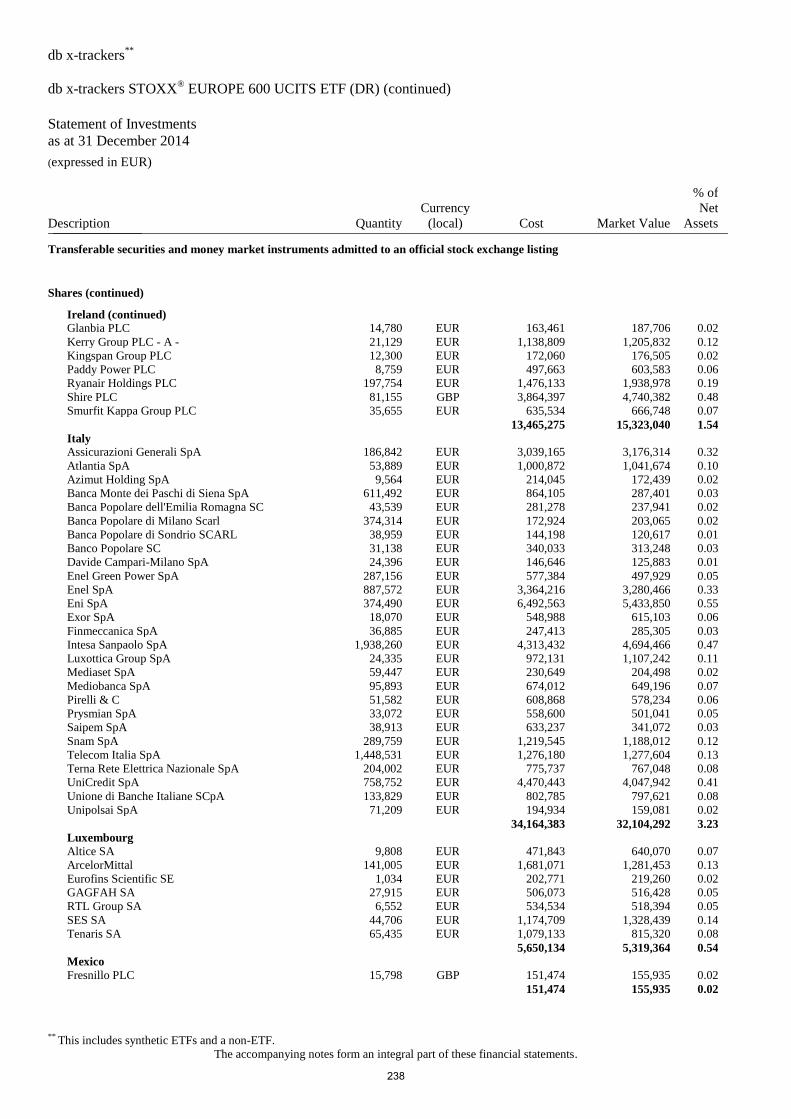
db x-trackers**
db x-trackers STOXX® EUROPE 600 UCITS ETF (DR) (continued)
Statement of Investments
as at 31 December 2014 (expressed in EUR)
** This includes synthetic ETFs and a non-ETF.
The accompanying notes form an integral part of these financial statements.
Description Quantity
Currency
(local) Cost Market Value
% of
Net
Assets _______________
Transferable securities and money market instruments admitted to an official stock exchange listing
Shares (continued)
Ireland (continued)
Glanbia PLC 14,780 EUR 163,461 187,706 0.02
Kerry Group PLC - A - 21,129 EUR 1,138,809 1,205,832 0.12
Kingspan Group PLC 12,300 EUR 172,060 176,505 0.02
Paddy Power PLC 8,759 EUR 497,663 603,583 0.06
Ryanair Holdings PLC 197,754 EUR 1,476,133 1,938,978 0.19
Shire PLC 81,155 GBP 3,864,397 4,740,382 0.48
Smurfit Kappa Group PLC 35,655 EUR 635,534 666,748 0.07
13,465,275 15,323,040 1.54
Italy
Assicurazioni Generali SpA 186,842 EUR 3,039,165 3,176,314 0.32
Atlantia SpA 53,889 EUR 1,000,872 1,041,674 0.10
Azimut Holding SpA 9,564 EUR 214,045 172,439 0.02
Banca Monte dei Paschi di Siena SpA 611,492 EUR 864,105 287,401 0.03
Banca Popolare dell'Emilia Romagna SC 43,539 EUR 281,278 237,941 0.02
Banca Popolare di Milano Scarl 374,314 EUR 172,924 203,065 0.02
Banca Popolare di Sondrio SCARL 38,959 EUR 144,198 120,617 0.01
Banco Popolare SC 31,138 EUR 340,033 313,248 0.03
Davide Campari-Milano SpA 24,396 EUR 146,646 125,883 0.01
Enel Green Power SpA 287,156 EUR 577,384 497,929 0.05
Enel SpA 887,572 EUR 3,364,216 3,280,466 0.33
Eni SpA 374,490 EUR 6,492,563 5,433,850 0.55
Exor SpA 18,070 EUR 548,988 615,103 0.06
Finmeccanica SpA 36,885 EUR 247,413 285,305 0.03
Intesa Sanpaolo SpA 1,938,260 EUR 4,313,432 4,694,466 0.47
Luxottica Group SpA 24,335 EUR 972,131 1,107,242 0.11
Mediaset SpA 59,447 EUR 230,649 204,498 0.02
Mediobanca SpA 95,893 EUR 674,012 649,196 0.07
Pirelli & C 51,582 EUR 608,868 578,234 0.06
Prysmian SpA 33,072 EUR 558,600 501,041 0.05
Saipem SpA 38,913 EUR 633,237 341,072 0.03
Snam SpA 289,759 EUR 1,219,545 1,188,012 0.12
Telecom Italia SpA 1,448,531 EUR 1,276,180 1,277,604 0.13
Terna Rete Elettrica Nazionale SpA 204,002 EUR 775,737 767,048 0.08
UniCredit SpA 758,752 EUR 4,470,443 4,047,942 0.41
Unione di Banche Italiane SCpA 133,829 EUR 802,785 797,621 0.08
Unipolsai SpA 71,209 EUR 194,934 159,081 0.02
34,164,383 32,104,292 3.23
Luxembourg
Altice SA 9,808 EUR 471,843 640,070 0.07
ArcelorMittal 141,005 EUR 1,681,071 1,281,453 0.13
Eurofins Scientific SE 1,034 EUR 202,771 219,260 0.02
GAGFAH SA 27,915 EUR 506,073 516,428 0.05
RTL Group SA 6,552 EUR 534,534 518,394 0.05
SES SA 44,706 EUR 1,174,709 1,328,439 0.14
Tenaris SA 65,435 EUR 1,079,133 815,320 0.08
5,650,134 5,319,364 0.54
Mexico
Fresnillo PLC 15,798 GBP 151,474 155,935 0.02
151,474 155,935 0.02
238
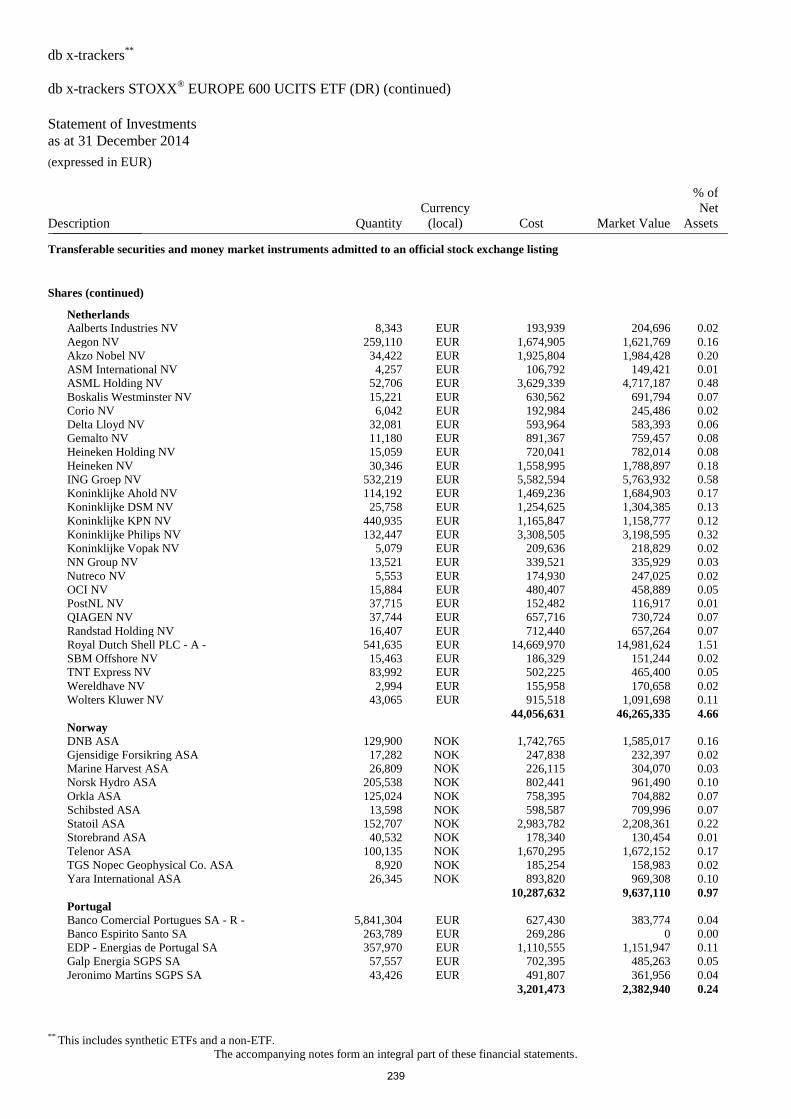
db x-trackers**
db x-trackers STOXX® EUROPE 600 UCITS ETF (DR) (continued)
Statement of Investments
as at 31 December 2014 (expressed in EUR)
** This includes synthetic ETFs and a non-ETF.
The accompanying notes form an integral part of these financial statements.
Description Quantity
Currency
(local) Cost Market Value
% of
Net
Assets _______________
Transferable securities and money market instruments admitted to an official stock exchange listing
Shares (continued)
Netherlands
Aalberts Industries NV 8,343 EUR 193,939 204,696 0.02
Aegon NV 259,110 EUR 1,674,905 1,621,769 0.16
Akzo Nobel NV 34,422 EUR 1,925,804 1,984,428 0.20
ASM International NV 4,257 EUR 106,792 149,421 0.01
ASML Holding NV 52,706 EUR 3,629,339 4,717,187 0.48
Boskalis Westminster NV 15,221 EUR 630,562 691,794 0.07
Corio NV 6,042 EUR 192,984 245,486 0.02
Delta Lloyd NV 32,081 EUR 593,964 583,393 0.06
Gemalto NV 11,180 EUR 891,367 759,457 0.08
Heineken Holding NV 15,059 EUR 720,041 782,014 0.08
Heineken NV 30,346 EUR 1,558,995 1,788,897 0.18
ING Groep NV 532,219 EUR 5,582,594 5,763,932 0.58
Koninklijke Ahold NV 114,192 EUR 1,469,236 1,684,903 0.17
Koninklijke DSM NV 25,758 EUR 1,254,625 1,304,385 0.13
Koninklijke KPN NV 440,935 EUR 1,165,847 1,158,777 0.12
Koninklijke Philips NV 132,447 EUR 3,308,505 3,198,595 0.32
Koninklijke Vopak NV 5,079 EUR 209,636 218,829 0.02
NN Group NV 13,521 EUR 339,521 335,929 0.03
Nutreco NV 5,553 EUR 174,930 247,025 0.02
OCI NV 15,884 EUR 480,407 458,889 0.05
PostNL NV 37,715 EUR 152,482 116,917 0.01
QIAGEN NV 37,744 EUR 657,716 730,724 0.07
Randstad Holding NV 16,407 EUR 712,440 657,264 0.07
Royal Dutch Shell PLC - A - 541,635 EUR 14,669,970 14,981,624 1.51
SBM Offshore NV 15,463 EUR 186,329 151,244 0.02
TNT Express NV 83,992 EUR 502,225 465,400 0.05
Wereldhave NV 2,994 EUR 155,958 170,658 0.02
Wolters Kluwer NV 43,065 EUR 915,518 1,091,698 0.11
44,056,631 46,265,335 4.66
Norway
DNB ASA 129,900 NOK 1,742,765 1,585,017 0.16
Gjensidige Forsikring ASA 17,282 NOK 247,838 232,397 0.02
Marine Harvest ASA 26,809 NOK 226,115 304,070 0.03
Norsk Hydro ASA 205,538 NOK 802,441 961,490 0.10
Orkla ASA 125,024 NOK 758,395 704,882 0.07
Schibsted ASA 13,598 NOK 598,587 709,996 0.07
Statoil ASA 152,707 NOK 2,983,782 2,208,361 0.22
Storebrand ASA 40,532 NOK 178,340 130,454 0.01
Telenor ASA 100,135 NOK 1,670,295 1,672,152 0.17
TGS Nopec Geophysical Co. ASA 8,920 NOK 185,254 158,983 0.02
Yara International ASA 26,345 NOK 893,820 969,308 0.10
10,287,632 9,637,110 0.97
Portugal
Banco Comercial Portugues SA - R - 5,841,304 EUR 627,430 383,774 0.04
Banco Espirito Santo SA 263,789 EUR 269,286 0 0.00
EDP - Energias de Portugal SA 357,970 EUR 1,110,555 1,151,947 0.11
Galp Energia SGPS SA 57,557 EUR 702,395 485,263 0.05
Jeronimo Martins SGPS SA 43,426 EUR 491,807 361,956 0.04
3,201,473 2,382,940 0.24
239
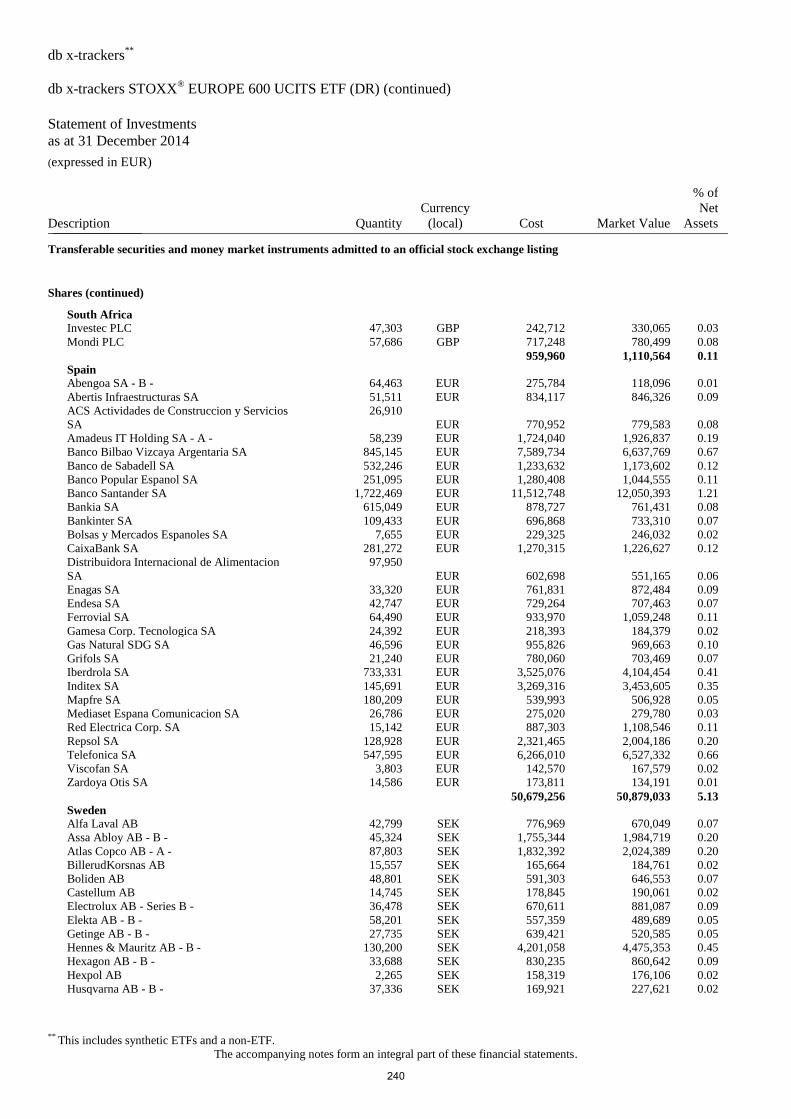
db x-trackers**
db x-trackers STOXX® EUROPE 600 UCITS ETF (DR) (continued)
Statement of Investments
as at 31 December 2014 (expressed in EUR)
** This includes synthetic ETFs and a non-ETF.
The accompanying notes form an integral part of these financial statements.
Description Quantity
Currency
(local) Cost Market Value
% of
Net
Assets _______________
Transferable securities and money market instruments admitted to an official stock exchange listing
Shares (continued)
South Africa
Investec PLC 47,303 GBP 242,712 330,065 0.03
Mondi PLC 57,686 GBP 717,248 780,499 0.08
959,960 1,110,564 0.11
Spain
Abengoa SA - B - 64,463 EUR 275,784 118,096 0.01
Abertis Infraestructuras SA 51,511 EUR 834,117 846,326 0.09
ACS Actividades de Construccion y Servicios
SA
26,910
EUR 770,952 779,583 0.08
Amadeus IT Holding SA - A - 58,239 EUR 1,724,040 1,926,837 0.19
Banco Bilbao Vizcaya Argentaria SA 845,145 EUR 7,589,734 6,637,769 0.67
Banco de Sabadell SA 532,246 EUR 1,233,632 1,173,602 0.12
Banco Popular Espanol SA 251,095 EUR 1,280,408 1,044,555 0.11
Banco Santander SA 1,722,469 EUR 11,512,748 12,050,393 1.21
Bankia SA 615,049 EUR 878,727 761,431 0.08
Bankinter SA 109,433 EUR 696,868 733,310 0.07
Bolsas y Mercados Espanoles SA 7,655 EUR 229,325 246,032 0.02
CaixaBank SA 281,272 EUR 1,270,315 1,226,627 0.12
Distribuidora Internacional de Alimentacion
SA
97,950
EUR 602,698 551,165 0.06
Enagas SA 33,320 EUR 761,831 872,484 0.09
Endesa SA 42,747 EUR 729,264 707,463 0.07
Ferrovial SA 64,490 EUR 933,970 1,059,248 0.11
Gamesa Corp. Tecnologica SA 24,392 EUR 218,393 184,379 0.02
Gas Natural SDG SA 46,596 EUR 955,826 969,663 0.10
Grifols SA 21,240 EUR 780,060 703,469 0.07
Iberdrola SA 733,331 EUR 3,525,076 4,104,454 0.41
Inditex SA 145,691 EUR 3,269,316 3,453,605 0.35
Mapfre SA 180,209 EUR 539,993 506,928 0.05
Mediaset Espana Comunicacion SA 26,786 EUR 275,020 279,780 0.03
Red Electrica Corp. SA 15,142 EUR 887,303 1,108,546 0.11
Repsol SA 128,928 EUR 2,321,465 2,004,186 0.20
Telefonica SA 547,595 EUR 6,266,010 6,527,332 0.66
Viscofan SA 3,803 EUR 142,570 167,579 0.02
Zardoya Otis SA 14,586 EUR 173,811 134,191 0.01
50,679,256 50,879,033 5.13
Sweden
Alfa Laval AB 42,799 SEK 776,969 670,049 0.07
Assa Abloy AB - B - 45,324 SEK 1,755,344 1,984,719 0.20
Atlas Copco AB - A - 87,803 SEK 1,832,392 2,024,389 0.20
BillerudKorsnas AB 15,557 SEK 165,664 184,761 0.02
Boliden AB 48,801 SEK 591,303 646,553 0.07
Castellum AB 14,745 SEK 178,845 190,061 0.02
Electrolux AB - Series B - 36,478 SEK 670,611 881,087 0.09
Elekta AB - B - 58,201 SEK 557,359 489,689 0.05
Getinge AB - B - 27,735 SEK 639,421 520,585 0.05
Hennes & Mauritz AB - B - 130,200 SEK 4,201,058 4,475,353 0.45
Hexagon AB - B - 33,688 SEK 830,235 860,642 0.09
Hexpol AB 2,265 SEK 158,319 176,106 0.02
Husqvarna AB - B - 37,336 SEK 169,921 227,621 0.02
240
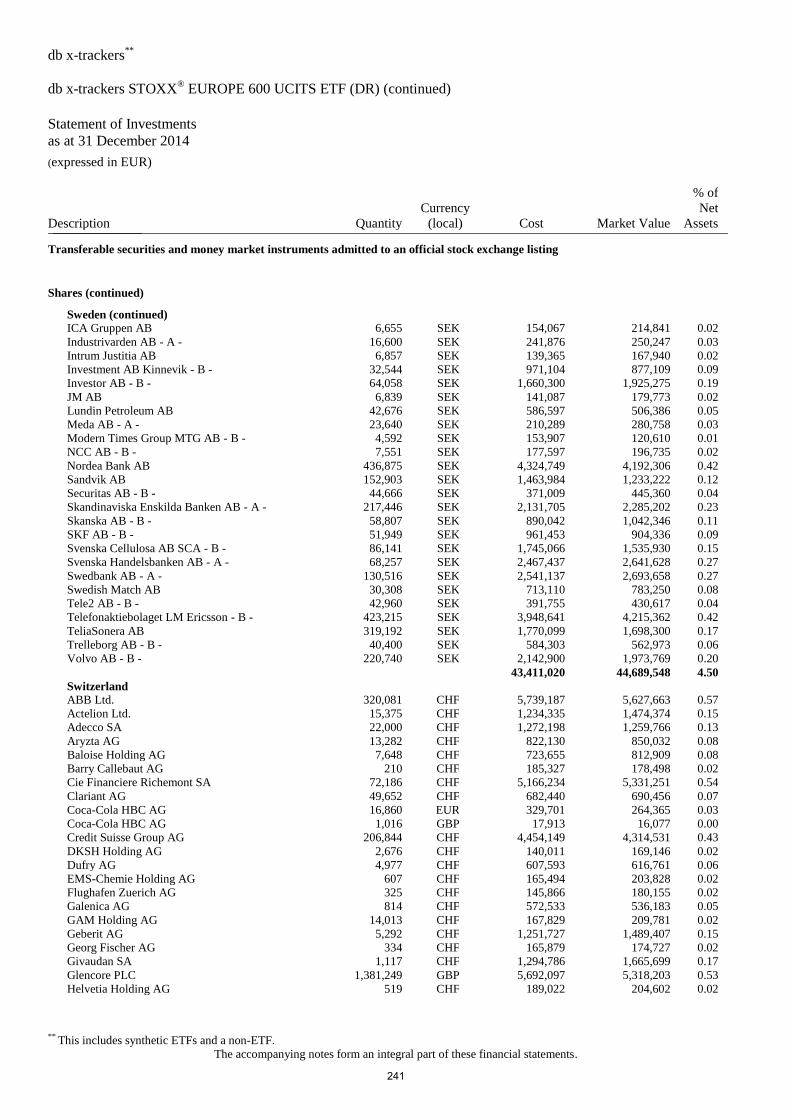
db x-trackers**
db x-trackers STOXX® EUROPE 600 UCITS ETF (DR) (continued)
Statement of Investments
as at 31 December 2014 (expressed in EUR)
** This includes synthetic ETFs and a non-ETF.
The accompanying notes form an integral part of these financial statements.
Description Quantity
Currency
(local) Cost Market Value
% of
Net
Assets _______________
Transferable securities and money market instruments admitted to an official stock exchange listing
Shares (continued)
Sweden (continued)
ICA Gruppen AB 6,655 SEK 154,067 214,841 0.02
Industrivarden AB - A - 16,600 SEK 241,876 250,247 0.03
Intrum Justitia AB 6,857 SEK 139,365 167,940 0.02
Investment AB Kinnevik - B - 32,544 SEK 971,104 877,109 0.09
Investor AB - B - 64,058 SEK 1,660,300 1,925,275 0.19
JM AB 6,839 SEK 141,087 179,773 0.02
Lundin Petroleum AB 42,676 SEK 586,597 506,386 0.05
Meda AB - A - 23,640 SEK 210,289 280,758 0.03
Modern Times Group MTG AB - B - 4,592 SEK 153,907 120,610 0.01
NCC AB - B - 7,551 SEK 177,597 196,735 0.02
Nordea Bank AB 436,875 SEK 4,324,749 4,192,306 0.42
Sandvik AB 152,903 SEK 1,463,984 1,233,222 0.12
Securitas AB - B - 44,666 SEK 371,009 445,360 0.04
Skandinaviska Enskilda Banken AB - A - 217,446 SEK 2,131,705 2,285,202 0.23
Skanska AB - B - 58,807 SEK 890,042 1,042,346 0.11
SKF AB - B - 51,949 SEK 961,453 904,336 0.09
Svenska Cellulosa AB SCA - B - 86,141 SEK 1,745,066 1,535,930 0.15
Svenska Handelsbanken AB - A - 68,257 SEK 2,467,437 2,641,628 0.27
Swedbank AB - A - 130,516 SEK 2,541,137 2,693,658 0.27
Swedish Match AB 30,308 SEK 713,110 783,250 0.08
Tele2 AB - B - 42,960 SEK 391,755 430,617 0.04
Telefonaktiebolaget LM Ericsson - B - 423,215 SEK 3,948,641 4,215,362 0.42
TeliaSonera AB 319,192 SEK 1,770,099 1,698,300 0.17
Trelleborg AB - B - 40,400 SEK 584,303 562,973 0.06
Volvo AB - B - 220,740 SEK 2,142,900 1,973,769 0.20
43,411,020 44,689,548 4.50
Switzerland
ABB Ltd. 320,081 CHF 5,739,187 5,627,663 0.57
Actelion Ltd. 15,375 CHF 1,234,335 1,474,374 0.15
Adecco SA 22,000 CHF 1,272,198 1,259,766 0.13
Aryzta AG 13,282 CHF 822,130 850,032 0.08
Baloise Holding AG 7,648 CHF 723,655 812,909 0.08
Barry Callebaut AG 210 CHF 185,327 178,498 0.02
Cie Financiere Richemont SA 72,186 CHF 5,166,234 5,331,251 0.54
Clariant AG 49,652 CHF 682,440 690,456 0.07
Coca-Cola HBC AG 16,860 EUR 329,701 264,365 0.03
Coca-Cola HBC AG 1,016 GBP 17,913 16,077 0.00
Credit Suisse Group AG 206,844 CHF 4,454,149 4,314,531 0.43
DKSH Holding AG 2,676 CHF 140,011 169,146 0.02
Dufry AG 4,977 CHF 607,593 616,761 0.06
EMS-Chemie Holding AG 607 CHF 165,494 203,828 0.02
Flughafen Zuerich AG 325 CHF 145,866 180,155 0.02
Galenica AG 814 CHF 572,533 536,183 0.05
GAM Holding AG 14,013 CHF 167,829 209,781 0.02
Geberit AG 5,292 CHF 1,251,727 1,489,407 0.15
Georg Fischer AG 334 CHF 165,879 174,727 0.02
Givaudan SA 1,117 CHF 1,294,786 1,665,699 0.17
Glencore PLC 1,381,249 GBP 5,692,097 5,318,203 0.53
Helvetia Holding AG 519 CHF 189,022 204,602 0.02
241
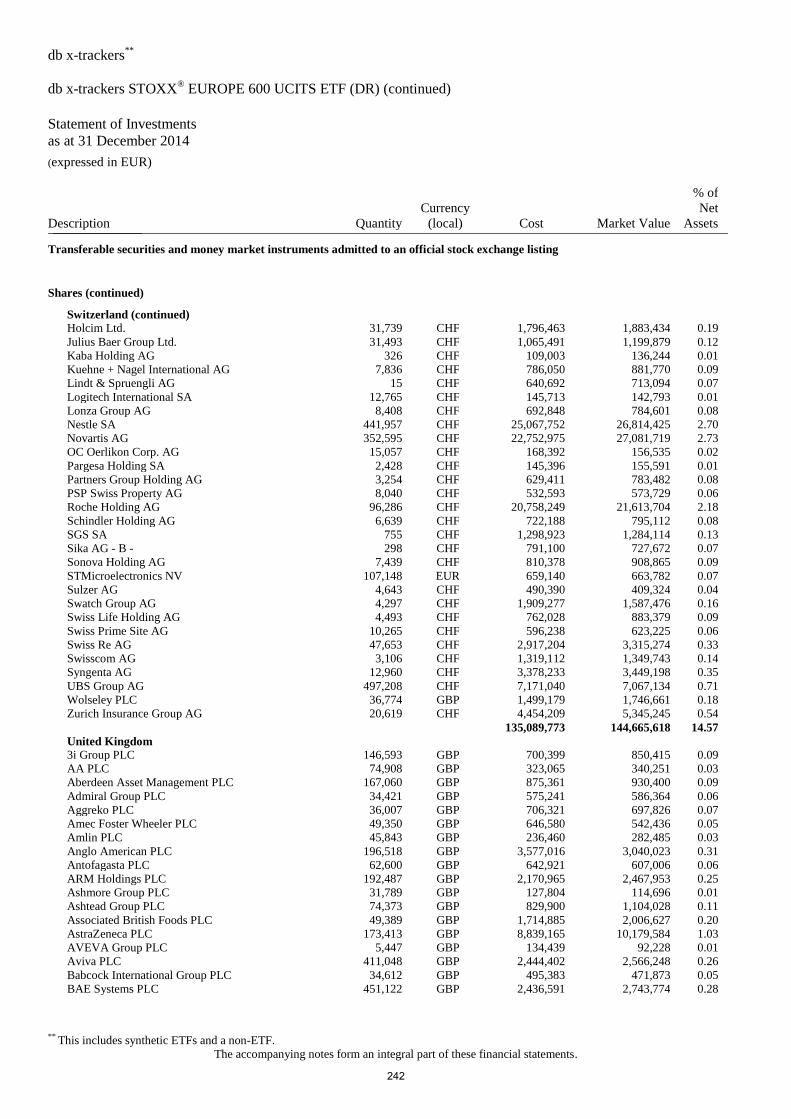
db x-trackers**
db x-trackers STOXX® EUROPE 600 UCITS ETF (DR) (continued)
Statement of Investments
as at 31 December 2014 (expressed in EUR)
** This includes synthetic ETFs and a non-ETF.
The accompanying notes form an integral part of these financial statements.
Description Quantity
Currency
(local) Cost Market Value
% of
Net
Assets _______________
Transferable securities and money market instruments admitted to an official stock exchange listing
Shares (continued)
Switzerland (continued)
Holcim Ltd. 31,739 CHF 1,796,463 1,883,434 0.19
Julius Baer Group Ltd. 31,493 CHF 1,065,491 1,199,879 0.12
Kaba Holding AG 326 CHF 109,003 136,244 0.01
Kuehne + Nagel International AG 7,836 CHF 786,050 881,770 0.09
Lindt & Spruengli AG 15 CHF 640,692 713,094 0.07
Logitech International SA 12,765 CHF 145,713 142,793 0.01
Lonza Group AG 8,408 CHF 692,848 784,601 0.08
Nestle SA 441,957 CHF 25,067,752 26,814,425 2.70
Novartis AG 352,595 CHF 22,752,975 27,081,719 2.73
OC Oerlikon Corp. AG 15,057 CHF 168,392 156,535 0.02
Pargesa Holding SA 2,428 CHF 145,396 155,591 0.01
Partners Group Holding AG 3,254 CHF 629,411 783,482 0.08
PSP Swiss Property AG 8,040 CHF 532,593 573,729 0.06
Roche Holding AG 96,286 CHF 20,758,249 21,613,704 2.18
Schindler Holding AG 6,639 CHF 722,188 795,112 0.08
SGS SA 755 CHF 1,298,923 1,284,114 0.13
Sika AG - B - 298 CHF 791,100 727,672 0.07
Sonova Holding AG 7,439 CHF 810,378 908,865 0.09
STMicroelectronics NV 107,148 EUR 659,140 663,782 0.07
Sulzer AG 4,643 CHF 490,390 409,324 0.04
Swatch Group AG 4,297 CHF 1,909,277 1,587,476 0.16
Swiss Life Holding AG 4,493 CHF 762,028 883,379 0.09
Swiss Prime Site AG 10,265 CHF 596,238 623,225 0.06
Swiss Re AG 47,653 CHF 2,917,204 3,315,274 0.33
Swisscom AG 3,106 CHF 1,319,112 1,349,743 0.14
Syngenta AG 12,960 CHF 3,378,233 3,449,198 0.35
UBS Group AG 497,208 CHF 7,171,040 7,067,134 0.71
Wolseley PLC 36,774 GBP 1,499,179 1,746,661 0.18
Zurich Insurance Group AG 20,619 CHF 4,454,209 5,345,245 0.54
135,089,773 144,665,618 14.57
United Kingdom
3i Group PLC 146,593 GBP 700,399 850,415 0.09
AA PLC 74,908 GBP 323,065 340,251 0.03
Aberdeen Asset Management PLC 167,060 GBP 875,361 930,400 0.09
Admiral Group PLC 34,421 GBP 575,241 586,364 0.06
Aggreko PLC 36,007 GBP 706,321 697,826 0.07
Amec Foster Wheeler PLC 49,350 GBP 646,580 542,436 0.05
Amlin PLC 45,843 GBP 236,460 282,485 0.03
Anglo American PLC 196,518 GBP 3,577,016 3,040,023 0.31
Antofagasta PLC 62,600 GBP 642,921 607,006 0.06
ARM Holdings PLC 192,487 GBP 2,170,965 2,467,953 0.25
Ashmore Group PLC 31,789 GBP 127,804 114,696 0.01
Ashtead Group PLC 74,373 GBP 829,900 1,104,028 0.11
Associated British Foods PLC 49,389 GBP 1,714,885 2,006,627 0.20
AstraZeneca PLC 173,413 GBP 8,839,165 10,179,584 1.03
AVEVA Group PLC 5,447 GBP 134,439 92,228 0.01
Aviva PLC 411,048 GBP 2,444,402 2,566,248 0.26
Babcock International Group PLC 34,612 GBP 495,383 471,873 0.05
BAE Systems PLC 451,122 GBP 2,436,591 2,743,774 0.28
242
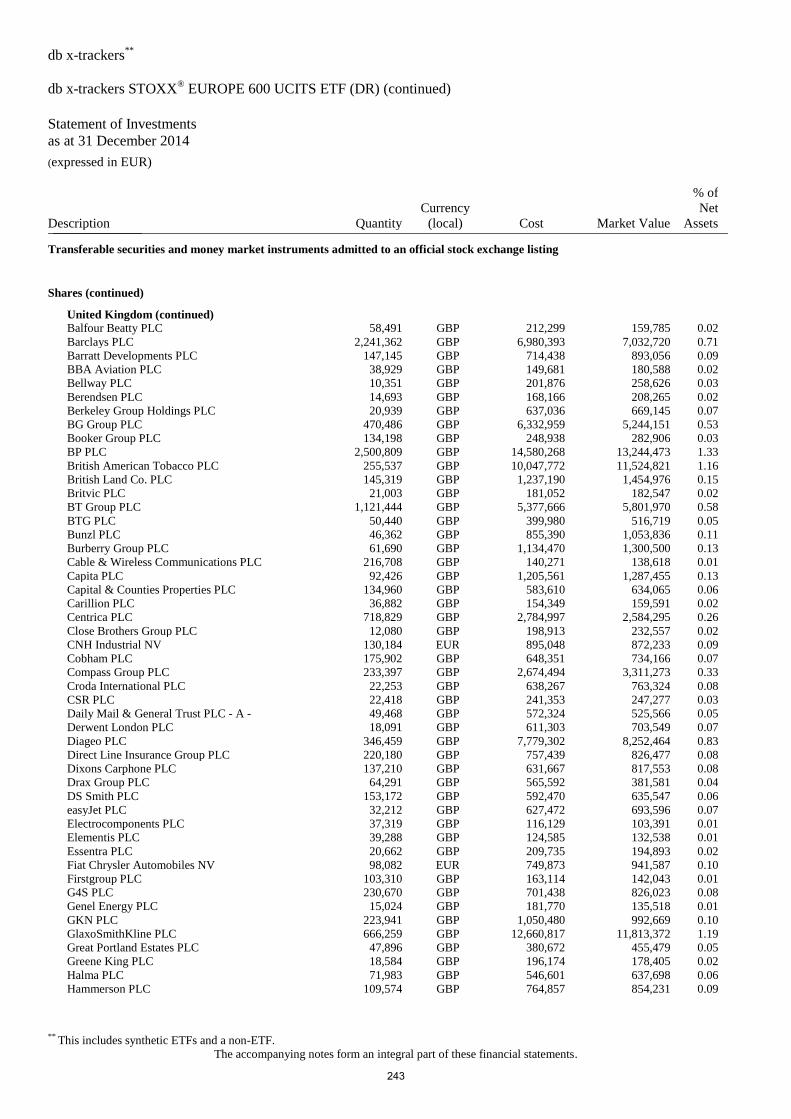
db x-trackers**
db x-trackers STOXX® EUROPE 600 UCITS ETF (DR) (continued)
Statement of Investments
as at 31 December 2014 (expressed in EUR)
** This includes synthetic ETFs and a non-ETF.
The accompanying notes form an integral part of these financial statements.
Description Quantity
Currency
(local) Cost Market Value
% of
Net
Assets _______________
Transferable securities and money market instruments admitted to an official stock exchange listing
Shares (continued)
United Kingdom (continued)
Balfour Beatty PLC 58,491 GBP 212,299 159,785 0.02
Barclays PLC 2,241,362 GBP 6,980,393 7,032,720 0.71
Barratt Developments PLC 147,145 GBP 714,438 893,056 0.09
BBA Aviation PLC 38,929 GBP 149,681 180,588 0.02
Bellway PLC 10,351 GBP 201,876 258,626 0.03
Berendsen PLC 14,693 GBP 168,166 208,265 0.02
Berkeley Group Holdings PLC 20,939 GBP 637,036 669,145 0.07
BG Group PLC 470,486 GBP 6,332,959 5,244,151 0.53
Booker Group PLC 134,198 GBP 248,938 282,906 0.03
BP PLC 2,500,809 GBP 14,580,268 13,244,473 1.33
British American Tobacco PLC 255,537 GBP 10,047,772 11,524,821 1.16
British Land Co. PLC 145,319 GBP 1,237,190 1,454,976 0.15
Britvic PLC 21,003 GBP 181,052 182,547 0.02
BT Group PLC 1,121,444 GBP 5,377,666 5,801,970 0.58
BTG PLC 50,440 GBP 399,980 516,719 0.05
Bunzl PLC 46,362 GBP 855,390 1,053,836 0.11
Burberry Group PLC 61,690 GBP 1,134,470 1,300,500 0.13
Cable & Wireless Communications PLC 216,708 GBP 140,271 138,618 0.01
Capita PLC 92,426 GBP 1,205,561 1,287,455 0.13
Capital & Counties Properties PLC 134,960 GBP 583,610 634,065 0.06
Carillion PLC 36,882 GBP 154,349 159,591 0.02
Centrica PLC 718,829 GBP 2,784,997 2,584,295 0.26
Close Brothers Group PLC 12,080 GBP 198,913 232,557 0.02
CNH Industrial NV 130,184 EUR 895,048 872,233 0.09
Cobham PLC 175,902 GBP 648,351 734,166 0.07
Compass Group PLC 233,397 GBP 2,674,494 3,311,273 0.33
Croda International PLC 22,253 GBP 638,267 763,324 0.08
CSR PLC 22,418 GBP 241,353 247,277 0.03
Daily Mail & General Trust PLC - A - 49,468 GBP 572,324 525,566 0.05
Derwent London PLC 18,091 GBP 611,303 703,549 0.07
Diageo PLC 346,459 GBP 7,779,302 8,252,464 0.83
Direct Line Insurance Group PLC 220,180 GBP 757,439 826,477 0.08
Dixons Carphone PLC 137,210 GBP 631,667 817,553 0.08
Drax Group PLC 64,291 GBP 565,592 381,581 0.04
DS Smith PLC 153,172 GBP 592,470 635,547 0.06
easyJet PLC 32,212 GBP 627,472 693,596 0.07
Electrocomponents PLC 37,319 GBP 116,129 103,391 0.01
Elementis PLC 39,288 GBP 124,585 132,538 0.01
Essentra PLC 20,662 GBP 209,735 194,893 0.02
Fiat Chrysler Automobiles NV 98,082 EUR 749,873 941,587 0.10
Firstgroup PLC 103,310 GBP 163,114 142,043 0.01
G4S PLC 230,670 GBP 701,438 826,023 0.08
Genel Energy PLC 15,024 GBP 181,770 135,518 0.01
GKN PLC 223,941 GBP 1,050,480 992,669 0.10
GlaxoSmithKline PLC 666,259 GBP 12,660,817 11,813,372 1.19
Great Portland Estates PLC 47,896 GBP 380,672 455,479 0.05
Greene King PLC 18,584 GBP 196,174 178,405 0.02
Halma PLC 71,983 GBP 546,601 637,698 0.06
Hammerson PLC 109,574 GBP 764,857 854,231 0.09
243
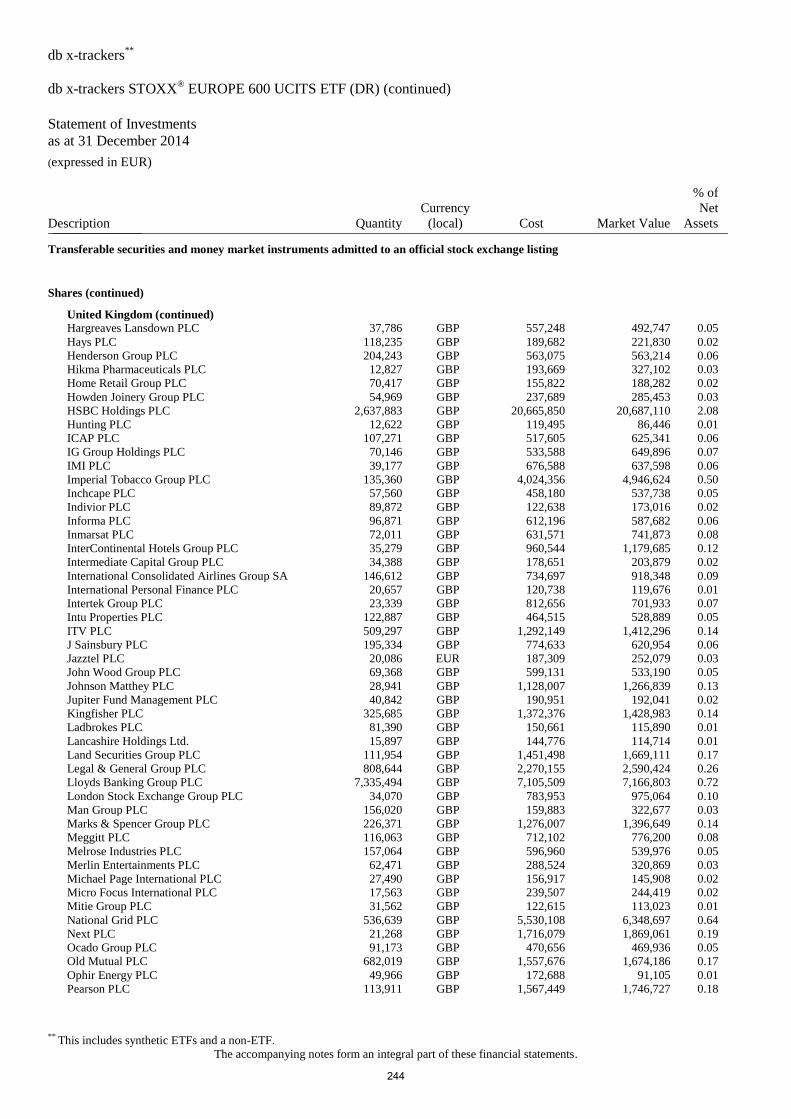
db x-trackers**
db x-trackers STOXX® EUROPE 600 UCITS ETF (DR) (continued)
Statement of Investments
as at 31 December 2014 (expressed in EUR)
** This includes synthetic ETFs and a non-ETF.
The accompanying notes form an integral part of these financial statements.
Description Quantity
Currency
(local) Cost Market Value
% of
Net
Assets _______________
Transferable securities and money market instruments admitted to an official stock exchange listing
Shares (continued)
United Kingdom (continued)
Hargreaves Lansdown PLC 37,786 GBP 557,248 492,747 0.05
Hays PLC 118,235 GBP 189,682 221,830 0.02
Henderson Group PLC 204,243 GBP 563,075 563,214 0.06
Hikma Pharmaceuticals PLC 12,827 GBP 193,669 327,102 0.03
Home Retail Group PLC 70,417 GBP 155,822 188,282 0.02
Howden Joinery Group PLC 54,969 GBP 237,689 285,453 0.03
HSBC Holdings PLC 2,637,883 GBP 20,665,850 20,687,110 2.08
Hunting PLC 12,622 GBP 119,495 86,446 0.01
ICAP PLC 107,271 GBP 517,605 625,341 0.06
IG Group Holdings PLC 70,146 GBP 533,588 649,896 0.07
IMI PLC 39,177 GBP 676,588 637,598 0.06
Imperial Tobacco Group PLC 135,360 GBP 4,024,356 4,946,624 0.50
Inchcape PLC 57,560 GBP 458,180 537,738 0.05
Indivior PLC 89,872 GBP 122,638 173,016 0.02
Informa PLC 96,871 GBP 612,196 587,682 0.06
Inmarsat PLC 72,011 GBP 631,571 741,873 0.08
InterContinental Hotels Group PLC 35,279 GBP 960,544 1,179,685 0.12
Intermediate Capital Group PLC 34,388 GBP 178,651 203,879 0.02
International Consolidated Airlines Group SA 146,612 GBP 734,697 918,348 0.09
International Personal Finance PLC 20,657 GBP 120,738 119,676 0.01
Intertek Group PLC 23,339 GBP 812,656 701,933 0.07
Intu Properties PLC 122,887 GBP 464,515 528,889 0.05
ITV PLC 509,297 GBP 1,292,149 1,412,296 0.14
J Sainsbury PLC 195,334 GBP 774,633 620,954 0.06
Jazztel PLC 20,086 EUR 187,309 252,079 0.03
John Wood Group PLC 69,368 GBP 599,131 533,190 0.05
Johnson Matthey PLC 28,941 GBP 1,128,007 1,266,839 0.13
Jupiter Fund Management PLC 40,842 GBP 190,951 192,041 0.02
Kingfisher PLC 325,685 GBP 1,372,376 1,428,983 0.14
Ladbrokes PLC 81,390 GBP 150,661 115,890 0.01
Lancashire Holdings Ltd. 15,897 GBP 144,776 114,714 0.01
Land Securities Group PLC 111,954 GBP 1,451,498 1,669,111 0.17
Legal & General Group PLC 808,644 GBP 2,270,155 2,590,424 0.26
Lloyds Banking Group PLC 7,335,494 GBP 7,105,509 7,166,803 0.72
London Stock Exchange Group PLC 34,070 GBP 783,953 975,064 0.10
Man Group PLC 156,020 GBP 159,883 322,677 0.03
Marks & Spencer Group PLC 226,371 GBP 1,276,007 1,396,649 0.14
Meggitt PLC 116,063 GBP 712,102 776,200 0.08
Melrose Industries PLC 157,064 GBP 596,960 539,976 0.05
Merlin Entertainments PLC 62,471 GBP 288,524 320,869 0.03
Michael Page International PLC 27,490 GBP 156,917 145,908 0.02
Micro Focus International PLC 17,563 GBP 239,507 244,419 0.02
Mitie Group PLC 31,562 GBP 122,615 113,023 0.01
National Grid PLC 536,639 GBP 5,530,108 6,348,697 0.64
Next PLC 21,268 GBP 1,716,079 1,869,061 0.19
Ocado Group PLC 91,173 GBP 470,656 469,936 0.05
Old Mutual PLC 682,019 GBP 1,557,676 1,674,186 0.17
Ophir Energy PLC 49,966 GBP 172,688 91,105 0.01
Pearson PLC 113,911 GBP 1,567,449 1,746,727 0.18
244
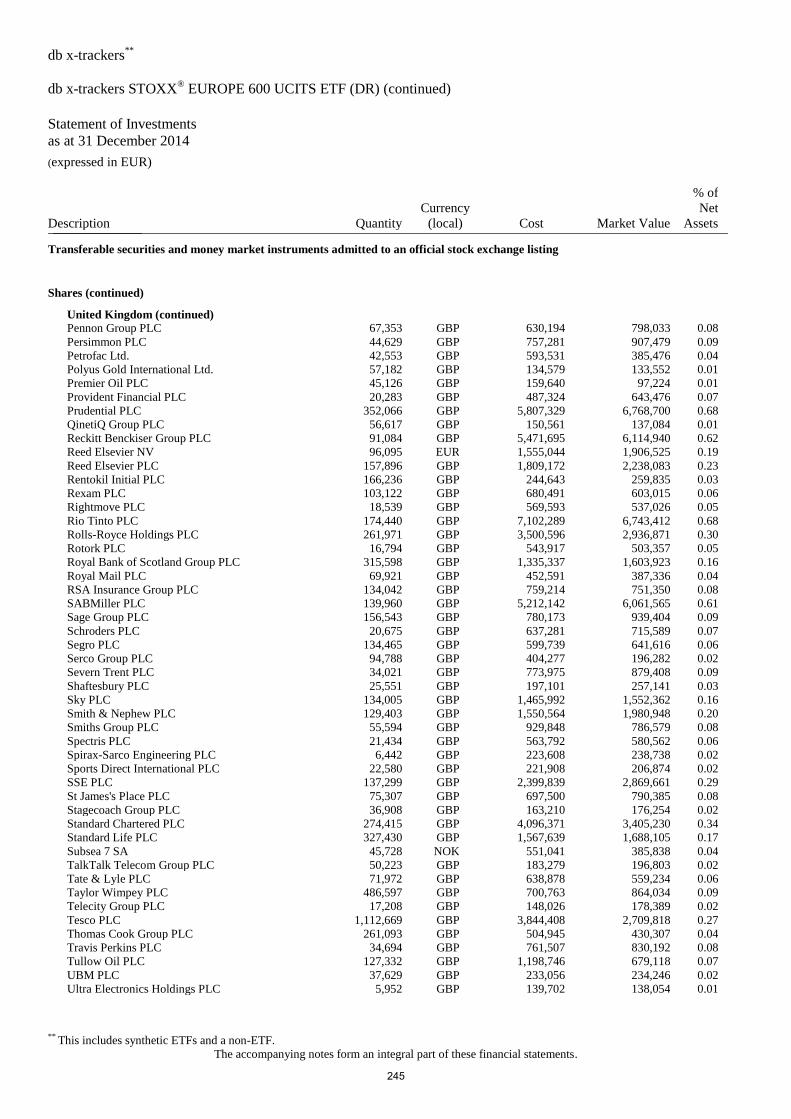
db x-trackers**
db x-trackers STOXX® EUROPE 600 UCITS ETF (DR) (continued)
Statement of Investments
as at 31 December 2014 (expressed in EUR)
** This includes synthetic ETFs and a non-ETF.
The accompanying notes form an integral part of these financial statements.
Description Quantity
Currency
(local) Cost Market Value
% of
Net
Assets _______________
Transferable securities and money market instruments admitted to an official stock exchange listing
Shares (continued)
United Kingdom (continued)
Pennon Group PLC 67,353 GBP 630,194 798,033 0.08
Persimmon PLC 44,629 GBP 757,281 907,479 0.09
Petrofac Ltd. 42,553 GBP 593,531 385,476 0.04
Polyus Gold International Ltd. 57,182 GBP 134,579 133,552 0.01
Premier Oil PLC 45,126 GBP 159,640 97,224 0.01
Provident Financial PLC 20,283 GBP 487,324 643,476 0.07
Prudential PLC 352,066 GBP 5,807,329 6,768,700 0.68
QinetiQ Group PLC 56,617 GBP 150,561 137,084 0.01
Reckitt Benckiser Group PLC 91,084 GBP 5,471,695 6,114,940 0.62
Reed Elsevier NV 96,095 EUR 1,555,044 1,906,525 0.19
Reed Elsevier PLC 157,896 GBP 1,809,172 2,238,083 0.23
Rentokil Initial PLC 166,236 GBP 244,643 259,835 0.03
Rexam PLC 103,122 GBP 680,491 603,015 0.06
Rightmove PLC 18,539 GBP 569,593 537,026 0.05
Rio Tinto PLC 174,440 GBP 7,102,289 6,743,412 0.68
Rolls-Royce Holdings PLC 261,971 GBP 3,500,596 2,936,871 0.30
Rotork PLC 16,794 GBP 543,917 503,357 0.05
Royal Bank of Scotland Group PLC 315,598 GBP 1,335,337 1,603,923 0.16
Royal Mail PLC 69,921 GBP 452,591 387,336 0.04
RSA Insurance Group PLC 134,042 GBP 759,214 751,350 0.08
SABMiller PLC 139,960 GBP 5,212,142 6,061,565 0.61
Sage Group PLC 156,543 GBP 780,173 939,404 0.09
Schroders PLC 20,675 GBP 637,281 715,589 0.07
Segro PLC 134,465 GBP 599,739 641,616 0.06
Serco Group PLC 94,788 GBP 404,277 196,282 0.02
Severn Trent PLC 34,021 GBP 773,975 879,408 0.09
Shaftesbury PLC 25,551 GBP 197,101 257,141 0.03
Sky PLC 134,005 GBP 1,465,992 1,552,362 0.16
Smith & Nephew PLC 129,403 GBP 1,550,564 1,980,948 0.20
Smiths Group PLC 55,594 GBP 929,848 786,579 0.08
Spectris PLC 21,434 GBP 563,792 580,562 0.06
Spirax-Sarco Engineering PLC 6,442 GBP 223,608 238,738 0.02
Sports Direct International PLC 22,580 GBP 221,908 206,874 0.02
SSE PLC 137,299 GBP 2,399,839 2,869,661 0.29
St James's Place PLC 75,307 GBP 697,500 790,385 0.08
Stagecoach Group PLC 36,908 GBP 163,210 176,254 0.02
Standard Chartered PLC 274,415 GBP 4,096,371 3,405,230 0.34
Standard Life PLC 327,430 GBP 1,567,639 1,688,105 0.17
Subsea 7 SA 45,728 NOK 551,041 385,838 0.04
TalkTalk Telecom Group PLC 50,223 GBP 183,279 196,803 0.02
Tate & Lyle PLC 71,972 GBP 638,878 559,234 0.06
Taylor Wimpey PLC 486,597 GBP 700,763 864,034 0.09
Telecity Group PLC 17,208 GBP 148,026 178,389 0.02
Tesco PLC 1,112,669 GBP 3,844,408 2,709,818 0.27
Thomas Cook Group PLC 261,093 GBP 504,945 430,307 0.04
Travis Perkins PLC 34,694 GBP 761,507 830,192 0.08
Tullow Oil PLC 127,332 GBP 1,198,746 679,118 0.07
UBM PLC 37,629 GBP 233,056 234,246 0.02
Ultra Electronics Holdings PLC 5,952 GBP 139,702 138,054 0.01
245
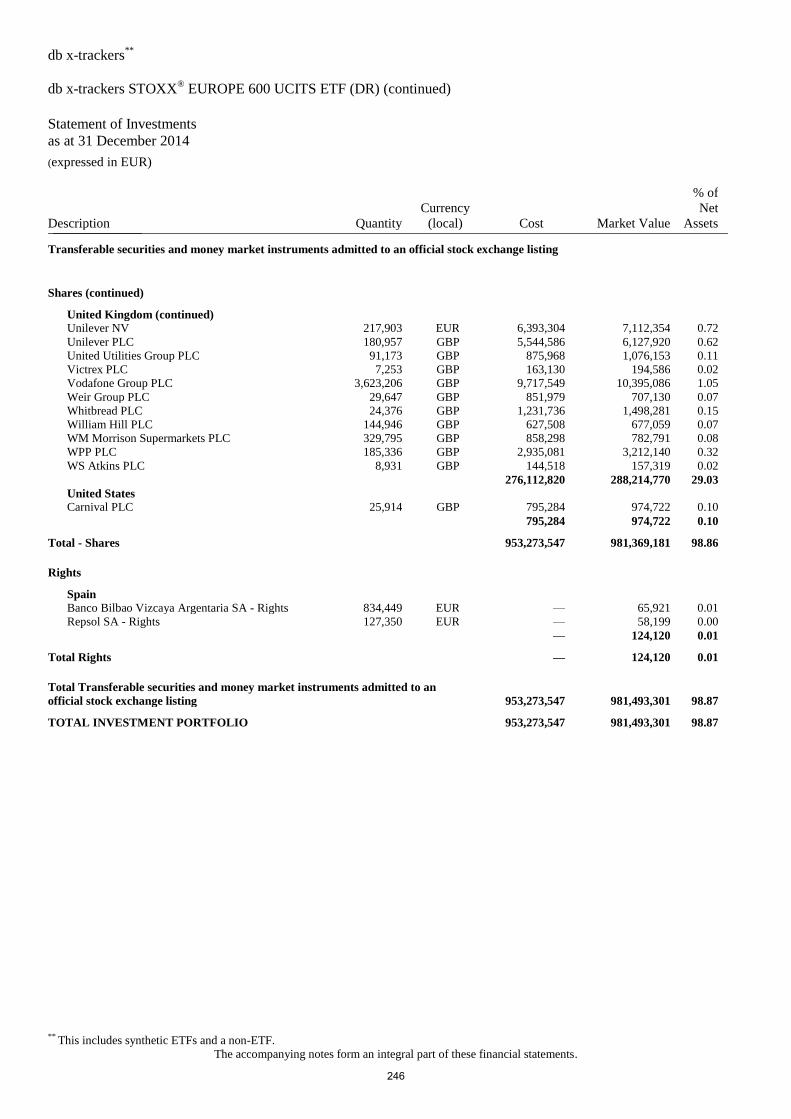
db x-trackers**
db x-trackers STOXX® EUROPE 600 UCITS ETF (DR) (continued)
Statement of Investments
as at 31 December 2014 (expressed in EUR)
** This includes synthetic ETFs and a non-ETF.
The accompanying notes form an integral part of these financial statements.
Description Quantity
Currency
(local) Cost Market Value
% of
Net
Assets _______________
Transferable securities and money market instruments admitted to an official stock exchange listing
Shares (continued)
United Kingdom (continued)
Unilever NV 217,903 EUR 6,393,304 7,112,354 0.72
Unilever PLC 180,957 GBP 5,544,586 6,127,920 0.62
United Utilities Group PLC 91,173 GBP 875,968 1,076,153 0.11
Victrex PLC 7,253 GBP 163,130 194,586 0.02
Vodafone Group PLC 3,623,206 GBP 9,717,549 10,395,086 1.05
Weir Group PLC 29,647 GBP 851,979 707,130 0.07
Whitbread PLC 24,376 GBP 1,231,736 1,498,281 0.15
William Hill PLC 144,946 GBP 627,508 677,059 0.07
WM Morrison Supermarkets PLC 329,795 GBP 858,298 782,791 0.08
WPP PLC 185,336 GBP 2,935,081 3,212,140 0.32
WS Atkins PLC 8,931 GBP 144,518 157,319 0.02
276,112,820 288,214,770 29.03
United States
Carnival PLC 25,914 GBP 795,284 974,722 0.10
795,284 974,722 0.10
Total - Shares 953,273,547 981,369,181 98.86
Rights
Spain
Banco Bilbao Vizcaya Argentaria SA - Rights 834,449 EUR — 65,921 0.01
Repsol SA - Rights 127,350 EUR — 58,199 0.00
— 124,120 0.01
Total Rights — 124,120 0.01
Total Transferable securities and money market instruments admitted to an
official stock exchange listing 953,273,547 981,493,301 98.87
TOTAL INVESTMENT PORTFOLIO 953,273,547 981,493,301 98.87
246
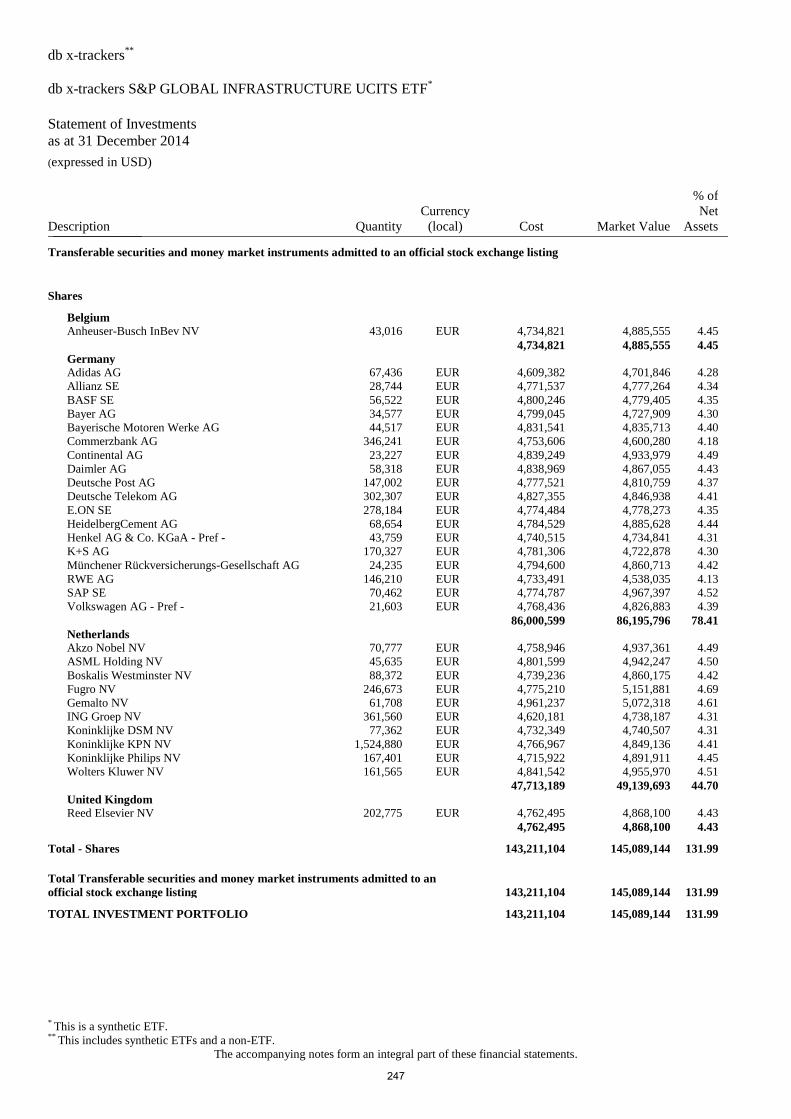
db x-trackers**
db x-trackers S&P GLOBAL INFRASTRUCTURE UCITS ETF*
Statement of Investments
as at 31 December 2014 (expressed in USD)
* This is a synthetic ETF. ** This includes synthetic ETFs and a non-ETF.
The accompanying notes form an integral part of these financial statements.
Description Quantity
Currency
(local) Cost Market Value
% of
Net
Assets _______________
Transferable securities and money market instruments admitted to an official stock exchange listing
Shares
Belgium
Anheuser-Busch InBev NV 43,016 EUR 4,734,821 4,885,555 4.45
4,734,821 4,885,555 4.45
Germany
Adidas AG 67,436 EUR 4,609,382 4,701,846 4.28
Allianz SE 28,744 EUR 4,771,537 4,777,264 4.34
BASF SE 56,522 EUR 4,800,246 4,779,405 4.35
Bayer AG 34,577 EUR 4,799,045 4,727,909 4.30
Bayerische Motoren Werke AG 44,517 EUR 4,831,541 4,835,713 4.40
Commerzbank AG 346,241 EUR 4,753,606 4,600,280 4.18
Continental AG 23,227 EUR 4,839,249 4,933,979 4.49
Daimler AG 58,318 EUR 4,838,969 4,867,055 4.43
Deutsche Post AG 147,002 EUR 4,777,521 4,810,759 4.37
Deutsche Telekom AG 302,307 EUR 4,827,355 4,846,938 4.41
E.ON SE 278,184 EUR 4,774,484 4,778,273 4.35
HeidelbergCement AG 68,654 EUR 4,784,529 4,885,628 4.44
Henkel AG & Co. KGaA - Pref - 43,759 EUR 4,740,515 4,734,841 4.31
K+S AG 170,327 EUR 4,781,306 4,722,878 4.30
Münchener Rückversicherungs-Gesellschaft AG 24,235 EUR 4,794,600 4,860,713 4.42
RWE AG 146,210 EUR 4,733,491 4,538,035 4.13
SAP SE 70,462 EUR 4,774,787 4,967,397 4.52
Volkswagen AG - Pref - 21,603 EUR 4,768,436 4,826,883 4.39
86,000,599 86,195,796 78.41
Netherlands
Akzo Nobel NV 70,777 EUR 4,758,946 4,937,361 4.49
ASML Holding NV 45,635 EUR 4,801,599 4,942,247 4.50
Boskalis Westminster NV 88,372 EUR 4,739,236 4,860,175 4.42
Fugro NV 246,673 EUR 4,775,210 5,151,881 4.69
Gemalto NV 61,708 EUR 4,961,237 5,072,318 4.61
ING Groep NV 361,560 EUR 4,620,181 4,738,187 4.31
Koninklijke DSM NV 77,362 EUR 4,732,349 4,740,507 4.31
Koninklijke KPN NV 1,524,880 EUR 4,766,967 4,849,136 4.41
Koninklijke Philips NV 167,401 EUR 4,715,922 4,891,911 4.45
Wolters Kluwer NV 161,565 EUR 4,841,542 4,955,970 4.51
47,713,189 49,139,693 44.70
United Kingdom
Reed Elsevier NV 202,775 EUR 4,762,495 4,868,100 4.43
4,762,495 4,868,100 4.43
Total - Shares 143,211,104 145,089,144 131.99
Total Transferable securities and money market instruments admitted to an
official stock exchange listing 143,211,104 145,089,144 131.99
TOTAL INVESTMENT PORTFOLIO 143,211,104 145,089,144 131.99
247
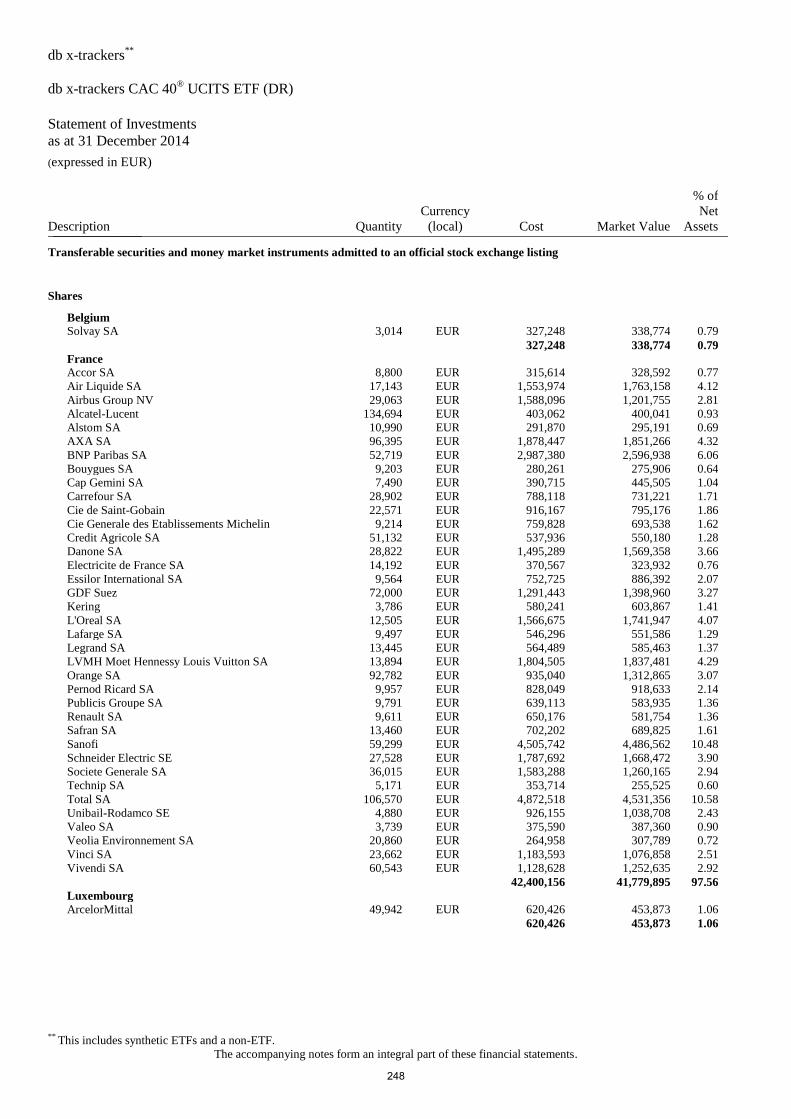
db x-trackers**
db x-trackers CAC 40® UCITS ETF (DR)
Statement of Investments
as at 31 December 2014 (expressed in EUR)
** This includes synthetic ETFs and a non-ETF.
The accompanying notes form an integral part of these financial statements.
Description Quantity
Currency
(local) Cost Market Value
% of
Net
Assets _______________
Transferable securities and money market instruments admitted to an official stock exchange listing
Shares
Belgium
Solvay SA 3,014 EUR 327,248 338,774 0.79
327,248 338,774 0.79
France
Accor SA 8,800 EUR 315,614 328,592 0.77
Air Liquide SA 17,143 EUR 1,553,974 1,763,158 4.12
Airbus Group NV 29,063 EUR 1,588,096 1,201,755 2.81
Alcatel-Lucent 134,694 EUR 403,062 400,041 0.93
Alstom SA 10,990 EUR 291,870 295,191 0.69
AXA SA 96,395 EUR 1,878,447 1,851,266 4.32
BNP Paribas SA 52,719 EUR 2,987,380 2,596,938 6.06
Bouygues SA 9,203 EUR 280,261 275,906 0.64
Cap Gemini SA 7,490 EUR 390,715 445,505 1.04
Carrefour SA 28,902 EUR 788,118 731,221 1.71
Cie de Saint-Gobain 22,571 EUR 916,167 795,176 1.86
Cie Generale des Etablissements Michelin 9,214 EUR 759,828 693,538 1.62
Credit Agricole SA 51,132 EUR 537,936 550,180 1.28
Danone SA 28,822 EUR 1,495,289 1,569,358 3.66
Electricite de France SA 14,192 EUR 370,567 323,932 0.76
Essilor International SA 9,564 EUR 752,725 886,392 2.07
GDF Suez 72,000 EUR 1,291,443 1,398,960 3.27
Kering 3,786 EUR 580,241 603,867 1.41
L'Oreal SA 12,505 EUR 1,566,675 1,741,947 4.07
Lafarge SA 9,497 EUR 546,296 551,586 1.29
Legrand SA 13,445 EUR 564,489 585,463 1.37
LVMH Moet Hennessy Louis Vuitton SA 13,894 EUR 1,804,505 1,837,481 4.29
Orange SA 92,782 EUR 935,040 1,312,865 3.07
Pernod Ricard SA 9,957 EUR 828,049 918,633 2.14
Publicis Groupe SA 9,791 EUR 639,113 583,935 1.36
Renault SA 9,611 EUR 650,176 581,754 1.36
Safran SA 13,460 EUR 702,202 689,825 1.61
Sanofi 59,299 EUR 4,505,742 4,486,562 10.48
Schneider Electric SE 27,528 EUR 1,787,692 1,668,472 3.90
Societe Generale SA 36,015 EUR 1,583,288 1,260,165 2.94
Technip SA 5,171 EUR 353,714 255,525 0.60
Total SA 106,570 EUR 4,872,518 4,531,356 10.58
Unibail-Rodamco SE 4,880 EUR 926,155 1,038,708 2.43
Valeo SA 3,739 EUR 375,590 387,360 0.90
Veolia Environnement SA 20,860 EUR 264,958 307,789 0.72
Vinci SA 23,662 EUR 1,183,593 1,076,858 2.51
Vivendi SA 60,543 EUR 1,128,628 1,252,635 2.92
42,400,156 41,779,895 97.56
Luxembourg
ArcelorMittal 49,942 EUR 620,426 453,873 1.06
620,426 453,873 1.06
248
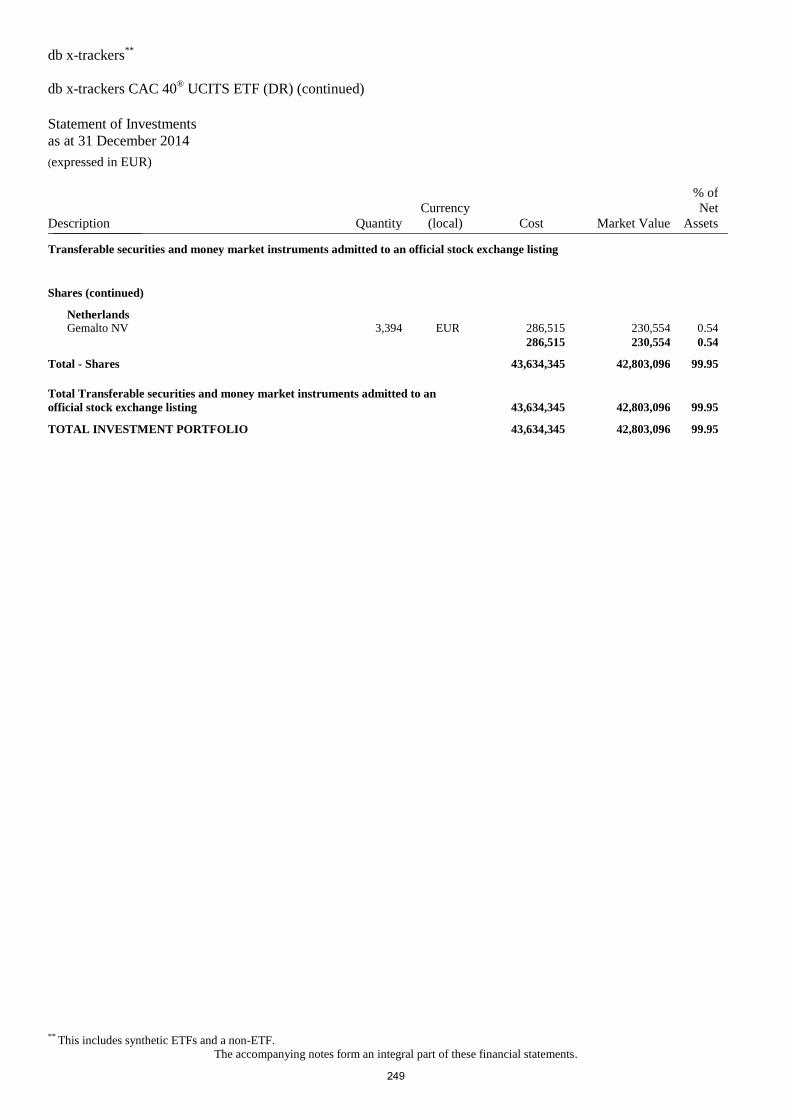
db x-trackers**
db x-trackers CAC 40® UCITS ETF (DR) (continued)
Statement of Investments
as at 31 December 2014 (expressed in EUR)
** This includes synthetic ETFs and a non-ETF.
The accompanying notes form an integral part of these financial statements.
Description Quantity
Currency
(local) Cost Market Value
% of
Net
Assets _______________
Transferable securities and money market instruments admitted to an official stock exchange listing
Shares (continued)
Netherlands
Gemalto NV 3,394 EUR 286,515 230,554 0.54
286,515 230,554 0.54
Total - Shares 43,634,345 42,803,096 99.95
Total Transferable securities and money market instruments admitted to an
official stock exchange listing 43,634,345 42,803,096 99.95
TOTAL INVESTMENT PORTFOLIO 43,634,345 42,803,096 99.95
249
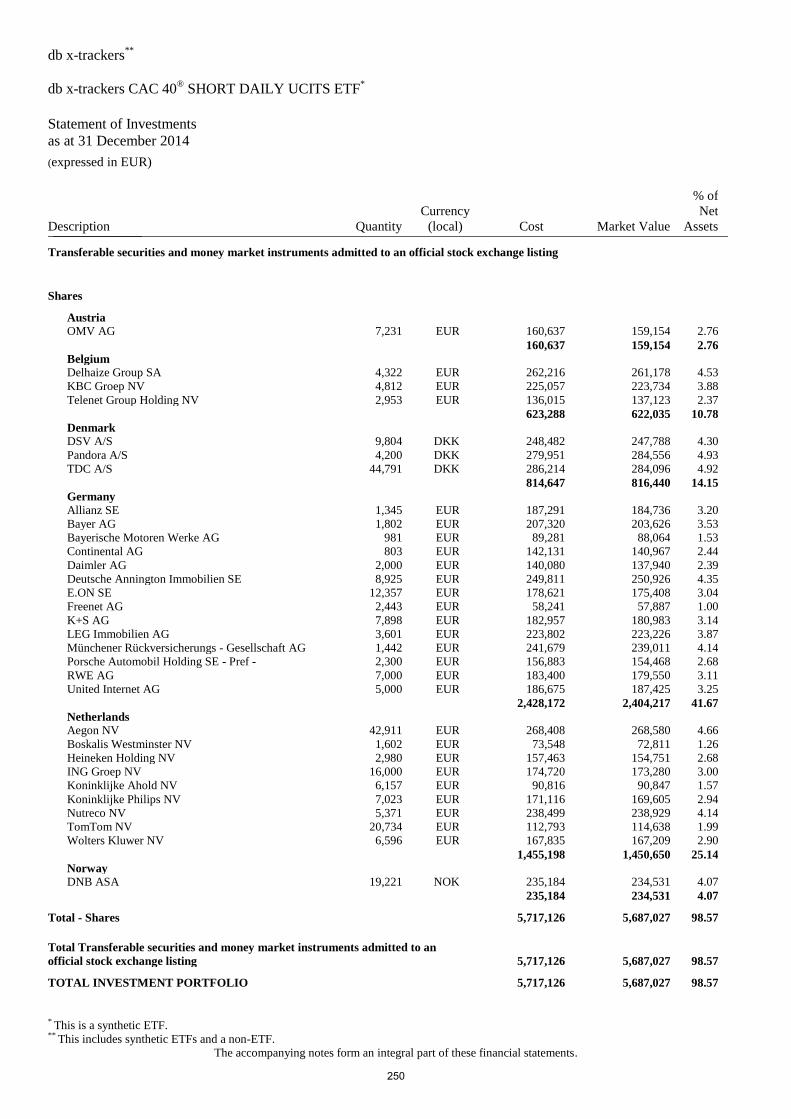
db x-trackers**
db x-trackers CAC 40® SHORT DAILY UCITS ETF
*
Statement of Investments
as at 31 December 2014 (expressed in EUR)
* This is a synthetic ETF. ** This includes synthetic ETFs and a non-ETF.
The accompanying notes form an integral part of these financial statements.
Description Quantity
Currency
(local) Cost Market Value
% of
Net
Assets _______________
Transferable securities and money market instruments admitted to an official stock exchange listing
Shares
Austria
OMV AG 7,231 EUR 160,637 159,154 2.76
160,637 159,154 2.76
Belgium
Delhaize Group SA 4,322 EUR 262,216 261,178 4.53
KBC Groep NV 4,812 EUR 225,057 223,734 3.88
Telenet Group Holding NV 2,953 EUR 136,015 137,123 2.37
623,288 622,035 10.78
Denmark
DSV A/S 9,804 DKK 248,482 247,788 4.30
Pandora A/S 4,200 DKK 279,951 284,556 4.93
TDC A/S 44,791 DKK 286,214 284,096 4.92
814,647 816,440 14.15
Germany
Allianz SE 1,345 EUR 187,291 184,736 3.20
Bayer AG 1,802 EUR 207,320 203,626 3.53
Bayerische Motoren Werke AG 981 EUR 89,281 88,064 1.53
Continental AG 803 EUR 142,131 140,967 2.44
Daimler AG 2,000 EUR 140,080 137,940 2.39
Deutsche Annington Immobilien SE 8,925 EUR 249,811 250,926 4.35
E.ON SE 12,357 EUR 178,621 175,408 3.04
Freenet AG 2,443 EUR 58,241 57,887 1.00
K+S AG 7,898 EUR 182,957 180,983 3.14
LEG Immobilien AG 3,601 EUR 223,802 223,226 3.87
Münchener Rückversicherungs - Gesellschaft AG 1,442 EUR 241,679 239,011 4.14
Porsche Automobil Holding SE - Pref - 2,300 EUR 156,883 154,468 2.68
RWE AG 7,000 EUR 183,400 179,550 3.11
United Internet AG 5,000 EUR 186,675 187,425 3.25
2,428,172 2,404,217 41.67
Netherlands
Aegon NV 42,911 EUR 268,408 268,580 4.66
Boskalis Westminster NV 1,602 EUR 73,548 72,811 1.26
Heineken Holding NV 2,980 EUR 157,463 154,751 2.68
ING Groep NV 16,000 EUR 174,720 173,280 3.00
Koninklijke Ahold NV 6,157 EUR 90,816 90,847 1.57
Koninklijke Philips NV 7,023 EUR 171,116 169,605 2.94
Nutreco NV 5,371 EUR 238,499 238,929 4.14
TomTom NV 20,734 EUR 112,793 114,638 1.99
Wolters Kluwer NV 6,596 EUR 167,835 167,209 2.90
1,455,198 1,450,650 25.14
Norway
DNB ASA 19,221 NOK 235,184 234,531 4.07
235,184 234,531 4.07
Total - Shares 5,717,126 5,687,027 98.57
Total Transferable securities and money market instruments admitted to an
official stock exchange listing 5,717,126 5,687,027 98.57
TOTAL INVESTMENT PORTFOLIO 5,717,126 5,687,027 98.57
250
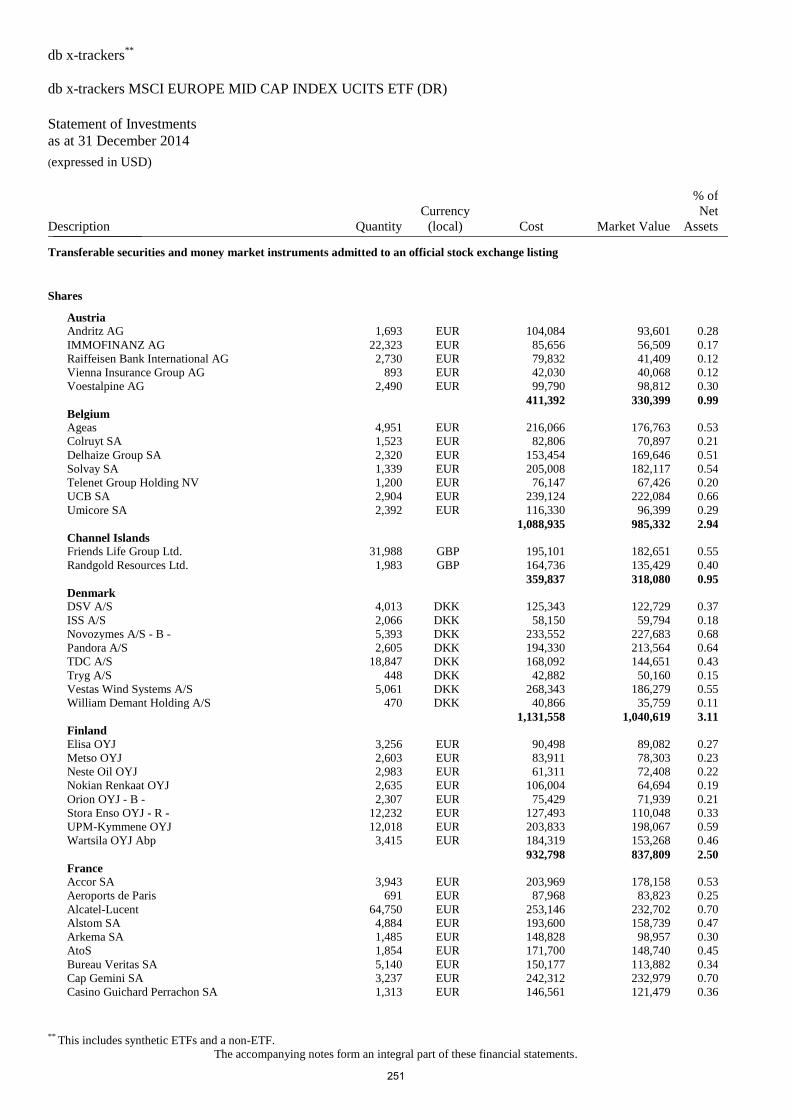
db x-trackers**
db x-trackers MSCI EUROPE MID CAP INDEX UCITS ETF (DR)
Statement of Investments
as at 31 December 2014 (expressed in USD)
** This includes synthetic ETFs and a non-ETF.
The accompanying notes form an integral part of these financial statements.
Description Quantity
Currency
(local) Cost Market Value
% of
Net
Assets _______________
Transferable securities and money market instruments admitted to an official stock exchange listing
Shares
Austria
Andritz AG 1,693 EUR 104,084 93,601 0.28
IMMOFINANZ AG 22,323 EUR 85,656 56,509 0.17
Raiffeisen Bank International AG 2,730 EUR 79,832 41,409 0.12
Vienna Insurance Group AG 893 EUR 42,030 40,068 0.12
Voestalpine AG 2,490 EUR 99,790 98,812 0.30
411,392 330,399 0.99
Belgium
Ageas 4,951 EUR 216,066 176,763 0.53
Colruyt SA 1,523 EUR 82,806 70,897 0.21
Delhaize Group SA 2,320 EUR 153,454 169,646 0.51
Solvay SA 1,339 EUR 205,008 182,117 0.54
Telenet Group Holding NV 1,200 EUR 76,147 67,426 0.20
UCB SA 2,904 EUR 239,124 222,084 0.66
Umicore SA 2,392 EUR 116,330 96,399 0.29
1,088,935 985,332 2.94
Channel Islands
Friends Life Group Ltd. 31,988 GBP 195,101 182,651 0.55
Randgold Resources Ltd. 1,983 GBP 164,736 135,429 0.40
359,837 318,080 0.95
Denmark
DSV A/S 4,013 DKK 125,343 122,729 0.37
ISS A/S 2,066 DKK 58,150 59,794 0.18
Novozymes A/S - B - 5,393 DKK 233,552 227,683 0.68
Pandora A/S 2,605 DKK 194,330 213,564 0.64
TDC A/S 18,847 DKK 168,092 144,651 0.43
Tryg A/S 448 DKK 42,882 50,160 0.15
Vestas Wind Systems A/S 5,061 DKK 268,343 186,279 0.55
William Demant Holding A/S 470 DKK 40,866 35,759 0.11
1,131,558 1,040,619 3.11
Finland
Elisa OYJ 3,256 EUR 90,498 89,082 0.27
Metso OYJ 2,603 EUR 83,911 78,303 0.23
Neste Oil OYJ 2,983 EUR 61,311 72,408 0.22
Nokian Renkaat OYJ 2,635 EUR 106,004 64,694 0.19
Orion OYJ - B - 2,307 EUR 75,429 71,939 0.21
Stora Enso OYJ - R - 12,232 EUR 127,493 110,048 0.33
UPM-Kymmene OYJ 12,018 EUR 203,833 198,067 0.59
Wartsila OYJ Abp 3,415 EUR 184,319 153,268 0.46
932,798 837,809 2.50
France
Accor SA 3,943 EUR 203,969 178,158 0.53
Aeroports de Paris 691 EUR 87,968 83,823 0.25
Alcatel-Lucent 64,750 EUR 253,146 232,702 0.70
Alstom SA 4,884 EUR 193,600 158,739 0.47
Arkema SA 1,485 EUR 148,828 98,957 0.30
AtoS 1,854 EUR 171,700 148,740 0.45
Bureau Veritas SA 5,140 EUR 150,177 113,882 0.34
Cap Gemini SA 3,237 EUR 242,312 232,979 0.70
Casino Guichard Perrachon SA 1,313 EUR 146,561 121,479 0.36
251
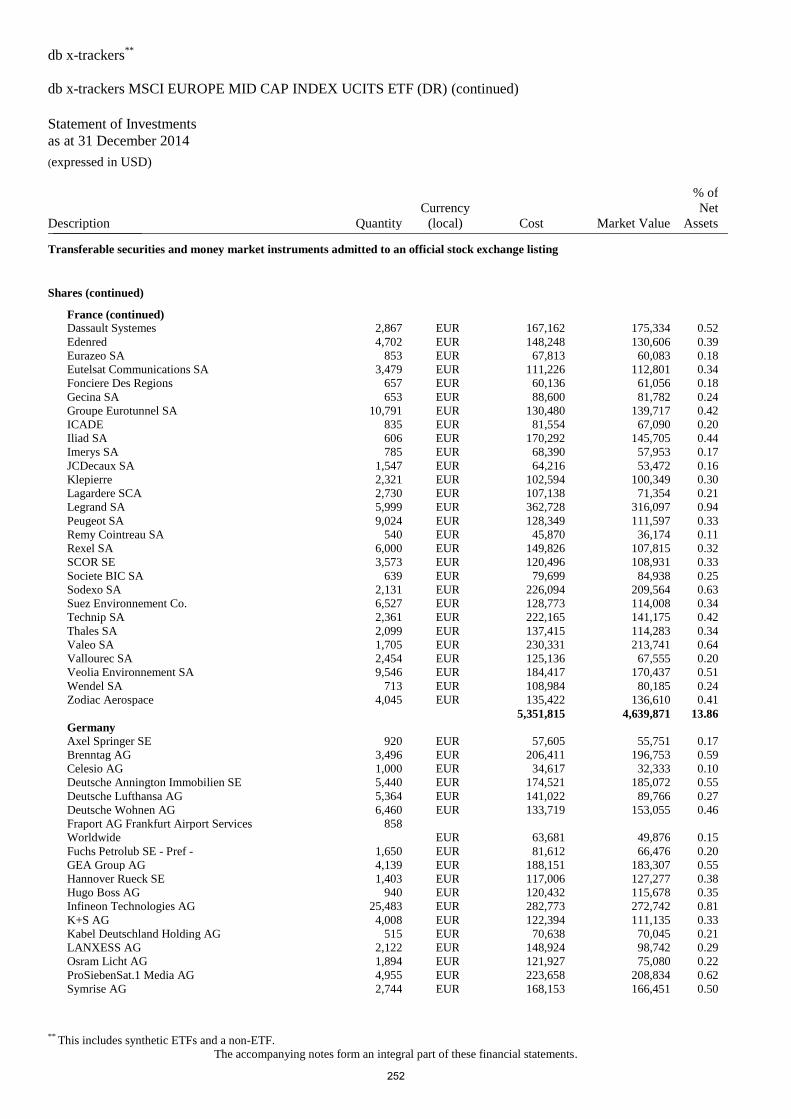
db x-trackers**
db x-trackers MSCI EUROPE MID CAP INDEX UCITS ETF (DR) (continued)
Statement of Investments
as at 31 December 2014 (expressed in USD)
** This includes synthetic ETFs and a non-ETF.
The accompanying notes form an integral part of these financial statements.
Description Quantity
Currency
(local) Cost Market Value
% of
Net
Assets _______________
Transferable securities and money market instruments admitted to an official stock exchange listing
Shares (continued)
France (continued)
Dassault Systemes 2,867 EUR 167,162 175,334 0.52
Edenred 4,702 EUR 148,248 130,606 0.39
Eurazeo SA 853 EUR 67,813 60,083 0.18
Eutelsat Communications SA 3,479 EUR 111,226 112,801 0.34
Fonciere Des Regions 657 EUR 60,136 61,056 0.18
Gecina SA 653 EUR 88,600 81,782 0.24
Groupe Eurotunnel SA 10,791 EUR 130,480 139,717 0.42
ICADE 835 EUR 81,554 67,090 0.20
Iliad SA 606 EUR 170,292 145,705 0.44
Imerys SA 785 EUR 68,390 57,953 0.17
JCDecaux SA 1,547 EUR 64,216 53,472 0.16
Klepierre 2,321 EUR 102,594 100,349 0.30
Lagardere SCA 2,730 EUR 107,138 71,354 0.21
Legrand SA 5,999 EUR 362,728 316,097 0.94
Peugeot SA 9,024 EUR 128,349 111,597 0.33
Remy Cointreau SA 540 EUR 45,870 36,174 0.11
Rexel SA 6,000 EUR 149,826 107,815 0.32
SCOR SE 3,573 EUR 120,496 108,931 0.33
Societe BIC SA 639 EUR 79,699 84,938 0.25
Sodexo SA 2,131 EUR 226,094 209,564 0.63
Suez Environnement Co. 6,527 EUR 128,773 114,008 0.34
Technip SA 2,361 EUR 222,165 141,175 0.42
Thales SA 2,099 EUR 137,415 114,283 0.34
Valeo SA 1,705 EUR 230,331 213,741 0.64
Vallourec SA 2,454 EUR 125,136 67,555 0.20
Veolia Environnement SA 9,546 EUR 184,417 170,437 0.51
Wendel SA 713 EUR 108,984 80,185 0.24
Zodiac Aerospace 4,045 EUR 135,422 136,610 0.41
5,351,815 4,639,871 13.86
Germany
Axel Springer SE 920 EUR 57,605 55,751 0.17
Brenntag AG 3,496 EUR 206,411 196,753 0.59
Celesio AG 1,000 EUR 34,617 32,333 0.10
Deutsche Annington Immobilien SE 5,440 EUR 174,521 185,072 0.55
Deutsche Lufthansa AG 5,364 EUR 141,022 89,766 0.27
Deutsche Wohnen AG 6,460 EUR 133,719 153,055 0.46
Fraport AG Frankfurt Airport Services
Worldwide
858
EUR 63,681 49,876 0.15
Fuchs Petrolub SE - Pref - 1,650 EUR 81,612 66,476 0.20
GEA Group AG 4,139 EUR 188,151 183,307 0.55
Hannover Rueck SE 1,403 EUR 117,006 127,277 0.38
Hugo Boss AG 940 EUR 120,432 115,678 0.35
Infineon Technologies AG 25,483 EUR 282,773 272,742 0.81
K+S AG 4,008 EUR 122,394 111,135 0.33
Kabel Deutschland Holding AG 515 EUR 70,638 70,045 0.21
LANXESS AG 2,122 EUR 148,924 98,742 0.29
Osram Licht AG 1,894 EUR 121,927 75,080 0.22
ProSiebenSat.1 Media AG 4,955 EUR 223,658 208,834 0.62
Symrise AG 2,744 EUR 168,153 166,451 0.50
252
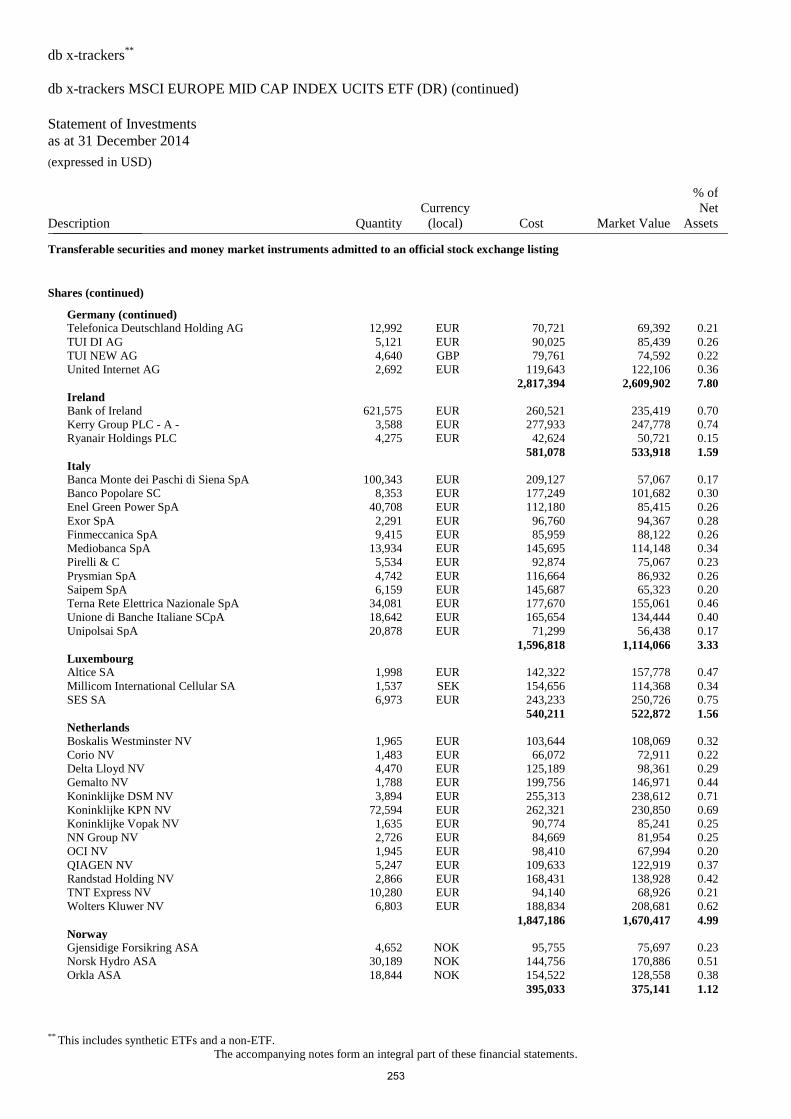
db x-trackers**
db x-trackers MSCI EUROPE MID CAP INDEX UCITS ETF (DR) (continued)
Statement of Investments
as at 31 December 2014 (expressed in USD)
** This includes synthetic ETFs and a non-ETF.
The accompanying notes form an integral part of these financial statements.
Description Quantity
Currency
(local) Cost Market Value
% of
Net
Assets _______________
Transferable securities and money market instruments admitted to an official stock exchange listing
Shares (continued)
Germany (continued)
Telefonica Deutschland Holding AG 12,992 EUR 70,721 69,392 0.21
TUI DI AG 5,121 EUR 90,025 85,439 0.26
TUI NEW AG 4,640 GBP 79,761 74,592 0.22
United Internet AG 2,692 EUR 119,643 122,106 0.36
2,817,394 2,609,902 7.80
Ireland
Bank of Ireland 621,575 EUR 260,521 235,419 0.70
Kerry Group PLC - A - 3,588 EUR 277,933 247,778 0.74
Ryanair Holdings PLC 4,275 EUR 42,624 50,721 0.15
581,078 533,918 1.59
Italy
Banca Monte dei Paschi di Siena SpA 100,343 EUR 209,127 57,067 0.17
Banco Popolare SC 8,353 EUR 177,249 101,682 0.30
Enel Green Power SpA 40,708 EUR 112,180 85,415 0.26
Exor SpA 2,291 EUR 96,760 94,367 0.28
Finmeccanica SpA 9,415 EUR 85,959 88,122 0.26
Mediobanca SpA 13,934 EUR 145,695 114,148 0.34
Pirelli & C 5,534 EUR 92,874 75,067 0.23
Prysmian SpA 4,742 EUR 116,664 86,932 0.26
Saipem SpA 6,159 EUR 145,687 65,323 0.20
Terna Rete Elettrica Nazionale SpA 34,081 EUR 177,670 155,061 0.46
Unione di Banche Italiane SCpA 18,642 EUR 165,654 134,444 0.40
Unipolsai SpA 20,878 EUR 71,299 56,438 0.17
1,596,818 1,114,066 3.33
Luxembourg
Altice SA 1,998 EUR 142,322 157,778 0.47
Millicom International Cellular SA 1,537 SEK 154,656 114,368 0.34
SES SA 6,973 EUR 243,233 250,726 0.75
540,211 522,872 1.56
Netherlands
Boskalis Westminster NV 1,965 EUR 103,644 108,069 0.32
Corio NV 1,483 EUR 66,072 72,911 0.22
Delta Lloyd NV 4,470 EUR 125,189 98,361 0.29
Gemalto NV 1,788 EUR 199,756 146,971 0.44
Koninklijke DSM NV 3,894 EUR 255,313 238,612 0.71
Koninklijke KPN NV 72,594 EUR 262,321 230,850 0.69
Koninklijke Vopak NV 1,635 EUR 90,774 85,241 0.25
NN Group NV 2,726 EUR 84,669 81,954 0.25
OCI NV 1,945 EUR 98,410 67,994 0.20
QIAGEN NV 5,247 EUR 109,633 122,919 0.37
Randstad Holding NV 2,866 EUR 168,431 138,928 0.42
TNT Express NV 10,280 EUR 94,140 68,926 0.21
Wolters Kluwer NV 6,803 EUR 188,834 208,681 0.62
1,847,186 1,670,417 4.99
Norway
Gjensidige Forsikring ASA 4,652 NOK 95,755 75,697 0.23
Norsk Hydro ASA 30,189 NOK 144,756 170,886 0.51
Orkla ASA 18,844 NOK 154,522 128,558 0.38
395,033 375,141 1.12
253
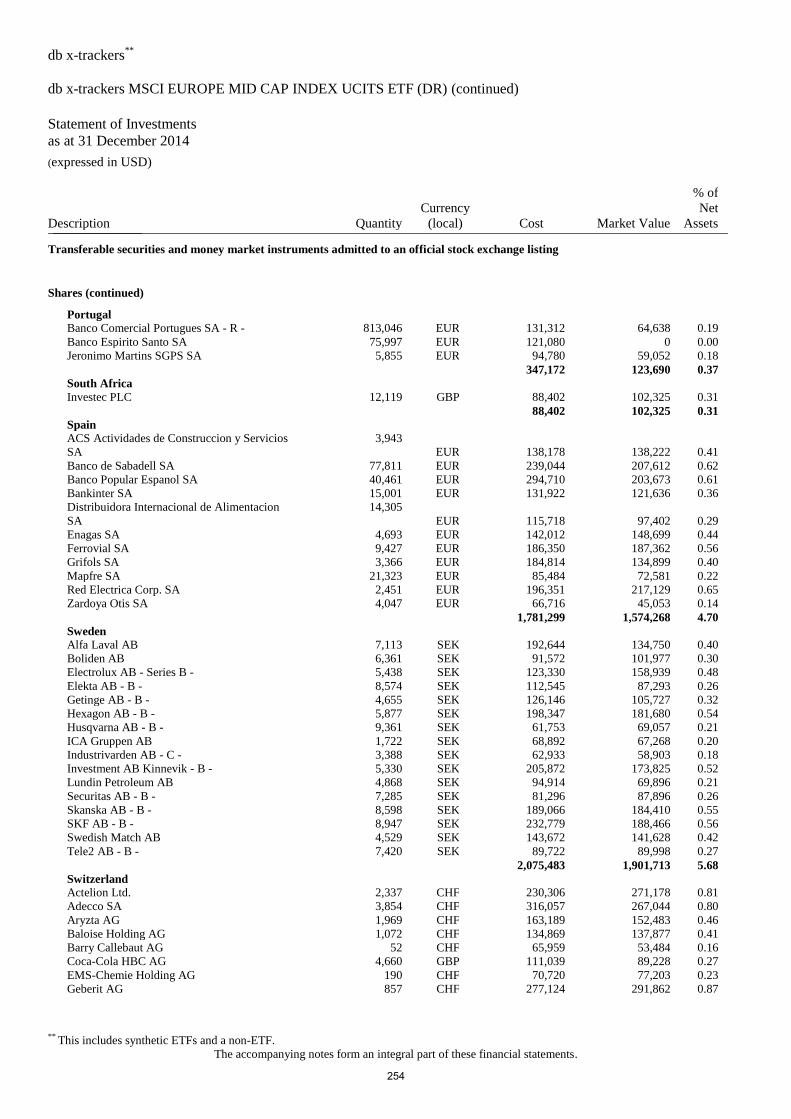
db x-trackers**
db x-trackers MSCI EUROPE MID CAP INDEX UCITS ETF (DR) (continued)
Statement of Investments
as at 31 December 2014 (expressed in USD)
** This includes synthetic ETFs and a non-ETF.
The accompanying notes form an integral part of these financial statements.
Description Quantity
Currency
(local) Cost Market Value
% of
Net
Assets _______________
Transferable securities and money market instruments admitted to an official stock exchange listing
Shares (continued)
Portugal
Banco Comercial Portugues SA - R - 813,046 EUR 131,312 64,638 0.19
Banco Espirito Santo SA 75,997 EUR 121,080 0 0.00
Jeronimo Martins SGPS SA 5,855 EUR 94,780 59,052 0.18
347,172 123,690 0.37
South Africa
Investec PLC 12,119 GBP 88,402 102,325 0.31
88,402 102,325 0.31
Spain
ACS Actividades de Construccion y Servicios
SA
3,943
EUR 138,178 138,222 0.41
Banco de Sabadell SA 77,811 EUR 239,044 207,612 0.62
Banco Popular Espanol SA 40,461 EUR 294,710 203,673 0.61
Bankinter SA 15,001 EUR 131,922 121,636 0.36
Distribuidora Internacional de Alimentacion
SA
14,305
EUR 115,718 97,402 0.29
Enagas SA 4,693 EUR 142,012 148,699 0.44
Ferrovial SA 9,427 EUR 186,350 187,362 0.56
Grifols SA 3,366 EUR 184,814 134,899 0.40
Mapfre SA 21,323 EUR 85,484 72,581 0.22
Red Electrica Corp. SA 2,451 EUR 196,351 217,129 0.65
Zardoya Otis SA 4,047 EUR 66,716 45,053 0.14
1,781,299 1,574,268 4.70
Sweden
Alfa Laval AB 7,113 SEK 192,644 134,750 0.40
Boliden AB 6,361 SEK 91,572 101,977 0.30
Electrolux AB - Series B - 5,438 SEK 123,330 158,939 0.48
Elekta AB - B - 8,574 SEK 112,545 87,293 0.26
Getinge AB - B - 4,655 SEK 126,146 105,727 0.32
Hexagon AB - B - 5,877 SEK 198,347 181,680 0.54
Husqvarna AB - B - 9,361 SEK 61,753 69,057 0.21
ICA Gruppen AB 1,722 SEK 68,892 67,268 0.20
Industrivarden AB - C - 3,388 SEK 62,933 58,903 0.18
Investment AB Kinnevik - B - 5,330 SEK 205,872 173,825 0.52
Lundin Petroleum AB 4,868 SEK 94,914 69,896 0.21
Securitas AB - B - 7,285 SEK 81,296 87,896 0.26
Skanska AB - B - 8,598 SEK 189,066 184,410 0.55
SKF AB - B - 8,947 SEK 232,779 188,466 0.56
Swedish Match AB 4,529 SEK 143,672 141,628 0.42
Tele2 AB - B - 7,420 SEK 89,722 89,998 0.27
2,075,483 1,901,713 5.68
Switzerland
Actelion Ltd. 2,337 CHF 230,306 271,178 0.81
Adecco SA 3,854 CHF 316,057 267,044 0.80
Aryzta AG 1,969 CHF 163,189 152,483 0.46
Baloise Holding AG 1,072 CHF 134,869 137,877 0.41
Barry Callebaut AG 52 CHF 65,959 53,484 0.16
Coca-Cola HBC AG 4,660 GBP 111,039 89,228 0.27
EMS-Chemie Holding AG 190 CHF 70,720 77,203 0.23
Geberit AG 857 CHF 277,124 291,862 0.87
254
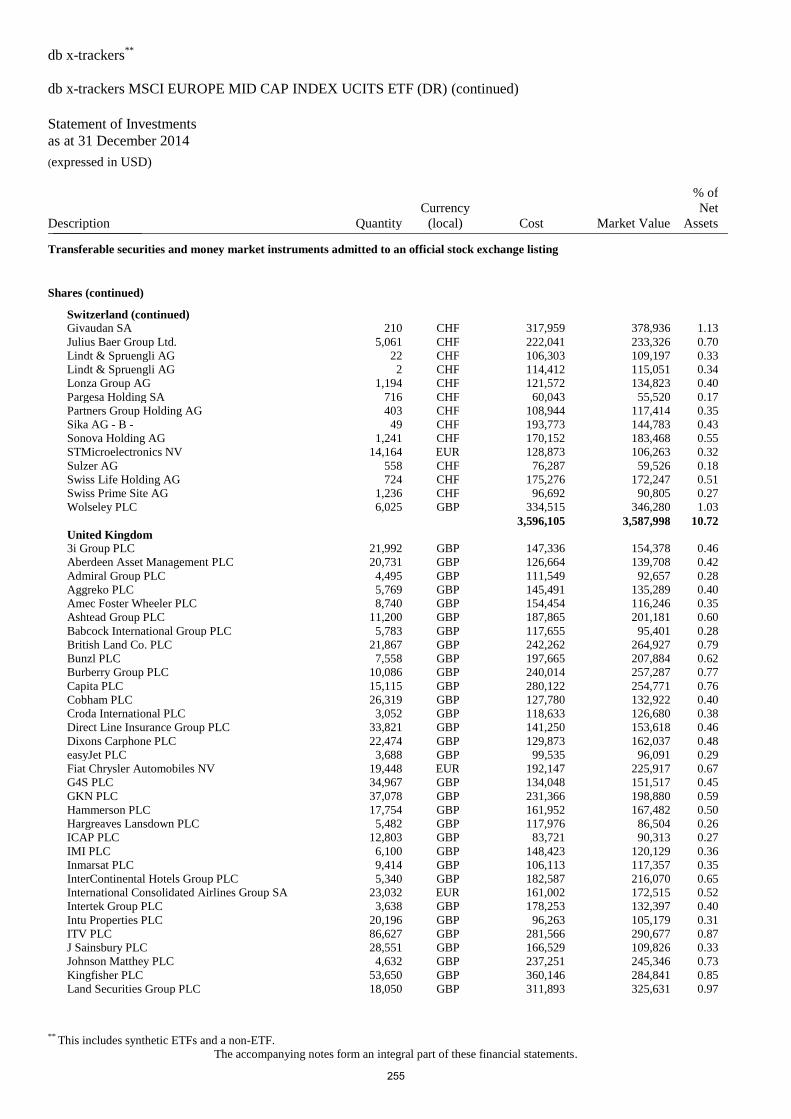
db x-trackers**
db x-trackers MSCI EUROPE MID CAP INDEX UCITS ETF (DR) (continued)
Statement of Investments
as at 31 December 2014 (expressed in USD)
** This includes synthetic ETFs and a non-ETF.
The accompanying notes form an integral part of these financial statements.
Description Quantity
Currency
(local) Cost Market Value
% of
Net
Assets _______________
Transferable securities and money market instruments admitted to an official stock exchange listing
Shares (continued)
Switzerland (continued)
Givaudan SA 210 CHF 317,959 378,936 1.13
Julius Baer Group Ltd. 5,061 CHF 222,041 233,326 0.70
Lindt & Spruengli AG 22 CHF 106,303 109,197 0.33
Lindt & Spruengli AG 2 CHF 114,412 115,051 0.34
Lonza Group AG 1,194 CHF 121,572 134,823 0.40
Pargesa Holding SA 716 CHF 60,043 55,520 0.17
Partners Group Holding AG 403 CHF 108,944 117,414 0.35
Sika AG - B - 49 CHF 193,773 144,783 0.43
Sonova Holding AG 1,241 CHF 170,152 183,468 0.55
STMicroelectronics NV 14,164 EUR 128,873 106,263 0.32
Sulzer AG 558 CHF 76,287 59,526 0.18
Swiss Life Holding AG 724 CHF 175,276 172,247 0.51
Swiss Prime Site AG 1,236 CHF 96,692 90,805 0.27
Wolseley PLC 6,025 GBP 334,515 346,280 1.03
3,596,105 3,587,998 10.72
United Kingdom
3i Group PLC 21,992 GBP 147,336 154,378 0.46
Aberdeen Asset Management PLC 20,731 GBP 126,664 139,708 0.42
Admiral Group PLC 4,495 GBP 111,549 92,657 0.28
Aggreko PLC 5,769 GBP 145,491 135,289 0.40
Amec Foster Wheeler PLC 8,740 GBP 154,454 116,246 0.35
Ashtead Group PLC 11,200 GBP 187,865 201,181 0.60
Babcock International Group PLC 5,783 GBP 117,655 95,401 0.28
British Land Co. PLC 21,867 GBP 242,262 264,927 0.79
Bunzl PLC 7,558 GBP 197,665 207,884 0.62
Burberry Group PLC 10,086 GBP 240,014 257,287 0.77
Capita PLC 15,115 GBP 280,122 254,771 0.76
Cobham PLC 26,319 GBP 127,780 132,922 0.40
Croda International PLC 3,052 GBP 118,633 126,680 0.38
Direct Line Insurance Group PLC 33,821 GBP 141,250 153,618 0.46
Dixons Carphone PLC 22,474 GBP 129,873 162,037 0.48
easyJet PLC 3,688 GBP 99,535 96,091 0.29
Fiat Chrysler Automobiles NV 19,448 EUR 192,147 225,917 0.67
G4S PLC 34,967 GBP 134,048 151,517 0.45
GKN PLC 37,078 GBP 231,366 198,880 0.59
Hammerson PLC 17,754 GBP 161,952 167,482 0.50
Hargreaves Lansdown PLC 5,482 GBP 117,976 86,504 0.26
ICAP PLC 12,803 GBP 83,721 90,313 0.27
IMI PLC 6,100 GBP 148,423 120,129 0.36
Inmarsat PLC 9,414 GBP 106,113 117,357 0.35
InterContinental Hotels Group PLC 5,340 GBP 182,587 216,070 0.65
International Consolidated Airlines Group SA 23,032 EUR 161,002 172,515 0.52
Intertek Group PLC 3,638 GBP 178,253 132,397 0.40
Intu Properties PLC 20,196 GBP 96,263 105,179 0.31
ITV PLC 86,627 GBP 281,566 290,677 0.87
J Sainsbury PLC 28,551 GBP 166,529 109,826 0.33
Johnson Matthey PLC 4,632 GBP 237,251 245,346 0.73
Kingfisher PLC 53,650 GBP 360,146 284,841 0.85
Land Securities Group PLC 18,050 GBP 311,893 325,631 0.97
255
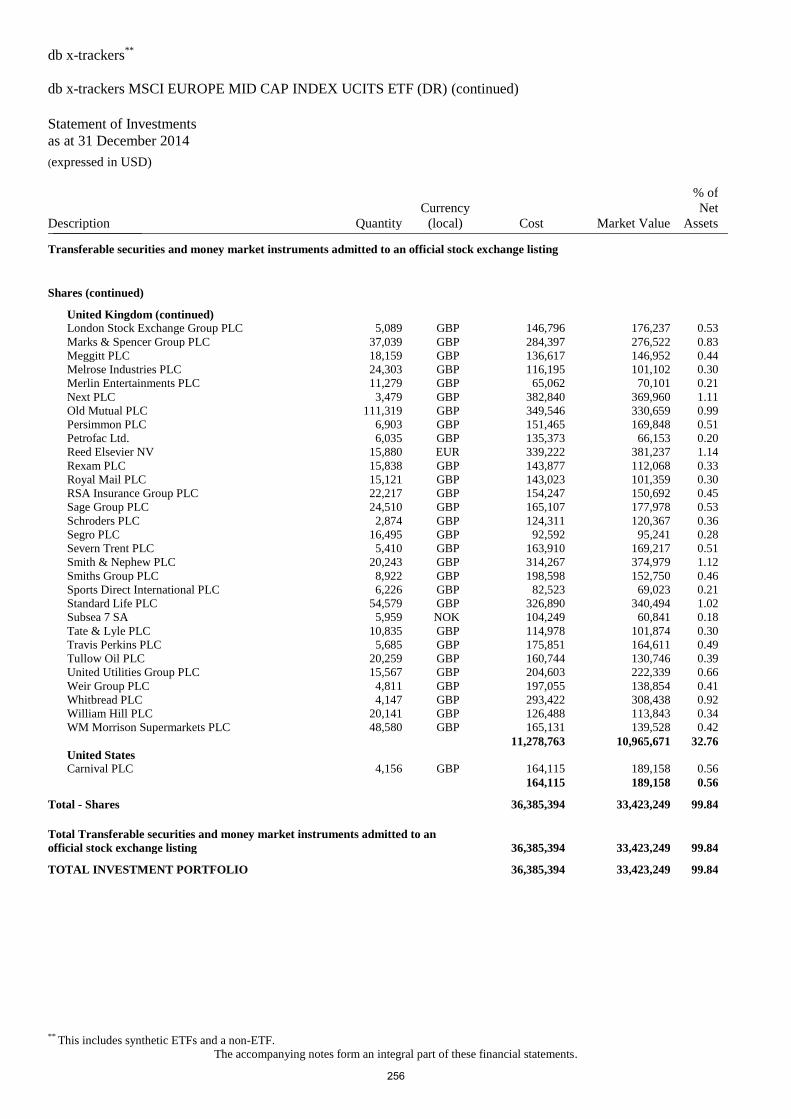
db x-trackers**
db x-trackers MSCI EUROPE MID CAP INDEX UCITS ETF (DR) (continued)
Statement of Investments
as at 31 December 2014 (expressed in USD)
** This includes synthetic ETFs and a non-ETF.
The accompanying notes form an integral part of these financial statements.
Description Quantity
Currency
(local) Cost Market Value
% of
Net
Assets _______________
Transferable securities and money market instruments admitted to an official stock exchange listing
Shares (continued)
United Kingdom (continued)
London Stock Exchange Group PLC 5,089 GBP 146,796 176,237 0.53
Marks & Spencer Group PLC 37,039 GBP 284,397 276,522 0.83
Meggitt PLC 18,159 GBP 136,617 146,952 0.44
Melrose Industries PLC 24,303 GBP 116,195 101,102 0.30
Merlin Entertainments PLC 11,279 GBP 65,062 70,101 0.21
Next PLC 3,479 GBP 382,840 369,960 1.11
Old Mutual PLC 111,319 GBP 349,546 330,659 0.99
Persimmon PLC 6,903 GBP 151,465 169,848 0.51
Petrofac Ltd. 6,035 GBP 135,373 66,153 0.20
Reed Elsevier NV 15,880 EUR 339,222 381,237 1.14
Rexam PLC 15,838 GBP 143,877 112,068 0.33
Royal Mail PLC 15,121 GBP 143,023 101,359 0.30
RSA Insurance Group PLC 22,217 GBP 154,247 150,692 0.45
Sage Group PLC 24,510 GBP 165,107 177,978 0.53
Schroders PLC 2,874 GBP 124,311 120,367 0.36
Segro PLC 16,495 GBP 92,592 95,241 0.28
Severn Trent PLC 5,410 GBP 163,910 169,217 0.51
Smith & Nephew PLC 20,243 GBP 314,267 374,979 1.12
Smiths Group PLC 8,922 GBP 198,598 152,750 0.46
Sports Direct International PLC 6,226 GBP 82,523 69,023 0.21
Standard Life PLC 54,579 GBP 326,890 340,494 1.02
Subsea 7 SA 5,959 NOK 104,249 60,841 0.18
Tate & Lyle PLC 10,835 GBP 114,978 101,874 0.30
Travis Perkins PLC 5,685 GBP 175,851 164,611 0.49
Tullow Oil PLC 20,259 GBP 160,744 130,746 0.39
United Utilities Group PLC 15,567 GBP 204,603 222,339 0.66
Weir Group PLC 4,811 GBP 197,055 138,854 0.41
Whitbread PLC 4,147 GBP 293,422 308,438 0.92
William Hill PLC 20,141 GBP 126,488 113,843 0.34
WM Morrison Supermarkets PLC 48,580 GBP 165,131 139,528 0.42
11,278,763 10,965,671 32.76
United States
Carnival PLC 4,156 GBP 164,115 189,158 0.56
164,115 189,158 0.56
Total - Shares 36,385,394 33,423,249 99.84
Total Transferable securities and money market instruments admitted to an
official stock exchange listing 36,385,394 33,423,249 99.84
TOTAL INVESTMENT PORTFOLIO 36,385,394 33,423,249 99.84
256
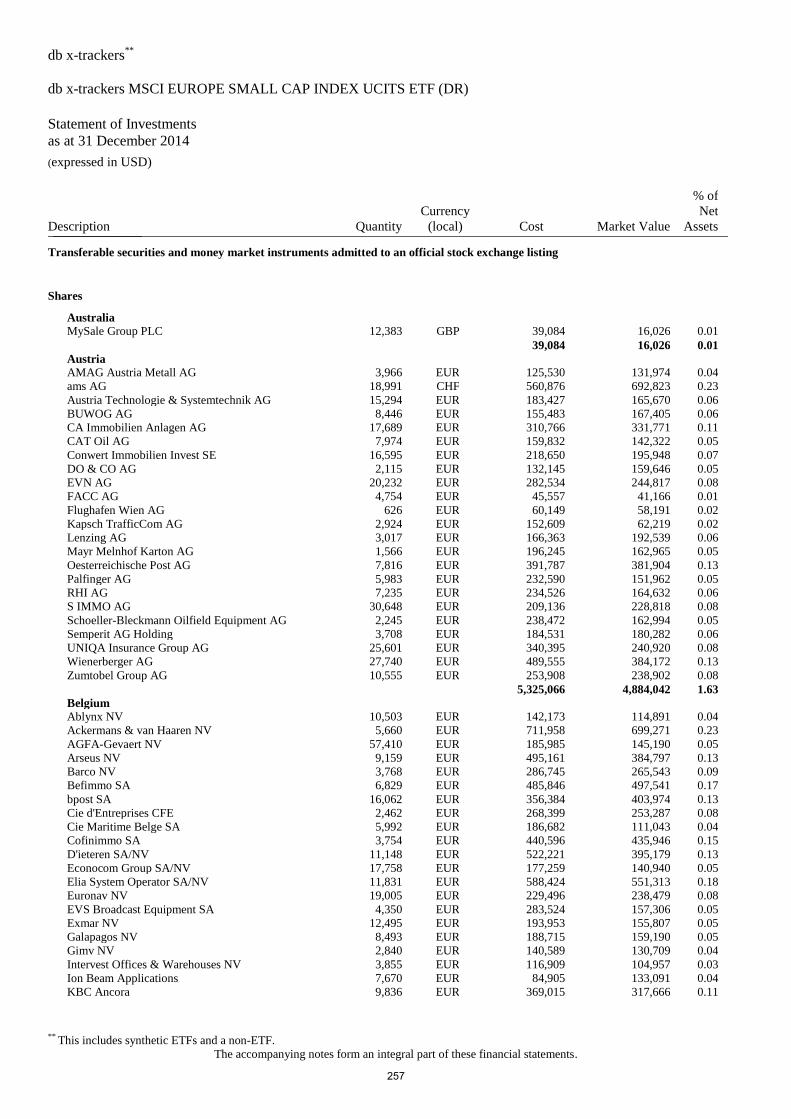
db x-trackers**
db x-trackers MSCI EUROPE SMALL CAP INDEX UCITS ETF (DR)
Statement of Investments
as at 31 December 2014 (expressed in USD)
** This includes synthetic ETFs and a non-ETF.
The accompanying notes form an integral part of these financial statements.
Description Quantity
Currency
(local) Cost Market Value
% of
Net
Assets _______________
Transferable securities and money market instruments admitted to an official stock exchange listing
Shares
Australia
MySale Group PLC 12,383 GBP 39,084 16,026 0.01
39,084 16,026 0.01
Austria
AMAG Austria Metall AG 3,966 EUR 125,530 131,974 0.04
ams AG 18,991 CHF 560,876 692,823 0.23
Austria Technologie & Systemtechnik AG 15,294 EUR 183,427 165,670 0.06
BUWOG AG 8,446 EUR 155,483 167,405 0.06
CA Immobilien Anlagen AG 17,689 EUR 310,766 331,771 0.11
CAT Oil AG 7,974 EUR 159,832 142,322 0.05
Conwert Immobilien Invest SE 16,595 EUR 218,650 195,948 0.07
DO & CO AG 2,115 EUR 132,145 159,646 0.05
EVN AG 20,232 EUR 282,534 244,817 0.08
FACC AG 4,754 EUR 45,557 41,166 0.01
Flughafen Wien AG 626 EUR 60,149 58,191 0.02
Kapsch TrafficCom AG 2,924 EUR 152,609 62,219 0.02
Lenzing AG 3,017 EUR 166,363 192,539 0.06
Mayr Melnhof Karton AG 1,566 EUR 196,245 162,965 0.05
Oesterreichische Post AG 7,816 EUR 391,787 381,904 0.13
Palfinger AG 5,983 EUR 232,590 151,962 0.05
RHI AG 7,235 EUR 234,526 164,632 0.06
S IMMO AG 30,648 EUR 209,136 228,818 0.08
Schoeller-Bleckmann Oilfield Equipment AG 2,245 EUR 238,472 162,994 0.05
Semperit AG Holding 3,708 EUR 184,531 180,282 0.06
UNIQA Insurance Group AG 25,601 EUR 340,395 240,920 0.08
Wienerberger AG 27,740 EUR 489,555 384,172 0.13
Zumtobel Group AG 10,555 EUR 253,908 238,902 0.08
5,325,066 4,884,042 1.63
Belgium
Ablynx NV 10,503 EUR 142,173 114,891 0.04
Ackermans & van Haaren NV 5,660 EUR 711,958 699,271 0.23
AGFA-Gevaert NV 57,410 EUR 185,985 145,190 0.05
Arseus NV 9,159 EUR 495,161 384,797 0.13
Barco NV 3,768 EUR 286,745 265,543 0.09
Befimmo SA 6,829 EUR 485,846 497,541 0.17
bpost SA 16,062 EUR 356,384 403,974 0.13
Cie d'Entreprises CFE 2,462 EUR 268,399 253,287 0.08
Cie Maritime Belge SA 5,992 EUR 186,682 111,043 0.04
Cofinimmo SA 3,754 EUR 440,596 435,946 0.15
D'ieteren SA/NV 11,148 EUR 522,221 395,179 0.13
Econocom Group SA/NV 17,758 EUR 177,259 140,940 0.05
Elia System Operator SA/NV 11,831 EUR 588,424 551,313 0.18
Euronav NV 19,005 EUR 229,496 238,479 0.08
EVS Broadcast Equipment SA 4,350 EUR 283,524 157,306 0.05
Exmar NV 12,495 EUR 193,953 155,807 0.05
Galapagos NV 8,493 EUR 188,715 159,190 0.05
Gimv NV 2,840 EUR 140,589 130,709 0.04
Intervest Offices & Warehouses NV 3,855 EUR 116,909 104,957 0.03
Ion Beam Applications 7,670 EUR 84,905 133,091 0.04
KBC Ancora 9,836 EUR 369,015 317,666 0.11
257
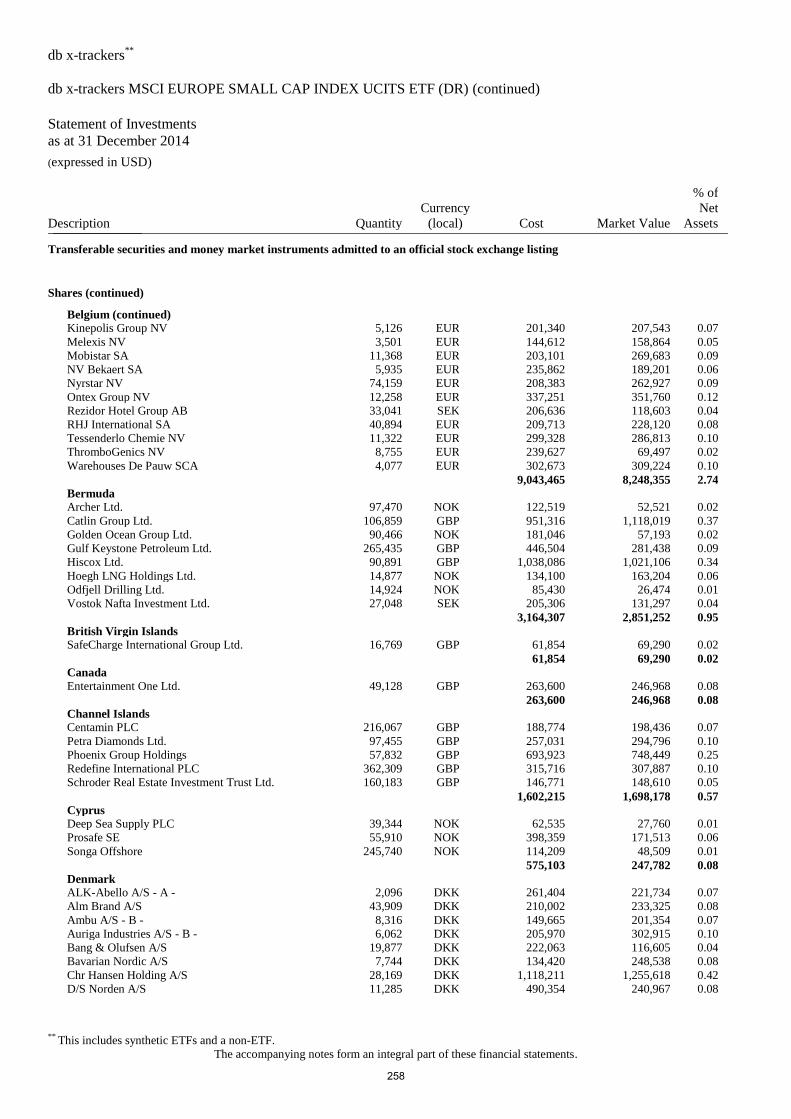
db x-trackers**
db x-trackers MSCI EUROPE SMALL CAP INDEX UCITS ETF (DR) (continued)
Statement of Investments
as at 31 December 2014 (expressed in USD)
** This includes synthetic ETFs and a non-ETF.
The accompanying notes form an integral part of these financial statements.
Description Quantity
Currency
(local) Cost Market Value
% of
Net
Assets _______________
Transferable securities and money market instruments admitted to an official stock exchange listing
Shares (continued)
Belgium (continued)
Kinepolis Group NV 5,126 EUR 201,340 207,543 0.07
Melexis NV 3,501 EUR 144,612 158,864 0.05
Mobistar SA 11,368 EUR 203,101 269,683 0.09
NV Bekaert SA 5,935 EUR 235,862 189,201 0.06
Nyrstar NV 74,159 EUR 208,383 262,927 0.09
Ontex Group NV 12,258 EUR 337,251 351,760 0.12
Rezidor Hotel Group AB 33,041 SEK 206,636 118,603 0.04
RHJ International SA 40,894 EUR 209,713 228,120 0.08
Tessenderlo Chemie NV 11,322 EUR 299,328 286,813 0.10
ThromboGenics NV 8,755 EUR 239,627 69,497 0.02
Warehouses De Pauw SCA 4,077 EUR 302,673 309,224 0.10
9,043,465 8,248,355 2.74
Bermuda
Archer Ltd. 97,470 NOK 122,519 52,521 0.02
Catlin Group Ltd. 106,859 GBP 951,316 1,118,019 0.37
Golden Ocean Group Ltd. 90,466 NOK 181,046 57,193 0.02
Gulf Keystone Petroleum Ltd. 265,435 GBP 446,504 281,438 0.09
Hiscox Ltd. 90,891 GBP 1,038,086 1,021,106 0.34
Hoegh LNG Holdings Ltd. 14,877 NOK 134,100 163,204 0.06
Odfjell Drilling Ltd. 14,924 NOK 85,430 26,474 0.01
Vostok Nafta Investment Ltd. 27,048 SEK 205,306 131,297 0.04
3,164,307 2,851,252 0.95
British Virgin Islands
SafeCharge International Group Ltd. 16,769 GBP 61,854 69,290 0.02
61,854 69,290 0.02
Canada
Entertainment One Ltd. 49,128 GBP 263,600 246,968 0.08
263,600 246,968 0.08
Channel Islands
Centamin PLC 216,067 GBP 188,774 198,436 0.07
Petra Diamonds Ltd. 97,455 GBP 257,031 294,796 0.10
Phoenix Group Holdings 57,832 GBP 693,923 748,449 0.25
Redefine International PLC 362,309 GBP 315,716 307,887 0.10
Schroder Real Estate Investment Trust Ltd. 160,183 GBP 146,771 148,610 0.05
1,602,215 1,698,178 0.57
Cyprus
Deep Sea Supply PLC 39,344 NOK 62,535 27,760 0.01
Prosafe SE 55,910 NOK 398,359 171,513 0.06
Songa Offshore 245,740 NOK 114,209 48,509 0.01
575,103 247,782 0.08
Denmark
ALK-Abello A/S - A - 2,096 DKK 261,404 221,734 0.07
Alm Brand A/S 43,909 DKK 210,002 233,325 0.08
Ambu A/S - B - 8,316 DKK 149,665 201,354 0.07
Auriga Industries A/S - B - 6,062 DKK 205,970 302,915 0.10
Bang & Olufsen A/S 19,877 DKK 222,063 116,605 0.04
Bavarian Nordic A/S 7,744 DKK 134,420 248,538 0.08
Chr Hansen Holding A/S 28,169 DKK 1,118,211 1,255,618 0.42
D/S Norden A/S 11,285 DKK 490,354 240,967 0.08
258
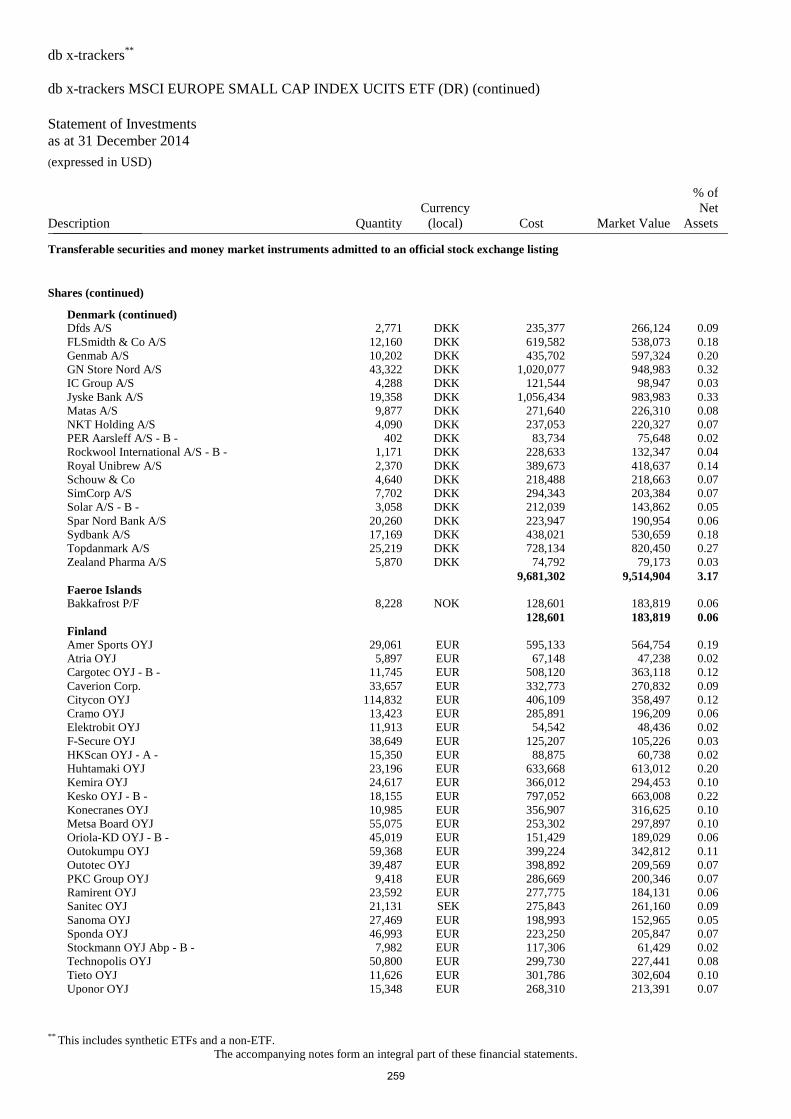
db x-trackers**
db x-trackers MSCI EUROPE SMALL CAP INDEX UCITS ETF (DR) (continued)
Statement of Investments
as at 31 December 2014 (expressed in USD)
** This includes synthetic ETFs and a non-ETF.
The accompanying notes form an integral part of these financial statements.
Description Quantity
Currency
(local) Cost Market Value
% of
Net
Assets _______________
Transferable securities and money market instruments admitted to an official stock exchange listing
Shares (continued)
Denmark (continued)
Dfds A/S 2,771 DKK 235,377 266,124 0.09
FLSmidth & Co A/S 12,160 DKK 619,582 538,073 0.18
Genmab A/S 10,202 DKK 435,702 597,324 0.20
GN Store Nord A/S 43,322 DKK 1,020,077 948,983 0.32
IC Group A/S 4,288 DKK 121,544 98,947 0.03
Jyske Bank A/S 19,358 DKK 1,056,434 983,983 0.33
Matas A/S 9,877 DKK 271,640 226,310 0.08
NKT Holding A/S 4,090 DKK 237,053 220,327 0.07
PER Aarsleff A/S - B - 402 DKK 83,734 75,648 0.02
Rockwool International A/S - B - 1,171 DKK 228,633 132,347 0.04
Royal Unibrew A/S 2,370 DKK 389,673 418,637 0.14
Schouw & Co 4,640 DKK 218,488 218,663 0.07
SimCorp A/S 7,702 DKK 294,343 203,384 0.07
Solar A/S - B - 3,058 DKK 212,039 143,862 0.05
Spar Nord Bank A/S 20,260 DKK 223,947 190,954 0.06
Sydbank A/S 17,169 DKK 438,021 530,659 0.18
Topdanmark A/S 25,219 DKK 728,134 820,450 0.27
Zealand Pharma A/S 5,870 DKK 74,792 79,173 0.03
9,681,302 9,514,904 3.17
Faeroe Islands
Bakkafrost P/F 8,228 NOK 128,601 183,819 0.06
128,601 183,819 0.06
Finland
Amer Sports OYJ 29,061 EUR 595,133 564,754 0.19
Atria OYJ 5,897 EUR 67,148 47,238 0.02
Cargotec OYJ - B - 11,745 EUR 508,120 363,118 0.12
Caverion Corp. 33,657 EUR 332,773 270,832 0.09
Citycon OYJ 114,832 EUR 406,109 358,497 0.12
Cramo OYJ 13,423 EUR 285,891 196,209 0.06
Elektrobit OYJ 11,913 EUR 54,542 48,436 0.02
F-Secure OYJ 38,649 EUR 125,207 105,226 0.03
HKScan OYJ - A - 15,350 EUR 88,875 60,738 0.02
Huhtamaki OYJ 23,196 EUR 633,668 613,012 0.20
Kemira OYJ 24,617 EUR 366,012 294,453 0.10
Kesko OYJ - B - 18,155 EUR 797,052 663,008 0.22
Konecranes OYJ 10,985 EUR 356,907 316,625 0.10
Metsa Board OYJ 55,075 EUR 253,302 297,897 0.10
Oriola-KD OYJ - B - 45,019 EUR 151,429 189,029 0.06
Outokumpu OYJ 59,368 EUR 399,224 342,812 0.11
Outotec OYJ 39,487 EUR 398,892 209,569 0.07
PKC Group OYJ 9,418 EUR 286,669 200,346 0.07
Ramirent OYJ 23,592 EUR 277,775 184,131 0.06
Sanitec OYJ 21,131 SEK 275,843 261,160 0.09
Sanoma OYJ 27,469 EUR 198,993 152,965 0.05
Sponda OYJ 46,993 EUR 223,250 205,847 0.07
Stockmann OYJ Abp - B - 7,982 EUR 117,306 61,429 0.02
Technopolis OYJ 50,800 EUR 299,730 227,441 0.08
Tieto OYJ 11,626 EUR 301,786 302,604 0.10
Uponor OYJ 15,348 EUR 268,310 213,391 0.07
259
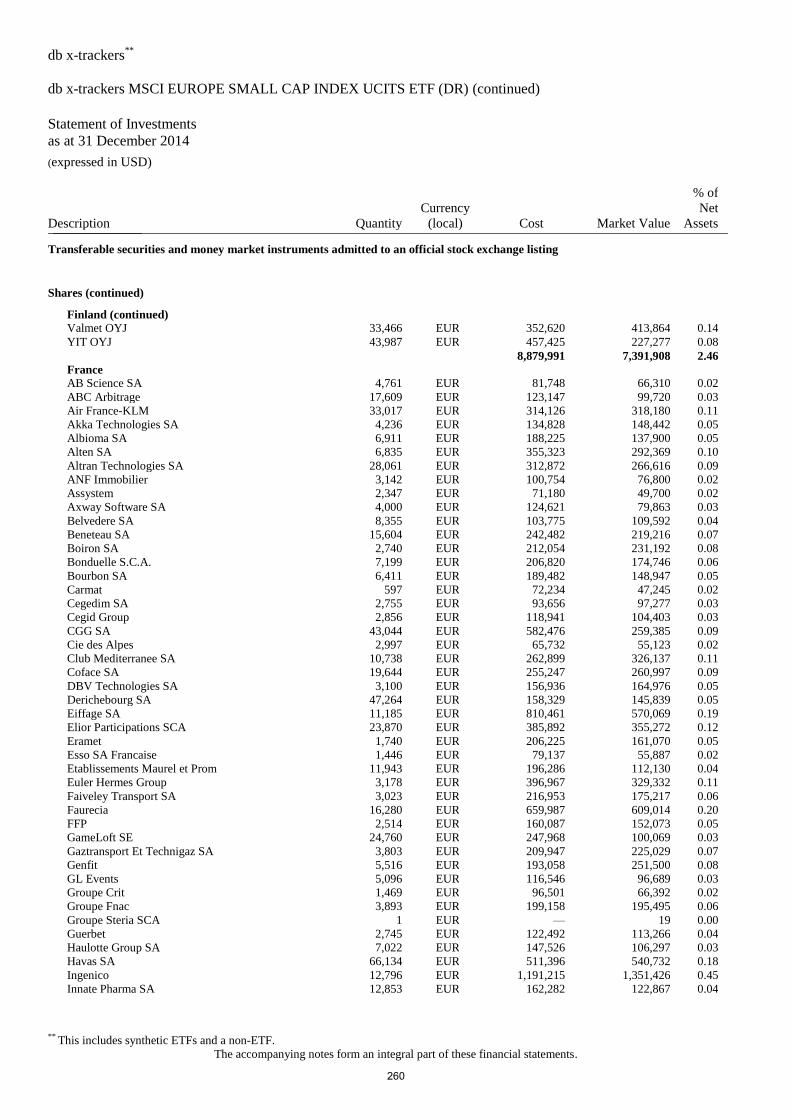
db x-trackers**
db x-trackers MSCI EUROPE SMALL CAP INDEX UCITS ETF (DR) (continued)
Statement of Investments
as at 31 December 2014 (expressed in USD)
** This includes synthetic ETFs and a non-ETF.
The accompanying notes form an integral part of these financial statements.
Description Quantity
Currency
(local) Cost Market Value
% of
Net
Assets _______________
Transferable securities and money market instruments admitted to an official stock exchange listing
Shares (continued)
Finland (continued)
Valmet OYJ 33,466 EUR 352,620 413,864 0.14
YIT OYJ 43,987 EUR 457,425 227,277 0.08
8,879,991 7,391,908 2.46
France
AB Science SA 4,761 EUR 81,748 66,310 0.02
ABC Arbitrage 17,609 EUR 123,147 99,720 0.03
Air France-KLM 33,017 EUR 314,126 318,180 0.11
Akka Technologies SA 4,236 EUR 134,828 148,442 0.05
Albioma SA 6,911 EUR 188,225 137,900 0.05
Alten SA 6,835 EUR 355,323 292,369 0.10
Altran Technologies SA 28,061 EUR 312,872 266,616 0.09
ANF Immobilier 3,142 EUR 100,754 76,800 0.02
Assystem 2,347 EUR 71,180 49,700 0.02
Axway Software SA 4,000 EUR 124,621 79,863 0.03
Belvedere SA 8,355 EUR 103,775 109,592 0.04
Beneteau SA 15,604 EUR 242,482 219,216 0.07
Boiron SA 2,740 EUR 212,054 231,192 0.08
Bonduelle S.C.A. 7,199 EUR 206,820 174,746 0.06
Bourbon SA 6,411 EUR 189,482 148,947 0.05
Carmat 597 EUR 72,234 47,245 0.02
Cegedim SA 2,755 EUR 93,656 97,277 0.03
Cegid Group 2,856 EUR 118,941 104,403 0.03
CGG SA 43,044 EUR 582,476 259,385 0.09
Cie des Alpes 2,997 EUR 65,732 55,123 0.02
Club Mediterranee SA 10,738 EUR 262,899 326,137 0.11
Coface SA 19,644 EUR 255,247 260,997 0.09
DBV Technologies SA 3,100 EUR 156,936 164,976 0.05
Derichebourg SA 47,264 EUR 158,329 145,839 0.05
Eiffage SA 11,185 EUR 810,461 570,069 0.19
Elior Participations SCA 23,870 EUR 385,892 355,272 0.12
Eramet 1,740 EUR 206,225 161,070 0.05
Esso SA Francaise 1,446 EUR 79,137 55,887 0.02
Etablissements Maurel et Prom 11,943 EUR 196,286 112,130 0.04
Euler Hermes Group 3,178 EUR 396,967 329,332 0.11
Faiveley Transport SA 3,023 EUR 216,953 175,217 0.06
Faurecia 16,280 EUR 659,987 609,014 0.20
FFP 2,514 EUR 160,087 152,073 0.05
GameLoft SE 24,760 EUR 247,968 100,069 0.03
Gaztransport Et Technigaz SA 3,803 EUR 209,947 225,029 0.07
Genfit 5,516 EUR 193,058 251,500 0.08
GL Events 5,096 EUR 116,546 96,689 0.03
Groupe Crit 1,469 EUR 96,501 66,392 0.02
Groupe Fnac 3,893 EUR 199,158 195,495 0.06
Groupe Steria SCA 1 EUR — 19 0.00
Guerbet 2,745 EUR 122,492 113,266 0.04
Haulotte Group SA 7,022 EUR 147,526 106,297 0.03
Havas SA 66,134 EUR 511,396 540,732 0.18
Ingenico 12,796 EUR 1,191,215 1,351,426 0.45
Innate Pharma SA 12,853 EUR 162,282 122,867 0.04
260
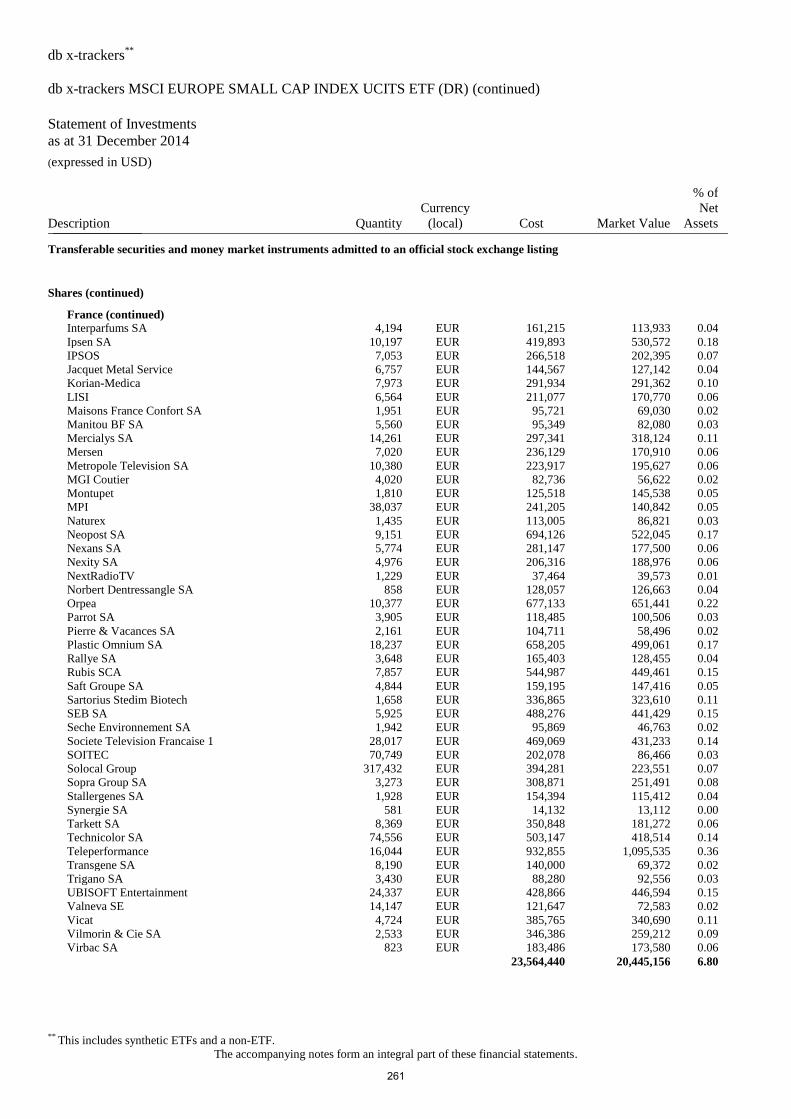
db x-trackers**
db x-trackers MSCI EUROPE SMALL CAP INDEX UCITS ETF (DR) (continued)
Statement of Investments
as at 31 December 2014 (expressed in USD)
** This includes synthetic ETFs and a non-ETF.
The accompanying notes form an integral part of these financial statements.
Description Quantity
Currency
(local) Cost Market Value
% of
Net
Assets _______________
Transferable securities and money market instruments admitted to an official stock exchange listing
Shares (continued)
France (continued)
Interparfums SA 4,194 EUR 161,215 113,933 0.04
Ipsen SA 10,197 EUR 419,893 530,572 0.18
IPSOS 7,053 EUR 266,518 202,395 0.07
Jacquet Metal Service 6,757 EUR 144,567 127,142 0.04
Korian-Medica 7,973 EUR 291,934 291,362 0.10
LISI 6,564 EUR 211,077 170,770 0.06
Maisons France Confort SA 1,951 EUR 95,721 69,030 0.02
Manitou BF SA 5,560 EUR 95,349 82,080 0.03
Mercialys SA 14,261 EUR 297,341 318,124 0.11
Mersen 7,020 EUR 236,129 170,910 0.06
Metropole Television SA 10,380 EUR 223,917 195,627 0.06
MGI Coutier 4,020 EUR 82,736 56,622 0.02
Montupet 1,810 EUR 125,518 145,538 0.05
MPI 38,037 EUR 241,205 140,842 0.05
Naturex 1,435 EUR 113,005 86,821 0.03
Neopost SA 9,151 EUR 694,126 522,045 0.17
Nexans SA 5,774 EUR 281,147 177,500 0.06
Nexity SA 4,976 EUR 206,316 188,976 0.06
NextRadioTV 1,229 EUR 37,464 39,573 0.01
Norbert Dentressangle SA 858 EUR 128,057 126,663 0.04
Orpea 10,377 EUR 677,133 651,441 0.22
Parrot SA 3,905 EUR 118,485 100,506 0.03
Pierre & Vacances SA 2,161 EUR 104,711 58,496 0.02
Plastic Omnium SA 18,237 EUR 658,205 499,061 0.17
Rallye SA 3,648 EUR 165,403 128,455 0.04
Rubis SCA 7,857 EUR 544,987 449,461 0.15
Saft Groupe SA 4,844 EUR 159,195 147,416 0.05
Sartorius Stedim Biotech 1,658 EUR 336,865 323,610 0.11
SEB SA 5,925 EUR 488,276 441,429 0.15
Seche Environnement SA 1,942 EUR 95,869 46,763 0.02
Societe Television Francaise 1 28,017 EUR 469,069 431,233 0.14
SOITEC 70,749 EUR 202,078 86,466 0.03
Solocal Group 317,432 EUR 394,281 223,551 0.07
Sopra Group SA 3,273 EUR 308,871 251,491 0.08
Stallergenes SA 1,928 EUR 154,394 115,412 0.04
Synergie SA 581 EUR 14,132 13,112 0.00
Tarkett SA 8,369 EUR 350,848 181,272 0.06
Technicolor SA 74,556 EUR 503,147 418,514 0.14
Teleperformance 16,044 EUR 932,855 1,095,535 0.36
Transgene SA 8,190 EUR 140,000 69,372 0.02
Trigano SA 3,430 EUR 88,280 92,556 0.03
UBISOFT Entertainment 24,337 EUR 428,866 446,594 0.15
Valneva SE 14,147 EUR 121,647 72,583 0.02
Vicat 4,724 EUR 385,765 340,690 0.11
Vilmorin & Cie SA 2,533 EUR 346,386 259,212 0.09
Virbac SA 823 EUR 183,486 173,580 0.06
23,564,440 20,445,156 6.80
261
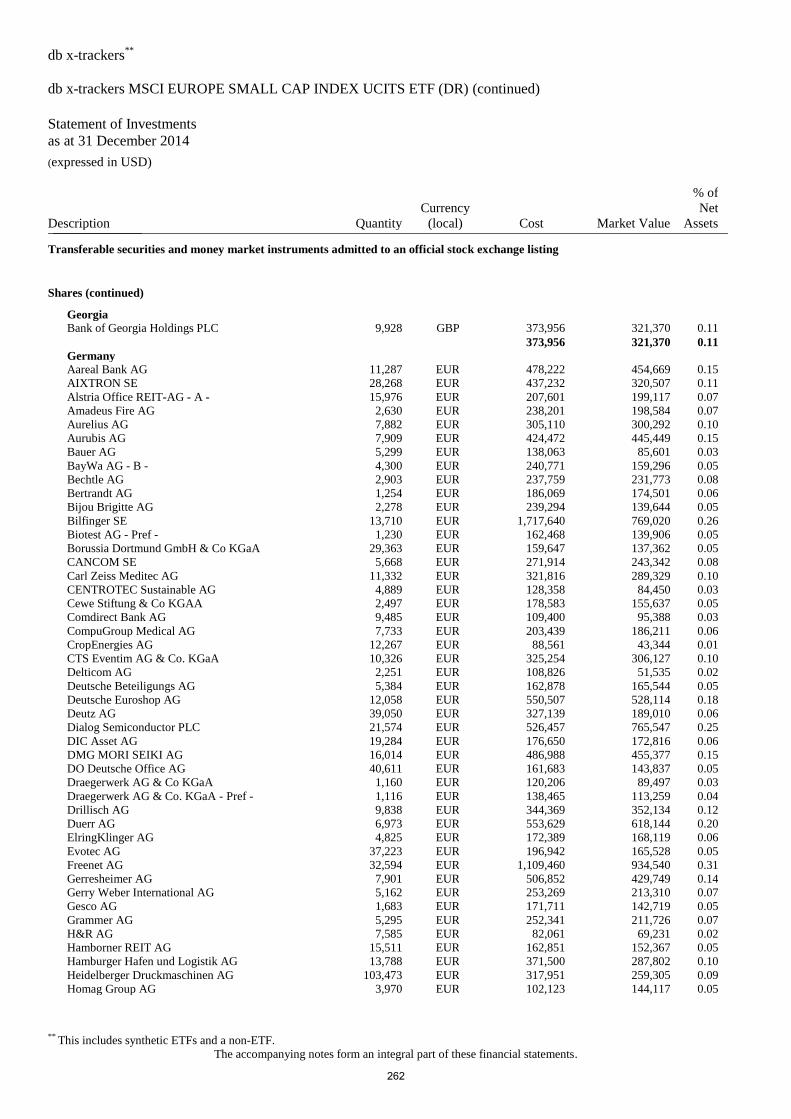
db x-trackers**
db x-trackers MSCI EUROPE SMALL CAP INDEX UCITS ETF (DR) (continued)
Statement of Investments
as at 31 December 2014 (expressed in USD)
** This includes synthetic ETFs and a non-ETF.
The accompanying notes form an integral part of these financial statements.
Description Quantity
Currency
(local) Cost Market Value
% of
Net
Assets _______________
Transferable securities and money market instruments admitted to an official stock exchange listing
Shares (continued)
Georgia
Bank of Georgia Holdings PLC 9,928 GBP 373,956 321,370 0.11
373,956 321,370 0.11
Germany
Aareal Bank AG 11,287 EUR 478,222 454,669 0.15
AIXTRON SE 28,268 EUR 437,232 320,507 0.11
Alstria Office REIT-AG - A - 15,976 EUR 207,601 199,117 0.07
Amadeus Fire AG 2,630 EUR 238,201 198,584 0.07
Aurelius AG 7,882 EUR 305,110 300,292 0.10
Aurubis AG 7,909 EUR 424,472 445,449 0.15
Bauer AG 5,299 EUR 138,063 85,601 0.03
BayWa AG - B - 4,300 EUR 240,771 159,296 0.05
Bechtle AG 2,903 EUR 237,759 231,773 0.08
Bertrandt AG 1,254 EUR 186,069 174,501 0.06
Bijou Brigitte AG 2,278 EUR 239,294 139,644 0.05
Bilfinger SE 13,710 EUR 1,717,640 769,020 0.26
Biotest AG - Pref - 1,230 EUR 162,468 139,906 0.05
Borussia Dortmund GmbH & Co KGaA 29,363 EUR 159,647 137,362 0.05
CANCOM SE 5,668 EUR 271,914 243,342 0.08
Carl Zeiss Meditec AG 11,332 EUR 321,816 289,329 0.10
CENTROTEC Sustainable AG 4,889 EUR 128,358 84,450 0.03
Cewe Stiftung & Co KGAA 2,497 EUR 178,583 155,637 0.05
Comdirect Bank AG 9,485 EUR 109,400 95,388 0.03
CompuGroup Medical AG 7,733 EUR 203,439 186,211 0.06
CropEnergies AG 12,267 EUR 88,561 43,344 0.01
CTS Eventim AG & Co. KGaA 10,326 EUR 325,254 306,127 0.10
Delticom AG 2,251 EUR 108,826 51,535 0.02
Deutsche Beteiligungs AG 5,384 EUR 162,878 165,544 0.05
Deutsche Euroshop AG 12,058 EUR 550,507 528,114 0.18
Deutz AG 39,050 EUR 327,139 189,010 0.06
Dialog Semiconductor PLC 21,574 EUR 526,457 765,547 0.25
DIC Asset AG 19,284 EUR 176,650 172,816 0.06
DMG MORI SEIKI AG 16,014 EUR 486,988 455,377 0.15
DO Deutsche Office AG 40,611 EUR 161,683 143,837 0.05
Draegerwerk AG & Co KGaA 1,160 EUR 120,206 89,497 0.03
Draegerwerk AG & Co. KGaA - Pref - 1,116 EUR 138,465 113,259 0.04
Drillisch AG 9,838 EUR 344,369 352,134 0.12
Duerr AG 6,973 EUR 553,629 618,144 0.20
ElringKlinger AG 4,825 EUR 172,389 168,119 0.06
Evotec AG 37,223 EUR 196,942 165,528 0.05
Freenet AG 32,594 EUR 1,109,460 934,540 0.31
Gerresheimer AG 7,901 EUR 506,852 429,749 0.14
Gerry Weber International AG 5,162 EUR 253,269 213,310 0.07
Gesco AG 1,683 EUR 171,711 142,719 0.05
Grammer AG 5,295 EUR 252,341 211,726 0.07
H&R AG 7,585 EUR 82,061 69,231 0.02
Hamborner REIT AG 15,511 EUR 162,851 152,367 0.05
Hamburger Hafen und Logistik AG 13,788 EUR 371,500 287,802 0.10
Heidelberger Druckmaschinen AG 103,473 EUR 317,951 259,305 0.09
Homag Group AG 3,970 EUR 102,123 144,117 0.05
262
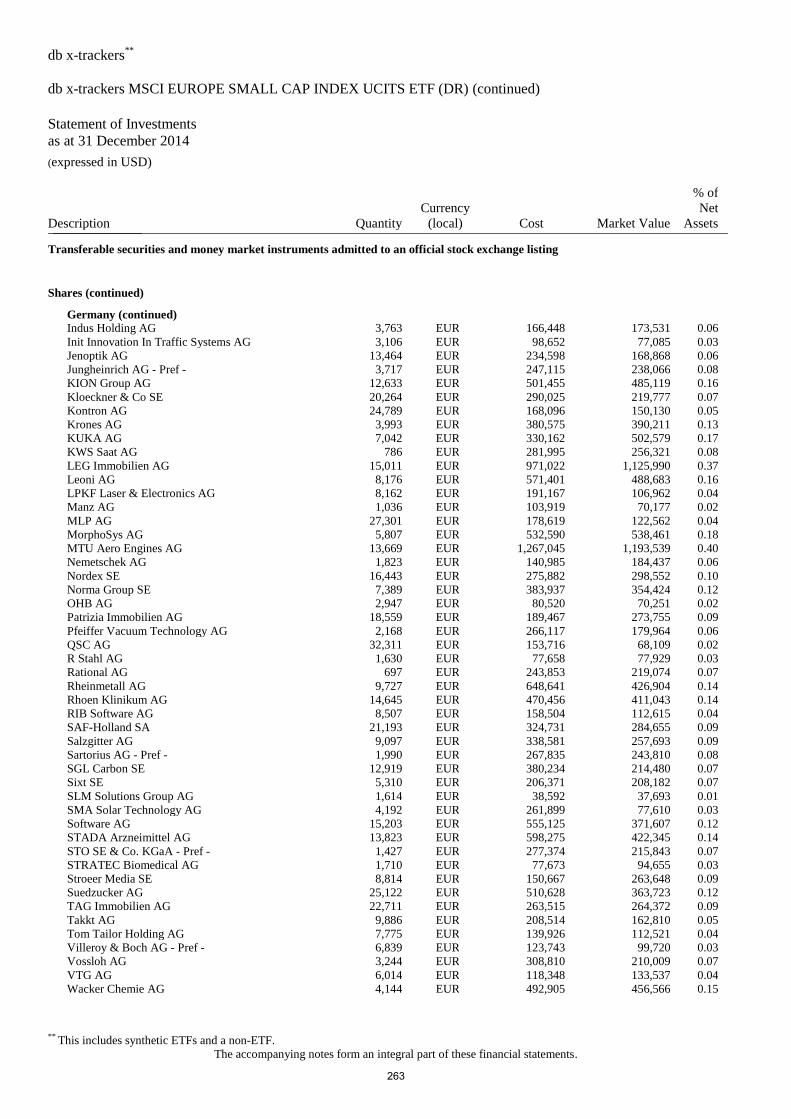
db x-trackers**
db x-trackers MSCI EUROPE SMALL CAP INDEX UCITS ETF (DR) (continued)
Statement of Investments
as at 31 December 2014 (expressed in USD)
** This includes synthetic ETFs and a non-ETF.
The accompanying notes form an integral part of these financial statements.
Description Quantity
Currency
(local) Cost Market Value
% of
Net
Assets _______________
Transferable securities and money market instruments admitted to an official stock exchange listing
Shares (continued)
Germany (continued)
Indus Holding AG 3,763 EUR 166,448 173,531 0.06
Init Innovation In Traffic Systems AG 3,106 EUR 98,652 77,085 0.03
Jenoptik AG 13,464 EUR 234,598 168,868 0.06
Jungheinrich AG - Pref - 3,717 EUR 247,115 238,066 0.08
KION Group AG 12,633 EUR 501,455 485,119 0.16
Kloeckner & Co SE 20,264 EUR 290,025 219,777 0.07
Kontron AG 24,789 EUR 168,096 150,130 0.05
Krones AG 3,993 EUR 380,575 390,211 0.13
KUKA AG 7,042 EUR 330,162 502,579 0.17
KWS Saat AG 786 EUR 281,995 256,321 0.08
LEG Immobilien AG 15,011 EUR 971,022 1,125,990 0.37
Leoni AG 8,176 EUR 571,401 488,683 0.16
LPKF Laser & Electronics AG 8,162 EUR 191,167 106,962 0.04
Manz AG 1,036 EUR 103,919 70,177 0.02
MLP AG 27,301 EUR 178,619 122,562 0.04
MorphoSys AG 5,807 EUR 532,590 538,461 0.18
MTU Aero Engines AG 13,669 EUR 1,267,045 1,193,539 0.40
Nemetschek AG 1,823 EUR 140,985 184,437 0.06
Nordex SE 16,443 EUR 275,882 298,552 0.10
Norma Group SE 7,389 EUR 383,937 354,424 0.12
OHB AG 2,947 EUR 80,520 70,251 0.02
Patrizia Immobilien AG 18,559 EUR 189,467 273,755 0.09
Pfeiffer Vacuum Technology AG 2,168 EUR 266,117 179,964 0.06
QSC AG 32,311 EUR 153,716 68,109 0.02
R Stahl AG 1,630 EUR 77,658 77,929 0.03
Rational AG 697 EUR 243,853 219,074 0.07
Rheinmetall AG 9,727 EUR 648,641 426,904 0.14
Rhoen Klinikum AG 14,645 EUR 470,456 411,043 0.14
RIB Software AG 8,507 EUR 158,504 112,615 0.04
SAF-Holland SA 21,193 EUR 324,731 284,655 0.09
Salzgitter AG 9,097 EUR 338,581 257,693 0.09
Sartorius AG - Pref - 1,990 EUR 267,835 243,810 0.08
SGL Carbon SE 12,919 EUR 380,234 214,480 0.07
Sixt SE 5,310 EUR 206,371 208,182 0.07
SLM Solutions Group AG 1,614 EUR 38,592 37,693 0.01
SMA Solar Technology AG 4,192 EUR 261,899 77,610 0.03
Software AG 15,203 EUR 555,125 371,607 0.12
STADA Arzneimittel AG 13,823 EUR 598,275 422,345 0.14
STO SE & Co. KGaA - Pref - 1,427 EUR 277,374 215,843 0.07
STRATEC Biomedical AG 1,710 EUR 77,673 94,655 0.03
Stroeer Media SE 8,814 EUR 150,667 263,648 0.09
Suedzucker AG 25,122 EUR 510,628 363,723 0.12
TAG Immobilien AG 22,711 EUR 263,515 264,372 0.09
Takkt AG 9,886 EUR 208,514 162,810 0.05
Tom Tailor Holding AG 7,775 EUR 139,926 112,521 0.04
Villeroy & Boch AG - Pref - 6,839 EUR 123,743 99,720 0.03
Vossloh AG 3,244 EUR 308,810 210,009 0.07
VTG AG 6,014 EUR 118,348 133,537 0.04
Wacker Chemie AG 4,144 EUR 492,905 456,566 0.15
263
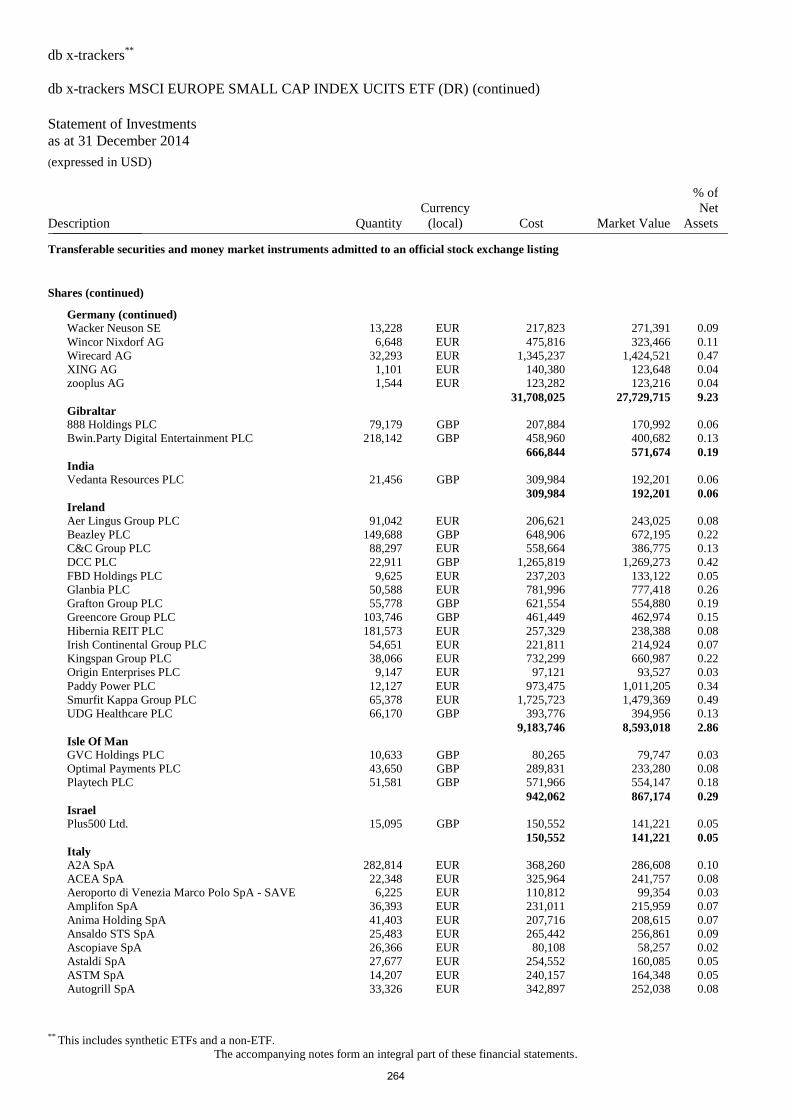
db x-trackers**
db x-trackers MSCI EUROPE SMALL CAP INDEX UCITS ETF (DR) (continued)
Statement of Investments
as at 31 December 2014 (expressed in USD)
** This includes synthetic ETFs and a non-ETF.
The accompanying notes form an integral part of these financial statements.
Description Quantity
Currency
(local) Cost Market Value
% of
Net
Assets _______________
Transferable securities and money market instruments admitted to an official stock exchange listing
Shares (continued)
Germany (continued)
Wacker Neuson SE 13,228 EUR 217,823 271,391 0.09
Wincor Nixdorf AG 6,648 EUR 475,816 323,466 0.11
Wirecard AG 32,293 EUR 1,345,237 1,424,521 0.47
XING AG 1,101 EUR 140,380 123,648 0.04
zooplus AG 1,544 EUR 123,282 123,216 0.04
31,708,025 27,729,715 9.23
Gibraltar
888 Holdings PLC 79,179 GBP 207,884 170,992 0.06
Bwin.Party Digital Entertainment PLC 218,142 GBP 458,960 400,682 0.13
666,844 571,674 0.19
India
Vedanta Resources PLC 21,456 GBP 309,984 192,201 0.06
309,984 192,201 0.06
Ireland
Aer Lingus Group PLC 91,042 EUR 206,621 243,025 0.08
Beazley PLC 149,688 GBP 648,906 672,195 0.22
C&C Group PLC 88,297 EUR 558,664 386,775 0.13
DCC PLC 22,911 GBP 1,265,819 1,269,273 0.42
FBD Holdings PLC 9,625 EUR 237,203 133,122 0.05
Glanbia PLC 50,588 EUR 781,996 777,418 0.26
Grafton Group PLC 55,778 GBP 621,554 554,880 0.19
Greencore Group PLC 103,746 GBP 461,449 462,974 0.15
Hibernia REIT PLC 181,573 EUR 257,329 238,388 0.08
Irish Continental Group PLC 54,651 EUR 221,811 214,924 0.07
Kingspan Group PLC 38,066 EUR 732,299 660,987 0.22
Origin Enterprises PLC 9,147 EUR 97,121 93,527 0.03
Paddy Power PLC 12,127 EUR 973,475 1,011,205 0.34
Smurfit Kappa Group PLC 65,378 EUR 1,725,723 1,479,369 0.49
UDG Healthcare PLC 66,170 GBP 393,776 394,956 0.13
9,183,746 8,593,018 2.86
Isle Of Man
GVC Holdings PLC 10,633 GBP 80,265 79,747 0.03
Optimal Payments PLC 43,650 GBP 289,831 233,280 0.08
Playtech PLC 51,581 GBP 571,966 554,147 0.18
942,062 867,174 0.29
Israel
Plus500 Ltd. 15,095 GBP 150,552 141,221 0.05
150,552 141,221 0.05
Italy
A2A SpA 282,814 EUR 368,260 286,608 0.10
ACEA SpA 22,348 EUR 325,964 241,757 0.08
Aeroporto di Venezia Marco Polo SpA - SAVE 6,225 EUR 110,812 99,354 0.03
Amplifon SpA 36,393 EUR 231,011 215,959 0.07
Anima Holding SpA 41,403 EUR 207,716 208,615 0.07
Ansaldo STS SpA 25,483 EUR 265,442 256,861 0.09
Ascopiave SpA 26,366 EUR 80,108 58,257 0.02
Astaldi SpA 27,677 EUR 254,552 160,085 0.05
ASTM SpA 14,207 EUR 240,157 164,348 0.05
Autogrill SpA 33,326 EUR 342,897 252,038 0.08
264
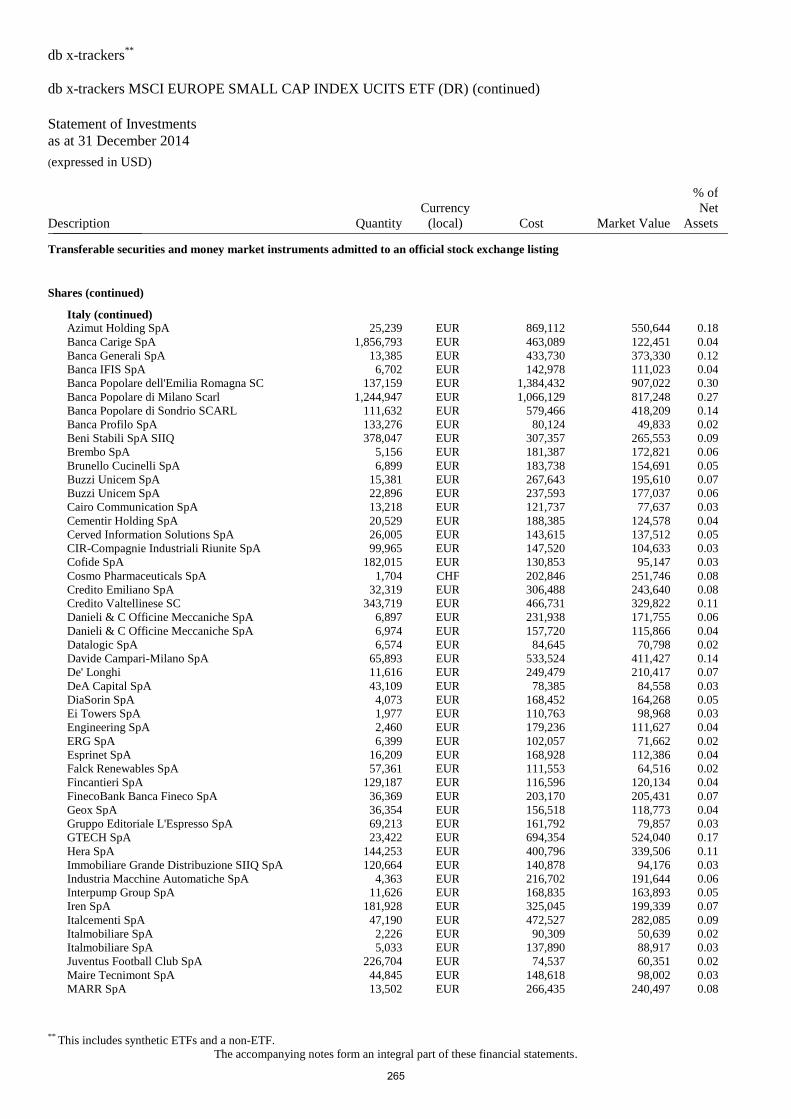
db x-trackers**
db x-trackers MSCI EUROPE SMALL CAP INDEX UCITS ETF (DR) (continued)
Statement of Investments
as at 31 December 2014 (expressed in USD)
** This includes synthetic ETFs and a non-ETF.
The accompanying notes form an integral part of these financial statements.
Description Quantity
Currency
(local) Cost Market Value
% of
Net
Assets _______________
Transferable securities and money market instruments admitted to an official stock exchange listing
Shares (continued)
Italy (continued)
Azimut Holding SpA 25,239 EUR 869,112 550,644 0.18
Banca Carige SpA 1,856,793 EUR 463,089 122,451 0.04
Banca Generali SpA 13,385 EUR 433,730 373,330 0.12
Banca IFIS SpA 6,702 EUR 142,978 111,023 0.04
Banca Popolare dell'Emilia Romagna SC 137,159 EUR 1,384,432 907,022 0.30
Banca Popolare di Milano Scarl 1,244,947 EUR 1,066,129 817,248 0.27
Banca Popolare di Sondrio SCARL 111,632 EUR 579,466 418,209 0.14
Banca Profilo SpA 133,276 EUR 80,124 49,833 0.02
Beni Stabili SpA SIIQ 378,047 EUR 307,357 265,553 0.09
Brembo SpA 5,156 EUR 181,387 172,821 0.06
Brunello Cucinelli SpA 6,899 EUR 183,738 154,691 0.05
Buzzi Unicem SpA 15,381 EUR 267,643 195,610 0.07
Buzzi Unicem SpA 22,896 EUR 237,593 177,037 0.06
Cairo Communication SpA 13,218 EUR 121,737 77,637 0.03
Cementir Holding SpA 20,529 EUR 188,385 124,578 0.04
Cerved Information Solutions SpA 26,005 EUR 143,615 137,512 0.05
CIR-Compagnie Industriali Riunite SpA 99,965 EUR 147,520 104,633 0.03
Cofide SpA 182,015 EUR 130,853 95,147 0.03
Cosmo Pharmaceuticals SpA 1,704 CHF 202,846 251,746 0.08
Credito Emiliano SpA 32,319 EUR 306,488 243,640 0.08
Credito Valtellinese SC 343,719 EUR 466,731 329,822 0.11
Danieli & C Officine Meccaniche SpA 6,897 EUR 231,938 171,755 0.06
Danieli & C Officine Meccaniche SpA 6,974 EUR 157,720 115,866 0.04
Datalogic SpA 6,574 EUR 84,645 70,798 0.02
Davide Campari-Milano SpA 65,893 EUR 533,524 411,427 0.14
De' Longhi 11,616 EUR 249,479 210,417 0.07
DeA Capital SpA 43,109 EUR 78,385 84,558 0.03
DiaSorin SpA 4,073 EUR 168,452 164,268 0.05
Ei Towers SpA 1,977 EUR 110,763 98,968 0.03
Engineering SpA 2,460 EUR 179,236 111,627 0.04
ERG SpA 6,399 EUR 102,057 71,662 0.02
Esprinet SpA 16,209 EUR 168,928 112,386 0.04
Falck Renewables SpA 57,361 EUR 111,553 64,516 0.02
Fincantieri SpA 129,187 EUR 116,596 120,134 0.04
FinecoBank Banca Fineco SpA 36,369 EUR 203,170 205,431 0.07
Geox SpA 36,354 EUR 156,518 118,773 0.04
Gruppo Editoriale L'Espresso SpA 69,213 EUR 161,792 79,857 0.03
GTECH SpA 23,422 EUR 694,354 524,040 0.17
Hera SpA 144,253 EUR 400,796 339,506 0.11
Immobiliare Grande Distribuzione SIIQ SpA 120,664 EUR 140,878 94,176 0.03
Industria Macchine Automatiche SpA 4,363 EUR 216,702 191,644 0.06
Interpump Group SpA 11,626 EUR 168,835 163,893 0.05
Iren SpA 181,928 EUR 325,045 199,339 0.07
Italcementi SpA 47,190 EUR 472,527 282,085 0.09
Italmobiliare SpA 2,226 EUR 90,309 50,639 0.02
Italmobiliare SpA 5,033 EUR 137,890 88,917 0.03
Juventus Football Club SpA 226,704 EUR 74,537 60,351 0.02
Maire Tecnimont SpA 44,845 EUR 148,618 98,002 0.03
MARR SpA 13,502 EUR 266,435 240,497 0.08
265
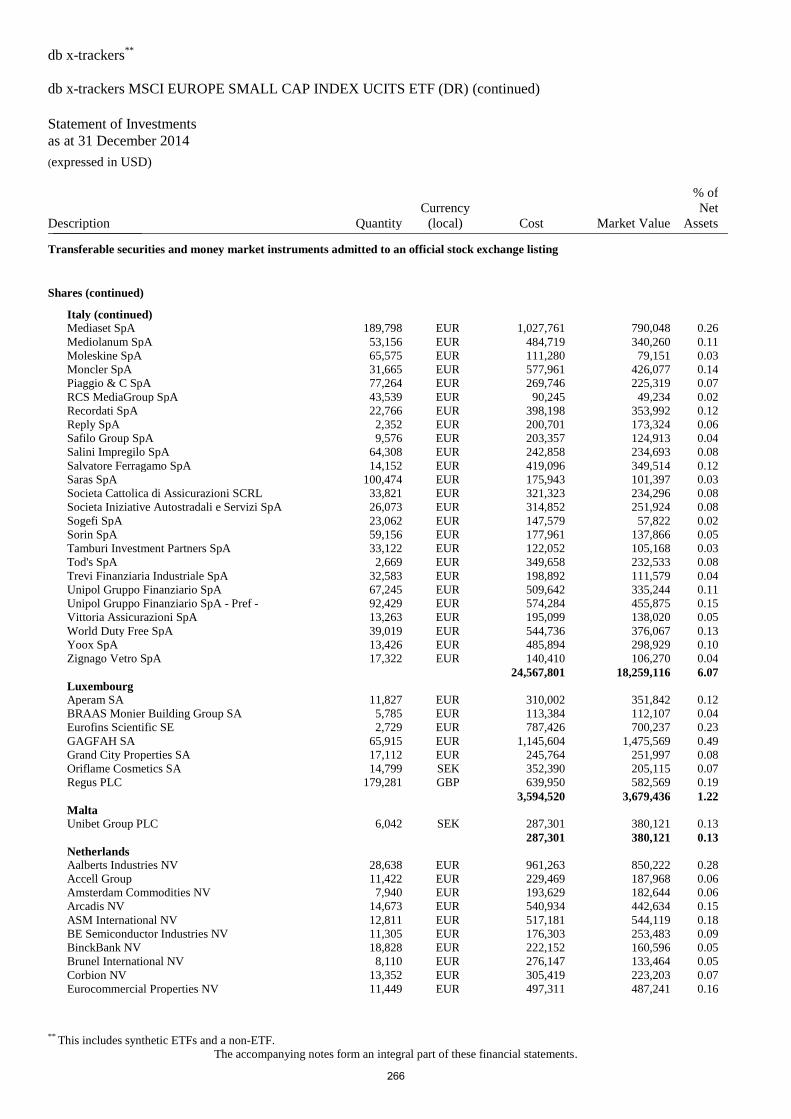
db x-trackers**
db x-trackers MSCI EUROPE SMALL CAP INDEX UCITS ETF (DR) (continued)
Statement of Investments
as at 31 December 2014 (expressed in USD)
** This includes synthetic ETFs and a non-ETF.
The accompanying notes form an integral part of these financial statements.
Description Quantity
Currency
(local) Cost Market Value
% of
Net
Assets _______________
Transferable securities and money market instruments admitted to an official stock exchange listing
Shares (continued)
Italy (continued)
Mediaset SpA 189,798 EUR 1,027,761 790,048 0.26
Mediolanum SpA 53,156 EUR 484,719 340,260 0.11
Moleskine SpA 65,575 EUR 111,280 79,151 0.03
Moncler SpA 31,665 EUR 577,961 426,077 0.14
Piaggio & C SpA 77,264 EUR 269,746 225,319 0.07
RCS MediaGroup SpA 43,539 EUR 90,245 49,234 0.02
Recordati SpA 22,766 EUR 398,198 353,992 0.12
Reply SpA 2,352 EUR 200,701 173,324 0.06
Safilo Group SpA 9,576 EUR 203,357 124,913 0.04
Salini Impregilo SpA 64,308 EUR 242,858 234,693 0.08
Salvatore Ferragamo SpA 14,152 EUR 419,096 349,514 0.12
Saras SpA 100,474 EUR 175,943 101,397 0.03
Societa Cattolica di Assicurazioni SCRL 33,821 EUR 321,323 234,296 0.08
Societa Iniziative Autostradali e Servizi SpA 26,073 EUR 314,852 251,924 0.08
Sogefi SpA 23,062 EUR 147,579 57,822 0.02
Sorin SpA 59,156 EUR 177,961 137,866 0.05
Tamburi Investment Partners SpA 33,122 EUR 122,052 105,168 0.03
Tod's SpA 2,669 EUR 349,658 232,533 0.08
Trevi Finanziaria Industriale SpA 32,583 EUR 198,892 111,579 0.04
Unipol Gruppo Finanziario SpA 67,245 EUR 509,642 335,244 0.11
Unipol Gruppo Finanziario SpA - Pref - 92,429 EUR 574,284 455,875 0.15
Vittoria Assicurazioni SpA 13,263 EUR 195,099 138,020 0.05
World Duty Free SpA 39,019 EUR 544,736 376,067 0.13
Yoox SpA 13,426 EUR 485,894 298,929 0.10
Zignago Vetro SpA 17,322 EUR 140,410 106,270 0.04
24,567,801 18,259,116 6.07
Luxembourg
Aperam SA 11,827 EUR 310,002 351,842 0.12
BRAAS Monier Building Group SA 5,785 EUR 113,384 112,107 0.04
Eurofins Scientific SE 2,729 EUR 787,426 700,237 0.23
GAGFAH SA 65,915 EUR 1,145,604 1,475,569 0.49
Grand City Properties SA 17,112 EUR 245,764 251,997 0.08
Oriflame Cosmetics SA 14,799 SEK 352,390 205,115 0.07
Regus PLC 179,281 GBP 639,950 582,569 0.19
3,594,520 3,679,436 1.22
Malta
Unibet Group PLC 6,042 SEK 287,301 380,121 0.13
287,301 380,121 0.13
Netherlands
Aalberts Industries NV 28,638 EUR 961,263 850,222 0.28
Accell Group 11,422 EUR 229,469 187,968 0.06
Amsterdam Commodities NV 7,940 EUR 193,629 182,644 0.06
Arcadis NV 14,673 EUR 540,934 442,634 0.15
ASM International NV 12,811 EUR 517,181 544,119 0.18
BE Semiconductor Industries NV 11,305 EUR 176,303 253,483 0.09
BinckBank NV 18,828 EUR 222,152 160,596 0.05
Brunel International NV 8,110 EUR 276,147 133,464 0.05
Corbion NV 13,352 EUR 305,419 223,203 0.07
Eurocommercial Properties NV 11,449 EUR 497,311 487,241 0.16
266
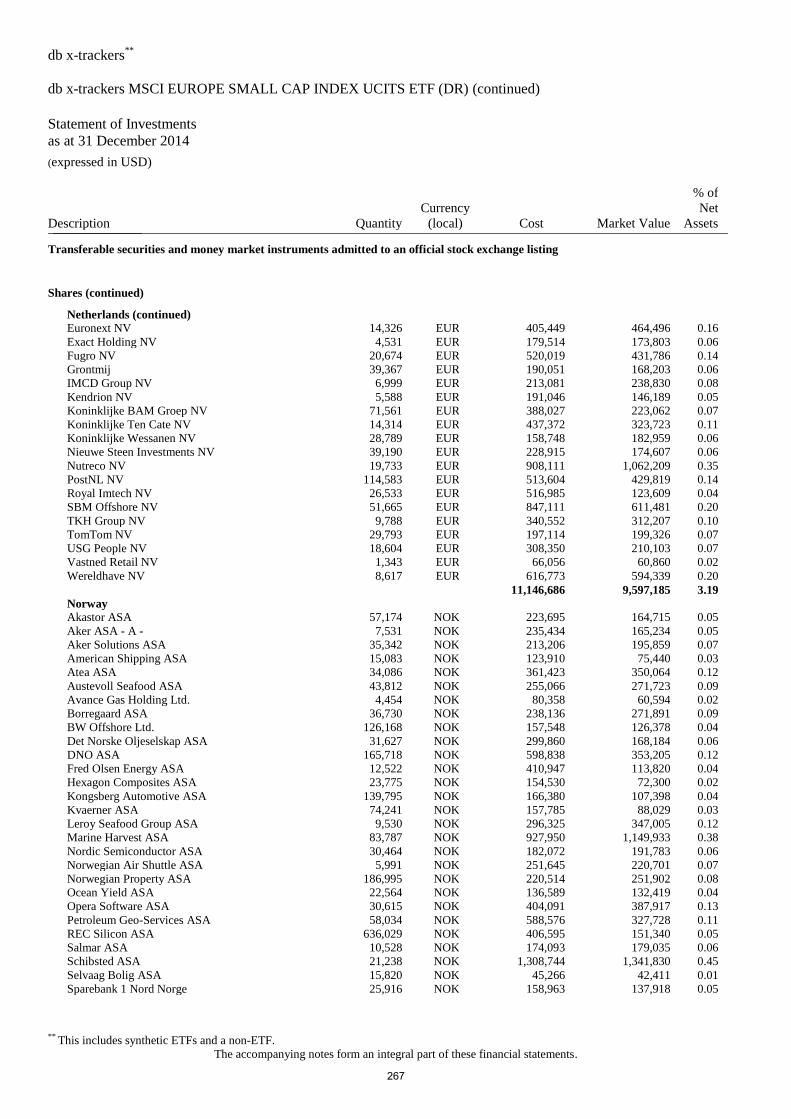
db x-trackers**
db x-trackers MSCI EUROPE SMALL CAP INDEX UCITS ETF (DR) (continued)
Statement of Investments
as at 31 December 2014 (expressed in USD)
** This includes synthetic ETFs and a non-ETF.
The accompanying notes form an integral part of these financial statements.
Description Quantity
Currency
(local) Cost Market Value
% of
Net
Assets _______________
Transferable securities and money market instruments admitted to an official stock exchange listing
Shares (continued)
Netherlands (continued)
Euronext NV 14,326 EUR 405,449 464,496 0.16
Exact Holding NV 4,531 EUR 179,514 173,803 0.06
Fugro NV 20,674 EUR 520,019 431,786 0.14
Grontmij 39,367 EUR 190,051 168,203 0.06
IMCD Group NV 6,999 EUR 213,081 238,830 0.08
Kendrion NV 5,588 EUR 191,046 146,189 0.05
Koninklijke BAM Groep NV 71,561 EUR 388,027 223,062 0.07
Koninklijke Ten Cate NV 14,314 EUR 437,372 323,723 0.11
Koninklijke Wessanen NV 28,789 EUR 158,748 182,959 0.06
Nieuwe Steen Investments NV 39,190 EUR 228,915 174,607 0.06
Nutreco NV 19,733 EUR 908,111 1,062,209 0.35
PostNL NV 114,583 EUR 513,604 429,819 0.14
Royal Imtech NV 26,533 EUR 516,985 123,609 0.04
SBM Offshore NV 51,665 EUR 847,111 611,481 0.20
TKH Group NV 9,788 EUR 340,552 312,207 0.10
TomTom NV 29,793 EUR 197,114 199,326 0.07
USG People NV 18,604 EUR 308,350 210,103 0.07
Vastned Retail NV 1,343 EUR 66,056 60,860 0.02
Wereldhave NV 8,617 EUR 616,773 594,339 0.20
11,146,686 9,597,185 3.19
Norway
Akastor ASA 57,174 NOK 223,695 164,715 0.05
Aker ASA - A - 7,531 NOK 235,434 165,234 0.05
Aker Solutions ASA 35,342 NOK 213,206 195,859 0.07
American Shipping ASA 15,083 NOK 123,910 75,440 0.03
Atea ASA 34,086 NOK 361,423 350,064 0.12
Austevoll Seafood ASA 43,812 NOK 255,066 271,723 0.09
Avance Gas Holding Ltd. 4,454 NOK 80,358 60,594 0.02
Borregaard ASA 36,730 NOK 238,136 271,891 0.09
BW Offshore Ltd. 126,168 NOK 157,548 126,378 0.04
Det Norske Oljeselskap ASA 31,627 NOK 299,860 168,184 0.06
DNO ASA 165,718 NOK 598,838 353,205 0.12
Fred Olsen Energy ASA 12,522 NOK 410,947 113,820 0.04
Hexagon Composites ASA 23,775 NOK 154,530 72,300 0.02
Kongsberg Automotive ASA 139,795 NOK 166,380 107,398 0.04
Kvaerner ASA 74,241 NOK 157,785 88,029 0.03
Leroy Seafood Group ASA 9,530 NOK 296,325 347,005 0.12
Marine Harvest ASA 83,787 NOK 927,950 1,149,933 0.38
Nordic Semiconductor ASA 30,464 NOK 182,072 191,783 0.06
Norwegian Air Shuttle ASA 5,991 NOK 251,645 220,701 0.07
Norwegian Property ASA 186,995 NOK 220,514 251,902 0.08
Ocean Yield ASA 22,564 NOK 136,589 132,419 0.04
Opera Software ASA 30,615 NOK 404,091 387,917 0.13
Petroleum Geo-Services ASA 58,034 NOK 588,576 327,728 0.11
REC Silicon ASA 636,029 NOK 406,595 151,340 0.05
Salmar ASA 10,528 NOK 174,093 179,035 0.06
Schibsted ASA 21,238 NOK 1,308,744 1,341,830 0.45
Selvaag Bolig ASA 15,820 NOK 45,266 42,411 0.01
Sparebank 1 Nord Norge 25,916 NOK 158,963 137,918 0.05
267
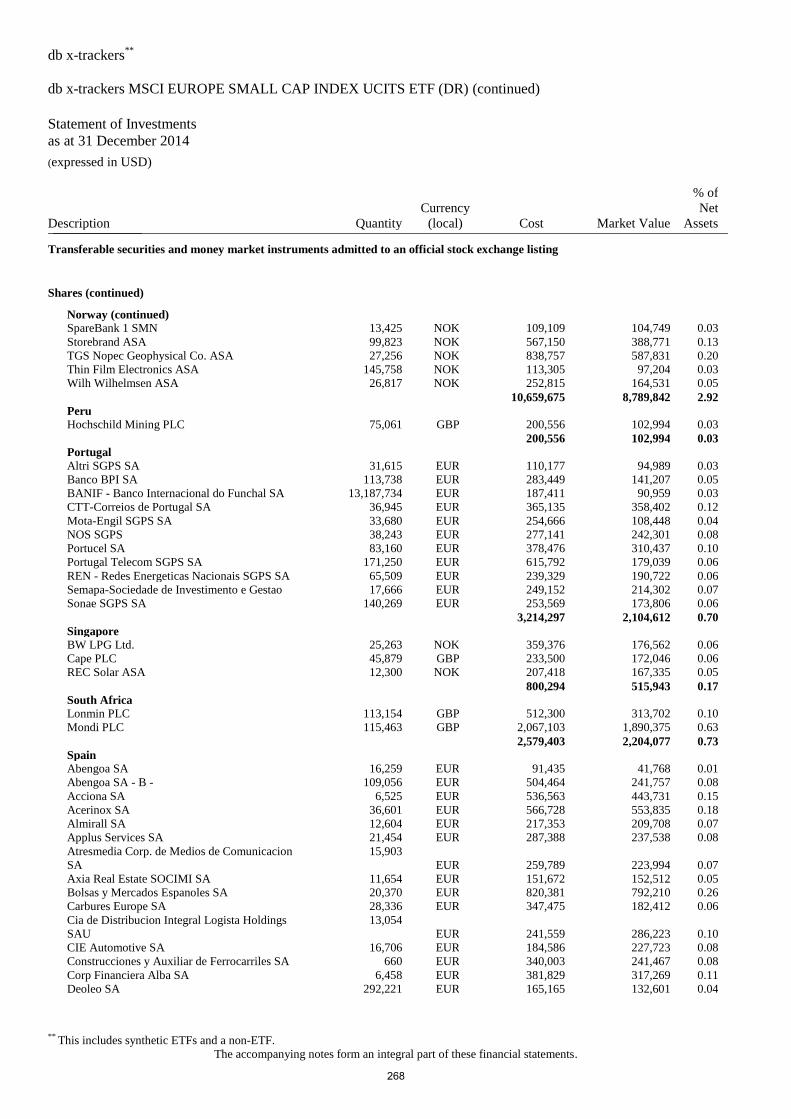
db x-trackers**
db x-trackers MSCI EUROPE SMALL CAP INDEX UCITS ETF (DR) (continued)
Statement of Investments
as at 31 December 2014 (expressed in USD)
** This includes synthetic ETFs and a non-ETF.
The accompanying notes form an integral part of these financial statements.
Description Quantity
Currency
(local) Cost Market Value
% of
Net
Assets _______________
Transferable securities and money market instruments admitted to an official stock exchange listing
Shares (continued)
Norway (continued)
SpareBank 1 SMN 13,425 NOK 109,109 104,749 0.03
Storebrand ASA 99,823 NOK 567,150 388,771 0.13
TGS Nopec Geophysical Co. ASA 27,256 NOK 838,757 587,831 0.20
Thin Film Electronics ASA 145,758 NOK 113,305 97,204 0.03
Wilh Wilhelmsen ASA 26,817 NOK 252,815 164,531 0.05
10,659,675 8,789,842 2.92
Peru
Hochschild Mining PLC 75,061 GBP 200,556 102,994 0.03
200,556 102,994 0.03
Portugal
Altri SGPS SA 31,615 EUR 110,177 94,989 0.03
Banco BPI SA 113,738 EUR 283,449 141,207 0.05
BANIF - Banco Internacional do Funchal SA 13,187,734 EUR 187,411 90,959 0.03
CTT-Correios de Portugal SA 36,945 EUR 365,135 358,402 0.12
Mota-Engil SGPS SA 33,680 EUR 254,666 108,448 0.04
NOS SGPS 38,243 EUR 277,141 242,301 0.08
Portucel SA 83,160 EUR 378,476 310,437 0.10
Portugal Telecom SGPS SA 171,250 EUR 615,792 179,039 0.06
REN - Redes Energeticas Nacionais SGPS SA 65,509 EUR 239,329 190,722 0.06
Semapa-Sociedade de Investimento e Gestao 17,666 EUR 249,152 214,302 0.07
Sonae SGPS SA 140,269 EUR 253,569 173,806 0.06
3,214,297 2,104,612 0.70
Singapore
BW LPG Ltd. 25,263 NOK 359,376 176,562 0.06
Cape PLC 45,879 GBP 233,500 172,046 0.06
REC Solar ASA 12,300 NOK 207,418 167,335 0.05
800,294 515,943 0.17
South Africa
Lonmin PLC 113,154 GBP 512,300 313,702 0.10
Mondi PLC 115,463 GBP 2,067,103 1,890,375 0.63
2,579,403 2,204,077 0.73
Spain
Abengoa SA 16,259 EUR 91,435 41,768 0.01
Abengoa SA - B - 109,056 EUR 504,464 241,757 0.08
Acciona SA 6,525 EUR 536,563 443,731 0.15
Acerinox SA 36,601 EUR 566,728 553,835 0.18
Almirall SA 12,604 EUR 217,353 209,708 0.07
Applus Services SA 21,454 EUR 287,388 237,538 0.08
Atresmedia Corp. de Medios de Comunicacion
SA
15,903
EUR 259,789 223,994 0.07
Axia Real Estate SOCIMI SA 11,654 EUR 151,672 152,512 0.05
Bolsas y Mercados Espanoles SA 20,370 EUR 820,381 792,210 0.26
Carbures Europe SA 28,336 EUR 347,475 182,412 0.06
Cia de Distribucion Integral Logista Holdings
SAU
13,054
EUR 241,559 286,223 0.10
CIE Automotive SA 16,706 EUR 184,586 227,723 0.08
Construcciones y Auxiliar de Ferrocarriles SA 660 EUR 340,003 241,467 0.08
Corp Financiera Alba SA 6,458 EUR 381,829 317,269 0.11
Deoleo SA 292,221 EUR 165,165 132,601 0.04
268
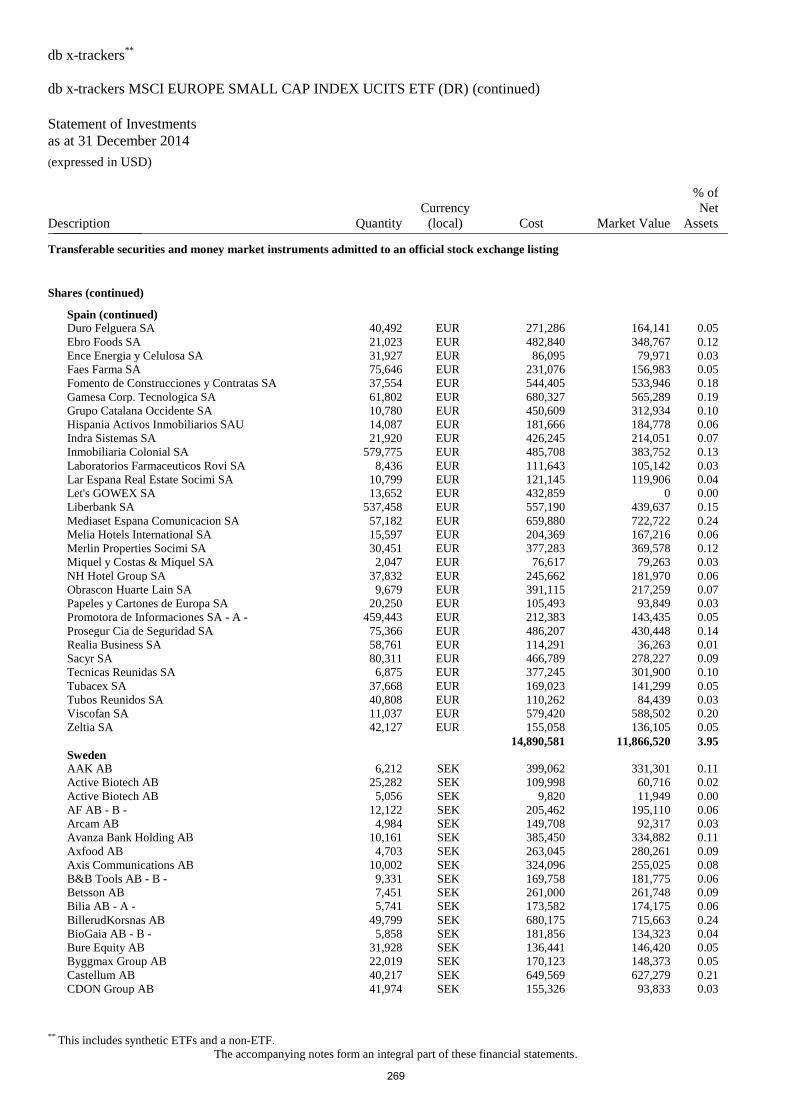
db x-trackers**
db x-trackers MSCI EUROPE SMALL CAP INDEX UCITS ETF (DR) (continued)
Statement of Investments
as at 31 December 2014 (expressed in USD)
** This includes synthetic ETFs and a non-ETF.
The accompanying notes form an integral part of these financial statements.
Description Quantity
Currency
(local) Cost Market Value
% of
Net
Assets _______________
Transferable securities and money market instruments admitted to an official stock exchange listing
Shares (continued)
Spain (continued)
Duro Felguera SA 40,492 EUR 271,286 164,141 0.05
Ebro Foods SA 21,023 EUR 482,840 348,767 0.12
Ence Energia y Celulosa SA 31,927 EUR 86,095 79,971 0.03
Faes Farma SA 75,646 EUR 231,076 156,983 0.05
Fomento de Construcciones y Contratas SA 37,554 EUR 544,405 533,946 0.18
Gamesa Corp. Tecnologica SA 61,802 EUR 680,327 565,289 0.19
Grupo Catalana Occidente SA 10,780 EUR 450,609 312,934 0.10
Hispania Activos Inmobiliarios SAU 14,087 EUR 181,666 184,778 0.06
Indra Sistemas SA 21,920 EUR 426,245 214,051 0.07
Inmobiliaria Colonial SA 579,775 EUR 485,708 383,752 0.13
Laboratorios Farmaceuticos Rovi SA 8,436 EUR 111,643 105,142 0.03
Lar Espana Real Estate Socimi SA 10,799 EUR 121,145 119,906 0.04
Let's GOWEX SA 13,652 EUR 432,859 0 0.00
Liberbank SA 537,458 EUR 557,190 439,637 0.15
Mediaset Espana Comunicacion SA 57,182 EUR 659,880 722,722 0.24
Melia Hotels International SA 15,597 EUR 204,369 167,216 0.06
Merlin Properties Socimi SA 30,451 EUR 377,283 369,578 0.12
Miquel y Costas & Miquel SA 2,047 EUR 76,617 79,263 0.03
NH Hotel Group SA 37,832 EUR 245,662 181,970 0.06
Obrascon Huarte Lain SA 9,679 EUR 391,115 217,259 0.07
Papeles y Cartones de Europa SA 20,250 EUR 105,493 93,849 0.03
Promotora de Informaciones SA - A - 459,443 EUR 212,383 143,435 0.05
Prosegur Cia de Seguridad SA 75,366 EUR 486,207 430,448 0.14
Realia Business SA 58,761 EUR 114,291 36,263 0.01
Sacyr SA 80,311 EUR 466,789 278,227 0.09
Tecnicas Reunidas SA 6,875 EUR 377,245 301,900 0.10
Tubacex SA 37,668 EUR 169,023 141,299 0.05
Tubos Reunidos SA 40,808 EUR 110,262 84,439 0.03
Viscofan SA 11,037 EUR 579,420 588,502 0.20
Zeltia SA 42,127 EUR 155,058 136,105 0.05
14,890,581 11,866,520 3.95
Sweden
AAK AB 6,212 SEK 399,062 331,301 0.11
Active Biotech AB 25,282 SEK 109,998 60,716 0.02
Active Biotech AB 5,056 SEK 9,820 11,949 0.00
AF AB - B - 12,122 SEK 205,462 195,110 0.06
Arcam AB 4,984 SEK 149,708 92,317 0.03
Avanza Bank Holding AB 10,161 SEK 385,450 334,882 0.11
Axfood AB 4,703 SEK 263,045 280,261 0.09
Axis Communications AB 10,002 SEK 324,096 255,025 0.08
B&B Tools AB - B - 9,331 SEK 169,758 181,775 0.06
Betsson AB 7,451 SEK 261,000 261,748 0.09
Bilia AB - A - 5,741 SEK 173,582 174,175 0.06
BillerudKorsnas AB 49,799 SEK 680,175 715,663 0.24
BioGaia AB - B - 5,858 SEK 181,856 134,323 0.04
Bure Equity AB 31,928 SEK 136,441 146,420 0.05
Byggmax Group AB 22,019 SEK 170,123 148,373 0.05
Castellum AB 40,217 SEK 649,569 627,279 0.21
CDON Group AB 41,974 SEK 155,326 93,833 0.03
269
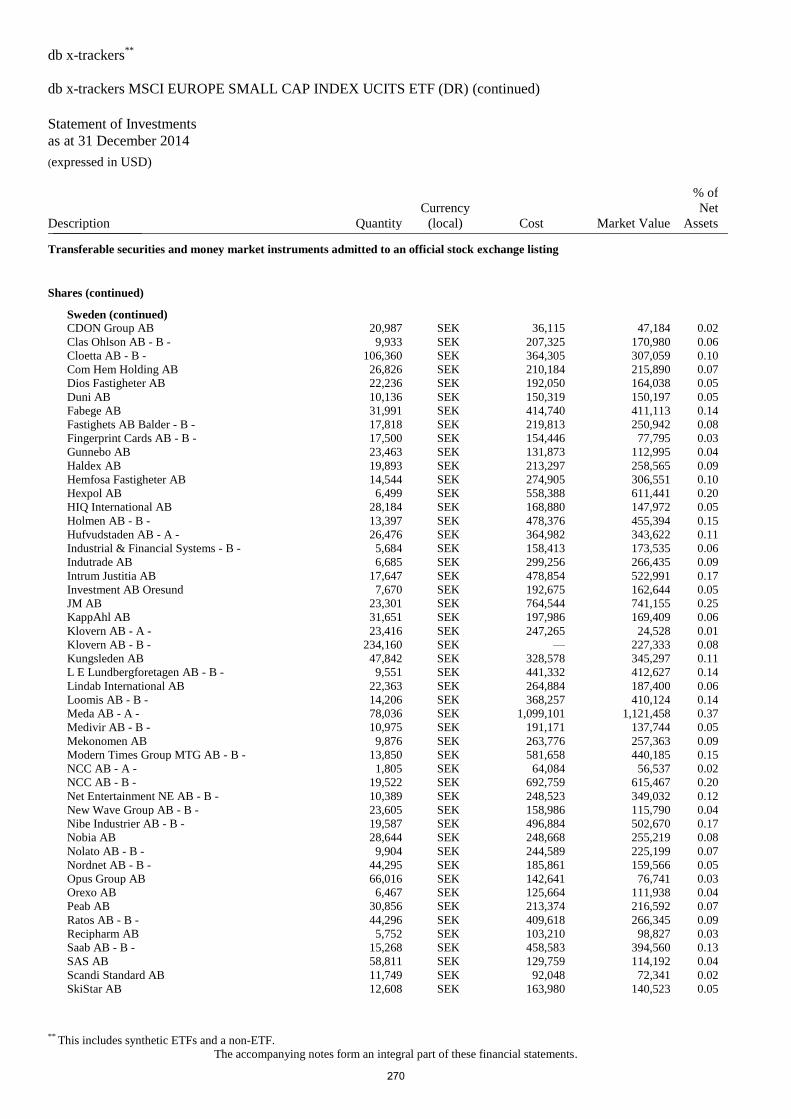
db x-trackers**
db x-trackers MSCI EUROPE SMALL CAP INDEX UCITS ETF (DR) (continued)
Statement of Investments
as at 31 December 2014 (expressed in USD)
** This includes synthetic ETFs and a non-ETF.
The accompanying notes form an integral part of these financial statements.
Description Quantity
Currency
(local) Cost Market Value
% of
Net
Assets _______________
Transferable securities and money market instruments admitted to an official stock exchange listing
Shares (continued)
Sweden (continued)
CDON Group AB 20,987 SEK 36,115 47,184 0.02
Clas Ohlson AB - B - 9,933 SEK 207,325 170,980 0.06
Cloetta AB - B - 106,360 SEK 364,305 307,059 0.10
Com Hem Holding AB 26,826 SEK 210,184 215,890 0.07
Dios Fastigheter AB 22,236 SEK 192,050 164,038 0.05
Duni AB 10,136 SEK 150,319 150,197 0.05
Fabege AB 31,991 SEK 414,740 411,113 0.14
Fastighets AB Balder - B - 17,818 SEK 219,813 250,942 0.08
Fingerprint Cards AB - B - 17,500 SEK 154,446 77,795 0.03
Gunnebo AB 23,463 SEK 131,873 112,995 0.04
Haldex AB 19,893 SEK 213,297 258,565 0.09
Hemfosa Fastigheter AB 14,544 SEK 274,905 306,551 0.10
Hexpol AB 6,499 SEK 558,388 611,441 0.20
HIQ International AB 28,184 SEK 168,880 147,972 0.05
Holmen AB - B - 13,397 SEK 478,376 455,394 0.15
Hufvudstaden AB - A - 26,476 SEK 364,982 343,622 0.11
Industrial & Financial Systems - B - 5,684 SEK 158,413 173,535 0.06
Indutrade AB 6,685 SEK 299,256 266,435 0.09
Intrum Justitia AB 17,647 SEK 478,854 522,991 0.17
Investment AB Oresund 7,670 SEK 192,675 162,644 0.05
JM AB 23,301 SEK 764,544 741,155 0.25
KappAhl AB 31,651 SEK 197,986 169,409 0.06
Klovern AB - A - 23,416 SEK 247,265 24,528 0.01
Klovern AB - B - 234,160 SEK — 227,333 0.08
Kungsleden AB 47,842 SEK 328,578 345,297 0.11
L E Lundbergforetagen AB - B - 9,551 SEK 441,332 412,627 0.14
Lindab International AB 22,363 SEK 264,884 187,400 0.06
Loomis AB - B - 14,206 SEK 368,257 410,124 0.14
Meda AB - A - 78,036 SEK 1,099,101 1,121,458 0.37
Medivir AB - B - 10,975 SEK 191,171 137,744 0.05
Mekonomen AB 9,876 SEK 263,776 257,363 0.09
Modern Times Group MTG AB - B - 13,850 SEK 581,658 440,185 0.15
NCC AB - A - 1,805 SEK 64,084 56,537 0.02
NCC AB - B - 19,522 SEK 692,759 615,467 0.20
Net Entertainment NE AB - B - 10,389 SEK 248,523 349,032 0.12
New Wave Group AB - B - 23,605 SEK 158,986 115,790 0.04
Nibe Industrier AB - B - 19,587 SEK 496,884 502,670 0.17
Nobia AB 28,644 SEK 248,668 255,219 0.08
Nolato AB - B - 9,904 SEK 244,589 225,199 0.07
Nordnet AB - B - 44,295 SEK 185,861 159,566 0.05
Opus Group AB 66,016 SEK 142,641 76,741 0.03
Orexo AB 6,467 SEK 125,664 111,938 0.04
Peab AB 30,856 SEK 213,374 216,592 0.07
Ratos AB - B - 44,296 SEK 409,618 266,345 0.09
Recipharm AB 5,752 SEK 103,210 98,827 0.03
Saab AB - B - 15,268 SEK 458,583 394,560 0.13
SAS AB 58,811 SEK 129,759 114,192 0.04
Scandi Standard AB 11,749 SEK 92,048 72,341 0.02
SkiStar AB 12,608 SEK 163,980 140,523 0.05
270
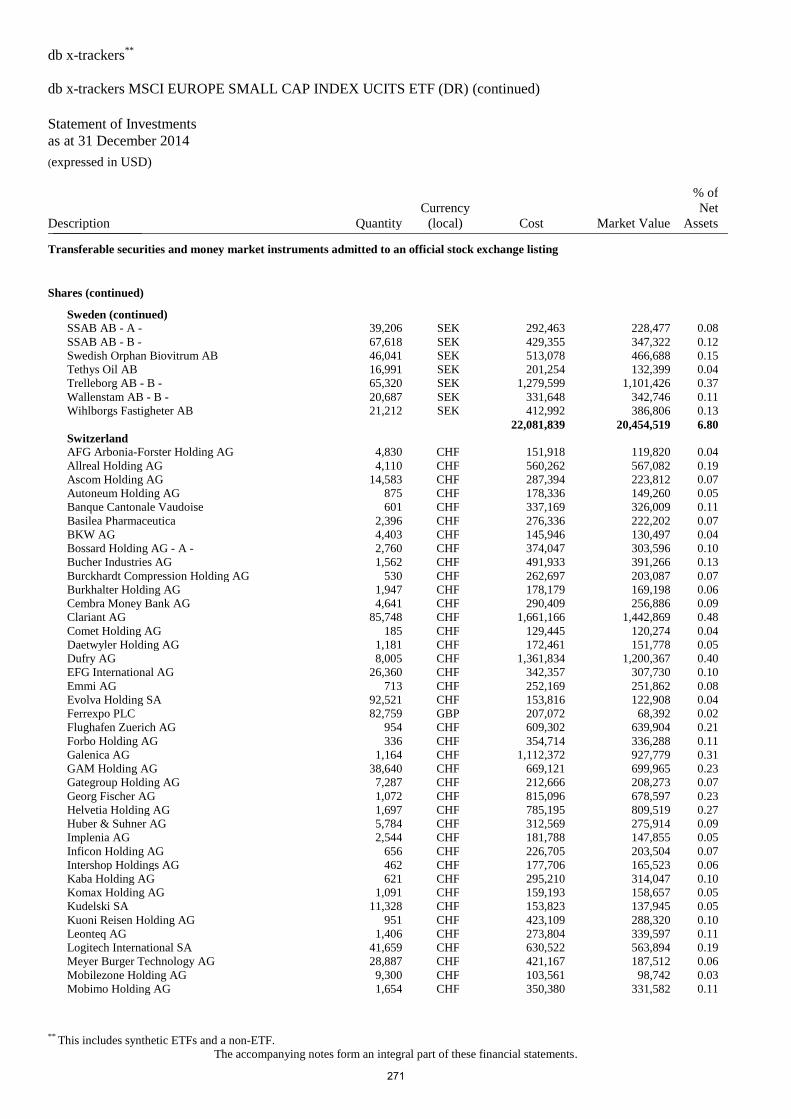
db x-trackers**
db x-trackers MSCI EUROPE SMALL CAP INDEX UCITS ETF (DR) (continued)
Statement of Investments
as at 31 December 2014 (expressed in USD)
** This includes synthetic ETFs and a non-ETF.
The accompanying notes form an integral part of these financial statements.
Description Quantity
Currency
(local) Cost Market Value
% of
Net
Assets _______________
Transferable securities and money market instruments admitted to an official stock exchange listing
Shares (continued)
Sweden (continued)
SSAB AB - A - 39,206 SEK 292,463 228,477 0.08
SSAB AB - B - 67,618 SEK 429,355 347,322 0.12
Swedish Orphan Biovitrum AB 46,041 SEK 513,078 466,688 0.15
Tethys Oil AB 16,991 SEK 201,254 132,399 0.04
Trelleborg AB - B - 65,320 SEK 1,279,599 1,101,426 0.37
Wallenstam AB - B - 20,687 SEK 331,648 342,746 0.11
Wihlborgs Fastigheter AB 21,212 SEK 412,992 386,806 0.13
22,081,839 20,454,519 6.80
Switzerland
AFG Arbonia-Forster Holding AG 4,830 CHF 151,918 119,820 0.04
Allreal Holding AG 4,110 CHF 560,262 567,082 0.19
Ascom Holding AG 14,583 CHF 287,394 223,812 0.07
Autoneum Holding AG 875 CHF 178,336 149,260 0.05
Banque Cantonale Vaudoise 601 CHF 337,169 326,009 0.11
Basilea Pharmaceutica 2,396 CHF 276,336 222,202 0.07
BKW AG 4,403 CHF 145,946 130,497 0.04
Bossard Holding AG - A - 2,760 CHF 374,047 303,596 0.10
Bucher Industries AG 1,562 CHF 491,933 391,266 0.13
Burckhardt Compression Holding AG 530 CHF 262,697 203,087 0.07
Burkhalter Holding AG 1,947 CHF 178,179 169,198 0.06
Cembra Money Bank AG 4,641 CHF 290,409 256,886 0.09
Clariant AG 85,748 CHF 1,661,166 1,442,869 0.48
Comet Holding AG 185 CHF 129,445 120,274 0.04
Daetwyler Holding AG 1,181 CHF 172,461 151,778 0.05
Dufry AG 8,005 CHF 1,361,834 1,200,367 0.40
EFG International AG 26,360 CHF 342,357 307,730 0.10
Emmi AG 713 CHF 252,169 251,862 0.08
Evolva Holding SA 92,521 CHF 153,816 122,908 0.04
Ferrexpo PLC 82,759 GBP 207,072 68,392 0.02
Flughafen Zuerich AG 954 CHF 609,302 639,904 0.21
Forbo Holding AG 336 CHF 354,714 336,288 0.11
Galenica AG 1,164 CHF 1,112,372 927,779 0.31
GAM Holding AG 38,640 CHF 669,121 699,965 0.23
Gategroup Holding AG 7,287 CHF 212,666 208,273 0.07
Georg Fischer AG 1,072 CHF 815,096 678,597 0.23
Helvetia Holding AG 1,697 CHF 785,195 809,519 0.27
Huber & Suhner AG 5,784 CHF 312,569 275,914 0.09
Implenia AG 2,544 CHF 181,788 147,855 0.05
Inficon Holding AG 656 CHF 226,705 203,504 0.07
Intershop Holdings AG 462 CHF 177,706 165,523 0.06
Kaba Holding AG 621 CHF 295,210 314,047 0.10
Komax Holding AG 1,091 CHF 159,193 158,657 0.05
Kudelski SA 11,328 CHF 153,823 137,945 0.05
Kuoni Reisen Holding AG 951 CHF 423,109 288,320 0.10
Leonteq AG 1,406 CHF 273,804 339,597 0.11
Logitech International SA 41,659 CHF 630,522 563,894 0.19
Meyer Burger Technology AG 28,887 CHF 421,167 187,512 0.06
Mobilezone Holding AG 9,300 CHF 103,561 98,742 0.03
Mobimo Holding AG 1,654 CHF 350,380 331,582 0.11
271
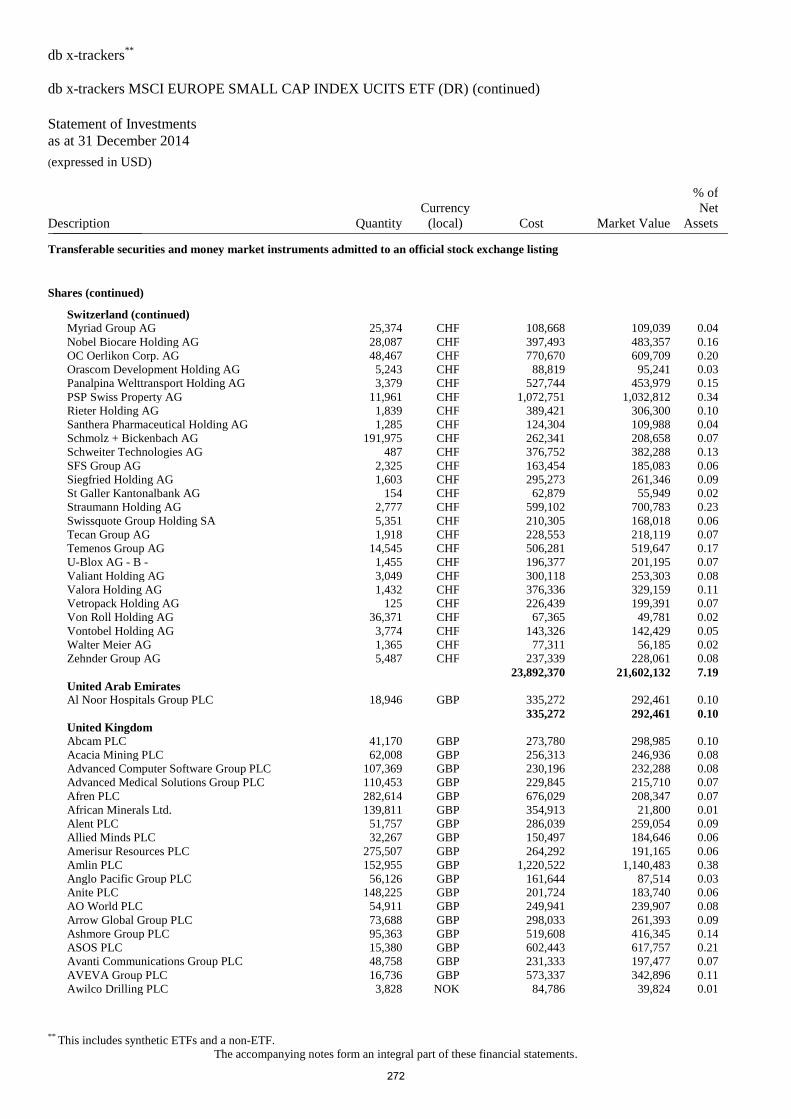
db x-trackers**
db x-trackers MSCI EUROPE SMALL CAP INDEX UCITS ETF (DR) (continued)
Statement of Investments
as at 31 December 2014 (expressed in USD)
** This includes synthetic ETFs and a non-ETF.
The accompanying notes form an integral part of these financial statements.
Description Quantity
Currency
(local) Cost Market Value
% of
Net
Assets _______________
Transferable securities and money market instruments admitted to an official stock exchange listing
Shares (continued)
Switzerland (continued)
Myriad Group AG 25,374 CHF 108,668 109,039 0.04
Nobel Biocare Holding AG 28,087 CHF 397,493 483,357 0.16
OC Oerlikon Corp. AG 48,467 CHF 770,670 609,709 0.20
Orascom Development Holding AG 5,243 CHF 88,819 95,241 0.03
Panalpina Welttransport Holding AG 3,379 CHF 527,744 453,979 0.15
PSP Swiss Property AG 11,961 CHF 1,072,751 1,032,812 0.34
Rieter Holding AG 1,839 CHF 389,421 306,300 0.10
Santhera Pharmaceutical Holding AG 1,285 CHF 124,304 109,988 0.04
Schmolz + Bickenbach AG 191,975 CHF 262,341 208,658 0.07
Schweiter Technologies AG 487 CHF 376,752 382,288 0.13
SFS Group AG 2,325 CHF 163,454 185,083 0.06
Siegfried Holding AG 1,603 CHF 295,273 261,346 0.09
St Galler Kantonalbank AG 154 CHF 62,879 55,949 0.02
Straumann Holding AG 2,777 CHF 599,102 700,783 0.23
Swissquote Group Holding SA 5,351 CHF 210,305 168,018 0.06
Tecan Group AG 1,918 CHF 228,553 218,119 0.07
Temenos Group AG 14,545 CHF 506,281 519,647 0.17
U-Blox AG - B - 1,455 CHF 196,377 201,195 0.07
Valiant Holding AG 3,049 CHF 300,118 253,303 0.08
Valora Holding AG 1,432 CHF 376,336 329,159 0.11
Vetropack Holding AG 125 CHF 226,439 199,391 0.07
Von Roll Holding AG 36,371 CHF 67,365 49,781 0.02
Vontobel Holding AG 3,774 CHF 143,326 142,429 0.05
Walter Meier AG 1,365 CHF 77,311 56,185 0.02
Zehnder Group AG 5,487 CHF 237,339 228,061 0.08
23,892,370 21,602,132 7.19
United Arab Emirates
Al Noor Hospitals Group PLC 18,946 GBP 335,272 292,461 0.10
335,272 292,461 0.10
United Kingdom
Abcam PLC 41,170 GBP 273,780 298,985 0.10
Acacia Mining PLC 62,008 GBP 256,313 246,936 0.08
Advanced Computer Software Group PLC 107,369 GBP 230,196 232,288 0.08
Advanced Medical Solutions Group PLC 110,453 GBP 229,845 215,710 0.07
Afren PLC 282,614 GBP 676,029 208,347 0.07
African Minerals Ltd. 139,811 GBP 354,913 21,800 0.01
Alent PLC 51,757 GBP 286,039 259,054 0.09
Allied Minds PLC 32,267 GBP 150,497 184,646 0.06
Amerisur Resources PLC 275,507 GBP 264,292 191,165 0.06
Amlin PLC 152,955 GBP 1,220,522 1,140,483 0.38
Anglo Pacific Group PLC 56,126 GBP 161,644 87,514 0.03
Anite PLC 148,225 GBP 201,724 183,740 0.06
AO World PLC 54,911 GBP 249,941 239,907 0.08
Arrow Global Group PLC 73,688 GBP 298,033 261,393 0.09
Ashmore Group PLC 95,363 GBP 519,608 416,345 0.14
ASOS PLC 15,380 GBP 602,443 617,757 0.21
Avanti Communications Group PLC 48,758 GBP 231,333 197,477 0.07
AVEVA Group PLC 16,736 GBP 573,337 342,896 0.11
Awilco Drilling PLC 3,828 NOK 84,786 39,824 0.01
272
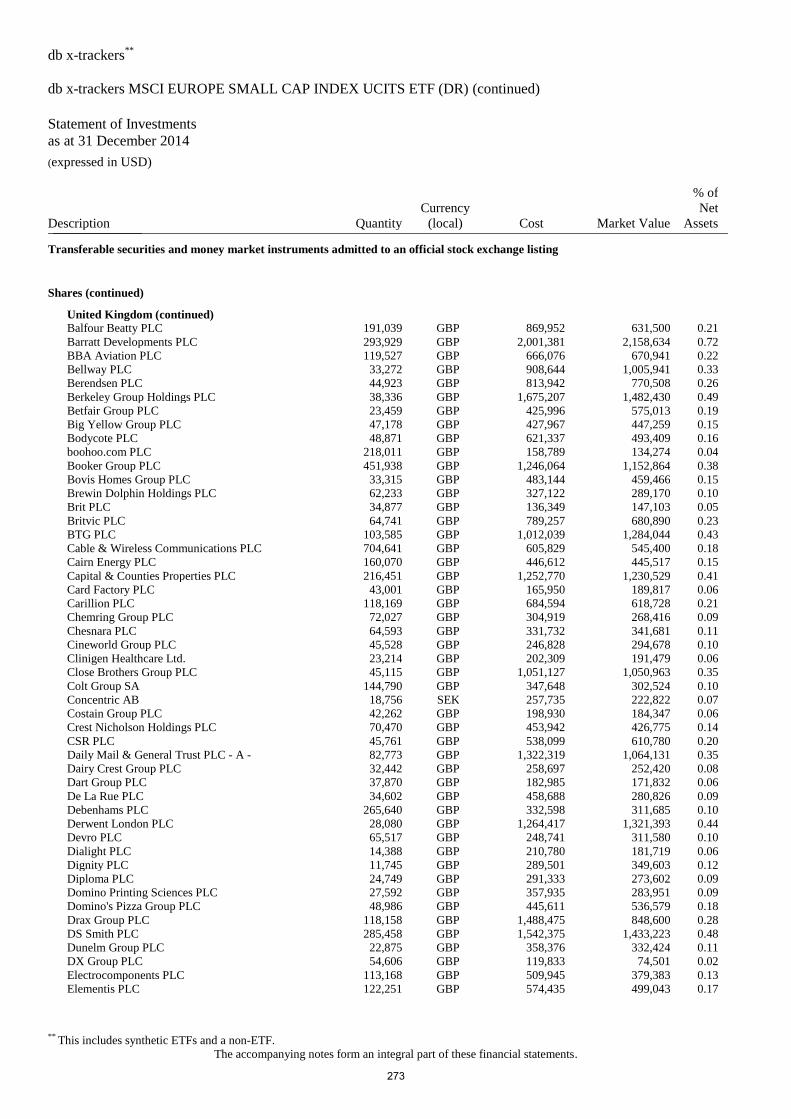
db x-trackers**
db x-trackers MSCI EUROPE SMALL CAP INDEX UCITS ETF (DR) (continued)
Statement of Investments
as at 31 December 2014 (expressed in USD)
** This includes synthetic ETFs and a non-ETF.
The accompanying notes form an integral part of these financial statements.
Description Quantity
Currency
(local) Cost Market Value
% of
Net
Assets _______________
Transferable securities and money market instruments admitted to an official stock exchange listing
Shares (continued)
United Kingdom (continued)
Balfour Beatty PLC 191,039 GBP 869,952 631,500 0.21
Barratt Developments PLC 293,929 GBP 2,001,381 2,158,634 0.72
BBA Aviation PLC 119,527 GBP 666,076 670,941 0.22
Bellway PLC 33,272 GBP 908,644 1,005,941 0.33
Berendsen PLC 44,923 GBP 813,942 770,508 0.26
Berkeley Group Holdings PLC 38,336 GBP 1,675,207 1,482,430 0.49
Betfair Group PLC 23,459 GBP 425,996 575,013 0.19
Big Yellow Group PLC 47,178 GBP 427,967 447,259 0.15
Bodycote PLC 48,871 GBP 621,337 493,409 0.16
boohoo.com PLC 218,011 GBP 158,789 134,274 0.04
Booker Group PLC 451,938 GBP 1,246,064 1,152,864 0.38
Bovis Homes Group PLC 33,315 GBP 483,144 459,466 0.15
Brewin Dolphin Holdings PLC 62,233 GBP 327,122 289,170 0.10
Brit PLC 34,877 GBP 136,349 147,103 0.05
Britvic PLC 64,741 GBP 789,257 680,890 0.23
BTG PLC 103,585 GBP 1,012,039 1,284,044 0.43
Cable & Wireless Communications PLC 704,641 GBP 605,829 545,400 0.18
Cairn Energy PLC 160,070 GBP 446,612 445,517 0.15
Capital & Counties Properties PLC 216,451 GBP 1,252,770 1,230,529 0.41
Card Factory PLC 43,001 GBP 165,950 189,817 0.06
Carillion PLC 118,169 GBP 684,594 618,728 0.21
Chemring Group PLC 72,027 GBP 304,919 268,416 0.09
Chesnara PLC 64,593 GBP 331,732 341,681 0.11
Cineworld Group PLC 45,528 GBP 246,828 294,678 0.10
Clinigen Healthcare Ltd. 23,214 GBP 202,309 191,479 0.06
Close Brothers Group PLC 45,115 GBP 1,051,127 1,050,963 0.35
Colt Group SA 144,790 GBP 347,648 302,524 0.10
Concentric AB 18,756 SEK 257,735 222,822 0.07
Costain Group PLC 42,262 GBP 198,930 184,347 0.06
Crest Nicholson Holdings PLC 70,470 GBP 453,942 426,775 0.14
CSR PLC 45,761 GBP 538,099 610,780 0.20
Daily Mail & General Trust PLC - A - 82,773 GBP 1,322,319 1,064,131 0.35
Dairy Crest Group PLC 32,442 GBP 258,697 252,420 0.08
Dart Group PLC 37,870 GBP 182,985 171,832 0.06
De La Rue PLC 34,602 GBP 458,688 280,826 0.09
Debenhams PLC 265,640 GBP 332,598 311,685 0.10
Derwent London PLC 28,080 GBP 1,264,417 1,321,393 0.44
Devro PLC 65,517 GBP 248,741 311,580 0.10
Dialight PLC 14,388 GBP 210,780 181,719 0.06
Dignity PLC 11,745 GBP 289,501 349,603 0.12
Diploma PLC 24,749 GBP 291,333 273,602 0.09
Domino Printing Sciences PLC 27,592 GBP 357,935 283,951 0.09
Domino's Pizza Group PLC 48,986 GBP 445,611 536,579 0.18
Drax Group PLC 118,158 GBP 1,488,475 848,600 0.28
DS Smith PLC 285,458 GBP 1,542,375 1,433,223 0.48
Dunelm Group PLC 22,875 GBP 358,376 332,424 0.11
DX Group PLC 54,606 GBP 119,833 74,501 0.02
Electrocomponents PLC 113,168 GBP 509,945 379,383 0.13
Elementis PLC 122,251 GBP 574,435 499,043 0.17
273
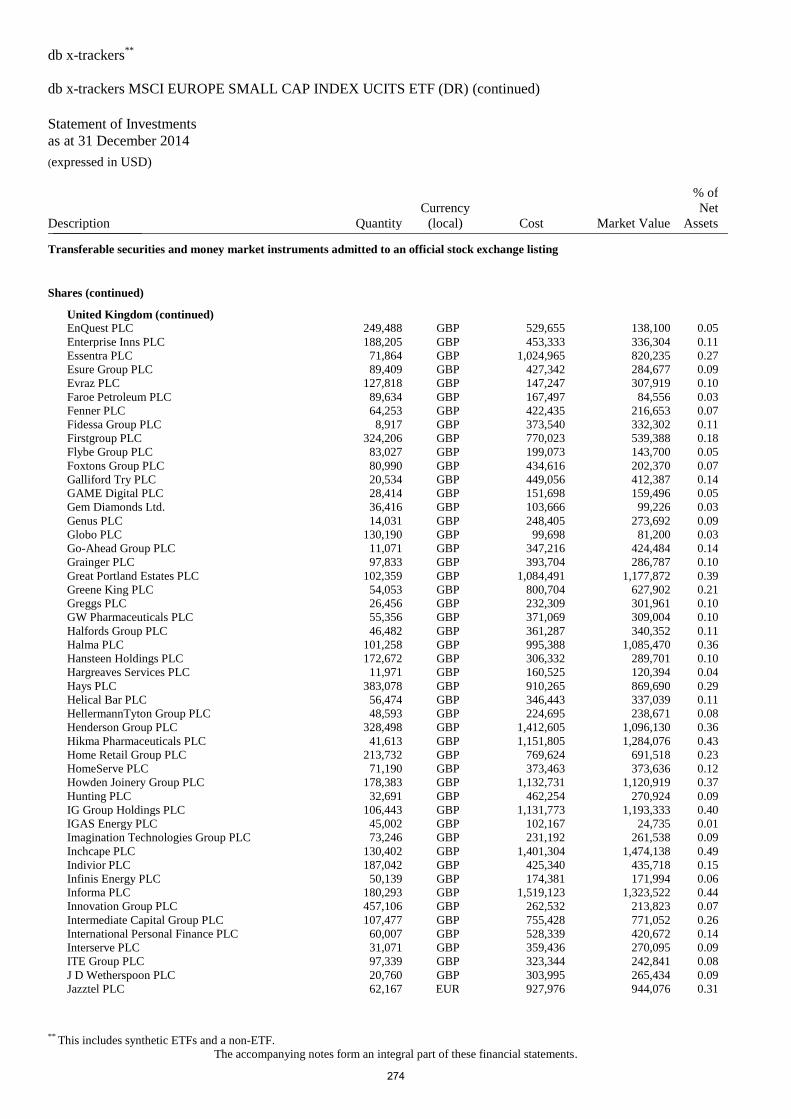
db x-trackers**
db x-trackers MSCI EUROPE SMALL CAP INDEX UCITS ETF (DR) (continued)
Statement of Investments
as at 31 December 2014 (expressed in USD)
** This includes synthetic ETFs and a non-ETF.
The accompanying notes form an integral part of these financial statements.
Description Quantity
Currency
(local) Cost Market Value
% of
Net
Assets _______________
Transferable securities and money market instruments admitted to an official stock exchange listing
Shares (continued)
United Kingdom (continued)
EnQuest PLC 249,488 GBP 529,655 138,100 0.05
Enterprise Inns PLC 188,205 GBP 453,333 336,304 0.11
Essentra PLC 71,864 GBP 1,024,965 820,235 0.27
Esure Group PLC 89,409 GBP 427,342 284,677 0.09
Evraz PLC 127,818 GBP 147,247 307,919 0.10
Faroe Petroleum PLC 89,634 GBP 167,497 84,556 0.03
Fenner PLC 64,253 GBP 422,435 216,653 0.07
Fidessa Group PLC 8,917 GBP 373,540 332,302 0.11
Firstgroup PLC 324,206 GBP 770,023 539,388 0.18
Flybe Group PLC 83,027 GBP 199,073 143,700 0.05
Foxtons Group PLC 80,990 GBP 434,616 202,370 0.07
Galliford Try PLC 20,534 GBP 449,056 412,387 0.14
GAME Digital PLC 28,414 GBP 151,698 159,496 0.05
Gem Diamonds Ltd. 36,416 GBP 103,666 99,226 0.03
Genus PLC 14,031 GBP 248,405 273,692 0.09
Globo PLC 130,190 GBP 99,698 81,200 0.03
Go-Ahead Group PLC 11,071 GBP 347,216 424,484 0.14
Grainger PLC 97,833 GBP 393,704 286,787 0.10
Great Portland Estates PLC 102,359 GBP 1,084,491 1,177,872 0.39
Greene King PLC 54,053 GBP 800,704 627,902 0.21
Greggs PLC 26,456 GBP 232,309 301,961 0.10
GW Pharmaceuticals PLC 55,356 GBP 371,069 309,004 0.10
Halfords Group PLC 46,482 GBP 361,287 340,352 0.11
Halma PLC 101,258 GBP 995,388 1,085,470 0.36
Hansteen Holdings PLC 172,672 GBP 306,332 289,701 0.10
Hargreaves Services PLC 11,971 GBP 160,525 120,394 0.04
Hays PLC 383,078 GBP 910,265 869,690 0.29
Helical Bar PLC 56,474 GBP 346,443 337,039 0.11
HellermannTyton Group PLC 48,593 GBP 224,695 238,671 0.08
Henderson Group PLC 328,498 GBP 1,412,605 1,096,130 0.36
Hikma Pharmaceuticals PLC 41,613 GBP 1,151,805 1,284,076 0.43
Home Retail Group PLC 213,732 GBP 769,624 691,518 0.23
HomeServe PLC 71,190 GBP 373,463 373,636 0.12
Howden Joinery Group PLC 178,383 GBP 1,132,731 1,120,919 0.37
Hunting PLC 32,691 GBP 462,254 270,924 0.09
IG Group Holdings PLC 106,443 GBP 1,131,773 1,193,333 0.40
IGAS Energy PLC 45,002 GBP 102,167 24,735 0.01
Imagination Technologies Group PLC 73,246 GBP 231,192 261,538 0.09
Inchcape PLC 130,402 GBP 1,401,304 1,474,138 0.49
Indivior PLC 187,042 GBP 425,340 435,718 0.15
Infinis Energy PLC 50,139 GBP 174,381 171,994 0.06
Informa PLC 180,293 GBP 1,519,123 1,323,522 0.44
Innovation Group PLC 457,106 GBP 262,532 213,823 0.07
Intermediate Capital Group PLC 107,477 GBP 755,428 771,052 0.26
International Personal Finance PLC 60,007 GBP 528,339 420,672 0.14
Interserve PLC 31,071 GBP 359,436 270,095 0.09
ITE Group PLC 97,339 GBP 323,344 242,841 0.08
J D Wetherspoon PLC 20,760 GBP 303,995 265,434 0.09
Jazztel PLC 62,167 EUR 927,976 944,076 0.31
274
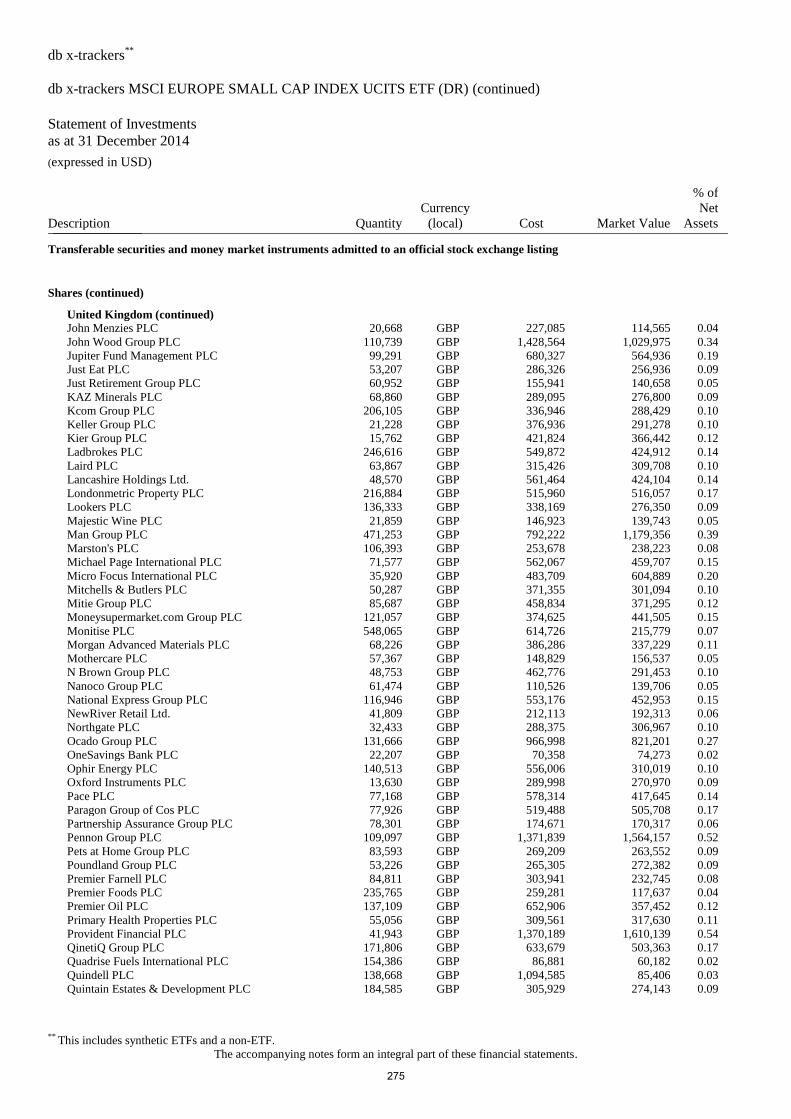
db x-trackers**
db x-trackers MSCI EUROPE SMALL CAP INDEX UCITS ETF (DR) (continued)
Statement of Investments
as at 31 December 2014 (expressed in USD)
** This includes synthetic ETFs and a non-ETF.
The accompanying notes form an integral part of these financial statements.
Description Quantity
Currency
(local) Cost Market Value
% of
Net
Assets _______________
Transferable securities and money market instruments admitted to an official stock exchange listing
Shares (continued)
United Kingdom (continued)
John Menzies PLC 20,668 GBP 227,085 114,565 0.04
John Wood Group PLC 110,739 GBP 1,428,564 1,029,975 0.34
Jupiter Fund Management PLC 99,291 GBP 680,327 564,936 0.19
Just Eat PLC 53,207 GBP 286,326 256,936 0.09
Just Retirement Group PLC 60,952 GBP 155,941 140,658 0.05
KAZ Minerals PLC 68,860 GBP 289,095 276,800 0.09
Kcom Group PLC 206,105 GBP 336,946 288,429 0.10
Keller Group PLC 21,228 GBP 376,936 291,278 0.10
Kier Group PLC 15,762 GBP 421,824 366,442 0.12
Ladbrokes PLC 246,616 GBP 549,872 424,912 0.14
Laird PLC 63,867 GBP 315,426 309,708 0.10
Lancashire Holdings Ltd. 48,570 GBP 561,464 424,104 0.14
Londonmetric Property PLC 216,884 GBP 515,960 516,057 0.17
Lookers PLC 136,333 GBP 338,169 276,350 0.09
Majestic Wine PLC 21,859 GBP 146,923 139,743 0.05
Man Group PLC 471,253 GBP 792,222 1,179,356 0.39
Marston's PLC 106,393 GBP 253,678 238,223 0.08
Michael Page International PLC 71,577 GBP 562,067 459,707 0.15
Micro Focus International PLC 35,920 GBP 483,709 604,889 0.20
Mitchells & Butlers PLC 50,287 GBP 371,355 301,094 0.10
Mitie Group PLC 85,687 GBP 458,834 371,295 0.12
Moneysupermarket.com Group PLC 121,057 GBP 374,625 441,505 0.15
Monitise PLC 548,065 GBP 614,726 215,779 0.07
Morgan Advanced Materials PLC 68,226 GBP 386,286 337,229 0.11
Mothercare PLC 57,367 GBP 148,829 156,537 0.05
N Brown Group PLC 48,753 GBP 462,776 291,453 0.10
Nanoco Group PLC 61,474 GBP 110,526 139,706 0.05
National Express Group PLC 116,946 GBP 553,176 452,953 0.15
NewRiver Retail Ltd. 41,809 GBP 212,113 192,313 0.06
Northgate PLC 32,433 GBP 288,375 306,967 0.10
Ocado Group PLC 131,666 GBP 966,998 821,201 0.27
OneSavings Bank PLC 22,207 GBP 70,358 74,273 0.02
Ophir Energy PLC 140,513 GBP 556,006 310,019 0.10
Oxford Instruments PLC 13,630 GBP 289,998 270,970 0.09
Pace PLC 77,168 GBP 578,314 417,645 0.14
Paragon Group of Cos PLC 77,926 GBP 519,488 505,708 0.17
Partnership Assurance Group PLC 78,301 GBP 174,671 170,317 0.06
Pennon Group PLC 109,097 GBP 1,371,839 1,564,157 0.52
Pets at Home Group PLC 83,593 GBP 269,209 263,552 0.09
Poundland Group PLC 53,226 GBP 265,305 272,382 0.09
Premier Farnell PLC 84,811 GBP 303,941 232,745 0.08
Premier Foods PLC 235,765 GBP 259,281 117,637 0.04
Premier Oil PLC 137,109 GBP 652,906 357,452 0.12
Primary Health Properties PLC 55,056 GBP 309,561 317,630 0.11
Provident Financial PLC 41,943 GBP 1,370,189 1,610,139 0.54
QinetiQ Group PLC 171,806 GBP 633,679 503,363 0.17
Quadrise Fuels International PLC 154,386 GBP 86,881 60,182 0.02
Quindell PLC 138,668 GBP 1,094,585 85,406 0.03
Quintain Estates & Development PLC 184,585 GBP 305,929 274,143 0.09
275
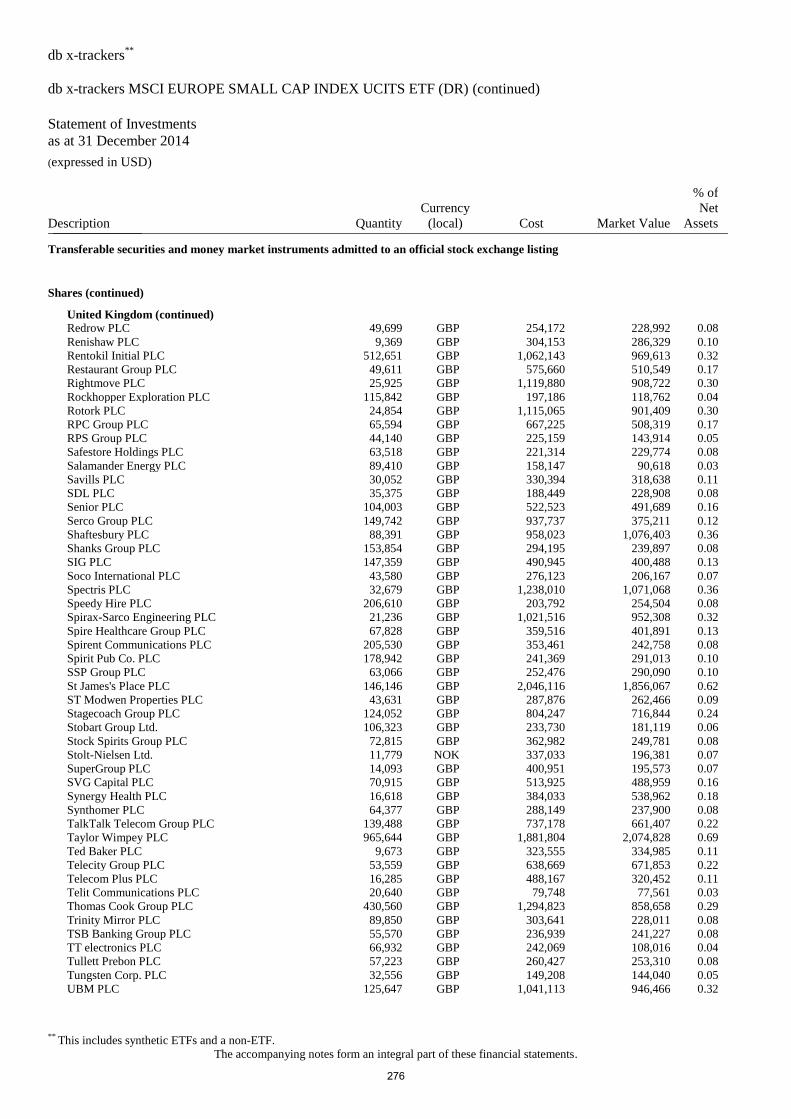
db x-trackers**
db x-trackers MSCI EUROPE SMALL CAP INDEX UCITS ETF (DR) (continued)
Statement of Investments
as at 31 December 2014 (expressed in USD)
** This includes synthetic ETFs and a non-ETF.
The accompanying notes form an integral part of these financial statements.
Description Quantity
Currency
(local) Cost Market Value
% of
Net
Assets _______________
Transferable securities and money market instruments admitted to an official stock exchange listing
Shares (continued)
United Kingdom (continued)
Redrow PLC 49,699 GBP 254,172 228,992 0.08
Renishaw PLC 9,369 GBP 304,153 286,329 0.10
Rentokil Initial PLC 512,651 GBP 1,062,143 969,613 0.32
Restaurant Group PLC 49,611 GBP 575,660 510,549 0.17
Rightmove PLC 25,925 GBP 1,119,880 908,722 0.30
Rockhopper Exploration PLC 115,842 GBP 197,186 118,762 0.04
Rotork PLC 24,854 GBP 1,115,065 901,409 0.30
RPC Group PLC 65,594 GBP 667,225 508,319 0.17
RPS Group PLC 44,140 GBP 225,159 143,914 0.05
Safestore Holdings PLC 63,518 GBP 221,314 229,774 0.08
Salamander Energy PLC 89,410 GBP 158,147 90,618 0.03
Savills PLC 30,052 GBP 330,394 318,638 0.11
SDL PLC 35,375 GBP 188,449 228,908 0.08
Senior PLC 104,003 GBP 522,523 491,689 0.16
Serco Group PLC 149,742 GBP 937,737 375,211 0.12
Shaftesbury PLC 88,391 GBP 958,023 1,076,403 0.36
Shanks Group PLC 153,854 GBP 294,195 239,897 0.08
SIG PLC 147,359 GBP 490,945 400,488 0.13
Soco International PLC 43,580 GBP 276,123 206,167 0.07
Spectris PLC 32,679 GBP 1,238,010 1,071,068 0.36
Speedy Hire PLC 206,610 GBP 203,792 254,504 0.08
Spirax-Sarco Engineering PLC 21,236 GBP 1,021,516 952,308 0.32
Spire Healthcare Group PLC 67,828 GBP 359,516 401,891 0.13
Spirent Communications PLC 205,530 GBP 353,461 242,758 0.08
Spirit Pub Co. PLC 178,942 GBP 241,369 291,013 0.10
SSP Group PLC 63,066 GBP 252,476 290,090 0.10
St James's Place PLC 146,146 GBP 2,046,116 1,856,067 0.62
ST Modwen Properties PLC 43,631 GBP 287,876 262,466 0.09
Stagecoach Group PLC 124,052 GBP 804,247 716,844 0.24
Stobart Group Ltd. 106,323 GBP 233,730 181,119 0.06
Stock Spirits Group PLC 72,815 GBP 362,982 249,781 0.08
Stolt-Nielsen Ltd. 11,779 NOK 337,033 196,381 0.07
SuperGroup PLC 14,093 GBP 400,951 195,573 0.07
SVG Capital PLC 70,915 GBP 513,925 488,959 0.16
Synergy Health PLC 16,618 GBP 384,033 538,962 0.18
Synthomer PLC 64,377 GBP 288,149 237,900 0.08
TalkTalk Telecom Group PLC 139,488 GBP 737,178 661,407 0.22
Taylor Wimpey PLC 965,644 GBP 1,881,804 2,074,828 0.69
Ted Baker PLC 9,673 GBP 323,555 334,985 0.11
Telecity Group PLC 53,559 GBP 638,669 671,853 0.22
Telecom Plus PLC 16,285 GBP 488,167 320,452 0.11
Telit Communications PLC 20,640 GBP 79,748 77,561 0.03
Thomas Cook Group PLC 430,560 GBP 1,294,823 858,658 0.29
Trinity Mirror PLC 89,850 GBP 303,641 228,011 0.08
TSB Banking Group PLC 55,570 GBP 236,939 241,227 0.08
TT electronics PLC 66,932 GBP 242,069 108,016 0.04
Tullett Prebon PLC 57,223 GBP 260,427 253,310 0.08
Tungsten Corp. PLC 32,556 GBP 149,208 144,040 0.05
UBM PLC 125,647 GBP 1,041,113 946,466 0.32
276
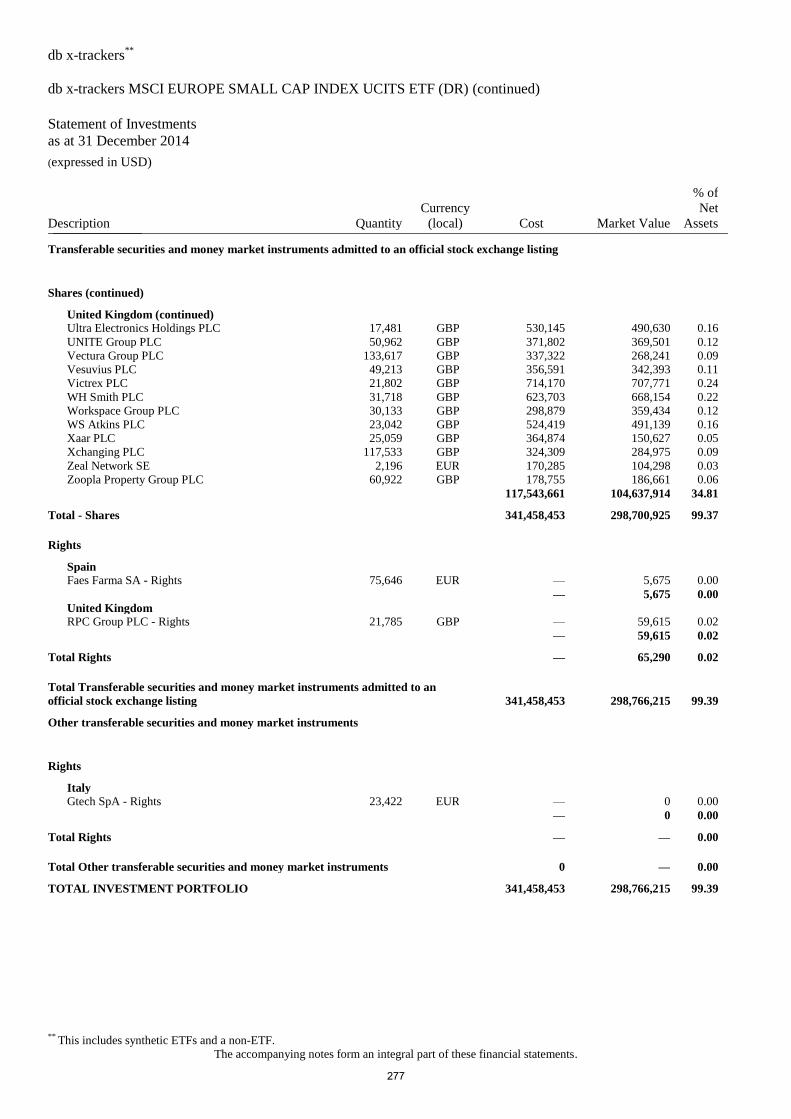
db x-trackers**
db x-trackers MSCI EUROPE SMALL CAP INDEX UCITS ETF (DR) (continued)
Statement of Investments
as at 31 December 2014 (expressed in USD)
** This includes synthetic ETFs and a non-ETF.
The accompanying notes form an integral part of these financial statements.
Description Quantity
Currency
(local) Cost Market Value
% of
Net
Assets _______________
Transferable securities and money market instruments admitted to an official stock exchange listing
Shares (continued)
United Kingdom (continued)
Ultra Electronics Holdings PLC 17,481 GBP 530,145 490,630 0.16
UNITE Group PLC 50,962 GBP 371,802 369,501 0.12
Vectura Group PLC 133,617 GBP 337,322 268,241 0.09
Vesuvius PLC 49,213 GBP 356,591 342,393 0.11
Victrex PLC 21,802 GBP 714,170 707,771 0.24
WH Smith PLC 31,718 GBP 623,703 668,154 0.22
Workspace Group PLC 30,133 GBP 298,879 359,434 0.12
WS Atkins PLC 23,042 GBP 524,419 491,139 0.16
Xaar PLC 25,059 GBP 364,874 150,627 0.05
Xchanging PLC 117,533 GBP 324,309 284,975 0.09
Zeal Network SE 2,196 EUR 170,285 104,298 0.03
Zoopla Property Group PLC 60,922 GBP 178,755 186,661 0.06
117,543,661 104,637,914 34.81
Total - Shares 341,458,453 298,700,925 99.37
Rights
Spain
Faes Farma SA - Rights 75,646 EUR — 5,675 0.00
— 5,675 0.00
United Kingdom
RPC Group PLC - Rights 21,785 GBP — 59,615 0.02
— 59,615 0.02
Total Rights — 65,290 0.02
Total Transferable securities and money market instruments admitted to an
official stock exchange listing 341,458,453 298,766,215 99.39
Other transferable securities and money market instruments
Rights
Italy
Gtech SpA - Rights 23,422 EUR — 0 0.00
— 0 0.00
Total Rights — — 0.00
Total Other transferable securities and money market instruments 0 — 0.00
TOTAL INVESTMENT PORTFOLIO 341,458,453 298,766,215 99.39
277
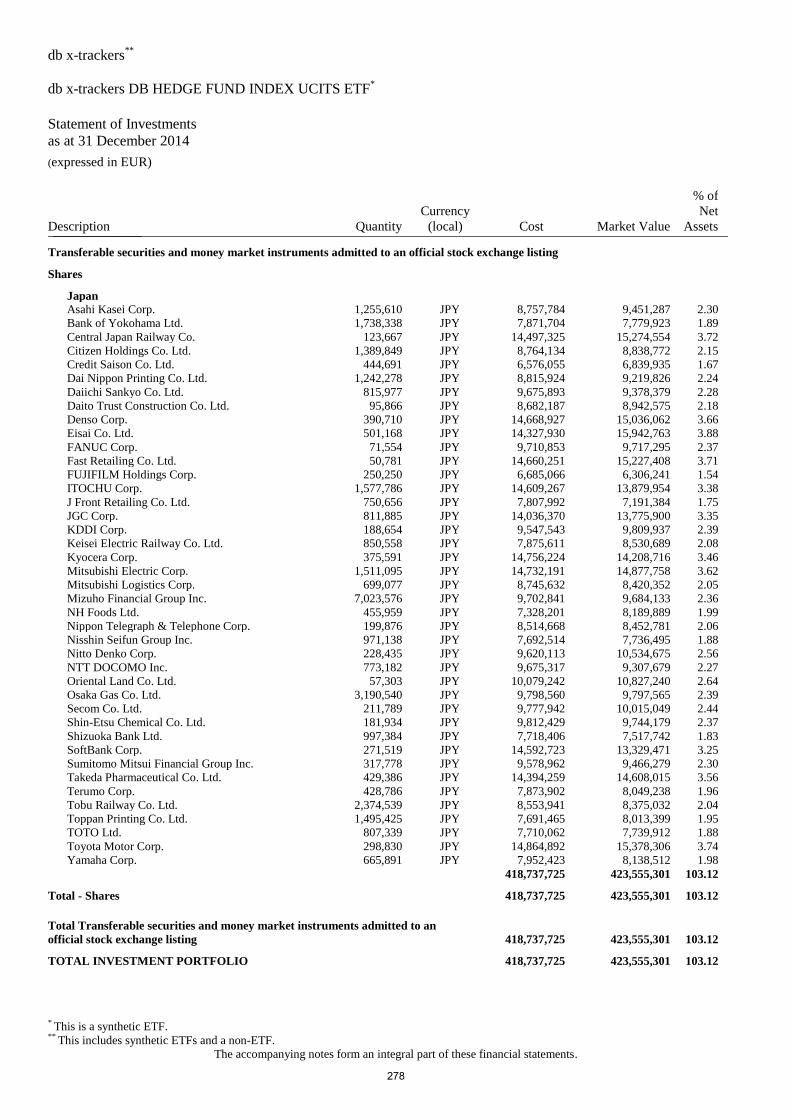
db x-trackers**
db x-trackers DB HEDGE FUND INDEX UCITS ETF*
Statement of Investments
as at 31 December 2014 (expressed in EUR)
* This is a synthetic ETF. ** This includes synthetic ETFs and a non-ETF.
The accompanying notes form an integral part of these financial statements.
Description Quantity
Currency
(local) Cost Market Value
% of
Net
Assets _______________
Transferable securities and money market instruments admitted to an official stock exchange listing
Shares
Japan
Asahi Kasei Corp. 1,255,610 JPY 8,757,784 9,451,287 2.30
Bank of Yokohama Ltd. 1,738,338 JPY 7,871,704 7,779,923 1.89
Central Japan Railway Co. 123,667 JPY 14,497,325 15,274,554 3.72
Citizen Holdings Co. Ltd. 1,389,849 JPY 8,764,134 8,838,772 2.15
Credit Saison Co. Ltd. 444,691 JPY 6,576,055 6,839,935 1.67
Dai Nippon Printing Co. Ltd. 1,242,278 JPY 8,815,924 9,219,826 2.24
Daiichi Sankyo Co. Ltd. 815,977 JPY 9,675,893 9,378,379 2.28
Daito Trust Construction Co. Ltd. 95,866 JPY 8,682,187 8,942,575 2.18
Denso Corp. 390,710 JPY 14,668,927 15,036,062 3.66
Eisai Co. Ltd. 501,168 JPY 14,327,930 15,942,763 3.88
FANUC Corp. 71,554 JPY 9,710,853 9,717,295 2.37
Fast Retailing Co. Ltd. 50,781 JPY 14,660,251 15,227,408 3.71
FUJIFILM Holdings Corp. 250,250 JPY 6,685,066 6,306,241 1.54
ITOCHU Corp. 1,577,786 JPY 14,609,267 13,879,954 3.38
J Front Retailing Co. Ltd. 750,656 JPY 7,807,992 7,191,384 1.75
JGC Corp. 811,885 JPY 14,036,370 13,775,900 3.35
KDDI Corp. 188,654 JPY 9,547,543 9,809,937 2.39
Keisei Electric Railway Co. Ltd. 850,558 JPY 7,875,611 8,530,689 2.08
Kyocera Corp. 375,591 JPY 14,756,224 14,208,716 3.46
Mitsubishi Electric Corp. 1,511,095 JPY 14,732,191 14,877,758 3.62
Mitsubishi Logistics Corp. 699,077 JPY 8,745,632 8,420,352 2.05
Mizuho Financial Group Inc. 7,023,576 JPY 9,702,841 9,684,133 2.36
NH Foods Ltd. 455,959 JPY 7,328,201 8,189,889 1.99
Nippon Telegraph & Telephone Corp. 199,876 JPY 8,514,668 8,452,781 2.06
Nisshin Seifun Group Inc. 971,138 JPY 7,692,514 7,736,495 1.88
Nitto Denko Corp. 228,435 JPY 9,620,113 10,534,675 2.56
NTT DOCOMO Inc. 773,182 JPY 9,675,317 9,307,679 2.27
Oriental Land Co. Ltd. 57,303 JPY 10,079,242 10,827,240 2.64
Osaka Gas Co. Ltd. 3,190,540 JPY 9,798,560 9,797,565 2.39
Secom Co. Ltd. 211,789 JPY 9,777,942 10,015,049 2.44
Shin-Etsu Chemical Co. Ltd. 181,934 JPY 9,812,429 9,744,179 2.37
Shizuoka Bank Ltd. 997,384 JPY 7,718,406 7,517,742 1.83
SoftBank Corp. 271,519 JPY 14,592,723 13,329,471 3.25
Sumitomo Mitsui Financial Group Inc. 317,778 JPY 9,578,962 9,466,279 2.30
Takeda Pharmaceutical Co. Ltd. 429,386 JPY 14,394,259 14,608,015 3.56
Terumo Corp. 428,786 JPY 7,873,902 8,049,238 1.96
Tobu Railway Co. Ltd. 2,374,539 JPY 8,553,941 8,375,032 2.04
Toppan Printing Co. Ltd. 1,495,425 JPY 7,691,465 8,013,399 1.95
TOTO Ltd. 807,339 JPY 7,710,062 7,739,912 1.88
Toyota Motor Corp. 298,830 JPY 14,864,892 15,378,306 3.74
Yamaha Corp. 665,891 JPY 7,952,423 8,138,512 1.98
418,737,725 423,555,301 103.12
Total - Shares 418,737,725 423,555,301 103.12
Total Transferable securities and money market instruments admitted to an
official stock exchange listing 418,737,725 423,555,301 103.12
TOTAL INVESTMENT PORTFOLIO 418,737,725 423,555,301 103.12
278
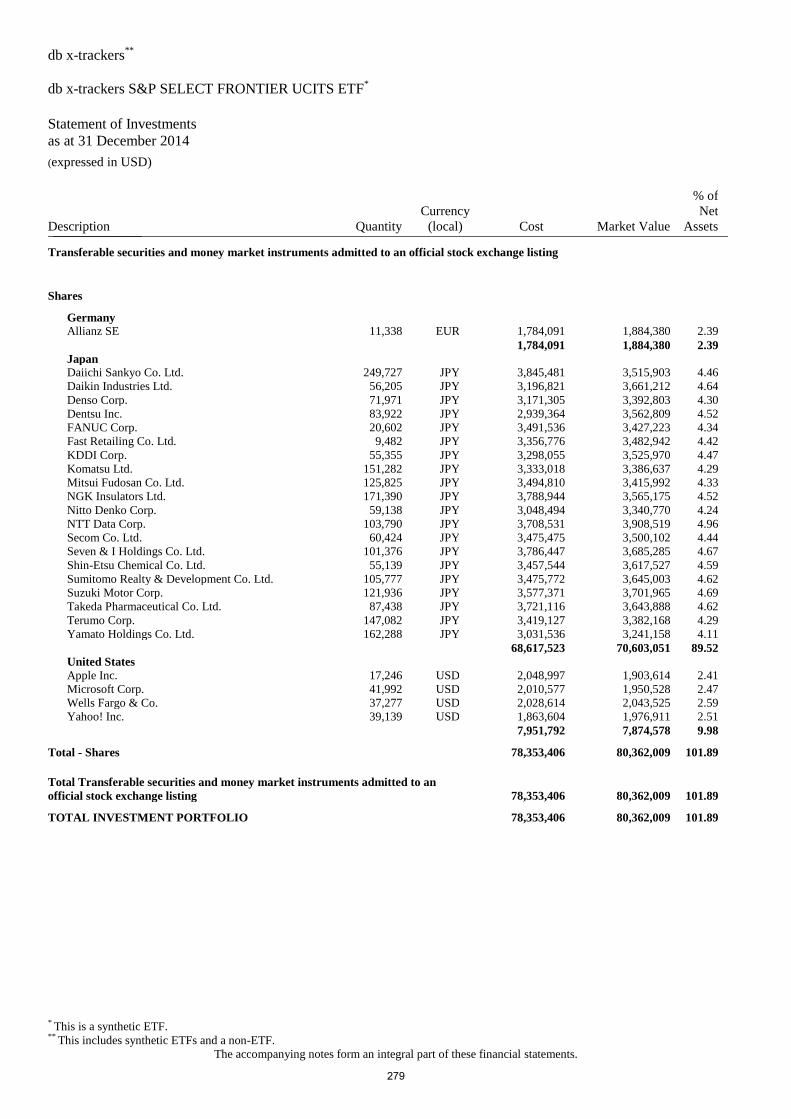
db x-trackers**
db x-trackers S&P SELECT FRONTIER UCITS ETF*
Statement of Investments
as at 31 December 2014 (expressed in USD)
* This is a synthetic ETF. ** This includes synthetic ETFs and a non-ETF.
The accompanying notes form an integral part of these financial statements.
Description Quantity
Currency
(local) Cost Market Value
% of
Net
Assets _______________
Transferable securities and money market instruments admitted to an official stock exchange listing
Shares
Germany
Allianz SE 11,338 EUR 1,784,091 1,884,380 2.39
1,784,091 1,884,380 2.39
Japan
Daiichi Sankyo Co. Ltd. 249,727 JPY 3,845,481 3,515,903 4.46
Daikin Industries Ltd. 56,205 JPY 3,196,821 3,661,212 4.64
Denso Corp. 71,971 JPY 3,171,305 3,392,803 4.30
Dentsu Inc. 83,922 JPY 2,939,364 3,562,809 4.52
FANUC Corp. 20,602 JPY 3,491,536 3,427,223 4.34
Fast Retailing Co. Ltd. 9,482 JPY 3,356,776 3,482,942 4.42
KDDI Corp. 55,355 JPY 3,298,055 3,525,970 4.47
Komatsu Ltd. 151,282 JPY 3,333,018 3,386,637 4.29
Mitsui Fudosan Co. Ltd. 125,825 JPY 3,494,810 3,415,992 4.33
NGK Insulators Ltd. 171,390 JPY 3,788,944 3,565,175 4.52
Nitto Denko Corp. 59,138 JPY 3,048,494 3,340,770 4.24
NTT Data Corp. 103,790 JPY 3,708,531 3,908,519 4.96
Secom Co. Ltd. 60,424 JPY 3,475,475 3,500,102 4.44
Seven & I Holdings Co. Ltd. 101,376 JPY 3,786,447 3,685,285 4.67
Shin-Etsu Chemical Co. Ltd. 55,139 JPY 3,457,544 3,617,527 4.59
Sumitomo Realty & Development Co. Ltd. 105,777 JPY 3,475,772 3,645,003 4.62
Suzuki Motor Corp. 121,936 JPY 3,577,371 3,701,965 4.69
Takeda Pharmaceutical Co. Ltd. 87,438 JPY 3,721,116 3,643,888 4.62
Terumo Corp. 147,082 JPY 3,419,127 3,382,168 4.29
Yamato Holdings Co. Ltd. 162,288 JPY 3,031,536 3,241,158 4.11
68,617,523 70,603,051 89.52
United States
Apple Inc. 17,246 USD 2,048,997 1,903,614 2.41
Microsoft Corp. 41,992 USD 2,010,577 1,950,528 2.47
Wells Fargo & Co. 37,277 USD 2,028,614 2,043,525 2.59
Yahoo! Inc. 39,139 USD 1,863,604 1,976,911 2.51
7,951,792 7,874,578 9.98
Total - Shares 78,353,406 80,362,009 101.89
Total Transferable securities and money market instruments admitted to an
official stock exchange listing 78,353,406 80,362,009 101.89
TOTAL INVESTMENT PORTFOLIO 78,353,406 80,362,009 101.89
279
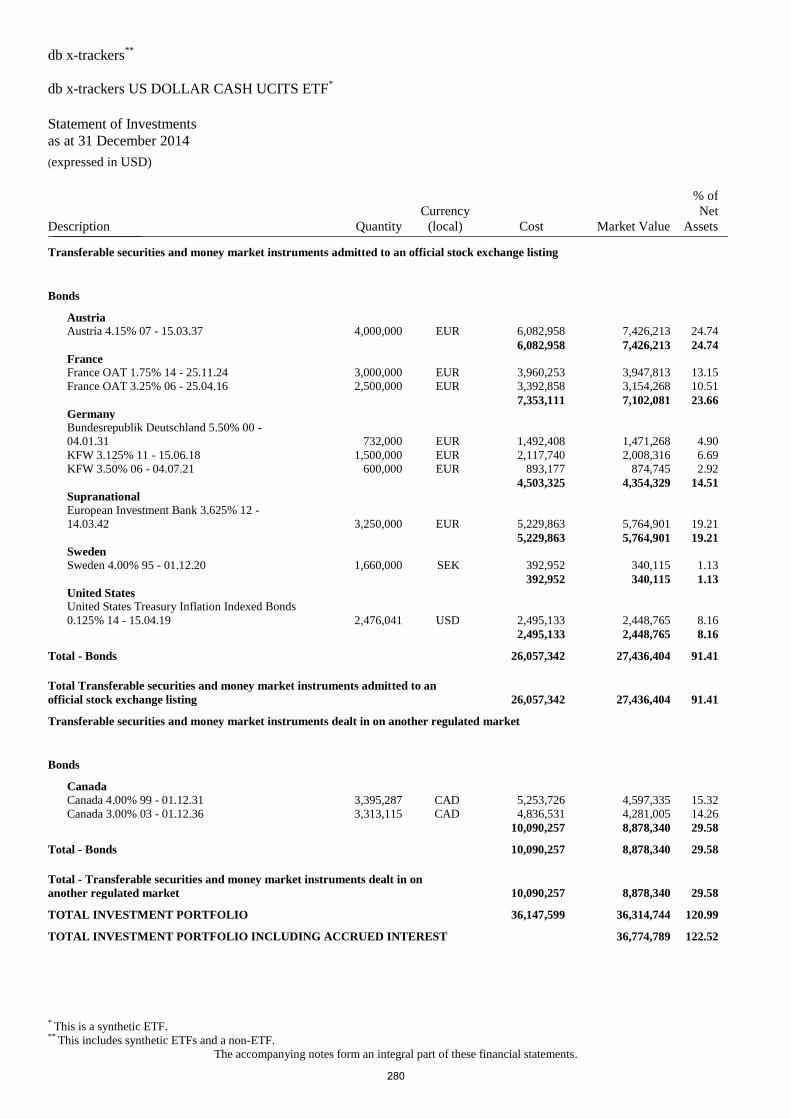
db x-trackers**
db x-trackers US DOLLAR CASH UCITS ETF*
Statement of Investments
as at 31 December 2014 (expressed in USD)
* This is a synthetic ETF. ** This includes synthetic ETFs and a non-ETF.
The accompanying notes form an integral part of these financial statements.
Description Quantity
Currency
(local) Cost Market Value
% of
Net
Assets _______________
Transferable securities and money market instruments admitted to an official stock exchange listing
Bonds
Austria
Austria 4.15% 07 - 15.03.37 4,000,000 EUR 6,082,958 7,426,213 24.74
6,082,958 7,426,213 24.74
France
France OAT 1.75% 14 - 25.11.24 3,000,000 EUR 3,960,253 3,947,813 13.15
France OAT 3.25% 06 - 25.04.16 2,500,000 EUR 3,392,858 3,154,268 10.51
7,353,111 7,102,081 23.66
Germany
Bundesrepublik Deutschland 5.50% 00 -
04.01.31 732,000 EUR 1,492,408 1,471,268 4.90
KFW 3.125% 11 - 15.06.18 1,500,000 EUR 2,117,740 2,008,316 6.69
KFW 3.50% 06 - 04.07.21 600,000 EUR 893,177 874,745 2.92
4,503,325 4,354,329 14.51
Supranational
European Investment Bank 3.625% 12 -
14.03.42 3,250,000 EUR 5,229,863 5,764,901 19.21
5,229,863 5,764,901 19.21
Sweden
Sweden 4.00% 95 - 01.12.20 1,660,000 SEK 392,952 340,115 1.13
392,952 340,115 1.13
United States
United States Treasury Inflation Indexed Bonds
0.125% 14 - 15.04.19 2,476,041 USD 2,495,133 2,448,765 8.16
2,495,133 2,448,765 8.16
Total - Bonds 26,057,342 27,436,404 91.41
Total Transferable securities and money market instruments admitted to an
official stock exchange listing 26,057,342 27,436,404 91.41
Transferable securities and money market instruments dealt in on another regulated market
Bonds
Canada
Canada 4.00% 99 - 01.12.31 3,395,287 CAD 5,253,726 4,597,335 15.32
Canada 3.00% 03 - 01.12.36 3,313,115 CAD 4,836,531 4,281,005 14.26
10,090,257 8,878,340 29.58
Total - Bonds 10,090,257 8,878,340 29.58
Total - Transferable securities and money market instruments dealt in on
another regulated market 10,090,257 8,878,340 29.58
TOTAL INVESTMENT PORTFOLIO 36,147,599 36,314,744 120.99
TOTAL INVESTMENT PORTFOLIO INCLUDING ACCRUED INTEREST 36,774,789 122.52
280
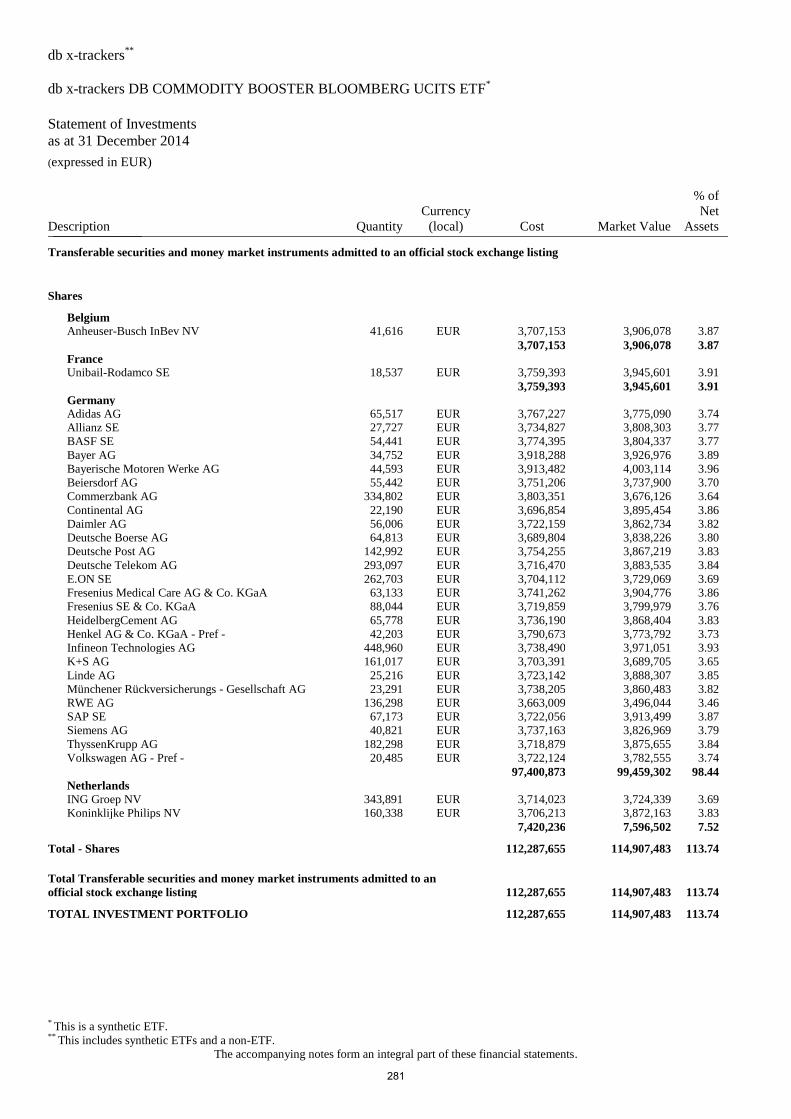
db x-trackers**
db x-trackers DB COMMODITY BOOSTER BLOOMBERG UCITS ETF*
Statement of Investments
as at 31 December 2014 (expressed in EUR)
* This is a synthetic ETF. ** This includes synthetic ETFs and a non-ETF.
The accompanying notes form an integral part of these financial statements.
Description Quantity
Currency
(local) Cost Market Value
% of
Net
Assets _______________
Transferable securities and money market instruments admitted to an official stock exchange listing
Shares
Belgium
Anheuser-Busch InBev NV 41,616 EUR 3,707,153 3,906,078 3.87
3,707,153 3,906,078 3.87
France
Unibail-Rodamco SE 18,537 EUR 3,759,393 3,945,601 3.91
3,759,393 3,945,601 3.91
Germany
Adidas AG 65,517 EUR 3,767,227 3,775,090 3.74
Allianz SE 27,727 EUR 3,734,827 3,808,303 3.77
BASF SE 54,441 EUR 3,774,395 3,804,337 3.77
Bayer AG 34,752 EUR 3,918,288 3,926,976 3.89
Bayerische Motoren Werke AG 44,593 EUR 3,913,482 4,003,114 3.96
Beiersdorf AG 55,442 EUR 3,751,206 3,737,900 3.70
Commerzbank AG 334,802 EUR 3,803,351 3,676,126 3.64
Continental AG 22,190 EUR 3,696,854 3,895,454 3.86
Daimler AG 56,006 EUR 3,722,159 3,862,734 3.82
Deutsche Boerse AG 64,813 EUR 3,689,804 3,838,226 3.80
Deutsche Post AG 142,992 EUR 3,754,255 3,867,219 3.83
Deutsche Telekom AG 293,097 EUR 3,716,470 3,883,535 3.84
E.ON SE 262,703 EUR 3,704,112 3,729,069 3.69
Fresenius Medical Care AG & Co. KGaA 63,133 EUR 3,741,262 3,904,776 3.86
Fresenius SE & Co. KGaA 88,044 EUR 3,719,859 3,799,979 3.76
HeidelbergCement AG 65,778 EUR 3,736,190 3,868,404 3.83
Henkel AG & Co. KGaA - Pref - 42,203 EUR 3,790,673 3,773,792 3.73
Infineon Technologies AG 448,960 EUR 3,738,490 3,971,051 3.93
K+S AG 161,017 EUR 3,703,391 3,689,705 3.65
Linde AG 25,216 EUR 3,723,142 3,888,307 3.85
Münchener Rückversicherungs - Gesellschaft AG 23,291 EUR 3,738,205 3,860,483 3.82
RWE AG 136,298 EUR 3,663,009 3,496,044 3.46
SAP SE 67,173 EUR 3,722,056 3,913,499 3.87
Siemens AG 40,821 EUR 3,737,163 3,826,969 3.79
ThyssenKrupp AG 182,298 EUR 3,718,879 3,875,655 3.84
Volkswagen AG - Pref - 20,485 EUR 3,722,124 3,782,555 3.74
97,400,873 99,459,302 98.44
Netherlands
ING Groep NV 343,891 EUR 3,714,023 3,724,339 3.69
Koninklijke Philips NV 160,338 EUR 3,706,213 3,872,163 3.83
7,420,236 7,596,502 7.52
Total - Shares 112,287,655 114,907,483 113.74
Total Transferable securities and money market instruments admitted to an
official stock exchange listing 112,287,655 114,907,483 113.74
TOTAL INVESTMENT PORTFOLIO 112,287,655 114,907,483 113.74
281
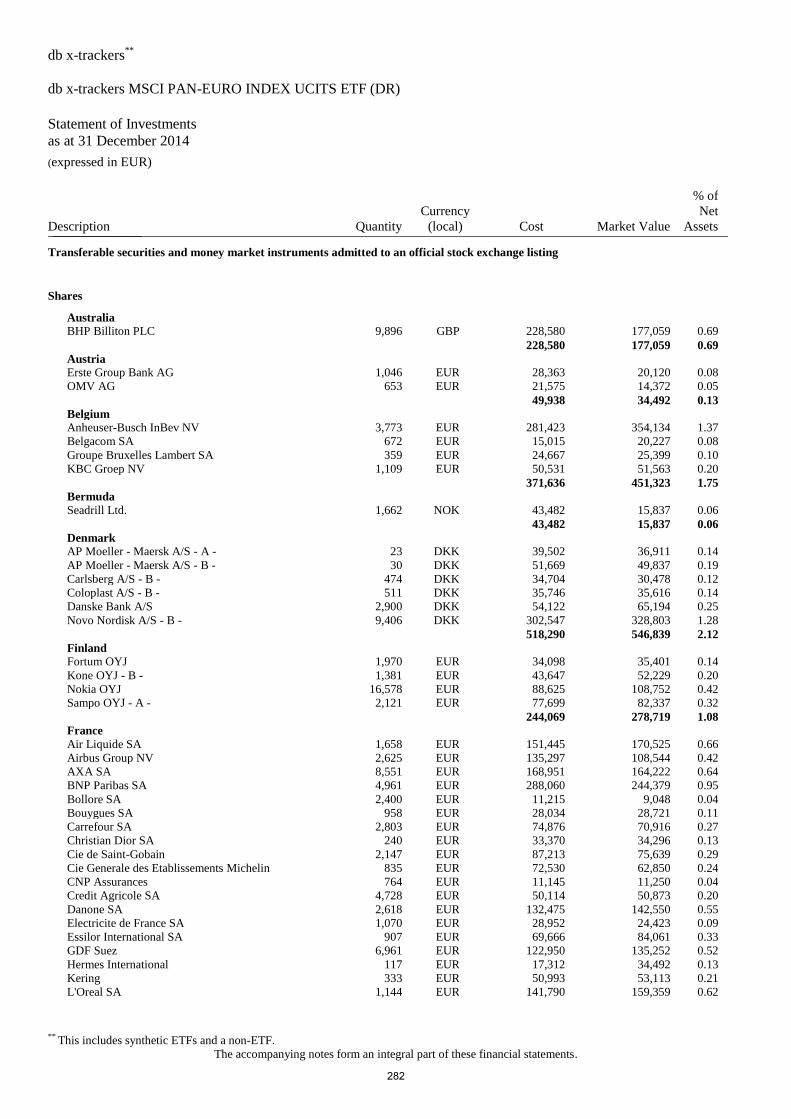
db x-trackers**
db x-trackers MSCI PAN-EURO INDEX UCITS ETF (DR)
Statement of Investments
as at 31 December 2014 (expressed in EUR)
** This includes synthetic ETFs and a non-ETF.
The accompanying notes form an integral part of these financial statements.
Description Quantity
Currency
(local) Cost Market Value
% of
Net
Assets _______________
Transferable securities and money market instruments admitted to an official stock exchange listing
Shares
Australia
BHP Billiton PLC 9,896 GBP 228,580 177,059 0.69
228,580 177,059 0.69
Austria
Erste Group Bank AG 1,046 EUR 28,363 20,120 0.08
OMV AG 653 EUR 21,575 14,372 0.05
49,938 34,492 0.13
Belgium
Anheuser-Busch InBev NV 3,773 EUR 281,423 354,134 1.37
Belgacom SA 672 EUR 15,015 20,227 0.08
Groupe Bruxelles Lambert SA 359 EUR 24,667 25,399 0.10
KBC Groep NV 1,109 EUR 50,531 51,563 0.20
371,636 451,323 1.75
Bermuda
Seadrill Ltd. 1,662 NOK 43,482 15,837 0.06
43,482 15,837 0.06
Denmark
AP Moeller - Maersk A/S - A - 23 DKK 39,502 36,911 0.14
AP Moeller - Maersk A/S - B - 30 DKK 51,669 49,837 0.19
Carlsberg A/S - B - 474 DKK 34,704 30,478 0.12
Coloplast A/S - B - 511 DKK 35,746 35,616 0.14
Danske Bank A/S 2,900 DKK 54,122 65,194 0.25
Novo Nordisk A/S - B - 9,406 DKK 302,547 328,803 1.28
518,290 546,839 2.12
Finland
Fortum OYJ 1,970 EUR 34,098 35,401 0.14
Kone OYJ - B - 1,381 EUR 43,647 52,229 0.20
Nokia OYJ 16,578 EUR 88,625 108,752 0.42
Sampo OYJ - A - 2,121 EUR 77,699 82,337 0.32
244,069 278,719 1.08
France
Air Liquide SA 1,658 EUR 151,445 170,525 0.66
Airbus Group NV 2,625 EUR 135,297 108,544 0.42
AXA SA 8,551 EUR 168,951 164,222 0.64
BNP Paribas SA 4,961 EUR 288,060 244,379 0.95
Bollore SA 2,400 EUR 11,215 9,048 0.04
Bouygues SA 958 EUR 28,034 28,721 0.11
Carrefour SA 2,803 EUR 74,876 70,916 0.27
Christian Dior SA 240 EUR 33,370 34,296 0.13
Cie de Saint-Gobain 2,147 EUR 87,213 75,639 0.29
Cie Generale des Etablissements Michelin 835 EUR 72,530 62,850 0.24
CNP Assurances 764 EUR 11,145 11,250 0.04
Credit Agricole SA 4,728 EUR 50,114 50,873 0.20
Danone SA 2,618 EUR 132,475 142,550 0.55
Electricite de France SA 1,070 EUR 28,952 24,423 0.09
Essilor International SA 907 EUR 69,666 84,061 0.33
GDF Suez 6,961 EUR 122,950 135,252 0.52
Hermes International 117 EUR 17,312 34,492 0.13
Kering 333 EUR 50,993 53,113 0.21
L'Oreal SA 1,144 EUR 141,790 159,359 0.62
282
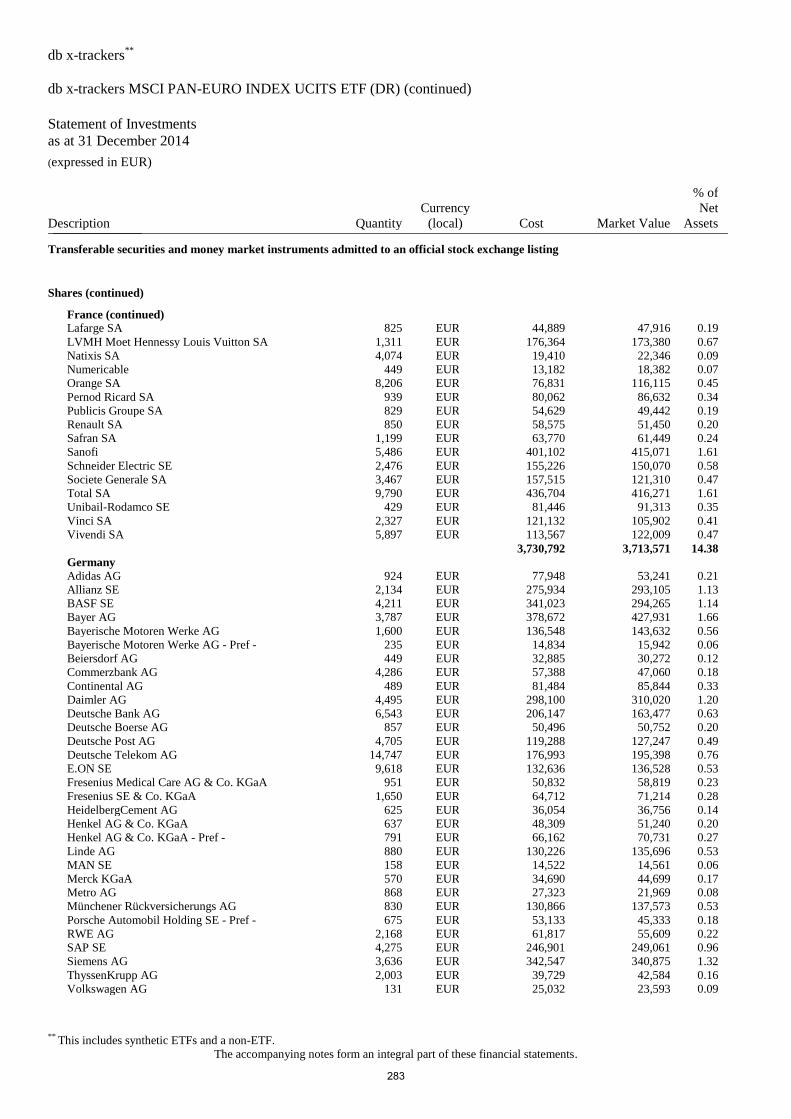
db x-trackers**
db x-trackers MSCI PAN-EURO INDEX UCITS ETF (DR) (continued)
Statement of Investments
as at 31 December 2014 (expressed in EUR)
** This includes synthetic ETFs and a non-ETF.
The accompanying notes form an integral part of these financial statements.
Description Quantity
Currency
(local) Cost Market Value
% of
Net
Assets _______________
Transferable securities and money market instruments admitted to an official stock exchange listing
Shares (continued)
France (continued)
Lafarge SA 825 EUR 44,889 47,916 0.19
LVMH Moet Hennessy Louis Vuitton SA 1,311 EUR 176,364 173,380 0.67
Natixis SA 4,074 EUR 19,410 22,346 0.09
Numericable 449 EUR 13,182 18,382 0.07
Orange SA 8,206 EUR 76,831 116,115 0.45
Pernod Ricard SA 939 EUR 80,062 86,632 0.34
Publicis Groupe SA 829 EUR 54,629 49,442 0.19
Renault SA 850 EUR 58,575 51,450 0.20
Safran SA 1,199 EUR 63,770 61,449 0.24
Sanofi 5,486 EUR 401,102 415,071 1.61
Schneider Electric SE 2,476 EUR 155,226 150,070 0.58
Societe Generale SA 3,467 EUR 157,515 121,310 0.47
Total SA 9,790 EUR 436,704 416,271 1.61
Unibail-Rodamco SE 429 EUR 81,446 91,313 0.35
Vinci SA 2,327 EUR 121,132 105,902 0.41
Vivendi SA 5,897 EUR 113,567 122,009 0.47
3,730,792 3,713,571 14.38
Germany
Adidas AG 924 EUR 77,948 53,241 0.21
Allianz SE 2,134 EUR 275,934 293,105 1.13
BASF SE 4,211 EUR 341,023 294,265 1.14
Bayer AG 3,787 EUR 378,672 427,931 1.66
Bayerische Motoren Werke AG 1,600 EUR 136,548 143,632 0.56
Bayerische Motoren Werke AG - Pref - 235 EUR 14,834 15,942 0.06
Beiersdorf AG 449 EUR 32,885 30,272 0.12
Commerzbank AG 4,286 EUR 57,388 47,060 0.18
Continental AG 489 EUR 81,484 85,844 0.33
Daimler AG 4,495 EUR 298,100 310,020 1.20
Deutsche Bank AG 6,543 EUR 206,147 163,477 0.63
Deutsche Boerse AG 857 EUR 50,496 50,752 0.20
Deutsche Post AG 4,705 EUR 119,288 127,247 0.49
Deutsche Telekom AG 14,747 EUR 176,993 195,398 0.76
E.ON SE 9,618 EUR 132,636 136,528 0.53
Fresenius Medical Care AG & Co. KGaA 951 EUR 50,832 58,819 0.23
Fresenius SE & Co. KGaA 1,650 EUR 64,712 71,214 0.28
HeidelbergCement AG 625 EUR 36,054 36,756 0.14
Henkel AG & Co. KGaA 637 EUR 48,309 51,240 0.20
Henkel AG & Co. KGaA - Pref - 791 EUR 66,162 70,731 0.27
Linde AG 880 EUR 130,226 135,696 0.53
MAN SE 158 EUR 14,522 14,561 0.06
Merck KGaA 570 EUR 34,690 44,699 0.17
Metro AG 868 EUR 27,323 21,969 0.08
Münchener Rückversicherungs AG 830 EUR 130,866 137,573 0.53
Porsche Automobil Holding SE - Pref - 675 EUR 53,133 45,333 0.18
RWE AG 2,168 EUR 61,817 55,609 0.22
SAP SE 4,275 EUR 246,901 249,061 0.96
Siemens AG 3,636 EUR 342,547 340,875 1.32
ThyssenKrupp AG 2,003 EUR 39,729 42,584 0.16
Volkswagen AG 131 EUR 25,032 23,593 0.09
283
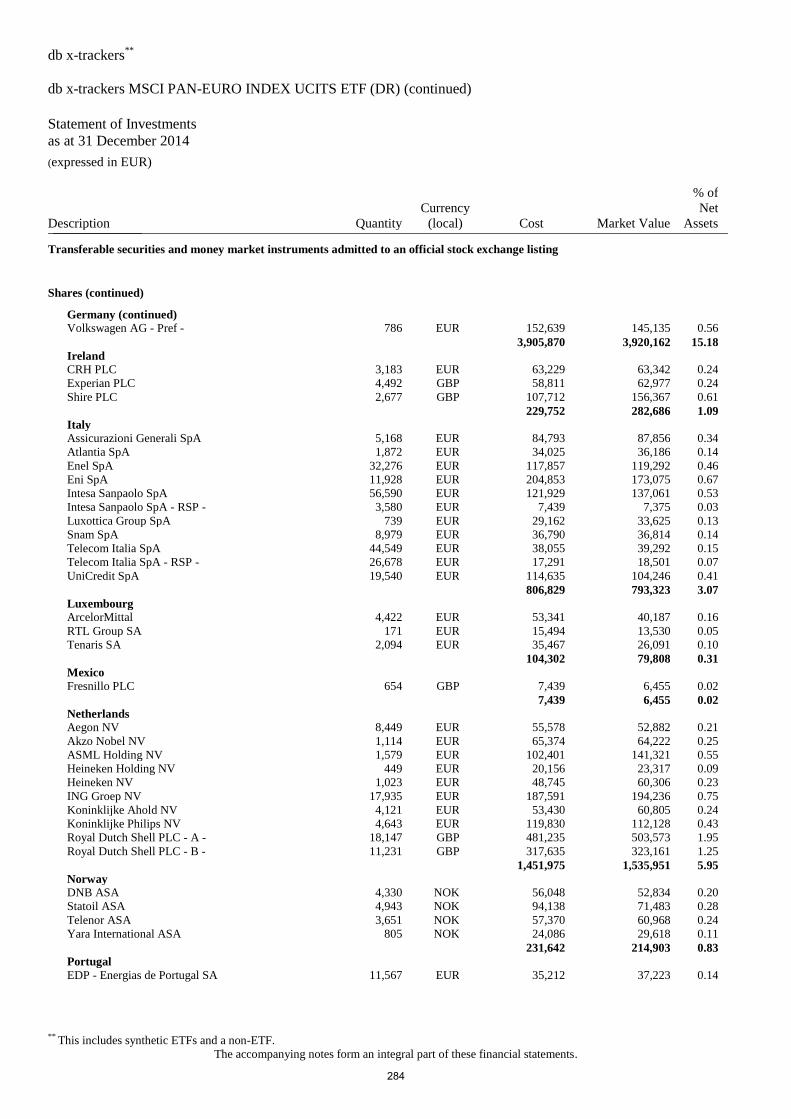
db x-trackers**
db x-trackers MSCI PAN-EURO INDEX UCITS ETF (DR) (continued)
Statement of Investments
as at 31 December 2014 (expressed in EUR)
** This includes synthetic ETFs and a non-ETF.
The accompanying notes form an integral part of these financial statements.
Description Quantity
Currency
(local) Cost Market Value
% of
Net
Assets _______________
Transferable securities and money market instruments admitted to an official stock exchange listing
Shares (continued)
Germany (continued)
Volkswagen AG - Pref - 786 EUR 152,639 145,135 0.56
3,905,870 3,920,162 15.18
Ireland
CRH PLC 3,183 EUR 63,229 63,342 0.24
Experian PLC 4,492 GBP 58,811 62,977 0.24
Shire PLC 2,677 GBP 107,712 156,367 0.61
229,752 282,686 1.09
Italy
Assicurazioni Generali SpA 5,168 EUR 84,793 87,856 0.34
Atlantia SpA 1,872 EUR 34,025 36,186 0.14
Enel SpA 32,276 EUR 117,857 119,292 0.46
Eni SpA 11,928 EUR 204,853 173,075 0.67
Intesa Sanpaolo SpA 56,590 EUR 121,929 137,061 0.53
Intesa Sanpaolo SpA - RSP - 3,580 EUR 7,439 7,375 0.03
Luxottica Group SpA 739 EUR 29,162 33,625 0.13
Snam SpA 8,979 EUR 36,790 36,814 0.14
Telecom Italia SpA 44,549 EUR 38,055 39,292 0.15
Telecom Italia SpA - RSP - 26,678 EUR 17,291 18,501 0.07
UniCredit SpA 19,540 EUR 114,635 104,246 0.41
806,829 793,323 3.07
Luxembourg
ArcelorMittal 4,422 EUR 53,341 40,187 0.16
RTL Group SA 171 EUR 15,494 13,530 0.05
Tenaris SA 2,094 EUR 35,467 26,091 0.10
104,302 79,808 0.31
Mexico
Fresnillo PLC 654 GBP 7,439 6,455 0.02
7,439 6,455 0.02
Netherlands
Aegon NV 8,449 EUR 55,578 52,882 0.21
Akzo Nobel NV 1,114 EUR 65,374 64,222 0.25
ASML Holding NV 1,579 EUR 102,401 141,321 0.55
Heineken Holding NV 449 EUR 20,156 23,317 0.09
Heineken NV 1,023 EUR 48,745 60,306 0.23
ING Groep NV 17,935 EUR 187,591 194,236 0.75
Koninklijke Ahold NV 4,121 EUR 53,430 60,805 0.24
Koninklijke Philips NV 4,643 EUR 119,830 112,128 0.43
Royal Dutch Shell PLC - A - 18,147 GBP 481,235 503,573 1.95
Royal Dutch Shell PLC - B - 11,231 GBP 317,635 323,161 1.25
1,451,975 1,535,951 5.95
Norway
DNB ASA 4,330 NOK 56,048 52,834 0.20
Statoil ASA 4,943 NOK 94,138 71,483 0.28
Telenor ASA 3,651 NOK 57,370 60,968 0.24
Yara International ASA 805 NOK 24,086 29,618 0.11
231,642 214,903 0.83
Portugal
EDP - Energias de Portugal SA 11,567 EUR 35,212 37,223 0.14
284
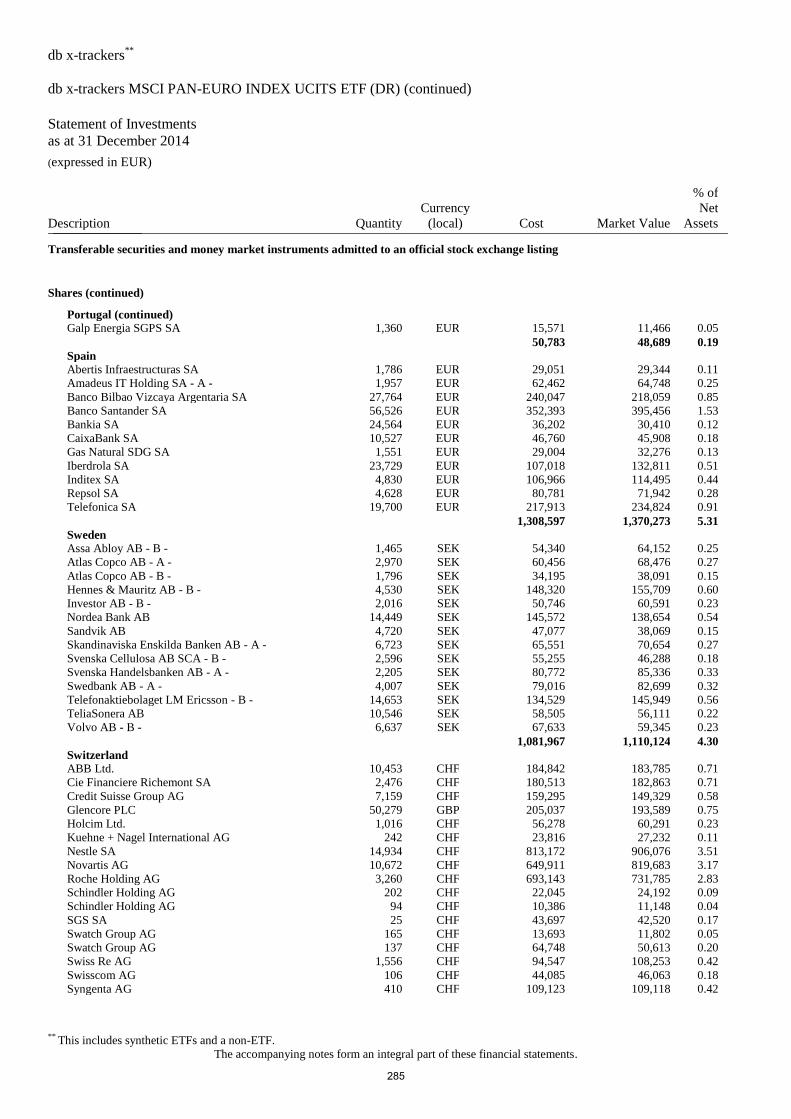
db x-trackers**
db x-trackers MSCI PAN-EURO INDEX UCITS ETF (DR) (continued)
Statement of Investments
as at 31 December 2014 (expressed in EUR)
** This includes synthetic ETFs and a non-ETF.
The accompanying notes form an integral part of these financial statements.
Description Quantity
Currency
(local) Cost Market Value
% of
Net
Assets _______________
Transferable securities and money market instruments admitted to an official stock exchange listing
Shares (continued)
Portugal (continued)
Galp Energia SGPS SA 1,360 EUR 15,571 11,466 0.05
50,783 48,689 0.19
Spain
Abertis Infraestructuras SA 1,786 EUR 29,051 29,344 0.11
Amadeus IT Holding SA - A - 1,957 EUR 62,462 64,748 0.25
Banco Bilbao Vizcaya Argentaria SA 27,764 EUR 240,047 218,059 0.85
Banco Santander SA 56,526 EUR 352,393 395,456 1.53
Bankia SA 24,564 EUR 36,202 30,410 0.12
CaixaBank SA 10,527 EUR 46,760 45,908 0.18
Gas Natural SDG SA 1,551 EUR 29,004 32,276 0.13
Iberdrola SA 23,729 EUR 107,018 132,811 0.51
Inditex SA 4,830 EUR 106,966 114,495 0.44
Repsol SA 4,628 EUR 80,781 71,942 0.28
Telefonica SA 19,700 EUR 217,913 234,824 0.91
1,308,597 1,370,273 5.31
Sweden
Assa Abloy AB - B - 1,465 SEK 54,340 64,152 0.25
Atlas Copco AB - A - 2,970 SEK 60,456 68,476 0.27
Atlas Copco AB - B - 1,796 SEK 34,195 38,091 0.15
Hennes & Mauritz AB - B - 4,530 SEK 148,320 155,709 0.60
Investor AB - B - 2,016 SEK 50,746 60,591 0.23
Nordea Bank AB 14,449 SEK 145,572 138,654 0.54
Sandvik AB 4,720 SEK 47,077 38,069 0.15
Skandinaviska Enskilda Banken AB - A - 6,723 SEK 65,551 70,654 0.27
Svenska Cellulosa AB SCA - B - 2,596 SEK 55,255 46,288 0.18
Svenska Handelsbanken AB - A - 2,205 SEK 80,772 85,336 0.33
Swedbank AB - A - 4,007 SEK 79,016 82,699 0.32
Telefonaktiebolaget LM Ericsson - B - 14,653 SEK 134,529 145,949 0.56
TeliaSonera AB 10,546 SEK 58,505 56,111 0.22
Volvo AB - B - 6,637 SEK 67,633 59,345 0.23
1,081,967 1,110,124 4.30
Switzerland
ABB Ltd. 10,453 CHF 184,842 183,785 0.71
Cie Financiere Richemont SA 2,476 CHF 180,513 182,863 0.71
Credit Suisse Group AG 7,159 CHF 159,295 149,329 0.58
Glencore PLC 50,279 GBP 205,037 193,589 0.75
Holcim Ltd. 1,016 CHF 56,278 60,291 0.23
Kuehne + Nagel International AG 242 CHF 23,816 27,232 0.11
Nestle SA 14,934 CHF 813,172 906,076 3.51
Novartis AG 10,672 CHF 649,911 819,683 3.17
Roche Holding AG 3,260 CHF 693,143 731,785 2.83
Schindler Holding AG 202 CHF 22,045 24,192 0.09
Schindler Holding AG 94 CHF 10,386 11,148 0.04
SGS SA 25 CHF 43,697 42,520 0.17
Swatch Group AG 165 CHF 13,693 11,802 0.05
Swatch Group AG 137 CHF 64,748 50,613 0.20
Swiss Re AG 1,556 CHF 94,547 108,253 0.42
Swisscom AG 106 CHF 44,085 46,063 0.18
Syngenta AG 410 CHF 109,123 109,118 0.42
285
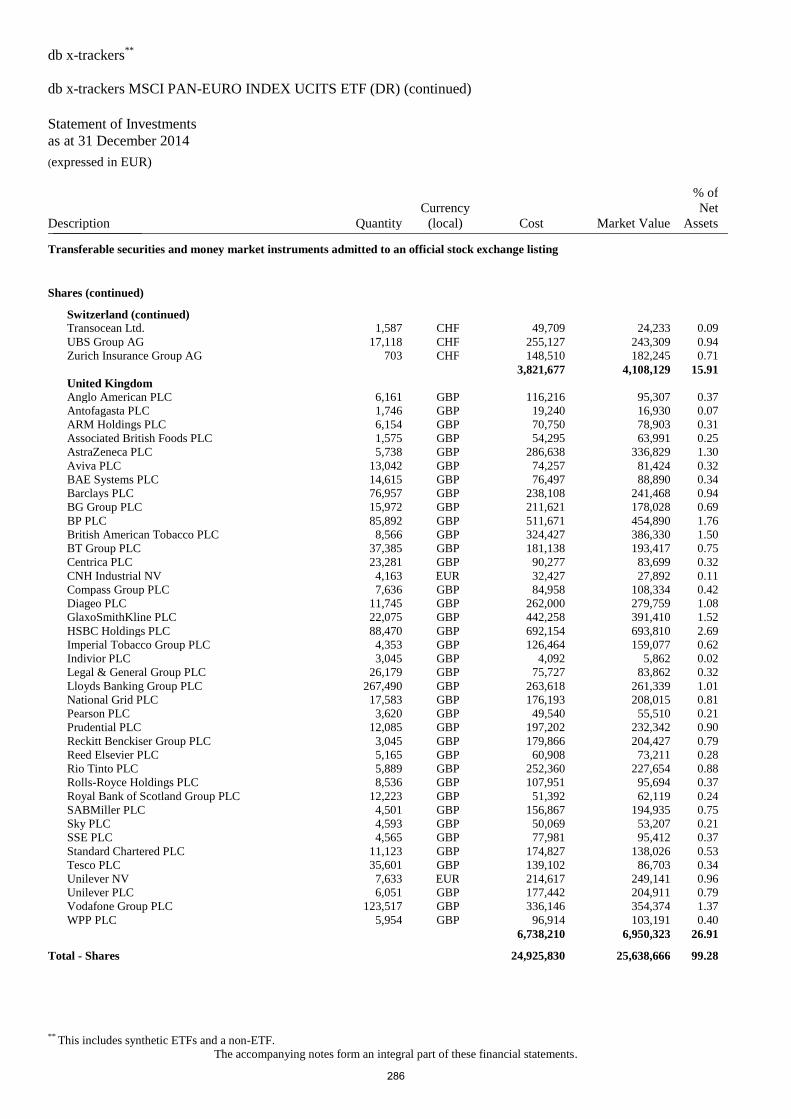
db x-trackers**
db x-trackers MSCI PAN-EURO INDEX UCITS ETF (DR) (continued)
Statement of Investments
as at 31 December 2014 (expressed in EUR)
** This includes synthetic ETFs and a non-ETF.
The accompanying notes form an integral part of these financial statements.
Description Quantity
Currency
(local) Cost Market Value
% of
Net
Assets _______________
Transferable securities and money market instruments admitted to an official stock exchange listing
Shares (continued)
Switzerland (continued)
Transocean Ltd. 1,587 CHF 49,709 24,233 0.09
UBS Group AG 17,118 CHF 255,127 243,309 0.94
Zurich Insurance Group AG 703 CHF 148,510 182,245 0.71
3,821,677 4,108,129 15.91
United Kingdom
Anglo American PLC 6,161 GBP 116,216 95,307 0.37
Antofagasta PLC 1,746 GBP 19,240 16,930 0.07
ARM Holdings PLC 6,154 GBP 70,750 78,903 0.31
Associated British Foods PLC 1,575 GBP 54,295 63,991 0.25
AstraZeneca PLC 5,738 GBP 286,638 336,829 1.30
Aviva PLC 13,042 GBP 74,257 81,424 0.32
BAE Systems PLC 14,615 GBP 76,497 88,890 0.34
Barclays PLC 76,957 GBP 238,108 241,468 0.94
BG Group PLC 15,972 GBP 211,621 178,028 0.69
BP PLC 85,892 GBP 511,671 454,890 1.76
British American Tobacco PLC 8,566 GBP 324,427 386,330 1.50
BT Group PLC 37,385 GBP 181,138 193,417 0.75
Centrica PLC 23,281 GBP 90,277 83,699 0.32
CNH Industrial NV 4,163 EUR 32,427 27,892 0.11
Compass Group PLC 7,636 GBP 84,958 108,334 0.42
Diageo PLC 11,745 GBP 262,000 279,759 1.08
GlaxoSmithKline PLC 22,075 GBP 442,258 391,410 1.52
HSBC Holdings PLC 88,470 GBP 692,154 693,810 2.69
Imperial Tobacco Group PLC 4,353 GBP 126,464 159,077 0.62
Indivior PLC 3,045 GBP 4,092 5,862 0.02
Legal & General Group PLC 26,179 GBP 75,727 83,862 0.32
Lloyds Banking Group PLC 267,490 GBP 263,618 261,339 1.01
National Grid PLC 17,583 GBP 176,193 208,015 0.81
Pearson PLC 3,620 GBP 49,540 55,510 0.21
Prudential PLC 12,085 GBP 197,202 232,342 0.90
Reckitt Benckiser Group PLC 3,045 GBP 179,866 204,427 0.79
Reed Elsevier PLC 5,165 GBP 60,908 73,211 0.28
Rio Tinto PLC 5,889 GBP 252,360 227,654 0.88
Rolls-Royce Holdings PLC 8,536 GBP 107,951 95,694 0.37
Royal Bank of Scotland Group PLC 12,223 GBP 51,392 62,119 0.24
SABMiller PLC 4,501 GBP 156,867 194,935 0.75
Sky PLC 4,593 GBP 50,069 53,207 0.21
SSE PLC 4,565 GBP 77,981 95,412 0.37
Standard Chartered PLC 11,123 GBP 174,827 138,026 0.53
Tesco PLC 35,601 GBP 139,102 86,703 0.34
Unilever NV 7,633 EUR 214,617 249,141 0.96
Unilever PLC 6,051 GBP 177,442 204,911 0.79
Vodafone Group PLC 123,517 GBP 336,146 354,374 1.37
WPP PLC 5,954 GBP 96,914 103,191 0.40
6,738,210 6,950,323 26.91
Total - Shares 24,925,830 25,638,666 99.28
286
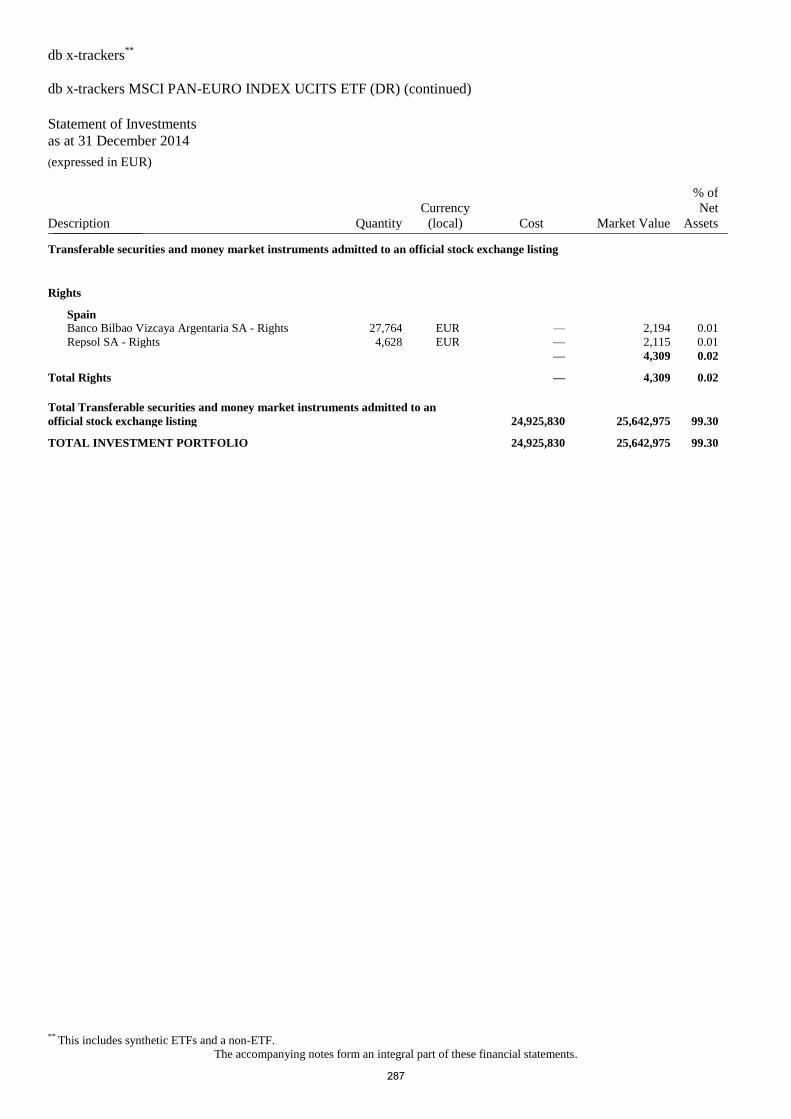
db x-trackers**
db x-trackers MSCI PAN-EURO INDEX UCITS ETF (DR) (continued)
Statement of Investments
as at 31 December 2014 (expressed in EUR)
** This includes synthetic ETFs and a non-ETF.
The accompanying notes form an integral part of these financial statements.
Description Quantity
Currency
(local) Cost Market Value
% of
Net
Assets _______________
Transferable securities and money market instruments admitted to an official stock exchange listing
Rights
Spain
Banco Bilbao Vizcaya Argentaria SA - Rights 27,764 EUR — 2,194 0.01
Repsol SA - Rights 4,628 EUR — 2,115 0.01
— 4,309 0.02
Total Rights — 4,309 0.02
Total Transferable securities and money market instruments admitted to an
official stock exchange listing 24,925,830 25,642,975 99.30
TOTAL INVESTMENT PORTFOLIO 24,925,830 25,642,975 99.30
287
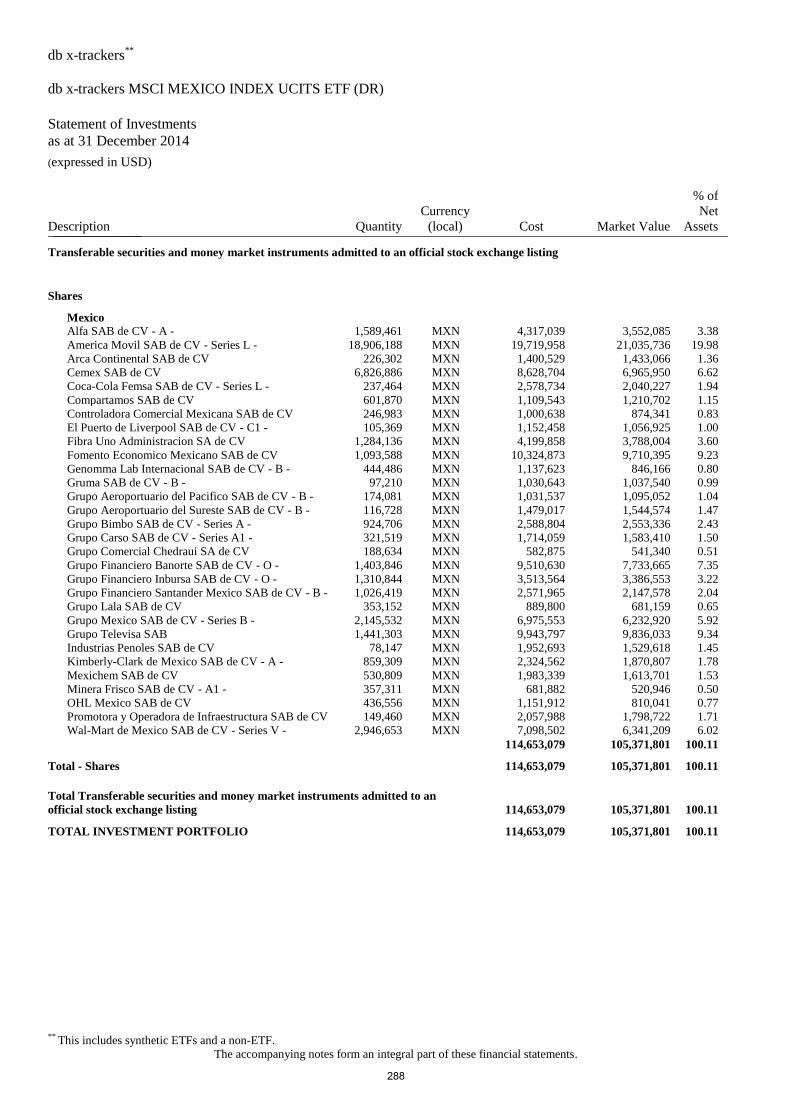
db x-trackers**
db x-trackers MSCI MEXICO INDEX UCITS ETF (DR)
Statement of Investments
as at 31 December 2014 (expressed in USD)
** This includes synthetic ETFs and a non-ETF.
The accompanying notes form an integral part of these financial statements.
Description Quantity
Currency
(local) Cost Market Value
% of
Net
Assets _______________
Transferable securities and money market instruments admitted to an official stock exchange listing
Shares
Mexico
Alfa SAB de CV - A - 1,589,461 MXN 4,317,039 3,552,085 3.38
America Movil SAB de CV - Series L - 18,906,188 MXN 19,719,958 21,035,736 19.98
Arca Continental SAB de CV 226,302 MXN 1,400,529 1,433,066 1.36
Cemex SAB de CV 6,826,886 MXN 8,628,704 6,965,950 6.62
Coca-Cola Femsa SAB de CV - Series L - 237,464 MXN 2,578,734 2,040,227 1.94
Compartamos SAB de CV 601,870 MXN 1,109,543 1,210,702 1.15
Controladora Comercial Mexicana SAB de CV 246,983 MXN 1,000,638 874,341 0.83
El Puerto de Liverpool SAB de CV - C1 - 105,369 MXN 1,152,458 1,056,925 1.00
Fibra Uno Administracion SA de CV 1,284,136 MXN 4,199,858 3,788,004 3.60
Fomento Economico Mexicano SAB de CV 1,093,588 MXN 10,324,873 9,710,395 9.23
Genomma Lab Internacional SAB de CV - B - 444,486 MXN 1,137,623 846,166 0.80
Gruma SAB de CV - B - 97,210 MXN 1,030,643 1,037,540 0.99
Grupo Aeroportuario del Pacifico SAB de CV - B - 174,081 MXN 1,031,537 1,095,052 1.04
Grupo Aeroportuario del Sureste SAB de CV - B - 116,728 MXN 1,479,017 1,544,574 1.47
Grupo Bimbo SAB de CV - Series A - 924,706 MXN 2,588,804 2,553,336 2.43
Grupo Carso SAB de CV - Series A1 - 321,519 MXN 1,714,059 1,583,410 1.50
Grupo Comercial Chedraui SA de CV 188,634 MXN 582,875 541,340 0.51
Grupo Financiero Banorte SAB de CV - O - 1,403,846 MXN 9,510,630 7,733,665 7.35
Grupo Financiero Inbursa SAB de CV - O - 1,310,844 MXN 3,513,564 3,386,553 3.22
Grupo Financiero Santander Mexico SAB de CV - B - 1,026,419 MXN 2,571,965 2,147,578 2.04
Grupo Lala SAB de CV 353,152 MXN 889,800 681,159 0.65
Grupo Mexico SAB de CV - Series B - 2,145,532 MXN 6,975,553 6,232,920 5.92
Grupo Televisa SAB 1,441,303 MXN 9,943,797 9,836,033 9.34
Industrias Penoles SAB de CV 78,147 MXN 1,952,693 1,529,618 1.45
Kimberly-Clark de Mexico SAB de CV - A - 859,309 MXN 2,324,562 1,870,807 1.78
Mexichem SAB de CV 530,809 MXN 1,983,339 1,613,701 1.53
Minera Frisco SAB de CV - A1 - 357,311 MXN 681,882 520,946 0.50
OHL Mexico SAB de CV 436,556 MXN 1,151,912 810,041 0.77
Promotora y Operadora de Infraestructura SAB de CV 149,460 MXN 2,057,988 1,798,722 1.71
Wal-Mart de Mexico SAB de CV - Series V - 2,946,653 MXN 7,098,502 6,341,209 6.02
114,653,079 105,371,801 100.11
Total - Shares 114,653,079 105,371,801 100.11
Total Transferable securities and money market instruments admitted to an
official stock exchange listing 114,653,079 105,371,801 100.11
TOTAL INVESTMENT PORTFOLIO 114,653,079 105,371,801 100.11
288
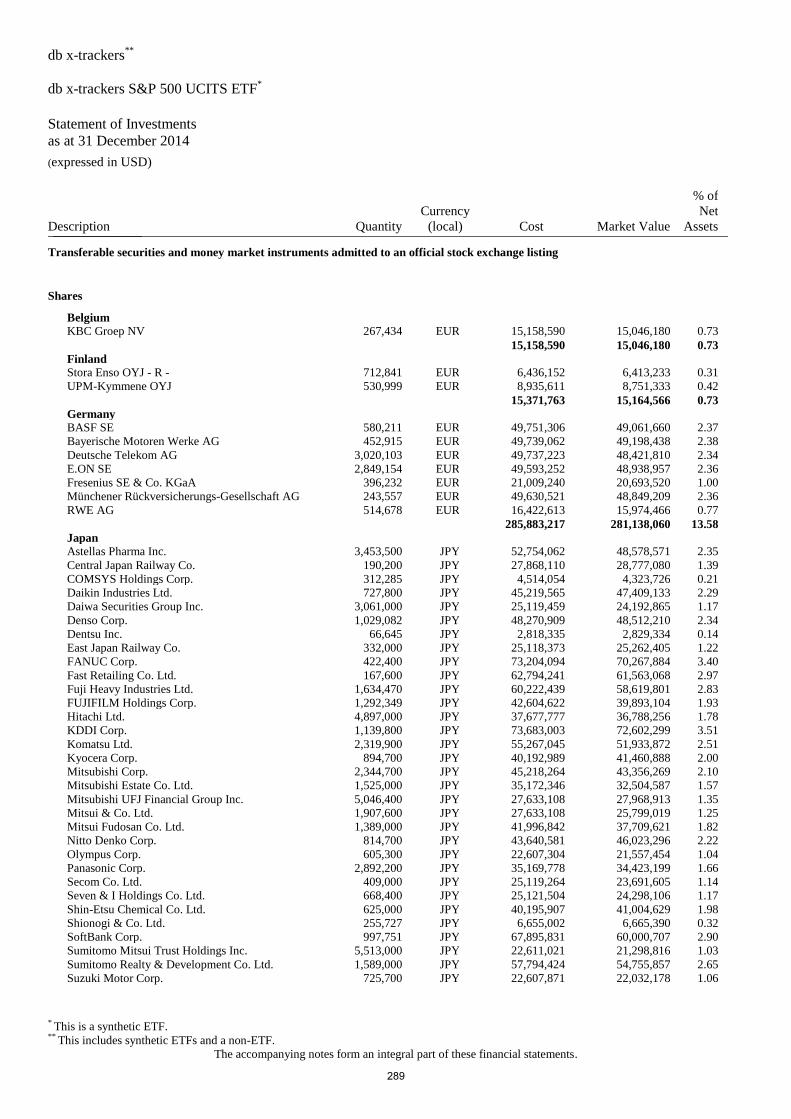
db x-trackers**
db x-trackers S&P 500 UCITS ETF*
Statement of Investments
as at 31 December 2014 (expressed in USD)
* This is a synthetic ETF. ** This includes synthetic ETFs and a non-ETF.
The accompanying notes form an integral part of these financial statements.
Description Quantity
Currency
(local) Cost Market Value
% of
Net
Assets _______________
Transferable securities and money market instruments admitted to an official stock exchange listing
Shares
Belgium
KBC Groep NV 267,434 EUR 15,158,590 15,046,180 0.73
15,158,590 15,046,180 0.73
Finland
Stora Enso OYJ - R - 712,841 EUR 6,436,152 6,413,233 0.31
UPM-Kymmene OYJ 530,999 EUR 8,935,611 8,751,333 0.42
15,371,763 15,164,566 0.73
Germany
BASF SE 580,211 EUR 49,751,306 49,061,660 2.37
Bayerische Motoren Werke AG 452,915 EUR 49,739,062 49,198,438 2.38
Deutsche Telekom AG 3,020,103 EUR 49,737,223 48,421,810 2.34
E.ON SE 2,849,154 EUR 49,593,252 48,938,957 2.36
Fresenius SE & Co. KGaA 396,232 EUR 21,009,240 20,693,520 1.00
Münchener Rückversicherungs-Gesellschaft AG 243,557 EUR 49,630,521 48,849,209 2.36
RWE AG 514,678 EUR 16,422,613 15,974,466 0.77
285,883,217 281,138,060 13.58
Japan
Astellas Pharma Inc. 3,453,500 JPY 52,754,062 48,578,571 2.35
Central Japan Railway Co. 190,200 JPY 27,868,110 28,777,080 1.39
COMSYS Holdings Corp. 312,285 JPY 4,514,054 4,323,726 0.21
Daikin Industries Ltd. 727,800 JPY 45,219,565 47,409,133 2.29
Daiwa Securities Group Inc. 3,061,000 JPY 25,119,459 24,192,865 1.17
Denso Corp. 1,029,082 JPY 48,270,909 48,512,210 2.34
Dentsu Inc. 66,645 JPY 2,818,335 2,829,334 0.14
East Japan Railway Co. 332,000 JPY 25,118,373 25,262,405 1.22
FANUC Corp. 422,400 JPY 73,204,094 70,267,884 3.40
Fast Retailing Co. Ltd. 167,600 JPY 62,794,241 61,563,068 2.97
Fuji Heavy Industries Ltd. 1,634,470 JPY 60,222,439 58,619,801 2.83
FUJIFILM Holdings Corp. 1,292,349 JPY 42,604,622 39,893,104 1.93
Hitachi Ltd. 4,897,000 JPY 37,677,777 36,788,256 1.78
KDDI Corp. 1,139,800 JPY 73,683,003 72,602,299 3.51
Komatsu Ltd. 2,319,900 JPY 55,267,045 51,933,872 2.51
Kyocera Corp. 894,700 JPY 40,192,989 41,460,888 2.00
Mitsubishi Corp. 2,344,700 JPY 45,218,264 43,356,269 2.10
Mitsubishi Estate Co. Ltd. 1,525,000 JPY 35,172,346 32,504,587 1.57
Mitsubishi UFJ Financial Group Inc. 5,046,400 JPY 27,633,108 27,968,913 1.35
Mitsui & Co. Ltd. 1,907,600 JPY 27,633,108 25,799,019 1.25
Mitsui Fudosan Co. Ltd. 1,389,000 JPY 41,996,842 37,709,621 1.82
Nitto Denko Corp. 814,700 JPY 43,640,581 46,023,296 2.22
Olympus Corp. 605,300 JPY 22,607,304 21,557,454 1.04
Panasonic Corp. 2,892,200 JPY 35,169,778 34,423,199 1.66
Secom Co. Ltd. 409,000 JPY 25,119,264 23,691,605 1.14
Seven & I Holdings Co. Ltd. 668,400 JPY 25,121,504 24,298,106 1.17
Shin-Etsu Chemical Co. Ltd. 625,000 JPY 40,195,907 41,004,629 1.98
Shionogi & Co. Ltd. 255,727 JPY 6,655,002 6,665,390 0.32
SoftBank Corp. 997,751 JPY 67,895,831 60,000,707 2.90
Sumitomo Mitsui Trust Holdings Inc. 5,513,000 JPY 22,611,021 21,298,816 1.03
Sumitomo Realty & Development Co. Ltd. 1,589,000 JPY 57,794,424 54,755,857 2.65
Suzuki Motor Corp. 725,700 JPY 22,607,871 22,032,178 1.06
289
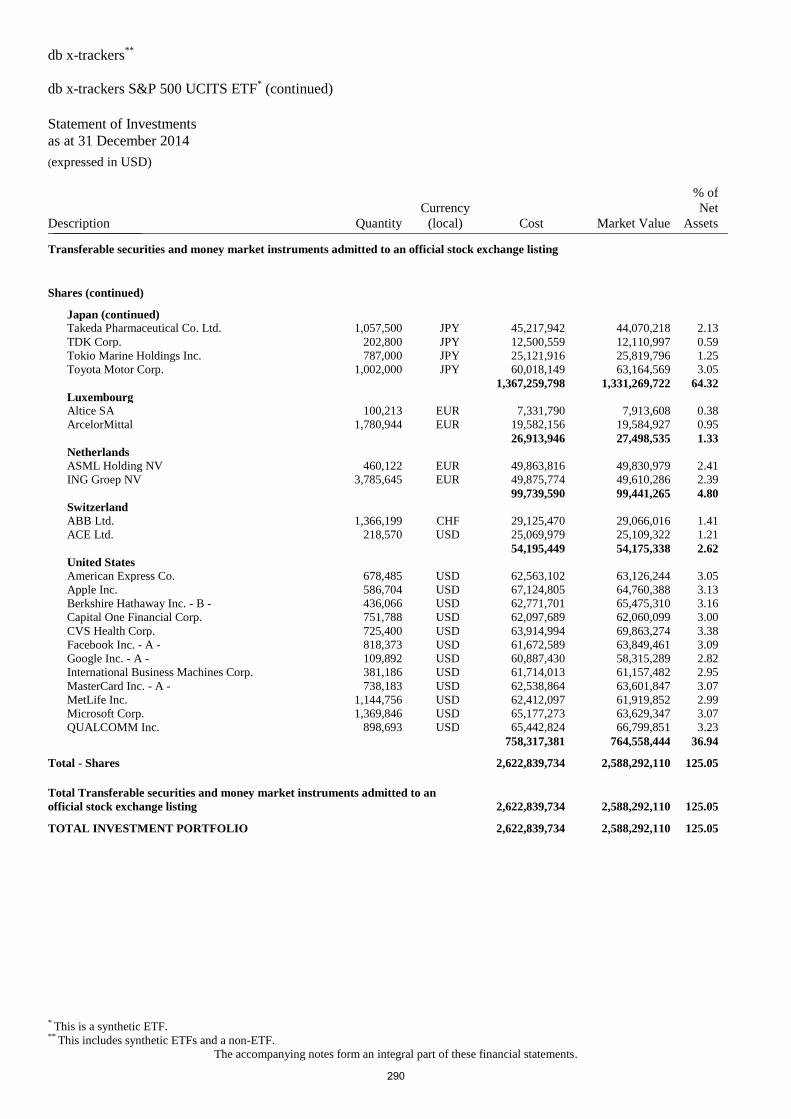
db x-trackers**
db x-trackers S&P 500 UCITS ETF* (continued)
Statement of Investments
as at 31 December 2014 (expressed in USD)
* This is a synthetic ETF. ** This includes synthetic ETFs and a non-ETF.
The accompanying notes form an integral part of these financial statements.
Description Quantity
Currency
(local) Cost Market Value
% of
Net
Assets _______________
Transferable securities and money market instruments admitted to an official stock exchange listing
Shares (continued)
Japan (continued)
Takeda Pharmaceutical Co. Ltd. 1,057,500 JPY 45,217,942 44,070,218 2.13
TDK Corp. 202,800 JPY 12,500,559 12,110,997 0.59
Tokio Marine Holdings Inc. 787,000 JPY 25,121,916 25,819,796 1.25
Toyota Motor Corp. 1,002,000 JPY 60,018,149 63,164,569 3.05
1,367,259,798 1,331,269,722 64.32
Luxembourg
Altice SA 100,213 EUR 7,331,790 7,913,608 0.38
ArcelorMittal 1,780,944 EUR 19,582,156 19,584,927 0.95
26,913,946 27,498,535 1.33
Netherlands
ASML Holding NV 460,122 EUR 49,863,816 49,830,979 2.41
ING Groep NV 3,785,645 EUR 49,875,774 49,610,286 2.39
99,739,590 99,441,265 4.80
Switzerland
ABB Ltd. 1,366,199 CHF 29,125,470 29,066,016 1.41
ACE Ltd. 218,570 USD 25,069,979 25,109,322 1.21
54,195,449 54,175,338 2.62
United States
American Express Co. 678,485 USD 62,563,102 63,126,244 3.05
Apple Inc. 586,704 USD 67,124,805 64,760,388 3.13
Berkshire Hathaway Inc. - B - 436,066 USD 62,771,701 65,475,310 3.16
Capital One Financial Corp. 751,788 USD 62,097,689 62,060,099 3.00
CVS Health Corp. 725,400 USD 63,914,994 69,863,274 3.38
Facebook Inc. - A - 818,373 USD 61,672,589 63,849,461 3.09
Google Inc. - A - 109,892 USD 60,887,430 58,315,289 2.82
International Business Machines Corp. 381,186 USD 61,714,013 61,157,482 2.95
MasterCard Inc. - A - 738,183 USD 62,538,864 63,601,847 3.07
MetLife Inc. 1,144,756 USD 62,412,097 61,919,852 2.99
Microsoft Corp. 1,369,846 USD 65,177,273 63,629,347 3.07
QUALCOMM Inc. 898,693 USD 65,442,824 66,799,851 3.23
758,317,381 764,558,444 36.94
Total - Shares 2,622,839,734 2,588,292,110 125.05
Total Transferable securities and money market instruments admitted to an
official stock exchange listing 2,622,839,734 2,588,292,110 125.05
TOTAL INVESTMENT PORTFOLIO 2,622,839,734 2,588,292,110 125.05
290
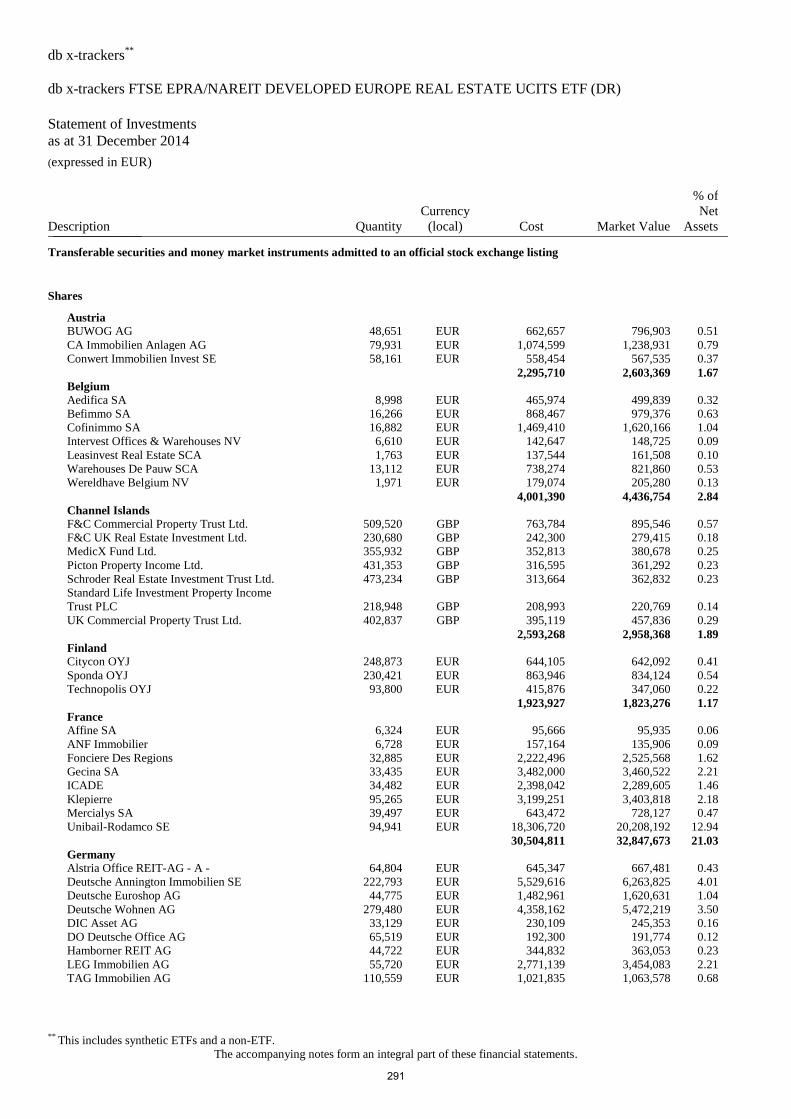
db x-trackers**
db x-trackers FTSE EPRA/NAREIT DEVELOPED EUROPE REAL ESTATE UCITS ETF (DR)
Statement of Investments
as at 31 December 2014 (expressed in EUR)
** This includes synthetic ETFs and a non-ETF.
The accompanying notes form an integral part of these financial statements.
Description Quantity
Currency
(local) Cost Market Value
% of
Net
Assets _______________
Transferable securities and money market instruments admitted to an official stock exchange listing
Shares
Austria
BUWOG AG 48,651 EUR 662,657 796,903 0.51
CA Immobilien Anlagen AG 79,931 EUR 1,074,599 1,238,931 0.79
Conwert Immobilien Invest SE 58,161 EUR 558,454 567,535 0.37
2,295,710 2,603,369 1.67
Belgium
Aedifica SA 8,998 EUR 465,974 499,839 0.32
Befimmo SA 16,266 EUR 868,467 979,376 0.63
Cofinimmo SA 16,882 EUR 1,469,410 1,620,166 1.04
Intervest Offices & Warehouses NV 6,610 EUR 142,647 148,725 0.09
Leasinvest Real Estate SCA 1,763 EUR 137,544 161,508 0.10
Warehouses De Pauw SCA 13,112 EUR 738,274 821,860 0.53
Wereldhave Belgium NV 1,971 EUR 179,074 205,280 0.13
4,001,390 4,436,754 2.84
Channel Islands
F&C Commercial Property Trust Ltd. 509,520 GBP 763,784 895,546 0.57
F&C UK Real Estate Investment Ltd. 230,680 GBP 242,300 279,415 0.18
MedicX Fund Ltd. 355,932 GBP 352,813 380,678 0.25
Picton Property Income Ltd. 431,353 GBP 316,595 361,292 0.23
Schroder Real Estate Investment Trust Ltd. 473,234 GBP 313,664 362,832 0.23
Standard Life Investment Property Income
Trust PLC
218,948 GBP 208,993 220,769 0.14
UK Commercial Property Trust Ltd. 402,837 GBP 395,119 457,836 0.29
2,593,268 2,958,368 1.89
Finland
Citycon OYJ 248,873 EUR 644,105 642,092 0.41
Sponda OYJ 230,421 EUR 863,946 834,124 0.54
Technopolis OYJ 93,800 EUR 415,876 347,060 0.22
1,923,927 1,823,276 1.17
France
Affine SA 6,324 EUR 95,666 95,935 0.06
ANF Immobilier 6,728 EUR 157,164 135,906 0.09
Fonciere Des Regions 32,885 EUR 2,222,496 2,525,568 1.62
Gecina SA 33,435 EUR 3,482,000 3,460,522 2.21
ICADE 34,482 EUR 2,398,042 2,289,605 1.46
Klepierre 95,265 EUR 3,199,251 3,403,818 2.18
Mercialys SA 39,497 EUR 643,472 728,127 0.47
Unibail-Rodamco SE 94,941 EUR 18,306,720 20,208,192 12.94
30,504,811 32,847,673 21.03
Germany
Alstria Office REIT-AG - A - 64,804 EUR 645,347 667,481 0.43
Deutsche Annington Immobilien SE 222,793 EUR 5,529,616 6,263,825 4.01
Deutsche Euroshop AG 44,775 EUR 1,482,961 1,620,631 1.04
Deutsche Wohnen AG 279,480 EUR 4,358,162 5,472,219 3.50
DIC Asset AG 33,129 EUR 230,109 245,353 0.16
DO Deutsche Office AG 65,519 EUR 192,300 191,774 0.12
Hamborner REIT AG 44,722 EUR 344,832 363,053 0.23
LEG Immobilien AG 55,720 EUR 2,771,139 3,454,083 2.21
TAG Immobilien AG 110,559 EUR 1,021,835 1,063,578 0.68
291
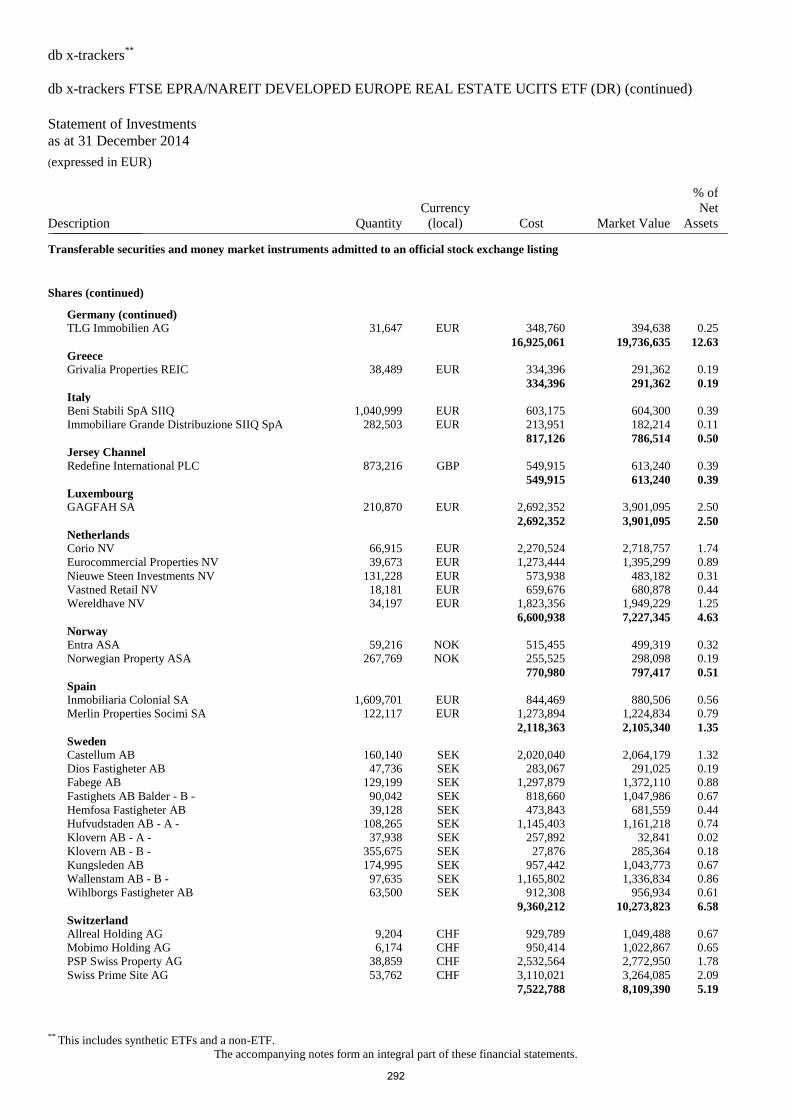
db x-trackers**
db x-trackers FTSE EPRA/NAREIT DEVELOPED EUROPE REAL ESTATE UCITS ETF (DR) (continued)
Statement of Investments
as at 31 December 2014 (expressed in EUR)
** This includes synthetic ETFs and a non-ETF.
The accompanying notes form an integral part of these financial statements.
Description Quantity
Currency
(local) Cost Market Value
% of
Net
Assets _______________
Transferable securities and money market instruments admitted to an official stock exchange listing
Shares (continued)
Germany (continued)
TLG Immobilien AG 31,647 EUR 348,760 394,638 0.25
16,925,061 19,736,635 12.63
Greece
Grivalia Properties REIC 38,489 EUR 334,396 291,362 0.19
334,396 291,362 0.19
Italy
Beni Stabili SpA SIIQ 1,040,999 EUR 603,175 604,300 0.39
Immobiliare Grande Distribuzione SIIQ SpA 282,503 EUR 213,951 182,214 0.11
817,126 786,514 0.50
Jersey Channel
Redefine International PLC 873,216 GBP 549,915 613,240 0.39
549,915 613,240 0.39
Luxembourg
GAGFAH SA 210,870 EUR 2,692,352 3,901,095 2.50
2,692,352 3,901,095 2.50
Netherlands
Corio NV 66,915 EUR 2,270,524 2,718,757 1.74
Eurocommercial Properties NV 39,673 EUR 1,273,444 1,395,299 0.89
Nieuwe Steen Investments NV 131,228 EUR 573,938 483,182 0.31
Vastned Retail NV 18,181 EUR 659,676 680,878 0.44
Wereldhave NV 34,197 EUR 1,823,356 1,949,229 1.25
6,600,938 7,227,345 4.63
Norway
Entra ASA 59,216 NOK 515,455 499,319 0.32
Norwegian Property ASA 267,769 NOK 255,525 298,098 0.19
770,980 797,417 0.51
Spain
Inmobiliaria Colonial SA 1,609,701 EUR 844,469 880,506 0.56
Merlin Properties Socimi SA 122,117 EUR 1,273,894 1,224,834 0.79
2,118,363 2,105,340 1.35
Sweden
Castellum AB 160,140 SEK 2,020,040 2,064,179 1.32
Dios Fastigheter AB 47,736 SEK 283,067 291,025 0.19
Fabege AB 129,199 SEK 1,297,879 1,372,110 0.88
Fastighets AB Balder - B - 90,042 SEK 818,660 1,047,986 0.67
Hemfosa Fastigheter AB 39,128 SEK 473,843 681,559 0.44
Hufvudstaden AB - A - 108,265 SEK 1,145,403 1,161,218 0.74
Klovern AB - A - 37,938 SEK 257,892 32,841 0.02
Klovern AB - B - 355,675 SEK 27,876 285,364 0.18
Kungsleden AB 174,995 SEK 957,442 1,043,773 0.67
Wallenstam AB - B - 97,635 SEK 1,165,802 1,336,834 0.86
Wihlborgs Fastigheter AB 63,500 SEK 912,308 956,934 0.61
9,360,212 10,273,823 6.58
Switzerland
Allreal Holding AG 9,204 CHF 929,789 1,049,488 0.67
Mobimo Holding AG 6,174 CHF 950,414 1,022,867 0.65
PSP Swiss Property AG 38,859 CHF 2,532,564 2,772,950 1.78
Swiss Prime Site AG 53,762 CHF 3,110,021 3,264,085 2.09
7,522,788 8,109,390 5.19
292
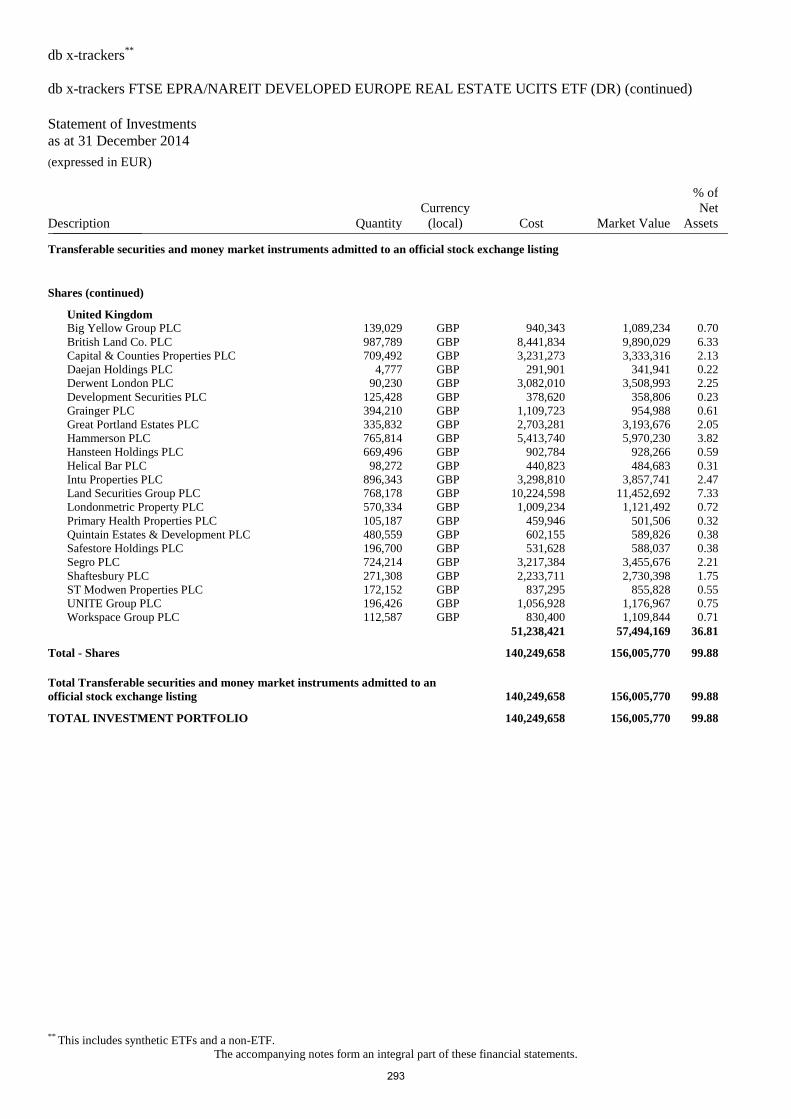
db x-trackers**
db x-trackers FTSE EPRA/NAREIT DEVELOPED EUROPE REAL ESTATE UCITS ETF (DR) (continued)
Statement of Investments
as at 31 December 2014 (expressed in EUR)
** This includes synthetic ETFs and a non-ETF.
The accompanying notes form an integral part of these financial statements.
Description Quantity
Currency
(local) Cost Market Value
% of
Net
Assets _______________
Transferable securities and money market instruments admitted to an official stock exchange listing
Shares (continued)
United Kingdom
Big Yellow Group PLC 139,029 GBP 940,343 1,089,234 0.70
British Land Co. PLC 987,789 GBP 8,441,834 9,890,029 6.33
Capital & Counties Properties PLC 709,492 GBP 3,231,273 3,333,316 2.13
Daejan Holdings PLC 4,777 GBP 291,901 341,941 0.22
Derwent London PLC 90,230 GBP 3,082,010 3,508,993 2.25
Development Securities PLC 125,428 GBP 378,620 358,806 0.23
Grainger PLC 394,210 GBP 1,109,723 954,988 0.61
Great Portland Estates PLC 335,832 GBP 2,703,281 3,193,676 2.05
Hammerson PLC 765,814 GBP 5,413,740 5,970,230 3.82
Hansteen Holdings PLC 669,496 GBP 902,784 928,266 0.59
Helical Bar PLC 98,272 GBP 440,823 484,683 0.31
Intu Properties PLC 896,343 GBP 3,298,810 3,857,741 2.47
Land Securities Group PLC 768,178 GBP 10,224,598 11,452,692 7.33
Londonmetric Property PLC 570,334 GBP 1,009,234 1,121,492 0.72
Primary Health Properties PLC 105,187 GBP 459,946 501,506 0.32
Quintain Estates & Development PLC 480,559 GBP 602,155 589,826 0.38
Safestore Holdings PLC 196,700 GBP 531,628 588,037 0.38
Segro PLC 724,214 GBP 3,217,384 3,455,676 2.21
Shaftesbury PLC 271,308 GBP 2,233,711 2,730,398 1.75
ST Modwen Properties PLC 172,152 GBP 837,295 855,828 0.55
UNITE Group PLC 196,426 GBP 1,056,928 1,176,967 0.75
Workspace Group PLC 112,587 GBP 830,400 1,109,844 0.71
51,238,421 57,494,169 36.81
Total - Shares 140,249,658 156,005,770 99.88
Total Transferable securities and money market instruments admitted to an
official stock exchange listing 140,249,658 156,005,770 99.88
TOTAL INVESTMENT PORTFOLIO 140,249,658 156,005,770 99.88
293
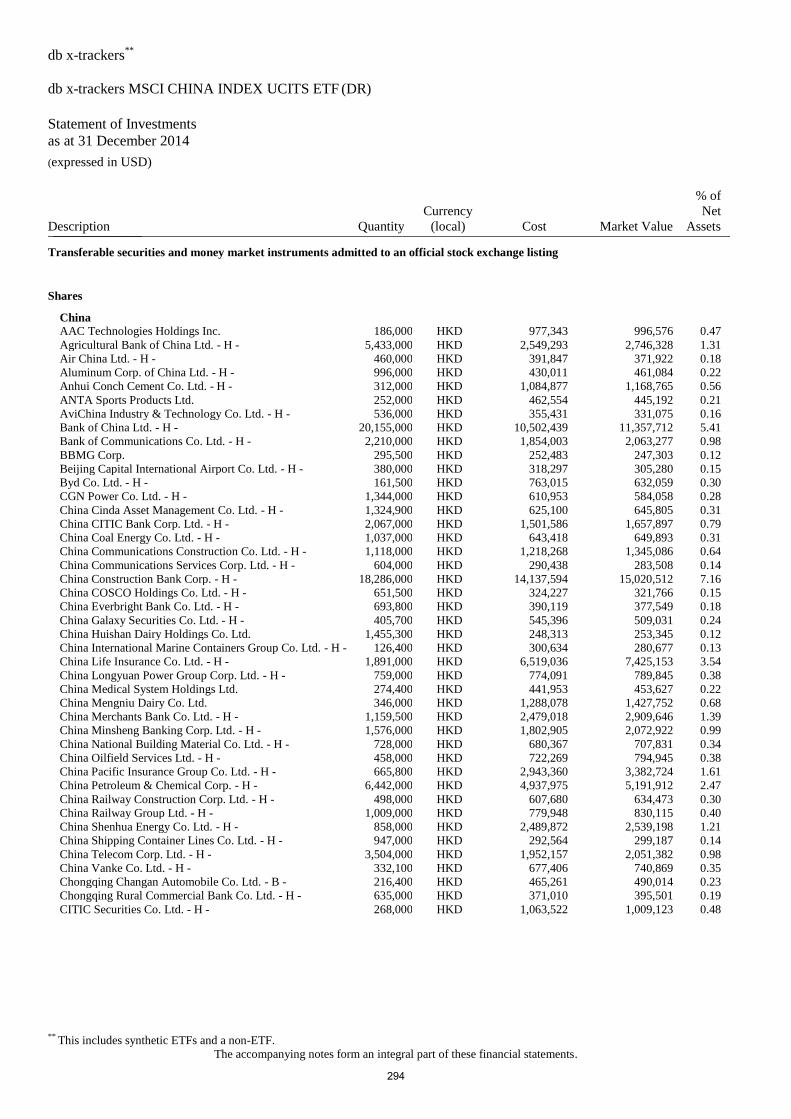
db x-trackers**
db x-trackers MSCI CHINA INDEX UCITS ETF (DR)
Statement of Investments
as at 31 December 2014 (expressed in USD)
** This includes synthetic ETFs and a non-ETF.
The accompanying notes form an integral part of these financial statements.
Description Quantity
Currency
(local) Cost Market Value
% of
Net
Assets _______________
Transferable securities and money market instruments admitted to an official stock exchange listing
Shares
China
AAC Technologies Holdings Inc. 186,000 HKD 977,343 996,576 0.47
Agricultural Bank of China Ltd. - H - 5,433,000 HKD 2,549,293 2,746,328 1.31
Air China Ltd. - H - 460,000 HKD 391,847 371,922 0.18
Aluminum Corp. of China Ltd. - H - 996,000 HKD 430,011 461,084 0.22
Anhui Conch Cement Co. Ltd. - H - 312,000 HKD 1,084,877 1,168,765 0.56
ANTA Sports Products Ltd. 252,000 HKD 462,554 445,192 0.21
AviChina Industry & Technology Co. Ltd. - H - 536,000 HKD 355,431 331,075 0.16
Bank of China Ltd. - H - 20,155,000 HKD 10,502,439 11,357,712 5.41
Bank of Communications Co. Ltd. - H - 2,210,000 HKD 1,854,003 2,063,277 0.98
BBMG Corp. 295,500 HKD 252,483 247,303 0.12
Beijing Capital International Airport Co. Ltd. - H - 380,000 HKD 318,297 305,280 0.15
Byd Co. Ltd. - H - 161,500 HKD 763,015 632,059 0.30
CGN Power Co. Ltd. - H - 1,344,000 HKD 610,953 584,058 0.28
China Cinda Asset Management Co. Ltd. - H - 1,324,900 HKD 625,100 645,805 0.31
China CITIC Bank Corp. Ltd. - H - 2,067,000 HKD 1,501,586 1,657,897 0.79
China Coal Energy Co. Ltd. - H - 1,037,000 HKD 643,418 649,893 0.31
China Communications Construction Co. Ltd. - H - 1,118,000 HKD 1,218,268 1,345,086 0.64
China Communications Services Corp. Ltd. - H - 604,000 HKD 290,438 283,508 0.14
China Construction Bank Corp. - H - 18,286,000 HKD 14,137,594 15,020,512 7.16
China COSCO Holdings Co. Ltd. - H - 651,500 HKD 324,227 321,766 0.15
China Everbright Bank Co. Ltd. - H - 693,800 HKD 390,119 377,549 0.18
China Galaxy Securities Co. Ltd. - H - 405,700 HKD 545,396 509,031 0.24
China Huishan Dairy Holdings Co. Ltd. 1,455,300 HKD 248,313 253,345 0.12
China International Marine Containers Group Co. Ltd. - H - 126,400 HKD 300,634 280,677 0.13
China Life Insurance Co. Ltd. - H - 1,891,000 HKD 6,519,036 7,425,153 3.54
China Longyuan Power Group Corp. Ltd. - H - 759,000 HKD 774,091 789,845 0.38
China Medical System Holdings Ltd. 274,400 HKD 441,953 453,627 0.22
China Mengniu Dairy Co. Ltd. 346,000 HKD 1,288,078 1,427,752 0.68
China Merchants Bank Co. Ltd. - H - 1,159,500 HKD 2,479,018 2,909,646 1.39
China Minsheng Banking Corp. Ltd. - H - 1,576,000 HKD 1,802,905 2,072,922 0.99
China National Building Material Co. Ltd. - H - 728,000 HKD 680,367 707,831 0.34
China Oilfield Services Ltd. - H - 458,000 HKD 722,269 794,945 0.38
China Pacific Insurance Group Co. Ltd. - H - 665,800 HKD 2,943,360 3,382,724 1.61
China Petroleum & Chemical Corp. - H - 6,442,000 HKD 4,937,975 5,191,912 2.47
China Railway Construction Corp. Ltd. - H - 498,000 HKD 607,680 634,473 0.30
China Railway Group Ltd. - H - 1,009,000 HKD 779,948 830,115 0.40
China Shenhua Energy Co. Ltd. - H - 858,000 HKD 2,489,872 2,539,198 1.21
China Shipping Container Lines Co. Ltd. - H - 947,000 HKD 292,564 299,187 0.14
China Telecom Corp. Ltd. - H - 3,504,000 HKD 1,952,157 2,051,382 0.98
China Vanke Co. Ltd. - H - 332,100 HKD 677,406 740,869 0.35
Chongqing Changan Automobile Co. Ltd. - B - 216,400 HKD 465,261 490,014 0.23
Chongqing Rural Commercial Bank Co. Ltd. - H - 635,000 HKD 371,010 395,501 0.19
CITIC Securities Co. Ltd. - H - 268,000 HKD 1,063,522 1,009,123 0.48
294
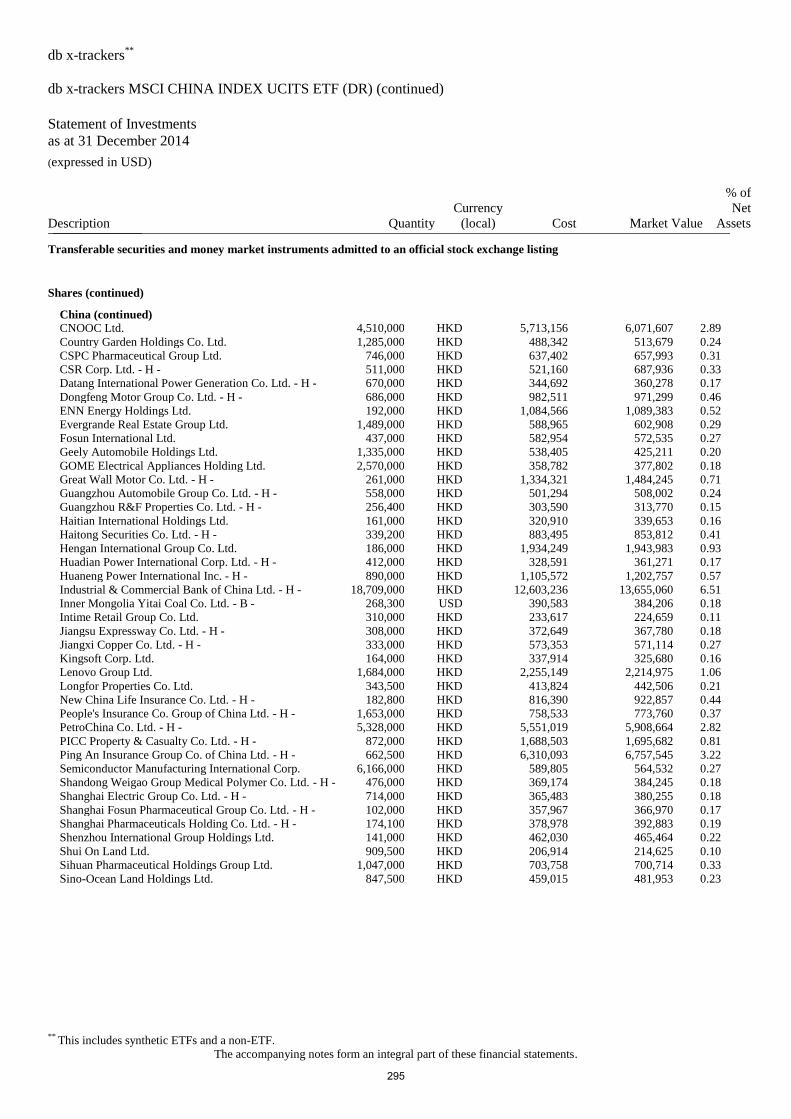
db x-trackers**
db x-trackers MSCI CHINA INDEX UCITS ETF (DR) (continued)
Statement of Investments
as at 31 December 2014 (expressed in USD)
** This includes synthetic ETFs and a non-ETF.
The accompanying notes form an integral part of these financial statements.
Description Quantity
Currency
(local) Cost Market Value
% of
Net
Assets _______________
Transferable securities and money market instruments admitted to an official stock exchange listing
Shares (continued)
China (continued)
CNOOC Ltd. 4,510,000 HKD 5,713,156 6,071,607 2.89
Country Garden Holdings Co. Ltd. 1,285,000 HKD 488,342 513,679 0.24
CSPC Pharmaceutical Group Ltd. 746,000 HKD 637,402 657,993 0.31
CSR Corp. Ltd. - H - 511,000 HKD 521,160 687,936 0.33
Datang International Power Generation Co. Ltd. - H - 670,000 HKD 344,692 360,278 0.17
Dongfeng Motor Group Co. Ltd. - H - 686,000 HKD 982,511 971,299 0.46
ENN Energy Holdings Ltd. 192,000 HKD 1,084,566 1,089,383 0.52
Evergrande Real Estate Group Ltd. 1,489,000 HKD 588,965 602,908 0.29
Fosun International Ltd. 437,000 HKD 582,954 572,535 0.27
Geely Automobile Holdings Ltd. 1,335,000 HKD 538,405 425,211 0.20
GOME Electrical Appliances Holding Ltd. 2,570,000 HKD 358,782 377,802 0.18
Great Wall Motor Co. Ltd. - H - 261,000 HKD 1,334,321 1,484,245 0.71
Guangzhou Automobile Group Co. Ltd. - H - 558,000 HKD 501,294 508,002 0.24
Guangzhou R&F Properties Co. Ltd. - H - 256,400 HKD 303,590 313,770 0.15
Haitian International Holdings Ltd. 161,000 HKD 320,910 339,653 0.16
Haitong Securities Co. Ltd. - H - 339,200 HKD 883,495 853,812 0.41
Hengan International Group Co. Ltd. 186,000 HKD 1,934,249 1,943,983 0.93
Huadian Power International Corp. Ltd. - H - 412,000 HKD 328,591 361,271 0.17
Huaneng Power International Inc. - H - 890,000 HKD 1,105,572 1,202,757 0.57
Industrial & Commercial Bank of China Ltd. - H - 18,709,000 HKD 12,603,236 13,655,060 6.51
Inner Mongolia Yitai Coal Co. Ltd. - B - 268,300 USD 390,583 384,206 0.18
Intime Retail Group Co. Ltd. 310,000 HKD 233,617 224,659 0.11
Jiangsu Expressway Co. Ltd. - H - 308,000 HKD 372,649 367,780 0.18
Jiangxi Copper Co. Ltd. - H - 333,000 HKD 573,353 571,114 0.27
Kingsoft Corp. Ltd. 164,000 HKD 337,914 325,680 0.16
Lenovo Group Ltd. 1,684,000 HKD 2,255,149 2,214,975 1.06
Longfor Properties Co. Ltd. 343,500 HKD 413,824 442,506 0.21
New China Life Insurance Co. Ltd. - H - 182,800 HKD 816,390 922,857 0.44
People's Insurance Co. Group of China Ltd. - H - 1,653,000 HKD 758,533 773,760 0.37
PetroChina Co. Ltd. - H - 5,328,000 HKD 5,551,019 5,908,664 2.82
PICC Property & Casualty Co. Ltd. - H - 872,000 HKD 1,688,503 1,695,682 0.81
Ping An Insurance Group Co. of China Ltd. - H - 662,500 HKD 6,310,093 6,757,545 3.22
Semiconductor Manufacturing International Corp. 6,166,000 HKD 589,805 564,532 0.27
Shandong Weigao Group Medical Polymer Co. Ltd. - H - 476,000 HKD 369,174 384,245 0.18
Shanghai Electric Group Co. Ltd. - H - 714,000 HKD 365,483 380,255 0.18
Shanghai Fosun Pharmaceutical Group Co. Ltd. - H - 102,000 HKD 357,967 366,970 0.17
Shanghai Pharmaceuticals Holding Co. Ltd. - H - 174,100 HKD 378,978 392,883 0.19
Shenzhou International Group Holdings Ltd. 141,000 HKD 462,030 465,464 0.22
Shui On Land Ltd. 909,500 HKD 206,914 214,625 0.10
Sihuan Pharmaceutical Holdings Group Ltd. 1,047,000 HKD 703,758 700,714 0.33
Sino-Ocean Land Holdings Ltd. 847,500 HKD 459,015 481,953 0.23
295
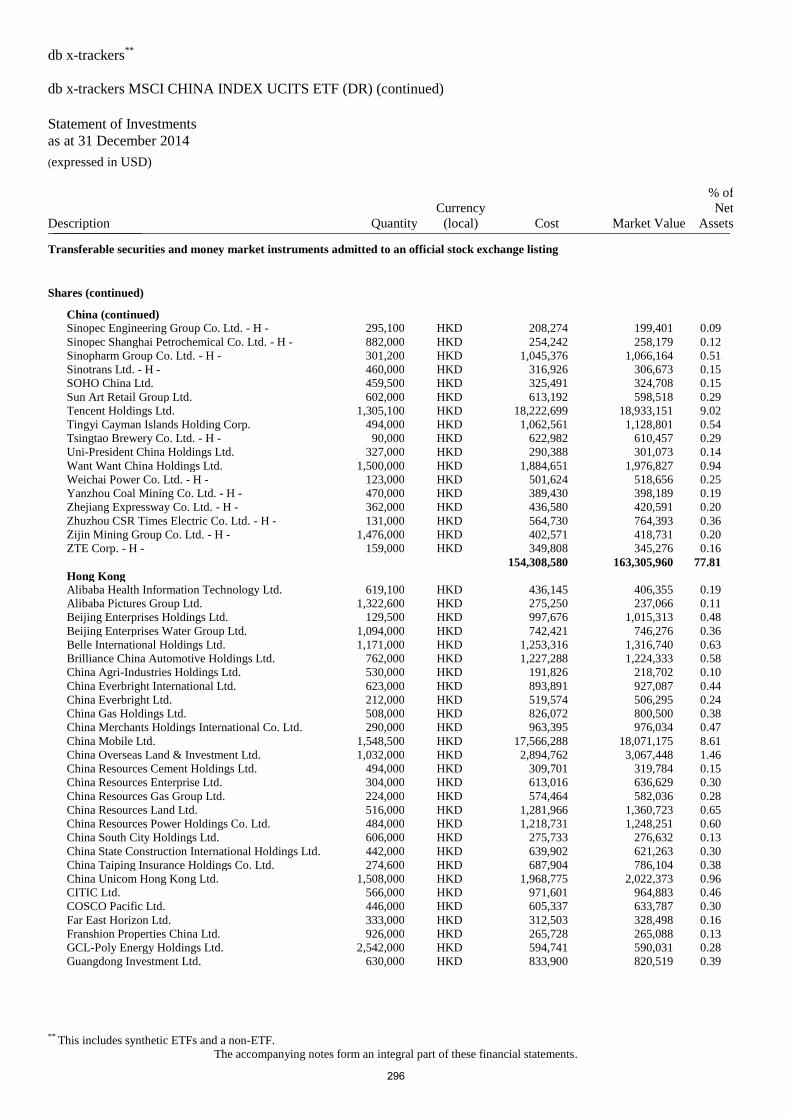
db x-trackers**
db x-trackers MSCI CHINA INDEX UCITS ETF (DR) (continued)
Statement of Investments
as at 31 December 2014 (expressed in USD)
** This includes synthetic ETFs and a non-ETF.
The accompanying notes form an integral part of these financial statements.
Description Quantity
Currency
(local) Cost Market Value
% of
Net
Assets _______________
Transferable securities and money market instruments admitted to an official stock exchange listing
Shares (continued)
China (continued)
Sinopec Engineering Group Co. Ltd. - H - 295,100 HKD 208,274 199,401 0.09
Sinopec Shanghai Petrochemical Co. Ltd. - H - 882,000 HKD 254,242 258,179 0.12
Sinopharm Group Co. Ltd. - H - 301,200 HKD 1,045,376 1,066,164 0.51
Sinotrans Ltd. - H - 460,000 HKD 316,926 306,673 0.15
SOHO China Ltd. 459,500 HKD 325,491 324,708 0.15
Sun Art Retail Group Ltd. 602,000 HKD 613,192 598,518 0.29
Tencent Holdings Ltd. 1,305,100 HKD 18,222,699 18,933,151 9.02
Tingyi Cayman Islands Holding Corp. 494,000 HKD 1,062,561 1,128,801 0.54
Tsingtao Brewery Co. Ltd. - H - 90,000 HKD 622,982 610,457 0.29
Uni-President China Holdings Ltd. 327,000 HKD 290,388 301,073 0.14
Want Want China Holdings Ltd. 1,500,000 HKD 1,884,651 1,976,827 0.94
Weichai Power Co. Ltd. - H - 123,000 HKD 501,624 518,656 0.25
Yanzhou Coal Mining Co. Ltd. - H - 470,000 HKD 389,430 398,189 0.19
Zhejiang Expressway Co. Ltd. - H - 362,000 HKD 436,580 420,591 0.20
Zhuzhou CSR Times Electric Co. Ltd. - H - 131,000 HKD 564,730 764,393 0.36
Zijin Mining Group Co. Ltd. - H - 1,476,000 HKD 402,571 418,731 0.20
ZTE Corp. - H - 159,000 HKD 349,808 345,276 0.16
154,308,580 163,305,960 77.81
Hong Kong
Alibaba Health Information Technology Ltd. 619,100 HKD 436,145 406,355 0.19
Alibaba Pictures Group Ltd. 1,322,600 HKD 275,250 237,066 0.11
Beijing Enterprises Holdings Ltd. 129,500 HKD 997,676 1,015,313 0.48
Beijing Enterprises Water Group Ltd. 1,094,000 HKD 742,421 746,276 0.36
Belle International Holdings Ltd. 1,171,000 HKD 1,253,316 1,316,740 0.63
Brilliance China Automotive Holdings Ltd. 762,000 HKD 1,227,288 1,224,333 0.58
China Agri-Industries Holdings Ltd. 530,000 HKD 191,826 218,702 0.10
China Everbright International Ltd. 623,000 HKD 893,891 927,087 0.44
China Everbright Ltd. 212,000 HKD 519,574 506,295 0.24
China Gas Holdings Ltd. 508,000 HKD 826,072 800,500 0.38
China Merchants Holdings International Co. Ltd. 290,000 HKD 963,395 976,034 0.47
China Mobile Ltd. 1,548,500 HKD 17,566,288 18,071,175 8.61
China Overseas Land & Investment Ltd. 1,032,000 HKD 2,894,762 3,067,448 1.46
China Resources Cement Holdings Ltd. 494,000 HKD 309,701 319,784 0.15
China Resources Enterprise Ltd. 304,000 HKD 613,016 636,629 0.30
China Resources Gas Group Ltd. 224,000 HKD 574,464 582,036 0.28
China Resources Land Ltd. 516,000 HKD 1,281,966 1,360,723 0.65
China Resources Power Holdings Co. Ltd. 484,000 HKD 1,218,731 1,248,251 0.60
China South City Holdings Ltd. 606,000 HKD 275,733 276,632 0.13
China State Construction International Holdings Ltd. 442,000 HKD 639,902 621,263 0.30
China Taiping Insurance Holdings Co. Ltd. 274,600 HKD 687,904 786,104 0.38
China Unicom Hong Kong Ltd. 1,508,000 HKD 1,968,775 2,022,373 0.96
CITIC Ltd. 566,000 HKD 971,601 964,883 0.46
COSCO Pacific Ltd. 446,000 HKD 605,337 633,787 0.30
Far East Horizon Ltd. 333,000 HKD 312,503 328,498 0.16
Franshion Properties China Ltd. 926,000 HKD 265,728 265,088 0.13
GCL-Poly Energy Holdings Ltd. 2,542,000 HKD 594,741 590,031 0.28
Guangdong Investment Ltd. 630,000 HKD 833,900 820,519 0.39
296
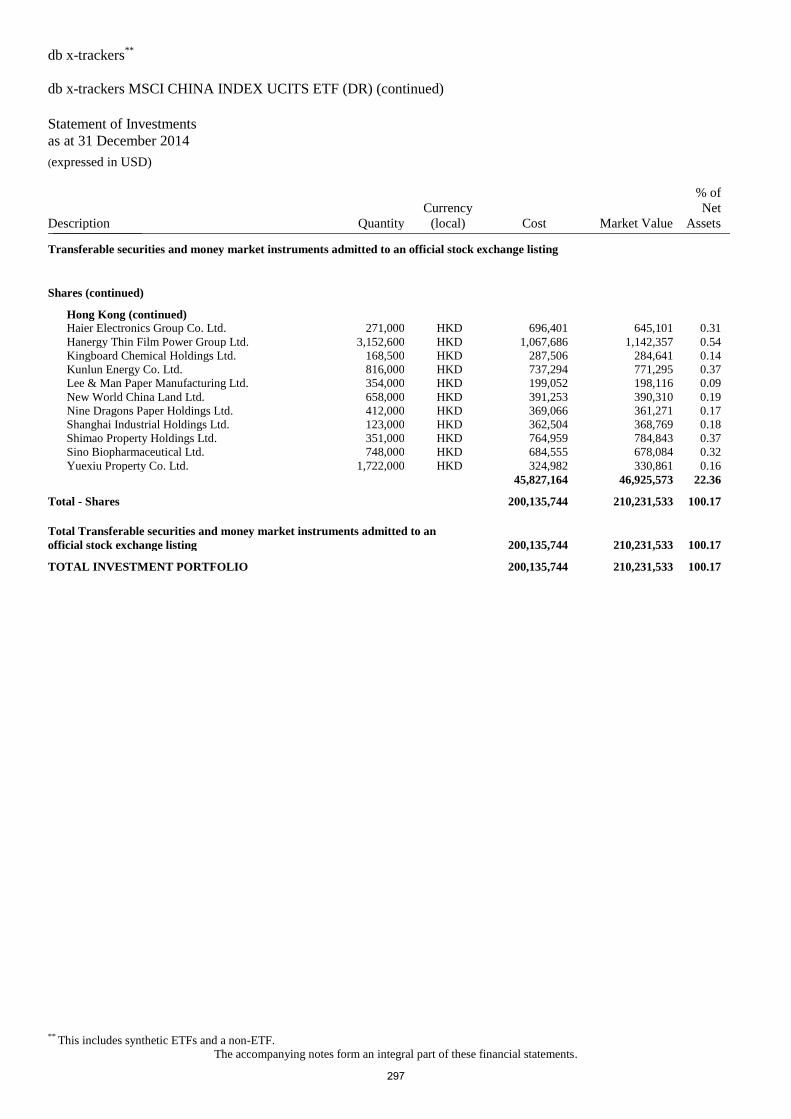
db x-trackers**
db x-trackers MSCI CHINA INDEX UCITS ETF (DR) (continued)
Statement of Investments
as at 31 December 2014 (expressed in USD)
** This includes synthetic ETFs and a non-ETF.
The accompanying notes form an integral part of these financial statements.
Description Quantity
Currency
(local) Cost Market Value
% of
Net
Assets _______________
Transferable securities and money market instruments admitted to an official stock exchange listing
Shares (continued)
Hong Kong (continued)
Haier Electronics Group Co. Ltd. 271,000 HKD 696,401 645,101 0.31
Hanergy Thin Film Power Group Ltd. 3,152,600 HKD 1,067,686 1,142,357 0.54
Kingboard Chemical Holdings Ltd. 168,500 HKD 287,506 284,641 0.14
Kunlun Energy Co. Ltd. 816,000 HKD 737,294 771,295 0.37
Lee & Man Paper Manufacturing Ltd. 354,000 HKD 199,052 198,116 0.09
New World China Land Ltd. 658,000 HKD 391,253 390,310 0.19
Nine Dragons Paper Holdings Ltd. 412,000 HKD 369,066 361,271 0.17
Shanghai Industrial Holdings Ltd. 123,000 HKD 362,504 368,769 0.18
Shimao Property Holdings Ltd. 351,000 HKD 764,959 784,843 0.37
Sino Biopharmaceutical Ltd. 748,000 HKD 684,555 678,084 0.32
Yuexiu Property Co. Ltd. 1,722,000 HKD 324,982 330,861 0.16
45,827,164 46,925,573 22.36
Total - Shares 200,135,744 210,231,533 100.17
Total Transferable securities and money market instruments admitted to an
official stock exchange listing 200,135,744 210,231,533 100.17
TOTAL INVESTMENT PORTFOLIO 200,135,744 210,231,533 100.17
297
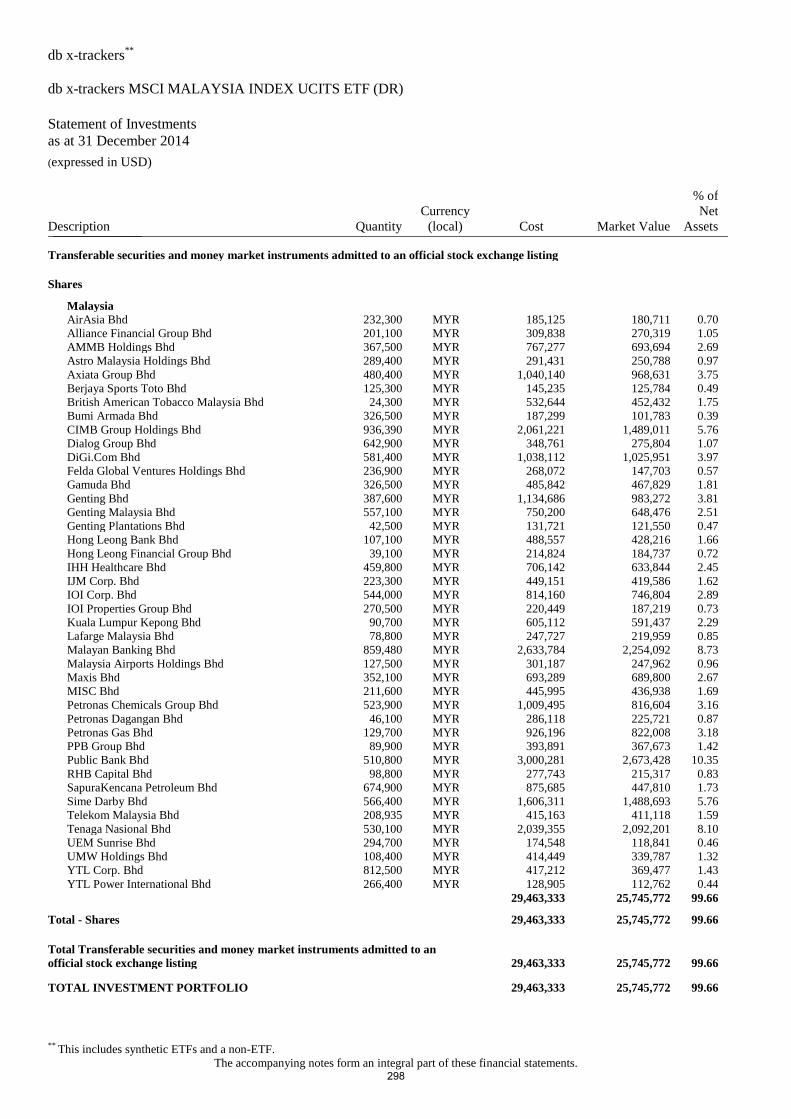
db x-trackers**
db x-trackers MSCI MALAYSIA INDEX UCITS ETF (DR)
Statement of Investments
as at 31 December 2014 (expressed in USD)
** This includes synthetic ETFs and a non-ETF.
The accompanying notes form an integral part of these financial statements.
Description Quantity
Currency
(local) Cost Market Value
% of
Net
Assets _______________
Transferable securities and money market instruments admitted to an official stock exchange listing
Shares
Malaysia
AirAsia Bhd 232,300 MYR 185,125 180,711 0.70
Alliance Financial Group Bhd 201,100 MYR 309,838 270,319 1.05
AMMB Holdings Bhd 367,500 MYR 767,277 693,694 2.69
Astro Malaysia Holdings Bhd 289,400 MYR 291,431 250,788 0.97
Axiata Group Bhd 480,400 MYR 1,040,140 968,631 3.75
Berjaya Sports Toto Bhd 125,300 MYR 145,235 125,784 0.49
British American Tobacco Malaysia Bhd 24,300 MYR 532,644 452,432 1.75
Bumi Armada Bhd 326,500 MYR 187,299 101,783 0.39
CIMB Group Holdings Bhd 936,390 MYR 2,061,221 1,489,011 5.76
Dialog Group Bhd 642,900 MYR 348,761 275,804 1.07
DiGi.Com Bhd 581,400 MYR 1,038,112 1,025,951 3.97
Felda Global Ventures Holdings Bhd 236,900 MYR 268,072 147,703 0.57
Gamuda Bhd 326,500 MYR 485,842 467,829 1.81
Genting Bhd 387,600 MYR 1,134,686 983,272 3.81
Genting Malaysia Bhd 557,100 MYR 750,200 648,476 2.51
Genting Plantations Bhd 42,500 MYR 131,721 121,550 0.47
Hong Leong Bank Bhd 107,100 MYR 488,557 428,216 1.66
Hong Leong Financial Group Bhd 39,100 MYR 214,824 184,737 0.72
IHH Healthcare Bhd 459,800 MYR 706,142 633,844 2.45
IJM Corp. Bhd 223,300 MYR 449,151 419,586 1.62
IOI Corp. Bhd 544,000 MYR 814,160 746,804 2.89
IOI Properties Group Bhd 270,500 MYR 220,449 187,219 0.73
Kuala Lumpur Kepong Bhd 90,700 MYR 605,112 591,437 2.29
Lafarge Malaysia Bhd 78,800 MYR 247,727 219,959 0.85
Malayan Banking Bhd 859,480 MYR 2,633,784 2,254,092 8.73
Malaysia Airports Holdings Bhd 127,500 MYR 301,187 247,962 0.96
Maxis Bhd 352,100 MYR 693,289 689,800 2.67
MISC Bhd 211,600 MYR 445,995 436,938 1.69
Petronas Chemicals Group Bhd 523,900 MYR 1,009,495 816,604 3.16
Petronas Dagangan Bhd 46,100 MYR 286,118 225,721 0.87
Petronas Gas Bhd 129,700 MYR 926,196 822,008 3.18
PPB Group Bhd 89,900 MYR 393,891 367,673 1.42
Public Bank Bhd 510,800 MYR 3,000,281 2,673,428 10.35
RHB Capital Bhd 98,800 MYR 277,743 215,317 0.83
SapuraKencana Petroleum Bhd 674,900 MYR 875,685 447,810 1.73
Sime Darby Bhd 566,400 MYR 1,606,311 1,488,693 5.76
Telekom Malaysia Bhd 208,935 MYR 415,163 411,118 1.59
Tenaga Nasional Bhd 530,100 MYR 2,039,355 2,092,201 8.10
UEM Sunrise Bhd 294,700 MYR 174,548 118,841 0.46
UMW Holdings Bhd 108,400 MYR 414,449 339,787 1.32
YTL Corp. Bhd 812,500 MYR 417,212 369,477 1.43
YTL Power International Bhd 266,400 MYR 128,905 112,762 0.44
29,463,333 25,745,772 99.66
Total - Shares 29,463,333 25,745,772 99.66
Total Transferable securities and money market instruments admitted to an
official stock exchange listing 29,463,333 25,745,772 99.66
TOTAL INVESTMENT PORTFOLIO 29,463,333 25,745,772 99.66
298
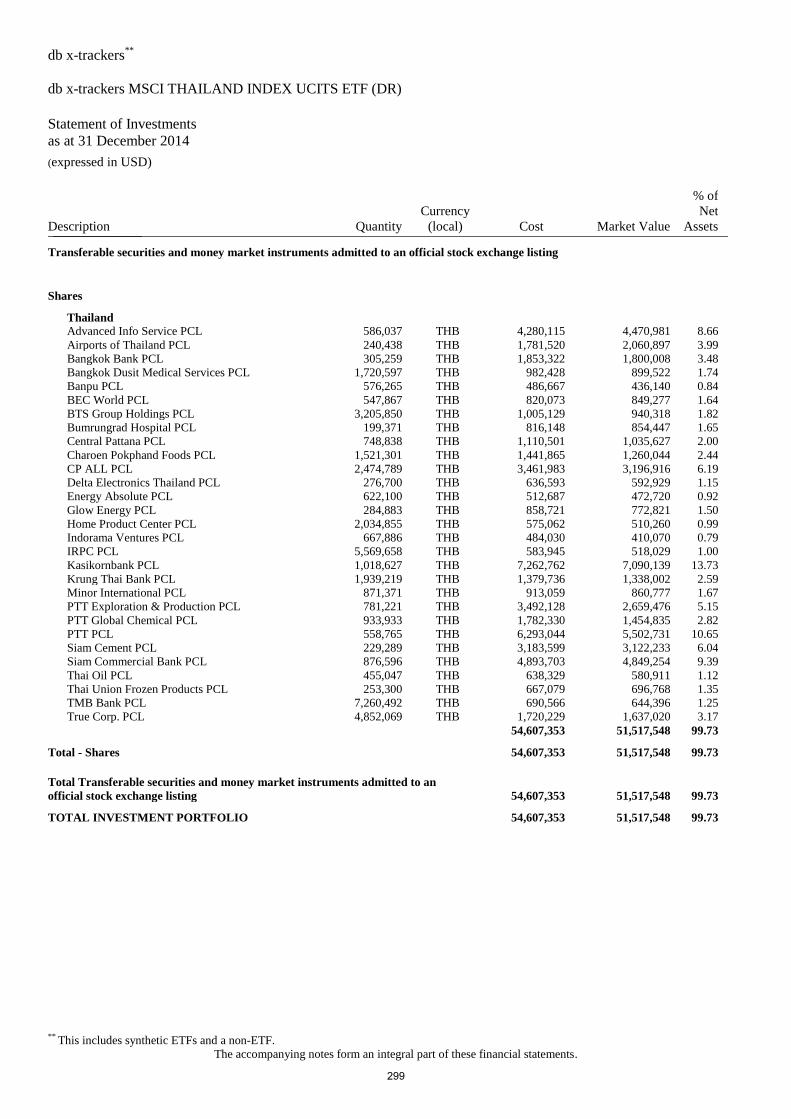
db x-trackers**
db x-trackers MSCI THAILAND INDEX UCITS ETF (DR)
Statement of Investments
as at 31 December 2014 (expressed in USD)
** This includes synthetic ETFs and a non-ETF.
The accompanying notes form an integral part of these financial statements.
Description Quantity
Currency
(local) Cost Market Value
% of
Net
Assets _______________
Transferable securities and money market instruments admitted to an official stock exchange listing
Shares
Thailand
Advanced Info Service PCL 586,037 THB 4,280,115 4,470,981 8.66
Airports of Thailand PCL 240,438 THB 1,781,520 2,060,897 3.99
Bangkok Bank PCL 305,259 THB 1,853,322 1,800,008 3.48
Bangkok Dusit Medical Services PCL 1,720,597 THB 982,428 899,522 1.74
Banpu PCL 576,265 THB 486,667 436,140 0.84
BEC World PCL 547,867 THB 820,073 849,277 1.64
BTS Group Holdings PCL 3,205,850 THB 1,005,129 940,318 1.82
Bumrungrad Hospital PCL 199,371 THB 816,148 854,447 1.65
Central Pattana PCL 748,838 THB 1,110,501 1,035,627 2.00
Charoen Pokphand Foods PCL 1,521,301 THB 1,441,865 1,260,044 2.44
CP ALL PCL 2,474,789 THB 3,461,983 3,196,916 6.19
Delta Electronics Thailand PCL 276,700 THB 636,593 592,929 1.15
Energy Absolute PCL 622,100 THB 512,687 472,720 0.92
Glow Energy PCL 284,883 THB 858,721 772,821 1.50
Home Product Center PCL 2,034,855 THB 575,062 510,260 0.99
Indorama Ventures PCL 667,886 THB 484,030 410,070 0.79
IRPC PCL 5,569,658 THB 583,945 518,029 1.00
Kasikornbank PCL 1,018,627 THB 7,262,762 7,090,139 13.73
Krung Thai Bank PCL 1,939,219 THB 1,379,736 1,338,002 2.59
Minor International PCL 871,371 THB 913,059 860,777 1.67
PTT Exploration & Production PCL 781,221 THB 3,492,128 2,659,476 5.15
PTT Global Chemical PCL 933,933 THB 1,782,330 1,454,835 2.82
PTT PCL 558,765 THB 6,293,044 5,502,731 10.65
Siam Cement PCL 229,289 THB 3,183,599 3,122,233 6.04
Siam Commercial Bank PCL 876,596 THB 4,893,703 4,849,254 9.39
Thai Oil PCL 455,047 THB 638,329 580,911 1.12
Thai Union Frozen Products PCL 253,300 THB 667,079 696,768 1.35
TMB Bank PCL 7,260,492 THB 690,566 644,396 1.25
True Corp. PCL 4,852,069 THB 1,720,229 1,637,020 3.17
54,607,353 51,517,548 99.73
Total - Shares 54,607,353 51,517,548 99.73
Total Transferable securities and money market instruments admitted to an
official stock exchange listing 54,607,353 51,517,548 99.73
TOTAL INVESTMENT PORTFOLIO 54,607,353 51,517,548 99.73
299
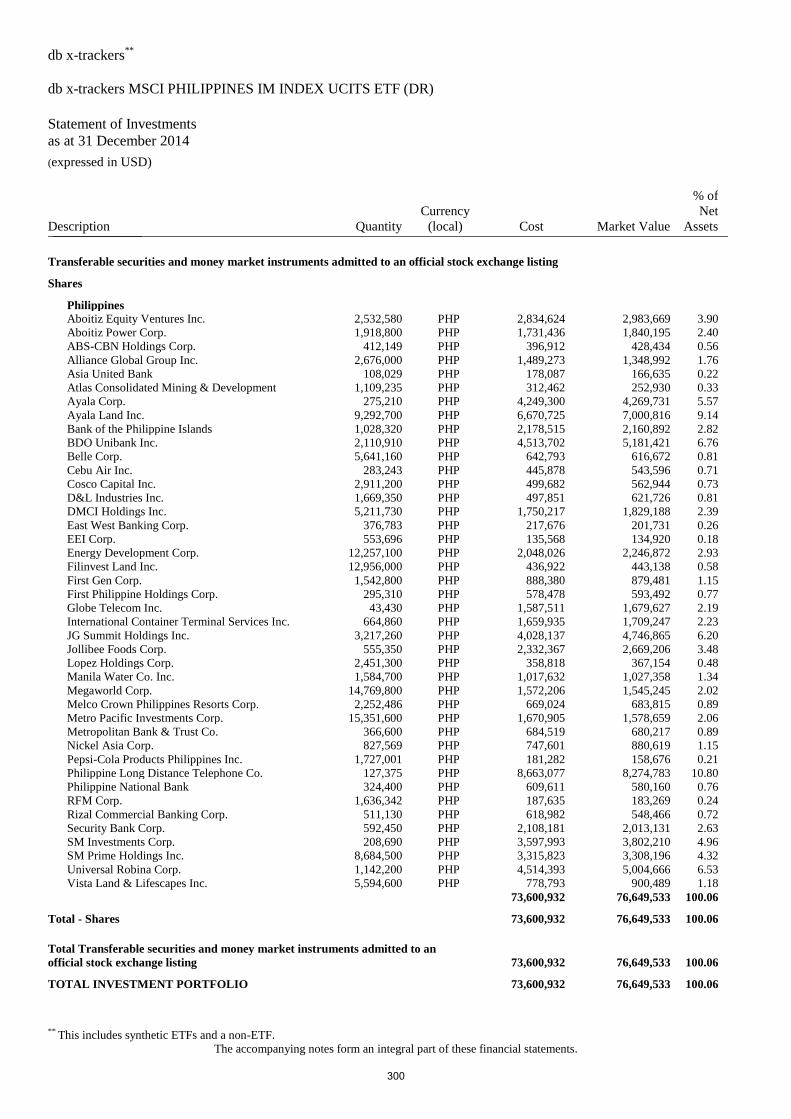
db x-trackers**
db x-trackers MSCI PHILIPPINES IM INDEX UCITS ETF (DR)
Statement of Investments
as at 31 December 2014 (expressed in USD)
** This includes synthetic ETFs and a non-ETF.
The accompanying notes form an integral part of these financial statements.
Description Quantity
Currency
(local) Cost Market Value
% of
Net
Assets _______________
Transferable securities and money market instruments admitted to an official stock exchange listing
Shares
Philippines
Aboitiz Equity Ventures Inc. 2,532,580 PHP 2,834,624 2,983,669 3.90
Aboitiz Power Corp. 1,918,800 PHP 1,731,436 1,840,195 2.40
ABS-CBN Holdings Corp. 412,149 PHP 396,912 428,434 0.56
Alliance Global Group Inc. 2,676,000 PHP 1,489,273 1,348,992 1.76
Asia United Bank 108,029 PHP 178,087 166,635 0.22
Atlas Consolidated Mining & Development 1,109,235 PHP 312,462 252,930 0.33
Ayala Corp. 275,210 PHP 4,249,300 4,269,731 5.57
Ayala Land Inc. 9,292,700 PHP 6,670,725 7,000,816 9.14
Bank of the Philippine Islands 1,028,320 PHP 2,178,515 2,160,892 2.82
BDO Unibank Inc. 2,110,910 PHP 4,513,702 5,181,421 6.76
Belle Corp. 5,641,160 PHP 642,793 616,672 0.81
Cebu Air Inc. 283,243 PHP 445,878 543,596 0.71
Cosco Capital Inc. 2,911,200 PHP 499,682 562,944 0.73
D&L Industries Inc. 1,669,350 PHP 497,851 621,726 0.81
DMCI Holdings Inc. 5,211,730 PHP 1,750,217 1,829,188 2.39
East West Banking Corp. 376,783 PHP 217,676 201,731 0.26
EEI Corp. 553,696 PHP 135,568 134,920 0.18
Energy Development Corp. 12,257,100 PHP 2,048,026 2,246,872 2.93
Filinvest Land Inc. 12,956,000 PHP 436,922 443,138 0.58
First Gen Corp. 1,542,800 PHP 888,380 879,481 1.15
First Philippine Holdings Corp. 295,310 PHP 578,478 593,492 0.77
Globe Telecom Inc. 43,430 PHP 1,587,511 1,679,627 2.19
International Container Terminal Services Inc. 664,860 PHP 1,659,935 1,709,247 2.23
JG Summit Holdings Inc. 3,217,260 PHP 4,028,137 4,746,865 6.20
Jollibee Foods Corp. 555,350 PHP 2,332,367 2,669,206 3.48
Lopez Holdings Corp. 2,451,300 PHP 358,818 367,154 0.48
Manila Water Co. Inc. 1,584,700 PHP 1,017,632 1,027,358 1.34
Megaworld Corp. 14,769,800 PHP 1,572,206 1,545,245 2.02
Melco Crown Philippines Resorts Corp. 2,252,486 PHP 669,024 683,815 0.89
Metro Pacific Investments Corp. 15,351,600 PHP 1,670,905 1,578,659 2.06
Metropolitan Bank & Trust Co. 366,600 PHP 684,519 680,217 0.89
Nickel Asia Corp. 827,569 PHP 747,601 880,619 1.15
Pepsi-Cola Products Philippines Inc. 1,727,001 PHP 181,282 158,676 0.21
Philippine Long Distance Telephone Co. 127,375 PHP 8,663,077 8,274,783 10.80
Philippine National Bank 324,400 PHP 609,611 580,160 0.76
RFM Corp. 1,636,342 PHP 187,635 183,269 0.24
Rizal Commercial Banking Corp. 511,130 PHP 618,982 548,466 0.72
Security Bank Corp. 592,450 PHP 2,108,181 2,013,131 2.63
SM Investments Corp. 208,690 PHP 3,597,993 3,802,210 4.96
SM Prime Holdings Inc. 8,684,500 PHP 3,315,823 3,308,196 4.32
Universal Robina Corp. 1,142,200 PHP 4,514,393 5,004,666 6.53
Vista Land & Lifescapes Inc. 5,594,600 PHP 778,793 900,489 1.18
73,600,932 76,649,533 100.06
Total - Shares 73,600,932 76,649,533 100.06
Total Transferable securities and money market instruments admitted to an
official stock exchange listing 73,600,932 76,649,533 100.06
TOTAL INVESTMENT PORTFOLIO 73,600,932 76,649,533 100.06
300
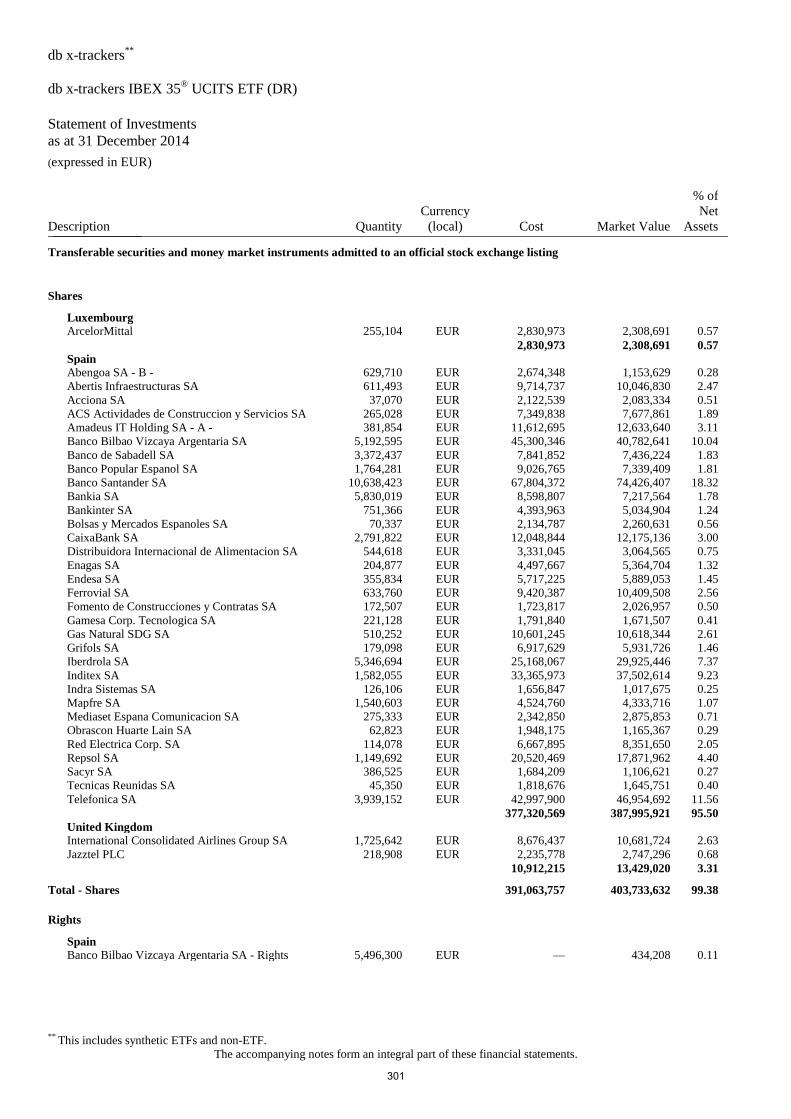
db x-trackers**
db x-trackers IBEX 35® UCITS ETF (DR)
Statement of Investments
as at 31 December 2014 (expressed in EUR)
** This includes synthetic ETFs and non-ETF.
The accompanying notes form an integral part of these financial statements.
Description Quantity
Currency
(local) Cost Market Value
% of
Net
Assets _______________
Transferable securities and money market instruments admitted to an official stock exchange listing
Shares
Luxembourg
ArcelorMittal 255,104 EUR 2,830,973 2,308,691 0.57
2,830,973 2,308,691 0.57
Spain
Abengoa SA - B - 629,710 EUR 2,674,348 1,153,629 0.28
Abertis Infraestructuras SA 611,493 EUR 9,714,737 10,046,830 2.47
Acciona SA 37,070 EUR 2,122,539 2,083,334 0.51
ACS Actividades de Construccion y Servicios SA 265,028 EUR 7,349,838 7,677,861 1.89
Amadeus IT Holding SA - A - 381,854 EUR 11,612,695 12,633,640 3.11
Banco Bilbao Vizcaya Argentaria SA 5,192,595 EUR 45,300,346 40,782,641 10.04
Banco de Sabadell SA 3,372,437 EUR 7,841,852 7,436,224 1.83
Banco Popular Espanol SA 1,764,281 EUR 9,026,765 7,339,409 1.81
Banco Santander SA 10,638,423 EUR 67,804,372 74,426,407 18.32
Bankia SA 5,830,019 EUR 8,598,807 7,217,564 1.78
Bankinter SA 751,366 EUR 4,393,963 5,034,904 1.24
Bolsas y Mercados Espanoles SA 70,337 EUR 2,134,787 2,260,631 0.56
CaixaBank SA 2,791,822 EUR 12,048,844 12,175,136 3.00
Distribuidora Internacional de Alimentacion SA 544,618 EUR 3,331,045 3,064,565 0.75
Enagas SA 204,877 EUR 4,497,667 5,364,704 1.32
Endesa SA 355,834 EUR 5,717,225 5,889,053 1.45
Ferrovial SA 633,760 EUR 9,420,387 10,409,508 2.56
Fomento de Construcciones y Contratas SA 172,507 EUR 1,723,817 2,026,957 0.50
Gamesa Corp. Tecnologica SA 221,128 EUR 1,791,840 1,671,507 0.41
Gas Natural SDG SA 510,252 EUR 10,601,245 10,618,344 2.61
Grifols SA 179,098 EUR 6,917,629 5,931,726 1.46
Iberdrola SA 5,346,694 EUR 25,168,067 29,925,446 7.37
Inditex SA 1,582,055 EUR 33,365,973 37,502,614 9.23
Indra Sistemas SA 126,106 EUR 1,656,847 1,017,675 0.25
Mapfre SA 1,540,603 EUR 4,524,760 4,333,716 1.07
Mediaset Espana Comunicacion SA 275,333 EUR 2,342,850 2,875,853 0.71
Obrascon Huarte Lain SA 62,823 EUR 1,948,175 1,165,367 0.29
Red Electrica Corp. SA 114,078 EUR 6,667,895 8,351,650 2.05
Repsol SA 1,149,692 EUR 20,520,469 17,871,962 4.40
Sacyr SA 386,525 EUR 1,684,209 1,106,621 0.27
Tecnicas Reunidas SA 45,350 EUR 1,818,676 1,645,751 0.40
Telefonica SA 3,939,152 EUR 42,997,900 46,954,692 11.56
377,320,569 387,995,921 95.50
United Kingdom
International Consolidated Airlines Group SA 1,725,642 EUR 8,676,437 10,681,724 2.63
Jazztel PLC 218,908 EUR 2,235,778 2,747,296 0.68
10,912,215 13,429,020 3.31
Total - Shares 391,063,757 403,733,632 99.38
Rights
Spain
Banco Bilbao Vizcaya Argentaria SA - Rights 5,496,300 EUR — 434,208 0.11
301
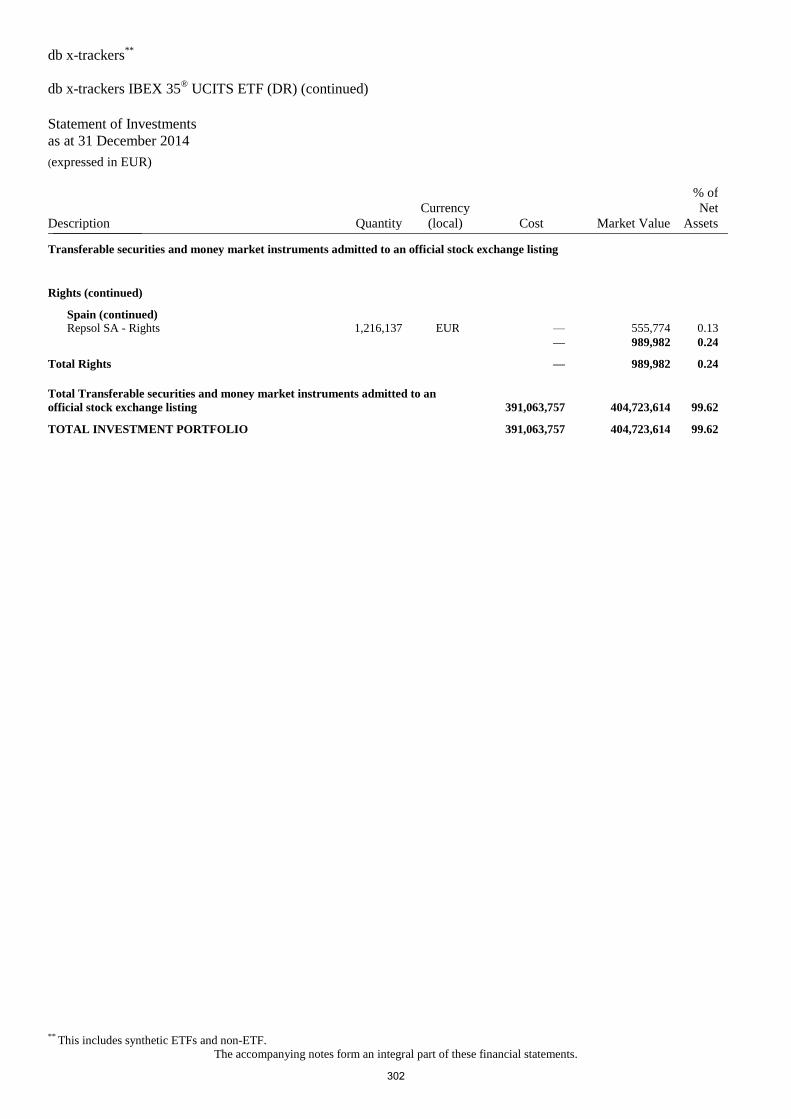
db x-trackers**
db x-trackers IBEX 35® UCITS ETF (DR) (continued)
Statement of Investments
as at 31 December 2014 (expressed in EUR)
** This includes synthetic ETFs and non-ETF.
The accompanying notes form an integral part of these financial statements.
Description Quantity
Currency
(local) Cost Market Value
% of
Net
Assets _______________
Transferable securities and money market instruments admitted to an official stock exchange listing
Rights (continued)
Spain (continued)
Repsol SA - Rights 1,216,137 EUR — 555,774 0.13
— 989,982 0.24
Total Rights — 989,982 0.24
Total Transferable securities and money market instruments admitted to an
official stock exchange listing 391,063,757 404,723,614 99.62
TOTAL INVESTMENT PORTFOLIO 391,063,757 404,723,614 99.62
302
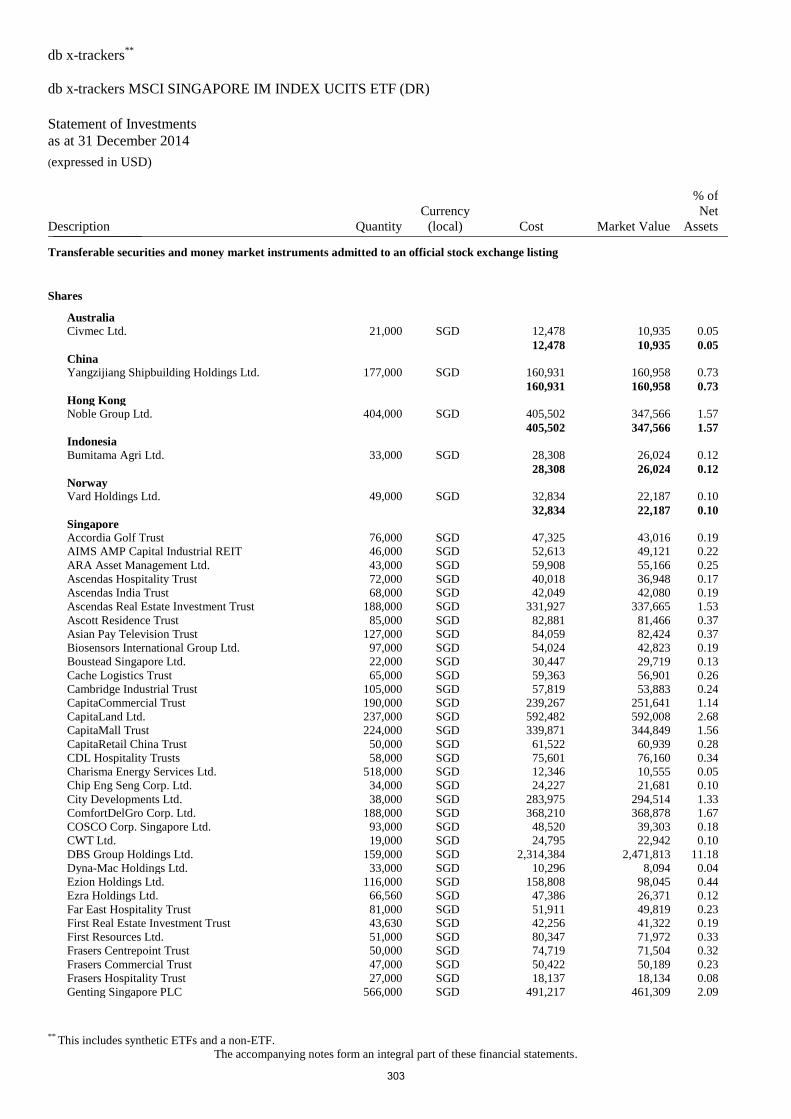
db x-trackers**
db x-trackers MSCI SINGAPORE IM INDEX UCITS ETF (DR)
Statement of Investments
as at 31 December 2014 (expressed in USD)
** This includes synthetic ETFs and a non-ETF.
The accompanying notes form an integral part of these financial statements.
Description Quantity
Currency
(local) Cost Market Value
% of
Net
Assets _______________
Transferable securities and money market instruments admitted to an official stock exchange listing
Shares
Australia
Civmec Ltd. 21,000 SGD 12,478 10,935 0.05
12,478 10,935 0.05
China
Yangzijiang Shipbuilding Holdings Ltd. 177,000 SGD 160,931 160,958 0.73
160,931 160,958 0.73
Hong Kong
Noble Group Ltd. 404,000 SGD 405,502 347,566 1.57
405,502 347,566 1.57
Indonesia
Bumitama Agri Ltd. 33,000 SGD 28,308 26,024 0.12
28,308 26,024 0.12
Norway
Vard Holdings Ltd. 49,000 SGD 32,834 22,187 0.10
32,834 22,187 0.10
Singapore
Accordia Golf Trust 76,000 SGD 47,325 43,016 0.19
AIMS AMP Capital Industrial REIT 46,000 SGD 52,613 49,121 0.22
ARA Asset Management Ltd. 43,000 SGD 59,908 55,166 0.25
Ascendas Hospitality Trust 72,000 SGD 40,018 36,948 0.17
Ascendas India Trust 68,000 SGD 42,049 42,080 0.19
Ascendas Real Estate Investment Trust 188,000 SGD 331,927 337,665 1.53
Ascott Residence Trust 85,000 SGD 82,881 81,466 0.37
Asian Pay Television Trust 127,000 SGD 84,059 82,424 0.37
Biosensors International Group Ltd. 97,000 SGD 54,024 42,823 0.19
Boustead Singapore Ltd. 22,000 SGD 30,447 29,719 0.13
Cache Logistics Trust 65,000 SGD 59,363 56,901 0.26
Cambridge Industrial Trust 105,000 SGD 57,819 53,883 0.24
CapitaCommercial Trust 190,000 SGD 239,267 251,641 1.14
CapitaLand Ltd. 237,000 SGD 592,482 592,008 2.68
CapitaMall Trust 224,000 SGD 339,871 344,849 1.56
CapitaRetail China Trust 50,000 SGD 61,522 60,939 0.28
CDL Hospitality Trusts 58,000 SGD 75,601 76,160 0.34
Charisma Energy Services Ltd. 518,000 SGD 12,346 10,555 0.05
Chip Eng Seng Corp. Ltd. 34,000 SGD 24,227 21,681 0.10
City Developments Ltd. 38,000 SGD 283,975 294,514 1.33
ComfortDelGro Corp. Ltd. 188,000 SGD 368,210 368,878 1.67
COSCO Corp. Singapore Ltd. 93,000 SGD 48,520 39,303 0.18
CWT Ltd. 19,000 SGD 24,795 22,942 0.10
DBS Group Holdings Ltd. 159,000 SGD 2,314,384 2,471,813 11.18
Dyna-Mac Holdings Ltd. 33,000 SGD 10,296 8,094 0.04
Ezion Holdings Ltd. 116,000 SGD 158,808 98,045 0.44
Ezra Holdings Ltd. 66,560 SGD 47,386 26,371 0.12
Far East Hospitality Trust 81,000 SGD 51,911 49,819 0.23
First Real Estate Investment Trust 43,630 SGD 42,256 41,322 0.19
First Resources Ltd. 51,000 SGD 80,347 71,972 0.33
Frasers Centrepoint Trust 50,000 SGD 74,719 71,504 0.32
Frasers Commercial Trust 47,000 SGD 50,422 50,189 0.23
Frasers Hospitality Trust 27,000 SGD 18,137 18,134 0.08
Genting Singapore PLC 566,000 SGD 491,217 461,309 2.09
303
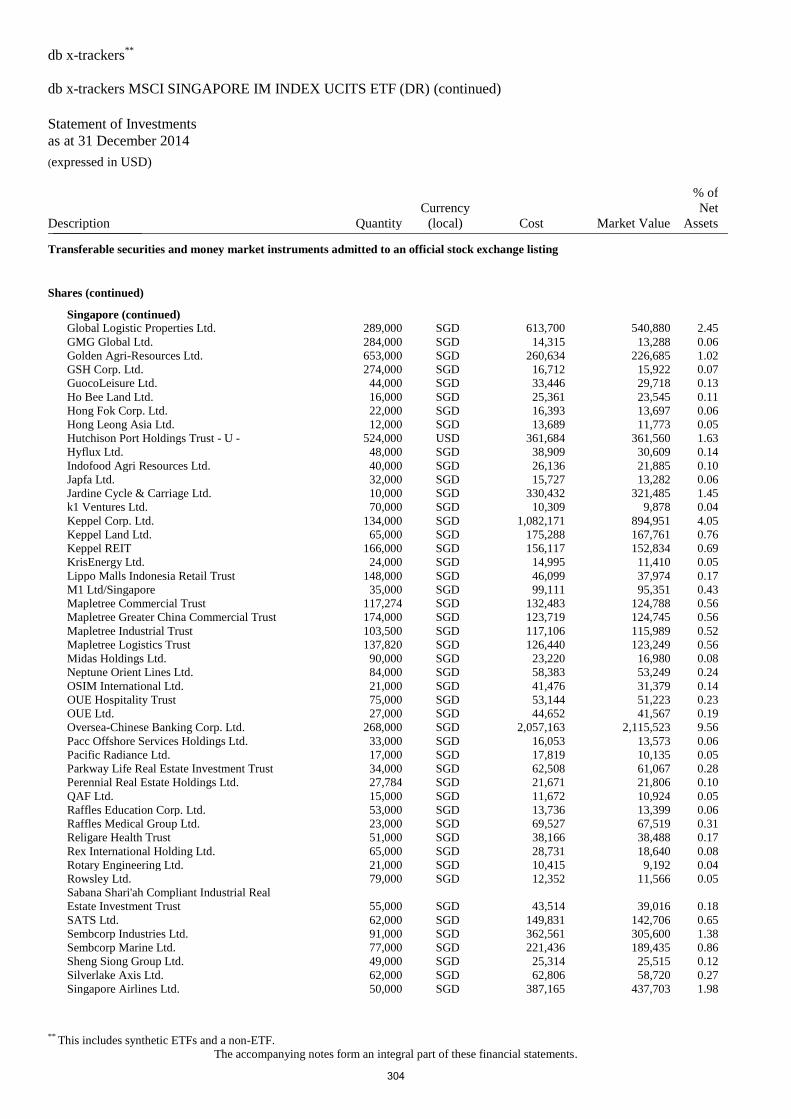
db x-trackers**
db x-trackers MSCI SINGAPORE IM INDEX UCITS ETF (DR) (continued)
Statement of Investments
as at 31 December 2014 (expressed in USD)
** This includes synthetic ETFs and a non-ETF.
The accompanying notes form an integral part of these financial statements.
Description Quantity
Currency
(local) Cost Market Value
% of
Net
Assets _______________
Transferable securities and money market instruments admitted to an official stock exchange listing
Shares (continued)
Singapore (continued)
Global Logistic Properties Ltd. 289,000 SGD 613,700 540,880 2.45
GMG Global Ltd. 284,000 SGD 14,315 13,288 0.06
Golden Agri-Resources Ltd. 653,000 SGD 260,634 226,685 1.02
GSH Corp. Ltd. 274,000 SGD 16,712 15,922 0.07
GuocoLeisure Ltd. 44,000 SGD 33,446 29,718 0.13
Ho Bee Land Ltd. 16,000 SGD 25,361 23,545 0.11
Hong Fok Corp. Ltd. 22,000 SGD 16,393 13,697 0.06
Hong Leong Asia Ltd. 12,000 SGD 13,689 11,773 0.05
Hutchison Port Holdings Trust - U - 524,000 USD 361,684 361,560 1.63
Hyflux Ltd. 48,000 SGD 38,909 30,609 0.14
Indofood Agri Resources Ltd. 40,000 SGD 26,136 21,885 0.10
Japfa Ltd. 32,000 SGD 15,727 13,282 0.06
Jardine Cycle & Carriage Ltd. 10,000 SGD 330,432 321,485 1.45
k1 Ventures Ltd. 70,000 SGD 10,309 9,878 0.04
Keppel Corp. Ltd. 134,000 SGD 1,082,171 894,951 4.05
Keppel Land Ltd. 65,000 SGD 175,288 167,761 0.76
Keppel REIT 166,000 SGD 156,117 152,834 0.69
KrisEnergy Ltd. 24,000 SGD 14,995 11,410 0.05
Lippo Malls Indonesia Retail Trust 148,000 SGD 46,099 37,974 0.17
M1 Ltd/Singapore 35,000 SGD 99,111 95,351 0.43
Mapletree Commercial Trust 117,274 SGD 132,483 124,788 0.56
Mapletree Greater China Commercial Trust 174,000 SGD 123,719 124,745 0.56
Mapletree Industrial Trust 103,500 SGD 117,106 115,989 0.52
Mapletree Logistics Trust 137,820 SGD 126,440 123,249 0.56
Midas Holdings Ltd. 90,000 SGD 23,220 16,980 0.08
Neptune Orient Lines Ltd. 84,000 SGD 58,383 53,249 0.24
OSIM International Ltd. 21,000 SGD 41,476 31,379 0.14
OUE Hospitality Trust 75,000 SGD 53,144 51,223 0.23
OUE Ltd. 27,000 SGD 44,652 41,567 0.19
Oversea-Chinese Banking Corp. Ltd. 268,000 SGD 2,057,163 2,115,523 9.56
Pacc Offshore Services Holdings Ltd. 33,000 SGD 16,053 13,573 0.06
Pacific Radiance Ltd. 17,000 SGD 17,819 10,135 0.05
Parkway Life Real Estate Investment Trust 34,000 SGD 62,508 61,067 0.28
Perennial Real Estate Holdings Ltd. 27,784 SGD 21,671 21,806 0.10
QAF Ltd. 15,000 SGD 11,672 10,924 0.05
Raffles Education Corp. Ltd. 53,000 SGD 13,736 13,399 0.06
Raffles Medical Group Ltd. 23,000 SGD 69,527 67,519 0.31
Religare Health Trust 51,000 SGD 38,166 38,488 0.17
Rex International Holding Ltd. 65,000 SGD 28,731 18,640 0.08
Rotary Engineering Ltd. 21,000 SGD 10,415 9,192 0.04
Rowsley Ltd. 79,000 SGD 12,352 11,566 0.05
Sabana Shari'ah Compliant Industrial Real
Estate Investment Trust 55,000 SGD 43,514 39,016 0.18
SATS Ltd. 62,000 SGD 149,831 142,706 0.65
Sembcorp Industries Ltd. 91,000 SGD 362,561 305,600 1.38
Sembcorp Marine Ltd. 77,000 SGD 221,436 189,435 0.86
Sheng Siong Group Ltd. 49,000 SGD 25,314 25,515 0.12
Silverlake Axis Ltd. 62,000 SGD 62,806 58,720 0.27
Singapore Airlines Ltd. 50,000 SGD 387,165 437,703 1.98
304
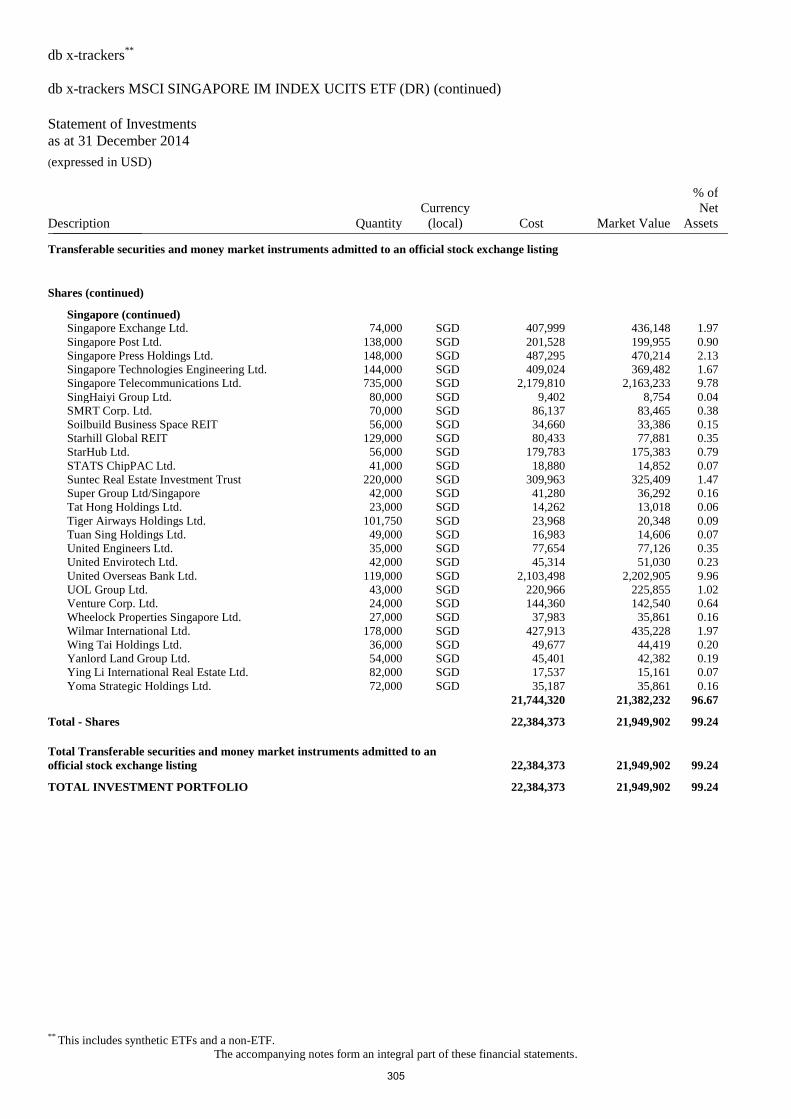
db x-trackers**
db x-trackers MSCI SINGAPORE IM INDEX UCITS ETF (DR) (continued)
Statement of Investments
as at 31 December 2014 (expressed in USD)
** This includes synthetic ETFs and a non-ETF.
The accompanying notes form an integral part of these financial statements.
Description Quantity
Currency
(local) Cost Market Value
% of
Net
Assets _______________
Transferable securities and money market instruments admitted to an official stock exchange listing
Shares (continued)
Singapore (continued)
Singapore Exchange Ltd. 74,000 SGD 407,999 436,148 1.97
Singapore Post Ltd. 138,000 SGD 201,528 199,955 0.90
Singapore Press Holdings Ltd. 148,000 SGD 487,295 470,214 2.13
Singapore Technologies Engineering Ltd. 144,000 SGD 409,024 369,482 1.67
Singapore Telecommunications Ltd. 735,000 SGD 2,179,810 2,163,233 9.78
SingHaiyi Group Ltd. 80,000 SGD 9,402 8,754 0.04
SMRT Corp. Ltd. 70,000 SGD 86,137 83,465 0.38
Soilbuild Business Space REIT 56,000 SGD 34,660 33,386 0.15
Starhill Global REIT 129,000 SGD 80,433 77,881 0.35
StarHub Ltd. 56,000 SGD 179,783 175,383 0.79
STATS ChipPAC Ltd. 41,000 SGD 18,880 14,852 0.07
Suntec Real Estate Investment Trust 220,000 SGD 309,963 325,409 1.47
Super Group Ltd/Singapore 42,000 SGD 41,280 36,292 0.16
Tat Hong Holdings Ltd. 23,000 SGD 14,262 13,018 0.06
Tiger Airways Holdings Ltd. 101,750 SGD 23,968 20,348 0.09
Tuan Sing Holdings Ltd. 49,000 SGD 16,983 14,606 0.07
United Engineers Ltd. 35,000 SGD 77,654 77,126 0.35
United Envirotech Ltd. 42,000 SGD 45,314 51,030 0.23
United Overseas Bank Ltd. 119,000 SGD 2,103,498 2,202,905 9.96
UOL Group Ltd. 43,000 SGD 220,966 225,855 1.02
Venture Corp. Ltd. 24,000 SGD 144,360 142,540 0.64
Wheelock Properties Singapore Ltd. 27,000 SGD 37,983 35,861 0.16
Wilmar International Ltd. 178,000 SGD 427,913 435,228 1.97
Wing Tai Holdings Ltd. 36,000 SGD 49,677 44,419 0.20
Yanlord Land Group Ltd. 54,000 SGD 45,401 42,382 0.19
Ying Li International Real Estate Ltd. 82,000 SGD 17,537 15,161 0.07
Yoma Strategic Holdings Ltd. 72,000 SGD 35,187 35,861 0.16
21,744,320 21,382,232 96.67
Total - Shares 22,384,373 21,949,902 99.24
Total Transferable securities and money market instruments admitted to an
official stock exchange listing 22,384,373 21,949,902 99.24
TOTAL INVESTMENT PORTFOLIO 22,384,373 21,949,902 99.24
305
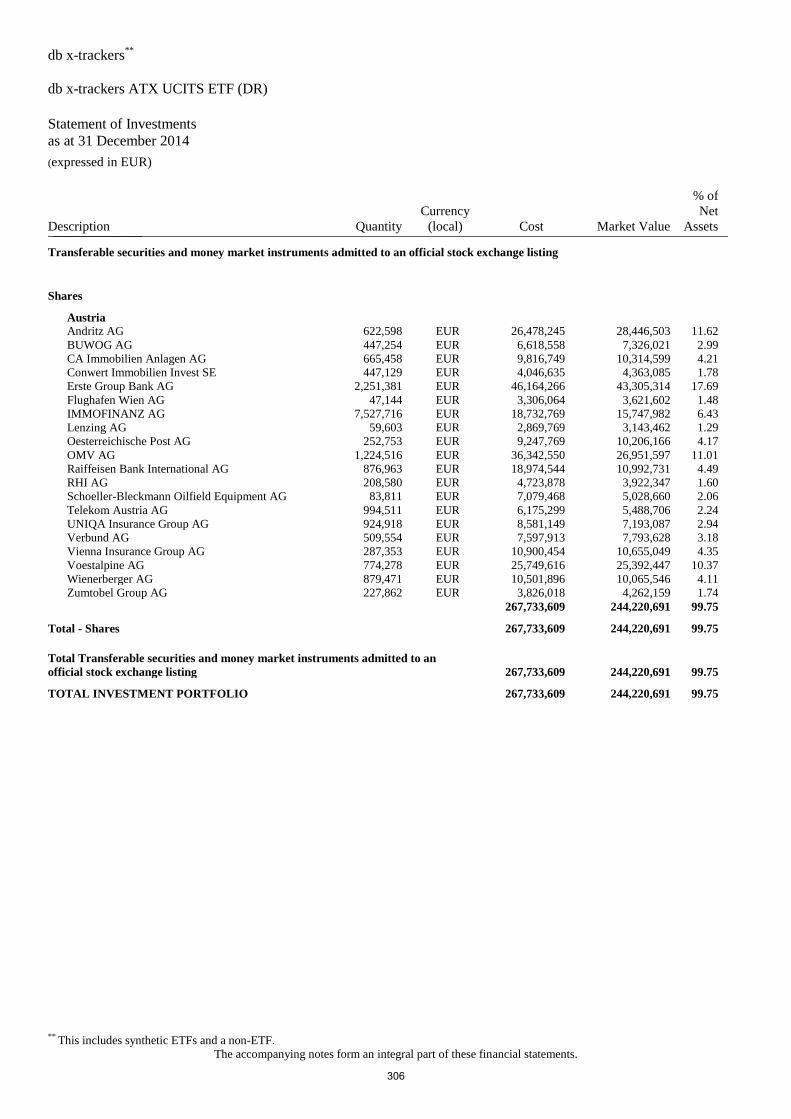
db x-trackers**
db x-trackers ATX UCITS ETF (DR)
Statement of Investments
as at 31 December 2014 (expressed in EUR)
** This includes synthetic ETFs and a non-ETF.
The accompanying notes form an integral part of these financial statements.
Description Quantity
Currency
(local) Cost Market Value
% of
Net
Assets _______________
Transferable securities and money market instruments admitted to an official stock exchange listing
Shares
Austria
Andritz AG 622,598 EUR 26,478,245 28,446,503 11.62
BUWOG AG 447,254 EUR 6,618,558 7,326,021 2.99
CA Immobilien Anlagen AG 665,458 EUR 9,816,749 10,314,599 4.21
Conwert Immobilien Invest SE 447,129 EUR 4,046,635 4,363,085 1.78
Erste Group Bank AG 2,251,381 EUR 46,164,266 43,305,314 17.69
Flughafen Wien AG 47,144 EUR 3,306,064 3,621,602 1.48
IMMOFINANZ AG 7,527,716 EUR 18,732,769 15,747,982 6.43
Lenzing AG 59,603 EUR 2,869,769 3,143,462 1.29
Oesterreichische Post AG 252,753 EUR 9,247,769 10,206,166 4.17
OMV AG 1,224,516 EUR 36,342,550 26,951,597 11.01
Raiffeisen Bank International AG 876,963 EUR 18,974,544 10,992,731 4.49
RHI AG 208,580 EUR 4,723,878 3,922,347 1.60
Schoeller-Bleckmann Oilfield Equipment AG 83,811 EUR 7,079,468 5,028,660 2.06
Telekom Austria AG 994,511 EUR 6,175,299 5,488,706 2.24
UNIQA Insurance Group AG 924,918 EUR 8,581,149 7,193,087 2.94
Verbund AG 509,554 EUR 7,597,913 7,793,628 3.18
Vienna Insurance Group AG 287,353 EUR 10,900,454 10,655,049 4.35
Voestalpine AG 774,278 EUR 25,749,616 25,392,447 10.37
Wienerberger AG 879,471 EUR 10,501,896 10,065,546 4.11
Zumtobel Group AG 227,862 EUR 3,826,018 4,262,159 1.74
267,733,609 244,220,691 99.75
Total - Shares 267,733,609 244,220,691 99.75
Total Transferable securities and money market instruments admitted to an
official stock exchange listing 267,733,609 244,220,691 99.75
TOTAL INVESTMENT PORTFOLIO 267,733,609 244,220,691 99.75
306
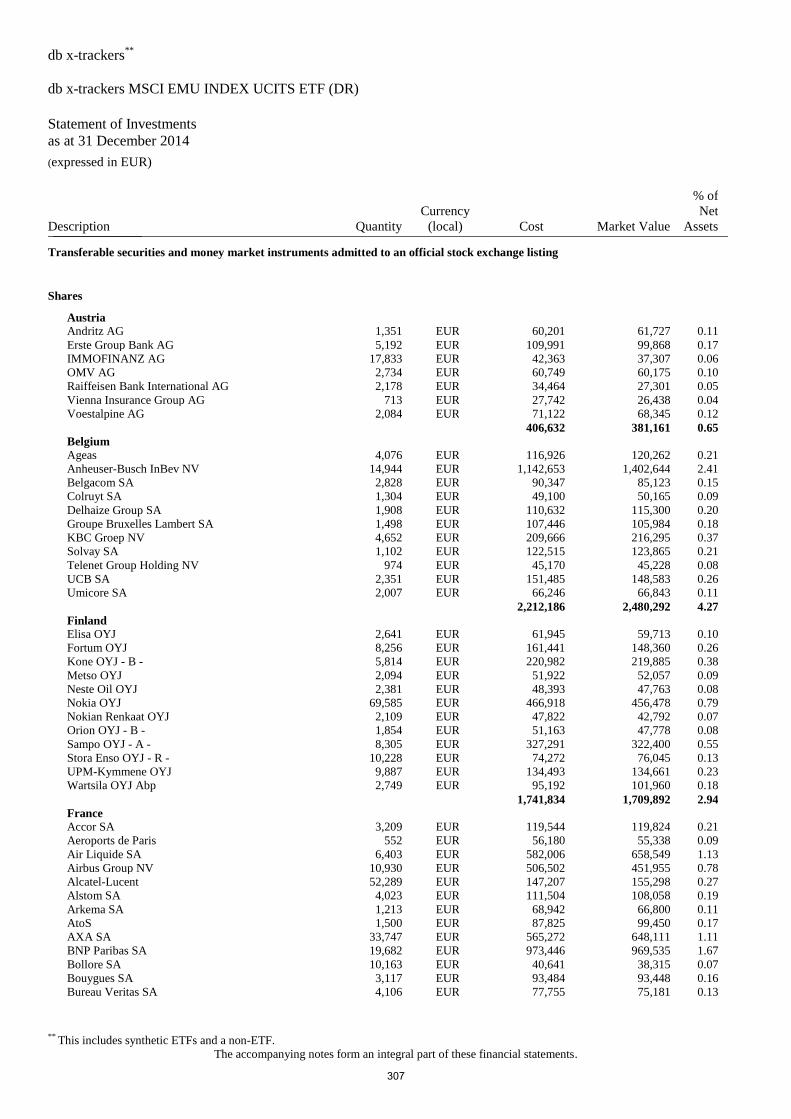
db x-trackers**
db x-trackers MSCI EMU INDEX UCITS ETF (DR)
Statement of Investments
as at 31 December 2014 (expressed in EUR)
** This includes synthetic ETFs and a non-ETF.
The accompanying notes form an integral part of these financial statements.
Description Quantity
Currency
(local) Cost Market Value
% of
Net
Assets _______________
Transferable securities and money market instruments admitted to an official stock exchange listing
Shares
Austria
Andritz AG 1,351 EUR 60,201 61,727 0.11
Erste Group Bank AG 5,192 EUR 109,991 99,868 0.17
IMMOFINANZ AG 17,833 EUR 42,363 37,307 0.06
OMV AG 2,734 EUR 60,749 60,175 0.10
Raiffeisen Bank International AG 2,178 EUR 34,464 27,301 0.05
Vienna Insurance Group AG 713 EUR 27,742 26,438 0.04
Voestalpine AG 2,084 EUR 71,122 68,345 0.12
406,632 381,161 0.65
Belgium
Ageas 4,076 EUR 116,926 120,262 0.21
Anheuser-Busch InBev NV 14,944 EUR 1,142,653 1,402,644 2.41
Belgacom SA 2,828 EUR 90,347 85,123 0.15
Colruyt SA 1,304 EUR 49,100 50,165 0.09
Delhaize Group SA 1,908 EUR 110,632 115,300 0.20
Groupe Bruxelles Lambert SA 1,498 EUR 107,446 105,984 0.18
KBC Groep NV 4,652 EUR 209,666 216,295 0.37
Solvay SA 1,102 EUR 122,515 123,865 0.21
Telenet Group Holding NV 974 EUR 45,170 45,228 0.08
UCB SA 2,351 EUR 151,485 148,583 0.26
Umicore SA 2,007 EUR 66,246 66,843 0.11
2,212,186 2,480,292 4.27
Finland
Elisa OYJ 2,641 EUR 61,945 59,713 0.10
Fortum OYJ 8,256 EUR 161,441 148,360 0.26
Kone OYJ - B - 5,814 EUR 220,982 219,885 0.38
Metso OYJ 2,094 EUR 51,922 52,057 0.09
Neste Oil OYJ 2,381 EUR 48,393 47,763 0.08
Nokia OYJ 69,585 EUR 466,918 456,478 0.79
Nokian Renkaat OYJ 2,109 EUR 47,822 42,792 0.07
Orion OYJ - B - 1,854 EUR 51,163 47,778 0.08
Sampo OYJ - A - 8,305 EUR 327,291 322,400 0.55
Stora Enso OYJ - R - 10,228 EUR 74,272 76,045 0.13
UPM-Kymmene OYJ 9,887 EUR 134,493 134,661 0.23
Wartsila OYJ Abp 2,749 EUR 95,192 101,960 0.18
1,741,834 1,709,892 2.94
France
Accor SA 3,209 EUR 119,544 119,824 0.21
Aeroports de Paris 552 EUR 56,180 55,338 0.09
Air Liquide SA 6,403 EUR 582,006 658,549 1.13
Airbus Group NV 10,930 EUR 506,502 451,955 0.78
Alcatel-Lucent 52,289 EUR 147,207 155,298 0.27
Alstom SA 4,023 EUR 111,504 108,058 0.19
Arkema SA 1,213 EUR 68,942 66,800 0.11
AtoS 1,500 EUR 87,825 99,450 0.17
AXA SA 33,747 EUR 565,272 648,111 1.11
BNP Paribas SA 19,682 EUR 973,446 969,535 1.67
Bollore SA 10,163 EUR 40,641 38,315 0.07
Bouygues SA 3,117 EUR 93,484 93,448 0.16
Bureau Veritas SA 4,106 EUR 77,755 75,181 0.13
307
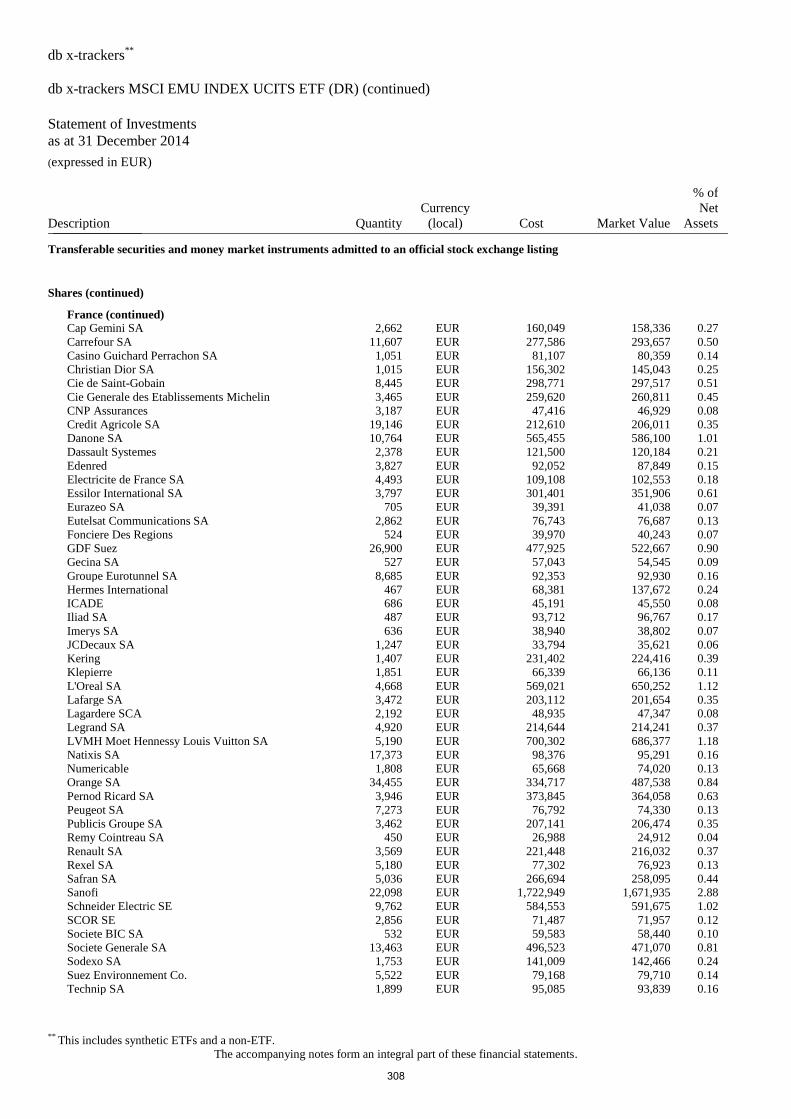
db x-trackers**
db x-trackers MSCI EMU INDEX UCITS ETF (DR) (continued)
Statement of Investments
as at 31 December 2014 (expressed in EUR)
** This includes synthetic ETFs and a non-ETF.
The accompanying notes form an integral part of these financial statements.
Description Quantity
Currency
(local) Cost Market Value
% of
Net
Assets _______________
Transferable securities and money market instruments admitted to an official stock exchange listing
Shares (continued)
France (continued)
Cap Gemini SA 2,662 EUR 160,049 158,336 0.27
Carrefour SA 11,607 EUR 277,586 293,657 0.50
Casino Guichard Perrachon SA 1,051 EUR 81,107 80,359 0.14
Christian Dior SA 1,015 EUR 156,302 145,043 0.25
Cie de Saint-Gobain 8,445 EUR 298,771 297,517 0.51
Cie Generale des Etablissements Michelin 3,465 EUR 259,620 260,811 0.45
CNP Assurances 3,187 EUR 47,416 46,929 0.08
Credit Agricole SA 19,146 EUR 212,610 206,011 0.35
Danone SA 10,764 EUR 565,455 586,100 1.01
Dassault Systemes 2,378 EUR 121,500 120,184 0.21
Edenred 3,827 EUR 92,052 87,849 0.15
Electricite de France SA 4,493 EUR 109,108 102,553 0.18
Essilor International SA 3,797 EUR 301,401 351,906 0.61
Eurazeo SA 705 EUR 39,391 41,038 0.07
Eutelsat Communications SA 2,862 EUR 76,743 76,687 0.13
Fonciere Des Regions 524 EUR 39,970 40,243 0.07
GDF Suez 26,900 EUR 477,925 522,667 0.90
Gecina SA 527 EUR 57,043 54,545 0.09
Groupe Eurotunnel SA 8,685 EUR 92,353 92,930 0.16
Hermes International 467 EUR 68,381 137,672 0.24
ICADE 686 EUR 45,191 45,550 0.08
Iliad SA 487 EUR 93,712 96,767 0.17
Imerys SA 636 EUR 38,940 38,802 0.07
JCDecaux SA 1,247 EUR 33,794 35,621 0.06
Kering 1,407 EUR 231,402 224,416 0.39
Klepierre 1,851 EUR 66,339 66,136 0.11
L'Oreal SA 4,668 EUR 569,021 650,252 1.12
Lafarge SA 3,472 EUR 203,112 201,654 0.35
Lagardere SCA 2,192 EUR 48,935 47,347 0.08
Legrand SA 4,920 EUR 214,644 214,241 0.37
LVMH Moet Hennessy Louis Vuitton SA 5,190 EUR 700,302 686,377 1.18
Natixis SA 17,373 EUR 98,376 95,291 0.16
Numericable 1,808 EUR 65,668 74,020 0.13
Orange SA 34,455 EUR 334,717 487,538 0.84
Pernod Ricard SA 3,946 EUR 373,845 364,058 0.63
Peugeot SA 7,273 EUR 76,792 74,330 0.13
Publicis Groupe SA 3,462 EUR 207,141 206,474 0.35
Remy Cointreau SA 450 EUR 26,988 24,912 0.04
Renault SA 3,569 EUR 221,448 216,032 0.37
Rexel SA 5,180 EUR 77,302 76,923 0.13
Safran SA 5,036 EUR 266,694 258,095 0.44
Sanofi 22,098 EUR 1,722,949 1,671,935 2.88
Schneider Electric SE 9,762 EUR 584,553 591,675 1.02
SCOR SE 2,856 EUR 71,487 71,957 0.12
Societe BIC SA 532 EUR 59,583 58,440 0.10
Societe Generale SA 13,463 EUR 496,523 471,070 0.81
Sodexo SA 1,753 EUR 141,009 142,466 0.24
Suez Environnement Co. 5,522 EUR 79,168 79,710 0.14
Technip SA 1,899 EUR 95,085 93,839 0.16
308
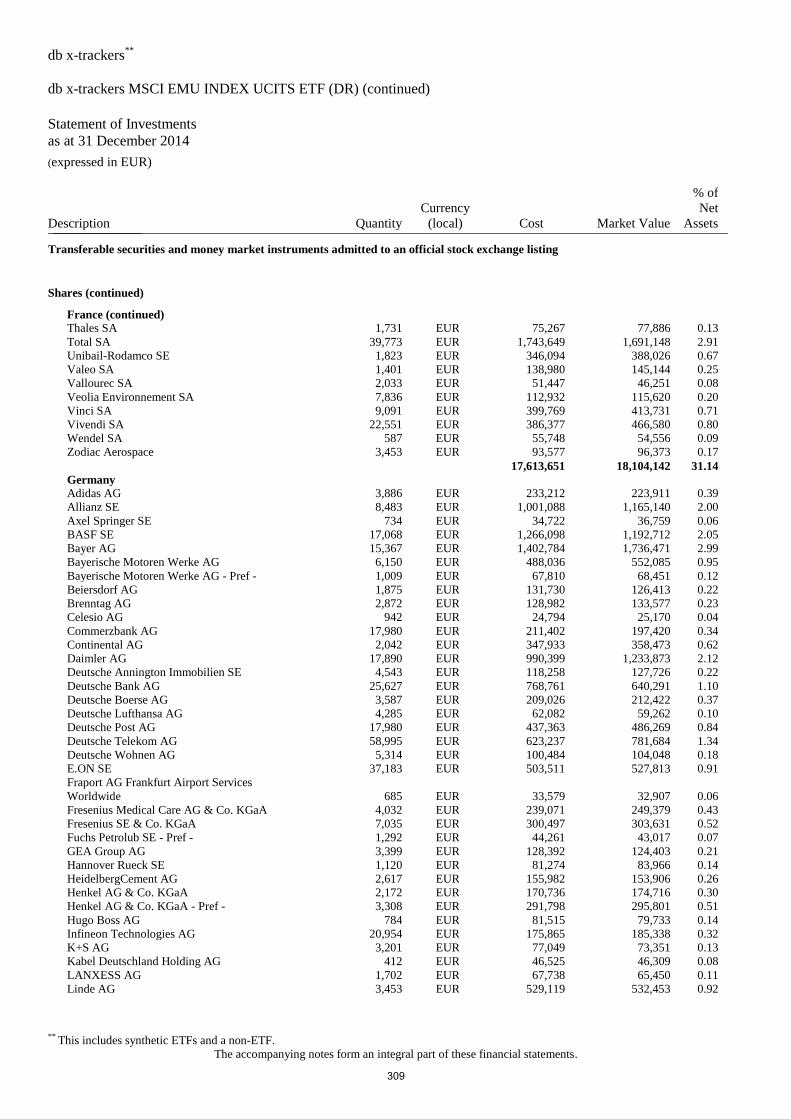
db x-trackers**
db x-trackers MSCI EMU INDEX UCITS ETF (DR) (continued)
Statement of Investments
as at 31 December 2014 (expressed in EUR)
** This includes synthetic ETFs and a non-ETF.
The accompanying notes form an integral part of these financial statements.
Description Quantity
Currency
(local) Cost Market Value
% of
Net
Assets _______________
Transferable securities and money market instruments admitted to an official stock exchange listing
Shares (continued)
France (continued)
Thales SA 1,731 EUR 75,267 77,886 0.13
Total SA 39,773 EUR 1,743,649 1,691,148 2.91
Unibail-Rodamco SE 1,823 EUR 346,094 388,026 0.67
Valeo SA 1,401 EUR 138,980 145,144 0.25
Vallourec SA 2,033 EUR 51,447 46,251 0.08
Veolia Environnement SA 7,836 EUR 112,932 115,620 0.20
Vinci SA 9,091 EUR 399,769 413,731 0.71
Vivendi SA 22,551 EUR 386,377 466,580 0.80
Wendel SA 587 EUR 55,748 54,556 0.09
Zodiac Aerospace 3,453 EUR 93,577 96,373 0.17
17,613,651 18,104,142 31.14
Germany
Adidas AG 3,886 EUR 233,212 223,911 0.39
Allianz SE 8,483 EUR 1,001,088 1,165,140 2.00
Axel Springer SE 734 EUR 34,722 36,759 0.06
BASF SE 17,068 EUR 1,266,098 1,192,712 2.05
Bayer AG 15,367 EUR 1,402,784 1,736,471 2.99
Bayerische Motoren Werke AG 6,150 EUR 488,036 552,085 0.95
Bayerische Motoren Werke AG - Pref - 1,009 EUR 67,810 68,451 0.12
Beiersdorf AG 1,875 EUR 131,730 126,413 0.22
Brenntag AG 2,872 EUR 128,982 133,577 0.23
Celesio AG 942 EUR 24,794 25,170 0.04
Commerzbank AG 17,980 EUR 211,402 197,420 0.34
Continental AG 2,042 EUR 347,933 358,473 0.62
Daimler AG 17,890 EUR 990,399 1,233,873 2.12
Deutsche Annington Immobilien SE 4,543 EUR 118,258 127,726 0.22
Deutsche Bank AG 25,627 EUR 768,761 640,291 1.10
Deutsche Boerse AG 3,587 EUR 209,026 212,422 0.37
Deutsche Lufthansa AG 4,285 EUR 62,082 59,262 0.10
Deutsche Post AG 17,980 EUR 437,363 486,269 0.84
Deutsche Telekom AG 58,995 EUR 623,237 781,684 1.34
Deutsche Wohnen AG 5,314 EUR 100,484 104,048 0.18
E.ON SE 37,183 EUR 503,511 527,813 0.91
Fraport AG Frankfurt Airport Services
Worldwide 685 EUR 33,579 32,907 0.06
Fresenius Medical Care AG & Co. KGaA 4,032 EUR 239,071 249,379 0.43
Fresenius SE & Co. KGaA 7,035 EUR 300,497 303,631 0.52
Fuchs Petrolub SE - Pref - 1,292 EUR 44,261 43,017 0.07
GEA Group AG 3,399 EUR 128,392 124,403 0.21
Hannover Rueck SE 1,120 EUR 81,274 83,966 0.14
HeidelbergCement AG 2,617 EUR 155,982 153,906 0.26
Henkel AG & Co. KGaA 2,172 EUR 170,736 174,716 0.30
Henkel AG & Co. KGaA - Pref - 3,308 EUR 291,798 295,801 0.51
Hugo Boss AG 784 EUR 81,515 79,733 0.14
Infineon Technologies AG 20,954 EUR 175,865 185,338 0.32
K+S AG 3,201 EUR 77,049 73,351 0.13
Kabel Deutschland Holding AG 412 EUR 46,525 46,309 0.08
LANXESS AG 1,702 EUR 67,738 65,450 0.11
Linde AG 3,453 EUR 529,119 532,453 0.92
309
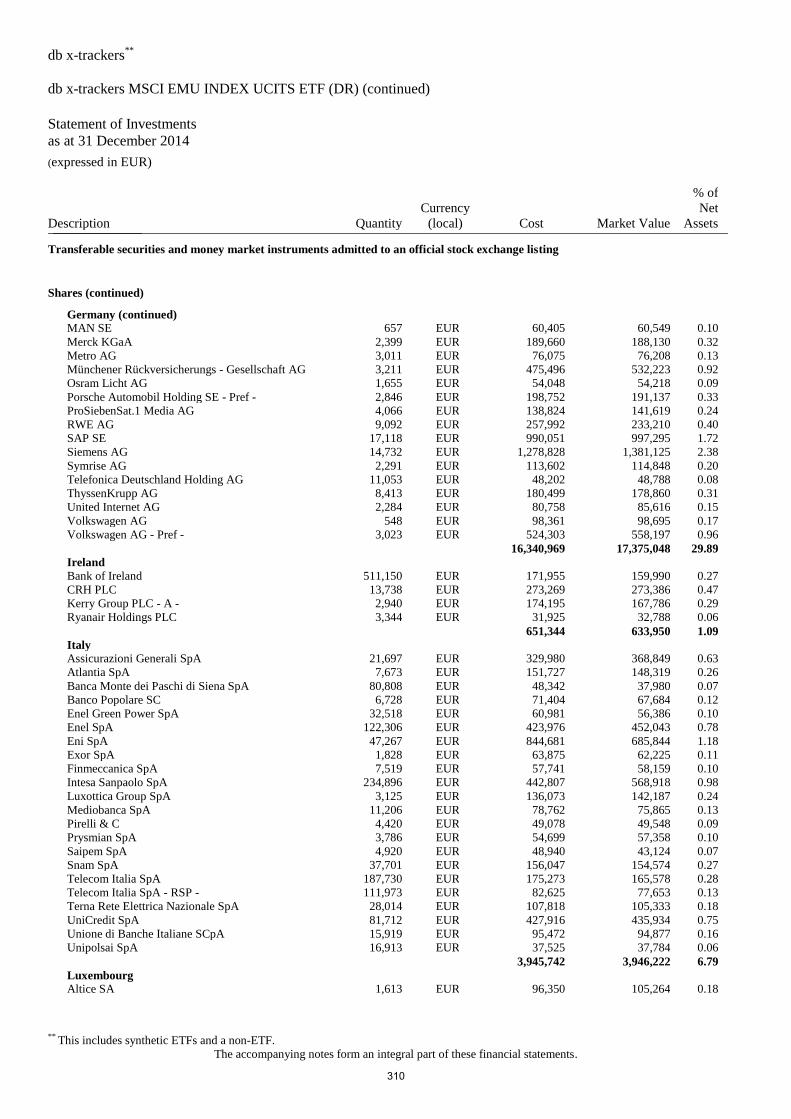
db x-trackers**
db x-trackers MSCI EMU INDEX UCITS ETF (DR) (continued)
Statement of Investments
as at 31 December 2014 (expressed in EUR)
** This includes synthetic ETFs and a non-ETF.
The accompanying notes form an integral part of these financial statements.
Description Quantity
Currency
(local) Cost Market Value
% of
Net
Assets _______________
Transferable securities and money market instruments admitted to an official stock exchange listing
Shares (continued)
Germany (continued)
MAN SE 657 EUR 60,405 60,549 0.10
Merck KGaA 2,399 EUR 189,660 188,130 0.32
Metro AG 3,011 EUR 76,075 76,208 0.13
Münchener Rückversicherungs - Gesellschaft AG 3,211 EUR 475,496 532,223 0.92
Osram Licht AG 1,655 EUR 54,048 54,218 0.09
Porsche Automobil Holding SE - Pref - 2,846 EUR 198,752 191,137 0.33
ProSiebenSat.1 Media AG 4,066 EUR 138,824 141,619 0.24
RWE AG 9,092 EUR 257,992 233,210 0.40
SAP SE 17,118 EUR 990,051 997,295 1.72
Siemens AG 14,732 EUR 1,278,828 1,381,125 2.38
Symrise AG 2,291 EUR 113,602 114,848 0.20
Telefonica Deutschland Holding AG 11,053 EUR 48,202 48,788 0.08
ThyssenKrupp AG 8,413 EUR 180,499 178,860 0.31
United Internet AG 2,284 EUR 80,758 85,616 0.15
Volkswagen AG 548 EUR 98,361 98,695 0.17
Volkswagen AG - Pref - 3,023 EUR 524,303 558,197 0.96
16,340,969 17,375,048 29.89
Ireland
Bank of Ireland 511,150 EUR 171,955 159,990 0.27
CRH PLC 13,738 EUR 273,269 273,386 0.47
Kerry Group PLC - A - 2,940 EUR 174,195 167,786 0.29
Ryanair Holdings PLC 3,344 EUR 31,925 32,788 0.06
651,344 633,950 1.09
Italy
Assicurazioni Generali SpA 21,697 EUR 329,980 368,849 0.63
Atlantia SpA 7,673 EUR 151,727 148,319 0.26
Banca Monte dei Paschi di Siena SpA 80,808 EUR 48,342 37,980 0.07
Banco Popolare SC 6,728 EUR 71,404 67,684 0.12
Enel Green Power SpA 32,518 EUR 60,981 56,386 0.10
Enel SpA 122,306 EUR 423,976 452,043 0.78
Eni SpA 47,267 EUR 844,681 685,844 1.18
Exor SpA 1,828 EUR 63,875 62,225 0.11
Finmeccanica SpA 7,519 EUR 57,741 58,159 0.10
Intesa Sanpaolo SpA 234,896 EUR 442,807 568,918 0.98
Luxottica Group SpA 3,125 EUR 136,073 142,187 0.24
Mediobanca SpA 11,206 EUR 78,762 75,865 0.13
Pirelli & C 4,420 EUR 49,078 49,548 0.09
Prysmian SpA 3,786 EUR 54,699 57,358 0.10
Saipem SpA 4,920 EUR 48,940 43,124 0.07
Snam SpA 37,701 EUR 156,047 154,574 0.27
Telecom Italia SpA 187,730 EUR 175,273 165,578 0.28
Telecom Italia SpA - RSP - 111,973 EUR 82,625 77,653 0.13
Terna Rete Elettrica Nazionale SpA 28,014 EUR 107,818 105,333 0.18
UniCredit SpA 81,712 EUR 427,916 435,934 0.75
Unione di Banche Italiane SCpA 15,919 EUR 95,472 94,877 0.16
Unipolsai SpA 16,913 EUR 37,525 37,784 0.06
3,945,742 3,946,222 6.79
Luxembourg
Altice SA 1,613 EUR 96,350 105,264 0.18
310
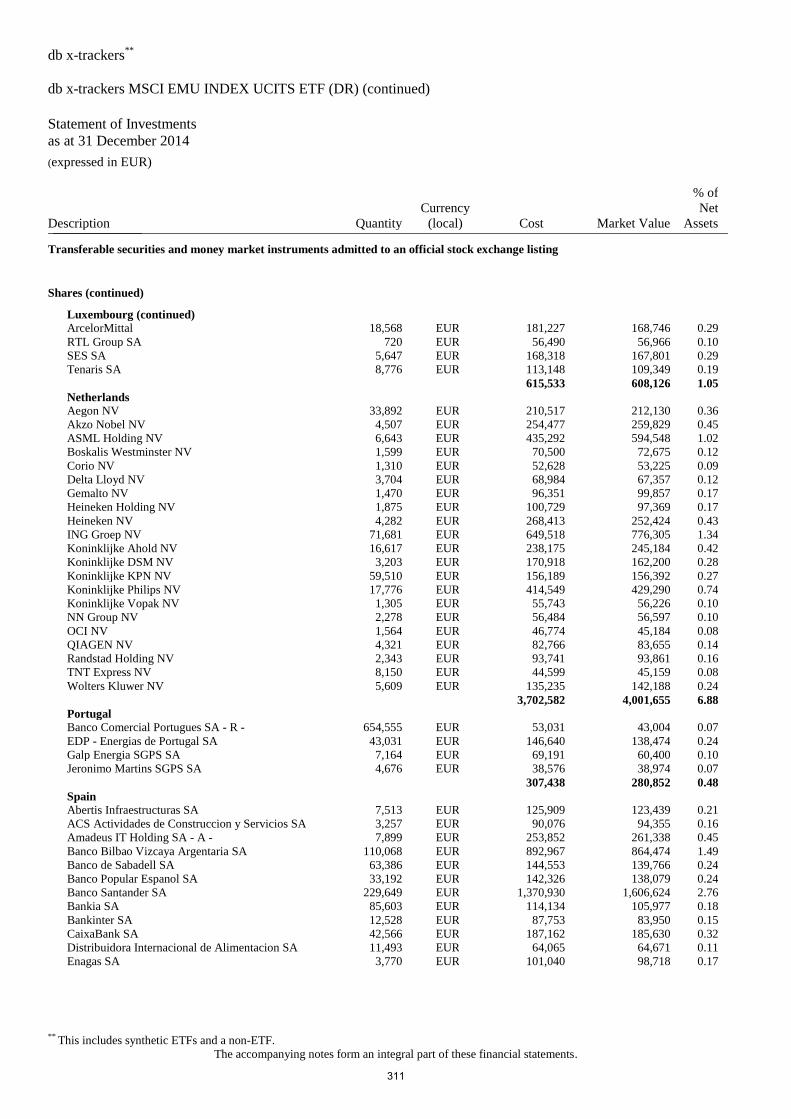
db x-trackers**
db x-trackers MSCI EMU INDEX UCITS ETF (DR) (continued)
Statement of Investments
as at 31 December 2014 (expressed in EUR)
** This includes synthetic ETFs and a non-ETF.
The accompanying notes form an integral part of these financial statements.
Description Quantity
Currency
(local) Cost Market Value
% of
Net
Assets _______________
Transferable securities and money market instruments admitted to an official stock exchange listing
Shares (continued)
Luxembourg (continued)
ArcelorMittal 18,568 EUR 181,227 168,746 0.29
RTL Group SA 720 EUR 56,490 56,966 0.10
SES SA 5,647 EUR 168,318 167,801 0.29
Tenaris SA 8,776 EUR 113,148 109,349 0.19
615,533 608,126 1.05
Netherlands
Aegon NV 33,892 EUR 210,517 212,130 0.36
Akzo Nobel NV 4,507 EUR 254,477 259,829 0.45
ASML Holding NV 6,643 EUR 435,292 594,548 1.02
Boskalis Westminster NV 1,599 EUR 70,500 72,675 0.12
Corio NV 1,310 EUR 52,628 53,225 0.09
Delta Lloyd NV 3,704 EUR 68,984 67,357 0.12
Gemalto NV 1,470 EUR 96,351 99,857 0.17
Heineken Holding NV 1,875 EUR 100,729 97,369 0.17
Heineken NV 4,282 EUR 268,413 252,424 0.43
ING Groep NV 71,681 EUR 649,518 776,305 1.34
Koninklijke Ahold NV 16,617 EUR 238,175 245,184 0.42
Koninklijke DSM NV 3,203 EUR 170,918 162,200 0.28
Koninklijke KPN NV 59,510 EUR 156,189 156,392 0.27
Koninklijke Philips NV 17,776 EUR 414,549 429,290 0.74
Koninklijke Vopak NV 1,305 EUR 55,743 56,226 0.10
NN Group NV 2,278 EUR 56,484 56,597 0.10
OCI NV 1,564 EUR 46,774 45,184 0.08
QIAGEN NV 4,321 EUR 82,766 83,655 0.14
Randstad Holding NV 2,343 EUR 93,741 93,861 0.16
TNT Express NV 8,150 EUR 44,599 45,159 0.08
Wolters Kluwer NV 5,609 EUR 135,235 142,188 0.24
3,702,582 4,001,655 6.88
Portugal
Banco Comercial Portugues SA - R - 654,555 EUR 53,031 43,004 0.07
EDP - Energias de Portugal SA 43,031 EUR 146,640 138,474 0.24
Galp Energia SGPS SA 7,164 EUR 69,191 60,400 0.10
Jeronimo Martins SGPS SA 4,676 EUR 38,576 38,974 0.07
307,438 280,852 0.48
Spain
Abertis Infraestructuras SA 7,513 EUR 125,909 123,439 0.21
ACS Actividades de Construccion y Servicios SA 3,257 EUR 90,076 94,355 0.16
Amadeus IT Holding SA - A - 7,899 EUR 253,852 261,338 0.45
Banco Bilbao Vizcaya Argentaria SA 110,068 EUR 892,967 864,474 1.49
Banco de Sabadell SA 63,386 EUR 144,553 139,766 0.24
Banco Popular Espanol SA 33,192 EUR 142,326 138,079 0.24
Banco Santander SA 229,649 EUR 1,370,930 1,606,624 2.76
Bankia SA 85,603 EUR 114,134 105,977 0.18
Bankinter SA 12,528 EUR 87,753 83,950 0.15
CaixaBank SA 42,566 EUR 187,162 185,630 0.32
Distribuidora Internacional de Alimentacion SA 11,493 EUR 64,065 64,671 0.11
Enagas SA 3,770 EUR 101,040 98,718 0.17
311
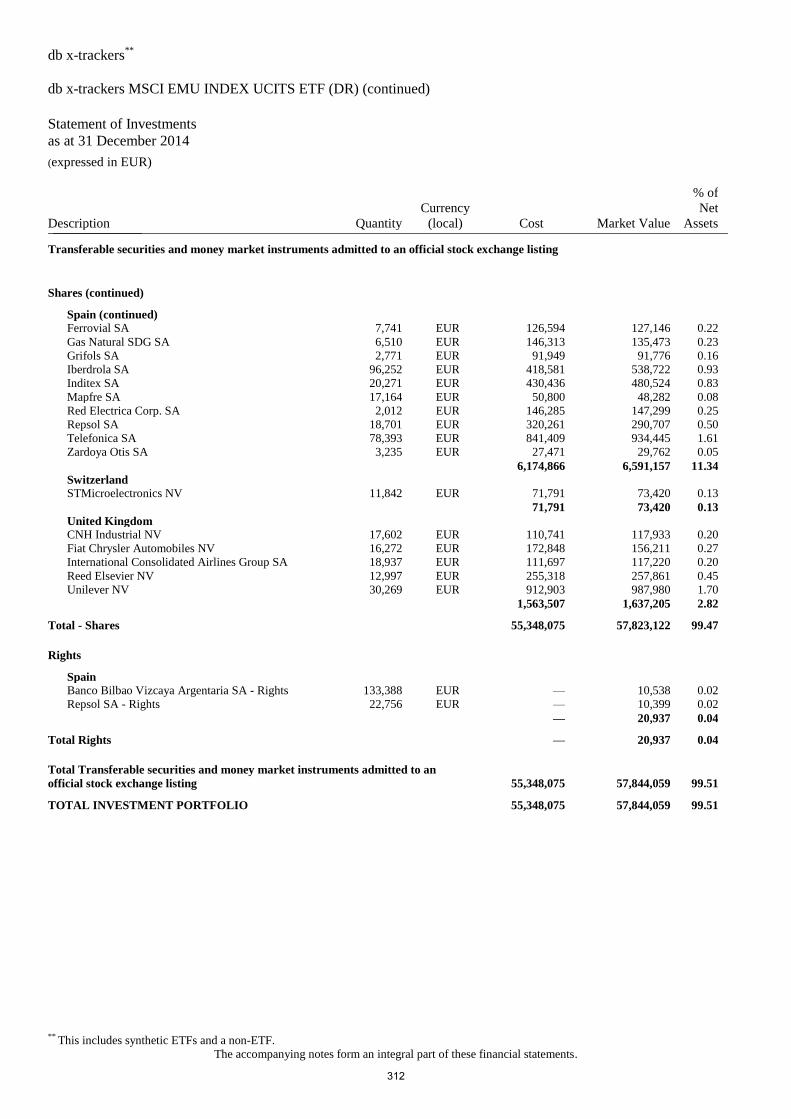
db x-trackers**
db x-trackers MSCI EMU INDEX UCITS ETF (DR) (continued)
Statement of Investments
as at 31 December 2014 (expressed in EUR)
** This includes synthetic ETFs and a non-ETF.
The accompanying notes form an integral part of these financial statements.
Description Quantity
Currency
(local) Cost Market Value
% of
Net
Assets _______________
Transferable securities and money market instruments admitted to an official stock exchange listing
Shares (continued)
Spain (continued)
Ferrovial SA 7,741 EUR 126,594 127,146 0.22
Gas Natural SDG SA 6,510 EUR 146,313 135,473 0.23
Grifols SA 2,771 EUR 91,949 91,776 0.16
Iberdrola SA 96,252 EUR 418,581 538,722 0.93
Inditex SA 20,271 EUR 430,436 480,524 0.83
Mapfre SA 17,164 EUR 50,800 48,282 0.08
Red Electrica Corp. SA 2,012 EUR 146,285 147,299 0.25
Repsol SA 18,701 EUR 320,261 290,707 0.50
Telefonica SA 78,393 EUR 841,409 934,445 1.61
Zardoya Otis SA 3,235 EUR 27,471 29,762 0.05
6,174,866 6,591,157 11.34
Switzerland
STMicroelectronics NV 11,842 EUR 71,791 73,420 0.13
71,791 73,420 0.13
United Kingdom
CNH Industrial NV 17,602 EUR 110,741 117,933 0.20
Fiat Chrysler Automobiles NV 16,272 EUR 172,848 156,211 0.27
International Consolidated Airlines Group SA 18,937 EUR 111,697 117,220 0.20
Reed Elsevier NV 12,997 EUR 255,318 257,861 0.45
Unilever NV 30,269 EUR 912,903 987,980 1.70
1,563,507 1,637,205 2.82
Total - Shares 55,348,075 57,823,122 99.47
Rights
Spain
Banco Bilbao Vizcaya Argentaria SA - Rights 133,388 EUR — 10,538 0.02
Repsol SA - Rights 22,756 EUR — 10,399 0.02
— 20,937 0.04
Total Rights — 20,937 0.04
Total Transferable securities and money market instruments admitted to an
official stock exchange listing 55,348,075 57,844,059 99.51
TOTAL INVESTMENT PORTFOLIO 55,348,075 57,844,059 99.51
312
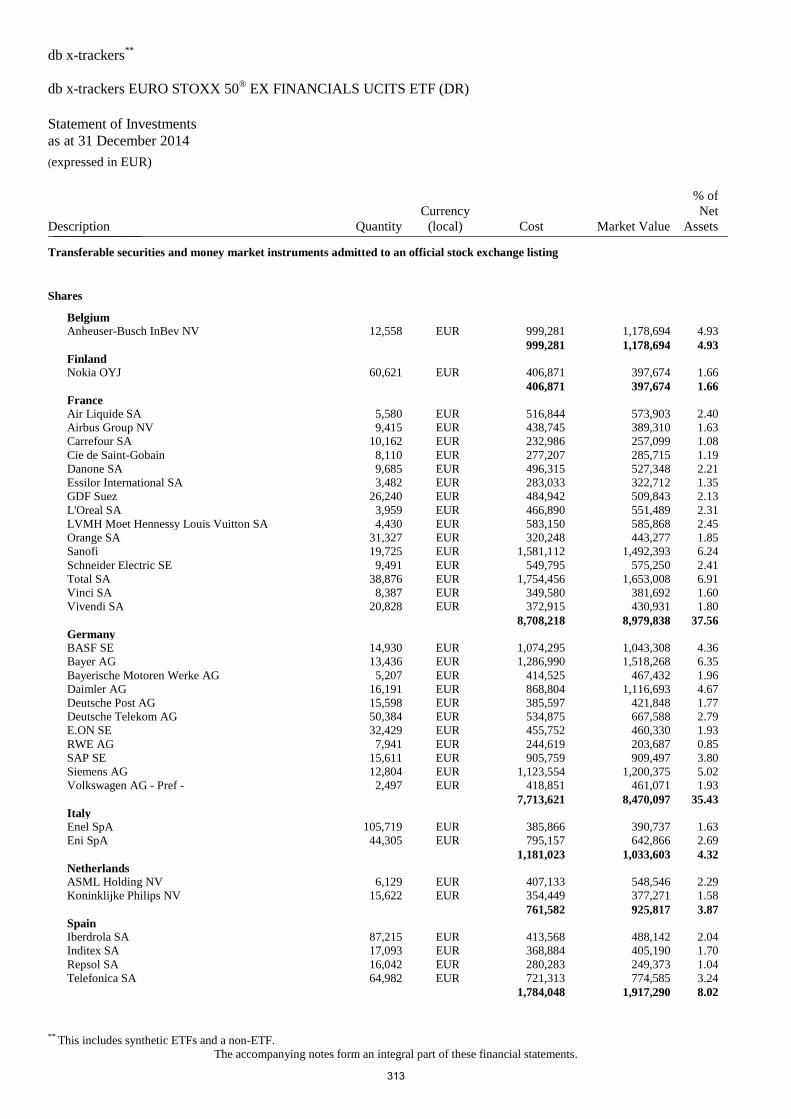
db x-trackers**
db x-trackers EURO STOXX 50® EX FINANCIALS UCITS ETF (DR)
Statement of Investments
as at 31 December 2014 (expressed in EUR)
** This includes synthetic ETFs and a non-ETF.
The accompanying notes form an integral part of these financial statements.
Description Quantity
Currency
(local) Cost Market Value
% of
Net
Assets _______________
Transferable securities and money market instruments admitted to an official stock exchange listing
Shares
Belgium
Anheuser-Busch InBev NV 12,558 EUR 999,281 1,178,694 4.93
999,281 1,178,694 4.93
Finland
Nokia OYJ 60,621 EUR 406,871 397,674 1.66
406,871 397,674 1.66
France
Air Liquide SA 5,580 EUR 516,844 573,903 2.40
Airbus Group NV 9,415 EUR 438,745 389,310 1.63
Carrefour SA 10,162 EUR 232,986 257,099 1.08
Cie de Saint-Gobain 8,110 EUR 277,207 285,715 1.19
Danone SA 9,685 EUR 496,315 527,348 2.21
Essilor International SA 3,482 EUR 283,033 322,712 1.35
GDF Suez 26,240 EUR 484,942 509,843 2.13
L'Oreal SA 3,959 EUR 466,890 551,489 2.31
LVMH Moet Hennessy Louis Vuitton SA 4,430 EUR 583,150 585,868 2.45
Orange SA 31,327 EUR 320,248 443,277 1.85
Sanofi 19,725 EUR 1,581,112 1,492,393 6.24
Schneider Electric SE 9,491 EUR 549,795 575,250 2.41
Total SA 38,876 EUR 1,754,456 1,653,008 6.91
Vinci SA 8,387 EUR 349,580 381,692 1.60
Vivendi SA 20,828 EUR 372,915 430,931 1.80
8,708,218 8,979,838 37.56
Germany
BASF SE 14,930 EUR 1,074,295 1,043,308 4.36
Bayer AG 13,436 EUR 1,286,990 1,518,268 6.35
Bayerische Motoren Werke AG 5,207 EUR 414,525 467,432 1.96
Daimler AG 16,191 EUR 868,804 1,116,693 4.67
Deutsche Post AG 15,598 EUR 385,597 421,848 1.77
Deutsche Telekom AG 50,384 EUR 534,875 667,588 2.79
E.ON SE 32,429 EUR 455,752 460,330 1.93
RWE AG 7,941 EUR 244,619 203,687 0.85
SAP SE 15,611 EUR 905,759 909,497 3.80
Siemens AG 12,804 EUR 1,123,554 1,200,375 5.02
Volkswagen AG - Pref - 2,497 EUR 418,851 461,071 1.93
7,713,621 8,470,097 35.43
Italy
Enel SpA 105,719 EUR 385,866 390,737 1.63
Eni SpA 44,305 EUR 795,157 642,866 2.69
1,181,023 1,033,603 4.32
Netherlands
ASML Holding NV 6,129 EUR 407,133 548,546 2.29
Koninklijke Philips NV 15,622 EUR 354,449 377,271 1.58
761,582 925,817 3.87
Spain
Iberdrola SA 87,215 EUR 413,568 488,142 2.04
Inditex SA 17,093 EUR 368,884 405,190 1.70
Repsol SA 16,042 EUR 280,283 249,373 1.04
Telefonica SA 64,982 EUR 721,313 774,585 3.24
1,784,048 1,917,290 8.02
313
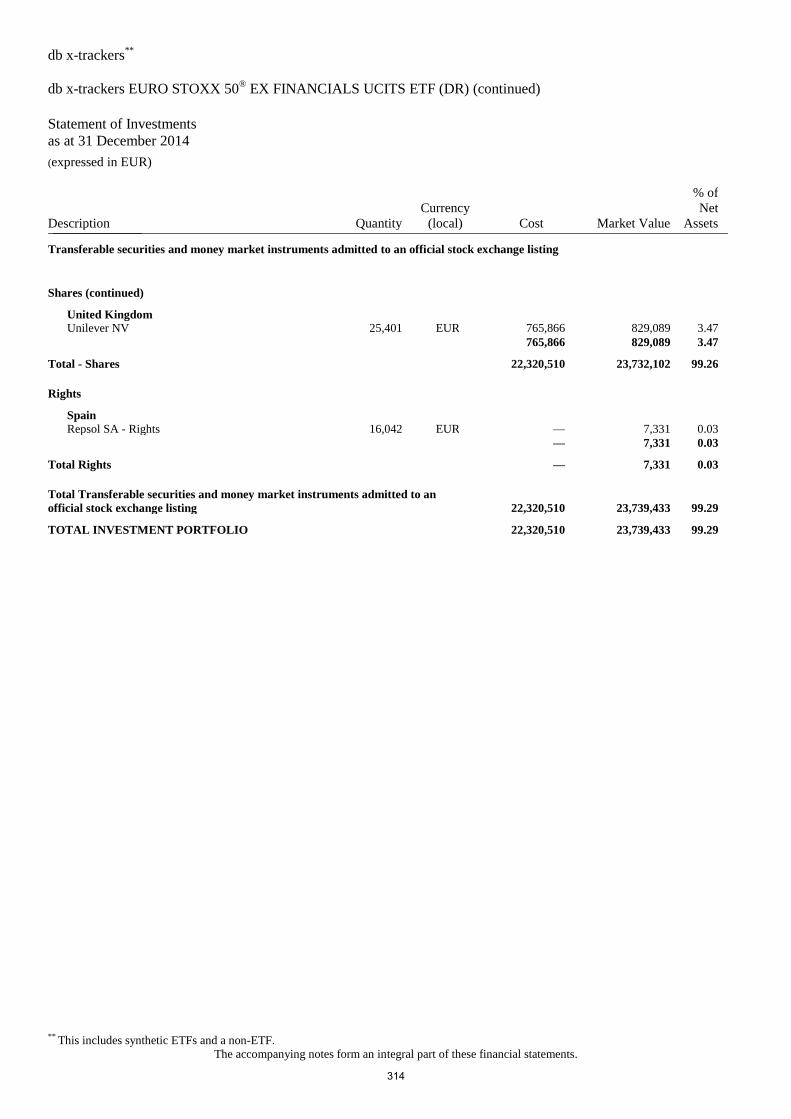
db x-trackers**
db x-trackers EURO STOXX 50® EX FINANCIALS UCITS ETF (DR) (continued)
Statement of Investments
as at 31 December 2014 (expressed in EUR)
** This includes synthetic ETFs and a non-ETF.
The accompanying notes form an integral part of these financial statements.
Description Quantity
Currency
(local) Cost Market Value
% of
Net
Assets _______________
Transferable securities and money market instruments admitted to an official stock exchange listing
Shares (continued)
United Kingdom
Unilever NV 25,401 EUR 765,866 829,089 3.47
765,866 829,089 3.47
Total - Shares 22,320,510 23,732,102 99.26
Rights
Spain
Repsol SA - Rights 16,042 EUR — 7,331 0.03
— 7,331 0.03
Total Rights — 7,331 0.03
Total Transferable securities and money market instruments admitted to an
official stock exchange listing 22,320,510 23,739,433 99.29
TOTAL INVESTMENT PORTFOLIO 22,320,510 23,739,433 99.29
314
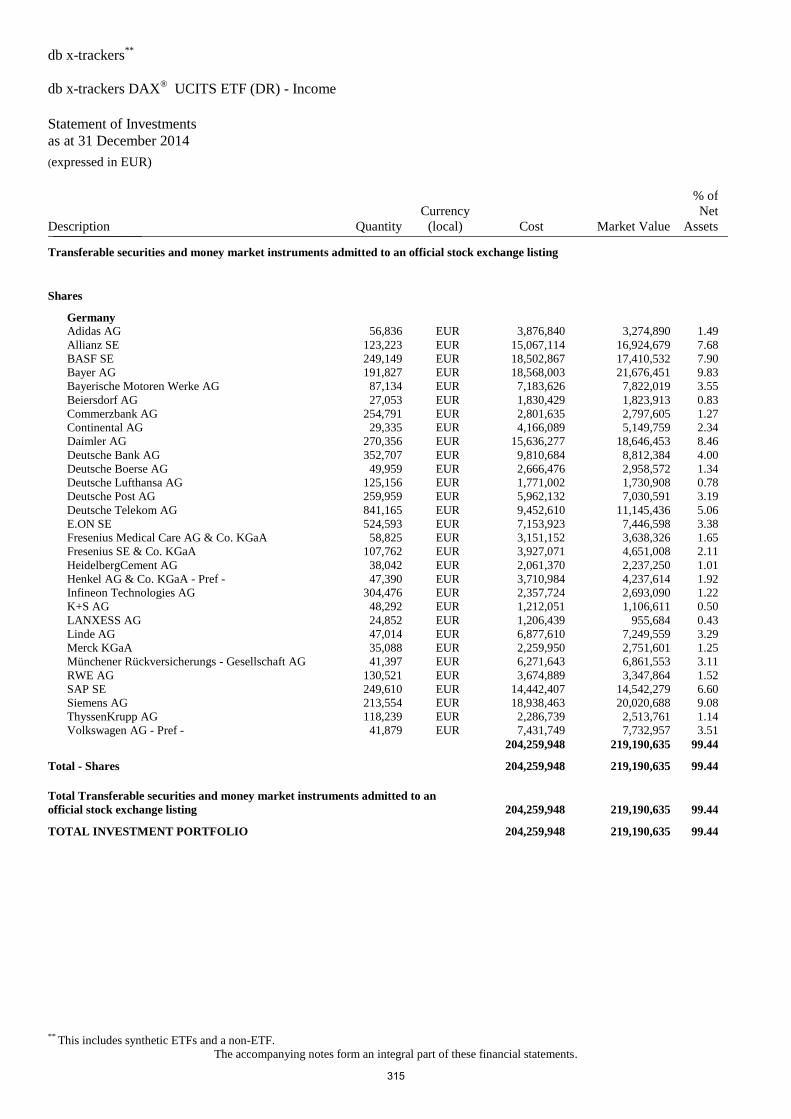
db x-trackers**
db x-trackers DAX® UCITS ETF (DR) - Income
Statement of Investments
as at 31 December 2014 (expressed in EUR)
** This includes synthetic ETFs and a non-ETF.
The accompanying notes form an integral part of these financial statements.
Description Quantity
Currency
(local) Cost Market Value
% of
Net
Assets _______________
Transferable securities and money market instruments admitted to an official stock exchange listing
Shares
Germany
Adidas AG 56,836 EUR 3,876,840 3,274,890 1.49
Allianz SE 123,223 EUR 15,067,114 16,924,679 7.68
BASF SE 249,149 EUR 18,502,867 17,410,532 7.90
Bayer AG 191,827 EUR 18,568,003 21,676,451 9.83
Bayerische Motoren Werke AG 87,134 EUR 7,183,626 7,822,019 3.55
Beiersdorf AG 27,053 EUR 1,830,429 1,823,913 0.83
Commerzbank AG 254,791 EUR 2,801,635 2,797,605 1.27
Continental AG 29,335 EUR 4,166,089 5,149,759 2.34
Daimler AG 270,356 EUR 15,636,277 18,646,453 8.46
Deutsche Bank AG 352,707 EUR 9,810,684 8,812,384 4.00
Deutsche Boerse AG 49,959 EUR 2,666,476 2,958,572 1.34
Deutsche Lufthansa AG 125,156 EUR 1,771,002 1,730,908 0.78
Deutsche Post AG 259,959 EUR 5,962,132 7,030,591 3.19
Deutsche Telekom AG 841,165 EUR 9,452,610 11,145,436 5.06
E.ON SE 524,593 EUR 7,153,923 7,446,598 3.38
Fresenius Medical Care AG & Co. KGaA 58,825 EUR 3,151,152 3,638,326 1.65
Fresenius SE & Co. KGaA 107,762 EUR 3,927,071 4,651,008 2.11
HeidelbergCement AG 38,042 EUR 2,061,370 2,237,250 1.01
Henkel AG & Co. KGaA - Pref - 47,390 EUR 3,710,984 4,237,614 1.92
Infineon Technologies AG 304,476 EUR 2,357,724 2,693,090 1.22
K+S AG 48,292 EUR 1,212,051 1,106,611 0.50
LANXESS AG 24,852 EUR 1,206,439 955,684 0.43
Linde AG 47,014 EUR 6,877,610 7,249,559 3.29
Merck KGaA 35,088 EUR 2,259,950 2,751,601 1.25
Münchener Rückversicherungs - Gesellschaft AG 41,397 EUR 6,271,643 6,861,553 3.11
RWE AG 130,521 EUR 3,674,889 3,347,864 1.52
SAP SE 249,610 EUR 14,442,407 14,542,279 6.60
Siemens AG 213,554 EUR 18,938,463 20,020,688 9.08
ThyssenKrupp AG 118,239 EUR 2,286,739 2,513,761 1.14
Volkswagen AG - Pref - 41,879 EUR 7,431,749 7,732,957 3.51
204,259,948 219,190,635 99.44
Total - Shares 204,259,948 219,190,635 99.44
Total Transferable securities and money market instruments admitted to an
official stock exchange listing 204,259,948 219,190,635 99.44
TOTAL INVESTMENT PORTFOLIO 204,259,948 219,190,635 99.44
315
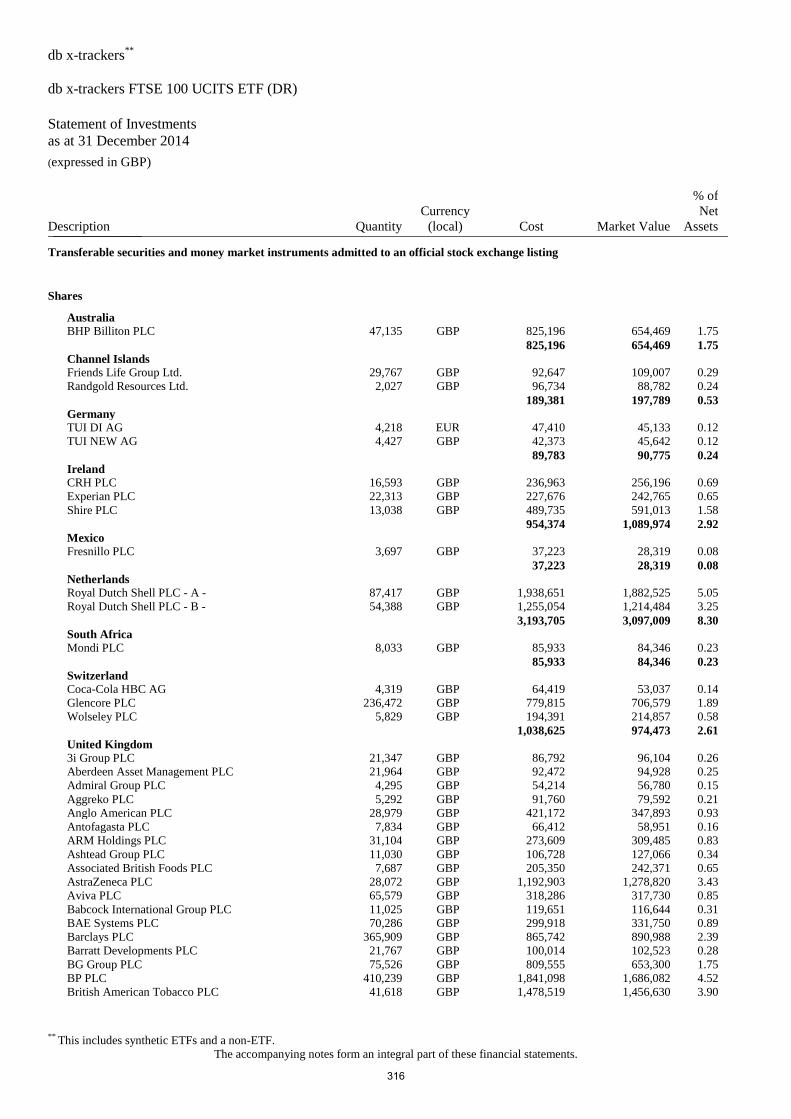
db x-trackers**
db x-trackers FTSE 100 UCITS ETF (DR)
Statement of Investments
as at 31 December 2014 (expressed in GBP)
** This includes synthetic ETFs and a non-ETF.
The accompanying notes form an integral part of these financial statements.
Description Quantity
Currency
(local) Cost Market Value
% of
Net
Assets _______________
Transferable securities and money market instruments admitted to an official stock exchange listing
Shares
Australia
BHP Billiton PLC 47,135 GBP 825,196 654,469 1.75
825,196 654,469 1.75
Channel Islands
Friends Life Group Ltd. 29,767 GBP 92,647 109,007 0.29
Randgold Resources Ltd. 2,027 GBP 96,734 88,782 0.24
189,381 197,789 0.53
Germany
TUI DI AG 4,218 EUR 47,410 45,133 0.12
TUI NEW AG 4,427 GBP 42,373 45,642 0.12
89,783 90,775 0.24
Ireland
CRH PLC 16,593 GBP 236,963 256,196 0.69
Experian PLC 22,313 GBP 227,676 242,765 0.65
Shire PLC 13,038 GBP 489,735 591,013 1.58
954,374 1,089,974 2.92
Mexico
Fresnillo PLC 3,697 GBP 37,223 28,319 0.08
37,223 28,319 0.08
Netherlands
Royal Dutch Shell PLC - A - 87,417 GBP 1,938,651 1,882,525 5.05
Royal Dutch Shell PLC - B - 54,388 GBP 1,255,054 1,214,484 3.25
3,193,705 3,097,009 8.30
South Africa
Mondi PLC 8,033 GBP 85,933 84,346 0.23
85,933 84,346 0.23
Switzerland
Coca-Cola HBC AG 4,319 GBP 64,419 53,037 0.14
Glencore PLC 236,472 GBP 779,815 706,579 1.89
Wolseley PLC 5,829 GBP 194,391 214,857 0.58
1,038,625 974,473 2.61
United Kingdom
3i Group PLC 21,347 GBP 86,792 96,104 0.26
Aberdeen Asset Management PLC 21,964 GBP 92,472 94,928 0.25
Admiral Group PLC 4,295 GBP 54,214 56,780 0.15
Aggreko PLC 5,292 GBP 91,760 79,592 0.21
Anglo American PLC 28,979 GBP 421,172 347,893 0.93
Antofagasta PLC 7,834 GBP 66,412 58,951 0.16
ARM Holdings PLC 31,104 GBP 273,609 309,485 0.83
Ashtead Group PLC 11,030 GBP 106,728 127,066 0.34
Associated British Foods PLC 7,687 GBP 205,350 242,371 0.65
AstraZeneca PLC 28,072 GBP 1,192,903 1,278,820 3.43
Aviva PLC 65,579 GBP 318,286 317,730 0.85
Babcock International Group PLC 11,025 GBP 119,651 116,644 0.31
BAE Systems PLC 70,286 GBP 299,918 331,750 0.89
Barclays PLC 365,909 GBP 865,742 890,988 2.39
Barratt Developments PLC 21,767 GBP 100,014 102,523 0.28
BG Group PLC 75,526 GBP 809,555 653,300 1.75
BP PLC 410,239 GBP 1,841,098 1,686,082 4.52
British American Tobacco PLC 41,618 GBP 1,478,519 1,456,630 3.90
316
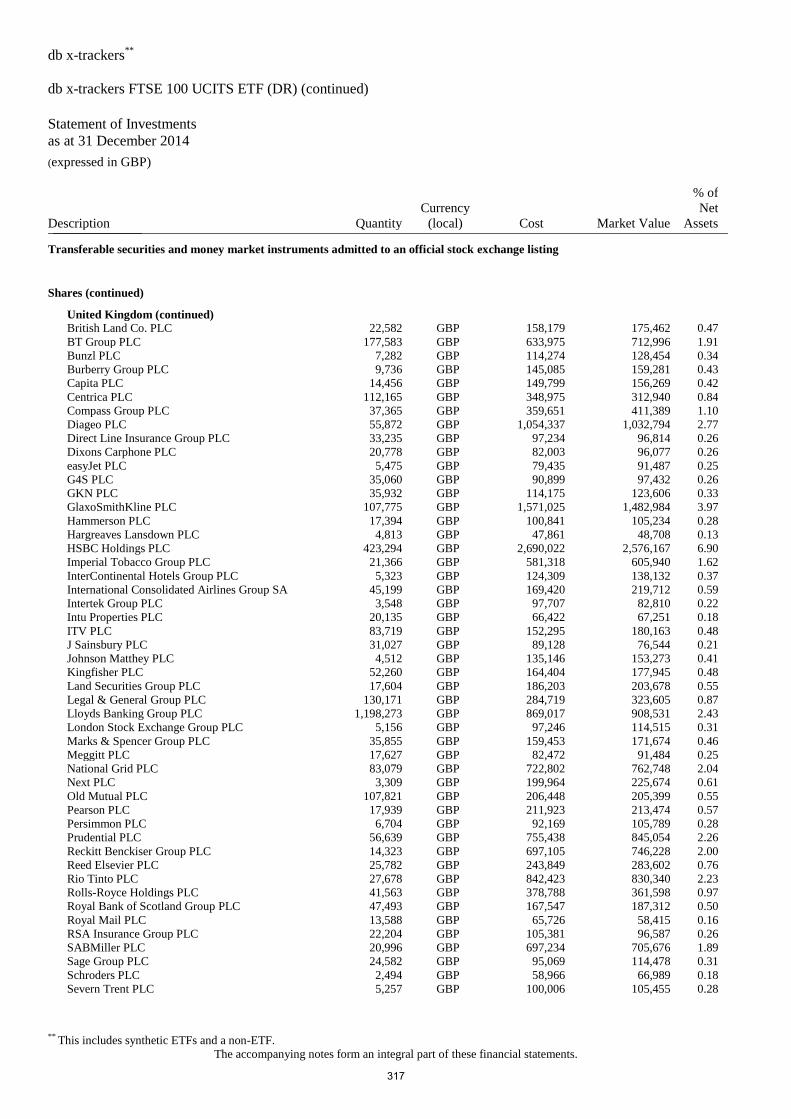
db x-trackers**
db x-trackers FTSE 100 UCITS ETF (DR) (continued)
Statement of Investments
as at 31 December 2014 (expressed in GBP)
** This includes synthetic ETFs and a non-ETF.
The accompanying notes form an integral part of these financial statements.
Description Quantity
Currency
(local) Cost Market Value
% of
Net
Assets _______________
Transferable securities and money market instruments admitted to an official stock exchange listing
Shares (continued)
United Kingdom (continued)
British Land Co. PLC 22,582 GBP 158,179 175,462 0.47
BT Group PLC 177,583 GBP 633,975 712,996 1.91
Bunzl PLC 7,282 GBP 114,274 128,454 0.34
Burberry Group PLC 9,736 GBP 145,085 159,281 0.43
Capita PLC 14,456 GBP 149,799 156,269 0.42
Centrica PLC 112,165 GBP 348,975 312,940 0.84
Compass Group PLC 37,365 GBP 359,651 411,389 1.10
Diageo PLC 55,872 GBP 1,054,337 1,032,794 2.77
Direct Line Insurance Group PLC 33,235 GBP 97,234 96,814 0.26
Dixons Carphone PLC 20,778 GBP 82,003 96,077 0.26
easyJet PLC 5,475 GBP 79,435 91,487 0.25
G4S PLC 35,060 GBP 90,899 97,432 0.26
GKN PLC 35,932 GBP 114,175 123,606 0.33
GlaxoSmithKline PLC 107,775 GBP 1,571,025 1,482,984 3.97
Hammerson PLC 17,394 GBP 100,841 105,234 0.28
Hargreaves Lansdown PLC 4,813 GBP 47,861 48,708 0.13
HSBC Holdings PLC 423,294 GBP 2,690,022 2,576,167 6.90
Imperial Tobacco Group PLC 21,366 GBP 581,318 605,940 1.62
InterContinental Hotels Group PLC 5,323 GBP 124,309 138,132 0.37
International Consolidated Airlines Group SA 45,199 GBP 169,420 219,712 0.59
Intertek Group PLC 3,548 GBP 97,707 82,810 0.22
Intu Properties PLC 20,135 GBP 66,422 67,251 0.18
ITV PLC 83,719 GBP 152,295 180,163 0.48
J Sainsbury PLC 31,027 GBP 89,128 76,544 0.21
Johnson Matthey PLC 4,512 GBP 135,146 153,273 0.41
Kingfisher PLC 52,260 GBP 164,404 177,945 0.48
Land Securities Group PLC 17,604 GBP 186,203 203,678 0.55
Legal & General Group PLC 130,171 GBP 284,719 323,605 0.87
Lloyds Banking Group PLC 1,198,273 GBP 869,017 908,531 2.43
London Stock Exchange Group PLC 5,156 GBP 97,246 114,515 0.31
Marks & Spencer Group PLC 35,855 GBP 159,453 171,674 0.46
Meggitt PLC 17,627 GBP 82,472 91,484 0.25
National Grid PLC 83,079 GBP 722,802 762,748 2.04
Next PLC 3,309 GBP 199,964 225,674 0.61
Old Mutual PLC 107,821 GBP 206,448 205,399 0.55
Pearson PLC 17,939 GBP 211,923 213,474 0.57
Persimmon PLC 6,704 GBP 92,169 105,789 0.28
Prudential PLC 56,639 GBP 755,438 845,054 2.26
Reckitt Benckiser Group PLC 14,323 GBP 697,105 746,228 2.00
Reed Elsevier PLC 25,782 GBP 243,849 283,602 0.76
Rio Tinto PLC 27,678 GBP 842,423 830,340 2.23
Rolls-Royce Holdings PLC 41,563 GBP 378,788 361,598 0.97
Royal Bank of Scotland Group PLC 47,493 GBP 167,547 187,312 0.50
Royal Mail PLC 13,588 GBP 65,726 58,415 0.16
RSA Insurance Group PLC 22,204 GBP 105,381 96,587 0.26
SABMiller PLC 20,996 GBP 697,234 705,676 1.89
Sage Group PLC 24,582 GBP 95,069 114,478 0.31
Schroders PLC 2,494 GBP 58,966 66,989 0.18
Severn Trent PLC 5,257 GBP 100,006 105,455 0.28
317
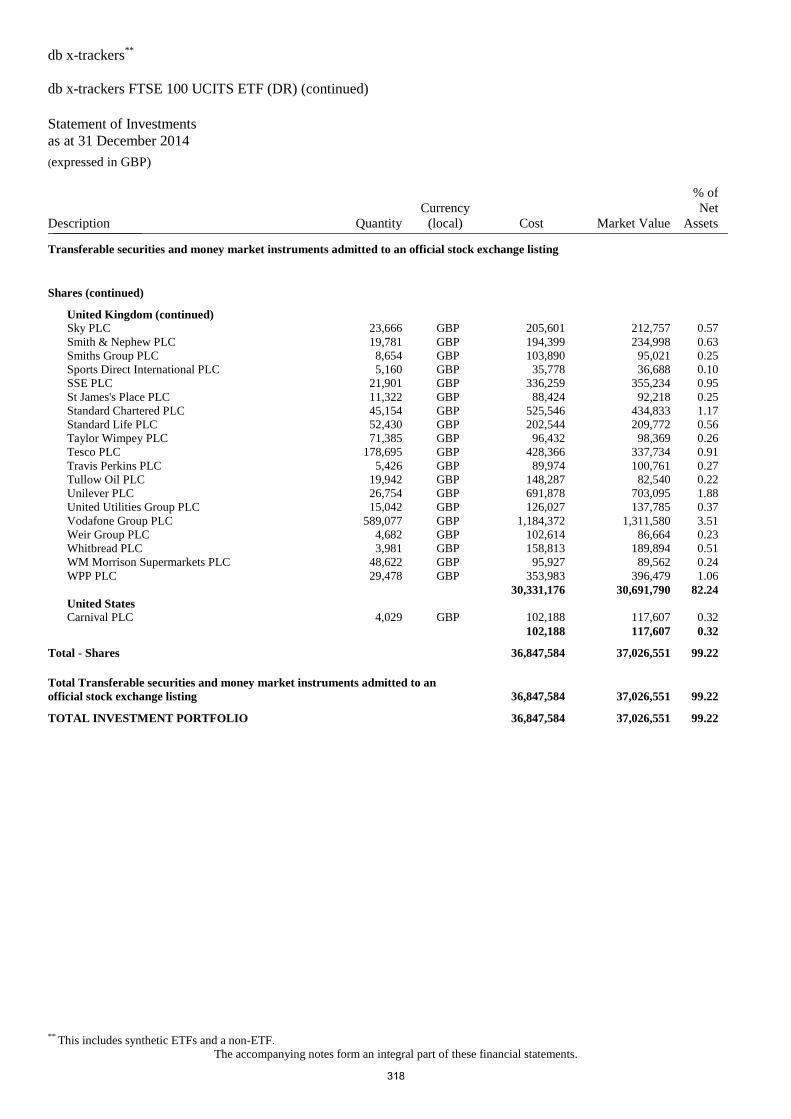
db x-trackers**
db x-trackers FTSE 100 UCITS ETF (DR) (continued)
Statement of Investments
as at 31 December 2014 (expressed in GBP)
** This includes synthetic ETFs and a non-ETF.
The accompanying notes form an integral part of these financial statements.
Description Quantity
Currency
(local) Cost Market Value
% of
Net
Assets _______________
Transferable securities and money market instruments admitted to an official stock exchange listing
Shares (continued)
United Kingdom (continued)
Sky PLC 23,666 GBP 205,601 212,757 0.57
Smith & Nephew PLC 19,781 GBP 194,399 234,998 0.63
Smiths Group PLC 8,654 GBP 103,890 95,021 0.25
Sports Direct International PLC 5,160 GBP 35,778 36,688 0.10
SSE PLC 21,901 GBP 336,259 355,234 0.95
St James's Place PLC 11,322 GBP 88,424 92,218 0.25
Standard Chartered PLC 45,154 GBP 525,546 434,833 1.17
Standard Life PLC 52,430 GBP 202,544 209,772 0.56
Taylor Wimpey PLC 71,385 GBP 96,432 98,369 0.26
Tesco PLC 178,695 GBP 428,366 337,734 0.91
Travis Perkins PLC 5,426 GBP 89,974 100,761 0.27
Tullow Oil PLC 19,942 GBP 148,287 82,540 0.22
Unilever PLC 26,754 GBP 691,878 703,095 1.88
United Utilities Group PLC 15,042 GBP 126,027 137,785 0.37
Vodafone Group PLC 589,077 GBP 1,184,372 1,311,580 3.51
Weir Group PLC 4,682 GBP 102,614 86,664 0.23
Whitbread PLC 3,981 GBP 158,813 189,894 0.51
WM Morrison Supermarkets PLC 48,622 GBP 95,927 89,562 0.24
WPP PLC 29,478 GBP 353,983 396,479 1.06
30,331,176 30,691,790 82.24
United States
Carnival PLC 4,029 GBP 102,188 117,607 0.32
102,188 117,607 0.32
Total - Shares 36,847,584 37,026,551 99.22
Total Transferable securities and money market instruments admitted to an
official stock exchange listing 36,847,584 37,026,551 99.22
TOTAL INVESTMENT PORTFOLIO 36,847,584 37,026,551 99.22
318
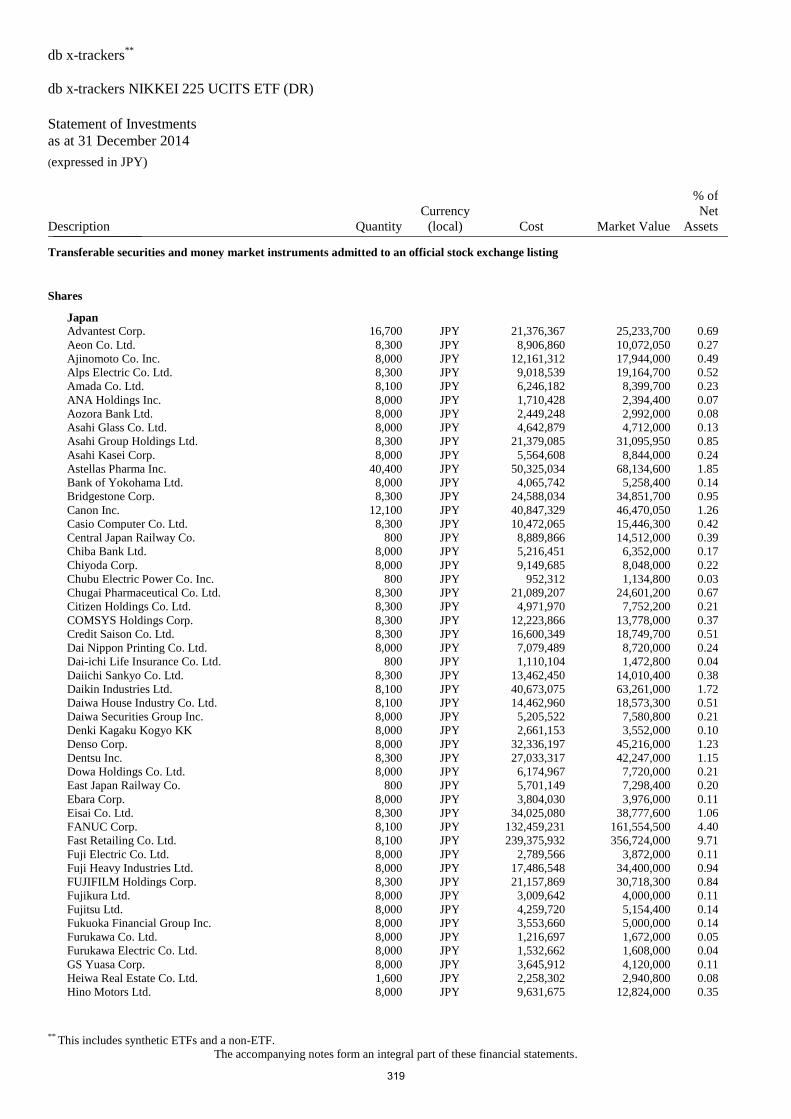
db x-trackers**
db x-trackers NIKKEI 225 UCITS ETF (DR)
Statement of Investments
as at 31 December 2014 (expressed in JPY)
** This includes synthetic ETFs and a non-ETF.
The accompanying notes form an integral part of these financial statements.
Description Quantity
Currency
(local) Cost Market Value
% of
Net
Assets _______________
Transferable securities and money market instruments admitted to an official stock exchange listing
Shares
Japan
Advantest Corp. 16,700 JPY 21,376,367 25,233,700 0.69
Aeon Co. Ltd. 8,300 JPY 8,906,860 10,072,050 0.27
Ajinomoto Co. Inc. 8,000 JPY 12,161,312 17,944,000 0.49
Alps Electric Co. Ltd. 8,300 JPY 9,018,539 19,164,700 0.52
Amada Co. Ltd. 8,100 JPY 6,246,182 8,399,700 0.23
ANA Holdings Inc. 8,000 JPY 1,710,428 2,394,400 0.07
Aozora Bank Ltd. 8,000 JPY 2,449,248 2,992,000 0.08
Asahi Glass Co. Ltd. 8,000 JPY 4,642,879 4,712,000 0.13
Asahi Group Holdings Ltd. 8,300 JPY 21,379,085 31,095,950 0.85
Asahi Kasei Corp. 8,000 JPY 5,564,608 8,844,000 0.24
Astellas Pharma Inc. 40,400 JPY 50,325,034 68,134,600 1.85
Bank of Yokohama Ltd. 8,000 JPY 4,065,742 5,258,400 0.14
Bridgestone Corp. 8,300 JPY 24,588,034 34,851,700 0.95
Canon Inc. 12,100 JPY 40,847,329 46,470,050 1.26
Casio Computer Co. Ltd. 8,300 JPY 10,472,065 15,446,300 0.42
Central Japan Railway Co. 800 JPY 8,889,866 14,512,000 0.39
Chiba Bank Ltd. 8,000 JPY 5,216,451 6,352,000 0.17
Chiyoda Corp. 8,000 JPY 9,149,685 8,048,000 0.22
Chubu Electric Power Co. Inc. 800 JPY 952,312 1,134,800 0.03
Chugai Pharmaceutical Co. Ltd. 8,300 JPY 21,089,207 24,601,200 0.67
Citizen Holdings Co. Ltd. 8,300 JPY 4,971,970 7,752,200 0.21
COMSYS Holdings Corp. 8,300 JPY 12,223,866 13,778,000 0.37
Credit Saison Co. Ltd. 8,300 JPY 16,600,349 18,749,700 0.51
Dai Nippon Printing Co. Ltd. 8,000 JPY 7,079,489 8,720,000 0.24
Dai-ichi Life Insurance Co. Ltd. 800 JPY 1,110,104 1,472,800 0.04
Daiichi Sankyo Co. Ltd. 8,300 JPY 13,462,450 14,010,400 0.38
Daikin Industries Ltd. 8,100 JPY 40,673,075 63,261,000 1.72
Daiwa House Industry Co. Ltd. 8,100 JPY 14,462,960 18,573,300 0.51
Daiwa Securities Group Inc. 8,000 JPY 5,205,522 7,580,800 0.21
Denki Kagaku Kogyo KK 8,000 JPY 2,661,153 3,552,000 0.10
Denso Corp. 8,000 JPY 32,336,197 45,216,000 1.23
Dentsu Inc. 8,300 JPY 27,033,317 42,247,000 1.15
Dowa Holdings Co. Ltd. 8,000 JPY 6,174,967 7,720,000 0.21
East Japan Railway Co. 800 JPY 5,701,149 7,298,400 0.20
Ebara Corp. 8,000 JPY 3,804,030 3,976,000 0.11
Eisai Co. Ltd. 8,300 JPY 34,025,080 38,777,600 1.06
FANUC Corp. 8,100 JPY 132,459,231 161,554,500 4.40
Fast Retailing Co. Ltd. 8,100 JPY 239,375,932 356,724,000 9.71
Fuji Electric Co. Ltd. 8,000 JPY 2,789,566 3,872,000 0.11
Fuji Heavy Industries Ltd. 8,000 JPY 17,486,548 34,400,000 0.94
FUJIFILM Holdings Corp. 8,300 JPY 21,157,869 30,718,300 0.84
Fujikura Ltd. 8,000 JPY 3,009,642 4,000,000 0.11
Fujitsu Ltd. 8,000 JPY 4,259,720 5,154,400 0.14
Fukuoka Financial Group Inc. 8,000 JPY 3,553,660 5,000,000 0.14
Furukawa Co. Ltd. 8,000 JPY 1,216,697 1,672,000 0.05
Furukawa Electric Co. Ltd. 8,000 JPY 1,532,662 1,608,000 0.04
GS Yuasa Corp. 8,000 JPY 3,645,912 4,120,000 0.11
Heiwa Real Estate Co. Ltd. 1,600 JPY 2,258,302 2,940,800 0.08
Hino Motors Ltd. 8,000 JPY 9,631,675 12,824,000 0.35
319
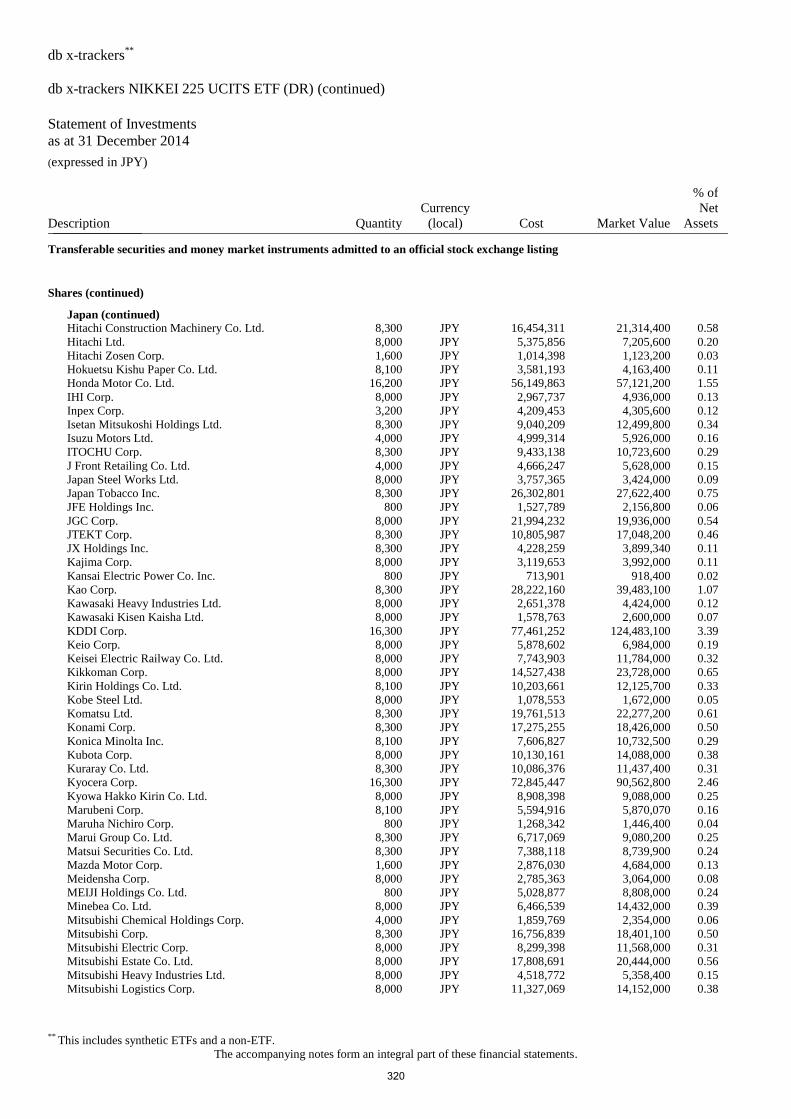
db x-trackers**
db x-trackers NIKKEI 225 UCITS ETF (DR) (continued)
Statement of Investments
as at 31 December 2014 (expressed in JPY)
** This includes synthetic ETFs and a non-ETF.
The accompanying notes form an integral part of these financial statements.
Description Quantity
Currency
(local) Cost Market Value
% of
Net
Assets _______________
Transferable securities and money market instruments admitted to an official stock exchange listing
Shares (continued)
Japan (continued)
Hitachi Construction Machinery Co. Ltd. 8,300 JPY 16,454,311 21,314,400 0.58
Hitachi Ltd. 8,000 JPY 5,375,856 7,205,600 0.20
Hitachi Zosen Corp. 1,600 JPY 1,014,398 1,123,200 0.03
Hokuetsu Kishu Paper Co. Ltd. 8,100 JPY 3,581,193 4,163,400 0.11
Honda Motor Co. Ltd. 16,200 JPY 56,149,863 57,121,200 1.55
IHI Corp. 8,000 JPY 2,967,737 4,936,000 0.13
Inpex Corp. 3,200 JPY 4,209,453 4,305,600 0.12
Isetan Mitsukoshi Holdings Ltd. 8,300 JPY 9,040,209 12,499,800 0.34
Isuzu Motors Ltd. 4,000 JPY 4,999,314 5,926,000 0.16
ITOCHU Corp. 8,300 JPY 9,433,138 10,723,600 0.29
J Front Retailing Co. Ltd. 4,000 JPY 4,666,247 5,628,000 0.15
Japan Steel Works Ltd. 8,000 JPY 3,757,365 3,424,000 0.09
Japan Tobacco Inc. 8,300 JPY 26,302,801 27,622,400 0.75
JFE Holdings Inc. 800 JPY 1,527,789 2,156,800 0.06
JGC Corp. 8,000 JPY 21,994,232 19,936,000 0.54
JTEKT Corp. 8,300 JPY 10,805,987 17,048,200 0.46
JX Holdings Inc. 8,300 JPY 4,228,259 3,899,340 0.11
Kajima Corp. 8,000 JPY 3,119,653 3,992,000 0.11
Kansai Electric Power Co. Inc. 800 JPY 713,901 918,400 0.02
Kao Corp. 8,300 JPY 28,222,160 39,483,100 1.07
Kawasaki Heavy Industries Ltd. 8,000 JPY 2,651,378 4,424,000 0.12
Kawasaki Kisen Kaisha Ltd. 8,000 JPY 1,578,763 2,600,000 0.07
KDDI Corp. 16,300 JPY 77,461,252 124,483,100 3.39
Keio Corp. 8,000 JPY 5,878,602 6,984,000 0.19
Keisei Electric Railway Co. Ltd. 8,000 JPY 7,743,903 11,784,000 0.32
Kikkoman Corp. 8,000 JPY 14,527,438 23,728,000 0.65
Kirin Holdings Co. Ltd. 8,100 JPY 10,203,661 12,125,700 0.33
Kobe Steel Ltd. 8,000 JPY 1,078,553 1,672,000 0.05
Komatsu Ltd. 8,300 JPY 19,761,513 22,277,200 0.61
Konami Corp. 8,300 JPY 17,275,255 18,426,000 0.50
Konica Minolta Inc. 8,100 JPY 7,606,827 10,732,500 0.29
Kubota Corp. 8,000 JPY 10,130,161 14,088,000 0.38
Kuraray Co. Ltd. 8,300 JPY 10,086,376 11,437,400 0.31
Kyocera Corp. 16,300 JPY 72,845,447 90,562,800 2.46
Kyowa Hakko Kirin Co. Ltd. 8,000 JPY 8,908,398 9,088,000 0.25
Marubeni Corp. 8,100 JPY 5,594,916 5,870,070 0.16
Maruha Nichiro Corp. 800 JPY 1,268,342 1,446,400 0.04
Marui Group Co. Ltd. 8,300 JPY 6,717,069 9,080,200 0.25
Matsui Securities Co. Ltd. 8,300 JPY 7,388,118 8,739,900 0.24
Mazda Motor Corp. 1,600 JPY 2,876,030 4,684,000 0.13
Meidensha Corp. 8,000 JPY 2,785,363 3,064,000 0.08
MEIJI Holdings Co. Ltd. 800 JPY 5,028,877 8,808,000 0.24
Minebea Co. Ltd. 8,000 JPY 6,466,539 14,432,000 0.39
Mitsubishi Chemical Holdings Corp. 4,000 JPY 1,859,769 2,354,000 0.06
Mitsubishi Corp. 8,300 JPY 16,756,839 18,401,100 0.50
Mitsubishi Electric Corp. 8,000 JPY 8,299,398 11,568,000 0.31
Mitsubishi Estate Co. Ltd. 8,000 JPY 17,808,691 20,444,000 0.56
Mitsubishi Heavy Industries Ltd. 8,000 JPY 4,518,772 5,358,400 0.15
Mitsubishi Logistics Corp. 8,000 JPY 11,327,069 14,152,000 0.38
320
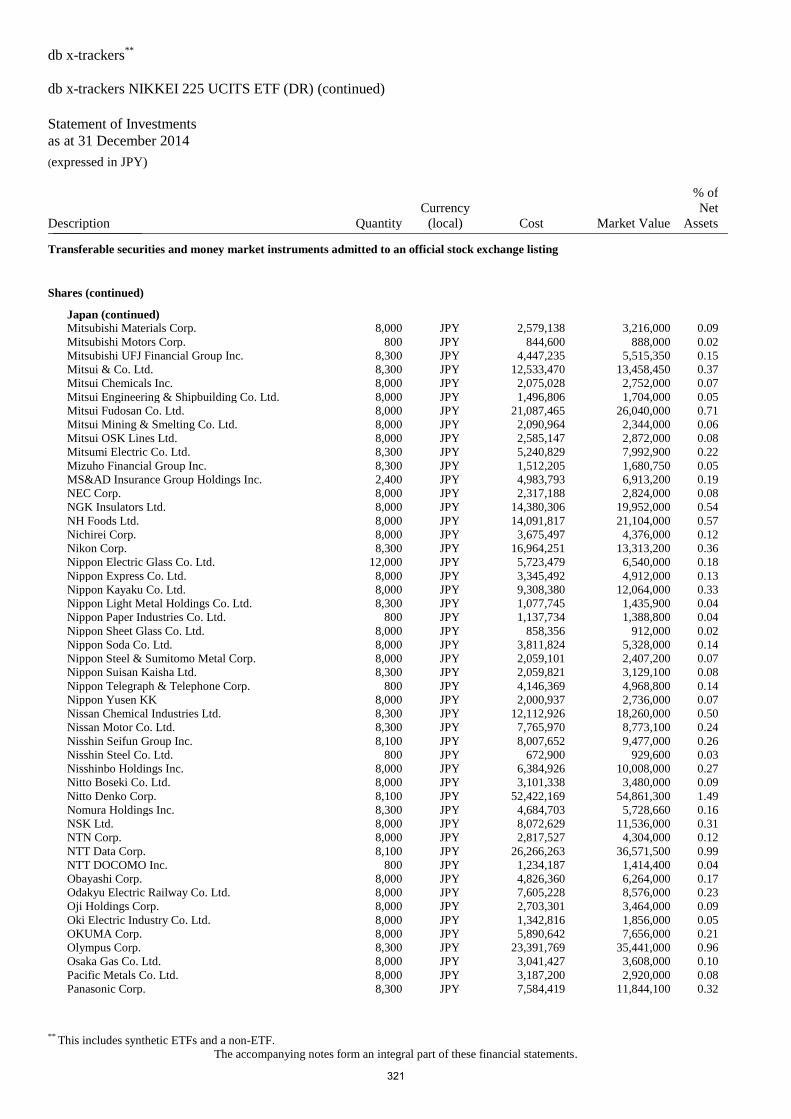
db x-trackers**
db x-trackers NIKKEI 225 UCITS ETF (DR) (continued)
Statement of Investments
as at 31 December 2014 (expressed in JPY)
** This includes synthetic ETFs and a non-ETF.
The accompanying notes form an integral part of these financial statements.
Description Quantity
Currency
(local) Cost Market Value
% of
Net
Assets _______________
Transferable securities and money market instruments admitted to an official stock exchange listing
Shares (continued)
Japan (continued)
Mitsubishi Materials Corp. 8,000 JPY 2,579,138 3,216,000 0.09
Mitsubishi Motors Corp. 800 JPY 844,600 888,000 0.02
Mitsubishi UFJ Financial Group Inc. 8,300 JPY 4,447,235 5,515,350 0.15
Mitsui & Co. Ltd. 8,300 JPY 12,533,470 13,458,450 0.37
Mitsui Chemicals Inc. 8,000 JPY 2,075,028 2,752,000 0.07
Mitsui Engineering & Shipbuilding Co. Ltd. 8,000 JPY 1,496,806 1,704,000 0.05
Mitsui Fudosan Co. Ltd. 8,000 JPY 21,087,465 26,040,000 0.71
Mitsui Mining & Smelting Co. Ltd. 8,000 JPY 2,090,964 2,344,000 0.06
Mitsui OSK Lines Ltd. 8,000 JPY 2,585,147 2,872,000 0.08
Mitsumi Electric Co. Ltd. 8,300 JPY 5,240,829 7,992,900 0.22
Mizuho Financial Group Inc. 8,300 JPY 1,512,205 1,680,750 0.05
MS&AD Insurance Group Holdings Inc. 2,400 JPY 4,983,793 6,913,200 0.19
NEC Corp. 8,000 JPY 2,317,188 2,824,000 0.08
NGK Insulators Ltd. 8,000 JPY 14,380,306 19,952,000 0.54
NH Foods Ltd. 8,000 JPY 14,091,817 21,104,000 0.57
Nichirei Corp. 8,000 JPY 3,675,497 4,376,000 0.12
Nikon Corp. 8,300 JPY 16,964,251 13,313,200 0.36
Nippon Electric Glass Co. Ltd. 12,000 JPY 5,723,479 6,540,000 0.18
Nippon Express Co. Ltd. 8,000 JPY 3,345,492 4,912,000 0.13
Nippon Kayaku Co. Ltd. 8,000 JPY 9,308,380 12,064,000 0.33
Nippon Light Metal Holdings Co. Ltd. 8,300 JPY 1,077,745 1,435,900 0.04
Nippon Paper Industries Co. Ltd. 800 JPY 1,137,734 1,388,800 0.04
Nippon Sheet Glass Co. Ltd. 8,000 JPY 858,356 912,000 0.02
Nippon Soda Co. Ltd. 8,000 JPY 3,811,824 5,328,000 0.14
Nippon Steel & Sumitomo Metal Corp. 8,000 JPY 2,059,101 2,407,200 0.07
Nippon Suisan Kaisha Ltd. 8,300 JPY 2,059,821 3,129,100 0.08
Nippon Telegraph & Telephone Corp. 800 JPY 4,146,369 4,968,800 0.14
Nippon Yusen KK 8,000 JPY 2,000,937 2,736,000 0.07
Nissan Chemical Industries Ltd. 8,300 JPY 12,112,926 18,260,000 0.50
Nissan Motor Co. Ltd. 8,300 JPY 7,765,970 8,773,100 0.24
Nisshin Seifun Group Inc. 8,100 JPY 8,007,652 9,477,000 0.26
Nisshin Steel Co. Ltd. 800 JPY 672,900 929,600 0.03
Nisshinbo Holdings Inc. 8,000 JPY 6,384,926 10,008,000 0.27
Nitto Boseki Co. Ltd. 8,000 JPY 3,101,338 3,480,000 0.09
Nitto Denko Corp. 8,100 JPY 52,422,169 54,861,300 1.49
Nomura Holdings Inc. 8,300 JPY 4,684,703 5,728,660 0.16
NSK Ltd. 8,000 JPY 8,072,629 11,536,000 0.31
NTN Corp. 8,000 JPY 2,817,527 4,304,000 0.12
NTT Data Corp. 8,100 JPY 26,266,263 36,571,500 0.99
NTT DOCOMO Inc. 800 JPY 1,234,187 1,414,400 0.04
Obayashi Corp. 8,000 JPY 4,826,360 6,264,000 0.17
Odakyu Electric Railway Co. Ltd. 8,000 JPY 7,605,228 8,576,000 0.23
Oji Holdings Corp. 8,000 JPY 2,703,301 3,464,000 0.09
Oki Electric Industry Co. Ltd. 8,000 JPY 1,342,816 1,856,000 0.05
OKUMA Corp. 8,000 JPY 5,890,642 7,656,000 0.21
Olympus Corp. 8,300 JPY 23,391,769 35,441,000 0.96
Osaka Gas Co. Ltd. 8,000 JPY 3,041,427 3,608,000 0.10
Pacific Metals Co. Ltd. 8,000 JPY 3,187,200 2,920,000 0.08
Panasonic Corp. 8,300 JPY 7,584,419 11,844,100 0.32
321
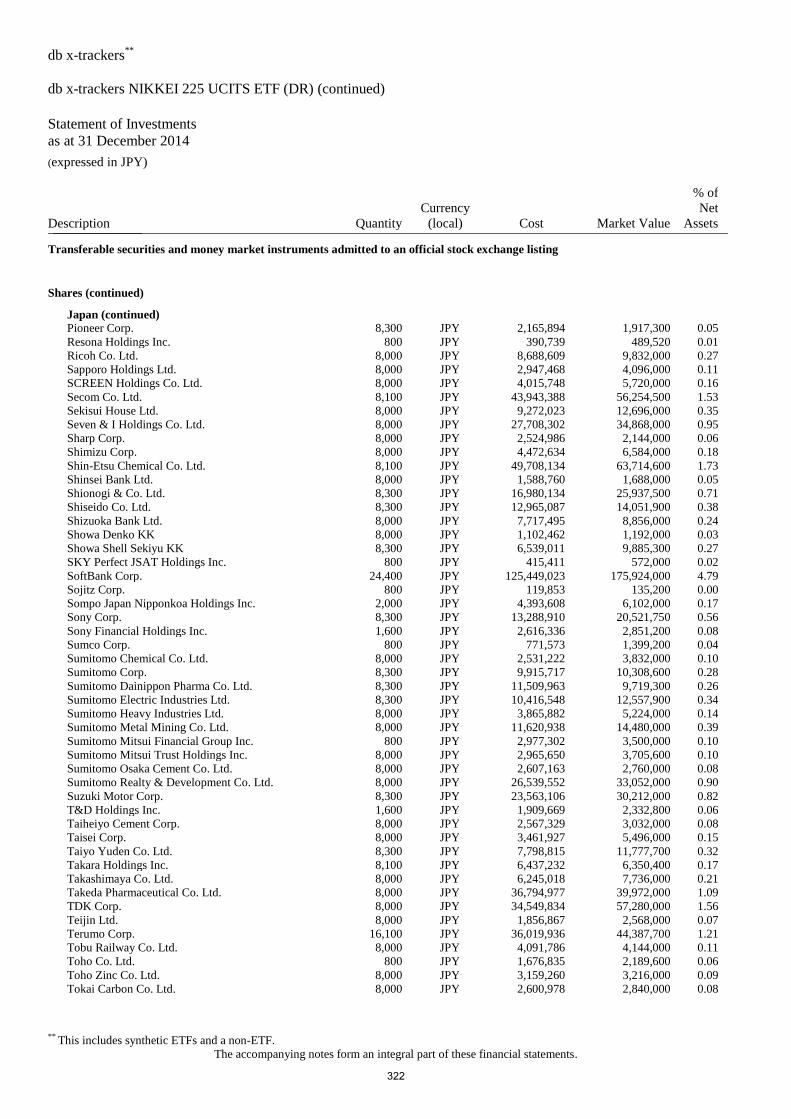
db x-trackers**
db x-trackers NIKKEI 225 UCITS ETF (DR) (continued)
Statement of Investments
as at 31 December 2014 (expressed in JPY)
** This includes synthetic ETFs and a non-ETF.
The accompanying notes form an integral part of these financial statements.
Description Quantity
Currency
(local) Cost Market Value
% of
Net
Assets _______________
Transferable securities and money market instruments admitted to an official stock exchange listing
Shares (continued)
Japan (continued)
Pioneer Corp. 8,300 JPY 2,165,894 1,917,300 0.05
Resona Holdings Inc. 800 JPY 390,739 489,520 0.01
Ricoh Co. Ltd. 8,000 JPY 8,688,609 9,832,000 0.27
Sapporo Holdings Ltd. 8,000 JPY 2,947,468 4,096,000 0.11
SCREEN Holdings Co. Ltd. 8,000 JPY 4,015,748 5,720,000 0.16
Secom Co. Ltd. 8,100 JPY 43,943,388 56,254,500 1.53
Sekisui House Ltd. 8,000 JPY 9,272,023 12,696,000 0.35
Seven & I Holdings Co. Ltd. 8,000 JPY 27,708,302 34,868,000 0.95
Sharp Corp. 8,000 JPY 2,524,986 2,144,000 0.06
Shimizu Corp. 8,000 JPY 4,472,634 6,584,000 0.18
Shin-Etsu Chemical Co. Ltd. 8,100 JPY 49,708,134 63,714,600 1.73
Shinsei Bank Ltd. 8,000 JPY 1,588,760 1,688,000 0.05
Shionogi & Co. Ltd. 8,300 JPY 16,980,134 25,937,500 0.71
Shiseido Co. Ltd. 8,300 JPY 12,965,087 14,051,900 0.38
Shizuoka Bank Ltd. 8,000 JPY 7,717,495 8,856,000 0.24
Showa Denko KK 8,000 JPY 1,102,462 1,192,000 0.03
Showa Shell Sekiyu KK 8,300 JPY 6,539,011 9,885,300 0.27
SKY Perfect JSAT Holdings Inc. 800 JPY 415,411 572,000 0.02
SoftBank Corp. 24,400 JPY 125,449,023 175,924,000 4.79
Sojitz Corp. 800 JPY 119,853 135,200 0.00
Sompo Japan Nipponkoa Holdings Inc. 2,000 JPY 4,393,608 6,102,000 0.17
Sony Corp. 8,300 JPY 13,288,910 20,521,750 0.56
Sony Financial Holdings Inc. 1,600 JPY 2,616,336 2,851,200 0.08
Sumco Corp. 800 JPY 771,573 1,399,200 0.04
Sumitomo Chemical Co. Ltd. 8,000 JPY 2,531,222 3,832,000 0.10
Sumitomo Corp. 8,300 JPY 9,915,717 10,308,600 0.28
Sumitomo Dainippon Pharma Co. Ltd. 8,300 JPY 11,509,963 9,719,300 0.26
Sumitomo Electric Industries Ltd. 8,300 JPY 10,416,548 12,557,900 0.34
Sumitomo Heavy Industries Ltd. 8,000 JPY 3,865,882 5,224,000 0.14
Sumitomo Metal Mining Co. Ltd. 8,000 JPY 11,620,938 14,480,000 0.39
Sumitomo Mitsui Financial Group Inc. 800 JPY 2,977,302 3,500,000 0.10
Sumitomo Mitsui Trust Holdings Inc. 8,000 JPY 2,965,650 3,705,600 0.10
Sumitomo Osaka Cement Co. Ltd. 8,000 JPY 2,607,163 2,760,000 0.08
Sumitomo Realty & Development Co. Ltd. 8,000 JPY 26,539,552 33,052,000 0.90
Suzuki Motor Corp. 8,300 JPY 23,563,106 30,212,000 0.82
T&D Holdings Inc. 1,600 JPY 1,909,669 2,332,800 0.06
Taiheiyo Cement Corp. 8,000 JPY 2,567,329 3,032,000 0.08
Taisei Corp. 8,000 JPY 3,461,927 5,496,000 0.15
Taiyo Yuden Co. Ltd. 8,300 JPY 7,798,815 11,777,700 0.32
Takara Holdings Inc. 8,100 JPY 6,437,232 6,350,400 0.17
Takashimaya Co. Ltd. 8,000 JPY 6,245,018 7,736,000 0.21
Takeda Pharmaceutical Co. Ltd. 8,000 JPY 36,794,977 39,972,000 1.09
TDK Corp. 8,000 JPY 34,549,834 57,280,000 1.56
Teijin Ltd. 8,000 JPY 1,856,867 2,568,000 0.07
Terumo Corp. 16,100 JPY 36,019,936 44,387,700 1.21
Tobu Railway Co. Ltd. 8,000 JPY 4,091,786 4,144,000 0.11
Toho Co. Ltd. 800 JPY 1,676,835 2,189,600 0.06
Toho Zinc Co. Ltd. 8,000 JPY 3,159,260 3,216,000 0.09
Tokai Carbon Co. Ltd. 8,000 JPY 2,600,978 2,840,000 0.08
322
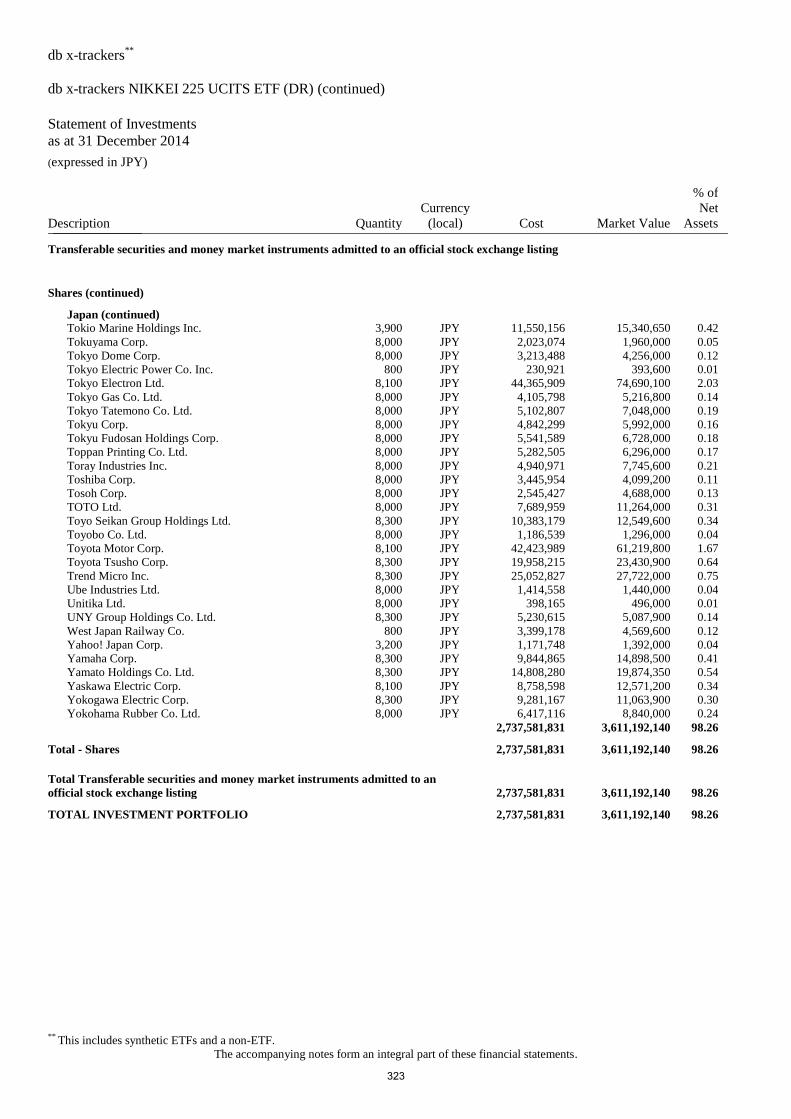
db x-trackers**
db x-trackers NIKKEI 225 UCITS ETF (DR) (continued)
Statement of Investments
as at 31 December 2014 (expressed in JPY)
** This includes synthetic ETFs and a non-ETF.
The accompanying notes form an integral part of these financial statements.
Description Quantity
Currency
(local) Cost Market Value
% of
Net
Assets _______________
Transferable securities and money market instruments admitted to an official stock exchange listing
Shares (continued)
Japan (continued)
Tokio Marine Holdings Inc. 3,900 JPY 11,550,156 15,340,650 0.42
Tokuyama Corp. 8,000 JPY 2,023,074 1,960,000 0.05
Tokyo Dome Corp. 8,000 JPY 3,213,488 4,256,000 0.12
Tokyo Electric Power Co. Inc. 800 JPY 230,921 393,600 0.01
Tokyo Electron Ltd. 8,100 JPY 44,365,909 74,690,100 2.03
Tokyo Gas Co. Ltd. 8,000 JPY 4,105,798 5,216,800 0.14
Tokyo Tatemono Co. Ltd. 8,000 JPY 5,102,807 7,048,000 0.19
Tokyu Corp. 8,000 JPY 4,842,299 5,992,000 0.16
Tokyu Fudosan Holdings Corp. 8,000 JPY 5,541,589 6,728,000 0.18
Toppan Printing Co. Ltd. 8,000 JPY 5,282,505 6,296,000 0.17
Toray Industries Inc. 8,000 JPY 4,940,971 7,745,600 0.21
Toshiba Corp. 8,000 JPY 3,445,954 4,099,200 0.11
Tosoh Corp. 8,000 JPY 2,545,427 4,688,000 0.13
TOTO Ltd. 8,000 JPY 7,689,959 11,264,000 0.31
Toyo Seikan Group Holdings Ltd. 8,300 JPY 10,383,179 12,549,600 0.34
Toyobo Co. Ltd. 8,000 JPY 1,186,539 1,296,000 0.04
Toyota Motor Corp. 8,100 JPY 42,423,989 61,219,800 1.67
Toyota Tsusho Corp. 8,300 JPY 19,958,215 23,430,900 0.64
Trend Micro Inc. 8,300 JPY 25,052,827 27,722,000 0.75
Ube Industries Ltd. 8,000 JPY 1,414,558 1,440,000 0.04
Unitika Ltd. 8,000 JPY 398,165 496,000 0.01
UNY Group Holdings Co. Ltd. 8,300 JPY 5,230,615 5,087,900 0.14
West Japan Railway Co. 800 JPY 3,399,178 4,569,600 0.12
Yahoo! Japan Corp. 3,200 JPY 1,171,748 1,392,000 0.04
Yamaha Corp. 8,300 JPY 9,844,865 14,898,500 0.41
Yamato Holdings Co. Ltd. 8,300 JPY 14,808,280 19,874,350 0.54
Yaskawa Electric Corp. 8,100 JPY 8,758,598 12,571,200 0.34
Yokogawa Electric Corp. 8,300 JPY 9,281,167 11,063,900 0.30
Yokohama Rubber Co. Ltd. 8,000 JPY 6,417,116 8,840,000 0.24
2,737,581,831 3,611,192,140 98.26
Total - Shares 2,737,581,831 3,611,192,140 98.26
Total Transferable securities and money market instruments admitted to an
official stock exchange listing 2,737,581,831 3,611,192,140 98.26
TOTAL INVESTMENT PORTFOLIO 2,737,581,831 3,611,192,140 98.26
323
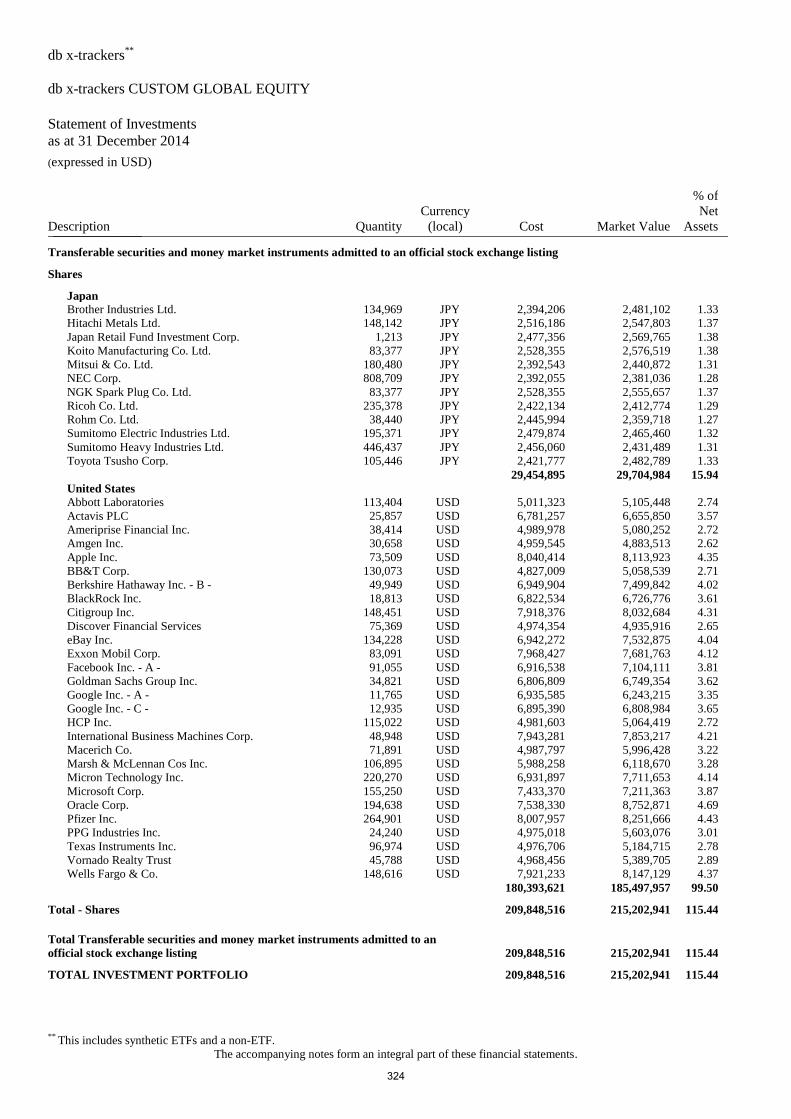
db x-trackers**
db x-trackers CUSTOM GLOBAL EQUITY
Statement of Investments
as at 31 December 2014 (expressed in USD)
** This includes synthetic ETFs and a non-ETF.
The accompanying notes form an integral part of these financial statements.
Description Quantity
Currency
(local) Cost Market Value
% of
Net
Assets _______________
Transferable securities and money market instruments admitted to an official stock exchange listing
Shares
Japan
Brother Industries Ltd. 134,969 JPY 2,394,206 2,481,102 1.33
Hitachi Metals Ltd. 148,142 JPY 2,516,186 2,547,803 1.37
Japan Retail Fund Investment Corp. 1,213 JPY 2,477,356 2,569,765 1.38
Koito Manufacturing Co. Ltd. 83,377 JPY 2,528,355 2,576,519 1.38
Mitsui & Co. Ltd. 180,480 JPY 2,392,543 2,440,872 1.31
NEC Corp. 808,709 JPY 2,392,055 2,381,036 1.28
NGK Spark Plug Co. Ltd. 83,377 JPY 2,528,355 2,555,657 1.37
Ricoh Co. Ltd. 235,378 JPY 2,422,134 2,412,774 1.29
Rohm Co. Ltd. 38,440 JPY 2,445,994 2,359,718 1.27
Sumitomo Electric Industries Ltd. 195,371 JPY 2,479,874 2,465,460 1.32
Sumitomo Heavy Industries Ltd. 446,437 JPY 2,456,060 2,431,489 1.31
Toyota Tsusho Corp. 105,446 JPY 2,421,777 2,482,789 1.33
29,454,895 29,704,984 15.94
United States
Abbott Laboratories 113,404 USD 5,011,323 5,105,448 2.74
Actavis PLC 25,857 USD 6,781,257 6,655,850 3.57
Ameriprise Financial Inc. 38,414 USD 4,989,978 5,080,252 2.72
Amgen Inc. 30,658 USD 4,959,545 4,883,513 2.62
Apple Inc. 73,509 USD 8,040,414 8,113,923 4.35
BB&T Corp. 130,073 USD 4,827,009 5,058,539 2.71
Berkshire Hathaway Inc. - B - 49,949 USD 6,949,904 7,499,842 4.02
BlackRock Inc. 18,813 USD 6,822,534 6,726,776 3.61
Citigroup Inc. 148,451 USD 7,918,376 8,032,684 4.31
Discover Financial Services 75,369 USD 4,974,354 4,935,916 2.65
eBay Inc. 134,228 USD 6,942,272 7,532,875 4.04
Exxon Mobil Corp. 83,091 USD 7,968,427 7,681,763 4.12
Facebook Inc. - A - 91,055 USD 6,916,538 7,104,111 3.81
Goldman Sachs Group Inc. 34,821 USD 6,806,809 6,749,354 3.62
Google Inc. - A - 11,765 USD 6,935,585 6,243,215 3.35
Google Inc. - C - 12,935 USD 6,895,390 6,808,984 3.65
HCP Inc. 115,022 USD 4,981,603 5,064,419 2.72
International Business Machines Corp. 48,948 USD 7,943,281 7,853,217 4.21
Macerich Co. 71,891 USD 4,987,797 5,996,428 3.22
Marsh & McLennan Cos Inc. 106,895 USD 5,988,258 6,118,670 3.28
Micron Technology Inc. 220,270 USD 6,931,897 7,711,653 4.14
Microsoft Corp. 155,250 USD 7,433,370 7,211,363 3.87
Oracle Corp. 194,638 USD 7,538,330 8,752,871 4.69
Pfizer Inc. 264,901 USD 8,007,957 8,251,666 4.43
PPG Industries Inc. 24,240 USD 4,975,018 5,603,076 3.01
Texas Instruments Inc. 96,974 USD 4,976,706 5,184,715 2.78
Vornado Realty Trust 45,788 USD 4,968,456 5,389,705 2.89
Wells Fargo & Co. 148,616 USD 7,921,233 8,147,129 4.37
180,393,621 185,497,957 99.50
Total - Shares 209,848,516 215,202,941 115.44
Total Transferable securities and money market instruments admitted to an
official stock exchange listing 209,848,516 215,202,941 115.44
TOTAL INVESTMENT PORTFOLIO 209,848,516 215,202,941 115.44
324
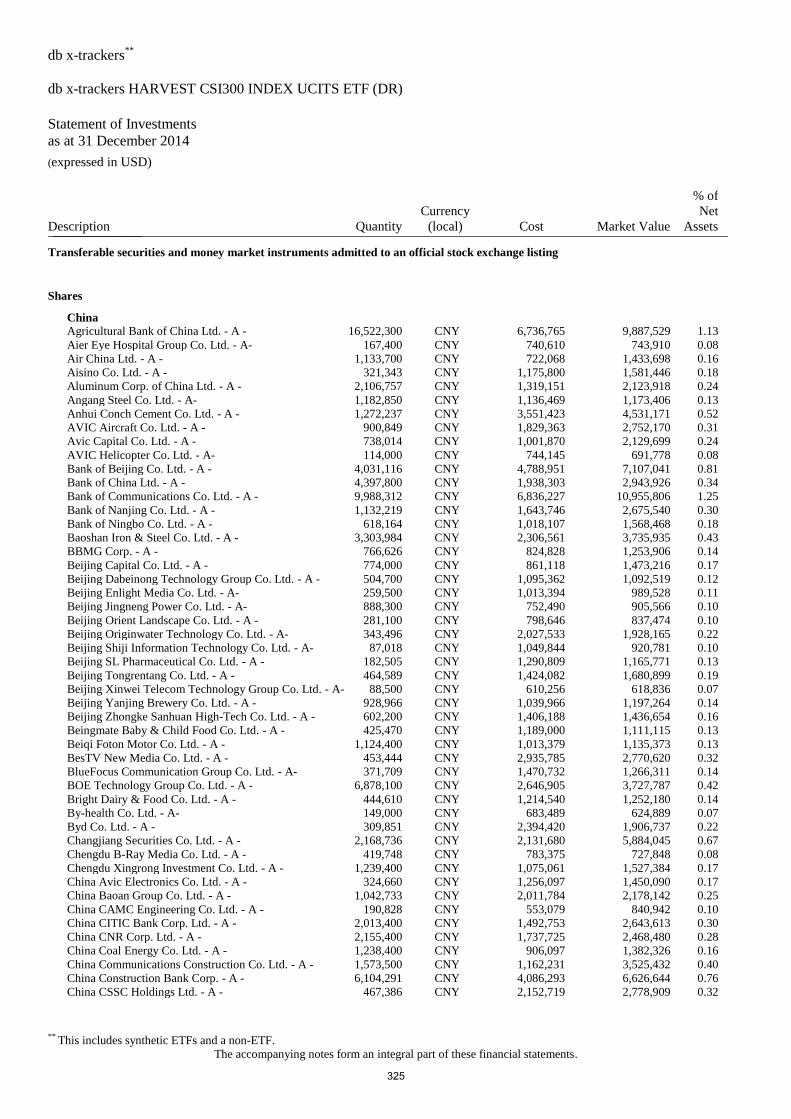
db x-trackers**
db x-trackers HARVEST CSI300 INDEX UCITS ETF (DR)
Statement of Investments
as at 31 December 2014 (expressed in USD)
** This includes synthetic ETFs and a non-ETF.
The accompanying notes form an integral part of these financial statements.
Description Quantity
Currency
(local) Cost Market Value
% of
Net
Assets _______________
Transferable securities and money market instruments admitted to an official stock exchange listing
Shares
China
Agricultural Bank of China Ltd. - A - 16,522,300 CNY 6,736,765 9,887,529 1.13
Aier Eye Hospital Group Co. Ltd. - A- 167,400 CNY 740,610 743,910 0.08
Air China Ltd. - A - 1,133,700 CNY 722,068 1,433,698 0.16
Aisino Co. Ltd. - A - 321,343 CNY 1,175,800 1,581,446 0.18
Aluminum Corp. of China Ltd. - A - 2,106,757 CNY 1,319,151 2,123,918 0.24
Angang Steel Co. Ltd. - A- 1,182,850 CNY 1,136,469 1,173,406 0.13
Anhui Conch Cement Co. Ltd. - A - 1,272,237 CNY 3,551,423 4,531,171 0.52
AVIC Aircraft Co. Ltd. - A - 900,849 CNY 1,829,363 2,752,170 0.31
Avic Capital Co. Ltd. - A - 738,014 CNY 1,001,870 2,129,699 0.24
AVIC Helicopter Co. Ltd. - A- 114,000 CNY 744,145 691,778 0.08
Bank of Beijing Co. Ltd. - A - 4,031,116 CNY 4,788,951 7,107,041 0.81
Bank of China Ltd. - A - 4,397,800 CNY 1,938,303 2,943,926 0.34
Bank of Communications Co. Ltd. - A - 9,988,312 CNY 6,836,227 10,955,806 1.25
Bank of Nanjing Co. Ltd. - A - 1,132,219 CNY 1,643,746 2,675,540 0.30
Bank of Ningbo Co. Ltd. - A - 618,164 CNY 1,018,107 1,568,468 0.18
Baoshan Iron & Steel Co. Ltd. - A - 3,303,984 CNY 2,306,561 3,735,935 0.43
BBMG Corp. - A - 766,626 CNY 824,828 1,253,906 0.14
Beijing Capital Co. Ltd. - A - 774,000 CNY 861,118 1,473,216 0.17
Beijing Dabeinong Technology Group Co. Ltd. - A - 504,700 CNY 1,095,362 1,092,519 0.12
Beijing Enlight Media Co. Ltd. - A- 259,500 CNY 1,013,394 989,528 0.11
Beijing Jingneng Power Co. Ltd. - A- 888,300 CNY 752,490 905,566 0.10
Beijing Orient Landscape Co. Ltd. - A - 281,100 CNY 798,646 837,474 0.10
Beijing Originwater Technology Co. Ltd. - A- 343,496 CNY 2,027,533 1,928,165 0.22
Beijing Shiji Information Technology Co. Ltd. - A- 87,018 CNY 1,049,844 920,781 0.10
Beijing SL Pharmaceutical Co. Ltd. - A - 182,505 CNY 1,290,809 1,165,771 0.13
Beijing Tongrentang Co. Ltd. - A - 464,589 CNY 1,424,082 1,680,899 0.19
Beijing Xinwei Telecom Technology Group Co. Ltd. - A- 88,500 CNY 610,256 618,836 0.07
Beijing Yanjing Brewery Co. Ltd. - A - 928,966 CNY 1,039,966 1,197,264 0.14
Beijing Zhongke Sanhuan High-Tech Co. Ltd. - A - 602,200 CNY 1,406,188 1,436,654 0.16
Beingmate Baby & Child Food Co. Ltd. - A - 425,470 CNY 1,189,000 1,111,115 0.13
Beiqi Foton Motor Co. Ltd. - A - 1,124,400 CNY 1,013,379 1,135,373 0.13
BesTV New Media Co. Ltd. - A - 453,444 CNY 2,935,785 2,770,620 0.32
BlueFocus Communication Group Co. Ltd. - A- 371,709 CNY 1,470,732 1,266,311 0.14
BOE Technology Group Co. Ltd. - A - 6,878,100 CNY 2,646,905 3,727,787 0.42
Bright Dairy & Food Co. Ltd. - A - 444,610 CNY 1,214,540 1,252,180 0.14
By-health Co. Ltd. - A- 149,000 CNY 683,489 624,889 0.07
Byd Co. Ltd. - A - 309,851 CNY 2,394,420 1,906,737 0.22
Changjiang Securities Co. Ltd. - A - 2,168,736 CNY 2,131,680 5,884,045 0.67
Chengdu B-Ray Media Co. Ltd. - A - 419,748 CNY 783,375 727,848 0.08
Chengdu Xingrong Investment Co. Ltd. - A - 1,239,400 CNY 1,075,061 1,527,384 0.17
China Avic Electronics Co. Ltd. - A - 324,660 CNY 1,256,097 1,450,090 0.17
China Baoan Group Co. Ltd. - A - 1,042,733 CNY 2,011,784 2,178,142 0.25
China CAMC Engineering Co. Ltd. - A - 190,828 CNY 553,079 840,942 0.10
China CITIC Bank Corp. Ltd. - A - 2,013,400 CNY 1,492,753 2,643,613 0.30
China CNR Corp. Ltd. - A - 2,155,400 CNY 1,737,725 2,468,480 0.28
China Coal Energy Co. Ltd. - A - 1,238,400 CNY 906,097 1,382,326 0.16
China Communications Construction Co. Ltd. - A - 1,573,500 CNY 1,162,231 3,525,432 0.40
China Construction Bank Corp. - A - 6,104,291 CNY 4,086,293 6,626,644 0.76
China CSSC Holdings Ltd. - A - 467,386 CNY 2,152,719 2,778,909 0.32
325
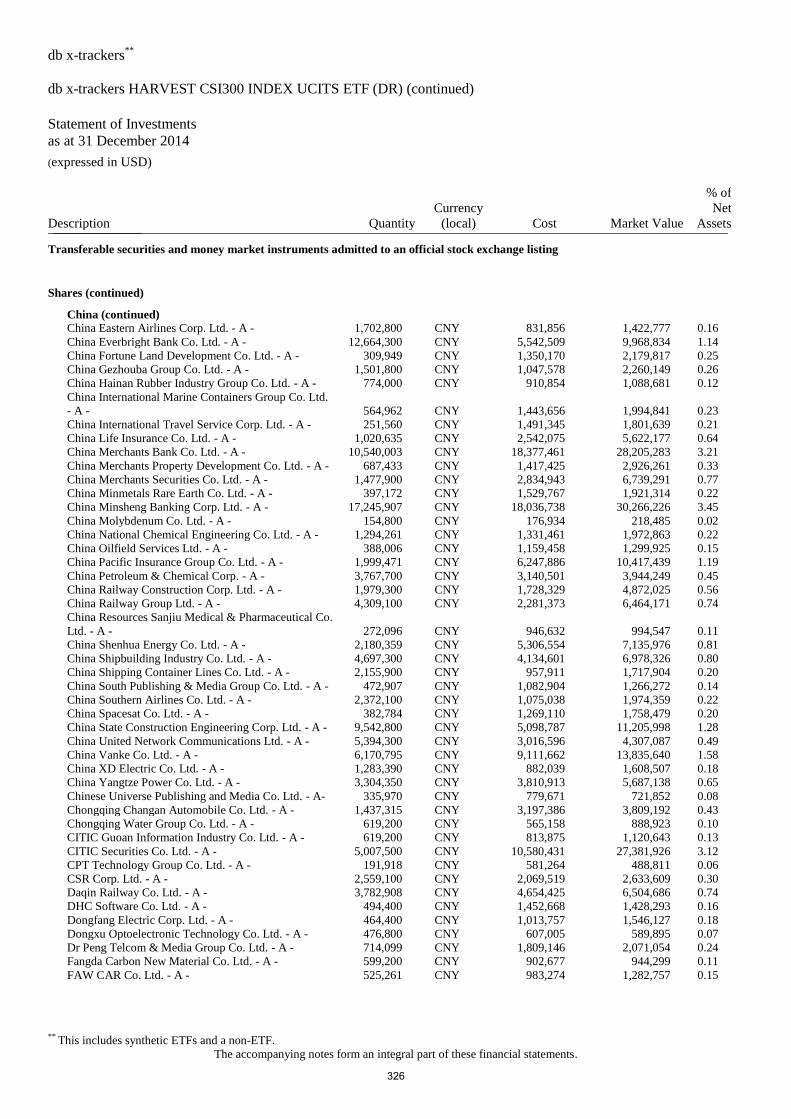
db x-trackers**
db x-trackers HARVEST CSI300 INDEX UCITS ETF (DR) (continued)
Statement of Investments
as at 31 December 2014 (expressed in USD)
** This includes synthetic ETFs and a non-ETF.
The accompanying notes form an integral part of these financial statements.
Description Quantity
Currency
(local) Cost Market Value
% of
Net
Assets _______________
Transferable securities and money market instruments admitted to an official stock exchange listing
Shares (continued)
China (continued)
China Eastern Airlines Corp. Ltd. - A - 1,702,800 CNY 831,856 1,422,777 0.16
China Everbright Bank Co. Ltd. - A - 12,664,300 CNY 5,542,509 9,968,834 1.14
China Fortune Land Development Co. Ltd. - A - 309,949 CNY 1,350,170 2,179,817 0.25
China Gezhouba Group Co. Ltd. - A - 1,501,800 CNY 1,047,578 2,260,149 0.26
China Hainan Rubber Industry Group Co. Ltd. - A - 774,000 CNY 910,854 1,088,681 0.12
China International Marine Containers Group Co. Ltd.
- A - 564,962 CNY 1,443,656 1,994,841 0.23
China International Travel Service Corp. Ltd. - A - 251,560 CNY 1,491,345 1,801,639 0.21
China Life Insurance Co. Ltd. - A - 1,020,635 CNY 2,542,075 5,622,177 0.64
China Merchants Bank Co. Ltd. - A - 10,540,003 CNY 18,377,461 28,205,283 3.21
China Merchants Property Development Co. Ltd. - A - 687,433 CNY 1,417,425 2,926,261 0.33
China Merchants Securities Co. Ltd. - A - 1,477,900 CNY 2,834,943 6,739,291 0.77
China Minmetals Rare Earth Co. Ltd. - A - 397,172 CNY 1,529,767 1,921,314 0.22
China Minsheng Banking Corp. Ltd. - A - 17,245,907 CNY 18,036,738 30,266,226 3.45
China Molybdenum Co. Ltd. - A - 154,800 CNY 176,934 218,485 0.02
China National Chemical Engineering Co. Ltd. - A - 1,294,261 CNY 1,331,461 1,972,863 0.22
China Oilfield Services Ltd. - A - 388,006 CNY 1,159,458 1,299,925 0.15
China Pacific Insurance Group Co. Ltd. - A - 1,999,471 CNY 6,247,886 10,417,439 1.19
China Petroleum & Chemical Corp. - A - 3,767,700 CNY 3,140,501 3,944,249 0.45
China Railway Construction Corp. Ltd. - A - 1,979,300 CNY 1,728,329 4,872,025 0.56
China Railway Group Ltd. - A - 4,309,100 CNY 2,281,373 6,464,171 0.74
China Resources Sanjiu Medical & Pharmaceutical Co.
Ltd. - A - 272,096 CNY 946,632 994,547 0.11
China Shenhua Energy Co. Ltd. - A - 2,180,359 CNY 5,306,554 7,135,976 0.81
China Shipbuilding Industry Co. Ltd. - A - 4,697,300 CNY 4,134,601 6,978,326 0.80
China Shipping Container Lines Co. Ltd. - A - 2,155,900 CNY 957,911 1,717,904 0.20
China South Publishing & Media Group Co. Ltd. - A - 472,907 CNY 1,082,904 1,266,272 0.14
China Southern Airlines Co. Ltd. - A - 2,372,100 CNY 1,075,038 1,974,359 0.22
China Spacesat Co. Ltd. - A - 382,784 CNY 1,269,110 1,758,479 0.20
China State Construction Engineering Corp. Ltd. - A - 9,542,800 CNY 5,098,787 11,205,998 1.28
China United Network Communications Ltd. - A - 5,394,300 CNY 3,016,596 4,307,087 0.49
China Vanke Co. Ltd. - A - 6,170,795 CNY 9,111,662 13,835,640 1.58
China XD Electric Co. Ltd. - A - 1,283,390 CNY 882,039 1,608,507 0.18
China Yangtze Power Co. Ltd. - A - 3,304,350 CNY 3,810,913 5,687,138 0.65
Chinese Universe Publishing and Media Co. Ltd. - A- 335,970 CNY 779,671 721,852 0.08
Chongqing Changan Automobile Co. Ltd. - A - 1,437,315 CNY 3,197,386 3,809,192 0.43
Chongqing Water Group Co. Ltd. - A - 619,200 CNY 565,158 888,923 0.10
CITIC Guoan Information Industry Co. Ltd. - A - 619,200 CNY 813,875 1,120,643 0.13
CITIC Securities Co. Ltd. - A - 5,007,500 CNY 10,580,431 27,381,926 3.12
CPT Technology Group Co. Ltd. - A - 191,918 CNY 581,264 488,811 0.06
CSR Corp. Ltd. - A - 2,559,100 CNY 2,069,519 2,633,609 0.30
Daqin Railway Co. Ltd. - A - 3,782,908 CNY 4,654,425 6,504,686 0.74
DHC Software Co. Ltd. - A - 494,400 CNY 1,452,668 1,428,293 0.16
Dongfang Electric Corp. Ltd. - A - 464,400 CNY 1,013,757 1,546,127 0.18
Dongxu Optoelectronic Technology Co. Ltd. - A - 476,800 CNY 607,005 589,895 0.07
Dr Peng Telcom & Media Group Co. Ltd. - A - 714,099 CNY 1,809,146 2,071,054 0.24
Fangda Carbon New Material Co. Ltd. - A - 599,200 CNY 902,677 944,299 0.11
FAW CAR Co. Ltd. - A - 525,261 CNY 983,274 1,282,757 0.15
326
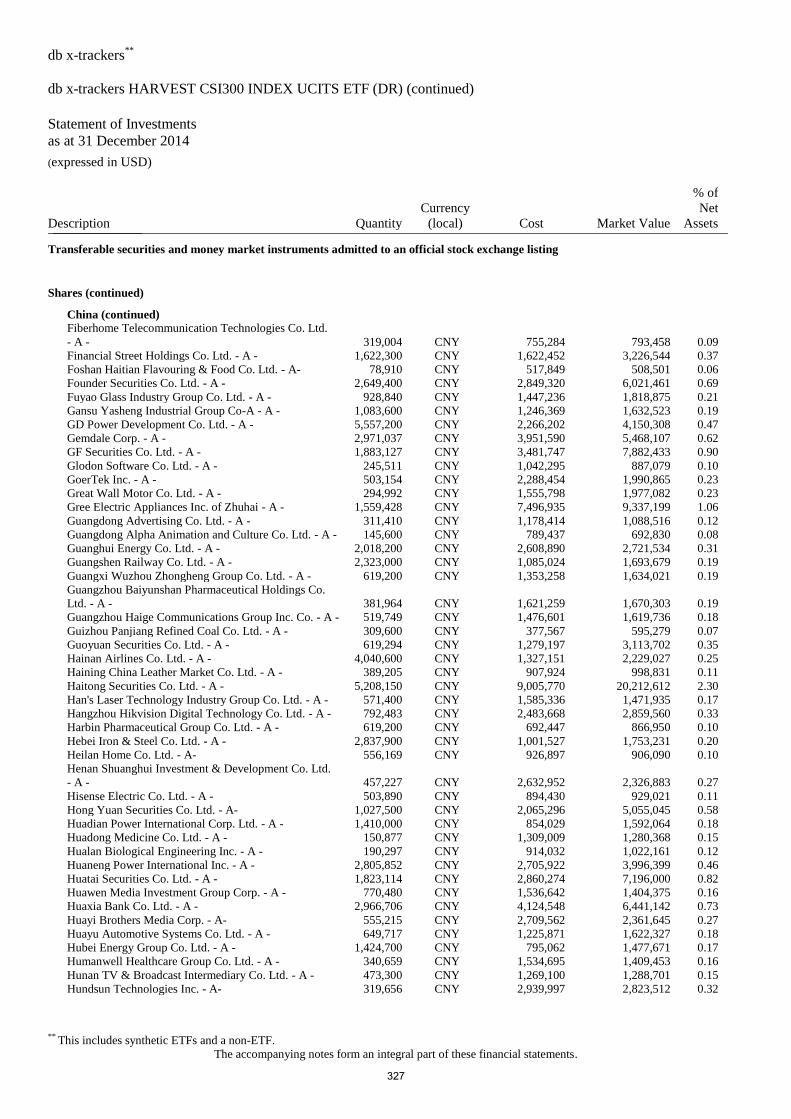
db x-trackers**
db x-trackers HARVEST CSI300 INDEX UCITS ETF (DR) (continued)
Statement of Investments
as at 31 December 2014 (expressed in USD)
** This includes synthetic ETFs and a non-ETF.
The accompanying notes form an integral part of these financial statements.
Description Quantity
Currency
(local) Cost Market Value
% of
Net
Assets _______________
Transferable securities and money market instruments admitted to an official stock exchange listing
Shares (continued)
China (continued)
Fiberhome Telecommunication Technologies Co. Ltd.
- A -
319,004 CNY 755,284 793,458 0.09
Financial Street Holdings Co. Ltd. - A - 1,622,300 CNY 1,622,452 3,226,544 0.37
Foshan Haitian Flavouring & Food Co. Ltd. - A- 78,910 CNY 517,849 508,501 0.06
Founder Securities Co. Ltd. - A - 2,649,400 CNY 2,849,320 6,021,461 0.69
Fuyao Glass Industry Group Co. Ltd. - A - 928,840 CNY 1,447,236 1,818,875 0.21
Gansu Yasheng Industrial Group Co-A - A - 1,083,600 CNY 1,246,369 1,632,523 0.19
GD Power Development Co. Ltd. - A - 5,557,200 CNY 2,266,202 4,150,308 0.47
Gemdale Corp. - A - 2,971,037 CNY 3,951,590 5,468,107 0.62
GF Securities Co. Ltd. - A - 1,883,127 CNY 3,481,747 7,882,433 0.90
Glodon Software Co. Ltd. - A - 245,511 CNY 1,042,295 887,079 0.10
GoerTek Inc. - A - 503,154 CNY 2,288,454 1,990,865 0.23
Great Wall Motor Co. Ltd. - A - 294,992 CNY 1,555,798 1,977,082 0.23
Gree Electric Appliances Inc. of Zhuhai - A - 1,559,428 CNY 7,496,935 9,337,199 1.06
Guangdong Advertising Co. Ltd. - A - 311,410 CNY 1,178,414 1,088,516 0.12
Guangdong Alpha Animation and Culture Co. Ltd. - A - 145,600 CNY 789,437 692,830 0.08
Guanghui Energy Co. Ltd. - A - 2,018,200 CNY 2,608,890 2,721,534 0.31
Guangshen Railway Co. Ltd. - A - 2,323,000 CNY 1,085,024 1,693,679 0.19
Guangxi Wuzhou Zhongheng Group Co. Ltd. - A - 619,200 CNY 1,353,258 1,634,021 0.19
Guangzhou Baiyunshan Pharmaceutical Holdings Co.
Ltd. - A - 381,964 CNY 1,621,259 1,670,303 0.19
Guangzhou Haige Communications Group Inc. Co. - A - 519,749 CNY 1,476,601 1,619,736 0.18
Guizhou Panjiang Refined Coal Co. Ltd. - A - 309,600 CNY 377,567 595,279 0.07
Guoyuan Securities Co. Ltd. - A - 619,294 CNY 1,279,197 3,113,702 0.35
Hainan Airlines Co. Ltd. - A - 4,040,600 CNY 1,327,151 2,229,027 0.25
Haining China Leather Market Co. Ltd. - A - 389,205 CNY 907,924 998,831 0.11
Haitong Securities Co. Ltd. - A - 5,208,150 CNY 9,005,770 20,212,612 2.30
Han's Laser Technology Industry Group Co. Ltd. - A - 571,400 CNY 1,585,336 1,471,935 0.17
Hangzhou Hikvision Digital Technology Co. Ltd. - A - 792,483 CNY 2,483,668 2,859,560 0.33
Harbin Pharmaceutical Group Co. Ltd. - A - 619,200 CNY 692,447 866,950 0.10
Hebei Iron & Steel Co. Ltd. - A - 2,837,900 CNY 1,001,527 1,753,231 0.20
Heilan Home Co. Ltd. - A- 556,169 CNY 926,897 906,090 0.10
Henan Shuanghui Investment & Development Co. Ltd.
- A - 457,227 CNY 2,632,952 2,326,883 0.27
Hisense Electric Co. Ltd. - A - 503,890 CNY 894,430 929,021 0.11
Hong Yuan Securities Co. Ltd. - A- 1,027,500 CNY 2,065,296 5,055,045 0.58
Huadian Power International Corp. Ltd. - A - 1,410,000 CNY 854,029 1,592,064 0.18
Huadong Medicine Co. Ltd. - A - 150,877 CNY 1,309,009 1,280,368 0.15
Hualan Biological Engineering Inc. - A - 190,297 CNY 914,032 1,022,161 0.12
Huaneng Power International Inc. - A - 2,805,852 CNY 2,705,922 3,996,399 0.46
Huatai Securities Co. Ltd. - A - 1,823,114 CNY 2,860,274 7,196,000 0.82
Huawen Media Investment Group Corp. - A - 770,480 CNY 1,536,642 1,404,375 0.16
Huaxia Bank Co. Ltd. - A - 2,966,706 CNY 4,124,548 6,441,142 0.73
Huayi Brothers Media Corp. - A- 555,215 CNY 2,709,562 2,361,645 0.27
Huayu Automotive Systems Co. Ltd. - A - 649,717 CNY 1,225,871 1,622,327 0.18
Hubei Energy Group Co. Ltd. - A - 1,424,700 CNY 795,062 1,477,671 0.17
Humanwell Healthcare Group Co. Ltd. - A - 340,659 CNY 1,534,695 1,409,453 0.16
Hunan TV & Broadcast Intermediary Co. Ltd. - A - 473,300 CNY 1,269,100 1,288,701 0.15
Hundsun Technologies Inc. - A- 319,656 CNY 2,939,997 2,823,512 0.32
327
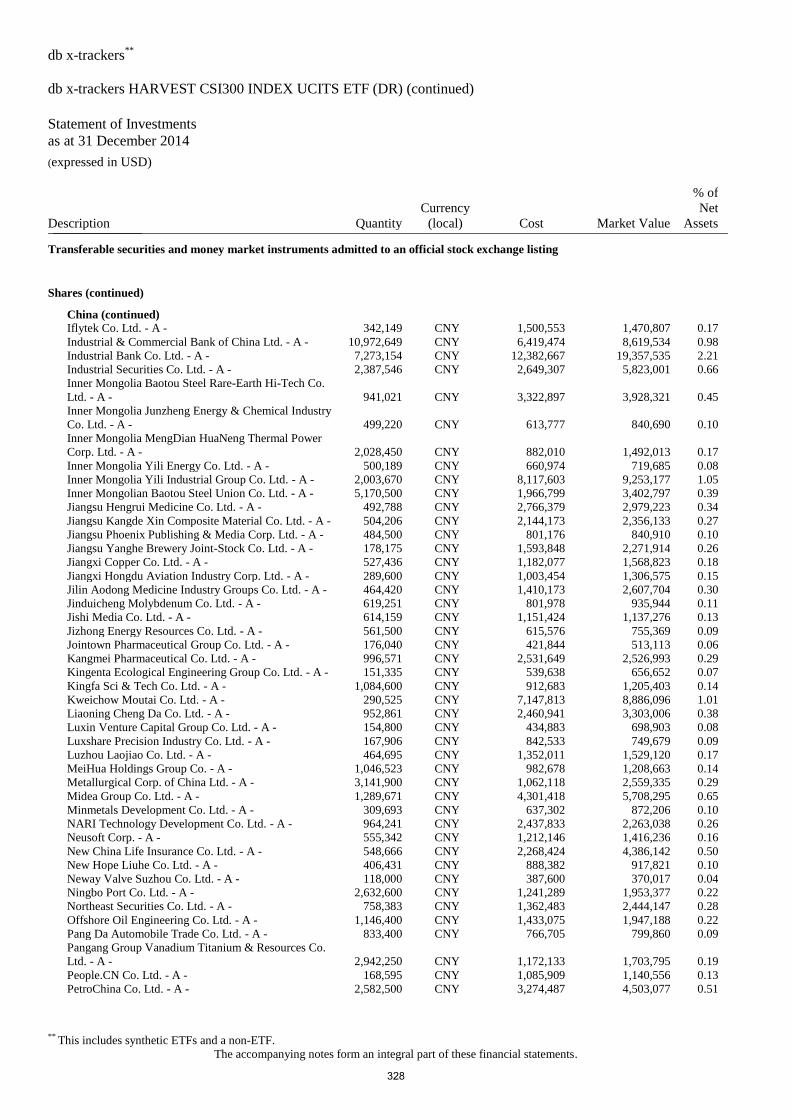
db x-trackers**
db x-trackers HARVEST CSI300 INDEX UCITS ETF (DR) (continued)
Statement of Investments
as at 31 December 2014 (expressed in USD)
** This includes synthetic ETFs and a non-ETF.
The accompanying notes form an integral part of these financial statements.
Description Quantity
Currency
(local) Cost Market Value
% of
Net
Assets _______________
Transferable securities and money market instruments admitted to an official stock exchange listing
Shares (continued)
China (continued)
Iflytek Co. Ltd. - A - 342,149 CNY 1,500,553 1,470,807 0.17
Industrial & Commercial Bank of China Ltd. - A - 10,972,649 CNY 6,419,474 8,619,534 0.98
Industrial Bank Co. Ltd. - A - 7,273,154 CNY 12,382,667 19,357,535 2.21
Industrial Securities Co. Ltd. - A - 2,387,546 CNY 2,649,307 5,823,001 0.66
Inner Mongolia Baotou Steel Rare-Earth Hi-Tech Co.
Ltd. - A - 941,021 CNY 3,322,897 3,928,321 0.45
Inner Mongolia Junzheng Energy & Chemical Industry
Co. Ltd. - A - 499,220 CNY 613,777 840,690 0.10
Inner Mongolia MengDian HuaNeng Thermal Power
Corp. Ltd. - A - 2,028,450 CNY 882,010 1,492,013 0.17
Inner Mongolia Yili Energy Co. Ltd. - A - 500,189 CNY 660,974 719,685 0.08
Inner Mongolia Yili Industrial Group Co. Ltd. - A - 2,003,670 CNY 8,117,603 9,253,177 1.05
Inner Mongolian Baotou Steel Union Co. Ltd. - A - 5,170,500 CNY 1,966,799 3,402,797 0.39
Jiangsu Hengrui Medicine Co. Ltd. - A - 492,788 CNY 2,766,379 2,979,223 0.34
Jiangsu Kangde Xin Composite Material Co. Ltd. - A - 504,206 CNY 2,144,173 2,356,133 0.27
Jiangsu Phoenix Publishing & Media Corp. Ltd. - A - 484,500 CNY 801,176 840,910 0.10
Jiangsu Yanghe Brewery Joint-Stock Co. Ltd. - A - 178,175 CNY 1,593,848 2,271,914 0.26
Jiangxi Copper Co. Ltd. - A - 527,436 CNY 1,182,077 1,568,823 0.18
Jiangxi Hongdu Aviation Industry Corp. Ltd. - A - 289,600 CNY 1,003,454 1,306,575 0.15
Jilin Aodong Medicine Industry Groups Co. Ltd. - A - 464,420 CNY 1,410,173 2,607,704 0.30
Jinduicheng Molybdenum Co. Ltd. - A - 619,251 CNY 801,978 935,944 0.11
Jishi Media Co. Ltd. - A - 614,159 CNY 1,151,424 1,137,276 0.13
Jizhong Energy Resources Co. Ltd. - A - 561,500 CNY 615,576 755,369 0.09
Jointown Pharmaceutical Group Co. Ltd. - A - 176,040 CNY 421,844 513,113 0.06
Kangmei Pharmaceutical Co. Ltd. - A - 996,571 CNY 2,531,649 2,526,993 0.29
Kingenta Ecological Engineering Group Co. Ltd. - A - 151,335 CNY 539,638 656,652 0.07
Kingfa Sci & Tech Co. Ltd. - A - 1,084,600 CNY 912,683 1,205,403 0.14
Kweichow Moutai Co. Ltd. - A - 290,525 CNY 7,147,813 8,886,096 1.01
Liaoning Cheng Da Co. Ltd. - A - 952,861 CNY 2,460,941 3,303,006 0.38
Luxin Venture Capital Group Co. Ltd. - A - 154,800 CNY 434,883 698,903 0.08
Luxshare Precision Industry Co. Ltd. - A - 167,906 CNY 842,533 749,679 0.09
Luzhou Laojiao Co. Ltd. - A - 464,695 CNY 1,352,011 1,529,120 0.17
MeiHua Holdings Group Co. - A - 1,046,523 CNY 982,678 1,208,663 0.14
Metallurgical Corp. of China Ltd. - A - 3,141,900 CNY 1,062,118 2,559,335 0.29
Midea Group Co. Ltd. - A - 1,289,671 CNY 4,301,418 5,708,295 0.65
Minmetals Development Co. Ltd. - A - 309,693 CNY 637,302 872,206 0.10
NARI Technology Development Co. Ltd. - A - 964,241 CNY 2,437,833 2,263,038 0.26
Neusoft Corp. - A - 555,342 CNY 1,212,146 1,416,236 0.16
New China Life Insurance Co. Ltd. - A - 548,666 CNY 2,268,424 4,386,142 0.50
New Hope Liuhe Co. Ltd. - A - 406,431 CNY 888,382 917,821 0.10
Neway Valve Suzhou Co. Ltd. - A - 118,000 CNY 387,600 370,017 0.04
Ningbo Port Co. Ltd. - A - 2,632,600 CNY 1,241,289 1,953,377 0.22
Northeast Securities Co. Ltd. - A - 758,383 CNY 1,362,483 2,444,147 0.28
Offshore Oil Engineering Co. Ltd. - A - 1,146,400 CNY 1,433,075 1,947,188 0.22
Pang Da Automobile Trade Co. Ltd. - A - 833,400 CNY 766,705 799,860 0.09
Pangang Group Vanadium Titanium & Resources Co.
Ltd. - A - 2,942,250 CNY 1,172,133 1,703,795 0.19
People.CN Co. Ltd. - A - 168,595 CNY 1,085,909 1,140,556 0.13
PetroChina Co. Ltd. - A - 2,582,500 CNY 3,274,487 4,503,077 0.51
328
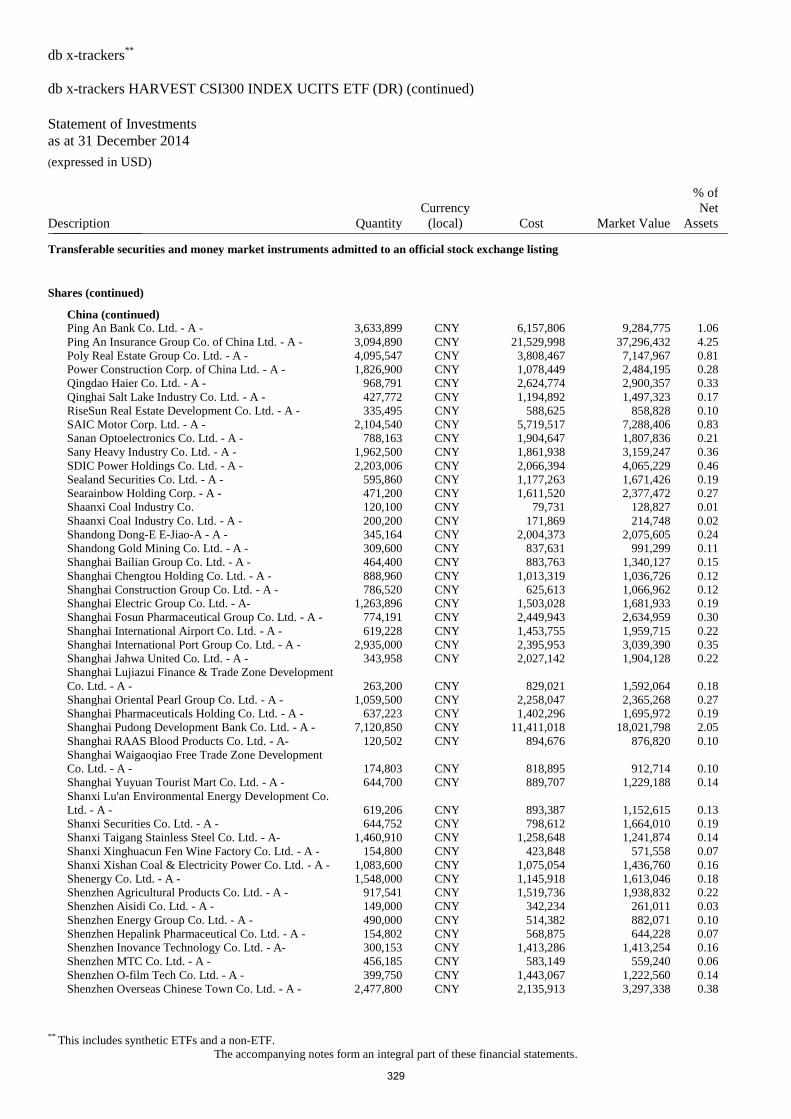
db x-trackers**
db x-trackers HARVEST CSI300 INDEX UCITS ETF (DR) (continued)
Statement of Investments
as at 31 December 2014 (expressed in USD)
** This includes synthetic ETFs and a non-ETF.
The accompanying notes form an integral part of these financial statements.
Description Quantity
Currency
(local) Cost Market Value
% of
Net
Assets _______________
Transferable securities and money market instruments admitted to an official stock exchange listing
Shares (continued)
China (continued)
Ping An Bank Co. Ltd. - A - 3,633,899 CNY 6,157,806 9,284,775 1.06
Ping An Insurance Group Co. of China Ltd. - A - 3,094,890 CNY 21,529,998 37,296,432 4.25
Poly Real Estate Group Co. Ltd. - A - 4,095,547 CNY 3,808,467 7,147,967 0.81
Power Construction Corp. of China Ltd. - A - 1,826,900 CNY 1,078,449 2,484,195 0.28
Qingdao Haier Co. Ltd. - A - 968,791 CNY 2,624,774 2,900,357 0.33
Qinghai Salt Lake Industry Co. Ltd. - A - 427,772 CNY 1,194,892 1,497,323 0.17
RiseSun Real Estate Development Co. Ltd. - A - 335,495 CNY 588,625 858,828 0.10
SAIC Motor Corp. Ltd. - A - 2,104,540 CNY 5,719,517 7,288,406 0.83
Sanan Optoelectronics Co. Ltd. - A - 788,163 CNY 1,904,647 1,807,836 0.21
Sany Heavy Industry Co. Ltd. - A - 1,962,500 CNY 1,861,938 3,159,247 0.36
SDIC Power Holdings Co. Ltd. - A - 2,203,006 CNY 2,066,394 4,065,229 0.46
Sealand Securities Co. Ltd. - A - 595,860 CNY 1,177,263 1,671,426 0.19
Searainbow Holding Corp. - A - 471,200 CNY 1,611,520 2,377,472 0.27
Shaanxi Coal Industry Co. 120,100 CNY 79,731 128,827 0.01
Shaanxi Coal Industry Co. Ltd. - A - 200,200 CNY 171,869 214,748 0.02
Shandong Dong-E E-Jiao-A - A - 345,164 CNY 2,004,373 2,075,605 0.24
Shandong Gold Mining Co. Ltd. - A - 309,600 CNY 837,631 991,299 0.11
Shanghai Bailian Group Co. Ltd. - A - 464,400 CNY 883,763 1,340,127 0.15
Shanghai Chengtou Holding Co. Ltd. - A - 888,960 CNY 1,013,319 1,036,726 0.12
Shanghai Construction Group Co. Ltd. - A - 786,520 CNY 625,613 1,066,962 0.12
Shanghai Electric Group Co. Ltd. - A- 1,263,896 CNY 1,503,028 1,681,933 0.19
Shanghai Fosun Pharmaceutical Group Co. Ltd. - A - 774,191 CNY 2,449,943 2,634,959 0.30
Shanghai International Airport Co. Ltd. - A - 619,228 CNY 1,453,755 1,959,715 0.22
Shanghai International Port Group Co. Ltd. - A - 2,935,000 CNY 2,395,953 3,039,390 0.35
Shanghai Jahwa United Co. Ltd. - A - 343,958 CNY 2,027,142 1,904,128 0.22
Shanghai Lujiazui Finance & Trade Zone Development
Co. Ltd. - A - 263,200 CNY 829,021 1,592,064 0.18
Shanghai Oriental Pearl Group Co. Ltd. - A - 1,059,500 CNY 2,258,047 2,365,268 0.27
Shanghai Pharmaceuticals Holding Co. Ltd. - A - 637,223 CNY 1,402,296 1,695,972 0.19
Shanghai Pudong Development Bank Co. Ltd. - A - 7,120,850 CNY 11,411,018 18,021,798 2.05
Shanghai RAAS Blood Products Co. Ltd. - A- 120,502 CNY 894,676 876,820 0.10
Shanghai Waigaoqiao Free Trade Zone Development
Co. Ltd. - A - 174,803 CNY 818,895 912,714 0.10
Shanghai Yuyuan Tourist Mart Co. Ltd. - A - 644,700 CNY 889,707 1,229,188 0.14
Shanxi Lu'an Environmental Energy Development Co.
Ltd. - A - 619,206 CNY 893,387 1,152,615 0.13
Shanxi Securities Co. Ltd. - A - 644,752 CNY 798,612 1,664,010 0.19
Shanxi Taigang Stainless Steel Co. Ltd. - A- 1,460,910 CNY 1,258,648 1,241,874 0.14
Shanxi Xinghuacun Fen Wine Factory Co. Ltd. - A - 154,800 CNY 423,848 571,558 0.07
Shanxi Xishan Coal & Electricity Power Co. Ltd. - A - 1,083,600 CNY 1,075,054 1,436,760 0.16
Shenergy Co. Ltd. - A - 1,548,000 CNY 1,145,918 1,613,046 0.18
Shenzhen Agricultural Products Co. Ltd. - A - 917,541 CNY 1,519,736 1,938,832 0.22
Shenzhen Aisidi Co. Ltd. - A - 149,000 CNY 342,234 261,011 0.03
Shenzhen Energy Group Co. Ltd. - A - 490,000 CNY 514,382 882,071 0.10
Shenzhen Hepalink Pharmaceutical Co. Ltd. - A - 154,802 CNY 568,875 644,228 0.07
Shenzhen Inovance Technology Co. Ltd. - A- 300,153 CNY 1,413,286 1,413,254 0.16
Shenzhen MTC Co. Ltd. - A - 456,185 CNY 583,149 559,240 0.06
Shenzhen O-film Tech Co. Ltd. - A - 399,750 CNY 1,443,067 1,222,560 0.14
Shenzhen Overseas Chinese Town Co. Ltd. - A - 2,477,800 CNY 2,135,913 3,297,338 0.38
329
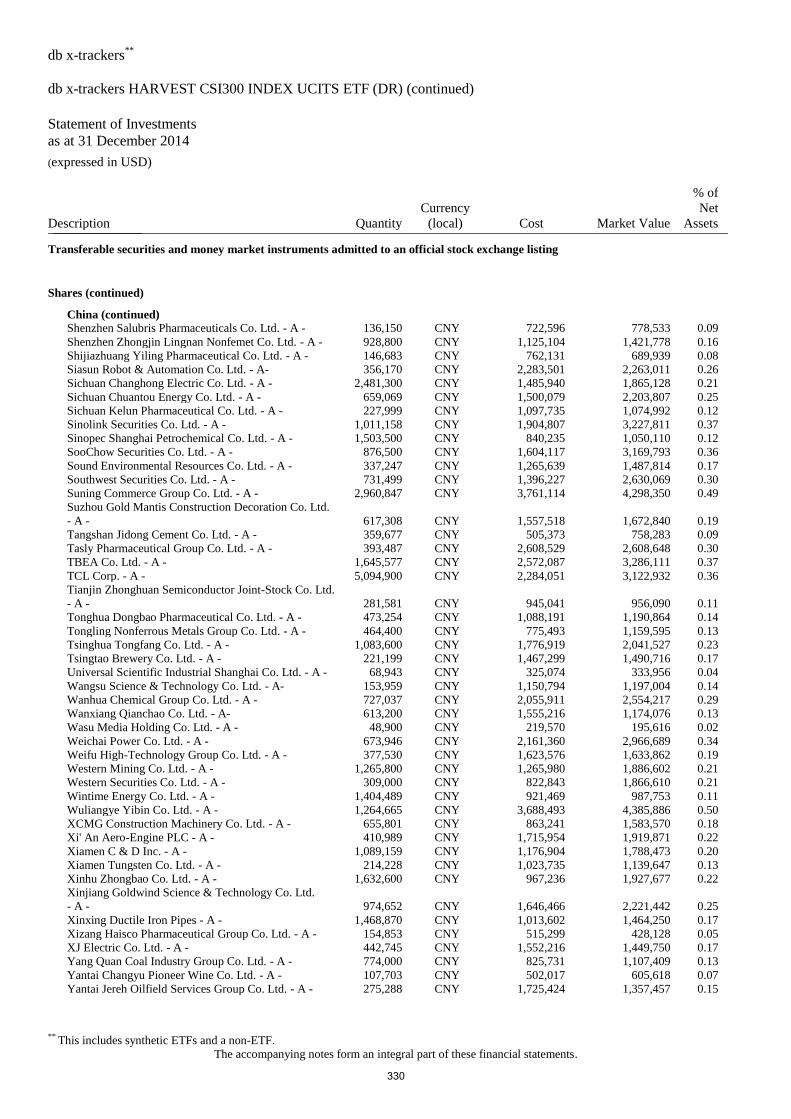
db x-trackers**
db x-trackers HARVEST CSI300 INDEX UCITS ETF (DR) (continued)
Statement of Investments
as at 31 December 2014 (expressed in USD)
** This includes synthetic ETFs and a non-ETF.
The accompanying notes form an integral part of these financial statements.
Description Quantity
Currency
(local) Cost Market Value
% of
Net
Assets _______________
Transferable securities and money market instruments admitted to an official stock exchange listing
Shares (continued)
China (continued)
Shenzhen Salubris Pharmaceuticals Co. Ltd. - A - 136,150 CNY 722,596 778,533 0.09
Shenzhen Zhongjin Lingnan Nonfemet Co. Ltd. - A - 928,800 CNY 1,125,104 1,421,778 0.16
Shijiazhuang Yiling Pharmaceutical Co. Ltd. - A - 146,683 CNY 762,131 689,939 0.08
Siasun Robot & Automation Co. Ltd. - A- 356,170 CNY 2,283,501 2,263,011 0.26
Sichuan Changhong Electric Co. Ltd. - A - 2,481,300 CNY 1,485,940 1,865,128 0.21
Sichuan Chuantou Energy Co. Ltd. - A - 659,069 CNY 1,500,079 2,203,807 0.25
Sichuan Kelun Pharmaceutical Co. Ltd. - A - 227,999 CNY 1,097,735 1,074,992 0.12
Sinolink Securities Co. Ltd. - A - 1,011,158 CNY 1,904,807 3,227,811 0.37
Sinopec Shanghai Petrochemical Co. Ltd. - A - 1,503,500 CNY 840,235 1,050,110 0.12
SooChow Securities Co. Ltd. - A - 876,500 CNY 1,604,117 3,169,793 0.36
Sound Environmental Resources Co. Ltd. - A - 337,247 CNY 1,265,639 1,487,814 0.17
Southwest Securities Co. Ltd. - A - 731,499 CNY 1,396,227 2,630,069 0.30
Suning Commerce Group Co. Ltd. - A - 2,960,847 CNY 3,761,114 4,298,350 0.49
Suzhou Gold Mantis Construction Decoration Co. Ltd.
- A - 617,308 CNY 1,557,518 1,672,840 0.19
Tangshan Jidong Cement Co. Ltd. - A - 359,677 CNY 505,373 758,283 0.09
Tasly Pharmaceutical Group Co. Ltd. - A - 393,487 CNY 2,608,529 2,608,648 0.30
TBEA Co. Ltd. - A - 1,645,577 CNY 2,572,087 3,286,111 0.37
TCL Corp. - A - 5,094,900 CNY 2,284,051 3,122,932 0.36
Tianjin Zhonghuan Semiconductor Joint-Stock Co. Ltd.
- A - 281,581 CNY 945,041 956,090 0.11
Tonghua Dongbao Pharmaceutical Co. Ltd. - A - 473,254 CNY 1,088,191 1,190,864 0.14
Tongling Nonferrous Metals Group Co. Ltd. - A - 464,400 CNY 775,493 1,159,595 0.13
Tsinghua Tongfang Co. Ltd. - A - 1,083,600 CNY 1,776,919 2,041,527 0.23
Tsingtao Brewery Co. Ltd. - A - 221,199 CNY 1,467,299 1,490,716 0.17
Universal Scientific Industrial Shanghai Co. Ltd. - A - 68,943 CNY 325,074 333,956 0.04
Wangsu Science & Technology Co. Ltd. - A- 153,959 CNY 1,150,794 1,197,004 0.14
Wanhua Chemical Group Co. Ltd. - A - 727,037 CNY 2,055,911 2,554,217 0.29
Wanxiang Qianchao Co. Ltd. - A- 613,200 CNY 1,555,216 1,174,076 0.13
Wasu Media Holding Co. Ltd. - A - 48,900 CNY 219,570 195,616 0.02
Weichai Power Co. Ltd. - A - 673,946 CNY 2,161,360 2,966,689 0.34
Weifu High-Technology Group Co. Ltd. - A - 377,530 CNY 1,623,576 1,633,862 0.19
Western Mining Co. Ltd. - A - 1,265,800 CNY 1,265,980 1,886,602 0.21
Western Securities Co. Ltd. - A - 309,000 CNY 822,843 1,866,610 0.21
Wintime Energy Co. Ltd. - A - 1,404,489 CNY 921,469 987,753 0.11
Wuliangye Yibin Co. Ltd. - A - 1,264,665 CNY 3,688,493 4,385,886 0.50
XCMG Construction Machinery Co. Ltd. - A - 655,801 CNY 863,241 1,583,570 0.18
Xi' An Aero-Engine PLC - A - 410,989 CNY 1,715,954 1,919,871 0.22
Xiamen C & D Inc. - A - 1,089,159 CNY 1,176,904 1,788,473 0.20
Xiamen Tungsten Co. Ltd. - A - 214,228 CNY 1,023,735 1,139,647 0.13
Xinhu Zhongbao Co. Ltd. - A - 1,632,600 CNY 967,236 1,927,677 0.22
Xinjiang Goldwind Science & Technology Co. Ltd.
- A - 974,652 CNY 1,646,466 2,221,442 0.25
Xinxing Ductile Iron Pipes - A - 1,468,870 CNY 1,013,602 1,464,250 0.17
Xizang Haisco Pharmaceutical Group Co. Ltd. - A - 154,853 CNY 515,299 428,128 0.05
XJ Electric Co. Ltd. - A - 442,745 CNY 1,552,216 1,449,750 0.17
Yang Quan Coal Industry Group Co. Ltd. - A - 774,000 CNY 825,731 1,107,409 0.13
Yantai Changyu Pioneer Wine Co. Ltd. - A - 107,703 CNY 502,017 605,618 0.07
Yantai Jereh Oilfield Services Group Co. Ltd. - A - 275,288 CNY 1,725,424 1,357,457 0.15
330
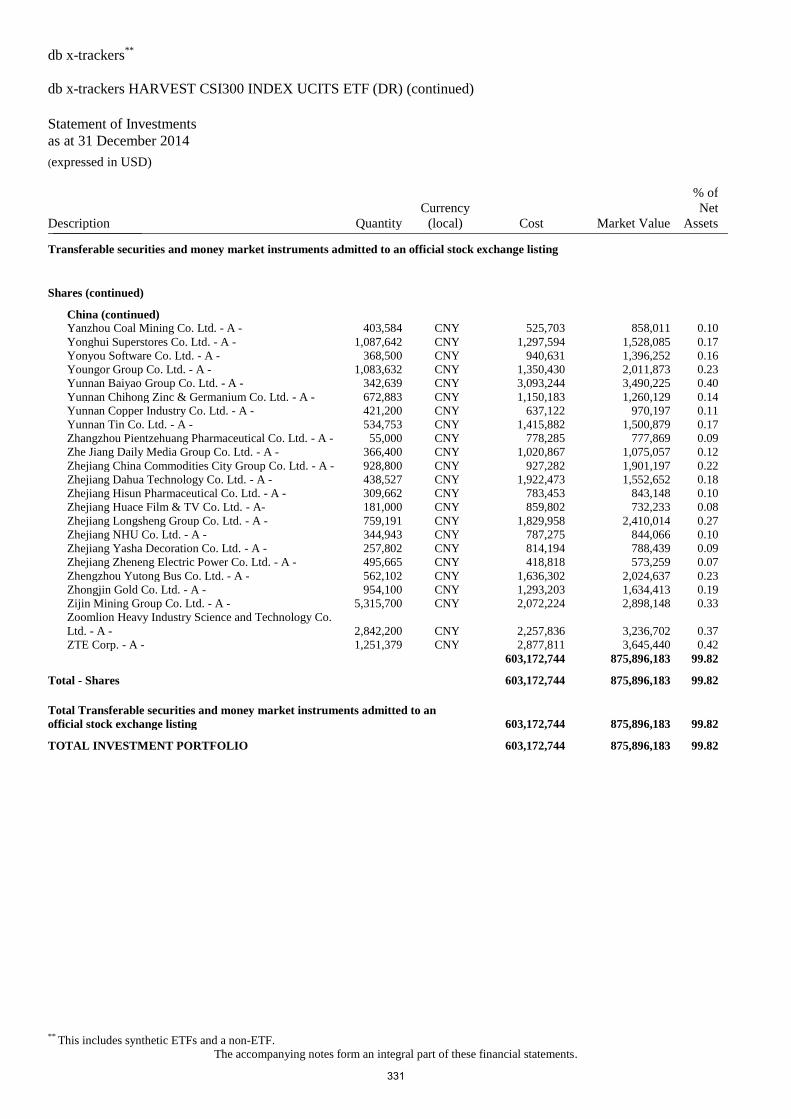
db x-trackers**
db x-trackers HARVEST CSI300 INDEX UCITS ETF (DR) (continued)
Statement of Investments
as at 31 December 2014 (expressed in USD)
** This includes synthetic ETFs and a non-ETF.
The accompanying notes form an integral part of these financial statements.
Description Quantity
Currency
(local) Cost Market Value
% of
Net
Assets _______________
Transferable securities and money market instruments admitted to an official stock exchange listing
Shares (continued)
China (continued)
Yanzhou Coal Mining Co. Ltd. - A - 403,584 CNY 525,703 858,011 0.10
Yonghui Superstores Co. Ltd. - A - 1,087,642 CNY 1,297,594 1,528,085 0.17
Yonyou Software Co. Ltd. - A - 368,500 CNY 940,631 1,396,252 0.16
Youngor Group Co. Ltd. - A - 1,083,632 CNY 1,350,430 2,011,873 0.23
Yunnan Baiyao Group Co. Ltd. - A - 342,639 CNY 3,093,244 3,490,225 0.40
Yunnan Chihong Zinc & Germanium Co. Ltd. - A - 672,883 CNY 1,150,183 1,260,129 0.14
Yunnan Copper Industry Co. Ltd. - A - 421,200 CNY 637,122 970,197 0.11
Yunnan Tin Co. Ltd. - A - 534,753 CNY 1,415,882 1,500,879 0.17
Zhangzhou Pientzehuang Pharmaceutical Co. Ltd. - A - 55,000 CNY 778,285 777,869 0.09
Zhe Jiang Daily Media Group Co. Ltd. - A - 366,400 CNY 1,020,867 1,075,057 0.12
Zhejiang China Commodities City Group Co. Ltd. - A - 928,800 CNY 927,282 1,901,197 0.22
Zhejiang Dahua Technology Co. Ltd. - A - 438,527 CNY 1,922,473 1,552,652 0.18
Zhejiang Hisun Pharmaceutical Co. Ltd. - A - 309,662 CNY 783,453 843,148 0.10
Zhejiang Huace Film & TV Co. Ltd. - A- 181,000 CNY 859,802 732,233 0.08
Zhejiang Longsheng Group Co. Ltd. - A - 759,191 CNY 1,829,958 2,410,014 0.27
Zhejiang NHU Co. Ltd. - A - 344,943 CNY 787,275 844,066 0.10
Zhejiang Yasha Decoration Co. Ltd. - A - 257,802 CNY 814,194 788,439 0.09
Zhejiang Zheneng Electric Power Co. Ltd. - A - 495,665 CNY 418,818 573,259 0.07
Zhengzhou Yutong Bus Co. Ltd. - A - 562,102 CNY 1,636,302 2,024,637 0.23
Zhongjin Gold Co. Ltd. - A - 954,100 CNY 1,293,203 1,634,413 0.19
Zijin Mining Group Co. Ltd. - A - 5,315,700 CNY 2,072,224 2,898,148 0.33
Zoomlion Heavy Industry Science and Technology Co.
Ltd. - A - 2,842,200 CNY 2,257,836 3,236,702 0.37
ZTE Corp. - A - 1,251,379 CNY 2,877,811 3,645,440 0.42
603,172,744 875,896,183 99.82
Total - Shares 603,172,744 875,896,183 99.82
Total Transferable securities and money market instruments admitted to an
official stock exchange listing 603,172,744 875,896,183 99.82
TOTAL INVESTMENT PORTFOLIO 603,172,744 875,896,183 99.82
331
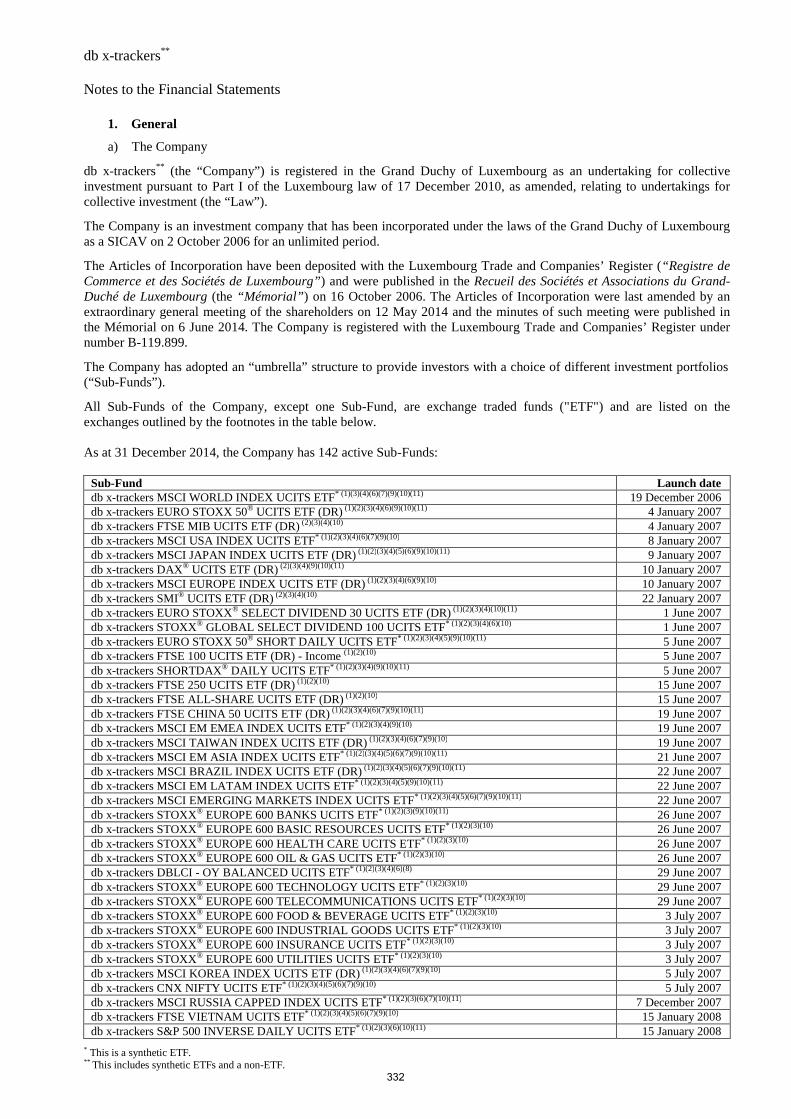
db x-trackers** Notes to the Financial Statements
* This is a synthetic ETF. ** This includes synthetic ETFs and a non-ETF.
1. General
a) The Company
db x-trackers** (the “Company”) is registered in the Grand Duchy of Luxembourg as an undertaking for collective investment pursuant to Part I of the Luxembourg law of 17 December 2010, as amended, relating to undertakings for collective investment (the “Law”).
The Company is an investment company that has been incorporated under the laws of the Grand Duchy of Luxembourg as a SICAV on 2 October 2006 for an unlimited period.
The Articles of Incorporation have been deposited with the Luxembourg Trade and Companies’ Register (“Registre de Commerce et des Sociétés de Luxembourg”) and were published in the Recueil des Sociétés et Associations du Grand-Duché de Luxembourg (the “Mémorial” ) on 16 October 2006. The Articles of Incorporation were last amended by an extraordinary general meeting of the shareholders on 12 May 2014 and the minutes of such meeting were published in the Mémorial on 6 June 2014. The Company is registered with the Luxembourg Trade and Companies’ Register under number B-119.899.
The Company has adopted an “umbrella” structure to provide investors with a choice of different investment portfolios (“Sub-Funds”).
All Sub-Funds of the Company, except one Sub-Fund, are exchange traded funds ("ETF") and are listed on the exchanges outlined by the footnotes in the table below. As at 31 December 2014, the Company has 142 active Sub-Funds:
Sub-Fund Launch date db x-trackers MSCI WORLD INDEX UCITS ETF* (1)(3)(4)(6)(7)(9)(10)(11) 19 December 2006 db x-trackers EURO STOXX 50® UCITS ETF (DR) (1)(2)(3)(4)(6)(9)(10)(11) 4 January 2007 db x-trackers FTSE MIB UCITS ETF (DR) (2)(3)(4)(10) 4 January 2007 db x-trackers MSCI USA INDEX UCITS ETF* (1)(2)(3)(4)(6)(7)(9)(10) 8 January 2007 db x-trackers MSCI JAPAN INDEX UCITS ETF (DR) (1)(2)(3)(4)(5)(6)(9)(10)(11) 9 January 2007 db x-trackers DAX® UCITS ETF (DR) (2)(3)(4)(9)(10)(11) 10 January 2007 db x-trackers MSCI EUROPE INDEX UCITS ETF (DR) (1)(2)(3)(4)(6)(9)(10) 10 January 2007 db x-trackers SMI® UCITS ETF (DR) (2)(3)(4)(10) 22 January 2007 db x-trackers EURO STOXX® SELECT DIVIDEND 30 UCITS ETF (DR) (1)(2)(3)(4)(10)(11) 1 June 2007 db x-trackers STOXX® GLOBAL SELECT DIVIDEND 100 UCITS ETF* (1)(2)(3)(4)(6)(10) 1 June 2007 db x-trackers EURO STOXX 50® SHORT DAILY UCITS ETF* (1)(2)(3)(4)(5)(9)(10)(11) 5 June 2007 db x-trackers FTSE 100 UCITS ETF (DR) - Income (1)(2)(10) 5 June 2007 db x-trackers SHORTDAX® DAILY UCITS ETF* (1)(2)(3)(4)(9)(10)(11) 5 June 2007 db x-trackers FTSE 250 UCITS ETF (DR) (1)(2)(10) 15 June 2007 db x-trackers FTSE ALL-SHARE UCITS ETF (DR) (1)(2)(10) 15 June 2007 db x-trackers FTSE CHINA 50 UCITS ETF (DR) (1)(2)(3)(4)(6)(7)(9)(10)(11) 19 June 2007 db x-trackers MSCI EM EMEA INDEX UCITS ETF* (1)(2)(3)(4)(9)(10) 19 June 2007 db x-trackers MSCI TAIWAN INDEX UCITS ETF (DR) (1)(2)(3)(4)(6)(7)(9)(10) 19 June 2007 db x-trackers MSCI EM ASIA INDEX UCITS ETF* (1)(2)(3)(4)(5)(6)(7)(9)(10)(11) 21 June 2007 db x-trackers MSCI BRAZIL INDEX UCITS ETF (DR) (1)(2)(3)(4)(5)(6)(7)(9)(10)(11) 22 June 2007 db x-trackers MSCI EM LATAM INDEX UCITS ETF* (1)(2)(3)(4)(5)(9)(10)(11) 22 June 2007 db x-trackers MSCI EMERGING MARKETS INDEX UCITS ETF* (1)(2)(3)(4)(5)(6)(7)(9)(10)(11) 22 June 2007 db x-trackers STOXX® EUROPE 600 BANKS UCITS ETF* (1)(2)(3)(9)(10)(11) 26 June 2007 db x-trackers STOXX® EUROPE 600 BASIC RESOURCES UCITS ETF* (1)(2)(3)(10) 26 June 2007 db x-trackers STOXX® EUROPE 600 HEALTH CARE UCITS ETF* (1)(2)(3)(10) 26 June 2007 db x-trackers STOXX® EUROPE 600 OIL & GAS UCITS ETF* (1)(2)(3)(10) 26 June 2007 db x-trackers DBLCI - OY BALANCED UCITS ETF* (1)(2)(3)(4)(6)(8) 29 June 2007 db x-trackers STOXX® EUROPE 600 TECHNOLOGY UCITS ETF* (1)(2)(3)(10) 29 June 2007 db x-trackers STOXX® EUROPE 600 TELECOMMUNICATIONS UCITS ETF* (1)(2)(3)(10) 29 June 2007 db x-trackers STOXX® EUROPE 600 FOOD & BEVERAGE UCITS ETF* (1)(2)(3)(10) 3 July 2007 db x-trackers STOXX® EUROPE 600 INDUSTRIAL GOODS UCITS ETF* (1)(2)(3)(10) 3 July 2007 db x-trackers STOXX® EUROPE 600 INSURANCE UCITS ETF* (1)(2)(3)(10) 3 July 2007 db x-trackers STOXX® EUROPE 600 UTILITIES UCITS ETF* (1)(2)(3)(10) 3 July 2007 db x-trackers MSCI KOREA INDEX UCITS ETF (DR) (1)(2)(3)(4)(6)(7)(9)(10) 5 July 2007 db x-trackers CNX NIFTY UCITS ETF* (1)(2)(3)(4)(5)(6)(7)(9)(10) 5 July 2007 db x-trackers MSCI RUSSIA CAPPED INDEX UCITS ETF* (1)(2)(3)(6)(7)(10)(11) 7 December 2007 db x-trackers FTSE VIETNAM UCITS ETF* (1)(2)(3)(4)(5)(6)(7)(9)(10) 15 January 2008 db x-trackers S&P 500 INVERSE DAILY UCITS ETF* (1)(2)(3)(6)(10)(11) 15 January 2008
332
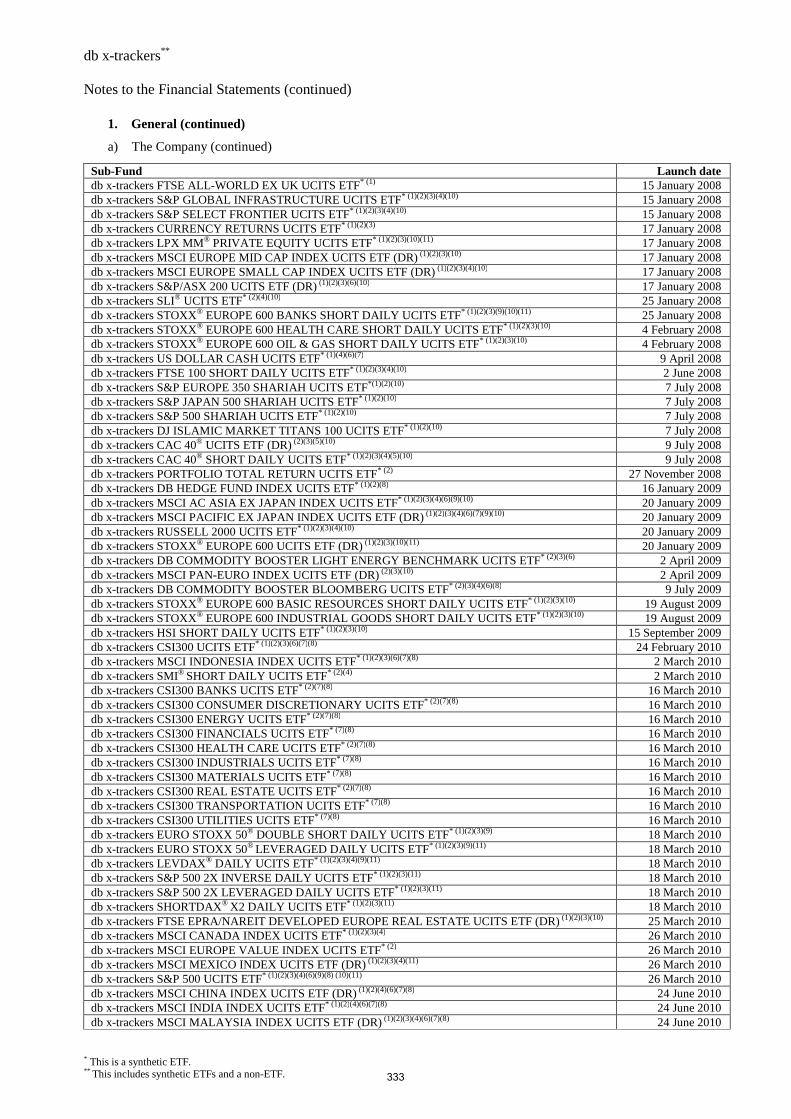
db x-trackers** Notes to the Financial Statements (continued)
* This is a synthetic ETF. ** This includes synthetic ETFs and a non-ETF.
1. General (continued)
a) The Company (continued)
Sub-Fund Launch date db x-trackers FTSE ALL-WORLD EX UK UCITS ETF* (1) 15 January 2008 db x-trackers S&P GLOBAL INFRASTRUCTURE UCITS ETF* (1)(2)(3)(4)(10) 15 January 2008 db x-trackers S&P SELECT FRONTIER UCITS ETF* (1)(2)(3)(4)(10) 15 January 2008 db x-trackers CURRENCY RETURNS UCITS ETF* (1)(2)(3) 17 January 2008 db x-trackers LPX MM® PRIVATE EQUITY UCITS ETF* (1)(2)(3)(10)(11) 17 January 2008 db x-trackers MSCI EUROPE MID CAP INDEX UCITS ETF (DR) (1)(2)(3)(10) 17 January 2008 db x-trackers MSCI EUROPE SMALL CAP INDEX UCITS ETF (DR) (1)(2)(3)(4)(10) 17 January 2008 db x-trackers S&P/ASX 200 UCITS ETF (DR) (1)(2)(3)(6)(10) 17 January 2008 db x-trackers SLI® UCITS ETF* (2)(4)(10) 25 January 2008 db x-trackers STOXX® EUROPE 600 BANKS SHORT DAILY UCITS ETF* (1)(2)(3)(9)(10)(11) 25 January 2008 db x-trackers STOXX® EUROPE 600 HEALTH CARE SHORT DAILY UCITS ETF* (1)(2)(3)(10) 4 February 2008 db x-trackers STOXX® EUROPE 600 OIL & GAS SHORT DAILY UCITS ETF* (1)(2)(3)(10) 4 February 2008 db x-trackers US DOLLAR CASH UCITS ETF* (1)(4)(6)(7) 9 April 2008 db x-trackers FTSE 100 SHORT DAILY UCITS ETF* (1)(2)(3)(4)(10) 2 June 2008 db x-trackers S&P EUROPE 350 SHARIAH UCITS ETF*(1)(2)(10) 7 July 2008 db x-trackers S&P JAPAN 500 SHARIAH UCITS ETF* (1)(2)(10) 7 July 2008 db x-trackers S&P 500 SHARIAH UCITS ETF* (1)(2)(10) 7 July 2008 db x-trackers DJ ISLAMIC MARKET TITANS 100 UCITS ETF* (1)(2)(10) 7 July 2008 db x-trackers CAC 40® UCITS ETF (DR) (2)(3)(5)(10) 9 July 2008 db x-trackers CAC 40® SHORT DAILY UCITS ETF* (1)(2)(3)(4)(5)(10) 9 July 2008 db x-trackers PORTFOLIO TOTAL RETURN UCITS ETF* (2) 27 November 2008 db x-trackers DB HEDGE FUND INDEX UCITS ETF* (1)(2)(8) 16 January 2009 db x-trackers MSCI AC ASIA EX JAPAN INDEX UCITS ETF* (1)(2)(3)(4)(6)(9)(10) 20 January 2009 db x-trackers MSCI PACIFIC EX JAPAN INDEX UCITS ETF (DR) (1)(2)(3)(4)(6)(7)(9)(10) 20 January 2009 db x-trackers RUSSELL 2000 UCITS ETF* (1)(2)(3)(4)(10) 20 January 2009 db x-trackers STOXX® EUROPE 600 UCITS ETF (DR) (1)(2)(3)(10)(11) 20 January 2009 db x-trackers DB COMMODITY BOOSTER LIGHT ENERGY BENCHMARK UCITS ETF* (2)(3)(6) 2 April 2009 db x-trackers MSCI PAN-EURO INDEX UCITS ETF (DR) (2)(3)(10) 2 April 2009 db x-trackers DB COMMODITY BOOSTER BLOOMBERG UCITS ETF* (2)(3)(4)(6)(8) 9 July 2009 db x-trackers STOXX® EUROPE 600 BASIC RESOURCES SHORT DAILY UCITS ETF* (1)(2)(3)(10) 19 August 2009 db x-trackers STOXX® EUROPE 600 INDUSTRIAL GOODS SHORT DAILY UCITS ETF* (1)(2)(3)(10) 19 August 2009 db x-trackers HSI SHORT DAILY UCITS ETF* (1)(2)(3)(10) 15 September 2009 db x-trackers CSI300 UCITS ETF* (1)(2)(3)(6)(7)(8) 24 February 2010 db x-trackers MSCI INDONESIA INDEX UCITS ETF* (1)(2)(3)(6)(7)(8) 2 March 2010 db x-trackers SMI® SHORT DAILY UCITS ETF* (2)(4) 2 March 2010 db x-trackers CSI300 BANKS UCITS ETF* (2)(7)(8) 16 March 2010 db x-trackers CSI300 CONSUMER DISCRETIONARY UCITS ETF* (2)(7)(8) 16 March 2010 db x-trackers CSI300 ENERGY UCITS ETF* (2)(7)(8) 16 March 2010 db x-trackers CSI300 FINANCIALS UCITS ETF* (7)(8) 16 March 2010 db x-trackers CSI300 HEALTH CARE UCITS ETF* (2)(7)(8) 16 March 2010 db x-trackers CSI300 INDUSTRIALS UCITS ETF* (7)(8) 16 March 2010 db x-trackers CSI300 MATERIALS UCITS ETF* (7)(8) 16 March 2010 db x-trackers CSI300 REAL ESTATE UCITS ETF* (2)(7)(8) 16 March 2010 db x-trackers CSI300 TRANSPORTATION UCITS ETF* (7)(8) 16 March 2010 db x-trackers CSI300 UTILITIES UCITS ETF* (7)(8) 16 March 2010 db x-trackers EURO STOXX 50® DOUBLE SHORT DAILY UCITS ETF* (1)(2)(3)(9) 18 March 2010 db x-trackers EURO STOXX 50® LEVERAGED DAILY UCITS ETF* (1)(2)(3)(9)(11) 18 March 2010 db x-trackers LEVDAX® DAILY UCITS ETF* (1)(2)(3)(4)(9)(11) 18 March 2010 db x-trackers S&P 500 2X INVERSE DAILY UCITS ETF* (1)(2)(3)(11) 18 March 2010 db x-trackers S&P 500 2X LEVERAGED DAILY UCITS ETF* (1)(2)(3)(11) 18 March 2010 db x-trackers SHORTDAX® X2 DAILY UCITS ETF* (1)(2)(3)(11) 18 March 2010 db x-trackers FTSE EPRA/NAREIT DEVELOPED EUROPE REAL ESTATE UCITS ETF (DR) (1)(2)(3)(10) 25 March 2010 db x-trackers MSCI CANADA INDEX UCITS ETF* (1)(2)(3)(4) 26 March 2010 db x-trackers MSCI EUROPE VALUE INDEX UCITS ETF* (2) 26 March 2010 db x-trackers MSCI MEXICO INDEX UCITS ETF (DR) (1)(2)(3)(4)(11) 26 March 2010 db x-trackers S&P 500 UCITS ETF* (1)(2)(3)(4)(6)(9)(8) (10)(11) 26 March 2010 db x-trackers MSCI CHINA INDEX UCITS ETF (DR) (1)(2)(4)(6)(7)(8) 24 June 2010 db x-trackers MSCI INDIA INDEX UCITS ETF* (1)(2)(4)(6)(7)(8) 24 June 2010 db x-trackers MSCI MALAYSIA INDEX UCITS ETF (DR) (1)(2)(3)(4)(6)(7)(8) 24 June 2010
333
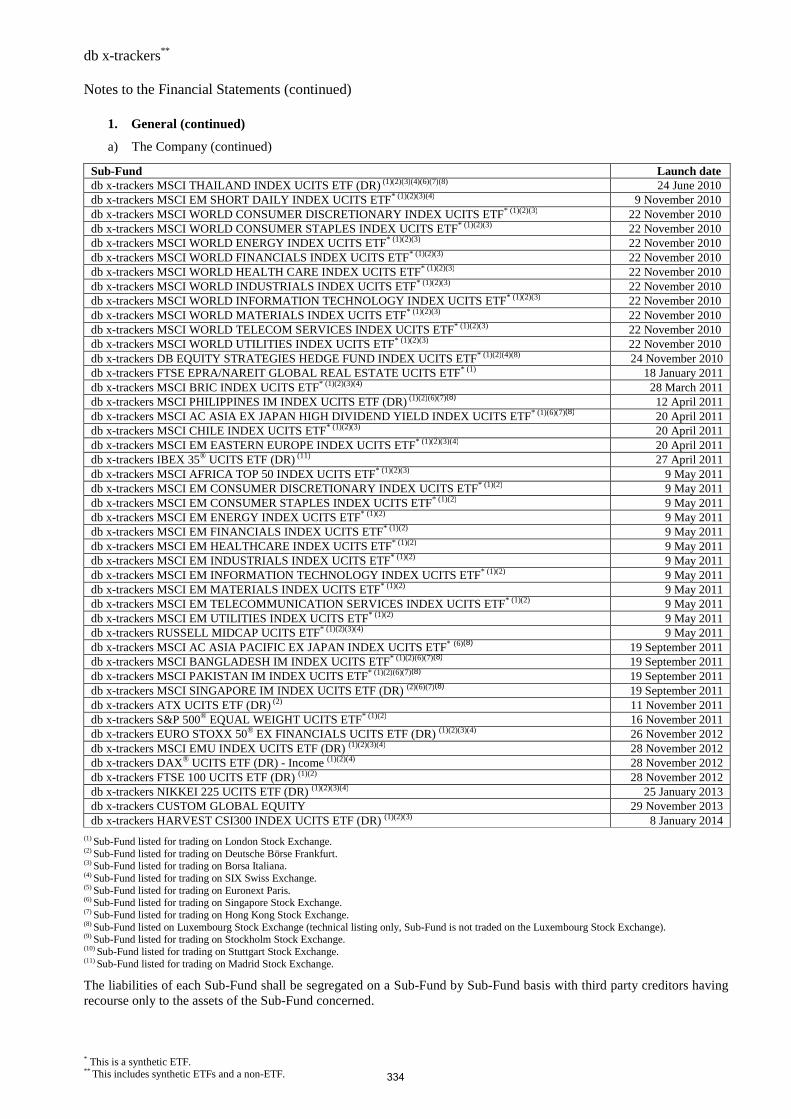
db x-trackers** Notes to the Financial Statements (continued)
* This is a synthetic ETF. ** This includes synthetic ETFs and a non-ETF.
1. General (continued)
a) The Company (continued)
Sub-Fund Launch date db x-trackers MSCI THAILAND INDEX UCITS ETF (DR) (1)(2)(3)(4)(6)(7)(8) 24 June 2010 db x-trackers MSCI EM SHORT DAILY INDEX UCITS ETF* (1)(2)(3)(4) 9 November 2010 db x-trackers MSCI WORLD CONSUMER DISCRETIONARY INDEX UCITS ETF* (1)(2)(3) 22 November 2010 db x-trackers MSCI WORLD CONSUMER STAPLES INDEX UCITS ETF* (1)(2)(3) 22 November 2010 db x-trackers MSCI WORLD ENERGY INDEX UCITS ETF* (1)(2)(3) 22 November 2010 db x-trackers MSCI WORLD FINANCIALS INDEX UCITS ETF* (1)(2)(3) 22 November 2010 db x-trackers MSCI WORLD HEALTH CARE INDEX UCITS ETF* (1)(2)(3) 22 November 2010 db x-trackers MSCI WORLD INDUSTRIALS INDEX UCITS ETF* (1)(2)(3) 22 November 2010 db x-trackers MSCI WORLD INFORMATION TECHNOLOGY INDEX UCITS ETF* (1)(2)(3) 22 November 2010 db x-trackers MSCI WORLD MATERIALS INDEX UCITS ETF* (1)(2)(3) 22 November 2010 db x-trackers MSCI WORLD TELECOM SERVICES INDEX UCITS ETF* (1)(2)(3) 22 November 2010 db x-trackers MSCI WORLD UTILITIES INDEX UCITS ETF* (1)(2)(3) 22 November 2010 db x-trackers DB EQUITY STRATEGIES HEDGE FUND INDEX UCITS ETF* (1)(2)(4)(8) 24 November 2010 db x-trackers FTSE EPRA/NAREIT GLOBAL REAL ESTATE UCITS ETF* (1) 18 January 2011 db x-trackers MSCI BRIC INDEX UCITS ETF* (1)(2)(3)(4) 28 March 2011 db x-trackers MSCI PHILIPPINES IM INDEX UCITS ETF (DR) (1)(2)(6)(7)(8) 12 April 2011 db x-trackers MSCI AC ASIA EX JAPAN HIGH DIVIDEND YIELD INDEX UCITS ETF* (1)(6)(7)(8) 20 April 2011 db x-trackers MSCI CHILE INDEX UCITS ETF* (1)(2)(3) 20 April 2011 db x-trackers MSCI EM EASTERN EUROPE INDEX UCITS ETF* (1)(2)(3)(4) 20 April 2011 db x-trackers IBEX 35® UCITS ETF (DR) (11) 27 April 2011 db x-trackers MSCI AFRICA TOP 50 INDEX UCITS ETF* (1)(2)(3) 9 May 2011 db x-trackers MSCI EM CONSUMER DISCRETIONARY INDEX UCITS ETF* (1)(2) 9 May 2011 db x-trackers MSCI EM CONSUMER STAPLES INDEX UCITS ETF* (1)(2) 9 May 2011 db x-trackers MSCI EM ENERGY INDEX UCITS ETF* (1)(2) 9 May 2011 db x-trackers MSCI EM FINANCIALS INDEX UCITS ETF* (1)(2) 9 May 2011 db x-trackers MSCI EM HEALTHCARE INDEX UCITS ETF* (1)(2) 9 May 2011 db x-trackers MSCI EM INDUSTRIALS INDEX UCITS ETF* (1)(2) 9 May 2011 db x-trackers MSCI EM INFORMATION TECHNOLOGY INDEX UCITS ETF* (1)(2) 9 May 2011 db x-trackers MSCI EM MATERIALS INDEX UCITS ETF* (1)(2) 9 May 2011 db x-trackers MSCI EM TELECOMMUNICATION SERVICES INDEX UCITS ETF* (1)(2) 9 May 2011 db x-trackers MSCI EM UTILITIES INDEX UCITS ETF* (1)(2) 9 May 2011 db x-trackers RUSSELL MIDCAP UCITS ETF* (1)(2)(3)(4) 9 May 2011 db x-trackers MSCI AC ASIA PACIFIC EX JAPAN INDEX UCITS ETF* (6)(8) 19 September 2011 db x-trackers MSCI BANGLADESH IM INDEX UCITS ETF* (1)(2)(6)(7)(8) 19 September 2011 db x-trackers MSCI PAKISTAN IM INDEX UCITS ETF* (1)(2)(6)(7)(8) 19 September 2011 db x-trackers MSCI SINGAPORE IM INDEX UCITS ETF (DR) (2)(6)(7)(8) 19 September 2011 db x-trackers ATX UCITS ETF (DR) (2) 11 November 2011 db x-trackers S&P 500® EQUAL WEIGHT UCITS ETF* (1)(2) 16 November 2011 db x-trackers EURO STOXX 50® EX FINANCIALS UCITS ETF (DR) (1)(2)(3)(4) 26 November 2012 db x-trackers MSCI EMU INDEX UCITS ETF (DR) (1)(2)(3)(4) 28 November 2012 db x-trackers DAX® UCITS ETF (DR) - Income (1)(2)(4) 28 November 2012 db x-trackers FTSE 100 UCITS ETF (DR) (1)(2) 28 November 2012 db x-trackers NIKKEI 225 UCITS ETF (DR) (1)(2)(3)(4) 25 January 2013 db x-trackers CUSTOM GLOBAL EQUITY 29 November 2013 db x-trackers HARVEST CSI300 INDEX UCITS ETF (DR) (1)(2)(3) 8 January 2014
(1) Sub-Fund listed for trading on London Stock Exchange. (2) Sub-Fund listed for trading on Deutsche Börse Frankfurt. (3) Sub-Fund listed for trading on Borsa Italiana. (4) Sub-Fund listed for trading on SIX Swiss Exchange. (5) Sub-Fund listed for trading on Euronext Paris. (6) Sub-Fund listed for trading on Singapore Stock Exchange. (7) Sub-Fund listed for trading on Hong Kong Stock Exchange. (8) Sub-Fund listed on Luxembourg Stock Exchange (technical listing only, Sub-Fund is not traded on the Luxembourg Stock Exchange). (9) Sub-Fund listed for trading on Stockholm Stock Exchange. (10) Sub-Fund listed for trading on Stuttgart Stock Exchange. (11) Sub-Fund listed for trading on Madrid Stock Exchange.
The liabilities of each Sub-Fund shall be segregated on a Sub-Fund by Sub-Fund basis with third party creditors having recourse only to the assets of the Sub-Fund concerned.
334
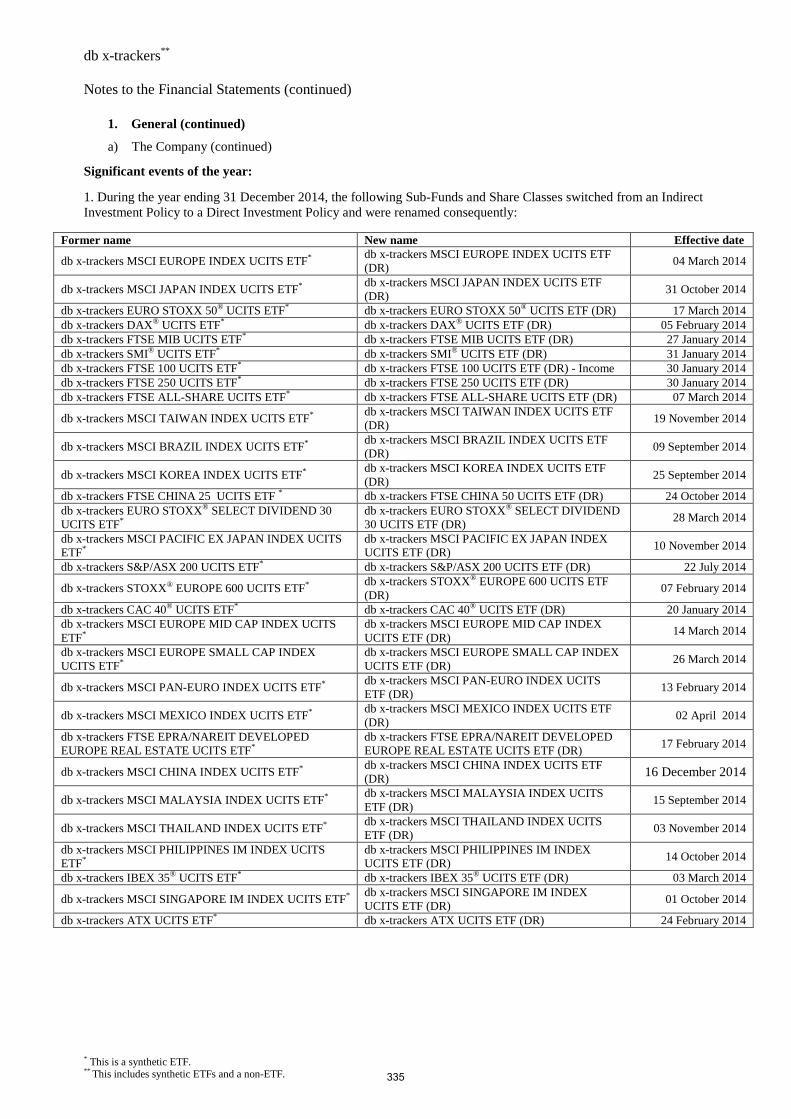
db x-trackers** Notes to the Financial Statements (continued)
* This is a synthetic ETF. ** This includes synthetic ETFs and a non-ETF.
1. General (continued)
a) The Company (continued)
Significant events of the year:
1. During the year ending 31 December 2014, the following Sub-Funds and Share Classes switched from an Indirect Investment Policy to a Direct Investment Policy and were renamed consequently:
Former name New name Effective date
db x-trackers MSCI EUROPE INDEX UCITS ETF* db x-trackers MSCI EUROPE INDEX UCITS ETF (DR)
04 March 2014
db x-trackers MSCI JAPAN INDEX UCITS ETF* db x-trackers MSCI JAPAN INDEX UCITS ETF (DR)
31 October 2014
db x-trackers EURO STOXX 50® UCITS ETF* db x-trackers EURO STOXX 50® UCITS ETF (DR) 17 March 2014 db x-trackers DAX® UCITS ETF* db x-trackers DAX® UCITS ETF (DR) 05 February 2014 db x-trackers FTSE MIB UCITS ETF* db x-trackers FTSE MIB UCITS ETF (DR) 27 January 2014 db x-trackers SMI® UCITS ETF* db x-trackers SMI® UCITS ETF (DR) 31 January 2014 db x-trackers FTSE 100 UCITS ETF* db x-trackers FTSE 100 UCITS ETF (DR) - Income 30 January 2014 db x-trackers FTSE 250 UCITS ETF* db x-trackers FTSE 250 UCITS ETF (DR) 30 January 2014 db x-trackers FTSE ALL-SHARE UCITS ETF* db x-trackers FTSE ALL-SHARE UCITS ETF (DR) 07 March 2014
db x-trackers MSCI TAIWAN INDEX UCITS ETF* db x-trackers MSCI TAIWAN INDEX UCITS ETF (DR)
19 November 2014
db x-trackers MSCI BRAZIL INDEX UCITS ETF* db x-trackers MSCI BRAZIL INDEX UCITS ETF (DR)
09 September 2014
db x-trackers MSCI KOREA INDEX UCITS ETF* db x-trackers MSCI KOREA INDEX UCITS ETF (DR)
25 September 2014
db x-trackers FTSE CHINA 25 UCITS ETF * db x-trackers FTSE CHINA 50 UCITS ETF (DR) 24 October 2014 db x-trackers EURO STOXX® SELECT DIVIDEND 30 UCITS ETF*
db x-trackers EURO STOXX® SELECT DIVIDEND 30 UCITS ETF (DR)
28 March 2014
db x-trackers MSCI PACIFIC EX JAPAN INDEX UCITS ETF*
db x-trackers MSCI PACIFIC EX JAPAN INDEX UCITS ETF (DR)
10 November 2014
db x-trackers S&P/ASX 200 UCITS ETF* db x-trackers S&P/ASX 200 UCITS ETF (DR) 22 July 2014
db x-trackers STOXX® EUROPE 600 UCITS ETF* db x-trackers STOXX® EUROPE 600 UCITS ETF (DR)
07 February 2014
db x-trackers CAC 40® UCITS ETF* db x-trackers CAC 40® UCITS ETF (DR) 20 January 2014 db x-trackers MSCI EUROPE MID CAP INDEX UCITS ETF*
db x-trackers MSCI EUROPE MID CAP INDEX UCITS ETF (DR)
14 March 2014
db x-trackers MSCI EUROPE SMALL CAP INDEX UCITS ETF*
db x-trackers MSCI EUROPE SMALL CAP INDEX UCITS ETF (DR)
26 March 2014
db x-trackers MSCI PAN-EURO INDEX UCITS ETF* db x-trackers MSCI PAN-EURO INDEX UCITS ETF (DR)
13 February 2014
db x-trackers MSCI MEXICO INDEX UCITS ETF* db x-trackers MSCI MEXICO INDEX UCITS ETF (DR)
02 April 2014
db x-trackers FTSE EPRA/NAREIT DEVELOPED EUROPE REAL ESTATE UCITS ETF*
db x-trackers FTSE EPRA/NAREIT DEVELOPED EUROPE REAL ESTATE UCITS ETF (DR)
17 February 2014
db x-trackers MSCI CHINA INDEX UCITS ETF* db x-trackers MSCI CHINA INDEX UCITS ETF (DR) 16 December 2014
db x-trackers MSCI MALAYSIA INDEX UCITS ETF* db x-trackers MSCI MALAYSIA INDEX UCITS ETF (DR)
15 September 2014
db x-trackers MSCI THAILAND INDEX UCITS ETF* db x-trackers MSCI THAILAND INDEX UCITS ETF (DR)
03 November 2014
db x-trackers MSCI PHILIPPINES IM INDEX UCITS ETF*
db x-trackers MSCI PHILIPPINES IM INDEX UCITS ETF (DR)
14 October 2014
db x-trackers IBEX 35® UCITS ETF* db x-trackers IBEX 35® UCITS ETF (DR) 03 March 2014
db x-trackers MSCI SINGAPORE IM INDEX UCITS ETF* db x-trackers MSCI SINGAPORE IM INDEX UCITS ETF (DR)
01 October 2014
db x-trackers ATX UCITS ETF* db x-trackers ATX UCITS ETF (DR) 24 February 2014
335
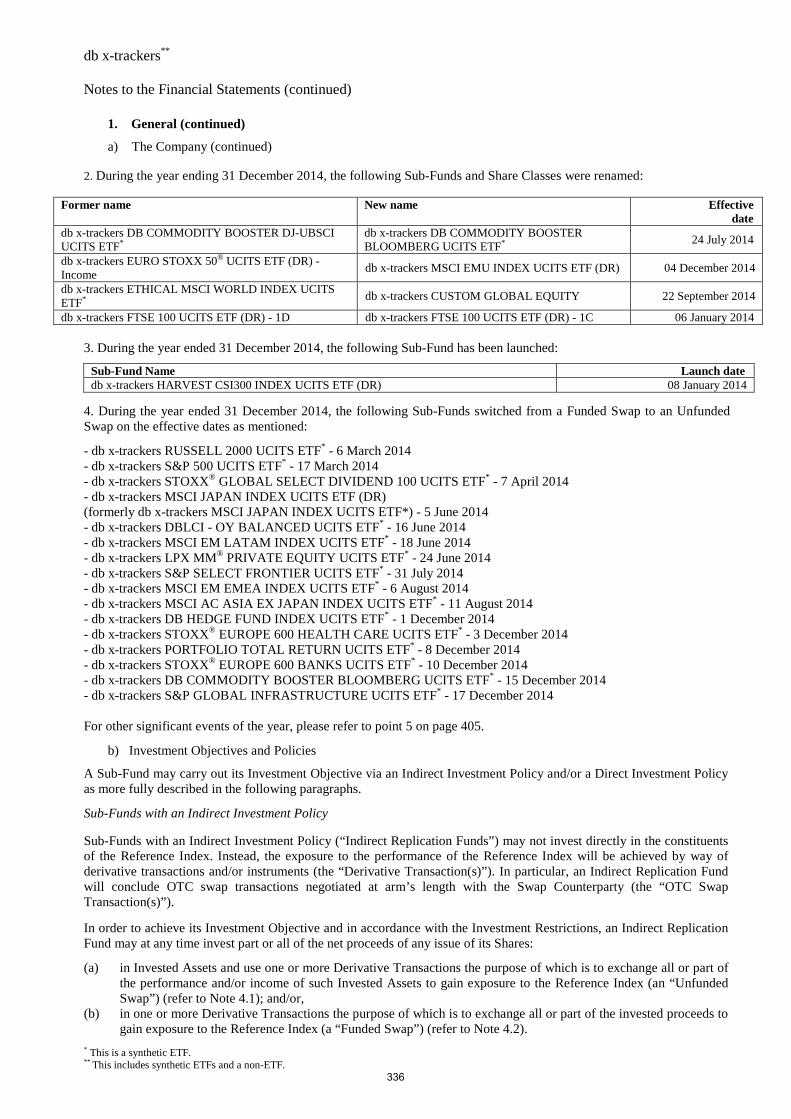
db x-trackers** Notes to the Financial Statements (continued)
* This is a synthetic ETF. ** This includes synthetic ETFs and a non-ETF.
1. General (continued)
a) The Company (continued) 2. During the year ending 31 December 2014, the following Sub-Funds and Share Classes were renamed:
Former name New name Effective date
db x-trackers DB COMMODITY BOOSTER DJ-UBSCI UCITS ETF*
db x-trackers DB COMMODITY BOOSTER BLOOMBERG UCITS ETF*
24 July 2014
db x-trackers EURO STOXX 50® UCITS ETF (DR) - Income
db x-trackers MSCI EMU INDEX UCITS ETF (DR) 04 December 2014
db x-trackers ETHICAL MSCI WORLD INDEX UCITS ETF* db x-trackers CUSTOM GLOBAL EQUITY 22 September 2014
db x-trackers FTSE 100 UCITS ETF (DR) - 1D db x-trackers FTSE 100 UCITS ETF (DR) - 1C 06 January 2014 3. During the year ended 31 December 2014, the following Sub-Fund has been launched:
Sub-Fund Name Launch date db x-trackers HARVEST CSI300 INDEX UCITS ETF (DR) 08 January 2014
4. During the year ended 31 December 2014, the following Sub-Funds switched from a Funded Swap to an Unfunded Swap on the effective dates as mentioned:
- db x-trackers RUSSELL 2000 UCITS ETF* - 6 March 2014 - db x-trackers S&P 500 UCITS ETF* - 17 March 2014 - db x-trackers STOXX® GLOBAL SELECT DIVIDEND 100 UCITS ETF* - 7 April 2014 - db x-trackers MSCI JAPAN INDEX UCITS ETF (DR) (formerly db x-trackers MSCI JAPAN INDEX UCITS ETF*) - 5 June 2014 - db x-trackers DBLCI - OY BALANCED UCITS ETF* - 16 June 2014 - db x-trackers MSCI EM LATAM INDEX UCITS ETF* - 18 June 2014 - db x-trackers LPX MM® PRIVATE EQUITY UCITS ETF* - 24 June 2014 - db x-trackers S&P SELECT FRONTIER UCITS ETF* - 31 July 2014 - db x-trackers MSCI EM EMEA INDEX UCITS ETF* - 6 August 2014 - db x-trackers MSCI AC ASIA EX JAPAN INDEX UCITS ETF* - 11 August 2014 - db x-trackers DB HEDGE FUND INDEX UCITS ETF* - 1 December 2014 - db x-trackers STOXX® EUROPE 600 HEALTH CARE UCITS ETF* - 3 December 2014 - db x-trackers PORTFOLIO TOTAL RETURN UCITS ETF* - 8 December 2014 - db x-trackers STOXX® EUROPE 600 BANKS UCITS ETF* - 10 December 2014
- db x-trackers DB COMMODITY BOOSTER BLOOMBERG UCITS ETF* - 15 December 2014 - db x-trackers S&P GLOBAL INFRASTRUCTURE UCITS ETF* - 17 December 2014 For other significant events of the year, please refer to point 5 on page 405.
b) Investment Objectives and Policies
A Sub-Fund may carry out its Investment Objective via an Indirect Investment Policy and/or a Direct Investment Policy as more fully described in the following paragraphs.
Sub-Funds with an Indirect Investment Policy Sub-Funds with an Indirect Investment Policy (“Indirect Replication Funds”) may not invest directly in the constituents of the Reference Index. Instead, the exposure to the performance of the Reference Index will be achieved by way of derivative transactions and/or instruments (the “Derivative Transaction(s)”). In particular, an Indirect Replication Fund will conclude OTC swap transactions negotiated at arm’s length with the Swap Counterparty (the “OTC Swap Transaction(s)”).
In order to achieve its Investment Objective and in accordance with the Investment Restrictions, an Indirect Replication Fund may at any time invest part or all of the net proceeds of any issue of its Shares:
(a) in Invested Assets and use one or more Derivative Transactions the purpose of which is to exchange all or part of the performance and/or income of such Invested Assets to gain exposure to the Reference Index (an “Unfunded Swap”) (refer to Note 4.1); and/or,
(b) in one or more Derivative Transactions the purpose of which is to exchange all or part of the invested proceeds to gain exposure to the Reference Index (a “Funded Swap”) (refer to Note 4.2).
336
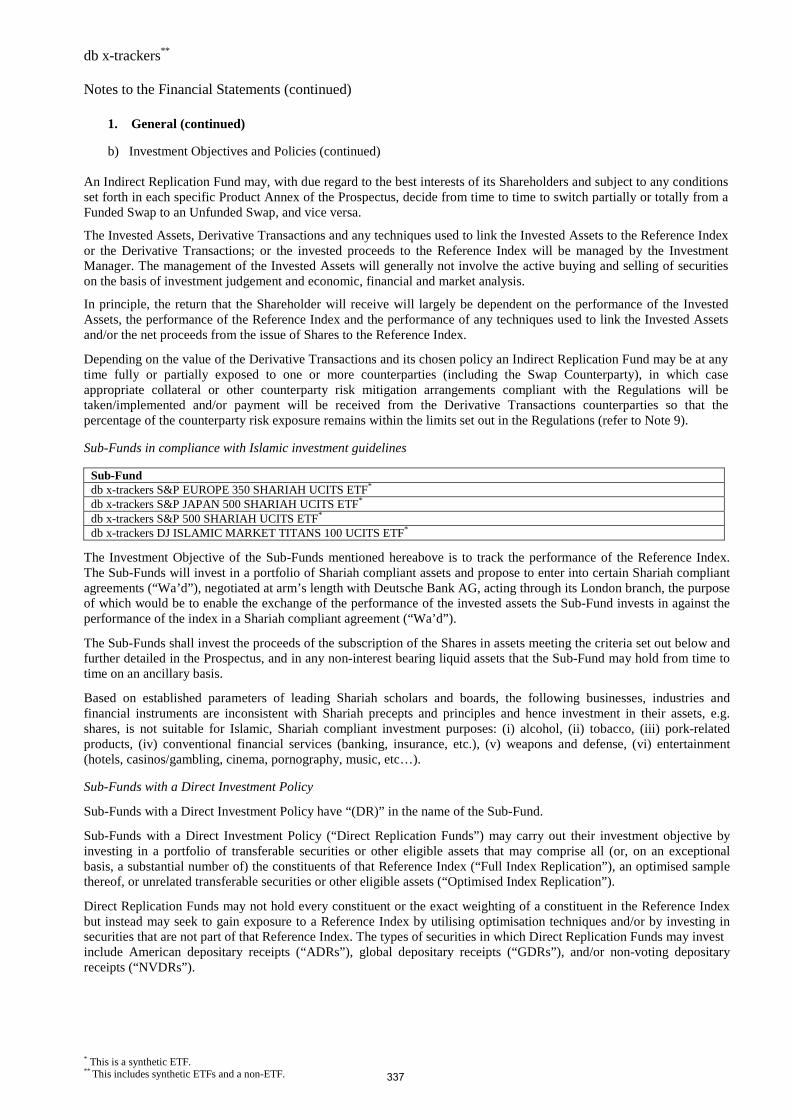
db x-trackers** Notes to the Financial Statements (continued)
* This is a synthetic ETF. ** This includes synthetic ETFs and a non-ETF.
1. General (continued)
b) Investment Objectives and Policies (continued) An Indirect Replication Fund may, with due regard to the best interests of its Shareholders and subject to any conditions set forth in each specific Product Annex of the Prospectus, decide from time to time to switch partially or totally from a Funded Swap to an Unfunded Swap, and vice versa.
The Invested Assets, Derivative Transactions and any techniques used to link the Invested Assets to the Reference Index or the Derivative Transactions; or the invested proceeds to the Reference Index will be managed by the Investment Manager. The management of the Invested Assets will generally not involve the active buying and selling of securities on the basis of investment judgement and economic, financial and market analysis.
In principle, the return that the Shareholder will receive will largely be dependent on the performance of the Invested Assets, the performance of the Reference Index and the performance of any techniques used to link the Invested Assets and/or the net proceeds from the issue of Shares to the Reference Index.
Depending on the value of the Derivative Transactions and its chosen policy an Indirect Replication Fund may be at any time fully or partially exposed to one or more counterparties (including the Swap Counterparty), in which case appropriate collateral or other counterparty risk mitigation arrangements compliant with the Regulations will be taken/implemented and/or payment will be received from the Derivative Transactions counterparties so that the percentage of the counterparty risk exposure remains within the limits set out in the Regulations (refer to Note 9). Sub-Funds in compliance with Islamic investment guidelines
Sub-Fund db x-trackers S&P EUROPE 350 SHARIAH UCITS ETF* db x-trackers S&P JAPAN 500 SHARIAH UCITS ETF* db x-trackers S&P 500 SHARIAH UCITS ETF* db x-trackers DJ ISLAMIC MARKET TITANS 100 UCITS ETF*
The Investment Objective of the Sub-Funds mentioned hereabove is to track the performance of the Reference Index. The Sub-Funds will invest in a portfolio of Shariah compliant assets and propose to enter into certain Shariah compliant agreements (“Wa’d”), negotiated at arm’s length with Deutsche Bank AG, acting through its London branch, the purpose of which would be to enable the exchange of the performance of the invested assets the Sub-Fund invests in against the performance of the index in a Shariah compliant agreement (“Wa’d”).
The Sub-Funds shall invest the proceeds of the subscription of the Shares in assets meeting the criteria set out below and further detailed in the Prospectus, and in any non-interest bearing liquid assets that the Sub-Fund may hold from time to time on an ancillary basis.
Based on established parameters of leading Shariah scholars and boards, the following businesses, industries and financial instruments are inconsistent with Shariah precepts and principles and hence investment in their assets, e.g. shares, is not suitable for Islamic, Shariah compliant investment purposes: (i) alcohol, (ii) tobacco, (iii) pork-related products, (iv) conventional financial services (banking, insurance, etc.), (v) weapons and defense, (vi) entertainment (hotels, casinos/gambling, cinema, pornography, music, etc…). Sub-Funds with a Direct Investment Policy
Sub-Funds with a Direct Investment Policy have “(DR)” in the name of the Sub-Fund.
Sub-Funds with a Direct Investment Policy (“Direct Replication Funds”) may carry out their investment objective by investing in a portfolio of transferable securities or other eligible assets that may comprise all (or, on an exceptional basis, a substantial number of) the constituents of that Reference Index (“Full Index Replication”), an optimised sample thereof, or unrelated transferable securities or other eligible assets (“Optimised Index Replication”).
Direct Replication Funds may not hold every constituent or the exact weighting of a constituent in the Reference Index but instead may seek to gain exposure to a Reference Index by utilising optimisation techniques and/or by investing in securities that are not part of that Reference Index. The types of securities in which Direct Replication Funds may invest include American depositary receipts (“ADRs”), global depositary receipts (“GDRs”), and/or non-voting depositary receipts (“NVDRs”).
337
db x-trackers** Notes to the Financial Statements (continued)
* This is a synthetic ETF. ** This includes synthetic ETFs and a non-ETF.
1. General (continued)
b) Investment Objectives and Policies (continued)
The extent to which a Direct Replication Fund utilises optimisation techniques will partly depend on the nature of the constituents of its Reference Index. For example, a Direct Replication Fund may utilise optimisation techniques and may be able to provide a return similar to that of its Reference Index by investing in a sub-set of the constituents on its Reference Index. Use of these investment techniques, the implementation of which is subject to a number of constraints detailed in the “Investment Restrictions” section of the Prospectus, may not produce the intended results.
c) The Shares
The Shares will be issued by the Company exclusively in relation to Sub-Funds with the aforementioned Investment Policies and may be subscribed in cash or in kind (or a combination of both cash and in kind). The Shares may be differentiated between Distribution Shares (identified by the letter “D”) and Capitalisation Shares (identified by the letter “C”). Other Classes may be offered with specific features such as conversion or redemption charge, minimum subscription amount or other specific features. Within each Class of Shares, several types of sub-classes can be issued (identified by capital alphabetic letters), differentiating between (but not limited to) dividend payment structures, dividend payment dates, and fee structures. The Shares will be listed for trading on one or more stock exchanges.
2. Accounting policies The financial statements of the Company have been prepared according to accounting principles generally accepted in Luxembourg and applicable for investment funds. The significant accounting policies used are as follows:
a) Valuation of investments The Net Asset Value of the Company is at any time equal to the total of the Net Asset Values of the Sub-Funds in the base currency of the Company. The Net Asset Value of the Sub-Funds shall be determined in accordance with the following rules:
(i) the value of any cash on hand or on deposit, bills and demand notes and accounts receivable, prepaid expenses, cash dividends and interest declared or accrued and not yet received is deemed to be the full amount thereof, unless in any case the same is unlikely to be paid or received in full, in which case the value thereof shall be determined after making such discount as may be considered appropriate in such case to reflect the true value thereof;
(ii) the value of all securities which are listed or traded on an official stock exchange or traded on any other Regulated Market will be valued on the basis of the last available prices on the Business Day immediately preceding the Valuation Day or on the basis of the last available prices on the main market on which the investments of the Sub-Funds are principally traded. The Board of Directors will approve a pricing service which will supply the above prices. If, in the opinion of the Board of Directors, such prices do not truly reflect the fair market value of the relevant securities, the value of such securities will be determined in good faith by the Board of Directors either by reference to any other publicly available source or by reference to such other sources as it deems in its discretion appropriate;
(iii) securities not listed or traded on a stock exchange or a Regulated Market will be valued on the basis of the probable sales price determined prudently and in good faith by the Board of Directors;
(iv) the swap agreements are valued on the basis of total return swaps, which correspond to the net positive or negative value resulting from, on one hand, either the market appreciation/ depreciation of the portfolio of investments, including income earned on these investments or the net proceeds of any issue of Shares, and, on the other hand, of the market value of the index plus dividend distributions for those indices which are total return indices. The net positive or negative value is disclosed in the financial statements as “Unrealised gain on swap” or as “Unrealised loss on swap”;
338
db x-trackers** Notes to the Financial Statements (continued)
* This is a synthetic ETF. ** This includes synthetic ETFs and a non-ETF.
2. Accounting policies (continued) a) Valuation of investments (continued)
(v) the liquidating value of futures or forward contracts that are not traded on exchanges or on other organised markets shall be determined pursuant to the policies established by the Board of Directors, on a basis consistently applied. The liquidating value of futures or forward contracts traded on exchanges or on other organised markets shall be based upon the last available settlement prices of these contracts on exchanges and organised markets on which the particular futures or forward contracts are traded; provided that if a futures or forward contract could not be liquidated on such Business Day with respect to which a Net Asset Value is being determined, then the basis for determining the liquidating value of such contract shall be such value as the Board of Directors may deem fair and reasonable;
(vi) for Sub-Funds investing part or all of their net proceeds in swaps transactions, “Receivable due from swap counterparty” represents an advance to the counterparty of the swap agreement to finance the swap (at nominal value). Swap agreements are valued as described hereabove under (iv);
(vii) all other securities and other permissible assets as well as any of the above mentioned assets for which the valuation in accordance with the above sub-paragraphs would not be possible or practicable, or would not be representative of their fair value, will be valued at fair market value, as determined in good faith pursuant to procedures established by the Board of Directors;
(viii) the value of the Shariah compliant agreements (“Wa’d”) will correspond to the net positive or negative value resulting from, on one hand, the market appreciation/depreciation of the Invested Assets and, on the other hand, of the market value of the Shariah compliant index. The net positive or negative value is disclosed in the financial statements as “Unrealised gain on Wa’d” or as “Unrealised loss on Wa’d”.
b) Investment transactions
The net realised gain / (loss) on sale of investments is determined on the basis of the average cost of investments sold. Investment transactions are accounted for on a trade date basis. The net realised gain / (loss) on sale of investments is disclosed in the financial statements as “Net realised gain / (loss) on investments”.
c) Conversion of foreign currencies
Accounting records are kept for each Sub-Fund in its reference currency. The combined statement of net assets and statement of operations and changes in net assets of the Company are presented in Euro based on the exchange rate prevailing at the date of the Statement of Net Assets. Income and expenses in currencies other than the reference currency of a Sub-Fund are translated into the reference currency of the relevant Sub-Fund at the exchange rates prevailing at the transaction date. Assets and liabilities in currencies other than the reference currency of a Sub-Fund are translated into the reference currency of the relevant Sub-Fund at the exchange rates prevailing at the date of the Statement of Net Assets. The exchange rates used as at 31 December 2014 are: 1 Euro = 1.478646 AUD 1 Euro = 1.401541 CAD 1 Euro = 1.202366 CHF 1 Euro = 27.714990 CZK 1 Euro = 7.446346 DKK 1 Euro = 0.776046 GBP 1 Euro = 9.383758 HKD 1 Euro = 145.078968 JPY 1 Euro = 9.072412 NOK 1 Euro = 9.472575 SEK 1 Euro = 1.210050 USD
339
db x-trackers** Notes to the Financial Statements (continued)
* This is a synthetic ETF. ** This includes synthetic ETFs and a non-ETF.
2. Accounting policies (continued)
d) Income
Interest is recorded on an accrual basis. Dividends are accounted for on the ex-date, net of withholding tax. 3. Taxation of the Company
Under current law and practice, the Company is not liable to any Luxembourg income taxes, stamp or other tax. Investment income and capital gains, if any, received or realised by the Company may, however, be subject to taxation in the country of origin at varying rates, which normally cannot be recovered by the Company.
Although the Company is, in principle, subject in Luxembourg to a subscription tax (“Taxe d'Abonnement”) at an annual rate of 0.05% or 0.01% for the category of shares reserved to institutional investors, all Sub-Funds which are ETFs are exempt from such tax as (i) all their Shares are listed or traded on at least one stock exchange or another regulated market operating regularly, recognised and open to the public; and (ii) their exclusive objective is to reflect the performance of one or more indices, it being understood that this condition of exclusive objective does not prevent the management of liquid assets, if any, on an ancillary basis, or the use of techniques and instruments used for hedging or for purposes of efficient portfolio management. A Grand-Ducal regulation may determine additional or alternative criteria with respect to the indices under that exemption.
4. Swaps 4.1 Sub-Funds with investments in transferable securities or money market instruments The swap agreements are concluded at the beginning of the life of the Sub-Fund with the transferable securities and money market instruments having a similar cost to the notional value of the index. This position may however change during the life of the swap whereby the cost of the transferable securities and money market instruments may become higher / lower than the notional value of the index due to additional purchases / sales of transferable securities and money market instruments compared to the index notional. The difference between these notional values is accounted for and disclosed in the financial statements as “Receivable due from swap counterparty” or as “Payable due to swap counterparty” depending on which notional is higher. The receivable balances will be settled to the Sub-Fund and the payable balances will be settled to the swap counterparty on termination of the respective swap agreement. The table below lists the notional values of the paying and receiving legs of the swap and the unrealised gain / (loss) on swap per Sub-Fund.
Sub-Fund Underlying exposure Currency Notional Value -
Paying leg
Notional Value -
Receiving leg
Receivable / (Payable) due
from / (to) swap counterparty
Unrealised gain / (loss)
on swap
db x-trackers MSCI WORLD INDEX UCITS ETF*
MSCI TRN WORLD INDEX
USD 3,055,403,233 2,526,658,763 (528,744,470) (13,663,420)
db x-trackers MSCI EM LATAM INDEX UCITS ETF*
MSCI TRN EM LATIN AMERICA INDEX
USD 190,743,606 148,418,546 (42,325,060) 6,581,601
db x-trackers MSCI EM EMEA INDEX UCITS ETF*
MSCI TRN EM EMEA INDEX
USD 68,520,003 68,449,928 (70,075) (3,321,769)
db x-trackers STOXX® GLOBAL SELECT DIVIDEND 100 UCITS ETF*
STOXX® GLOBAL SELECT DIVIDEND 100 INDEX
EUR 522,645,562 505,895,201 (16,750,361) 6,639,729
db x-trackers STOXX® EUROPE 600 HEALTH CARE UCITS ETF*
STOXX® EUROPE 600 HEALTH CARE INDEX
EUR 278,162,908 192,520,148 (85,642,760) 2,661,385
db x-trackers STOXX® EUROPE 600 BANKS UCITS ETF*
STOXX® EUROPE 600 BANKS INDEX
EUR 158,141,255 141,705,721 (16,435,534) (1,841,290)
db x-trackers DBLCI - OY BALANCED UCITS ETF*
DBLCI-OY BALANCED INDEX
EUR 608,079,339 563,818,775 (44,260,564) (90,166,578)
db x-trackers RUSSELL 2000 UCITS ETF*
RUSSELL 2000® INDEX USD 390,943,976 387,561,866 (3,382,110) (5,963,423)
db x-trackers PORTFOLIO TOTAL RETURN UCITS ETF*
PORTFOLIO TOTAL RETURN INDEX
EUR 219,725,895 212,229,045 (7,496,850) 10,216,020
340
db x-trackers** Notes to the Financial Statements (continued)
* This is a synthetic ETF. ** This includes synthetic ETFs and a non-ETF.
4. Swaps (continued)
4.1 Sub-Funds with investments in transferable securities or money market instruments (continued)
Sub-Fund Underlying exposure Currency Notional Value -
Paying leg
Notional Value -
Receiving leg
Receivable / (Payable) due
from / (to) swap counterparty
Unrealised gain / (loss)
on swap
db x-trackers MSCI AC ASIA EX JAPAN INDEX UCITS ETF*
MSCI AC ASIA EX JAPAN TRN INDEX
USD 928,357,117 908,859,016 (19,498,101) (28,201,195)
db x-trackers LPX MM® PRIVATE EQUITY UCITS ETF*
LPX MM® INDEX EUR 135,846,035 141,479,853 5,633,818 (8,914,470)
db x-trackers S&P GLOBAL INFRASTRUCTURE UCITS ETF*
S&P GLOBAL INFRASTRUCTURE INDEX
USD 143,211,104 110,399,382 (32,811,722) (2,149,700)
db x-trackers CAC 40® SHORT DAILY UCITS ETF*
CAC 40® SHORT INDEX EUR 5,717,126 5,717,126 0 87,691
db x-trackers DB HEDGE FUND INDEX UCITS ETF*
DB HEDGE FUND INDEX
EUR 418,737,725 407,919,601 (10,818,124) (1,043,413)
db x-trackers S&P SELECT FRONTIER UCITS ETF*
S&P SELECT FRONTIER INDEX
USD 78,353,406 78,984,756 631,350 (1,902,952)
db x-trackers US DOLLAR CASH UCITS ETF*
FED FUNDS EFFECTIVE RATE TOTAL RETURN INDEX®
USD 36,147,599 29,898,058 (6,249,541) (523,908)
db x-trackers DB COMMODITY BOOSTER BLOOMBERG UCITS ETF*
DEUTSCHE BANK COMMODITY BOOSTER - BLOOMBERG INDEX
EUR 112,287,655 112,458,681 171,026 (13,786,474)
db x-trackers S&P 500 UCITS ETF*
S&P 500 INDEX USD 2,622,839,734 2,103,378,352 (519,461,382) 2,073,551
db x-trackers CUSTOM GLOBAL EQUITY
MSCI TRN WORLD INDEX
USD 209,848,516 186,906,355 (22,942,161) (5,711,505)
4.2 Sub-Funds investing all of their net proceeds in swaps transactions and fully collateralised The following Sub-Funds have invested all of their net proceeds in one or more swap transactions and exchange the invested proceeds against the performance of the Reference Index. The investment by the Sub-Funds of part or all their net proceeds in swap transactions is accounted for and disclosed in the financial statements as “Receivable due from swap counterparty”.
Sub-Fund Underlying exposure Currency Receivable due from swap
counterparty
Unrealised gain / (loss) on swap
db x-trackers MSCI USA INDEX UCITS ETF* MSCI TRN USA INDEX USD 1,609,902,488 (15,113,808)
db x-trackers MSCI EMERGING MARKETS INDEX UCITS ETF*
MSCI TRN EMERGING MARKETS INDEX
USD 2,529,637,806 13,903,139
db x-trackers MSCI EM ASIA INDEX UCITS ETF* MSCI TRN EM ASIA INDEX USD 715,869,161 7,957,638
db x-trackers CNX NIFTY UCITS ETF* CNX NIFTY INDEX USD 263,926,511 1,908,645
db x-trackers STOXX® EUROPE 600 BASIC RESOURCES UCITS ETF*
STOXX® EUROPE 600 BASIC RESOURCES INDEX
EUR 47,528,872 845,221
db x-trackers STOXX® EUROPE 600 OIL & GAS UCITS ETF*
STOXX® EUROPE 600 OIL & GAS INDEX
EUR 51,440,370 (767,669)
db x-trackers STOXX® EUROPE 600 TELECOMMUNICATIONS UCITS ETF*
STOXX® EUROPE 600 TELECOMMUNICATIONS INDEX
EUR 20,218,518 (254,888)
db x-trackers STOXX® EUROPE 600 TECHNOLOGY UCITS ETF*
STOXX® EUROPE 600 TECHNOLOGY INDEX
EUR 32,623,141 1,209,536
db x-trackers STOXX® EUROPE 600 UTILITIES UCITS ETF*
STOXX® EUROPE 600 UTILITIES INDEX
EUR 27,958,333 (263,033)
db x-trackers STOXX® EUROPE 600 INSURANCE UCITS ETF*
STOXX® EUROPE 600 INSURANCE INDEX
EUR 28,308,802 (284,978)
341
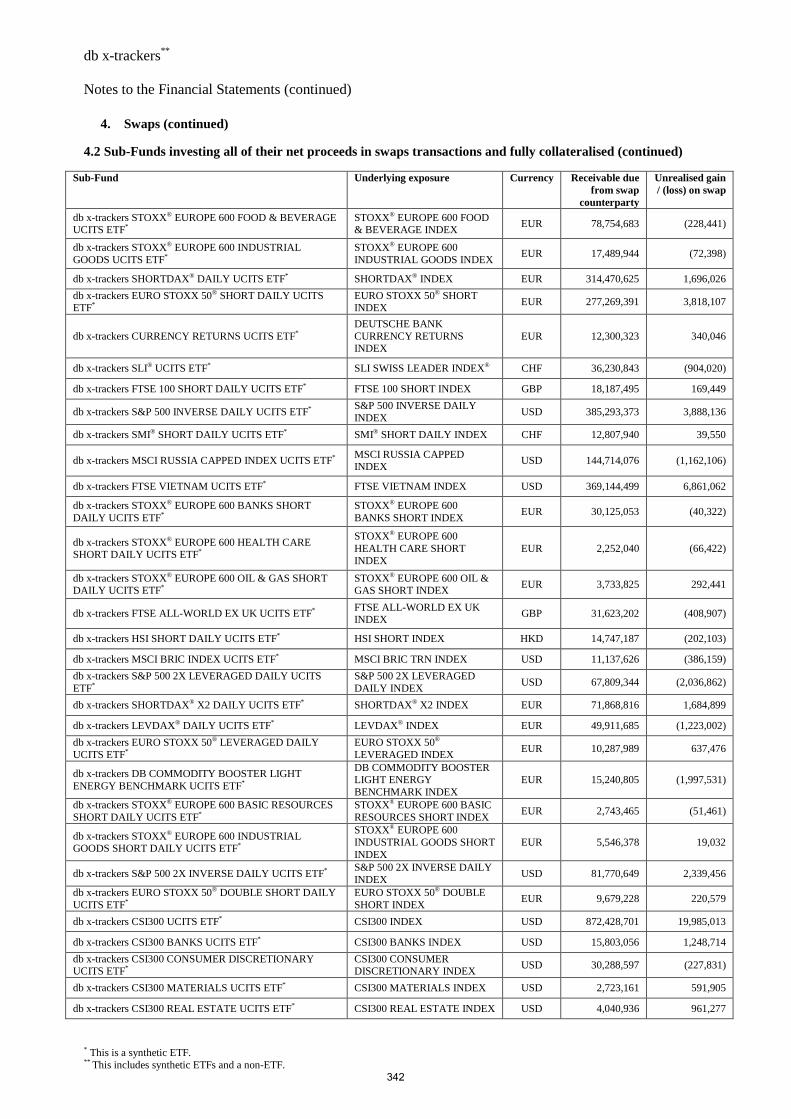
db x-trackers** Notes to the Financial Statements (continued)
* This is a synthetic ETF. ** This includes synthetic ETFs and a non-ETF.
4. Swaps (continued) 4.2 Sub-Funds investing all of their net proceeds in swaps transactions and fully collateralised (continued)
Sub-Fund Underlying exposure Currency Receivable due from swap
counterparty
Unrealised gain / (loss) on swap
db x-trackers STOXX® EUROPE 600 FOOD & BEVERAGE UCITS ETF*
STOXX® EUROPE 600 FOOD & BEVERAGE INDEX
EUR 78,754,683 (228,441)
db x-trackers STOXX® EUROPE 600 INDUSTRIAL GOODS UCITS ETF*
STOXX® EUROPE 600 INDUSTRIAL GOODS INDEX
EUR 17,489,944 (72,398)
db x-trackers SHORTDAX® DAILY UCITS ETF* SHORTDAX® INDEX EUR 314,470,625 1,696,026
db x-trackers EURO STOXX 50® SHORT DAILY UCITS ETF*
EURO STOXX 50® SHORT INDEX
EUR 277,269,391 3,818,107
db x-trackers CURRENCY RETURNS UCITS ETF* DEUTSCHE BANK CURRENCY RETURNS INDEX
EUR 12,300,323 340,046
db x-trackers SLI® UCITS ETF* SLI SWISS LEADER INDEX® CHF 36,230,843 (904,020)
db x-trackers FTSE 100 SHORT DAILY UCITS ETF* FTSE 100 SHORT INDEX GBP 18,187,495 169,449
db x-trackers S&P 500 INVERSE DAILY UCITS ETF* S&P 500 INVERSE DAILY INDEX
USD 385,293,373 3,888,136
db x-trackers SMI® SHORT DAILY UCITS ETF* SMI® SHORT DAILY INDEX CHF 12,807,940 39,550
db x-trackers MSCI RUSSIA CAPPED INDEX UCITS ETF* MSCI RUSSIA CAPPED INDEX
USD 144,714,076 (1,162,106)
db x-trackers FTSE VIETNAM UCITS ETF* FTSE VIETNAM INDEX USD 369,144,499 6,861,062
db x-trackers STOXX® EUROPE 600 BANKS SHORT DAILY UCITS ETF*
STOXX® EUROPE 600 BANKS SHORT INDEX
EUR 30,125,053 (40,322)
db x-trackers STOXX® EUROPE 600 HEALTH CARE SHORT DAILY UCITS ETF*
STOXX® EUROPE 600 HEALTH CARE SHORT INDEX
EUR 2,252,040 (66,422)
db x-trackers STOXX® EUROPE 600 OIL & GAS SHORT DAILY UCITS ETF*
STOXX® EUROPE 600 OIL & GAS SHORT INDEX
EUR 3,733,825 292,441
db x-trackers FTSE ALL-WORLD EX UK UCITS ETF* FTSE ALL-WORLD EX UK INDEX
GBP 31,623,202 (408,907)
db x-trackers HSI SHORT DAILY UCITS ETF* HSI SHORT INDEX HKD 14,747,187 (202,103)
db x-trackers MSCI BRIC INDEX UCITS ETF* MSCI BRIC TRN INDEX USD 11,137,626 (386,159)
db x-trackers S&P 500 2X LEVERAGED DAILY UCITS ETF*
S&P 500 2X LEVERAGED DAILY INDEX
USD 67,809,344 (2,036,862)
db x-trackers SHORTDAX® X2 DAILY UCITS ETF* SHORTDAX® X2 INDEX EUR 71,868,816 1,684,899
db x-trackers LEVDAX® DAILY UCITS ETF* LEVDAX® INDEX EUR 49,911,685 (1,223,002)
db x-trackers EURO STOXX 50® LEVERAGED DAILY UCITS ETF*
EURO STOXX 50® LEVERAGED INDEX
EUR 10,287,989 637,476
db x-trackers DB COMMODITY BOOSTER LIGHT ENERGY BENCHMARK UCITS ETF*
DB COMMODITY BOOSTER LIGHT ENERGY BENCHMARK INDEX
EUR 15,240,805 (1,997,531)
db x-trackers STOXX® EUROPE 600 BASIC RESOURCES SHORT DAILY UCITS ETF*
STOXX® EUROPE 600 BASIC RESOURCES SHORT INDEX
EUR 2,743,465 (51,461)
db x-trackers STOXX® EUROPE 600 INDUSTRIAL GOODS SHORT DAILY UCITS ETF*
STOXX® EUROPE 600 INDUSTRIAL GOODS SHORT INDEX
EUR 5,546,378 19,032
db x-trackers S&P 500 2X INVERSE DAILY UCITS ETF* S&P 500 2X INVERSE DAILY INDEX
USD 81,770,649 2,339,456
db x-trackers EURO STOXX 50® DOUBLE SHORT DAILY UCITS ETF*
EURO STOXX 50® DOUBLE SHORT INDEX
EUR 9,679,228 220,579
db x-trackers CSI300 UCITS ETF* CSI300 INDEX USD 872,428,701 19,985,013
db x-trackers CSI300 BANKS UCITS ETF* CSI300 BANKS INDEX USD 15,803,056 1,248,714
db x-trackers CSI300 CONSUMER DISCRETIONARY UCITS ETF*
CSI300 CONSUMER DISCRETIONARY INDEX
USD 30,288,597 (227,831)
db x-trackers CSI300 MATERIALS UCITS ETF* CSI300 MATERIALS INDEX USD 2,723,161 591,905
db x-trackers CSI300 REAL ESTATE UCITS ETF* CSI300 REAL ESTATE INDEX USD 4,040,936 961,277
342
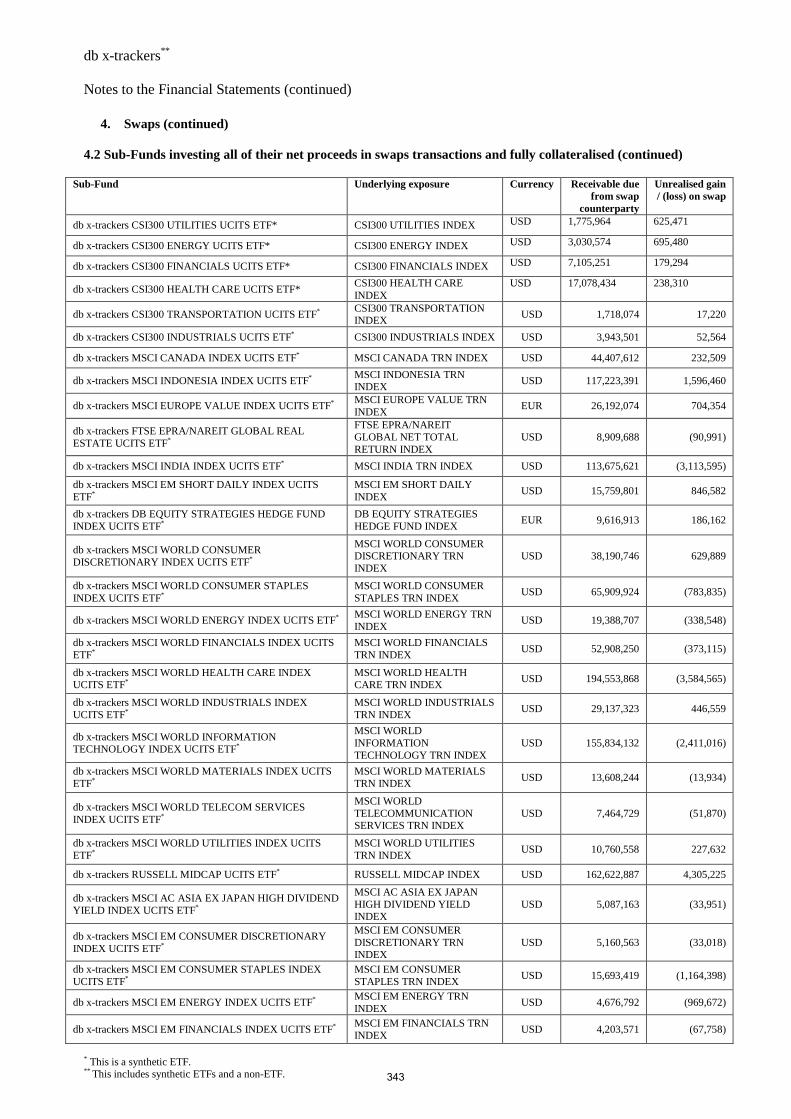
db x-trackers** Notes to the Financial Statements (continued)
* This is a synthetic ETF. ** This includes synthetic ETFs and a non-ETF.
4. Swaps (continued)
4.2 Sub-Funds investing all of their net proceeds in swaps transactions and fully collateralised (continued)
Sub-Fund Underlying exposure Currency Receivable due from swap
counterparty
Unrealised gain / (loss) on swap
db x-trackers CSI300 UTILITIES UCITS ETF* CSI300 UTILITIES INDEX USD 1,775,964 625,471
db x-trackers CSI300 ENERGY UCITS ETF* CSI300 ENERGY INDEX USD 3,030,574 695,480
db x-trackers CSI300 FINANCIALS UCITS ETF* CSI300 FINANCIALS INDEX USD 7,105,251 179,294
db x-trackers CSI300 HEALTH CARE UCITS ETF* CSI300 HEALTH CARE INDEX
USD 17,078,434 238,310
db x-trackers CSI300 TRANSPORTATION UCITS ETF* CSI300 TRANSPORTATION INDEX
USD 1,718,074 17,220
db x-trackers CSI300 INDUSTRIALS UCITS ETF* CSI300 INDUSTRIALS INDEX USD 3,943,501 52,564
db x-trackers MSCI CANADA INDEX UCITS ETF* MSCI CANADA TRN INDEX USD 44,407,612 232,509
db x-trackers MSCI INDONESIA INDEX UCITS ETF* MSCI INDONESIA TRN INDEX
USD 117,223,391 1,596,460
db x-trackers MSCI EUROPE VALUE INDEX UCITS ETF* MSCI EUROPE VALUE TRN INDEX
EUR 26,192,074 704,354
db x-trackers FTSE EPRA/NAREIT GLOBAL REAL ESTATE UCITS ETF*
FTSE EPRA/NAREIT GLOBAL NET TOTAL RETURN INDEX
USD 8,909,688 (90,991)
db x-trackers MSCI INDIA INDEX UCITS ETF* MSCI INDIA TRN INDEX USD 113,675,621 (3,113,595)
db x-trackers MSCI EM SHORT DAILY INDEX UCITS ETF*
MSCI EM SHORT DAILY INDEX
USD 15,759,801 846,582
db x-trackers DB EQUITY STRATEGIES HEDGE FUND INDEX UCITS ETF*
DB EQUITY STRATEGIES HEDGE FUND INDEX
EUR 9,616,913 186,162
db x-trackers MSCI WORLD CONSUMER DISCRETIONARY INDEX UCITS ETF*
MSCI WORLD CONSUMER DISCRETIONARY TRN INDEX
USD 38,190,746 629,889
db x-trackers MSCI WORLD CONSUMER STAPLES INDEX UCITS ETF*
MSCI WORLD CONSUMER STAPLES TRN INDEX
USD 65,909,924 (783,835)
db x-trackers MSCI WORLD ENERGY INDEX UCITS ETF* MSCI WORLD ENERGY TRN INDEX
USD 19,388,707 (338,548)
db x-trackers MSCI WORLD FINANCIALS INDEX UCITS ETF*
MSCI WORLD FINANCIALS TRN INDEX
USD 52,908,250 (373,115)
db x-trackers MSCI WORLD HEALTH CARE INDEX UCITS ETF*
MSCI WORLD HEALTH CARE TRN INDEX
USD 194,553,868 (3,584,565)
db x-trackers MSCI WORLD INDUSTRIALS INDEX UCITS ETF*
MSCI WORLD INDUSTRIALS TRN INDEX
USD 29,137,323 446,559
db x-trackers MSCI WORLD INFORMATION TECHNOLOGY INDEX UCITS ETF*
MSCI WORLD INFORMATION TECHNOLOGY TRN INDEX
USD 155,834,132 (2,411,016)
db x-trackers MSCI WORLD MATERIALS INDEX UCITS ETF*
MSCI WORLD MATERIALS TRN INDEX
USD 13,608,244 (13,934)
db x-trackers MSCI WORLD TELECOM SERVICES INDEX UCITS ETF*
MSCI WORLD TELECOMMUNICATION SERVICES TRN INDEX
USD 7,464,729 (51,870)
db x-trackers MSCI WORLD UTILITIES INDEX UCITS ETF*
MSCI WORLD UTILITIES TRN INDEX
USD 10,760,558 227,632
db x-trackers RUSSELL MIDCAP UCITS ETF* RUSSELL MIDCAP INDEX USD 162,622,887 4,305,225
db x-trackers MSCI AC ASIA EX JAPAN HIGH DIVIDEND YIELD INDEX UCITS ETF*
MSCI AC ASIA EX JAPAN HIGH DIVIDEND YIELD INDEX
USD 5,087,163 (33,951)
db x-trackers MSCI EM CONSUMER DISCRETIONARY INDEX UCITS ETF*
MSCI EM CONSUMER DISCRETIONARY TRN INDEX
USD 5,160,563 (33,018)
db x-trackers MSCI EM CONSUMER STAPLES INDEX UCITS ETF*
MSCI EM CONSUMER STAPLES TRN INDEX
USD 15,693,419 (1,164,398)
db x-trackers MSCI EM ENERGY INDEX UCITS ETF* MSCI EM ENERGY TRN INDEX
USD 4,676,792 (969,672)
db x-trackers MSCI EM FINANCIALS INDEX UCITS ETF* MSCI EM FINANCIALS TRN INDEX
USD 4,203,571 (67,758)
343
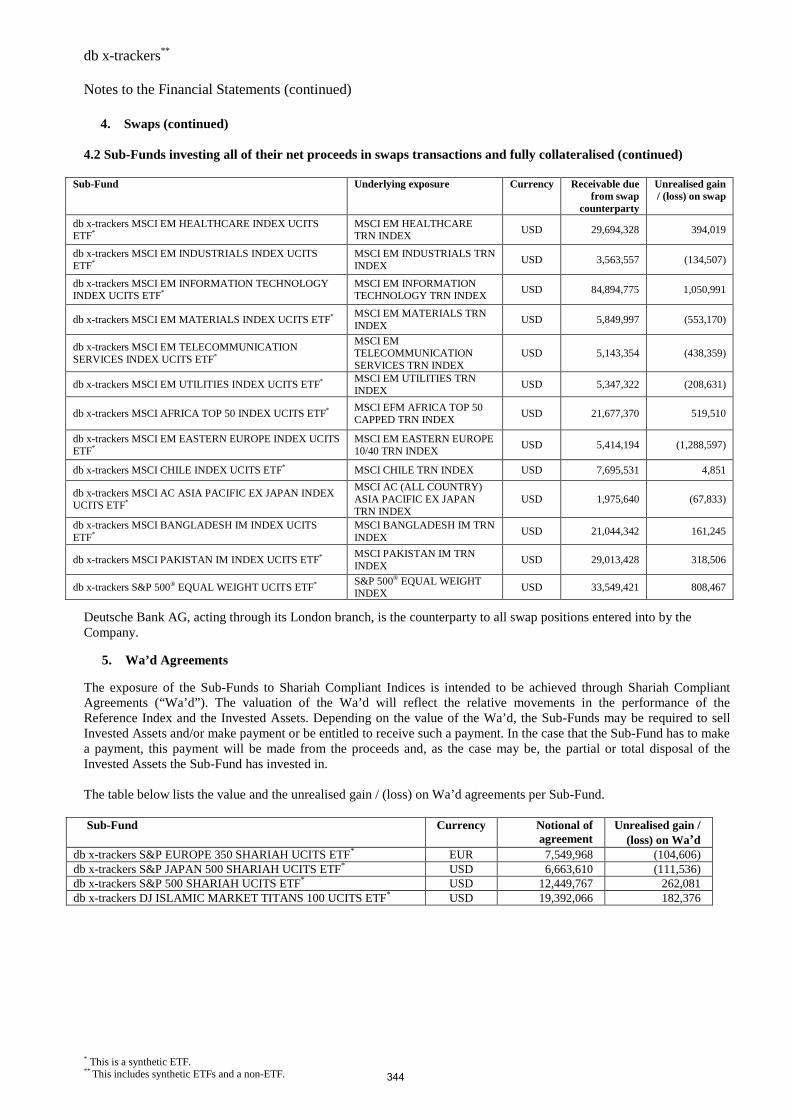
db x-trackers** Notes to the Financial Statements (continued)
* This is a synthetic ETF. ** This includes synthetic ETFs and a non-ETF.
4. Swaps (continued)
4.2 Sub-Funds investing all of their net proceeds in swaps transactions and fully collateralised (continued)
Sub-Fund Underlying exposure Currency Receivable due from swap
counterparty
Unrealised gain / (loss) on swap
db x-trackers MSCI EM HEALTHCARE INDEX UCITS ETF*
MSCI EM HEALTHCARE TRN INDEX
USD 29,694,328 394,019
db x-trackers MSCI EM INDUSTRIALS INDEX UCITS ETF*
MSCI EM INDUSTRIALS TRN INDEX
USD 3,563,557 (134,507)
db x-trackers MSCI EM INFORMATION TECHNOLOGY INDEX UCITS ETF*
MSCI EM INFORMATION TECHNOLOGY TRN INDEX
USD 84,894,775 1,050,991
db x-trackers MSCI EM MATERIALS INDEX UCITS ETF* MSCI EM MATERIALS TRN INDEX
USD 5,849,997 (553,170)
db x-trackers MSCI EM TELECOMMUNICATION SERVICES INDEX UCITS ETF*
MSCI EM TELECOMMUNICATION SERVICES TRN INDEX
USD 5,143,354 (438,359)
db x-trackers MSCI EM UTILITIES INDEX UCITS ETF* MSCI EM UTILITIES TRN INDEX
USD 5,347,322 (208,631)
db x-trackers MSCI AFRICA TOP 50 INDEX UCITS ETF* MSCI EFM AFRICA TOP 50 CAPPED TRN INDEX
USD 21,677,370 519,510
db x-trackers MSCI EM EASTERN EUROPE INDEX UCITS ETF*
MSCI EM EASTERN EUROPE 10/40 TRN INDEX
USD 5,414,194 (1,288,597)
db x-trackers MSCI CHILE INDEX UCITS ETF* MSCI CHILE TRN INDEX USD 7,695,531 4,851
db x-trackers MSCI AC ASIA PACIFIC EX JAPAN INDEX UCITS ETF*
MSCI AC (ALL COUNTRY) ASIA PACIFIC EX JAPAN TRN INDEX
USD 1,975,640 (67,833)
db x-trackers MSCI BANGLADESH IM INDEX UCITS ETF*
MSCI BANGLADESH IM TRN INDEX
USD 21,044,342 161,245
db x-trackers MSCI PAKISTAN IM INDEX UCITS ETF* MSCI PAKISTAN IM TRN INDEX
USD 29,013,428 318,506
db x-trackers S&P 500® EQUAL WEIGHT UCITS ETF* S&P 500® EQUAL WEIGHT INDEX
USD 33,549,421 808,467
Deutsche Bank AG, acting through its London branch, is the counterparty to all swap positions entered into by the Company.
5. Wa’d Agreements The exposure of the Sub-Funds to Shariah Compliant Indices is intended to be achieved through Shariah Compliant Agreements (“Wa’d”). The valuation of the Wa’d will reflect the relative movements in the performance of the Reference Index and the Invested Assets. Depending on the value of the Wa’d, the Sub-Funds may be required to sell Invested Assets and/or make payment or be entitled to receive such a payment. In the case that the Sub-Fund has to make a payment, this payment will be made from the proceeds and, as the case may be, the partial or total disposal of the Invested Assets the Sub-Fund has invested in.
The table below lists the value and the unrealised gain / (loss) on Wa’d agreements per Sub-Fund.
Sub-Fund Currency Notional of agreement
Unrealised gain / (loss) on Wa’d
db x-trackers S&P EUROPE 350 SHARIAH UCITS ETF* EUR 7,549,968 (104,606) db x-trackers S&P JAPAN 500 SHARIAH UCITS ETF* USD 6,663,610 (111,536) db x-trackers S&P 500 SHARIAH UCITS ETF* USD 12,449,767 262,081 db x-trackers DJ ISLAMIC MARKET TITANS 100 UCITS ETF* USD 19,392,066 182,376
344
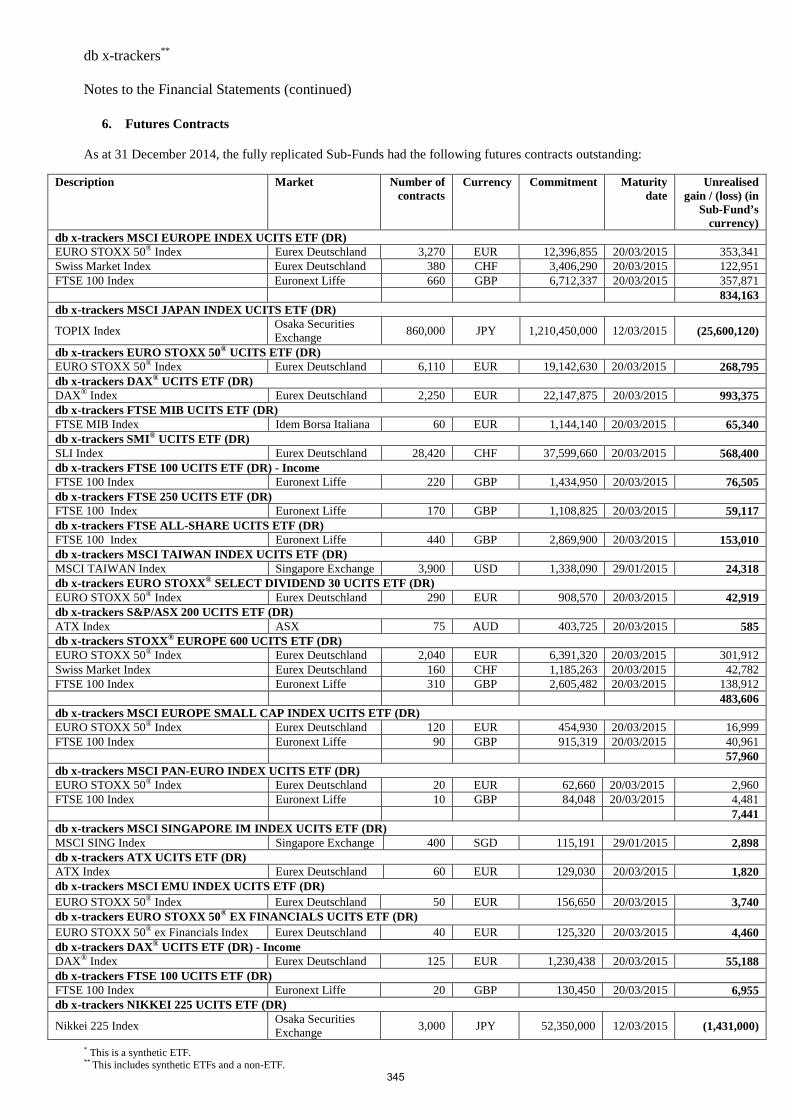
db x-trackers** Notes to the Financial Statements (continued)
* This is a synthetic ETF. ** This includes synthetic ETFs and a non-ETF.
6. Futures Contracts
As at 31 December 2014, the fully replicated Sub-Funds had the following futures contracts outstanding:
Description Mar ket Number of contracts
Currency Commitment Maturity date
Unrealised gain / (loss) (in
Sub-Fund’s currency)
db x-trackers MSCI EUROPE INDEX UCITS ETF (DR) EURO STOXX 50® Index Eurex Deutschland 3,270 EUR 12,396,855 20/03/2015 353,341 Swiss Market Index Eurex Deutschland 380 CHF 3,406,290 20/03/2015 122,951 FTSE 100 Index Euronext Liffe 660 GBP 6,712,337 20/03/2015 357,871 834,163 db x-trackers MSCI JAPAN INDEX UCITS ETF (DR)
TOPIX Index Osaka Securities Exchange
860,000 JPY 1,210,450,000 12/03/2015 (25,600,120)
db x-trackers EURO STOXX 50® UCITS ETF (DR) EURO STOXX 50® Index Eurex Deutschland 6,110 EUR 19,142,630 20/03/2015 268,795 db x-trackers DAX® UCITS ETF (DR) DAX ® Index Eurex Deutschland 2,250 EUR 22,147,875 20/03/2015 993,375 db x-trackers FTSE MIB UCITS ETF (DR) FTSE MIB Index Idem Borsa Italiana 60 EUR 1,144,140 20/03/2015 65,340 db x-trackers SMI® UCITS ETF (DR) SLI Index Eurex Deutschland 28,420 CHF 37,599,660 20/03/2015 568,400 db x-trackers FTSE 100 UCITS ETF (DR) - Income FTSE 100 Index Euronext Liffe 220 GBP 1,434,950 20/03/2015 76,505 db x-trackers FTSE 250 UCITS ETF (DR) FTSE 100 Index Euronext Liffe 170 GBP 1,108,825 20/03/2015 59,117 db x-trackers FTSE ALL-SHARE UCITS ETF (DR) FTSE 100 Index Euronext Liffe 440 GBP 2,869,900 20/03/2015 153,010 db x-trackers MSCI TAIWAN INDEX UCITS ETF (DR) MSCI TAIWAN Index Singapore Exchange 3,900 USD 1,338,090 29/01/2015 24,318 db x-trackers EURO STOXX® SELECT DIVIDEND 30 UCITS ETF (DR) EURO STOXX 50® Index Eurex Deutschland 290 EUR 908,570 20/03/2015 42,919 db x-trackers S&P/ASX 200 UCITS ETF (DR) ATX Index ASX 75 AUD 403,725 20/03/2015 585 db x-trackers STOXX® EUROPE 600 UCITS ETF (DR) EURO STOXX 50® Index Eurex Deutschland 2,040 EUR 6,391,320 20/03/2015 301,912 Swiss Market Index Eurex Deutschland 160 CHF 1,185,263 20/03/2015 42,782 FTSE 100 Index Euronext Liffe 310 GBP 2,605,482 20/03/2015 138,912 483,606 db x-trackers MSCI EUROPE SMALL CAP INDEX UCITS ETF (DR) EURO STOXX 50® Index Eurex Deutschland 120 EUR 454,930 20/03/2015 16,999 FTSE 100 Index Euronext Liffe 90 GBP 915,319 20/03/2015 40,961 57,960 db x-trackers MSCI PAN-EURO INDEX UCITS ETF (DR) EURO STOXX 50® Index Eurex Deutschland 20 EUR 62,660 20/03/2015 2,960 FTSE 100 Index Euronext Liffe 10 GBP 84,048 20/03/2015 4,481 7,441 db x-trackers MSCI SINGAPORE IM INDEX UCITS ETF (DR) MSCI SING Index Singapore Exchange 400 SGD 115,191 29/01/2015 2,898 db x-trackers ATX UCITS ETF (DR) ATX Index Eurex Deutschland 60 EUR 129,030 20/03/2015 1,820 db x-trackers MSCI EMU INDEX UCITS ETF (DR) EURO STOXX 50® Index Eurex Deutschland 50 EUR 156,650 20/03/2015 3,740 db x-trackers EURO STOXX 50® EX FINANCIALS UCITS ETF (DR) EURO STOXX 50® ex Financials Index Eurex Deutschland 40 EUR 125,320 20/03/2015 4,460 db x-trackers DAX® UCITS ETF (DR) - Income DAX ® Index Eurex Deutschland 125 EUR 1,230,438 20/03/2015 55,188 db x-trackers FTSE 100 UCITS ETF (DR) FTSE 100 Index Euronext Liffe 20 GBP 130,450 20/03/2015 6,955 db x-trackers NIKKEI 225 UCITS ETF (DR)
Nikkei 225 Index Osaka Securities Exchange
3,000 JPY 52,350,000 12/03/2015 (1,431,000)
345
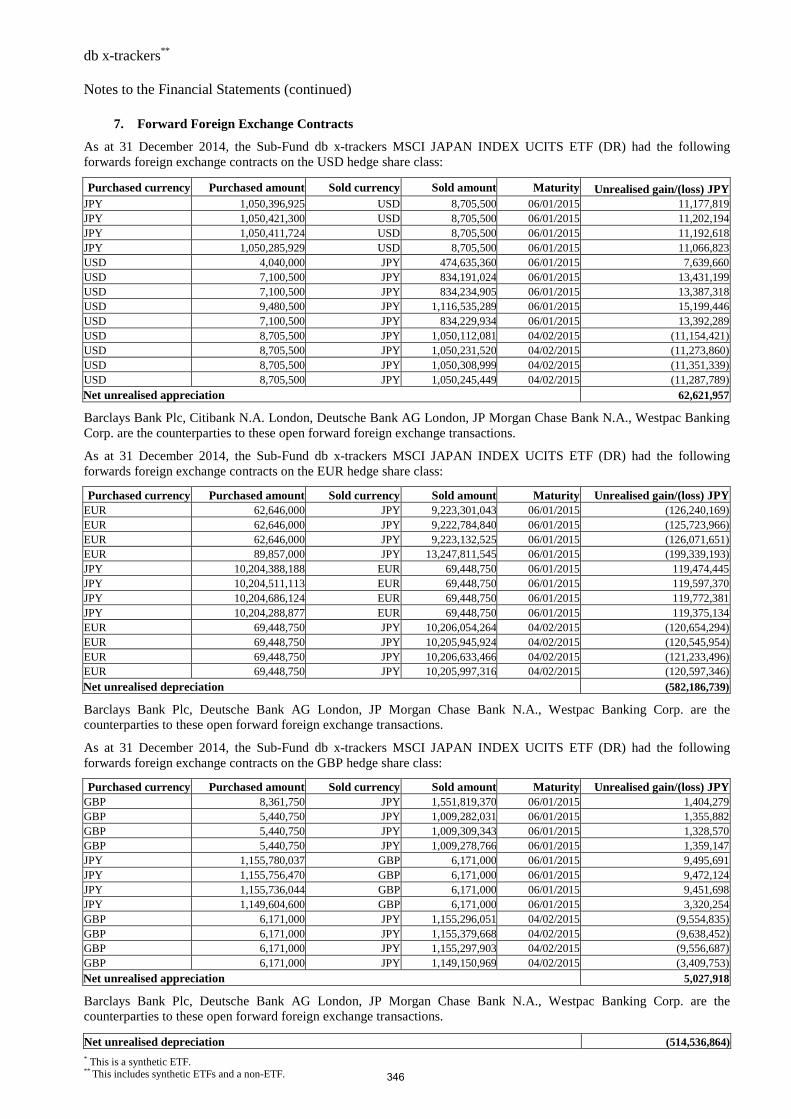
db x-trackers** Notes to the Financial Statements (continued)
* This is a synthetic ETF. ** This includes synthetic ETFs and a non-ETF.
7. Forward Foreign Exchange Contracts
As at 31 December 2014, the Sub-Fund db x-trackers MSCI JAPAN INDEX UCITS ETF (DR) had the following forwards foreign exchange contracts on the USD hedge share class:
Purchased currency Purchased amount Sold currency Sold amount Maturity Unrealised gain/(loss) JPY JPY 1,050,396,925 USD 8,705,500 06/01/2015 11,177,819 JPY 1,050,421,300 USD 8,705,500 06/01/2015 11,202,194 JPY 1,050,411,724 USD 8,705,500 06/01/2015 11,192,618 JPY 1,050,285,929 USD 8,705,500 06/01/2015 11,066,823 USD 4,040,000 JPY 474,635,360 06/01/2015 7,639,660 USD 7,100,500 JPY 834,191,024 06/01/2015 13,431,199 USD 7,100,500 JPY 834,234,905 06/01/2015 13,387,318 USD 9,480,500 JPY 1,116,535,289 06/01/2015 15,199,446 USD 7,100,500 JPY 834,229,934 06/01/2015 13,392,289 USD 8,705,500 JPY 1,050,112,081 04/02/2015 (11,154,421) USD 8,705,500 JPY 1,050,231,520 04/02/2015 (11,273,860) USD 8,705,500 JPY 1,050,308,999 04/02/2015 (11,351,339) USD 8,705,500 JPY 1,050,245,449 04/02/2015 (11,287,789) Net unrealised appreciation 62,621,957
Barclays Bank Plc, Citibank N.A. London, Deutsche Bank AG London, JP Morgan Chase Bank N.A., Westpac Banking Corp. are the counterparties to these open forward foreign exchange transactions.
As at 31 December 2014, the Sub-Fund db x-trackers MSCI JAPAN INDEX UCITS ETF (DR) had the following forwards foreign exchange contracts on the EUR hedge share class:
Purchased currency Purchased amount Sold currency Sold amount Maturity Unrealised gain/(loss) JPY EUR 62,646,000 JPY 9,223,301,043 06/01/2015 (126,240,169) EUR 62,646,000 JPY 9,222,784,840 06/01/2015 (125,723,966) EUR 62,646,000 JPY 9,223,132,525 06/01/2015 (126,071,651) EUR 89,857,000 JPY 13,247,811,545 06/01/2015 (199,339,193) JPY 10,204,388,188 EUR 69,448,750 06/01/2015 119,474,445 JPY 10,204,511,113 EUR 69,448,750 06/01/2015 119,597,370 JPY 10,204,686,124 EUR 69,448,750 06/01/2015 119,772,381 JPY 10,204,288,877 EUR 69,448,750 06/01/2015 119,375,134 EUR 69,448,750 JPY 10,206,054,264 04/02/2015 (120,654,294) EUR 69,448,750 JPY 10,205,945,924 04/02/2015 (120,545,954) EUR 69,448,750 JPY 10,206,633,466 04/02/2015 (121,233,496) EUR 69,448,750 JPY 10,205,997,316 04/02/2015 (120,597,346) Net unrealised depreciation (582,186,739)
Barclays Bank Plc, Deutsche Bank AG London, JP Morgan Chase Bank N.A., Westpac Banking Corp. are the counterparties to these open forward foreign exchange transactions.
As at 31 December 2014, the Sub-Fund db x-trackers MSCI JAPAN INDEX UCITS ETF (DR) had the following forwards foreign exchange contracts on the GBP hedge share class:
Purchased currency Purchased amount Sold currency Sold amount Maturity Unrealised gain/(loss) JPY GBP 8,361,750 JPY 1,551,819,370 06/01/2015 1,404,279 GBP 5,440,750 JPY 1,009,282,031 06/01/2015 1,355,882 GBP 5,440,750 JPY 1,009,309,343 06/01/2015 1,328,570 GBP 5,440,750 JPY 1,009,278,766 06/01/2015 1,359,147 JPY 1,155,780,037 GBP 6,171,000 06/01/2015 9,495,691 JPY 1,155,756,470 GBP 6,171,000 06/01/2015 9,472,124 JPY 1,155,736,044 GBP 6,171,000 06/01/2015 9,451,698 JPY 1,149,604,600 GBP 6,171,000 06/01/2015 3,320,254 GBP 6,171,000 JPY 1,155,296,051 04/02/2015 (9,554,835) GBP 6,171,000 JPY 1,155,379,668 04/02/2015 (9,638,452) GBP 6,171,000 JPY 1,155,297,903 04/02/2015 (9,556,687) GBP 6,171,000 JPY 1,149,150,969 04/02/2015 (3,409,753) Net unrealised appreciation 5,027,918
Barclays Bank Plc, Deutsche Bank AG London, JP Morgan Chase Bank N.A., Westpac Banking Corp. are the counterparties to these open forward foreign exchange transactions.
Net unrealised depreciation (514,536,864)
346
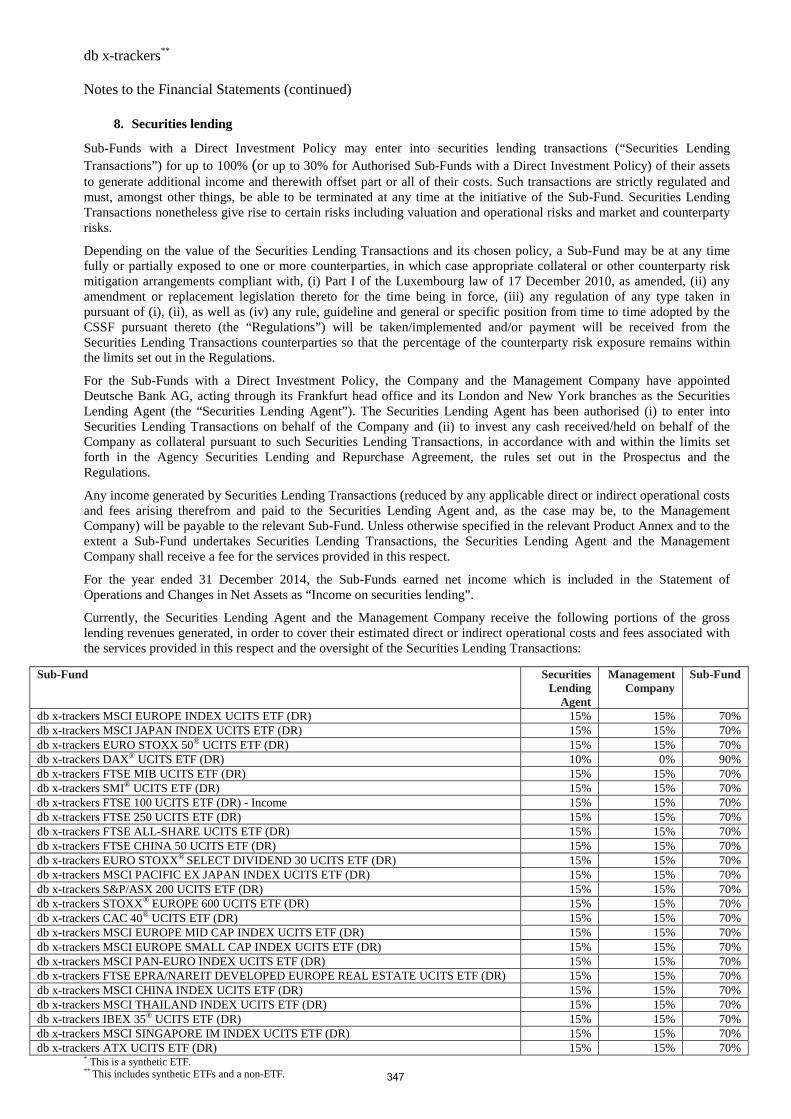
db x-trackers** Notes to the Financial Statements (continued)
* This is a synthetic ETF. ** This includes synthetic ETFs and a non-ETF.
8. Securities lending
Sub-Funds with a Direct Investment Policy may enter into securities lending transactions (“Securities Lending Transactions”) for up to 100% (or up to 30% for Authorised Sub-Funds with a Direct Investment Policy) of their assets to generate additional income and therewith offset part or all of their costs. Such transactions are strictly regulated and must, amongst other things, be able to be terminated at any time at the initiative of the Sub-Fund. Securities Lending Transactions nonetheless give rise to certain risks including valuation and operational risks and market and counterparty risks.
Depending on the value of the Securities Lending Transactions and its chosen policy, a Sub-Fund may be at any time fully or partially exposed to one or more counterparties, in which case appropriate collateral or other counterparty risk mitigation arrangements compliant with, (i) Part I of the Luxembourg law of 17 December 2010, as amended, (ii) any amendment or replacement legislation thereto for the time being in force, (iii) any regulation of any type taken in pursuant of (i), (ii), as well as (iv) any rule, guideline and general or specific position from time to time adopted by the CSSF pursuant thereto (the “Regulations”) will be taken/implemented and/or payment will be received from the Securities Lending Transactions counterparties so that the percentage of the counterparty risk exposure remains within the limits set out in the Regulations.
For the Sub-Funds with a Direct Investment Policy, the Company and the Management Company have appointed Deutsche Bank AG, acting through its Frankfurt head office and its London and New York branches as the Securities Lending Agent (the “Securities Lending Agent”). The Securities Lending Agent has been authorised (i) to enter into Securities Lending Transactions on behalf of the Company and (ii) to invest any cash received/held on behalf of the Company as collateral pursuant to such Securities Lending Transactions, in accordance with and within the limits set forth in the Agency Securities Lending and Repurchase Agreement, the rules set out in the Prospectus and the Regulations.
Any income generated by Securities Lending Transactions (reduced by any applicable direct or indirect operational costs and fees arising therefrom and paid to the Securities Lending Agent and, as the case may be, to the Management Company) will be payable to the relevant Sub-Fund. Unless otherwise specified in the relevant Product Annex and to the extent a Sub-Fund undertakes Securities Lending Transactions, the Securities Lending Agent and the Management Company shall receive a fee for the services provided in this respect.
For the year ended 31 December 2014, the Sub-Funds earned net income which is included in the Statement of Operations and Changes in Net Assets as “Income on securities lending”.
Currently, the Securities Lending Agent and the Management Company receive the following portions of the gross lending revenues generated, in order to cover their estimated direct or indirect operational costs and fees associated with the services provided in this respect and the oversight of the Securities Lending Transactions:
Sub-Fund Securities Lending
Agent
Management Company
Sub-Fund
db x-trackers MSCI EUROPE INDEX UCITS ETF (DR) 15% 15% 70% db x-trackers MSCI JAPAN INDEX UCITS ETF (DR) 15% 15% 70% db x-trackers EURO STOXX 50® UCITS ETF (DR) 15% 15% 70% db x-trackers DAX® UCITS ETF (DR) 10% 0% 90% db x-trackers FTSE MIB UCITS ETF (DR) 15% 15% 70% db x-trackers SMI® UCITS ETF (DR) 15% 15% 70% db x-trackers FTSE 100 UCITS ETF (DR) - Income 15% 15% 70% db x-trackers FTSE 250 UCITS ETF (DR) 15% 15% 70% db x-trackers FTSE ALL-SHARE UCITS ETF (DR) 15% 15% 70% db x-trackers FTSE CHINA 50 UCITS ETF (DR) 15% 15% 70% db x-trackers EURO STOXX® SELECT DIVIDEND 30 UCITS ETF (DR) 15% 15% 70% db x-trackers MSCI PACIFIC EX JAPAN INDEX UCITS ETF (DR) 15% 15% 70% db x-trackers S&P/ASX 200 UCITS ETF (DR) 15% 15% 70% db x-trackers STOXX® EUROPE 600 UCITS ETF (DR) 15% 15% 70% db x-trackers CAC 40® UCITS ETF (DR) 15% 15% 70% db x-trackers MSCI EUROPE MID CAP INDEX UCITS ETF (DR) 15% 15% 70% db x-trackers MSCI EUROPE SMALL CAP INDEX UCITS ETF (DR) 15% 15% 70% db x-trackers MSCI PAN-EURO INDEX UCITS ETF (DR) 15% 15% 70% db x-trackers FTSE EPRA/NAREIT DEVELOPED EUROPE REAL ESTATE UCITS ETF (DR) 15% 15% 70% db x-trackers MSCI CHINA INDEX UCITS ETF (DR) 15% 15% 70% db x-trackers MSCI THAILAND INDEX UCITS ETF (DR) 15% 15% 70% db x-trackers IBEX 35® UCITS ETF (DR) 15% 15% 70% db x-trackers MSCI SINGAPORE IM INDEX UCITS ETF (DR) 15% 15% 70% db x-trackers ATX UCITS ETF (DR) 15% 15% 70%
347
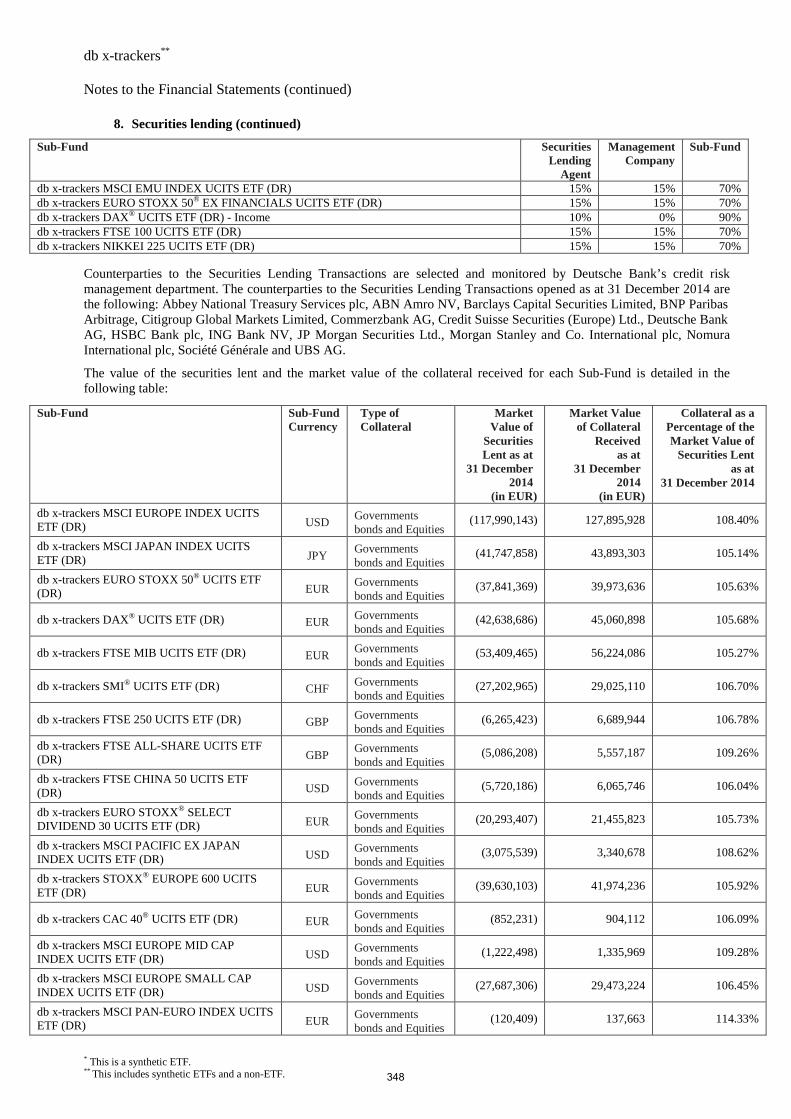
db x-trackers** Notes to the Financial Statements (continued)
* This is a synthetic ETF. ** This includes synthetic ETFs and a non-ETF.
8. Securities lending (continued)
Sub-Fund Securities Lending
Agent
Management Company
Sub-Fund
db x-trackers MSCI EMU INDEX UCITS ETF (DR) 15% 15% 70% db x-trackers EURO STOXX 50® EX FINANCIALS UCITS ETF (DR) 15% 15% 70% db x-trackers DAX® UCITS ETF (DR) - Income 10% 0% 90% db x-trackers FTSE 100 UCITS ETF (DR) 15% 15% 70% db x-trackers NIKKEI 225 UCITS ETF (DR) 15% 15% 70%
Counterparties to the Securities Lending Transactions are selected and monitored by Deutsche Bank’s credit risk management department. The counterparties to the Securities Lending Transactions opened as at 31 December 2014 are the following: Abbey National Treasury Services plc, ABN Amro NV, Barclays Capital Securities Limited, BNP Paribas Arbitrage, Citigroup Global Markets Limited, Commerzbank AG, Credit Suisse Securities (Europe) Ltd., Deutsche Bank AG, HSBC Bank plc, ING Bank NV, JP Morgan Securities Ltd., Morgan Stanley and Co. International plc, Nomura International plc, Société Générale and UBS AG.
The value of the securities lent and the market value of the collateral received for each Sub-Fund is detailed in the following table:
Sub-Fund Sub-Fund Curr ency
Type of Collateral
Market Value of
Securities Lent as at
31 December 2014
(in EUR)
Market Value of Collateral
Received as at
31 December 2014
(in EUR)
Collateral as a Percentage of the Market Value of
Securities Lent as at
31 December 2014
db x-trackers MSCI EUROPE INDEX UCITS ETF (DR) USD
Governments bonds and Equities
(117,990,143) 127,895,928 108.40%
db x-trackers MSCI JAPAN INDEX UCITS ETF (DR) JPY
Governments bonds and Equities
(41,747,858) 43,893,303 105.14%
db x-trackers EURO STOXX 50® UCITS ETF (DR) EUR
Governments bonds and Equities
(37,841,369) 39,973,636 105.63%
db x-trackers DAX® UCITS ETF (DR) EUR Governments bonds and Equities
(42,638,686) 45,060,898 105.68%
db x-trackers FTSE MIB UCITS ETF (DR) EUR Governments bonds and Equities
(53,409,465) 56,224,086 105.27%
db x-trackers SMI® UCITS ETF (DR) CHF Governments bonds and Equities
(27,202,965) 29,025,110 106.70%
db x-trackers FTSE 250 UCITS ETF (DR) GBP Governments bonds and Equities
(6,265,423) 6,689,944 106.78%
db x-trackers FTSE ALL-SHARE UCITS ETF (DR) GBP
Governments bonds and Equities
(5,086,208) 5,557,187 109.26%
db x-trackers FTSE CHINA 50 UCITS ETF (DR) USD
Governments bonds and Equities
(5,720,186) 6,065,746 106.04%
db x-trackers EURO STOXX® SELECT DIVIDEND 30 UCITS ETF (DR) EUR
Governments bonds and Equities
(20,293,407) 21,455,823 105.73%
db x-trackers MSCI PACIFIC EX JAPAN INDEX UCITS ETF (DR) USD
Governments bonds and Equities
(3,075,539) 3,340,678 108.62%
db x-trackers STOXX® EUROPE 600 UCITS ETF (DR) EUR
Governments bonds and Equities
(39,630,103) 41,974,236 105.92%
db x-trackers CAC 40® UCITS ETF (DR) EUR Governments bonds and Equities
(852,231) 904,112 106.09%
db x-trackers MSCI EUROPE MID CAP INDEX UCITS ETF (DR) USD
Governments bonds and Equities
(1,222,498) 1,335,969 109.28%
db x-trackers MSCI EUROPE SMALL CAP INDEX UCITS ETF (DR) USD
Governments bonds and Equities
(27,687,306) 29,473,224 106.45%
db x-trackers MSCI PAN-EURO INDEX UCITS ETF (DR) EUR
Governments bonds and Equities
(120,409) 137,663 114.33%
348
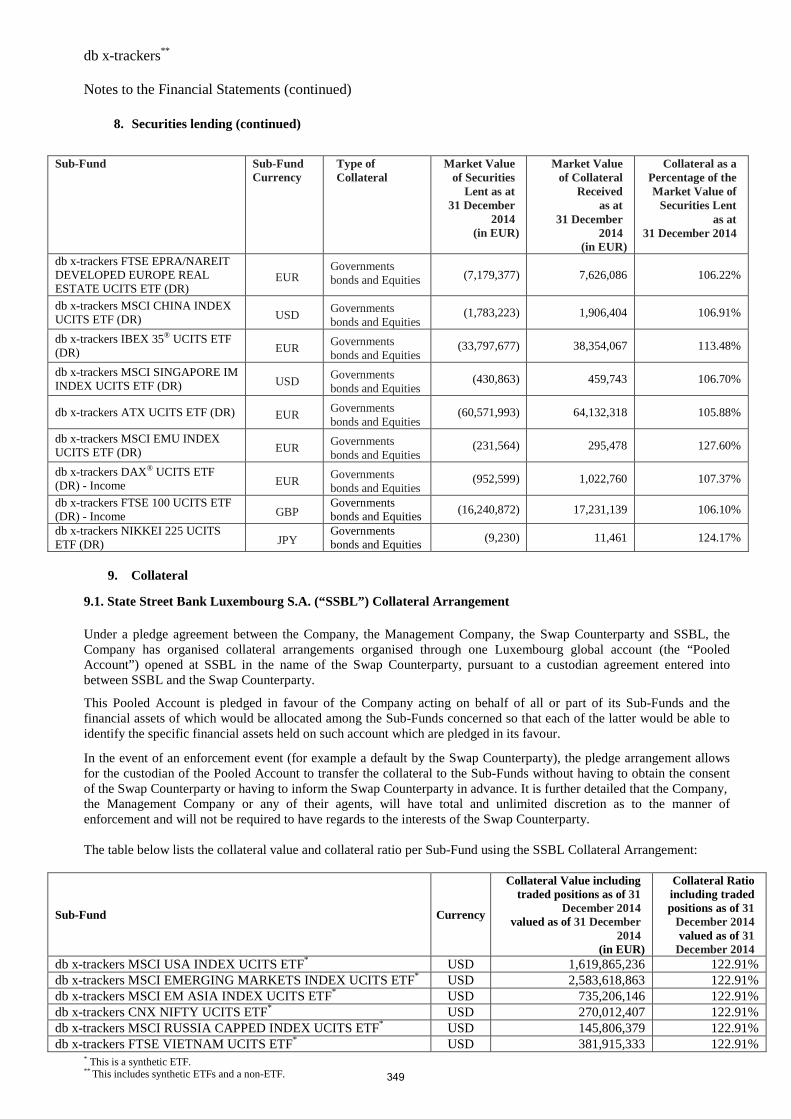
db x-trackers** Notes to the Financial Statements (continued)
* This is a synthetic ETF. ** This includes synthetic ETFs and a non-ETF.
8. Securities lending (continued)
Sub-Fund Sub-Fund Curr ency
Type of Collateral
Market Value of Securities
Lent as at 31 December
2014 (in EUR)
Market Value of Collateral
Received as at
31 December 2014
(in EUR)
Collateral as a Percentage of the Market Value of
Securities Lent as at
31 December 2014
db x-trackers FTSE EPRA/NAREIT DEVELOPED EUROPE REAL ESTATE UCITS ETF (DR)
EUR Governments bonds and Equities (7,179,377) 7,626,086 106.22%
db x-trackers MSCI CHINA INDEX UCITS ETF (DR) USD
Governments bonds and Equities
(1,783,223) 1,906,404 106.91%
db x-trackers IBEX 35® UCITS ETF (DR) EUR
Governments bonds and Equities
(33,797,677) 38,354,067 113.48%
db x-trackers MSCI SINGAPORE IM INDEX UCITS ETF (DR) USD
Governments bonds and Equities
(430,863) 459,743 106.70%
db x-trackers ATX UCITS ETF (DR) EUR Governments bonds and Equities
(60,571,993) 64,132,318 105.88%
db x-trackers MSCI EMU INDEX UCITS ETF (DR) EUR
Governments bonds and Equities
(231,564) 295,478 127.60%
db x-trackers DAX® UCITS ETF (DR) - Income EUR
Governments bonds and Equities
(952,599) 1,022,760 107.37%
db x-trackers FTSE 100 UCITS ETF (DR) - Income GBP
Governments bonds and Equities
(16,240,872) 17,231,139 106.10%
db x-trackers NIKKEI 225 UCITS ETF (DR) JPY
Governments bonds and Equities
(9,230) 11,461 124.17%
9. Collateral
9.1. State Street Bank Luxembourg S.A. (“SSBL”) Collateral Arrangement
Under a pledge agreement between the Company, the Management Company, the Swap Counterparty and SSBL, the Company has organised collateral arrangements organised through one Luxembourg global account (the “Pooled Account”) opened at SSBL in the name of the Swap Counterparty, pursuant to a custodian agreement entered into between SSBL and the Swap Counterparty.
This Pooled Account is pledged in favour of the Company acting on behalf of all or part of its Sub-Funds and the financial assets of which would be allocated among the Sub-Funds concerned so that each of the latter would be able to identify the specific financial assets held on such account which are pledged in its favour.
In the event of an enforcement event (for example a default by the Swap Counterparty), the pledge arrangement allows for the custodian of the Pooled Account to transfer the collateral to the Sub-Funds without having to obtain the consent of the Swap Counterparty or having to inform the Swap Counterparty in advance. It is further detailed that the Company, the Management Company or any of their agents, will have total and unlimited discretion as to the manner of enforcement and will not be required to have regards to the interests of the Swap Counterparty. The table below lists the collateral value and collateral ratio per Sub-Fund using the SSBL Collateral Arrangement:
Sub-Fund Currency
Collateral Value including traded positions as of 31
December 2014 valued as of 31 December
2014 (in EUR)
Collateral Ratio including traded positions as of 31
December 2014 valued as of 31 December 2014
db x-trackers MSCI USA INDEX UCITS ETF* USD 1,619,865,236 122.91% db x-trackers MSCI EMERGING MARKETS INDEX UCITS ETF* USD 2,583,618,863 122.91% db x-trackers MSCI EM ASIA INDEX UCITS ETF* USD 735,206,146 122.91% db x-trackers CNX NIFTY UCITS ETF* USD 270,012,407 122.91% db x-trackers MSCI RUSSIA CAPPED INDEX UCITS ETF* USD 145,806,379 122.91% db x-trackers FTSE VIETNAM UCITS ETF* USD 381,915,333 122.91%
349
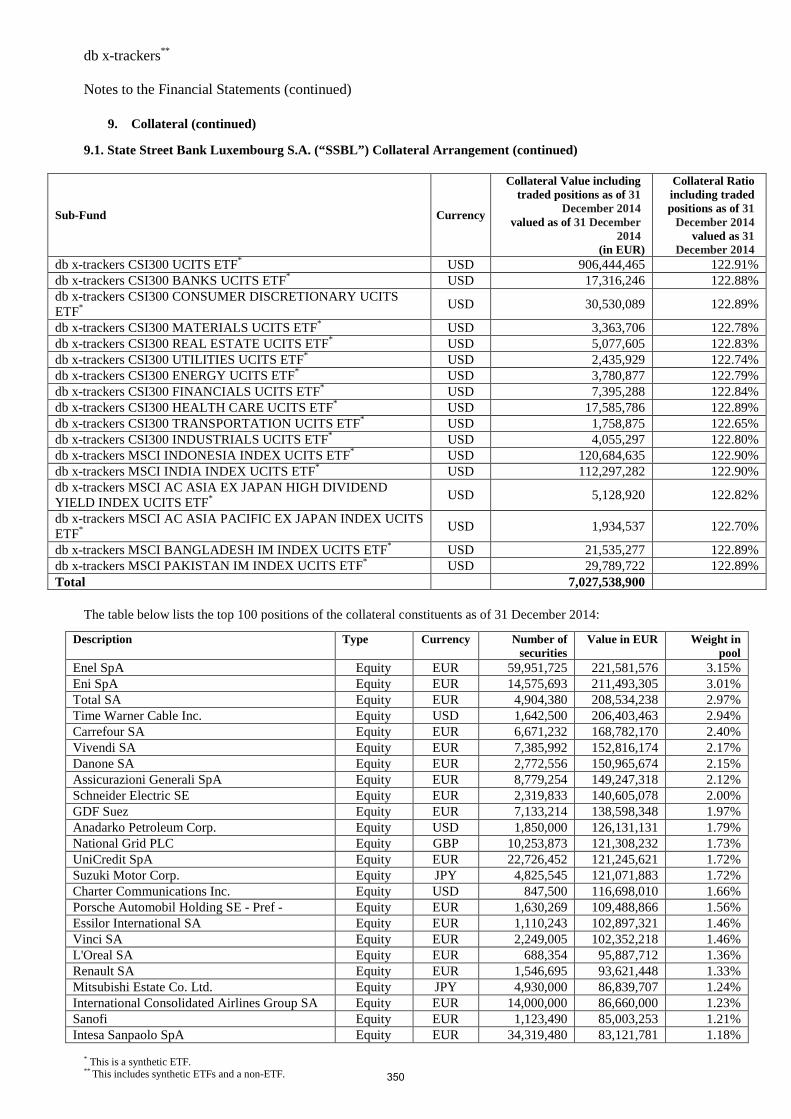
db x-trackers** Notes to the Financial Statements (continued)
* This is a synthetic ETF. ** This includes synthetic ETFs and a non-ETF.
9. Collateral (continued)
9.1. State Street Bank Luxembourg S.A. (“SSBL”) Collateral Arrangement (continued)
Sub-Fund Currency
Collateral Value including traded positions as of 31
December 2014 valued as of 31 December
2014 (in EUR)
Collateral Ratio including traded positions as of 31
December 2014 valued as 31
December 2014 db x-trackers CSI300 UCITS ETF* USD 906,444,465 122.91% db x-trackers CSI300 BANKS UCITS ETF* USD 17,316,246 122.88% db x-trackers CSI300 CONSUMER DISCRETIONARY UCITS ETF*
USD 30,530,089 122.89%
db x-trackers CSI300 MATERIALS UCITS ETF* USD 3,363,706 122.78% db x-trackers CSI300 REAL ESTATE UCITS ETF* USD 5,077,605 122.83% db x-trackers CSI300 UTILITIES UCITS ETF* USD 2,435,929 122.74% db x-trackers CSI300 ENERGY UCITS ETF* USD 3,780,877 122.79% db x-trackers CSI300 FINANCIALS UCITS ETF* USD 7,395,288 122.84% db x-trackers CSI300 HEALTH CARE UCITS ETF* USD 17,585,786 122.89% db x-trackers CSI300 TRANSPORTATION UCITS ETF* USD 1,758,875 122.65% db x-trackers CSI300 INDUSTRIALS UCITS ETF* USD 4,055,297 122.80% db x-trackers MSCI INDONESIA INDEX UCITS ETF* USD 120,684,635 122.90% db x-trackers MSCI INDIA INDEX UCITS ETF* USD 112,297,282 122.90% db x-trackers MSCI AC ASIA EX JAPAN HIGH DIVIDEND YIELD INDEX UCITS ETF*
USD 5,128,920 122.82%
db x-trackers MSCI AC ASIA PACIFIC EX JAPAN INDEX UCITS ETF*
USD 1,934,537 122.70%
db x-trackers MSCI BANGLADESH IM INDEX UCITS ETF* USD 21,535,277 122.89% db x-trackers MSCI PAKISTAN IM INDEX UCITS ETF* USD 29,789,722 122.89% Total 7,027,538,900
The table below lists the top 100 positions of the collateral constituents as of 31 December 2014:
Description Type Currency Number of securities
Value in EUR Weight in pool
Enel SpA Equity EUR 59,951,725 221,581,576 3.15% Eni SpA Equity EUR 14,575,693 211,493,305 3.01% Total SA Equity EUR 4,904,380 208,534,238 2.97% Time Warner Cable Inc. Equity USD 1,642,500 206,403,463 2.94% Carrefour SA Equity EUR 6,671,232 168,782,170 2.40% Vivendi SA Equity EUR 7,385,992 152,816,174 2.17% Danone SA Equity EUR 2,772,556 150,965,674 2.15% Assicurazioni Generali SpA Equity EUR 8,779,254 149,247,318 2.12% Schneider Electric SE Equity EUR 2,319,833 140,605,078 2.00% GDF Suez Equity EUR 7,133,214 138,598,348 1.97% Anadarko Petroleum Corp. Equity USD 1,850,000 126,131,131 1.79% National Grid PLC Equity GBP 10,253,873 121,308,232 1.73% UniCredit SpA Equity EUR 22,726,452 121,245,621 1.72% Suzuki Motor Corp. Equity JPY 4,825,545 121,071,883 1.72% Charter Communications Inc. Equity USD 847,500 116,698,010 1.66% Porsche Automobil Holding SE - Pref - Equity EUR 1,630,269 109,488,866 1.56% Essilor International SA Equity EUR 1,110,243 102,897,321 1.46% Vinci SA Equity EUR 2,249,005 102,352,218 1.46% L'Oreal SA Equity EUR 688,354 95,887,712 1.36% Renault SA Equity EUR 1,546,695 93,621,448 1.33% Mitsubishi Estate Co. Ltd. Equity JPY 4,930,000 86,839,707 1.24% International Consolidated Airlines Group SA Equity EUR 14,000,000 86,660,000 1.23% Sanofi Equity EUR 1,123,490 85,003,253 1.21% Intesa Sanpaolo SpA Equity EUR 34,319,480 83,121,781 1.18%
350
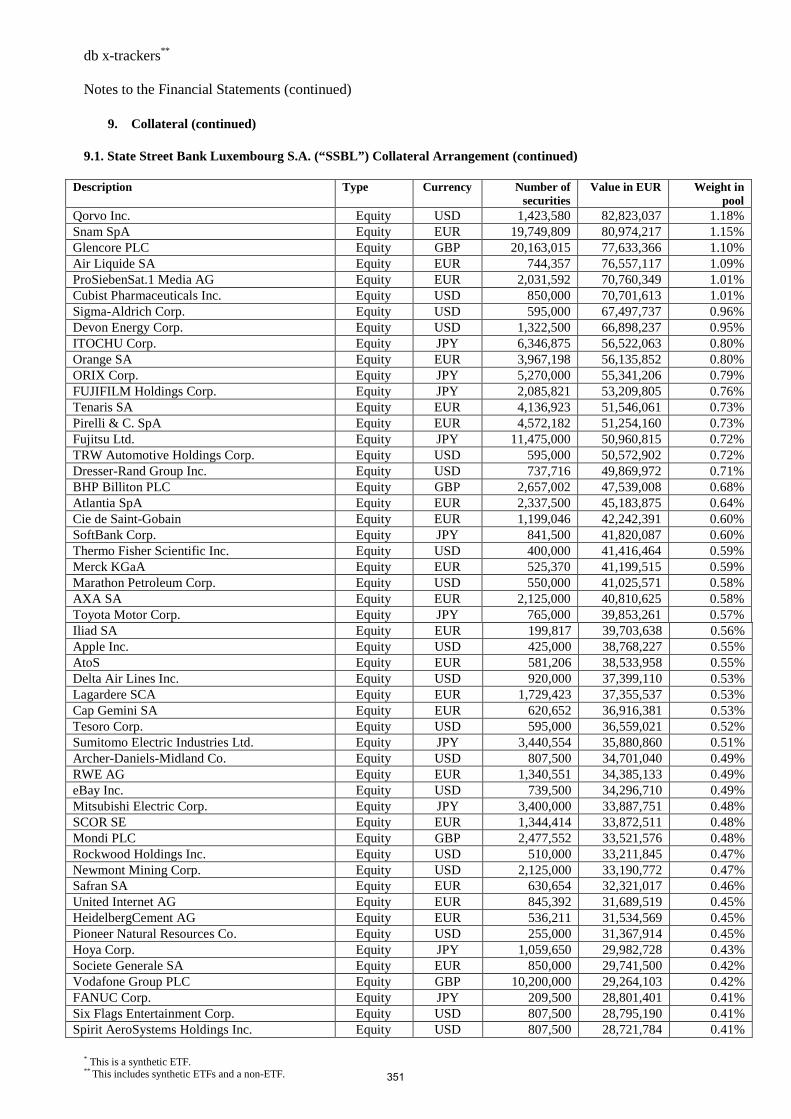
db x-trackers** Notes to the Financial Statements (continued)
* This is a synthetic ETF. ** This includes synthetic ETFs and a non-ETF.
9. Collateral (continued) 9.1. State Street Bank Luxembourg S.A. (“SSBL”) Collateral Arrangement (continued)
Description Type Currency Number of securities
Value in EUR Weight in pool
Qorvo Inc. Equity USD 1,423,580 82,823,037 1.18% Snam SpA Equity EUR 19,749,809 80,974,217 1.15% Glencore PLC Equity GBP 20,163,015 77,633,366 1.10% Air Liquide SA Equity EUR 744,357 76,557,117 1.09% ProSiebenSat.1 Media AG Equity EUR 2,031,592 70,760,349 1.01% Cubist Pharmaceuticals Inc. Equity USD 850,000 70,701,613 1.01% Sigma-Aldrich Corp. Equity USD 595,000 67,497,737 0.96% Devon Energy Corp. Equity USD 1,322,500 66,898,237 0.95% ITOCHU Corp. Equity JPY 6,346,875 56,522,063 0.80% Orange SA Equity EUR 3,967,198 56,135,852 0.80% ORIX Corp. Equity JPY 5,270,000 55,341,206 0.79% FUJIFILM Holdings Corp. Equity JPY 2,085,821 53,209,805 0.76% Tenaris SA Equity EUR 4,136,923 51,546,061 0.73% Pirelli & C. SpA Equity EUR 4,572,182 51,254,160 0.73% Fujitsu Ltd. Equity JPY 11,475,000 50,960,815 0.72% TRW Automotive Holdings Corp. Equity USD 595,000 50,572,902 0.72% Dresser-Rand Group Inc. Equity USD 737,716 49,869,972 0.71% BHP Billiton PLC Equity GBP 2,657,002 47,539,008 0.68% Atlantia SpA Equity EUR 2,337,500 45,183,875 0.64% Cie de Saint-Gobain Equity EUR 1,199,046 42,242,391 0.60% SoftBank Corp. Equity JPY 841,500 41,820,087 0.60% Thermo Fisher Scientific Inc. Equity USD 400,000 41,416,464 0.59% Merck KGaA Equity EUR 525,370 41,199,515 0.59% Marathon Petroleum Corp. Equity USD 550,000 41,025,571 0.58% AXA SA Equity EUR 2,125,000 40,810,625 0.58% Toyota Motor Corp. Equity JPY 765,000 39,853,261 0.57% Iliad SA Equity EUR 199,817 39,703,638 0.56% Apple Inc. Equity USD 425,000 38,768,227 0.55% AtoS Equity EUR 581,206 38,533,958 0.55% Delta Air Lines Inc. Equity USD 920,000 37,399,110 0.53% Lagardere SCA Equity EUR 1,729,423 37,355,537 0.53% Cap Gemini SA Equity EUR 620,652 36,916,381 0.53% Tesoro Corp. Equity USD 595,000 36,559,021 0.52% Sumitomo Electric Industries Ltd. Equity JPY 3,440,554 35,880,860 0.51% Archer-Daniels-Midland Co. Equity USD 807,500 34,701,040 0.49% RWE AG Equity EUR 1,340,551 34,385,133 0.49% eBay Inc. Equity USD 739,500 34,296,710 0.49% Mitsubishi Electric Corp. Equity JPY 3,400,000 33,887,751 0.48% SCOR SE Equity EUR 1,344,414 33,872,511 0.48% Mondi PLC Equity GBP 2,477,552 33,521,576 0.48% Rockwood Holdings Inc. Equity USD 510,000 33,211,845 0.47% Newmont Mining Corp. Equity USD 2,125,000 33,190,772 0.47% Safran SA Equity EUR 630,654 32,321,017 0.46% United Internet AG Equity EUR 845,392 31,689,519 0.45% HeidelbergCement AG Equity EUR 536,211 31,534,569 0.45% Pioneer Natural Resources Co. Equity USD 255,000 31,367,914 0.45% Hoya Corp. Equity JPY 1,059,650 29,982,728 0.43% Societe Generale SA Equity EUR 850,000 29,741,500 0.42% Vodafone Group PLC Equity GBP 10,200,000 29,264,103 0.42% FANUC Corp. Equity JPY 209,500 28,801,401 0.41% Six Flags Entertainment Corp. Equity USD 807,500 28,795,190 0.41% Spirit AeroSystems Holdings Inc. Equity USD 807,500 28,721,784 0.41%
351
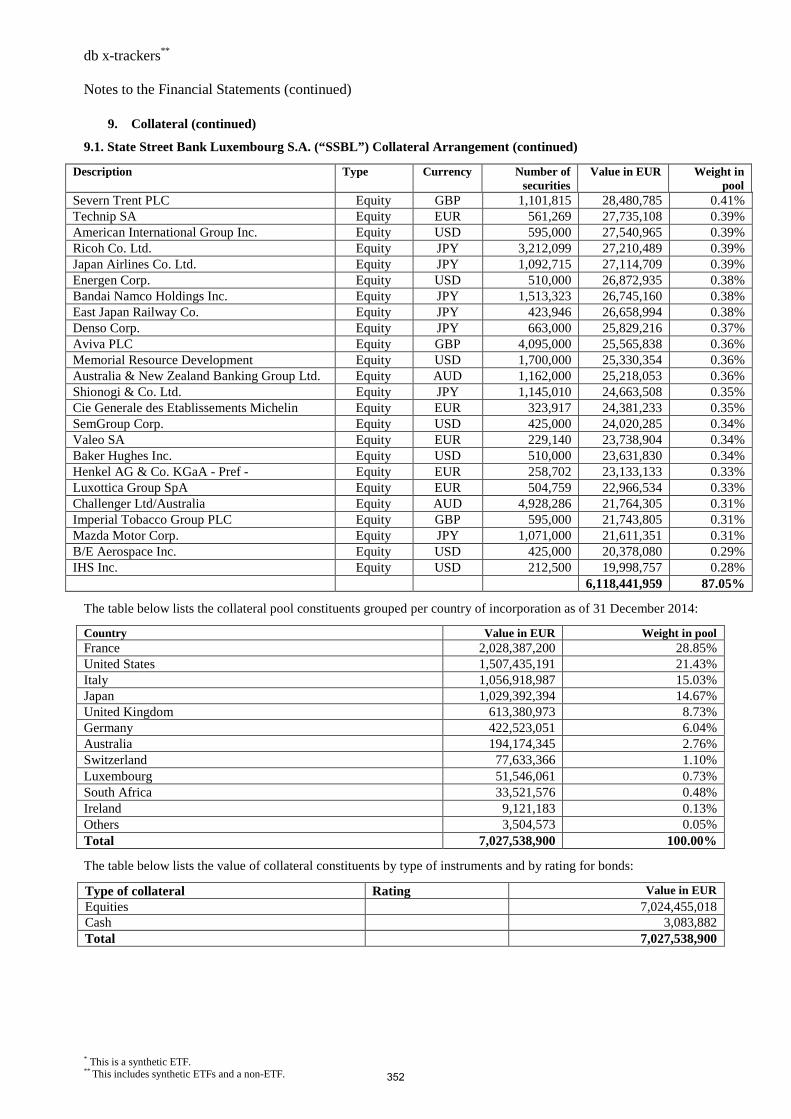
db x-trackers** Notes to the Financial Statements (continued)
* This is a synthetic ETF. ** This includes synthetic ETFs and a non-ETF.
9. Collateral (continued)
9.1. State Street Bank Luxembourg S.A. (“SSBL”) Collateral Arrangement (continued)
Description Type Currency Number of securities
Value in EUR Weight in pool
Severn Trent PLC Equity GBP 1,101,815 28,480,785 0.41% Technip SA Equity EUR 561,269 27,735,108 0.39% American International Group Inc. Equity USD 595,000 27,540,965 0.39% Ricoh Co. Ltd. Equity JPY 3,212,099 27,210,489 0.39% Japan Airlines Co. Ltd. Equity JPY 1,092,715 27,114,709 0.39% Energen Corp. Equity USD 510,000 26,872,935 0.38% Bandai Namco Holdings Inc. Equity JPY 1,513,323 26,745,160 0.38% East Japan Railway Co. Equity JPY 423,946 26,658,994 0.38% Denso Corp. Equity JPY 663,000 25,829,216 0.37% Aviva PLC Equity GBP 4,095,000 25,565,838 0.36% Memorial Resource Development Equity USD 1,700,000 25,330,354 0.36% Australia & New Zealand Banking Group Ltd. Equity AUD 1,162,000 25,218,053 0.36% Shionogi & Co. Ltd. Equity JPY 1,145,010 24,663,508 0.35% Cie Generale des Etablissements Michelin Equity EUR 323,917 24,381,233 0.35% SemGroup Corp. Equity USD 425,000 24,020,285 0.34% Valeo SA Equity EUR 229,140 23,738,904 0.34% Baker Hughes Inc. Equity USD 510,000 23,631,830 0.34% Henkel AG & Co. KGaA - Pref - Equity EUR 258,702 23,133,133 0.33% Luxottica Group SpA Equity EUR 504,759 22,966,534 0.33% Challenger Ltd/Australia Equity AUD 4,928,286 21,764,305 0.31% Imperial Tobacco Group PLC Equity GBP 595,000 21,743,805 0.31% Mazda Motor Corp. Equity JPY 1,071,000 21,611,351 0.31% B/E Aerospace Inc. Equity USD 425,000 20,378,080 0.29% IHS Inc. Equity USD 212,500 19,998,757 0.28%
6,118,441,959 87.05%
The table below lists the collateral pool constituents grouped per country of incorporation as of 31 December 2014:
Country Value in EUR Weight in pool France 2,028,387,200 28.85% United States 1,507,435,191 21.43% Italy 1,056,918,987 15.03% Japan 1,029,392,394 14.67% United Kingdom 613,380,973 8.73% Germany 422,523,051 6.04% Australia 194,174,345 2.76% Switzerland 77,633,366 1.10% Luxembourg 51,546,061 0.73% South Africa 33,521,576 0.48% Ireland 9,121,183 0.13% Others 3,504,573 0.05% Total 7,027,538,900 100.00%
The table below lists the value of collateral constituents by type of instruments and by rating for bonds:
Type of collateral Rating Value in EUR Equities 7,024,455,018 Cash 3,083,882 Total 7,027,538,900
352
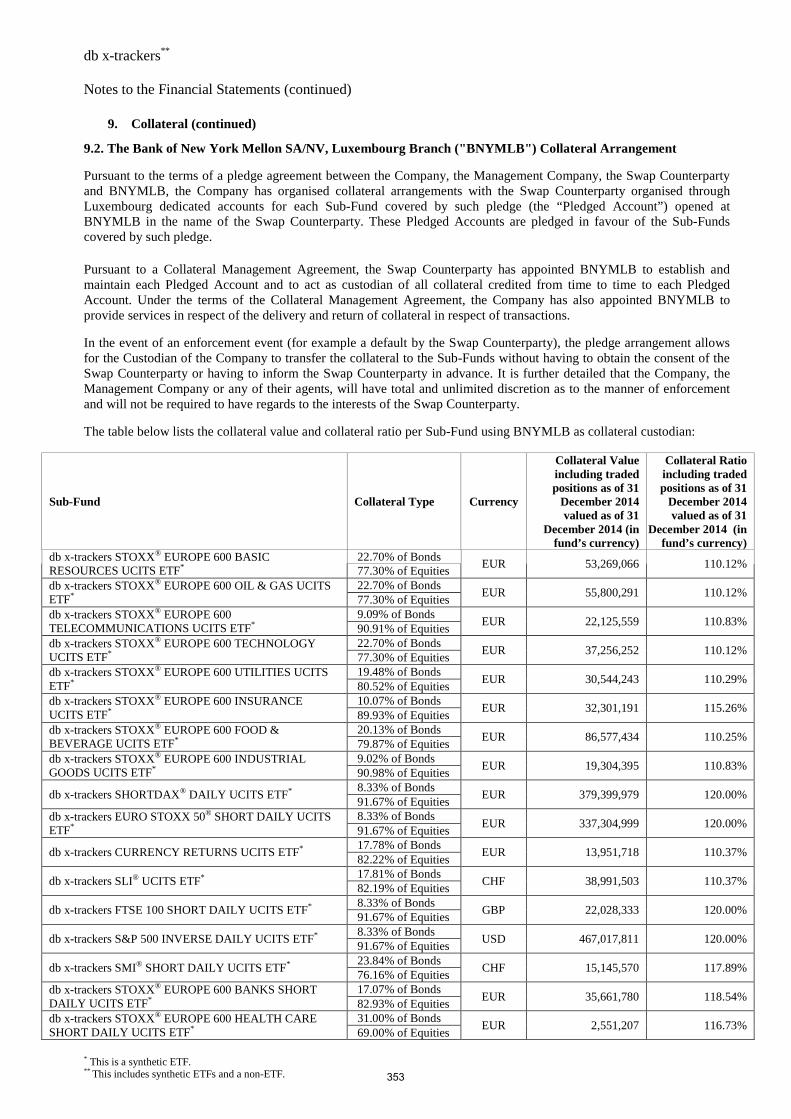
db x-trackers** Notes to the Financial Statements (continued)
* This is a synthetic ETF. ** This includes synthetic ETFs and a non-ETF.
9. Collateral (continued)
9.2. The Bank of New York Mellon SA/NV, Luxembourg Branch ("BNYMLB") Collateral Arrangement Pursuant to the terms of a pledge agreement between the Company, the Management Company, the Swap Counterparty and BNYMLB, the Company has organised collateral arrangements with the Swap Counterparty organised through Luxembourg dedicated accounts for each Sub-Fund covered by such pledge (the “Pledged Account”) opened at BNYMLB in the name of the Swap Counterparty. These Pledged Accounts are pledged in favour of the Sub-Funds covered by such pledge.
Pursuant to a Collateral Management Agreement, the Swap Counterparty has appointed BNYMLB to establish and maintain each Pledged Account and to act as custodian of all collateral credited from time to time to each Pledged Account. Under the terms of the Collateral Management Agreement, the Company has also appointed BNYMLB to provide services in respect of the delivery and return of collateral in respect of transactions. In the event of an enforcement event (for example a default by the Swap Counterparty), the pledge arrangement allows for the Custodian of the Company to transfer the collateral to the Sub-Funds without having to obtain the consent of the Swap Counterparty or having to inform the Swap Counterparty in advance. It is further detailed that the Company, the Management Company or any of their agents, will have total and unlimited discretion as to the manner of enforcement and will not be required to have regards to the interests of the Swap Counterparty. The table below lists the collateral value and collateral ratio per Sub-Fund using BNYMLB as collateral custodian:
Sub-Fund Collateral Type Currency
Collateral Value including traded positions as of 31
December 2014 valued as of 31
December 2014 (in fund’s currency)
Collateral Ratio including traded positions as of 31
December 2014 valued as of 31
December 2014 (in fund’s currency)
db x-trackers STOXX® EUROPE 600 BASIC RESOURCES UCITS ETF*
22.70% of Bonds EUR 53,269,066 110.12%
77.30% of Equities db x-trackers STOXX® EUROPE 600 OIL & GAS UCITS ETF*
22.70% of Bonds EUR 55,800,291 110.12%
77.30% of Equities db x-trackers STOXX® EUROPE 600 TELECOMMUNICATIONS UCITS ETF*
9.09% of Bonds EUR 22,125,559 110.83%
90.91% of Equities db x-trackers STOXX® EUROPE 600 TECHNOLOGY UCITS ETF*
22.70% of Bonds EUR 37,256,252 110.12%
77.30% of Equities db x-trackers STOXX® EUROPE 600 UTILITIES UCITS ETF*
19.48% of Bonds EUR 30,544,243 110.29%
80.52% of Equities db x-trackers STOXX® EUROPE 600 INSURANCE UCITS ETF*
10.07% of Bonds EUR 32,301,191 115.26%
89.93% of Equities db x-trackers STOXX® EUROPE 600 FOOD & BEVERAGE UCITS ETF*
20.13% of Bonds EUR 86,577,434 110.25%
79.87% of Equities db x-trackers STOXX® EUROPE 600 INDUSTRIAL GOODS UCITS ETF*
9.02% of Bonds EUR 19,304,395 110.83%
90.98% of Equities
db x-trackers SHORTDAX® DAILY UCITS ETF* 8.33% of Bonds
EUR 379,399,979 120.00% 91.67% of Equities
db x-trackers EURO STOXX 50® SHORT DAILY UCITS ETF*
8.33% of Bonds EUR 337,304,999 120.00%
91.67% of Equities
db x-trackers CURRENCY RETURNS UCITS ETF* 17.78% of Bonds
EUR 13,951,718 110.37% 82.22% of Equities
db x-trackers SLI® UCITS ETF* 17.81% of Bonds
CHF 38,991,503 110.37% 82.19% of Equities
db x-trackers FTSE 100 SHORT DAILY UCITS ETF* 8.33% of Bonds
GBP 22,028,333 120.00% 91.67% of Equities
db x-trackers S&P 500 INVERSE DAILY UCITS ETF* 8.33% of Bonds
USD 467,017,811 120.00% 91.67% of Equities
db x-trackers SMI® SHORT DAILY UCITS ETF* 23.84% of Bonds
CHF 15,145,570 117.89% 76.16% of Equities
db x-trackers STOXX® EUROPE 600 BANKS SHORT DAILY UCITS ETF*
17.07% of Bonds EUR 35,661,780 118.54%
82.93% of Equities db x-trackers STOXX® EUROPE 600 HEALTH CARE SHORT DAILY UCITS ETF*
31.00% of Bonds EUR 2,551,207 116.73%
69.00% of Equities
353
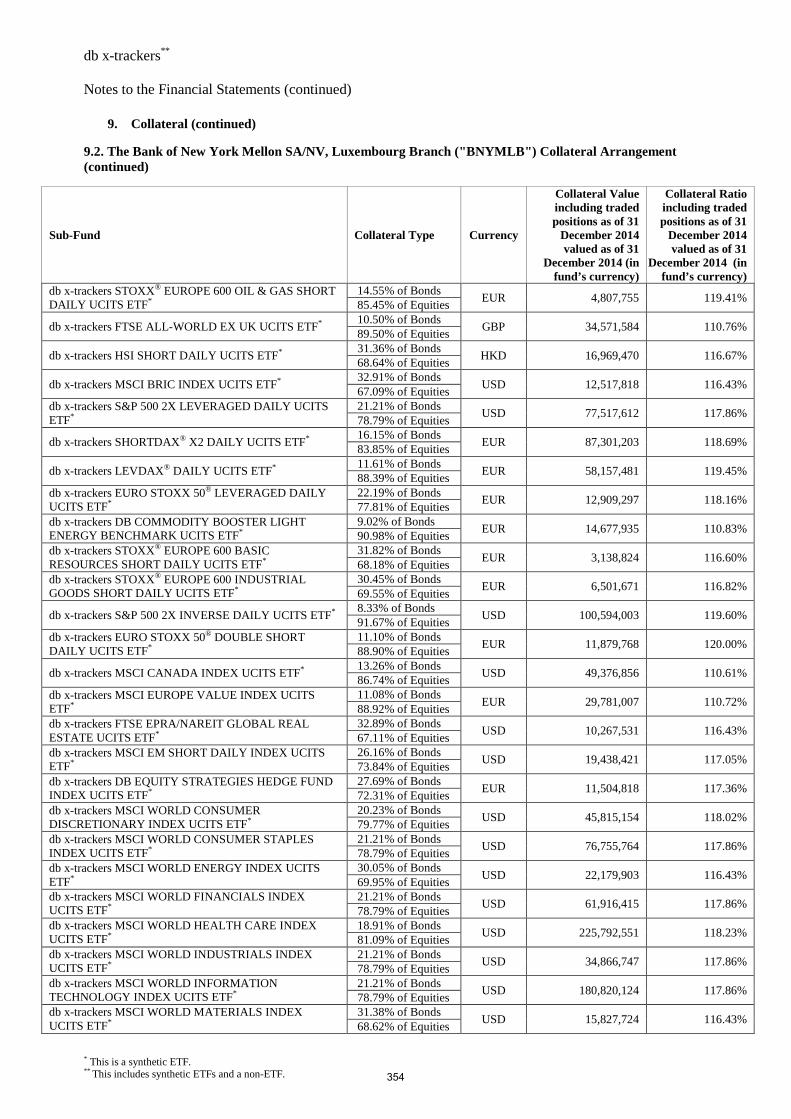
db x-trackers** Notes to the Financial Statements (continued)
* This is a synthetic ETF. ** This includes synthetic ETFs and a non-ETF.
9. Collateral (continued) 9.2. The Bank of New York Mellon SA/NV, Luxembourg Branch ("BNYMLB") Collateral Arrangement (continued)
Sub-Fund Collateral Type Currency
Collateral Value including traded positions as of 31
December 2014 valued as of 31
December 2014 (in fund’s currency)
Collateral Ratio including traded positions as of 31
December 2014 valued as of 31
December 2014 (in fund’s currency)
db x-trackers STOXX® EUROPE 600 OIL & GAS SHORT DAILY UCITS ETF*
14.55% of Bonds EUR 4,807,755 119.41%
85.45% of Equities
db x-trackers FTSE ALL-WORLD EX UK UCITS ETF* 10.50% of Bonds
GBP 34,571,584 110.76% 89.50% of Equities
db x-trackers HSI SHORT DAILY UCITS ETF* 31.36% of Bonds
HKD 16,969,470 116.67% 68.64% of Equities
db x-trackers MSCI BRIC INDEX UCITS ETF* 32.91% of Bonds
USD 12,517,818 116.43% 67.09% of Equities
db x-trackers S&P 500 2X LEVERAGED DAILY UCITS ETF*
21.21% of Bonds USD 77,517,612 117.86%
78.79% of Equities
db x-trackers SHORTDAX® X2 DAILY UCITS ETF* 16.15% of Bonds
EUR 87,301,203 118.69% 83.85% of Equities
db x-trackers LEVDAX® DAILY UCITS ETF* 11.61% of Bonds
EUR 58,157,481 119.45% 88.39% of Equities
db x-trackers EURO STOXX 50® LEVERAGED DAILY UCITS ETF*
22.19% of Bonds EUR 12,909,297 118.16%
77.81% of Equities db x-trackers DB COMMODITY BOOSTER LIGHT ENERGY BENCHMARK UCITS ETF*
9.02% of Bonds EUR 14,677,935 110.83%
90.98% of Equities db x-trackers STOXX® EUROPE 600 BASIC RESOURCES SHORT DAILY UCITS ETF*
31.82% of Bonds EUR 3,138,824 116.60%
68.18% of Equities db x-trackers STOXX® EUROPE 600 INDUSTRIAL GOODS SHORT DAILY UCITS ETF*
30.45% of Bonds EUR 6,501,671 116.82%
69.55% of Equities
db x-trackers S&P 500 2X INVERSE DAILY UCITS ETF* 8.33% of Bonds
USD 100,594,003 119.60% 91.67% of Equities
db x-trackers EURO STOXX 50® DOUBLE SHORT DAILY UCITS ETF*
11.10% of Bonds EUR 11,879,768 120.00%
88.90% of Equities
db x-trackers MSCI CANADA INDEX UCITS ETF* 13.26% of Bonds
USD 49,376,856 110.61% 86.74% of Equities
db x-trackers MSCI EUROPE VALUE INDEX UCITS ETF*
11.08% of Bonds EUR 29,781,007 110.72%
88.92% of Equities db x-trackers FTSE EPRA/NAREIT GLOBAL REAL ESTATE UCITS ETF*
32.89% of Bonds USD 10,267,531 116.43%
67.11% of Equities db x-trackers MSCI EM SHORT DAILY INDEX UCITS ETF*
26.16% of Bonds USD 19,438,421 117.05%
73.84% of Equities db x-trackers DB EQUITY STRATEGIES HEDGE FUND INDEX UCITS ETF*
27.69% of Bonds EUR 11,504,818 117.36%
72.31% of Equities db x-trackers MSCI WORLD CONSUMER DISCRETIONARY INDEX UCITS ETF*
20.23% of Bonds USD 45,815,154 118.02%
79.77% of Equities db x-trackers MSCI WORLD CONSUMER STAPLES INDEX UCITS ETF*
21.21% of Bonds USD 76,755,764 117.86%
78.79% of Equities db x-trackers MSCI WORLD ENERGY INDEX UCITS ETF*
30.05% of Bonds USD 22,179,903 116.43%
69.95% of Equities db x-trackers MSCI WORLD FINANCIALS INDEX UCITS ETF*
21.21% of Bonds USD 61,916,415 117.86%
78.79% of Equities db x-trackers MSCI WORLD HEALTH CARE INDEX UCITS ETF*
18.91% of Bonds USD 225,792,551 118.23%
81.09% of Equities db x-trackers MSCI WORLD INDUSTRIALS INDEX UCITS ETF*
21.21% of Bonds USD 34,866,747 117.86%
78.79% of Equities db x-trackers MSCI WORLD INFORMATION TECHNOLOGY INDEX UCITS ETF*
21.21% of Bonds USD 180,820,124 117.86%
78.79% of Equities db x-trackers MSCI WORLD MATERIALS INDEX UCITS ETF*
31.38% of Bonds USD 15,827,724 116.43%
68.62% of Equities
354
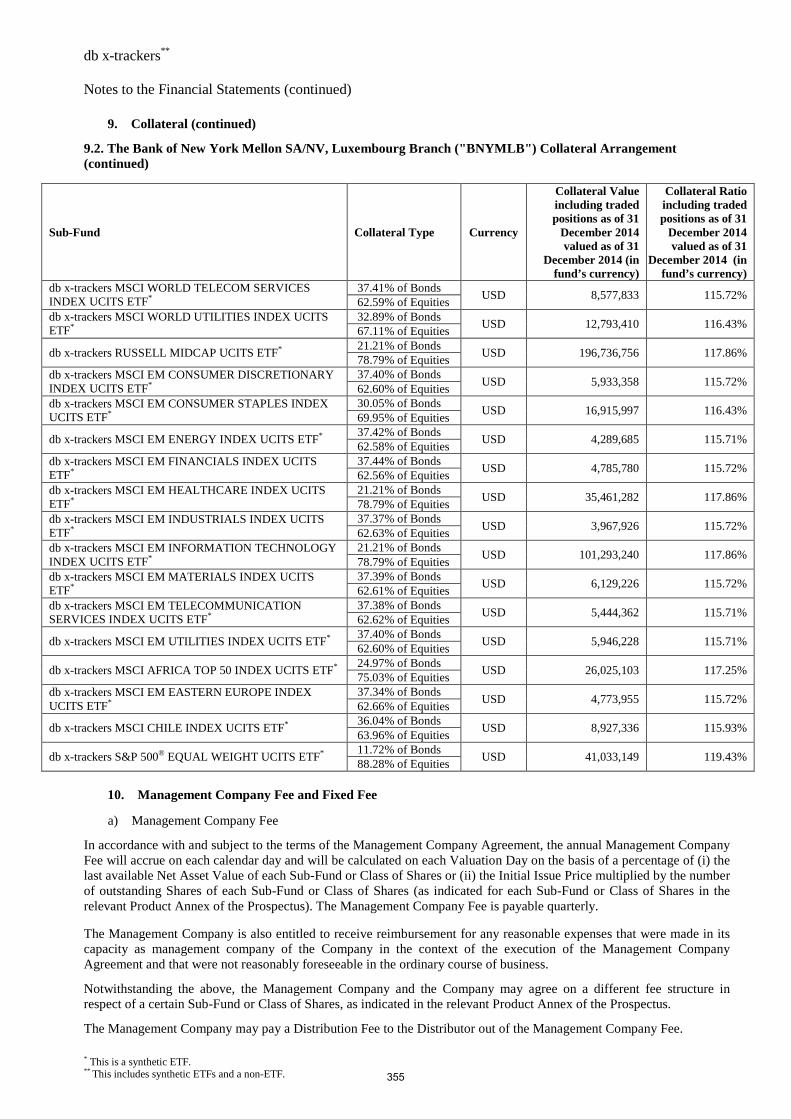
db x-trackers** Notes to the Financial Statements (continued)
* This is a synthetic ETF. ** This includes synthetic ETFs and a non-ETF.
9. Collateral (continued)
9.2. The Bank of New York Mellon SA/NV, Luxembourg Branch ("BNYMLB") Collateral Arrangement (continued)
Sub-Fund Collateral Type Currency
Collateral Value including traded positions as of 31
December 2014 valued as of 31
December 2014 (in fund’s currency)
Collateral Ratio including traded positions as of 31
December 2014 valued as of 31
December 2014 (in fund’s currency)
db x-trackers MSCI WORLD TELECOM SERVICES INDEX UCITS ETF*
37.41% of Bonds USD 8,577,833 115.72%
62.59% of Equities db x-trackers MSCI WORLD UTILITIES INDEX UCITS ETF*
32.89% of Bonds USD 12,793,410 116.43%
67.11% of Equities
db x-trackers RUSSELL MIDCAP UCITS ETF* 21.21% of Bonds
USD 196,736,756 117.86% 78.79% of Equities
db x-trackers MSCI EM CONSUMER DISCRETIONARY INDEX UCITS ETF*
37.40% of Bonds USD 5,933,358 115.72%
62.60% of Equities db x-trackers MSCI EM CONSUMER STAPLES INDEX UCITS ETF*
30.05% of Bonds USD 16,915,997 116.43%
69.95% of Equities
db x-trackers MSCI EM ENERGY INDEX UCITS ETF* 37.42% of Bonds
USD 4,289,685 115.71% 62.58% of Equities
db x-trackers MSCI EM FINANCIALS INDEX UCITS ETF*
37.44% of Bonds USD 4,785,780 115.72%
62.56% of Equities db x-trackers MSCI EM HEALTHCARE INDEX UCITS ETF*
21.21% of Bonds USD 35,461,282 117.86%
78.79% of Equities db x-trackers MSCI EM INDUSTRIALS INDEX UCITS ETF*
37.37% of Bonds USD 3,967,926 115.72%
62.63% of Equities db x-trackers MSCI EM INFORMATION TECHNOLOGY INDEX UCITS ETF*
21.21% of Bonds USD 101,293,240 117.86%
78.79% of Equities db x-trackers MSCI EM MATERIALS INDEX UCITS ETF*
37.39% of Bonds USD 6,129,226 115.72%
62.61% of Equities db x-trackers MSCI EM TELECOMMUNICATION SERVICES INDEX UCITS ETF*
37.38% of Bonds USD 5,444,362 115.71%
62.62% of Equities
db x-trackers MSCI EM UTILITIES INDEX UCITS ETF* 37.40% of Bonds
USD 5,946,228 115.71% 62.60% of Equities
db x-trackers MSCI AFRICA TOP 50 INDEX UCITS ETF* 24.97% of Bonds
USD 26,025,103 117.25% 75.03% of Equities
db x-trackers MSCI EM EASTERN EUROPE INDEX UCITS ETF*
37.34% of Bonds USD 4,773,955 115.72%
62.66% of Equities
db x-trackers MSCI CHILE INDEX UCITS ETF* 36.04% of Bonds
USD 8,927,336 115.93% 63.96% of Equities
db x-trackers S&P 500® EQUAL WEIGHT UCITS ETF* 11.72% of Bonds
USD 41,033,149 119.43% 88.28% of Equities
10. Management Company Fee and Fixed Fee
a) Management Company Fee
In accordance with and subject to the terms of the Management Company Agreement, the annual Management Company Fee will accrue on each calendar day and will be calculated on each Valuation Day on the basis of a percentage of (i) the last available Net Asset Value of each Sub-Fund or Class of Shares or (ii) the Initial Issue Price multiplied by the number of outstanding Shares of each Sub-Fund or Class of Shares (as indicated for each Sub-Fund or Class of Shares in the relevant Product Annex of the Prospectus). The Management Company Fee is payable quarterly. The Management Company is also entitled to receive reimbursement for any reasonable expenses that were made in its capacity as management company of the Company in the context of the execution of the Management Company Agreement and that were not reasonably foreseeable in the ordinary course of business.
Notwithstanding the above, the Management Company and the Company may agree on a different fee structure in respect of a certain Sub-Fund or Class of Shares, as indicated in the relevant Product Annex of the Prospectus.
The Management Company may pay a Distribution Fee to the Distributor out of the Management Company Fee.
355
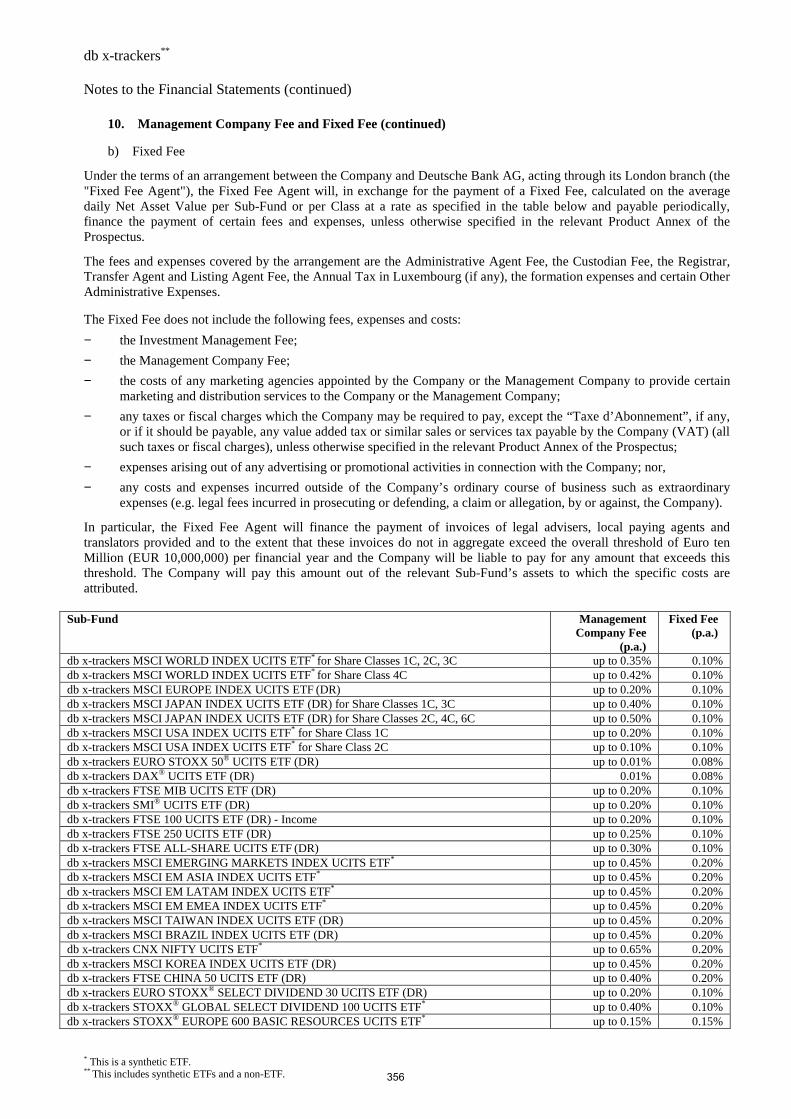
db x-trackers** Notes to the Financial Statements (continued)
* This is a synthetic ETF. ** This includes synthetic ETFs and a non-ETF.
10. Management Company Fee and Fixed Fee (continued)
b) Fixed Fee
Under the terms of an arrangement between the Company and Deutsche Bank AG, acting through its London branch (the "Fixed Fee Agent"), the Fixed Fee Agent will, in exchange for the payment of a Fixed Fee, calculated on the average daily Net Asset Value per Sub-Fund or per Class at a rate as specified in the table below and payable periodically, finance the payment of certain fees and expenses, unless otherwise specified in the relevant Product Annex of the Prospectus.
The fees and expenses covered by the arrangement are the Administrative Agent Fee, the Custodian Fee, the Registrar, Transfer Agent and Listing Agent Fee, the Annual Tax in Luxembourg (if any), the formation expenses and certain Other Administrative Expenses. The Fixed Fee does not include the following fees, expenses and costs:
− the Investment Management Fee;
− the Management Company Fee;
− the costs of any marketing agencies appointed by the Company or the Management Company to provide certain marketing and distribution services to the Company or the Management Company;
− any taxes or fiscal charges which the Company may be required to pay, except the “Taxe d’Abonnement”, if any, or if it should be payable, any value added tax or similar sales or services tax payable by the Company (VAT) (all such taxes or fiscal charges), unless otherwise specified in the relevant Product Annex of the Prospectus;
− expenses arising out of any advertising or promotional activities in connection with the Company; nor,
− any costs and expenses incurred outside of the Company’s ordinary course of business such as extraordinary expenses (e.g. legal fees incurred in prosecuting or defending, a claim or allegation, by or against, the Company).
In particular, the Fixed Fee Agent will finance the payment of invoices of legal advisers, local paying agents and translators provided and to the extent that these invoices do not in aggregate exceed the overall threshold of Euro ten Million (EUR 10,000,000) per financial year and the Company will be liable to pay for any amount that exceeds this threshold. The Company will pay this amount out of the relevant Sub-Fund’s assets to which the specific costs are attributed.
Sub-Fund Management Company Fee
(p.a.)
Fixed Fee (p.a.)
db x-trackers MSCI WORLD INDEX UCITS ETF* for Share Classes 1C, 2C, 3C up to 0.35% 0.10% db x-trackers MSCI WORLD INDEX UCITS ETF* for Share Class 4C up to 0.42% 0.10% db x-trackers MSCI EUROPE INDEX UCITS ETF (DR) up to 0.20% 0.10% db x-trackers MSCI JAPAN INDEX UCITS ETF (DR) for Share Classes 1C, 3C up to 0.40% 0.10% db x-trackers MSCI JAPAN INDEX UCITS ETF (DR) for Share Classes 2C, 4C, 6C up to 0.50% 0.10% db x-trackers MSCI USA INDEX UCITS ETF* for Share Class 1C up to 0.20% 0.10% db x-trackers MSCI USA INDEX UCITS ETF* for Share Class 2C up to 0.10% 0.10% db x-trackers EURO STOXX 50® UCITS ETF (DR) up to 0.01% 0.08% db x-trackers DAX® UCITS ETF (DR) 0.01% 0.08% db x-trackers FTSE MIB UCITS ETF (DR) up to 0.20% 0.10% db x-trackers SMI® UCITS ETF (DR) up to 0.20% 0.10% db x-trackers FTSE 100 UCITS ETF (DR) - Income up to 0.20% 0.10% db x-trackers FTSE 250 UCITS ETF (DR) up to 0.25% 0.10% db x-trackers FTSE ALL-SHARE UCITS ETF (DR) up to 0.30% 0.10% db x-trackers MSCI EMERGING MARKETS INDEX UCITS ETF* up to 0.45% 0.20% db x-trackers MSCI EM ASIA INDEX UCITS ETF* up to 0.45% 0.20% db x-trackers MSCI EM LATAM INDEX UCITS ETF* up to 0.45% 0.20% db x-trackers MSCI EM EMEA INDEX UCITS ETF* up to 0.45% 0.20% db x-trackers MSCI TAIWAN INDEX UCITS ETF (DR) up to 0.45% 0.20% db x-trackers MSCI BRAZIL INDEX UCITS ETF (DR) up to 0.45% 0.20% db x-trackers CNX NIFTY UCITS ETF* up to 0.65% 0.20% db x-trackers MSCI KOREA INDEX UCITS ETF (DR) up to 0.45% 0.20% db x-trackers FTSE CHINA 50 UCITS ETF (DR) up to 0.40% 0.20% db x-trackers EURO STOXX® SELECT DIVIDEND 30 UCITS ETF (DR) up to 0.20% 0.10% db x-trackers STOXX® GLOBAL SELECT DIVIDEND 100 UCITS ETF* up to 0.40% 0.10% db x-trackers STOXX® EUROPE 600 BASIC RESOURCES UCITS ETF* up to 0.15% 0.15%
356
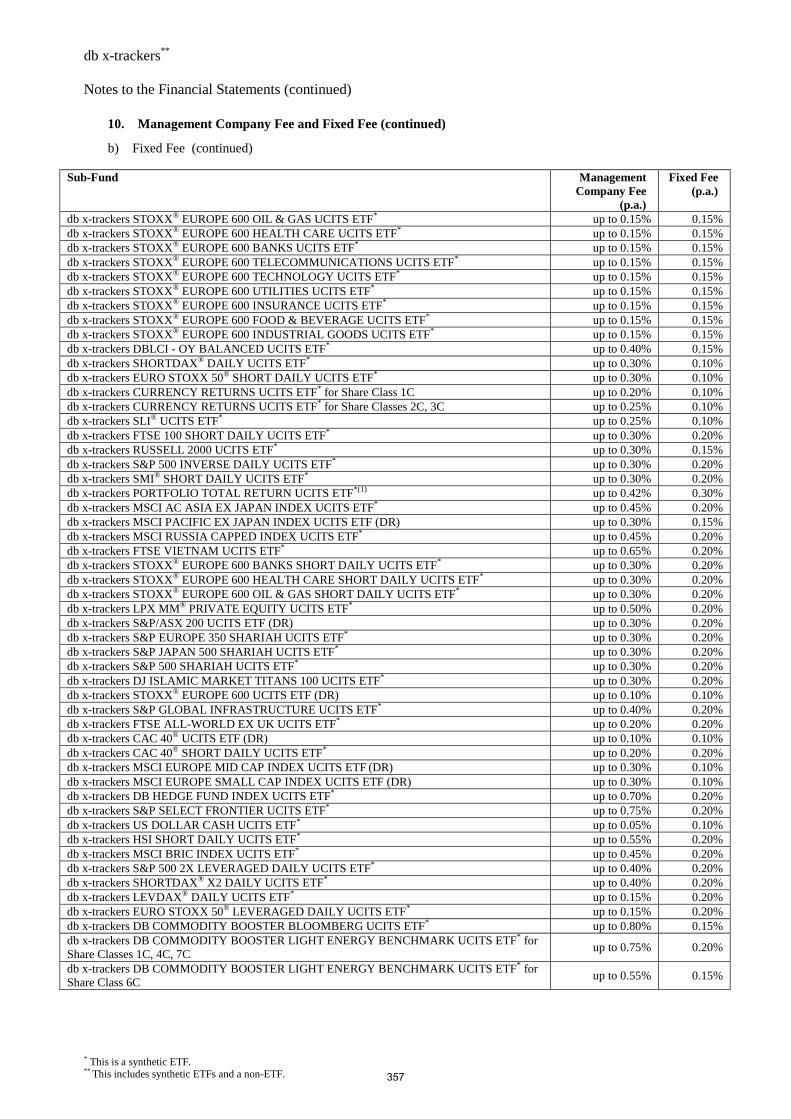
db x-trackers** Notes to the Financial Statements (continued)
* This is a synthetic ETF. ** This includes synthetic ETFs and a non-ETF.
10. Management Company Fee and Fixed Fee (continued)
b) Fixed Fee (continued)
Sub-Fund Management Company Fee
(p.a.)
Fixed Fee (p.a.)
db x-trackers STOXX® EUROPE 600 OIL & GAS UCITS ETF* up to 0.15% 0.15% db x-trackers STOXX® EUROPE 600 HEALTH CARE UCITS ETF* up to 0.15% 0.15% db x-trackers STOXX® EUROPE 600 BANKS UCITS ETF* up to 0.15% 0.15% db x-trackers STOXX® EUROPE 600 TELECOMMUNICATIONS UCITS ETF* up to 0.15% 0.15% db x-trackers STOXX® EUROPE 600 TECHNOLOGY UCITS ETF* up to 0.15% 0.15% db x-trackers STOXX® EUROPE 600 UTILITIES UCITS ETF* up to 0.15% 0.15% db x-trackers STOXX® EUROPE 600 INSURANCE UCITS ETF* up to 0.15% 0.15% db x-trackers STOXX® EUROPE 600 FOOD & BEVERAGE UCITS ETF* up to 0.15% 0.15% db x-trackers STOXX® EUROPE 600 INDUSTRIAL GOODS UCITS ETF* up to 0.15% 0.15% db x-trackers DBLCI - OY BALANCED UCITS ETF* up to 0.40% 0.15% db x-trackers SHORTDAX® DAILY UCITS ETF* up to 0.30% 0.10% db x-trackers EURO STOXX 50® SHORT DAILY UCITS ETF* up to 0.30% 0.10% db x-trackers CURRENCY RETURNS UCITS ETF* for Share Class 1C up to 0.20% 0.10% db x-trackers CURRENCY RETURNS UCITS ETF* for Share Classes 2C, 3C up to 0.25% 0.10% db x-trackers SLI® UCITS ETF* up to 0.25% 0.10% db x-trackers FTSE 100 SHORT DAILY UCITS ETF* up to 0.30% 0.20% db x-trackers RUSSELL 2000 UCITS ETF* up to 0.30% 0.15% db x-trackers S&P 500 INVERSE DAILY UCITS ETF* up to 0.30% 0.20% db x-trackers SMI® SHORT DAILY UCITS ETF* up to 0.30% 0.20% db x-trackers PORTFOLIO TOTAL RETURN UCITS ETF* (1) up to 0.42% 0.30% db x-trackers MSCI AC ASIA EX JAPAN INDEX UCITS ETF* up to 0.45% 0.20% db x-trackers MSCI PACIFIC EX JAPAN INDEX UCITS ETF (DR) up to 0.30% 0.15% db x-trackers MSCI RUSSIA CAPPED INDEX UCITS ETF* up to 0.45% 0.20% db x-trackers FTSE VIETNAM UCITS ETF* up to 0.65% 0.20% db x-trackers STOXX® EUROPE 600 BANKS SHORT DAILY UCITS ETF* up to 0.30% 0.20% db x-trackers STOXX® EUROPE 600 HEALTH CARE SHORT DAILY UCITS ETF* up to 0.30% 0.20% db x-trackers STOXX® EUROPE 600 OIL & GAS SHORT DAILY UCITS ETF* up to 0.30% 0.20% db x-trackers LPX MM® PRIVATE EQUITY UCITS ETF* up to 0.50% 0.20% db x-trackers S&P/ASX 200 UCITS ETF (DR) up to 0.30% 0.20% db x-trackers S&P EUROPE 350 SHARIAH UCITS ETF* up to 0.30% 0.20% db x-trackers S&P JAPAN 500 SHARIAH UCITS ETF* up to 0.30% 0.20% db x-trackers S&P 500 SHARIAH UCITS ETF* up to 0.30% 0.20% db x-trackers DJ ISLAMIC MARKET TITANS 100 UCITS ETF* up to 0.30% 0.20% db x-trackers STOXX® EUROPE 600 UCITS ETF (DR) up to 0.10% 0.10% db x-trackers S&P GLOBAL INFRASTRUCTURE UCITS ETF* up to 0.40% 0.20% db x-trackers FTSE ALL-WORLD EX UK UCITS ETF* up to 0.20% 0.20% db x-trackers CAC 40® UCITS ETF (DR) up to 0.10% 0.10% db x-trackers CAC 40® SHORT DAILY UCITS ETF* up to 0.20% 0.20% db x-trackers MSCI EUROPE MID CAP INDEX UCITS ETF (DR) up to 0.30% 0.10% db x-trackers MSCI EUROPE SMALL CAP INDEX UCITS ETF (DR) up to 0.30% 0.10% db x-trackers DB HEDGE FUND INDEX UCITS ETF* up to 0.70% 0.20% db x-trackers S&P SELECT FRONTIER UCITS ETF* up to 0.75% 0.20% db x-trackers US DOLLAR CASH UCITS ETF* up to 0.05% 0.10% db x-trackers HSI SHORT DAILY UCITS ETF* up to 0.55% 0.20% db x-trackers MSCI BRIC INDEX UCITS ETF* up to 0.45% 0.20% db x-trackers S&P 500 2X LEVERAGED DAILY UCITS ETF* up to 0.40% 0.20% db x-trackers SHORTDAX® X2 DAILY UCITS ETF* up to 0.40% 0.20% db x-trackers LEVDAX® DAILY UCITS ETF* up to 0.15% 0.20% db x-trackers EURO STOXX 50® LEVERAGED DAILY UCITS ETF* up to 0.15% 0.20% db x-trackers DB COMMODITY BOOSTER BLOOMBERG UCITS ETF* up to 0.80% 0.15% db x-trackers DB COMMODITY BOOSTER LIGHT ENERGY BENCHMARK UCITS ETF* for Share Classes 1C, 4C, 7C
up to 0.75% 0.20%
db x-trackers DB COMMODITY BOOSTER LIGHT ENERGY BENCHMARK UCITS ETF* for Share Class 6C
up to 0.55% 0.15%
357
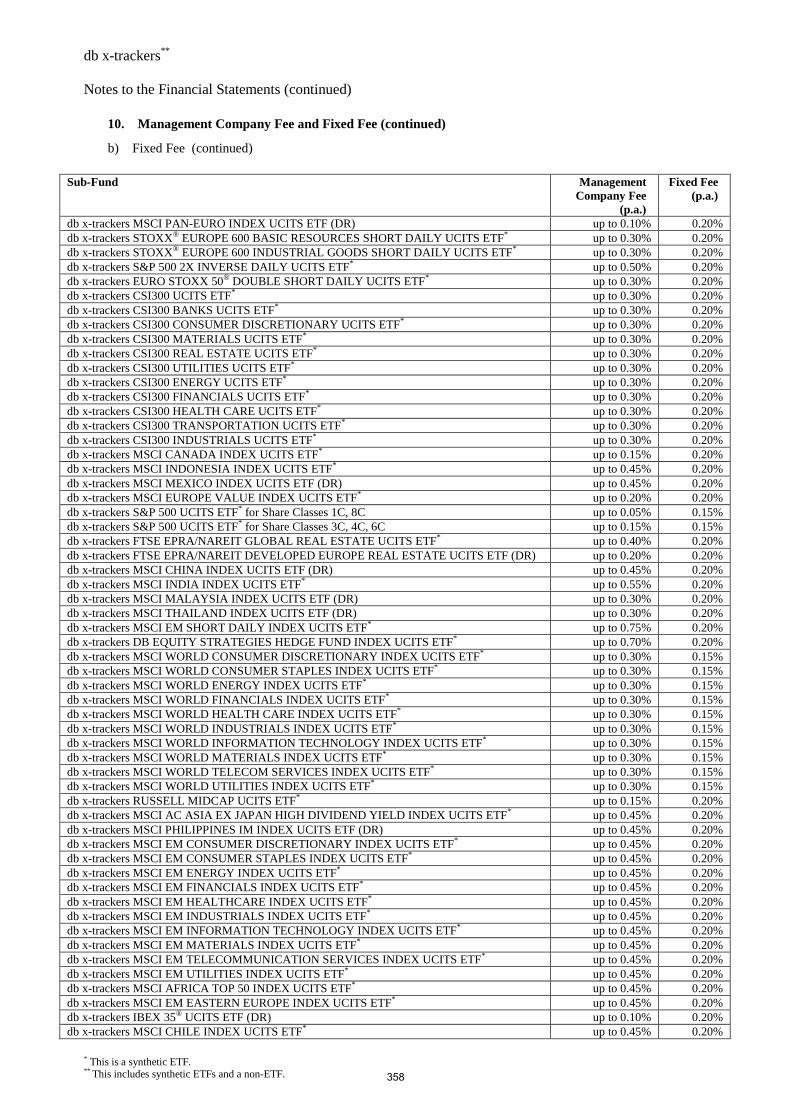
db x-trackers** Notes to the Financial Statements (continued)
* This is a synthetic ETF. ** This includes synthetic ETFs and a non-ETF.
10. Management Company Fee and Fixed Fee (continued)
b) Fixed Fee (continued)
Sub-Fund Management Company Fee
(p.a.)
Fixed Fee (p.a.)
db x-trackers MSCI PAN-EURO INDEX UCITS ETF (DR) up to 0.10% 0.20% db x-trackers STOXX® EUROPE 600 BASIC RESOURCES SHORT DAILY UCITS ETF* up to 0.30% 0.20% db x-trackers STOXX® EUROPE 600 INDUSTRIAL GOODS SHORT DAILY UCITS ETF* up to 0.30% 0.20% db x-trackers S&P 500 2X INVERSE DAILY UCITS ETF* up to 0.50% 0.20% db x-trackers EURO STOXX 50® DOUBLE SHORT DAILY UCITS ETF* up to 0.30% 0.20% db x-trackers CSI300 UCITS ETF* up to 0.30% 0.20% db x-trackers CSI300 BANKS UCITS ETF* up to 0.30% 0.20% db x-trackers CSI300 CONSUMER DISCRETIONARY UCITS ETF* up to 0.30% 0.20% db x-trackers CSI300 MATERIALS UCITS ETF* up to 0.30% 0.20% db x-trackers CSI300 REAL ESTATE UCITS ETF* up to 0.30% 0.20% db x-trackers CSI300 UTILITIES UCITS ETF* up to 0.30% 0.20% db x-trackers CSI300 ENERGY UCITS ETF* up to 0.30% 0.20% db x-trackers CSI300 FINANCIALS UCITS ETF* up to 0.30% 0.20% db x-trackers CSI300 HEALTH CARE UCITS ETF* up to 0.30% 0.20% db x-trackers CSI300 TRANSPORTATION UCITS ETF* up to 0.30% 0.20% db x-trackers CSI300 INDUSTRIALS UCITS ETF* up to 0.30% 0.20% db x-trackers MSCI CANADA INDEX UCITS ETF* up to 0.15% 0.20% db x-trackers MSCI INDONESIA INDEX UCITS ETF* up to 0.45% 0.20% db x-trackers MSCI MEXICO INDEX UCITS ETF (DR) up to 0.45% 0.20% db x-trackers MSCI EUROPE VALUE INDEX UCITS ETF* up to 0.20% 0.20% db x-trackers S&P 500 UCITS ETF* for Share Classes 1C, 8C up to 0.05% 0.15% db x-trackers S&P 500 UCITS ETF* for Share Classes 3C, 4C, 6C up to 0.15% 0.15% db x-trackers FTSE EPRA/NAREIT GLOBAL REAL ESTATE UCITS ETF* up to 0.40% 0.20% db x-trackers FTSE EPRA/NAREIT DEVELOPED EUROPE REAL ESTATE UCITS ETF (DR) up to 0.20% 0.20% db x-trackers MSCI CHINA INDEX UCITS ETF (DR) up to 0.45% 0.20% db x-trackers MSCI INDIA INDEX UCITS ETF* up to 0.55% 0.20% db x-trackers MSCI MALAYSIA INDEX UCITS ETF (DR) up to 0.30% 0.20% db x-trackers MSCI THAILAND INDEX UCITS ETF (DR) up to 0.30% 0.20% db x-trackers MSCI EM SHORT DAILY INDEX UCITS ETF* up to 0.75% 0.20% db x-trackers DB EQUITY STRATEGIES HEDGE FUND INDEX UCITS ETF* up to 0.70% 0.20% db x-trackers MSCI WORLD CONSUMER DISCRETIONARY INDEX UCITS ETF* up to 0.30% 0.15% db x-trackers MSCI WORLD CONSUMER STAPLES INDEX UCITS ETF* up to 0.30% 0.15% db x-trackers MSCI WORLD ENERGY INDEX UCITS ETF* up to 0.30% 0.15% db x-trackers MSCI WORLD FINANCIALS INDEX UCITS ETF* up to 0.30% 0.15% db x-trackers MSCI WORLD HEALTH CARE INDEX UCITS ETF* up to 0.30% 0.15% db x-trackers MSCI WORLD INDUSTRIALS INDEX UCITS ETF* up to 0.30% 0.15% db x-trackers MSCI WORLD INFORMATION TECHNOLOGY INDEX UCITS ETF* up to 0.30% 0.15% db x-trackers MSCI WORLD MATERIALS INDEX UCITS ETF* up to 0.30% 0.15% db x-trackers MSCI WORLD TELECOM SERVICES INDEX UCITS ETF* up to 0.30% 0.15% db x-trackers MSCI WORLD UTILITIES INDEX UCITS ETF* up to 0.30% 0.15% db x-trackers RUSSELL MIDCAP UCITS ETF* up to 0.15% 0.20% db x-trackers MSCI AC ASIA EX JAPAN HIGH DIVIDEND YIELD INDEX UCITS ETF* up to 0.45% 0.20% db x-trackers MSCI PHILIPPINES IM INDEX UCITS ETF (DR) up to 0.45% 0.20% db x-trackers MSCI EM CONSUMER DISCRETIONARY INDEX UCITS ETF* up to 0.45% 0.20% db x-trackers MSCI EM CONSUMER STAPLES INDEX UCITS ETF* up to 0.45% 0.20% db x-trackers MSCI EM ENERGY INDEX UCITS ETF* up to 0.45% 0.20% db x-trackers MSCI EM FINANCIALS INDEX UCITS ETF* up to 0.45% 0.20% db x-trackers MSCI EM HEALTHCARE INDEX UCITS ETF* up to 0.45% 0.20% db x-trackers MSCI EM INDUSTRIALS INDEX UCITS ETF* up to 0.45% 0.20% db x-trackers MSCI EM INFORMATION TECHNOLOGY INDEX UCITS ETF* up to 0.45% 0.20% db x-trackers MSCI EM MATERIALS INDEX UCITS ETF* up to 0.45% 0.20% db x-trackers MSCI EM TELECOMMUNICATION SERVICES INDEX UCITS ETF* up to 0.45% 0.20% db x-trackers MSCI EM UTILITIES INDEX UCITS ETF* up to 0.45% 0.20% db x-trackers MSCI AFRICA TOP 50 INDEX UCITS ETF* up to 0.45% 0.20% db x-trackers MSCI EM EASTERN EUROPE INDEX UCITS ETF* up to 0.45% 0.20% db x-trackers IBEX 35® UCITS ETF (DR) up to 0.10% 0.20% db x-trackers MSCI CHILE INDEX UCITS ETF* up to 0.45% 0.20%
358
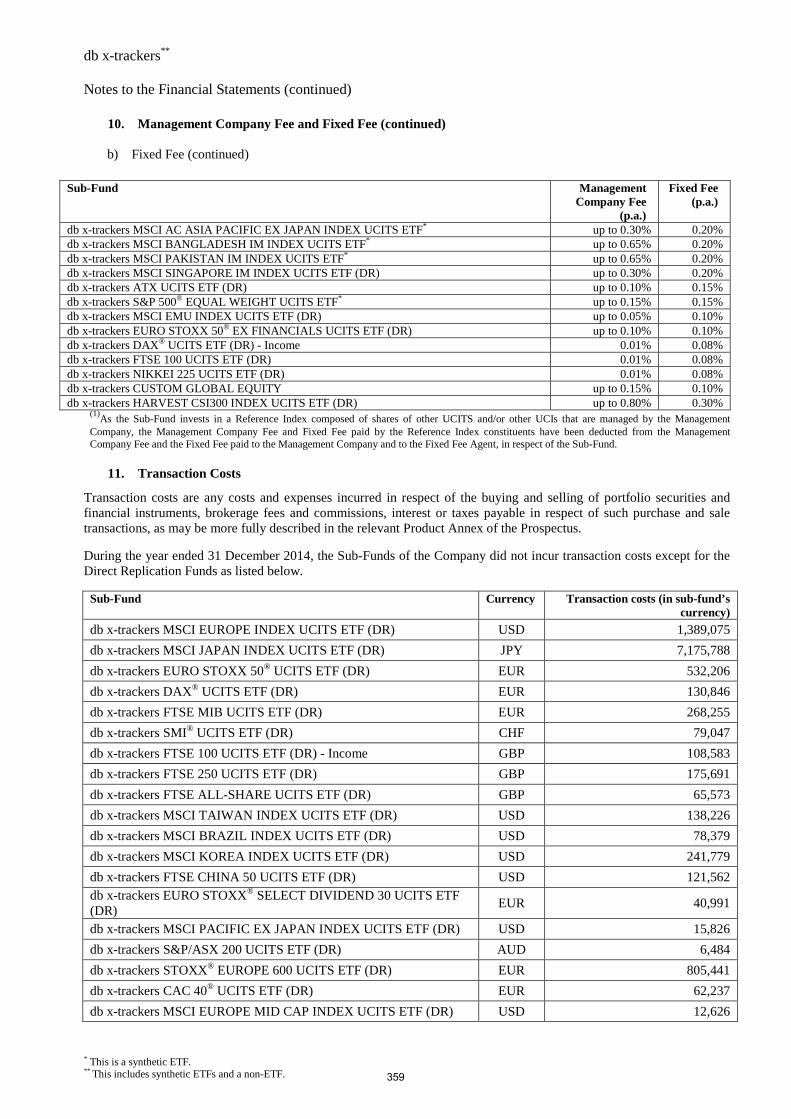
db x-trackers** Notes to the Financial Statements (continued)
* This is a synthetic ETF. ** This includes synthetic ETFs and a non-ETF.
10. Management Company Fee and Fixed Fee (continued)
b) Fixed Fee (continued)
Sub-Fund Management Company Fee
(p.a.)
Fixed Fee (p.a.)
db x-trackers MSCI AC ASIA PACIFIC EX JAPAN INDEX UCITS ETF* up to 0.30% 0.20% db x-trackers MSCI BANGLADESH IM INDEX UCITS ETF* up to 0.65% 0.20% db x-trackers MSCI PAKISTAN IM INDEX UCITS ETF* up to 0.65% 0.20% db x-trackers MSCI SINGAPORE IM INDEX UCITS ETF (DR) up to 0.30% 0.20% db x-trackers ATX UCITS ETF (DR) up to 0.10% 0.15% db x-trackers S&P 500® EQUAL WEIGHT UCITS ETF* up to 0.15% 0.15% db x-trackers MSCI EMU INDEX UCITS ETF (DR) up to 0.05% 0.10% db x-trackers EURO STOXX 50® EX FINANCIALS UCITS ETF (DR) up to 0.10% 0.10% db x-trackers DAX® UCITS ETF (DR) - Income 0.01% 0.08% db x-trackers FTSE 100 UCITS ETF (DR) 0.01% 0.08% db x-trackers NIKKEI 225 UCITS ETF (DR) 0.01% 0.08% db x-trackers CUSTOM GLOBAL EQUITY up to 0.15% 0.10% db x-trackers HARVEST CSI300 INDEX UCITS ETF (DR) up to 0.80% 0.30%
(1)As the Sub-Fund invests in a Reference Index composed of shares of other UCITS and/or other UCIs that are managed by the Management
Company, the Management Company Fee and Fixed Fee paid by the Reference Index constituents have been deducted from the Management Company Fee and the Fixed Fee paid to the Management Company and to the Fixed Fee Agent, in respect of the Sub-Fund.
11. Transaction Costs
Transaction costs are any costs and expenses incurred in respect of the buying and selling of portfolio securities and financial instruments, brokerage fees and commissions, interest or taxes payable in respect of such purchase and sale transactions, as may be more fully described in the relevant Product Annex of the Prospectus. During the year ended 31 December 2014, the Sub-Funds of the Company did not incur transaction costs except for the Direct Replication Funds as listed below. Sub-Fund Currency Transaction costs (in sub-fund’s
currency)
db x-trackers MSCI EUROPE INDEX UCITS ETF (DR) USD 1,389,075
db x-trackers MSCI JAPAN INDEX UCITS ETF (DR) JPY 7,175,788
db x-trackers EURO STOXX 50® UCITS ETF (DR) EUR 532,206
db x-trackers DAX® UCITS ETF (DR) EUR 130,846
db x-trackers FTSE MIB UCITS ETF (DR) EUR 268,255
db x-trackers SMI® UCITS ETF (DR) CHF 79,047
db x-trackers FTSE 100 UCITS ETF (DR) - Income GBP 108,583
db x-trackers FTSE 250 UCITS ETF (DR) GBP 175,691
db x-trackers FTSE ALL-SHARE UCITS ETF (DR) GBP 65,573
db x-trackers MSCI TAIWAN INDEX UCITS ETF (DR) USD 138,226
db x-trackers MSCI BRAZIL INDEX UCITS ETF (DR) USD 78,379
db x-trackers MSCI KOREA INDEX UCITS ETF (DR) USD 241,779
db x-trackers FTSE CHINA 50 UCITS ETF (DR) USD 121,562 db x-trackers EURO STOXX® SELECT DIVIDEND 30 UCITS ETF (DR)
EUR 40,991
db x-trackers MSCI PACIFIC EX JAPAN INDEX UCITS ETF (DR) USD 15,826
db x-trackers S&P/ASX 200 UCITS ETF (DR) AUD 6,484
db x-trackers STOXX® EUROPE 600 UCITS ETF (DR) EUR 805,441
db x-trackers CAC 40® UCITS ETF (DR) EUR 62,237
db x-trackers MSCI EUROPE MID CAP INDEX UCITS ETF (DR) USD 12,626
359
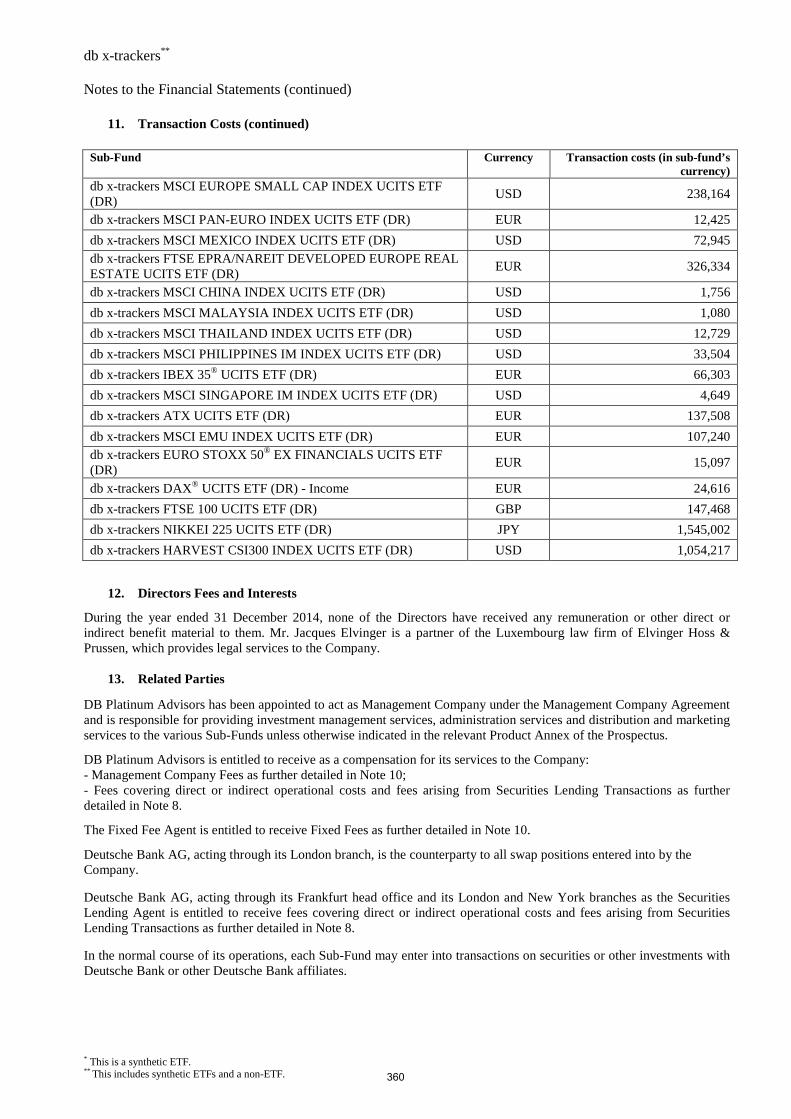
db x-trackers** Notes to the Financial Statements (continued)
* This is a synthetic ETF. ** This includes synthetic ETFs and a non-ETF.
11. Transaction Costs (continued) Sub-Fund Currency Transaction costs (in sub-fund’s
currency) db x-trackers MSCI EUROPE SMALL CAP INDEX UCITS ETF (DR)
USD 238,164
db x-trackers MSCI PAN-EURO INDEX UCITS ETF (DR) EUR 12,425
db x-trackers MSCI MEXICO INDEX UCITS ETF (DR) USD 72,945 db x-trackers FTSE EPRA/NAREIT DEVELOPED EUROPE REAL ESTATE UCITS ETF (DR)
EUR 326,334
db x-trackers MSCI CHINA INDEX UCITS ETF (DR) USD 1,756
db x-trackers MSCI MALAYSIA INDEX UCITS ETF (DR) USD 1,080
db x-trackers MSCI THAILAND INDEX UCITS ETF (DR) USD 12,729
db x-trackers MSCI PHILIPPINES IM INDEX UCITS ETF (DR) USD 33,504
db x-trackers IBEX 35® UCITS ETF (DR) EUR 66,303
db x-trackers MSCI SINGAPORE IM INDEX UCITS ETF (DR) USD 4,649
db x-trackers ATX UCITS ETF (DR) EUR 137,508
db x-trackers MSCI EMU INDEX UCITS ETF (DR) EUR 107,240 db x-trackers EURO STOXX 50® EX FINANCIALS UCITS ETF (DR)
EUR 15,097
db x-trackers DAX® UCITS ETF (DR) - Income EUR 24,616
db x-trackers FTSE 100 UCITS ETF (DR) GBP 147,468
db x-trackers NIKKEI 225 UCITS ETF (DR) JPY 1,545,002
db x-trackers HARVEST CSI300 INDEX UCITS ETF (DR) USD 1,054,217
12. Directors Fees and Interests
During the year ended 31 December 2014, none of the Directors have received any remuneration or other direct or indirect benefit material to them. Mr. Jacques Elvinger is a partner of the Luxembourg law firm of Elvinger Hoss & Prussen, which provides legal services to the Company.
13. Related Parties
DB Platinum Advisors has been appointed to act as Management Company under the Management Company Agreement and is responsible for providing investment management services, administration services and distribution and marketing services to the various Sub-Funds unless otherwise indicated in the relevant Product Annex of the Prospectus.
DB Platinum Advisors is entitled to receive as a compensation for its services to the Company: - Management Company Fees as further detailed in Note 10; - Fees covering direct or indirect operational costs and fees arising from Securities Lending Transactions as further detailed in Note 8.
The Fixed Fee Agent is entitled to receive Fixed Fees as further detailed in Note 10.
Deutsche Bank AG, acting through its London branch, is the counterparty to all swap positions entered into by the Company. Deutsche Bank AG, acting through its Frankfurt head office and its London and New York branches as the Securities Lending Agent is entitled to receive fees covering direct or indirect operational costs and fees arising from Securities Lending Transactions as further detailed in Note 8. In the normal course of its operations, each Sub-Fund may enter into transactions on securities or other investments with Deutsche Bank or other Deutsche Bank affiliates.
360
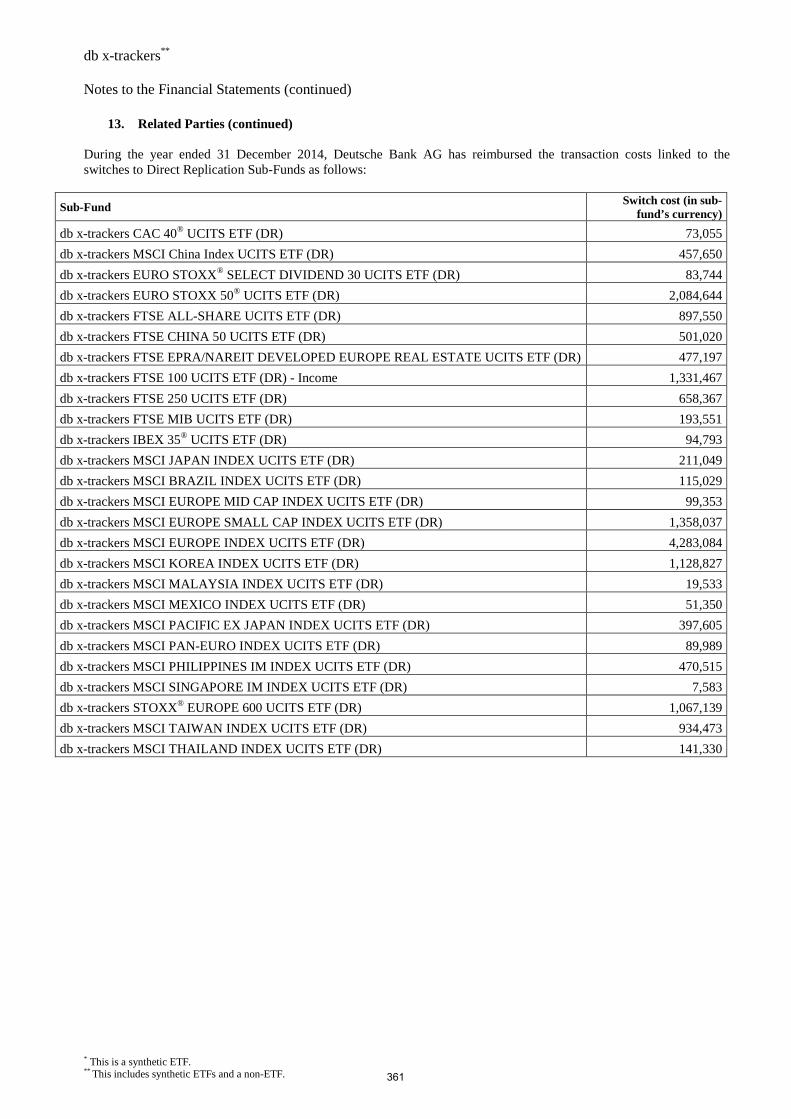
db x-trackers** Notes to the Financial Statements (continued)
* This is a synthetic ETF. ** This includes synthetic ETFs and a non-ETF.
13. Related Parties (continued)
During the year ended 31 December 2014, Deutsche Bank AG has reimbursed the transaction costs linked to the switches to Direct Replication Sub-Funds as follows:
Sub-Fund Switch cost (in sub-fund’s currency)
db x-trackers CAC 40® UCITS ETF (DR) 73,055
db x-trackers MSCI China Index UCITS ETF (DR) 457,650
db x-trackers EURO STOXX® SELECT DIVIDEND 30 UCITS ETF (DR) 83,744
db x-trackers EURO STOXX 50® UCITS ETF (DR) 2,084,644
db x-trackers FTSE ALL-SHARE UCITS ETF (DR) 897,550
db x-trackers FTSE CHINA 50 UCITS ETF (DR) 501,020
db x-trackers FTSE EPRA/NAREIT DEVELOPED EUROPE REAL ESTATE UCITS ETF (DR) 477,197
db x-trackers FTSE 100 UCITS ETF (DR) - Income 1,331,467
db x-trackers FTSE 250 UCITS ETF (DR) 658,367
db x-trackers FTSE MIB UCITS ETF (DR) 193,551
db x-trackers IBEX 35® UCITS ETF (DR) 94,793
db x-trackers MSCI JAPAN INDEX UCITS ETF (DR) 211,049
db x-trackers MSCI BRAZIL INDEX UCITS ETF (DR) 115,029
db x-trackers MSCI EUROPE MID CAP INDEX UCITS ETF (DR) 99,353
db x-trackers MSCI EUROPE SMALL CAP INDEX UCITS ETF (DR) 1,358,037
db x-trackers MSCI EUROPE INDEX UCITS ETF (DR) 4,283,084
db x-trackers MSCI KOREA INDEX UCITS ETF (DR) 1,128,827
db x-trackers MSCI MALAYSIA INDEX UCITS ETF (DR) 19,533
db x-trackers MSCI MEXICO INDEX UCITS ETF (DR) 51,350
db x-trackers MSCI PACIFIC EX JAPAN INDEX UCITS ETF (DR) 397,605
db x-trackers MSCI PAN-EURO INDEX UCITS ETF (DR) 89,989
db x-trackers MSCI PHILIPPINES IM INDEX UCITS ETF (DR) 470,515
db x-trackers MSCI SINGAPORE IM INDEX UCITS ETF (DR) 7,583
db x-trackers STOXX® EUROPE 600 UCITS ETF (DR) 1,067,139
db x-trackers MSCI TAIWAN INDEX UCITS ETF (DR) 934,473
db x-trackers MSCI THAILAND INDEX UCITS ETF (DR) 141,330
361
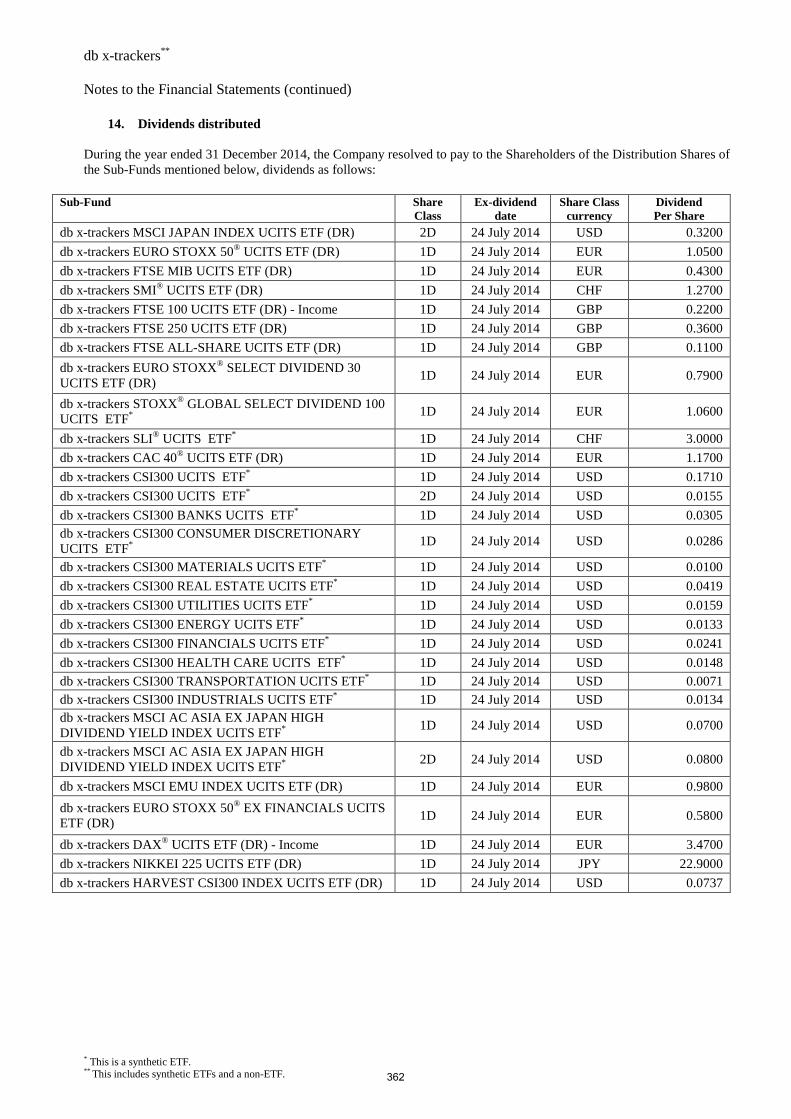
db x-trackers** Notes to the Financial Statements (continued)
* This is a synthetic ETF. ** This includes synthetic ETFs and a non-ETF.
14. Dividends distributed
During the year ended 31 December 2014, the Company resolved to pay to the Shareholders of the Distribution Shares of the Sub-Funds mentioned below, dividends as follows:
Sub-Fund
Share Class
Ex-dividend date
Share Class currency
Dividend Per Share
db x-trackers MSCI JAPAN INDEX UCITS ETF (DR) 2D 24 July 2014 USD 0.3200
db x-trackers EURO STOXX 50® UCITS ETF (DR) 1D 24 July 2014 EUR 1.0500
db x-trackers FTSE MIB UCITS ETF (DR) 1D 24 July 2014 EUR 0.4300
db x-trackers SMI® UCITS ETF (DR) 1D 24 July 2014 CHF 1.2700
db x-trackers FTSE 100 UCITS ETF (DR) - Income 1D 24 July 2014 GBP 0.2200
db x-trackers FTSE 250 UCITS ETF (DR) 1D 24 July 2014 GBP 0.3600
db x-trackers FTSE ALL-SHARE UCITS ETF (DR) 1D 24 July 2014 GBP 0.1100
db x-trackers EURO STOXX® SELECT DIVIDEND 30 UCITS ETF (DR)
1D 24 July 2014 EUR 0.7900
db x-trackers STOXX® GLOBAL SELECT DIVIDEND 100 UCITS ETF*
1D 24 July 2014 EUR 1.0600
db x-trackers SLI® UCITS ETF* 1D 24 July 2014 CHF 3.0000
db x-trackers CAC 40® UCITS ETF (DR) 1D 24 July 2014 EUR 1.1700
db x-trackers CSI300 UCITS ETF* 1D 24 July 2014 USD 0.1710
db x-trackers CSI300 UCITS ETF* 2D 24 July 2014 USD 0.0155
db x-trackers CSI300 BANKS UCITS ETF* 1D 24 July 2014 USD 0.0305 db x-trackers CSI300 CONSUMER DISCRETIONARY UCITS ETF*
1D 24 July 2014 USD 0.0286
db x-trackers CSI300 MATERIALS UCITS ETF* 1D 24 July 2014 USD 0.0100
db x-trackers CSI300 REAL ESTATE UCITS ETF* 1D 24 July 2014 USD 0.0419
db x-trackers CSI300 UTILITIES UCITS ETF* 1D 24 July 2014 USD 0.0159
db x-trackers CSI300 ENERGY UCITS ETF* 1D 24 July 2014 USD 0.0133
db x-trackers CSI300 FINANCIALS UCITS ETF* 1D 24 July 2014 USD 0.0241
db x-trackers CSI300 HEALTH CARE UCITS ETF* 1D 24 July 2014 USD 0.0148
db x-trackers CSI300 TRANSPORTATION UCITS ETF* 1D 24 July 2014 USD 0.0071 db x-trackers CSI300 INDUSTRIALS UCITS ETF* 1D 24 July 2014 USD 0.0134 db x-trackers MSCI AC ASIA EX JAPAN HIGH DIVIDEND YIELD INDEX UCITS ETF*
1D 24 July 2014 USD 0.0700
db x-trackers MSCI AC ASIA EX JAPAN HIGH DIVIDEND YIELD INDEX UCITS ETF* 2D 24 July 2014 USD 0.0800
db x-trackers MSCI EMU INDEX UCITS ETF (DR) 1D 24 July 2014 EUR 0.9800
db x-trackers EURO STOXX 50® EX FINANCIALS UCITS ETF (DR)
1D 24 July 2014 EUR 0.5800
db x-trackers DAX® UCITS ETF (DR) - Income 1D 24 July 2014 EUR 3.4700
db x-trackers NIKKEI 225 UCITS ETF (DR) 1D 24 July 2014 JPY 22.9000
db x-trackers HARVEST CSI300 INDEX UCITS ETF (DR) 1D 24 July 2014 USD 0.0737
362
db x-trackers** Notes to the Financial Statements (continued)
* This is a synthetic ETF. ** This includes synthetic ETFs and a non-ETF.
15. Taxation in the People’s Republic of China
a) Synthetic CSI300 Sub-Funds
In 2010, synthetic Sub-Funds were launched which track the performance of the CSI300 Index or a sector or sub-sector of the CSI300 Index (Sub-Funds hereafter referred collectively to as the “Synthetic CSI300 Sub-Funds” and each such index a “CSI300 Index”). Each CSI300 Index measures the performance of A-shares traded on the Shanghai Stock Exchange or the Shenzhen Stock Exchange in the People’s Republic of China (“PRC”). The investment and trading in such A-shares by foreign entities requires such entities to be granted a license as a Qualified Foreign Institutional Investor (“QFII”) by the China Securities Regulatory Commission (“CSRC”). As described in the Product Annex of each Sub-Fund, the Sub-Funds do not invest directly in A-shares which are the constituent securities of the relevant Reference Index, but seek to obtain an exposure to the performance of the relevant Reference Index by way of OTC Swap Transaction(s) with the Swap Counterparty. The OTC Swap Transaction(s) entered into between a Synthetic CSI300 Sub-Fund and the Swap Counterparty includes a provision according to the terms of which the Synthetic CSI300 Sub-Fund undertakes to keep the Swap Counterparty fully indemnified for any tax liability that may arise in a prospective or retrospective manner in connection with such OTC Swap Transaction(s) to the extent of the same level of tax that a hypothetical offshore investor having invested in the A-shares (which are the constituent securities of the relevant Reference Index) would potentially sustain or incur. On 14 November 2014, the Ministry of Finance (the "MoF") of the PRC, the State Administration of Taxation of the PRC (“SAT”) and the CSRC issued the "Notice on the issues of temporary exemption from the imposition of capital gains tax arising from gains from the transfer of equity investment assets such as PRC domestic stocks by QFII and Renminbi Qualified Foreign Institutional Investor (“RQFII”)" Caishui [2014] No.79 (the "Tax Announcement"). According to the Tax Announcement, QFIIs and RQFIIs without an establishment or a place of business in the PRC are temporarily exempt from Corporate Income Tax (“CIT”) on gains derived from the trading of A-shares effective from 17 November 2014. With respect to gains derived prior to 17 November 2014, QFIIs and RQFIIs are subject to CIT in accordance with the relevant tax laws and regulations. On the basis of the information set out in the Tax Announcement, the Management Company made an adjustment to the Net Asset Value of each Synthetic CSI300 Sub-Fund as of 17 November 2014 to reflect the expected amount of tax related liability to the Swap Counterparty which was attributable to gross realised capital gains derived from the trading of A-shares since the date of inception of each Synthetic CSI300 Sub-Fund up to and including 14 November 2014 (the "Relevant Tax-related Liability"). Each Synthetic CSI300 Sub-Fund made a payment ("Payment Amount") to the Swap Counterparty as a provision of such Relevant Tax-related Liability. Following such payment, the Swap Counterparty agreed that (a) if the Payment Amount is insufficient to meet the Synthetic CSI300 Sub-Funds’ obligations under the Swap Agreement to keep the Swap Counterparty indemnified for any tax liability in connection with the OTC Swap Transactions attributable to the Relevant Tax-related Liability (the "Relevant Tax Indemnity"), the Swap Counterparty will not exercise its rights or remedies in respect of the Relevant Tax Indemnity.
and
(b) if the Payment Amount (converted into RMB at the spot exchange rate prevailing around the payment date of the Payment Amount) is in excess to meet the Synthetic CSI300 Sub-Funds’ obligations under the Relevant Tax Indemnity, the Swap Counterparty will pay such excess (the "Excess Amount") to the Synthetic CSI300 Sub-Funds (converted into USD at the spot exchange rate prevailing around the payment date of such excess). Shareholders’ attention is drawn to the foreign exchange risk as further described in (f) of the Specific Risk Warning section as set out in the Product Annex of each Synthetic CSI300 Sub-Fund. Should an Excess Amount be paid to the Synthetic CSI300 Sub-Funds, the then existing Shareholders will benefit from such Excess Payment. Shareholders who have already redeemed their Shares in the Synthetic CSI300 Sub-Funds before the payment of such Excess Payment will not be entitled or have any right to claim any part of such amount. The Company and the Management Company determined to make a downward adjustment to the Net Asset Value of each Synthetic CSI300 Sub-Fund, capped at approximately 2.5% of the respective Net Asset Value as of 17 November 2014 to reflect the expected amount of tax-related liability to the Swap Counterparty which is attributable to gross realised capital gains derived from the trading of A-shares since the date of inception of the relevant Synthetic CSI300 Sub-Fund up to and including 14 November 2014. Shareholders who sold or redeemed shares in a Synthetic CSI300 Sub-Fund prior to 17 November 2014 will not be affected by such negative impact.
363
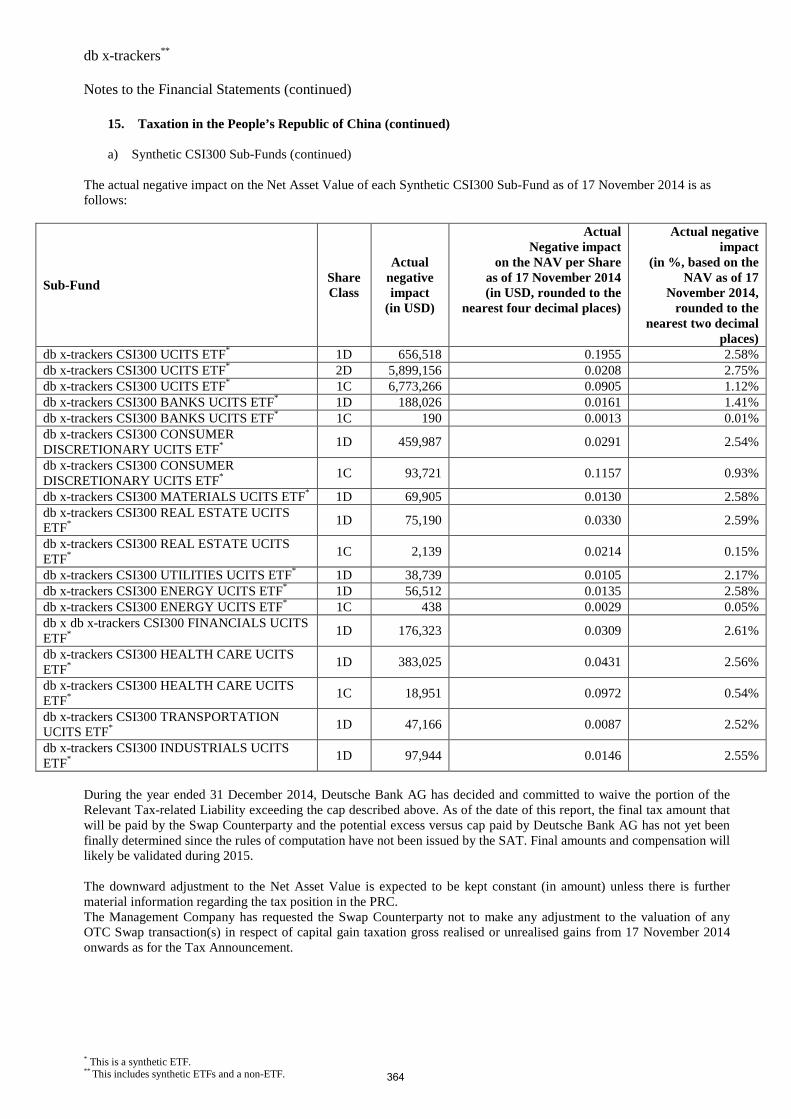
db x-trackers** Notes to the Financial Statements (continued)
* This is a synthetic ETF. ** This includes synthetic ETFs and a non-ETF.
15. Taxation in the People’s Republic of China (continued) a) Synthetic CSI300 Sub-Funds (continued)
The actual negative impact on the Net Asset Value of each Synthetic CSI300 Sub-Fund as of 17 November 2014 is as follows:
Sub-Fund Share Class
Actual negative impact
(in USD)
Actual Negative impact
on the NAV per Share as of 17 November 2014 (in USD, rounded to the
nearest four decimal places)
Actual negative impact
(in %, based on the NAV as of 17
November 2014, rounded to the
nearest two decimal places)
db x-trackers CSI300 UCITS ETF* 1D 656,518 0.1955 2.58% db x-trackers CSI300 UCITS ETF* 2D 5,899,156 0.0208 2.75% db x-trackers CSI300 UCITS ETF* 1C 6,773,266 0.0905 1.12% db x-trackers CSI300 BANKS UCITS ETF* 1D 188,026 0.0161 1.41% db x-trackers CSI300 BANKS UCITS ETF* 1C 190 0.0013 0.01% db x-trackers CSI300 CONSUMER DISCRETIONARY UCITS ETF*
1D 459,987 0.0291 2.54%
db x-trackers CSI300 CONSUMER DISCRETIONARY UCITS ETF*
1C 93,721 0.1157 0.93%
db x-trackers CSI300 MATERIALS UCITS ETF* 1D 69,905 0.0130 2.58% db x-trackers CSI300 REAL ESTATE UCITS ETF*
1D 75,190 0.0330 2.59%
db x-trackers CSI300 REAL ESTATE UCITS ETF*
1C 2,139 0.0214 0.15%
db x-trackers CSI300 UTILITIES UCITS ETF* 1D 38,739 0.0105 2.17% db x-trackers CSI300 ENERGY UCITS ETF* 1D 56,512 0.0135 2.58% db x-trackers CSI300 ENERGY UCITS ETF* 1C 438 0.0029 0.05% db x db x-trackers CSI300 FINANCIALS UCITS ETF*
1D 176,323 0.0309 2.61%
db x-trackers CSI300 HEALTH CARE UCITS ETF* 1D 383,025 0.0431 2.56%
db x-trackers CSI300 HEALTH CARE UCITS ETF* 1C 18,951 0.0972 0.54%
db x-trackers CSI300 TRANSPORTATION UCITS ETF*
1D 47,166 0.0087 2.52%
db x-trackers CSI300 INDUSTRIALS UCITS ETF*
1D 97,944 0.0146 2.55%
During the year ended 31 December 2014, Deutsche Bank AG has decided and committed to waive the portion of the Relevant Tax-related Liability exceeding the cap described above. As of the date of this report, the final tax amount that will be paid by the Swap Counterparty and the potential excess versus cap paid by Deutsche Bank AG has not yet been finally determined since the rules of computation have not been issued by the SAT. Final amounts and compensation will likely be validated during 2015. The downward adjustment to the Net Asset Value is expected to be kept constant (in amount) unless there is further material information regarding the tax position in the PRC. The Management Company has requested the Swap Counterparty not to make any adjustment to the valuation of any OTC Swap transaction(s) in respect of capital gain taxation gross realised or unrealised gains from 17 November 2014 onwards as for the Tax Announcement.
364
db x-trackers** Notes to the Financial Statements (continued)
* This is a synthetic ETF. ** This includes synthetic ETFs and a non-ETF.
15. Taxation in the People’s Republic of China (continued)
b) db x-trackers HARVEST CSI300 INDEX UCITS ETF (DR)
db x-trackers HARVEST CSI300 INDEX UCITS ETF (DR) (“Harvest CSI300 Sub-Fund”) was launched on 8 January 2014. The methodology adopted for the potential capital gain tax which may be enforced by the SAT on the trading of Chinese A-shares on foreign investors under the Harvest CSI300 Sub-Fund differed from the above methodology described and used by the Synthetic CSI300 Sub-Funds. From launch date until 10 July 2014 (inclusive), the Board of Directors made a provision of 10% in respect of any potential tax on capital gains from its investments of the Harvest CSI300 Sub-Fund in A-shares issued by companies. With effect from 11 July 2014 to 14 November 2014 (both dates inclusive), a provision of 10% was made for the account of the Harvest CSI300 Sub-Fund in respect of any potential tax on capital gains from investments of the Harvest CSI300 Sub-Fund in A-shares issued by companies which qualify as "land rich companies". A company is treated as a "land rich company" if the value of its immovable property in the PRC is more than 50% of its total assets. Investors should note that such provision may be excessive or inadequate to meet actual PRC tax liabilities on investments made by the Harvest CSI300 Sub-Fund.
On the basis of the information set out in the Tax Announcement, the Management Company has determined to: (a) make a provision of 10% for the account of the Harvest CSI300 Sub-Fund in respect of the Harvest CSI300 Sub-Fund’s gross realised capital gains derived from trading of A-Shares since the Harvest CSI300 Sub-Fund’s date of inception up to and including 14 November 2014. This excludes the realised gains derived from the Harvest CSI300 Sub-Fund’s trading of A-Shares issued by "land rich companies" (for which a provision has already been made). This had a negative impact on the Net Asset Value of the Harvest CSI300 Sub-Fund; and (b) reverse the provision in respect of the Harvest CSI300 Sub-Fund's gross unrealised capital gains derived from investment in A-Shares issued by land rich companies made prior to 17 November 2014. This had a positive impact on the Net Asset Value of the Harvest CSI300 Sub-Fund, the net impact of (a) and (b) was positive and is referred to as the "Withholding". For illustration purposes, the actual positive impact of the Withholding to the Net Asset Value of the Harvest CSI300 Sub-Fund was approximately USD 476,355.72 (or approximately 0.07% of the Net Asset Value as of 14 November 2014). The impact of the Withholding was reflected in the Net Asset Value of the Harvest CSI300 Sub-Fund as of 17 November 2014. The Withholding is expected to be kept constant (in amount) unless there is further material information regarding the tax position in the PRC. Consequently, under the withholding methodology adopted for the Harvest CSI300 Sub-Fund, shareholders may be advantaged or disadvantaged depending upon the final tax liabilities, the level of provision and when they subscribed and/or redeemed their shares. If the actual applicable tax rate levied by the SAT, is higher than that provided for by the Harvest CSI300 Sub-Fund so that there is a shortfall in the tax provision amount, Shareholders should note that the Net Asset Value of the Harvest CSI300 Sub-Fund may suffer more than the tax provision amount as the Harvest CSI300 Sub-Fund will ultimately have to bear the additional tax liabilities. In this case, the then existing and new Shareholders will be disadvantaged. On the other hand, if the actual applicable tax rate levied by SAT is lower than that provided for by the Harvest CSI300 Sub-Fund so that there is an excess in the tax provision amount, Shareholders who have redeemed their Shares before SAT’s ruling, decision or guidance in this respect will be disadvantaged as they would have borne the loss from the Harvest CSI300 Sub-Fund’s overprovision. In this case, the difference between the tax provision and the actual taxation liability under that lower tax rate can be returned to the account of the Harvest CSI300 Sub-Fund as assets thereof. Notwithstanding the above provisions, shareholders who have already redeemed their shares in the Harvest CSI300 Sub-Fund before the return of any overprovision to the account of the Harvest CSI300 Sub-Fund will not be entitled or have any right to claim any part of such overprovision. In consideration of the Tax Announcement, it is the current intention of the Management Company not to make new tax provision on gross realised or unrealised capital gains derived from trading of A-Shares from 17 November 2014 onwards.
365
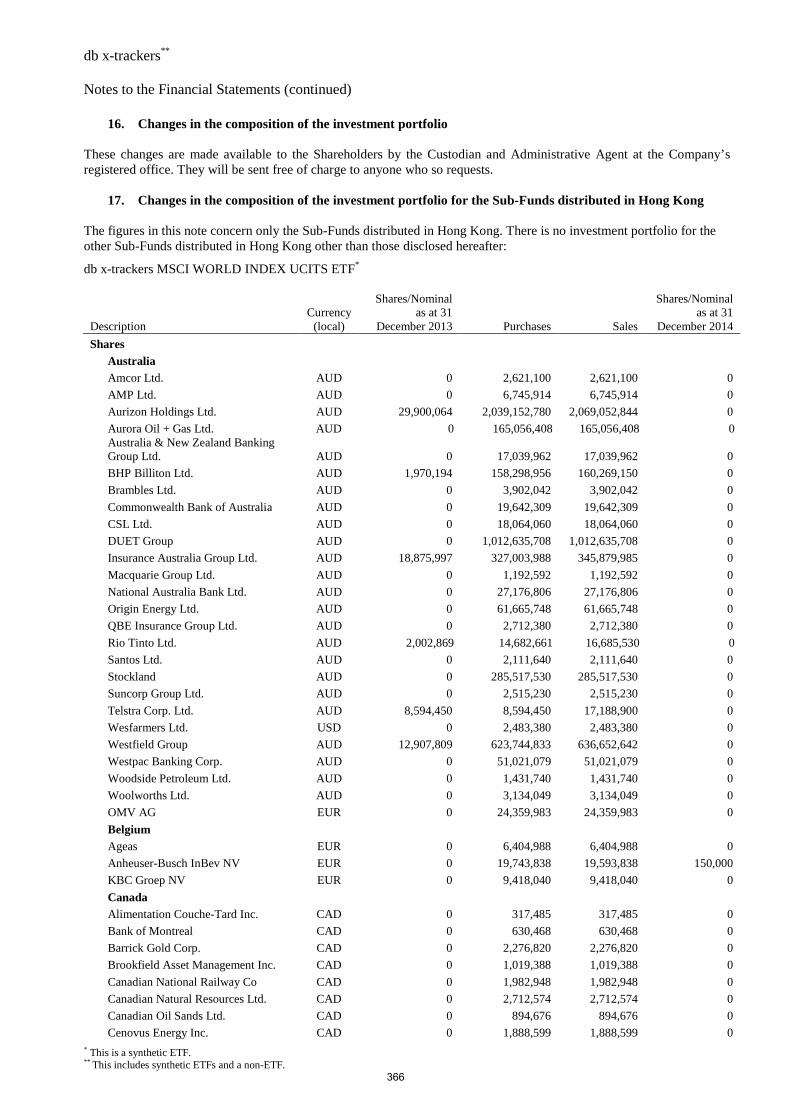
db x-trackers** Notes to the Financial Statements (continued)
* This is a synthetic ETF. ** This includes synthetic ETFs and a non-ETF.
16. Changes in the composition of the investment portfolio These changes are made available to the Shareholders by the Custodian and Administrative Agent at the Company’s registered office. They will be sent free of charge to anyone who so requests.
17. Changes in the composition of the investment portfolio for the Sub-Funds distributed in Hong Kong The figures in this note concern only the Sub-Funds distributed in Hong Kong. There is no investment portfolio for the other Sub-Funds distributed in Hong Kong other than those disclosed hereafter:
db x-trackers MSCI WORLD INDEX UCITS ETF*
Description Currency (local)
Shares/Nominal as at 31
December 2013 Purchases Sales
Shares/Nominal as at 31
December 2014
Shares Australia Amcor Ltd. AUD 0 2,621,100 2,621,100 0
AMP Ltd. AUD 0 6,745,914 6,745,914 0
Aurizon Holdings Ltd. AUD 29,900,064 2,039,152,780 2,069,052,844 0
Aurora Oil + Gas Ltd. AUD 0 165,056,408 165,056,408 0 Australia & New Zealand Banking Group Ltd. AUD 0 17,039,962 17,039,962 0
BHP Billiton Ltd. AUD 1,970,194 158,298,956 160,269,150 0
Brambles Ltd. AUD 0 3,902,042 3,902,042 0
Commonwealth Bank of Australia AUD 0 19,642,309 19,642,309 0
CSL Ltd. AUD 0 18,064,060 18,064,060 0
DUET Group AUD 0 1,012,635,708 1,012,635,708 0
Insurance Australia Group Ltd. AUD 18,875,997 327,003,988 345,879,985 0
Macquarie Group Ltd. AUD 0 1,192,592 1,192,592 0
National Australia Bank Ltd. AUD 0 27,176,806 27,176,806 0
Origin Energy Ltd. AUD 0 61,665,748 61,665,748 0
QBE Insurance Group Ltd. AUD 0 2,712,380 2,712,380 0
Rio Tinto Ltd. AUD 2,002,869 14,682,661 16,685,530 0
Santos Ltd. AUD 0 2,111,640 2,111,640 0
Stockland AUD 0 285,517,530 285,517,530 0
Suncorp Group Ltd. AUD 0 2,515,230 2,515,230 0
Telstra Corp. Ltd. AUD 8,594,450 8,594,450 17,188,900 0
Wesfarmers Ltd. USD 0 2,483,380 2,483,380 0
Westfield Group AUD 12,907,809 623,744,833 636,652,642 0
Westpac Banking Corp. AUD 0 51,021,079 51,021,079 0
Woodside Petroleum Ltd. AUD 0 1,431,740 1,431,740 0
Woolworths Ltd. AUD 0 3,134,049 3,134,049 0
OMV AG EUR 0 24,359,983 24,359,983 0
Belgium Ageas EUR 0 6,404,988 6,404,988 0
Anheuser-Busch InBev NV EUR 0 19,743,838 19,593,838 150,000
KBC Groep NV EUR 0 9,418,040 9,418,040 0
Canada Alimentation Couche-Tard Inc. CAD 0 317,485 317,485 0
Bank of Montreal CAD 0 630,468 630,468 0
Barrick Gold Corp. CAD 0 2,276,820 2,276,820 0
Brookfield Asset Management Inc. CAD 0 1,019,388 1,019,388 0
Canadian National Railway Co CAD 0 1,982,948 1,982,948 0
Canadian Natural Resources Ltd. CAD 0 2,712,574 2,712,574 0
Canadian Oil Sands Ltd. CAD 0 894,676 894,676 0
Cenovus Energy Inc. CAD 0 1,888,599 1,888,599 0
366
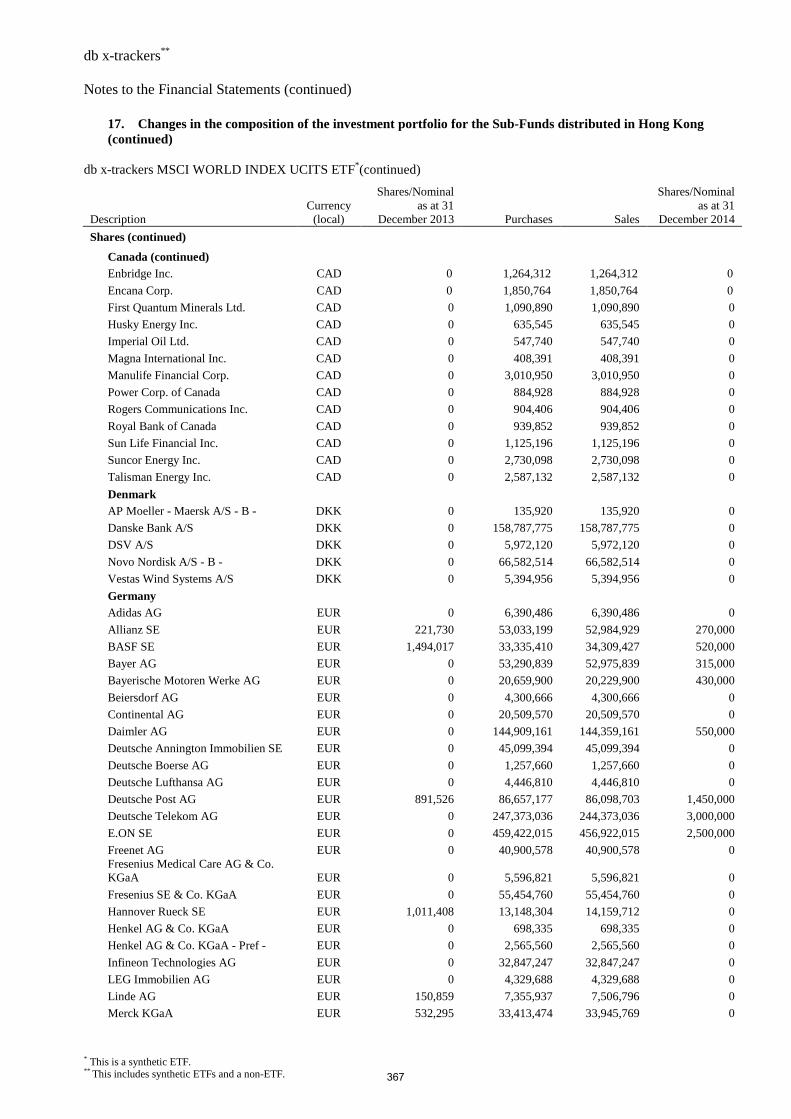
db x-trackers** Notes to the Financial Statements (continued)
* This is a synthetic ETF. ** This includes synthetic ETFs and a non-ETF.
17. Changes in the composition of the investment portfolio for the Sub-Funds distributed in Hong Kong (continued)
db x-trackers MSCI WORLD INDEX UCITS ETF*(continued)
Description Currency (local)
Shares/Nominal as at 31
December 2013 Purchases Sales
Shares/Nominal as at 31
December 2014
Shares (continued)
Canada (continued)
Enbridge Inc. CAD 0 1,264,312 1,264,312 0
Encana Corp. CAD 0 1,850,764 1,850,764 0
First Quantum Minerals Ltd. CAD 0 1,090,890 1,090,890 0
Husky Energy Inc. CAD 0 635,545 635,545 0
Imperial Oil Ltd. CAD 0 547,740 547,740 0
Magna International Inc. CAD 0 408,391 408,391 0
Manulife Financial Corp. CAD 0 3,010,950 3,010,950 0
Power Corp. of Canada CAD 0 884,928 884,928 0
Rogers Communications Inc. CAD 0 904,406 904,406 0
Royal Bank of Canada CAD 0 939,852 939,852 0
Sun Life Financial Inc. CAD 0 1,125,196 1,125,196 0
Suncor Energy Inc. CAD 0 2,730,098 2,730,098 0
Talisman Energy Inc. CAD 0 2,587,132 2,587,132 0
Denmark AP Moeller - Maersk A/S - B - DKK 0 135,920 135,920 0
Danske Bank A/S DKK 0 158,787,775 158,787,775 0
DSV A/S DKK 0 5,972,120 5,972,120 0
Novo Nordisk A/S - B - DKK 0 66,582,514 66,582,514 0
Vestas Wind Systems A/S DKK 0 5,394,956 5,394,956 0
Germany Adidas AG EUR 0 6,390,486 6,390,486 0
Allianz SE EUR 221,730 53,033,199 52,984,929 270,000
BASF SE EUR 1,494,017 33,335,410 34,309,427 520,000
Bayer AG EUR 0 53,290,839 52,975,839 315,000
Bayerische Motoren Werke AG EUR 0 20,659,900 20,229,900 430,000
Beiersdorf AG EUR 0 4,300,666 4,300,666 0
Continental AG EUR 0 20,509,570 20,509,570 0
Daimler AG EUR 0 144,909,161 144,359,161 550,000
Deutsche Annington Immobilien SE EUR 0 45,099,394 45,099,394 0
Deutsche Boerse AG EUR 0 1,257,660 1,257,660 0
Deutsche Lufthansa AG EUR 0 4,446,810 4,446,810 0
Deutsche Post AG EUR 891,526 86,657,177 86,098,703 1,450,000
Deutsche Telekom AG EUR 0 247,373,036 244,373,036 3,000,000
E.ON SE EUR 0 459,422,015 456,922,015 2,500,000
Freenet AG EUR 0 40,900,578 40,900,578 0 Fresenius Medical Care AG & Co. KGaA EUR 0 5,596,821 5,596,821 0
Fresenius SE & Co. KGaA EUR 0 55,454,760 55,454,760 0
Hannover Rueck SE EUR 1,011,408 13,148,304 14,159,712 0
Henkel AG & Co. KGaA EUR 0 698,335 698,335 0
Henkel AG & Co. KGaA - Pref - EUR 0 2,565,560 2,565,560 0
Infineon Technologies AG EUR 0 32,847,247 32,847,247 0
LEG Immobilien AG EUR 0 4,329,688 4,329,688 0
Linde AG EUR 150,859 7,355,937 7,506,796 0
Merck KGaA EUR 532,295 33,413,474 33,945,769 0
367
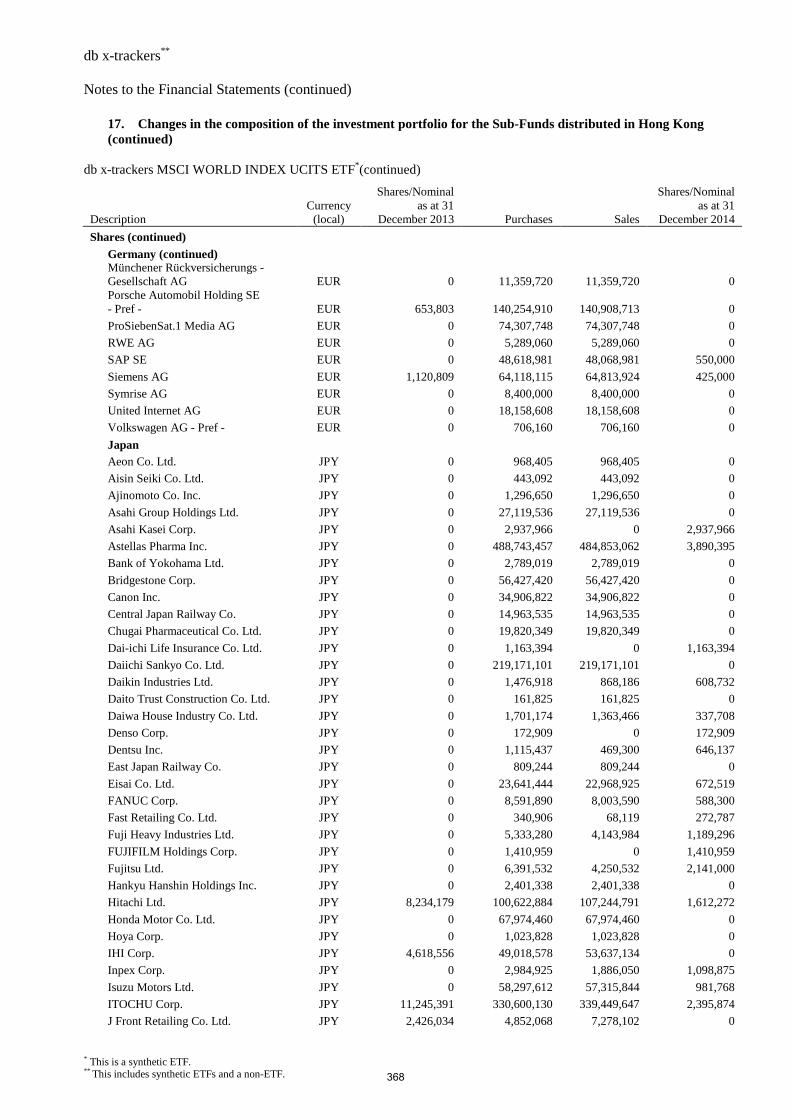
db x-trackers** Notes to the Financial Statements (continued)
* This is a synthetic ETF. ** This includes synthetic ETFs and a non-ETF.
17. Changes in the composition of the investment portfolio for the Sub-Funds distributed in Hong Kong (continued)
db x-trackers MSCI WORLD INDEX UCITS ETF*(continued)
Description Currency (local)
Shares/Nominal as at 31
December 2013 Purchases Sales
Shares/Nominal as at 31
December 2014
Shares (continued)
Germany (continued) Münchener Rückversicherungs - Gesellschaft AG EUR 0 11,359,720 11,359,720 0 Porsche Automobil Holding SE - Pref - EUR 653,803 140,254,910 140,908,713 0
ProSiebenSat.1 Media AG EUR 0 74,307,748 74,307,748 0
RWE AG EUR 0 5,289,060 5,289,060 0
SAP SE EUR 0 48,618,981 48,068,981 550,000
Siemens AG EUR 1,120,809 64,118,115 64,813,924 425,000
Symrise AG EUR 0 8,400,000 8,400,000 0
United Internet AG EUR 0 18,158,608 18,158,608 0
Volkswagen AG - Pref - EUR 0 706,160 706,160 0
Japan Aeon Co. Ltd. JPY 0 968,405 968,405 0
Aisin Seiki Co. Ltd. JPY 0 443,092 443,092 0
Ajinomoto Co. Inc. JPY 0 1,296,650 1,296,650 0
Asahi Group Holdings Ltd. JPY 0 27,119,536 27,119,536 0
Asahi Kasei Corp. JPY 0 2,937,966 0 2,937,966
Astellas Pharma Inc. JPY 0 488,743,457 484,853,062 3,890,395
Bank of Yokohama Ltd. JPY 0 2,789,019 2,789,019 0
Bridgestone Corp. JPY 0 56,427,420 56,427,420 0
Canon Inc. JPY 0 34,906,822 34,906,822 0
Central Japan Railway Co. JPY 0 14,963,535 14,963,535 0
Chugai Pharmaceutical Co. Ltd. JPY 0 19,820,349 19,820,349 0
Dai-ichi Life Insurance Co. Ltd. JPY 0 1,163,394 0 1,163,394
Daiichi Sankyo Co. Ltd. JPY 0 219,171,101 219,171,101 0
Daikin Industries Ltd. JPY 0 1,476,918 868,186 608,732
Daito Trust Construction Co. Ltd. JPY 0 161,825 161,825 0
Daiwa House Industry Co. Ltd. JPY 0 1,701,174 1,363,466 337,708
Denso Corp. JPY 0 172,909 0 172,909
Dentsu Inc. JPY 0 1,115,437 469,300 646,137
East Japan Railway Co. JPY 0 809,244 809,244 0
Eisai Co. Ltd. JPY 0 23,641,444 22,968,925 672,519
FANUC Corp. JPY 0 8,591,890 8,003,590 588,300
Fast Retailing Co. Ltd. JPY 0 340,906 68,119 272,787
Fuji Heavy Industries Ltd. JPY 0 5,333,280 4,143,984 1,189,296
FUJIFILM Holdings Corp. JPY 0 1,410,959 0 1,410,959
Fujitsu Ltd. JPY 0 6,391,532 4,250,532 2,141,000
Hankyu Hanshin Holdings Inc. JPY 0 2,401,338 2,401,338 0
Hitachi Ltd. JPY 8,234,179 100,622,884 107,244,791 1,612,272
Honda Motor Co. Ltd. JPY 0 67,974,460 67,974,460 0
Hoya Corp. JPY 0 1,023,828 1,023,828 0
IHI Corp. JPY 4,618,556 49,018,578 53,637,134 0
Inpex Corp. JPY 0 2,984,925 1,886,050 1,098,875
Isuzu Motors Ltd. JPY 0 58,297,612 57,315,844 981,768
ITOCHU Corp. JPY 11,245,391 330,600,130 339,449,647 2,395,874
J Front Retailing Co. Ltd. JPY 2,426,034 4,852,068 7,278,102 0
368
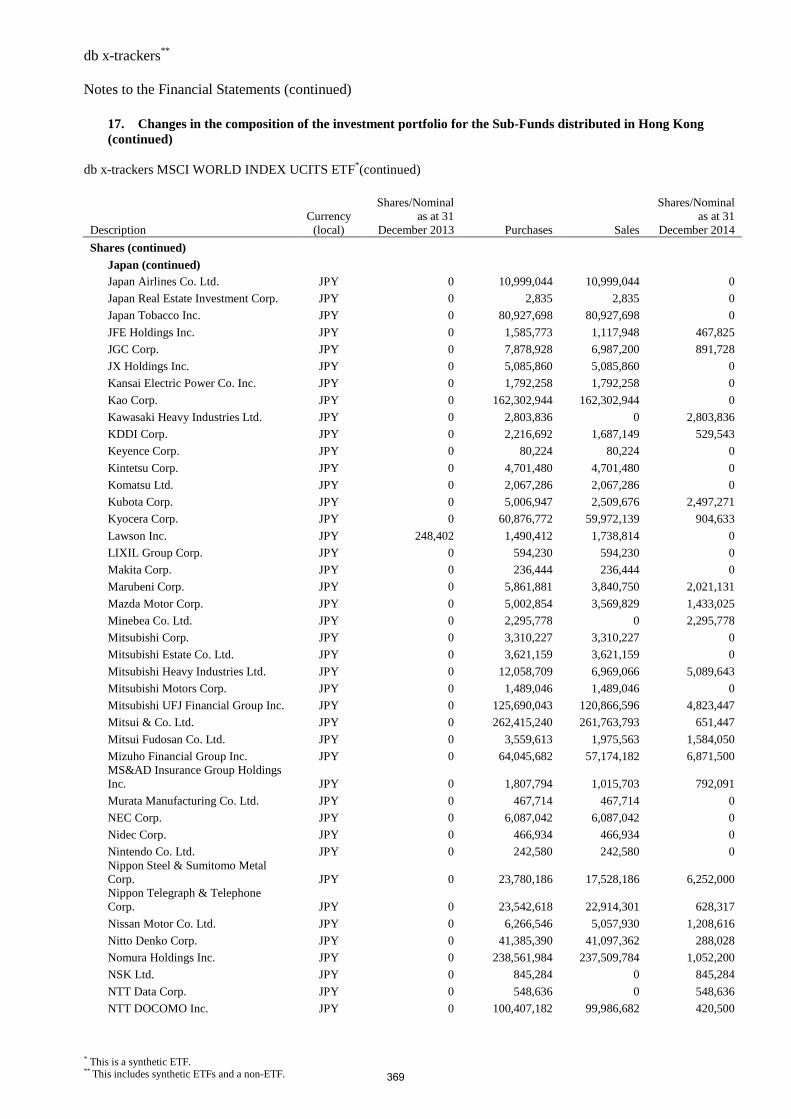
db x-trackers** Notes to the Financial Statements (continued)
* This is a synthetic ETF. ** This includes synthetic ETFs and a non-ETF.
17. Changes in the composition of the investment portfolio for the Sub-Funds distributed in Hong Kong (continued)
db x-trackers MSCI WORLD INDEX UCITS ETF*(continued)
Description Currency (local)
Shares/Nominal as at 31
December 2013 Purchases Sales
Shares/Nominal as at 31
December 2014
Shares (continued)
Japan (continued)
Japan Airlines Co. Ltd. JPY 0 10,999,044 10,999,044 0
Japan Real Estate Investment Corp. JPY 0 2,835 2,835 0
Japan Tobacco Inc. JPY 0 80,927,698 80,927,698 0
JFE Holdings Inc. JPY 0 1,585,773 1,117,948 467,825
JGC Corp. JPY 0 7,878,928 6,987,200 891,728
JX Holdings Inc. JPY 0 5,085,860 5,085,860 0
Kansai Electric Power Co. Inc. JPY 0 1,792,258 1,792,258 0
Kao Corp. JPY 0 162,302,944 162,302,944 0
Kawasaki Heavy Industries Ltd. JPY 0 2,803,836 0 2,803,836
KDDI Corp. JPY 0 2,216,692 1,687,149 529,543
Keyence Corp. JPY 0 80,224 80,224 0
Kintetsu Corp. JPY 0 4,701,480 4,701,480 0
Komatsu Ltd. JPY 0 2,067,286 2,067,286 0
Kubota Corp. JPY 0 5,006,947 2,509,676 2,497,271
Kyocera Corp. JPY 0 60,876,772 59,972,139 904,633
Lawson Inc. JPY 248,402 1,490,412 1,738,814 0
LIXIL Group Corp. JPY 0 594,230 594,230 0
Makita Corp. JPY 0 236,444 236,444 0
Marubeni Corp. JPY 0 5,861,881 3,840,750 2,021,131
Mazda Motor Corp. JPY 0 5,002,854 3,569,829 1,433,025
Minebea Co. Ltd. JPY 0 2,295,778 0 2,295,778
Mitsubishi Corp. JPY 0 3,310,227 3,310,227 0
Mitsubishi Estate Co. Ltd. JPY 0 3,621,159 3,621,159 0
Mitsubishi Heavy Industries Ltd. JPY 0 12,058,709 6,969,066 5,089,643
Mitsubishi Motors Corp. JPY 0 1,489,046 1,489,046 0
Mitsubishi UFJ Financial Group Inc. JPY 0 125,690,043 120,866,596 4,823,447
Mitsui & Co. Ltd. JPY 0 262,415,240 261,763,793 651,447
Mitsui Fudosan Co. Ltd. JPY 0 3,559,613 1,975,563 1,584,050
Mizuho Financial Group Inc. JPY 0 64,045,682 57,174,182 6,871,500 MS&AD Insurance Group Holdings Inc. JPY 0 1,807,794 1,015,703 792,091
Murata Manufacturing Co. Ltd. JPY 0 467,714 467,714 0
NEC Corp. JPY 0 6,087,042 6,087,042 0
Nidec Corp. JPY 0 466,934 466,934 0
Nintendo Co. Ltd. JPY 0 242,580 242,580 0 Nippon Steel & Sumitomo Metal Corp. JPY 0 23,780,186 17,528,186 6,252,000 Nippon Telegraph & Telephone Corp. JPY 0 23,542,618 22,914,301 628,317
Nissan Motor Co. Ltd. JPY 0 6,266,546 5,057,930 1,208,616
Nitto Denko Corp. JPY 0 41,385,390 41,097,362 288,028
Nomura Holdings Inc. JPY 0 238,561,984 237,509,784 1,052,200
NSK Ltd. JPY 0 845,284 0 845,284
NTT Data Corp. JPY 0 548,636 0 548,636
NTT DOCOMO Inc. JPY 0 100,407,182 99,986,682 420,500
369
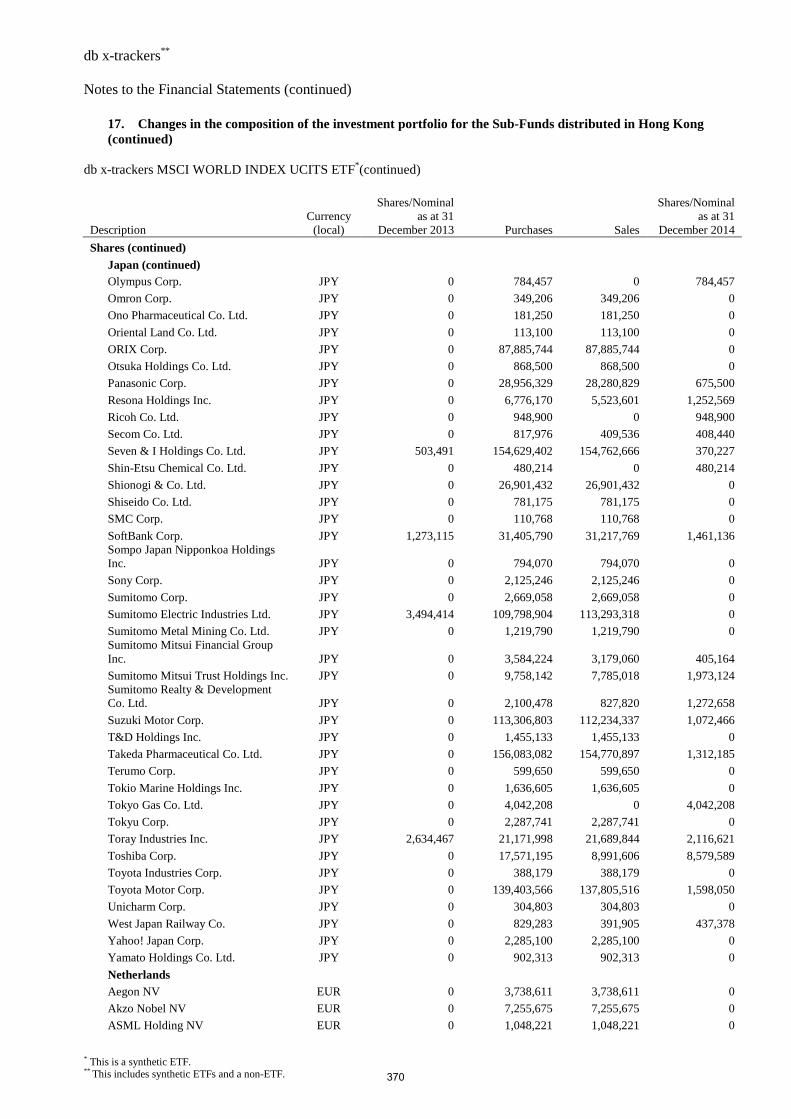
db x-trackers** Notes to the Financial Statements (continued)
* This is a synthetic ETF. ** This includes synthetic ETFs and a non-ETF.
17. Changes in the composition of the investment portfolio for the Sub-Funds distributed in Hong Kong (continued)
db x-trackers MSCI WORLD INDEX UCITS ETF*(continued)
Description Currency (local)
Shares/Nominal as at 31
December 2013 Purchases Sales
Shares/Nominal as at 31
December 2014
Shares (continued)
Japan (continued)
Olympus Corp. JPY 0 784,457 0 784,457
Omron Corp. JPY 0 349,206 349,206 0
Ono Pharmaceutical Co. Ltd. JPY 0 181,250 181,250 0
Oriental Land Co. Ltd. JPY 0 113,100 113,100 0
ORIX Corp. JPY 0 87,885,744 87,885,744 0
Otsuka Holdings Co. Ltd. JPY 0 868,500 868,500 0
Panasonic Corp. JPY 0 28,956,329 28,280,829 675,500
Resona Holdings Inc. JPY 0 6,776,170 5,523,601 1,252,569
Ricoh Co. Ltd. JPY 0 948,900 0 948,900
Secom Co. Ltd. JPY 0 817,976 409,536 408,440
Seven & I Holdings Co. Ltd. JPY 503,491 154,629,402 154,762,666 370,227
Shin-Etsu Chemical Co. Ltd. JPY 0 480,214 0 480,214
Shionogi & Co. Ltd. JPY 0 26,901,432 26,901,432 0
Shiseido Co. Ltd. JPY 0 781,175 781,175 0
SMC Corp. JPY 0 110,768 110,768 0
SoftBank Corp. JPY 1,273,115 31,405,790 31,217,769 1,461,136 Sompo Japan Nipponkoa Holdings Inc. JPY 0 794,070 794,070 0
Sony Corp. JPY 0 2,125,246 2,125,246 0
Sumitomo Corp. JPY 0 2,669,058 2,669,058 0
Sumitomo Electric Industries Ltd. JPY 3,494,414 109,798,904 113,293,318 0
Sumitomo Metal Mining Co. Ltd. JPY 0 1,219,790 1,219,790 0 Sumitomo Mitsui Financial Group Inc. JPY 0 3,584,224 3,179,060 405,164
Sumitomo Mitsui Trust Holdings Inc. JPY 0 9,758,142 7,785,018 1,973,124 Sumitomo Realty & Development Co. Ltd. JPY 0 2,100,478 827,820 1,272,658
Suzuki Motor Corp. JPY 0 113,306,803 112,234,337 1,072,466
T&D Holdings Inc. JPY 0 1,455,133 1,455,133 0
Takeda Pharmaceutical Co. Ltd. JPY 0 156,083,082 154,770,897 1,312,185
Terumo Corp. JPY 0 599,650 599,650 0
Tokio Marine Holdings Inc. JPY 0 1,636,605 1,636,605 0
Tokyo Gas Co. Ltd. JPY 0 4,042,208 0 4,042,208
Tokyu Corp. JPY 0 2,287,741 2,287,741 0
Toray Industries Inc. JPY 2,634,467 21,171,998 21,689,844 2,116,621
Toshiba Corp. JPY 0 17,571,195 8,991,606 8,579,589
Toyota Industries Corp. JPY 0 388,179 388,179 0
Toyota Motor Corp. JPY 0 139,403,566 137,805,516 1,598,050
Unicharm Corp. JPY 0 304,803 304,803 0
West Japan Railway Co. JPY 0 829,283 391,905 437,378
Yahoo! Japan Corp. JPY 0 2,285,100 2,285,100 0
Yamato Holdings Co. Ltd. JPY 0 902,313 902,313 0
Netherlands
Aegon NV EUR 0 3,738,611 3,738,611 0
Akzo Nobel NV EUR 0 7,255,675 7,255,675 0
ASML Holding NV EUR 0 1,048,221 1,048,221 0
370
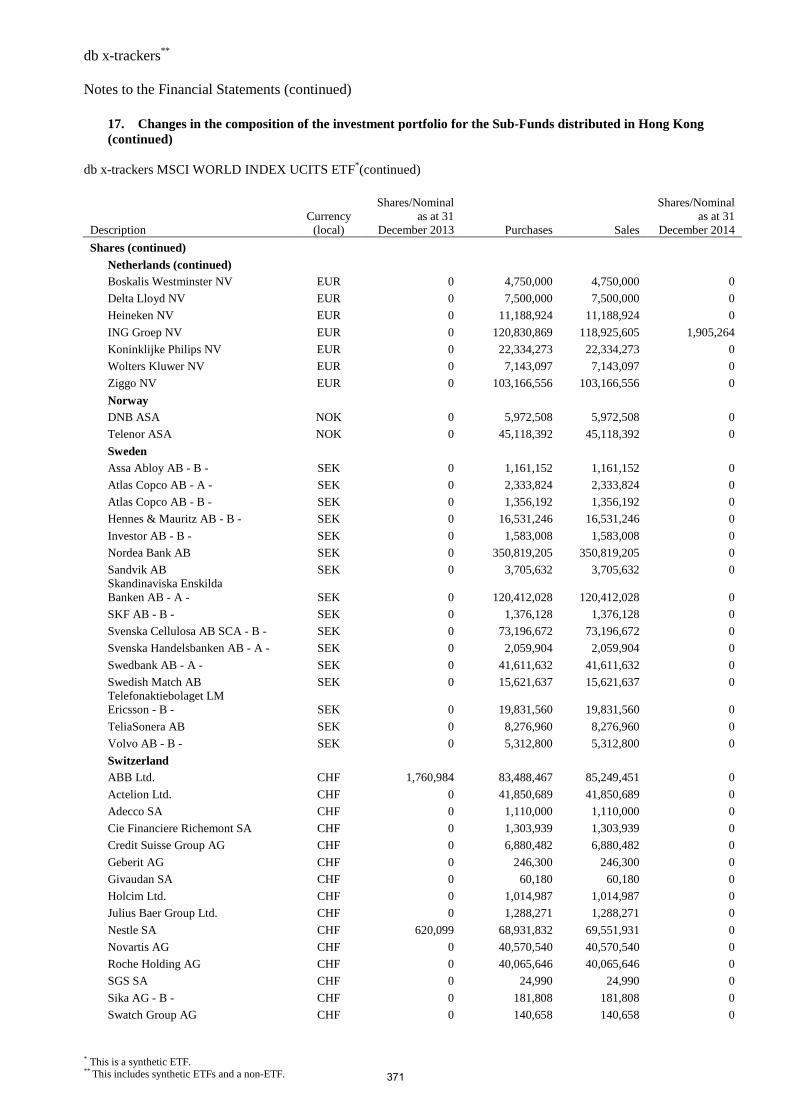
db x-trackers** Notes to the Financial Statements (continued)
* This is a synthetic ETF. ** This includes synthetic ETFs and a non-ETF.
17. Changes in the composition of the investment portfolio for the Sub-Funds distributed in Hong Kong (continued)
db x-trackers MSCI WORLD INDEX UCITS ETF*(continued)
Description Currency (local)
Shares/Nominal as at 31
December 2013 Purchases Sales
Shares/Nominal as at 31
December 2014
Shares (continued)
Netherlands (continued) Boskalis Westminster NV EUR 0 4,750,000 4,750,000 0
Delta Lloyd NV EUR 0 7,500,000 7,500,000 0
Heineken NV EUR 0 11,188,924 11,188,924 0
ING Groep NV EUR 0 120,830,869 118,925,605 1,905,264
Koninklijke Philips NV EUR 0 22,334,273 22,334,273 0
Wolters Kluwer NV EUR 0 7,143,097 7,143,097 0
Ziggo NV EUR 0 103,166,556 103,166,556 0
Norway DNB ASA NOK 0 5,972,508 5,972,508 0
Telenor ASA NOK 0 45,118,392 45,118,392 0
Sweden Assa Abloy AB - B - SEK 0 1,161,152 1,161,152 0
Atlas Copco AB - A - SEK 0 2,333,824 2,333,824 0
Atlas Copco AB - B - SEK 0 1,356,192 1,356,192 0
Hennes & Mauritz AB - B - SEK 0 16,531,246 16,531,246 0
Investor AB - B - SEK 0 1,583,008 1,583,008 0
Nordea Bank AB SEK 0 350,819,205 350,819,205 0
Sandvik AB SEK 0 3,705,632 3,705,632 0 Skandinaviska Enskilda Banken AB - A - SEK 0 120,412,028 120,412,028 0
SKF AB - B - SEK 0 1,376,128 1,376,128 0
Svenska Cellulosa AB SCA - B - SEK 0 73,196,672 73,196,672 0
Svenska Handelsbanken AB - A - SEK 0 2,059,904 2,059,904 0
Swedbank AB - A - SEK 0 41,611,632 41,611,632 0
Swedish Match AB SEK 0 15,621,637 15,621,637 0 Telefonaktiebolaget LM Ericsson - B - SEK 0 19,831,560 19,831,560 0
TeliaSonera AB SEK 0 8,276,960 8,276,960 0
Volvo AB - B - SEK 0 5,312,800 5,312,800 0
Switzerland ABB Ltd. CHF 1,760,984 83,488,467 85,249,451 0
Actelion Ltd. CHF 0 41,850,689 41,850,689 0
Adecco SA CHF 0 1,110,000 1,110,000 0
Cie Financiere Richemont SA CHF 0 1,303,939 1,303,939 0
Credit Suisse Group AG CHF 0 6,880,482 6,880,482 0
Geberit AG CHF 0 246,300 246,300 0
Givaudan SA CHF 0 60,180 60,180 0
Holcim Ltd. CHF 0 1,014,987 1,014,987 0
Julius Baer Group Ltd. CHF 0 1,288,271 1,288,271 0
Nestle SA CHF 620,099 68,931,832 69,551,931 0
Novartis AG CHF 0 40,570,540 40,570,540 0
Roche Holding AG CHF 0 40,065,646 40,065,646 0
SGS SA CHF 0 24,990 24,990 0
Sika AG - B - CHF 0 181,808 181,808 0
Swatch Group AG CHF 0 140,658 140,658 0
371
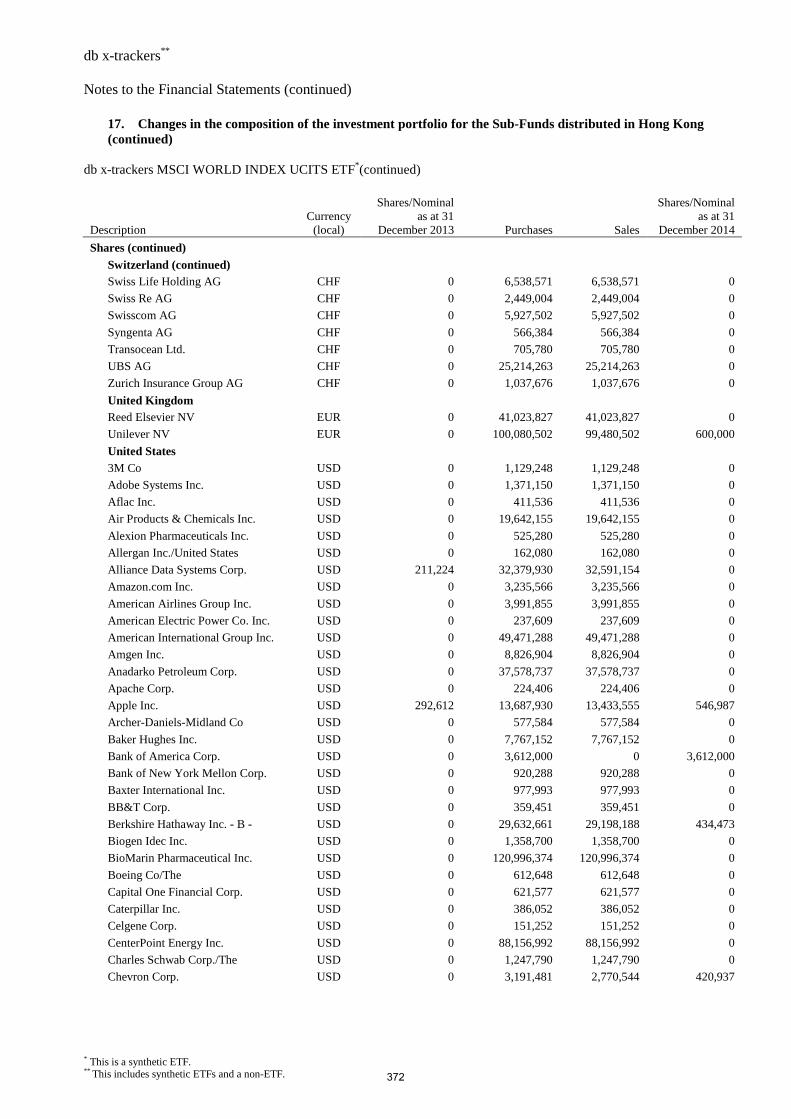
db x-trackers** Notes to the Financial Statements (continued)
* This is a synthetic ETF. ** This includes synthetic ETFs and a non-ETF.
17. Changes in the composition of the investment portfolio for the Sub-Funds distributed in Hong Kong (continued)
db x-trackers MSCI WORLD INDEX UCITS ETF*(continued)
Description Currency (local)
Shares/Nominal as at 31
December 2013 Purchases Sales
Shares/Nominal as at 31
December 2014
Shares (continued)
Switzerland (continued)
Swiss Life Holding AG CHF 0 6,538,571 6,538,571 0
Swiss Re AG CHF 0 2,449,004 2,449,004 0
Swisscom AG CHF 0 5,927,502 5,927,502 0
Syngenta AG CHF 0 566,384 566,384 0
Transocean Ltd. CHF 0 705,780 705,780 0
UBS AG CHF 0 25,214,263 25,214,263 0
Zurich Insurance Group AG CHF 0 1,037,676 1,037,676 0
United Kingdom
Reed Elsevier NV EUR 0 41,023,827 41,023,827 0
Unilever NV EUR 0 100,080,502 99,480,502 600,000
United States 3M Co USD 0 1,129,248 1,129,248 0
Adobe Systems Inc. USD 0 1,371,150 1,371,150 0
Aflac Inc. USD 0 411,536 411,536 0
Air Products & Chemicals Inc. USD 0 19,642,155 19,642,155 0
Alexion Pharmaceuticals Inc. USD 0 525,280 525,280 0
Allergan Inc./United States USD 0 162,080 162,080 0
Alliance Data Systems Corp. USD 211,224 32,379,930 32,591,154 0
Amazon.com Inc. USD 0 3,235,566 3,235,566 0
American Airlines Group Inc. USD 0 3,991,855 3,991,855 0
American Electric Power Co. Inc. USD 0 237,609 237,609 0
American International Group Inc. USD 0 49,471,288 49,471,288 0
Amgen Inc. USD 0 8,826,904 8,826,904 0
Anadarko Petroleum Corp. USD 0 37,578,737 37,578,737 0
Apache Corp. USD 0 224,406 224,406 0
Apple Inc. USD 292,612 13,687,930 13,433,555 546,987
Archer-Daniels-Midland Co USD 0 577,584 577,584 0
Baker Hughes Inc. USD 0 7,767,152 7,767,152 0
Bank of America Corp. USD 0 3,612,000 0 3,612,000
Bank of New York Mellon Corp. USD 0 920,288 920,288 0
Baxter International Inc. USD 0 977,993 977,993 0
BB&T Corp. USD 0 359,451 359,451 0
Berkshire Hathaway Inc. - B - USD 0 29,632,661 29,198,188 434,473
Biogen Idec Inc. USD 0 1,358,700 1,358,700 0
BioMarin Pharmaceutical Inc. USD 0 120,996,374 120,996,374 0
Boeing Co/The USD 0 612,648 612,648 0
Capital One Financial Corp. USD 0 621,577 621,577 0
Caterpillar Inc. USD 0 386,052 386,052 0
Celgene Corp. USD 0 151,252 151,252 0
CenterPoint Energy Inc. USD 0 88,156,992 88,156,992 0
Charles Schwab Corp./The USD 0 1,247,790 1,247,790 0
Chevron Corp. USD 0 3,191,481 2,770,544 420,937
372
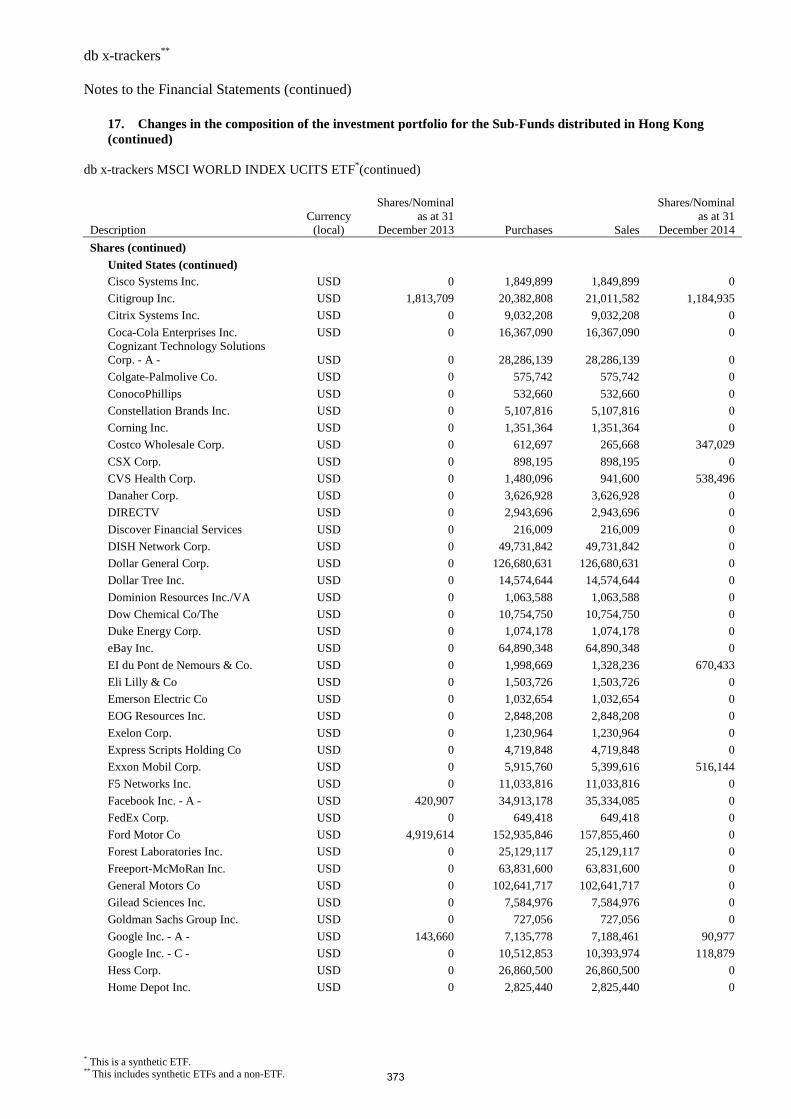
db x-trackers** Notes to the Financial Statements (continued)
* This is a synthetic ETF. ** This includes synthetic ETFs and a non-ETF.
17. Changes in the composition of the investment portfolio for the Sub-Funds distributed in Hong Kong (continued)
db x-trackers MSCI WORLD INDEX UCITS ETF*(continued)
Description Currency (local)
Shares/Nominal as at 31
December 2013 Purchases Sales
Shares/Nominal as at 31
December 2014
Shares (continued)
United States (continued)
Cisco Systems Inc. USD 0 1,849,899 1,849,899 0
Citigroup Inc. USD 1,813,709 20,382,808 21,011,582 1,184,935
Citrix Systems Inc. USD 0 9,032,208 9,032,208 0
Coca-Cola Enterprises Inc. USD 0 16,367,090 16,367,090 0 Cognizant Technology Solutions Corp. - A - USD 0 28,286,139 28,286,139 0
Colgate-Palmolive Co. USD 0 575,742 575,742 0
ConocoPhillips USD 0 532,660 532,660 0
Constellation Brands Inc. USD 0 5,107,816 5,107,816 0
Corning Inc. USD 0 1,351,364 1,351,364 0
Costco Wholesale Corp. USD 0 612,697 265,668 347,029
CSX Corp. USD 0 898,195 898,195 0
CVS Health Corp. USD 0 1,480,096 941,600 538,496
Danaher Corp. USD 0 3,626,928 3,626,928 0
DIRECTV USD 0 2,943,696 2,943,696 0
Discover Financial Services USD 0 216,009 216,009 0
DISH Network Corp. USD 0 49,731,842 49,731,842 0
Dollar General Corp. USD 0 126,680,631 126,680,631 0
Dollar Tree Inc. USD 0 14,574,644 14,574,644 0
Dominion Resources Inc./VA USD 0 1,063,588 1,063,588 0
Dow Chemical Co/The USD 0 10,754,750 10,754,750 0
Duke Energy Corp. USD 0 1,074,178 1,074,178 0
eBay Inc. USD 0 64,890,348 64,890,348 0
EI du Pont de Nemours & Co. USD 0 1,998,669 1,328,236 670,433
Eli Lilly & Co USD 0 1,503,726 1,503,726 0
Emerson Electric Co USD 0 1,032,654 1,032,654 0
EOG Resources Inc. USD 0 2,848,208 2,848,208 0
Exelon Corp. USD 0 1,230,964 1,230,964 0
Express Scripts Holding Co USD 0 4,719,848 4,719,848 0
Exxon Mobil Corp. USD 0 5,915,760 5,399,616 516,144
F5 Networks Inc. USD 0 11,033,816 11,033,816 0
Facebook Inc. - A - USD 420,907 34,913,178 35,334,085 0
FedEx Corp. USD 0 649,418 649,418 0
Ford Motor Co USD 4,919,614 152,935,846 157,855,460 0
Forest Laboratories Inc. USD 0 25,129,117 25,129,117 0
Freeport-McMoRan Inc. USD 0 63,831,600 63,831,600 0
General Motors Co USD 0 102,641,717 102,641,717 0
Gilead Sciences Inc. USD 0 7,584,976 7,584,976 0
Goldman Sachs Group Inc. USD 0 727,056 727,056 0
Google Inc. - A - USD 143,660 7,135,778 7,188,461 90,977
Google Inc. - C - USD 0 10,512,853 10,393,974 118,879
Hess Corp. USD 0 26,860,500 26,860,500 0
Home Depot Inc. USD 0 2,825,440 2,825,440 0
373
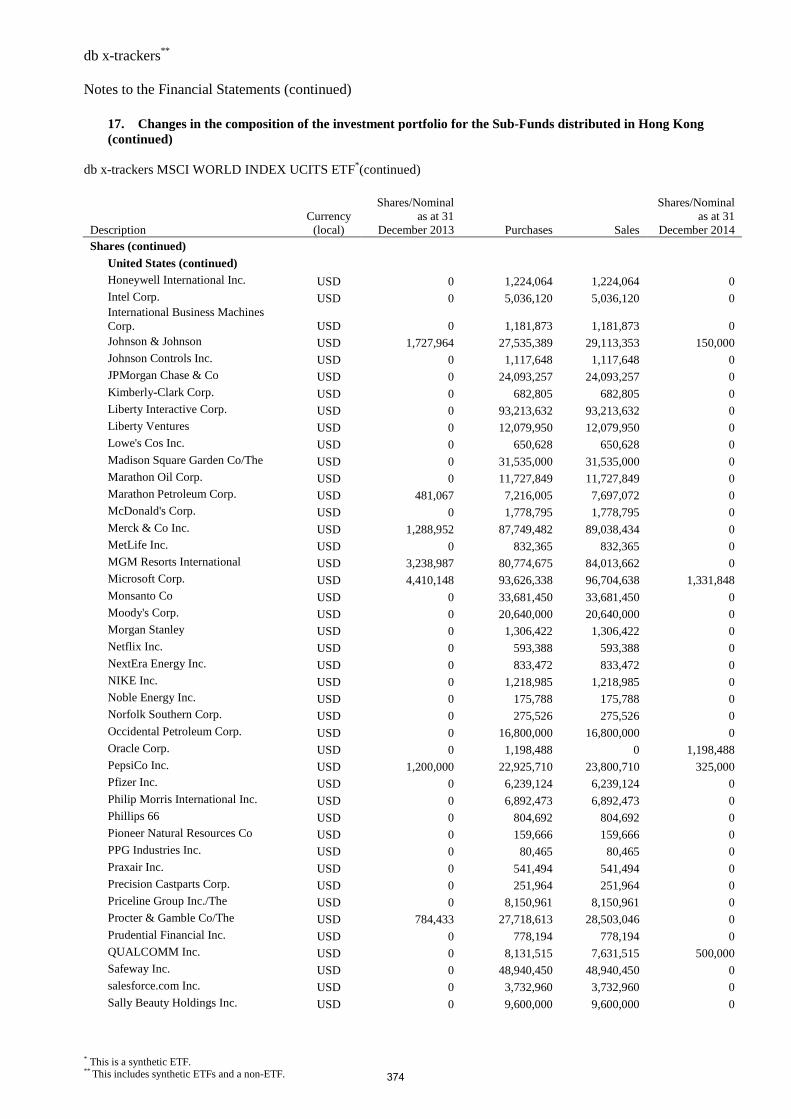
db x-trackers** Notes to the Financial Statements (continued)
* This is a synthetic ETF. ** This includes synthetic ETFs and a non-ETF.
17. Changes in the composition of the investment portfolio for the Sub-Funds distributed in Hong Kong (continued)
db x-trackers MSCI WORLD INDEX UCITS ETF*(continued)
Description Currency (local)
Shares/Nominal as at 31
December 2013 Purchases Sales
Shares/Nominal as at 31
December 2014 Shares (continued)
United States (continued)
Honeywell International Inc. USD 0 1,224,064 1,224,064 0 Intel Corp. USD 0 5,036,120 5,036,120 0 International Business Machines Corp. USD 0 1,181,873 1,181,873 0 Johnson & Johnson USD 1,727,964 27,535,389 29,113,353 150,000 Johnson Controls Inc. USD 0 1,117,648 1,117,648 0 JPMorgan Chase & Co USD 0 24,093,257 24,093,257 0 Kimberly-Clark Corp. USD 0 682,805 682,805 0 Liberty Interactive Corp. USD 0 93,213,632 93,213,632 0 Liberty Ventures USD 0 12,079,950 12,079,950 0 Lowe's Cos Inc. USD 0 650,628 650,628 0 Madison Square Garden Co/The USD 0 31,535,000 31,535,000 0 Marathon Oil Corp. USD 0 11,727,849 11,727,849 0 Marathon Petroleum Corp. USD 481,067 7,216,005 7,697,072 0 McDonald's Corp. USD 0 1,778,795 1,778,795 0 Merck & Co Inc. USD 1,288,952 87,749,482 89,038,434 0 MetLife Inc. USD 0 832,365 832,365 0 MGM Resorts International USD 3,238,987 80,774,675 84,013,662 0 Microsoft Corp. USD 4,410,148 93,626,338 96,704,638 1,331,848 Monsanto Co USD 0 33,681,450 33,681,450 0 Moody's Corp. USD 0 20,640,000 20,640,000 0 Morgan Stanley USD 0 1,306,422 1,306,422 0 Netflix Inc. USD 0 593,388 593,388 0 NextEra Energy Inc. USD 0 833,472 833,472 0 NIKE Inc. USD 0 1,218,985 1,218,985 0 Noble Energy Inc. USD 0 175,788 175,788 0 Norfolk Southern Corp. USD 0 275,526 275,526 0 Occidental Petroleum Corp. USD 0 16,800,000 16,800,000 0 Oracle Corp. USD 0 1,198,488 0 1,198,488 PepsiCo Inc. USD 1,200,000 22,925,710 23,800,710 325,000 Pfizer Inc. USD 0 6,239,124 6,239,124 0 Philip Morris International Inc. USD 0 6,892,473 6,892,473 0 Phillips 66 USD 0 804,692 804,692 0 Pioneer Natural Resources Co USD 0 159,666 159,666 0 PPG Industries Inc. USD 0 80,465 80,465 0 Praxair Inc. USD 0 541,494 541,494 0 Precision Castparts Corp. USD 0 251,964 251,964 0 Priceline Group Inc./The USD 0 8,150,961 8,150,961 0 Procter & Gamble Co/The USD 784,433 27,718,613 28,503,046 0 Prudential Financial Inc. USD 0 778,194 778,194 0 QUALCOMM Inc. USD 0 8,131,515 7,631,515 500,000 Safeway Inc. USD 0 48,940,450 48,940,450 0 salesforce.com Inc. USD 0 3,732,960 3,732,960 0 Sally Beauty Holdings Inc. USD 0 9,600,000 9,600,000 0
374
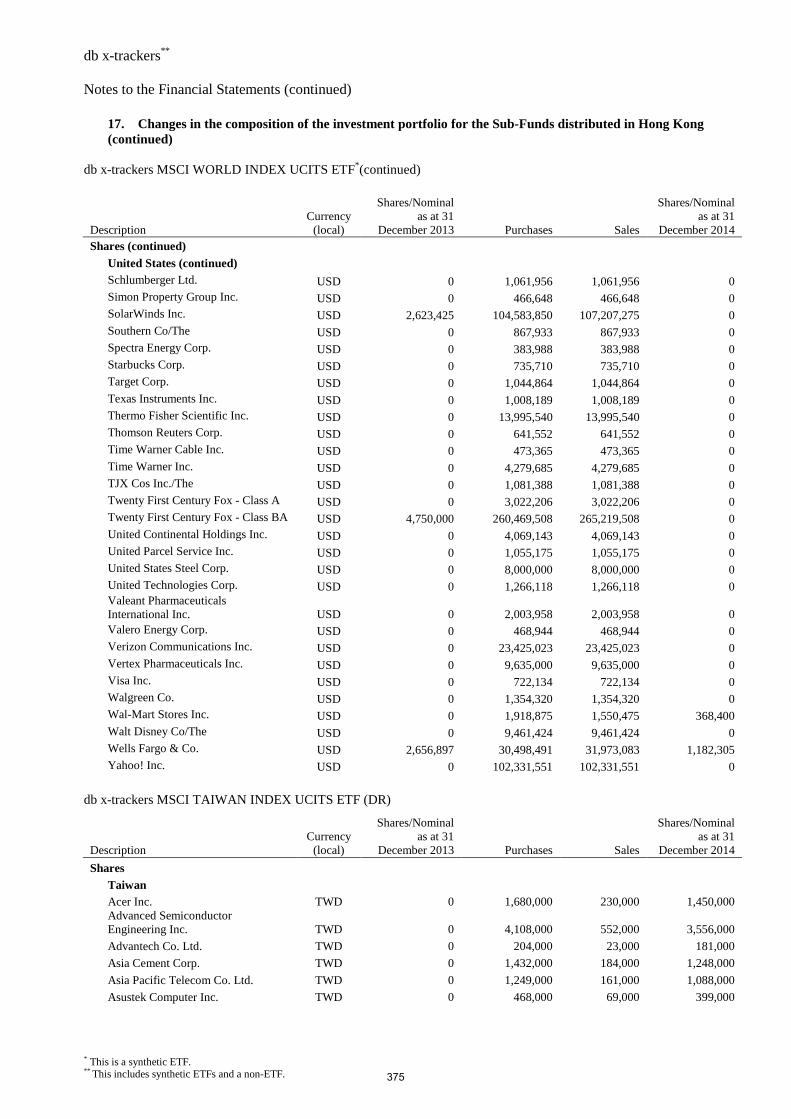
db x-trackers** Notes to the Financial Statements (continued)
* This is a synthetic ETF. ** This includes synthetic ETFs and a non-ETF.
17. Changes in the composition of the investment portfolio for the Sub-Funds distributed in Hong Kong (continued)
db x-trackers MSCI WORLD INDEX UCITS ETF*(continued)
Description Currency (local)
Shares/Nominal as at 31
December 2013 Purchases Sales
Shares/Nominal as at 31
December 2014 Shares (continued)
United States (continued)
Schlumberger Ltd. USD 0 1,061,956 1,061,956 0 Simon Property Group Inc. USD 0 466,648 466,648 0 SolarWinds Inc. USD 2,623,425 104,583,850 107,207,275 0 Southern Co/The USD 0 867,933 867,933 0 Spectra Energy Corp. USD 0 383,988 383,988 0 Starbucks Corp. USD 0 735,710 735,710 0 Target Corp. USD 0 1,044,864 1,044,864 0 Texas Instruments Inc. USD 0 1,008,189 1,008,189 0 Thermo Fisher Scientific Inc. USD 0 13,995,540 13,995,540 0 Thomson Reuters Corp. USD 0 641,552 641,552 0 Time Warner Cable Inc. USD 0 473,365 473,365 0 Time Warner Inc. USD 0 4,279,685 4,279,685 0 TJX Cos Inc./The USD 0 1,081,388 1,081,388 0 Twenty First Century Fox - Class A USD 0 3,022,206 3,022,206 0 Twenty First Century Fox - Class BA USD 4,750,000 260,469,508 265,219,508 0 United Continental Holdings Inc. USD 0 4,069,143 4,069,143 0 United Parcel Service Inc. USD 0 1,055,175 1,055,175 0 United States Steel Corp. USD 0 8,000,000 8,000,000 0 United Technologies Corp. USD 0 1,266,118 1,266,118 0 Valeant Pharmaceuticals International Inc. USD 0 2,003,958 2,003,958 0 Valero Energy Corp. USD 0 468,944 468,944 0 Verizon Communications Inc. USD 0 23,425,023 23,425,023 0 Vertex Pharmaceuticals Inc. USD 0 9,635,000 9,635,000 0 Visa Inc. USD 0 722,134 722,134 0 Walgreen Co. USD 0 1,354,320 1,354,320 0 Wal-Mart Stores Inc. USD 0 1,918,875 1,550,475 368,400 Walt Disney Co/The USD 0 9,461,424 9,461,424 0 Wells Fargo & Co. USD 2,656,897 30,498,491 31,973,083 1,182,305 Yahoo! Inc. USD 0 102,331,551 102,331,551 0
db x-trackers MSCI TAIWAN INDEX UCITS ETF (DR)
Description Currency (local)
Shares/Nominal as at 31
December 2013 Purchases Sales
Shares/Nominal as at 31
December 2014
Shares
Taiwan
Acer Inc. TWD 0 1,680,000 230,000 1,450,000 Advanced Semiconductor Engineering Inc. TWD 0 4,108,000 552,000 3,556,000
Advantech Co. Ltd. TWD 0 204,000 23,000 181,000
Asia Cement Corp. TWD 0 1,432,000 184,000 1,248,000
Asia Pacific Telecom Co. Ltd. TWD 0 1,249,000 161,000 1,088,000
Asustek Computer Inc. TWD 0 468,000 69,000 399,000
375
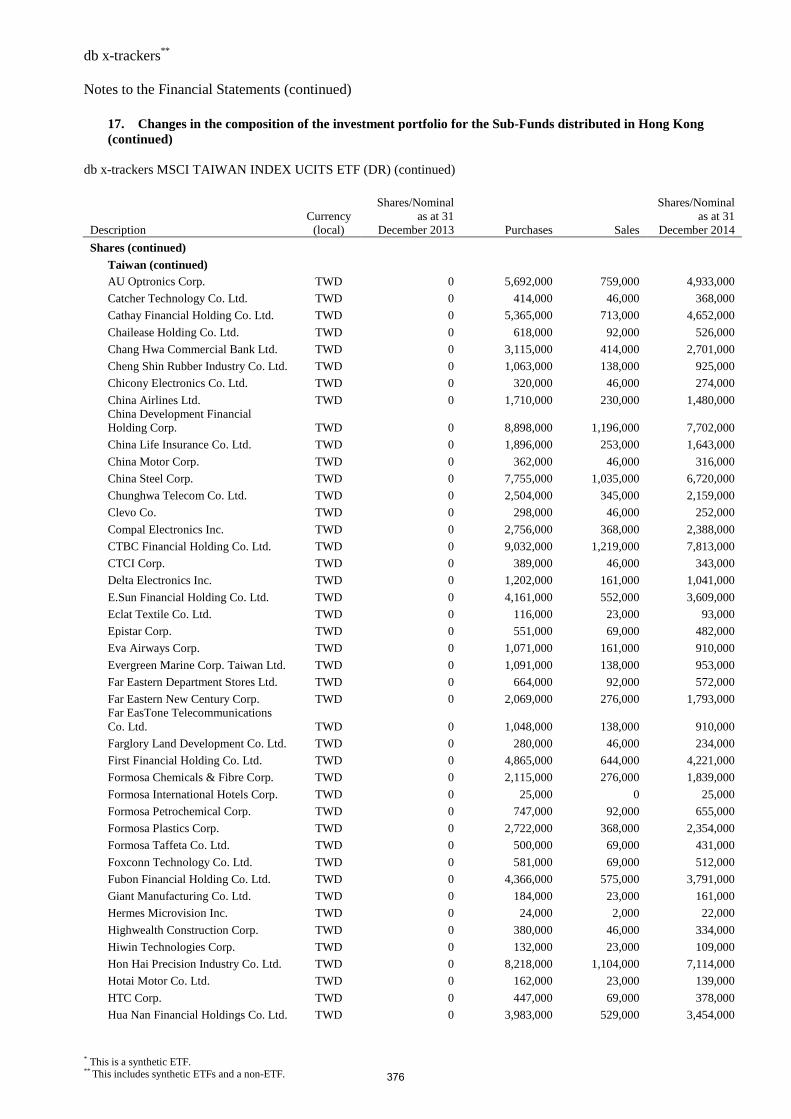
db x-trackers** Notes to the Financial Statements (continued)
* This is a synthetic ETF. ** This includes synthetic ETFs and a non-ETF.
17. Changes in the composition of the investment portfolio for the Sub-Funds distributed in Hong Kong (continued)
db x-trackers MSCI TAIWAN INDEX UCITS ETF (DR) (continued)
Description Currency (local)
Shares/Nominal as at 31
December 2013 Purchases Sales
Shares/Nominal as at 31
December 2014
Shares (continued)
Taiwan (continued)
AU Optronics Corp. TWD 0 5,692,000 759,000 4,933,000
Catcher Technology Co. Ltd. TWD 0 414,000 46,000 368,000
Cathay Financial Holding Co. Ltd. TWD 0 5,365,000 713,000 4,652,000
Chailease Holding Co. Ltd. TWD 0 618,000 92,000 526,000
Chang Hwa Commercial Bank Ltd. TWD 0 3,115,000 414,000 2,701,000
Cheng Shin Rubber Industry Co. Ltd. TWD 0 1,063,000 138,000 925,000
Chicony Electronics Co. Ltd. TWD 0 320,000 46,000 274,000
China Airlines Ltd. TWD 0 1,710,000 230,000 1,480,000 China Development Financial Holding Corp. TWD 0 8,898,000 1,196,000 7,702,000
China Life Insurance Co. Ltd. TWD 0 1,896,000 253,000 1,643,000
China Motor Corp. TWD 0 362,000 46,000 316,000
China Steel Corp. TWD 0 7,755,000 1,035,000 6,720,000
Chunghwa Telecom Co. Ltd. TWD 0 2,504,000 345,000 2,159,000
Clevo Co. TWD 0 298,000 46,000 252,000
Compal Electronics Inc. TWD 0 2,756,000 368,000 2,388,000
CTBC Financial Holding Co. Ltd. TWD 0 9,032,000 1,219,000 7,813,000
CTCI Corp. TWD 0 389,000 46,000 343,000
Delta Electronics Inc. TWD 0 1,202,000 161,000 1,041,000
E.Sun Financial Holding Co. Ltd. TWD 0 4,161,000 552,000 3,609,000
Eclat Textile Co. Ltd. TWD 0 116,000 23,000 93,000
Epistar Corp. TWD 0 551,000 69,000 482,000
Eva Airways Corp. TWD 0 1,071,000 161,000 910,000
Evergreen Marine Corp. Taiwan Ltd. TWD 0 1,091,000 138,000 953,000
Far Eastern Department Stores Ltd. TWD 0 664,000 92,000 572,000
Far Eastern New Century Corp. TWD 0 2,069,000 276,000 1,793,000 Far EasTone Telecommunications Co. Ltd. TWD 0 1,048,000 138,000 910,000
Farglory Land Development Co. Ltd. TWD 0 280,000 46,000 234,000
First Financial Holding Co. Ltd. TWD 0 4,865,000 644,000 4,221,000
Formosa Chemicals & Fibre Corp. TWD 0 2,115,000 276,000 1,839,000
Formosa International Hotels Corp. TWD 0 25,000 0 25,000
Formosa Petrochemical Corp. TWD 0 747,000 92,000 655,000
Formosa Plastics Corp. TWD 0 2,722,000 368,000 2,354,000
Formosa Taffeta Co. Ltd. TWD 0 500,000 69,000 431,000
Foxconn Technology Co. Ltd. TWD 0 581,000 69,000 512,000
Fubon Financial Holding Co. Ltd. TWD 0 4,366,000 575,000 3,791,000
Giant Manufacturing Co. Ltd. TWD 0 184,000 23,000 161,000
Hermes Microvision Inc. TWD 0 24,000 2,000 22,000
Highwealth Construction Corp. TWD 0 380,000 46,000 334,000
Hiwin Technologies Corp. TWD 0 132,000 23,000 109,000
Hon Hai Precision Industry Co. Ltd. TWD 0 8,218,000 1,104,000 7,114,000
Hotai Motor Co. Ltd. TWD 0 162,000 23,000 139,000
HTC Corp. TWD 0 447,000 69,000 378,000
Hua Nan Financial Holdings Co. Ltd. TWD 0 3,983,000 529,000 3,454,000
376
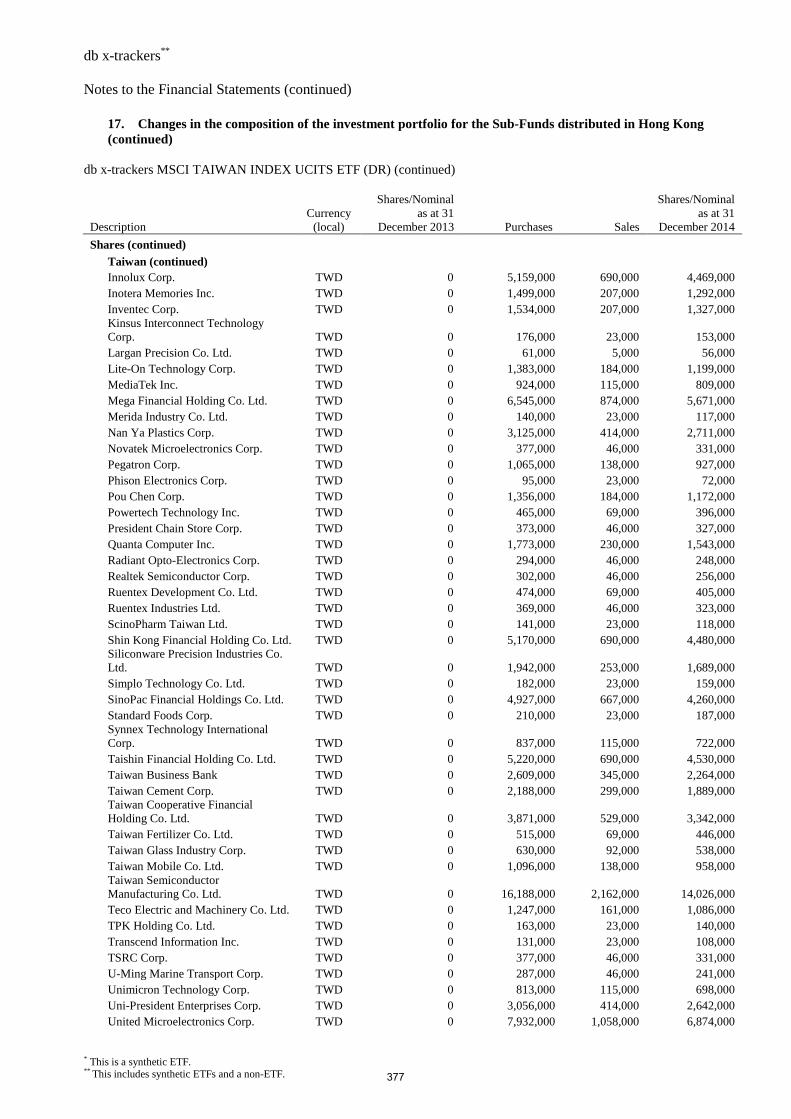
db x-trackers** Notes to the Financial Statements (continued)
* This is a synthetic ETF. ** This includes synthetic ETFs and a non-ETF.
17. Changes in the composition of the investment portfolio for the Sub-Funds distributed in Hong Kong (continued)
db x-trackers MSCI TAIWAN INDEX UCITS ETF (DR) (continued)
Description Currency (local)
Shares/Nominal as at 31
December 2013 Purchases Sales
Shares/Nominal as at 31
December 2014
Shares (continued)
Taiwan (continued) Innolux Corp. TWD 0 5,159,000 690,000 4,469,000 Inotera Memories Inc. TWD 0 1,499,000 207,000 1,292,000 Inventec Corp. TWD 0 1,534,000 207,000 1,327,000 Kinsus Interconnect Technology Corp. TWD 0 176,000 23,000 153,000 Largan Precision Co. Ltd. TWD 0 61,000 5,000 56,000 Lite-On Technology Corp. TWD 0 1,383,000 184,000 1,199,000 MediaTek Inc. TWD 0 924,000 115,000 809,000 Mega Financial Holding Co. Ltd. TWD 0 6,545,000 874,000 5,671,000 Merida Industry Co. Ltd. TWD 0 140,000 23,000 117,000 Nan Ya Plastics Corp. TWD 0 3,125,000 414,000 2,711,000 Novatek Microelectronics Corp. TWD 0 377,000 46,000 331,000 Pegatron Corp. TWD 0 1,065,000 138,000 927,000 Phison Electronics Corp. TWD 0 95,000 23,000 72,000 Pou Chen Corp. TWD 0 1,356,000 184,000 1,172,000 Powertech Technology Inc. TWD 0 465,000 69,000 396,000 President Chain Store Corp. TWD 0 373,000 46,000 327,000 Quanta Computer Inc. TWD 0 1,773,000 230,000 1,543,000 Radiant Opto-Electronics Corp. TWD 0 294,000 46,000 248,000 Realtek Semiconductor Corp. TWD 0 302,000 46,000 256,000 Ruentex Development Co. Ltd. TWD 0 474,000 69,000 405,000 Ruentex Industries Ltd. TWD 0 369,000 46,000 323,000 ScinoPharm Taiwan Ltd. TWD 0 141,000 23,000 118,000 Shin Kong Financial Holding Co. Ltd. TWD 0 5,170,000 690,000 4,480,000 Siliconware Precision Industries Co. Ltd. TWD 0 1,942,000 253,000 1,689,000 Simplo Technology Co. Ltd. TWD 0 182,000 23,000 159,000 SinoPac Financial Holdings Co. Ltd. TWD 0 4,927,000 667,000 4,260,000 Standard Foods Corp. TWD 0 210,000 23,000 187,000 Synnex Technology International Corp. TWD 0 837,000 115,000 722,000 Taishin Financial Holding Co. Ltd. TWD 0 5,220,000 690,000 4,530,000 Taiwan Business Bank TWD 0 2,609,000 345,000 2,264,000 Taiwan Cement Corp. TWD 0 2,188,000 299,000 1,889,000 Taiwan Cooperative Financial Holding Co. Ltd. TWD 0 3,871,000 529,000 3,342,000 Taiwan Fertilizer Co. Ltd. TWD 0 515,000 69,000 446,000 Taiwan Glass Industry Corp. TWD 0 630,000 92,000 538,000 Taiwan Mobile Co. Ltd. TWD 0 1,096,000 138,000 958,000 Taiwan Semiconductor Manufacturing Co. Ltd. TWD 0 16,188,000 2,162,000 14,026,000 Teco Electric and Machinery Co. Ltd. TWD 0 1,247,000 161,000 1,086,000 TPK Holding Co. Ltd. TWD 0 163,000 23,000 140,000 Transcend Information Inc. TWD 0 131,000 23,000 108,000 TSRC Corp. TWD 0 377,000 46,000 331,000 U-Ming Marine Transport Corp. TWD 0 287,000 46,000 241,000 Unimicron Technology Corp. TWD 0 813,000 115,000 698,000 Uni-President Enterprises Corp. TWD 0 3,056,000 414,000 2,642,000 United Microelectronics Corp. TWD 0 7,932,000 1,058,000 6,874,000
377
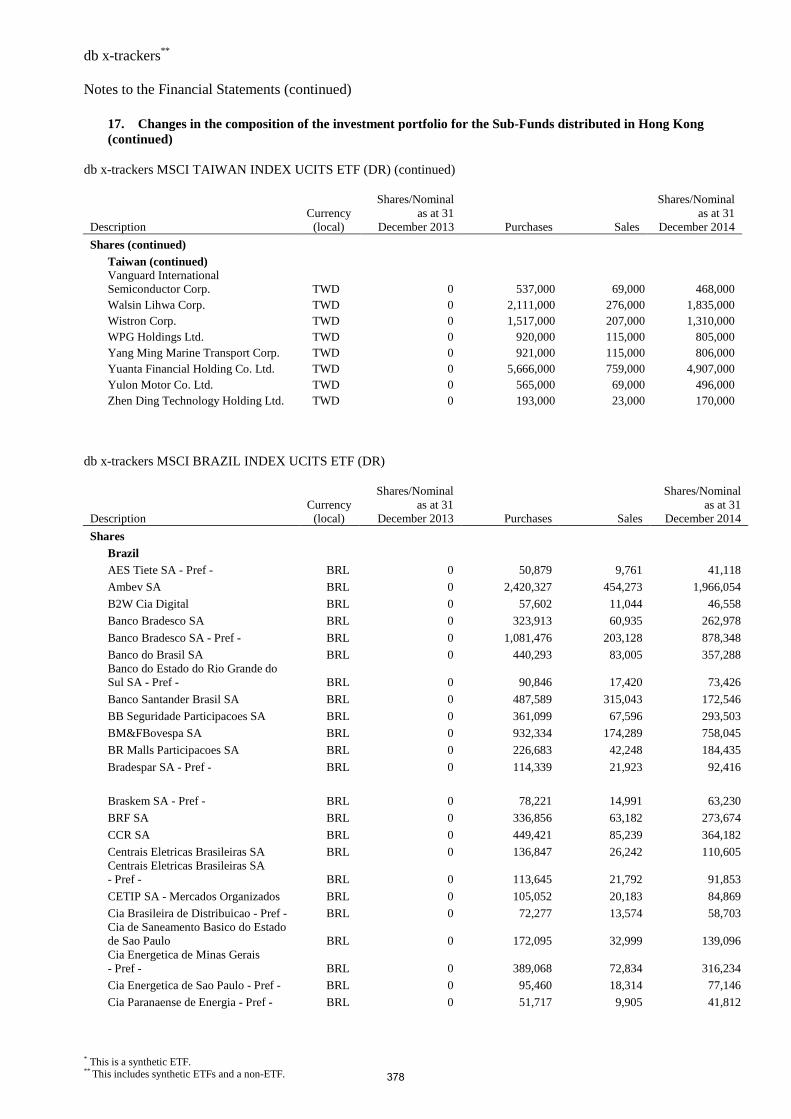
db x-trackers** Notes to the Financial Statements (continued)
* This is a synthetic ETF. ** This includes synthetic ETFs and a non-ETF.
17. Changes in the composition of the investment portfolio for the Sub-Funds distributed in Hong Kong (continued)
db x-trackers MSCI TAIWAN INDEX UCITS ETF (DR) (continued)
Description Currency (local)
Shares/Nominal as at 31
December 2013 Purchases Sales
Shares/Nominal as at 31
December 2014
Shares (continued)
Taiwan (continued) Vanguard International Semiconductor Corp. TWD 0 537,000 69,000 468,000 Walsin Lihwa Corp. TWD 0 2,111,000 276,000 1,835,000 Wistron Corp. TWD 0 1,517,000 207,000 1,310,000 WPG Holdings Ltd. TWD 0 920,000 115,000 805,000 Yang Ming Marine Transport Corp. TWD 0 921,000 115,000 806,000 Yuanta Financial Holding Co. Ltd. TWD 0 5,666,000 759,000 4,907,000 Yulon Motor Co. Ltd. TWD 0 565,000 69,000 496,000 Zhen Ding Technology Holding Ltd. TWD 0 193,000 23,000 170,000
db x-trackers MSCI BRAZIL INDEX UCITS ETF (DR)
Description Currency (local)
Shares/Nominal as at 31
December 2013 Purchases Sales
Shares/Nominal as at 31
December 2014
Shares Brazil AES Tiete SA - Pref - BRL 0 50,879 9,761 41,118
Ambev SA BRL 0 2,420,327 454,273 1,966,054
B2W Cia Digital BRL 0 57,602 11,044 46,558
Banco Bradesco SA BRL 0 323,913 60,935 262,978
Banco Bradesco SA - Pref - BRL 0 1,081,476 203,128 878,348
Banco do Brasil SA BRL 0 440,293 83,005 357,288 Banco do Estado do Rio Grande do Sul SA - Pref - BRL 0 90,846 17,420 73,426
Banco Santander Brasil SA BRL 0 487,589 315,043 172,546
BB Seguridade Participacoes SA BRL 0 361,099 67,596 293,503
BM&FBovespa SA BRL 0 932,334 174,289 758,045
BR Malls Participacoes SA BRL 0 226,683 42,248 184,435
Bradespar SA - Pref - BRL 0 114,339 21,923 92,416
Braskem SA - Pref - BRL 0 78,221 14,991 63,230
BRF SA BRL 0 336,856 63,182 273,674
CCR SA BRL 0 449,421 85,239 364,182
Centrais Eletricas Brasileiras SA BRL 0 136,847 26,242 110,605 Centrais Eletricas Brasileiras SA - Pref - BRL 0 113,645 21,792 91,853
CETIP SA - Mercados Organizados BRL 0 105,052 20,183 84,869
Cia Brasileira de Distribuicao - Pref - BRL 0 72,277 13,574 58,703 Cia de Saneamento Basico do Estado de Sao Paulo BRL 0 172,095 32,999 139,096 Cia Energetica de Minas Gerais - Pref - BRL 0 389,068 72,834 316,234
Cia Energetica de Sao Paulo - Pref - BRL 0 95,460 18,314 77,146
Cia Paranaense de Energia - Pref - BRL 0 51,717 9,905 41,812
378
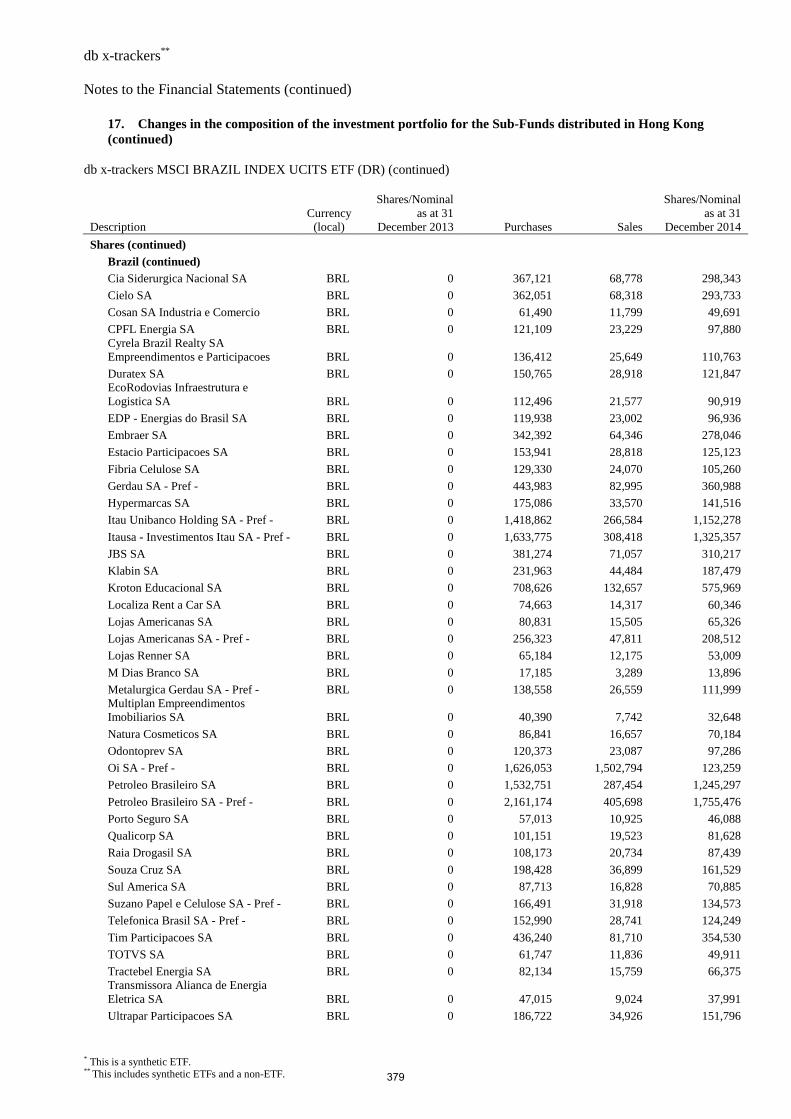
db x-trackers** Notes to the Financial Statements (continued)
* This is a synthetic ETF. ** This includes synthetic ETFs and a non-ETF.
17. Changes in the composition of the investment portfolio for the Sub-Funds distributed in Hong Kong (continued)
db x-trackers MSCI BRAZIL INDEX UCITS ETF (DR) (continued)
Description Currency (local)
Shares/Nominal as at 31
December 2013 Purchases Sales
Shares/Nominal as at 31
December 2014
Shares (continued)
Brazil (continued)
Cia Siderurgica Nacional SA BRL 0 367,121 68,778 298,343
Cielo SA BRL 0 362,051 68,318 293,733
Cosan SA Industria e Comercio BRL 0 61,490 11,799 49,691
CPFL Energia SA BRL 0 121,109 23,229 97,880 Cyrela Brazil Realty SA Empreendimentos e Participacoes BRL 0 136,412 25,649 110,763
Duratex SA BRL 0 150,765 28,918 121,847 EcoRodovias Infraestrutura e Logistica SA BRL 0 112,496 21,577 90,919
EDP - Energias do Brasil SA BRL 0 119,938 23,002 96,936
Embraer SA BRL 0 342,392 64,346 278,046
Estacio Participacoes SA BRL 0 153,941 28,818 125,123
Fibria Celulose SA BRL 0 129,330 24,070 105,260
Gerdau SA - Pref - BRL 0 443,983 82,995 360,988
Hypermarcas SA BRL 0 175,086 33,570 141,516
Itau Unibanco Holding SA - Pref - BRL 0 1,418,862 266,584 1,152,278
Itausa - Investimentos Itau SA - Pref - BRL 0 1,633,775 308,418 1,325,357
JBS SA BRL 0 381,274 71,057 310,217
Klabin SA BRL 0 231,963 44,484 187,479
Kroton Educacional SA BRL 0 708,626 132,657 575,969
Localiza Rent a Car SA BRL 0 74,663 14,317 60,346
Lojas Americanas SA BRL 0 80,831 15,505 65,326
Lojas Americanas SA - Pref - BRL 0 256,323 47,811 208,512
Lojas Renner SA BRL 0 65,184 12,175 53,009
M Dias Branco SA BRL 0 17,185 3,289 13,896
Metalurgica Gerdau SA - Pref - BRL 0 138,558 26,559 111,999 Multiplan Empreendimentos Imobiliarios SA BRL 0 40,390 7,742 32,648
Natura Cosmeticos SA BRL 0 86,841 16,657 70,184
Odontoprev SA BRL 0 120,373 23,087 97,286
Oi SA - Pref - BRL 0 1,626,053 1,502,794 123,259
Petroleo Brasileiro SA BRL 0 1,532,751 287,454 1,245,297
Petroleo Brasileiro SA - Pref - BRL 0 2,161,174 405,698 1,755,476
Porto Seguro SA BRL 0 57,013 10,925 46,088
Qualicorp SA BRL 0 101,151 19,523 81,628
Raia Drogasil SA BRL 0 108,173 20,734 87,439
Souza Cruz SA BRL 0 198,428 36,899 161,529
Sul America SA BRL 0 87,713 16,828 70,885
Suzano Papel e Celulose SA - Pref - BRL 0 166,491 31,918 134,573
Telefonica Brasil SA - Pref - BRL 0 152,990 28,741 124,249
Tim Participacoes SA BRL 0 436,240 81,710 354,530
TOTVS SA BRL 0 61,747 11,836 49,911
Tractebel Energia SA BRL 0 82,134 15,759 66,375 Transmissora Alianca de Energia Eletrica SA BRL 0 47,015 9,024 37,991
Ultrapar Participacoes SA BRL 0 186,722 34,926 151,796
379
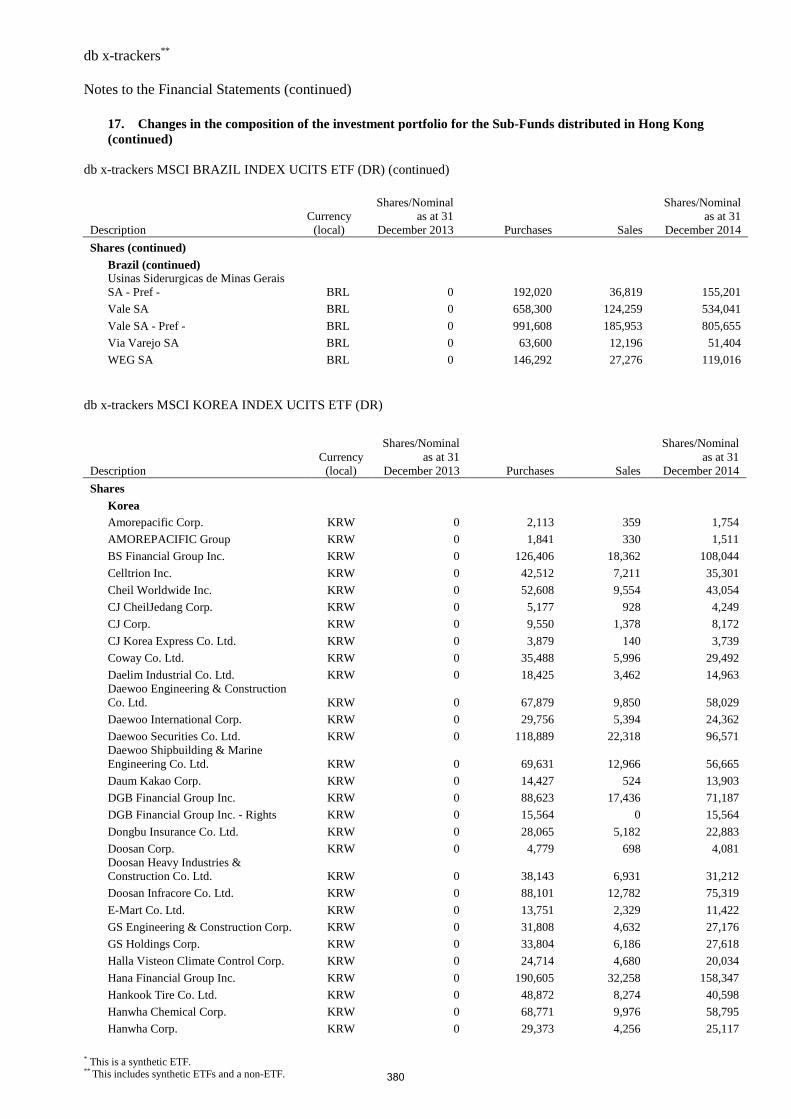
db x-trackers** Notes to the Financial Statements (continued)
* This is a synthetic ETF. ** This includes synthetic ETFs and a non-ETF.
17. Changes in the composition of the investment portfolio for the Sub-Funds distributed in Hong Kong (continued)
db x-trackers MSCI BRAZIL INDEX UCITS ETF (DR) (continued)
Description Currency (local)
Shares/Nominal as at 31
December 2013 Purchases Sales
Shares/Nominal as at 31
December 2014
Shares (continued)
Brazil (continued) Usinas Siderurgicas de Minas Gerais SA - Pref - BRL 0 192,020 36,819 155,201
Vale SA BRL 0 658,300 124,259 534,041
Vale SA - Pref - BRL 0 991,608 185,953 805,655
Via Varejo SA BRL 0 63,600 12,196 51,404
WEG SA BRL 0 146,292 27,276 119,016 db x-trackers MSCI KOREA INDEX UCITS ETF (DR)
Description Currency (local)
Shares/Nominal as at 31
December 2013 Purchases Sales
Shares/Nominal as at 31
December 2014
Shares Korea Amorepacific Corp. KRW 0 2,113 359 1,754
AMOREPACIFIC Group KRW 0 1,841 330 1,511
BS Financial Group Inc. KRW 0 126,406 18,362 108,044
Celltrion Inc. KRW 0 42,512 7,211 35,301
Cheil Worldwide Inc. KRW 0 52,608 9,554 43,054
CJ CheilJedang Corp. KRW 0 5,177 928 4,249
CJ Corp. KRW 0 9,550 1,378 8,172
CJ Korea Express Co. Ltd. KRW 0 3,879 140 3,739
Coway Co. Ltd. KRW 0 35,488 5,996 29,492
Daelim Industrial Co. Ltd. KRW 0 18,425 3,462 14,963 Daewoo Engineering & Construction Co. Ltd. KRW 0 67,879 9,850 58,029
Daewoo International Corp. KRW 0 29,756 5,394 24,362
Daewoo Securities Co. Ltd. KRW 0 118,889 22,318 96,571 Daewoo Shipbuilding & Marine Engineering Co. Ltd. KRW 0 69,631 12,966 56,665
Daum Kakao Corp. KRW 0 14,427 524 13,903
DGB Financial Group Inc. KRW 0 88,623 17,436 71,187
DGB Financial Group Inc. - Rights KRW 0 15,564 0 15,564
Dongbu Insurance Co. Ltd. KRW 0 28,065 5,182 22,883
Doosan Corp. KRW 0 4,779 698 4,081 Doosan Heavy Industries & Construction Co. Ltd. KRW 0 38,143 6,931 31,212
Doosan Infracore Co. Ltd. KRW 0 88,101 12,782 75,319
E-Mart Co. Ltd. KRW 0 13,751 2,329 11,422
GS Engineering & Construction Corp. KRW 0 31,808 4,632 27,176
GS Holdings Corp. KRW 0 33,804 6,186 27,618
Halla Visteon Climate Control Corp. KRW 0 24,714 4,680 20,034
Hana Financial Group Inc. KRW 0 190,605 32,258 158,347
Hankook Tire Co. Ltd. KRW 0 48,872 8,274 40,598
Hanwha Chemical Corp. KRW 0 68,771 9,976 58,795
Hanwha Corp. KRW 0 29,373 4,256 25,117
380
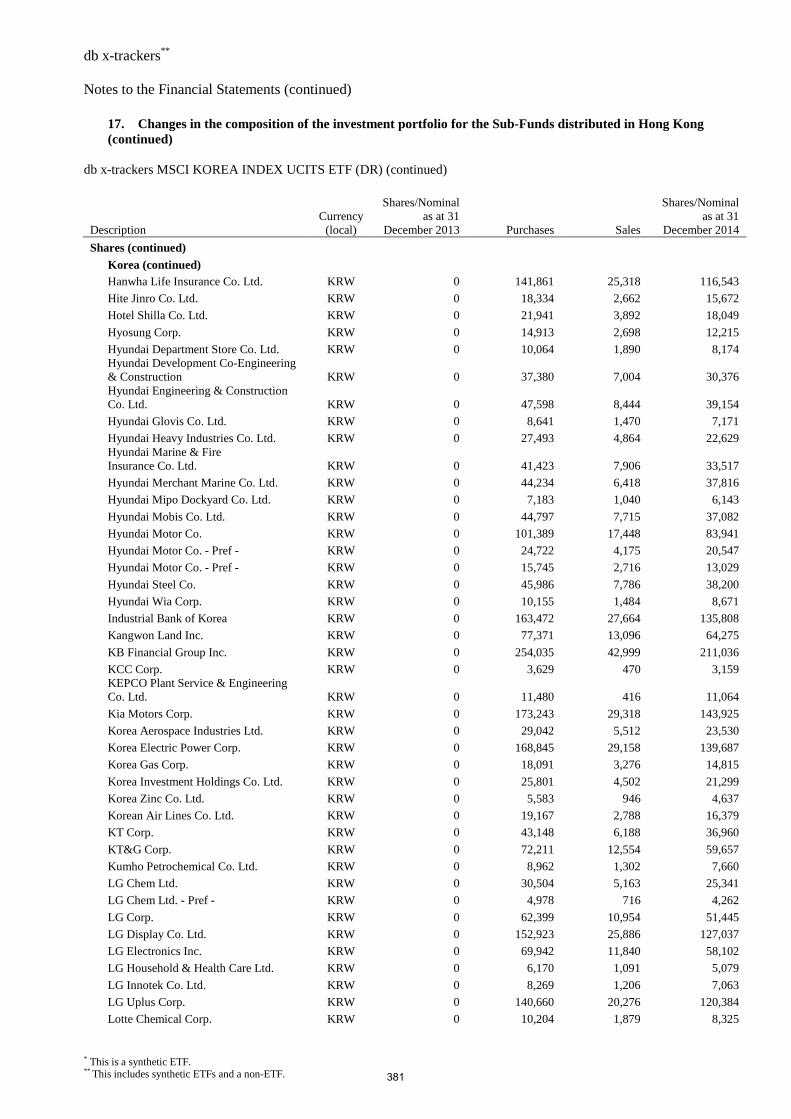
db x-trackers** Notes to the Financial Statements (continued)
* This is a synthetic ETF. ** This includes synthetic ETFs and a non-ETF.
17. Changes in the composition of the investment portfolio for the Sub-Funds distributed in Hong Kong (continued)
db x-trackers MSCI KOREA INDEX UCITS ETF (DR) (continued)
Description Currency (local)
Shares/Nominal as at 31
December 2013 Purchases Sales
Shares/Nominal as at 31
December 2014
Shares (continued)
Korea (continued)
Hanwha Life Insurance Co. Ltd. KRW 0 141,861 25,318 116,543
Hite Jinro Co. Ltd. KRW 0 18,334 2,662 15,672
Hotel Shilla Co. Ltd. KRW 0 21,941 3,892 18,049
Hyosung Corp. KRW 0 14,913 2,698 12,215
Hyundai Department Store Co. Ltd. KRW 0 10,064 1,890 8,174 Hyundai Development Co-Engineering & Construction KRW 0 37,380 7,004 30,376 Hyundai Engineering & Construction Co. Ltd. KRW 0 47,598 8,444 39,154
Hyundai Glovis Co. Ltd. KRW 0 8,641 1,470 7,171
Hyundai Heavy Industries Co. Ltd. KRW 0 27,493 4,864 22,629 Hyundai Marine & Fire Insurance Co. Ltd. KRW 0 41,423 7,906 33,517
Hyundai Merchant Marine Co. Ltd. KRW 0 44,234 6,418 37,816
Hyundai Mipo Dockyard Co. Ltd. KRW 0 7,183 1,040 6,143
Hyundai Mobis Co. Ltd. KRW 0 44,797 7,715 37,082
Hyundai Motor Co. KRW 0 101,389 17,448 83,941
Hyundai Motor Co. - Pref - KRW 0 24,722 4,175 20,547
Hyundai Motor Co. - Pref - KRW 0 15,745 2,716 13,029
Hyundai Steel Co. KRW 0 45,986 7,786 38,200
Hyundai Wia Corp. KRW 0 10,155 1,484 8,671
Industrial Bank of Korea KRW 0 163,472 27,664 135,808
Kangwon Land Inc. KRW 0 77,371 13,096 64,275
KB Financial Group Inc. KRW 0 254,035 42,999 211,036
KCC Corp. KRW 0 3,629 470 3,159 KEPCO Plant Service & Engineering Co. Ltd. KRW 0 11,480 416 11,064
Kia Motors Corp. KRW 0 173,243 29,318 143,925
Korea Aerospace Industries Ltd. KRW 0 29,042 5,512 23,530
Korea Electric Power Corp. KRW 0 168,845 29,158 139,687
Korea Gas Corp. KRW 0 18,091 3,276 14,815
Korea Investment Holdings Co. Ltd. KRW 0 25,801 4,502 21,299
Korea Zinc Co. Ltd. KRW 0 5,583 946 4,637
Korean Air Lines Co. Ltd. KRW 0 19,167 2,788 16,379
KT Corp. KRW 0 43,148 6,188 36,960
KT&G Corp. KRW 0 72,211 12,554 59,657
Kumho Petrochemical Co. Ltd. KRW 0 8,962 1,302 7,660
LG Chem Ltd. KRW 0 30,504 5,163 25,341
LG Chem Ltd. - Pref - KRW 0 4,978 716 4,262
LG Corp. KRW 0 62,399 10,954 51,445
LG Display Co. Ltd. KRW 0 152,923 25,886 127,037
LG Electronics Inc. KRW 0 69,942 11,840 58,102
LG Household & Health Care Ltd. KRW 0 6,170 1,091 5,079
LG Innotek Co. Ltd. KRW 0 8,269 1,206 7,063
LG Uplus Corp. KRW 0 140,660 20,276 120,384
Lotte Chemical Corp. KRW 0 10,204 1,879 8,325
381
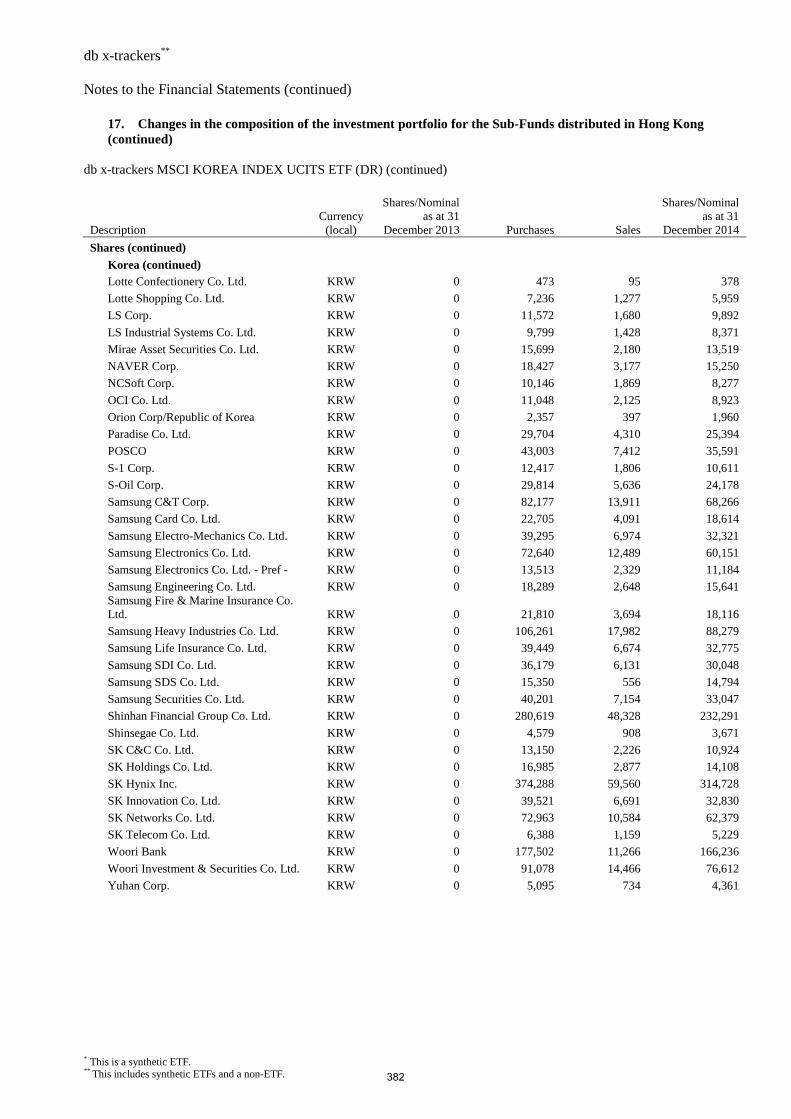
db x-trackers** Notes to the Financial Statements (continued)
* This is a synthetic ETF. ** This includes synthetic ETFs and a non-ETF.
17. Changes in the composition of the investment portfolio for the Sub-Funds distributed in Hong Kong (continued)
db x-trackers MSCI KOREA INDEX UCITS ETF (DR) (continued)
Description Currency (local)
Shares/Nominal as at 31
December 2013 Purchases Sales
Shares/Nominal as at 31
December 2014
Shares (continued)
Korea (continued)
Lotte Confectionery Co. Ltd. KRW 0 473 95 378
Lotte Shopping Co. Ltd. KRW 0 7,236 1,277 5,959
LS Corp. KRW 0 11,572 1,680 9,892
LS Industrial Systems Co. Ltd. KRW 0 9,799 1,428 8,371
Mirae Asset Securities Co. Ltd. KRW 0 15,699 2,180 13,519
NAVER Corp. KRW 0 18,427 3,177 15,250
NCSoft Corp. KRW 0 10,146 1,869 8,277
OCI Co. Ltd. KRW 0 11,048 2,125 8,923
Orion Corp/Republic of Korea KRW 0 2,357 397 1,960
Paradise Co. Ltd. KRW 0 29,704 4,310 25,394
POSCO KRW 0 43,003 7,412 35,591
S-1 Corp. KRW 0 12,417 1,806 10,611
S-Oil Corp. KRW 0 29,814 5,636 24,178
Samsung C&T Corp. KRW 0 82,177 13,911 68,266
Samsung Card Co. Ltd. KRW 0 22,705 4,091 18,614
Samsung Electro-Mechanics Co. Ltd. KRW 0 39,295 6,974 32,321
Samsung Electronics Co. Ltd. KRW 0 72,640 12,489 60,151
Samsung Electronics Co. Ltd. - Pref - KRW 0 13,513 2,329 11,184
Samsung Engineering Co. Ltd. KRW 0 18,289 2,648 15,641 Samsung Fire & Marine Insurance Co. Ltd. KRW 0 21,810 3,694 18,116
Samsung Heavy Industries Co. Ltd. KRW 0 106,261 17,982 88,279
Samsung Life Insurance Co. Ltd. KRW 0 39,449 6,674 32,775
Samsung SDI Co. Ltd. KRW 0 36,179 6,131 30,048
Samsung SDS Co. Ltd. KRW 0 15,350 556 14,794
Samsung Securities Co. Ltd. KRW 0 40,201 7,154 33,047
Shinhan Financial Group Co. Ltd. KRW 0 280,619 48,328 232,291
Shinsegae Co. Ltd. KRW 0 4,579 908 3,671
SK C&C Co. Ltd. KRW 0 13,150 2,226 10,924
SK Holdings Co. Ltd. KRW 0 16,985 2,877 14,108
SK Hynix Inc. KRW 0 374,288 59,560 314,728
SK Innovation Co. Ltd. KRW 0 39,521 6,691 32,830
SK Networks Co. Ltd. KRW 0 72,963 10,584 62,379
SK Telecom Co. Ltd. KRW 0 6,388 1,159 5,229
Woori Bank KRW 0 177,502 11,266 166,236
Woori Investment & Securities Co. Ltd. KRW 0 91,078 14,466 76,612
Yuhan Corp. KRW 0 5,095 734 4,361
382
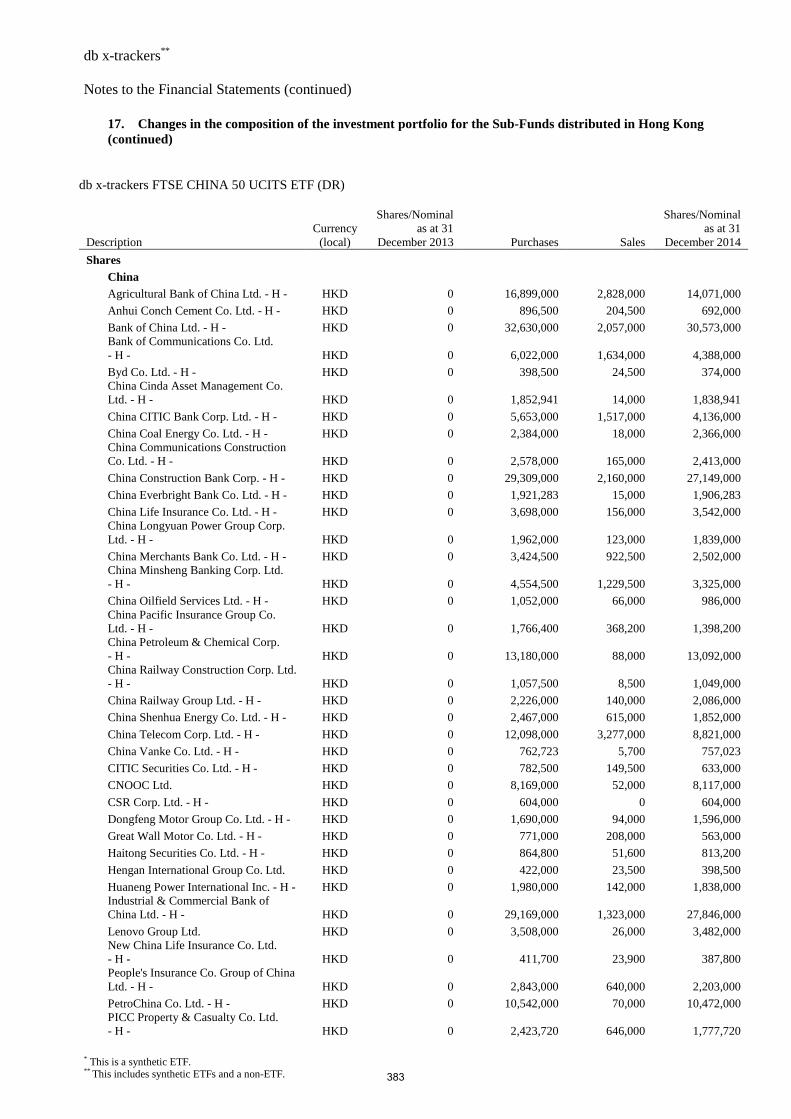
db x-trackers** Notes to the Financial Statements (continued)
* This is a synthetic ETF. ** This includes synthetic ETFs and a non-ETF.
17. Changes in the composition of the investment portfolio for the Sub-Funds distributed in Hong Kong (continued)
db x-trackers FTSE CHINA 50 UCITS ETF (DR)
Description Currency (local)
Shares/Nominal as at 31
December 2013 Purchases Sales
Shares/Nominal as at 31
December 2014
Shares China Agricultural Bank of China Ltd. - H - HKD 0 16,899,000 2,828,000 14,071,000
Anhui Conch Cement Co. Ltd. - H - HKD 0 896,500 204,500 692,000
Bank of China Ltd. - H - HKD 0 32,630,000 2,057,000 30,573,000 Bank of Communications Co. Ltd. - H - HKD 0 6,022,000 1,634,000 4,388,000
Byd Co. Ltd. - H - HKD 0 398,500 24,500 374,000 China Cinda Asset Management Co. Ltd. - H - HKD 0 1,852,941 14,000 1,838,941
China CITIC Bank Corp. Ltd. - H - HKD 0 5,653,000 1,517,000 4,136,000
China Coal Energy Co. Ltd. - H - HKD 0 2,384,000 18,000 2,366,000 China Communications Construction Co. Ltd. - H - HKD 0 2,578,000 165,000 2,413,000
China Construction Bank Corp. - H - HKD 0 29,309,000 2,160,000 27,149,000
China Everbright Bank Co. Ltd. - H - HKD 0 1,921,283 15,000 1,906,283
China Life Insurance Co. Ltd. - H - HKD 0 3,698,000 156,000 3,542,000 China Longyuan Power Group Corp. Ltd. - H - HKD 0 1,962,000 123,000 1,839,000
China Merchants Bank Co. Ltd. - H - HKD 0 3,424,500 922,500 2,502,000 China Minsheng Banking Corp. Ltd. - H - HKD 0 4,554,500 1,229,500 3,325,000
China Oilfield Services Ltd. - H - HKD 0 1,052,000 66,000 986,000 China Pacific Insurance Group Co. Ltd. - H - HKD 0 1,766,400 368,200 1,398,200 China Petroleum & Chemical Corp. - H - HKD 0 13,180,000 88,000 13,092,000 China Railway Construction Corp. Ltd. - H - HKD 0 1,057,500 8,500 1,049,000
China Railway Group Ltd. - H - HKD 0 2,226,000 140,000 2,086,000
China Shenhua Energy Co. Ltd. - H - HKD 0 2,467,000 615,000 1,852,000
China Telecom Corp. Ltd. - H - HKD 0 12,098,000 3,277,000 8,821,000
China Vanke Co. Ltd. - H - HKD 0 762,723 5,700 757,023
CITIC Securities Co. Ltd. - H - HKD 0 782,500 149,500 633,000
CNOOC Ltd. HKD 0 8,169,000 52,000 8,117,000
CSR Corp. Ltd. - H - HKD 0 604,000 0 604,000
Dongfeng Motor Group Co. Ltd. - H - HKD 0 1,690,000 94,000 1,596,000
Great Wall Motor Co. Ltd. - H - HKD 0 771,000 208,000 563,000
Haitong Securities Co. Ltd. - H - HKD 0 864,800 51,600 813,200
Hengan International Group Co. Ltd. HKD 0 422,000 23,500 398,500
Huaneng Power International Inc. - H - HKD 0 1,980,000 142,000 1,838,000 Industrial & Commercial Bank of China Ltd. - H - HKD 0 29,169,000 1,323,000 27,846,000
Lenovo Group Ltd. HKD 0 3,508,000 26,000 3,482,000 New China Life Insurance Co. Ltd. - H - HKD 0 411,700 23,900 387,800 People's Insurance Co. Group of China Ltd. - H - HKD 0 2,843,000 640,000 2,203,000
PetroChina Co. Ltd. - H - HKD 0 10,542,000 70,000 10,472,000 PICC Property & Casualty Co. Ltd. - H - HKD 0 2,423,720 646,000 1,777,720
383
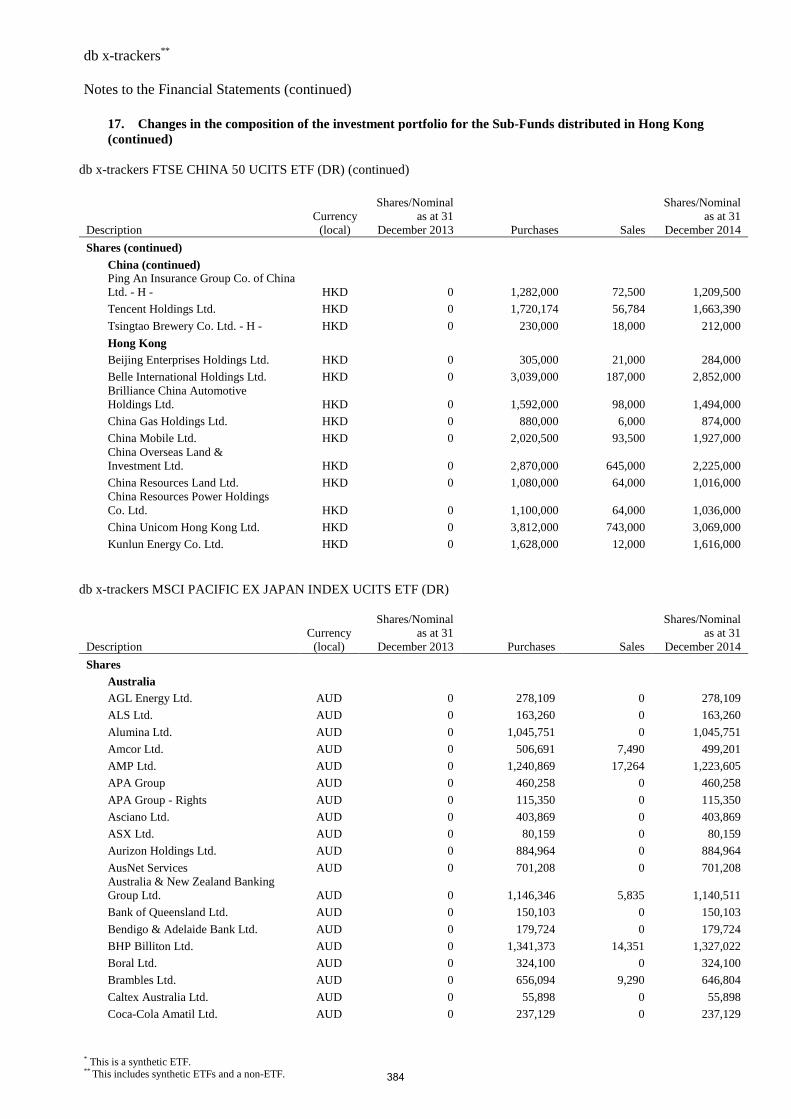
db x-trackers** Notes to the Financial Statements (continued)
* This is a synthetic ETF. ** This includes synthetic ETFs and a non-ETF.
17. Changes in the composition of the investment portfolio for the Sub-Funds distributed in Hong Kong (continued)
db x-trackers FTSE CHINA 50 UCITS ETF (DR) (continued)
Description Currency (local)
Shares/Nominal as at 31
December 2013 Purchases Sales
Shares/Nominal as at 31
December 2014
Shares (continued)
China (continued) Ping An Insurance Group Co. of China Ltd. - H - HKD 0 1,282,000 72,500 1,209,500
Tencent Holdings Ltd. HKD 0 1,720,174 56,784 1,663,390
Tsingtao Brewery Co. Ltd. - H - HKD 0 230,000 18,000 212,000
Hong Kong Beijing Enterprises Holdings Ltd. HKD 0 305,000 21,000 284,000
Belle International Holdings Ltd. HKD 0 3,039,000 187,000 2,852,000 Brilliance China Automotive Holdings Ltd. HKD 0 1,592,000 98,000 1,494,000
China Gas Holdings Ltd. HKD 0 880,000 6,000 874,000
China Mobile Ltd. HKD 0 2,020,500 93,500 1,927,000 China Overseas Land & Investment Ltd. HKD 0 2,870,000 645,000 2,225,000
China Resources Land Ltd. HKD 0 1,080,000 64,000 1,016,000 China Resources Power Holdings Co. Ltd. HKD 0 1,100,000 64,000 1,036,000
China Unicom Hong Kong Ltd. HKD 0 3,812,000 743,000 3,069,000
Kunlun Energy Co. Ltd. HKD 0 1,628,000 12,000 1,616,000 db x-trackers MSCI PACIFIC EX JAPAN INDEX UCITS ETF (DR)
Description Currency (local)
Shares/Nominal as at 31
December 2013 Purchases Sales
Shares/Nominal as at 31
December 2014
Shares Australia AGL Energy Ltd. AUD 0 278,109 0 278,109
ALS Ltd. AUD 0 163,260 0 163,260
Alumina Ltd. AUD 0 1,045,751 0 1,045,751
Amcor Ltd. AUD 0 506,691 7,490 499,201
AMP Ltd. AUD 0 1,240,869 17,264 1,223,605
APA Group AUD 0 460,258 0 460,258
APA Group - Rights AUD 0 115,350 0 115,350
Asciano Ltd. AUD 0 403,869 0 403,869
ASX Ltd. AUD 0 80,159 0 80,159
Aurizon Holdings Ltd. AUD 0 884,964 0 884,964
AusNet Services AUD 0 701,208 0 701,208 Australia & New Zealand Banking Group Ltd. AUD 0 1,146,346 5,835 1,140,511
Bank of Queensland Ltd. AUD 0 150,103 0 150,103
Bendigo & Adelaide Bank Ltd. AUD 0 179,724 0 179,724
BHP Billiton Ltd. AUD 0 1,341,373 14,351 1,327,022
Boral Ltd. AUD 0 324,100 0 324,100
Brambles Ltd. AUD 0 656,094 9,290 646,804
Caltex Australia Ltd. AUD 0 55,898 0 55,898
Coca-Cola Amatil Ltd. AUD 0 237,129 0 237,129
384
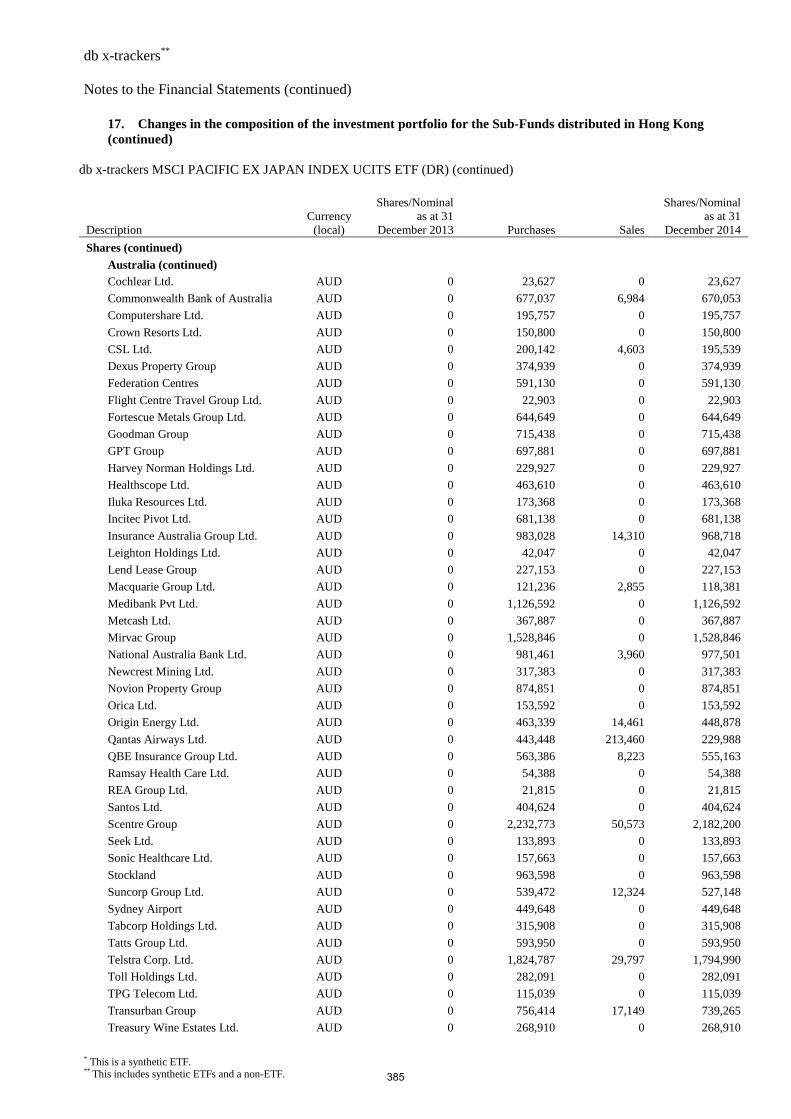
db x-trackers** Notes to the Financial Statements (continued)
* This is a synthetic ETF. ** This includes synthetic ETFs and a non-ETF.
17. Changes in the composition of the investment portfolio for the Sub-Funds distributed in Hong Kong (continued)
db x-trackers MSCI PACIFIC EX JAPAN INDEX UCITS ETF (DR) (continued)
Description Currency (local)
Shares/Nominal as at 31
December 2013 Purchases Sales
Shares/Nominal as at 31
December 2014
Shares (continued)
Australia (continued)
Cochlear Ltd. AUD 0 23,627 0 23,627
Commonwealth Bank of Australia AUD 0 677,037 6,984 670,053
Computershare Ltd. AUD 0 195,757 0 195,757
Crown Resorts Ltd. AUD 0 150,800 0 150,800
CSL Ltd. AUD 0 200,142 4,603 195,539
Dexus Property Group AUD 0 374,939 0 374,939
Federation Centres AUD 0 591,130 0 591,130
Flight Centre Travel Group Ltd. AUD 0 22,903 0 22,903
Fortescue Metals Group Ltd. AUD 0 644,649 0 644,649
Goodman Group AUD 0 715,438 0 715,438
GPT Group AUD 0 697,881 0 697,881
Harvey Norman Holdings Ltd. AUD 0 229,927 0 229,927
Healthscope Ltd. AUD 0 463,610 0 463,610
Iluka Resources Ltd. AUD 0 173,368 0 173,368
Incitec Pivot Ltd. AUD 0 681,138 0 681,138
Insurance Australia Group Ltd. AUD 0 983,028 14,310 968,718
Leighton Holdings Ltd. AUD 0 42,047 0 42,047
Lend Lease Group AUD 0 227,153 0 227,153
Macquarie Group Ltd. AUD 0 121,236 2,855 118,381
Medibank Pvt Ltd. AUD 0 1,126,592 0 1,126,592
Metcash Ltd. AUD 0 367,887 0 367,887
Mirvac Group AUD 0 1,528,846 0 1,528,846
National Australia Bank Ltd. AUD 0 981,461 3,960 977,501
Newcrest Mining Ltd. AUD 0 317,383 0 317,383
Novion Property Group AUD 0 874,851 0 874,851
Orica Ltd. AUD 0 153,592 0 153,592
Origin Energy Ltd. AUD 0 463,339 14,461 448,878
Qantas Airways Ltd. AUD 0 443,448 213,460 229,988
QBE Insurance Group Ltd. AUD 0 563,386 8,223 555,163
Ramsay Health Care Ltd. AUD 0 54,388 0 54,388
REA Group Ltd. AUD 0 21,815 0 21,815
Santos Ltd. AUD 0 404,624 0 404,624
Scentre Group AUD 0 2,232,773 50,573 2,182,200
Seek Ltd. AUD 0 133,893 0 133,893
Sonic Healthcare Ltd. AUD 0 157,663 0 157,663
Stockland AUD 0 963,598 0 963,598
Suncorp Group Ltd. AUD 0 539,472 12,324 527,148
Sydney Airport AUD 0 449,648 0 449,648
Tabcorp Holdings Ltd. AUD 0 315,908 0 315,908
Tatts Group Ltd. AUD 0 593,950 0 593,950
Telstra Corp. Ltd. AUD 0 1,824,787 29,797 1,794,990
Toll Holdings Ltd. AUD 0 282,091 0 282,091
TPG Telecom Ltd. AUD 0 115,039 0 115,039
Transurban Group AUD 0 756,414 17,149 739,265
Treasury Wine Estates Ltd. AUD 0 268,910 0 268,910
385
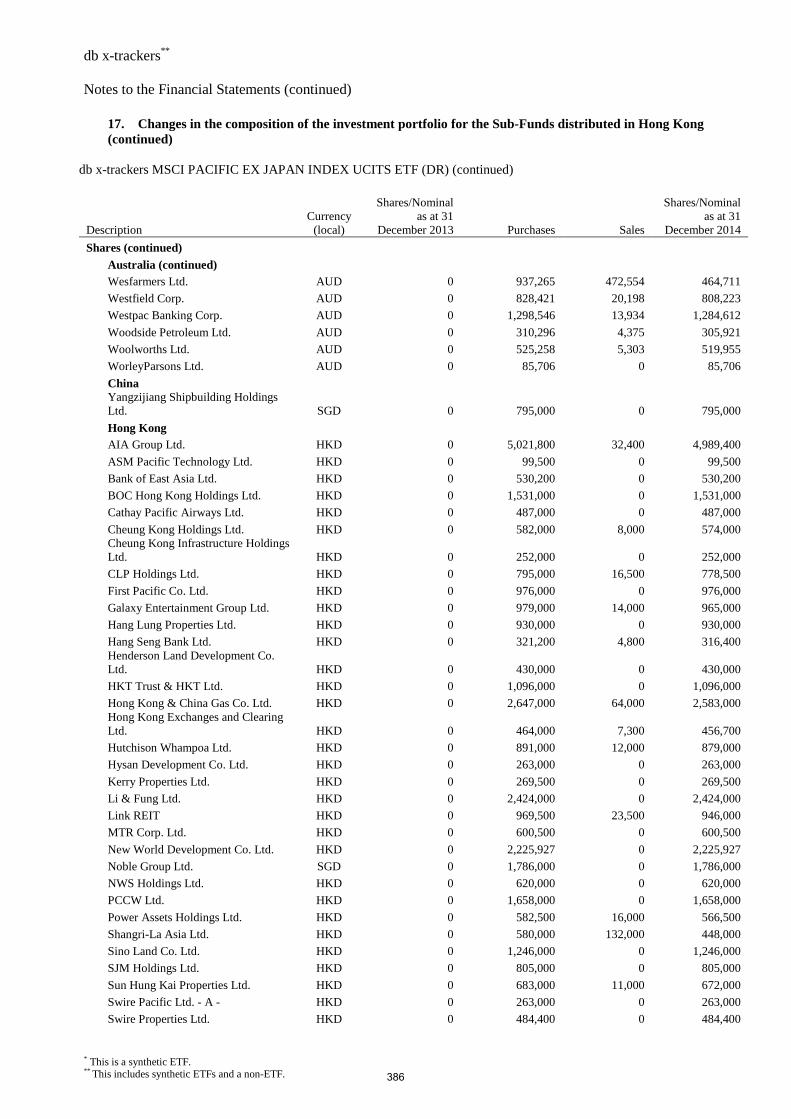
db x-trackers** Notes to the Financial Statements (continued)
* This is a synthetic ETF. ** This includes synthetic ETFs and a non-ETF.
17. Changes in the composition of the investment portfolio for the Sub-Funds distributed in Hong Kong (continued)
db x-trackers MSCI PACIFIC EX JAPAN INDEX UCITS ETF (DR) (continued)
Description Currency (local)
Shares/Nominal as at 31
December 2013 Purchases Sales
Shares/Nominal as at 31
December 2014
Shares (continued)
Australia (continued)
Wesfarmers Ltd. AUD 0 937,265 472,554 464,711
Westfield Corp. AUD 0 828,421 20,198 808,223
Westpac Banking Corp. AUD 0 1,298,546 13,934 1,284,612
Woodside Petroleum Ltd. AUD 0 310,296 4,375 305,921
Woolworths Ltd. AUD 0 525,258 5,303 519,955
WorleyParsons Ltd. AUD 0 85,706 0 85,706
China Yangzijiang Shipbuilding Holdings Ltd. SGD 0 795,000 0 795,000
Hong Kong AIA Group Ltd. HKD 0 5,021,800 32,400 4,989,400
ASM Pacific Technology Ltd. HKD 0 99,500 0 99,500
Bank of East Asia Ltd. HKD 0 530,200 0 530,200
BOC Hong Kong Holdings Ltd. HKD 0 1,531,000 0 1,531,000
Cathay Pacific Airways Ltd. HKD 0 487,000 0 487,000
Cheung Kong Holdings Ltd. HKD 0 582,000 8,000 574,000 Cheung Kong Infrastructure Holdings Ltd. HKD 0 252,000 0 252,000
CLP Holdings Ltd. HKD 0 795,000 16,500 778,500
First Pacific Co. Ltd. HKD 0 976,000 0 976,000
Galaxy Entertainment Group Ltd. HKD 0 979,000 14,000 965,000
Hang Lung Properties Ltd. HKD 0 930,000 0 930,000
Hang Seng Bank Ltd. HKD 0 321,200 4,800 316,400 Henderson Land Development Co. Ltd. HKD 0 430,000 0 430,000
HKT Trust & HKT Ltd. HKD 0 1,096,000 0 1,096,000
Hong Kong & China Gas Co. Ltd. HKD 0 2,647,000 64,000 2,583,000 Hong Kong Exchanges and Clearing Ltd. HKD 0 464,000 7,300 456,700
Hutchison Whampoa Ltd. HKD 0 891,000 12,000 879,000
Hysan Development Co. Ltd. HKD 0 263,000 0 263,000
Kerry Properties Ltd. HKD 0 269,500 0 269,500
Li & Fung Ltd. HKD 0 2,424,000 0 2,424,000
Link REIT HKD 0 969,500 23,500 946,000
MTR Corp. Ltd. HKD 0 600,500 0 600,500
New World Development Co. Ltd. HKD 0 2,225,927 0 2,225,927
Noble Group Ltd. SGD 0 1,786,000 0 1,786,000
NWS Holdings Ltd. HKD 0 620,000 0 620,000
PCCW Ltd. HKD 0 1,658,000 0 1,658,000
Power Assets Holdings Ltd. HKD 0 582,500 16,000 566,500
Shangri-La Asia Ltd. HKD 0 580,000 132,000 448,000
Sino Land Co. Ltd. HKD 0 1,246,000 0 1,246,000
SJM Holdings Ltd. HKD 0 805,000 0 805,000
Sun Hung Kai Properties Ltd. HKD 0 683,000 11,000 672,000
Swire Pacific Ltd. - A - HKD 0 263,000 0 263,000
Swire Properties Ltd. HKD 0 484,400 0 484,400
386
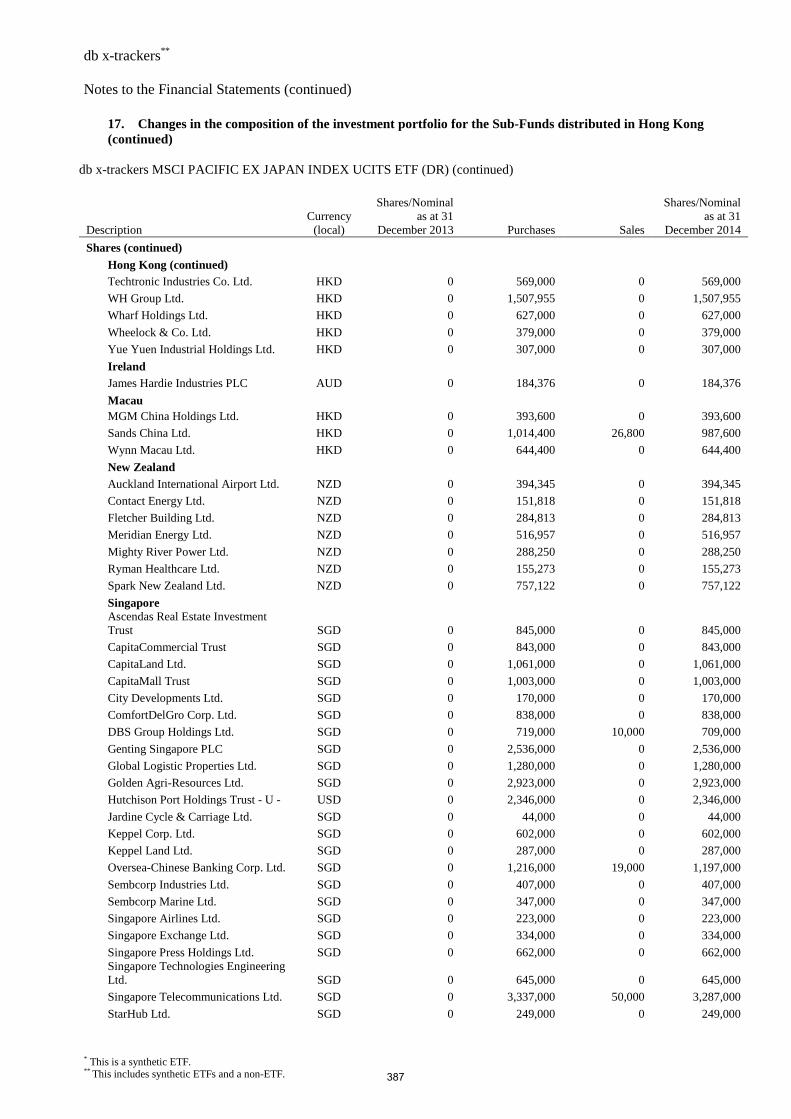
db x-trackers** Notes to the Financial Statements (continued)
* This is a synthetic ETF. ** This includes synthetic ETFs and a non-ETF.
17. Changes in the composition of the investment portfolio for the Sub-Funds distributed in Hong Kong (continued)
db x-trackers MSCI PACIFIC EX JAPAN INDEX UCITS ETF (DR) (continued)
Description Currency (local)
Shares/Nominal as at 31
December 2013 Purchases Sales
Shares/Nominal as at 31
December 2014
Shares (continued)
Hong Kong (continued)
Techtronic Industries Co. Ltd. HKD 0 569,000 0 569,000
WH Group Ltd. HKD 0 1,507,955 0 1,507,955
Wharf Holdings Ltd. HKD 0 627,000 0 627,000
Wheelock & Co. Ltd. HKD 0 379,000 0 379,000
Yue Yuen Industrial Holdings Ltd. HKD 0 307,000 0 307,000
Ireland James Hardie Industries PLC AUD 0 184,376 0 184,376
Macau MGM China Holdings Ltd. HKD 0 393,600 0 393,600
Sands China Ltd. HKD 0 1,014,400 26,800 987,600
Wynn Macau Ltd. HKD 0 644,400 0 644,400
New Zealand Auckland International Airport Ltd. NZD 0 394,345 0 394,345
Contact Energy Ltd. NZD 0 151,818 0 151,818
Fletcher Building Ltd. NZD 0 284,813 0 284,813
Meridian Energy Ltd. NZD 0 516,957 0 516,957
Mighty River Power Ltd. NZD 0 288,250 0 288,250
Ryman Healthcare Ltd. NZD 0 155,273 0 155,273
Spark New Zealand Ltd. NZD 0 757,122 0 757,122
Singapore Ascendas Real Estate Investment Trust SGD 0 845,000 0 845,000
CapitaCommercial Trust SGD 0 843,000 0 843,000
CapitaLand Ltd. SGD 0 1,061,000 0 1,061,000
CapitaMall Trust SGD 0 1,003,000 0 1,003,000
City Developments Ltd. SGD 0 170,000 0 170,000
ComfortDelGro Corp. Ltd. SGD 0 838,000 0 838,000
DBS Group Holdings Ltd. SGD 0 719,000 10,000 709,000
Genting Singapore PLC SGD 0 2,536,000 0 2,536,000
Global Logistic Properties Ltd. SGD 0 1,280,000 0 1,280,000
Golden Agri-Resources Ltd. SGD 0 2,923,000 0 2,923,000
Hutchison Port Holdings Trust - U - USD 0 2,346,000 0 2,346,000
Jardine Cycle & Carriage Ltd. SGD 0 44,000 0 44,000
Keppel Corp. Ltd. SGD 0 602,000 0 602,000
Keppel Land Ltd. SGD 0 287,000 0 287,000
Oversea-Chinese Banking Corp. Ltd. SGD 0 1,216,000 19,000 1,197,000
Sembcorp Industries Ltd. SGD 0 407,000 0 407,000
Sembcorp Marine Ltd. SGD 0 347,000 0 347,000
Singapore Airlines Ltd. SGD 0 223,000 0 223,000
Singapore Exchange Ltd. SGD 0 334,000 0 334,000
Singapore Press Holdings Ltd. SGD 0 662,000 0 662,000 Singapore Technologies Engineering Ltd. SGD 0 645,000 0 645,000
Singapore Telecommunications Ltd. SGD 0 3,337,000 50,000 3,287,000
StarHub Ltd. SGD 0 249,000 0 249,000
387
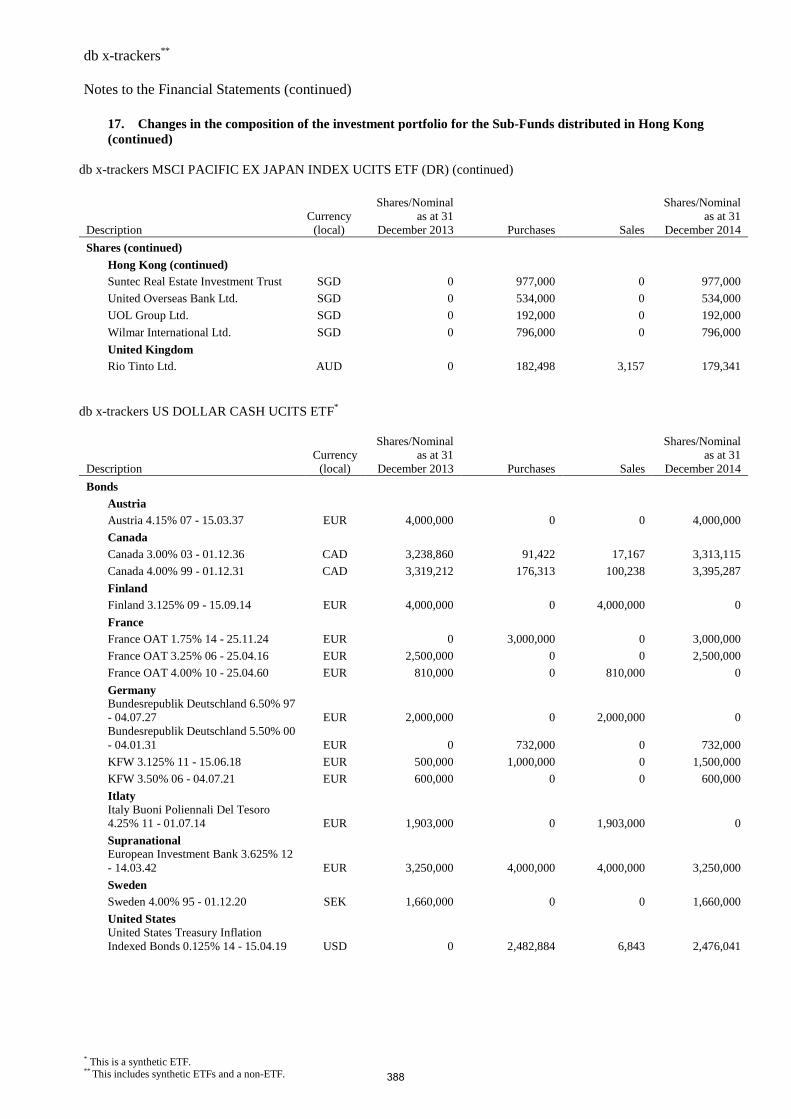
db x-trackers** Notes to the Financial Statements (continued)
* This is a synthetic ETF. ** This includes synthetic ETFs and a non-ETF.
17. Changes in the composition of the investment portfolio for the Sub-Funds distributed in Hong Kong (continued)
db x-trackers MSCI PACIFIC EX JAPAN INDEX UCITS ETF (DR) (continued)
Description Currency (local)
Shares/Nominal as at 31
December 2013 Purchases Sales
Shares/Nominal as at 31
December 2014
Shares (continued)
Hong Kong (continued)
Suntec Real Estate Investment Trust SGD 0 977,000 0 977,000
United Overseas Bank Ltd. SGD 0 534,000 0 534,000
UOL Group Ltd. SGD 0 192,000 0 192,000
Wilmar International Ltd. SGD 0 796,000 0 796,000
United Kingdom Rio Tinto Ltd. AUD 0 182,498 3,157 179,341
db x-trackers US DOLLAR CASH UCITS ETF*
Description Currency (local)
Shares/Nominal as at 31
December 2013 Purchases Sales
Shares/Nominal as at 31
December 2014
Bonds Austria Austria 4.15% 07 - 15.03.37 EUR 4,000,000 0 0 4,000,000
Canada Canada 3.00% 03 - 01.12.36 CAD 3,238,860 91,422 17,167 3,313,115
Canada 4.00% 99 - 01.12.31 CAD 3,319,212 176,313 100,238 3,395,287
Finland Finland 3.125% 09 - 15.09.14 EUR 4,000,000 0 4,000,000 0
France France OAT 1.75% 14 - 25.11.24 EUR 0 3,000,000 0 3,000,000
France OAT 3.25% 06 - 25.04.16 EUR 2,500,000 0 0 2,500,000
France OAT 4.00% 10 - 25.04.60 EUR 810,000 0 810,000 0
Germany Bundesrepublik Deutschland 6.50% 97 - 04.07.27 EUR 2,000,000 0 2,000,000 0 Bundesrepublik Deutschland 5.50% 00 - 04.01.31 EUR 0 732,000 0 732,000
KFW 3.125% 11 - 15.06.18 EUR 500,000 1,000,000 0 1,500,000
KFW 3.50% 06 - 04.07.21 EUR 600,000 0 0 600,000
Itlaty Italy Buoni Poliennali Del Tesoro 4.25% 11 - 01.07.14 EUR 1,903,000 0 1,903,000 0
Supranational European Investment Bank 3.625% 12 - 14.03.42 EUR 3,250,000 4,000,000 4,000,000 3,250,000
Sweden
Sweden 4.00% 95 - 01.12.20 SEK 1,660,000 0 0 1,660,000
United States United States Treasury Inflation Indexed Bonds 0.125% 14 - 15.04.19 USD 0 2,482,884 6,843 2,476,041
388
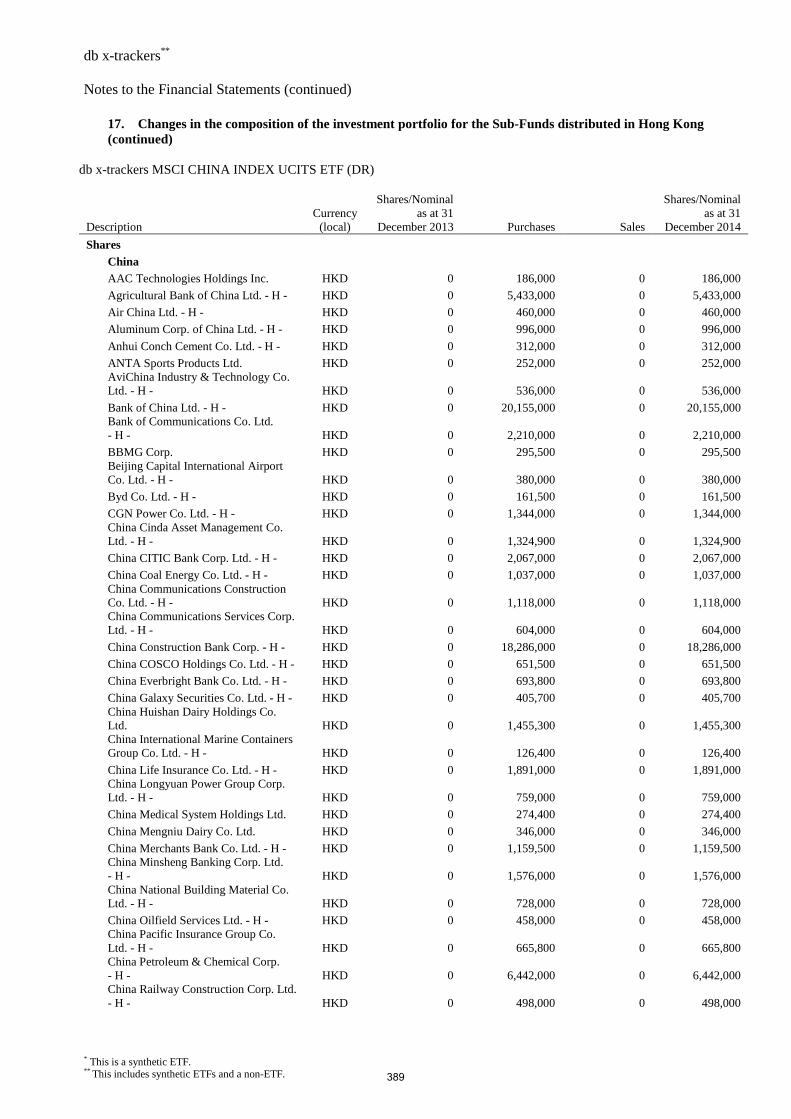
db x-trackers** Notes to the Financial Statements (continued)
* This is a synthetic ETF. ** This includes synthetic ETFs and a non-ETF.
17. Changes in the composition of the investment portfolio for the Sub-Funds distributed in Hong Kong (continued)
db x-trackers MSCI CHINA INDEX UCITS ETF (DR)
Description Currency (local)
Shares/Nominal as at 31
December 2013 Purchases Sales
Shares/Nominal as at 31
December 2014
Shares
China AAC Technologies Holdings Inc. HKD 0 186,000 0 186,000
Agricultural Bank of China Ltd. - H - HKD 0 5,433,000 0 5,433,000
Air China Ltd. - H - HKD 0 460,000 0 460,000
Aluminum Corp. of China Ltd. - H - HKD 0 996,000 0 996,000
Anhui Conch Cement Co. Ltd. - H - HKD 0 312,000 0 312,000
ANTA Sports Products Ltd. HKD 0 252,000 0 252,000 AviChina Industry & Technology Co. Ltd. - H - HKD 0 536,000 0 536,000
Bank of China Ltd. - H - HKD 0 20,155,000 0 20,155,000 Bank of Communications Co. Ltd. - H - HKD 0 2,210,000 0 2,210,000
BBMG Corp. HKD 0 295,500 0 295,500 Beijing Capital International Airport Co. Ltd. - H - HKD 0 380,000 0 380,000
Byd Co. Ltd. - H - HKD 0 161,500 0 161,500
CGN Power Co. Ltd. - H - HKD 0 1,344,000 0 1,344,000 China Cinda Asset Management Co. Ltd. - H - HKD 0 1,324,900 0 1,324,900
China CITIC Bank Corp. Ltd. - H - HKD 0 2,067,000 0 2,067,000
China Coal Energy Co. Ltd. - H - HKD 0 1,037,000 0 1,037,000 China Communications Construction Co. Ltd. - H - HKD 0 1,118,000 0 1,118,000 China Communications Services Corp. Ltd. - H - HKD 0 604,000 0 604,000
China Construction Bank Corp. - H - HKD 0 18,286,000 0 18,286,000
China COSCO Holdings Co. Ltd. - H - HKD 0 651,500 0 651,500
China Everbright Bank Co. Ltd. - H - HKD 0 693,800 0 693,800
China Galaxy Securities Co. Ltd. - H - HKD 0 405,700 0 405,700 China Huishan Dairy Holdings Co. Ltd. HKD 0 1,455,300 0 1,455,300 China International Marine Containers Group Co. Ltd. - H - HKD 0 126,400 0 126,400
China Life Insurance Co. Ltd. - H - HKD 0 1,891,000 0 1,891,000 China Longyuan Power Group Corp. Ltd. - H - HKD 0 759,000 0 759,000
China Medical System Holdings Ltd. HKD 0 274,400 0 274,400
China Mengniu Dairy Co. Ltd. HKD 0 346,000 0 346,000
China Merchants Bank Co. Ltd. - H - HKD 0 1,159,500 0 1,159,500 China Minsheng Banking Corp. Ltd. - H - HKD 0 1,576,000 0 1,576,000 China National Building Material Co. Ltd. - H - HKD 0 728,000 0 728,000
China Oilfield Services Ltd. - H - HKD 0 458,000 0 458,000 China Pacific Insurance Group Co. Ltd. - H - HKD 0 665,800 0 665,800 China Petroleum & Chemical Corp. - H - HKD 0 6,442,000 0 6,442,000 China Railway Construction Corp. Ltd. - H - HKD 0 498,000 0 498,000
389
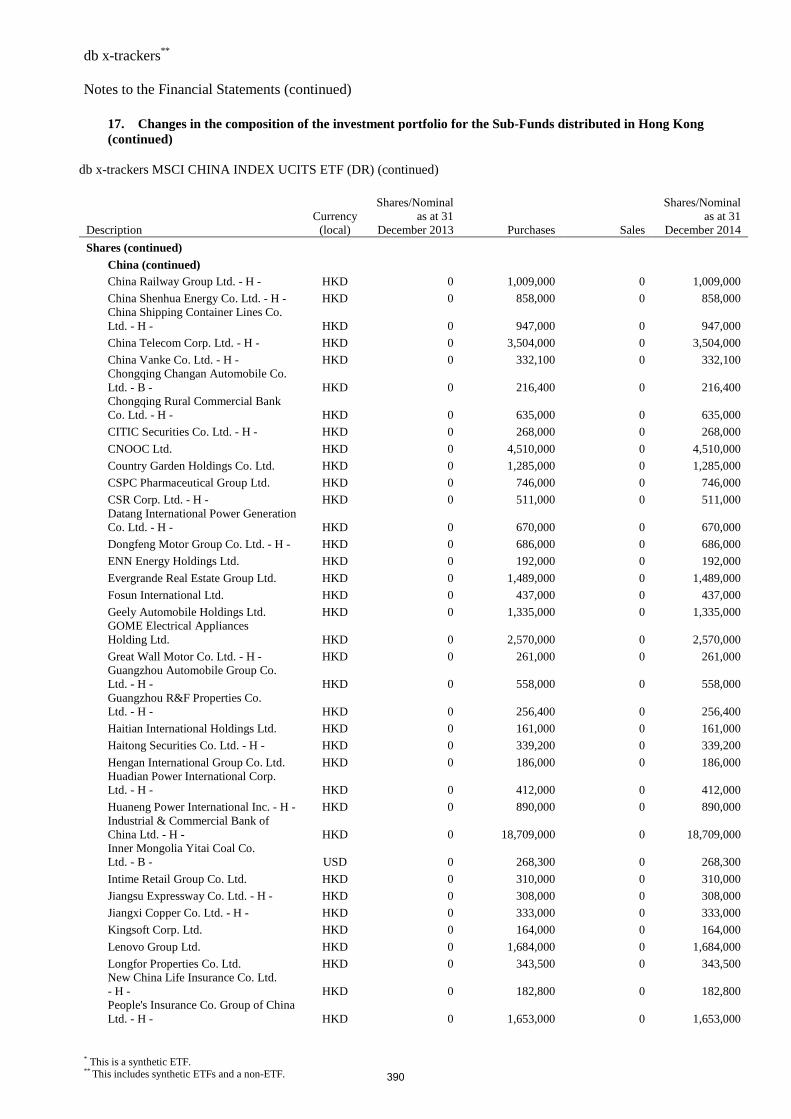
db x-trackers** Notes to the Financial Statements (continued)
* This is a synthetic ETF. ** This includes synthetic ETFs and a non-ETF.
17. Changes in the composition of the investment portfolio for the Sub-Funds distributed in Hong Kong (continued)
db x-trackers MSCI CHINA INDEX UCITS ETF (DR) (continued)
Description Currency (local)
Shares/Nominal as at 31
December 2013 Purchases Sales
Shares/Nominal as at 31
December 2014
Shares (continued)
China (continued)
China Railway Group Ltd. - H - HKD 0 1,009,000 0 1,009,000
China Shenhua Energy Co. Ltd. - H - HKD 0 858,000 0 858,000 China Shipping Container Lines Co. Ltd. - H - HKD 0 947,000 0 947,000
China Telecom Corp. Ltd. - H - HKD 0 3,504,000 0 3,504,000
China Vanke Co. Ltd. - H - HKD 0 332,100 0 332,100 Chongqing Changan Automobile Co. Ltd. - B - HKD 0 216,400 0 216,400 Chongqing Rural Commercial Bank Co. Ltd. - H - HKD 0 635,000 0 635,000
CITIC Securities Co. Ltd. - H - HKD 0 268,000 0 268,000
CNOOC Ltd. HKD 0 4,510,000 0 4,510,000
Country Garden Holdings Co. Ltd. HKD 0 1,285,000 0 1,285,000
CSPC Pharmaceutical Group Ltd. HKD 0 746,000 0 746,000
CSR Corp. Ltd. - H - HKD 0 511,000 0 511,000 Datang International Power Generation Co. Ltd. - H - HKD 0 670,000 0 670,000
Dongfeng Motor Group Co. Ltd. - H - HKD 0 686,000 0 686,000
ENN Energy Holdings Ltd. HKD 0 192,000 0 192,000
Evergrande Real Estate Group Ltd. HKD 0 1,489,000 0 1,489,000
Fosun International Ltd. HKD 0 437,000 0 437,000
Geely Automobile Holdings Ltd. HKD 0 1,335,000 0 1,335,000 GOME Electrical Appliances Holding Ltd. HKD 0 2,570,000 0 2,570,000
Great Wall Motor Co. Ltd. - H - HKD 0 261,000 0 261,000 Guangzhou Automobile Group Co. Ltd. - H - HKD 0 558,000 0 558,000 Guangzhou R&F Properties Co. Ltd. - H - HKD 0 256,400 0 256,400
Haitian International Holdings Ltd. HKD 0 161,000 0 161,000
Haitong Securities Co. Ltd. - H - HKD 0 339,200 0 339,200
Hengan International Group Co. Ltd. HKD 0 186,000 0 186,000 Huadian Power International Corp. Ltd. - H - HKD 0 412,000 0 412,000
Huaneng Power International Inc. - H - HKD 0 890,000 0 890,000 Industrial & Commercial Bank of China Ltd. - H - HKD 0 18,709,000 0 18,709,000 Inner Mongolia Yitai Coal Co. Ltd. - B - USD 0 268,300 0 268,300
Intime Retail Group Co. Ltd. HKD 0 310,000 0 310,000
Jiangsu Expressway Co. Ltd. - H - HKD 0 308,000 0 308,000
Jiangxi Copper Co. Ltd. - H - HKD 0 333,000 0 333,000
Kingsoft Corp. Ltd. HKD 0 164,000 0 164,000
Lenovo Group Ltd. HKD 0 1,684,000 0 1,684,000
Longfor Properties Co. Ltd. HKD 0 343,500 0 343,500 New China Life Insurance Co. Ltd. - H - HKD 0 182,800 0 182,800 People's Insurance Co. Group of China Ltd. - H - HKD 0 1,653,000 0 1,653,000
390
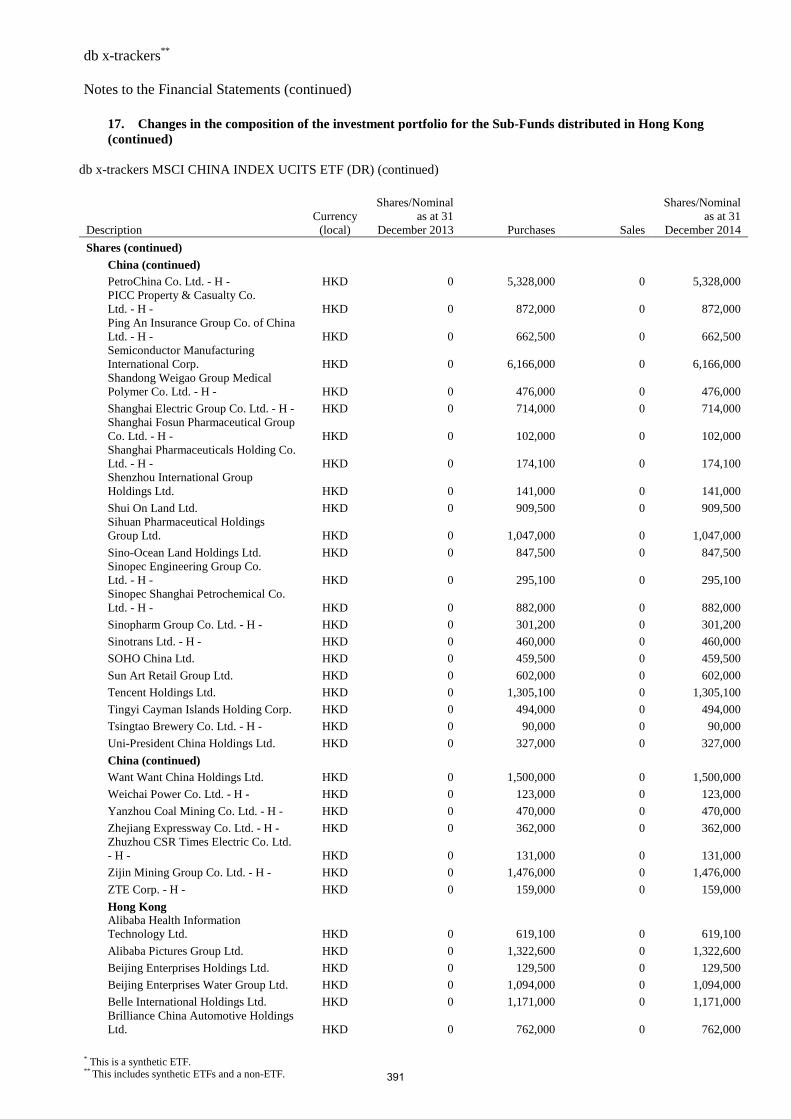
db x-trackers** Notes to the Financial Statements (continued)
* This is a synthetic ETF. ** This includes synthetic ETFs and a non-ETF.
17. Changes in the composition of the investment portfolio for the Sub-Funds distributed in Hong Kong (continued)
db x-trackers MSCI CHINA INDEX UCITS ETF (DR) (continued)
Description Currency (local)
Shares/Nominal as at 31
December 2013 Purchases Sales
Shares/Nominal as at 31
December 2014
Shares (continued)
China (continued)
PetroChina Co. Ltd. - H - HKD 0 5,328,000 0 5,328,000 PICC Property & Casualty Co. Ltd. - H - HKD 0 872,000 0 872,000 Ping An Insurance Group Co. of China Ltd. - H - HKD 0 662,500 0 662,500 Semiconductor Manufacturing International Corp. HKD 0 6,166,000 0 6,166,000 Shandong Weigao Group Medical Polymer Co. Ltd. - H - HKD 0 476,000 0 476,000
Shanghai Electric Group Co. Ltd. - H - HKD 0 714,000 0 714,000 Shanghai Fosun Pharmaceutical Group Co. Ltd. - H - HKD 0 102,000 0 102,000 Shanghai Pharmaceuticals Holding Co. Ltd. - H - HKD 0 174,100 0 174,100 Shenzhou International Group Holdings Ltd. HKD 0 141,000 0 141,000
Shui On Land Ltd. HKD 0 909,500 0 909,500 Sihuan Pharmaceutical Holdings Group Ltd. HKD 0 1,047,000 0 1,047,000
Sino-Ocean Land Holdings Ltd. HKD 0 847,500 0 847,500 Sinopec Engineering Group Co. Ltd. - H - HKD 0 295,100 0 295,100 Sinopec Shanghai Petrochemical Co. Ltd. - H - HKD 0 882,000 0 882,000
Sinopharm Group Co. Ltd. - H - HKD 0 301,200 0 301,200
Sinotrans Ltd. - H - HKD 0 460,000 0 460,000
SOHO China Ltd. HKD 0 459,500 0 459,500
Sun Art Retail Group Ltd. HKD 0 602,000 0 602,000
Tencent Holdings Ltd. HKD 0 1,305,100 0 1,305,100
Tingyi Cayman Islands Holding Corp. HKD 0 494,000 0 494,000
Tsingtao Brewery Co. Ltd. - H - HKD 0 90,000 0 90,000
Uni-President China Holdings Ltd. HKD 0 327,000 0 327,000
China (continued)
Want Want China Holdings Ltd. HKD 0 1,500,000 0 1,500,000
Weichai Power Co. Ltd. - H - HKD 0 123,000 0 123,000
Yanzhou Coal Mining Co. Ltd. - H - HKD 0 470,000 0 470,000
Zhejiang Expressway Co. Ltd. - H - HKD 0 362,000 0 362,000 Zhuzhou CSR Times Electric Co. Ltd. - H - HKD 0 131,000 0 131,000
Zijin Mining Group Co. Ltd. - H - HKD 0 1,476,000 0 1,476,000
ZTE Corp. - H - HKD 0 159,000 0 159,000
Hong Kong Alibaba Health Information Technology Ltd. HKD 0 619,100 0 619,100
Alibaba Pictures Group Ltd. HKD 0 1,322,600 0 1,322,600
Beijing Enterprises Holdings Ltd. HKD 0 129,500 0 129,500
Beijing Enterprises Water Group Ltd. HKD 0 1,094,000 0 1,094,000
Belle International Holdings Ltd. HKD 0 1,171,000 0 1,171,000 Brilliance China Automotive Holdings Ltd. HKD 0 762,000 0 762,000
391
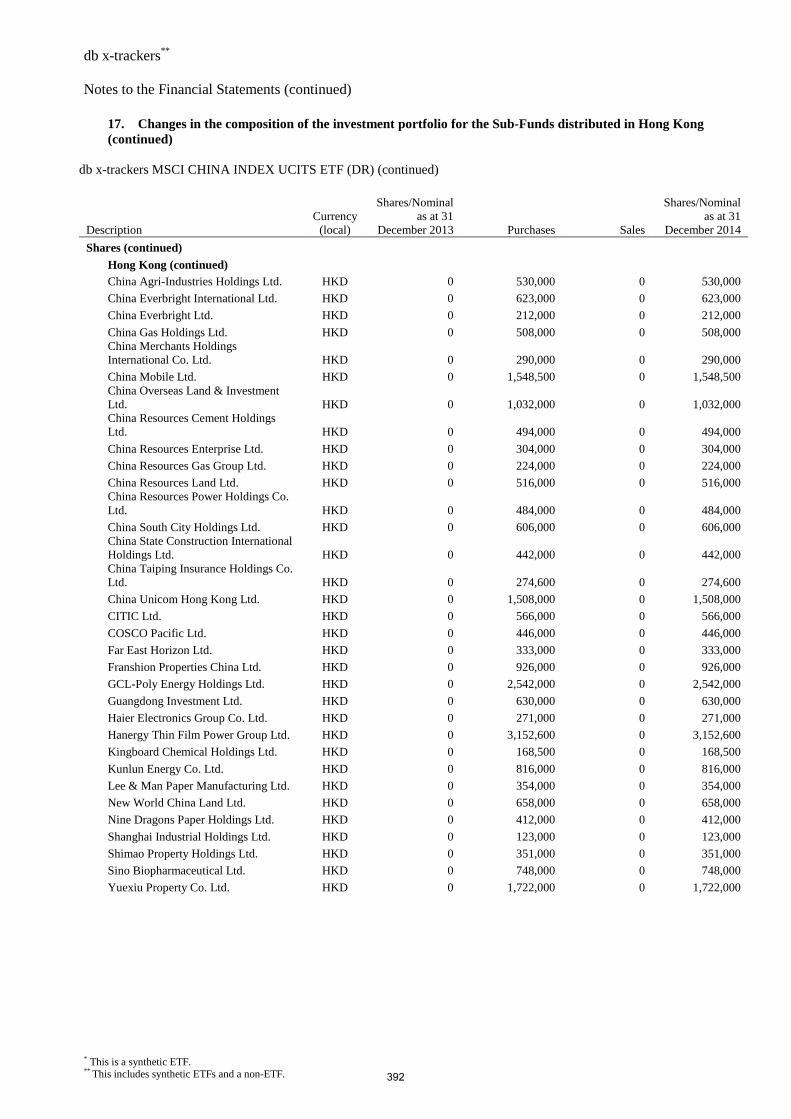
db x-trackers** Notes to the Financial Statements (continued)
* This is a synthetic ETF. ** This includes synthetic ETFs and a non-ETF.
17. Changes in the composition of the investment portfolio for the Sub-Funds distributed in Hong Kong (continued)
db x-trackers MSCI CHINA INDEX UCITS ETF (DR) (continued)
Description Currency (local)
Shares/Nominal as at 31
December 2013 Purchases Sales
Shares/Nominal as at 31
December 2014
Shares (continued)
Hong Kong (continued)
China Agri-Industries Holdings Ltd. HKD 0 530,000 0 530,000
China Everbright International Ltd. HKD 0 623,000 0 623,000
China Everbright Ltd. HKD 0 212,000 0 212,000
China Gas Holdings Ltd. HKD 0 508,000 0 508,000 China Merchants Holdings International Co. Ltd. HKD 0 290,000 0 290,000
China Mobile Ltd. HKD 0 1,548,500 0 1,548,500 China Overseas Land & Investment Ltd. HKD 0 1,032,000 0 1,032,000 China Resources Cement Holdings Ltd. HKD 0 494,000 0 494,000
China Resources Enterprise Ltd. HKD 0 304,000 0 304,000
China Resources Gas Group Ltd. HKD 0 224,000 0 224,000
China Resources Land Ltd. HKD 0 516,000 0 516,000 China Resources Power Holdings Co. Ltd. HKD 0 484,000 0 484,000
China South City Holdings Ltd. HKD 0 606,000 0 606,000 China State Construction International Holdings Ltd. HKD 0 442,000 0 442,000 China Taiping Insurance Holdings Co. Ltd. HKD 0 274,600 0 274,600
China Unicom Hong Kong Ltd. HKD 0 1,508,000 0 1,508,000
CITIC Ltd. HKD 0 566,000 0 566,000
COSCO Pacific Ltd. HKD 0 446,000 0 446,000
Far East Horizon Ltd. HKD 0 333,000 0 333,000
Franshion Properties China Ltd. HKD 0 926,000 0 926,000
GCL-Poly Energy Holdings Ltd. HKD 0 2,542,000 0 2,542,000
Guangdong Investment Ltd. HKD 0 630,000 0 630,000
Haier Electronics Group Co. Ltd. HKD 0 271,000 0 271,000
Hanergy Thin Film Power Group Ltd. HKD 0 3,152,600 0 3,152,600
Kingboard Chemical Holdings Ltd. HKD 0 168,500 0 168,500
Kunlun Energy Co. Ltd. HKD 0 816,000 0 816,000
Lee & Man Paper Manufacturing Ltd. HKD 0 354,000 0 354,000
New World China Land Ltd. HKD 0 658,000 0 658,000
Nine Dragons Paper Holdings Ltd. HKD 0 412,000 0 412,000
Shanghai Industrial Holdings Ltd. HKD 0 123,000 0 123,000
Shimao Property Holdings Ltd. HKD 0 351,000 0 351,000
Sino Biopharmaceutical Ltd. HKD 0 748,000 0 748,000
Yuexiu Property Co. Ltd. HKD 0 1,722,000 0 1,722,000
392
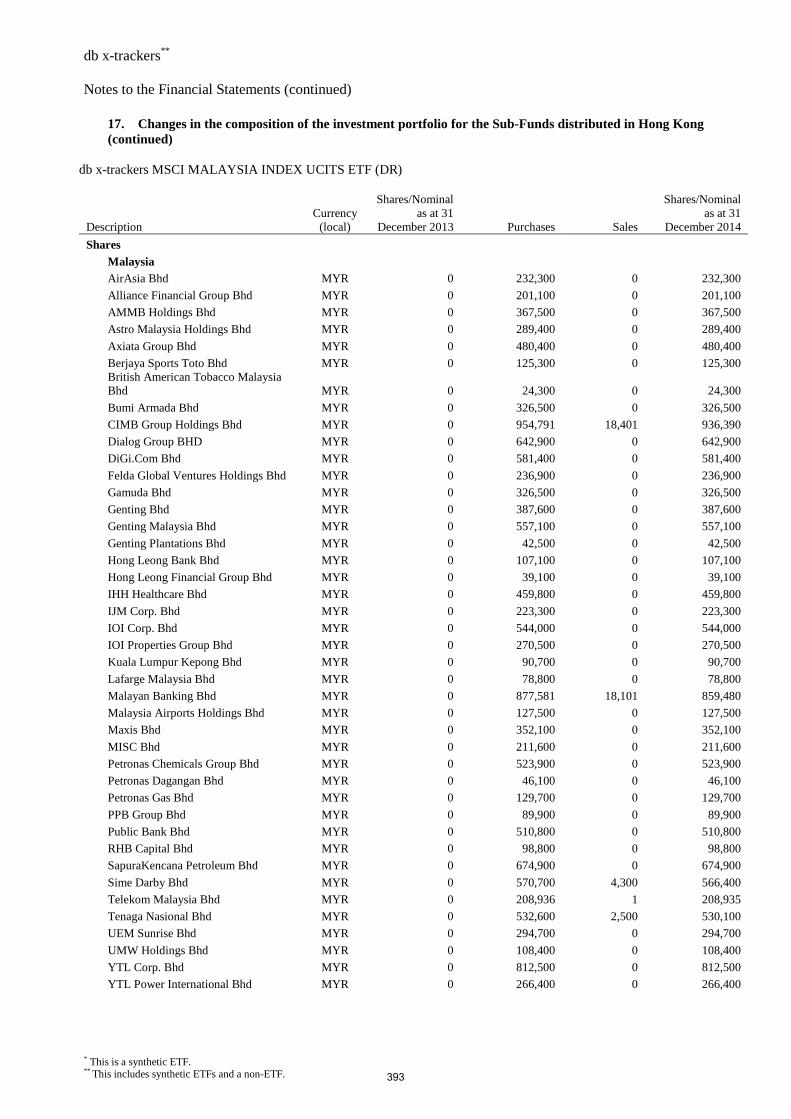
db x-trackers** Notes to the Financial Statements (continued)
* This is a synthetic ETF. ** This includes synthetic ETFs and a non-ETF.
17. Changes in the composition of the investment portfolio for the Sub-Funds distributed in Hong Kong (continued)
db x-trackers MSCI MALAYSIA INDEX UCITS ETF (DR)
Description Currency (local)
Shares/Nominal as at 31
December 2013 Purchases Sales
Shares/Nominal as at 31
December 2014
Shares Malaysia AirAsia Bhd MYR 0 232,300 0 232,300
Alliance Financial Group Bhd MYR 0 201,100 0 201,100
AMMB Holdings Bhd MYR 0 367,500 0 367,500
Astro Malaysia Holdings Bhd MYR 0 289,400 0 289,400
Axiata Group Bhd MYR 0 480,400 0 480,400
Berjaya Sports Toto Bhd MYR 0 125,300 0 125,300 British American Tobacco Malaysia Bhd MYR 0 24,300 0 24,300
Bumi Armada Bhd MYR 0 326,500 0 326,500
CIMB Group Holdings Bhd MYR 0 954,791 18,401 936,390
Dialog Group BHD MYR 0 642,900 0 642,900
DiGi.Com Bhd MYR 0 581,400 0 581,400
Felda Global Ventures Holdings Bhd MYR 0 236,900 0 236,900
Gamuda Bhd MYR 0 326,500 0 326,500
Genting Bhd MYR 0 387,600 0 387,600
Genting Malaysia Bhd MYR 0 557,100 0 557,100
Genting Plantations Bhd MYR 0 42,500 0 42,500
Hong Leong Bank Bhd MYR 0 107,100 0 107,100
Hong Leong Financial Group Bhd MYR 0 39,100 0 39,100
IHH Healthcare Bhd MYR 0 459,800 0 459,800
IJM Corp. Bhd MYR 0 223,300 0 223,300
IOI Corp. Bhd MYR 0 544,000 0 544,000
IOI Properties Group Bhd MYR 0 270,500 0 270,500
Kuala Lumpur Kepong Bhd MYR 0 90,700 0 90,700
Lafarge Malaysia Bhd MYR 0 78,800 0 78,800
Malayan Banking Bhd MYR 0 877,581 18,101 859,480
Malaysia Airports Holdings Bhd MYR 0 127,500 0 127,500
Maxis Bhd MYR 0 352,100 0 352,100
MISC Bhd MYR 0 211,600 0 211,600
Petronas Chemicals Group Bhd MYR 0 523,900 0 523,900
Petronas Dagangan Bhd MYR 0 46,100 0 46,100
Petronas Gas Bhd MYR 0 129,700 0 129,700
PPB Group Bhd MYR 0 89,900 0 89,900
Public Bank Bhd MYR 0 510,800 0 510,800
RHB Capital Bhd MYR 0 98,800 0 98,800
SapuraKencana Petroleum Bhd MYR 0 674,900 0 674,900
Sime Darby Bhd MYR 0 570,700 4,300 566,400
Telekom Malaysia Bhd MYR 0 208,936 1 208,935
Tenaga Nasional Bhd MYR 0 532,600 2,500 530,100
UEM Sunrise Bhd MYR 0 294,700 0 294,700
UMW Holdings Bhd MYR 0 108,400 0 108,400
YTL Corp. Bhd MYR 0 812,500 0 812,500
YTL Power International Bhd MYR 0 266,400 0 266,400
393
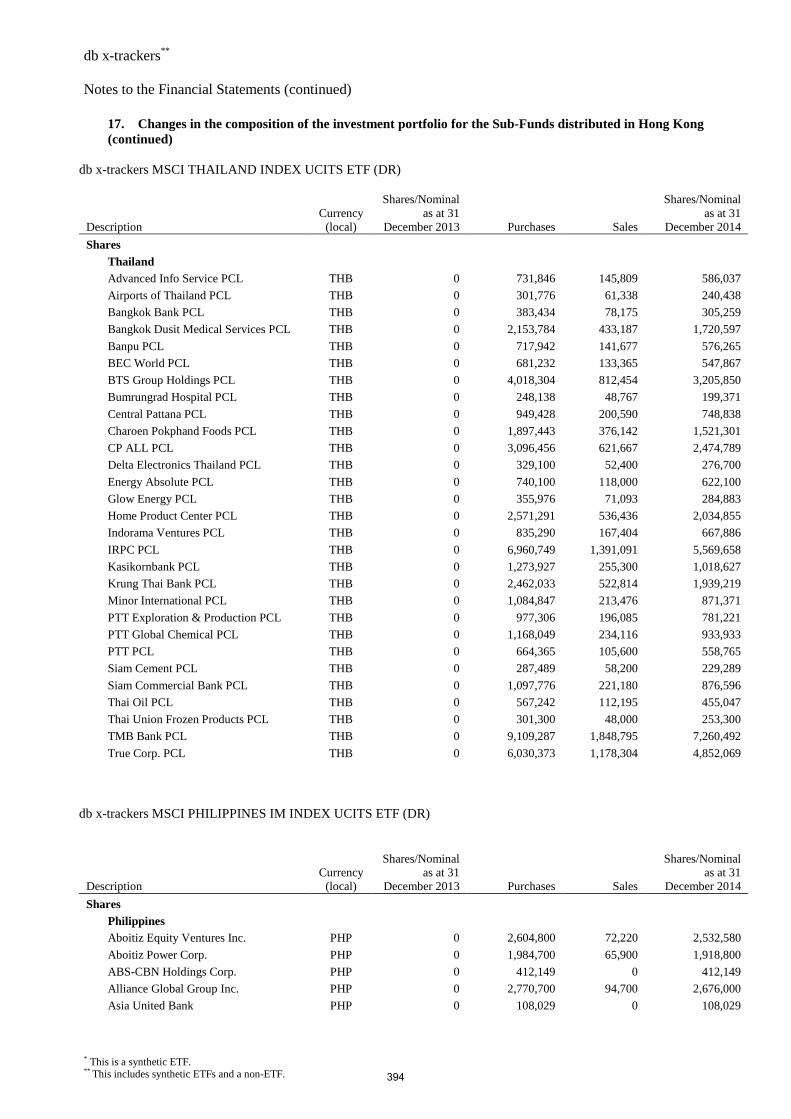
db x-trackers** Notes to the Financial Statements (continued)
* This is a synthetic ETF. ** This includes synthetic ETFs and a non-ETF.
17. Changes in the composition of the investment portfolio for the Sub-Funds distributed in Hong Kong (continued)
db x-trackers MSCI THAILAND INDEX UCITS ETF (DR)
Description Currency (local)
Shares/Nominal as at 31
December 2013 Purchases Sales
Shares/Nominal as at 31
December 2014
Shares Thailand Advanced Info Service PCL THB 0 731,846 145,809 586,037
Airports of Thailand PCL THB 0 301,776 61,338 240,438
Bangkok Bank PCL THB 0 383,434 78,175 305,259
Bangkok Dusit Medical Services PCL THB 0 2,153,784 433,187 1,720,597
Banpu PCL THB 0 717,942 141,677 576,265
BEC World PCL THB 0 681,232 133,365 547,867
BTS Group Holdings PCL THB 0 4,018,304 812,454 3,205,850
Bumrungrad Hospital PCL THB 0 248,138 48,767 199,371
Central Pattana PCL THB 0 949,428 200,590 748,838
Charoen Pokphand Foods PCL THB 0 1,897,443 376,142 1,521,301
CP ALL PCL THB 0 3,096,456 621,667 2,474,789
Delta Electronics Thailand PCL THB 0 329,100 52,400 276,700
Energy Absolute PCL THB 0 740,100 118,000 622,100
Glow Energy PCL THB 0 355,976 71,093 284,883
Home Product Center PCL THB 0 2,571,291 536,436 2,034,855
Indorama Ventures PCL THB 0 835,290 167,404 667,886
IRPC PCL THB 0 6,960,749 1,391,091 5,569,658
Kasikornbank PCL THB 0 1,273,927 255,300 1,018,627
Krung Thai Bank PCL THB 0 2,462,033 522,814 1,939,219
Minor International PCL THB 0 1,084,847 213,476 871,371
PTT Exploration & Production PCL THB 0 977,306 196,085 781,221
PTT Global Chemical PCL THB 0 1,168,049 234,116 933,933
PTT PCL THB 0 664,365 105,600 558,765
Siam Cement PCL THB 0 287,489 58,200 229,289
Siam Commercial Bank PCL THB 0 1,097,776 221,180 876,596
Thai Oil PCL THB 0 567,242 112,195 455,047
Thai Union Frozen Products PCL THB 0 301,300 48,000 253,300
TMB Bank PCL THB 0 9,109,287 1,848,795 7,260,492
True Corp. PCL THB 0 6,030,373 1,178,304 4,852,069
db x-trackers MSCI PHILIPPINES IM INDEX UCITS ETF (DR)
Description Currency (local)
Shares/Nominal as at 31
December 2013 Purchases Sales
Shares/Nominal as at 31
December 2014
Shares Philippines Aboitiz Equity Ventures Inc. PHP 0 2,604,800 72,220 2,532,580
Aboitiz Power Corp. PHP 0 1,984,700 65,900 1,918,800
ABS-CBN Holdings Corp. PHP 0 412,149 0 412,149
Alliance Global Group Inc. PHP 0 2,770,700 94,700 2,676,000
Asia United Bank PHP 0 108,029 0 108,029
394
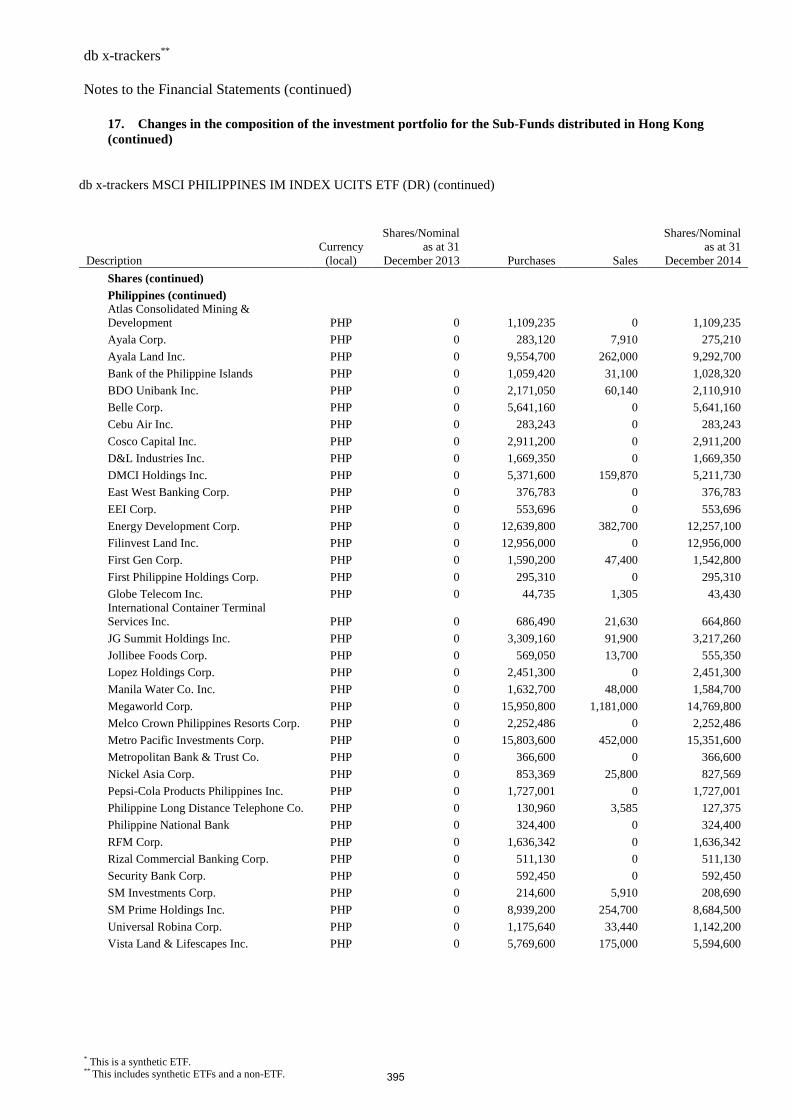
db x-trackers** Notes to the Financial Statements (continued)
* This is a synthetic ETF. ** This includes synthetic ETFs and a non-ETF.
17. Changes in the composition of the investment portfolio for the Sub-Funds distributed in Hong Kong (continued)
db x-trackers MSCI PHILIPPINES IM INDEX UCITS ETF (DR) (continued)
Description Currency (local)
Shares/Nominal as at 31
December 2013 Purchases Sales
Shares/Nominal as at 31
December 2014
Shares (continued)
Philippines (continued) Atlas Consolidated Mining & Development PHP 0 1,109,235 0 1,109,235
Ayala Corp. PHP 0 283,120 7,910 275,210
Ayala Land Inc. PHP 0 9,554,700 262,000 9,292,700
Bank of the Philippine Islands PHP 0 1,059,420 31,100 1,028,320
BDO Unibank Inc. PHP 0 2,171,050 60,140 2,110,910
Belle Corp. PHP 0 5,641,160 0 5,641,160
Cebu Air Inc. PHP 0 283,243 0 283,243
Cosco Capital Inc. PHP 0 2,911,200 0 2,911,200
D&L Industries Inc. PHP 0 1,669,350 0 1,669,350
DMCI Holdings Inc. PHP 0 5,371,600 159,870 5,211,730
East West Banking Corp. PHP 0 376,783 0 376,783
EEI Corp. PHP 0 553,696 0 553,696
Energy Development Corp. PHP 0 12,639,800 382,700 12,257,100
Filinvest Land Inc. PHP 0 12,956,000 0 12,956,000
First Gen Corp. PHP 0 1,590,200 47,400 1,542,800
First Philippine Holdings Corp. PHP 0 295,310 0 295,310
Globe Telecom Inc. PHP 0 44,735 1,305 43,430 International Container Terminal Services Inc. PHP 0 686,490 21,630 664,860
JG Summit Holdings Inc. PHP 0 3,309,160 91,900 3,217,260
Jollibee Foods Corp. PHP 0 569,050 13,700 555,350
Lopez Holdings Corp. PHP 0 2,451,300 0 2,451,300
Manila Water Co. Inc. PHP 0 1,632,700 48,000 1,584,700
Megaworld Corp. PHP 0 15,950,800 1,181,000 14,769,800
Melco Crown Philippines Resorts Corp. PHP 0 2,252,486 0 2,252,486
Metro Pacific Investments Corp. PHP 0 15,803,600 452,000 15,351,600
Metropolitan Bank & Trust Co. PHP 0 366,600 0 366,600
Nickel Asia Corp. PHP 0 853,369 25,800 827,569
Pepsi-Cola Products Philippines Inc. PHP 0 1,727,001 0 1,727,001
Philippine Long Distance Telephone Co. PHP 0 130,960 3,585 127,375
Philippine National Bank PHP 0 324,400 0 324,400
RFM Corp. PHP 0 1,636,342 0 1,636,342
Rizal Commercial Banking Corp. PHP 0 511,130 0 511,130
Security Bank Corp. PHP 0 592,450 0 592,450
SM Investments Corp. PHP 0 214,600 5,910 208,690
SM Prime Holdings Inc. PHP 0 8,939,200 254,700 8,684,500
Universal Robina Corp. PHP 0 1,175,640 33,440 1,142,200
Vista Land & Lifescapes Inc. PHP 0 5,769,600 175,000 5,594,600
395
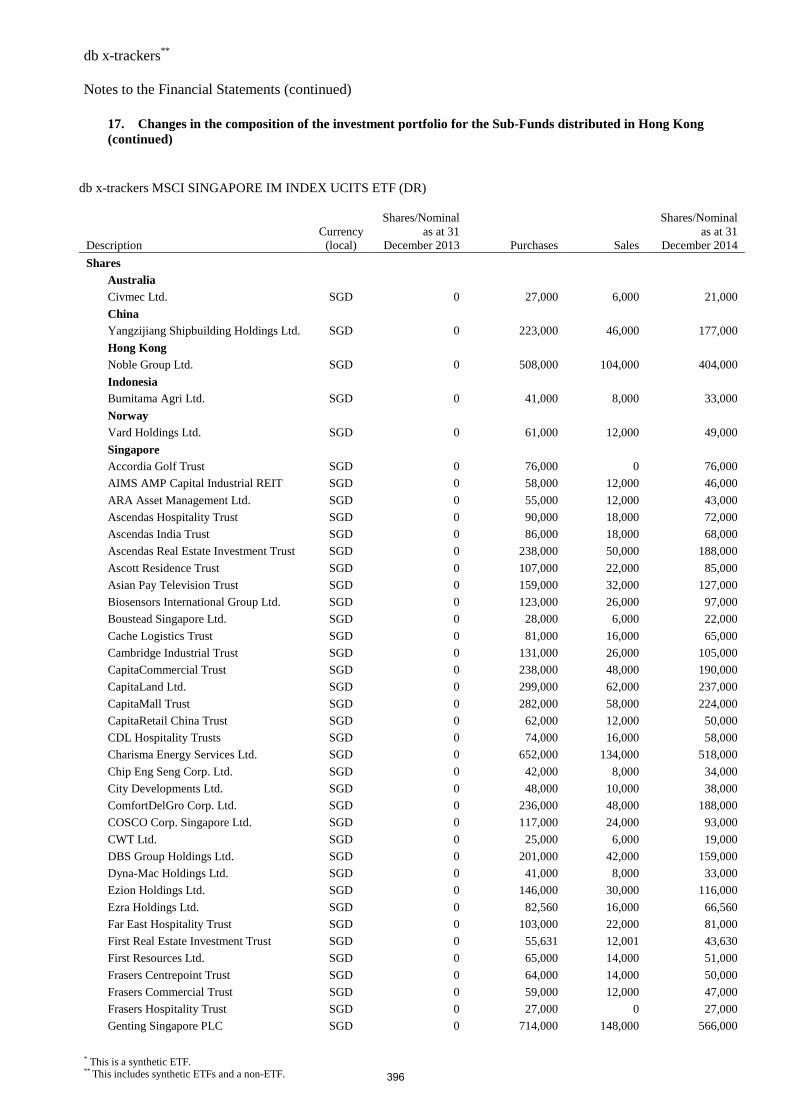
db x-trackers** Notes to the Financial Statements (continued)
* This is a synthetic ETF. ** This includes synthetic ETFs and a non-ETF.
17. Changes in the composition of the investment portfolio for the Sub-Funds distributed in Hong Kong (continued)
db x-trackers MSCI SINGAPORE IM INDEX UCITS ETF (DR)
Description Currency (local)
Shares/Nominal as at 31
December 2013 Purchases Sales
Shares/Nominal as at 31
December 2014
Shares Australia Civmec Ltd. SGD 0 27,000 6,000 21,000
China Yangzijiang Shipbuilding Holdings Ltd. SGD 0 223,000 46,000 177,000
Hong Kong Noble Group Ltd. SGD 0 508,000 104,000 404,000
Indonesia Bumitama Agri Ltd. SGD 0 41,000 8,000 33,000
Norway Vard Holdings Ltd. SGD 0 61,000 12,000 49,000
Singapore Accordia Golf Trust SGD 0 76,000 0 76,000
AIMS AMP Capital Industrial REIT SGD 0 58,000 12,000 46,000
ARA Asset Management Ltd. SGD 0 55,000 12,000 43,000
Ascendas Hospitality Trust SGD 0 90,000 18,000 72,000
Ascendas India Trust SGD 0 86,000 18,000 68,000
Ascendas Real Estate Investment Trust SGD 0 238,000 50,000 188,000
Ascott Residence Trust SGD 0 107,000 22,000 85,000
Asian Pay Television Trust SGD 0 159,000 32,000 127,000
Biosensors International Group Ltd. SGD 0 123,000 26,000 97,000
Boustead Singapore Ltd. SGD 0 28,000 6,000 22,000
Cache Logistics Trust SGD 0 81,000 16,000 65,000
Cambridge Industrial Trust SGD 0 131,000 26,000 105,000
CapitaCommercial Trust SGD 0 238,000 48,000 190,000
CapitaLand Ltd. SGD 0 299,000 62,000 237,000
CapitaMall Trust SGD 0 282,000 58,000 224,000
CapitaRetail China Trust SGD 0 62,000 12,000 50,000
CDL Hospitality Trusts SGD 0 74,000 16,000 58,000
Charisma Energy Services Ltd. SGD 0 652,000 134,000 518,000
Chip Eng Seng Corp. Ltd. SGD 0 42,000 8,000 34,000
City Developments Ltd. SGD 0 48,000 10,000 38,000
ComfortDelGro Corp. Ltd. SGD 0 236,000 48,000 188,000
COSCO Corp. Singapore Ltd. SGD 0 117,000 24,000 93,000
CWT Ltd. SGD 0 25,000 6,000 19,000
DBS Group Holdings Ltd. SGD 0 201,000 42,000 159,000
Dyna-Mac Holdings Ltd. SGD 0 41,000 8,000 33,000
Ezion Holdings Ltd. SGD 0 146,000 30,000 116,000
Ezra Holdings Ltd. SGD 0 82,560 16,000 66,560
Far East Hospitality Trust SGD 0 103,000 22,000 81,000
First Real Estate Investment Trust SGD 0 55,631 12,001 43,630
First Resources Ltd. SGD 0 65,000 14,000 51,000
Frasers Centrepoint Trust SGD 0 64,000 14,000 50,000
Frasers Commercial Trust SGD 0 59,000 12,000 47,000
Frasers Hospitality Trust SGD 0 27,000 0 27,000
Genting Singapore PLC SGD 0 714,000 148,000 566,000
396
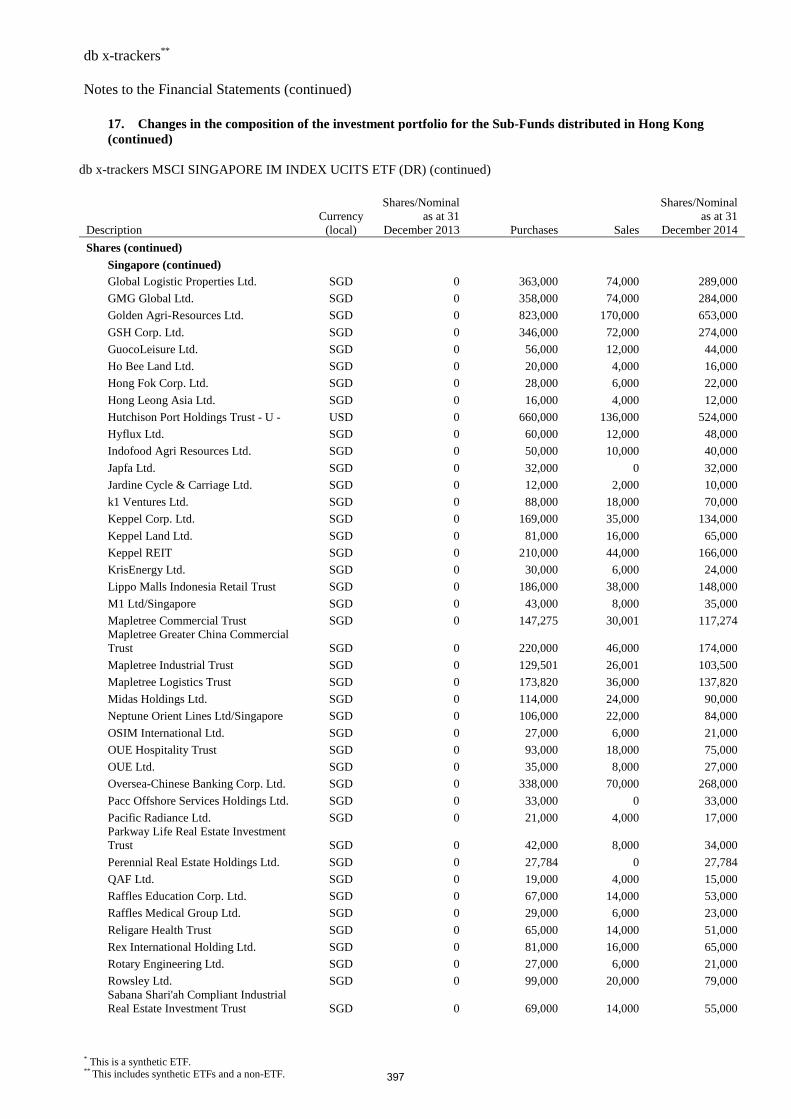
db x-trackers** Notes to the Financial Statements (continued)
* This is a synthetic ETF. ** This includes synthetic ETFs and a non-ETF.
17. Changes in the composition of the investment portfolio for the Sub-Funds distributed in Hong Kong (continued)
db x-trackers MSCI SINGAPORE IM INDEX UCITS ETF (DR) (continued)
Description Currency (local)
Shares/Nominal as at 31
December 2013 Purchases Sales
Shares/Nominal as at 31
December 2014
Shares (continued)
Singapore (continued)
Global Logistic Properties Ltd. SGD 0 363,000 74,000 289,000
GMG Global Ltd. SGD 0 358,000 74,000 284,000
Golden Agri-Resources Ltd. SGD 0 823,000 170,000 653,000
GSH Corp. Ltd. SGD 0 346,000 72,000 274,000
GuocoLeisure Ltd. SGD 0 56,000 12,000 44,000
Ho Bee Land Ltd. SGD 0 20,000 4,000 16,000
Hong Fok Corp. Ltd. SGD 0 28,000 6,000 22,000
Hong Leong Asia Ltd. SGD 0 16,000 4,000 12,000
Hutchison Port Holdings Trust - U - USD 0 660,000 136,000 524,000
Hyflux Ltd. SGD 0 60,000 12,000 48,000
Indofood Agri Resources Ltd. SGD 0 50,000 10,000 40,000
Japfa Ltd. SGD 0 32,000 0 32,000
Jardine Cycle & Carriage Ltd. SGD 0 12,000 2,000 10,000
k1 Ventures Ltd. SGD 0 88,000 18,000 70,000
Keppel Corp. Ltd. SGD 0 169,000 35,000 134,000
Keppel Land Ltd. SGD 0 81,000 16,000 65,000
Keppel REIT SGD 0 210,000 44,000 166,000
KrisEnergy Ltd. SGD 0 30,000 6,000 24,000
Lippo Malls Indonesia Retail Trust SGD 0 186,000 38,000 148,000
M1 Ltd/Singapore SGD 0 43,000 8,000 35,000
Mapletree Commercial Trust SGD 0 147,275 30,001 117,274 Mapletree Greater China Commercial Trust SGD 0 220,000 46,000 174,000
Mapletree Industrial Trust SGD 0 129,501 26,001 103,500
Mapletree Logistics Trust SGD 0 173,820 36,000 137,820
Midas Holdings Ltd. SGD 0 114,000 24,000 90,000
Neptune Orient Lines Ltd/Singapore SGD 0 106,000 22,000 84,000
OSIM International Ltd. SGD 0 27,000 6,000 21,000
OUE Hospitality Trust SGD 0 93,000 18,000 75,000
OUE Ltd. SGD 0 35,000 8,000 27,000
Oversea-Chinese Banking Corp. Ltd. SGD 0 338,000 70,000 268,000
Pacc Offshore Services Holdings Ltd. SGD 0 33,000 0 33,000
Pacific Radiance Ltd. SGD 0 21,000 4,000 17,000 Parkway Life Real Estate Investment Trust SGD 0 42,000 8,000 34,000
Perennial Real Estate Holdings Ltd. SGD 0 27,784 0 27,784
QAF Ltd. SGD 0 19,000 4,000 15,000
Raffles Education Corp. Ltd. SGD 0 67,000 14,000 53,000
Raffles Medical Group Ltd. SGD 0 29,000 6,000 23,000
Religare Health Trust SGD 0 65,000 14,000 51,000
Rex International Holding Ltd. SGD 0 81,000 16,000 65,000
Rotary Engineering Ltd. SGD 0 27,000 6,000 21,000
Rowsley Ltd. SGD 0 99,000 20,000 79,000 Sabana Shari'ah Compliant Industrial Real Estate Investment Trust SGD 0 69,000 14,000 55,000
397
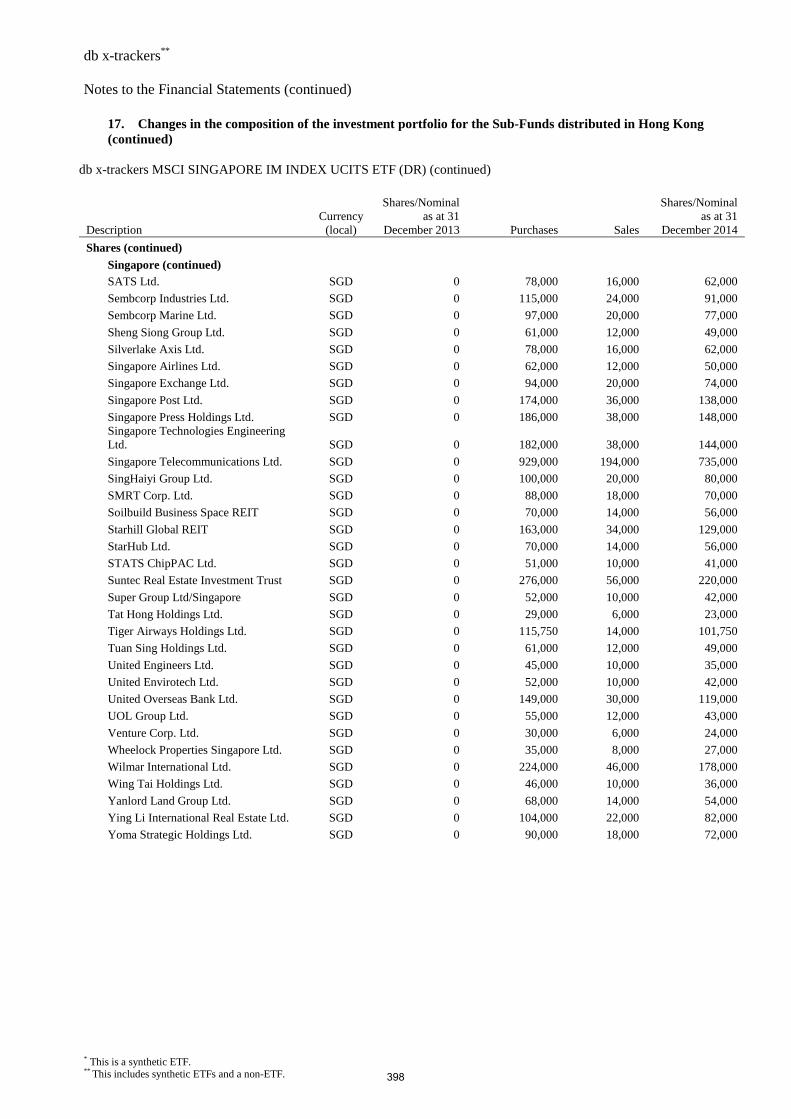
db x-trackers** Notes to the Financial Statements (continued)
* This is a synthetic ETF. ** This includes synthetic ETFs and a non-ETF.
17. Changes in the composition of the investment portfolio for the Sub-Funds distributed in Hong Kong (continued)
db x-trackers MSCI SINGAPORE IM INDEX UCITS ETF (DR) (continued)
Description Currency (local)
Shares/Nominal as at 31
December 2013 Purchases Sales
Shares/Nominal as at 31
December 2014
Shares (continued)
Singapore (continued)
SATS Ltd. SGD 0 78,000 16,000 62,000
Sembcorp Industries Ltd. SGD 0 115,000 24,000 91,000
Sembcorp Marine Ltd. SGD 0 97,000 20,000 77,000
Sheng Siong Group Ltd. SGD 0 61,000 12,000 49,000
Silverlake Axis Ltd. SGD 0 78,000 16,000 62,000
Singapore Airlines Ltd. SGD 0 62,000 12,000 50,000
Singapore Exchange Ltd. SGD 0 94,000 20,000 74,000
Singapore Post Ltd. SGD 0 174,000 36,000 138,000
Singapore Press Holdings Ltd. SGD 0 186,000 38,000 148,000 Singapore Technologies Engineering Ltd. SGD 0 182,000 38,000 144,000
Singapore Telecommunications Ltd. SGD 0 929,000 194,000 735,000
SingHaiyi Group Ltd. SGD 0 100,000 20,000 80,000
SMRT Corp. Ltd. SGD 0 88,000 18,000 70,000
Soilbuild Business Space REIT SGD 0 70,000 14,000 56,000
Starhill Global REIT SGD 0 163,000 34,000 129,000
StarHub Ltd. SGD 0 70,000 14,000 56,000
STATS ChipPAC Ltd. SGD 0 51,000 10,000 41,000
Suntec Real Estate Investment Trust SGD 0 276,000 56,000 220,000
Super Group Ltd/Singapore SGD 0 52,000 10,000 42,000
Tat Hong Holdings Ltd. SGD 0 29,000 6,000 23,000
Tiger Airways Holdings Ltd. SGD 0 115,750 14,000 101,750
Tuan Sing Holdings Ltd. SGD 0 61,000 12,000 49,000
United Engineers Ltd. SGD 0 45,000 10,000 35,000
United Envirotech Ltd. SGD 0 52,000 10,000 42,000
United Overseas Bank Ltd. SGD 0 149,000 30,000 119,000
UOL Group Ltd. SGD 0 55,000 12,000 43,000
Venture Corp. Ltd. SGD 0 30,000 6,000 24,000
Wheelock Properties Singapore Ltd. SGD 0 35,000 8,000 27,000
Wilmar International Ltd. SGD 0 224,000 46,000 178,000
Wing Tai Holdings Ltd. SGD 0 46,000 10,000 36,000
Yanlord Land Group Ltd. SGD 0 68,000 14,000 54,000
Ying Li International Real Estate Ltd. SGD 0 104,000 22,000 82,000
Yoma Strategic Holdings Ltd. SGD 0 90,000 18,000 72,000
398
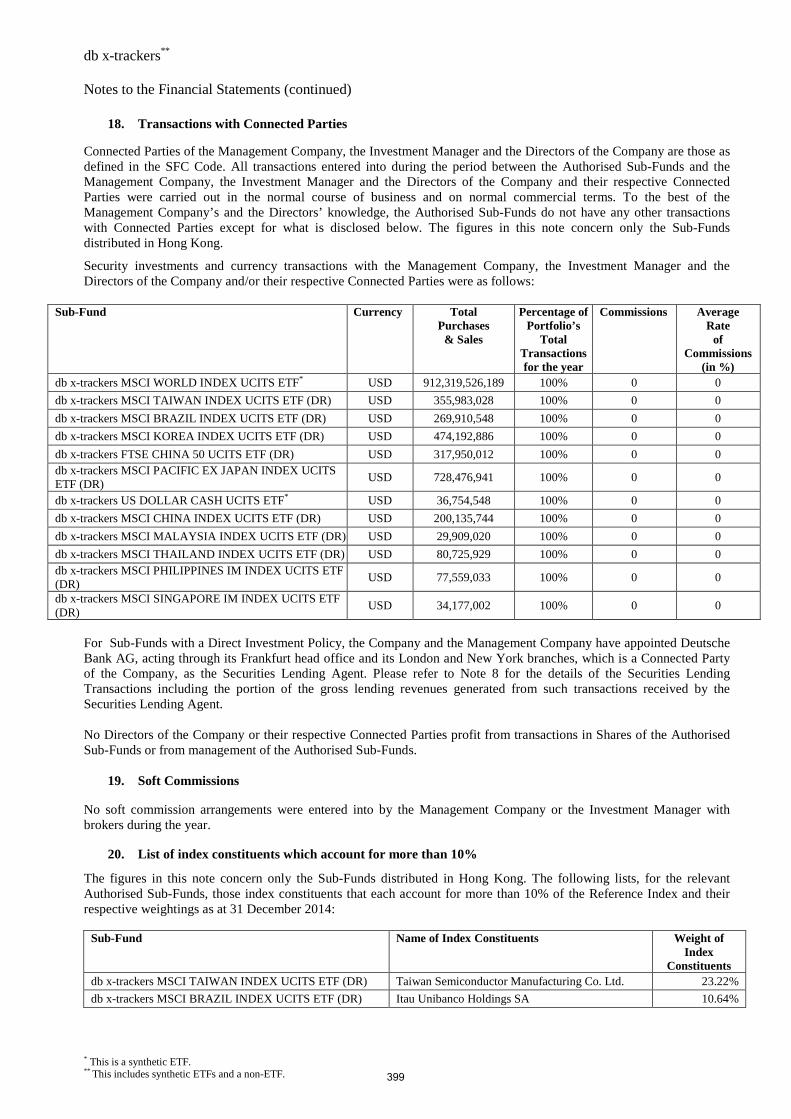
db x-trackers** Notes to the Financial Statements (continued)
* This is a synthetic ETF. ** This includes synthetic ETFs and a non-ETF.
18. Transactions with Connected Parties Connected Parties of the Management Company, the Investment Manager and the Directors of the Company are those as defined in the SFC Code. All transactions entered into during the period between the Authorised Sub-Funds and the Management Company, the Investment Manager and the Directors of the Company and their respective Connected Parties were carried out in the normal course of business and on normal commercial terms. To the best of the Management Company’s and the Directors’ knowledge, the Authorised Sub-Funds do not have any other transactions with Connected Parties except for what is disclosed below. The figures in this note concern only the Sub-Funds distributed in Hong Kong.
Security investments and currency transactions with the Management Company, the Investment Manager and the Directors of the Company and/or their respective Connected Parties were as follows:
Sub-Fund Currency Total Purchases & Sales
Percentage of Portfolio’s
Total Transactions for the year
Commissions Average Rate
of Commissions
(in %) db x-trackers MSCI WORLD INDEX UCITS ETF* USD 912,319,526,189 100% 0 0
db x-trackers MSCI TAIWAN INDEX UCITS ETF (DR) USD 355,983,028 100% 0 0
db x-trackers MSCI BRAZIL INDEX UCITS ETF (DR) USD 269,910,548 100% 0 0
db x-trackers MSCI KOREA INDEX UCITS ETF (DR) USD 474,192,886 100% 0 0
db x-trackers FTSE CHINA 50 UCITS ETF (DR) USD 317,950,012 100% 0 0 db x-trackers MSCI PACIFIC EX JAPAN INDEX UCITS ETF (DR)
USD 728,476,941 100% 0 0
db x-trackers US DOLLAR CASH UCITS ETF* USD 36,754,548 100% 0 0
db x-trackers MSCI CHINA INDEX UCITS ETF (DR) USD 200,135,744 100% 0 0
db x-trackers MSCI MALAYSIA INDEX UCITS ETF (DR) USD 29,909,020 100% 0 0
db x-trackers MSCI THAILAND INDEX UCITS ETF (DR) USD 80,725,929 100% 0 0 db x-trackers MSCI PHILIPPINES IM INDEX UCITS ETF (DR)
USD 77,559,033 100% 0 0
db x-trackers MSCI SINGAPORE IM INDEX UCITS ETF (DR)
USD 34,177,002 100% 0 0
For Sub-Funds with a Direct Investment Policy, the Company and the Management Company have appointed Deutsche Bank AG, acting through its Frankfurt head office and its London and New York branches, which is a Connected Party of the Company, as the Securities Lending Agent. Please refer to Note 8 for the details of the Securities Lending Transactions including the portion of the gross lending revenues generated from such transactions received by the Securities Lending Agent. No Directors of the Company or their respective Connected Parties profit from transactions in Shares of the Authorised Sub-Funds or from management of the Authorised Sub-Funds.
19. Soft Commissions
No soft commission arrangements were entered into by the Management Company or the Investment Manager with brokers during the year.
20. List of index constituents which account for more than 10%
The figures in this note concern only the Sub-Funds distributed in Hong Kong. The following lists, for the relevant Authorised Sub-Funds, those index constituents that each account for more than 10% of the Reference Index and their respective weightings as at 31 December 2014:
Sub-Fund Name of Index Constituents Weight of Index
Constituents db x-trackers MSCI TAIWAN INDEX UCITS ETF (DR) Taiwan Semiconductor Manufacturing Co. Ltd. 23.22%
db x-trackers MSCI BRAZIL INDEX UCITS ETF (DR) Itau Unibanco Holdings SA 10.64%
399
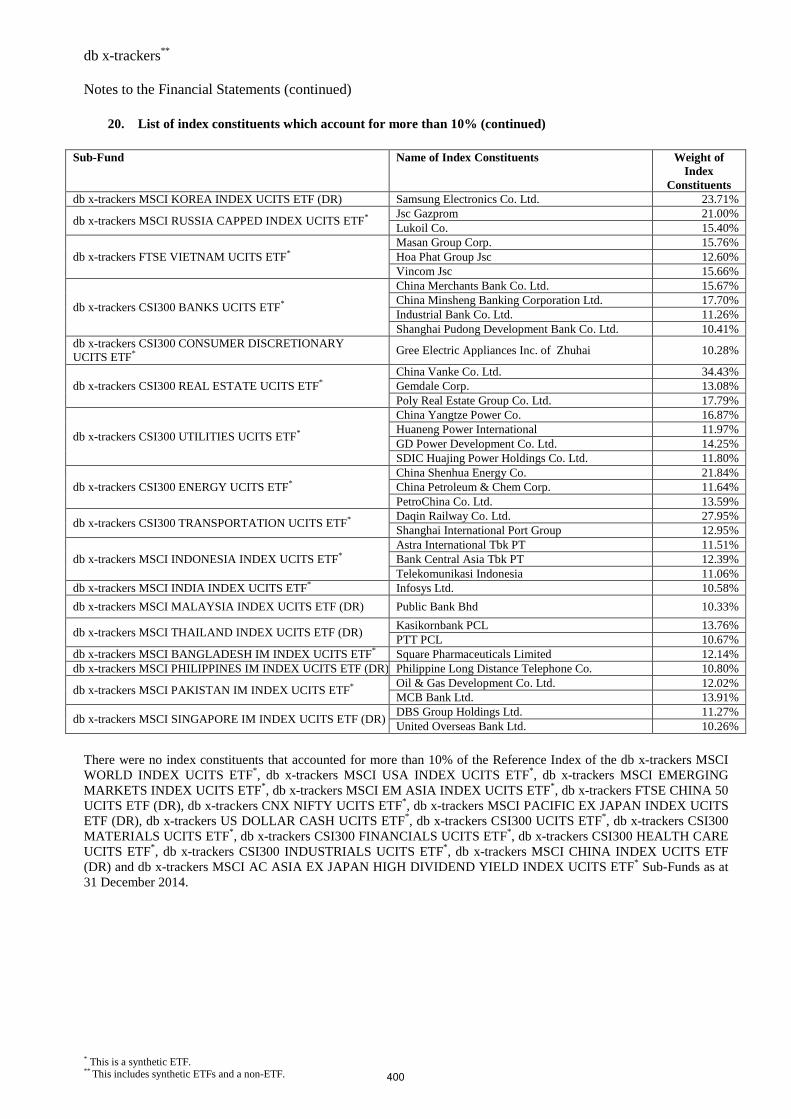
db x-trackers** Notes to the Financial Statements (continued)
* This is a synthetic ETF. ** This includes synthetic ETFs and a non-ETF.
20. List of index constituents which account for more than 10% (continued)
Sub-Fund Name of Index Constituents Weight of Index
Constituents db x-trackers MSCI KOREA INDEX UCITS ETF (DR) Samsung Electronics Co. Ltd. 23.71%
db x-trackers MSCI RUSSIA CAPPED INDEX UCITS ETF* Jsc Gazprom 21.00% Lukoil Co. 15.40%
db x-trackers FTSE VIETNAM UCITS ETF* Masan Group Corp. 15.76% Hoa Phat Group Jsc 12.60% Vincom Jsc 15.66%
db x-trackers CSI300 BANKS UCITS ETF*
China Merchants Bank Co. Ltd. 15.67% China Minsheng Banking Corporation Ltd. 17.70% Industrial Bank Co. Ltd. 11.26% Shanghai Pudong Development Bank Co. Ltd. 10.41%
db x-trackers CSI300 CONSUMER DISCRETIONARY UCITS ETF*
Gree Electric Appliances Inc. of Zhuhai 10.28%
db x-trackers CSI300 REAL ESTATE UCITS ETF* China Vanke Co. Ltd. 34.43% Gemdale Corp. 13.08% Poly Real Estate Group Co. Ltd. 17.79%
db x-trackers CSI300 UTILITIES UCITS ETF*
China Yangtze Power Co. 16.87% Huaneng Power International 11.97% GD Power Development Co. Ltd. 14.25% SDIC Huajing Power Holdings Co. Ltd. 11.80%
db x-trackers CSI300 ENERGY UCITS ETF* China Shenhua Energy Co. 21.84% China Petroleum & Chem Corp. 11.64% PetroChina Co. Ltd. 13.59%
db x-trackers CSI300 TRANSPORTATION UCITS ETF* Daqin Railway Co. Ltd. 27.95% Shanghai International Port Group 12.95%
db x-trackers MSCI INDONESIA INDEX UCITS ETF* Astra International Tbk PT 11.51% Bank Central Asia Tbk PT 12.39% Telekomunikasi Indonesia 11.06%
db x-trackers MSCI INDIA INDEX UCITS ETF* Infosys Ltd. 10.58%
db x-trackers MSCI MALAYSIA INDEX UCITS ETF (DR) Public Bank Bhd 10.33%
db x-trackers MSCI THAILAND INDEX UCITS ETF (DR) Kasikornbank PCL 13.76% PTT PCL 10.67%
db x-trackers MSCI BANGLADESH IM INDEX UCITS ETF* Square Pharmaceuticals Limited 12.14% db x-trackers MSCI PHILIPPINES IM INDEX UCITS ETF (DR)Philippine Long Distance Telephone Co. 10.80%
db x-trackers MSCI PAKISTAN IM INDEX UCITS ETF* Oil & Gas Development Co. Ltd. 12.02% MCB Bank Ltd. 13.91%
db x-trackers MSCI SINGAPORE IM INDEX UCITS ETF (DR) DBS Group Holdings Ltd. 11.27% United Overseas Bank Ltd. 10.26%
There were no index constituents that accounted for more than 10% of the Reference Index of the db x-trackers MSCI WORLD INDEX UCITS ETF*, db x-trackers MSCI USA INDEX UCITS ETF*, db x-trackers MSCI EMERGING MARKETS INDEX UCITS ETF*, db x-trackers MSCI EM ASIA INDEX UCITS ETF*, db x-trackers FTSE CHINA 50 UCITS ETF (DR), db x-trackers CNX NIFTY UCITS ETF*, db x-trackers MSCI PACIFIC EX JAPAN INDEX UCITS ETF (DR), db x-trackers US DOLLAR CASH UCITS ETF*, db x-trackers CSI300 UCITS ETF*, db x-trackers CSI300 MATERIALS UCITS ETF*, db x-trackers CSI300 FINANCIALS UCITS ETF*, db x-trackers CSI300 HEALTH CARE UCITS ETF*, db x-trackers CSI300 INDUSTRIALS UCITS ETF*, db x-trackers MSCI CHINA INDEX UCITS ETF (DR) and db x-trackers MSCI AC ASIA EX JAPAN HIGH DIVIDEND YIELD INDEX UCITS ETF* Sub-Funds as at 31 December 2014.
400
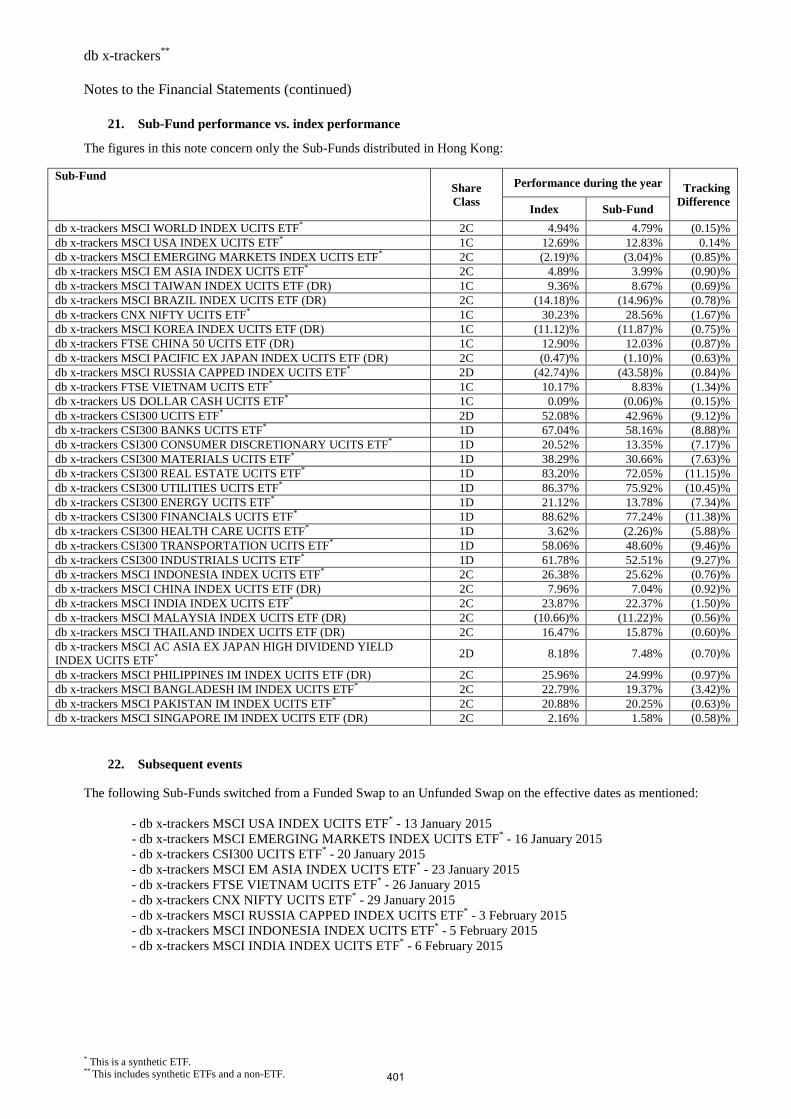
db x-trackers** Notes to the Financial Statements (continued)
* This is a synthetic ETF. ** This includes synthetic ETFs and a non-ETF.
21. Sub-Fund performance vs. index performance
The figures in this note concern only the Sub-Funds distributed in Hong Kong:
Sub-Fund Share Class
Performance during the year Tracking Difference
Index Sub-Fund
db x-trackers MSCI WORLD INDEX UCITS ETF* 2C 4.94% 4.79% (0.15)% db x-trackers MSCI USA INDEX UCITS ETF* 1C 12.69% 12.83% 0.14% db x-trackers MSCI EMERGING MARKETS INDEX UCITS ETF* 2C (2.19)% (3.04)% (0.85)% db x-trackers MSCI EM ASIA INDEX UCITS ETF* 2C 4.89% 3.99% (0.90)% db x-trackers MSCI TAIWAN INDEX UCITS ETF (DR) 1C 9.36% 8.67% (0.69)% db x-trackers MSCI BRAZIL INDEX UCITS ETF (DR) 2C (14.18)% (14.96)% (0.78)% db x-trackers CNX NIFTY UCITS ETF* 1C 30.23% 28.56% (1.67)% db x-trackers MSCI KOREA INDEX UCITS ETF (DR) 1C (11.12)% (11.87)% (0.75)% db x-trackers FTSE CHINA 50 UCITS ETF (DR) 1C 12.90% 12.03% (0.87)% db x-trackers MSCI PACIFIC EX JAPAN INDEX UCITS ETF (DR) 2C (0.47)% (1.10)% (0.63)% db x-trackers MSCI RUSSIA CAPPED INDEX UCITS ETF* 2D (42.74)% (43.58)% (0.84)% db x-trackers FTSE VIETNAM UCITS ETF* 1C 10.17% 8.83% (1.34)% db x-trackers US DOLLAR CASH UCITS ETF* 1C 0.09% (0.06)% (0.15)% db x-trackers CSI300 UCITS ETF* 2D 52.08% 42.96% (9.12)% db x-trackers CSI300 BANKS UCITS ETF* 1D 67.04% 58.16% (8.88)% db x-trackers CSI300 CONSUMER DISCRETIONARY UCITS ETF* 1D 20.52% 13.35% (7.17)% db x-trackers CSI300 MATERIALS UCITS ETF* 1D 38.29% 30.66% (7.63)% db x-trackers CSI300 REAL ESTATE UCITS ETF* 1D 83.20% 72.05% (11.15)% db x-trackers CSI300 UTILITIES UCITS ETF* 1D 86.37% 75.92% (10.45)% db x-trackers CSI300 ENERGY UCITS ETF* 1D 21.12% 13.78% (7.34)% db x-trackers CSI300 FINANCIALS UCITS ETF* 1D 88.62% 77.24% (11.38)% db x-trackers CSI300 HEALTH CARE UCITS ETF* 1D 3.62% (2.26)% (5.88)% db x-trackers CSI300 TRANSPORTATION UCITS ETF* 1D 58.06% 48.60% (9.46)% db x-trackers CSI300 INDUSTRIALS UCITS ETF* 1D 61.78% 52.51% (9.27)% db x-trackers MSCI INDONESIA INDEX UCITS ETF* 2C 26.38% 25.62% (0.76)% db x-trackers MSCI CHINA INDEX UCITS ETF (DR) 2C 7.96% 7.04% (0.92)% db x-trackers MSCI INDIA INDEX UCITS ETF* 2C 23.87% 22.37% (1.50)% db x-trackers MSCI MALAYSIA INDEX UCITS ETF (DR) 2C (10.66)% (11.22)% (0.56)% db x-trackers MSCI THAILAND INDEX UCITS ETF (DR) 2C 16.47% 15.87% (0.60)% db x-trackers MSCI AC ASIA EX JAPAN HIGH DIVIDEND YIELD INDEX UCITS ETF*
2D 8.18% 7.48% (0.70)%
db x-trackers MSCI PHILIPPINES IM INDEX UCITS ETF (DR) 2C 25.96% 24.99% (0.97)% db x-trackers MSCI BANGLADESH IM INDEX UCITS ETF* 2C 22.79% 19.37% (3.42)% db x-trackers MSCI PAKISTAN IM INDEX UCITS ETF* 2C 20.88% 20.25% (0.63)% db x-trackers MSCI SINGAPORE IM INDEX UCITS ETF (DR) 2C 2.16% 1.58% (0.58)%
22. Subsequent events The following Sub-Funds switched from a Funded Swap to an Unfunded Swap on the effective dates as mentioned:
- db x-trackers MSCI USA INDEX UCITS ETF* - 13 January 2015 - db x-trackers MSCI EMERGING MARKETS INDEX UCITS ETF* - 16 January 2015
- db x-trackers CSI300 UCITS ETF* - 20 January 2015 - db x-trackers MSCI EM ASIA INDEX UCITS ETF* - 23 January 2015 - db x-trackers FTSE VIETNAM UCITS ETF* - 26 January 2015 - db x-trackers CNX NIFTY UCITS ETF* - 29 January 2015 - db x-trackers MSCI RUSSIA CAPPED INDEX UCITS ETF* - 3 February 2015 - db x-trackers MSCI INDONESIA INDEX UCITS ETF* - 5 February 2015 - db x-trackers MSCI INDIA INDEX UCITS ETF* - 6 February 2015
401
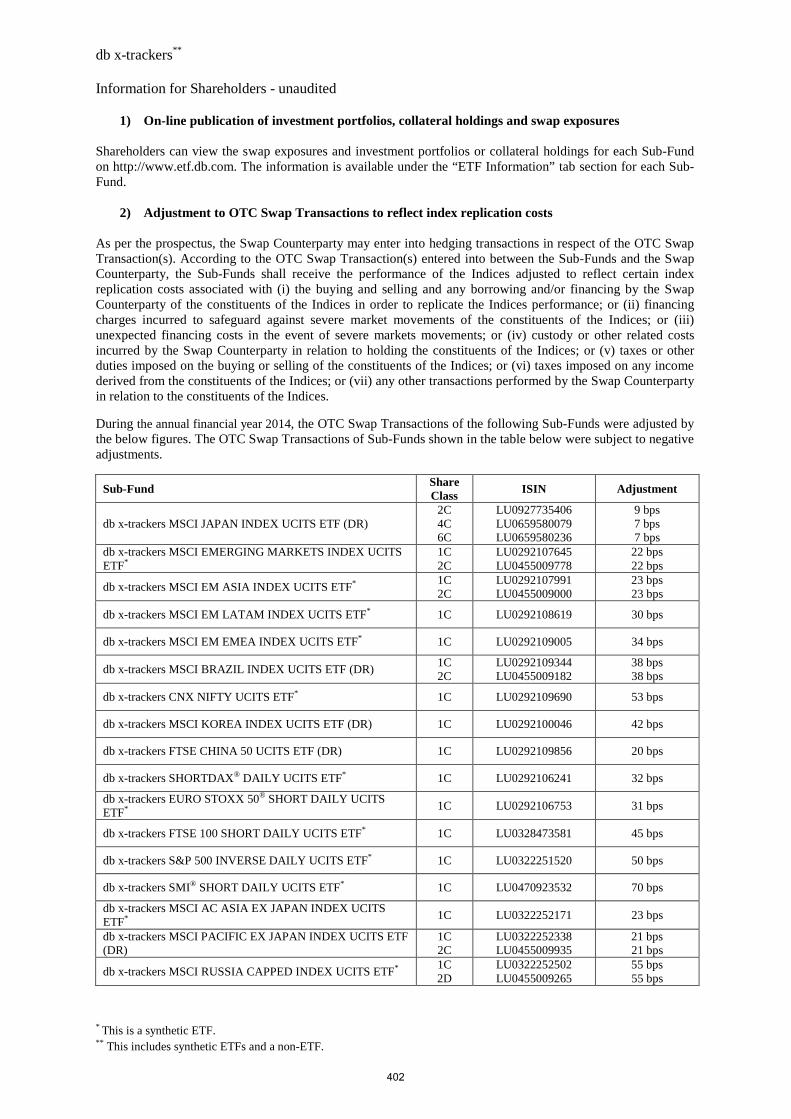
db x-trackers**
* This is a synthetic ETF.
** This includes synthetic ETFs and a non-ETF.
Information for Shareholders - unaudited
1) On-line publication of investment portfolios, collateral holdings and swap exposures
Shareholders can view the swap exposures and investment portfolios or collateral holdings for each Sub-Fund on http://www.etf.db.com. The information is available under the “ETF Information” tab section for each Sub-Fund.
2) Adjustment to OTC Swap Transactions to reflect index replication costs
As per the prospectus, the Swap Counterparty may enter into hedging transactions in respect of the OTC Swap Transaction(s). According to the OTC Swap Transaction(s) entered into between the Sub-Funds and the Swap Counterparty, the Sub-Funds shall receive the performance of the Indices adjusted to reflect certain index replication costs associated with (i) the buying and selling and any borrowing and/or financing by the Swap Counterparty of the constituents of the Indices in order to replicate the Indices performance; or (ii) financing charges incurred to safeguard against severe market movements of the constituents of the Indices; or (iii) unexpected financing costs in the event of severe markets movements; or (iv) custody or other related costs incurred by the Swap Counterparty in relation to holding the constituents of the Indices; or (v) taxes or other duties imposed on the buying or selling of the constituents of the Indices; or (vi) taxes imposed on any income derived from the constituents of the Indices; or (vii) any other transactions performed by the Swap Counterparty in relation to the constituents of the Indices. During the annual financial year 2014, the OTC Swap Transactions of the following Sub-Funds were adjusted by the below figures. The OTC Swap Transactions of Sub-Funds shown in the table below were subject to negative adjustments.
Sub-Fund Share Class ISIN Adjustment
db x-trackers MSCI JAPAN INDEX UCITS ETF (DR) 2C 4C 6C
LU0927735406 LU0659580079 LU0659580236
9 bps 7 bps 7 bps
db x-trackers MSCI EMERGING MARKETS INDEX UCITS ETF*
1C 2C
LU0292107645 LU0455009778
22 bps 22 bps
db x-trackers MSCI EM ASIA INDEX UCITS ETF* 1C 2C
LU0292107991 LU0455009000
23 bps 23 bps
db x-trackers MSCI EM LATAM INDEX UCITS ETF* 1C LU0292108619 30 bps
db x-trackers MSCI EM EMEA INDEX UCITS ETF* 1C LU0292109005 34 bps
db x-trackers MSCI BRAZIL INDEX UCITS ETF (DR) 1C 2C
LU0292109344 LU0455009182
38 bps 38 bps
db x-trackers CNX NIFTY UCITS ETF* 1C LU0292109690 53 bps
db x-trackers MSCI KOREA INDEX UCITS ETF (DR) 1C LU0292100046 42 bps
db x-trackers FTSE CHINA 50 UCITS ETF (DR) 1C LU0292109856 20 bps
db x-trackers SHORTDAX® DAILY UCITS ETF* 1C LU0292106241 32 bps
db x-trackers EURO STOXX 50® SHORT DAILY UCITS ETF*
1C LU0292106753 31 bps
db x-trackers FTSE 100 SHORT DAILY UCITS ETF* 1C LU0328473581 45 bps
db x-trackers S&P 500 INVERSE DAILY UCITS ETF* 1C LU0322251520 50 bps
db x-trackers SMI® SHORT DAILY UCITS ETF* 1C LU0470923532 70 bps
db x-trackers MSCI AC ASIA EX JAPAN INDEX UCITS ETF*
1C LU0322252171 23 bps
db x-trackers MSCI PACIFIC EX JAPAN INDEX UCITS ETF (DR)
1C 2C
LU0322252338 LU0455009935
21 bps 21 bps
db x-trackers MSCI RUSSIA CAPPED INDEX UCITS ETF* 1C 2D
LU0322252502 LU0455009265
55 bps 55 bps
402
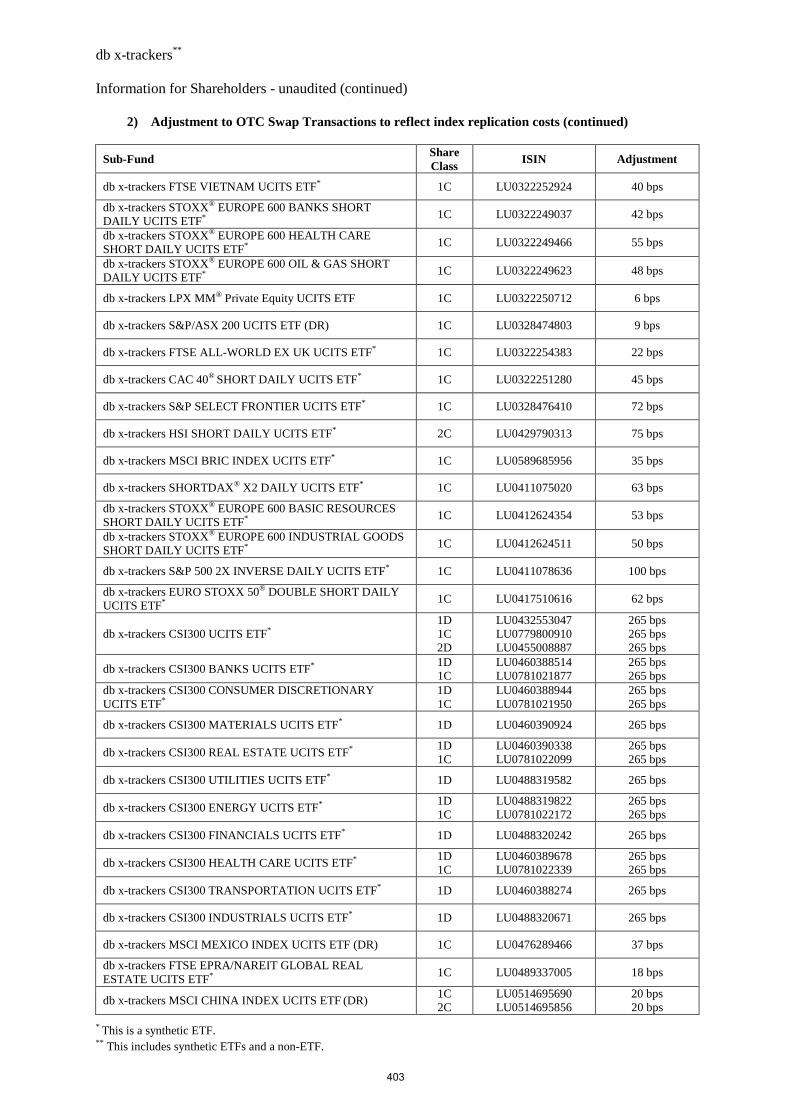
db x-trackers**
* This is a synthetic ETF.
** This includes synthetic ETFs and a non-ETF.
Information for Shareholders - unaudited (continued)
2) Adjustment to OTC Swap Transactions to reflect index replication costs (continued)
Sub-Fund Share Class
ISIN Adjustment
db x-trackers FTSE VIETNAM UCITS ETF* 1C LU0322252924 40 bps
db x-trackers STOXX® EUROPE 600 BANKS SHORT DAILY UCITS ETF*
1C LU0322249037 42 bps
db x-trackers STOXX® EUROPE 600 HEALTH CARE SHORT DAILY UCITS ETF*
1C LU0322249466 55 bps
db x-trackers STOXX® EUROPE 600 OIL & GAS SHORT DAILY UCITS ETF*
1C LU0322249623 48 bps
db x-trackers LPX MM® Private Equity UCITS ETF 1C LU0322250712 6 bps
db x-trackers S&P/ASX 200 UCITS ETF (DR) 1C LU0328474803 9 bps
db x-trackers FTSE ALL-WORLD EX UK UCITS ETF* 1C LU0322254383 22 bps
db x-trackers CAC 40® SHORT DAILY UCITS ETF* 1C LU0322251280 45 bps
db x-trackers S&P SELECT FRONTIER UCITS ETF* 1C LU0328476410 72 bps
db x-trackers HSI SHORT DAILY UCITS ETF* 2C LU0429790313 75 bps
db x-trackers MSCI BRIC INDEX UCITS ETF* 1C LU0589685956 35 bps
db x-trackers SHORTDAX® X2 DAILY UCITS ETF* 1C LU0411075020 63 bps
db x-trackers STOXX® EUROPE 600 BASIC RESOURCES SHORT DAILY UCITS ETF*
1C LU0412624354 53 bps
db x-trackers STOXX® EUROPE 600 INDUSTRIAL GOODS SHORT DAILY UCITS ETF*
1C LU0412624511 50 bps
db x-trackers S&P 500 2X INVERSE DAILY UCITS ETF* 1C LU0411078636 100 bps
db x-trackers EURO STOXX 50® DOUBLE SHORT DAILY UCITS ETF*
1C LU0417510616 62 bps
db x-trackers CSI300 UCITS ETF* 1D 1C 2D
LU0432553047 LU0779800910 LU0455008887
265 bps 265 bps 265 bps
db x-trackers CSI300 BANKS UCITS ETF* 1D 1C
LU0460388514 LU0781021877
265 bps 265 bps
db x-trackers CSI300 CONSUMER DISCRETIONARY UCITS ETF*
1D 1C
LU0460388944 LU0781021950
265 bps 265 bps
db x-trackers CSI300 MATERIALS UCITS ETF* 1D LU0460390924 265 bps
db x-trackers CSI300 REAL ESTATE UCITS ETF* 1D 1C
LU0460390338 LU0781022099
265 bps 265 bps
db x-trackers CSI300 UTILITIES UCITS ETF* 1D LU0488319582 265 bps
db x-trackers CSI300 ENERGY UCITS ETF* 1D 1C
LU0488319822 LU0781022172
265 bps 265 bps
db x-trackers CSI300 FINANCIALS UCITS ETF* 1D LU0488320242 265 bps
db x-trackers CSI300 HEALTH CARE UCITS ETF* 1D 1C
LU0460389678 LU0781022339
265 bps 265 bps
db x-trackers CSI300 TRANSPORTATION UCITS ETF* 1D LU0460388274 265 bps
db x-trackers CSI300 INDUSTRIALS UCITS ETF* 1D LU0488320671 265 bps
db x-trackers MSCI MEXICO INDEX UCITS ETF (DR) 1C LU0476289466 37 bps
db x-trackers FTSE EPRA/NAREIT GLOBAL REAL ESTATE UCITS ETF*
1C LU0489337005 18 bps
db x-trackers MSCI CHINA INDEX UCITS ETF (DR) 1C 2C
LU0514695690 LU0514695856
20 bps 20 bps
403
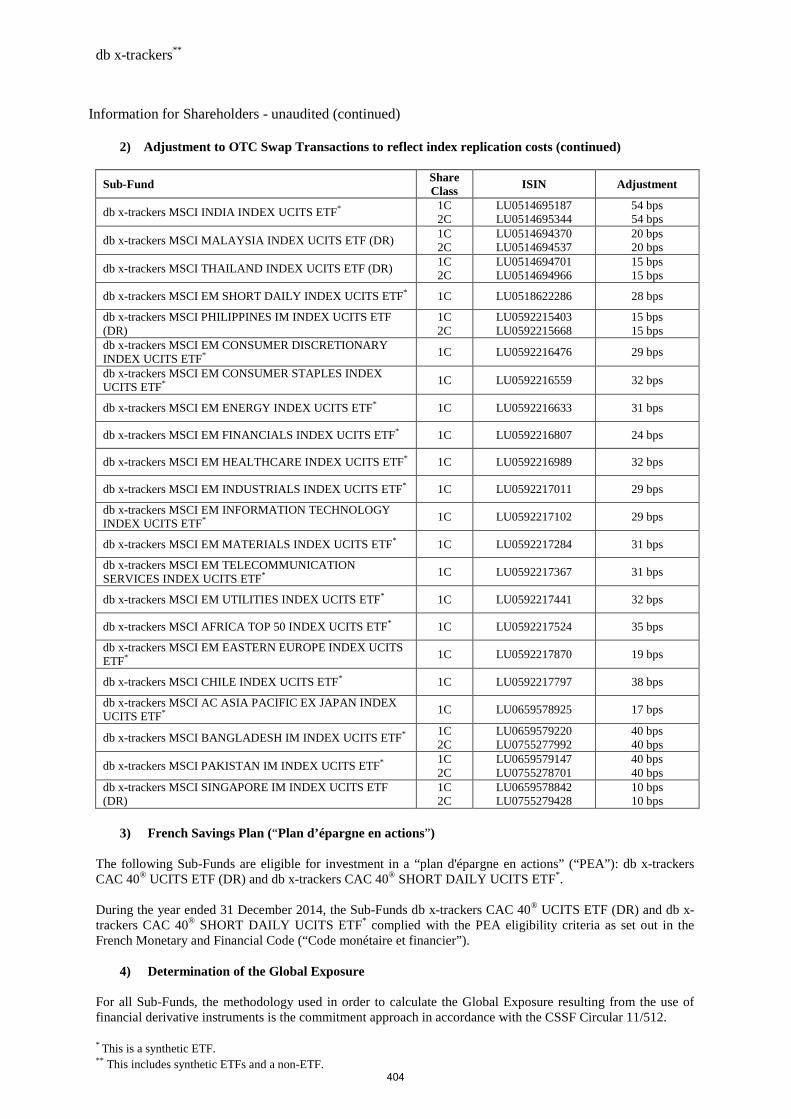
db x-trackers**
* This is a synthetic ETF.
** This includes synthetic ETFs and a non-ETF.
Information for Shareholders - unaudited (continued)
2) Adjustment to OTC Swap Transactions to reflect index replication costs (continued)
Sub-Fund Share Class ISIN Adjustment
db x-trackers MSCI INDIA INDEX UCITS ETF* 1C 2C
LU0514695187 LU0514695344
54 bps 54 bps
db x-trackers MSCI MALAYSIA INDEX UCITS ETF (DR) 1C 2C
LU0514694370 LU0514694537
20 bps 20 bps
db x-trackers MSCI THAILAND INDEX UCITS ETF (DR) 1C 2C
LU0514694701 LU0514694966
15 bps 15 bps
db x-trackers MSCI EM SHORT DAILY INDEX UCITS ETF* 1C LU0518622286 28 bps
db x-trackers MSCI PHILIPPINES IM INDEX UCITS ETF (DR)
1C 2C
LU0592215403 LU0592215668
15 bps 15 bps
db x-trackers MSCI EM CONSUMER DISCRETIONARY INDEX UCITS ETF*
1C LU0592216476 29 bps
db x-trackers MSCI EM CONSUMER STAPLES INDEX UCITS ETF*
1C LU0592216559 32 bps
db x-trackers MSCI EM ENERGY INDEX UCITS ETF* 1C LU0592216633 31 bps
db x-trackers MSCI EM FINANCIALS INDEX UCITS ETF* 1C LU0592216807 24 bps
db x-trackers MSCI EM HEALTHCARE INDEX UCITS ETF* 1C LU0592216989 32 bps
db x-trackers MSCI EM INDUSTRIALS INDEX UCITS ETF* 1C LU0592217011 29 bps
db x-trackers MSCI EM INFORMATION TECHNOLOGY INDEX UCITS ETF*
1C LU0592217102 29 bps
db x-trackers MSCI EM MATERIALS INDEX UCITS ETF* 1C LU0592217284 31 bps
db x-trackers MSCI EM TELECOMMUNICATION SERVICES INDEX UCITS ETF*
1C LU0592217367 31 bps
db x-trackers MSCI EM UTILITIES INDEX UCITS ETF* 1C LU0592217441 32 bps
db x-trackers MSCI AFRICA TOP 50 INDEX UCITS ETF* 1C LU0592217524 35 bps
db x-trackers MSCI EM EASTERN EUROPE INDEX UCITS ETF* 1C LU0592217870 19 bps
db x-trackers MSCI CHILE INDEX UCITS ETF* 1C LU0592217797 38 bps
db x-trackers MSCI AC ASIA PACIFIC EX JAPAN INDEX UCITS ETF*
1C LU0659578925 17 bps
db x-trackers MSCI BANGLADESH IM INDEX UCITS ETF* 1C 2C
LU0659579220 LU0755277992
40 bps 40 bps
db x-trackers MSCI PAKISTAN IM INDEX UCITS ETF* 1C 2C
LU0659579147 LU0755278701
40 bps 40 bps
db x-trackers MSCI SINGAPORE IM INDEX UCITS ETF (DR)
1C 2C
LU0659578842 LU0755279428
10 bps 10 bps
3) French Savings Plan (“Plan d’épargne en actions” )
The following Sub-Funds are eligible for investment in a “plan d'épargne en actions” (“PEA”): db x-trackers CAC 40® UCITS ETF (DR) and db x-trackers CAC 40® SHORT DAILY UCITS ETF*. During the year ended 31 December 2014, the Sub-Funds db x-trackers CAC 40® UCITS ETF (DR) and db x-trackers CAC 40® SHORT DAILY UCITS ETF* complied with the PEA eligibility criteria as set out in the French Monetary and Financial Code (“Code monétaire et financier”).
4) Determination of the Global Exposure
For all Sub-Funds, the methodology used in order to calculate the Global Exposure resulting from the use of financial derivative instruments is the commitment approach in accordance with the CSSF Circular 11/512.
404
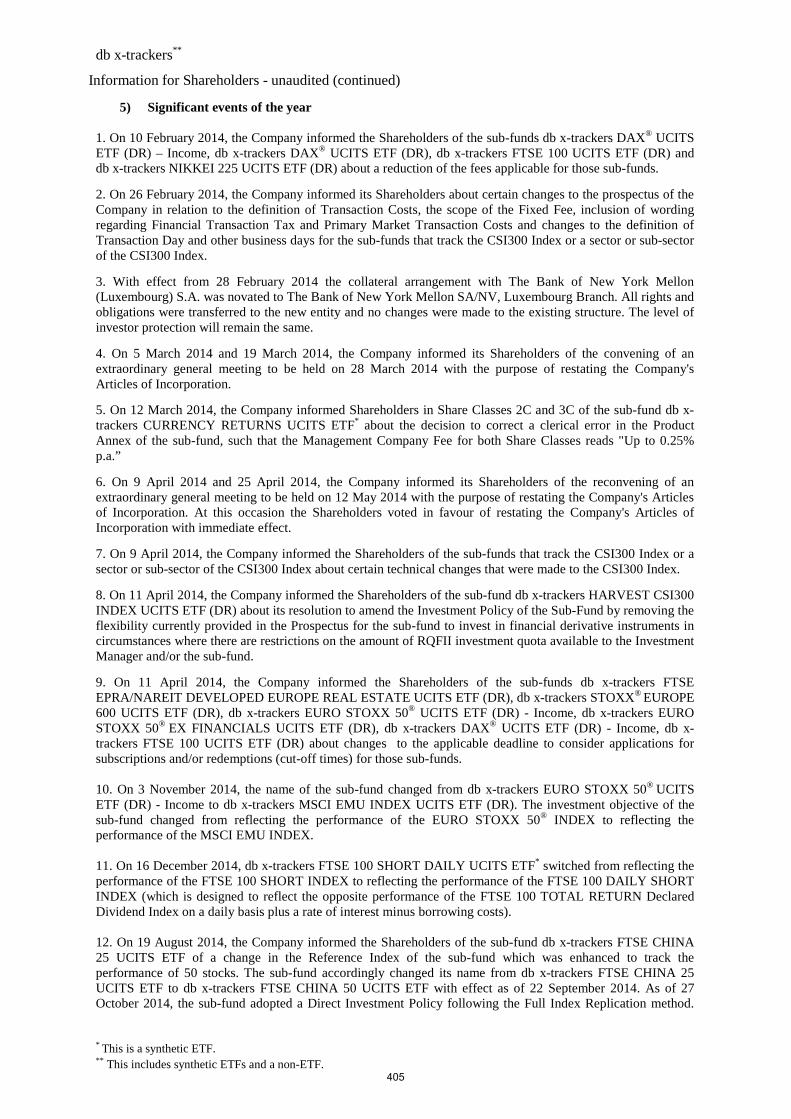
db x-trackers**
* This is a synthetic ETF.
** This includes synthetic ETFs and a non-ETF.
Information for Shareholders - unaudited (continued)
5) Significant events of the year
1. On 10 February 2014, the Company informed the Shareholders of the sub-funds db x-trackers DAX® UCITS ETF (DR) – Income, db x-trackers DAX® UCITS ETF (DR), db x-trackers FTSE 100 UCITS ETF (DR) and db x-trackers NIKKEI 225 UCITS ETF (DR) about a reduction of the fees applicable for those sub-funds.
2. On 26 February 2014, the Company informed its Shareholders about certain changes to the prospectus of the Company in relation to the definition of Transaction Costs, the scope of the Fixed Fee, inclusion of wording regarding Financial Transaction Tax and Primary Market Transaction Costs and changes to the definition of Transaction Day and other business days for the sub-funds that track the CSI300 Index or a sector or sub-sector of the CSI300 Index.
3. With effect from 28 February 2014 the collateral arrangement with The Bank of New York Mellon (Luxembourg) S.A. was novated to The Bank of New York Mellon SA/NV, Luxembourg Branch. All rights and obligations were transferred to the new entity and no changes were made to the existing structure. The level of investor protection will remain the same.
4. On 5 March 2014 and 19 March 2014, the Company informed its Shareholders of the convening of an extraordinary general meeting to be held on 28 March 2014 with the purpose of restating the Company's Articles of Incorporation.
5. On 12 March 2014, the Company informed Shareholders in Share Classes 2C and 3C of the sub-fund db x-trackers CURRENCY RETURNS UCITS ETF* about the decision to correct a clerical error in the Product Annex of the sub-fund, such that the Management Company Fee for both Share Classes reads "Up to 0.25% p.a.”
6. On 9 April 2014 and 25 April 2014, the Company informed its Shareholders of the reconvening of an extraordinary general meeting to be held on 12 May 2014 with the purpose of restating the Company's Articles of Incorporation. At this occasion the Shareholders voted in favour of restating the Company's Articles of Incorporation with immediate effect.
7. On 9 April 2014, the Company informed the Shareholders of the sub-funds that track the CSI300 Index or a sector or sub-sector of the CSI300 Index about certain technical changes that were made to the CSI300 Index.
8. On 11 April 2014, the Company informed the Shareholders of the sub-fund db x-trackers HARVEST CSI300 INDEX UCITS ETF (DR) about its resolution to amend the Investment Policy of the Sub-Fund by removing the flexibility currently provided in the Prospectus for the sub-fund to invest in financial derivative instruments in circumstances where there are restrictions on the amount of RQFII investment quota available to the Investment Manager and/or the sub-fund.
9. On 11 April 2014, the Company informed the Shareholders of the sub-funds db x-trackers FTSE EPRA/NAREIT DEVELOPED EUROPE REAL ESTATE UCITS ETF (DR), db x-trackers STOXX® EUROPE 600 UCITS ETF (DR), db x-trackers EURO STOXX 50® UCITS ETF (DR) - Income, db x-trackers EURO STOXX 50® EX FINANCIALS UCITS ETF (DR), db x-trackers DAX® UCITS ETF (DR) - Income, db x-trackers FTSE 100 UCITS ETF (DR) about changes to the applicable deadline to consider applications for subscriptions and/or redemptions (cut-off times) for those sub-funds. 10. On 3 November 2014, the name of the sub-fund changed from db x-trackers EURO STOXX 50® UCITS ETF (DR) - Income to db x-trackers MSCI EMU INDEX UCITS ETF (DR). The investment objective of the sub-fund changed from reflecting the performance of the EURO STOXX 50® INDEX to reflecting the performance of the MSCI EMU INDEX. 11. On 16 December 2014, db x-trackers FTSE 100 SHORT DAILY UCITS ETF* switched from reflecting the performance of the FTSE 100 SHORT INDEX to reflecting the performance of the FTSE 100 DAILY SHORT INDEX (which is designed to reflect the opposite performance of the FTSE 100 TOTAL RETURN Declared Dividend Index on a daily basis plus a rate of interest minus borrowing costs). 12. On 19 August 2014, the Company informed the Shareholders of the sub-fund db x-trackers FTSE CHINA 25 UCITS ETF of a change in the Reference Index of the sub-fund which was enhanced to track the performance of 50 stocks. The sub-fund accordingly changed its name from db x-trackers FTSE CHINA 25 UCITS ETF to db x-trackers FTSE CHINA 50 UCITS ETF with effect as of 22 September 2014. As of 27 October 2014, the sub-fund adopted a Direct Investment Policy following the Full Index Replication method.
405
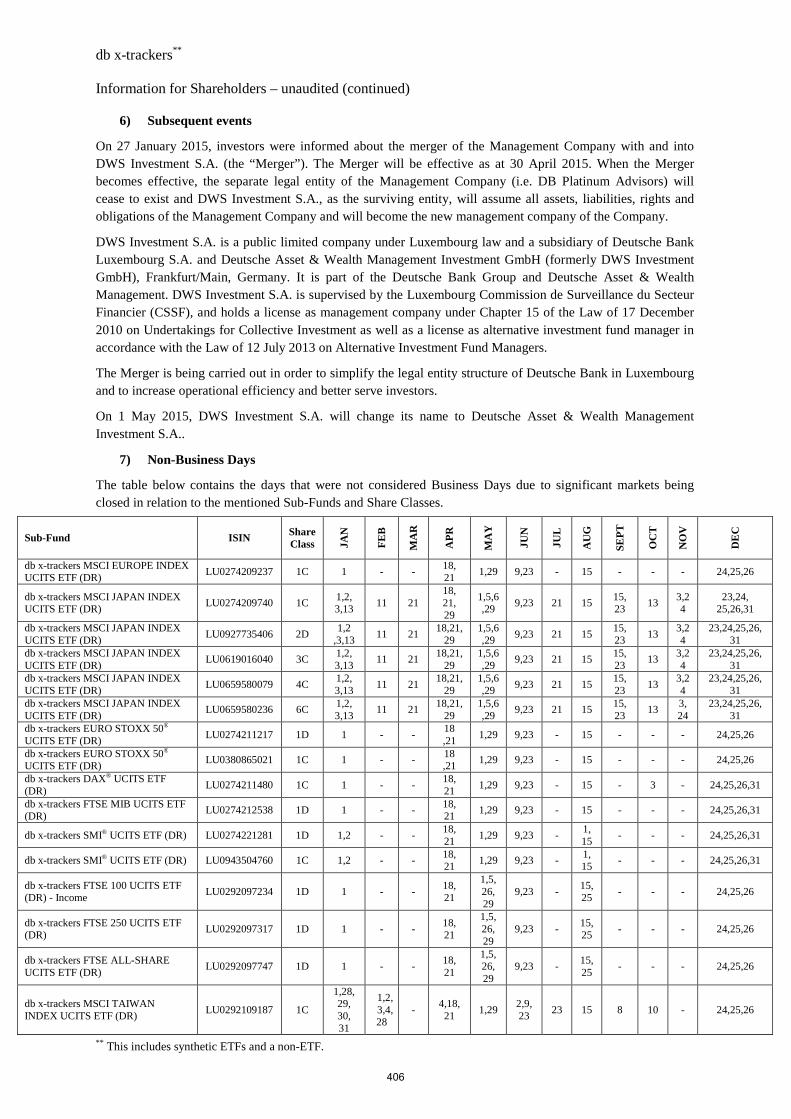
db x-trackers**
** This includes synthetic ETFs and a non-ETF.
Information for Shareholders – unaudited (continued)
6) Subsequent events
On 27 January 2015, investors were informed about the merger of the Management Company with and into DWS Investment S.A. (the “Merger”). The Merger will be effective as at 30 April 2015. When the Merger becomes effective, the separate legal entity of the Management Company (i.e. DB Platinum Advisors) will cease to exist and DWS Investment S.A., as the surviving entity, will assume all assets, liabilities, rights and obligations of the Management Company and will become the new management company of the Company.
DWS Investment S.A. is a public limited company under Luxembourg law and a subsidiary of Deutsche Bank Luxembourg S.A. and Deutsche Asset & Wealth Management Investment GmbH (formerly DWS Investment GmbH), Frankfurt/Main, Germany. It is part of the Deutsche Bank Group and Deutsche Asset & Wealth Management. DWS Investment S.A. is supervised by the Luxembourg Commission de Surveillance du Secteur Financier (CSSF), and holds a license as management company under Chapter 15 of the Law of 17 December 2010 on Undertakings for Collective Investment as well as a license as alternative investment fund manager in accordance with the Law of 12 July 2013 on Alternative Investment Fund Managers.
The Merger is being carried out in order to simplify the legal entity structure of Deutsche Bank in Luxembourg and to increase operational efficiency and better serve investors.
On 1 May 2015, DWS Investment S.A. will change its name to Deutsche Asset & Wealth Management Investment S.A..
7) Non-Business Days
The table below contains the days that were not considered Business Days due to significant markets being closed in relation to the mentioned Sub-Funds and Share Classes.
Sub-Fund ISIN Share Class JA
N
FE
B
MA
R
AP
R
MA
Y
JUN
JUL
AU
G
SE
PT
OC
T
NO
V
DE
C
db x-trackers MSCI EUROPE INDEX UCITS ETF (DR)
LU0274209237 1C 1 - - 18, 21
1,29 9,23 - 15 - - - 24,25,26
db x-trackers MSCI JAPAN INDEX UCITS ETF (DR)
LU0274209740 1C 1,2, 3,13
11 21 18, 21, 29
1,5,6,29
9,23 21 15 15, 23
13 3,24
23,24, 25,26,31
db x-trackers MSCI JAPAN INDEX UCITS ETF (DR)
LU0927735406 2D 1,2
,3,13 11 21
18,21,29
1,5,6,29
9,23 21 15 15, 23
13 3,24
23,24,25,26, 31
db x-trackers MSCI JAPAN INDEX UCITS ETF (DR)
LU0619016040 3C 1,2, 3,13
11 21 18,21,
29 1,5,6,29
9,23 21 15 15, 23
13 3,24
23,24,25,26, 31
db x-trackers MSCI JAPAN INDEX UCITS ETF (DR)
LU0659580079 4C 1,2, 3,13
11 21 18,21,
29 1,5,6,29
9,23 21 15 15, 23
13 3,24
23,24,25,26, 31
db x-trackers MSCI JAPAN INDEX UCITS ETF (DR)
LU0659580236 6C 1,2, 3,13
11 21 18,21,
29 1,5,6,29
9,23 21 15 15, 23
13 3, 24
23,24,25,26, 31
db x-trackers EURO STOXX 50® UCITS ETF (DR)
LU0274211217 1D 1 - - 18 ,21
1,29 9,23 - 15 - - - 24,25,26
db x-trackers EURO STOXX 50® UCITS ETF (DR)
LU0380865021 1C 1 - - 18 ,21
1,29 9,23 - 15 - - - 24,25,26
db x-trackers DAX® UCITS ETF (DR)
LU0274211480 1C 1 - - 18, 21
1,29 9,23 - 15 - 3 - 24,25,26,31
db x-trackers FTSE MIB UCITS ETF (DR)
LU0274212538 1D 1 - - 18, 21
1,29 9,23 - 15 - - - 24,25,26,31
db x-trackers SMI® UCITS ETF (DR) LU0274221281 1D 1,2 - - 18, 21
1,29 9,23 - 1, 15
- - - 24,25,26,31
db x-trackers SMI® UCITS ETF (DR) LU0943504760 1C 1,2 - - 18, 21
1,29 9,23 - 1, 15
- - - 24,25,26,31
db x-trackers FTSE 100 UCITS ETF (DR) - Income
LU0292097234 1D 1 - - 18, 21
1,5, 26, 29
9,23 - 15,25
- - - 24,25,26
db x-trackers FTSE 250 UCITS ETF (DR)
LU0292097317 1D 1 - - 18, 21
1,5, 26, 29
9,23 - 15,25
- - - 24,25,26
db x-trackers FTSE ALL-SHARE UCITS ETF (DR)
LU0292097747 1D 1 - - 18, 21
1,5, 26, 29
9,23 - 15,25
- - - 24,25,26
db x-trackers MSCI TAIWAN INDEX UCITS ETF (DR)
LU0292109187 1C
1,28, 29, 30, 31
1,2, 3,4, 28
- 4,18, 21
1,29 2,9, 23
23 15 8 10 - 24,25,26
406
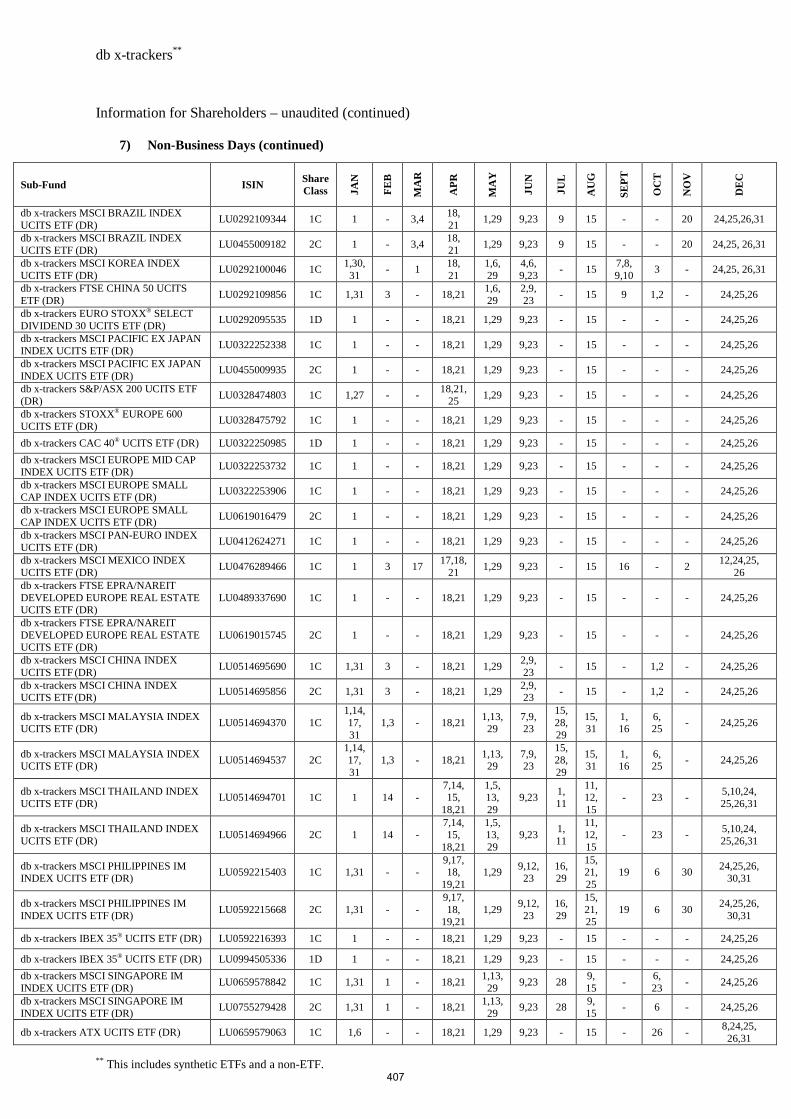
db x-trackers**
** This includes synthetic ETFs and a non-ETF.
Information for Shareholders – unaudited (continued)
7) Non-Business Days (continued)
Sub-Fund ISIN Share Class JA
N
FE
B
MA
R
AP
R
MA
Y
JUN
JUL
AU
G
SE
PT
OC
T
NO
V
DE
C
db x-trackers MSCI BRAZIL INDEX UCITS ETF (DR)
LU0292109344 1C 1 - 3,4 18, 21
1,29 9,23 9 15 - - 20 24,25,26,31
db x-trackers MSCI BRAZIL INDEX UCITS ETF (DR)
LU0455009182 2C 1 - 3,4 18, 21
1,29 9,23 9 15 - - 20 24,25, 26,31
db x-trackers MSCI KOREA INDEX UCITS ETF (DR)
LU0292100046 1C 1,30, 31
- 1 18, 21
1,6, 29
4,6, 9,23
- 15 7,8, 9,10
3 - 24,25, 26,31
db x-trackers FTSE CHINA 50 UCITS ETF (DR)
LU0292109856 1C 1,31 3 - 18,21 1,6, 29
2,9, 23
- 15 9 1,2 - 24,25,26
db x-trackers EURO STOXX® SELECT DIVIDEND 30 UCITS ETF (DR)
LU0292095535 1D 1 - - 18,21 1,29 9,23 - 15 - - - 24,25,26
db x-trackers MSCI PACIFIC EX JAPAN INDEX UCITS ETF (DR)
LU0322252338 1C 1 - - 18,21 1,29 9,23 - 15 - - - 24,25,26
db x-trackers MSCI PACIFIC EX JAPAN INDEX UCITS ETF (DR)
LU0455009935 2C 1 - - 18,21 1,29 9,23 - 15 - - - 24,25,26
db x-trackers S&P/ASX 200 UCITS ETF (DR)
LU0328474803 1C 1,27 - - 18,21,
25 1,29 9,23 - 15 - - - 24,25,26
db x-trackers STOXX® EUROPE 600 UCITS ETF (DR)
LU0328475792 1C 1 - - 18,21 1,29 9,23 - 15 - - - 24,25,26
db x-trackers CAC 40® UCITS ETF (DR) LU0322250985 1D 1 - - 18,21 1,29 9,23 - 15 - - - 24,25,26
db x-trackers MSCI EUROPE MID CAP INDEX UCITS ETF (DR)
LU0322253732 1C 1 - - 18,21 1,29 9,23 - 15 - - - 24,25,26
db x-trackers MSCI EUROPE SMALL CAP INDEX UCITS ETF (DR)
LU0322253906 1C 1 - - 18,21 1,29 9,23 - 15 - - - 24,25,26
db x-trackers MSCI EUROPE SMALL CAP INDEX UCITS ETF (DR)
LU0619016479 2C 1 - - 18,21 1,29 9,23 - 15 - - - 24,25,26
db x-trackers MSCI PAN-EURO INDEX UCITS ETF (DR)
LU0412624271 1C 1 - - 18,21 1,29 9,23 - 15 - - - 24,25,26
db x-trackers MSCI MEXICO INDEX UCITS ETF (DR)
LU0476289466 1C 1 3 17 17,18,
21 1,29 9,23 - 15 16 - 2
12,24,25, 26
db x-trackers FTSE EPRA/NAREIT DEVELOPED EUROPE REAL ESTATE UCITS ETF (DR)
LU0489337690 1C 1 - - 18,21 1,29 9,23 - 15 - - - 24,25,26
db x-trackers FTSE EPRA/NAREIT DEVELOPED EUROPE REAL ESTATE UCITS ETF (DR)
LU0619015745 2C 1 - - 18,21 1,29 9,23 - 15 - - - 24,25,26
db x-trackers MSCI CHINA INDEX UCITS ETF (DR)
LU0514695690 1C 1,31 3 - 18,21 1,29 2,9, 23
- 15 - 1,2 - 24,25,26
db x-trackers MSCI CHINA INDEX UCITS ETF (DR)
LU0514695856 2C 1,31 3 - 18,21 1,29 2,9, 23
- 15 - 1,2 - 24,25,26
db x-trackers MSCI MALAYSIA INDEX UCITS ETF (DR)
LU0514694370 1C 1,14, 17, 31
1,3 - 18,21 1,13, 29
7,9, 23
15,28,29
15,31
1, 16
6, 25
- 24,25,26
db x-trackers MSCI MALAYSIA INDEX UCITS ETF (DR)
LU0514694537 2C 1,14, 17, 31
1,3 - 18,21 1,13, 29
7,9, 23
15,28,29
15,31
1, 16
6, 25
- 24,25,26
db x-trackers MSCI THAILAND INDEX UCITS ETF (DR)
LU0514694701 1C 1 14 - 7,14, 15,
18,21
1,5, 13, 29
9,23 1, 11
11,12,15
- 23 - 5,10,24, 25,26,31
db x-trackers MSCI THAILAND INDEX UCITS ETF (DR)
LU0514694966 2C 1 14 - 7,14, 15,
18,21
1,5, 13, 29
9,23 1, 11
11,12,15
- 23 - 5,10,24, 25,26,31
db x-trackers MSCI PHILIPPINES IM INDEX UCITS ETF (DR)
LU0592215403 1C 1,31 - - 9,17, 18,
19,21 1,29
9,12, 23
16, 29
15,21,25
19 6 30 24,25,26,
30,31
db x-trackers MSCI PHILIPPINES IM INDEX UCITS ETF (DR)
LU0592215668 2C 1,31 - - 9,17, 18,
19,21 1,29
9,12, 23
16, 29
15,21,25
19 6 30 24,25,26,
30,31
db x-trackers IBEX 35® UCITS ETF (DR) LU0592216393 1C 1 - - 18,21 1,29 9,23 - 15 - - - 24,25,26
db x-trackers IBEX 35® UCITS ETF (DR) LU0994505336 1D 1 - - 18,21 1,29 9,23 - 15 - - - 24,25,26
db x-trackers MSCI SINGAPORE IM INDEX UCITS ETF (DR)
LU0659578842 1C 1,31 1 - 18,21 1,13, 29
9,23 28 9, 15
- 6, 23
- 24,25,26
db x-trackers MSCI SINGAPORE IM INDEX UCITS ETF (DR)
LU0755279428 2C 1,31 1 - 18,21 1,13, 29
9,23 28 9, 15
- 6 - 24,25,26
db x-trackers ATX UCITS ETF (DR) LU0659579063 1C 1,6 - - 18,21 1,29 9,23 - 15 - 26 - 8,24,25, 26,31
407
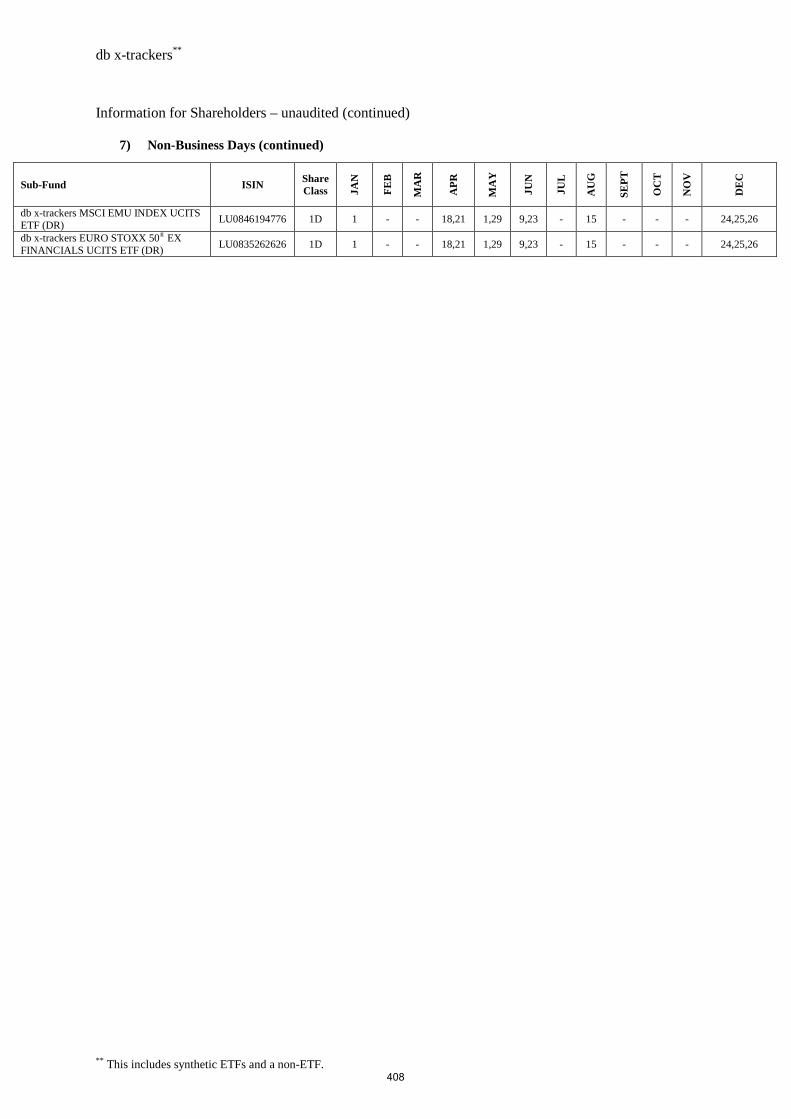
db x-trackers**
** This includes synthetic ETFs and a non-ETF.
Information for Shareholders – unaudited (continued)
7) Non-Business Days (continued)
Sub-Fund ISIN Share Class JA
N
FE
B
MA
R
AP
R
MA
Y
JUN
JUL
AU
G
SE
PT
OC
T
NO
V
DE
C
db x-trackers MSCI EMU INDEX UCITS ETF (DR)
LU0846194776 1D 1 - - 18,21 1,29 9,23 - 15 - - - 24,25,26
db x-trackers EURO STOXX 50® EX FINANCIALS UCITS ETF (DR)
LU0835262626 1D 1 - - 18,21 1,29 9,23 - 15 - - - 24,25,26
408


![[DB 기출문제] 산업 11년2회 [DB 기출문제] 산업 11년2회](https://img.pdfslide.net/doc/110x75/63134b92aca2b42b580d2089/db-112-db-112.jpg)


