Embed Size (px)
Citation preview

GOVERNMENT OF THE NORTHWEST TERRITORIES
TECHNICAL INTERVENTION
FOR
DE BEERS CANADA MINING INC. SNAP LAKE DIAMOND MINE WATER LICENCE RENEWAL
MV2019L2-0004
Submitted to:
Mackenzie Valley Land and Water Board 7th Floor – 4910 50th Avenue, Box 2130
Yellowknife, NT X1A 2P6
October 7th, 2019
1
TABLE OF CONTENTS LIST OF ACRONYMS .............................................................................................................. 2 1.0 Introduction .................................................................................................................... 3
1.1 Report Outline ............................................................................................................ 3 2.0 Water Licence Renewal Application .............................................................................. 4 3.0 Final Closure and Reclamation Plan .............................................................................. 5
3.1 Closure Criteria .......................................................................................................... 7 3.1.1 Physical Stability Criteria ...................................................................................... 8
4.0 Effluent Discharge Locations ......................................................................................... 9 5.0 Effluent Quality Criteria and Water Quality Model(s) ................................................... 10
5.1 Mixing Zone Configuration ....................................................................................... 10 5.2 North Pile Runoff Model Input .................................................................................. 12 5.3 Toxicity Modifying Factors ........................................................................................ 14 5.4 Selecting Parameters of Potential Concern .............................................................. 15 5.5 Effluent Quality Criteria ............................................................................................ 17
6.0 Surface Water and Biological Monitoring ..................................................................... 19 6.1 Surveillance Network Program ................................................................................. 19
6.1.1 Elimination of SNP Stations ................................................................................ 19 6.1.2 Uncontrolled Runoff Monitoring Stations ............................................................. 21 6.1.3 Monitoring Frequencies ...................................................................................... 21
6.2 Aquatic Effects Monitoring Program ......................................................................... 22 7.0 North Pile ..................................................................................................................... 23
7.1 Thermal Regime ....................................................................................................... 23 7.2 North Pile Cover Material Sources ........................................................................... 24 7.3 Overall Blended Rock Units ..................................................................................... 25 7.4 Acid Rock Drainage and Geochemical Characterization Plan - Seepage Surveys .. 27
8.0 Securities ..................................................................................................................... 28 8.1 Security Estimate revisions ...................................................................................... 28 8.2 SNP and AEMP Monitoring ...................................................................................... 29 8.3 Phasing of Security .................................................................................................. 29 8.4 Environmental Agreement Security .......................................................................... 30 8.5 Interim Care and Maintenance ................................................................................. 30 8.6 Revised Security Estimate Amount .......................................................................... 31
REFERENCES ....................................................................................................................... 33 Appendix A: Zajdlik & Associated Inc. – Technical Memorandum Appendix B: Brodie Consulting Ltd. – Technical Memorandum Appendix C: Brodie Consulting Ltd. – Memorandum and Review of Security Estimate Appendix D: Technical Expert CVs
2
LIST OF ACRONYMS Acid Rock Drainage ARD
Aquatic Effects Monitoring Program AEMP
Aboriginal Affairs and Northern Development Canada AANDC
Brodie Consulting Limited BCL
Canadian Council of Ministers of the Environment CCME
East Influent Storage Pond EISP
Effluent Quality Criteria EQC
Environment and Climate Change Canada ECCC
Environmental Assessment EA
Final Closure and Reclamation Plan FCRP
Government of the Northwest Territories GNWT
Influent Storage Pond ISP
Information Request IR
Issued for Construction IFC
Mackenzie Valley Land and Water Board MVLWB
Metal Leaching ML
Parameter of Potential Concern POPC
Perimeter Water Collection System PWCS
Potentially Acid-Generating PAG
Reverse Osmosis RO
Site Specific Water Quality Objectives SSWQOs
Snap Lake Environmental Monitoring Agency SLEMA
Surveillance Network Program SNP
Total Dissolved Solids TDS
Total Petroleum Hydrocarbons TPH
Total Suspended Solids TSS
Water Management Pond WMP
Water Treatment Plant WTP
West Influent Storage Pond WISP

3
1.0 Introduction The following concerns and issues have resulted from the Government of the Northwest Territories (GNWT) and their retained experts’ review of plans, proposed monitoring programs and submissions as part of the De Beers Canada Mining Incorporated’s (De Beers) Snap Lake Mine water licence renewal application MV2019L2-0004. This technical intervention explains the GNWT’s concerns and provides recommendations for the Mackenzie Valley Land and Water Board’s (MVLWB’s) consideration. Of note, this submission takes into consideration all of the documents provided during the renewal process up to September 25th, 2019 with the exception of some security related correspondence that was discussed with De Beers the week prior to submission. The GNWT appreciates the opportunity to express its concerns and provide recommendations and suggestions to the MVLWB. The GNWT and its retained experts intend to provide technical input at the public hearing on November 26-27, 2019 to assist the MVLWB in making a decision related to the water licence renewal. 1.1 Report Outline
This technical intervention is structured to discuss components included within the water licence renewal application and supporting documents. The intervention is divided into the following sections:
Section 1 – Introduction to the technical intervention and the GNWT’s involvement in the regulatory review; Section 2 - Discussion of GNWT recommendations related to the Water Licence Renewal Application and Review Process; Section 3 – Discussion of GNWT recommendations on the Final Closure and Reclamation Plan (FCRP) including discussions on closure criteria; Section 4 – Discussion of GNWT recommendations related to Effluent Discharge Locations; Section 5 – Discussion of GNWT recommendations related to Effluent Quality Criteria and associated Water Quality Model Reports; Section 6 – Discussion of GNWT recommendations related to Surface Water and Biological Monitoring including the Aquatic Effects Monitoring Program (AEMP) and Surveillance Network Program (SNP); Section 7 – Discussion of GNWT recommendations related to the North Pile monitoring including seepage surveys and geochemical requirements; and, Section 8 - Discussion of GNWT recommendations related to security estimates including review of De Beers’ estimate.

4
2.0 Water Licence Renewal Application As part of the water licence renewal application, De Beers has proposed a draft water licence that is an amended version of the current water licence (MV2011L2-0004). The proposed changes to the water licence are intended to reflect the closure and reclamation phase of the project. The changes to the water licence are therefore based on the proposed Final Closure and Reclamation Plan (FCRP) and supporting documents that were submitted with the water licence renewal application. The GNWT notes a water licence must be granted before a plan can be required and approved under that same licence. Plans should therefore be required as a term of the licence with defined required components of these plans. It is concerning to the GNWT that during the review process, De Beers has significantly altered the plan for final closure and reclamation. In version 1 of the Effluent Quality Criteria Report for Closure and Post-Closure (Golder, 2019c) that was included with the application, De Beers proposed to maintain the existing effluent quality criteria (EQC) for the modular water treatment plant/reverse osmosis (WTP)/(RO) unit during Closure and apply EQC for nitrate, total suspended solids (TSS) and pH to the outlet of the constructed wetlands during the Post-Closure period. Subsequently, during the July Technical Session, De Beers proposed to reduce the number of EQC parameters in Closure from 18 to 4 and reduce the size of the mixing zone in Post-Closure to 100 m (Technical Session, 2019a, p.27 and 2019b, p. 179). In version 2 of the Snap Lake Effluent Quality Criteria Report for Closure and Post-Closure (Golder, 2019h) that was submitted in response to information request (IR)#6, De Beers changed the screening process to identify parameters of potential concern (POPCs), increased the proposed EQC for nitrate, increased the mixing zones for Post-Closure back to 200 m as originally proposed, and removed the requirement for constructed wetlands. Finally, at the September Technical Workshop, De Beers informed stakeholders that they are now proposing to increase the number of mixing zones before the gravity fed collection system is in place from 1 to 3. During the process of proposing changes to the initial application, De Beers has only provided updates to the plans and reports that are directly affected, e.g. the Snap Lake Effluent Quality Criteria Report for Closure and Post-Closure. However, De Beers has also identified that other plans will require updating based on the proposed changes such as the Aquatic Effects Monitoring Program (AEMP) Design. This has made it challenging for reviewers as there are numerous inconsistencies between the various plans. Some plans have been updated through the renewal process, while others have not. This causes concern that the implications of changing the model and EQC reports, on the various other management and monitoring plans, have not been fully taken into account during this process. In addition to updates based on reviewer feedback in written comments and discussion during the technical session and workshop, it is likely that further updates to the FCRP and associated documents will be needed as a result of the water licence proceedings. The GNWT notes that typically a closure and reclamation review process involves several stages of review and discussion which results in the plan changing based on reviewer input. However, the changes that have been proposed by De Beers throughout this process are not founded on reviewer input or preference. It is also not clear if these changes will result in more, less or the same level of environmental protection. However, these recent changes deviate from commitments made during the original Environmental Assessment (EA) process:

5
“De Beers is committed to reducing residual environmental effects at the site upon Closure” and, “To reduce or eliminate environmental effects once the mine ceases operations” (EA01-004, MVEIRB, 2003). It is concerning to the GNWT that De Beers has proposed drastic changes to the application at multiple stages of the process, causing review process issues. It is important to note that a FCRP typically require several months to years to review and approve. The legislated water licence process timelines (9 months) are notably shorter than typical closure and reclamation plan reviews. Recommendation: The GNWT recommends the MVLWB require the FCRP and supporting documents be resubmitted for approval post-issuance of the Water Licence. The MVLWB should ensure sufficient review time is available for each of these documents.
3.0 Final Closure and Reclamation Plan The conditions in the draft water licence proposed by De Beers that specifically apply to closure and reclamation are limited to: the submission of an Annual Closure and Reclamation Plan Progress Report, submission of a FCRP and, the requirement for the licensee to act in accordance with the approved FCRP. The GNWT notes that a water licence is granted to regulate activities identified under the Waters Act and Waters Regulations. The water licence is a legal instrument and should therefore include conditions that define the required components of a FCRP and supporting documents to facilitate successful closure and reclamation of the mine. It has become apparent during the review process that the conditions in the draft water licence proposed by De Beers and the proposed FCRP do not include sufficient detail to adequately facilitate successful closure and reclamation. Without any specific direction in the water licence, schedules and Surveillance Network Program (SNP) pertaining to closure, closure completion reports, performance assessment reports, long-term monitoring and maintenance plans, water management, effluent testing, aquatic effects monitoring, etc. the licensee is left to their devices to determine closure requirements and steps. This is exemplified by the changes to the closure application that De Beers has proposed during the water licence review process.
The Guidelines for the Closure and Reclamation of Advanced Mineral Exploration and Mine Sites in the Northwest Territories (MVLWB/AANDC, 2013) outline the elements that are required for a FCRP to be effective. This includes elements such as closure criteria that are used to determine whether the selected closure activity meets the closure objective and detailed descriptions of selected closure activities. An FCRP should also include response frameworks to ensure a plan is in place should closure criteria not be met. The GNWT has noted the following examples of outstanding items:
• For the North Pile, De Beers has explained that closure cover field trials that will inform the design are currently on-going and results will be included with the Issued for

6
Construction (IFC) drawings (Technical Session, 2019a, p. 84-85). Final elements to the North Pile design are therefore still being developed that will dictate closure criteria and the Closure and Post-Closure response frameworks. De Beers proposes that this information will all be submitted with the IFC drawings 90 days prior to construction (Technical Session, 2019a, p. 90-92 and p. 99).
• The Final Landform Plan explains an initial site inspection is to be completed to inform the development of a final landform execution plan prior to any work being completed (Appendix G, De Beers, 2019a).
• In the Response to Follow-up Questions from the Technical Workshop submitted by De Beers, in response to question 10, De Beers commits to developing a study design plan for toxicity testing of water from the Water Management Pond (WMP). De Beers commits to conducting toxicity testing prior to discharging effluent directly from the WMP to Snap Lake.
• Since De Beers is no longer proposing to construct wetlands, a plan for the reclamation of the WMP should be developed. This is supported by the FCRP, “If the constructed wetland is found not to be required, this WMP area will be reclaimed, including characterization and handling of existing sediments that have accumulated, grading, and placement of engineered cover for physical stability…”
In addition to the supporting documents that have been submitted with the FCRP, the conditions of the water licence should identify outstanding information such as the items noted above that are required for final closure. Note, these plans would typically be included in an FCRP as they pertain to site-wide closure of the mine site. In order for the FCRP to be comprehensive and be considered final, such information must be submitted. The GNWT is particularly concerned with the approach De Beers has taken to develop closure criteria for the North Pile that is described in the first bullet above. As per the guidelines noted above, closure criteria are developed to measure whether closure objectives have been achieved. Closure activities are therefore selected on the basis of meeting closure criteria. Currently, De Beers’ proposal is to submit criteria and the response framework with the IFC drawings because they will be informed by the cover field trials. This will result in criteria that are based on what the closure activity can achieve, instead of a standard that will achieve the closure objective. The GNWT is concerned that this will result in a lower closure standard as the effectiveness of the cover will determine long-term closure conditions. The North Pile closure criteria and the response framework are critical information to the closure plan that require careful consideration. Submitting this information with the IFC drawings 90 days prior to construction is not appropriate nor in accordance with the guidelines. Specific review, debate and decisions need to be made about these closure items. Since there is a high likelihood that there will be multiple versions of these documents before they are approved, adequate time should be included in the water licence for a public review process.

7
Recommendation: The GNWT recommends the MVLWB require all closure criteria and response frameworks be submitted as part of the FCRP with sufficient time for public review and approval by the MVLWB. The GNWT recommends that in addition to components that have been submitted with the FCRP, the MVLWB require submission of all outstanding items including, but not limited to, the:
• Final Landform Execution Plan; • Toxicity Testing Design Plan for the WMP; and, • Reclamation Plan for the WMP if wetlands are not constructed.
3.1 Closure Criteria The closure and reclamation process is a critical phase of the mine’s life as it occurs in an effort for the company to achieve successful relinquishment. Relinquishment is determined on a case-by-case basis and is reliant on results of monitoring that demonstrate the closure criteria have been met and therefore that closure objectives and the closure goal have been achieved. For this reason it is imperative that each stage of the closure process be clearly linked to the approved closure objectives and criteria to achieve successful closure and relinquishment. The FCRP submitted by De Beers for approval by the MVLWB included proposed updates to closure criteria. In review of the updated criteria, the GNWT, the Snap Lake Environmental Monitoring Agency (SLEMA), Environment and Climate Change Canada (ECCC) and MVLWB staff expressed concerns (Review Comment Table, 2019). This included concerns about the ability of the proposed closure criteria to adequately and clearly measure the success of the closure activities in meeting the closure objective and their link to design and monitoring plans. In response to reviewer comments (Review Comment Table, 2019), De Beers provided an update to Table 5.2 from the FCRP as part of the supplemental responses submitted on July 3rd, 2019. Further progress was made during the Technical Sessions, where the link of closure objectives and closure criteria to various monitoring plans was discussed by the GNWT and De Beers. Even though the link to design, monitoring and reporting is identified in the proposed FCRP, if the identification of relevant closure objectives and closure criteria are not a requirement within such documents, there is a risk of divergence from the approved closure objectives and criteria. The consistent link to closure objectives and criteria within the documents required during the closure process will help ensure that proper and successful closure of the mine occurs. The GNWT notes these types of conditions have been proposed as part of the Giant Mine Remediation Water Licence (MV2007L8-0031).

8
Recommendation: The GNWT recommends that the conditions of the water licence and schedules ensure that the link to closure objectives and closure criteria is incorporated into the various phases of closure documents such as design and construction plans, monitoring and management plans, reclamation completion reports and performance assessment reports.
3.1.1 Physical Stability Criteria De Beers has proposed physical stability closure criteria to assess closure objectives SW2, SW4, SW5, SW6, NP2, and I2 to include:
Acceptable results of visual monitoring for deformation and degradation for a minimum of three years Post-Closure as part of site geotechnical inspections completed and signed off by a professional engineer.
In review of the water licence application, the GNWT and the MVLWB staff requested De Beers clarify how visual monitoring will be used to assess/measure conditions against the approved closure criteria (Review Comment Table, 2019). For closure objective SW2, De Beers responded that visual monitoring will correspond with a response framework similar to Appendix C of the 2018 North Pile Management Plan (De Beers, 2018c). De Beers further suggested this could be part of a comprehensive Post-Closure site-wide physical stability monitoring response framework provided as a condition of the water licence. Based on discussions at the Technical Session, the GNWT understands that De Beers intends to submit an updated version of the response framework in the 2018 North Pile Management Plan with the final closure design for the North Pile. The updated response framework will include criteria that will be used to define “acceptable results of visual monitoring”. De Beers also indicated that it is their preference to leave the measurable numeric and/or descriptive criteria within the monitoring plan due to the number of criteria that will be part of the assessment. Adaptive management frameworks include various thresholds that trigger response actions. Listing closure criteria as “acceptable results of visual monitoring” with the numeric and/or descriptive closure criteria within adaptive management frameworks makes it difficult for reviewers to understand which criteria will be considered when determining whether closure objectives have been met. Closure criteria must be included in the closure plan, in this case the FCRP and the monitoring programs then assess conditions against these criteria. Recommendation: The GNWT recommends a Post-Closure site-wide physical stability monitoring plan with a response framework for each mine component be required as a condition of the Water Licence.

9
The GNWT recommends that the water licence require the FCRP include closure criteria that will be used to assess whether the closure objective has been met.
4.0 Effluent Discharge Locations Version 2 of the Snap Lake Effluent Quality Criteria Report for Closure and Post-Closure (Golder, 2019h) notes that “EQC were developed such that AEMP benchmarks would be met at the mixing zone boundary stations throughout Closure (i.e. SNP 02-20e and SNP 02-20f) and Post-Closure (i.e., proposed stations SNP 02-20h and SNP 02-20i) in the main basin of Snap Lake near the outflow from the East Influent Storage Pond, and SNP 02-20j and SNP 02-20k in the northwest arm near the outflow from the West Influent Storage Pond.” The GNWT understood that two discharge locations were being proposed for the Post-Closure period since the gravity fed collection system could not be constructed to allow for passive flow to one discharge location. At the September Technical Workshop, it was clarified by De Beers that they are requesting the ability to discharge from three different locations during the time period before the gravity fed collection system is in place. It was further explained by De Beers that this is being requested as a scenario could exist whereby effluent is discharged to Snap Lake directly from both influent storage ponds (ISPs) and from the WMP via the diffuser all at the same time. This results in three locations discharging effluent concurrently and therefore requires three mixing zones in Snap Lake. The GNWT notes that water pumped from the WMP to the underground during this time period is also assumed to enter the bottom of Snap Lake via mine seepage, creating a fourth point of discharge to Snap Lake (Golder, 2019i). In the Response to Follow-up Questions from the Technical Workshop (Question 7) (De Beers, 2019h), De Beers presented different scenarios to justify requesting the flexibility to discharge from different locations at the same time. The GNWT notes that none of the scenarios presented by De Beers indicated that they require the ability to discharge from all three locations (East Influent Storage Pond (EISP), West Influent Storage Pond (WISP) and WMP at the same time. Typically, operators of mines are required to limit the number of points of discharge during operations. The GNWT understands that the water licence is for Closure and Post-Closure and therefore that it may be impractical to limit the number of points of discharge (i.e. requiring active site management). However, in accordance with the Water and Effluent Quality Management Policy (MVLWB, 2011), the deposit of waste is to be regulated such that the amount of waste to be deposited to the receiving environment is minimized. Recommendation: The GNWT recommends the MVLWB minimize the amount of waste that is to be deposited to the receiving environment, consistent with the Water and Effluent Quality Management Policy (MVLWB, 2011).

10
The GNWT recommends that the MVLWB consider the cumulative effects of multiple effluent discharge points to Snap Lake prior to approving multiple point source discharges, including the pumping of site water to the underground.
5.0 Effluent Quality Criteria and Water Quality Model(s) As discussed in Section 2.0, De Beers has made several changes to their application during the review process including changes to the proposed EQC, and the number and size of mixing zones. To reflect these changes, De Beers provided updated versions of the Snap Lake Effluent Quality Criteria Report for Closure and Post-Closure (Golder, 2019h) as well as the Snap Lake Hydrodynamic and Water Quality Model Report (Golder, 2019i) and the Downstream Lakes Water Quality report (Golder, 2019j). As each of these plans have implications on EQC development, the GNWT’s recommendations on each of these items have been outlined below.
5.1 Mixing Zone Configuration In version 1 of the Snap Lake Mine - Effluent Quality Criteria Report for Closure and Post-Closure (Golder, 2019c) included with the initial water licence application, De Beers proposed to maintain the currently approved 200 m mixing zone in the main basin of Snap Lake for the Closure period. This mixing zone was based on discharge volumes during operations (maximum was 57,687 m3/day; De Beers, 2018b), whereas maximum discharge during Extended Care and Maintenance and Closure is predicted to be less than 4,000 m3/day. During Post-Closure, De Beers proposed a 200 m mixing zone from the effluent discharge locations from Sump 3 and 5. In Post-Closure, the maximum annual discharge volumes are predicted to be 4,763 m3/day from Sump 3 to the main basin, and 6,668 m3/day from Sump 5 to the northwest arm, respectively (Golder, 2019h). It could be assumed that mixing zone size should be reduced based on these lower discharge volumes during Closure and Post-Closure relative to operations. In review of the water licence application, both the GNWT and ECCC requested additional information on the selection of the size of the mixing zone. The GNWT recommended that De Beers provide updated mixing zone predictions based on maximum discharge volumes during Post-Closure for 50 m, 100 m, and 200 m from shore (Review Comment Table, 2019). In response, De Beers provided a technical memorandum which concluded that a mixing zone boundary of no smaller than 100 m from each of the outfalls is recommended in Snap Lake Post-Closure (Golder, 2019f). At the July Technical Session, ECCC asked for clarification on whether or not De Beers was proposing to amend the proposed mixing zones based on the technical memo. De Beers responded that the current 200 m mixing zone for effluent from the WTP will be maintained, and that “For future discharge locations, we are proposing a 100 m mixing zone” (Technical Session 2019b, p. 179). This was confirmed again on day three of the Technical Session (Technical Session Transcript 2019c, p. 31). However, in response to IR#6, version 2 of the Snap Lake Effluent Quality Criteria Report for Closure and Post-Closure (Golder, 2019h) maintained the 200 m mixing zones for Post-Closure instead of the 100 m mixing zones. On September 5th, 2019, the MVLWB issued

11
additional IRs seeking clarification on this issue. De Beers responded on September 12th, 2019 that they were requesting approval for 200 m mixing zones Post-Closure (De Beers, 2019g). Overall, the GNWT is concerned with the method De Beers has employed to determine the need and size of Snap Lake mixing zones. This makes the development of SNP sites for the active and post-closure periods difficult as well as the subsequent development of AEMP benchmarks and EQC. Of note, De Beers’ proposal does not align with the overall goal of Closure (to return the site to as close to pre-development conditions as possible) or the Guidelines for Effluent Mixing Zones (MVLWB/GNWT, 2017). The guidelines state that mixing zones should be as small as reasonably possible (maximum radius of 100 m or 25% of the width of the lake, whichever is smaller) and not be used as a surrogate for reasonable or practical water treatment (MVLWB/GNWT, 2017). To date, the GNWT believes the evidence and rationale that De Beers has provided has not been sufficient to support a 200 m mixing zone. The GNWT notes the proposed EQC and mixing zone size appear to be driven by achievability without treatment. This was described in the September IR responses, where De Beers explained that one of the reasons the proposed Post-Closure mixing zones were increased in size from 100 m to 200 m was to “…provide an opportunity to present a Closure scenario for the Snap Lake Mine that does not depend on treatment of nitrate using constructed wetlands…” (De Beers, 2019g) suggesting that the increased size (i.e. dilution) is being used as a surrogate for treatment. During the September Technical Workshop, the GNWT and MVLWB staff asked De Beers to justify a 200 m mixing zone in relation to the guidance on mixing zones (MVLWB/GNWT, 2017). Criteria 3 states “Mixing zones must not be used as an alternative to reasonable and practical pollution prevention practices, including wastewater treatment”. In response, De Beers explains “there is currently no reasonable or practical treatment technology that could be used for a closed Mine to treat the predicted discharges to Snap Lake to below AEMP benchmarks.” (De Beers, 2019h). The GNWT understands that active treatment is not in accordance with the closure principle of no long-term active care, however, this does not consider that there is a finite amount of nitrate and that an operational (and hence practical) best available, treatment technology is already in place at site. The GNWT is concerned that a 200 m mixing zone is being proposed without an analysis of the time that may be required to treat nitrate, resulting in a smaller mixing zone Post-Closure and less impact on Snap Lake. Additionally, the GNWT is concerned with some of the assumptions used to derive the EQC and mixing zone size that are reported to be conservative, resulting in predicted concentrations being potentially higher than they will actually be. These assumptions include:
• Maintaining a constant concentration of 60 mg/L nitrate for the duration of the model timeframe (to 2050) rather than assume some attenuation with freezing of the North Pile or flushing of nitrate. Note: The Site Water Quality Model (Golder, 2019d) assumed a flushing of major ions, total dissolved solids (TDS), nitrate, nitrite, manganese, and total alkalinity from the embankment slowly over the span of 30 years.
• Maintaining concentrations of all other parameters at the 95th percentile of model predictions (even if the model predictions are not conservative as suggested Section

12
5.2 it is expected that for most parameters, concentrations from the North Pile will decline over time).
• Assuming all water pumped underground from the WMP reports to Snap Lake in the model during the Closure period (Golder, 2019i). It is recognized that this avoids having to demonstrate certainty as to the ultimate transport and fate of water pumped to the underground. However, there is uncertainty as to the extent of seepage entering Snap Lake from the underground.
To summarize, while the GNWT acknowledges that the modelled predictions currently show that a 200 m mixing zone is required in order to meet AEMP benchmarks at the edge of the mixing zone, the GNWT still strongly believes that the size of the mixing zone should be made as small as possible and does not support a larger mixing zone to eliminate the need to treat discharge. Treatment should be considered as a viable option to reduce the size of the mixing zone. As well, based on the unduly conservative assumptions used to derive the EQC and mixing zone size noted above, the GNWT lacks confidence that a 200 m mixing zone Post-Closure is necessary. Given the finite amount of nitrate in the North Pile, attenuation of concentrations is expected with time. The modelled scenario likely over-predicted these concentrations, resulting in the requirement for a larger mixing zone than necessary in order for AEMP benchmarks to be met. Finally, the GNWT is concerned that De Beers has removed the requirement for a Plume Delineation Study from the proposed draft water licence stating that it is no longer required “as the volume of water discharged to Snap Lake is drastically reduced, and the quality of the effluent is improved” (De Beers, 2019c). While it is true that the volume of water discharged has been reduced, for some parameters the quality of the effluent has not improved, and has actually worsened compared to the treated discharge from Operations, as well as the predicted effluent quality in the initial application. Recommendation: The GNWT recommends the MVLWB not approve the proposed mixing zone at this time due to the over conservative assumptions that were included in the linked models. The exact mixing zone dimensions for each effluent discharge location should be determined and included in the SNP after plume delineation studies have been completed. The GNWT recommends that in the interim, the mixing zones could be set at 200 m for the main site diffuser and 100 m for the East and West Influent Storage Ponds.
5.2 North Pile Runoff Model Input The GNWT has two primary concerns for the predicted quality of North Pile inflows to Snap Lake from the Site Water Quality Model (Golder, 2019d):
• Model assumptions include diluted concentrations from the North Pile runoff and seepage; and,

13
• The assumption that the two months of highest flows from the North Pile, May and June, have been assigned a water chemistry considered representative of the rock cover (75th percentile of SNP 02-05) following Closure of the North Pile (2023 in the model), which has lower concentrations in comparison to North Pile seepage and runoff (75th percentile of SNP 02-02) during those same months.
De Beers has selected SNP 02-02 to be the most representative water quality for North Pile runoff, however the GNWT does not agree with this given that water quality data exists for the North Pile perimeter sumps. SNP 02-02 represents all water collected from the perimeter water collection system (PWCS), including seepage and runoff from the North Pile, runoff from catchment areas other than the North Pile, and direct precipitation. As a result, there is dilution of seepage and runoff from the North Pile inherent in measured concentrations at this location. When this water chemistry is then assigned to seepage from the North Pile to the sumps, and other sources contributing to inflow to the sumps are assigned water chemistry of Stream 1 (undeveloped), dilution of concentrations from the North Pile overlap. This dilution is quantified with an example from the monthly base water balance estimates provided as Attachment A of IR #8 (De Beers, 2019a). For 2018, concentrations from North Pile inflows are being diluted by 2x or more (i.e. catchment runoff includes precipitation as well as Stream 1 inflows). De Beers has assumed for the conceptual model that once the North Pile has been reconfigured and the cover placed, water will sheet off and not infiltrate into or otherwise interact with processed kimberlite. The basis for this assumption is that the processed kimberlite below the rock cover will be frozen. Therefore, for May and June, once the cover is placed (2023 in the model), the water chemistry of the runoff is assigned a water chemistry of SNP 02-05. For the remainder of the year (from July to April), the water chemistry is that of SNP 02-02. However, in general, the water chemistry at SNP 02-05 is relatively clean compared to the water quality from the North Pile seepage and runoff monitored in the sumps and at SNP 02-02 for those months. Section 3.3.2.3 of the Site Water Quality Model Report (Golder 2019d) also recognizes this assumption to be a key influencing factor related to North pile runoff model input:
The assignment of typical site runoff chemistry (from SNP 02-05) to the North Pile runoff during May and June. This is considered reasonable since the cover material will be composed of similar granitic materials as the overall site, and since, due to freezing of the active layer, the processed kimberlite below the cover materials will remain frozen during winter and through May and June. This assumption will need to be confirmed once the cover is in place. Once this layer has melted, the runoff is assumed to infiltrate into, or otherwise interact with the processed kimberlite and is therefore assigned the SNP 02-02 chemistry for the remainder of the year.
At the July Technical Session, the GNWT asked De Beers to comment on the sensitivity of the model to changes in water quality inputs for May and June. Specifically, if half of June runoff were assigned the water quality of SNP 02-02, what effect would that have on the model? De Beers (Golder) responded that this scenario has not been tested in the model (Technical Session 2019b, p.130). Further, De Beers is basing the decision to use SNP 02-05 water quality for May and June on the assumption that the processed kimberlite below the cover

14
materials will remain frozen during winter including May and June, which cannot be confirmed until after the cover is in place. The GNWT notes that existing thermal monitoring data should be able to demonstrate that the depth of thaw is not expected to extend beyond 0.3 m by the end of June in order to support this assumption. The GNWT is concerned about the representativeness of current North Pile runoff model input as this input has important implications on the water quality predictions, and subsequent screening for POPCs and EQC development for the Closure and Post-Closure periods. It is not clear why De Beers has selected SNP 02-02 to represent North Pile runoff instead of using water quality from the North Pile perimeter sumps. Furthermore, De Beers has not provided sufficient rationale for using SNP 02-05 water quality for seepage runoff from the North Pile for the months of May and June, and has not presented a sensitivity analysis that assigns SNP 02-02 water chemistry to seepage runoff from the North Pile for all months, including May and June. Given that this has been identified as a key influencing factor on the North Pile runoff, it is not clear why bounds were not placed on the sensitivity of the predictions to this factor. A better understanding of the sensitivity to this assumption would also provide a better understanding of potential implications such as climate warming which will result in unfrozen conditions for a greater portion of the year. Recommendation: The GNWT recommends that the Site Water Quality Model be updated to include the following to inform predicted water quality conditions in Snap Lake Post-Closure:
• Thermal monitoring assessments, including the depth of thaw and the time needed for the North Pile to freeze and thaw, to better support the assumption that there will be a substantially reduced contribution from processed kimberlite to loading during May and June with placement of the cover.
• A sensitivity analysis with a scenario that assigns SNP 02-02 water chemistry to May and June seepage and runoff from the North Pile Perimeter Water Collection System (i.e. combined inflows of all sources to the PWCS) for some time after the cover is placed.
• A North Pile runoff model input based on the most representative data available, with the least amount of dilution (i.e. perimeter sumps), with rationale and sensitivity analyses to support the selection.
5.3 Toxicity Modifying Factors As a result of discharge from the WMP to Snap Lake, predicted hardness concentrations in Snap Lake are expected to increase over time (Golder, 2019i). De Beers proposes to apply calculated hardness-dependent AEMP benchmarks based on predicted hardness concentrations at the proposed mixing zone boundaries (Golder, 2019h). In essence, De Beers proposes to use this anthropogenically increased hardness to increase their discharge limits, by adjusting their hardness-dependent AEMP benchmarks, and thus EQC. The GNWT has previously expressed opposition, from a policy perspective, to using anthropogenically influenced hardness as natural hardness. The issue of concern is that

15
proponents can use the effluent to deposit POPCs at increasing concentrations which are greater than the pre-development conditions, based on the higher hardness concentrations existing in the receiving environment. From a water and environmental policy perspective, the discharge of waste should be limited to the extent reasonably possible and the use of known toxicity modifying factor relationships should not be used to increase contaminant loads by taking advantage of these ameliorative properties coincidentally found in an effluent stream. This may allow a proponent to simply modify the effluent composition (i.e. hardness) to increase loads to the environment. This was proposed by De Beers in the version 2 documents provided in response to IR #6 (Golder, 2019h, i & j), whereby the modelled scenario involved direct discharge from the WMP, instead of treatment with the WTP/RO unit, thereby increasing the predicted hardness concentrations at the edge of the existing mixing zone, and in turn, increasing the calculated AEMP benchmarks and associated EQCs (Golder, 2019h & i). This is clearly not the intent of the site-specific water quality derivation process or the “Guiding Principles” of the Water and Effluent Quality Management Policy (MVLWB, 2011). Canadian Council of Ministers of the Environment (CCME) (1999) is emphatic on this point stating "… modifications of guidelines to site specific objectives should not be made on the basis of aquatic ecosystem characteristics that have arisen as a direct result of previous human activities." Further, CCME (2007) reiterates this point stating “Similarly, modifications of guidelines to site-specific objectives should not be made on the basis of degraded aquatic ecosystem characteristics that have arisen as a direct negative result of previous human activities”. The GNWT’s position on toxicity modifying factors is further supported by the theoretical notion that increasing concentrations of POPCs in the effluent would increase the zone of influence of an applicant over time. In the case of Snap Lake entering Closure, the expectation is that the zone of influence decrease with time, and that the site is returned to pre-development conditions wherever possible. Authorizing discharges at increasingly higher concentrations of POPCs in the effluent over many years does not align with the closure goal of reducing impacts and influence on the receiving environment. Increasing POPCs concentrations does not align with the precepts of CCME, the pollution prevention and waste reduction principles in the MVLWB Policy (2011) and the vision of Northwest Territories Water Stewardship Strategy (GNWT, 2018). Recommendation: The GNWT recommends that AEMP benchmarks should be re-calculated using ambient hardness concentrations from the beginning of Closure prior to effluent discharge, for parameters where toxicity is affected by hardness. The GNWT recommends that the screening process for parameters of potential concern and development of updated EQC be revised based on the updated AEMP benchmarks.
5.4 Selecting Parameters of Potential Concern
In selecting POPCs, De Beers eliminated parameters for a number of reasons. Initially, only analytes for which predictions are available were included in the list of potential parameters of

16
interest (Golder, 2019h) which includes all the analytes associated with mining as defined by the Guidelines for Effluent Mixing Zones (MWLWB/GNWT, 2017) with the exception of pH, total organic carbon, TPH (total petroleum hydrocarbons), TSS and Escherichia coli. Parameters that did not have a toxicity-based guideline or an AEMP benchmark were also eliminated. The list of excluded parameters of interest includes cesium, lithium and rubidium, which as noted in the AEMP Re-Evaluation Report (Golder, 2019f) are “chemical signatures of treated Mine effluent” and “have increased over time relative to baseline concentrations in Snap Lake”. In 2015, cesium, thorium, and strontium triggered Low Action Level exceedances on the basis of elevated fish tissue concentrations of a magnitude greater than 30% relative to the reference lakes and exceeded the normal range (DeBeers, 2016). The rationale provided for the exclusion of TPH was that “There is no mine-related source of total petroleum hydrocarbons to the WMP, Sump 3 or Sump 5 in Closure or Post-Closure.” In the review comments submitted in May, the GNWT noted that there is a tank farm on site and that remediation will require heavy machinery work all over the site. Therefore, there will be multiple potential sources of hydrocarbons until such time that the site is fully reclaimed (Review Comment Table, 2019), and the rationale to remove TPH does not hold. In version 2 of the Snap Lake Effluent Quality Criteria Report for Closure and Post-Closure (Golder, 2019h), step 2 and 3 of the screening procedure to identify POPCs compared AEMP benchmarks to predicted 95th percentile WMP/sump concentrations and predicted 95th percentile mixing zone boundary concentrations respectively. This was a change from version 1 of this report (Golder, 2019c) where 75% of the AEMP benchmarks was used instead of 100% of the AEMP benchmarks. In response to IR #2 (De Beers, 2019g), De Beers states that 75% of AEMP benchmarks used was selected based on the AEMP Response Framework presented in the 2019 AEMP Design Plan (Golder, 2019a). The EQC were therefore calculated so that predicted parameter concentrations in Snap Lake would remain below 75% of the AEMP benchmarks. De Beers notes that this extra layer of conservatism was added to reduce the possibility of triggering a low action level (De Beers, 2019g). The rationale provided by De Beers for changing the screening procedure by using 100% of the AEMP benchmarks for screening in version 2 of the report (Golder, 2019h) includes:
• aligning the methods used to develop EQC for Closure and Post-Closure with the methods used to develop EQC for Operations (Golder, 2014);
• providing a closure scenario for the mine that does not depend on treatment of nitrate using constructed wetlands; and,
• reducing the level of conservatism in the calculation of EQC (De Beers, 2019g). The GNWT does not agree that methods used to develop EQC during Closure and Post-Closure must align with Operations. The GNWT also does not agree with De Beers’ rationale to reduce the level of conservatism in the calculation of EQC. Since De Beers is entering the Closure phase, a greater level of conservatism should be used than during operations as the mine is transitioning into a state of reduced monitoring frequency. The extra layer of conservatism of screening against 75% of the AEMP benchmarks allows an additional level of protection for the receiving environment during the Closure and Post-Closure phase by

17
increasing the likelihood of parameters screening in as POPCs and better regulation of parameters that are more likely to approach the Low Action Level. Using the selection process outlined in Golder (2019g), the only parameter of interest retained for development of an EQC was nitrate. The rationale provided speaks to reduced loads, reduced duration of loads, and predictions that concentrations will be lower than benchmarks. The GNWT notes that while it is correct that loads are lower because operations have ceased, it is important to note that the mine will continue to release contaminants to the receiving environment after it is closed. Recommendation: The GNWT recommends that the analyte list for screening parameters of potential concern include parameters that do not have a toxicity-based guideline. The GNWT recommends that De Beers use the 75% AEMP benchmark for screening potential parameters of concern, and development of EQCs. The GNWT recommends that the MVLWB retain TPH as a regulated parameter until remediation is completed at the site.
5.5 Effluent Quality Criteria EQC proposed by De Beers in the initial water licence application included maintaining the existing EQC (in the licence MV2011L2-0004) during Closure and reducing the EQC to nitrate, TSS and pH during Post-Closure. At the July Technical Session, De Beers proposed to change the originally proposed EQC to a single set of EQC for both Closure and Post-Closure. The EQC proposed for the Post-Closure period were unchanged which included nitrate, TSS, and pH. The EQC proposed for Closure included the same as Post-Closure with the addition of EQC for faecal coliforms due to sewage treatment occurring. This change would reduce the number of parameters with EQC limits during Closure from 18 parameters to four. In response to the proposed change, the GNWT requested that De Beers provide an updated EQC report with rationale and evidence to support this decision. This request became part of IR # 6 which was for “De Beers to provide an updated EQC Report and Snap Lake Water Quality Model Report that reflect the revised proposed EQC.” In response to IR #6, the updated EQC report provided by De Beers included the same parameters proposed during the July Technical Session that would be applied for Closure and Post-Closure. However, the proposed limits for nitrate and pH were revised. The newly proposed maximum average concentration for nitrate EQC increased from 25 mg/L to 60 mg/L, representing a 140% increase, and the proposed maximum grab concentration nitrate EQC increased from 50 mg/L to 80 mg/L. The pH range was changed from 6.5 to 9.0 to a range of 6.0 to 9.0 (Golder, 2019h). The GNWT notes this constituted a steady increase in proposed nitrate EQCs with final proposed EQCs for the maximum average concentration and maximum grab concentration being 500% and 470% higher respectively, during Closure and Post-Closure than when the Mine was operating. However, a fully operational RO treatment plant exists on site.

18
As described in Section 5.4.1 of version 2 of the Snap Lake Hydrodynamic and Water Quality Model Report, De Beers excluded treatment by the WTP/RO unit or constructed wetlands and instead examined the direct discharge of water from the WMP (Golder, 2019i). Of note, this change was not presented or discussed at the July Technical Session and was outside the scope of IR #6. As a result of this scenario change, predicted concentrations at the edge of the 200 m mixing zones in Snap Lake also changed (Golder, 2019i). This is particularly important for hardness concentrations as the predicted hardness values play a crucial role in the development of AEMP benchmarks proposed by De Beers, and subsequently EQC. In version 2 of the EQC report, De Beers revised the AEMP benchmarks presented in Tables 5-1 and 5-2, with a footnote for the parameters that are hardness dependent, containing the range of predicted hardness values corresponding to the Closure and Post-Closure periods (Golder, 2019h). The GNWT notes that the predicted hardness concentrations have increased from those presented in version 1 of the EQC Report (Golder, 2019c). The GNWT notes that the Snap Lake Hydrodynamic and Water Quality Model Report – Version 2 (Golder, 2019i) does not contain any rationale or justification for the changes to the modelled scenario that have been presented. During the July Technical Session, concern was raised by MVLWB staff in relation to De Beers ability to meet Measures 1(a) and 1(d) from the Report of EA (EA 1314-02) (MVEIRB, 2014). De Beers indicated that this would be further addressed in the updated EQC report. As the response to IR #6 did not address this question, the MVLWB issued an additional IR seeking clarification and further evidence from De Beers as to how the proposed EQC meet the requirements of Report of EA Measures 1(a) and 1(d). De Beers responded that the proposed EQC meets the requirements of Measure 1(a) because parameter concentrations in Snap Lake are predicted to remain below AEMP benchmarks, and that the aquatic ecosystem is therefore protected. During the September Technical Workshop, MVLWB staff further questioned De Beers on this topic and reiterated that the language in the Measure states that “…The Mackenzie Valley Land and Water Board will set numerical Site Specific Water Quality Objectives for Total Dissolved Solids and constituent ions of concern to apply during mine operations, Closure, and Post-Closure.” The GNWT notes that De Beers conducted their screening process with the constituent ions of TDS, but did not screen TDS itself, and therefore has not set an AEMP benchmark for it. In order to be compliant with Measure 1, De Beers should include TDS in the screening process for POPCs, and assign an EQC as appropriate. The GNWT is concerned that the EQC proposed now may be unnecessarily high, particularly given the level of conservatism used in the model assumptions as discussed in Sections 5.1 and 5.2. In addition, the GNWT does not support the use of anthropogenically influenced hardness concentrations for EQC development as discussed in Section 5.3. The GNWT did not have the opportunity to include an assessment of what is achievable versus what is necessary (for EQC) due to the raw data being provided with insufficient time for review. The GNWT is not supportive of EQC for Closure and Post-Closure that are higher than during operations. The overall goal of closure is to return the site to pre-development conditions to the extent practical. As operations have ceased, effluent water quality should improve relative

19
to operational conditions, and therefore, EQC should be decreased. Currently as proposed by De Beers, only four parameters would be regulated during Closure, reducing to three during Post-Closure, with the maximum nitrate concentration EQC increasing relative to Operations. The proposed reduction in regulated parameters associated with increased maximum allowable concentrations introduces the risk that discharge to Snap Lake will have elevated concentrations of other unregulated parameters compared to operational conditions, potentially resulting in adverse impacts on Snap Lake water quality. Without additional EQC, elevated concentrations of unregulated parameters may not be detected until action levels are triggered within the AEMP. Recommendation: The GNWT recommends that the existing EQC remain in the Closure and Post-Closure Licence on an interim basis until such a time as De Beers has updated models, and AEMP Benchmarks, and submitted these updates with a revised EQC Report. The GNWT recommends that the MVLWB set numerical SSWQOs for TDS and constituent ions of concern for Closure and Post-Closure to ensure compliance with Measure 1 of the Report of EA. The GNWT recommends that the EQCs adopted in the water licence align with the Pollution Prevention principle and Objective 2 of the MVLWB Water and Effluent Quality Management Policy (MVLWB, 2011). The GNWT recommends that there be a condition in the Water Licence requiring monthly representative water quality samples from sumps 3 and 5, and the WMP (as part of the SNP) to assess changes in water quality over the Closure period. The condition should include updated modelling based on this data to inform selection of POPCs and derivation of EQCs for Post-Closure.
6.0 Surface Water and Biological Monitoring
6.1 Surveillance Network Program
6.1.1 Elimination of SNP Stations De Beers has requested to remove a number of SNP stations (SNP 02-03 through to SNP 02-13, 02-17, 02-18, 02-19, 02-21 to 02-24) from the current SNP for Closure and Post-Closure periods. In review of the water licence application package, the GNWT recommended that De Beers provide a summary of trends and additional rationale for the removal of each SNP station, and identify any issues that have been observed over the life of the mine. In response De Beers referenced trends included in the Acid Rock Drainage (ARD) and Geochemical Annual Report submitted with the Annual Water Licence Report, but did not address the recommendation to identify any issues that have been observed at each site over the life of the mine (Review Comment Table, 2019).

20
De Beers stated in Appendix B of the Water Management Plan V.4 that their rationale for removing several stations (SNP 02-03, 02-04, 02-05, 02-06, and 02-09) is that there has been “no evidence of acid generation. Additional monitoring for acid generation is not warranted.” Additionally, the rationale for the removal of SNP stations 02-03 and 02-04 state that monitoring for acid generation “was the primary reason for monitoring this site” which is not exactly accurate as the station descriptions state they are used to provide information about the geochemical stability/rate of weathering of the rock used for construction of the site, and airstrip, respectively (De Beers, 2019d). The GNWT notes that additional parameters such as metals (metal leaching) and nitrates (blast residue) are also contaminants of concern. In the 2018 ARD and Geochemical Characterization Report, included with the 2018 Water Licence Annual Report (De Beers, 2019e), several SNP stations had concentrations in exceedance of existing EQCs, including the following examples: Table 1: A selection of 2018 SNP exceedances
SNP location
2018 Average concentration (as presented in the 2018 ARD report, De Beers, 2019e)
Exceedances
SNP 02-04 Total Al = 0.256 mg/L Total Al Max grab (0.2 mg/L), AEMP benchmark Al (0.1 mg/L)
SNP 02-05 Total Al = 0.221 mg/L, Total Cu = 0.0125
Total Al Max grab (0.2 mg/L), AEMP benchmark Al (0.1 mg/L) Total Cu Max grab (0.006 mg/L), AEMP benchmark Cu (0.0044-0.0086 mg/L*)
SNP 02-06
TSS = 34.9 mg/L, Total Al = 1.156 mg/L, Total Cu = 0.00397 mg/L, Total Zn = 0.011 mg/L
TSS max grab = 14 mg/L, Total Al Max grab (0.2 mg/L), AEMP benchmark Al (0.1 mg/L) Total Cu Max avg (0.003 mg/L), Total Zn Max avg (0.01 mg/L)
SNP 02-10 TSS = 12.3 mg/L, Total Al=0.316 mg/L
TSS max avg = 7 mg/L, Total Al Max grab (0.2 mg/L), AEMP benchmark Al (0.1 mg/L)
The GNWT concludes that De Beers has not provided sufficient rationale for eliminating these sites from the monitoring program, particularly those that have demonstrated exceedances of current EQC, and AEMP benchmarks. These stations are required in order to assess potential changes in water quality during Closure and Post-Closure. The removal of SNP stations reduces De Beers’ ability to determine potential on-site sources for water quality trends observed in the ISPs or in Snap Lake. Without the ability to determine a source, mitigation actions cannot be developed. Recommendation: The GNWT recommends that all existing SNP stations be retained in the new water licence until sufficient evidence is provided to demonstrate whether or not high concentrations measured at the current SNP locations are indicative of a continuing trend during active closure, and if so, provide a description of actions that will be taken to address them.

21
The GNWT recommends that the water licence include a condition that should De Beers wish to remove a station from the SNP, a report be submitted to the MVLWB for approval that includes potential trends in metal leaching for each of the SNP sites that are proposed to be eliminated, and any previous exceedances at each station.
6.1.2 Uncontrolled Runoff Monitoring Stations In the AEMP Design Plan (Golder, 2019a), De Beers discusses sediment release from uncontrolled runoff during Closure and Post-Closure. In reviewing the water licence application, the GNWT recommended that if uncontrolled runoff is expected during extensive site regrading, additional SNP stations should be added during the Closure period to assess potential effects to water quality in Snap Lake. In response to reviewer comments, as well as during the July Technical Session, De Beers responded that establishing SNP stations at this time is preliminary as the potential locations of runoff have not been determined. However, De Beers did note that there would be monitoring and control of run-off during construction activities, if necessary (Technical Session Transcript Day 2, p.226-227). The process by which De Beers will monitor for surface runoff and assign monitoring stations remains unclear. The GNWT is concerned that sediment release events could occur from uncontrolled runoff if stations are not established prior to site regrading. Recommendation: The GNWT recommends that Sediment and Erosion Control Plans be required for remediation activities that will occur within 150 m from Snap Lake. The GNWT recommends that the MVLWB require that SNP stations be determined prior to commencement of regrading at site within 100 m of Snap Lake during the Closure period.
6.1.3 Monitoring Frequencies In the draft water licence submitted with their initial application, De Beers proposed monitoring frequencies for each SNP station. These monitoring frequencies have not been updated since the initial application was submitted, despite various changes proposed by De Beers to the plans for water management, EQC, and mixing zone size. The GNWT has concerns about the implementation of the proposed monitoring frequencies, particularly in relation to the calculation of average concentrations in order to ensure compliance with the maximum average concentration EQC. Currently, the draft water licence proposes to define the maximum average concentration as: “the running average of any four (4) consecutive analytical results submitted to the MVLWB in accordance with the sampling and analysis requirements specified in the Surveillance Network Program.”
22
The GNWT notes that the proposed monitoring frequencies at key SNP stations where effluent may be discharged do not allow for sufficient samples to be collected during discharge (or in a given year) to obtain the minimum of 4 consecutive samples to determine an average. For example, the proposed sampling frequency at SNP 02-02b (EISP) and SNP 02-02c (WISP) is once annually (De Beers, 2019c). In this case, four years of monitoring would be required to obtain the minimum number of samples to determine the average concentration. The same issue exists for stations SNP 02-17c (East passive wetland) and SNP 02-17d (West passive wetland) where sampling is proposed once monthly during discharge (June, July, August). If discharge only occurs from June to August (three sampling events), it will take 2 years of sampling to obtain the minimum required samples to calculate the average concentration to ensure compliance with the maximum average concentration. The GNWT is concerned that given the proposed monitoring frequencies, there is a risk for effluent to exceed the maximum average concentration EQC for a given parameter for an entire open water season prior to there being sufficient monitoring data to assess compliance. Recommendation: The GNWT recommends that the monitoring frequencies for all SNP stations that may discharge to the receiving environment be sampled every two weeks during the Closure period in order to be able to adequately assess compliance with the maximum average concentration EQCs. The GNWT recommends that the frequency and locations be evaluated following completion of active closure of the Mine Site.
6.2 Aquatic Effects Monitoring Program In January 2018, during review of the Extended Care and Maintenance Plan, Version 2, the GNWT commented on the discharge of surface water to underground (MVLWB, 2018). MVLWB staff analysis following De Beers’ response recommended that De Beers ensure that AEMP annual reporting specifically and adequately accounts for the decreasing TDS trend as they analyze for potential aquatic effects of high-TDS water entering Snap Lake via the underground. The GNWT notes that pumping untreated water underground has been De Beers’ primary method of water management despite many of the documents reviewed giving the impression that surface water pumped to the WMP is treated and discharged to Snap Lake. According to Table 4-1 of De Beers’ response to Technical Session IR #4, 29,720 m3 was treated and discharged to Snap lake in 2018, and 144,808 m3 was pumped from the WMP to underground (De Beers, 2019f). Of note, the total volumes for 2019 only include to the end of July. If water treatment had been completed by that time, then 11,070 m3 was discharged as treated water and over 94,506 m3 of untreated water was pumped from the WMP to the underground. As the process by which high TDS water continues to enter Snap Lake via the underground is still not fully understood, the GNWT is concerned that with the decreasing trend in TDS

23
concentration expected to continue, AEMP annual reporting may not adequately account for potential aquatic effects of this high TDS water input to Snap Lake. Regarding Post-Closure monitoring, the GNWT notes that Section 5.3.2.1 of the FCRP states that “flushing of mine-impacted water from the North Pile will require up to 30 years”. Table 5.6 in the FCRP outlines monitoring programs and notes that SNP and AEMP will be reported for 3 years Post-Closure (De Beers, 2019a). However, Table 5.2 in the FCRP contradicts this whereby closure objective SW3 (surface runoff and seepage water quality that is safe for people, vegetation, aquatic life, and wildlife) requires meeting EQC in surface discharge to achieve in-lake SSWQOs as described in the approved MVLWB Water Licence and demonstrated by Post-Closure monitoring for a minimum period of 5 years after construction of the passive water treatment system. Even with 5 years of Post-Closure monitoring as described in the closure criteria (that have yet to be approved), the GNWT is concerned that this may be an insufficient window to monitor potential impacts from site Post-Closure given the length of time nitrates are expected to remain in the North Pile. Recommendation: The GNWT recommends that De Beers ensure that AEMP annual reporting specifically and adequately accounts for potential aquatic effects of high-TDS water entering Snap Lake via the underground, as has been recommended by the MVLWB (response to GNWT-ENR Comment ID2, Review Comment Table). This monitoring data should then be used to update the hydrodynamic model. The GNWT recommends that De Beers continue the SNP and AEMP water quality monitoring until such time that De Beers has demonstrated that closure conditions are stable and closure criteria have been consistently met.
7.0 North Pile
7.1 Thermal Regime De Beers has identified nitrate as a parameter of potential concern from the North Pile during Closure and Post-Closure (Golder, 2019a). In addition to closure activities that are aimed to address this concern, De Beers has explained that aggradation of permafrost over time within the North Pile will lead to reductions in the volume of infiltration/seepage and entrainment of nitrate in the frozen material. However, De Beers explains that the water quality model assumes that groundwater flow and draindown occurs in an unfrozen North Pile to account for climate change (De Beers, 2019a). De Beers further notes that since there is a finite amount of nitrate within the North Pile, it is predicted that it will take up to 30 years for the flushing of mine-impacted water from the North Pile. During the July Technical Session, the GNWT requested that De Beers describe the possibility of permafrost thawing Post-Closure and resulting in a release of elevated nitrate concentrations beyond the predicted timeframe for flushing of mine-impacted water from the North Pile. In response De Beers explained that although it is not expected that the entire North Pile will unfreeze, the active layer will increase (Technical Session, 2019b, p.188).

24
However, De Beers has not developed predictions of how the active layer within the pile may change over time due to climate change. In Appendix A of the proposed North Pile Management Plan (De Beers, 2019b), it is explained that existing and proposed thermistors in the North Pile will monitor the thermal profile of the North Pile during Closure and Post-Closure. The plan further explains that:
As part of the transition from closure to post closure, thermistor data will need to be evaluated, and the contribution of freezing to the long term post closure stability considered in terms of global warming projections the time of transition.
Although this statement suggests thermistor data should be considered in terms of global warming projections, it is intended to address physical stability, not chemical stability. The GNWT is concerned that without an understanding of how climate change could affect the thickness of the active layer of the North Pile, there is an uncertain level of risk that delayed release of elevated nitrate concentrations beyond the anticipated 30 years could occur. The GNWT notes the timing of nitrate release is of importance as the AEMP benchmark for nitrate is hardness dependent and hardness concentrations are predicted to decrease with time, thereby increasing the potential for water quality exceedances in the receiving environment. Recommendation: The GNWT recommends the Water Licence require that the Performance Assessment Report for the North Pile include a comprehensive description on the thermal regime in the North Pile that includes predicted changes to the active layer. This includes ensuring that the associated monitoring program is developed with the Performance Assessment Report requirements in mind.
7.2 North Pile Cover Material Sources De Beers has confirmed that potentially acid-generating (PAG) material will be excluded from North Pile cover construction for both surface and side slopes. Borrow sources for the North Pile rock cover material are listed in Table 3.1 of the North Pile Management Plan, and include West Cell Divider Dyke and embankments/rib berms (De Beers, 2019c). The embankments and rib berms are further described in Appendix A of the North Pile Closure Design- Part 4, Design Basis and Criteria (Appendix H, Golder, 2019a), as containing up to 40% PAG waste rock at various embankments and rib berms throughout the facility. Given that embankments/rib berms are listed as a borrow source for cover material, of which 40% may be PAG rock, the GNWT requested clarification, in review of the water licence renewal application, regarding the process and methodology to be used by De Beers to ensure that PAG material is not used in the construction of the cover for the North Pile. De Beers responded that “geochemical characterization will be used to confirm PAG/ non-PAG materials when the classification is unknown.” (Review Comment Table, 2019).

25
During the July Technical Sessions, the GNWT asked De Beers how and when this geochemical characterization would take place. De Beers responded that it is factored into the construction management, and confirmed that the testing would include metals analysis (Technical Session, 2019a, p.172-175). De Beers did not provide any additional details on geochemical sampling program methodologies. As part of the initial application review, the GNWT also recommended that De Beers provide information on the location and volume of PAG material within various areas of the North Pile. De Beers did not provide a response to this comment or to a subsequent request from the GNWT on July 10, 2019, for this information in advance of the July Technical Session. During the July Technical Session, the MVLWB issued IR #10 to De Beers requiring the total quantity of all material, including PAG and non-PAG, and the PAG material’s approximate placement location in the North Pile. In response to IR #10, De Beers provided the total quantity of material in the North Pile generated from 2000 to 2015 broken down into the following categories: non-acid generating granite, non-acid generating metavolcanic, PAG metavolcanic, and processed kimberlite. As discussed in the North Pile Closure Design, Table 10-2 in IR #10 lists a number of embankments and rib berms where PAG metavolcanic material was previously placed (De Beers, 2019a). Based on this IR response, it remains unclear to the GNWT how De Beers will use the embankments/rib berms for non-PAG closure cover material if these structures are known to have been constructed with a variable portion of PAG material. The GNWT is concerned that if De Beers uses material from the embankments and rib berms within the North Pile, without proper geochemical characterization of the material to confirm it is non-PAG and non-metal leaching, material may be used as cover that has the potential to create long-term acid-rock drainage/metal leaching (ARD/ML) issues which will influence seepage and runoff water quality. Recommendation: The GNWT recommends there be a condition in the water licence requiring that all construction material, including material to be used for the North Pile cover, be non-PAG (≤ 0.17% by weight total sulfur) and free of contaminants. The GNWT recommends that geochemical testing results be provided to the MVLWB for approval prior to using the material for remediation.
7.3 Overall Blended Rock Units As part of the FCRP, De Beers conducted a review of geochemical data and found that by completing an overall geochemical characterization of blended materials (by rock type), each rock type is non-AG with excess neutralizing potential. De Beers also stated that they consider it reasonable to use these combined data as the materials have undergone substantial mixing, blending through blasting, hauling, dumping and dozing as part of the construction process.

26
In review of the water licence renewal application package, the GNWT and ECCC noted concerns regarding this classification of metavolcanics, and the resulting potential for it to be used in construction (Review Comment Table, 2019). The GNWT noted that this method of geochemical characterization is not sufficient to adequately characterize material for closure, and that this method could lead to uncertainty for long-term ARD/ML potential, and implications for runoff and seepage quality. This is particularly problematic for metavolcanics, as the overall material unit is characterized as non-PAG using this method, which is a less conservative approach than was applied during operations, when all metavolcanic material was treated as PAG. As noted by De Beers, small pockets of metavolcanic rock may have some acid generation potential, and could develop pockets of acidic leachate. Research on test piles at Diavik Diamond Mine have proven this with field trial results showing that a waste rock pile containing low sulfur (0.035 wt %S), non-PAG waste rock, contained small pockets of depressed pH and elevated metal concentrations (Atherton, 2017). In review of the water licence application package, the GNWT recommended that De Beers provide additional justification for revising the classification of metavolcanic rock, address the uncertainty related to this approach, and develop contingency methods in the event of unexpected leachate and runoff results. In their response to comments, De Beers referenced 15 years of neutral runoff to date, low sulphide content and the blended nature of the rock, but did not provide any additional supporting evidence for this classification (Review Comment Table, 2019). In response to both the GNWT and ECCC’s recommendations regarding contingency and adaptive management, De Beers highlighted that the runoff will be collected in the downstream sumps, and that in the event of changes to water quality due to ARD, release would be controlled, and additional management measures taken. The GNWT notes that it is not clear what additional management measures would be taken given that De Beers does not intend to conduct any other water quality monitoring on site outside of the ISPs during Closure. Recommendation: The GNWT recommends that the ARD and Geochemical Characterization Plan remain as a condition in the water licence during Closure to ensure that the appropriate geochemical characterization of material continues including during all blasting and earthworks activities. As an item under this plan, GNWT recommends that De Beers submit a geochemical characterization/sampling plan for review and approval for the geochemical assessment that will be conducted in areas where the acid generation potential of cover construction material needs to be confirmed and/or further defined. The GNWT recommends that all PAG material, including PAG material encountered during cover construction, and west perimeter embankment re-grade be relocated as required in order to meet the setback requirements in the North Pile Cover Design. This PAG material should be placed appropriately and covered by at least 3 m of non-PAG material.

27
7.4 Acid Rock Drainage and Geochemical Characterization Plan - Seepage Surveys
The Seepage Surveys at Snap Lake are part of the Acid Rock Drainage and Geochemical Characterization Plan. De Beers has proposed to remove this plan, including the associated seepage surveys, from the water licence conditions stating that “There is no need for continued implementation of this plan.” De Beers goes on to say that “This plan was only meant for construction and operation phases.” (De Beers, 2019c). The GNWT notes that De Beers will be undertaking earthworks and construction of a cover for the North Pile, as well as potential construction of passive wetland treatment systems. As such, the Acid Rock Drainage and Geochemical Characterization Plan should continue as these activities meet the criteria to be classified as construction. The GNWT also notes that at the July Technical Session, De Beers stated that they would be conducting sampling and geochemical analysis on any cover material that had unknown acid generation potential (Technical Session, 2019a, p.172-175). In relation to the seepage survey portion of this plan, De Beers stated in the proposed draft Water Licence that “drainage from the North Pile reports to the sumps which are monitored through the SNP.” The GNWT notes that De Beers has also proposed that stations SNP 02-11, 02-12, and 02-13 (that would provide seepage data) be discontinued through the Post-Closure period (De Beers, 2019c). The GNWT notes that in De Beers’ 2018 Snap Lake Seepage Survey Summary Report, included with the 2018 Water Licence Annual Report, there are numerous water quality concerns throughout the site. The report states “all monitoring locations had at least one measurement that was elevated compared to the Water Licence’s treated effluent quality criteria.” The report also concludes by saying “Monitoring locations will be re-evaluated in subsequent seepage surveys to assess if high concentrations remain.” (De Beers, 2019e). The 2018 ARD report recommends that for locations west of the WMP including Pond Laydown 1, and the quarry, that “Monitoring from these locations should continue to assess if the observed concentrations are indicative of a trend, or represent typical variability at this location.” Table 24 in the 2018 ARD report also recommends that ongoing monitoring of seepage and runoff within the North Pile catchment is required; as is monitoring of water quality in the vicinity of the airstrip and laydown (De Beers, 2019e). In the May 2019 review comment submission, the GNWT recommended seepage surveys be retained until there is sufficient evidence demonstrating no impacts to the environment or until De Beers has sufficiently characterized seepage (Review Comment Table, 2019). De Beers disagreed with these recommendations and responded to further questioning at the Technical Session that seepage will be monitored at the two new SNP stations being proposed for the East (SNP 02-02b) and West (SNP 02-02c) ISPs (Technical Session 2019b, p.196). The GNWT remains concerned about the elimination of the seepage monitoring program and the limited number of SNP sampling locations proposed by De Beers. Not all existing monitoring locations are within the catchment of the Mine that directs the water to the water management pond for treatment. Without the continuation of seepage surveys, these non-

28
point source discharges will not be monitored during Closure or Post-Closure. By only monitoring water quality in the ISPs, it is not clear how De Beers will confirm modelled trends for surface runoff and seepage water quality. Recommendation: The GNWT recommends that seepage surveys be retained as part of a Seepage Monitoring Program throughout the Closure period, as a condition in the Water Licence. The GNWT recommends that if seepage assessments are to be covered by the SNP, the SNP station locations be reviewed as part of a public review process to ensure they are appropriate to effectively characterize seepage at the site and that SNP sampling occurs. The GNWT recommends that the Seepage Monitoring Program conducted during the Closure period will determine how long, if at all, the monitoring should continue into the Post-Closure period.
8.0 Securities
8.1 Security Estimate revisions The GNWT has reviewed De Beers’ 2019 Financial Security Estimate submitted as Appendix F of the Snap Lake Mine Final Closure and Reclamation Plan. To aid in the review of the estimate, the GNWT has retained Brodie Consulting Limited (BCL) to provide recommendations and clarifications to De Beers on the estimate and a recommendation for the revised security to be held for the water licence and land use permit for closure and reclamation. In an effort to reconcile differences prior to making recommendations to the MVLWB, initial comments were provided to De Beers in a BCL memorandum of August 19, 2019. A teleconference was held on August 26, 2019 which was attended by the GNWT, De Beers, BCL and ARKTIS Solutions Inc. (consultant to De Beers) to discuss the comments. The GNWT would like to acknowledge De Beers’ effort in addressing the security component of this application in their continued discussions with the GNWT. BCL and the GNWT have a few remaining items that require attention by De Beers and the MVLWB regarding the most recent discussions on the estimate. As such, the GNWT has attached in Appendix 2 a memorandum and RECLAIM estimate from BCL that provide details on how the GNWT has developed its recommendation on the security amount and recommendations to De Beers to address future estimates. Of significance is De Beers’ omission of recommendations regarding monitoring program efforts and associated costs, which are discussed in the subsequent section. The GNWT encourages De Beers and the MVLWB to review the attachment, which provides additional background information.

29
Recommendation: The GNWT recommends that De Beers and the MVLWB refer to the attached memorandum and associated RECLAIM estimate for additional background and context supporting the GNWT’s comments and recommendations regarding the Financial Security Estimate and the Snap Lake Mine Final Closure and Reclamation Plan.
8.2 SNP and AEMP Monitoring As the GNWT has discussed previously regarding SNP and AEMP monitoring (see section 6), a final plan outlining monitoring requirements for Closure and Post-Closure has not yet been approved. The GNWT does not believe the monitoring program proposed by De Beers is sufficient and that further discussion and review of the proposed monitoring program is warranted. As such, the GNWT is unable to fully describe the costs that would be associated with a realistic and appropriate monitoring program for Closure and Post-Closure of the site. The GNWT therefore believes the costs proposed by De Beers associated with monitoring are likely not sufficient. However, without a final approved plan by the MVLWB, the GNWT has not reviewed and revised De Beers’ estimate in terms of differences in frequency, duration, number of stations, etc. The GNWT requests that upon final approval of the FCRP by the MVLWB, the MVLWB require De Beers to submit a revised Financial Security Estimate that accurately reflects the approved monitoring requirements and frequency for the site for the Closure period. Recommendation: The GNWT recommends that the Financial Security Estimate be updated by De Beers based on the final SNP and AEMP, following the MVLWB’s final approval of the FCRP.
8.3 Phasing of Security De Beers has proposed a phasing of security reductions that align with milestones at which major physical works will have been completed. These are at the end of Year 4 and Year 8 of Closure and then every 5 years of Post-Closure. However, the basis of the reductions proposed in the 2019 Financial Security report assumed 100% reduction in direct costs once closure and reclamation of a component is complete. De Beers’ memo of September 3, 2019 acknowledges that it is understood that the significant portion of the securities will be returned upon completion of the reclamation activity, and that the remainder would be returned upon submission and acceptance of a Performance Assessment Report. As such, there does not seem to be a lot of value in maintaining the phasing of security reductions as it exists in the 2019 Financial Security Estimate as these reductions do not reflect a) the expectation that there will be some amount of holdback until monitoring performance assessments have been completed and b) De Beers’ reiteration that schedules are subject to change.

30
Recommendation: The GNWT recommends that the security amounts to be returned to De Beers be evaluated at the time of the request for a security adjustment. Pre-determined phasing of security returns should not be approved.
8.4 Environmental Agreement Security Section 4, Table 9 of the 2019 Financial Security Estimate report states:
The security allocated to the Water Licence and Land Use Permit should not include security held under the Environmental Agreement. Based on discussions between De Beers and the GNWT in 2018, and subject to final determination by the GNWT, the Environmental Agreement security allocates $1,390,000 of the funds for activities that are also included in this 2019 RECLAIM estimate.
The GNWT contacted De Beers on October 3, 2019 to seek clarity on the allocation of $1,390,000 referred to by De Beers in the report, and whether it is duplicated between the Environmental Agreement security and Water Licence and Land Use Permit security amount. De Beers has revised the amount in an email sent to GNWT on October 3, 2019. The revised amount is $875,000. A final determination by the GNWT cannot be confirmed until the GNWT have officially amended the Environmental Agreement to allow for the return of the Environmental Agreement security funds. The GNWT is supportive of ensuring that De Beers is neither under or over secured as per requirements between the Environmental Agreement security and land and water authorizations. However, until the Environmental Agreement determination process is finalized, the GNWT cannot support the return of Environmental Agreement associated funds requested by De Beers in the RECLAIM estimate. Recommendation: The GNWT recommends that costs associated with Environmental Agreement Security remain until the Environmental Agreement is officially amended. Once finalized, the GNWT is committed to reviewing these items to ensure their accuracy.
8.5 Interim Care and Maintenance De Beers have reduced the period of Interim Care and Maintenance in the Security Estimate from two years to one, presumably to align with the plan to advance closure activities beginning in 2021. Provisions for Interim Care and Maintenance are intended to cover the period of time required to transfer ownership of the site, finalize a closure plan, retain a water licence for closure, mobilize equipment to the site, and conduct procurement activities to retain reclamation contractors in the event a company defaults. The generally accepted minimum for most Security Estimates for mines in the Northwest Territories is two to three years. In principle, there is no reason that this would be any different for the Snap Lake Mine.

31
Given the current status of the Mine and with a Final Closure Plan currently under review, the GNWT’s position is that a time period of 2 years is justified. Recommendation: The GNWT recommends that the period of ICM be maintained at 2 years, and not reduced to 1 as proposed by De Beers.
8.6 Revised Security Estimate Amount The GNWT has completed a revised estimate of security for De Beers 2019 Financial Security Estimate. The 2019 Financial Security Estimate is considered to be an acceptable amount for the purposes of maintaining security prior to De Beers proceeding with the activities described in the FCRP. There are only a few items that the GNWT is of the opinion are too low, or too high, which are described in further detailed in BCL’s memorandum (Appendix 2). The following table summarizes the recommendations for revisions to De Beers 2019 Financial Security Estimate and BCL’s estimate for the GNWT. The result is an increase in security from that which has been proposed by De Beers. However, as discussed above, the recommended changes to reflect the GNWT’s recommendations for the SNP and AEMP have not been quantified and will need to be captured in the next security review, following approval of the closure plan by the MVLWB. Table 2: GNWT Recommendations for Security Revisions Reference Number Description Amount Difference De Beers BCL
Ref #1 Organics stockpile - increase quantity to be used in reclamation
$152,545 $524,790 $372,245
Ref #2 Monitoring costs - increase labor rate $3,219,515 $3,424,243 $204,728
Ref #3 Post-closure maintenance - increase amount per campaign $85,000 $700,000 $615,000
Ref #4 Revise mobilization/demobilization costs
$16,407,640 $15,462,279 - $945,361
Ref #5 Maintain ICM at 2 years, not 1 year $1,707,209 $3,439,985 $1,719,992
Total Security $85,473,129 $87,520,940 $2,047,811

32
Recommendation: The GNWT recommends that the amount of security required for the Snap Lake mine totals $87,520,940.00, for which is split between land related liability of $39,712,564.00 and water related liability of $47,808,376.00.
33
REFERENCES Atherton, 2017. An Investigation of Heterogeneity and the Impact of Acidic Regions on Bulk Effluent from a Deconstructed Low Sulfide Waste-Rock Pile. Brodie Consulting, Ltd. 2019. Review of De Beers Snap Lake Mine 2019 Final Closure and Reclamation Plan. Prepared for: Government of the Northwest Territories Environment and Natural Resources. September 27, 2019. CCME (Canadian Council of Ministers of the Environment). 1999. A Protocol for the Derivation of Water Quality Guidelines for the Protection of Aquatic Life. Canadian Council of Ministers of the Environment. Winnipeg, MB, Canada. CCME (Canadian Council of Ministers of the Environment). 2007. A protocol for the derivation of water quality guidelines for the protection of aquatic life. In: Canadian environmental quality guidelines, 1999. CCME, Winnipeg. CCME (Canadian Council of Ministers of the Environment). 2012. Scientific Criteria Document for the Development of the Canadian Water Quality Guidelines for the Protection of Aquatic Life: Nitrate Ion. PN 1470. De Beers Canada Mining Inc. (De Beers). 2016. De Beers Canada Inc. Snap Lake Mine Aquatic Effects Monitoring Program 2015 Annual Report. De Beers Canada Mining Inc. (De Beers). 2018a. Aquatic Effects Monitoring Program 2017 Annual Report Snap Lake Mine, Type A Water Licence MV2011L2-0004. May 2018. De Beers Canada Mining Inc. (De Beers). 2018b. 2018b Annual Report Type A Water Licence MV2011l2-0004, Snap Lake Mine, March 2019 (June 10, 2019 Resubmission). De Beers Canada Mining Inc. (De Beers). 2018c. North Pile Management Plan – Snap Lake Mine. June, 2018. De Beers Canada Mining Inc. (De Beers). 2019a. Final Closure and Reclamation Plan. March 2019. De Beers Canada Mining Inc. (De Beers). 2019b. North Pile Management Plan V.3. March 2019. De Beers Canada Mining Inc. (De Beers). 2019c. Water Licence (MV2011L2-0004) Renewal Application. March 2019. De Beers Canada Mining Inc. (De Beers). 2019d. Water Management Plan V.4. March 2019. De Beers Canada Mining Inc. (De Beers). 2019e. 2018 Annual Water License Report Snap Lake Mine (MV2011L2-0004)_Resubmission. April 2019.
34
De Beers Canada Mining Inc. (De Beers). 2019f. Technical Session (July 16 to 18, 2019) Information Request Responses – Snap Lake Water Licence (MV2019L2-0004) Application and Final Closure and Reclamation Plan. August, 2019. De Beers Canada Mining Inc. (De Beers). 2019g. Information Request Responses – Outstanding Information. September 12, 2019. De Beers Canada Mining Inc. (De Beers). 2019h. Response to Follow-up Questions from the Technical Workshop. September 24, 2019. Golder Associates. 2014. Appendix III: Updated Effluent Quality Criteria Report. MV2011L2-0004 Water Licence Amendment Post-EA Information Package. Prepared for the Mackenzie Valley Land and Water Board. Yellowknife, NT, Canada. November 2014. Golder Associates. 2018. North Pile Closure Cover Feasibility Design – Design Basis and Criteria. Report Prepared for De Beers Group of Companies. November 2018. Golder Associates. 2019a. 2019 Aquatic Effects Monitoring Program Design Plan for Closure and Post-Closure, Version 0. Report prepared for De Beers Group of Companies. March 2019. Golder Associates. 2019b. North Pile Passive Treatment Systems Detailed Design – Snap Lake Mine. Report prepared for De Beers Group of Companies. March, 2019. Golder Associates. 2019c. Snap Lake Mine - Effluent Quality Criteria Report for Closure and Post-Closure. Report prepared for De Beers Group of Companies. March, 2019. Golder Associates. 2019d. Snap Lake Mine - Site Water Quality Model Report. March 2019 Golder Associates. 2019e. Snap Lake Mine – Snap Lake Hydrodynamic and Water Quality Model Report. Report prepared for De Beers Group of Companies. March, 2019. Golder Associates. 2019f. 2018 Aquatic Effects Re-evaluation Report - Snap Lake. Submitted to De Beers Canada Inc., March 2019. Golder Associates. 2019g. Near-Field Mixing of Outflows From Sump 3 and Sump 5 in Snap Lake. Technical Memorandum Prepared for De Beers Canada Inc. July, 2019. Golder Associates, 2019h. Snap Lake Effluent Quality Criteria Report for Closure and Post-closure – Version 2. Report prepared for De Beers Canada Inc. August 2019. Golder Associates. 2019i. Snap Lake Hydrodynamic and Water Quality Model Report – Version 2. Report prepared for De Beers Canada Inc. August 2019. Golder Associates, 2019j. Snap Lake Mine Downstream Lakes Water Quality Model Report – Version 2. Report prepared for De Beers Canada Inc. August 2019.

35
Government of the Northwest Territories (GNWT), 2018. Northern Voices, Northern Waters, NWT Water Stewardship Strategy. January, 2018 Mackenzie Valley Environmental Impact Review Board. 2003. Report of Environmental Assessment and Reasons for Decision on the De Beers Canada Mining Inc. Snap Lake Diamond Project, July 24, 2003. Mackenzie Valley Environmental Impact Review Board (MVEIRB). 2014. Report of Environmental Assessment and Reasons for Decision: De Beers Canada Inc. Snap Lake Amendment Project (REA) EA1314-02. Mackenzie Valley Land and Water Board (MVLWB). 2011. Water and Effluent Quality Management Policy, March 31, 2011. Mackenzie Valley Land and Water Board and Aboriginal Affairs and Northern Development Canada (MVLWB/AANDC). 2013. Guidelines for the Closure and Reclamation of Advanced Mineral Exploration and Mine Sites in the Northwest Territories. November, 2013. Mackenzie Valley Land and Water Board and Government of the Northwest Territories (MVLWB/GNWT). 2017. Guidelines for Effluent Mixing Zones. September 2017. Mackenzie Valley Land and Water Board. 2018. Extended Care and Maintenance Plan Staff Report and Comments February 8, 2018. Rescan (Rescan Environmental Services Ltd.). 2012. Ekati Diamond Mine. Site-Specific Water Quality Objective for Nitrate. 2012. Prepared for BHP Billiton Canada Inc. Yellowknife, NT, Canada. Review Comment Table, 2018. Extended Care and Maintenance Plan Version 2; and Request to not file the Interim Closure and Reclamation Plan (ICRP). Review Comment Table. 2019. Review Comment Table – De Beers Canada Inc. – Snap Lake – Water Licence Renewal and Land Use Permit Amendment Application (MV2019L2-0004 and MV2017D0032). June, 2019. Technical Session, 2019a. De Beers Canada Inc. (De Beers) – Snap Lake Project MV2019L2-0004 and MV2017D0032 Technical Session. July 16, 2019. Technical Session. 2019b. De Beers Canada Inc. (De Beers) – Snap Lake Project MV2019L2-0004 and MV2017D0032 Technical Session. July 17, 2019. Technical Session. 2019c. De Beers Canada Inc. (De Beers) – Snap Lake Project MV2019L2-0004 and MV2017D0032 Technical Session. July 18, 2019. Wek’èezhìi Land and Water Board. 2019. Final Closure and Reclamation Plan – Extension Request – Reasons for Decision. August, 2019.

36
Zajdlik Associates Inc. (Zajdlik). 2019. Review of De Beers Snap Lake 2019 Closure Effluent Quality Criteria and Aquatic Effects Monitoring Program. Prepared for Government of the Northwest Territories. August, 2019.

Appendix A: Zajdlik & Associated Inc. – Technical Memorandum

Review of DeBeers Snap Lake Water Licence Renewal
Application
Prepared for:
L. Malone
Government of the Northwest Territories
Environment and Natural Resources
Prepared by:
Zajdlik & Associates Inc.
September 27th
, 2019

Zajdlik & Associates Inc. Page i 29/09/2019
Table of Contents
1 Introduction ............................................................................................................................. 1
2 General Considerations for Mine Closure .............................................................................. 1
3 Issues - Conflicting ................................................................................................................. 2
3.1 Mixing Zones ................................................................................................................... 2
3.1.1 Recommendation ...................................................................................................... 5
3.2 Selecting Potential Parameters of Concern (POPC) ........................................................ 6
3.2.1 Recommendations ..................................................................................................... 6
3.3 Effluent Quality Criteria................................................................................................... 8
3.3.1 Recommendation .................................................................................................... 10
3.4 GNWT ENR Comment ID 91 – Hydrodynamic and Water Quality Model Report,
Stability of Generic Concentration Predictions ........................................................................ 10
3.4.1 Recommendation .................................................................................................... 11
4 Issues - At an Impasse........................................................................................................... 11
4.1 GNWT ENR Comment ID 102 – Nitrate AEMP Benchmark ....................................... 11
4.1.1 Technical Meeting (July 17th
, 2019) Request ......................................................... 11
4.1.2 Recommendation .................................................................................................... 12
5 Issues – Additional Recommendations to GNWT ................................................................ 12
5.1 GNWT ENR Comment ID 70 – AEMP Design, Fish Tissue Monitoring ..................... 12
5.1.1 Recommendation .................................................................................................... 13
5.2 GNWT ENR Comment ID 93 – Final Closure and Reclamation Plan, Sediment
Mercury ..................................................................................................................................... 13
5.2.1 Recommendation .................................................................................................... 13
5.3 GNWT ENR Comment ID 104 – Final Closure and Reclamation Plan – Monitoring,
SNP and AEMP Monitoring Time Frame ................................................................................ 13
5.3.1 Recommendation .................................................................................................... 14
5.4 GNWT ENR Comment ID 107 – Assessing Compliance with Sulphate Benchmark ... 14
5.4.1 Technical Meeting (July 17th, 2019) Request ........................................................ 15
5.4.2 Recommendation to ENR ....................................................................................... 16
5.5 Composition of Underground Flow Path Water ............................................................ 16

Zajdlik & Associates Inc. Page ii 29/09/2019
6 Issues - Resolved................................................................................................................... 19
6.1 Minewater Management Plan During Closure ............................................................... 19
6.2 GNWT ENR Comment ID 86 – Hydrodynamic and Water Quality Model Report,
Water Management Pond Seepage ........................................................................................... 20
7 Modelling Uncertainty .......................................................................................................... 20
8 EA Measures ......................................................................................................................... 21
9 References ............................................................................................................................. 22
List of Tables
Table 1: Acronym Definitions ....................................................................................................... iii
Table 2: Approved and Proposed EQC for Nitrate as N (mg/L) .................................................... 9

Zajdlik & Associates Inc. Page iii 29/09/2019
Table 1: Acronym Definitions
AEMP aquatic effects monitoring program
BC MOE British Columbia Ministry of Environment
CCME Canadian Council of Ministers of the Environment
COPC(s) contaminant(s) of potential concern
EQC effluent quality criteria
GNWT ENR Government of the Northwest Territories Environment and Natural Resources
MVEIRB Mackenzie Valley Environmental Impact Review Water Board
MVLWB Mackenzie Valley Land and Water Board
POPC parameters of potential concern
RO reverse osmosis
SNP surveillance network program
SSWQO(s) site specific water quality objective(s)
TPHs total petroleum hydrocarbons
TSS total suspended solids
WMP water management pond
WTP water treatment plant

Zajdlik & Associates Inc. Page 1 29/09/2019
1 Introduction
Zajdlik & Associates Inc. was retained by the Government of the Northwest Territories,
Environment and Natural Resources (GNWT ENR) to provide technical assistance in the water
licensing process pertaining to closure of the Snap Lake Mine. This document synthesizes
reviews of incremental versions of effluent quality criteria (EQC), hydrodynamic and water
quality modelling and, partial reviews of the final closure and reclamation plan, aquatic effects
monitoring program (AEMP) and AEMP re-evaluation report.
2 General Considerations for Mine Closure
The stated closure objective for surface runoff and seepage water quality for De Beers as of
March, 2019 is to: “ Meet Effluent Quality Criteria (EQCs) in surface discharge to achieve in-
lake site specific water quality objectives (SSWQOs) as described in the approved MVLWB
Water Licence and demonstrated by post closure monitoring for a minimum period of 5 years
after construction of the passive water treatment system” (De Beers, 2019b). Of note is that the
commitment speaks to currently approved EQC and construction of a passive water treatment
system. That commitment is consistent with commitments made during the Environmental
Assessment. That is, “De Beers is committed to reducing residual environmental effects at the
site upon closure” and, “To reduce or eliminate environmental effects once the mine ceases
operations” (MVEIRB, 2003). These statements are specifically considered in the context of
mixing zones (please see §3.1, herein) and EQCs (please see §3.3) and generally, elsewhere.

Zajdlik & Associates Inc. Page 2 29/09/2019
3 Issues - Conflicting
3.1 Mixing Zones
With respect to discharge to the main basin, Golder (2019d §4.1), proposed to use the existing
mixing zone with a radius of 200 and using SNP (surveillance network program) stations SNP
02-20e and SNP 02-20f. The proposal was to drop current SNP stations SNP 02-20d and SNP
02-20g. With respect to discharge to the east arm, Golder (2019d §4.1) proposed to establish
SNP locations on the basis of the “approved” main basin. That mixing zone has a radius of
200m and was established on the basis of flows during the operations period. Comments were
made regarding the size of the proposed mixing zone (MVLWB 2019, GNWT Comment # 78,
79).
Although, predictions regarding achievability at the edge of the 200m mixing zone were
provided in March (Golder, 2019d), it was not until Supplemental Information was released in
July 2019 as a response to the GNWT comments, that the necessity for a 200m mixing zone
could be assessed. In that document several dilution factors were assessed. Using the results
provided for the least amount of dilution, Golder (2019g, §3.2.1) states: “If Sump 3 water was
discharged directly to Snap Lake, predicted parameter concentrations in the main basin of Snap
Lake 50 m from the Sump 3 outfall were below 75% of the AEMP benchmarks, with the
exception of nitrate and total phosphorus (Table 10)”. Examination of Golder (2019g, Table 10)
shows that AEMP benchmarks will not be exceeded for any parameter using a mixing zone of
50m in the main basin. Golder (2019g, Table 13) shows that if a nitrate maximum average
concentration EQC of 25 mg/l (as N) were used, predicted concentrations will be well below the
current AEMP nitrate benchmark within 50m of the sump discharge. Evidence that the current
nitrate maximum average concentration EQC of 12 mg/l (as N) could be met at the edge of a
50m mixing zone in the main basin was not provided. With respect to the Northwest Arm,
Golder (2019g, §3.2.2) states: “If Sump 5 water was discharged directly to Snap Lake, predicted
parameter concentrations in the northwest arm of Snap Lake 50 m from the Sump 5 outfall were
below 75% of the AEMP benchmarks, with the exception of nitrate and total phosphorus (Table
14)”. Examination of Golder (2019g, Table 14) shows that AEMP benchmarks will not be

Zajdlik & Associates Inc. Page 3 29/09/2019
exceeded for any parameter using a mixing zone of 50m in the Northwest Arm. Golder (2019g,
Table 17) shows that if a nitrate maximum average concentration EQC of 25 mg/l (as N) were
used, predicted concentrations will be well below the current AEMP nitrate benchmark within
50m of the sump discharge. Evidence that the current nitrate maximum average concentration
EQC of 12 mg/l (as N) could be met at the edge of a 50m mixing zone in the Northwest Arm was
not provided. The reduction in mixing zone size relative to the operation period is expected due
to the much lower volumes reporting to Snap Lake. Despite being able to meet AEMP
benchmarks within 50m of the sumps Golder (2019g) states: “…mixing zone boundary of no
smaller than 100 m from each of the outfalls is recommended in Snap Lake due to near-field
modelling limitations and uncertainties (e.g., dilution factor predictions accurate to within
±50%).
Subsequent to this, at the July Technical Meeting, Ms. Colleen Prather (De Beers) stated: “For
future discharge locations, we are proposing a 100-metre mixing zone” (Technical Meeting
Transcript July 17th
, pg. 179), which addressed GNWT Comments # 78 and 79 (MVLWB 2019).
However, in August of 2019, Golder (2019c §4.1) again proposed 200 m mixing zones for the
closure period that remain unchanged from the Operations period. Golder (2019c §4.2) states
that the post-closure mixing zone will also be 200m because that is already approved and the
Snap Lake 3D model has a 200m grid size1. The reason for the request to maintain a 200m
mixing zone is that model predictions that reflect De Beers’ decision to not treat water during the
closure period show that AEMP benchmarks can be met with a 200m mixing zone (Golder
2019c, Table 6-8). Golder (2019c, Table 6-10) used predicted rather than measured
concentrations from sumps 3 and 5 to show that the current AEMP nitrate benchmark would be
exceeded in the Northwest Arm, post closure. De Beers did not assess the ability to meet AEMP
benchmarks during closure, in a smaller mixing zone in this later EQC document (Golder 2019c)
and merely asserted that they were necessary.
1 The relevance of this latter point is not clear as the nearfield model has been used to predict nearfield
concentrations.

Zajdlik & Associates Inc. Page 4 29/09/2019
A request from the MVLWB to provide this additional information was met at the September
Technical Workshop (De Beers 2019d). De Beers (2019d Slide 31) shows that is discharge2
occurs at the proposed maximum average concentration of 60 mg/L nitrate (as N), a 200m
mixing zone is required. It is important to understand the rationalization for this proposed
maximum average concentration. Golder (2019c) states: “A nitrate concentration of 60 mg/L as
nitrogen was selected as the MAC EQC. A constant concentration of 60 mg/L as nitrogen could
be discharged from the WMP (water management pond), Sump 3 and Sump 5 while maintaining
nitrate concentrations at the edge of the mixing zones in Snap Lake below the AEMP benchmark
(Tables 6-13-6-16 and Figure 6-6)”. The evidence provided shows that a mixing zone of 200m
is required for the proposed maximum average concentration but; the argument is circular. With
one slight exception3 the evidence provided does not speak to the mixing zone required for the
conservatively predicted concentrations as does De Beers (2019d). It also does not speak to the
expected attenuation of nitrate and other analytes in the sumps over time. Finally, it does not
speak to actual measured concentrations of nitrate and other analytes in the sumps and WMP
(water management pond). Note that measured concentrations of nitrate and other analytes in
the sumps, WMP and location SNP-02-02 were requested from De Beers during the September
technical session but the data provided were incomplete. The potentially most important data are
those which are most recent, as they will demonstrate (or not), attenuation in analyte
concentrations. Data were provided until September of 2018 but data at least for the WMP and
SNP-02-02 are publicly available up to and including July of 2019. Also, the data were provided
in insufficient time4 to assess and include in the assessment of what is achievable versus what is
necessary.
The MVLWB / GNWT (2017) decision criteria for allocating regulated mixing zones, point 1
states that: “The dimensions of the mixing zone must be as small as practicable”. MVLWB /
GNWT (2017) decision criteria for allocating regulated mixing zones, point 3, states that:
“Mixing zones must not be used as an alternative to reasonable and practical pollution prevention
2 It is assumed that discharge is at a constant rate as was the stated case for CORMIX modelling presented in Golder
(2019g). If correct, this is an overprediction as flows are expected to be seasonal. 3 Note that predicted nitrate concentrations in the Norwest Arm in the post closure period only do slightly exceed the
AEMP benchmark (Golder 2019c, Table 6-10). See also §7, herein for a concern regarding predicted concentration
differences between Golder (2019c, Table 6-10) and Golder (2019d, Table 7-7). 4 Information was received the evening of September 26
th but the internal GNWT deadline was September 27
th.
Zajdlik & Associates Inc. Page 5 29/09/2019
practices, including wastewater treatment”. During the September technical session, MVLWB
Staff, K. Harris asked De Beers to provide justification on the 200m mixing zone in relation to
the MVLWB guidance on mixing zone boundaries (De Beers 2019d). The response from De
Beers is that “Mixing zones in the main basin and northwest arm are required because there is
currently no reasonable or practical treatment technology that could be used for a closed Mine to
treat the predicted discharges to Snap Lake to below AEMP benchmarks” (De Beers 2019d,
Table 6-1, Point 3 Rationale). This response does not acknowledge that an operational (and
hence practical) best available, treatment technology is already in place. More importantly, the
response does not acknowledge that it is the predicted water quality following cessation of
treatment during closure5 that drives the requirement for a 200 m mixing zone.
The two sets of EQC presented (Golder 2019c, d) use the same modelling with the only
difference being the omission of water treatment during the closure period (De Beers 2019c Slide
7 (closure), slide 8 (post closure). Although a nitrate maximum average concentration EQC of 25
mg/L was proposed it is likely that a lower EQC could be met. The evidence provided suggests
that a maximum average EQC of less than 25 mg/L (as N) is achievable by continuing to use the
existing best available technology during the closure period. Adoption of a higher maximum
average EQC, especially as high as 60 mg/L (Golder 2019c) circumvents MVLWB / GNWT
(2017) decision criteria for allocating regulated mixing zones, point 3 which states that: “Mixing
zones must not be used as an alternative to reasonable and practical pollution prevention
practices, including wastewater treatment”.
3.1.1 Recommendation
Modelling predictions provided by De Beers show that water treatment using existing best
available technology during the closure period allows AEMP benchmarks to be met within 50m
of the discharge areas. A larger mixing zone should not be used as an alternative to the
reasonable and practical pollution prevention practice currently available on site during the
closure period.
5 This is shown by contrasting slide 7 with slide 8 in De Beers (2019d) where “Before Gravity Fed Collection
System” is equivalent to the closure period and “After Gravity Fed Collection System” is equivalent to the post
closure period.

Zajdlik & Associates Inc. Page 6 29/09/2019
3.2 Selecting Potential Parameters of Concern (POPC)
The provision to consider as potential parameters of concern, those analytes for which
predictions are available (Golder, 2019c §6.1.1), only makes sense if criteria for the list of
analytes for which predictions are made, includes considerations such as loads for nutrients and
bioaccumulative substances, difference from natural background and, potential for adverse
ecological or human health effects. That said, the list of analytes for which predictions are
available, includes all those analytes associated with mining as defined by (MWLWB/GNWT
2017) with the exception of pH, TOC, TPH (total petroleum hydrocarbons), TSS and
Escherichia coli. Of these, the GNWT has expressed concerns regarding TPH. Those concerns
are not re-expressed at this time.
3.2.1 Recommendations
The following recommendations are provided in no particular order.
GNWT ENR should note that TPHs were not identified as potential parameters of
concern because predicted concentrations were not available.
Parameters should not be excluded from the list of potential interest simply because the
“parameter did not have a toxicity-based guideline or an AEMP benchmark”. The list
provided in Golder (2019c) includes: TDS, Ca, Mg, K, Na, total Kjeldahl nitrogen, Be,
Bi, Cs, Li, Rb and Ti. The list of excluded parameters of interest includes Cs, Li, Rb
which as noted by Golder (2019f) are “chemical signatures of the treated Mine effluent”
and, “have increased over time relative to baseline concentrations in Snap Lake”. In 2015
Cs, Th and Sr triggered Low Action Level exceedances on the basis of elevated tissue
concentrations of a magnitude greater than 30 percent (%) relative to the reference lakes
and exceeded the normal range (DeBeers, 2016a).
De Beers should retain Th as a parameter of interest due to 1) the past (2015 and 2018)
Action Level exceedances for tissue residues, and; 2) uncertainty regarding Th loads

Zajdlik & Associates Inc. Page 7 29/09/2019
from the North Pile6 reporting to the WMP, particularly in light of the recent water
management plan to not treat water from the WMP if EQC are met (Golder 2019c; De
Beers 2019c). Monitoring Th in water can be used to contextualize changes in Th levels
in fish tissues and assuage concerns that “fish remain safe to eat” (Please see §7, Point 1c,
herein).
Using the paradigm presented in Golder (2019c Figure 6-1), the only parameter of
interest retained for development of an EQC was nitrate. Golder (2019c) concludes that
“water-quality based EQC only be developed for nitrate for the Closure and Post –
Closure periods. This is reasonable because:
o The POPC is for a Mine in Closure and Post-closure, not an operational Mine.
o Minewater is not being pumped from the underground mine to Snap Lake. As a
result, the annual volume of water discharged from the Mine site to Snap Lake in
Closure and Post-closure is substantially lower than in Operations (Section 2.1).
Consequently, the annual parameter loads discharged from the Mine site to Snap
Lake in Closure and Post-closure are much lower than in Operations. For
example, the chloride loading to Snap Lake was greater than 6,000,000 kg in
2016 and is expected to be approximately 41,000 kg in Post-closure (Section 4.2.4
in Golder 2019f).
o The WMP, Sump 3 and Sump 5 outflows to Snap Lake are short-term and are
projected to occur during the open-water season in freshet and during periods of
rainfall for the Closure and Post-closure period.
6 Golder (2019f, §3.7.3.3) attributes increases in tissue to runoff from the north pile and discharge of minewater.
With respect to Cs and Th, DeBeers (2016b) states: “The largest sources of loading of cesium and thallium to Snap
Lake are the interactions within the underground mine and the North Pile, which discharge via the WTP. The extent
to which the north pile will continue to be a source of metals is not clear as a runoff collection system was in place
prior to the tissue residue action level exceedances. That said, the north pile will eventually be capped which should
reduce infiltration and movement of metals.

Zajdlik & Associates Inc. Page 8 29/09/2019
o Predicted concentrations at the edge of the mixing zones in the main basin and
the northwest arm of Snap Lake are well below benchmarks for parameters other
than nitrate”.
The argument that the POPC list is reasonable for a Mine in Closure and Post-closure
misses the point that if one POPC is being considered, then a precedent has been set and
there is no reason that others cannot be considered. The other arguments speak to
reduced loads, reduced duration of loads and predictions that concentrations will be lower
than benchmarks. While it is correct that loads are lower because Mine operations have
ceased it is also correct that the Mine will continue to release contaminants to the
receiving environment after it is closed. The closure objective for surface runoff and
seepage water quality is to: “ Meet Effluent Quality Criteria (EQCs) in surface discharge
to achieve in-lake site specific water quality objectives (SSWQOs) as described in the
approved MVLWB Water Licence and demonstrated by post closure monitoring for a
minimum period of 5 years after construction of the passive water treatment system” (De
Beers, 2019b). There is no proviso that the analyte list be reduced because the Mine is in
the Post – Closure period. It is recommended that the analyte list used during the
Operations period be maintained during the closure period with a review at the end of the
closure period. At that time, the associated EQCs could be adjusted to reflect the lower
discharge volumes and changes in the mixing zones.
3.3 Effluent Quality Criteria
Effluent quality criteria prescribe “the maximum allowable concentrations or quantities of any
contaminants of potential concern (COPC) in the waste discharge stream” (MVLWB/GNWT
2017). The intent of effluent quality criteria is to ensure that water quality objectives, possibly at
the edge of a regulated mixing zone are met. With respect to Snap Lake, the water quality
objectives are the AEMP benchmarks. As noted by MVLWB/GNWT (2017) “concentrations of
some substances may not comply with water quality objectives that have been set site-
specifically for the receiving environment”. The MVWB/GNWT guidelines do not state that

Zajdlik & Associates Inc. Page 9 29/09/2019
short term maximum average concentrations should be exceeded. Short term maximum water
quality guidelines are defined by BC MOE (2018) as: “Short-term maximum (i.e. “acute”)
WQGs are set to protect against severe effects such as lethality (e.g. LC50) or other equivalent
measures (e.g. EC50) to the most sensitive species and life stage over a defined short-term
exposure period (e.g. 96 hours)”. CCME (2012) defines short term benchmarks as levels “where
severe effects are likely to be observed during brief elevated exposure of a substance in water
(e.g. spill). They do not provide guidance on protective levels of a substance in the aquatic
environment (do not protect against adverse effects)”. The various accepted proposed and EQC
are presented below.
Table 2: Approved and Proposed EQC for Nitrate as N (mg/L)
Maximum Average
Concentration
Maximum Grab
Concentration
Operations (MVLWB 2016) 12 17
Golder (2019 d) Closure 12 17
Golder (2019 d) Post Closure 25 50
Golder (2019 c) Closure 60 80
Golder (2019 c) Post Closure 60 80
There is a steady increase in proposed nitrate EQCs with final proposed EQCs for the Maximum
Average Concentration and Maximum Grab Concentration being 500% and 470% higher
respectively, during post closure than when the Mine was operating. The proposed EQC are
greater than the BC MOE (2009) short-term guideline of 32.8 mg/L as N, but lower than the
CCME (2012) short-term guideline of 124 mg/L as N. The BC MOE (2009) guideline is derived
by applying a 50% safety factor to a toxicity test conducted on Hydropsyche occidentalis;
members of this genus are found in the Northwest Territories (GNWT, 2016). Using this
guideline severe effects are expected in the mixing zone. However, use of the CCME (2012)
guideline, that avoids the use of safety factors, and, uses a more modern species sensitivity
distribution approach, suggests that severe effects would not be observed in the mixing zone.
Zajdlik & Associates Inc. Page 10 29/09/2019
Golder (2019g) acknowledges one limitation of the modelling to date; arguing for a 100 m
mixing zone “due to near-field modelling limitations and uncertainties (e.g., dilution factor
predictions accurate to within ±50%)”. The modelling conducted to date also does not speak to
the expected attenuation of nitrate and other analytes in the sumps over time, nor does it use
actual measured concentrations of nitrate and other analytes in the sumps and WMP. As noted in
§3.1, herein the expansion of the mixing zones in the latest version of EQC derivations is due to
avoiding use of best available technology already in place. For these reasons, the following
recommendation is provided.
3.3.1 Recommendation
The current EQCs in the water licence should be applied to the closure period.
De Beers should collect monthly representative water quality samples from sumps 3 and
5, and the WMP, to assess changes in water quality over the closure period.
At the end of the closure period, this measured water quality should be used as inputs to a
model to predict mixing in the nearfield following closure. The updated modelling could
be used to inform selection of POPC and derivation of EQCs.
3.4 GNWT ENR Comment ID 91 – Hydrodynamic and Water Quality Model
Report, Stability of Generic Concentration Predictions
The GNWT recommended that: “De Beers clarify how the results displayed in Figure 5-2
regarding increasing concentrations Sump 3 and Sump 5 discharge into Snap Lake beyond 2050
relate to specific parameters such as nitrate and how this translates into long-term risk, site
monitoring and water management requirements at the site into the future (i.e. post-closure
period)”. The response provided by De Beers in MVLWB (2019) is that the generic
concentrations are stabilizing and that “If the model simulation time were extended, based on the

Zajdlik & Associates Inc. Page 11 29/09/2019
modelled steady state of loads, concentrations in the lake are projected to remain below AEMP
benchmarks.”
3.4.1 Recommendation
De Beers has not provided sufficient evidence to support the assertion that generic
concentrations are stabilizing. De Beers should extend the prediction period to clearly
demonstrate an asymptote and optimize the presentation scale to show the concentration
asymptote.
4 Issues - At an Impasse
4.1 GNWT ENR Comment ID 102 – Nitrate AEMP Benchmark
Prior to the July Technical meeting, the GNWT recommended that: “De Beers demonstrate the
homogeneity of slopes used to derive the hardness adjustment (MVLWB, 2019, GNWT ENR
Comment ID 102). Failing that, the CCME (2012) guideline of 3.0 mg NO3− - N /L should be
adopted”. De Beers did not address this recommendation but did state that “The SSWQO
derivation methodology (including the evaluation of the homogeneity of the slopes for the
hardness adjustment) was reviewed by three parties (Nautilus Environmental, Rescan, and
Golder Associates; Rescan 2012) and the approach was considered valid”. A citation was
provided for only one of these documents (Rescan, 2012). A review of this document shows that
homogeneity of slopes was not tested as requested.
4.1.1 Technical Meeting (July 17th
, 2019) Request
During the technical meeting (July 17th, 2019) the following question was posed: “Is De Beers
able to address the explicit GNWT recommendation to demonstrate the homogeneity of slopes
used to derive the nitrate hardness adjustment (MVLWB, 2019, GNWT ENR Comment ID

Zajdlik & Associates Inc. Page 12 29/09/2019
102)?” De Beers stated that they will not provide additional information and that the nitrate
guideline has been approved.
4.1.2 Recommendation
The currently proposed nitrate guideline is based on a process that was rejected by CCME
(2012). Based on visual assessment of the data provided in Rescan (2012) it is likely that a
formal test of homogeneity of the slopes of the hardness-toxicity relationships would show that
slopes are not homogeneous. Thus, it is not possible to standardize data without inducing bias in
the SSD datapoints. CCME (2012) examined the slopes of various nitrate-hardness toxicity
relationships and concluded that “As a result, it was decided that the data could not be combined
in order to generate a pooled slope, and there would be no derivation of a hardness-dependent
long-term equation for use in hardness dependent long-term guideline derivation”. A defensible
recommendation is to use the Federally derived and peer reviewed nitrate guideline. The
importance of choosing a defensible nitrate benchmark is highlighted by the proximity of nitrate
predictions to the current AEMP nitrate benchmark (Golder 2019c, Figures 6-2 through 6-4).
5 Issues – Additional Recommendations to GNWT
5.1 GNWT ENR Comment ID 70 – AEMP Design, Fish Tissue Monitoring
The GNWT recommended that: “fish tissue monitoring be continued on a three-year cycle until
low action levels are no longer triggered. The response provided by DeBeers in MVLWB (2019)
is that: “De Beers has committed to conducting a fish tissue monitoring program once during
closure. If there is still a low-action level trigger, then another program will be conducted. If a
low-action level is not triggered, further monitoring is not required”.

Zajdlik & Associates Inc. Page 13 29/09/2019
5.1.1 Recommendation
The cessation of fish tissue monitoring should also require that a statistically significant decrease
in trend is identified or, that primary exposure pathway (aqueous, food, sediment) concentrations
show statistically significantly decreasing trends.
5.2 GNWT ENR Comment ID 93 – Final Closure and Reclamation Plan,
Sediment Mercury
The GNWT recommended that: “that sediment analysis for mercury continue during the
closure/post-closure period until such time that it is indicated mercury levels in Snap Lake are no
longer increasing (with due consideration of mercury trends in reference lakes)”. The response
provided by De Beers in MVLWB (2019) is that sediment sampling will occur in “the next
AEMP study (AEMP study design, Section 6.2.2)”. This sampling event will provide an
opportunity to further assess trends.
5.2.1 Recommendation
The GNWT should assess the temporal trend in sediment mercury when these data become
available.
5.3 GNWT ENR Comment ID 104 – Final Closure and Reclamation Plan –
Monitoring, SNP and AEMP Monitoring Time Frame
GNWT ENR Comment ID 104 (MVLWB, 2019) recommended that: De Beers provide
additional rationale on the relatively short time period proposed for SNP and AEMP monitoring
in relation to the anticipated time of post-closure effects (e.g. 30 years, beyond 2050, etc.).” The
response provided by DeBeers in MVLWB (2019) states that loads are lower than during
Operations and that “The proposed length of time for monitoring is commensurate with potential

Zajdlik & Associates Inc. Page 14 29/09/2019
residual effects”. The purpose of monitoring is not only to assess residual effects but also to
verify that the many model predictions are correct.
5.3.1 Recommendation
It is strongly recommended that SNP monitoring accompany the “monitoring in Snap Lake that
will continue for three years or more, depending on when water quality concentrations have
stabilized or are decreasing” (Golder 2019e).
5.4 GNWT ENR Comment ID 107 – Assessing Compliance with Sulphate
Benchmark
GNWT ENR Comment ID 107 (MVLWB, 2019) recommended that: “De Beers outline how a
single sampling event can assess compliance with the proposed sulphate guideline. Further, the
response should discuss the sampling distribution and how sampling variability will be used to
adjust the BC MOE (2013) sulphate water quality guideline downward to accommodate the
discrepancy between the proposed sampling and the obligatory 30-day sampling requirement.”
The De Beers response is that “average concentrations at the edge of a mixing zone exceed 75%
of the BC MOE water quality guideline during any single sampling event and trigger a Low
Action Level, the response could include additional monitoring. Please also see response to
GNWT-ENR ID 70 and 165”.
Golder (2019e, Table 5.1-1) indicates that a single sample will be collected during the open
water season and once every 3 years during the ice cover season. A single sampling event does
not comply with the requirements of the BC MOE (2013) sulphate water quality guideline. The
De Beers response to GNWT-ENR ID 70 (MVLWB, 2019) discusses two SNP locations which
also do not deal with temporal variability. The De Beers response to GNWT-ENR ID 165
(MVLWB, 2019) discusses reduction in loads over time and does not deal with temporal
variability. The De Beers response does not discuss how the obligatory 30-day sampling

Zajdlik & Associates Inc. Page 15 29/09/2019
requirement for the proposed BC MOE (2013) guideline will be met and is therefore
unacceptable.
5.4.1 Technical Meeting (July 17th, 2019) Request
During the technical meeting (July 17th
, 2019) the following question was posed: “Can De Beers
discuss how a single sampling event can be used to assess compliance with the proposed BC
MOE (2013) sulphate guideline which has an obligatory 30-day sampling requirement?” De
Beers stated that they would avail themselves of provisos from BC MOE regarding compliance
with guidelines. These were reviewed. Although BC MOE (2013) does not speak to this issue
BC MOE (2018) states: “Long-term average (i.e. “chronic”) WQGs are intended to protect the
most sensitive species and life stage against sub-lethal and lethal effects for indefinite exposures.
An averaging period approach is used for these WQGs. This approach allows concentrations of a
substance to fluctuate above and below the guideline provided that the short-term maximum is
never exceeded and the long-term average is met over the specified averaging period (e.g. 5
samples in 30 days).
The averaging period for the long-term average WQG may differ depending on the substance
under investigation and is somewhat arbitrary. These averaging periods were chosen as
reasonable and practical durations to address long-term effects and to fit into monitoring
timetables for provincial agencies. Five samples are considered the minimum needed to calculate
the average; however, in some cases where the concentrations fluctuate widely in nature, more
than 5 samples may be necessary. On the other hand, if concentrations are uniform and rarely
exceed the long-term average guideline, less frequent monitoring may be justified. In this case,
failure of any individual sample to meet the long-term average guideline would serve as an alert
signal to increase the monitoring frequency”.

Zajdlik & Associates Inc. Page 16 29/09/2019
5.4.2 Recommendation to ENR
De Beers committed to providing daily concentrations for sulphate at the Technical Meeting on
July 17th
. These data were provided in the file
“Snap_Lake_Model_Sulphate_Results_Daily_August2019.xlsx” on August 23rd
, 2019. The
maximum observed concentration in the data provided is 46.22 mg/L which is well below the
range of hardness – adjusted AEMP benchmarks (128 to 409 mg/L in Tables 5-1 and 5-2, Golder
2019c). As the predicted sulphate concentrations are low relative to hardness-adjusted
benchmarks, the proposed sampling approach is acceptable. However, if action level 1 is
triggered then more intensive sampling during the open water season will be required. This will
require a minimum of 5 samples / month as discussed in BC MOE (2018).
5.5 Composition of Underground Flow Path Water
Information request #3 from the July Technical hearing was driven by review of the flow paths
presented in Golder (2019d7, Table 3-3). In that document, Flow path 12 (seepage from
underground mine assumed to enter the bottom of Snap Lake) was not included as a COPC
source during the post-closure period. Information Request # 3 was that: “De Beers provide a
3D model prediction to demonstrate the sensitivity to varying concentrations of WTP (water
treatment plant) residuals reporting to Snap Lake via the underground flow path during closure
period”. The equation presented (De Beers 2019d, Equation IR.3) does not include a term for
underground water reporting to Snap Lake. It assumes that all water from the WMP and WTP
report to Snap Lake. Water from these two sources will mix with connate water or a
“minewater-connate water mixture” and then report to Snap Lake.
Based on flow monitoring data in 2018, 24 percent (%) of the water pumped to the underground
mine was from the WTP residuals and 76% was from WMP (De Beers 2019a, IR#3). The
modelling assumes that the ratio of WTP residuals and WMP estimated in 2018 remains
7 The same table (with the addition of flow path 14a) is presented in Golder (2019c).

Zajdlik & Associates Inc. Page 17 29/09/2019
constant. This ratio should decrease over time as less water is treated. The results presented by
De Beers show that:
• Under scenarios 3-5, total phosphorous concentrations will reach or exceed the AEMP
benchmark for total phosphorous at SNAP 03.
• Under scenarios 4-5, total phosphorous concentrations will reach or exceed the AEMP
benchmark for total phosphorous at SNP 02-20e.
When using actual monitoring data, without mathematically increasing concentrations, De Beers
(2019d, Table 3-1, Scenario 1) shows that inputs to the bottom of Snap Lake will exceed AEMP
benchmarks for sulphate, nitrate, as N, total phosphorus, total aluminum, total cobalt and total
iron. Analytes which exhibit toxicity modifying factors for which AEMP benchmarks exist and
could be exceeded include chloride, nitrite as N and Cu. This is of concern because adverse
effects are expected for some aquatic species. It is not known where the modelled discharge
point is and consequently the degree of dilution leading to the reduction in COPCs
concentrations at SNAP 03 and SNP 02-20e (such that only total P exceedances are noted for
some scenarios). It is also not known to what extent this worst-case scenario (direct reporting of
WMP and RO (reverse osmosis) unit residuals to Snap Lake) deviates from actual losses from
the underground workings to Snap Lake. Three considerations for the simulation conducted
remain. These are:
1. If the WTP remains operational during closure, and, if the WTP residual COPC
concentrations are < those from the water management plant, predictions will be biased
downwards (i.e. too low) relative to the scenario where WMP concentrations are
increased in a simulation. WTP concentrations are lower than WMP concentrations for
total ammonia, total Al, total B, Cd, Cr, Co, Mn, Ni and Ag. This observation suggests
that simulations include the situation where WMP concentrations are varied.
2. If the WTP remains operational during closure, and, if the WTP residual COPC
concentrations are > those from the water management plant and ratio of treated water to

Zajdlik & Associates Inc. Page 18 29/09/2019
water from the management plant increases, then predictions will be biased downwards
(i.e. too low).
3. If the WTP remains operational during closure, and, if the combined WTP residuals and
WMP COPC concentrations are > the “minewater-connate water mixture”, predictions
will be conservative; otherwise they will be too low.
The net benefit of treating water that does not meet EQCs and pumping the residuals to the
underground workings (with eventual, assumed displacement to Snap Lake) versus not treating
water and pumping water that does not meet EQCs to the underground workings (with eventual,
assumed displacement to Snap Lake) is not clear. If the former, there is a decreased volume but
increased concentration; in the latter there is an increased volume but decreased concentration.
Under the assumption that any volumes pumped to the underground report directly to Snap Lake,
it is possible that loadings integrated over the closure period would remain the same in either
scenario but that, AEMP benchmarks would be more frequently exceeded and, that exceedances
would be of a larger magnitude when WMP water that does not meet EQCs is treated.
4.1.1 Recommendations
In order to better understand the importance of this closure flow path it would be ideal if De
Beers could:
Provide the location or locations assumed to be the discharge point for the underground
flow path to Snap Lake; and,
Using the CMix concentrations presented in De Beers (2019d, Equation IR.3), provide
maps delimiting the areas in Snap Lake where predicted COPC concentrations exceed
AEMP benchmarks.
Consider simulations where the WMP concentrations are varied.

Zajdlik & Associates Inc. Page 19 29/09/2019
Discuss how the ratio of water treatment plan residuals and WMP volumes changes over
time if water treatment occurs during closure.
Discuss the implications of using 100% WMP water that does not meet EQCs for the “no
treatment during closure” scenario proposed in Golder (2019c).
Given, the current position in the Water License amendment process and, in the absence of this
information GNWT should be aware that the predictions on the public record show that six
AEMP benchmarks which are intended to be protective of chronic effects in the receiving
environment will be exceeded and three AEMP benchmarks that vary with toxicity modifying
factors could be exceeded. Furthermore, GNWT should be aware that not all analytes for which
AEMP benchmarks exist were considered in De Beers (2019d, IR#3). Therefore, it is possible
that additional benchmarks would be exceeded. Given the number of AEMP benchmark
exceedances it is likely that adverse effects will occur during closure if collected surface water
pumped to the underground workings directly reports to Snap Lake. The spatial extent of effects
is unknown as is the potential dilutive effect of waters already within the underground workings.
Note that these effects may already have occurred during the extended care and maintenance
period but a dearth of monitoring data likely precludes assessing potential effects.
6 Issues - Resolved
6.1 Minewater Management Plan During Closure
Golder (2019c, Table 3-3) is contrasted with Golder (2019d, Table 3-3). Model input # 14 in
both versions remains the same but Golder (2019c, Table 3-3) adds model input 14a: WMP
pumping to Snap Lake from January 2020 to December 2025 which was populated using the Site
model. Golder (2019c) notes that: “The WMP is assumed to pump directly into Snap Lake from
2020 to 2026 if WMP parameter concentrations meet EQC. If parameter concentrations in the
WMP do not meet EQC during this time, the water will be treated in the modular WTP+RO unit
before being discharged to Snap Lake”.

Zajdlik & Associates Inc. Page 20 29/09/2019
The primary difference between the Minewater Management plan seems to be that during
closure, water from the WMP will report directly to Snap Lake (Golder, 2019c) instead of being
treated by the WTP plant or RO unit (Golder, 2019d). This difference was clarified by De Beers
(2019c). No further clarification regarding the difference between modelling inputs used in
Golder (2019d) and Golder (2019c) is required.
6.2 GNWT ENR Comment ID 86 – Hydrodynamic and Water Quality Model
Report, Water Management Pond Seepage
The GNWT recommended that: “Water Management Pond seepage into Snap Lake be included
in the Hydrodynamic and Water Quality Model Report and within the model for both the closure
and post-closure periods”. The response provided by DeBeers in MVLWB (2019) is
satisfactorily addresses this recommendation.
7 Modelling Uncertainty
Modelling uncertainty has not been comprehensively reviewed at this time. However, the
uncertainties encountered, during review of other issues, uncertainty are recorded below. At this
point, no recommendations are provided. The uncertainties noted serve to contextualize general
concerns with model predictions and, undue reliance on predictions.
Figures A-1 through A-41 (Golder 2019b) exhibit consistent and substantive
underprediction at Snap 29.
There is a progression in the model’s underprediction of TDS at SNP 02-20e from 2016-
2018 (Golder 2019b Figures A-42 through A-44). In 2018, there is almost a 50%
underprediction of TDS.
There is a progression in the model’s underprediction of TDS at Snap 08 from 2016-2018
(Golder 2019b Figures A-45 through A-47). In 2018, there is more than a 20%
underprediction of TDS.

Zajdlik & Associates Inc. Page 21 29/09/2019
There is a progression in the model’s underprediction of TDS at Snap 29 from 2016-2018
(Golder 2019b Figures A-48 through A-51). In 2018, there is approximately a 10%
underprediction of TDS.
There is a progression in the model’s underprediction of TDS at Snap 06 from 2016-2018
(Golder 2019b Figures A-51 through A-53). In 2018, there is approximately a 15%
underprediction of TDS.
A comparison of predicted 95th
percentile concentrations at the edge of the mixing zone
in the Northwest Arm of Snap Lake Golder (2019c, Table 6-10) and Golder (2019d,
Table 7-7) show that predicted concentrations and AEMP benchmarks that rely on
toxicity modifying factors increase in Golder (2019c). Although not stated this may be a
carry-forward due to not treating water from the WMP during closure.
8 EA Measures
EA measures are presented below for cross-referencing purposes.
1a. The aquatic ecosystem is protected so that fish populations and fish species composition are
not adversely affected compared to pre-mining conditions;
b. Water in Snap Lake is safe to drink according to the health-based standards of Health
Canada’s Guidelines for Canadian Drinking Water Quality (August 2012 edition);
c. Fish are safe to eat in Snap Lake and downstream; and,
d. No Total Dissolved Solids or its constituent ions from the Snap Lake mine effluent will be
detectable, relative to the range of natural variability, at the inlet to Mackay Lake, 44 km
downstream of Snap Lake.

Zajdlik & Associates Inc. Page 22 29/09/2019
9 References
BC MOE (British Columbia Ministry of Environment). 2009. Water Quality Guidelines for
Nitrogen (Nitrate, Nitrite, and Ammonia).
BC MOE (British Columbia Ministry of Environment). 2013. Ambient Water Quality
Guidelines for Sulphate Technical Appendix.
BC MOE (British Columbia Ministry of Environment). 2018. British Columbia Approved Water
Quality Guidelines: Aquatic Life, Wildlife & Agriculture, March 2018.
CCME (Canadian Council of Ministers of the Environment). 2012. Scientific Criteria
Document for the Development of the Canadian Water Quality Guidelines for the
Protection of Aquatic Life: Nitrate Ion. PN 1470.
DeBeers. 2014a. 2013 Annual Report Type A Water License MV2011l2-0004 Snap Lake Mine,
March 2014.
DeBeers. 2016a. De Beers Canada Inc. Snap Lake Mine Aquatic Effects Monitoring Program
2015 Annual Report.
DeBeers. 2016b. De Beers Canada Inc. Snap Lake Mine Thallium and Cesium in Fish Tissue
Response Plan for the Mackenzie Valley Land and Water Board Version 2, April 2016.
De Beers 2018a. 2018 Annual Report Type A Water Licence MV2011l2-0004, Snap Lake Mine,
March 2019 (June 10, 2019 Resubmission).
DeBeers. 2018b. Aquatic Effects Monitoring Program 2017 Annual Report Snap Lake Mine,
Type A Water Licence MV2011L2-0004. May 2018.

Zajdlik & Associates Inc. Page 23 29/09/2019
De Beers. 2019a. Technical Session (July 16 to 18, 2019) Information Request Responses – Snap
Lake Water License (MV2019L2-0004) Application and Final Closure and Reclamation
Plan, August 6, 2019.
De Beers. 2019b. Snap Lake Mine Final Closure and Reclamation Plan, March 2019.
De Beers 2019c. Outstanding Information Effluent Quality Criteria. Technical Workshop. Snap
Lake Mine Final Closure, Water Licence and Land Permit Renewal, September 19th
,
2019.
De Beers 2019d. Snap Lake Water License (MV2019L2-0004) Application and Final Closure
and Reclamation Plan – Technical Workshop (September 19, 2019) – Response to
Follow-up Questions. September 24, 2019.
De Beers 2019e. Snap Lake Mine Monthly Water License Report: July 2019 Water License #
MV2011L2-0004.
GNWT ENR (Government of the Northwest Territories Department of Environment and Natural
Resources). 2016. NWT Species 2016-2020: General status ranks of wild species in the
Northwest Territories.
Golder. 2019a. Snap Lake Mine Snap Lake Hydrodynamic and Water Quality Model Report.
Submitted to De Beers Canada Inc., March 2019.
Golder. 2019b. Snap Lake Mine Snap Lake Hydrodynamic and Water Quality Model Report -
Version 2. Submitted to De Beers Canada Inc., August 2019.
Golder. 2019c. Snap Lake Mine Effluent Quality Criteria Report for Closure and Post Closure -
Version 2, August 2019.

Zajdlik & Associates Inc. Page 24 29/09/2019
Golder. 2019d. Snap Lake Mine Effluent Quality Criteria Report for Closure and Post Closure.
Submitted to De Beers Canada Inc., March 2019.
Golder. 2019e. 2019 Aquatic Effects Monitoring Program Design Plan for Closure and Post-
closure, Version 0. Submitted to De Beers Canada Inc., March 2019.
Golder. 2019f. 2018 Aquatic Effects Re-evaluation Report - Snap Lake. Submitted to De Beers
Canada Inc., March 2019.
Golder. 2019g. Near-Field Mixing of Outflows from Sump 3 And Sump 5 In Snap Lake,
Technical Memorandum, Prepared for De Beers Canada Inc. July 3, 2019.
MVEIRB (Mackenzie Valley Environmental Impact Review Water Board). 2003. Report of
Environmental Assessment and Reasons for Decision on the De Beers Canada Mining
Inc. Snap Lake Diamond Project.
MVLWB (Mackenzie Valley Land and Water Board). 2011. Water and Effluent Quality
Management Policy.
MVLWB (Mackenzie Valley Land and Water Board). 2015. Water Licence MV2011 L2-0004
Amendment - September 16, 2015.
MVLWB (Mackenzie Valley Land and Water Board). 2019. De Beers Canada Inc. - Snap Lake
- Water Licence Renewal and Land Use Permit Amendment Application (MV2019L2-
0004 and MV2017D0032) Comment Table.
MVLWB/GNWT (Mackenzie Valley Land and Water Board / Government of the Northwest
Territories). 2017. MVLWB/GNWT Guidelines for Effluent Mixing Zones.

Zajdlik & Associates Inc. Page 25 29/09/2019
Rescan (Rescan Environmental Services Ltd.). 2012. Ekati Diamond Mine. Site-Specific Water
Quality Objective for Nitrate. 2012. Prepared for BHP Billiton Canada Inc. Yellowknife,
NT, Canada.

Appendix B: Brodie Consulting Ltd. – Technical Memorandum

Review of DeBeers Snap Lake Mine 2019 Final Closure and Reclamation Plan
Prepared By:
Brodie Consulting Ltd. 8627 Seascape Drive
West Vancouver, B.C. V7W 3J7
Prepared For:
Government of the Northwest Territories Environment and Natural Resources
September 27, 2019

Snap Lake FCRP Review September 27, 2019
Contents 1 Introduction .............................................................................................................................. 1
2 Comments Regarding Water Management and Modeling ....................................................... 1
2.1 Summary of Water Management ....................................................................................... 1
2.2 Water Management - Pumping Water to Underground ..................................................... 1
2.3 North Pile Inflows to Snap Lake ....................................................................................... 5
2.4 Mixing Zone and AEMP Benchmarks .............................................................................. 7
2.5 Number of Proposed Mixing Zones .................................................................................. 7
2.6 Decrease in Concentrations in Sump 3 and Sump 5 Overflow ......................................... 8
2.7 Hydrodynamic Model Calibration ..................................................................................... 9
3 Other Comments ...................................................................................................................... 9
3.1 Total Quantity of Materials in North Pile and Mitigation for PAG Material .................... 9
3.1.1 Total Quantity .......................................................................................................... 10
3.1.2 Approximate Placement ........................................................................................... 10
3.1.3 Mitigation ................................................................................................................. 11
3.2 West Cell Divider Dyke .................................................................................................. 11
3.3 Organics Stockpile ........................................................................................................... 12
4 References .............................................................................................................................. 12
Snap Lake FCRP Review September 27, 2019
______________________________________________________________________________________________
Brodie Consulting Ltd. Page 1 of 15
1 INTRODUCTION
De Beers Canada Inc. (De Beers) submitted an application for a Type A Water Licence to renew
De Beers' current Water Licence MV2011L2-0004. The purpose of the Application is to support
the closure and post-closure phases of the Snap Lake Mine. Technical Sessions were held July 16
- 18, 2019. An Effluent Quality Criteria (EQC) Technical Workshop was held September 19,
2019.
GNWT Environment and Natural Resources (ENR) retained Brodie Consulting Ltd. (BCL) to
provide support in review of the Snap Lake Mine Final Closure and Reclamation Plan (FCRP, De
Beers 2019a) and select Appendices. BCL retained Katie Jones of Mavin Terra Solutions to assist
in the review of the water quality models submitted by De Beers in association with the
Application. The comments and recommendations provided in this document are for ENR's
consideration in written Interventions to the Mackenzie Valley Land and Water Board
(MVLWB) for renewal of De Beers' Licence.
In general the comments that are contained in this report are quite lengthy in order to summarize
our understanding gained from the Technical Session, review of various documents, and the EQC
Technical Workshop.
2 COMMENTS REGARDING WATER MANAGEMENT AND MODELING
2.1 Summary of Water Management
De Beers have presented a number of options to manage surface and groundwater in the Snap
Lake Mine Water Management Plan V.4 (De Beers 2019b). These include pumping untreated
water from the Water Management Pond (WMP) to the underground, treating water in the
modular water treatment plant/reverse osmosis (WTP/RO) system commissioned in 2018 with
water treatment residuals pumped underground, pumping water that meets EQCs from the WMP
to Snap Lake via the diffuser, and once constructed, allowing water to flow passively from the
North Pile to proposed Influent Storage Ponds (West and East). If necessary, Constructed
Wetland Treatment Systems (CWTS) would be constructed such that water would flow passively
via the CWTS from the ISPs to Snap Lake.
De Beers have provided a series of linked predictive models and reports that reflect the current
and planned management and/or treatment of surface water. From these predictions, De Beers
have proposed EQCs and mixing zone boundaries intended to achieve Aquatic Effects
Monitoring Plan (AEMP) benchmarks at the edge of the proposed mixing zone.
2.2 Water Management - Pumping Water to Underground
BCL and ENR have raised a number of questions regarding potential risks to Snap Lake water
quality that may arise from De Beers' water management plan to pump untreated water from the
WMP and water treatment residuals to the underground. The questions have generally focused on
the following:
1. How likely is it that water from the WMP and WTP/RO residuals that is pumped to
the underground will report to Snap Lake.
2. Whether the existing and proposed monitoring stations are located in the vicinity of
the water return line points of discharge, or to known zones of higher hydraulic
connectivity between the underground and the lake, such that changes due to inputs
from the underground could be detected at those locations.

Snap Lake FCRP Review September 27, 2019
______________________________________________________________________________________________
Brodie Consulting Ltd. Page 2 of 15
3. How the Snap Lake water quality model incorporates water and residuals pumped
to the underground.
To help answer these questions, sections of the following documents have been reviewed:
De Beers provided response to Technical Session IR2 (De Beers 2019c) that included a
figure showing the extent of the underground ramp and workings, the approximate
locations of the water return lines for discharge of water management pond water and
reverse osmosis treatment plan residuals and SNP stations.
De Beers provided a slide deck titled Underground Water Modeling References -
MVLWB Technical Session July 16 to 18, 2019 (De Beers 2019d). The slide deck
included a report by Itasca (December 2013) titled Snap Lake Groundwater Flow Model
Meeting Presentation as well as a presentation titled Snap Lake Water Licence
Amendment Application Overview April 15, 2014 that includes a figure showing
structural geology and "water hit areas" encountered during mining.
The Memorandum by Itasca of April 13, 2016 titled Predictions of Mine Water Seepage
and Concentrations of Total Dissolved Solids at Snap Lake Mine Under Care and
Maintenance Conditions included as Appendix IIIA of Extended Care and Maintenance
Plan Version 1.
It is understood from the information reviewed that:
The entry elevations of the mine portal and conveyor portal are 5,444 and 5,460
respectively (mine elevations are masl plus 5,000)
The WMP return line and RO residual return line are shown at depths of 300 and 400
mbgs respectively
There is a spatial distance of more than 550 m horizontal and ~ 100 m vertical between
the WMP return line and RO residual return line
The total void volume is 2,939,597 m3. The void volume from 5,151 to 5,450 (~300 m
below the portals) is 2,141,506 m3 (i.e. majority of workings are above 300 m depth)
Extensive faulting was identified, some of which were described to be sufficiently large
that grouting was considered impractical
The hydraulic connection of fractures was difficult to assess
Based on this information, our current understanding of the questions that have been outlined
above is as follows:
1. How likely is it that water from the WMP and WTP/RO residuals that is pumped to the
underground will report to Snap Lake.
It is reassuring to learn that there is a spatial distance of more than 550 m horizontal and ~ 100 m
vertical between the WMP return line and RO residual return line. It had not been apparent that
the return lines were separated and concern was that the two streams would mix at the point of
discharge. Furthermore, at the depths of 300 and 400 mbgs, and the distance away from the
portal, it is of less concern that pumping water underground is akin to direct discharge of surface
water into Snap Lake.

Snap Lake FCRP Review September 27, 2019
______________________________________________________________________________________________
Brodie Consulting Ltd. Page 3 of 15
In addition, response to Technical Session IR4 (De Beers, 2019d) indicates that a volume of
145,000 m3 was pumped from the WMP to the underground in 2018. This represents ~ 7% of
the total void volume between the elevation of the WMP return line point of discharge and the
portal elevation. Which suggests that it would be a number of years before sufficient volumes of
water would be displaced in the underground such that surface water would be impacted.
Therefore, BCL does not view the discharge of untreated water from the WMP, or water
treatment residuals to the underground as posing a risk to Snap Lake. At least not in the context
of the anticipated duration for which pumping is planned.
2. Whether the existing and proposed monitoring stations are located in the vicinity of the water
return line points of discharge, or to known zones of higher hydraulic connectivity between the
underground and the lake, such that changes due to inputs from the underground would be
detected at those locations.
Predicting where untreated water and brine would possibly report to in Snap Lake and/or within
the underground workings would be difficult. Monitoring of the minewater at the portals would
detect changes that may be a result of water being displaced upward but the main access portal
has been backfilled and the conveyor portal will be as part of closure. De Beers has responded in
a previous comment which was made by ENR in 2018 based on review of the Extended Care and
Maintenance Plan Version 2 (ENR Comment ID2, MVLWB, 2018):
The quality of the lake is monitored as part of the SNP program at 6 stations within the
main lake basin. Of these stations, SNP Station 02-20 contains three sample locations
around the lake discharge diffuser and they are effectively immediately down slope of the
mine. Another three stations are situated on the main basin and form part of the Aquatic
Effects Monitoring Plan. Any change in lake water chemistry would be observed in these
SNP station and would trigger the action response plan.
Similarly, we are not suggesting that stations could be better located to detect potential changes
due to inflows from the underground to Snap Lake.
3. How the Snap Lake water quality model incorporates water and residuals pumped to the
underground.
The conceptual model for the Snap Lake Hydrodynamic and Water Quality Model Report
(Golder, 2019a) assumes the water that is pumped underground from the WMP reports to the
bottom of Snap Lake with the same volume and without any change in concentration. This is
conservative in terms of potential loading to Snap Lake. However, the result is that the
concentrations of parameters in Snap Lake would be higher than if it is assumed that that water
would not directly report to Snap Lake. These concentrations in turn drive both the AEMP
benchmarks and the achievability of those benchmarks, as will be discussed in Section 2.4. As for
the water treatment residuals, it seems reasonable to assume that the brine would remain at depth,
which is consistent with how this stream is considered in the Snap Lake Hydrodynamic and
Water Quality Model.
Section 2.5.5 of the Water Management Plan V.4 (De Beers 2019b) states that:

Snap Lake FCRP Review September 27, 2019
______________________________________________________________________________________________
Brodie Consulting Ltd. Page 4 of 15
Water that does not meet EQC will be directed to the water treatment plant. If the
discharge rate is less than 4,000m3/day, water will be directed to the underground using an
existing pipeline, and as deep as can practically be achieved; if the discharge rate is more
than 4,000 m3/day, treated water will be discharged to Snap Lake via the submersed
diffuser or spillway.
In the Site, Snap Lake, and Downstream Lakes Water Quantity Model Report (Golder 2019b) the
assumption was made that the pump rate is 2,000 m3/day during the non-winter season.
Although there seems to be some discrepancy between this and the Monthly Water Balance
included as Appendix A of the Water Management Plan V.4.
Summary
While not a hydrogeological assessment, based on the information reviewed, De Beers' plan to
continue to pump untreated surface water to the underground for a limited number of years is not
considered a high risk to Snap Lake water quality. BCL concurs with the Board staff
recommendation (ENR Comment ID2, MVLWB, 2018) that De Beers ensure that AEMP annual
reporting specifically and adequately accounts for potential aquatic effects of high-TDS water
entering Snap Lake via the underground.
We do think it is important however for it to be clear that pumping untreated water underground
has been De Beers’ primary method of water management despite many of the documents
reviewed giving the impression that surface water pumped to the WMP is treated and discharged
to Snap Lake. According to Table 4-1 of De Beers’ response to Technical Session IR4, 29,720 m3
was treated and discharged to Snap Lake in 2018 and 144,808 m3 was pumped from the WMP to
underground. The total volumes for 2019 are only to the end of July. If water treatment had been
completed by that time, then 11,070 m3 was discharged as treated water and over 94,506 m
3 of
untreated water was pumped from the WMP to the underground.

Snap Lake FCRP Review September 27, 2019
______________________________________________________________________________________________
Brodie Consulting Ltd. Page 5 of 15
Recommendation
As has been recommended by the Board (response to ENR Comment ID2, MVLWB 2018)
it is recommended that De Beers ensure that AEMP annual reporting specifically and
adequately accounts for potential aquatic effects of high-TDS water entering Snap Lake via
the underground.
2.3 North Pile Inflows to Snap Lake
Two primary concerns for the predicted quality of North Pile inflows to Snap Lake arise from the
Site Water Quality Model (Golder, 2019c) assumptions:
The potential that the model assumptions result in diluting concentrations from the
North Pile runoff and seepage.
The assumption in the Site Water Quality Model that the two months of highest flows
from the North Pile, May and June, have been assigned a water chemistry considered
representative of the rock cover (75th percentile of SNP 02-05) following closure of the
North Pile (2023 in the model), which has lower concentrations in comparison to North
Pile seepage and runoff (75th percentile of SNP 02-02) during those same months. This
is an optimistic assumption.
These points are elaborated upon in the following paragraphs.
Bullet 1
SNP 02-02 represents all water collected from the Perimeter Water Collection System (PWCS),
including seepage and runoff from the North Pile, runoff from catchment areas other than the
North Pile, and direct precipitation. Therefore, there is dilution of seepage and runoff from the
North Pile inherent in measured concentrations at this location. When this water chemistry is then
assigned only to inflow from the North Pile to the sumps, and other sources contributing to
inflow to the sumps are assigned a water chemistry of Stream 1 (undeveloped), dilution of
concentrations from the North Pile are overlapped. This dilution is quantified with an example
from the monthly base water balance estimates provided as Attachment A of IR#8. For the year
2018, catchment area runoff plus precipitation into Sumps 1, 2, 3, 4 and 5 accounts for 48%,
83%, 38%, 50%, 62% of total inflows respectively. Stream 1 water chemistry (or SNP 02-05
water chemistry, it isn't clear) is applied to these sump inflows. The concern is then that
concentrations from North Pile inflows are being diluted by 2x or more.
Bullet 2
De Beers has assumed for the conceptual model that once the North Pile has been reconfigured
and the cover placed, water will sheet off and not infiltrate into or otherwise interact with
processed kimberlite. The basis for this assumption is that the processed kimberlite below the
rock cover will be frozen. Therefore, for May and June, once the cover is placed (2023 in the
model) the water chemistry of the runoff is assigned a water chemistry of SNP 02-05. From July
to April the water chemistry is that of SNP 02-02. We have not done a comparison for all
parameters, but in general, the water chemistry at SNP 02-05 is relatively clean compared to the
water quality from the North Pile seepage and runoff monitored in the sumps and at SNP02-02
for those months.
Section 3.3.2.3 North Pile of the Site Water Quality Model Report (Golder 2019a) also
recognizes this assumption to be a key influencing factor:

Snap Lake FCRP Review September 27, 2019
______________________________________________________________________________________________
Brodie Consulting Ltd. Page 6 of 15
Key influencing factors related to North Pile runoff include:
o The assignment of typical site runoff chemistry (from SNP 02-05) to the North Pile
runoff during May and June. This is considered reasonable since the cover material
will be composed of similar granitic materials as the overall site, and since, due to
freezing of the active layer, the processed kimberlite below the cover materials will
remain frozen during winter and through May and June. This assumption will need
to be confirmed once the cover is in place. Once this layer has melted, the runoff is
assumed to infiltrate into, or otherwise interact with the processed kimberlite and is
therefore assigned the SNP 02-02 chemistry for the remainder of the year.
We agree that the closure design will convey more water off the North Pile. It also isn't
unreasonable to expect the fine PK at surface to remain frozen through much of May and June.
However given the assumption that inflow from the North Pile will have a water chemistry
similar to that monitored at SNP 02-05, and the resultant significant change to the water
chemistry from the North Pile during the months of peak flow, De Beers should be able to
provide the following information:
Demonstrate that the depth of thaw is not expected to extend beyond 0.3 m by the end of
June. We expect that it will, particularly in coarser grained material where the moisture
content is low such as embankments, rib berms, and where processed kimberlite is used
as transition materials.
Updates on the expected time for freeze back of the North Pile as seepage from unfrozen
portions of the pile during May and June will be occurring for several years to come.
A sensitivity analysis that places bounds on the impact variations that this assumption
has to concentrations in the WMP during closure and Sump 3 and Sump 5 overflow
during post-closure.
Summary
We do not have sufficient information to know the impacts these assumptions have on the
predicted concentrations in the WMP during closure and Sump 3 and Sump 5 overflow during
post-closure. As such, it is unknown how many of the parameters would still be screened out with
the EQC screening process that was undertaken in the EQC Report for Closure and Post-Closure
(Golder, 2019). This provides further justification for maintaining EQC's in the interim until the
North Pile is closed and monitoring of actual concentrations can be carried out.
In future updates to models, a sensitivity analysis would be useful in placing bounds as to how
much of an impact the water chemistry assigned to the inflows from the North Pile will have to
predicted concentrations in Snap Lake given that this was identified in the report as a key
influencing factor. That the chemistry of inflows from the North Pile are being diluted in the
model should also be considered.
Recommendation
Future updates to the Site Water Quality Model should include:
Thermal monitoring assessments, including the depth of thaw and the time for the
North Pile to freeze, to better support the assumption that there will be a
substantially reduced contribution from processed kimberlite to loading during
May and June with placement of the cover.

Snap Lake FCRP Review September 27, 2019
______________________________________________________________________________________________
Brodie Consulting Ltd. Page 7 of 15
A sensitivity analysis with a scenario that assigns SNP 02-02 water chemistry to
May and June seepage and runoff from the North Pile Perimeter Water Collection
System (i.e. combined inflows of all sources to PWCS) for some time after the cover
is placed.
Consideration that concentrations measured at SNP02-02 includes sources other
than North Pile seepage and runoff to avoid layering of dilution to predicted
concentrations.
2.4 Mixing Zone and AEMP Benchmarks
De Beers’ updated Snap Lake Hydrodynamic and Water Quality Model Report (Golder 2019a)
proposed a 200 m mixing zone boundary and EQCs for nitrate of 60 mg/L maximum average and
80 mg/L maximum grab. In part, these concentrations have been proposed as being driven by
achievability. However, it is noted that some of the assumptions that have been made in the
linked models, and described in the reports as being conservative, result in predicted
concentrations being potentially higher than they likely will be. These are:
Maintaining a constant concentration of 60 mg/L nitrate for the duration of the model
timeframe (to 2050) rather than assume some attenuation with freezing of the North Pile
or flushing of nitrate. Note: The Site Water Quality Model (Golder, 2019c) assumed a
flushing of major ions, TDS, nitrate, nitrite, manganese, and total alkalinity from the
embankment slowly over the span of 30 years.
Maintaining concentrations of all other parameters at the 95th percentile of model
predictions (even if the model predictions are not conservative as suggested in the
previous Section, it is expected that for most parameters concentrations from the North
Pile will decline over time).
Assuming all water pumped underground from the WMP reports to Snap Lake in the
model. It is recognized that this avoids having to demonstrate certainty as to the ultimate
transport and fate of water pumped to the underground. However, De Beers has
expressed the opinion that water that is pumped underground will not re-surface.
Recommendation
It is recommended that the tradeoff between conservative assumptions in the models, which
have the effect of potentially over predicting concentrations in Snap Lake, versus
achievability be considered carefully in the development of EQCs and the mixing zone
boundary. Both could be lower if concentrations have been over-predicted by way of
conservative assumptions.
2.5 Number of Proposed Mixing Zones
De Beers has indicated that the closure Perimeter Water Control System (PWCS) and Influent
Storage Ponds (ISPs) could not be constructed to allow for passive flow to one discharge
location. Both an East and West ISP are planned to be constructed. Based on this, De Beers
proposed two 200 m mixing zones for post-closure. During the EQC Workshop, De Beers
indicated that the scenario could exist whereby water was being pumped from the WMP to Snap
Lake via the diffuser concurrently with flow from the two ISPs and therefore the existing 200 m
mixing zone from the diffuser would also be maintained resulting in three mixing zones. BCL
notes that a fourth point of discharge is to the underground for the duration of time that this is
planned.
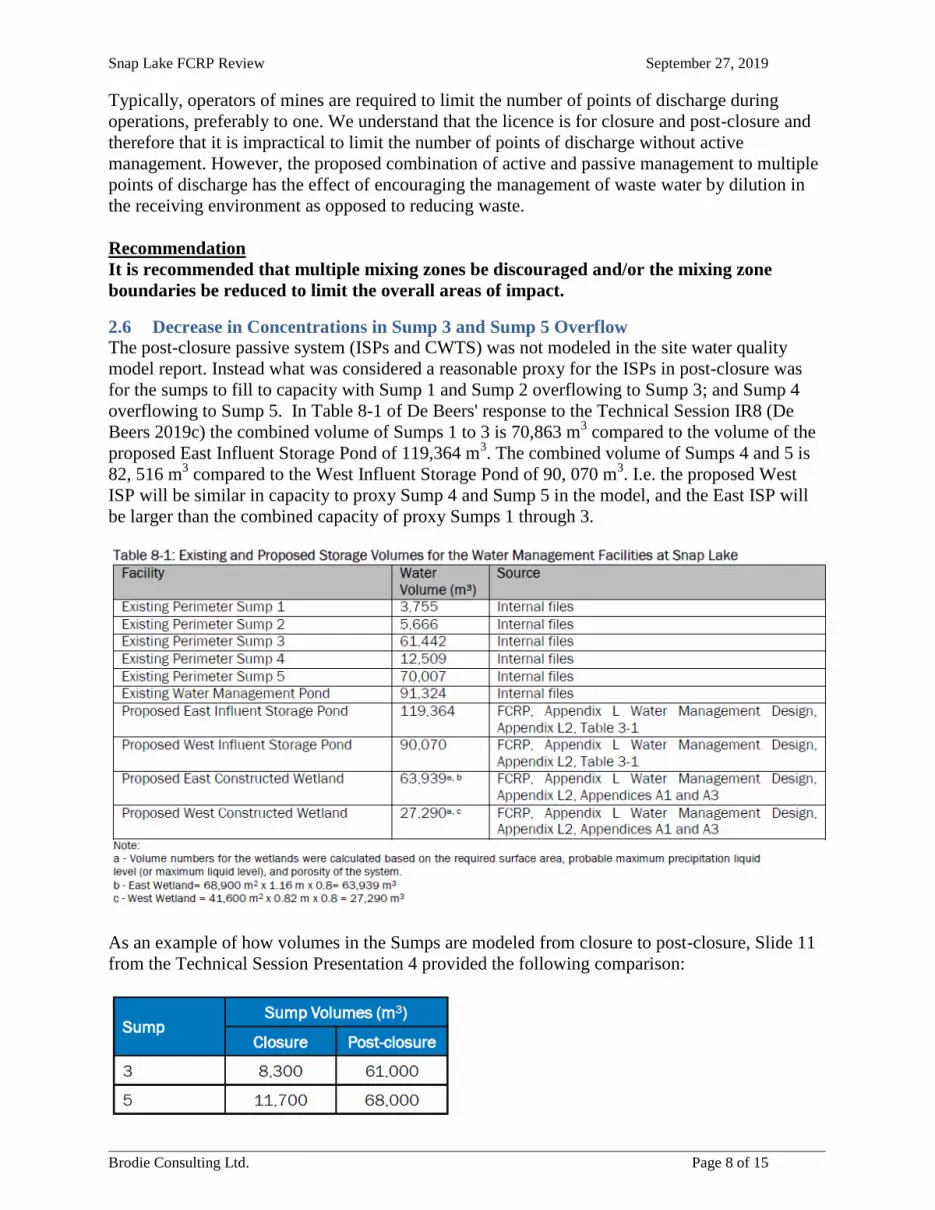
Snap Lake FCRP Review September 27, 2019
______________________________________________________________________________________________
Brodie Consulting Ltd. Page 8 of 15
Typically, operators of mines are required to limit the number of points of discharge during
operations, preferably to one. We understand that the licence is for closure and post-closure and
therefore that it is impractical to limit the number of points of discharge without active
management. However, the proposed combination of active and passive management to multiple
points of discharge has the effect of encouraging the management of waste water by dilution in
the receiving environment as opposed to reducing waste.
Recommendation
It is recommended that multiple mixing zones be discouraged and/or the mixing zone
boundaries be reduced to limit the overall areas of impact.
2.6 Decrease in Concentrations in Sump 3 and Sump 5 Overflow
The post-closure passive system (ISPs and CWTS) was not modeled in the site water quality
model report. Instead what was considered a reasonable proxy for the ISPs in post-closure was
for the sumps to fill to capacity with Sump 1 and Sump 2 overflowing to Sump 3; and Sump 4
overflowing to Sump 5. In Table 8-1 of De Beers' response to the Technical Session IR8 (De
Beers 2019c) the combined volume of Sumps 1 to 3 is 70,863 m3 compared to the volume of the
proposed East Influent Storage Pond of 119,364 m3. The combined volume of Sumps 4 and 5 is
82, 516 m3 compared to the West Influent Storage Pond of 90, 070 m
3. I.e. the proposed West
ISP will be similar in capacity to proxy Sump 4 and Sump 5 in the model, and the East ISP will
be larger than the combined capacity of proxy Sumps 1 through 3.
As an example of how volumes in the Sumps are modeled from closure to post-closure, Slide 11
from the Technical Session Presentation 4 provided the following comparison:

Snap Lake FCRP Review September 27, 2019
______________________________________________________________________________________________
Brodie Consulting Ltd. Page 9 of 15
As per BCL's request, De Beers provided additional explanation as to why the predicted open
water concentrations in the Sump 3 and Sump 5 overflow are expected to decrease in post-closure
in Response 5 of the EQC Technical Session follow up package. It is still not clear what the
source of dilution is as the catchment area and precipitation remain the same in the model, and it
is only that the sumps are allowed to fill. Which, if the passive North Pile water management
system is designed to minimize interception of sources other than from the North Pile, could
potentially fill with water having much the same water chemistry as from the North Pile. In any
case, it will be important to monitor concentrations in the sumps or ISPs as they fill in order to
validate predictions.
Recommendation
It is recommended that monitoring of the sumps or ISP's as they fill be used to validate site
water quality model predictions.
2.7 Hydrodynamic Model Calibration
Based on Figures A-42 to A-44 of Attachment A: Snap Lake Model Calibration Results of the
Snap Lake Hydrodynamic and Water Quality Report (Golder, 2019a), it was observed that
concentrations of TDS at depth at SNP-2-20e (main basin diffuser area edge of mixing zone)
during the open-water season have increased year over year since 2016 and more closely remain
at the ice-covered concentrations.
It was also observed in Figures A-45 to A-47 that at SNAP 08 (outlet of Snap Lake) the model
tended to over predict TDS concentrations in 2016, accurately predict concentrations in 2017, and
under predict TDS concentrations in 2018.
It is recognized that there are a number of explanations for this observed trend, and that it may be
linked to the time of monitoring (i.e. seasonality), model calibration, and model validation. The
model calibration was developed for two scenarios, one of which reduced the natural runoff
volumes to Snap Lake in 2013, 2014, and 2015 by 50% compared to the natural runoff volumes
from the Snap Lake water balance model. This reduction was not carried forward for future years
of the model and the reason for the temporary reduction was only described as unexpected.
Therefore, it is unclear if the reduction could occur again in the future and furthermore, how
sensitive the model predictions are to this input.
It is understood that continued monitoring of natural runoff volumes to Snap Lake is underway
and is of greater importance as an input to Snap Lake following cessation of discharge of much
larger operational volumes.
Recommendation
Continue to refine the calibration of the hydrodynamic model with ongoing monitoring.
Ensure that if the lake is not mixing or flushing as predicted, or that if increasing trends are
observed, that this is reflected in updates to the model. Continue to collect TDS profiles of
the Lake to evaluate stratification and potential for flow from the underground to the Lake.
3 OTHER COMMENTS
3.1 Total Quantity of Materials in North Pile and Mitigation for PAG Material
De Beers provided response to IR10 of the Technical Session, with the "total quantity of all
material, including Potentially Acid Generating (PAG) and non-PAG, and the PAG material’s
approximate placement location in the North Pile."
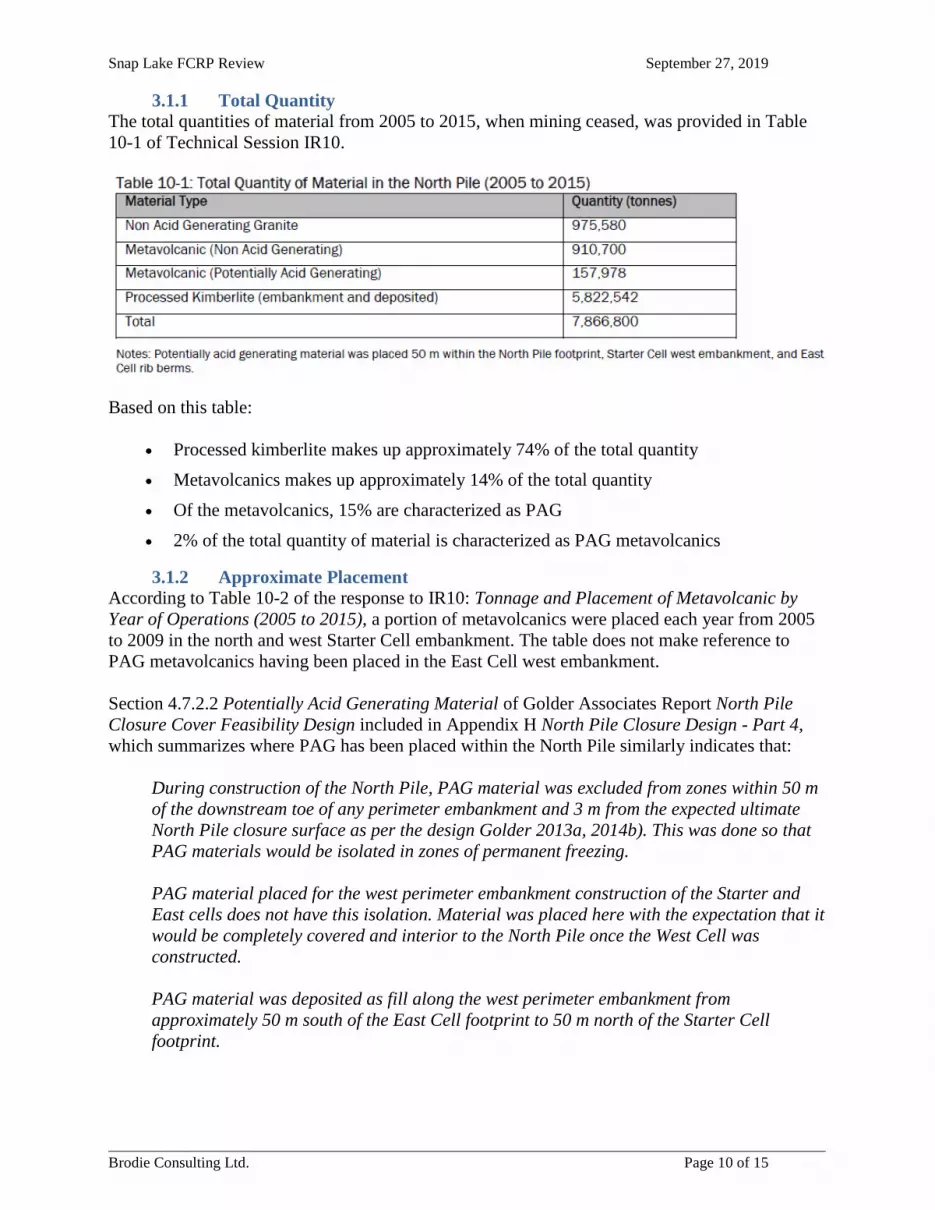
Snap Lake FCRP Review September 27, 2019
______________________________________________________________________________________________
Brodie Consulting Ltd. Page 10 of 15
3.1.1 Total Quantity
The total quantities of material from 2005 to 2015, when mining ceased, was provided in Table
10-1 of Technical Session IR10.
Based on this table:
Processed kimberlite makes up approximately 74% of the total quantity
Metavolcanics makes up approximately 14% of the total quantity
Of the metavolcanics, 15% are characterized as PAG
2% of the total quantity of material is characterized as PAG metavolcanics
3.1.2 Approximate Placement
According to Table 10-2 of the response to IR10: Tonnage and Placement of Metavolcanic by
Year of Operations (2005 to 2015), a portion of metavolcanics were placed each year from 2005
to 2009 in the north and west Starter Cell embankment. The table does not make reference to
PAG metavolcanics having been placed in the East Cell west embankment.
Section 4.7.2.2 Potentially Acid Generating Material of Golder Associates Report North Pile
Closure Cover Feasibility Design included in Appendix H North Pile Closure Design - Part 4,
which summarizes where PAG has been placed within the North Pile similarly indicates that:
During construction of the North Pile, PAG material was excluded from zones within 50 m
of the downstream toe of any perimeter embankment and 3 m from the expected ultimate
North Pile closure surface as per the design Golder 2013a, 2014b). This was done so that
PAG materials would be isolated in zones of permanent freezing.
PAG material placed for the west perimeter embankment construction of the Starter and
East cells does not have this isolation. Material was placed here with the expectation that it
would be completely covered and interior to the North Pile once the West Cell was
constructed.
PAG material was deposited as fill along the west perimeter embankment from
approximately 50 m south of the East Cell footprint to 50 m north of the Starter Cell
footprint.
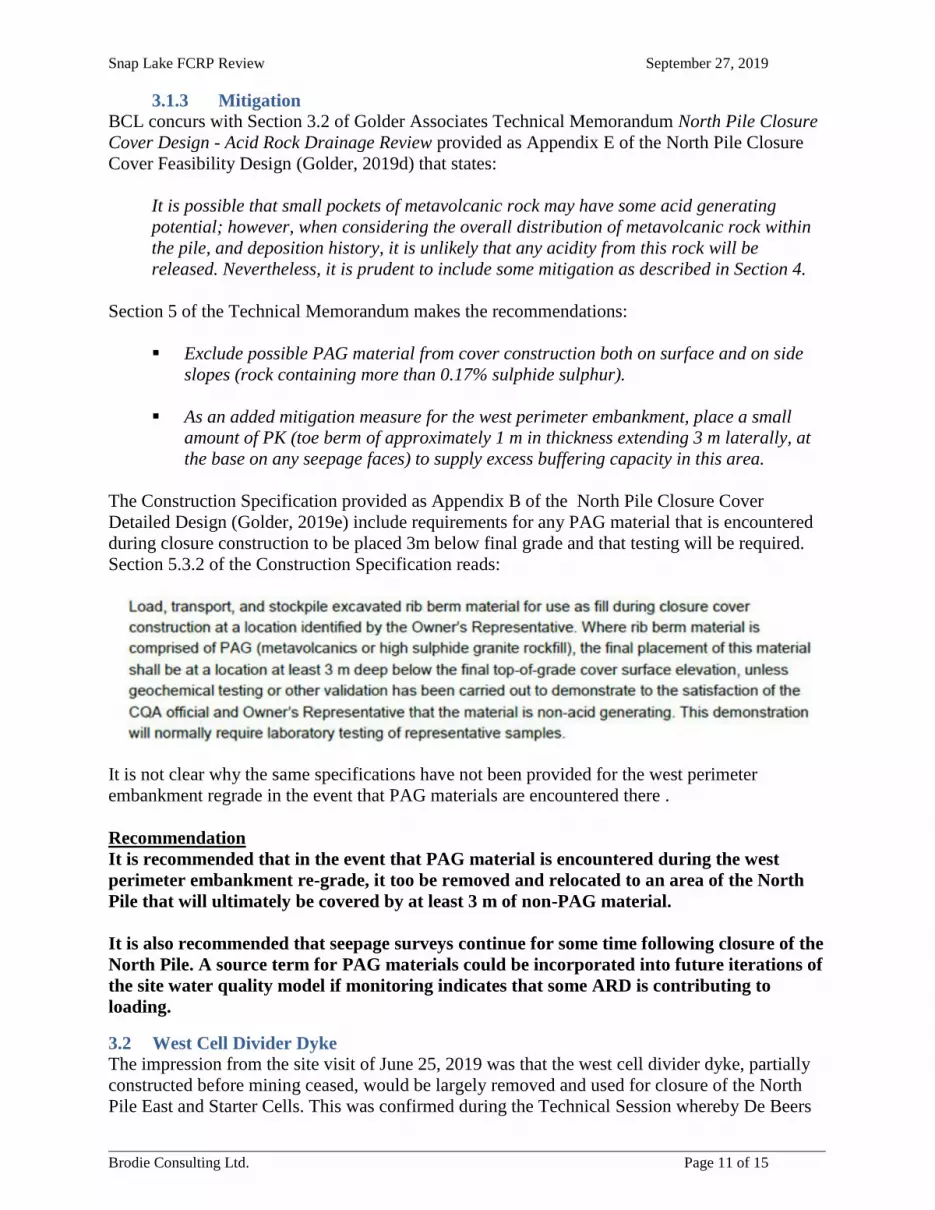
Snap Lake FCRP Review September 27, 2019
______________________________________________________________________________________________
Brodie Consulting Ltd. Page 11 of 15
3.1.3 Mitigation
BCL concurs with Section 3.2 of Golder Associates Technical Memorandum North Pile Closure
Cover Design - Acid Rock Drainage Review provided as Appendix E of the North Pile Closure
Cover Feasibility Design (Golder, 2019d) that states:
It is possible that small pockets of metavolcanic rock may have some acid generating
potential; however, when considering the overall distribution of metavolcanic rock within
the pile, and deposition history, it is unlikely that any acidity from this rock will be
released. Nevertheless, it is prudent to include some mitigation as described in Section 4.
Section 5 of the Technical Memorandum makes the recommendations:
Exclude possible PAG material from cover construction both on surface and on side
slopes (rock containing more than 0.17% sulphide sulphur).
As an added mitigation measure for the west perimeter embankment, place a small
amount of PK (toe berm of approximately 1 m in thickness extending 3 m laterally, at
the base on any seepage faces) to supply excess buffering capacity in this area.
The Construction Specification provided as Appendix B of the North Pile Closure Cover
Detailed Design (Golder, 2019e) include requirements for any PAG material that is encountered
during closure construction to be placed 3m below final grade and that testing will be required.
Section 5.3.2 of the Construction Specification reads:
It is not clear why the same specifications have not been provided for the west perimeter
embankment regrade in the event that PAG materials are encountered there .
Recommendation
It is recommended that in the event that PAG material is encountered during the west
perimeter embankment re-grade, it too be removed and relocated to an area of the North
Pile that will ultimately be covered by at least 3 m of non-PAG material.
It is also recommended that seepage surveys continue for some time following closure of the
North Pile. A source term for PAG materials could be incorporated into future iterations of
the site water quality model if monitoring indicates that some ARD is contributing to
loading.
3.2 West Cell Divider Dyke
The impression from the site visit of June 25, 2019 was that the west cell divider dyke, partially
constructed before mining ceased, would be largely removed and used for closure of the North
Pile East and Starter Cells. This was confirmed during the Technical Session whereby De Beers

Snap Lake FCRP Review September 27, 2019
______________________________________________________________________________________________
Brodie Consulting Ltd. Page 12 of 15
indicated that the west cell divider dyke would be prioritized as a source of material for closure of
the North Pile. The Final Closure and Reclamation Plan and North Pile Closure Design should be
updated to reflect this modification. It is understood from the meeting of August 24 between De
Beers and ENR to discuss the Financial Security Estimate that construction of a channel in this
area would still be required to allow passive drainage from the TS4 north to the West ISP even
with removal of the divider dyke.
Recommendation
It is recommended that the FCRP be updated to show removal of the West Cell Divider
Dyke with placement of the materials from the Dyke in the North Pile.
3.3 Organics Stockpile
There has been some ambiguity as to whether all of the organics in the Organics Stockpile will be
utilized to enhance reclamation efforts, or whether the quantity to be used is limited to that which
is estimated from the Revegetation Plan (Arktis, 2019), and any remaining will be contoured and
re-vegetated.
Recommendation
It is recommended that De Beers update the Revegetation Plan to clarify the commitment to
use all available organic material in the stockpile, or that could potentially be available with
any additional stripping that is required, in use for enhancing reclamation efforts.
4 REFERENCES
Arktis Solutions Inc., 2019. De Beers Canada Inc., Snap Lake Mine Revegetation Plan. March 1,
2019
De Beers Group of Companies, 2019a. Snap Lake Mine Final Closure and Reclamation Plan,
March 2019
De Beers Group of Companies, 2019b. Snap Lake Mine Water Management Plan V.4, March
2019
De Beers Group of Companies, 2019 c. Technical Session (July 16-18, 2019) Information
Request Responses - Snap Lake Water Licence (MV2019L2-0004) Application and Final
Closure and Reclamation Plan. August 6, 2019.
De Beers Group of Companies, 2019d. Underground Water Modeling References. MVLWB
Technical Session. Snap Lake Mine Final Closure, and Water Licence and Land Permit Renewal.
July 16-19.
Golder Associates Ltd. 2019a. Snap Lake Mine - Snap Lake Water Quality and Hydrodynamic
Report - Version 2. August 2019
Golder Associates Ltd. 2019b. Snap Lake Mine - Site, Snap Lake, and Downstream Lakes Water
Quantity Model Report. March 2019
Golder Associates Ltd. 2019c. Snap Lake Mine - Site Water Quality Model Report. March 2019

Snap Lake FCRP Review September 27, 2019
______________________________________________________________________________________________
Brodie Consulting Ltd. Page 13 of 15
Golder Associates Ltd. 2019d. North Pile Closure Cover Feasibility Design Appendix E
Technical Memorandum: North Pile Closure Cover Design - Acid Rock Drainage Review
Golder Associates Ltd. 2019e. North Pile Closure Cover Detailed Design Snap Lake Mine. 12
March 2019
Mackenzie Valley Land and Water Board, 2018. Extended Care and Maintenance Plan Staff
Report and Comments February 8, 2018.

Appendix C: Brodie Consulting Ltd. – Memorandum and Review of Security Estimate

Brodie Consulting Ltd. 8627 Seascape Drive, West Vancouver, B.C. V7W 3J7
604-790-1853 email:[email protected]; [email protected]
MEMORANDUM
______________________________________________________________________________
DATE: October 3, 2019
TO: Bill Pain; GNWT – ENR
FROM: Lara Fletcher, P.Eng. (BC, NT/NU); John Brodie, P.Eng. (BC, NT/NU)
SUBJECT: Review of DeBeers Snap Lake Mine 2019 Final Closure and Reclamation Plan
Appendix F Financial Security Estimate
______________________________________________________________________________
1 INTRODUCTION
GNWT - ENR retained Brodie Consulting Ltd. (BCL) to review De Beers Canada Inc's Financial
Security Estimate submitted as Appendix F of the Snap Lake Mine Final Closure and
Reclamation Plan (De Beers, 2019a).
The 2019 Financial Security Estimate (Arktis, 2019a) has been updated from the 2018 Estimate
(Arktis, 2018) to reflect the Final Closure and Reclamation Plan. Initial comments were provided
to De Beers in a memorandum of August 19, 2019. A meeting attended by ENR, De Beers, BCL
and Arktis (consultant to De Beers) was held August 26, 2019 via teleconference to discuss the
comments. This memo provides documentation of comments raised by BCL for which there are
no further recommendations as well as comments and recommendations for revisions to the
Financial Security Estimate.
2 COMMENTS
As was stated in BCL's review of the 2018 Financial Security Estimate, also prepared by Arktis,
the 2019 Financial Security Estimate is well prepared, detailed, and thorough. De Beers has made
explicit that the 2019 Financial Security Estimate was prepared in RECLAIM 7.0 utilizing the
unit rates contained therein, unless none were available or more site relevant rates were available.
In general though, most of the unit costs were those from the RECLAIM unit cost table as
opposed site specific rates.
The 2019 Financial Security Estimate is considered to be an acceptable amount for the purposes
of maintaining security prior to De Beers proceeding with the activities described in the Final
Closure and Reclamation Plan. There are only a few items that BCL is of the opinion are too low,
or too high, which are described in the following sections.
2.1 Costs for Water Treatment
ENR has made several requests for De Beers to provide a breakdown of costs for water treatment
based on actual site specific costs to support the unit cost adopted from RECLAIM of $2.00/m3.
The breakdown was requested to include power, labour, reagents, operating supplies, and annual
commissioning and decommissioning.

Review of DeBeers Snap Lake FCRP Appendix F October 3, 2019
______________________________________________________________________________________________
Brodie Consulting Ltd. Page 2 of 9
In the meeting of August 26, 2019 De Beers reiterated that the provisions that have been included
in the 2019 Financial Security Estimate are considered reasonable.
BCL notes that in 2014 when De Beers was evaluating options for water treatment a report titled
'Best Available Technology Economically Achievable' (De Beers 2014) presented expected costs
for a modular RO treatment system. Based on Figure 6-2 Parameters Associated with the Initial
Module of the report, the costs based on a treatment rate of 3,000 m3/day were $0.5M/year for
OPEX, $1.4M/year for power, and $1M/year for labour. This works out to be $1.74/m3 for OPEX
and power, and $2.65/m3 with labour added. Based on these costs, $2.00/m
3 is low. Particularly
for the current and future costs as inefficiencies would result with the current annual
commissioning and decommissioning of the plant (versus year round operation as was the
assumption in the 2014 report).
However, what potentially offsets lower unit costs for water treatment is that in the 2019
Financial Security Estimate, the annual costs for water treatment are based on an average annual
volume of water from Years 2020-2025 of the water balance model (Appendix A of the Water
Management Plan V4.0, De Beers 2019b). The annual volume for each of these years from the
model is nearly the same. I.e. the amount doesn't appreciably decline each year. Furthermore,
water treatment for nine years is included in the estimate. Which represents 1 year of Interim
Care and Maintenance and 8 years of closure. The passive treatment system is planned for
commissioning in Year 2 - 4 of closure (Figure 1.9 of the FCRP).
As such, while the unit cost may not adequately represent costs for annual water treatment, the
provision as a whole may be adequate for the following reasons:
The volume used as a basis of costs in the Security Estimate seems reasonable and is
expected to decline. For comparison, the volume in the estimate is 92,904m3. In 2018
the volume pumped from the WMP to the WTP was 105,390 m3 and in 2019 was
27,162 m3 (up to July 31 but water treatment may have ceased by that time).
The duration of water treatment included in the estimate is conservative relative to De
Beers current expectations. That is, it already represents a contingency for water
treatment while the passive system is being commissioned and develops.
Unless there are changes to the water management plan that would see a divergence from the
amounts or duration of water treatment required it is recommended that the costs for water
treatment be considered sufficient at this time. Costs should be re-evaluated in say 5 years time
with continued monitoring of volumes and be based on actual site specific costs if active
treatment continues to be required.
2.2 Unit Costs for Earthworks - North Pile and Water Management System
It is noted that a number of the unit costs for the earthworks required to carry out the closure
design for the North Pile and Water Management have been changed from the previous version
of De Beers' Financial Security Estimate. In part this is due to the previous costs for the cover
being based on much higher rates to quarry and process rock whereas the 2019 Financial Security
Estimate is based on there being borrow sources available such that quarrying rock will not be
required. Potential borrow sources have been identified. The 2019 Security Estimate uses a
general unit cost of SBSH = $6.30/m3 whether that involves dozing, excavation, hauling or not,
cut to fill, different source materials etc. This topic was not discussed with De Beers during the
meeting of August 26, 2019.

Review of DeBeers Snap Lake FCRP Appendix F October 3, 2019
______________________________________________________________________________________________
Brodie Consulting Ltd. Page 3 of 9
It could be argued that higher unit costs would better reflect the amount of segregation and
double handling that has been suggested for different types of material from identified borrow
areas, or scraping up material from here and there. For example, the Organics Stockpile has been
identified as a source of the following three types of material: boulders for rip rap, material
having the highest organic content for the constructed wetlands, and re-vegation substrate. On the
other hand, it can be expected that where possible, construction of components of the water
management system will be carried out in parallel with placing the cover thereby some direct
placement can be assumed and double handling avoided. Further, where dozing will be used to
lower and distribute internal berms or recontour embankments, unit costs would be lower.
In summary, the costs used for the North Pile and Water Management earthworks are considered
reasonable.
2.3 Zero occupancy
The basis of the security estimate for closure is based on a site presence of 6 months per year.
BCL had noted that during a site visit of June 25, 2019, a representative of De Beers had said that
during times of zero occupancy there is still at minimum one person flying from Yellowknife
every 20 days or so to maintain the generator and carry out inspections.
During the teleconference of August 26, De Beers explained that the requirement to go in every
20 days or so is to service the microwave tower generator. De Beers stated that the microwave
tower is not needed for transmission of monitoring data, and expects that Northwest Tel will take
over responsibility for the tower. Also, for the current Care and Maintenance phase, visual
inspections are a monthly obligation. De Beers expects that for closure and post-closure there will
not be a continued requirement for monthly inspections nor any other site presence.
2.4 West Cell Divider Dyke
The detailed designs for closure of the North Pile do not include plans for the divider dyke other
than a channel to be excavated through it. However, the West Cell divider dyke in its current
configuration is not believed to meet the objectives of physical stability nor objective SW5 -
'landscape features (shape and vegetation) match aesthetics of the surrounding natural area'. Nor
does there appear to be any designs to intercept and integrate seepage/runoff to the passive
treatment system. During the Technical Session of June 16-18, 2019 BCL questioned whether the
materials in the West Cell divider dyke could preferentially be used for closure of the North Pile,
and thereby remove the divider dyke. De Beers response was that it could (Technical Session
Transcripts, Day 1 p. 219).
Cost for removal of West Cell divider dike were not included in De Beers Estimate. However, it
is understood that as this material is expected to be used in the cover of the North Pile and
therefore no additional cost items are needed for removal above what has already been included
for costs to place the cover. It is also understood that water management requirements still
necessitate excavation of a small channel to allow passive flow from the former TS4 north area
toward Sump 5. Costs for the channel have been included in De Beers Estimate.
2.5 Organics Stockpile (Reference #1)
The Revegetation Plan (Arktis, 2019b) indicates that there is approximately 130,100 m3 of
salvaged material in the Organics Stockpile. In a memo provided by De Beers on September 3,
2019, the quantity is estimated at approximately 147,000 m3. Approximately 20% to 30% is
assumed to be made up of boulders, which has been identified as a possible source of rip rap.
There is therefore approximately 103, 000 m3 - 118, 000 m
3 available for reclamation.

Review of DeBeers Snap Lake FCRP Appendix F October 3, 2019
______________________________________________________________________________________________
Brodie Consulting Ltd. Page 4 of 9
The Revegetation Plan states that approximately 29,911 m3 of overburden is required to place a
layer of 0.2 m thickness over the areas identified as Active-OFS (overburden-fertilizer-seed).
Any excess overburden will be left in place and revegetated. As such, only a portion of the
available organics stockpile is included in the cost estimate. In contrast, De Beers has indicated
that as much as possible of the organic stockpile would be utilized, whether for increasing the
areas that the material will be spread, or increasing the depth in areas that it is planned for use
(MVLWB, Technical Session Transcripts - Day 1, p.220).
It is understood that some organic material is also required for construction of the CWTS's.
However, De Beers has described that the CWTS West is proposed to be constructed in an area
that has not yet been disturbed and that the quantity of organics that would be stripped from
within the footprint has been estimated conservatively. That is, there is likely more than the
estimated quantity available (Technical Session transcript p 213). The memo provided by De
Beers on September 12, 2019 indicated that there was also organic material available from the
West Cell Divider Dyke.
It is recommended that the basis of the 2019 Financial Security Estimate be that:
All organic material that is currently stockpiled is used to improve re-vegetation efforts,
either increasing the depth in some areas, or increasing the area over which it is spread.
Organic material that may be required for the constructed wetlands is assumed to be
sourced from stripping of the west constructed wetlands footprint or the West Cell
Divider Dyke.
BCL has increased the quantity of organic material in line 201 of worksheet "Buildings and
Equipment" from 29,911 m3 to 102,900 m
3 (147,000 m
3 less 30%). The result is an increase from
$152,545 to $524,790.
Recommendation
It is recommended that the quantities included in the Financial Security Estimate be updated to
reflect all organics that are available in the organics stockpile being used to improve re-
vegetation of disturbed areas. This is an increase from 29,911 m3 to 102,900 m
3 and a resultant
increase in direct costs of $372,245
2.6 Constructed Wetlands Organics
Section 5.1 of the North Pile Passive Treatment Systems Detailed Design (Golder, 2019) states
that:
Locally sourced organic soil and plants are required to the extent possible so that a
minimum of non-native plants or materials are introduced to the Northwest Territories.
However, due to limited soil availability, the majority of soil may need to be brought from
off site and must be in compliance with the non-native species requirements under the
Northwest Territories Wildlife Act.
Whereas the security estimate states that organic soil is assumed to be available onsite. Based on
discussion during the meeting of August 26, the technical session (Technical Session Transcripts
Day 1 p.214), and De Beers memos of September 3 and September 12, it is understood that De
Beers expects there to be sufficient quantities of material available on site for construction of the
wetland. The memo from September 12 indicates that there may be a deficit of approximately
30,000 m3 of high quality soil but that:

Review of DeBeers Snap Lake FCRP Appendix F October 3, 2019
______________________________________________________________________________________________
Brodie Consulting Ltd. Page 5 of 9
The low quality organic material will be improved with a soil amendment. De Beers is
currently investigating and evaluating the benefits of various types of soil amendments to
determine the best option for the Snap Lake Mine.
Recommendation
As there has been some discrepancy as to whether sufficient quantities of material having
sufficient organics content is available on site, and that costs to amend low quality organic
material will be entirely dependent on the quantities and source of amendments, it is
recommended that De Beers identify the likely types of soil amendments, what quantity would
be required and costs if needed to be brought from off-site.
2.7 Monitoring Costs (Reference #2)
The labor rate of $36.00/hour used for air quality, vegetation, wildlife, SNP and AEMP
monitoring is too low. In the event of a company's insolvency it can be assumed that government
would retain an environmental consultant to carry out monitoring and reporting. Even for a junior
environmental technician or scientist the rate would be in range of $80/hr. The RECLAIM unit
cost for an environmental coordinator is recommended instead.
Recommendation
It is recommended that the hourly rate that forms the basis of environmental monitoring costs be
increased from the RECLAIM unit cost for an environmental technician to an environmental
coordinator ($36/hour to $74.16/hour).
2.8 SNP and AEMP Monitoring
It is understood that ENR will be providing recommendations for SNP and AEMP Monitoring
that is different than what has been proposed by De Beers and therefore what forms the basis of
De Beers Financial Security Estimate for monitoring. BCL has not quantified ENR's
recommendations in terms of differences in frequency, duration, number of stations, etc.
Recommendation
It is recommended that the Financial Security Estimate be updated based on the final SNP and
AEMP.
2.9 Post-Closure Maintenance (Reference #3)
BCL recognizes that it is difficult to accurately estimate post-closure maintenance costs.
Furthermore, as De Beers now plans for closure to extend for eight years, some maintenance of
components that have been closed and reclaimed can be carried out while other closure activities
are being completed which may therefore result in a relatively small additional cost. However,
the $10,000 to $25,000 that has been proposed in De Beers Financial Security Estimate is not
considered a sufficient provision for any post closure maintenance that may be required.
BCL recommends that a provision for minor earthworks to address potential erosion, settlement
or reshaping be based on a level of effort equivalent to a crew of eight people on site for 3 weeks.
Mob/demob of equipment is not included as De Beers has included costs to purchase a small fleet
of equipment to remain on site.
The costs add up to approximately $175,000, which has been revised in the 2019 Financial
Security Estimate tab 'Monitoring Quantities' in the column Maintenance.

Review of DeBeers Snap Lake FCRP Appendix F October 3, 2019
______________________________________________________________________________________________
Brodie Consulting Ltd. Page 6 of 9
Maintenance of the constructed wetland treatment system may be unique and hasn't been
specifically addressed. Should De Beers decide to proceed with construction of the wetlands, it is
recommended that realistic expectations for monitoring and maintenance be defined.
Recommendation
It is recommended that the provisions for post-closure maintenance be increased from De Beers
provision for four campaigns of $10,000 to $25,000 per campaign to $175,000 per campaign.
Should the decision be made to construct the wetland treatment system, it is recommended
realistic expectations for monitoring and maintenance be defined and the costs in the Financial
Security Estimate be re-evaluated.
2.10 Mobilization/Demobilization of Equipment (Reference #4)
BCL had noted that the costs for mob/demob of equipment seemed high and suggested that De
Beers would have known costs of contractor rates for mob/demob of equipment. No known costs
were provided by De Beers. BCL has proposed revisions to the costs included in the 2019
Financial Security Estimate that result in an overall decrease to the total. These include the
following:
Change units for mobilization of heavy equipment from km‧tonnes to km.
Change unit rates for mobilizing heavy equipment from MHERL of $3.40/km to
MHERH of $10.25/km.
Amalgamate mobilization of minor tools and equipment (line 64) with truck tires (line
65) such that costs are reduced from $1,000,000 to $500,000. The basis of this
adjustment is that these costs are adopted from the Diavik mine security estimate which
is larger site, and with greater wear expected on tires in the activities planned.
Apply winter road tariff to total km‧tonnes (2019 Security Estimate only applied to total
tonnes).
Add one more construction of winter road than the three that have been included for the
reason that a winter road would be needed to demobilize demolition equipment. It
cannot be assumed that demolition equipment would remain on site until Year 1 of Post-
closure unless incurring substantial standby costs. It is suggested instead that there
would be construction of a winter road in Year 7 of Closure according to the schedule of
closure activities shown in Figure 1.9 of the FCRP. A small fleet of equipment and camp
would remain on site during Post-Closure, which would require one final winter road to
remove.
The result is a total decrease of $945,361 to the mobilization costs proposed by De Beers in the
2019 Security Estimate.
2.11 Interim Care and Maintenance (Reference #5)
De Beers have reduced the period of Interim Care and Maintenance in the Security Estimate from
two years to one, presumably to align with the plan to advance closure activities beginning in
2021. Provisions for Interim Care and Maintenance are intended to cover the period of time
required to transfer ownership of the site, finalize a closure plan, retain a water licence for
closure, mobilize equipment to the site, and conduct procurement activities to retain reclamation
contractors in the event a company defaults. The generally accepted minimum for most Security
Estimates for mines in the Northwest Territories is two to three years. In principal, there is no
reason that this would be any different for the Snap Lake Mine. Given the current status of the

Review of DeBeers Snap Lake FCRP Appendix F October 3, 2019
______________________________________________________________________________________________
Brodie Consulting Ltd. Page 7 of 9
Mine and with a Final Closure Plan currently under review a time period of 2 years is justified,
but not less.
Recommendation:
It is recommended that the period of ICM be maintained at 2 years, and not reduced to 1 as
proposed by De Beers. This adds $1,719,992 to the costs for ICM (incorporates monitoring cost
recommendation Reference #3).
2.12 IR11 No Wetland Scenario
In response to IR11, De Beers provided a Security Estimate for a scenario of no constructed
wetland treatment system (Arktis, 2019c). The recommendations that have been made above for
Scenario 1 - Wetlands Included (References 1 through 4) are also relevant to the Scenario 2 - No
Wetlands. In addition, it is recommended that the unit cost for excavation of the Influent Storage
Pond East and West, line 40 and 49 of the worksheet Water Management, be RB1L $11.40/m3
(unit cost for drill/blast/load/haul rock) as opposed to SC1L $4.30/m3 (unit cost for soil
excavation). The line item is described as requiring blasting, and the cross sections shown in
Dwg A1-142221-6200-121-0859 of the North Pile Passive Treatment Systems Detailed Design
(Golder 2019) also show that excavation of bedrock will be required. Furthermore, the version of
the security estimate for Scenario 1 uses a unit cost code of RB1L for excavation of the ISP's and
CWTS's.
The result is an increase of $2,749,120 in direct costs and an increase of $3,491,383 with indirect
costs applied. As IR11 was requested to help quantify the approximate costs to construct the
wetlands, and the role that plays in decision making, this recommendation will only be relevant if
Scenario 2 forms the basis of the Security Estimate for the Water Licence and Land Use Permit.
Recommendation
In addition to the recommendations provided for Scenario 1 - Wetlands Included, it is
recommended that the unit costs for excavation of the Influent Storage Ponds East and West for
Scenario 2 - no wetlands, be revised from SC1L to RB1L to reflect excavation of bedrock.
2.13 Phasing of Security
De Beers have proposed a phasing of security reductions that align with milestones at which
major physical works will have been completed. These are at the end of Year 4 and Year 8 of
Closure and then every 5 years of Post-Closure. However, the basis of the reductions proposed in
the 2019 Financial Security report assumed 100% reduction in direct costs once closure and
reclamation of a component is complete. De Beers memo of September 3, 2019 acknowledges
that it is understood that the significant portion of the securities will be returned upon completion
of the reclamation activity, and that the remainder would be returned upon submission and
acceptance of a Performance Assessment Report. As such, there does not seem to be a lot of
value in maintaining the phasing of security reductions as it exists in the 2019 Financial Security
Estimate as they not only do not reflect the expectation that there will be some amount of
holdback until monitoring performance assessments have been completed, but De Beers have
reiterated that schedules are subject to change.
Recommendation
The tables that outline the expected milestones for completion of major physical works and
expected requests for security adjustment could be maintained, but it is recommended that the
security estimate amounts at each phase be removed as the amount to be maintained would be

Review of DeBeers Snap Lake FCRP Appendix F October 3, 2019
______________________________________________________________________________________________
Brodie Consulting Ltd. Page 8 of 9
evaluated at the time of the request for adjustment and would be contingent on a number of
factors.
2.14 Environmental Agreement Security
Section 4, Table 9 of the 2019 Financial Security Estimate report states:
The security allocated to the Water Licence and Land Use Permit should not include
security held under the Environmental Agreement. Based on discussions between De Beers
and the GNWT in 2018, and subject to final determination by the GNWT, the
Environmental Agreement security allocates $1,390,000 of the funds for activities that are
also included in this 2019 RECLAIM estimate.
De Beers has revised the amount in an email sent to GNWT October 3, 2019. The revised amount
is $875,000, which BCL understands may be subject to further review between GNWT and De
Beers.
3 SUMMARY
The following table summarizes the recommendations for revisions to De Beers 2019 Financial
Security Estimate. The result is an increase in security from what has been proposed by De Beers.
Note that this does not include any potential changes in the SNP and AEMP from what has been
proposed by De Beers and is subject to any other changes that result with approval of the Final
Closure and Reclamation Plan.
Reference
Number
Description Amount Difference
De Beers BCL
Ref #1 Organics stockpile - increase
quantity to be used in reclamation
$152,545 $524,790 $372,245
Ref #2 Monitoring costs - increase labor
rate
$3,219,515 $3,424,243 $204,728
Ref #3 Post-closure maintenance -
increase amount per campaign
$85,000 $700,000 $615,000
Ref #4 Revise moblization/
demobolization costs
$16,407,640 $15,462,279 - $945,361
Ref #5 Maintain ICM at 2 years $1,707,209 $3,439,985 $1,719,992
Total Security $85,473,129 $87,520,940
$2,047,811
Attachment: De Beers Snap Lake Mine Financial Security Estimate RECLAIM Outputs with
recommended revisions highlighted in yellow.

Review of DeBeers Snap Lake FCRP Appendix F October 3, 2019
______________________________________________________________________________________________
Brodie Consulting Ltd. Page 9 of 9
4 REFERENCES
Arktis Solutions Inc., 2019a. De Beers Canada Inc. Snap Lake Mine 2019 Financial Security
Estimate. March 26, 2019. Appendix F of De Beers Final Closure and Reclamation Plan. Report
prepared for De Beers Canada Inc.
Arktis Solutions Inc., 2019b. De Beers Canada Inc., Snap Lake Mine Revegetation Plan. March
1, 2019. Appendix J of De Beers Final Closure and Reclamation Plan. Report prepared for De
Beers Canada Inc.
Arktis Solutions Inc., 2019c. Regulatory - RECLAIM Update for Closure of the Snap Lake Mine
- No Wetland Scenario. Response to MVLWB Information Request #11.Technical Memorandum
to De Beers Canada Inc. July 30, 2019. Technical Memorandum prepared for De Beers Canada
Inc.
Arktis Solutions Inc., 2018. De Beers Canada Inc. Snap Lake Mine 2018 Financial Security
Estimate. April 16, 2018. Report prepared for De Beers Canada Inc.
Brodie Consulting Ltd., 2019. Review of De Beers Snap Lake Mine 2019 Final Closure and
Reclamation Plan. Report prepared for Government of the Northwest Territories Environment
and Natural Resources
De Beers Group of Companies, 2014. Preliminary Evaluation of Best Available Technologies
Economically Acievable (BATEA) for Reduction of Total Dissolved Solides (TDS) in Effluent at
Snap Lake Mine. November 28, 2014. Post Environmental Assessment Information Package -
Appendix 5
De Beers Group of Companies, 2019a. Snap Lake Mine Final Closure and Reclamation Plan,
March 2019
De Beers Group of Companies, 2019b. Snap Lake Mine Water Management Plan V.4, March
2019
Golder Associates Ltd. 2019. North Pile Passive Treatment Systems Detailed Design Snap Lake
Mine. March 21, 2019. Appendix L - Part 2 of the Final Closure and Reclamation Plan

Review of DeBeers Snap Lake FCRP Appendix F October 3, 2019
______________________________________________________________________________________________
Brodie Consulting Ltd.
Attachment: De Beers Snap Lake Mine Financial Security Estimate
RECLAIM Outputs with recommended revisions

2019-10-07Reclaim 7.0 Project: Snap Lake Reclaim - BCL 20191003
SUMMARY OF COSTS - TOTAL SECURITY
CAPITAL COSTS
COMPONENT
NAME COST LAND LIABILITY
WATER
LIABILITY
OPEN PIT $0 $0 $0
UNDERGROUND MINE $240,102 $240,102 $0
PROCESSED KIMBERLITE FACILITY $6,766,283 $3,384,835 $3,381,448
ROCK PILE $0 $0 $0
BUILDINGS AND EQUIPMENT $16,764,564 $16,690,353 $74,211
CHEMICALS AND CONTAMINATED SOIL MANAGEMENT $4,541,172 $2,270,586 $2,270,586
SURFACE AND GROUNDWATER MANAGEMENT $18,024,007 - $18,024,007
INTERIM CARE AND MAINTENANCE $3,439,985 - $3,439,985
SUBTOTAL: Capital Costs $49,776,112 $22,585,875 $27,190,236
PERCENT OF SUBTOTAL 45% 55%
INDIRECT COSTS COST LAND LIABILITY
WATER
LIABILITY
MOBILIZATION/DEMOBILIZATION $15,462,279 $7,015,998 $8,446,281
POST-CLOSURE MONITORING AND MAINTENANCE $8,842,999 $4,012,505 $4,830,495
ENGINEERING 5% $2,488,806 $1,129,294 $1,359,512
PROJECT MANAGEMENT 5% $2,488,806 $1,129,294 $1,359,512
HEALTH AND SAFETY PLANS/MONITORING & QA/QC 1% $497,761 $225,859 $271,902
BONDING/INSURANCE 1% $497,761 $225,859 $271,902
CONTINGENCY 15% $7,466,417 $3,387,881 $4,078,535
MARKET PRICE FACTOR ADJUSTMENT 0% $0 $0 $0
SUBTOTAL: Indirect Costs $37,744,828 $17,126,689 $20,618,139
TOTAL COSTS $87,520,940 $39,712,564 $47,808,376
MV2017D0032 MV2019L2-0004 - De Beers Snap Lake - De Beers Response to IR 11 - Part 1 - BCL Oct_3_2019.xlsm 1 of 1

2019-10-07Reclaim 7.0 Project: Snap Lake Reclaim - BCL 20191003
Underground Mine - Total Security Snap Lake Mine
ACTIVITY/MATERIAL Notes Unit QtyCost Code Unit Cost Cost % Land Land Cost Water Cost
CONTROL ACCESSSigns Allowance each 20 SL $12.36 $247 100% $247 $0
Plug main access portalBased on Opening to Surface Closure Design (Golder, 2018d). m3 25.2 PORS $1,200.00 $30,240 100% $30,240 $0
Plug conveyor portalBased on Opening to Surface Closure Design (Golder, 2018d). m3 25.2 PORS $1,200.00 $30,240 100% $30,240 $0
Backfill, grade and contour access portal rampQuantites estimated from mine site plan and 2016 statmap. m3 3,544 SBSH $6.30 $22,327 100% $22,327 $0
Backfill, grade and contour conveyor portal rampQuantites estimated from mine site plan and 2016 statmap. m3 18,354 SBSH $6.30 $115,630 100% $115,630 $0
Cap fresh air raise # 1Based on Opening to Surface Closure Design (Golder, 2018d). m2 21 SRL $645.00 $13,622 100% $13,622 $0
Cap fresh air raise # 2Based on Opening to Surface Closure Design (Golder, 2018d). m2 22 SRL $645.00 $14,147 100% $14,147 $0
Cap return air raise # 1Based on Opening to Surface Closure Design (Golder, 2018d). m2 21 SRL $645.00 $13,648 100% $13,648 $0
Other #N/A $0.00 $0 $0 $0REMOVE HAZARDOUS MATERIALS Completed during Extended C&MRemove hazardous materials hr #N/A $0.00 $0 $0 $0Remove/decontam stationary & elect. equip hr #N/A $0.00 $0 $0 $0Remove/decontam mobile equipmen hr #N/A $0.00 $0 $0 $0Other #N/A $0.00 $0 $0 $0FLOOD MINE Completed during Extended C&MSupply/install pump each #N/A $0.00 $0 $0 $0Supply/install piping system each #N/A $0.00 $0 $0 $0Operate pumps to flood workings m3 #N/A $0.00 $0 $0 $0Other #N/A $0.00 $0 $0 $0
Total $240,102 $240,102 $0% of Total 100% 0%
MV2017D0032 MV2019L2-0004 - De Beers Snap Lake - De Beers Response to IR 11 - Part 1 - BCL Oct_3_2019.xlsm 1 of 1

2019-10-07Reclaim 7.0 Project: Snap Lake Reclaim - BCL 20191003
PK Facility - Total Security North Pile
ACTIVITY/MATERIAL Notes Units Quantity Cost Code Unit Cost Cost % Land Land Cost Water CostCONTROL ACCESSFence Assume temporary movable to control localized work m 250 FNCL $13.55 $3,388 100% $3,388 $0Signs each #N/A $0.00 $0 $0 $0Berm m3 #N/A $0.00 $0 $0 $0Block roads m3 #N/A $0.00 $0 $0 $0Other #N/A $0.00 $0 $0 $0EARTHWORKS FOR GRADINGExcavate deposited PK material from Cell 2 and place in Cell 3 Based on North Pile Closure Cover Detailed Design (Golder, 2018a). m3 37300 SBTS $15.50 $578,150 50% $289,075 $289,075Excavate Rib Berm 1 and place in Cell 2 (against Rib Berm 3) Based on North Pile Closure Cover Detailed Design (Golder, 2018a). m3 11600 SBSH $6.30 $73,080 50% $36,540 $36,540Excavate Rib Berm 1 and place in Cells 3, 4, or 5 Based on North Pile Closure Cover Detailed Design (Golder, 2018a). m3 2600 SBSH $6.30 $16,380 50% $8,190 $8,190Excavate and place embankment/rib berm (local cut to fill) Based on North Pile Closure Cover Detailed Design (Golder, 2018a). m3 43300 SBSH $6.30 $272,790 50% $136,395 $136,395Excavate embankment/rib berm (excludes Rib Berm 1) and place in Cells 3, 4, and 5 Based on North Pile Closure Cover Detailed Design (Golder, 2018a). m3 116600 SBSH $6.30 $734,580 50% $367,290 $367,290Excavate embankment/rib berm and place in Starter Cell Based on North Pile Closure Cover Detailed Design (Golder, 2018a). m3 6100 SBSH $6.30 $38,430 50% $19,215 $19,215Excavate embankment/rib berm and place in west perimeter embankment Based on North Pile Closure Cover Detailed Design (Golder, 2018a). m3 4900 SBSH $6.30 $30,870 50% $15,435 $15,435Excavate embankment/rib berm and stockpile for cover Based on North Pile Closure Cover Detailed Design (Golder, 2018a). m3 29000 SBSH $6.30 $182,700 50% $91,350 $91,350Excavate Cell LF and place in Cells 1 and 2 Based on North Pile Closure Cover Detailed Design (Golder, 2018a). m3 29600 SBSH $6.30 $186,480 50% $93,240 $93,240EARTHWORKS FOR COVER PLACEMENTPlace transition material Based on North Pile Closure Cover Detailed Design (Golder, 2018a). m3 78400 SBSH $6.30 $493,920 50% $246,960 $246,960Place transition and/or erosion protection cover over landfill waste Based on North Pile Closure Cover Detailed Design (Golder, 2018a). m3 76100 SBSH $6.30 $479,430 50% $239,715 $239,715Place erosion protection cover over North Pile Based on North Pile Closure Cover Detailed Design (Golder, 2018a). m3 120300 SBSH $6.30 $757,890 50% $378,945 $378,945RIPRAP PLACEMENTPlace riprap for swales (D50=150mm) Based on North Pile Closure Cover Detailed Design (Golder, 2018a). m3 5600 SBSH $6.30 $35,280 50% $17,640 $17,640Place riprap for swales (D50=300mm) Based on North Pile Closure Cover Detailed Design (Golder, 2018a). m3 800 SBSH $6.30 $5,040 50% $2,520 $2,520Place riprap for Cell 1 channel outlet (D50=600mm) Based on North Pile Closure Cover Detailed Design (Golder, 2018a). m3 800 SBSH $6.30 $5,040 50% $2,520 $2,520CONSTRUCT DIVERSION DITCHES AND CHANNELSCell 5 Outlet Channel Bedrock blasting Based on North Pile Surface Water Management for Closure Detailed Design (Golder, 2018c). m3 #N/A $0.00 $0 50% $0 $0 Excavation Based on North Pile Surface Water Management for Closure Detailed Design (Golder, 2018c). m3 21000 RB1L $11.40 $239,400 50% $119,700 $119,700 Common Fill Based on North Pile Surface Water Management for Closure Detailed Design (Golder, 2018c). m3 100 SBSH $6.30 $630 50% $315 $315 Type 4/5 Rockfill Based on North Pile Surface Water Management for Closure Detailed Design (Golder, 2018c). m3 #N/A Erosion Protection Material Based on North Pile Surface Water Management for Closure Detailed Design (Golder, 2018c). m3 #N/A Transition Material Based on North Pile Surface Water Management for Closure Detailed Design (Golder, 2018c). m3 1400 SBSH $6.30 $8,820 50% $4,410 $4,410 Riprap (D50=150mm) Based on North Pile Surface Water Management for Closure Detailed Design (Golder, 2018c). m3 1300 SBSH $6.30 $8,190 50% $4,095 $4,095 Riprap (D50=300mm) Based on North Pile Surface Water Management for Closure Detailed Design (Golder, 2018c). m3 2100 SBSH $6.30 $13,230 50% $6,615 $6,615 Riprap (D50=600mm) Based on North Pile Surface Water Management for Closure Detailed Design (Golder, 2018c). m3 5200 SBSH $6.30 $32,760 50% $16,380 $16,380 Liner Bedding Based on North Pile Surface Water Management for Closure Detailed Design (Golder, 2018c). m3 #N/A Liner Area Based on North Pile Surface Water Management for Closure Detailed Design (Golder, 2018c). m3 #N/ASouth Perimeter Ditch Bedrock blasting Based on North Pile Surface Water Management for Closure Detailed Design (Golder, 2018c). m3 36500 RB1L $11.40 $416,100 50% $208,050 $208,050 Excavation Based on North Pile Surface Water Management for Closure Detailed Design (Golder, 2018c). m3 66100 RB1L $11.40 $753,540 50% $376,770 $376,770 Common Fill Based on North Pile Surface Water Management for Closure Detailed Design (Golder, 2018c). m3 45400 SBSH $6.30 $286,020 50% $143,010 $143,010 Type 4/5 Rockfill Based on North Pile Surface Water Management for Closure Detailed Design (Golder, 2018c). m3 #N/A $0.00 $0 50% $0 $0 Erosion Protection Material Based on North Pile Surface Water Management for Closure Detailed Design (Golder, 2018c). m3 4800 SBSH $6.30 $30,240 50% $15,120 $15,120 Transition Material Based on North Pile Surface Water Management for Closure Detailed Design (Golder, 2018c). m3 6100 SBSH $6.30 $38,430 50% $19,215 $19,215 Riprap (D50=150mm) Based on North Pile Surface Water Management for Closure Detailed Design (Golder, 2018c). m3 7600 SBSH $6.30 $47,880 50% $23,940 $23,940 Riprap (D50=300mm) Based on North Pile Surface Water Management for Closure Detailed Design (Golder, 2018c). m3 #N/A $0.00 $0 50% $0 $0 Riprap (D50=600mm) Based on North Pile Surface Water Management for Closure Detailed Design (Golder, 2018c). m3 1100 SBSH $6.30 $6,930 50% $3,465 $3,465 Liner Bedding Based on North Pile Surface Water Management for Closure Detailed Design (Golder, 2018c). m3 #N/A $0.00 $0 50% $0 $0 Liner Area Based on North Pile Surface Water Management for Closure Detailed Design (Golder, 2018c). m3 #N/A $0.00 $0 50% $0 $0North Perimeter Ditch Bedrock blasting Based on North Pile Surface Water Management for Closure Detailed Design (Golder, 2018c). m3 #N/A $0.00 $0 50% $0 $0 Excavation Based on North Pile Surface Water Management for Closure Detailed Design (Golder, 2018c). m3 #N/A $0.00 $0 50% $0 $0 Common Fill Based on North Pile Surface Water Management for Closure Detailed Design (Golder, 2018c). m3 75300 SBSH $6.30 $474,390 50% $237,195 $237,195 Type 4/5 Rockfill Based on North Pile Surface Water Management for Closure Detailed Design (Golder, 2018c). m3 12200 SBSH $6.30 $76,860 50% $38,430 $38,430 Erosion Protection Material Based on North Pile Surface Water Management for Closure Detailed Design (Golder, 2018c). m3 20400 SBSH $6.30 $128,520 50% $64,260 $64,260 Transition Material Based on North Pile Surface Water Management for Closure Detailed Design (Golder, 2018c). m3 4800 SBSH $6.30 $30,240 50% $15,120 $15,120 Riprap (D50=150mm) Based on North Pile Surface Water Management for Closure Detailed Design (Golder, 2018c). m3 4800 SBSH $6.30 $30,240 50% $15,120 $15,120 Riprap (D50=300mm) Based on North Pile Surface Water Management for Closure Detailed Design (Golder, 2018c). m3 #N/A $0.00 $0 50% $0 $0 Riprap (D50=600mm) Based on North Pile Surface Water Management for Closure Detailed Design (Golder, 2018c). m3 #N/A $0.00 $0 50% $0 $0 Liner Bedding Based on North Pile Surface Water Management for Closure Detailed Design (Golder, 2018c). m3 3900 SBSH $6.30 $24,570 50% $12,285 $12,285 Liner Area Based on North Pile Surface Water Management for Closure Detailed Design (Golder, 2018c). m2 9700 GSHDPEL $7.95 $77,115 50% $38,558 $38,558
MV2017D0032 MV2019L2-0004 - De Beers Snap Lake - De Beers Response to IR 11 - Part 1 - BCL Oct_3_2019.xlsm 1 of 2

2019-10-07Reclaim 7.0 Project: Snap Lake Reclaim - BCL 20191003
PK Facility - Total Security North Pile
ACTIVITY/MATERIAL Notes Units Quantity Cost Code Unit Cost Cost % Land Land Cost Water CostWest Cell Initial Divider Dyke Channel Bedrock blasting Based on North Pile Surface Water Management for Closure Detailed Design (Golder, 2018c). m3 #N/A $0.00 $0 50% $0 $0 Excavation Based on North Pile Surface Water Management for Closure Detailed Design (Golder, 2018c). m3 5500 RB1L $11.40 $62,700 50% $31,350 $31,350 Common Fill Based on North Pile Surface Water Management for Closure Detailed Design (Golder, 2018c). m3 #N/A $0.00 $0 50% $0 $0 Type 4/5 Rockfill Based on North Pile Surface Water Management for Closure Detailed Design (Golder, 2018c). m3 #N/A $0.00 $0 50% $0 $0 Erosion Protection Material Based on North Pile Surface Water Management for Closure Detailed Design (Golder, 2018c). m3 #N/A $0.00 $0 50% $0 $0 Transition Material Based on North Pile Surface Water Management for Closure Detailed Design (Golder, 2018c). m3 600 SBSH $6.30 $3,780 50% $1,890 $1,890 Riprap (D50=150mm) Based on North Pile Surface Water Management for Closure Detailed Design (Golder, 2018c). m3 600 SBSH $6.30 $3,780 50% $1,890 $1,890 Riprap (D50=300mm) Based on North Pile Surface Water Management for Closure Detailed Design (Golder, 2018c). m3 #N/A $0.00 $0 50% $0 $0 Riprap (D50=600mm) Based on North Pile Surface Water Management for Closure Detailed Design (Golder, 2018c). m3 #N/A $0.00 $0 50% $0 $0 Liner Bedding Based on North Pile Surface Water Management for Closure Detailed Design (Golder, 2018c). m3 #N/A $0.00 $0 50% $0 $0 Liner Area Based on North Pile Surface Water Management for Closure Detailed Design (Golder, 2018c). m3 #N/A $0.00 $0 50% $0 $0TS4 Grade/shape TS4 Area measured from 2015 site plan = 0.07 Ha RB1L 700 DSL $0.95 $665 50% $333 $333 Rock cover on TS4 0.5 m of non-PAG rock m3 350 SBSH $6.30 $2,205 50% $1,103 $1,103Other #N/A $0.00 $0 $0 $0SPECIALIZED ITEMSInstall permanent instrumentation, supply & technican 14 monitoring prisms, 7 thermistors each 21 SIH $3,600.00 $75,600 50% $37,800 $37,800TREAT SEEPAGE See "Water Management" and "Water Treatment"Pump water (to pit, U/G) m3 #N/A $0.00 $0 $0 $0Equipment maintenance and parts allow #N/A $0.00 $0 $0 $0Supply reagents tonne #N/A $0.00 $0 $0 $0
Annual treatment costs $0Number of years of treatment years
Total treatment costs $0 $0Total $6,766,283 $3,384,835 $3,381,448
% of Total 50% 50%* for construction of passive treatment system refer to "Water Management"
MV2017D0032 MV2019L2-0004 - De Beers Snap Lake - De Beers Response to IR 11 - Part 1 - BCL Oct_3_2019.xlsm 2 of 2

2019-10-07Reclaim 7.0 Project: Snap Lake Reclaim - BCL 20191003
Building / Equipment - Total Security
ACTIVITY/MATERIAL Building # Notes Units QuantityCost Code Unit Cost Cost % Land Land Cost Water Cost
DISPOSE MOBILE EQUIPMENT
Decontaminate and dispose on-site54 pieces from DEP Table 3-3-1 (De Beers, 2018a).2 hr/ea to decon and 2 hr/ea to mobilize to on-site disposal area. hr 216 LAB-SH $49.60 $10,714 100% $10,714 $0
Decontaminate and dispose on-siteStationary equipment. Assume included with building decontamination, demolition and removal. hr #N/A $0.00 $0 $0 $0
REMOVE BUILDINGS - see note belowLogistics - SSLOGAirport Winter Haven 1 - Fabric 1 Fabric tent m2 117 BRS1L $45.00 $5,256 100% $5,256 $0Airport Winter Haven 2 - Steel 2 m2 17 BRS1L $45.00 $783 100% $783 $0Airport Winter Haven 3 - Steel 3 m2 17 BRS1L $45.00 $783 100% $783 $0Airport Operations Building - Steel 4 m2 36 BRS1L $45.00 $1,607 100% $1,607 $0Logistics Office - Steel 13 m2 63 BRS1L $45.00 $2,835 100% $2,835 $0Logistics Warehouse Office - Steel 14 Attached to Heated Storage m2 94 BRS1L $45.00 $4,239 100% $4,239 $0Logistics Heated Storage - Steel 15 m2 1666 BRS1L $45.00 $74,970 100% $74,970 $0Logistics Cold Storage - Fabric 16 m2 2944 BRS1L $45.00 $132,494 100% $132,494 $0Winter Road Dispatch - Steel 34 m2 71 BRS1L $45.00 $3,213 100% $3,213 $0Projects - SSPRJSurface Crusher Complex - Steel 5 m2 338 BRS1L $45.00 $15,224 100% $15,224 $0Surface Crusher Complex Control Room - Steel 6 m2 34 BRS1L $45.00 $1,526 100% $1,526 $0Projects Offices - Steel 23 m2 851 BRS1L $45.00 $38,277 100% $38,277 $0Big Top - Fabric 48 aka Batch Plant. Fabric tent. m2 2717 BRS1L $45.00 $122,252 100% $122,252 $0
Big Top - Concrete 48 aka Batch Plant. Fabric tent. m2 815 BRCL $40.00 $32,600 100% $32,600 $0Mine Ops - SSUGOEmulsion Building - Fabric 7 Fabric tent m2 8988 BRS1L $45.00 $404,460 100% $404,460 $0Explosives Building - Steel 8 m2
Bulk Plant - Steel m2 263 BRS1L $45.00 $11,817 100% $11,817 $0Plant - Steel m2 296 BRS1L $45.00 $13,311 100% $13,311 $0Utility Building - Steel m2 30 BRS1L $45.00 $1,328 100% $1,328 $0Storage Tanks - Steel m2 77 BRS1L $45.00 $3,470 100% $3,470 $0Electrical Boxes/Sheds - Steel m2 25 BRS1L $45.00 $1,107 100% $1,107 $0Explosives Building Lunch Room - Steel 9 m2 32 BRS1L $45.00 $1,418 100% $1,418 $0
UG Services Building - Steel 62 m2 25 BRS1L $45.00 $1,107 100% $1,107 $0Site Services - SSGSSMobile Shelter 1 - Steel 10 Likely removed. m2 BRS1L $45.00 $0 100% $0 $0Mobile Shelter 2 - Steel 11 Likely removed. m2 BRS1L $45.00 $0 100% $0 $0Waste Management Office - Steel 12 m2 27 BRS1L $45.00 $1,211 100% $1,211 $0STP 2 - Steel 17 aka Unknown 2 m2 1550 BRS1L $45.00 $69,750 100% $69,750 $0Incinerator 1-West - Steel 18 m2 54 BRS1L $45.00 $2,448 100% $2,448 $0Incinerator 2-East - Steel 19 m2 54 BRS1L $45.00 $2,448 100% $2,448 $0Temporary Potable WTP - Steel 28 m2 45 BRS1L $45.00 $2,039 100% $2,039 $0STP 1 - Steel 29 m2 750 BRS1L $45.00 $33,750 100% $33,750 $0Fuel Farm Unloading Module - Steel 31 m2 110 BRS1L $45.00 $4,955 100% $4,955 $0Fuel Farm Warm-Up Shack - Steel 33 m2 36 BRS1L $45.00 $1,620 100% $1,620 $0Fuel Farm LV Module - Steel 35 m2 18 BRS1L $45.00 $824 100% $824 $0Frost Fighter Shop - Steel 42 m2 68 BRS1L $45.00 $3,051 100% $3,051 $0Fuel Farm Loading Module - Steel 43 m2 18 BRS1L $45.00 $797 100% $797 $0Old Water Pump House - Steel 45 m2 12 BRS1L $45.00 $536 100% $536 $0Main Water Pump House - Steel 47 m2 36 BRS1L $45.00 $1,602 100% $1,602 $0Large Vehicle Parking - Steel 49 aka maintenance shop m2 3688 BRS1L $45.00 $165,947 100% $165,947 $0
Large Vehicle Parking - Concrete m2 962 BRCL $40.00 $38,480 100% $38,480 $0Water World Storage - Steel 53 m2 1003 BRS1L $45.00 $45,126 100% $45,126 $0Utilities Complex - Steel 66 m2 28860 BRS1L $45.00 $1,298,700 100% $1,298,700 $0
Utilities Complex - Concrete m2 4810 BRCL $40.00 $192,400 100% $192,400 $0Platform @ 465.225m - Steel m2 280 BRS1L $45.00 $12,600 100% $12,600 $0Platform @ 465.225m - Concrete m2 280 BRCL $40.00 $11,200 100% $11,200 $0Platform @ 470.225m - Steel m2 266 BRS1L $45.00 $11,970 100% $11,970 $0Platform @ 470.225m - Concrete m2 266 BRCL $40.00 $10,640 100% $10,640 $0Platform @ 467.875m - Steel m2 262 BRS1L $45.00 $11,790 100% $11,790 $0Platform @ 467.875m - Concrete m2 262 BRCL $40.00 $10,480 100% $10,480 $0Platform @ 473.750m - Steel m2 176 BRS1L $45.00 $7,920 100% $7,920 $0Platform @ 473.750m - Concrete m2 176 BRCL $40.00 $7,040 100% $7,040 $02nd floor @ 468.350m - Steel m2 1430 BRS1L $45.00 $64,350 100% $64,350 $02nd floor @ 468.350m - Concrete m2 715 BRCL $40.00 $28,600 100% $28,600 $0Interior Enclosures (@465.350m & 470.350m) - Steel m2 604 BRS1L $45.00 $27,180 100% $27,180 $0Interior Enclosures (@465.350m & 470.350m) - Concrete m2 604 BRCL $40.00 $24,160 100% $24,160 $0
MV2017D0032 MV2019L2-0004 - De Beers Snap Lake - De Beers Response to IR 11 - Part 1 - BCL Oct_3_2019.xlsm 1 of 4

2019-10-07Reclaim 7.0 Project: Snap Lake Reclaim - BCL 20191003
Building / Equipment - Total Security
ACTIVITY/MATERIAL Building # Notes Units QuantityCost Code Unit Cost Cost % Land Land Cost Water Cost
Utilidor - Steel 68 m2 898 BRS1L $45.00 $40,406 100% $40,406 $0Utilidor - Concrete m2 69 BRCL $40.00 $2,776 100% $2,776 $0
Services Complex - Steel 73 m2 32768 BRS1L $45.00 $1,474,560 100% $1,474,560 $0Services Complex - Concrete m2 4400 BRCL $40.00 $176,000 100% $176,000 $0
Carpenter Shop - Steel 74 m2 423 BRS1L $45.00 $19,035 100% $19,035 $0Temporary Mine WTP - Steel 77 m2 298 BRS1L $45.00 $13,401 100% $13,401 $0WMP Skid 1 - Steel 78 m2 12 BRS1L $45.00 $549 100% $549 $0WMP Skid 2 - Steel 79 m2 12 BRS1L $45.00 $549 100% $549 $0Pump Station TS3 - Steel 83 removed m2 BRS1L $45.00 $0 100% $0 $0Pump Station TS4 - Steel 84 m2 16 BRS1L $45.00 $720 100% $720 $0Pump Station PS1 - Steel 85 m2 16 BRS1L $45.00 $720 100% $720 $0Pump Station PS2 - Steel 86 m2 16 BRS1L $45.00 $720 100% $720 $0Pump Station PS3 - Steel 87 m2 22 BRS1L $45.00 $977 100% $977 $0Pump Station PS4 - Steel 88 m2 16 BRS1L $45.00 $720 100% $720 $0Pump Station PS5 - Steel 89 m2 53 BRS1L $45.00 $2,381 100% $2,381 $0Pump Station PS5 - Wood 89 m2 24 BRWL $27.50 $660 100% $660 $0Analytics Module 90 Location unknown. Missing photo m2 BRS1L $45.00 $0 100% $0 $0Bouwa Whee Catering - SSBWCA Dorm - Steel 20 Counted from site photos taken August 2016 m2 141 BRS1L $45.00 $6,327 100% $6,327 $0B Dorm - Steel 21 Counted from site photos taken August 2016 m2 1125 BRS1L $45.00 $50,616 100% $50,616 $0C Dorm - Steel 22 m2 608 BRS1L $45.00 $27,347 100% $27,347 $0Warehouse (Kitchen) - Steel 67 m2 972 BRS1L $45.00 $43,736 100% $43,736 $0Accomodations Complex - Steel 75 m2 21112 BRS1L $45.00 $950,040 100% $950,040 $0
Accomodations Complex - Concrete m2 5278 BRCL $40.00 $211,120 100% $211,120 $0Smoking Room - Steel 76 missing photo m2 148 BRS1L $45.00 $6,660 100% $6,660 $0Process Ops - SSPOPBSP - Steel 24 m2 2384 BRS1H $65.00 $154,960 100% $154,960 $0Process Complex - Steel 80 m2 63081 BRS1H $65.00 $4,100,278 100% $4,100,278 $0
Process Complex - Concrete m2 6932 BRCL $40.00 $277,280 100% $277,280 $0Electrical/Control Building - Steel m2 1120 BRS1H $65.00 $72,800 100% $72,800 $0Electrical/Control Building - Concrete m2 448 BRCL $40.00 $17,920 100% $17,920 $03100 Area - Coarse Ore Storage Bin/Feeder, Reclaim Hopper - Steel
m2 1700 BRS1H $65.00 $110,500 100% $110,500 $03200 Area - Cone and Roll Crushers, Primary Scrubber - Steel m2 3519 BRS1H $65.00 $228,713 100% $228,713 $03300 Area - Concentrate Surge Bin, DMS Area, Tanks - Steel m2 5412 BRS1H $65.00 $351,780 100% $351,780 $03400 Area - Recovery Area - Steel m2 715 BRS1H $65.00 $46,497 100% $46,497 $03500 Area - Tanks, Flocculant Area - Steel m2 3541 BRS1H $65.00 $230,135 100% $230,135 $03700 Area - Paste Plant, Weigh Feeder Bins - Steel m2 1391 BRS1H $65.00 $90,393 100% $90,393 $0
Process Cement Plant - Steel 81 Area included within Process Complex m2 BRS1H $65.00 $0 100% $0 $0Process Transfer Tower 82
Transfer Tower 1 - Steel m2 2345 BRS1H $65.00 $152,425 100% $152,425 $0Transfer Tower 1 - Concrete m2 335 BRCL $40.00 $13,400 100% $13,400 $0Transfer Tower 2 - Steel m2 1911 BRS1H $65.00 $124,215 100% $124,215 $0Transfer Tower 2 - Concrete m2 273 BRCL $40.00 $10,920 100% $10,920 $0
Sandvik - SSANDVIKWarehouse - Steel 25 m2 1692 BRS1L $45.00 $76,140 100% $76,140 $0Geology - SSGEOCore Shack - Steel 26 m2 220 BRS1L $45.00 $9,900 100% $9,900 $0Environment - SSGENFish Cleaning Station - Steel 27 m2 24 BRS1L $45.00 $1,080 100% $1,080 $0Environmental Shop - Steel 30 aka Tli'Cho shop m2 450 BRS1L $45.00 $20,264 100% $20,264 $0
Environmental Shop - Wood m2 76 BRWL $27.50 $2,096 100% $2,096 $0Lake Shed - Steel 46 m2 40 BRS1L $45.00 $1,814 100% $1,814 $0
Lake Shed - Wood m2 14 BRWL $27.50 $374 100% $374 $0Gazebo - Wood 65 m2 31 BRWL $27.50 $858 100% $858 $0Surface Electrical - SSPLEFuel Farm Unloading Communication Module - Steel 32 m2 26 BRS1L $45.00 $1,152 100% $1,152 $0Fuel Farm LV Module Communication Module - Steel 36 m2 9 BRS1L $45.00 $405 100% $405 $0Fuel Farm Loading Communication Module - Steel 44 m2 9 BRS1L $45.00 $405 100% $405 $0Communications Module - Steel 61 m2 63 BRS1L $45.00 $2,831 100% $2,831 $0Auxialliary Generator Building - Steel 69 m2 206 BRS1L $45.00 $9,248 100% $9,248 $0Black Start Generator Building - Steel 70 Area included as part of Utilities Complex m2 BRS1L $45.00 $0 100% $0 $0HD Mechanical - SSGS1Light Vehicle - Tire Shop - Steel 37 m2 1971 BRS1L $45.00 $88,673 100% $88,673 $0Light Vehicle - Tire Shop Toilet - Steel 38 m2 45 BRS1L $45.00 $2,039 100% $2,039 $0
MV2017D0032 MV2019L2-0004 - De Beers Snap Lake - De Beers Response to IR 11 - Part 1 - BCL Oct_3_2019.xlsm 2 of 4
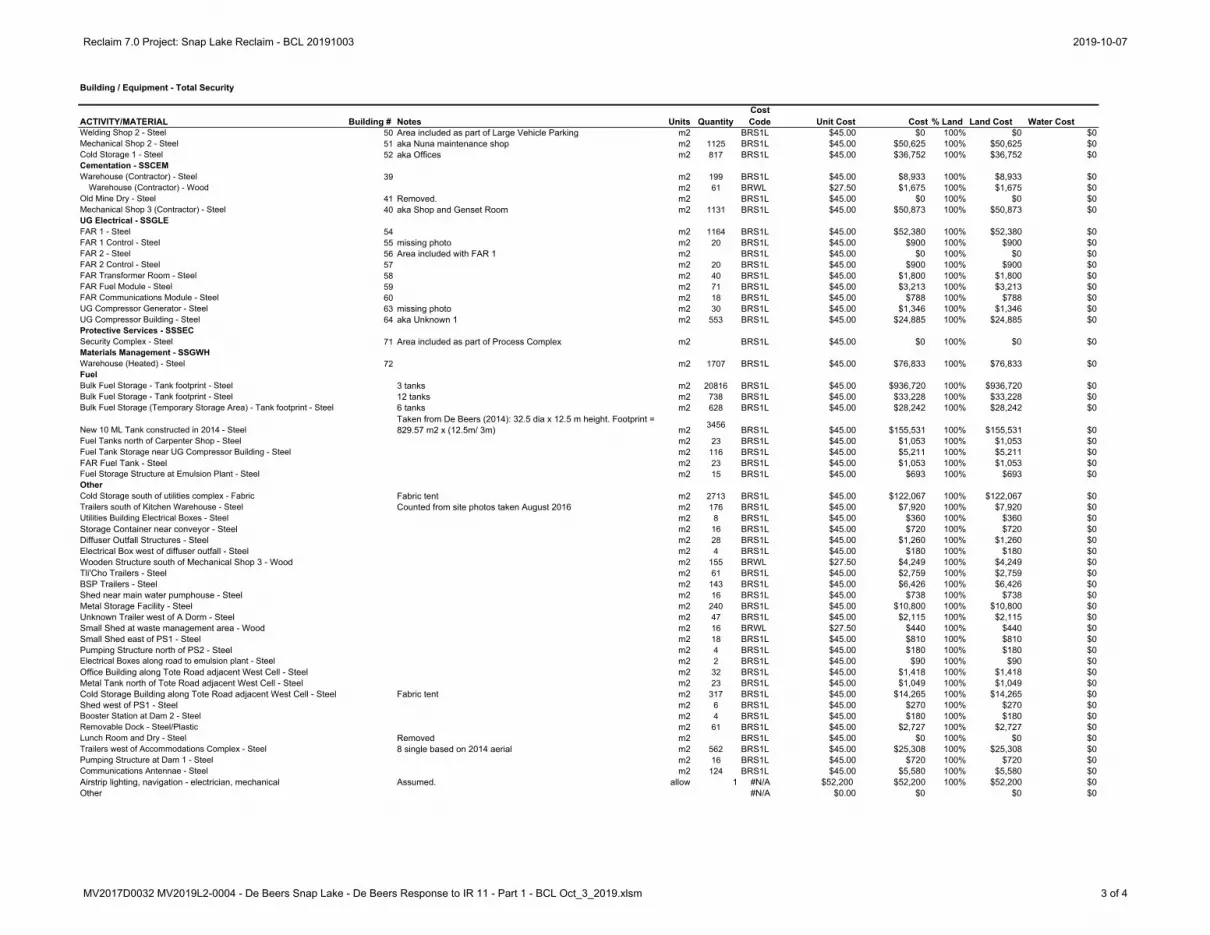
2019-10-07Reclaim 7.0 Project: Snap Lake Reclaim - BCL 20191003
Building / Equipment - Total Security
ACTIVITY/MATERIAL Building # Notes Units QuantityCost Code Unit Cost Cost % Land Land Cost Water Cost
Welding Shop 2 - Steel 50 Area included as part of Large Vehicle Parking m2 BRS1L $45.00 $0 100% $0 $0Mechanical Shop 2 - Steel 51 aka Nuna maintenance shop m2 1125 BRS1L $45.00 $50,625 100% $50,625 $0Cold Storage 1 - Steel 52 aka Offices m2 817 BRS1L $45.00 $36,752 100% $36,752 $0Cementation - SSCEMWarehouse (Contractor) - Steel 39 m2 199 BRS1L $45.00 $8,933 100% $8,933 $0
Warehouse (Contractor) - Wood m2 61 BRWL $27.50 $1,675 100% $1,675 $0Old Mine Dry - Steel 41 Removed. m2 BRS1L $45.00 $0 100% $0 $0Mechanical Shop 3 (Contractor) - Steel 40 aka Shop and Genset Room m2 1131 BRS1L $45.00 $50,873 100% $50,873 $0UG Electrical - SSGLEFAR 1 - Steel 54 m2 1164 BRS1L $45.00 $52,380 100% $52,380 $0FAR 1 Control - Steel 55 missing photo m2 20 BRS1L $45.00 $900 100% $900 $0FAR 2 - Steel 56 Area included with FAR 1 m2 BRS1L $45.00 $0 100% $0 $0FAR 2 Control - Steel 57 m2 20 BRS1L $45.00 $900 100% $900 $0FAR Transformer Room - Steel 58 m2 40 BRS1L $45.00 $1,800 100% $1,800 $0FAR Fuel Module - Steel 59 m2 71 BRS1L $45.00 $3,213 100% $3,213 $0FAR Communications Module - Steel 60 m2 18 BRS1L $45.00 $788 100% $788 $0UG Compressor Generator - Steel 63 missing photo m2 30 BRS1L $45.00 $1,346 100% $1,346 $0UG Compressor Building - Steel 64 aka Unknown 1 m2 553 BRS1L $45.00 $24,885 100% $24,885 $0Protective Services - SSSECSecurity Complex - Steel 71 Area included as part of Process Complex m2 BRS1L $45.00 $0 100% $0 $0Materials Management - SSGWHWarehouse (Heated) - Steel 72 m2 1707 BRS1L $45.00 $76,833 100% $76,833 $0FuelBulk Fuel Storage - Tank footprint - Steel 3 tanks m2 20816 BRS1L $45.00 $936,720 100% $936,720 $0Bulk Fuel Storage - Tank footprint - Steel 12 tanks m2 738 BRS1L $45.00 $33,228 100% $33,228 $0Bulk Fuel Storage (Temporary Storage Area) - Tank footprint - Steel 6 tanks m2 628 BRS1L $45.00 $28,242 100% $28,242 $0
New 10 ML Tank constructed in 2014 - SteelTaken from De Beers (2014): 32.5 dia x 12.5 m height. Footprint = 829.57 m2 x (12.5m/ 3m) m2 3456 BRS1L $45.00 $155,531 100% $155,531 $0
Fuel Tanks north of Carpenter Shop - Steel m2 23 BRS1L $45.00 $1,053 100% $1,053 $0Fuel Tank Storage near UG Compressor Building - Steel m2 116 BRS1L $45.00 $5,211 100% $5,211 $0FAR Fuel Tank - Steel m2 23 BRS1L $45.00 $1,053 100% $1,053 $0Fuel Storage Structure at Emulsion Plant - Steel m2 15 BRS1L $45.00 $693 100% $693 $0OtherCold Storage south of utilities complex - Fabric Fabric tent m2 2713 BRS1L $45.00 $122,067 100% $122,067 $0Trailers south of Kitchen Warehouse - Steel Counted from site photos taken August 2016 m2 176 BRS1L $45.00 $7,920 100% $7,920 $0Utilities Building Electrical Boxes - Steel m2 8 BRS1L $45.00 $360 100% $360 $0Storage Container near conveyor - Steel m2 16 BRS1L $45.00 $720 100% $720 $0Diffuser Outfall Structures - Steel m2 28 BRS1L $45.00 $1,260 100% $1,260 $0Electrical Box west of diffuser outfall - Steel m2 4 BRS1L $45.00 $180 100% $180 $0Wooden Structure south of Mechanical Shop 3 - Wood m2 155 BRWL $27.50 $4,249 100% $4,249 $0Tli'Cho Trailers - Steel m2 61 BRS1L $45.00 $2,759 100% $2,759 $0BSP Trailers - Steel m2 143 BRS1L $45.00 $6,426 100% $6,426 $0Shed near main water pumphouse - Steel m2 16 BRS1L $45.00 $738 100% $738 $0Metal Storage Facility - Steel m2 240 BRS1L $45.00 $10,800 100% $10,800 $0Unknown Trailer west of A Dorm - Steel m2 47 BRS1L $45.00 $2,115 100% $2,115 $0Small Shed at waste management area - Wood m2 16 BRWL $27.50 $440 100% $440 $0Small Shed east of PS1 - Steel m2 18 BRS1L $45.00 $810 100% $810 $0Pumping Structure north of PS2 - Steel m2 4 BRS1L $45.00 $180 100% $180 $0Electrical Boxes along road to emulsion plant - Steel m2 2 BRS1L $45.00 $90 100% $90 $0Office Building along Tote Road adjacent West Cell - Steel m2 32 BRS1L $45.00 $1,418 100% $1,418 $0Metal Tank north of Tote Road adjacent West Cell - Steel m2 23 BRS1L $45.00 $1,049 100% $1,049 $0Cold Storage Building along Tote Road adjacent West Cell - Steel Fabric tent m2 317 BRS1L $45.00 $14,265 100% $14,265 $0Shed west of PS1 - Steel m2 6 BRS1L $45.00 $270 100% $270 $0Booster Station at Dam 2 - Steel m2 4 BRS1L $45.00 $180 100% $180 $0Removable Dock - Steel/Plastic m2 61 BRS1L $45.00 $2,727 100% $2,727 $0Lunch Room and Dry - Steel Removed m2 BRS1L $45.00 $0 100% $0 $0Trailers west of Accommodations Complex - Steel 8 single based on 2014 aerial m2 562 BRS1L $45.00 $25,308 100% $25,308 $0Pumping Structure at Dam 1 - Steel m2 16 BRS1L $45.00 $720 100% $720 $0Communications Antennae - Steel m2 124 BRS1L $45.00 $5,580 100% $5,580 $0Airstrip lighting, navigation - electrician, mechanical Assumed. allow 1 #N/A $52,200 $52,200 100% $52,200 $0Other #N/A $0.00 $0 $0 $0
MV2017D0032 MV2019L2-0004 - De Beers Snap Lake - De Beers Response to IR 11 - Part 1 - BCL Oct_3_2019.xlsm 3 of 4

2019-10-07Reclaim 7.0 Project: Snap Lake Reclaim - BCL 20191003
Building / Equipment - Total Security
ACTIVITY/MATERIAL Building # Notes Units QuantityCost Code Unit Cost Cost % Land Land Cost Water Cost
LANDFILL FOR DEMOLITION WASTE
Remove inert building waste to landfill - Loader
From DEP Table C-3 (De Beers, 2018a). Assumed haul rate of 1926 m3/day by 1 loader and two dump trucks (70,870 m3 demo waste / 1926 = 36.8 days). Excludes overland pipes (5,460 m3), which are addressed in 'Water Management', and surface debris piles, addressed below. hr 883 LOAD-L $315.00 $278,208 100% $278,208 $0
Remove inert building waste to landfill - Dump truck 36.8 days, 2 drivers hr 1766 TRUCK-L $300.00 $529,920 100% $529,920 $0
Remove inert surface debris to landfill - Loader
From DEP Table D-2 (De Beers, 2018a). Assumed haul rate of 1926 m3/day by 1 loader and two dump trucks (16,932 m3 demo waste / 1926 = 8.8 days) hr 211 LOAD-L $315.00 $66,528 100% $66,528 $0
Remove inert surface debris to landfill - Dump truck 8.8 days, 2 drivers hr 422 TRUCK-L $300.00 $126,720 100% $126,720 $0
Remove concrete waste to landfill - Loader
From DEP Table C-2 (De Beers, 2018a) . Assumed haul rate of 1926 m3/day by 1 loader and two dump trucks (450 m3 demo waste / 1926 = 0.23 days) hr 6 LOAD-L $315.00 $1,739 100% $1,739 $0
Remove concrete waste to landfill - Dump truck 0.23 days, 2 drivers hr 11 TRUCK-L $300.00 $3,312 100% $3,312 $0GRADE, CONTOUR AND RECLAIM PADSInfrastructure Areas, Roads, Airstrip and Laydown - scarify/regrade for closure
Based on areas from Revegetation Plan (ARKTIS, 2019). Excludes areas for mine portals and concrete foundation areas (cost included elsewhere). ha 60.2 SCFYL $4,300.00 $258,702 100% $258,702 $0
Concrete foundations - cover and scarify/regrade for closure
Cover concrete foundations with 0.5 m of non-PAG material. Buildings with concrete foundations based on DEP Table D-1 (De Beers, 2018a).. m3 14834 RB3L $12.05 $178,745 100% $178,745 $0
Revegetate - apply topsoil
Based on volume of organics stockpile (less rip rap) from Revegetation Plan (ARKTIS, 2019). Assume all available organics will be used to improve reclamation. m3 102900 SB3L $5.10 $524,790 100% $524,790 $0
Revegetate - fertilize and seedBased on areas from Revegetation Plan (ARKTIS, 2019). Assume unit cost for hydro seeding. ha 47.8 VHFL $4,000.00 $191,111 100% $191,111 $0
Other #N/A $0.00 $0 $0 $0RECLAIM ROADSRemove culverts Excavate to 3H:1V side slopes. Estimate 54 culverts. m3 27960 SB1L $4.30 $120,228 50% $60,114 $60,114Place erosion protection material Cover culvert side slopes and base with 0.3m thick rock layer. m3 1541 RR1H $17.75 $27,357 50% $13,679 $13,679Remove culverts to landfill 10 culverts per load. 1 hr to load, offload and round trip. hr 5.4 HIABL $155.00 $837 50% $419 $419Scarify and install water breaks handled above ha #N/A $0.00 $0 $0 $0Scarify airstriip handled above ha #N/A $0.00 $0 $0 $0Scarify laydown areas handled above ha #N/A $0.00 $0 $0 $0Vegetate handled above ha #N/A $0.00 $0 $0 $0Other Remove electrical power poles & lines - assume 20 km. m 20000 POWRL $25.50 $510,000 100% $510,000 $0
Total $16,764,564 $16,690,353 $74,211% of Total 100% 0%
Note: Unit costs are based on 3m high, single storey building. Scale larger building areas accordingly. E.g. 10m high building multiply area by 3.3 (10/3)
MV2017D0032 MV2019L2-0004 - De Beers Snap Lake - De Beers Response to IR 11 - Part 1 - BCL Oct_3_2019.xlsm 4 of 4

2019-10-07Reclaim 7.0 Project: Snap Lake Reclaim - BCL 20191003
Chemicals/Soil - Total Security
ACTIVITY/MATERIAL Notes Units QuantityCost Code Unit Cost Cost % Land Land Cost Water Cost
HAZARDOUS MATERIALS AUDITHazardous materials audit each 1 CS2L $50,000.00 $50,000 50% $25,000 $25,000BUILDING DECONTAMINATION & CONSOLIDATION OF HAZARDOUS MATERIALSEnvironmental technician/coordinator Assumed hr 608 ENVCOH $130.00 $79,095 50% $39,547 $39,547Decontaminate process plant 500 m2/day, 7540 m2 area hr 1448 LAB-USH $43.98 $63,669 50% $31,834 $31,834Dontaminate fuel tanks 125 m2/day, 5720 m2 area hr 4393 LAB-USH $43.98 $193,212 50% $96,606 $96,606Other #N/A $0.00 $0 $0 $0HAZARDOUS MATERIALS REMOVAL
Diesel fuel6ML present on site per DBCI information. Assume 10% of volumeremoved from site. litre 600000 ORH $1.20 $720,000 50% $360,000 $360,000
Other fuel storage From DEP Table D-3 (De Beers, 2018a). litre 300800 ORH $1.20 $360,960 50% $180,480 $180,480Gear oils and lubricants From DEP Table C-1 (De Beers, 2018a). litre 300000 ORH $1.20 $360,000 50% $180,000 $180,000Windshield washer fluid From DEP Table C-1 (De Beers, 2018a). litre 10000 ORH $1.20 $12,000 50% $6,000 $6,000Ethylene Glyco Assume high cost for oil. From DEP Table C-1 (De Beers, 2018a) litre 23746 ORH $1.20 $28,495 50% $14,248 $14,248Propylene Glycol Assume high cost for oil. From DEP Table C-1 (De Beers, 2018a) litre 1000 ORH $1.20 $1,200 50% $600 $600Propane 95 (20lbs) and 20 (100lbs) tanks kg 1769 PCRH $2.50 $4,423 50% $2,211 $2,211
Oxygen and acetylene90 bottles total. Assume 100 lb cylinders. From DEP Table C-1 (DeBeers, 2018a). kg 4082 PCRH $2.50 $10,205 50% $5,103 $5,103
Paint and solvents From DEP Table C-1 (De Beers, 2018a). litre 1000 ORH $1.20 $1,200 50% $600 $600Sulphuric acid Assume 1L = 1kg. From DEP Table C-1 (De Beers, 2018a) kg 109000 PCRH $2.50 $272,500 50% $136,250 $136,250Lime Assume 1L = 1kg. From DEP Table C-1 (De Beers, 2018a) kg 18360 PCRH $2.50 $45,900 50% $22,950 $22,950Sodium hypochlorite Assume 1L = 1kg. From DEP Table C-1 (De Beers, 2018a) kg 500 PCRH $2.50 $1,250 50% $625 $625Concrete additives Assume 1L = 1kg. From DEP Table C-1 (De Beers, 2018a) kg 2000 PCRH $2.50 $5,000 50% $2,500 $2,500Curing compounds Assume 1L = 1kg. From DEP Table C-1 (De Beers, 2018a) kg 100 PCRH $2.50 $250 50% $125 $125Flocculants From DEP Table C-1 (De Beers, 2018a). kg 20000 PCRH $2.50 $50,000 50% $25,000 $25,000Ferric Sulphate From DEP Table C-1 (De Beers, 2018a). kg 17000 PCRH $2.50 $42,500 50% $21,250 $21,250Ferrosilicon Confirmed none onsite by DBC. kg 0 PCRH $2.50 $0 50% $0 $0Alum Assume 1L = 1kg. From DEP Table C-1 (De Beers, 2018a) kg 2000 PCRH $2.50 $5,000 50% $2,500 $2,500
Fire extinguishersAssume 100. Assume 20 lbs canisters. From DEP Table C-1 (DeBeers, 2018a). kg 907 PCRH $2.50 $2,268 50% $1,134 $1,134
Smoke alarms Assume 400. From DEP Table C-1 (De Beers, 2018a) allow 1 #N/A $1,000.00 $1,000 50% $500 $500Lights halogen and fluorescent, and ballasts (no PCBs) Assume 500. From DEP Table C-1 (De Beers, 2018a). allow 1 #N/A $1,000.00 $1,000 50% $500 $500
Old batteries from vehiclesAssume 30. From DEP Table C-1 (De Beers, 2018a). Allowancebased on NICO. allow 30 #N/A $500.00 $15,000 50% $7,500 $7,500
Old fluids from vehiclesAssume 30. From DEP Table C-1 (De Beers, 2018a). Assume 20Leach. litre 600 ORH $1.20 $720 50% $360 $360
Other hazardous materials #N/A $0.00 $0 $0 $0HAZARDOUS MATERIALS Transportation to disposal facility allow #N/A $0.00 $0 $0 $0Disposal fees allowance - various items from decontamination allow 1 #N/A $500,000 $500,000 50% $250,000 $250,000Other #N/A $0.00 $0 $0 $0CONTAMINATED SOILS Contam. soil investigation - Phase 1 each 1 CS1L $7,500 $7,500 50% $3,750 $3,750Contam. soil investigation - Phase 2 each 1 CS2L $50,000 $50,000 50% $25,000 $25,000CONTAMINATED SOIL REMEDIATION
Excavate, load, haul to landfarm
Soil moved to former 12.5 ML tank fuel storage area. Includes soil above liner in old landfarm (7600 m3), and top 0.3 m of soil in other fuel/oil storage areas (13688 m3). m3 21288 SB1L $4.30 $91,538 50% $45,769 $45,769
Remediate on-site in landfarmOperate for approx. 5 yrs. Includes soil to be moved (21288 m3) and soil already within the proposed landfarm area (12016 m3). m3 33304 CSRL $47.00 $1,565,288 50% $782,644 $782,644
Total $4,541,172 $2,270,586 $2,270,586% of Total 50% 50%
Note: The procedures, equipment and packaging for clean up and removal of chemicals or contaminated soils are highly dependent on the nature of the chemicals and their
MV2017D0032 MV2019L2-0004 - De Beers Snap Lake - De Beers Response to IR 11 - Part 1 - BCL Oct_3_2019.xlsm 1 of 1

2019-10-07Reclaim 7.0 Project: Snap Lake Reclaim - BCL 20191003
Water Management - Total Security
ACTIVITY/MATERIAL Notes Units Quantity Cost Code Unit Cost CostBREACH DYKE EMBANKMENTRemove fill m3 #N/A $0.00 $0Contour water intake area m3 #N/A $0.00 $0STABILIZE SEDIMENT PONDS/WATER MANAGEMENT PONDSPlace soil cover m3 #N/A $0.00 $0Doze & spread excavated materia m3 #N/A $0.00 $0Vegetate spread materia ha #N/A $0.00 $0Rip rap in channel base each #N/A $0.00 $0REDIRECT RUNOFF/CONSTRUCT DIVERSION DITCHESExcavate ditches -soil m3 #N/A $0.00 $0Excavate ditches -rock m3 #N/A $0.00 $0Stabilize side slopes m3 #N/A $0.00 $0Rip rap in channel base m3 #N/A $0.00 $0BREACH DITCHESExcavate breaches m3 #N/A $0.00 $0Backfill/recontour m3 #N/A $0.00 $0Install flow dissipation m3 #N/A $0.00 $0Vegetate remainder of ditch m2 #N/A $0.00 $0DECOMISSION FRESH WATER SUPPLYBreach embankment m #N/A $0.00 $0Remove pump LS #N/A $0.00 $0Remove pipeline m #N/A $0.00 $0WATER CONTROLInstall pumping system Existing pipe and pump infrastructure will be utilized. LS #N/A $0.00 $0Pump fuel - purchase See 'Water Treatment' litre #N/A $0.00 $0Pump fuel - mob See 'Water Treatment' litre #N/A $0.00 $0Pump/pipeline maintenance See 'Water Treatment' allow #N/A $0.00 $0Remove pumping system Addressed below LS #N/A $0.00 $0REMOVE PIPELINES
Remove Pipes
PK distribution, Sump dewatering, and Water Management pipes estimated based on as-built survey data provided by DBC and on aerial photographs from August 2014. m 19490 PLRL $22.00 $428,780
Remove Diffuser
Fill pipes with concrete and leave in-place. Snap Lake diffuser pipes (new= 525 m, old = 205 m) - measured from De Beers (2014) Snap Lake Mine Water License 2011L2-0004; As-Built Diffuser Drawings Stamped by Engineer. January 2, 2014. m 730 PLRL $22.00 $16,060
CONSTRUCT PASSIVE TREATMENT SYSTEM (e.g. Constructed Wetland)West Wetland and Influent Storage Pond Based on North Pile Passive Treatment System Detail Design (Golder, 2018b) Clearing and grubbing Based on a land multiplier of 1.25 m2 155000 SBCL $3.40 $527,000 Excavation Blasting required m3 440800 RB1L $11.40 $5,025,120 Fill m3 136600 SBSH $6.30 $860,580 Subgrade compaction Does not include exterior berm formation m2 52100 DSL $0.95 $49,495 Bitumiminous Liner Labour and equipment required for liner installation m2 57900 GSHDPEL $7.95 $460,305 Liner Cover/Bedding 0.2 m thick combined, 19 mm minus m3 11580 SBSH $6.30 $72,954 Erosion Protection 0.3 m thick covering liner on all berms, 150 mm minus m3 17370 SBSH $6.30 $109,431
MV2017D0032 MV2019L2-0004 - De Beers Snap Lake - De Beers Response to IR 11 - Part 1 - BCL Oct_3_2019.xlsm 1 of 2

2019-10-07Reclaim 7.0 Project: Snap Lake Reclaim - BCL 20191003
Water Management - Total Security
ACTIVITY/MATERIAL Notes Units Quantity Cost Code Unit Cost Cost Dental concrete to weld liner to assumed competen bedrock floor
For West and East ISPs, where the floor will be unlined. Assume addressed withcosting for bituminous liner. m 590 #N/A $0.00 $0
FWS constructed wetland plant/plantingLabour and equipment required for planting of wetlands. Assume unit cost forhydroseeding. ha 5.2 VHFL $4,000.00 $20,800
Organic soil
Interior berms and 0.3 m on floor of wetland cells. Organic soil assumed to beavailable onsite. Labour and equipment required for hauling, placement, compaction, and spreading of organic material. m3 17400 SB4H $11.00 $191,400
ISP to wetland piping - 100 mm diameter - supply and ship HDPE piping m 30 PSSH $11.10 $333 ISP to wetland piping - 150 mm diameter - supply and ship HDPE piping m 30 PSSH $11.10 $333 ISP to wetland piping - 100 mm diamete - instal HDPE piping m 30 PSIL $25.00 $750 ISP to wetland piping - 150 mm diameter - instal HDPE piping m 30 PSIL $25.00 $750
ISP to wetland pipe fittingsFittings related to 100 mm and 150 mm piping penetrating ISP and wetland liners (pipe boots, etc.). Assume included in costing for installation. each 4 #N/A $0.00 $0
Instrumentation related to flow monitoring Assumed needed for first 5-10 years of PTS operation each 1 SIH $3,600.00 $3,600East Wetland and Influent Storage Pond Based on North Pile Passive Treatment System Detail Design (Golder, 2018b) Clearing and grubbing Based on a land multiplier of 1.25 m2 145000 SBCL $3.40 $493,000 Excavation Blasting required m3 534100 RB1L $11.40 $6,088,740 Fill m3 22800 SBSH $6.30 $143,640 Subgrade compaction Does not include exterior berm formation m2 67200 DSL $0.95 $63,840 Bitumiminous Liner Labour and equipment required for liner installation m2 77100 GSHDPEL $7.95 $612,945 Liner Cover/Bedding 0.2 m thick combined, 19 mm minus m3 15420 SBSH $6.30 $97,146 Erosion Protection 0.3 m thick covering liner on all berms, 150 mm minus m3 23130 SBSH $6.30 $145,719 Dental concrete to weld liner to assumed competen bedrock floor
For West and East ISPs, where the floor will be unlined. Assume addressed withcosting for bituminous liner. m 500 #N/A $0.00 $0
FWS constructed wetland plant/plantingLabour and equipment required for planting of wetlands. Assume unit cost forhydroseeding. ha 6.8 VHFL $4,000.00 $27,200
Organic soil
Interior berms and 0.3 m on floor of wetland cells. Organic soil assumed to beavailable onsite. Labour and equipment required for hauling, placement, compaction, and spreading of organic material. m3 23500 SB4H $11.00 $258,500
ISP to wetland piping - 100 mm diameter - supply and ship HDPE piping m 100 PSSH $11.10 $1,110 ISP to wetland piping - 150 mm diameter - supply and ship HDPE piping m PSSH $11.10 $0 ISP to wetland piping - 100 mm diamete - instal HDPE piping m 100 PSIL $25.00 $2,500 ISP to wetland piping - 150 mm diameter - instal HDPE piping m PSIL $25.00 $0
ISP to wetland pipe fittingsFittings related to 100 mm and 150 mm piping penetrating ISP and wetland liners (pipe boots, etc.). Assume included in costing for installation. each 4 #N/A $0.00 $0
Instrumentation related to flow monitoring Assumed needed for first 5-10 years of PTS operation each 1 SIH $3,600.00 $3,600CONSTRUCT WATER TREATMENT PLANTBuild treatment plant Utilize existing water treatment system LS #N/A $0.00 $0Build sludge containment facility LS #N/A $0.00 $0WATER TREATMENTReclamation water treatment See Water Treatment for breakdown allow 8 #N/A 289,797.00$ $2,318,376
Total $18,024,007
MV2017D0032 MV2019L2-0004 - De Beers Snap Lake - De Beers Response to IR 11 - Part 1 - BCL Oct_3_2019.xlsm 2 of 2

2019-10-07Reclaim 7.0 Project: Snap Lake Reclaim - BCL 20191003
Water Treatment - Total Security
ACTIVITY/MATERIAL Notes Units QuantityCost Code Unit Cost Cost
WATER CONTROL
Pumping from North Pile to WMP
Predicted quantities from Water Management Plan for unfrozen condition from 2020 to 2026 (De Beers, 2019a). Quantity for 1-year duration. m3 169058 POCL $0.12 $20,287
Pumping from WMP to Underground
Predicted quantities from Water Management Plan for unfrozen condition from 2020 to 2026 (De Beers, 2019a). Quantity for 1-year duration. m3 141969 POCL $0.12 $17,036
WATER TREATMENT
RO Treatment Plant Operation
Treat WMP water. Predicted quantities from Water Management Plan for unfrozen condition from 2020 to 2026 (De Beers, 2019a). Quantity is for 1-year duration. m3 92904 TPOH $2.00 $185,807
ADDITION OF REAGENTS TO WTPH2O2 kg #N/A $0.00 $0lime kg #N/A $0.00 $0ferric sulphate kg #N/A $0.00 $0ferrous sulphate kg #N/A $0.00 $0flocculents kg #N/A $0.00 $0reagents kg #N/A $0.00 $0Other #N/A $0.00 $0LABOUR AND SUPPLIES
Water Treatment and Control Fuel - purchaseOperational data has fuel/water ratio of 0.0282. This ratio is doubled for the calculation. From DBCI. litres 22782 FCDH $1.39 $31,667
Water Treatment and Control Fuel - mob See 'Mobilization' litres #N/A $0.00 $0Pump/Pipeline/Treatment Plant maintenance allow 1 PML $25,000.00 $25,000Annual power kW-h #N/A $0.00 $0Electrician/mechanic to maintain treatment plant allow #N/A $0.00 $0Equipment maintenance and parts Estimate $5000/yr allow 1 #N/A $5,000.00 $5,000Misc. supplies, hoses, tools Estimate $5000/yr allow 1 #N/A $5,000.00 $5,000Communications allow #N/A $0.00 $0Other #N/A $0.00 $0WATER SAMPLING AND ANALYSES Addressed under Post Closure MonitoringSampling equipment allow #N/A $1,000.00 $0Analyses allow #N/A $5,283.50 $0Shipping to laboratory allow #N/A $100.00 $0Reporting allow #N/A $0.00 $0Other allow #N/A $5,000 $0SITE ACCESSRoad maintenance (incl. snow removal) allow #N/A $0.00 $0Winter road tariff allow #N/A $0.00 $0Truck rental allow #N/A $0.00 $0Air support allow #N/A $0.00 $0
Annual water treatment costs $289,797Number of years of water treatment during closure years 8
Total $2,318,376
MV2017D0032 MV2019L2-0004 - De Beers Snap Lake - De Beers Response to IR 11 - Part 1 - BCL Oct_3_2019.xlsm 1 of 1

2019-10-07Reclaim 7.0 Project: Snap Lake Reclaim - BCL 20191003
Interim Care and Maintenance - Total Security
ACTIVITY/MATERIAL Notes Units QuantityCost Code Unit Cost Cost
INTERIM CARE & MAINTENANCEMine manager 1 person with designate when not on site hr 1820 SMANL $125.00 $227,500Equipment operator 2 person at 26 wks/yr/person hr 1820 OPERL $41.00 $74,620
Cross over days hr 130 OPERL $41.00 $5,330Environmental coordinator 2 person, at 26 weeks/yr/person hr 1820 ENVCOL $74.16 $134,971
Cross over days hr 130 ENVCOL $74.16 $9,641Cook/housekeeper 2 person, at 26 weeks/yr/person hr 1820 COOKL $35.00 $63,700
Cross over days hr 130 COOKL $35.00 $4,550Extra personnel -electrician Call in as reqd. Assume 1 mo. work total/yr hr 280 ELECL $74.00 $20,720 -mechanic Call in as reqd. Assume 1 mo. work total/yr hr 280 MECHL $49.00 $13,720Worker accomodations mandays 823 ACCML $100.00 $82,300
Mob workers to sitebi-weekly flights from Yellowknife per year; Cost code from AANDC each 26 MWL $4,500.00 $117,000
Extra flights each 6 MWL $4,500.00 $27,000Equipment Addressed in 'Mobilization' each #N/A $0.00 $0Annual fuel - purchase Existing fuel onsite to be utilized L #N/A $0.00 $0Annual fuel - mob Existing fuel onsite to be utilized L #N/A $0.00 $0Communications equip and service allow 1 #N/A $50,000.00 $50,000Miscellaneous parts and materials allow 1 #N/A $50,000.00 $50,000MONITORING & INSPECTIONSMonitoring during ICM See Post-Closure for breakdown each 1 #N/A $549,143 $549,143INTERIM WATER TREATMENTTreatment See Water Treatment for breakdown allow 1 #N/A $289,797.00 $289,797
sub-total $1,719,992Number of years of ICM years 2 Total $3,439,985
MV2017D0032 MV2019L2-0004 - De Beers Snap Lake - De Beers Response to IR 11 - Part 1 - BCL Oct_3_2019.xlsm 1 of 1

2019-10-07Reclaim 7.0 Project: Snap Lake Reclaim - BCL 20191003
Mobilization/Demobilization - Total Security
ACTIVITY/MATERIAL Notes Units QuantityCost Code Unit Cost Cost
PURCHASE EQUIPMENTExcavator - 350 Used for post closure maintenance. Mob addressed below. allow 1 #N/A $125,000 $125,000Haul truck - Komatsu 350 Used for post closure maintenance. Mob addressed below. allow 1 #N/A $100,000 $100,000Truck - 3/4 ton pickup Used for post closure maintenance. Mob addressed below. allow 1 #N/A $50,000 $50,000Ski-doo Used for post closure maintenance. Mob addressed below. allow 1 #N/A $10,000 $10,000Kubota ATV Used for post closure maintenance. Mob addressed below each 1 #N/A $10,000 $10,000MOBILIZE HEAVY EQUIPMENTDozer - Komatsu 155 From DEP km 1436 MHERH 10.25 $14,719 Ref#4Dozer - Komatsu 65 From DEP km 718 MHERH 10.25 $7,360Excavator - 330 with Breaker From DEP km 1436 MHERH 10.25 $14,719Excavator - 330 with Shear From DEP km 1436 MHERH 10.25 $14,719Excavator - 350 From DEP km 1436 MHERH 10.25 $14,719Excavator - Komatsu 400 with thumb From DEP km 1436 MHERH 10.25 $14,719Excavator - 480 From DEP km 1436 MHERH 10.25 $14,719Excavator - 480 High Reach From DEP km 1436 MHERH 10.25 $14,719Excavator - Komatsu 650 From DEP km 1436 MHERH 10.25 $14,719Grader - JD 872D From DEP km 718 MHERH 10.25 $7,360Komatsu Loader 450 From DEP km 718 MHERH 10.25 $7,360Packer - Ride On - 84" From DEP km 718 MHERH 10.25 $7,360Haul truck - Komatsu 350 From DEP km 1436 MHERH 10.25 $14,719Hagglund 2004 All Terrain From DEP km 718 MHERH 10.25 $7,360Rock truck - Komatsu 350 From DEP km 1436 MHERH 10.25 $14,719Haul truck From DEP km 1436 MHERH 10.25 $14,719Tractor c/w Enclosed Box Trailer From DEP km 718 MHERH 10.25 $7,360Tractor c/w Load Bed Trailer From DEP km 718 MHERH 10.25 $7,360Tractor c/w Tandem End Dump From DEP km 718 MHERH 10.25 $7,360Tractor c/w Triaxle End Dump From DEP km 718 MHERH 10.25 $7,360Truck - 3/4 ton pickup From DEP km 718 MHERH 10.25 $7,360Truck - service unit - clearview From DEP km 718 MHERH 10.25 $7,360Truck - service unit - Rowe From DEP km 718 MHERH 10.25 $7,360Truck - cement mixer From DEP km 718 MHERH 10.25 $7,360Truck with bin From DEP km 718 MHERH 10.25 $7,360Air compressor From DEP km 718 MHERH 10.25 $7,360Bobcat - tired From DEP km 718 MHERH 10.25 $7,360Bobcat - Skidsteer From DEP km 718 MHERH 10.25 $7,360Breaker From DEP km 718 MHERH 10.25 $7,360Canadian Foremost Delta III cw 8x20 foot decks From DEP km 718 MHERH 10.25 $7,360
MV2017D0032 MV2019L2-0004 - De Beers Snap Lake - De Beers Response to IR 11 - Part 1 - BCL Oct_3_2019.xlsm 1 of 3
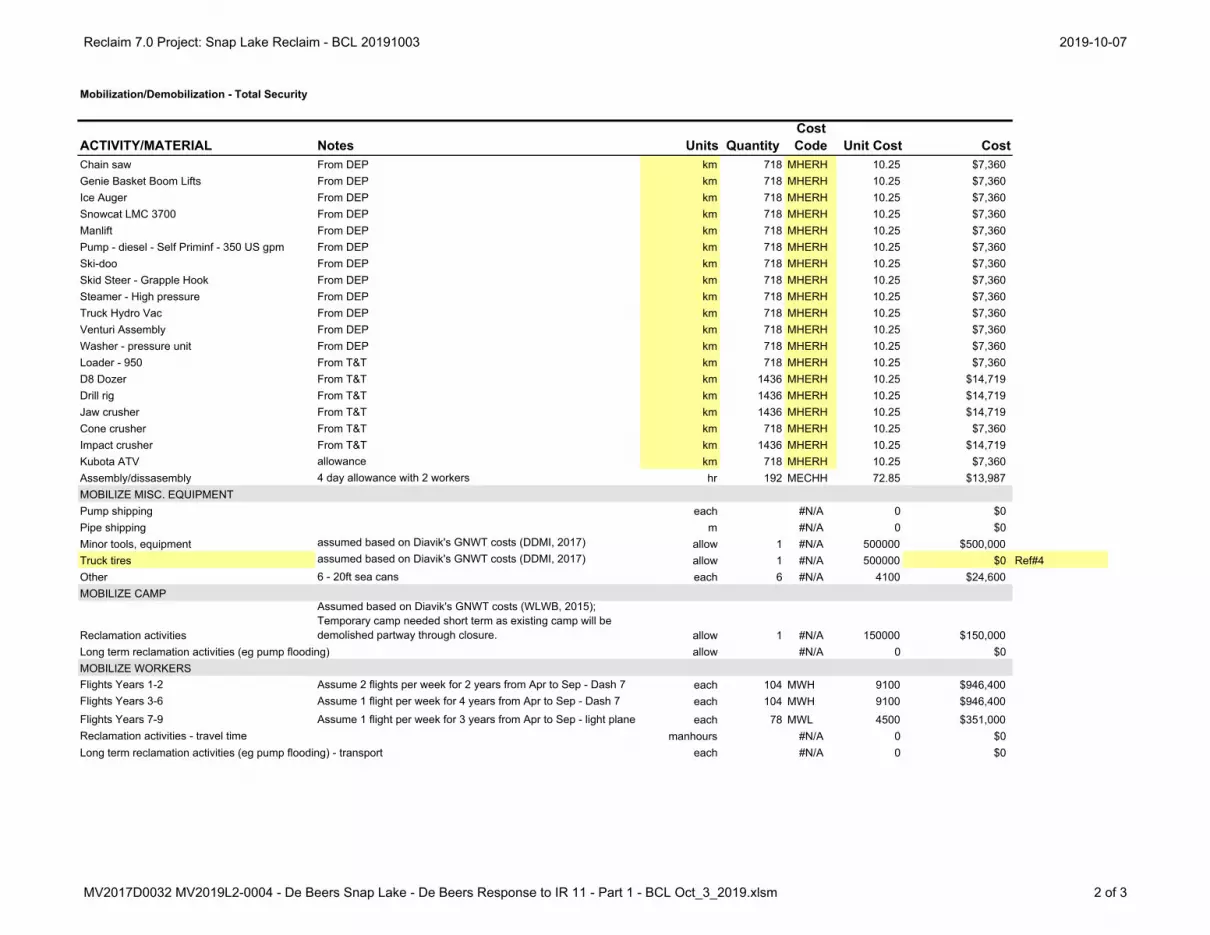
2019-10-07Reclaim 7.0 Project: Snap Lake Reclaim - BCL 20191003
Mobilization/Demobilization - Total Security
ACTIVITY/MATERIAL Notes Units QuantityCost Code Unit Cost Cost
Chain saw From DEP km 718 MHERH 10.25 $7,360Genie Basket Boom Lifts From DEP km 718 MHERH 10.25 $7,360Ice Auger From DEP km 718 MHERH 10.25 $7,360Snowcat LMC 3700 From DEP km 718 MHERH 10.25 $7,360Manlift From DEP km 718 MHERH 10.25 $7,360Pump - diesel - Self Priminf - 350 US gpm From DEP km 718 MHERH 10.25 $7,360Ski-doo From DEP km 718 MHERH 10.25 $7,360Skid Steer - Grapple Hook From DEP km 718 MHERH 10.25 $7,360Steamer - High pressure From DEP km 718 MHERH 10.25 $7,360Truck Hydro Vac From DEP km 718 MHERH 10.25 $7,360Venturi Assembly From DEP km 718 MHERH 10.25 $7,360Washer - pressure unit From DEP km 718 MHERH 10.25 $7,360Loader - 950 From T&T km 718 MHERH 10.25 $7,360D8 Dozer From T&T km 1436 MHERH 10.25 $14,719Drill rig From T&T km 1436 MHERH 10.25 $14,719Jaw crusher From T&T km 1436 MHERH 10.25 $14,719Cone crusher From T&T km 718 MHERH 10.25 $7,360Impact crusher From T&T km 1436 MHERH 10.25 $14,719Kubota ATV allowance km 718 MHERH 10.25 $7,360Assembly/dissasembly 4 day allowance with 2 workers hr 192 MECHH 72.85 $13,987MOBILIZE MISC. EQUIPMENTPump shipping each #N/A 0 $0Pipe shipping m #N/A 0 $0Minor tools, equipment assumed based on Diavik's GNWT costs (DDMI, 2017) allow 1 #N/A 500000 $500,000Truck tires assumed based on Diavik's GNWT costs (DDMI, 2017) allow 1 #N/A 500000 $0 Ref#4Other 6 - 20ft sea cans each 6 #N/A 4100 $24,600MOBILIZE CAMP
Reclamation activities
Assumed based on Diavik's GNWT costs (WLWB, 2015); Temporary camp needed short term as existing camp will be demolished partway through closure. allow 1 #N/A 150000 $150,000
Long term reclamation activities (eg pump flooding) allow #N/A 0 $0MOBILIZE WORKERSFlights Years 1-2 Assume 2 flights per week for 2 years from Apr to Sep - Dash 7 each 104 MWH 9100 $946,400Flights Years 3-6 Assume 1 flight per week for 4 years from Apr to Sep - Dash 7 each 104 MWH 9100 $946,400Flights Years 7-9 Assume 1 flight per week for 3 years from Apr to Sep - light plane each 78 MWL 4500 $351,000Reclamation activities - travel time manhours #N/A 0 $0Long term reclamation activities (eg pump flooding) - transport each #N/A 0 $0
MV2017D0032 MV2019L2-0004 - De Beers Snap Lake - De Beers Response to IR 11 - Part 1 - BCL Oct_3_2019.xlsm 2 of 3

2019-10-07Reclaim 7.0 Project: Snap Lake Reclaim - BCL 20191003
Mobilization/Demobilization - Total Security
ACTIVITY/MATERIAL Notes Units QuantityCost Code Unit Cost Cost
Long term reclamation activities (eg pump flooding) - travel time each #N/A 0 $0WORKER ACCOMODATIONSCrew - demolition 34 people per year for 2 years from Apr to Sep mandays 18615 ACCML 100 $1,861,500Crew - earthworks 16 people per year for 6 years from Apr to Sep mandays 17520 ACCML 100 $1,752,000Crew - other 20 people per year for 9 years from Apr to Sep mandays 32850 ACCML 100 $3,285,000Long term reclamation activities (eg pump flooding) manmonths #N/A 0 $0MOBILIZE FUELFuel freight - reclamation activities Fuel mob for 6 years of reclamation activities. litre 8263310 FCMH 0.42 $3,470,590
Fuel freight - water treatment and controlFuel mob for 9 years of water treatment and water managemen(i.e., pumping). litre 205035 FCMH 0.42 $86,115
Fuel freight - long term reclamation activities litre #N/A 0 $0Fuel freight accomodations litre #N/A 0 $0WINTER ROAD
Spur construction and operation - 30 kmAssume only spur needs to be constructed; Three times forcontractor mob/demob. km 120 WRCH 11500 $1,380,000 Ref#4
Winter road tarriff $0.1921 per loaded tonne per km, from Winter Road Joint Venture tonnekm 639659 #N/A 0.1921 $245,757 Ref#4DEMOBILIZE HEAVY EQUIPMENT
Round trip costs assumed above in Mobilization section. km #N/A 0 $0DEMOBILIZE CAMP
allow #N/A 0 $0DEMOBILIZE WORKERScrew travel time mandays #N/A 0 $0crew transportation demob will occur with mob of workforce each #N/A 0 $0Temporary Facilities rerquired for workWTP mobilzation and operation each #N/A 0 $0STP mobilization and operation each #N/A 0 $0Power Plant mobilization, O&M and fuel each #N/A 0 $0
Total $15,462,279
MV2017D0032 MV2019L2-0004 - De Beers Snap Lake - De Beers Response to IR 11 - Part 1 - BCL Oct_3_2019.xlsm 3 of 3

2019-10-07Reclaim 7.0 Project: Snap Lake Reclaim - BCL 20191003
Post-Closure Monitoring & Maintenance - Total Security
ACTIVITY/MATERIAL Notes Units QuantityCost Code Unit Cost Cost
MONITORING & INSPECTIONSAnnual geotechnical inspection each #N/A $0.00 $0Survey inspection each #N/A $0.00 $0Regulatory costs* each #N/A $0.00 $0Site water monitoring (AEMP and SNP) each #N/A $0.00 $0 - Active closure and flooding each #N/A $0.00 $0 - Post pit flooding each #N/A $0.00 $0Air Quality Monitoring Program (AQMP) each #N/A $0.00 $0Wildlife Effects and Habitat Monitoring Programs (WEMP AND WWHPP) each #N/A $0.00 $0Vegetation Monitoring each #N/A $0.00 $0
ALL MONITORING
See Monitoring Quantities; Cost does not include ICM monitoring - that is covered in the ICM tab each 1 #N/A $8,842,999 $8,842,999
POSTCLOSURE MAINTENANCE
Mobilize workers1 flight beginning and end and 1 flight during 3 week campaign flights 3 MWH $9,100.00 $27,300
Labour 8 person crew, 3 weeks hrs 1680 operH $65.00 $109,200Accomodation days 168 ACCMH $175.00 $29,400Fuel allow #N/A $10,000.00 $10,000Repair/upgrade access controls allow #N/A $0.00 $0Other #N/A $0.00 $0SPILLWAY MAINTENANCERepair erosion m3 #N/A $0.00 $0Clear spillway each #N/A $0.00 $0CWTS MAINTENANCEMaintain flow, restore vegetation allow #N/A $0.00 $0POST-CLOSURE WATER TREATMENT
Annual water treatment costWater Treatment is finished in the first year of post closure. See Water Treatment. allow #N/A $0.00 $0
Subtotal, Annual post-closure costs $8,842,999Discount rate for calculation of net present value of post-closure cost, %Number of years of post-closure activity 1 yearsPresent Value of payment stream $8,842,999
*Regulatory costs - annual reporting, management plans, progress reports etc
MV2017D0032 MV2019L2-0004 - De Beers Snap Lake - De Beers Response to IR 11 - Part 1 - BCL Oct_3_2019.xlsm 1 of 1

Appendix D: Technical Expert CVs

R. R. # 1 • Rockwood, Ontario N0B 2KO • Phone (519) 856-9440
Fax (519) 856-9446 • E-mail [email protected]
D R . B A R R Y Z A J D L I K , P R I N C I P A L
PROFESSIONAL EXPERIENCE
1991–present Zajdlik & Associates Inc. Rockwood, Ont.
Principal
Project management, contract acquisition.
Environmetrician, report writing.
1992–present Pollutech EnviroQuatics Pt. Edward, Ont.
Research Associate
Statistical consultation on experimental design, analysis and interpretation.
Project manager.
1989–1990 Department of Population Medicine Guelph, Ont.
Statistician
Guidance in statistical design, analysis and interpretation to faculty and staff in biomedical statistics.
Responsible for providing SAS seminars, computer support, (servicing, installation and purchasing), and custom Fortran and SAS programming.
1990-current Professional Activities
External Program/Project Manager
Managed international CIDA program, manage projects for other consulting firms.
Lecturer
An invited lecturer at various universities, governmental agencies, and professional societies with topics falling under the general umbrella of statistics and environmental science.
Panel Member
An invited panel member at the federal (since 1993), provincial (since 2000) and territorial (since 2012) governmental levels, on issues related to the application of statistics and environmental science.
Peer Reviewer
Review papers published in the primary literature, book chapters and governmental documents, in the areas of environmental toxicology and statistics.
Legal
Acted as expert witness, and provide reviews for legal proceedings.

R. R. # 1 • Rockwood, Ontario N0B 2KO • Phone (519) 856-9440
Fax (519) 856-9446 • E-mail [email protected]
PROJECT EXPERIENCE: SELECTED RESEARCH
Comparison of Toxicity Test Endpoints. A statistical methodology for hypothesis
testing of toxicity test endpoints when raw data are unavailable is to be developed. Environment Canada, Methods Development and Application Unit. 2018- ongoing.
Statistical Assumptions for Defensible Estimation of Toxicity Test Endpoints. Weighting (Poisson and inverse variance), transform both sides, and combinations thereof, were assessed for their ability to remedy heteroskedasticity and non-normality in the context of nonlinear regression. The effect of these remedies on bias and confidence interval coverage for ICp estimates was assessed. Environment Canada, Methods Development and Application Unit. 2015.
Assess Protectiveness of Safety Factors. The level of protection afforded by safety factors was shown to vary by sample size, degree of variation and underlying statistical distribution. The level of protection varies wildly and has implications for environmental management. Mining Association of British Columbia. 2014-2015.
Investigate Standardization Methods to Derive Zn CCME Water Quality Guideline. There is a desire to modify Zn water quality guidelines on the basis of known toxicity modifying factors. This project explored statistical adjustments of Zn toxicity in order to estimate site-specific Zn water quality guidelines. National Guidelines and Standards Office. 2013.
Develop a Tier II Site-Specific Remedial Objectives Paradigm. Soil quality guidelines for PHCs in Canada are primarily driven by the soil contact pathway. Although there is a provision to modify Tier II SSROs there is no method to do so. This project investigates a new paradigm for doing so. PERD, CAPP, Stantec 2012 Research Fund. 2013.
Estimate Background Concentrations of Soil Analytes in Ontario. Background concentrations underpin many of the regulations associated with soil use in Ontario. This project seeks to improve the current background estimation paradigm. 2007-2015. PhD.
Develop Soil Sampling Protocols for Cryosols. Cryosols cover a vast area of Canada and to date no systematic soil sampling protocol has been developed. Such a protocol is necessary to assess potential development effects in the Canadian North. INAC: 2009.
Applying SSD Concepts to Bimodal Distributions. This project involved extending the current CCME paradigm for generating water quality guidelines to substances that exhibit target-specific effects and non-target effects. Environment Canada: 2007.
Investigate Spatio-Temporal Variability in Arctic Lakes. Oil and gas exploration and development along the Mackenzie Valley corridor may lead to requirements for monitoring of lake water quality. The drivers of tundra lake water quality are not currently understood and are under investigation. Indian and Northern Affairs Canada: 2006-2008.
Incorporate Toxicity Modifying Factors in the SSD Approach to Estimating Canadian Water Quality Guidelines. The current water quality guidelines in Canada are generic and suffer from several shortcomings. New methods have been developed for use in Canada that obviate these shortcomings (work conducted by Zajdlik & Associates, Inc.). These new methods are still generic though. This project provides recommendations on how to make the new Canadian approach to generating water quality guidelines site-specific at least with respect to the principal toxicity modifying factors. CCME: February-April 2006.
Toxicity Modifying Factors in Ammonia Toxicity to D. magna. This project involves optimizing an experimental design to assess the simultaneous effects of pH and

R. R. # 1 • Rockwood, Ontario N0B 2KO • Phone (519) 856-9440
Fax (519) 856-9446 • E-mail [email protected]
PROJECT EXPERIENCE: SELECTED RESEARCH
acclimation temperature on ammonia toxicity for Daphnia magna. The results will be used to improve the applicability of Canadian Water Quality Guidelines for ammonia. Ontario Ministry of Environment: 2006.
Identify Statistical Models to Describe Species Sensitivity Distributions. This project involved assessing the statistical and ecotoxicological and regulatory literature to determine what statistical models have been used globally to describe species sensitivity distributions. Then, 7 species sensitivity distributions were examined to generate a suite of statistical models that could potentially describe all species sensitivity distributions for derivation of water quality guidelines within Canada. Ontario Ministry of Environment / CCME: March-October, 2005.
PROJECT EXPERIENCE: NORTHERN
NWT: Diavik Site
1. 2005: B. Blais, AANDC. Review of DDMI Baseline Data Set.
2. 2007: D. Balint, DFO. Review of DDMI 2005 Lakebed Sediment, Water Quality
and Benthic Invertebrate Study.
3. 2007: N. Richea, AANDC. Review of DDMI Limnology and “Lessons Learned”
Reports.
4. 2007: B. Hanna, DFO. Review of A21 Dike & South Island Causeway
Monitoring Study Design Plan.
5. 2008: N. Richea, AANDC. Review of DDMI Adaptive Management Plan.
6. 2008: N. Richea, AANDC. Review of DDMI Power Analyses.
7. 2009: B. Hanna, DFO. Review of DDMI Dike Monitoring Study Designs.
8. 2009: E. Erasmus, Tli Cho Government. Review of Selected Elements of the
DDMI 2009 AEMP.
9. 2009: N. Richea, AANDC. Review of DDMI Eutrophication Indicators.
10. 2012: B. Hanna, DFO. Review of Diavik Diamond Mine A154 and A418 Dike
Monitoring Program.
11. 2012: N. Richea, AANDC. Technical Advice; Diavik AEMP Design, Version
3.0.
12. 2014: K. Eggers, DFO. Power Analysis of Rio Tinto Dike Monitoring Benthic
Diversity Indices.
13. 2016: P. Green, GNWT ENR. DDMI Reference Area Study.
14. 2016: B. Pain, GNWT ENR. DDMI 2011-2013 Aquatic Effects Re-Evaluation
Report.
15. 2016: B. Pain, GNWT ENR. Review of 2014 AEMP.
16. 2016: B. Pain, GNWT ENR. Review of 2015 AEMP.
17. 2016: P. Green, GNWT ENR. Comment on Diavik AEMP Design, Version 4.0.
18. 2017: B. Pain, GNWT ENR. Review of 2016 AEMP.
19. 2017: B. Pain, GNWT ENR. Review of 2016 AEMP Response Plans.
20. 2018: B. Pain, GNWT ENR. Review of AEMP Design, Version 5.0
21. 2018: B. Pain, GNWT ENR. DDMI 2014-2016 Aquatic Effects Re-Evaluation
Report.
22. 2018: B. Pain, GNWT ENR. Review of 2017 AEMP.
23. 2018: B. Pain, GNWT ENR. Review of Diavik Mine Water Quality Modelling of
Mined Out Pits

R. R. # 1 • Rockwood, Ontario N0B 2KO • Phone (519) 856-9440
Fax (519) 856-9446 • E-mail [email protected]
PROJECT EXPERIENCE: NORTHERN
NWT: Ekati Diamond Mine Pipes 24. 2004: C. Mills, IEMA. Review of the Ekati Diamond Mine 2002 AEMP
25. 2006: R. Chouinard, AANDC. Overview of the BHP Proposed AEMP.
26. 2007: N. Richea. AANDC. Review of the BHP Proposed Chloride Discharge
Criterion.
27. 2008: R. Jenkins. Indian and Northern Affairs Canada. Comment on BHP
Adaptive Management Plan.
28. 2009: N. Richea, AANDC. Review of 2008 BHP AEMP and SSWQOs
29. 2009: N. Richea, AANDC. Review of the BHP Proposed Environmental Quality
Criteria for the Sable Site.
30. 2009: N. Richea, AANDC. Assess potential for nitrification and consequences on
BHP AEMP.
31. 2012: N. Richea, AANDC. Defining Acceptable Effects Levels for the Ekati
Diamond Mine.
32. 2013: P. Green, AANDC. Review of Chloride, Nitrate and Sulphate SSWQOs for
the Ekati Diamond Mine.
33. 2015: P. Green, GNWT ENR. Technical Review of DDEC Jay Pipe
Environmental Assessment.
34. 2015: P. Green, GNWT ENR. Review of Ekati 2015 AEMP.
35. 2016: P. Green, GNWT ENR. Review of Sable Pit AEMP version 1.0.
36. 2016: P. Green, GNWT ENR. Review of Sable Pit AEMP version 1.1.
37. 2016-17: P. Green, GNWT ENR. Technical Review of DDEC Jay Pipe Water
Licence Application and Participation in Technical Meeting and Hearing.
38. 2017: B. Pain, GNWT ENR. Review of Ekati 2016 AEMP.
39. 2017: B. Pain, GNWT ENR. Review of 2016 Pigeon AEMP Re-Evaluation.
40. 2017: B. Pain, GNWT ENR. Review of Sable AEMP Design and Response Plan.
41. 2017: B. Pain, GNWT ENR. Review of Ekati 2016 Selenium, Potassium,
Nitrogen and Fish Response Plans.
42. 2018: B. Pain, GNWT ENR. Review of Hydrodynamic and Pit Meromixis
Modelling and implications on Effluent Quality Criteria.
43. 2018: 2016: B. Pain, GNWT ENR. Review of Misery Underground Water
Licence Application.
44. 2019: B. Pain, GNWT ENR. Review of Jay Pipe 2018 AEMP.
45. 2019: B. Pain, GNWT ENR. Review of DDEC Fish, DO, TP and Chloride
Response Plans.
NWT: Lac de Gras 46. 2015: L. Brekke, GNWT CIMP. Review of Lac de Gras Cumulative Effects
Statistical Analysis.
47. 2016: J. Kanigan, GNWT CIMP. Detection of Cumulative Effects Associated
with Diamond Mining in Lac de Gras.
48. 2016: J. Kanigan, GNWT CIMP. Guidance on AEMP Design for Assessing
Cumulative Effects in Lac de Gras.
NWT: Snap Lakes
49. 2010: D. White, SLEMA. Review of Snap Lake AEMP.

R. R. # 1 • Rockwood, Ontario N0B 2KO • Phone (519) 856-9440
Fax (519) 856-9446 • E-mail [email protected]
PROJECT EXPERIENCE: NORTHERN
50. 2013: D. White, SLEMA. Review of Snap Lake AEMP.
51. 2013: D. White, SLEMA. Recommendations for Snap Lake Management
Response Action Levels.
52. 2015: P. Green and N. Richea, GNWT. Review of Power Analyses in the Snap
Lake Mine Downstream Watercourses Special Study Plan.
53. 2017: R. Walbourne, GNWT ENR. Comment on 2016 AEMP.
54. 2017: R. Walbourne, GNWT ENR. Review of 2016 Downstream Watercourses
Special Study.
55. 2019: R. Walbourne, GNWT ENR. Participation in Snap Lake Closure Water
Licence Application Review and Regulatory Processes
NWT: Marion River
56. 2012: P. Green, AANDC. Review of the Fortune-Nico Developer’s Assessment
Report.
57. 2013: P. Green, AANDC. Review of Nico Project Water Licence Technical
Information.
58. 2014: P. Green and N. Richea, AANDC. AEMP Development and Review of
the SSWQO and Effluent Quality Criteria for the NICO Mine.
59. 2017: P. Green, GNWT. Review of Fortune Minerals Supplemental Baseline
Monitoring Plan V 1.4.
60. 2018: B. Pain, GNWT. Review of Fortune Minerals Baseline Monitoring Data
Report.
NWT: Prairie Creek
61. 2011: P. Green and N. Richea, INAC. Review of Prairie Creek Environmental
Assessment Effluent Related Documentation.
62. 2011: P. Green and N. Richea, AANDC. Review of Canadian Zinc Water
Licence Related Documentation.
NWT: Gahcho Kué
63. 2015: N. Richea, GNWT ENR. Gahcho Kué AEMP Review.
64. 2017: R. Walbourne, GNWT ENR. Gahcho Kué 2016 AEMP Review.
NWT: Normal Wells
65. 2018: R. Walbourne, GNWT ENR. Imperial Oil 2018 AEMP Review.
NWT: General
66. 2008: B. Koedy, DIAND CRD. Review of Colomac Benthic Invertebrate
Monitoring Program
67. 2008: S. Kokelj, INAC. Sampling Protocols for Turbic Cryosols of the
Mackenzie Delta.
68. 2009: M. Culhane, INAC. Contribution to: INAC AEMP Guidance Document.

R. R. # 1 • Rockwood, Ontario N0B 2KO • Phone (519) 856-9440
Fax (519) 856-9446 • E-mail [email protected]
PROJECT EXPERIENCE: NORTHERN
69. 2009: S. Kokelj, INAC. Analysis of Sump-Affected Lakes Data.
70. 2010: J. Kanigan, INAC. Analysis of Drilling Sump Soil Data.
71. 2010: Terriplan Consultants. Contribution to: NWT CIMP Monitoring Principles
and VC Protocol Pilot Project.
72. 2010: P. Cott, DFO. Statistical support for assessing stressors on northern fishes.
73. 2011: A. Czarnecki and J. Sanderson, INAC. Modelling Slave River Water
Quality Variables at Fitzgerald.
74. 2013: P. Green, AANDC. Preparation for sensitivity analysis of NWT Water
Classification System.
75. 2014: P. Green and M. Culhane, AANDC. Estimating Ambient Concentrations of
Water Quality Variables in the NWT.
76. 2015: M. McPherson, DFO. Giant Mine - Analysis of Metal concentrations in
Fish Tissue in Yellowknife Bay.
77. 2016: L. Brekke and J. Kanigan, GNWT CIMP. General Guidance for
Conducting Cumulative Impact Assessments in the NWT.
78. 2016: B. Pain, GNWT ENR. Guidance on Collecting Baseline Water Quality
Data.
79. 2016: A. Czarnecki, GNWT ENR. Participation in trans-boundary water quality
assessment workshop.
80. 2016: N. Richea, GNWT ENR. Participation in GNWT water classification
workshop.
Yukon and Nunavut
81. 2017: B. Slater, Slater Environmental. A Statistical Justification for Baseline Data
Requirements in the Yukon.
82. 2019: H. Sonnenberg, Environmental and Regulatory Solutions. Derivation of
site-specific water quality objectives for As, Cu, Cd and Fe for the Meadowbank
Mine, Nunavut.
83. 2019: Yukon Government. Development of Adaptive Management Plan for the
Abandoned Ketza Mine.
PROJECT EXPERIENCE: SELECTED EXPERIMENTAL DESIGN
Design of numerous benthic community surveys to delineate spatial and temporal changes in areas, potentially impacted by heavy metals, PAHs, chlorinated organic compounds, insecticides, thermal plumes and unexploded ordnance residues. Various clients: 1991-2018.
Experimental Design Reviews: Approximately 30 distinct reviews of monitoring program designs pertaining to resource extraction in the Canadian Arctic. Aboriginal Affairs and Northern Development Canada, Government of Northwest Territories and Department of Fisheries and Oceans: 2004-2018.
Water Quality Baseline Assessment Guidance Document. See PROJECT EXPERIENCE: SELECTED GUIDANCE DOCUMENTS: 2016.
Probit analysis and study design approaches at field sites: context and analysis within a standardized toxicity testing framework. Environment Canada: 2014.
Aquatic Effects Monitoring Program Guidance Document. See PROJECT

R. R. # 1 • Rockwood, Ontario N0B 2KO • Phone (519) 856-9440
Fax (519) 856-9446 • E-mail [email protected]
PROJECT EXPERIENCE: NORTHERN
EXPERIENCE: SELECTED GUIDANCE DOCUMENTS. 2009.
Soil Sampling Protocols for Toxicity Testing. Provide guidance and direct input to newly developed protocol. Environment Canada: 2009-2010.
Design of environmental monitoring program to assess potential human and ecological effects of the Munitions Environmental Test Centre activities within the St. Laurence River and interpretation of results. Department of National Defense: 2004-2007
Design of experiments to compare the hepatocyte toxicity test with the Environment Canada regulatory rainbow trout toxicity test. Ontario Ministry of Environment: 2003
Redesign and interpretation of ongoing monitoring program to assess the potential cumulative ecological effects of uranium mines in northern Saskatchewan. Saskatchewan Environment: 2002 - 2004
Design of fish consumption survey to determine age-specific consumption rates in a First-Nations community. GlobalTox Environmental Inc. 2004.
Review of sampling plans to identify unexploded ordnance, Port Albert.
Design of experiment to evaluate the relative sensitivity of trout hepatocyte and gill cell lines and the 96-hour acute lethality rainbow trout test, to spiked industrial effluents to evaluate utility as an Environment Canada test method.
Design of experiments to assess the efficacy of Hg separators for dental amalgams and creation of a federal guidance document for technology verification. Ontario Centre for Environmental Technology Advancement: 2002
Design of experiments to determine the efficacy of As mitigation technologies in Bangladesh. Over 1, 000, 000 wells are contaminated with As. The WHO and Government of Bangladesh are using Canadian expertise in verifying environmental technologies to design a series of field and laboratory verification experiments that will be implemented by the British Geological survey. Ontario Centre for Environmental Technology Advancement: 2001-2002
Design of in situ bivalve bioaccumulation study to assess potential movement of PCB congeners from an industrial site. Confidential.
Design of adaptive soil sampling plans designed to reduce sampling costs and quantify the risk of undetected hot spots. The contaminants of concern were PAHs that had been stockpiled in a mixture containing highly and slightly contaminated soils. Confidential.
Design of experiments to estimate relative sensitivity of a sublethal, flagellate bioassay to mining effluents. This research contract was awarded through CANMET.
PROJECT EXPERIENCE: SELECTED ANALYSIS AND INTERPRETATION
Analyses of aquatic triad (benthic macroinvertebrate community structure, water quality
and sediment quality) and tetrad (triad + bioaccumulation / toxicity) experiments conducted under Federal Pulp and Paper or Mining Effluent Regulations and other non-regulated monitoring programs. More than 35 distinct projects involving mixed effects modelling, multivariate analyses, power analyses, various parametric and nonparametric analyses. Various clients: 1991-2018.
Model cumulative effects of diamond mining on Lac de Gras water quality. Government

R. R. # 1 • Rockwood, Ontario N0B 2KO • Phone (519) 856-9440
Fax (519) 856-9446 • E-mail [email protected]
PROJECT EXPERIENCE: SELECTED ANALYSIS AND INTERPRETATION
of the Northwest Territories. 2016.
Modelling fish tissue metal residues in association with the abandoned Giant mine. Department of Fisheries and Oceans. 2015.
Historical Review of Sarnia Lambton Environmental Associations Sediment Quality Surveys. Pollutech EnviroQuatics. 2015.
Mixed effects principal component regression of soil PHC fraction contaminants and toxicity modifying factors for Red Fescue emergence and growth metrics and Collembola survival and reproduction Stantec Consulting. 2014.
Estimating zinc water quality guidelines using multiple toxicity modifying factors. Environment Canada. 2013.
Modelling effects of contaminant releases from dikes in the Canadian Arctic. Department of Fisheries and Oceans. 2012.
Modelling crop yields and predicting adverse effect concentrations. Stantec Consulting. 2012.
Modelling temporal trends in Slave River water quality analytes. Aboriginal Affairs and Northern Development Canada: 2010-2011.
Analysis and interpretation of soil toxicity data. Stantec Consulting. 2011.
Historical Review of Sarnia Lambton Environmental Associations Sediment Quality Surveys. Pollutech EnviroQuatics. 2011.
Geostatistical analyses of eutrophication indicators. Department of Indian and Northern Affairs Canada. 2009.
Geostatistical analyses of sediment quality indices. Department of National Defense. 2007.
Estimate thresholds for remediation using 26 types of soil toxicity tests conducted on 49 soil samples. Stantec Consulting Ltd. 2007.
Assessed effects of mine tailings on plant growth in both field and laboratory experiments and assessed congruence between same. Ontario Ministry of Environment. 2004.
Determined probabilistic intervention criteria for soil B(a)P in the Ivy Avenue area of Toronto, based upon a human health risk-based intervention criterion. Ontario Ministry of Environment. 2004.
Predicted financial liabilities to the DFO due to ownership of contaminated sites across Canada. Department of Fisheries and Oceans 2002-2005.
Nonlinear calibrations to determine probable time to failure for groundwater As mitigation devices. Ontario Centre for Environmental Technology Advancement: 2005.
Interpreted multivariate data to independently confirm conclusions regarding potential human health effects of the Sydney tar ponds. Nova Scotia Department of Health: 2003.
Managed a risk assessment of the capability of marshland to retard movement of radionuclides. Pollutech EnviroQuatics: 2002.
Validation of toxicity test endpoint calculations conducted under GLP.
Determined probabilistic intervention criteria for soil Ni in the Rodney St. Area of Port Colborne, based upon a human health risk-based intervention criterion. Ontario Ministry of Environment: 2002.
Determined exposure of Walpole Island First Nation residents to contaminants in fish.

R. R. # 1 • Rockwood, Ontario N0B 2KO • Phone (519) 856-9440
Fax (519) 856-9446 • E-mail [email protected]
PROJECT EXPERIENCE: SELECTED ANALYSIS AND INTERPRETATION
GlobalTox: 2003.
Estimation of endpoints from problematic data generated by OECD method 201.
An evaluation of methods used to interpret the Vibrio fischeri solid-phase luminescence test. Environment Canada, Waste at Sea is considering using the Vibrio fischeri test in determining the suitability of dredged materials for disposal at sea. Environment Canada: 2000.
Developed the statistical component of the Canadian Environmental Technology Verification program. ETV Canada: 2000.
Analysis and interpretation of TEQ emission rates used to determine the impact of wood stove combustion on dioxins and furan loadings. Environment Canada, Environmental Technology Centre: 2000.
Analysis and interpretation of data generated by Cycle II EEM pulp and paper compliance monitoring programs (2 locations).
Design and interpretation of a contaminated harbour assessment on the St. Lawrence River, using a sediment quality triad approach. Pollutech EnviroQuatics: 2000.
Monte Carlo analysis of soil contaminant, volume estimates in an environment subject to tidal influences. Imperial Oil: 1999.
Managed an ecological risk assessment to investigate the risks of remediation of contaminated sediments in the St. Clair River. Sarnia Lambton Environmental Association: 1999-2001.
Determining the relationship between sediment, and porewater metal levels of lead in various forms to Amphiporeia virginiana following a spill of materials. Pollutech EnviroQuatics: 1999.
A commentary on the statistical implications of compliance biological test design and interpretation.
Estimation of limits of quantification used in setting criteria for the virtual elimination of PCBs and PCDDs in Canada. Environment Canada (Analysis and Methods Division).
Interpretive guidance for bioassays using pollution gradient studies. The performance of sediment bioassays along a gradient of PAH and PCB contamination was examined. Concomitant sediment chemistry and benthic macroinvertebrate abundance data was used to link toxicity test responses with environmental measurements and effects using the sediment quality triad paradigm. Recommendations for the assessment of dredged materials in Canada prior to ocean disposal were given. Environment Canada, Ocean Disposal: 1999-2000.
Analysis of round-robin data used to explore new methods for hydrocarbon analyses. BC MELP.
Estimation of spatial extent of toxicant contamination in marine sediments following a spill event.
Assessment of the correlation between metal contaminants in soil and crop yields and growth.
Analysis of experiments to refine the standard operating procedure for an experimental biological test used to assess water quality of mining effluents. CANMET Research Grant.
Analysis of air quality discontinuities resulting from process control changes in a chemical
R. R. # 1 • Rockwood, Ontario N0B 2KO • Phone (519) 856-9440
Fax (519) 856-9446 • E-mail [email protected]
PROJECT EXPERIENCE: SELECTED ANALYSIS AND INTERPRETATION
manufacturing plant.
Consultation on sampling design for routine monitoring of dredged material disposal sites. Environment Canada.
Predicting process control parameters in pilot effluent remediation studies to ensure effluent compliance.
Estimation of “Safe Levels” of food additives using structural class to conform to a defined risk. “Safe levels,” were estimated using the 5th percentile of NOECs, and by an empirical bootstrapping method developed by Zajdlik & Associates. The effects of using various types on endpoints (mortality, blood, liver, gonadal, kidney, etc.), and stratifying factors such as sex, species tested, and structural class.
Triad analysis of industrial, municipal and agricultural inputs to a fluvial system. This multi-year study compared sediment chemistry, sediment toxicity tests and benthic macroinvertebrate community structure using the sediment quality triad paradigm. Sarnia Lambton Environmental Association
Consultation on survey design for estimating daily nutrient intakes in Canada.
Incidence of mammary gland tumours in ACK treated rats. The dose-response between level of ACK and incidence of tumours in rat was estimated, stratifying by tumour type.
Determining the probability of detecting occasionally non-compliant industrial effluent under various sampling regimes.
Interpretative Guidance for Bioassays using Pollution Gradient Studies. The performance of sediment bioassays along a gradient of metal contamination was examined. Concomitant sediment chemistry and benthic macroinvertebrate abundance data was used to link toxicity test responses with environmental measurements and effects using the sediment quality triad paradigm. Environment Canada (Waste at Sea).
Geostatistical analysis of background levels of sediment associated metals. This contract explored the utility of existing background metals data sets in estimating background levels of metals in potential disposal sites. Environment Canada (Waste at Sea).
Conducted a statistical comparison of various micro and kit toxicity tests to the standard rainbow trout and Daphnia magna for the Canadian mining industry on behalf of Natural Resources Canada (CANMET). Tests were compared in part, on the basis of sensitivity to an effluent and the specificity of a response to toxicant levels within an effluent.
Participated in the development and validation of a rapid aggregation toxicity test for mining effluents. This is a sublethal, micro-scale flagellate bioassay that may be used to explore a hitherto, unexamined trophic level. Conducted through a research grant from CANMET.
Analysis of sediment quality triad data. Over 20 distinct projects.
Analysis of toxicity test responses and water chemistry variables to identify potential sources of toxicity. This type of analysis is routinely done. In one instance, an analysis of egg toxicity in a flow through situation resulted in a reassessment of culpability.
Analysis of multiple aquatic toxicity test types to determine most sensitive test.
Analysis of pharmacokinetic data using compartment models.
Analysis of non-quantal toxicity test data using threshold models.
Statistical modelling of the distribution of the combustion by-products of transformer fires containing PCB's. This predictive atmospheric disturbance model is used to

R. R. # 1 • Rockwood, Ontario N0B 2KO • Phone (519) 856-9440
Fax (519) 856-9446 • E-mail [email protected]
PROJECT EXPERIENCE: SELECTED ANALYSIS AND INTERPRETATION
determine evacuation areas downwind of PCB fires. Ontario Hydro.
PROJECT EXPERIENCE: CUSTOM PROGRAMMING
Custom software for international technology verification. Ontario Centre for
Environmental Technology Advancement: 2003
Custom Excel macros to address statistical requirements of Environment Canada toxicity test methods. Private Sector Laboratories: 2002 – ongoing.
Creation of statistical worksheets for the Canadian Environmental Technology Verification program. Ontario Centre for Environmental Technology Advancement: 2001
Writing software capable of predicting the dispersion of combustion by-products of PCB transformer fires. Ontario Hydro
Writing custom software to analyze captured video images consisting of arising from gel electrophoresis studies. University of Guelph
PROJECT EXPERIENCE: SOFTWARE VALIDATION
Validation of selected CETIS toxicity test analyses. Environment Canada, Methods
Development and Application Unit. 2015.
Validation and translation of general effect size into a toxicologically-meaningful effect. Environment Canada, Methods Development and Application Unit. 2014.
Validation of Canadian Council of Ministers of the Environment SSD Master Estimates. Environment Canada, National Guidelines and Standards Office. 2014
Validation of algorithmic stability and implementation of statistical theory underlying the analysis of quantal response data using the “Stephan” program circulated by Environment Canada. ESG International.
PROJECT EXPERIENCE: PROJECT MANAGEMENT
Managed projects within Zajdlik & Associates Inc. since company inception.
Managed CIDA funded program in Bangladesh, April 2003.
Provide external project management on an as-needed basis to Pollutech EnviroQuatics.

R. R. # 1 • Rockwood, Ontario N0B 2KO • Phone (519) 856-9440
Fax (519) 856-9446 • E-mail [email protected]
PROJECT EXPERIENCE: EXPERT WITNESS
Diavik Diamond Mine Water Licence Amendment Hearing, Yellowknife, 2019.
Misery Underground Water Licence Hearings, Behchoko, 2018
Jay Pipe EA and Water Licence Hearings, Yellowknife, 2015, 2016.
Fortune Minerals Water License Hearing, Behchoko, 2014.
Prairie Creek EA Hearing, Fort Simpson, 2013.
BHP Billiton AEMP Hearing, Yellowknife, 2009, Behchoko, 2013.
Diavik Diamond Mine AEMP Hearing, Rae Edzo, 2007.
Diavik Diamond Mine Technical Hearings, Yellowknife, 2005.
Crown vs. Hay Bay Genetics, Napanee, 2001
Crown vs. Provincial Papers, Thunder Bay, 2000.
PROJECT EXPERIENCE: SELECTED PEER REVIEW
Diavik Diamond Mine Pit Lake Modelling. Government of the Northwest Territories.
2018-2019.
Ekati Diamond Mine Aquatic Effects Monitoring Program and Response Management Plans. Government of the Northwest Territories. 2018.
Misery Underground Mine Expansion Water Licensing. Government of the Northwest Territories. 2017-2018.
Jay Pipe Environmental Assessment and Water Licensing. Government of the Northwest Territories. 2015-2017.
Consumer Release Aquatic Model. Environment Canada, Ecological Assessment Division. 2015-2016.
Fortune-NICO Environmental Assessment and Water License Submissions- Aboriginal Affairs and Northern Development. 2012; 2014, respectively.
Canadian Zinc Environmental Assessment and Water License Submissions- Aboriginal Affairs and Northern Development. 2011; 2013, respectively.
Aquatic Effects Monitoring Program Baseline – Diavik Diamond Mine. Department of Indian Affairs and Northern Development. 2006.
Aquatic Effects Monitoring Program – Ekati Diamond Mine. Department of Indian Affairs and Northern Development, Independent Environmental Monitoring Agency, Environment Canada. 2004.
Cumulative Effects Monitoring Program - Review of ongoing monitoring program to assess the potential cumulative ecological effects of uranium mines in northern Saskatchewan. Saskatchewan Environment. 2002 – 2004.
Urinary As Study for the Greater Sudbury Area. Ontario Ministry of Environment. 2004.
Test for Measuring Emergence and Growth of Terrestrial Plants Exposed to Contaminants in Soil. Environment Canada. 2004.
Human Health Risk Assessment. Designated expert reviewer for Ontario Ministry of Environment. 2003.
Ecological Risk Assessment Designated expert reviewer for Ontario Ministry of Environment. 2003.
CCME. 1996. A Protocol for the Derivation of Environmental and Human Health Soil

R. R. # 1 • Rockwood, Ontario N0B 2KO • Phone (519) 856-9440
Fax (519) 856-9446 • E-mail [email protected]
PROJECT EXPERIENCE: SELECTED PEER REVIEW
Quality Guidelines. 2003.
Statistical Guidance for Environment Canada Test Methods, Environment Canada, 2001- 2003.
Part A: MOE Report Soil Investigation and Human Health Assessment for the Rodney Street Community: Port Colborne, Ontario Ministry of Environment, 2001.
Background Environmental Concentrations for the Sydney Tar Ponds, Nova Scotia Department of Health, 2001.
EPA. 1999. Emission test evaluation of a crematory at Woodlawn Cemetery in the Bronx, N.Y. Volume I of III. Office of Air Quality, Planning and Standards. EPA-454/R-99-049. For, Ontario Ministry of Environment, 2001.
PROJECT EXPERIENCE: SELECTED GUIDANCE DOCUMENTS
Author: Zajdlik, B.A. 2016. Baseline Water Quality Data Collection Guidance. Prepared
for the Government of the Northwest Territories.
Author: Zajdlik, B.A. 2016. Guidance for Aquatic Cumulative Effects Assessments in the Northwest Territories. Prepared for the Government of the Northwest Territories.
Contributor to: Environment Canada, 2012. Guidance Document on the Sampling and Preparation of Contaminated Soil for Use in Biological Testing. Science and Technology Branch, Ottawa, February 2012.
Contributor to: Biological Test Method: Fertilization Assay Using Echinoids. EPS1/RM/27, Environment Canada. 2011.
Terriplan Consultants, C. Burn and B. Zajdlik. 2010. A Shared Path to Understanding the Land, NWT CIMP Guidelines and Principles for Monitoring Discussion Paper, March 31. Submitted to: M. Lange, Environment & Conservation, INAC, Yellowknife.
Contributor to: Guidelines for designing and implementing aquatic effects monitoring programs for development projects in the Northwest Territories. Indian and Northern Affairs, Canada: 2008-2009.
Contributor to: CCME. 2007. A Protocol for the Derivation of Water Quality Guidelines for the Protection of Aquatic Life – Draft. July, 2007.
Contributor to: Statistical Methods for Environmental Toxicity Tests. EPS 1/RM/46. Environment Canada. 2005.
Contributor to: OCETA (Ontario Centre for Environmental Technology Advancement). 2005. Environmental Technology Testing and Verification Protocol for Mercury Amalgam Removal Technologies. Version 1.0.
Author of: Guidance on Evaluating Environmental Monitoring Programs for Diamond Mines in the Canadian Arctic. Environment Canada. 2004.

R. R. # 1 • Rockwood, Ontario N0B 2KO • Phone (519) 856-9440
Fax (519) 856-9446 • E-mail [email protected]
OPINION PAPERS
Potential Statistical Models for Describing Species Sensitivity Distributions. Canadian
Council of Ministers of the Environment. 2006.
New Statistical Paradigms for Two-sample Toxicity Tests. U.S. EPA. 2005.
Guidance on Evaluating Environmental Monitoring Programs for Diamond Mines in the Canadian Arctic. Environment Canada, 2005.
Statistical Inference and the Species Sensitivity Distribution Approach to Deriving Water Quality Guidelines, Ontario Ministry of Environment, Canadian Council of Ministers of the Environment. 2004-2005.
SHORT COURSES
I’m Gonna Make You Love Me: Discover That You Love Stats and Stats Loves You
Back.
Topics:
1. Analysis of Field Toxicity Test Data when a Reference Site is Unavailable
2. Power Analysis – Theoretical Underpinnings
3. Why Statistical Assumptions Matter
Aquatic Toxicity Workshop, Ottawa, 2015. 30 participants.
Statistics for Environmental Scientists
SETAC Laurentian, - 30 participants, 1 day. July 2014, Guelph.
Environment Canada, Edmonton – 25 participants, 1.5 days, March 2012/13, Yellowknife – 20 participants, 3 days, January 2006.
Department of Indian Affairs and Northern Development - approximately 10 participants, 3 days, March 2005.
Bruce Nuclear – approximately 15 participants, 2 days, February 2005.
Ontario Ministry of Environment, - over 70 participants, 5 days, February 2004.
Graphical Presentation of Statistical Data, Ontario Ministry of Agriculture and Foods, approximately 30 participants, 1 hour, September 2013.
Principal Components Analysis, Agriculture and Agrifoods Canada - approximately 15 participants, 3 days, March 2013.
Working with Large Datasets, Department of Fisheries and Oceans, Yellowknife - approximately 10 participants, 3 days, January 2008.
Introduction to the ANOVA Table, Annual Aquatic Toxicity Workshop, Waterloo, 7 participants, October 2005.
Applied Environmental Statistics, Nonlinear Regression as Applied to Environment Canada Test Methods for Measuring Survival and Growth in Soil Using Terrestrial Plants. Environment Canada, Method Development and Technology Section, Charlottetown approximately 10 participants, October 2004
What to Look for and How to Interpret a Benthic Invertebrate Report: From Bugs to Statistics. Zaranko and Zajdlik, Annual Aquatic Toxicity Workshop, Ottawa, approximately 10 participants, October 2003.
An Introduction to Statistical Methods for Chronic Biological Testing, Annual Aquatic Toxicity Workshop, Québec, approximately 7 participants, October 1998.
R. R. # 1 • Rockwood, Ontario N0B 2KO • Phone (519) 856-9440
Fax (519) 856-9446 • E-mail [email protected]
SHORT COURSES
Statistical Issues in Toxicology, Annual Aquatic Toxicity Workshop, Calgary, Alberta, approximately 20 participants, October 1996.
Statistical Methods and Software for Toxicological Data Analysis", Society of Environmental Toxicologists and Chemists, Annual Meeting, Denver, Colorado, 50 participants, November 1994.
PROFESSIONAL AFFILIATIONS AND COMMITTEES
Invitee: NWT Water Quality Workshop – Towards the Development of a Decision
Support Tool for the Protection of Northern Waters. Sponsored by the Government of the Northwest Territories. 2016.
Invitee: Multi-jurisdictional Learning Workshop on Transboundary Water Quality. Sponsored by the Government of the Northwest Territories. 2016.
Invitee: A Workshop on Ecological Soil Levels—Next Steps in the Development of Metal Clean-up Values, Sponsored by US EPA. Utah. 2014.
Member of SSWQO Derivation Committee: Aboriginal Affairs and Northern Development, 2012.
Member of Scientific Advisory Committee: “Development of an Environment Canada Test Method for Measuring Survival and Growth in Soil Using Terrestrial Plants. Environment Canada, Method Development and Technology Section, 2001-2003.
Member of the Cumulative Effects Monitoring, working group for northern Saskatchewan. Saskatchewan Environment. (2001-2004)
Member of the “Advisory Committee on Statistics and Programs for Biological Tests” sponsored by the Technology Development Branch of Environment Canada. 1993-present.
Panel Member, “The Statistics Workshop for Toxicological Testing”, 1999 and 2001. Invitational Meeting under auspices of Environment Canada, Method Development and Application Section. Vancouver, British Columbia.
Statistical Workshop Chairperson, 1995 Annual Aquatic Toxicity Workshop, St. Andrews, New Brunswick. This workshop addressed the topic of “Statistical Issues in Toxicity Testing.”
Member of the 1995, SETAC U.K. discussion group entitled “Ecotoxicological Statistics: Asking the right questions,” Egham, Surrey, U.K.
Chairperson, 1994 Aquatic Toxicity Workshops session entitled "Toxicological Statistics," Sarnia, Ontario.

R. R. # 1 • Rockwood, Ontario N0B 2KO • Phone (519) 856-9440
Fax (519) 856-9446 • E-mail [email protected]
PUBLICATIONS
Cott, P.A., B.A. Zajdlik, M.J. Palmer and M. D. McPherson. 2016. Arsenic and mercury in lake
whitefish and burbot near the abandoned Giant Mine on Great Slave Lake. J. Great Lakes Res.
42:223-232.
Zajdlik, B. A. 2016. Statistical evaluation of the safety factor and species sensitivity distribution
approaches to deriving environmental quality guidelines. Integr. Environ. Assess. Manag.
12:380–387.
Zajdlik, B. A. 2015. The Statistical Derivation of Environmental Quality Guidelines. PhD. Thesis.
University of Waterloo.
Greenberg, M., I. Schoeters, R. Wentsel, D. Charters, I. Mitchell. and B. Zajdlik. 2014.
Regulatory Considerations for the Potential Development and Application of Metal Cleanup
Values. Integr. Environ. Assess. Manag 10:40-414.
Zajdlik, B. A. 2015. Issues in Developing Site-Specific Soil Remediation Objectives: A Case
Study Using Hydrocarbon-Contaminated Soils. IN: Alternative process for Developing Tier 2
SSROs prepared for the Petroleum Technology Alliance Canada by G.L. Stephenson (Stantec
Consulting Ltd.), E.G. Lamb (University of Saskatchewan), B. Zajdlik (Zajdlik Associates),
and M. Whitfield-Aslund (Intrinsik), September 2013.
Renoux, A.Y., B. Zajdlik, G.L. Stephenson and L.J. Moulins. 2013. Risk-Based management of
site soils contaminated with a mixture of hazardous substances: methodological approach and
case study. Hum. Ecol. Risk. Asses. 19:1127–1146.
Kanigan, J.C.N., B. Zajdlik and S.V. Kokelj. 2010. Delineation of salt contamination in patterned
ground. Proc. Canadian Geotech. Soc. 1466-1472.
Cott, P.A., B.A. Zajdlik, K. J. Bourassa, M. Lange and A. M. Gordon. 2010. Effects of forest fire
on young of-the-year Northern Pike, Esox lucius in the Northwest Territories. Canadian Field-
Naturalist 124(2): 104–112.
Zajdlik, B.A., D.G. Dixon and G. Stephenson. 2009. Estimating Water Quality Guidelines for
Environmental Contaminants Using Multi-Modal Species Sensitivity Distributions: A Case
Study with Atrazine. Human. Ecol. Risk Assess. 15(3):554 – 564.
Kokelj S.V., B. Zajdlik and M.S. Thompson. 2009. The impacts of thawing permafrost on the
chemistry of lakes across the subarctic boreal-tundra transition, Mackenzie Delta region,
Canada. Permafrost and Periglac. Process. 20:1-15.
Zajdlik, B.A. 2008. Scoping of Approaches Used to Deal with Bimodal Distributions of Pesticides
in Aquatic Ecosystems. National Agri-Environmental Standards Initiative Technical Series
Report No. 4-43. 90 p.
Macdonald, D. and B. Zajdlik. 2008. Guidelines for Designing and Implementing Aquatic Effects
Monitoring Programs for Development Projects in the Northwest Territories. Prepared for
Indian and Northern Affairs Canada, Northwest Territories.
ESG International and B. Zajdlik & Associates. 2002. Guidance Document for Acute Lethality
Testing of Metal Mining Effluents. Prepared for Ontario Ministry of the Environment,
Toronto, ON.

R. R. # 1 • Rockwood, Ontario N0B 2KO • Phone (519) 856-9440
Fax (519) 856-9446 • E-mail [email protected]
PUBLICATIONS
Zajdlik, B., G. Gilron, P. Riebel and G. Atkinson. 2001. The $500,000.00 fish. SETAC Globe,
2(1):28-30.
Jonczyk, E., G. Gilron and B. Zajdlik. Sea urchin fertilization assay: An evaluation of
assumptions related to sample salinity adjustment and use of natural and synthetic marine
waters for testing. Environ. Toxicol. Chem. 20(4): 804-809.
Zajdlik, B.A., K. G. Doe and L. M. Porebski. 2000. Report on biological toxicity tests using
biological gradients: Sydney Harbour. EPS/3/AT/2.
Zajdlik, B. and P. Riebel. 2000. The cost-benefit of EEM study design. Pulp & Paper Canada.
101(5): 46-48.
Porebski, L. M., K. G. Doe, B. A. Zajdlik, D. Lee, P. Pocklington, and J. Osborne. 1999.
Evaluating the techniques for a tiered testing approach to dredged sediment assessment - a
study over a metal concentration gradient. Env. Tox. Chem. 18:2600-2610.
Porebski, L., K. Doe, B. Zajdlik, D. Lee, P. Pocklington, G. Atkinson and J. Osborne. 1998.
Interpretive guidance for bioassays using pollution gradient studies - Belledune, New
Brunswick. WM-20.
Gilron, G., D. Lynn and B. A. Zajdlik. 1998. Further development and validation of a sublethal
protozoan bioassay for mining effluents. Prepared for Public Works and Government
Services on behalf of the National Biotechnology Strategy Program “Biotechnology for the
mining environment”.
Moran, T. S., and B. A. Zajdlik. 1995. Comparison of results from alternate toxicity tests with the
acute Rainbow Trout bioassay for select mine effluents. Proc. Aquatics Effects Technology
Evaluation First Annual Review, Nov. 1, 1995. Ottawa, Ontario.
Zajdlik, B. A. 1990. Analysis of irregularly spaced time series. MSc. Thesis University of Guelph.
Smith, I. R. and B. A. Zajdlik. 1989. Spontaneous regression of epidermal papillomas in white
suckers, Catastomus commersonii from Lake Ontario. J. Fish Diseases.

R. R. # 1 • Rockwood, Ontario N0B 2KO • Phone (519) 856-9440
Fax (519) 856-9446 • E-mail [email protected]
PAPERS PRESENTED
Zajdlik, B.A. Robust Regression to Estimate Water Quality Triggers. Canadian
Ecotoxicity Workshop, Guelph, 2017. Zajdlik, B.A. Considerations when estimating ambient water quality concentrations in the
Canadian North. Aquatic Toxicity Workshop, Ottawa, 2015. Zajdlik, B.A. and G.L. Stephenson. 2013. Alternative Tier II SSROs that Acknowledge
Non-Contaminant Effects. PTAC's Soil and Groundwater Forum, Calgary, 2013. Zajdlik, B.A., J. Velicogna, N. Feisthauer and R. Scroggins. 2010. Statistical Sampling
Designs for the Biological Assessment of Contaminated Soils. Aquatic Toxicity Workshop, Toronto, Oct. 2010.
Zajdlik, B.A., A. Renoux, G. L. Stephenson and L. J. Moulins. 2010. Methodological
Framework for Establishing Toxicity-based Site-specific Remedial Objectives For Contaminated Soils. Aquatic Toxicity Workshop, Toronto, Oct. 2010.
Poirier, D. and B. Zajdlik. 2008. The Effects of low temperatures and low pH on the
toxicity of ammonia to Daphnia magna. Aquatic Toxicity Workshop, Saskatoon, Oct. 2008.
Zajdlik, B.A. and D.D. MacDonald. Key Aquatic Effects Monitoring Program
Concepts. Aquatic Effects Monitoring Program Guidelines Workshop. Oct. 21-22, 2008.
Zajdlik, B.A. 2008. Integrating Traditional Knowledge into the Testable Hypothesis.
Science in the Changing North. Yellowknife. Zajdlik, B.A., D.G. Dixon and G. Stephenson. 2007. Estimating Water Quality
Guidelines For Atrazine and Diquat Using Multi-Modal Species Sensitivity Distributions. Society of Environmental Toxicology and Chemistry, Milwaukee.
Zajdlik, B.A., I.J. Young, J. Rebinczak, S. Barrett, B. Brady, P-Y Robidoux, G. Sunahara
and H. Fanous. 2007. Integrating Sediment Quality Metrics to Prioritize UXO Clearance in an Aquatic Ecosystem. Society of Environmental Toxicology and Chemistry, Milwaukee.
Zajdlik, B.A. 2007. Choosing Environmental Quality Guidelines for the North. Science
in the Changing North. Yellowknife. Zajdlik, B.A., S. Kokelj and M. Thompson. 2007. Regional Variability in Water Quality
of Tundra Lakes in the Mackenzie Delta. Environmental Studies across the Treeline. Yellowknife.
Scroggins, R., L. Taylor, Leana Van der Vliet and B. Zajdlik. 2007 Statistical Software
Development Project. Aquatic Toxicity Workshop, Halifax, Nova Scotia.
R. R. # 1 • Rockwood, Ontario N0B 2KO • Phone (519) 856-9440
Fax (519) 856-9446 • E-mail [email protected]
PAPERS PRESENTED
Zajdlik, B.A. 2006. Key Elements of Aquatic Effects Monitoring Program in the North. Invitational: A workshop on “Guidelines for Aquatic Monitoring and Assessment of Development Projects in the NWT”, sponsored by Indian and Northern Affairs Canada and Environment Canada, Yellowknife, April 11th-12th.
Zajdlik, B. A. 2006. Aquatic thresholds – conceptual and developmental challenges.
Invitational: A workshop on “Thresholds: From Theory to Practice”, co-sponsored by Indian and Northern Affairs Canada and Environment Canada, Yellowknife, March 13th-14th.
Zajdlik, B., G. Gilron, P. Riebel and G. Atkinson. 2000. The $500,000.00 fish. 27th
Annual Aquatic Toxicity Workshop, St. John’s, Newfoundland. Zajdlik, B. A. L. M. Porebski, K. G. Doe and J. M. Osborne. 1999. Making inferences
from a suite of biological tests. 26th Annual Aquatic Toxicity Workshop, Edmonton
Porebski, B. A. Zajdlik, K. G. Doe and J. M. Osborne. 1999. Taking it to the creek -
using an organic pollution gradient to evaluate techniques for dredged sediment
assessment. 26th Annual Aquatic Toxicity Workshop, Edmonton. Zajdlik, B. A. and P. Riebel. 1999. The cost-benefit of EEM study design. 85th Annual
Meeting of the Pulp and Paper Technical Association. Montréal. Jonczyk, E. G. Gilron and B. Zajdlik. 1998. Comparison of sea urchin fertilization test
results using natural and synthetic marine water. 25th Annual Aquatic Toxicity Workshop, Québec City.
Zajdlik, B. A., T. S. Moran and S. Munro. 1997. Assessing spatial extent of impacted
areas in the St. Clair River using the sediment quality triad. 24th Annual Aquatic Toxicity Workshop, Niagara Falls.
Zajdlik, B. A. 1997. Defining the word “replicate” in the context of sampling benthic
macroinvertebrate communities. 24th Annual Aquatic Toxicity Workshop, Niagara Falls.
Jonczyk, E. G. Gilron and B. Zajdlik. 1997. Sample salinity adjustment for culturing and
testing sea urchins. 24th Annual Aquatic Toxicity Workshop, Niagara Falls. Gilron, G. L., D. H. Lynn, B. Zajdlik, J. Schroeder and C. Krawczyk. 1997.
Development of a sublethal behavioral bioassay for mining effluents using the heterotrophic flagellate, Polytomella a. 24th Annual Aquatic Toxicity Workshop, Niagara Falls.
Zajdlik, B. A. Statistics: Why Bother? A Presentation to SETAC Laurentian Members,
1996. Guelph, Ontario. Zajdlik, B. A. An introduction to threshold modelling of non-quantal bioassay data. 1995
R. R. # 1 • Rockwood, Ontario N0B 2KO • Phone (519) 856-9440
Fax (519) 856-9446 • E-mail [email protected]
PAPERS PRESENTED
Annual Aquatic Toxicity Workshop, St. Andrews, New Brunswick. Zajdlik, B. A. A review of the ICp method. 1995 Annual Aquatic Toxicity Workshop, St.
Andrews, New Brunswick. Zajdlik, B. A., and D. G. Dixon. 1994. Statistical considerations in the design and analysis
of experiments using a first-order single compartment model. 15th Annual Meeting of the Society of Environmental Toxicologists and Chemists.
Zajdlik, B. A., T. S. Moran and S. Munro. 1994. Survival analysis of Rainbow trout
Oncoryhnchus mykiss egg hatchability data and environmental decision-making. 21st Annual Aquatic Toxicity Workshop, Sarnia.
Dutton, M. D., B. A. Zajdlik, D. G. Dixon and J. F. Klaverkamp. 1994. Reassessing
interactions between bioenergetics and cadmium bioaccumulation in Rainbow trout. 21st Annual Aquatic Toxicity Workshop, Sarnia.
Zajdlik, B. A. 1993. Statistical Software and the Analysis of Toxicological Data. 20th
Annual Aquatic Toxicity Workshop, Quebec City. Smith, I. R., B. A. Zajdlik, H. W. Ferguson and M. A. Hayes. 1987. Alterations in serum
chemistry in rainbow trout Salmo gairdneri with liver degeneration after partial hepatectomy or treatment with carbon tetrachloride or alpha-naphthyliso-thiocyanate. 14th Annual Aquatic Toxicity Workshop, Toronto

R. R. # 1 • Rockwood, Ontario N0B 2KO • Phone (519) 856-9440
Fax (519) 856-9446 • E-mail [email protected]
EDUCATION
1991–1995 University of Waterloo Waterloo, Ont.
Ph.D., Statistical Derivation of Environmental Quality Guidelines”
Resumed, Spring 2006, Completed 2015.
1987–1990 University of Guelph Guelph, Ont.
MSc., Applied Statistics, Project Title “Analysis of Irregularly Spaced Time Series”
1982–1987 University of Guelph Guelph, Ont.
BSc., Major: Aquatic Biology, Minor: Statistics
SCHOLARSHIPS AND AWARDS
2014 Risk Management Paper of the Year. Awarded by Journal of
Human and Ecological Risk Assessment, 2013. See Renoux et al in Papers Published.
2006 Ontario Ministry of Environment Strategic Partnership Grant
1994 University of Waterloo Graduate Scholarship
1992-1993 National Sciences and Engineering Research Scholarship
1991-1992 National Sciences and Engineering Research Scholarship
1989-1990 Ontario Graduate Scholarship
1988 University of Guelph Graduate Scholarship
1987 University of Guelph Graduate Scholarship
M. John Brodie, P. Eng. (B.C, Yukon & NWT/NU) Education: B.A.Sc. Geological Engineering, University of British Columbia, 1982
Experience:
Jan '95 - present Brodie Consulting Ltd.
Brodie Consulting has provided geotechnical and mine closure services on numerous sites, mostly in
Canada and Mexico. This work has included:
Mine water balance and waste management design/review for proposed and operating mines
Preparation and/or evaluation of closure plans and associated liability for new and existing mines,
Technical management of abandoned mines under government control,
Preparation of guidelines on mine closure planning and standards,
Risk characterization of mine closure hazards,
Due diligence assessment of mine reclamation liability for mergers/acquisitions.
Geotechnical work on mine dams has involved the following:
Rofomex Mine, Mexico: design of stabilization buttress for 2 dams, ongoing design of raises for 4
dams and associated management of tailings discharge, design of new tailings storage area.
La Negra Mine, Mexico: design of modifications for seepage control and raising of 2 dams
Giant Mine, NWT: lead engineering (shared with SRK) for emergency design and construction
supervision of B2 dam.
Since the mid-1990’s I have prepared mine closure reviews and cost estimates for the Federal or
Territorial governments for most mines in Northern Canada.
Working with Robertson GeoConsultants, I was the lead engineer for closure planning for three Anglo-
American sites in Chile. That project involved development of new closure plans to comply with recently
amended closure regulations in Chile.
I have been involved in the mine closure planning for the abandoned Faro Mine in Yukon since 2004.
Work on this project has involved: technical lead – engineering studies, chief engineer for care and
maintenance (2009/10), and senior reviewer of closure planning process.
I have been involved in the mine closure planning for the Giant Mine in NWT since 1998. Work on this
project has involved: review of technical closure studies, key resource on site risk assessment, lead
engineer for design and construction of bulkheads and B2 dam construction, ongoing oversight of mine
closure design.
I am engaged as independent geotechnical reviewer for 3 dams in BC, including the rehabilitated Mt.
Polley dam.

Key Project Experience
Indigenous & Northern Affairs Canada and Government of Northwest Territories
Giant Mine;
o Ongoing engineering related to arsenic storage bulkheads and chamber water management
o Design and construction supervision of bulkhead 14A for containment of arsenic waste
Design engineer partner and lead field engineer for re-construction of the B2 Dam in Yellowknife
Ongoing Peer Review of Giant Mine remediation planning process
Faro Mine, member Technical Review Committee, technical support to Peer Review Panel
Jericho Mine, Doris North Mine, Meadowbank Mine, Diavik Mine, Ekati Mine, Snap Lake Mine,
Cantung Mine, Colomac Mine review of closure plans and security estimate.
Project manager/technical advisor for water management and site maintenance of the Colomac Mine.
Pre-feasibility closure plan development, Mt. Nansen Mine
Estimation of mine closure costs on Brewery Creek, Mt. Nansen, Western Copper & Dublin Gulch
mines.
Tulsequah Chief Mine
Project lead for the original closure assessment of Tulsequah Chief in 1992 on behalf of Redfern
Resources. That work involved site assessment and concept level plans for mine flooding with
bulkheads to reduce the effects of ARD.
Kemess North Mine
Conceptual design and costing of alternative mine waste disposal strategies for the Kemess North
Mine for consideration by the Canada Environmental Assessment Agency Panel and stakeholders
Skeena Resources Ltd.
Closure planning and assistance with due diligence assessment for 3 former mines in BC.
Bralorne Gold Mine
Closure planning and ongoing participation in closure studies and conditions of permit.
Mt. Polley Mining Corporation
Member of Independent Review Board for raising of the repaired embankment and ongoing TSF
operations.
Casino Corporation
Lead engineer for closure planning for Casino Project, Yukon
Faro Mine Closure Planning Office
Technical manager for ongoing closure planning studies.
Chief Engineer for ongoing care & maintenance of the Faro site (2009/10)
Rofomex phosphate mine, La Paz Mexico
Design of repairs to 2 major tailings dams and modifications to tailings management strategy
Design of new tailings area for future production.
Aurcana Resources Inc.
Design of drainage systems and dam raising methodology for 2 dams in central Mexico,
Pre-feasibility design of tailings dam and impoundment liner for silver mine in Texas.

Page 1 of 2
Lara Fletcher, M.A.Sc., P.Eng. (BC, NT/NU) Phone: (250) 751-3755 Email: [email protected]
Summary of Experience: Lara is a geological engineer with 15 years of environmental and geotechnical experience with projects in British
Columbia, Northwest Territories, and Yukon. Areas of expertise includes mine closure and reclamation
planning, ARD/ML prevention and management, and liability cost estimating. Experienced in site
characterization, subsurface investigations, slope stability assessments, and construction inspections. Clients
include regulators, owners, and Indigenous Governments.
Education: M.A.Sc Geological Engineering, University of British Columbia, 2000
B.A.Sc. Chemical Engineering, University of British Columbia, 1994
Associations: Association of Professional Engineers and Geoscientists of British Columbia (APEGBC)
Northwest Territories and Nunavut Association of Professional Engineers and Geoscientists (NAPEG)
Employment History: 2012 - present: Brodie Consulting Ltd.
2009 - present: Independent
2002 - 2006: EBA Engineering Consultants Ltd.
2001 - 2002: Canadian Pacific Railway/Natural Resources Canada/UBC
2000 - 2001: Natural Resources Canada, Terrain Sciences Division
1995 - 1997: Terra Environmental Engineering Ltd.
Select Project Experience:
Mining
Government of Northwest Territories - Environment and Natural Resources (GNWT-ENR) - Providing
technical support with review of water licence submissions including closure plans, annual closure and
reclamation progress reports, water and waste management plans and security estimates for Diavik, Ekati,
Snap Lake, and Gahcho Kue diamond mines in Northwest Territories. Evaluation of metal leaching and acid
rock drainage, waste rock and tailings storage facility closure design, water balance and water quality models,
thermal and chemical predictions, and ecological risk assessment.
Government of Northwest Territories - Environment and Natural Resources (GNWT-ENR) - Lead author on
discussion paper regarding long term management and relinquishment of closed mines for input into the
development of government policy and guidelines.
Government of Northwest Territories - Environment and Natural Resources (GNWT-ENR) - Cantung Mine,
NWT. Review of water licence amendment application to utilize dry stack tailings technology. Review and
input into assessment of options to address instability of existing tailings storage facility dams. Review of
closure plans including design of covers to mitigate ARD and Ecological Risk Assessment of tailings
disposed of in Flat River. Development of independent security estimate.
Indigenous and Northern Affairs Canada (INAC) - Cantung Mine, NWT. Subsequent to insolvency of mine
owners, review of Interim Care and Maintenance Plan for the Cantung mine, NWT. Cost estimating of care
and maintenance program and development of scope of work and specifications for tendering of contracts.

Resume - Lara Fletcher Brodie Consulting Ltd.
Page 2 of 2
Provided input into identifying and quantifying hazards and risks for federal Contaminated Sites Program
Risk Registry.
Government of Northwest Territories - Environment and Natural Resources (GNWT-ENR) - Con Mine,
NWT. Provided technical support in review of post-closure water licence application including review of
security estimate for long term water treatment.
Government of Northwest Territories - Environment and Natural Resources (GNWT-ENR). Updated manual
and unit costs for RECLAIM model, which is used to estimate costs for mine closure and reclamation in the
Northwest Territories.
Avino Silver and Gold Mines Ltd. - Bralorne Mine, BC. Preparation of Closure and Reclamation Plan and
Liability Estimate to support Mines Act Amendment Application. Identified information gaps and
recommended studies to support plans for closure of historic mine currently in care and maintenance.
Provided technical support through review by BC Ministry of Energy and Mines.
Skeena Resources Ltd. - Blackdome mine, BC. Preparation of draft Closure and Reclamation Plan and
Liability Estimate, Care and Maintenance Plan, and Annual Reclamation Progress Report for historic mine in
care and maintenance. Prepared RFPs for ARD/ML assessment and reclamation plan on behalf of company
to address uncertainties in the closure plan.
Moose Cree First Nation - Detour Lake Mine, ON. Collaborated with technical team for review of Closure
Plan, Security Estimate and Dam Safety Review. Attended meetings with members of MCFN, regulators,
mine owners and consultants to advance review and approval over several year period.
Nisga’a Lisims Government - Kitsault Mine, BC. Collaborated with technical team and legal representatives
on review of BC Mines Act permit application and security estimate.
Canada Zinc Metals - Akie Project, BC. Rock core drilling, packer testing and core logging for development
of exploration portal and decline at very remote location in northern BC. Assessment of foundation
conditions for portal laydown area and waste rock dump. Assessment of potential for retrogression of large
landslide to impact road access to exploration portal and implications for future mine development.
Slope Stabilization and Assessments
Barkley Project Group - Quality assurance inspections for run-of-river hydroelectric developments. Included
foundation inspections, rock slope stability assessment and installation of rock dowels, installation and testing
of rock anchors and construction of GRS wall - Canoe Creek Hydro Project, Haa-ak-suuk Creek Hydro
Project, Winchie Creek Hydro Project
Assessment and design of stabilization measures for rock slopes and tunnels in numerous locations for BC
Ministry of Transportation, BC Ministry of Environment, Department of Fisheries and Oceans, BC Ferries
and Parks Canada. Provided recommendations and budget for stabilization measures. Inspected stabilization
construction programs including scaling, bolting, blasting and fence construction.
Parks Canada - Project manager for detailed hazard assessment of large rockslide, Highway 1 Glacier
National Park. Provided hazard rating as well as range of mitigative options to prevent highway closure.
BC Ministry of Transportation - Assisted in rockfall catchment research project to develop design guidelines
for conceptual phase widening Highway 99 for BC Ministry of Transportation. Completed a cost/benefit
analysis of stabilization of rock slope versus excavation of increased ditch widths for prevention and/or
containment of rockfall.
BC Transportation Financing Authority, Indian and Northern Affairs Canada, and Lax Kw’Alaams Band -
Debris flow assessment for a highway upgrade to Tuck Inlet. Performed a risk management analysis
including the implementation of a rainfall warning system.
Landslide hazard assessments and road deactivation prescriptions for forest service roads in BC.

Page 1 of 4
Katie Jones, M.Sc, P.Geo, P.Chem
01/16
EDUCATION
Master of Science,
Hydrogeology and Geochemistry
University of British Columbia
Bachelor of Science
University of Ottawa
PROFESSIONAL HISTORY
Mavin Terra Solutions Inc.
Hydrogeochemist
2014 - Present
BGC Engineering Inc.
Hydrogeology and Geochemistry Specialist
2012-2014
Rescan Environmental Services Ltd.
Geological Scientist
2010-2012
AMEC Earth and Environmental
Junior Environmental Scientist
2006
Accutest Laboratories Ltd.
Laboratory Technician (ICP-MS)
2005
University of Ottawa, Geology Department
Isotope Researcher
2005
Annis O’Sullivan, Vollebekk Ltd.
Land Surveyor
2003
BIOGRAPHY
Katie has a strong background in aqueous
geochemistry, with over 9 years of experience in
contaminant transport. Katie’s technical expertise
includes: source term development, ML/ARD
assessments, water quality modelling, water
management planning, and hydrogeology. She
regularly analyzes and interprets large datasets,
and models contaminant transport. Through her
experience as an environmental laboratory
technician, she developed a rounded
understanding of contaminant behavior. Katie
gained an appreciation for hydrogeology as an
environmental consultant involved with
groundwater remediation programs. During her
M.Sc., Katie modelled and analyzed reactive
transport processes using isotopes. While
working as a consultant for the mining sector, she
was able to apply her modelling skills to solve
unique environmental challenges. She has
developed models to evaluate flow and water
quality in receiving environments and basins, and
regularly integrates geochemical analysis into her
predictions. She has worked on an array of
projects, including open pit, underground, and oil
sand mines. As a result of her experiences, Katie
excels at advancing and managing geochemistry
and water quality prediction programs for
operating and proposed mines.
PROFESSIONAL REGISTRATION
Registered Professional Chemist in the Province
of British Columbia
Registered Professional Geoscientist
Province of British Columbia and Ontario
Page 2 of 4
Katie Jones, M.Sc, P.Geo, P.Chem
01/16
KATIE’S KEY PROJECT EXPERIENCE
Bonanza Ledge Gold Mine, British Columbia
Barkerville Goldmine Incorporated,
Analyzed water quality and geochemical datasets
to identify relevant geochemical processes and
mineralogical controls. Constructed a site wide
water balance and water quality model and
developed source terms for the model. (Project is
ongoing)
Unnamed Quarry, Northwest Territories
Government of the Northwest Territories
Evaluated existing geochemical datasets to
identify PAG rock and parameters of concern.
Developed a waste management plan for an
unnamed quarry. (2018)
New Afton Mine, British Columbia
KCC Geoconsulting / New Gold, Inc
Analyzed observed water quality to identify
relevant geochemical processes and mineralogical
controls on parameters of concern. Reviewed
static and kinetic information, developed source
terms for the site, and constructed a site wide
water balance and water quality model. (Project is
ongoing)
Murray River Project, British Columbia
ERM Group Inc / HD Mining Inc, Inc
Developed source terms using kinetic and
observed site data for inclusion into a site wide
water quality model used to identified parameters
of concern, develop triggers and support the
permitting process. Provides technical review of
water quality modelling. (Project is ongoing)
Ekati Diamond Mine, North West Territories
Marsland Environmental Associates /Dominion
Diamond Corporation
Analyzed water quality and developed a
geochemistry program to establish loading rates
and source terms for parameters of concern at
the mine. The program focuses on the
implications of saline water and cation exchange
on drainage water quality for various ore types.
(Project is ongoing)
Max Mine, British Columbia
MX Gold Corp.; British Columbia
Evaluated ML/ARD potential of existing waste
rock, construction material, and tailings material.
(Project is ongoing)
Willa Project, British Columbia
MX Gold Corp; British Columbia
Evaluated site geochemistry, developed a
comprehensive work plan for the bulk sample and
permitting programs. (Project is ongoing)
Casino EIA, Aqueous Geochemistry
Source Environmental Associates / Western
Copper and Gold; Yukon
Provided geochemistry and water quality
modelling support for the proposed mine project.
(2014-2015)
Aurora Mine, Hydrology and Hydrogeology
BGC Engineering Inc. / Syncrude Canada Ltd.;
Alberta
Predicted clean water discharge volumes,
including surface and groundwater estimates,
using analytical equations and modelling
software. (2012-2013)

Page 3 of 4
Katie Jones, M.Sc, P.Geo, P.Chem
01/16
Gibraltar Mine, Hydrogeology
BGC Engineering Inc. / Taseko Mines Ltd; British
Columbia
Developed and managed the installation of a
groundwater monitoring network, and evaluated
the associated flow and water quality. (2012-
2013)
Brucejack Project, British Columbia
BGC Engineering Inc. / Pretium Resources Inc
Developed a water quality model and
comprehensive water balance for the proposed
underground mine. Incorporated geochemical
software into analysis. Developed the 2013
ML/ARD geochemistry program to facilitate the
optimization of waste management strategies and
established source terms. (2012-2013)
Eagle Gold Mine, Yukon
BGC Engineering Inc. / Victoria Gold Corp
Developed a groundwater recharge estimation
technique and reviewed the groundwater
monitoring network. (2012)
Baker Mill, British Columbia
BGC Engineering Inc. / Pretium Resource Inc. a
Evaluated the ML/ARD characteristics of the
deposited tailings in the TMA. (2012)
Ekati Diamond Mine; North West Territories
Rescan Environmental Services Ltd. / BHP
Billiton Ltd/
Developed water quality predictions and water
volumes estimates for the expansion of operations
and deposition of tailings material. (2010-2011)
KSM Project, British Columbia
Rescan Environmental Services Ltd. / Seabridge
Gold Inc.
Developed a water quality model for the project
and identified parameters of concern. Developed
and evaluated source terms and analyzed
ML/ARD datasets. Evaluated the hydrogeology for
the TMF area. (2010-2011)
Island Copper Mine, British Columbia
Rescan Environmental Services Ltd / BHP
Billiton Ltd.
Evaluated water quality and modelled a pit lake
undergoing active fertilizer treatments. Assessed
the geochemistry and biology associated with the
Pit Lake. (2010-2011)
Detour Mine, Ontario
Source Environmental Associates / Moose Cree
First Nations
Reviews geochemistry and water quality for
operations and closure planning. (Project is
ongoing)
Kemess Underground Project, British
Columbia
Source Environmental Associates / Moose Tsay
Keh Ney
Reviews the proposed underground mine source
terms development, geochemistry and
hydrogeology. (Project is ongoing)
Red Mountain Underground Project, British
Columbia
Source Environmental Associates / Moose
Nisga’a Lisims Government
Reviews source term development and water
balance and load balance model for the mine.
Provided support for a tailings alternatives
assessment. (Project is ongoing)

Page 4 of 4
Katie Jones, M.Sc, P.Geo, P.Chem
01/16
Coffee Gold Project, British Columbia
Source Environmental Associates / Moose
Tr’ondeck Hwech’’in First Nations
Reviews the geochemistry, source term
development, water quality modelling and
hydrogeology. (Project is ongoing)
Endako Mine, British Columbia
Source Environmental Associates / Moose
Nadleh First Nations
Reviewed a mine expansion water quality model
and source terms. (2014-2015)
Elk Valley, British Columbia
Source Environmental Associates / Moose
Ktunaxa First Nation
Geochemistry and water quality model reviewer
for proposed mine operations / expansions.
(2015)
Dome Mountain Mine, British Columbia
Source Environmental Associates / Moose Lake
Babine First Nation
Reviews the geochemistry source terms and
existing water quality for proposed mine
operations. (2015-2016)
Frontier Drilling Project, Alberta
Source Environmental Associates / Moose
Athabasca Chipewyan First Nation
Reviewed past and proposed drilling programs for
the site with respect to relevant directives. (2015)
LIST OF SELECTED PUBLICATIONS
AND PRESENTATIONS
K. Jones, M. Lindsay, R. Kipfer, K.U. Mayer. 2014.
Atmospheric noble gases as tracers of biogenic gas dynamics in a shallow unconfined aquifer. Geochemica et Cosmochimica Acta, v. 128: 144-157.
K. Jones, 2012. Noble gases as tracers of biogenic
gas dynamics at a hydrocarbon contaminated site. GSA Abstracts and Programs, v. 44: 312.
S. Haque, K. Jones, K.U. Ulrich, 2009. Gas
generation in sand columns contaminated with small volume releases of ethanol. GSA Abstracts with Programs, v. 41: 653.
K.U. Mayer, S. Haque, S. Hund, K. Jones, 2009.
Examination of influences of gas generation and transport on LNAPL site evolution – implications for natural attenuation and groundwater remediation. University Consortium for Field-Focused Groundwater Contamination Research Annual Meeting, ON, Canada.
I. Clark, R. Timlin, A. Bourbonnais, K. Jones, D.
Lafleur, K. Wicke, 2008. Origin and fate of industrial ammonium in anoxic ground water—15N evidence for anaerobic oxidation. Groundwater Monitoring and Remediation, v. 28: 79-82.
K. Jones, O. Singurindy, S. Molins, R. Beckie, L.
Smith, K.U. Mayer, 2008. Reactive gases and inert gas tracers in vadose zone environmental applications. Goldschmidt Conference Abstracts, Vancouver.