Embed Size (px)
Citation preview

MAGNETIC RESONANCE IN MEDICINE 25,319-333 ( 1992)
Deblurring for Non-2D Fourier Transform Magnetic Resonance Imaging
DOUGLAS C. NOLL, * JOHN M. PAULY, CRAIG H. MEYER, DWIGHT G. NISHIMURA, AND ALBERT MACOVSKJ
Magnetic Resonance Systems Research Laboratory, Departnient ofElectrica1 Engineering, 120 Durand, Stanford University, Stanford, California 94305
Received May 14, 1991; revised July 15, 1991; accepted August 8, 1991
For several non-2D Fourier transform imaging methods, off-resonant reconstruction does not just cause geometric distortion, but changes the shape ofthe point spread function and causes blumng. This effect is well known for projection reconstruction and spiral k- space scanning sequences. We introduce here a method that automatically removes blur introduced by magnetic field inhomogeneity and susceptibility without using a resonant frequency map, making these imaging methods more useful. In this method, the raw data are modulated to several different frequencies and reconstructed to create a series of base images. Determination of degree of blur is done by calculating a focusing measure for each point in each base image and a composite image is then constructed using only the unblurred regions from each base image. This method has been successfully applied to phantom and in vivo images using projection-reconstruction and spiral-scan sequences. 0 1992 Academic Prm, Inc.
INTRODUCTION
The collection of data for magnetic resonance imaging (MRI) on spin warp or 2D Fourier transform (2DFT) k-space trajectories ( I , 2) has some significant advantages over other k-space trajectories, and one of the most important of these is that chemical- shift and main field ( Bo) inhomogeneity causes only geometric &stortion with typically very little degradation in the shape of the system impulse response or point spread function (3). Despite the advantages of spin-warp imaging, other k-space trajectories have become important recently for several applications. Projection reconstruction ( 4 ) and variants ( 5 ) with free-induction decay (FID) readouts have been used recently for the imaging of short T2 species ( 6 ) , lungs ( 7), and flow ( 8 ) . Spiraling trajectories (9-1 1 ) have been used for greater k-space coverage with each excitation for fast imaging. With these and other k-space trajectories, off-resonance behavior results in a degra- dation of the point spread function. Described below is a method that removes the blur caused by off-resonant reconstruction in an automatic fashion, that is, it does not require any intervention on the part of an observer and also does not require a an additional frequency map. This method can correct for off-resonance effects due
* Present address: Department of Radiology, University of Pittsburgh, Pittsburgh NMR Institute, 3260 Fifth Avenue, Pittsburgh, PA 15213.
319 0740-3194192 $5.00 Copyright 0 1992 by Academic Press, Inc. All rights of reproduction in any form reserved.
320 NOLL ET AL.
to magnetic field inhomogeneity and susceptibility, but not chemical shift. In this method, the raw data are modulated to several different frequencies and reconstructed to create a series of base images. Processing algorithms are used to identify the unblurred regions of each of the base images, and a composite image is then constructed using only these unblurred regions.
DESCRIPTION OF PROBLEM
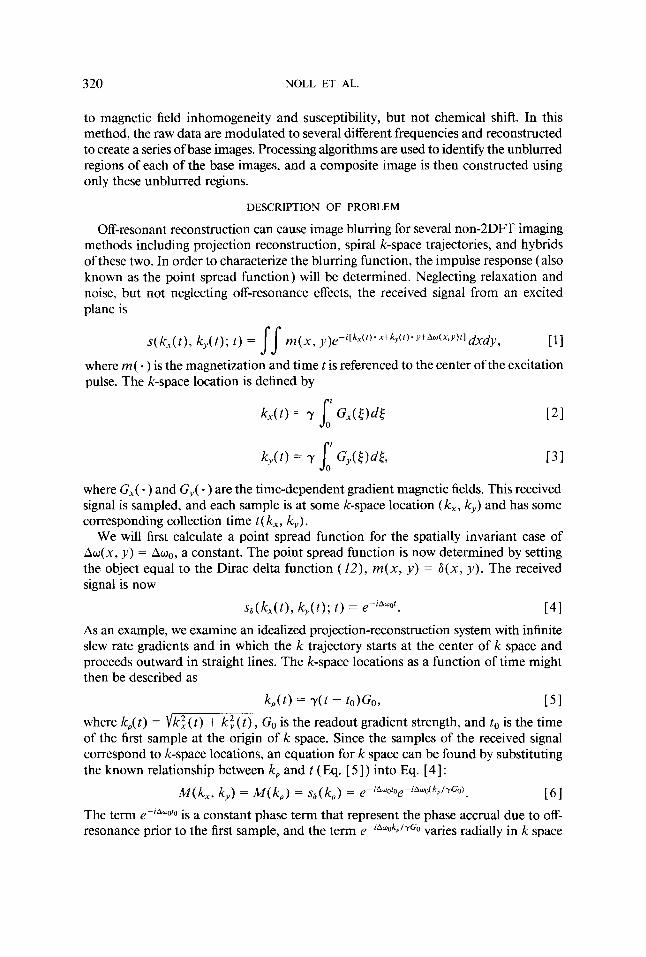
Off-resonant reconstruction can cause image blurring for several non-2DFI imaging methods including projection reconstruction, spiral k-space trajectories, and hybrids of these two. In order to characterize the blumng function, the impulse response (also known as the point spread function) will be determined. Neglecting relaxation and noise, but not neglecting off-resonance effects, the received signal from an excited plane is
where m( - ) is the magnetization and time t is referenced to the center of the excitation pulse. The k-space location is defined by
where G,( - ) and Gy( - ) are the time-dependent gradient magnetic fields. This received signal is sampled, and each sample is at some k-space location (k, , k,,) and has some corresponding collection time t ( k,, k,).
We will first calculate a point spread function for the spatially invariant case of Au(x , y ) = Awo, a constant. The point spread function is now determined by setting the object equal to the Dirac delta function (12), m(x , y ) = 6(x, y ) . The received signal is now
sg(kX(t), Icy([); t ) = e-lA'"O'. [41 As an example, we examine an idealized projection-reconstruction system with infinite slew rate gradients and in which the k trajectory starts at the center of k space and proceeds outward in straight lines. The k-space locations as a function of time might then be described as
k p ( t ) = Y(t - to)Go, [51 where k,( t ) = vk: ( t ) + k: ( t ) , Go is the readout gradient strength, and to is the time of the first sample at the origin of k space. Since the samples of the received signal correspond to k-space locations, an equation for k space can be found by substituting the known relationship between k, and t (Eq. [ 51) into Eq. [ 41 :
161 The term e~'Awo'o is a constant phase term that represent the phase accrual due to off- resonance prior to the first sample, and the term e-iAwokp'yCo varies radially in k space
&f(k,, k,) = M ( k , ) = ss(k,) = ,-iA~oto,-iA'"o(kpiYCO).

DEBLURRING FOR NON-2DFT MRI 32 1
and represents the phase accrual during data acquisition. The point spread function is just the Fourier transform of this k-space function:
This function does not have a simple analytical expression, but simulated point spread functions were calculated and are found in Fig. 1 for Awo = 0 and Awo = 4 ~ / T , where T = kmax/( yGo) is the length of the data acquisition window.
This point spread function was calculated for the spatially invariant case, but in general the local resonant frequency varies across the object. We will present only an informal argument for local space invariance since more formal arguments are given in (13-16) for this and other applications. This argument has two parts and both parts depend on the assumption that the local resonant frequency varies slowly across the object, which is commonly the case. The first part of space invariance is that only zeroth-order effects of inhomogeneity will affect the point spread function. The first derivative of inhomogeneity is effectively a gradient field that can skew the k trajectories. This and higher order effects, if substantial, can cause additional degradation of the point spread function. Since the local resonant frequency is assumed to be slowly varying, these derivatives are small with respect to gradient strength and can be ne- glected. When the receiver is tuned to resonance for a particular point of the object, the point spread function will then be approximately that of the on-resonant object in Fig. la under the assumption that first and higher order effects can be neglected. The second part of local invariance is that for an on-resonance receiver, the image point is not corrupted by blur from neighboring points that are at different local frequencies. Since the homogeneity varies slowly, nearby points will be blurred only slightly and therefore will not interfere with the point of interest. For points farther away in the object, the resonant frequency may differ substantially, causing severe blurring, but these points will then be too far away from the point of interest to interfere.
An important consequence of local space invariance is that any point in the image can be placed in focus by tuning the receiver to the proper frequency. This can also be done as part of the reconstruction by modulating the received signal to the appro- priate frequency,
FIG. 1 . Point spread function (a) on-resonance and (b) off-resonance with two cycles of phase accruing over the readout, or equivalently, Am,, . T = 4 ~ .

322 NOLL ET AL.
s( k,( t ) , k,( t ) ; t)eEAuO‘, [81 where the modulation frequency is Awo. In the case of an point object and an idealized projection reconstruction system, Eq. [ 61 representing the k-space data then becomes
M ( k,) = S6 ( kp)e‘Awdk’JYGo) = 1 [91 which would give the desired point spread function of Fig. 1 a. Even if this modulation is done, other regions of the image may still be blurred because those regions are at different resonant frequencies.
If a particular region of an image is of interest, then this region can be placed in focus by carefully modulating and reconstructing the image iteratively until that region is no longer blurred. If a map of the local resonant frequency is available, the image can be reconstructed so that entire image is unblurred using either a “conjugate phase” reconstruction in either a continuous (13) or time-segmented ( 14) formulation. For this application, a conjugate phase reconstruction is one where every time sample is multiplied by the phase conjugate of the accrued phase due to inhomogeneity as in Eq. [ 8 1. This must be done individually for each point in the image as the resonant frequency is not uniform. The map of the local resonant frequency can be determined by rapidly collecting two images with different echo times using FID or gradient- recalled readouts if eddy current induced phases are not too severe. The frequency at some point can then be calculated by taking the phase difference (with 2~ phase wraps removed) between the two images divided by the change in echo times ( I 7-1 9 ) . The field map can also be acquired by using spin-echo sequences based on a similar idea (20, 21 ) or spectroscopic imaging sequences.
The main point of this paper is a reconstruction method in which images are re- constructed without using a frequency map such that the entire image is unblurred. This reconstruction method, which is described under Method, is built upon another method that makes use of a frequency map and is described briefly here. In the method that uses the frequency map, the raw data are modulated at several different frequencies and reconstructed to generate a series of base images. In each of these images, regions will appear in focus when the local resonant frequency of those regions of the object is close to the effective receive frequency, which is the true receiver frequency minus the frequency of the modulation applied to the received data. A composite image is then generated from the set of base images using the frequency map as a guide. Spe- cifically, for each point in the composite image, the point from the base image having an effective receive frequency closest to the frequency as specified in the frequency map is included. Variations on this method include selecting a weighted average of appropriate base images using either complex or magnitude images.
METHOD
Described above is a method to reconstruct the images using a frequency map such that the entire image is simultaneously in focus. It is also possible to reconstruct an unblurred composite image from a set of base images without using a frequency map by selecting for inclusion the least blurred regions of those base images as determined by processing algorithms. Specifically, for each point in the composite image, we choose for inclusion the base image that best satisfies some focusing criterion at that point.

DEBLURRING FOR NON-2DFT MRI 323
Automatic focusing through the use of a focusing criterion is a problem that has been encountered in a number of other fields including astronomy (22, 2 3 , consumer optics (24, 25) , and ultrasound imaging (26). For these applications, a number of different focusing criteria have been explored, but perhaps the most common criterion is maximization of the integral of the square of the image intensity.
We now examine this criterion for the case of non-2DFT MR imaging. From Eq. [ 61, we observe that for an off-resonant receiver, the desired k-space function is cor- rupted with a phase term that varies across k space, which is responsible for the image blur. For the generalized case of non-2DFT imaging, this phase function is - Awo - t( k,, lev), where Awo is the off-resonance and t(k,, k,) the collection time associated with each k-space location. Letting Z(x, y ; Awo) be the image reconstructed with off-res- onance Awo and Mo( k,, k,) be the desired, on-resonance k-space function, then the criterion is the maximization of
r r
by invoking Parseval’s theorem ( 12). Equation [ 1 I] is independent of Awo, so the correct receiver or modulation frequency clearly cannot be selected by examining this function. This criterion works for the astronomy and consumer optics applications because these are incoherent optical systems, while the blurring we encounter in MRI is analogous to a coherent optical system. A criterion applied to ultrasound imaging, which is also a coherent system, is equivalent to the integral of the fourth power of the image magnitude. Trahey and Xhoa have shown that this function works in phased- array ultrasound because the desired array aperture is real and positive (27 ) , but k space, which is the equivalent in MRI to the aperture, is not a real function for general objects.
These and other focusing criteria (22) are functions of the magnitude of the image and do not take advantage of the inherent complex nature of MR images. We therefore propose focusing criteria that use functions of either the phase image or the complex image. One possible criterion here is to minimize the integral of some nonlinear func- tion of the imaginary part of the image; for example,
JJ I Imag{ W , Y ; A ~ o ) 1 I “dx& = 0, 1121
where the criterion is satisfied when the integral is at its minimum, zero. Experimen- tation and simulation suggest that acceptable performance of this criterion can be achieved when the parameter a takes on values in the range 0.5 to 1. Minimization of the imaginary part of MR images has also been suggested in a method to estimate phase variations across an image for noise reduction (28). As a practical consideration, some incidental constant and low-frequency phase shifts must be removed before applying this criterion. These phase shifts include residual phase from excitation, phase accrual due to inhomogeneity before the first sample such as the e-iAOOto term in Eq. [ 61, flow, gradient eddy currents, and other sources. Because the local resonant fre-

324 NOLL ET AL.
quency varies spatially, the criterion should only act on a region immediately sur- rounding the point of interest, and therefore, the integration is performed only over a small area centered at that point. The size of this area must be chosen so that it is small enough to vary with the changes in resonant frequency, but large enough to encompass most of the blurred point spread function.
In the example of the idealized projection reconstruction system, the phase due to inhomogeneity accrues as data collection proceeds outward in k space as shown in Eq. [ 61. In general, the average phase of the low spatial frequencies will consequently be different from the high spatial frequencies as demonstrated in Fig. 2. If the receiver is on-resonance, that is, Awo = 0, then no phase accrues and the average phase of the low and high spatial frequency parts will be the same. Spiraling trajectories and practical projection-reconstruction systems will show the same general trends with phase ac- cruing from the center toward the edges of k space, though the specifics of the phase accrual will be different.
Specifically, we decompose the reconstructed image into low- and high-frequency components,
I(x, y ; AWo) = [(x, y ; A w o ) e i ~ d J X A w o ) + h ( x , y ; A W O ) e i d h ( 4 ? ' ; A U O ) 1131
where hei4h and leidl are the complex representations of the low and high spatial fre- quency components of the image, respectively. The low spatial frequency component can then be used as a phase reference to remove the incidental phase variations. The focusing criterion will then be sJ IImag{ Z(x, y ; Auo)e-i@/(x,y;Awo)} I "dxdy = 0, [141
where A is area of integration surrounding the point of interest. Equation [ 141 can be shown to be equal to
r r
As stated, if the reconstruction is on-resonance, then no phase accrues over the region of integration causing $,,(X, y ; Awo) = d I ( x , y ; AWO) and the above expression to be
A
kP
FIG. 2 . Graphical depiction of phase accrual from the center toward the edges of k space.

DEBLURRING FOR NON-2DFT MRI 325
at its minimum, zero. Also, if the reconstruction is off-resonance, then &(x, y ; Awo) # d ~ ( x , y ; Ao0) due to phase accrual and the above expression for the focusing criterion will be nonzero. So by examining this criterion over some small local area, the correct reconstruction frequency can be selected for each point in the image.
Both constant and low-frequency phase terms are removed in the above criterion. However, it may be possible to construct a criterion removing only a constant phase term. This can be done if phase is a function of local resonant frequency only, that is, the phase term is a constant for every object point at a particular frequency. Removal of this constant phase can be done by calculating the phase response of the excitation pulse and the phase accrual before the first sample for various receive frequencies. If the receiver is on-resonance for a particular point, then the entire signal should be in the real part; otherwise, some spatial frequencies will be out of phase.
For a better understanding of the implementation considerations, we examine the response of the criterion of Eq. [ 141 to a point object. Because the criterion is nonlinear in I( x, y ; AOO) the true response of the criterion is not a superposition of these curves; however, the general considerations can still be understood by examining this response. Figure 3 contains the response of the criterion to an point object for varying degrees of off-resonance with the idealized projection reconstruction system, as described. The criterion in this example uses an integration size of 5 X 5 and a = 1, and the off- resonance is normalized to units of 1 /( 27rT), where T is the length of the data ac- quisition window. In this figure, the minimum occurs on-resonance ( Ao0 = 0), which identifies the desired reconstruction frequency.
Since each frequency of reconstruction is essentially a sample point on this curve, these frequencies should be spaced closely enough so that at least one sample will always fall near to the minimum. We can also see from this figure that the value of the integral decreases as the reconstruction frequency gets far off-resonance. The range of frequencies to be examined, therefore, should be limited so the desired minima can be found in the presence of noise and other imperfections. Also, the presence of two overlying or nearby species with different chemical shifts will cause the desired min-
Normalized Off-Resonance
FIG. 3. Sample response of focusing criterion to varying degrees of off-resonance using a 5 X 5 region of integration.

326 NOLL ET AL.
1 Increment Frequency
t
Demodulate Raw Data
Reconstruct 0 Focusing Criterion
L t ( X . Y )
FIG. 4. Flow diagram for automatic debluning algorithm, where I ( x . y ; Aw,) is a base image modulated at Awz . S, (x, y ) is the focusing criterion for each base image, Iou,(x, y ) is the composite image, and Sbcs,(xr v ) is the best value of the focusing criterion.
imum to be corrupted. Conceptually, chemical shift can be viewed as a lateral shift of the above curve in Fig. 3 and, therefore, the minima for the two species will not align and the desired minimum may not be found. This, for example, can cause performance degradation when applied to parts of the body with lipids, so this technique should be used in combination with some form of lipid suppression or in parts of the body having few lipids, such as the lungs. Another consideration is selection of the integration area, A, which must be carefully chosen so that it is large enough to en- compass most of the blurred point spread function, large enough to be immune to noise, but small enough to track variations in the inhomogeneity.

DEBLURRING FOR NON-2DFT MRI 327
L
FIG. 5. Flow diagram for box labeled “Update Iout(x, y ) and S,,” in Fig. 4, where Aw,,~(.x, y ) is the map showing which frequencies best satisfy the focusing criterion.
The computing resources must also be considered in the implementation of the deblurring algorithm. To minimize the memory requirements of the computer pro- gram, the algorithm is implemented so that the base images never exist simultaneously in the computer’s memory. Here, a base image, I ( x , y ; Awi) , is reconstructed and the focusing measure:
is calculated, where A (x, y ) is the integration area centered at (x, y ) . Before calculating the next base image, the current best values of the focusing measure and the output image, Sbest(x, y ) and lout(x, y ) , respectively, are updated. A flow diagram of this processing algorithm is given in Fig. 4, with the box labeled “Update Zout(x, y ) and Sbest(x, y)” described in more detail in Fig. 5. The loop in Fig. 4 increments through reconstruction frequencies, Aui , until the final frequency, AwN, is reached where N is the number of frequencies examined. The loop in Fig. 5 increments through every point in the image. At the stage where the current best values of the focusing measure and the output image are updated, the value of the frequency that best satisfies the focusing criterion can be stored. This array of frequencies, Aw,,,( x, y ) , is essentially
328 NOLL ET AL.
\ PI /Chopped
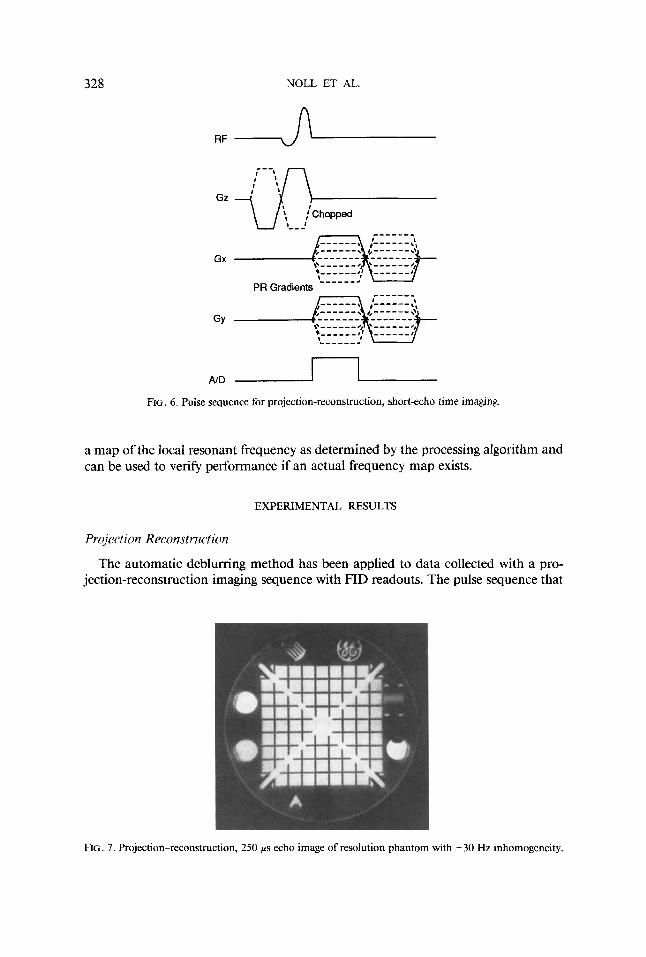
n FIG. 6. Pulse sequence for projection-reconstruction, short-echo time imaging.
a map of the local resonant frequency as determined by the processing algorithm and can be used to verify performance if an actual frequency map exists.
EXPERIMENTAL RESULTS
Projeclion R e c o ~ s ~ ~ c ~ ~ o n
The automatic debluning method has been applied to data collected with a pro- jection-reconstruction imaging sequence with FID readouts. The pulse sequence that
FIG. 7. Projection-reconstruction, 250 p s echo image of resolution phantom with k30 Hz inhomogeneity.

FIG. 8. (a) Projection-reconstruction image of resolution phantom with linearly varying inhomogeneity from f 200 to -400 Hz (a) before no deblumng and (b) after deblumng using base images reconstructed at 50 Hz intervals over a +200- to -400-Hz range. (c) Difference image of deblurred image and Fig. 7. Local resonant frequency map as determined (d) by the image deblumng algorithms and (e) by a frequency measuring protocol.
329

3 30 NOLL ET AL.
FIG. 9. Projection-reconstruction image of lungs (a) before image deblumng and ( b ) after deblumng using base images reconstructed at 50-Hz intervals over a t-250-Hz range.
was used for this study is found in Fig. 6. This sequence has two excitations using half-sinc excitation pulses that are “chopped” or combined to achieve the desired profile with no refocusing of the slice select gradient required (6). The readout gradients are vaned to trace out all of the required radial lines in k space. This, in conjunction with the FID readouts, allows echo times as short as 250 ps. These short echo times are useful for the imaging of short T2 species and flow. Additionally, projection re- construction sequences have excellent robustness to the effects of induced motion artifacts. The following images were acquired on a GE Signa 1.5-T system with shielded gradients, standard gradient amplifiers, and a 50-kHz bandwidth A I D filter.
The projection-reconstruction images shown here use 5 12 radial lines in k space with a usable acquisition window of T N 2 ms. The images are reconstructed using bilinear interpolation with 2D-FFT, each having 256 X 256 voxels over a 20-cm field of view (FOV). A reference image of a resolution phantom with a well-shimmed magnet (k30 Hz) and an echo time of 250 ps was acquired and is found in Fig. 7. For illustrative purposes, inhomogeneity is added to the system by modifying the x and y linear shim channels so that the new inhomogeneity is +200 to -400 Hz, and the resultant image is found in Fig. 8a. The homogeneity correction method was applied using base images reconstructed from data modulated at 50-Hz intervals from f200 to -400 Hz using a local area for integration of 7 X 7 pixels with a = 1. The homogeneity corrected image is found in Fig. 8b, and for comparison purposes, the image containing the difference of Fig. 8b and Fig. 7 is found in Fig. 8c. The difference image, which was windowed to 4 of the window level of the original image, shows very little loss of resolution, but does contain some low-frequency shading due to the off-resonance behavior of the half-sinc excitation pulse (6). Figures 8d and 8e contain maps of resonant frequencies as determined by the processing algorithm and by a field measurement protocol, respectively. These maps verify that in regions of the image where there is edge information, the deblurring algorithm correctly chooses the correct resonant frequency and in regions with no edge information and for which the recon- struction frequency has little effect on the image appearance of the image the algorithm chooses arbitrary frequencies.
This method was also applied to imaging of the lungs of a healthy volunteer using an ungated pulse sequence with a repetition time of 3 16 ms. Figure 9 contains images of the lungs over a 48-cm field-of-view before and after correction by the described

DEBLURRING FOR NON-2DFT MRI 33 1
RF
N D 2 L FIG. 10. Pulse sequence for spiral-scan imaging using the spectral-spatial selective excitation pulse.
method. Blur has been reduced for the fine structure and vessels in the posterior portion of the lungs where there are large susceptibility shifts.
Spiral Fast Scan The homogeneity correction algorithm has also been applied to spiral trajectory
fast scanning using a gridding reconstruction (29 ) . This imaging sequence uses only eight interleaves with no averaging in a cardiac-gated image of the abdomen. The pulse sequence is found in Fig. 10 and uses a simultaneously spectrally and spatially selective excitation pulse (30) for slice and water component selection. The readout window is T = 41 ms and the effective matrix of the reconstructed image is 190 X 190 over a 36-cm FOV.
FIG. 11. Spiral-scan image of the abdomen ( a ) before and ( b ) after deblumng using base images recon- structed at 5-Hz intervals over a k 5 0 - H ~ range.

332 NOLL ET AL.
Images of the abdomen before and after debluning by the above method are found in Fig. 1 1. Blur reduction occurs near the major vessels and the spine as well as other areas in the abdomen. The debluning method was implemented by modulating the data in 5-Hz increments over a f 5 0 - H ~ range of frequencies using an area of integration of 21 X 21 pixels with Q: = 0.5.
Algorithmic Parameters
For each of the imaging methods, the parameters associated with the deblumng algorithm were chosen empirically in conjunction with knowledge of the expected properties of the off-resonance function. These parameters include the integration area, frequency step size and range, and the parameter a. Once chosen, the parameters worked well for most images acquired using the same imaging pulse sequence. Knowl- edge of the expected properties of the off-resonance function was utilized primarily in selecting the integration area, A , and the frequency range examined. In the lungs, for example, the main source of off-resonance is susceptibility, which tends to vary rapidly, dictating a smaller area of integration than images from the abdomen where slowly varying inhomogeneity dominates. Frequency ranges for the in vivo images where selected to encompass typical values for susceptibility shifts in the lungs (31) and observed typical values of inhomogeneity the abdomen.
SUMMARY
Non-2D Fourier transform imaging methods can be useful for several applications including imaging of short T2 species, flow or parts of the body having large suscep- tibility dephasing, and also for fast imaging. These methods typically involve k-space trajectories that begin in the center and move outward in some fashion and have excellent motion and flow properties. However, if the reconstruction is off-resonance, these imaging methods exhibit image blumng. In the above described method, this blur is removed by automatic processing algorithms and does not require the use of a map of the local resonant frequencies. In this method, a series of base images are reconstructed after modulating the raw data to different frequencies. In each of these base images a focusing measure is calculated to determine what regions are in focus and what regions are blurred. Finally, an unblurred composite image is created using only the unblurred regions of the base images. This method has successfully been applied to phantom and in vivo images for projection-reconstruction and spiral tra- jectory imaging methods.
ACKNOWLEDGMENTS
We gratefully acknowledge the support fmm the National Institutes of Health under Grants HL34962, HL39478, HL39297, and CA50948 and GE Medical Systems Group under Contract No. 22-84. We also thank Dr. Colleen Bergin of the Department of Radiology, Stanford University School of Medicine, for her help in imaging of the lungs.
REFERENCES
I . A. KUMAR, D. WELTI, AND R. R. ERNST, J. Mugn. Res. 18,69 ( 1975). 2. W. A. EDELSTEIN, J. M. S. HUTCHISON, G. JOHNSON, AND T. REDPATH, Phys. Med. Bid. 25, 751
(1980).

DEBLURRING FOR NON-2DFT MRI 333
3. M. ODONNELL AND W. A. EDELSTEIN, Med. Phys. 12,20 ( 1985). 4. P. C. LALITERBUR, Nature 242, 190 (1973). 5. J. I. JACKSON, C. H. MEYER, AND A. MACOVSKI, “Proceedings, 9th Annu. Mtg. SOC. Magn. Reson.
6. J. M. PAULY, S. M. CONOLLY, D. G. NISHIMURA, AND A. MACOVSKI, “Proceedings, 8th Annu. Mtg.
7. C. J. BERGIN, J. M. PAULY, AND A. MACOVSKI, Radiology 179,777 ( 1991 ). 8. D. G. NISHIMURA, J. M. PAULY, AND A. MACOVSKI, Magn. Reson. Imaging S-Sl, 107 ( 1990). 9. C. B. AHN, J. H. KIM, AND Z. H. CHO, IEEE Trans. Med. Imaging MI-5, 2 ( 1986).
Med., 1990,” p. 428.
SOC. Magn. Reson. Med., 1989,” p. 28.
10. C. H. MEYER AND A. MACOVSIU, “Proceedings, 6th Annu. Mtg. SOC. Magn. Reson. Med., 1987,” p.
11. E. YUDILEVICH AND H. STARK, IEEE Trans. Med. Imaging MI-6,337 (1987). 12. R. N. BRACEWELL, “The Fourier Transform and its Applications,” 2nd ed, McGraw-Hill, New York,
13. A. MAEDA, K. SANO, AND T. YOKOYAMA, IEEE Trans. Med. Imaging M1-7,26 ( 1988). 14. D. C. NOLL, C. H. MEYER, J. M. PAULY, D. G. NISHIMURA, AND A. MAC~VSKI, J. Magn. Reson.
15. I. SHENBERG AND A. MACDVSKI, IEEE Trans. Med. Imaging MI-4, 165 (1985). 16. S. J. NORTON, IEEE Trans. Med. Imaging MM, 21 ( 1987). 17. H. W. PARK, Y. H. KIM, AND Z. H. CHO, Magn. Reson. Med. 7,340 ( 1988). 18. E. SCHNEIDERAND G. H. GLOVER, Magn. Reson. Med. 18,335 (1991). 19. P. G. WEBB AND A. MACOVSKI, Magn. Reson. Med. 20, 113 ( 1991 ). 20. R. E. SEPFQNEN, Magn. Reson. Imag. 3, 163 ( 1985). 21. K. SEKIHARA, S. MATSUI, AND H. KOHNO, IEEE Trans. Med. Imaging MIA, 193 (1985). 22. R. A. MULLER AND A. BUFFINGTON, J. Optical SOC. ‘4m. 64( 9), 1200 ( 1974). 23. A. BUFFMGTON, F. S. CRAWFORD, S. M. POLLAINE, C. D. ORTH, AND R. A. MULLER, Science 200( 434 1 1,
24. K. HANMA, M. MASUDA, H. NABEYAMA, AND Y. SAITO, IEEE Trans. Consumer Electronics CE-
25. H. TOYODA, S. NISHIKAWA, Y. KITAMURA, AND M. ONISHI, IEEE Trans. Consumer Electronics CF.-
26. G. TRAHEY, D. XHOA, J. A. MIGLIN, AND S. W. SMITH, IEEE Trans. Ultrasonics, Ferroelecirics, and
27. G. TRAHEY AND D. XHOA, “Medical Imaging IV: Image Formation” (R. H. Schneider, Ed.), Vol.
28. M. A. BERNSTEIN, D. M. THOMASSON, AND W. H. PERMAN, Med. Phys. 16(5), 813 (1989). 29. C. H. MEYER, A. MACOVSKI, AND D. G. NISHIMURA, “Proceedings 9th Annu. Mtg. SOC. Magn. Reson.
30. C. H. MEYER, J. M. PAULY, A. MACOVSKI, AND D. G. NISHIMURA, Magn. Reson. Med. 15,287 ( 1990). 31. C. J . BERGIN, G. H. GLOVER, AND J. M. PAULY, Radiology 180,845 ( 1991).
230.
1978.
Imaging 1(2), 238 (1991).
489 (1978).
29(3), 376 (1983).
32(3), 312 (1986).
Frequency Control 37(5), 418 (1990).
123 1, p. 40. Proceedings, SPIE, 1990.
Med., 1990,” p. 403.


