Embed Size (px)
Citation preview
The
Prepared by
Miguel Malta, Team Leader
Cristina Murphy, International Consultant
Raul Mendes, National Consultant (Fieldwork)
Rui Barbosa, National Consultant (Fieldwork)
Juan Sebastian Rodriguez, Research Assistant
Carolina Murgueitio, Quality Assurance
Decentralized Evaluation
Midterm Evaluation of McGovern-Dole Funded
School Feeding Project in Guinea-Bissau
(January 2016 - June 2018)
Dec
entr
alize
d e
valu
ati
on
fo
r ev
iden
ce-b
ase
d d
ecis
ion
ma
kin
g
March 2020
Guinea-Bissau Country office
Evaluation Manager: Elber Nosolini
Evaluation Report Version January 2019 i | P a g e
Acknowledgments
This Mid-term Evaluation would not have been possible without the help of the
beneficiaries of the project, namely the students (girls and boys), the headmasters,
teachers, cooks, members of the local communities and parent’s association,
inspectors and regional education focal points. It would also not be possible without
the help of the Ministry of Education (Direcção-Geral dos Assuntos Sociais e Cantinas
Escolares), the regional government of Biombo and other institutional partners are
directly or indirectly involved in the project as well as other regional governments,
national and international NGOs and UN agencies. Furthermore, this work would not
be possible without the help of the two national consultants, Raul Mendes Fernandes,
and Rui Daniel Barbosa de Andrade. Their experience and knowledge surrounding local
context were absolutely essential. The Evaluation Team is grateful to all the personnel
of the World Food Programme - Country Office in Guinea-Bissau, for their patience and
support given during the field mission. It was a real pleasure to work with all of them.
Many thanks to Ana Rosa Ortigoza for format editing and Steven Rozowicz for language
revision.
Disclaimer
The opinions expressed in this report are those of the Evaluation Team and do not
necessarily reflect those of the World Food Programme. Responsibility for the opinions
expressed in this report rest solely with the authors. Publication of this document does
not imply endorsement by WFP of the opinions expressed.
The designation employed and the presentation of material within the maps do
absolutely not imply any opinion on the part of WFP concerning the legal or
constitutional status of any country, territory or sea area. Nor does do they imply any
opinion concerning the delimitation of frontiers.
Evaluation Report Version January 2019 ii | P a g e
Table of Contents
Acknowledgments ................................................................................................................... i
Disclaimer ................................................................................................................................ i
Executive Summary ............................................................................................................... 1
Context ................................................................................................................................ 1
Methodology ....................................................................................................................... 2
Key Findings ........................................................................................................................ 2
Impact .................................................................................................................................. 3
Sustainability ....................................................................................................................... 4
Overall conclusions ............................................................................................................ 4
Recommendations ............................................................................................................. 5
1. Introduction .................................................................................................................... 1
Overview of the Evaluation Subject ........................................................................... 1
Context ......................................................................................................................... 4
Evaluation Methodology and Limitations ................................................................. 6
2. Evaluation Findings ........................................................................................................ 9
Relevance ............................................................................................................................ 9
Is the project’s strategy relevant to the needs of the beneficiaries? ..................... 9
Is the project aligned with the national government’s education and school
feeding policies and strategies? ...................................................................................... 14
Does the project complement other donor-funded, government initiatives? .... 14
Effectiveness and Efficiency ............................................................................................ 15
What is the progress of project implementation – is the project on track to carry
out all activities as planned? ........................................................................................... 15
To what degree have or have not the interventions resulted or not resulted in the
expected results and outcomes? In particular, to what extent did providing THR result
in increased attendance and enrollment of girl students? .......................................... 20
Is hunger reduced? ................................................................................................... 21
How can the theory of change be altered to increase efficiency and effectiveness?
Did assistance reach the right beneficiaries in the right quantity and quality at the
right time? ......................................................................................................................... 22
Impact ................................................................................................................................ 22
To what degree has the project made progress toward the results at the project-
level framework? .............................................................................................................. 23
Evaluation Report Version January 2019 iii | P a g e
Have there been any unintended outcomes, either positive or negative? ......... 31
What internal and external factors affected the project’s achievements of
intended results?Sub-question 2.10.1 Was the project implemented according to the
plan? If not, how did this affect the implementation of the project and in what
manner? ............................................................................................................................ 33
Sustainability ..................................................................................................................... 34
Are the school meal programmes sustainable, including a strategy for
sustainability; sound policy; stable funding; quality programme design; institutional
arrangements; local production and sourcing; partnership and coordination;
community participation and ownership? ..................................................................... 34
What substantive progress has the government made toward developing a
nationally owned school feeding programme? ............................................................. 40
How are local communities involved and contributing to school feeding? ...... 42
What needs remain in order to achieve a full handover and nationally-owned
school feeding programme? ........................................................................................... 43
3. Conclusions and Recommendations .......................................................................... 46
Relevance .......................................................................................................................... 46
Effectiveness and Efficiency ............................................................................................ 46
Impact ................................................................................................................................ 47
Sustainability ..................................................................................................................... 48
Overall Assessment and Conclusions ............................................................................ 49
Recommendations .................................................................................................... 51
Annex 1 - Map of the schools’ locations assisted by McGovern-Dole-Funded School
Feeding Project/WFP which were visited by the Evaluation Team in Guinea-Bissau .... 55
Annex 2 – Mc Govern-Dole- Funded School Feeding Project in Guinea-Bissau Factsheet
............................................................................................................................................... 56
Annex 3 - Reconstruction of the Logframe of the Mc Govern-Dole- Funded School
Feeding Project ..................................................................................................................... 57
Annex 4 - Evaluation Matrix ................................................................................................ 60
Annex 5 - Interviewed Stakeholders .................................................................................. 70
Annex 6 - Data Collection Tools .......................................................................................... 73
Annex 7 - Impact .................................................................................................................. 86
Annex 8 – Sustainability .................................................................................................... 107
Annex 9 - Nutrition............................................................................................................. 120
Annex 10 - Terms of Reference ........................................................................................ 125
Evaluation Report Version January 2019 iv | P a g e
Annex 11 - Documents Reviewed ..................................................................................... 151
Annex 12 – Documents gathered ..................................................................................... 160
Annex 13 - Blibliography ................................................................................................... 172
Annex 14 - Acronym........................................................................................................... 173
Annex 15. Map of the Intervention .................................................................................. 177
Annex 16. School Feeding Midterm Survey, 2018 .......................................................... 178
Annex 16.1 - Results of School Feeding Midterm Survey, 2018. ................................... 187
Annex 17. Questionário Escolar ....................................................................................... 265
Evaluation Report Version January 2019 v | P a g e
List of Tables
Table 1.1 - MGD-WFP SFP in Guinea-Bissau Factsheet ...................................................... 2
Table 1.2 - Food Distributed.................................................................................................. 3
Table 1.3 - Children Benefited by Food Distribution .......................................................... 3
Table 2.1 - Performance indicators: number of school-aged children (male, female,
total) receiving daily school meals ..................................................................................... 15
Table 2.2 - Performance indicators: number of girls (Grades 4-6) that receive all three
annual take-home ration distributions based on the attendance of 80 percent or better
and number of take-home rations provided .................................................................... 16
Table 2.3 - Performance indicators: number of kitchens constructed/rehabilitated,
number of fuel-efficient stoves provided and rehabilitated and number of schools with
improved storage equipment and food preparation tools ............................................ 17
Table 2.4 - Performance indicators: number of SMC members and cooks trained in food
preparation and storage and number of teachers, directors, and inspectors (male,
female and total) trained in food management and storage .......................................... 18
Table 2.5 - Enrolment change compared to the previous school year. Mean enrolment
for all applicable school levels and change between 2017 and 2018, according to the
school year and gender. School Feeding Midterm Survey, Guinea-Bissau, 2018 ......... 24
Table 2.6 - Percentage of students who ate a meal before and after schools, results of
School Feeding Baseline and Midterm surveys Guinea-Bissau (2016 and 2018) .......... 26
Table 2.7 - Nutritional content of one school meal *only considering food items
acquired by the project ....................................................................................................... 28
Table 2.8 - Improvements in school structures of the McGovern-Dole-Funded School
Feeding Project assisted schools, from 2016 to 2018 (percentage). .............................. 41
List of Figures
Figure 2.1 - Attendance of school children grade 4, School Feeding Midterm Survey
(2018)..................................................................................................................................... 25
Figure 2.2 - Profile of households and dietary diversity according to results in Food
Consumption Score in WFP and schools unassisted by the WFP (School Feeding
Midterm Survey, 2018 ......................................................................................................... 28
Evaluation Report Version January 2019 vi | P a g e
Evaluation Report Version Dic 2018 1 | P a g e
Executive Summary
1. This report presents the results of the Mid-term Evaluation of the McGovern-Dole
Funded School Feeding Project in Guinea-Bissau (March 2016 - July 2019). This
evaluation was commissioned by the World Food Programme (WFP) Guinea-Bissau
Country Office (CO) and covers the period from August 2017 (preparation phase) to July
2019 (final evaluation report). The present report corresponds to the Midterm
Evaluation. As stated in the Terms of Reference (ToR), a baseline study conducted
before the start of the project provided a situational analysis and allowed WFP to
establish indicator baseline information. It also verified the targets established in the
Project Agreement. This evaluation aims at allowing the WFP to monitor the progress
of the indicators established based on the results of the Baseline Study. WFP and its
project partners will use the Midterm Evaluation results to adjust course where needed
for the remainder of the project’s term. Therefore, this evaluation is intended to
improve the programme performance and to produce lessons for its current and future
implementation. The Midterm Evaluation uses five evaluation criteria; relevance,
effectiveness, efficiency, impact, and sustainability.
2. The project is the result of an agreement that established the allocation of USD 20
million distributed in three installments. These donations were aimed at supporting the
activities established in Guinea Bissau’s Country Programme, which are carried out by
the WFP.
3. WFP used this contribution to implement the following activities: provide school meals;
provide take-home rations; train school management committees, parent associations,
headmasters, and inspectors; build or rehabilitate school kitchens and storerooms;
provide storage, food preparation equipment, tools and eating utensils; distribute
deworming medication(s); and support the school feeding monitoring and evaluation
system.
4. The Midterm Evaluation has two complementary and reinforcing goals, which are
accountability, and learning. It was carried out by using a sample of 30 schools from all
eight targeted geographic regions of Guinea-Bissau (see Annex 1 for locations),
secondary data from project reports and a midterm, school feeding survey.
5. The Midterm Evaluation: (1) reviews the project’s relevance, effectiveness, efficiency,
impact, and sustainability; (2) collects performance indicator data; (3) assesses whether
or not the project is on track to meet results and targets; (4) reviews the result
framework and the theory of change; and (5) identifies any necessary mid-course
corrections. The evaluation relies on the Baseline Study for baseline data and
situational analysis necessary to evaluate the project at interim.
6. The primary users of this evaluation are the WFP Guinea-Bissau CO and its partners in
decision-making, namely the Ministry of Education of Guinéa-Bissau, the WFP Regional
Bureau (RB), and the Office of Evaluation (OEV) Headquarters.
Context
7. Guinea-Bissau is a coastal, West African country, which has a population of 1.7 million
people, 50% of whom were under 18 years old in 2014. The country occupies 36,000 km2,
which includes many islands1.
8. The illiteracy rate was 54.4% in 20162. Twenty-seven and a half percent of children over
five years of age have high levels of stunting3. In general, malnutrition levels are high.
Twenty-nine percent of boys and twenty-six percent of girls suffer from this condition4.
1 Source: Country Programme Guinea-Bissau 200846 (2016–2020). (2016). World Food Programme 2 Source: UNDP, 2018 3 Source: Unicef Annual Report 2016. (2016). Unicef (pag19) 4 Source:GUINEA-BISSAU INTERIM COUNTRY STRATEGIC PLAN 2018-2019
Evaluation Report Version Dic 2018 2 | P a g e
Although child mortality rates have been slowly decreasing, malnutrition still contributes
to 45% of deaths of children under five years of age5.
9. Guinea-Bissau has extraordinary growth potential due to its abundant agricultural,
forestry, and fishery resources, in addition to its strategic location.
Methodology
10. For data collection methods and tools, a mixed-methods approach was implemented.
Primary data was collected from stakeholders using inquiry techniques such as
questionnaires, interviews, and on-site observation. The quantitative approach used a
non-experimental method. The data was collected by using questionnaires of midterm
school feeding surveys in 60 schools in six regions of Guinea-Bissau. Thirty schools
subject to the WFP project intervention and a control group of 30 other schools were
given the questionnaire. To assess progress and results, the midterm school feeding
survey was created with the same baseline questionnaire as the school feeding survey.
Additionally, WFP reports were also used for triangulation with other sources of data.
11. The qualitative approach was based on semi-structured interviews and group
interviews during the fieldwork evaluation. These interviews were held in 30 project
supported schools located in eight regions of Guinea-Bissau. In Bissau, the team
interviewed the WFP team involved in project management, officers of the Ministry of
Education, Ministry of Agriculture, other government institutions, national and
international non-governmental organizations (NGOs), and representatives of United
Nations agencies such as the UNDP, World Bank (WB), UNICEF, and the World Health
Organization (WHO). Additionally, the team gathered secondary data from databases,
reports, surveys, web resources, and other existing documented sources. The results
of the midterm school feeding survey were also collected6.
12. Some limitations were encountered during fieldwork, such as unreliable road access
and diverse language use. Nevertheless, measures were taken to mitigate these
barriers as much as possible.
Key Findings
Relevance
13. The McGovern-Dole funded school feeding project’s strategy is relevant to the needs
of the beneficiaries, both boys and girls. School meals and Take-Home Rations (THR)
promote school attendance and help children avoid dropping out of school. THRs
decreased the burden of feeding families and contributed to higher school attendance
for girls, especially during the cashew campaign.
14. There is also a general perception among schools and the Ministry of Education (MoE)
staff that the number of students in schools supported by WFP is increasing. During a
minimum of nine months of the year, a large part of the students’ nutritional needs are
provided for by school meals and THRs. However, a greater diversification of meals is
suggested.
15. School meals and THRs help families to feed their children, which particularly benefit
girls and reduce short-term hunger. The project promoted compromise between the
community and schools. Ownership and participation by men and women of local
communities, including parents of school children, were promoted by the project.
5 Source: Unicef Annual Report 2016. (2016). Unicef 6 Annex 15 presents the mid-term school feeding survey and its results
Evaluation Report Version Dic 2018 3 | P a g e
16. The project is aligned with educational policies and strategies of the government of
Guinea-Bissau.
Effectiveness and Efficiency
17. The project has been successful in implementing the school meal programme in
schools, and in reaching its intended targets, per plan. Boys and girls equally share the
benefits of the School Feeding (SF) project. However, the project framework includes
multiple outcomes without activities planned. It is not clear how and in what frequency
the project is expected to contribute to its target. Participants of the project have high
levels of satisfaction.
18. As evidenced by the evaluation, the project is well underway. In March 2018, the target
for the number of school-age children receiving daily school meals (during 2017-2018)
was met and exceeded the expected outcomes. The target for females who were
supposed to receive all three annual THRs between fourth and six grade was achieved
and surpassed in 2017 (16,323). The target was 16,320 with an attendance of 80% or
higher. Targets defined for the number of kitchens and stoves constructed or renovated
were met in 2018. However, kindergartens located outside the school perimeter but in
the vicinity of these schools did not meet the targets
19. The target for the number of schools with improved storage equipment and an
increase in food preparation tools was achieved in 2017, but not met in 2018. The
targets defined for 2017 and 2018 for the number of School Management Committees
(SMCs), cooks and teachers trained were not achieved. In 2017, the targets for the
distribution of deworming medication were partially met with 63.6% of the intended
distribution occuring.
20. The migration of students to WFP assisted schools may have negatively impacted the
distribution of school meals and take-home rations. Some schools reported a reduction
of the portion size, which was adjusted due to the increased number of students.
21. The community participated in school management committees by donating firewood
and time to cook. The project developed sensitization campaigns and training aimed at
empowering the local community in decision-making in SF and how to oversee its
activities.
22. Results of both training in food preparation and storage practices were undermined by
a a high turnover of participants in school committees. There were delays caused by
school members having difficulties in performing their roles in implementing and
reporting activities as well as poor information being given on school feedings. There
were also problems in the quality of information being disseminated about SF.
23. School kitchens in Guinea-Bissau are very rudimentary and, in some cases, unsafe.
They are susceptible to fires. Energy saving stoves need to be reassessed because they
do not substantially improve the working conditions of the school cooks, nor do they
positively contribute to their health.
24. The migration of students to WFP assisted schools, due to a perception of injustice and
exclusion, might have negatively impacted the management of SF activities. The
increased number of new students is not always reflected in the WFP food delivery plan
given to the school.
Impact
25. Stakeholders who were interviewed, acknowledged the positive results of the project
on education and on the enhanced well-being of the community. The community
Evaluation Report Version Dic 2018 4 | P a g e
participates in the project and greatly appreciates its results. They reported that it
contributed to better lives for students and the local community. As stated before, there
was a slight increase between baseline and midterm with no statistically significance,
therefore this evaluation at the midterm stage could not prove an impact was made on
attendance and enrollment rates of students as a result of SF. On the other hand it is
worth to mention that both enrollment and attendance indicators were already high at
baseline, thus very difficult to increase in the short term.Regardless, qualitative data
indicated increased attendance of students in WFP assisted schools, and on their levels
of participation in classes.
26. The project potentially contributed to better beneficiary nutrition and health levels.
School meals and THRs represent a financial benefit for households in low socio-
economic brackets Many students go to class hungry, and many students do not have
a meal at home when returning from classes.
27. Results of the midterm survey did not show an improvement in the quality of diet in
households who had students receiving assistance from the WFP. Qualitative data
suggests an increased awareness of the health benefits of diet diversification among
students, cooks, teachers, and students. Additionally, school meals and THRs are
important financial contributions to the poorest families.
28. Two positive, unintended effects found as a result of the project’s activities were an
increase in the awareness of girls from local communities to enroll in schools, and the
greater availability of school inspectors to non WFP assisted schools.
Sustainability
29. An intended result of the project was an improved policy and regulatory framework,
even though no activity was planned to achieve this outcome. An initial step for a
nationally owned SF programme in Guinea-Bissau would be the approval of the School
Canteen Law. The draft of the bill was updated in 2018 with the support of the WFP.
However, it was waiting to be reviewed by the Council of Ministers and receive further
Parliament approval.
30. Although most foodstuff used in school meals is imported, the project along with a
local NGO, is supporting a SF pilot programme to test local procurement measures for
school canteens. This pilot programme prioritizes female farmers and is committed to
developing their knowledge of nutrition, literacy, and business skills.
31. The project relies on a partnership with NGOs for activities such as improving school
structures for SF, monitoring activities, and sensitizing and training the local community
and school staff. In general, the partnership with NGOs adds value to project
implementation.
32. A successful transition to the nationally owned SF programme of Guinea-Bissau will
require increasing inter-sectoral coordination and strengthening the capacity of locally
procured foods.
Overall conclusions
33. In the midterm of its development, most of the targets defined for the McGovern-Dole
funded school feeding project for 2017 and 2018 are met or almost met. Some have
even exceeded desired targets.
34. The project’s strategy is relevant to the needs of the beneficiaries. School meals and
THRs promote attendance and help students to avoid dropping out. THRs decrease the
burden of feeding families and contribute to the attendance of female students. The
Evaluation Report Version Dic 2018 5 | P a g e
delivery of school meals and take-home rations positively impacts the nutrition of
students.
35. School meals are well accepted by the students and, together with the THRs, help to
decrease the burden of feeding families. However, the diversification of products and
the inclusion of locally produced fresh vegetables in meals is requested by the
beneficiaries.
36. Around half of the schools in Guinea-Bissau are being supported by the McGovern-
Dole-Funded SF project. An observed, unintended effect of the project is the migration
of students to assisted schools.
37. As a result of the project, school kitchens, stoves, and storage rooms were built or
restored, increasing the existing capacity of the local government to implement a
national School Feeding Programme (SFP) further.
38. Despite the pilot project managed by MoE in Biombo, there were not proper conditions
for a nationally owned SFP prior to the approval of the National School Feeding Law,
nor was there a provision for this specific purpose in the annual national budgets.
Recommendations
39. Based on the evaluations and conclusions, there are ten plausible recommendations:
1 Diversify school meals and promote nutrition by purchasing local food from local
farmers, establishing school gardens, constructing school fences with edible plants,
and developing agroforestry nurseries that can supply home gardens. 1st priority
2 Improve kitchen infrastructure and working standards of school cooks by assessing
the overall conditions of school kitchens, designing one or more models of kitchen
to be used, improving the model of the stoves, and introducing uniforms and
compensation for school cooks. 1st priority
3 Expand school meals to kindergartens and assist kindergartners located in the same
community. 1st priority 3rd priority
4 Provide healthcare workers trained in nutrition to assist schools. Introduce
healthcare workers trained in nutrition at the local level. Provide nutrition advice on
school menus. Assist teachers in nutritional education activities. Train and/or advise
school cooks on food safety. 3rd priority
5 Rethink the system for delivering monthly monitoring reports. Develop a pilot
monitoring project using the internet or an SMS based system and organize training
for those involved. 1st priority
6 Map the work of organizations working within the education system in Guinea-Bissau
for better coordination by proposing the creation of a thematic group in school
canteens within the Local Education Group (LEG). Use simple internet participatory
tools to map. 3rd priority
7 Expand the involvement of civil society organizations (CSOs) in the project to other
regions. Monitor activities and transportation of food for the islands. 2nd priority
8 Clearly state the role of the project in promoting the quality of teaching and follow
up with the results. Include information about this issue in regular project reports.
1st priority
9 Create a multi-staffed school feeding unit by increasing the number of staff to be
trained. 3rd priority
10 Closely monitor the number of students enrolled in assisted schools and use
updated figures to plan the food distribution. Use updated figures for better
planning of food distribution. 1st priority
Evaluation Report Version Dic 2018 1 | P a g e
1. Introduction
40. The midterm evaluation of the McGovern-Dole (MGD) International Food for Education
and Child Nutrition Programme project (FFE-657-2015/019-00), implemented by the WFP
in Guinea-Bissau, aims to help the WFP and its partners to assess progress in
implementation and to ensure the project is on track to meet its goals. It also aims to
assess the relevance of the interventions, to provide an early sign of the effectiveness of
the interventions, to assess sustainability efforts to date, to discuss and recommend mid-
course corrections, to document lessons learned and to review the results, framework,
and assumptions.
41. The timing of the evaluation coincides with the implementation of the WFP Guinea-
Bissau Transitional Interim Country Strategic Plan (TI-CSP) which took place between
January 2018 and June 2019, and the design of the Country Strategic Plan (CSP). Results
of the assessment can contribute to better future implementation and design.
42. WFP and the government of Guinea-Bissau will use conclusions and suggestions made
by the evaluation team (ET) as inputs to develop a SFP and Monitoring and Evaluation
system (M&E) enhanced by supporting laws, budgets, and increased capacity. Finally,
the evaluation has two complementary and reinforcing goals. They are the following:
● Accountability - The evaluation must account for the activities carried out by the WFP
and the outputs and outcomes reached in accordance with the initial framework which
was agreed upon between the United States Department of Agriculture (USDA) and the
WFP.
• Learning - The ET have been commissioned to analyze the internal and external
(contextual) factors that have positively or negatively influenced the execution of the
proposed activities and how these factors contribute to reaching the expected outcomes.
The present midterm evaluation aims to draw lessons and identify good practices that
may be extended in what follows the implementation and other operations. The lessons
presented are based on evidence that supports them and allows them to make realistic
and strategic decisions.
• Coverage - The evaluation covers all of the activities established in the agreement
between the USDA and the WFP in eight regions of Guinea-Bissau which were
implemented between 2016 and 2018. This was done by conducting statistically
significant samples in each location.
43. The evaluation is of direct interest to the internal and external programme stakeholders.
It should be used by the WFP CO in Guinea-Bissau and its local implementation partners
to correct, improve, or maintain implementation actions and strategies in the present
object of the evaluation or future operations.
44. The results can be used by the government of Guinea-Bissau to design and implement
assertive country-wide interventions related to SF. The USDA is expected to use the
present evaluation. The USDA may extract lessons for other funded programmes and
supervise the use of its resources.
Overview of the Evaluation Subject
45. Agreement FFE-657-205/019-00, was signed in December 2015 between the Foreign
Agriculture Service (FAS), the USDA, and the WFP under the McGovern-Dole International
Food for Education and Child Nutrition Programme. This agreement established the
allocation of USD 20 million, which was distributed over three periods, shown in Table
Evaluation Report Version Dic 2018 2 | P a g e
1.1. These donations were aimed at supporting the activities established in Guinea
Bissau’s Country Programme (CP, carried out by WFP. Although aligned with the CP’s
logic framework, the agreement established its own set of activities, outputs, and
strategic objectives. In collaboration with the WFP, implementation activities should
benefit children and schools in eight regions of the country and must contribute to
capacity building at the local, regional, and national levels.
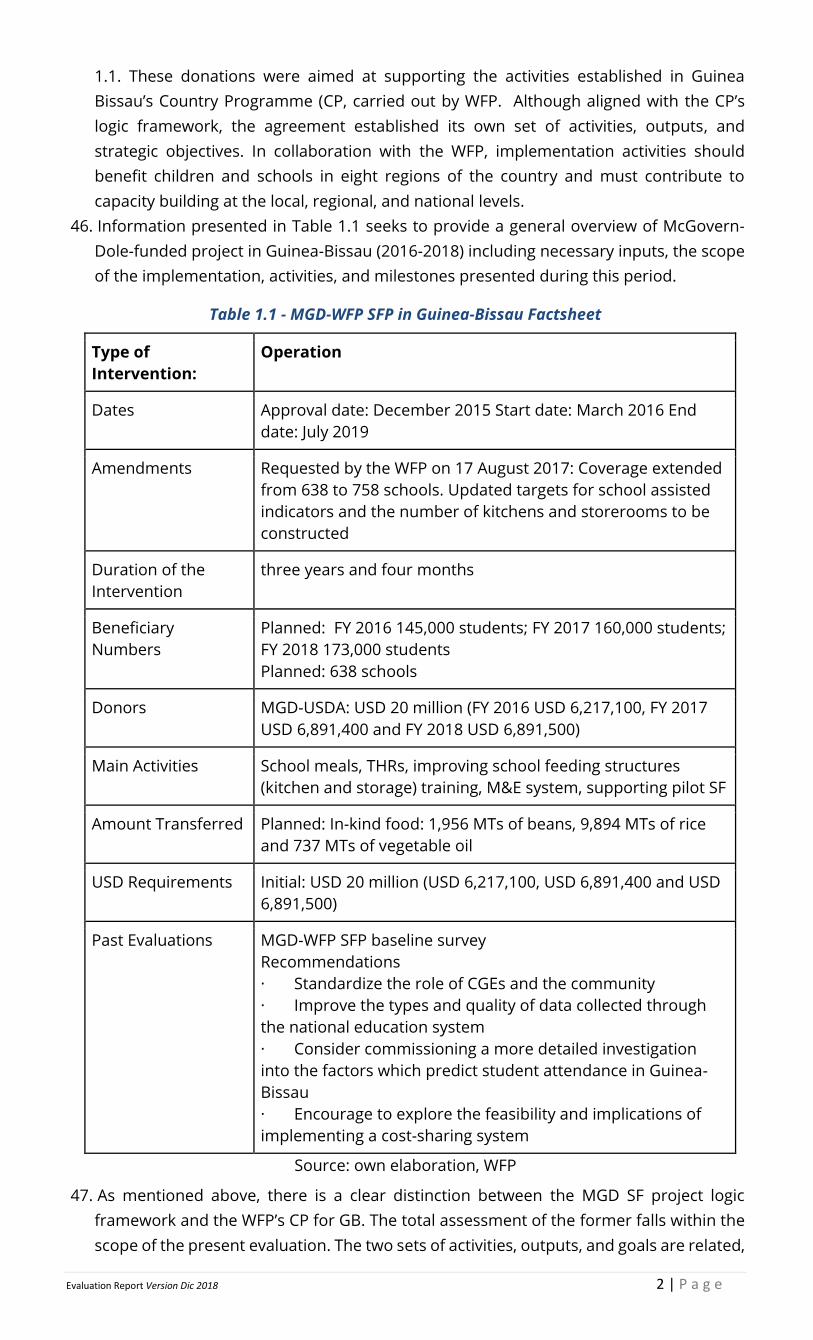
46. Information presented in Table 1.1 seeks to provide a general overview of McGovern-
Dole-funded project in Guinea-Bissau (2016-2018) including necessary inputs, the scope
of the implementation, activities, and milestones presented during this period.
Table 1.1 - MGD-WFP SFP in Guinea-Bissau Factsheet
Type of
Intervention:
Operation
Dates Approval date: December 2015 Start date: March 2016 End
date: July 2019
Amendments Requested by the WFP on 17 August 2017: Coverage extended
from 638 to 758 schools. Updated targets for school assisted
indicators and the number of kitchens and storerooms to be
constructed
Duration of the
Intervention
three years and four months
Beneficiary
Numbers
Planned: FY 2016 145,000 students; FY 2017 160,000 students;
FY 2018 173,000 students
Planned: 638 schools
Donors MGD-USDA: USD 20 million (FY 2016 USD 6,217,100, FY 2017
USD 6,891,400 and FY 2018 USD 6,891,500)
Main Activities School meals, THRs, improving school feeding structures
(kitchen and storage) training, M&E system, supporting pilot SF
Amount Transferred Planned: In-kind food: 1,956 MTs of beans, 9,894 MTs of rice
and 737 MTs of vegetable oil
USD Requirements Initial: USD 20 million (USD 6,217,100, USD 6,891,400 and USD
6,891,500)
Past Evaluations MGD-WFP SFP baseline survey
Recommendations
· Standardize the role of CGEs and the community
· Improve the types and quality of data collected through
the national education system
· Consider commissioning a more detailed investigation
into the factors which predict student attendance in Guinea-
Bissau
· Encourage to explore the feasibility and implications of
implementing a cost-sharing system
Source: own elaboration, WFP
47. As mentioned above, there is a clear distinction between the MGD SF project logic
framework and the WFP’s CP for GB. The total assessment of the former falls within the
scope of the present evaluation. The two sets of activities, outputs, and goals are related,
Evaluation Report Version Dic 2018 3 | P a g e
given the status of the WFP as the implementation partner of USDA’s expected activities.
The analysis of the MGD SF project logic framework and its relationship with the CP
(20046) and T-ICSP is presented below.
48. MGD SF has established two strategic objectives (SO). SO1 is the improved literacy of
school-aged children, and SO2 is the increased use of health and dietary practices.
49. The MGD SO1 and SO2 are integrated within the second component of WFP CP (2016-
2020), which tries to improve access to education and to support the government in
implementing a sustainable school meal programme. The MGD SO1 and SO2 are
included in Strategic Outcome 1 of the T-ICSP, which is that school-aged children in
Guinea-Bissau have adequate access to safe and nutritious food year-round. This
contributes to the achievement of the WFP Strategic Result 1; everyone has access to
food7.
50. Activities of the programme can be seen in Annex 3. As observed in the Guinea-Bissau
MGD project framework, the planned activities aim at two of the three intended
outcomes8 under SO1, improved literacy of school-age children; however the
programme addresses most of SO2, i.e increased use of health and dietary practices.
51. Expected outputs and activities are planned for activities that are within the WFP
mandate, which exclude improving the quality of teaching.
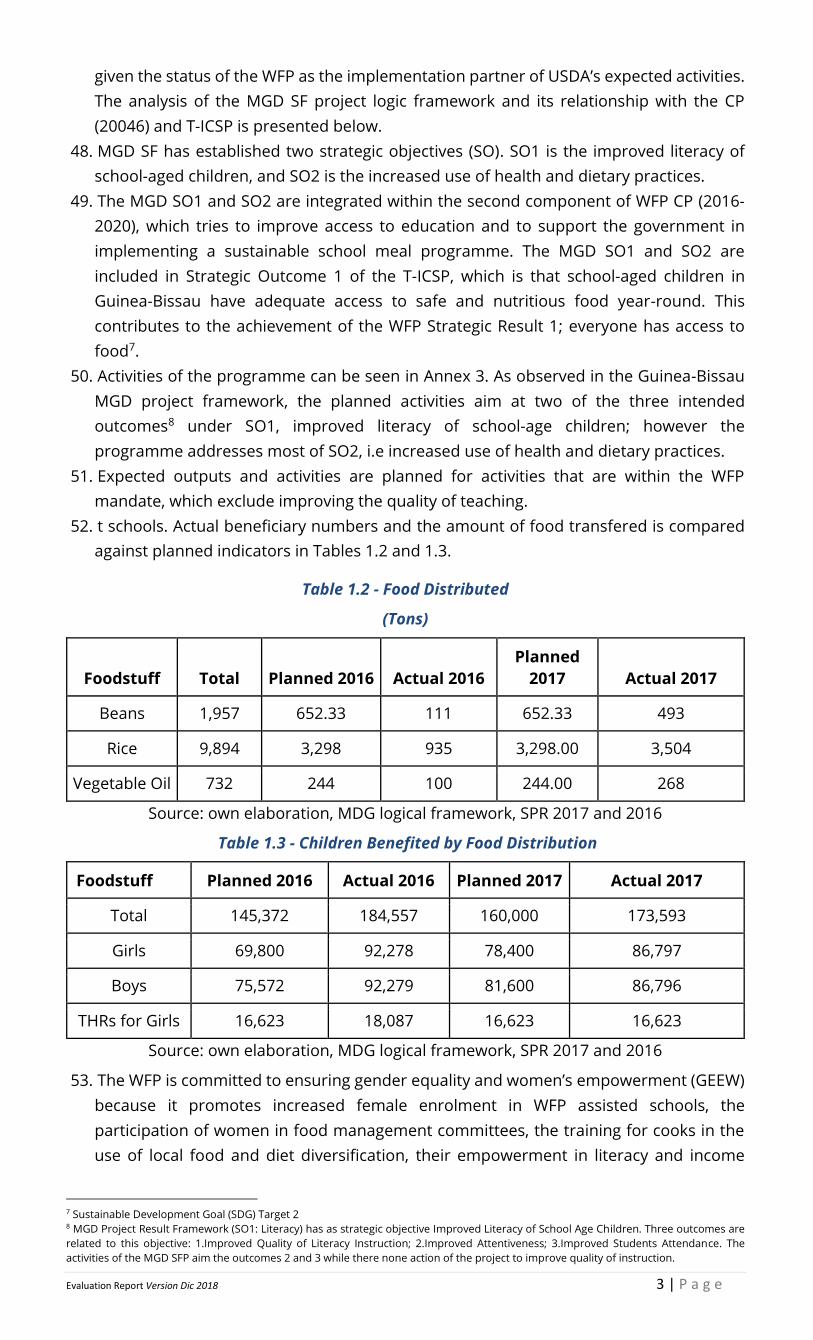
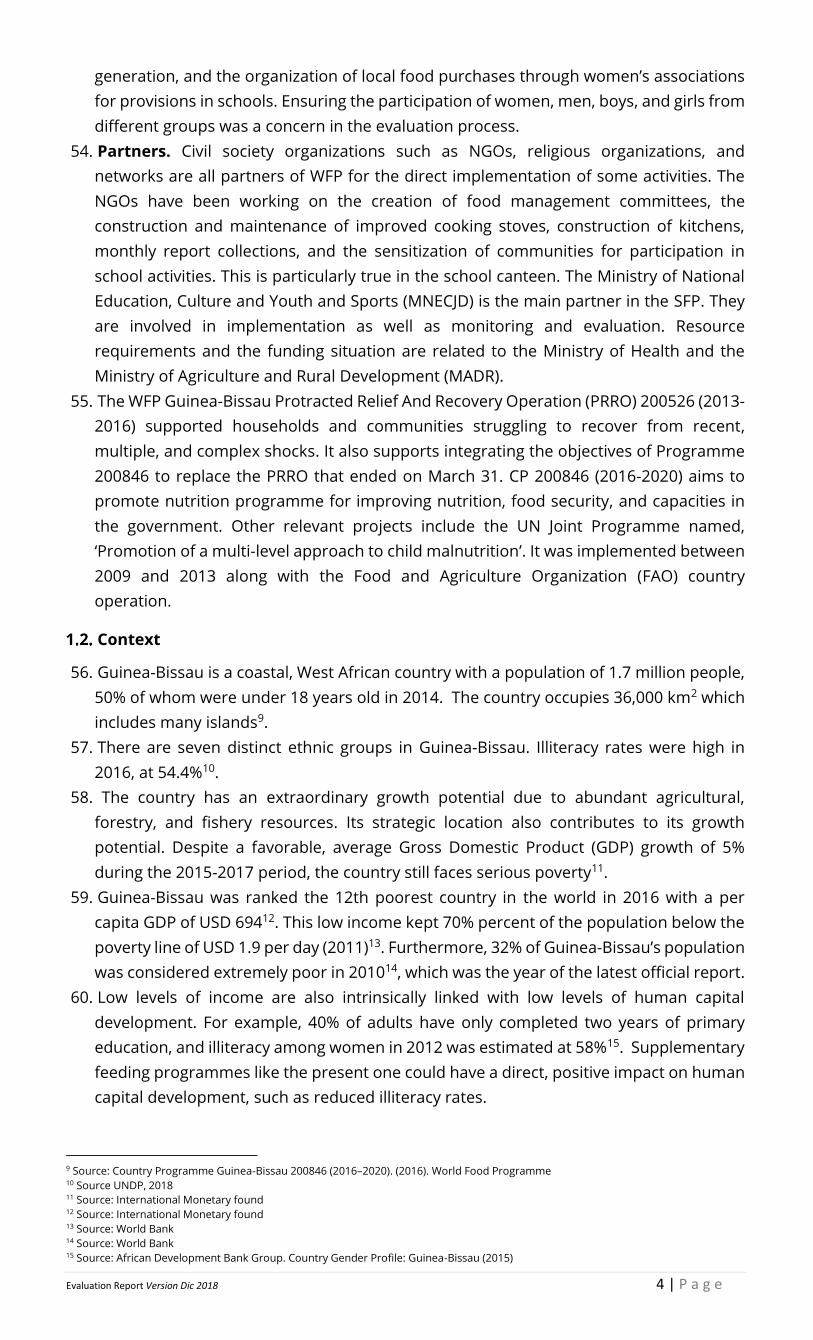
52. t schools. Actual beneficiary numbers and the amount of food transfered is compared
against planned indicators in Tables 1.2 and 1.3.
Table 1.2 - Food Distributed
(Tons)
Foodstuff Total Planned 2016 Actual 2016
Planned
2017 Actual 2017
Beans 1,957 652.33 111 652.33 493
Rice 9,894 3,298 935 3,298.00 3,504
Vegetable Oil 732 244 100 244.00 268
Source: own elaboration, MDG logical framework, SPR 2017 and 2016
Table 1.3 - Children Benefited by Food Distribution
Foodstuff Planned 2016 Actual 2016 Planned 2017 Actual 2017
Total 145,372 184,557 160,000 173,593
Girls 69,800 92,278 78,400 86,797
Boys 75,572 92,279 81,600 86,796
THRs for Girls 16,623 18,087 16,623 16,623
Source: own elaboration, MDG logical framework, SPR 2017 and 2016
53. The WFP is committed to ensuring gender equality and women’s empowerment (GEEW)
because it promotes increased female enrolment in WFP assisted schools, the
participation of women in food management committees, the training for cooks in the
use of local food and diet diversification, their empowerment in literacy and income
7 Sustainable Development Goal (SDG) Target 2 8 MGD Project Result Framework (SO1: Literacy) has as strategic objective Improved Literacy of School Age Children. Three outcomes are
related to this objective: 1.Improved Quality of Literacy Instruction; 2.Improved Attentiveness; 3.Improved Students Attendance. The
activities of the MGD SFP aim the outcomes 2 and 3 while there none action of the project to improve quality of instruction.
Evaluation Report Version Dic 2018 4 | P a g e
generation, and the organization of local food purchases through women’s associations
for provisions in schools. Ensuring the participation of women, men, boys, and girls from
different groups was a concern in the evaluation process.
54. Partners. Civil society organizations such as NGOs, religious organizations, and
networks are all partners of WFP for the direct implementation of some activities. The
NGOs have been working on the creation of food management committees, the
construction and maintenance of improved cooking stoves, construction of kitchens,
monthly report collections, and the sensitization of communities for participation in
school activities. This is particularly true in the school canteen. The Ministry of National
Education, Culture and Youth and Sports (MNECJD) is the main partner in the SFP. They
are involved in implementation as well as monitoring and evaluation. Resource
requirements and the funding situation are related to the Ministry of Health and the
Ministry of Agriculture and Rural Development (MADR).
55. The WFP Guinea-Bissau Protracted Relief And Recovery Operation (PRRO) 200526 (2013-
2016) supported households and communities struggling to recover from recent,
multiple, and complex shocks. It also supports integrating the objectives of Programme
200846 to replace the PRRO that ended on March 31. CP 200846 (2016-2020) aims to
promote nutrition programme for improving nutrition, food security, and capacities in
the government. Other relevant projects include the UN Joint Programme named,
‘Promotion of a multi-level approach to child malnutrition’. It was implemented between
2009 and 2013 along with the Food and Agriculture Organization (FAO) country
operation.
Context
56. Guinea-Bissau is a coastal, West African country with a population of 1.7 million people,
50% of whom were under 18 years old in 2014. The country occupies 36,000 km2 which
includes many islands9.
57. There are seven distinct ethnic groups in Guinea-Bissau. Illiteracy rates were high in
2016, at 54.4%10.
58. The country has an extraordinary growth potential due to abundant agricultural,
forestry, and fishery resources. Its strategic location also contributes to its growth
potential. Despite a favorable, average Gross Domestic Product (GDP) growth of 5%
during the 2015-2017 period, the country still faces serious poverty11.
59. Guinea-Bissau was ranked the 12th poorest country in the world in 2016 with a per
capita GDP of USD 69412. This low income kept 70% percent of the population below the
poverty line of USD 1.9 per day (2011)13. Furthermore, 32% of Guinea-Bissau’s population
was considered extremely poor in 201014, which was the year of the latest official report.
60. Low levels of income are also intrinsically linked with low levels of human capital
development. For example, 40% of adults have only completed two years of primary
education, and illiteracy among women in 2012 was estimated at 58%15. Supplementary
feeding programmes like the present one could have a direct, positive impact on human
capital development, such as reduced illiteracy rates.
9 Source: Country Programme Guinea-Bissau 200846 (2016–2020). (2016). World Food Programme 10 Source UNDP, 2018 11 Source: International Monetary found 12 Source: International Monetary found 13 Source: World Bank 14 Source: World Bank 15 Source: African Development Bank Group. Country Gender Profile: Guinea-Bissau (2015)
Evaluation Report Version Dic 2018 5 | P a g e
61. Guinea-Bissau has high maternal and neonatal mortality rates, even when compared
with neighboring West African nations. There are few, if any, newborn public health
policies. Low rates of skilled birth attendance, high rates of early pregnancy along with
malnutrition among pregnant women and socio-cultural factors all contribute to this
problem. Although child mortality rates had been slowly decreasing from 116 per 1,000
live births in 2010 to 89 per 1,000 live births in 201616, malnutrition still contributes to
45% of deaths of children under five years of age17.
62. Children over five years of age have high levels of stunting at a rate of 27.5%18.
Malnutrition rates are 29% for boys and 26% for girls19.
63. In addition, women are disadvantaged in relation to men, with lower access to
employment and social services. Women also suffer from restrictions to land access and
bank loans. Women also have limited decision-making power within their families20.
64. Legally, all forms of discrimination based on sex are prohibited according to articles 24
and 25 of Guinea-Bissau’s constitution. Nonetheless, customary laws and social practices
negatively impact the quality of life for girls and women. This generates disparities
between genders. In many rural societies across the country, women do not choose the
men they marry despite the legal age of marriage for women in Guinea Bissau being 14.
Many girls are forced to marry before this age. According to social institutions and the
Gender Index, 7% of girls are married before 15.
65. Although several bills were drawn to prevent domestic violence, the general acceptance
of violence as a method of settling disputes between couples, added to a male
dominated social structure, prevents offenders from being imprisoned. Rape against
women is rarely reported, and there are no laws punishing sexual harassment. On the
other hand, genital mutilation is deeply rooted in the Guinea-Bissau culture. Allegedly,
half of the girls between six and fourteen years old are circumcised21.
66. Furthermore, there are high rates of human immunodeficiency virus (HIV) among
women in the country, four times higher than the rate for men22.
67. Initial enrolment rates in primary schools do not vary across gender, but dropout rates
are significantly higher for girls, especially in high school. Early pregnancy and marriage
are the main factors contributing to dropout rates; however, inadequate sanitary
facilities may also deter girls from going to school. The result is a difference between
men and women’s illiteracy rates of 26 percentage points23.
68. Low human capital among the female population is one of the reasons why the
proportion of households headed by women suffer from more food insecurity than
those headed by men24.
69. Consequently, the WFP supplementary feeding programme has a clear gender
component. The programme aims to increase the retention rates of girls in grades five
to six. This is because the probability of dropping out increases during these grades
compared to previous grades. The programme focuses its efforts on the oldest primary
school age group.
16 Source: UNICEF Annual Report 2016. (2016). Unicef (pag 18) 17 Source: UNICEF Annual Report 2016. (2016). Unicef 18 Source: UNICEF Annual Report 2016. (2016). Unicef 19 Source: GUINEA-BISSAU INTERIM COUNTRY STRATEGIC PLAN
2018-2019 20 Source: WFP Guinea-Bissau Interim Country Strategic Plan 2018-2019 (January 2019.) 21 Source: World Bank 22 Source: World Bank 23 Source: WFP Guinea-Bissau Interim Country Strategic Plan 2018-2019 (January 2019.) 24 Source: Country Programme Guinea-Bissau 200846 (2016–2020). (2016). World Food Programme
Evaluation Report Version Dic 2018 6 | P a g e
70. The SFP and WFP committed to providing THRs to 16,600 girls in all of the targeted
regions. These rations were provided to girls that attended at least 80% of the classes in
a given month. The disbursement of THRs tried to reduce the education gap between
girls and boys and create awareness sessions to educate mothers on other topics to
improve the well-being of girls.
71. Political instability has been a constant, key factor that has negatively affected the
development of Guinea-Bissau. After a period of transition, Jose Mario Vaz was elected
president in a democratic process. Given the great challenges that the country faced, the
newly elected president, along with a series of organizations, including the European
Union, presented the long-term development plan “Terra Ranka.” This plan set up goals
for environmental, economic, infrastructure, and educational development.
72. Given the high levels of poverty and food insecurity that Guinea-Bissau has at present,
a series of agencies have made their presence known and have established long term
programmes in the country. The FAO has supported the government by implementing
key agricultural policies and has supported SFP through the Home-Grown School
Programme (HGSP). The WB has also supported the WFP by jointly providing technical
assistance in the implementation of SFP. Brazil and Portugal, through various state
agencies, are other key actors supporting improvements of food security in Guinea-
Bissau.
Evaluation Methodology and Limitations
73. The fourteen evaluation questions and their respective sub-questions in the midterm
evaluation of the McGovern-Dole funded SFP can be found in Annex 6. The midterm
evaluation uses five evaluation criteria; relevance, effectiveness, efficiency, impact, and
sustainability25. The first three criteria are critical, and the last two are subsidiary.
74. For data collection methods and tools, a mixed-methods approach was implemented.
Primary data was collected from stakeholders using questionnaire and interview inquiry
techniques. Primary information was also collected using on-site observation.
Additionally, the team collected secondary data from databases, reports, surveys, web
resources, and other existing documented sources. More specifically, the team used
document analysis, questionnaires, semi-structured interviews, group interviews, focus
groups, and observation. Document analysis (DA) was used in the inception phase to
understand the general context of the project. Reports were analyzed, other than those
written and web materials. DA was also used in the consultation of qualitative data using
the Monitoring and Evaluation System data. It was also used to analyze texts transcribed
from interviews and to analyze focus groups during the period of fieldwork. This was
done by beneficiaries, the WFP, other UN agencies, and other external stakeholders.
75. Two different approaches, quantitative and qualitative, were used. The quantitative
approach used questionnaires to survey 60 schools randomly selected, 30 of which were
with the WFP project intervention. The other 30 were a control group. In order to match
the baseline, this was done in six regions of Guinea-Bissau: Bafata, Biombo, Cacheu,
Gabu, Oio, and Quinara26.. The evaluation sample was based on a probability-
25 Relevance: The extent to which the objectives of programme are consistent with beneficiaries’ requirements or needs, Effectiveness: The
extent to which the development intervention’s objectives were achieved; Efficiency: A measure of how economically resources/inputs
(funds, expertise, time, etc.) are converted into results; Impact: Measures changes in human development and people’s well-being that are
brought about by the programme, directly or indirectly, intended or unintended; Sustainability: The likely continuation of net benefits from
a development intervention beyond the phase of external funding support. 26 The primary goal of the school feeding baseline survey was to provide a situational analysis before the programme begins and to provide
important context necessary for the midterm and final evaluations. The baseline survey was conducted in the six regions where WFP was
supporting the Government of Guinea-Bissau with school feeding operations in June 2016; the survey was conducted by the Ministry of
Evaluation Report Version Dic 2018 7 | P a g e
proportional-to-size technique to determine the required number of schools per region
to be surveyed and/or visited. This same sample approach was used before in the
Guinea-Bissau School Feeding Baseline Survey of 2016 . Thus, the sample size
distribution in regions was proportional to the number of schools in each region. In the
selection of schools, priority was given to those that were in baseline. When it was
necessary to carry out a selection of schools (when there were more than those
corresponding to the baseline evaluation in each region) a probabilistic selection was
made, assigning a probability with the negative coordinated selection method. In each
school, enumerators randomly sampled 10 students from 4th grade Enrolment roster27
(School Feeding Baseline Survey. Guinea Bissau 2016). In the mid-term survey 5 boys and
5 girls from 4 grade were integrated in the sample28.
76. The quantitative tool was applied to the school directors, as well as five male students,
five female students, all from fourth grade, and their respective households. The Rede de
Soberania e Segurança Alimentar e Nutricional da Guiné-Bissau (REDSSAN-GB) was hired to
develop this process. The questionnaire used in the baseline survey was applied to be
able to compare the results.
77. The qualitative approach used semi-structured interviews and group interviews. See the
list of topics in Annex 6. The interviews were led by a group of international and national
consultants using a different sample of 30 MGD and WFP supported schools in all eight
regions of programme implementation Guinea-Bissau, which include the same six of the
quantitative approach, adding Tombali and Bolama (the islands)29. Conducting the
qualitative work in different schools allowed the team to explore the recent program
implementation in the islands. When available, mixed gender groups of students and
teachers, groups of girls from 4th to 6th grade, directors, cooks, and the School
Management Committees were interviewed30. In some cases, community and parent
association representatives were also interviewed.
78. The project’s scope was at the regional level. Inspectors and governors were interviewed
by the team of consultants at the regional level. In Bissau, the consultants also
interviewed the WFP team involved in the project’s management, the United Nations
Development Programme (UNDP), WB, United Nations International Children's
Emergency Fund (UNICEF), WHO, and national and international NGOs.
79. Triangulation was used to find answers to evaluation questions by using the two
different approaches. The team used focus groups when groups of different
stakeholders were involved in the same activity or initiative. This tool facilitated the
Education’s Office of Information, Planning and Evaluation of the Education System (DGIPASE) and the National Directorate of Social Affairs
and School Feeding (DGASCE), with assistance from the UN World Food Programme (WFP), in June 2016
27 The Enrolment roster was collected by enumerators from grades fourth to sixth
28 Students selection was done using a systematic algorithm. With the listing of students in each course, two numbers were calculated,
the jump or interval and starting number. The jump is the ratio for the number students in the course and the selections number of the
student, which is ten (10). The starting number is a number between 1,0 and the jump number.The first student selected was the one
whose order number matched the starting number. For the selections of the second student, it was necessary to add the jump number
and the start number, the student selected were the one whose order number matches the starting number. The order of the following
students to select is found by adding the jump to the previous number.
29
The islands (Bolama) and Tombali were not covered by the quantitative approach since they were not part of baseline and on the other
hand, the programme had recently expanded to those regions an therefore impact could be underestimated. Qualitative approach did
cover the two additional regions in order to explore the recent programme implementation. 30 Note that an actor can integrate two or more of these groups, e.g.: a cook can be a representative of the community and a
mother/grandmother integrating the SMC in representation of the parents association.
Evaluation Report Version Dic 2018 8 | P a g e
understanding of the specific role of each person in the project. The list of topics and
respective stakeholders for the focus groups can be consulted in Annex 6.
80. In contrast, observation was used during visits to schools, kitchens, warehouses, and
other locations. Photos, sound recordings and video footage were taken for further
analysis and for use in presentations and reports. The team always asked permission to
take photos and to record video and sound for the interviews. These recordings were
only used in internal activities and shared only with the team members and WFP
personnel.
81. Data collection activities took place from 17 of June to 16 of July, 2018. The first two
weeks were used to visit the 30 schools and interview the beneficiaries (Annex 6). The
team started the first week in the south which consists of the Tombali, Quinara and
Boloma regions. Access can become complicated when the rainy season arrives. The
second week was used to visit the Cacheu, Biombo, Oio, Bafata, and Gabu regions. The
rainy season started while the team was in Oio. The third and fourth weeks were used
for interviews of regional governors, NGOs, the Ministry of Education, WFP, and other
UN agencies as was defined in the inception report.
82. Qualitative data was organized in an excel file which allowed for a transversal reading.
The analysis of the quantitative survey is explained in Annex 15.
83. Gender analysis was done throughout the evaluation criteria analysis. SFP gender
equality and protection and the factors that effected Gender Equality Emancipation of
Women (GEEW) results were evaluated by cross-checking primary and secondary
information. All the available data, disaggregated by gender, was used. GEEW results
were mostly evaluated through the information gathered in the interviews. Interviews
were conducted during the fieldwork with parents, SMC members, and focus groups,
including girls and boys. Specific questions addressing GEEW were included in the
evaluation tools. Gender issues were also openly discussed during fieldwork interviews.
Interviewees were free to express their opinions. Furthermore, the ET assured all voices
were heard and that the results were used in the analysis and triangulation.
84. The norms of the WFP Decentralized Evaluation Quality Assurance System (DEQAS) were
applied to this evaluation. Norms verified that all conclusions are clearly evidence-based
and that they logically follow the analysis that was made of the evaluators’ findings.
Recommendations were derived, logically, from the main conclusions of the evaluation
so as to be useful to the users of this evaluation. Following the DEQAS, Econometría
Consultores was responsible for internal quality control. Quality was ensured with the
usual mechanisms used by Econometría Consultores, the experience gained in the
framework of the operation evaluation Long Term Agreements (LTA) and the current
decentralized model. The results of this evaluation will also be critically reviewed by an
external quality support service.
85. Limitations - Guinea-Bissau is a multicultural country with more than 30 ethnic groups.
During the interaction, the team chose Portuguese, Creole, Fula and English, the
languages preferred by the stakeholder. The integration of experienced national
consultants helped to mitigate this issue of interpretation. To further mitigate this
limitation, all interviews were recorded. The translation from Creole to Portuguese was
a time-consuming activity. As previously stated, access to schools in the Boloma region
was very complicated due to time constraints. Fieldwork occurred at the beginning of the
rainy season, and access to one school in Quinara was complicated by the weather. This
forced the team to evaluate another school in the vicinity. In two schools, interviews had
to be interrupted due to the noise of rain on the roof. Two schools in Cacheu and Gabu
Evaluation Report Version Dic 2018 9 | P a g e
were impossible to reach within the existing timeframe. Alternative schools were
selected. The most isolated schools supported by the project in the sample were
discarded. This may constitute a favorable bias.
86. The midterm evaluation used a non-experimental approach. According to the WFP
Technical Note on Evaluation Methodology (2016), this approach does not compare
groups. It requires an understanding of the baseline scenario and builds arguments by
a plausible association between the intervention and observed changes. It typically uses
mixed-methods. It requires a certain level of baseline and monitoring data, and the
presence of documentation that explains the logic behind the design of the intervention
being evaluated. The evaluation efforts were organized around normative questions.
These questions assess performance against specific criteria.
87. The scope of the midterm evaluation contains all the activities covered by the McGovern-
Dole-Funded School Feeding Project in Guinea-Bissau (2016-2018). They were defined in
the agreement between USDA and WFP and transcribed within Annex 3. The evaluation
was carried out using a probability-proportional-to-size technique (number of schools
per region) in both quantitative and qualitative approaches. The size of the sample used
in the qualitative approach was determined in 30 schools targeted by the intervention
(WFP Local office). The 30 schools targeted by the project were randomly selected in eight
geographic regions. Only the autonomous sector of Bissau was excluded. These 30
schools were randomly selected from the sample used for the baseline survey in 2016
(Table 5.1). However, two new regions, Bolama and Tombali, were added to the original
six used in this survey. Therefore, some adjustments were needed to maintain
proportionality. Only four schools in the sample are “new schools.”
88. A map with schools visited is presented in Annex 1. The midterm Survey was applied to
a group of 6o randomly selected schools selected from the sample used for the baseline
survey in 2016. There were 30 within the WFP project intervention and a control group
of 30 other schools.
89. The evaluation was conducted with integrity and respect for the beliefs, manners, and
customs of the social and cultural environment in Guinea-Bissau. The team respected
the rights of institutions and individuals. Information was given in confidence, and
consent for the use of information was asked for.
2. Evaluation Findings
Relevance
Is the project’s strategy relevant to the needs of the beneficiaries?
Sub-question 2.1.1: To what extent did the project respond to the needs of the students,
specifically girls from 4th to 6th grade?
90. The education system in Guinea-Bissau faces multiple challenges, where the extreme
poverty of some families and their chronic food insecurity are additional issues31. The
MGD SF project activities contributed to the improvement of school structures that are
required for delivering meals to students.
31 According to findings of the mid-term survey (2018) 29% of students of WFP assisted schools and 40% of students of non-assisted schools
go to classes without eating a meal at their homes (Table 7.6, Annex 7)
Evaluation Report Version Dic 2018 10 | P a g e
91. In fact, quantitative data of the school feeding midterm survey (2018)32 showed that
89.7% of WFP/MGD assisted schools have a designated area for food storage33, while
80% of schools use energy efficient stoves for cooking meals.
92. However, the results of fieldwork showed that school kitchens still require structural
improvements to ensure safety while cooking and to ensure the safe preparation of
meals. Additionally, students complained about the hygienic conditions of the kitchens
and cooks. Nevertheless, it is difficult for cooks to maintain reasonable levels of hygiene
with poor kitchen conditions.
93. The project promotes the success of education for school-aged children by delivering
daily school meals to all enrolled students, and THRs to girls in 4th to 6th grade. Expected
outcomes of school feeding activities are higher levels of student nutrition, promoting
student well-being and attentiveness, and consequently improving their education34.
94. As expected, the daily distribution of school meals is appreciated by both boys and girls,
with respect to both the quality and quantity of the food. Students also acknowledge its
contribution to their learning. Although school meals support student nutrition, its
perceived contributions vary among ages and genders35. A greater variety of school
meals was requested by the students36.
95. The food distributed to students also financially benefits poorer families37. According to
the midterm survey,38 around 60% of girls from assisted schools reported receiving THRs
at some point.
96. The financial contribution of SF is especially significant for poorer families (Table 7.10,
Annex 7). Quantitative data shows that 65.5% of families from the poorest wealth
quintile, and 50.0% of families from the second poorest quintile, acknowledged receiving
a THR at some point.
97. One indicator demonstrating how the project has impacted the needs of students and
their families is the existing migration of students from schools not supported by WFP to
schools supported by WFP. In many cases, this requires them to travel long distances39
to attend classes. This was the perception of inspectors, school teachers, and cooks.
However, quantitative data from the midterm survey does not confirm this migration.
According to Patton40, "It is common that quantitative methods and qualitative methods
that are used complementary do not easily come together to provide a single, well-
integrated picture of the situation."
32 In June-July 2018 a school feeding midterm survey was developed by Econometria, to be used as complementary information on this
evaluation. This survey has collected data from a sample of 30 schools assisted by WFP SF, and 30 schools no-assisted, using the same
forms for data collection that were used in the SF baseline survey (2016). The data was used to produce tables which were included as part
of annexes on this evaluation report. The data of the midterm survey was used for impact analysis, among other. 33 According to data of the mid-term survey, 100% of assisted schools properly store food on palettes. 34 More information on expected results and targets are presented in Table 7.1, Annex 7 35 Additional information of school meals and students nutrition is presented in Annex 9 36 Findings of fieldwork shows that students demand more diversification in meals, and the introduction of the following products: canned
sardines (discontinued by WFP, donated in the past by the Government of Japan), porridge, milk, sugar, corned beef, other types of beans,
local vegetables and the use of flavorings (“gosto”). 37 Findings of fieldwork interviews shows the positive perception of the local community on the contributions of the project. 38 As shown on Table 7.10 (Annex 7) in average 7.6% of male students reported to have received take-home rations. Additionally, since 20%
of data for female students was missing the average of girls who benefited from the activity might be above 60%. 39 Headmasters of schools that were visited during fieldwork informed that the number of students has increased, as result of school
feeding. According to the interviewees some students migrated from nearby schools without school feeding and now travel long distances
(up to 15 km in one case) to attend to classes. Although, average travel times of students of assisted schools were higher for students of
schools without school feeding (Table 7.11, Annex 7) 40 Patton, Michael Quinn, HSR: Health Services Research 34:5 Part II (December 1999), Source:
https://www.ncbi.nlm.nih.gov/pmc/articles/PMC1089059/pdf/hsresearch00022-0112.pdf , access in January 16, 2019
Evaluation Report Version Dic 2018 11 | P a g e
Sub-question 2.1.2: To what extent did the project respond to the needs of teachers, cooks,
inspectors, and School Management Committees (SMC)?
98. According to the teachers interviewed41, some benefits of school meals provided by the
project are that it helps students to pay more attention in class, increases their capacity
to learn, and contributes to their progress in school. School meals also contribute to
student development and health42. In the 2016-2017 school year, and the first semester
of the 2017-2018 school year, retention rates for girls were above 90%, and drop-out
rates were below 6% in schools assisted by the MGD SF project. Compared to baseline,
WFP contributed to increase the school retention rate among adolescent girls by 0.9
percent in a context where the retention rate among girls is very low compared to boys.
This was a result of WFP-supported school meals and take-home ration for girls above
Grade 4. 43. This result contributed to the quality of education and facilitated the aims
of teachers.44.
99. Additionally, 69% of students successfully completed their respective grade. This rate is
higher than the national completeness indicator of 66% in 201545. Disaggregated data
shows 70% of boys and 68% of girls were able to complete the grade. An increase in
successful grade completion is expected as a result of the SF. School meals are expected
to promote attendance in classes, and higher well-being of students by reducing their
short-term hunger. The distribution of the THRs to girls from 4th to 6th grade promotes
higher attendance rates to classes and decreases dropout rates. Teachers and
community members acknowledged as well the positive impact of school feeding on
student attendance to classes. From the comparison between baseline and midline data,
there is no statistical difference46, however, there are significant differences between
treated and control shools in the midterm phase. not corroborate this (Tables 7.4, 7.8
and 7.9, Annex 7)47.
100. Qualitative data collected by this evaluation suggests that the school meal is the main
meal of the day for many students48. Additionally, quantitative data shows that about
23.7% of all students from assisted schools, and 30.9 % of students from non-assisted
schools arrive at school while fasting (Table 2.5). Teachers and school committee
members acknowledge that school meals decrease school dropout rates, especially with
respect to girls. During the cashew campaign, meals allowed students to remain in
school. In 2017, the retention rate in assisted schools was 95.9%, 96.0% for girls and
95.8% for boys, respectively49.
101. Qualitative data shows that school meals are attracting more students to school,
particularly girls. Teachers and headmasters reported an increase in the number of
students as a result of the project. Additionally, quantitative data collected from the
midterm survey shows enrollment rates of girls in grade six are slightly increased in
assisted schools (Table 7.7, Annex 7). However, the impact of SF was not conclusive when
comparing qualitative and quantitative data. Increased enrolment may also put
41 Qualitative data collected by interviews during fieldwork of mid-term evaluation 42 Qualitative information collected during fieldwork. 43 Source: WFP Standard Project Report, 2017 44 An increase in children successfully completing a grade is expected, as a result of the school feeding. 45 UNICEF Anuario Stadistico 2014-2015 46 The comparison was made with the result tables (using the confidence interval) since the data base from baseline is not available. 47 Student'’ attendance of female students of schools with school feeding was particularly higher in October 2017. However quantitative
data didn’t'’ confirm increased attendance rate as result of school feeding in the midterm survey from November 2017 to January 2018.
(Tables 7.4, 7.8 and 7.9 Annex 7). 48 According to qualitative data students attending school in the morning period, the school meal it the first meal of the day. Students
attending this period are those who live farther away from the school, this way they avoid the heat of the afternoon. Source: Fieldwork
interviews 49 Source: WFP- SPR 2017.
Evaluation Report Version Dic 2018 12 | P a g e
additional pressure on the WFP SF system. It could place a higher demand on
adjustments in the school with regards to infrastructure, equipment, teachers, other
personnel, meals, etc.
102. The findings of the fieldwork indicate that cooks who work in schools are mostly
women volunteers and are either mothers or grandmothers of students. Cooks have
been trained by NGOs to diversify school meals while using locally sourced products50.
However, there is little opportunity to put the training into practice, except where local
food is produced for cooks in pilot schools. All cooks agree that a variety of school meals
are important. The number of cooks per school within the sample taken varies between
one and ten.
103. In most schools, two meals are delivered per day. The meals are delivered during the
morning and afternoon shifts. In 25% of the schools visited, cooks are paid with
contributions made by the students. These contributions range from CFA 200-600 a
month51. These cooks receive monthly wages between CFA 5,000-30,000, depending on
the school. Unpaid cooks have demanded compensation.
104. Qualitative findings suggest that poor work attendance, tardiness, and in some cases,
disruption of the SF system, could be associated with the lack of compensation for their
work as cooks. Their volunteer activities were reported to have been scrutinized during
the nut harvest more so as well as when other social activities required their absence,
e.g., funerals. A rotating volunteer schedule for cooks has been identified as a potential
best practice. This is something which can be tested in other schools; however, this
system undermines the training of the cooks. An adaptation is needed. Additionally,
concerns over the health of cooks and the implications on food safety were raised during
the fieldwork. None of the cooks interviewed had health checkups and most of them
reported not having enough disposable income to be screened.
105. The project provided kitchen utensils to assisted schools such as pans, spoons, and
plates. Despite the aforementioned, cooks reported the need for additional items such
as water containers, serving spoons, and uniforms52. One concern is the structural
conditions of some school kitchens53. The kitchens are very poorly constructed. In some
cases, they are built with flammable materials, and some kitchens are placed
dangerously close to stoves and fire. The smoke produced by cooking stays in the
kitchen. Stove construction and maintenance were provided by the project in
partnership with a local NGO54. Fieldwork findings showed that after one year or so of
use, some of these stoves show signs of degradation or are abandoned. The model of
stove used by the programme allows communities to conserve fuel and reduce the
environmental impact of deforestation, but it does not provide dignified working
conditions for these women. Due to the placement of the stoves below standing height,
cooks must work bent over, thereby exposing themselves, and their unborn child when
pregnant to the heat and smoke expelled by the stove (Figure 8.1, Annex 8)55.
50 "The non-food items (cooking utensils: plates, spoons, cups, basins, buckets and cooking pots) were distributed to all 758 schools. Kitchen
construction materials (zincs, cement, nails) were distributed for construction of 150 kitchens at schools. The construction will occur from
April to May 2017". Source WFP - Narrative progress Report (Oct 2016 to Mar 2017). 51 Monthly students' contribution for school cooks range from 0.35 USD to 1.05 USD, currency exchange rate of September 30th 2018.
52 Findings of fieldwork, qualitative data.
53 Inadequate structure and working condition on some school kitchen was observed by the evaluation team during the fieldwork, as seen
in the Figure 8.1, Annex. In some schools cooks complained that the stove is too hot (“they even burn the hair of their legs”).
54 "The NGOs have been working on the creation of Food Management Committees, constructions and maintenance of improved cooking
stoves, construction of kitchens"” Source: Source WFP - Narrative progress Report (Oct 2016 to Mar 2017).
55 This video show the model of stove proposed https://www.youtube.com/watch?v=4gFYwEZogjQ
Evaluation Report Version Dic 2018 13 | P a g e
106. SMCs include teachers, parents, voluntary cooks, and other members of the
community participating in the SF activities. SMC members interviewed in this evaluation
perceive school meals as a very important activity because it helps to decrease the
burden on families to feed their children. They also acknowledge that SF helps to
decrease the dropout rate of girls56. SMC members also stated that school meals are an
opportunity to bring the community closer to the school because it requires the
participation of members of the community and of the parent associations in SF
management57.
107. During fieldwork interviews, some requests and recommendations were made by SMC
members such as 1. the continuation of the school feeding programme 2. An increase in
the quantity of food delivered 3. Greater variety of food on the school menu by using
locally purchased food 4. Construction of a dining room to serve school meals 5. Creation
of school gardens 6. Support with water wells 7. Uniforms for cooks 8. Additional training
for SMC members 9. Motorcycles or bicycles for transportation58.
Box 2.1 - Key findings and conclusions for question 2.1
• The project’s strategy is relevant to the beneficiaries’ needs. The daily distribution of
school meals reached the intended number of students, and the quality and quantity
of food are appreciated by both boys and girls. About 25% of students arrive at school
fasting, and school meals are very important to fight short-term hunger.
• Students also acknowledge the contribution of school feeding on their education.
School meals and take-home rations promote attendance and help to avoid students
dropping out of school.
• School meals support the nutritional needs of students. Its contribution varies among
ages and gender, whereby younger students and girls of all ages have greater
nutritional coverage. Additionally, greater diversification of school meals was requested
by the students, cooks, and the SMC.
• Teachers acknowledged the benefits of school meals in helping students to pay more
attention to classes, increasing their capacity to learn, contributing to their progress,
and contributing to the development and health of students.
• Take-home rations decrease the burden of families needing to feed themselves and
potentially contributes to higher attendance of girls, especially during the cashew
campaign.
• Qualitative data suggests that students of non-WFP schools are migrating to WFP
assisted schools and the number of students is increasing, although it was not
confirmed by quantitative data.
• Most cooks volunteer, and their participation in school could be a burden when
competing with economic or social activities. A rotation of school cooks could be used
to reduce the burden, but it requires more training.
• Kitchens are very basic and, in some cases, unsafe for cooks. The stoves need to be
replaced because they negatively impact the working conditions and health of the
cooks.
• SMC members find school meals are an opportunity to bring the community and the
school closer together. It requires the participation of members of the community and
of the parents. By demanding the involvement of local communities in the management
56 Qualitative data from fieldwork interviews. Triangulation of qualitative and quantitative data is this matter was previous presented on
paragraph (19) and footnote 21
57 All information provided in this paragraph refers to qualitative data collected in the fieldwork. The data was collected in a representative
sample of 30 supported schools located in 8 regions where the programme is implemented.
58 Results of fieldwork were recommendation on: Increase in the food portion was requested by the SMC members: 36% asked for
increase in the quantity , greater diversification on school menu was recommended by 20%, three of SMC interviewed requested the
construction of a dining room, three SMC requested the creation of school gardens; two demanded
Evaluation Report Version Dic 2018 14 | P a g e
of school feeding systems, the project promoted the rapprochement of communities
and schools.
Is the project aligned with the national government’s education and school
feeding policies and strategies?
Sub-question 2.2.1: To what extent is the intervention aligned with the educational policies
and the strategies of the government?
108. This intervention is aligned with the education policies and strategies of the
government of Guinea-Bissau. The country has experienced times of political instability,
which prevented the approval of the National Law on School Canteens. This instability
has also made it difficult to include SF in the main strategies and to budget for successive
governments in the past years. However, as a strategy to achieve universal schooling,
the establishment of canteens are predicted to be put in schools that do not yet have
them in the Sectoral Education Plan (2017-20125). Also, the government of Guinea-
Bissau funded a local purchase initiative in the schools of 20 communities in the Cacheu
and Oio regions. This initiative is managed by the WFP.
109. Although the MGD SF Project does not use local procurement to supply school meals,
the development of the pilot project to locally purchase food for school canteens is one
of its intended results. Insufficient documentation of the results of the pilot experiences
were found during this evaluation. The WFP could support the understanding of the
results of local purchases and their improvements by conducting regular assessments
and documenting the results of the pilot programmes.
110. The processes of defining and approving the National Law of school canteens and the
creation of the implementation plan for this law were discussed and scheduled in 2015
during the workshop for assessing National Capacities in School Feeding (SABER). This
was organized by the General Directorate for School feeding (Direcção-Geral das
Cantinas Escolares), the WB, and the Partnership for Child Development, and the WFP.
General elections in 2019 could potentially result in the advancement of SF in main
strategies and the annual budget.
Box 2.2 - Key Findings and conclusions for question 2.2
● This intervention is aligned with education policies and strategies of the government
of Guinea-Bissau.
● The political instability that prevented the approval of the National Law on School
Canteens made it difficult to include school feeding in the main strategies and budget
of future governments.
● Additional efforts by the WFP to assess and document results of the pilot programme
for local purchases for school feeding would support good practices and allow the
sharing of lessons learned.
Does the project complement other donor-funded, government initiatives?
Sub-question 2.3.1: To what extent are other donor-funded, initiatives complementary?
111. During the analysis period, the WFP/McGovern-Dole SFP was the main initiative
concerned with school feeding. However, there are other complementary initiatives such
as the Guinea Bissau government-funded local food purchase initiative in the Cacheu
and Oio regions. This initiative is managed by WFP with the support of NGOs and a
telecommunications company. The government of Japan has been contributing with
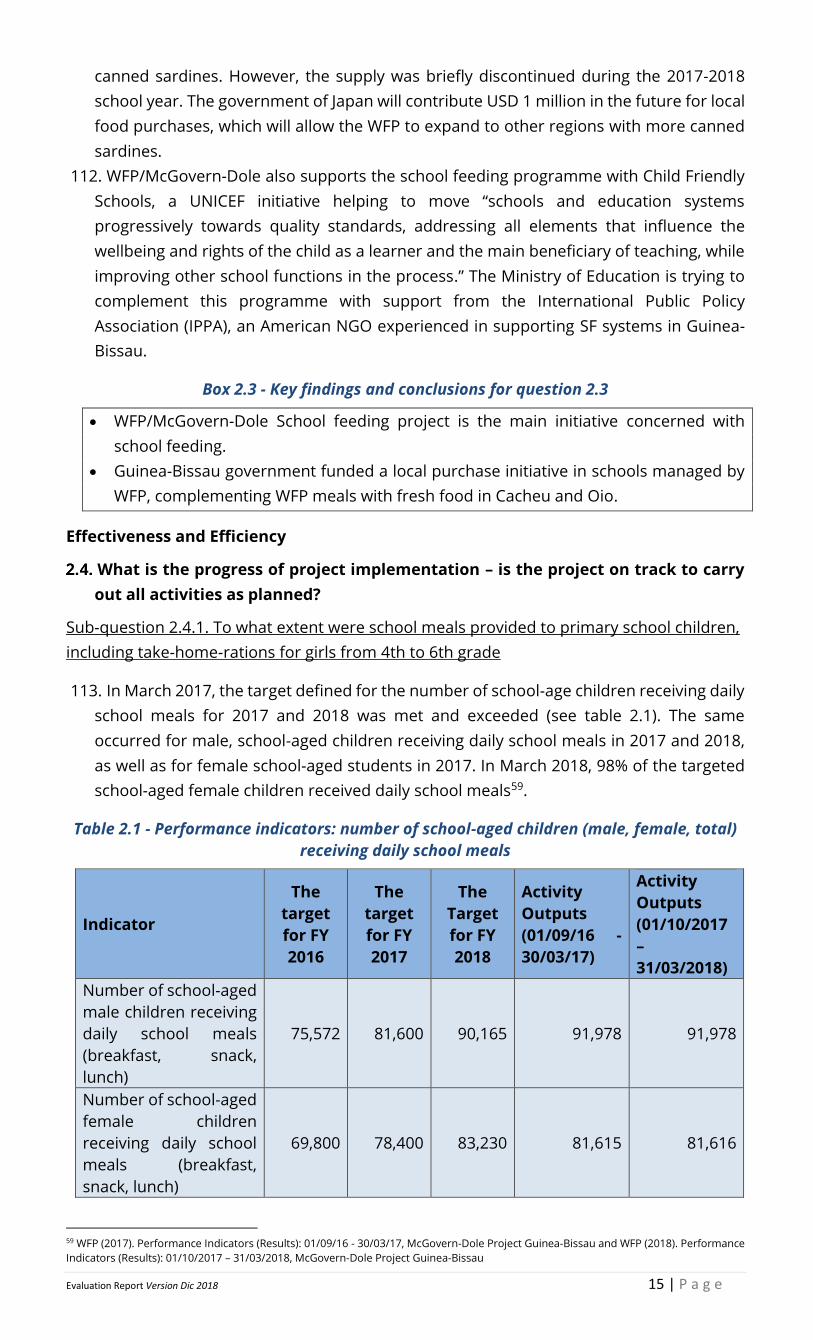
Evaluation Report Version Dic 2018 15 | P a g e
canned sardines. However, the supply was briefly discontinued during the 2017-2018
school year. The government of Japan will contribute USD 1 million in the future for local
food purchases, which will allow the WFP to expand to other regions with more canned
sardines.
112. WFP/McGovern-Dole also supports the school feeding programme with Child Friendly
Schools, a UNICEF initiative helping to move “schools and education systems
progressively towards quality standards, addressing all elements that influence the
wellbeing and rights of the child as a learner and the main beneficiary of teaching, while
improving other school functions in the process.” The Ministry of Education is trying to
complement this programme with support from the International Public Policy
Association (IPPA), an American NGO experienced in supporting SF systems in Guinea-
Bissau.
Box 2.3 - Key findings and conclusions for question 2.3
• WFP/McGovern-Dole School feeding project is the main initiative concerned with
school feeding.
• Guinea-Bissau government funded a local purchase initiative in schools managed by
WFP, complementing WFP meals with fresh food in Cacheu and Oio.
Effectiveness and Efficiency
What is the progress of project implementation – is the project on track to carry
out all activities as planned?
Sub-question 2.4.1. To what extent were school meals provided to primary school children,
including take-home-rations for girls from 4th to 6th grade
113. In March 2017, the target defined for the number of school-age children receiving daily
school meals for 2017 and 2018 was met and exceeded (see table 2.1). The same
occurred for male, school-aged children receiving daily school meals in 2017 and 2018,
as well as for female school-aged students in 2017. In March 2018, 98% of the targeted
school-aged female children received daily school meals59.
Table 2.1 - Performance indicators: number of school-aged children (male, female, total)
receiving daily school meals
Indicator
The
target
for FY
2016
The
target
for FY
2017
The
Target
for FY
2018
Activity
Outputs
(01/09/16 -
30/03/17)
Activity
Outputs
(01/10/2017
–
31/03/2018)
Number of school-aged
male children receiving
daily school meals
(breakfast, snack,
lunch)
75,572 81,600 90,165 91,978 91,978
Number of school-aged
female children
receiving daily school
meals (breakfast,
snack, lunch)
69,800 78,400 83,230 81,615 81,616
59 WFP (2017). Performance Indicators (Results): 01/09/16 - 30/03/17, McGovern-Dole Project Guinea-Bissau and WFP (2018). Performance
Indicators (Results): 01/10/2017 – 31/03/2018, McGovern-Dole Project Guinea-Bissau
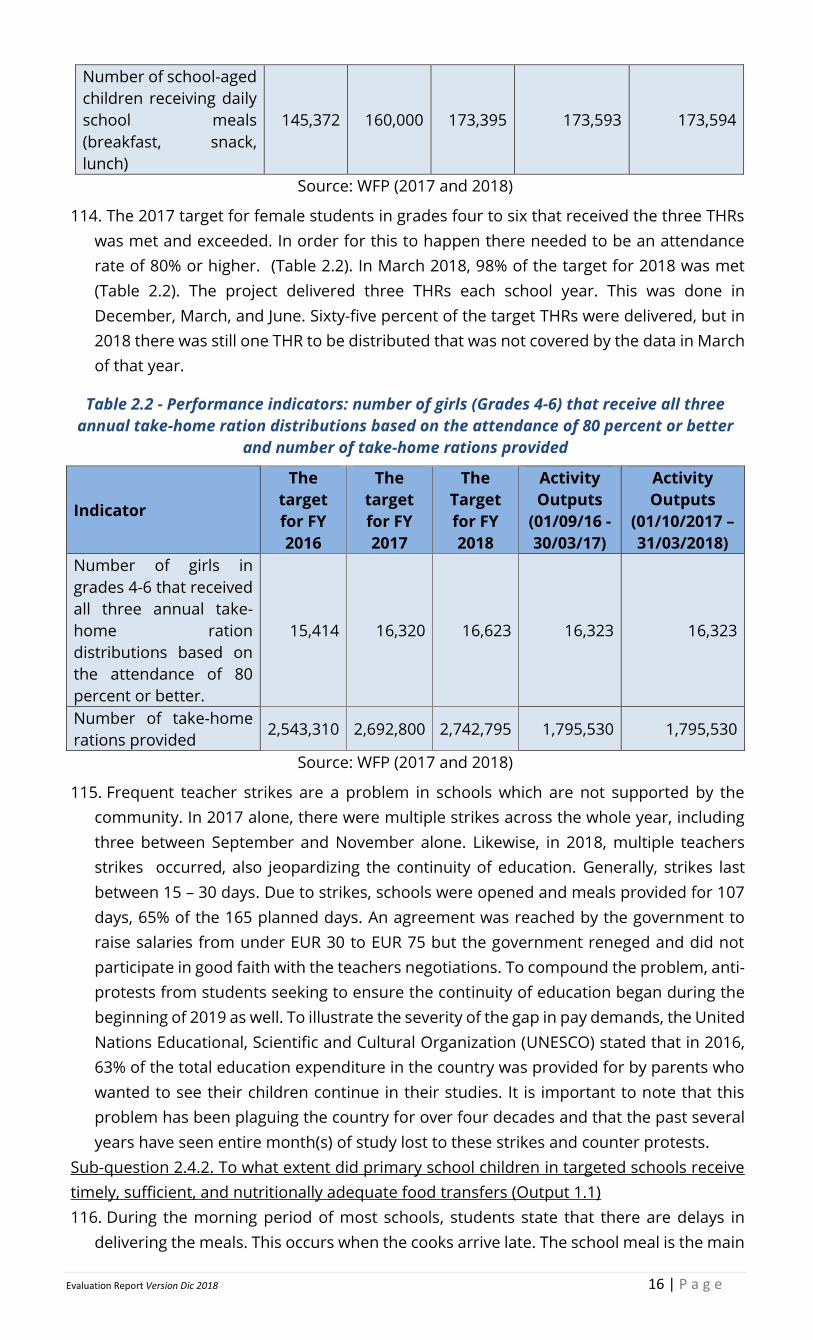
Evaluation Report Version Dic 2018 16 | P a g e
Number of school-aged
children receiving daily
school meals
(breakfast, snack,
lunch)
145,372 160,000 173,395 173,593 173,594
Source: WFP (2017 and 2018)
114. The 2017 target for female students in grades four to six that received the three THRs
was met and exceeded. In order for this to happen there needed to be an attendance
rate of 80% or higher. (Table 2.2). In March 2018, 98% of the target for 2018 was met
(Table 2.2). The project delivered three THRs each school year. This was done in
December, March, and June. Sixty-five percent of the target THRs were delivered, but in
2018 there was still one THR to be distributed that was not covered by the data in March
of that year.
Table 2.2 - Performance indicators: number of girls (Grades 4-6) that receive all three
annual take-home ration distributions based on the attendance of 80 percent or better
and number of take-home rations provided
Indicator
The
target
for FY
2016
The
target
for FY
2017
The
Target
for FY
2018
Activity
Outputs
(01/09/16 -
30/03/17)
Activity
Outputs
(01/10/2017 –
31/03/2018)
Number of girls in
grades 4-6 that received
all three annual take-
home ration
distributions based on
the attendance of 80
percent or better.
15,414 16,320 16,623 16,323 16,323
Number of take-home
rations provided 2,543,310 2,692,800 2,742,795 1,795,530 1,795,530
Source: WFP (2017 and 2018)
115. Frequent teacher strikes are a problem in schools which are not supported by the
community. In 2017 alone, there were multiple strikes across the whole year, including
three between September and November alone. Likewise, in 2018, multiple teachers
strikes occurred, also jeopardizing the continuity of education. Generally, strikes last
between 15 – 30 days. Due to strikes, schools were opened and meals provided for 107
days, 65% of the 165 planned days. An agreement was reached by the government to
raise salaries from under EUR 30 to EUR 75 but the government reneged and did not
participate in good faith with the teachers negotiations. To compound the problem, anti-
protests from students seeking to ensure the continuity of education began during the
beginning of 2019 as well. To illustrate the severity of the gap in pay demands, the United
Nations Educational, Scientific and Cultural Organization (UNESCO) stated that in 2016,
63% of the total education expenditure in the country was provided for by parents who
wanted to see their children continue in their studies. It is important to note that this
problem has been plaguing the country for over four decades and that the past several
years have seen entire month(s) of study lost to these strikes and counter protests.
Sub-question 2.4.2. To what extent did primary school children in targeted schools receive
timely, sufficient, and nutritionally adequate food transfers (Output 1.1)
116. During the morning period of most schools, students state that there are delays in
delivering the meals. This occurs when the cooks arrive late. The school meal is the main
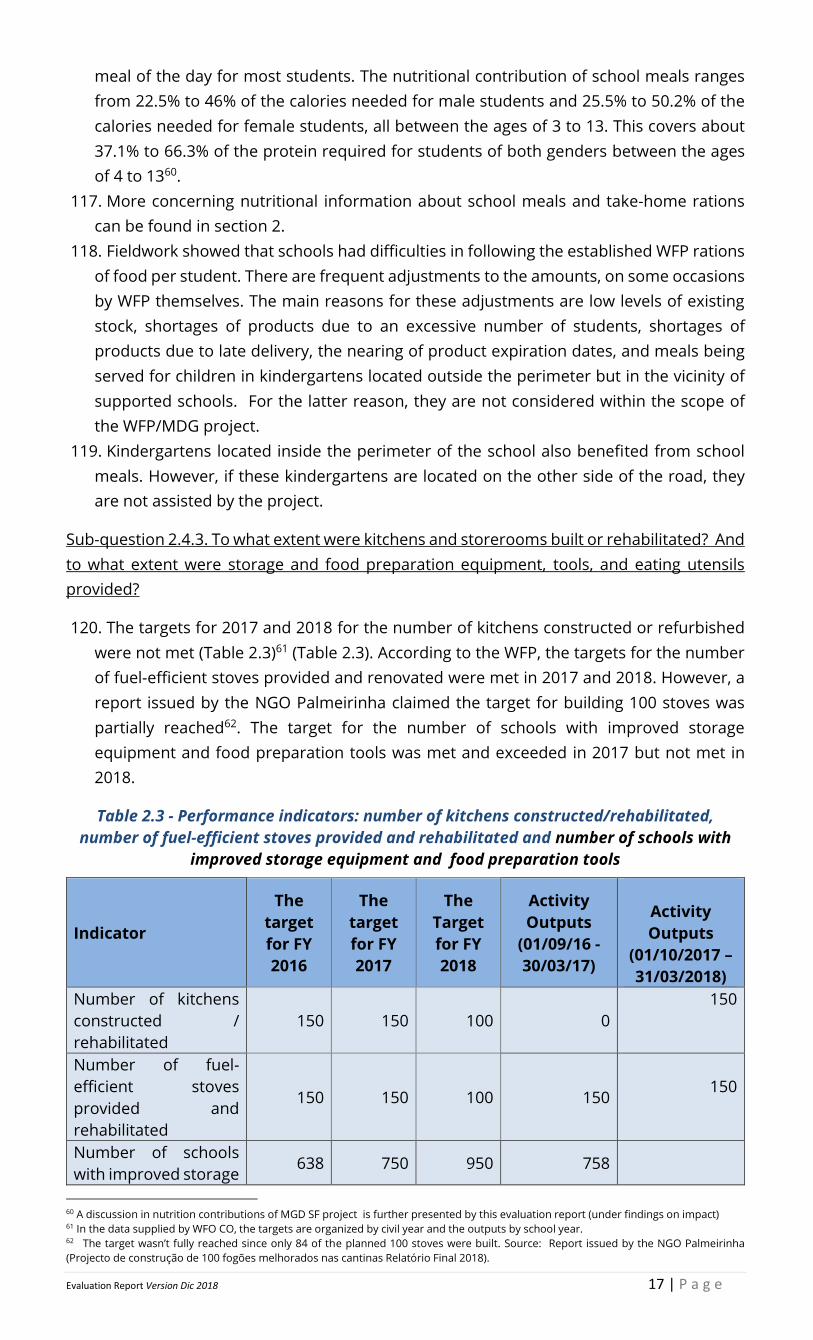
Evaluation Report Version Dic 2018 17 | P a g e
meal of the day for most students. The nutritional contribution of school meals ranges
from 22.5% to 46% of the calories needed for male students and 25.5% to 50.2% of the
calories needed for female students, all between the ages of 3 to 13. This covers about
37.1% to 66.3% of the protein required for students of both genders between the ages
of 4 to 1360.
117. More concerning nutritional information about school meals and take-home rations
can be found in section 2.
118. Fieldwork showed that schools had difficulties in following the established WFP rations
of food per student. There are frequent adjustments to the amounts, on some occasions
by WFP themselves. The main reasons for these adjustments are low levels of existing
stock, shortages of products due to an excessive number of students, shortages of
products due to late delivery, the nearing of product expiration dates, and meals being
served for children in kindergartens located outside the perimeter but in the vicinity of
supported schools. For the latter reason, they are not considered within the scope of
the WFP/MDG project.
119. Kindergartens located inside the perimeter of the school also benefited from school
meals. However, if these kindergartens are located on the other side of the road, they
are not assisted by the project.
Sub-question 2.4.3. To what extent were kitchens and storerooms built or rehabilitated? And
to what extent were storage and food preparation equipment, tools, and eating utensils
provided?
120. The targets for 2017 and 2018 for the number of kitchens constructed or refurbished
were not met (Table 2.3)61 (Table 2.3). According to the WFP, the targets for the number
of fuel-efficient stoves provided and renovated were met in 2017 and 2018. However, a
report issued by the NGO Palmeirinha claimed the target for building 100 stoves was
partially reached62. The target for the number of schools with improved storage
equipment and food preparation tools was met and exceeded in 2017 but not met in
2018.
Table 2.3 - Performance indicators: number of kitchens constructed/rehabilitated,
number of fuel-efficient stoves provided and rehabilitated and number of schools with
improved storage equipment and food preparation tools
Indicator
The
target
for FY
2016
The
target
for FY
2017
The
Target
for FY
2018
Activity
Outputs
(01/09/16 -
30/03/17)
Activity
Outputs
(01/10/2017 –
31/03/2018)
Number of kitchens
constructed /
rehabilitated
150 150 100 0
150
Number of fuel-
efficient stoves
provided and
rehabilitated
150 150 100 150
150
Number of schools
with improved storage 638 750 950 758
60 A discussion in nutrition contributions of MGD SF project is further presented by this evaluation report (under findings on impact) 61 In the data supplied by WFO CO, the targets are organized by civil year and the outputs by school year. 62 The target wasn’t fully reached since only 84 of the planned 100 stoves were built. Source: Report issued by the NGO Palmeirinha
(Projecto de construção de 100 fogões melhorados nas cantinas Relatório Final 2018).
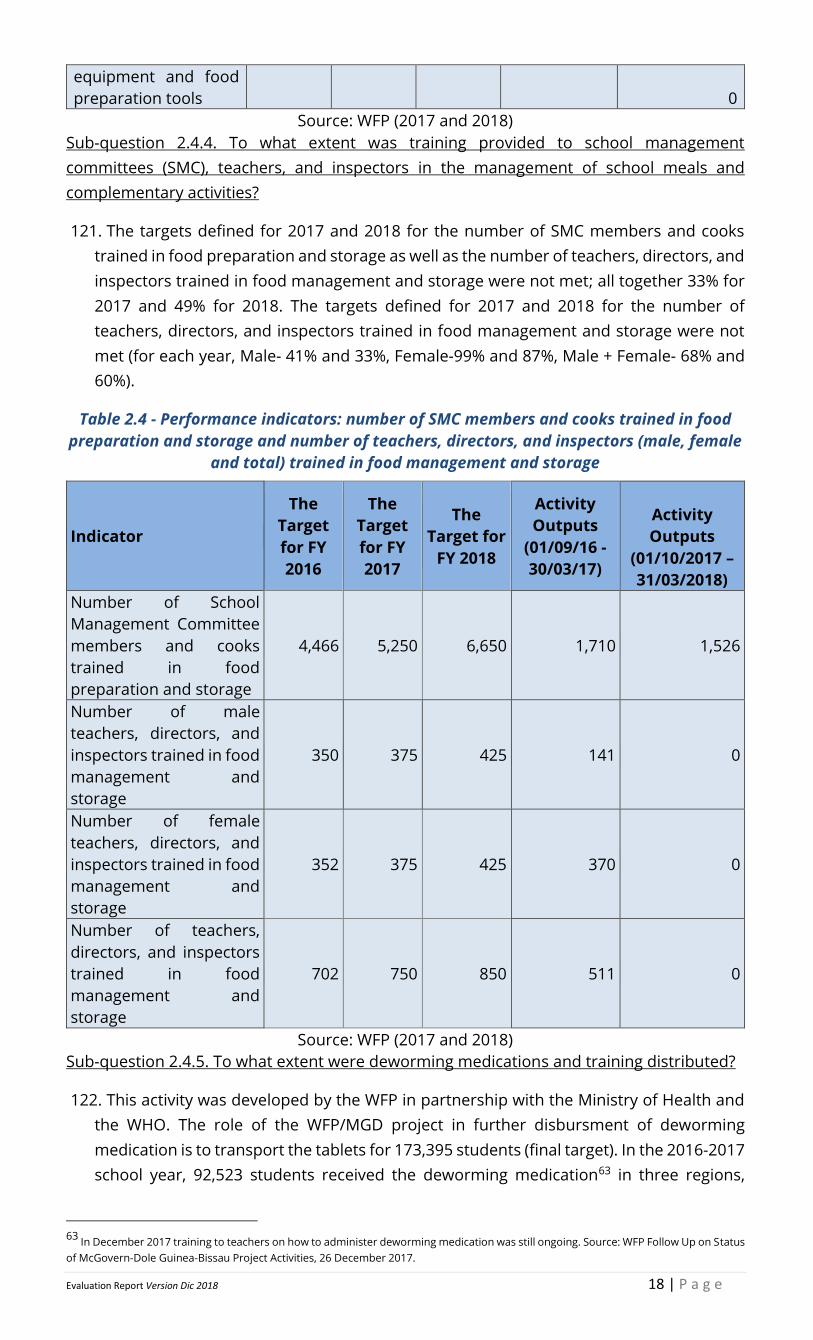
Evaluation Report Version Dic 2018 18 | P a g e
equipment and food
preparation tools
0
Source: WFP (2017 and 2018)
Sub-question 2.4.4. To what extent was training provided to school management
committees (SMC), teachers, and inspectors in the management of school meals and
complementary activities?
121. The targets defined for 2017 and 2018 for the number of SMC members and cooks
trained in food preparation and storage as well as the number of teachers, directors, and
inspectors trained in food management and storage were not met; all together 33% for
2017 and 49% for 2018. The targets defined for 2017 and 2018 for the number of
teachers, directors, and inspectors trained in food management and storage were not
met (for each year, Male- 41% and 33%, Female-99% and 87%, Male + Female- 68% and
60%).
Table 2.4 - Performance indicators: number of SMC members and cooks trained in food
preparation and storage and number of teachers, directors, and inspectors (male, female
and total) trained in food management and storage
Indicator
The
Target
for FY
2016
The
Target
for FY
2017
The
Target for
FY 2018
Activity
Outputs
(01/09/16 -
30/03/17)
Activity
Outputs
(01/10/2017 –
31/03/2018)
Number of School
Management Committee
members and cooks
trained in food
preparation and storage
4,466 5,250 6,650 1,710 1,526
Number of male
teachers, directors, and
inspectors trained in food
management and
storage
350 375 425 141 0
Number of female
teachers, directors, and
inspectors trained in food
management and
storage
352 375 425 370 0
Number of teachers,
directors, and inspectors
trained in food
management and
storage
702 750 850 511 0
Source: WFP (2017 and 2018)
Sub-question 2.4.5. To what extent were deworming medications and training distributed?
122. This activity was developed by the WFP in partnership with the Ministry of Health and
the WHO. The role of the WFP/MGD project in further disbursment of deworming
medication is to transport the tablets for 173,395 students (final target). In the 2016-2017
school year, 92,523 students received the deworming medication63 in three regions,
63
In December 2017 training to teachers on how to administer deworming medication was still ongoing. Source: WFP Follow Up on Status
of McGovern-Dole Guinea-Bissau Project Activities, 26 December 2017.
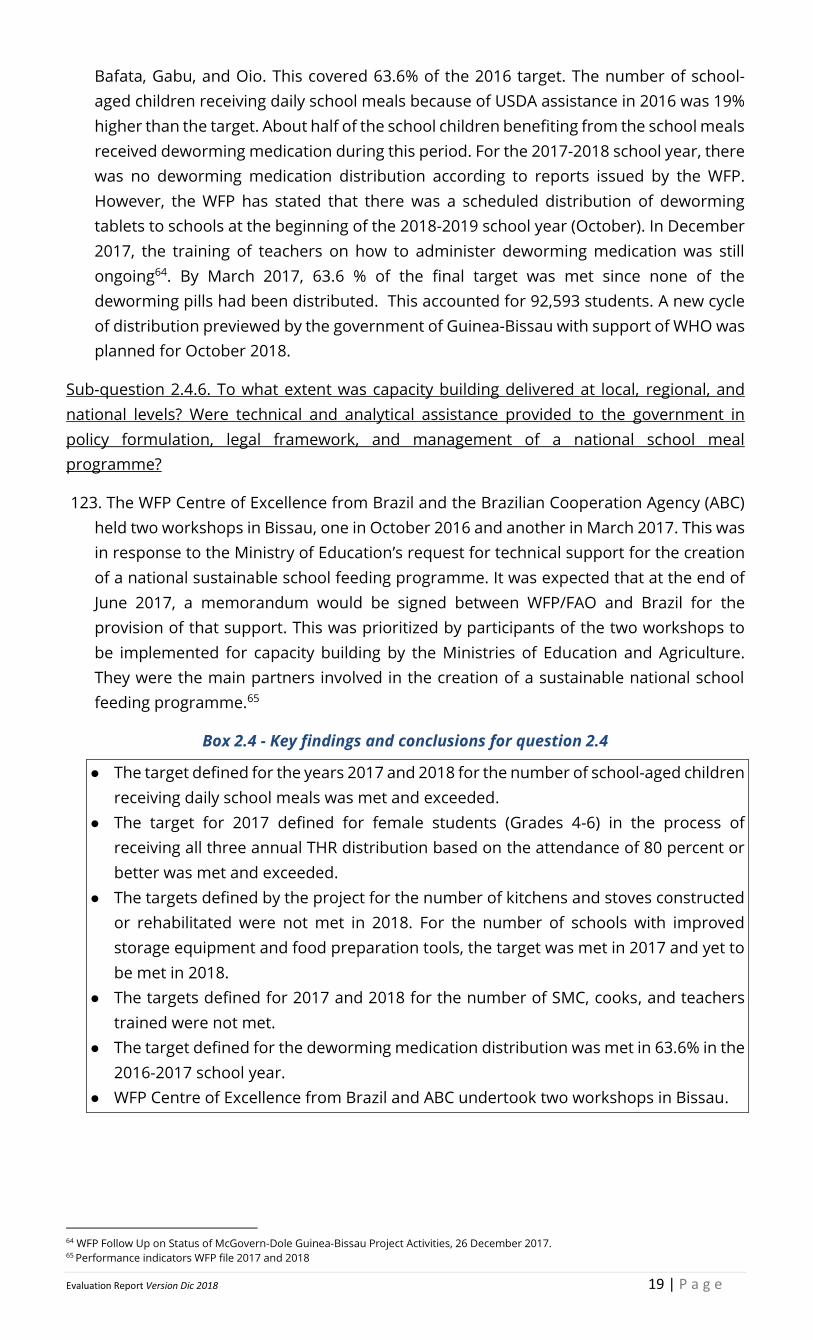
Evaluation Report Version Dic 2018 19 | P a g e
Bafata, Gabu, and Oio. This covered 63.6% of the 2016 target. The number of school-
aged children receiving daily school meals because of USDA assistance in 2016 was 19%
higher than the target. About half of the school children benefiting from the school meals
received deworming medication during this period. For the 2017-2018 school year, there
was no deworming medication distribution according to reports issued by the WFP.
However, the WFP has stated that there was a scheduled distribution of deworming
tablets to schools at the beginning of the 2018-2019 school year (October). In December
2017, the training of teachers on how to administer deworming medication was still
ongoing64. By March 2017, 63.6 % of the final target was met since none of the
deworming pills had been distributed. This accounted for 92,593 students. A new cycle
of distribution previewed by the government of Guinea-Bissau with support of WHO was
planned for October 2018.
Sub-question 2.4.6. To what extent was capacity building delivered at local, regional, and
national levels? Were technical and analytical assistance provided to the government in
policy formulation, legal framework, and management of a national school meal
programme?
123. The WFP Centre of Excellence from Brazil and the Brazilian Cooperation Agency (ABC)
held two workshops in Bissau, one in October 2016 and another in March 2017. This was
in response to the Ministry of Education’s request for technical support for the creation
of a national sustainable school feeding programme. It was expected that at the end of
June 2017, a memorandum would be signed between WFP/FAO and Brazil for the
provision of that support. This was prioritized by participants of the two workshops to
be implemented for capacity building by the Ministries of Education and Agriculture.
They were the main partners involved in the creation of a sustainable national school
feeding programme.65
Box 2.4 - Key findings and conclusions for question 2.4
● The target defined for the years 2017 and 2018 for the number of school-aged children
receiving daily school meals was met and exceeded.
● The target for 2017 defined for female students (Grades 4-6) in the process of
receiving all three annual THR distribution based on the attendance of 80 percent or
better was met and exceeded.
● The targets defined by the project for the number of kitchens and stoves constructed
or rehabilitated were not met in 2018. For the number of schools with improved
storage equipment and food preparation tools, the target was met in 2017 and yet to
be met in 2018.
● The targets defined for 2017 and 2018 for the number of SMC, cooks, and teachers
trained were not met.
● The target defined for the deworming medication distribution was met in 63.6% in the
2016-2017 school year.
● WFP Centre of Excellence from Brazil and ABC undertook two workshops in Bissau.
64 WFP Follow Up on Status of McGovern-Dole Guinea-Bissau Project Activities, 26 December 2017. 65 Performance indicators WFP file 2017 and 2018
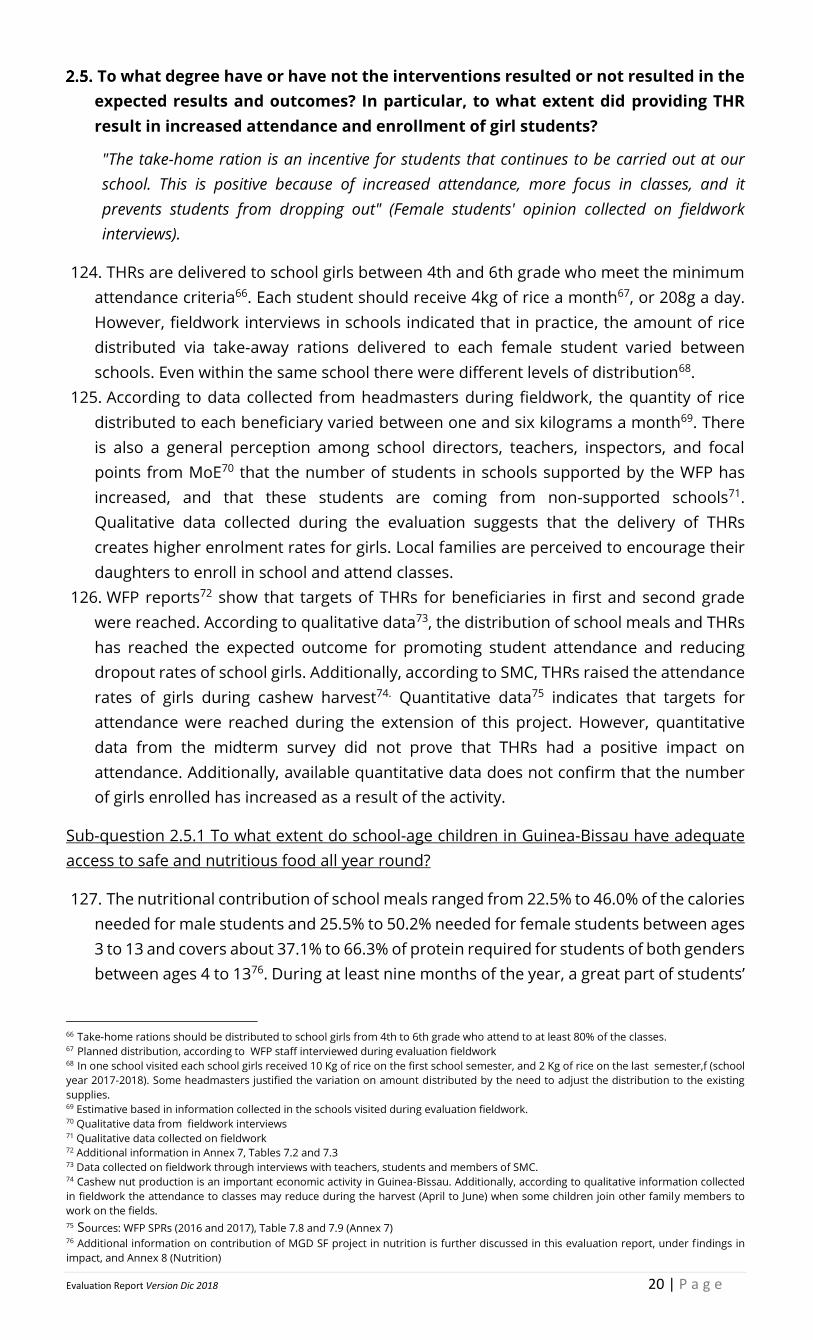
Evaluation Report Version Dic 2018 20 | P a g e
To what degree have or have not the interventions resulted or not resulted in the
expected results and outcomes? In particular, to what extent did providing THR
result in increased attendance and enrollment of girl students?
"The take-home ration is an incentive for students that continues to be carried out at our
school. This is positive because of increased attendance, more focus in classes, and it
prevents students from dropping out" (Female students' opinion collected on fieldwork
interviews).
124. THRs are delivered to school girls between 4th and 6th grade who meet the minimum
attendance criteria66. Each student should receive 4kg of rice a month67, or 208g a day.
However, fieldwork interviews in schools indicated that in practice, the amount of rice
distributed via take-away rations delivered to each female student varied between
schools. Even within the same school there were different levels of distribution68.
125. According to data collected from headmasters during fieldwork, the quantity of rice
distributed to each beneficiary varied between one and six kilograms a month69. There
is also a general perception among school directors, teachers, inspectors, and focal
points from MoE70 that the number of students in schools supported by the WFP has
increased, and that these students are coming from non-supported schools71.
Qualitative data collected during the evaluation suggests that the delivery of THRs
creates higher enrolment rates for girls. Local families are perceived to encourage their
daughters to enroll in school and attend classes.
126. WFP reports72 show that targets of THRs for beneficiaries in first and second grade
were reached. According to qualitative data73, the distribution of school meals and THRs
has reached the expected outcome for promoting student attendance and reducing
dropout rates of school girls. Additionally, according to SMC, THRs raised the attendance
rates of girls during cashew harvest74. Quantitative data75 indicates that targets for
attendance were reached during the extension of this project. However, quantitative
data from the midterm survey did not prove that THRs had a positive impact on
attendance. Additionally, available quantitative data does not confirm that the number
of girls enrolled has increased as a result of the activity.
Sub-question 2.5.1 To what extent do school-age children in Guinea-Bissau have adequate
access to safe and nutritious food all year round?
127. The nutritional contribution of school meals ranged from 22.5% to 46.0% of the calories
needed for male students and 25.5% to 50.2% needed for female students between ages
3 to 13 and covers about 37.1% to 66.3% of protein required for students of both genders
between ages 4 to 1376. During at least nine months of the year, a great part of students’
66 Take-home rations should be distributed to school girls from 4th to 6th grade who attend to at least 80% of the classes. 67 Planned distribution, according to WFP staff interviewed during evaluation fieldwork 68 In one school visited each school girls received 10 Kg of rice on the first school semester, and 2 Kg of rice on the last semester,f (school
year 2017-2018). Some headmasters justified the variation on amount distributed by the need to adjust the distribution to the existing
supplies. 69 Estimative based in information collected in the schools visited during evaluation fieldwork. 70 Qualitative data from fieldwork interviews 71 Qualitative data collected on fieldwork 72 Additional information in Annex 7, Tables 7.2 and 7.3 73 Data collected on fieldwork through interviews with teachers, students and members of SMC. 74 Cashew nut production is an important economic activity in Guinea-Bissau. Additionally, according to qualitative information collected
in fieldwork the attendance to classes may reduce during the harvest (April to June) when some children join other family members to
work on the fields. 75 Sources: WFP SPRs (2016 and 2017), Table 7.8 and 7.9 (Annex 7) 76 Additional information on contribution of MGD SF project in nutrition is further discussed in this evaluation report, under findings in
impact, and Annex 8 (Nutrition)
Evaluation Report Version Dic 2018 21 | P a g e
nutritional needs is provided for by school meals and THRs, when teacher strikes are
excluded. During holidays, students do not receive food from school. More about the
nutritional contribution of school meals and THRs can be found in section 2.8.
Box 2.5 - Key findings and conclusions for question 2.5
● During at least nine months of the year, a great part of student nutritional needs is
provided for by school meals and THRs when teacher strikes are excluded.
● There is a general perception among school directors, teachers, inspectors, and
regional focal points from MoE that the number of students in schools supported by
the WFP increased; however, this wasn’t valid quantitative data.
● Although there is a strong perception by school members of the positive result of
school feeding on girl’s enrollment and attendance, this evaluation couldn’t prove it.
Is hunger reduced?
Sub-question 2.6.1 To what extent is hunger reduced within local communities?
128. The project targeted very vulnerable school children from food insecure communities.
Thus, the SF programme constitutes an important form of nutritional and financial
support to many vulnerable and food insecure, or food deprived families. According to
the results of interviews with the SMC, school meals are very important since they
decrease the burden of families having to feed themselves77.
129. Results of the baseline and midterm surveys showed an increase in the number of
students who ate school meals delivered by the MGD SF project, from 80.1% to 92.5%,
from 2016 to 2018 respectively (Annex 7). Additionally, school meals reduce short-term
hunger and contribute to the nutrition of the children enrolled in the schools. An analysis
of the contribution to reducing the hunger of school children is further presented in sub-
question 2.8.1.
130. Reducing hunger and increasing dietary diversity of school-age children and families
requires interventions in factors beyond WFP control. The eating habits in households
do not only depend on what they know about nutrition but on if they can afford a diet
that includes all types of nutrition required. Therefore, it is not only a matter of how well
the teachers teach nutrition, or how much the students learn about nutrition, but of the
family’s capacity to buy and consume all the foods that are important for healthy eating.
Thus, this project can contribute by promoting nutritional education and reducing short-
term hunger at schools.
131. Even though the MGD SF project is an important contributor to reducing hunger,
further benefits to the community may occur by having more locally purchased food
supplied to school canteens. The SF programme establishes a regular market for locally
produced food. Generating income to poor families of smallholder farmers is an effective
strategy to reduce hunger because income strongly determines access to food.
132. According to the baseline survey and the 2018 survey, no significant change was
observed in the diet of families of students from MGD SF assisted schools. In 2016, 8.4%
of families were classified as poor or borderline poor (WFP Food Consumption Score). In
2018, this represented 8.2% of families. The change in food consumption scores seems
to be strongly related to poverty. This is shown by an increase in the number of families
with inadequate diets in the poorest quintile, from 12.6% to 18.3% in 2016 and 2018,
respectively (Annex 7, Table A7.6).
77 Interviews with stakeholders during mid-term evaluation fieldwork
Evaluation Report Version Dic 2018 22 | P a g e
Box 2.6 - Key findings and conclusions for question 2.6
● School meals are very important since they help to decrease the burden of families
having to feed themselves.
● School meals and take-home rations contribute to reducing hunger in food insecure
communities and reducing short- term hunger and because of their contribution to
the nutrition of students.
● The diversity of diet in families seems to be strongly related to poverty, though the
school feeding programme has great potential to further contribute to reducing
hunger and rural poverty by purchasing food locally produced by smallholder farmers.
How can the theory of change be altered to increase efficiency and effectiveness?
Did assistance reach the right beneficiaries in the right quantity and quality at the
right time?
Sub-question 2.7.1 To what extent did local beneficiaries participate in the process of project
design?
133. Local community representatives and parent associations are involved in the
organization of the system through the SMC, but they do not participate in the process
of project design. Some students participate in the organization of meals, helping to
distribute the food; however, they do not participate in the process of project design.
Sub-question 2.7.2 Is the food perceived as sufficient in terms of quantity and quality? Is
the food reaching the right beneficiaries?
134. Food is perceived as sufficient in terms of quantity and quality by students. However,
students are demanding greater diversification of meals through the introduction of the
following products: canned sardines which were discontinued by WFP and donated in
the past by the government of Japan, porridge, milk, sugar, corned beef, other types of
beans, local vegetables and the use of flavourings called ’gosto’.
Box 2.7 - Key findings and conclusions for question 2.7
● Local community representatives, parent associations, and students do not
participate in the process of project design.
● Food is perceived as enough in terms of quantity and quality by students. However,
students are demanding greater diversification of meals through the introduction of
new products.
Impact
135. Results on the impact of the project were assessed with the use of quantitative data
collected by the midterm survey (June 2018). Similar questionnaires and methodologies
that were used on the baseline survey (2016) were used to collect data with the purpose
of evaluating the results of two groups of schools. One group was WFP assisted and the
other was not. Findings on impact evidence resulted in WFP schools compared to schools
that were not assisted. Additionally, to assess temporal progress, the results of the
baseline survey were also used for impact analyses. Quantitative data provided by WFP
reports and qualitative data from fieldwork were used for triangulation. A set of tables
presenting quantitative data used for impact analysis is presented in Annex 7.
136. The MGD SF project has two SOs. SO1 improved literacy of school-aged children and
SO2 increased the use of health and dietary practices. Outcomes and outputs for each
Evaluation Report Version Dic 2018 23 | P a g e
SO and planned activities have specific targets for each year of implementation (Annex
7, Table A.7.1). MGD SO1 and SO2 are aligned to the WFP CO Strategic Outcome 1.
School-age children in Guinea-Bissau have adequate access to safe and nutritious food
year-round (T-ICSP). It also contributes to the achievement of the WFP Strategic Result 1:
“everyone having access to food”78. The MGD SF project’s framework, which presents the
strategic objectives, intended outcomes, planned activities,indicators monitored, and
yearly targets is presented in Annex 7.
To what degree has the project made progress toward the results at the project-
level framework?
137. Figures for delivering school meals to students and delivering THRs to girls surpassed
both established targets during the first two years of implementation. Details of their
progress and associated outcomes are presented under the following sub-question.
2.8.1 Sub-question: What was the progress of the project on improving the quality of
education and literacy of school children (boys and girls)?
"School feeding programs can help to get children into school and help to keep them there,
through enhancing enrollment and reducing absenteeism; and once the children are in
school, the programs can contribute to their learning, through avoiding hunger and
enhancing cognitive abilities' (Rethinking School Feeding, World Bank-2009)
138. Children living in extreme poverty often arrive at school hungry. If they remain hungry
at school, their level of attentiveness could decrease, compromising their learning
process and attendance at school. Chronic hunger increases the chance of a student
dropping out while poor nutrition impairs their learning. Inversely, there is evidence in
the scientific literature on the positive impact of school feeding improving children’s
learning capacity79,80, as well as on the negative consequences of chronic hunger on child
development81.
139. According to the MGD project that was implemented in Guinea-Bissau, the SO1 should
be reached through the implementation of the SF programme that benefits school
children from 758 schools located in all eight regions of the country. The main
assumption was that the WFP-MGD SF project could promote better literacy rates among
school-age children through the delivery of school meals and THRs for female students.
Although the project framework includes Improved Quality of Literacy Instruction, there
is no planned activity to achieve it (Annex 7). Therefore, the progress of the project's
outcomes on improvements in the quality of teaching as a result of USDA assistance
cannot be expected nor evaluated.
140. The WFP reports82 that in the 2016-2017 school year, and the first semester of the 2017-
2018 school year, retention rates were over 90% and drop-out rates were below 6% in
schools assisted by the MGD SF project. Additionally, the rate of completion for a given
grade was 69% (70% for boys, and 68% for girls). However, as shown in table 2.5, the SF
78 Sustainable Development Goal (SDG) Target 2.1.
79 A study conducted in USA that used cluster sample design to select a nationally representative sample of 21,260 kindergarten children
attending 1592 elementary schools in 1998 –1999 has found strong evidence that food insecurity is linked to specific developmental
consequences for children, both nutritional and non-nutritional. Source: Jyot D.F, Frongillo, E.A & Jones, S.J. Food Insecurity Affects School
Children's Academic Performance, Weight Gain, and Social Skills. The Journal of Nutrition, Volume 135, Issue 12, 1 December 2005, Pages
2831–2839. In https://academic.oup.com/jn/article/135/12/2831/4669915, access November 1st 2018.
80 Additional studies in this matter are presented by Bundy et al. Rethink School Feeding. Social Safety Nets, Child Development and
Education Sector. The World Bank (2009)http://siteresources.worldbank.org/EDUCATION/Resources/278200-1099079877269/547664-
1099080042112/DID_School_Feeding.pdf Access in November 1s
81 Source: Best, C et al. The Nutritional Status of school-aged children: Why should we care? Food and Nutrition Bulletin, vol.31, no 3 (2010),
The United Nations University;
82 Source: WFP Standard Project Report, 2017. t 2018.
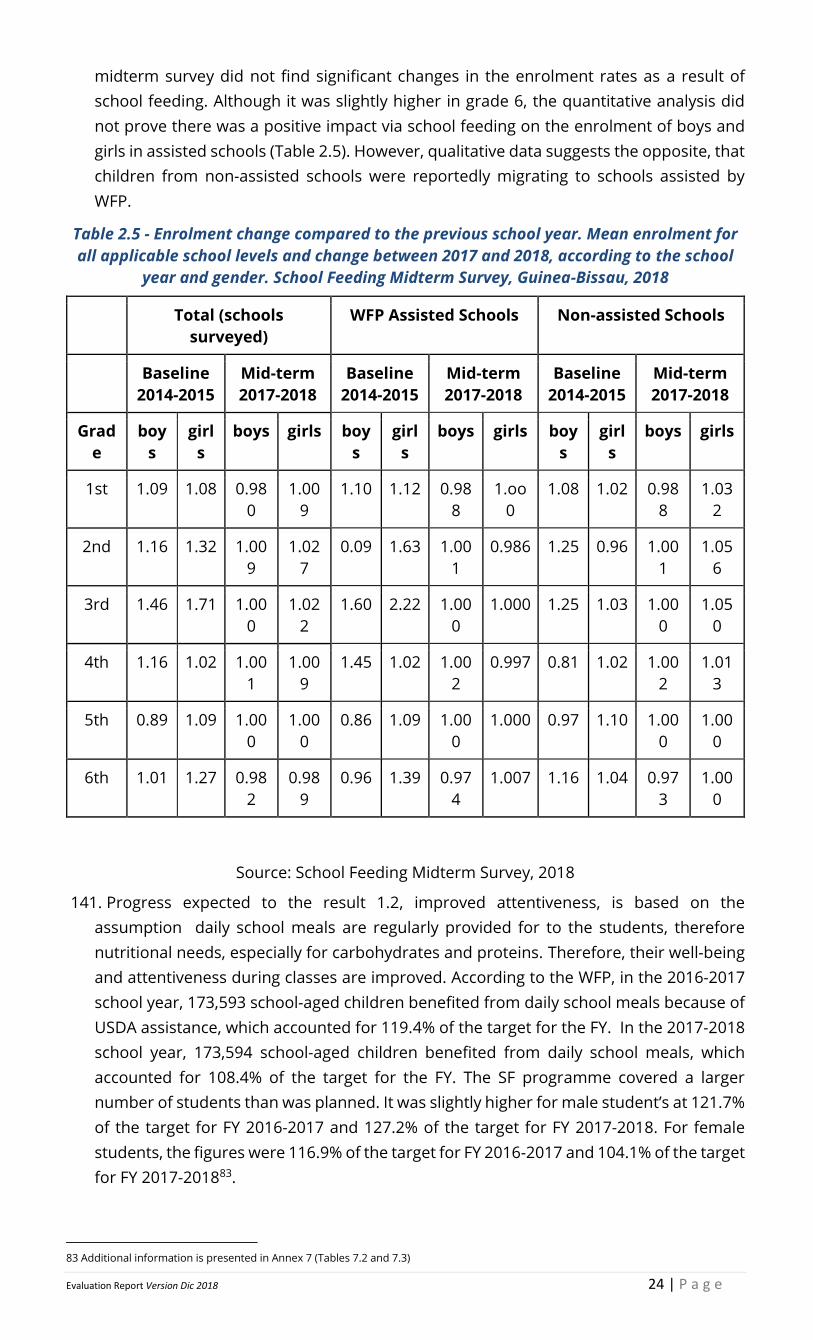
Evaluation Report Version Dic 2018 24 | P a g e
midterm survey did not find significant changes in the enrolment rates as a result of
school feeding. Although it was slightly higher in grade 6, the quantitative analysis did
not prove there was a positive impact via school feeding on the enrolment of boys and
girls in assisted schools (Table 2.5). However, qualitative data suggests the opposite, that
children from non-assisted schools were reportedly migrating to schools assisted by
WFP.
Table 2.5 - Enrolment change compared to the previous school year. Mean enrolment for
all applicable school levels and change between 2017 and 2018, according to the school
year and gender. School Feeding Midterm Survey, Guinea-Bissau, 2018
Total (schools
surveyed)
WFP Assisted Schools Non-assisted Schools
Baseline
2014-2015
Mid-term
2017-2018
Baseline
2014-2015
Mid-term
2017-2018
Baseline
2014-2015
Mid-term
2017-2018
Grad
e
boy
s
girl
s
boys girls boy
s
girl
s
boys girls boy
s
girl
s
boys girls
1st 1.09 1.08 0.98
0
1.00
9
1.10 1.12 0.98
8
1.oo
0
1.08 1.02 0.98
8
1.03
2
2nd 1.16 1.32 1.00
9
1.02
7
0.09 1.63 1.00
1
0.986 1.25 0.96 1.00
1
1.05
6
3rd 1.46 1.71 1.00
0
1.02
2
1.60 2.22 1.00
0
1.000 1.25 1.03 1.00
0
1.05
0
4th 1.16 1.02 1.00
1
1.00
9
1.45 1.02 1.00
2
0.997 0.81 1.02 1.00
2
1.01
3
5th 0.89 1.09 1.00
0
1.00
0
0.86 1.09 1.00
0
1.000 0.97 1.10 1.00
0
1.00
0
6th 1.01 1.27 0.98
2
0.98
9
0.96 1.39 0.97
4
1.007 1.16 1.04 0.97
3
1.00
0
Source: School Feeding Midterm Survey, 2018
141. Progress expected to the result 1.2, improved attentiveness, is based on the
assumption daily school meals are regularly provided for to the students, therefore
nutritional needs, especially for carbohydrates and proteins. Therefore, their well-being
and attentiveness during classes are improved. According to the WFP, in the 2016-2017
school year, 173,593 school-aged children benefited from daily school meals because of
USDA assistance, which accounted for 119.4% of the target for the FY. In the 2017-2018
school year, 173,594 school-aged children benefited from daily school meals, which
accounted for 108.4% of the target for the FY. The SF programme covered a larger
number of students than was planned. It was slightly higher for male student’s at 121.7%
of the target for FY 2016-2017 and 127.2% of the target for FY 2017-2018. For female
students, the figures were 116.9% of the target for FY 2016-2017 and 104.1% of the target
for FY 2017-201883.
83 Additional information is presented in Annex 7 (Tables 7.2 and 7.3)
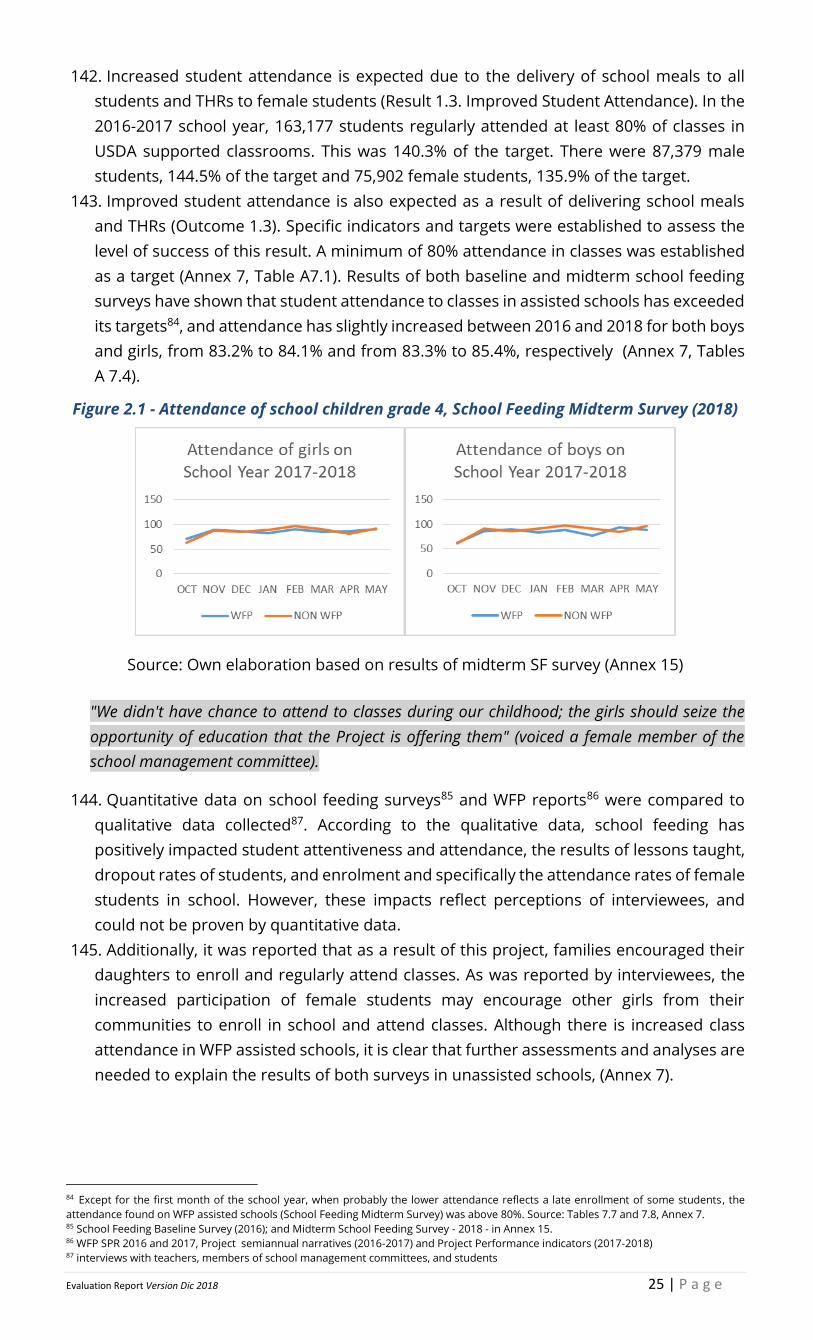
Evaluation Report Version Dic 2018 25 | P a g e
142. Increased student attendance is expected due to the delivery of school meals to all
students and THRs to female students (Result 1.3. Improved Student Attendance). In the
2016-2017 school year, 163,177 students regularly attended at least 80% of classes in
USDA supported classrooms. This was 140.3% of the target. There were 87,379 male
students, 144.5% of the target and 75,902 female students, 135.9% of the target.
143. Improved student attendance is also expected as a result of delivering school meals
and THRs (Outcome 1.3). Specific indicators and targets were established to assess the
level of success of this result. A minimum of 80% attendance in classes was established
as a target (Annex 7, Table A7.1). Results of both baseline and midterm school feeding
surveys have shown that student attendance to classes in assisted schools has exceeded
its targets84, and attendance has slightly increased between 2016 and 2018 for both boys
and girls, from 83.2% to 84.1% and from 83.3% to 85.4%, respectively (Annex 7, Tables
A 7.4).
Figure 2.1 - Attendance of school children grade 4, School Feeding Midterm Survey (2018)
Source: Own elaboration based on results of midterm SF survey (Annex 15)
"We didn't have chance to attend to classes during our childhood; the girls should seize the
opportunity of education that the Project is offering them" (voiced a female member of the
school management committee).
144. Quantitative data on school feeding surveys85 and WFP reports86 were compared to
qualitative data collected87. According to the qualitative data, school feeding has
positively impacted student attentiveness and attendance, the results of lessons taught,
dropout rates of students, and enrolment and specifically the attendance rates of female
students in school. However, these impacts reflect perceptions of interviewees, and
could not be proven by quantitative data.
145. Additionally, it was reported that as a result of this project, families encouraged their
daughters to enroll and regularly attend classes. As was reported by interviewees, the
increased participation of female students may encourage other girls from their
communities to enroll in school and attend classes. Although there is increased class
attendance in WFP assisted schools, it is clear that further assessments and analyses are
needed to explain the results of both surveys in unassisted schools, (Annex 7).
84 Except for the first month of the school year, when probably the lower attendance reflects a late enrollment of some students, the
attendance found on WFP assisted schools (School Feeding Midterm Survey) was above 80%. Source: Tables 7.7 and 7.8, Annex 7. 85 School Feeding Baseline Survey (2016); and Midterm School Feeding Survey - 2018 - in Annex 15. 86 WFP SPR 2016 and 2017, Project semiannual narratives (2016-2017) and Project Performance indicators (2017-2018) 87 interviews with teachers, members of school management committees, and students
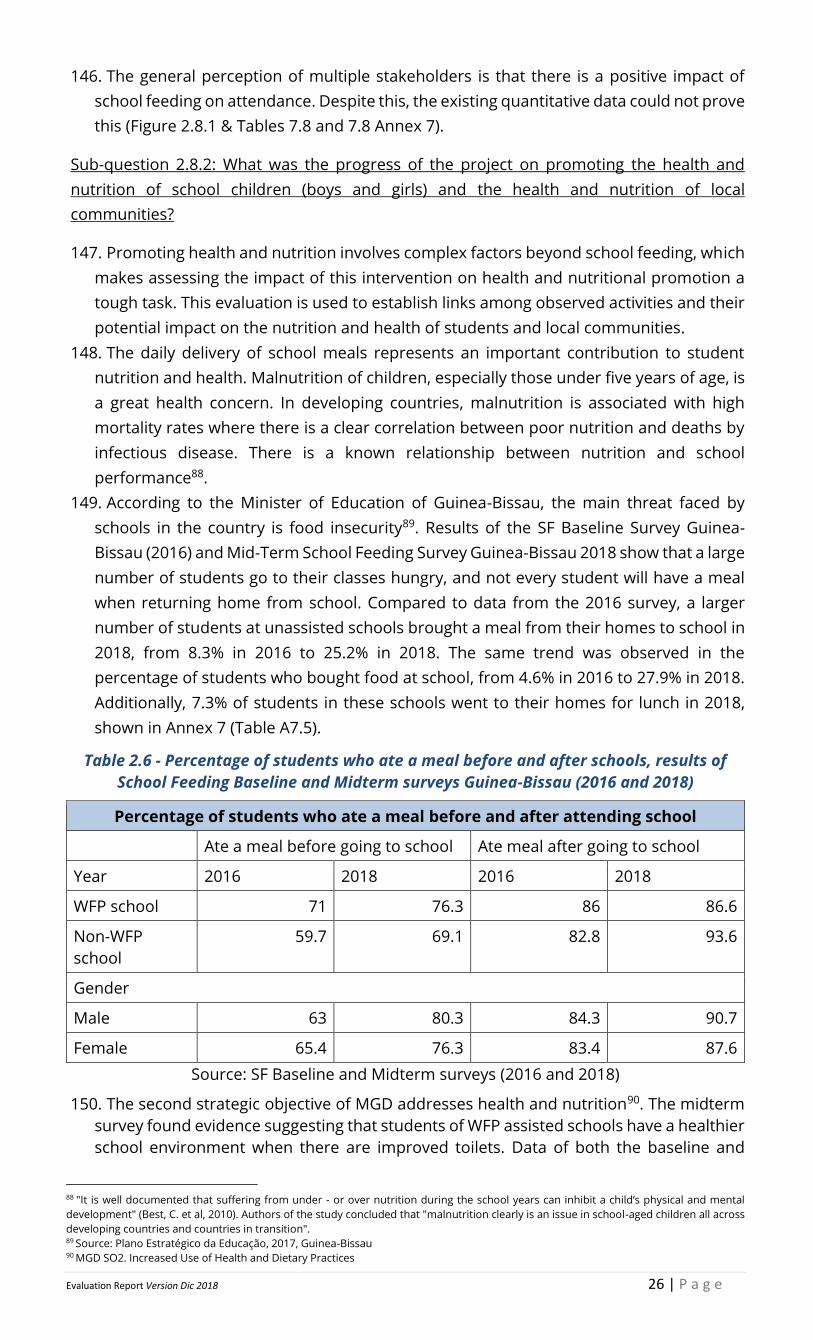
Evaluation Report Version Dic 2018 26 | P a g e
146. The general perception of multiple stakeholders is that there is a positive impact of
school feeding on attendance. Despite this, the existing quantitative data could not prove
this (Figure 2.8.1 & Tables 7.8 and 7.8 Annex 7).
Sub-question 2.8.2: What was the progress of the project on promoting the health and
nutrition of school children (boys and girls) and the health and nutrition of local
communities?
147. Promoting health and nutrition involves complex factors beyond school feeding, which
makes assessing the impact of this intervention on health and nutritional promotion a
tough task. This evaluation is used to establish links among observed activities and their
potential impact on the nutrition and health of students and local communities.
148. The daily delivery of school meals represents an important contribution to student
nutrition and health. Malnutrition of children, especially those under five years of age, is
a great health concern. In developing countries, malnutrition is associated with high
mortality rates where there is a clear correlation between poor nutrition and deaths by
infectious disease. There is a known relationship between nutrition and school
performance88.
149. According to the Minister of Education of Guinea-Bissau, the main threat faced by
schools in the country is food insecurity89. Results of the SF Baseline Survey Guinea-
Bissau (2016) and Mid-Term School Feeding Survey Guinea-Bissau 2018 show that a large
number of students go to their classes hungry, and not every student will have a meal
when returning home from school. Compared to data from the 2016 survey, a larger
number of students at unassisted schools brought a meal from their homes to school in
2018, from 8.3% in 2016 to 25.2% in 2018. The same trend was observed in the
percentage of students who bought food at school, from 4.6% in 2016 to 27.9% in 2018.
Additionally, 7.3% of students in these schools went to their homes for lunch in 2018,
shown in Annex 7 (Table A7.5).
Table 2.6 - Percentage of students who ate a meal before and after schools, results of
School Feeding Baseline and Midterm surveys Guinea-Bissau (2016 and 2018)
Percentage of students who ate a meal before and after attending school
Ate a meal before going to school Ate meal after going to school
Year 2016 2018 2016 2018
WFP school 71 76.3 86 86.6
Non-WFP
school
59.7 69.1 82.8 93.6
Gender
Male 63 80.3 84.3 90.7
Female 65.4 76.3 83.4 87.6
Source: SF Baseline and Midterm surveys (2016 and 2018)
150. The second strategic objective of MGD addresses health and nutrition90. The midterm
survey found evidence suggesting that students of WFP assisted schools have a healthier
school environment when there are improved toilets. Data of both the baseline and
88 "It is well documented that suffering from under - or over nutrition during the school years can inhibit a child’s physical and mental
development" (Best, C. et al, 2010). Authors of the study concluded that "malnutrition clearly is an issue in school-aged children all across
developing countries and countries in transition". 89 Source: Plano Estratégico da Educação, 2017, Guinea-Bissau 90 MGD SO2. Increased Use of Health and Dietary Practices
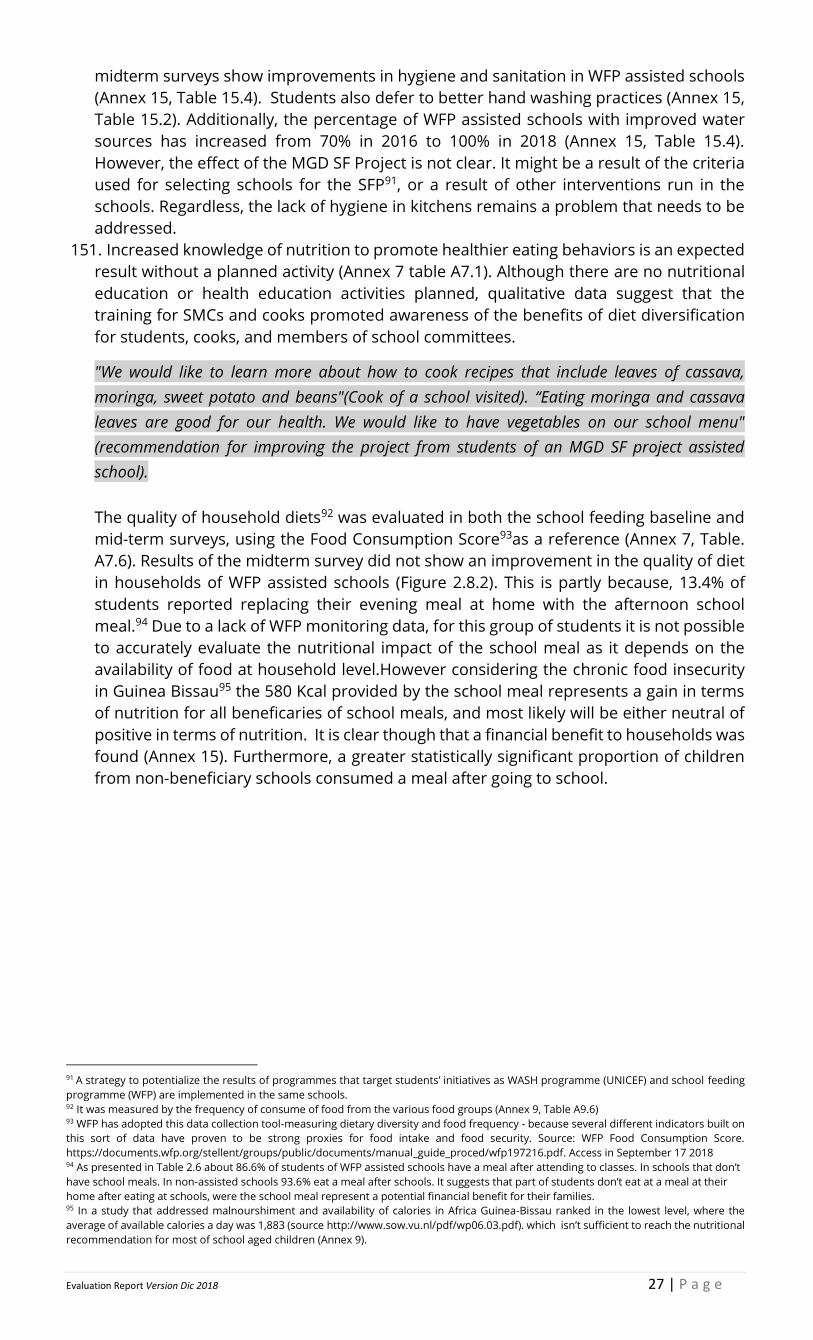
Evaluation Report Version Dic 2018 27 | P a g e
midterm surveys show improvements in hygiene and sanitation in WFP assisted schools
(Annex 15, Table 15.4). Students also defer to better hand washing practices (Annex 15,
Table 15.2). Additionally, the percentage of WFP assisted schools with improved water
sources has increased from 70% in 2016 to 100% in 2018 (Annex 15, Table 15.4).
However, the effect of the MGD SF Project is not clear. It might be a result of the criteria
used for selecting schools for the SFP91, or a result of other interventions run in the
schools. Regardless, the lack of hygiene in kitchens remains a problem that needs to be
addressed.
151. Increased knowledge of nutrition to promote healthier eating behaviors is an expected
result without a planned activity (Annex 7 table A7.1). Although there are no nutritional
education or health education activities planned, qualitative data suggest that the
training for SMCs and cooks promoted awareness of the benefits of diet diversification
for students, cooks, and members of school committees.
"We would like to learn more about how to cook recipes that include leaves of cassava,
moringa, sweet potato and beans"(Cook of a school visited). “Eating moringa and cassava
leaves are good for our health. We would like to have vegetables on our school menu"
(recommendation for improving the project from students of an MGD SF project assisted
school).
The quality of household diets92 was evaluated in both the school feeding baseline and
mid-term surveys, using the Food Consumption Score93as a reference (Annex 7, Table.
A7.6). Results of the midterm survey did not show an improvement in the quality of diet
in households of WFP assisted schools (Figure 2.8.2). This is partly because, 13.4% of
students reported replacing their evening meal at home with the afternoon school
meal.94 Due to a lack of WFP monitoring data, for this group of students it is not possible
to accurately evaluate the nutritional impact of the school meal as it depends on the
availability of food at household level.However considering the chronic food insecurity
in Guinea Bissau95 the 580 Kcal provided by the school meal represents a gain in terms
of nutrition for all beneficaries of school meals, and most likely will be either neutral of
positive in terms of nutrition. It is clear though that a financial benefit to households was
found (Annex 15). Furthermore, a greater statistically significant proportion of children
from non-beneficiary schools consumed a meal after going to school.
91 A strategy to potentialize the results of programmes that target students’ initiatives as WASH programme (UNICEF) and school feeding
programme (WFP) are implemented in the same schools. 92 It was measured by the frequency of consume of food from the various food groups (Annex 9, Table A9.6) 93 WFP has adopted this data collection tool-measuring dietary diversity and food frequency - because several different indicators built on
this sort of data have proven to be strong proxies for food intake and food security. Source: WFP Food Consumption Score.
https://documents.wfp.org/stellent/groups/public/documents/manual_guide_proced/wfp197216.pdf. Access in September 17 2018 94 As presented in Table 2.6 about 86.6% of students of WFP assisted schools have a meal after attending to classes. In schools that don’t
have school meals. In non-assisted schools 93.6% eat a meal after schools. It suggests that part of students don’t eat at a meal at their
home after eating at schools, were the school meal represent a potential financial benefit for their families. 95 In a study that addressed malnourshiment and availability of calories in Africa Guinea-Bissau ranked in the lowest level, where the
average of available calories a day was 1,883 (source http://www.sow.vu.nl/pdf/wp06.03.pdf). which isn’t sufficient to reach the nutritional
recommendation for most of school aged children (Annex 9).
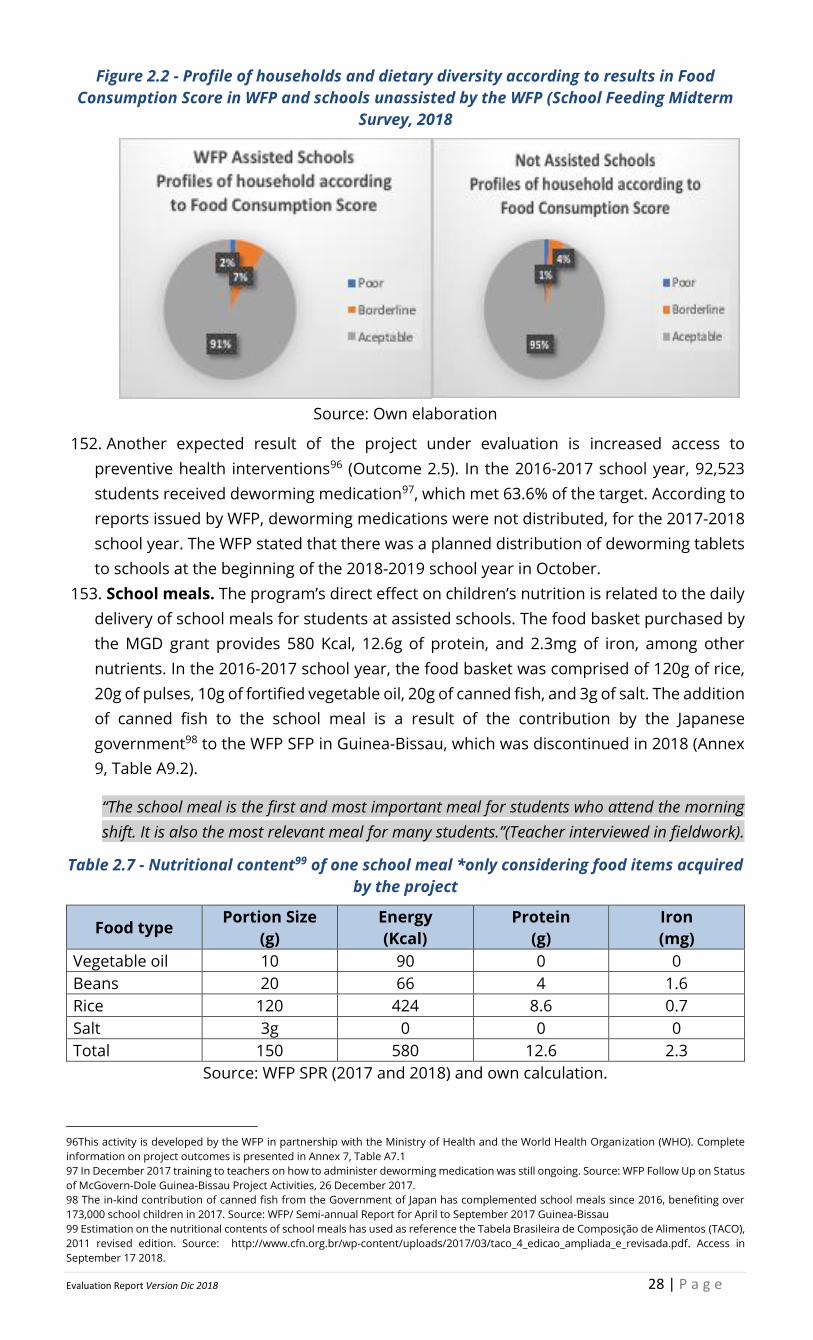
Evaluation Report Version Dic 2018 28 | P a g e
Figure 2.2 - Profile of households and dietary diversity according to results in Food
Consumption Score in WFP and schools unassisted by the WFP (School Feeding Midterm
Survey, 2018
Source: Own elaboration
152. Another expected result of the project under evaluation is increased access to
preventive health interventions96 (Outcome 2.5). In the 2016-2017 school year, 92,523
students received deworming medication97, which met 63.6% of the target. According to
reports issued by WFP, deworming medications were not distributed, for the 2017-2018
school year. The WFP stated that there was a planned distribution of deworming tablets
to schools at the beginning of the 2018-2019 school year in October.
153. School meals. The program’s direct effect on children’s nutrition is related to the daily
delivery of school meals for students at assisted schools. The food basket purchased by
the MGD grant provides 580 Kcal, 12.6g of protein, and 2.3mg of iron, among other
nutrients. In the 2016-2017 school year, the food basket was comprised of 120g of rice,
20g of pulses, 10g of fortified vegetable oil, 20g of canned fish, and 3g of salt. The addition
of canned fish to the school meal is a result of the contribution by the Japanese
government98 to the WFP SFP in Guinea-Bissau, which was discontinued in 2018 (Annex
9, Table A9.2).
“The school meal is the first and most important meal for students who attend the morning
shift. It is also the most relevant meal for many students.”(Teacher interviewed in fieldwork).
Table 2.7 - Nutritional content99 of one school meal *only considering food items acquired
by the project
Food type Portion Size
(g)
Energy
(Kcal)
Protein
(g)
Iron
(mg)
Vegetable oil 10 90 0 0
Beans 20 66 4 1.6
Rice 120 424 8.6 0.7
Salt 3g 0 0 0
Total 150 580 12.6 2.3
Source: WFP SPR (2017 and 2018) and own calculation.
96This activity is developed by the WFP in partnership with the Ministry of Health and the World Health Organization (WHO). Complete
information on project outcomes is presented in Annex 7, Table A7.1
97 In December 2017 training to teachers on how to administer deworming medication was still ongoing. Source: WFP Follow Up on Status
of McGovern-Dole Guinea-Bissau Project Activities, 26 December 2017.
98 The in-kind contribution of canned fish from the Government of Japan has complemented school meals since 2016, benefiting over
173,000 school children in 2017. Source: WFP/ Semi-annual Report for April to September 2017 Guinea-Bissau
99 Estimation on the nutritional contents of school meals has used as reference the Tabela Brasileira de Composição de Alimentos (TACO),
2011 revised edition. Source: http://www.cfn.org.br/wp-content/uploads/2017/03/taco_4_edicao_ampliada_e_revisada.pdf. Access in
September 17 2018.
Evaluation Report Version Dic 2018 29 | P a g e
154. The food basket supplied by the MGD grant, containing 580 Kcal, and 12.6g of protein
covers 22.8% to 46.0% of the calories recommended for boys between 3 to 13 years of
age, respectively. Due to different nutritional requirements between genders, the
contribution in calories is slightly higher for girls, ages 2 to 13, where 580 Kcal covers
25.5% to 50.2% of calories recommended. Although the contribution of school meals in
calories is communicated, this meal is even more relevant as a source of protein. The
combination of rice and beans in the food basket supplies 12.6g of proteins that covers
37.1% to 66.3%of the daily recommended protein for both girls and boys from 4 to 13
years of age.
155. By providing nutrients on a regular basis, the delivery of both school meals and THRs
likely impacts the nutrition of school children in a positive manner. School meals have a
positive impact in reducing short term hunger, particularly for students from the poorest
families. As presented in Annex 15 (Table 45), the number of school days, out of the
standard five, when the pupils eat a meal before classes ranges from three and a half
days for the poorest quintilies to just over four and a half for the richest quintiles.
(poorest quintiles) to 4.6 (richest quintiles) days in five school days. However, it is unclear
how much the daily school meal contributes to the 13.4% of students who do not eat a
meal prior to classes, in terms of both daily caloric and protein intake. The school meals
are well liked by the students. About 92.5% of students from WFP assisted schools ate
school meals on the day prior to the survey100 (Annex 7 Table, A7.5). The addition of 20g
of sardines101 to the school meals increased the amount of high-quality protein in the
food basket. Before this, the daily meal supplied 637 Kcal, 15.8 g of protein and, 3.0 mg
of iron. It was found that this school meal covers about 20% of the daily recommended
intake for iron for children between the ages of 7 and 12. It is important to note that the
sardines are included in the MGD supported school meals when they are available. They
are donated from the government of Japan, and in June of 2018, none of the schools
visited had sardines in stock102.
156. The daily contribution in calories and protein are considerable nutritional support for
the school children from poor households. Therefore, school meals are an important
element of support to children from families struggling to fulfill their daily nutritional
needs. The number of school children that benefited from school meals reached 119%
of the target during the 2016-2017 school year, which means that 173,593 school
children received nutritional support from the MGD project (Table A7.2, Annex 7).
Headmasters interviewed during the fieldwork stated that some schools have an
increased number of students that weren't included in the WFP food distribution plan.
This could then justify reported changes in the portion size distributed for each student
that, in some cases, has been smaller than expected, reducing its impact on nutrition.
157. THRs supply 745 Kcal, 15g of protein, and 1mg of iron, along with other nutrients.
During the 2016-2017 school year, 16,232 or about 105% of the targeted school girls
benefitted from THRs, and in the 2017-2018 school year, the target was reached but did
not exceed the target (Annex 7, Tables A7.2 and A7.3). The rice delivered to households
throughout this project also contributed to the nutrition of school girls and their family
members. It is difficult to assess its impact. Data from fieldwork103 showed that the
100 Source: School Feeding Midterm Survey (year 2018) 101 Sardines aren’t purchased with MGD grant but are a donation of Japan Government to the WFP School Feeding Programme in Guinea-
Bissau. While its presence in school meals food basket were discontinued at the moment of this evaluation there were plans to its return
in the future school year. 102 Source: Data collected by evaluation team in the fieldwork 103 Information collected in interviews with teachers and headmasters and female students during the fieldwork of this evaluation.
Evaluation Report Version Dic 2018 30 | P a g e
amount of rice distributed in take-away rations strongly varied among schools, and even
within the same school.
Sub-question 2.8.3.: What was the progress of the project in strengthening the capacity of
the government of Guinea-Bissau on developing and implementing a nationally owned and
sustainable school feeding?
158. There has not been a SABER assessment since 2015, meaning this section will be limited
to report findings on activities that contribute to capacity development in school feeding.
Capacity development in school feeding is a long-term process which requires a
systematic approach in both education and food security systems. Due to the
multisectorial nature of school feeding programmes, various sectors of government and
civil society should be involved in developing the capacity for a sustainable SFP.
Additionally, during this transition from the WFP SF to a nationally owned system, the
government should work in partnership with development agencies in the country.
159. The project includes Improved Policy and Regulatory Framework as outcome 2.7.2.
However, no specific activity was assigned to this outcome in the project framework.
Another outcome related to the capacity of the government is Increased Government
Support (Outcome 2.7.3). A specific activity is associated with this outcome (A.10 Support
Government to Develop School Feeding Pilot Project)104. The WFP monitors the progress
on increasing the capacity of the government of Guinea-Bissau on school feeding
through their School Feeding National Capacity Index (NCI). According to WFP SPRs (2017
and 2017), the established target of above 1.4 NCI was reached for the years covered by
this mid-term evaluation.
160. Strengthening the capacity of implementing school feeding and improving monitoring
and evaluation systems are expected outcomes under the general results (Increased
Capacity of Government Institutions). The 2016-2017 and 2017-2018 school years show
that training for government staff planned for both school years were developed,
although they did not reach most of the targets (Table 2.4)105.
161. Other planned activities included the training of teachers, directors, and inspectors in
food management and storage practices. School inspectors and most of the teachers
and headmasters are government employees who participate in the school feeding
programme. Targets for training for 2016-2017 reached 72%, 40% for males, and 105%
for females out of a total of 702 people106. No training was reported during the 2017-
2018 school year.
162. Qualitative data from fieldwork has found that headmasters and teachers have
difficulties in performing their role in managing the school feeding programme. Many of
the participants interviewed during the fieldwork stated that they did not participate in
training, and they asked for additional training.
163. According to the WFP report107, recurrent errors are found in data collected on daily
consumption sheets and monthly records. These errors were attributed to the
insufficient capability and knowledge of some teachers. This was worsened by the
persistent turnover of school headmasters. Recurrent delays of monthly reports,
prepared and sent by school headmasters to the Ministry of Education, negatively
104 At least 14 schools should participate in a pilot initiative of home-grown school feeding on the second year of MGD implementation. 105 Though most of planned trainings did not reach its target except for a training on monitoring and evaluation systems reported on the
school year 2017-2018 (Annex 7, Tables A7.1, A7.2, A7.3). 106 According to WFP project narrative report, headmasters of 241 schools newly integrated schools were trained on SF management (2016-
2017) and a refresher training included 270 headmasters of other schools. Complete results on (Annex 7, Tables A7.2 and A7.3). 107 Source: WFP Guinea-Bissau, Semi-annual Report for April to September 2017
Evaluation Report Version Dic 2018 31 | P a g e
impacted the performance of monitoring the school feeding programme. This
information was validated by stakeholder interviews during fieldwork.
Box 2.8 - Key findings and conclusions for question 2.8
• School meal deliveries have potential better nutrition for school children. The nutritional
contribution was slightly better for both female and younger children.108 The nutritional
input given by school meals ranged from 22.5% to 46.0% calories needed for male
students and 25.5% to 50.2% of calories needed for female students, ages three to 13 It
covered about 37.1% to 66.3% of protein required for students of both genders, ages 4
to 13 . Fieldwork showed that it was difficult for schools to maintain the planned food
portion during the distribution of school meals.
• The delivery of take-home rations for school girls has exceeded its targets for the two
first years of the project. Although the amount of rice distributed in take-away rations
delivered to each female student has varied among schools.
• Students of WFP assisted schools attended to at least 80% of classes109, although
evidence of the positive effect of the school feeding programme on attendance wasn't
clear. Qualitative data of fieldwork suggested that school feeding contributed to 1:
improved student’s attentiveness and attendance 2. Better results of students on
learning the lessons taught 3. Reduced dropout of students 4. Increased enrollment and
attendance of female students at the school. The 2018 midterm survey found an average
attendance in WFP assisted schools of 84.1% and 85%, for male and female students
respectively. Student attendance to classes slightly increased between the 2016 and
2018 SF surveys for both boys, from 83.2% to 84.1%, and girls from 83.3% to 85.4%, in
WFP assisted schools. A positive impact of the Project on attendance and enrollment
could not be proven by quantitative data analysis.
• Improvements in school sanitation and hygiene from 2016 to 2018 were found in WFP
assisted schools, although additional assessments are required to prove the impact of
the project on this matter.
• The project was partially successful in strengthening the capacity of school feeding.
Training of school management committees, teachers, headmasters, school cooks, and
government officers were partially developed. Several difficulties in performing their
roles in managing the school feeding and recurrent errors on reporting its results were
found. These issues have negatively impacted its implementation and monitoring.
Have there been any unintended outcomes, either positive or negative?
Sub-question 2.9.1 what were the intended and unintended long-term effects on
institutional capacities?
164. A possible unintended effect of the project on institutional capacities was the migration
of students from schools without school feeding programmes to schools assisted by the
WFP SF programme. Interviews with headmasters indicated that the excess of students
resulted in too many students per teacher. It has also caused a reduction in the size of
meals for each student110. Additionally, it seems that the number of students in schools
that do not benefit from the school feeding programme located in the surrounding area
108 In 2016-2017 school year 173,593 school children, and 173,594 in 2017-2018 benefited of school meals. 109 In 2016-2017 school year 163,177 students regularly attended at least 80% of classes in USDA supported classrooms/schools; and in
2017-2018 school year 160,323 student. 110 Source: qualitative data of fieldwork.
Evaluation Report Version Dic 2018 32 | P a g e
of the assisted schools has been greatly reduced. However, this cannot be supported by
quantitative data.
165. The migration of students to WFP assisted schools could cause distress in planning and
managing educational resources. In fact, qualitative fieldwork data found that some
students moved to schools far from their homes to receive school meals. They walked
long distances to attend classes. As a response, the community requested the creation
of a school transportation programme.
Sub-question 2.9.2 Were there unintended, positive or negative effects for recipients and
non-recipients of assistance, specifically for women and girls?
166. A positive, unintended outcome for girls was the sensitization of girls from local
communities to enroll in schools as a result of the project’s activities. Qualitative data
collected during fieldwork has indicated that the delivery of school meals, and especially
of THRs by schools, has resulted in increasing the enrolment of girls to the schools111. It
seems that local families encourage their daughters to enroll in school and attend classes
because of the project.
167. On the other hand, the migration of students fromschools unassisted by the WFP
school feeding programme to assisted schools resulted in a number of students
attending classes in schools that disperse meals. As reported in the fieldwork interviews,
the children leave their homes very early without eating a meal and walk long distances
to school. Some schools reported increasing the portion of food to students who live far
away from the schools to compensate for the long-distance walk. Although the intention
is good, this initiative might reduce the portion size of the school meal for other students
if there are many students making the long trek to WFP assisted schools.
168. Another unintended impact found by conducting fieldwork interviews112 was the
greater availability of school inspectors in schools not assisted by the project. WFP
provides a fuel subsidy to ensure the regular monitoring of school inspectors at the
assisted schools, which allows them to also visit other nearby schools.
Box 2.9 - Key findings and conclusions for question 2.9
• Qualitative data suggested migration of students from schools that do not distribute
school meals to schools assisted by the Project might be an unintended effect of the
project on institutional capacities of the education system of Guinea-Bissau. The
excessive number of students overload the capacity of the school and cause difficulties
in maintaining the planned portion size for the school meal and take-home ration.
However, it could not be proven by quantitative data.
• Qualitative data of fieldwork found a large number of students who live far away from
the school are enrolled in WFP assisted schools and walk long distances to attend to
classes. As a response to this new scenario, some community members interviewed
requested the creation of a students’ transportation programme to support those
students.
• Qualitative data suggested an unintended effect of projects activities that is positive for
the lives of girls, and their future was women. An increased in sensitization of girls from
local communities to enroll in schools was mentioned by many interviewees. Another
111 Source: Field work interviews at schools 112 Source: Field work with WFP staff.
Evaluation Report Version Dic 2018 33 | P a g e
unintended positive effect of the Project found was the greater availability of school
inspectors on non-assisted schools113.
What internal and external factors affected the project’s achievements of
intended results?Sub-question 2.10.1 Was the project implemented according to
the plan? If not, how did this affect the implementation of the project and in what
manner?
169. An internal factor observed in the programme concerns the actual framework. Some
intended results aren’t accompanied by planned activities, as previously discussed
(Annex 7, Table A7.1). For example, improving the quality of teaching (Outcome 1.1.
Improved Quality of Literacy Instruction), promoting awareness on the benefits of
education (Outcome 1.3.5 Increased Community Understanding of Benefits of
Education) and learning about health and diet (Outcomes 2.1 Improved Knowledge of
Health and Hygiene Practices and 2.3 Increased Knowledge of Nutrition) should be
expected as a direct result of the project activities.
170. On the other hand, the project has been relatively successful in running the school
meal programme in schools and reaching the recipients according to the plan. As
expected, recipients of this programme are students, community members, and school
staff, who are very satisfied with the school feeding activities and acknowledge its
contribution to the education and well-being of the local children. They recommend its
continuation114.
171. The project was implemented according to the plan; however, as presented in Annex
7, Tables A7.1 and A7.2 , the implementation of training as part of capacity building
activities, was delayed during the first year. Some school members115 reported
difficulties in running the school feeding programme and have stated that they have not
been sufficiently trained. School headmasters found it difficult to properly report
activities at school, which negatively impacted the monitoring activities116. The
systematic delays and insufficient quality of monitoring reports led to the adjustment of
the process in 2018 with WFP assuming increased responsibility117. Additionally, the high
turnover of headmasters and teachers increased the need for training to refresh their
knowledge or initially train them.
172. The recurring teacher strikes, and the reported migration of students to assisted
schools negatively impacted planning and the implementation of the school feeding
activities. As stated before, due to strikes, schools were opened and meals provided for
107 days, 65% of the 165 planned days. The increased number of students was not
planned for or considered during the WFP food delivery planning, thereby causing
unexpected adjustments such as a reduction in the portion size of the school meals and
THRs.
173. The recurring delays and poor quality of some monitoring reports issued by schools
caused delays and problems in the reports sent by the Ministry of Education to the WFP.
As a response, in 2018, the WFP increased their responsibility for monitoring the project
113 The Project contributes for the transportation of school inspectors to monitor WFP assisted schools. As result the same inspectors
involved in monitoring the school feeding activities have better conditions to visit nearby schools that aren't assisted by the SF Project. 114 Although some difficulties in implementing the project at school level were reported during the fieldwork interviews there was also a
high level of satisfaction of all stakeholders interviewed. All interviewees acknowledged the important contributions of the programme to
the education and wellbeing of the local community and recommended the continuation of the school feeding activities. 115 Multiple stakeholders interviewed during the fieldwork of this evaluation, including headmasters, teachers, and school management
committee members, reported difficulties on performing the expected activities on school feeding and/or lack of training on the matter 116 Source: WFP SPR (2017) 117, Source: Findings of the fieldwork interviews
Evaluation Report Version Dic 2018 34 | P a g e
by directly collecting and processing the school feeding reports sent by schools118. It is
not clear how to solve the issue of properly monitoring the project and increasing the
participation of the Ministry of Education in monitoring and evaluating for the future
hand-over of the school feeding activities (Outcome 1.4.1 Increased Capacity of
Government Institutions).
Box 2.10 - Key findings and conclusions for question 2.10
• The Project framework includes multiple outcomes without planned activities; thereby,
it is not clear how and in what intensity the project under evaluation is expected to
contribute to them.
• The project has been relatively successful in running the school meals programme in
schools and reaching the recipients according to the plan. There is a high level of
satisfaction by the users of this project. Positive results for education and wellbeing of
the local community is acknowledged by all stakeholders interviewed.
• Unexpected migration of students to some WFP assisted schools was reported on
fieldwork. An additional number of students may negatively impact the management of
school feeding activities if it is not reflected in the WFP food delivery plan to the school,
although this finding requires further investigation.
• Difficulties of members of schools in performing their roles in implementing the
programme caused delays or problems in the quality of information on school feeding
activities. There is still a great need for refresher training for developing capacity at the
school level.
Sustainability
Are the school meal programmes sustainable, including a strategy for
sustainability; sound policy; stable funding; quality programme design;
institutional arrangements; local production and sourcing; partnership and
coordination; community participation and ownership?
“Knowing that sustainable, home-grown school feeding is a long-term objective in Guinea-Bissau,
we need to start creating a stable link between schools, local food production, and local markets
as soon as possible (WFP GB, 2016)”119.
174. A sustainable school feeding programme requires multiple elements such as a strategy
for sustainability, a sound policy, regular funding, institutional arrangements,
partnerships, coordination, community participation and ownership120. The 2015
SABER121 exercise found that capacity of Guinea-Bissau on school feeding was at the
lowest level (latent)122 in four of five components addressed and only slightly better
(emerging) in the others: 1. Policy Framework (Latent); 2. Financial Capacity (Latent); 3.
Institutional Capacity and Coordination (Emerging); Programme Design and
Implementation (Latent); and 5. Community Participation and Ownership (Emerging), as
presented in Annex 8 (Table 8.2).
118 Source: Interviews with headmasters, and WFP staff responsible for monitoring activities 119 Source: WFP Standard Project Report, Guinea-Bissau 2017.
120 Sources: Rethinking School Feeding: Social Safety Nets, Child Development, and the Education Sector. World Bank (2009)
https://elibrary.worldbank.org/doi/abs/10.1596/978-0-8213-7974-5. Access in 8/12/2018; Terms of Reference, Mid-term and Final
Evaluations of McGovern-Dole funded School Feeding project in Guinea-Bissau (2016-2018)
121 Source: Report of SABER 2015. World Food Programme /Partnership for Child Development /World Bank: Workshop for Assessing
National Capacities in School Feeding in Guinea-Bissau (23-24 July 2015)
122 The levels of SABER rating are (from lowest to highest) - latent, emerging, established and advanced.
Evaluation Report Version Dic 2018 35 | P a g e
175. The Project Foundational Result expects results to improve the capacity of Guinea-
Bissau’s government which include: Increased Capacity of Government Institutions
(1.4.1/2.7.1), Improved Policy and Regulatory Framework (1.4.2/2.7.2), Increased
Government Support (1.4.3/2.7.3) and Increased Engagement of Local Organizations and
Community Groups (1.4.4/2.7.4). These results are supported by the WFP Guinea-Bissau
Country Interim Strategic Plan (2018-2020), where activities such as providing training and
technical assistance to school feeding are planned to reach strategic outcomes in school
feeding. The results of the project framework are closely aligned with the five policy goals
of SABER school feeding123. They guide the WFP in planning and evaluating actions to
improve the capacity of governments to start and properly run their national school
feeding programmes.
176. Background. In 2015, an action plan to strengthen the national capacity of school
feeding in Guinea-Bissau was developed as a result of the SABER exercise. The plan
created a schedule for developing each one of the actions (Annex 8, Table 8.2). However,
WFP support for the development of a national school feeding programme started earlier.
In 2010, the first school feeding of Guinea-Bissau was created, with WFP support.
Currently, the country still does not have a school feeding policy, and the existing school
feeding law has yet to be approved by the Parliament.
177. The draft of the school feeding law clearly states local procurement as a pillar to their
national school meal programme. This matter was addressed in the last SABER exercise
(2015)124. SABER recommended the evaluation for the ongoing pilot for local food
purchases for supplying school meals, documenting its good practices, and scaling it up.125
178. On the other hand, the project also includes Increased Government Support (outcome
1.4.3) as an outcomeand planned (A.10) Support Government to develop the school
feeding pilot project as an activity126. The SABER exercise did not clearly recommend
actions aimed towards locally procuring food. However, it recommends the adoption of a
school menu, diversified among regions of the country, which would consider the local
availability of food127. In June 2017, the establishment of a tripartite agreement among
Brazil, WFP, and FAO was among the actions proposed for the creation of a sustainable
school feeding programme in Guinea-Bissau128. In the same year, WFP contracted NGOs
COAJOQ, AD, and Kafo, to expand the local purchase of school meals for schools in the
Oio and Cacheu regions (SPR 2017). In partnership with the Ministry of Agriculture, these
NGOs conducted sensitization sessions with local communities, supported the
organization of smallholder farmer associations, and created food purchasing
committees129.
Sub-question 2.11.1: Is there a plan for the nationally owned SFP?
123
Source: Annex 8, Table 8.1; Report SABER 2015. World Food Programme /Partnership for Child Development /World Bank: Workshop
for Assessing National Capacities in School Feeding in Guinea-Bissau (23-24 July 2015)
During March, April and May (the cashew harvest) most of children skip classes to support their families in the harvest activities. Source:
WFP Semiannual Report for April to September 2017. 124 Source: WFP Semiannual Report for April to September 2017. 125 For more information see Annex 8, Table A8.3 126 Source: WFP Semiannual Report for April to September 2017. For more information on role of this MGD vide Annex 7, Table 7.1. 127Source: Report of SABER 2015. World Food Programme /Partnership for Child Development /World Bank: Workshop for Assessing
National Capacities in School Feeding in Guinea-Bissau (23-24 July 2015) 128 Source: WFP Semiannual Report for April to September 2017. 129 NGOs contracted by the WFP also support the MGD SF, on the following activities: 1. monitoring report and collection, 2. kitchen
construction, 3. creation and management of school committees, 4. construction of improved stoves, 5. creation of school gardens, 6.
improvement of school’s structures, 7. food distribution, 8. training of headmasters. Source: WFP Semiannual Report for April to
September 2017.
Evaluation Report Version Dic 2018 36 | P a g e
179. The findings of this evaluation show the existence of a broad plan for developing the
capacity of school feeding, aimed at developing the national school feeding programme.
This plan is mostly aligned with planned project activities (Annex 8, Table 8.1) that were
implemented with different levels of success (Annex 7, Tables 7.2, and 7.3). The SABER
exercise has not been developed since 2015, but internal evaluations addressed multiple
aspects of SF. Progress on the various policy goals (SABER SF) is regularly reported by
WFP. However, relevant aspects for developing the capacity of SF, such as a policy
framework, are not clearly addressed by the project in the evaluation. On the other hand,
by mostly adopting international procurement of food to supply schools, the project
does not directly support the preparation for local procurement, a pillar of sustainable
SF programmes. Additionally, the role of the project geared towards piloting local
procurement requires further clarification.
180. In 2015, an action plan for strengthening national capacity for school feeding was
developed (SABER 2015). Since then, it has guided the actions and activities of school
feeding in Guinea-Bissau (Annex 8, Tables 8.1, and 8.2). The same SABER benchmarks
were used to assess progress for the five main aspects of school feeding that were
directly or indirectly supported by the project130.
181. Policy framework progress. Since the development of the SABER action plan, SF
school meals have been successfully included in prominent education policy papers,
such as the Decennial Education Plan for 2015-2025131. However, at the time of issuing
this evaluation report, the document, School Feeding Law (April 2018) was still waiting
for Parliament’s approval.
182. Financial Capacity. The latest SABER from 2015 renders the financial capacity for
school feeding in Guinea-Bissau non-existent. There is no budget line or regular
allocation of funds for school feeding without legal support, a school feeding law, or
policy to support it.. There has been a new development concerning a pilot project for
SF funded and run by the government of Guinea-Bissau, beginning in the 2017-2018
school year. A total of USD 200,000 from the government of Guinea-Bissau was allocated
for the expansion of the previous pilot for local food purchases for school meals132.
183. Institutional Arrangements, Design, and Implementation. Because of the absence
of a national policy or law to define school feeding in Guinea-Bissau, school feeding
systems in the country strongly rely on WFP and donor policies and support. In
partnership with WFP Guinea-Bissau, the General Directorate for School Meals and Social
Affairs (DGASE) of the Ministry of Education (MNE) is responsible for planning and
implementing the SF programme133. They also coordinate and implement activities to
develop the SF capacity in the government of Guinea-Bissau. The activities implemented
by this directorate include a pilot project funded by the European Union that locally
procures food for supply school meals in the Bafata region. This has been operational
since 2014. A greater responsibility of the government of Guinea-Bissau is the expansion
130 The timeframe for each action planned ranged from 2015 to 2018. Source: World Food Programme /Partnership for Child Development
/World Bank: Workshop for Assessing National Capacities in School Feeding in Guinea-Bissau (23-24 July 2015)/ SABER Action Plan (Annex
8, Table 8.2.B)
131 A pilot on local purchase for supplying school meals was previously funded and run by WFP. Source: WFP SPR 2017; Semiannual Report
Narrative, October 1st 2016 to March 31st 2017. 132 This project benefits 40 schools in 40 communities (10,000 school children and 2,000 families) of Cacheu and Oio regions. Farmers
involved on selling their products to schools receive technical assistance from the Ministry of Agriculture and local NGOs on food
diversification. 133 NGOs contracted by the WFP also support the MGD SF, on the following activities: 1. monitoring report and collection, 2. kitchen
construction, 3. creation and management of school committees, 4. construction of improved stoves, 5. creation of school gardens, 6.
improvement of school’s structures, 7. food distribution, 8. training of headmasters.
Evaluation Report Version Dic 2018 37 | P a g e
of the previous pilot that has been funded and run by the government of Guinea-Bissau
since 2017-2018, as previously discussed134.
184. Local procurement of food to supply school meals is clearly stated in the draft of the
School Feeding Law of Guinea-Bissau. Prioritizing local food procurement is mentioned
in the third SABER policy goal (institutional capacity and coordination). This includes
procurement of foodstuff produced at the national level, and the purchase of food
produced close to schools, preferably from smallholder farmers or farmer associations.
“Countries and partners need to work towards achieving a balance between international,
national and local food supply to support local economies without compromising the quality
and stability of the domestic food supply (SABER Guinea-Bissau, 2015)135.
185. The contribution of the project to developing the pilot initiatives regarding local food
procurement within the project is not evident. No specific mention of the role of this
project was found in reports that were consulted, and there was conflicting qualitative
data collected in interviews with WFP staff.
186. Monitoring and evaluation. Recurrent delays by school directors of sending their
monthly school feeding reports and the inadequate quality of the reports were also
discovered. It was mentioned in an annual report (WFP SPR 2017) and validated by
fieldwork interviews during this evaluation. Additionally, the project target for issuing
timely SF reports was most likely not reached (Annex 7, Tables 7.2, and 7.3). It means
that a strong effort to develop the capacity of schools and other stakeholders to monitor
school feeding is still required. However, qualitative data found in this evaluation stated
that “training and provision of equipment led the Ministry of Education to a more active
role in the programme...positively influenced the quality of school meal reports…” (WFP,
SPR 2017). This suggests a positive outcome of the project on strengthening the
monitoring of school feeding.
187. Partnerships with local NGOs seemed to be an effective strategy to develop local
capacity for the SF programme. In 2016, five local NGOs136 were selected to work with
the WFP on monitoring school feeding activities in the regions of Cacheu, Tombali and
Bolama, remote areas difficult to access. Contracted by the WFP, these NGOs should
develop activities such as creating food management committees at schools, building
and maintaining stoves, and holding sensitization meetings with communities to
participate in the school feeding implementation, to name a few.137
188. From August to September 2017, an internal evaluation of school meal activities was
conducted by the WFP and their cooperating partners. This evaluation included
government institutions and civil society. At the regional level, it included schools,
regional education officers of education, health and agriculture, NGO and local
authorities. National education and research institutions also participated. Activities
implemented by NGOs partners with the WFP were assessed, and a contract extension
with five NGOs with good results was implemented based on an evaluation
reccomendation138. As a result of this evaluation, actions to improve the performance of
134 Difficulty in timely issuing monitoring reports were observed in the evaluation 135 A special recommendation of Saber was to evaluate pilot local school canteen sourcing experiences, document good practices and scale
it up 136 The NGOs assigned were COAJOQ (Cacheu) NIMBA (Tombali), PROBOLAMA (Bolama), FASPEBI (Bubaque), and Evangelical Church (Uno) 137Through sensitization meetings on school feeding parents were also encouraged to maintain their children regularly attending to classes.
These meetings were held at the beginning of academic year. Source: WFP Semiannual Report for April to September 2017. 138 Source: WFP Semiannual Report for April to September 2017. Recommendations of the 2017 evaluation at regional level included: 1.
Use figures of the previous year (number of students) to plan food requirement for first semester (the actual number of students should
be provided by education inspectors and statisticians to the next food delivery); 2.Expand the training for the food management committee
to three days, and include two staff of each school: maintain a multi-staffed school feeding unit at regional education offices for better
regional coordination and supervision. Source: WFP Semiannual Report for April to September 2017.
Evaluation Report Version Dic 2018 38 | P a g e
reporting school feeding activities aimed at avoiding recurrent errors and delays were
also recommended.
189. At the central level, participants of the 2017 evaluation formulated an action plan139,
which proposed: 1. Monitoring in order to set a deadline for education inspectors to
provide statistics to the Ministry of Education (MNE) and for their monthly report,
delivered on time to the WFP; 2. Trimestral school feeding meetings with NGOs, parent
associations, and local authorities were scheduled. 3. It called for a timely provision of
fuel to education inspectors to visit schools under their supervision. 4. Revision of the
School Feeding Law, its submission to the Council of Ministers to analysis, and further
submission to the Parliament for approval.
190. Some problems found in the 2107 evaluation continued into 2018. This was
demonstrated in the midterm evaluation. Delays on issuing monitoring reports, and the
pending approval of the school feeding law were found in multiple sources of qualitative
data used140.
Sub-question 2.11.2: How is the school feeding system perceived by local communities (men
and women)? What is not working? What could be improved?
“The school feeding programme is positive. Because we eat together at school our hunger is
reduced, and friendships among students is stronger. We don’t miss or arrive late for classes,
and our school performance is better”. (Students of assisted school)
191. The school feeding activities positively affected the community and greatly benefitted
the students, according to the qualitative information collected during fieldwork through
interviews with members of school management committees, students, and school
cooks. Problems with the quality of the rice distributed141 were mentioned in some
schools despite the high satisfaction of the users. Recommendations for improving the
school feeding activities were indicated in WFP reports (Annex 8, Table 8.5).
192. Cooks that were interviewed were very satisfied with this programme, and they all
acknowledged its importance in the lives of their children. Most cooks work as
volunteers, which seems to create irregularities in their attendance at the schools. The
hours spent daily in the school kitchen compete with economic activities that could help
their families to improve their living conditions. Rotating shifts of volunteers managed
by the schools was an observed good practice. However, even if it reduces the burden
on each cook, it creates the need for additional training. They also requested a larger
variety of food for preparing school meals. Now, there is little room for improving or
diversifying the daily school meal with the current food basket.
193. Schools that benefit from the programme have now had their structures improved.
Storage rooms and kitchens were built or renovated and equipment for cooking and
delivering meals was acquired. Results of the baseline and midterm surveys show an
increased number of school kitchens in WFP assisted schools, from 82% in 2016 to 93.3%
in 2018142. This is corrobarted by the data from WFP reports.
194. The construction of energy efficient stoves reduce the need for firewood, which is
positive for the local community who are responsible for donating wood for cooking. It
also protects the environment. Findings from the fieldwork showed important safety
139 Source: WFP Semiannual Report for April to September 2017. 140 More information on sources of data for this evaluation are presented in the Evaluation Matrix, in annex. 141 The pilot project is funded by the Government of Guinea-Bissau 142 Annex 15, Table 4
Evaluation Report Version Dic 2018 39 | P a g e
problems in some school kitchens and abhorrent and unsafe stove conditions (Figure
8.1, Annex 8).
195. Additionally, it was reported that some schools have difficulty keeping track of the
eating implements such as plates and spoons. Replacing some equipment that was
damaged is also proving difficult. This situation adds a greater burden to the regular
work of the cooks. Water is an essential element for cooking meals, but findings from
the fieldwork showed that some schools still struggle with attaining a regular water
supply. Lack of quality water is a risk for regular school meals and food safety.
196. Qualitative and quantitative data found communities have had greater participation in
school feeding activities. Therefore, the findings suggest that the project promoted
community ownership and contributed to a sustainable school feeding programme143.
The community regularly participates in school feeding activities through school
management committees. Regardless, additional efforts to build capacity and increase
participation to design the programme are recommended.
Sub-question 2.11.3: Are schools exploring the full potential in terms of the local institutional
purchase of food?
WFP CO intends to scale down direct food assistance throughout the life of its CP, while it is
committed to supporting the government in scaling up their own management of the school
feeding programme based on sustainable local resources (WFP to MGD, 2016)144.
197. The project relies on international procurement for the supplies of school meals,
although it is committed to testing local procurement as a pilot project. Since 2014, the
WFP has run a pilot on local purchases to supply schools. This was funded by the
European Union. The project purchases locally grown beans, peanuts, cassava,
vegetables and potatoes for school meals for 65 schools in 65 communities, benefiting
15,000 schoolchildren of the Bafata region.
“The pilot project in Bafata showed the fragility of the existing capacity of smallholder
farmers for the existing performing administrative process of WFP for local purchases. They
struggled on each step, such as the formulation of documents, invoices, etc. The existing
model required a heavy logistics where all products locally purchased had to come to the
central warehouses for evaluation and quality control, for later distribution” (WFP staff
interviewed during evaluation fieldwork).
198. In the 2017-2018 school year, this pilot was expanded to 40 schools benefiting 10,000
school children of the Cacheu and Oio regions, in a project funded and ran by the
government of Guinea-Bissau. Farmers that were involved received technical assistance
from the Ministry of Agriculture and from local NGOs with regard to food diversification.
Additionally, female farmers should be able to benefit from learning opportunities in
nutrition, literacy skills, gender awareness, and basic business skills145.
199. Qualitative data from the evaluation fieldwork interviews, with stakeholders at schools
and WFP staff, indicated an important issue is the delay of the payments to farmers. This
is problematic because it causes mistrust and dissatisfaction among suppliers. However,
the results from the pilot concerning local purchases are not an activity this evaluation
143 Increased participation of community in school management committees was found in WFP assisted schools (Midterm survey, Annex
15, Table 4). 144 The pilot is implemented by the Government of Guinea-Bissau 145 The pilot is testing a modality of home-grown school feeding programme for Guinea-Bissau, which include the major elements of the
existing school feeding law (not approved by the parliament yet)
Evaluation Report Version Dic 2018 40 | P a g e
considers. The project support for the pilot of local purchase was under evaluation.
Additionally, it is an essential activity for developing the capacity for the future home-
grown feeding programme of Guinea-Bissau. Improvements in the WFP evaluations of
pilots, and on documenting its results, would certainty contribute to a better
understanding of the existing practices in local institutional purchases of food to supply
school meals.
Box 2.11 - Key findings and conclusions for question 2.11
• This evaluation’s findings show the existence of a broad plan for developing the capacity
of school feeding, aimed at developing the national school feeding programme of
Guinea-Bissau.
• The project in Guinea-Bissau includes results and activities aimed at strengthening the
capacity of the government to the future establishment of their own sustainable school
feeding programme in its framework. Planned activities and results are aligned with
most recommendations of the last SABER exercise in Guinea-Bissau.
• The policy framework is still fragile in Guinea-Bissau since the country still does not have
a school feeding policy or programme. Although the project included as intended result
Improved Policy and Regulatory Framework, no activity was planned for this result.
• The project is committed to support the government to Develop School Feeding Pilot
Project, which is based on local procurement, although it currently does not include local
procurement since most of its foodstuff is acquired overseas. Additionally, the results of
the pilot project and the involvement of the project in the local purchase of food for
school meals should be further clarified and addressed in the project’s final evaluation.
• The project relies on the partnership with NGOs for activities such as improving school
structures for school feeding, sensitizing, and training the local community, school staff,
and monitoring. Partnerships with NGOs add value to the project implementation as it
promotes capacity development in school feeding.
• The community participates in the school feeding activities, acknowledging its positive
results and highly appreciating the project. Despite this, improvements in school
structure, water sources, cooking equipment, diversification of school menu are still
required.
• School cooks are mostly volunteers, which in some cases may disrupt their lives, causing
problems with their regular attendance at some schools. If the professionalization of
school cooks is not yet possible, an incentive or gratification should be established to
compensate them for their work.
What substantive progress has the government made toward developing a
nationally owned school feeding programme?
200. The project capacity development for school feeding aimed mostly at developing
knowledge and skills146 between government, teachers, school inspectors, and
community members. The project also contributed to improving school structures and
equipping schools for running a school meal programme.
146 Activities to increase the capacity of the government, such as trainings for government staff on management of a school feeding
programme, and improvements of the monitoring and evaluation system for this programme were included to the project, as presented
in Annex 7 (Tables A7.1, A7.2 and A7.3).
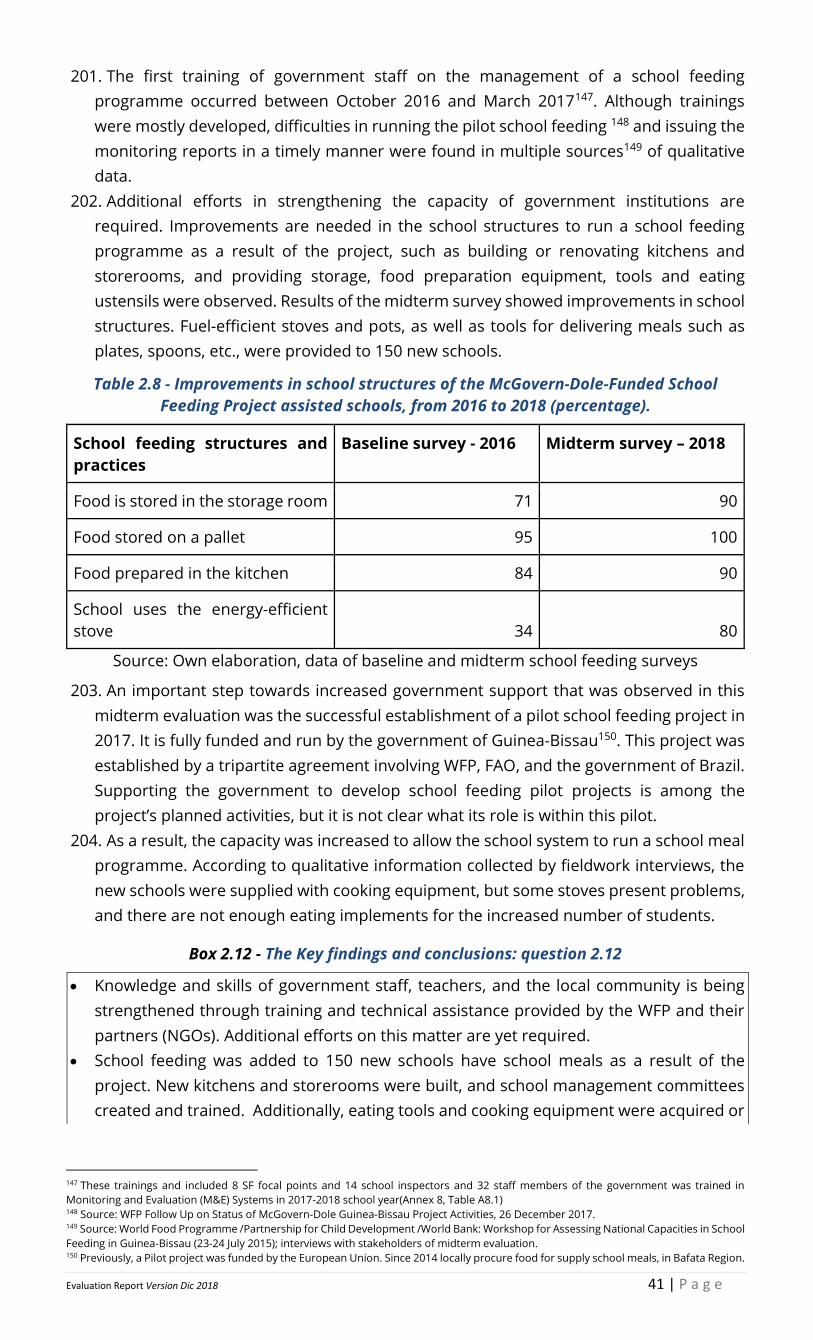
Evaluation Report Version Dic 2018 41 | P a g e
201. The first training of government staff on the management of a school feeding
programme occurred between October 2016 and March 2017147. Although trainings
were mostly developed, difficulties in running the pilot school feeding 148 and issuing the
monitoring reports in a timely manner were found in multiple sources149 of qualitative
data.
202. Additional efforts in strengthening the capacity of government institutions are
required. Improvements are needed in the school structures to run a school feeding
programme as a result of the project, such as building or renovating kitchens and
storerooms, and providing storage, food preparation equipment, tools and eating
ustensils were observed. Results of the midterm survey showed improvements in school
structures. Fuel-efficient stoves and pots, as well as tools for delivering meals such as
plates, spoons, etc., were provided to 150 new schools.
Table 2.8 - Improvements in school structures of the McGovern-Dole-Funded School
Feeding Project assisted schools, from 2016 to 2018 (percentage).
School feeding structures and
practices
Baseline survey - 2016 Midterm survey – 2018
Food is stored in the storage room 71 90
Food stored on a pallet 95 100
Food prepared in the kitchen 84 90
School uses the energy-efficient
stove 34 80
Source: Own elaboration, data of baseline and midterm school feeding surveys
203. An important step towards increased government support that was observed in this
midterm evaluation was the successful establishment of a pilot school feeding project in
2017. It is fully funded and run by the government of Guinea-Bissau150. This project was
established by a tripartite agreement involving WFP, FAO, and the government of Brazil.
Supporting the government to develop school feeding pilot projects is among the
project’s planned activities, but it is not clear what its role is within this pilot.
204. As a result, the capacity was increased to allow the school system to run a school meal
programme. According to qualitative information collected by fieldwork interviews, the
new schools were supplied with cooking equipment, but some stoves present problems,
and there are not enough eating implements for the increased number of students.
Box 2.12 - The Key findings and conclusions: question 2.12
• Knowledge and skills of government staff, teachers, and the local community is being
strengthened through training and technical assistance provided by the WFP and their
partners (NGOs). Additional efforts on this matter are yet required.
• School feeding was added to 150 new schools have school meals as a result of the
project. New kitchens and storerooms were built, and school management committees
created and trained. Additionally, eating tools and cooking equipment were acquired or
147 These trainings and included 8 SF focal points and 14 school inspectors and 32 staff members of the government was trained in
Monitoring and Evaluation (M&E) Systems in 2017-2018 school year(Annex 8, Table A8.1) 148 Source: WFP Follow Up on Status of McGovern-Dole Guinea-Bissau Project Activities, 26 December 2017. 149 Source: World Food Programme /Partnership for Child Development /World Bank: Workshop for Assessing National Capacities in School
Feeding in Guinea-Bissau (23-24 July 2015); interviews with stakeholders of midterm evaluation. 150 Previously, a Pilot project was funded by the European Union. Since 2014 locally procure food for supply school meals, in Bafata Region.
Evaluation Report Version Dic 2018 42 | P a g e
restored. These schools are now better prepared to implement a nationally owned
school feeding programme in the future.
• A school feeding pilot project for school feeding funded and run by the government of
Guinea-Bissau was successfully established. This project tests the local purchase of food
to supply school meals. According to the draft of the school feeding law, local
procurement of food to supply school meals is one of the pillars of the future school
programme of Guinea-Bissau.
• Additional efforts to assess results and draw lessons learned of pilots would better
support the development of the future national school feeding programme of Guinea-
Bissau.
How are local communities involved and contributing to school feeding?
Sub-question 2.13.1 To what extent should local communities participate in the school
feeding systems (men and women)? To what extent should communities contribute to local
SFS?
“Building on the Home-Grown School Feeding (HGSF) model, local communities will
contribute with locally produced fresh food, firewood, and water for cooking (FFE-657-
2015/010-00, Attachment A. Project Implementation).
205. Community participation and the ownership of the school feeding programme is one
of the pillars of the project. The men and women of local communities, including parents
of school children, should participate and take ownership of the school feeding
programme. The project activities were aimed at empowering the local community in
decision-making and overseeing the SF activities. Communities participate in the project
through their presence in school management committees. Female members of the local
community also supported the SF programme, volunteering as school cooks and by
donating firewood for cooking.
206. According to data collected during this evaluation, including fieldwork interviews, SMCs
are made up of five members, a president, a teacher (school canteen), two members of
the parent associations, one from each gender, and one cook. Cooks are women. This
committee is responsible for unloading the food delivered to the school, storing the
foodstuff, controlling the movement of inventory from the storage place, controlling the
attendance of the students in the classrooms, and sometimes supervising the cooks and
attending to the distribution of meals. Regardless, increased participation by the
community in school feeding activities was among the main concerns of the 2017 annual
school feeding evaluation151.
207. Midterm evaluation fieldwork findings showed that school management committees
participate in the school feeding programme. Their members met regularly, at least once
a month in most of the schools visited. Qualitative data indicated that committee
members have a great responsibility in maintaining proper storage space and controlling
how the food delivered to the schools is used.
208. Additionally, quantitative data of the baseline and midterm surveys showed an
important increase in community participation at WFP assisted schools. In 2016, 94.0%
of schools had committees such as school management (CGE), and 80% had a parent
teacher association (PTA). In 2018, 100% of schools had a CGE, and 96.7% had a PTA
151 Continuing a sensitization campaign among communities to promote their more active participation in management of school meals
was recommended.
Evaluation Report Version Dic 2018 43 | P a g e
(Annex 15, Table 4). Findings also suggest that community members could contribute to
the oversight of SF activities.
“The school management committee has an open communication line with the school
inspector, the headmaster, the administrator sector and the police commander, to ensure the
safety of the foodstuff” (a member of one school management committee).
209. Creating mechanisms for establishing regular communication between school
committees and school inspectors could increase community participation in overseeing
the SF programme. They should be supported by NGO activities through community
participation, sensitization, and capacity building for properly performing their roles as
members of school management committees and as school cooks are ongoing. In 2017,
a WFP partner, the NGO Palmeirinha,` distributed materials and trained the local
community to build 150 school kitchens152. Project training for food preparation and
storage practices was undermined by a high turnover of participants153. Interviewees
reported difficulty in performing their roles during the fieldwork evaluation.
210. A pilot project of local food purchases for school meals has aided 40 schools and 2,000
families since the beginning of the 2017-2018 school year. This project prioritizes
engaging female farmers in the school feeding market and developing their knowledge
of nutrition, literacy skills, gender awareness, and basic business skills. The pilot is the
first initiative by the government of Guinea-Bissau to develop their own school feeding
programme, fully funded and run by the government.
Box 2.13 - Key findings and conclusions on question 2.13
• Ownership and participation by men and women of the local community, including
parents of school children, are essential to the implementation of the project in schools.
The project develops activities such as sensitization campaigns and training to empower
the local community in decision-making and overseeing the SF activities.
• The community participates in school management committees, and by donating
firewood for cooking. Women additionally contribute by volunteering as school cooks.
• School management committees who were visited during the fieldwork reported
regularly performing their roles. A permanent effort of sensitization, and capacity
building activities are required to ensure community participation. Additionally, positive
results of training on food preparation and storage practices were undermined by a high
turnover of participants.
• A pilot project aimed at local food purchase for school meals implemented and funded
by the government of Guinea-Bissau prioritizes female farmers and is committed to
developing their knowledge on nutrition, literacy, and business skills in the smallholder
farmers benefitted.
What needs remain in order to achieve a full handover and nationally-owned
school feeding programme?
Following SABER undertook in 2015, WFP and MoE effort have been oriented creation of a
National School Feeding Law, national budget line, institutional and conceptual capacity from
152 Source: WFP - Implementation of USDA McGovern-Dole’s International Food for Education and Child Nutrition Programme to children
of Guinea-Bissau (25 August 2016). 153 Source: WFP Semiannual Report for April to September 2017.
Evaluation Report Version Dic 2018 44 | P a g e
Ministry of Education staff to design and implement a School Feeding Programme with
community participation (WFP, 2018154).
211. A nationally owned and funded school feeding programme is expected to be
established in Guinea-Bissau by 2030155.
Sub-question 2.14.1: Are the legal and political environments favorable to handover the
school feeding system to the government? If not, what is missing?
212. The political instability in Guinea-Bissau156 led to the turnover of the Ministry of
Education staff, which is the main government counterpart to the WFP for school feeding.
This is a challenge for the programme. In August 2015, the government was dismissed,
and the process had to be started again with a new minister. Political instability has also
delayed Brazil’s technical assistance towards developing a sustainable and nationally
owned school feeding programme in Guinea-Bissau157. Although the negative impact of
political instability is evident, a work plan for the activities on the school feeding project
is signed with the Ministry of Education every year.
213. In 2010, a draft of Lei das Cantinas Escolares, school feeding law, was developed and
signed by the President. In 2018, with assistance from the project, a review of the draft
bill was developed158. The law sets the course for a gradual transition to the nationally-
owned school meal programme of Guinea-Bissau. They would design, operate, and
finance it. However, during this evaluation, the law was still awaiting approval. Therefore,
no budget was assigned to school feeding.
214. According to the project implementation (Attachment A) in the project agreement, a
policy expert should be placed within the National Directorate of School Feeding (NDSF)
of the MoE. This should be done to support the revision of a national law enhancing
sustainability of school feeding, review the national school feeding strategy, revamp the
inter-ministerial committee, and strengthen the capacity of the NDSF at the central and
decentralized levels through training.
215. In 2017, a reviewed bill of the national school feeding law was ready for submission to
the Council of Ministers for its validation for further submission to the Parliament for
final approval159. The government supported the transition of school feeding to a
national programme. They demonstrated this by budgeting USD 280,000 to school
meals160 in 2018.
216. After its approval, the next steps will be to follow up with the MoE for the establishment
of the law on school meals, to add a permanent budget line in the national budget, and
to support the strengthening of regional school meal management structures.
154 According to WFP SPR 2016 (Outcomes, page 18) 155 Revision of the School Feeding Law, its submission to the Council of Ministers to analysis and further submission to the Parliament for
approval, was recommended in an school feeding evaluation exercise in 2017. 156 A tripartite agreement was expected to be signed among Brazil, WFP, and FAO in June 2017, to Build Ministry of Education and
Agriculture capacity to manage their school canteens. It aimed at supporting the creation of a National School Feeding Programme and
included a pilot initiative of local food purchase for the school canteens. Source: WFP Semiannual Report Narrative October 1 2016 to
March 31 2017. 157 MGD Foundational Results are presented in Annex 7, Table A 71. 158 WFP Guinea-Bissau Country Interim Strategic Plan (2018-2020): strategic outcome 1: School aged children in Guinea-Bissau have
adequate access to safe and nutritious food all year-round. Activity 2. Provide training to school management committees, teachers, and
inspectors on management school meals and complementary activities; Activity 3. Provide technical and analytical assistance to the
Government in policy formulation, legal framework and management of a national school meals programme. 159 The 5 SABER school feeding policy goals are:1. Policy Framework, 2. Financial Capacity, 3. Institutional Capacity and Coordination, 4.
Design and Implementation, and 5. Community Roles 160 SABER (Systems Approach for Better Education Results) School Feeding This is a government-led process that helps to build effective
school feeding policies and systems. Source: WFP https://documents.wfp.org/stellent/groups/public/documents/research/wfp273495.pdf.
Access in August 13, 2018
Evaluation Report Version Dic 2018 45 | P a g e
Sub-question 2.14.1: Is there the technical capacity at the national and regional levels to
implement school feeding programmes? If not, what kind of training is needed?
217. Capacity development for school feeding at the national and regional levels is an
ongoing effort. It involves preparing schools to run a school meal programme and to
develop knowledge and skills for government staff and the community to implement the
activities. Because of the project, new schools were included, which meant that
infrastructures such as school kitchens, stoves, and storage rooms were built or
restored, increasing the existing capacity of the local government to further implement
a national school feeding programme. A monitoring and evaluation system were also
established, although existing issues previously discussed still require efforts for proper
follow-up of the activities161.
218. Regional level focal points are responsible for overseeing and coordinating the school
feeding programme. At the national level, the National Directorate of School Feeding
(DGASE) and the Evaluation and Planning Department of the Ministry of Education
(DGPASE) are permanent partners of the programme. At the regional level, regional
education directors and the education sector inspectors (school inspectors) are directly
involved with the school feeding programme.
219. Multiple government staff at the national and regional levels participated in training on
school feeding management, monitoring, and evaluation. Some established targets were
not reached (Annex 7, Tables A7.2 and A7.3). Weaknesses were observed during the 2017
evaluation such as receiving food planning statistics later than anticipated by the WFP
and recurrent errors in the fulfillment of food recording tools.
220. Capacity development at the regional level also includes human resources. Now, the
School Meals Focal Point is the only person in charge of school feeding for each region.
The 2017 evaluation recommended by a multi-staffed school feeding unit should be
maintained at the regional level for better coordination and improved supervision162. If
this recommendation is to be implemented, a greater number of staff should be trained.
221. Additionally, the local purchase of food to supply the school meal programme is an
essential aspect of the proposed school feeding law. Therefore, efforts to increase the
capacity of the government to locally procure food will require both technical assistance
and training.
Box 2.14 - Key findings and conclusions for question 2.14
• The first step for a nationally owned school feeding programme is the approval of the
National School Feeding Law. The draft bill, first created in 2010, and updated in 2018 with
the support of the project under evaluation was still waiting for review by the Council of
Ministers and further parliament approval.
• Political instability and frequent turnover of government officers caused delays in the hand-
over plan and also increased the need for further training. Additionally, the project did not
reach the planned target for all trainings planned for the first two years.
• Monitoring and evaluation systems must be improved because the WFP receives food
planning statistics late and recurrent errors in fulfillment of food recording tools occur.
Both were weaknesses observed during the 2017 evaluation.
• Transitioning to the nationally owned school feeding programme of Guinea-Bissau will
require increasing inter-sectoral coordination and strengthening capacity to procure food
161 The presence of fresh food in the school menu is highly appreciated although recurrent delays on payments for the local small farmers
and associations was pointed as a great difficult by the stakeholders interviewed in schools where local purchase was tested. 162 Source: WFP Semiannual Report Narrative October 1 2016 to March 31 2017
Evaluation Report Version Dic 2018 46 | P a g e
locally. The pilot project on local purchase has indicated that further technical assistance in
local purchase to supply school meals is still required.
3. Conclusions and Recommendations
Relevance
222. The MGD SFP strategy is relevant to the needs of the beneficiaries, both boys and girls.
School meals and THRs promote higher attendance and help students to avoid dropping
out. THRs decreased the burden of feeding families and contributed to higher
attendance for girls, especially during the cashew campaign.
223. There is also a general perception among school directors, teachers, inspectors, and
regional focal points for MoE that the number of students in schools supported by WFP
is increasing. At least during nine months of the year, a great part of students’ nutritional
needs is provided by school meals and THRs. More importantly, this does not reflect a
true timeframe to which they receive these meals as teacher strikes, have, on a yearly
basis, shrunk the school year by months, with 15 and 30 day strikes occurring frequently
throughout the schoolyear. However, students, teachers, cooks, and SMCs demanded
more diversification in the meals.
224. School meals and THRs are very significant since they help families to feed their
children, particularly girls. It also reduces short-term hunger. By demanding the
involvement of the local community in the management of school feeding systems, the
project promoted the rapprochement of the community with schools. However, the local
community’s representatives, parent’s associations, and students do not participate in
project design.
225. Ownership and participation by men and women of local communities, including
parents of school children, were promoted by the project. Community participation is
essential to the implementation of the project in schools.
Effectiveness and Efficiency
226. The project is well underway. The last performance indicators from March 2018,
showed that the target for the number of school-age children receiving daily school
meals from 2017 and 2018 was met and exceeded. The target for female students
between grades four and six receiving all three annual THR distributions was met and
exceeded in 2017. They had to have an attendance of 80% or higher. In 2018, targets
defined for the number of kitchens and stoves constructed or rehabilitate were met163.
227. The target for the number of schools with improved storage equipment and food
preparation tools was met in 2017, but not met in 2018. The targets defined for 2017 and
2018 for the number of SMCs, cooks, and teachers trained were not met. In 2017, the
targets for distributing deworming medication was partially met at 63.6%.
228. The migration of students to WFP assisted schools may have negatively impacted the
distribution of school meals and THRs. Some schools reported a reduction in portion size
because of the increased number of students.
229. The community participates in SMCs, and donates firewood for cooking. Women make
an additional contribution to the school feeding programme by volunteering as school
cooks. The project developed sensitization campaigns and training aimed at empowering
the local community in the decision-making of SF and overseeing its activities. SMCs of
schools visited regularly performed their roles during fieldwork. Regardless, a
163 Further clarification on the number of stoves built in 2018 is recommended since contradictory data was found in the report of NGO
Palmeirinha.
Evaluation Report Version Dic 2018 47 | P a g e
permanent effort to sensitize and to build the capacity is required to ensure community
participation.
230. The results of the training, both with concern to food preparation and storage
practices, were undermined by a high turnover of participants on school committees.
Members of schools had difficulties in performing their roles in implementing and
reporting activities, which caused delays, and problems in the quality of information of
school feeding. There is still a great need to refresh training to develop capacities at the
school level.
231. School kitchens are very rudimentary and, in some cases, unsafe and vulnerable to
fires. Energy saving stoves need to be rethought as they do not substantially improve the
working conditions of the school cooks, nor do they positively contribute to their health.
Additional efforts to better prepare school structures to run a school meal programme
should address the working conditions of school cooks. Improvements in school
kitchens, sources of water, cooking equipment, diversification of school menus, and an
incentive or gratification package for school cooks are required.
232. Migration of students to WFP assisted schools may have negatively impacted the
management of school feeding activities. The increased number of students from this
perceived migration is not always reflected in the WFP food delivery plan to the school.
Impact
233. The project has been relatively successful in implementing the school meal programme
in schools, and on reaching its recipients according to the plan. Boys and girls have
equally benefited from the SF Project. The project framework includes multiple
outcomes without activities planned. It is not clear how and in what intensity the project
is expected to contribute to the outcomes. Recipients of the project report high levels of
satisfaction.
234. The project showed positive results in education, and on the well-being of the local
community. These were acknowledged by all stakeholders interviewed. The community
participated in the project and highly appreciated its results. They reported that it
contributed to better students and bettering the lives of local community members.
However, this evaluation could not prove there was an impact on attendance and
enrollment of students as a result of school feeding. Regardless, qualitative data
indicated increased participation by students in WFP assisted schools, and higher
attendance to classes. Positive changes in enrollment and attendance rates weren't
found by quantitative analysis.
235. The project potentially contributed to better nutrition for its beneficiaries. School meals
and THRs represent a financial benefit for poor households. The delivery of daily school
meals reduced the short-term hunger of students, promoted they're well being during
classes, and potentially contributed to their health. Both school meals and THRs partially
supplied the nutritional needs of students and their households by way of calories,
proteins, and other nutrients. This contribution may be significant, considering that food
insecurity was identified by the government of Guinea-Bissau as a major challenge faced
by the students of Guinea-Bissau.
236. This evaluation found that a large number of students go to the classes hungry, and
many students do not have a meal at their homes when returning from classes. Results
of the midterm survey did not show improvement in the quality of diet on households
of WFP assisted schools. However, qualitative data suggests an increased awareness of
the benefits of diet diversification for health among students, cooks, and members of
Evaluation Report Version Dic 2018 48 | P a g e
the school. Additionally, school meal deliveries and THRs represent an important
financial contribution to the poorest families.
Sustainability
237. The policy framework is fragile in Guinea-Bissau since the government of Guinea-
Bissau still does not have a school feeding policy or programme. An initial step for a
nationally owned school feeding programme in Guinea-Bissau is the approval of the
School Canteen Law. The draft of the bill first created in 2010 and updated in 2018 with
the support of the project under evaluation was still waiting for review by the Council of
Ministers and further Parliament approval. However, political instability prevented the
approval of this law. The project intentionally included the results of the improved policy
and regulatory framework. No activity was planned for this result.
238. The project is aligned with education policies and strategies of the government of
Guinea-Bissau. At this moment, the government of Guinea-Bissau does not have a
national policy or law164 that allows for both the inclusion of school feeding in the main
government strategy and the creation of a regular budget line for funding school meals.
The project is the main initiative for school feeding in Guinea-Bissau
239. The project is committed to supporting the government to develop a school feeding
pilot project to test local procurement for supplying school canteens. Now, most
foodstuff used on school meals is acquired overseas. A local procurement initiative for
schools was implemented by WFP in partnership with an NGO. The home-grown school
feeding in Guinea-Bissau was discussed in two workshops in Bissau that involved
government officials. The workshops were held in partnership with the WFP Centre of
Excellence against Hunger, and the Brazilian Cooperation Agency (ABC). Both initiatives
are from Brazil. Pilot initiatives for local purchases for supplying school meal workshops
were discussed during these workshops. A pilot project to locally purchase food for
school meals was implemented and currently funded by the government of Guinea-
Bissau. This pilot project prioritizes female farmers and is committed to developing their
knowledge in nutrition, literacy skills, and business skills.
240. The project relies on partnerships with NGOs for activities such as improving school
structures for school feeding, monitoring activities, and sensitizing and training the local
community and school staff. In general, partnerships with NGOs add value to project
implementation. A strategy for sustainability could be to rely on partnerships with NGOs
for school feeding as it can be cost-effective and can develop national capacities for SF
programmes.
241. An unintended effect of the project is the migration of students from schools that do
not distribute school meals to schools assisted by the project. If proved, it would
negatively impact institutional capacities in the education system in Guinea-Bissau. The
excessive number of students in assisted schools overloads the existing capacities of said
schools, disrupting education planning, and making it difficult to maintain the portion
size of both school meals and THRs. Further analysis of this matter is required.
242. Additionally, positive, unintended effects found as a result of the project’s activities was
an increase in sensitization of girls from local communities to enroll in schools and a
greater availability of school inspectors in unassisted schools.
243. Political instability and high turnover rates of government officers caused delays in
developing the school feeding handover plan and increased the need for further training
164 Government'’ regular funding for school meals programme requires the creation of a national school feeding policy, or approval of the
existing school feeding law.
Evaluation Report Version Dic 2018 49 | P a g e
among government officers. A successful transition to the nationally owned school
feeding programme of Guinea-Bissau will require increasing inter-sectoral coordination
and strengthening the capacity to procure food locally. The pilot project to strengthen
local purchases indicated some problems which would require additional technical
assistance in local purchases to supply school meals.
Overall Assessment and Conclusions
244. The McGovern-Dole-Funded School Feeding Project’s strategy is relevant to the needs
of the beneficiaries. Delivery of school meals and THRs benefit a large number of
students, contributing to their nutrition, mostly by reducing short-term hunger. The
distributions of school meals and improved schooling have potential benefits for student
health. Additionally, food aid represents a financial benefit for families and is an incentive
for sending children to classes, especially girls.
245. Although the project has great potential to contribute to promoting local food
production, it has largely not been explored. During this evaluation, the food procured
to supply school feeding was mostly imported. The pilot project for local purchases to
supply school canteens still faces challenges. It requires a deeper assessment and
further intervention. Most of the school menus do not include fresh food, which is locally
produced. This creates little variety.
246. The project is well underway, especially in activities and outputs related to the delivery
of school meals and THRs. According to the last performance indicators from March
2018, most of the targets defined for 2017 and 2018 were met or almost met. In some
cases the targets were surpassed altogether. Developing capacities at various levels in
school feeding requires further effort.
247. The purpose of this midterm evaluation was to learn whether the school feeding
project is heading towards its set of goals and objectives or not. By doing so it could be
acting as a call to change implementation strategies when and where it is necessary.
Although the program did not implement any direct activity related to literacy. there was
was a strong perception that it benefitted the improvement of the quality of education
and students’ literacy. Further assessments on the results of this project for improving
literacy, among others expected outcomes, should be included in the endline evaluation
in order to identify if there are any spillover effects .
248. As expected, school meals are well appreciated and are reported as an opportunity for
bringing the community and schools closer together. It requires the participation of
parents and other community members in school feeding management and promoting
community ownership. Although professionalization of the cooks and investing in better
kitchen structures are still required.
249. The monitoring system needs to be improved. Delays and recurrent errors in the
fulfillment of food recording tools were observed and documented. Expanding
partnerships with NGOs and using communication technologies could be beneficial to
developing the capacity to monitor school feeding. The training on monitoring for school
management committees should be expanded. Due to the turnover of teachers, a group
of four to five teachers in each school should be trained. It is also important for the
efficiency and sustainability of the system.
250. Around half of the schools of Guinea-Bissau are being supported by the project. This
means that there are always schools without this support in close proximity to supported
schools. An observed, unintended effect of the project on institutional capacities of the
Evaluation Report Version Dic 2018 50 | P a g e
education system of Guinea-Bissau is the migration of students to the schools supported
by the project. A perception of injustice and exclusion is the driver for this migration. As
already mentioned, this migration is not confirmed by quantitative data. The excessive
number of students migrating overload the existing capacities of the school and cause
difficulties in maintaining the planned portion size for the school meals and THRs.
251. Despite the pilot project managed by the Ministry of Education in the Biombo Region,
a nationally owned school feeding programme still depends on the approval of the
National School Feeding Law. Lacking a strong legal basis for school feeding, there is not
a provision for this in the national budget. Creating a specific thematic group related to
school canteens in the Education Local Group could contribute to the debate within the
government of Guinea-Bissau and with other development partners on the importance
of a nationally owned school feeding system in Guinea-Bissau.
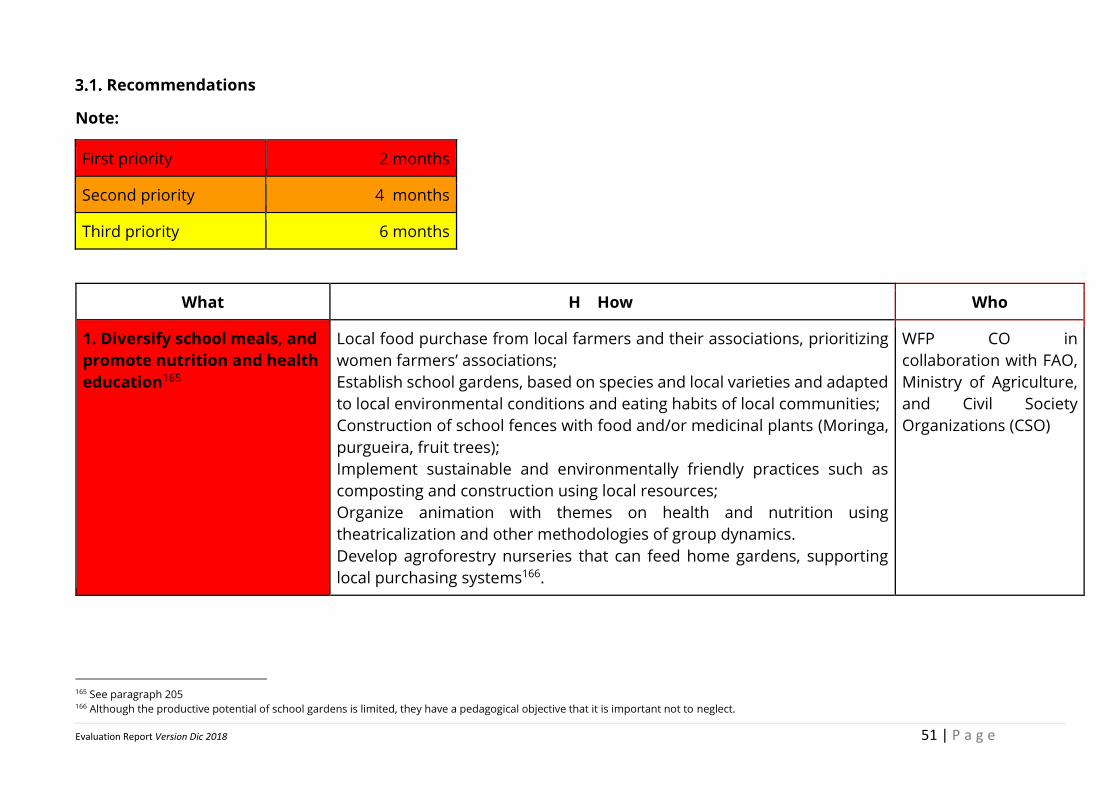
Evaluation Report Version Dic 2018 51 | P a g e
Recommendations
Note:
First priority 2 months
Second priority 4 months
Third priority 6 months
What H How Who
1. Diversify school meals, and
promote nutrition and health
education165
● Local food purchase from local farmers and their associations, prioritizing
women farmers’ associations;
● Establish school gardens, based on species and local varieties and adapted
to local environmental conditions and eating habits of local communities;
● Construction of school fences with food and/or medicinal plants (Moringa,
purgueira, fruit trees);
● Implement sustainable and environmentally friendly practices such as
composting and construction using local resources;
● Organize animation with themes on health and nutrition using
theatricalization and other methodologies of group dynamics.
● Develop agroforestry nurseries that can feed home gardens, supporting
local purchasing systems166.
WFP CO in
collaboration with FAO,
Ministry of Agriculture,
and Civil Society
Organizations (CSO)
165 See paragraph 205 166 Although the productive potential of school gardens is limited, they have a pedagogical objective that it is important not to neglect.
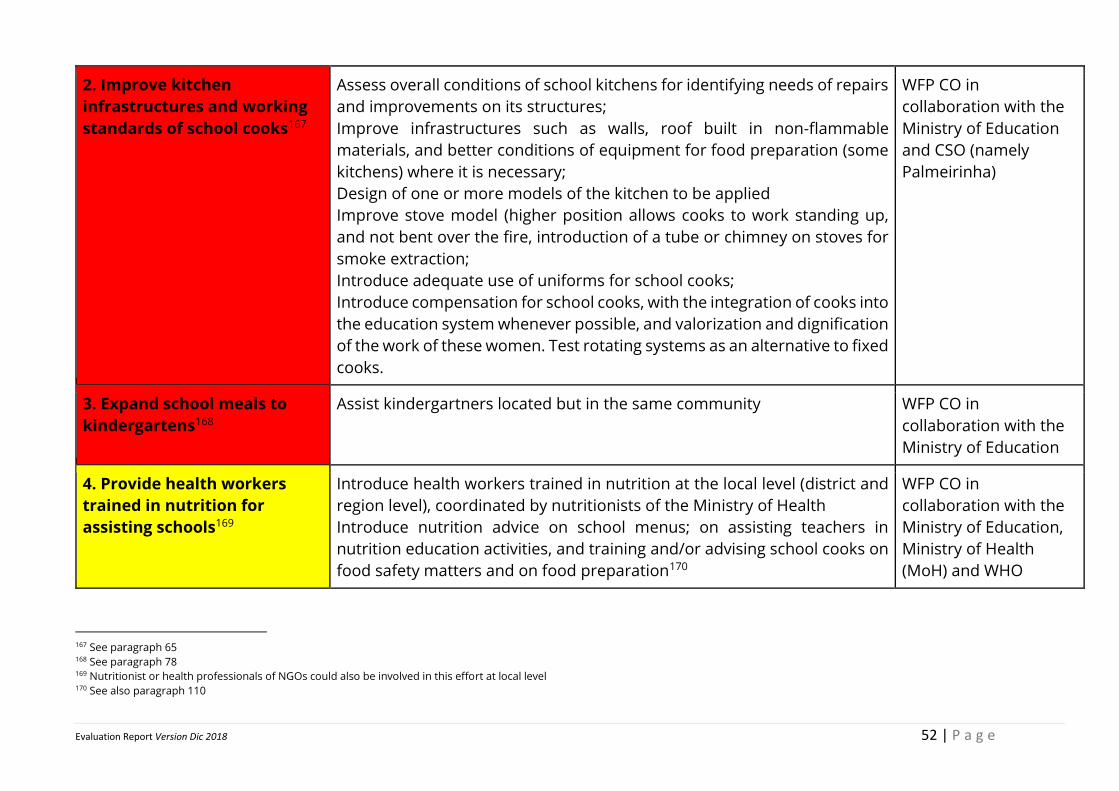
Evaluation Report Version Dic 2018 52 | P a g e
2. Improve kitchen
infrastructures and working
standards of school cooks167
● Assess overall conditions of school kitchens for identifying needs of repairs
and improvements on its structures;
● Improve infrastructures such as walls, roof built in non-flammable
materials, and better conditions of equipment for food preparation (some
kitchens) where it is necessary;
● Design of one or more models of the kitchen to be applied
● Improve stove model (higher position allows cooks to work standing up,
and not bent over the fire, introduction of a tube or chimney on stoves for
smoke extraction;
● Introduce adequate use of uniforms for school cooks;
● Introduce compensation for school cooks, with the integration of cooks into
the education system whenever possible, and valorization and dignification
of the work of these women. Test rotating systems as an alternative to fixed
cooks.
WFP CO in
collaboration with the
Ministry of Education
and CSO (namely
Palmeirinha)
● 3. Expand school meals to
kindergartens168
● Assist kindergartners located but in the same community WFP CO in
collaboration with the
Ministry of Education
● 4. Provide health workers
trained in nutrition for
assisting schools169
● Introduce health workers trained in nutrition at the local level (district and
region level), coordinated by nutritionists of the Ministry of Health
● Introduce nutrition advice on school menus; on assisting teachers in
nutrition education activities, and training and/or advising school cooks on
food safety matters and on food preparation170
WFP CO in
collaboration with the
Ministry of Education,
Ministry of Health
(MoH) and WHO
167 See paragraph 65 168 See paragraph 78 169 Nutritionist or health professionals of NGOs could also be involved in this effort at local level 170 See also paragraph 110
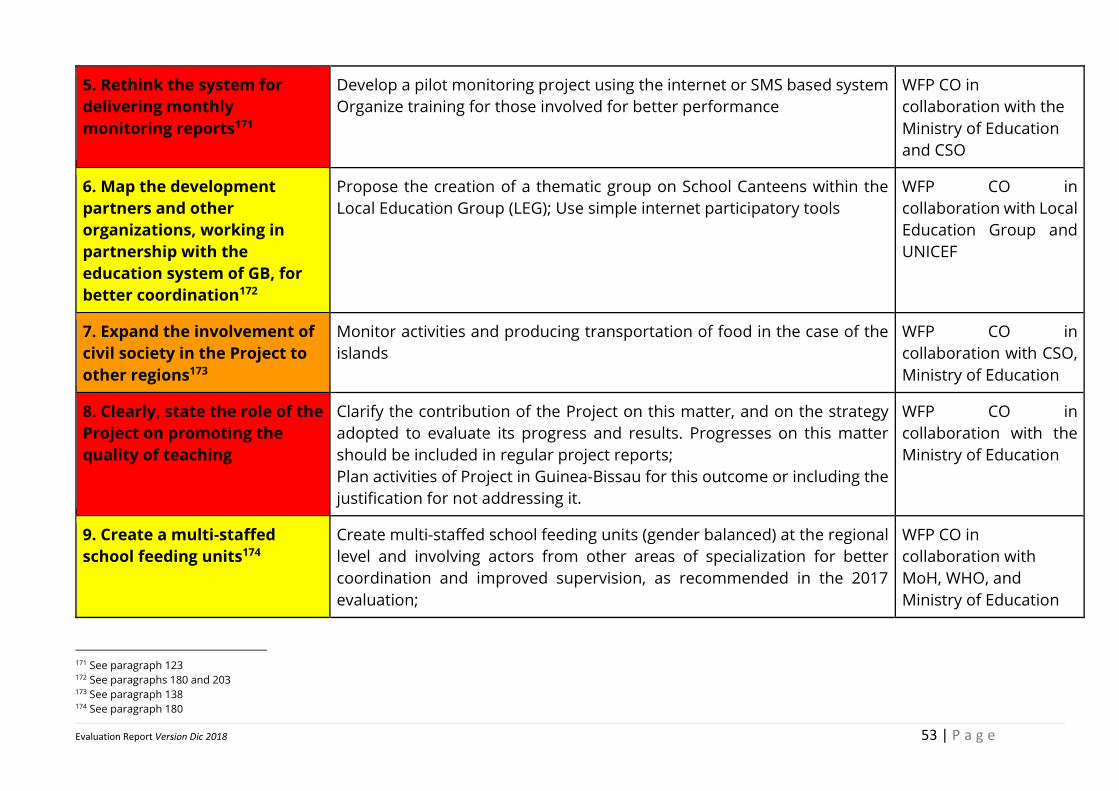
Evaluation Report Version Dic 2018 53 | P a g e
● 5. Rethink the system for
delivering monthly
monitoring reports171
● Develop a pilot monitoring project using the internet or SMS based system
● Organize training for those involved for better performance
WFP CO in
collaboration with the
Ministry of Education
and CSO
● 6. Map the development
partners and other
organizations, working in
partnership with the
education system of GB, for
better coordination172
● Propose the creation of a thematic group on School Canteens within the
Local Education Group (LEG); Use simple internet participatory tools
WFP CO in
collaboration with Local
Education Group and
UNICEF
● 7. Expand the involvement of
civil society in the Project to
other regions173
● Monitor activities and producing transportation of food in the case of the
islands
WFP CO in
collaboration with CSO,
Ministry of Education
● 8. Clearly, state the role of the
Project on promoting the
quality of teaching
● Clarify the contribution of the Project on this matter, and on the strategy
adopted to evaluate its progress and results. Progresses on this matter
should be included in regular project reports;
● Plan activities of Project in Guinea-Bissau for this outcome or including the
justification for not addressing it.
WFP CO in
collaboration with the
Ministry of Education
● 9. Create a multi-staffed
school feeding units174
● Create multi-staffed school feeding units (gender balanced) at the regional
level and involving actors from other areas of specialization for better
coordination and improved supervision, as recommended in the 2017
evaluation;
WFP CO in
collaboration with
MoH, WHO, and
Ministry of Education
171 See paragraph 123 172 See paragraphs 180 and 203 173 See paragraph 138 174 See paragraph 180
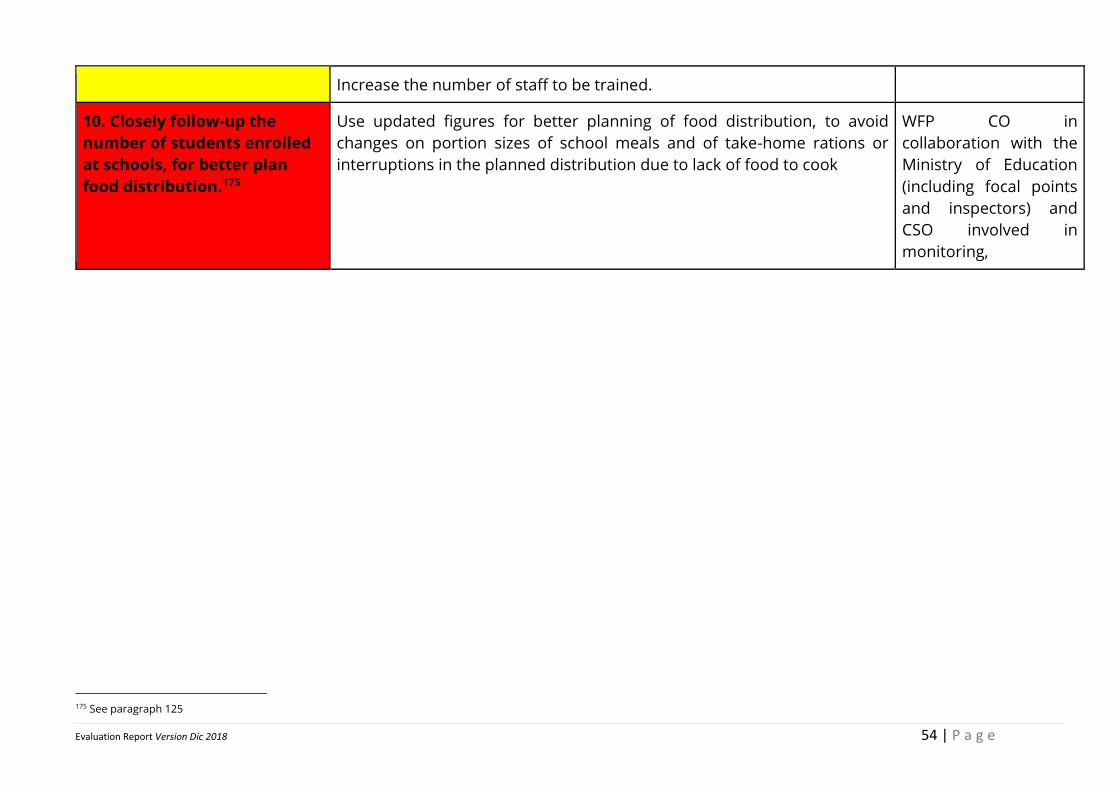
Evaluation Report Version Dic 2018 54 | P a g e
● Increase the number of staff to be trained.
● 10. Closely follow-up the
number of students enrolled
at schools, for better plan
food distribution.175
● Use updated figures for better planning of food distribution, to avoid
changes on portion sizes of school meals and of take-home rations or
interruptions in the planned distribution due to lack of food to cook
WFP CO in
collaboration with the
Ministry of Education
(including focal points
and inspectors) and
CSO involved in
monitoring,
175 See paragraph 125
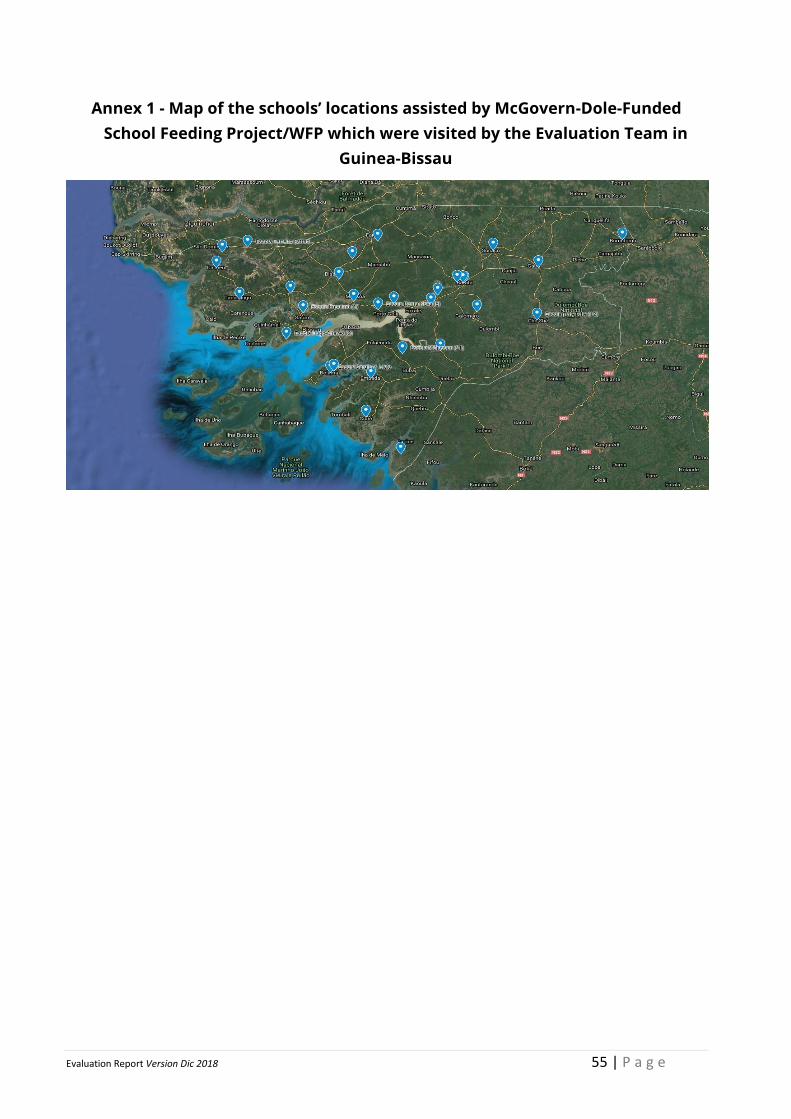
Evaluation Report Version Dic 2018 55 | P a g e
Annex 1 - Map of the schools’ locations assisted by McGovern-Dole-Funded
School Feeding Project/WFP which were visited by the Evaluation Team in
Guinea-Bissau

Evaluation Report Version Dic 2018 56 | P a g e
Annex 2 – Mc Govern-Dole- Funded School Feeding Project in Guinea-Bissau
Factsheet
Table A11 – Mc Govern-Dole Funded School Feeding Project / WFP SFP in Guinea-
Bissau Factsheet
Type of Intervention: Operation
Dates Approval date: December 2015, Start date: March 2016;
End date: July 2019
Amendments WFP requested in 17 August 2017: Coverage extension
from 638 to 758 schools. Updated targets for school
assisted indicators and numbers of kitchens and
storerooms to be constructed
Duration of the
Intervention
3 years and 4 months
Beneficiary Numbers Planned: 145,000 student FY 2016; 160,000 in FY2017; and
173,000 FY2018
Donors McGovern-Dole Fund-USDA: $US20 ($6,217,100 FY 2016,
$6,891,400 FY 2017 and $6,891,500 FY 2018)
Main Activities School meals, THR, improving school feeding structures
(kitchen and storage) trainings, M&E system, supporting
pilot SF
Amount Transfers Planned: In-kind food: 1,956 MT of beans, 9,894 MT of Rice
and 737 MT of vegetable oil
Distributed: (2,021 MT FY 2016, 5,709 MT FY 2017)
USD Requirements Initial: USD 2om ($6,217,100, $6,891,400 and $6,891,500,
respectively)
Evaluations Mac-Govern-Dole -WFP SFP baseline survey
Source: own elaboration
Evaluation Report Version Dic 2018 57 | P a g e
Annex 3 - Reconstruction of the Logframe of the Mc Govern-Dole- Funded
School Feeding Project
Outcome 1: School age children in Guinea-Bissau have adequate access to safe
and nutritious food all year-round
Output 1 - Primary school children in targeted schools receive timely, sufficient and
nutritionally adequate food transfers to meet their basic food and nutrition
requirements
Activity 1 - Provide school meals to primary school children,
Indicator 1 - Number of daily school meals provided to school-age children;
Indicator 2 - Number of school-aged children receiving daily school meals (male)
Indicator 3 - Number of school-aged children receiving daily school meals (women)
Indicator 4 - Number of school-aged children receiving daily school meals (2+3)
Indicator 5 - Number of school students enrolled in schools receiving assistance
(women)
Indicator 6 - Number of school students enrolled in schools receiving assistance (male)
Indicator 7 - Number of school students enrolled in schools receiving assistance (5+6)
Indicator 8 - Number of individuals receiving directly from funded intervention
Indicator (new)
Indicator 9 - Number of individuals receiving directly from funded intervention
(continuing)
Indicator 10 - Number of students regularly (80%) attending supported
classrooms/school (women)
Indicator 11 - Number of students regularly (80%) attending supported
classrooms/school (male)
Indicator 12 - Number of students regularly (80%) attending supported
classrooms/school (total)
Activity 2 - Provide take-home-rations for girls from 4th to 6th grade.
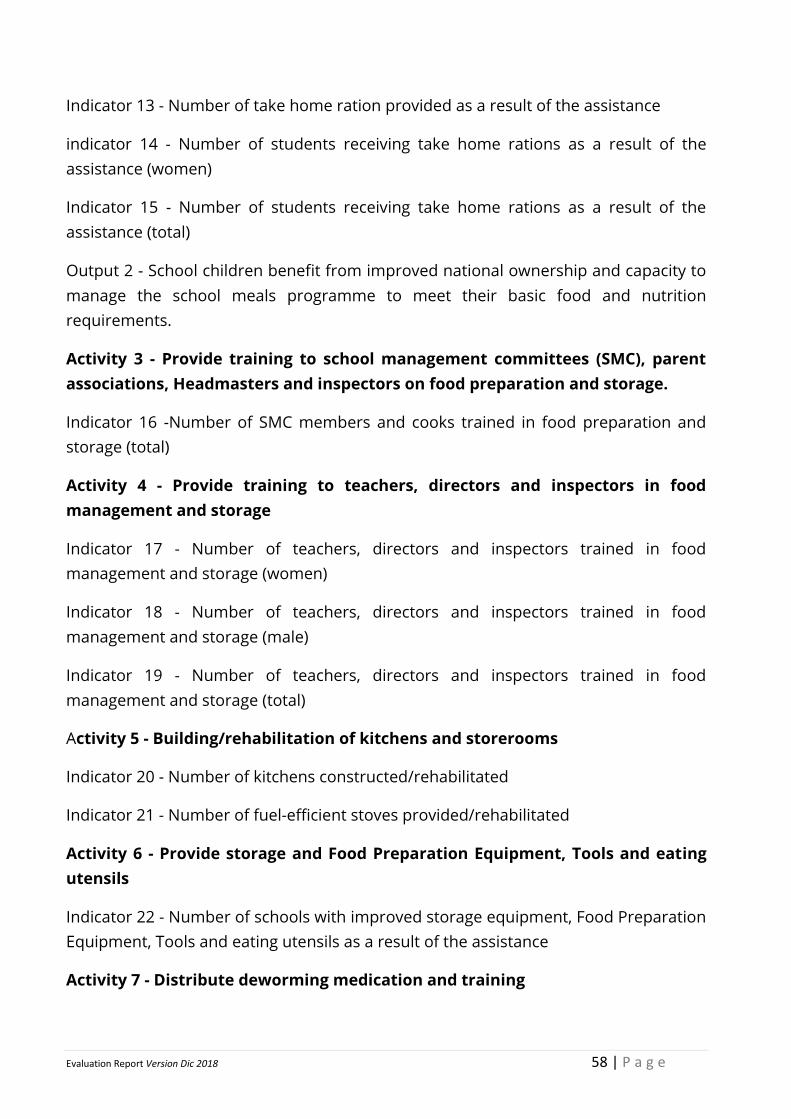
Evaluation Report Version Dic 2018 58 | P a g e
Indicator 13 - Number of take home ration provided as a result of the assistance
indicator 14 - Number of students receiving take home rations as a result of the
assistance (women)
Indicator 15 - Number of students receiving take home rations as a result of the
assistance (total)
Output 2 - School children benefit from improved national ownership and capacity to
manage the school meals programme to meet their basic food and nutrition
requirements.
Activity 3 - Provide training to school management committees (SMC), parent
associations, Headmasters and inspectors on food preparation and storage.
Indicator 16 -Number of SMC members and cooks trained in food preparation and
storage (total)
Activity 4 - Provide training to teachers, directors and inspectors in food
management and storage
Indicator 17 - Number of teachers, directors and inspectors trained in food
management and storage (women)
Indicator 18 - Number of teachers, directors and inspectors trained in food
management and storage (male)
Indicator 19 - Number of teachers, directors and inspectors trained in food
management and storage (total)
Activity 5 - Building/rehabilitation of kitchens and storerooms
Indicator 20 - Number of kitchens constructed/rehabilitated
Indicator 21 - Number of fuel-efficient stoves provided/rehabilitated
Activity 6 - Provide storage and Food Preparation Equipment, Tools and eating
utensils
Indicator 22 - Number of schools with improved storage equipment, Food Preparation
Equipment, Tools and eating utensils as a result of the assistance
Activity 7 - Distribute deworming medication and training
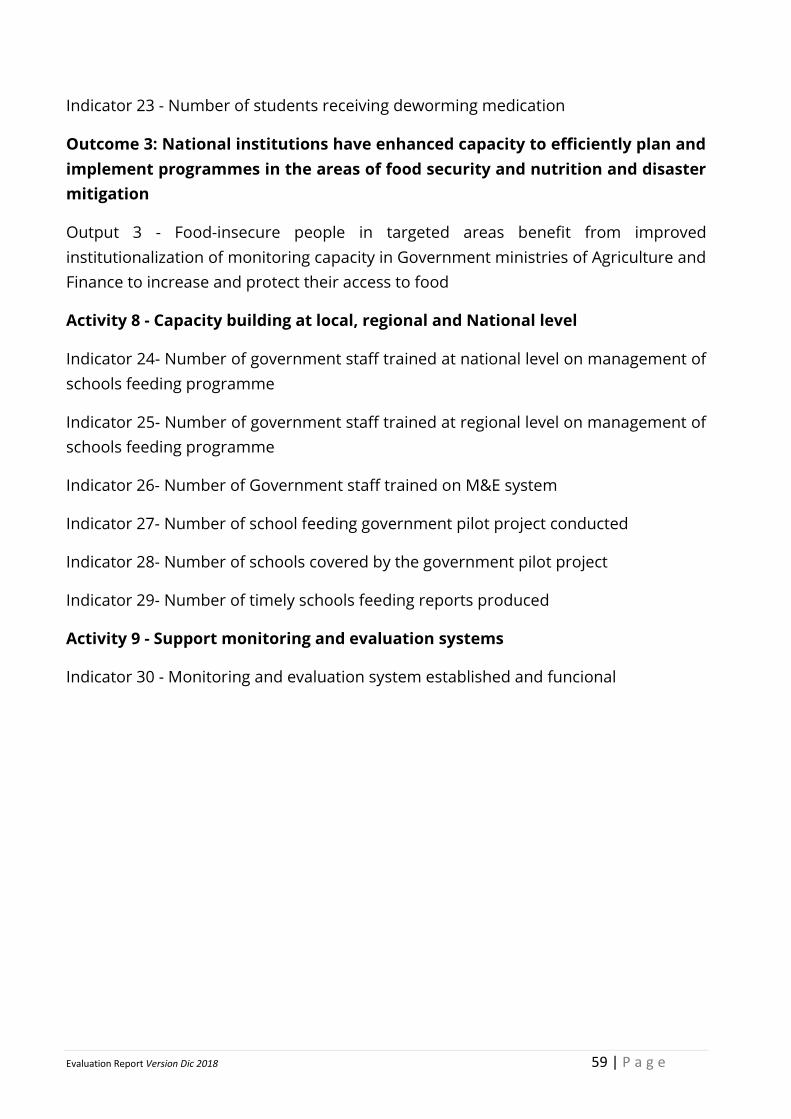
Evaluation Report Version Dic 2018 59 | P a g e
Indicator 23 - Number of students receiving deworming medication
Outcome 3: National institutions have enhanced capacity to efficiently plan and
implement programmes in the areas of food security and nutrition and disaster
mitigation
Output 3 - Food-insecure people in targeted areas benefit from improved
institutionalization of monitoring capacity in Government ministries of Agriculture and
Finance to increase and protect their access to food
Activity 8 - Capacity building at local, regional and National level
Indicator 24- Number of government staff trained at national level on management of
schools feeding programme
Indicator 25- Number of government staff trained at regional level on management of
schools feeding programme
Indicator 26- Number of Government staff trained on M&E system
Indicator 27- Number of school feeding government pilot project conducted
Indicator 28- Number of schools covered by the government pilot project
Indicator 29- Number of timely schools feeding reports produced
Activity 9 - Support monitoring and evaluation systems
Indicator 30 - Monitoring and evaluation system established and funcional
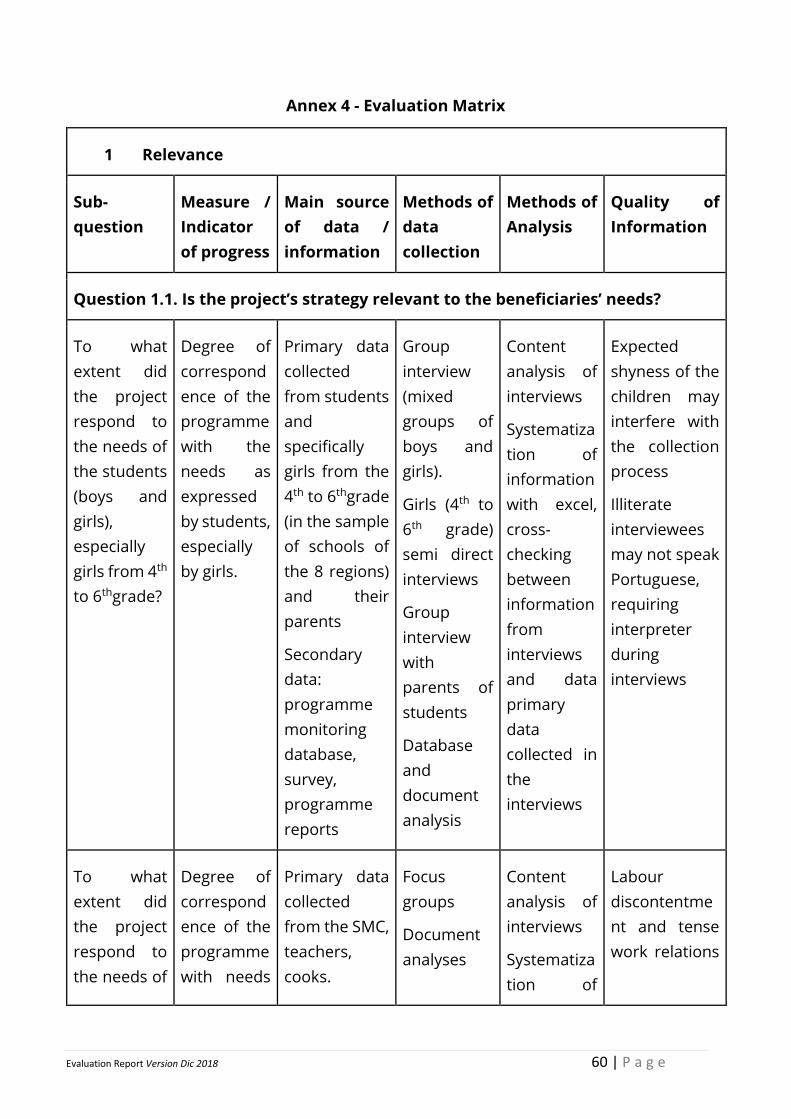
Evaluation Report Version Dic 2018 60 | P a g e
Annex 4 - Evaluation Matrix
1 Relevance
Sub-
question
Measure /
Indicator
of progress
Main source
of data /
information
Methods of
data
collection
Methods of
Analysis
Quality of
Information
Question 1.1. Is the project’s strategy relevant to the beneficiaries’ needs?
To what
extent did
the project
respond to
the needs of
the students
(boys and
girls),
especially
girls from 4th
to 6thgrade?
Degree of
correspond
ence of the
programme
with the
needs as
expressed
by students,
especially
by girls.
Primary data
collected
from students
and
specifically
girls from the
4th to 6thgrade
(in the sample
of schools of
the 8 regions)
and their
parents
Secondary
data:
programme
monitoring
database,
survey,
programme
reports
Group
interview
(mixed
groups of
boys and
girls).
Girls (4th to
6th grade)
semi direct
interviews
Group
interview
with
parents of
students
Database
and
document
analysis
Content
analysis of
interviews
Systematiza
tion of
information
with excel,
cross-
checking
between
information
from
interviews
and data
primary
data
collected in
the
interviews
Expected
shyness of the
children may
interfere with
the collection
process
Illiterate
interviewees
may not speak
Portuguese,
requiring
interpreter
during
interviews
To what
extent did
the project
respond to
the needs of
Degree of
correspond
ence of the
programme
with needs
Primary data
collected
from the SMC,
teachers,
cooks.
Focus
groups
Document
analyses
Content
analysis of
interviews
Systematiza
tion of
Labour
discontentme
nt and tense
work relations
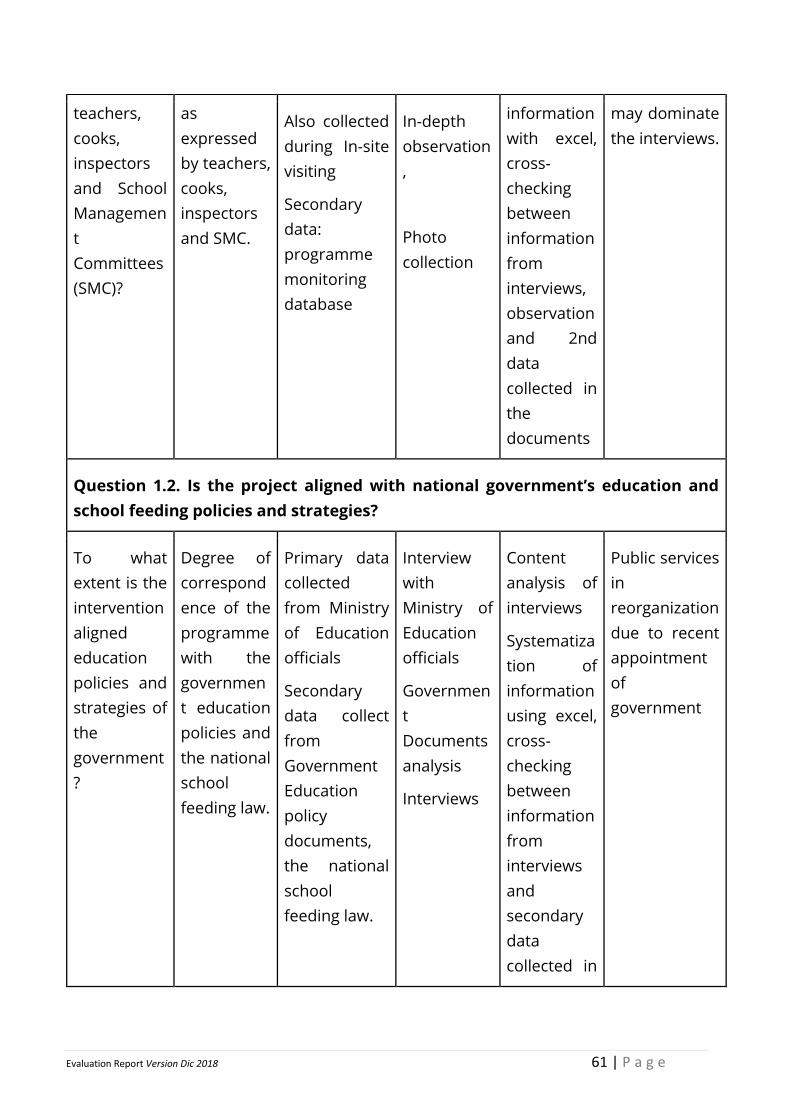
Evaluation Report Version Dic 2018 61 | P a g e
teachers,
cooks,
inspectors
and School
Managemen
t
Committees
(SMC)?
as
expressed
by teachers,
cooks,
inspectors
and SMC.
Also collected
during In-site
visiting
Secondary
data:
programme
monitoring
database
In-depth
observation
,
Photo
collection
information
with excel,
cross-
checking
between
information
from
interviews,
observation
and 2nd
data
collected in
the
documents
may dominate
the interviews.
Question 1.2. Is the project aligned with national government’s education and
school feeding policies and strategies?
To what
extent is the
intervention
aligned
education
policies and
strategies of
the
government
?
Degree of
correspond
ence of the
programme
with the
governmen
t education
policies and
the national
school
feeding law.
Primary data
collected
from Ministry
of Education
officials
Secondary
data collect
from
Government
Education
policy
documents,
the national
school
feeding law.
Interview
with
Ministry of
Education
officials
Governmen
t
Documents
analysis
Interviews
Content
analysis of
interviews
Systematiza
tion of
information
using excel,
cross-
checking
between
information
from
interviews
and
secondary
data
collected in
Public services
in
reorganization
due to recent
appointment
of
government
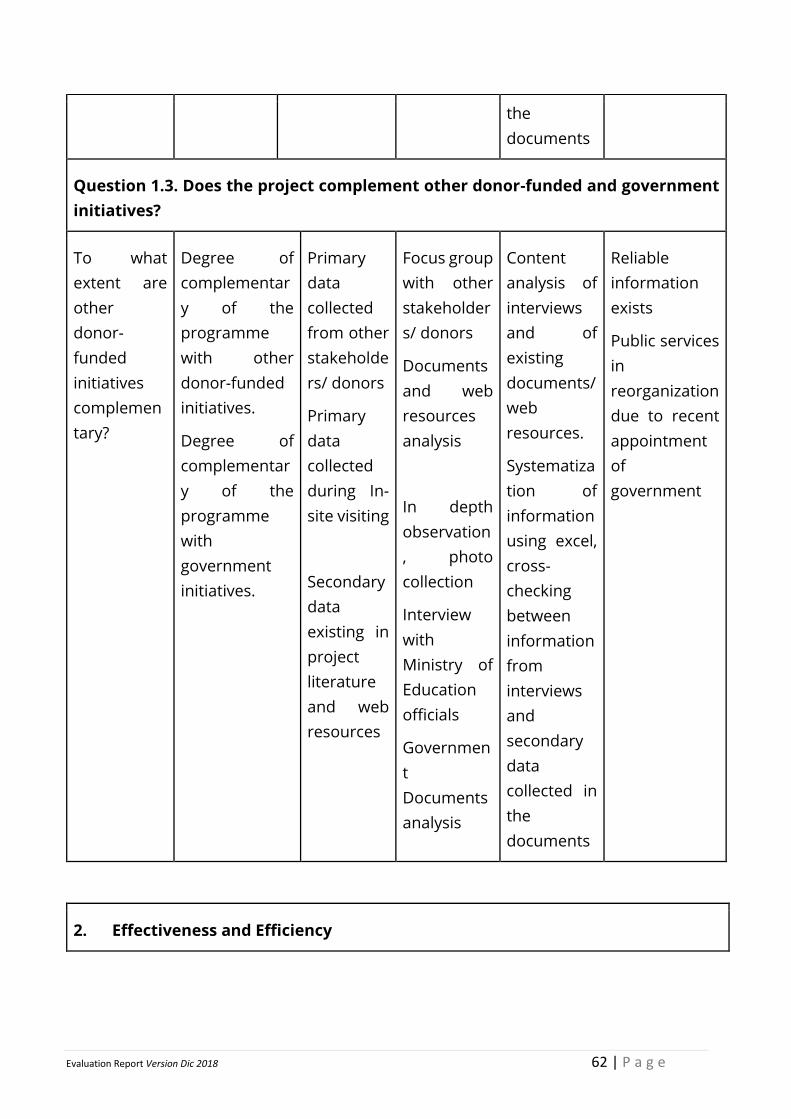
Evaluation Report Version Dic 2018 62 | P a g e
the
documents
Question 1.3. Does the project complement other donor-funded and government
initiatives?
To what
extent are
other
donor-
funded
initiatives
complemen
tary?
Degree of
complementar
y of the
programme
with other
donor-funded
initiatives.
Degree of
complementar
y of the
programme
with
government
initiatives.
Primary
data
collected
from other
stakeholde
rs/ donors
Primary
data
collected
during In-
site visiting
Secondary
data
existing in
project
literature
and web
resources
Focus group
with other
stakeholder
s/ donors
Documents
and web
resources
analysis
In depth
observation
, photo
collection
Interview
with
Ministry of
Education
officials
Governmen
t
Documents
analysis
Content
analysis of
interviews
and of
existing
documents/
web
resources.
Systematiza
tion of
information
using excel,
cross-
checking
between
information
from
interviews
and
secondary
data
collected in
the
documents
Reliable
information
exists
Public services
in
reorganization
due to recent
appointment
of
government
2. Effectiveness and Efficiency
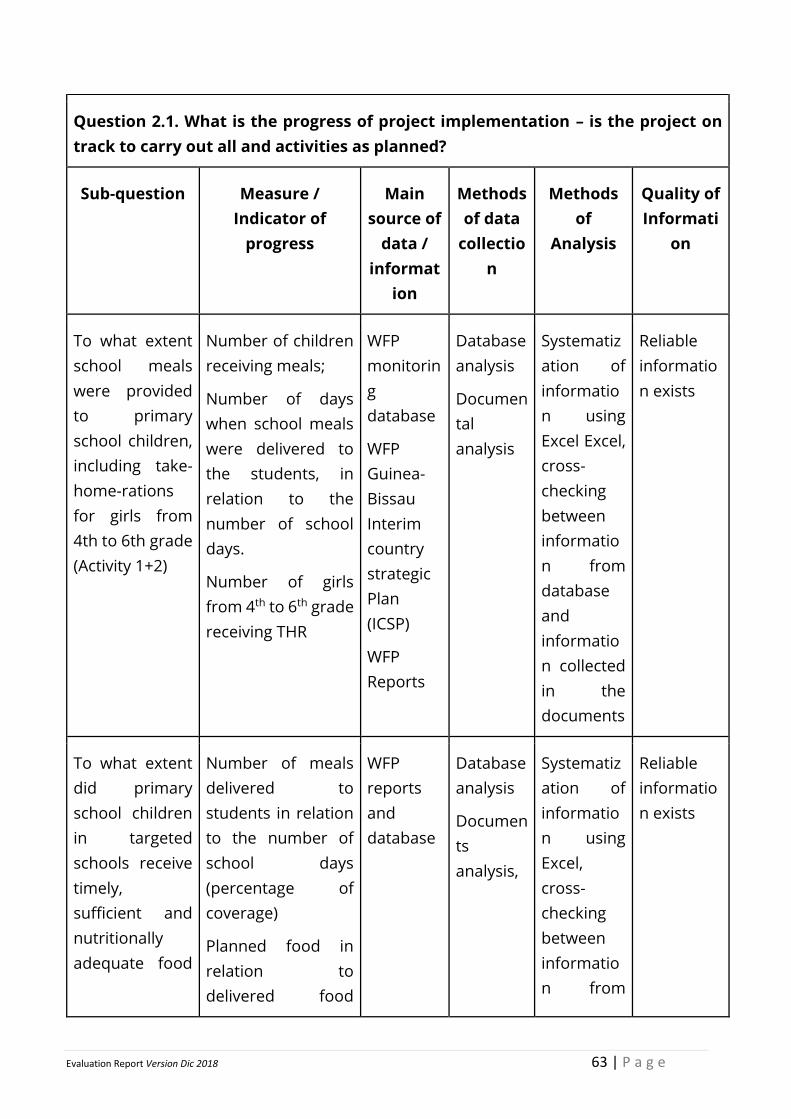
Evaluation Report Version Dic 2018 63 | P a g e
Question 2.1. What is the progress of project implementation – is the project on
track to carry out all and activities as planned?
Sub-question Measure /
Indicator of
progress
Main
source of
data /
informat
ion
Methods
of data
collectio
n
Methods
of
Analysis
Quality of
Informati
on
To what extent
school meals
were provided
to primary
school children,
including take-
home-rations
for girls from
4th to 6th grade
(Activity 1+2)
Number of children
receiving meals;
Number of days
when school meals
were delivered to
the students, in
relation to the
number of school
days.
Number of girls
from 4th to 6th grade
receiving THR
WFP
monitorin
g
database
WFP
Guinea-
Bissau
Interim
country
strategic
Plan
(ICSP)
WFP
Reports
Database
analysis
Documen
tal
analysis
Systematiz
ation of
informatio
n using
Excel Excel,
cross-
checking
between
informatio
n from
database
and
informatio
n collected
in the
documents
Reliable
informatio
n exists
To what extent
did primary
school children
in targeted
schools receive
timely,
sufficient and
nutritionally
adequate food
Number of meals
delivered to
students in relation
to the number of
school days
(percentage of
coverage)
Planned food in
relation to
delivered food
WFP
reports
and
database
Database
analysis
Documen
ts
analysis,
Systematiz
ation of
informatio
n using
Excel,
cross-
checking
between
informatio
n from
Reliable
informatio
n exists
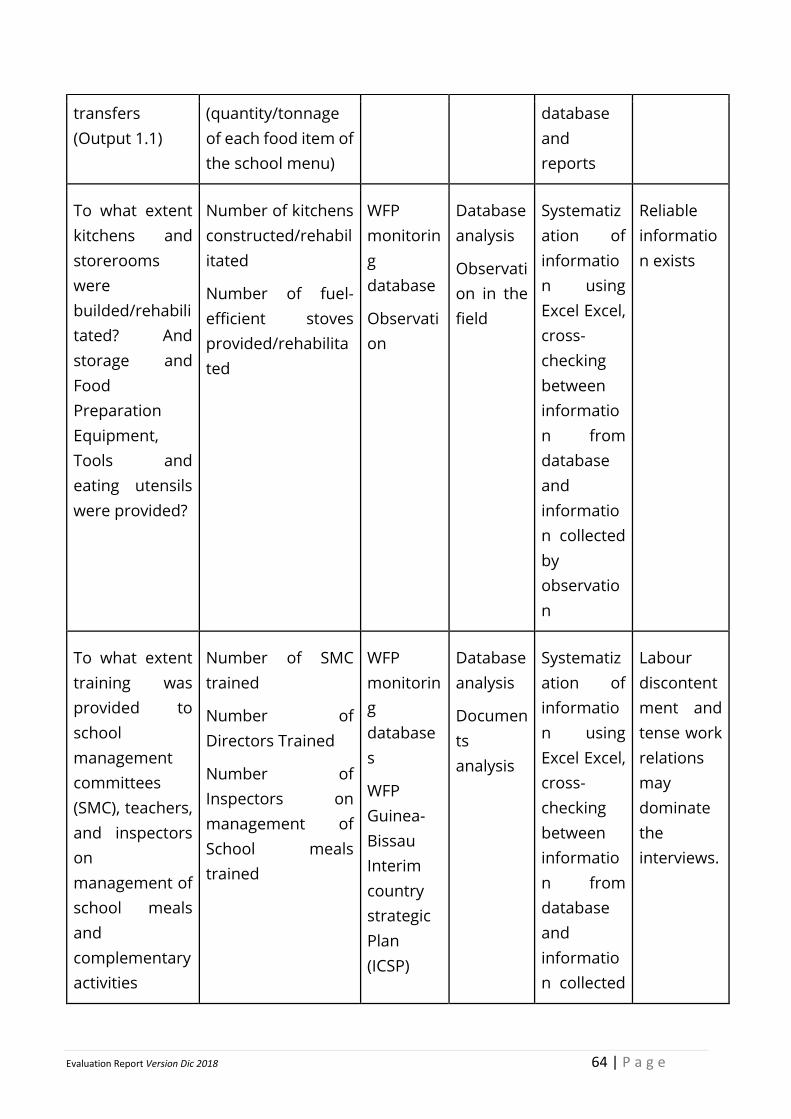
Evaluation Report Version Dic 2018 64 | P a g e
transfers
(Output 1.1)
(quantity/tonnage
of each food item of
the school menu)
database
and
reports
To what extent
kitchens and
storerooms
were
builded/rehabili
tated? And
storage and
Food
Preparation
Equipment,
Tools and
eating utensils
were provided?
Number of kitchens
constructed/rehabil
itated
Number of fuel-
efficient stoves
provided/rehabilita
ted
WFP
monitorin
g
database
Observati
on
Database
analysis
Observati
on in the
field
Systematiz
ation of
informatio
n using
Excel Excel,
cross-
checking
between
informatio
n from
database
and
informatio
n collected
by
observatio
n
Reliable
informatio
n exists
To what extent
training was
provided to
school
management
committees
(SMC), teachers,
and inspectors
on
management of
school meals
and
complementary
activities
Number of SMC
trained
Number of
Directors Trained
Number of
Inspectors on
management of
School meals
trained
WFP
monitorin
g
database
s
WFP
Guinea-
Bissau
Interim
country
strategic
Plan
(ICSP)
Database
analysis
Documen
ts
analysis
Systematiz
ation of
informatio
n using
Excel Excel,
cross-
checking
between
informatio
n from
database
and
informatio
n collected
Labour
discontent
ment and
tense work
relations
may
dominate
the
interviews.
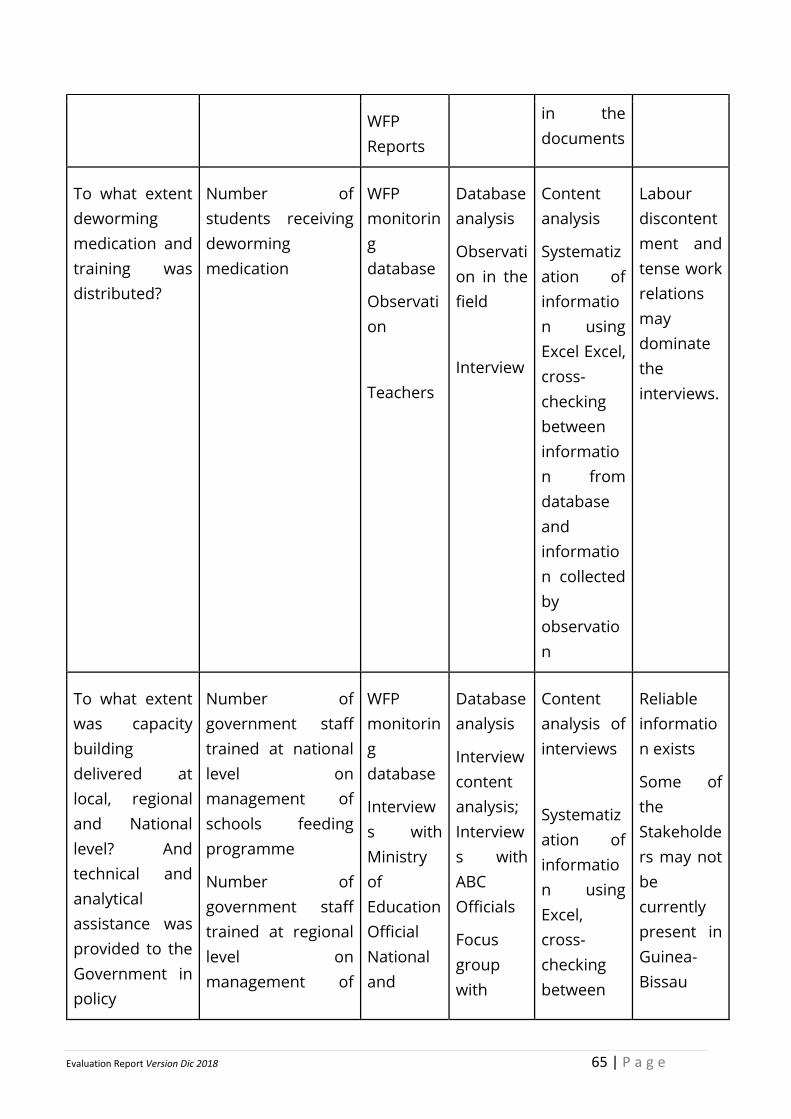
Evaluation Report Version Dic 2018 65 | P a g e
WFP
Reports
in the
documents
To what extent
deworming
medication and
training was
distributed?
Number of
students receiving
deworming
medication
WFP
monitorin
g
database
Observati
on
Teachers
Database
analysis
Observati
on in the
field
Interview
Content
analysis
Systematiz
ation of
informatio
n using
Excel Excel,
cross-
checking
between
informatio
n from
database
and
informatio
n collected
by
observatio
n
Labour
discontent
ment and
tense work
relations
may
dominate
the
interviews.
To what extent
was capacity
building
delivered at
local, regional
and National
level? And
technical and
analytical
assistance was
provided to the
Government in
policy
Number of
government staff
trained at national
level on
management of
schools feeding
programme
Number of
government staff
trained at regional
level on
management of
WFP
monitorin
g
database
Interview
s with
Ministry
of
Education
Official
National
and
Database
analysis
Interview
content
analysis;
Interview
s with
ABC
Officials
Focus
group
with
Content
analysis of
interviews
Systematiz
ation of
informatio
n using
Excel,
cross-
checking
between
Reliable
informatio
n exists
Some of
the
Stakeholde
rs may not
be
currently
present in
Guinea-
Bissau
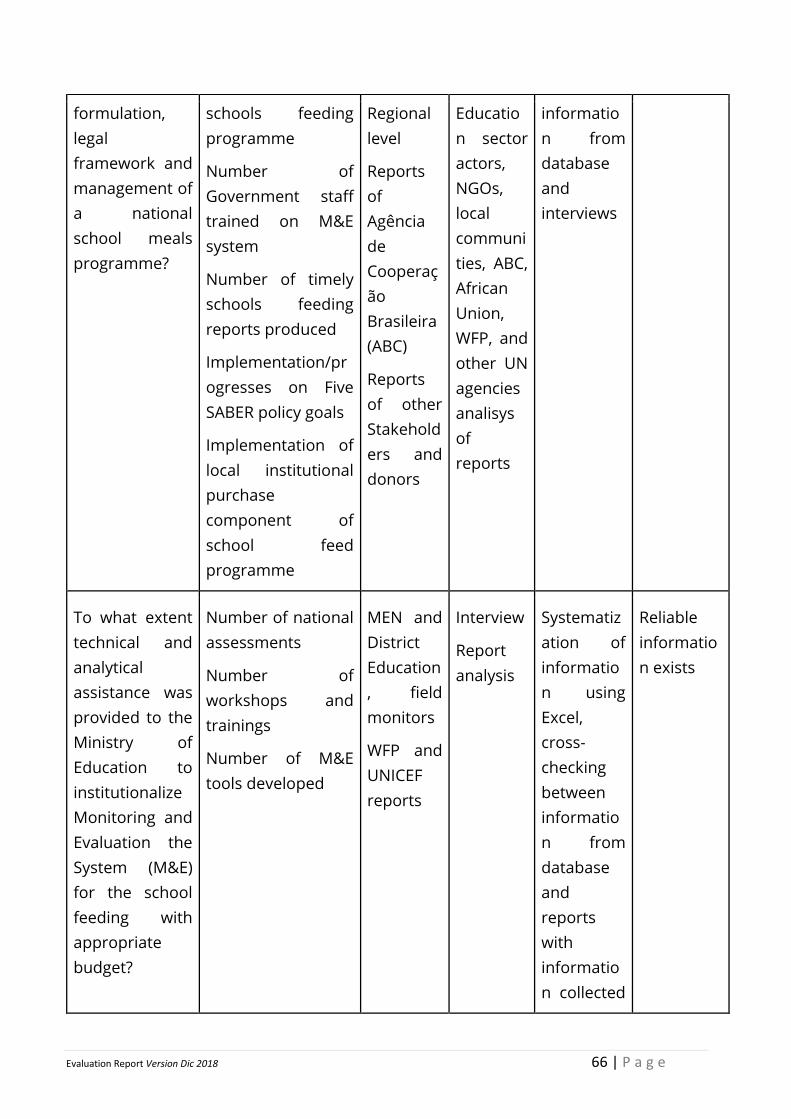
Evaluation Report Version Dic 2018 66 | P a g e
formulation,
legal
framework and
management of
a national
school meals
programme?
schools feeding
programme
Number of
Government staff
trained on M&E
system
Number of timely
schools feeding
reports produced
Implementation/pr
ogresses on Five
SABER policy goals
Implementation of
local institutional
purchase
component of
school feed
programme
Regional
level
Reports
of
Agência
de
Cooperaç
ão
Brasileira
(ABC)
Reports
of other
Stakehold
ers and
donors
Educatio
n sector
actors,
NGOs,
local
communi
ties, ABC,
African
Union,
WFP, and
other UN
agencies
analisys
of
reports
informatio
n from
database
and
interviews
To what extent
technical and
analytical
assistance was
provided to the
Ministry of
Education to
institutionalize
Monitoring and
Evaluation the
System (M&E)
for the school
feeding with
appropriate
budget?
Number of national
assessments
Number of
workshops and
trainings
Number of M&E
tools developed
MEN and
District
Education
, field
monitors
WFP and
UNICEF
reports
Interview
Report
analysis
Systematiz
ation of
informatio
n using
Excel,
cross-
checking
between
informatio
n from
database
and
reports
with
informatio
n collected
Reliable
informatio
n exists
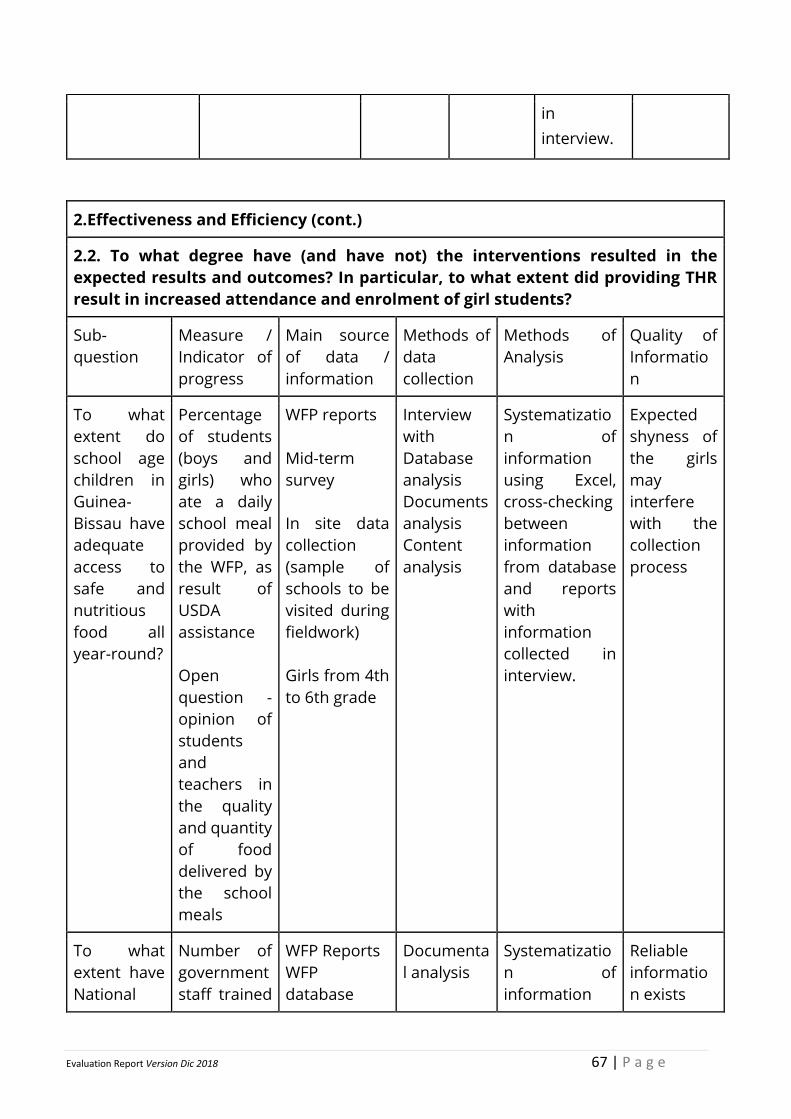
Evaluation Report Version Dic 2018 67 | P a g e
in
interview.
2.Effectiveness and Efficiency (cont.)
2.2. To what degree have (and have not) the interventions resulted in the
expected results and outcomes? In particular, to what extent did providing THR
result in increased attendance and enrolment of girl students?
Sub-
question
Measure /
Indicator of
progress
Main source
of data /
information
Methods of
data
collection
Methods of
Analysis
Quality of
Informatio
n
To what
extent do
school age
children in
Guinea-
Bissau have
adequate
access to
safe and
nutritious
food all
year-round?
Percentage
of students
(boys and
girls) who
ate a daily
school meal
provided by
the WFP, as
result of
USDA
assistance
Open
question -
opinion of
students
and
teachers in
the quality
and quantity
of food
delivered by
the school
meals
WFP reports
Mid-term
survey
In site data
collection
(sample of
schools to be
visited during
fieldwork)
Girls from 4th
to 6th grade
Interview
with
Database
analysis
Documents
analysis
Content
analysis
Systematizatio
n of
information
using Excel,
cross-checking
between
information
from database
and reports
with
information
collected in
interview.
Expected
shyness of
the girls
may
interfere
with the
collection
process
To what
extent have
National
Number of
government
staff trained
WFP Reports
WFP
database
Documenta
l analysis
Systematizatio
n of
information
Reliable
informatio
n exists
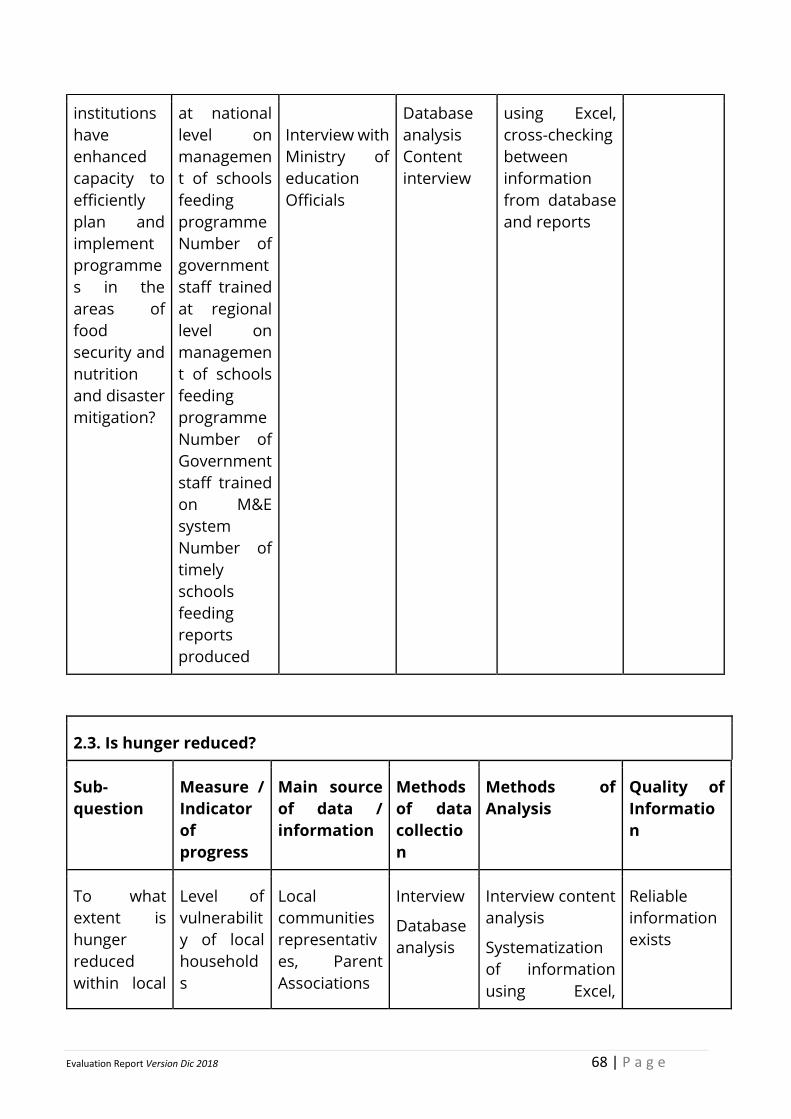
Evaluation Report Version Dic 2018 68 | P a g e
institutions
have
enhanced
capacity to
efficiently
plan and
implement
programme
s in the
areas of
food
security and
nutrition
and disaster
mitigation?
at national
level on
managemen
t of schools
feeding
programme
Number of
government
staff trained
at regional
level on
managemen
t of schools
feeding
programme
Number of
Government
staff trained
on M&E
system
Number of
timely
schools
feeding
reports
produced
Interview with
Ministry of
education
Officials
Database
analysis
Content
interview
using Excel,
cross-checking
between
information
from database
and reports
2.3. Is hunger reduced?
Sub-
question
Measure /
Indicator
of
progress
Main source
of data /
information
Methods
of data
collectio
n
Methods of
Analysis
Quality of
Informatio
n
To what
extent is
hunger
reduced
within local
Level of
vulnerabilit
y of local
household
s
Local
communities
representativ
es, Parent
Associations
Interview
Database
analysis
Interview content
analysis
Systematization
of information
using Excel,
Reliable
information
exists
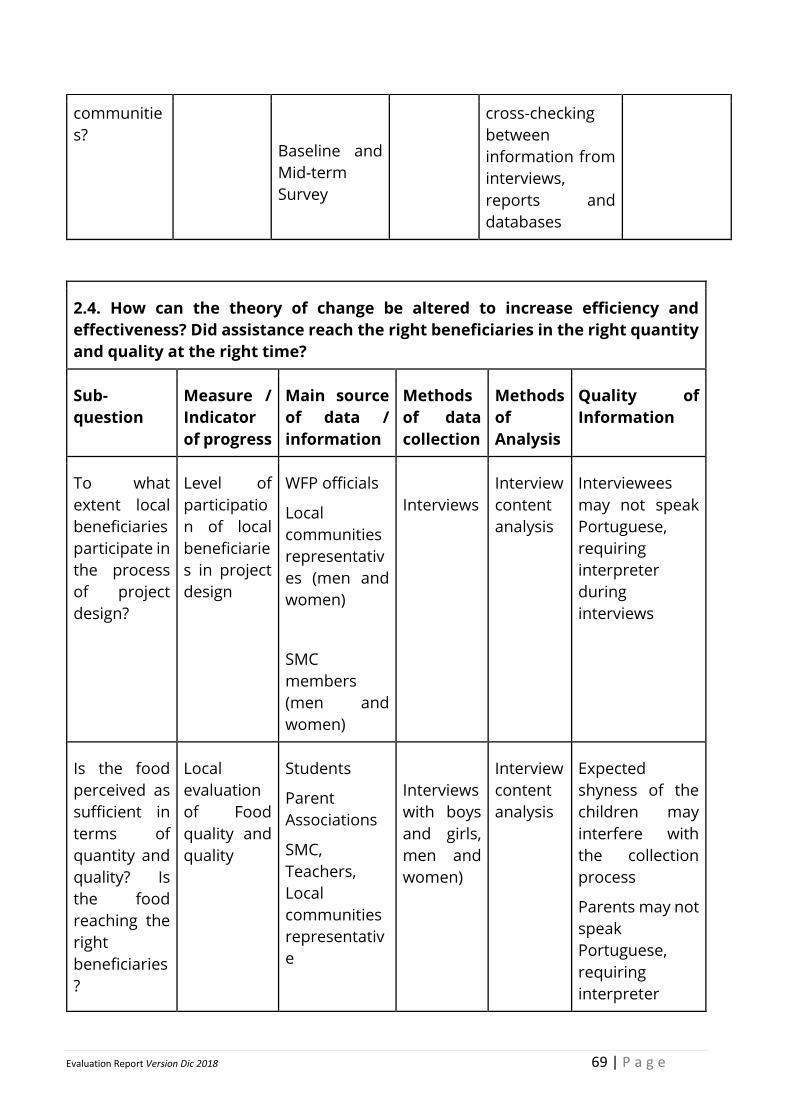
Evaluation Report Version Dic 2018 69 | P a g e
communitie
s?
Baseline and
Mid-term
Survey
cross-checking
between
information from
interviews,
reports and
databases
2.4. How can the theory of change be altered to increase efficiency and
effectiveness? Did assistance reach the right beneficiaries in the right quantity
and quality at the right time?
Sub-
question
Measure /
Indicator
of progress
Main source
of data /
information
Methods
of data
collection
Methods
of
Analysis
Quality of
Information
To what
extent local
beneficiaries
participate in
the process
of project
design?
Level of
participatio
n of local
beneficiarie
s in project
design
WFP officials
Local
communities
representativ
es (men and
women)
SMC
members
(men and
women)
Interviews
Interview
content
analysis
Interviewees
may not speak
Portuguese,
requiring
interpreter
during
interviews
Is the food
perceived as
sufficient in
terms of
quantity and
quality? Is
the food
reaching the
right
beneficiaries
?
Local
evaluation
of Food
quality and
quality
Students
Parent
Associations
SMC,
Teachers,
Local
communities
representativ
e
Interviews
with boys
and girls,
men and
women)
Interview
content
analysis
Expected
shyness of the
children may
interfere with
the collection
process
Parents may not
speak
Portuguese,
requiring
interpreter
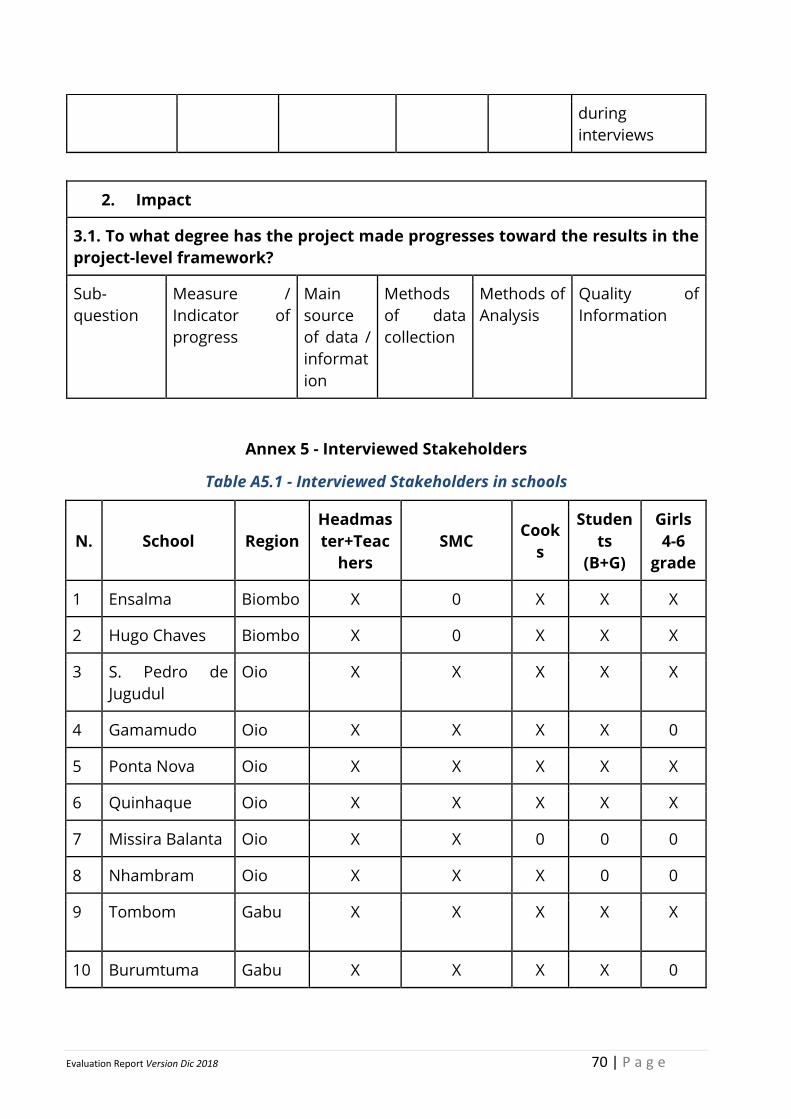
Evaluation Report Version Dic 2018 70 | P a g e
during
interviews
2. Impact
3.1. To what degree has the project made progresses toward the results in the
project-level framework?
Sub-
question
Measure /
Indicator of
progress
Main
source
of data /
informat
ion
Methods
of data
collection
Methods of
Analysis
Quality of
Information
Annex 5 - Interviewed Stakeholders
Table A5.1 - Interviewed Stakeholders in schools
N. School Region
Headmas
ter+Teac
hers
SMC Cook
s
Studen
ts
(B+G)
Girls
4-6
grade
1 Ensalma Biombo X 0 X X X
2 Hugo Chaves Biombo X 0 X X X
3 S. Pedro de
Jugudul
Oio X X X X X
4 Gamamudo Oio X X X X 0
5 Ponta Nova Oio X X X X X
6 Quinhaque Oio X X X X X
7 Missira Balanta Oio X X 0 0 0
8 Nhambram Oio X X X 0 0
9 Tombom
Gabu X X X X X
10 Burumtuma Gabu X X X X 0
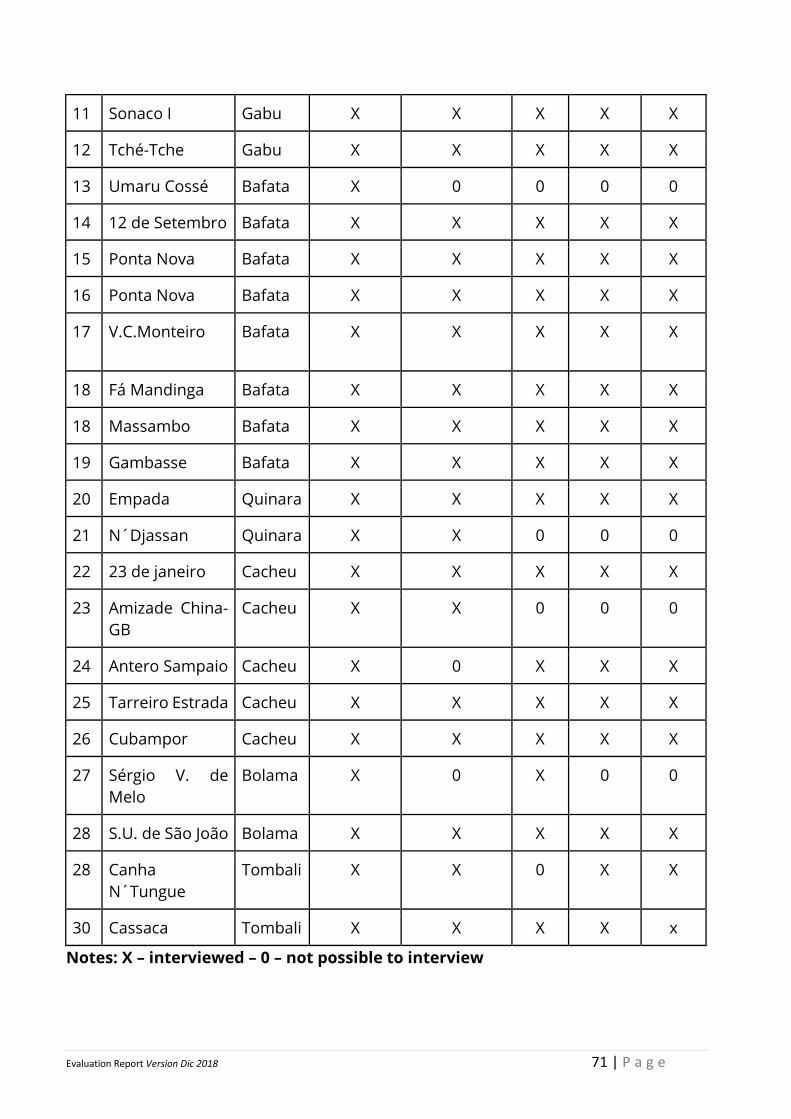
Evaluation Report Version Dic 2018 71 | P a g e
11 Sonaco I Gabu X X X X X
12 Tché-Tche Gabu X X X X X
13 Umaru Cossé Bafata X 0 0 0 0
14 12 de Setembro Bafata X X X X X
15 Ponta Nova Bafata X X X X X
16 Ponta Nova Bafata X X X X X
17 V.C.Monteiro
Bafata X X X X X
18 Fá Mandinga Bafata X X X X X
18 Massambo Bafata X X X X X
19 Gambasse Bafata X X X X X
20 Empada Quinara X X X X X
21 N´Djassan Quinara X X 0 0 0
22 23 de janeiro Cacheu X X X X X
23 Amizade China-
GB
Cacheu X X 0 0 0
24 Antero Sampaio Cacheu X 0 X X X
25 Tarreiro Estrada Cacheu X X X X X
26 Cubampor Cacheu X X X X X
27 Sérgio V. de
Melo
Bolama X 0 X 0 0
28 S.U. de São João Bolama X X X X X
28 Canha
N´Tungue
Tombali X X 0 X X
30 Cassaca Tombali X X X X x
Notes: X – interviewed – 0 – not possible to interview
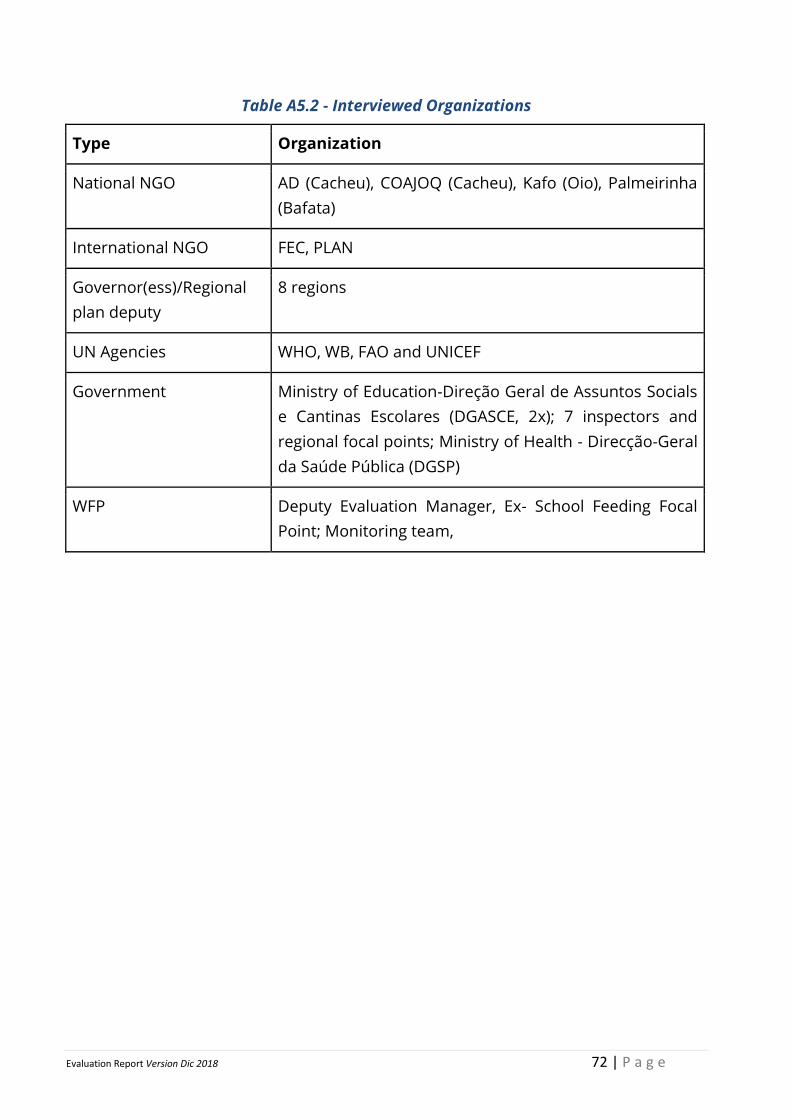
Evaluation Report Version Dic 2018 72 | P a g e
Table A5.2 - Interviewed Organizations
Type Organization
National NGO AD (Cacheu), COAJOQ (Cacheu), Kafo (Oio), Palmeirinha
(Bafata)
International NGO FEC, PLAN
Governor(ess)/Regional
plan deputy
8 regions
UN Agencies WHO, WB, FAO and UNICEF
Government Ministry of Education-Direção Geral de Assuntos Socials
e Cantinas Escolares (DGASCE, 2x); 7 inspectors and
regional focal points; Ministry of Health - Direcção-Geral
da Saúde Pública (DGSP)
WFP Deputy Evaluation Manager, Ex- School Feeding Focal
Point; Monitoring team,
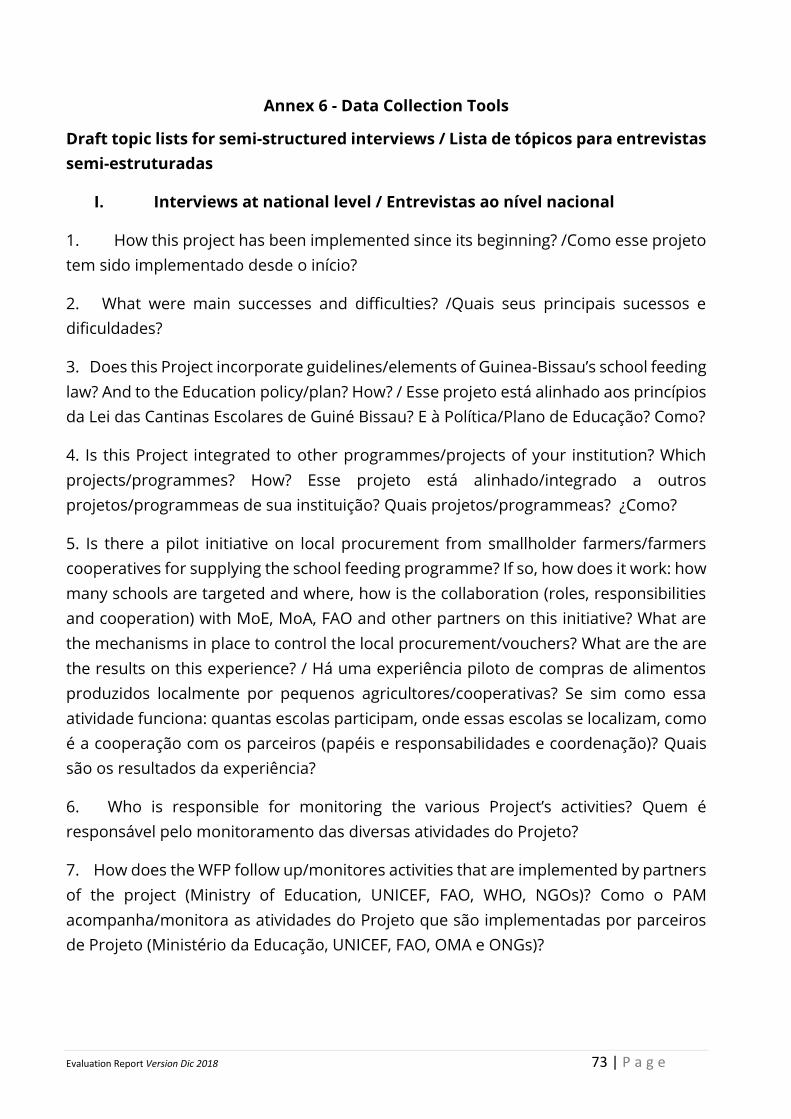
Evaluation Report Version Dic 2018 73 | P a g e
Annex 6 - Data Collection Tools
Draft topic lists for semi-structured interviews / Lista de tópicos para entrevistas
semi-estruturadas
I. Interviews at national level / Entrevistas ao nível nacional
1. How this project has been implemented since its beginning? /Como esse projeto
tem sido implementado desde o início?
2. What were main successes and difficulties? /Quais seus principais sucessos e
dificuldades?
3. Does this Project incorporate guidelines/elements of Guinea-Bissau’s school feeding
law? And to the Education policy/plan? How? / Esse projeto está alinhado aos princípios
da Lei das Cantinas Escolares de Guiné Bissau? E à Política/Plano de Educação? Como?
4. Is this Project integrated to other programmes/projects of your institution? Which
projects/programmes? How? Esse projeto está alinhado/integrado a outros
projetos/programmeas de sua instituição? Quais projetos/programmeas? ¿Como?
5. Is there a pilot initiative on local procurement from smallholder farmers/farmers
cooperatives for supplying the school feeding programme? If so, how does it work: how
many schools are targeted and where, how is the collaboration (roles, responsibilities
and cooperation) with MoE, MoA, FAO and other partners on this initiative? What are
the mechanisms in place to control the local procurement/vouchers? What are the are
the results on this experience? / Há uma experiência piloto de compras de alimentos
produzidos localmente por pequenos agricultores/cooperativas? Se sim como essa
atividade funciona: quantas escolas participam, onde essas escolas se localizam, como
é a cooperação com os parceiros (papéis e responsabilidades e coordenação)? Quais
são os resultados da experiência?
6. Who is responsible for monitoring the various Project’s activities? Quem é
responsável pelo monitoramento das diversas atividades do Projeto?
7. How does the WFP follow up/monitores activities that are implemented by partners
of the project (Ministry of Education, UNICEF, FAO, WHO, NGOs)? Como o PAM
acompanha/monitora as atividades do Projeto que são implementadas por parceiros
de Projeto (Ministério da Educação, UNICEF, FAO, OMA e ONGs)?
Evaluation Report Version Dic 2018 74 | P a g e
8. How often are the Project’s performance indicators are collected? By whom (WFP,
DGPASE, others)? Com que frequência os indicadores de performance são recolhidos?
por quem (WFP, DGPASE, others)?
9. Regarding to the following activities, please tell us about your successes and
difficulties. Is the activity implemented according to the plan (target)? Em relação às
atividades a seguir, indique quais foram os seus sucessos e dificuldades. As atividades
estão sendo implementadas de acordo com o planeamento (meta)?
a) Provision of daily school meals/ Distribuição de refeições escolares
b) Provision of take-home rations (to women students) / Distribuições de
rações/gêneros alimentícios (para raparigas)
c) Trainings on food management and storage for School Management Committees,
Parent Associations, Headmasters, Inspectors / Treinamentos em gestão da
alimentação escolar (em nível escolar) para Comitês de Gestão Escolar, Associações de
Pais de Alunos, Diretores e Inspetores escolares
d) Trainings on food preparation and storage practices for school cooks/ Treinamentos
em práticas para o armazenamento e preparo de alimentos, para cozinheiras das
escolas
e) Building and rehabilitating kitchens and storerooms/ Construção e reparos de
cozinhas e armazéns/dispensas escolares
f) Providing storage, food preparation equipment and eating utensils /
Fornecimento de equipamentos para armazenamento e preparo de alimentos e
utensílios para consumo de refeições escolares (talheres e pratos)
g) Distributing deworming medication to students/Distribuição de
vermífugos/desparasitantes aos alunos
h) Capacity building / Desenvolvimento de capacidade
a) at national level/Em nível nacional
b) b) at regional level/Em nível regional
c) at local level (district)/Em nível local
10. If there was an opportunity to adjust the project regarding its various activities
and targets, what changes would you recommend? / Se houvesse uma oportunidade
Evaluation Report Version Dic 2018 75 | P a g e
de ajustar o projeto em relação às diversas atividades previstas, qual seria sua
recomendação?
11. In your opinion were the targets established (for each planned activity) realistic?
Em sua opinião, as metas estabelecidas para cada atividade são realistas? Na sua
opinião os metas estabelecidas (para cada actividad) foram realistas?
12. Regarding to the challenges faced, tell us about the underlying causes. How these
difficulties could be solved?/ Em relação aos desafios enfrentados, nos conte sobre suas
causas principais/fundamentais. Como essas dificuldades poderiam ser superadas?
a) For the SF operations based on WFP (procurement and delivery of school meals and
take-home rations)/ Para a implementação das atividades de alimentação escolar pelo
PAM (aquisição de alimentos para distribuição de refeições e de rações(take-home)
escolares
b) For the capacity building activities (at national, regional and local level) /Para o
desenvolvimento/ fortalecimento da capacidade do governo (aos níveis nacional,
regional e local)
c) For monitoring and evaluating/Para o monitoramento/monitoria e avaliação
13. Regarding to the partnership with the Government of Guinea-Bissau, what is the
role/participation in the implementation and monitoring and evaluating of the Project
activities/Em relação a parceria entre o PAM e o Governo de Guiné Bissau, qual o
papel/responsabilidade:
a) The Ministry of Education/National Directorate of School Feeding (NDSF)/
Ministério da Educação / DGPASE
b) The Ministry of Agriculture/ Ministério da Agricultura
c) The Ministry of Health (deworming activities)/Ministério da Saúde
(distribuição de vermífugos/desparasitantes)
d) District governments/Governos distritais
14. Please explain us the financial aspects of this project/ Por favor, nos explique os
aspectos financeiros deste projeto:
a) Successes and difficulties on financing the activities? / Sucessos e
dificuldades (no financiamento das atividades)?
Evaluation Report Version Dic 2018 76 | P a g e
b) Outlook to the immediate future/Perspectivas para financiamento a curto
prazo
15. How is the collaboration with project partners, such as/Como tem sido a
colaboração com os principais parceiros de projeto, tais como
a) Ministry of Education/Ministério da Educação
b) Ministry of Health /school health and nutrition services/Ministério da
Saúde/serviço de nutrição e saúde escolar
c) UNICEF: provision of didactic materials, teachers’ trainings, potable water and
sanitation improvements and improvements of school structures/UNICEF:
fornecimento de materiais didáticos, treinamentos de professores, melhorias
nas condições sanitárias e de água potável em escolas, e melhorias nas
estruturas escolares em geral
d) FAO: support for school gardens and partner in the implementation of the
Home Grown School Feeding approach through the Country
Programme/FAO: assistência em hortas escolares, e parceria na
implementação/abordagem sustentável do programmea alimentação
escolar (Home Grown School Feeding) no Programmea do País
e) WHO: providing deworming medication/ OMS: fornecimento de
vermífugos/desparasitantes
f) NGOs (partners) that are responsible for sensitizing communities and
parents’ associations to build school kitchens / ONGs (parceiras) que são
responsáveis por sensibilizar comunidades e associações de pais de alunos
para a construção de cozinhas escolares
16. What are the contributions of the Project towards the development of national
school feeding programme (HGSF)?/Quais as contribuições desse projeto de
alimentação escolar para o desenvolvimento de um programmea nacional de
alimentação de Guiné-Bissau?
17. How do you evaluate the perspectives of GB towards/Como você avalia as
perspectivas de GB em relação a:
Evaluation Report Version Dic 2018 77 | P a g e
a) Funding SF in Guinea-Bissau after the completion of this project?/
Financiamento da alimentação escolar em Guiné Bissau após o término deste
projeto.
b) The Government of Guinea-Bissau establishing and running their own Home
Grown School Feeding Programme? O governo de Guiné Bissau
estabelecendo e gerindo seu programmea nacional de alimentação escolar
sustentável.
c) The Government of Guinea-Bissau regularly monitoring and evaluating the
SF activities, and timely issuing monitoring reports? O governo de Guiné
Bissau monitorando e avaliando regularmente as atividades de alimentação
escolar, e emitindo os relatórios de avaliação como regularidade.
18. How is the institutional coordination for implementing the Project/Como é a
coordenação institucional para a implementação do projeto de alimentação escolar?:
a) Coordination among Guinea-Bissau WFP CO and its sub-offices/ Coordenação
entre do Escritório do País, do PAM, e seus escritórios regionais.
b) Coordination among WFP and its partners (DGPASE, UNICEF, FAO, WHO,
NGOs)/ Coordenação entre PAM e seus parceiros (DGPASE, UNICEF, FAO,
OMS e ONGs)
c) Coordination among Education Sector (national, regional, local) and school
level (committees and community)
d) Coordenação entre os níveis do Setor da Educação (nacional, regional e
local) e nível escolar (comitês e comunidade)
e) Coordination inter-sectorial (Education, Agriculture, Health, Finance and
Planning)/Coordenação intersetorial (Educação, Agricultura, Saúde, Finanças
e Planeamento)
19. What are the Project’s outcomes in terms of gender equality and women’s
empowerment? / Quais são os resultados do Projeto em relação a igualdade de
gêneros e empoderamento das mulheres?
20. Which improvements would you wish to see in future SF programmes in Guinea-
Bissau? /Quais melhorias você gostaria de ver em futuros programmeas de
alimentação escolar de Guiné Bissau?
Evaluation Report Version Dic 2018 78 | P a g e
21. How the Project in monitored and evaluated at central level? Are the results of the
project reported to other government (beyond the Ministry of Education) institutions
and project'’ partners? How often?/ Como o projeto de alimentação escolar é
monitorado e avaliado a nível central? Os resultados do projeto são relatados e
divulgados para outras instituições (além do Ministério da Educação) e para parceiros
do projeto? Com que frequência?
22. In your opinion, is the existing WFP M&E of school feeding programme efficient
(performance indicators are timely monitored and reported)? And for monitoring other
activities planned on the Project? How the M&E of the Project could be improved?/ Em
sua opinião Sistema de Monitoramento e Avaliação utilizado no programmea de
alimentação escolar do PAM é eficiente (os indicadores de desempenho do projeto são
regularmente monitorados)? E para o monitoramento das outras atividades planeadas
no projeto de alimentação escolar do MGD/PAM? Como o monitoramento e avaliação
do projeto de alimentação escolar do MGD/PAM poderia ser melhorado?
I - Interviews at local level
Entrevistas em nível local
A. Escritório Regional do PAM
1. Qual a participação do escritório local no planejamento, implementação e
monitoramento das atividades do projecto?
2. Qual o tipo de colaboração dos diferentes parceiros institucionais, incluindo
governo? (construir Diagrama de Venn)
3. Como é feita a articulação entre o PAM e o governo local, a UNICEF, a FAO, a
OMS, e as NGOs parceiras, para coordenação das actividades desenvolvidas no
âmbito desse projeto? (treinamentos, construções e reformas nas estruturas
escolares, distribuição de vermífugos/desparasitantes,
sensitização/sensibilização e formação de camponeses/agricultores, etc..)
4. Como é feito o acompanhamento das actividades desenvolvidas pelos parceiros
do projeto nas escolas? E com os agricultores?
5. Como funciona a distribuição dos vouchers as escolas, para a aquisição de
alimentos produzidos pelos agricultores locais? Em sua avaliação, quais os
resultados dessa atividade (sucessos e dificuldades)?
6. Quais as experiências bem sucedidas? E as dificuldades e/ou fracassos na
implementação desse projeto (desde 2016)?
Evaluation Report Version Dic 2018 79 | P a g e
7. O que está contribuindo para sucesso do programmea na região? E o que está
causando dificuldades ou levando a fracassos do mesmo?
8. Como você avalia a participação/engajamento da comunidade local nas
atividades do Projecto? E do governo local?
9. Como você percebe os resultados/contribuição desse programmea para a
qualidade de vida da população que se beneficia do mesmo (homens e
mulheres, meninos e meninas)?
10. Caso seja possível ajustar as atividades e forma operacional de projeto para um
melhor desempenho, o que você recomendaria?
B. Membros dos governos regional e distrital (Educação e outros setores
envolvidos)
1. Como você percebe o programa de cantinas escolares do Projecto, isto é, quais
as atividades desenvolvidas e quem são os responsáveis pelas mesmas?
2. Qual o papel do governo regional/distrital no actual programmea das cantinas
escolares (WFP/MGD)?
3. De que forma o programmea cantinas escolares está inserido na
política/estratégia/ plano regional/distrital do governo local? E no plano da
educação?
4. Há alguma linha de financiamento (do governo) dentro do orçamento da
região/distrito para custear as atividades desse programmea?
5. Como é feita a articulação entre os sectores da educação, agricultura e saúde
para o desenvolvimento das atividades como distribuição de medicação anti-
verme, assistência técnica a agricultores, a outras atividades intersetoriais? Há
algum tipo de coordenação entre o governo local para esse fim?
6. Quais os resultados desse programmea nas escolas da região/distrito
(experiências bem sucedidas e dificuldades/fracassos)?
7. Caso haja fracassos, quais foram os motivos? O que deveria ser feito para evitar
que esses problemas se repitam, ou novos problemas surjam no futuro?
8. Os membros do governo receberam algum tipo de treinamento para
desenvolver as atividades relacionadas ao programmea de cantinas escolares?
Se recebeu, sente necessidade de treinamento adicional? Se sim, em que
aspectos?
9. O que poderia ser feito para melhorar o desempenho desse projeto na
região/distrito?
10. Existem planos para o alargamento das cantinas escolares a todas as escolas do
país?
Evaluation Report Version Dic 2018 80 | P a g e
C. Inspetores escolares
1. Quais as atividade desenvolvidas pelos inspetores da educação no Projecto?
2. Com que frequência cada escola é visitada pelos inspetores? O que é observado
na visita? Com que frequência os relatórios de visita são emitidos e divulgados
para outros setores dentro do departamento/ministério de educação?
3. Houve/há algum tipo de assistência técnica/treinamento/outro tipo de apoio por
parte do PAM para a participação dos inspetores da educação nas atividades
desenvolvidas pelo Projeto? Se sim, que tipo de assistência/treinamento?
4. Como você percebe os resultados desse programmea/projeto, ou seja sucessos
e dificuldades em relação ao bom funcionamento das cantinas escolares?
5. E em relação ao take-home, há algum tipo de participação/acompanhamento
dos inspetores escolares nessa atividade? Se sim qual?
6. Em sua opinião, qual resultado da alimentação escolar para a qualidade da
educação e condições de vida dos alunos das escolas beneficiárias?
7. O que poderia ser feito para tornar mais eficiente a participação dos inspetores
escolares nesse projeto?
8. Como é controlada (pelos inspetores) a utilização dos vouchers para a aquisição
de alimentos?
9. O que poderia ser feito para melhorar os resultados do projeto?
D. Professores e diretores
1. Como tem sido a experiência dessa escola com o projeto de Cantinas Escolares
do Projecto (desde 2016)? Quais os sucessos, dificuldades e fracassos ocorridos
no mesmo?
2. Desde o início desse programmea de cantinas escolares (Janeiro 2016), houve
algum dia ou período quando não foram distribuídas refeições aos alunos? Se
sim, qual foi o motivo?
3. Se houve interrupção na oferta de refeições, foi tomada alguma medida pela
escola para evitar que isso se repita? Se sim, o quê?
4. Qual a rotina de recebimento e armazenamento de alimentos, controle de
estoque, preparo e distribuição de refeições?
5. Há alguma diferença na quantidade de alimentos distribuída para meninos e
raparigas? Quem recebe primeiro as refeição (classe/idade, gênero, etc..)
6. Em relação às rações "take-home"” distribuídas pelo PAM: quem recebe as
rações, como é feito o controle dos beneficiários,
Evaluation Report Version Dic 2018 81 | P a g e
7. Qual a participação/responsabilidade do diretor e professores nas atividades
relacionadas ao programmea de cantinas escolares?
8. Como é a participação de professores/diretor na utilização de vouchers para a
aquisição de alimentos produzidos localmente?
9. Os professores/diretor receberam algum tipo de treinamento para desenvolver
as atividades no projeto? Se sim, em quê? O treinamento foi suficiente?
10. Em sua opinião, quais os resultados do projeto para a qualidade da educação
nessa escola? E para os alunos? E para a comunidade em geral?
11. Caso seja possível fazer ajustes nas atividade do projeto para melhorar o
desempenho/resultados do mesmo, o que você recomendaria?
E. Comitê de Gestão Escolar e Associação de Pais de Alunos
1. Qual a composição e participação do comitê de gestão escolar e associação de
pais de alunos nas atividades de alimentação escolar da escola? (incluir análise
de género)
2. Quais os cuidados/rotinas aplicadas para garantir a boa qualidade/higiene da
alimentação oferecida nas escolas?
3. De onde vem a água usada para beber, cozinhar e lavar equipamentos e
utensílios da cozinha? E quais os cuidados da escola para garantir a boa
qualidade da água usada para cozinhar e beber?
4. Quais os cuidados e rotinas para garantir a qualidade dos alimentos
armazenados nas escolas?
5. Os membros desse comitê receberam algum tipo de treinamento para
desenvolver as atividades relacionadas ao programmea de cantinas escolares?
Se recebeu, sente necessidade de treinamento adicional? Se sim, em que
aspectos?
6. Com que frequência esse comitê/membros do comitê desenvolvem atividades
na escola, relacionadas ao programmea de cantinas escolares?
7. Há algum tipo de comunicação formal entre esse comitê e os inspetores das
escolas/ oficiais do governo local em relação às atividades desenvolvidas pelas
cantinas escolares nas escolas (reunião, emissão de relatório ou outro tipo de
documento)?
8. Como funciona na escola os vouchers para aquisição de alimento dos
produtores locais? (planejamento, rotinas de controle, etc.) - apenas para escolas
piloto.
Evaluation Report Version Dic 2018 82 | P a g e
9. Em sua opinião, quais são os resultados do programmea cantinas escolares
(projeto MGD) para a qualidade da educação e na vida dos alunos? Quais seus
sucessos e dificuldades?
10. Em sua opinião, de que forma esse projeto contribui/afeta (ou não) a vida da
comunidade ao entorno dessa escola (famílias de alunos, moradores da
localidades, agricultores e comerciantes locais)?
11. Caso haja possibilidades de ajustes nas atividades desse comitê em contribuição
às atividades de cantinas escolares, o que deveria ser feito?
12. Caso haja possibilidade de modificar/ajustar a forma como o programmea
cantinas escolares é praticado/conduzido nessa escola para melhorar seus
resultados, o que deveria ser feito?
F. Cozinheiro(a)s
1. Quantas cozinheiras trabalham/são voluntárias nessa escola? Há algum tipo de
pagamento (ou incentivo) para as cozinheiras?
2. Como é o sistema de trabalho, todas as cozinheiras trabalham de segunda a
sexta ou há algum tipo de rotação?
3. Quais as atividades das cozinheiras no programmea cantinas escolares? Qual
sua jornada de trabalho (quando começa e quando termina o trabalho na
cozinha)?
4. Você recebeu algum tipo treinamento para ser cozinheira nas cantinas
escolares? O que você aprendeu nesse treinamento? Se recebeu, sente
necessidade de treinamento adicional? Se sim, em que aspectos?
5. Qual sua opinião sobre a alimentação oferecida aos alunos: a quantidade é
suficiente? e o que você pensa da qualidade da alimentação oferecida? Alguma
recomendação em relação a quantidade ou qualidade da alimentação?
6. Qual a rotina de distribuição de alimentos? Meninos e Meninas recebem a
mesma quantidade de alimento? Quem é servido em primeiro lugar?
7. Que tipos de alimentos são usados regularmente? Caso haja a utilização de
alimentos que não são distribuídos pelo PAM, de onde vêm esses alimentos
(doações, horta escolar, comprado com voucher?
8. Qual sua opinião em relação adição de alimentos frescos, produzidos pelos
agricultores locais, aos produtos secos (feijão, arroz, etc, distribuídos pelo PAM)
às refeições escolares? (benefícios e dificuldades, necessidades)
9. Você enfrenta alguma dificuldade para preparar os alimentos e distribuir as
refeições ao alunos? Se sim qual (quais)?
Evaluation Report Version Dic 2018 83 | P a g e
10. A cozinha tem os equipamentos e utensílios em quantidade e qualidade
necessária para o preparo e distribuição dos alimentos?
11. Quais os cuidados de higiene no preparo e distribuição dos alimentos? E para a
lavagem e armazenamento dos equipamentos e utensílios usados?
12. De onde vem a água utilizada para cozinhar, lavar equipamentos/utensílios, e
beber? Caso a água não venha de rede pública (água tratada) o que é feito na
escola/cozinha para garantir sua qualidade?
13. Quem é responsável por fornecer a lenha/combustível para a cozinha? Há
problemas de suprimento? Se sim o que poderia ser feito?
14. As cozinheiras dessa escola passam por algum tipo de avaliação de saúde (antes
de iniciar atividades e de tempos em tempos)? Qual?
15. Desde que você começou a trabalhar como cozinheira na escola houve falhas na
distribuição das refeições (dias sem alimentação ou dias quando a quantidade
de alimentos não foi suficiente)? Se sim, qual o motivo?
16. Caso seja possível fazer ajustes nas rotinas de trabalho na cozinha, e outras
atividades do programmea onde as cozinheiras participam, qual seria sua
recomendação?
G. Alunos (meninos e meninas) - grupos de 10 alunos (5 meninos e 5 meninas)
1. Quando é distribuída a alimentação em sua escola (horário, em relação ao início
da aula)?
2. Você comeu hoje antes de vir para a escola? Se sim o quê? se não, quando foi a
última vez que comeu antes de vir para a escola?
3. A alimentação escolar foi recebida todos os dias? Se não, você saberia responder
quantas vezes houve falta de alimentos (e por quanto tempo)? Neste caso
porque é que isto aconteceu?
4. Quem recebe primeiro a alimentação em sua escola? (meninos ou raparigas,
alunos mais jovens ou mais velhos, ou outro critério de organização da
distribuição de refeições)
5. Qual sua opinião sobre a alimentação distribuída nas cantinas escolares: a
quantidade é suficiente? Ou insuficiente, ou excessiva?
6. Qual sua contribuição para as cantinas escolares (ajuda no preparo comida ou
lavagem pratos e panelas, contribui com alimentos ou dinheiro, traz lenha ou
água, outras) (atenção, perguntar separadamente rapazes e meninas)?
Evaluation Report Version Dic 2018 84 | P a g e
7. O que você pensa sobre a adição de produtos frescos (verduras, legumes, frutas,
ovos/peixe/carne) a alimentação escolar? - perguntar em escolas piloto /com
voucher.
8. Em sua opinião, quais os benefícios de ter as cantinas escolares nessa escola
(distribuição de refeições escolares pelo projecto)? Você percebe algum
resultado positivo na sua vida como aluno (a)? qual?
9. O que você aprendeu sobre saúde, nutrição e higiene na escola? Você pratica em
sua casa algo que aprendeu na escola sobre higiene, saúde e nutrição? Se sim, o
que?
10. Caso fosse possível modificar ou ajustar o programmea de cantinas escolares,
para torná-lo melhor, o que você recomendaria?
H. Meninas (da 4ª à 6ª classe) - de 6 a 10 raparigas
1. Como funciona o "take-home" nessa escola: quem recebe as rações (somente
meninas ou meninos e meninas, alunos de todas as classes ou de 4-6, etc)?
2. Há algum tipo de controle pela escola para que seja feita a distribuição das
rações secas (arroz ou outra)?
3. Você recebe a take-home todos os meses ou houve meses quando não recebeu
os alimentos? ¿Caso não tenha recebido em algum mês, qual foi o motivo?
4. Como você percebe essa atividade, isto é, você acha que de alguma forma afeta
sua escolaridade/participação nas atividades da escola?
5. ¿E sua família, como eles percebem essa atividade? Há algum tipo de incentivo
por parte de sua família para que você atenda regularmente as classes para
receber a ajuda mensal de alimentos?
6. Caso sua escola deixe de distribuir os alimentos (take-home), isso afetaria de
alguma forma sua participação nas aulas/estudo? Se sim qual seria o impacto
para você?
7. ¿O que poderia ser feito para melhorar essa atividade?
I. Agricultores locais (Mulheres e Homens)
1. Você participa de alguma associação/cooperativa ou produz e vende seus
alimentos de forma independente?
2. ¿O que você pensa do programmea de cantinas escolares?
3. Você participa alguma forma desse programmea, isto é, vendendo produtos
alimentícios para o programmea/escola?
4. Se sim, ¿que produtos e quantidades vende para a cantina escolar (por semana)?
Evaluation Report Version Dic 2018 85 | P a g e
5. ¿Se sim, o que você pensa do sistema de vouchers escolares? Funcionam bem
ou trazem alguma dificuldade para os agricultores? (questão apenas para
agricultores que vendem produtos para escolas/cantinas escolares)
6. Se não, quais são suas expectativas, como produtor rural, ¿em relação a
participação do programmea de cantinas escolares?
7. Você (ou sua associação de agricultores) recebe ou recebeu algum tipo de apoio
(assistência técnica e capacitação/treinamento relacionado ao programmea
cantinas escolares/ PMA? (pode ter sido feita por parceiros do programmea,
como FAO/NGOs, financiados pelo projecto)? Se sim qual/quais?
8. Caso você tenha recebido capacitação/treinamento de que forma sua prática
como agricultor/produtor rural foi melhorada (ou não)?
9. Há algum aspeto relacionado com a sua atividade em que gostaria de ser
treinado?
10. Você participou ou conhece alguém que participou de atividades como aulas de
alfabetização para agricultores (financiadas pelo Projeto)? Se sim, qual sua
opinião em relação às mesmas?
11. Como produtor rural/agricultor, qual seria sua recomendação para melhorar sua
participação no programmea de cantinas escolares?
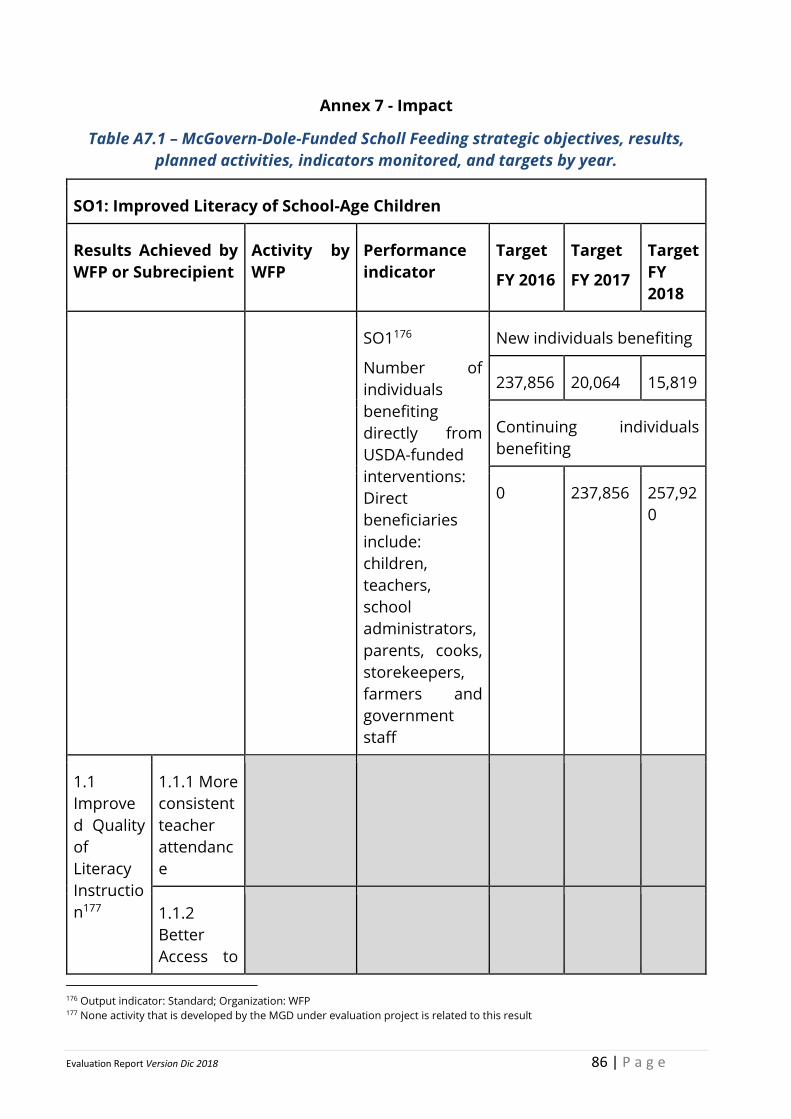
Evaluation Report Version Dic 2018 86 | P a g e
Annex 7 - Impact
Table A7.1 – McGovern-Dole-Funded Scholl Feeding strategic objectives, results,
planned activities, indicators monitored, and targets by year.
SO1: Improved Literacy of School-Age Children
Results Achieved by
WFP or Subrecipient
Activity by
WFP
Performance
indicator
Target
FY 2016
Target
FY 2017
Target
FY
2018
SO1176
Number of
individuals
benefiting
directly from
USDA-funded
interventions:
Direct
beneficiaries
include:
children,
teachers,
school
administrators,
parents, cooks,
storekeepers,
farmers and
government
staff
New individuals benefiting
237,856 20,064 15,819
Continuing individuals
benefiting
0 237,856 257,92
0
1.1
Improve
d Quality
of
Literacy
Instructio
n177
1.1.1 More
consistent
teacher
attendanc
e
1.1.2
Better
Access to
176 Output indicator: Standard; Organization: WFP 177 None activity that is developed by the MGD under evaluation project is related to this result
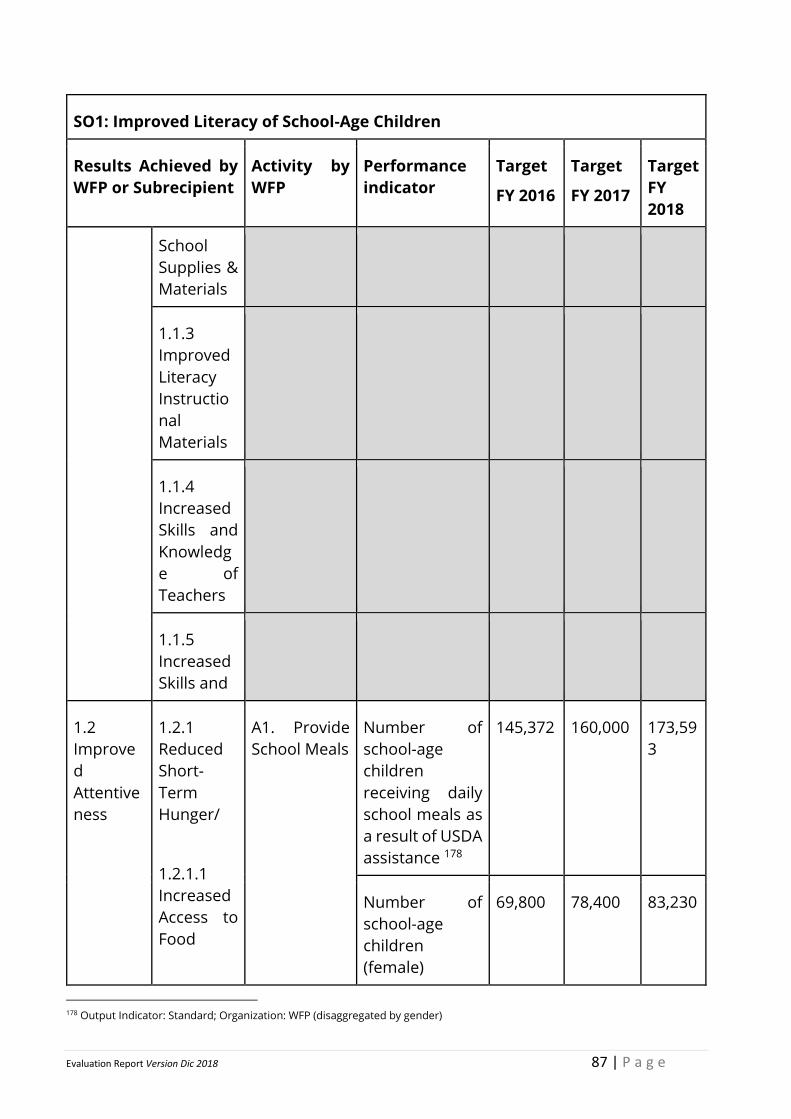
Evaluation Report Version Dic 2018 87 | P a g e
SO1: Improved Literacy of School-Age Children
Results Achieved by
WFP or Subrecipient
Activity by
WFP
Performance
indicator
Target
FY 2016
Target
FY 2017
Target
FY
2018
School
Supplies &
Materials
1.1.3
Improved
Literacy
Instructio
nal
Materials
1.1.4
Increased
Skills and
Knowledg
e of
Teachers
1.1.5
Increased
Skills and
1.2
Improve
d
Attentive
ness
1.2.1
Reduced
Short-
Term
Hunger/
1.2.1.1
Increased
Access to
Food
A1. Provide
School Meals
Number of
school-age
children
receiving daily
school meals as
a result of USDA
assistance 178
145,372 160,000 173,59
3
Number of
school-age
children
(female)
69,800 78,400 83,230
178 Output Indicator: Standard; Organization: WFP (disaggregated by gender)
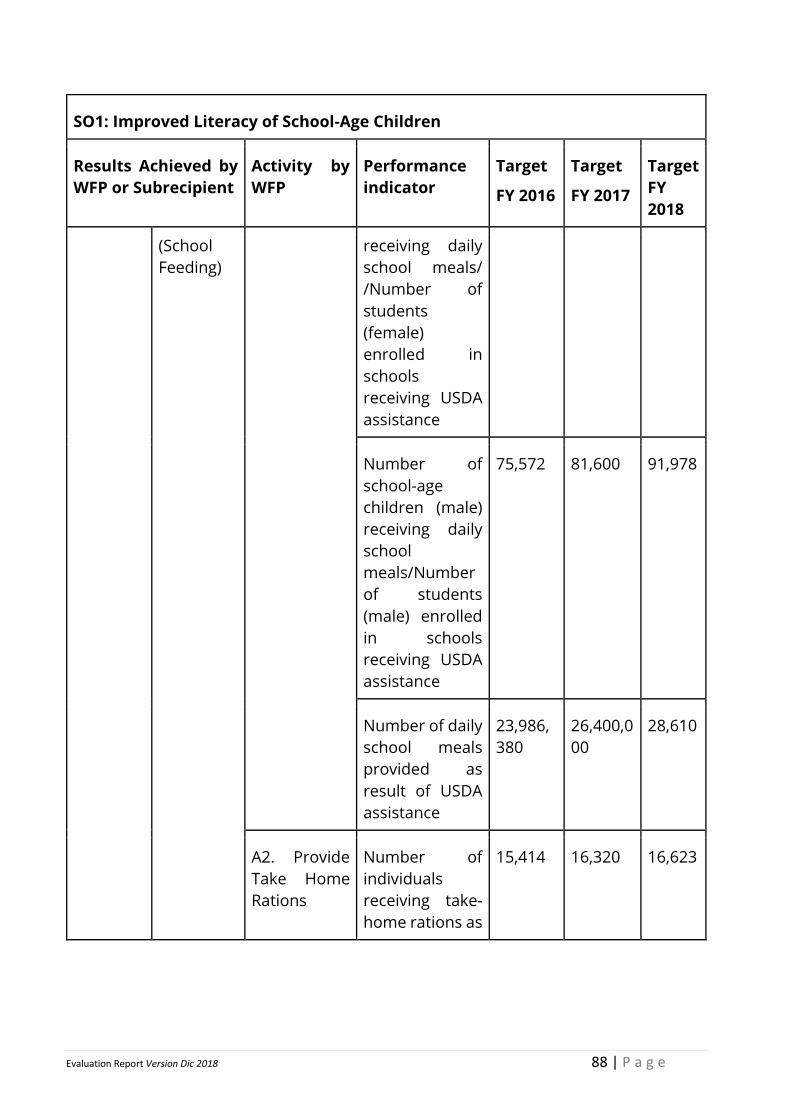
Evaluation Report Version Dic 2018 88 | P a g e
SO1: Improved Literacy of School-Age Children
Results Achieved by
WFP or Subrecipient
Activity by
WFP
Performance
indicator
Target
FY 2016
Target
FY 2017
Target
FY
2018
(School
Feeding)
receiving daily
school meals/
/Number of
students
(female)
enrolled in
schools
receiving USDA
assistance
Number of
school-age
children (male)
receiving daily
school
meals/Number
of students
(male) enrolled
in schools
receiving USDA
assistance
75,572 81,600 91,978
Number of daily
school meals
provided as
result of USDA
assistance
23,986,
380
26,400,0
00
28,610
A2. Provide
Take Home
Rations
Number of
individuals
receiving take-
home rations as
15,414 16,320 16,623
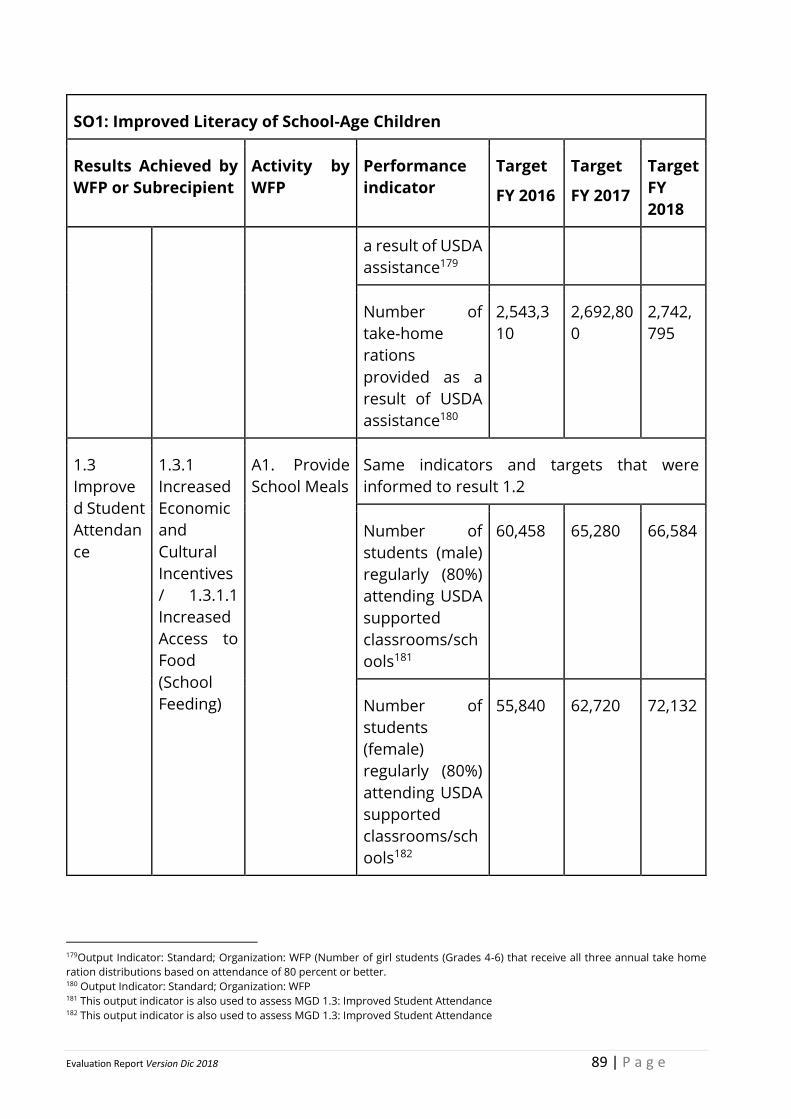
Evaluation Report Version Dic 2018 89 | P a g e
SO1: Improved Literacy of School-Age Children
Results Achieved by
WFP or Subrecipient
Activity by
WFP
Performance
indicator
Target
FY 2016
Target
FY 2017
Target
FY
2018
a result of USDA
assistance179
Number of
take-home
rations
provided as a
result of USDA
assistance180
2,543,3
10
2,692,80
0
2,742,
795
1.3
Improve
d Student
Attendan
ce
1.3.1
Increased
Economic
and
Cultural
Incentives
/ 1.3.1.1
Increased
Access to
Food
(School
Feeding)
A1. Provide
School Meals
Same indicators and targets that were
informed to result 1.2
Number of
students (male)
regularly (80%)
attending USDA
supported
classrooms/sch
ools181
60,458 65,280 66,584
Number of
students
(female)
regularly (80%)
attending USDA
supported
classrooms/sch
ools182
55,840 62,720 72,132
179Output Indicator: Standard; Organization: WFP (Number of girl students (Grades 4-6) that receive all three annual take home
ration distributions based on attendance of 80 percent or better. 180 Output Indicator: Standard; Organization: WFP 181 This output indicator is also used to assess MGD 1.3: Improved Student Attendance 182 This output indicator is also used to assess MGD 1.3: Improved Student Attendance
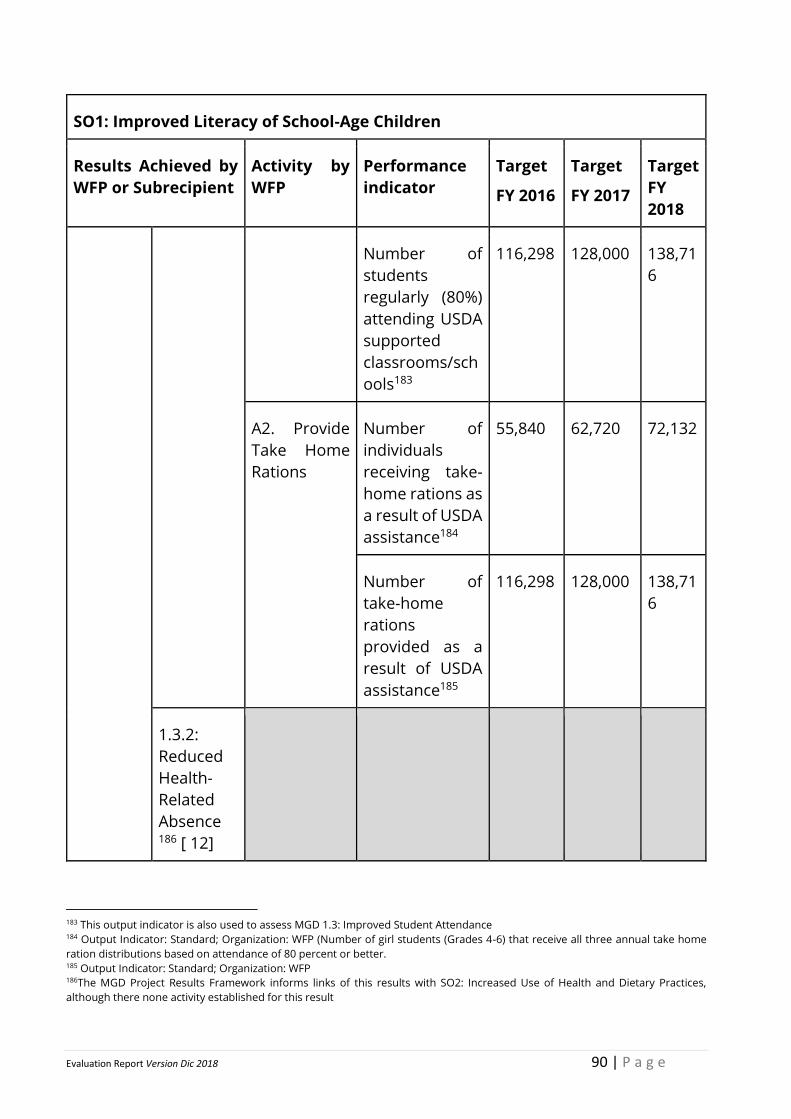
Evaluation Report Version Dic 2018 90 | P a g e
SO1: Improved Literacy of School-Age Children
Results Achieved by
WFP or Subrecipient
Activity by
WFP
Performance
indicator
Target
FY 2016
Target
FY 2017
Target
FY
2018
Number of
students
regularly (80%)
attending USDA
supported
classrooms/sch
ools183
116,298 128,000 138,71
6
A2. Provide
Take Home
Rations
Number of
individuals
receiving take-
home rations as
a result of USDA
assistance184
55,840 62,720 72,132
Number of
take-home
rations
provided as a
result of USDA
assistance185
116,298 128,000 138,71
6
1.3.2:
Reduced
Health-
Related
Absence186 [ 12]
183 This output indicator is also used to assess MGD 1.3: Improved Student Attendance 184 Output Indicator: Standard; Organization: WFP (Number of girl students (Grades 4-6) that receive all three annual take home
ration distributions based on attendance of 80 percent or better. 185 Output Indicator: Standard; Organization: WFP 186The MGD Project Results Framework informs links of this results with SO2: Increased Use of Health and Dietary Practices,
although there none activity established for this result

Evaluation Report Version Dic 2018 91 | P a g e
SO1: Improved Literacy of School-Age Children
Results Achieved by
WFP or Subrecipient
Activity by
WFP
Performance
indicator
Target
FY 2016
Target
FY 2017
Target
FY
2018
1.3.3:
Improved
School
Infrastruct
ure
A.5.
Build/Rehabi
litate
Kitchens and
Storerooms
Number of
kitchens
constructed /
rehabilitated187
150 150 100
Number of fuel-
efficient stoves
provided and
rehabilitated188
150 150 100
1.3.4:
Increases
Student
Enrollmen
t
A1. Provide
School Meals
Same indicators and targets that were
informed to result 1.2
A2. Provide
Take Home
Rations
Same indicators and targets that were
informed to result 1.2
1.3.5:
Increased
Communit
y
Understan
ding of
Benefits of
Education189
Not
informed
1.4.1
Increased
Capacity
of
A.8 Train
Government
Staff on
Managemen
Number of
Government
staff trained at
national level
19 0 0
187Output Indicator: Custom; Organization: WFP 188Output Indicator: Custom; Organization: WFP 189None activity that is developed by the MGD under evaluation project is related to this result
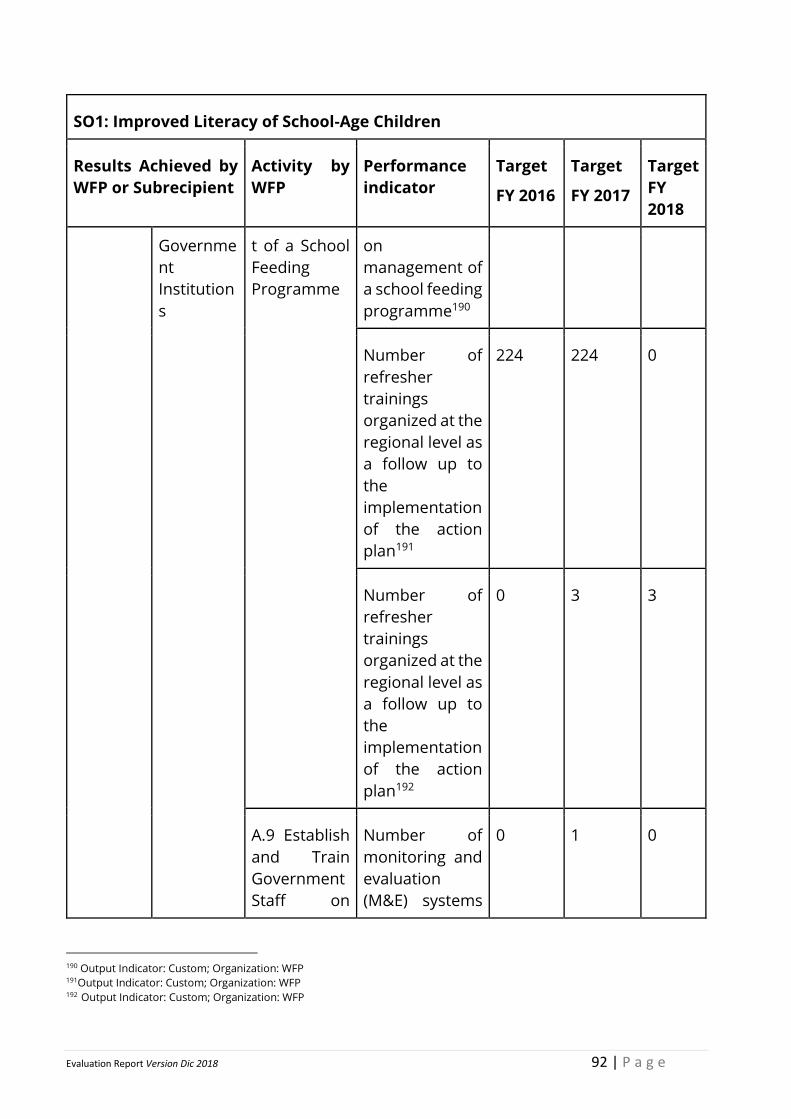
Evaluation Report Version Dic 2018 92 | P a g e
SO1: Improved Literacy of School-Age Children
Results Achieved by
WFP or Subrecipient
Activity by
WFP
Performance
indicator
Target
FY 2016
Target
FY 2017
Target
FY
2018
Governme
nt
Institution
s
t of a School
Feeding
Programme
on
management of
a school feeding
programme190
Number of
refresher
trainings
organized at the
regional level as
a follow up to
the
implementation
of the action
plan191
224 224 0
Number of
refresher
trainings
organized at the
regional level as
a follow up to
the
implementation
of the action
plan192
0 3 3
A.9 Establish
and Train
Government
Staff on
Number of
monitoring and
evaluation
(M&E) systems
0 1 0
190 Output Indicator: Custom; Organization: WFP 191Output Indicator: Custom; Organization: WFP 192 Output Indicator: Custom; Organization: WFP
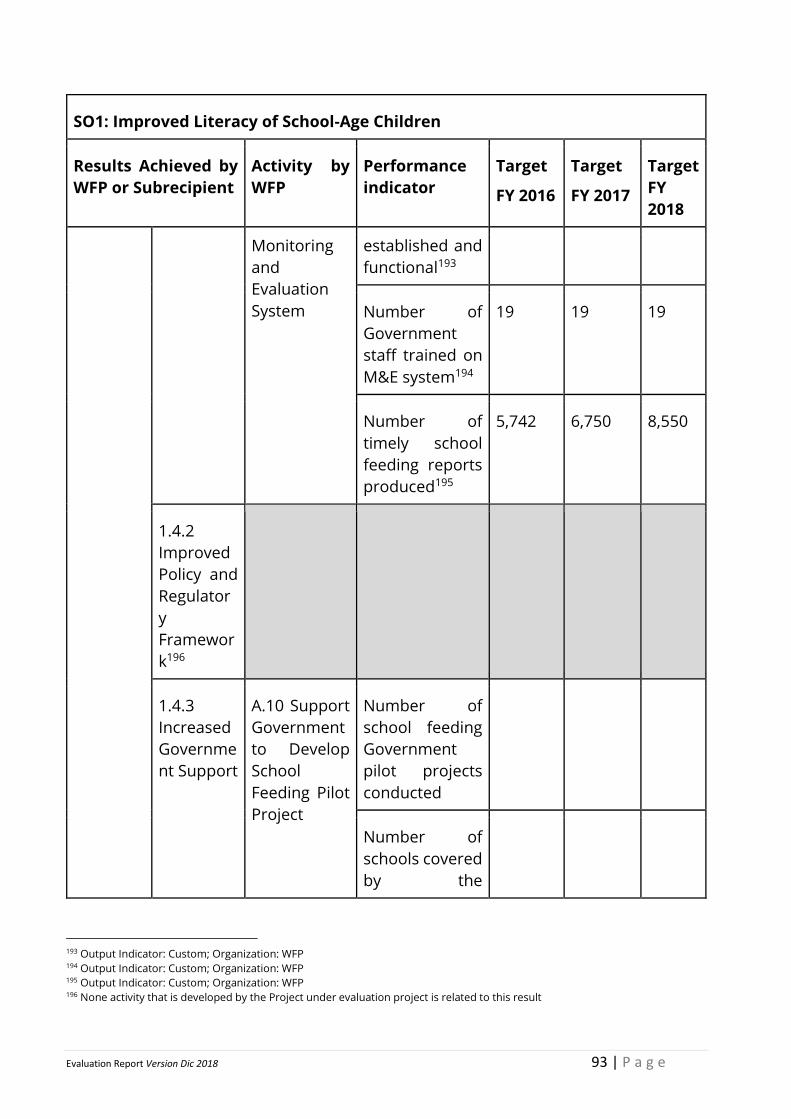
Evaluation Report Version Dic 2018 93 | P a g e
SO1: Improved Literacy of School-Age Children
Results Achieved by
WFP or Subrecipient
Activity by
WFP
Performance
indicator
Target
FY 2016
Target
FY 2017
Target
FY
2018
Monitoring
and
Evaluation
System
established and
functional193
Number of
Government
staff trained on
M&E system194
19 19 19
Number of
timely school
feeding reports
produced195
5,742 6,750 8,550
1.4.2
Improved
Policy and
Regulator
y
Framewor
k196
1.4.3
Increased
Governme
nt Support
A.10 Support
Government
to Develop
School
Feeding Pilot
Project
Number of
school feeding
Government
pilot projects
conducted
Number of
schools covered
by the
193 Output Indicator: Custom; Organization: WFP 194 Output Indicator: Custom; Organization: WFP 195 Output Indicator: Custom; Organization: WFP 196 None activity that is developed by the Project under evaluation project is related to this result
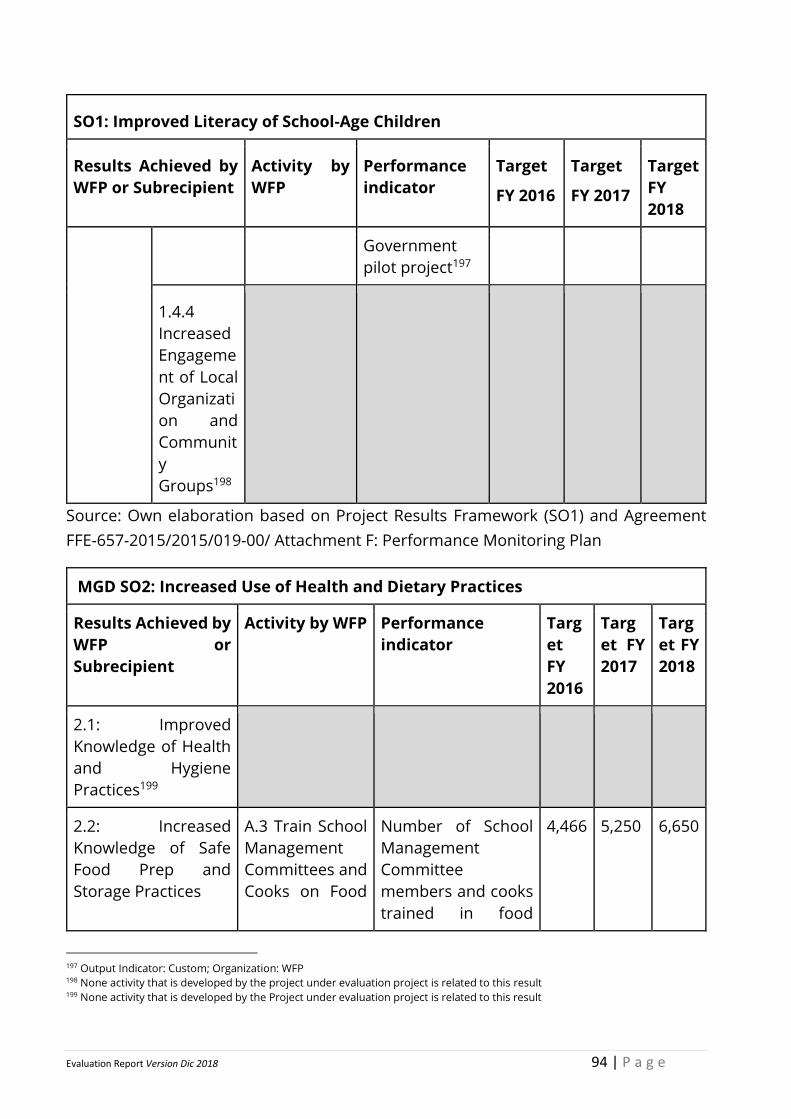
Evaluation Report Version Dic 2018 94 | P a g e
SO1: Improved Literacy of School-Age Children
Results Achieved by
WFP or Subrecipient
Activity by
WFP
Performance
indicator
Target
FY 2016
Target
FY 2017
Target
FY
2018
Government
pilot project197
1.4.4
Increased
Engageme
nt of Local
Organizati
on and
Communit
y
Groups198
Source: Own elaboration based on Project Results Framework (SO1) and Agreement
FFE-657-2015/2015/019-00/ Attachment F: Performance Monitoring Plan
MGD SO2: Increased Use of Health and Dietary Practices
Results Achieved by
WFP or
Subrecipient
Activity by WFP Performance
indicator
Targ
et
FY
2016
Targ
et FY
2017
Targ
et FY
2018
2.1: Improved
Knowledge of Health
and Hygiene
Practices199
2.2: Increased
Knowledge of Safe
Food Prep and
Storage Practices
A.3 Train School
Management
Committees and
Cooks on Food
Number of School
Management
Committee
members and cooks
trained in food
4,466 5,250 6,650
197 Output Indicator: Custom; Organization: WFP 198 None activity that is developed by the project under evaluation project is related to this result 199 None activity that is developed by the Project under evaluation project is related to this result
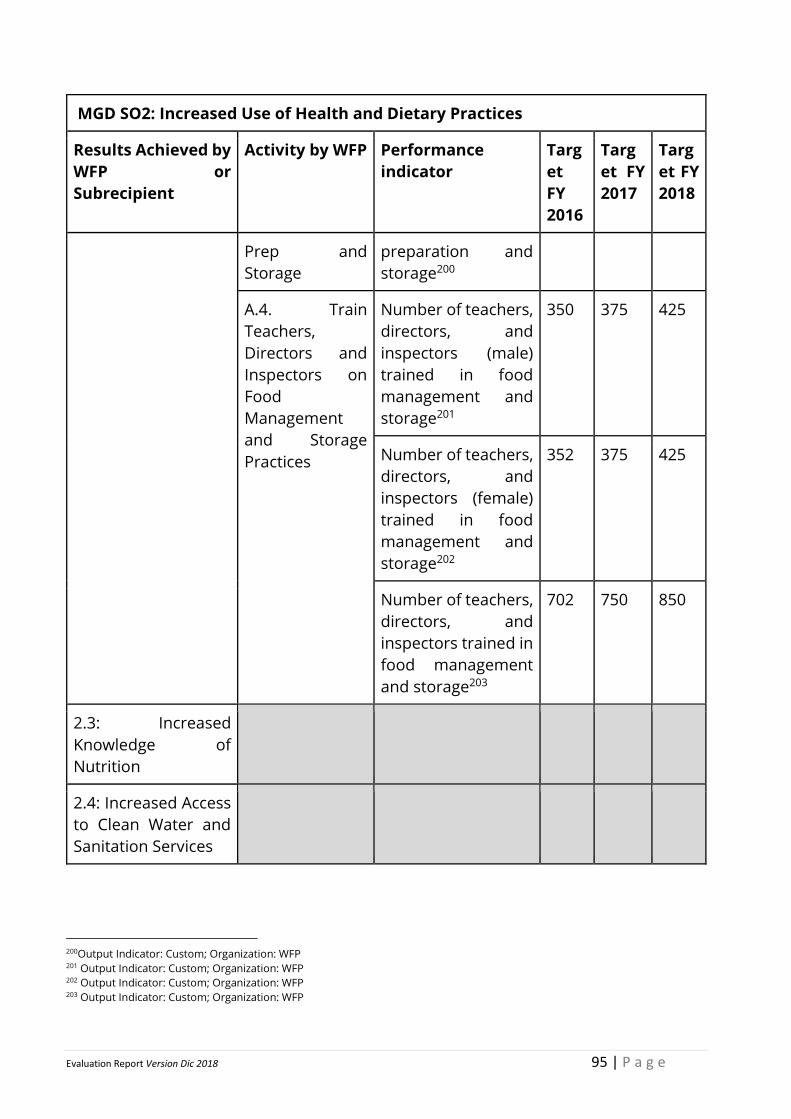
Evaluation Report Version Dic 2018 95 | P a g e
MGD SO2: Increased Use of Health and Dietary Practices
Results Achieved by
WFP or
Subrecipient
Activity by WFP Performance
indicator
Targ
et
FY
2016
Targ
et FY
2017
Targ
et FY
2018
Prep and
Storage
preparation and
storage200
A.4. Train
Teachers,
Directors and
Inspectors on
Food
Management
and Storage
Practices
Number of teachers,
directors, and
inspectors (male)
trained in food
management and
storage201
350 375 425
Number of teachers,
directors, and
inspectors (female)
trained in food
management and
storage202
352 375 425
Number of teachers,
directors, and
inspectors trained in
food management
and storage203
702 750 850
2.3: Increased
Knowledge of
Nutrition
2.4: Increased Access
to Clean Water and
Sanitation Services
200Output Indicator: Custom; Organization: WFP 201 Output Indicator: Custom; Organization: WFP 202 Output Indicator: Custom; Organization: WFP 203 Output Indicator: Custom; Organization: WFP
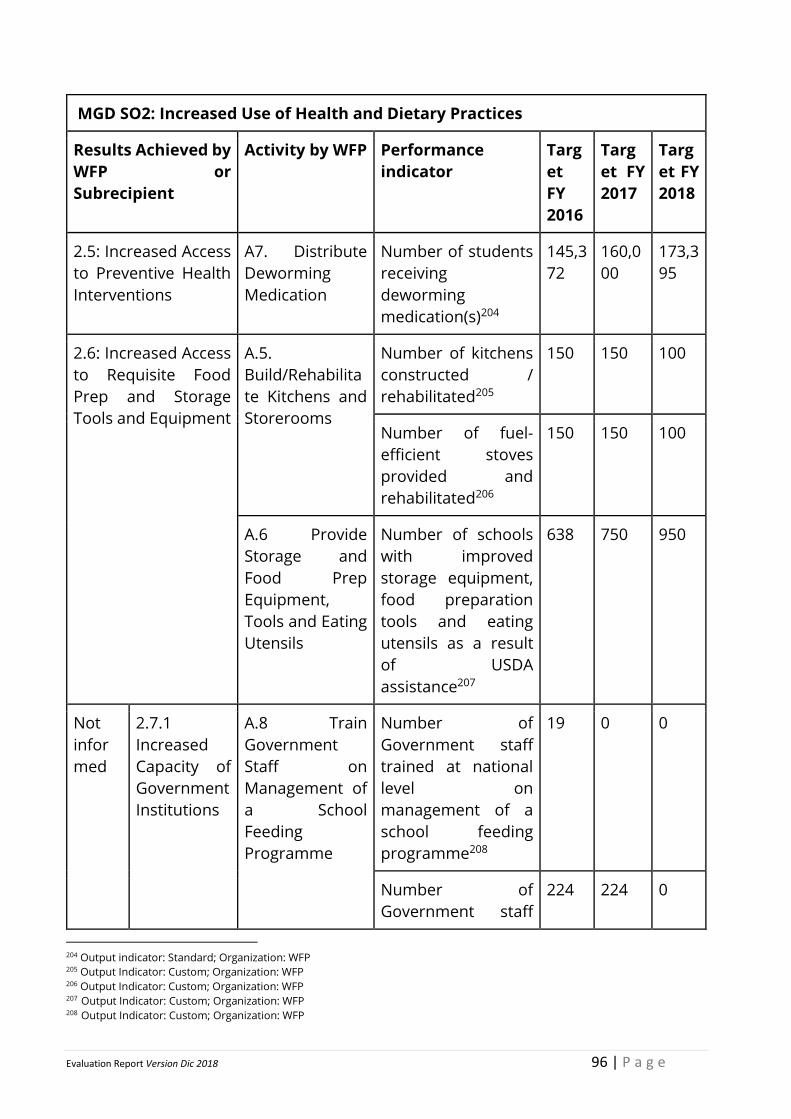
Evaluation Report Version Dic 2018 96 | P a g e
MGD SO2: Increased Use of Health and Dietary Practices
Results Achieved by
WFP or
Subrecipient
Activity by WFP Performance
indicator
Targ
et
FY
2016
Targ
et FY
2017
Targ
et FY
2018
2.5: Increased Access
to Preventive Health
Interventions
A7. Distribute
Deworming
Medication
Number of students
receiving
deworming
medication(s)204
145,3
72
160,0
00
173,3
95
2.6: Increased Access
to Requisite Food
Prep and Storage
Tools and Equipment
A.5.
Build/Rehabilita
te Kitchens and
Storerooms
Number of kitchens
constructed /
rehabilitated205
150 150 100
Number of fuel-
efficient stoves
provided and
rehabilitated206
150 150 100
A.6 Provide
Storage and
Food Prep
Equipment,
Tools and Eating
Utensils
Number of schools
with improved
storage equipment,
food preparation
tools and eating
utensils as a result
of USDA
assistance207
638 750 950
Not
infor
med
2.7.1
Increased
Capacity of
Government
Institutions
A.8 Train
Government
Staff on
Management of
a School
Feeding
Programme
Number of
Government staff
trained at national
level on
management of a
school feeding
programme208
19 0 0
Number of
Government staff
224 224 0
204 Output indicator: Standard; Organization: WFP 205 Output Indicator: Custom; Organization: WFP 206 Output Indicator: Custom; Organization: WFP 207 Output Indicator: Custom; Organization: WFP 208 Output Indicator: Custom; Organization: WFP
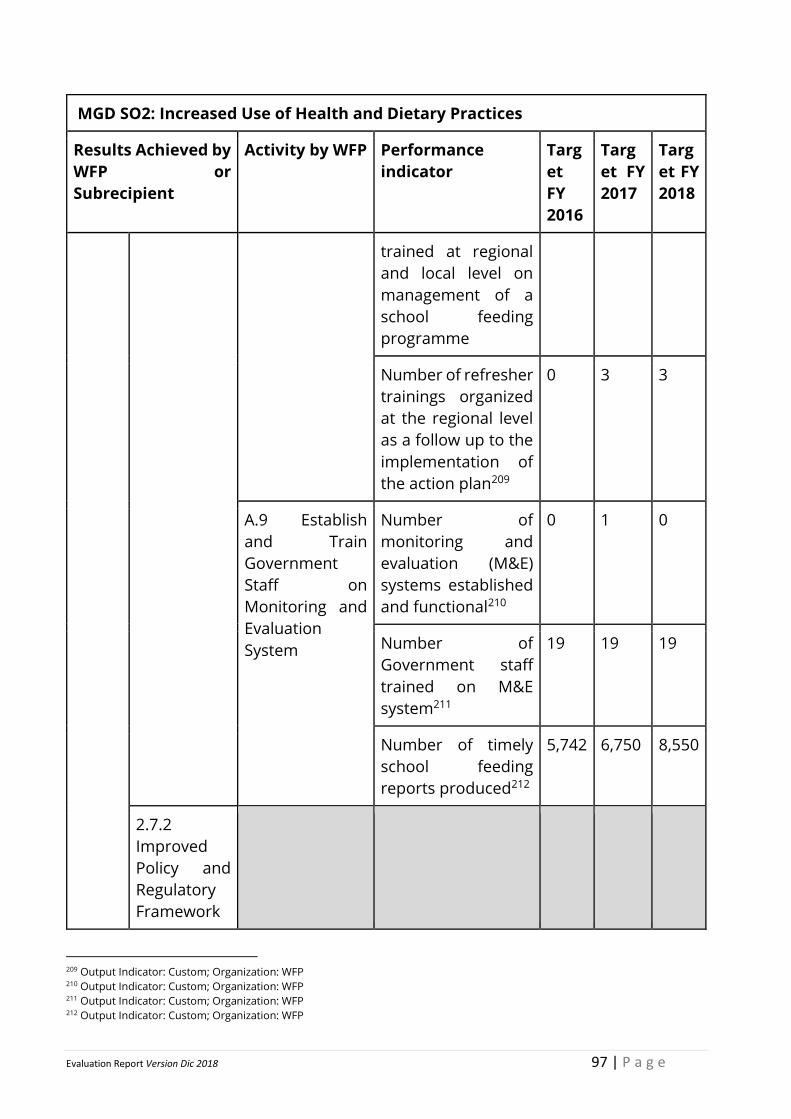
Evaluation Report Version Dic 2018 97 | P a g e
MGD SO2: Increased Use of Health and Dietary Practices
Results Achieved by
WFP or
Subrecipient
Activity by WFP Performance
indicator
Targ
et
FY
2016
Targ
et FY
2017
Targ
et FY
2018
trained at regional
and local level on
management of a
school feeding
programme
Number of refresher
trainings organized
at the regional level
as a follow up to the
implementation of
the action plan209
0 3 3
A.9 Establish
and Train
Government
Staff on
Monitoring and
Evaluation
System
Number of
monitoring and
evaluation (M&E)
systems established
and functional210
0 1 0
Number of
Government staff
trained on M&E
system211
19 19 19
Number of timely
school feeding
reports produced212
5,742 6,750 8,550
2.7.2
Improved
Policy and
Regulatory
Framework
209 Output Indicator: Custom; Organization: WFP 210 Output Indicator: Custom; Organization: WFP 211 Output Indicator: Custom; Organization: WFP 212 Output Indicator: Custom; Organization: WFP
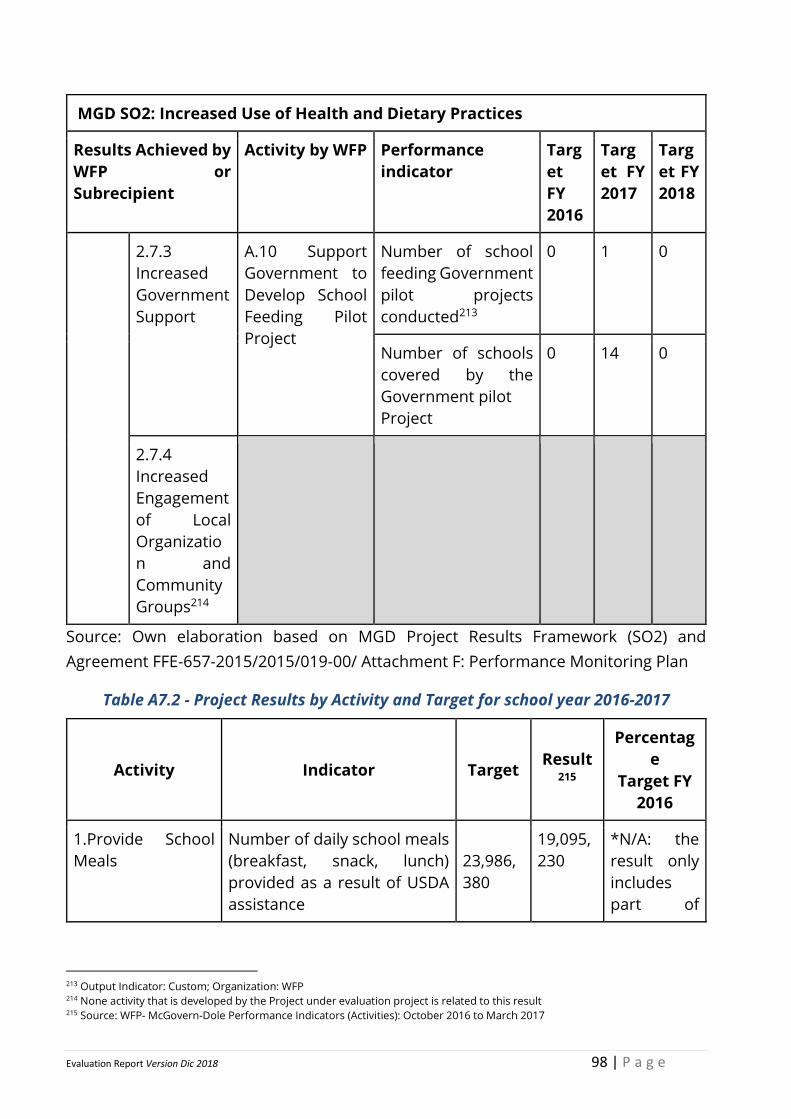
Evaluation Report Version Dic 2018 98 | P a g e
MGD SO2: Increased Use of Health and Dietary Practices
Results Achieved by
WFP or
Subrecipient
Activity by WFP Performance
indicator
Targ
et
FY
2016
Targ
et FY
2017
Targ
et FY
2018
2.7.3
Increased
Government
Support
A.10 Support
Government to
Develop School
Feeding Pilot
Project
Number of school
feeding Government
pilot projects
conducted213
0 1 0
Number of schools
covered by the
Government pilot
Project
0 14 0
2.7.4
Increased
Engagement
of Local
Organizatio
n and
Community
Groups214
Source: Own elaboration based on MGD Project Results Framework (SO2) and
Agreement FFE-657-2015/2015/019-00/ Attachment F: Performance Monitoring Plan
Table A7.2 - Project Results by Activity and Target for school year 2016-2017
Activity Indicator Target Result
215
Percentag
e
Target FY
2016
1.Provide School
Meals
Number of daily school meals
(breakfast, snack, lunch)
provided as a result of USDA
assistance
23,986,
380
19,095,
230
*N/A: the
result only
includes
part of
213 Output Indicator: Custom; Organization: WFP 214 None activity that is developed by the Project under evaluation project is related to this result 215 Source: WFP- McGovern-Dole Performance Indicators (Activities): October 2016 to March 2017
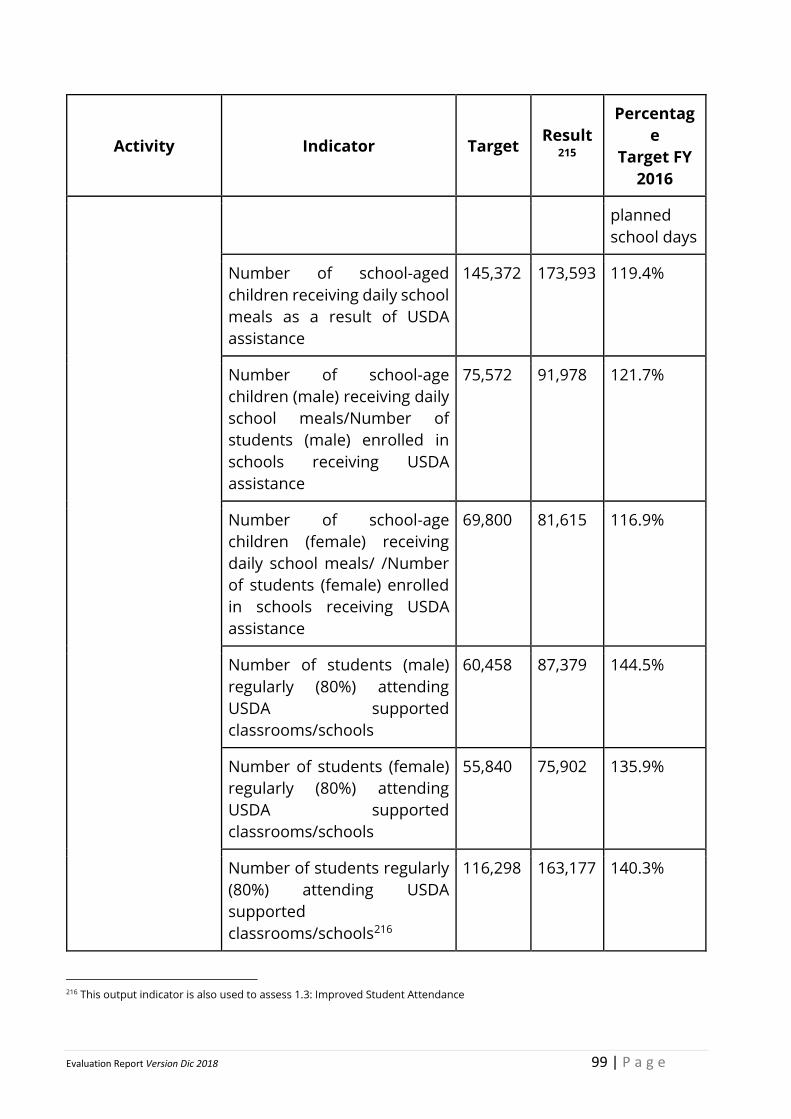
Evaluation Report Version Dic 2018 99 | P a g e
Activity Indicator Target Result
215
Percentag
e
Target FY
2016
planned
school days
Number of school-aged
children receiving daily school
meals as a result of USDA
assistance
145,372 173,593 119.4%
Number of school-age
children (male) receiving daily
school meals/Number of
students (male) enrolled in
schools receiving USDA
assistance
75,572 91,978 121.7%
Number of school-age
children (female) receiving
daily school meals/ /Number
of students (female) enrolled
in schools receiving USDA
assistance
69,800 81,615 116.9%
Number of students (male)
regularly (80%) attending
USDA supported
classrooms/schools
60,458 87,379 144.5%
Number of students (female)
regularly (80%) attending
USDA supported
classrooms/schools
55,840 75,902 135.9%
Number of students regularly
(80%) attending USDA
supported
classrooms/schools216
116,298 163,177 140.3%
216 This output indicator is also used to assess 1.3: Improved Student Attendance
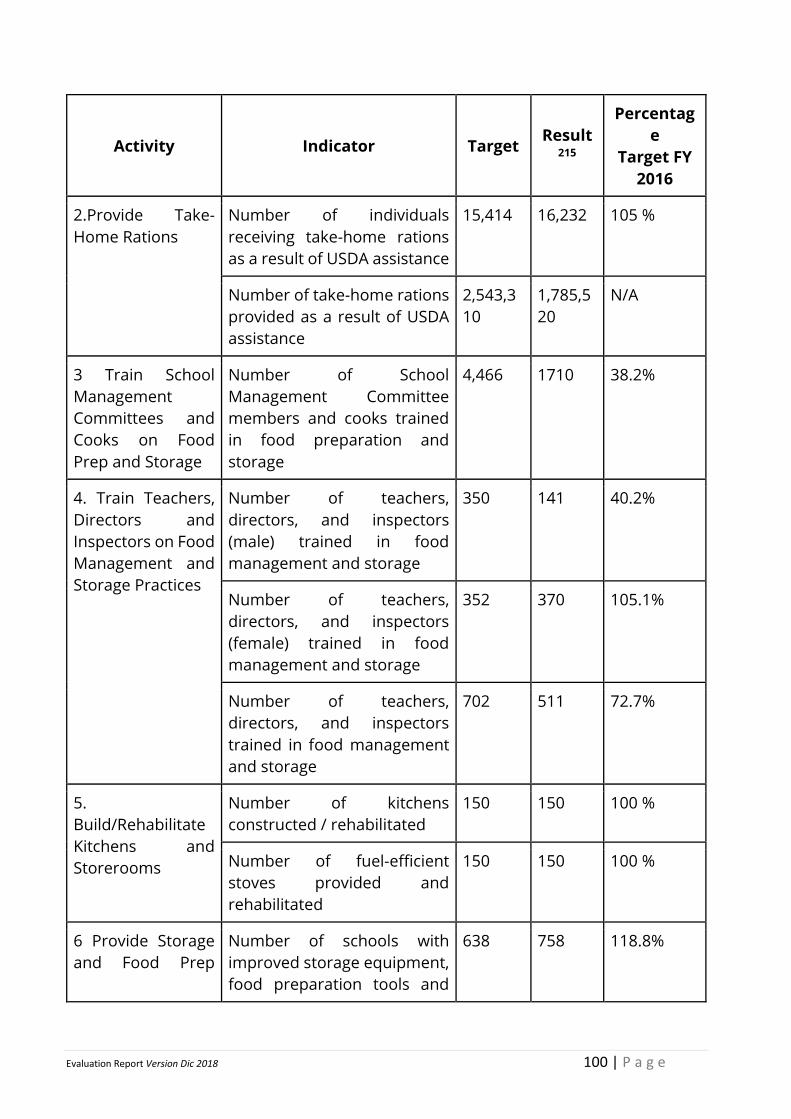
Evaluation Report Version Dic 2018 100 | P a g e
Activity Indicator Target Result
215
Percentag
e
Target FY
2016
2.Provide Take-
Home Rations
Number of individuals
receiving take-home rations
as a result of USDA assistance
15,414 16,232 105 %
Number of take-home rations
provided as a result of USDA
assistance
2,543,3
10
1,785,5
20
N/A
3 Train School
Management
Committees and
Cooks on Food
Prep and Storage
Number of School
Management Committee
members and cooks trained
in food preparation and
storage
4,466 1710 38.2%
4. Train Teachers,
Directors and
Inspectors on Food
Management and
Storage Practices
Number of teachers,
directors, and inspectors
(male) trained in food
management and storage
350 141 40.2%
Number of teachers,
directors, and inspectors
(female) trained in food
management and storage
352 370 105.1%
Number of teachers,
directors, and inspectors
trained in food management
and storage
702 511 72.7%
5.
Build/Rehabilitate
Kitchens and
Storerooms
Number of kitchens
constructed / rehabilitated
150 150 100 %
Number of fuel-efficient
stoves provided and
rehabilitated
150 150 100 %
6 Provide Storage
and Food Prep
Number of schools with
improved storage equipment,
food preparation tools and
638 758 118.8%
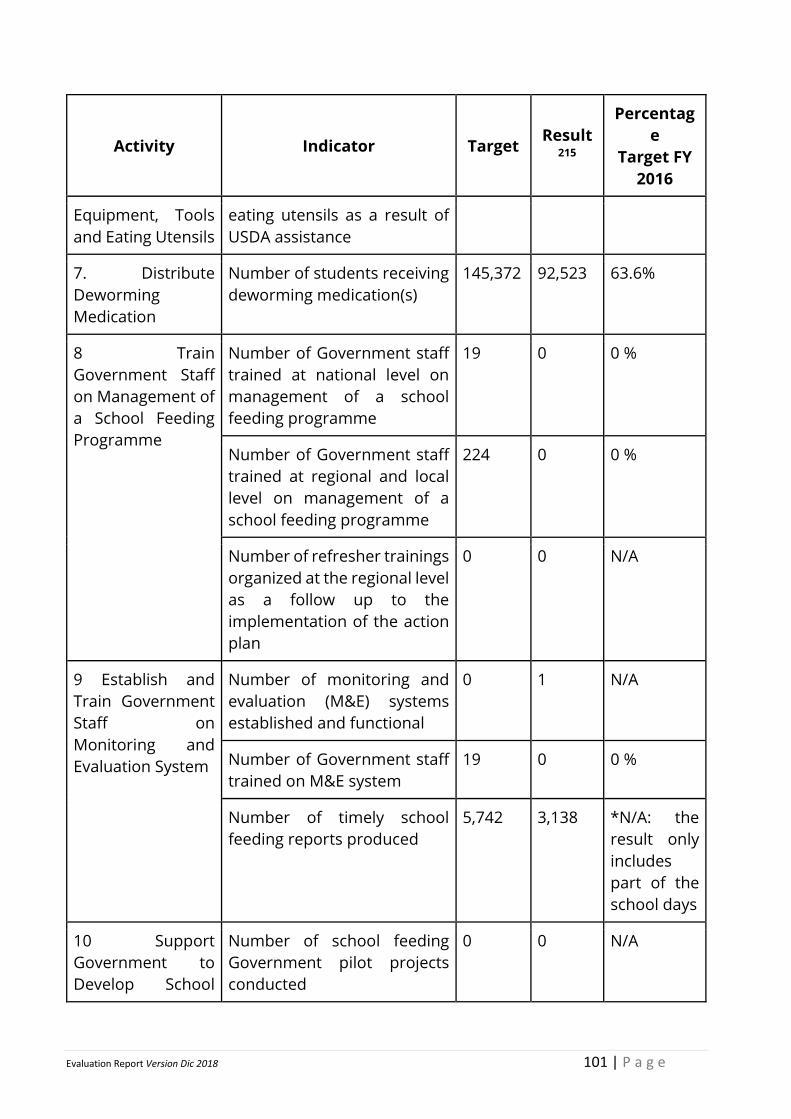
Evaluation Report Version Dic 2018 101 | P a g e
Activity Indicator Target Result
215
Percentag
e
Target FY
2016
Equipment, Tools
and Eating Utensils
eating utensils as a result of
USDA assistance
7. Distribute
Deworming
Medication
Number of students receiving
deworming medication(s)
145,372 92,523 63.6%
8 Train
Government Staff
on Management of
a School Feeding
Programme
Number of Government staff
trained at national level on
management of a school
feeding programme
19 0 0 %
Number of Government staff
trained at regional and local
level on management of a
school feeding programme
224 0 0 %
Number of refresher trainings
organized at the regional level
as a follow up to the
implementation of the action
plan
0 0 N/A
9 Establish and
Train Government
Staff on
Monitoring and
Evaluation System
Number of monitoring and
evaluation (M&E) systems
established and functional
0 1 N/A
Number of Government staff
trained on M&E system
19 0 0 %
Number of timely school
feeding reports produced
5,742 3,138 *N/A: the
result only
includes
part of the
school days
10 Support
Government to
Develop School
Number of school feeding
Government pilot projects
conducted
0 0 N/A
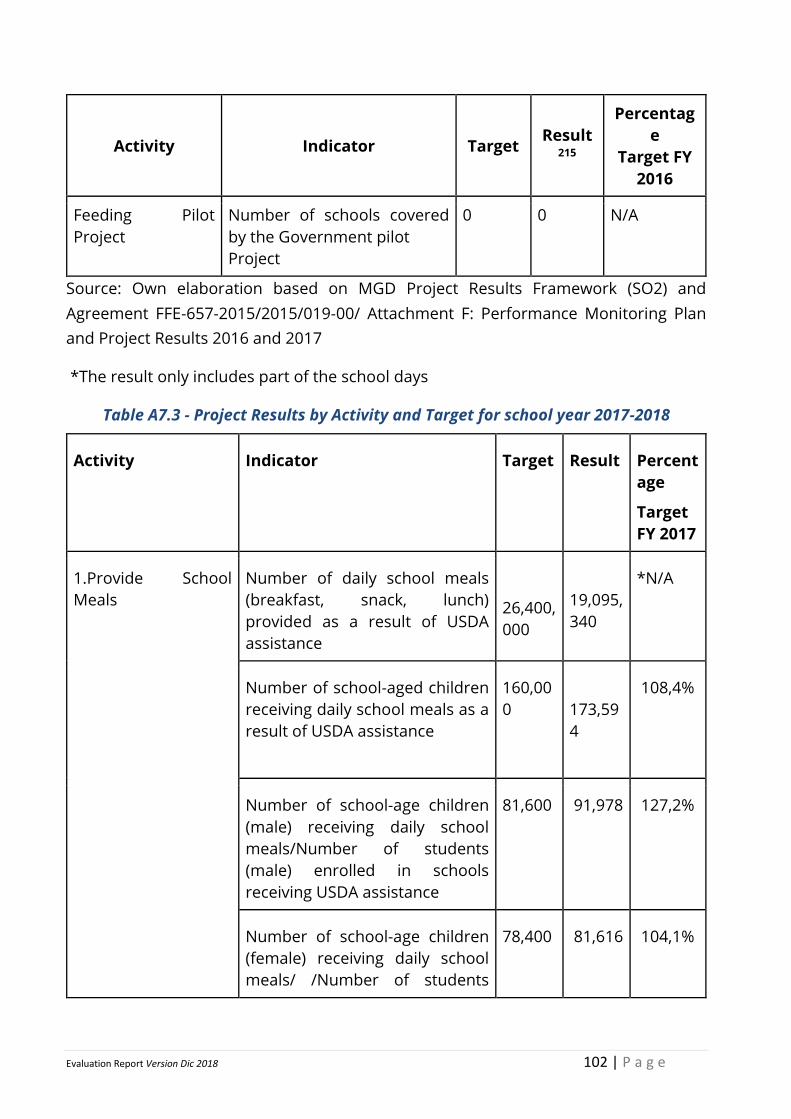
Evaluation Report Version Dic 2018 102 | P a g e
Activity Indicator Target Result
215
Percentag
e
Target FY
2016
Feeding Pilot
Project
Number of schools covered
by the Government pilot
Project
0 0 N/A
Source: Own elaboration based on MGD Project Results Framework (SO2) and
Agreement FFE-657-2015/2015/019-00/ Attachment F: Performance Monitoring Plan
and Project Results 2016 and 2017
*The result only includes part of the school days
Table A7.3 - Project Results by Activity and Target for school year 2017-2018
Activity Indicator Target Result Percent
age
Target
FY 2017
1.Provide School
Meals
Number of daily school meals
(breakfast, snack, lunch)
provided as a result of USDA
assistance
26,400,
000
19,095,
340
*N/A
Number of school-aged children
receiving daily school meals as a
result of USDA assistance
160,00
0
173,59
4
108,4%
Number of school-age children
(male) receiving daily school
meals/Number of students
(male) enrolled in schools
receiving USDA assistance
81,600 91,978 127,2%
Number of school-age children
(female) receiving daily school
meals/ /Number of students
78,400 81,616 104,1%
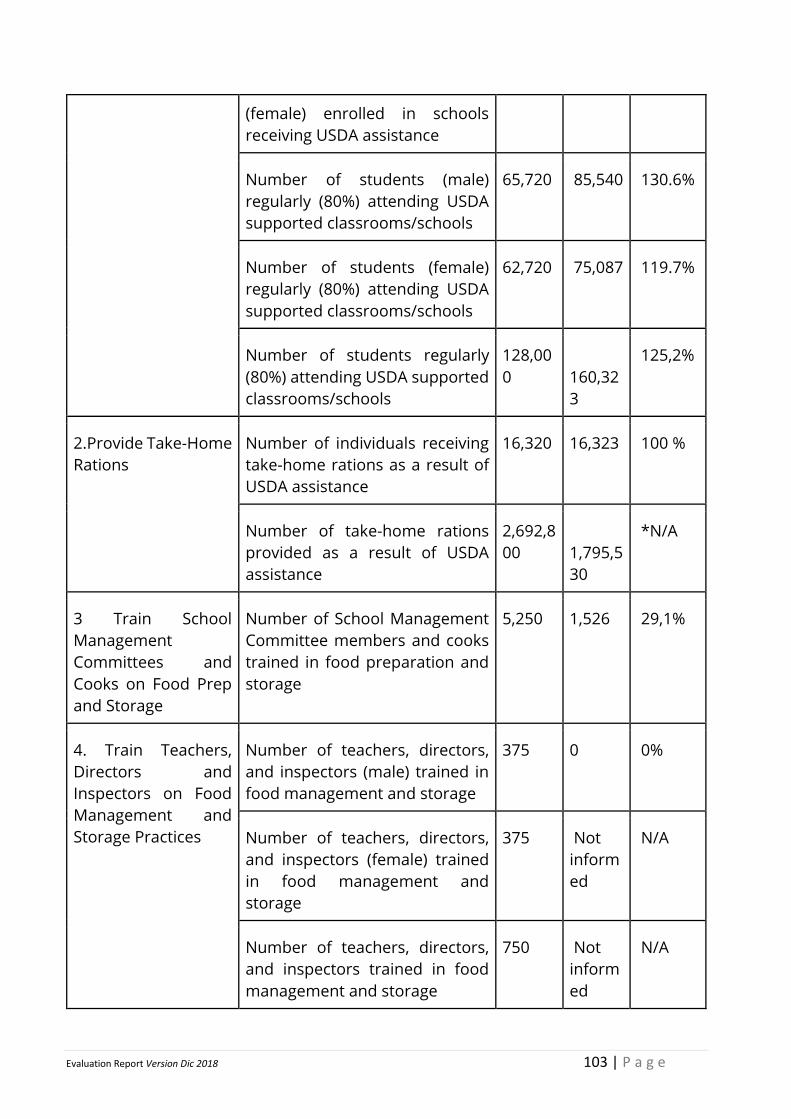
Evaluation Report Version Dic 2018 103 | P a g e
(female) enrolled in schools
receiving USDA assistance
Number of students (male)
regularly (80%) attending USDA
supported classrooms/schools
65,720 85,540 130.6%
Number of students (female)
regularly (80%) attending USDA
supported classrooms/schools
62,720 75,087 119.7%
Number of students regularly
(80%) attending USDA supported
classrooms/schools
128,00
0
160,32
3
125,2%
2.Provide Take-Home
Rations
Number of individuals receiving
take-home rations as a result of
USDA assistance
16,320 16,323 100 %
Number of take-home rations
provided as a result of USDA
assistance
2,692,8
00
1,795,5
30
*N/A
3 Train School
Management
Committees and
Cooks on Food Prep
and Storage
Number of School Management
Committee members and cooks
trained in food preparation and
storage
5,250 1,526 29,1%
4. Train Teachers,
Directors and
Inspectors on Food
Management and
Storage Practices
Number of teachers, directors,
and inspectors (male) trained in
food management and storage
375 0 0%
Number of teachers, directors,
and inspectors (female) trained
in food management and
storage
375 Not
inform
ed
N/A
Number of teachers, directors,
and inspectors trained in food
management and storage
750 Not
inform
ed
N/A
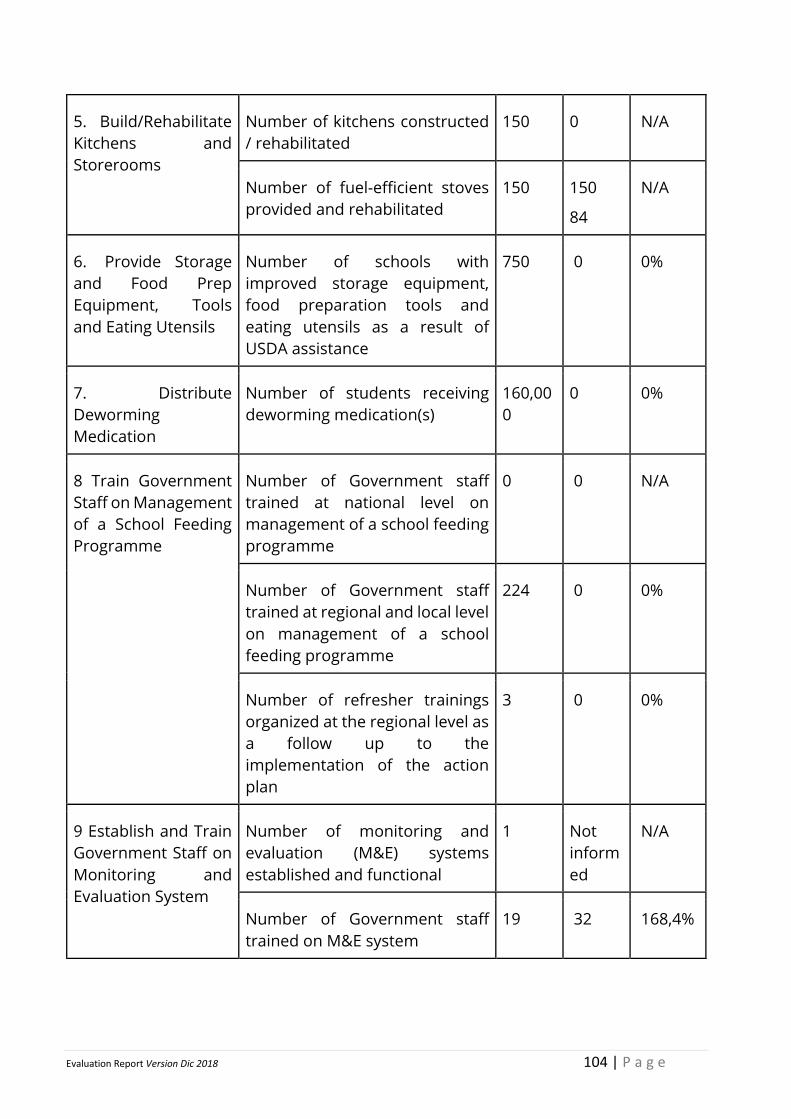
Evaluation Report Version Dic 2018 104 | P a g e
5. Build/Rehabilitate
Kitchens and
Storerooms
Number of kitchens constructed
/ rehabilitated
150 0 N/A
Number of fuel-efficient stoves
provided and rehabilitated
150 150
84
N/A
6. Provide Storage
and Food Prep
Equipment, Tools
and Eating Utensils
Number of schools with
improved storage equipment,
food preparation tools and
eating utensils as a result of
USDA assistance
750 0 0%
7. Distribute
Deworming
Medication
Number of students receiving
deworming medication(s)
160,00
0
0 0%
8 Train Government
Staff on Management
of a School Feeding
Programme
Number of Government staff
trained at national level on
management of a school feeding
programme
0 0 N/A
Number of Government staff
trained at regional and local level
on management of a school
feeding programme
224 0 0%
Number of refresher trainings
organized at the regional level as
a follow up to the
implementation of the action
plan
3 0 0%
9 Establish and Train
Government Staff on
Monitoring and
Evaluation System
Number of monitoring and
evaluation (M&E) systems
established and functional
1 Not
inform
ed
N/A
Number of Government staff
trained on M&E system
19 32 168,4%
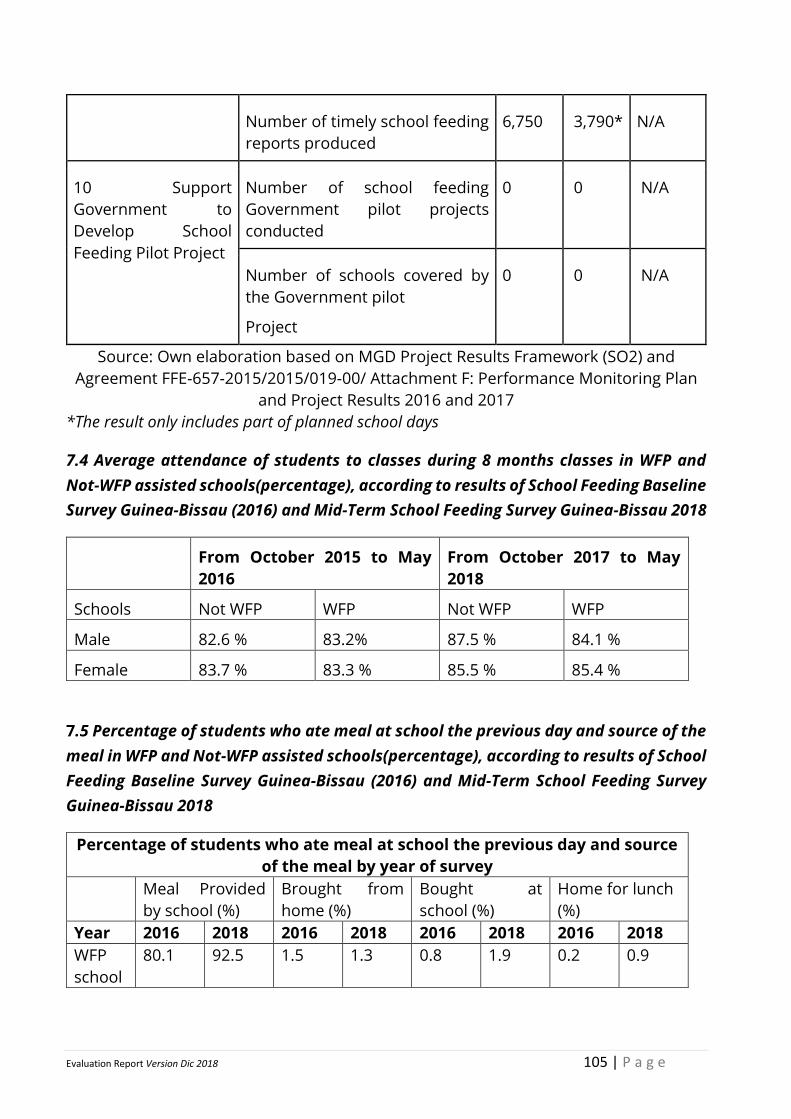
Evaluation Report Version Dic 2018 105 | P a g e
Number of timely school feeding
reports produced
6,750 3,790* N/A
10 Support
Government to
Develop School
Feeding Pilot Project
Number of school feeding
Government pilot projects
conducted
0 0 N/A
Number of schools covered by
the Government pilot
Project
0 0 N/A
Source: Own elaboration based on MGD Project Results Framework (SO2) and
Agreement FFE-657-2015/2015/019-00/ Attachment F: Performance Monitoring Plan
and Project Results 2016 and 2017
*The result only includes part of planned school days
7.4 Average attendance of students to classes during 8 months classes in WFP and
Not-WFP assisted schools(percentage), according to results of School Feeding Baseline
Survey Guinea-Bissau (2016) and Mid-Term School Feeding Survey Guinea-Bissau 2018
From October 2015 to May
2016
From October 2017 to May
2018
Schools Not WFP WFP Not WFP WFP
Male 82.6 % 83.2% 87.5 % 84.1 %
Female 83.7 % 83.3 % 85.5 % 85.4 %
7.5 Percentage of students who ate meal at school the previous day and source of the
meal in WFP and Not-WFP assisted schools(percentage), according to results of School
Feeding Baseline Survey Guinea-Bissau (2016) and Mid-Term School Feeding Survey
Guinea-Bissau 2018
Percentage of students who ate meal at school the previous day and source
of the meal by year of survey
Meal Provided
by school (%)
Brought from
home (%)
Bought at
school (%)
Home for lunch
(%)
Year 2016 2018 2016 2018 2016 2018 2016 2018
WFP
school
80.1 92.5 1.5 1.3 0.8 1.9 0.2 0.9
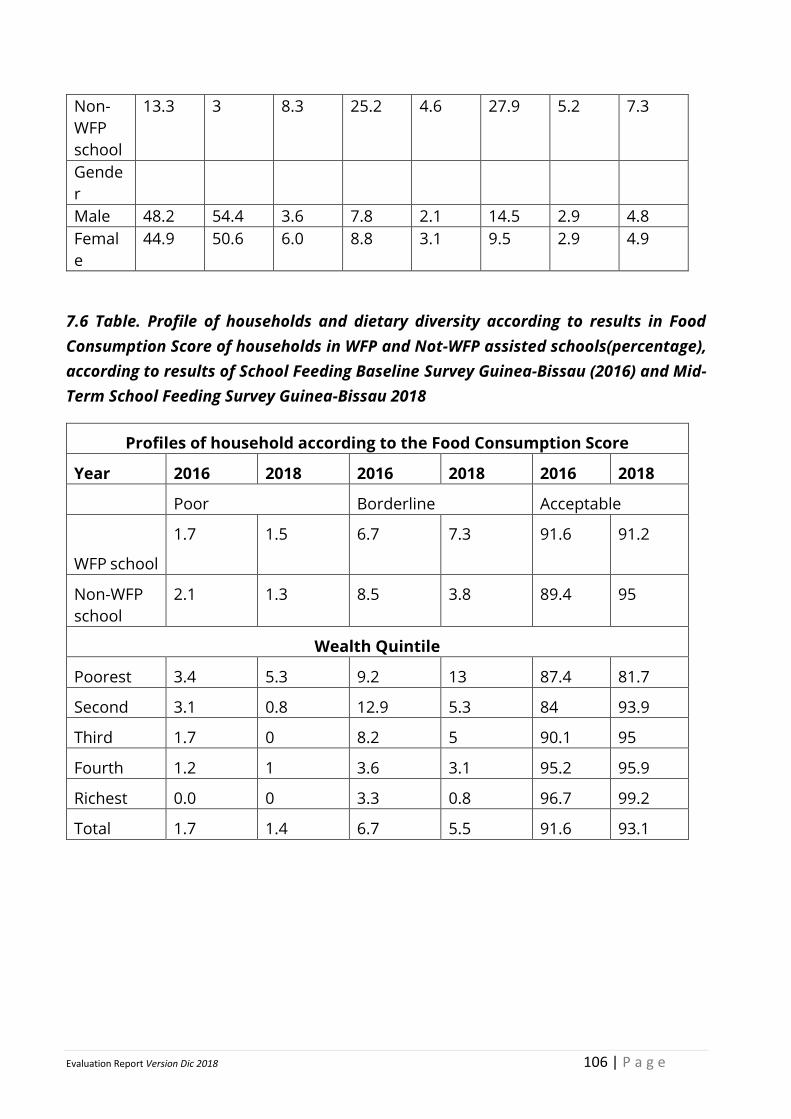
Evaluation Report Version Dic 2018 106 | P a g e
Non-
WFP
school
13.3 3 8.3 25.2 4.6 27.9 5.2 7.3
Gende
r
Male 48.2 54.4 3.6 7.8 2.1 14.5 2.9 4.8
Femal
e
44.9 50.6 6.0 8.8 3.1 9.5 2.9 4.9
7.6 Table. Profile of households and dietary diversity according to results in Food
Consumption Score of households in WFP and Not-WFP assisted schools(percentage),
according to results of School Feeding Baseline Survey Guinea-Bissau (2016) and Mid-
Term School Feeding Survey Guinea-Bissau 2018
Profiles of household according to the Food Consumption Score
Year 2016 2018 2016 2018 2016 2018
Poor Borderline Acceptable
WFP school
1.7 1.5 6.7 7.3 91.6 91.2
Non-WFP
school
2.1 1.3 8.5 3.8 89.4 95
Wealth Quintile
Poorest 3.4 5.3 9.2 13 87.4 81.7
Second 3.1 0.8 12.9 5.3 84 93.9
Third 1.7 0 8.2 5 90.1 95
Fourth 1.2 1 3.6 3.1 95.2 95.9
Richest 0.0 0 3.3 0.8 96.7 99.2
Total 1.7 1.4 6.7 5.5 91.6 93.1
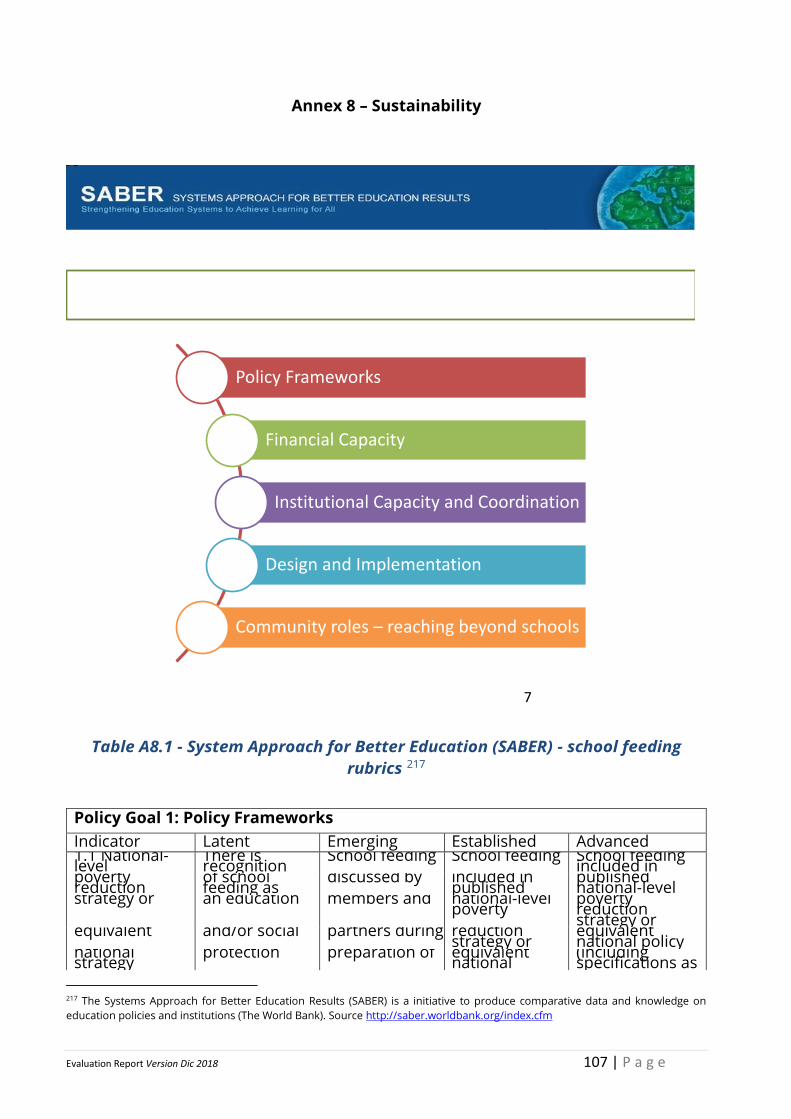
Evaluation Report Version Dic 2018 107 | P a g e
Annex 8 – Sustainability
Table A8.1 - System Approach for Better Education (SABER) - school feeding
rubrics 217
Policy Goal 1: Policy Frameworks
Indicator Latent Emerging Established Advanced 1.1 National-level
There is recognition
School feeding School feeding School feeding included in
poverty reduction
of school feeding as
discussed by included in published
published national-level
strategy or an education members and national-level poverty
poverty reduction strategy or
equivalent and/or social partners during reduction strategy or
equivalent national policy
national strategy
protection preparation of equivalent national
(including specifications as
217 The Systems Approach for Better Education Results (SABER) is a initiative to produce comparative data and knowledge on
education policies and institutions (The World Bank). Source http://saber.worldbank.org/index.cfm
Better Prepared And Ready to Help
Emergency Preparedness Mission Nepal February 2011
SF SABER FIVE POLICY GOALS
Policy Frameworks
Financial Capacity
Institutional Capacity and Coordination
Design and Implementation
Community roles – reaching beyond schools
7
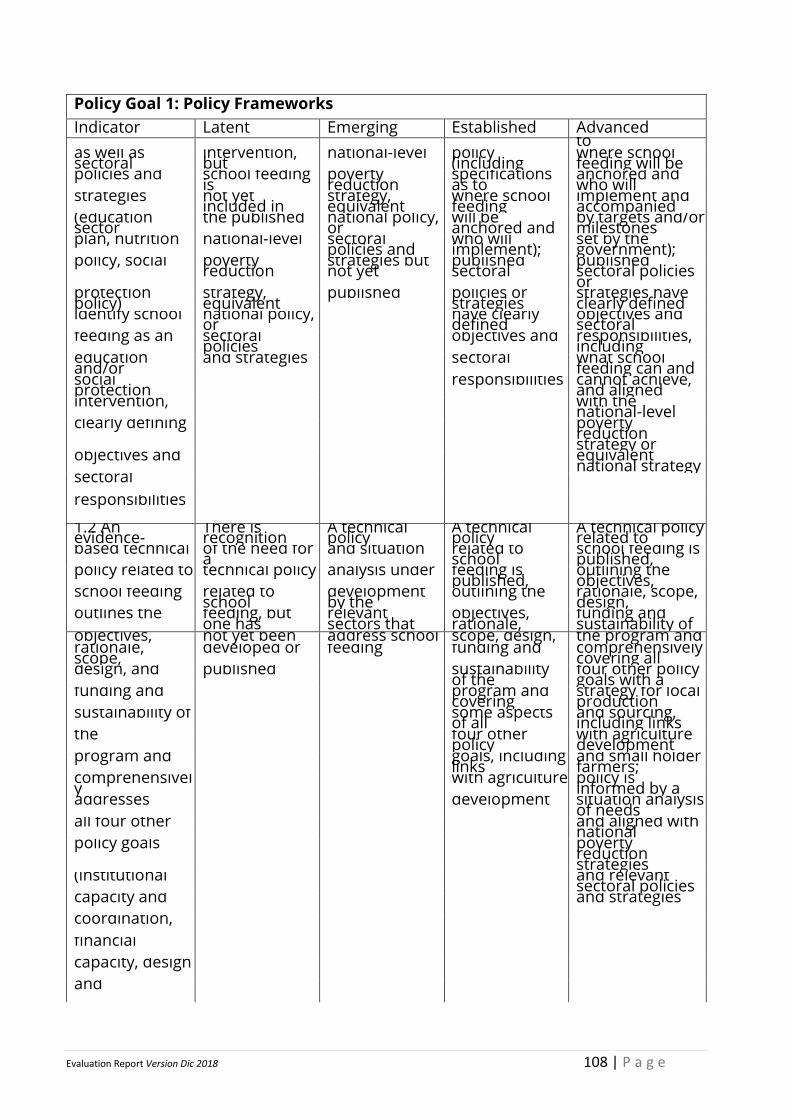
Evaluation Report Version Dic 2018 108 | P a g e
Policy Goal 1: Policy Frameworks
Indicator Latent Emerging Established Advanced to
as well as sectoral
intervention, but
national-level policy (including
where school feeding will be
policies and school feeding is
poverty reduction
specifications as to
anchored and who will
strategies not yet included in
strategy, equivalent
where school feeding
implement and accompanied
(education sector
the published national policy, or
will be anchored and
by targets and/or milestones
plan, nutrition national-level sectoral policies and
who will implement);
set by the government);
policy, social poverty reduction
strategies but not yet
published sectoral
published sectoral policies or
protection policy)
strategy, equivalent
published policies or strategies
strategies have clearly defined
identify school national policy, or
have clearly defined
objectives and sectoral
feeding as an sectoral policies
objectives and responsibilities, including
education and/or
and strategies
sectoral what school feeding can and
social protection
responsibilities cannot achieve, and aligned
intervention,
with the national-level
clearly defining
poverty reduction strategy or
objectives and
equivalent national strategy
sectoral
responsibilities
1.2 An evidence-
There is recognition
A technical policy
A technical policy
A technical policy related to
based technical of the need for a
and situation related to school
school feeding is published,
policy related to technical policy analysis under feeding is published,
outlining the objectives,
school feeding related to school
development by the
outlining the rationale, scope, design,
outlines the feeding, but one has
relevant sectors that
objectives, rationale,
funding and sustainability of
objectives, not yet been address school scope, design, the program and rationale, scope,
developed or feeding funding and comprehensively covering all
design, and published
sustainability of the
four other policy goals with a
funding and
program and covering
strategy for local production
sustainability of
some aspects of all
and sourcing, including links
the
four other policy
with agriculture development
program and
goals, including links
and small holder farmers;
comprehensively
with agriculture policy is informed by a
addresses
development situation analysis of needs
all four other
and aligned with national
policy goals
poverty reduction strategies
(institutional
and relevant sectoral policies
capacity and
and strategies
coordination,
financial
capacity, design
and
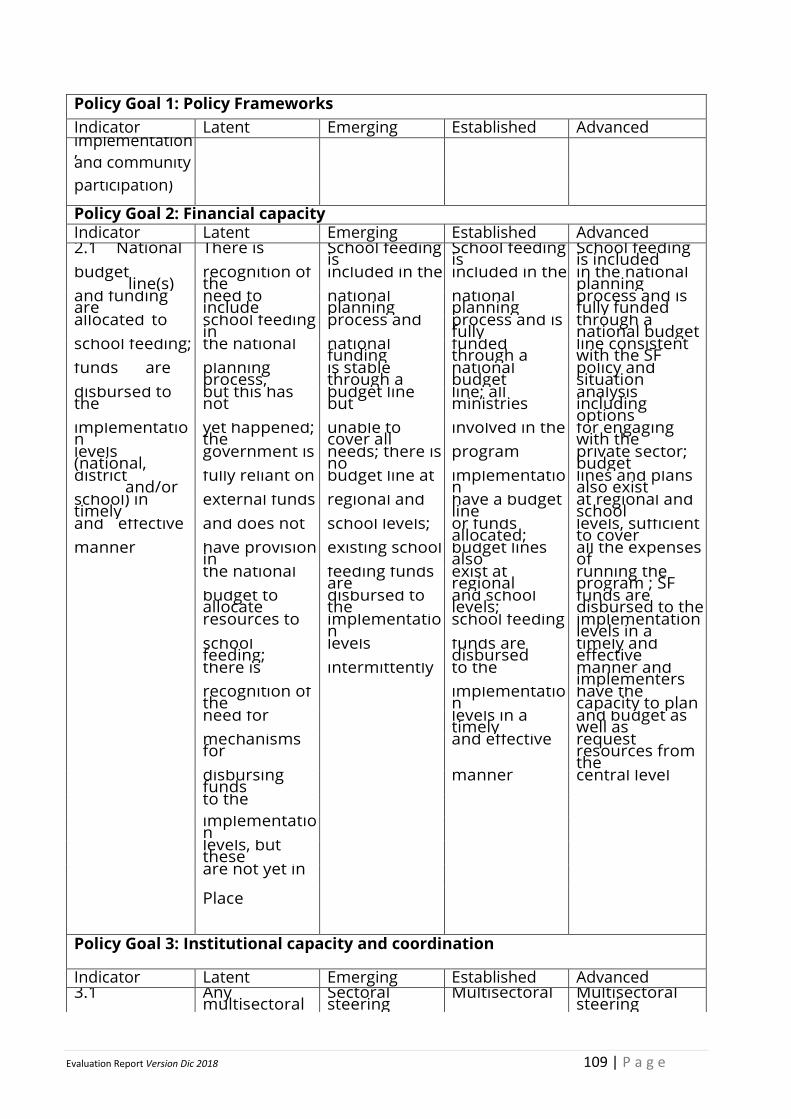
Evaluation Report Version Dic 2018 109 | P a g e
Policy Goal 1: Policy Frameworks
Indicator Latent Emerging Established Advanced implementation, and community
participation)
Policy Goal 2: Financial capacity Indicator Latent Emerging Established Advanced 2.1 National There is School feeding
is School feeding is
School feeding is included
budget line(s)
recognition of the
included in the included in the in the national planning
and funding are
need to include
national planning
national planning
process and is fully funded
allocated to school feeding in
process and process and is fully
through a national budget
school feeding; the national national funding
funded through a
line consistent with the SF
funds are planning process,
is stable through a
national budget
policy and situation
disbursed to the
but this has not
budget line but
line; all ministries
analysis including options
implementation
yet happened; the
unable to cover all
involved in the for engaging with the
levels (national,
government is needs; there is no
program private sector; budget
district and/or
fully reliant on budget line at implementation
lines and plans also exist
school) in timely
external funds regional and have a budget line
at regional and school
and effective and does not school levels; or funds allocated;
levels, sufficient to cover
manner have provision in
existing school budget lines also
all the expenses of
the national feeding funds are
exist at regional
running the program ; SF
budget to allocate
disbursed to the
and school levels;
funds are disbursed to the
resources to implementation
school feeding implementation levels in a
school feeding;
levels funds are disbursed
timely and effective
there is intermittently to the manner and implementers
recognition of the implementatio
n have the capacity to plan
need for levels in a timely
and budget as well as
mechanisms for and effective request
resources from the
disbursing funds manner central level
to the
implementation
levels, but these
are not yet in
Place
Policy Goal 3: Institutional capacity and coordination
Indicator Latent Emerging Established Advanced 3.1 Any
multisectoral Sectoral steering
Multisectoral Multisectoral steering
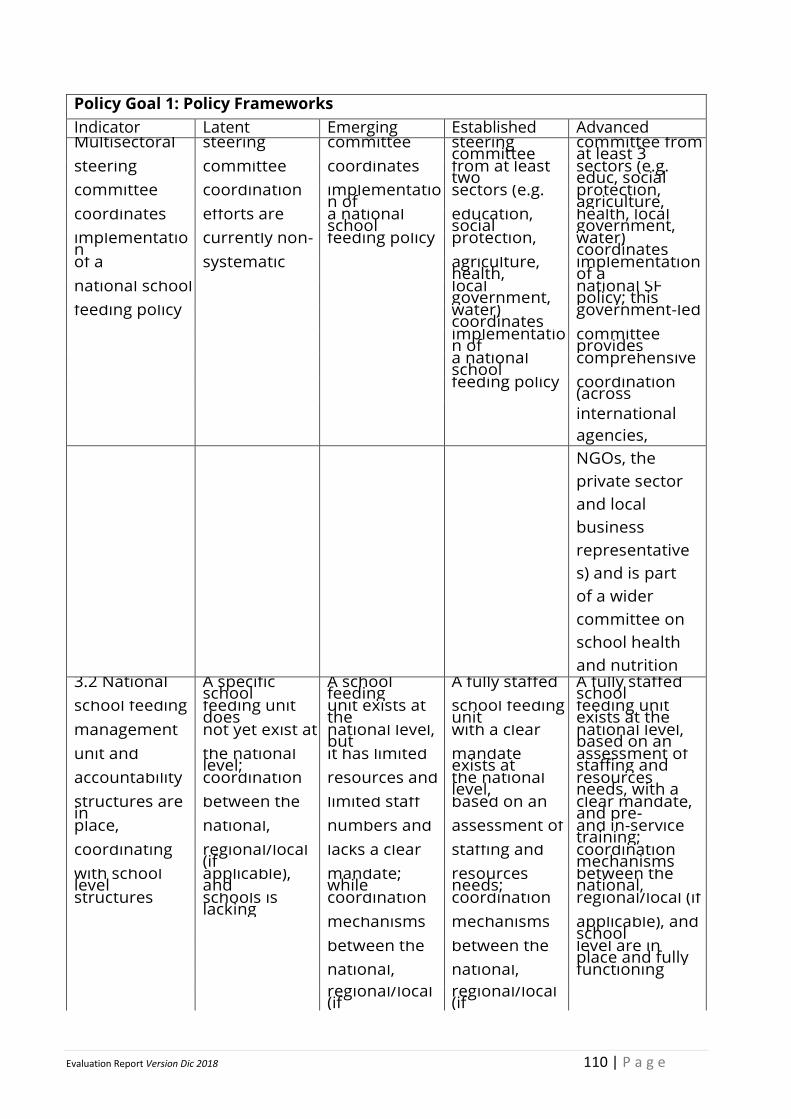
Evaluation Report Version Dic 2018 110 | P a g e
Policy Goal 1: Policy Frameworks
Indicator Latent Emerging Established Advanced Multisectoral steering committee steering
committee committee from at least 3
steering committee coordinates from at least two
sectors (e.g. educ, social
committee coordination implementation of
sectors (e.g. protection, agriculture,
coordinates efforts are a national school
education, social
health, local government,
implementation
currently non- feeding policy protection, water) coordinates
of a systematic agriculture, health,
implementation of a
national school local government,
national SF policy; this
feeding policy water) coordinates
government-led
implementation of
committee provides
a national school
comprehensive
feeding policy coordination (across
international
agencies,
NGOs, the
private sector
and local
business
representative
s) and is part
of a wider
committee on
school health
and nutrition 3.2 National A specific
school A school feeding
A fully staffed A fully staffed school
school feeding feeding unit does
unit exists at the
school feeding unit
feeding unit exists at the
management not yet exist at national level, but
with a clear national level, based on an
unit and the national level;
it has limited mandate exists at
assessment of staffing and
accountability coordination resources and the national level,
resources needs, with a
structures are in
between the limited staff based on an clear mandate, and pre-
place, national, numbers and assessment of and in-service training;
coordinating regional/local (if
lacks a clear staffing and coordination mechanisms
with school level
applicable), and
mandate; while
resources needs;
between the national,
structures schools is lacking
coordination coordination regional/local (if
mechanisms mechanisms applicable), and school
between the between the level are in place and fully
national, national, functioning
regional/local (if
regional/local (if
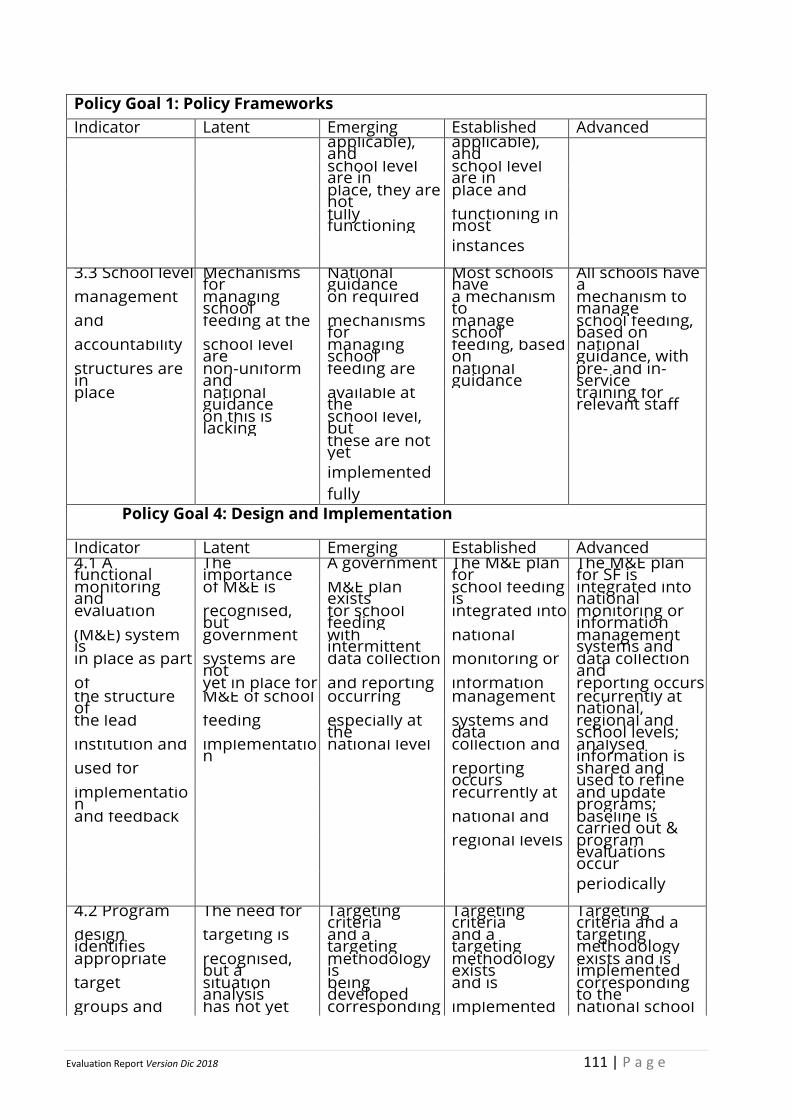
Evaluation Report Version Dic 2018 111 | P a g e
Policy Goal 1: Policy Frameworks
Indicator Latent Emerging Established Advanced
applicable), and
applicable), and
school level are in
school level are in
place, they are not
place and
fully functioning
functioning in most
instances
3.3 School level Mechanisms for
National guidance
Most schools have
All schools have a
management managing school
on required a mechanism to
mechanism to manage
and feeding at the mechanisms for
manage school
school feeding, based on
accountability school level are
managing school
feeding, based on
national guidance, with
structures are in
non-uniform and
feeding are national guidance
pre- and in-service
place national guidance
available at the training for
relevant staff on this is
lacking school level, but
these are not yet
implemented
fully
Policy Goal 4: Design and Implementation
Indicator Latent Emerging Established Advanced 4.1 A functional
The importance
A government The M&E plan for
The M&E plan for SF is
monitoring and
of M&E is M&E plan exists
school feeding is
integrated into national
evaluation recognised, but
for school feeding
integrated into monitoring or information
(M&E) system is
government with intermittent
national management systems and
in place as part systems are not
data collection monitoring or data collection and
of yet in place for and reporting information reporting occurs the structure of
M&E of school occurring management recurrently at national,
the lead feeding especially at the
systems and data
regional and school levels;
institution and implementation
national level collection and analysed information is
used for reporting occurs
shared and used to refine
implementation recurrently at and update
programs; and feedback national and baseline is
carried out & regional levels program
evaluations occur
periodically
4.2 Program The need for Targeting criteria
Targeting criteria
Targeting criteria and a
design identifies
targeting is and a targeting
and a targeting
targeting methodology
appropriate recognised, but a
methodology is
methodology exists
exists and is implemented
target situation analysis
being developed
and is corresponding to the
groups and has not yet corresponding implemented national school
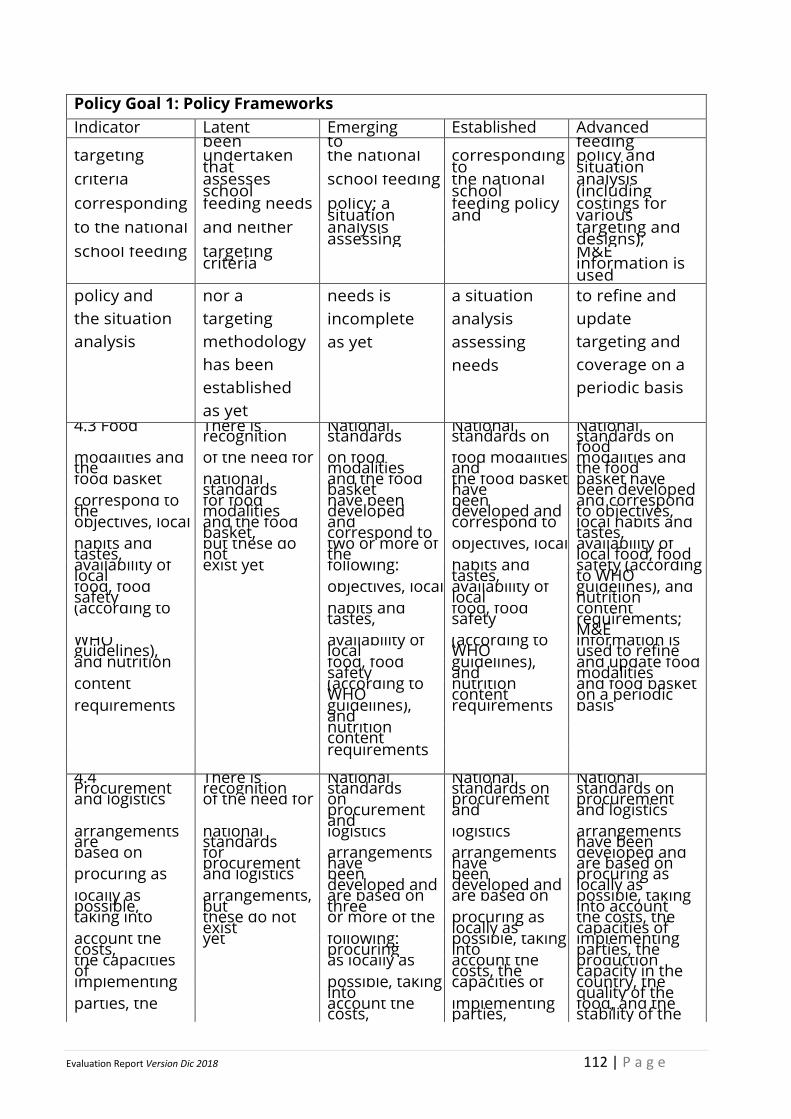
Evaluation Report Version Dic 2018 112 | P a g e
Policy Goal 1: Policy Frameworks
Indicator Latent Emerging Established Advanced been to feeding
targeting undertaken that
the national corresponding to
policy and situation
criteria assesses school
school feeding the national school
analysis (including
corresponding feeding needs policy; a situation
feeding policy and
costings for various
to the national and neither analysis assessing targeting and
designs); school feeding targeting
criteria M&E information is used
policy and
the situation
analysis
nor a
targeting
methodology
has been
established
as yet
needs is
incomplete
as yet
a situation
analysis
assessing
needs
to refine and
update
targeting and
coverage on a
periodic basis
4.3 Food There is recognition
National standards
National standards on
National standards on food
modalities and the
of the need for on food modalities
food modalities and
modalities and the food
food basket national standards
and the food basket
the food basket have
basket have been developed
correspond to the
for food modalities
have been developed
been developed and
and correspond to objectives,
objectives, local and the food basket,
and correspond to
correspond to local habits and tastes,
habits and tastes,
but these do not
two or more of the
objectives, local availability of local food, food
availability of local
exist yet following: habits and tastes,
safety (according to WHO
food, food safety
objectives, local availability of local
guidelines), and nutrition
(according to
habits and tastes,
food, food safety
content requirements; M&E
WHO guidelines),
availability of local
(according to WHO
information is used to refine
and nutrition
food, food safety
guidelines), and
and update food modalities
content
(according to WHO
nutrition content
and food basket on a periodic
requirements
guidelines), and
requirements basis
nutrition content
requirements
4.4 Procurement
There is recognition
National standards
National standards on
National standards on
and logistics of the need for on procurement and
procurement and
procurement and logistics
arrangements are
national standards
logistics logistics arrangements have been
based on for procurement
arrangements have
arrangements have
developed and are based on
procuring as and logistics been developed and
been developed and
procuring as locally as
locally as possible,
arrangements, but
are based on three
are based on possible, taking into account
taking into these do not exist
or more of the procuring as locally as
the costs, the capacities of
account the costs,
yet following: procuring
possible, taking into
implementing parties, the
the capacities of
as locally as account the costs, the
production capacity in the
implementing
possible, taking into
capacities of country, the quality of the
parties, the
account the costs,
implementing parties,
food, and the stability of the
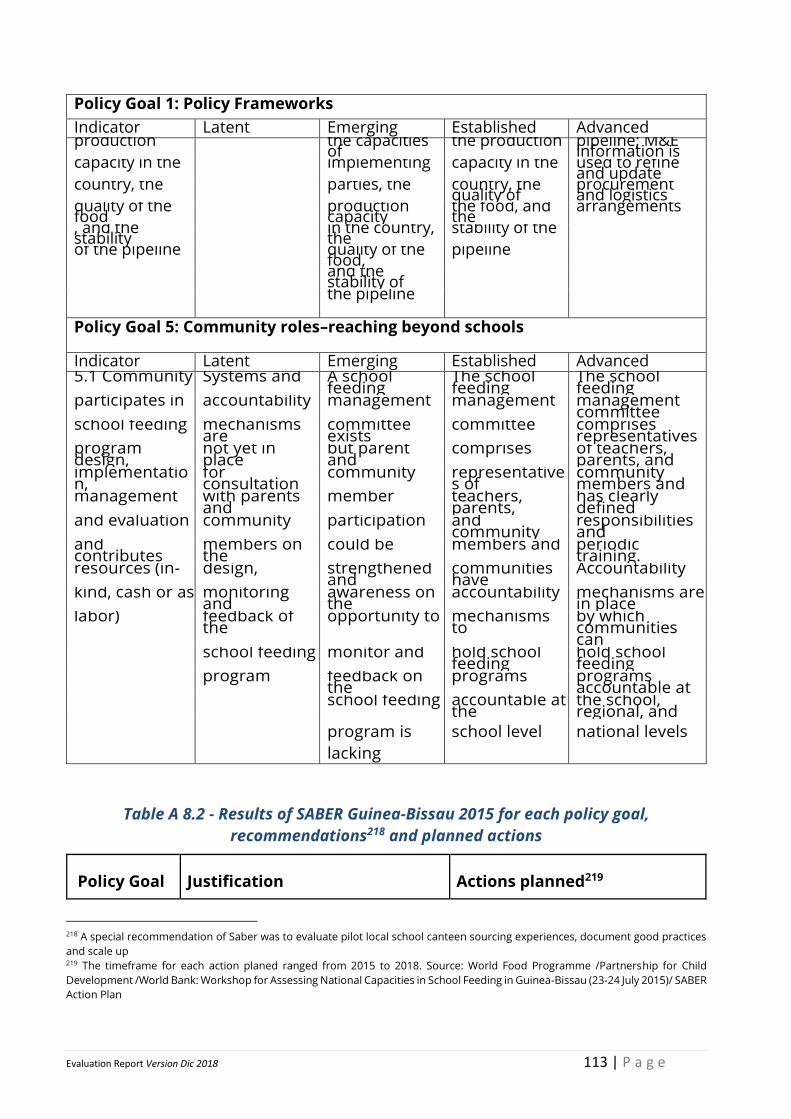
Evaluation Report Version Dic 2018 113 | P a g e
Policy Goal 1: Policy Frameworks
Indicator Latent Emerging Established Advanced production
the capacities of
the production pipeline; M&E information is
capacity in the
implementing capacity in the used to refine and update
country, the
parties, the country, the quality of
procurement and logistics
quality of the food
production capacity
the food, and the
arrangements
, and the stability
in the country, the
stability of the
of the pipeline
quality of the food,
pipeline
and the stability of
the pipeline
Policy Goal 5: Community roles–reaching beyond schools
Indicator Latent Emerging Established Advanced 5.1 Community Systems and A school
feeding The school feeding
The school feeding
participates in accountability management management management committee
school feeding mechanisms are
committee exists
committee comprises representatives
program design,
not yet in place
but parent and
comprises of teachers, parents, and
implementation,
for consultation
community representatives of
community members and
management with parents and
member teachers, parents,
has clearly defined
and evaluation community participation and community
responsibilities and
and contributes
members on the
could be members and periodic training.
resources (in- design, strengthened and
communities have
Accountability
kind, cash or as monitoring and
awareness on the
accountability mechanisms are in place
labor) feedback of the
opportunity to mechanisms to
by which communities can
school feeding monitor and hold school feeding
hold school feeding
program feedback on the
programs programs accountable at
school feeding accountable at the
the school, regional, and
program is
lacking
school level national levels
Table A 8.2 - Results of SABER Guinea-Bissau 2015 for each policy goal,
recommendations218 and planned actions
Policy Goal Justification Actions planned219
218 A special recommendation of Saber was to evaluate pilot local school canteen sourcing experiences, document good practices
and scale up 219 The timeframe for each action planed ranged from 2015 to 2018. Source: World Food Programme /Partnership for Child
Development /World Bank: Workshop for Assessing National Capacities in School Feeding in Guinea-Bissau (23-24 July 2015)/ SABER
Action Plan
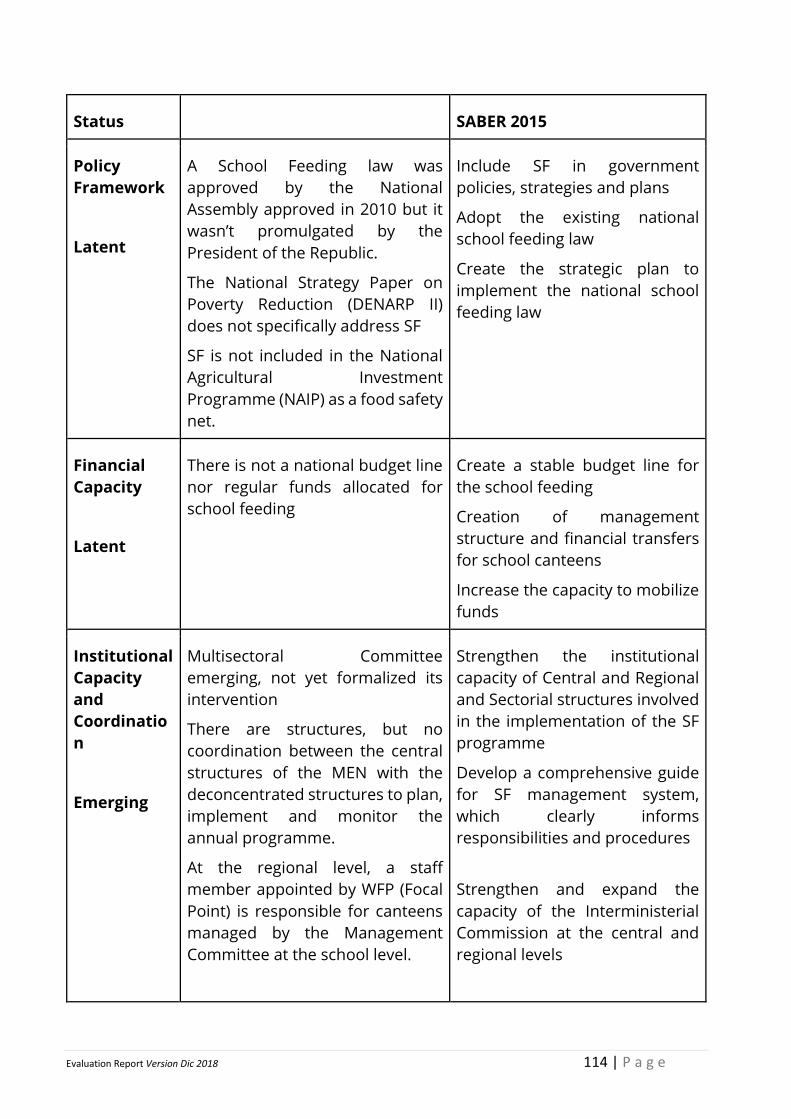
Evaluation Report Version Dic 2018 114 | P a g e
Status SABER 2015
Policy
Framework
Latent
A School Feeding law was
approved by the National
Assembly approved in 2010 but it
wasn’t promulgated by the
President of the Republic.
The National Strategy Paper on
Poverty Reduction (DENARP II)
does not specifically address SF
SF is not included in the National
Agricultural Investment
Programme (NAIP) as a food safety
net.
Include SF in government
policies, strategies and plans
Adopt the existing national
school feeding law
Create the strategic plan to
implement the national school
feeding law
Financial
Capacity
Latent
There is not a national budget line
nor regular funds allocated for
school feeding
Create a stable budget line for
the school feeding
Creation of management
structure and financial transfers
for school canteens
Increase the capacity to mobilize
funds
Institutional
Capacity
and
Coordinatio
n
Emerging
Multisectoral Committee
emerging, not yet formalized its
intervention
There are structures, but no
coordination between the central
structures of the MEN with the
deconcentrated structures to plan,
implement and monitor the
annual programme.
At the regional level, a staff
member appointed by WFP (Focal
Point) is responsible for canteens
managed by the Management
Committee at the school level.
Strengthen the institutional
capacity of Central and Regional
and Sectorial structures involved
in the implementation of the SF
programme
Develop a comprehensive guide
for SF management system,
which clearly informs
responsibilities and procedures
Strengthen and expand the
capacity of the Interministerial
Commission at the central and
regional levels
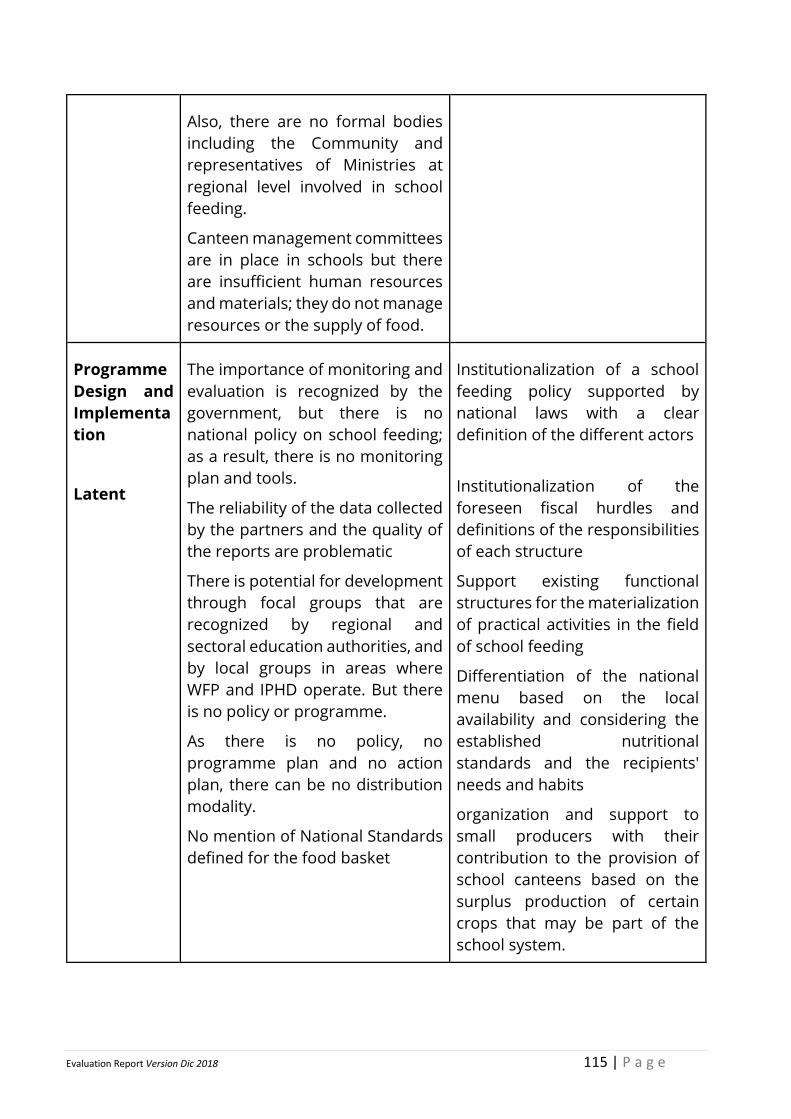
Evaluation Report Version Dic 2018 115 | P a g e
Also, there are no formal bodies
including the Community and
representatives of Ministries at
regional level involved in school
feeding.
Canteen management committees
are in place in schools but there
are insufficient human resources
and materials; they do not manage
resources or the supply of food.
Programme
Design and
Implementa
tion
Latent
The importance of monitoring and
evaluation is recognized by the
government, but there is no
national policy on school feeding;
as a result, there is no monitoring
plan and tools.
The reliability of the data collected
by the partners and the quality of
the reports are problematic
There is potential for development
through focal groups that are
recognized by regional and
sectoral education authorities, and
by local groups in areas where
WFP and IPHD operate. But there
is no policy or programme.
As there is no policy, no
programme plan and no action
plan, there can be no distribution
modality.
No mention of National Standards
defined for the food basket
Institutionalization of a school
feeding policy supported by
national laws with a clear
definition of the different actors
Institutionalization of the
foreseen fiscal hurdles and
definitions of the responsibilities
of each structure
Support existing functional
structures for the materialization
of practical activities in the field
of school feeding
Differentiation of the national
menu based on the local
availability and considering the
established nutritional
standards and the recipients'
needs and habits
organization and support to
small producers with their
contribution to the provision of
school canteens based on the
surplus production of certain
crops that may be part of the
school system.
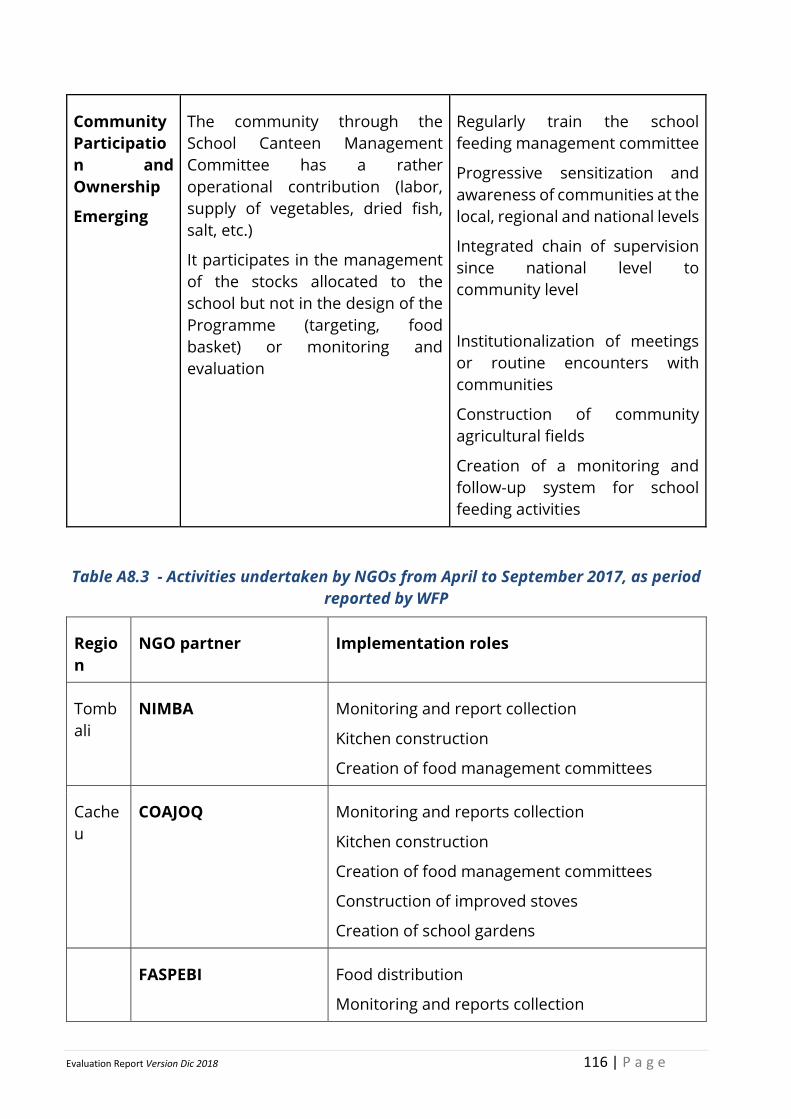
Evaluation Report Version Dic 2018 116 | P a g e
Community
Participatio
n and
Ownership
Emerging
The community through the
School Canteen Management
Committee has a rather
operational contribution (labor,
supply of vegetables, dried fish,
salt, etc.)
It participates in the management
of the stocks allocated to the
school but not in the design of the
Programme (targeting, food
basket) or monitoring and
evaluation
Regularly train the school
feeding management committee
Progressive sensitization and
awareness of communities at the
local, regional and national levels
Integrated chain of supervision
since national level to
community level
Institutionalization of meetings
or routine encounters with
communities
Construction of community
agricultural fields
Creation of a monitoring and
follow-up system for school
feeding activities
Table A8.3 - Activities undertaken by NGOs from April to September 2017, as period
reported by WFP
Regio
n
NGO partner Implementation roles
Tomb
ali
NIMBA Monitoring and report collection
Kitchen construction
Creation of food management committees
Cache
u
COAJOQ Monitoring and reports collection
Kitchen construction
Creation of food management committees
Construction of improved stoves
Creation of school gardens
FASPEBI Food distribution
Monitoring and reports collection
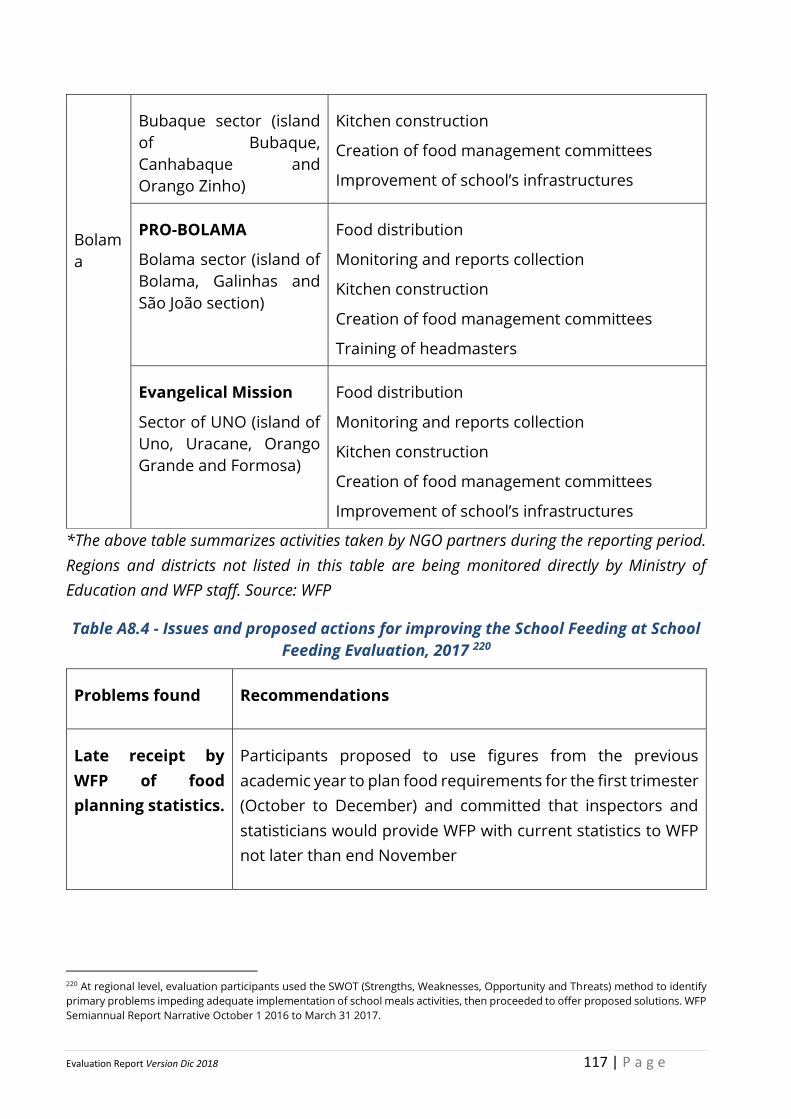
Evaluation Report Version Dic 2018 117 | P a g e
Bolam
a
Bubaque sector (island
of Bubaque,
Canhabaque and
Orango Zinho)
Kitchen construction
Creation of food management committees
Improvement of school’s infrastructures
PRO-BOLAMA
Bolama sector (island of
Bolama, Galinhas and
São João section)
Food distribution
Monitoring and reports collection
Kitchen construction
Creation of food management committees
Training of headmasters
Evangelical Mission
Sector of UNO (island of
Uno, Uracane, Orango
Grande and Formosa)
Food distribution
Monitoring and reports collection
Kitchen construction
Creation of food management committees
Improvement of school’s infrastructures
*The above table summarizes activities taken by NGO partners during the reporting period.
Regions and districts not listed in this table are being monitored directly by Ministry of
Education and WFP staff. Source: WFP
Table A8.4 - Issues and proposed actions for improving the School Feeding at School
Feeding Evaluation, 2017 220
Problems found Recommendations
Late receipt by
WFP of food
planning statistics.
Participants proposed to use figures from the previous
academic year to plan food requirements for the first trimester
(October to December) and committed that inspectors and
statisticians would provide WFP with current statistics to WFP
not later than end November
220 At regional level, evaluation participants used the SWOT (Strengths, Weaknesses, Opportunity and Threats) method to identify
primary problems impeding adequate implementation of school meals activities, then proceeded to offer proposed solutions. WFP
Semiannual Report Narrative October 1 2016 to March 31 2017.
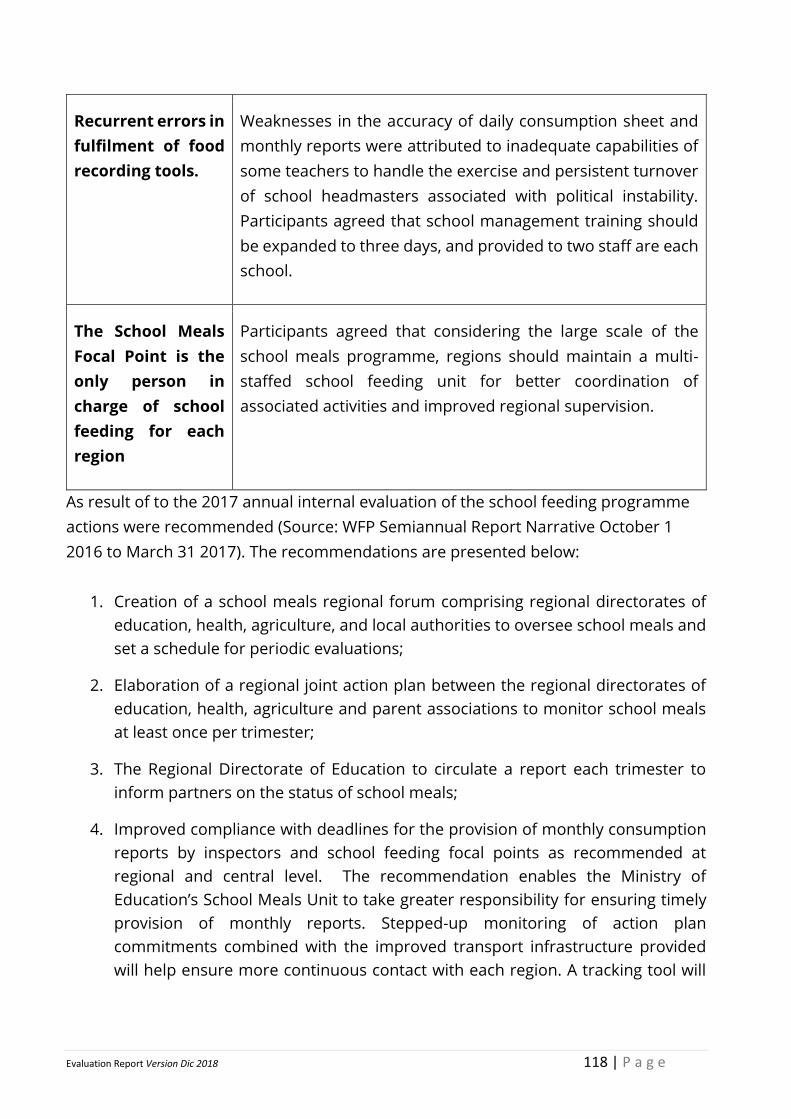
Evaluation Report Version Dic 2018 118 | P a g e
Recurrent errors in
fulfilment of food
recording tools.
Weaknesses in the accuracy of daily consumption sheet and
monthly reports were attributed to inadequate capabilities of
some teachers to handle the exercise and persistent turnover
of school headmasters associated with political instability.
Participants agreed that school management training should
be expanded to three days, and provided to two staff are each
school.
The School Meals
Focal Point is the
only person in
charge of school
feeding for each
region
Participants agreed that considering the large scale of the
school meals programme, regions should maintain a multi-
staffed school feeding unit for better coordination of
associated activities and improved regional supervision.
As result of to the 2017 annual internal evaluation of the school feeding programme
actions were recommended (Source: WFP Semiannual Report Narrative October 1
2016 to March 31 2017). The recommendations are presented below:
1. Creation of a school meals regional forum comprising regional directorates of
education, health, agriculture, and local authorities to oversee school meals and
set a schedule for periodic evaluations;
2. Elaboration of a regional joint action plan between the regional directorates of
education, health, agriculture and parent associations to monitor school meals
at least once per trimester;
3. The Regional Directorate of Education to circulate a report each trimester to
inform partners on the status of school meals;
4. Improved compliance with deadlines for the provision of monthly consumption
reports by inspectors and school feeding focal points as recommended at
regional and central level. The recommendation enables the Ministry of
Education’s School Meals Unit to take greater responsibility for ensuring timely
provision of monthly reports. Stepped-up monitoring of action plan
commitments combined with the improved transport infrastructure provided
will help ensure more continuous contact with each region. A tracking tool will
Evaluation Report Version Dic 2018 119 | P a g e
also be introduced for early detection of lags in reporting by month and by
school; and
5. Continuing sensitisation campaign among communities to promote their more
active participation in management of school meals.
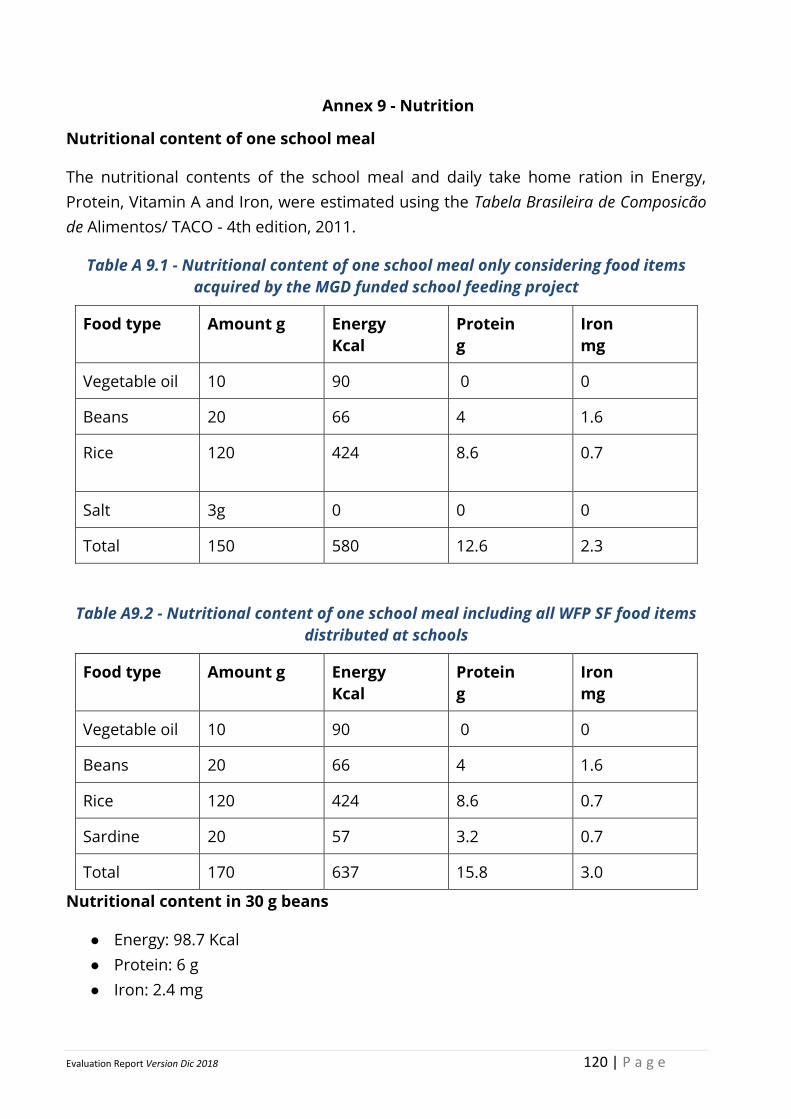
Evaluation Report Version Dic 2018 120 | P a g e
Annex 9 - Nutrition
Nutritional content of one school meal
The nutritional contents of the school meal and daily take home ration in Energy,
Protein, Vitamin A and Iron, were estimated using the Tabela Brasileira de Composicão
de Alimentos/ TACO - 4th edition, 2011.
Table A 9.1 - Nutritional content of one school meal only considering food items
acquired by the MGD funded school feeding project
Food type Amount g Energy
Kcal
Protein
g
Iron
mg
Vegetable oil 10 90 0 0
Beans 20 66 4 1.6
Rice
120 424 8.6 0.7
Salt 3g 0 0 0
Total 150 580 12.6 2.3
Table A9.2 - Nutritional content of one school meal including all WFP SF food items
distributed at schools
Food type Amount g Energy
Kcal
Protein
g
Iron
mg
Vegetable oil 10 90 0 0
Beans 20 66 4 1.6
Rice 120 424 8.6 0.7
Sardine 20 57 3.2 0.7
Total 170 637 15.8 3.0
Nutritional content in 30 g beans
● Energy: 98.7 Kcal
● Protein: 6 g
● Iron: 2.4 mg
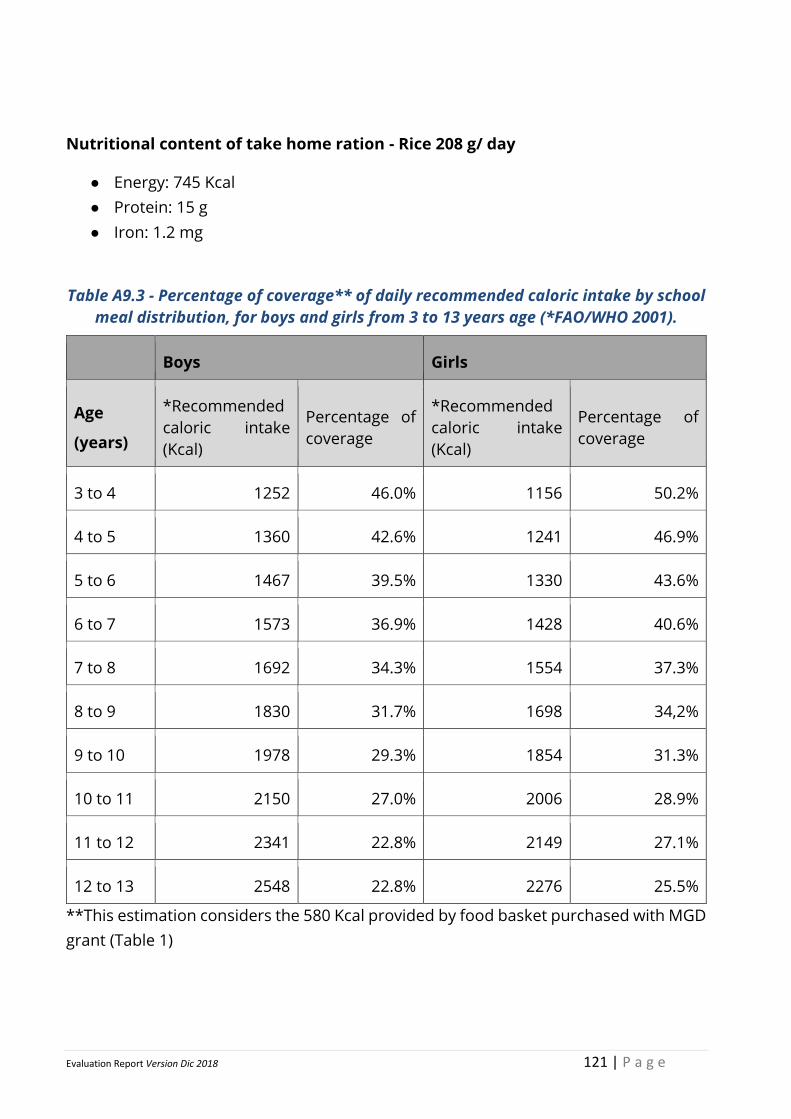
Evaluation Report Version Dic 2018 121 | P a g e
Nutritional content of take home ration - Rice 208 g/ day
● Energy: 745 Kcal
● Protein: 15 g
● Iron: 1.2 mg
Table A9.3 - Percentage of coverage** of daily recommended caloric intake by school
meal distribution, for boys and girls from 3 to 13 years age (*FAO/WHO 2001).
Boys Girls
Age
(years)
*Recommended
caloric intake
(Kcal)
Percentage of
coverage
*Recommended
caloric intake
(Kcal)
Percentage of
coverage
3 to 4 1252 46.0% 1156 50.2%
4 to 5 1360 42.6% 1241 46.9%
5 to 6 1467 39.5% 1330 43.6%
6 to 7 1573 36.9% 1428 40.6%
7 to 8 1692 34.3% 1554 37.3%
8 to 9 1830 31.7% 1698 34,2%
9 to 10 1978 29.3% 1854 31.3%
10 to 11 2150 27.0% 2006 28.9%
11 to 12 2341 22.8% 2149 27.1%
12 to 13 2548 22.8% 2276 25.5%
**This estimation considers the 580 Kcal provided by food basket purchased with MGD
grant (Table 1)
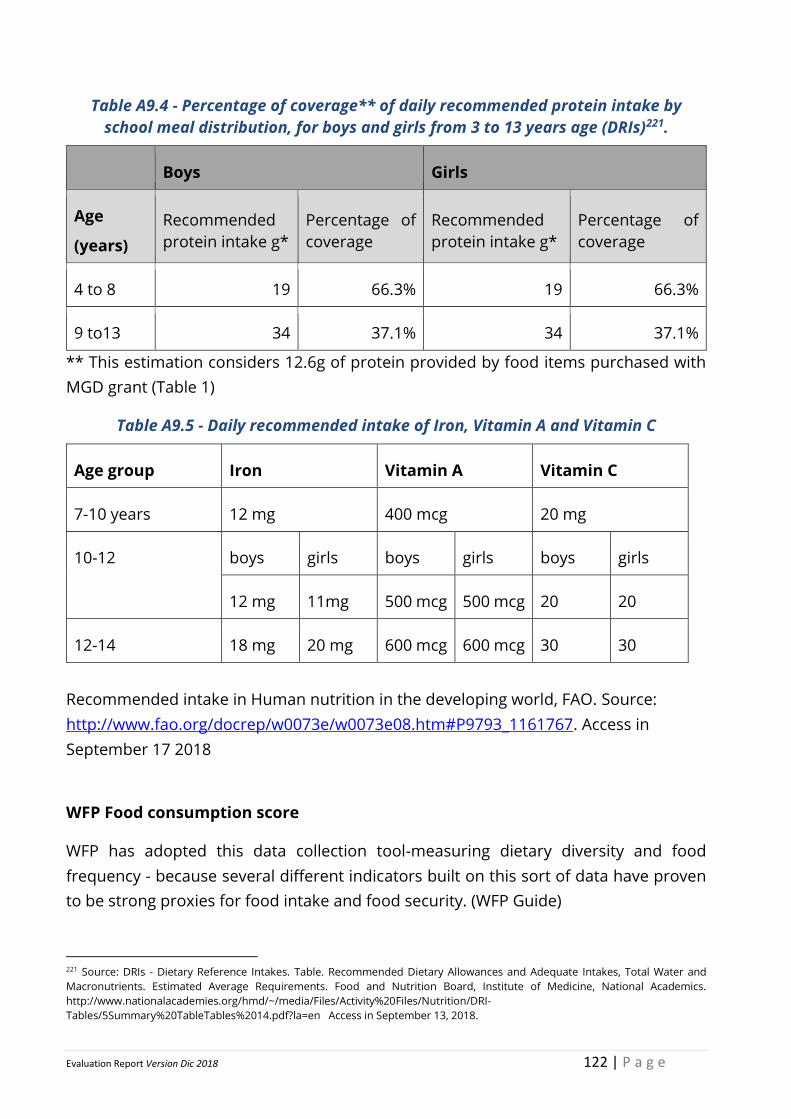
Evaluation Report Version Dic 2018 122 | P a g e
Table A9.4 - Percentage of coverage** of daily recommended protein intake by
school meal distribution, for boys and girls from 3 to 13 years age (DRIs)221.
Boys Girls
Age
(years)
Recommended
protein intake g*
Percentage of
coverage
Recommended
protein intake g*
Percentage of
coverage
4 to 8 19 66.3% 19 66.3%
9 to13 34 37.1% 34 37.1%
** This estimation considers 12.6g of protein provided by food items purchased with
MGD grant (Table 1)
Table A9.5 - Daily recommended intake of Iron, Vitamin A and Vitamin C
Age group Iron Vitamin A Vitamin C
7-10 years 12 mg 400 mcg 20 mg
10-12 boys girls boys girls boys girls
12 mg 11mg 500 mcg 500 mcg 20 20
12-14 18 mg 20 mg 600 mcg 600 mcg 30 30
Recommended intake in Human nutrition in the developing world, FAO. Source:
http://www.fao.org/docrep/w0073e/w0073e08.htm#P9793_1161767. Access in
September 17 2018
WFP Food consumption score
WFP has adopted this data collection tool-measuring dietary diversity and food
frequency - because several different indicators built on this sort of data have proven
to be strong proxies for food intake and food security. (WFP Guide)
221 Source: DRIs - Dietary Reference Intakes. Table. Recommended Dietary Allowances and Adequate Intakes, Total Water and
Macronutrients. Estimated Average Requirements. Food and Nutrition Board, Institute of Medicine, National Academics.
http://www.nationalacademies.org/hmd/~/media/Files/Activity%20Files/Nutrition/DRI-
Tables/5Summary%20TableTables%2014.pdf?la=en Access in September 13, 2018.
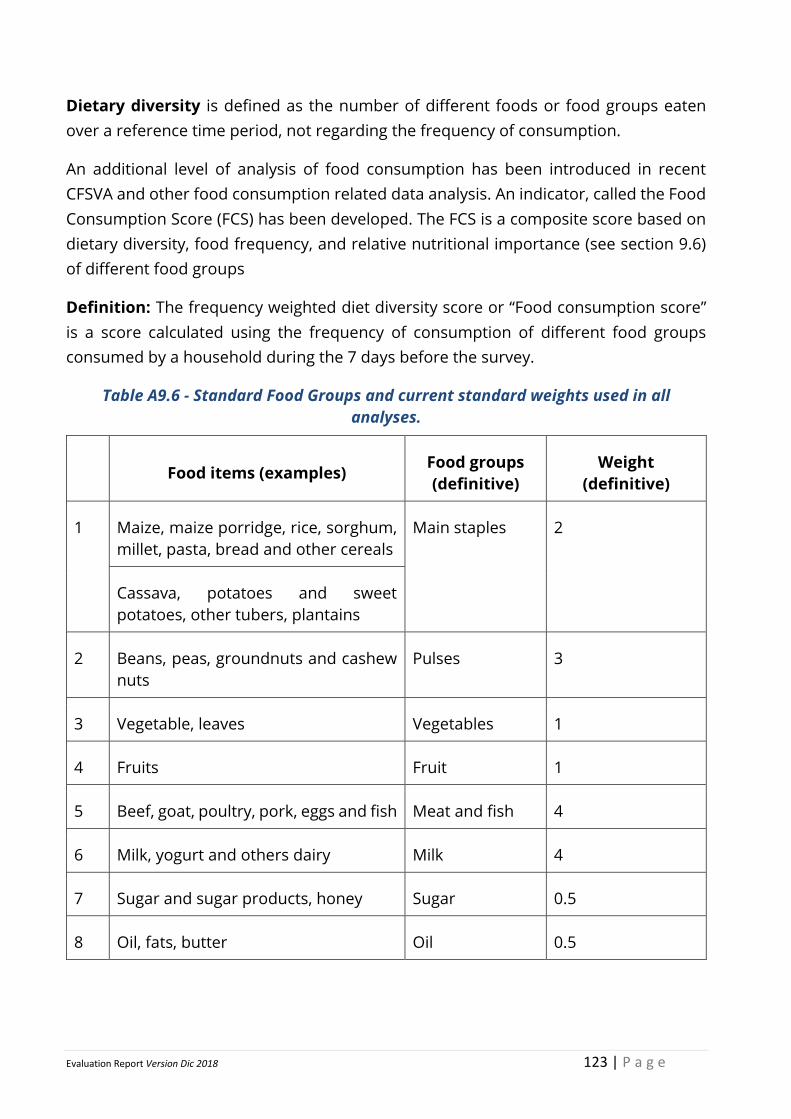
Evaluation Report Version Dic 2018 123 | P a g e
Dietary diversity is defined as the number of different foods or food groups eaten
over a reference time period, not regarding the frequency of consumption.
An additional level of analysis of food consumption has been introduced in recent
CFSVA and other food consumption related data analysis. An indicator, called the Food
Consumption Score (FCS) has been developed. The FCS is a composite score based on
dietary diversity, food frequency, and relative nutritional importance (see section 9.6)
of different food groups
Definition: The frequency weighted diet diversity score or “Food consumption score”
is a score calculated using the frequency of consumption of different food groups
consumed by a household during the 7 days before the survey.
Table A9.6 - Standard Food Groups and current standard weights used in all
analyses.
Food items (examples) Food groups
(definitive)
Weight
(definitive)
1 Maize, maize porridge, rice, sorghum,
millet, pasta, bread and other cereals
Main staples 2
Cassava, potatoes and sweet
potatoes, other tubers, plantains
2 Beans, peas, groundnuts and cashew
nuts
Pulses 3
3 Vegetable, leaves Vegetables 1
4 Fruits Fruit 1
5 Beef, goat, poultry, pork, eggs and fish Meat and fish 4
6 Milk, yogurt and others dairy Milk 4
7 Sugar and sugar products, honey Sugar 0.5
8 Oil, fats, butter Oil 0.5
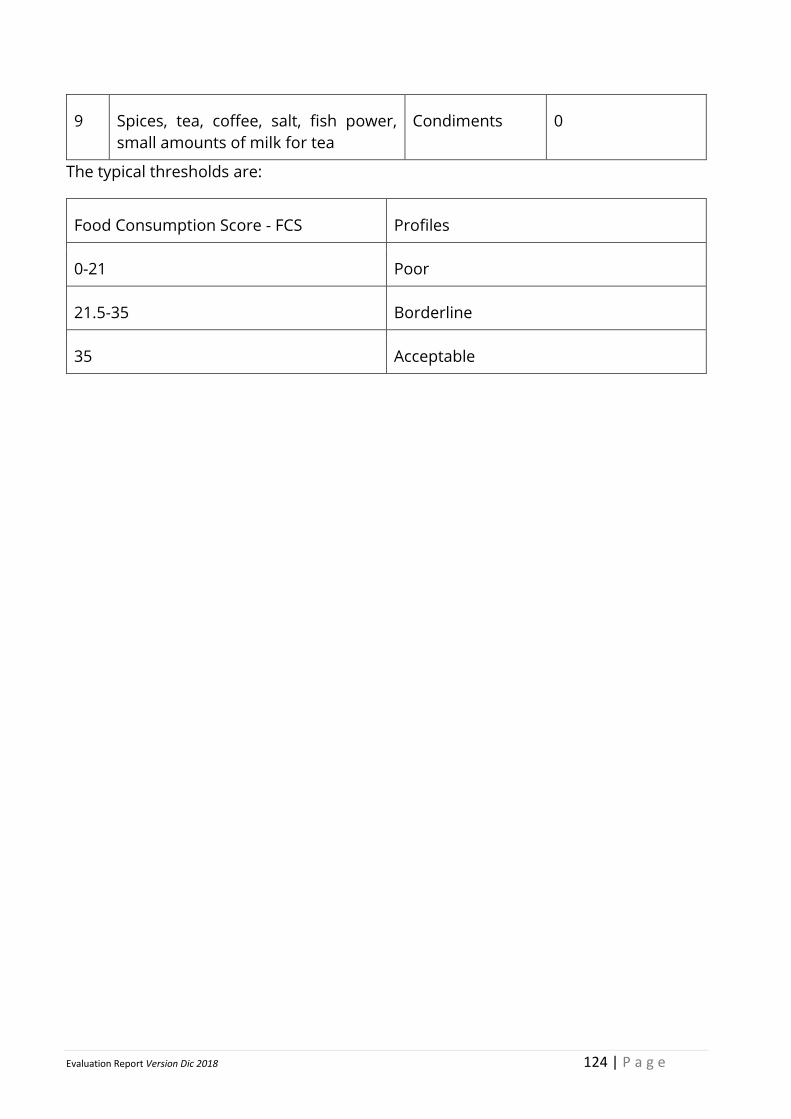
Evaluation Report Version Dic 2018 124 | P a g e
9 Spices, tea, coffee, salt, fish power,
small amounts of milk for tea
Condiments 0
The typical thresholds are:
Food Consumption Score - FCS Profiles
0-21 Poor
21.5-35 Borderline
35 Acceptable
Evaluation Report Version Dic 2018 125 | P a g e
Annex 10 - Terms of Reference
Terms of Reference
Mid-term and Final Evaluations of the McGovern-Dole International Food for
Education and Child Nutrition Program project in Guinea-Bissau
(2016 - 2018)
WFP Guinea-Bissau Country Office
Fig
hti
ng
Hu
ng
er W
orl
dw
ide
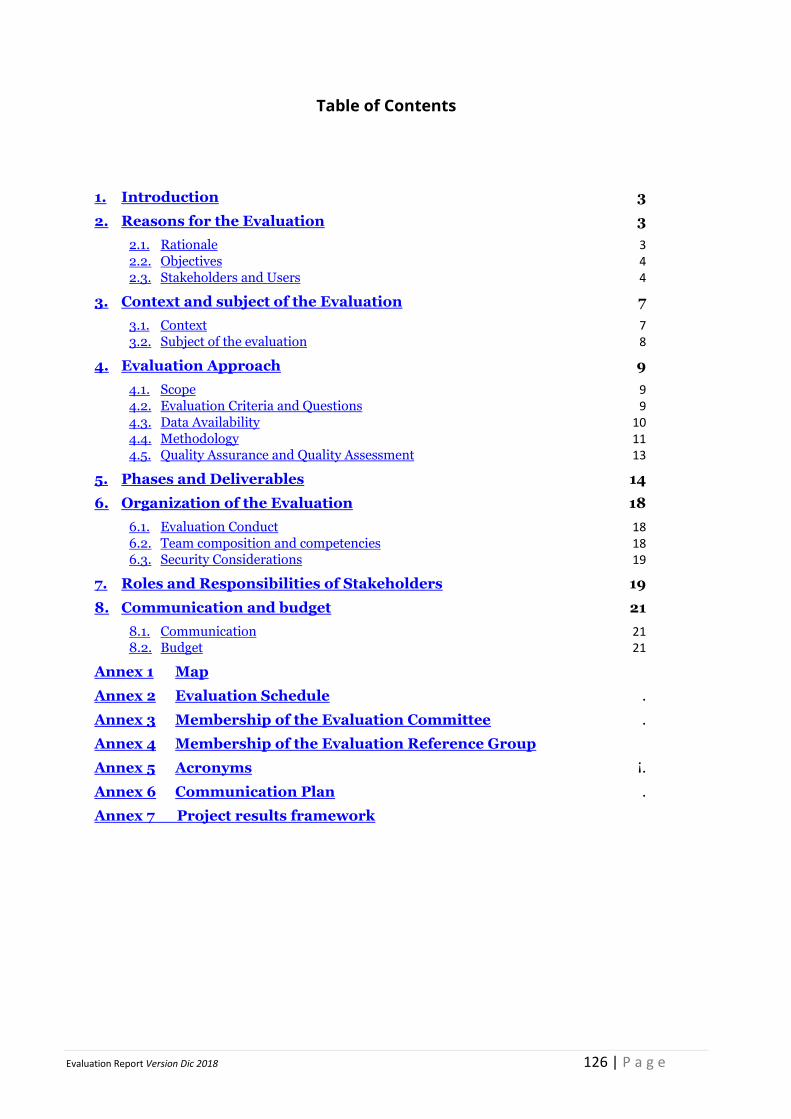
Evaluation Report Version Dic 2018 126 | P a g e
Table of Contents
1. Introduction 3
2. Reasons for the Evaluation 3
2.1. Rationale 3 2.2. Objectives 4 2.3. Stakeholders and Users 4
3. Context and subject of the Evaluation 7
3.1. Context 7 3.2. Subject of the evaluation 8
4. Evaluation Approach 9
4.1. Scope 9 4.2. Evaluation Criteria and Questions 9 4.3. Data Availability 10 4.4. Methodology 11 4.5. Quality Assurance and Quality Assessment 13
5. Phases and Deliverables 14
6. Organization of the Evaluation 18
6.1. Evaluation Conduct 18 6.2. Team composition and competencies 18 6.3. Security Considerations 19
7. Roles and Responsibilities of Stakeholders 19
8. Communication and budget 21
8.1. Communication 21 8.2. Budget 21
Annex 1 Map
Annex 2 Evaluation Schedule .
Annex 3 Membership of the Evaluation Committee .
Annex 4 Membership of the Evaluation Reference Group
Annex 5 Acronyms ¡.
Annex 6 Communication Plan .
Annex 7 Project results framework
Evaluation Report Version Dic 2018 127 | P a g e
1. Introduction
1. These Terms of Reference (TOR) are for the mid-term and final evaluations of the
McGovern-Dole project in Guinea-Bissau. This evaluation is commissioned by WFP
Guinea-Bissau Country Office and will cover the period from August 2017
(preparation phase) to July 2019 (final evaluation report).
2. These TOR were prepared by the Monitoring and Evaluation unit of WFP Guinea-
Bissau Country Office based upon an initial document review and consultation with
stakeholders and following a standard template. The purpose of the TOR is twofold.
Firstly, it provides key information to the evaluation team and helps guide them
throughout the evaluation process; and secondly, it provides key information to
stakeholders about the proposed evaluation. Thirdly, since the McGovern-Dole
agreement (USD $20 million) covers the period from March 2016 to July 2019, the
mid term evaluation results will allow comparison with baseline survey results to
mesure the progress/ achievement in the proposed indicators.
3. The midterm and final evaluation will meet the criteria in the project’s Evaluation
Plan and USDA’s Monitoring and Evaluation Policy222.
4. Currently, 758 schools receive school meals and a total of 173,593 children are fed
every school day. The evaluation will be based on a reperesentative sample of
schools selected from 8 regions of WFP intervention (Oio, Bafata, Gabu, Cacheu,
Quinara , Bolama, Tombali and Biombo).
2. Reasons for the Evaluation
3. The reasons for the evaluation being commissioned are presented below.
2.1. Rationale
4. The evaluations are being commissioned for the following reasons: Since 2016,
WFP and the Government of Guinea-Bissau have been implementing a three-year
McGovern-DoleMcGovern-Dole project in Guinea-Bissau. A baseline study
conducted before the start of the project provided a situational analysis and
allowed WFP to establish indicator baseline information and to verify the targets
established in the Project Agreement. These evaluations will allow WFP to monitor
the progress of the indicators established based on the results of the baseline
study.
5. WFP and its project partners will use the mid-term evaluation results to adjust
course as necessary for the remainder of the project term.
222 https://www.fas.usda.gov/sites/default/files/2014-03/evalpol.pdf

Evaluation Report Version Dic 2018 128 | P a g e
6. WFP will also use the evaluations findings as a platform for an evidence-based
policy dialogue and to inform engagement with the Government of Guinea-Bissau
on the development of the national school feeding program and Monitoring and
Evaluation system. Following SABER undertaken in 2015, WFP and MoE effort has
been oriented to creation of a National School Feeding Programme adopted with
an approved School Feeding Law, national budget line, institutional and
conceptional capacity from Ministry of Education staff to design and implement
the School Feeding Programme with comuinity participation. The evaluations will
look into this aspect to come up with information on progress achieved and
underline new strategies adapted to political context to proceed with creation of
National School Feeding programme.
7. Furthermore, WFP will use the mid-term and final evaluations’ findings to create
awareness among key school feeding stakeholders about project activities that
could be incorporated into Guinea-Bissau’s national school meals program for
nationwide implementation.
8. Findings and recommendations from the mid-term evaluation would inform and
feed into the implementation of the WFP Guinea-Bissau transitional interim
Country Strategic Plan (TI-CSP) (January 2018 - June 2019) and the design of the
fully fledged Country Strategic Plan (CSP), which is planned to start in July 2019;
subsequently, findings and recommendations from the final evaluation would
inform the implementation of the CSP during its first years.
2.2. Objectives
9. Evaluations in WFP serve the dual and mutually reinforcing objectives of
accountability and learning.
● Accountability – The evaluation will assess and report on the performance and
results of the McGovern-Dole school feeding project.
● Learning – The evaluation will determine the reasons why certain results
occurred or not to draw lessons, derive good practices and pointers for learning.
It will provide evidence-based findings to inform operational and strategic
decision-making. Findings will be actively disseminated and lessons will be
incorporated into relevant lesson sharing systems.
2.3. Stakeholders and Users
10. A number of stakeholders both inside and outside of WFP have interests in the
results of the evaluation and some of these will be asked to play a role in the
evaluation process. Table 1 below provides a preliminary stakeholder analysis,
which should be deepened by the evaluation team as part of the Inception phase.
The Stakeholders organized around the “Essential Learning Package”, to improve
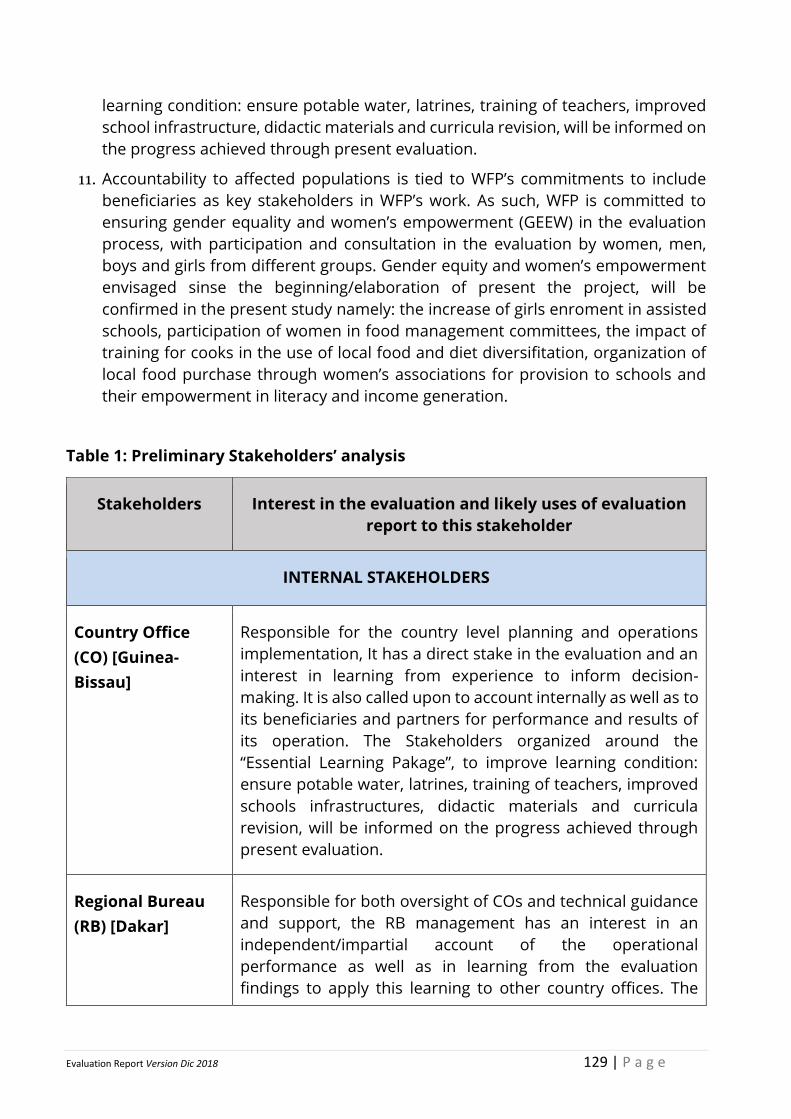
Evaluation Report Version Dic 2018 129 | P a g e
learning condition: ensure potable water, latrines, training of teachers, improved
school infrastructure, didactic materials and curricula revision, will be informed on
the progress achieved through present evaluation.
11. Accountability to affected populations is tied to WFP’s commitments to include
beneficiaries as key stakeholders in WFP’s work. As such, WFP is committed to
ensuring gender equality and women’s empowerment (GEEW) in the evaluation
process, with participation and consultation in the evaluation by women, men,
boys and girls from different groups. Gender equity and women’s empowerment
envisaged sinse the beginning/elaboration of present the project, will be
confirmed in the present study namely: the increase of girls enroment in assisted
schools, participation of women in food management committees, the impact of
training for cooks in the use of local food and diet diversifitation, organization of
local food purchase through women’s associations for provision to schools and
their empowerment in literacy and income generation.
Table 1: Preliminary Stakeholders’ analysis
Stakeholders Interest in the evaluation and likely uses of evaluation
report to this stakeholder
INTERNAL STAKEHOLDERS
Country Office
(CO) [Guinea-
Bissau]
Responsible for the country level planning and operations
implementation, It has a direct stake in the evaluation and an
interest in learning from experience to inform decision-
making. It is also called upon to account internally as well as to
its beneficiaries and partners for performance and results of
its operation. The Stakeholders organized around the
“Essential Learning Pakage”, to improve learning condition:
ensure potable water, latrines, training of teachers, improved
schools infrastructures, didactic materials and curricula
revision, will be informed on the progress achieved through
present evaluation.
Regional Bureau
(RB) [Dakar]
Responsible for both oversight of COs and technical guidance
and support, the RB management has an interest in an
independent/impartial account of the operational
performance as well as in learning from the evaluation
findings to apply this learning to other country offices. The
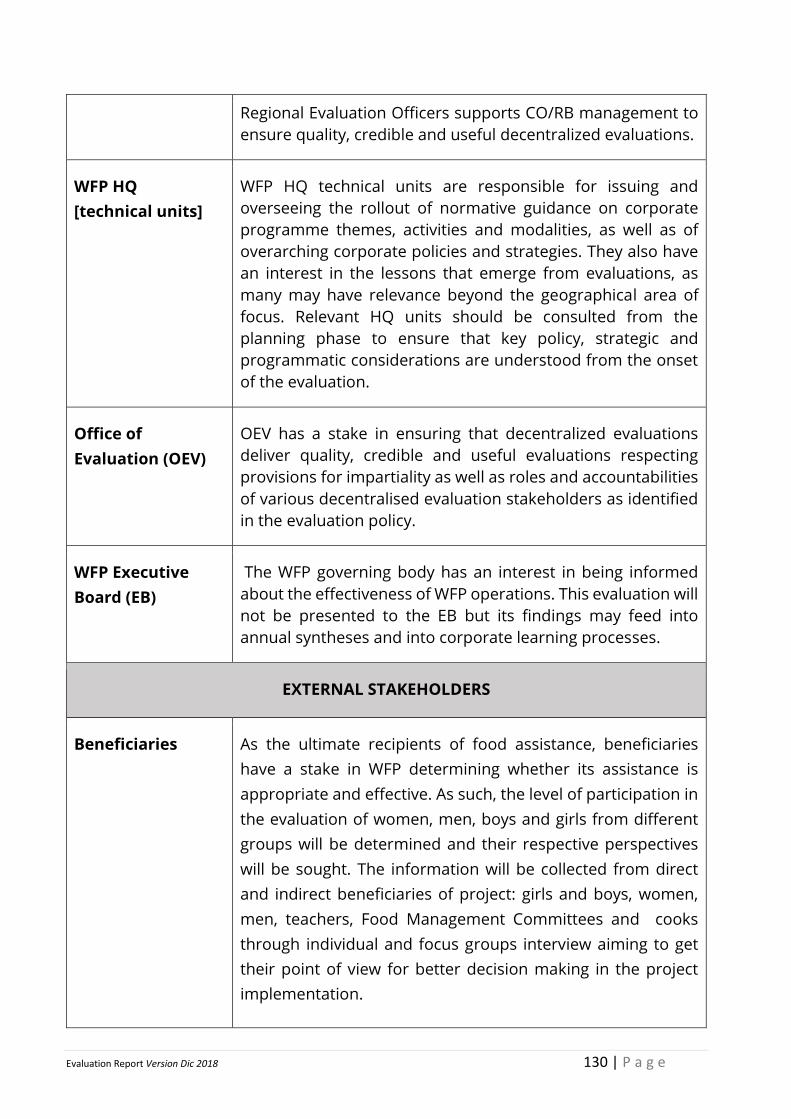
Evaluation Report Version Dic 2018 130 | P a g e
Regional Evaluation Officers supports CO/RB management to
ensure quality, credible and useful decentralized evaluations.
WFP HQ
[technical units]
WFP HQ technical units are responsible for issuing and
overseeing the rollout of normative guidance on corporate
programme themes, activities and modalities, as well as of
overarching corporate policies and strategies. They also have
an interest in the lessons that emerge from evaluations, as
many may have relevance beyond the geographical area of
focus. Relevant HQ units should be consulted from the
planning phase to ensure that key policy, strategic and
programmatic considerations are understood from the onset
of the evaluation.
Office of
Evaluation (OEV)
OEV has a stake in ensuring that decentralized evaluations
deliver quality, credible and useful evaluations respecting
provisions for impartiality as well as roles and accountabilities
of various decentralised evaluation stakeholders as identified
in the evaluation policy.
WFP Executive
Board (EB)
The WFP governing body has an interest in being informed
about the effectiveness of WFP operations. This evaluation will
not be presented to the EB but its findings may feed into
annual syntheses and into corporate learning processes.
EXTERNAL STAKEHOLDERS
Beneficiaries As the ultimate recipients of food assistance, beneficiaries
have a stake in WFP determining whether its assistance is
appropriate and effective. As such, the level of participation in
the evaluation of women, men, boys and girls from different
groups will be determined and their respective perspectives
will be sought. The information will be collected from direct
and indirect beneficiaries of project: girls and boys, women,
men, teachers, Food Management Committees and cooks
through individual and focus groups interview aiming to get
their point of view for better decision making in the project
implementation.
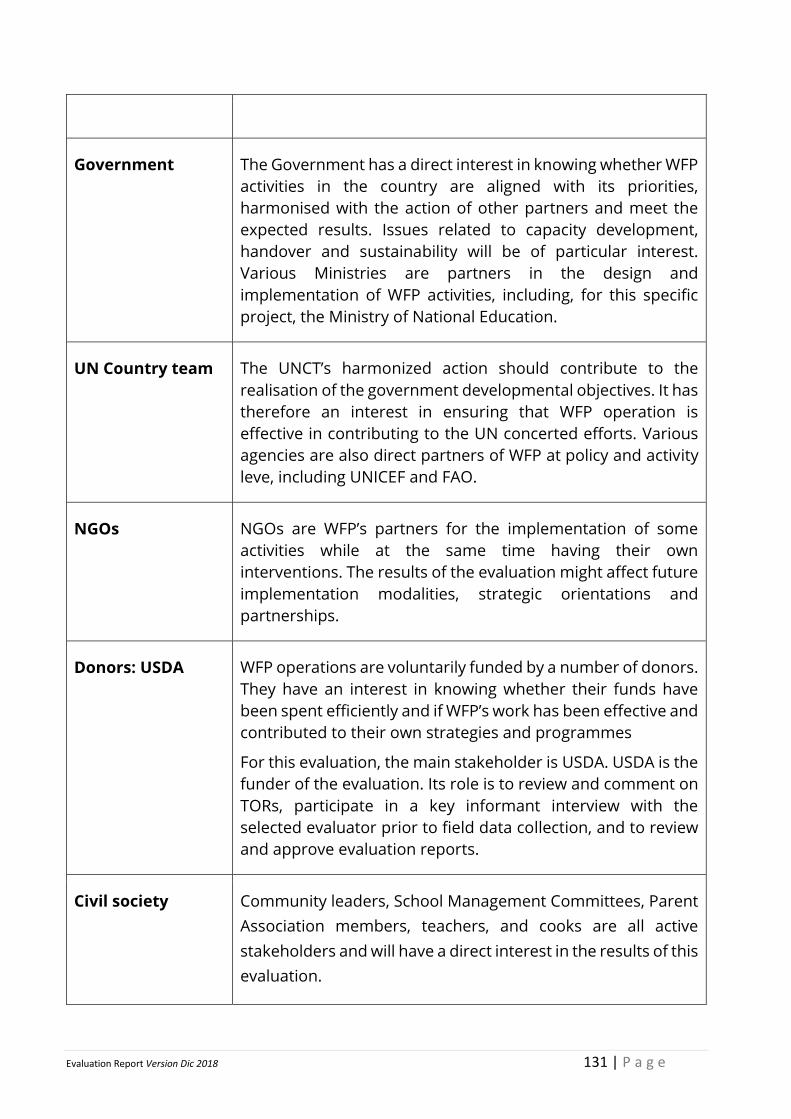
Evaluation Report Version Dic 2018 131 | P a g e
Government The Government has a direct interest in knowing whether WFP
activities in the country are aligned with its priorities,
harmonised with the action of other partners and meet the
expected results. Issues related to capacity development,
handover and sustainability will be of particular interest.
Various Ministries are partners in the design and
implementation of WFP activities, including, for this specific
project, the Ministry of National Education.
UN Country team The UNCT’s harmonized action should contribute to the
realisation of the government developmental objectives. It has
therefore an interest in ensuring that WFP operation is
effective in contributing to the UN concerted efforts. Various
agencies are also direct partners of WFP at policy and activity
leve, including UNICEF and FAO.
NGOs NGOs are WFP’s partners for the implementation of some
activities while at the same time having their own
interventions. The results of the evaluation might affect future
implementation modalities, strategic orientations and
partnerships.
Donors: USDA WFP operations are voluntarily funded by a number of donors.
They have an interest in knowing whether their funds have
been spent efficiently and if WFP’s work has been effective and
contributed to their own strategies and programmes
For this evaluation, the main stakeholder is USDA. USDA is the
funder of the evaluation. Its role is to review and comment on
TORs, participate in a key informant interview with the
selected evaluator prior to field data collection, and to review
and approve evaluation reports.
Civil society Community leaders, School Management Committees, Parent
Association members, teachers, and cooks are all active
stakeholders and will have a direct interest in the results of this
evaluation.
Evaluation Report Version Dic 2018 132 | P a g e
12. The primary users of this evaluation will be:
● The WFP Guinea-Bissau Country Office and its partners in decision-making,
notably related to programme implementation and/or design, Country Strategy
and partnerships. The evaluation should provide an evidence-based,
independent assessment of performance of the school feeding project so that
WFP and its project partners can adjust course as necessary for the remainder
of the project term.
● Given the core functions of the Regional Bureau (RB), the RB is expected to use
the evaluation findings to provide strategic guidance, programme support, and
oversight.
● WFP HQ may use evaluations for wider organizational learning and
accountability.
● OEV may use the evaluation findings, as appropriate, to feed into evaluation
syntheses as well as for annual reporting to the Executive Board.
● USDA will use evaluation findings to inform planning and implementation of
other McGovern-Dole projects.
3. Context and subject of the Evaluation
3.1. Context223
13. Guinea-Bissau is a low-income country with a population of 1.8 million people
(50.3 percent of women and 49.7 percent of men) and national territory of 36,125
square kilometres, located on the West African coast. Three-fifths of Bissau-
Guineans are under 25 and the annual population growth rate is 2.4 percent.1 Due
to persistent political instablity, no elected president has successfully served a full
five-year term since independence from Portugal in 1973. It is ranked 178 out of
188 countries in the 2016 Human Development Index.2
14. Despite significant potential in agriculture and fisheries, gross domestic product
(GDP) grew only 0.4 percent between 2000 and 2014, underperforming the 1.9
percent average of Sub-Saharan African countries during the same period.3 Forty
years of political instability have deeply constrained socio-economic and human
development. Since democratic elections in 2014, five Prime Ministers have been
nominated, four formed new governments, and three were subsequently
dismissed. Each government has brought new ministerial appointments and
changes in the cadre of technical policy makers, necessitating reestablishment of
working relationships.
223 Source: WFP Guinea-Bissau transitional interim Country Strategic Plan (January 2018 – June 2019)
Evaluation Report Version Dic 2018 133 | P a g e
15. Women are more likely to be unemployed and have more difficulty in accessing
social services than men. In some ethnic groups, customary laws deny women
access to land or other resources. Women’s access to bank loans and property
other than land is restricted because men have authority over most family
decision-making. More than two-thirds of the population live below the poverty
line.4 Half the population age 15 and above are illiterate, with large disparities
between men (45 percent) and women (71 percent). Illiteracy among women is
associated with lack of parental interest in education, poverty, distance to schools,
forced marriage and early pregnancy. Due to the gender bias in access to
resources, poverty impacts women more than men. Women are also vulnerable
to forced marriage, early pregnancy, and maternal mortality
16. The primary school completion rate is 62 percent,6 reflecting delayed enrolment,
a 20 percent repetition rate, and high numbers of drop-outs between years 4 and
5, especially among rural girls. This leads to gender disparity from 1.0 in primary
schools – with regional variations – to 0.81 in secondary schools. Among children
of school age, 45 percent are out of school (27 percent boys and 51 percent girls).
Oio, Bafata and Gabu regions have the lowest education indicators. Net
attendance in urban areas is 76 percent in primary schools and 74 percent in
secondary schools, in contrast to rural areas where net attendance is 54 percent
in primary and secondary schools. Disparities in attendance are also
incomerelated. According to UNESCO, despite progress made in increasing access
and reducing gender disparity in primary schools, poor retention rates contribute
to completion rates reaching only 62 percent countrywide and even lower in the
most vulnerable regions targeted by WFP operations.
3.2. Subject of the evaluation
17. The McGovern-Dole project in Guinea-Bissau (January 2016-December 2018) is
using USDA commodities and cash funding, in the total amount of USD 20,000,000.
WFP used this contribution to carry out the following activities: provide school
meals; provide take home rations; train school management committees, parent
associations, Headmasters, and Inspectors; Training: food preparation and
storage practices; build/rehabiltate kitchens and storerooms; provide storage and
food preparation equipment, tools & eating utensils; distribute deworming
medication(s); capacity building: local, regional, and national level; and support
monitoring and evaluation system.
18. WFP aimed to incorporate a strong focus on capacity building and long-term
sustainability by targeting two of McGovern-Dole’s four Foundational Results:
Increased Capacity of Government Institutions and Increased Government
Support. Activities that aim to contribute to these Foundational Results include:
Train Government Staff on Management of a School Feeding Programme in
particular women school directors; Establish and Train Government Staff on
Evaluation Report Version Dic 2018 134 | P a g e
Monitoring and Evaluation System; and Support Government to Develop School
Feeding Pilot Project. The full project results framework in provided in Annex 7.
19. WFP has developed a nutritionally-balanced school meals program. For 2016, daily
hot school meals consisted of 120g of rice, 20g of pulses, 10g of fortified vegetable
oil, 20g of canned fish and 3g of salt. The ration provided about 35 percent of the
daily nutritional food requirements to school children.224 In all targeted schools,
take-home rations of rice (4kg/month) had been provided to girls in grades 4-6
who maintained 80% attendance. Studies conducted in Guinea-Bissau showed
that 70% of girls and women are illiterate and the drop out level among girls is
higher than among boys. Simultaneously, WFP worked to build the capacity of the
Government of Guinea-Bissau and local communities to manage and operate a
nationally-owned school feeding program. WFP leveraged its close partnership
with the Government of Guinea-Bissau and local communities to ensure
successful project implementation. WFP anticipated assisting approximately
145,000 student beneficiaries in FY16, 160,000 in FY17, and 173,000 in FY18. The
project is operating in eight regions of the country: Cacheu, Biombo, Oio, Bafata,
Gabu, Tombali, Quinara, and Boloma-Bijagos.
20. Currently, the McGovern-Dole funded School feeding project is embedded in the
WFP Guinea-Bissau Country Programme 2016-2018 and T-ICSP January 2018 –
June 2019. Additional activities covered by the Country Programme are stunting
prevention, treatment of moderate acute malnutrition (MAM), HIV/TB
care&treatment and Food Assistance for Assets (FFA). Original project document,
resource situation updates and the 2016 standard project report (SPR) of the
Country Programme can be consulted here.
21. As of January 2018, the project will be transitioned to the WFP Gunea-Bissau
Transitional Interim Counry Strategic Plan (TI-CSP) (January 2018-June 2019). The
approved TI-CSP document can be consulted here.
4. Evaluation Approach
4.1. Scope and Purpose
22. The scope of the mid-term and final evaluations is the entirety of activities covered
by the McGovern-Dole project in Guinea-Bissau (2016-2018). The evaluations will
be carried out with sample from all eight targeted geographic regions.
23. Specifically, the midterm evaluation will (1) review the project’s relevance,
effectiveness and efficiency, impact and sustainability; (2) collect performance
indicator data; (3) assess whether the project is on track to meet results and
224 WFP has mobilized sufficient canned fish from Japan to ensure its inclusion in the daily ration throughout 2016. While WFP will
continue to appeal for the provision of fish for 2017 and 2018, at this time it is not guaranteed. Therefore, starting from 2017 the
ration will include a higher quantity of pulses (30g) instead of fish.
Evaluation Report Version Dic 2018 135 | P a g e
targets; (4) review the results frameworks and theory of change; and (5) identify
any necessary mid-course corrections.
24. The final evaluation will, in line with the mid-term evaluation, (1) review the
project’s relevance, effectiveness and efficiency, impact and sustainability and (2)
collect performance indicator data. More specifically it will (3) assess whether or
not the project achieved its expected results; (4) identify lessons learned; (5) assess
project replicability; and (6) assess whether or not midterm evaluation
recommendations were implemented.
25. The evaluations will rely on the Baseline Study for baseline data and situational
analysis necessary to evaluate the project at interim and at the final stage. WFP
envisions that the midterm evaluation will be conducted approximately halfway
through project implementation, from January to June 2018, whereas the final
evaluation will be conducted during the first half of 2019.
4.2. Evaluation Criteria and Questions
26. Evaluation Criteria The evaluation will apply the international evaluation criteria
of relevance, effectiveness and efficiency, impact and sustainability.225 Gender
Equality and empowerment of women should be mainstreamed throughout.
27. Evaluation Questions Allied to the evaluation criteria, the evaluation will address
the following key questions, which will be further developed by the evaluation
team during the inception phase. Collectively, the questions aim at highlighting the
key lessons and performance of the McGovern-Dole funded school feeding
project, which could inform future strategic and operational decisions.
28. Gender equality and women’s empowerment will be mainstreamed throughout
the evaluation questions and sub-questions with consideration of how the
perspectives of men, women, boys and girls will be sought in the evaluation
process. Data collected will require disaggregation by gender as relevant.
29. Key criteria and questions are outlined in Table 2 below. Key evaluation questions
may need to be re-visited for the final evaluation.
Table 2: Criteria and evaluation questions
Criteria Evaluation Questions
Relevance ▪ Is the project’s strategy relevant to the beneficiaries’ needs?
▪ Is the project aligned with national government’s education and
school feeding policies and strategies?
▪ Does the project complement other donor-funded and
government initiatives?
225 For more detail see: http://www.oecd.org/dac/evaluation/daccriteriaforevaluatingdevelopmentassistance.htm and
http://www.alnap.org/what-we-do/evaluation/eha
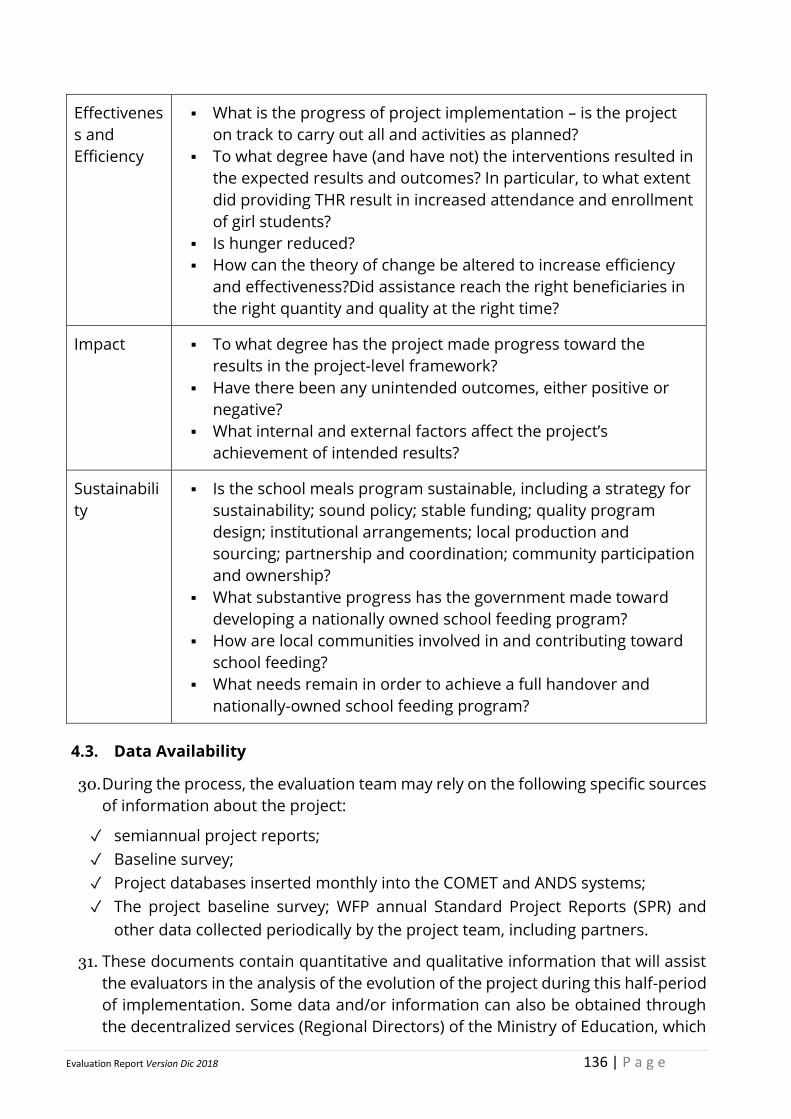
Evaluation Report Version Dic 2018 136 | P a g e
Effectivenes
s and
Efficiency
▪ What is the progress of project implementation – is the project
on track to carry out all and activities as planned?
▪ To what degree have (and have not) the interventions resulted in
the expected results and outcomes? In particular, to what extent
did providing THR result in increased attendance and enrollment
of girl students?
▪ Is hunger reduced?
▪ How can the theory of change be altered to increase efficiency
and effectiveness?Did assistance reach the right beneficiaries in
the right quantity and quality at the right time?
Impact
▪ To what degree has the project made progress toward the
results in the project-level framework?
▪ Have there been any unintended outcomes, either positive or
negative?
▪ What internal and external factors affect the project’s
achievement of intended results?
Sustainabili
ty
▪ Is the school meals program sustainable, including a strategy for
sustainability; sound policy; stable funding; quality program
design; institutional arrangements; local production and
sourcing; partnership and coordination; community participation
and ownership?
▪ What substantive progress has the government made toward
developing a nationally owned school feeding program?
▪ How are local communities involved in and contributing toward
school feeding?
▪ What needs remain in order to achieve a full handover and
nationally-owned school feeding program?
4.3. Data Availability
30. During the process, the evaluation team may rely on the following specific sources
of information about the project:
✓ semiannual project reports;
✓ Baseline survey;
✓ Project databases inserted monthly into the COMET and ANDS systems;
✓ The project baseline survey; WFP annual Standard Project Reports (SPR) and
other data collected periodically by the project team, including partners.
31. These documents contain quantitative and qualitative information that will assist
the evaluators in the analysis of the evolution of the project during this half-period
of implementation. Some data and/or information can also be obtained through
the decentralized services (Regional Directors) of the Ministry of Education, which
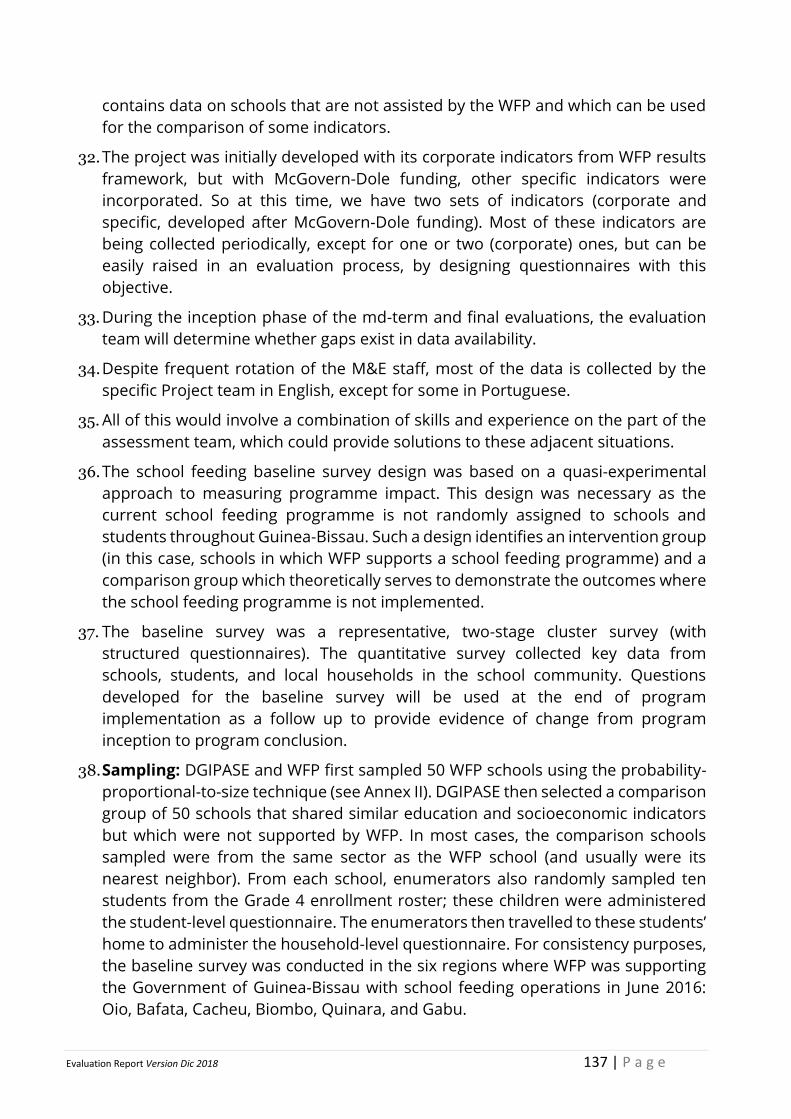
Evaluation Report Version Dic 2018 137 | P a g e
contains data on schools that are not assisted by the WFP and which can be used
for the comparison of some indicators.
32. The project was initially developed with its corporate indicators from WFP results
framework, but with McGovern-Dole funding, other specific indicators were
incorporated. So at this time, we have two sets of indicators (corporate and
specific, developed after McGovern-Dole funding). Most of these indicators are
being collected periodically, except for one or two (corporate) ones, but can be
easily raised in an evaluation process, by designing questionnaires with this
objective.
33. During the inception phase of the md-term and final evaluations, the evaluation
team will determine whether gaps exist in data availability.
34. Despite frequent rotation of the M&E staff, most of the data is collected by the
specific Project team in English, except for some in Portuguese.
35. All of this would involve a combination of skills and experience on the part of the
assessment team, which could provide solutions to these adjacent situations.
36. The school feeding baseline survey design was based on a quasi-experimental
approach to measuring programme impact. This design was necessary as the
current school feeding programme is not randomly assigned to schools and
students throughout Guinea-Bissau. Such a design identifies an intervention group
(in this case, schools in which WFP supports a school feeding programme) and a
comparison group which theoretically serves to demonstrate the outcomes where
the school feeding programme is not implemented.
37. The baseline survey was a representative, two-stage cluster survey (with
structured questionnaires). The quantitative survey collected key data from
schools, students, and local households in the school community. Questions
developed for the baseline survey will be used at the end of program
implementation as a follow up to provide evidence of change from program
inception to program conclusion.
38. Sampling: DGIPASE and WFP first sampled 50 WFP schools using the probability-
proportional-to-size technique (see Annex II). DGIPASE then selected a comparison
group of 50 schools that shared similar education and socioeconomic indicators
but which were not supported by WFP. In most cases, the comparison schools
sampled were from the same sector as the WFP school (and usually were its
nearest neighbor). From each school, enumerators also randomly sampled ten
students from the Grade 4 enrollment roster; these children were administered
the student-level questionnaire. The enumerators then travelled to these students’
home to administer the household-level questionnaire. For consistency purposes,
the baseline survey was conducted in the six regions where WFP was supporting
the Government of Guinea-Bissau with school feeding operations in June 2016:
Oio, Bafata, Cacheu, Biombo, Quinara, and Gabu.
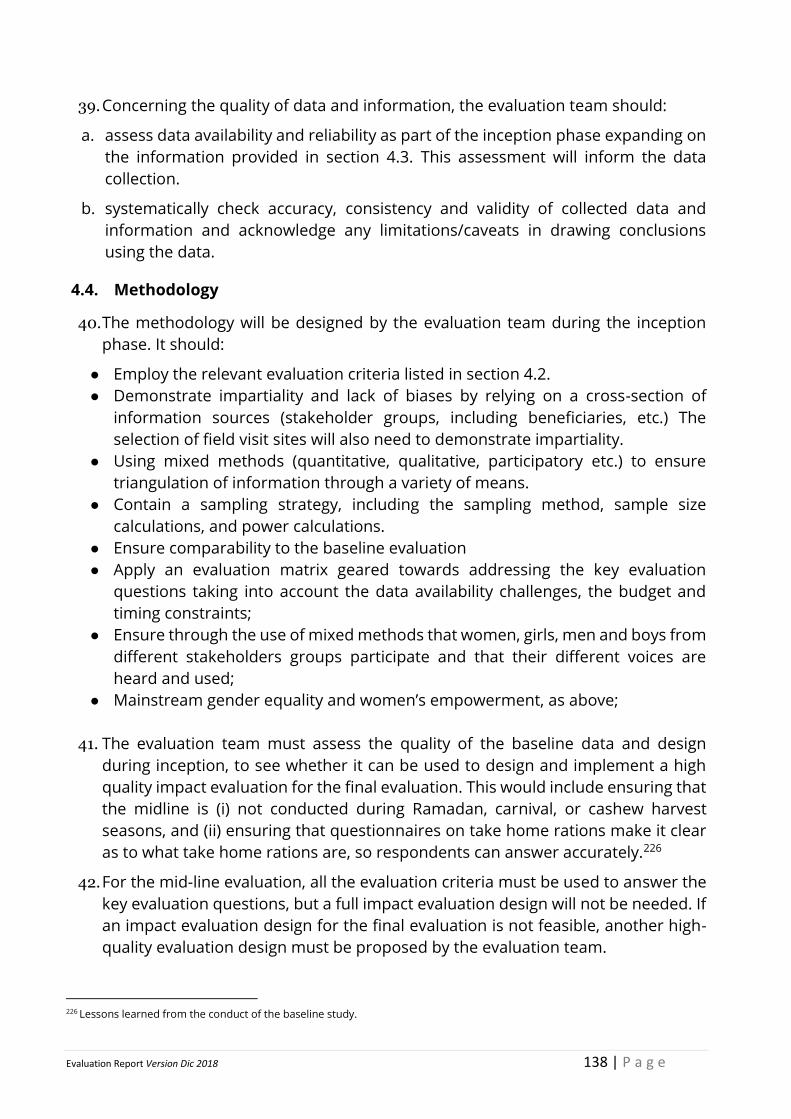
Evaluation Report Version Dic 2018 138 | P a g e
39. Concerning the quality of data and information, the evaluation team should:
a. assess data availability and reliability as part of the inception phase expanding on
the information provided in section 4.3. This assessment will inform the data
collection.
b. systematically check accuracy, consistency and validity of collected data and
information and acknowledge any limitations/caveats in drawing conclusions
using the data.
4.4. Methodology
40. The methodology will be designed by the evaluation team during the inception
phase. It should:
● Employ the relevant evaluation criteria listed in section 4.2.
● Demonstrate impartiality and lack of biases by relying on a cross-section of
information sources (stakeholder groups, including beneficiaries, etc.) The
selection of field visit sites will also need to demonstrate impartiality.
● Using mixed methods (quantitative, qualitative, participatory etc.) to ensure
triangulation of information through a variety of means.
● Contain a sampling strategy, including the sampling method, sample size
calculations, and power calculations.
● Ensure comparability to the baseline evaluation
● Apply an evaluation matrix geared towards addressing the key evaluation
questions taking into account the data availability challenges, the budget and
timing constraints;
● Ensure through the use of mixed methods that women, girls, men and boys from
different stakeholders groups participate and that their different voices are
heard and used;
● Mainstream gender equality and women’s empowerment, as above;
41. The evaluation team must assess the quality of the baseline data and design
during inception, to see whether it can be used to design and implement a high
quality impact evaluation for the final evaluation. This would include ensuring that
the midline is (i) not conducted during Ramadan, carnival, or cashew harvest
seasons, and (ii) ensuring that questionnaires on take home rations make it clear
as to what take home rations are, so respondents can answer accurately.226
42. For the mid-line evaluation, all the evaluation criteria must be used to answer the
key evaluation questions, but a full impact evaluation design will not be needed. If
an impact evaluation design for the final evaluation is not feasible, another high-
quality evaluation design must be proposed by the evaluation team.
226 Lessons learned from the conduct of the baseline study.
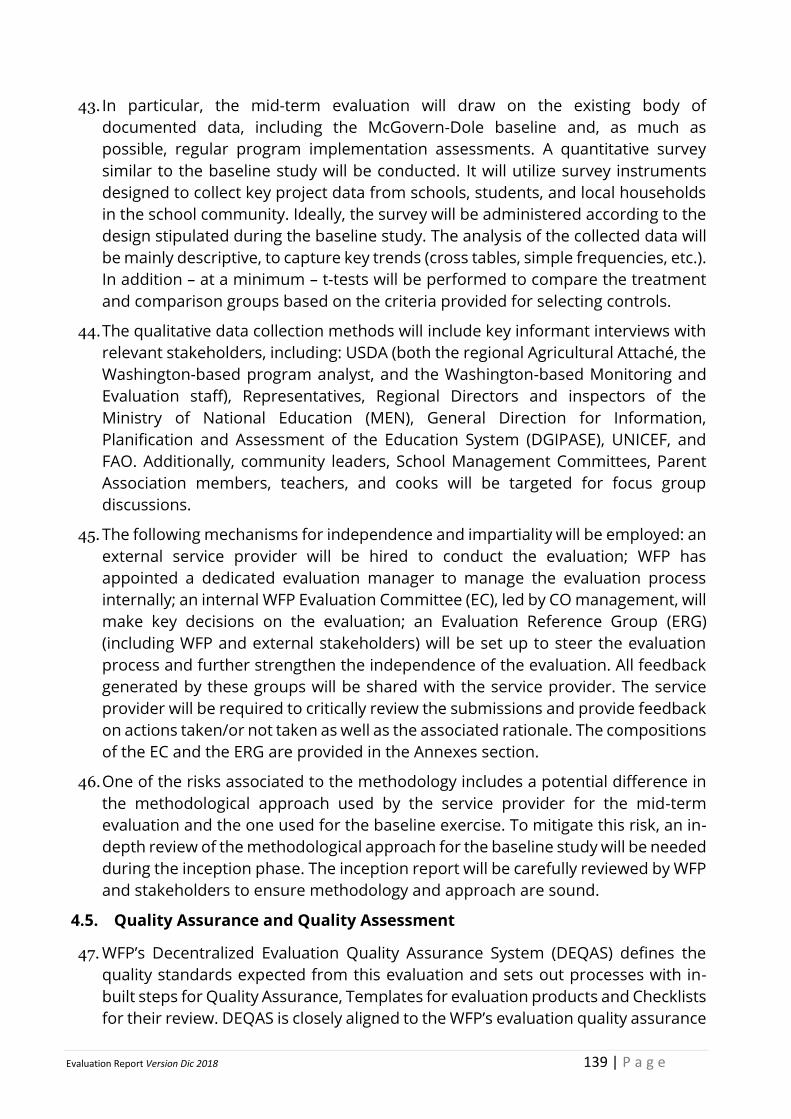
Evaluation Report Version Dic 2018 139 | P a g e
43. In particular, the mid-term evaluation will draw on the existing body of
documented data, including the McGovern-Dole baseline and, as much as
possible, regular program implementation assessments. A quantitative survey
similar to the baseline study will be conducted. It will utilize survey instruments
designed to collect key project data from schools, students, and local households
in the school community. Ideally, the survey will be administered according to the
design stipulated during the baseline study. The analysis of the collected data will
be mainly descriptive, to capture key trends (cross tables, simple frequencies, etc.).
In addition – at a minimum – t-tests will be performed to compare the treatment
and comparison groups based on the criteria provided for selecting controls.
44. The qualitative data collection methods will include key informant interviews with
relevant stakeholders, including: USDA (both the regional Agricultural Attaché, the
Washington-based program analyst, and the Washington-based Monitoring and
Evaluation staff), Representatives, Regional Directors and inspectors of the
Ministry of National Education (MEN), General Direction for Information,
Planification and Assessment of the Education System (DGIPASE), UNICEF, and
FAO. Additionally, community leaders, School Management Committees, Parent
Association members, teachers, and cooks will be targeted for focus group
discussions.
45. The following mechanisms for independence and impartiality will be employed: an
external service provider will be hired to conduct the evaluation; WFP has
appointed a dedicated evaluation manager to manage the evaluation process
internally; an internal WFP Evaluation Committee (EC), led by CO management, will
make key decisions on the evaluation; an Evaluation Reference Group (ERG)
(including WFP and external stakeholders) will be set up to steer the evaluation
process and further strengthen the independence of the evaluation. All feedback
generated by these groups will be shared with the service provider. The service
provider will be required to critically review the submissions and provide feedback
on actions taken/or not taken as well as the associated rationale. The compositions
of the EC and the ERG are provided in the Annexes section.
46. One of the risks associated to the methodology includes a potential difference in
the methodological approach used by the service provider for the mid-term
evaluation and the one used for the baseline exercise. To mitigate this risk, an in-
depth review of the methodological approach for the baseline study will be needed
during the inception phase. The inception report will be carefully reviewed by WFP
and stakeholders to ensure methodology and approach are sound.
4.5. Quality Assurance and Quality Assessment
47. WFP’s Decentralized Evaluation Quality Assurance System (DEQAS) defines the
quality standards expected from this evaluation and sets out processes with in-
built steps for Quality Assurance, Templates for evaluation products and Checklists
for their review. DEQAS is closely aligned to the WFP’s evaluation quality assurance
Evaluation Report Version Dic 2018 140 | P a g e
system (EQAS) and is based on the UNEG norms and standards and good practice
of the international evaluation community and aims to ensure that the evaluation
process and products conform to best practice.
48. DEQAS will be systematically applied to this evaluation. The WFP Evaluation
Manager will be responsible for ensuring that the evaluation progresses as per the
DEQAS Process Guide and for conducting a rigorous quality control of the
evaluation products ahead of their finalization.
49. In particular, the DEQAS is also consistent with the principles and criteria outlined
in the USDA’s Food Assistance Division’s Monitoring & Evaluation Policy. The
evaluation team will make arrangements to ensure data used in the evaluation
report is checked for accuracy and reliability, and the report will clearly indicate
limitations to the conclusions that can be drawn from the evidence.
50. WFP has developed a set of Quality Assurance Checklists for its decentralized
evaluations. This includes Checklists for feedback on quality for each of the
evaluation products. The relevant Checklist will be applied at each stage, to ensure
the quality of the evaluation process and outputs.
51. To enhance the quality and credibility of this evaluation, an outsourced quality
support (QS) service directly managed by WFP’s Office of Evaluation in
Headquarters provides review of the draft inception and evaluation report (in
addition to the same provided on draft TOR), and provide:
a. systematic feedback from an evaluation perspective, on the quality of the draft
inception and evaluation report;
b. recommendations on how to improve the quality of the final
inception/evaluation report.
52. The evaluation manager will review the feedback and recommendations from QS
and share with the team leader, who is expected to use them to finalise the
inception/ evaluation report. To ensure transparency and credibility of the process
in line with the UNEG norms and standards227[1], a rationale should be provided
for any recommendations that the team does not consider when finalising the
report.
53. This quality assurance process as outline above does not interfere with the views
and independence of the evaluation team, but ensures the report provides the
necessary evidence in a clear and convincing way and draws its conclusions on
that basis.
54. The evaluation team will be required to ensure the quality of data (validity,
consistency and accuracy) throughout the analytical and reporting phases. The
evaluation team should be assured of the accessibility of all relevant
227[1] UNEG Norm #7 states “that transparency is an essential element that establishes trust and builds confidence, enhances
stakeholder ownership and increases public accountability”
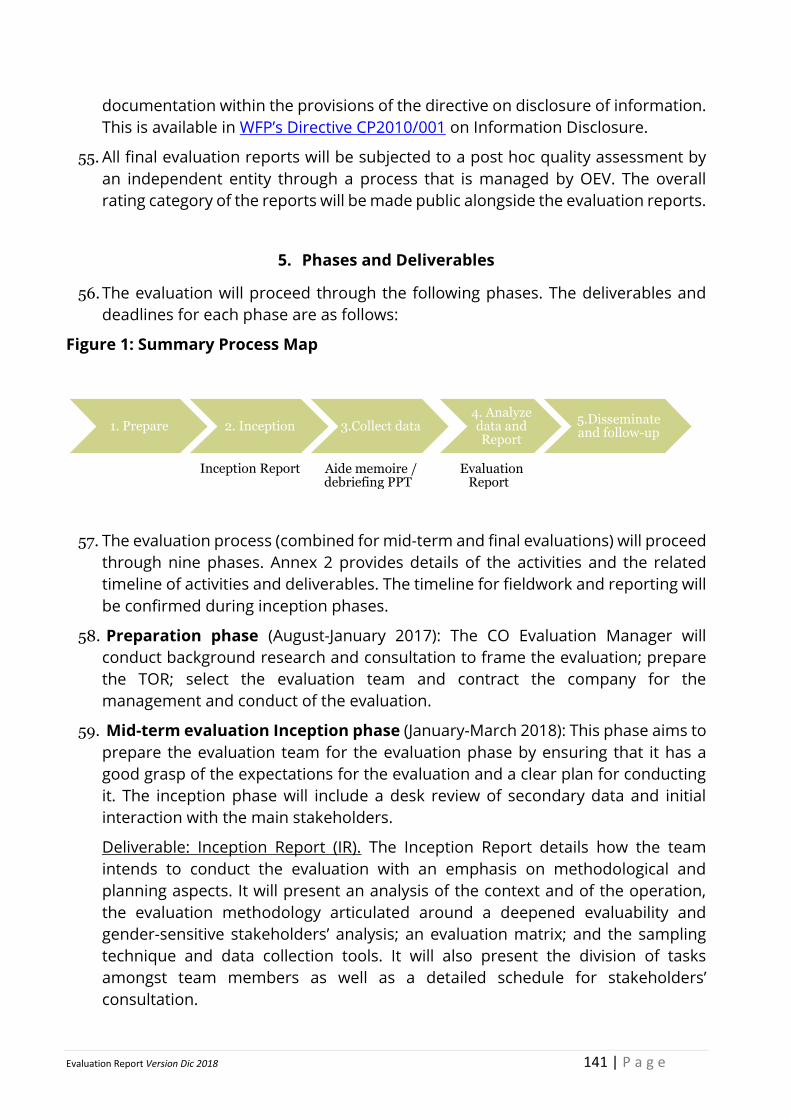
Evaluation Report Version Dic 2018 141 | P a g e
documentation within the provisions of the directive on disclosure of information.
This is available in WFP’s Directive CP2010/001 on Information Disclosure.
55. All final evaluation reports will be subjected to a post hoc quality assessment by
an independent entity through a process that is managed by OEV. The overall
rating category of the reports will be made public alongside the evaluation reports.
5. Phases and Deliverables
56. The evaluation will proceed through the following phases. The deliverables and
deadlines for each phase are as follows:
Figure 1: Summary Process Map
57. The evaluation process (combined for mid-term and final evaluations) will proceed
through nine phases. Annex 2 provides details of the activities and the related
timeline of activities and deliverables. The timeline for fieldwork and reporting will
be confirmed during inception phases.
58. Preparation phase (August-January 2017): The CO Evaluation Manager will
conduct background research and consultation to frame the evaluation; prepare
the TOR; select the evaluation team and contract the company for the
management and conduct of the evaluation.
59. Mid-term evaluation Inception phase (January-March 2018): This phase aims to
prepare the evaluation team for the evaluation phase by ensuring that it has a
good grasp of the expectations for the evaluation and a clear plan for conducting
it. The inception phase will include a desk review of secondary data and initial
interaction with the main stakeholders.
Deliverable: Inception Report (IR). The Inception Report details how the team
intends to conduct the evaluation with an emphasis on methodological and
planning aspects. It will present an analysis of the context and of the operation,
the evaluation methodology articulated around a deepened evaluability and
gender-sensitive stakeholders’ analysis; an evaluation matrix; and the sampling
technique and data collection tools. It will also present the division of tasks
amongst team members as well as a detailed schedule for stakeholders’
consultation.
1. Prepare
2. Inception
Inception Report
3.Collect data
Aide memoire / debriefing PPT
4. Analyze data and Report
Evaluation
Report
5.Disseminate and follow-up
Evaluation Report Version Dic 2018 142 | P a g e
The draft IR will be submitted to the QS service for comments; a revised version
will then be shared with the Evaluation Reference Group for comments before
being submitted to the Evaluation Committee for approval. Stakeholders’
comments will be recorded in a matrix by the evaluation manager and provided
to the evaluation team for their consideration before finalisation of the IR. For
more details, refer to the content guide for the IR.
60. Mid-term Evaluation Data Collection phase (April-May 2018): The fieldwork
will span over one month and will include visits to schools and primary and
secondary data collection from local stakeholders. Two debriefing sessions will be
held upon completion of the field work. The first one will involve the Country Office
(relevant RB and HQ colleagues will be invited to participate through a
teleconference) and the second one will be held with external stakeholders. Data
collection needs to be completed before Ramadan starts (May 15, 2018).
Deliverable: Exit debriefing presentation. An exit debriefing presentation of
preliminary findings and conclusions (PowerPoint presentation) will be prepared
to support the de-briefings.
61. Mid-term Evaluation Reporting phase (May-July 2018): The evaluation team will
analyse the data collected during the desk review and the field work, conduct
additional consultations with stakeholders, as required, and draft the evaluation
report. It will be submitted to the evaluation manager for quality assurance.
Deliverable: Evaluation report (ER). The evaluation report will present the findings,
conclusions and recommendations of the evaluation in a concise report of 40
pages maximum, not including annexes. Findings should be evidence-based and
relevant to the evaluation questions. Data will be disaggregated by sex and the
evaluation findings and conclusions will highlight differences in performance and
results of the operation for different beneficiary groups as appropriate. There
should be a logical flow from findings to conclusions and from conclusions to
recommendations. Recommendations will be limited in number, actionable and
targeted to the relevant users. These will form the basis of the WFP management
response to the evaluation.
The draft ER will be submitted to the QS service for comments; a revised version
will then be shared with the Evaluation Reference Group for comments before
being submitted to the Evaluation Committee for approval. Stakeholders’
comments will be recorded in a matrix by the evaluation manager and provided
to the evaluation team for their consideration before finalisation of the ER. The
draft ER must be submitted to USDA within 60 days of fieldwork completion. For
more details, refer to the content guide for the ER.
62. Mid-term Evaluation Follow-up and dissemination phase (from August 2018):
The CO management will respond to the evaluation recommendations by
providing actions that will be taken to address each recommendation and
Evaluation Report Version Dic 2018 143 | P a g e
estimated timelines for taking those actions. The RB will support WFP’s
management response to the evaluation as appropriate, including following up
with country offices on status of implementation of the actions. OEV will also
subject the evaluation report to an external post-hoc quality assessment to report
independently on the quality, credibility and utility of the evaluation in line with
evaluation norms and standards. The final evaluation report will be published on
the WFP public website. Findings will be disseminated, and lessons will be
incorporated into other relevant lesson sharing systems.
63. Final evaluation Inception phase (January-March, 2019): This phase aims to
prepare the evaluation team for the evaluation phase by ensuring that it has a
good grasp of the expectations for the evaluation and a clear plan for conducting
it. The inception phase will include a desk review of secondary data and initial
interaction with the main stakeholders.
Deliverable: Inception Report (IR). The Inception Report details how the team
intends to conduct the evaluation with an emphasis on methodological and
planning aspects. It will present an analysis of the context and of the operation,
the evaluation methodology articulated around a deepened evaluability and
gender-sensitive stakeholders’ analysis; an evaluation matrix; and the sampling
technique and data collection tools. It will also present the division of tasks
amongst team members as well as a detailed schedule for stakeholders’
consultation.
The draft IR will be submitted to the QS service for comments; a revised version
will then be shared with the Evaluation Reference Group for comments before
being submitted to the Evaluation Committee for approval. Stakeholders’
comments will be recorded in a matrix by the evaluation manager and provided
to the evaluation team for their consideration before finalisation of the IR. For
more details, refer to the content guide for the IR.
64. Final Evaluation Data Collection phase (March-April 2019): The fieldwork will
span over one month and will include visits to project sites (schools) and primary
and secondary data collection from local stakeholders. Two debriefing sessions
will be held upon completion of the field work. The first one will involve the Country
Office (relevant RB and HQ colleagues will be invited to participate through a
teleconference) and the second one will be held with external stakeholders. Data
collection needs to be completed before Ramadan starts (May 5, 2019).
Deliverable: Exit debriefing presentation. An exit debriefing presentation of
preliminary findings and conclusions (PowerPoint presentation) will be prepared
to support the de-briefings.
65. Final Evaluation Reporting phase (May-July 2019): The evaluation team will
analyse the data collected during the desk review and the field work, conduct
Evaluation Report Version Dic 2018 144 | P a g e
additional consultations with stakeholders, as required, and draft the evaluation
report. It will be submitted to the evaluation manager for quality assurance.
Deliverable: Evaluation report (ER). The evaluation report will present the findings,
conclusions and recommendations of the evaluation in a concise report of 40
pages maximum. Findings should be evidence-based and relevant to the
evaluation questions. Data will be disaggregated by sex and the evaluation
findings and conclusions will highlight differences in performance and results of
the operation for different beneficiary groups as appropriate. There should be a
logical flow from findings to conclusions and from conclusions to
recommendations. Recommendations will be limited in number, actionable and
targeted to the relevant users. These will form the basis of the WFP management
response to the evaluation.
The draft ER will be submitted to the QS service for comments; a revised version
will then be shared with the Evaluation Reference Group for comments before
being submitted to the Evaluation Committee for approval. Stakeholders’
comments will be recorded in a matrix by the evaluation manager and provided
to the evaluation team for their consideration before finalisation of the ER. For
more details, refer to the content guide for the ER.
66. Final Evaluation Follow-up and dissemination phase (from August 2019): The
CO management will respond to the evaluation recommendations by providing
actions that will be taken to address each recommendation and estimated
timelines for taking those actions. The RB will support WFP’s management
response to the evaluation as appropriate, including following up with country
offices on status of implementation of the actions. OEV will also subject the
evaluation report to an external post-hoc quality assessment to report
independently on the quality, credibility and utility of the evaluation in line with
evaluation norms and standards. The final evaluation report will be published on
the WFP public website. Findings will be disseminated and lessons will be
incorporated into other relevant lesson sharing systems.
Notes on deliverables (mid-term and final evaluations):
67. A full list of expected deliverables is provided below:
a. Inception, draft, and final evaluation reports (mid-term and final)
b. Quality Assurance Plan
c. Raw and clean data sets
d. Suggested table of contents for evaluation reports:
o Executive Summary
o Introduction
o Background (Program description and purpose of evaluation)
o Methodology and Implementation
Evaluation Report Version Dic 2018 145 | P a g e
o Results and Findings
o Conclusions
o Recommendations
o Lessons Learned
o Annexes
I. Table of McGovern-Dole performance indicators with
updated values in comparison to baseline values
II. List of meetings
III. Survey instruments
IV. TOR
V. Project-Level Results Framework
e. A final evaluation summary brief, not to exceed 4 pages, that summarizes
the main findings of the report. It should include charts, graphs, etc. to
visualize the data in a clear, easy to read format, accessible to stakeholders
from the community level to the government level. The final results and
summary reports will be shared with project stakeholders. (final
evaluation only)
68. The inception and evaluation reports shall be written in English and follow the
DEQAS templates. The evaluation team is expected to produce written work that
is of very high standard, evidence-based, and free of errors. The evaluation
company is ultimately responsible for the timeliness and quality of the evaluation
products. If the expected standards are not met the evaluation company will, at its
own expense, make the necessary amendments to bring the evaluation products
to required quality level.
69. The evaluation TOR, evaluation reports and management responses will be public and
posted on the WFP External Website (wfp.org/evaluation). The other evaluation
products will be kept internal. The CO will translate final evaluation products in
Portuguese as relevant, for broader dissemination at country level.
6. Organization of the Evaluation
6.1. Evaluation Conduct
70. The evaluation team will conduct the evaluation under the direction of its team
leader and in close communication with the WFP evaluation manager. The team
will be hired following agreement with WFP on its composition.
71. The evaluation team will not have been involved in the design or implementation
of the subject of evaluation or have any other conflicts of interest. Further, they
will act impartially and respect the code of conduct of the evaluation profession.
Evaluation Report Version Dic 2018 146 | P a g e
6.2. Team composition and competencies
72. The evaluation team is expected to include three to four members, including the
team leader and at least one national consultant. To the extent possible, the
evaluation will be conducted by a gender-balanced, geographically and culturally
diverse team with appropriate skills to assess gender dimensions of the subject as
specified in the scope, approach and methodology sections of the ToR. At least
one team member should have WFP experience.
73. The team will be multi-disciplinary and include members who together include an
appropriate balance of expertise and practical knowledge in the following areas:
● School Feeding programmes
● Food and Nutrition Security
● Institutional capacity development
● Gender expertise / good knowledge of gender issues
● Familiarity with the USDA M&E policy
● All team members should have strong analytical and communication skills,
evaluation experience and, to the extent possible, familiarity with Guinea-Bissau
and/or western Africa development context.
● Oral and written language requirements include proficiency in English and
Portuguese among team members. The inception and evaluation reports will be
delivered in English.
74. The Team leader will have technical expertise in one of the technical areas listed
above as well as expertise in designing methodology and data collection tools and
demonstrated experience in leading similar evaluations. She/he will also have
leadership, analytical and communication skills, including a track record of
excellent English and Portuguese writing and presentation skills.
75. Her/his primary responsibilities will be: i) defining the evaluation approach and
methodology; ii) guiding and managing the team; iii) leading the evaluation
mission and representing the evaluation team; iv) drafting and revising, as
required, the inception report, the end of field work (i.e. exit) debriefing
presentation and evaluation report in line with DEQAS.
76. The team members will bring together a complementary combination of the
technical expertise required and have a track record of written work on similar
assignments.
77. Team members will: i) contribute to the methodology in their area of expertise
based on a document review; ii) conduct field work; iii) participate in team
meetings and meetings with stakeholders; iv) contribute to the drafting and
revision of the evaluation products in their technical area(s).
Evaluation Report Version Dic 2018 147 | P a g e
6.3. Security Considerations
78. Security clearance where required is to be obtained from WFP Guinea-Bissau CO.
● As an ‘independent supplier’ of evaluation services to WFP, the evaluation
company is responsible for ensuring the security of all persons contracted,
including adequate arrangements for evacuation for medical or situational
reasons. The consultants contracted by the evaluation company do not fall under
the UN Department of Safety & Security (UNDSS) system for UN personnel.
● Consultants hired independently are covered by the UN Department of Safety &
Security (UNDSS) system for UN personnel which cover WFP staff and
consultants contracted directly by WFP. Independent consultants must obtain
UNDSS security clearance for travelling to be obtained from designated duty
station and complete the UN system’s Basic and Advance Security in the Field
courses in advance, print out their certificates and take them with them.228
79. However, to avoid any security incidents, the Evaluation Manager is requested to
ensure that:
● The WFP CO registers the team members with the Security Officer on arrival in
country and arranges a security briefing for them to gain an understanding of
the security situation on the ground.
● The team members observe applicable UN security rules and regulations – e.g.
curfews etc.
7. Roles and Responsibilities of Stakeholders
80. The WFP Guinea-Bissau CO:
a- The WFP Guinea-Bissau CO: Management (Director or Deputy Director) will take
responsibility to:
o Assign an Evaluation Manager for the evaluation: Elber Nosolini, National
Programme Officer.
o Compose the internal evaluation committee and the evaluation reference group
(see below).
o Internally approve the final Tor, inception and evaluation reports.
o Ensure the independence and impartiality of the evaluation at all stages, including
establishment of an Evaluation Committee and of a Reference Group (see below
and TN on Independence and Impartiality).
o Participate in discussions with the evaluation team on the evaluation design and
the evaluation subject, its performance and results with the Evaluation Manager
and the evaluation team
o Organise and participate in two separate debriefings, one internal and one with
external stakeholders
228 Field Courses: Basic; Advanced
Evaluation Report Version Dic 2018 148 | P a g e
o Oversee dissemination and follow-up processes, including the preparation of a
Management Response to the evaluation recommendations
b- The Evaluation Manager:
o Manages the evaluation process through all phases including drafting this TOR
o Ensures quality assurance mechanisms are operational
o Consolidates and shares comments on draft TOR, inception and evaluation
reports with the evaluation team
o Ensures expected use of quality assurance mechanisms (checklists, quality
support
o Ensures that the team has access to all documentation and information necessary
to the evaluation; facilitates the team’s contacts with local stakeholders; sets up
meetings, field visits; provides logistic support during the fieldwork; and arranges
for interpretation, if required.
o Organises security briefings for the evaluation team and provides any materials
as required
c- An internal Evaluation Committee has been formed as part of ensuring the
independence and impartiality of the evaluation. This committee will be composed
by Chair-Kiyomi Kawaguchi CD; deputy ChairBob Barad DCD; Secretary-Elber
Nosolini NPO; Member-Jose Cabral School Meals Focal Point, Filippo Pompili,
Regional Evaluation Officer. The members of the committee will provide inputs to
the evaluation process and comment on evaluation products and make key decisions
such as internal approval of evaluation deliverables (Refer to Annex 3 for the list of
members).
81. USDA will be involved in the evaluation at the following stages: Appropriate
members of USDA (Programme analyst and M&E lead) will be consulted for
comment and approval of the TOR; serve as a member of the ERG; participate in
key informant interviews with selected evaluators prior to field data collection; and
participate in stakeholder meetings and presentation of the evaluation findings,
as appropriate. As per agreement between USDA and WFP in the context of the
McGovern-Dole grant, the final approval of the evaluation main products will be at
USDA level.
82. An Evaluation Reference Group has been formed, as appropriate, with
representation from DGASE, DGPASE, UNICEF and USDA. The ERG members will
review and comment on the draft evaluation products and act as key informants
in order to further safeguard against bias and influence.
83. The Regional Bureau: will take responsibility to:
o Advise the Evaluation Manager and provide support to the evaluation process
where appropriate.
o Participate in discussions with the evaluation team on the evaluation design and
on the evaluation subject as relevant, as required.
o Provide comments on the draft TOR, Inception and Evaluation reports
Evaluation Report Version Dic 2018 149 | P a g e
o Support the Management Response to the evaluation and track the
implementation of the recommendations.
While the Regional Evaluation Officer, Filippo Pompili, will perform most of the
above responsibilities, other RB relevant technical staff may participate in the
evaluation reference group and/or comment on evaluation products as
appropriate.
84. Relevant WFP Headquarters divisions will take responsibility to:
o Discuss WFP strategies, policies or systems in their area of responsibility and
subject of evaluation.
o Comment on the evaluation TOR, inception and evaluation reports, as required.
85. The Office of Evaluation (OEV). OEV, through the Regional Evaluation Officer, will
advise the Evaluation Manager and provide support to the evaluation process
when required. It is responsible for providing access to the outsourced quality
support service reviewing draft ToR, inception and evaluation reports from an
evaluation perspective. It also ensures a help desk function upon request.
8. Communication and budget
8.1. Communication
86. To ensure a smooth and efficient process and enhance the learning from this
evaluation, the evaluation team should place emphasis on transparent and open
communication with key stakeholders. These will be achieved by ensuring a clear
agreement on channels and frequency of communication with and between key
stakeholders.
87. As part of the international standards for evaluation, WFP requires that all
evaluations are made publicly available. Following the approval of the final
evaluation report, The CO will translate the final TOR and report in Portuguese.
Final evaluation products of the evaluation will be disseminated or made available
to partners in electronic and print form. See an overview of the Communication
and Learning plan in Annex 6.
8.2. Budget
88. For the purpose of this evaluation, the budget will be based on pre-agreed rates
with long-term agreement evaluation firms. Firm engagement for the final
evaluation is dependent upon satisfactory completion of the midterm evaluation.
The evaluation budget is planned under Mc-Govern-Dole contribution.
89. The evaluation budget should include costs associated with international travel
and daily subsistence. Local travel will be supported by the Country Office.
Evaluation Report Version Dic 2018 150 | P a g e
Please send any queries to Elber Nosolini , NPO, at [email protected], +245 95 565 17
29].
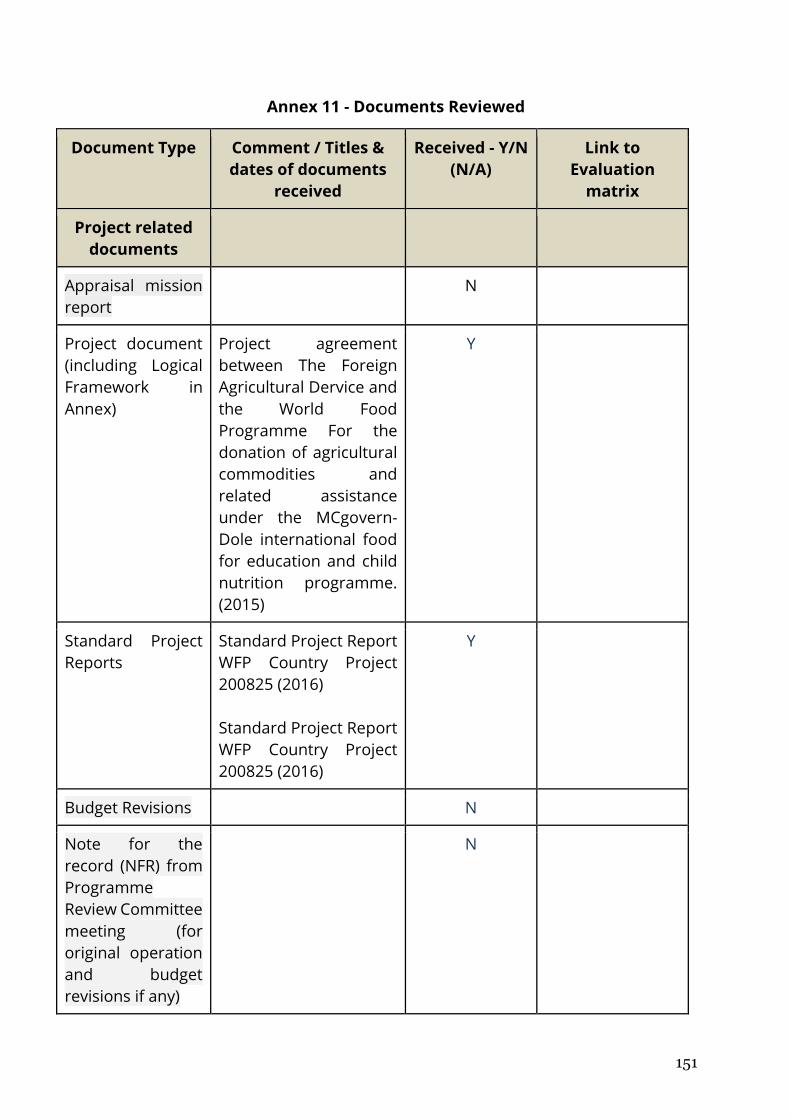
151
Annex 11 - Documents Reviewed
Document Type Comment / Titles &
dates of documents
received
Received - Y/N
(N/A)
Link to
Evaluation
matrix
Project related
documents
Appraisal mission
report
N
Project document
(including Logical
Framework in
Annex)
Project agreement
between The Foreign
Agricultural Dervice and
the World Food
Programme For the
donation of agricultural
commodities and
related assistance
under the MCgovern-
Dole international food
for education and child
nutrition programme.
(2015)
Y
Standard Project
Reports
Standard Project Report
WFP Country Project
200825 (2016)
Standard Project Report
WFP Country Project
200825 (2016)
Y
Budget Revisions N
Note for the
record (NFR) from
Programme
Review Committee
meeting (for
original operation
and budget
revisions if any)
N
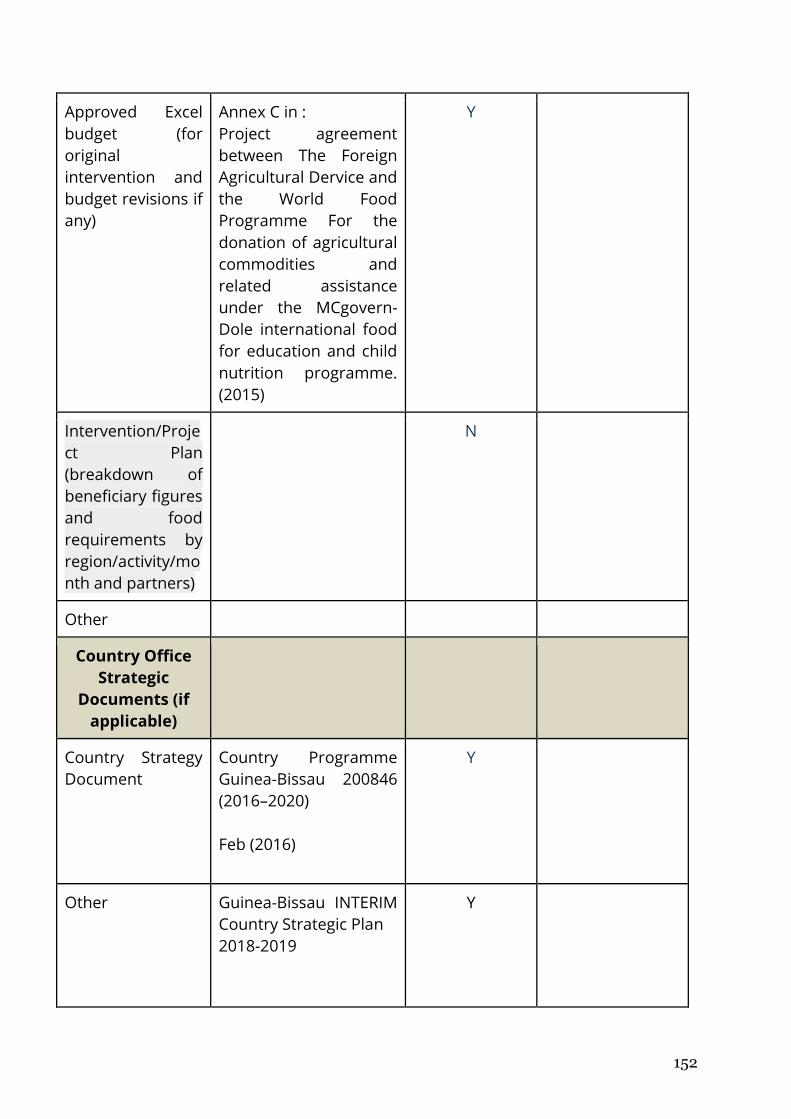
152
Approved Excel
budget (for
original
intervention and
budget revisions if
any)
Annex C in :
Project agreement
between The Foreign
Agricultural Dervice and
the World Food
Programme For the
donation of agricultural
commodities and
related assistance
under the MCgovern-
Dole international food
for education and child
nutrition programme.
(2015)
Y
Intervention/Proje
ct Plan
(breakdown of
beneficiary figures
and food
requirements by
region/activity/mo
nth and partners)
N
Other
Country Office
Strategic
Documents (if
applicable)
Country Strategy
Document
Country Programme
Guinea-Bissau 200846
(2016–2020)
Feb (2016)
Y
Other
Guinea-Bissau INTERIM
Country Strategic Plan
2018-2019
Y
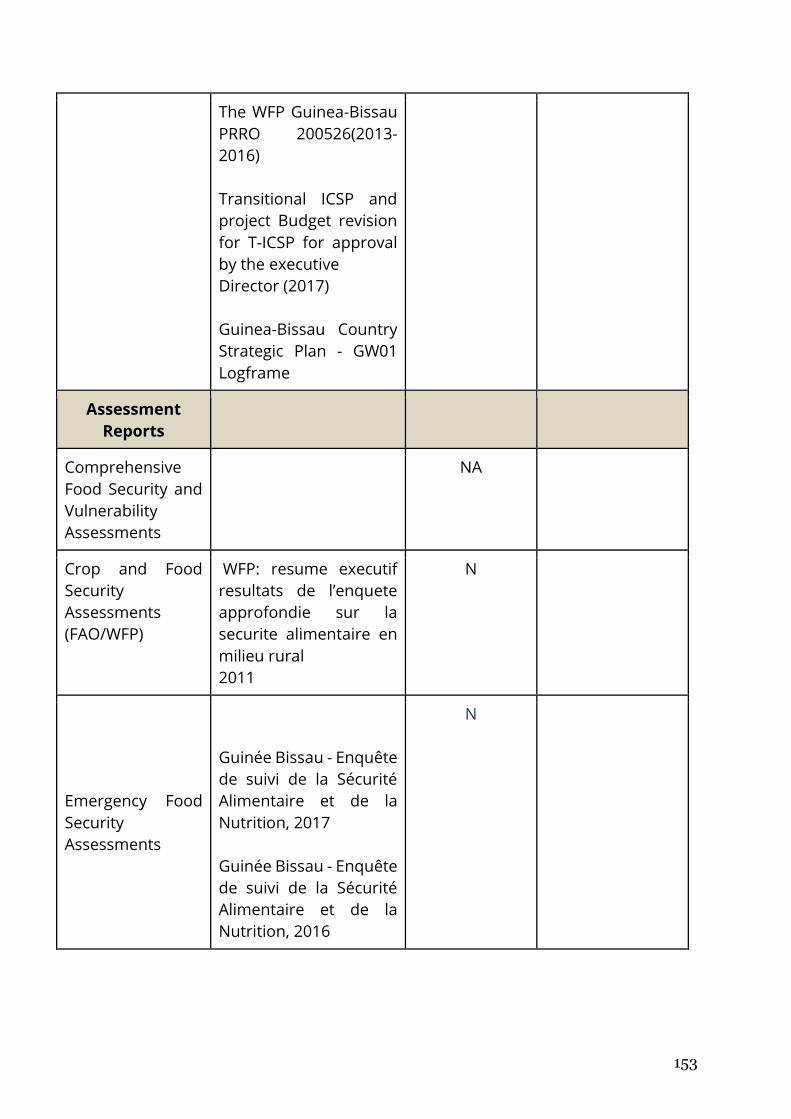
153
The WFP Guinea-Bissau
PRRO 200526(2013-
2016)
Transitional ICSP and
project Budget revision
for T-ICSP for approval
by the executive
Director (2017)
Guinea-Bissau Country
Strategic Plan - GW01
Logframe
Assessment
Reports
Comprehensive
Food Security and
Vulnerability
Assessments
NA
Crop and Food
Security
Assessments
(FAO/WFP)
WFP: resume executif
resultats de l’enquete
approfondie sur la
securite alimentaire en
milieu rural
2011
N
Emergency Food
Security
Assessments
Guinée Bissau - Enquête
de suivi de la Sécurité
Alimentaire et de la
Nutrition, 2017
Guinée Bissau - Enquête
de suivi de la Sécurité
Alimentaire et de la
Nutrition, 2016
N
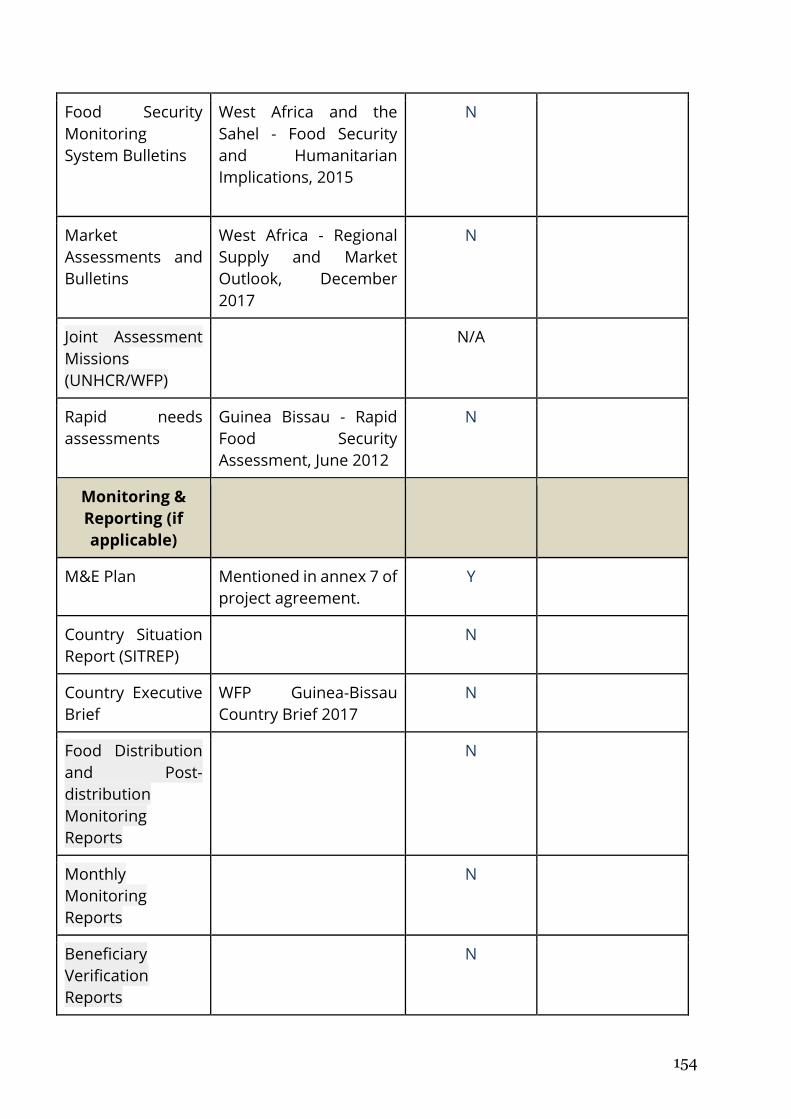
154
Food Security
Monitoring
System Bulletins
West Africa and the
Sahel - Food Security
and Humanitarian
Implications, 2015
N
Market
Assessments and
Bulletins
West Africa - Regional
Supply and Market
Outlook, December
2017
N
Joint Assessment
Missions
(UNHCR/WFP)
N/A
Rapid needs
assessments
Guinea Bissau - Rapid
Food Security
Assessment, June 2012
N
Monitoring &
Reporting (if
applicable)
M&E Plan Mentioned in annex 7 of
project agreement.
Y
Country Situation
Report (SITREP)
N
Country Executive
Brief
WFP Guinea-Bissau
Country Brief 2017
N
Food Distribution
and Post-
distribution
Monitoring
Reports
N
Monthly
Monitoring
Reports
N
Beneficiary
Verification
Reports
N
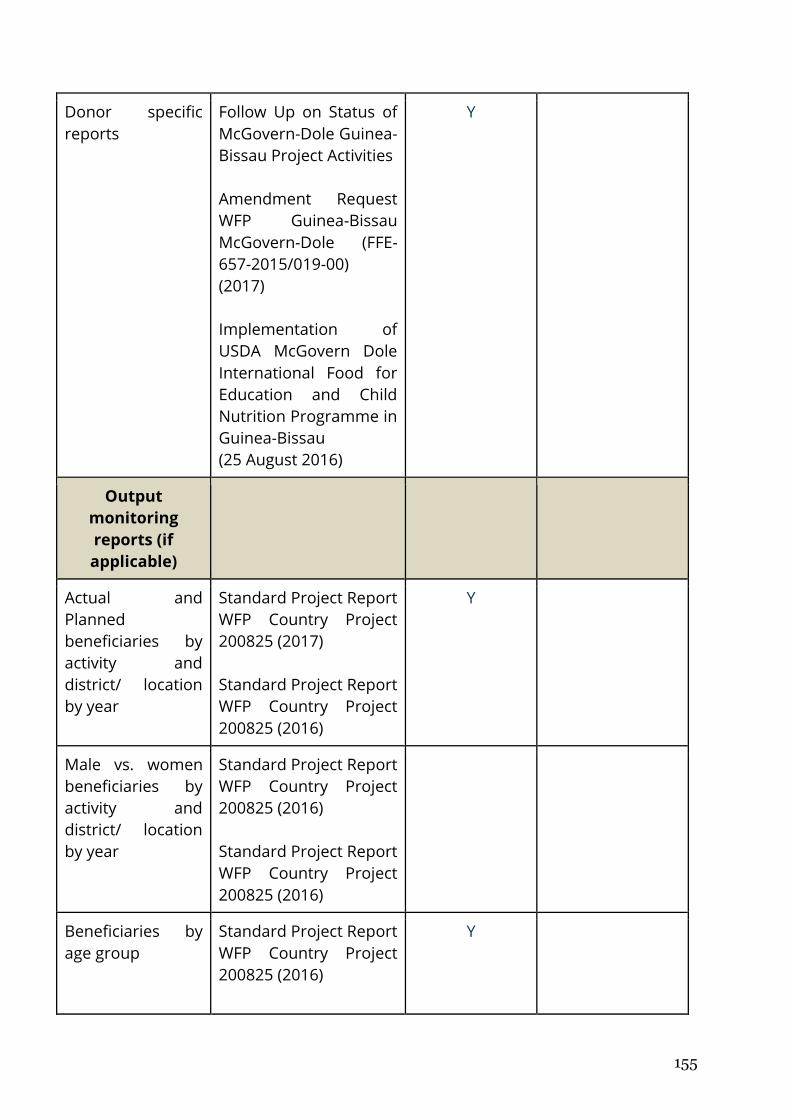
155
Donor specific
reports
Follow Up on Status of
McGovern-Dole Guinea-
Bissau Project Activities
Amendment Request
WFP Guinea-Bissau
McGovern-Dole (FFE-
657-2015/019-00)
(2017)
Implementation of
USDA McGovern Dole
International Food for
Education and Child
Nutrition Programme in
Guinea-Bissau
(25 August 2016)
Y
Output
monitoring
reports (if
applicable)
Actual and
Planned
beneficiaries by
activity and
district/ location
by year
Standard Project Report
WFP Country Project
200825 (2017)
Standard Project Report
WFP Country Project
200825 (2016)
Y
Male vs. women
beneficiaries by
activity and
district/ location
by year
Standard Project Report
WFP Country Project
200825 (2016)
Standard Project Report
WFP Country Project
200825 (2016)
Beneficiaries by
age group
Standard Project Report
WFP Country Project
200825 (2016)
Y
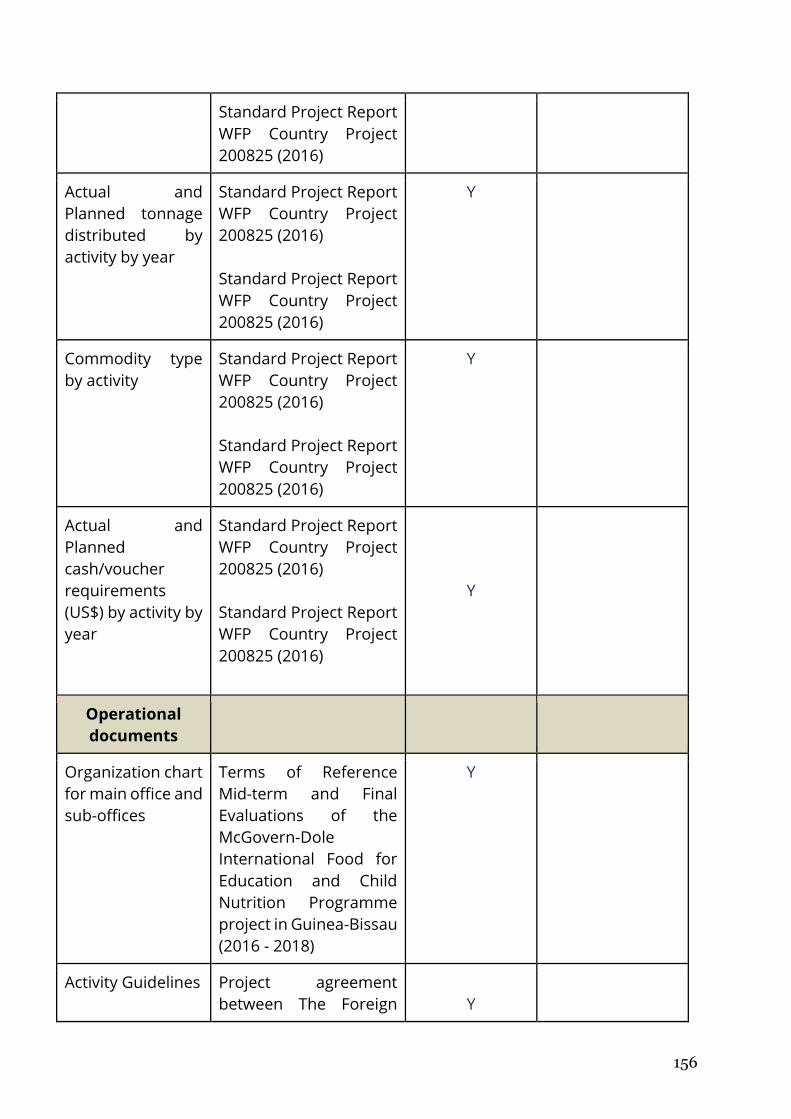
156
Standard Project Report
WFP Country Project
200825 (2016)
Actual and
Planned tonnage
distributed by
activity by year
Standard Project Report
WFP Country Project
200825 (2016)
Standard Project Report
WFP Country Project
200825 (2016)
Y
Commodity type
by activity
Standard Project Report
WFP Country Project
200825 (2016)
Standard Project Report
WFP Country Project
200825 (2016)
Y
Actual and
Planned
cash/voucher
requirements
(US$) by activity by
year
Standard Project Report
WFP Country Project
200825 (2016)
Standard Project Report
WFP Country Project
200825 (2016)
Y
Operational
documents
Organization chart
for main office and
sub-offices
Terms of Reference
Mid-term and Final
Evaluations of the
McGovern-Dole
International Food for
Education and Child
Nutrition Programme
project in Guinea-Bissau
(2016 - 2018)
Y
Activity Guidelines
Project agreement
between The Foreign
Y
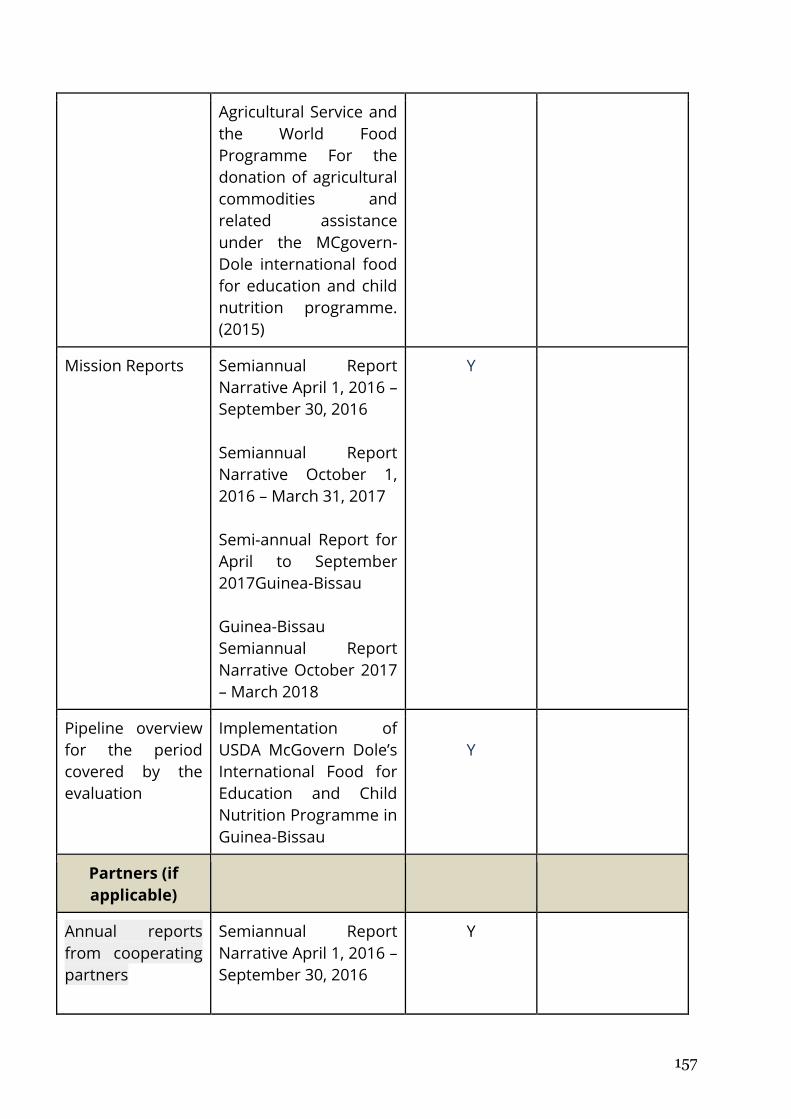
157
Agricultural Service and
the World Food
Programme For the
donation of agricultural
commodities and
related assistance
under the MCgovern-
Dole international food
for education and child
nutrition programme.
(2015)
Mission Reports
Semiannual Report
Narrative April 1, 2016 –
September 30, 2016
Semiannual Report
Narrative October 1,
2016 – March 31, 2017
Semi-annual Report for
April to September
2017Guinea-Bissau
Guinea-Bissau
Semiannual Report
Narrative October 2017
– March 2018
Y
Pipeline overview
for the period
covered by the
evaluation
Implementation of
USDA McGovern Dole’s
International Food for
Education and Child
Nutrition Programme in
Guinea-Bissau
Y
Partners (if
applicable)
Annual reports
from cooperating
partners
Semiannual Report
Narrative April 1, 2016 –
September 30, 2016
Y
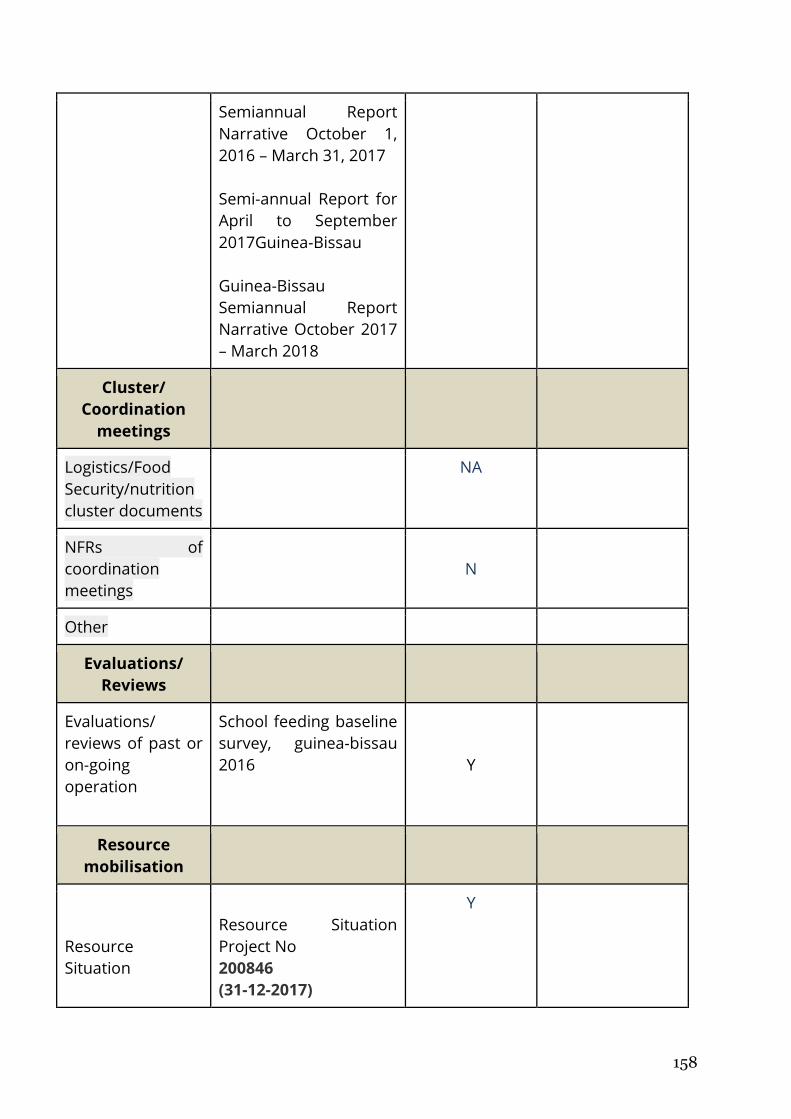
158
Semiannual Report
Narrative October 1,
2016 – March 31, 2017
Semi-annual Report for
April to September
2017Guinea-Bissau
Guinea-Bissau
Semiannual Report
Narrative October 2017
– March 2018
Cluster/
Coordination
meetings
Logistics/Food
Security/nutrition
cluster documents
NA
NFRs of
coordination
meetings
N
Other
Evaluations/
Reviews
Evaluations/
reviews of past or
on-going
operation
School feeding baseline
survey, guinea-bissau
2016
Y
Resource
mobilisation
Resource
Situation
Resource Situation
Project No
200846
(31-12-2017)
Y
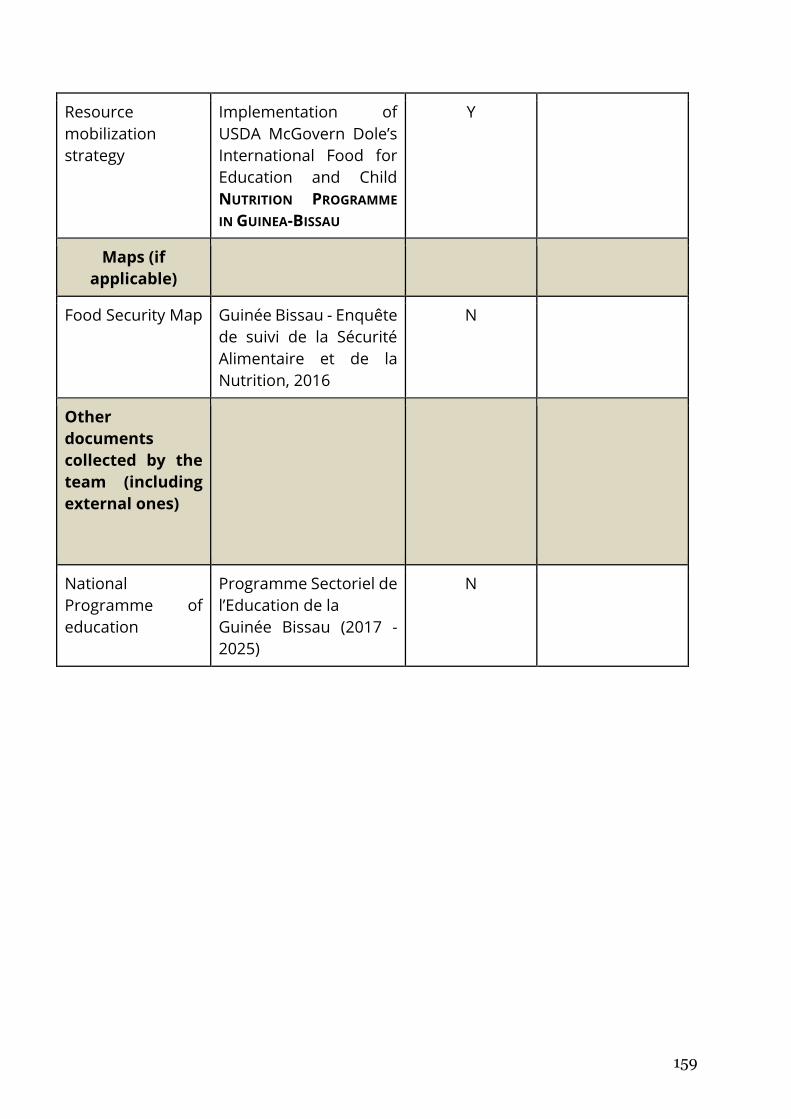
159
Resource
mobilization
strategy
Implementation of
USDA McGovern Dole’s
International Food for
Education and Child
NUTRITION PROGRAMME
IN GUINEA-BISSAU
Y
Maps (if
applicable)
Food Security Map
Guinée Bissau - Enquête
de suivi de la Sécurité
Alimentaire et de la
Nutrition, 2016
N
Other
documents
collected by the
team (including
external ones)
National
Programme of
education
Programme Sectoriel de
l’Education de la
Guinée Bissau (2017 -
2025)
N
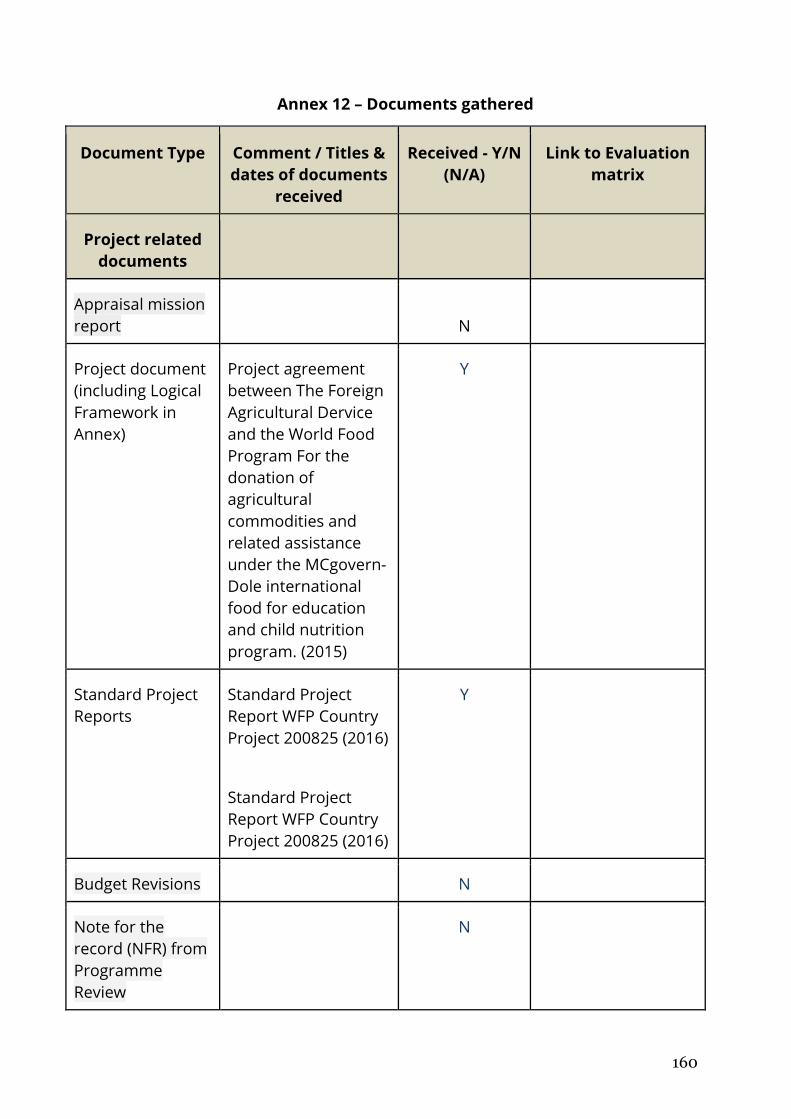
160
Annex 12 – Documents gathered
Document Type Comment / Titles &
dates of documents
received
Received - Y/N
(N/A)
Link to Evaluation
matrix
Project related
documents
Appraisal mission
report
N
Project document
(including Logical
Framework in
Annex)
Project agreement
between The Foreign
Agricultural Dervice
and the World Food
Program For the
donation of
agricultural
commodities and
related assistance
under the MCgovern-
Dole international
food for education
and child nutrition
program. (2015)
Y
Standard Project
Reports
Standard Project
Report WFP Country
Project 200825 (2016)
Standard Project
Report WFP Country
Project 200825 (2016)
Y
Budget Revisions N
Note for the
record (NFR) from
Programme
Review
N
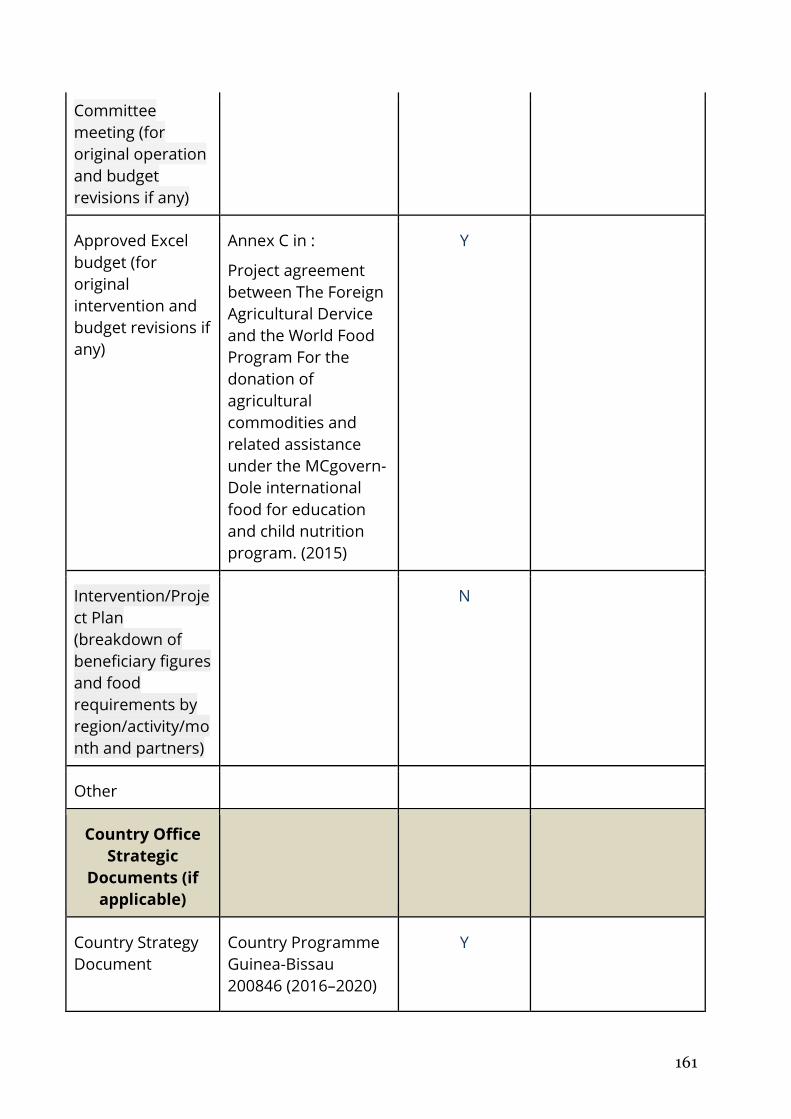
161
Committee
meeting (for
original operation
and budget
revisions if any)
Approved Excel
budget (for
original
intervention and
budget revisions if
any)
Annex C in :
Project agreement
between The Foreign
Agricultural Dervice
and the World Food
Program For the
donation of
agricultural
commodities and
related assistance
under the MCgovern-
Dole international
food for education
and child nutrition
program. (2015)
Y
Intervention/Proje
ct Plan
(breakdown of
beneficiary figures
and food
requirements by
region/activity/mo
nth and partners)
N
Other
Country Office
Strategic
Documents (if
applicable)
Country Strategy
Document
Country Programme
Guinea-Bissau
200846 (2016–2020)
Y
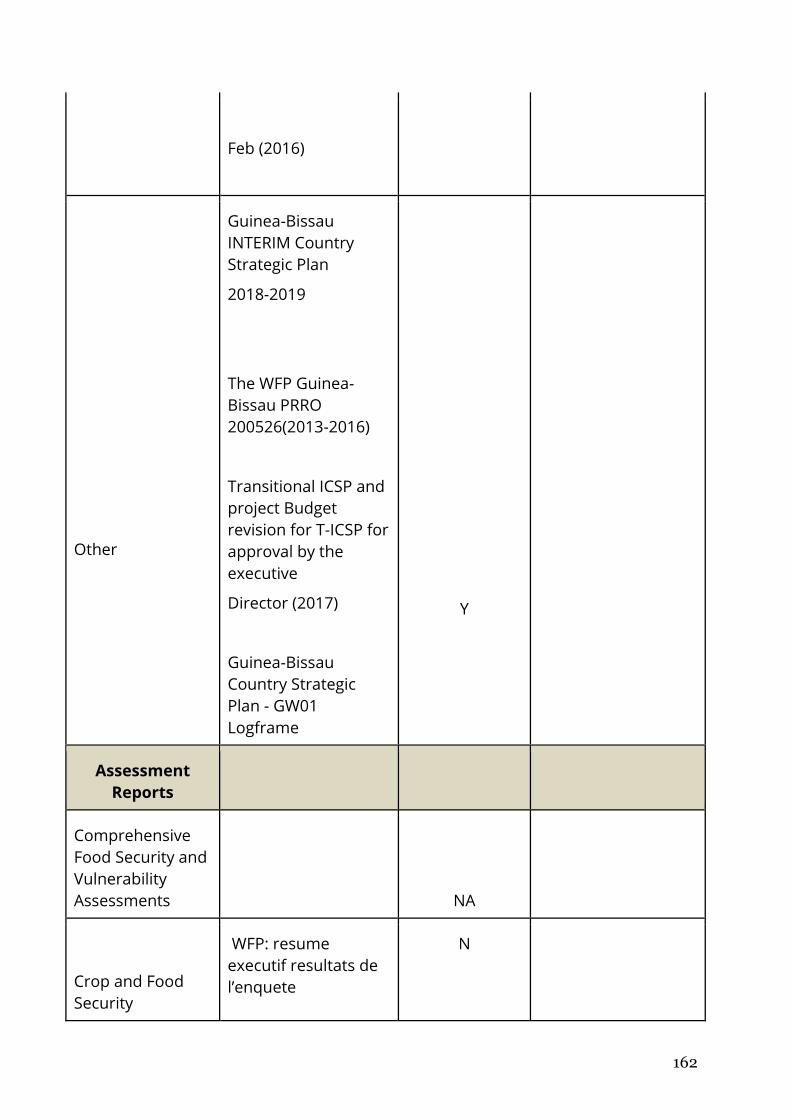
162
Feb (2016)
Other
Guinea-Bissau
INTERIM Country
Strategic Plan
2018-2019
The WFP Guinea-
Bissau PRRO
200526(2013-2016)
Transitional ICSP and
project Budget
revision for T-ICSP for
approval by the
executive
Director (2017)
Guinea-Bissau
Country Strategic
Plan - GW01
Logframe
Y
Assessment
Reports
Comprehensive
Food Security and
Vulnerability
Assessments
NA
Crop and Food
Security
WFP: resume
executif resultats de
l’enquete
N
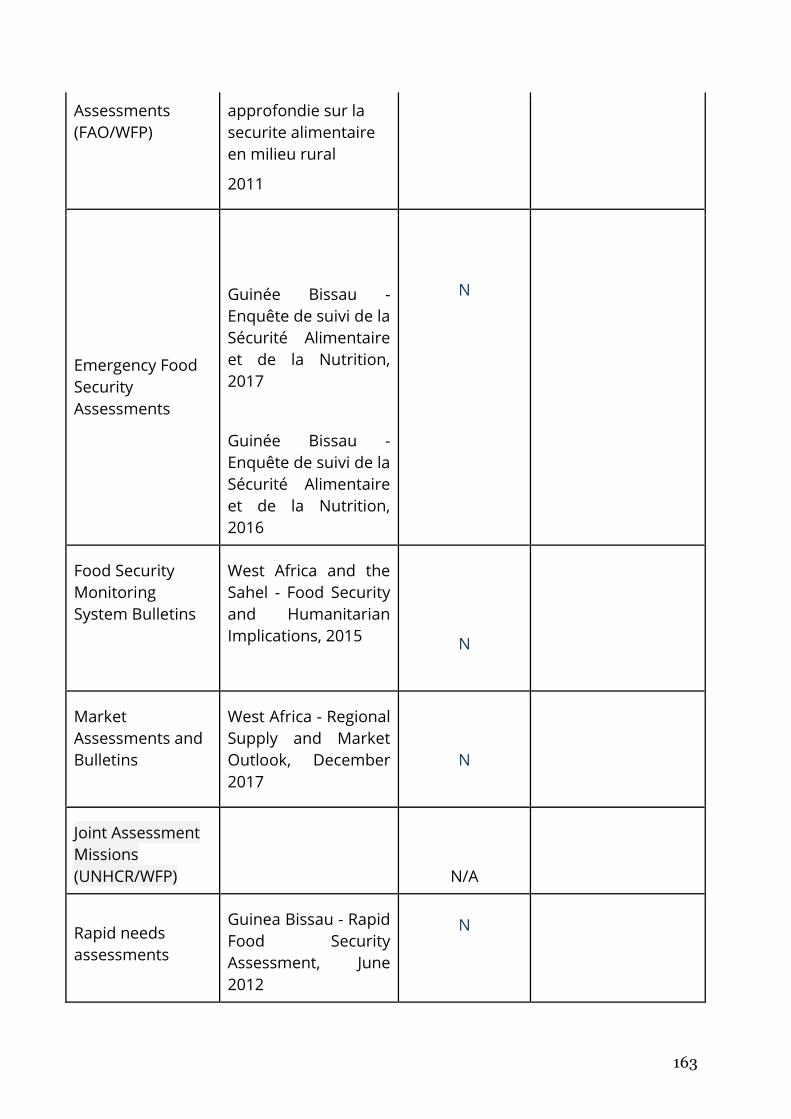
163
Assessments
(FAO/WFP)
approfondie sur la
securite alimentaire
en milieu rural
2011
Emergency Food
Security
Assessments
Guinée Bissau -
Enquête de suivi de la
Sécurité Alimentaire
et de la Nutrition,
2017
Guinée Bissau -
Enquête de suivi de la
Sécurité Alimentaire
et de la Nutrition,
2016
N
Food Security
Monitoring
System Bulletins
West Africa and the
Sahel - Food Security
and Humanitarian
Implications, 2015 N
Market
Assessments and
Bulletins
West Africa - Regional
Supply and Market
Outlook, December
2017
N
Joint Assessment
Missions
(UNHCR/WFP)
N/A
Rapid needs
assessments
Guinea Bissau - Rapid
Food Security
Assessment, June
2012
N
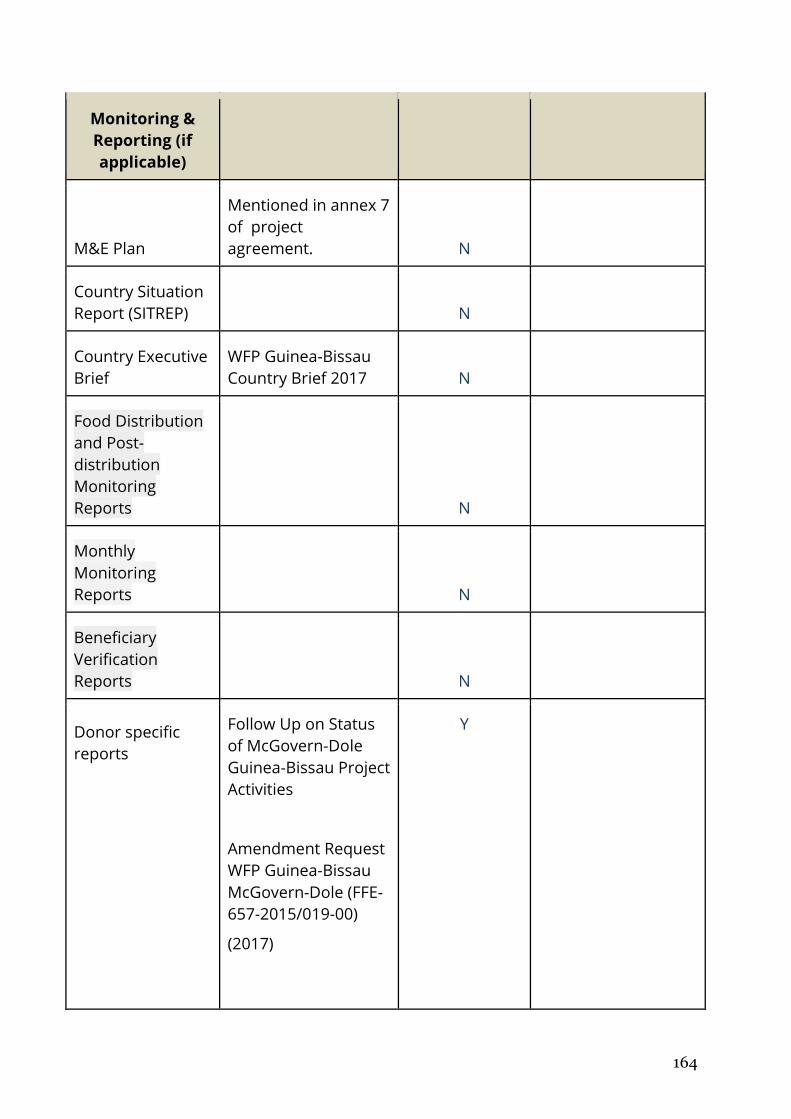
164
Monitoring &
Reporting (if
applicable)
M&E Plan
Mentioned in annex 7
of project
agreement. N
Country Situation
Report (SITREP)
N
Country Executive
Brief
WFP Guinea-Bissau
Country Brief 2017 N
Food Distribution
and Post-
distribution
Monitoring
Reports
N
Monthly
Monitoring
Reports
N
Beneficiary
Verification
Reports
N
Donor specific
reports
Follow Up on Status
of McGovern-Dole
Guinea-Bissau Project
Activities
Amendment Request
WFP Guinea-Bissau
McGovern-Dole (FFE-
657-2015/019-00)
(2017)
Y
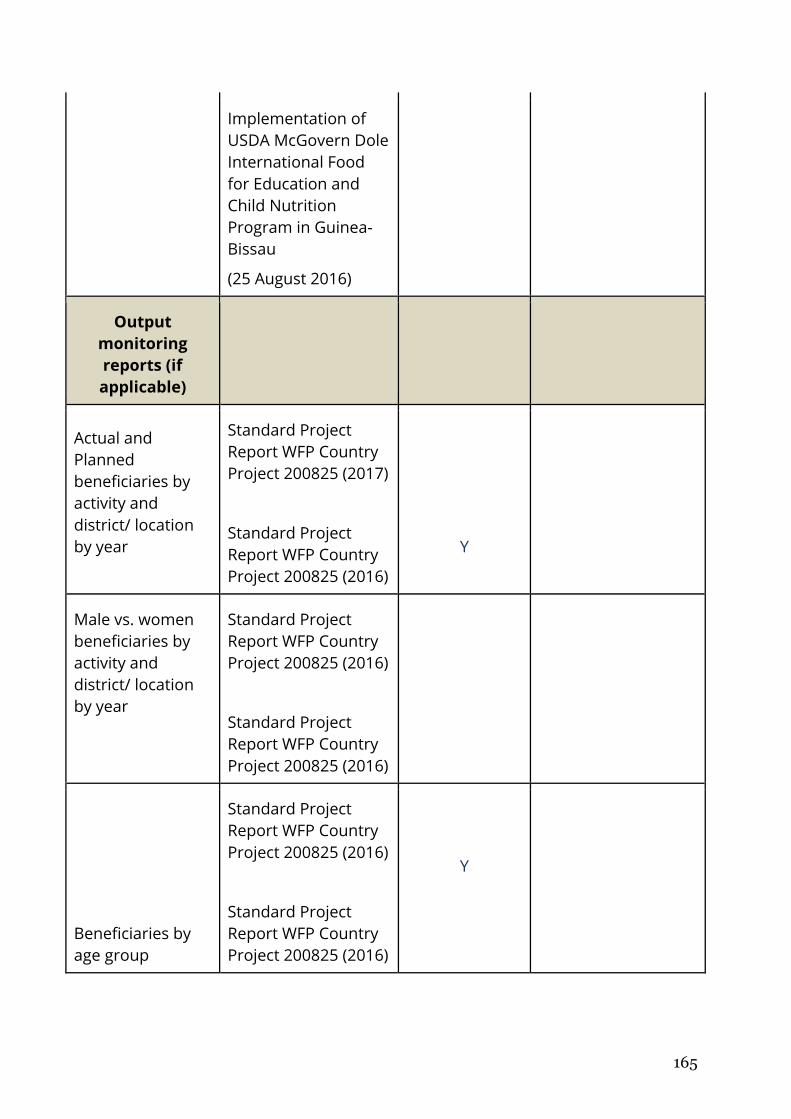
165
Implementation of
USDA McGovern Dole
International Food
for Education and
Child Nutrition
Program in Guinea-
Bissau
(25 August 2016)
Output
monitoring
reports (if
applicable)
Actual and
Planned
beneficiaries by
activity and
district/ location
by year
Standard Project
Report WFP Country
Project 200825 (2017)
Standard Project
Report WFP Country
Project 200825 (2016)
Y
Male vs. women
beneficiaries by
activity and
district/ location
by year
Standard Project
Report WFP Country
Project 200825 (2016)
Standard Project
Report WFP Country
Project 200825 (2016)
Beneficiaries by
age group
Standard Project
Report WFP Country
Project 200825 (2016)
Standard Project
Report WFP Country
Project 200825 (2016)
Y
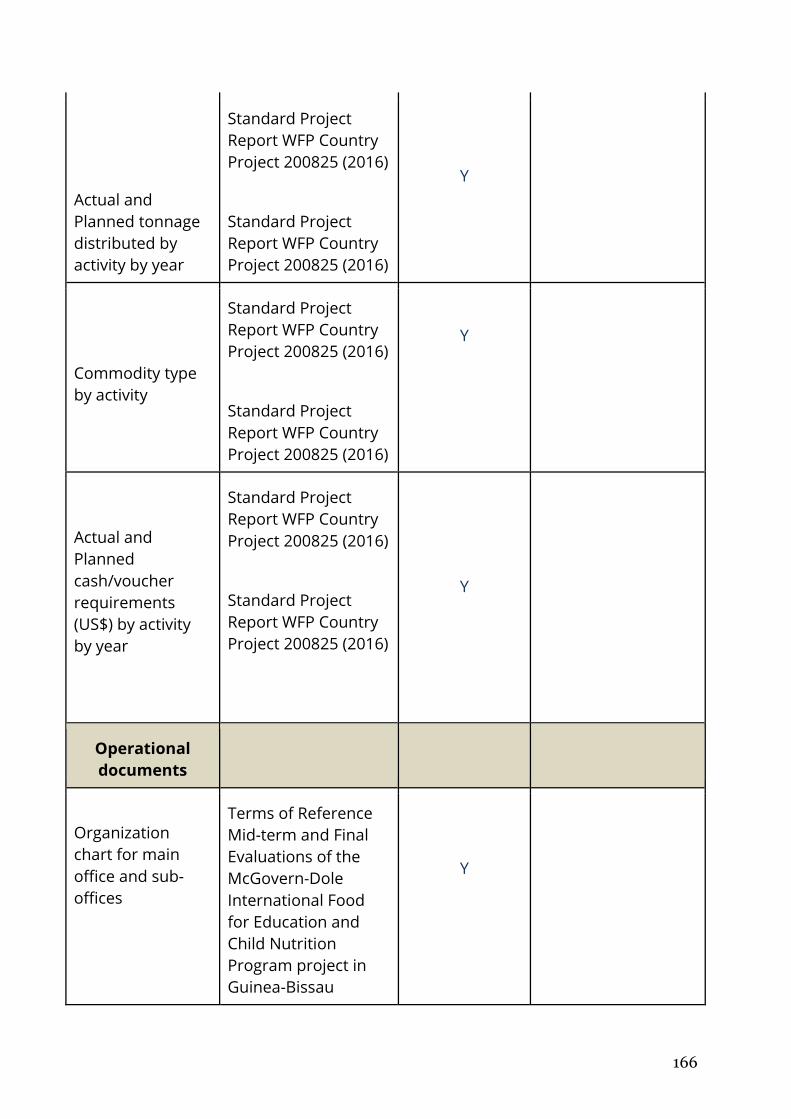
166
Actual and
Planned tonnage
distributed by
activity by year
Standard Project
Report WFP Country
Project 200825 (2016)
Standard Project
Report WFP Country
Project 200825 (2016)
Y
Commodity type
by activity
Standard Project
Report WFP Country
Project 200825 (2016)
Standard Project
Report WFP Country
Project 200825 (2016)
Y
Actual and
Planned
cash/voucher
requirements
(US$) by activity
by year
Standard Project
Report WFP Country
Project 200825 (2016)
Standard Project
Report WFP Country
Project 200825 (2016)
Y
Operational
documents
Organization
chart for main
office and sub-
offices
Terms of Reference
Mid-term and Final
Evaluations of the
McGovern-Dole
International Food
for Education and
Child Nutrition
Program project in
Guinea-Bissau
Y
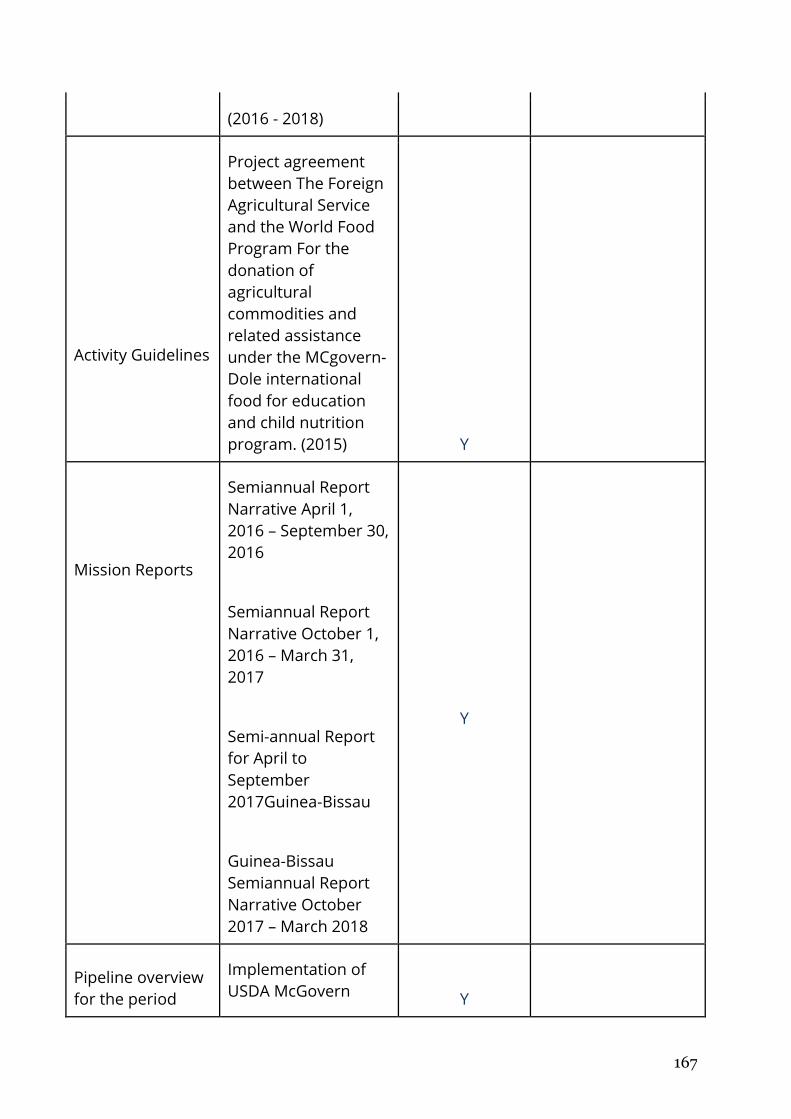
167
(2016 - 2018)
Activity Guidelines
Project agreement
between The Foreign
Agricultural Service
and the World Food
Program For the
donation of
agricultural
commodities and
related assistance
under the MCgovern-
Dole international
food for education
and child nutrition
program. (2015)
Y
Mission Reports
Semiannual Report
Narrative April 1,
2016 – September 30,
2016
Semiannual Report
Narrative October 1,
2016 – March 31,
2017
Semi-annual Report
for April to
September
2017Guinea-Bissau
Guinea-Bissau
Semiannual Report
Narrative October
2017 – March 2018
Y
Pipeline overview
for the period
Implementation of
USDA McGovern
Y
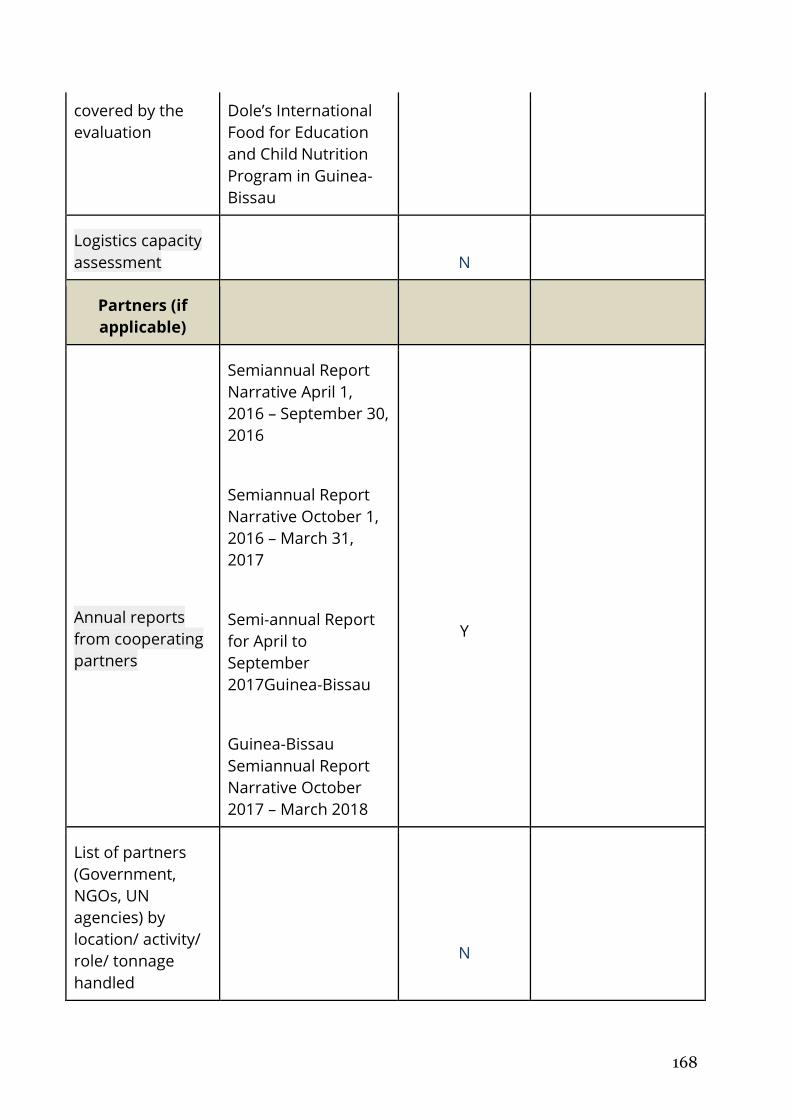
168
covered by the
evaluation
Dole’s International
Food for Education
and Child Nutrition
Program in Guinea-
Bissau
Logistics capacity
assessment
N
Partners (if
applicable)
Annual reports
from cooperating
partners
Semiannual Report
Narrative April 1,
2016 – September 30,
2016
Semiannual Report
Narrative October 1,
2016 – March 31,
2017
Semi-annual Report
for April to
September
2017Guinea-Bissau
Guinea-Bissau
Semiannual Report
Narrative October
2017 – March 2018
Y
List of partners
(Government,
NGOs, UN
agencies) by
location/ activity/
role/ tonnage
handled
N
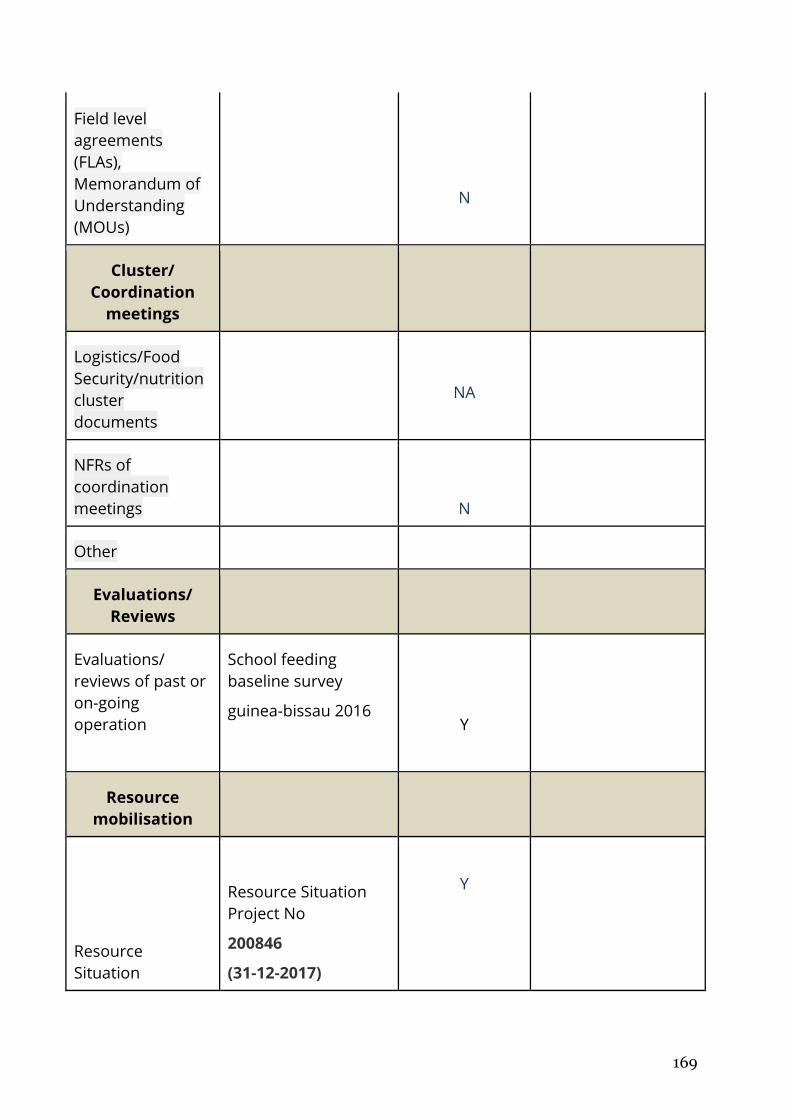
169
Field level
agreements
(FLAs),
Memorandum of
Understanding
(MOUs)
N
Cluster/
Coordination
meetings
Logistics/Food
Security/nutrition
cluster
documents
NA
NFRs of
coordination
meetings
N
Other
Evaluations/
Reviews
Evaluations/
reviews of past or
on-going
operation
School feeding
baseline survey
guinea-bissau 2016
Y
Resource
mobilisation
Resource
Situation
Resource Situation
Project No
200846
(31-12-2017)
Y
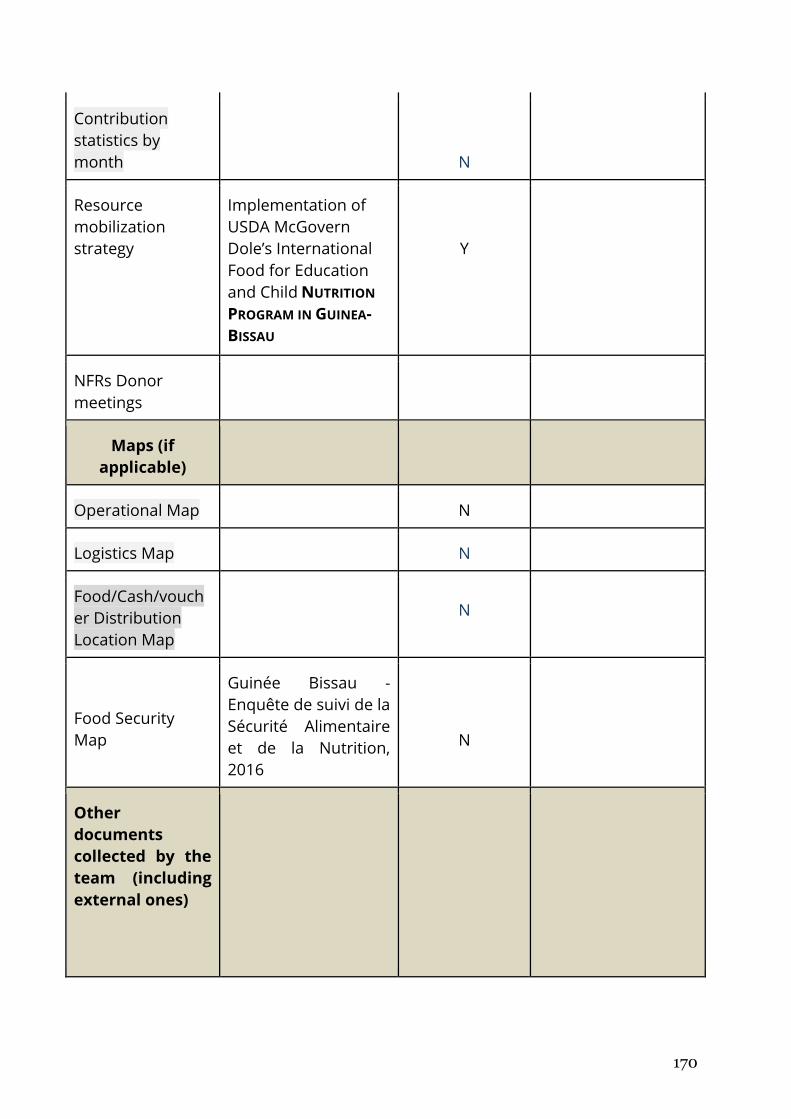
170
Contribution
statistics by
month
N
Resource
mobilization
strategy
Implementation of
USDA McGovern
Dole’s International
Food for Education
and Child NUTRITION
PROGRAM IN GUINEA-
BISSAU
Y
NFRs Donor
meetings
Maps (if
applicable)
Operational Map N
Logistics Map N
Food/Cash/vouch
er Distribution
Location Map
N
Food Security
Map
Guinée Bissau -
Enquête de suivi de la
Sécurité Alimentaire
et de la Nutrition,
2016
N
Other
documents
collected by the
team (including
external ones)
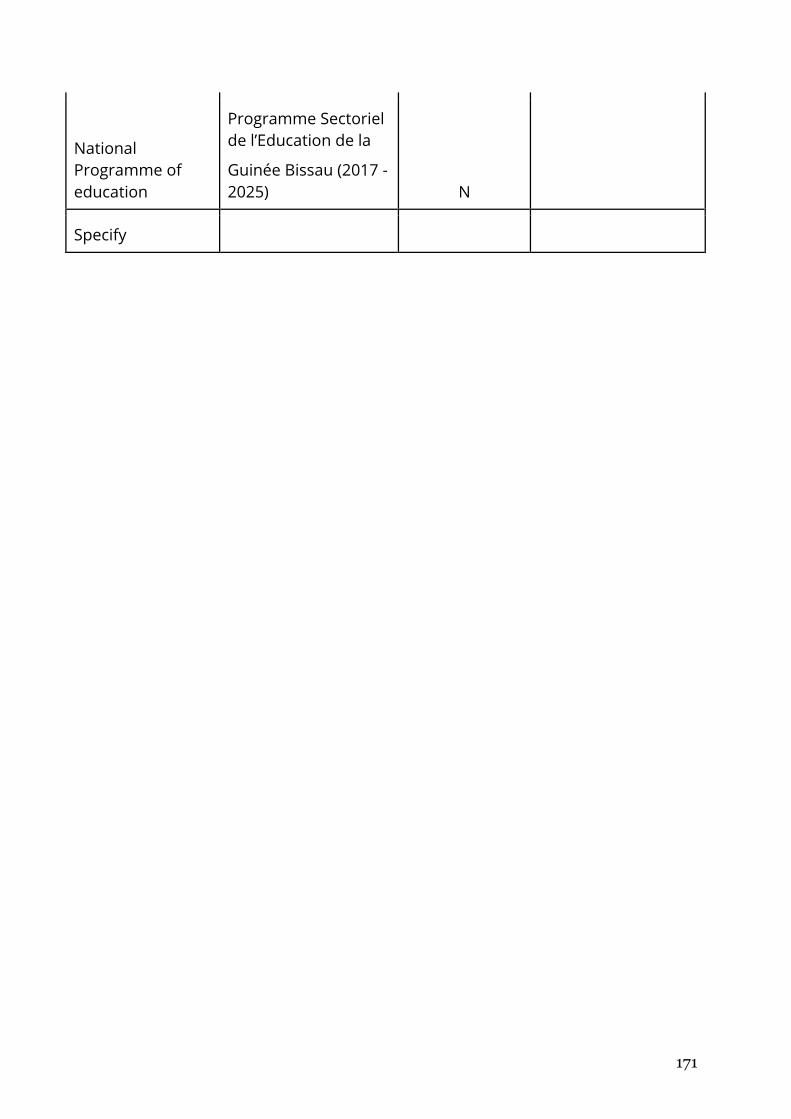
171
National
Programme of
education
Programme Sectoriel
de l’Education de la
Guinée Bissau (2017 -
2025) N
Specify
172
Annex 13 - Blibliography
Country Programme Guinea-Bissau 200846 (2016–2020). (2016). World Food
Programme.
WFP Guinea-Bissau Interim Country Strategic Plan 2018-2019 (January 2019.)
International Monetary Fund. (2017).
African Development Bank Group. Country Gender Profile: Guinea-Bissau (2015)
Unicef Annual Report 2016. (2016). Unicef.
Major overhaul of the Guinea-Bissau education system is well overdue (Country
Note 26 ). (2015). Unesco.
Country Programme Guinea-Bissau 200846 (2016–2020). (2016). World Food
Programme
WFP Guinea-Bissau CO - Standard Project Report 2016
Carvalho, Clara; Barreto, Maria Antónia and Barros, Miguel (2017). Avaliação
Externa à Intervenção da Cooperação Portuguesa no Setor da Educação (Pré-
escolar, Básico e Secundário) na Guiné-Bissau (2009-2016). Centro de Estudos
Internacionais / ISCTE - Instituto Universitário de Lisboa Camões, Instituto da
Cooperação e da Língua, Lisboa
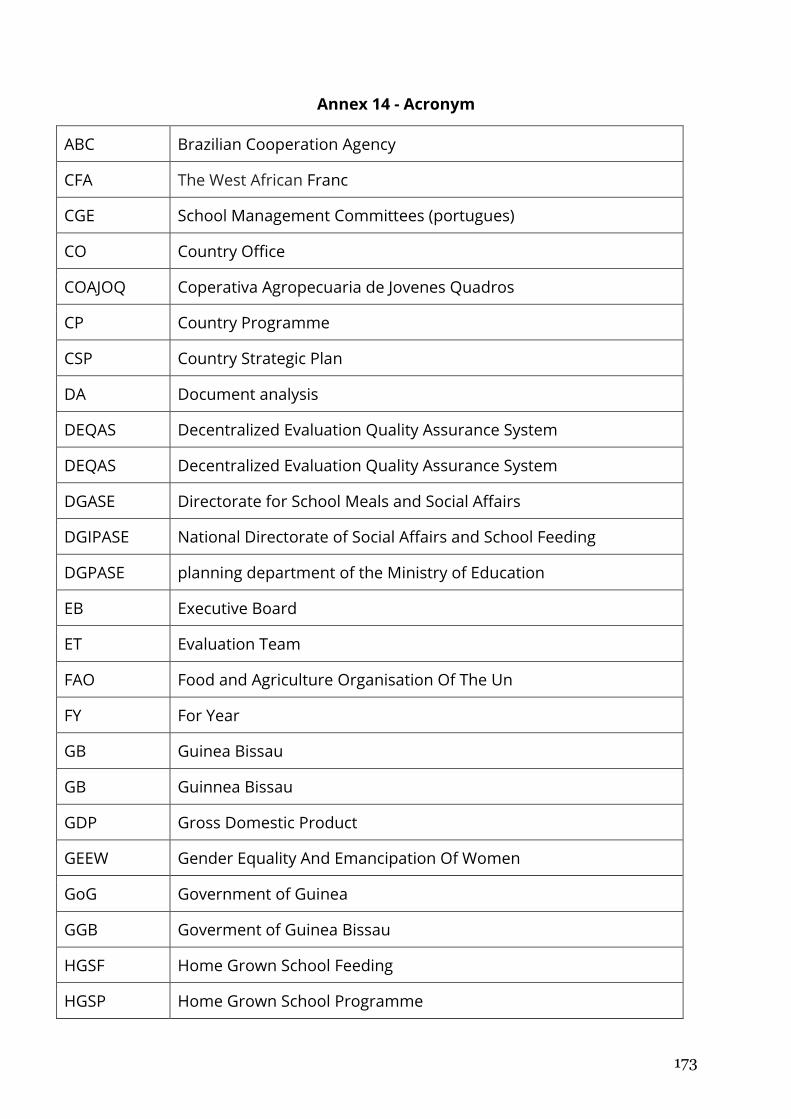
173
Annex 14 - Acronym
ABC Brazilian Cooperation Agency
CFA The West African Franc
CGE School Management Committees (portugues)
CO Country Office
COAJOQ Coperativa Agropecuaria de Jovenes Quadros
CP Country Programme
CSP Country Strategic Plan
DA Document analysis
DEQAS Decentralized Evaluation Quality Assurance System
DEQAS Decentralized Evaluation Quality Assurance System
DGASE Directorate for School Meals and Social Affairs
DGIPASE National Directorate of Social Affairs and School Feeding
DGPASE planning department of the Ministry of Education
EB Executive Board
ET Evaluation Team
FAO Food and Agriculture Organisation Of The Un
FY For Year
GB Guinea Bissau
GB Guinnea Bissau
GDP Gross Domestic Product
GEEW Gender Equality And Emancipation Of Women
GoG Government of Guinea
GGB Goverment of Guinea Bissau
HGSF Home Grown School Feeding
HGSP Home Grown School Programme
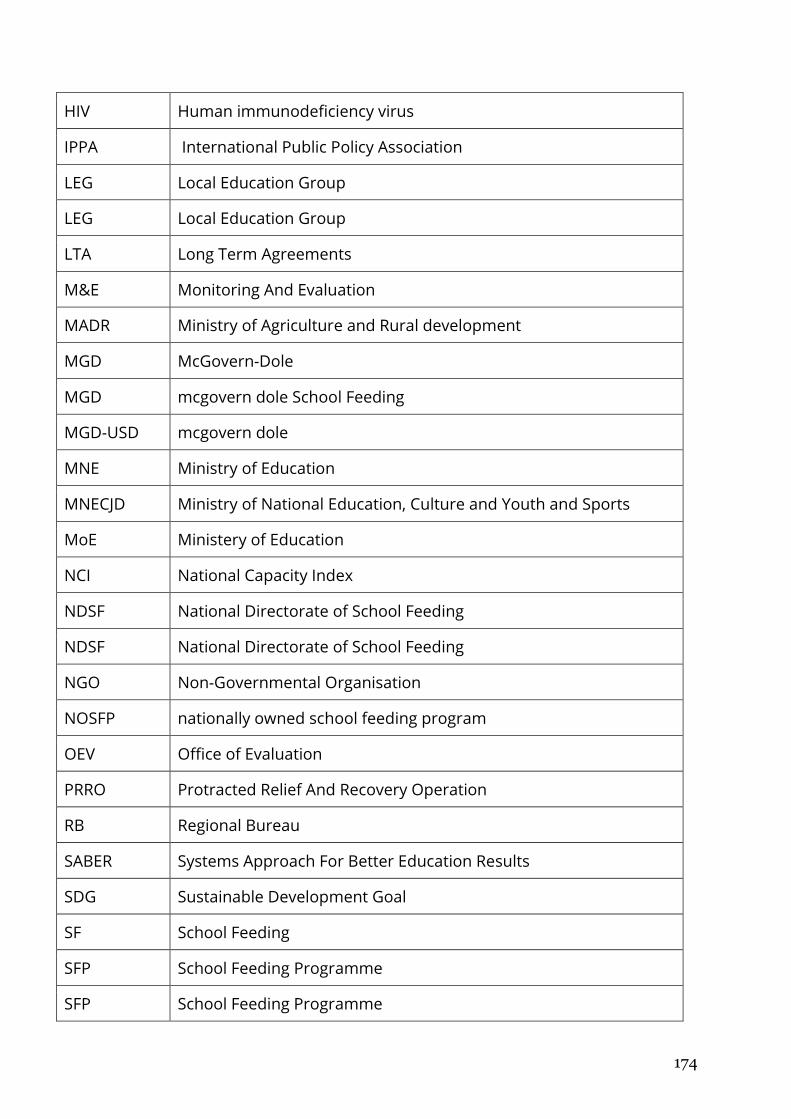
174
HIV Human immunodeficiency virus
IPPA International Public Policy Association
LEG Local Education Group
LEG Local Education Group
LTA Long Term Agreements
M&E Monitoring And Evaluation
MADR Ministry of Agriculture and Rural development
MGD McGovern-Dole
MGD mcgovern dole School Feeding
MGD-USD mcgovern dole
MNE Ministry of Education
MNECJD Ministry of National Education, Culture and Youth and Sports
MoE Ministery of Education
NCI National Capacity Index
NDSF National Directorate of School Feeding
NDSF National Directorate of School Feeding
NGO Non-Governmental Organisation
NOSFP nationally owned school feeding program
OEV Office of Evaluation
PRRO Protracted Relief And Recovery Operation
RB Regional Bureau
SABER Systems Approach For Better Education Results
SDG Sustainable Development Goal
SF School Feeding
SFP School Feeding Programme
SFP School Feeding Programme
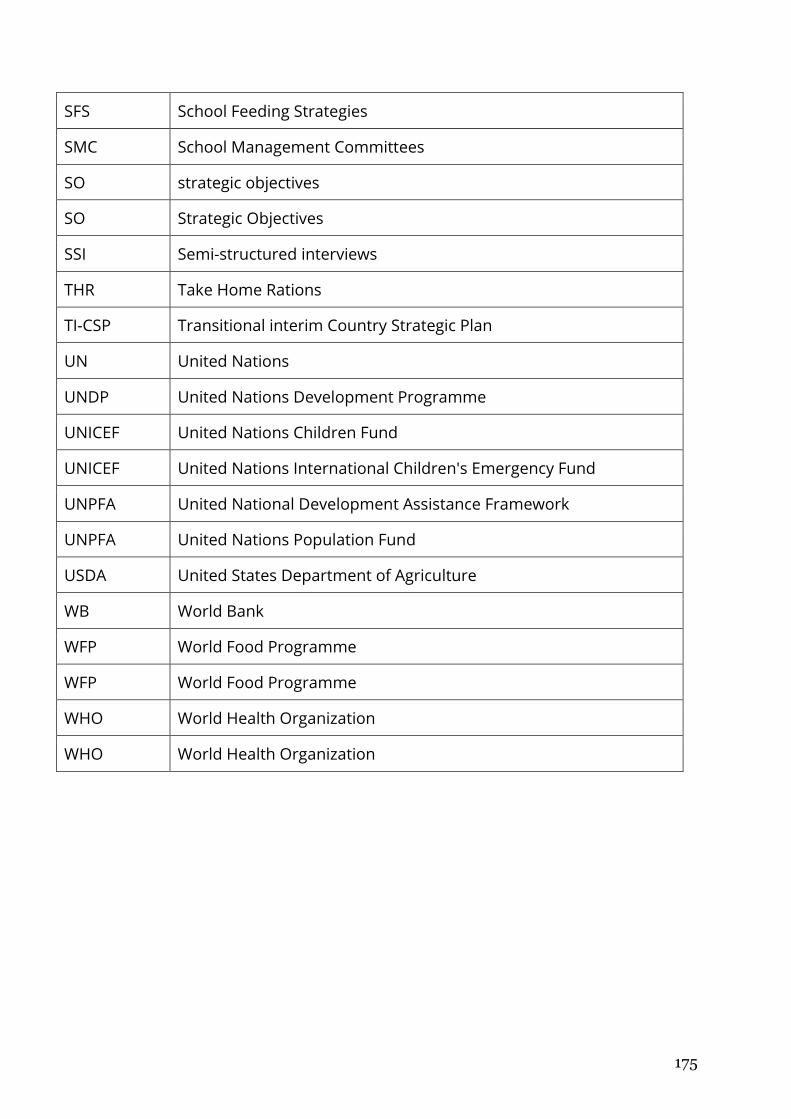
175
SFS School Feeding Strategies
SMC School Management Committees
SO strategic objectives
SO Strategic Objectives
SSI Semi-structured interviews
THR Take Home Rations
TI-CSP Transitional interim Country Strategic Plan
UN United Nations
UNDP United Nations Development Programme
UNICEF United Nations Children Fund
UNICEF United Nations International Children's Emergency Fund
UNPFA United National Development Assistance Framework
UNPFA United Nations Population Fund
USDA United States Department of Agriculture
WB World Bank
WFP World Food Programme
WFP World Food Programme
WHO World Health Organization
WHO World Health Organization

176
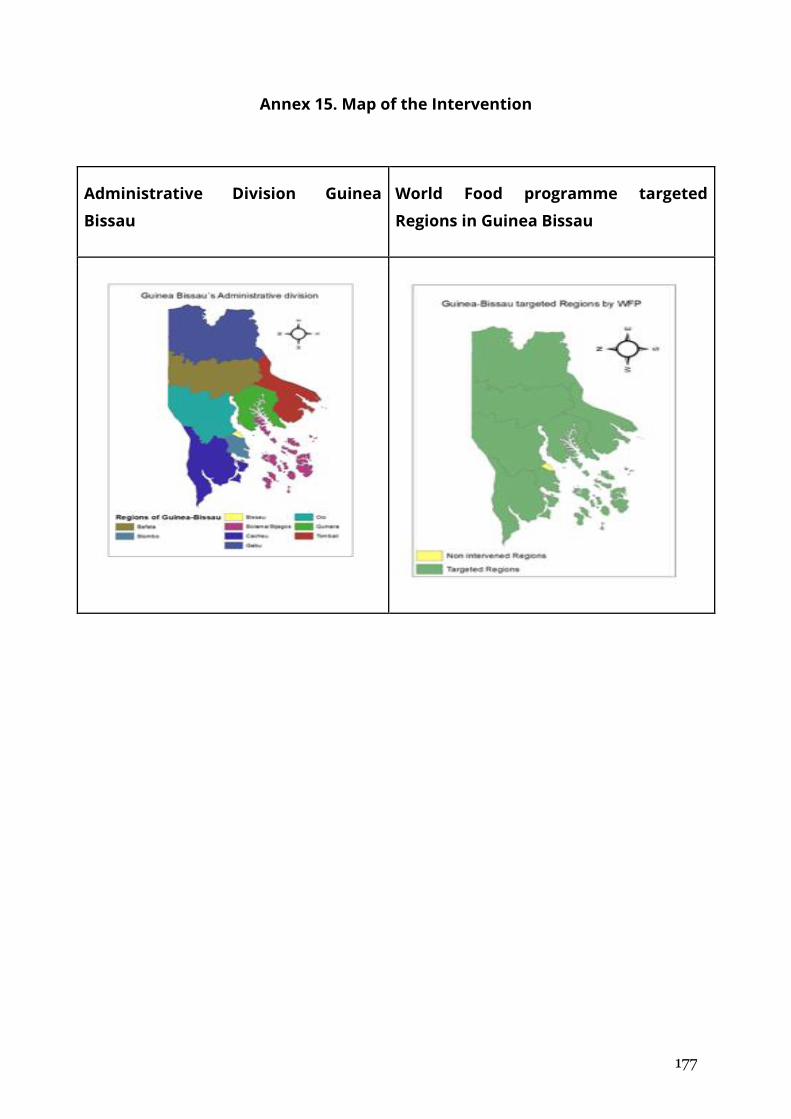
177
Annex 15. Map of the Intervention
Administrative Division Guinea
Bissau
World Food programme targeted
Regions in Guinea Bissau
178
Annex 16. School Feeding Midterm Survey, 2018
1. Introduction
According to the scope of the mid-term evaluation presented on the TOR, the
evaluation firm conducted a primary data collection. The data collection based on
a Quasi-experimental design can determine the impact of the implementation on
a series of variables of interest defined by the stakeholders, mainly WFP and USDA.
The analysis may support the hypothesis that WFP implementation activities have
a positive impact on the variables the initial logical framework aimed to improve;
reduce short term hunger, contribute to school enrolment, attendance,
competition, attentiveness and learning; increase capacity of schools, local,
regional and national entities to manage a SFP; and finally contribute to children
health. The effectiveness of the programme may be measure by the magnitude of
the impact in the variables of interest.
Econometria performed a follow up and update process to the baseline
quantitative information. The baseline a Quasi-experimental survey design, as
mention above, this design was necessary as the current school feeding
programme is not randomly assigned to schools and students throughout Guinea-
Bissau. Two groups of the interests were identified; beneficiaries and non-
beneficiaries of WFP activities in GB. On the other hand three sources of
information were also identified given the scope of the implementation activities
Each sub-category supplies information of interest at a different level of
implementation but can also be contrasted in order to guarantee consistency or
identify anomalies,
2. Baseline School Feeding Survey (2016) Mapping. DGIPASE and WFP first
sampled 50 WFP schools using the probability-proportional-to-size technique.
DGIPASE then selected a comparison group of 50 schools that shared similar
education and socioeconomic indicators but which were not supported by WFP. In
most cases, the comparison schools sampled were from the same sector as the
WFP School (and usually were its nearest neighbour). From each school,
enumerators also randomly sampled ten students from the Grade 4 enrolment
roster; these children were administered the student-level questionnaire. The
enumerators then travelled to these students’ home to administer the household-
level questionnaire. For consistency purposes, the baseline survey was conducted
in the six regions where WFP was supporting the GoGB with school feeding
operations in June 2016: Oio, Bafata, Cacheu, Biombo, Quinara, and Gabu.
3. Survey Mapping. For the mid-term evaluation, sixty school were selected with
equal distribution of treatment and control observations. Thirty schools with WFP
179
assistance were randomly selected in six geographic regions (only the
autonomous sector of Bissau was excluded) based on the fifty originally surveyed
schools (Baseline); only four schools of the sample are “new schools”. Selection of
control schools or not WFP assisted is based on geographic proximity and socio-
economic similarity.
3.1 Midterm SF Survey Process:
Sampling process was carried out between July 17 and August 18 of 2018.
Enumerators applied three different questionnaires that were originally designed
for the baseline survey. Minor adjustments were made (see annex 16), in order to
guarantee consistency. Table 15.1 presents the general results of the survey
process.
• Questionnaire 1: it was applied to the principal of each selected school. The
questionnaire was divided into five sections Information about; general
characteristics, infrastructure characteristics, gender and age distributions,
teaching staff, attendance and enrolment, hygiene practices and most
important the school feeding practices for each school is collected through
questionnaire 1.
• Questionnaire 2: 10 students of each school were selected (five boys & five
girls) from 4thto 6th grade. Questionnaire 2 collected information about the
SFP and the feeding behavior from the student perspective.
• Questionnaire 3: it was applied to the households of the selected students
in order to obtain socio-demographics characteristics and more precise
food consumption information.
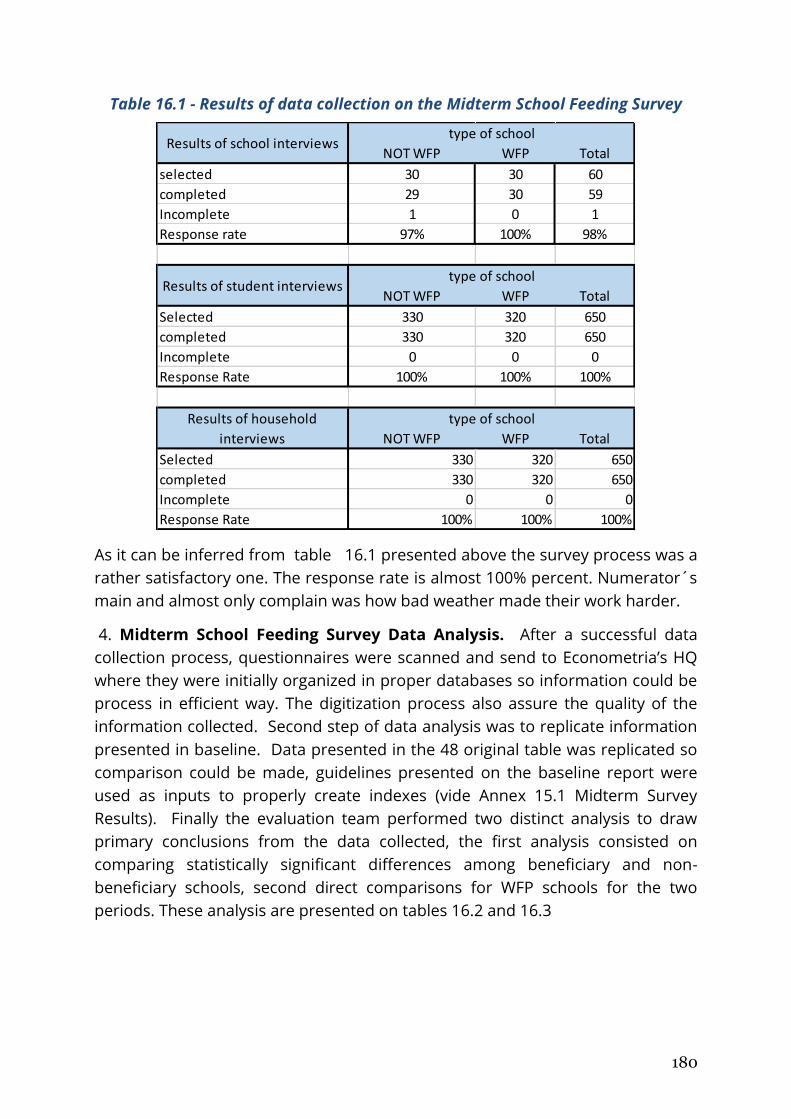
180
Table 16.1 - Results of data collection on the Midterm School Feeding Survey
As it can be inferred from table 16.1 presented above the survey process was a
rather satisfactory one. The response rate is almost 100% percent. Numerator´s
main and almost only complain was how bad weather made their work harder.
4. Midterm School Feeding Survey Data Analysis. After a successful data
collection process, questionnaires were scanned and send to Econometria’s HQ
where they were initially organized in proper databases so information could be
process in efficient way. The digitization process also assure the quality of the
information collected. Second step of data analysis was to replicate information
presented in baseline. Data presented in the 48 original table was replicated so
comparison could be made, guidelines presented on the baseline report were
used as inputs to properly create indexes (vide Annex 15.1 Midterm Survey
Results). Finally the evaluation team performed two distinct analysis to draw
primary conclusions from the data collected, the first analysis consisted on
comparing statistically significant differences among beneficiary and non-
beneficiary schools, second direct comparisons for WFP schools for the two
periods. These analysis are presented on tables 16.2 and 16.3
NOT WFP WFP Total
selected 30 30 60
completed 29 30 59
Incomplete 1 0 1
Response rate 97% 100% 98%
NOT WFP WFP Total
Selected 330 320 650
completed 330 320 650
Incomplete 0 0 0
Response Rate 100% 100% 100%
NOT WFP WFP Total
Selected 330 320 650
completed 330 320 650
Incomplete 0 0 0
Response Rate 100% 100% 100%
type of schoolResults of school interviews
Results of student interviewstype of school
Results of household
interviews
type of school
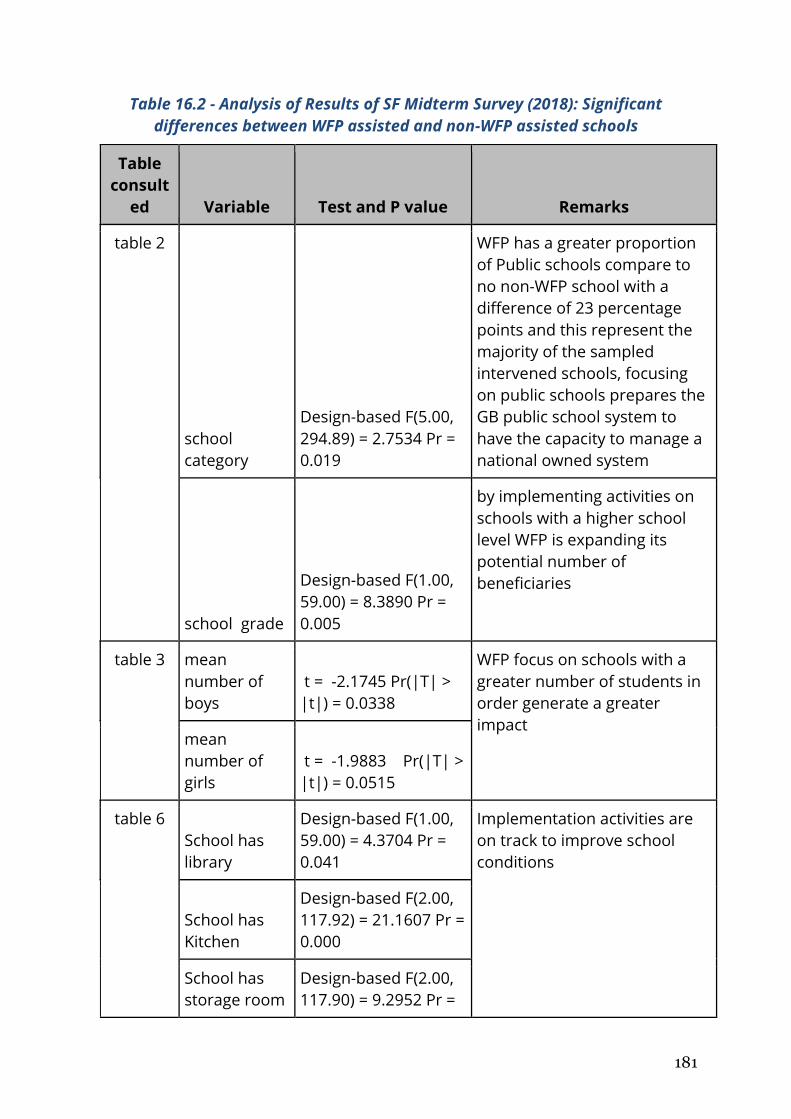
181
Table 16.2 - Analysis of Results of SF Midterm Survey (2018): Significant
differences between WFP assisted and non-WFP assisted schools
Table
consult
ed Variable Test and P value Remarks
table 2
school
category
Design-based F(5.00,
294.89) = 2.7534 Pr =
0.019
WFP has a greater proportion
of Public schools compare to
no non-WFP school with a
difference of 23 percentage
points and this represent the
majority of the sampled
intervened schools, focusing
on public schools prepares the
GB public school system to
have the capacity to manage a
national owned system
school grade
Design-based F(1.00,
59.00) = 8.3890 Pr =
0.005
by implementing activities on
schools with a higher school
level WFP is expanding its
potential number of
beneficiaries
table 3 mean
number of
boys
t = -2.1745 Pr(|T| >
|t|) = 0.0338
WFP focus on schools with a
greater number of students in
order generate a greater
impact mean
number of
girls
t = -1.9883 Pr(|T| >
|t|) = 0.0515
table 6
School has
library
Design-based F(1.00,
59.00) = 4.3704 Pr =
0.041
Implementation activities are
on track to improve school
conditions
School has
Kitchen
Design-based F(2.00,
117.92) = 21.1607 Pr =
0.000
School has
storage room
Design-based F(2.00,
117.90) = 9.2952 Pr =
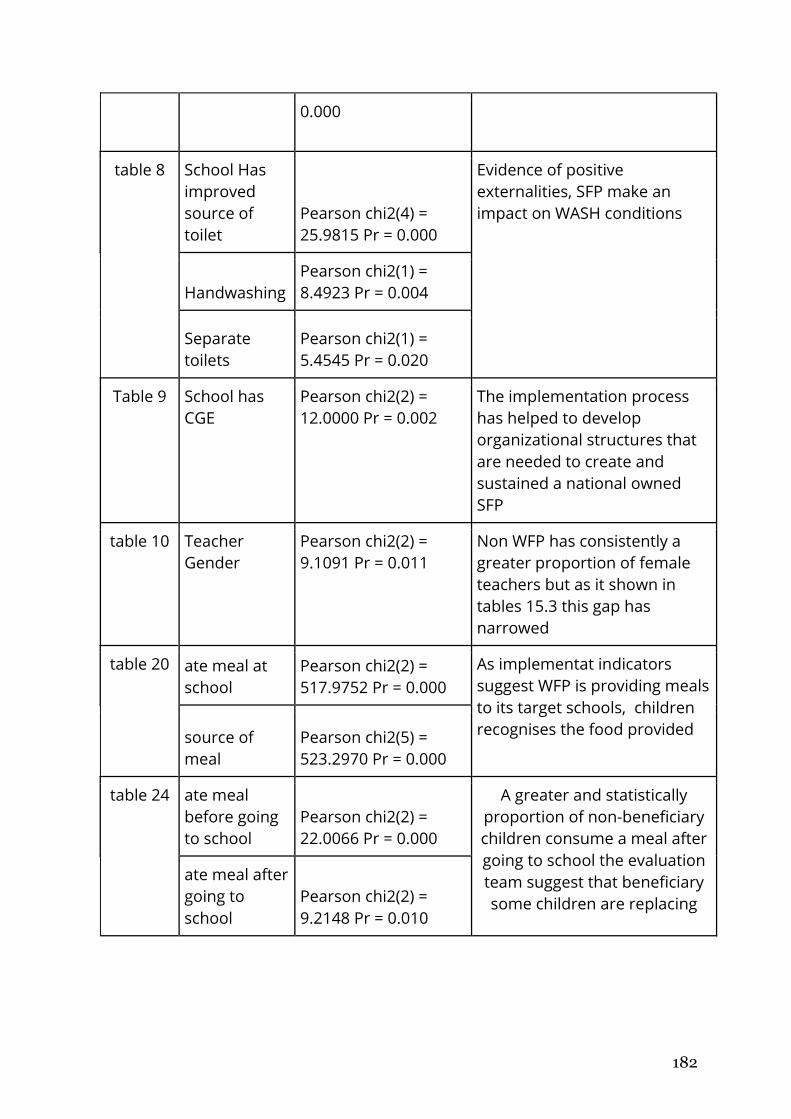
182
0.000
table 8 School Has
improved
source of
toilet
Pearson chi2(4) =
25.9815 Pr = 0.000
Evidence of positive
externalities, SFP make an
impact on WASH conditions
Handwashing
Pearson chi2(1) =
8.4923 Pr = 0.004
Separate
toilets
Pearson chi2(1) =
5.4545 Pr = 0.020
Table 9 School has
CGE
Pearson chi2(2) =
12.0000 Pr = 0.002
The implementation process
has helped to develop
organizational structures that
are needed to create and
sustained a national owned
SFP
table 10 Teacher
Gender
Pearson chi2(2) =
9.1091 Pr = 0.011
Non WFP has consistently a
greater proportion of female
teachers but as it shown in
tables 15.3 this gap has
narrowed
table 20 ate meal at
school
Pearson chi2(2) =
517.9752 Pr = 0.000
As implementat indicators
suggest WFP is providing meals
to its target schools, children
recognises the food provided source of
meal
Pearson chi2(5) =
523.2970 Pr = 0.000
table 24 ate meal
before going
to school
Pearson chi2(2) =
22.0066 Pr = 0.000
A greater and statistically
proportion of non-beneficiary
children consume a meal after
going to school the evaluation
team suggest that beneficiary
some children are replacing
ate meal after
going to
school
Pearson chi2(2) =
9.2148 Pr = 0.010
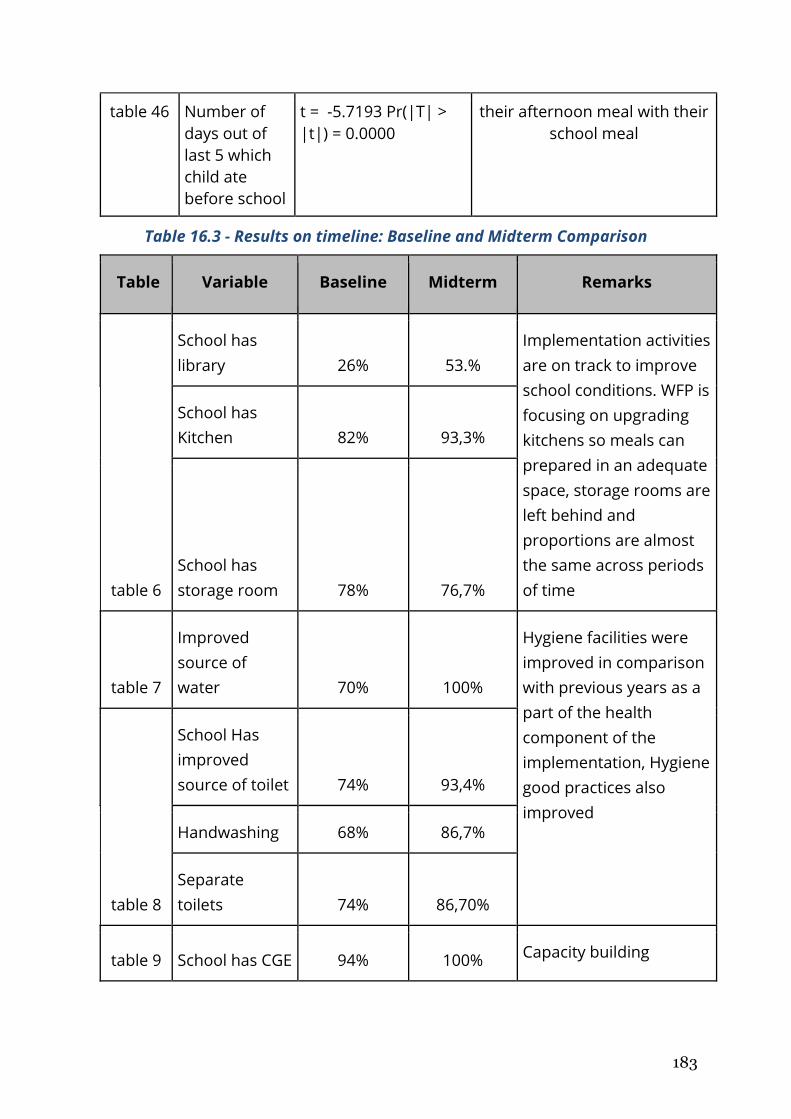
183
table 46 Number of
days out of
last 5 which
child ate
before school
t = -5.7193 Pr(|T| >
|t|) = 0.0000
their afternoon meal with their
school meal
Table 16.3 - Results on timeline: Baseline and Midterm Comparison
Table Variable Baseline Midterm Remarks
table 6
School has
library 26% 53.%
Implementation activities
are on track to improve
school conditions. WFP is
focusing on upgrading
kitchens so meals can
prepared in an adequate
space, storage rooms are
left behind and
proportions are almost
the same across periods
of time
School has
Kitchen 82% 93,3%
School has
storage room 78% 76,7%
table 7
Improved
source of
water 70% 100%
Hygiene facilities were
improved in comparison
with previous years as a
part of the health
component of the
implementation, Hygiene
good practices also
improved
table 8
School Has
improved
source of toilet 74% 93,4%
Handwashing 68% 86,7%
Separate
toilets 74% 86,70%
table 9 School has CGE 94% 100% Capacity building
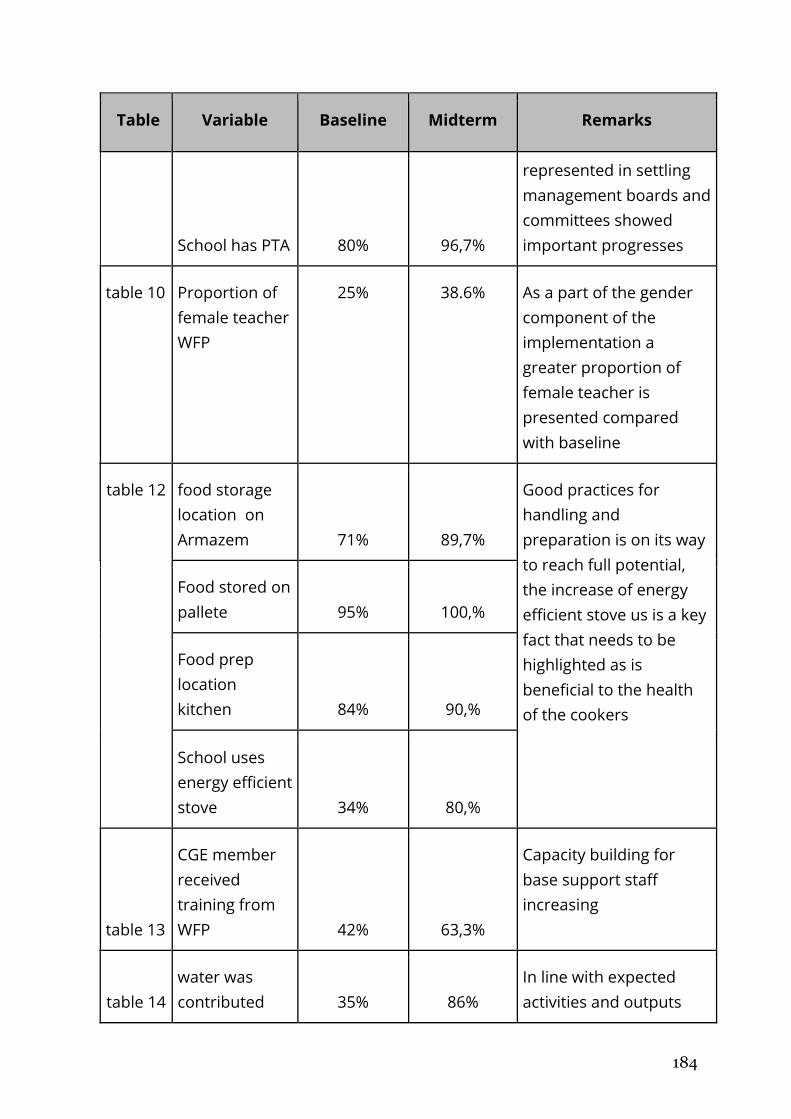
184
Table Variable Baseline Midterm Remarks
School has PTA 80% 96,7%
represented in settling
management boards and
committees showed
important progresses
table 10 Proportion of
female teacher
WFP
25% 38.6% As a part of the gender
component of the
implementation a
greater proportion of
female teacher is
presented compared
with baseline
table 12 food storage
location on
Armazem 71% 89,7%
Good practices for
handling and
preparation is on its way
to reach full potential,
the increase of energy
efficient stove us is a key
fact that needs to be
highlighted as is
beneficial to the health
of the cookers
Food stored on
pallete 95% 100,%
Food prep
location
kitchen 84% 90,%
School uses
energy efficient
stove 34% 80,%
table 13
CGE member
received
training from
WFP 42% 63,3%
Capacity building for
base support staff
increasing
table 14
water was
contributed 35% 86%
In line with expected
activities and outputs
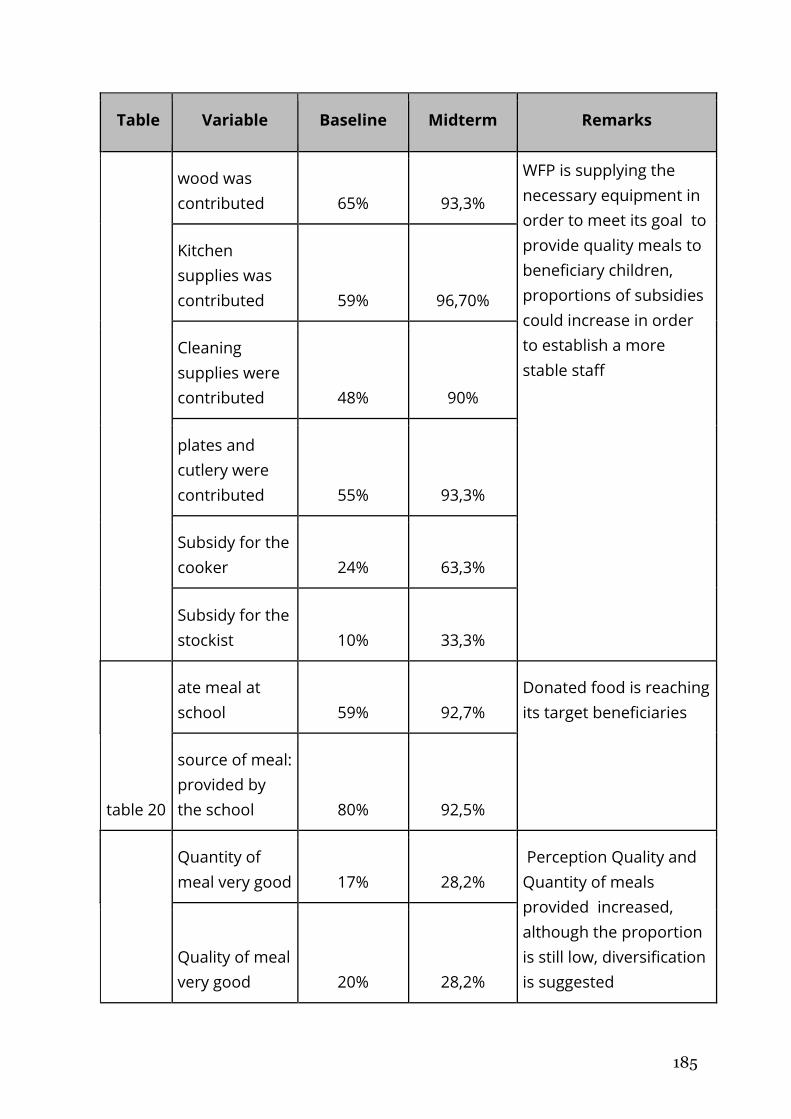
185
Table Variable Baseline Midterm Remarks
wood was
contributed 65% 93,3%
WFP is supplying the
necessary equipment in
order to meet its goal to
provide quality meals to
beneficiary children,
proportions of subsidies
could increase in order
to establish a more
stable staff
Kitchen
supplies was
contributed 59% 96,70%
Cleaning
supplies were
contributed 48% 90%
plates and
cutlery were
contributed 55% 93,3%
Subsidy for the
cooker 24% 63,3%
Subsidy for the
stockist 10% 33,3%
table 20
ate meal at
school 59% 92,7%
Donated food is reaching
its target beneficiaries
source of meal:
provided by
the school 80% 92,5%
Quantity of
meal very good 17% 28,2%
Perception Quality and
Quantity of meals
provided increased,
although the proportion
is still low, diversification
is suggested
Quality of meal
very good 20% 28,2%

186
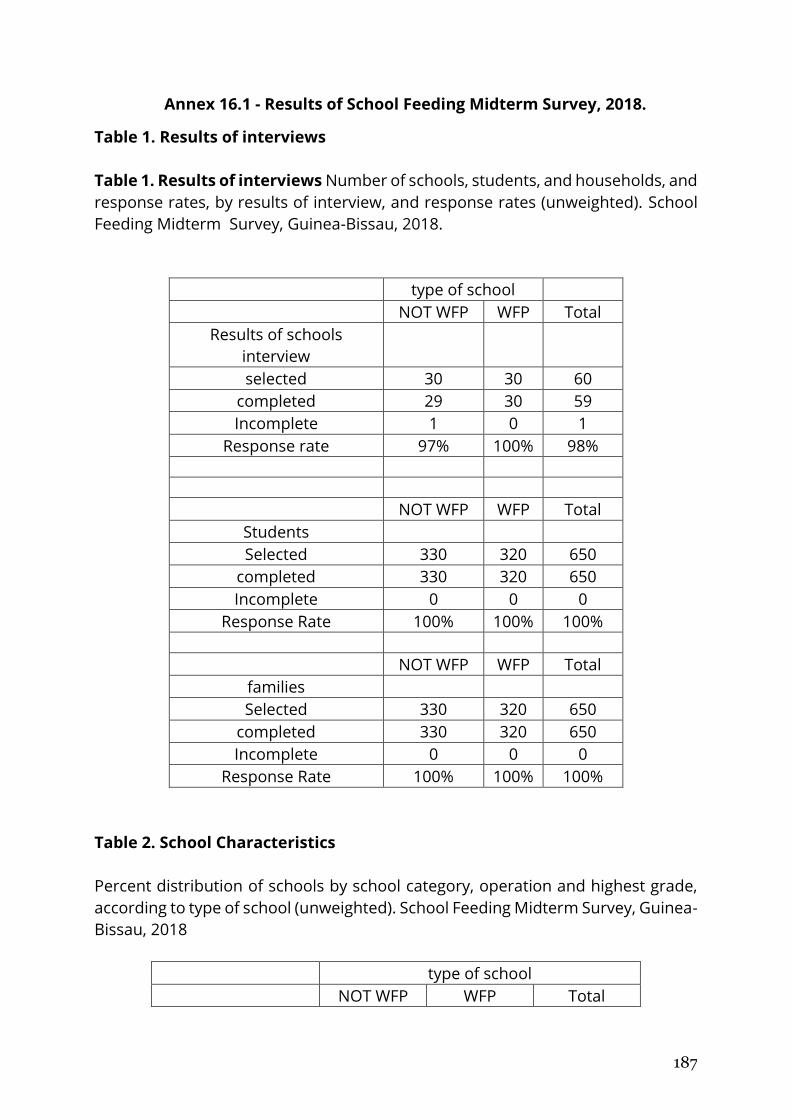
187
Annex 16.1 - Results of School Feeding Midterm Survey, 2018.
Table 1. Results of interviews
Table 1. Results of interviews Number of schools, students, and households, and
response rates, by results of interview, and response rates (unweighted). School
Feeding Midterm Survey, Guinea-Bissau, 2018.
type of school
NOT WFP WFP Total
Results of schools
interview
selected 30 30 60
completed 29 30 59
Incomplete 1 0 1
Response rate 97% 100% 98%
NOT WFP WFP Total
Students Selected 330 320 650
completed 330 320 650
Incomplete 0 0 0
Response Rate 100% 100% 100%
NOT WFP WFP Total
families Selected 330 320 650
completed 330 320 650
Incomplete 0 0 0
Response Rate 100% 100% 100%
Table 2. School Characteristics
Percent distribution of schools by school category, operation and highest grade,
according to type of school (unweighted). School Feeding Midterm Survey, Guinea-
Bissau, 2018
type of school
NOT WFP WFP Total
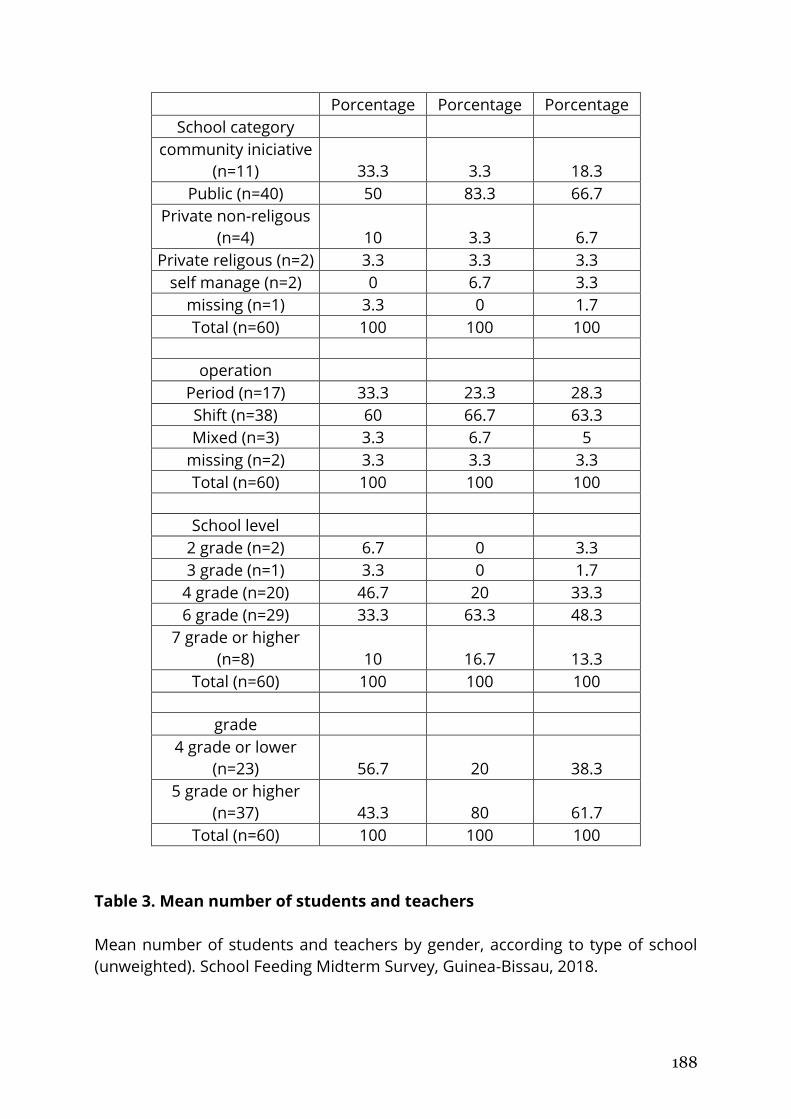
188
Porcentage Porcentage Porcentage
School category community iniciative
(n=11) 33.3 3.3 18.3
Public (n=40) 50 83.3 66.7
Private non-religous
(n=4) 10 3.3 6.7
Private religous (n=2) 3.3 3.3 3.3
self manage (n=2) 0 6.7 3.3
missing (n=1) 3.3 0 1.7
Total (n=60) 100 100 100
operation
Period (n=17) 33.3 23.3 28.3
Shift (n=38) 60 66.7 63.3
Mixed (n=3) 3.3 6.7 5
missing (n=2) 3.3 3.3 3.3
Total (n=60) 100 100 100
School level
2 grade (n=2) 6.7 0 3.3
3 grade (n=1) 3.3 0 1.7
4 grade (n=20) 46.7 20 33.3
6 grade (n=29) 33.3 63.3 48.3
7 grade or higher
(n=8) 10 16.7 13.3
Total (n=60) 100 100 100
grade
4 grade or lower
(n=23) 56.7 20 38.3
5 grade or higher
(n=37) 43.3 80 61.7
Total (n=60) 100 100 100
Table 3. Mean number of students and teachers
Mean number of students and teachers by gender, according to type of school
(unweighted). School Feeding Midterm Survey, Guinea-Bissau, 2018.
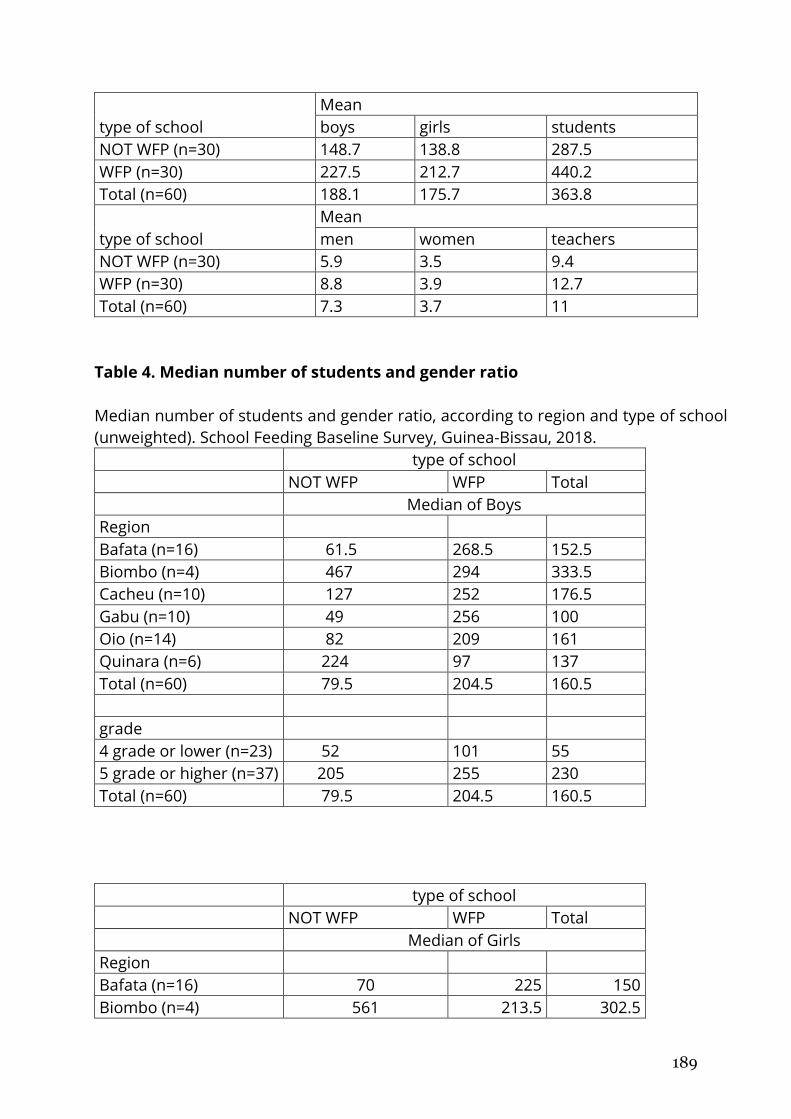
189
type of school
Mean
boys girls students
NOT WFP (n=30) 148.7 138.8 287.5
WFP (n=30) 227.5 212.7 440.2
Total (n=60) 188.1 175.7 363.8
type of school
Mean
men women teachers
NOT WFP (n=30) 5.9 3.5 9.4
WFP (n=30) 8.8 3.9 12.7
Total (n=60) 7.3 3.7 11
Table 4. Median number of students and gender ratio
Median number of students and gender ratio, according to region and type of school
(unweighted). School Feeding Baseline Survey, Guinea-Bissau, 2018.
type of school
NOT WFP WFP Total
Median of Boys
Region Bafata (n=16) 61.5 268.5 152.5
Biombo (n=4) 467 294 333.5
Cacheu (n=10) 127 252 176.5
Gabu (n=10) 49 256 100
Oio (n=14) 82 209 161
Quinara (n=6) 224 97 137
Total (n=60) 79.5 204.5 160.5
grade 4 grade or lower (n=23) 52 101 55
5 grade or higher (n=37) 205 255 230
Total (n=60) 79.5 204.5 160.5
type of school
NOT WFP WFP Total
Median of Girls
Region Bafata (n=16) 70 225 150
Biombo (n=4) 561 213.5 302.5
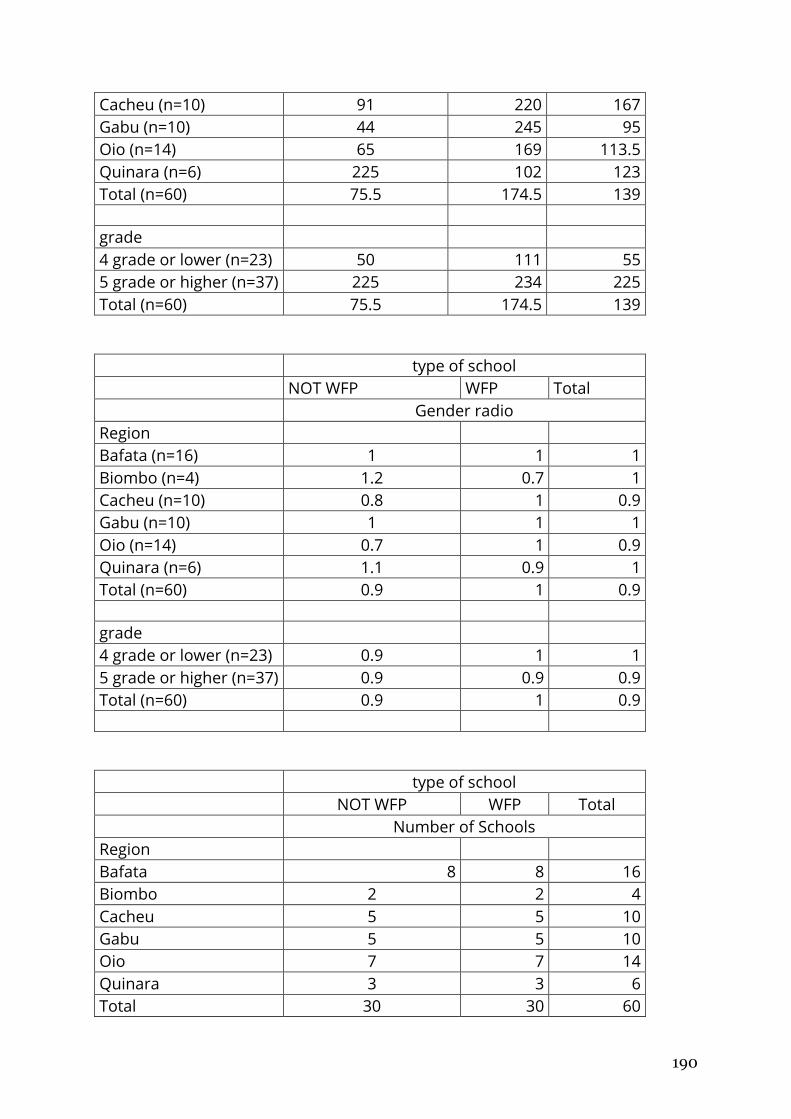
190
Cacheu (n=10) 91 220 167
Gabu (n=10) 44 245 95
Oio (n=14) 65 169 113.5
Quinara (n=6) 225 102 123
Total (n=60) 75.5 174.5 139
grade 4 grade or lower (n=23) 50 111 55
5 grade or higher (n=37) 225 234 225
Total (n=60) 75.5 174.5 139
type of school
NOT WFP WFP Total
Gender radio
Region Bafata (n=16) 1 1 1
Biombo (n=4) 1.2 0.7 1
Cacheu (n=10) 0.8 1 0.9
Gabu (n=10) 1 1 1
Oio (n=14) 0.7 1 0.9
Quinara (n=6) 1.1 0.9 1
Total (n=60) 0.9 1 0.9
grade 4 grade or lower (n=23) 0.9 1 1
5 grade or higher (n=37) 0.9 0.9 0.9
Total (n=60) 0.9 1 0.9
type of school
NOT WFP WFP Total
Number of Schools
Region
Bafata 8 8 16
Biombo 2 2 4
Cacheu 5 5 10
Gabu 5 5 10
Oio 7 7 14
Quinara 3 3 6
Total 30 30 60
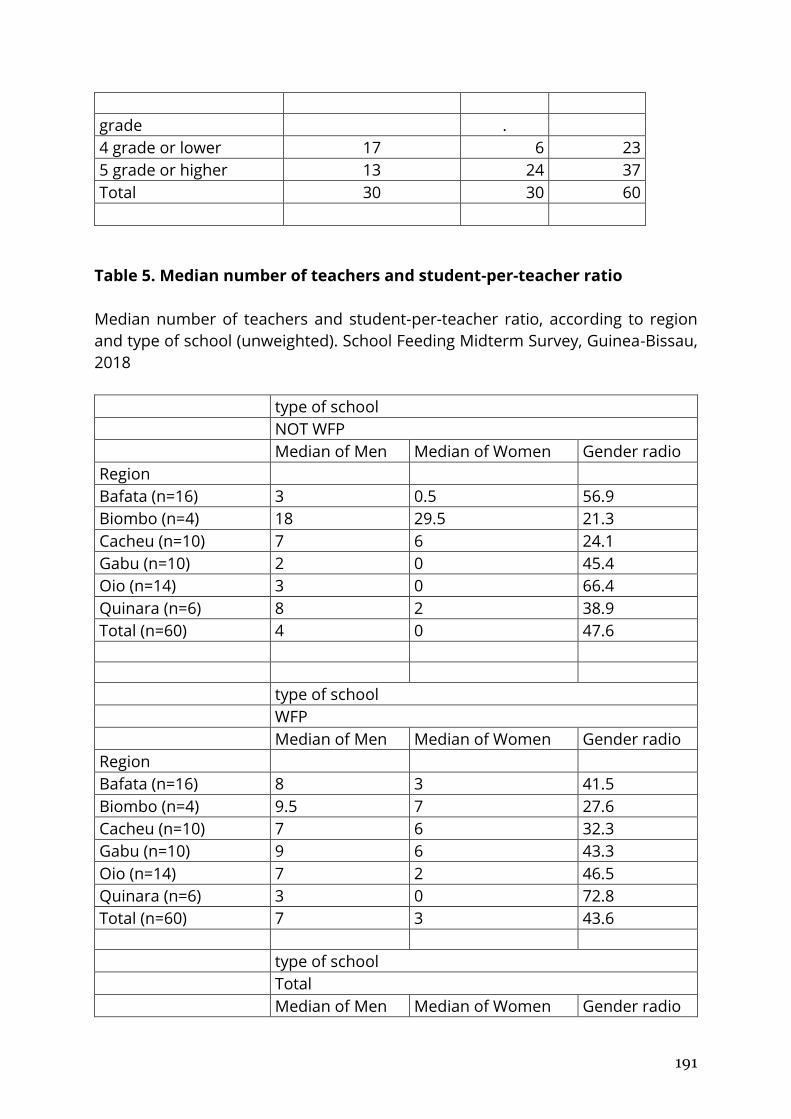
191
grade . 4 grade or lower 17 6 23
5 grade or higher 13 24 37
Total 30 30 60
Table 5. Median number of teachers and student-per-teacher ratio
Median number of teachers and student-per-teacher ratio, according to region
and type of school (unweighted). School Feeding Midterm Survey, Guinea-Bissau,
2018
type of school
NOT WFP
Median of Men Median of Women Gender radio
Region Bafata (n=16) 3 0.5 56.9
Biombo (n=4) 18 29.5 21.3
Cacheu (n=10) 7 6 24.1
Gabu (n=10) 2 0 45.4
Oio (n=14) 3 0 66.4
Quinara (n=6) 8 2 38.9
Total (n=60) 4 0 47.6
type of school
WFP
Median of Men Median of Women Gender radio
Region Bafata (n=16) 8 3 41.5
Biombo (n=4) 9.5 7 27.6
Cacheu (n=10) 7 6 32.3
Gabu (n=10) 9 6 43.3
Oio (n=14) 7 2 46.5
Quinara (n=6) 3 0 72.8
Total (n=60) 7 3 43.6
type of school
Total
Median of Men Median of Women Gender radio
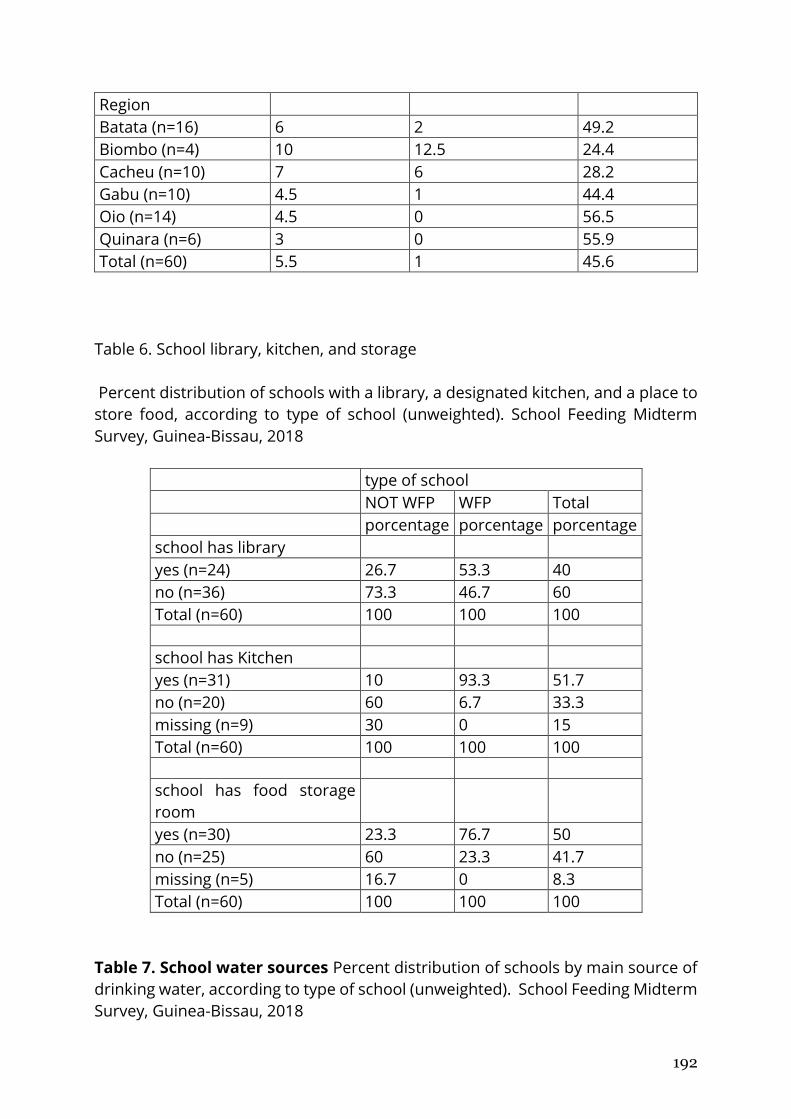
192
Region Batata (n=16) 6 2 49.2
Biombo (n=4) 10 12.5 24.4
Cacheu (n=10) 7 6 28.2
Gabu (n=10) 4.5 1 44.4
Oio (n=14) 4.5 0 56.5
Quinara (n=6) 3 0 55.9
Total (n=60) 5.5 1 45.6
Table 6. School library, kitchen, and storage
Percent distribution of schools with a library, a designated kitchen, and a place to
store food, according to type of school (unweighted). School Feeding Midterm
Survey, Guinea-Bissau, 2018
type of school
NOT WFP WFP Total
porcentage porcentage porcentage
school has library yes (n=24) 26.7 53.3 40
no (n=36) 73.3 46.7 60
Total (n=60) 100 100 100
school has Kitchen yes (n=31) 10 93.3 51.7
no (n=20) 60 6.7 33.3
missing (n=9) 30 0 15
Total (n=60) 100 100 100
school has food storage
room yes (n=30) 23.3 76.7 50
no (n=25) 60 23.3 41.7
missing (n=5) 16.7 0 8.3
Total (n=60) 100 100 100
Table 7. School water sources Percent distribution of schools by main source of
drinking water, according to type of school (unweighted). School Feeding Midterm
Survey, Guinea-Bissau, 2018
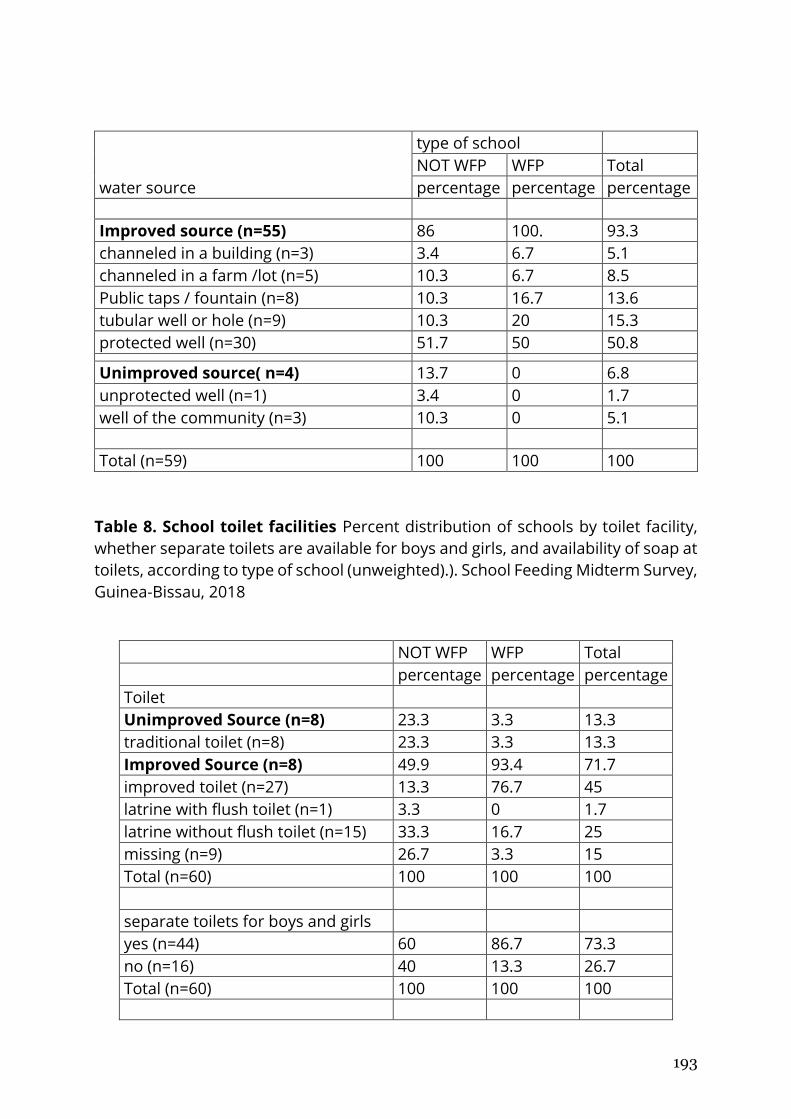
193
water source
type of school
NOT WFP WFP Total
percentage percentage percentage
Improved source (n=55) 86 100. 93.3
channeled in a building (n=3) 3.4 6.7 5.1
channeled in a farm /lot (n=5) 10.3 6.7 8.5
Public taps / fountain (n=8) 10.3 16.7 13.6
tubular well or hole (n=9) 10.3 20 15.3
protected well (n=30) 51.7 50 50.8 Unimproved source( n=4) 13.7 0 6.8
unprotected well (n=1) 3.4 0 1.7
well of the community (n=3) 10.3 0 5.1
Total (n=59) 100 100 100
Table 8. School toilet facilities Percent distribution of schools by toilet facility,
whether separate toilets are available for boys and girls, and availability of soap at
toilets, according to type of school (unweighted).). School Feeding Midterm Survey,
Guinea-Bissau, 2018
NOT WFP WFP Total
percentage percentage percentage
Toilet Unimproved Source (n=8) 23.3 3.3 13.3
traditional toilet (n=8) 23.3 3.3 13.3
Improved Source (n=8) 49.9 93.4 71.7
improved toilet (n=27) 13.3 76.7 45
latrine with flush toilet (n=1) 3.3 0 1.7
latrine without flush toilet (n=15) 33.3 16.7 25
missing (n=9) 26.7 3.3 15
Total (n=60) 100 100 100
separate toilets for boys and girls
yes (n=44) 60 86.7 73.3
no (n=16) 40 13.3 26.7
Total (n=60) 100 100 100
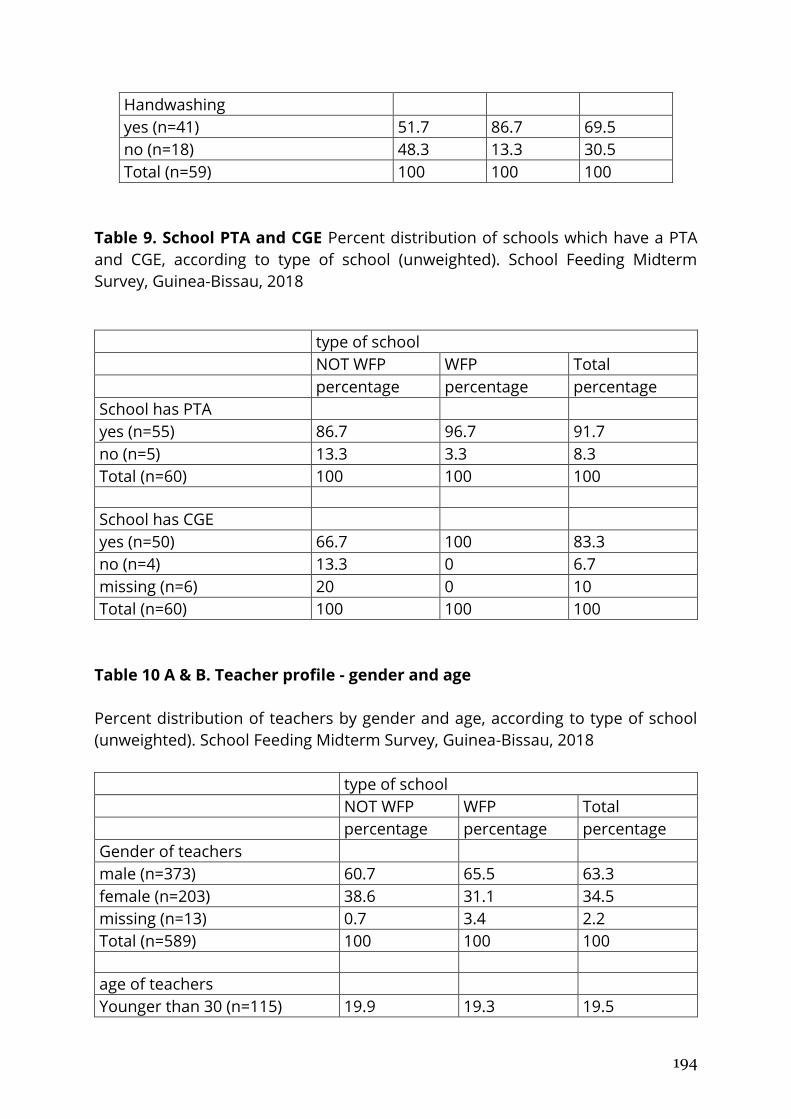
194
Handwashing
yes (n=41) 51.7 86.7 69.5
no (n=18) 48.3 13.3 30.5
Total (n=59) 100 100 100
Table 9. School PTA and CGE Percent distribution of schools which have a PTA
and CGE, according to type of school (unweighted). School Feeding Midterm
Survey, Guinea-Bissau, 2018
type of school
NOT WFP WFP Total
percentage percentage percentage
School has PTA yes (n=55) 86.7 96.7 91.7
no (n=5) 13.3 3.3 8.3
Total (n=60) 100 100 100
School has CGE yes (n=50) 66.7 100 83.3
no (n=4) 13.3 0 6.7
missing (n=6) 20 0 10
Total (n=60) 100 100 100
Table 10 A & B. Teacher profile - gender and age
Percent distribution of teachers by gender and age, according to type of school
(unweighted). School Feeding Midterm Survey, Guinea-Bissau, 2018
type of school
NOT WFP WFP Total
percentage percentage percentage
Gender of teachers male (n=373) 60.7 65.5 63.3
female (n=203) 38.6 31.1 34.5
missing (n=13) 0.7 3.4 2.2
Total (n=589) 100 100 100
age of teachers Younger than 30 (n=115) 19.9 19.3 19.5
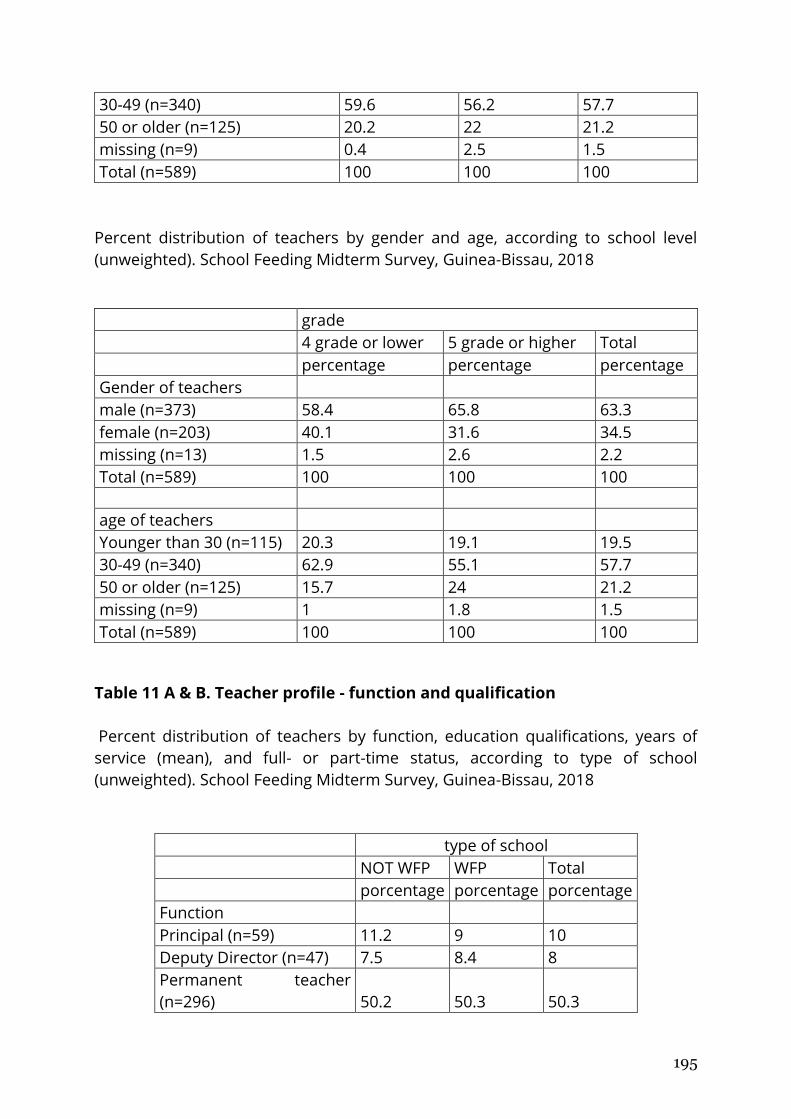
195
30-49 (n=340) 59.6 56.2 57.7
50 or older (n=125) 20.2 22 21.2
missing (n=9) 0.4 2.5 1.5
Total (n=589) 100 100 100
Percent distribution of teachers by gender and age, according to school level
(unweighted). School Feeding Midterm Survey, Guinea-Bissau, 2018
grade
4 grade or lower 5 grade or higher Total
percentage percentage percentage
Gender of teachers male (n=373) 58.4 65.8 63.3
female (n=203) 40.1 31.6 34.5
missing (n=13) 1.5 2.6 2.2
Total (n=589) 100 100 100
age of teachers Younger than 30 (n=115) 20.3 19.1 19.5
30-49 (n=340) 62.9 55.1 57.7
50 or older (n=125) 15.7 24 21.2
missing (n=9) 1 1.8 1.5
Total (n=589) 100 100 100
Table 11 A & B. Teacher profile - function and qualification
Percent distribution of teachers by function, education qualifications, years of
service (mean), and full- or part-time status, according to type of school
(unweighted). School Feeding Midterm Survey, Guinea-Bissau, 2018
type of school
NOT WFP WFP Total
porcentage porcentage porcentage
Function
Principal (n=59) 11.2 9 10
Deputy Director (n=47) 7.5 8.4 8
Permanent teacher
(n=296) 50.2 50.3 50.3
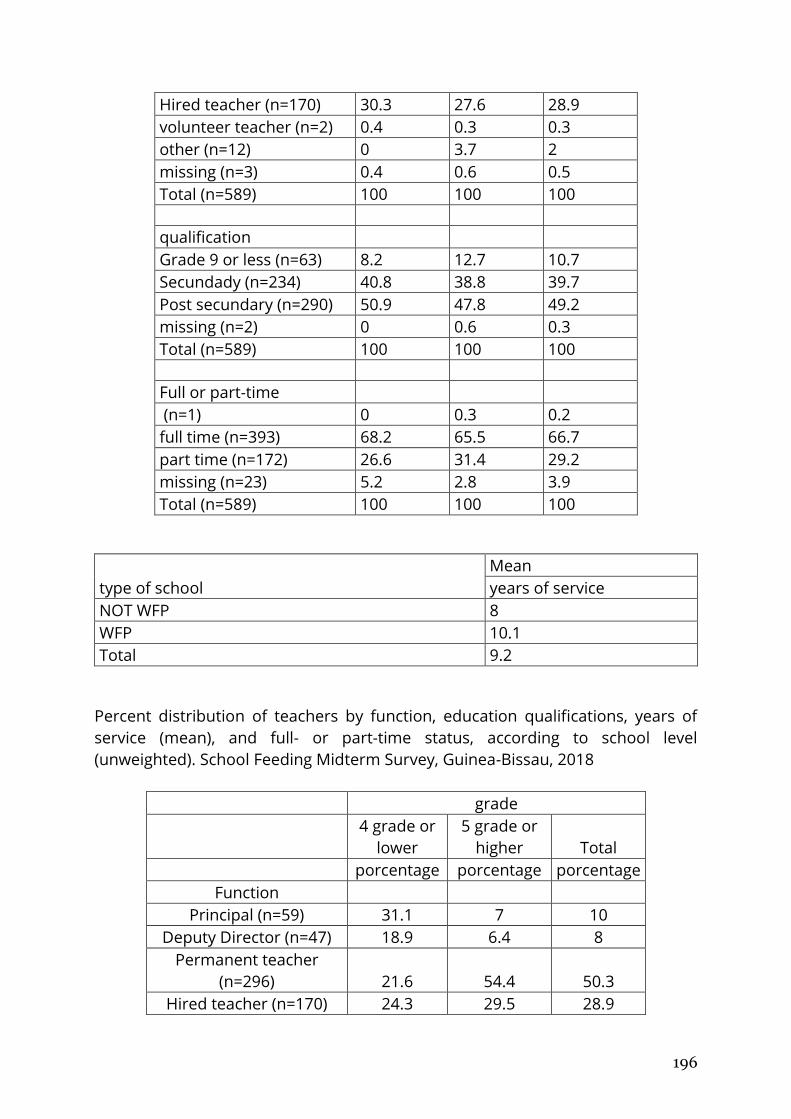
196
Hired teacher (n=170) 30.3 27.6 28.9
volunteer teacher (n=2) 0.4 0.3 0.3
other (n=12) 0 3.7 2
missing (n=3) 0.4 0.6 0.5
Total (n=589) 100 100 100
qualification Grade 9 or less (n=63) 8.2 12.7 10.7
Secundady (n=234) 40.8 38.8 39.7
Post secundary (n=290) 50.9 47.8 49.2
missing (n=2) 0 0.6 0.3
Total (n=589) 100 100 100
Full or part-time (n=1) 0 0.3 0.2
full time (n=393) 68.2 65.5 66.7
part time (n=172) 26.6 31.4 29.2
missing (n=23) 5.2 2.8 3.9
Total (n=589) 100 100 100
type of school
Mean
years of service
NOT WFP 8
WFP 10.1
Total 9.2
Percent distribution of teachers by function, education qualifications, years of
service (mean), and full- or part-time status, according to school level
(unweighted). School Feeding Midterm Survey, Guinea-Bissau, 2018
grade
4 grade or
lower
5 grade or
higher Total
porcentage porcentage porcentage
Function Principal (n=59) 31.1 7 10
Deputy Director (n=47) 18.9 6.4 8
Permanent teacher
(n=296) 21.6 54.4 50.3
Hired teacher (n=170) 24.3 29.5 28.9
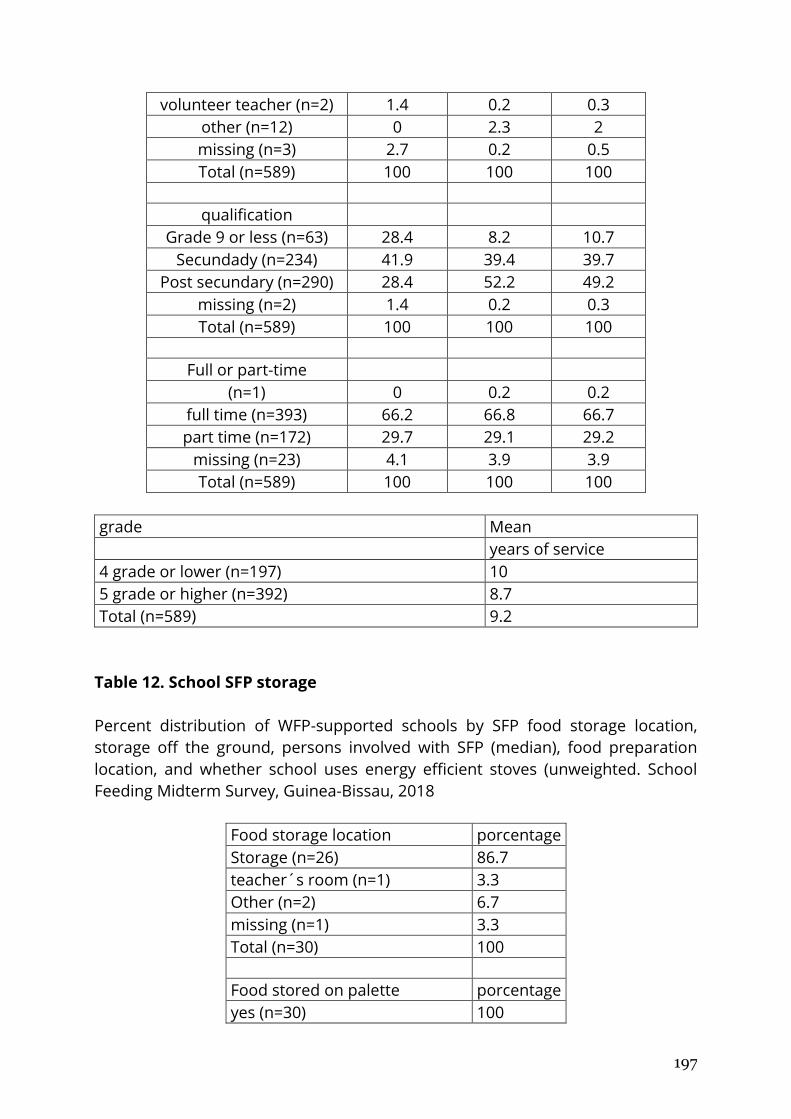
197
volunteer teacher (n=2) 1.4 0.2 0.3
other (n=12) 0 2.3 2
missing (n=3) 2.7 0.2 0.5
Total (n=589) 100 100 100
qualification
Grade 9 or less (n=63) 28.4 8.2 10.7
Secundady (n=234) 41.9 39.4 39.7
Post secundary (n=290) 28.4 52.2 49.2
missing (n=2) 1.4 0.2 0.3
Total (n=589) 100 100 100
Full or part-time
(n=1) 0 0.2 0.2
full time (n=393) 66.2 66.8 66.7
part time (n=172) 29.7 29.1 29.2
missing (n=23) 4.1 3.9 3.9
Total (n=589) 100 100 100
grade Mean
years of service
4 grade or lower (n=197) 10
5 grade or higher (n=392) 8.7
Total (n=589) 9.2
Table 12. School SFP storage
Percent distribution of WFP-supported schools by SFP food storage location,
storage off the ground, persons involved with SFP (median), food preparation
location, and whether school uses energy efficient stoves (unweighted. School
Feeding Midterm Survey, Guinea-Bissau, 2018
Food storage location porcentage
Storage (n=26) 86.7
teacher´s room (n=1) 3.3
Other (n=2) 6.7
missing (n=1) 3.3
Total (n=30) 100
Food stored on palette porcentage
yes (n=30) 100
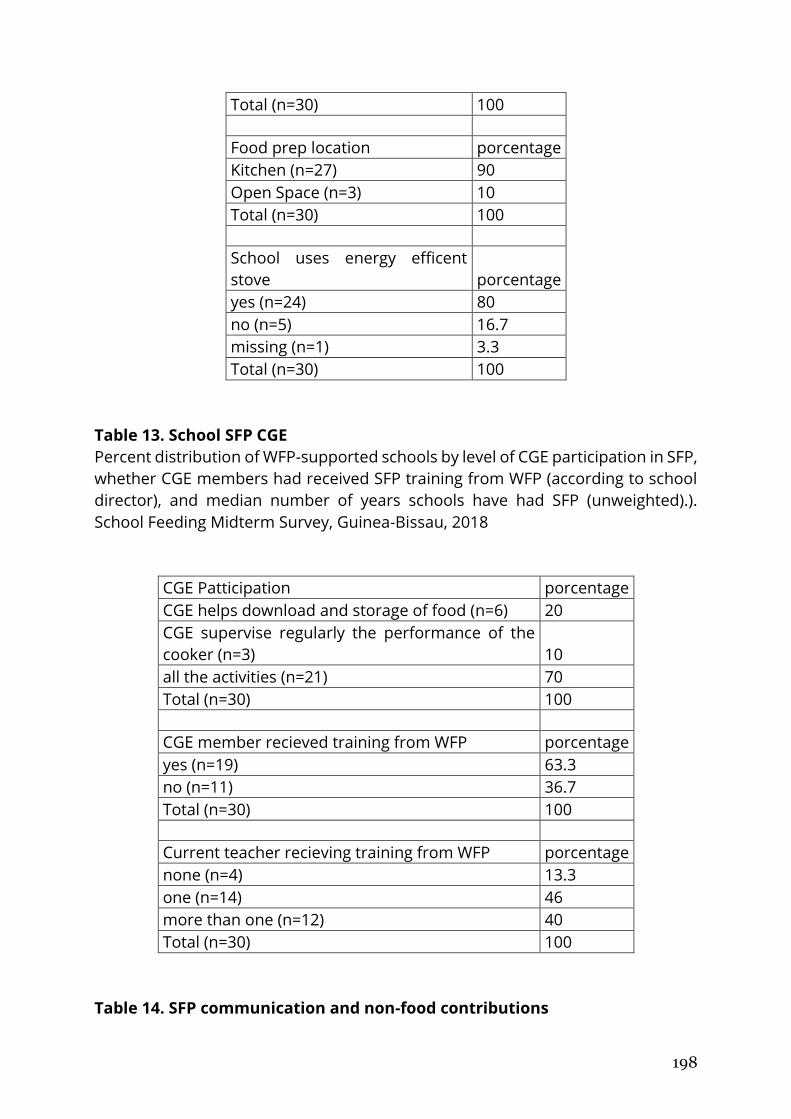
198
Total (n=30) 100
Food prep location porcentage
Kitchen (n=27) 90
Open Space (n=3) 10
Total (n=30) 100
School uses energy efficent
stove porcentage
yes (n=24) 80
no (n=5) 16.7
missing (n=1) 3.3
Total (n=30) 100
Table 13. School SFP CGE
Percent distribution of WFP-supported schools by level of CGE participation in SFP,
whether CGE members had received SFP training from WFP (according to school
director), and median number of years schools have had SFP (unweighted).).
School Feeding Midterm Survey, Guinea-Bissau, 2018
CGE Patticipation porcentage
CGE helps download and storage of food (n=6) 20
CGE supervise regularly the performance of the
cooker (n=3) 10
all the activities (n=21) 70
Total (n=30) 100
CGE member recieved training from WFP porcentage
yes (n=19) 63.3
no (n=11) 36.7
Total (n=30) 100
Current teacher recieving training from WFP porcentage
none (n=4) 13.3
one (n=14) 46
more than one (n=12) 40
Total (n=30) 100
Table 14. SFP communication and non-food contributions
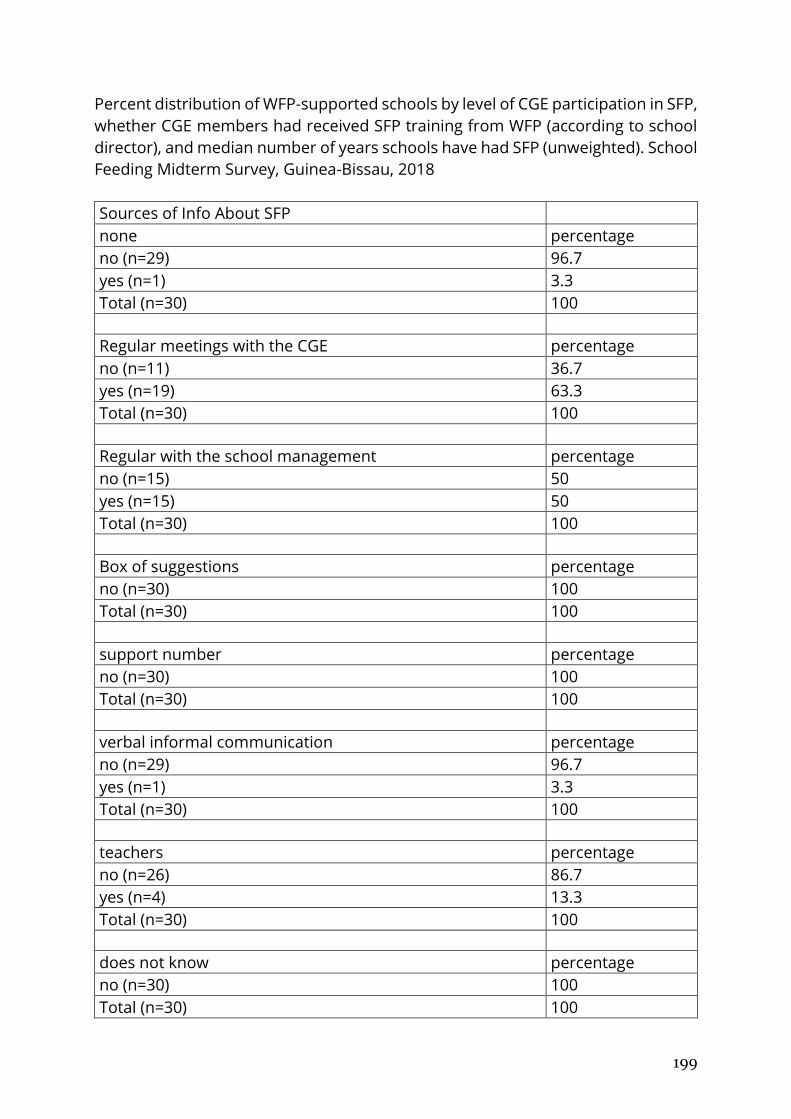
199
Percent distribution of WFP-supported schools by level of CGE participation in SFP,
whether CGE members had received SFP training from WFP (according to school
director), and median number of years schools have had SFP (unweighted). School
Feeding Midterm Survey, Guinea-Bissau, 2018
Sources of Info About SFP
none percentage
no (n=29) 96.7
yes (n=1) 3.3
Total (n=30) 100
Regular meetings with the CGE percentage
no (n=11) 36.7
yes (n=19) 63.3
Total (n=30) 100
Regular with the school management percentage
no (n=15) 50
yes (n=15) 50
Total (n=30) 100
Box of suggestions percentage
no (n=30) 100
Total (n=30) 100
support number percentage
no (n=30) 100
Total (n=30) 100
verbal informal communication percentage
no (n=29) 96.7
yes (n=1) 3.3
Total (n=30) 100
teachers percentage
no (n=26) 86.7
yes (n=4) 13.3
Total (n=30) 100
does not know percentage
no (n=30) 100
Total (n=30) 100
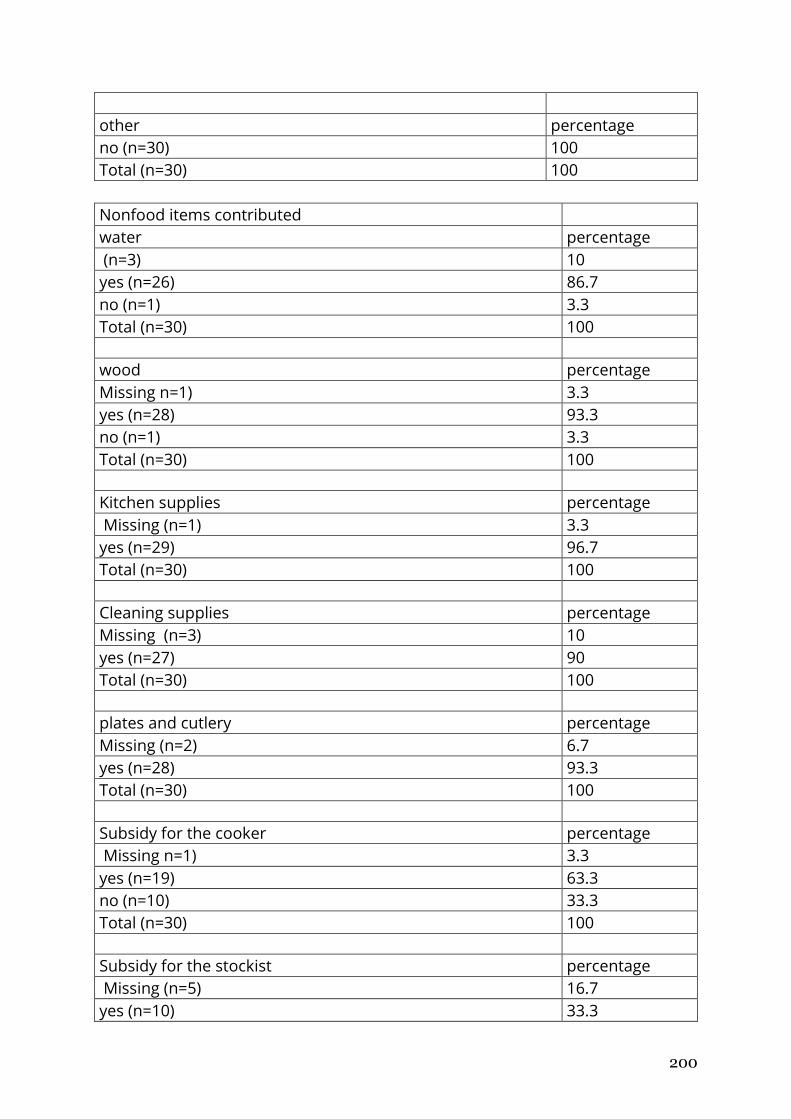
200
other percentage
no (n=30) 100
Total (n=30) 100
Nonfood items contributed
water percentage
(n=3) 10
yes (n=26) 86.7
no (n=1) 3.3
Total (n=30) 100
wood percentage
Missing n=1) 3.3
yes (n=28) 93.3
no (n=1) 3.3
Total (n=30) 100
Kitchen supplies percentage
Missing (n=1) 3.3
yes (n=29) 96.7
Total (n=30) 100
Cleaning supplies percentage
Missing (n=3) 10
yes (n=27) 90
Total (n=30) 100
plates and cutlery percentage
Missing (n=2) 6.7
yes (n=28) 93.3
Total (n=30) 100
Subsidy for the cooker percentage
Missing n=1) 3.3
yes (n=19) 63.3
no (n=10) 33.3
Total (n=30) 100
Subsidy for the stockist percentage
Missing (n=5) 16.7
yes (n=10) 33.3
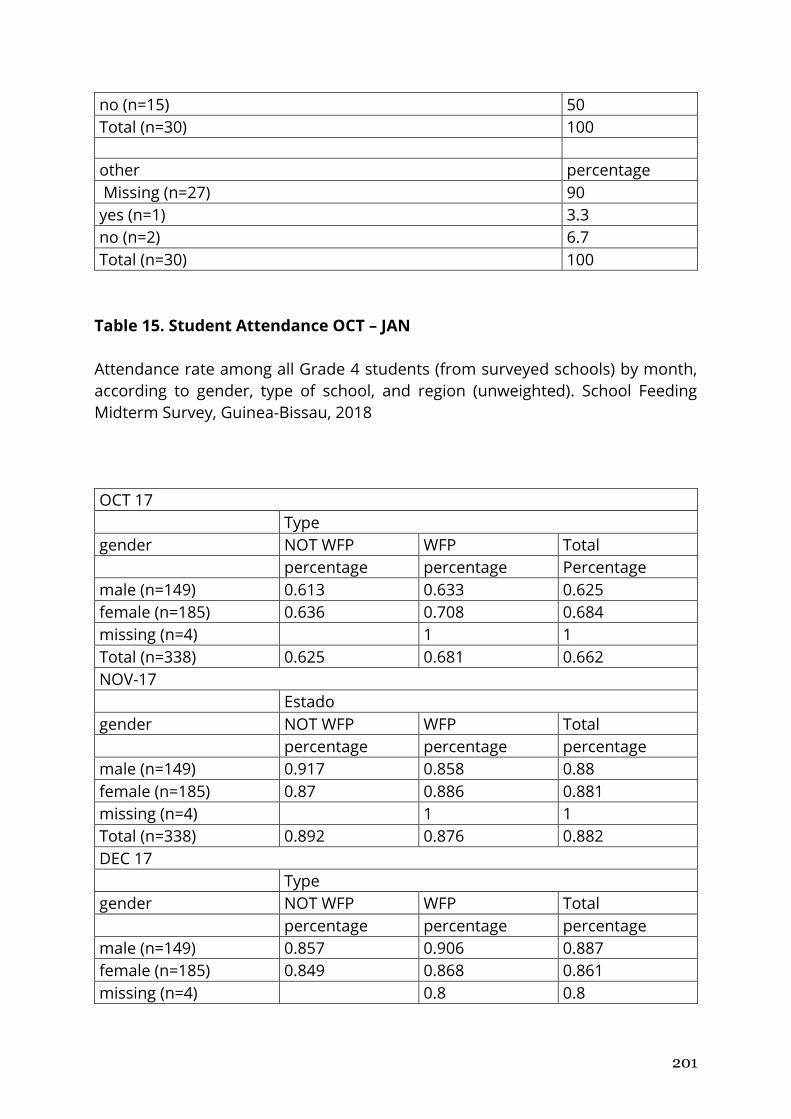
201
no (n=15) 50
Total (n=30) 100
other percentage
Missing (n=27) 90
yes (n=1) 3.3
no (n=2) 6.7
Total (n=30) 100
Table 15. Student Attendance OCT – JAN
Attendance rate among all Grade 4 students (from surveyed schools) by month,
according to gender, type of school, and region (unweighted). School Feeding
Midterm Survey, Guinea-Bissau, 2018
OCT 17
Type
gender NOT WFP WFP Total
percentage percentage Percentage
male (n=149) 0.613 0.633 0.625
female (n=185) 0.636 0.708 0.684
missing (n=4) 1 1
Total (n=338) 0.625 0.681 0.662
NOV-17
Estado
gender NOT WFP WFP Total
percentage percentage percentage
male (n=149) 0.917 0.858 0.88
female (n=185) 0.87 0.886 0.881
missing (n=4) 1 1
Total (n=338) 0.892 0.876 0.882
DEC 17
Type
gender NOT WFP WFP Total
percentage percentage percentage
male (n=149) 0.857 0.906 0.887
female (n=185) 0.849 0.868 0.861
missing (n=4) 0.8 0.8
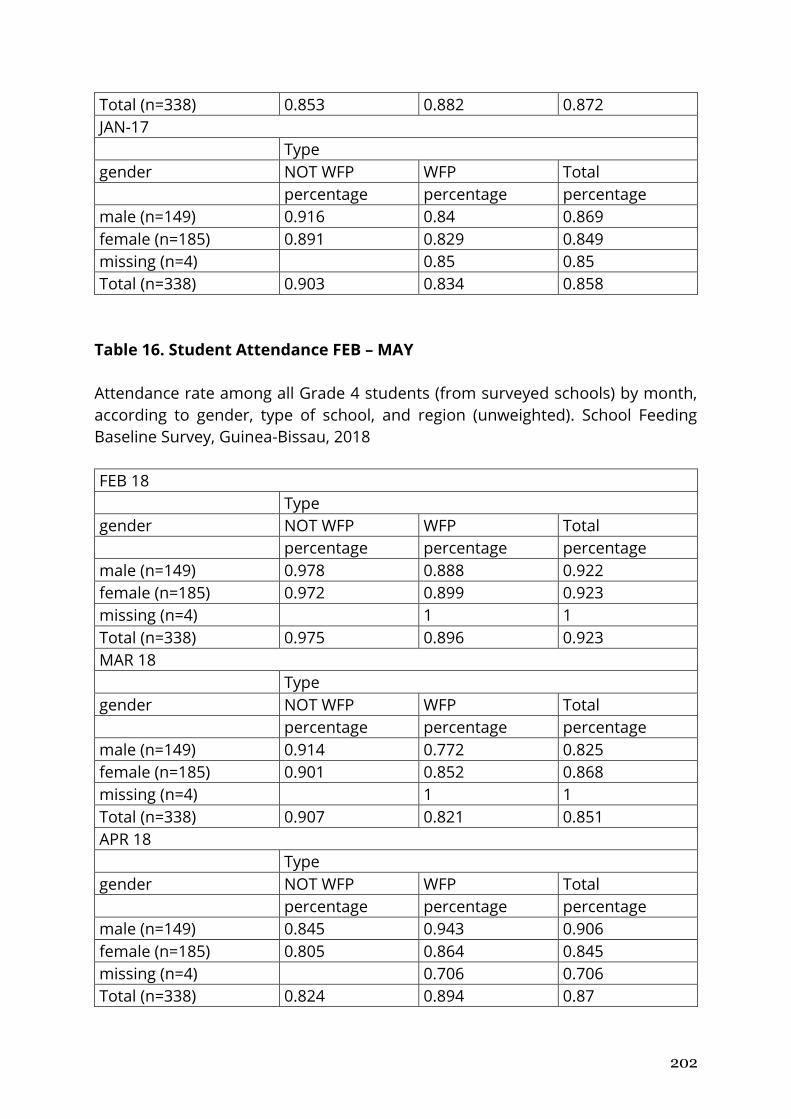
202
Total (n=338) 0.853 0.882 0.872
JAN-17
Type
gender NOT WFP WFP Total
percentage percentage percentage
male (n=149) 0.916 0.84 0.869
female (n=185) 0.891 0.829 0.849
missing (n=4) 0.85 0.85
Total (n=338) 0.903 0.834 0.858
Table 16. Student Attendance FEB – MAY
Attendance rate among all Grade 4 students (from surveyed schools) by month,
according to gender, type of school, and region (unweighted). School Feeding
Baseline Survey, Guinea-Bissau, 2018
FEB 18
Type
gender NOT WFP WFP Total
percentage percentage percentage
male (n=149) 0.978 0.888 0.922
female (n=185) 0.972 0.899 0.923
missing (n=4) 1 1
Total (n=338) 0.975 0.896 0.923
MAR 18
Type
gender NOT WFP WFP Total
percentage percentage percentage
male (n=149) 0.914 0.772 0.825
female (n=185) 0.901 0.852 0.868
missing (n=4) 1 1
Total (n=338) 0.907 0.821 0.851
APR 18
Type
gender NOT WFP WFP Total
percentage percentage percentage
male (n=149) 0.845 0.943 0.906
female (n=185) 0.805 0.864 0.845
missing (n=4) 0.706 0.706
Total (n=338) 0.824 0.894 0.87
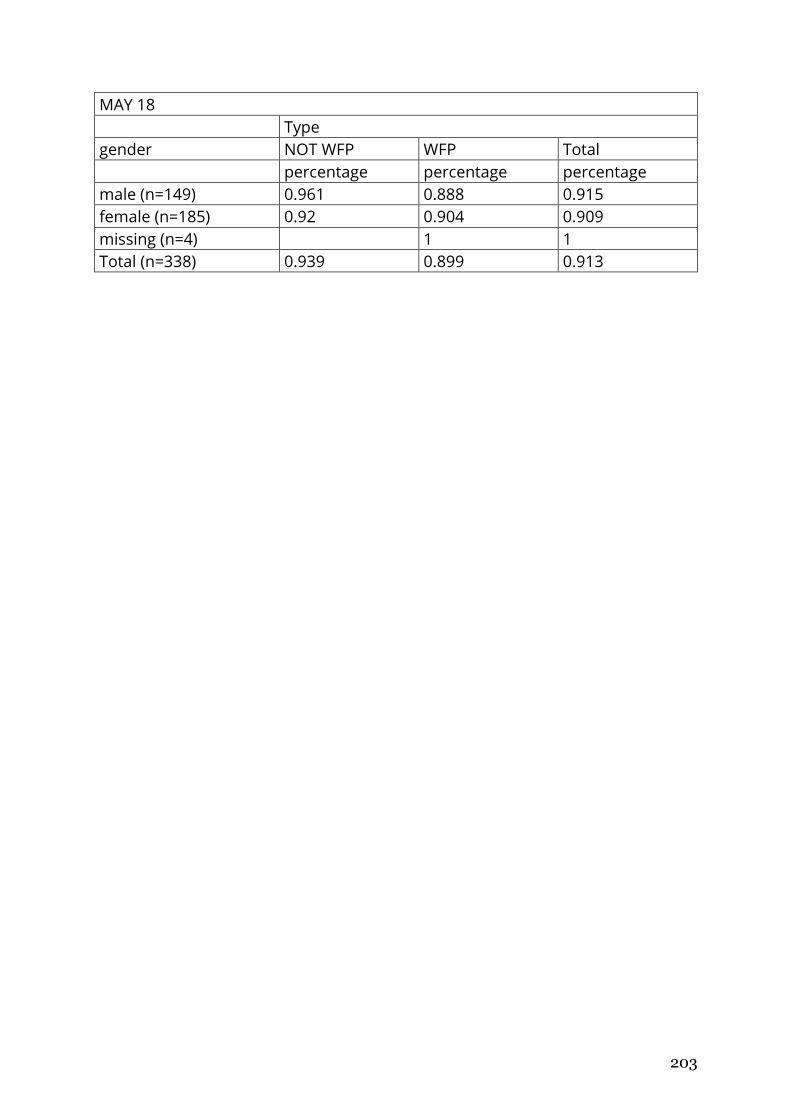
203
MAY 18
Type
gender NOT WFP WFP Total
percentage percentage percentage
male (n=149) 0.961 0.888 0.915
female (n=185) 0.92 0.904 0.909
missing (n=4) 1 1
Total (n=338) 0.939 0.899 0.913
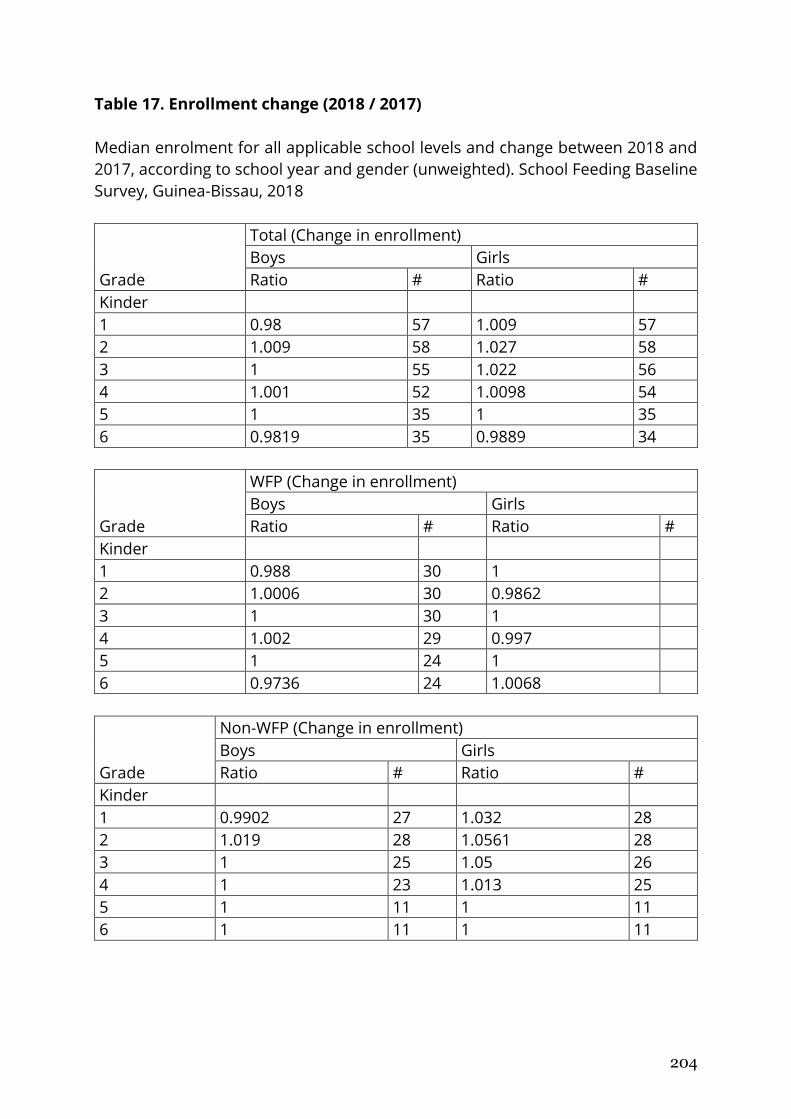
204
Table 17. Enrollment change (2018 / 2017)
Median enrolment for all applicable school levels and change between 2018 and
2017, according to school year and gender (unweighted). School Feeding Baseline
Survey, Guinea-Bissau, 2018
Grade
Total (Change in enrollment)
Boys Girls
Ratio # Ratio #
Kinder 1 0.98 57 1.009 57
2 1.009 58 1.027 58
3 1 55 1.022 56
4 1.001 52 1.0098 54
5 1 35 1 35
6 0.9819 35 0.9889 34
Grade
WFP (Change in enrollment)
Boys Girls
Ratio # Ratio #
Kinder 1 0.988 30 1 2 1.0006 30 0.9862 3 1 30 1 4 1.002 29 0.997 5 1 24 1 6 0.9736 24 1.0068
Grade
Non-WFP (Change in enrollment)
Boys Girls
Ratio # Ratio #
Kinder 1 0.9902 27 1.032 28
2 1.019 28 1.0561 28
3 1 25 1.05 26
4 1 23 1.013 25
5 1 11 1 11
6 1 11 1 11
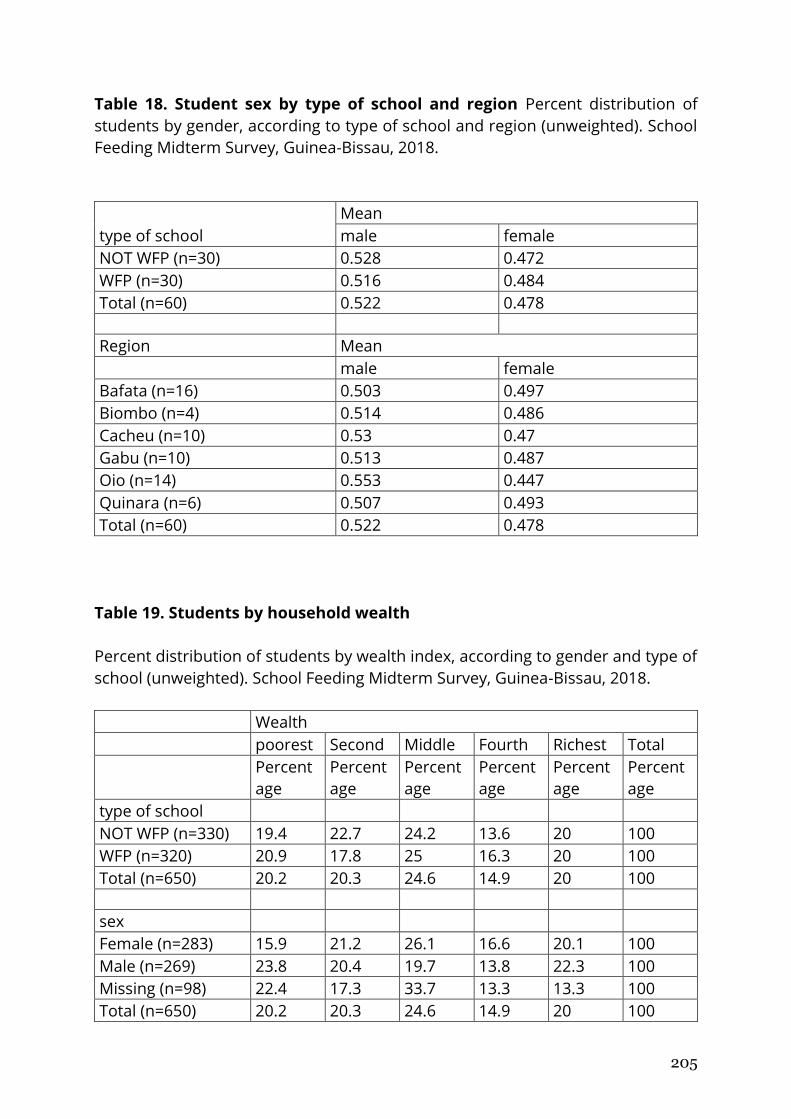
205
Table 18. Student sex by type of school and region Percent distribution of
students by gender, according to type of school and region (unweighted). School
Feeding Midterm Survey, Guinea-Bissau, 2018.
type of school
Mean
male female
NOT WFP (n=30) 0.528 0.472
WFP (n=30) 0.516 0.484
Total (n=60) 0.522 0.478
Region Mean
male female
Bafata (n=16) 0.503 0.497
Biombo (n=4) 0.514 0.486
Cacheu (n=10) 0.53 0.47
Gabu (n=10) 0.513 0.487
Oio (n=14) 0.553 0.447
Quinara (n=6) 0.507 0.493
Total (n=60) 0.522 0.478
Table 19. Students by household wealth
Percent distribution of students by wealth index, according to gender and type of
school (unweighted). School Feeding Midterm Survey, Guinea-Bissau, 2018.
Wealth
poorest Second Middle Fourth Richest Total
Percent
age
Percent
age
Percent
age
Percent
age
Percent
age
Percent
age
type of school NOT WFP (n=330) 19.4 22.7 24.2 13.6 20 100
WFP (n=320) 20.9 17.8 25 16.3 20 100
Total (n=650) 20.2 20.3 24.6 14.9 20 100
sex Female (n=283) 15.9 21.2 26.1 16.6 20.1 100
Male (n=269) 23.8 20.4 19.7 13.8 22.3 100
Missing (n=98) 22.4 17.3 33.7 13.3 13.3 100
Total (n=650) 20.2 20.3 24.6 14.9 20 100
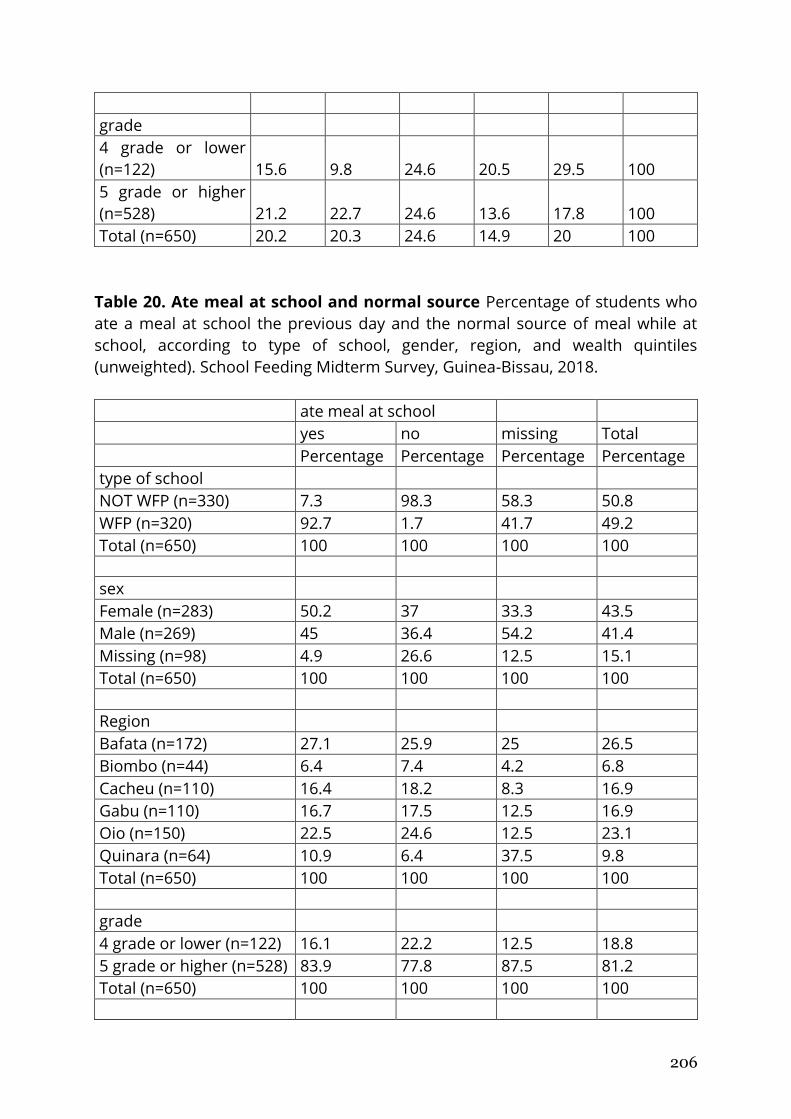
206
grade 4 grade or lower
(n=122) 15.6 9.8 24.6 20.5 29.5 100
5 grade or higher
(n=528) 21.2 22.7 24.6 13.6 17.8 100
Total (n=650) 20.2 20.3 24.6 14.9 20 100
Table 20. Ate meal at school and normal source Percentage of students who
ate a meal at school the previous day and the normal source of meal while at
school, according to type of school, gender, region, and wealth quintiles
(unweighted). School Feeding Midterm Survey, Guinea-Bissau, 2018.
ate meal at school
yes no missing Total
Percentage Percentage Percentage Percentage
type of school NOT WFP (n=330) 7.3 98.3 58.3 50.8
WFP (n=320) 92.7 1.7 41.7 49.2
Total (n=650) 100 100 100 100
sex Female (n=283) 50.2 37 33.3 43.5
Male (n=269) 45 36.4 54.2 41.4
Missing (n=98) 4.9 26.6 12.5 15.1
Total (n=650) 100 100 100 100
Region Bafata (n=172) 27.1 25.9 25 26.5
Biombo (n=44) 6.4 7.4 4.2 6.8
Cacheu (n=110) 16.4 18.2 8.3 16.9
Gabu (n=110) 16.7 17.5 12.5 16.9
Oio (n=150) 22.5 24.6 12.5 23.1
Quinara (n=64) 10.9 6.4 37.5 9.8
Total (n=650) 100 100 100 100
grade 4 grade or lower (n=122) 16.1 22.2 12.5 18.8
5 grade or higher (n=528) 83.9 77.8 87.5 81.2
Total (n=650) 100 100 100 100
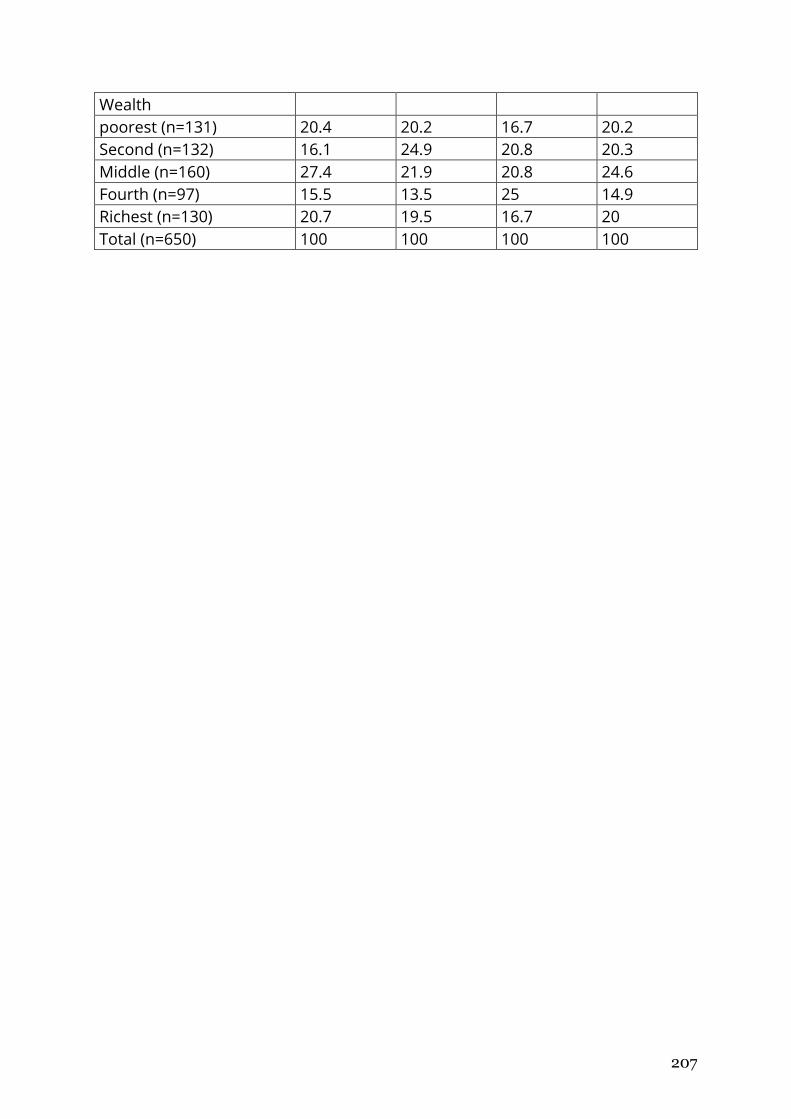
207
Wealth poorest (n=131) 20.4 20.2 16.7 20.2
Second (n=132) 16.1 24.9 20.8 20.3
Middle (n=160) 27.4 21.9 20.8 24.6
Fourth (n=97) 15.5 13.5 25 14.9
Richest (n=130) 20.7 19.5 16.7 20
Total (n=650) 100 100 100 100
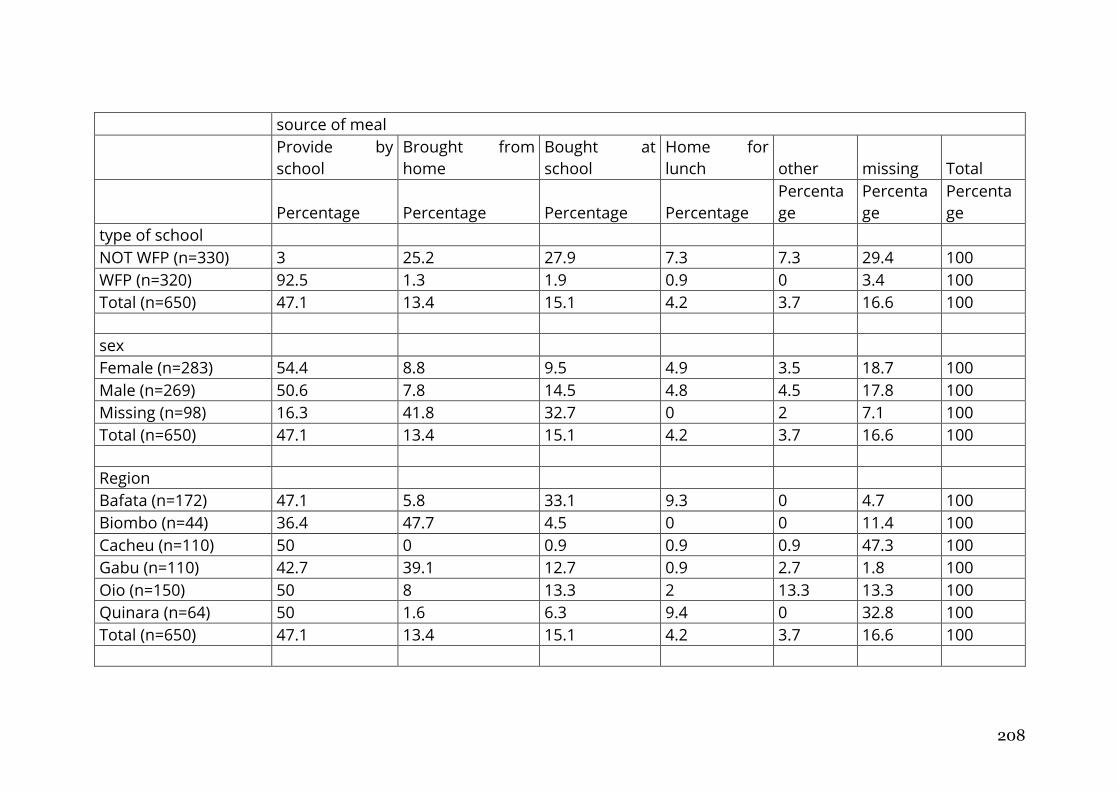
208
source of meal
Provide by
school
Brought from
home
Bought at
school
Home for
lunch other missing Total
Percentage Percentage Percentage Percentage
Percenta
ge
Percenta
ge
Percenta
ge
type of school NOT WFP (n=330) 3 25.2 27.9 7.3 7.3 29.4 100
WFP (n=320) 92.5 1.3 1.9 0.9 0 3.4 100
Total (n=650) 47.1 13.4 15.1 4.2 3.7 16.6 100
sex Female (n=283) 54.4 8.8 9.5 4.9 3.5 18.7 100
Male (n=269) 50.6 7.8 14.5 4.8 4.5 17.8 100
Missing (n=98) 16.3 41.8 32.7 0 2 7.1 100
Total (n=650) 47.1 13.4 15.1 4.2 3.7 16.6 100
Region Bafata (n=172) 47.1 5.8 33.1 9.3 0 4.7 100
Biombo (n=44) 36.4 47.7 4.5 0 0 11.4 100
Cacheu (n=110) 50 0 0.9 0.9 0.9 47.3 100
Gabu (n=110) 42.7 39.1 12.7 0.9 2.7 1.8 100
Oio (n=150) 50 8 13.3 2 13.3 13.3 100
Quinara (n=64) 50 1.6 6.3 9.4 0 32.8 100
Total (n=650) 47.1 13.4 15.1 4.2 3.7 16.6 100
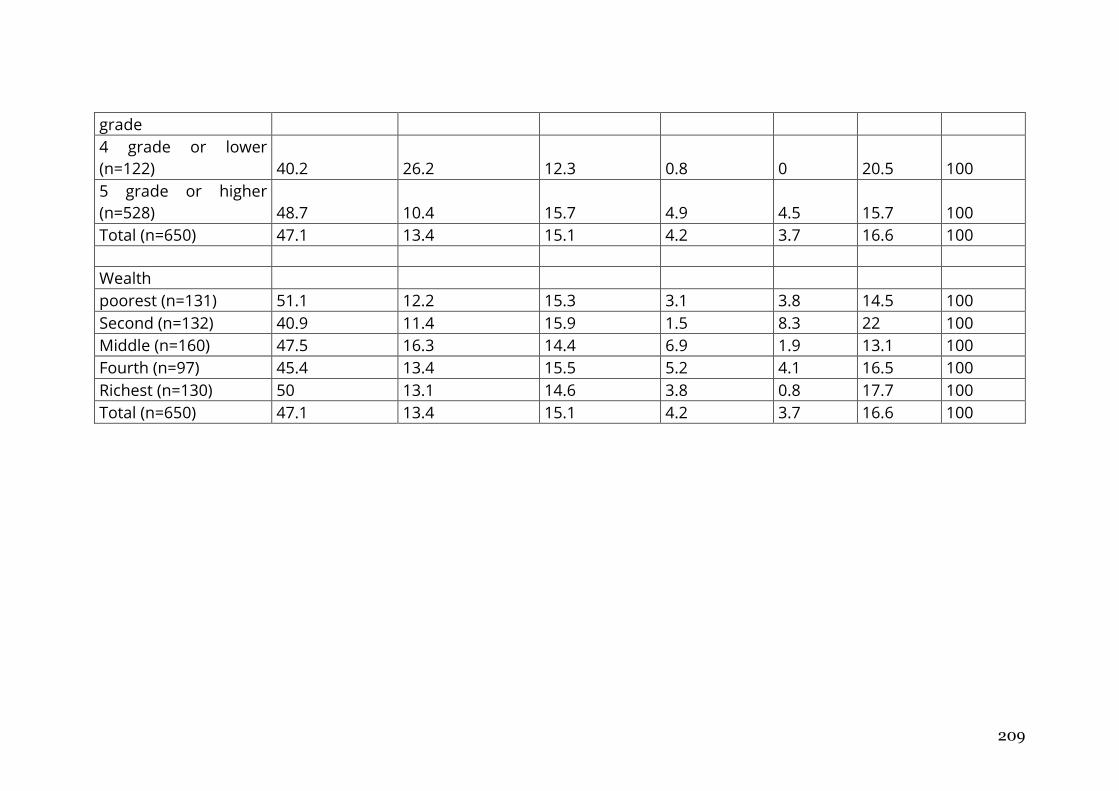
209
grade 4 grade or lower
(n=122) 40.2 26.2 12.3 0.8 0 20.5 100
5 grade or higher
(n=528) 48.7 10.4 15.7 4.9 4.5 15.7 100
Total (n=650) 47.1 13.4 15.1 4.2 3.7 16.6 100
Wealth poorest (n=131) 51.1 12.2 15.3 3.1 3.8 14.5 100
Second (n=132) 40.9 11.4 15.9 1.5 8.3 22 100
Middle (n=160) 47.5 16.3 14.4 6.9 1.9 13.1 100
Fourth (n=97) 45.4 13.4 15.5 5.2 4.1 16.5 100
Richest (n=130) 50 13.1 14.6 3.8 0.8 17.7 100
Total (n=650) 47.1 13.4 15.1 4.2 3.7 16.6 100
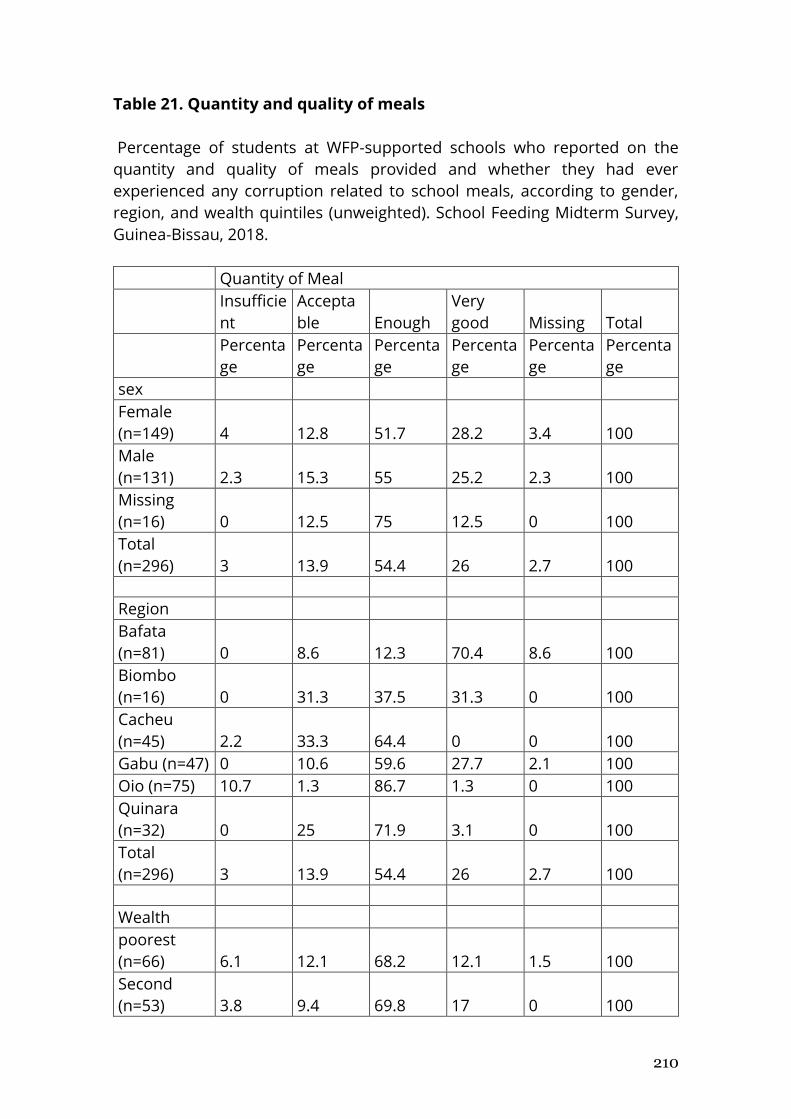
210
Table 21. Quantity and quality of meals
Percentage of students at WFP-supported schools who reported on the
quantity and quality of meals provided and whether they had ever
experienced any corruption related to school meals, according to gender,
region, and wealth quintiles (unweighted). School Feeding Midterm Survey,
Guinea-Bissau, 2018.
Quantity of Meal
Insufficie
nt
Accepta
ble Enough
Very
good Missing Total
Percenta
ge
Percenta
ge
Percenta
ge
Percenta
ge
Percenta
ge
Percenta
ge
sex Female
(n=149) 4 12.8 51.7 28.2 3.4 100
Male
(n=131) 2.3 15.3 55 25.2 2.3 100
Missing
(n=16) 0 12.5 75 12.5 0 100
Total
(n=296) 3 13.9 54.4 26 2.7 100
Region Bafata
(n=81) 0 8.6 12.3 70.4 8.6 100
Biombo
(n=16) 0 31.3 37.5 31.3 0 100
Cacheu
(n=45) 2.2 33.3 64.4 0 0 100
Gabu (n=47) 0 10.6 59.6 27.7 2.1 100
Oio (n=75) 10.7 1.3 86.7 1.3 0 100
Quinara
(n=32) 0 25 71.9 3.1 0 100
Total
(n=296) 3 13.9 54.4 26 2.7 100
Wealth poorest
(n=66) 6.1 12.1 68.2 12.1 1.5 100
Second
(n=53) 3.8 9.4 69.8 17 0 100
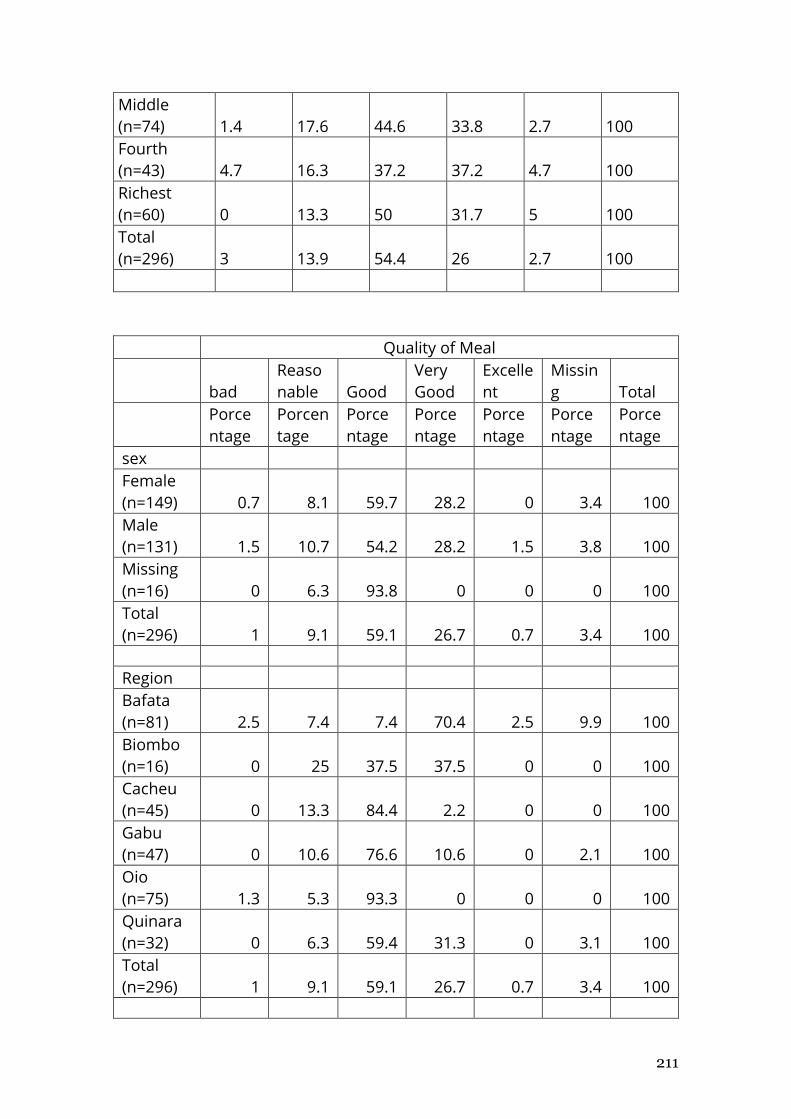
211
Middle
(n=74) 1.4 17.6 44.6 33.8 2.7 100
Fourth
(n=43) 4.7 16.3 37.2 37.2 4.7 100
Richest
(n=60) 0 13.3 50 31.7 5 100
Total
(n=296) 3 13.9 54.4 26 2.7 100
Quality of Meal
bad
Reaso
nable Good
Very
Good
Excelle
nt
Missin
g Total
Porce
ntage
Porcen
tage
Porce
ntage
Porce
ntage
Porce
ntage
Porce
ntage
Porce
ntage
sex Female
(n=149) 0.7 8.1 59.7 28.2 0 3.4 100
Male
(n=131) 1.5 10.7 54.2 28.2 1.5 3.8 100
Missing
(n=16) 0 6.3 93.8 0 0 0 100
Total
(n=296) 1 9.1 59.1 26.7 0.7 3.4 100
Region Bafata
(n=81) 2.5 7.4 7.4 70.4 2.5 9.9 100
Biombo
(n=16) 0 25 37.5 37.5 0 0 100
Cacheu
(n=45) 0 13.3 84.4 2.2 0 0 100
Gabu
(n=47) 0 10.6 76.6 10.6 0 2.1 100
Oio
(n=75) 1.3 5.3 93.3 0 0 0 100
Quinara
(n=32) 0 6.3 59.4 31.3 0 3.1 100
Total
(n=296) 1 9.1 59.1 26.7 0.7 3.4 100
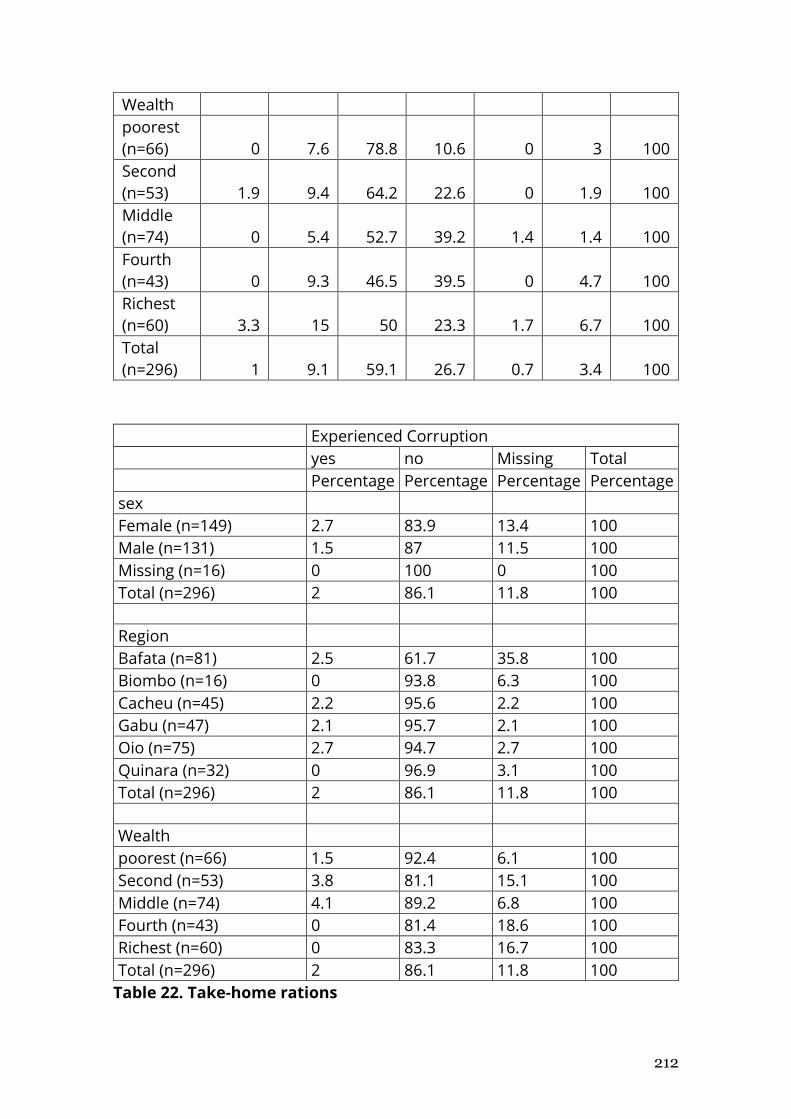
212
Wealth poorest
(n=66) 0 7.6 78.8 10.6 0 3 100
Second
(n=53) 1.9 9.4 64.2 22.6 0 1.9 100
Middle
(n=74) 0 5.4 52.7 39.2 1.4 1.4 100
Fourth
(n=43) 0 9.3 46.5 39.5 0 4.7 100
Richest
(n=60) 3.3 15 50 23.3 1.7 6.7 100
Total
(n=296) 1 9.1 59.1 26.7 0.7 3.4 100
Experienced Corruption
yes no Missing Total
Percentage Percentage Percentage Percentage
sex Female (n=149) 2.7 83.9 13.4 100
Male (n=131) 1.5 87 11.5 100
Missing (n=16) 0 100 0 100
Total (n=296) 2 86.1 11.8 100
Region Bafata (n=81) 2.5 61.7 35.8 100
Biombo (n=16) 0 93.8 6.3 100
Cacheu (n=45) 2.2 95.6 2.2 100
Gabu (n=47) 2.1 95.7 2.1 100
Oio (n=75) 2.7 94.7 2.7 100
Quinara (n=32) 0 96.9 3.1 100
Total (n=296) 2 86.1 11.8 100
Wealth poorest (n=66) 1.5 92.4 6.1 100
Second (n=53) 3.8 81.1 15.1 100
Middle (n=74) 4.1 89.2 6.8 100
Fourth (n=43) 0 81.4 18.6 100
Richest (n=60) 0 83.3 16.7 100
Total (n=296) 2 86.1 11.8 100
Table 22. Take-home rations
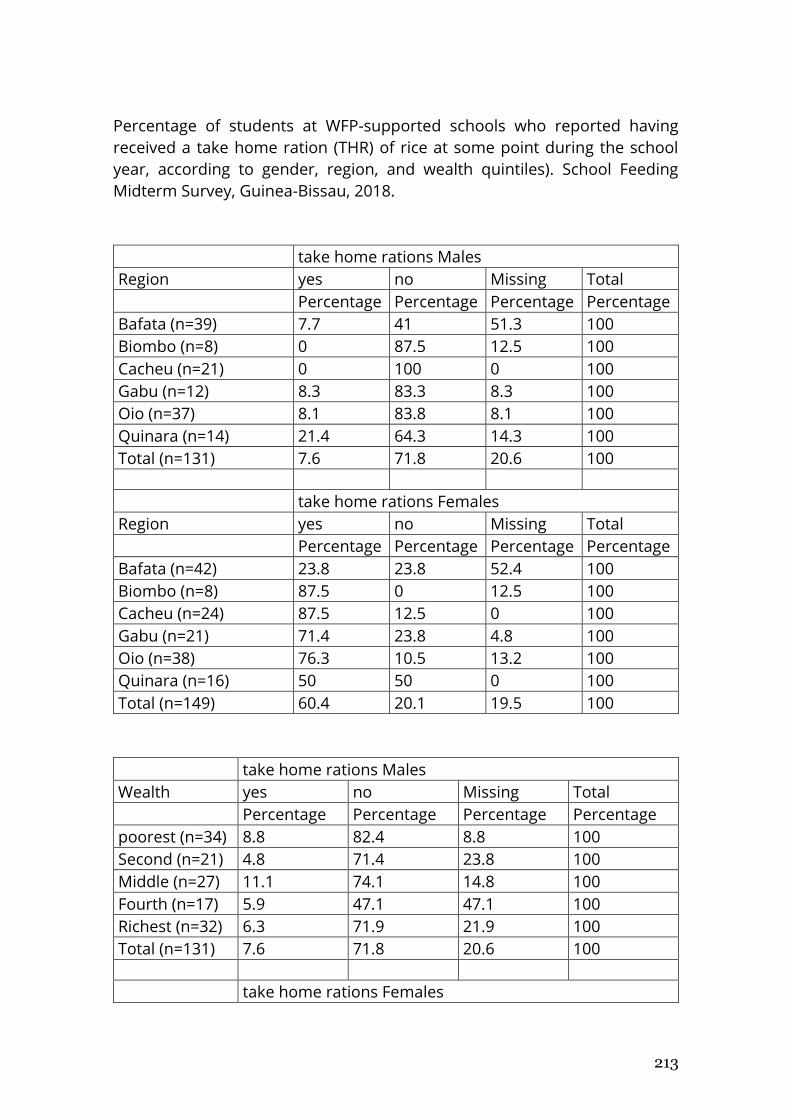
213
Percentage of students at WFP-supported schools who reported having
received a take home ration (THR) of rice at some point during the school
year, according to gender, region, and wealth quintiles). School Feeding
Midterm Survey, Guinea-Bissau, 2018.
take home rations Males
Region yes no Missing Total
Percentage Percentage Percentage Percentage
Bafata (n=39) 7.7 41 51.3 100
Biombo (n=8) 0 87.5 12.5 100
Cacheu (n=21) 0 100 0 100
Gabu (n=12) 8.3 83.3 8.3 100
Oio (n=37) 8.1 83.8 8.1 100
Quinara (n=14) 21.4 64.3 14.3 100
Total (n=131) 7.6 71.8 20.6 100
take home rations Females
Region yes no Missing Total
Percentage Percentage Percentage Percentage
Bafata (n=42) 23.8 23.8 52.4 100
Biombo (n=8) 87.5 0 12.5 100
Cacheu (n=24) 87.5 12.5 0 100
Gabu (n=21) 71.4 23.8 4.8 100
Oio (n=38) 76.3 10.5 13.2 100
Quinara (n=16) 50 50 0 100
Total (n=149) 60.4 20.1 19.5 100
take home rations Males
Wealth yes no Missing Total
Percentage Percentage Percentage Percentage
poorest (n=34) 8.8 82.4 8.8 100
Second (n=21) 4.8 71.4 23.8 100
Middle (n=27) 11.1 74.1 14.8 100
Fourth (n=17) 5.9 47.1 47.1 100
Richest (n=32) 6.3 71.9 21.9 100
Total (n=131) 7.6 71.8 20.6 100
take home rations Females
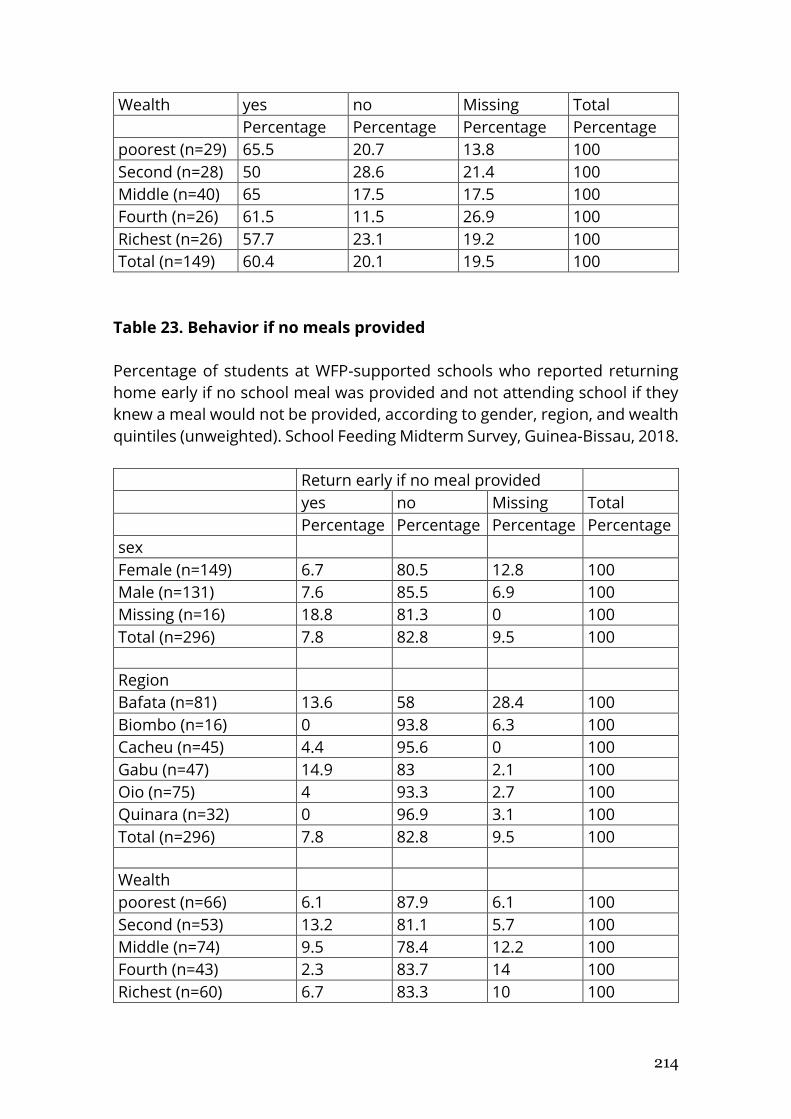
214
Wealth yes no Missing Total
Percentage Percentage Percentage Percentage
poorest (n=29) 65.5 20.7 13.8 100
Second (n=28) 50 28.6 21.4 100
Middle (n=40) 65 17.5 17.5 100
Fourth (n=26) 61.5 11.5 26.9 100
Richest (n=26) 57.7 23.1 19.2 100
Total (n=149) 60.4 20.1 19.5 100
Table 23. Behavior if no meals provided
Percentage of students at WFP-supported schools who reported returning
home early if no school meal was provided and not attending school if they
knew a meal would not be provided, according to gender, region, and wealth
quintiles (unweighted). School Feeding Midterm Survey, Guinea-Bissau, 2018.
Return early if no meal provided
yes no Missing Total
Percentage Percentage Percentage Percentage
sex Female (n=149) 6.7 80.5 12.8 100
Male (n=131) 7.6 85.5 6.9 100
Missing (n=16) 18.8 81.3 0 100
Total (n=296) 7.8 82.8 9.5 100
Region Bafata (n=81) 13.6 58 28.4 100
Biombo (n=16) 0 93.8 6.3 100
Cacheu (n=45) 4.4 95.6 0 100
Gabu (n=47) 14.9 83 2.1 100
Oio (n=75) 4 93.3 2.7 100
Quinara (n=32) 0 96.9 3.1 100
Total (n=296) 7.8 82.8 9.5 100
Wealth poorest (n=66) 6.1 87.9 6.1 100
Second (n=53) 13.2 81.1 5.7 100
Middle (n=74) 9.5 78.4 12.2 100
Fourth (n=43) 2.3 83.7 14 100
Richest (n=60) 6.7 83.3 10 100
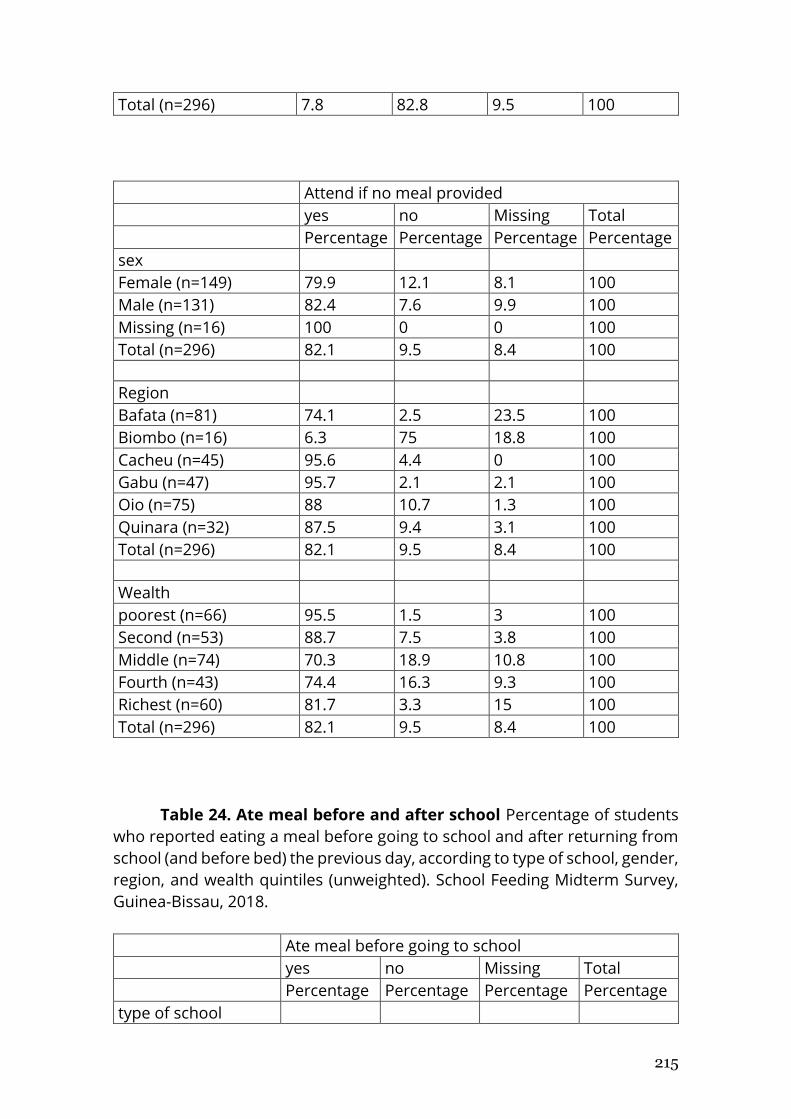
215
Total (n=296) 7.8 82.8 9.5 100
Attend if no meal provided
yes no Missing Total
Percentage Percentage Percentage Percentage
sex Female (n=149) 79.9 12.1 8.1 100
Male (n=131) 82.4 7.6 9.9 100
Missing (n=16) 100 0 0 100
Total (n=296) 82.1 9.5 8.4 100
Region Bafata (n=81) 74.1 2.5 23.5 100
Biombo (n=16) 6.3 75 18.8 100
Cacheu (n=45) 95.6 4.4 0 100
Gabu (n=47) 95.7 2.1 2.1 100
Oio (n=75) 88 10.7 1.3 100
Quinara (n=32) 87.5 9.4 3.1 100
Total (n=296) 82.1 9.5 8.4 100
Wealth poorest (n=66) 95.5 1.5 3 100
Second (n=53) 88.7 7.5 3.8 100
Middle (n=74) 70.3 18.9 10.8 100
Fourth (n=43) 74.4 16.3 9.3 100
Richest (n=60) 81.7 3.3 15 100
Total (n=296) 82.1 9.5 8.4 100
Table 24. Ate meal before and after school Percentage of students
who reported eating a meal before going to school and after returning from
school (and before bed) the previous day, according to type of school, gender,
region, and wealth quintiles (unweighted). School Feeding Midterm Survey,
Guinea-Bissau, 2018.
Ate meal before going to school
yes no Missing Total
Percentage Percentage Percentage Percentage
type of school
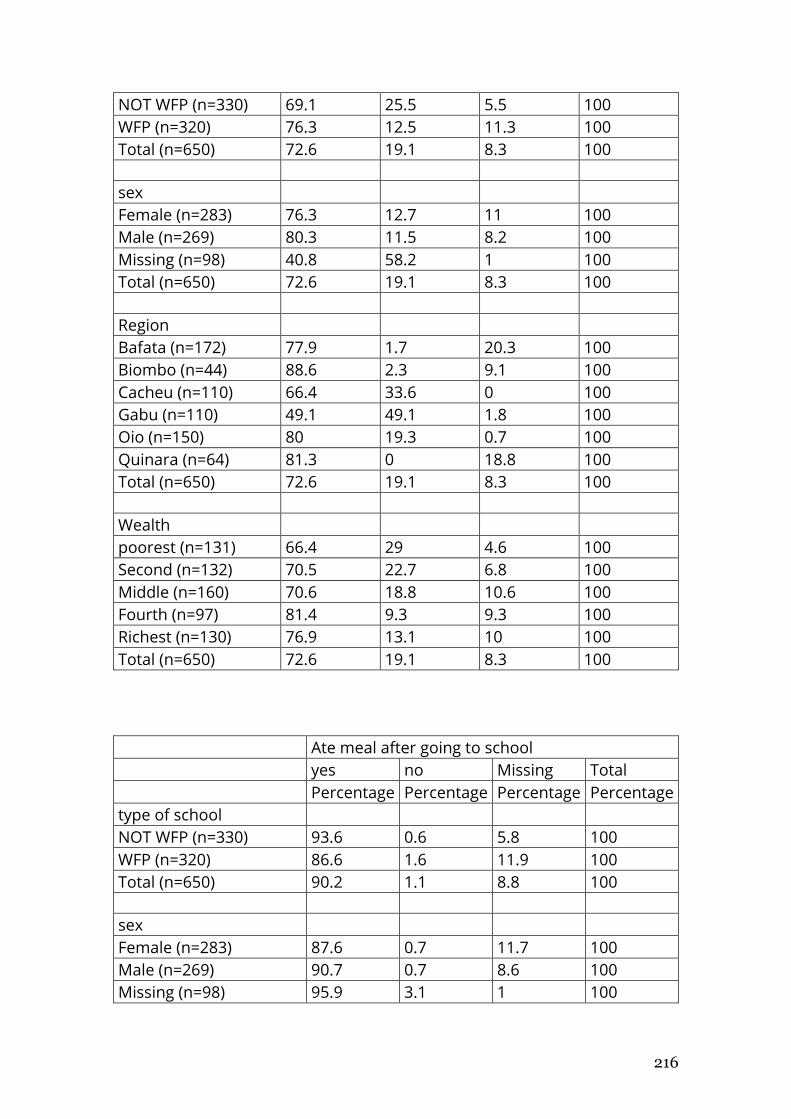
216
NOT WFP (n=330) 69.1 25.5 5.5 100
WFP (n=320) 76.3 12.5 11.3 100
Total (n=650) 72.6 19.1 8.3 100
sex Female (n=283) 76.3 12.7 11 100
Male (n=269) 80.3 11.5 8.2 100
Missing (n=98) 40.8 58.2 1 100
Total (n=650) 72.6 19.1 8.3 100
Region Bafata (n=172) 77.9 1.7 20.3 100
Biombo (n=44) 88.6 2.3 9.1 100
Cacheu (n=110) 66.4 33.6 0 100
Gabu (n=110) 49.1 49.1 1.8 100
Oio (n=150) 80 19.3 0.7 100
Quinara (n=64) 81.3 0 18.8 100
Total (n=650) 72.6 19.1 8.3 100
Wealth poorest (n=131) 66.4 29 4.6 100
Second (n=132) 70.5 22.7 6.8 100
Middle (n=160) 70.6 18.8 10.6 100
Fourth (n=97) 81.4 9.3 9.3 100
Richest (n=130) 76.9 13.1 10 100
Total (n=650) 72.6 19.1 8.3 100
Ate meal after going to school
yes no Missing Total
Percentage Percentage Percentage Percentage
type of school NOT WFP (n=330) 93.6 0.6 5.8 100
WFP (n=320) 86.6 1.6 11.9 100
Total (n=650) 90.2 1.1 8.8 100
sex Female (n=283) 87.6 0.7 11.7 100
Male (n=269) 90.7 0.7 8.6 100
Missing (n=98) 95.9 3.1 1 100
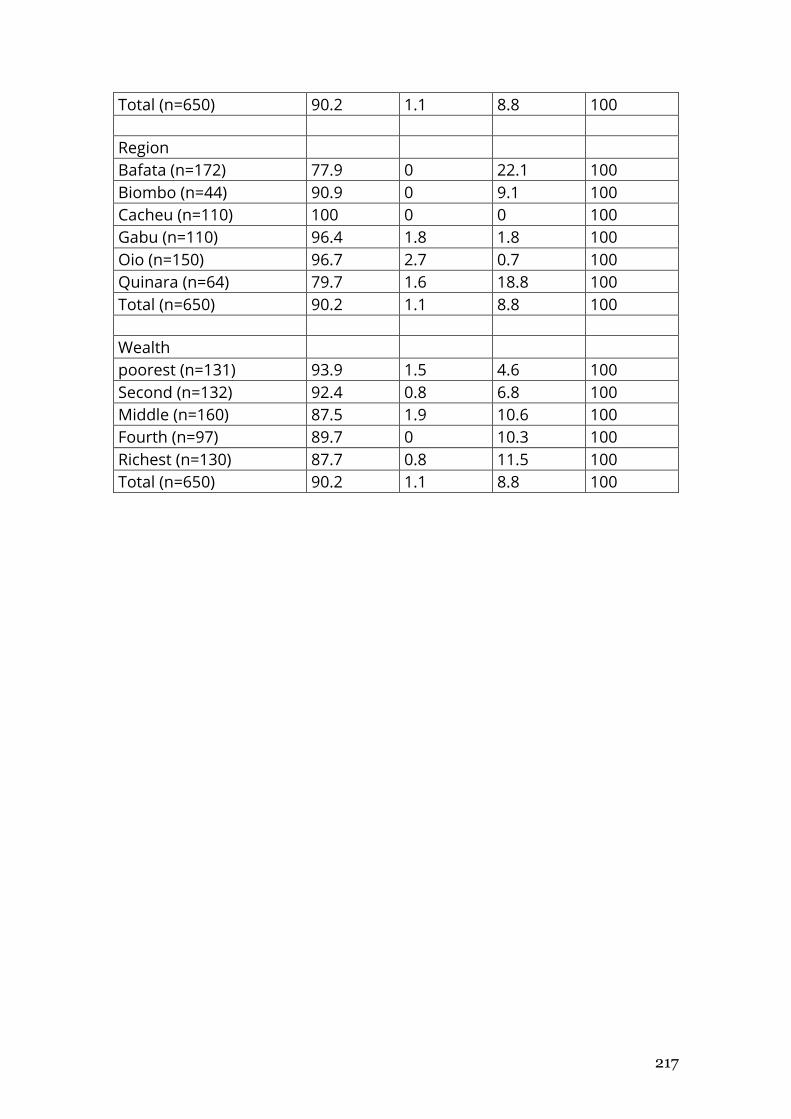
217
Total (n=650) 90.2 1.1 8.8 100
Region Bafata (n=172) 77.9 0 22.1 100
Biombo (n=44) 90.9 0 9.1 100
Cacheu (n=110) 100 0 0 100
Gabu (n=110) 96.4 1.8 1.8 100
Oio (n=150) 96.7 2.7 0.7 100
Quinara (n=64) 79.7 1.6 18.8 100
Total (n=650) 90.2 1.1 8.8 100
Wealth poorest (n=131) 93.9 1.5 4.6 100
Second (n=132) 92.4 0.8 6.8 100
Middle (n=160) 87.5 1.9 10.6 100
Fourth (n=97) 89.7 0 10.3 100
Richest (n=130) 87.7 0.8 11.5 100
Total (n=650) 90.2 1.1 8.8 100
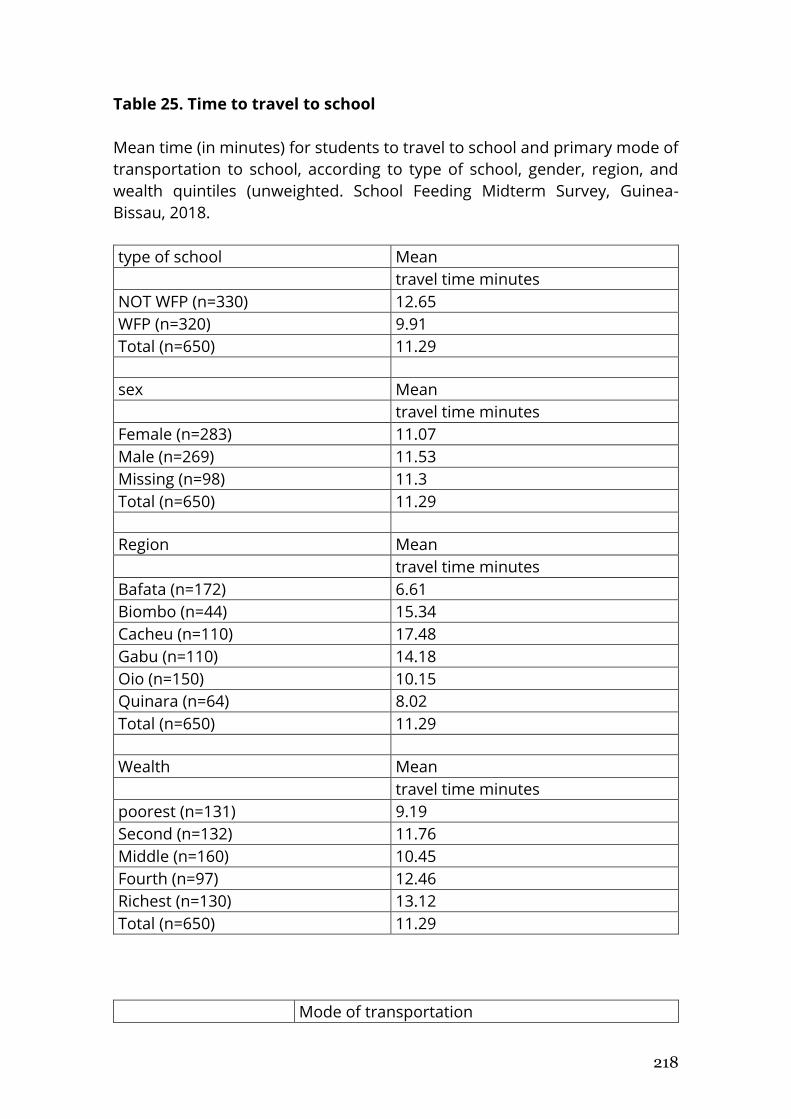
218
Table 25. Time to travel to school
Mean time (in minutes) for students to travel to school and primary mode of
transportation to school, according to type of school, gender, region, and
wealth quintiles (unweighted. School Feeding Midterm Survey, Guinea-
Bissau, 2018.
type of school Mean
travel time minutes
NOT WFP (n=330) 12.65
WFP (n=320) 9.91
Total (n=650) 11.29
sex Mean
travel time minutes
Female (n=283) 11.07
Male (n=269) 11.53
Missing (n=98) 11.3
Total (n=650) 11.29
Region Mean
travel time minutes
Bafata (n=172) 6.61
Biombo (n=44) 15.34
Cacheu (n=110) 17.48
Gabu (n=110) 14.18
Oio (n=150) 10.15
Quinara (n=64) 8.02
Total (n=650) 11.29
Wealth Mean
travel time minutes
poorest (n=131) 9.19
Second (n=132) 11.76
Middle (n=160) 10.45
Fourth (n=97) 12.46
Richest (n=130) 13.12
Total (n=650) 11.29
Mode of transportation
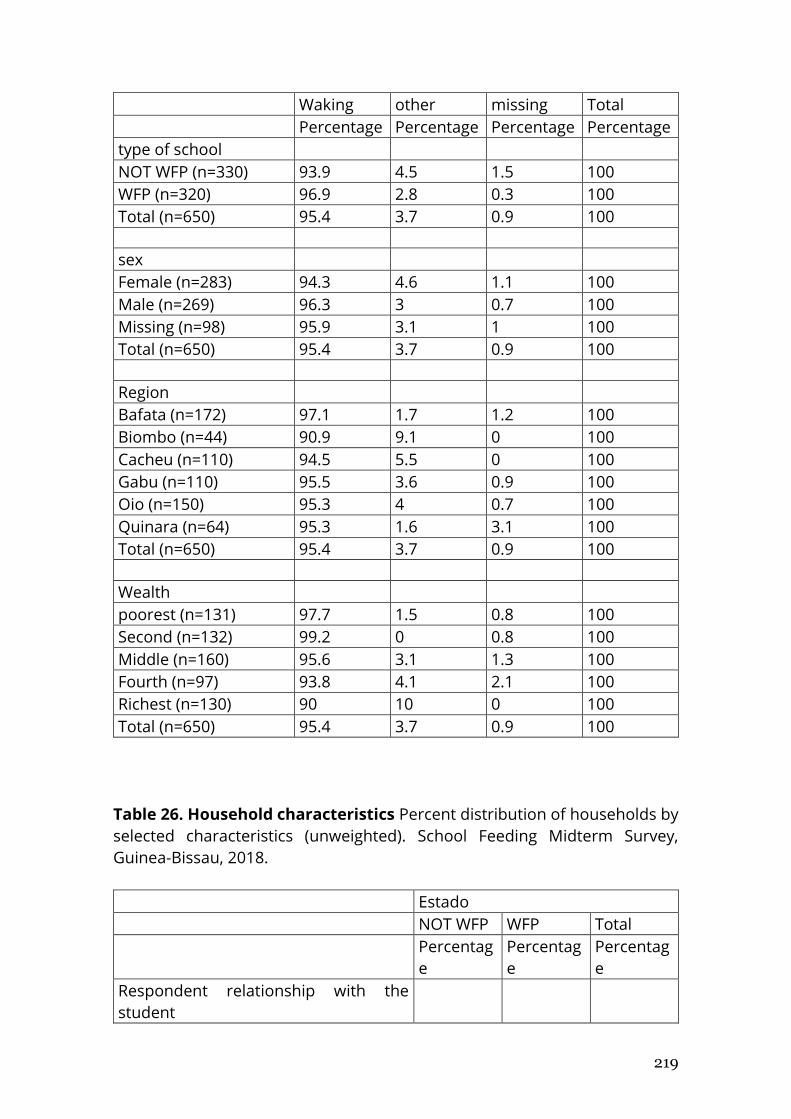
219
Waking other missing Total
Percentage Percentage Percentage Percentage
type of school NOT WFP (n=330) 93.9 4.5 1.5 100
WFP (n=320) 96.9 2.8 0.3 100
Total (n=650) 95.4 3.7 0.9 100
sex Female (n=283) 94.3 4.6 1.1 100
Male (n=269) 96.3 3 0.7 100
Missing (n=98) 95.9 3.1 1 100
Total (n=650) 95.4 3.7 0.9 100
Region Bafata (n=172) 97.1 1.7 1.2 100
Biombo (n=44) 90.9 9.1 0 100
Cacheu (n=110) 94.5 5.5 0 100
Gabu (n=110) 95.5 3.6 0.9 100
Oio (n=150) 95.3 4 0.7 100
Quinara (n=64) 95.3 1.6 3.1 100
Total (n=650) 95.4 3.7 0.9 100
Wealth poorest (n=131) 97.7 1.5 0.8 100
Second (n=132) 99.2 0 0.8 100
Middle (n=160) 95.6 3.1 1.3 100
Fourth (n=97) 93.8 4.1 2.1 100
Richest (n=130) 90 10 0 100
Total (n=650) 95.4 3.7 0.9 100
Table 26. Household characteristics Percent distribution of households by
selected characteristics (unweighted). School Feeding Midterm Survey,
Guinea-Bissau, 2018.
Estado
NOT WFP WFP Total
Percentag
e
Percentag
e
Percentag
e
Respondent relationship with the
student
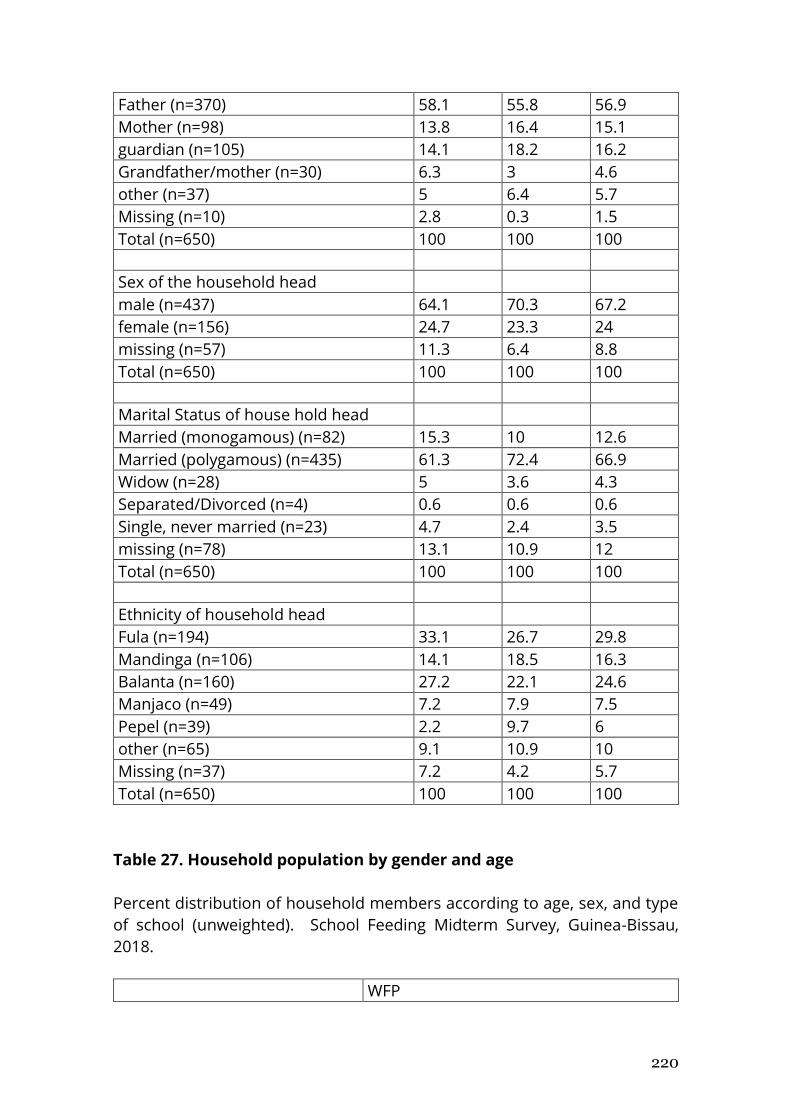
220
Father (n=370) 58.1 55.8 56.9
Mother (n=98) 13.8 16.4 15.1
guardian (n=105) 14.1 18.2 16.2
Grandfather/mother (n=30) 6.3 3 4.6
other (n=37) 5 6.4 5.7
Missing (n=10) 2.8 0.3 1.5
Total (n=650) 100 100 100
Sex of the household head male (n=437) 64.1 70.3 67.2
female (n=156) 24.7 23.3 24
missing (n=57) 11.3 6.4 8.8
Total (n=650) 100 100 100
Marital Status of house hold head Married (monogamous) (n=82) 15.3 10 12.6
Married (polygamous) (n=435) 61.3 72.4 66.9
Widow (n=28) 5 3.6 4.3
Separated/Divorced (n=4) 0.6 0.6 0.6
Single, never married (n=23) 4.7 2.4 3.5
missing (n=78) 13.1 10.9 12
Total (n=650) 100 100 100
Ethnicity of household head Fula (n=194) 33.1 26.7 29.8
Mandinga (n=106) 14.1 18.5 16.3
Balanta (n=160) 27.2 22.1 24.6
Manjaco (n=49) 7.2 7.9 7.5
Pepel (n=39) 2.2 9.7 6
other (n=65) 9.1 10.9 10
Missing (n=37) 7.2 4.2 5.7
Total (n=650) 100 100 100
Table 27. Household population by gender and age
Percent distribution of household members according to age, sex, and type
of school (unweighted). School Feeding Midterm Survey, Guinea-Bissau,
2018.
WFP
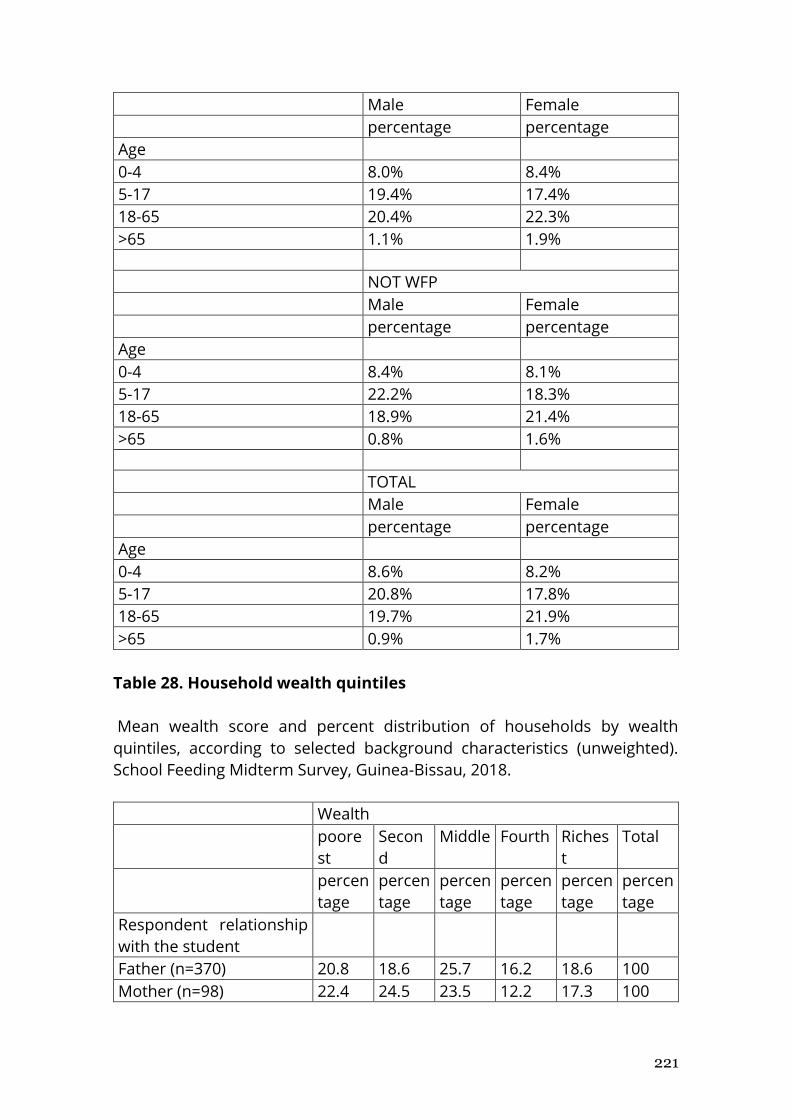
221
Male Female
percentage percentage
Age 0-4 8.0% 8.4%
5-17 19.4% 17.4%
18-65 20.4% 22.3%
>65 1.1% 1.9%
NOT WFP
Male Female
percentage percentage
Age 0-4 8.4% 8.1%
5-17 22.2% 18.3%
18-65 18.9% 21.4%
>65 0.8% 1.6%
TOTAL
Male Female
percentage percentage
Age 0-4 8.6% 8.2%
5-17 20.8% 17.8%
18-65 19.7% 21.9%
>65 0.9% 1.7%
Table 28. Household wealth quintiles
Mean wealth score and percent distribution of households by wealth
quintiles, according to selected background characteristics (unweighted).
School Feeding Midterm Survey, Guinea-Bissau, 2018.
Wealth poore
st
Secon
d
Middle Fourth Riches
t
Total
percen
tage
percen
tage
percen
tage
percen
tage
percen
tage
percen
tage
Respondent relationship
with the student
Father (n=370) 20.8 18.6 25.7 16.2 18.6 100
Mother (n=98) 22.4 24.5 23.5 12.2 17.3 100
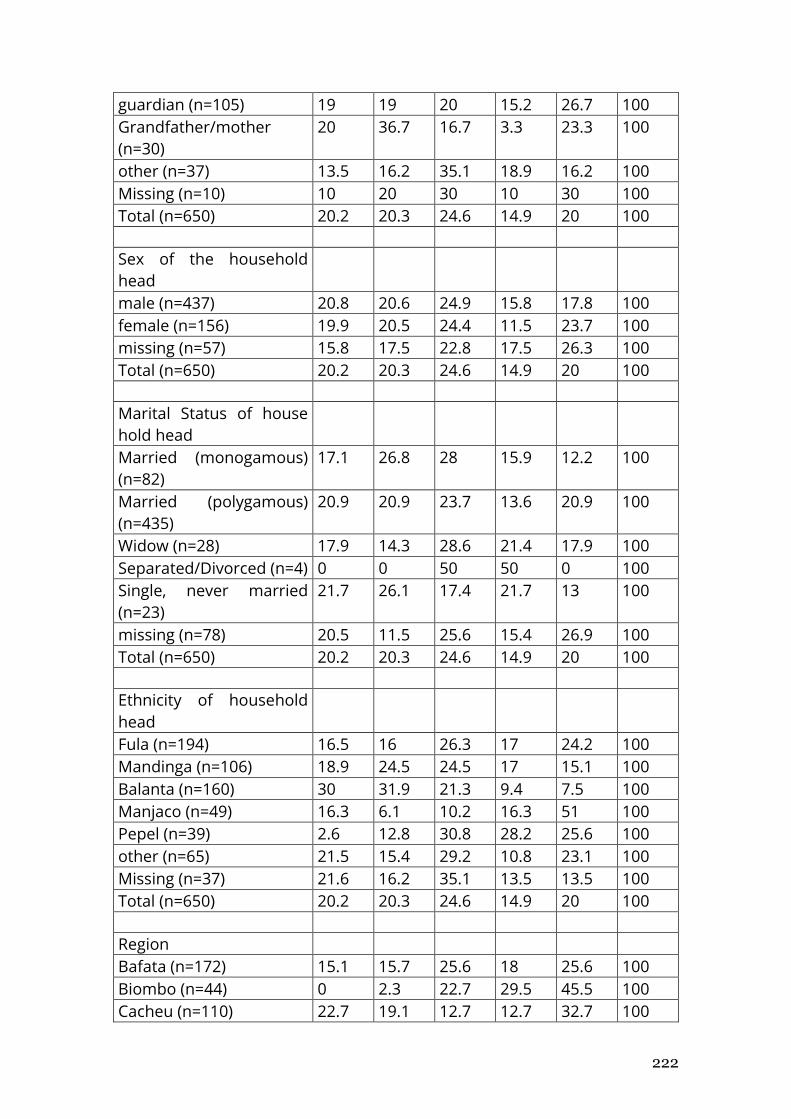
222
guardian (n=105) 19 19 20 15.2 26.7 100
Grandfather/mother
(n=30)
20 36.7 16.7 3.3 23.3 100
other (n=37) 13.5 16.2 35.1 18.9 16.2 100
Missing (n=10) 10 20 30 10 30 100
Total (n=650) 20.2 20.3 24.6 14.9 20 100
Sex of the household
head
male (n=437) 20.8 20.6 24.9 15.8 17.8 100
female (n=156) 19.9 20.5 24.4 11.5 23.7 100
missing (n=57) 15.8 17.5 22.8 17.5 26.3 100
Total (n=650) 20.2 20.3 24.6 14.9 20 100
Marital Status of house
hold head
Married (monogamous)
(n=82)
17.1 26.8 28 15.9 12.2 100
Married (polygamous)
(n=435)
20.9 20.9 23.7 13.6 20.9 100
Widow (n=28) 17.9 14.3 28.6 21.4 17.9 100
Separated/Divorced (n=4) 0 0 50 50 0 100
Single, never married
(n=23)
21.7 26.1 17.4 21.7 13 100
missing (n=78) 20.5 11.5 25.6 15.4 26.9 100
Total (n=650) 20.2 20.3 24.6 14.9 20 100
Ethnicity of household
head
Fula (n=194) 16.5 16 26.3 17 24.2 100
Mandinga (n=106) 18.9 24.5 24.5 17 15.1 100
Balanta (n=160) 30 31.9 21.3 9.4 7.5 100
Manjaco (n=49) 16.3 6.1 10.2 16.3 51 100
Pepel (n=39) 2.6 12.8 30.8 28.2 25.6 100
other (n=65) 21.5 15.4 29.2 10.8 23.1 100
Missing (n=37) 21.6 16.2 35.1 13.5 13.5 100
Total (n=650) 20.2 20.3 24.6 14.9 20 100
Region
Bafata (n=172) 15.1 15.7 25.6 18 25.6 100
Biombo (n=44) 0 2.3 22.7 29.5 45.5 100
Cacheu (n=110) 22.7 19.1 12.7 12.7 32.7 100
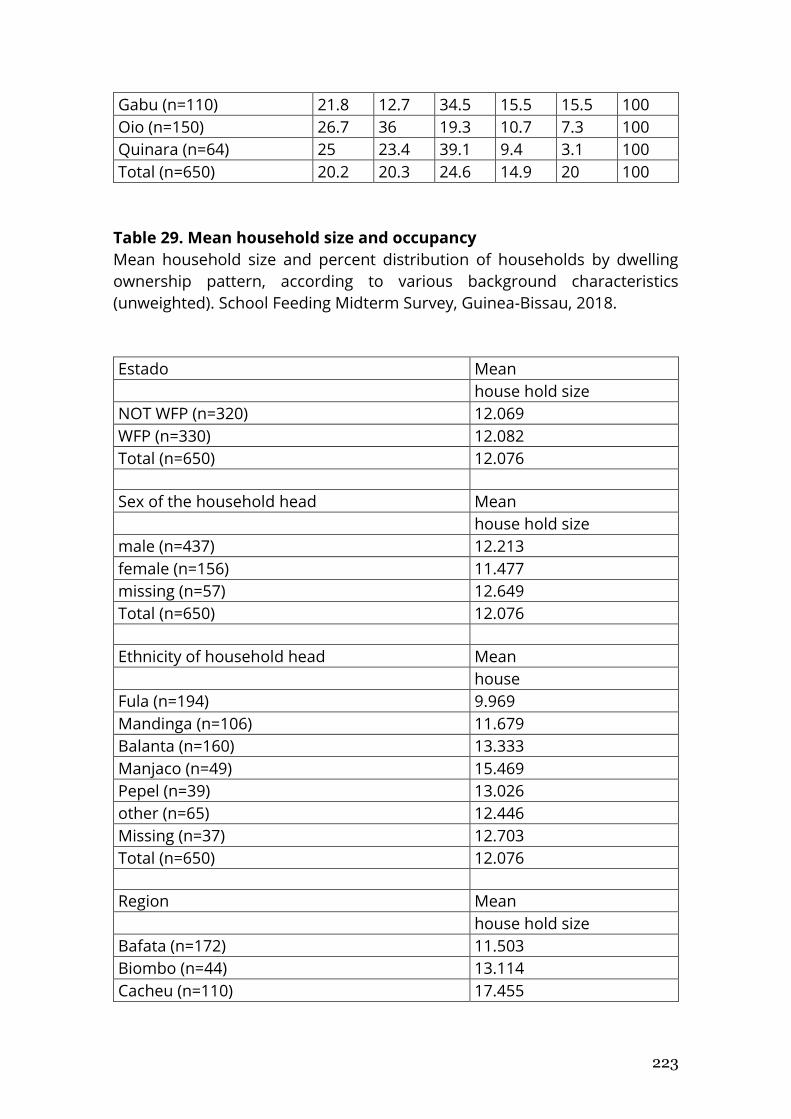
223
Gabu (n=110) 21.8 12.7 34.5 15.5 15.5 100
Oio (n=150) 26.7 36 19.3 10.7 7.3 100
Quinara (n=64) 25 23.4 39.1 9.4 3.1 100
Total (n=650) 20.2 20.3 24.6 14.9 20 100
Table 29. Mean household size and occupancy
Mean household size and percent distribution of households by dwelling
ownership pattern, according to various background characteristics
(unweighted). School Feeding Midterm Survey, Guinea-Bissau, 2018.
Estado Mean
house hold size
NOT WFP (n=320) 12.069
WFP (n=330) 12.082
Total (n=650) 12.076
Sex of the household head Mean
house hold size
male (n=437) 12.213
female (n=156) 11.477
missing (n=57) 12.649
Total (n=650) 12.076
Ethnicity of household head Mean
house
Fula (n=194) 9.969
Mandinga (n=106) 11.679
Balanta (n=160) 13.333
Manjaco (n=49) 15.469
Pepel (n=39) 13.026
other (n=65) 12.446
Missing (n=37) 12.703
Total (n=650) 12.076
Region Mean
house hold size
Bafata (n=172) 11.503
Biombo (n=44) 13.114
Cacheu (n=110) 17.455
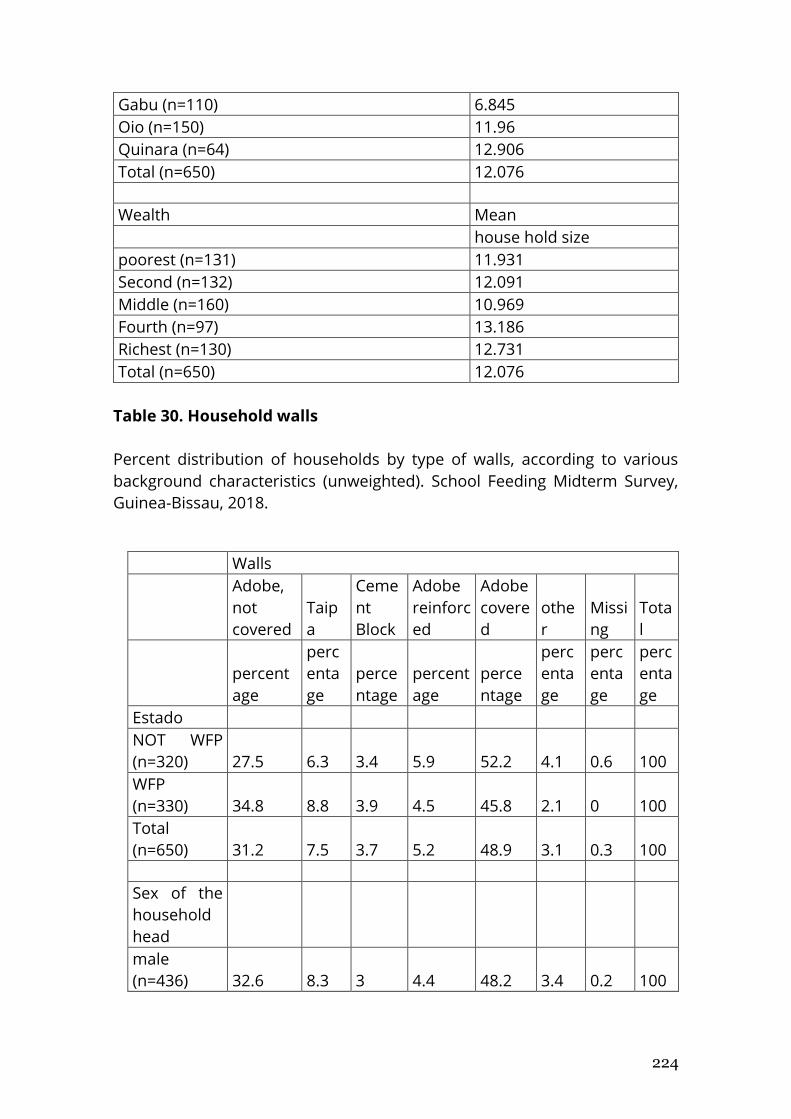
224
Gabu (n=110) 6.845
Oio (n=150) 11.96
Quinara (n=64) 12.906
Total (n=650) 12.076
Wealth Mean
house hold size
poorest (n=131) 11.931
Second (n=132) 12.091
Middle (n=160) 10.969
Fourth (n=97) 13.186
Richest (n=130) 12.731
Total (n=650) 12.076
Table 30. Household walls
Percent distribution of households by type of walls, according to various
background characteristics (unweighted). School Feeding Midterm Survey,
Guinea-Bissau, 2018.
Walls
Adobe,
not
covered
Taip
a
Ceme
nt
Block
Adobe
reinforc
ed
Adobe
covere
d
othe
r
Missi
ng
Tota
l
percent
age
perc
enta
ge
perce
ntage
percent
age
perce
ntage
perc
enta
ge
perc
enta
ge
perc
enta
ge
Estado NOT WFP
(n=320) 27.5 6.3 3.4 5.9 52.2 4.1 0.6 100
WFP
(n=330) 34.8 8.8 3.9 4.5 45.8 2.1 0 100
Total
(n=650) 31.2 7.5 3.7 5.2 48.9 3.1 0.3 100
Sex of the
household
head male
(n=436) 32.6 8.3 3 4.4 48.2 3.4 0.2 100
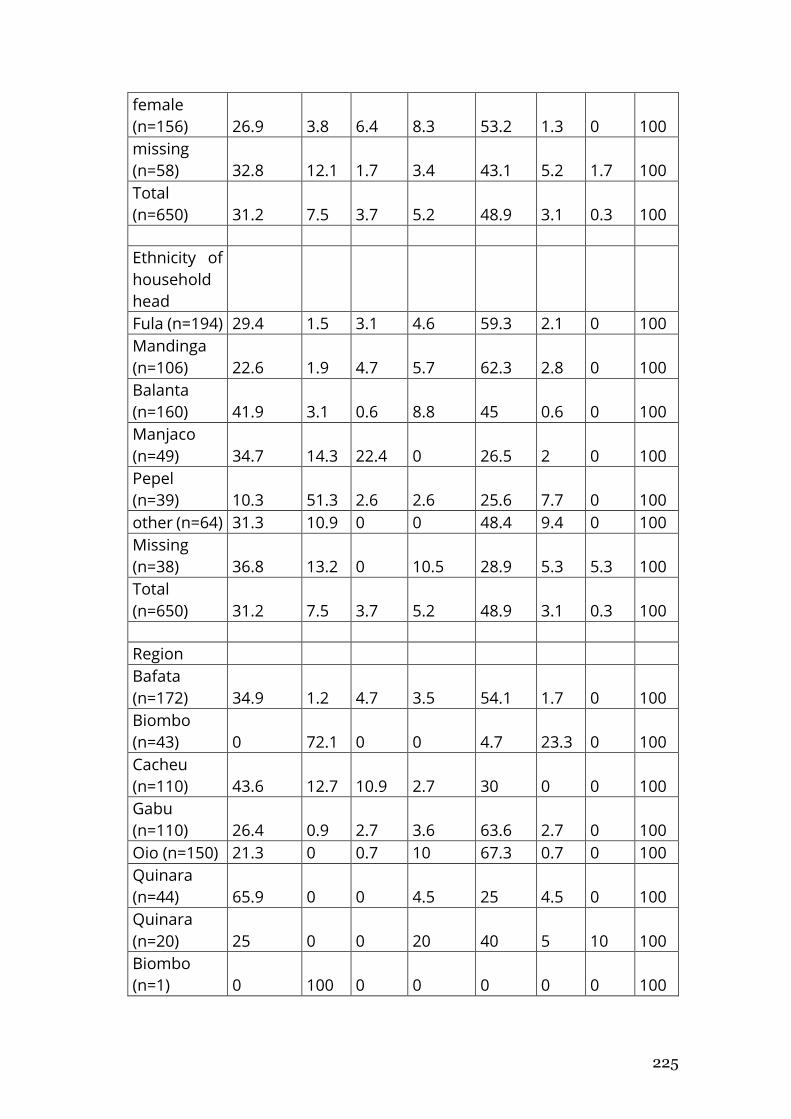
225
female
(n=156) 26.9 3.8 6.4 8.3 53.2 1.3 0 100
missing
(n=58) 32.8 12.1 1.7 3.4 43.1 5.2 1.7 100
Total
(n=650) 31.2 7.5 3.7 5.2 48.9 3.1 0.3 100
Ethnicity of
household
head Fula (n=194) 29.4 1.5 3.1 4.6 59.3 2.1 0 100
Mandinga
(n=106) 22.6 1.9 4.7 5.7 62.3 2.8 0 100
Balanta
(n=160) 41.9 3.1 0.6 8.8 45 0.6 0 100
Manjaco
(n=49) 34.7 14.3 22.4 0 26.5 2 0 100
Pepel
(n=39) 10.3 51.3 2.6 2.6 25.6 7.7 0 100
other (n=64) 31.3 10.9 0 0 48.4 9.4 0 100
Missing
(n=38) 36.8 13.2 0 10.5 28.9 5.3 5.3 100
Total
(n=650) 31.2 7.5 3.7 5.2 48.9 3.1 0.3 100
Region Bafata
(n=172) 34.9 1.2 4.7 3.5 54.1 1.7 0 100
Biombo
(n=43) 0 72.1 0 0 4.7 23.3 0 100
Cacheu
(n=110) 43.6 12.7 10.9 2.7 30 0 0 100
Gabu
(n=110) 26.4 0.9 2.7 3.6 63.6 2.7 0 100
Oio (n=150) 21.3 0 0.7 10 67.3 0.7 0 100
Quinara
(n=44) 65.9 0 0 4.5 25 4.5 0 100
Quinara
(n=20) 25 0 0 20 40 5 10 100
Biombo
(n=1) 0 100 0 0 0 0 0 100
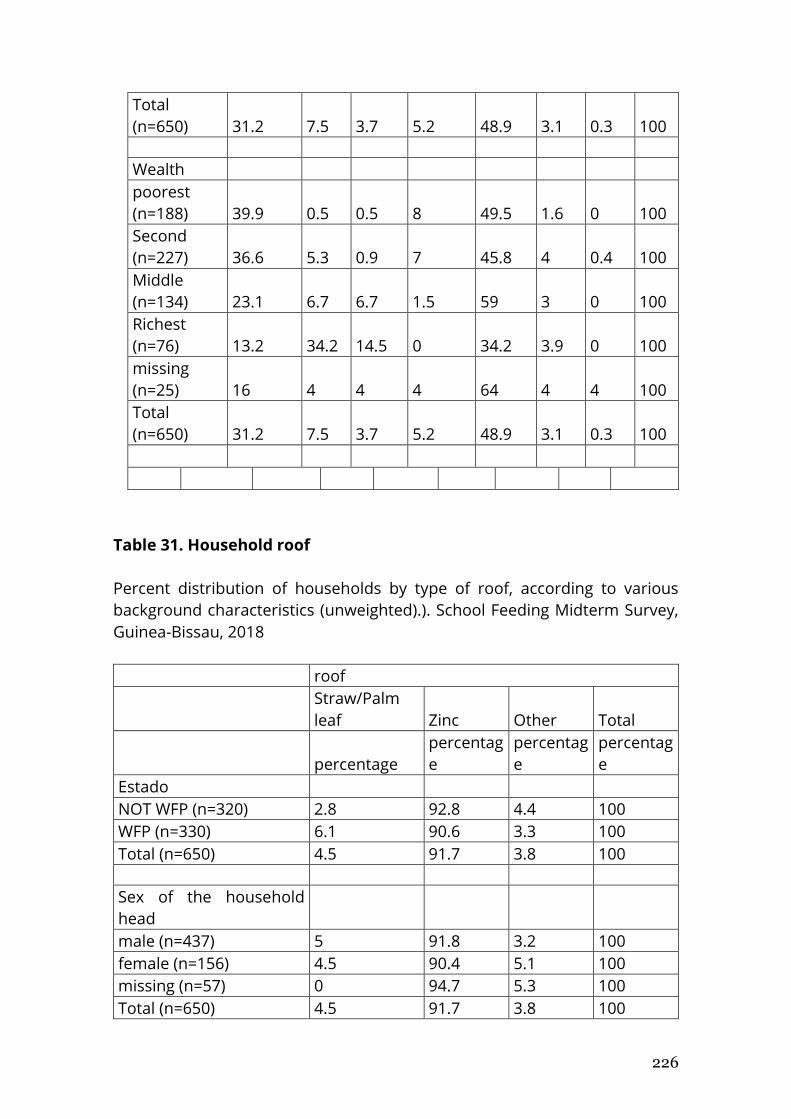
226
Total
(n=650) 31.2 7.5 3.7 5.2 48.9 3.1 0.3 100
Wealth poorest
(n=188) 39.9 0.5 0.5 8 49.5 1.6 0 100
Second
(n=227) 36.6 5.3 0.9 7 45.8 4 0.4 100
Middle
(n=134) 23.1 6.7 6.7 1.5 59 3 0 100
Richest
(n=76) 13.2 34.2 14.5 0 34.2 3.9 0 100
missing
(n=25) 16 4 4 4 64 4 4 100
Total
(n=650) 31.2 7.5 3.7 5.2 48.9 3.1 0.3 100
Table 31. Household roof
Percent distribution of households by type of roof, according to various
background characteristics (unweighted).). School Feeding Midterm Survey,
Guinea-Bissau, 2018
roof
Straw/Palm
leaf Zinc Other Total
percentage
percentag
e
percentag
e
percentag
e
Estado NOT WFP (n=320) 2.8 92.8 4.4 100
WFP (n=330) 6.1 90.6 3.3 100
Total (n=650) 4.5 91.7 3.8 100
Sex of the household
head male (n=437) 5 91.8 3.2 100
female (n=156) 4.5 90.4 5.1 100
missing (n=57) 0 94.7 5.3 100
Total (n=650) 4.5 91.7 3.8 100
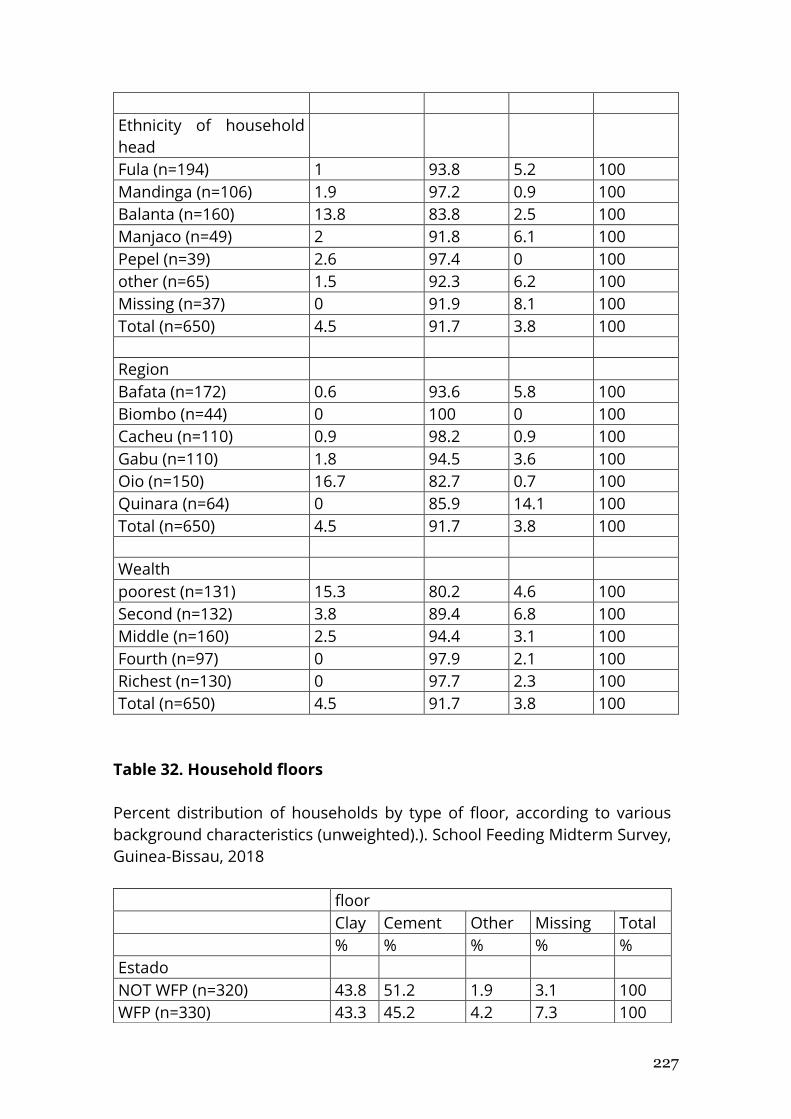
227
Ethnicity of household
head Fula (n=194) 1 93.8 5.2 100
Mandinga (n=106) 1.9 97.2 0.9 100
Balanta (n=160) 13.8 83.8 2.5 100
Manjaco (n=49) 2 91.8 6.1 100
Pepel (n=39) 2.6 97.4 0 100
other (n=65) 1.5 92.3 6.2 100
Missing (n=37) 0 91.9 8.1 100
Total (n=650) 4.5 91.7 3.8 100
Region Bafata (n=172) 0.6 93.6 5.8 100
Biombo (n=44) 0 100 0 100
Cacheu (n=110) 0.9 98.2 0.9 100
Gabu (n=110) 1.8 94.5 3.6 100
Oio (n=150) 16.7 82.7 0.7 100
Quinara (n=64) 0 85.9 14.1 100
Total (n=650) 4.5 91.7 3.8 100
Wealth poorest (n=131) 15.3 80.2 4.6 100
Second (n=132) 3.8 89.4 6.8 100
Middle (n=160) 2.5 94.4 3.1 100
Fourth (n=97) 0 97.9 2.1 100
Richest (n=130) 0 97.7 2.3 100
Total (n=650) 4.5 91.7 3.8 100
Table 32. Household floors
Percent distribution of households by type of floor, according to various
background characteristics (unweighted).). School Feeding Midterm Survey,
Guinea-Bissau, 2018
floor
Clay Cement Other Missing Total
% % % % %
Estado NOT WFP (n=320) 43.8 51.2 1.9 3.1 100
WFP (n=330) 43.3 45.2 4.2 7.3 100
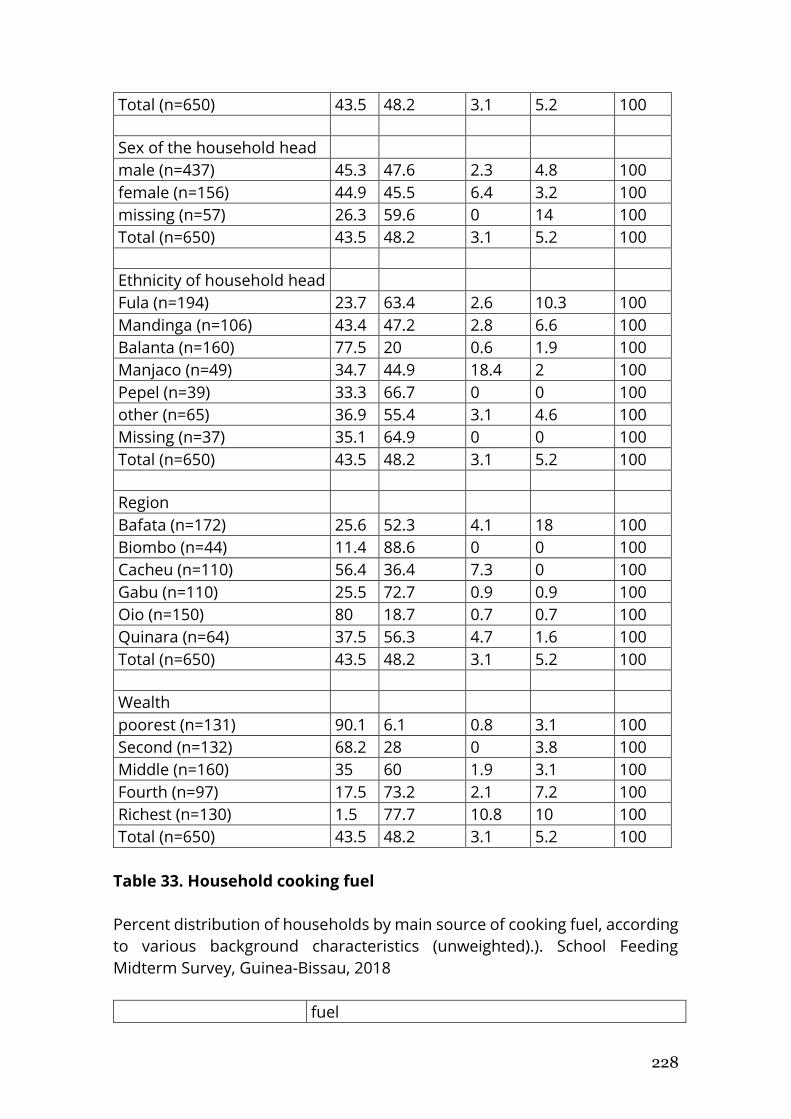
228
Total (n=650) 43.5 48.2 3.1 5.2 100
Sex of the household head male (n=437) 45.3 47.6 2.3 4.8 100
female (n=156) 44.9 45.5 6.4 3.2 100
missing (n=57) 26.3 59.6 0 14 100
Total (n=650) 43.5 48.2 3.1 5.2 100
Ethnicity of household head Fula (n=194) 23.7 63.4 2.6 10.3 100
Mandinga (n=106) 43.4 47.2 2.8 6.6 100
Balanta (n=160) 77.5 20 0.6 1.9 100
Manjaco (n=49) 34.7 44.9 18.4 2 100
Pepel (n=39) 33.3 66.7 0 0 100
other (n=65) 36.9 55.4 3.1 4.6 100
Missing (n=37) 35.1 64.9 0 0 100
Total (n=650) 43.5 48.2 3.1 5.2 100
Region Bafata (n=172) 25.6 52.3 4.1 18 100
Biombo (n=44) 11.4 88.6 0 0 100
Cacheu (n=110) 56.4 36.4 7.3 0 100
Gabu (n=110) 25.5 72.7 0.9 0.9 100
Oio (n=150) 80 18.7 0.7 0.7 100
Quinara (n=64) 37.5 56.3 4.7 1.6 100
Total (n=650) 43.5 48.2 3.1 5.2 100
Wealth poorest (n=131) 90.1 6.1 0.8 3.1 100
Second (n=132) 68.2 28 0 3.8 100
Middle (n=160) 35 60 1.9 3.1 100
Fourth (n=97) 17.5 73.2 2.1 7.2 100
Richest (n=130) 1.5 77.7 10.8 10 100
Total (n=650) 43.5 48.2 3.1 5.2 100
Table 33. Household cooking fuel
Percent distribution of households by main source of cooking fuel, according
to various background characteristics (unweighted).). School Feeding
Midterm Survey, Guinea-Bissau, 2018
fuel
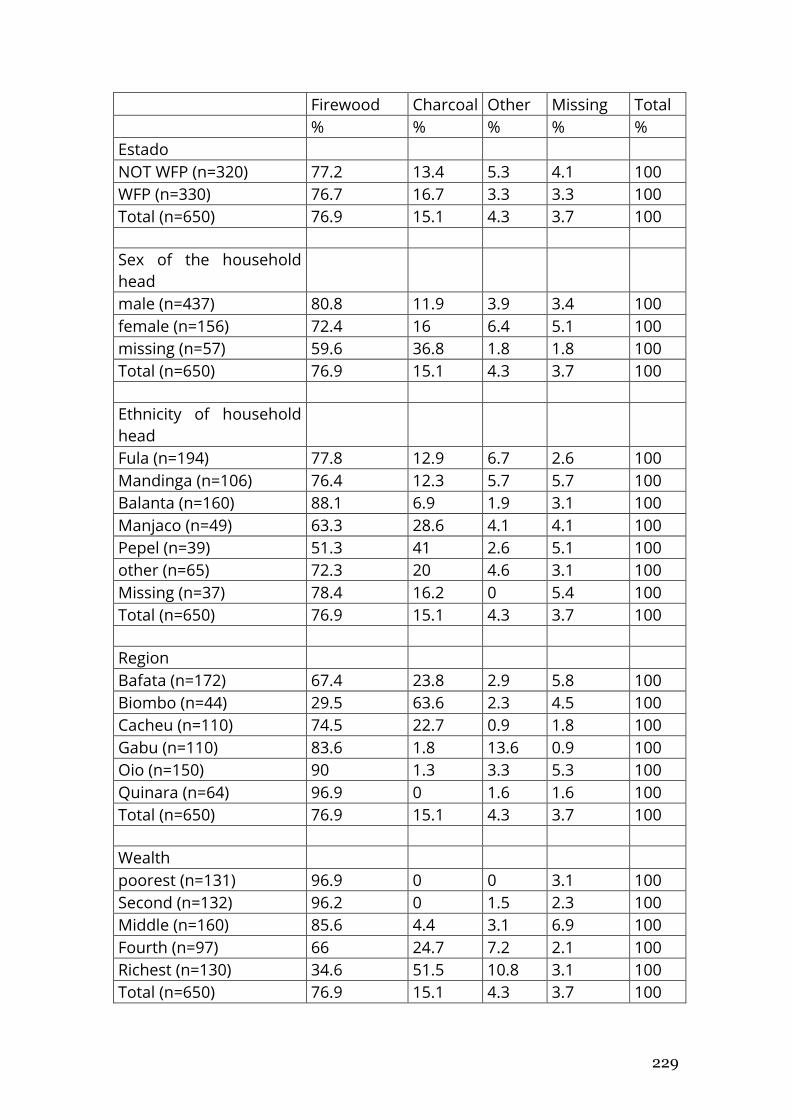
229
Firewood Charcoal Other Missing Total
% % % % %
Estado NOT WFP (n=320) 77.2 13.4 5.3 4.1 100
WFP (n=330) 76.7 16.7 3.3 3.3 100
Total (n=650) 76.9 15.1 4.3 3.7 100
Sex of the household
head male (n=437) 80.8 11.9 3.9 3.4 100
female (n=156) 72.4 16 6.4 5.1 100
missing (n=57) 59.6 36.8 1.8 1.8 100
Total (n=650) 76.9 15.1 4.3 3.7 100
Ethnicity of household
head Fula (n=194) 77.8 12.9 6.7 2.6 100
Mandinga (n=106) 76.4 12.3 5.7 5.7 100
Balanta (n=160) 88.1 6.9 1.9 3.1 100
Manjaco (n=49) 63.3 28.6 4.1 4.1 100
Pepel (n=39) 51.3 41 2.6 5.1 100
other (n=65) 72.3 20 4.6 3.1 100
Missing (n=37) 78.4 16.2 0 5.4 100
Total (n=650) 76.9 15.1 4.3 3.7 100
Region Bafata (n=172) 67.4 23.8 2.9 5.8 100
Biombo (n=44) 29.5 63.6 2.3 4.5 100
Cacheu (n=110) 74.5 22.7 0.9 1.8 100
Gabu (n=110) 83.6 1.8 13.6 0.9 100
Oio (n=150) 90 1.3 3.3 5.3 100
Quinara (n=64) 96.9 0 1.6 1.6 100
Total (n=650) 76.9 15.1 4.3 3.7 100
Wealth poorest (n=131) 96.9 0 0 3.1 100
Second (n=132) 96.2 0 1.5 2.3 100
Middle (n=160) 85.6 4.4 3.1 6.9 100
Fourth (n=97) 66 24.7 7.2 2.1 100
Richest (n=130) 34.6 51.5 10.8 3.1 100
Total (n=650) 76.9 15.1 4.3 3.7 100
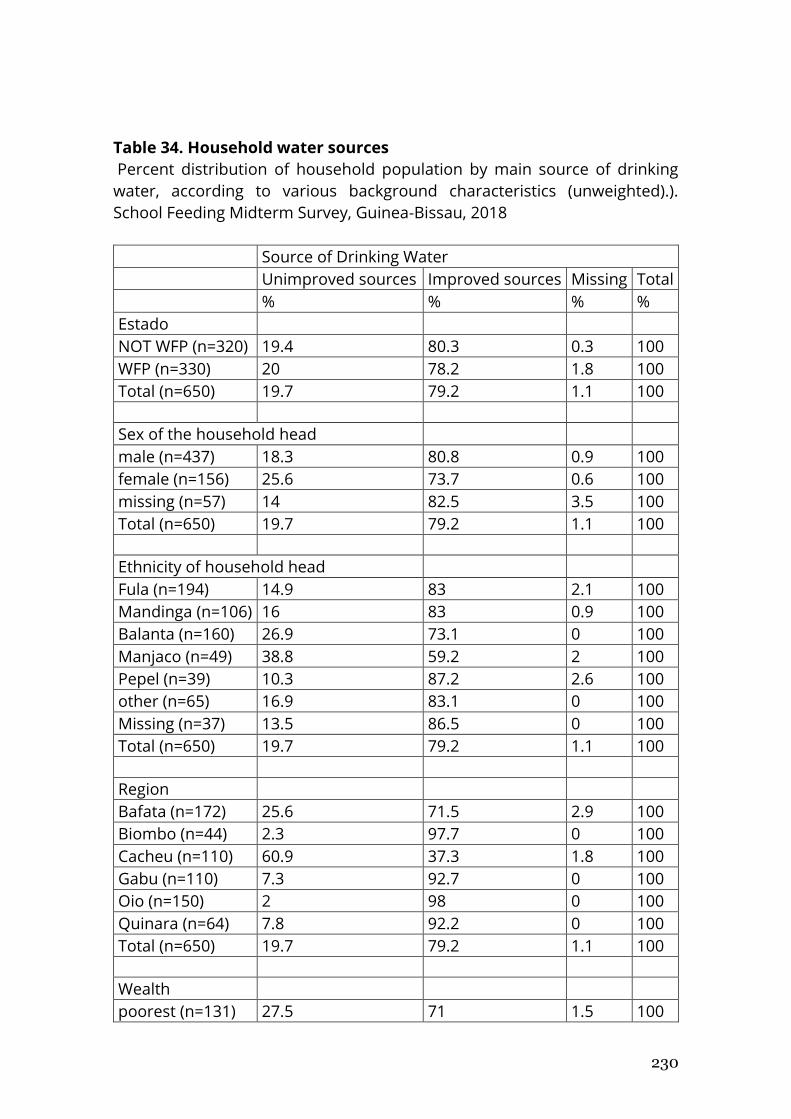
230
Table 34. Household water sources
Percent distribution of household population by main source of drinking
water, according to various background characteristics (unweighted).).
School Feeding Midterm Survey, Guinea-Bissau, 2018
Source of Drinking Water
Unimproved sources Improved sources Missing Total
% % % %
Estado NOT WFP (n=320) 19.4 80.3 0.3 100
WFP (n=330) 20 78.2 1.8 100
Total (n=650) 19.7 79.2 1.1 100
Sex of the household head male (n=437) 18.3 80.8 0.9 100
female (n=156) 25.6 73.7 0.6 100
missing (n=57) 14 82.5 3.5 100
Total (n=650) 19.7 79.2 1.1 100
Ethnicity of household head Fula (n=194) 14.9 83 2.1 100
Mandinga (n=106) 16 83 0.9 100
Balanta (n=160) 26.9 73.1 0 100
Manjaco (n=49) 38.8 59.2 2 100
Pepel (n=39) 10.3 87.2 2.6 100
other (n=65) 16.9 83.1 0 100
Missing (n=37) 13.5 86.5 0 100
Total (n=650) 19.7 79.2 1.1 100
Region Bafata (n=172) 25.6 71.5 2.9 100
Biombo (n=44) 2.3 97.7 0 100
Cacheu (n=110) 60.9 37.3 1.8 100
Gabu (n=110) 7.3 92.7 0 100
Oio (n=150) 2 98 0 100
Quinara (n=64) 7.8 92.2 0 100
Total (n=650) 19.7 79.2 1.1 100
Wealth poorest (n=131) 27.5 71 1.5 100
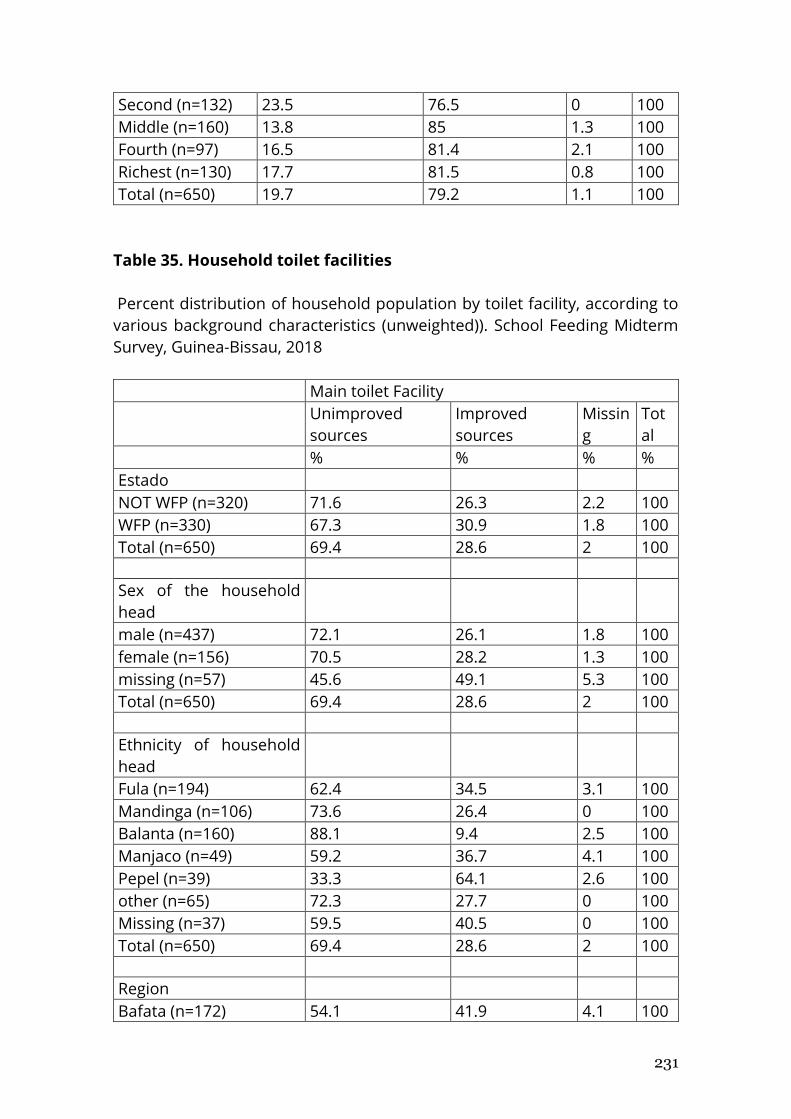
231
Second (n=132) 23.5 76.5 0 100
Middle (n=160) 13.8 85 1.3 100
Fourth (n=97) 16.5 81.4 2.1 100
Richest (n=130) 17.7 81.5 0.8 100
Total (n=650) 19.7 79.2 1.1 100
Table 35. Household toilet facilities
Percent distribution of household population by toilet facility, according to
various background characteristics (unweighted)). School Feeding Midterm
Survey, Guinea-Bissau, 2018
Main toilet Facility
Unimproved
sources
Improved
sources
Missin
g
Tot
al
% % % %
Estado NOT WFP (n=320) 71.6 26.3 2.2 100
WFP (n=330) 67.3 30.9 1.8 100
Total (n=650) 69.4 28.6 2 100
Sex of the household
head male (n=437) 72.1 26.1 1.8 100
female (n=156) 70.5 28.2 1.3 100
missing (n=57) 45.6 49.1 5.3 100
Total (n=650) 69.4 28.6 2 100
Ethnicity of household
head Fula (n=194) 62.4 34.5 3.1 100
Mandinga (n=106) 73.6 26.4 0 100
Balanta (n=160) 88.1 9.4 2.5 100
Manjaco (n=49) 59.2 36.7 4.1 100
Pepel (n=39) 33.3 64.1 2.6 100
other (n=65) 72.3 27.7 0 100
Missing (n=37) 59.5 40.5 0 100
Total (n=650) 69.4 28.6 2 100
Region Bafata (n=172) 54.1 41.9 4.1 100
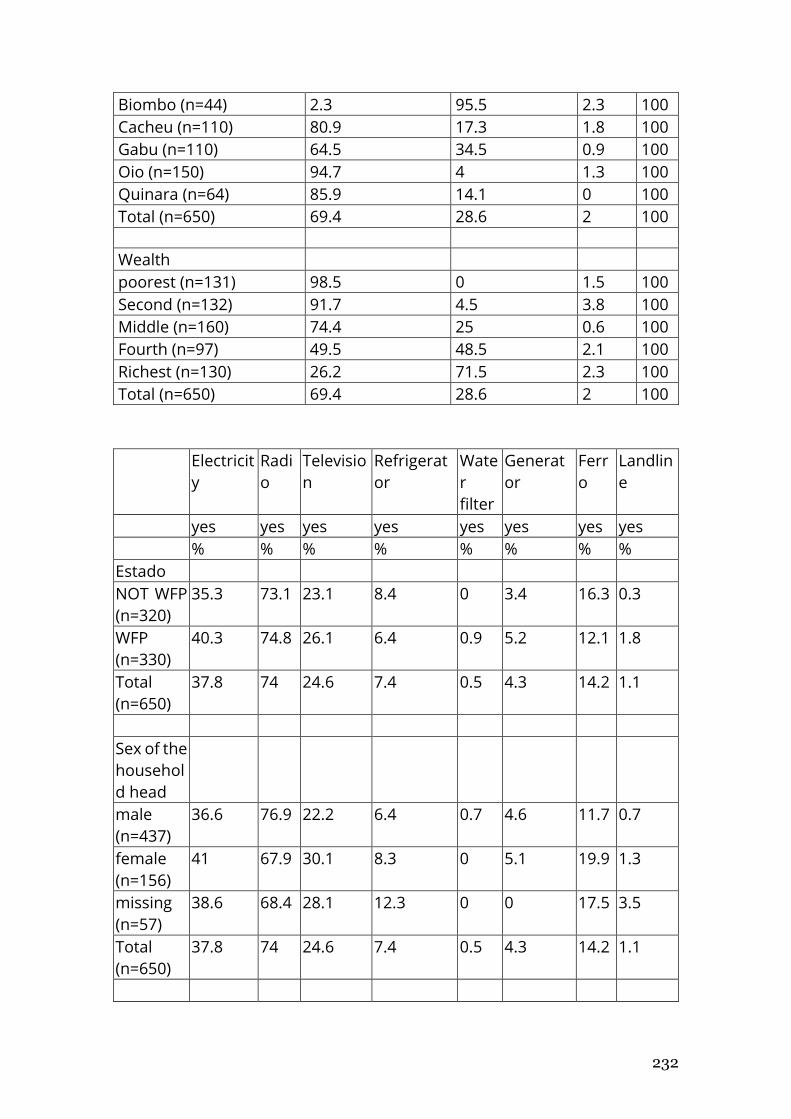
232
Biombo (n=44) 2.3 95.5 2.3 100
Cacheu (n=110) 80.9 17.3 1.8 100
Gabu (n=110) 64.5 34.5 0.9 100
Oio (n=150) 94.7 4 1.3 100
Quinara (n=64) 85.9 14.1 0 100
Total (n=650) 69.4 28.6 2 100
Wealth poorest (n=131) 98.5 0 1.5 100
Second (n=132) 91.7 4.5 3.8 100
Middle (n=160) 74.4 25 0.6 100
Fourth (n=97) 49.5 48.5 2.1 100
Richest (n=130) 26.2 71.5 2.3 100
Total (n=650) 69.4 28.6 2 100
Electricit
y
Radi
o
Televisio
n
Refrigerat
or
Wate
r
filter
Generat
or
Ferr
o
Landlin
e
yes yes yes yes yes yes yes yes
% % % % % % % %
Estado
NOT WFP
(n=320)
35.3 73.1 23.1 8.4 0 3.4 16.3 0.3
WFP
(n=330)
40.3 74.8 26.1 6.4 0.9 5.2 12.1 1.8
Total
(n=650)
37.8 74 24.6 7.4 0.5 4.3 14.2 1.1
Sex of the
househol
d head
male
(n=437)
36.6 76.9 22.2 6.4 0.7 4.6 11.7 0.7
female
(n=156)
41 67.9 30.1 8.3 0 5.1 19.9 1.3
missing
(n=57)
38.6 68.4 28.1 12.3 0 0 17.5 3.5
Total
(n=650)
37.8 74 24.6 7.4 0.5 4.3 14.2 1.1
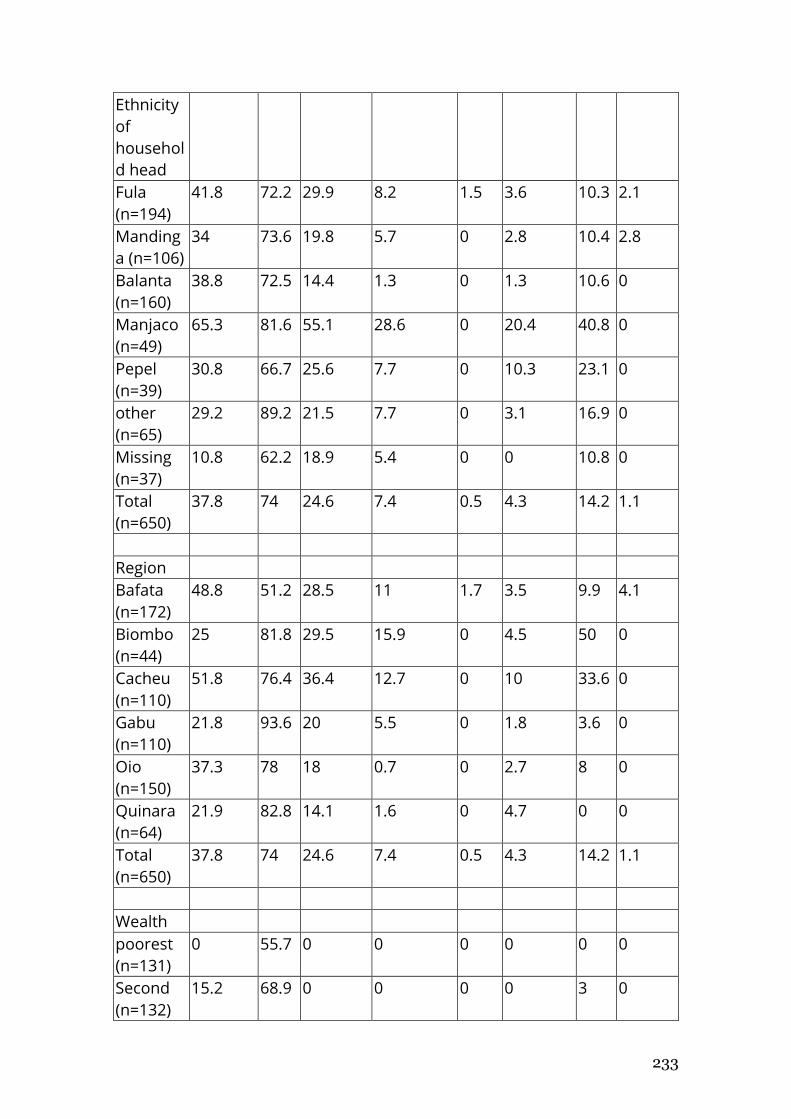
233
Ethnicity
of
househol
d head
Fula
(n=194)
41.8 72.2 29.9 8.2 1.5 3.6 10.3 2.1
Manding
a (n=106)
34 73.6 19.8 5.7 0 2.8 10.4 2.8
Balanta
(n=160)
38.8 72.5 14.4 1.3 0 1.3 10.6 0
Manjaco
(n=49)
65.3 81.6 55.1 28.6 0 20.4 40.8 0
Pepel
(n=39)
30.8 66.7 25.6 7.7 0 10.3 23.1 0
other
(n=65)
29.2 89.2 21.5 7.7 0 3.1 16.9 0
Missing
(n=37)
10.8 62.2 18.9 5.4 0 0 10.8 0
Total
(n=650)
37.8 74 24.6 7.4 0.5 4.3 14.2 1.1
Region
Bafata
(n=172)
48.8 51.2 28.5 11 1.7 3.5 9.9 4.1
Biombo
(n=44)
25 81.8 29.5 15.9 0 4.5 50 0
Cacheu
(n=110)
51.8 76.4 36.4 12.7 0 10 33.6 0
Gabu
(n=110)
21.8 93.6 20 5.5 0 1.8 3.6 0
Oio
(n=150)
37.3 78 18 0.7 0 2.7 8 0
Quinara
(n=64)
21.9 82.8 14.1 1.6 0 4.7 0 0
Total
(n=650)
37.8 74 24.6 7.4 0.5 4.3 14.2 1.1
Wealth
poorest
(n=131)
0 55.7 0 0 0 0 0 0
Second
(n=132)
15.2 68.9 0 0 0 0 3 0
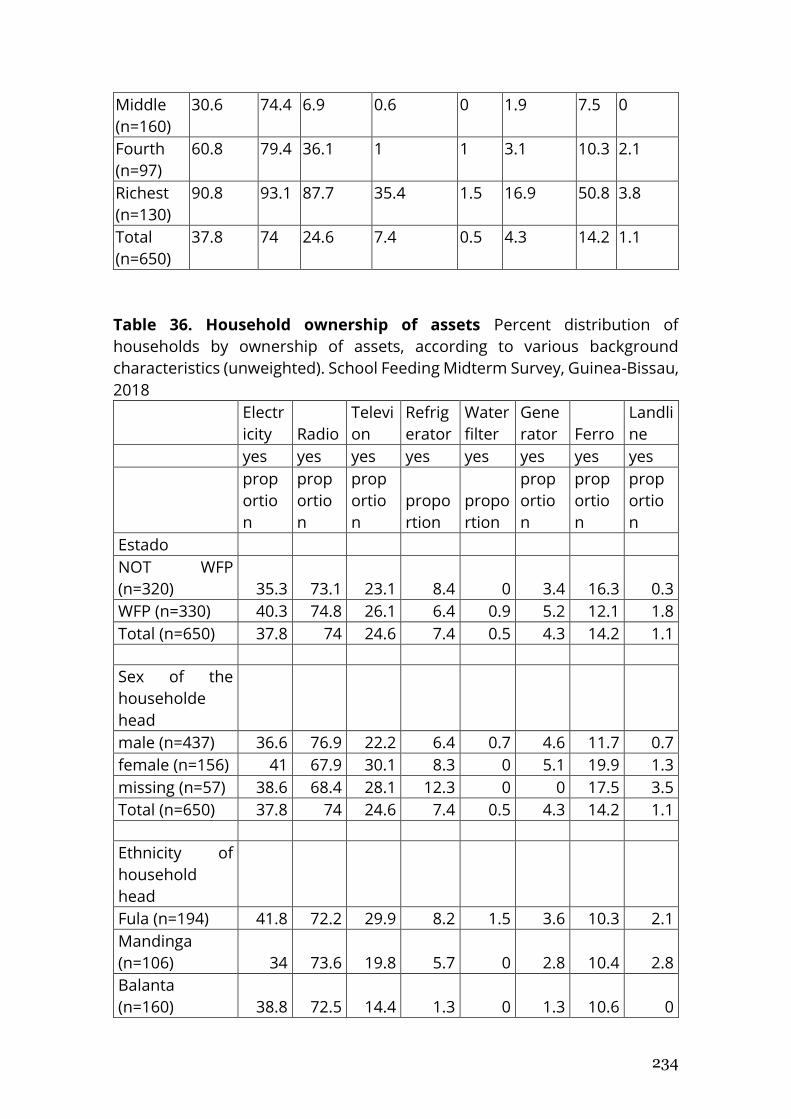
234
Middle
(n=160)
30.6 74.4 6.9 0.6 0 1.9 7.5 0
Fourth
(n=97)
60.8 79.4 36.1 1 1 3.1 10.3 2.1
Richest
(n=130)
90.8 93.1 87.7 35.4 1.5 16.9 50.8 3.8
Total
(n=650)
37.8 74 24.6 7.4 0.5 4.3 14.2 1.1
Table 36. Household ownership of assets Percent distribution of
households by ownership of assets, according to various background
characteristics (unweighted). School Feeding Midterm Survey, Guinea-Bissau,
2018
Electr
icity Radio
Televi
on
Refrig
erator
Water
filter
Gene
rator Ferro
Landli
ne
yes yes yes yes yes yes yes yes
prop
ortio
n
prop
ortio
n
prop
ortio
n
propo
rtion
propo
rtion
prop
ortio
n
prop
ortio
n
prop
ortio
n
Estado NOT WFP
(n=320) 35.3 73.1 23.1 8.4 0 3.4 16.3 0.3
WFP (n=330) 40.3 74.8 26.1 6.4 0.9 5.2 12.1 1.8
Total (n=650) 37.8 74 24.6 7.4 0.5 4.3 14.2 1.1
Sex of the
householde
head male (n=437) 36.6 76.9 22.2 6.4 0.7 4.6 11.7 0.7
female (n=156) 41 67.9 30.1 8.3 0 5.1 19.9 1.3
missing (n=57) 38.6 68.4 28.1 12.3 0 0 17.5 3.5
Total (n=650) 37.8 74 24.6 7.4 0.5 4.3 14.2 1.1
Ethnicity of
household
head Fula (n=194) 41.8 72.2 29.9 8.2 1.5 3.6 10.3 2.1
Mandinga
(n=106) 34 73.6 19.8 5.7 0 2.8 10.4 2.8
Balanta
(n=160) 38.8 72.5 14.4 1.3 0 1.3 10.6 0
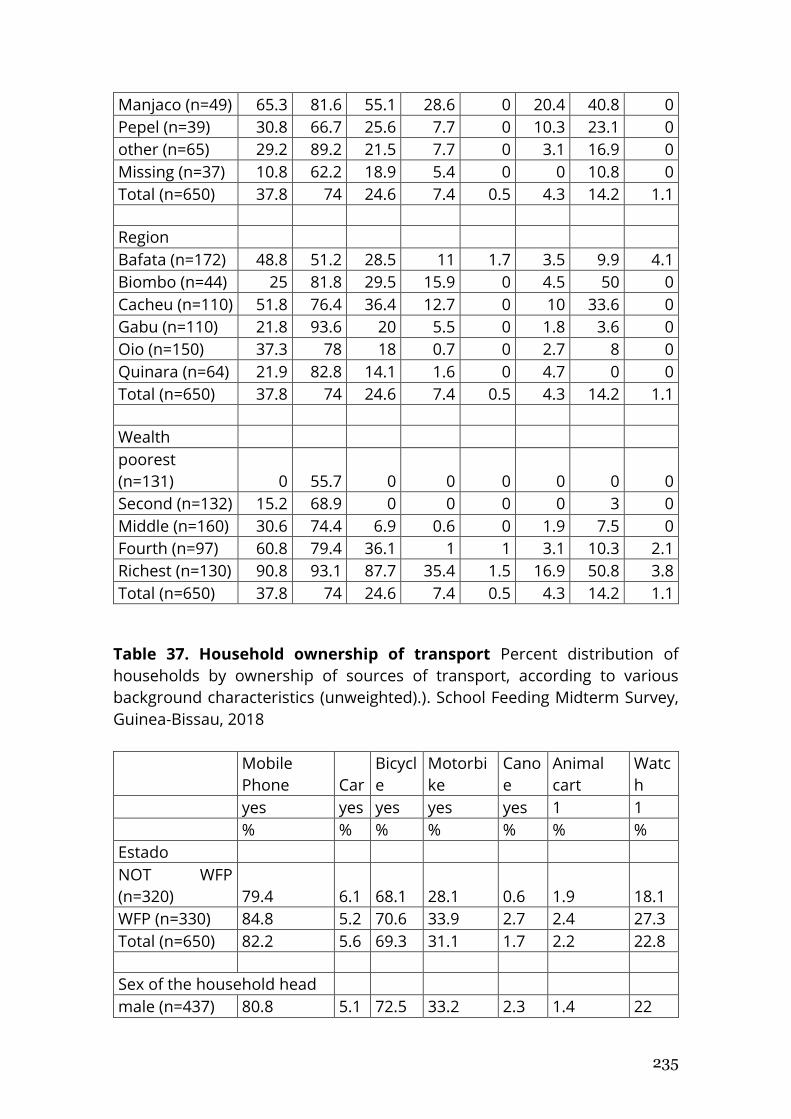
235
Manjaco (n=49) 65.3 81.6 55.1 28.6 0 20.4 40.8 0
Pepel (n=39) 30.8 66.7 25.6 7.7 0 10.3 23.1 0
other (n=65) 29.2 89.2 21.5 7.7 0 3.1 16.9 0
Missing (n=37) 10.8 62.2 18.9 5.4 0 0 10.8 0
Total (n=650) 37.8 74 24.6 7.4 0.5 4.3 14.2 1.1
Region Bafata (n=172) 48.8 51.2 28.5 11 1.7 3.5 9.9 4.1
Biombo (n=44) 25 81.8 29.5 15.9 0 4.5 50 0
Cacheu (n=110) 51.8 76.4 36.4 12.7 0 10 33.6 0
Gabu (n=110) 21.8 93.6 20 5.5 0 1.8 3.6 0
Oio (n=150) 37.3 78 18 0.7 0 2.7 8 0
Quinara (n=64) 21.9 82.8 14.1 1.6 0 4.7 0 0
Total (n=650) 37.8 74 24.6 7.4 0.5 4.3 14.2 1.1
Wealth poorest
(n=131) 0 55.7 0 0 0 0 0 0
Second (n=132) 15.2 68.9 0 0 0 0 3 0
Middle (n=160) 30.6 74.4 6.9 0.6 0 1.9 7.5 0
Fourth (n=97) 60.8 79.4 36.1 1 1 3.1 10.3 2.1
Richest (n=130) 90.8 93.1 87.7 35.4 1.5 16.9 50.8 3.8
Total (n=650) 37.8 74 24.6 7.4 0.5 4.3 14.2 1.1
Table 37. Household ownership of transport Percent distribution of
households by ownership of sources of transport, according to various
background characteristics (unweighted).). School Feeding Midterm Survey,
Guinea-Bissau, 2018
Mobile
Phone Car
Bicycl
e
Motorbi
ke
Cano
e
Animal
cart
Watc
h
yes yes yes yes yes 1 1
% % % % % % %
Estado NOT WFP
(n=320) 79.4 6.1 68.1 28.1 0.6 1.9 18.1
WFP (n=330) 84.8 5.2 70.6 33.9 2.7 2.4 27.3
Total (n=650) 82.2 5.6 69.3 31.1 1.7 2.2 22.8
Sex of the household head male (n=437) 80.8 5.1 72.5 33.2 2.3 1.4 22
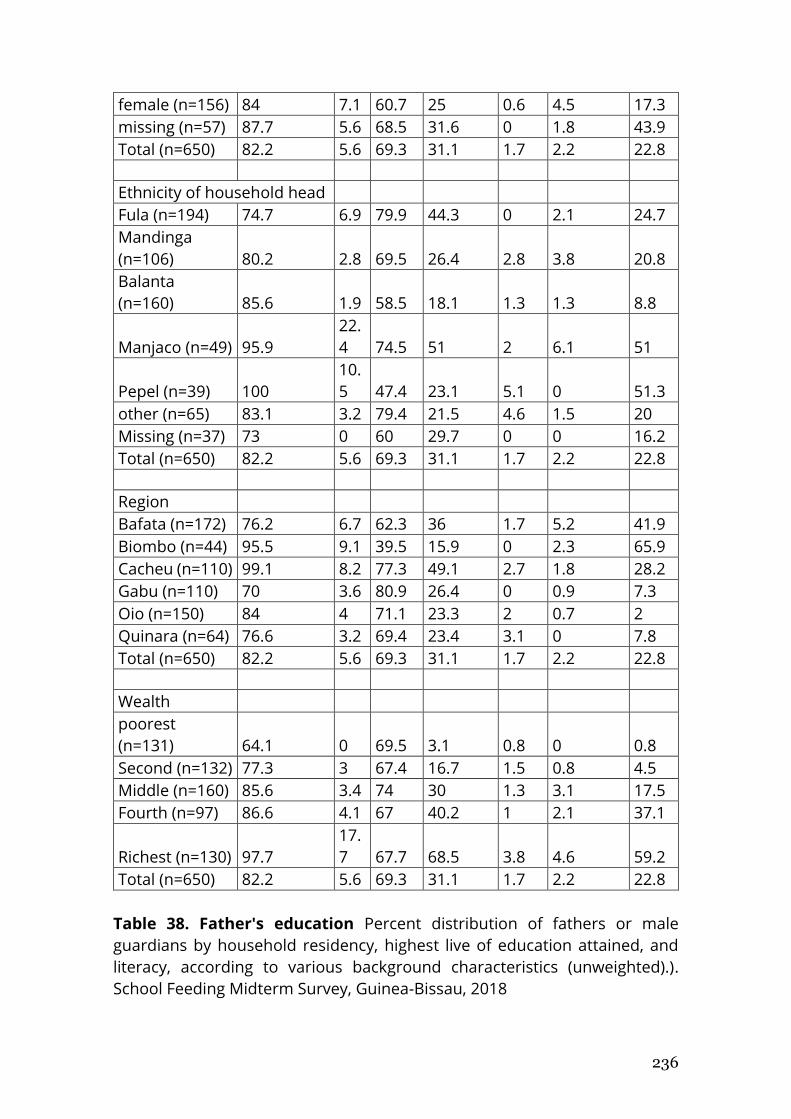
236
female (n=156) 84 7.1 60.7 25 0.6 4.5 17.3
missing (n=57) 87.7 5.6 68.5 31.6 0 1.8 43.9
Total (n=650) 82.2 5.6 69.3 31.1 1.7 2.2 22.8
Ethnicity of household head Fula (n=194) 74.7 6.9 79.9 44.3 0 2.1 24.7
Mandinga
(n=106) 80.2 2.8 69.5 26.4 2.8 3.8 20.8
Balanta
(n=160) 85.6 1.9 58.5 18.1 1.3 1.3 8.8
Manjaco (n=49) 95.9
22.
4 74.5 51 2 6.1 51
Pepel (n=39) 100
10.
5 47.4 23.1 5.1 0 51.3
other (n=65) 83.1 3.2 79.4 21.5 4.6 1.5 20
Missing (n=37) 73 0 60 29.7 0 0 16.2
Total (n=650) 82.2 5.6 69.3 31.1 1.7 2.2 22.8
Region Bafata (n=172) 76.2 6.7 62.3 36 1.7 5.2 41.9
Biombo (n=44) 95.5 9.1 39.5 15.9 0 2.3 65.9
Cacheu (n=110) 99.1 8.2 77.3 49.1 2.7 1.8 28.2
Gabu (n=110) 70 3.6 80.9 26.4 0 0.9 7.3
Oio (n=150) 84 4 71.1 23.3 2 0.7 2
Quinara (n=64) 76.6 3.2 69.4 23.4 3.1 0 7.8
Total (n=650) 82.2 5.6 69.3 31.1 1.7 2.2 22.8
Wealth poorest
(n=131) 64.1 0 69.5 3.1 0.8 0 0.8
Second (n=132) 77.3 3 67.4 16.7 1.5 0.8 4.5
Middle (n=160) 85.6 3.4 74 30 1.3 3.1 17.5
Fourth (n=97) 86.6 4.1 67 40.2 1 2.1 37.1
Richest (n=130) 97.7
17.
7 67.7 68.5 3.8 4.6 59.2
Total (n=650) 82.2 5.6 69.3 31.1 1.7 2.2 22.8
Table 38. Father's education Percent distribution of fathers or male
guardians by household residency, highest live of education attained, and
literacy, according to various background characteristics (unweighted).).
School Feeding Midterm Survey, Guinea-Bissau, 2018
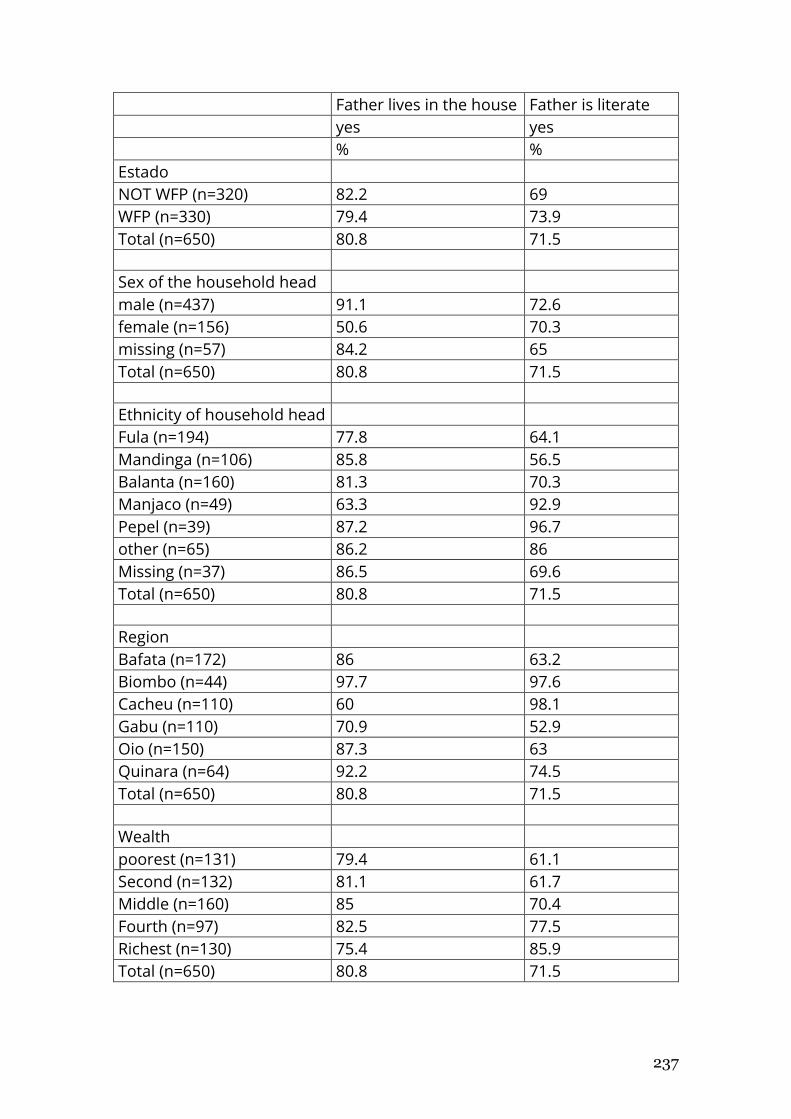
237
Father lives in the house Father is literate
yes yes
% %
Estado NOT WFP (n=320) 82.2 69
WFP (n=330) 79.4 73.9
Total (n=650) 80.8 71.5
Sex of the household head male (n=437) 91.1 72.6
female (n=156) 50.6 70.3
missing (n=57) 84.2 65
Total (n=650) 80.8 71.5
Ethnicity of household head Fula (n=194) 77.8 64.1
Mandinga (n=106) 85.8 56.5
Balanta (n=160) 81.3 70.3
Manjaco (n=49) 63.3 92.9
Pepel (n=39) 87.2 96.7
other (n=65) 86.2 86
Missing (n=37) 86.5 69.6
Total (n=650) 80.8 71.5
Region Bafata (n=172) 86 63.2
Biombo (n=44) 97.7 97.6
Cacheu (n=110) 60 98.1
Gabu (n=110) 70.9 52.9
Oio (n=150) 87.3 63
Quinara (n=64) 92.2 74.5
Total (n=650) 80.8 71.5
Wealth poorest (n=131) 79.4 61.1
Second (n=132) 81.1 61.7
Middle (n=160) 85 70.4
Fourth (n=97) 82.5 77.5
Richest (n=130) 75.4 85.9
Total (n=650) 80.8 71.5
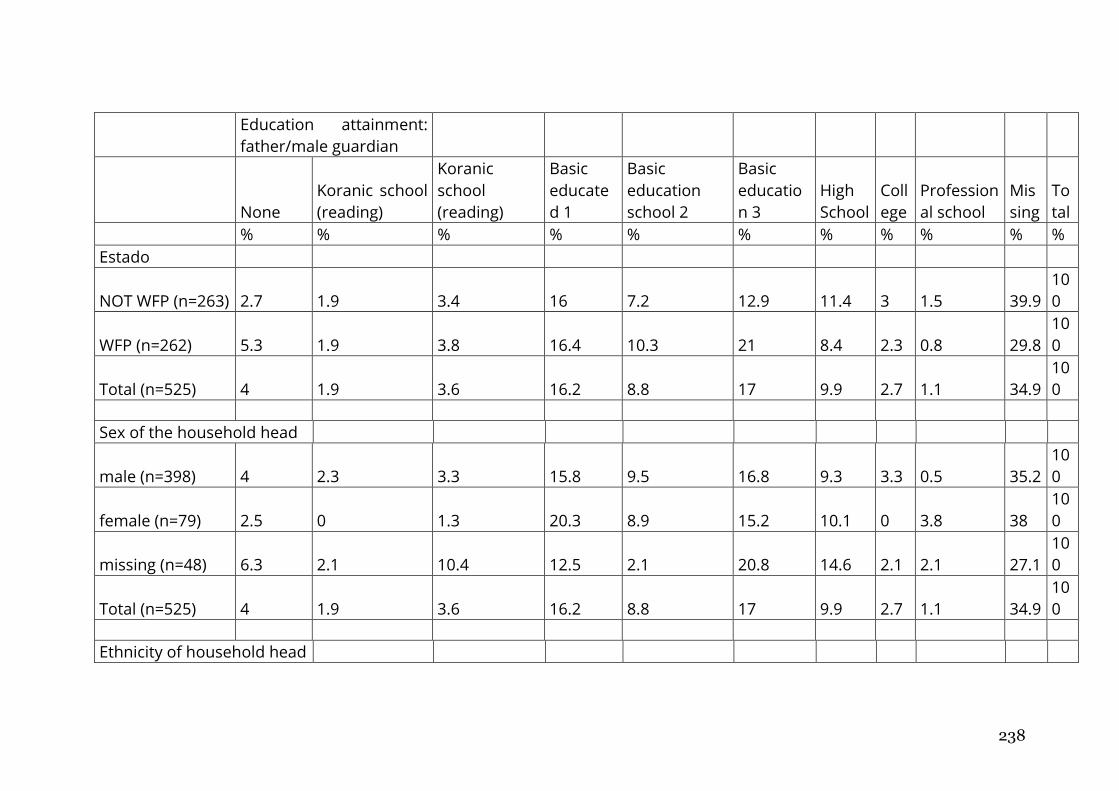
238
Education attainment:
father/male guardian
None
Koranic school
(reading)
Koranic
school
(reading)
Basic
educate
d 1
Basic
education
school 2
Basic
educatio
n 3
High
School
Coll
ege
Profession
al school
Mis
sing
To
tal
% % % % % % % % % % %
Estado
NOT WFP (n=263) 2.7 1.9 3.4 16 7.2 12.9 11.4 3 1.5 39.9
10
0
WFP (n=262) 5.3 1.9 3.8 16.4 10.3 21 8.4 2.3 0.8 29.8
10
0
Total (n=525) 4 1.9 3.6 16.2 8.8 17 9.9 2.7 1.1 34.9
10
0
Sex of the household head
male (n=398) 4 2.3 3.3 15.8 9.5 16.8 9.3 3.3 0.5 35.2
10
0
female (n=79) 2.5 0 1.3 20.3 8.9 15.2 10.1 0 3.8 38
10
0
missing (n=48) 6.3 2.1 10.4 12.5 2.1 20.8 14.6 2.1 2.1 27.1
10
0
Total (n=525) 4 1.9 3.6 16.2 8.8 17 9.9 2.7 1.1 34.9
10
0
Ethnicity of household head
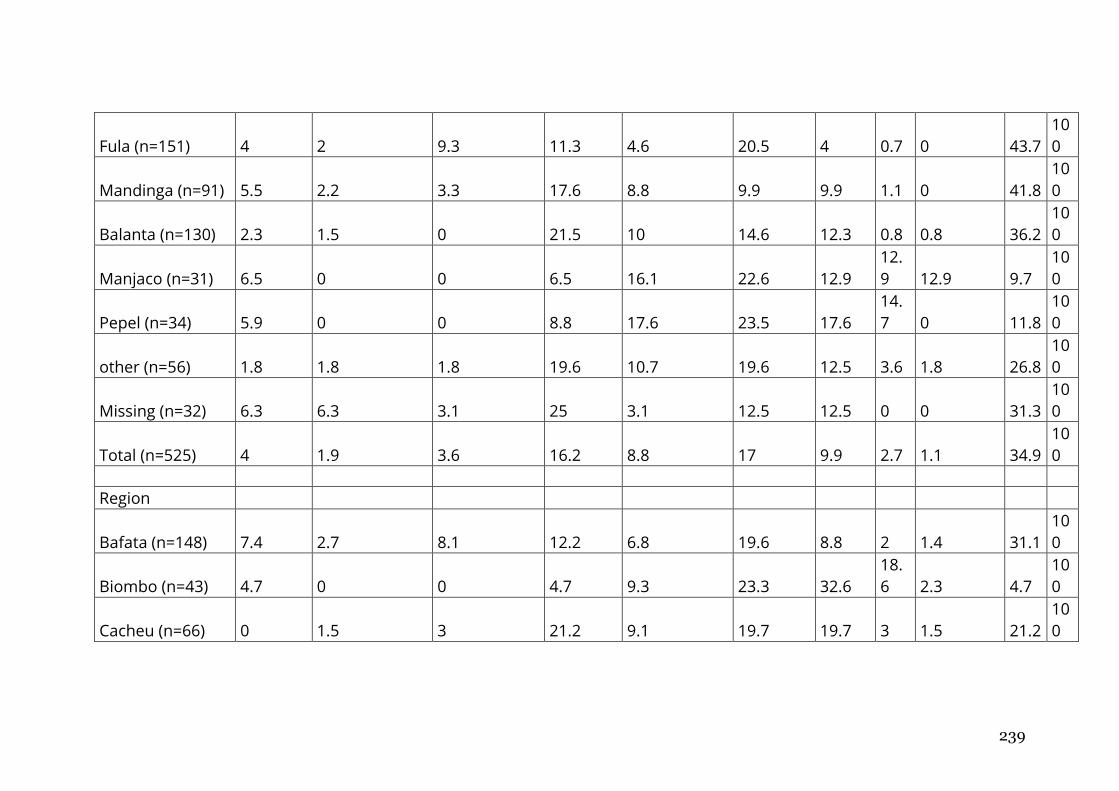
239
Fula (n=151) 4 2 9.3 11.3 4.6 20.5 4 0.7 0 43.7
10
0
Mandinga (n=91) 5.5 2.2 3.3 17.6 8.8 9.9 9.9 1.1 0 41.8
10
0
Balanta (n=130) 2.3 1.5 0 21.5 10 14.6 12.3 0.8 0.8 36.2
10
0
Manjaco (n=31) 6.5 0 0 6.5 16.1 22.6 12.9
12.
9 12.9 9.7
10
0
Pepel (n=34) 5.9 0 0 8.8 17.6 23.5 17.6
14.
7 0 11.8
10
0
other (n=56) 1.8 1.8 1.8 19.6 10.7 19.6 12.5 3.6 1.8 26.8
10
0
Missing (n=32) 6.3 6.3 3.1 25 3.1 12.5 12.5 0 0 31.3
10
0
Total (n=525) 4 1.9 3.6 16.2 8.8 17 9.9 2.7 1.1 34.9
10
0
Region
Bafata (n=148) 7.4 2.7 8.1 12.2 6.8 19.6 8.8 2 1.4 31.1
10
0
Biombo (n=43) 4.7 0 0 4.7 9.3 23.3 32.6
18.
6 2.3 4.7
10
0
Cacheu (n=66) 0 1.5 3 21.2 9.1 19.7 19.7 3 1.5 21.2
10
0
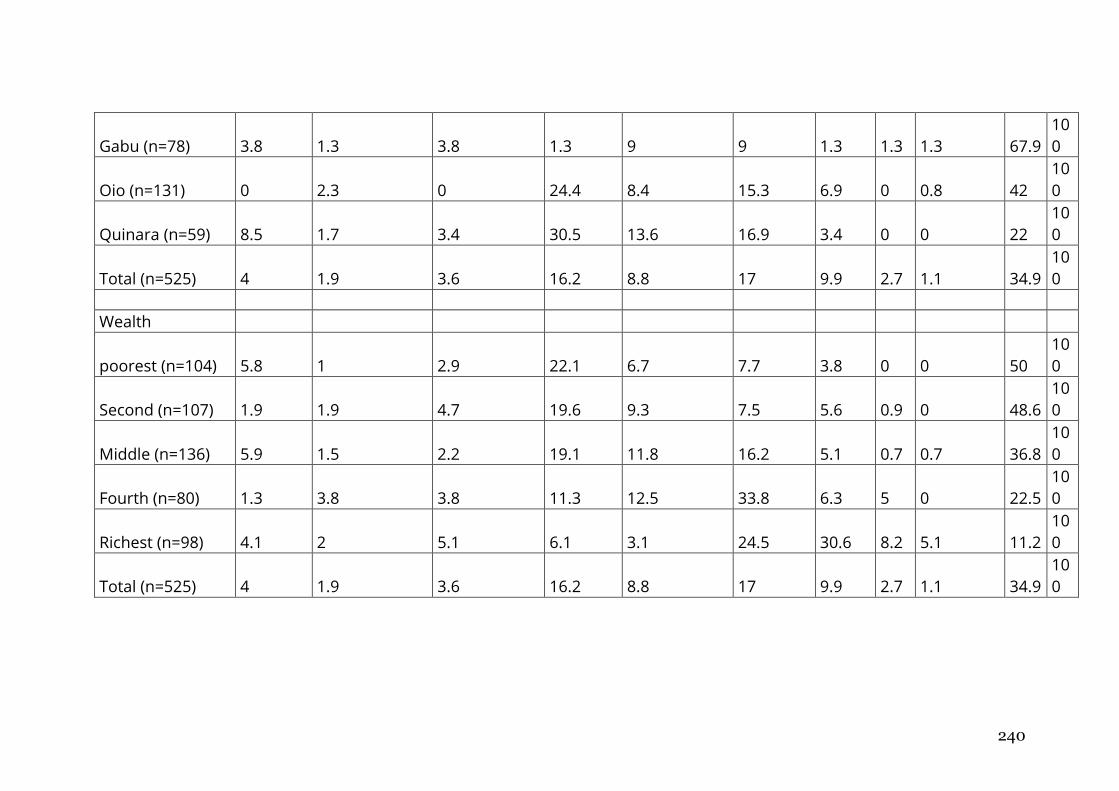
240
Gabu (n=78) 3.8 1.3 3.8 1.3 9 9 1.3 1.3 1.3 67.9
10
0
Oio (n=131) 0 2.3 0 24.4 8.4 15.3 6.9 0 0.8 42
10
0
Quinara (n=59) 8.5 1.7 3.4 30.5 13.6 16.9 3.4 0 0 22
10
0
Total (n=525) 4 1.9 3.6 16.2 8.8 17 9.9 2.7 1.1 34.9
10
0
Wealth
poorest (n=104) 5.8 1 2.9 22.1 6.7 7.7 3.8 0 0 50
10
0
Second (n=107) 1.9 1.9 4.7 19.6 9.3 7.5 5.6 0.9 0 48.6
10
0
Middle (n=136) 5.9 1.5 2.2 19.1 11.8 16.2 5.1 0.7 0.7 36.8
10
0
Fourth (n=80) 1.3 3.8 3.8 11.3 12.5 33.8 6.3 5 0 22.5
10
0
Richest (n=98) 4.1 2 5.1 6.1 3.1 24.5 30.6 8.2 5.1 11.2
10
0
Total (n=525) 4 1.9 3.6 16.2 8.8 17 9.9 2.7 1.1 34.9
10
0
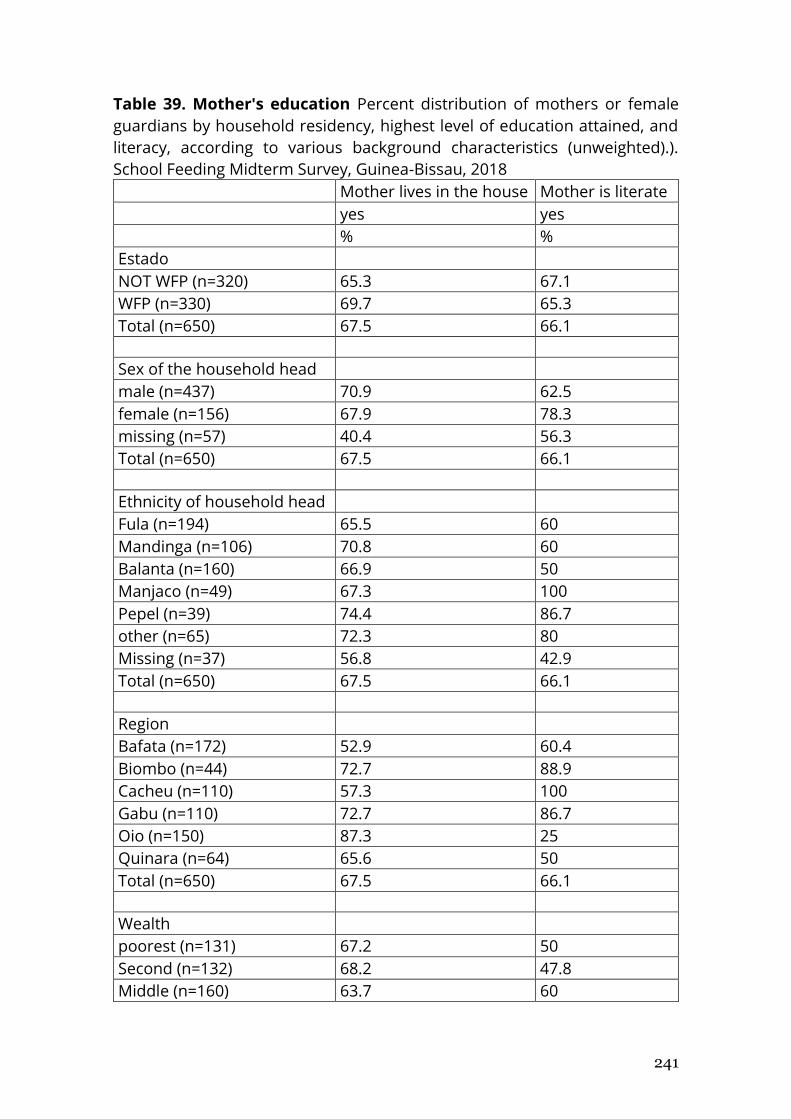
241
Table 39. Mother's education Percent distribution of mothers or female
guardians by household residency, highest level of education attained, and
literacy, according to various background characteristics (unweighted).).
School Feeding Midterm Survey, Guinea-Bissau, 2018
Mother lives in the house Mother is literate
yes yes
% %
Estado NOT WFP (n=320) 65.3 67.1
WFP (n=330) 69.7 65.3
Total (n=650) 67.5 66.1
Sex of the household head male (n=437) 70.9 62.5
female (n=156) 67.9 78.3
missing (n=57) 40.4 56.3
Total (n=650) 67.5 66.1
Ethnicity of household head Fula (n=194) 65.5 60
Mandinga (n=106) 70.8 60
Balanta (n=160) 66.9 50
Manjaco (n=49) 67.3 100
Pepel (n=39) 74.4 86.7
other (n=65) 72.3 80
Missing (n=37) 56.8 42.9
Total (n=650) 67.5 66.1
Region Bafata (n=172) 52.9 60.4
Biombo (n=44) 72.7 88.9
Cacheu (n=110) 57.3 100
Gabu (n=110) 72.7 86.7
Oio (n=150) 87.3 25
Quinara (n=64) 65.6 50
Total (n=650) 67.5 66.1
Wealth poorest (n=131) 67.2 50
Second (n=132) 68.2 47.8
Middle (n=160) 63.7 60
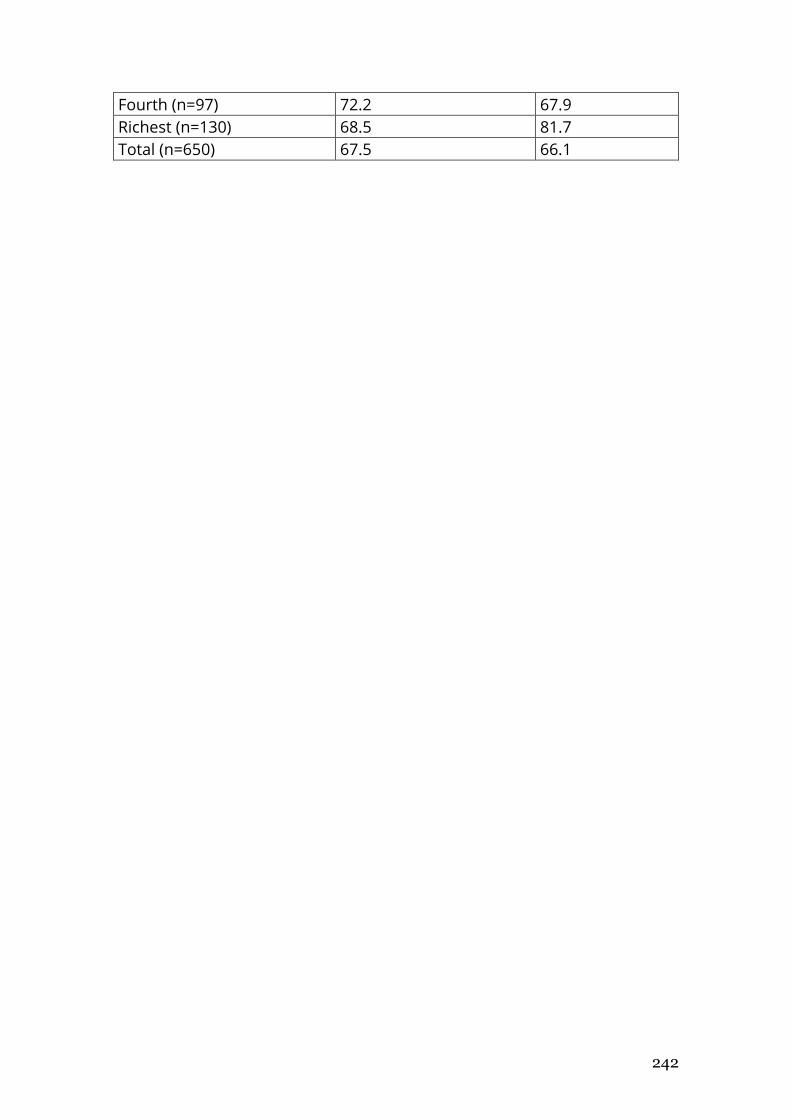
242
Fourth (n=97) 72.2 67.9
Richest (n=130) 68.5 81.7
Total (n=650) 67.5 66.1
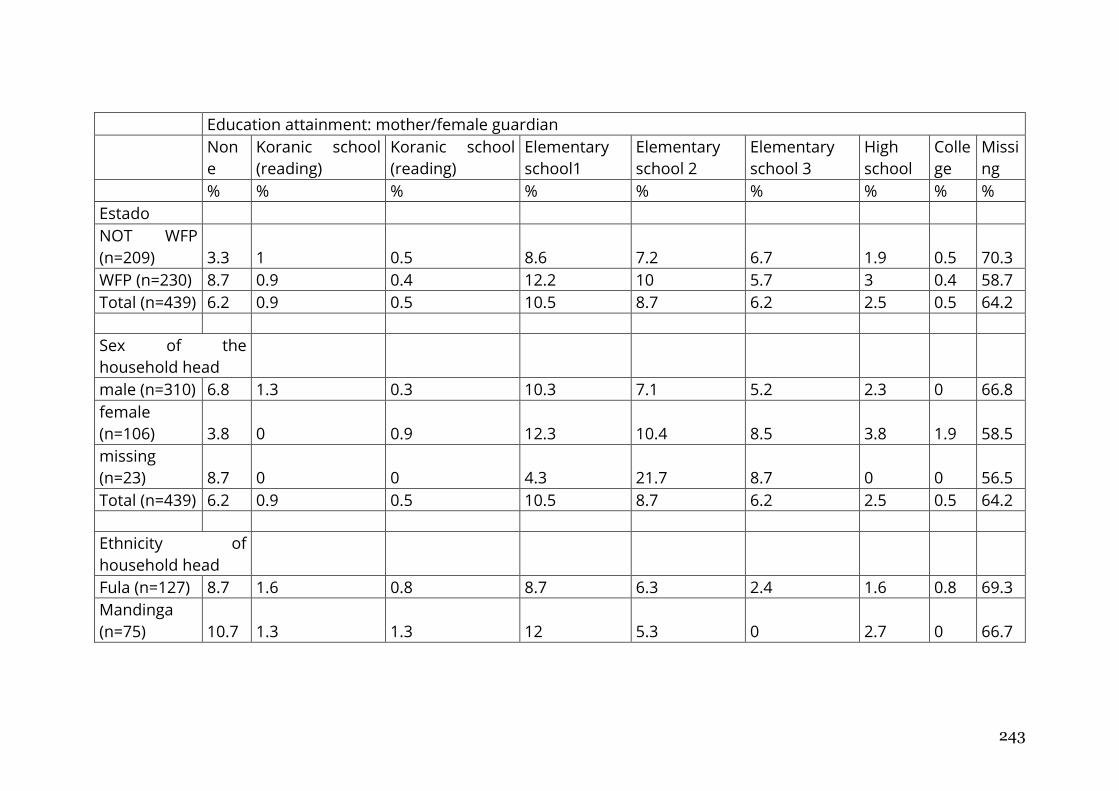
243
Education attainment: mother/female guardian
Non
e
Koranic school
(reading)
Koranic school
(reading)
Elementary
school1
Elementary
school 2
Elementary
school 3
High
school
Colle
ge
Missi
ng
% % % % % % % % %
Estado NOT WFP
(n=209) 3.3 1 0.5 8.6 7.2 6.7 1.9 0.5 70.3
WFP (n=230) 8.7 0.9 0.4 12.2 10 5.7 3 0.4 58.7
Total (n=439) 6.2 0.9 0.5 10.5 8.7 6.2 2.5 0.5 64.2
Sex of the
household head male (n=310) 6.8 1.3 0.3 10.3 7.1 5.2 2.3 0 66.8
female
(n=106) 3.8 0 0.9 12.3 10.4 8.5 3.8 1.9 58.5
missing
(n=23) 8.7 0 0 4.3 21.7 8.7 0 0 56.5
Total (n=439) 6.2 0.9 0.5 10.5 8.7 6.2 2.5 0.5 64.2
Ethnicity of
household head Fula (n=127) 8.7 1.6 0.8 8.7 6.3 2.4 1.6 0.8 69.3
Mandinga
(n=75) 10.7 1.3 1.3 12 5.3 0 2.7 0 66.7
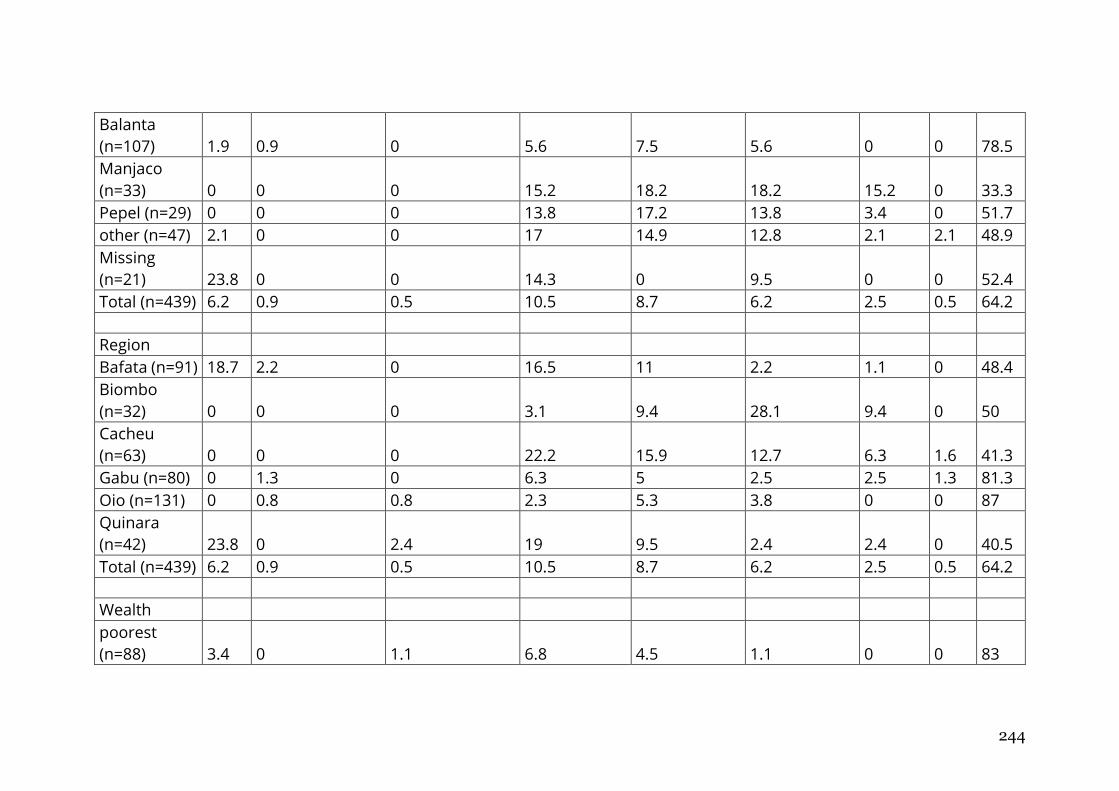
244
Balanta
(n=107) 1.9 0.9 0 5.6 7.5 5.6 0 0 78.5
Manjaco
(n=33) 0 0 0 15.2 18.2 18.2 15.2 0 33.3
Pepel (n=29) 0 0 0 13.8 17.2 13.8 3.4 0 51.7
other (n=47) 2.1 0 0 17 14.9 12.8 2.1 2.1 48.9
Missing
(n=21) 23.8 0 0 14.3 0 9.5 0 0 52.4
Total (n=439) 6.2 0.9 0.5 10.5 8.7 6.2 2.5 0.5 64.2
Region Bafata (n=91) 18.7 2.2 0 16.5 11 2.2 1.1 0 48.4
Biombo
(n=32) 0 0 0 3.1 9.4 28.1 9.4 0 50
Cacheu
(n=63) 0 0 0 22.2 15.9 12.7 6.3 1.6 41.3
Gabu (n=80) 0 1.3 0 6.3 5 2.5 2.5 1.3 81.3
Oio (n=131) 0 0.8 0.8 2.3 5.3 3.8 0 0 87
Quinara
(n=42) 23.8 0 2.4 19 9.5 2.4 2.4 0 40.5
Total (n=439) 6.2 0.9 0.5 10.5 8.7 6.2 2.5 0.5 64.2
Wealth poorest
(n=88) 3.4 0 1.1 6.8 4.5 1.1 0 0 83
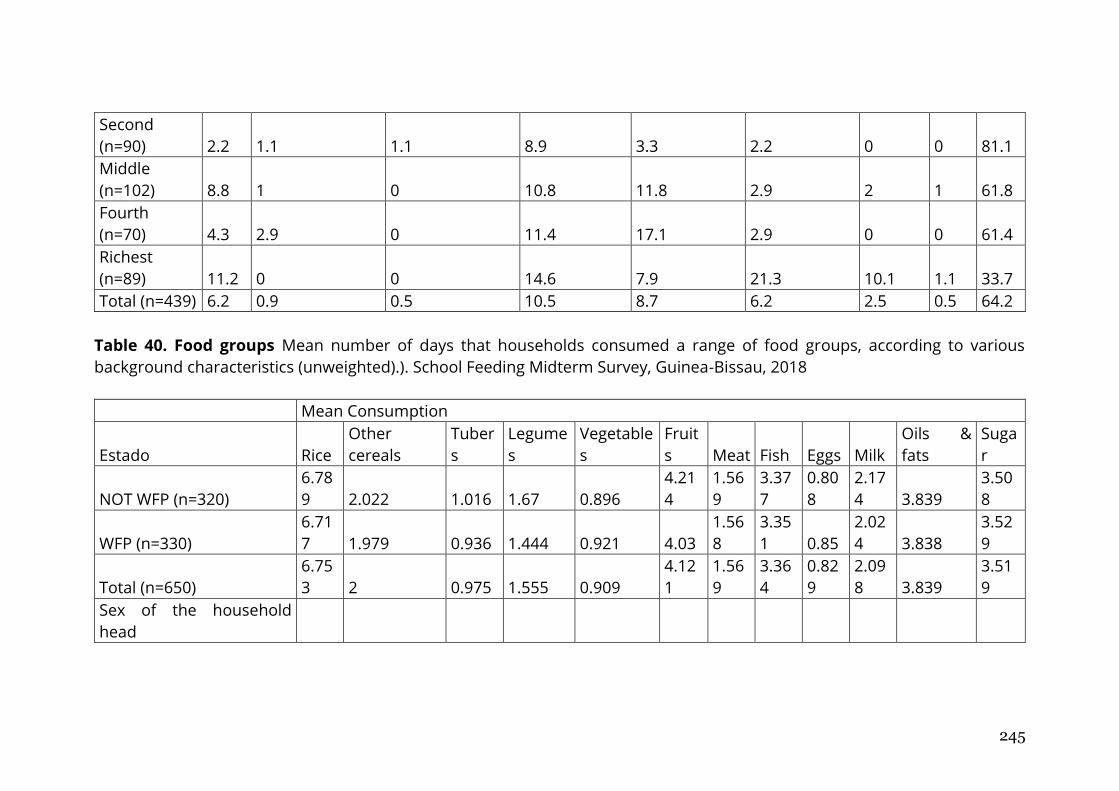
245
Second
(n=90) 2.2 1.1 1.1 8.9 3.3 2.2 0 0 81.1
Middle
(n=102) 8.8 1 0 10.8 11.8 2.9 2 1 61.8
Fourth
(n=70) 4.3 2.9 0 11.4 17.1 2.9 0 0 61.4
Richest
(n=89) 11.2 0 0 14.6 7.9 21.3 10.1 1.1 33.7
Total (n=439) 6.2 0.9 0.5 10.5 8.7 6.2 2.5 0.5 64.2
Table 40. Food groups Mean number of days that households consumed a range of food groups, according to various
background characteristics (unweighted).). School Feeding Midterm Survey, Guinea-Bissau, 2018
Mean Consumption
Estado Rice
Other
cereals
Tuber
s
Legume
s
Vegetable
s
Fruit
s Meat Fish Eggs Milk
Oils &
fats
Suga
r
NOT WFP (n=320)
6.78
9 2.022 1.016 1.67 0.896
4.21
4
1.56
9
3.37
7
0.80
8
2.17
4 3.839
3.50
8
WFP (n=330)
6.71
7 1.979 0.936 1.444 0.921 4.03
1.56
8
3.35
1 0.85
2.02
4 3.838
3.52
9
Total (n=650)
6.75
3 2 0.975 1.555 0.909
4.12
1
1.56
9
3.36
4
0.82
9
2.09
8 3.839
3.51
9
Sex of the household
head
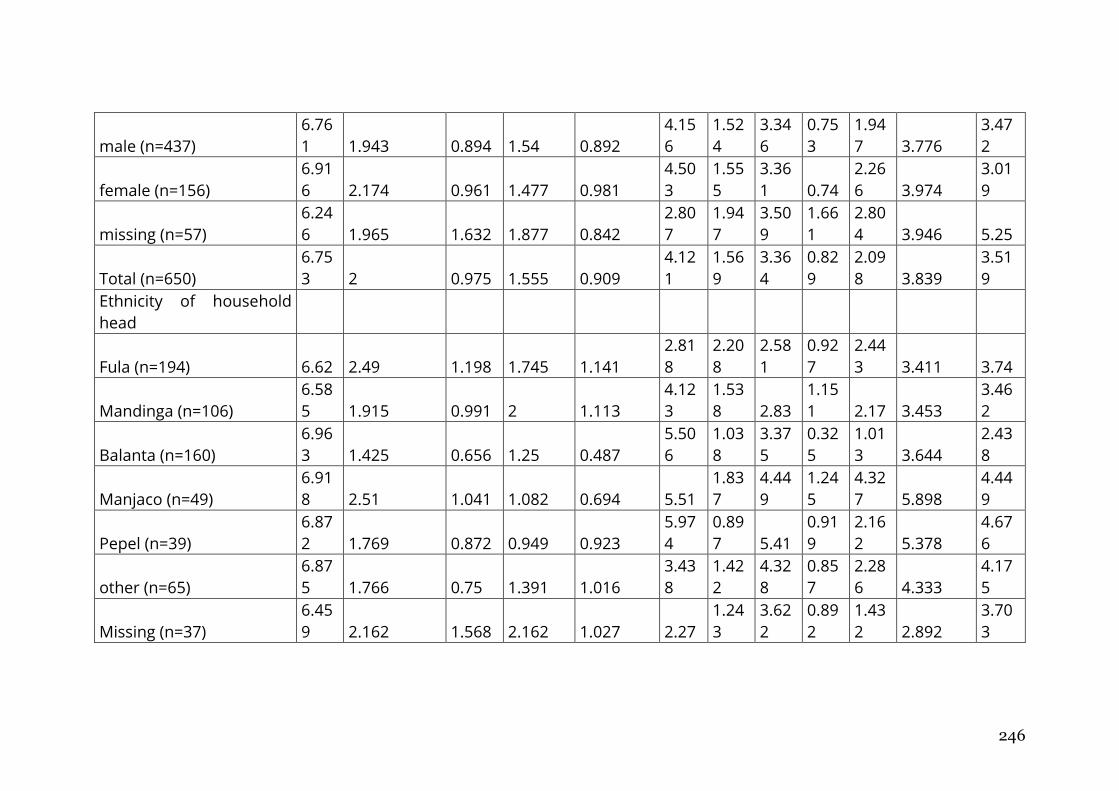
246
male (n=437)
6.76
1 1.943 0.894 1.54 0.892
4.15
6
1.52
4
3.34
6
0.75
3
1.94
7 3.776
3.47
2
female (n=156)
6.91
6 2.174 0.961 1.477 0.981
4.50
3
1.55
5
3.36
1 0.74
2.26
6 3.974
3.01
9
missing (n=57)
6.24
6 1.965 1.632 1.877 0.842
2.80
7
1.94
7
3.50
9
1.66
1
2.80
4 3.946 5.25
Total (n=650)
6.75
3 2 0.975 1.555 0.909
4.12
1
1.56
9
3.36
4
0.82
9
2.09
8 3.839
3.51
9
Ethnicity of household
head
Fula (n=194) 6.62 2.49 1.198 1.745 1.141
2.81
8
2.20
8
2.58
1
0.92
7
2.44
3 3.411 3.74
Mandinga (n=106)
6.58
5 1.915 0.991 2 1.113
4.12
3
1.53
8 2.83
1.15
1 2.17 3.453
3.46
2
Balanta (n=160)
6.96
3 1.425 0.656 1.25 0.487
5.50
6
1.03
8
3.37
5
0.32
5
1.01
3 3.644
2.43
8
Manjaco (n=49)
6.91
8 2.51 1.041 1.082 0.694 5.51
1.83
7
4.44
9
1.24
5
4.32
7 5.898
4.44
9
Pepel (n=39)
6.87
2 1.769 0.872 0.949 0.923
5.97
4
0.89
7 5.41
0.91
9
2.16
2 5.378
4.67
6
other (n=65)
6.87
5 1.766 0.75 1.391 1.016
3.43
8
1.42
2
4.32
8
0.85
7
2.28
6 4.333
4.17
5
Missing (n=37)
6.45
9 2.162 1.568 2.162 1.027 2.27
1.24
3
3.62
2
0.89
2
1.43
2 2.892
3.70
3
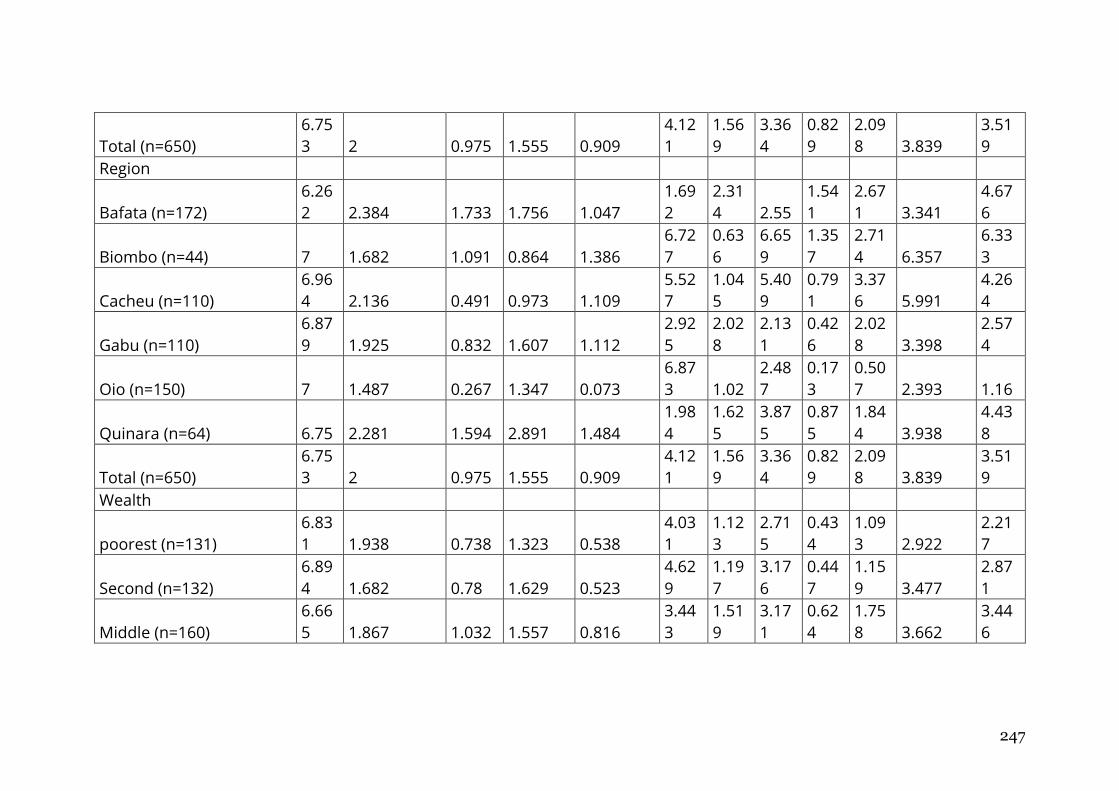
247
Total (n=650)
6.75
3 2 0.975 1.555 0.909
4.12
1
1.56
9
3.36
4
0.82
9
2.09
8 3.839
3.51
9
Region
Bafata (n=172)
6.26
2 2.384 1.733 1.756 1.047
1.69
2
2.31
4 2.55
1.54
1
2.67
1 3.341
4.67
6
Biombo (n=44) 7 1.682 1.091 0.864 1.386
6.72
7
0.63
6
6.65
9
1.35
7
2.71
4 6.357
6.33
3
Cacheu (n=110)
6.96
4 2.136 0.491 0.973 1.109
5.52
7
1.04
5
5.40
9
0.79
1
3.37
6 5.991
4.26
4
Gabu (n=110)
6.87
9 1.925 0.832 1.607 1.112
2.92
5
2.02
8
2.13
1
0.42
6
2.02
8 3.398
2.57
4
Oio (n=150) 7 1.487 0.267 1.347 0.073
6.87
3 1.02
2.48
7
0.17
3
0.50
7 2.393 1.16
Quinara (n=64) 6.75 2.281 1.594 2.891 1.484
1.98
4
1.62
5
3.87
5
0.87
5
1.84
4 3.938
4.43
8
Total (n=650)
6.75
3 2 0.975 1.555 0.909
4.12
1
1.56
9
3.36
4
0.82
9
2.09
8 3.839
3.51
9
Wealth
poorest (n=131)
6.83
1 1.938 0.738 1.323 0.538
4.03
1
1.12
3
2.71
5
0.43
4
1.09
3 2.922
2.21
7
Second (n=132)
6.89
4 1.682 0.78 1.629 0.523
4.62
9
1.19
7
3.17
6
0.44
7
1.15
9 3.477
2.87
1
Middle (n=160)
6.66
5 1.867 1.032 1.557 0.816
3.44
3
1.51
9
3.17
1
0.62
4
1.75
8 3.662
3.44
6
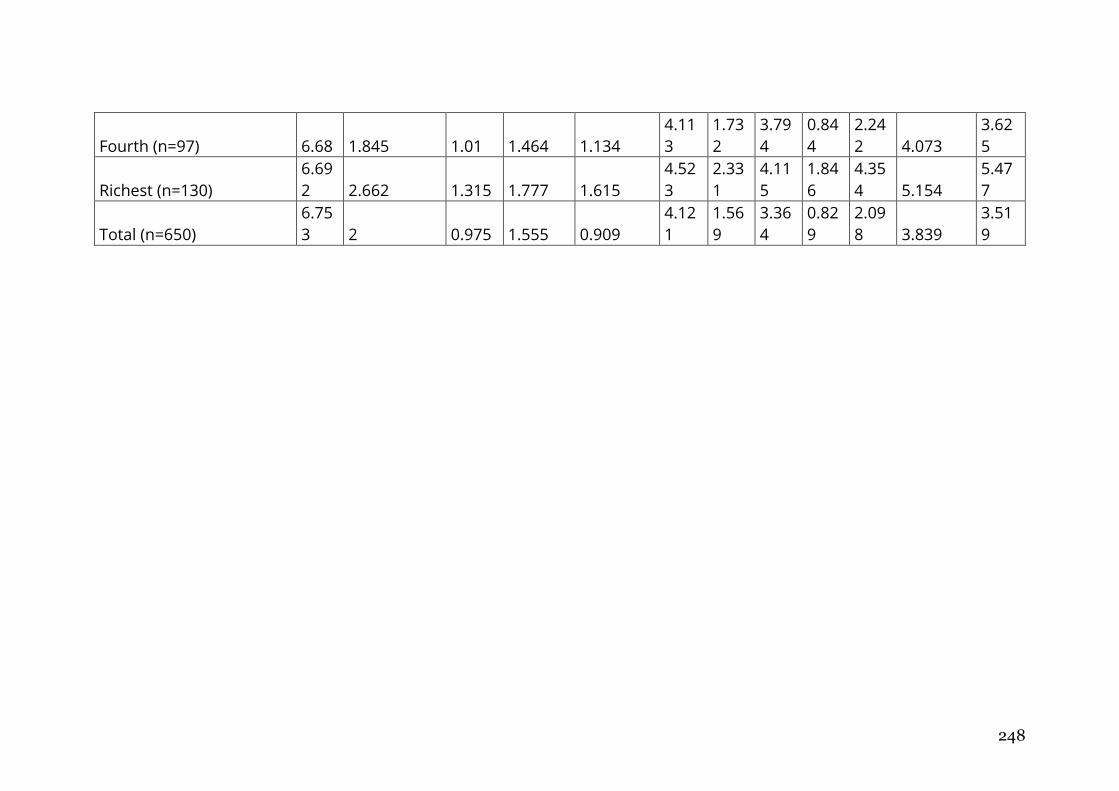
248
Fourth (n=97) 6.68 1.845 1.01 1.464 1.134
4.11
3
1.73
2
3.79
4
0.84
4
2.24
2 4.073
3.62
5
Richest (n=130)
6.69
2 2.662 1.315 1.777 1.615
4.52
3
2.33
1
4.11
5
1.84
6
4.35
4 5.154
5.47
7
Total (n=650)
6.75
3 2 0.975 1.555 0.909
4.12
1
1.56
9
3.36
4
0.82
9
2.09
8 3.839
3.51
9
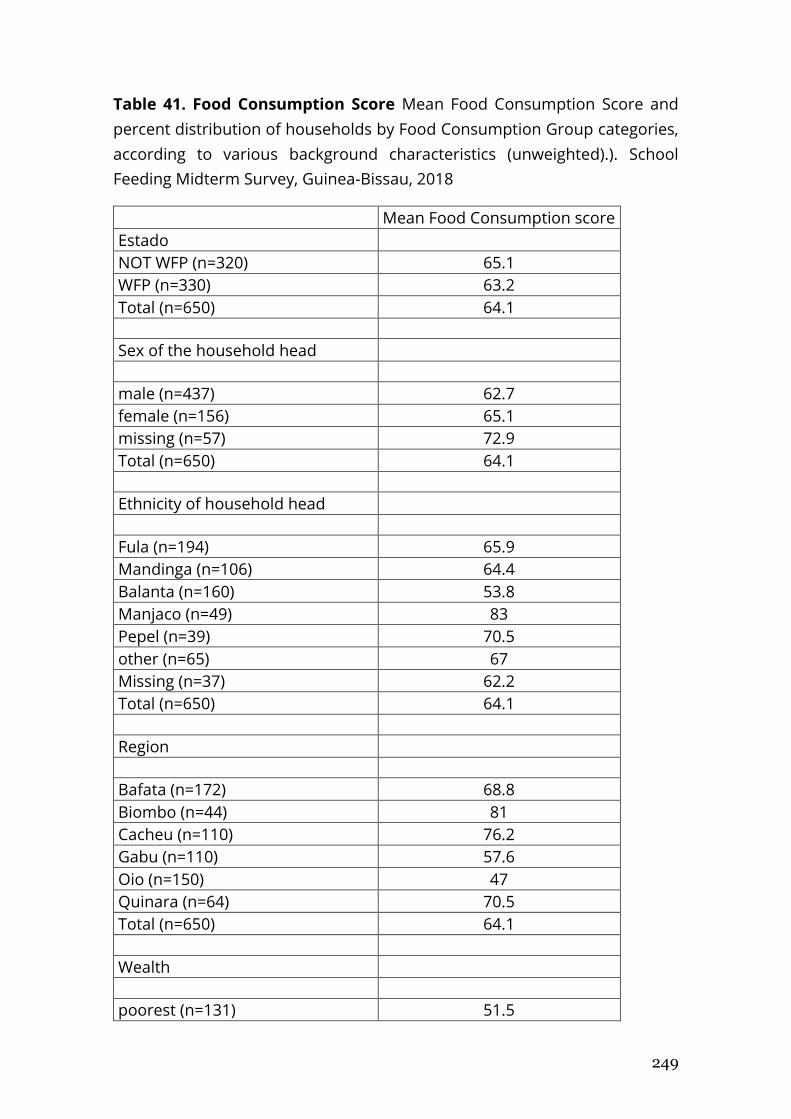
249
Table 41. Food Consumption Score Mean Food Consumption Score and
percent distribution of households by Food Consumption Group categories,
according to various background characteristics (unweighted).). School
Feeding Midterm Survey, Guinea-Bissau, 2018
Mean Food Consumption score
Estado
NOT WFP (n=320) 65.1
WFP (n=330) 63.2
Total (n=650) 64.1
Sex of the household head
male (n=437) 62.7
female (n=156) 65.1
missing (n=57) 72.9
Total (n=650) 64.1
Ethnicity of household head
Fula (n=194) 65.9
Mandinga (n=106) 64.4
Balanta (n=160) 53.8
Manjaco (n=49) 83
Pepel (n=39) 70.5
other (n=65) 67
Missing (n=37) 62.2
Total (n=650) 64.1
Region
Bafata (n=172) 68.8
Biombo (n=44) 81
Cacheu (n=110) 76.2
Gabu (n=110) 57.6
Oio (n=150) 47
Quinara (n=64) 70.5
Total (n=650) 64.1
Wealth
poorest (n=131) 51.5
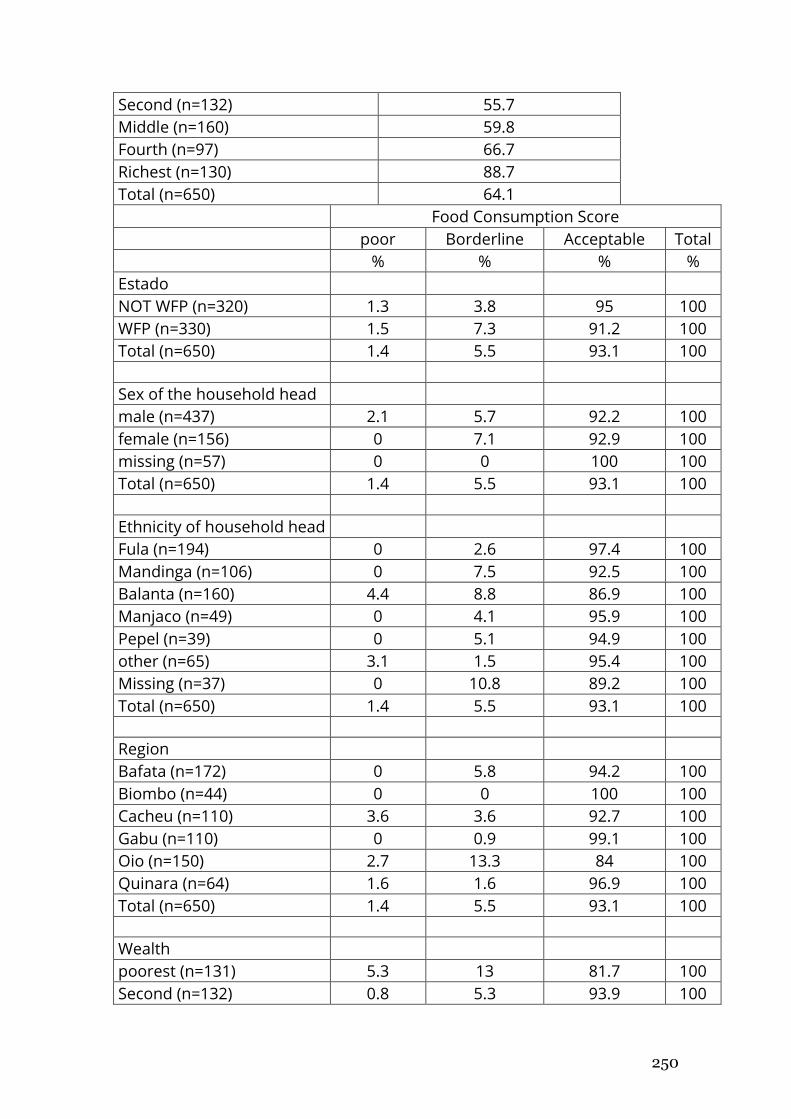
250
Second (n=132) 55.7
Middle (n=160) 59.8
Fourth (n=97) 66.7
Richest (n=130) 88.7
Total (n=650) 64.1
Food Consumption Score poor Borderline Acceptable Total
% % % %
Estado
NOT WFP (n=320) 1.3 3.8 95 100
WFP (n=330) 1.5 7.3 91.2 100
Total (n=650) 1.4 5.5 93.1 100
Sex of the household head
male (n=437) 2.1 5.7 92.2 100
female (n=156) 0 7.1 92.9 100
missing (n=57) 0 0 100 100
Total (n=650) 1.4 5.5 93.1 100
Ethnicity of household head
Fula (n=194) 0 2.6 97.4 100
Mandinga (n=106) 0 7.5 92.5 100
Balanta (n=160) 4.4 8.8 86.9 100
Manjaco (n=49) 0 4.1 95.9 100
Pepel (n=39) 0 5.1 94.9 100
other (n=65) 3.1 1.5 95.4 100
Missing (n=37) 0 10.8 89.2 100
Total (n=650) 1.4 5.5 93.1 100
Region
Bafata (n=172) 0 5.8 94.2 100
Biombo (n=44) 0 0 100 100
Cacheu (n=110) 3.6 3.6 92.7 100
Gabu (n=110) 0 0.9 99.1 100
Oio (n=150) 2.7 13.3 84 100
Quinara (n=64) 1.6 1.6 96.9 100
Total (n=650) 1.4 5.5 93.1 100
Wealth
poorest (n=131) 5.3 13 81.7 100
Second (n=132) 0.8 5.3 93.9 100
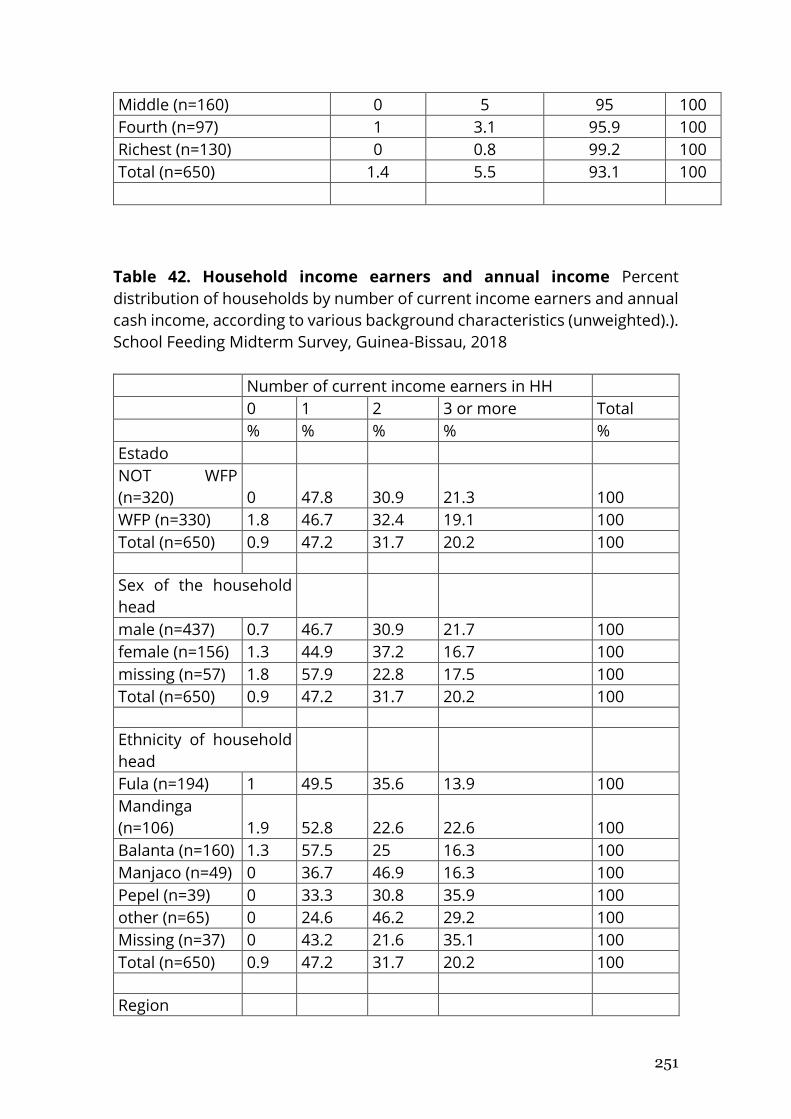
251
Middle (n=160) 0 5 95 100
Fourth (n=97) 1 3.1 95.9 100
Richest (n=130) 0 0.8 99.2 100
Total (n=650) 1.4 5.5 93.1 100
Table 42. Household income earners and annual income Percent
distribution of households by number of current income earners and annual
cash income, according to various background characteristics (unweighted).).
School Feeding Midterm Survey, Guinea-Bissau, 2018
Number of current income earners in HH
0 1 2 3 or more Total
% % % % %
Estado NOT WFP
(n=320) 0 47.8 30.9 21.3 100
WFP (n=330) 1.8 46.7 32.4 19.1 100
Total (n=650) 0.9 47.2 31.7 20.2 100
Sex of the household
head male (n=437) 0.7 46.7 30.9 21.7 100
female (n=156) 1.3 44.9 37.2 16.7 100
missing (n=57) 1.8 57.9 22.8 17.5 100
Total (n=650) 0.9 47.2 31.7 20.2 100
Ethnicity of household
head Fula (n=194) 1 49.5 35.6 13.9 100
Mandinga
(n=106) 1.9 52.8 22.6 22.6 100
Balanta (n=160) 1.3 57.5 25 16.3 100
Manjaco (n=49) 0 36.7 46.9 16.3 100
Pepel (n=39) 0 33.3 30.8 35.9 100
other (n=65) 0 24.6 46.2 29.2 100
Missing (n=37) 0 43.2 21.6 35.1 100
Total (n=650) 0.9 47.2 31.7 20.2 100
Region
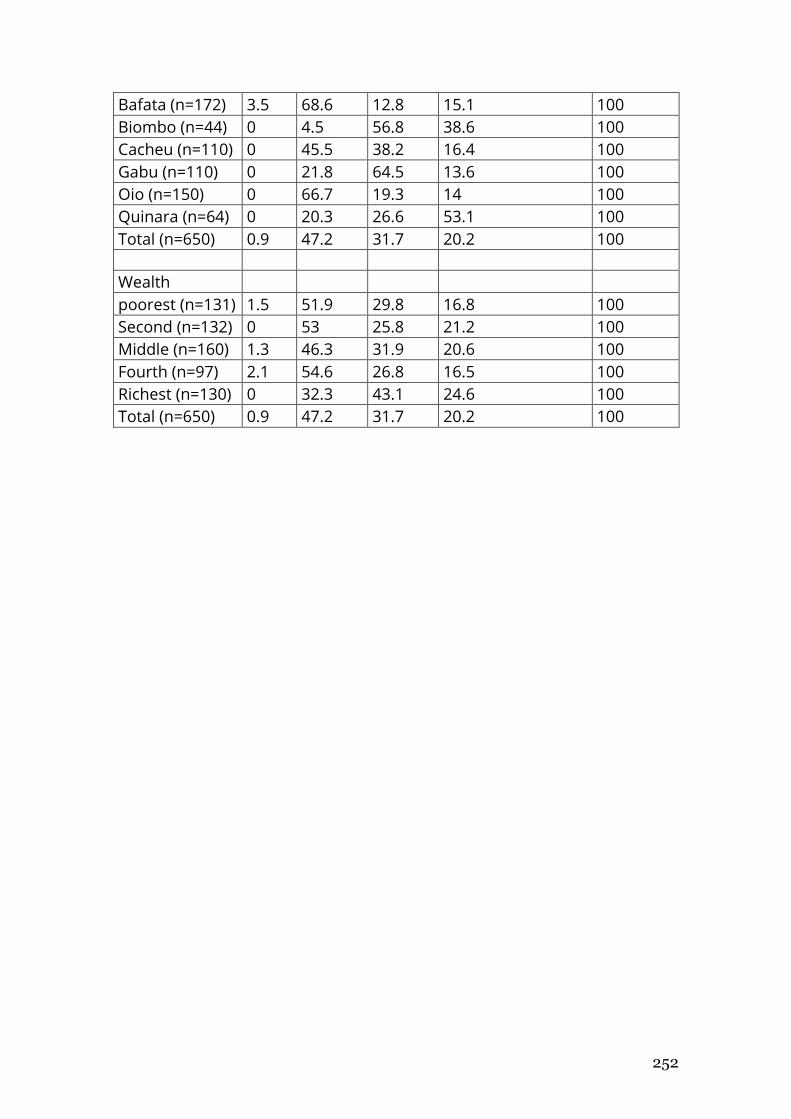
252
Bafata (n=172) 3.5 68.6 12.8 15.1 100
Biombo (n=44) 0 4.5 56.8 38.6 100
Cacheu (n=110) 0 45.5 38.2 16.4 100
Gabu (n=110) 0 21.8 64.5 13.6 100
Oio (n=150) 0 66.7 19.3 14 100
Quinara (n=64) 0 20.3 26.6 53.1 100
Total (n=650) 0.9 47.2 31.7 20.2 100
Wealth poorest (n=131) 1.5 51.9 29.8 16.8 100
Second (n=132) 0 53 25.8 21.2 100
Middle (n=160) 1.3 46.3 31.9 20.6 100
Fourth (n=97) 2.1 54.6 26.8 16.5 100
Richest (n=130) 0 32.3 43.1 24.6 100
Total (n=650) 0.9 47.2 31.7 20.2 100
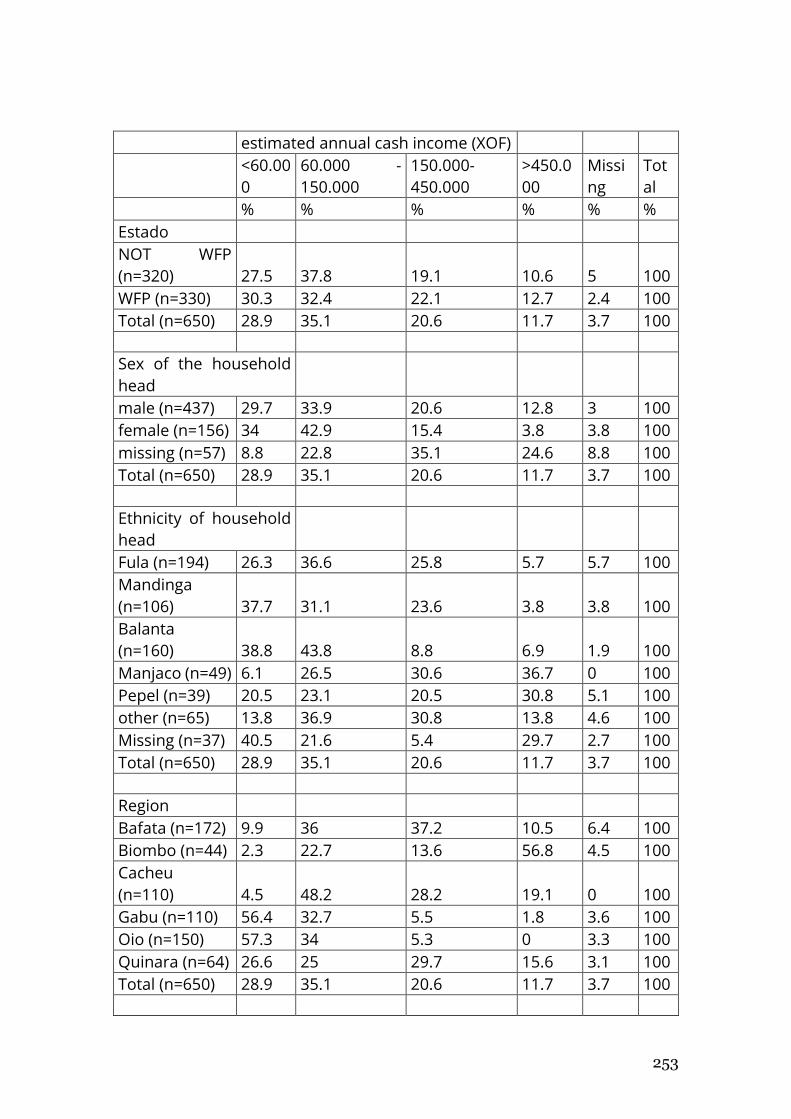
253
estimated annual cash income (XOF)
<60.00
0
60.000 -
150.000
150.000-
450.000
>450.0
00
Missi
ng
Tot
al
% % % % % %
Estado NOT WFP
(n=320) 27.5 37.8 19.1 10.6 5 100
WFP (n=330) 30.3 32.4 22.1 12.7 2.4 100
Total (n=650) 28.9 35.1 20.6 11.7 3.7 100
Sex of the household
head male (n=437) 29.7 33.9 20.6 12.8 3 100
female (n=156) 34 42.9 15.4 3.8 3.8 100
missing (n=57) 8.8 22.8 35.1 24.6 8.8 100
Total (n=650) 28.9 35.1 20.6 11.7 3.7 100
Ethnicity of household
head Fula (n=194) 26.3 36.6 25.8 5.7 5.7 100
Mandinga
(n=106) 37.7 31.1 23.6 3.8 3.8 100
Balanta
(n=160) 38.8 43.8 8.8 6.9 1.9 100
Manjaco (n=49) 6.1 26.5 30.6 36.7 0 100
Pepel (n=39) 20.5 23.1 20.5 30.8 5.1 100
other (n=65) 13.8 36.9 30.8 13.8 4.6 100
Missing (n=37) 40.5 21.6 5.4 29.7 2.7 100
Total (n=650) 28.9 35.1 20.6 11.7 3.7 100
Region Bafata (n=172) 9.9 36 37.2 10.5 6.4 100
Biombo (n=44) 2.3 22.7 13.6 56.8 4.5 100
Cacheu
(n=110) 4.5 48.2 28.2 19.1 0 100
Gabu (n=110) 56.4 32.7 5.5 1.8 3.6 100
Oio (n=150) 57.3 34 5.3 0 3.3 100
Quinara (n=64) 26.6 25 29.7 15.6 3.1 100
Total (n=650) 28.9 35.1 20.6 11.7 3.7 100
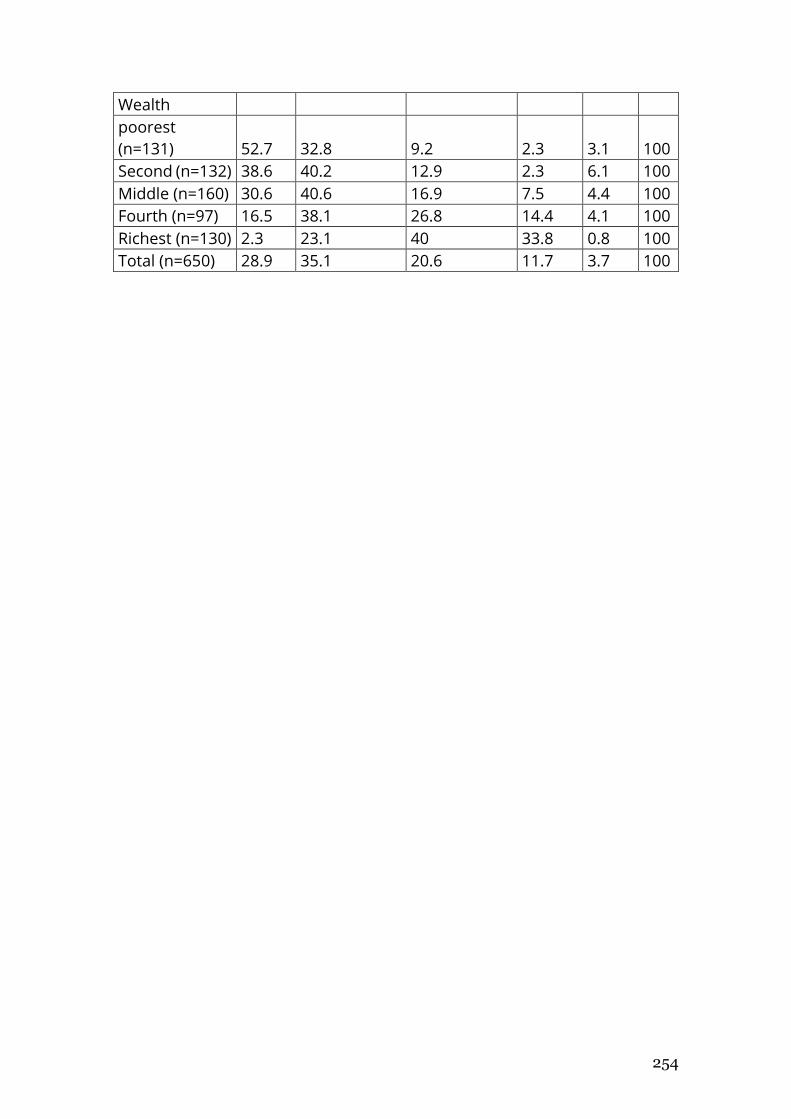
254
Wealth poorest
(n=131) 52.7 32.8 9.2 2.3 3.1 100
Second (n=132) 38.6 40.2 12.9 2.3 6.1 100
Middle (n=160) 30.6 40.6 16.9 7.5 4.4 100
Fourth (n=97) 16.5 38.1 26.8 14.4 4.1 100
Richest (n=130) 2.3 23.1 40 33.8 0.8 100
Total (n=650) 28.9 35.1 20.6 11.7 3.7 100
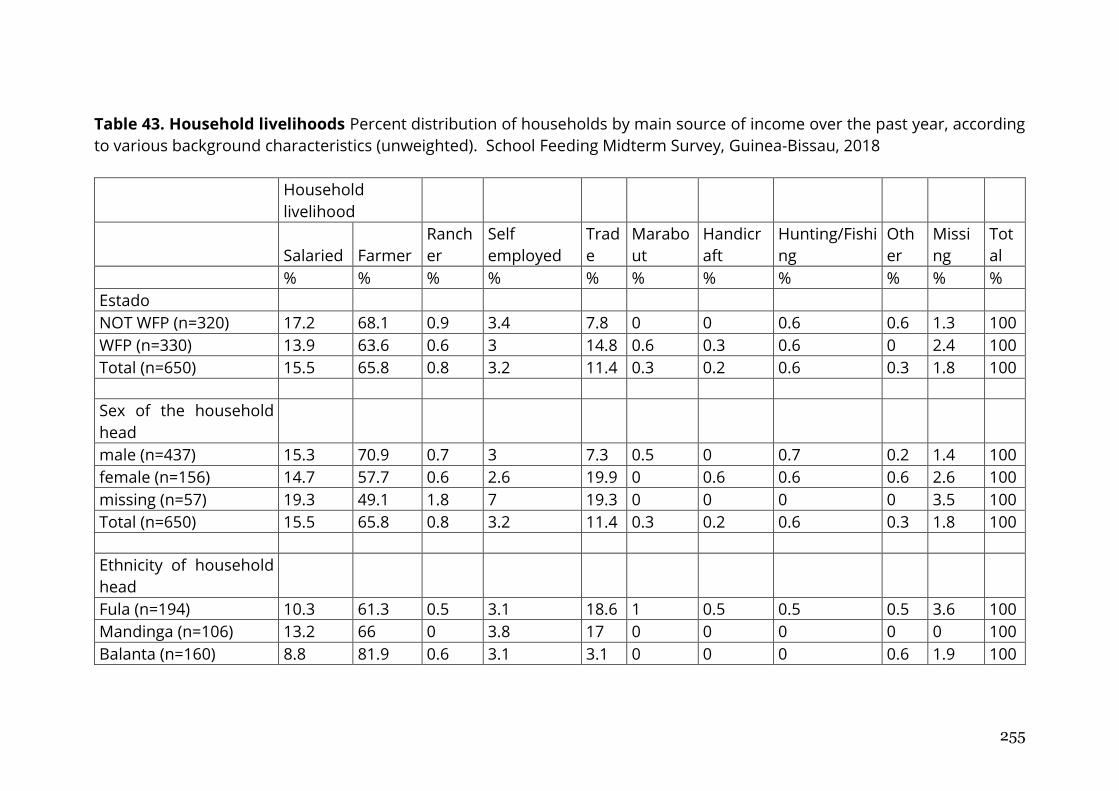
255
Table 43. Household livelihoods Percent distribution of households by main source of income over the past year, according
to various background characteristics (unweighted). School Feeding Midterm Survey, Guinea-Bissau, 2018
Household
livelihood
Salaried Farmer
Ranch
er
Self
employed
Trad
e
Marabo
ut
Handicr
aft
Hunting/Fishi
ng
Oth
er
Missi
ng
Tot
al
% % % % % % % % % % %
Estado NOT WFP (n=320) 17.2 68.1 0.9 3.4 7.8 0 0 0.6 0.6 1.3 100
WFP (n=330) 13.9 63.6 0.6 3 14.8 0.6 0.3 0.6 0 2.4 100
Total (n=650) 15.5 65.8 0.8 3.2 11.4 0.3 0.2 0.6 0.3 1.8 100
Sex of the household
head male (n=437) 15.3 70.9 0.7 3 7.3 0.5 0 0.7 0.2 1.4 100
female (n=156) 14.7 57.7 0.6 2.6 19.9 0 0.6 0.6 0.6 2.6 100
missing (n=57) 19.3 49.1 1.8 7 19.3 0 0 0 0 3.5 100
Total (n=650) 15.5 65.8 0.8 3.2 11.4 0.3 0.2 0.6 0.3 1.8 100
Ethnicity of household
head Fula (n=194) 10.3 61.3 0.5 3.1 18.6 1 0.5 0.5 0.5 3.6 100
Mandinga (n=106) 13.2 66 0 3.8 17 0 0 0 0 0 100
Balanta (n=160) 8.8 81.9 0.6 3.1 3.1 0 0 0 0.6 1.9 100
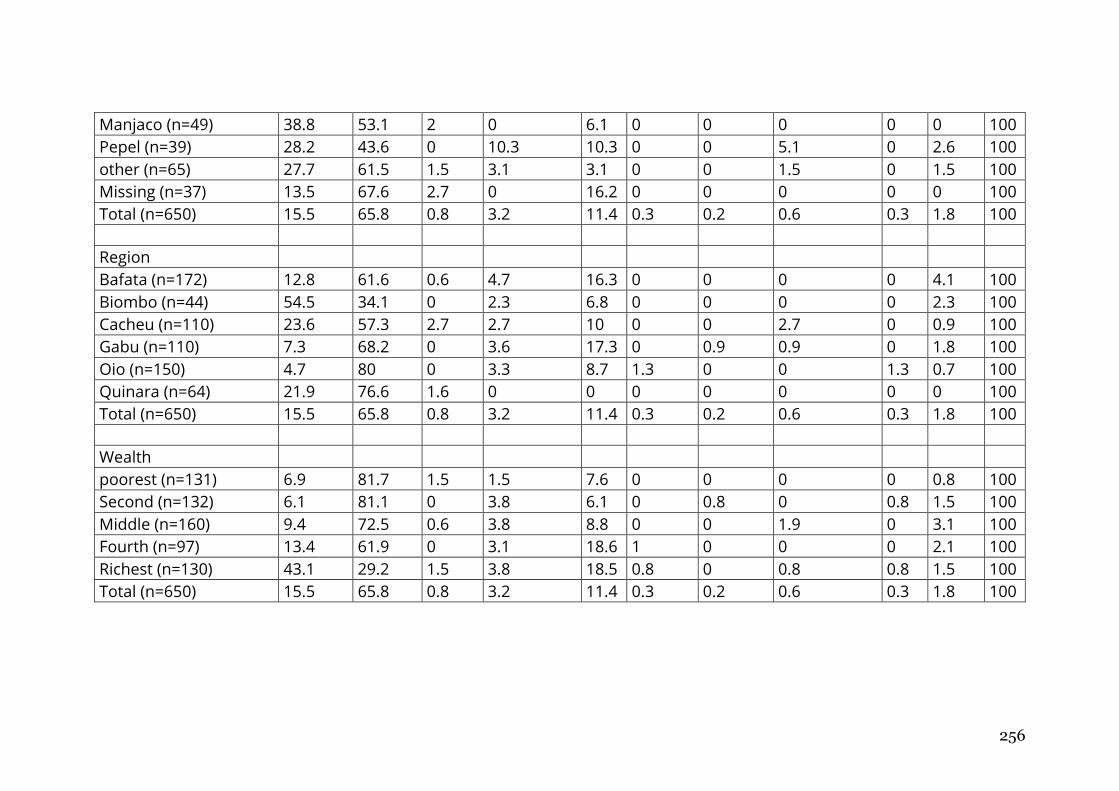
256
Manjaco (n=49) 38.8 53.1 2 0 6.1 0 0 0 0 0 100
Pepel (n=39) 28.2 43.6 0 10.3 10.3 0 0 5.1 0 2.6 100
other (n=65) 27.7 61.5 1.5 3.1 3.1 0 0 1.5 0 1.5 100
Missing (n=37) 13.5 67.6 2.7 0 16.2 0 0 0 0 0 100
Total (n=650) 15.5 65.8 0.8 3.2 11.4 0.3 0.2 0.6 0.3 1.8 100
Region Bafata (n=172) 12.8 61.6 0.6 4.7 16.3 0 0 0 0 4.1 100
Biombo (n=44) 54.5 34.1 0 2.3 6.8 0 0 0 0 2.3 100
Cacheu (n=110) 23.6 57.3 2.7 2.7 10 0 0 2.7 0 0.9 100
Gabu (n=110) 7.3 68.2 0 3.6 17.3 0 0.9 0.9 0 1.8 100
Oio (n=150) 4.7 80 0 3.3 8.7 1.3 0 0 1.3 0.7 100
Quinara (n=64) 21.9 76.6 1.6 0 0 0 0 0 0 0 100
Total (n=650) 15.5 65.8 0.8 3.2 11.4 0.3 0.2 0.6 0.3 1.8 100
Wealth poorest (n=131) 6.9 81.7 1.5 1.5 7.6 0 0 0 0 0.8 100
Second (n=132) 6.1 81.1 0 3.8 6.1 0 0.8 0 0.8 1.5 100
Middle (n=160) 9.4 72.5 0.6 3.8 8.8 0 0 1.9 0 3.1 100
Fourth (n=97) 13.4 61.9 0 3.1 18.6 1 0 0 0 2.1 100
Richest (n=130) 43.1 29.2 1.5 3.8 18.5 0.8 0 0.8 0.8 1.5 100
Total (n=650) 15.5 65.8 0.8 3.2 11.4 0.3 0.2 0.6 0.3 1.8 100
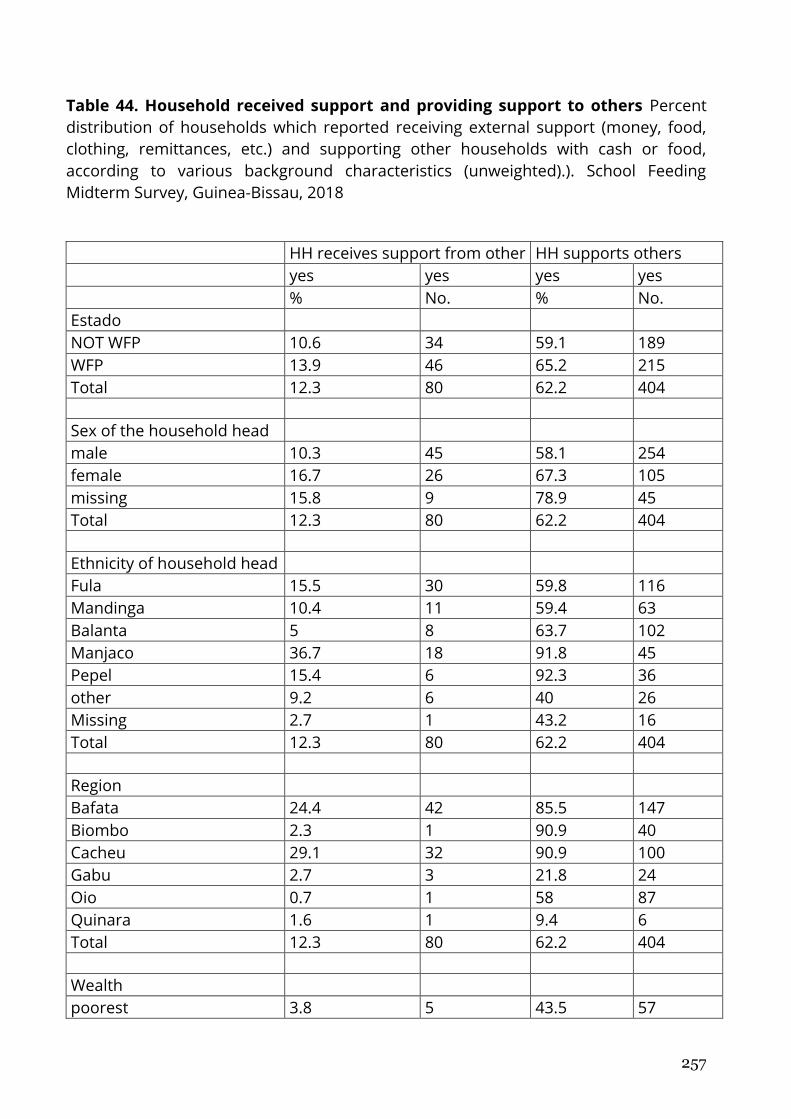
257
Table 44. Household received support and providing support to others Percent
distribution of households which reported receiving external support (money, food,
clothing, remittances, etc.) and supporting other households with cash or food,
according to various background characteristics (unweighted).). School Feeding
Midterm Survey, Guinea-Bissau, 2018
HH receives support from other HH supports others
yes yes yes yes
% No. % No.
Estado NOT WFP 10.6 34 59.1 189
WFP 13.9 46 65.2 215
Total 12.3 80 62.2 404
Sex of the household head male 10.3 45 58.1 254
female 16.7 26 67.3 105
missing 15.8 9 78.9 45
Total 12.3 80 62.2 404
Ethnicity of household head Fula 15.5 30 59.8 116
Mandinga 10.4 11 59.4 63
Balanta 5 8 63.7 102
Manjaco 36.7 18 91.8 45
Pepel 15.4 6 92.3 36
other 9.2 6 40 26
Missing 2.7 1 43.2 16
Total 12.3 80 62.2 404
Region Bafata 24.4 42 85.5 147
Biombo 2.3 1 90.9 40
Cacheu 29.1 32 90.9 100
Gabu 2.7 3 21.8 24
Oio 0.7 1 58 87
Quinara 1.6 1 9.4 6
Total 12.3 80 62.2 404
Wealth poorest 3.8 5 43.5 57
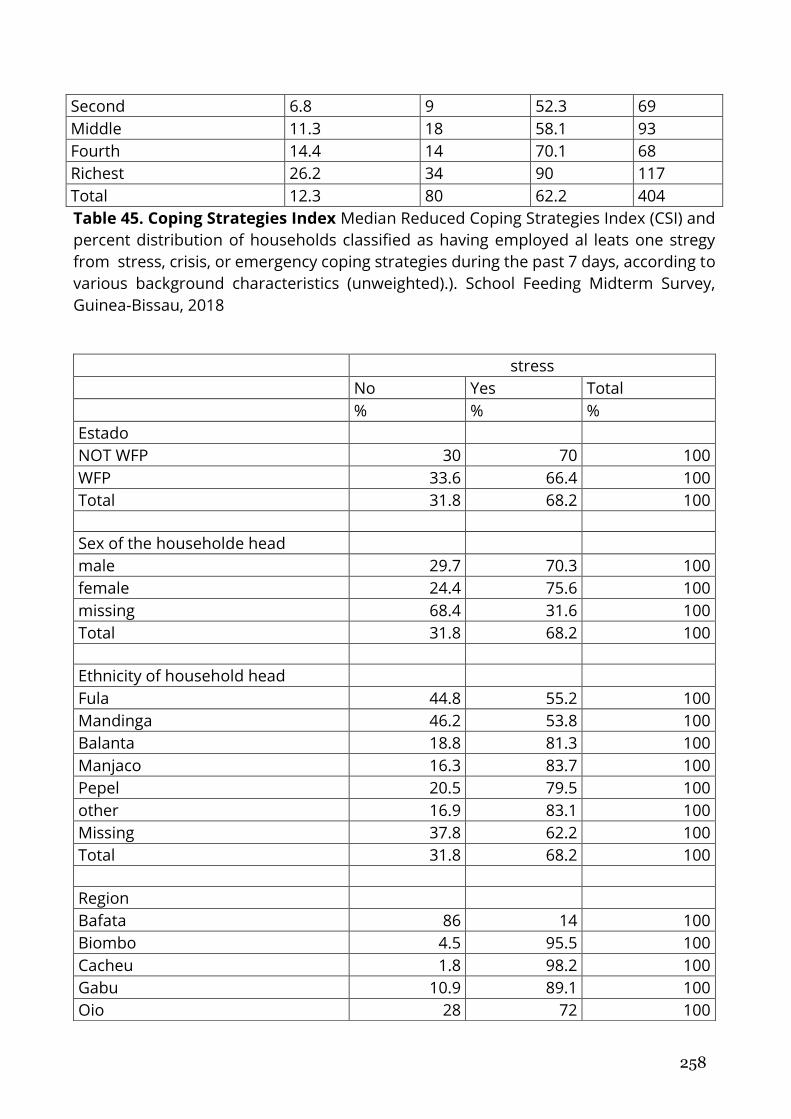
258
Second 6.8 9 52.3 69
Middle 11.3 18 58.1 93
Fourth 14.4 14 70.1 68
Richest 26.2 34 90 117
Total 12.3 80 62.2 404
Table 45. Coping Strategies Index Median Reduced Coping Strategies Index (CSI) and
percent distribution of households classified as having employed al leats one stregy
from stress, crisis, or emergency coping strategies during the past 7 days, according to
various background characteristics (unweighted).). School Feeding Midterm Survey,
Guinea-Bissau, 2018
stress
No Yes Total
% % %
Estado NOT WFP 30 70 100
WFP 33.6 66.4 100
Total 31.8 68.2 100
Sex of the householde head male 29.7 70.3 100
female 24.4 75.6 100
missing 68.4 31.6 100
Total 31.8 68.2 100
Ethnicity of household head Fula 44.8 55.2 100
Mandinga 46.2 53.8 100
Balanta 18.8 81.3 100
Manjaco 16.3 83.7 100
Pepel 20.5 79.5 100
other 16.9 83.1 100
Missing 37.8 62.2 100
Total 31.8 68.2 100
Region Bafata 86 14 100
Biombo 4.5 95.5 100
Cacheu 1.8 98.2 100
Gabu 10.9 89.1 100
Oio 28 72 100
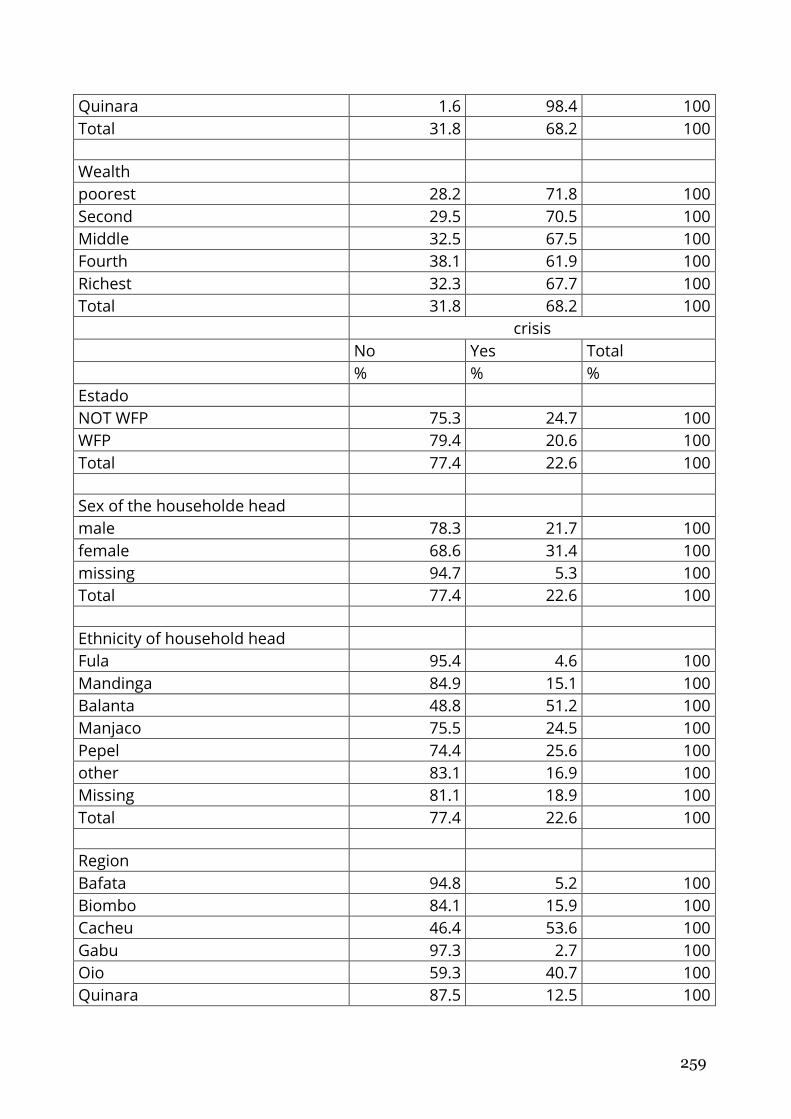
259
Quinara 1.6 98.4 100
Total 31.8 68.2 100
Wealth poorest 28.2 71.8 100
Second 29.5 70.5 100
Middle 32.5 67.5 100
Fourth 38.1 61.9 100
Richest 32.3 67.7 100
Total 31.8 68.2 100
crisis
No Yes Total
% % %
Estado NOT WFP 75.3 24.7 100
WFP 79.4 20.6 100
Total 77.4 22.6 100
Sex of the householde head male 78.3 21.7 100
female 68.6 31.4 100
missing 94.7 5.3 100
Total 77.4 22.6 100
Ethnicity of household head Fula 95.4 4.6 100
Mandinga 84.9 15.1 100
Balanta 48.8 51.2 100
Manjaco 75.5 24.5 100
Pepel 74.4 25.6 100
other 83.1 16.9 100
Missing 81.1 18.9 100
Total 77.4 22.6 100
Region Bafata 94.8 5.2 100
Biombo 84.1 15.9 100
Cacheu 46.4 53.6 100
Gabu 97.3 2.7 100
Oio 59.3 40.7 100
Quinara 87.5 12.5 100
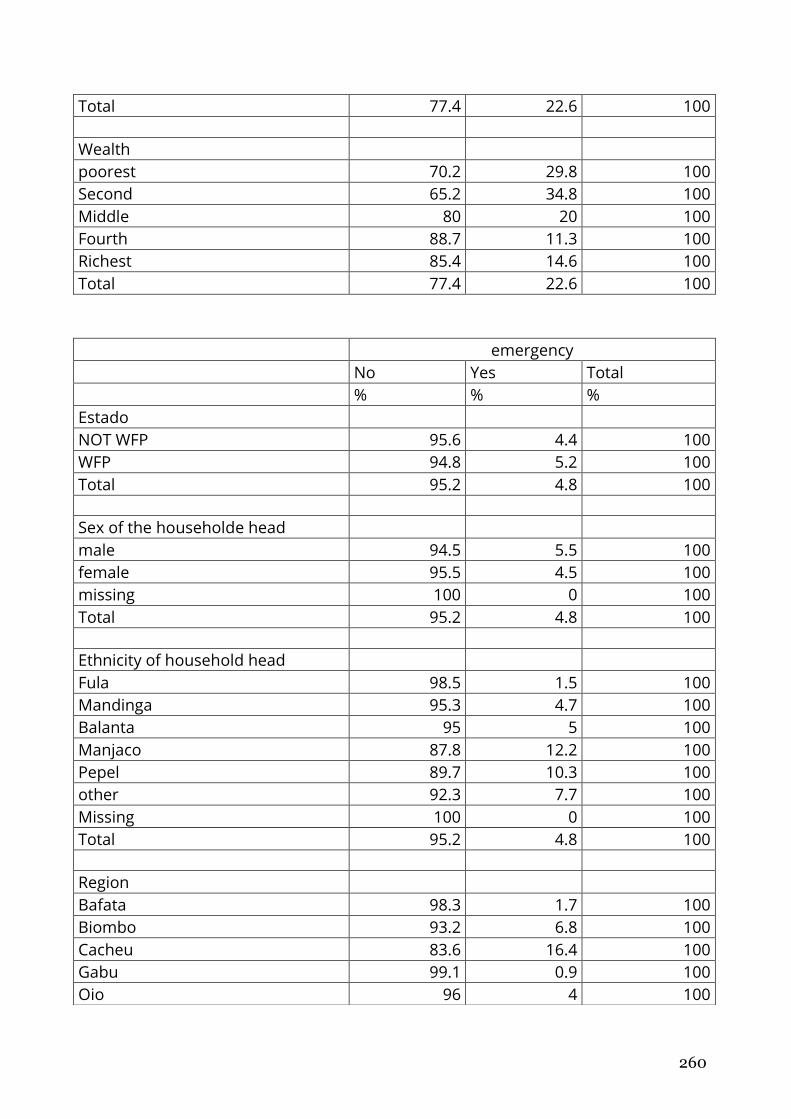
260
Total 77.4 22.6 100
Wealth poorest 70.2 29.8 100
Second 65.2 34.8 100
Middle 80 20 100
Fourth 88.7 11.3 100
Richest 85.4 14.6 100
Total 77.4 22.6 100
emergency
No Yes Total
% % %
Estado NOT WFP 95.6 4.4 100
WFP 94.8 5.2 100
Total 95.2 4.8 100
Sex of the householde head male 94.5 5.5 100
female 95.5 4.5 100
missing 100 0 100
Total 95.2 4.8 100
Ethnicity of household head Fula 98.5 1.5 100
Mandinga 95.3 4.7 100
Balanta 95 5 100
Manjaco 87.8 12.2 100
Pepel 89.7 10.3 100
other 92.3 7.7 100
Missing 100 0 100
Total 95.2 4.8 100
Region Bafata 98.3 1.7 100
Biombo 93.2 6.8 100
Cacheu 83.6 16.4 100
Gabu 99.1 0.9 100
Oio 96 4 100
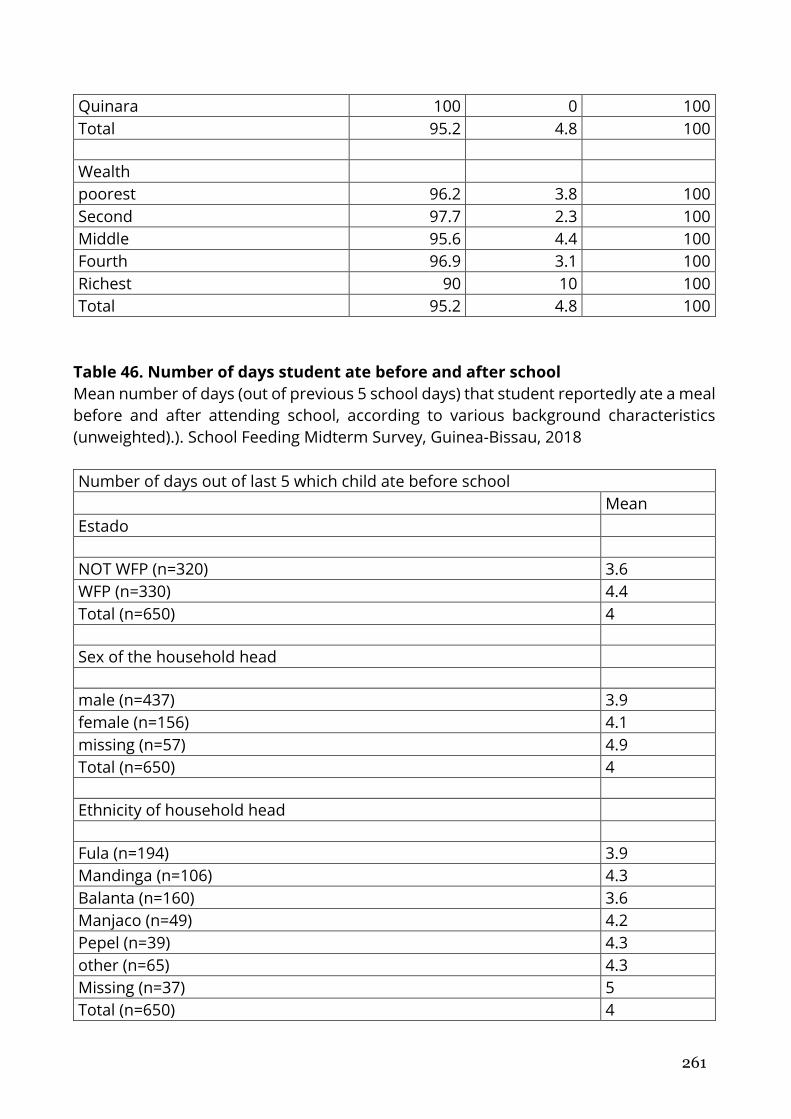
261
Quinara 100 0 100
Total 95.2 4.8 100
Wealth poorest 96.2 3.8 100
Second 97.7 2.3 100
Middle 95.6 4.4 100
Fourth 96.9 3.1 100
Richest 90 10 100
Total 95.2 4.8 100
Table 46. Number of days student ate before and after school
Mean number of days (out of previous 5 school days) that student reportedly ate a meal
before and after attending school, according to various background characteristics
(unweighted).). School Feeding Midterm Survey, Guinea-Bissau, 2018
Number of days out of last 5 which child ate before school
Mean
Estado
NOT WFP (n=320) 3.6
WFP (n=330) 4.4
Total (n=650) 4
Sex of the household head
male (n=437) 3.9
female (n=156) 4.1
missing (n=57) 4.9
Total (n=650) 4
Ethnicity of household head
Fula (n=194) 3.9
Mandinga (n=106) 4.3
Balanta (n=160) 3.6
Manjaco (n=49) 4.2
Pepel (n=39) 4.3
other (n=65) 4.3
Missing (n=37) 5
Total (n=650) 4
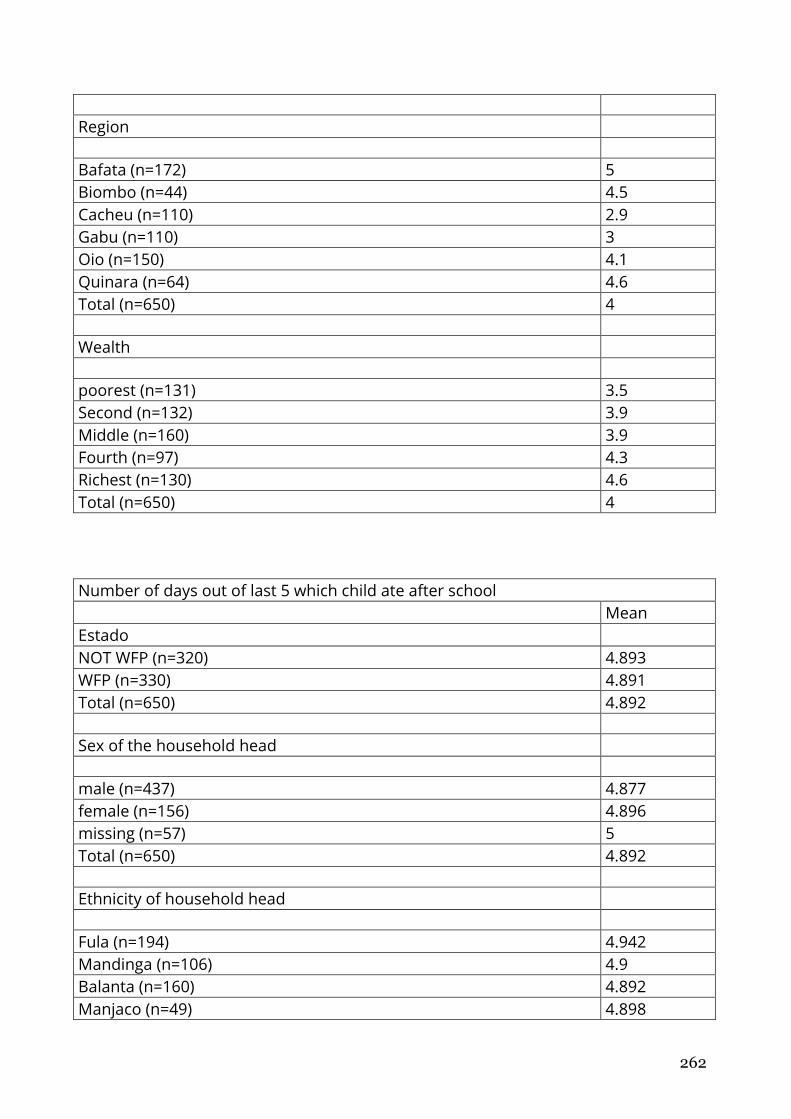
262
Region
Bafata (n=172) 5
Biombo (n=44) 4.5
Cacheu (n=110) 2.9
Gabu (n=110) 3
Oio (n=150) 4.1
Quinara (n=64) 4.6
Total (n=650) 4
Wealth
poorest (n=131) 3.5
Second (n=132) 3.9
Middle (n=160) 3.9
Fourth (n=97) 4.3
Richest (n=130) 4.6
Total (n=650) 4
Number of days out of last 5 which child ate after school
Mean
Estado NOT WFP (n=320) 4.893
WFP (n=330) 4.891
Total (n=650) 4.892
Sex of the household head
male (n=437) 4.877
female (n=156) 4.896
missing (n=57) 5
Total (n=650) 4.892
Ethnicity of household head
Fula (n=194) 4.942
Mandinga (n=106) 4.9
Balanta (n=160) 4.892
Manjaco (n=49) 4.898
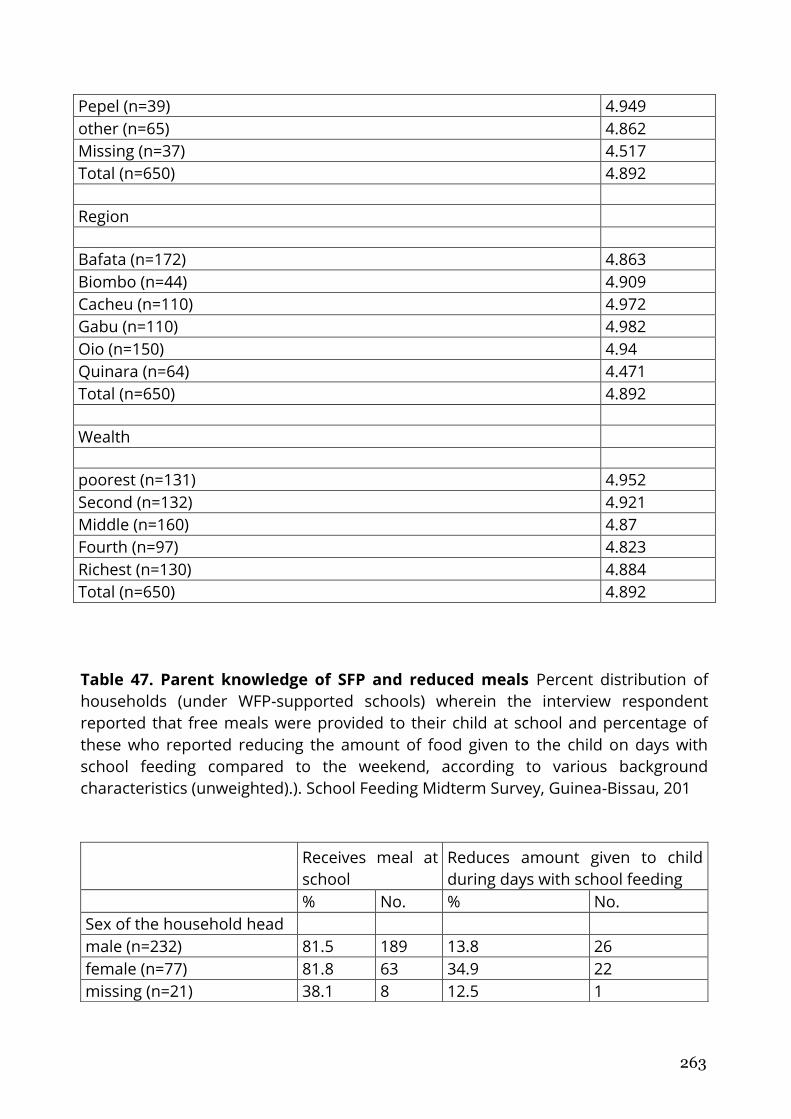
263
Pepel (n=39) 4.949
other (n=65) 4.862
Missing (n=37) 4.517
Total (n=650) 4.892
Region
Bafata (n=172) 4.863
Biombo (n=44) 4.909
Cacheu (n=110) 4.972
Gabu (n=110) 4.982
Oio (n=150) 4.94
Quinara (n=64) 4.471
Total (n=650) 4.892
Wealth
poorest (n=131) 4.952
Second (n=132) 4.921
Middle (n=160) 4.87
Fourth (n=97) 4.823
Richest (n=130) 4.884
Total (n=650) 4.892
Table 47. Parent knowledge of SFP and reduced meals Percent distribution of
households (under WFP-supported schools) wherein the interview respondent
reported that free meals were provided to their child at school and percentage of
these who reported reducing the amount of food given to the child on days with
school feeding compared to the weekend, according to various background
characteristics (unweighted).). School Feeding Midterm Survey, Guinea-Bissau, 201
Receives meal at
school
Reduces amount given to child
during days with school feeding
% No. % No.
Sex of the household head male (n=232) 81.5 189 13.8 26
female (n=77) 81.8 63 34.9 22
missing (n=21) 38.1 8 12.5 1
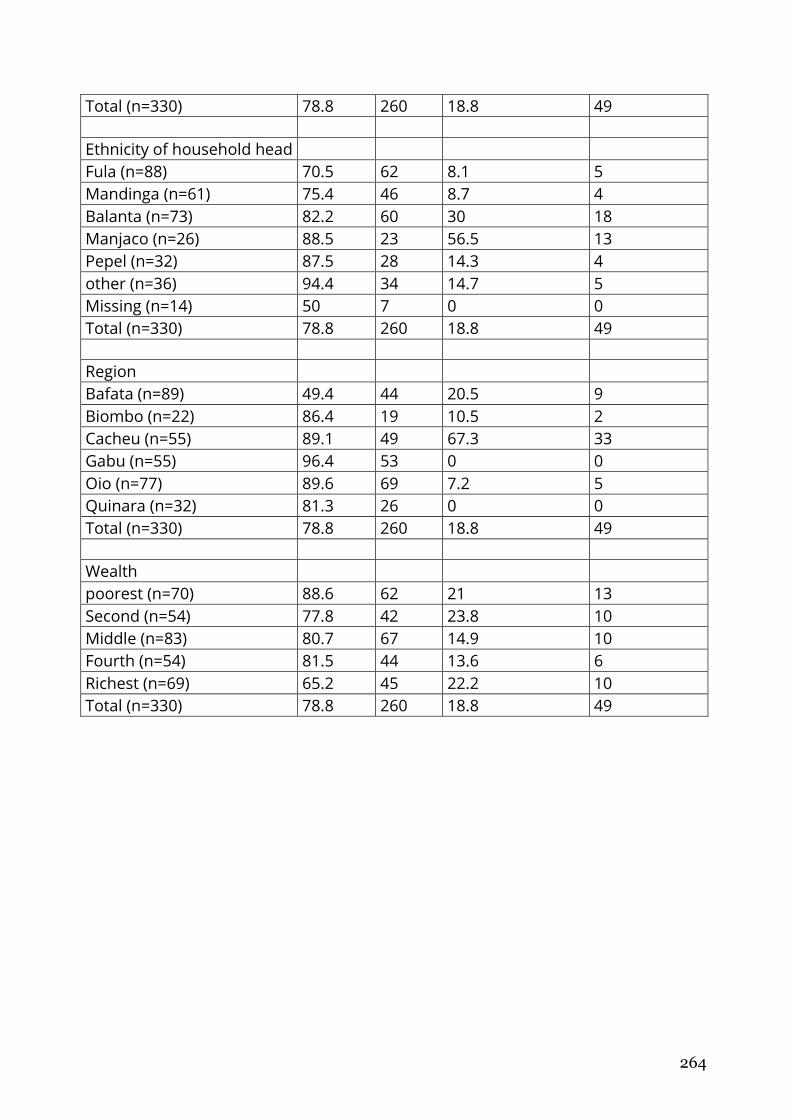
264
Total (n=330) 78.8 260 18.8 49
Ethnicity of household head Fula (n=88) 70.5 62 8.1 5
Mandinga (n=61) 75.4 46 8.7 4
Balanta (n=73) 82.2 60 30 18
Manjaco (n=26) 88.5 23 56.5 13
Pepel (n=32) 87.5 28 14.3 4
other (n=36) 94.4 34 14.7 5
Missing (n=14) 50 7 0 0
Total (n=330) 78.8 260 18.8 49
Region Bafata (n=89) 49.4 44 20.5 9
Biombo (n=22) 86.4 19 10.5 2
Cacheu (n=55) 89.1 49 67.3 33
Gabu (n=55) 96.4 53 0 0
Oio (n=77) 89.6 69 7.2 5
Quinara (n=32) 81.3 26 0 0
Total (n=330) 78.8 260 18.8 49
Wealth poorest (n=70) 88.6 62 21 13
Second (n=54) 77.8 42 23.8 10
Middle (n=83) 80.7 67 14.9 10
Fourth (n=54) 81.5 44 13.6 6
Richest (n=69) 65.2 45 22.2 10
Total (n=330) 78.8 260 18.8 49
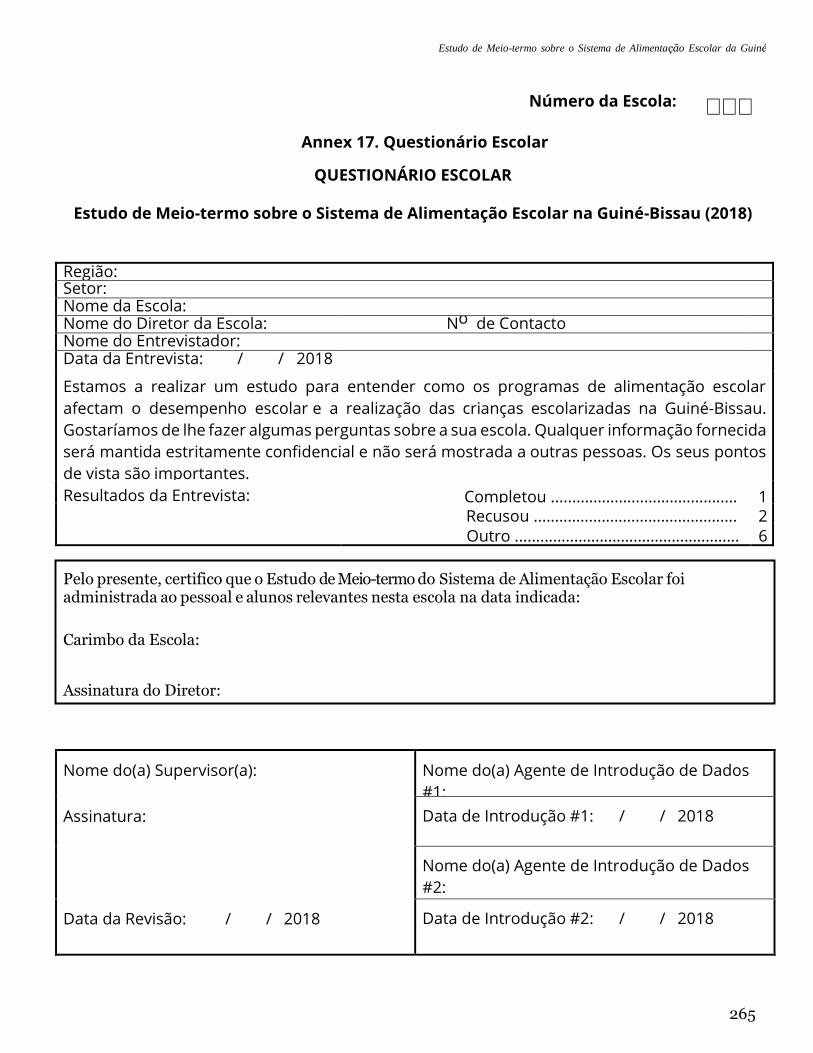
Estudo de Meio-termo sobre o Sistema de Alimentação Escolar da Guiné
(2018)
265
Número da Escola: ⎕⎕⎕
Annex 17. Questionário Escolar
QUESTIONÁRIO ESCOLAR
Estudo de Meio-termo sobre o Sistema de Alimentação Escolar na Guiné-Bissau (2018)
Região: Setor: Nome da Escola: Nome do Diretor da Escola: No de Contacto Nome do Entrevistador: Data da Entrevista: / / 2018
Estamos a realizar um estudo para entender como os programas de alimentação escolar
afectam o desempenho escolar e a realização das crianças escolarizadas na Guiné-Bissau.
Gostaríamos de lhe fazer algumas perguntas sobre a sua escola. Qualquer informação fornecida
será mantida estritamente confidencial e não será mostrada a outras pessoas. Os seus pontos
de vista são importantes.
Tem alguma questão?
Resultados da Entrevista: Completou ............................................ 1 Recusou ................................................ 2 Outro ..................................................... 6
Nome do(a) Supervisor(a): Nome do(a) Agente de Introdução de Dados
#1:
Assinatura: Data de Introdução #1: / / 2018
Nome do(a) Agente de Introdução de Dados
#2:
Data da Revisão: / / 2018 Data de Introdução #2: / / 2018
Pelo presente, certifico que o Estudo de Meio-termo do Sistema de Alimentação Escolar foi administrada ao pessoal e alunos relevantes nesta escola na data indicada:
Carimbo da Escola:
Assinatura do Diretor:
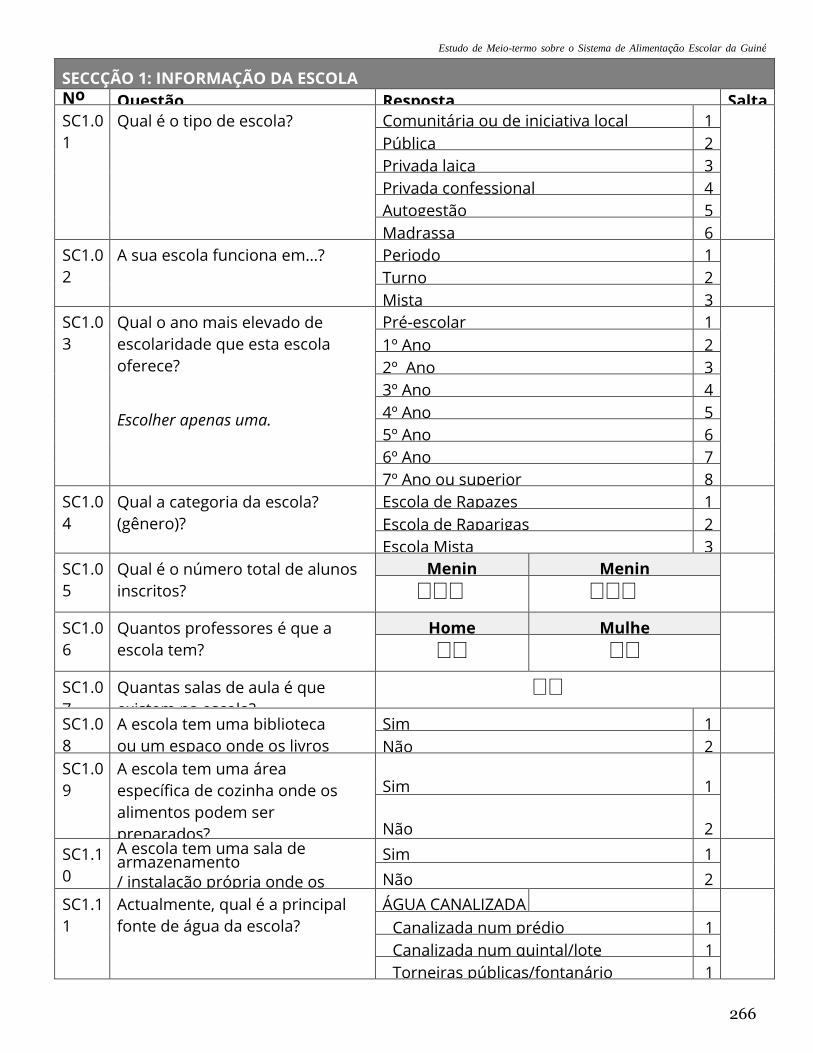
Estudo de Meio-termo sobre o Sistema de Alimentação Escolar da Guiné
(2018)
266
SECCÇÃO 1: INFORMAÇÃO DA ESCOLA No Questão Resposta Salta
r SC1.0
1
Qual é o tipo de escola? Comunitária ou de iniciativa local
.....................................
1
Pública
.........................................................................
.....
2
Privada laica
.....................................................................
3
Privada confessional
.........................................................
4
Autogestão
........................................................................
5
Madrassa
.........................................................................
.
6
SC1.0
2
A sua escola funciona em…? Periodo
.........................................................................
....
1
Turno
.........................................................................
.......
2
Mista
.........................................................................
........
3
SC1.0
3
Qual o ano mais elevado de
escolaridade que esta escola
oferece?
Escolher apenas uma.
Pré-escolar
.......................................................................
1
1º Ano
.........................................................................
.....
2
2º Ano
.........................................................................
.....
3
3º Ano
.........................................................................
.....
4
4º Ano
.........................................................................
.....
5
5º Ano
.........................................................................
.....
6
6º Ano
.........................................................................
.....
7
7º Ano ou superior
............................................................
8
SC1.0
4
Qual a categoria da escola?
(gênero)?
Escola de Rapazes
...........................................................
1
Escola de Raparigas
.........................................................
2
Escola Mista
.....................................................................
3
SC1.0
5
Qual é o número total de alunos
inscritos?
Menin
os
Menin
as
⎕⎕⎕ ⎕⎕⎕
SC1.0
6
Quantos professores é que a
escola tem?
NB: Inclua o Diretor da Escola, em
número.
Home
ns
Mulhe
res
⎕⎕ ⎕⎕
SC1.0
7
Quantas salas de aula é que
existem na escola?
⎕⎕
SC1.0
8
A escola tem uma biblioteca
ou um espaço onde os livros
são armazenados?
Sim
.........................................................................
.........
1
Não
.........................................................................
.........
2
SC1.0
9
A escola tem uma área
específica de cozinha onde os
alimentos podem ser
preparados?
Isto refere-se a uma estrutura
com paredes e/ou tecto. Ao ar
livre não se aplica.
Sim
.........................................................................
.........
1
Não
.........................................................................
.........
2
SC1.1
0
A escola tem uma sala de armazenamento / instalação própria onde os
produtos alimentares podem
ser armazenados?
Sim
.........................................................................
.........
1
Não
.........................................................................
.........
2
SC1.1
1
Actualmente, qual é a principal
fonte de água da escola?
ÁGUA CANALIZADA
Canalizada num prédio
................................................
1
1 Canalizada num quintal/lote
........................................
1
2 Torneiras públicas/fontanário
.......................................
1
3
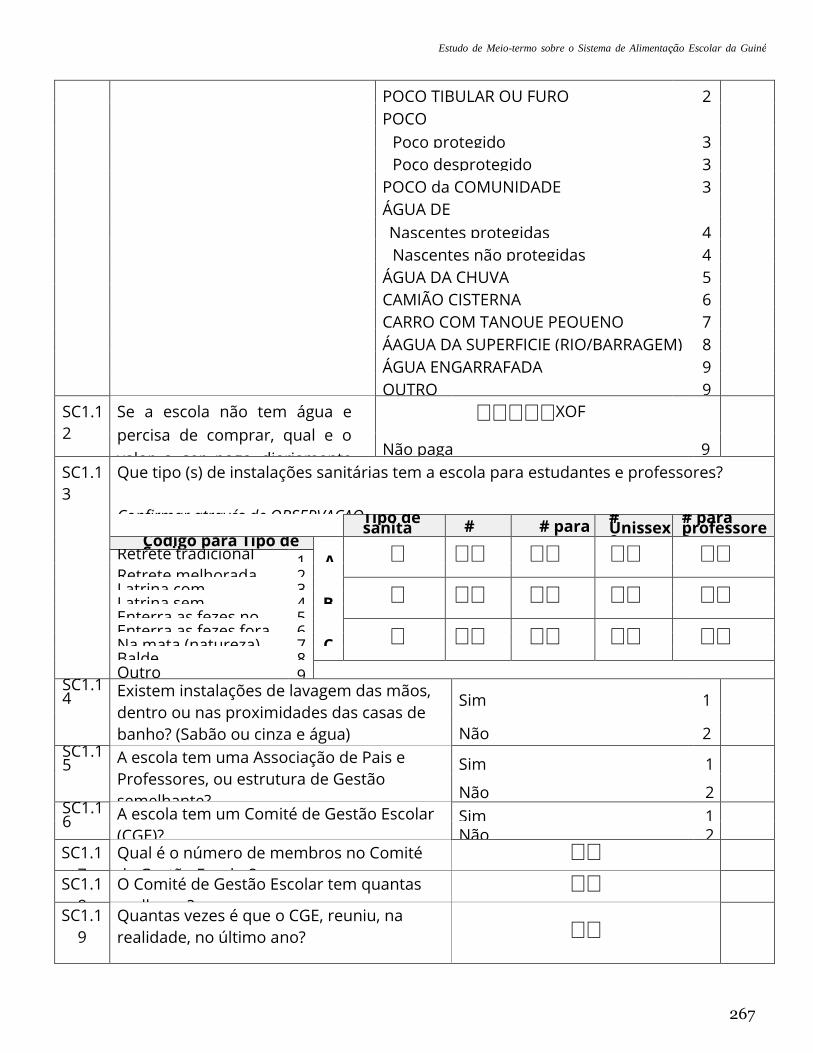
Estudo de Meio-termo sobre o Sistema de Alimentação Escolar da Guiné
(2018)
267
POÇO TIBULAR OU FURO
..........................................
2
1
POÇO
Poço protegido
.............................................................
3
1 Poço desprotegido
.......................................................
3
2 POCO da COMUNIDADE
................................................
3
3 ÁGUA DE
NASCENTE
Nascentes protegidas
...................................................
4
1 Nascentes não protegidas
...........................................
4
2 ÁGUA DA CHUVA
..........................................................
5
1 CAMIÃO CISTERNA
.......................................................
6
1 CARRO COM TANQUE PEQUENO
...............................
7
1 ÁAGUA DA SUPERFICIE (RIO/BARRAGEM)
...............
8
1 ÁGUA ENGARRAFADA
.................................................
9
1 OUTRO
.........................................................................
..
9
6 SC1.1
2
Se a escola não tem água e
percisa de comprar, qual e o
valor a ser pago diariamente
para o funcionamento da
cantina?
⎕⎕⎕⎕⎕XOF
Não paga
.......................................................................
9
5 SC1.1
3
Que tipo (s) de instalações sanitárias tem a escola para estudantes e professores?
Confirmar através de OBSERVACAO.
Tipo de sanita #
para
rapaz
es
# para
raparig
as
# Unissexo
# para professores Código para Tipo de
Sanita ⎕ ⎕⎕ ⎕⎕ ⎕⎕ ⎕⎕ Retrete tradicional ........................ 1 A
. Retrete melhorada
........................
2 Latrina com
autoclismo ................
3 ⎕ ⎕⎕ ⎕⎕ ⎕⎕ ⎕⎕ Latrina sem
autoclismo ................
4 B. Enterra as fezes no
quintal ...........
5 Enterra as fezes fora
do quintal ...
6 ⎕ ⎕⎕ ⎕⎕ ⎕⎕ ⎕⎕ Na mata (natureza)
......................
7 C. Balde
........................................
....
8 Outro
........................................
....
9 SC1.14 Existem instalações de lavagem das mãos,
dentro ou nas proximidades das casas de
banho? (Sabão ou cinza e água)
Confirmar através de OBSERVAÇÃO.
Sim
.......................................................
......
1
Não
.......................................................
......
2 SC1.15 A escola tem uma Associação de Pais e
Professores, ou estrutura de Gestão
semelhante?
Sim
.......................................................
......
1
Não
.......................................................
......
2 SC1.16 A escola tem um Comité de Gestão Escolar
(CGE)? Sim
.......................................................
......
1
Não
.......................................................
......
2 SC1.1
7
Qual é o número de membros no Comité
de Gestão Escolar?
⎕⎕
SC1.1
8
O Comité de Gestão Escolar tem quantas
mulheres?
⎕⎕
SC1.1
9
Quantas vezes é que o CGE, reuniu, na
realidade, no último ano?
Confirmar através do livro de registo ou acta
de de reuniões.
⎕⎕
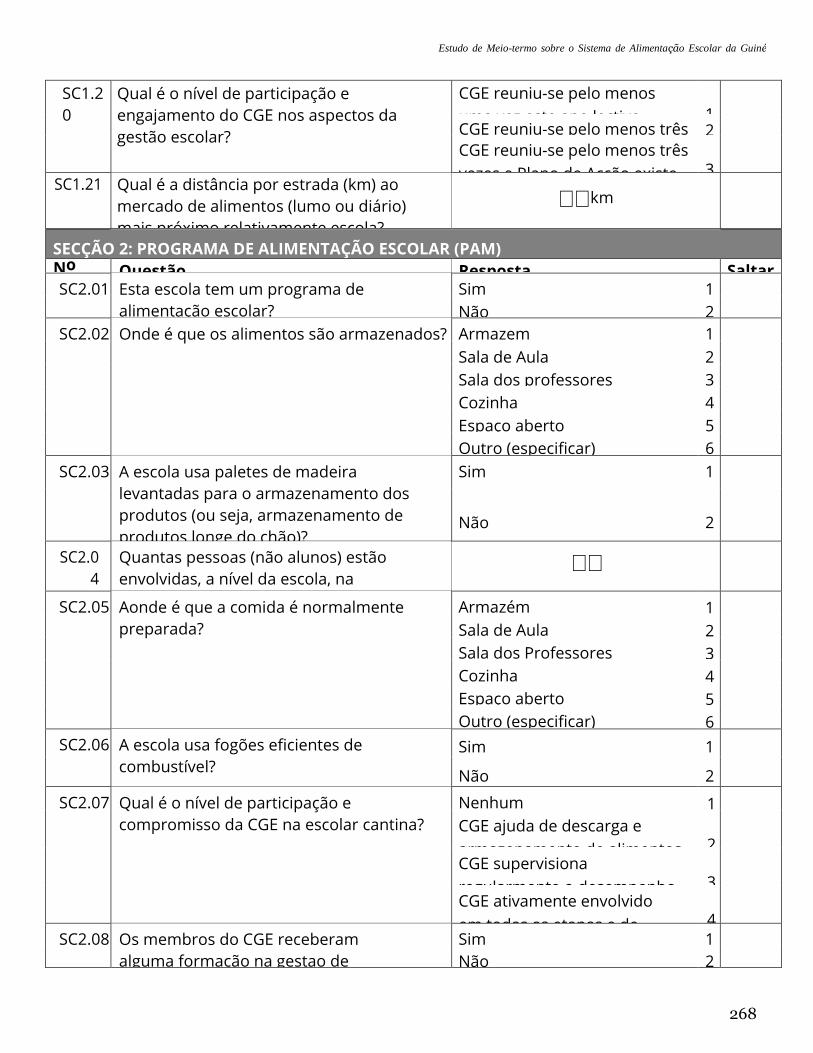
Estudo de Meio-termo sobre o Sistema de Alimentação Escolar da Guiné
(2018)
268
SC1.2
0
Qual é o nível de participação e
engajamento do CGE nos aspectos da
gestão escolar?
Escolher apenas uma.
CGE reuniu-se pelo menos
uma vez este ano lectivo
…………………………………...
1
CGE reuniu-se pelo menos três
vezes ……
2 CGE reuniu-se pelo menos três
vezes e Plano de Acção existe
………………………
3 SC1.21 Qual é a distância por estrada (km) ao
mercado de alimentos (lumo ou diário)
mais próximo relativamente escola?
Registar ‘00’ se menos de 1.
⎕⎕km
SECÇÃO 2: PROGRAMA DE ALIMENTAÇÃO ESCOLAR (PAM) No Questão Resposta Saltar SC2.01 Esta escola tem um programa de
alimentação escolar?
Sim
........................................................
...
1
→SC3.
01
Não
........................................................
...
2
SC2.02 Onde é que os alimentos são armazenados? Armazem
.................................................
1
Sala de Aula
............................................
2
Sala dos professores
...............................
3
Cozinha
....................................................
4
Espaço aberto
..........................................
5
Outro (especificar)
...................................
6
SC2.03 A escola usa paletes de madeira
levantadas para o armazenamento dos
produtos (ou seja, armazenamento de
produtos longe do chão)?
Confirmar através de OBSERVACAO.
Sim
........................................................
...
1
Não
........................................................
...
2
SC2.0
4
Quantas pessoas (não alunos) estão
envolvidas, a nível da escola, na
preparação dos alimentos (preparadores
de comida, cozinheiro e responsável de
armazém)?
⎕⎕
SC2.05 Aonde é que a comida é normalmente
preparada?
Armazém
...................................................
1
Sala de Aula
...............................................
2
Sala dos Professores
..................................
3
Cozinha
....................................................
4
Espaço aberto
...........................................
5
Outro (especificar)
.....................................
6
SC2.06 A escola usa fogões eficientes de
combustível?
Confirmar através de OBSERVAÇÃO.
Sim
........................................................
...
1
Não
........................................................
...
2
SC2.07 Qual é o nível de participação e
compromisso da CGE na escolar cantina?
Nenhum
………………………………………
1
CGE ajuda de descarga e
armazenamento de alimentos
................................................
2 CGE supervisiona
regularmente o desempenho
do cozinheiro …………………
3 CGE ativamente envolvido
em todas as etapas e de
gestão ………………………
4 SC2.08 Os membros do CGE receberam
alguma formação na gestao de
cantinas escolar do PAM?
Sim
........................................................
...
1
Não
........................................................
...
2
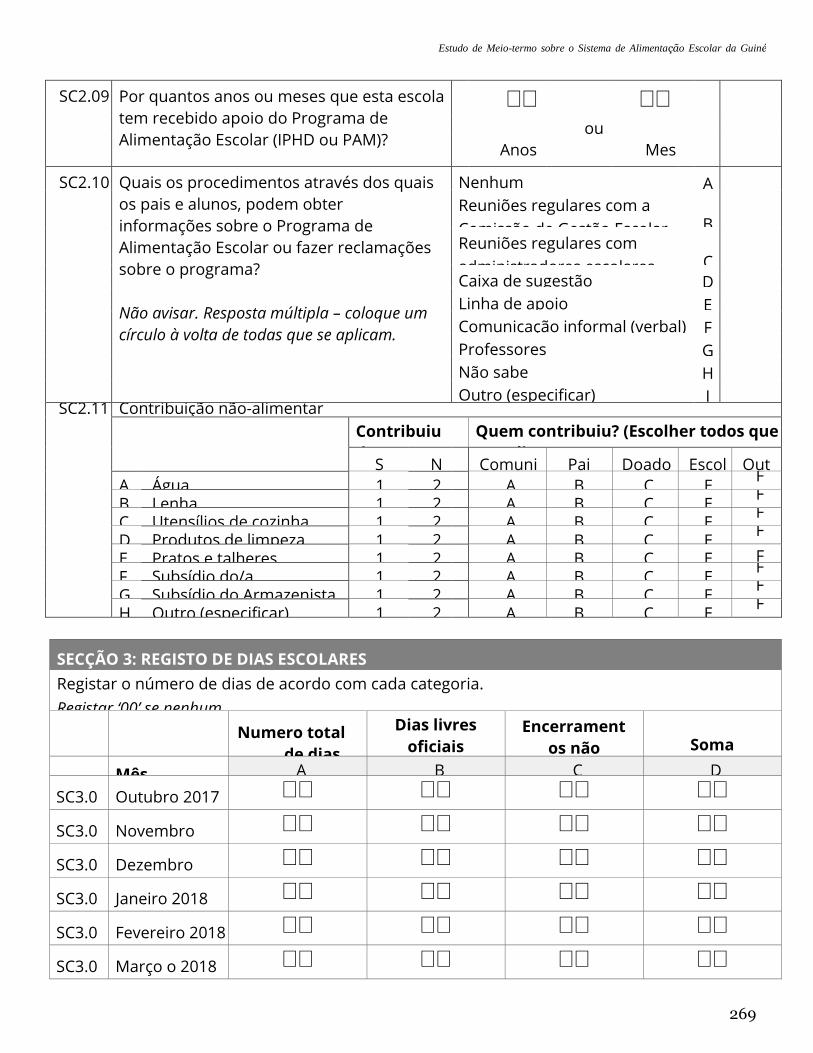
Estudo de Meio-termo sobre o Sistema de Alimentação Escolar da Guiné
(2018)
269
SC2.09 Por quantos anos ou meses que esta escola
tem recebido apoio do Programa de
Alimentação Escolar (IPHD ou PAM)?
NB: Isso abrange qualquer componente do
programa de alimentação escolar.
⎕⎕ ⎕⎕
ou Anos Mes
es
SC2.10 Quais os procedimentos através dos quais
os pais e alunos, podem obter
informações sobre o Programa de
Alimentação Escolar ou fazer reclamações
sobre o programa?
Não avisar. Resposta múltipla – coloque um
círculo à volta de todas que se aplicam.
Nenhum
…………………………………......
A
Reuniões regulares com a
Comissão de Gestão Escolar
(CGE) ................................
B Reuniões regulares com
administradores escolares
...................................................
C Caixa de sugestão
.....................................
D
Linha de apoio
...........................................
E
Comunicação informal (verbal)
com ..........
F
Professores
...............................................
G
Não sabe
...................................................
H
Outro (especificar)
.....................................
I SC2.11 Contribuição não-alimentar
Item Não Alimentar
Contribuiu
durante o
ano escolar
2015?
Quem contribuiu? (Escolher todos que
se aplicam) S N Comuni
dade
Pai
s
Doado
res
Escol
a
Out
ro A. Água 1 2 A B C E F
B. Lenha 1 2 A B C E F
C. Utensílios de cozinha 1 2 A B C E F
D. Produtos de limpeza 1 2 A B C E F
E. Pratos e talheres 1 2 A B C E F
F. Subsídio do/a
cozinheiro/a
1 2 A B C E F
G. Subsídio do Armazenista 1 2 A B C E F
H. Outro (especificar) 1 2 A B C E F
SECÇÃO 3: REGISTO DE DIAS ESCOLARES
Registar o número de dias de acordo com cada categoria.
Registar ‘00’ se nenhum.
Numero total
de dias
de aulas
Dias livres
oficiais
(Feriados /
Fins-de-
semana)
Encerrament
os não
planeados
(Greve de
professores,
etc.)
Soma
Mês A B C D
SC3.0
1
Outubro 2017 ⎕⎕ ⎕⎕ ⎕⎕ ⎕⎕
SC3.0
2
Novembro
2017
⎕⎕ ⎕⎕ ⎕⎕ ⎕⎕
SC3.0
3
Dezembro
2017
⎕⎕ ⎕⎕ ⎕⎕ ⎕⎕
SC3.0
4
Janeiro 2018 ⎕⎕ ⎕⎕ ⎕⎕ ⎕⎕
SC3.0
5
Fevereiro 2018 ⎕⎕ ⎕⎕ ⎕⎕ ⎕⎕
SC3.0
6
Março o 2018 ⎕⎕ ⎕⎕ ⎕⎕ ⎕⎕
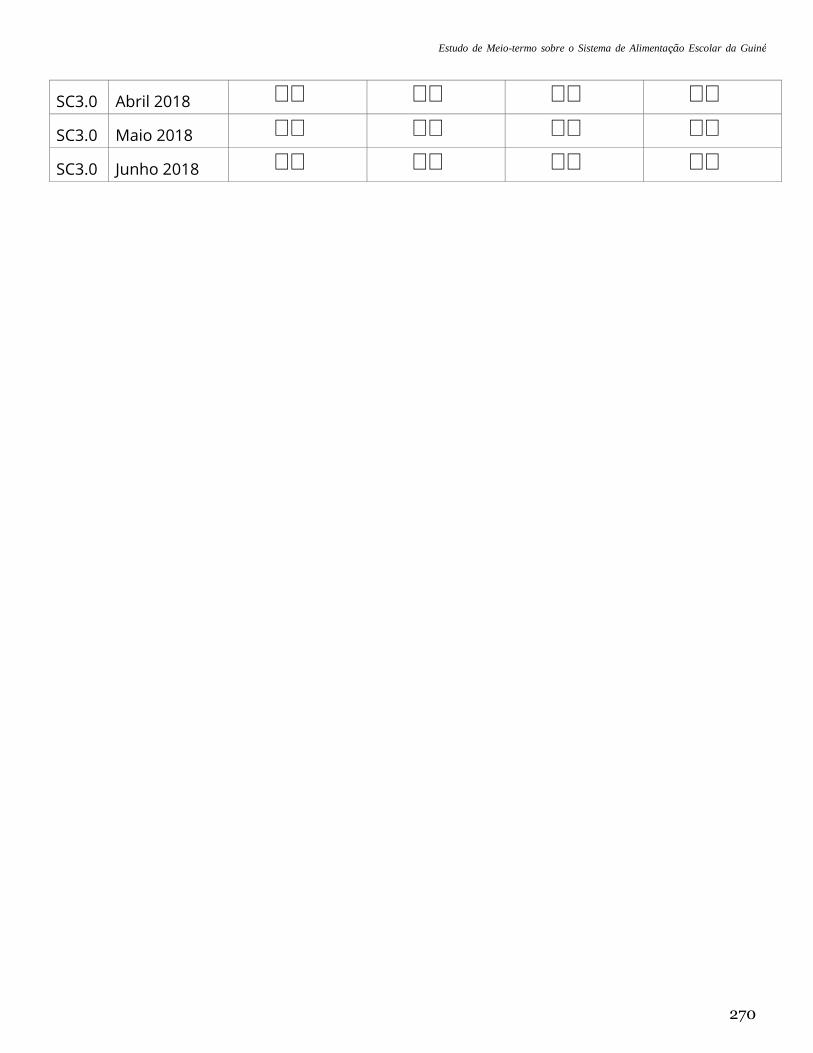
Estudo de Meio-termo sobre o Sistema de Alimentação Escolar da Guiné
(2018)
270
SC3.0
7
Abril 2018 ⎕⎕ ⎕⎕ ⎕⎕ ⎕⎕
SC3.0
8
Maio 2018 ⎕⎕ ⎕⎕ ⎕⎕ ⎕⎕
SC3.0
9
Junho 2018 ⎕⎕ ⎕⎕ ⎕⎕ ⎕⎕
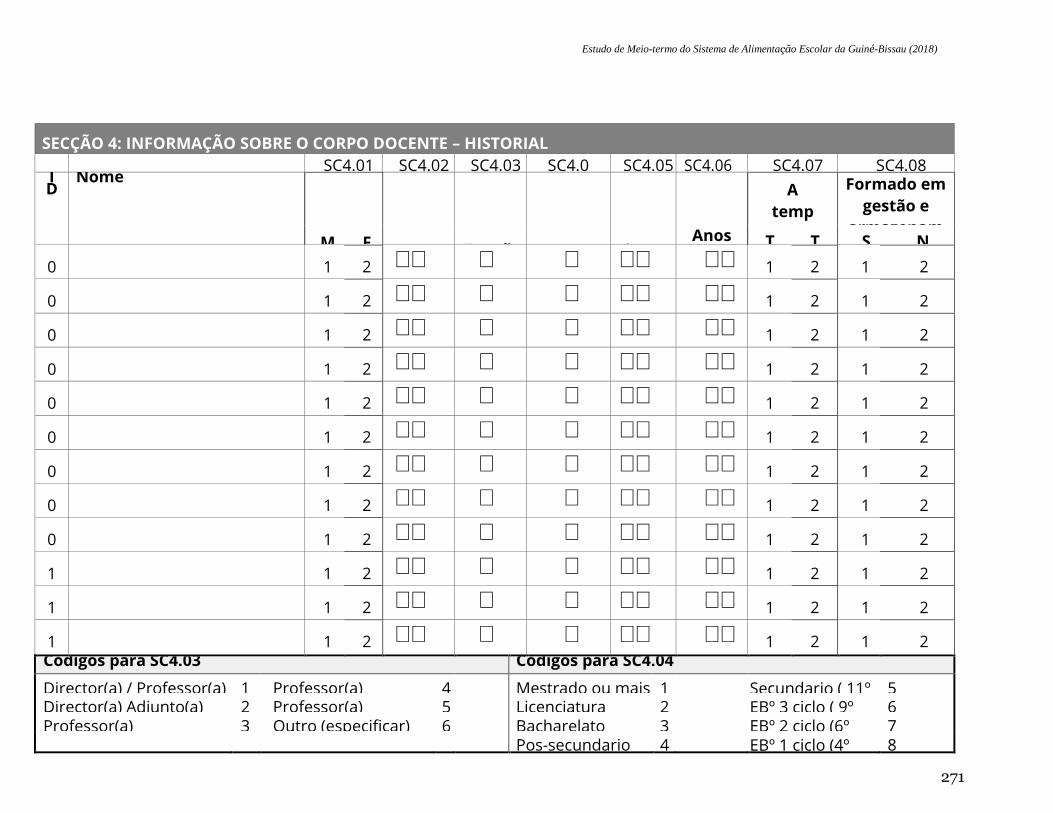
Estudo de Meio-termo do Sistema de Alimentação Escolar da Guiné-Bissau (2018)
271
SECÇÃO 4: INFORMAÇÃO SOBRE O CORPO DOCENTE – HISTORIAL
SC4.01 SC4.02 SC4.03 SC4.0
4
SC4.05 SC4.06 SC4.07 SC4.08 ID
Nome
Sex
o
Idade
Funçã
o na
escol
a
Qualifica
ção
Anos
de
servi
ço
Anos
na
actu
al
funç
ão
A
temp
o
inteir
o ou
parci
al?
Formado em
gestão e
armazenam
ento seguro
de
alimentos
do PAM?
M F T
I
T
P
S N
0
1
1 2
⎕⎕ ⎕ ⎕ ⎕⎕ ⎕⎕ 1 2 1 2
0
2
1 2
⎕⎕ ⎕ ⎕ ⎕⎕ ⎕⎕ 1 2 1 2
0
3
1 2
⎕⎕ ⎕ ⎕ ⎕⎕ ⎕⎕ 1 2 1 2
0
4
1 2
⎕⎕ ⎕ ⎕ ⎕⎕ ⎕⎕ 1 2 1 2
0
5
1 2
⎕⎕ ⎕ ⎕ ⎕⎕ ⎕⎕ 1 2 1 2
0
6
1 2
⎕⎕ ⎕ ⎕ ⎕⎕ ⎕⎕ 1 2 1 2
0
7
1 2
⎕⎕ ⎕ ⎕ ⎕⎕ ⎕⎕ 1 2 1 2
0
8
1 2
⎕⎕ ⎕ ⎕ ⎕⎕ ⎕⎕ 1 2 1 2
0
9
1 2
⎕⎕ ⎕ ⎕ ⎕⎕ ⎕⎕ 1 2 1 2
1
0
1 2
⎕⎕ ⎕ ⎕ ⎕⎕ ⎕⎕ 1 2 1 2
1
1
1 2
⎕⎕ ⎕ ⎕ ⎕⎕ ⎕⎕ 1 2 1 2
1
2
1 2
⎕⎕ ⎕ ⎕ ⎕⎕ ⎕⎕ 1 2 1 2
Códigos para SC4.03 Códigos para SC4.04
Director(a) / Professor(a)
principal .....
1 Professor(a)
(contratado/a) .......
4 Mestrado ou mais
..............
1 Secundario ( 11º
- 12º) ...
5 Director(a) Adjunto(a)
.........................
2 Professor(a)
(voluntário/a)) .......
5 Licenciatura
......................
2 EBº 3 ciclo ( 9º
ano) .......
6 Professor(a)
(permanente / regular) ...
3 Outro (especificar)
....................
6 Bacharelato
......................
3 EBº 2 ciclo (6º
ano) ........
7 Pos-secundario
(médio) ....
4 EBº 1 ciclo (4º
ano) .........
8
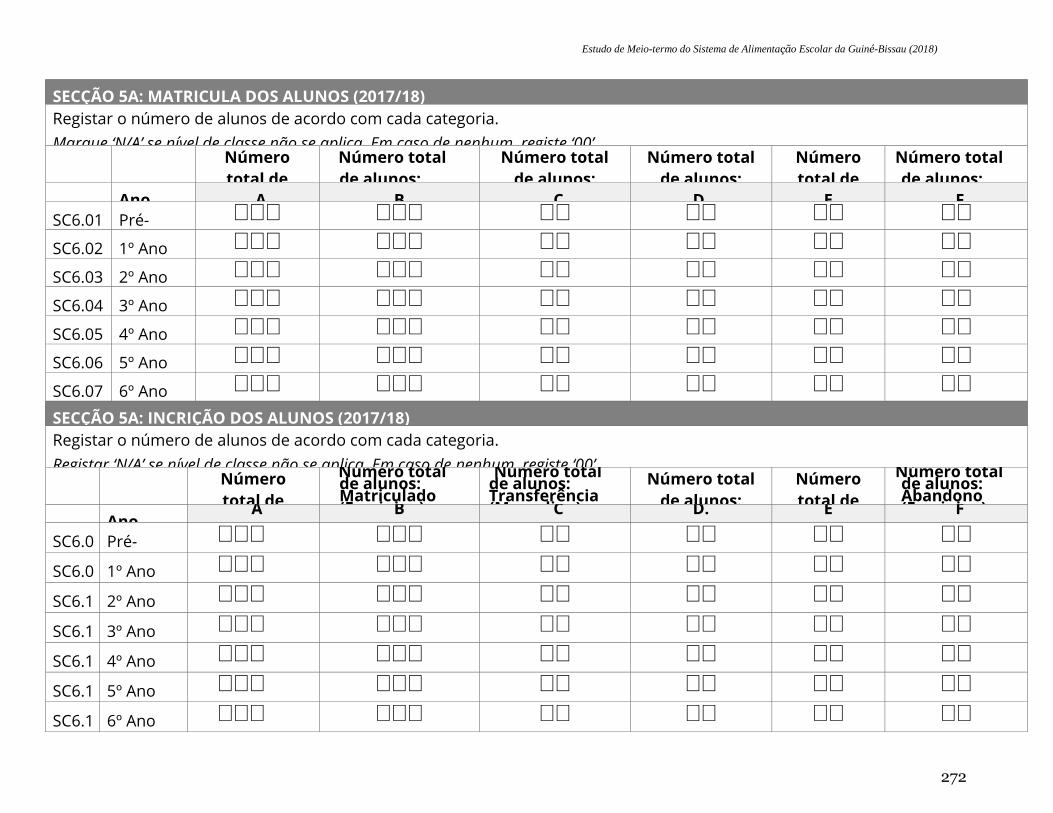
Estudo de Meio-termo do Sistema de Alimentação Escolar da Guiné-Bissau (2018)
272
SECÇÃO 5A: MATRICULA DOS ALUNOS (2017/18)
Registar o número de alunos de acordo com cada categoria.
Marque ‘N/A’ se nível de classe não se aplica. Em caso de nenhum, registe ‘00’. Número
total de
alunos:
Matriculado
(Masculino)
Número total
de alunos:
Matriculado
(Feminino)
Número total
de alunos:
Transferência
para fora
(Masculino)
Número total
de alunos:
Transferência
para fora
(Feminino)
Número
total de
alunos:
Abandono
(Masculino)
Número total
de alunos:
Abandono
(Feminino)
Ano A B C D. E F
SC6.01 Pré-
Primário
⎕⎕⎕ ⎕⎕⎕ ⎕⎕ ⎕⎕ ⎕⎕ ⎕⎕
SC6.02 1º Ano ⎕⎕⎕ ⎕⎕⎕ ⎕⎕ ⎕⎕ ⎕⎕ ⎕⎕
SC6.03 2º Ano ⎕⎕⎕ ⎕⎕⎕ ⎕⎕ ⎕⎕ ⎕⎕ ⎕⎕
SC6.04 3º Ano ⎕⎕⎕ ⎕⎕⎕ ⎕⎕ ⎕⎕ ⎕⎕ ⎕⎕
SC6.05 4º Ano ⎕⎕⎕ ⎕⎕⎕ ⎕⎕ ⎕⎕ ⎕⎕ ⎕⎕
SC6.06 5º Ano ⎕⎕⎕ ⎕⎕⎕ ⎕⎕ ⎕⎕ ⎕⎕ ⎕⎕
SC6.07 6º Ano ⎕⎕⎕ ⎕⎕⎕ ⎕⎕ ⎕⎕ ⎕⎕ ⎕⎕
SECÇÃO 5A: INCRIÇÃO DOS ALUNOS (2017/18)
Registar o número de alunos de acordo com cada categoria.
Registar ‘N/A’ se nível de classe não se aplica. Em caso de nenhum, registe ‘00’. Número
total de
alunos:
Matriculado
(Masculino)
Número total de alunos: Matriculado (Feminino)
Número total de alunos: Transferência (Masculino)
Número total
de alunos:
Transferência
(Feminino)
Número
total de
alunos:
Abandono
(Masculino)
Número total de alunos: Abandono (Feminino)
Ano A B C D. E F
SC6.0
8
Pré-
Primário
⎕⎕⎕ ⎕⎕⎕ ⎕⎕ ⎕⎕ ⎕⎕ ⎕⎕
SC6.0
9
1º Ano ⎕⎕⎕ ⎕⎕⎕ ⎕⎕ ⎕⎕ ⎕⎕ ⎕⎕
SC6.1
0
2º Ano ⎕⎕⎕ ⎕⎕⎕ ⎕⎕ ⎕⎕ ⎕⎕ ⎕⎕
SC6.1
1
3º Ano ⎕⎕⎕ ⎕⎕⎕ ⎕⎕ ⎕⎕ ⎕⎕ ⎕⎕
SC6.1
2
4º Ano ⎕⎕⎕ ⎕⎕⎕ ⎕⎕ ⎕⎕ ⎕⎕ ⎕⎕
SC6.1
3
5º Ano ⎕⎕⎕ ⎕⎕⎕ ⎕⎕ ⎕⎕ ⎕⎕ ⎕⎕
SC6.1
4
6º Ano ⎕⎕⎕ ⎕⎕⎕ ⎕⎕ ⎕⎕ ⎕⎕ ⎕⎕
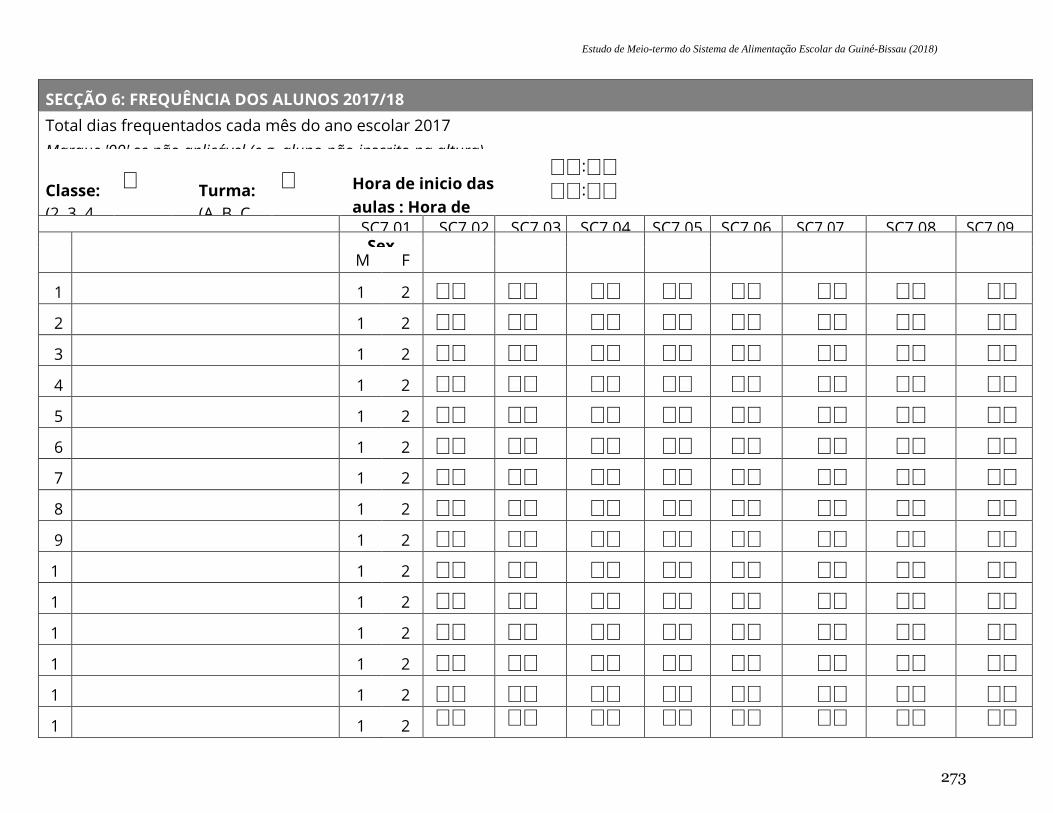
Estudo de Meio-termo do Sistema de Alimentação Escolar da Guiné-Bissau (2018)
273
SECÇÃO 6: FREQUÊNCIA DOS ALUNOS 2017/18
Total dias frequentados cada mês do ano escolar 2017
Marque '99' se não aplicável (e.g. aluno não inscrito na altura)
Classe:
(2, 3, 4,
etc.)
⎕
Turma:
(A, B, C,
etc.)
⎕
Hora de inicio das
aulas : Hora de
termino das aulas:
⎕⎕:⎕⎕
⎕⎕:⎕⎕
SC7.01 SC7.02 SC7.03 SC7.04 SC7.05 SC7.06 SC7.07 SC7.08 SC7.09
I
D
No
me
Sex
o
Out-
17
Nov-
17
Dez-17
Jan-18
Fev-18
Mar-18
Abr-18
Mai-18
M F
1 1 2 ⎕⎕ ⎕⎕ ⎕⎕ ⎕⎕ ⎕⎕ ⎕⎕ ⎕⎕ ⎕⎕
2 1 2 ⎕⎕ ⎕⎕ ⎕⎕ ⎕⎕ ⎕⎕ ⎕⎕ ⎕⎕ ⎕⎕
3 1 2 ⎕⎕ ⎕⎕ ⎕⎕ ⎕⎕ ⎕⎕ ⎕⎕ ⎕⎕ ⎕⎕
4 1 2 ⎕⎕ ⎕⎕ ⎕⎕ ⎕⎕ ⎕⎕ ⎕⎕ ⎕⎕ ⎕⎕
5 1 2 ⎕⎕ ⎕⎕ ⎕⎕ ⎕⎕ ⎕⎕ ⎕⎕ ⎕⎕ ⎕⎕
6 1 2 ⎕⎕ ⎕⎕ ⎕⎕ ⎕⎕ ⎕⎕ ⎕⎕ ⎕⎕ ⎕⎕
7 1 2 ⎕⎕ ⎕⎕ ⎕⎕ ⎕⎕ ⎕⎕ ⎕⎕ ⎕⎕ ⎕⎕
8 1 2 ⎕⎕ ⎕⎕ ⎕⎕ ⎕⎕ ⎕⎕ ⎕⎕ ⎕⎕ ⎕⎕
9 1 2 ⎕⎕ ⎕⎕ ⎕⎕ ⎕⎕ ⎕⎕ ⎕⎕ ⎕⎕ ⎕⎕
1
0
1 2 ⎕⎕ ⎕⎕ ⎕⎕ ⎕⎕ ⎕⎕ ⎕⎕ ⎕⎕ ⎕⎕
1
1
1 2 ⎕⎕ ⎕⎕ ⎕⎕ ⎕⎕ ⎕⎕ ⎕⎕ ⎕⎕ ⎕⎕
1
2
1 2 ⎕⎕ ⎕⎕ ⎕⎕ ⎕⎕ ⎕⎕ ⎕⎕ ⎕⎕ ⎕⎕
1
3
1 2 ⎕⎕ ⎕⎕ ⎕⎕ ⎕⎕ ⎕⎕ ⎕⎕ ⎕⎕ ⎕⎕
1
4
1 2 ⎕⎕ ⎕⎕ ⎕⎕ ⎕⎕ ⎕⎕ ⎕⎕ ⎕⎕ ⎕⎕
1
5
1 2 ⎕⎕ ⎕⎕ ⎕⎕ ⎕⎕ ⎕⎕ ⎕⎕ ⎕⎕ ⎕⎕
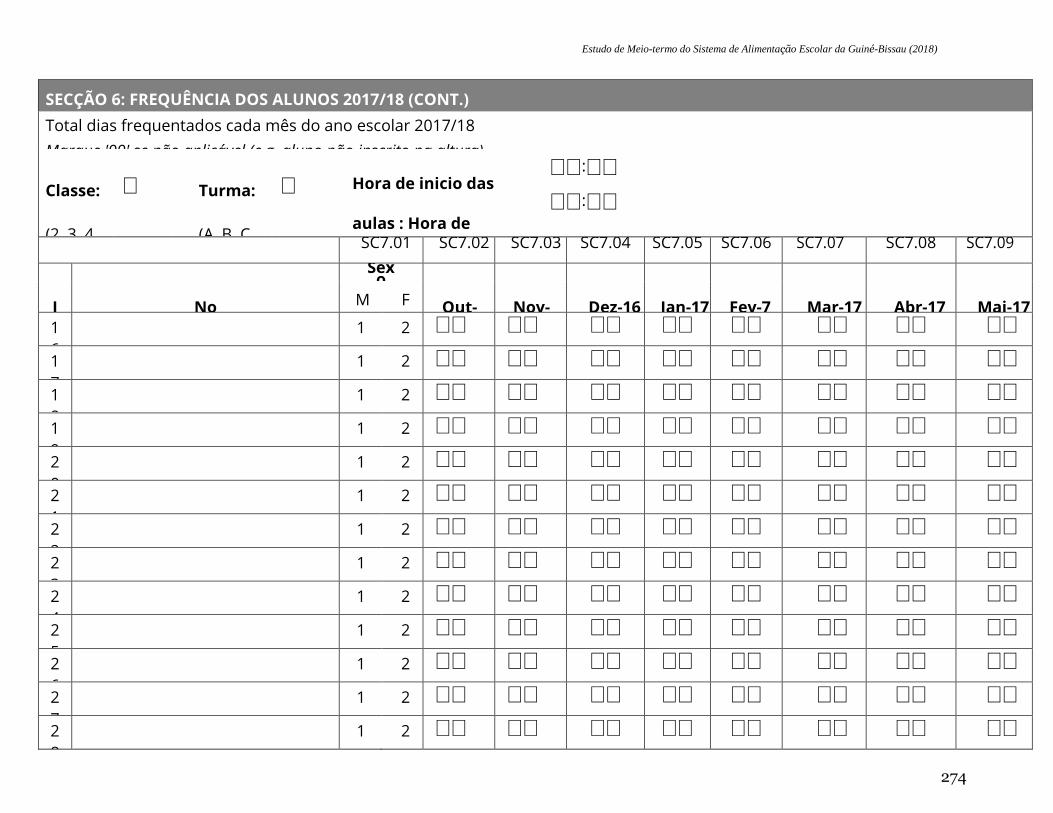
Estudo de Meio-termo do Sistema de Alimentação Escolar da Guiné-Bissau (2018)
274
SECÇÃO 6: FREQUÊNCIA DOS ALUNOS 2017/18 (CONT.)
Total dias frequentados cada mês do ano escolar 2017/18
Marque '99' se não aplicável (e.g. aluno não inscrito na altura)
Classe:
(2, 3, 4,
etc.)
⎕
Turma:
(A, B, C,
etc.)
⎕
Hora de inicio das
aulas : Hora de
tèrmino das aulas:
⎕⎕:⎕⎕
⎕⎕:⎕⎕
SC7.01 SC7.02 SC7.03 SC7.04 SC7.05 SC7.06 SC7.07 SC7.08 SC7.09
I
D
No
me
Sexo
Out-
16
Nov-
16
Dez-16
Jan-17
Fev-7
Mar-17
Abr-17
Mai-17 M F
1
6
1 2 ⎕⎕ ⎕⎕ ⎕⎕ ⎕⎕ ⎕⎕ ⎕⎕ ⎕⎕ ⎕⎕
1
7
1 2 ⎕⎕ ⎕⎕ ⎕⎕ ⎕⎕ ⎕⎕ ⎕⎕ ⎕⎕ ⎕⎕
1
8
1 2 ⎕⎕ ⎕⎕ ⎕⎕ ⎕⎕ ⎕⎕ ⎕⎕ ⎕⎕ ⎕⎕
1
9
1 2 ⎕⎕ ⎕⎕ ⎕⎕ ⎕⎕ ⎕⎕ ⎕⎕ ⎕⎕ ⎕⎕
2
0
1 2 ⎕⎕ ⎕⎕ ⎕⎕ ⎕⎕ ⎕⎕ ⎕⎕ ⎕⎕ ⎕⎕
2
1
1 2 ⎕⎕ ⎕⎕ ⎕⎕ ⎕⎕ ⎕⎕ ⎕⎕ ⎕⎕ ⎕⎕
2
2
1 2 ⎕⎕ ⎕⎕ ⎕⎕ ⎕⎕ ⎕⎕ ⎕⎕ ⎕⎕ ⎕⎕
2
3
1 2 ⎕⎕ ⎕⎕ ⎕⎕ ⎕⎕ ⎕⎕ ⎕⎕ ⎕⎕ ⎕⎕
2
4
1 2 ⎕⎕ ⎕⎕ ⎕⎕ ⎕⎕ ⎕⎕ ⎕⎕ ⎕⎕ ⎕⎕
2
5
1 2 ⎕⎕ ⎕⎕ ⎕⎕ ⎕⎕ ⎕⎕ ⎕⎕ ⎕⎕ ⎕⎕
2
6
1 2 ⎕⎕ ⎕⎕ ⎕⎕ ⎕⎕ ⎕⎕ ⎕⎕ ⎕⎕ ⎕⎕
2
7
1 2 ⎕⎕ ⎕⎕ ⎕⎕ ⎕⎕ ⎕⎕ ⎕⎕ ⎕⎕ ⎕⎕
2
8
1 2 ⎕⎕ ⎕⎕ ⎕⎕ ⎕⎕ ⎕⎕ ⎕⎕ ⎕⎕ ⎕⎕
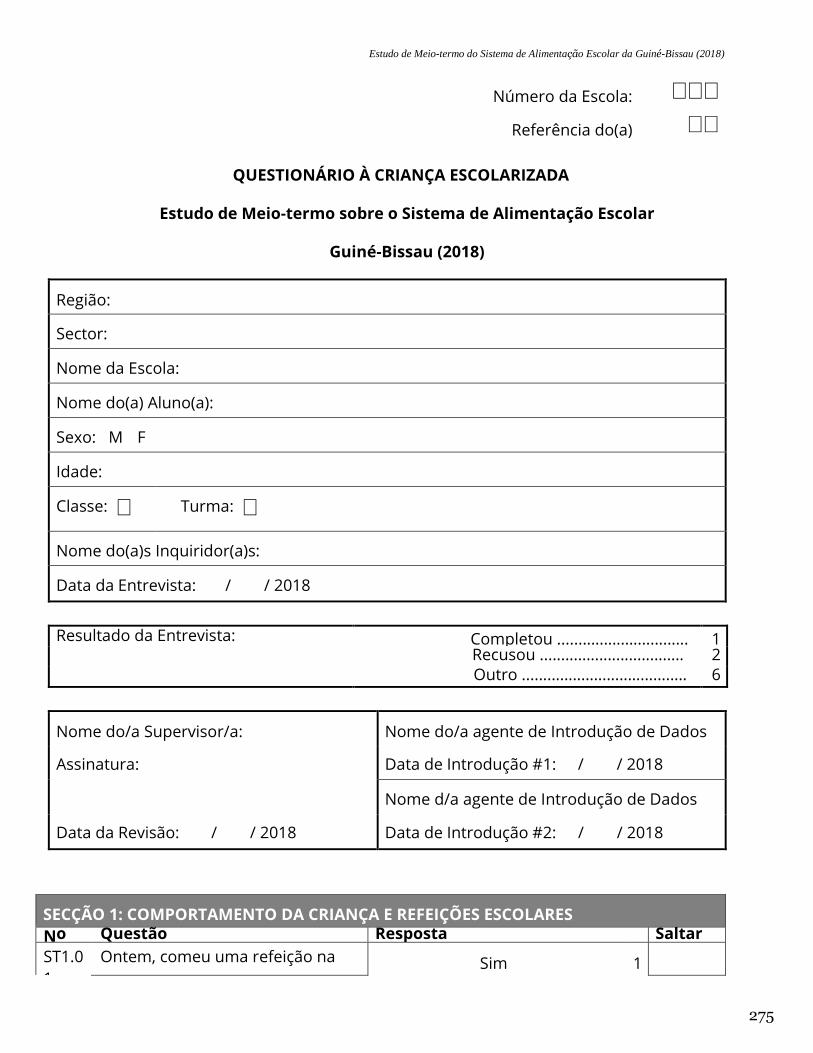
Estudo de Meio-termo do Sistema de Alimentação Escolar da Guiné-Bissau (2018)
275
Número da Escola: ⎕⎕⎕
Referência do(a)
Aluno(a):
⎕⎕
QUESTIONÁRIO À CRIANÇA ESCOLARIZADA
Estudo de Meio-termo sobre o Sistema de Alimentação Escolar
Guiné-Bissau (2018)
Região:
Sector:
Nome da Escola:
Nome do(a) Aluno(a):
Sexo: M F
Idade:
Classe: ⎕ Turma: ⎕
Nome do(a)s Inquiridor(a)s:
Data da Entrevista: / / 2018
Resultado da Entrevista: Completou ............................... 1 Recusou .................................. 2
Outro ....................................... 6
Nome do/a Supervisor/a: Nome do/a agente de Introdução de Dados
#1: Assinatura: Data de Introdução #1: / / 2018
Nome d/a agente de Introdução de Dados
#2: Data da Revisão: / / 2018 Data de Introdução #2: / / 2018
SECÇÃO 1: COMPORTAMENTO DA CRIANÇA E REFEIÇÕES ESCOLARES
No Questão Resposta Saltar
ST1.0
1
Ontem, comeu uma refeição na Sim
.........................................................
.......
1
Estudo de Meio-termo do Sistema de Alimentação Escolar da Guiné-Bissau (2018)
276
escola?
NB: Se não houve escola no dia anterior, perguntar sobre o mais recente dia de escola.
Não
........................................................
........
2
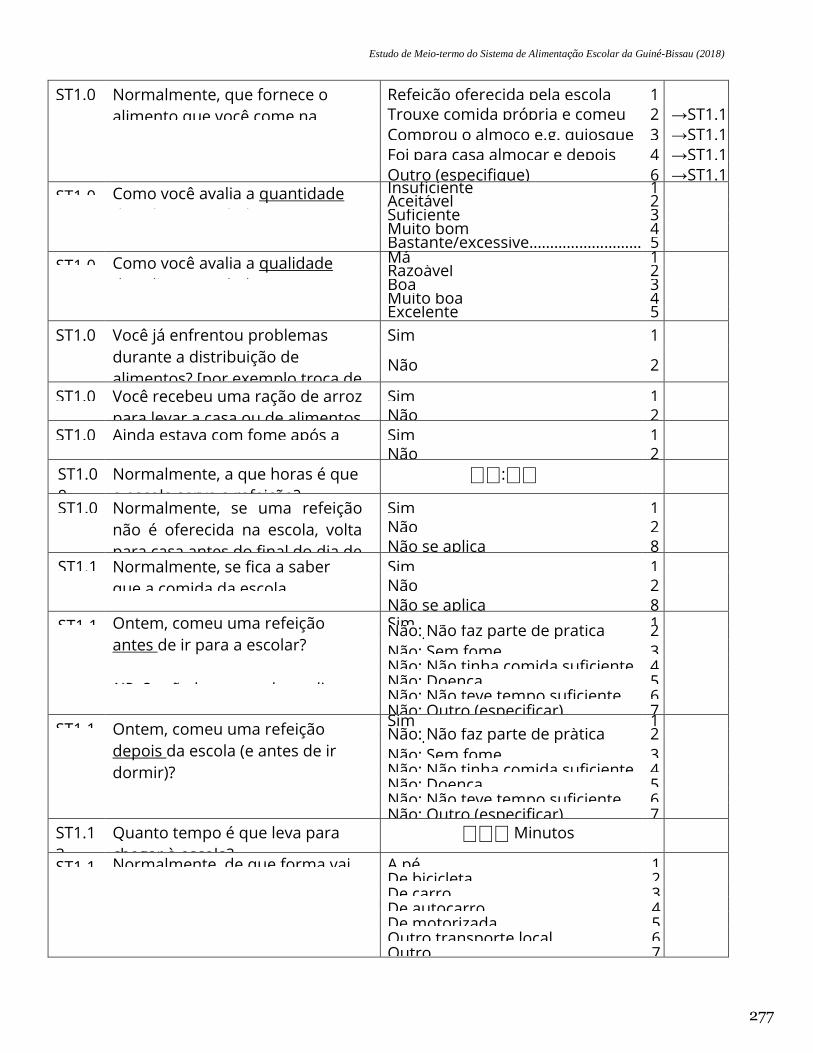
Estudo de Meio-termo do Sistema de Alimentação Escolar da Guiné-Bissau (2018)
277
ST1.0
2
Normalmente, que fornece o
alimento que você come na
escola?
Refeição oferecida pela escola
....................
1 Trouxe comida própria e comeu
na escola ..
2 →ST1.1
1 Comprou o almoço e.g. quiosque
.................
3 →ST1.1
1 Foi para casa almoçar e depois
regressou ..
4 →ST1.1
1 Outro (especifique)
.......................................
6 →ST1.1
1 ST1.0
3
Como você avalia a quantidade
dos alimentos dados (na cantina
escolar)?
Insuficiente …………………………………….
1 Aceitável
……………………………………… 2
Suficiente ……………………………………….
3
Muito bom ………………………………………
4 Bastante/excessive………………………
……. ……………………………………….. 5
ST1.0
4
Como você avalia a qualidade
dos alimentos dados?
Má .................................................................
1 Razoàvel
....................................................... 2
Boa ...............................................................
3 Muito boa
...................................................... 4
Excelente ......................................................
5
ST1.0
5
Você já enfrentou problemas
durante a distribuição de
alimentos? [por exemplo troca de
alimentos por favor / trabalho,
pagar para receber o alimento,
etc.]
Sim
...........................................................
.....
1
Não
...........................................................
....
2
ST1.0
6
Você recebeu uma ração de arroz
para levar a casa ou de alimentos
durante este ano lectivo?
Sim
...........................................................
.....
1 Não
...........................................................
....
2 ST1.0
7
Ainda estava com fome após a
refeição?
Sim
...........................................................
.....
1 Não
...........................................................
....
2
ST1.0
8
Normalmente, a que horas é que
a escola serve a refeição?
⎕⎕:⎕⎕
ST1.0
9
Normalmente, se uma refeição
não é oferecida na escola, volta
para casa antes do final do dia de
escola?
Sim
...........................................................
.....
1 Não
...........................................................
....
2 Não se aplica
................................................
8
ST1.1
0
Normalmente, se fica a saber
que a comida da escola
terminou, volta para lá no dia
seguinte?
Sim
...........................................................
.....
1 Não
...........................................................
....
2 Não se aplica
................................................
8
ST1.1
1
Ontem, comeu uma refeição
antes de ir para a escolar?
NB: Se não houve escola no dia
anterior, perguntar sobre o mais
recente dia de escola.
Sim
...........................................................
.....
1 Não: Não faz parte de pratica
regular .......... 2
Não: Sem fome
.............................................
3 Não: Não tinha comida suficiente
em casa ..
4 Não: Doença
.................................................
5 Não: Não teve tempo suficiente
...................
6 Não: Outro (especificar)
................................
7 ST1.1
2
Ontem, comeu uma refeição
depois da escola (e antes de ir
dormir)?
NB: Se não houve escola no dia anterior, perguntar sobre o mais recente dia de escola.
Sim ................................................................
1 Não: Não faz parte de pràtica
regular .......... 2
Não: Sem fome
.............................................
3 Não: Não tinha comida suficiente
em casa ..
4 Não: Doença
.................................................
5 Não: Não teve tempo suficiente
...................
6 Não: Outro (especificar)
................................
7 ST1.1
3
Quanto tempo é que leva para
chegar à escola?
⎕⎕⎕ Minutos
ST1.1
4
Normalmente, de que forma vai
para a escola?
A pé
...........................................................
.....
1 De bicicleta
.....................................................
2 De carro
..........................................................
3 De autocarro
...................................................
4 De motorizada
................................................
5 Outro transporte local
.....................................
6 Outro
...........................................................
....
7
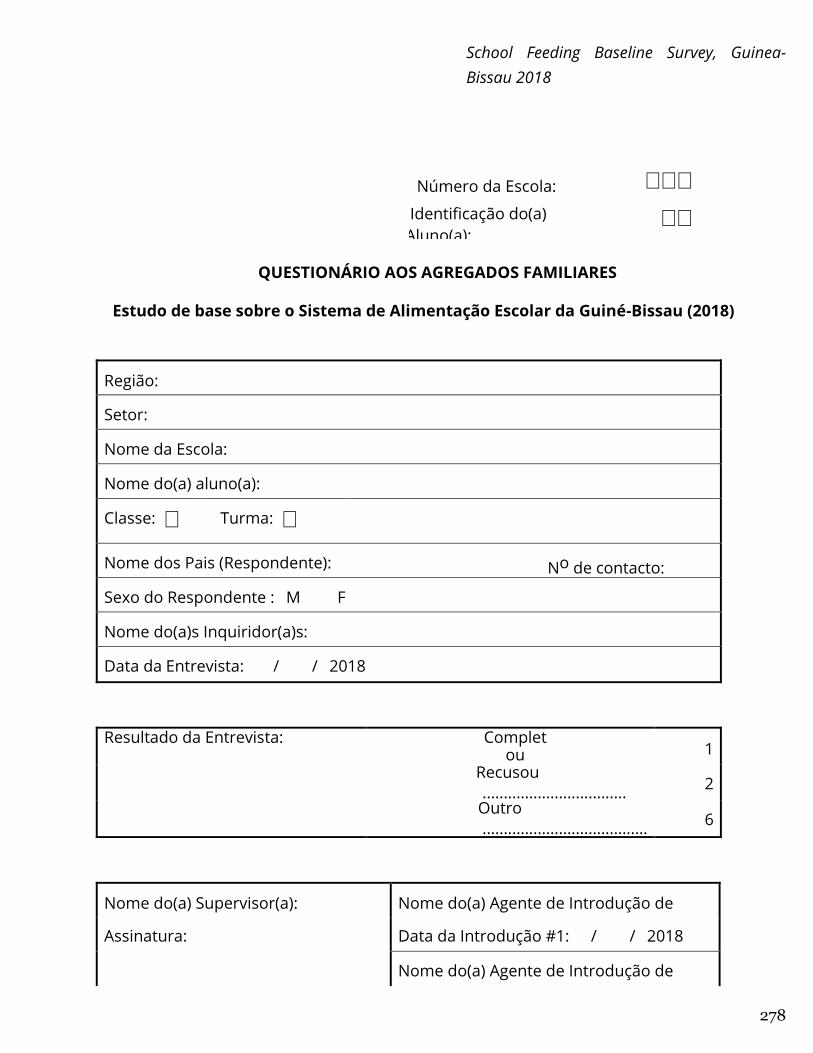
278
School Feeding Baseline Survey, Guinea-
Bissau 2018
Número da Escola: ⎕⎕⎕
IIdentificação do(a)
Aluno(a): ⎕⎕
QUESTIONÁRIO AOS AGREGADOS FAMILIARES
Estudo de base sobre o Sistema de Alimentação Escolar da Guiné-Bissau (2018)
Região:
Setor:
Nome da Escola:
Nome do(a) aluno(a):
Classe: ⎕ Turma: ⎕
Nome dos Pais (Respondente): No de contacto:
Sexo do Respondente : M F
Nome do(a)s Inquiridor(a)s:
Data da Entrevista: / / 2018
Resultado da Entrevista: Completou
..............................
1
Recusou
.................................. 2
Outro
....................................... 6
Nome do(a) Supervisor(a): Nome do(a) Agente de Introdução de
Dados #1: Assinatura: Data da Introdução #1: / / 2018
Nome do(a) Agente de Introdução de
Dados #2:
279
Data de Revisão: / / 2018 Data da Introdução #2: / / 2018
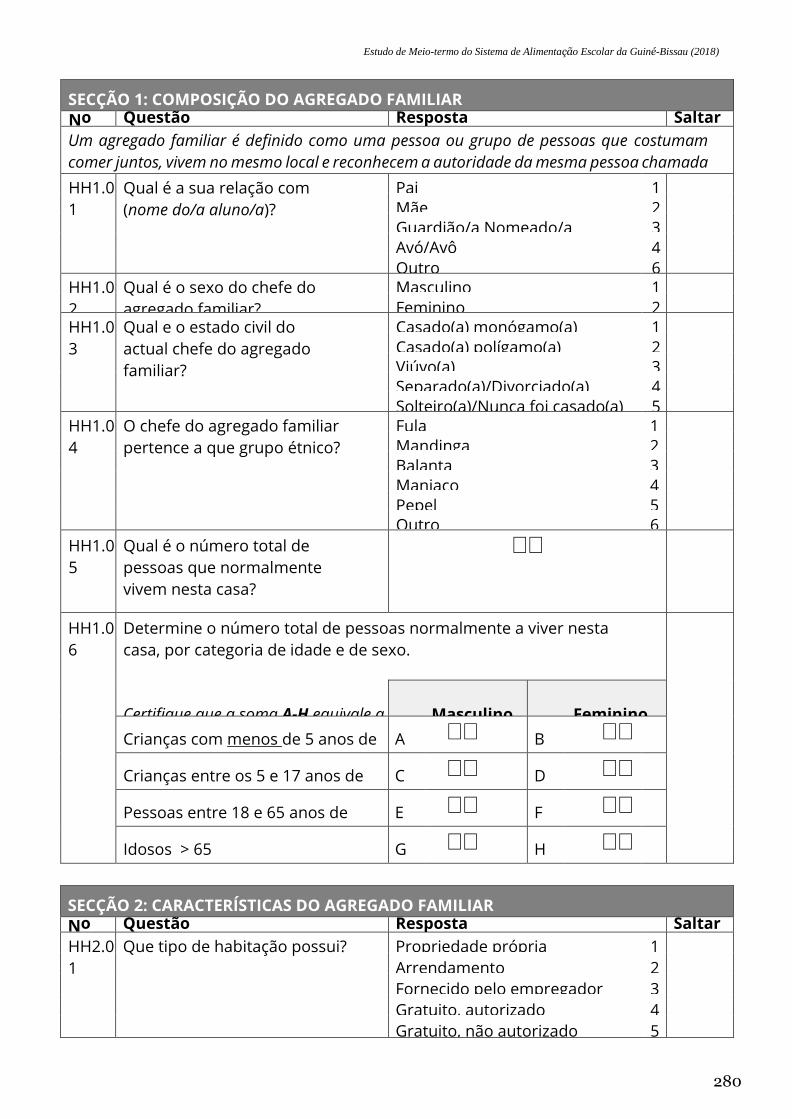
Estudo de Meio-termo do Sistema de Alimentação Escolar da Guiné-Bissau (2018)
280
SECÇÃO 1: COMPOSIÇÃO DO AGREGADO FAMILIAR
No Questão Resposta Saltar
Um agregado familiar é definido como uma pessoa ou grupo de pessoas que costumam
comer juntos, vivem no mesmo local e reconhecem a autoridade da mesma pessoa chamada
chefe do agregado familiar. É possível que essas pessoas vivem em casas diferentes. HH1.0
1
Qual é a sua relação com
(nome do/a aluno/a)?
Pai
.........................................................
.......
1
Mãe
.........................................................
......
2 Guardião/a Nomeado/a
................................
3 Avó/Avô
.........................................................
.....
4
Outro
.........................................................
....
6 HH1.0
2
Qual é o sexo do chefe do
agregado familiar?
Masculino
.....................................................
1
Feminino
.......................................................
2 HH1.0
3
Qual e o estado civil do
actual chefe do agregado
familiar?
Casado(a) monógamo(a)
.............................
1
Casado(a) polígamo(a)
................................
2 Viúvo(a)
........................................................
3 Separado(a)/Divorciado(a)
...........................
4 Solteiro(a)/Nunca foi casado(a)
....................
5 HH1.0
4
O chefe do agregado familiar
pertence a que grupo étnico?
Fula
.........................................................
......
1
Mandinga
......................................................
2 Balanta
.........................................................
3 Manjaco
........................................................
4 Pepel
.........................................................
...
5 Outro
.........................................................
....
6
HH1.0
5
Qual é o número total de
pessoas que normalmente
vivem nesta casa?
NB: O número de pessoas
que comem e dormem nas
mesmas instalações
⎕⎕
HH1.0
6
Determine o número total de pessoas normalmente a viver nesta
casa, por categoria de idade e de sexo.
Escreve “00” se não existe nenhum.
Certifique que a soma A-H equivale a
HH1.05
Masculino
Feminino
Crianças com menos de 5 anos de
idade
A ⎕⎕
B ⎕⎕
Crianças entre os 5 e 17 anos de
idade
C ⎕⎕
D ⎕⎕
Pessoas entre 18 e 65 anos de
idade
E ⎕⎕
F ⎕⎕
Idosos > 65 G ⎕⎕
H ⎕⎕
SECÇÃO 2: CARACTERÍSTICAS DO AGREGADO FAMILIAR
No Questão Resposta Saltar
HH2.0
1
Que tipo de habitação possui? Propriedade própria
......................................
1
Arrendamento
...............................................
2
Fornecido pelo empregador
..........................
3
Gratuito, autorizado
.......................................
4
Gratuito, não autorizado
(ocupação) .............
5
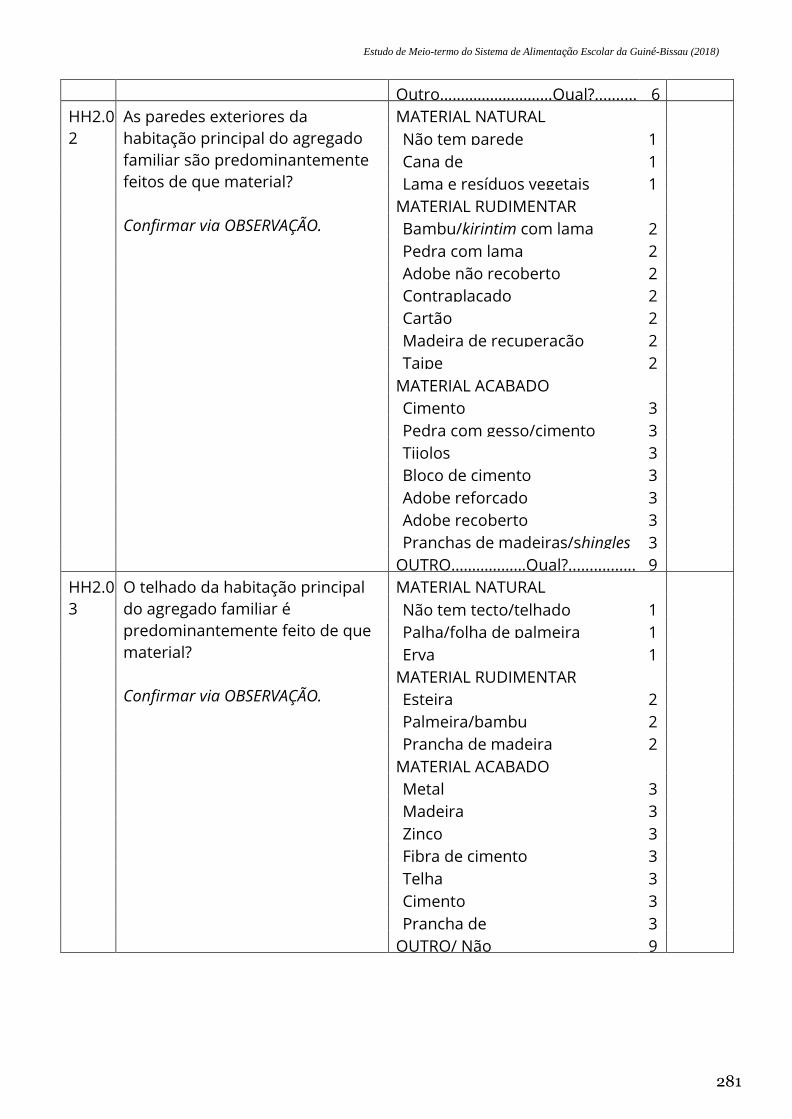
Estudo de Meio-termo do Sistema de Alimentação Escolar da Guiné-Bissau (2018)
281
Outro………………………Qual?..........
.........
6
HH2.0
2
As paredes exteriores da
habitação principal do agregado
familiar são predominantemente
feitos de que material?
Confirmar via OBSERVAÇÃO.
MATERIAL NATURAL
Não tem parede
........................................
1
1 Cana de
bambu/palmeira/tronco
..............
1
2 Lama e resíduos vegetais
........................
1
3 MATERIAL RUDIMENTAR
Bambu/kirintim com lama
.........................
2
1 Pedra com lama
.......................................
2
2 Adobe não recoberto
................................
2
3 Contraplacado
..........................................
2
4 Cartão
.......................................................
2
5 Madeira de recuperação
...........................
2
6 Taipe
.......................................................
..
2
7 MATERIAL ACABADO
Cimento
....................................................
3
1 Pedra com gesso/cimento
........................
3
2 Tijolos
.......................................................
3
3 Bloco de cimento
......................................
3
4 Adobe reforçado
.......................................
3
5 Adobe recoberto
.......................................
3
6 Pranchas de madeiras/shingles
...............
3
7 OUTRO………………Qual?................
........
9
6 HH2.0
3
O telhado da habitação principal
do agregado familiar é
predominantemente feito de que
material?
Confirmar via OBSERVAÇÃO.
MATERIAL NATURAL
Não tem tecto/telhado
..............................
1
1 Palha/folha de palmeira
............................
1
2 Erva
.......................................................
...
1
3 MATERIAL RUDIMENTAR
Esteira
......................................................
2
1 Palmeira/bambu
.......................................
2
2 Prancha de madeira
.................................
2
3 MATERIAL ACABADO
Metal
.......................................................
..
3
1 Madeira
.....................................................
3
2 Zinco
.......................................................
..
3
3 Fibra de cimento
.......................................
3
4 Telha
.......................................................
..
3
5 Cimento
....................................................
3
6 Prancha de
madeira/shingles....................
3
7 OUTRO/ Não
tem……………………………...
9
6
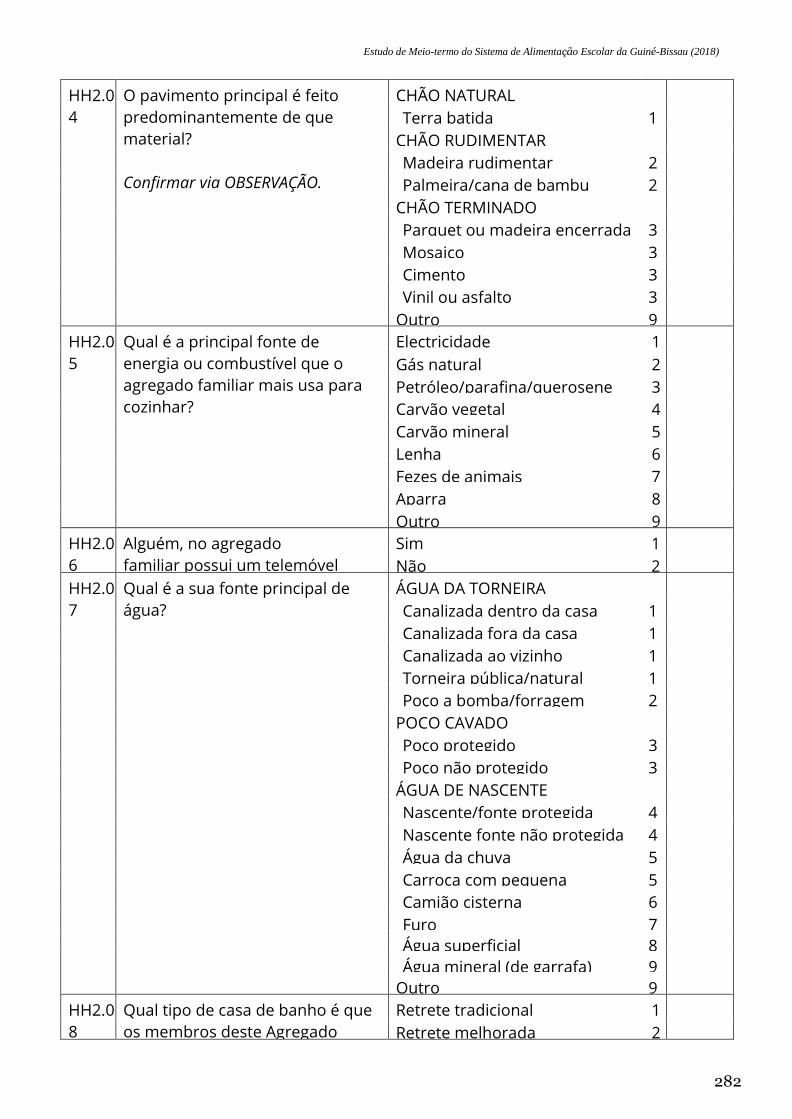
Estudo de Meio-termo do Sistema de Alimentação Escolar da Guiné-Bissau (2018)
282
HH2.0
4
O pavimento principal é feito
predominantemente de que
material?
Confirmar via OBSERVAÇÃO.
CHÃO NATURAL
Terra batida
..............................................
1
1 CHÃO RUDIMENTAR
Madeira rudimentar
..................................
2
1 Palmeira/cana de bambu
..........................
2
2 CHÃO TERMINADO
Parquet ou madeira encerrada
.................
3
1 Mosaico
....................................................
3
2 Cimento
....................................................
3
3 Vinil ou asfalto
..........................................
3
4 Outro
.........................................................
..
9
6 HH2.0
5
Qual é a principal fonte de
energia ou combustível que o
agregado familiar mais usa para
cozinhar?
Electricidade
...............................................
1
Gás natural
.................................................
2
Petróleo/parafina/querosene
......................
3
Carvão vegetal
...........................................
4
Carvão mineral
...........................................
5
Lenha
.........................................................
.
6
Fezes de animais
.......................................
7
Aparra
.........................................................
8
Outro
.........................................................
..
9
HH2.0
6
Alguém, no agregado
familiar possui um telemóvel
que funciona para
comunicar?
Sim
.........................................................
.......
1
Não
.........................................................
.......
2
HH2.0
7
Qual é a sua fonte principal de
água?
ÁGUA DA TORNEIRA
Canalizada dentro da casa
.......................
1
1 Canalizada fora da casa
(pátio/quintal) ....
1
2 Canalizada ao vizinho
..............................
1
3 Torneira pública/natural
fontanário ...........
1
4 Poço a bomba/forragem
...........................
2
1 POÇO CAVADO
Poço protegido
.........................................
3
1 Poço não protegido
..................................
3
2 ÁGUA DE NASCENTE
Nascente/fonte protegida
.........................
4
1 Nascente fonte não protegida
..................
4
2 Água da chuva
..........................................
5
1 Carroça com pequena
cisterna/barril .......
5
2 Camião cisterna
........................................
6
1 Furo
.......................................................
...
7
1 Água superficial
(rio/lagoa/canal etc.) ......
8
1 Água mineral (de garrafa)
.........................
9
1 Outro
.........................................................
.
9
6 HH2.0
8
Qual tipo de casa de banho é que
os membros deste Agregado
Familiar, normalmente utilizam?
Retrete tradicional
.........................................
1
Retrete melhorada
........................................
2
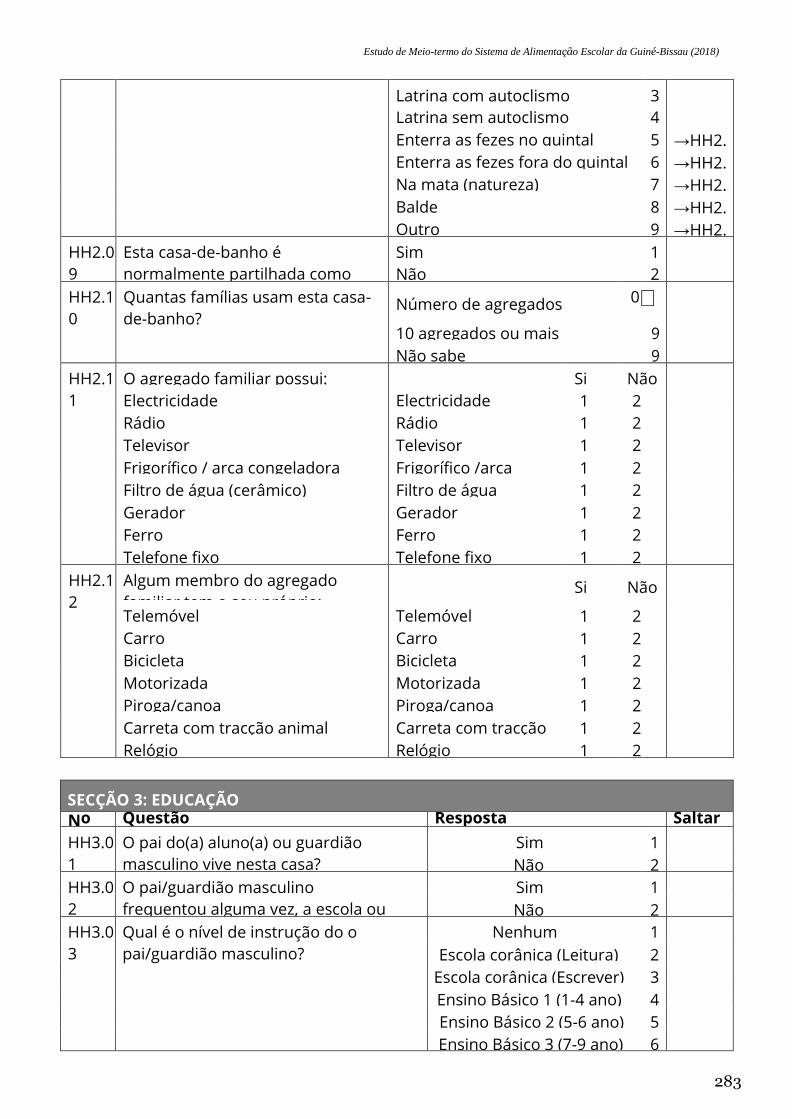
Estudo de Meio-termo do Sistema de Alimentação Escolar da Guiné-Bissau (2018)
283
Latrina com autoclismo
.................................
3
Latrina sem autoclismo
.................................
4
Enterra as fezes no quintal
...........................
5 →HH2.
11 Enterra as fezes fora do quintal
....................
6 →HH2.
11 Na mata (natureza)
.......................................
7 →HH2.
11 Balde
..........................................................
...
8 →HH2.
11 Outro
..........................................................
...
9 →HH2.
11 HH2.0
9
Esta casa-de-banho é
normalmente partilhada como
com outros agregados?
Sim
..........................................................
......
1
→HH2.
11
Não
..........................................................
......
2
HH2.1
0
Quantas famílias usam esta casa-
de-banho? Número de agregados
.........................
0⎕
10 agregados ou mais
..............................
9
5 Não sabe
..................................................
9
8 HH2.1
1
O agregado familiar possui: Si
m
Não
Electricidade Electricidade
............................
1 2
Rádio Rádio
......................................
.
1 2
Televisor Televisor
.................................
1 2
Frigorífico / arca congeladora Frigorífico /arca
congeladora ..
1 2
Filtro de água (cerâmico) Filtro de água
(cerâmico) ........
1 2
Gerador Gerador
...................................
1 2
Ferro Ferro
......................................
.
1 2
Telefone fixo Telefone fixo
...........................
1 2
HH2.1
2
Algum membro do agregado
familiar tem o seu próprio:
Si
m
Não
Telemóvel Telemóvel
...............................
1 2
Carro Carro
......................................
.
1 2
Bicicleta Bicicleta
...................................
1 2
Motorizada Motorizada
..............................
1 2
Piroga/canoa Piroga/canoa
...........................
1 2
Carreta com tracção animal Carreta com tracção
animal ....
1 2
Relógio Relógio
....................................
1 2
SECÇÃO 3: EDUCAÇÃO
No Questão Resposta Saltar
HH3.0
1
O pai do(a) aluno(a) ou guardião
masculino vive nesta casa?
Sim
...............................................
...
1
→HH3.
05
Não
...............................................
..
2
HH3.0
2
O pai/guardião masculino
frequentou alguma vez, a escola ou
pré-escola?
Sim
...............................................
...
1
→HH3.
05
Não
...............................................
..
2
HH3.0
3
Qual é o nível de instrução do o
pai/guardião masculino?
Nenhum
……………………………
1
Escola corânica (Leitura)
……….....
2
Escola corânica (Escrever)
………..
3
Ensino Básico 1 (1-4 ano)
…………
4
Ensino Básico 2 (5-6 ano)
……….....
5
Ensino Básico 3 (7-9 ano)
………….
6
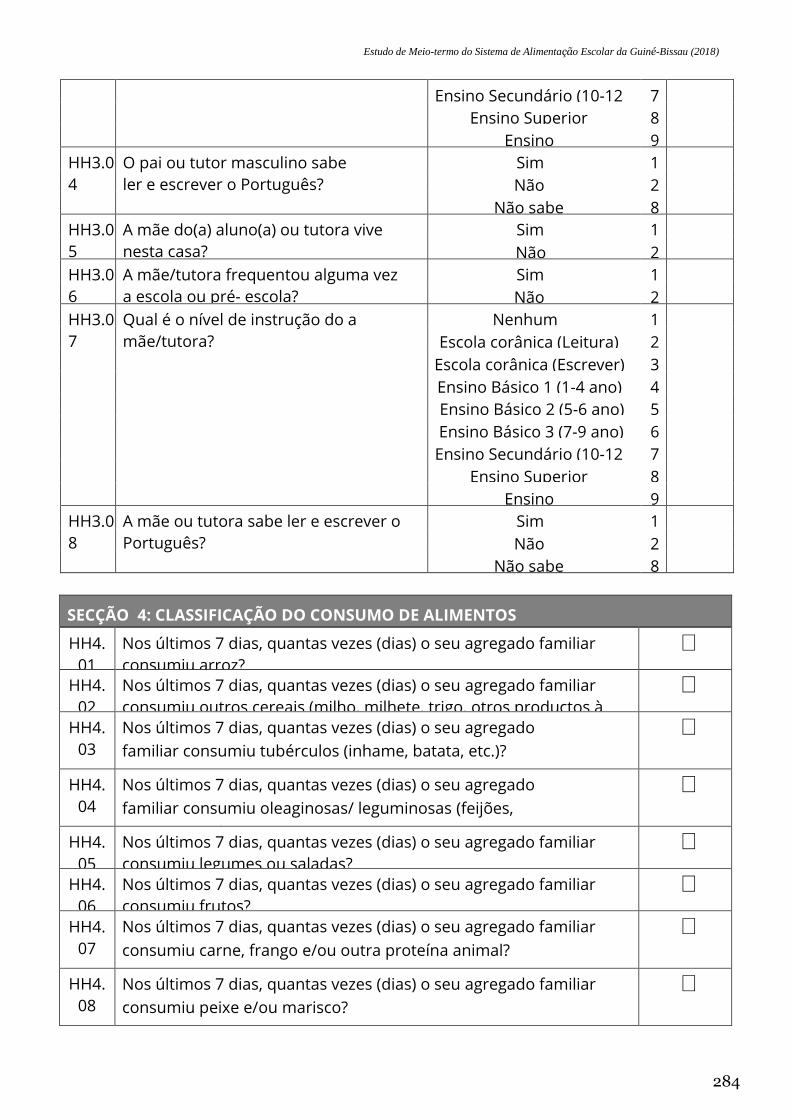
Estudo de Meio-termo do Sistema de Alimentação Escolar da Guiné-Bissau (2018)
284
Ensino Secundário (10-12
ano) …..
7
Ensino Superior
…………………….
8
Ensino
Técnico/profissional ……….
9
HH3.0
4
O pai ou tutor masculino sabe
ler e escrever o Português?
Sim
..............................................
....
1
Não
..............................................
...
2
Não sabe
........................................
8
HH3.0
5
A mãe do(a) aluno(a) ou tutora vive
nesta casa?
Sim
..............................................
....
1
→HH4.
01
Não
..............................................
....
2
HH3.0
6
A mãe/tutora frequentou alguma vez
a escola ou pré- escola?
Sim
..............................................
....
1
→HH4.
01
Não
..............................................
...
2
HH3.0
7
Qual é o nível de instrução do a
mãe/tutora?
Nenhum
……………………………
1
Escola corânica (Leitura)
……….....
2
Escola corânica (Escrever)
………..
3
Ensino Básico 1 (1-4 ano)
…………
4
Ensino Básico 2 (5-6 ano)
……….....
5
Ensino Básico 3 (7-9 ano)
………….
6
Ensino Secundário (10-12
ano) …..
7
Ensino Superior
…………………….
8
Ensino
Técnico/profissional ……….
9
HH3.0
8
A mãe ou tutora sabe ler e escrever o
Português?
Sim
..............................................
....
1
Não
..............................................
...
2
Não sabe
........................................
8
SECÇÃO 4: CLASSIFICAÇÃO DO CONSUMO DE ALIMENTOS
HH4.
01
Nos últimos 7 dias, quantas vezes (dias) o seu agregado familiar
consumiu arroz?
⎕
HH4.
02
Nos últimos 7 dias, quantas vezes (dias) o seu agregado familiar
consumiu outros cereais (milho, milhete, trigo, otros productos à
base de trigo (como pão e massas)?
⎕
HH4.
03
Nos últimos 7 dias, quantas vezes (dias) o seu agregado
familiar consumiu tubérculos (inhame, batata, etc.)?
⎕
HH4.
04
Nos últimos 7 dias, quantas vezes (dias) o seu agregado
familiar consumiu oleaginosas/ leguminosas (feijões,
mancarra,etc)
⎕
HH4.
05
Nos últimos 7 dias, quantas vezes (dias) o seu agregado familiar
consumiu legumes ou saladas?
⎕
HH4.
06
Nos últimos 7 dias, quantas vezes (dias) o seu agregado familiar
consumiu frutos?
⎕
HH4.
07
Nos últimos 7 dias, quantas vezes (dias) o seu agregado familiar
consumiu carne, frango e/ou outra proteína animal?
⎕
HH4.
08
Nos últimos 7 dias, quantas vezes (dias) o seu agregado familiar
consumiu peixe e/ou marisco?
⎕
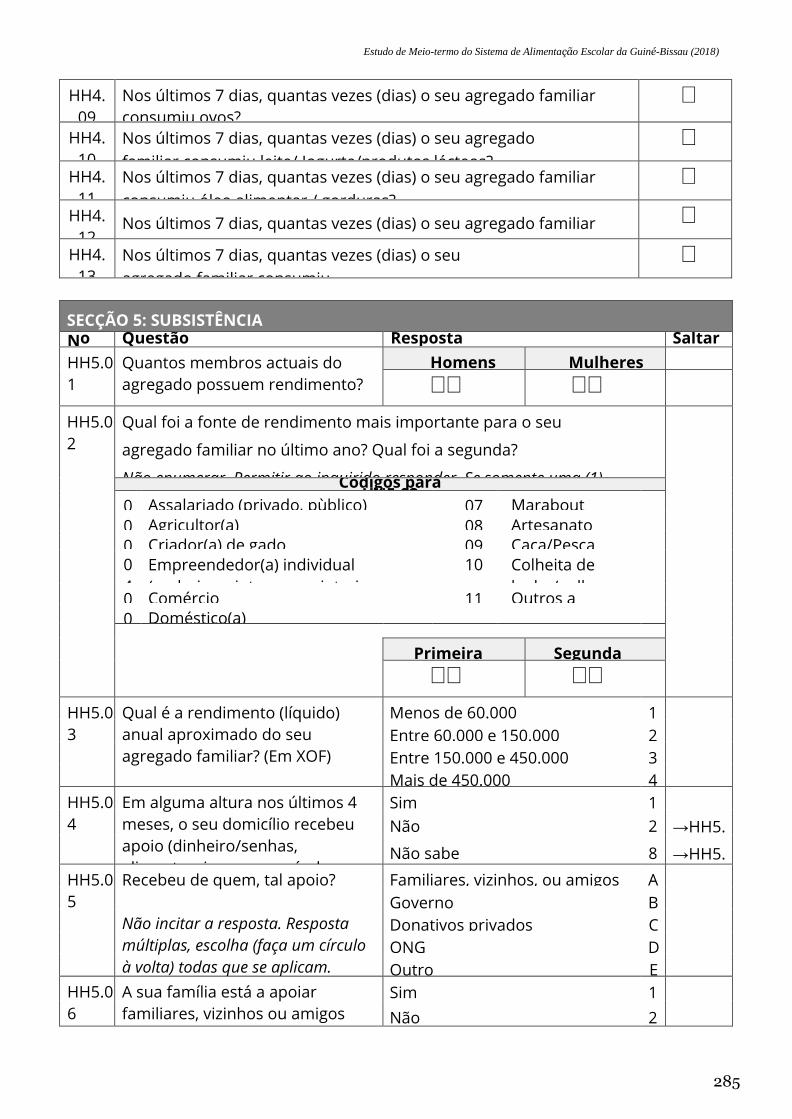
Estudo de Meio-termo do Sistema de Alimentação Escolar da Guiné-Bissau (2018)
285
HH4.
09
Nos últimos 7 dias, quantas vezes (dias) o seu agregado familiar
consumiu ovos?
⎕
HH4.
10
Nos últimos 7 dias, quantas vezes (dias) o seu agregado
familiar consumiu leite/ Iogurte/produtos lácteos?
⎕
HH4.
11
Nos últimos 7 dias, quantas vezes (dias) o seu agregado familiar
consumiu óleo alimentar / gorduras?
⎕
HH4.
12 Nos últimos 7 dias, quantas vezes (dias) o seu agregado familiar
consumiu açúcar ou mel?
⎕
HH4.
13
Nos últimos 7 dias, quantas vezes (dias) o seu
agregado familiar consumiu
condimentos/especiarías?
⎕
SECÇÃO 5: SUBSISTÊNCIA
No Questão Resposta Saltar
HH5.0
1
Quantos membros actuais do
agregado possuem rendimento?
Homens Mulheres
⎕⎕ ⎕⎕
HH5.0
2
Qual foi a fonte de rendimento mais importante para o seu
agregado familiar no último ano? Qual foi a segunda?
Não enumerar. Permitir ao inquirido responder. Se somente uma (1)
fonte, registar “99” para a segunda fonte.
Códigos para HH5.02
0
1
Assalariado (privado, pùblico) 07 Marabout
(“muro”)
0
2
Agricultor(a) 08 Artesanato
0
3
Criador(a) de gado 09 Caça/Pesca
0
4
Empreendedor(a) individual
(pedreiro, pintura, carpintaria,
artesanato, etc)
10 Colheita de
lenha/palha
0
5
Comércio 11 Outros a
especificar
0
6
Doméstico(a) Primeira
fonte
Segunda
fonte ⎕⎕ ⎕⎕
HH5.0
3
Qual é a rendimento (líquido)
anual aproximado do seu
agregado familiar? (Em XOF)
Menos de 60.000
...........................................
1
Entre 60.000 e 150.000
..................................
2
Entre 150.000 e 450.000
................................
3
Mais de 450.000
.............................................
4
HH5.0
4
Em alguma altura nos últimos 4
meses, o seu domicílio recebeu
apoio (dinheiro/senhas,
alimentos, insumos agrícolas,
materiais de construção, etc.)
para ajudá-lo a lidar com a
situação económica do seu
agregado familiar?
Sim
...........................................................
......
1
Não
...........................................................
......
2 →HH5.
06 Não sabe
........................................................
8 →HH5.
06 HH5.0
5
Recebeu de quem, tal apoio?
Não incitar a resposta. Resposta
múltiplas, escolha (faça um círculo
à volta) todas que se aplicam.
Familiares, vizinhos, ou amigos
.....................
A
Governo
..........................................................
B
Donativos privados
........................................
C
ONG
...........................................................
....
D
Outro
...........................................................
...
E
HH5.0
6
A sua família está a apoiar
familiares, vizinhos ou amigos
com alimentos ou dinheiro de
momento?
Sim
...........................................................
......
1
Não
...........................................................
......
2
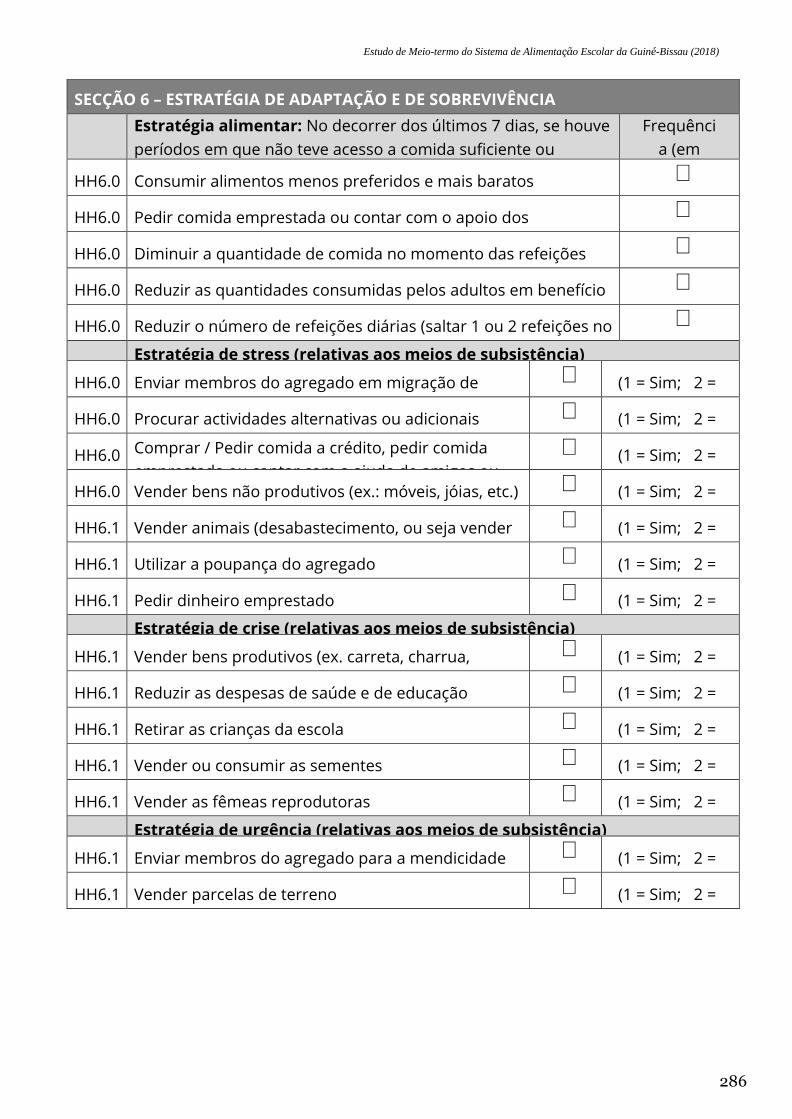
Estudo de Meio-termo do Sistema de Alimentação Escolar da Guiné-Bissau (2018)
286
SECÇÃO 6 – ESTRATÉGIA DE ADAPTAÇÃO E DE SOBREVIVÊNCIA
Estratégia alimentar: No decorrer dos últimos 7 dias, se houve
períodos em que não teve acesso a comida suficiente ou
recursos suficientes para comprar comida, quantas vezes seu
agregado recorreu às práticas seguintes ?
Frequênci
a (em
nûmero
de dias de
0 a 7)
HH6.0
1
Consumir alimentos menos preferidos e mais baratos ⎕
HH6.0
2
Pedir comida emprestada ou contar com o apoio dos
parentes/amigos
⎕
HH6.0
3
Diminuir a quantidade de comida no momento das refeições ⎕
HH6.0
4
Reduzir as quantidades consumidas pelos adultos em benefício
das crianças mais novas
⎕
HH6.0
5
Reduzir o número de refeições diárias (saltar 1 ou 2 refeições no
dia)
⎕
Estratégia de stress (relativas aos meios de subsistência)
HH6.0
6
Enviar membros do agregado em migração de
trabalho
⎕ (1 = Sim; 2 =
Não) HH6.0
7
Procurar actividades alternativas ou adicionais ⎕
(1 = Sim; 2 =
Não) HH6.0
8
Comprar / Pedir comida a crédito, pedir comida
emprestada ou contar com a ajuda de amigos ou
parentes
⎕ (1 = Sim; 2 =
Não) HH6.0
9
Vender bens não produtivos (ex.: móveis, jóias, etc.) ⎕
(1 = Sim; 2 =
Não) HH6.1
0
Vender animais (desabastecimento, ou seja vender
mais que o habitual)
⎕ (1 = Sim; 2 =
Não) HH6.1
1
Utilizar a poupança do agregado ⎕
(1 = Sim; 2 =
Não) HH6.1
2
Pedir dinheiro emprestado ⎕
(1 = Sim; 2 =
Não) Estratégia de crise (relativas aos meios de subsistência)
HH6.1
3
Vender bens produtivos (ex. carreta, charrua,
sementes, etc.)
⎕ (1 = Sim; 2 =
Não) HH6.1
4
Reduzir as despesas de saúde e de educação ⎕
(1 = Sim; 2 =
Não) HH6.1
5
Retirar as crianças da escola ⎕
(1 = Sim; 2 =
Não) HH6.1
6
Vender ou consumir as sementes ⎕
(1 = Sim; 2 =
Não) HH6.1
7
Vender as fêmeas reprodutoras ⎕
(1 = Sim; 2 =
Não) Estratégia de urgência (relativas aos meios de subsistência)
HH6.1
8
Enviar membros do agregado para a mendicidade ⎕
(1 = Sim; 2 =
Não) HH6.1
9
Vender parcelas de terreno ⎕
(1 = Sim; 2 =
Não)
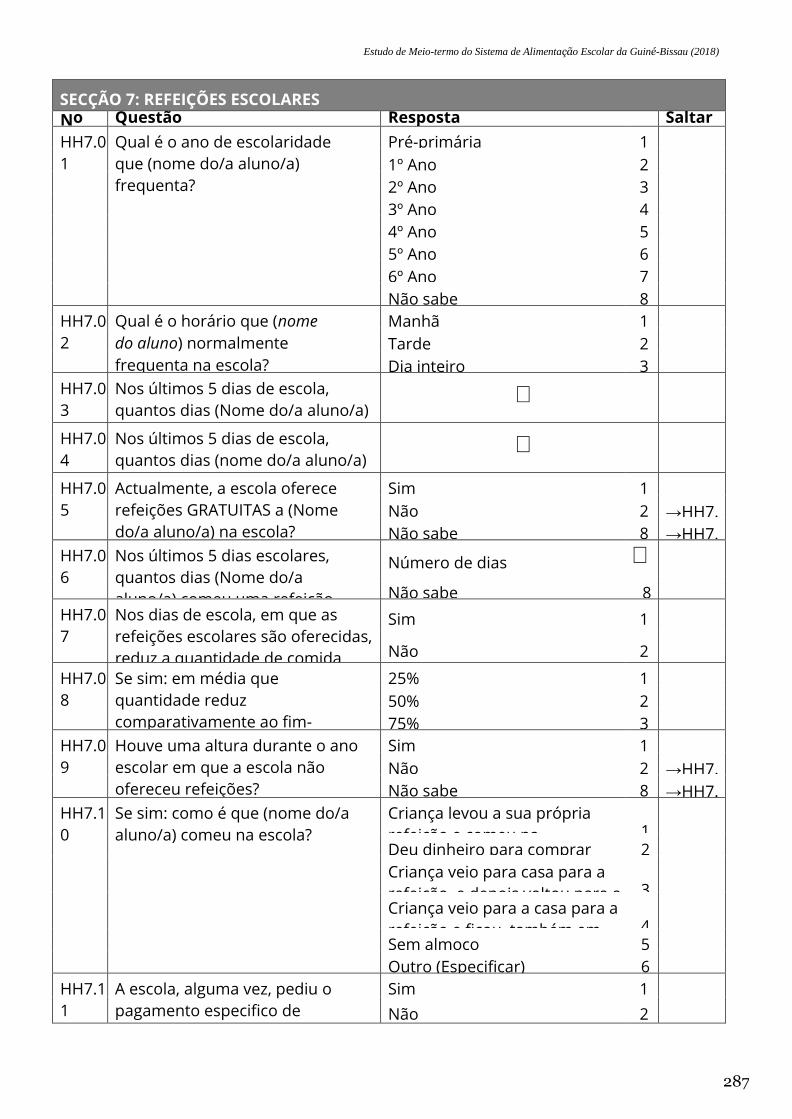
Estudo de Meio-termo do Sistema de Alimentação Escolar da Guiné-Bissau (2018)
287
SECÇÃO 7: REFEIÇÕES ESCOLARES
No Questão Resposta Saltar
HH7.0
1
Qual é o ano de escolaridade
que (nome do/a aluno/a)
frequenta?
Pré-primária
..................................................
1
1º Ano
.......................................................
....
2
2º Ano
.......................................................
....
3
3º Ano
.......................................................
....
4
4º Ano
.......................................................
....
5
5º Ano
.......................................................
....
6
6º Ano
.......................................................
....
7
Não sabe
......................................................
8
HH7.0
2
Qual é o horário que (nome
do aluno) normalmente
frequenta na escola?
Manhã
.......................................................
...
1
Tarde
.......................................................
.....
2
Dia inteiro
.....................................................
3
HH7.0
3
Nos últimos 5 dias de escola,
quantos dias (Nome do/a aluno/a)
comeu uma refeição antes de ir à
escola?
⎕
HH7.0
4
Nos últimos 5 dias de escola,
quantos dias (nome do/a aluno/a)
comeu uma refeição após a escola
(e antes de ir para a cama à
noite)?
⎕
HH7.0
5
Actualmente, a escola oferece
refeições GRATUITAS a (Nome
do/a aluno/a) na escola?
Sim
.......................................................
........
1
Não
.......................................................
........
2 →HH7.
13 Não sabe
......................................................
8 →HH7.
13 HH7.0
6
Nos últimos 5 dias escolares,
quantos dias (Nome do/a
aluno/a) comeu uma refeição
na escolar?
Número de dias
.......................................
⎕
Não sabe
....................................................
8
HH7.0
7
Nos dias de escola, em que as
refeições escolares são oferecidas,
reduz a quantidade de comida
servida a (nome do/a aluno/a)
comparado ao fim-de-semana?
Sim
.......................................................
........
1
→HH7.
09
Não
.......................................................
........
2
HH7.0
8
Se sim: em média que
quantidade reduz
comparativamente ao fim-
de-semana?
25%
.......................................................
.......
1
50%
.......................................................
.......
2
75%
.......................................................
.......
3
HH7.0
9
Houve uma altura durante o ano
escolar em que a escola não
ofereceu refeições?
Sim
.......................................................
.......
1
Não
.......................................................
.......
2 →HH7.
11 Não sabe
.....................................................
8 →HH7.
11 HH7.1
0
Se sim: como é que (nome do/a
aluno/a) comeu na escola?
Criança levou a sua própria
refeição e comeu na
escola..........................................
1
Deu dinheiro para comprar
comida na escola
2
Criança veio para casa para a
refeição, e depois voltou para a
escola ..........................
3 Criança veio para a casa para a
refeição e ficou, também em
casa ................................
4 Sem almoço
.................................................
5
Outro (Especificar)
.......................................
6
HH7.1
1
A escola, alguma vez, pediu o
pagamento especifico de
refeições escolares durante este
ano escolar (2015)?
Sim
.......................................................
........
1
Não
.......................................................
........
2
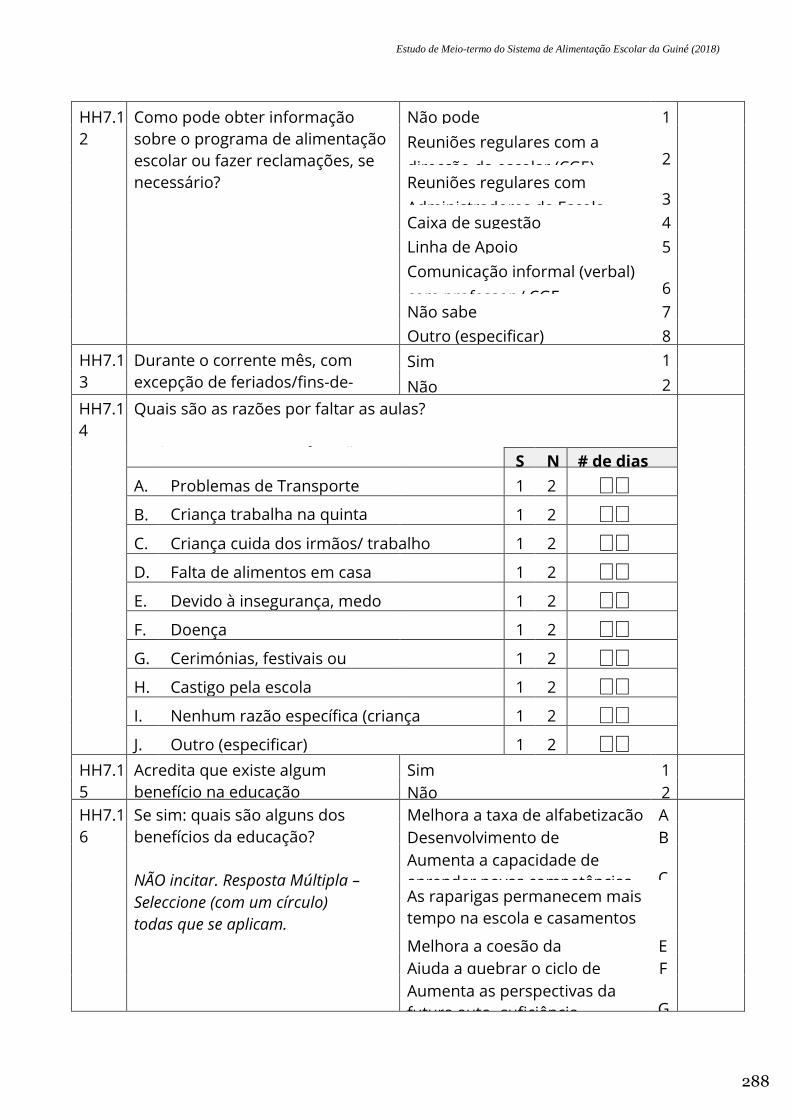
Estudo de Meio-termo do Sistema de Alimentação Escolar da Guiné (2018)
288
HH7.1
2
Como pode obter informação
sobre o programa de alimentação
escolar ou fazer reclamações, se
necessário?
Não pode
........................................................
1
Reuniões regulares com a
direcção da escolar (CGE)
...............................................
2
Reuniões regulares com
Administradores da Escola
.......................................................
....
3
Caixa de sugestão
........................................
4
Linha de Apoio
.............................................
5
Comunicação informal (verbal)
com professor / CGE
............................................
6
Não sabe
......................................................
7
Outro (especificar)
........................................
8
HH7.1
3
Durante o corrente mês, com
excepção de feriados/fins-de-
semana, o/a (nome de/a
aluno/a) faltou dias de escola?
Sim
.........................................................
......
1
→HH7.
15
Não
.........................................................
......
2
HH7.1
4
Quais são as razões por faltar as aulas?
Registar ‘00’ se resposta for ‘Não’.
S N # de dias
faltados A. Problemas de Transporte 1 2 ⎕⎕
B. Criança trabalha na quinta
/cuida do gado
1 2 ⎕⎕
C. Criança cuida dos irmãos/ trabalho
domestico
1 2 ⎕⎕
D. Falta de alimentos em casa 1 2 ⎕⎕
E. Devido à insegurança, medo
de ir à escola
1 2 ⎕⎕
F. Doença 1 2 ⎕⎕
G. Cerimónias, festivais ou
eventos familiares
1 2 ⎕⎕
H. Castigo pela escola 1 2 ⎕⎕
I. Nenhum razão específica (criança
simplesmente faltou)
1 2 ⎕⎕
J. Outro (especificar) 1 2 ⎕⎕
HH7.1
5
Acredita que existe algum
benefício na educação
primária?
Sim
.........................................................
.....
1
→HH7.
17
Não
.........................................................
.....
2
HH7.1
6
Se sim: quais são alguns dos
benefícios da educação?
NÃO incitar. Resposta Múltipla –
Seleccione (com um círculo)
todas que se aplicam.
Melhora a taxa de alfabetização
.................
A
Desenvolvimento de
competências sociais .
B
Aumenta a capacidade de
aprender novas competências
(adopção de tecnologia) ......
C As raparigas permanecem mais
tempo na escola e casamentos
precoces são atrasados
...................................................
D Melhora a coesão da
comunidade .............
E
Ajuda a quebrar o ciclo de
pobreza ............
F
Aumenta as perspectivas da
futura auto- suficiência
económica do pupilo
.................
G
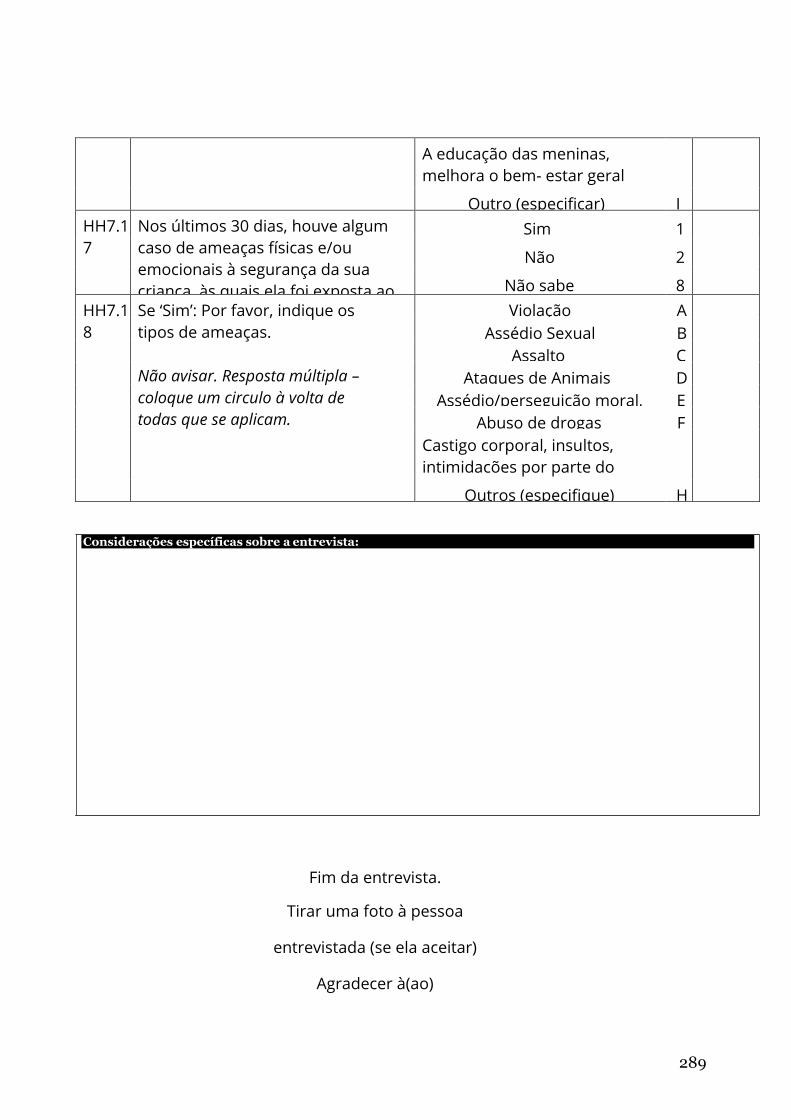
289
A educação das meninas,
melhora o bem- estar geral
das famílias (nutrição, saúde,
etc.)
......................................................
.......
H
Outro (especificar)
......................................
I
HH7.1
7
Nos últimos 30 dias, houve algum
caso de ameaças físicas e/ou
emocionais à segurança da sua
criança, às quais ela foi exposta ao
regressar da escola, ou na própria
escola?
Sim
........................................................
......
1
Não
........................................................
.......
2
Não sabe
......................................................
8
HH7.1
8
Se ‘Sim’: Por favor, indique os
tipos de ameaças.
Não avisar. Resposta múltipla –
coloque um circulo à volta de
todas que se aplicam.
Violação
........................................................
A
Assédio Sexual
.............................................
B
Assalto
.......................................................
..
C
Ataques de Animais
....................................
D
Assédio/perseguição moral,
intimidação ......
E
Abuso de drogas
..........................................
F
Castigo corporal, insultos,
intimidacões por parte do
corpo docente ou outro actor
adulto da escola
......................................................
G Outros (especifique)
.....................................
H
Fim da entrevista.
Tirar uma foto à pessoa
entrevistada (se ela aceitar)
Agradecer à(ao)
Considerações específicas sobre a entrevista:
290
entrevistada(o) a sua
disponibilidade
[Pla
ce
, Mo
nth
an
d Y
ea
r, Re
po
rt nu
mb
er]
[Name of commissioning Office]
[Link to the website]