Embed Size (px)
Citation preview
Computers in Industry 62 (2011) 587–596
Decision support systems and the coordination of supply consortium partners§
Jorn Schonberger *, Herbert Kopfer
University of Bremen, Chair of Logistics, Wilhelm-Herbst-Straße 5, 28359 Bremen, Germany
A R T I C L E I N F O
Article history:
Accepted 28 March 2011
Available online 28 May 2011
Abstract: We propose to enhance decision support systems (DSS) by coordination capabilities to align the
decision making of consortium partners for improving the process quality in volatile process
environments. In computer simulation experiments, we reveal conceptional shortcomings of traditional
DSS if unforeseen process-threatening events like unexpected workloads have to be handled by a
consortium. It is demonstrated for a transportation process planning scenario that a process quality
increase is achieved if a DSS is extended by components that align the process-related decision making of
legally independent supply consortium partners. The central idea proposed to add coordination
capabilities to DSS is to temporarily adjust decision models of subordinate consortium partners to the
fulfillment degree of consortium objectives in order to establish a coordinated decision making.
� 2011 Elsevier B.V. All rights reserved.
Contents lists available at ScienceDirect
Computers in Industry
jo ur n al ho m epag e: ww w.els evier . c om / lo cat e/co mp in d
1. Introduction
A decision support system (DSS) is an information processingsystem especially dedicated to derive or support the derivation ofgoal-oriented decisions in complex decision situations. Such asystem combines process-related data with analytical decisionmodels in order to enable a computer-based control of valuecreation processes [1]. DSS are set up according to some commonlyagreed design paradigms.
Within this contribution we report a research about theevaluation of existing DSS-concepts for the management oftransport processes in a volatile process environment. In suchan environment, the planning conditions and requirements varysignificantly within a small time span. Processes running in avolatile environment need a frequent update in order to maintaintheir efficiency.
The management of processes in a volatile surroundingbecomes even more challenging if two or more decision makersare involved (often on different decision levels). Here, the needsand objectives of all participating acteurs have to be consideredsimultaneously during the process planning. A supply chainconsortium is an often found example for such a complicateddecision making scenario. The superior coordinator instructs asubordinate service partner to fulfill certain orders. In reaction tothis call, the service partner deploys its resources to fulfill the
§ This research was supported by the German Research Foundation (DFG) as part
of the Collaborative Research Center 637 ‘‘Autonomous Cooperating Logistic
Processes’’ (Subproject B7).
* Corresponding author. Fax: +49 421 218 98 66 929.
E-mail addresses: [email protected] (J. Schonberger), [email protected]
(H. Kopfer).
0166-3615/$ – see front matter � 2011 Elsevier B.V. All rights reserved.
doi:10.1016/j.compind.2011.04.008
orders by executing processes. In this report, we deal with such atwo-decision-maker-situation arising from a supply chain sce-nario, in which the subordinate service partner offers transporta-tion.
By means of the two-decision-maker situation from supplychain planning, we reveal shortcomings of DSS design paradigmscaused by extraordinary events whose processing is not defined inadvance. Although previous research [2,3] has addressed newideas for handling those events DSS architectures are unable tohandle these events efficiently. The main contribution of thisarticle is the proposal of an extension of the three-layer event-handling-concept [4] by a fourth layer that controls even thehandling of extraordinary events. We define and evaluate a fourlayer event handling system for the management of extraordinarysituations in the above-mentioned two-decision-maker-situation.
We state the following research hypotheses guiding theresearch reported here: (i) two (or more) concurrent processdecisions makers cannot be sufficiently supported by a DSS set upaccording to existing design paradigms. (ii) A consideration ofseveral decision makers in the layout of a DSS contributes toovercome some deficiencies arising from conflicting or evencontradicting planning goals of interacting process decisionmakers.
The organization of this paper is as follows. We start with thedescription of the investigated process decision situation (Section2). Then, we compile DSS-design principles (Section 3), propose amulti-agent-system-based DSS for the aforementioned decisionsituation (Section 4), and demonstrate its shortcomings. Aconceptual extension of design guidelines for DSS is proposed inSection 5 and applied to extend the DSS from Section 4. Performingcomputational simulation experiments, we evaluate the extendedsystem (Section 6).
J. Schonberger, H. Kopfer / Computers in Industry 62 (2011) 587–596588
2. A dynamic transport process planning problem
We start with the description of the derivation of transportprocesses from customer demand in a supply consortium(Subsection 2.1). Then we introduce a specific transport processchallenge (Subsection 2.2) and discuss the need for a coordinateddecision making in a supply consortium (Subsection 2.3). An onlineoptimization model for the investigated scenario is proposed(Subsection 2.4).
2.1. Transport process planning in a supply chain scenario
A supply chain consortium is a collaboration of independentcompanies that set up, maintain and operate a value creation chaincontributing their specific knowledge and resources to the valuecreation processes. Due to the spatial scatter of the value creatinglocations (plants, storages, and customers) excessive transport ofraw materials, semi-finished or finished goods has to be carriedout. A freight forwarding company is the partner within theconsortium that is responsible for configuring the necessarytransport processes and deploying the accessible transportresources (trucks or external and booked capacities).
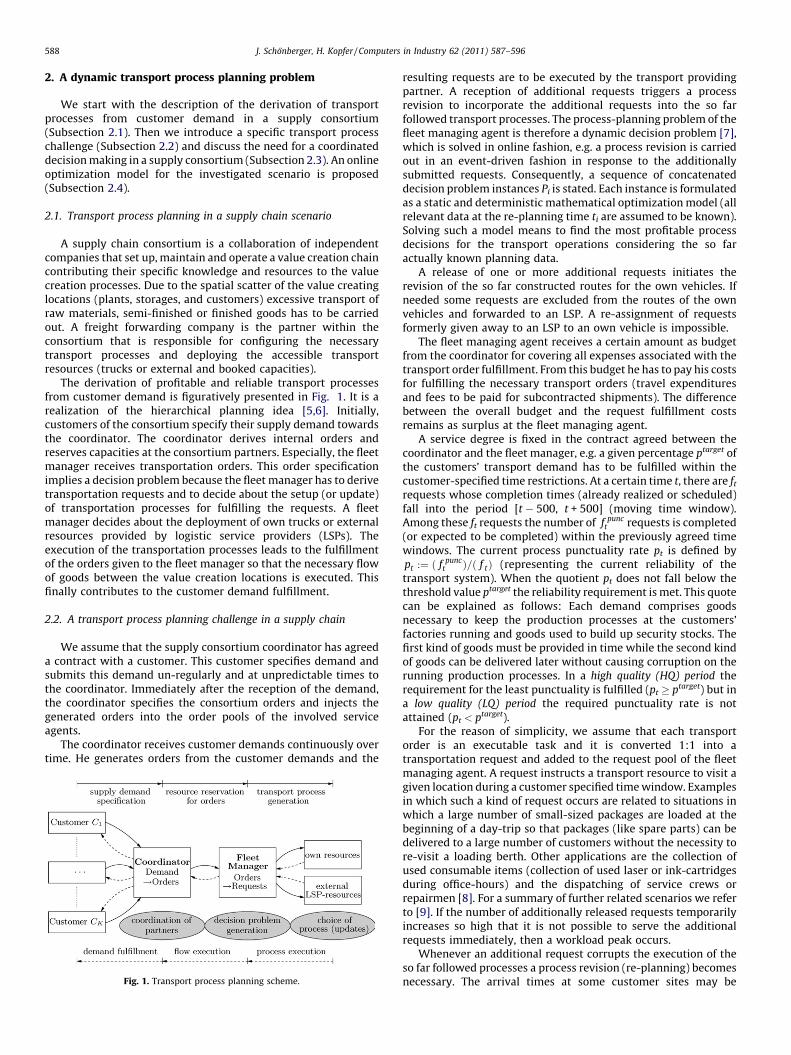
The derivation of profitable and reliable transport processesfrom customer demand is figuratively presented in Fig. 1. It is arealization of the hierarchical planning idea [5,6]. Initially,customers of the consortium specify their supply demand towardsthe coordinator. The coordinator derives internal orders andreserves capacities at the consortium partners. Especially, the fleetmanager receives transportation orders. This order specificationimplies a decision problem because the fleet manager has to derivetransportation requests and to decide about the setup (or update)of transportation processes for fulfilling the requests. A fleetmanager decides about the deployment of own trucks or externalresources provided by logistic service providers (LSPs). Theexecution of the transportation processes leads to the fulfillmentof the orders given to the fleet manager so that the necessary flowof goods between the value creation locations is executed. Thisfinally contributes to the customer demand fulfillment.
2.2. A transport process planning challenge in a supply chain
We assume that the supply consortium coordinator has agreeda contract with a customer. This customer specifies demand andsubmits this demand un-regularly and at unpredictable times tothe coordinator. Immediately after the reception of the demand,the coordinator specifies the consortium orders and injects thegenerated orders into the order pools of the involved serviceagents.
The coordinator receives customer demands continuously overtime. He generates orders from the customer demands and the
Fig. 1. Transport process planning scheme.
resulting requests are to be executed by the transport providingpartner. A reception of additional requests triggers a processrevision to incorporate the additional requests into the so farfollowed transport processes. The process-planning problem of thefleet managing agent is therefore a dynamic decision problem [7],which is solved in online fashion, e.g. a process revision is carriedout in an event-driven fashion in response to the additionallysubmitted requests. Consequently, a sequence of concatenateddecision problem instances Pi is stated. Each instance is formulatedas a static and deterministic mathematical optimization model (allrelevant data at the re-planning time ti are assumed to be known).Solving such a model means to find the most profitable processdecisions for the transport operations considering the so faractually known planning data.
A release of one or more additional requests initiates therevision of the so far constructed routes for the own vehicles. Ifneeded some requests are excluded from the routes of the ownvehicles and forwarded to an LSP. A re-assignment of requestsformerly given away to an LSP to an own vehicle is impossible.
The fleet managing agent receives a certain amount as budgetfrom the coordinator for covering all expenses associated with thetransport order fulfillment. From this budget he has to pay his costsfor fulfilling the necessary transport orders (travel expendituresand fees to be paid for subcontracted shipments). The differencebetween the overall budget and the request fulfillment costsremains as surplus at the fleet managing agent.
A service degree is fixed in the contract agreed between thecoordinator and the fleet manager, e.g. a given percentage ptarget ofthe customers’ transport demand has to be fulfilled within thecustomer-specified time restrictions. At a certain time t, there are ft
requests whose completion times (already realized or scheduled)fall into the period [t � 500, t + 500] (moving time window).Among these ft requests the number of f punc
t requests is completed(or expected to be completed) within the previously agreed timewindows. The current process punctuality rate pt is defined bypt :¼ ð f punc
t Þ=ð f tÞ (representing the current reliability of thetransport system). When the quotient pt does not fall below thethreshold value ptarget the reliability requirement is met. This quotecan be explained as follows: Each demand comprises goodsnecessary to keep the production processes at the customers’factories running and goods used to build up security stocks. Thefirst kind of goods must be provided in time while the second kindof goods can be delivered later without causing corruption on therunning production processes. In a high quality (HQ) period therequirement for the least punctuality is fulfilled (pt � ptarget) but ina low quality (LQ) period the required punctuality rate is notattained (pt < ptarget).
For the reason of simplicity, we assume that each transportorder is an executable task and it is converted 1:1 into atransportation request and added to the request pool of the fleetmanaging agent. A request instructs a transport resource to visit agiven location during a customer specified time window. Examplesin which such a kind of request occurs are related to situations inwhich a large number of small-sized packages are loaded at thebeginning of a day-trip so that packages (like spare parts) can bedelivered to a large number of customers without the necessity tore-visit a loading berth. Other applications are the collection ofused consumable items (collection of used laser or ink-cartridgesduring office-hours) and the dispatching of service crews orrepairmen [8]. For a summary of further related scenarios we referto [9]. If the number of additionally released requests temporarilyincreases so high that it is not possible to serve the additionalrequests immediately, then a workload peak occurs.
Whenever an additional request corrupts the execution of theso far followed processes a process revision (re-planning) becomesnecessary. The arrival times at some customer sites may be
J. Schonberger, H. Kopfer / Computers in Industry 62 (2011) 587–596 589
postponed to have the possibility to serve one or several additionalcustomers earlier by the same vehicle. Typically, the processes ofseveral transport resources have to be updated simultaneouslybecause a re-assignment of requests is necessary if the originallyselected vehicle is not able anymore to fulfill one or more requestsin a profitable way. Subsequently arriving requests are handled byupdating the existing transportation plan by altering the processes.
2.3. Coordination of the consortium partners
The two considered consortium members (agents) aspiredifferent and to a certain extend contradicting planning goals.While the fleet managing agent aims at maximizing his profit bykeeping costs as low as possible in each re-planning scenario thecoordinator agent targets to achieve the promised least punctuali-ty degree (pt � ptarget) whenever a re-planning is carried out. Thestrive for minimizing the operational costs restrains the fleetmanaging agent from investing additional expenditures toincrease the punctuality rate if this rate has fallen below thethreshold value, i.e. if the LSP charges are quite high. For thisreason, the contract between the coordinator and the service agentmust contain some specific measures in order to ensure that theservice agent’s strive for profit maximization does not lead to anegligence of the coordinator’s requirements.
Efforts to improve the quality of processes conjointly derived byconsortium partners are subsumed under the term coordination
[10]. Here, coordination of the superior coordinator agent and ofthe subordinate fleet manager is necessary in order to close aninformation gap caused by information asymmetry among thesetwo agents [11]. While the fleet manager maintains detailedinformation about the transport processes and resources thecoordinator agent has (global) information about the systemworkload, expected demand or the current punctuality of supplyconsortium wide processes. Coordination is achieved by inter-changing information between the two agents and using it foradjusting processes to the current system state.
A direct way to ensure the achievement of the desired leastpunctuality rate is to force the subordinate service providingagent to generate only processes fulfilling the least punctualityrequirement (brute-force coordination). Every process proposalwhich does not obey the least punctuality condition and whichleads to a lower punctuality will be rejected by the coordinator.The minimization of costs is only addressed as a second rangdesire. It is not a mandatory planning requirement. Theachievement of the least punctuality is the superior planninggoal. We refer to this configuration as the hard conditionconfiguration (HARD-configuration) of the investigated supplyconsortium scenario.
The least (minimal) punctuality rate ptarget has been agreedbetween the coordinator and the fleet manager. An averageworkload has been assumed while fixing the agreed service levelptarget. A significant increase in the number of customer sites(workload peak) augments the process costs and therefore lowersthe profit of the transport partner. It is quite unfair that theadditional expenses are not shared with the coordinator (andthereby among all supply consortium partners). Thus, a strictenforcement of the least punctuality discriminates the transportpartner and enforces him to leave the consortium as soon aspossible in order to prevent serious financial damage. For thisreason, the HARD configuration is neither realistic nor applicable.We use it as reference configuration to provide comparable resultsfor simulation experiments. These reference results enable anestimation of the costs necessary for ensuring the achievement ofthe service goal.
In a more elaborated coordination scheme, the coordinatormust provide incentives to each service providing partner in the
supply consortium if the partners act in the sense of thecommon goals instead of acting only in the sense of their owninterest. For each partner, a major motivation to participate inthe supply consortium is to maintain or increase the own profit.Vice versa, the attempt of a partner for maximizing its profitenables the supply consortium controller to influence andregulate the behavior of this partner. Here, the fleet manager ispromised a higher benefit if it acts in accordance with thecommon supply consortium wide goals but its profit is reducedif the fleet manager refrains from acting in the sense of thecoordinator.
The main idea of the penalty configuration (PEN-configura-tion) is to monetarily penalize the fleet manager for each requestwhose on-site fulfillment starts with a delay. Thereby, thispartner is motivated to fulfill as much requests as possible ontime so that the punctuality rate ptarget can be guaranteed. If ademand peak occurs then the fleet manager freely decideswhether to accept the profit reduction or to spend more effortsto maintain or even increase the service level. Here, the negativeimpacts of a workload peak are shared between the coordinator(and therefore among all partners in the consortium) and thefleet manager: The latter pays penalties for late arrivals but thesupply chain consortium accepts a temporarily reduced punc-tuality.
2.4. Dispatching task of the fleet-managing agent
A sequence of transportation plans TP0, TP1, TP2, . . . isgenerated reactively at the ex ante unknown update times t0, t1,t2, . . . and each single transportation plan is executed as long asit is not updated. In order to determine the transportation planTPi at time ti a static decision problem Pi requires a solving. Theproblem Pi represents the task of selecting the least costtransportation plan from the set of all transportation plansavailable at time ti. Thus, Pi is an optimization problem and thesequence P0, P1, . . . is an online optimization problemrepresenting the dynamic decision problem of the subordinatefleet managing agent.
In the following, we propose a mathematical model Mi foreach instance Pi of this online optimization problem. A singlerequest r attains consecutively different states that change withongoing time. Initially, r is known but it is not yet scheduled (K).Then, r is assigned to an own vehicle (I, short for internalfulfillment) or subcontracted (E, short for externalization). If theoperation at the corresponding customer site has already beenstarted but not yet been finished the state S (short for startedrequest) is assigned to r. The set R+(ti) is composed of additionalrequests released at time ti. Requests completed after the lasttransportation plan update at time ti�1 are stored in the setRC(ti�1, ti). At time ti, the recent request stock R(ti) is determinedby R(ti) : = R(ti�1) [ R+(ti) RC(ti�1, ti). Each request belongs at eachtime to exactly one of the sets RK(ti), RE(ti), RI(ti) or RS(ti), inwhich the requests having a common state are collected.
The plan updating problem Pi at time ti is as follows. Let V
denote the set of all own vehicles, PvðtiÞ the set of all paths(sequence of visited sites beginning with the position of thevehicle at time ti and ending with the central depot) executableby vehicle v in TPi and let P(ti) denote the union of the sets PvðtiÞ(v 2 V). If the request r is served in a path p then the binaryparameter arp is set to 1, otherwise it is set to 0. A request r,already known at time ti�1 that is not subcontracted in TPi�1 isserved by vehicle vr . The travel costs associated with path p aredenoted as C1(p). Finally, C3(r) gives the subcontracting costs ofrequest r.
In order to code the necessary decisions for determining atransportation plan in the representation Mi of Pi, we deploy two
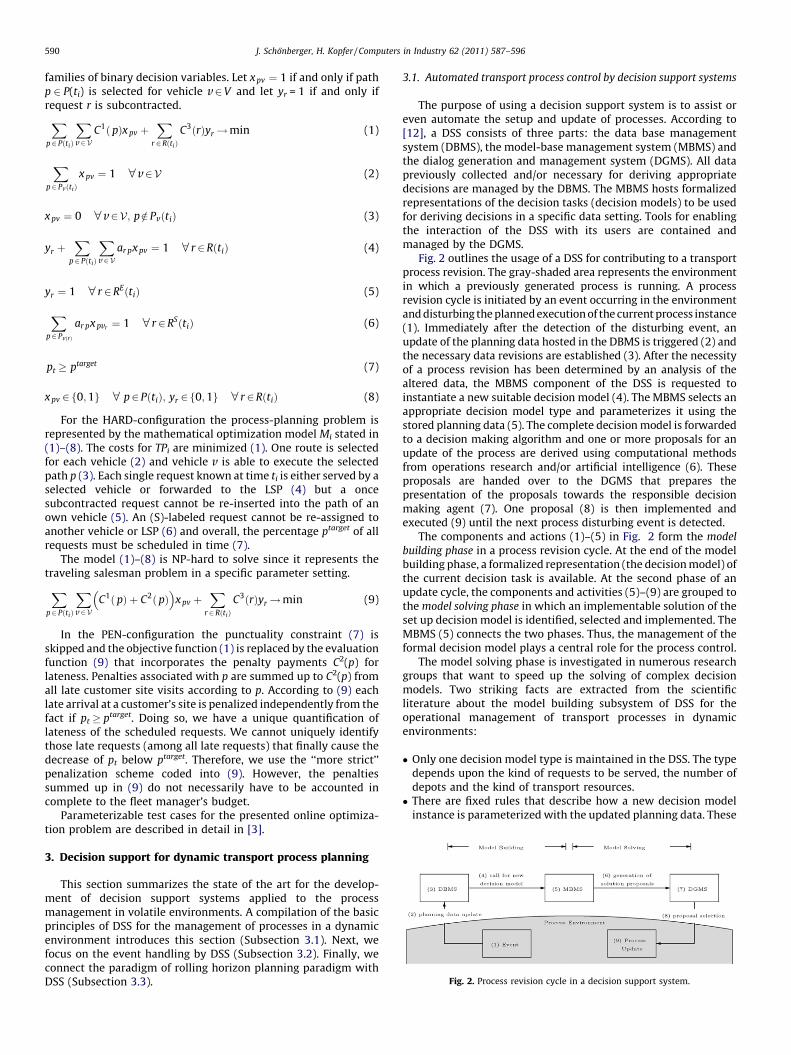
Fig. 2. Process revision cycle in a decision support system.
J. Schonberger, H. Kopfer / Computers in Industry 62 (2011) 587–596590
families of binary decision variables. Let x pv ¼ 1 if and only if pathp 2 P(ti) is selected for vehicle v 2 V and let yr = 1 if and only ifrequest r is subcontracted.
Xp 2 PðtiÞ
Xv 2 V
C1ð pÞx pv þX
r 2 RðtiÞC3ðrÞyr! min (1)
Xp 2 PvðtiÞ
x pv ¼ 1 8 v 2 V (2)
x pv ¼ 0 8 v 2 V; p =2 PvðtiÞ (3)
yr þX
p 2 PðtiÞ
Xv 2 V
ar px pv ¼ 1 8 r 2 RðtiÞ (4)
yr ¼ 1 8 r 2 REðtiÞ (5)
Xp 2 PvðrÞ
ar px pvr ¼ 1 8 r 2 RSðtiÞ (6)
pt � ptarget (7)
x pv 2 f0; 1g 8 p 2 PðtiÞ; yr 2 f0; 1g 8 r 2 RðtiÞ (8)
For the HARD-configuration the process-planning problem isrepresented by the mathematical optimization model Mi stated in(1)–(8). The costs for TPi are minimized (1). One route is selectedfor each vehicle (2) and vehicle v is able to execute the selectedpath p (3). Each single request known at time ti is either served by aselected vehicle or forwarded to the LSP (4) but a oncesubcontracted request cannot be re-inserted into the path of anown vehicle (5). An (S)-labeled request cannot be re-assigned toanother vehicle or LSP (6) and overall, the percentage ptarget of allrequests must be scheduled in time (7).
The model (1)–(8) is NP-hard to solve since it represents thetraveling salesman problem in a specific parameter setting.
Xp 2 PðtiÞ
Xv 2 V
C1ð pÞ þ C2ð pÞ� �
x pv þX
r 2 RðtiÞC3ðrÞyr! min (9)
In the PEN-configuration the punctuality constraint (7) isskipped and the objective function (1) is replaced by the evaluationfunction (9) that incorporates the penalty payments C2(p) forlateness. Penalties associated with p are summed up to C2(p) fromall late customer site visits according to p. According to (9) eachlate arrival at a customer’s site is penalized independently from thefact if pt � ptarget. Doing so, we have a unique quantification oflateness of the scheduled requests. We cannot uniquely identifythose late requests (among all late requests) that finally cause thedecrease of pt below ptarget. Therefore, we use the ‘‘more strict’’penalization scheme coded into (9). However, the penaltiessummed up in (9) do not necessarily have to be accounted incomplete to the fleet manager’s budget.
Parameterizable test cases for the presented online optimiza-tion problem are described in detail in [3].
3. Decision support for dynamic transport process planning
This section summarizes the state of the art for the develop-ment of decision support systems applied to the processmanagement in volatile environments. A compilation of the basicprinciples of DSS for the management of processes in a dynamicenvironment introduces this section (Subsection 3.1). Next, wefocus on the event handling by DSS (Subsection 3.2). Finally, weconnect the paradigm of rolling horizon planning paradigm withDSS (Subsection 3.3).
3.1. Automated transport process control by decision support systems
The purpose of using a decision support system is to assist oreven automate the setup and update of processes. According to[12], a DSS consists of three parts: the data base managementsystem (DBMS), the model-base management system (MBMS) andthe dialog generation and management system (DGMS). All datapreviously collected and/or necessary for deriving appropriatedecisions are managed by the DBMS. The MBMS hosts formalizedrepresentations of the decision tasks (decision models) to be usedfor deriving decisions in a specific data setting. Tools for enablingthe interaction of the DSS with its users are contained andmanaged by the DGMS.
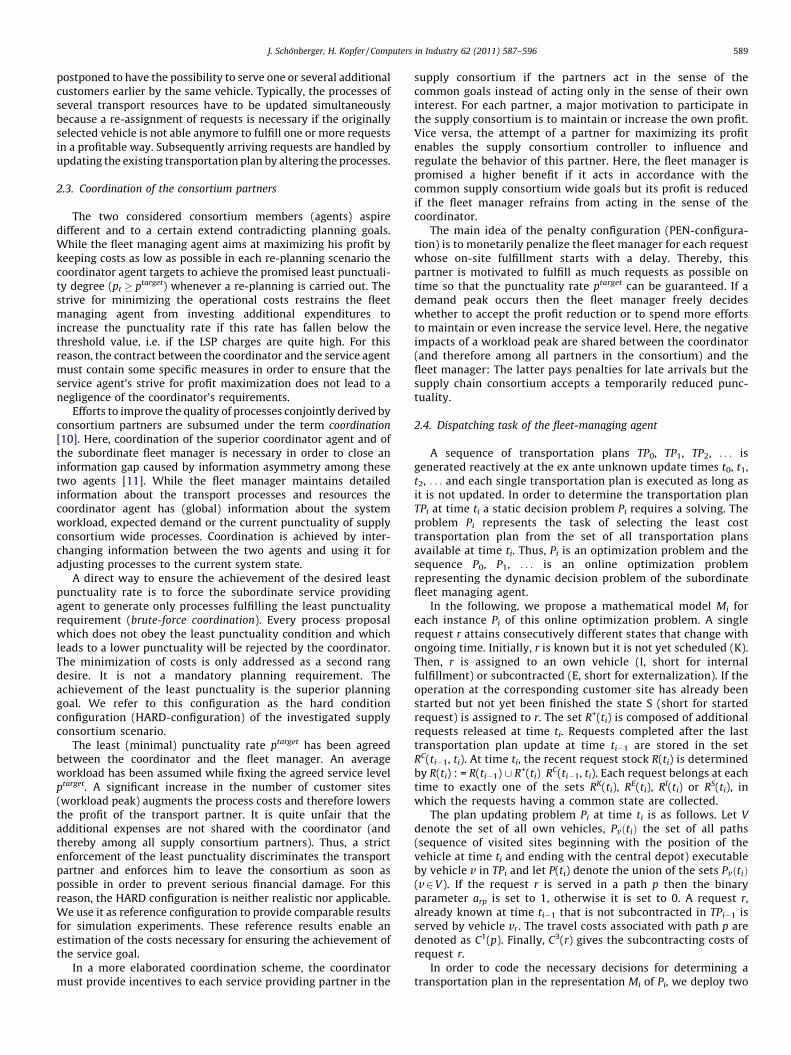
Fig. 2 outlines the usage of a DSS for contributing to a transportprocess revision. The gray-shaded area represents the environmentin which a previously generated process is running. A processrevision cycle is initiated by an event occurring in the environmentand disturbing the planned execution of the current process instance(1). Immediately after the detection of the disturbing event, anupdate of the planning data hosted in the DBMS is triggered (2) andthe necessary data revisions are established (3). After the necessityof a process revision has been determined by an analysis of thealtered data, the MBMS component of the DSS is requested toinstantiate a new suitable decision model (4). The MBMS selects anappropriate decision model type and parameterizes it using thestored planning data (5). The complete decision model is forwardedto a decision making algorithm and one or more proposals for anupdate of the process are derived using computational methodsfrom operations research and/or artificial intelligence (6). Theseproposals are handed over to the DGMS that prepares thepresentation of the proposals towards the responsible decisionmaking agent (7). One proposal (8) is then implemented andexecuted (9) until the next process disturbing event is detected.
The components and actions (1)–(5) in Fig. 2 form the model
building phase in a process revision cycle. At the end of the modelbuilding phase, a formalized representation (the decision model) ofthe current decision task is available. At the second phase of anupdate cycle, the components and activities (5)–(9) are grouped tothe model solving phase in which an implementable solution of theset up decision model is identified, selected and implemented. TheMBMS (5) connects the two phases. Thus, the management of theformal decision model plays a central role for the process control.
The model solving phase is investigated in numerous researchgroups that want to speed up the solving of complex decisionmodels. Two striking facts are extracted from the scientificliterature about the model building subsystem of DSS for theoperational management of transport processes in dynamicenvironments:
� Only one decision model type is maintained in the DSS. The typedepends upon the kind of requests to be served, the number ofdepots and the kind of transport resources.� There are fixed rules that describe how a new decision model
instance is parameterized with the updated planning data. These
J. Schonberger, H. Kopfer / Computers in Industry 62 (2011) 587–596 591
rules remain unchanged throughout the complete running timeof the DSS. They are not changed over time or in response to anunexpected event.
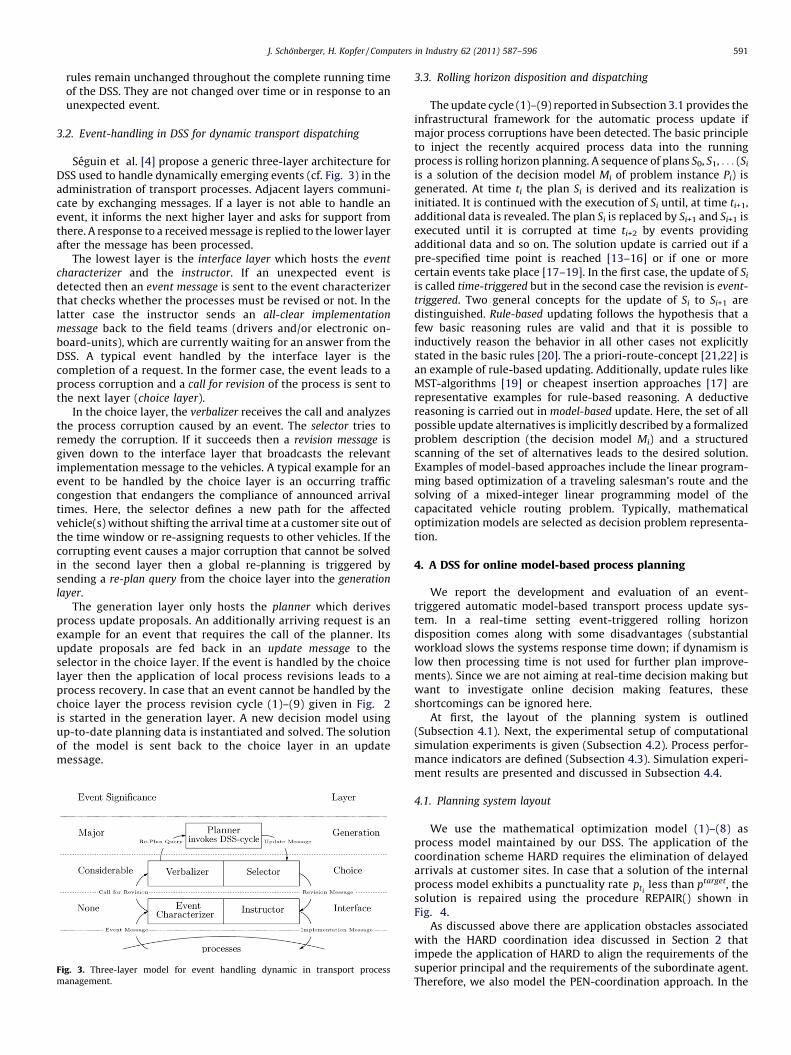
3.2. Event-handling in DSS for dynamic transport dispatching
Seguin et al. [4] propose a generic three-layer architecture forDSS used to handle dynamically emerging events (cf. Fig. 3) in theadministration of transport processes. Adjacent layers communi-cate by exchanging messages. If a layer is not able to handle anevent, it informs the next higher layer and asks for support fromthere. A response to a received message is replied to the lower layerafter the message has been processed.
The lowest layer is the interface layer which hosts the event
characterizer and the instructor. If an unexpected event isdetected then an event message is sent to the event characterizerthat checks whether the processes must be revised or not. In thelatter case the instructor sends an all-clear implementation
message back to the field teams (drivers and/or electronic on-board-units), which are currently waiting for an answer from theDSS. A typical event handled by the interface layer is thecompletion of a request. In the former case, the event leads to aprocess corruption and a call for revision of the process is sent tothe next layer (choice layer).
In the choice layer, the verbalizer receives the call and analyzesthe process corruption caused by an event. The selector tries toremedy the corruption. If it succeeds then a revision message isgiven down to the interface layer that broadcasts the relevantimplementation message to the vehicles. A typical example for anevent to be handled by the choice layer is an occurring trafficcongestion that endangers the compliance of announced arrivaltimes. Here, the selector defines a new path for the affectedvehicle(s) without shifting the arrival time at a customer site out ofthe time window or re-assigning requests to other vehicles. If thecorrupting event causes a major corruption that cannot be solvedin the second layer then a global re-planning is triggered bysending a re-plan query from the choice layer into the generation
layer.The generation layer only hosts the planner which derives
process update proposals. An additionally arriving request is anexample for an event that requires the call of the planner. Itsupdate proposals are fed back in an update message to theselector in the choice layer. If the event is handled by the choicelayer then the application of local process revisions leads to aprocess recovery. In case that an event cannot be handled by thechoice layer the process revision cycle (1)–(9) given in Fig. 2is started in the generation layer. A new decision model usingup-to-date planning data is instantiated and solved. The solutionof the model is sent back to the choice layer in an updatemessage.
Fig. 3. Three-layer model for event handling dynamic in transport process
management.
3.3. Rolling horizon disposition and dispatching
The update cycle (1)–(9) reported in Subsection 3.1 provides theinfrastructural framework for the automatic process update ifmajor process corruptions have been detected. The basic principleto inject the recently acquired process data into the runningprocess is rolling horizon planning. A sequence of plans S0, S1, . . . (Si
is a solution of the decision model Mi of problem instance Pi) isgenerated. At time ti the plan Si is derived and its realization isinitiated. It is continued with the execution of Si until, at time ti+1,additional data is revealed. The plan Si is replaced by Si+1 and Si+1 isexecuted until it is corrupted at time ti+2 by events providingadditional data and so on. The solution update is carried out if apre-specified time point is reached [13–16] or if one or morecertain events take place [17–19]. In the first case, the update of Si
is called time-triggered but in the second case the revision is event-
triggered. Two general concepts for the update of Si to Si+1 aredistinguished. Rule-based updating follows the hypothesis that afew basic reasoning rules are valid and that it is possible toinductively reason the behavior in all other cases not explicitlystated in the basic rules [20]. The a priori-route-concept [21,22] isan example of rule-based updating. Additionally, update rules likeMST-algorithms [19] or cheapest insertion approaches [17] arerepresentative examples for rule-based reasoning. A deductivereasoning is carried out in model-based update. Here, the set of allpossible update alternatives is implicitly described by a formalizedproblem description (the decision model Mi) and a structuredscanning of the set of alternatives leads to the desired solution.Examples of model-based approaches include the linear program-ming based optimization of a traveling salesman’s route and thesolving of a mixed-integer linear programming model of thecapacitated vehicle routing problem. Typically, mathematicaloptimization models are selected as decision problem representa-tion.
4. A DSS for online model-based process planning
We report the development and evaluation of an event-triggered automatic model-based transport process update sys-tem. In a real-time setting event-triggered rolling horizondisposition comes along with some disadvantages (substantialworkload slows the systems response time down; if dynamism islow then processing time is not used for further plan improve-ments). Since we are not aiming at real-time decision making butwant to investigate online decision making features, theseshortcomings can be ignored here.
At first, the layout of the planning system is outlined(Subsection 4.1). Next, the experimental setup of computationalsimulation experiments is given (Subsection 4.2). Process perfor-mance indicators are defined (Subsection 4.3). Simulation experi-ment results are presented and discussed in Subsection 4.4.
4.1. Planning system layout
We use the mathematical optimization model (1)–(8) asprocess model maintained by our DSS. The application of thecoordination scheme HARD requires the elimination of delayedarrivals at customer sites. In case that a solution of the internalprocess model exhibits a punctuality rate pti
less than ptarget, thesolution is repaired using the procedure REPAIR() shown inFig. 4.
As discussed above there are application obstacles associatedwith the HARD coordination idea discussed in Section 2 thatimpede the application of HARD to align the requirements of thesuperior principal and the requirements of the subordinate agent.Therefore, we also model the PEN-coordination approach. In the
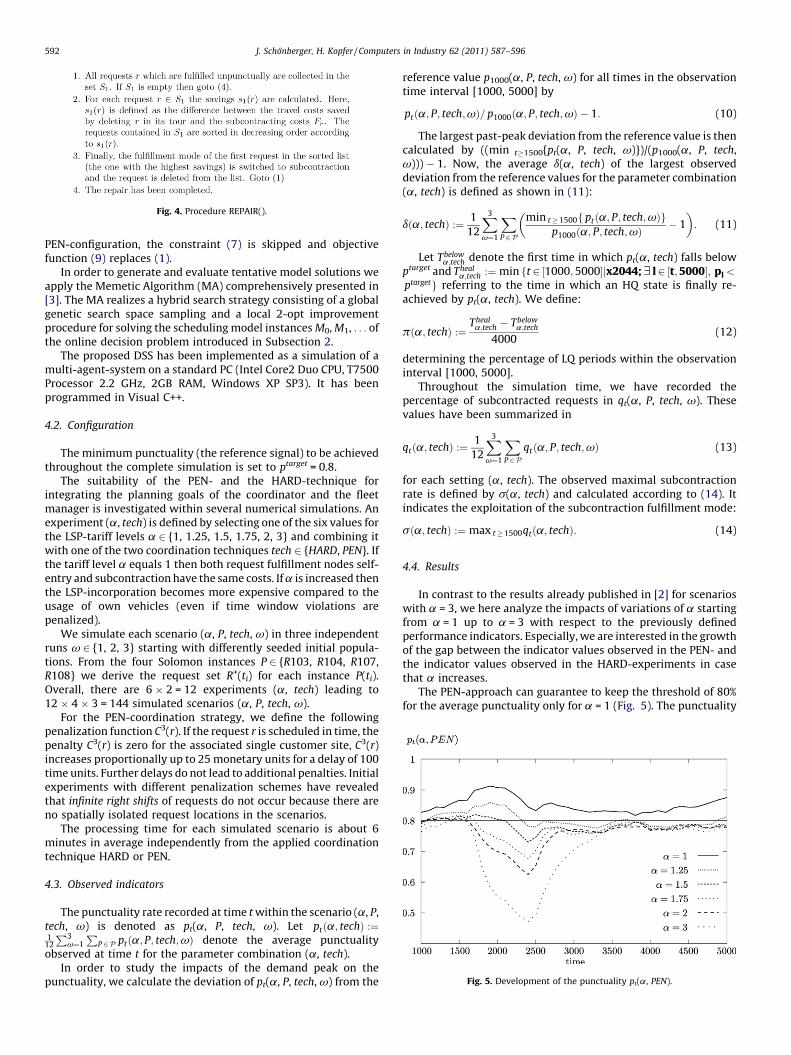
Fig. 4. Procedure REPAIR().
Fig. 5. Development of the punctuality pt(a, PEN).
J. Schonberger, H. Kopfer / Computers in Industry 62 (2011) 587–596592
PEN-configuration, the constraint (7) is skipped and objectivefunction (9) replaces (1).
In order to generate and evaluate tentative model solutions weapply the Memetic Algorithm (MA) comprehensively presented in[3]. The MA realizes a hybrid search strategy consisting of a globalgenetic search space sampling and a local 2-opt improvementprocedure for solving the scheduling model instances M0, M1, . . . ofthe online decision problem introduced in Subsection 2.
The proposed DSS has been implemented as a simulation of amulti-agent-system on a standard PC (Intel Core2 Duo CPU, T7500Processor 2.2 GHz, 2GB RAM, Windows XP SP3). It has beenprogrammed in Visual C++.
4.2. Configuration
The minimum punctuality (the reference signal) to be achievedthroughout the complete simulation is set to ptarget = 0.8.
The suitability of the PEN- and the HARD-technique forintegrating the planning goals of the coordinator and the fleetmanager is investigated within several numerical simulations. Anexperiment (a, tech) is defined by selecting one of the six values forthe LSP-tariff levels a 2 {1, 1.25, 1.5, 1.75, 2, 3} and combining itwith one of the two coordination techniques tech 2 {HARD, PEN}. Ifthe tariff level a equals 1 then both request fulfillment nodes self-entry and subcontraction have the same costs. If a is increased thenthe LSP-incorporation becomes more expensive compared to theusage of own vehicles (even if time window violations arepenalized).
We simulate each scenario (a, P, tech, v) in three independentruns v 2 {1, 2, 3} starting with differently seeded initial popula-tions. From the four Solomon instances P 2 {R103, R104, R107,R108} we derive the request set R+(ti) for each instance P(ti).Overall, there are 6 � 2 = 12 experiments (a, tech) leading to12 � 4 � 3 = 144 simulated scenarios (a, P, tech, v).
For the PEN-coordination strategy, we define the followingpenalization function C3(r). If the request r is scheduled in time, thepenalty C3(r) is zero for the associated single customer site, C3(r)increases proportionally up to 25 monetary units for a delay of 100time units. Further delays do not lead to additional penalties. Initialexperiments with different penalization schemes have revealedthat infinite right shifts of requests do not occur because there areno spatially isolated request locations in the scenarios.
The processing time for each simulated scenario is about 6minutes in average independently from the applied coordinationtechnique HARD or PEN.
4.3. Observed indicators
The punctuality rate recorded at time t within the scenario (a, P,tech, v) is denoted as pt(a, P, tech, v). Let ptða; techÞ :¼1
12
P3v¼1
PP 2 P ptða; P; tech; vÞ denote the average punctuality
observed at time t for the parameter combination (a, tech).In order to study the impacts of the demand peak on the
punctuality, we calculate the deviation of pt(a, P, tech, v) from the
reference value p1000(a, P, tech, v) for all times in the observationtime interval [1000, 5000] by
ptða; P; tech; vÞ= p1000ða; P; tech; vÞ � 1: (10)
The largest past-peak deviation from the reference value is thencalculated by ((min t�1500{pt(a, P, tech, v)})/(p1000(a, P, tech,v))) � 1. Now, the average d(a, tech) of the largest observeddeviation from the reference values for the parameter combination(a, tech) is defined as shown in (11):
dða; techÞ :¼ 1
12
X3
v¼1
XP 2 P
min t � 1500f ptða; P; tech; vÞgp1000ða; P; tech; vÞ � 1
� �: (11)
Let Tbelowa;tech denote the first time in which pt(a, tech) falls below
ptarget and Theala;tech :¼ min t 2 ½1000; 5000�jx2044; 9 l 2 ½t; 5000�; pl <f
ptargetg referring to the time in which an HQ state is finally re-achieved by pt(a, tech). We define:
pða; techÞ :¼Theala;tech � Tbelow
a;tech
4000(12)
determining the percentage of LQ periods within the observationinterval [1000, 5000].
Throughout the simulation time, we have recorded thepercentage of subcontracted requests in qt(a, P, tech, v). Thesevalues have been summarized in
qtða; techÞ :¼ 1
12
X3
v¼1
XP 2 P
qtða; P; tech; vÞ (13)
for each setting (a, tech). The observed maximal subcontractionrate is defined by s(a, tech) and calculated according to (14). Itindicates the exploitation of the subcontraction fulfillment mode:
sða; techÞ :¼ max t � 1500qtða; techÞ: (14)
4.4. Results
In contrast to the results already published in [2] for scenarioswith a = 3, we here analyze the impacts of variations of a startingfrom a = 1 up to a = 3 with respect to the previously definedperformance indicators. Especially, we are interested in the growthof the gap between the indicator values observed in the PEN- andthe indicator values observed in the HARD-experiments in casethat a increases.
The PEN-approach can guarantee to keep the threshold of 80%for the average punctuality only for a = 1 (Fig. 5). The punctuality
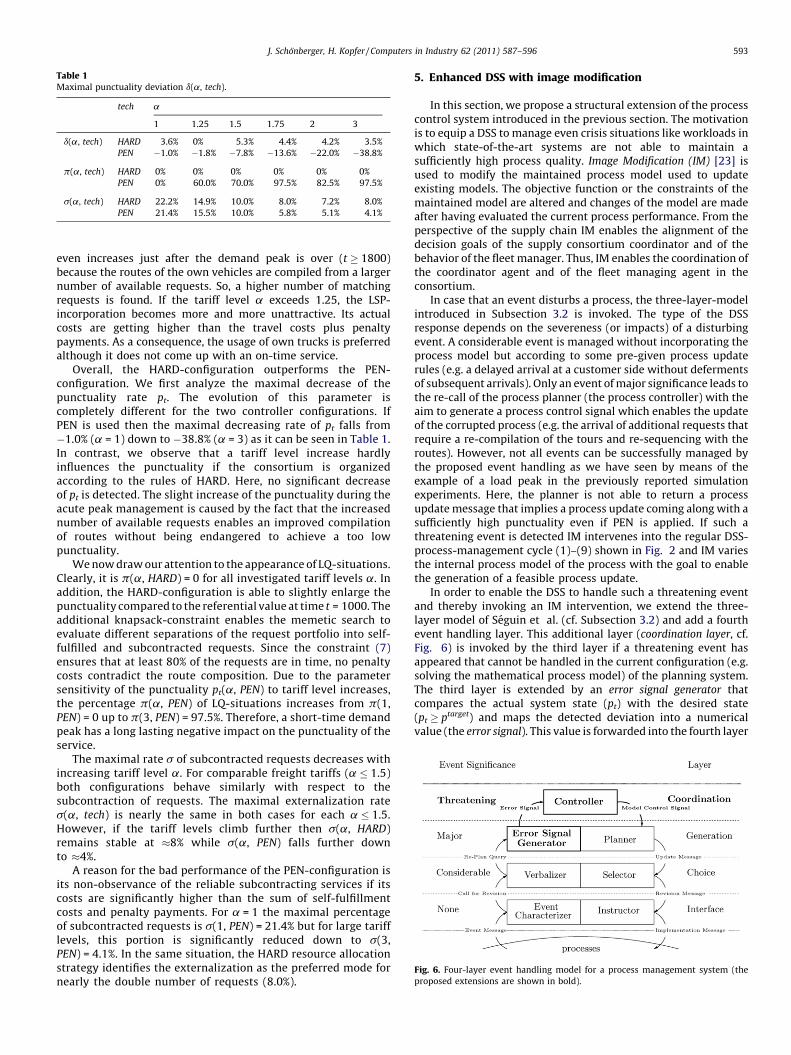
Table 1Maximal punctuality deviation d(a, tech).
tech a
1 1.25 1.5 1.75 2 3
d(a, tech) HARD 3.6% 0% 5.3% 4.4% 4.2% 3.5%
PEN �1.0% �1.8% �7.8% �13.6% �22.0% �38.8%
p(a, tech) HARD 0% 0% 0% 0% 0% 0%
PEN 0% 60.0% 70.0% 97.5% 82.5% 97.5%
s(a, tech) HARD 22.2% 14.9% 10.0% 8.0% 7.2% 8.0%
PEN 21.4% 15.5% 10.0% 5.8% 5.1% 4.1%
Fig. 6. Four-layer event handling model for a process management system (the
proposed extensions are shown in bold).
J. Schonberger, H. Kopfer / Computers in Industry 62 (2011) 587–596 593
even increases just after the demand peak is over (t � 1800)because the routes of the own vehicles are compiled from a largernumber of available requests. So, a higher number of matchingrequests is found. If the tariff level a exceeds 1.25, the LSP-incorporation becomes more and more unattractive. Its actualcosts are getting higher than the travel costs plus penaltypayments. As a consequence, the usage of own trucks is preferredalthough it does not come up with an on-time service.
Overall, the HARD-configuration outperforms the PEN-configuration. We first analyze the maximal decrease of thepunctuality rate pt. The evolution of this parameter iscompletely different for the two controller configurations. IfPEN is used then the maximal decreasing rate of pt falls from�1.0% (a = 1) down to �38.8% (a = 3) as it can be seen in Table 1.In contrast, we observe that a tariff level increase hardlyinfluences the punctuality if the consortium is organizedaccording to the rules of HARD. Here, no significant decreaseof pt is detected. The slight increase of the punctuality during theacute peak management is caused by the fact that the increasednumber of available requests enables an improved compilationof routes without being endangered to achieve a too lowpunctuality.
We now draw our attention to the appearance of LQ-situations.Clearly, it is p(a, HARD) = 0 for all investigated tariff levels a. Inaddition, the HARD-configuration is able to slightly enlarge thepunctuality compared to the referential value at time t = 1000. Theadditional knapsack-constraint enables the memetic search toevaluate different separations of the request portfolio into self-fulfilled and subcontracted requests. Since the constraint (7)ensures that at least 80% of the requests are in time, no penaltycosts contradict the route composition. Due to the parametersensitivity of the punctuality pt(a, PEN) to tariff level increases,the percentage p(a, PEN) of LQ-situations increases from p(1,PEN) = 0 up to p(3, PEN) = 97.5%. Therefore, a short-time demandpeak has a long lasting negative impact on the punctuality of theservice.
The maximal rate s of subcontracted requests decreases withincreasing tariff level a. For comparable freight tariffs (a � 1.5)both configurations behave similarly with respect to thesubcontraction of requests. The maximal externalization rates(a, tech) is nearly the same in both cases for each a � 1.5.However, if the tariff levels climb further then s(a, HARD)remains stable at �8% while s(a, PEN) falls further downto �4%.
A reason for the bad performance of the PEN-configuration isits non-observance of the reliable subcontracting services if itscosts are significantly higher than the sum of self-fulfillmentcosts and penalty payments. For a = 1 the maximal percentageof subcontracted requests is s(1, PEN) = 21.4% but for large tarifflevels, this portion is significantly reduced down to s(3,PEN) = 4.1%. In the same situation, the HARD resource allocationstrategy identifies the externalization as the preferred mode fornearly the double number of requests (8.0%).
5. Enhanced DSS with image modification
In this section, we propose a structural extension of the processcontrol system introduced in the previous section. The motivationis to equip a DSS to manage even crisis situations like workloads inwhich state-of-the-art systems are not able to maintain asufficiently high process quality. Image Modification (IM) [23] isused to modify the maintained process model used to updateexisting models. The objective function or the constraints of themaintained model are altered and changes of the model are madeafter having evaluated the current process performance. From theperspective of the supply chain IM enables the alignment of thedecision goals of the supply consortium coordinator and of thebehavior of the fleet manager. Thus, IM enables the coordination ofthe coordinator agent and of the fleet managing agent in theconsortium.
In case that an event disturbs a process, the three-layer-modelintroduced in Subsection 3.2 is invoked. The type of the DSSresponse depends on the severeness (or impacts) of a disturbingevent. A considerable event is managed without incorporating theprocess model but according to some pre-given process updaterules (e.g. a delayed arrival at a customer side without defermentsof subsequent arrivals). Only an event of major significance leads tothe re-call of the process planner (the process controller) with theaim to generate a process control signal which enables the updateof the corrupted process (e.g. the arrival of additional requests thatrequire a re-compilation of the tours and re-sequencing with theroutes). However, not all events can be successfully managed bythe proposed event handling as we have seen by means of theexample of a load peak in the previously reported simulationexperiments. Here, the planner is not able to return a processupdate message that implies a process update coming along with asufficiently high punctuality even if PEN is applied. If such athreatening event is detected IM intervenes into the regular DSS-process-management cycle (1)–(9) shown in Fig. 2 and IM variesthe internal process model of the process with the goal to enablethe generation of a feasible process update.
In order to enable the DSS to handle such a threatening eventand thereby invoking an IM intervention, we extend the three-layer model of Seguin et al. (cf. Subsection 3.2) and add a fourthevent handling layer. This additional layer (coordination layer, cf.Fig. 6) is invoked by the third layer if a threatening event hasappeared that cannot be handled in the current configuration (e.g.solving the mathematical process model) of the planning system.The third layer is extended by an error signal generator thatcompares the actual system state (pt) with the desired state(pt � ptarget) and maps the detected deviation into a numericalvalue (the error signal). This value is forwarded into the fourth layer
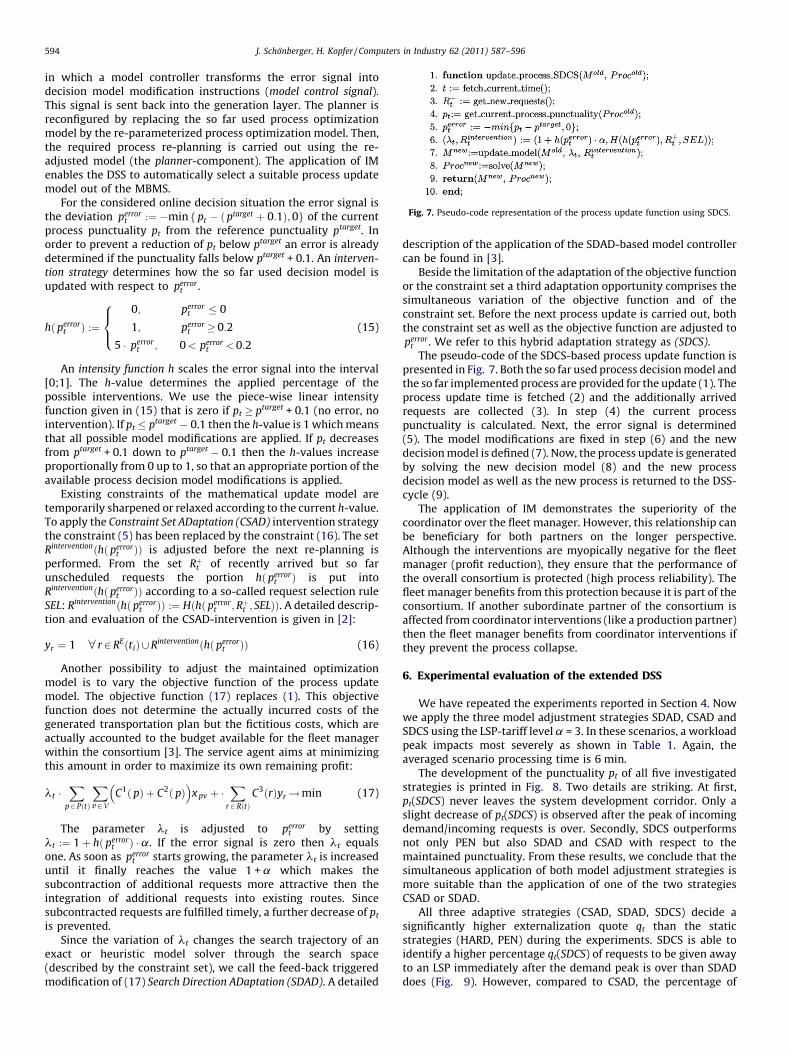
Fig. 7. Pseudo-code representation of the process update function using SDCS.
J. Schonberger, H. Kopfer / Computers in Industry 62 (2011) 587–596594
in which a model controller transforms the error signal intodecision model modification instructions (model control signal).This signal is sent back into the generation layer. The planner isreconfigured by replacing the so far used process optimizationmodel by the re-parameterized process optimization model. Then,the required process re-planning is carried out using the re-adjusted model (the planner-component). The application of IMenables the DSS to automatically select a suitable process updatemodel out of the MBMS.
For the considered online decision situation the error signal isthe deviation perror
t :¼ �min f pt � ð ptarget þ 0:1Þ; 0g of the currentprocess punctuality pt from the reference punctuality ptarget. Inorder to prevent a reduction of pt below ptarget an error is alreadydetermined if the punctuality falls below ptarget + 0.1. An interven-
tion strategy determines how the so far used decision model isupdated with respect to perror
t .
hð perrort Þ :¼
0; perrort � 0
1; perrort � 0:2
5 perrort ; 0 < perror
t < 0:2
8><>: (15)
An intensity function h scales the error signal into the interval[0;1]. The h-value determines the applied percentage of thepossible interventions. We use the piece-wise linear intensityfunction given in (15) that is zero if pt � ptarget + 0.1 (no error, nointervention). If pt � ptarget � 0.1 then the h-value is 1 which meansthat all possible model modifications are applied. If pt decreasesfrom ptarget + 0.1 down to ptarget � 0.1 then the h-values increaseproportionally from 0 up to 1, so that an appropriate portion of theavailable process decision model modifications is applied.
Existing constraints of the mathematical update model aretemporarily sharpened or relaxed according to the current h-value.To apply the Constraint Set ADaptation (CSAD) intervention strategythe constraint (5) has been replaced by the constraint (16). The setRinterventionðhð perror
t ÞÞ is adjusted before the next re-planning isperformed. From the set Rþt of recently arrived but so farunscheduled requests the portion hð perror
t Þ is put intoRinterventionðhð perror
t ÞÞ according to a so-called request selection ruleSEL: Rinterventionðhð perror
t ÞÞ :¼ Hðhð perrort ; Rþt ; SELÞÞ. A detailed descrip-
tion and evaluation of the CSAD-intervention is given in [2]:
yr ¼ 1 8 r 2 REðtiÞ [ Rinterventionðhð perrort ÞÞ (16)
Another possibility to adjust the maintained optimizationmodel is to vary the objective function of the process updatemodel. The objective function (17) replaces (1). This objectivefunction does not determine the actually incurred costs of thegenerated transportation plan but the fictitious costs, which areactually accounted to the budget available for the fleet managerwithin the consortium [3]. The service agent aims at minimizingthis amount in order to maximize its own remaining profit:
lt X
p 2 PðtÞ
Xv 2 V
C1ð pÞ þ C2ð pÞ� �
x pv þ X
r 2 RðtÞC3ðrÞyr! min (17)
The parameter lt is adjusted to perrort by setting
lt :¼ 1 þ hð perrort Þ a. If the error signal is zero then lt equals
one. As soon as perrort starts growing, the parameter lt is increased
until it finally reaches the value 1 + a which makes thesubcontraction of additional requests more attractive then theintegration of additional requests into existing routes. Sincesubcontracted requests are fulfilled timely, a further decrease of pt
is prevented.Since the variation of lt changes the search trajectory of an
exact or heuristic model solver through the search space(described by the constraint set), we call the feed-back triggeredmodification of (17) Search Direction ADaptation (SDAD). A detailed
description of the application of the SDAD-based model controllercan be found in [3].
Beside the limitation of the adaptation of the objective functionor the constraint set a third adaptation opportunity comprises thesimultaneous variation of the objective function and of theconstraint set. Before the next process update is carried out, boththe constraint set as well as the objective function are adjusted toperror
t . We refer to this hybrid adaptation strategy as (SDCS).The pseudo-code of the SDCS-based process update function is
presented in Fig. 7. Both the so far used process decision model andthe so far implemented process are provided for the update (1). Theprocess update time is fetched (2) and the additionally arrivedrequests are collected (3). In step (4) the current processpunctuality is calculated. Next, the error signal is determined(5). The model modifications are fixed in step (6) and the newdecision model is defined (7). Now, the process update is generatedby solving the new decision model (8) and the new processdecision model as well as the new process is returned to the DSS-cycle (9).
The application of IM demonstrates the superiority of thecoordinator over the fleet manager. However, this relationship canbe beneficiary for both partners on the longer perspective.Although the interventions are myopically negative for the fleetmanager (profit reduction), they ensure that the performance ofthe overall consortium is protected (high process reliability). Thefleet manager benefits from this protection because it is part of theconsortium. If another subordinate partner of the consortium isaffected from coordinator interventions (like a production partner)then the fleet manager benefits from coordinator interventions ifthey prevent the process collapse.
6. Experimental evaluation of the extended DSS
We have repeated the experiments reported in Section 4. Nowwe apply the three model adjustment strategies SDAD, CSAD andSDCS using the LSP-tariff level a = 3. In these scenarios, a workloadpeak impacts most severely as shown in Table 1. Again, theaveraged scenario processing time is 6 min.
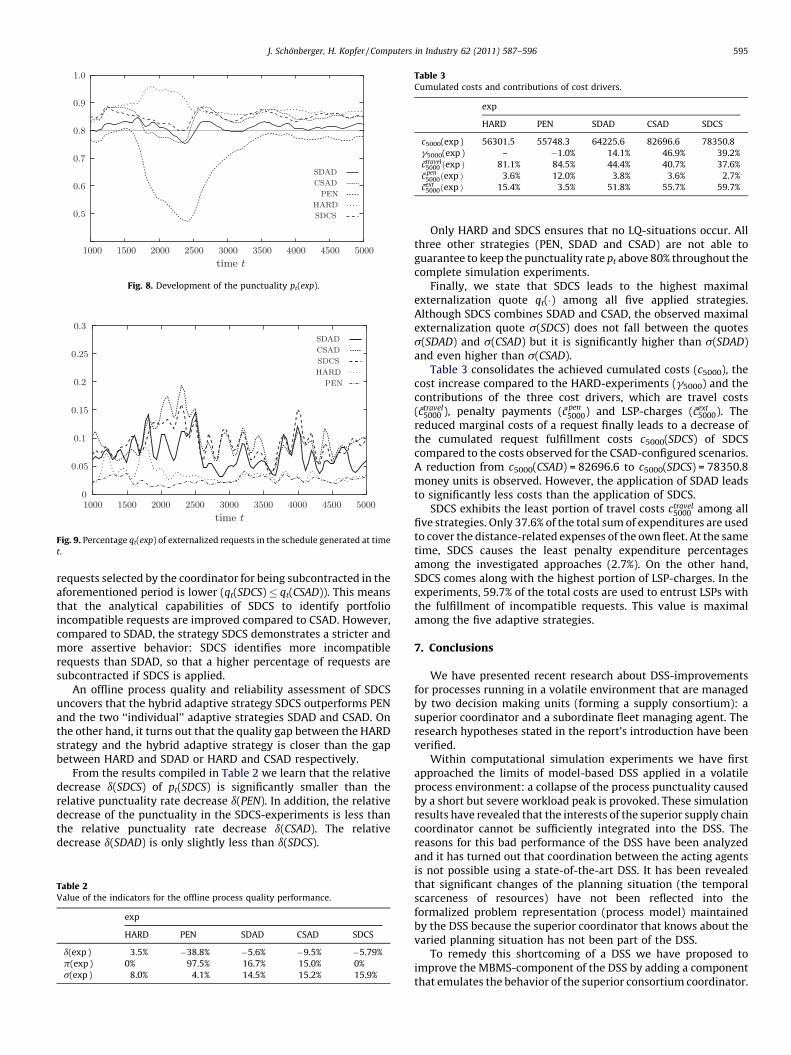
The development of the punctuality pt of all five investigatedstrategies is printed in Fig. 8. Two details are striking. At first,pt(SDCS) never leaves the system development corridor. Only aslight decrease of pt(SDCS) is observed after the peak of incomingdemand/incoming requests is over. Secondly, SDCS outperformsnot only PEN but also SDAD and CSAD with respect to themaintained punctuality. From these results, we conclude that thesimultaneous application of both model adjustment strategies ismore suitable than the application of one of the two strategiesCSAD or SDAD.
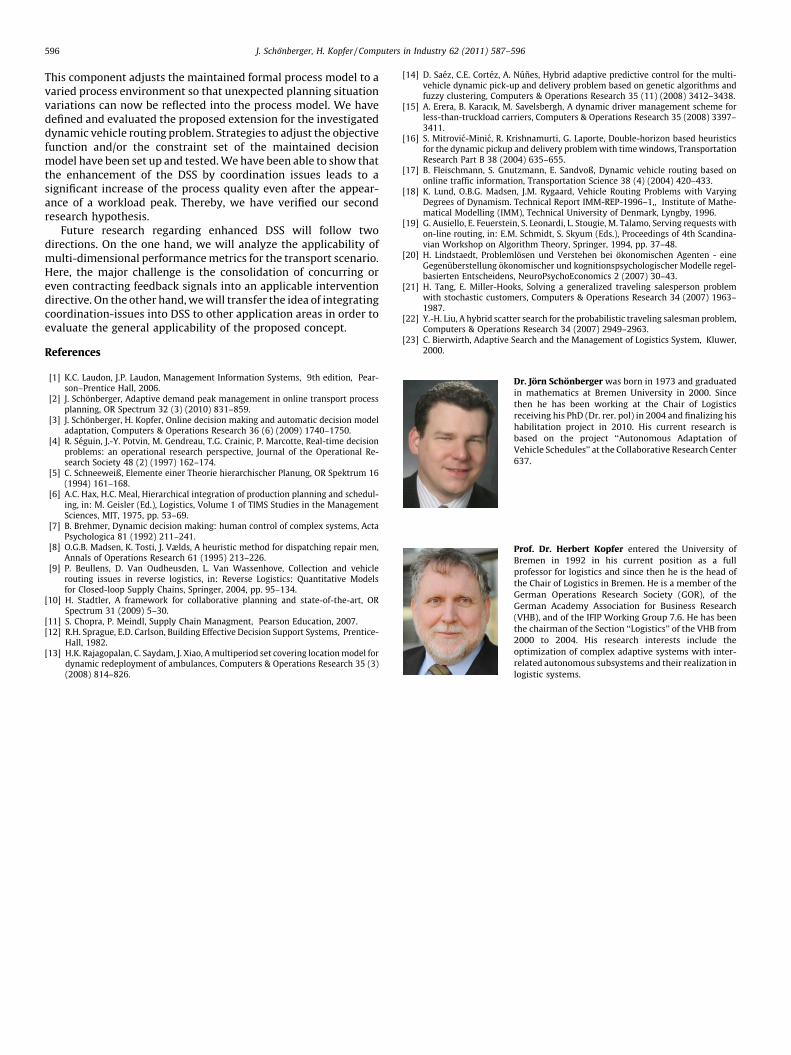
All three adaptive strategies (CSAD, SDAD, SDCS) decide asignificantly higher externalization quote qt than the staticstrategies (HARD, PEN) during the experiments. SDCS is able toidentify a higher percentage qt(SDCS) of requests to be given awayto an LSP immediately after the demand peak is over than SDADdoes (Fig. 9). However, compared to CSAD, the percentage of
500045004000350030002500200015001000
time t
0.5
0.6
0.7
0.8
0.9
1.0
SDAD
CSAD
PEN
HARD
SDCS
Fig. 8. Development of the punctuality pt(exp).
500045004000350030002500200015001000
time t
0
0.05
0.1
0.15
0.2
0.25
0.3
SDAD
CSAD
PEN
HARD
SDCS
Fig. 9. Percentage qt(exp) of externalized requests in the schedule generated at time
t.
Table 3Cumulated costs and contributions of cost drivers.
exp
HARD PEN SDAD CSAD SDCS
c5000(exp ) 56301.5 55748.3 64225.6 82696.6 78350.8
g5000(exp ) – �1.0% 14.1% 46.9% 39.2%
ctravel5000 ðexp Þ 81.1% 84.5% 44.4% 40.7% 37.6%
c pen5000ðexp Þ 3.6% 12.0% 3.8% 3.6% 2.7%
cext5000ðexp Þ 15.4% 3.5% 51.8% 55.7% 59.7%
J. Schonberger, H. Kopfer / Computers in Industry 62 (2011) 587–596 595
requests selected by the coordinator for being subcontracted in theaforementioned period is lower (qt(SDCS) � qt(CSAD)). This meansthat the analytical capabilities of SDCS to identify portfolioincompatible requests are improved compared to CSAD. However,compared to SDAD, the strategy SDCS demonstrates a stricter andmore assertive behavior: SDCS identifies more incompatiblerequests than SDAD, so that a higher percentage of requests aresubcontracted if SDCS is applied.
An offline process quality and reliability assessment of SDCSuncovers that the hybrid adaptive strategy SDCS outperforms PENand the two ‘‘individual’’ adaptive strategies SDAD and CSAD. Onthe other hand, it turns out that the quality gap between the HARDstrategy and the hybrid adaptive strategy is closer than the gapbetween HARD and SDAD or HARD and CSAD respectively.
From the results compiled in Table 2 we learn that the relativedecrease d(SDCS) of pt(SDCS) is significantly smaller than therelative punctuality rate decrease d(PEN). In addition, the relativedecrease of the punctuality in the SDCS-experiments is less thanthe relative punctuality rate decrease d(CSAD). The relativedecrease d(SDAD) is only slightly less than d(SDCS).
Table 2Value of the indicators for the offline process quality performance.
exp
HARD PEN SDAD CSAD SDCS
d(exp ) 3.5% �38.8% �5.6% �9.5% �5.79%
p(exp ) 0% 97.5% 16.7% 15.0% 0%
s(exp ) 8.0% 4.1% 14.5% 15.2% 15.9%
Only HARD and SDCS ensures that no LQ-situations occur. Allthree other strategies (PEN, SDAD and CSAD) are not able toguarantee to keep the punctuality rate pt above 80% throughout thecomplete simulation experiments.
Finally, we state that SDCS leads to the highest maximalexternalization quote qt() among all five applied strategies.Although SDCS combines SDAD and CSAD, the observed maximalexternalization quote s(SDCS) does not fall between the quotess(SDAD) and s(CSAD) but it is significantly higher than s(SDAD)and even higher than s(CSAD).
Table 3 consolidates the achieved cumulated costs (c5000), thecost increase compared to the HARD-experiments (g5000) and thecontributions of the three cost drivers, which are travel costs(ctravel
5000 ), penalty payments (c pen5000) and LSP-charges (cext
5000). Thereduced marginal costs of a request finally leads to a decrease ofthe cumulated request fulfillment costs c5000(SDCS) of SDCScompared to the costs observed for the CSAD-configured scenarios.A reduction from c5000(CSAD) = 82696.6 to c5000(SDCS) = 78350.8money units is observed. However, the application of SDAD leadsto significantly less costs than the application of SDCS.
SDCS exhibits the least portion of travel costs ctravel5000 among all
five strategies. Only 37.6% of the total sum of expenditures are usedto cover the distance-related expenses of the own fleet. At the sametime, SDCS causes the least penalty expenditure percentagesamong the investigated approaches (2.7%). On the other hand,SDCS comes along with the highest portion of LSP-charges. In theexperiments, 59.7% of the total costs are used to entrust LSPs withthe fulfillment of incompatible requests. This value is maximalamong the five adaptive strategies.
7. Conclusions
We have presented recent research about DSS-improvementsfor processes running in a volatile environment that are managedby two decision making units (forming a supply consortium): asuperior coordinator and a subordinate fleet managing agent. Theresearch hypotheses stated in the report’s introduction have beenverified.
Within computational simulation experiments we have firstapproached the limits of model-based DSS applied in a volatileprocess environment: a collapse of the process punctuality causedby a short but severe workload peak is provoked. These simulationresults have revealed that the interests of the superior supply chaincoordinator cannot be sufficiently integrated into the DSS. Thereasons for this bad performance of the DSS have been analyzedand it has turned out that coordination between the acting agentsis not possible using a state-of-the-art DSS. It has been revealedthat significant changes of the planning situation (the temporalscarceness of resources) have not been reflected into theformalized problem representation (process model) maintainedby the DSS because the superior coordinator that knows about thevaried planning situation has not been part of the DSS.
To remedy this shortcoming of a DSS we have proposed toimprove the MBMS-component of the DSS by adding a componentthat emulates the behavior of the superior consortium coordinator.
J. Schonberger, H. Kopfer / Computers in Industry 62 (2011) 587–596596
This component adjusts the maintained formal process model to avaried process environment so that unexpected planning situationvariations can now be reflected into the process model. We havedefined and evaluated the proposed extension for the investigateddynamic vehicle routing problem. Strategies to adjust the objectivefunction and/or the constraint set of the maintained decisionmodel have been set up and tested. We have been able to show thatthe enhancement of the DSS by coordination issues leads to asignificant increase of the process quality even after the appear-ance of a workload peak. Thereby, we have verified our secondresearch hypothesis.
Future research regarding enhanced DSS will follow twodirections. On the one hand, we will analyze the applicability ofmulti-dimensional performance metrics for the transport scenario.Here, the major challenge is the consolidation of concurring oreven contracting feedback signals into an applicable interventiondirective. On the other hand, we will transfer the idea of integratingcoordination-issues into DSS to other application areas in order toevaluate the general applicability of the proposed concept.
References
[1] K.C. Laudon, J.P. Laudon, Management Information Systems, 9th edition, Pear-son–Prentice Hall, 2006.
[2] J. Schonberger, Adaptive demand peak management in online transport processplanning, OR Spectrum 32 (3) (2010) 831–859.
[3] J. Schonberger, H. Kopfer, Online decision making and automatic decision modeladaptation, Computers & Operations Research 36 (6) (2009) 1740–1750.
[4] R. Seguin, J.-Y. Potvin, M. Gendreau, T.G. Crainic, P. Marcotte, Real-time decisionproblems: an operational research perspective, Journal of the Operational Re-search Society 48 (2) (1997) 162–174.
[5] C. Schneeweiß, Elemente einer Theorie hierarchischer Planung, OR Spektrum 16(1994) 161–168.
[6] A.C. Hax, H.C. Meal, Hierarchical integration of production planning and schedul-ing, in: M. Geisler (Ed.), Logistics, Volume 1 of TIMS Studies in the ManagementSciences, MIT, 1975, pp. 53–69.
[7] B. Brehmer, Dynamic decision making: human control of complex systems, ActaPsychologica 81 (1992) 211–241.
[8] O.G.B. Madsen, K. Tosti, J. Vælds, A heuristic method for dispatching repair men,Annals of Operations Research 61 (1995) 213–226.
[9] P. Beullens, D. Van Oudheusden, L. Van Wassenhove, Collection and vehiclerouting issues in reverse logistics, in: Reverse Logistics: Quantitative Modelsfor Closed-loop Supply Chains, Springer, 2004, pp. 95–134.
[10] H. Stadtler, A framework for collaborative planning and state-of-the-art, ORSpectrum 31 (2009) 5–30.
[11] S. Chopra, P. Meindl, Supply Chain Managment, Pearson Education, 2007.[12] R.H. Sprague, E.D. Carlson, Building Effective Decision Support Systems, Prentice-
Hall, 1982.[13] H.K. Rajagopalan, C. Saydam, J. Xiao, A multiperiod set covering location model for
dynamic redeployment of ambulances, Computers & Operations Research 35 (3)(2008) 814–826.
[14] D. Saez, C.E. Cortez, A. Nunes, Hybrid adaptive predictive control for the multi-vehicle dynamic pick-up and delivery problem based on genetic algorithms andfuzzy clustering, Computers & Operations Research 35 (11) (2008) 3412–3438.
[15] A. Erera, B. Karacık, M. Savelsbergh, A dynamic driver management scheme forless-than-truckload carriers, Computers & Operations Research 35 (2008) 3397–3411.
[16] S. Mitrovic-Minic, R. Krishnamurti, G. Laporte, Double-horizon based heuristicsfor the dynamic pickup and delivery problem with time windows, TransportationResearch Part B 38 (2004) 635–655.
[17] B. Fleischmann, S. Gnutzmann, E. Sandvoß, Dynamic vehicle routing based ononline traffic information, Transportation Science 38 (4) (2004) 420–433.
[18] K. Lund, O.B.G. Madsen, J.M. Rygaard, Vehicle Routing Problems with VaryingDegrees of Dynamism. Technical Report IMM-REP-1996–1,, Institute of Mathe-matical Modelling (IMM), Technical University of Denmark, Lyngby, 1996.
[19] G. Ausiello, E. Feuerstein, S. Leonardi, L. Stougie, M. Talamo, Serving requests withon-line routing, in: E.M. Schmidt, S. Skyum (Eds.), Proceedings of 4th Scandina-vian Workshop on Algorithm Theory, Springer, 1994, pp. 37–48.
[20] H. Lindstaedt, Problemlosen und Verstehen bei okonomischen Agenten - eineGegenuberstellung okonomischer und kognitionspsychologischer Modelle regel-basierten Entscheidens, NeuroPsychoEconomics 2 (2007) 30–43.
[21] H. Tang, E. Miller-Hooks, Solving a generalized traveling salesperson problemwith stochastic customers, Computers & Operations Research 34 (2007) 1963–1987.
[22] Y.-H. Liu, A hybrid scatter search for the probabilistic traveling salesman problem,Computers & Operations Research 34 (2007) 2949–2963.
[23] C. Bierwirth, Adaptive Search and the Management of Logistics System, Kluwer,2000.
Dr. Jorn Schonberger was born in 1973 and graduated
in mathematics at Bremen University in 2000. Since
then he has been working at the Chair of Logistics
receiving his PhD (Dr. rer. pol) in 2004 and finalizing his
habilitation project in 2010. His current research is
based on the project ‘‘Autonomous Adaptation of
Vehicle Schedules’’ at the Collaborative Research Center
637.
Prof. Dr. Herbert Kopfer entered the University of
Bremen in 1992 in his current position as a full
professor for logistics and since then he is the head of
the Chair of Logistics in Bremen. He is a member of the
German Operations Research Society (GOR), of the
German Academy Association for Business Research
(VHB), and of the IFIP Working Group 7.6. He has been
the chairman of the Section ‘‘Logistics’’ of the VHB from
2000 to 2004. His research interests include the
optimization of complex adaptive systems with inter-
related autonomous subsystems and their realization in
logistic systems.