Embed Size (px)
Citation preview
Prostate Cancer
Decreasing Rate and Extent of Lymph Node Staging in Patients
Undergoing Radical Prostatectomy May Undermine the Rate of
Diagnosis of Lymph Node Metastases in Prostate Cancer
Firas Abdollah a,b,1,*, Maxine Sun a,1, Rodolphe Thuret a, Lars Budaus a, Claudio Jeldres a,Markus Graefen c, Alberto Briganti b, Paul Perrotte a, Patrizio Rigatti b, Francesco Montorsi b,Pierre I. Karakiewicz a
a Cancer Prognostics and Health Outcomes Unit, University of Montreal Health Center, Montreal, QC, Canadab Vita-Salute University/Hospital San Raffaele, Milan, Italyc Martiniclinic, Prostate Cancer Center University Hospital Hamburg-Eppendorf, Hamburg, Germany
E U R O P E A N U R O L O G Y 5 8 ( 2 0 1 0 ) 8 8 2 – 8 9 2
avai lable at www.sciencedirect .com
journal homepage: www.europeanurology.com
Article info
Article history:Accepted September 16, 2010Published online ahead ofprint on September 28, 2010
Keywords:
Lymphatic metastasis/diagnosis
Lymph node excision/statistics
and numerical data
Prostatic neoplasm/pathology
SEER program
Abstract
Background: At radical prostatectomy (RP), pelvic lymph node dissection (PLND)
represents the most accurate staging procedure for the presence of lymph node
(LN) metastases.
Objective: We evaluated the rate of PLND use and its lymph node count (LNC) over
the last two decades. We also tested the relationship between LNC and the rate of
pN1 stage.
Design, setting, and participants: Between 1988 and 2006, 130 080 RPs were
recorded in 17 Surveillance Epidemiology and End Results registries.
Measurements: The statistical significance of temporal trends was evaluated with
the chi-square trend test. Separate univariable and multivariable regression anal-
yses tested the relationship between predictors and two end points: (1) lack of LN
staging (pNx) and (2) presence of LN metastases (pN1).
Results and limitations: Stage pNx was recorded in 25.9% of patients, and pNx rate
was higher in more contemporary years (30.1% in 2000–2006 vs 20.8% in 1988–
1993; multivariable p < 0.001). When PLND was performed, an average of 7.4 LNs
(median: 6) were removed. The average LNC decreased from 12.0 nodes (median:
12) in 1988 to 6.0 nodes (median: 4) in 2006. Overall pN1 rate was 3.4% and
decreased from 10.7% to 3.1% between 1988 and 2006 ( p < 0.001). LNC was an
independent predictor of pN1 stage (multivariable p < 0.001).
Conclusions: An increasingly larger proportion of prostate cancer patients remain
without LN staging at RP. Fewer LNs were removed at PLND over time, resulting in
fewer patients diagnosed with pN1 stage at RP. The impact of this phenomenon on
cancer control outcomes is still to be verified.
# 2010 European Association of Urology. Published by Elsevier B.V. All rights reserved.
ted equally to the manuscript.. Cancer Prognostics and Health Outcomes Unit, University of Montreall, QC, Canada. Tel. +514 890 8000 ext. 35336; Fax: +514 227 5103.
1 Both authors contribu* Corresponding authorHealth Center, Montrea
E-mail address: [email protected] (F. Abdollah).0302-2838/$ – see back matter # 2010 European Association of Urology. Published by Elsevier B.V. All rights reserved. doi:10.1016/j.eururo.2010.09.029
E U R O P E A N U R O L O G Y 5 8 ( 2 0 1 0 ) 8 8 2 – 8 9 2 883
1. Introduction
Most prostate cancer patients present with clinically
localized disease and are treated with radical prostatectomy
(RP) [1,2]. At surgery, pelvic lymph node dissection (PLND)
represents the most accurate staging procedure for the
presence of lymph node (LN) metastases [3,4].
Over the past two decades, an ongoing debate has
focused on the extent of PLND that should ideally be
performed to more accurately assign LN stage [3]. The
opinions range from omitting the PLND [5,6] to performing
an extended PLND that encompasses virtually all pelvic LNs
[7,8]. To date, only institutional studies of limited sample
size have examined the relationship between the extent of
PLND and its ability to detect the presence of LN metastases
[7–15]. Therefore the existing data regarding the indica-
tions, rationale, and extent of PLND originate from relatively
small studies. Based on the paucity of data, we decided to
examine the rate of PLND and the variation in LN count
(LNC) at PLND over the past two decades within the
Surveillance Epidemiology and End Results (SEER) database.
We also examined the relationship between LNC and the
likelihood of finding LN metastases.
2. Patients and methods
2.1. Patient population
Patients treated with RP for histologically confirmed nonmetastatic
adenocarcinoma of the prostate between 1988 and 2006 were identified
using the 17 SEER [16] database (International Classification of Disease
for Oncology [61.9]; histologic code: 8140). All patients were between 34
and 94 yr of age. Patients with missing stage and/or grade were excluded.
We also excluded individuals with undifferentiated disease because this
histology may be confounded with small cell histology. These selection
criteria yielded 130 080 assessable individuals.
For all patients, age (years), race (white vs black vs other), SEER
registries, pathologic tumor stage (pT2 vs pT3 vs pT4), tumor grade
(Gleason score 2–4 vs Gleason score 5–7 vs Gleason score 8–10), PLND
status, and year of surgery categories (1988–1993 vs 1994–1999 vs 2000–
2006) were available. For patients treated strictly between 2004 and 2006,
additional information on serum prostate-specific antigen (PSA), primary
Gleason grade, and secondary Gleason grade became available.
2.2. Statistical analyses
Chi-square and student t tests were used to compare proportions and
means, respectively. The chi-square trend test was used to examine the
statistical significance of temporal trends for proportions. Separate
linear regression analyses were used to test the relationship between
LNC and year of surgery as well as SEER registry. Smoothed scatter plots
were used to display the data graphically [17].
Separate univariable and multivariable logistic regression models
were used to test the relationship between predictors and the two
examined end points: pNx stage and pN1 stage. LNC was modeled as a
categorical variable using quartiles. Covariates consisted of age, race,
pathologic tumor stage, tumor grade, year of surgery categories, and
SEER registry. The methodology just described was repeated in the
subset of patients operated on between 2004 and 2006 with
available information on PSA primary Gleason grade, and secondary
Gleason grade (n = 21618). All statistical tests were performed with
S-PLUS Professional v.1.0 (TIBCO Software Inc, Palo Alto, CA, USA) with a
two-sided significance level set at < 0.05.
3. Results
A total of 130 080 patients treated with RP were evaluated
(Table 1). PLND was omitted (pNx) in 25.9% of patients. The
rate of pNx was 29% in pT2 patients versus 14.5% and 16.7%
in pT3 and pT4 patients, respectively ( p < 0.001). Similarly,
the rate of pNx was 27.0%, 27.2%, and 22.9% in patients with
Gleason scores 2–4, 5–7, and 8–10, respectively ( p < 0.001).
The rate of pNx increased in the most contemporary year of
the surgery category (30.1% in 2000–2006 vs 20.8% in 1988–
1993; p < 0.001). The rate of pNx varied between SEER
registries. For example, the pNx rate was 34.5% in New
Mexico versus 14.1% in Utah ( p < 0.001). In multivariable
analyses focusing on the rate of pNx stage (Table 2), tumor
stage, grade, year of surgery, SEER registry, age, and race
achieved an independent predictor status (all p < 0.001). In
the subset of patients treated between 2004 and 2006
(Table 2) with available data on PSA, the latter also achieved
independent predictor status ( p < 0.001).
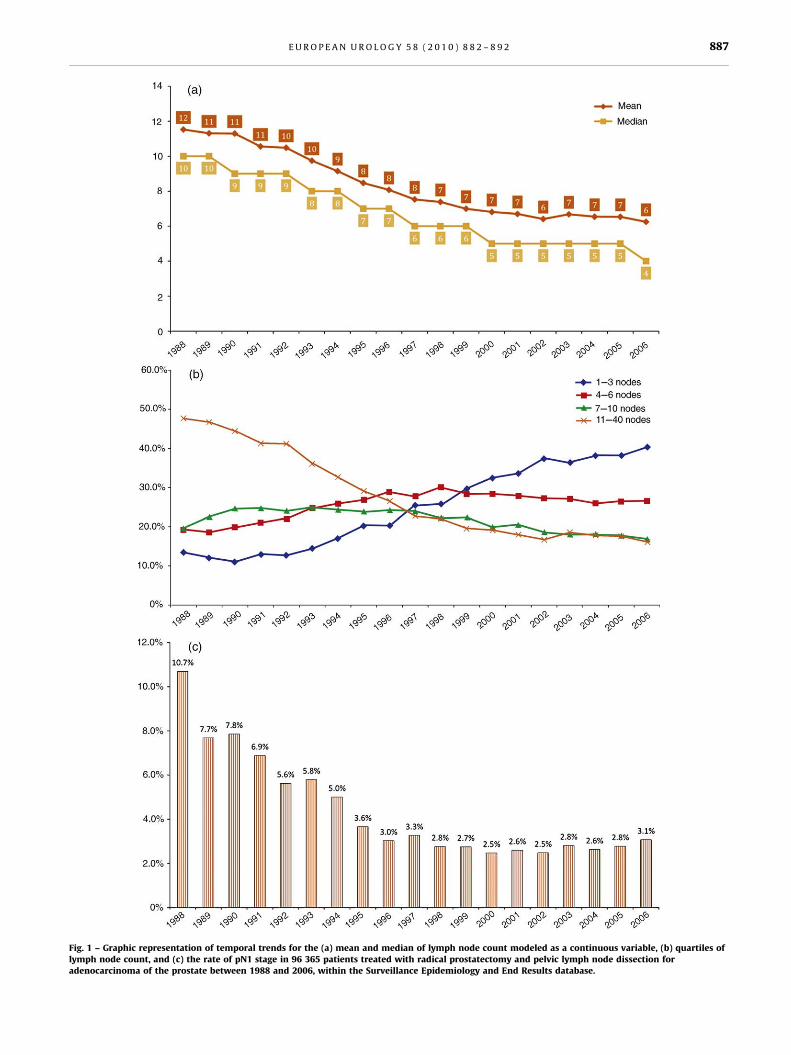
In 96 365 patients subjected to PLND (Table 3), the average
number of examined LNs was 7.4 (median: 6). Average LNC
decreased from 12.0 nodes (median: 12) in 1988 to 6.0 nodes
(median: 4) in 2006 ( p < 0.001; Fig. 1a). The quartile
classification of LNC was 1–3, 4–6, 7–10, and 11–40. Between
1988 and 2006, the percentage of patients in the first and
second LNC quartiles increased from 13.5% and 19.2% to
40.3% and 26.6%, respectively ( p < 0.001). Conversely, the
percentage of patients in the third and fourth quartiles
decreased from 19.7% and 47.6% to 17.0% and 16.1%,
respectively, for the same period ( p < 0.001; Fig. 1b). Linear
regression analyses focusing on the relationship between
LNC and SEER registry revealed a statistically significant
relationship between these two variables. The highest mean
and median LNC were 10 and 8 nodes, respectively, for San
Francisco-Oakland, and the lowest were 5 and 4 nodes,
respectively, for New Jersey ( p < 0.001, Fig. 1c).
In patients who underwent a PLND, the rate of pN1 stage
was 3.4% (Table 3). In pN1 patients, more LNs were
examined (mean: 10.8, median: 9.0) than in pN0 patients
(mean: 7.3, median: 6.0; p < 0.001). The rate of pN1 stage
was also directly related to tumor stage and grade (all
p < 0.001). A decrease in the rate of pN1 stage from 10.7% to
3.1% was recorded between 1988 and 2006 (chi-square
trend: p < 0.001; Fig. 1c). The rate of pN1 stage varied
significantly according to the SEER registry ( p < 0.001). For
example, the highest rate of pN1 stage (5.5%) was recorded
in the San Francisco-Oakland registry versus the lowest rate
(1.7%) in the New Jersey registry ( p < 0.001). In the subset
of patients operated on between 2004 and 2006, the rate of
pN1 stage increased with increasing serum PSA. The
proportions of pN1 stage were 2.0%, 1.9%, and 6.6% for
PSA strata of 0.1–4.0, 4.1–10.0, and >10.0 ng/ml, respec-
tively ( p < 0.001; Table 3).
The rate of pN1 stage was related to LNC. Specifically,
1.4% of patients in the first LNC quartile had pN1 stage
versus 2.8%, 3.8%, and 6.3% of patients in the second, third,
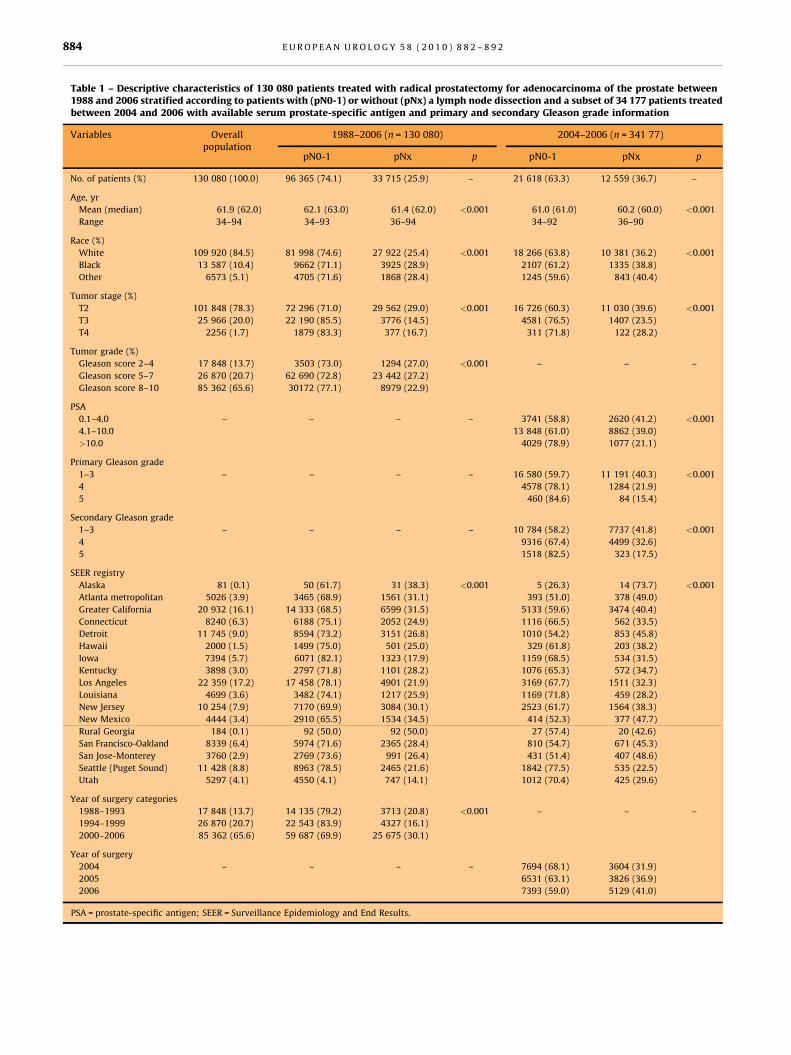
Table 1 – Descriptive characteristics of 130 080 patients treated with radical prostatectomy for adenocarcinoma of the prostate between1988 and 2006 stratified according to patients with (pN0-1) or without (pNx) a lymph node dissection and a subset of 34 177 patients treatedbetween 2004 and 2006 with available serum prostate-specific antigen and primary and secondary Gleason grade information
Variables Overallpopulation
1988–2006 (n = 130 080) 2004–2006 (n = 341 77)
pN0-1 pNx p pN0-1 pNx p
No. of patients (%) 130 080 (100.0) 96 365 (74.1) 33 715 (25.9) – 21 618 (63.3) 12 559 (36.7) –
Age, yr
Mean (median) 61.9 (62.0) 62.1 (63.0) 61.4 (62.0) <0.001 61.0 (61.0) 60.2 (60.0) <0.001
Range 34–94 34–93 36–94 34–92 36–90
Race (%)
White 109 920 (84.5) 81 998 (74.6) 27 922 (25.4) <0.001 18 266 (63.8) 10 381 (36.2) <0.001
Black 13 587 (10.4) 9662 (71.1) 3925 (28.9) 2107 (61.2) 1335 (38.8)
Other 6573 (5.1) 4705 (71.6) 1868 (28.4) 1245 (59.6) 843 (40.4)
Tumor stage (%)
T2 101 848 (78.3) 72 296 (71.0) 29 562 (29.0) <0.001 16 726 (60.3) 11 030 (39.6) <0.001
T3 25 966 (20.0) 22 190 (85.5) 3776 (14.5) 4581 (76.5) 1407 (23.5)
T4 2256 (1.7) 1879 (83.3) 377 (16.7) 311 (71.8) 122 (28.2)
Tumor grade (%)
Gleason score 2–4 17 848 (13.7) 3503 (73.0) 1294 (27.0) <0.001 – – –
Gleason score 5–7 26 870 (20.7) 62 690 (72.8) 23 442 (27.2)
Gleason score 8–10 85 362 (65.6) 30172 (77.1) 8979 (22.9)
PSA
0.1–4.0 – – – – 3741 (58.8) 2620 (41.2) <0.001
4.1–10.0 13 848 (61.0) 8862 (39.0)
>10.0 4029 (78.9) 1077 (21.1)
Primary Gleason grade
1–3 – – – – 16 580 (59.7) 11 191 (40.3) <0.001
4 4578 (78.1) 1284 (21.9)
5 460 (84.6) 84 (15.4)
Secondary Gleason grade
1–3 – – – – 10 784 (58.2) 7737 (41.8) <0.001
4 9316 (67.4) 4499 (32.6)
5 1518 (82.5) 323 (17.5)
SEER registry
Alaska 81 (0.1) 50 (61.7) 31 (38.3) <0.001 5 (26.3) 14 (73.7) <0.001
Atlanta metropolitan 5026 (3.9) 3465 (68.9) 1561 (31.1) 393 (51.0) 378 (49.0)
Greater California 20 932 (16.1) 14 333 (68.5) 6599 (31.5) 5133 (59.6) 3474 (40.4)
Connecticut 8240 (6.3) 6188 (75.1) 2052 (24.9) 1116 (66.5) 562 (33.5)
Detroit 11 745 (9.0) 8594 (73.2) 3151 (26.8) 1010 (54.2) 853 (45.8)
Hawaii 2000 (1.5) 1499 (75.0) 501 (25.0) 329 (61.8) 203 (38.2)
Iowa 7394 (5.7) 6071 (82.1) 1323 (17.9) 1159 (68.5) 534 (31.5)
Kentucky 3898 (3.0) 2797 (71.8) 1101 (28.2) 1076 (65.3) 572 (34.7)
Los Angeles 22 359 (17.2) 17 458 (78.1) 4901 (21.9) 3169 (67.7) 1511 (32.3)
Louisiana 4699 (3.6) 3482 (74.1) 1217 (25.9) 1169 (71.8) 459 (28.2)
New Jersey 10 254 (7.9) 7170 (69.9) 3084 (30.1) 2523 (61.7) 1564 (38.3)
New Mexico 4444 (3.4) 2910 (65.5) 1534 (34.5) 414 (52.3) 377 (47.7)
Rural Georgia 184 (0.1) 92 (50.0) 92 (50.0) 27 (57.4) 20 (42.6)
San Francisco-Oakland 8339 (6.4) 5974 (71.6) 2365 (28.4) 810 (54.7) 671 (45.3)
San Jose-Monterey 3760 (2.9) 2769 (73.6) 991 (26.4) 431 (51.4) 407 (48.6)
Seattle (Puget Sound) 11 428 (8.8) 8963 (78.5) 2465 (21.6) 1842 (77.5) 535 (22.5)
Utah 5297 (4.1) 4550 (4.1) 747 (14.1) 1012 (70.4) 425 (29.6)
Year of surgery categories
1988–1993 17 848 (13.7) 14 135 (79.2) 3713 (20.8) <0.001 – – –
1994–1999 26 870 (20.7) 22 543 (83.9) 4327 (16.1)
2000–2006 85 362 (65.6) 59 687 (69.9) 25 675 (30.1)
Year of surgery
2004 – – – – 7694 (68.1) 3604 (31.9)
2005 6531 (63.1) 3826 (36.9)
2006 7393 (59.0) 5129 (41.0)
PSA = prostate-specific antigen; SEER = Surveillance Epidemiology and End Results.
E U R O P E A N U R O L O G Y 5 8 ( 2 0 1 0 ) 8 8 2 – 8 9 2884
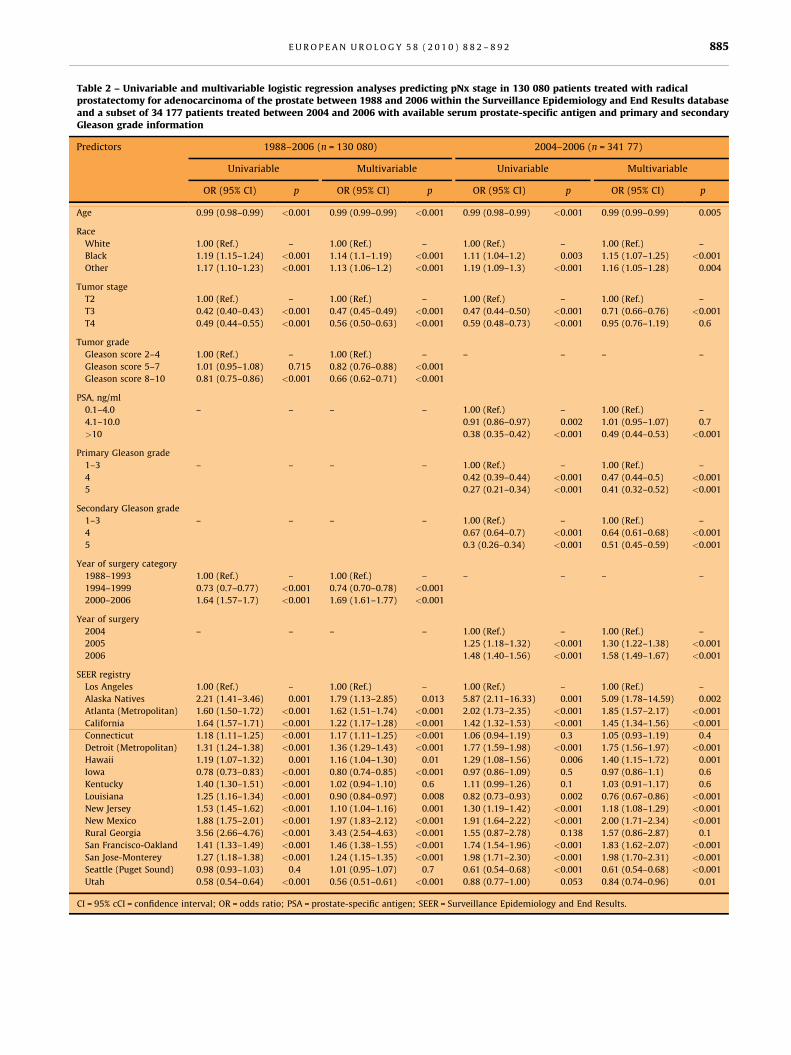
Table 2 – Univariable and multivariable logistic regression analyses predicting pNx stage in 130 080 patients treated with radicalprostatectomy for adenocarcinoma of the prostate between 1988 and 2006 within the Surveillance Epidemiology and End Results databaseand a subset of 34 177 patients treated between 2004 and 2006 with available serum prostate-specific antigen and primary and secondaryGleason grade information
Predictors 1988–2006 (n = 130 080) 2004–2006 (n = 341 77)
Univariable Multivariable Univariable Multivariable
OR (95% CI) p OR (95% CI) p OR (95% CI) p OR (95% CI) p
Age 0.99 (0.98–0.99) <0.001 0.99 (0.99–0.99) <0.001 0.99 (0.98–0.99) <0.001 0.99 (0.99–0.99) 0.005
Race
White 1.00 (Ref.) – 1.00 (Ref.) – 1.00 (Ref.) – 1.00 (Ref.) –
Black 1.19 (1.15–1.24) <0.001 1.14 (1.1–1.19) <0.001 1.11 (1.04–1.2) 0.003 1.15 (1.07–1.25) <0.001
Other 1.17 (1.10–1.23) <0.001 1.13 (1.06–1.2) <0.001 1.19 (1.09–1.3) <0.001 1.16 (1.05–1.28) 0.004
Tumor stage
T2 1.00 (Ref.) – 1.00 (Ref.) – 1.00 (Ref.) – 1.00 (Ref.) –
T3 0.42 (0.40–0.43) <0.001 0.47 (0.45–0.49) <0.001 0.47 (0.44–0.50) <0.001 0.71 (0.66–0.76) <0.001
T4 0.49 (0.44–0.55) <0.001 0.56 (0.50–0.63) <0.001 0.59 (0.48–0.73) <0.001 0.95 (0.76–1.19) 0.6
Tumor grade
Gleason score 2–4 1.00 (Ref.) – 1.00 (Ref.) – – – – –
Gleason score 5–7 1.01 (0.95–1.08) 0.715 0.82 (0.76–0.88) <0.001
Gleason score 8–10 0.81 (0.75–0.86) <0.001 0.66 (0.62–0.71) <0.001
PSA, ng/ml
0.1–4.0 – – – – 1.00 (Ref.) – 1.00 (Ref.) –
4.1–10.0 0.91 (0.86–0.97) 0.002 1.01 (0.95–1.07) 0.7
>10 0.38 (0.35–0.42) <0.001 0.49 (0.44–0.53) <0.001
Primary Gleason grade
1–3 – – – – 1.00 (Ref.) – 1.00 (Ref.) –
4 0.42 (0.39–0.44) <0.001 0.47 (0.44–0.5) <0.001
5 0.27 (0.21–0.34) <0.001 0.41 (0.32–0.52) <0.001
Secondary Gleason grade
1–3 – – – – 1.00 (Ref.) – 1.00 (Ref.) –
4 0.67 (0.64–0.7) <0.001 0.64 (0.61–0.68) <0.001
5 0.3 (0.26–0.34) <0.001 0.51 (0.45–0.59) <0.001
Year of surgery category
1988–1993 1.00 (Ref.) – 1.00 (Ref.) – – – – –
1994–1999 0.73 (0.7–0.77) <0.001 0.74 (0.70–0.78) <0.001
2000–2006 1.64 (1.57–1.7) <0.001 1.69 (1.61–1.77) <0.001
Year of surgery
2004 – – – – 1.00 (Ref.) – 1.00 (Ref.) –
2005 1.25 (1.18–1.32) <0.001 1.30 (1.22–1.38) <0.001
2006 1.48 (1.40–1.56) <0.001 1.58 (1.49–1.67) <0.001
SEER registry
Los Angeles 1.00 (Ref.) – 1.00 (Ref.) – 1.00 (Ref.) – 1.00 (Ref.) –
Alaska Natives 2.21 (1.41–3.46) 0.001 1.79 (1.13–2.85) 0.013 5.87 (2.11–16.33) 0.001 5.09 (1.78–14.59) 0.002
Atlanta (Metropolitan) 1.60 (1.50–1.72) <0.001 1.62 (1.51–1.74) <0.001 2.02 (1.73–2.35) <0.001 1.85 (1.57–2.17) <0.001
California 1.64 (1.57–1.71) <0.001 1.22 (1.17–1.28) <0.001 1.42 (1.32–1.53) <0.001 1.45 (1.34–1.56) <0.001
Connecticut 1.18 (1.11–1.25) <0.001 1.17 (1.11–1.25) <0.001 1.06 (0.94–1.19) 0.3 1.05 (0.93–1.19) 0.4
Detroit (Metropolitan) 1.31 (1.24–1.38) <0.001 1.36 (1.29–1.43) <0.001 1.77 (1.59–1.98) <0.001 1.75 (1.56–1.97) <0.001
Hawaii 1.19 (1.07–1.32) 0.001 1.16 (1.04–1.30) 0.01 1.29 (1.08–1.56) 0.006 1.40 (1.15–1.72) 0.001
Iowa 0.78 (0.73–0.83) <0.001 0.80 (0.74–0.85) <0.001 0.97 (0.86–1.09) 0.5 0.97 (0.86–1.1) 0.6
Kentucky 1.40 (1.30–1.51) <0.001 1.02 (0.94–1.10) 0.6 1.11 (0.99–1.26) 0.1 1.03 (0.91–1.17) 0.6
Louisiana 1.25 (1.16–1.34) <0.001 0.90 (0.84–0.97) 0.008 0.82 (0.73–0.93) 0.002 0.76 (0.67–0.86) <0.001
New Jersey 1.53 (1.45–1.62) <0.001 1.10 (1.04–1.16) 0.001 1.30 (1.19–1.42) <0.001 1.18 (1.08–1.29) <0.001
New Mexico 1.88 (1.75–2.01) <0.001 1.97 (1.83–2.12) <0.001 1.91 (1.64–2.22) <0.001 2.00 (1.71–2.34) <0.001
Rural Georgia 3.56 (2.66–4.76) <0.001 3.43 (2.54–4.63) <0.001 1.55 (0.87–2.78) 0.138 1.57 (0.86–2.87) 0.1
San Francisco-Oakland 1.41 (1.33–1.49) <0.001 1.46 (1.38–1.55) <0.001 1.74 (1.54–1.96) <0.001 1.83 (1.62–2.07) <0.001
San Jose-Monterey 1.27 (1.18–1.38) <0.001 1.24 (1.15–1.35) <0.001 1.98 (1.71–2.30) <0.001 1.98 (1.70–2.31) <0.001
Seattle (Puget Sound) 0.98 (0.93–1.03) 0.4 1.01 (0.95–1.07) 0.7 0.61 (0.54–0.68) <0.001 0.61 (0.54–0.68) <0.001
Utah 0.58 (0.54–0.64) <0.001 0.56 (0.51–0.61) <0.001 0.88 (0.77–1.00) 0.053 0.84 (0.74–0.96) 0.01
CI = 95% cCI = confidence interval; OR = odds ratio; PSA = prostate-specific antigen; SEER = Surveillance Epidemiology and End Results.
E U R O P E A N U R O L O G Y 5 8 ( 2 0 1 0 ) 8 8 2 – 8 9 2 885
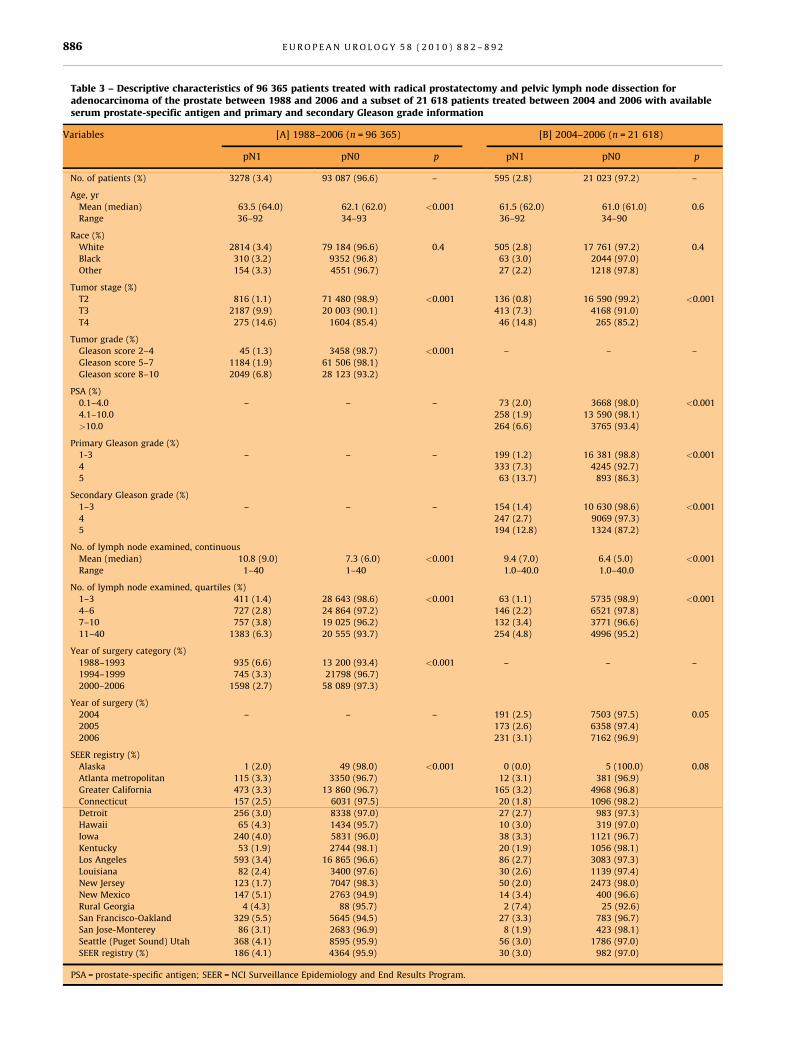
Table 3 – Descriptive characteristics of 96 365 patients treated with radical prostatectomy and pelvic lymph node dissection foradenocarcinoma of the prostate between 1988 and 2006 and a subset of 21 618 patients treated between 2004 and 2006 with availableserum prostate-specific antigen and primary and secondary Gleason grade information
Variables [A] 1988–2006 (n = 96 365) [B] 2004–2006 (n = 21 618)
pN1 pN0 p pN1 pN0 p
No. of patients (%) 3278 (3.4) 93 087 (96.6) – 595 (2.8) 21 023 (97.2) –
Age, yr
Mean (median) 63.5 (64.0) 62.1 (62.0) <0.001 61.5 (62.0) 61.0 (61.0) 0.6
Range 36–92 34–93 36–92 34–90
Race (%)
White 2814 (3.4) 79 184 (96.6) 0.4 505 (2.8) 17 761 (97.2) 0.4
Black 310 (3.2) 9352 (96.8) 63 (3.0) 2044 (97.0)
Other 154 (3.3) 4551 (96.7) 27 (2.2) 1218 (97.8)
Tumor stage (%)
T2 816 (1.1) 71 480 (98.9) <0.001 136 (0.8) 16 590 (99.2) <0.001
T3 2187 (9.9) 20 003 (90.1) 413 (7.3) 4168 (91.0)
T4 275 (14.6) 1604 (85.4) 46 (14.8) 265 (85.2)
Tumor grade (%)
Gleason score 2–4 45 (1.3) 3458 (98.7) <0.001 – – –
Gleason score 5–7 1184 (1.9) 61 506 (98.1)
Gleason score 8–10 2049 (6.8) 28 123 (93.2)
PSA (%)
0.1–4.0 – – – 73 (2.0) 3668 (98.0) <0.001
4.1–10.0 258 (1.9) 13 590 (98.1)
>10.0 264 (6.6) 3765 (93.4)
Primary Gleason grade (%)
1-3 – – – 199 (1.2) 16 381 (98.8) <0.001
4 333 (7.3) 4245 (92.7)
5 63 (13.7) 893 (86.3)
Secondary Gleason grade (%)
1–3 – – – 154 (1.4) 10 630 (98.6) <0.001
4 247 (2.7) 9069 (97.3)
5 194 (12.8) 1324 (87.2)
No. of lymph node examined, continuous
Mean (median) 10.8 (9.0) 7.3 (6.0) <0.001 9.4 (7.0) 6.4 (5.0) <0.001
Range 1–40 1–40 1.0–40.0 1.0–40.0
No. of lymph node examined, quartiles (%)
1–3 411 (1.4) 28 643 (98.6) <0.001 63 (1.1) 5735 (98.9) <0.001
4–6 727 (2.8) 24 864 (97.2) 146 (2.2) 6521 (97.8)
7–10 757 (3.8) 19 025 (96.2) 132 (3.4) 3771 (96.6)
11–40 1383 (6.3) 20 555 (93.7) 254 (4.8) 4996 (95.2)
Year of surgery category (%)
1988–1993 935 (6.6) 13 200 (93.4) <0.001 – – –
1994–1999 745 (3.3) 21798 (96.7)
2000–2006 1598 (2.7) 58 089 (97.3)
Year of surgery (%)
2004 – – – 191 (2.5) 7503 (97.5) 0.05
2005 173 (2.6) 6358 (97.4)
2006 231 (3.1) 7162 (96.9)
SEER registry (%)
Alaska 1 (2.0) 49 (98.0) <0.001 0 (0.0) 5 (100.0) 0.08
Atlanta metropolitan 115 (3.3) 3350 (96.7) 12 (3.1) 381 (96.9)
Greater California 473 (3.3) 13 860 (96.7) 165 (3.2) 4968 (96.8)
Connecticut 157 (2.5) 6031 (97.5) 20 (1.8) 1096 (98.2)
Detroit 256 (3.0) 8338 (97.0) 27 (2.7) 983 (97.3)
Hawaii 65 (4.3) 1434 (95.7) 10 (3.0) 319 (97.0)
Iowa 240 (4.0) 5831 (96.0) 38 (3.3) 1121 (96.7)
Kentucky 53 (1.9) 2744 (98.1) 20 (1.9) 1056 (98.1)
Los Angeles 593 (3.4) 16 865 (96.6) 86 (2.7) 3083 (97.3)
Louisiana 82 (2.4) 3400 (97.6) 30 (2.6) 1139 (97.4)
New Jersey 123 (1.7) 7047 (98.3) 50 (2.0) 2473 (98.0)
New Mexico 147 (5.1) 2763 (94.9) 14 (3.4) 400 (96.6)
Rural Georgia 4 (4.3) 88 (95.7) 2 (7.4) 25 (92.6)
San Francisco-Oakland 329 (5.5) 5645 (94.5) 27 (3.3) 783 (96.7)
San Jose-Monterey 86 (3.1) 2683 (96.9) 8 (1.9) 423 (98.1)
Seattle (Puget Sound) Utah 368 (4.1) 8595 (95.9) 56 (3.0) 1786 (97.0)
SEER registry (%) 186 (4.1) 4364 (95.9) 30 (3.0) 982 (97.0)
PSA = prostate-specific antigen; SEER = NCI Surveillance Epidemiology and End Results Program.
E U R O P E A N U R O L O G Y 5 8 ( 2 0 1 0 ) 8 8 2 – 8 9 2886
[(Fig._1)TD$FIG]
Fig. 1 – Graphic representation of temporal trends for the (a) mean and median of lymph node count modeled as a continuous variable, (b) quartiles oflymph node count, and (c) the rate of pN1 stage in 96 365 patients treated with radical prostatectomy and pelvic lymph node dissection foradenocarcinoma of the prostate between 1988 and 2006, within the Surveillance Epidemiology and End Results database.
E U R O P E A N U R O L O G Y 5 8 ( 2 0 1 0 ) 8 8 2 – 8 9 2 887
[(Fig._2)TD$FIG]
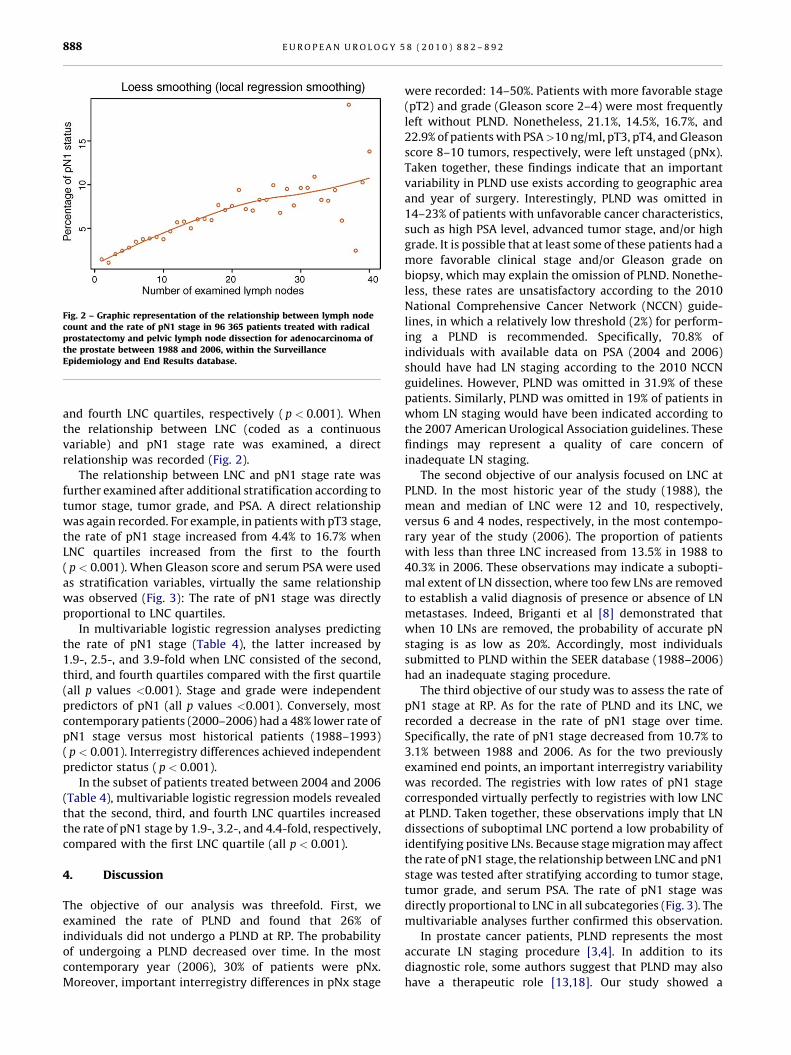
Fig. 2 – Graphic representation of the relationship between lymph nodecount and the rate of pN1 stage in 96 365 patients treated with radicalprostatectomy and pelvic lymph node dissection for adenocarcinoma ofthe prostate between 1988 and 2006, within the SurveillanceEpidemiology and End Results database.
E U R O P E A N U R O L O G Y 5 8 ( 2 0 1 0 ) 8 8 2 – 8 9 2888
and fourth LNC quartiles, respectively ( p < 0.001). When
the relationship between LNC (coded as a continuous
variable) and pN1 stage rate was examined, a direct
relationship was recorded (Fig. 2).
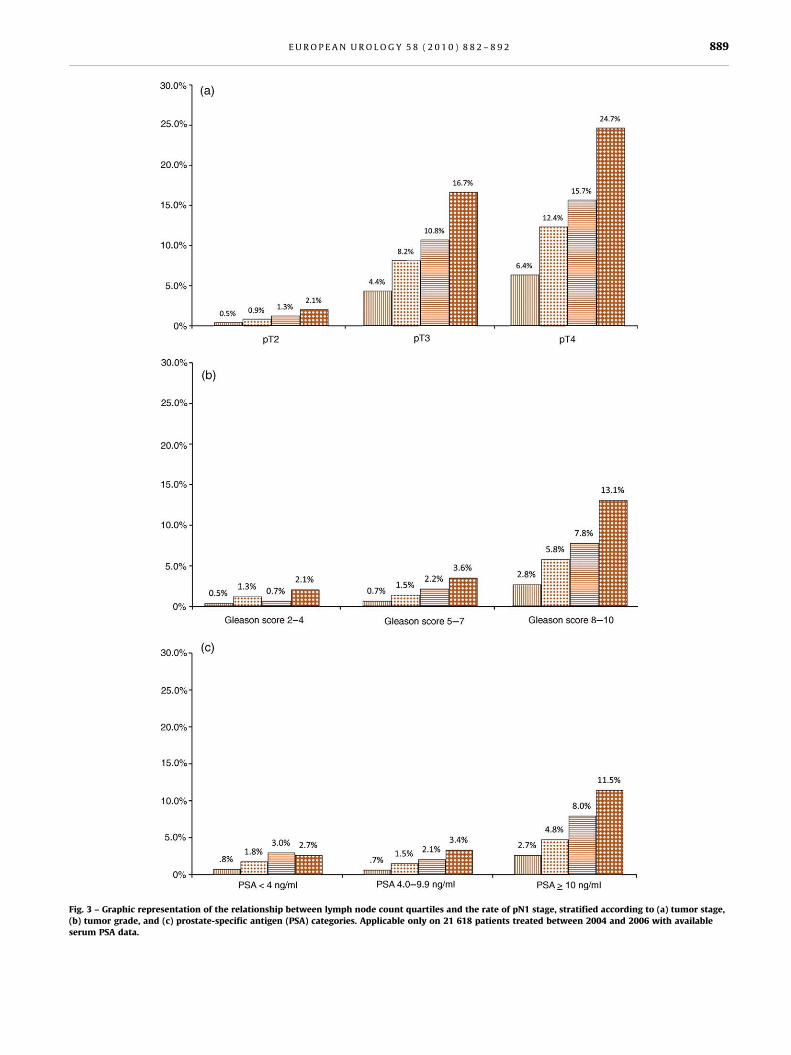
The relationship between LNC and pN1 stage rate was
further examined after additional stratification according to
tumor stage, tumor grade, and PSA. A direct relationship
was again recorded. For example, in patients with pT3 stage,
the rate of pN1 stage increased from 4.4% to 16.7% when
LNC quartiles increased from the first to the fourth
( p < 0.001). When Gleason score and serum PSA were used
as stratification variables, virtually the same relationship
was observed (Fig. 3): The rate of pN1 stage was directly
proportional to LNC quartiles.
In multivariable logistic regression analyses predicting
the rate of pN1 stage (Table 4), the latter increased by
1.9-, 2.5-, and 3.9-fold when LNC consisted of the second,
third, and fourth quartiles compared with the first quartile
(all p values <0.001). Stage and grade were independent
predictors of pN1 (all p values <0.001). Conversely, most
contemporary patients (2000–2006) had a 48% lower rate of
pN1 stage versus most historical patients (1988–1993)
( p < 0.001). Interregistry differences achieved independent
predictor status ( p < 0.001).
In the subset of patients treated between 2004 and 2006
(Table 4), multivariable logistic regression models revealed
that the second, third, and fourth LNC quartiles increased
the rate of pN1 stage by 1.9-, 3.2-, and 4.4-fold, respectively,
compared with the first LNC quartile (all p < 0.001).
4. Discussion
The objective of our analysis was threefold. First, we
examined the rate of PLND and found that 26% of
individuals did not undergo a PLND at RP. The probability
of undergoing a PLND decreased over time. In the most
contemporary year (2006), 30% of patients were pNx.
Moreover, important interregistry differences in pNx stage
were recorded: 14–50%. Patients with more favorable stage
(pT2) and grade (Gleason score 2–4) were most frequently
left without PLND. Nonetheless, 21.1%, 14.5%, 16.7%, and
22.9% of patients with PSA>10 ng/ml, pT3, pT4, and Gleason
score 8–10 tumors, respectively, were left unstaged (pNx).
Taken together, these findings indicate that an important
variability in PLND use exists according to geographic area
and year of surgery. Interestingly, PLND was omitted in
14–23% of patients with unfavorable cancer characteristics,
such as high PSA level, advanced tumor stage, and/or high
grade. It is possible that at least some of these patients had a
more favorable clinical stage and/or Gleason grade on
biopsy, which may explain the omission of PLND. Nonethe-
less, these rates are unsatisfactory according to the 2010
National Comprehensive Cancer Network (NCCN) guide-
lines, in which a relatively low threshold (2%) for perform-
ing a PLND is recommended. Specifically, 70.8% of
individuals with available data on PSA (2004 and 2006)
should have had LN staging according to the 2010 NCCN
guidelines. However, PLND was omitted in 31.9% of these
patients. Similarly, PLND was omitted in 19% of patients in
whom LN staging would have been indicated according to
the 2007 American Urological Association guidelines. These
findings may represent a quality of care concern of
inadequate LN staging.
The second objective of our analysis focused on LNC at
PLND. In the most historic year of the study (1988), the
mean and median of LNC were 12 and 10, respectively,
versus 6 and 4 nodes, respectively, in the most contempo-
rary year of the study (2006). The proportion of patients
with less than three LNC increased from 13.5% in 1988 to
40.3% in 2006. These observations may indicate a subopti-
mal extent of LN dissection, where too few LNs are removed
to establish a valid diagnosis of presence or absence of LN
metastases. Indeed, Briganti et al [8] demonstrated that
when 10 LNs are removed, the probability of accurate pN
staging is as low as 20%. Accordingly, most individuals
submitted to PLND within the SEER database (1988–2006)
had an inadequate staging procedure.
The third objective of our study was to assess the rate of
pN1 stage at RP. As for the rate of PLND and its LNC, we
recorded a decrease in the rate of pN1 stage over time.
Specifically, the rate of pN1 stage decreased from 10.7% to
3.1% between 1988 and 2006. As for the two previously
examined end points, an important interregistry variability
was recorded. The registries with low rates of pN1 stage
corresponded virtually perfectly to registries with low LNC
at PLND. Taken together, these observations imply that LN
dissections of suboptimal LNC portend a low probability of
identifying positive LNs. Because stage migration may affect
the rate of pN1 stage, the relationship between LNC and pN1
stage was tested after stratifying according to tumor stage,
tumor grade, and serum PSA. The rate of pN1 stage was
directly proportional to LNC in all subcategories (Fig. 3). The
multivariable analyses further confirmed this observation.
In prostate cancer patients, PLND represents the most
accurate LN staging procedure [3,4]. In addition to its
diagnostic role, some authors suggest that PLND may also
have a therapeutic role [13,18]. Our study showed a
[(Fig._3)TD$FIG]
Fig. 3 – Graphic representation of the relationship between lymph node count quartiles and the rate of pN1 stage, stratified according to (a) tumor stage,(b) tumor grade, and (c) prostate-specific antigen (PSA) categories. Applicable only on 21 618 patients treated between 2004 and 2006 with availableserum PSA data.
E U R O P E A N U R O L O G Y 5 8 ( 2 0 1 0 ) 8 8 2 – 8 9 2 889
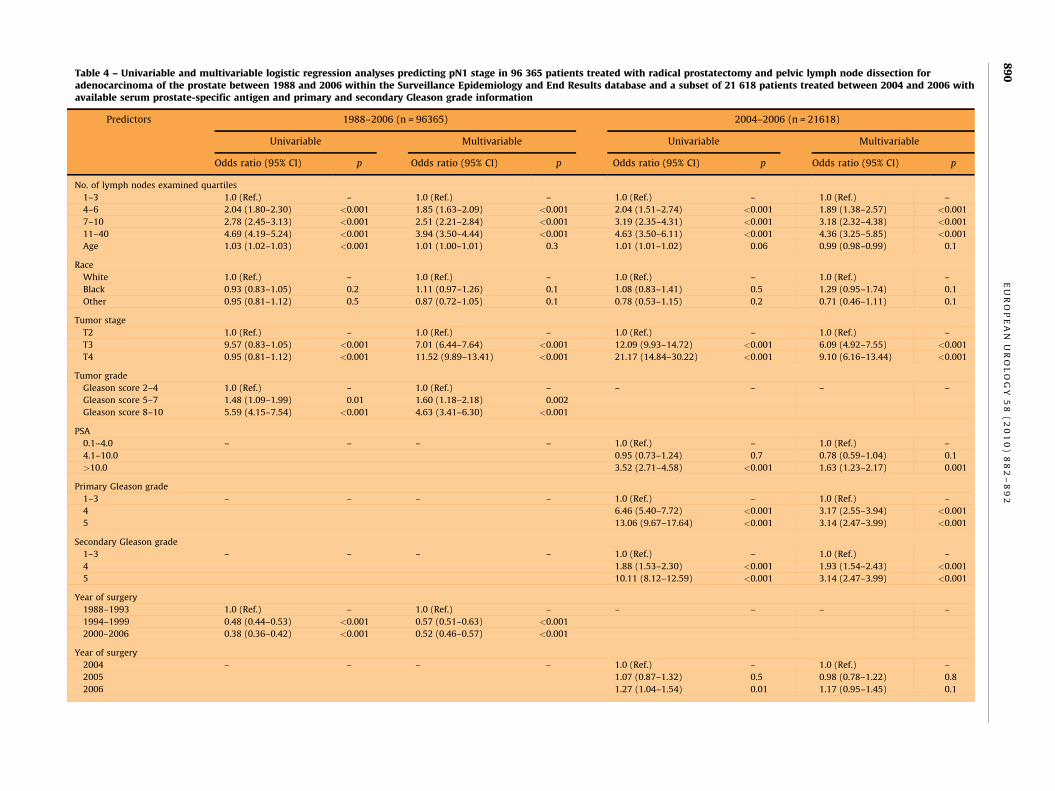
Table 4 – Univariable and multivariable logistic regression analyses predicting pN1 stage in 96 365 patients treated with radical prostatectomy and pelvic lymph node dissection foradenocarcinoma of the prostate between 1988 and 2006 within the Surveillance Epidemiology and End Results database and a subset of 21 618 patients treated between 2004 and 2006 withavailable serum prostate-specific antigen and primary and secondary Gleason grade information
Predictors 1988–2006 (n = 96365) 2004–2006 (n = 21618)
Univariable Multivariable Univariable Multivariable
Odds ratio (95% CI) p Odds ratio (95% CI) p Odds ratio (95% CI) p Odds ratio (95% CI) p
No. of lymph nodes examined quartiles
1–3 1.0 (Ref.) – 1.0 (Ref.) – 1.0 (Ref.) – 1.0 (Ref.) –
4–6 2.04 (1.80–2.30) <0.001 1.85 (1.63–2.09) <0.001 2.04 (1.51–2.74) <0.001 1.89 (1.38–2.57) <0.001
7–10 2.78 (2.45–3.13) <0.001 2.51 (2.21–2.84) <0.001 3.19 (2.35–4.31) <0.001 3.18 (2.32–4.38) <0.001
11–40 4.69 (4.19–5.24) <0.001 3.94 (3.50–4.44) <0.001 4.63 (3.50–6.11) <0.001 4.36 (3.25–5.85) <0.001
Age 1.03 (1.02–1.03) <0.001 1.01 (1.00–1.01) 0.3 1.01 (1.01–1.02) 0.06 0.99 (0.98–0.99) 0.1
Race
White 1.0 (Ref.) – 1.0 (Ref.) – 1.0 (Ref.) – 1.0 (Ref.) –
Black 0.93 (0.83–1.05) 0.2 1.11 (0.97–1.26) 0.1 1.08 (0.83–1.41) 0.5 1.29 (0.95–1.74) 0.1
Other 0.95 (0.81–1.12) 0.5 0.87 (0.72–1.05) 0.1 0.78 (0.53–1.15) 0.2 0.71 (0.46–1.11) 0.1
Tumor stage
T2 1.0 (Ref.) – 1.0 (Ref.) – 1.0 (Ref.) – 1.0 (Ref.) –
T3 9.57 (0.83–1.05) <0.001 7.01 (6.44–7.64) <0.001 12.09 (9.93–14.72) <0.001 6.09 (4.92–7.55) <0.001
T4 0.95 (0.81–1.12) <0.001 11.52 (9.89–13.41) <0.001 21.17 (14.84–30.22) <0.001 9.10 (6.16–13.44) <0.001
Tumor grade
Gleason score 2–4 1.0 (Ref.) – 1.0 (Ref.) – – – – –
Gleason score 5–7 1.48 (1.09–1.99) 0.01 1.60 (1.18–2.18) 0.002
Gleason score 8–10 5.59 (4.15–7.54) <0.001 4.63 (3.41–6.30) <0.001
PSA
0.1–4.0 – – – – 1.0 (Ref.) – 1.0 (Ref.) –
4.1–10.0 0.95 (0.73–1.24) 0.7 0.78 (0.59–1.04) 0.1
>10.0 3.52 (2.71–4.58) <0.001 1.63 (1.23–2.17) 0.001
Primary Gleason grade
1–3 – – – – 1.0 (Ref.) – 1.0 (Ref.) –
4 6.46 (5.40–7.72) <0.001 3.17 (2.55–3.94) <0.001
5 13.06 (9.67–17.64) <0.001 3.14 (2.47–3.99) <0.001
Secondary Gleason grade
1–3 – – – – 1.0 (Ref.) – 1.0 (Ref.) –
4 1.88 (1.53–2.30) <0.001 1.93 (1.54–2.43) <0.001
5 10.11 (8.12–12.59) <0.001 3.14 (2.47–3.99) <0.001
Year of surgery
1988–1993 1.0 (Ref.) – 1.0 (Ref.) – – – – –
1994–1999 0.48 (0.44–0.53) <0.001 0.57 (0.51–0.63) <0.001
2000–2006 0.38 (0.36–0.42) <0.001 0.52 (0.46–0.57) <0.001
Year of surgery
2004 – – – – 1.0 (Ref.) – 1.0 (Ref.) –
2005 1.07 (0.87–1.32) 0.5 0.98 (0.78–1.22) 0.8
2006 1.27 (1.04–1.54) 0.01 1.17 (0.95–1.45) 0.1
EU
RO
PE
AN
UR
OL
OG
Y5
8(
20
10
)8
82
–8
92
89
0
SE
ER
reg
istr
y
Los
An
ge
les
1.0
(Re
f.)
–1
.0(R
ef.
)–
1.0
(Re
f.)
–1
.0(R
ef.
)–
Ala
ska
Na
tiv
es
0.5
8(0
.08
–4
.21
)0
.60
.98
(0.1
3–
7.5
1)
0.9
0.0
1(0
.0–
9.9
)0
.80
.01
(0.0
1–
8.5
0)
0.9
Atl
an
ta(m
etr
op
oli
tan
)0
.98
(0.8
0–
1.2
0)
0.8
1.2
7(1
.02
–1
.57
)0
.03
1.1
3(0
.61
–2
.08
)0
.61
.89
(0.9
7–
3.6
6)
0.1
Ca
lifo
rnia
0.9
7(0
.86
–1
.10
)0
.61
.27
(1.1
1–
1.4
6)
0.0
01
1.1
9(0
.91
–1
.55
)0
.11
.14
(0.8
6–
1.5
2)
0.3
Co
nn
ect
icu
t0
.74
(0.6
2–
0.8
8)
0.0
01
0.9
2(0
.76
–1
.11
)0
.40
.65
(0.4
0–
1.0
7)
0.0
10
.67
(0.4
0–
1.1
3)
0.1
De
tro
it(m
etr
op
oli
tan
)0
.87
(0.7
5–
1.0
1)
0.0
70
.97
(0.8
3–
1.1
4)
0.7
0.9
8(0
.64
–1
.53
)0
.90
.94
(0.5
8–
1.5
0)
0.7
Ha
wa
ii1
.29
(0.9
9–
1.6
7)
0.0
61
.24
(0.9
2–
1.6
6)
0.2
1.1
2(0
.58
–2
.18
)0
.71
.11
(0.5
3–
2.3
5)
0.7
Iow
a1
.17
(1.0
0–
1.3
6)
0.0
41
.26
(1.0
7–
1.4
8)
0.0
05
1.2
2(0
.82
–1
.79
)0
.31
.36
(0.8
9–
2.0
7)
0.1
Ke
ntu
cky
0.5
5(0
.41
–0
.73
)<
0.0
01
0.9
3(0
.69
–1
.25
)0
.60
.68
(0.4
2–
1.1
1)
0.1
0.8
6(0
.51
–1
.45
)0
.5
Lou
isia
na
0.6
9(0
.54
–0
.87
)0
.00
21
.04
(0.8
1–
1.3
4)
0.7
0.9
4(0
.62
–1
.44
)0
.71
.17
(0.7
3–
1.8
5)
0.5
Ne
wJe
rse
y0
.50
(0.4
1–
0.6
0)
<0
.00
10
.88
(0.7
1–
1.0
9)
0.2
0.7
2(0
.51
–1
.03
)0
.10
.86
(0.5
9–
1.2
6)
0.4
Ne
wM
ex
ico
1.5
1(1
.26
–1
.82
)<
0.0
01
1.4
8(1
.21
–1
.80
)<
0.0
01
1.2
5(0
.71
–2
.23
)0
.41
.91
(1.0
3–
3.5
6)
0.0
4
Ru
ral
Ge
org
ia1
.29
(0.4
7–
3.5
3)
0.6
1.4
3(0
.50
–4
.08
)0
.52
.87
(0.6
7–
12
.30
)0
.12
.72
(0.5
9–
12
.63
)0
.2
Sa
nFr
an
cisc
o-O
ak
lan
d1
.66
(1.4
4–
1.9
0)
<0
.00
11
.50
(1.2
9–
1.7
4)
<0
.00
11
.24
(0.8
0–
1.9
2)
0.3
1.3
0(0
.81
–2
.08
)0
.2
Sa
nJo
se-M
on
tere
y0
.91
(0.7
2–
1.1
5)
0.4
1.3
1(1
.03
–1
.66
)0
.03
0.6
8(0
.33
–1
.41
)0
.21
.14
(0.5
2–
2.4
9)
0.7
Se
att
le(P
ug
et
So
un
d)
1.2
2(1
.07
–1
.39
)0
.00
41
.36
(1.1
8–
1.5
7)
<0
.00
11
.12
(0.8
0–
1.5
8)
0.5
1.1
2(0
.77
–1
.61
)0
.5
Uta
h1
.21
(1.0
2–
1.4
3)
0.0
31
.20
(1.0
1–
1.4
4)
0.0
41
.10
(0.7
2–
1.6
7)
0.6
1.3
4(0
.85
–2
.11
)0
.2
CI
=co
nfi
de
nce
inte
rva
l;P
SA
:p
rost
ate
-sp
eci
fic
an
tig
en
;S
EE
R=
NC
IS
urv
eil
lan
ceE
pid
em
iolo
gy
an
dE
nd
Re
sult
sP
rog
ram
.
E U R O P E A N U R O L O G Y 5 8 ( 2 0 1 0 ) 8 8 2 – 8 9 2 891
decreasing rate of PLND and LNC over time. This observation
corroborates previous findings. Specifically, DiMarco et al
[19] showed that LNC decreased from a median of 14 LNs in
1987–1989 to 5 LNs in 1999–2000. As in several previous
reports, the removal of fewer LNs was associated with a
lower rate of pN1 stage [7–10,12,18]. However, virtually
all previous studies represented single institutional series
with limited sample sizes. Our report represents the largest
and most contemporary population-based analysis that
has addressed the rate of PLND use and its LNC over
the past two decades. Moreover, we demonstrated that
the direct relationship between PLND extent and pN1 stage
is independent from serum PSA, tumor stage, and tumor
grade.
Our study is not devoid of limitations. First, we were
unable to characterize the anatomic borders of PLND, and
we could not address whether LNs were submitted en bloc
or in separate packets, which is known to affect LNC [20,21].
LN specimens were not handled according to a standardized
pathologic protocol. These limitations are shared by
virtually all reports based on the SEER database that
address a similar topic [18,22,23]. Second, stage migration
may have played a role in our results. However, our analyses
captured patients exclusively in the PSA era. Moreover, even
in patients with a low PSA, organ-confined disease, and/or a
low grade, lower LNC was associated with a lower rate of
pN1 (Fig. 3). This was further confirmed in the multivariable
analyses that were adjusted for tumor characteristics as
well as year of surgery. Thus stage migration alone cannot
explain our findings. Finally, it is possible that the
introduction of minimally invasive RP may have contribut-
ed to the drop in LNC. Unfortunately, the SEER database
does not distinguish between open or minimally invasive
RP. However, the drop in LNC, regardless of its cause, is
associated with a less accurate LN staging.
5. Conclusions
Our study showed a clear trend with fewer PLNDs
performed over time at RP, even in patients with
unfavorable preoperative clinical and/or pathologic char-
acteristics. Additionally, when PLND is performed, LNC is
frequently insufficient, which undermines the ability of
PLND to detect pN1 stage. As a direct result, fewer patients
are diagnosed with LN metastases. Our findings cannot be
attributed exclusively to stage migration. The impact of
this phenomenon on cancer control outcomes still needs to
be verified.
Author contributions: Firas Abdollah had full access to all the data in the
study and takes responsibility for the integrity of the data and the
accuracy of the data analysis.
Study concept and design: Abdollah, Briganti, Karakiewicz.
Acquisition of data: Abdollah, Sun, Budaus, Thuret.
Analysis and interpretation of data: Abdollah, Sun, Jeldres.
Drafting of the manuscript: Abdollah, Sun, Karakiewicz.
Critical revision of the manuscript for important intellectual content: Rigatti,
Montorsi, Graefen, Karakiewicz.
E U R O P E A N U R O L O G Y 5 8 ( 2 0 1 0 ) 8 8 2 – 8 9 2892
Statistical analysis: Abdollah, Sun, Thuret.
Obtaining funding: Karakiewicz.
Administrative, technical, or material support: Perrotte, Karakiewicz.
Supervision: Montorsi, Karakiewicz.
Other (specify): None.
Financial disclosures: I certify that all conflicts of interest, including
specific financial interests and relationships and affiliations relevant to the
subject matter or materials discussed in the manuscript (eg, employment/
affiliation, grants or funding, consultancies, honoraria, stock ownership or
options, expert testimony, royalties, or patents filed, received, or pending),
are the following: Pierre I. Karakiewicz is partially supported by the
University of Montreal Health Center Fonds de la Recherche en Sante du
Quebec, the University of Montreal Department of Surgery, and the
University of Montreal Health Center (CHUM) Foundation.
Funding/Support and role of the sponsor: None.
References
[1] Lin DW, Porter M, Montgomery B. Treatment and survival outcomes
in young men diagnosed with prostate cancer: a population-based
cohort study. Cancer 2009;115:2863–71.
[2] Liu L, Coker AL, Du XL, Cormier JN, Ford CE, Fang S. Long-term
survival after radical prostatectomy compared to other treatments
in older men with local/regional prostate cancer. J Surg Oncol 2008;
97:583–91.
[3] Briganti A, Blute ML, Eastham JH, et al. Pelvic lymph node dissection
in prostate cancer. Eur Urol 2009;55:1251–65.
[4] Heidenreich A, Aus G, Bolla M, et al. EAU guidelines on prostate
cancer. Eur Urol 2008;53:68–80.
[5] Bishoff JT, Reyes A, Thompson IM, et al. Pelvic lymphadenectomy can
be omitted in selected patients with carcinoma of the prostate:
development of a system of patient selection. Urology 1995;45:
270–4.
[6] Klein EA, Kattan M, Stephenson A, Vickers A. How many lymphad-
enectomies does it take to cure one patient? Eur Urol 2008;53:13–
5, discussion 18–20.
[7] Allaf ME, Palapattu GS, Trock BJ, Carter HB, Walsh PC. Anatomical
extent of lymph node dissection: impact on men with clinically
localized prostate cancer. J Urol 2004;172:1840–4.
[8] Briganti A, Chun FK, Salonia A, et al. Critical assessment of ideal
nodal yield at pelvic lymphadenectomy to accurately diagnose
prostate cancer nodal metastasis in patients undergoing radical
retropubic prostatectomy. Urology 2007;69:147–51.
[9] Bader P, Burkhard FC, Markwalder R, Studer UE. Is a limited lymph
node dissection an adequate staging procedure for prostate cancer?
J Urol 2002;168:514–8, discussion 518.
[10] Barth PJ, Gerharz EW, Ramaswamy A, Riedmiller H. The influence of
lymph node counts on the detection of pelvic lymph node metas-
tasis in prostate cancer. Pathol Res Pract 1999;195:633–6.
[11] Clark T, Parekh DJ, Cookson MS, et al. Randomized prospective
evaluation of extended versus limited lymph node dissection in
patients with clinically localized prostate cancer. J Urol 2003;169:
145–7, discussion 147–8.
[12] Heidenreich A, Varga Z, Von Knobloch R. Extended pelvic
lymphadenectomy in patients undergoing radical prostatectomy:
high incidence of lymph node metastasis. J Urol 2002;167:1681–6.
[13] Masterson TA, Bianco Jr FJ, Vickers AJ, et al. The association between
total and positive lymph node counts, and disease progression in
clinically localized prostate cancer. J Urol 2006;175:1320–4, dis-
cussion 1324–5.
[14] Stone NN, Stock RG, Unger P. Laparoscopic pelvic lymph node
dissection for prostate cancer: comparison of the extended and
modified techniques. J Urol 1997;158:1891–4.
[15] Touijer K, Rabbani F, Otero JR, et al. Standard versus limited pelvic
lymph node dissection for prostate cancer in patients with a pre-
dicted probability of nodal metastasis greater than 1%. J Urol 2007;
178:120–4.
[16] Ries LAG, Melbert D, Krapcho M, et al. SEER cancer statistics review,
1975-2004. Bethesda, MD: National Cancer Institute. SEER Web
site. http://seer.cancer.gov/csr/1975_2004/.
[17] Cleveland WS. Robust locally weighted regression and smoothing
scatterplots. J Am Stat Assoc 1979;74:829–36.
[18] Joslyn SA, Konety BR. Impact of extent of lymphadenectomy on
survival after radical prostatectomy for prostate cancer. Urology
2006;68:121–5.
[19] DiMarco DS, Zincke H, Sebo TJ, Slezak J, Bergstralh EJ, Blute ML. The
extent of lymphadenectomy for pTXNO prostate cancer does not
affect prostate cancer outcome in the prostate specific antigen era. J
Urol 2005;173:1121–5.
[20] Bochner BH, Cho D, Herr HW, Donat M, Kattan MW, Dalbagni G.
Prospectively packaged lymph node dissections with radical cys-
tectomy: evaluation of node count variability and node mapping. J
Urol 2004;172:1286–90.
[21] Bochner BH, Herr HW, Reuter VE. Impact of separate versus en bloc
pelvic lymph node dissection on the number of lymph nodes
retrieved in cystectomy specimens. J Urol 2001;166:2295–6.
[22] Konety BR, Joslyn SA, O’Donnell MA. Extent of pelvic lymphadenec-
tomy and its impact on outcome in patients diagnosed with bladder
cancer: analysis of data from the Surveillance. Epidemiology and
End Results Program data base. J Urol 2003;169:946–50.
[23] Wright JL, Lin DW, Porter MP. The association between extent
of lymphadenectomy and survival among patients with lymph
node metastases undergoing radical cystectomy. Cancer 2008;112:
2401–8.


