Embed Size (px)
Citation preview
Defining Neighborhood Boundaries for Urban Health Research
Linda Weiss, PhD1, Danielle Ompad, PhD2, Sandro Galea, MD, DrPH2,3, and David Vlahov,PhD2
1 Office of Special Populations, The New York Academy of Medicine, New York, NY
2 Center for Urban Epidemiologic Studies, The New York Academy of Medicine, New York, NY
3 Center for Social Epidemiology and Population Health, University of Michigan School of Public Health,Ann Arbor, MI
AbstractThe body of literature exploring neighborhood effects on health has increased rapidly in recent years,yet a number of methodological concerns remain, including preferred methods for identification anddelineation of study neighborhoods. In research combining census or other publicly available datawith surveys of residents and/or street-level observations, questions regarding neighborhooddefinition take on added significance. Neighborhoods must be identified and delineated in such away as to optimize quality and availability of data from each of these sources.
IMPACT, a multi-level study examining associations between features of the urban environment andmental health, drug use, and sexual behavior, utilized a multi-step neighborhood definition processincluding development of census block group maps, review of land use and census tract data, andfield visits and observation in each of the targeted communities. Field observations were guided bya pre-identified list of environmental features focused on the potential for recruitment (e.g. pedestrianvolume); characteristics commonly used to define neighborhood boundaries (e.g. obstructions topedestrian traffic, changes in land use), and characteristics that have been associated in the literaturewith health behaviors and health outcomes (such as housing type, maintenance and use of openspaces). This process, implemented in February through July 2005, proved feasible and offered theopportunity to identify neighborhoods appropriate to study objectives and to collect descriptiveinformation that can be used as a context for understanding study results.
INTRODUCTIONThe body of literature exploring neighborhood effects on health has increased rapidly in recentyears.1–3 Social, institutional, and physical characteristics of neighborhoods are being linkedto a variety of health behaviors4–6 and outcomes7 including substance abuse,8, 9 asthma,10cardiovascular disease,11, 12 birth outcomes,13–15 respiratory infections,16 sexuallytransmitted diseases,17 cancer,18 and all-cause mortality.19–22 Methodologic concernsremain,3, 23–28 however, including specification of social, institutional and physicalcharacteristics of neighborhoods that should be included in such research; appropriate methodsfor collecting neighborhood data (e.g., resident surveys, secondary source data, and/or direct,
Correspondence and reprints requests: Linda Weiss, PhD, Office of Special Populations, The New York Academy of Medicine, 1216Fifth Avenue, New York, NY 10029, Tel: 212-822-7298; Fax: 212-876-4220; E-mail: [email protected]'s Disclaimer: This is a PDF file of an unedited manuscript that has been accepted for publication. As a service to our customerswe are providing this early version of the manuscript. The manuscript will undergo copyediting, typesetting, and review of the resultingproof before it is published in its final citable form. Please note that during the production process errors may be discovered which couldaffect the content, and all legal disclaimers that apply to the journal pertain.
NIH Public AccessAuthor ManuscriptAm J Prev Med. Author manuscript; available in PMC 2008 July 15.
Published in final edited form as:Am J Prev Med. 2007 June ; 32(6 Suppl): S154–S159.
NIH
-PA Author Manuscript
NIH
-PA Author Manuscript
NIH
-PA Author Manuscript
systematic observation); and guidelines for identification and delineation of studyneighborhoods.
Interest in neighborhoods and the impact they have on residents has spanned decades anddisciplines,29–32 including sociology, child development, and public health. There is ageneral, if not unanimous, consensus within the literature that “neighborhood” refers to ageographic unit of limited size, with relative homogeneity in housing and population, as wellas some level of social interaction and symbolic significance to residents.33, 34 Thesubjectivity of neighborhood boundaries, demonstrated repeatedly in empirical research,35,36 is also widely accepted.37 Social connections, common use of public facilities (e.g., schools,shopping areas), and physical barriers (e.g., major thoroughfares) may contribute to overlap inresidents’ neighborhood definitions, but their perceptions are also affected by individualcharacteristics, such as gender, age, and daily activities.34, 38, 39 Particularly in cities, wherelocal travel is easy and frequent, neighborhood boundaries are likely to be malleable.
Given the difficulties inherent in neighborhood delineation, public health researchers havemost often opted for pre-defined boundaries consistent with sociodemographic and health dataavailable from secondary sources (e.g., census tracts in the U.S., electoral wards in the UK).26 Pre-defined boundaries are easily identified, replicable, and obviously allow for the use ofsecondary source data. Their disadvantage rests in possible discrepancies with contemporarysettlement patterns and resident perceptions of neighborhood boundaries. Local-levelvariability may be obscured within these pre-selected units, particularly if they are too large.26 In addition, exclusive reliance on secondary source boundaries may be inefficient for studiesinvolving primary data collection, as it may be impossible to discern, prior to the start of datacollection, if factors of interest are present in the selected geographic areas. Despite theselimitations, there is little in the public health literature suggesting that alternative methods fordelineating neighborhood boundaries have been attempted.26 Direct observations andelicitation of resident perceptions of neighborhood boundaries represent alternatives to pre-defined boundaries but are generally dismissed as subjective, inconsistent (internally and withrespect to secondary source data), and/or labor intensive.17, 23, 25
This paper describes methods used for defining neighborhood boundaries for research purposesthat supplements census block group information with reviews of publicly available land-usedata and systematic observation. The objective in combining these methods was the selectionof neighborhood boundaries consistent with census data, study recruitment goals, and residencepatterns. A secondary objective was to ensure that the range of environmental characteristicsto be examined in the research was present in study neighborhoods.
BACKGROUNDIMPACT (Inner-City Mental Health Study Predicting HIV/AIDS, Club and Other DrugTransitions) is a five-year, multi-level neighborhood study aimed at: (1) identifyingassociations between features of the social and physical urban environment, sexual and druguse risk behavior, and HIV prevalence in New York City (NYC) neighborhoods; and (2)evaluating interrelations between features of the urban social and physical environment thatshape individual sexual and drug use risk behavior and that may facilitate identification of highrisk areas that can benefit from intervention.
To ensure the inclusion of neighborhoods with a range of environmental characteristics, 36NYC neighborhoods were included in the study: three neighborhoods in each of 12 largercommunities. The 12 communities were selected for high rates of HIV infection and heroinoverdose. They are primarily but not exclusively low income and are geographically disperse:four of the 12 are in the borough of Manhattan (East and Central Harlem, Chelsea and the
Weiss et al. Page 2
Am J Prev Med. Author manuscript; available in PMC 2008 July 15.
NIH
-PA Author Manuscript
NIH
-PA Author Manuscript
NIH
-PA Author Manuscript
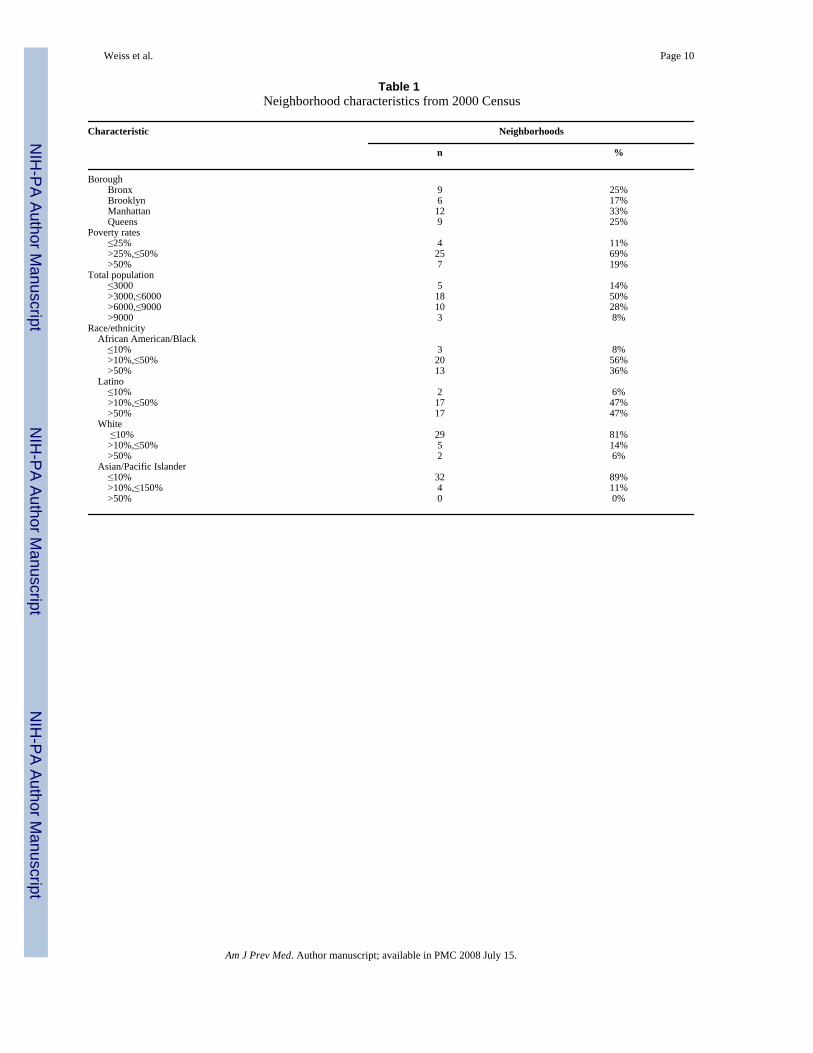
Lower East Side); three in the Bronx (South Bronx, Hunts Point, and Tremont); three in Queens(Long Island City, Corona and Jamaica); and two in Brooklyn (Bedford-Stuyvesant andBushwick) (see Table 1). IMPACT was approved by the Institutional Review Board at TheNew York Academy of Medicine.
Study design called for recruitment of 3000 participants, approximately 83 per neighborhood,between January 2005 and December 2008. A systematic random sampling procedure wasdeveloped to approach pedestrians in each of the defined neighborhoods for screening andstudy enrollment. Potential participants were required to be residents of the neighborhood orto spend at least 50% of their time there. Interested individuals meeting these criteria werescreened for drug use so as to be categorized as: current drug user (ever injected), current druguser (never injected), former drug user, and never used drugs (except alcohol and marijuana).Within each neighborhood, approximately one-quarter of study participants were required tofall within each of these categories. Eligible individuals who agreed to participate completeda comprehensive interview probing demographics, HIV risk behaviors, social support, andpsychosocial stress. Study design also included blood tests of participants for HIV, hepatitisB, hepatitis C, and syphilis and urine testing for chlamydia, gonorrhea, and trichomonas.Participants were paid $20 for their time and effort.
Attributes of the neighborhood social and physical environment that have been associated witha variety of health-related behaviors and outcomes15, 17 were gathered from the census andother secondary sources (e.g., population, income, race and ethnicity, use of public benefits)and from annual street level observation and assessments40 (e.g., land use, communityinstitutions, vacancy and construction of buildings, green space, and upkeep of private andpublic spaces).
METHODSAn essential step in the implementation of the study was to delineate boundaries for each ofthe thirty-six neighborhoods that could then be used to establish sampling frames and as keyunits of analytic interest. Consistency vis-a-vis census data was considered essential, so thatsociodemographic and other publicly available data could be incorporated into analyses. Thedegree to which any particular census-defined area was appropriate for study purposes couldnot be determined from secondary source data alone, however – some check was essential.Feedback from residents was an option, but the processes required for eliciting and reconcilingresident views were considered too time consuming, given the number of neighborhoodsincluded in the study.41 Instead, reviews of published land-use data and systematic street levelobservations, carried out between February and July 2005, were utilized.
The specific procedures used to delineate neighborhoods were: (1) identification of threegeneral locations in each of the twelve broader communities within which (or around which)specific neighborhoods could be identified. Criteria used to select these more general locationsfocused on potential for recruitment (based on field visits), clear placement within the broadlydefined community (rather than straddling a border commonly used for city planning or otherpurposes), and a requirement that none of the neighborhoods be contiguous; (2) developmentof maps, using specialized mapping software (ArcGIS), of the targeted and outlying areas,indicating census block group boundaries; (3) review of land-use maps and census tract dataavailable from the NYC Department of City Planning42 to ensure, prior to going into the field,that particular census block groups were residential and likely to have sufficient population (atleast 1000 per census tract) for recruitment purposes; and (4) field visits and observation ineach of the targeted areas, as described below.
Weiss et al. Page 3
Am J Prev Med. Author manuscript; available in PMC 2008 July 15.
NIH
-PA Author Manuscript
NIH
-PA Author Manuscript
NIH
-PA Author Manuscript
Field visits to prospective neighborhoods involved observation and written documentation(primarily on the maps indicating block group boundaries) of environmental features of eachstreet considered as a neighborhood boundary and 75%–100% of internal streets. Similarobservations and documentation were made of streets near to the projected boundary, in orderto assess logical expansions of, or shifts in, neighborhoods. Observations were made on footand required an average of 2 hours (range 30 minutes to 4 hours) per neighborhood, withadditional time required for areas that seemed appropriate according to census data but werejudged inappropriate upon observation (generally due to very low levels of pedestrian traffic).To ensure consistency across neighborhoods, observations were guided by a pre-identified listof environmental features and conducted by a single individual (experienced in communitylevel and qualitative research). Input and consultation regarding the appropriate size ofneighborhoods, adequate distance between neighborhoods, and acceptable levels of withinneighborhood heterogeneity was provided by study investigators and other study staff.
Although size of the neighborhoods was not strictly defined in advance, each neighborhoodhad to be large enough so that recruitment would be feasible, yet small enough to allow forcomprehensive mapping of each block in the study neighborhoods. The neighborhoods alsohad to be of a size so that there would be some relation to resident perceptions of theneighborhood, and environmental factors considered in the analysis were near enough to allblocks included to be relevant to survey participants.
In making the final decisions regarding neighborhood boundaries and the inclusion or exclusionof particular streets, a number of guidelines, listed in order of priority, were utilized.
1. Census block group boundariesCensus data has been used in the study to describe a number of sociodemographicneighborhood characteristics, consequently block groups, the smallest unit for which censusdata are tabulated,43 were only divided (i.e.,, part of the block group was included in the studyneighborhood and part excluded) if they were on the perimeter of the defined neighborhoodand if the excluded portion had neither residences (and therefore no residential census dataattributed to them) nor appropriate pedestrian traffic (e.g., streets with warehouses).
2. The potential for efficient recruitment of appropriate participantsBlock groups without sufficient population density, lacking local pedestrian traffic and/oroutdoor places where adults congregate (such as parks) were excluded from consideration,since recruitment of participants would require a disproportionate allocation of projectresources.
3. Evidence of homogeneityRelative homogeneity was considered important to the definition process, because it is acharacteristic commonly used by residents to define the boundaries of their neighborhood. Inaddition, homogeneity facilitates the appropriate attribution of census data to study participantsrecruited in particular neighborhoods. Homogeneity in economic status (as evidenced byhousing type and housing maintenance), was the primary consideration. Homogeneity of othercharacteristics (e.g., ethnicity) was a secondary consideration, evident in the majority but notall defined neighborhoods.
4. Connectivity to and/or segregation from adjacent blocksIn a further effort to define neighborhood boundaries in a way that would most likely beconsistent with resident perceptions, observable physical obstructions were used asneighborhood boundaries if present (e.g., major thoroughfares, railroad tracks and institutions
Weiss et al. Page 4
Am J Prev Med. Author manuscript; available in PMC 2008 July 15.
NIH
-PA Author Manuscript
NIH
-PA Author Manuscript
NIH
-PA Author Manuscript
covering multiple blocks). Where obvious boundaries were absent, blocks appearingrepresentative of the surrounding area were selected.
5. Heterogeneity of social and physical characteristics across study neighborhoodsDifferences in ethnicity, housing type (e.g., public housing, private subsidized, other private),land use (mixed use or purely residential), proximity to public transportation, andenvironmental features likely to affect quality of life (e.g., elevated trains, parks, vacant lots)were necessary for study objectives, but are widespread in NYC neighborhoods. Becausediversity arose naturally, it was a secondary consideration in the neighborhood definitionprocess. Minimizing the significance of particular environmental attributes to neighborhooddefinition should reduce bias in analyses related to those features.
RESULTSDefined neighborhoods range from 1 to 8 census block groups, with populations (accordingto the 2000 census)44 ranging from 2252 to 11,503 (mean=5320) (see Table 1). Eighteenneighborhoods included public housing, in all (five neighborhoods) or in part (13neighborhoods). Three neighborhoods were ten minutes or further from a subway stop, eightincluded or were bordered by streets with light industry (e.g., warehouses, auto painting), 11were bordered by or incorporated an elevated train or highway. Most neighborhoods includedin the study had a majority black (12 neighborhoods) or Latino (17 neighborhoods) population.Percent of population below poverty ranged form 9.7% to 65.9% (mean = 40.0%), comparedto 21.2% for NYC as a whole.45
Descriptive information on four IMPACT neighborhoods is presented below. Thesedescriptions, provided as examples, demonstrate that the use of observation as part of theboundary definition process facilitates the identification and grouping of census block groupshaving attributes consistent with the concept of “neighborhood” and with study objectives.
South Bronx 1The equivalent of eight city blocks and two census block groups, this neighborhood includeda public housing development at one end and a busy commercial and transit hub at the other.The streets between had older residences (generally, two or three family homes) and smallbusinesses targeted to local consumers. The bordering areas that were excluded from thedefined neighborhood following field observations contained a main shopping area for theSouth Bronx (considered inefficient for recruiting neighborhood residents) and several blocksof new row-houses with gated driveways and entries (considered inefficient for recruitmentdue to an absence of pedestrian traffic; also considered to be socioeconomically disparate fromincluded blocks). Triangular in shape, the two lengthy borders were large commercial streets.The third border was chosen because housing type and land use was significantly different inthe adjoining census block group.
Hunts Point 2Hunts Point 2 was striking in the number of environmental characteristics it contained thatwould be considered detrimental to health and well-being. It sat within a small, industrial SouthBronx peninsula (Hunts Point), separated from other Bronx neighborhoods by an expressway.Hunts Point houses multiple waste transfer stations and a large City-owned food distributioncenter. There is no subway service on Hunts Point and businesses catering to local residentsare sparse; residents must walk under the expressway for the subway and most shopping. Theequivalent of nine city blocks and five census block groups, Hunts Point 2 partially surroundeda multi-block juvenile detention center. The other borders were major thoroughfares, includingone border street that was a heavily traveled, and therefore noisy, truck route to the food
Weiss et al. Page 5
Am J Prev Med. Author manuscript; available in PMC 2008 July 15.
NIH
-PA Author Manuscript
NIH
-PA Author Manuscript
NIH
-PA Author Manuscript
distribution center. The far side of this thoroughfare was excluded after review of land-usemaps, due to the sparseness of housing. The neighborhood was mixed use, with significantlight industry and housing. The housing, which included some new construction, was relativelywell maintained. The neighborhood had a large community garden, also well maintained.
Central Harlem 1A traditionally African-American community, Central Harlem has been economicallydepressed for decades yet by the time of this study was experiencing gentrification and growingeconomic disparities. A number of easily observed conditions in Harlem appeared to make thegentrification process there unique, including: (1) architecturally rich but poorly maintained(including vacant) housing, meaning that purchase prices were likely to be low andrefurbishment could meet the expectations of new buyers; (2) empty lots that allowed forsignificant new construction; and (3) the extreme disparity in value of new (or newlyrefurbished) and older housing. Historically, poverty rates have been high in Central Harlem;at the time of the study, luxury apartments and brownstone shells each sold for over $1 million.46 The neighborhood designated as Central Harlem 1, consisting of six city blocks and threecensus block groups, typified the changes occurring in Harlem. Virtually every street had somecombination of buildings that appeared to have been continuously occupied and modestlymaintained, vacant buildings, buildings under construction, and newly built or refurbishedluxury buildings. The blocks designated as Harlem 1 were not distinct from those that surroundthem, rather they were chosen as representative of the wider area. The observation processresulted in a shift in four blocks included in the neighborhood. A large apartment complex wasexcluded in favor of alternate blocks that were consistent with those described above.
Corona 2A largely Latino section of Queens, Corona 2 covered approximately eight city blocks and twocensus block groups. The housing was primarily one and two family, much of it with someevidence of deterioration. Apartment “for rent” signs (in Spanish) were evident throughout theneighborhood, in windows and on telephone poles, an unusual sight in most of NYC. Therewas some new construction in the area, primarily apartment buildings ranging from 4 to 20units. The defined neighborhood had two commercial strips (one of which was used as aneighborhood border); both had stores catering to local customers. One commercial street hadan elevated subway running above it. Although the street was loud and lacking in sunlight, itremained vibrant. A second above-ground train also ran through the neighborhood and wasused as a second neighborhood border. Block group boundaries were used to define theremaining boundaries, although observable boundaries were lacking.
DISCUSSIONDespite the growing body of literature exploring neighborhood effects on health, little attentionhas been paid to processes for neighborhood delineation. Most researchers utilize pre-definedboundaries consistent with secondary source data, despite shortcomings, which includepossible obfuscation of local level variability and inconsistency with respect to the social orenvironmental factors being examined. For research involving primary data collection,including surveys or systematic documentation of neighborhood features, secondary sourceboundaries pose an additional problem in that it may be impossible to discern, prior to the startof data collection, the suitability of such areas for participant recruitment and/or examinationof environmental features of interest.
Because neighborhood boundary definitions are subjective, varying even among residents,there is no one precise way to delineate a “neighborhood.” A multistep process that begins withthe development of census maps and reviews of published land use and census data for targeted
Weiss et al. Page 6
Am J Prev Med. Author manuscript; available in PMC 2008 July 15.
NIH
-PA Author Manuscript
NIH
-PA Author Manuscript
NIH
-PA Author Manuscript
communities, and continues with systematic street-level observations, is a relatively efficientmethodology that allows for consideration of a range of factors commonly used inneighborhood definition, including sociodemographic characteristics, housing type, andobstructions to pedestrian traffic. An added value of the street level observations is theopportunity to collect qualitative information that can be used as context for quantitativeanalyses.
Limitations to the method exist, however, including its subjectivity and lack of residentperspective. Resident perspective could be added if time and funding permit, althoughreconciliation of diverse perspectives is likely to represent a challenge. Although subjectivitycannot be eliminated, neighborhoods defined this way can be compared to block groupcombinations identified by cluster analyses of census data.
The research utilizing the defined neighborhoods is just beginning. We anticipate thatmanuscripts describing preliminary results will be published within one year; final results willbe available once data collection and analysis is complete. As the study progresses, thesuitability of neighborhoods defined through this process will be assessed relative to studyobjectives and through more detailed observation of neighborhood characteristics 40 including,if funds are available, resident perceptions of neighborhood attributes and boundaries.
Acknowledgements
W e gratefully acknowledge the assistance of Vincent Edwards, who assisted with the preliminary mapping of NYCneighborhoods, and Shannon Blaney, who prepared numerous census maps and compiled census data forneighborhoods included in the study. This study is supported by the National Institute on Drug Abuse (DA017020and DA018061) and the National Institute of Mental Health (MH68192).
No financial conflict of interest was reported by the authors of this paper.
References1. Flourney, R.; Yen, I. The Influence of Cummunity Factors on Health: An Annotated Bibliography.
Oakland, CA: Policy Link; 2004.2. Kawachi, I.; Berkman, LF., editors. Neighborhoods and Health. New York: Oxford University Press;
2003.3. Macintyre S, Ellaway A, Cummins S. Place Effects on Health: How Can we Conceptualize,
Operationalize and Measure Them? Social Science and Medicine 2002;55:125–139. [PubMed:12137182]
4. Morland K, Wing S, Diez Roux AV. The Contextual Effect of the Local Food Environment onResidents Diets: The Atherosclerosis Risk in Community Study. AJPH 2002;92:1761–1767.
5. Yen I, Kaplan G. Poverty Area Residence and Changes in Physical Activity Level: Evidence from theAlameda County Study. AJPH 1998;88:1709–1712.
6. Duncan C, Jones K, Moon G. Smoking and Deprivation: Are There Neighborhood Effects. SocialScience and Medicine 1999;48:497–505. [PubMed: 10075175]
7. Ellen I, Dillman K, Mijanovich T. Neighborhood Effects on Health: Exploring the Links and Assessingthe Evidence. Journal of Urban Affairs 2001;23:391–408.
8. Fuller CM, Borrell LN, Latkin CA, et al. Effects of race, neighborhood, and social network on age atinitiation of injection drug use. Am J Public Health Apr 2005;95(4):689–695.
9. Kadushin C, Reber E, Saxe L, Livert D. The substance use system: social and neighborhoodenvironments associated with substance use and misuse. Subst Use Misuse Jun 1998;33(8):1681–1710.
10. Wright, RJ.; Fisher, EB. Putting Asthma into Context: Community Influences on Risk, Behavior, andIntervention. In: Kawachi, I.; Berkman, LF., editors. Neighborhoods and Health. New York: OxfordUniversity Press; 2003. p. 233-262.
11. Diez Roux AV. Residential Environments and Cardiovascular Risk. Journal of Urban Health 2003;80(4):569–589. [PubMed: 14709706]
Weiss et al. Page 7
Am J Prev Med. Author manuscript; available in PMC 2008 July 15.
NIH
-PA Author Manuscript
NIH
-PA Author Manuscript
NIH
-PA Author Manuscript
12. Diez Roux AV, Merkin S, Arnett D, et al. Neighborhood of Residence and Incidence of CoronaryHeart Disease. NEJM 2001;345(2):99–106. [PubMed: 11450679]
13. O'Campo PJ, Xue X, Wang M, Caughy MO. Neighborhood Risk Factors for Low Birthweight inBaltimore: A Multilevel Analysis. AJPH 1997;87(7):1113–1118.
14. Matteson DW, Burr JA, Marshall JR. Infant Mortality: A Multi-Level Analysis of Individual andCommunity Risk. Social Science and Medicine 1998;47(11):1841–1854. [PubMed: 9877352]
15. Ponce NA, Hoggatt KJ, Wilhelm M, Ritz B. Preterm birth: the interaction of traffic-related airpollution with economic hardship in Los Angeles neighborhoods. Am J Epidemiol Jul 15;2005 162(2):140–148. [PubMed: 15972941]
16. Vliet P, Knape M, de Hartog J, Janssen N, Harssema H, Brunekreef B. Motor Vehicle Exhaust adnChronic Respitory Symptoms in Children Living near Freeways. Environmental Research1997;74:122–132. [PubMed: 9339225]
17. Cohen D, Spear S, Scribner R, Kissinger P, Mason K, Wildgen. Broken Windows and the Risk ofGonorrhea. AJPH 2000;90(2):230–236.
18. Litt J, Tran N, Burke T. Examining Urban Brownfields through the Public Health Macroscope.Environmental Health Perspectives 2002;110(Suppl 2):183–193. [PubMed: 11929727]
19. Jackson S, Anderson R. The Relation of Residential Segregation to All-cause Mortality: A Study inBlack and White. AJPH 2000;90:615–617.
20. Bosma H, Van de Mheen H, Borsboom G, Mackenbach J. Neighborhood Socio-economic Status andAll-cause Mortality. American Journal of Epidemiology 2001;153:363–371. [PubMed: 11207154]
21. Haan M, Kaplan G, Camacho T. Poverty and Health: Prospective Evidence from the Alameda CountyStudy. American Journal of Epidemiology 1987;125:989–998. [PubMed: 3578257]
22. Waitzman N, Smith K. Phantom of the Area: Poverty-Area Residence and Mortality in the UnitedStates. AJPH 1998;88(6):973–976.
23. Diez, Roux AV. The Examination of Neighborhood Effects on Health: Conceptual andMethodological Issues Related to the Presence of Multiple Levels of Organization. In: Kawachi, I.;Berkman, LF., editors. Neighborhoods and Health. New York: Oxford University Press; 2003. p.45-64.
24. Krieger, N.; Zierler, S.; Hogan, JW., et al. Geocoding and Measurement of NeighborhoodSocioeconomic Position: A U.S. Perspective. In: Kawachi, I.; Berkman, LF., editors. Neighborhoodsand Health. New York: Oxford University Press; 2003. p. 147-178.
25. Diez Roux AV. Investigating Neighborhood and Area Effects on Health. AJPH 2001;91(11):1783–1789.
26. Pickett K, Pearl M. Multilivel Analyses of Neighbourhood Socioeconomic Context and HealthOutcomes: A Critical Review. Journal of Epidemiology and Community Health 2001;55:111–122.[PubMed: 11154250]
27. Cummins S, Macintyre S, Davidson S, Ellaway A. Measuring Neighborhood Social and MaterialContext: Generation and Interpretation of Ecological Data from Routine and Non-Routine Sources.Health and Place 2005;11:249–260. [PubMed: 15774331]
28. Hillemeier MM, Lynch J, Harper S, Casper M. Measurement Issues in Social Determinants:Measuring Contextual Characteristics for Community Health. Health Services Research 2003;38(6):1645–1717. [PubMed: 14727793]
29. Hojnacki WP. What is a Neighborhood. Social Policy Sept/Oct;1979 :47–52.30. Jacobs, J. The Death and Life of Great American Cities. New York: Vintage Books; 1992.31. Sampson, RJ.; Morenoff, JD. Ecological Perspectives on the Neighborhood Context of Poverty: Past
and Present. In: Brooks-Dunn, J.; Duncan, GJ.; Aber, JL., editors. Neighborhood Poverty: PolicyImplications in Studying Neighborhoods. II. New York: Russel Sage Foundation; 1997. p. 1-22.
32. Brooks-Dunn, J.; Duncan, GJ.; Aber, JL., editors. Neighborhood Poverty, Volumes I & II. New York:Russel Sage Foundation; 1977.
33. Gephart, MA. Neighborhoods and Communities as Contexts for Development. In: Brooks-Dunn, J.;Duncan, GJ.; Aber, JL., editors. Neighborhood Poverty: Context and Consequences for Children. 1.New York: Russal Sage Foundation; 1997. p. 1-43.
Weiss et al. Page 8
Am J Prev Med. Author manuscript; available in PMC 2008 July 15.
NIH
-PA Author Manuscript
NIH
-PA Author Manuscript
NIH
-PA Author Manuscript
34. Chaskin RJ. Perspectives on Neighborhood and Community: A Review of the Literature. SocialService Review 1997;7(4):521–547.
35. Gould, P.; White, R. Mental Maps, Second Edition. London: Routledge; 2002.36. Coulton, C.; Korbin, J.; Chan, T.; Su, M. Mapping Residents' Perceptions of Neighborhood
Boundaries: A Methodological Note. Center on Urban Poverty and Social Change, Case WesternReserve University. [Accessed 8/15/05]. Available at:http://povertycenter.cwru.edu/urban_poverty/dev/pdf/wp9704mapwe6.pdf
37. Furstenberg, FF.; Hughes, ME. The Influence of Neighborhoods on Children's Development: ATheoretical Perspective and a Research Agenda. In: Aber, JL., editor. Neighborhood Poverty: PolicyImplications in Studying Neighborhoods. II. New York: Russel Sage Foundation; 1977. p. 23-47.
38. Burton, LM.; Price-Spratlen, T.; Spencer, MB. On Ways of Thinking about MeasuringNeighborhoods: Implications for Studying Context and Developmental Outcomes for Children. In:Brooks-Dunn, J.; Duncan, GJ.; Aber, JL., editors. Neighborhood Poverty: Policy Implications inStudying Neighborhoods. II. New York: Russel Sage Foundation; 1997. p. 132-144.
39. Sastry, N.; Pebley, AR.; Zonta, M. Neighborhood Definitions and the Spatial Dimension of DailyLife in Los Angeles. California Center for Population Research, UCLA; [Accessed 8/15/05].Available at: http://www.ccpr.ucla.edu/ccprwpseries/ccpr_033_04.pdf
40. Ompad, DC.; Galea, S.; Weiss, L.; Vlahov, D. A Scale to Evaluate the Urban Physical and SocialEnvironment. Paper presented at: International Society for Urban Health Annual Conference; 2005;Toronto.
41. Pebley, AR.; Sastry, N. Neighborhoods, Poverty and Children's Well-being: A Review. CaliforniaCenter for Population Research, UCLA. [Accessed 8/15/05]. Available at:http://www.ccpr.ucla.edu/ccprwpseries/ccpr_035_04.pdf
42. NYC Department of City Planning. Community District Profiles. [Accessed 7/20/05, 2005]. Availableat: http://www.nyc.gov/html/dcp/html/lucds/cdstart.html
43. U.S. Census Bureau. Census 2000 Basics. Washington DC: U.S. Government Printing Office; 2002.44. U.S. Census Bureau. Census 2000 Summary File 3. Washington DC: U.S. Government Printing
Office; 2002.45. NYC Department of City Planning. Socioeconomic Profile Social Characteristics. New York City:
2004.46. Powell M. Harlem's New Rush: Booming Real Estate. Washington Post March 13;2005 :A3.
Weiss et al. Page 9
Am J Prev Med. Author manuscript; available in PMC 2008 July 15.
NIH
-PA Author Manuscript
NIH
-PA Author Manuscript
NIH
-PA Author Manuscript
NIH
-PA Author Manuscript
NIH
-PA Author Manuscript
NIH
-PA Author Manuscript
Weiss et al. Page 10
Table 1Neighborhood characteristics from 2000 Census
Characteristic Neighborhoods
n %
Borough Bronx 9 25% Brooklyn 6 17% Manhattan 12 33% Queens 9 25%Poverty rates ≤25% 4 11% >25%,≤50% 25 69% >50% 7 19%Total population ≤3000 5 14% >3000,≤6000 18 50% >6000,≤9000 10 28% >9000 3 8%Race/ethnicity African American/Black ≤10% 3 8% >10%,≤50% 20 56% >50% 13 36% Latino ≤10% 2 6% >10%,≤50% 17 47% >50% 17 47% White ≤10% 29 81% >10%,≤50% 5 14% >50% 2 6% Asian/Pacific Islander ≤10% 32 89% >10%,≤150% 4 11% >50% 0 0%
Am J Prev Med. Author manuscript; available in PMC 2008 July 15.