Embed Size (px)
Citation preview
DEFINING QUALITY EDUCATION:
A CONTENT ANALYSIS OF ALBERTA
HIGH SCHOOL MISSION STATEMENTS
by
Edmund J Saley
A Dissertation Presented in Partial Fulfillment
Of the Requirements for the Degree
Doctor of Philosophy
Capella University
March 2006

© Edmund J Saley 2006
Leadership does not begin with power. It begins with a compelling vision.
Frederick Smith, founder of Federal Express
If I had 8 hours to chop down a tree, I would spend 6 sharpening my axe.
Attributed to Abraham Lincoln
Where there is no vision, the people perish.
Proverbs 29:18a
DEFINING QUALITY EDUCATION:
A CONTENT ANALYSIS OF ALBERTA
HIGH SCHOOL MISSION STATEMENTS
by
Edmund Julius Saley
has been approved
February 2006
APPROVED:
DANIEL C. BRUCH, D.Min., Ph.D., Sc.D., Faculty Mentor and Chair
BERNARD KLEIN, Ph.D., Committee Member
RODERICK C. SIMS, Ph.D., Committee Member
ACCEPTED AND SIGNED:
__________________________________________
DANIEL C. BRUCH, D.Min., Ph.D., Sc.D.
__________________________________________ James A. Wold, Ph.D. Dean, School of Education
Abstract
This research study used quantitative as well as qualitative techniques to investigate the content
and manner of presentation of high school mission statements. Text analysis was done by human
raters as well as by computer. High school mission statements were analyzed for characteristics
of content, clarity and motivational tone. Independent variables were the recognized sources of
authority defining school systems such as public, separate, private sectarian and private
Christian. Fifteen dependent variables were categorized according to four themes within the
educational enterprise: stakeholders; philosophy; strategic planning; and presentation. Two
hypotheses were tested with the following overall results: (1) High school mission statements
exhibited different content and text clarity according to sources of institutional authority; (2) The
mission statements of academically higher performing schools exhibited more of the desired
components. The private sector and in particular the Christian sector came out looking much
more educationally vigorous than the public sector.

iii
Soli Deo Gloria
iv
Acknowledgements
To my wife Josephine, I thank you and love you. You have given me the love, stability,
and nurturing environment allowing me to the time to quietly study and reflect. Not only did you
manage most family affairs especially the needs of our children but you also took up much of my
training and travel responsibilities especially during my comprehensives and dissertation in the
last two years of my program. To my children Timothy and Hannah, I thank you. You have been
so patient and loving toward your philosopher Dad who might have spent more of his time
playing basket ball or board games, etc., with you. I am deeply grateful and hope that the past
three years of neglecting time with you can be made up through other opportunities for time and
fellowship in the future. I love you.
My faithful and encouraging mentor Dr. Bruch, was with me from the beginning of my
Capella studies. He allowed me to soar to my heart’s content in my comprehensive papers but
then helped me to channel my very broad interests into a focused empirical study. Thank you
from the bottom of my heart, Dr. Bruch. Thanks to Dr. Bernie Klein who made me feel very
special especially for his surprising tolerance for my soaring excursions of scholarly dreaming in
papers I have written for him in the past. Thanks to Dr. Sims for your challenge to more
precisely articulate just what I’ve been doing. Thank you to others in Capella who provided
special encouragement, in particular, Dr. Liz Bruch, Nou Yang, Dr. Pam Hanfelt, Dr. Larry
Reynolds and Dr. Mark Rossman.
I want to acknowledge a deep appreciation for my three raters: Dr. P. K. Tam, Daniel
Tam, and Keith Davies who were so enthusiastic and faithful in the many statements you worked
v
through. Yours was a labor of love for which I will be always grateful and may God richly bless
your generosity. Thank you also for the quick responses to my emails when I had questions
during the data analysis.
Thank you to those who helped me set up the statistical strategy for this study in
particular Dr. P. K. Tam and Dr. W. Y. Poon of the Chinese University of Hong Kong as well as
Joshua Tam and Dr. Ron Gray. I would not have got off the ground without Dr. Poon’s generous
expert advice.
I thank the following for special encouragement: Jamie Taylor, Dr. Jim Taylor, Richard
Konieczny, Rose Carlton, Mrs. Dorothy Tam, Dr. Lynne Yang, and Dr. Eric Drewry.
Both my parents are now deceased but their memory cannot but remain a powerful
influence in my life. My dear mother Nelly has already been gone 34 years. I will never forget
the debt I owe to her generous and self-sacrificing love. I also remember her predicting that I
would always be a man of books. How I wish she could see that I have become a man of one
book. From my dear father Karl Heinz, I have a philosophic bent. I have the privilege to pursue
those of his gifts which he was never able to develop because of his passionate commitment to
business. Also, I cannot forget my stepmother Evelyn who has since my father’s death truly
taken up the mantel of a parent and grandparent.
vi
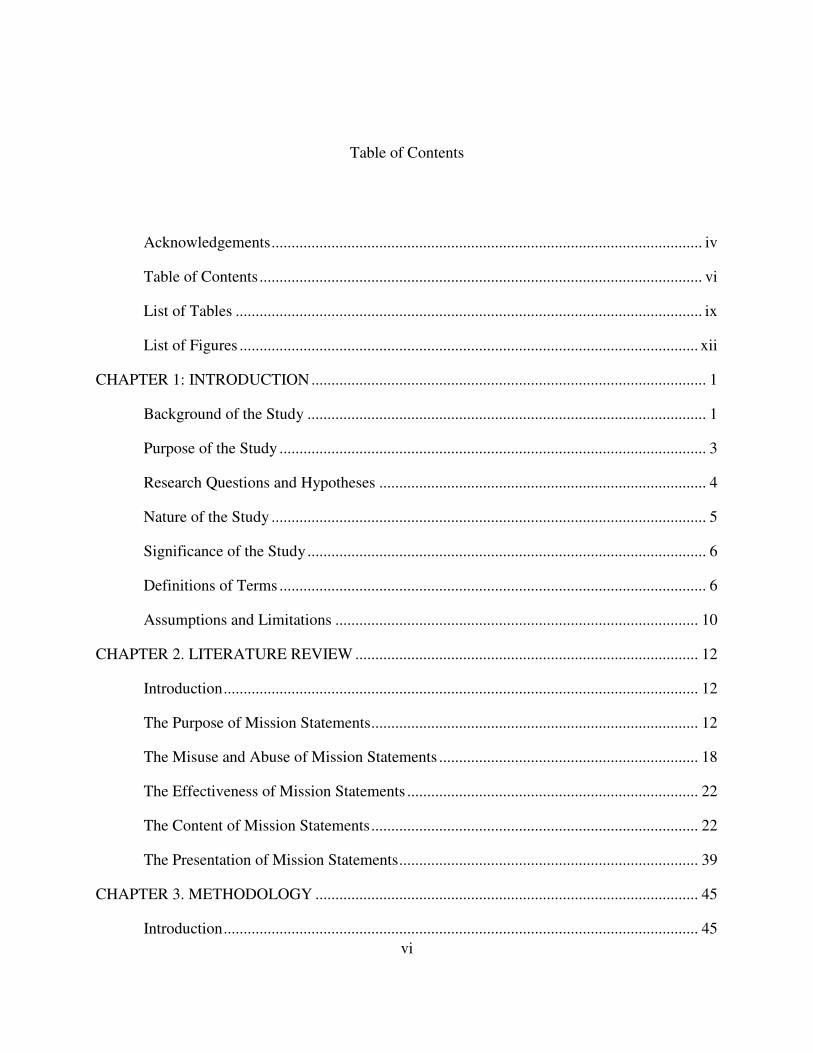
Table of Contents
Acknowledgements............................................................................................................ iv
Table of Contents............................................................................................................... vi
List of Tables ..................................................................................................................... ix
List of Figures ................................................................................................................... xii
CHAPTER 1: INTRODUCTION................................................................................................... 1
Background of the Study .................................................................................................... 1
Purpose of the Study ........................................................................................................... 3
Research Questions and Hypotheses .................................................................................. 4
Nature of the Study ............................................................................................................. 5
Significance of the Study.................................................................................................... 6
Definitions of Terms ........................................................................................................... 6
Assumptions and Limitations ........................................................................................... 10
CHAPTER 2. LITERATURE REVIEW ...................................................................................... 12
Introduction....................................................................................................................... 12
The Purpose of Mission Statements.................................................................................. 12
The Misuse and Abuse of Mission Statements ................................................................. 18
The Effectiveness of Mission Statements ......................................................................... 22
The Content of Mission Statements.................................................................................. 22
The Presentation of Mission Statements........................................................................... 39
CHAPTER 3. METHODOLOGY ................................................................................................ 45
Introduction....................................................................................................................... 45
vii
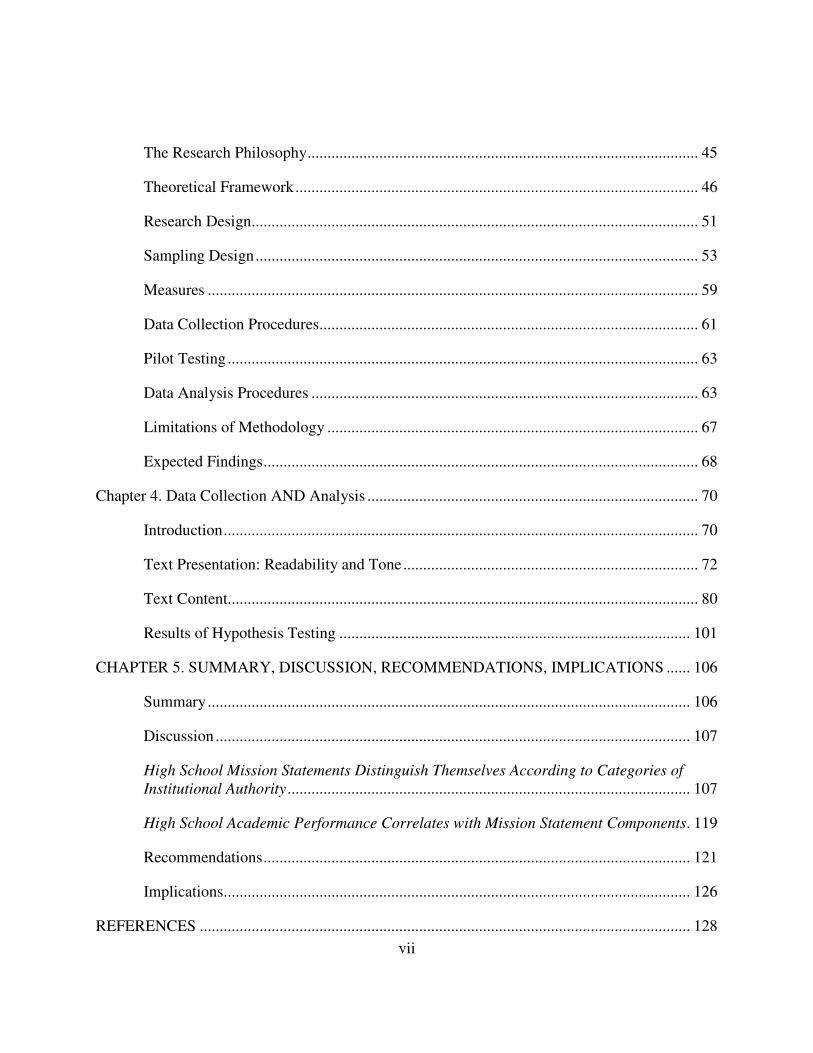
The Research Philosophy.................................................................................................. 45
Theoretical Framework..................................................................................................... 46
Research Design................................................................................................................ 51
Sampling Design............................................................................................................... 53
Measures ........................................................................................................................... 59
Data Collection Procedures............................................................................................... 61
Pilot Testing...................................................................................................................... 63
Data Analysis Procedures ................................................................................................. 63
Limitations of Methodology ............................................................................................. 67
Expected Findings............................................................................................................. 68
Chapter 4. Data Collection AND Analysis ................................................................................... 70
Introduction....................................................................................................................... 70
Text Presentation: Readability and Tone.......................................................................... 72
Text Content...................................................................................................................... 80
Results of Hypothesis Testing ........................................................................................ 101
CHAPTER 5. SUMMARY, DISCUSSION, RECOMMENDATIONS, IMPLICATIONS ...... 106
Summary......................................................................................................................... 106
Discussion ....................................................................................................................... 107
High School Mission Statements Distinguish Themselves According to Categories of Institutional Authority ..................................................................................................... 107
High School Academic Performance Correlates with Mission Statement Components. 119
Recommendations........................................................................................................... 121
Implications..................................................................................................................... 126
REFERENCES ........................................................................................................................... 128
viii
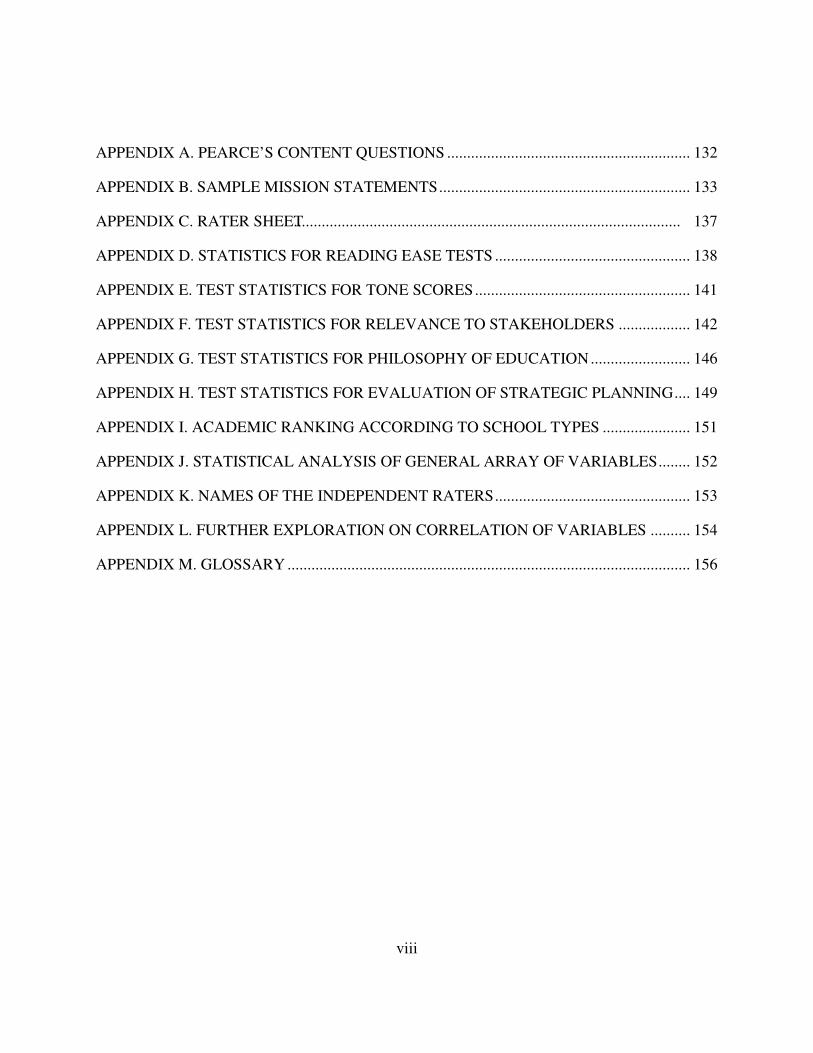
APPENDIX A. PEARCE’S CONTENT QUESTIONS ............................................................. 132
APPENDIX B. SAMPLE MISSION STATEMENTS............................................................... 133
APPENDIX C. RATER SHEET................................................................................................. 137
APPENDIX D. STATISTICS FOR READING EASE TESTS ................................................. 138
APPENDIX E. TEST STATISTICS FOR TONE SCORES...................................................... 141
APPENDIX F. TEST STATISTICS FOR RELEVANCE TO STAKEHOLDERS .................. 142
APPENDIX G. TEST STATISTICS FOR PHILOSOPHY OF EDUCATION......................... 146
APPENDIX H. TEST STATISTICS FOR EVALUATION OF STRATEGIC PLANNING.... 149
APPENDIX I. ACADEMIC RANKING ACCORDING TO SCHOOL TYPES ...................... 151
APPENDIX J. STATISTICAL ANALYSIS OF GENERAL ARRAY OF VARIABLES........ 152
APPENDIX K. NAMES OF THE INDEPENDENT RATERS................................................. 153
APPENDIX L. FURTHER EXPLORATION ON CORRELATION OF VARIABLES .......... 154
APPENDIX M. GLOSSARY ..................................................................................................... 156
ix
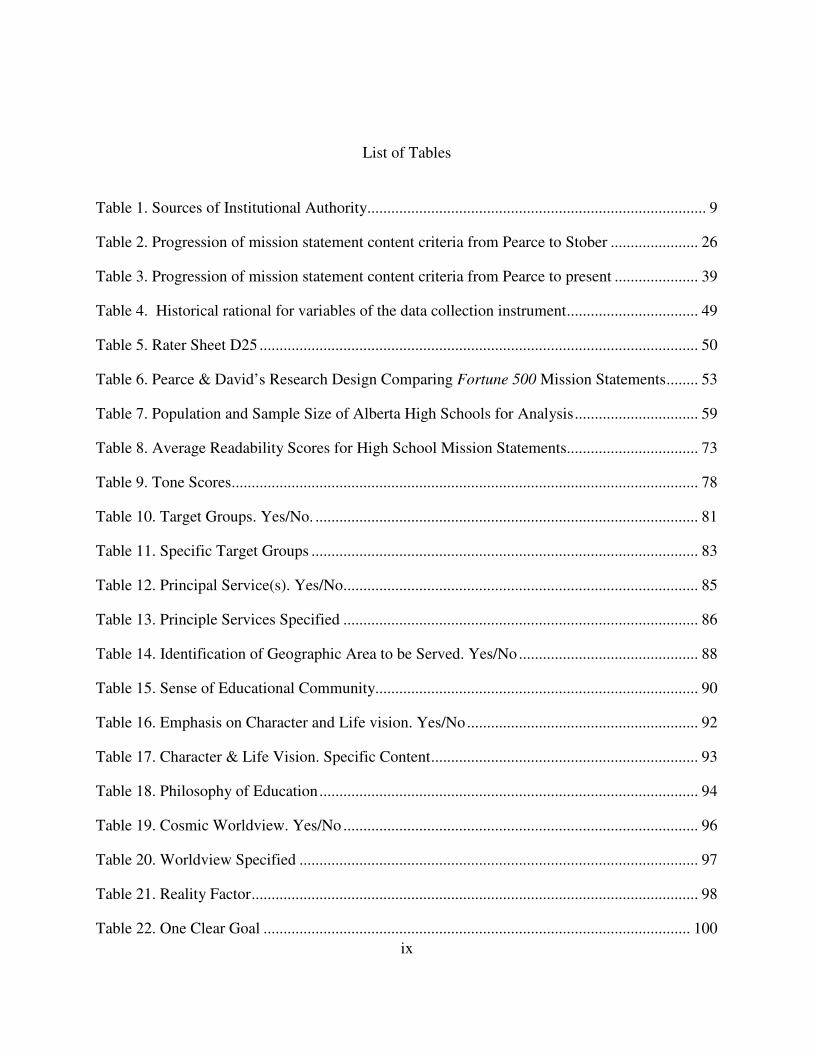
List of Tables
Table 1. Sources of Institutional Authority..................................................................................... 9
Table 2. Progression of mission statement content criteria from Pearce to Stober ...................... 26
Table 3. Progression of mission statement content criteria from Pearce to present ..................... 39
Table 4. Historical rational for variables of the data collection instrument................................. 49
Table 5. Rater Sheet D25 .............................................................................................................. 50
Table 6. Pearce & David’s Research Design Comparing Fortune 500 Mission Statements........ 53
Table 7. Population and Sample Size of Alberta High Schools for Analysis............................... 59
Table 8. Average Readability Scores for High School Mission Statements................................. 73
Table 9. Tone Scores..................................................................................................................... 78
Table 10. Target Groups. Yes/No. ................................................................................................ 81
Table 11. Specific Target Groups ................................................................................................. 83
Table 12. Principal Service(s). Yes/No......................................................................................... 85
Table 13. Principle Services Specified ......................................................................................... 86
Table 14. Identification of Geographic Area to be Served. Yes/No............................................. 88
Table 15. Sense of Educational Community................................................................................. 90
Table 16. Emphasis on Character and Life vision. Yes/No.......................................................... 92
Table 17. Character & Life Vision. Specific Content................................................................... 93
Table 18. Philosophy of Education............................................................................................... 94
Table 19. Cosmic Worldview. Yes/No ......................................................................................... 96
Table 20. Worldview Specified .................................................................................................... 97
Table 21. Reality Factor................................................................................................................ 98
Table 22. One Clear Goal ........................................................................................................... 100
x
Table 23. Overall Academic Rating............................................................................................ 103
Table 24. General Array of Purpose Statement Components ..................................................... 104
Table 25. Appendix D-1. Raw data for Reading Ease Tests ...................................................... 138
Table 26. Appendix D-2. Test Statisticsd for FRE only Alberta................................................. 139
Table 27. Appendix D-2. Test Statisticsd for FRE with 5 Added BC Secular Private Schools.. 139
Table 28. Appendix D-3. Test Statisticsd for LD ....................................................................... 140
Table 29. Appendix D-4. Test Statisticsc for Word Count ......................................................... 140
Table 30. Appendix E. Test Statisticsc. Tone Scores.................................................................. 141
Table 31. Appendix F-1. Test Statisticsd Target Groups Part 1.................................................. 142
Table 32. Appendix F-1. Test Statisticsd. Target Groups Part 2-a. Religious Groups................ 142
Table 33. Appendix F-1. Test Statisticsd. Target Groups Part 2-b. Racial/Ethnic Groups......... 142
Table 34. Appendix F-2. Test Statisticsc. Principle Services. Part 1 .......................................... 143
Table 35. Appendix F-2. Principle Services. Part 2-gd. Christian Education & Discipleship .... 143
Table 36. Appendix. F-3.Test Statisticsd for Geographical Area Scores.................................... 144
Table 37. Appendix F-4. Test Statisticsc for Sense of Community (Yes/No) ............................ 145
Table 38. Appendix F-4. Test Statisticsc. Scaled “Sense of Community” Score ....................... 145
Table 39. Appendix G-1. Test Statisticsc. Character Part 1. ...................................................... 146
Table 40. Appendix G-1. Test Statisticsd. Character Part 2. Christian ....................................... 146
Table 41. Appendix G-1. Test Statisticsd. Character Part 2. Whole Child. ................................ 146
Table 42. Appendix G-2. Test Statisticsc. Philosophy ................................................................ 147
Table 43. Appendix G-3. Test Statisticsc. Worldview. Part 1 .................................................... 148
Table 44. Appendix G-3. Test Statisticsd. Worldview. Part 2-N ................................................ 148
Table 45. Appendix G-3. Test Statisticsd. Worldview. Part 2-C ................................................ 148
xi
Table 46. Appendix H-1. Test Statisticsc. Reality Scaled score. ................................................ 149
Table 47. Appendix H-1. Test Statisticsc. Clear Big Goal.......................................................... 149
Table 48. Appendix H-2. Clear Big Goal. Test Statisticsc. Summary of Significant Pairs ........ 150
Table 49. Appendix I. Test Statisticsd. Academic Ranking of Alberta High Schools................ 151
Table 50. Appendix I. Academic Ranking of Alberta Schools Plus Five BC Private Secular Schools ................................................................................................................................ 151
Table 51. Appendix I. Test Statistics. Academic Ranking with Five BC schools added. .......... 151
Table 52. Appendix J. Test Statisticsb. General Array ............................................................... 152
Table 53. Appendix L. Non Parametric Correlations ................................................................. 154
Table 54. Appendix L. Proximity Matrices. A dissimilarity matrix........................................... 155
Table 55. Appendix L. Proximity Matrices. A similarity matrix................................................ 155
xii
List of Figures
Figure 1. Average readability scores for high school mission statements according to sources of institutional control ............................................................................................................... 74
Figure 2. Reading ease means reconfigured to increasing readability (only Alberta).................. 75
Figure 3. Line graph with reading ease means scaled to increasing readability........................... 77
Figure 4. Tone scores. Average readability scores for secondary statements of purpose according to sources of institutional control.......................................................................................... 79
Figure 5. Target group(s). Yes/No. Average content item scores for secondary statements of purpose according to sources of institutional control ........................................................... 82
Figure 6. Specific target groups. Average tally scores for the presence of specific target groups identified in secondary statements of purpose according to sources of institutional control 84
Figure 7. Principal service(s). Yes/No. Average content item scores for secondary statements of purpose according to sources of institutional control ........................................................... 86
Figure 8. Principal services specified. Average tally scores for the presence of specific services identified in secondary statements of purpose according to sources of institutional control 87
Figure 9. Identification of geographic area to be served. Yes/No ................................................ 89
Figure 10. Sense of Educational Community ............................................................................... 91
Figure 11. Emphasis on character and life vision. Yes/No........................................................... 92
Figure 12. Character and life vision. Specific content.................................................................. 93
Figure 13. Philosophy of education .............................................................................................. 95
Figure 14. Cosmic worldview. Yes/No......................................................................................... 97
Figure 15. Worldview specified.................................................................................................... 97
Figure 16. Reality factor. Scale adjusted for direction ................................................................. 99
Figure 17. One clear goal............................................................................................................ 100
Figure 18. Overall academic rating. Sample results for overall academic rating of Alberta high schools according to sources of institutional authority....................................................... 103
xiii
Figure 19. General array of purpose statement components grouped by average academic rank............................................................................................................................................. 105
Figure 20. Line graph with reading ease means scaled to increasing readability....................... 109
Figure 21. Percentage of teachers who strongly agreed with various statements about the school’s professional climate and working conditions, by sector and private school type: 1999–2000............................................................................................................................................. 115
CHAPTER 1: INTRODUCTION
This study was conceived in two contexts: that of a practical need and that of some leads
in educational research. The practical need was to develop a philosophical foundation for a
secondary school. The leads in education research come from studies and reports on the relative
performance of public and private schools in the U.S. These have revealed large and significant
differences in the performance of school types. Not only are there significant differences in
outcomes, but reports brought out by the National Center for Education Statistics (NCES),
suggest that the difference in success is related to the difference in educational goals, vision and
mission of schools. These two motivations led to the investigation of high school mission
statements.
Background of the Study
Mission statements were first investigated in the business world (Bart, 1998, 2001;
Caruthers & Lott, 1981; Cochran & David, 1986; David, 1989; Pearce, 1982; Pearce & David,
1987; Toftoy & Chatterjee, 2004), and then in the hospital industry (Bart, 2000). Later such
investigations were also applied to tertiary education (Lang & Lopers-Sweetman, 1991; Lopers-
Sweetman, 1991; Newsom & Hayes, 1991; Stemler & Bebell, 1999; Stober, 1997). There have
been numerous global comparisons of primary and secondary school types (Alt & Peter, 2002;
Barrow, 2002; Broughman & Colaciello, 2001; Coulson, 1999; Holton & Broughman, 2003;
McLaughlin & Broughman, 1997; Shokraii, 1997; Wirt et al., 2004). However, this study did not
reveal anyone who had done a content analysis of high school mission statements.
Defining Quality Education 2
To benefit from previous studies on mission statements in business, hospitals and tertiary
education and to enhance the body of knowledge already built up, this study applies these
previous aims and methodologies to the field of secondary education. While the original interest
has been the contrast between secular and religious vision and mission, this study will attempt to
establish a foundation in the larger area of research in this field and focus on integrating previous
research in the area of vision and mission both in business and in education. This study is then
foundational to further work in the area of mission statements and their effect in secondary
education.
One starting question for investigations of business mission statements has been whether
or not an organization has any mission statement at all and what the effect of having no mission
statement is on those firms which do have one. Applied to education, are schools with no mission
statement less effective than schools with a mission statement? However, a review of school web
sites as part of this study revealed that the school with no mission statement at all is very rare. A
random sample of 43 schools of all school types out of a total of 655 Alberta schools, revealed
only one school for which there was nothing at all displayed resembling a mission statement.
This study will focus on the following two questions. The first is to see whether the
content and presentation of mission statements correlates with the traditional and established
categories of educational authority. The second is whether there are some visions and missions
that are more effective than others. For the purposes of this study effectiveness will be
constrained to the area of academic effectiveness.
Defining Quality Education 3
Purpose of the Study
1. Investigate the Content and Manner of Presentation of High School Mission Statements in
Conformity with Variables Introduced from the Research Literature.
This study used quantitative as well as qualitative techniques to investigate the content
and manner of presentation of high school mission statements. High school mission statements
according to institutional authority were analyzed for characteristics of content, clarity and
motivational tone. Independent variables consisted of the sources of authority defining school
systems. Dependent variables consisted of four groups: (1) those relevant to stakeholders in the
educational process; (2) those related to the philosophy of education; (3) those concerned with
strategic planning; and (4) those of presentation. These four larger themes of dependent
variables were further broken down into more specific variables which could be measured both
quantitatively and qualitatively. The first theme relevance to stakeholders include d variables of
target group, principal service, geographic area and educational community. The second theme
philosophy of education included variables of philosophy, students’ character and life vision and
cosmic worldview. The third theme strategic planning included a variable estimating the reality
and doability of the mission and a variable inquiring about the focus of the statement. The fourth
theme presentation included readability measures and tone. The authorities by which these
variables were determined in the literature and in this study will be explained in chapters 2 and 3
respectively.
Besides the investigation of the content profile on each school sector according to the
above variables, this research study sought to verify that the content and presentation of school
Defining Quality Education 4
mission statements actually reflect the sources of control (in particular, public, private sectarian,
private non-sectarian) or whether mission statements are skewed according to the eroding
influences of the market, the ideologies of the age, and the locus of current political power.
2. Investigate the Relationship between Mission Statements and School Academic Performance
This study also investigated the correspondence between the content and characteristics
of mission statements and school performance as measured by students’ academic outcomes.
Research Questions and Hypotheses
Research Question 1: Do high school mission statements differ in content and presentation
according to sources of institutional authority?
Hypothesis 1: A random sample of mission statements stratified to include public,
independent non-sectarian, and independent sectarian high schools will exhibit similar
content and presentation according to groupings by sources of authority.
Null hypothesis: A random sample of mission statements stratified to include public,
independent non-sectarian, and independent sectarian high schools will exhibit similar
content and presentation irrespective of sources of authority.
Research Question 2: Does the content and presentation of high school mission statements differ
between high performing and low performing schools?
Hypothesis 2: The content and presentation of high school mission statements bear a
significant relationship to school performance as measured by students’ academic
outcomes.
Defining Quality Education 5
Null hypothesis: The content and presentation of mission statements bear no significant
relationship to school performance as measured by students’ academic outcomes.
Nature of the Study
This research study used quantitative as well as qualitative techniques to investigate the
content of high school mission statements. High school mission statements of school types
according to institutional authority were analyzed for characteristics of content, clarity and
motivational tone. Independent variables were the widely recognized sources of authority
defining school systems such as public, separate, private sectarian and private Christian.
Dependent variables consisted of four groups of variables: (1) stakeholders; (2) philosophy; (3)
strategic planning; and (4) presentation. These four larger themes of dependent variables were
further be broken down into more specific variables that could be measured both quantitatively
and qualitatively. The first theme relevance to stakeholders included variables of target group,
principal service, geographic area, and educational community. The second theme philosophy of
education included variables of philosophy, students’ character and life vision, and cosmic
worldview (see Appendix M). The third theme strategic planning included a variable estimating
the reality and doability of the mission and one inquiring about the focus of the statement. The
fourth theme presentation included tone and readability.
In investigating the mission statement profile for each school sector according to the
above variables, this research study sought to verify whether the content and presentation of
school mission statements actually reflect the foundational sources of authority or whether
mission statements are skewed according to market pressures and attitudes. The study also
Defining Quality Education 6
investigated the correspondence between the content and characteristics of mission statements
and school performance as measured by students’ academic outcomes. While much is known
about high school education, there has been little study about their mission statements, the
content contained therein, and the differences in the statements between various types of high
schools.
Significance of the Study
Three educational stakeholders may benefit from this study. Schools will have the
opportunity to acquire better insight into the dynamics of effective mission statements. This is
extremely important for purposes of self-understanding, organizational focus, strategic planning,
stakeholder motivation and marketing. Governments will have the opportunity to acquire a better
appreciation for the effectiveness of a diversity of educational sources of authority. Educational
researchers may benefit from a study of high school mission statements to complement what has
been done on business and college mission statements. Education researchers, government
authorities as well as school administrators and strategists may have the opportunity to acquire
fresh insights into the purposes and visions of other schools and school sectors.
Definitions of Terms
Mission Statement. A mission statement was defined for the purpose of this study as a
formal public statement defining an institution and its purpose as published on the school web
site. Mission statements might have other labels as well, such as creed, values, purpose, vision,
beliefs, objectives, or goals. Statements of purpose identified by these and similar headings were
Defining Quality Education 7
part of this study. The protocol used to gather statements from internet sites is described in
chapter 3.
Dependent Variables
For the purpose of this study, content included specific categories grouped into four
themes: stakeholders; philosophy; strategic planning; and presentation. These four larger themes
of dependent variables were further broken down into more specific variables which could be
measured both quantitatively and qualitatively. The first theme relevance to stakeholders
included variables of (1) target group, (2) principal service, (3) geographic area, and (4)
educational community. The second theme philosophy of education included variables of (5)
philosophy, (6) students’ character and life vision, and (7) cosmic worldview. The third theme
strategic planning included a variable estimating the (8) reality and doability of the mission and
one inquiring about the (9) focus of the statement. The fourth theme presentation included (10)
tone and (11-15) readability scores.
This study operationally defined content and presentation according to criteria and
methodologies similar to those used by past researchers such as Stober (1997) in his study of
college mission statements in the Middle States, by Pearce and David (1987) in their study of the
mission statements of Fortune 500 companies, and by Newsom and Hayes (1990) in their review
of college and university mission statements. Using the techniques of previous studies, three
independent raters examined sample mission statements for the presence of the above mentioned
content criteria. Independent raters also considered the tone of the text (was it inspiring,
Defining Quality Education 8
motivating, or stimulating?) according to procedures modified from those of Stober (1997) as
well as Cochran and David (1986).
For the purpose of this study, readability (or text clarity) was measured via computer
analysis using a grammar and style software to establish document readability scores. Analysis
included techniques similar to those used by Stober (1997) in his study of college mission
statements and by Cochran and David (1986) in their study of mission statements prepared by
businesses and schools of business. To operationalize reading ease, they manually computed
Gunning’s Fog Index for each mission statement. As with Stober, this study used computer
software to build a database of readability measures for each mission statement to calculate: the
Flesch Reading Ease (FRE) score, a 100 point scale with 0 being most difficult to read, and the
Gunning’s Fog Index (GFI), a scale approximating the reading grade level necessary to
comprehend a document. In addition, this study added a third reading ease test, the Flesch-
Kincaid Grade Level score, which rates text on a U.S. grade-school level. These variables and
procedures are described more fully in Chapters 2 and 3.
Independent Variables
Sources of Institutional Authority
In the U.S., the generic categorization of sources of institutional authority are: public,
independent non-sectarian, and independent sectarian. These were the categories used by Stober
(1997) and others working with American schools. High schools in Canada include these
familiar school types but include also a number of further distinctions as presented in Table 1.
Defining Quality Education 9
Whereas in the U.S. public schools consist only of regular public schools and charter schools, in
Canada, there is also a separate public school system consisting of a Catholic system and in rare
cases also of a separate Protestant school system. In addition, there are Francophone public
schools which use exclusively the French language.
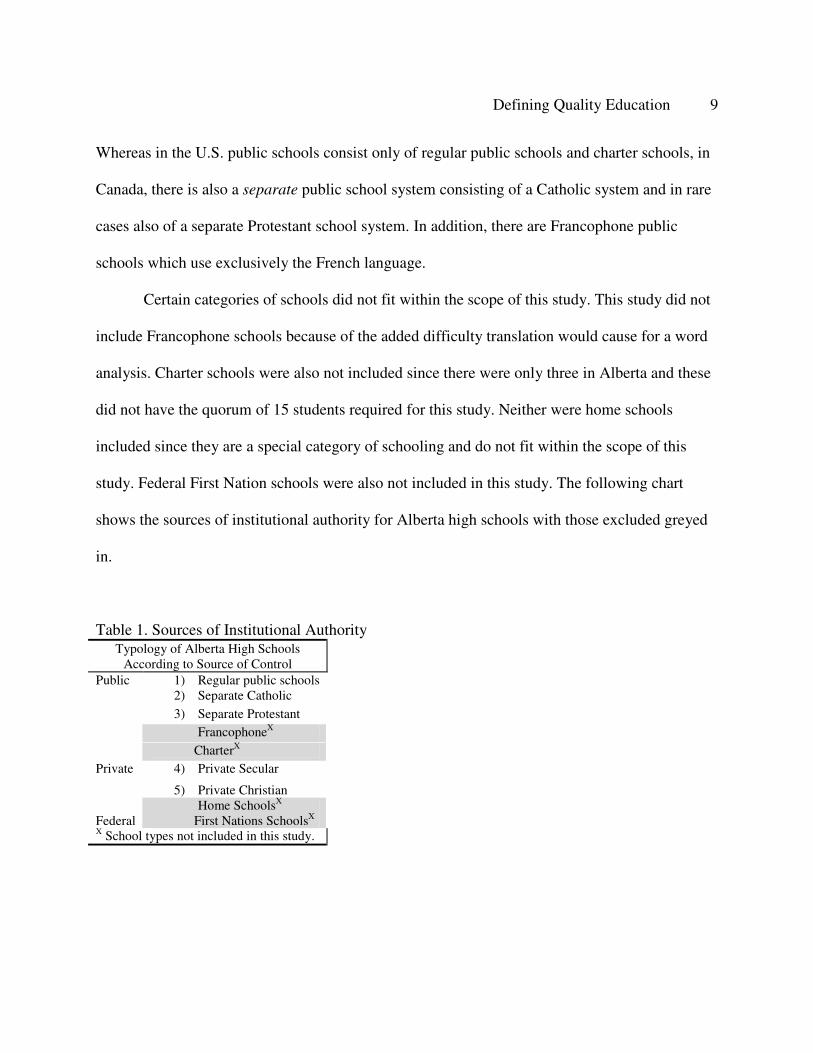
Certain categories of schools did not fit within the scope of this study. This study did not
include Francophone schools because of the added difficulty translation would cause for a word
analysis. Charter schools were also not included since there were only three in Alberta and these
did not have the quorum of 15 students required for this study. Neither were home schools
included since they are a special category of schooling and do not fit within the scope of this
study. Federal First Nation schools were also not included in this study. The following chart
shows the sources of institutional authority for Alberta high schools with those excluded greyed
in.
Table 1. Sources of Institutional AuthorityTypology of Alberta High Schools
According to Source of Control1) Regular public schools2) Separate Catholic3) Separate Protestant
FrancophoneX
Public
CharterX
4) Private Secular
5) Private Christian
Private
Home SchoolsX
Federal First Nations SchoolsX
X School types not included in this study.
Defining Quality Education 10
Assumptions and Limitations
A Focus on Canada
While there has been much study of the U.S. educational scene with respect to K-12
schools, there has been less about the Canadian K-12 educational scene. Nonetheless, Canada
provides an intriguing study since the Federal government in Canada has constitutionally very
little to do with K-12 education, that being the responsibility of each of the provinces
respectively. As a result, there is a great variation in the kind of schooling offered in the different
provinces.
A Further Focus on Alberta
The Fraser Institute, an independent Canadian economic and social research and
educational organization, has done a number of studies on school choice in Canada (Cowley &
Easton, 2004; Hepburn, 1999; Hepburn & Belle, 2003). A 2003 study by Hepburn and Belle
devised an instrument based on similar studies in the United States to evaluate each province on
a “freedom index” to establish the nature and relative availability of school choice among the
Canadian provinces. Alberta came out as the number one province for the availability of school
choice. There being a fuller complement of categories of school authority to choose in Alberta,
makes this province an especially rich field from which to take samples on the relative efficacy
of school mission statements.
Defining Quality Education 11
Sample Limited to Web Sites
Samples all taken from school web sites present ed many advantages but also entailed
some assumptions. It was assumed in particular that the venue of a web presentation as opposed
to the traditional college catalogue presentation would not alter the proportional differences in
variables of mission statement characteristics. Both defining mission statements written up in
school catalogues or as presented on the web requires studied judgments. As George Cole in his
study of mission statements on the web has noted, it is not simple to assess whether a given text
is merely history or consists of a value statement, or as to which statements have no apparent
relationship to directions or objectives. Another problem is that some Web sites present
information in a format that does not rely on standard structures for either sentences or
paragraphs but favor concerns with issues of site design (Cole, 2002).
CHAPTER 2. LITERATURE REVIEW
Introduction
This literature review will show how the focus of this paper emerged from previous
studies. The review begins with an introduction into the importance of research into mission
statements dealing with their purpose, the consequences of their misuse, and their effectiveness.
Following this introduction, the major part of the review concerns the two major themes of this
study, the content and the presentation of mission statements.
The Purpose of Mission Statements
Every educational institution or program needs a mission statement. Otherwise one ends
up moving the target to where the arrow went. A mission statement brings clarity to purposes,
goals and objectives. If we don't aim at something, we are that much less likely to hit it. If one is
going to build or develop a school, there must be a reason for doing it. An institution cannot be
effective if it wanders aimlessly (Benson, 2001). An increasing amount of literature has been
emerging in recent decades on the topic of mission statements. Why should educators study
mission statements? Christopher J. Lucas (1997) in his Crisis in the Academy comments that if
there is true crisis in American higher education today, it is chiefly a crisis of “purpose within the
university" (p. xiv). Mission statements are said to be essential for an effective organization.
Christopher Bart notes in his study of the mission statements of innovative firms:
Without a doubt, the mission statement is regarded as one of the most fundamental building blocks of an organization. It is both the cornerstone of any firm's strategic planning process and is considered the starting point in such hot topics as reengineering, TQM, and self directed work teams. (Bart, 1998)
Defining Quality Education 13
In Futuring Tools for Strategic Quality Planning in Education (1999), Alexander and
Serfass assert that scientific planning requires organizations to establish their mission, vision,
shared values, goals, and a procedure for the deployment of these goals throughout the
organization. The following summary is a brief outline of some of their uses as brought out in the
literature.
Articulate the Vision of and Justify the Existence of the Organization
The mission statement gives a brief summary of the nature of an institution. It briefly
describes the institution and its reason for existence. This is essential in application for license,
accreditation or charter. Regional accreditation is primarily a tool for determining the degree to
which an institution fulfills its mission.
The Middle States Commission on Higher Education states: “Well-defined and clearly
stated missions are necessary so that institutions can remain true to their basic orientation while
strategically responding to external and internal forces” (1991).
The mission statement is also considered essential to help in strategic planning. The
Baldrige National Quality Program in Education assessment asks each school to begin its
application with an organizational profile. The key aspect of this profile is the organization’s
vision and mission. The assessment manual explains:
Use of such terms as “purpose,” “vision,” “mission,” and “values” varies depending on the organization…. Nevertheless, you should have a clear understanding of the essence of your organization, why it exists, and where your senior leaders want to take it in the future. This clarity enables you to make and implement strategic decisions affecting the future of your organization. (Baldrige National Quality Program--Education Criteria for Performance Excellence, 2005, p. 38)
Defining Quality Education 14
Give Direction to the Organization
Toftoy and Chatterjee assert that the mission statement is an essential component of the
business plan of a company. “A company without a mission is like a ship without a rudder!”
(Toftoy & Chatterjee, 2004). The mission statement guides the school on what to teach. Warren
Benson, Professor of Christian Education at Trinity Evangelical Divinity School, notes that we
can no longer be content to argue on the level of teaching techniques when the whole matter of
what to teach is up in the air. Every educational institution or program needs a mission statement.
Otherwise one ends up moving the target to where the arrow went. A mission statement brings
clarity to purposes, goals and objectives (Benson, 2001). If we don't aim at something we are that
much less likely to hit it. If one is going to build or develop a school there must be a reason for
doing it. An institution cannot be effective if it wanders aimlessly. The mission statement guides
curriculum, classroom management and everything that happens in the school. Travers and
Rebore, in their book Foundations of Education—Becoming a Teacher, point out “the
curriculum, discipline, classroom organization, and student performance all stem from the
mission of the school" (2000, p. 79).
Promote the Organization
Each educational institution is called to promote its vision and mission both in the
community and among its students. It needs to do this to attract students to the institution in the
first place, in particular if it is a private institution. Johnson and Meyerson (1994) suggest that
donors will target their charitable giving by clarifying their mission, and that institutions with
well-defined and communicated missions will more effectively compete for those charitable
Defining Quality Education 15
dollars. Stober notes: “Mission statements serve to define an institution, and to distinguish it
from other organizations within this diverse group. In this capacity, the mission statement also
serves as a tool for marketing the institution to prospective students and charitable donors”
(Stober, 1997).
Institutions need students and money, but they also need to attract the good will and
enthusiastic participation of the community. This includes the involvement of parents in
students’ activities and in school projects that involve the financial and other support of the
community.
A school, as a community of scholars and teachers, also has the mandate to educate the
whole community. It can do this by demonstrating its vision and mission statement and
educational philosophy in all its activities. The mandate of the school must also be promoted
among the students to have their full cooperation and enthusiastic involvement in the programs
set up for their intellectual, psychological, social, physical and spiritual growth.
On the negative side, in his analysis of mission statements, Stober notes that mission
statements are often used as smoke-screens for opportunism (Stober, p. 14).
Mitigate the Forces of Erosion
Institutions may be tempted to compromise the integrity of their basic orientation by
redefining themselves in ways that are most likely to attract students and funding. Well-defined
and clearly stated missions are necessary so that institutions can remain true to their basic
orientation while strategically responding to external and internal forces (Commission on Higher
Education, 1991).
Defining Quality Education 16
Related to this issue are the powers of ideological pressure and of changing social
fashions, which can have a powerful influence on compromising the original vision and mission
of an institution. Hepburn (2002) notes that the now secular public school system in Canada and
the United States was originally largely a Protestant Christian system. G. M. Marsden (1996) has
documented the en mass discarding of American Church founded colleges of their Christian
visions and missions with the onslaught of modern ideologies.
Motivate and Unify the Stakeholders
In their NCES survey of private schools, Alt and Peter point out that "the principal’s top-
priority goals, if communicated effectively to teachers and other staff, can influence both daily
practices and the professional climate at the school" (2002). They further note that a school’s
professional climate, in particular the existence of a strong shared purpose among staff members
and cooperative interactions among people at the school, is likely to contribute to its
effectiveness…. Newmann and Wehlage (1995) found that when teachers feel a sense of
community at their schools, they can better communicate consistent goals to students and
collaborate more effectively on raising student achievement…. Another study (Bryk & Driscoll,
1988) found that teachers who work toward shared goals express higher job satisfaction and have
lower absentee rates than do other teachers (2002, p. 15).
It is the nature of an educational institution to promote its vision and mission both in the
community and among its students. It needs to do this to attract students to the institution in the
first place, in particular if it is a private institution, but also to attract the good will and
enthusiastic participation of the community. This includes the involvement of parents in
Defining Quality Education 17
students’ activities and in school projects that involve the financial and other support of the
community. A school, as a community of scholars and teachers, also has the mandate to educate
the whole community. It can do this through its vision and mission statement and educational
philosophy. As mentioned above, the mandate of the school must also be promoted among the
students to have their full cooperation and enthusiastic involvement in the programs set up for
their growth.
Morally Justify the Endeavor
The observation that an institution needs a vision and mission leads to the further
question of what is the right mission or aim. It is important to have an aim, but the character and
nature of that mission is also of vital importance. That one can aim also means one can miss the
mark. Just as teaching techniques are not all equally effective, so philosophies of education and
visions and missions are not equally good. Parker J. Palmer says that “all education is a process
of spiritual formation or deformation” (2003). This paper will not attempt to answer the age old
question of what should be the aim of education although it is hoped that the empirical evidence
gathered in this study will help toward a better discernment in the strategic design of school
missions.
Provide a Standard for Assessment
“CPIE members have concluded that the most appropriate standards for assessments
undertaken at, about, or by Collin County Community College District (CCCCD) are the
District’s stated mission and goals” (Wallace & Martin, 2004, p. 1).
Defining Quality Education 18
The Misuse and Abuse of Mission Statements
The topic of moral justification for an endeavor leads into the problem of the misuse of
mission statements. Critics of mission statements have called them at best ineffective and at
worst immorally misleading.
The Problem of Vacuousness
The usefulness of mission statements is perceived as variable, mainly because they tend
to be either too general or lack elements which would drive planning or delivery (Edem,
Spencer, & Fyfield, 2003, p. 21). Many of today's mission statements are too vague to make
them useful as a benchmark. "Right now, [entrepreneurs] can do better than just saying 'We're
going to produce high-quality goods and satisfy our customers, and we consider our employees
our greatest asset,'" says Paul Davis, president of the Scanlon Leadership Network. "It's so
innocuous that it doesn't mean anything" (Penttila, 2002).
In a statement of unusual candor, the Ohio Board of Regents in a discussion paper, noted
that there is a tendency for the mission statements of four-year colleges and universities to claim
to have an "over-arching commitment to providing quality instruction, research and public
service" (Ohio Board of Regents, 1993). They decried the indistinguishable similarity of too
many mission statements in higher education. Unfortunately, the generality of mission
statements does not provide the directional cues that are necessary in today's academic
organizations (Cole, 2002).
Defining Quality Education 19
The Temptation to Opportunism
Stober refers to research by Lang and Lopers-Sweetman which points out that mission
statements may become an opportunistic tool when they enable the institution to mimic an
abstract model that is most likely to obtain funding, or attract students (Lang & Lopers-
Sweetman, 1991; Stober, 1997, p. 15). Lang and Lopers-Sweetman (1991) proposed that
There are systemic forces that, at least, do not encourage colleges and universities to express highly differentiated roles and that, at most, force institutions into a common academic mold, which in practice separates mission statements from plans and planning. (p. 608)
Public funding via measurable cost to benefit criterion may encourage institutions to mimic a
model most likely to receive funding (Stober, 1997).
Stobers cites Johnson and Meyerson who suggest that donors will target their charitable
giving by clarifying their missions, and that institutions with well-defined and communicated
missions will more effectively compete for those charitable dollars. However, the diversity of
private funding sources may encourage both public and independent institutions to define their
unique missions to tap those sources (Stober, 1997, p. 16).
The forces of secular humanism emanating from the secular state have also been
responsible for great pressures on originally religious schools. For instance, the now secular
public school system in Canada and the United States was originally largely a Protestant
Christian system (Hepburn, 2002) . The en mass discarding of American Church founded
colleges of their Christian visions and missions is not only proverbial but well documented
(Marsden, 1996; Marsden & Longfield, 1992). A question corollary to this investigation would
Defining Quality Education 20
be: is there any indication of the school compromising its foundational mission to conform to
external pressures whether of the market or from the state?
The Problem of Crass Lack of Ethics
"I suspect the majority of mission statements don't reflect reality, and I think it's apparent
to employees," says Lin Grensing-Pophal, a Chippewa Falls, Wisconsin, consultant and the
author of HR Essentials: Your Guide to Starting and Running the HR Function (Cited in Penttila,
2002). One of the most startling examples of this is Enron, whose mission statement noted that
the company prided itself on four key values: respect, integrity, communication and excellence.
Among other things, all business dealings at Enron were supposed to be "open and fair." It's
obvious the former seventh-largest U.S. company wasn't living its own mission statement
(Penttila, 2002).
The Social Reinforcement of Hypocrisy
An article by Entine and Nichols (1996) notes that as well-meaning as codes and mission
statements purport to be, promises that companies don’t or cannot hope to implement divert
attention from the need for structural changes. Unfortunately, our social attitudes are such that
the real benefits of many well-publicized codes have gone to the companies who were
embarrassed into drafting them, not the people they were designed to help. Entine and Nichols
refer to the fashionable ethics-in-business movement in which “good intentions” has become the
new standard of corporate ethics. Highly-praised New Age firms that sell commodity products at
premium prices have been found lacking in critical areas of accountability and honesty of
marketing. In February 1995, Starbucks became the first company in the agricultural
Defining Quality Education 21
commodities sector to announce a “framework” for a code-of-conduct…. But according to
CEP’s Executive Director Alice Tepper Marlin, the mission statement alone was enough to earn
Starbucks its honor. How has it enforced its code? “We’ve done nothing yet,” acknowledges
Olsen. “It’s a slow incremental process.” First condemned for labor practices which it could not
hope to change, Starbucks is now praised for actions it has not yet taken.
Celebrating good intentions in the absence of accountability goes to the heart of the
corporate ethics conundrum. “Researchers have found no correlation between company ethics
codes and ethical practices,” says Kirk Hanson, a Stanford lecturer who has written extensively
on corporate responsibility. The Gap, Levi Strauss, Nike, K-Mart and J.C. Penney, which all
have admirable ethics codes, have sourced from foreign sweatshops. Or consider Reebok which
gives out an annual Human Rights Award but sprints from one low wage country to the next,
paying its Indonesian workers twenty-three cents an hour (Entine & Nichols, 1996) .
It’s a dangerous trend that companies promote Thoreau-like mission statements without
organizational commitments to implement those ideals. “So many so-called progressive
companies have noble corporate philosophies,” says Jon Lickerman, director of research at the
Calvert Group, which promotes socially responsible companies, “but mistreat their own
employees, vendors, and customers” (Entine & Nichols, 1996).
The Importance of Accountability
To be effective a mission statement should conform to the "smart" rule. It should be
specific, measurable, attainable, relevant and trackable (Penttila, 2002).
Defining Quality Education 22
The Need for a Clarification of Values
Stober suggests that to prevent mission statements from becoming simply a “smoke
screen for opportunism,” there needs to be a clarification of institutional values. Wilcox and
Ebbs suggest that ethical leadership requires that stake-holders be given an opportunity to
discuss the institution’s essential values: a “values audit” (Wilcox & Ebbs, 1993). George Keller
notes also the importance of taking seriously and keeping in touch with the traditions, values and
hopes of an institution. He points out that a strategy can never be effective if it tries to ignore
those powerful intangibles. Rather than being overlooked they should be articulated (Keller,
1983).
The Effectiveness of Mission Statements
Lopers-Sweetman in their study supported the notion that mission statements are most
effective if linked to the planning process and if stakeholders are fully engaged in the process
(Lopers-Sweetman, 1991). To be effective, the mission statement,
has to come from within the bowels of the organization. Everyone should participate in a meaningful way—not just the top strategy planners, but everyone. Once again, the involvement process is as important as the written product and is the key to its use.(Terez, 2003)
The Content of Mission Statements
The Work of Pearce and David 1989
In the early 80’s, educational literature considered mission statement content in a general
sense, but components were not considered. For instance, Caruthers and Lott (1981) suggested
Defining Quality Education 23
that a mission statement should be “permissive and restrictive” with the permissive portion
defining an institution’s heritage and destiny, while the restrictive portion making public what
the institution “does not believe itself to be” (Stober, 1997).
Unlike the education literature, the business literature of the time tended to be specific.
Pearce operationalized and tested eight key components of mission statements: (1) target
customers, (2) basic products or services, (3) primary markets, (4) principal technology, (5)
concern for survival, growth, and development, (6) company philosophy, (7) company self-
concept, and (8) concern for public image (1982; Pearce & David, 1987). Pearce’s list has been
the standard and has subsequently appeared throughout the literature, sometimes with minor
modifications. In a 1989 review of 75 mission statements selected from Business Week 1000
firms, Fred David adds a ninth component “concern for employees” (1989).
Lang and Lopers-Sweetman did a review of the form and content of 32 post-secondary
mission statements and 12 master plans for higher education (Lang & Lopers-Sweetman, 1991).
Although Lang and Lopers-Sweetman did not report the methodology used to establish these
groups and their categories have not turned out as productive as those of Pearce, yet their work
reinforced the concept, already worked on by Pearce and David, that mission statements should
be operationally (concretely, measurably, and thus transferably) defined for analysis.
Pearce and David (1987) tested the hypothesis: “the mission statements of high
performing Fortune 500 companies will exhibit more of the desired components than will those
of low performing Fortune 500 firms” (p. 109). To prepare for the content analysis, three raters
read and discussed selected literature including sample mission statements. The raters then
independently read mission statements selected for the study and recorded the presence, or
Defining Quality Education 24
absence of each criterion adapted from Pearce (Pearce, 1982; Pearce & David, 1987). Inter-rater
reliability coefficients indicated consistency, and analysis using Pearson interrelations
established that the eight components were distinct variables. Mean values for “high performers
and “low performers” were compared for each of the eight components. For three content
items—philosophy, self-concept, and public image—the mean values for “high performers” were
significantly higher than the mean values for “low performers.” Although the results of their
study focused on business mission statements, the methodology served as a way to define
operationally the content of mission statements.
The Work of Newsom and Hayes 1991
Pearce and David had defined and applied their content criteria to business mission
statements. Newsom and Hayes demonstrated that it is possible to extend this type of analysis to
post-secondary educational intuitions. They adapted the work of Pearce and David to study the
stated missions of 142 post-secondary institutions in 11 southeastern states (Newsom & Hayes,
1991). The response rate was 80% (114 institutions) of which 93 provided comments appropriate
for analysis. Newsom and Hayes compared public, private non-sectarian, and private sectarian
post-secondary institutions. They used a modification of Pearce’s eight components reducing the
number to seven by combining: principal technology and concern for survival, growth and
development into a single category they called commitment. Newsom and Hayes used techniques
similar to those of Pearce and David, but without statistical analysis. Their work also supported
the concept that mission statements may differ in content according to institutional sources of
Defining Quality Education 25
authority (e.g., public, private, sectarian and non-sectarian). Their data suggested that mission
statements of public institutions are most likely to define a region the college serves, but
sectarian institutions were most likely to define the institution’s philosophy and desired public
image (1991; Stober, 1997, p. 129).
The Work of Stober 1997
Spencer Stober (1997) followed closely the methodology of Pearce and David and like
Newsom and Hayes also applied it to colleges and universities. He combined the category of
commitment, which Newsom and Hayes had made from combining Pearce’s unique technologies
with concern for survival, and further combined it with principal services also naming this new
combination principal services. Moreover, Stober somewhat modified the Pearce components by
combining philosophy, self-concept, and public image into one criterion simply called
philosophy. Thus Stober telescoped Pearce’s criteria from eight to four components. Stober did
not ask about the effectiveness of mission statements relative to performance as had Pearce and
David. However, Stober did add to the content variables of Pearce and David variables of tone
and of clarity which he adapted from the work of Cochran and David (1986).
Stober’s idea was to combine both qualitative and quantitative research techniques to do
more than simply count words. He notes that while content analysis was originally designed to
be objective by focusing on the words, phrases, and concepts (i.e., frequency equals
significance), rather than on meanings and motives or circumstances surrounding production of
the text, this approach was found to be inadequate since in some cases it may not be possible or
Defining Quality Education 26
appropriate to simply count words without considering implied meanings (e.g., measuring tone
and philosophical intensity of statements within the study). In his study, he intended to produce
frequencies but also consider interpretation by readers as well as motives or circumstances
surrounding production of the text (Stober, 1997, p. 40).
Independent human raters read and interpreted the text of sample mission statements, and
these statements were then examined using an outside observer (a computer). The qualitative
data gathered by independent raters was used to inform quantitative data collection (computer
word searches), and whereas this added a subjective component to quantitative data collection,
the construction of computer generated word profiles was independent of work done by raters
(Stober, 1997, pp. 39-40).
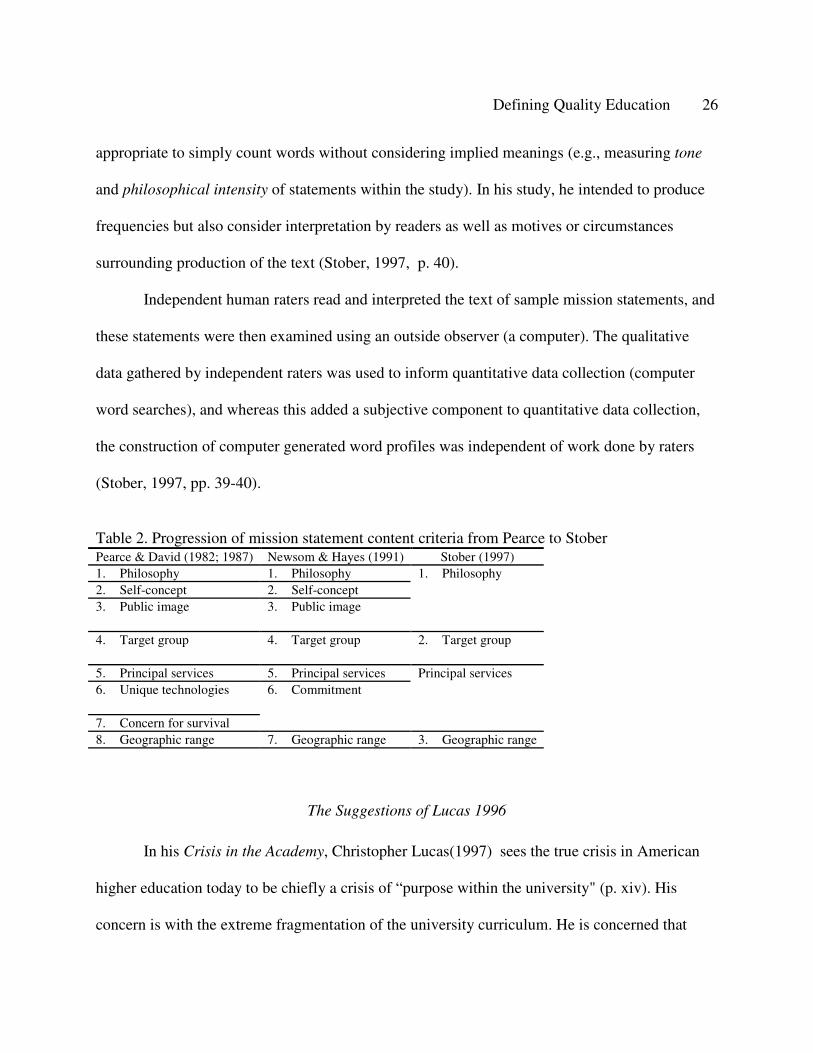
Table 2. Progression of mission statement content criteria from Pearce to StoberPearce & David (1982; 1987) Newsom & Hayes (1991) Stober (1997)1. Philosophy 1. Philosophy2. Self-concept 2. Self-concept3. Public image 3. Public image
1. Philosophy
4. Target group 4. Target group 2. Target group
5. Principal services 5. Principal services6. Unique technologies
7. Concern for survival
6. CommitmentPrincipal services
8. Geographic range 7. Geographic range 3. Geographic range
The Suggestions of Lucas 1996
In his Crisis in the Academy, Christopher Lucas (1997) sees the true crisis in American
higher education today to be chiefly a crisis of “purpose within the university" (p. xiv). His
concern is with the extreme fragmentation of the university curriculum. He is concerned that
Defining Quality Education 27
there be an attempt to inspire students with a life vision (Lucas, 1997, p. 52). He sees the need to
aim at developing the character of students (Lucas, 1997, p. 55). He writes of the civic function
of the university, that it should prepare students as citizens. “Citizens need to be clear reflective
thinkers; they need cultural awareness and appreciation for society’s traditions. They require full
awareness of the social and natural environment in which they live” (Lucas, 1997, p. 46, 52). He
articulates the need for broad liberal learning?
Lucas is concerned also with the formation of the students’ worldview. He is concerned
that it is typically too narrow. He decries the distortion of the original German idea of
Wissenschaft or science as knowledge in general or integrated knowledge into a focus on
empiricism, which had not originally been the connotation of the word. It was not enough that
psychology, sociology, anthropology, and similar fields should seek to become social sciences,
but the same imperative was also felt in the humanities. He notes that closely connected with the
ideology of scientism was a tendency toward intellectual fragmentation and the “carving up” of
knowledge domains into ever smaller and more manageable pieces. This has led to
institutionalized specialization, a focus on the immediate use of knowledge, a drive toward the
professionalization of occupations and vocations with a resulting overwhelming of liberal
education by specialized education (Lucas, 1997, pp. 66-70).
If we are to have a broader curriculum to shape the character of the student as Lucas
proposes, what would inform the worldview of that curriculum? Some postulate that any vision
so long as it is well defined and articulated serves the same purpose. Others would disagree and
maintain that the character and nature of the mission is important. Parker J. Palmer says that “all
education is a process of spiritual formation or deformation” (2003). This view implies that
Defining Quality Education 28
philosophies of education and visions and missions are not equally good. Such considerations
lead this study to ask: Does the mission statement make clear the character or worldview of the
mission? And how might that worldview be related to other components of the mission statement
as well as student outcomes?
Lucas has emphasized that a broad, liberal curriculum should aim at the social,
recreational, and spiritual development of its young people (Lucas, 1997, p. 51). In an analysis of
mission statements it would be helpful to see just what purposes for education missions
statements of different schools do reflect. This idea is addressed in the analysis of Steve Stemler
and Damian Bebell (1999).
The Work of Stemler and Bebell 1999
In 1999, Steve Stemler and Damian Bebell published a content analysis of university
mission statements in which they looked for educational goals to be found in American
schooling. They compared educational themes addressed by the school systems according to
source of institutional authority. Stemler and Bebell attempted to take a sample of educational
institutions from the whole educational age spectrum across the U.S. (elementary, middle,
secondary, and post secondary institutions). They looked for major themes in their sample of
mission statements and identified ten major themes with their relative frequencies for each of the
levels and school types. Their ten themes were (1) cognitive/academic, (2) social, (3) citizenship/
vocational, (4) physical, (5) attitude/ values/ emotional development, (6) school environment, (7)
spiritual community, (8) local community, (9) global community, (10) faculty/staff. They
Defining Quality Education 29
concluded that the purpose of school shifts from emotional development in the early levels of
schooling to cognitive development at the college level.
Unique about their study was that all mission statements were obtained from school web
sites. The Stemler and Bebell methodology has some shortcomings. Unfortunately, their
selection of school mission statements were taken from one particular private web site (The
Global School Net Foundation) which, although having a large number of schools subscribed,
would tend to attract mainly those schools of similar vision and mission. The groupings and
selection of themes and especially the groupings seemed also somewhat arbitrary. Moreover,
they did not mainly use independent raters, as did the Pearce and David and the Stober studies,
preferring to do the analysis themselves. Nevertheless, the Stemler and Bebell study do provide
us with a list of educational themes to investigate in an analysis of mission statements.
The Work of Bart 1998
A Comparison of Mission Statement Content to Outcomes
Christopher Bart (1998) asked, “Are there differences in the content and characteristics of
mission statements between innovative and non-innovative organizations?” (p. 66). This study
would also like to ask this question of high and low performing schools. As Pearce and David
(1987) had looked for differences in the content of mission statements between high and low
performing firms, so Bart (1998) looked for differences in the content of mission statements
between innovative and non-innovative organizations. The methodology and questions which
have been used for the business world give us helpful direction in investigating the mission
Defining Quality Education 30
statements of schools. As with business organizations, the differences in the content of school
mission statements could also be compared to their performance. If suggestions for the
improvement in the innovation and performance track record of North American firms would be
welcome, how much more would identification of unique characteristics of the mission
statements of successful schools be welcome if it might lead to better performance in the area of
education? For if the literature is correct, schools are in even worse trouble than businesses.
Organizational Contingency Theory and the Benefits of Diversity
Not all organizational circumstances are the same and therefore the managerial responses
required should be tailored to fit the specific context. This approach is often referred to as
organizational contingency theory and has been applied to the case of innovative organizations
by Galbraith and Kazanjian (1986) as follows:
For the innovating organization, what is called for is an absence of formal structure as bureaucracy is anathema to innovation. Rules, regulations, procedures, accepted practice and programmed activity will stifle creativity and drive out new ideas ... What is needed is the organizational climate of an independent start up firm, characterized by an informal, unstructured, group problem solving approach where decisions are made quickly and communications are personal and face to face. (Galbraith et al., 1986)
From this idea Bart argues that innovative corporations require organizational
arrangements (i.e., systems, procedures, approaches, etc.) different from non-innovative ones.
Moreover, one would also expect the nature and content of mission statements to vary
significantly between different types of organizations—especially, innovative and non-
innovative companies.
Organization contingency, if applied to education argues that a one-administration-fits-all
approach is not in the best interests of citizens and their educational needs. As in the case of
Defining Quality Education 31
business, monopoly and bureaucracy reduces competitiveness, creativity and ultimately threatens
survival. The best interests of a nation are in allowing more freedom to education providers as
well as parents and students in the education market. Unfortunately, diversity of educational
opportunities is often not encouraged. Could this be a cause for the malaise in our education
system? It appears that where there is more freedom for educational diversity there is also a
significant improvement in results. In Canada, for instance, the province which encourages the
most freedom of educational options, Alberta, also has the best educational outcomes.
Mission Statement Components
Ten of the 25 mission statement components Bart investigated were found, in the case of
the innovative firms, to be used significantly more often than in the case of the non-innovative
firms. These high-use mission components were: competitive strategy, behavior standards, one
big goal, specific financial objectives, non-financial objectives, technology defined, concern for
survival, concern for employees, concern for shareholders, and a statement of vision.
Moreover the respondents in the innovative firms were significantly more satisfied with
the content of their particular firm’s mission statement, its clarity and its understandability than
those respondents in the non-innovative firms. The former also reported that their missions were
perceived to have significantly greater influence over both their own behavior as well as the
behavior of others. As a result, respondents in innovative firms claimed to be significantly more
committed to their mission statements than those in the non-innovative organizations (Bart,
1998).
Defining Quality Education 32
Measurable Standards
Bart found that among the 10 content variables that were most significant in the content
statements of innovative firms six of them centered on the notion of accountability and
measurability. These were the components of: competitive strategy, behavior standards, one big
goal, specific financial objectives, non-financial objectives, and technology defined. Bart found
that specific objectives helped in making the mission statement more than just a set of good
intentions. For instance, Bart notes that “where firms specify somewhere in their mission the
innovative behaviors expected, high levels of the actual behaviors appear to follow” (1998, p.
71). This suggests that any analysis of mission statements should check to see whether it contains
measurable strategic variables.
Technology Definition and Concern for Survival
Bart (1998) found that technology definition and concern for survival were more highly
specified in the case of innovative firms. He notes that no firm can expect to be innovative in
everything. He suggested that non-innovative firms, on the other hand, do not make the choices
of focus to do well (p. 71). We mentioned earlier the advantage of a diversity of educational
institutions which can focus on the particulars of their vision and mission. We noted that some
state jurisdictions allow more of such diversity than others and that those which allow more
freedom seem to have more success. It is hoped that an analysis of the respective mission
statements of institutions according to authority will give further insight into this question.
Defining Quality Education 33
What is Innovation and What is Success?
Bart’s results suggested that high numbers of new products are not necessarily what make
a firm innovative. Instead, it is the number of new products brought successfully to market. In
addition, the mission statements of innovative companies were ones that appeared to make a
difference in the everyday lives of firm members. They created action (Bart, 1998, p. 73). This
also applies to schools. There may be a lot of innovation, but does it actually result in better
outcomes for the students?
Mission Statement Rationales—Concern for Customers, Employees and Shareholders
In his study, Bart (1998) also investigated the difference in rationales for mission
statements between innovative and non-innovative firms. He found that only four of the ten
drivers were found to produce significant differences between the innovative and non-innovative
sub-sets of firms. The four high-usage drivers were: providing a common purpose, creating
shared values, emphasizing the interests of external stakeholders, and inspiring employees.
Notable is that these drivers are exactly the ones held to be important for schools by major
reports published by the National Council of Educational Statistics of the U.S. Department of
Education.
Writing for the NCES, Alt and Peter (2002) cite a number of studies that found links
between teachers’ perceptions of a school’s professional climate, on the one hand, and teachers’
effectiveness and job satisfaction on the other (Mitchell, Ortiz, & Mitchell, 1987; Rosenholtz,
1991). They note an extensive 1993 study of Catholic high schools by Bryk, Lee, and Holland in
which a range of attributes were found to contribute to school effectiveness. These attributes
Defining Quality Education 34
included the staff’s communal organization to advance shared goals; principals having primary
decision making authority for most school management matters; teachers’ commitment to the
academic, spiritual, and social development of students (which encompassed providing extra
help when needed and supporting extracurricular activities); and an atmosphere of mutual respect
among everyone in the school (Cited in Alt & Peter, 2002, p. 12). Alt and Peter point out that a
school’s professional climate, in particular the existence of a strong, shared purpose among staff
members and cooperative interactions among people at the school is likely to contribute to its
effectiveness. They note Newmann and Wehlage (1995) found that when teachers feel a sense of
community at their schools, they can better communicate consistent goals to students and
collaborate more effectively on raising student achievement. “Similarly, another study (Bryk and
Driscoll 1988) found that teachers who work toward shared goals express higher job satisfaction
and have lower absentee rates than do other teachers" (Cited in Alt & Peter, 2002, p. 15). It will
be helpful to keep these results in mind. When looking at school mission statements we will want
to ask if there are references to providing a common purpose, creating shared values,
emphasizing the interests of external stakeholders, and inspiring employees.
Another interesting question raised by Bart is whether innovative firms approach the
creation (or, re-formulation) of their mission statements differently because they are
fundamentally different from non-innovative firms. Do innovative firms better understand
(perhaps almost intuitively) the importance of having a common purpose, maintaining shared
values, considering external stakeholders and inspiring employees and thus create their missions
with these thoughts in mind. Or, is it that by emphasizing, to a significant extent, the firm's
purpose, values, external stakeholders and motivation during the mission's creation, a more
Defining Quality Education 35
innovative organization will result (Bart, 1998, pp. 72-73). Is it the organization that makes the
mission statement or the mission statement that makes the organization?
Bart notes:
The mission statements of innovative organizations contained significantly clearer and more explicit references in their concern for employees and shareholders than our non-innovative organizations. Innovative firms obviously seem to better appreciate the need for recognizing the contribution which these stakeholders make to company success. By giving them equal prominence in their firms' mission, innovative companies help balance the (potentially competing) interests of multiple stakeholders for the benefit of the entire organization. Non-innovative firms, in contrast, appear to be working in a state of imbalance and may, in fact, be focusing on the customer to the detriment of other critical stakeholder groups. (Bart, 1998, p. 72)
Some have said that when a school system has a monopoly on education, there is a tendency
toward bureaucratization and insensitivity toward the customer, which are the parents and
students, and a focus on the benefits and views of teachers’ unions, government administrators,
and academic ideology. That is why the research of Bart and others suggests the benefit of focus
on a broader ranger of stakeholders and, in particular, on those on the receiving end of the whole
process, the parents and students. Many good intentions may be voiced but if the resulting
education is poor the whole exercise is in vain.
Vision
Bart notes that innovative firms were observed to have significantly more prominent
statements of vision imbedded in their documents than non-innovative firms. He suggested that
they have a better sense of direction than non-innovative organizations. “They know where they
are going” (Bart, 1998, p. 72). When analyzing the vision statements of educational institutions
we will also want to look for statements of vision.
Defining Quality Education 36
Commitment
Bart’s responses indicate that innovative firms have much higher levels of committed
employees than non-innovative organizations. He notes that significant differences in the degree
to which selected behavior standards were expressed in the mission statements apparently
existed. He suggests that both innovative and non-innovative firms understand why they are
creating and deploying their missions in the first place but that innovative firms manage to
articulate the required behavior standards in their mission statements more effectively. “Non-
innovative firms may argue the need for behavior standards (in their mission rationales) just as
forcefully and persuasively as innovative firms. The difference is that the non-innovative firms
don't seem to mean it or want it as much” (Bart, 1998, p. 73).
The Work of Edem, Spencer, and Fyfield 2003
A British report on provider missions by Edem, Spencer, and Fyfield (2003) of the
Learning and Skills Development Agency, commissioned by the Department for Education and
Skills identifies a range of practice in establishing an institutional mission and presents proposals
for the effective development and review of institutional missions. The literature review
identifies the value of the process of mission development, especially when mission is developed
with stakeholder involvement and used to drive strategy and operational activity. The survey of
providers indicated that the development, content and use of mission are variable among
providers.
Defining Quality Education 37
The report cites Mullane (2002) who shows that in studies of mission, the importance of
the process is acknowledged by managers. In one study Mullane cites, 73% of managers were
less than fully satisfied with the process used to create mission, “primarily because major
stakeholder groups, most notably employees and managers, had been left out of the process.” In
another study, he notes that managers found mission to be the most used tool out of 25 identified.
The claim here was that “satisfaction rested on the mission statement’s efficacy at creating
organizational integration—getting everyone focused on common objectives” (Cited in Edem et
al., 2003, p. 4).
On a related theme, Bart and Baetz (1998) introduced the concept of mission–
organizational alignment as a potentially important antecedent to a mission’s influence over
employee behavior. They observed that the more closely an organization was able to align its
structure, systems and procedures with its mission, the greater the impact on performance
generally, and on employee behavior, in particular. Bart (1999) obtained similar results in his
study of 103 hospitals. The key elements here are employee involvement and correspondence of
mission with actual operational reality. The employees of a school are the teachers. An analysis
of school mission statements must therefore probe the integration and satisfaction of teachers
with the school vision and mission.
Edem et al. (2003) conclude that mission statements can be potentially powerful strategic
tools. But to be effective internally and externally, they need to be the end result of a careful
process of consultation, involving the participation of key stakeholders, to enable them to
genuinely convey the sense of mission of the whole organization. Mission statements must also
Defining Quality Education 38
have operational relevance. In addition to probing the concern for having the teachers on board
another element to probe for would be operational relevance.
The Work of Toftoy & Chatterjee, 2004
Toftoy and Chatterjee (2004) give a readable and comprehensive review of the findings
about mission statements up to the present. They repeat, summarize, and emphasize the criteria
already brought out by earlier researchers. Their purpose is to help small business people to
realize the importance of the mission statement as a crucial part of planning and securing the
success of their business.
A unique contribution of their paper is their observations of certain situations when
formulating a mission may not be beneficial. They suggest three such kinds of situation. One
such situation arises if members of the top management are ideologically divided, it is better not
to develop a mission and thrust it upon the managers. Rather, it is wiser to eliminate the aberrant
manager or wait till he or she has moved on. A second such situation arises when senior
management is volatile and unstable, such as if top executives are changing frequently or if new
leaders are not involved in the mission development process. Third, creation of a mission
statement may be counter-productive if the company strategy is rapidly changing or uncertain
due to the business environment or abrupt changes in business regulations, fiscal or monetary
policies. They note that all such circumstances demand flexibility in strategy and values (Toftoy
& Chatterjee, 2004, p. 8).
Table 3 outlines the progression of mission statement content criteria from Pearce to
present.
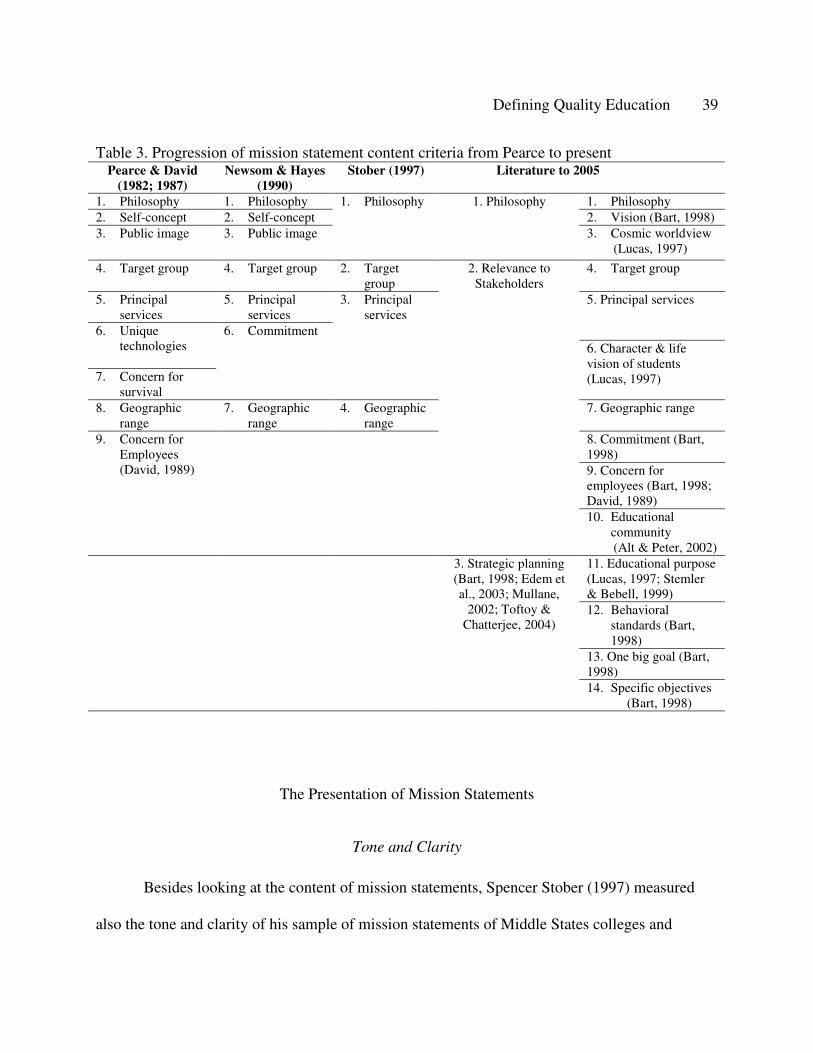
Defining Quality Education 39
Table 3. Progression of mission statement content criteria from Pearce to presentPearce & David
(1982; 1987)Newsom & Hayes
(1990)Stober (1997) Literature to 2005
1. Philosophy 1. Philosophy 1. Philosophy 2. Self-concept 2. Self-concept 2. Vision (Bart, 1998)3. Public image 3. Public image
1. Philosophy 1. Philosophy
3. Cosmic worldview (Lucas, 1997)
4. Target group 4. Target group 2. Target group
4. Target group
5. Principal services
5. Principal services
5. Principal services
6. Unique technologies
7. Concern for survival
6. Commitment
3. Principal services
6. Character & life vision of students (Lucas, 1997)
8. Geographic range
7. Geographic range
4. Geographic range
7. Geographic range
8. Commitment (Bart, 1998)9. Concern for employees (Bart, 1998; David, 1989)
9. Concern for Employees (David, 1989)
2. Relevance to Stakeholders
10. Educational community(Alt & Peter, 2002)
11. Educational purpose (Lucas, 1997; Stemler & Bebell, 1999)12. Behavioral
standards (Bart, 1998)
13. One big goal (Bart, 1998)
3. Strategic planning(Bart, 1998; Edem et al., 2003; Mullane,
2002; Toftoy & Chatterjee, 2004)
14. Specific objectives (Bart, 1998)
The Presentation of Mission Statements
Tone and Clarity
Besides looking at the content of mission statements, Spencer Stober (1997) measured
also the tone and clarity of his sample of mission statements of Middle States colleges and
Defining Quality Education 40
universities. Stober adapted his techniques for operationalizing the presentation of mission
statements from a study by Cochran and David (1986). Thus in addition to comparing the content
of mission statements, Stober included the question whether colleges and university mission
statements differed in content and text clarity according to sources of institutional authority and
the Carnegie Classification (Stober, 1997, p. 5).
Cochran and David (1986) assumed that good mission statements should project an
“inspiring tone” and be clearly written. More recently, Toftoy and Chatterjee point out that a
mission statement should be sufficiently clear and concise to be understood by employees
throughout the organization (2004).
Cochran and David (1986)1 compared the tone and readability of mission statements
prepared by schools of business to statements prepared by businesses. They systematically
sampled the 1984 Fortune 500 companies (n = 61) and the schools of business accredited by the
American Assembly of Collegiate Schools of Business (n = 74). The methodology to establish
tone was similar to the technique previously described for the Pearce and David study for their
analysis of content using independent human raters. The inspiring attribute was operationalized
by training two independent raters to consider one key question while reading the mission
statements: “Is the mission statement motivating and stimulating, i.e., is it written in a futuristic
positive, optimistic tone?” Cochran and David reported that their calculation of inter-rater
reliability indicated no significant differences in ratings. To operationalize readability, the Fog
Index was computed for each mission statement.
1 Description of Cochran and David’s study is cited from Stober (1997).
Defining Quality Education 41
Cochran and David (1986) reported that “corporate mission statements (78% of n = 61)
are written in a more positive tone that university mission statements (26% of n = 74),” and that
“both groups of mission statements are written with a high readability level (x = 24.61 years of
education” (p. 115). The work of Cochran and David later informed that of Stober (1997) who
included this instrument in his study of the mission statements of Middle State colleges and
universities.
Stober’s hypothesis about presentation was that “a random sample of mission statements
stratified to include public, independent non-sectarian, and independent sectarian colleges and
universities will exhibit similar text clarity” (specifically: Flesch Reading Ease and Gunning’s
Fog Index scores, word counts, and scaled tone scores). This analysis will adapt Stober’s
approach to investigage text clarity.
With reference to text clarity, Stober’s study concluded:
Through the eyes of a computer, sectarian statements were significantly easier to read that were public statements, and human raters judged these statements to be more enriching, inspiring, motivating and stimulating. While the philosophical language associated most frequently with sectarian statements did not reduce computer generated readability scores, it many have caused raters to judge these statements to be of a more inspiring and enriching tone. (Stober, 1997, p. 130)
In his study, Stober also used a technique of making word profiles. The results here
showed that public institutions were more likely to reference words such as access, opportunity
and support. Sectarian institutions were more likely to reference words such as life, faith, and
values. And non-sectarian institutions were more likely to reference words such as arts, sciences
and society. Stober notes that these missions complement each other and are a complement that
Defining Quality Education 42
characterizes American higher education and may in part contribute to its success (Stober, 1997.
p. 142).
One problem we may encounter with a writing ease analysis of web site mission
statements is that when text presentations are mixed with a visual presentation, we will not be
able to do a similar analysis as with a purely textual presentation as might be found in a school
catalogue. In his review of web site mission statements, Cole noted that the posted mission
statements did not necessarily follow an essay format, so the measurement of certain mission
statement elements was judgmental. As an example, a bulleted listing, in a mission statement,
would usually be treated, by software, as if all items were part of one sentence, unless a period
was used at the end of each item on the list. Often, the listing of items used incomplete sentences
and, thus, in total, appeared to be part of one very long sentence, by text analysis software (Cole,
2002). The dissimilarity of presentation will be even greater if the web site uses a fully
audiovisual presentation. In such a case, we may not be able to use normal text analysis but must
use analysis specifically designed for web site and audiovisual presentation.
Mission Statements on the World Wide Web—Bart, 2001
Christopher Bart had found that to secure the success of mission statements, they should
be communicated and disseminated to as many internal and external stakeholders as possible
(Bart, 2001). In an earlier study, Bart had found that a positive relationship existed between, on
the one hand, the total number of methods used to communicate and disseminate a mission and,
on the other, firm performance (Bart, 2000). Bart suggested that mission statements become
Defining Quality Education 43
more effective when they are easily remembered—especially by employees. Therefore, high
visibility—with postings in many locations—helps aid the development of mission familiarity
and recognition (Bart, 2001, p. 361).
Before Bart, Sashkin (1988) as well as Deal and Peterson (1994) suggested several key
ways to communicate and articulate vision, including communicating the school's mission
symbolically through mottos, flags, banners, and materials that are sent out from the school, such
as letterheads, pencils, and so forth (Peterson, 1995).
An increasingly strategic method for communicating a mission statement is through the
Internet and the posting of an organization's mission statement on its company Web site (Bart,
2001). The Internet provides a means for organizations to communicate an enormous amount of
information to their relevant stakeholders (i.e., customers, employees and investors), as well as to
large numbers of other interested parties (e.g., students) and organizations, for relatively
insignificant costs. That organizations have been realizing this is attested to in that a simple
search query on the World Wide Web using only one search engine can produce hundreds of
thousands of mission statements (Bart, 2001). Stemler and Bebell in their study of school
mission statements, also related the analysis of mission statements to the Word Wide Web, but
focused solely on the use of the Web for data collection (1999).
In his 2001 study, Bart investigated what types of organizations are using the Web to
advertise their missions; where a mission statement is typically located in a corporate Web site;
and what some of the motivations are that an organization has for posting or not posting its
mission. Bart found that the mission category dominating the sample of listings investigated was
educational institutions (38%) and the least frequently mentioned ones were religious
Defining Quality Education 44
organizations (10%) and government agencies (9%). For-profit corporations and not-for-profit
associations represented the middle of the survey standings with 23% and 20% respectively
(Bart, 2001, p. 363). It is helpful for this study that of all organizations utilizing the Web for
presentation of missions, educational institutions are foremost. This supports the use of using the
Web to analyze and compare missions among educational institutions.
In an analysis of mission statements found on the web one would want to assess the
quality of the web site as this would both reflect on the attitude of the institution toward its
mission statement as well as the effectiveness of that statement among stakeholders. Simple
questions to ask might be: Has the school made good use of the possibilities of the Web? Is the
site well done or poorly done?
CHAPTER 3. METHODOLOGY
Introduction
This chapter presents the methodology used to gather data describing the content and
readability of high school mission statements. Topics focus on the philosophy of research,
theoretical framework, research design, sampling design, measures, data collection procedures,
pilot testing, data analysis procedures, limitations of methodology, and expected findings.
The Research Philosophy
Research approaches vary depending on the nature of the data sought. This study used a
mixed methods approach. It is of the interpretive research paradigm in that human raters read
between the lines to discover meaning and it is of the positivist (or scientific) research paradigm
in that it rigorously and objectively quantified text variables.
Why use a quantitative approach at all considering the qualitative nature of mission
statements? A key reason for including the quantitative approach is that previous researchers into
mission statements and, in particular, content analysis of mission statements have included
quantitative approaches. To fit this study into the context of previous studies, there has been an
attempt at similarity of approach. Although in some respects the emphasis was different, the
methodology of this study approximately followed the methodology of Spencer Stober (1997)
whose study looked at tertiary institutions. This was to see if a study focusing on secondary
institutions would get similar results. This study, however, expanded on some of the quantitative
variables suggested by Stober and reined in the qualitative for the sake of coherence and focus.
Defining Quality Education 46
The types of school authority can be compared in a purely quantitative way when doing
text analysis which is simply related to word and grammar counts. The questionnaire deals with
both types of variables but this study kept mainly to the quantitative aspect of the variables
comparing their quantitative degree, that is, to what degree each of the school types have those
components pointed out by the literature as being relevant to good mission statements. Therefore
although the nature of mission statements is both qualitative and quantitative, for the sake of
focus and simplicity, this study concentrates on the quantitative aspect of mission statements.
This may seem strange considering that the subject of the study goes far beyond what can be
adequately explained quantitatively. Therefore, a later investigation should follow this up with a
more qualitative study which may not be empirical but may deal with a philosophical
explanation of existing empirical data.
Theoretical Framework
The theoretical development of this research instrument is illustrated by three tables—
Table 3, Table 4, and Table 5. Table 3 presents the historical progression of mission statement
content criteria in the literature. Table 4 presents these criteria culled from the literature ordered
in the form of research questions under four headings: relevance to stakeholders, philosophy of
education, strategic planning, and presentation. The research questions under these headings
were developed into the data collection instrument presented in Table 5.
Defining Quality Education 47
Relevance to Stakeholders
This study used all of Pearce and David’s (1987) criteria six of which are grouped under
the general heading of relevance to stakeholders—target group, principal services, unique
technologies, concern for survival, geographic range, and concern for employees (Table 5, Rater
Sheet, Items 1-4). Many researchers have highlighted the importance of involving all
stakeholders in the process of mission statement development (Alt & Peter, 2002; Bart, 1998,
2001; Edem et al., 2003; Mullane, 2002). This study has thus attempted to gauge the stakeholder
involvement with the question: Is there a sense of educational community involving all
stakeholders—particularly teachers and parents (Table 5, Rater Sheet, Item 4).
Philosophy of Education
Christopher Lucas in his Crisis in the Academy was concerned with the extreme
fragmentation of the university curriculum and the demise of broad liberal learning. He was
concerned that there be an attempt to inspire students with a life vision (Lucas, 1997, p. 52). He
saw the need to aim to develop the character of the students (p. 55). Thus this study introduced a
character and life-vision variable to test the presence in the mission statement of a concern for a
unified life vision and for character education, operationalized in the question: Is there a concern
for the character and life vision of the students? (Table 5, Rater Sheet, Item 5)
Stober (1997) combined philosophy, self-concept and public image into the one criterion
called philosophy. This study has used Stober’s original question: Does the mission statement
clearly define the school’s beliefs, values or philosophy? (Table 5 , Rater Sheet, Item 6)
Defining Quality Education 48
Palmer noted that all education is a process of spiritual formation or deformation (2003).
Therefore, our instrument probed into the character or worldview revealed by the mission
statement? Does the mission statement define a cosmic worldview? (Table 5, Rater Sheet, Item 7)
Strategic Planning
In recent years, the literature has emphasized the efficacy of mission statements:
distinguishing those factors that make them either of central effectiveness for the school or just
good intentions and fine words without any import (Bart, 1998; Edem et al., 2003; Mullane,
2002; Toftoy & Chatterjee, 2004). This analysis sought some indication of whether the mission
statement operationalizes its good intentions. Thus, the rater sheet question 9 probed for a reality
measure (Table 5).
Bart (1998) found that innovative firms were observed to have significantly more
prominent statements of vision embedded in their documents than non-innovative firms. They
simply seemed to have a better sense of direction. “They know where they are going” (Bart,
1998, p. 72). Therefore, this study sought to probe whether the purpose statement projected a
vision of where the institution was going. The raters were asked whether the mission statement
reflects one big goal (Table 5, Rater Sheet, Item 10).
Presentation
Another variable continuously reiterated in the literature is the notion of commitment
(Bart, 1998; Newsom & Hayes, 1991; Stober, 1997). Bart noted, “Non-innovative firms may
argue the need for behavior standards (in their mission rationales) just as forcefully and
persuasively as innovative firms. The difference is that the non-innovative firms don't seem to
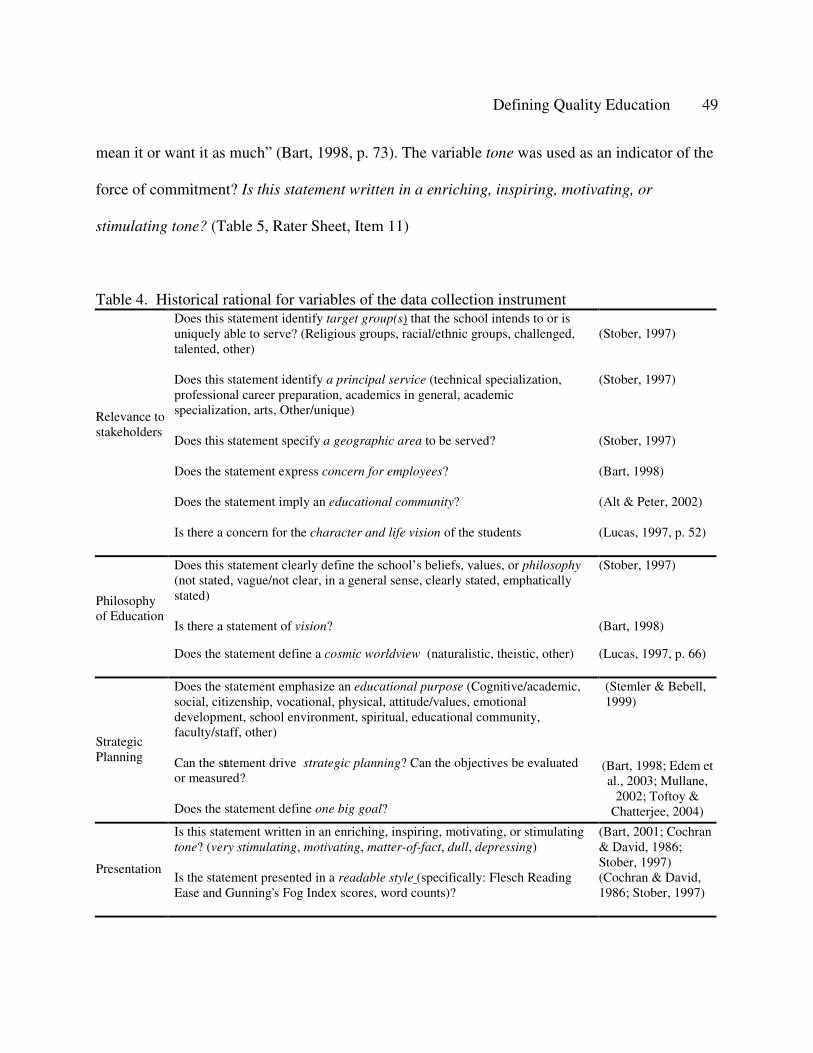
Defining Quality Education 49
mean it or want it as much” (Bart, 1998, p. 73). The variable tone was used as an indicator of the
force of commitment? Is this statement written in a enriching, inspiring, motivating, or
stimulating tone? (Table 5, Rater Sheet, Item 11)
Table 4. Historical rational for variables of the data collection instrument Does this statement identify target group(s) that the school intends to or is uniquely able to serve? (Religious groups, racial/ethnic groups, challenged, talented, other)
(Stober, 1997)
Does this statement identify a principal service (technical specialization, professional career preparation, academics in general, academic specialization, arts, Other/unique)
(Stober, 1997)
Does this statement specify a geographic area to be served? (Stober, 1997)
Does the statement express concern for employees? (Bart, 1998)
Does the statement imply an educational community? (Alt & Peter, 2002)
Relevance to stakeholders
Is there a concern for the character and life vision of the students (Lucas, 1997, p. 52)
Does this statement clearly define the school’s beliefs, values, or philosophy(not stated, vague/not clear, in a general sense, clearly stated, emphatically stated)
(Stober, 1997)
Is there a statement of vision? (Bart, 1998)
Philosophy of Education
Does the statement define a cosmic worldview (naturalistic, theistic, other) (Lucas, 1997, p. 66)
Does the statement emphasize an educational purpose (Cognitive/academic, social, citizenship, vocational, physical, attitude/values, emotional development, school environment, spiritual, educational community, faculty/staff, other)
(Stemler & Bebell, 1999)
Can the statement drive strategic planning? Can the objectives be evaluated or measured?
Strategic Planning
Does the statement define one big goal?
(Bart, 1998; Edem et al., 2003; Mullane,
2002; Toftoy & Chatterjee, 2004)
Is this statement written in an enriching, inspiring, motivating, or stimulating tone? (very stimulating, motivating, matter-of-fact, dull, depressing)
(Bart, 2001; Cochran & David, 1986; Stober, 1997)Presentation
Is the statement presented in a readable style (specifically: Flesch Reading Ease and Gunning's Fog Index scores, word counts)?
(Cochran & David, 1986; Stober, 1997)
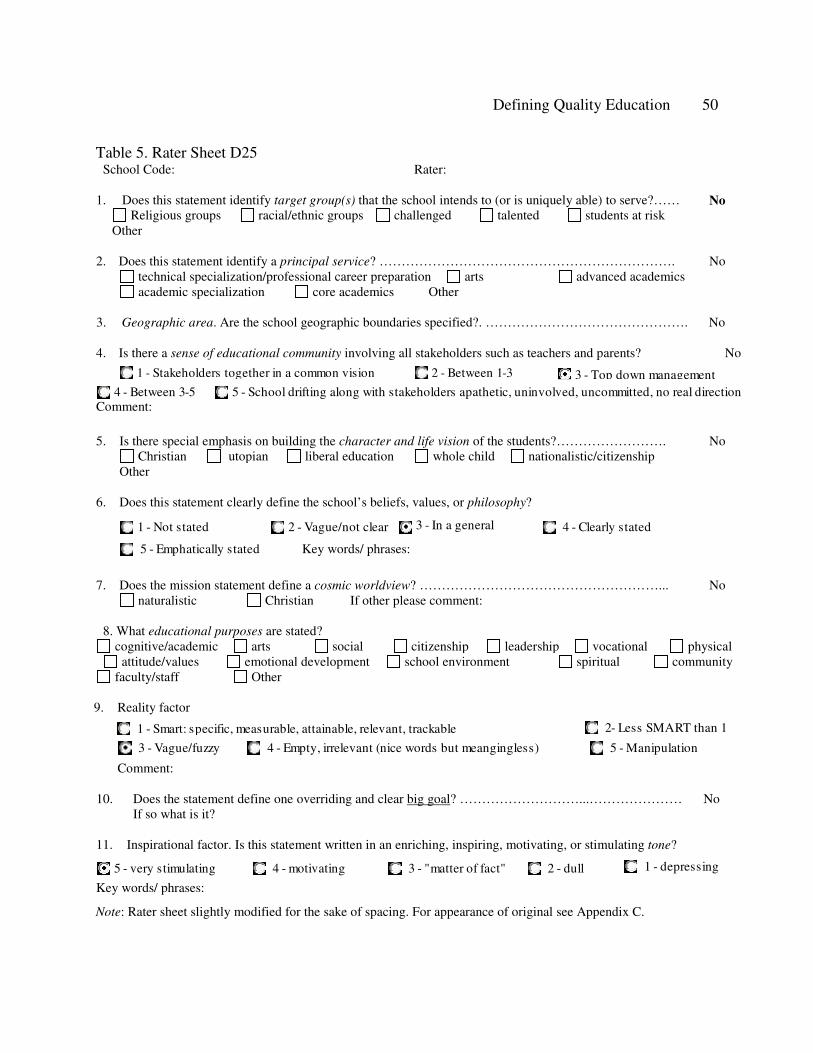
Defining Quality Education 50
Table 5. Rater Sheet D25School Code: Rater:
1. Does this statement identify target group(s) that the school intends to (or is uniquely able) to serve?…… No Religious groups racial/ethnic groups challenged talented students at risk
Other
2. Does this statement identify a principal service? …………………………………………………………. No technical specialization/professional career preparation arts advanced academics academic specialization core academics Other
3. Geographic area. Are the school geographic boundaries specified?. ………………………………………. No
4. Is there a sense of educational community involving all stakeholders such as teachers and parents? No
1 - Stakeholders together in a common vision 2 - Between 1-3 3 - Top down management4 - Between 3-5 5 - School drifting along with stakeholders apathetic, uninvolved, uncommitted, no real direction
Comment:
5. Is there special emphasis on building the character and life vision of the students?……………………. No Christian utopian liberal education whole child nationalistic/citizenship
Other
6. Does this statement clearly define the school’s beliefs, values, or philosophy?
1 - Not stated 2 - Vague/not clear 3 - In a general 4 - Clearly stated
5 - Emphatically stated Key words/ phrases:
7. Does the mission statement define a cosmic worldview? ………………………………………………... No naturalistic Christian If other please comment:
8. What educational purposes are stated? cognitive/academic arts social citizenship leadership vocational physical
attitude/values emotional development school environment spiritual community faculty/staff Other
9. Reality factor
1 - Smart: specific, measurable, attainable, relevant, trackable 2- Less SMART than 1
3 - Vague/fuzzy 4 - Empty, irrelevant (nice words but meangingless) 5 - Manipulation
Comment:
10. Does the statement define one overriding and clear big goal? ………………………...………………… NoIf so what is it?
11. Inspirational factor. Is this statement written in an enriching, inspiring, motivating, or stimulating tone?
5 - very stimulating 4 - motivating 3 - "matter of fact" 2 - dull 1 - depressing
Key words/ phrases:
Note: Rater sheet slightly modified for the sake of spacing. For appearance of original see Appendix C.
Defining Quality Education 51
Research Design
Design for Hypothesis 1
Hypothesis 1, which relates the content and presentation of school mission statements to
institutional authority, was modeled on that of Spencer Stober (1997) who had in turn closely
followed the work of Pearce and David (1987) as well as Newsom and Hayes (1991).
As with Stober (1997), this study combined both qualitative and quantitative research
techniques to do more than simply count words. Stober noted that content analysis was originally
designed to be objective by focusing on the words, phrases, and concepts (i.e., frequency equals
significance), rather than on meanings and motives or circumstances surrounding production of
the text. However, as previous researchers have found, it is necessary not only to produce
frequencies but also consider interpretation by readers as well as motives or circumstances
surrounding production of the text.
Independent human raters read and interpreted the text of sample mission statements, and
these statements were then also examined using an outside observer (a computer). Stober
explained that this methodology is of the interpretive research paradigm in that human raters read
between the lines to discover meaning and it is of the positivist (or scientific) research paradigm
in that it rigorously and objectively quantifies text variables. These paradigms complement one
another. In some cases, it may not be possible or appropriate to simply count words without
considering implied meanings (e.g., measuring tone and philosophical intensity of statements).
For these reasons, even quantitative data had to be collected using qualitative techniques while
Defining Quality Education 52
the qualitative data gathered by independent raters were used to inform purely quantitative data
collection (computer word analysis).
During preparatory work in sampling the data, it was noted that the best results would be
obtained by a combination of analysis by the researcher in conjunction with parallel analysis by
independent raters. In this way, the researcher could keep in close touch with the unique
characteristics of the data.
Design for Hypothesis 2
Hypothesis 2, which carries the inquiry of hypothesis 1 a step further, relates the content
and presentation of mission statements to school performance. The research design here was
based on the work of Pearce and David who hypothesized in the case of business mission
statements that “the mission statements of high performing Fortune 500 companies will exhibit
more of the desired components than will those of low performing Fortune 500 firms” (Pearce &
David, 1987, p. 109). For each mission statement component, Pearce and David compared the
differences in the average scores for components among high performing companies with the
average scores of low performing companies, looking for significant differences between these
average scores. In Pearce and David’s study, high performers were firms in the top quartile of a
profit margin distribution of all responding Fortune 500 companies. Low performers were the
lower quartile firms (Pearce & David, 1987, p. 112). Although the particular components as well
as the measure of performance differ between businesses and educational institutions, the basic
hypothesis is the same and a similar methodology was applied (see Table 6).
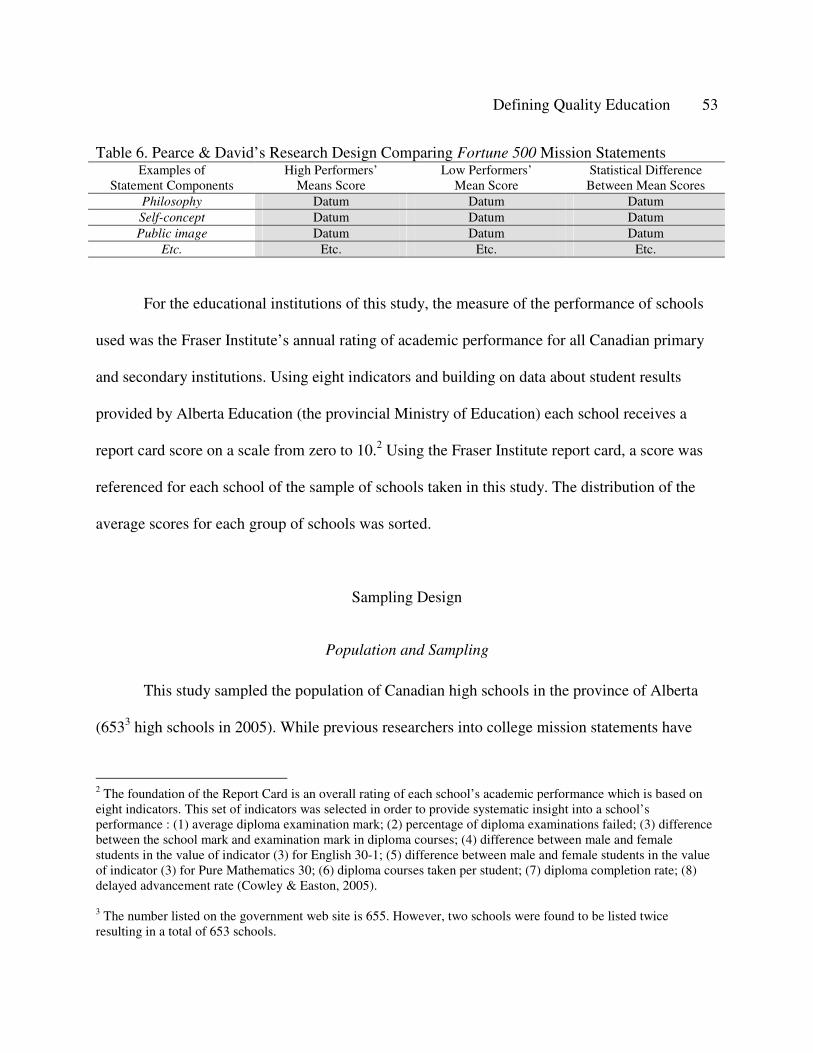
Defining Quality Education 53
Table 6. Pearce & David’s Research Design Comparing Fortune 500 Mission StatementsExamples of
Statement ComponentsHigh Performers’
Means ScoreLow Performers’
Mean ScoreStatistical Difference Between Mean Scores
Philosophy Datum Datum DatumSelf-concept Datum Datum DatumPublic image Datum Datum Datum
Etc. Etc. Etc. Etc.
For the educational institutions of this study, the measure of the performance of schools
used was the Fraser Institute’s annual rating of academic performance for all Canadian primary
and secondary institutions. Using eight indicators and building on data about student results
provided by Alberta Education (the provincial Ministry of Education) each school receives a
report card score on a scale from zero to 10.2 Using the Fraser Institute report card, a score was
referenced for each school of the sample of schools taken in this study. The distribution of the
average scores for each group of schools was sorted.
Sampling Design
Population and Sampling
This study sampled the population of Canadian high schools in the province of Alberta
(6533 high schools in 2005). While previous researchers into college mission statements have
2 The foundation of the Report Card is an overall rating of each school’s academic performance which is based on eight indicators. This set of indicators was selected in order to provide systematic insight into a school’s performance : (1) average diploma examination mark; (2) percentage of diploma examinations failed; (3) difference between the school mark and examination mark in diploma courses; (4) difference between male and female students in the value of indicator (3) for English 30-1; (5) difference between male and female students in the value of indicator (3) for Pure Mathematics 30; (6) diploma courses taken per student; (7) diploma completion rate; (8) delayed advancement rate (Cowley & Easton, 2005).
3 The number listed on the government web site is 655. However, two schools were found to be listed twice resulting in a total of 653 schools.
Defining Quality Education 54
taken samples of college catalogues, the current study has used the internet as a convenient and
technologically up-to-date method of obtaining data. This was also a precedent set by others such
as Stemler and Bebell (1999).
Rationale for Population Sampled
Why Focus on Canada? Canada provides an intriguing study since the federal
government in Canada has constitutionally very little to do with K-12 education, that being the
responsibility of each of the provinces respectively. As a result, there is a great variation in the
kind of schooling offered in the different provinces.
Why Focus on Alberta? There being a fuller complement of categories of school
authority to choose in Alberta, makes this province an especially rich field from which to take
samples on the relative efficacy of school mission statements. The Fraser Institute, an
independent Canadian economic and social research and educational organization, has done a
number of studies on school choice in Canada (Cowley & Easton, 2004; Cowley & Easton,
2005; Hepburn, 1999; Hepburn & Belle, 2003). A 2003 study by Hepburn and Belle devised an
instrument based on similar studies in the United States to evaluate each province on a freedom
index to establish the nature and relative availability of school choice among the Canadian
provinces. Alberta was revealed to be the number one province for the availability of school
choice while B.C. came in second on the freedom index.
Defining Quality Education 55
Sources of Information on Alberta
The Government of Alberta has initiated extensive inventories of its educational
programs making the statistics available on the web. For instance, the Alberta Government web
site (http://www.education.gov.ab.ca/ei/maps/) lists and categorizes the schools of the province
according to level, geographical area and governing authority. Although the major categories of
information seem to be covered, not all information about every school is necessarily available.
It may be that some schools have declined to make all information available. For instance, many
of the private schools have web sites but these are not listed in the government list of schools
with web sites. This may be because web sites are relatively new and it has been an optional item
of information to publish on the government web site.4
Procedure for Getting a Data Sample
The following was the procedure used to establish a definition of a data set:
1. Obtained the total list of Alberta high schools. From the Government of Alberta web
site (Schools and School Boards, 2005) obtained a list of K-12 schools in Alberta (2214 K-12
schools). Using MS Excel sorted the list isolating those schools offering the high school level.
Thus, obtained a list of high schools (653 high schools).
4 The schools listed with web sites are not the only ones with web sites. It seems the sites most conveniently known to the provincial Department of Education are listed. However, that they are or not listed does not correspond to the existence or even the quality of the web site. Thus, when sampling, it is better to just choose the school whether or not a web site is listed and then later find out whether or not there is a web site. In almost all cases, a web site exists.Some web sites of schools were just going up and the mission statement had not yet been inserted.
Defining Quality Education 56
2. Sorted the 653 high schools according to governing authority using MS Excel. It
proved to be better to start by taking the list according to governing authority before choosing
schools with web sites since preliminary investigation showed that there was no reliable list of
school web sites. In particular, many web sites of Christian institutions were not listed on the
government web site. Because all schools were required to register with the government, the
official government lists of schools were otherwise very reliable. After all schools were listed,
one could later check to see whether the schools in the sample had web sites.5
3. Sorted by whether the schools qualified for a report card ranking. The latest Report
Card on Alberta's High Schools put out by the Fraser Institute (Cowley & Easton, 2005) ranked
269 high schools (see next section for the criteria of schools that have a report card).
4. Took a larger sample than needed to have some schools to do a pilot study. This study
aimed for a sample of 10 schools for each school authority if available. However, this many
schools turned out to be available for only three of the seven school types. The other school types
simply did not have that many schools in Alberta. For the other school types, the full population
of available schools was sampled.
Linkage of Sample with Availability of High School Report Card
The link of content analysis with the ranking of schools followed the pattern taken
already by studies in business but not yet in the area of education. To compare the academic
5 Definition of Christian. Contrary to categorization in the U.S., the Alberta Government reports do not officially distinguish between Christian and secular private schools. The philosophy of education is very different yet these schools are not distinguished by government categorization. I thus put into the Christian category any private school which claimed intentionally to base its educational philosophy on Christian principles. The education landscape in Alberta provided some surprises. The “Edmonton Christian School” is a sizable public school with a Christian mission. I have not yet found this anywhere else on the Continent.
Defining Quality Education 57
evaluation ranking against a content analysis of the vision and mission statements added a
valuable dimension to the study. Ideal for this purpose was the yearly ranking of Canadian
schools developed by the Fraser Institute. The Fraser Institute in their annual Report Card
(Cowley & Easton, 2004; Cowley & Easton, 2005) has listed 269 Alberta high schools. They
have included all high schools in Alberta except (1) schools at which fewer than 15 regular day
students were enrolled in grade 12, and (2) schools that did not generate a sufficiently large set of
student data to enable the calculation of an overall rating out of 10. (3) Also excluded from the
ratings and rankings are centers for adult education and continuing education; (4) schools that
cater largely to non-resident foreign students; (5) home-schooling support centers, and (6) certain
alternative schools that do not offer a full program of courses (Cowley & Easton, 2005, p. 43).
This still left the vast majority of high schools according to the various levels of authority.6
Schools Not Included in the Sample
1. Francophone schools. These were not included in this study because of the
complications translation would present to the content analysis.
2. Federal Schools. The First Nations schools were also not included because these were
not included in the annual Report Card survey by the Fraser Institute and are for cultural,
historical reasons more complex to compare to the provincial education system and must be
taken as a special case perhaps to be included in another kind of study.
6 The Fraser Report makes clear that the exclusion of a school from the Report Card should in no way be construed as a judgment of the school’s effectiveness but only that it did not fit the above logistical assessment criteria(Cowley & Easton, 2005, p. 43).
Defining Quality Education 58
3. Charter schools. Among the three charter schools none had the quorum of 15 to be on
the 2005 Report card of the Fraser Institute.
4. Home schools. The category of home schools is proportionately large in Alberta which
is the only province where home schooling is partially funded by the government, giving one
more educational choice for Alberta citizens. However, home schools were not included in
the sample of mission statements to be investigated. This category was for the purposes of
this study too unique.
A Viable Sample Size
How many school web sites were needed to make the data viable? Stober studied 120
colleges in his sample because it permitted at least 20 institutions per group (1997, p. 41). He
reasoned that ANOVA group sizes should be similar and greater than ten; therefore, 20 schools
would give him a large margin. Stober noted that 10 samples in each category would be a
reasonable minimum. Stober’s sample size approximated that used in a similar study of South
Eastern colleges by Newsom and Hayes (1991).
This study randomly selected a maximum of ten samples in each category which fit the
criteria of the study. The 10 samples were screened from a much larger sample since some of the
schools did not qualify to be among the 268 for which a report card was available. Table 7
presents the cross-section of Alberta school types with those not included in this study grayed
out. Although it was hoped that 10 samples would be available for each school type, separate
Protestant schools turned out to have only a total of three schools, only two of which fit the
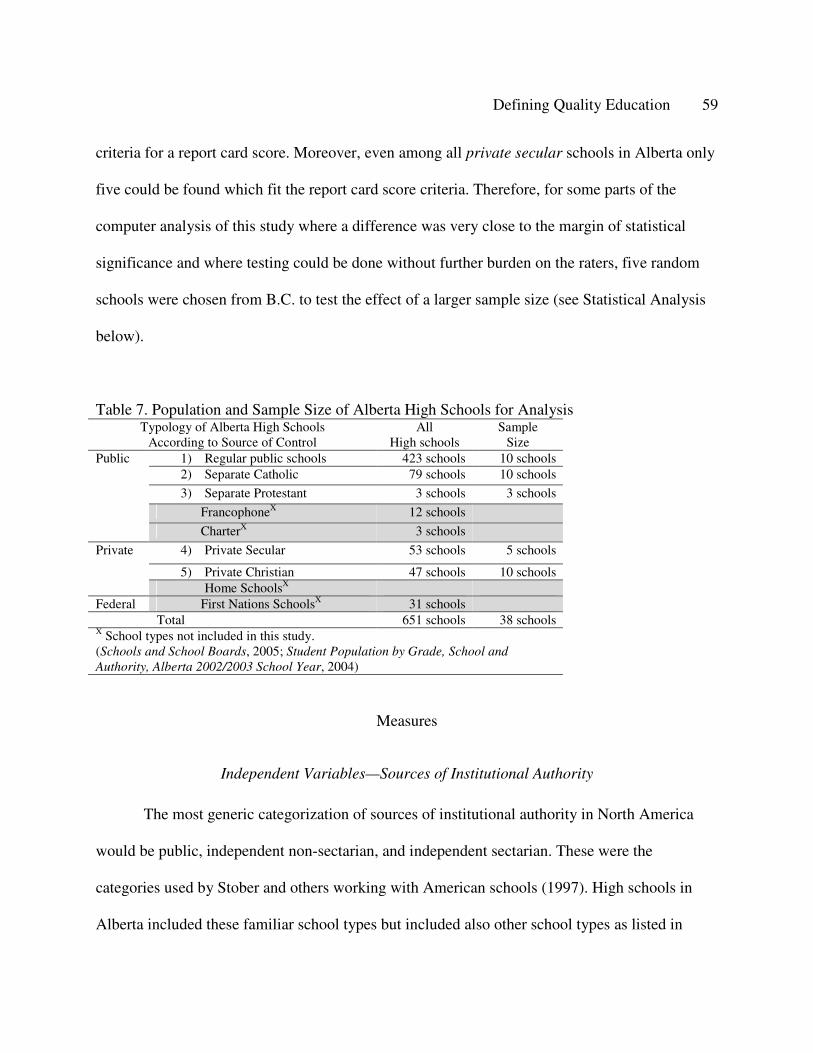
Defining Quality Education 59
criteria for a report card score. Moreover, even among all private secular schools in Alberta only
five could be found which fit the report card score criteria. Therefore, for some parts of the
computer analysis of this study where a difference was very close to the margin of statistical
significance and where testing could be done without further burden on the raters, five random
schools were chosen from B.C. to test the effect of a larger sample size (see Statistical Analysis
below).
Table 7. Population and Sample Size of Alberta High Schools for AnalysisTypology of Alberta High Schools
According to Source of ControlAll
High schoolsSample
Size 1) Regular public schools 423 schools 10 schools2) Separate Catholic 79 schools 10 schools
3) Separate Protestant 3 schools 3 schools
FrancophoneX 12 schools
Public
CharterX 3 schools
4) Private Secular 53 schools 5 schools
5) Private Christian 47 schools 10 schools
Private
Home SchoolsX
Federal First Nations SchoolsX 31 schoolsTotal 651 schools 38 schools
X School types not included in this study.(Schools and School Boards, 2005; Student Population by Grade, School and Authority, Alberta 2002/2003 School Year, 2004)
Measures
Independent Variables—Sources of Institutional Authority
The most generic categorization of sources of institutional authority in North America
would be public, independent non-sectarian, and independent sectarian. These were the
categories used by Stober and others working with American schools (1997). High schools in
Alberta included these familiar school types but included also other school types as listed in
Defining Quality Education 60
Table 1 and in Table 7. However, as explained above, this study did not include francophone
schools, federal (First Nations) schools, charter schools and home schools.
Dependent Variables—Content and Presentation
Content
For the purpose of this study, content included specific categories grouped into three
themes. The first theme relevance to stakeholders included variables of target group, principal
service, geographic area, and educational community. The second theme philosophy of
education included variables of character & life vision, philosophy, and cosmic worldview. The
third theme strategic planning consisted of the variables: reality factor and one big goal.
This study operationally defined content according to criteria and methodologies similar
to those used by past researchers such as Stober (1997) in his study of college mission statements
in the Middle States, by Pearce and David (1987) in their study of the stated missions of Fortune
500 companies, and by Newsom and Hayes (1990) in their review of college and university
mission statements. Using the techniques of previous studies (Cochran & David, 1986; Newsom
& Hayes, 1991; Pearce, 1982; Pearce & David, 1987; Stemler & Bebell, 1999; Stober, 1997),
three independent raters were engaged to examine sampled mission statements for the presence
of content criteria. In this study, the researcher also joined as one of the raters both to have a
larger sample of ratings but also to have a closer understanding and inside view of the rating
process.
Defining Quality Education 61
Presentation
Presentation measurements were represented by two variables: tone and readability.
Three independent raters plus the researcher considered the tone of the text (i.e., was it inspiring,
motivating, or stimulating?) according to procedures modified from those of Stober (1997) as
well as Cochran and David (1986). For the purpose of this study, text clarity was measured via
computer analysis using a grammar and style checker to establish document readability scores
(see section below, Computer Analysis for Readability).
Data Collection Procedures
Data collection included gathering mission statements and converting them to MS Word
files. The literature shows a similar methodology in studies on mission statements of tertiary
institutions although the procedures have been evolving in pace with the development of internet
technology. Newsom and Hayes (1990) gathered their samples of Mission statements by way of
a letter and survey. Mathieu (1993) and Stober (1997) improved upon this by taking their
samples of mission statements directly from college catalogs. This assured that schools selected
were part of the study and that statements used were public pronouncements describing the
institution. Stober had improved upon Mathieu with the availability of a College Catalogue Index
on CD-ROM. This at least made the data more readily available and presumably presented in a
consistent format. This study used an approach similar to that of Stemler and Bebell who
extracted mission statements from the Internet (Stemler & Bebell, 1999). This study improved
upon Stemler and Bebell in that while their web sites all came from the master web site of a
private ideologically restricted organization, the data base for this sample consisted of the total
Defining Quality Education 62
schools for all sources of institutional authority in the province of Alberta. Since they were
samples randomly take from the whole population of Alberta schools, they could be inferred to
give a relatively accurate reflection of the nature of schools in Alberta.
The location of the mission statement of a school is not a cut and dry matter. As was
found by other researchers, statements of institutional purpose were often embedded in sections
under a heading other than mission (e.g., vision, beliefs, values, purpose, objectives, etc.). Many
schools had more than one such heading to include the total mission statement. In many cases,
the problem was further complicated in that the district to which a school belonged had a mission
statement for all the schools under its jurisdiction. The individual school may or may not have its
own mission statement. Often the district had a mission statement and the individual school
would state an abbreviated version or an adaptation of the district statement. Or, the individual
school would refer to the larger district mission statement in its particular statement.
Gathering statements from a web site began with a search for any statements on a
particular school’s web site related to the idea of mission. References to a larger district mission
statement were also copied. All references found were copied and pasted onto an MS Word file
for that school. Files of mission statements to be evaluated by raters were identified only by the
code name of the school, a four digit number giving no clue to source of authority. These files
were kept track of through a master list which listed all schools in the sample and by which
responses could later be re-identified.
Defining Quality Education 63
Pilot Testing
Samples of schools were collected and organized from public government web sites.
Samples of mission statements from these schools were recorded. In the meantime, the
questionnaire was being refined to better reflect the respective options to be discerned in the
mission statements. An informal pilot study was done by the researcher using ten randomly
chosen high schools not included in the population to be used in the study. This helped to
develop computer techniques for collecting, managing, and analyzing electronic files containing
the statements as well as design and test questions to be answered by independent raters as they
read the statements (see Table 7 for a graphical outline of the school types and sample sizes).
Data Analysis Procedures
Computer Analysis for Readability
Computer analysis was used to measure statement readability. When Cochran and David
(1986) examined mission statements prepared by businesses and schools of business, they
operationalized readability by manually computing Gunning’s Fog Index for each mission
statement. Stober calculated three readability scores for each mission statement: (1) the Flesch
Reading Ease score (the FRE-score is a 100 point scale with 0 being most difficult to read), (2)
the Gunning’s Fog Index (the GFI-score is a scale that approximates the reading grade level
necessary to comprehend a document), and (3) the number of words in the statement. For the
sake of consistency and comparison, this study continued using the instruments used by Stober
and others. This study added two more measures of reading ease, the Flesch-Kincaid Grade
Defining Quality Education 64
Level score, which rates text on a U.S. grade-school level and lexical density (number of
different words / total number of words x 100). Texts with a lower density are more easily
understood. Readability scores for each statement were entered in an SPSS database for analysis.
Gunning’s Fog Index and lexical density were calculated through online software (Text Content
Analysis Tool, 2005). The others were calculated using the readability statistics function of the
Microsoft Word grammar tool. Average FRE, GFI, FKGL, lexical density and word count values
for each of the groups were summarized in tables.
Rater Analysis for Content and Tone
In Stober’s study, three independent raters examined statements for the presence of
general content criteria modified from those used by earlier researchers (Pearce, 1982; Pearce
and David, 1987; David, 1989; Newsom and Hayes, 1990). The content criteria used by Stober
were the following: (1) target groups, (2) commitment or principal service, (3) geographic area
to be served, and (4) communication of the college’s beliefs, values or philosophy. This study
has added to Stober’s list other variables identified as important in the literature. The content
variables investigated in this study were the following:
A. Relevance to stakeholders1. Target groups2. Commitment or principal service,3. Geographic area to be served,4. Educational community
B. Philosophy of Education5. Character & life vision6. Philosophy7. Cosmic worldview
C. Strategic planning
Defining Quality Education 65
8. Reality factor9. One big goal
As with the presentation variables, these content variables were also investigated to test the
hypothesis that a random sample of high school mission statements stratified into the traditional
North American categories of: public, private Christian, private secular, as well as the peculiarly
Canadian separate Catholic and the peculiarly Albertan separate Protestant would exhibit
similar content items. Stober had also used the first three categories, while the later two are
peculiar to the Canadian context.
The 38 statements were prepared for evaluation by raters. To reduce bias on the part of
raters as they read the documents, the following steps were taken. Institutional identifiers were
removed, statements were prepared in a uniform font (Times New Roman, 10 point, single
spaced), and a uniform page layout was maintained (left margin at one inch). Italics and
underlines were removed, but capitals, paragraphs, and lists were maintained (see Appendix B
for sample statements). Raters independently completed electronic data forms on an electronic
MS Word template (Appendix C) as they read each of the 38 statements. Raters sent in forms by
email as they were completed.
Data from forms was entered and statistically analyzed using SPSS.7 Yes and No
responses for each of the four raters were converted to “1” and “0” values respectively, and then
totaled for a minimum value of “0” to a maximum value of “4” for each statement criterion. A
second level of analysis for content included a tally of specific content items identified by each
rater. Average group tally scores for content items were tabulated.
7 SPSS is a statistical program for the social sciences. This study used release 12.0.0 ("SPSS 12.0 for Windows," 2003).
Defining Quality Education 66
To generate tone scores, independent raters responded to the question: Is this statement
written in an enriching, inspiring, motivating or stimulating tone? An average scaled tone score
for each group was calculated by totaling Likert values provided by raters: a score of 0-3 is
depressing; 4-6 is dull; 7-9 is matter of fact; 10-12 is motivating; and 13-15 is very stimulating.
Readability scores were summarized and displayed in a table.
Statistical Analysis
To test the whether there were statistically significant differences between outcomes of
the authority types, this study chose to use the Wilcoxon Rank Sum test. The Wilcoxon Rank
Sum method tests the null hypothesis that two related medians are the same. This test allows one
to compare medians of paired sample distributions. Since there were only the means of samples
from five authority types to match, this was a very doable test. Written notationally, all of the
tests done for this study could be set up as testing H0: Mx = My. If the p-value turned out small,
we could reject H0. An acceptably small p-value would be less than 0.05 or a 95% confidence
level that the difference was reliable. This is also the threshold of statistical significance used by
Stober in his tests of universities and college purpose statements.
Although the most popular test of the significance of the difference between means is the
t-test, this assumes a normal distribution and a large sample size. If the data is normal, this is the
best option since the power would be larger. However, since in this case the sample was small
Defining Quality Education 67
and the distribution was not known to be normal, it was thought safer to use the Wilcoxon Rank
Sum test instead of the t-test.8
Limitations of Methodology
Perhaps the biggest limitation of this study was the smallness and narrow geographic
focus of the sample. The research population consisted of high schools accredited by the
Government of Alberta. A preliminary survey suggested that 56 high schools could be included
in the study. However, this number had to be reduced to 38 schools for the following reasons: (1)
the First Nations schools are left out because they are a special category and not included in the
annual Frazer Report Card used in the second hypothesis; (2) the separate Protestant schools
proved to be three schools instead of four as listed on the government web site9 and of these
three schools only two fully fit the criteria for the study; (3) Although the study had hoped to use
10 secular private schools for evaluation, only five schools were found in Alberta which met the
criterion of at least 15 grade-12 students. This limitation in sample size, especially for private
secular and separate Protestant schools, greatly hindered the confirmation of statistical
significance in some cases. That was the case for example in rater sheet question 5: Is there
special emphasis on building the character and life vision of the students? (Yes/No). The lack of
significant results from the private secular type points to the weakness of the limited sample size
(see chapter 4).
8 I am very grateful for the professional opinion of Professor P. K. Tam and Dr. W. Y. Poon of the Chinese University of Hong Kong for their invaluable help in this area. They not only have immaculate professional competence and integrity but have great generosity which comes from their love for their students. Although they suggested a possible methodology for the mathematical aspects of the study, the responsibility for the use I have made of it in the way of implications or recommendations is mine.9 One of the schools was listed as two schools solely for funding purposes.
Defining Quality Education 68
However, because little study has been done in this area in the field of education, and this
being the first study of this kind with high schools, it was hoped that at least a beginning could
be made. Methodology has been tested and refined for use with secondary education, and future
research can extend the geographic area and the size of the sample. The natural subjectivity
involved in using human raters was also a difficult problem to overcome. Other studies have
faced the same problem and this study has made as much effort at impartiality as the other
studies which have used this methodology. A third problem is the difficulty of accessing the
most critical variables. This study has sought to meet this challenge by a thorough and extensive
literature review.
Expected Findings
As typical in scientific studies, we use a methodology which leans toward the Type II
error and begins by assuming the null hypothesis, that there is no significant difference between
the components or presentation of the mission statements of the various school types. This was
also the starting point for Pearce and David, Stober, and others. Of course, it was hoped that
some differences would be found and, in particular, that these differences would align according
to types of institutional authority. If we did find differences, they would have to be large enough
so that the gap between those expected if we assume no difference and the actual results obtained
was just too big to have arisen out of sampling variation alone.
Similarly, although we suspect from the findings of research in the commercial field that
the content and presentation of mission statements will bear a significant relationship to
institutional performance, we will first assume that the content and presentation of mission
Defining Quality Education 69
statements bear no significant relationship to school performance as measured by students’
academic outcomes. If we do find a difference it will have to be too large to have arisen by
expected sampling variation within one population alone.
CHAPTER 4. DATA COLLECTION AND ANALYSIS
Introduction
A review of the literature indicated that well defined and clearly stated missions are
necessary so that institutions can remain true to their basic orientation while strategically
responding to external and internal forces. The literature also indicated that more successful
organizations tend to have more comprehensive mission statements and exhibit more of the
desired components on such statements than those of low performing organizations.
The study described here continued the tradition of adapting methodologies from
research into the commercial field to program evaluation in the education field. This study
further adapted and expanded methodologies developed by earlier researchers to examine the
content of college and university mission statements and applied them to high school mission
statements. Previous studies were expanded by (a) adopting content criteria to fit more accurately
the educational setting at the high school level, (b) extending the readability measures of
previous content analyses of mission statements, and (c) adding more content variables than
previous studies to consolidate, to reflect and to test the findings of previous research.
The research population consisted of high schools accredited by the Government of
Alberta. The original plan had been to include 56 high schools. However, this number was
reduced to a more modest number of 38 schools for the following reasons: (1) the First Nations
schools are left out because they are a special category and not included in the annual Frazer
Report Card used in the second hypothesis; (2) the separate Protestant schools proved to be
three schools instead of four as listed on the government web site (listed as two schools for
funding purposes only) and of these three schools only two fully fit the criteria for the study; (3)
Defining Quality Education 71
although the study had hoped to use 10 secular private schools for evaluation, only five schools
were found which met the criteria of at least 15 grade-12 students. Thus the final total sample of
school types contained 38 high schools in five groups: 10 regular public schools; 10 separate
Catholic schools; 3 separate Protestant schools; 10 private evangelical Christian schools and 5
private secular schools (see Table 7).
The sample mission statements from these five school types were then gathered
according to the procedure detailed in chapter three and then tested with a comprehensive set of
criteria developed from the literature. These criteria and methodologies were used to test the
following hypotheses.
Hypothesis 1: A random sample of mission statements stratified to include public,
independent non-sectarian, and independent sectarian high schools will exhibit similar
content items (relevance to stakeholders, philosophy of education, strategic planning) and
presentation (Flesch Reading Ease, Gunning’s Fog Index, Flesch-Kincaid Grade Level,
lexical density, word counts and tone scores).
Hypothesis 2: The content and presentation of mission statements will bear a significant
relationship to school performance as measured by students’ academic outcomes.
To test the first hypothesis, evaluation criteria for mission statements developed from the
literature were grouped according to a total of 15 categories: (a) six for text presentation
(readability with five subcategories and tone scores) and (b) nine for text content (relevance to
stakeholders with four subcategories, philosophy of education with three subcategories, and
Defining Quality Education 72
strategic planning with two subcategories). For the sake of clarity of presentation and where
applicable, the data was sorted according to size. Significant differences between values were
indicated by asterisked subscripts. For additional clarity, the results obtained are displayed in the
form of bar graphs. Testing the first hypothesis required that at least one among the 15 mission
statement criteria would prove to be statistically different among the five school types.
Testing the second hypothesis required that the mission statements of higher performing
schools would consistently reflect more of the criteria desirable in effective purpose statements.
Text Presentation: Readability and Tone
Readability Scores
Table 8 and Figure 1 summarize readability scores for groups according to sources of
institutional control. Text readability statistics were computed for each of the five tests of
readability: (1) the average Flesch Reading Ease score, (2) the average Gunning’s Fog Index, (3)
the average Flesch-Kincaid Grade Level (4) the average lexical density, and (5) the average
words per statement.
Graphs are helpful to see all the readability data at a glance as a general picture. Figure 1
shows that the Gunning’s Fog Index (GFI) and the Flesch-Kincaid Grade Level (FKGL) are
clustered very close together and suggest no particular difference. However, the graph suggests a
much more substantial difference in the Flesch Reading Ease, the average lexical density, and
the average number of words per statement scores.
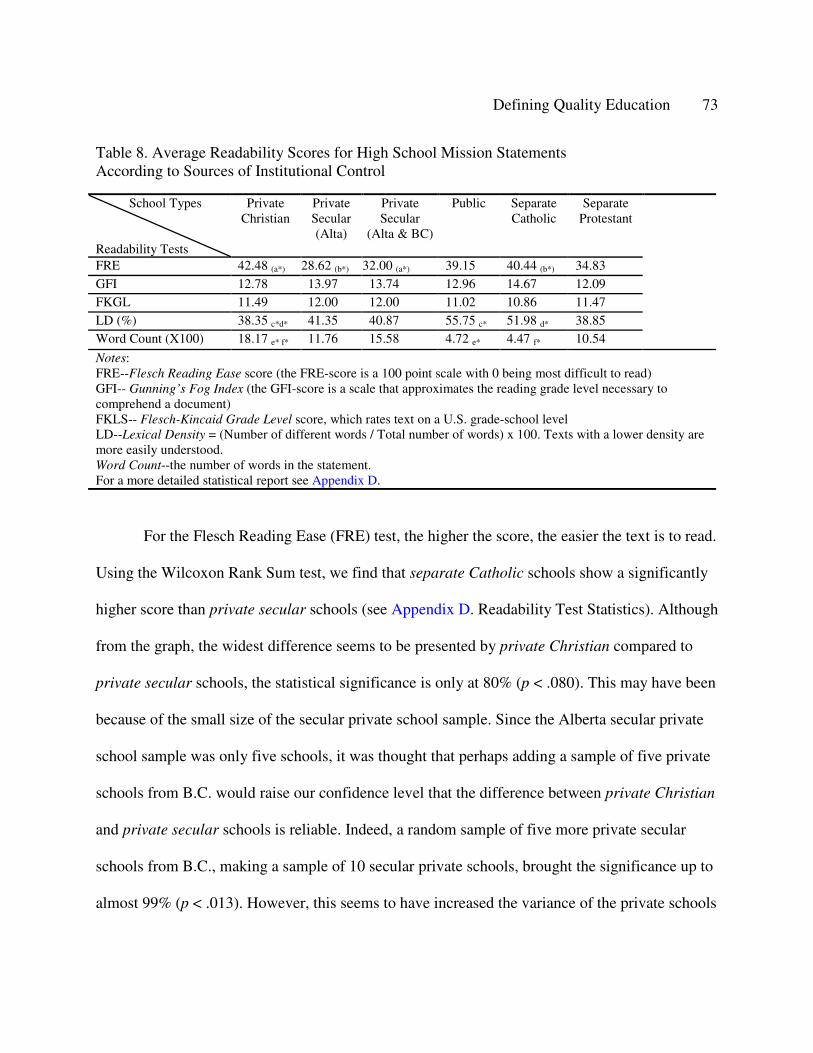
Defining Quality Education 73
Table 8. Average Readability Scores for High School Mission Statements According to Sources of Institutional Control
School Types
Readability Tests
Private Christian
Private Secular (Alta)
Private Secular
(Alta & BC)
Public SeparateCatholic
Separate Protestant
FRE 42.48 (a*) 28.62 (b*) 32.00 (a*) 39.15 40.44 (b*) 34.83GFI 12.78 13.97 13.74 12.96 14.67 12.09FKGL 11.49 12.00 12.00 11.02 10.86 11.47LD (%) 38.35 c*d* 41.35 40.87 55.75 c* 51.98 d* 38.85Word Count (X100) 18.17 e* f* 11.76 15.58 4.72 e* 4.47 f* 10.54
Notes: FRE--Flesch Reading Ease score (the FRE-score is a 100 point scale with 0 being most difficult to read)GFI-- Gunning’s Fog Index (the GFI-score is a scale that approximates the reading grade level necessary to comprehend a document)FKLS-- Flesch-Kincaid Grade Level score, which rates text on a U.S. grade-school levelLD--Lexical Density = (Number of different words / Total number of words) x 100. Texts with a lower density are more easily understood.Word Count--the number of words in the statement.For a more detailed statistical report see Appendix D.
For the Flesch Reading Ease (FRE) test, the higher the score, the easier the text is to read.
Using the Wilcoxon Rank Sum test, we find that separate Catholic schools show a significantly
higher score than private secular schools (see Appendix D. Readability Test Statistics). Although
from the graph, the widest difference seems to be presented by private Christian compared to
private secular schools, the statistical significance is only at 80% (p < .080). This may have been
because of the small size of the secular private school sample. Since the Alberta secular private
school sample was only five schools, it was thought that perhaps adding a sample of five private
schools from B.C. would raise our confidence level that the difference between private Christian
and private secular schools is reliable. Indeed, a random sample of five more private secular
schools from B.C., making a sample of 10 secular private schools, brought the significance up to
almost 99% (p < .013). However, this seems to have increased the variance of the private schools
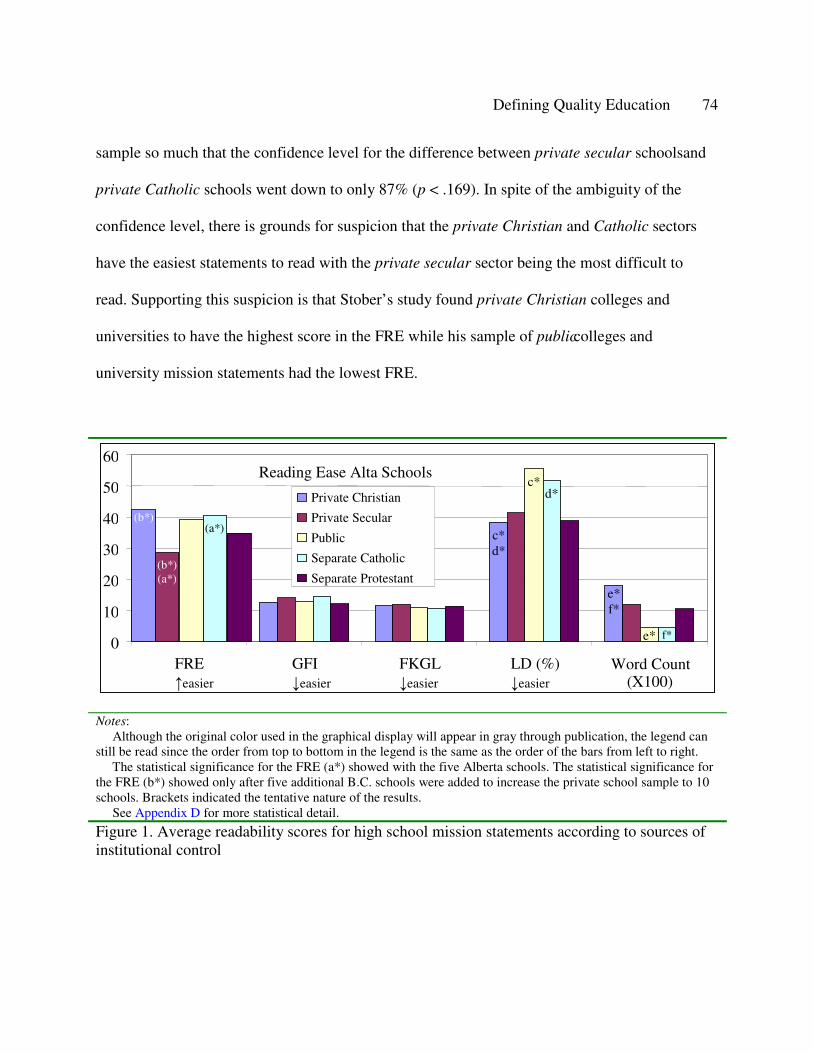
Defining Quality Education 74
sample so much that the confidence level for the difference between private secular schools and
private Catholic schools went down to only 87% (p < .169). In spite of the ambiguity of the
confidence level, there is grounds for suspicion that the private Christian and Catholic sectors
have the easiest statements to read with the private secular sector being the most difficult to
read. Supporting this suspicion is that Stober’s study found private Christian colleges and
universities to have the highest score in the FRE while his sample of public colleges and
university mission statements had the lowest FRE.
Notes: Although the original color used in the graphical display will appear in gray through publication, the legend can
still be read since the order from top to bottom in the legend is the same as the order of the bars from left to right. The statistical significance for the FRE (a*) showed with the five Alberta schools. The statistical significance for
the FRE (b*) showed only after five additional B.C. schools were added to increase the private school sample to 10 schools. Brackets indicated the tentative nature of the results.
See Appendix D for more statistical detail.
Figure 1. Average readability scores for high school mission statements according to sources of institutional control
(b*)
c*d*
e* f*
(b*)(a*)
c*
e*
(a*)
d*
f*
Reading Ease Alta Schools
0
10
20
30
40
50
60
FRE↑easier
GFI↓easier
FKGL↓easier
LD (%)↓easier
Word Count(X100)
Private Christian
Private Secular
Public
Separate Catholic
Separate Protestant
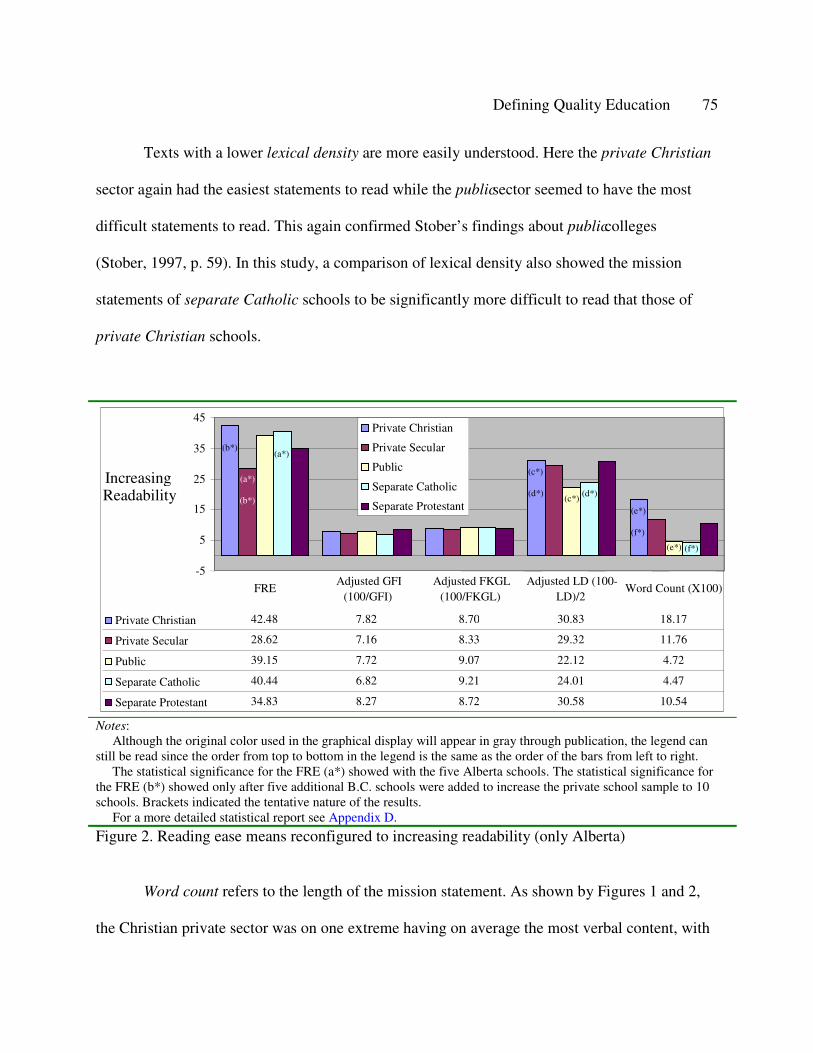
Defining Quality Education 75
Texts with a lower lexical density are more easily understood. Here the private Christian
sector again had the easiest statements to read while the public sector seemed to have the most
difficult statements to read. This again confirmed Stober’s findings about public colleges
(Stober, 1997, p. 59). In this study, a comparison of lexical density also showed the mission
statements of separate Catholic schools to be significantly more difficult to read that those of
private Christian schools.
Notes:Although the original color used in the graphical display will appear in gray through publication, the legend can
still be read since the order from top to bottom in the legend is the same as the order of the bars from left to right.The statistical significance for the FRE (a*) showed with the five Alberta schools. The statistical significance for
the FRE (b*) showed only after five additional B.C. schools were added to increase the private school sample to 10 schools. Brackets indicated the tentative nature of the results.
For a more detailed statistical report see Appendix D.
Figure 2. Reading ease means reconfigured to increasing readability (only Alberta)
Word count refers to the length of the mission statement. As shown by Figures 1 and 2,
the Christian private sector was on one extreme having on average the most verbal content, with
(b*)
(c*)
(d*)
(e*)
(f*)
(a*)
(b*) (c*)
(e*)
(a*)
(d*)
(f*)
-5
5
15
25
35
45
Increasing Readability
Private Christian
Private Secular
Public
Separate Catholic
Separate Protestant
Private Christian 42.48 7.82 8.70 30.83 18.17
Private Secular 28.62 7.16 8.33 29.32 11.76
Public 39.15 7.72 9.07 22.12 4.72
Separate Catholic 40.44 6.82 9.21 24.01 4.47
Separate Protestant 34.83 8.27 8.72 30.58 10.54
FREAdjusted GFI
(100/GFI)Adjusted FKGL
(100/FKGL)Adjusted LD (100-
LD)/2Word Count (X100)
Defining Quality Education 76
the public and separate Catholic systems having the shortest mission statements. The Wilcoxon
Rank Sum test showed that in this sample, the private Christian schools had on the average
significantly longer mission statements than either public schools (at p < .047) or separate
Catholic high schools (at p < .009). There is no statistically significant difference between the
statement lengths of the other school types.
Recapitulation and Discussion of Readability Scores
Although the GFI and the FKGL suggest no particular differences between the readability
of school types, the Flesch Reading Ease, the lexical density, and the number of words per
statement scores suggest differences consistent with each other as well as consistent with
previous research. This is easier to see if we reconfigure and rescale the data to be all
consistently going in one direction, so that a higher score consistently means an easier reading
level. Such a reconfigured scale would look like Figure 2 in the form of a bar graph or Figure 3
in the form of a line graph. Those three variables which show a difference between school types
all flow in the same direction, although somewhat erratically. A larger sample size may help to
take out the jaggedness of the lines. For the variables of reading ease the sample size of secular
Protestant schools proved to be too small to make significant comments.
The FRE suggests that the statements of private Christian schools and private Catholic
schools are easier to read that those of private secular schools. With regard to lexical density, the
private Christian sector again had the easiest statements to read, next came private secular
schools, third Catholic separate schools and the public sector had the most difficult statements to
read. This confirmed Stober’s findings about public colleges (Stober, 1997, p. 59). The Christian
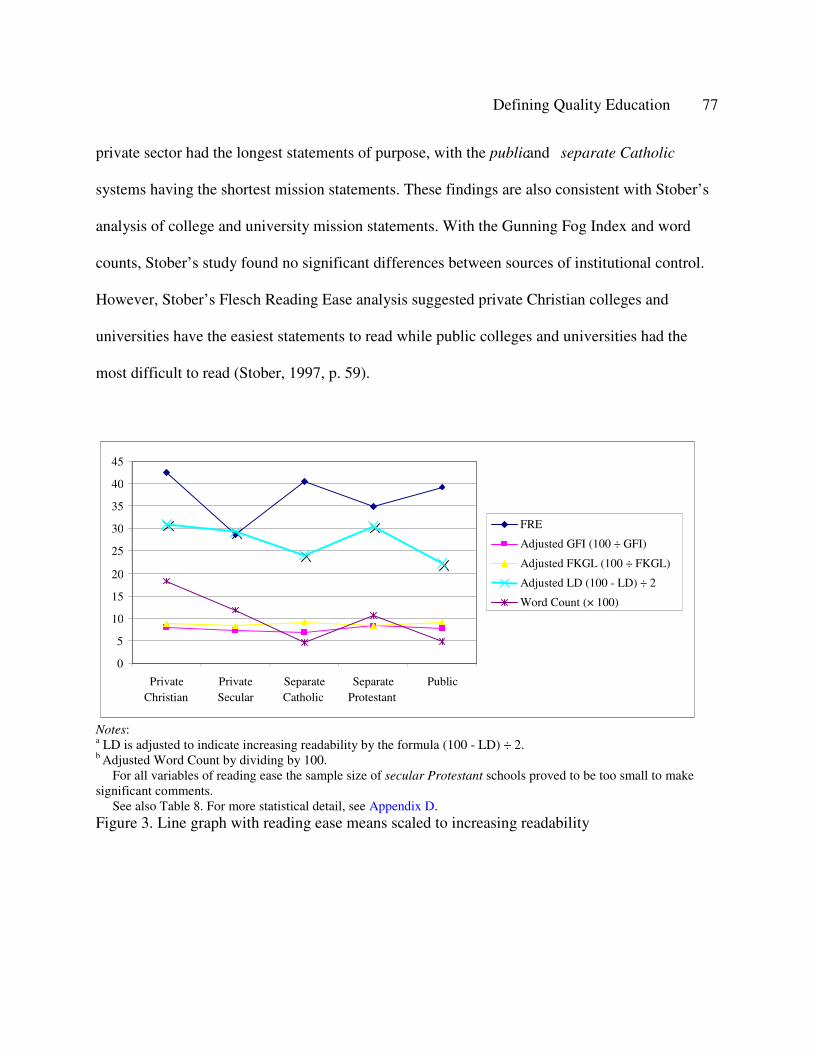
Defining Quality Education 77
private sector had the longest statements of purpose, with the public and separate Catholic
systems having the shortest mission statements. These findings are also consistent with Stober’s
analysis of college and university mission statements. With the Gunning Fog Index and word
counts, Stober’s study found no significant differences between sources of institutional control.
However, Stober’s Flesch Reading Ease analysis suggested private Christian colleges and
universities have the easiest statements to read while public colleges and universities had the
most difficult to read (Stober, 1997, p. 59).
Notes: a LD is adjusted to indicate increasing readability by the formula (100 - LD) ÷ 2. b Adjusted Word Count by dividing by 100.
For all variables of reading ease the sample size of secular Protestant schools proved to be too small to make significant comments. See also Table 8. For more statistical detail, see Appendix D.Figure 3. Line graph with reading ease means scaled to increasing readability
0
5
10
15
20
25
30
35
40
45
PrivateChristian
PrivateSecular
SeparateCatholic
SeparateProtestant
Public
FRE
Adjusted GFI (100 ÷ GFI)
Adjusted FKGL (100 ÷ FKGL)
Adjusted LD (100 - LD) ÷ 2
Word Count (× 100)
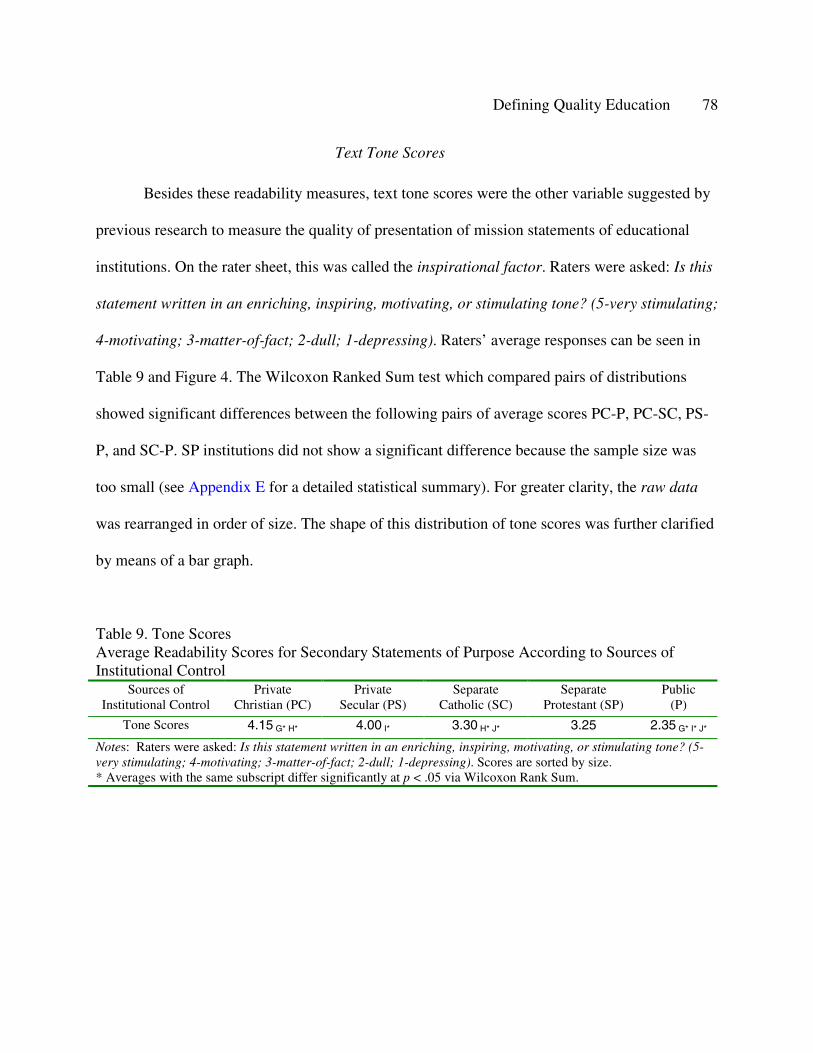
Defining Quality Education 78
Text Tone Scores
Besides these readability measures, text tone scores were the other variable suggested by
previous research to measure the quality of presentation of mission statements of educational
institutions. On the rater sheet, this was called the inspirational factor. Raters were asked: Is this
statement written in an enriching, inspiring, motivating, or stimulating tone? (5-very stimulating;
4-motivating; 3-matter-of-fact; 2-dull; 1-depressing). Raters’ average responses can be seen in
Table 9 and Figure 4. The Wilcoxon Ranked Sum test which compared pairs of distributions
showed significant differences between the following pairs of average scores PC-P, PC-SC, PS-
P, and SC-P. SP institutions did not show a significant difference because the sample size was
too small (see Appendix E for a detailed statistical summary). For greater clarity, the raw data
was rearranged in order of size. The shape of this distribution of tone scores was further clarified
by means of a bar graph.
Table 9. Tone ScoresAverage Readability Scores for Secondary Statements of Purpose According to Sources of Institutional Control
Sources of Institutional Control
Private Christian (PC)
Private Secular (PS)
Separate Catholic (SC)
Separate Protestant (SP)
Public(P)
Tone Scores 4.15 G* H* 4.00 I* 3.30 H* J* 3.25 2.35 G* I* J*
Notes: Raters were asked: Is this statement written in an enriching, inspiring, motivating, or stimulating tone? (5-very stimulating; 4-motivating; 3-matter-of-fact; 2-dull; 1-depressing). Scores are sorted by size.* Averages with the same subscript differ significantly at p < .05 via Wilcoxon Rank Sum.
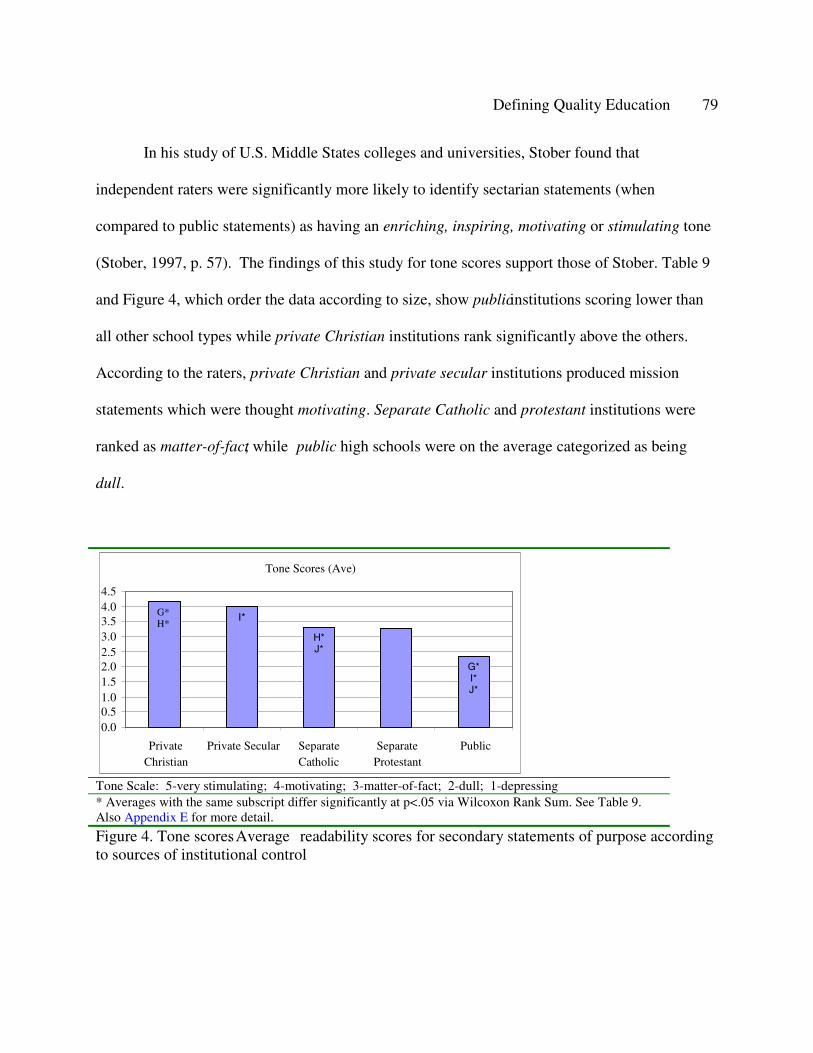
Defining Quality Education 79
In his study of U.S. Middle States colleges and universities, Stober found that
independent raters were significantly more likely to identify sectarian statements (when
compared to public statements) as having an enriching, inspiring, motivating or stimulating tone
(Stober, 1997, p. 57). The findings of this study for tone scores support those of Stober. Table 9
and Figure 4, which order the data according to size, show public institutions scoring lower than
all other school types while private Christian institutions rank significantly above the others.
According to the raters, private Christian and private secular institutions produced mission
statements which were thought motivating. Separate Catholic and protestant institutions were
ranked as matter-of-fact, while public high schools were on the average categorized as being
dull.
Tone Scale: 5-very stimulating; 4-motivating; 3-matter-of-fact; 2-dull; 1-depressing* Averages with the same subscript differ significantly at p<.05 via Wilcoxon Rank Sum. See Table 9. Also Appendix E for more detail.
Figure 4. Tone scores. Average readability scores for secondary statements of purpose according to sources of institutional control
G*H*
I*
H* J*
G* I*J*
Tone Scores (Ave)
0.00.51.01.52.02.53.03.54.04.5
PrivateChristian
Private Secular SeparateCatholic
SeparateProtestant
Public
Defining Quality Education 80
Text Content
Nine content criteria of good mission statements identified by the literature were sorted
under three general topic areas:
A. Relevance to stakeholders1. Identification of target groups2. Identification of commitment or principal service3. Identification of geographic area to be served4. Sense of educational community
B. Philosophy of Education5. Emphasis on building character & life vision6. Defining a philosophy7. Defining a cosmic worldview
C. Strategic planning 8. Reality factor9. Defining one overriding and clear big goal
As with the six presentation variables, these content variables were investigated to test the
hypothesis that a random sample of high school mission statements stratified into the traditional
North American sources of educational authority will exhibit similar content items.
Identification of Target Groups
On the rater sheet, target groups are the first of the group of variables identified from the
literature as being relevant to stakeholders (see Appendix C). Raters were asked: Does this
statement identify target group(s) that the school intends to or is uniquely able to serve?
(Yes/No). A subset of this variable inquired more specifically into the categories of target groups.
Raters were asked to specify which targets were mentioned in the school’s purpose statement: a-
religious groups; b-racial/ethnic groups; c-challenged; d-talented; e-students at risk; or f-other.
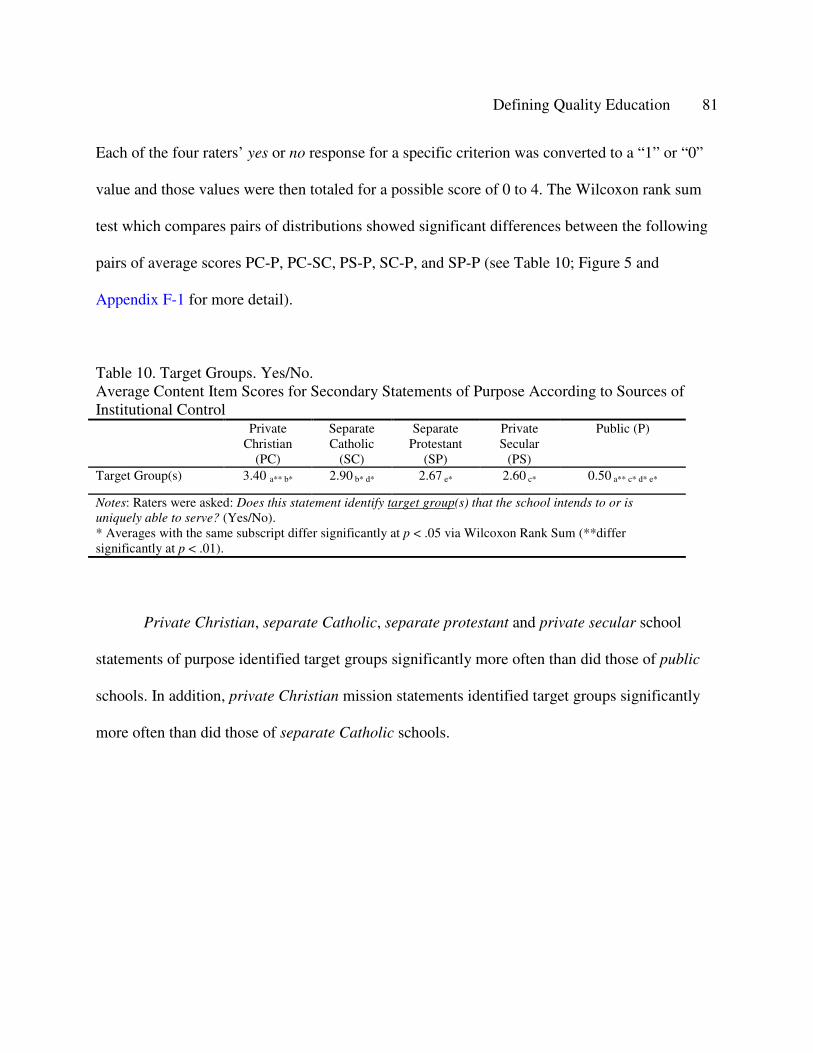
Defining Quality Education 81
Each of the four raters’ yes or no response for a specific criterion was converted to a “1” or “0”
value and those values were then totaled for a possible score of 0 to 4. The Wilcoxon rank sum
test which compares pairs of distributions showed significant differences between the following
pairs of average scores PC-P, PC-SC, PS-P, SC-P, and SP-P (see Table 10; Figure 5 and
Appendix F-1 for more detail).
Table 10. Target Groups. Yes/No. Average Content Item Scores for Secondary Statements of Purpose According to Sources of Institutional Control
Private Christian
(PC)
Separate Catholic
(SC)
Separate Protestant
(SP)
Private Secular
(PS)
Public (P)
Target Group(s) 3.40 a** b* 2.90 b* d* 2.67 e* 2.60 c* 0.50 a** c* d* e*
Notes: Raters were asked: Does this statement identify target group(s) that the school intends to or is uniquely able to serve? (Yes/No). * Averages with the same subscript differ significantly at p < .05 via Wilcoxon Rank Sum (**differ significantly at p < .01).
Private Christian, separate Catholic, separate protestant and private secular school
statements of purpose identified target groups significantly more often than did those of public
schools. In addition, private Christian mission statements identified target groups significantly
more often than did those of separate Catholic schools.
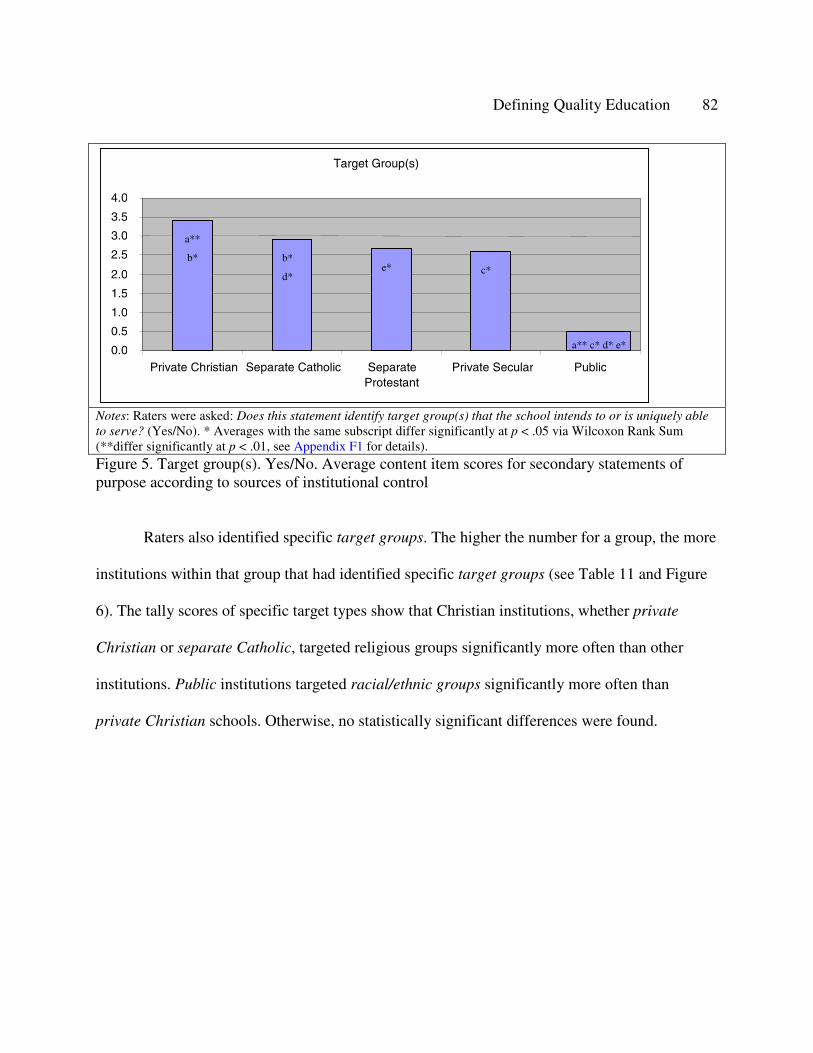
Defining Quality Education 82
Notes: Raters were asked: Does this statement identify target group(s) that the school intends to or is uniquely able to serve? (Yes/No). * Averages with the same subscript differ significantly at p < .05 via Wilcoxon Rank Sum(**differ significantly at p < .01, see Appendix F1 for details).Figure 5. Target group(s). Yes/No. Average content item scores for secondary statements of purpose according to sources of institutional control
Raters also identified specific target groups. The higher the number for a group, the more
institutions within that group that had identified specific target groups (see Table 11 and Figure
6). The tally scores of specific target types show that Christian institutions, whether private
Christian or separate Catholic, targeted religious groups significantly more often than other
institutions. Public institutions targeted racial/ethnic groups significantly more often than
private Christian schools. Otherwise, no statistically significant differences were found.
a**
b* b*
d*e* c*
a** c* d* e*
Target Group(s)
0.0
0.5
1.0
1.5
2.0
2.5
3.0
3.5
4.0
Private Christian Separate Catholic SeparateProtestant
Private Secular Public
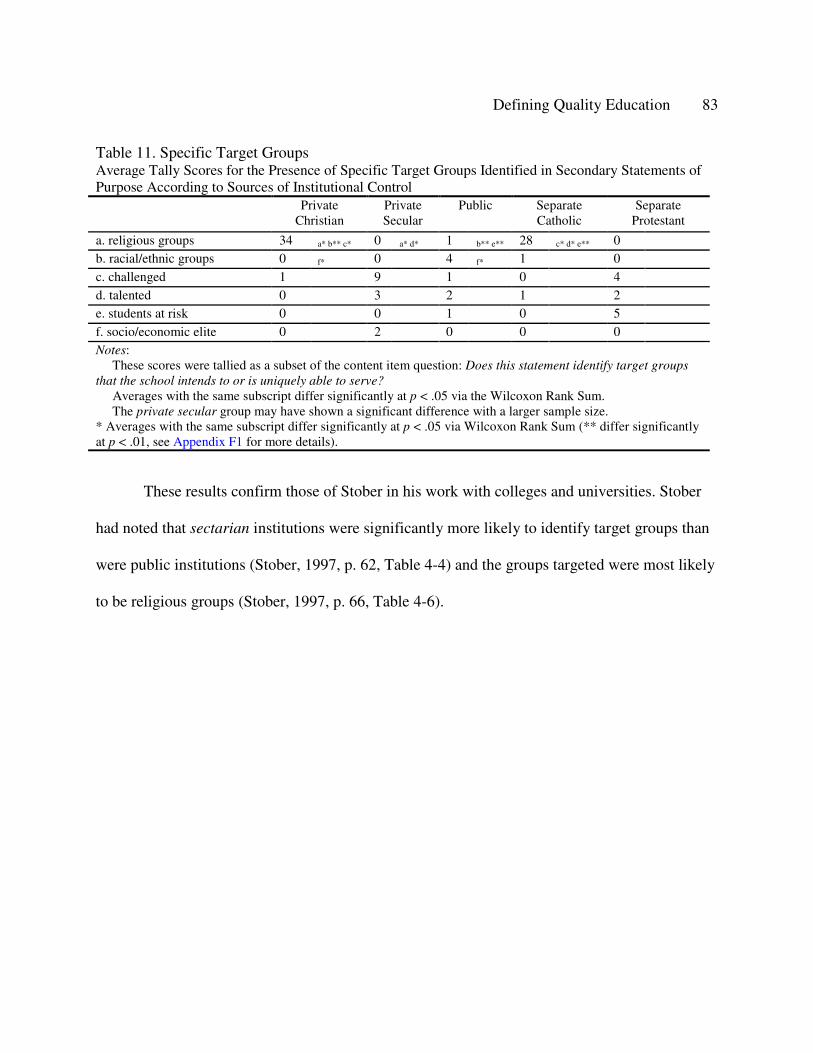
Defining Quality Education 83
Table 11. Specific Target GroupsAverage Tally Scores for the Presence of Specific Target Groups Identified in Secondary Statements of Purpose According to Sources of Institutional Control
Private Christian
Private Secular
Public Separate Catholic
Separate Protestant
a. religious groups 34 a* b** c* 0 a* d* 1 b** e** 28 c* d* e** 0b. racial/ethnic groups 0 f* 0 4 f* 1 0c. challenged 1 9 1 0 4d. talented 0 3 2 1 2e. students at risk 0 0 1 0 5f. socio/economic elite 0 2 0 0 0Notes:
These scores were tallied as a subset of the content item question: Does this statement identify target groups that the school intends to or is uniquely able to serve?
Averages with the same subscript differ significantly at p < .05 via the Wilcoxon Rank Sum. The private secular group may have shown a significant difference with a larger sample size.
* Averages with the same subscript differ significantly at p < .05 via Wilcoxon Rank Sum (** differ significantly at p < .01, see Appendix F1 for more details).
These results confirm those of Stober in his work with colleges and universities. Stober
had noted that sectarian institutions were significantly more likely to identify target groups than
were public institutions (Stober, 1997, p. 62, Table 4-4) and the groups targeted were most likely
to be religious groups (Stober, 1997, p. 66, Table 4-6).
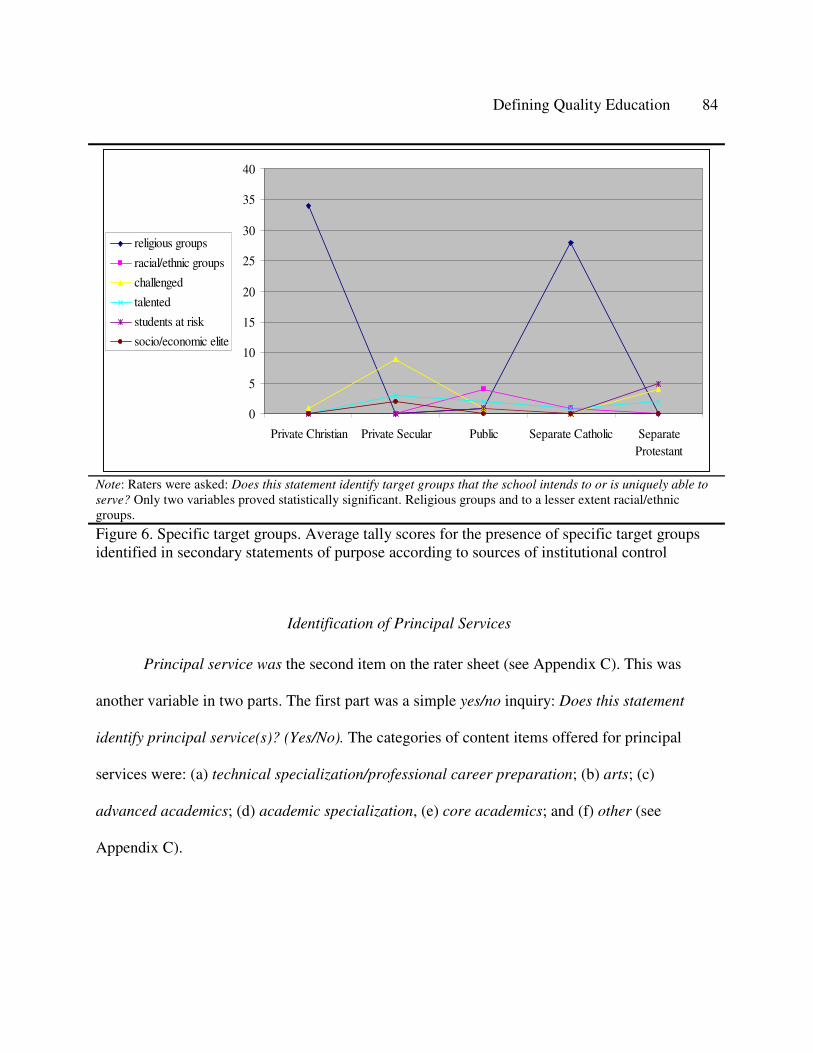
Defining Quality Education 84
0
5
10
15
20
25
30
35
40
Private Christian Private Secular Public Separate Catholic SeparateProtestant
religious groups
racial/ethnic groups
challenged
talented
students at risk
socio/economic elite
Note: Raters were asked: Does this statement identify target groups that the school intends to or is uniquely able to serve? Only two variables proved statistically significant. Religious groups and to a lesser extent racial/ethnic groups.
Figure 6. Specific target groups. Average tally scores for the presence of specific target groups identified in secondary statements of purpose according to sources of institutional control
Identification of Principal Services
Principal service was the second item on the rater sheet (see Appendix C). This was
another variable in two parts. The first part was a simple yes/no inquiry: Does this statement
identify principal service(s)? (Yes/No). The categories of content items offered for principal
services were: (a) technical specialization/professional career preparation; (b) arts; (c)
advanced academics; (d) academic specialization, (e) core academics; and (f) other (see
Appendix C).
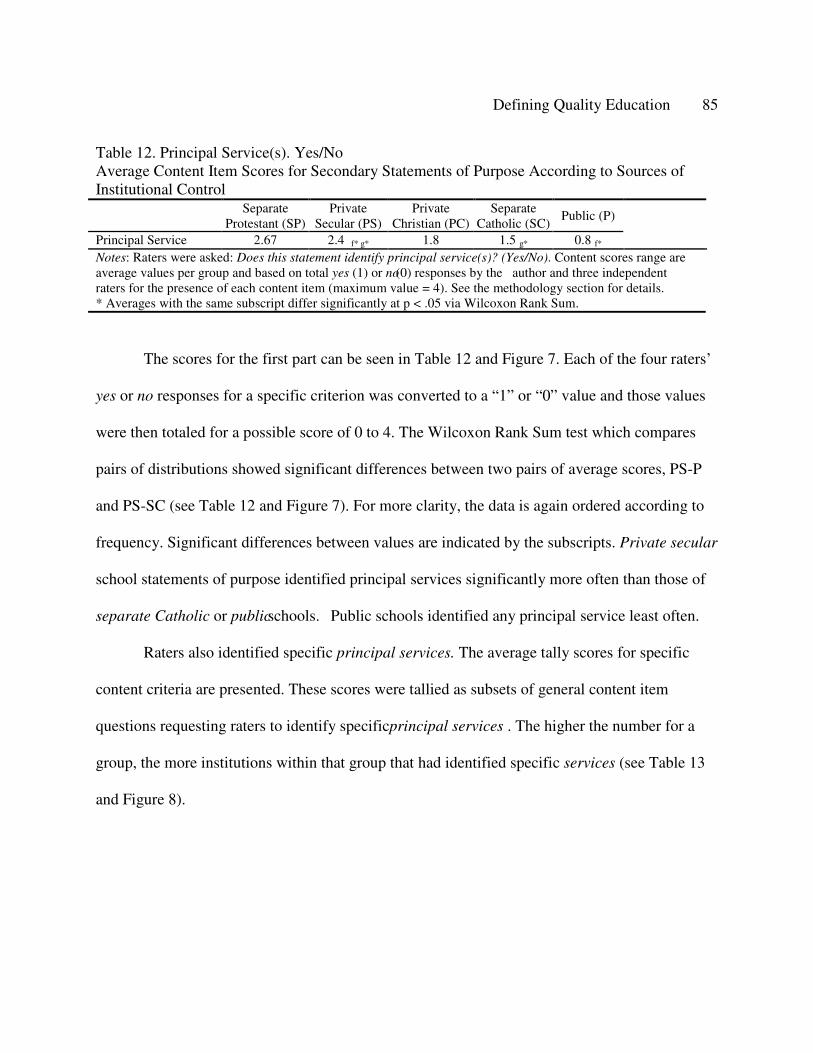
Defining Quality Education 85
Table 12. Principal Service(s). Yes/NoAverage Content Item Scores for Secondary Statements of Purpose According to Sources of Institutional Control
Separate Protestant (SP)
Private Secular (PS)
Private Christian (PC)
Separate Catholic (SC)
Public (P)
Principal Service 2.67 2.4 f* g* 1.8 1.5 g* 0.8 f*Notes: Raters were asked: Does this statement identify principal service(s)? (Yes/No). Content scores range are average values per group and based on total yes (1) or no (0) responses by the author and three independent raters for the presence of each content item (maximum value = 4). See the methodology section for details. * Averages with the same subscript differ significantly at p < .05 via Wilcoxon Rank Sum.
The scores for the first part can be seen in Table 12 and Figure 7. Each of the four raters’
yes or no responses for a specific criterion was converted to a “1” or “0” value and those values
were then totaled for a possible score of 0 to 4. The Wilcoxon Rank Sum test which compares
pairs of distributions showed significant differences between two pairs of average scores, PS-P
and PS-SC (see Table 12 and Figure 7). For more clarity, the data is again ordered according to
frequency. Significant differences between values are indicated by the subscripts. Private secular
school statements of purpose identified principal services significantly more often than those of
separate Catholic or public schools. Public schools identified any principal service least often.
Raters also identified specific principal services. The average tally scores for specific
content criteria are presented. These scores were tallied as subsets of general content item
questions requesting raters to identify specific principal services . The higher the number for a
group, the more institutions within that group that had identified specific services (see Table 13
and Figure 8).
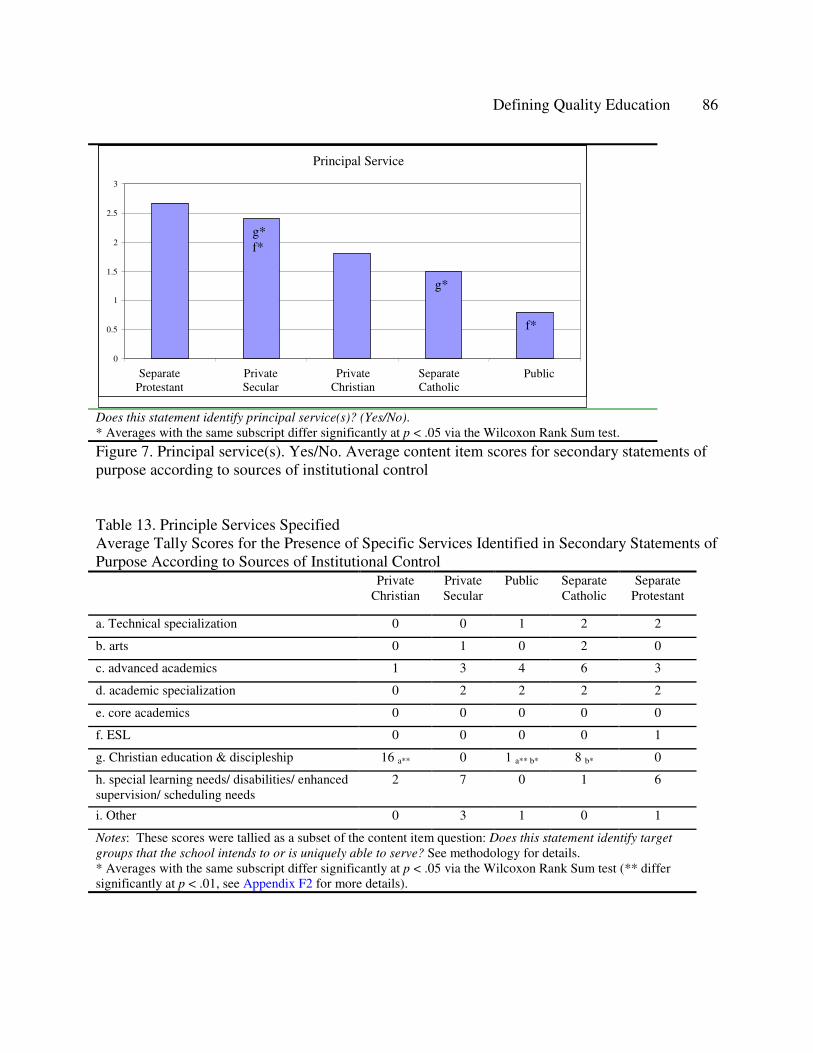
Defining Quality Education 86
Does this statement identify principal service(s)? (Yes/No).* Averages with the same subscript differ significantly at p < .05 via the Wilcoxon Rank Sum test.
Figure 7. Principal service(s). Yes/No. Average content item scores for secondary statements of purpose according to sources of institutional control
Table 13. Principle Services SpecifiedAverage Tally Scores for the Presence of Specific Services Identified in Secondary Statements of Purpose According to Sources of Institutional Control
Private Christian
Private Secular
Public Separate Catholic
Separate Protestant
a. Technical specialization 0 0 1 2 2
b. arts 0 1 0 2 0
c. advanced academics 1 3 4 6 3
d. academic specialization 0 2 2 2 2
e. core academics 0 0 0 0 0
f. ESL 0 0 0 0 1
g. Christian education & discipleship 16 a** 0 1 a** b* 8 b* 0
h. special learning needs/ disabilities/ enhanced supervision/ scheduling needs
2 7 0 1 6
i. Other 0 3 1 0 1
Notes: These scores were tallied as a subset of the content item question: Does this statement identify target groups that the school intends to or is uniquely able to serve? See methodology for details. * Averages with the same subscript differ significantly at p < .05 via the Wilcoxon Rank Sum test (** differ significantly at p < .01, see Appendix F2 for more details).
g* f*
g*
f*
Principal Service
0
0.5
1
1.5
2
2.5
3
SeparateProtestant
PrivateSecular
PrivateChristian
SeparateCatholic
Public
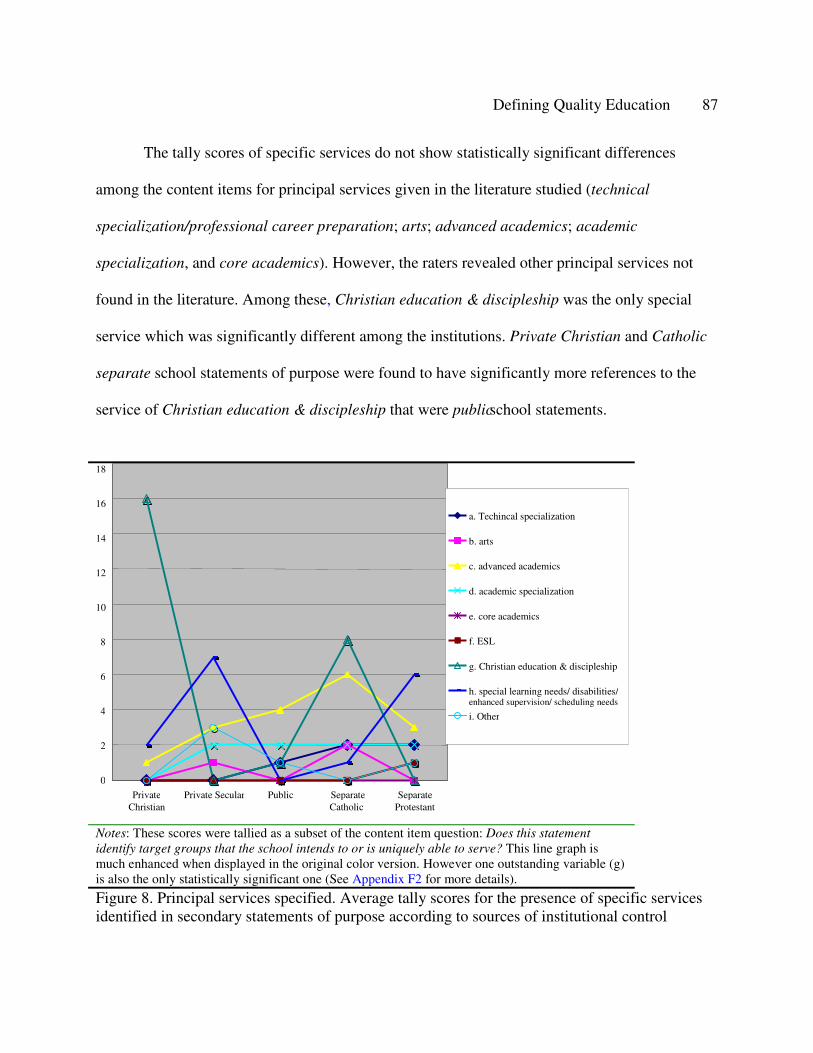
Defining Quality Education 87
The tally scores of specific services do not show statistically significant differences
among the content items for principal services given in the literature studied (technical
specialization/professional career preparation; arts; advanced academics; academic
specialization, and core academics). However, the raters revealed other principal services not
found in the literature. Among these, Christian education & discipleship was the only special
service which was significantly different among the institutions. Private Christian and Catholic
separate school statements of purpose were found to have significantly more references to the
service of Christian education & discipleship that were public school statements.
Notes: These scores were tallied as a subset of the content item question: Does this statement identify target groups that the school intends to or is uniquely able to serve? This line graph is much enhanced when displayed in the original color version. However one outstanding variable (g) is also the only statistically significant one (See Appendix F2 for more details).
Figure 8. Principal services specified. Average tally scores for the presence of specific services identified in secondary statements of purpose according to sources of institutional control
0
2
4
6
8
10
12
14
16
18
PrivateChristian
Private Secular Public SeparateCatholic
SeparateProtestant
a. Techincal specialization
b. arts
c. advanced academics
d. academic specialization
e. core academics
f. ESL
g. Christian education & discipleship
h. special learning needs/ disabilities/enhanced supervision/ scheduling needs
i. Other
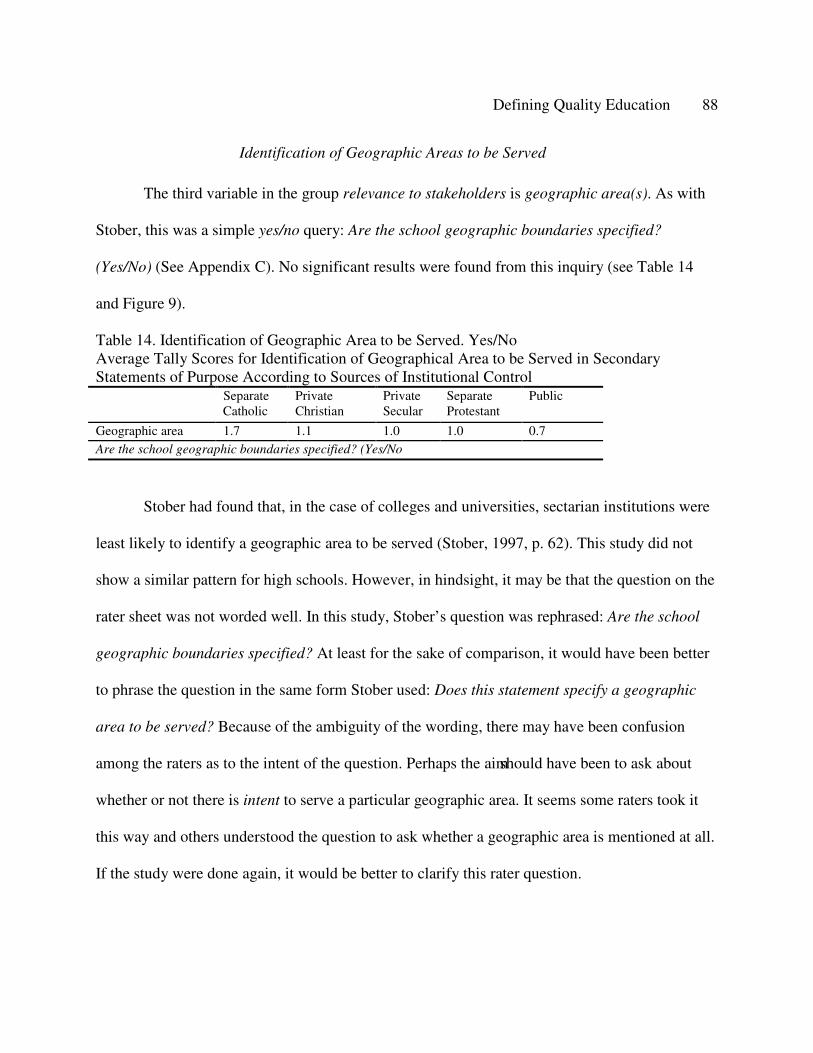
Defining Quality Education 88
Identification of Geographic Areas to be Served
The third variable in the group relevance to stakeholders is geographic area(s). As with
Stober, this was a simple yes/no query: Are the school geographic boundaries specified?
(Yes/No) (See Appendix C). No significant results were found from this inquiry (see Table 14
and Figure 9).
Table 14. Identification of Geographic Area to be Served. Yes/NoAverage Tally Scores for Identification of Geographical Area to be Served in Secondary Statements of Purpose According to Sources of Institutional Control
Separate Catholic
Private Christian
Private Secular
Separate Protestant
Public
Geographic area 1.7 1.1 1.0 1.0 0.7Are the school geographic boundaries specified? (Yes/No
Stober had found that, in the case of colleges and universities, sectarian institutions were
least likely to identify a geographic area to be served (Stober, 1997, p. 62). This study did not
show a similar pattern for high schools. However, in hindsight, it may be that the question on the
rater sheet was not worded well. In this study, Stober’s question was rephrased: Are the school
geographic boundaries specified? At least for the sake of comparison, it would have been better
to phrase the question in the same form Stober used: Does this statement specify a geographic
area to be served? Because of the ambiguity of the wording, there may have been confusion
among the raters as to the intent of the question. Perhaps the aim should have been to ask about
whether or not there is intent to serve a particular geographic area. It seems some raters took it
this way and others understood the question to ask whether a geographic area is mentioned at all.
If the study were done again, it would be better to clarify this rater question.
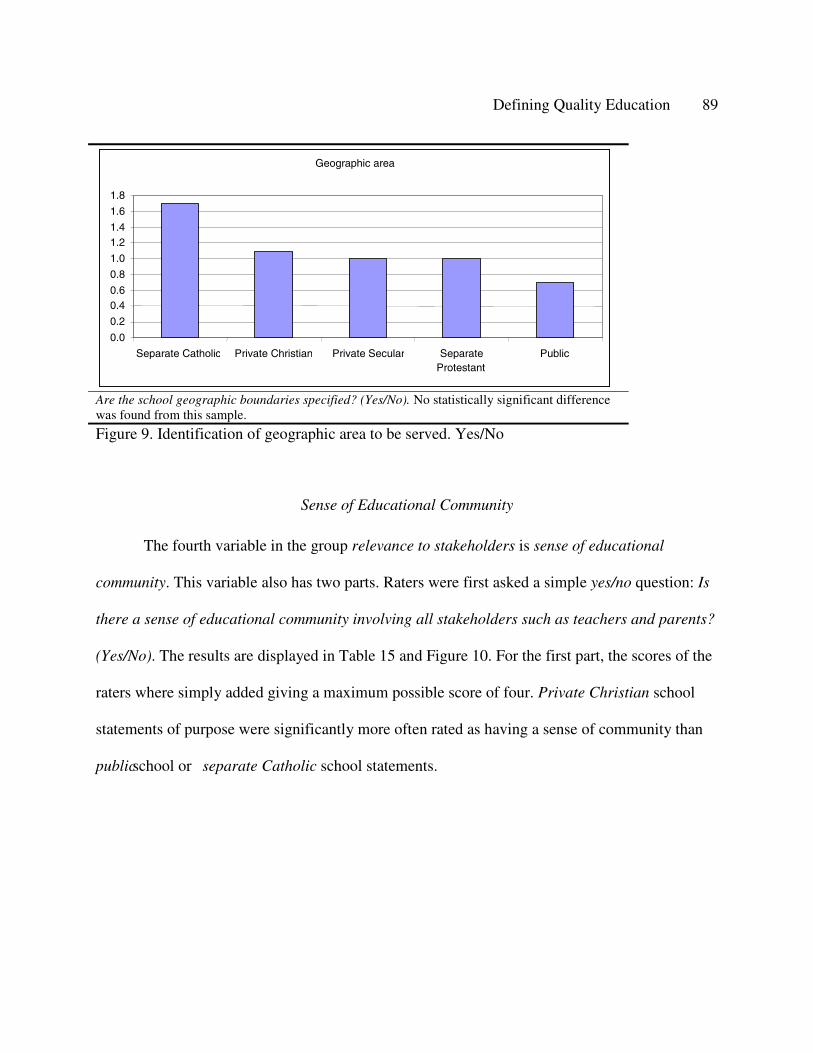
Defining Quality Education 89
Are the school geographic boundaries specified? (Yes/No). No statistically significant difference was found from this sample.
Figure 9. Identification of geographic area to be served. Yes/No
Sense of Educational Community
The fourth variable in the group relevance to stakeholders is sense of educational
community. This variable also has two parts. Raters were first asked a simple yes/no question: Is
there a sense of educational community involving all stakeholders such as teachers and parents?
(Yes/No). The results are displayed in Table 15 and Figure 10. For the first part, the scores of the
raters where simply added giving a maximum possible score of four. Private Christian school
statements of purpose were significantly more often rated as having a sense of community than
public school or separate Catholic school statements.
Geographic area
0.0
0.2
0.40.6
0.8
1.0
1.21.4
1.6
1.8
Separate Catholic Private Christian Private Secular SeparateProtestant
Public
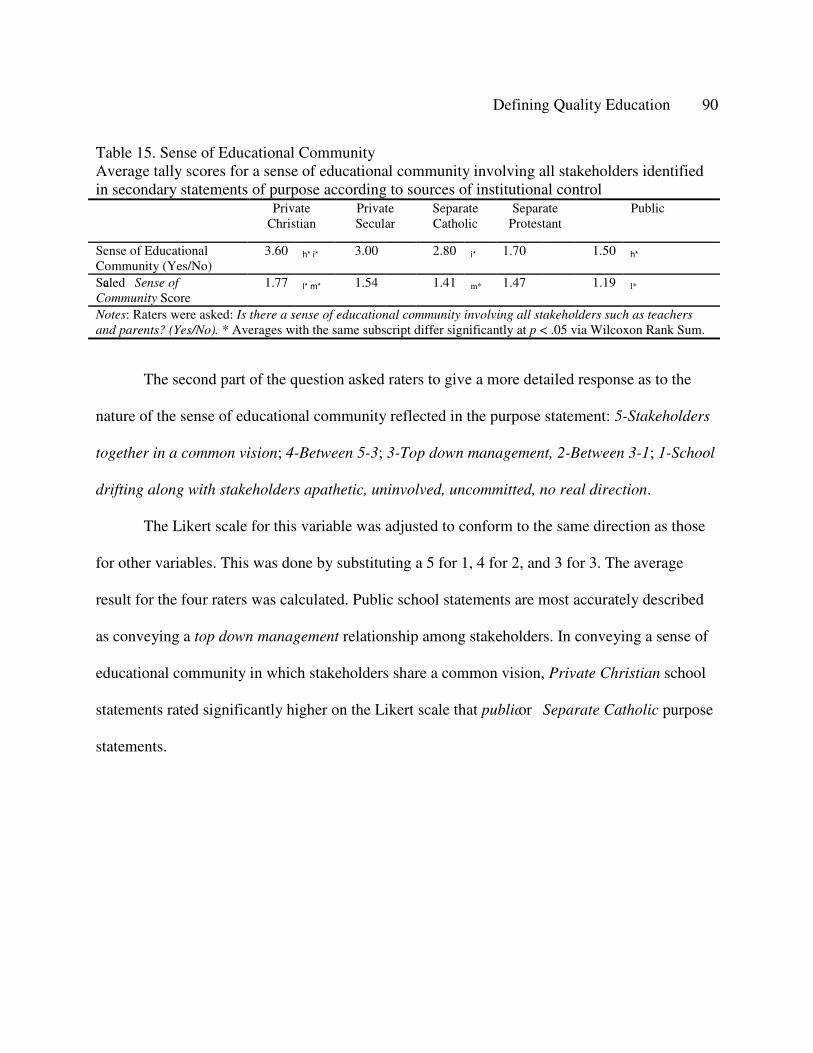
Defining Quality Education 90
Table 15. Sense of Educational CommunityAverage tally scores for a sense of educational community involving all stakeholders identified in secondary statements of purpose according to sources of institutional control
Private Christian
Private Secular
Separate Catholic
Separate Protestant
Public
Sense of Educational Community (Yes/No)
3.60 h* i* 3.00 2.80 i* 1.70 1.50 h*
Scaled Sense of Community Score
1.77 l* m* 1.54 1.41 m* 1.47 1.19 l*
Notes: Raters were asked: Is there a sense of educational community involving all stakeholders such as teachers and parents? (Yes/No). * Averages with the same subscript differ significantly at p < .05 via Wilcoxon Rank Sum.
The second part of the question asked raters to give a more detailed response as to the
nature of the sense of educational community reflected in the purpose statement: 5-Stakeholders
together in a common vision; 4-Between 5-3; 3-Top down management, 2-Between 3-1; 1-School
drifting along with stakeholders apathetic, uninvolved, uncommitted, no real direction.
The Likert scale for this variable was adjusted to conform to the same direction as those
for other variables. This was done by substituting a 5 for 1, 4 for 2, and 3 for 3. The average
result for the four raters was calculated. Public school statements are most accurately described
as conveying a top down management relationship among stakeholders. In conveying a sense of
educational community in which stakeholders share a common vision, Private Christian school
statements rated significantly higher on the Likert scale that public or Separate Catholic purpose
statements.
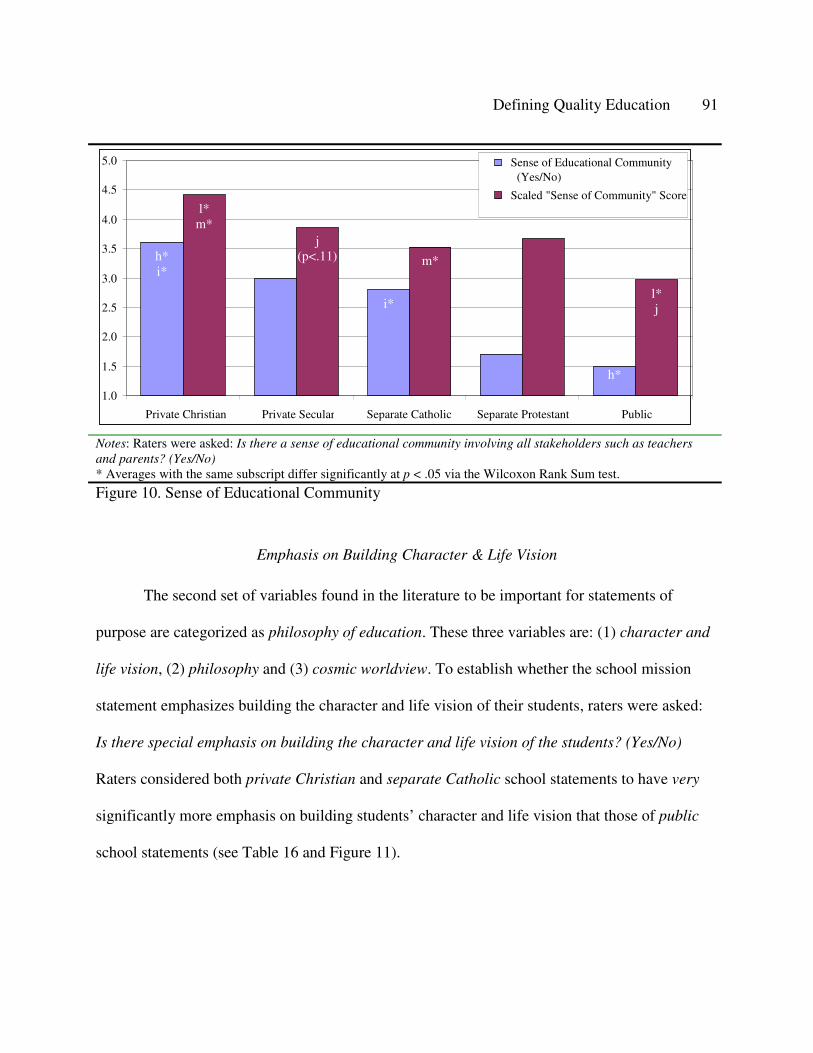
Defining Quality Education 91
Notes: Raters were asked: Is there a sense of educational community involving all stakeholders such as teachers and parents? (Yes/No)* Averages with the same subscript differ significantly at p < .05 via the Wilcoxon Rank Sum test.
Figure 10. Sense of Educational Community
Emphasis on Building Character & Life Vision
The second set of variables found in the literature to be important for statements of
purpose are categorized as philosophy of education. These three variables are: (1) character and
life vision, (2) philosophy and (3) cosmic worldview. To establish whether the school mission
statement emphasizes building the character and life vision of their students, raters were asked:
Is there special emphasis on building the character and life vision of the students? (Yes/No)
Raters considered both private Christian and separate Catholic school statements to have very
significantly more emphasis on building students’ character and life vision that those of public
school statements (see Table 16 and Figure 11).
h* i*
i*
h*
l*m*
j(p<.11) m*
l*j
1.0
1.5
2.0
2.5
3.0
3.5
4.0
4.5
5.0
Private Christian Private Secular Separate Catholic Separate Protestant Public
Sense of Educational Community(Yes/No)
Scaled "Sense of Community" Score
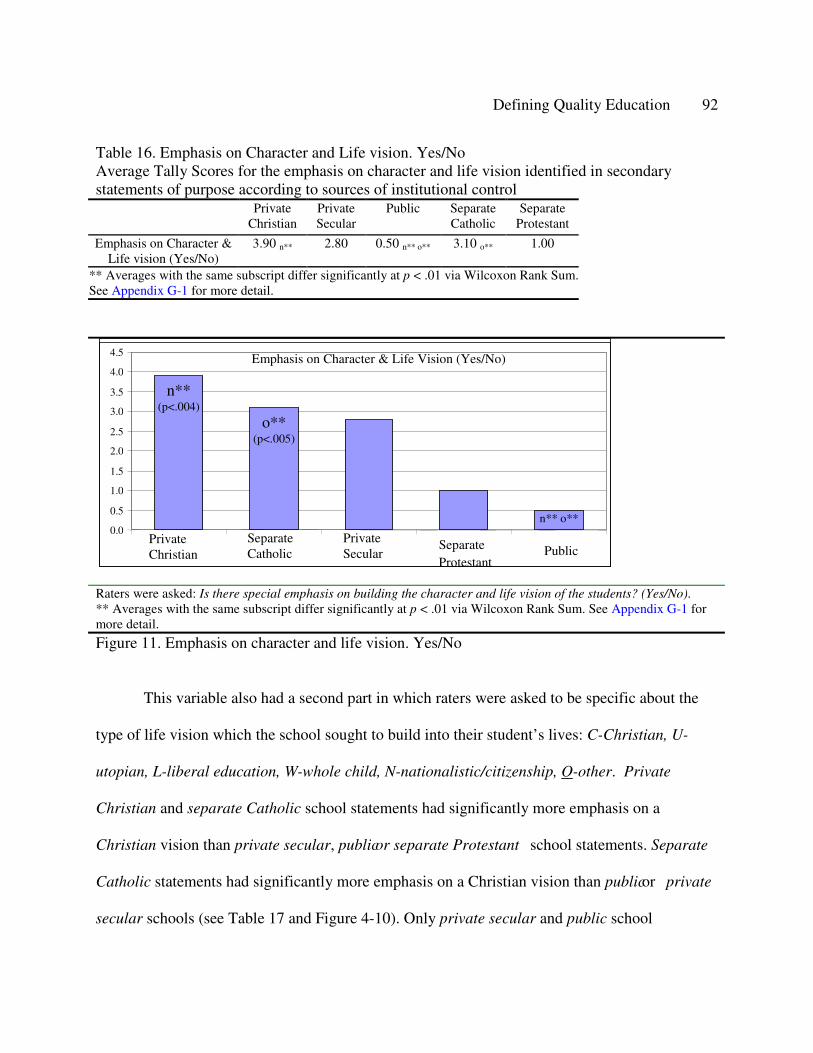
Defining Quality Education 92
Table 16. Emphasis on Character and Life vision. Yes/NoAverage Tally Scores for the emphasis on character and life vision identified in secondary statements of purpose according to sources of institutional control
PrivateChristian
Private Secular
Public Separate Catholic
SeparateProtestant
Emphasis on Character &Life vision (Yes/No)
3.90 n** 2.80 0.50 n** o** 3.10 o** 1.00
** Averages with the same subscript differ significantly at p < .01 via Wilcoxon Rank Sum.See Appendix G-1 for more detail.
Raters were asked: Is there special emphasis on building the character and life vision of the students? (Yes/No).** Averages with the same subscript differ significantly at p < .01 via Wilcoxon Rank Sum. See Appendix G-1 for more detail.
Figure 11. Emphasis on character and life vision. Yes/No
This variable also had a second part in which raters were asked to be specific about the
type of life vision which the school sought to build into their student’s lives: C-Christian, U-
utopian, L-liberal education, W-whole child, N-nationalistic/citizenship, O-other. Private
Christian and separate Catholic school statements had significantly more emphasis on a
Christian vision than private secular, public or separate Protestant school statements. Separate
Catholic statements had significantly more emphasis on a Christian vision than public or private
secular schools (see Table 17 and Figure 4-10). Only private secular and public school
n**(p<.004)
o**(p<.005)
n** o**
Emphasis on Character & Life Vision (Yes/No)
0.0
0.5
1.0
1.5
2.0
2.5
3.0
3.5
4.0
4.5
Separate Catholic
Private Secular
SeparateProtestant
PublicPrivate Christian
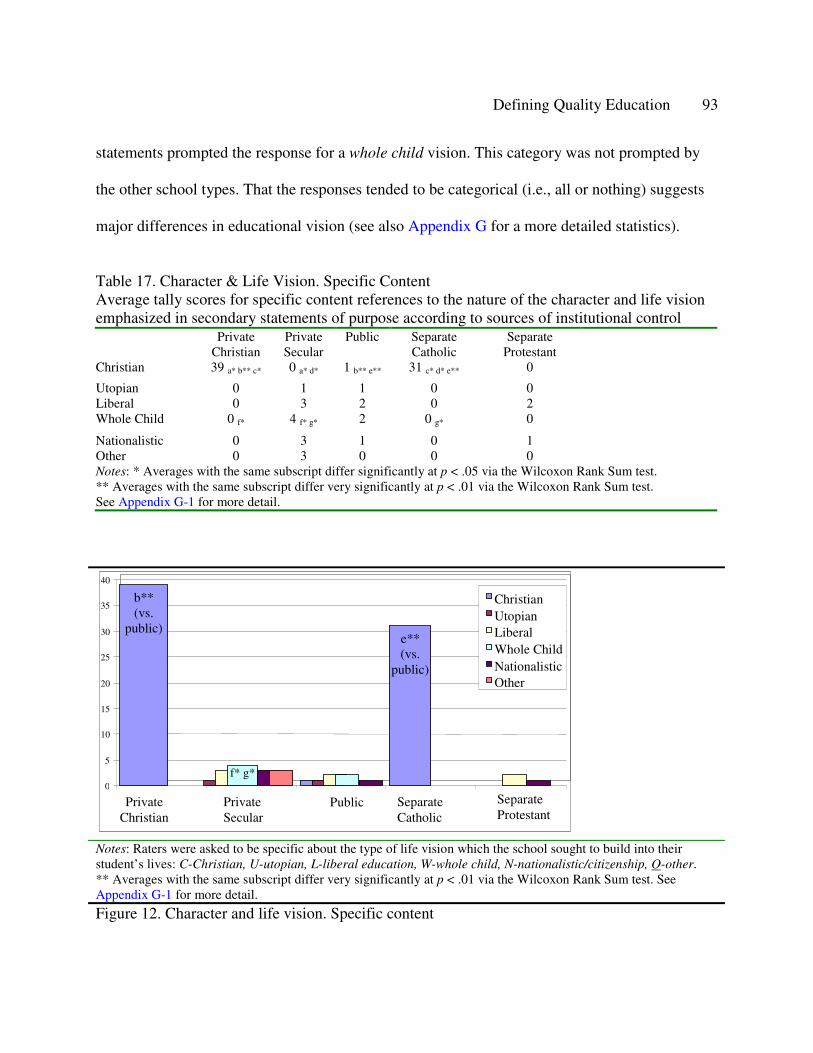
Defining Quality Education 93
statements prompted the response for a whole child vision. This category was not prompted by
the other school types. That the responses tended to be categorical (i.e., all or nothing) suggests
major differences in educational vision (see also Appendix G for a more detailed statistics).
Table 17. Character & Life Vision. Specific ContentAverage tally scores for specific content references to the nature of the character and life vision emphasized in secondary statements of purpose according to sources of institutional control
Private Christian
Private Secular
Public Separate Catholic
Separate Protestant
Christian 39 a* b** c* 0 a* d* 1 b** e** 31 c* d* e** 0
Utopian 0 1 1 0 0Liberal 0 3 2 0 2Whole Child 0 f* 4 f* g* 2 0 g* 0
Nationalistic 0 3 1 0 1Other 0 3 0 0 0Notes: * Averages with the same subscript differ significantly at p < .05 via the Wilcoxon Rank Sum test.** Averages with the same subscript differ very significantly at p < .01 via the Wilcoxon Rank Sum test.See Appendix G-1 for more detail.
Notes: Raters were asked to be specific about the type of life vision which the school sought to build into their student’s lives: C-Christian, U-utopian, L-liberal education, W-whole child, N-nationalistic/citizenship, O-other. ** Averages with the same subscript differ very significantly at p < .01 via the Wilcoxon Rank Sum test. See Appendix G-1 for more detail.
Figure 12. Character and life vision. Specific content
b**(vs.
public)e**(vs.
public)
f* g*0
5
10
15
20
25
30
35
40
PrivateChristian
Private Secular
Public Separate Catholic
Separate Protestant
ChristianUtopianLiberalWhole ChildNationalisticOther
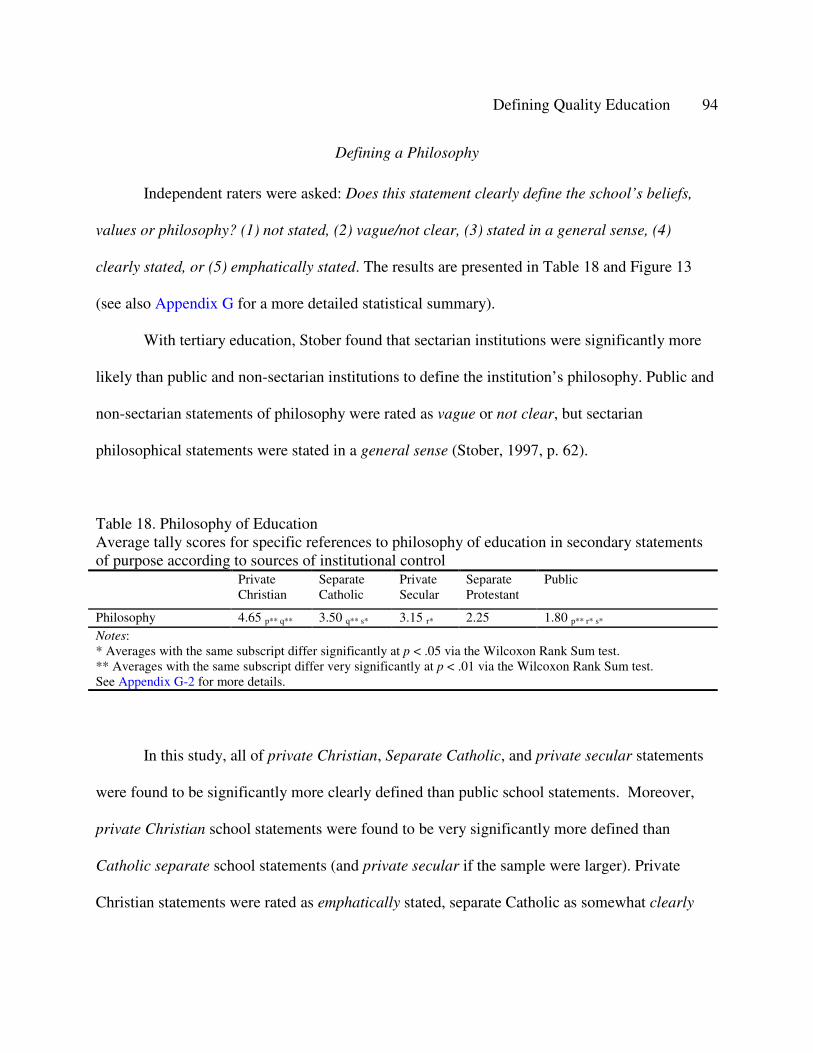
Defining Quality Education 94
Defining a Philosophy
Independent raters were asked: Does this statement clearly define the school’s beliefs,
values or philosophy? (1) not stated, (2) vague/not clear, (3) stated in a general sense, (4)
clearly stated, or (5) emphatically stated. The results are presented in Table 18 and Figure 13
(see also Appendix G for a more detailed statistical summary).
With tertiary education, Stober found that sectarian institutions were significantly more
likely than public and non-sectarian institutions to define the institution’s philosophy. Public and
non-sectarian statements of philosophy were rated as vague or not clear, but sectarian
philosophical statements were stated in a general sense (Stober, 1997, p. 62).
Table 18. Philosophy of EducationAverage tally scores for specific references to philosophy of education in secondary statements of purpose according to sources of institutional control
Private Christian
Separate Catholic
Private Secular
Separate Protestant
Public
Philosophy 4.65 p** q** 3.50 q** s* 3.15 r* 2.25 1.80 p** r* s*
Notes: * Averages with the same subscript differ significantly at p < .05 via the Wilcoxon Rank Sum test.** Averages with the same subscript differ very significantly at p < .01 via the Wilcoxon Rank Sum test.See Appendix G-2 for more details.
In this study, all of private Christian, Separate Catholic, and private secular statements
were found to be significantly more clearly defined than public school statements. Moreover,
private Christian school statements were found to be very significantly more defined than
Catholic separate school statements (and private secular if the sample were larger). Private
Christian statements were rated as emphatically stated, separate Catholic as somewhat clearly
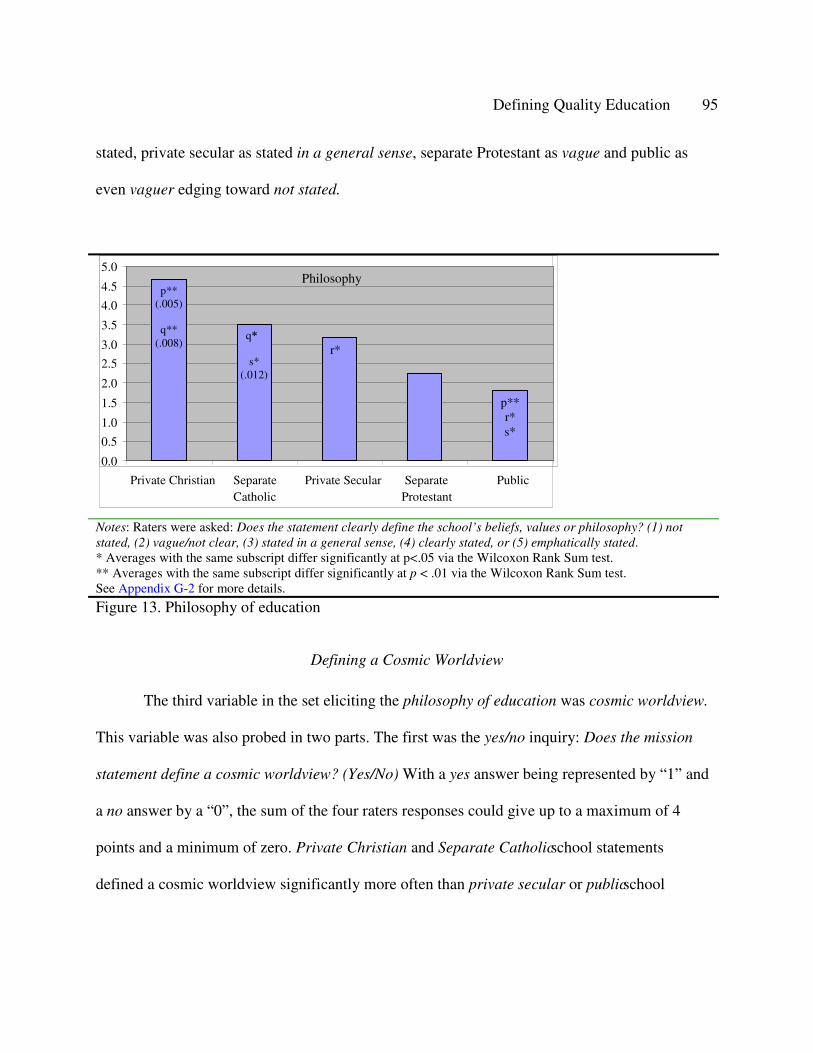
Defining Quality Education 95
stated, private secular as stated in a general sense, separate Protestant as vague and public as
even vaguer edging toward not stated.
Notes: Raters were asked: Does the statement clearly define the school’s beliefs, values or philosophy? (1) not stated, (2) vague/not clear, (3) stated in a general sense, (4) clearly stated, or (5) emphatically stated.* Averages with the same subscript differ significantly at p<.05 via the Wilcoxon Rank Sum test.** Averages with the same subscript differ significantly at p < .01 via the Wilcoxon Rank Sum test.See Appendix G-2 for more details.
Figure 13. Philosophy of education
Defining a Cosmic Worldview
The third variable in the set eliciting the philosophy of education was cosmic worldview.
This variable was also probed in two parts. The first was the yes/no inquiry: Does the mission
statement define a cosmic worldview? (Yes/No) With a yes answer being represented by “1” and
a no answer by a “0”, the sum of the four raters responses could give up to a maximum of 4
points and a minimum of zero. Private Christian and Separate Catholic school statements
defined a cosmic worldview significantly more often than private secular or public school
p** (.005)
q**(.008)
q**
s*(.012)
r*
p**r*s*
Philosophy
0.0
0.5
1.0
1.5
2.0
2.5
3.0
3.5
4.0
4.5
5.0
Private Christian SeparateCatholic
Private Secular SeparateProtestant
Public
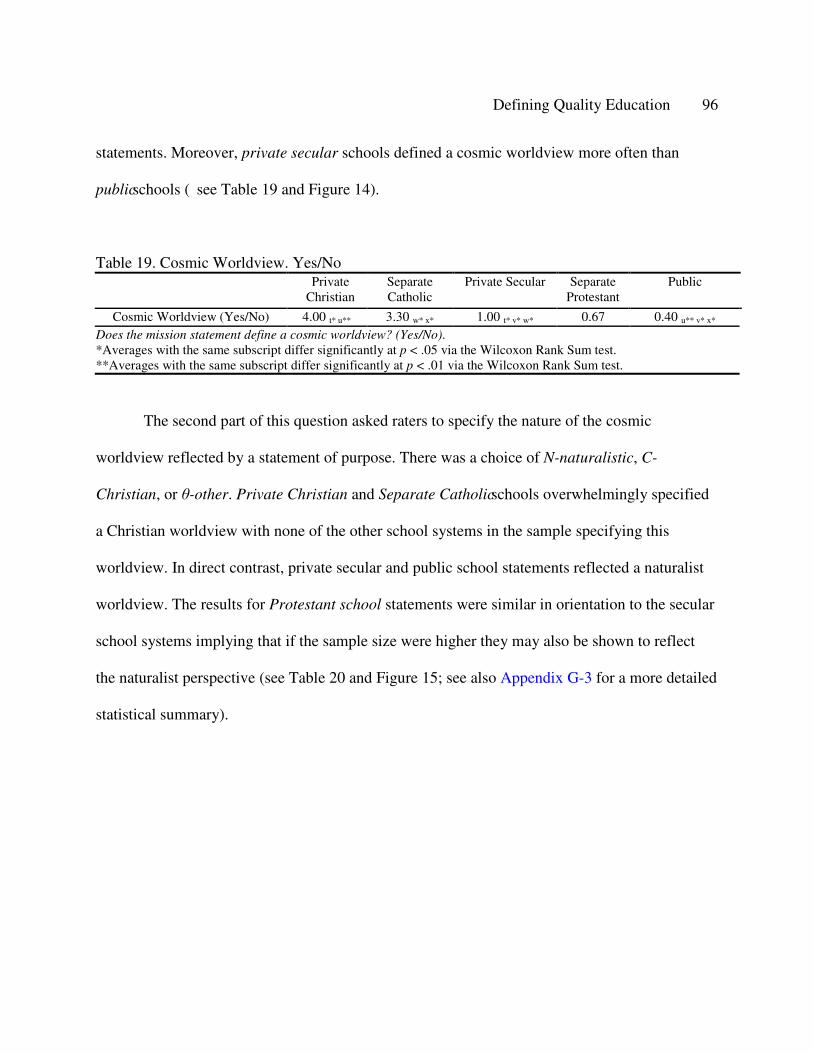
Defining Quality Education 96
statements. Moreover, private secular schools defined a cosmic worldview more often than
public schools ( see Table 19 and Figure 14).
Table 19. Cosmic Worldview. Yes/NoPrivate
ChristianSeparate Catholic
Private Secular Separate Protestant
Public
Cosmic Worldview (Yes/No) 4.00 t* u** 3.30 w* x* 1.00 t* v* w* 0.67 0.40 u** v* x*
Does the mission statement define a cosmic worldview? (Yes/No).*Averages with the same subscript differ significantly at p < .05 via the Wilcoxon Rank Sum test.**Averages with the same subscript differ significantly at p < .01 via the Wilcoxon Rank Sum test.
The second part of this question asked raters to specify the nature of the cosmic
worldview reflected by a statement of purpose. There was a choice of N-naturalistic, C-
Christian, or θ-other. Private Christian and Separate Catholic schools overwhelmingly specified
a Christian worldview with none of the other school systems in the sample specifying this
worldview. In direct contrast, private secular and public school statements reflected a naturalist
worldview. The results for Protestant school statements were similar in orientation to the secular
school systems implying that if the sample size were higher they may also be shown to reflect
the naturalist perspective (see Table 20 and Figure 15; see also Appendix G-3 for a more detailed
statistical summary).
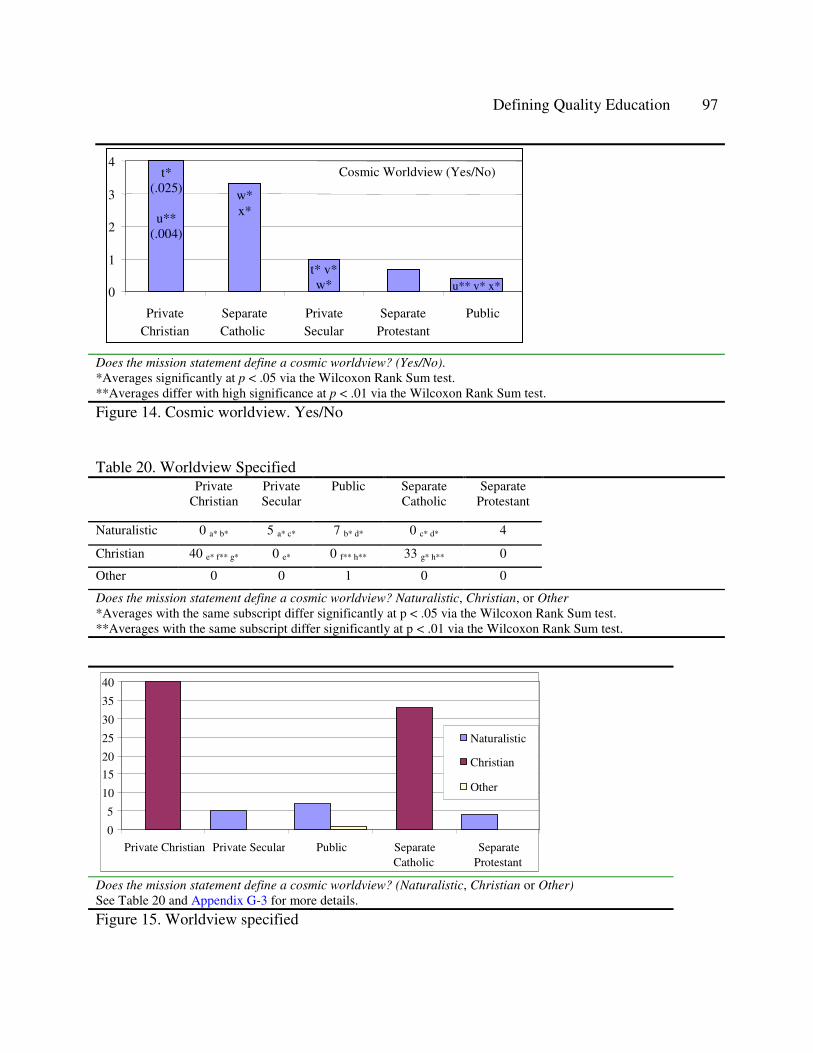
Defining Quality Education 97
Does the mission statement define a cosmic worldview? (Yes/No).*Averages significantly at p < .05 via the Wilcoxon Rank Sum test.**Averages differ with high significance at p < .01 via the Wilcoxon Rank Sum test.
Figure 14. Cosmic worldview. Yes/No
Table 20. Worldview SpecifiedPrivate
ChristianPrivate Secular
Public Separate Catholic
Separate Protestant
Naturalistic 0 a* b* 5 a* c* 7 b* d* 0 c* d* 4
Christian 40 e* f** g* 0 e* 0 f** h** 33 g* h** 0
Other 0 0 1 0 0
Does the mission statement define a cosmic worldview? Naturalistic, Christian, or Other*Averages with the same subscript differ significantly at p < .05 via the Wilcoxon Rank Sum test.**Averages with the same subscript differ significantly at p < .01 via the Wilcoxon Rank Sum test.
Does the mission statement define a cosmic worldview? (Naturalistic, Christian or Other)See Table 20 and Appendix G-3 for more details.
Figure 15. Worldview specified
t*(.025)
u**(.004)
w* x*
t* v*w* u** v* x*
Cosmic Worldview (Yes/No)
0
1
2
3
4
PrivateChristian
SeparateCatholic
PrivateSecular
SeparateProtestant
Public
0
5
10
15
20
25
30
35
40
Private Christian Private Secular Public SeparateCatholic
SeparateProtestant
Naturalistic
Christian
Other
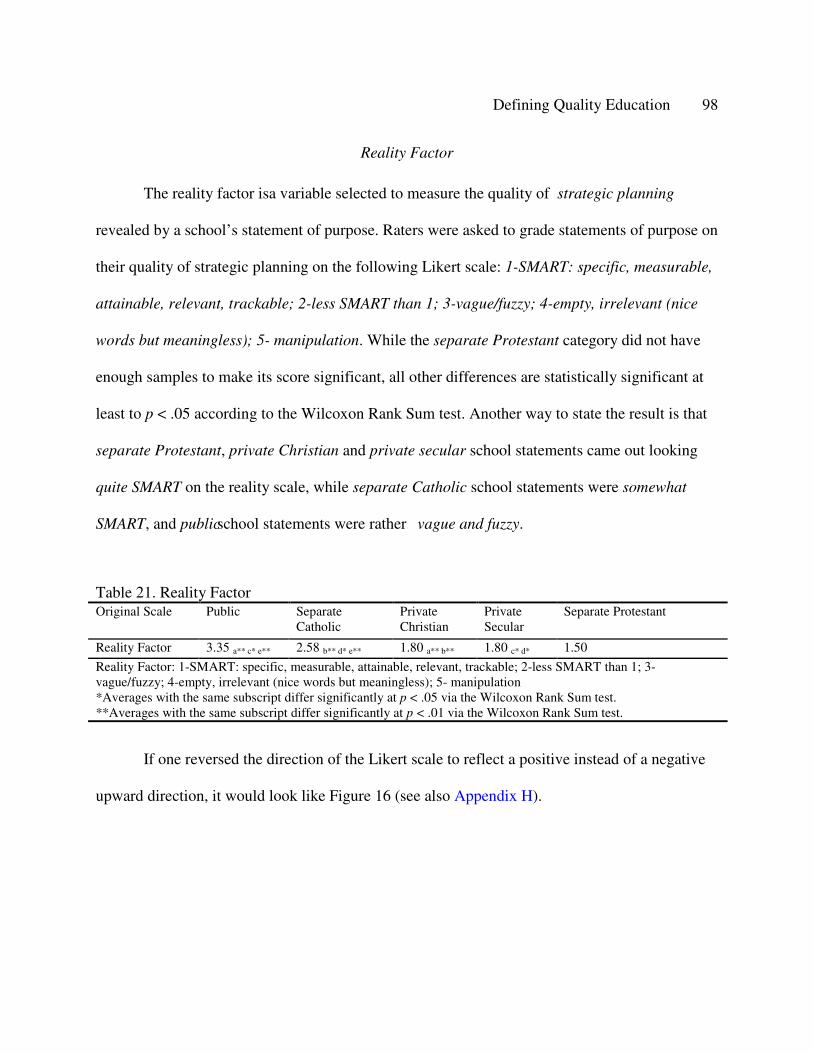
Defining Quality Education 98
Reality Factor
The reality factor is a variable selected to measure the quality of strategic planning
revealed by a school’s statement of purpose. Raters were asked to grade statements of purpose on
their quality of strategic planning on the following Likert scale: 1-SMART: specific, measurable,
attainable, relevant, trackable; 2-less SMART than 1; 3-vague/fuzzy; 4-empty, irrelevant (nice
words but meaningless); 5- manipulation. While the separate Protestant category did not have
enough samples to make its score significant, all other differences are statistically significant at
least to p < .05 according to the Wilcoxon Rank Sum test. Another way to state the result is that
separate Protestant, private Christian and private secular school statements came out looking
quite SMART on the reality scale, while separate Catholic school statements were somewhat
SMART, and public school statements were rather vague and fuzzy.
Table 21. Reality Factor Original Scale Public Separate
Catholic Private Christian
Private Secular
Separate Protestant
Reality Factor 3.35 a** c* e** 2.58 b** d* e** 1.80 a** b** 1.80 c* d* 1.50
Reality Factor: 1-SMART: specific, measurable, attainable, relevant, trackable; 2-less SMART than 1; 3-vague/fuzzy; 4-empty, irrelevant (nice words but meaningless); 5- manipulation*Averages with the same subscript differ significantly at p < .05 via the Wilcoxon Rank Sum test.**Averages with the same subscript differ significantly at p < .01 via the Wilcoxon Rank Sum test.
If one reversed the direction of the Likert scale to reflect a positive instead of a negative
upward direction, it would look like Figure 16 (see also Appendix H).
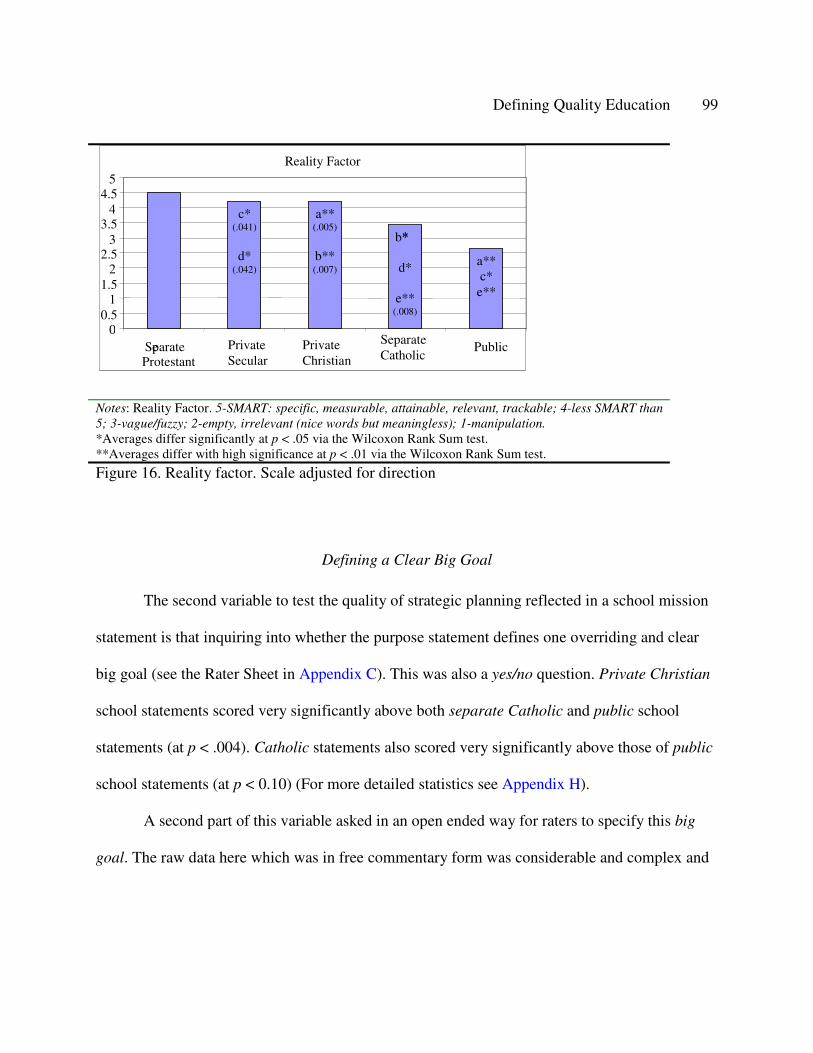
Defining Quality Education 99
Notes: Reality Factor. 5-SMART: specific, measurable, attainable, relevant, trackable; 4-less SMART than 5; 3-vague/fuzzy; 2-empty, irrelevant (nice words but meaningless); 1-manipulation.*Averages differ significantly at p < .05 via the Wilcoxon Rank Sum test.**Averages differ with high significance at p < .01 via the Wilcoxon Rank Sum test.
Figure 16. Reality factor. Scale adjusted for direction
Defining a Clear Big Goal
The second variable to test the quality of strategic planning reflected in a school mission
statement is that inquiring into whether the purpose statement defines one overriding and clear
big goal (see the Rater Sheet in Appendix C). This was also a yes/no question. Private Christian
school statements scored very significantly above both separate Catholic and public school
statements (at p < .004). Catholic statements also scored very significantly above those of public
school statements (at p < 0.10) (For more detailed statistics see Appendix H).
A second part of this variable asked in an open ended way for raters to specify this big
goal. The raw data here which was in free commentary form was considerable and complex and
c*(.041)
d*(.042)
a**(.005)
b**(.007)
b**
d*
e**(.008)
a**c*
e**
Reality Factor
00.5
11.5
22.5
33.5
44.5
5
SeparateProtestant
Private Secular
Private Christian
Separate Catholic
Public
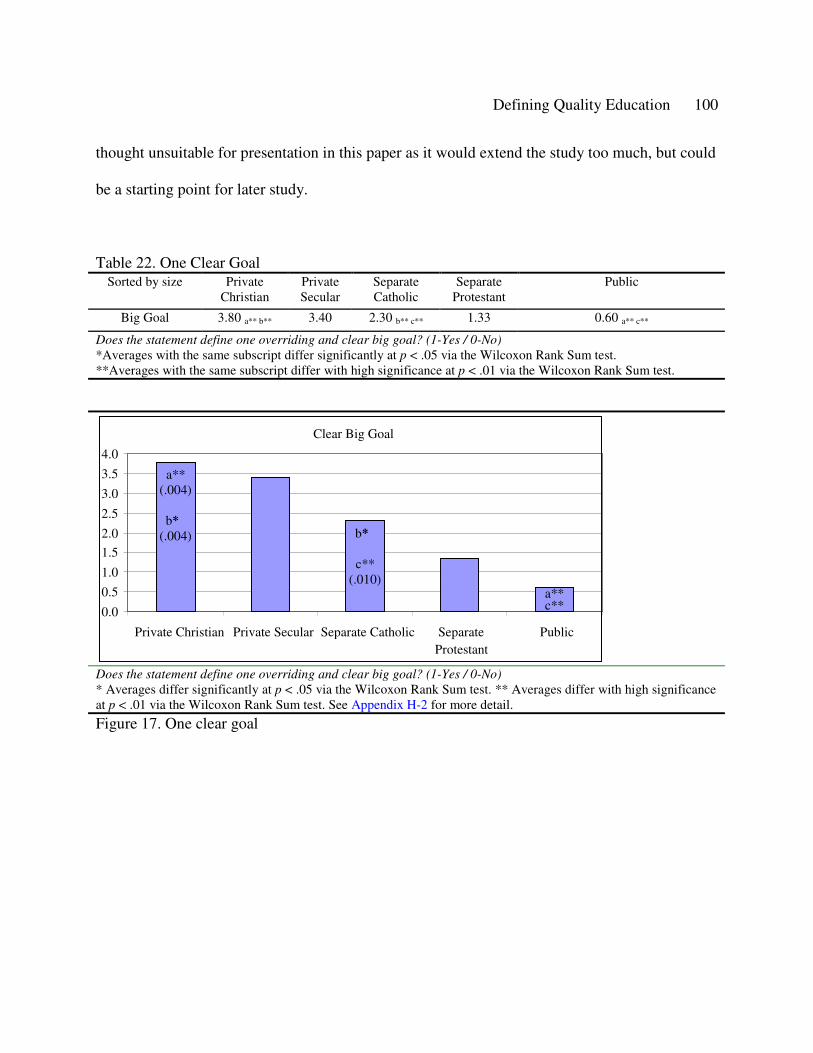
Defining Quality Education 100
thought unsuitable for presentation in this paper as it would extend the study too much, but could
be a starting point for later study.
Table 22. One Clear GoalSorted by size Private
ChristianPrivate Secular
Separate Catholic
Separate Protestant
Public
Big Goal 3.80 a** b** 3.40 2.30 b** c** 1.33 0.60 a** c**
Does the statement define one overriding and clear big goal? (1-Yes / 0-No)*Averages with the same subscript differ significantly at p < .05 via the Wilcoxon Rank Sum test.**Averages with the same subscript differ with high significance at p < .01 via the Wilcoxon Rank Sum test.
Does the statement define one overriding and clear big goal? (1-Yes / 0-No)* Averages differ significantly at p < .05 via the Wilcoxon Rank Sum test. ** Averages differ with high significanceat p < .01 via the Wilcoxon Rank Sum test. See Appendix H-2 for more detail.
Figure 17. One clear goal
a**(.004)
b**(.004) b**
c**(.010)
a**c**
Clear Big Goal
0.0
0.5
1.0
1.5
2.0
2.5
3.0
3.5
4.0
Private Christian Private Secular Separate Catholic SeparateProtestant
Public
Defining Quality Education 101
Results of Hypothesis Testing
Hypothesis 1
Data presented support the following conclusion with respect to the first hypothesis. High
school mission statements within this research sample exhibited different content and text clarity
according to sources of institutional authority.
Hypothesis 2
The second hypothesis to be tested in this study was that t he content and presentation of
mission statements bear a significant relationship to school performance as measured by
students’ academic outcomes. This hypothesis was based on the design of Pearce and David who
hypothesized in the case of business mission statements that “the mission statements of high
performing Fortune 500 companies will exhibit more of the desired components than will those
of low performing Fortune 500 firms” (Pearce & David, 1987, p. 109). Pearce and David
compared the differences in the average scores for mission statement components among high
performing companies to the average scores of low performing companies, for each component
looking for statistical differences between these average scores. The schema for Pearce and
David’s comparison of corporate mission statements is outlined in Table 6.
In Pearce and David’s study high performers were firms in the top quartile of a profit
margin distribution of all responding Fortune 500 companies. Low performers were the lower
quartile firms (Pearce & David, 1987, p. 112). Although the particular components as well as the
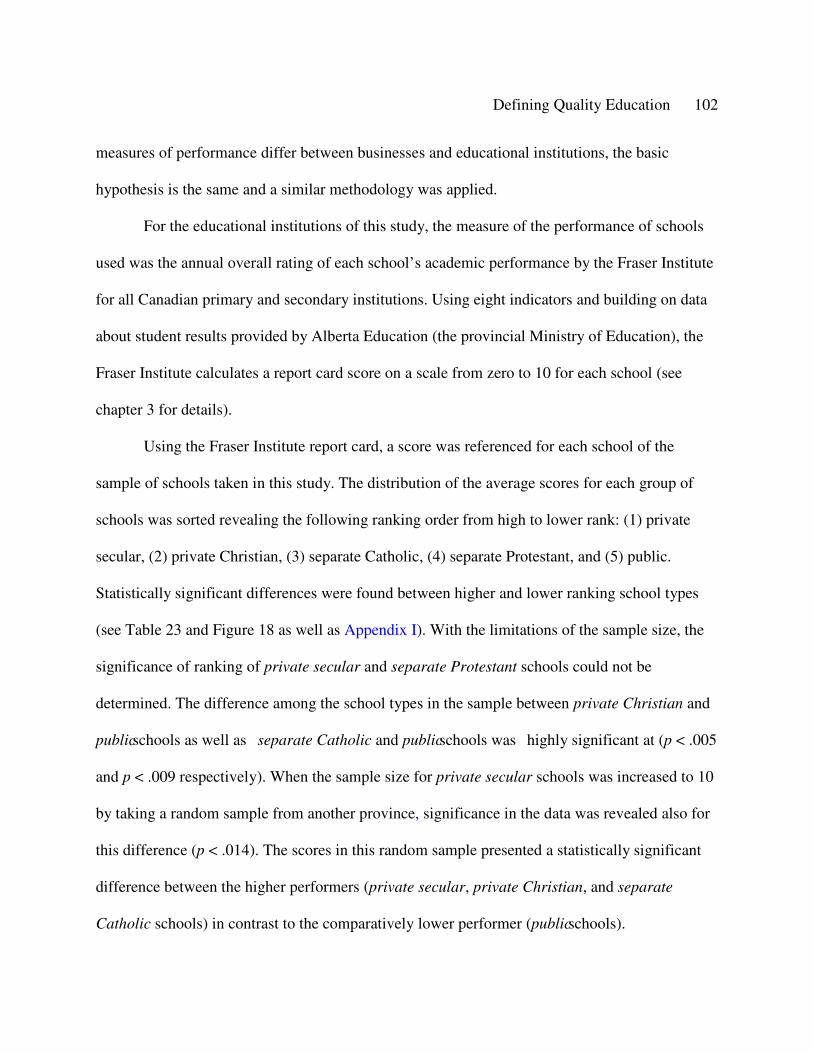
Defining Quality Education 102
measures of performance differ between businesses and educational institutions, the basic
hypothesis is the same and a similar methodology was applied.
For the educational institutions of this study, the measure of the performance of schools
used was the annual overall rating of each school’s academic performance by the Fraser Institute
for all Canadian primary and secondary institutions. Using eight indicators and building on data
about student results provided by Alberta Education (the provincial Ministry of Education), the
Fraser Institute calculates a report card score on a scale from zero to 10 for each school (see
chapter 3 for details).
Using the Fraser Institute report card, a score was referenced for each school of the
sample of schools taken in this study. The distribution of the average scores for each group of
schools was sorted revealing the following ranking order from high to lower rank: (1) private
secular, (2) private Christian, (3) separate Catholic, (4) separate Protestant, and (5) public.
Statistically significant differences were found between higher and lower ranking school types
(see Table 23 and Figure 18 as well as Appendix I). With the limitations of the sample size, the
significance of ranking of private secular and separate Protestant schools could not be
determined. The difference among the school types in the sample between private Christian and
public schools as well as separate Catholic and public schools was highly significant at (p < .005
and p < .009 respectively). When the sample size for private secular schools was increased to 10
by taking a random sample from another province, significance in the data was revealed also for
this difference (p < .014). The scores in this random sample presented a statistically significant
difference between the higher performers (private secular, private Christian, and separate
Catholic schools) in contrast to the comparatively lower performer (public schools).
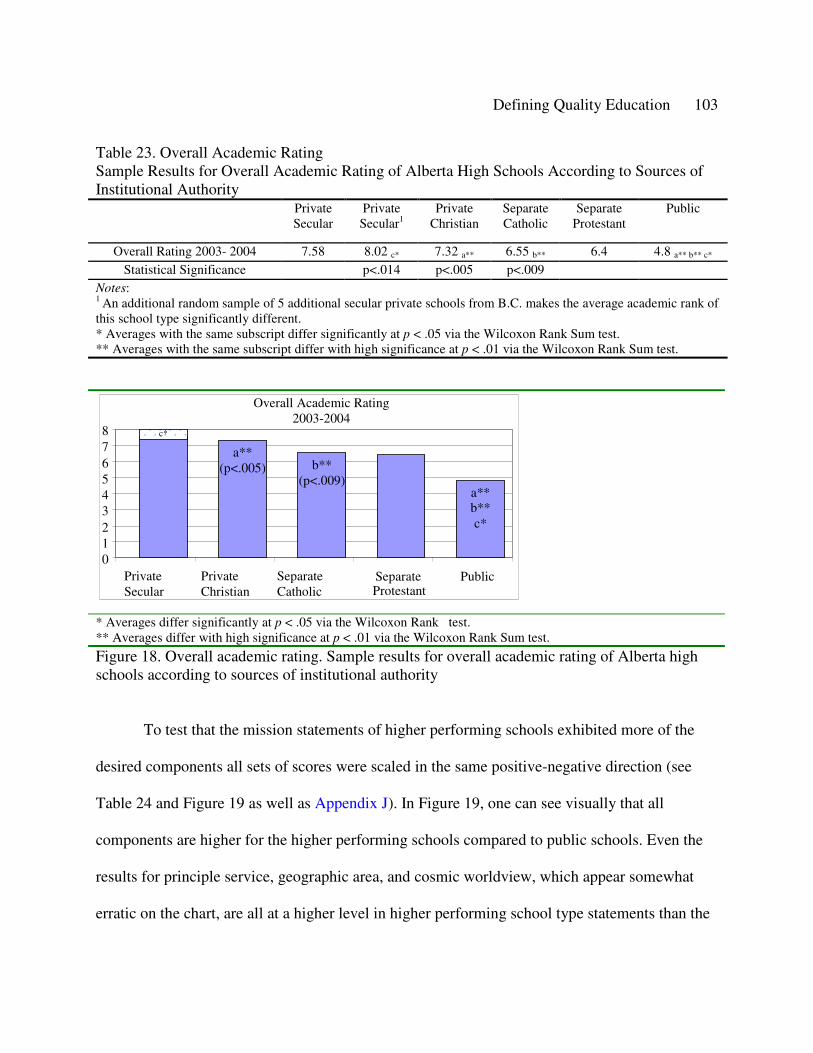
Defining Quality Education 103
Table 23. Overall Academic RatingSample Results for Overall Academic Rating of Alberta High Schools According to Sources of Institutional Authority
Private Secular
Private Secular1
Private Christian
Separate Catholic
Separate Protestant
Public
Overall Rating 2003- 2004 7.58 8.02 c* 7.32 a** 6.55 b** 6.4 4.8 a** b** c*
Statistical Significance p<.014 p<.005 p<.009Notes: 1 An additional random sample of 5 additional secular private schools from B.C. makes the average academic rank of this school type significantly different. * Averages with the same subscript differ significantly at p < .05 via the Wilcoxon Rank Sum test.** Averages with the same subscript differ with high significance at p < .01 via the Wilcoxon Rank Sum test.
* Averages differ significantly at p < .05 via the Wilcoxon Rank test.** Averages differ with high significance at p < .01 via the Wilcoxon Rank Sum test.
Figure 18. Overall academic rating. Sample results for overall academic rating of Alberta high schools according to sources of institutional authority
To test that the mission statements of higher performing schools exhibited more of the
desired components all sets of scores were scaled in the same positive-negative direction (see
Table 24 and Figure 19 as well as Appendix J). In Figure 19, one can see visually that all
components are higher for the higher performing schools compared to public schools. Even the
results for principle service, geographic area, and cosmic worldview, which appear somewhat
erratic on the chart, are all at a higher level in higher performing school type statements than the
a**(p<.005)
a** b**c*
Overall Academic Rating2003-2004
012345678
Private Secular
Private Christian
Separate Catholic
SeparateProtestant
Public
c*
b**(p<.009)
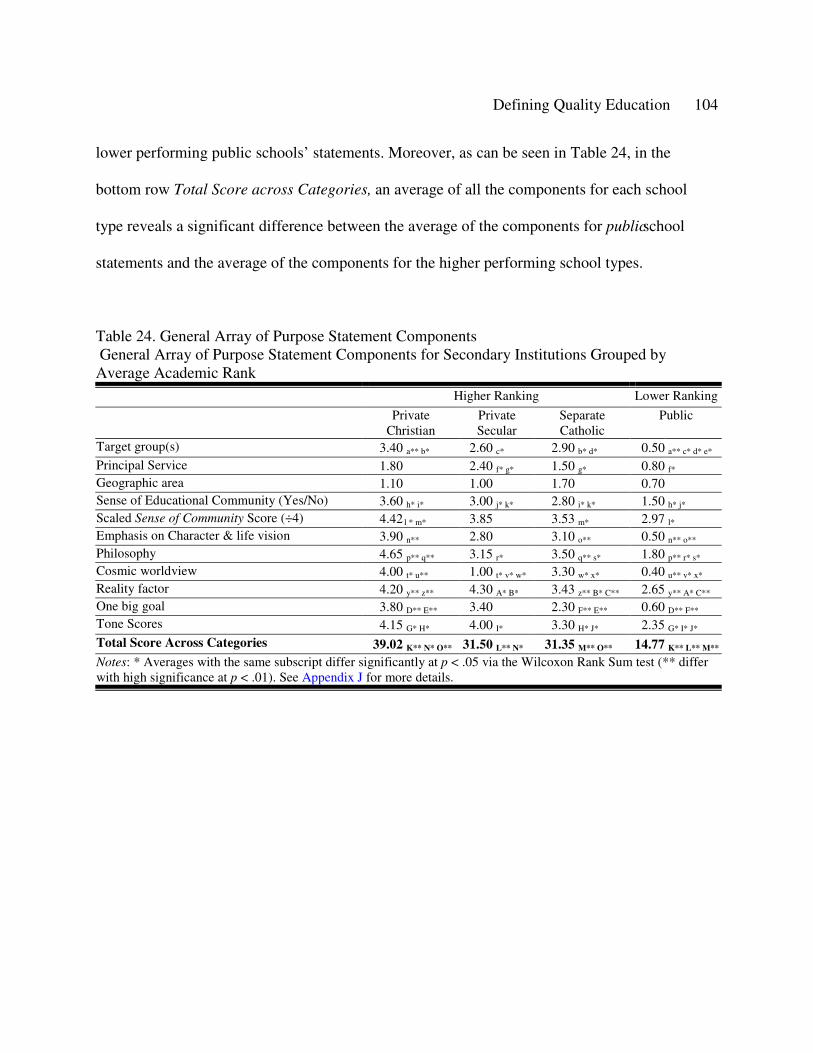
Defining Quality Education 104
lower performing public schools’ statements. Moreover, as can be seen in Table 24, in the
bottom row Total Score across Categories, an average of all the components for each school
type reveals a significant difference between the average of the components for public school
statements and the average of the components for the higher performing school types.
Table 24. General Array of Purpose Statement ComponentsGeneral Array of Purpose Statement Components for Secondary Institutions Grouped by Average Academic Rank
Higher Ranking Lower Ranking
PrivateChristian
PrivateSecular
SeparateCatholic
Public
Target group(s) 3.40 a** b* 2.60 c* 2.90 b* d* 0.50 a** c* d* e*
Principal Service 1.80 2.40 f* g* 1.50 g* 0.80 f*
Geographic area 1.10 1.00 1.70 0.70Sense of Educational Community (Yes/No) 3.60 h* i* 3.00 j* k* 2.80 i* k* 1.50 h* j*
Scaled Sense of Community Score (÷4) 4.42l * m* 3.85 3.53 m* 2.97 l*
Emphasis on Character & life vision 3.90 n** 2.80 3.10 o** 0.50 n** o**
Philosophy 4.65 p** q** 3.15 r* 3.50 q** s* 1.80 p** r* s*
Cosmic worldview 4.00 t* u** 1.00 t* v* w* 3.30 w* x* 0.40 u** v* x*
Reality factor 4.20 y** z** 4.30 A* B* 3.43 z** B* C** 2.65 y** A* C**
One big goal 3.80 D** E** 3.40 2.30 F** E** 0.60 D** F**
Tone Scores 4.15 G* H* 4.00 I* 3.30 H* J* 2.35 G* I* J*
Total Score Across Categories 39.02 K** N* O** 31.50 L** N* 31.35 M** O** 14.77 K** L** M**
Notes: * Averages with the same subscript differ significantly at p < .05 via the Wilcoxon Rank Sum test (** differ with high significance at p < .01). See Appendix J for more details.
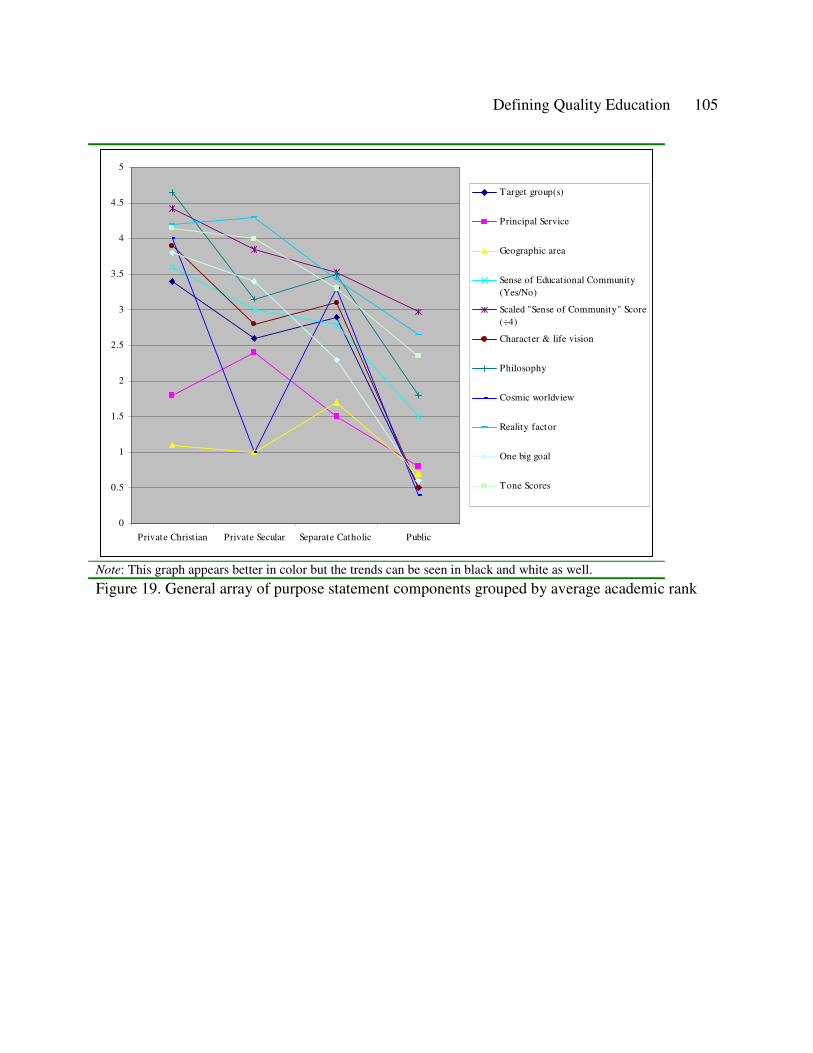
Defining Quality Education 105
0
0.5
1
1.5
2
2.5
3
3.5
4
4.5
5
Private Christian Private Secular Separate Catholic Public
Target group(s)
Principal Service
Geographic area
Sense of Educational Community(Yes/No)
Scaled "Sense of Community" Score(÷4)
Character & life vision
Philosophy
Cosmic worldview
Reality factor
One big goal
Tone Scores
Note: This graph appears better in color but the trends can be seen in black and white as well.
Figure 19. General array of purpose statement components grouped by average academic rank
CHAPTER 5. SUMMARY, DISCUSSION, RECOMMENDATIONS, IMPLICATIONS
Summary
Well defined and clearly stated missions are necessary so that institutions can remain true
to their basic orientation while strategically responding to external and internal forces. This study
examined the content and text clarity of 38 mission statements as published by secondary schools
accredited by the Province of Alberta, Canada. Mission statements were gathered from the web
sites of high schools within the research sample. Techniques of earlier researchers were
enhanced to examine the statements for content items (dealing with relevance to stakeholders,
philosophy of education, strategic planning) and for presentation (through Flesch Reading Ease,
Gunning’s Fog Index, Flesch-Kincaid Grade Level, lexical density, word counts and tone
scores). Statistically significant differences were observed between the five institutional
categories studied—public, separate Catholic, separate Protestant, private secular and private
Christian. Results have been presented in chapter 4, and specific data have been referenced in the
summary and discussion that follows. Recommendations and implications are discussed along
with suggestions for further research. Although this discussion is limited to secondary schools
accredited in the Province of Alberta, it is possible that these finding may be applied with
caution to other populations of North American secondary schools.
With respect to the first hypothesis, it was found that mission statements of high schools
reflect significant differences between sources of educational authority. Significant differences
were found for 12 of the 15 components tested. Among the five readability measures tested by
grammatical analysis, three out of five tests showed significant differences. Among the content
variables, all except one (geographic area) showed significant differences. In addition, there is a
Defining Quality Education 107
noticeable correlation between the character of the components of mission statements and the
types of institutional sources of authority (see Appendix L). This adds weight to the argument
that the sources of authority have characteristic differences.
The second hypothesis, tested correlation between academic soundness and mission
statement characteristics and found both that characteristic mission statement components and
source of institutional authority correlate with the academic success of an educational enterprise.
We had already found through hypothesis 1 that sources of institutional authority produce
characteristic mission statements. It seems that the differing kinds of educational institutional
authority produce correspondingly different qualities of mission statements which in turn are
related to predictably differing qualities of education (at least from the point of view of academic
success). The discussion which follows will expand upon these findings as well as cite other
studies which show similar trends.
Discussion
High School Mission Statements Distinguish Themselves According to Categories of Institutional
Authority
The contention that the mission statements of secondary schools are basically similar
across the school types has been shown to be false. Secondary schools in this study distinguished
themselves according to school authority in all but three of the 15 components used to test them.
School types have significantly unique mission statement contents and presentation. Institutional
authorities distinguish themselves by (a) readability and tone, (b) by relevance to stakeholders
Defining Quality Education 108
(target groups, principal services, and educational community), (c) by philosophy of education
(emphasis on character and life vision, philosophy, worldview), and (d) by the quality of
strategic planning (reality factor and definition of a clear overall goal).
Institutional Authorities Distinguish Themselves by Readability and Tone
Readability Analysis
Although the Gunning’s Fog Index (GFI) and the Flesch-Kincaid Grade Level (FKGL)
suggested no particular difference between the grammatical reading ease of school types, the
Flesch Reading Ease, the lexical density, and the number of words per statement scores
suggested differences consistent with each other, consistent with tone and content scores
submitted by human raters, as well as consistent with previous research. This was easier to see
by rescaling and synchronizing the data to be all going in one direction so that higher scores
consistently mean an easier reading level. This was done in Figure 2 and Figure 3. The three
variables which showed a difference between school types all flowed in the same direction
although somewhat erratically. A larger sample size may have helped to take out the jaggedness
of the lines. Among the tables and figures for this data, the line graph Figure 3 showed the trend
of the data most clearly and is reproduced here in Figure 20.
The FRE suggests that the statements of private Christian schools are easier to read that
those of private secular schools. For the FRE, these findings show the private Christian sector to
have the easiest statements to read with the private secular sector being the most difficult to
read. With regard to lexical density, the private Christian sector again had the easiest statements
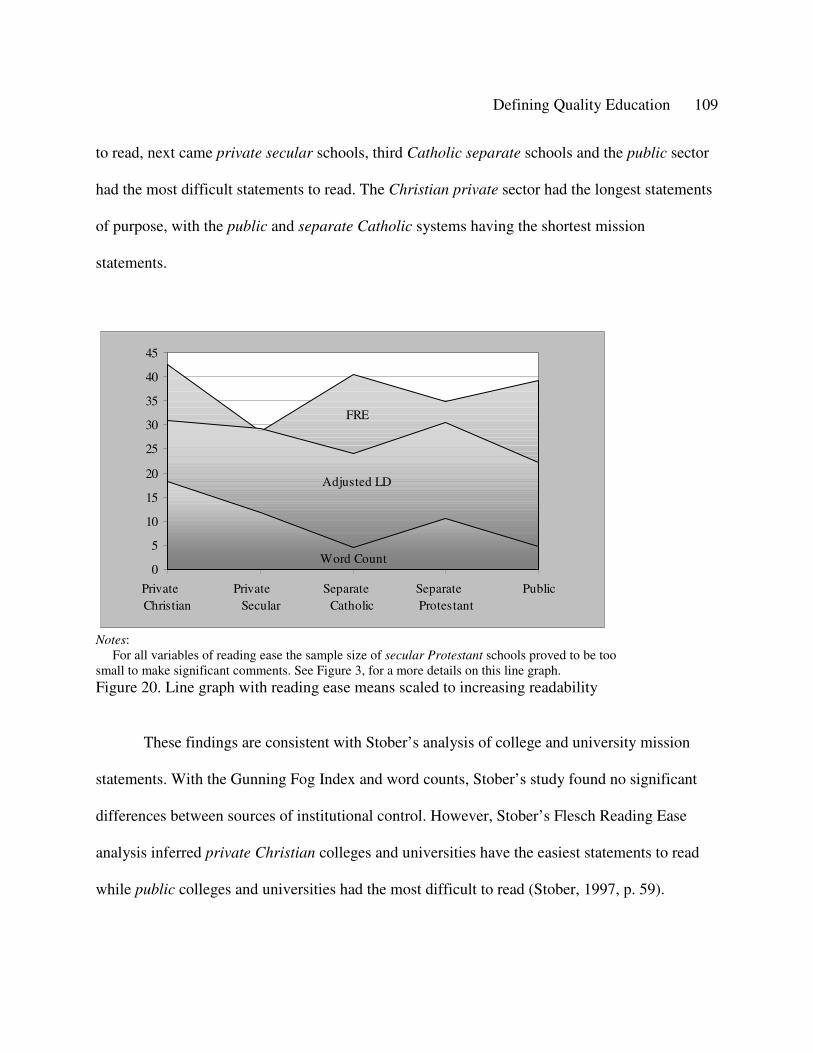
Defining Quality Education 109
to read, next came private secular schools, third Catholic separate schools and the public sector
had the most difficult statements to read. The Christian private sector had the longest statements
of purpose, with the public and separate Catholic systems having the shortest mission
statements.
FRE
Adjusted LD
Word Count0
5
10
15
20
25
30
35
40
45
Private Christian
Private Secular
Separate Catholic
Separate Protestant
Public
Notes: For all variables of reading ease the sample size of secular Protestant schools proved to be too
small to make significant comments. See Figure 3, for a more details on this line graph. Figure 20. Line graph with reading ease means scaled to increasing readability
These findings are consistent with Stober’s analysis of college and university mission
statements. With the Gunning Fog Index and word counts, Stober’s study found no significant
differences between sources of institutional control. However, Stober’s Flesch Reading Ease
analysis inferred private Christian colleges and universities have the easiest statements to read
while public colleges and universities had the most difficult to read (Stober, 1997, p. 59).
Defining Quality Education 110
In summary, Albertan private Christian school statements had the easiest statements to
read, followed by either private secular or separate Catholic school statements with public
school statements being the most difficult to read as well as among the shortest. The next step
would be to take samples from other provinces as well to see if the Canada-wide picture looks
the same as that in Alberta. It is suggested that the differences found in Alberta will be even
more extreme in other provinces because of the sectarian nature of the general population of
Alberta where even in the public school sector mission statements can be found which have a
sectarian vision and mission. This would be particularly rare in a province like Ontario which
according to a report by the Fraser Institute tends to be much less tolerant of private institutions
of any kind (Hepburn & Belle, 2003). Thus one would expect differences between the secular
and the religious visions and missions to be even more pronounced in a province such as
Ontario.
Tone Scores
Besides these readability measures, text tone scores were the other variable suggested by
previous research to measure the quality of presentation of mission statements of educational
institutions. In his study of U.S. Middle States colleges and universities, Stober found that
independent raters were significantly more likely to identify sectarian statements (when
compared to public statements) as having an enriching, inspiring, motivating or stimulating tone
(Stober, 1997, p. 57).
The findings of this study for tone scores support those of Stober. In this study, private
Christian and private secular institutions produced mission statements which were thought
Defining Quality Education 111
motivating. Separate Catholic and Protestant institutions were ranked as matter-of-fact, while
public high schools were on the average categorized as being dull.
Institutional Authorities Distinguish Themselves by Relevance to Stakeholders
Identification of Target Groups
Private Christian, separate Catholic, separate protestant and private secular school
statements of purpose (in that order) identified target groups more often than those of public
schools. Striking is the contrast between public schools and other school types. Every one of
these school types distinguished themselves with statistical significance by identifying target
groups more often than public schools.
Christian institutions (both private and separate Catholic) targeted religious groups more
often than other institutions. Public institutions targeted racial/ethnic groups more often than
private Christian schools. With a larger sample size private secular schools may have been
found to target challenged students more often that other groups.
These results confirm those of Stober in his work with colleges and universities. Stober
had noted that sectarian intuitions were significantly more likely to identify target groups than
were public institutions (Stober, 1997, p. 62, Table 4-4) and the groups targeted were most likely
to be religious groups (Stober, 1997, p. 66, Table 4-6).
Defining Quality Education 112
Identification of Principal Services
Private secular school statements of purpose identified principle services significantly
more often than those of separate Catholic or public schools. Public schools identified any
principle service least often.
Raters also identified specific principle services. The tally scores of specific services do
not show statistically significant differences among the content items for principle services given
in the literature studied (i.e., technical specialization/professional career preparation; arts;
advanced academics; academic specialization, and core academics). Stober had not found any
significant difference in principal services among institutions according to institutional authority
for the categories in his survey either (Stober, 1997, p. 62, Table 4-4). Interestingly, however, the
raters revealed other principle services not found in the literature. Among these Christian
education & discipleship was the only special service which was significantly different among
the institutions. Private Christian and Catholic separate school statements of purpose were
found to have significantly more references to the service of Christian education & discipleship
than were public school statements.
Identification of Geographic Areas to be Served
With respect to the variable identification of geographic area to be served, no significant
results were found from this inquiry. However, Stober had found that, in the case of colleges and
universities, sectarian institutions were least likely to identify a geographic area to be served
(Stober, 1997, p. 62). This study did not show a similar pattern for high schools. If anything, the
results of this study tended to go in the opposite direction of Stober’s study suggesting that
Defining Quality Education 113
sectarian institutions identified a geographic area to be served more often than public institutions.
However, the difference was only statistically significant to p < .10. In hindsight, it may be that
the question on the rater sheet was not worded well and this should be improved in another such
study (see Recommendations in this chapter).
Sense of Educational Community
Private Christian school statements came closest to conveying a sense of educational
community in which stakeholders share a common vision. Separate Catholic and private secular
statements were described as having some sense of educational community but tending toward
top down management.10 Instead of having a sense of educational community, public school
statements were most often described as conveying a top down management relationship among
stakeholders.
Stober (1997) did not investigate this variable in his study. However, these findings are
consistent with findings of reports by the NCES on private schools in America such as that of Alt
and Peter (2002). Alt and Peter pointed out a number of studies that found links between
teachers’ perceptions of a school’s professional climate and teachers’ effectiveness and job
satisfaction (Mitchell, Ortiz, & Mitchell, 1987; Rosenholtz, 1991). They cited an extensive study
of Catholic high schools in which a range of attributes were found to contribute to school
effectiveness. These attributes included the staff’s communal organization to advance shared
goals; principals’ having primary decision making authority for most school management
matters; teachers’ commitment to the academic, spiritual, and social development of students;
10 The sample size for private secular schools was too small to give a 95% confidence level.
Defining Quality Education 114
and an atmosphere of mutual respect among everyone in the school (Bryk, Lee, and Holland
1993). They point out that a school’s professional climate, in particular, the existence of a strong,
shared purpose among staff members and cooperative interactions among people at the school, is
likely to contribute to its effectiveness. They note Newmann and Wehlage (1995) found that
when teachers feel a sense of community at their schools, they can better communicate
consistent goals to students and collaborate more effectively on raising student achievement.
Similarly, they point out a study by Bryk and Driscoll (1988) found that “teachers who work
toward shared goals express higher job satisfaction and have lower absentee rates than do other
teachers” (Cited in Alt & Peter, 2002, p. 15). Presented in Figure 21, the survey on School
Climate and Working conditions done by Alt and Peter on a large sample of the whole
population of American primary and secondary schools showed a similar pattern to that found in
this study. The other religious11 category, of Alt and Peter’s study, which shows the highest
levels of teacher satisfaction, refers to all private religious schools other than Catholic and is
closely equivalent to the private Christian sector of this study. The comparatively better school
climate and working conditions in private Christian schools in the American study compare with
the similarly higher sense of educational community in the private Christian sector of this
Alberta study.
11 In the U.S., the other religious sector consist of 96.8% Christian and 99.4% Judeo-Christian schools (the remainder are Islamic with 0.6% of schools) (Broughman & Colaciello, 2001, 6)
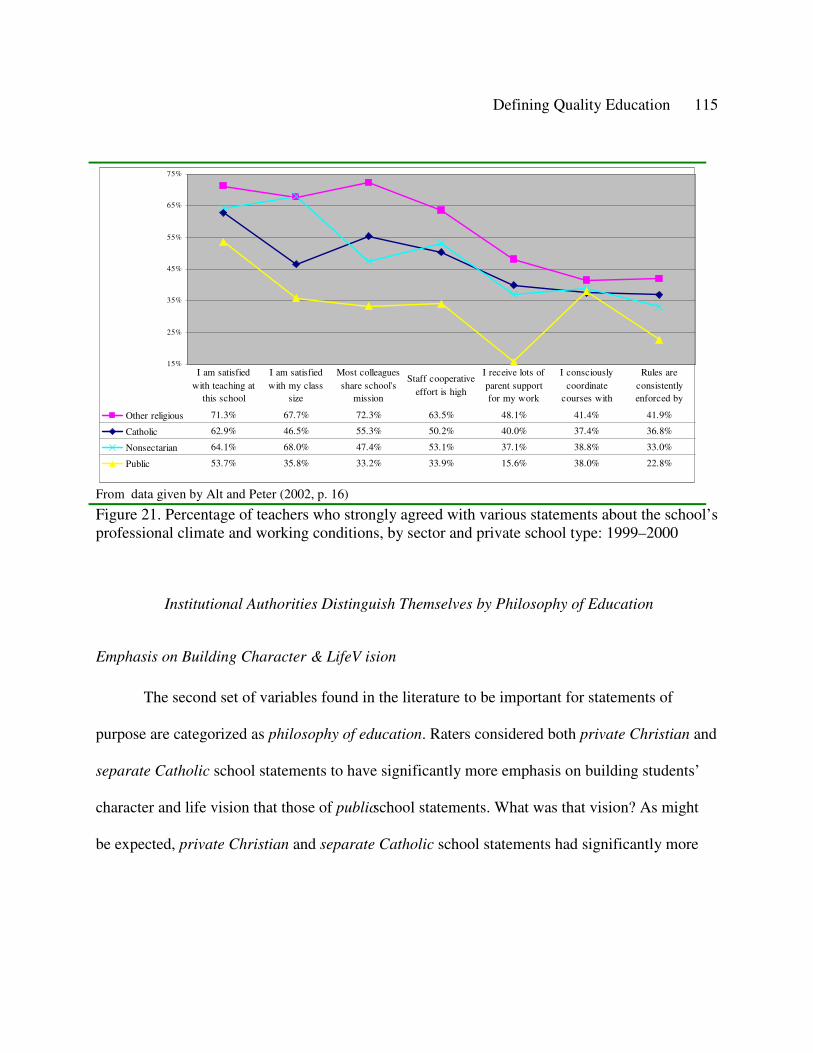
Defining Quality Education 115
15%
25%
35%
45%
55%
65%
75%
Other religious 71.3% 67.7% 72.3% 63.5% 48.1% 41.4% 41.9%
Catholic 62.9% 46.5% 55.3% 50.2% 40.0% 37.4% 36.8%
Nonsectarian 64.1% 68.0% 47.4% 53.1% 37.1% 38.8% 33.0%
Public 53.7% 35.8% 33.2% 33.9% 15.6% 38.0% 22.8%
I am satisfied with teaching at
this school
I am satisfied with my class
size
Most colleagues share school's
mission
Staff cooperative effort is high
I receive lots of parent support for my work
I consciously coordinate
courses with
Rules are consistently enforced by
From data given by Alt and Peter (2002, p. 16)
Figure 21. Percentage of teachers who strongly agreed with various statements about the school’s professional climate and working conditions, by sector and private school type: 1999–2000
Institutional Authorities Distinguish Themselves by Philosophy of Education
Emphasis on Building Character & Life V ision
The second set of variables found in the literature to be important for statements of
purpose are categorized as philosophy of education. Raters considered both private Christian and
separate Catholic school statements to have significantly more emphasis on building students’
character and life vision that those of public school statements. What was that vision? As might
be expected, private Christian and separate Catholic school statements had significantly more
Defining Quality Education 116
emphasis on a Christian vision than private secular12 or public school statements. However,
private Christian schools had significantly more emphasis on a specifically Christian vision and
mission than separate Catholic schools.
One of the purposes of this study was to inquire to what extent mission statements of
schools reflect the traditional mission and vision of the institutional authority which they
represent and to what extent the statement reflects an erosion of the original vision and mission
of that institutional authority. Does the weaker emphasis on a specifically Christian vision and
mission relative to private Christian schools indicate a dilution of the Christian vision and
mission among the Catholic school sector? This study suggests evidence which points in that
direction.
Only private secular and public school statements prompted the response for a whole
child vision. This category was not prompted by the other school types. That the responses
tended to be significantly categorical (i.e., all or nothing) suggests major differences in
educational vision. Another question brought out here is: just what does an institution mean by a
whole child vision? A glance at the literature shows that this term is ambiguous enough to be
used to go along with any vision and mission. Does that an ambiguous term is most used to
describe the private secular and public school statements indicate a corresponding ambiguity in
their vision and mission? The responses for the other two variables queried in the philosophy
section would also support such a suggestion.
12 The lack of a significant result from secular private schools shows the weakness of the small sample size. However, only five schools were found in this category which met the criteria of the study (see Recommendations).
Defining Quality Education 117
Defining a Philosophy
With tertiary education, Stober found that sectarian institutions were significantly more
likely than public and non-sectarian institutions to define the institution’s philosophy. Public and
non-sectarian statements of philosophy were rated as “vague” or “not clear,” but sectarian
philosophical statements were at least stated in a “general sense” (Stober, 1997, p. 62).
In this study, all of private Christian, separate Catholic, and private secular statements were
found to be significantly more clearly defined than public school statements . Moreover, private
Christian school statements were found to be significantly more defined that Catholic separate
school statements.13 Private Christian statements were rated as emphatically stated, separate
Catholic as somewhat clearly stated, private secular as stated in a general sense, separate
Protestant as vague and public as even vaguer edging toward not stated. The impression given is
that the philosophy and vision articulated by the public category is either not there or vaguely
stated with no educationally charismatic appeal.
Defining a Cosmic Worldview
For the first part of this query, Private Christian and Separate Catholic school statements
defined a cosmic worldview14 significantly more often than private secular or public school
statements. In turn, private secular schools defined a cosmic worldview more often than public
schools.
The second part of this question asked raters to specify the nature of the cosmic
worldview reflected by a statement of purpose. Private Christian and separate Catholic schools
13 and private secular if the sample were larger (see Recommendations). 14 For a definition of cosmic worldview see Appendix M: Glossary.
Defining Quality Education 118
overwhelmingly specified a Christian worldview with none of the other school systems in the
sample specifying this worldview. In direct contrast, private secular and public school
statements reflected a naturalist worldview.15 The categorical and absolute nature of the
dichotomy reflects back on a similar response to the character and life vision variable. We seem
to be looking at diametrically opposed worldviews. However, the one seems to hold most of the
educational charisma while the other is ambiguously held and lacking in educationally visionary
power.
Institutional Authorities Distinguish Themselves in the Quality of Strategic Planning
Reality Factor
The reality factor was a variable selected to measure the quality of strategic planning
revealed by a school’s statement of purpose. The results of the strategic planning variable were
striking if only because all differences were significant.16
Private Christian statements together with private secular schools had the highest
ranking on the reality scale. Separate Catholic school statements were a significant second and
public school statements were a significant last on the reality scale. Another w ay to state the
result is that private Christian and private secular school statements came out looking quite
SMART (specific, measurable, attainable, relevant, trackable) on the reality scale, while separate
15 The results for protestant schools statements were similar in orientation to the secular school systems implying that if the sample size were higher they may also be shown to reflect the naturalist perspective (see Table 4-14 and Figure 4-14)16 With the exception of the Protestant category which did not have enough samples for a statistically significant inference.
Defining Quality Education 119
Catholic school statements were somewhat SMART, and public school statements were rather
vague and fuzzy. There is a pattern here among the results of this analysis of school purpose
statements. In fact, the private sector and in particular the Christian sector comes out looking
much more educationally vigorous than the public sector.
Defining a Clear Big Goal
The second variable to test the quality of strategic planning reflected in a school mission
statement is that inquiring into whether the purpose statement defines one overriding and clear
big goal. Private Christian school statements scored significantly above both separate Catholic
and public school statements. Catholic statements also scored significantly above those of public
school statements.17
A second part of this variable asked raters to specify this big goal. The raw data here,
which was in free commentary form, was considerable and complex and thought unsuitable for
presentation in this paper as it would extend the study too much, but could be a starting point for
later study.
High School Academic Performance Correlates with Mission Statement Components
Using the Fraser Institute report card, a score was referenced for each school of the
sample of schools taken in this study. The distribution of the average scores for each group of
schools was sorted revealing the following ranking order from high to lower rank: (1) private
secular, (2) private Christian, (3) separate Catholic, (4) separate Protestant, and (5) public.
17 Here both private secular and separate Protestant school samples were not large enough to register statistical significance.
Defining Quality Education 120
Statistically significant differences were found between higher and lower ranking school types
(see Table 23 and Figure 18). With the limitations of the sample size the significance of ranking
of private secular and separate Protestant schools could not be determined. The differences
among the school types in the samples between private Christian and public schools as well as
separate Catholic and public schools w ere highly significant. When the sample size for private
secular schools was increased the significant difference in the data was also revealed.
Thus, scores of this random sample of Alberta high schools presented a statistically significant
difference between the higher performers (private secular, private Christian, and separate
Catholic schools) in contrast to the comparatively lower performer (public schools).
To test that the mission statements of higher performing schools exhibited more of the
desired components, all sets of scores were scaled in the same positive-negative direction. The
results were tabulated in Table 24 but can best be seen in Figure 19. It can be seen visually that
all components are higher for the higher performing schools compared to public schools. Even
the results for principle service, geographic area, and cosmic worldview, which appear somewhat
erratic on the chart, are all at a higher level in higher performing school type statements than the
lower performing public schools’ statements. Moreover, an average of all the components for
each school type reveals a significant difference from the average of the components for public
school statements for each of the higher performing school types.
Defining Quality Education 121
Recommendations
Recommendations for Administration
How can the results of this study be put to immediate, practical use and by whom? The
following educational stakeholders would potentially benefit from this study.
Schools will have the opportunity to acquire better insight into the dynamics of effective
mission statements. This is extremely important for purposes of self-understanding,
organizational focus, strategic planning, stakeholder motivation and marketing.
Governments will have the opportunity to acquire a better appreciation for the
effectiveness of a diversity of educational sources of authority. The shortcomings of the present
system of public education as revealed in the systemic and comprehensive weaknesses of public
school mission statements as well as the shortfall in the academic bottom line should point
governmental efforts at more decentralization, community autonomy, and sensitivity in the area
of education. The success of private and sectarian schools suggests that governments linking
more to the real needs of the grassroots educational stakeholders, the parents and students, would
ensure a greater vitality in the educational endeavour. This is underlined by the observation that
the provinces with the greatest educational choice (Alberta and B.C.) are also those which have
the greatest success in average academic result. It is also true that those provinces where
government offers least educational freedom are also those in which students do most poorly on
both internal and international comparisons (Hepburn & Belle, 2003).
Educational researchers may benefit from a study of high school mission statements to
complement what has been done on business and college mission statements.
Defining Quality Education 122
This study may offer particular encouragement to those stakeholders in private education
who struggle in an uphill battle to offer a viable educational package to those families which are
looking for alternatives to currently fashionable curriculum offered by the public system of
education.
Education researchers, government authorities, school administrators and any interested
stakeholders may have the opportunity to acquire fresh insights into the purposes and visions of
other schools and school sectors.
Recommendations for Future Research
It is hoped that this study will be helpful in the chain of research of what has already been
done in the area of missions and visions in education and that it would prove stimulating and
helpful as one stepping stone toward further research in this area. It is hoped that future studies
would confirm, enlarge on and refine the findings of this study and develop those aspects of the
study which go beyond its limitations. Such further research may wish to include some of the
following suggestions.
Further Investigation using Computer Generated Word Profiles
In his study of Middle States college mission statements, Stober (1997) had done some
interesting work with word profiles, listing the most frequently used words for each group of
mission statements and then searching for unique content related words. Computer analysis was
used to build word profiles for statements grouped according to institutional authority groupings.
Word profiles were developed to identify the 25 most frequently used words in each group. The
Defining Quality Education 123
top 25 content words for each group were scanned for words unique to each group. Due to
considerations of time and scope this study omitted this interesting investigation (Stober, 1997).
Refinement of the Wording of Rater Questions
The rater question for identification of geographic areas in particular needs to be
reworded. Although Stober had found that, in the case of colleges and universities, sectarian
institutions were least likely to identify a geographic area to be served (Stober, 1997, p. 62), this
study did not show a similar pattern for high schools. However, in hindsight, it may be that the
question on the rater sheet was not worded well. In this case, Stober’s question was rephrased:
Are the school geographic boundaries specified? At least for the sake of comparison, it would
have been better to phrase the question in the same form Stober used: Does this statement specify
a geographic area to be served? Because of the ambiguity of the wording, there may have been
confusion among the raters as to the intent of the question. Perhaps the aim should have been to
ask about whether or not there is intent to serve a particular geographical area. It seems some
raters took it this way and others understood the question to ask whether a geographical area is
mentioned at all. If the study were done again, it would be better to clarify this rater question.
Further Exploration of the Possible Effects of the Personal P hilosophy of Raters
More thought needs to be given to the effect of the philosophy of the raters on the results.
It is difficult to determine independence when the categories may set raters against each other.
Other studies have used a similar methodology and have also done little to investigate or discuss
the effects of rater bias. To attain more independence, it may be best to take raters from outside
the social-political-philosophic environment in which the school sample is taken. In this study,
Defining Quality Education 124
two out of the three independent raters had all of their primary and secondary schooling outside
of North America. They would not share the same social-political-philosophic biases toward the
school system as that of North American raters, giving them somewhat more independence. If it
could be arranged, one could intentionally set raters with opposing philosophies on the rating
team. However, even if raters disagree, one suspects that that may only highlight the fact that the
mission statements are different. Most of the mission statement criteria would not be affected by
philosophy. For instance, target groups, geographic area, principal services, educational
community, and even the criteria probing philosophy of education are all more rooted in the
content of the mission statements rather than in the raters’ ideological perceptions. The only
variable that might conceivably be somewhat obscured is the tone score which actually measures
the extent to which the statement inspires the raters’ feelings. It is even conceivable that
differences in philosophy of education among the raters would not reduce significant differences
of response with respect to different sources of educational authority and may even accentuate
the differences.
Increase of Sample Size and Population Geographic Range
To increase the reliability of the findings would require more samples and to increase the
generalizability of the findings would require a wider geographic area. This study has focused on
the high schools in Alberta, one province in Canada. Now that the variables and the study model
have been somewhat tested, the next step might be to do a Canada-wide study. If that proved
interesting enough, a U.S. study would come next since that is the country next most similar to
Canada. If the study is to develop into the Chinese context, it might be best to start with Hong
Defining Quality Education 125
Kong which is a region thriving on a large proportion of publicly supported separate and private
schooling.
Thoughts about Comparisons with China
Hong Kong would be an interesting study. What is interesting about Hong Kong is the
huge part the private sector plays as the provider of education. As with many economically
developed countries and regions, Hong Kong has a system of free and compulsory education.
But instead of playing the role of direct provider of education, the Hong Kong Government relies
on mostly non-governmental organizations (NGOs), or the Third Sector, to provide basic
education for Hong Kong’s residents (Charles Chan, 2004, p. 39). According to the Education
Indicators for the Hong Kong School Education System 2001 Abridged Report, NGO’s managed
82.6% of the primary schools and 68.3% of secondary schools. Only 5.8% were government
schools, 12.8% were local private and 4.5% were private international schools, operated by
NGOs or by profit-m aking organizations (Charles Chan, 2004, p. 46).18
Deeper Study into the O verall Purposes of Education
Steve Stemler and Damian Bebell (1999) considered the purposes of education in their
analysis of post-secondary mission statements. I gained insight and encouragement from Stemler
and Damian’s study and had at first planned to include the variable educational purpose in this
18 If as this study infers: (1) private Christian schools are more relevant to stakeholders than public schools; (2) private Christian schools have a philosophy of education with educational charisma and visionary power while public system is vague or lacking vision altogether; (3) private Christian schools have the highest rank in the reality scale, looking SMART while public schools are “vague and fuzzy.” Why are we then not putting more public funding into promoting private Christian education, as is done in Hong Kong, since this sector is doing such a good job at education?
Defining Quality Education 126
study. However, it became apparent that this category should be identified for future research but
left out at present for the sake of keeping this research paper within reasonable limits.
More thought needs to be put into the nature of the differences found among school
types. This study has categorized mission statement components under two main types:
presentation and content. Presentation included readability and intensity of impression. This
measured not only presentation as reflecting the orientation of a school but also as reflecting the
impact on the audience, that is, the level of stakeholder motivation aroused by the statement.
Both these aspects of presentation reflect a level of charisma. Content variables were categorized
into those related to stakeholders, those of philosophy and those related to strategic planning.
Among variables of philosophy, it was found that school systems aligned themselves into large
and systematic worldview groups. It would be worthwhile to explore further how the various
components correlate systematically with the specific philosophies of education. Indeed, the
marked commonalities among school types suggest that there are connected relationships which
must be better understood to discern the reasons for or lack of the effectiveness of mission
statements and of school systems.
Implications
It is not the purpose of this paper to delve deeply into the implications of the results. This
was intended to be an empirical study, the logical and philosophic implications of which have yet
to be further explored and fleshed out. Nor has the purpose been mainly a practical one. The
value is hopefully philosophic and long range. It was hoped first of all to build a model with
Defining Quality Education 127
which to investigate fundamental differences between educational approaches in order to get a
better understanding of possible reasons for their effectiveness or lack of it. If the results of this
study have suggested further areas of investigation, it has served its purpose.
Certainly, much in this study is suggestive for philosophical explanation. Stober found
school philosophy to align significantly with authority type. U.S. studies show that religious
schools have better academic results. One hypothesis is that there exists a causal relationship
between the vision and mission of religious schools and academic results. The results of this
study could support such a hypothesis. Stephen Covey (1990) emphasized that the mission
statement
has to come from within the bowels of the organization. Everyone should participate in a meaningful way—not just the top strategy planners, but everyone. Once again, the involvement process is as important as the written product and is the key to its use. (Cited in Terez, 2003)
Yet, as one considers the accelerating historical growth of the public sector one is aware of large
social and historical forces of bureaucratization increasingly reducing community participation
and freedom of choice in education. Is this related to the tendency toward mediocrity seen in the
apparent dilution of vision in the statements of the public school sector? Another large issue
revealed by this investigation is the real clash of worldviews and spiritual oppositions in the
categorically differing philosophic foundations of school authorities. But such larger philosophic
considerations go beyond the limitations of this study or even the work of this investigator. It is
hoped that others who value education and seek the most solid educational foundations for both
teaching and research will pick up the torch of the present study and continue where this study
left off.
REFERENCES
Alexander, W. F., & Serfass, R. W. (1999). Futuring tools for strategic quality planning in education. Milwaukee, WI: ASQ Quality Press.
Alt, M. N., & Peter, K. (2002). Private schools: A brief portrait, NCES 2002-013. Washington, DC: U.S. Department of Education, National Center for Education Statistics.
Baldrige National Quality Program--Education Criteria for Performance Excellence. (2005). Gaithersburg, MD: National Institute of Standards and Technology. Technology Administration. United States Department of Commerce.
Barrow, L. (2002). Private school location and neighborhood characteristics. Chicago: Federal Reserve Bank of Chicago.
Bart, C. K. (1998). A comparison of mission statements and their rationales in innovative and non-innovative firms. International Journal of Technology Management, 16(1, 2, 3), 64-77.
Bart, C. K. (2000). Mission statements in Canadian not-forprofit hospitals: does process matter? Health Care Management Review, 25(2), 45-63.
Bart, C. K. (2001). Exploring the application of mission statements on the World Wide Web. Internet Research: Electronic Networking Applications and Policy, 11(4), 360-368.
Benson, W. S. (2001). Setting and achieving objectives for adult learning. In K. O. Gangel & J. C. Wilhoit (Eds.), The Christian Educator's Handbook on Adult Education (pp. 158-177). Grand Rapids: Baker Books.
Broughman, S. P., & Colaciello, L. A. (2001). Private school universe survey, 1999–2000, NCES 2001–330. Washington, DC: U.S. Department of Education, National Center for Education Statistics.
Caruthers, J. K., & Lott, G. B. (1981). Mission review: foundation for strategic planning: National Centre for Higher Education Management Systems.
Charles Chan, P. D. (2004). Education and research. In Study on the Third Sector Landscape in Hong Kong: The Central Policy Unit, The Government of the Hong Kong, SAR.
Cochran, D. S., & David, F. R. (1986). Communication effectiveness of organizational mission statements. Journal of Applied Communication Research, 14(2), 108-118.
Cole, G. S. (2002). Online mission statements: Briefly stated. First Monday, 7(8).
Coulson, A. J. (1999). Market education: The unknown history. New Brunswick, NJ: Transaction Publishers.
Defining Quality Education 129
Covey, S. R. (1990). The 7 habits of highly effective people. New York: Free Press.
Cowley, P., & Easton, D. S. T. (2004). Report Card on Alberta's High Schools: 2004 Edition. Vancouver, B.C.: The Fraser Institute.
Cowley, P., & Easton, S. T. (2005). Report card on Alberta's high schools: 2005 edition. Vancouver, B.C.: The Fraser Institute.
David, F. R. (1989). How companies define their mission. Long Range Planning, 22(1), 90-97.
Edem, A., Spencer, P., & Fyfield, B. (2003). Provider missions and their development--A report by the LSDA for the DfES. London: Learning and Skills Development Agency, Department for Education and Skills.
Entine, J., & Nichols, M. (1996, June 20). Blowing the whistle on meaningles "good intentions". Retrieved March, 2006, from http://www.jonentine.com/reviews/blowing_the_whistle.htm
Galbraith, J. R., Nathanson, D. A., Kazanjian, R. K., & Kazanjian, R. J. (1986). Strategy implementation: Structure, systems and process. St. Paul, MN: West.
Hepburn, C. R. (1999). The case for school choice: Models from the United States, New Zealand, Denmark, and Sweden. Vancouver, B.C.: The Fraser Institute.
Hepburn, C. R. (2002). Learning from success: What Americans can learn from school choice in Canada: The Fraser Institute.
Hepburn, C. R., & Belle, R. V. (2003). The Canadian education freedom index (Studies in Education Policy). Vancouver, B.C.: The Fraser Institute.
Holton, B., & Broughman, S. P. (2003). A brief profile of America’s private schools (No. NCES 2003–417). Washington, DC: 2003: U.S. Department of Education, National Center for Education Statistics.
Johnson, S. L., & Meyerson, J. W. (1994). Agenda priorities: Top institutional concerns for 1994. Trusteeship, 2(1), 21-25.
Keller, G. (1983). Academic strategy. The management revolution in American higher education.Baltimore, MD: The Johns Hopkins University Press.
Lang, D. W., & Lopers-Sweetman, R. (1991). The role of statements of institutional purpose. Research in Higher Education, 32(6), 599-624.
Lopers-Sweetman, R. (1991). The utility of mission statements. Unpublished master's thesis, University of Toronto, Toronto, Canada.
Defining Quality Education 130
Lucas, C. J. (1997). Crisis in the academy: Rethinking higher education in America. New York: St. Martin's.
Marsden, G. (1996). The soul of the American university: From Protestant establishment to established nonbelief. New York: Oxford University Press.
Marsden, G., & Longfield, B. (Eds.). (1992). The secularization of the academy. New York: Oxford University Press.
Mathieu, D. (1993). Distinctiveness of Midwestern private college mission statements in relation to setting: An analysis of content. Unpublished Doctoral Dissertation, University of South Dakota.
McLaughlin, D. H., & Broughman, S. (1997). Private schools in the United States: A statistical profile, 1993-94 (No. NCES 97459). Washington, D. C.: U.S. Department of Education Office of Educational Research and Improvement NCES 97-459.
Middle States Commission on Higher Education. (1991). Designs for excellence: Handbook for institutional self-study. Philadelphia, PA: Middle States Association of Colleges and Schools.
Mullane, J. V. (2002). The mission statement is a strategic tool: when used properly. Management Decision, 40(5), 448-455.
Newsom, W., & Hayes, C. R. (1991). Are mission statements worthwhile? Planning for Higher Education, 19(2), 28-30.
Palmer, P. J. (2003). Toward a spirituality of higher education. In D. V. Henry & B. R. Agee (Eds.), Faithful Learning and the Christian Scholarly Vocation (pp. 75-84). Grand Rapids, Michigan: Eerdmans.
Pearce, J. A., II. (1982). The company mission as a strategic tool. Sloan Management Review Association, 23(3), 15-24.
Pearce, J. A., II, & David, F. (1987). Corporate mission statements: The bottom line. Academy of Management Executive, 1(2), 109.
Penttila, C. (2002, May). Missed mission. Retrieved June 2, 2005, from http://www.entrepreneur.com/article/0,4621,299009,00.html
Peterson, K. (1995). Critical issue: Building a collective vision. Retrieved May 20, 2005, from http://www.ncrel.org/sdrs/areas/issues/educatrs/leadrshp/le100.htm
Schools and School Boards. (2005). Retrieved May 2, 2005, from http://www.education.gov.ab.ca/ei/maps/
Defining Quality Education 131
Shokraii, N. H. (1997). Why Catholic schools spell success for America's inner-city children, from www.heritage.org/heritage/schools/
Sire, J. (1997). The Universe Next Door--A Basic Worldview Catalogue (3 ed.). Downers Grove, Illinois: InterVarsity Press.
SPSS 12.0 for Windows. (2003). (Student ed.). Chicago, Ilinois: SPSS Inc.
Stemler, S. E., & Bebell, D. (1999, April). An empirical approach to understanding and analyzing the mission statements of selected educational institutions. Paper presented at the annual meeting of the New England Educational Research Organization, Portsmouth, New Hampshire.
Stober, S. S. (1997). A content analysis of college and university mission statements, Temple University Graduate Board (pp. 183 pages). Philadelphia: Temple University.
Student Population by Grade, School and Authority, Alberta 2002/2003 School Year. (2004). Edmonton: Information Services Branch, Alberta Learning, Government of Alberta, Canada.
Terez, T. (2003). A burning sense of mission, from http://www.betterworkplacenow.com/mission.html
Text Content Analysis Tool. (2005, 16 June 2005). Retrieved July 2, 2005, from http://www.usingenglish.com/resources/text-statistics.php
Toftoy, C. N., & Chatterjee, J. (2004). Mission statements and the small business. Business Strategy Review, Oxford, 15(3), 41.
Travers, P. D., & Rebore, R. W. (2000). Foundations of education: Becoming a teacher (4th ed.). Boston: Allyn & Bacon.
Wallace, D., & Martin, T. K. (2004). Collin county community college assessment methods guide: Council on Planning and Institutional Effectiveness, Collin County Community College District (CCCCD).
Wilcox, J. R., & Ebbs, S. L. (1993). Ethical leadership: Successfully communicating institutional values. Business Officer, 26(9), 36-41.
Wirt, J., Choy, S., Rooney, P., Provasnik, S., Sen, A., Tobin, R., et al. (2004). The condition of education 2004 (NCES 2004-077). Washington, DC: U.S. Department of Education, National Center for Education Statistics.
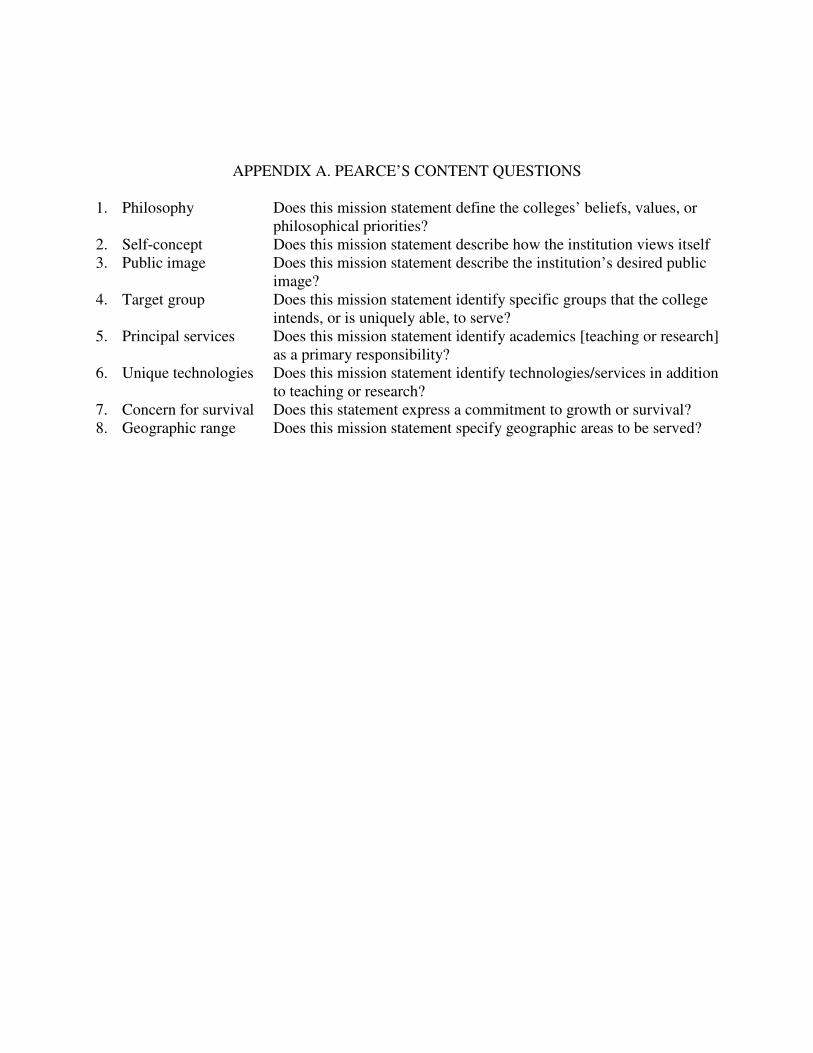
APPENDIX A. PEARCE’S CONTENT QUESTIONS
1. Philosophy Does this mission statement define the colleges’ beliefs, values, or philosophical priorities?
2. Self-concept Does this mission statement describe how the institution views itself3. Public image Does this mission statement describe the institution’s desired public
image?4. Target group Does this mission statement identify specific groups that the college
intends, or is uniquely able, to serve?5. Principal services Does this mission statement identify academics [teaching or research]
as a primary responsibility?6. Unique technologies Does this mission statement identify technologies/services in addition
to teaching or research?7. Concern for survival Does this statement express a commitment to growth or survival?8. Geographic range Does this mission statement specify geographic areas to be served?
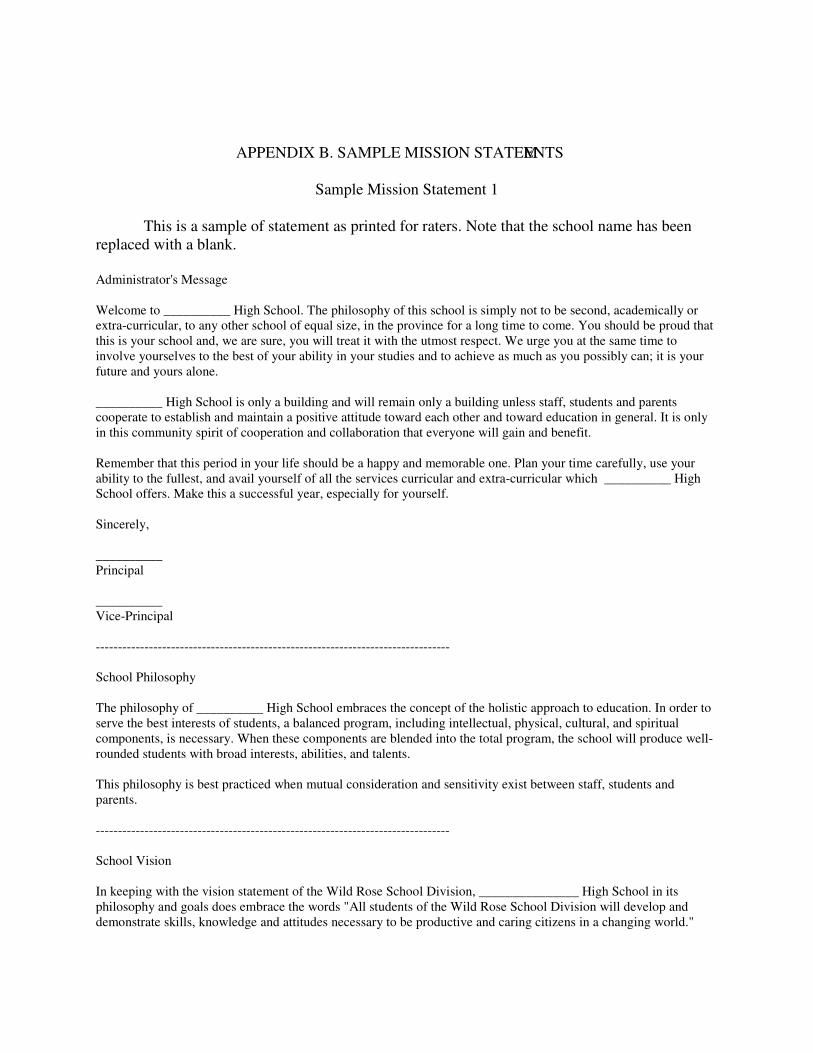
APPENDIX B. SAMPLE MISSION STATEMENTS
Sample Mission Statement 1
This is a sample of statement as printed for raters. Note that the school name has been replaced with a blank.
Administrator's Message
Welcome to __________ High School. The philosophy of this school is simply not to be second, academically or extra-curricular, to any other school of equal size, in the province for a long time to come. You should be proud that this is your school and, we are sure, you will treat it with the utmost respect. We urge you at the same time to involve yourselves to the best of your ability in your studies and to achieve as much as you possibly can; it is your future and yours alone.
__________ High School is only a building and will remain only a building unless staff, students and parents cooperate to establish and maintain a positive attitude toward each other and toward education in general. It is only in this community spirit of cooperation and collaboration that everyone will gain and benefit.
Remember that this period in your life should be a happy and memorable one. Plan your time carefully, use your ability to the fullest, and avail yourself of all the services curricular and extra-curricular which __________ High School offers. Make this a successful year, especially for yourself.
Sincerely,
__________Principal
__________Vice-Principal
--------------------------------------------------------------------------------
School Philosophy
The philosophy of __________ High School embraces the concept of the holistic approach to education. In order to serve the best interests of students, a balanced program, including intellectual, physical, cultural, and spiritual components, is necessary. When these components are blended into the total program, the school will produce well-rounded students with broad interests, abilities, and talents.
This philosophy is best practiced when mutual consideration and sensitivity exist between staff, students and parents.
--------------------------------------------------------------------------------
School Vision
In keeping with the vision statement of the Wild Rose School Division, _______________ High School in its philosophy and goals does embrace the words "All students of the Wild Rose School Division will develop and demonstrate skills, knowledge and attitudes necessary to be productive and caring citizens in a changing world."
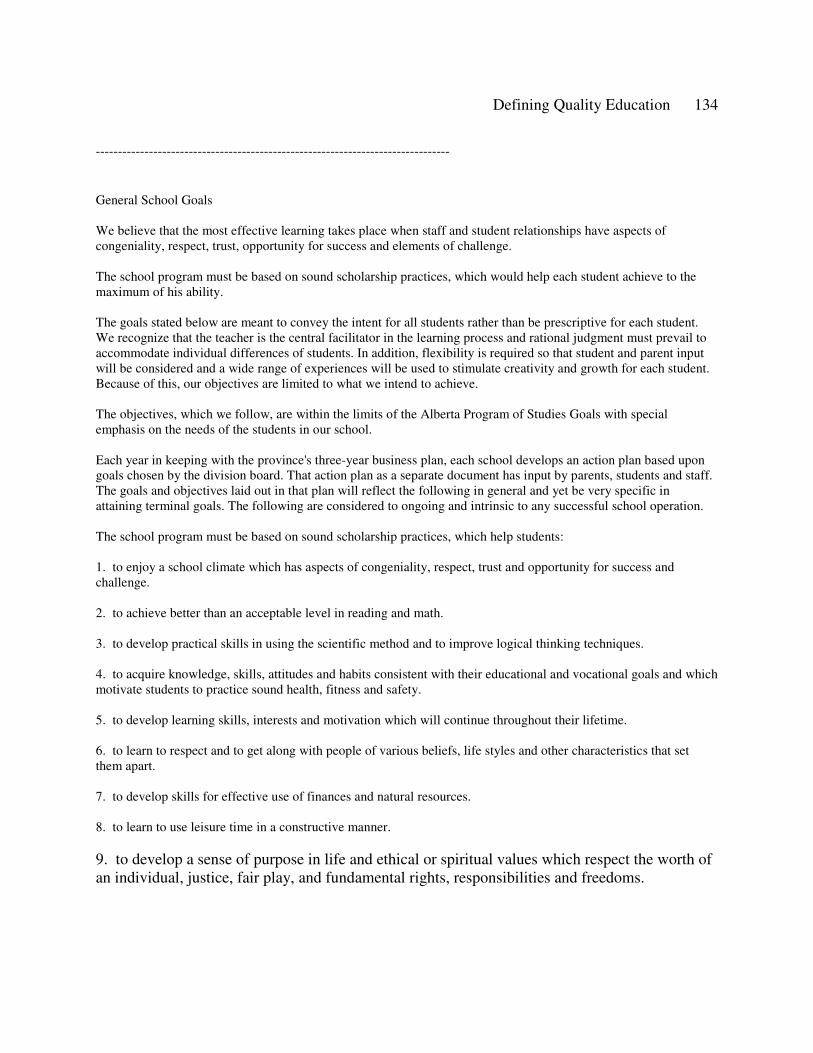
Defining Quality Education 134
--------------------------------------------------------------------------------
General School Goals
We believe that the most effective learning takes place when staff and student relationships have aspects of congeniality, respect, trust, opportunity for success and elements of challenge.
The school program must be based on sound scholarship practices, which would help each student achieve to the maximum of his ability.
The goals stated below are meant to convey the intent for all students rather than be prescriptive for each student. We recognize that the teacher is the central facilitator in the learning process and rational judgment must prevail to accommodate individual differences of students. In addition, flexibility is required so that student and parent input will be considered and a wide range of experiences will be used to stimulate creativity and growth for each student. Because of this, our objectives are limited to what we intend to achieve.
The objectives, which we follow, are within the limits of the Alberta Program of Studies Goals with special emphasis on the needs of the students in our school.
Each year in keeping with the province's three-year business plan, each school develops an action plan based upon goals chosen by the division board. That action plan as a separate document has input by parents, students and staff. The goals and objectives laid out in that plan will reflect the following in general and yet be very specific in attaining terminal goals. The following are considered to ongoing and intrinsic to any successful school operation.
The school program must be based on sound scholarship practices, which help students:
1. to enjoy a school climate which has aspects of congeniality, respect, trust and opportunity for success and challenge.
2. to achieve better than an acceptable level in reading and math.
3. to develop practical skills in using the scientific method and to improve logical thinking techniques.
4. to acquire knowledge, skills, attitudes and habits consistent with their educational and vocational goals and which motivate students to practice sound health, fitness and safety.
5. to develop learning skills, interests and motivation which will continue throughout their lifetime.
6. to learn to respect and to get along with people of various beliefs, life styles and other characteristics that set them apart.
7. to develop skills for effective use of finances and natural resources.
8. to learn to use leisure time in a constructive manner.
9. to develop a sense of purpose in life and ethical or spiritual values which respect the worth of an individual, justice, fair play, and fundamental rights, responsibilities and freedoms.
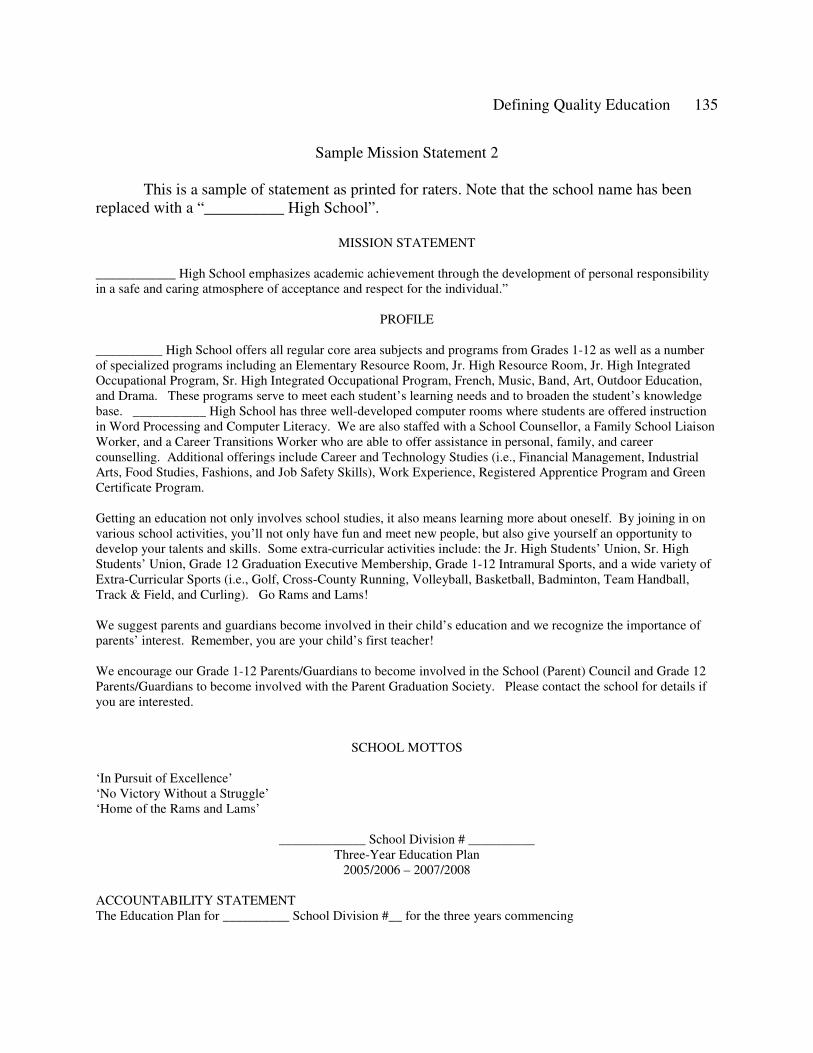
Defining Quality Education 135
Sample Mission Statement 2
This is a sample of statement as printed for raters. Note that the school name has been replaced with a “__________ High School”.
MISSION STATEMENT
____________ High School emphasizes academic achievement through the development of personal responsibility in a safe and caring atmosphere of acceptance and respect for the individual.”
PROFILE
__________ High School offers all regular core area subjects and programs from Grades 1-12 as well as a number of specialized programs including an Elementary Resource Room, Jr. High Resource Room, Jr. High Integrated Occupational Program, Sr. High Integrated Occupational Program, French, Music, Band, Art, Outdoor Education, and Drama. These programs serve to meet each student’s learning needs and to broaden the student’s knowledge base. ___________ High School has three well-developed computer rooms where students are offered instruction in Word Processing and Computer Literacy. We are also staffed with a School Counsellor, a Family School Liaison Worker, and a Career Transitions Worker who are able to offer assistance in personal, family, and career counselling. Additional offerings include Career and Technology Studies (i.e., Financial Management, Industrial Arts, Food Studies, Fashions, and Job Safety Skills), Work Experience, Registered Apprentice Program and Green Certificate Program.
Getting an education not only involves school studies, it also means learning more about oneself. By joining in on various school activities, you’ll not only have fun and meet new people, but also give yourself an opportunity to develop your talents and skills. Some extra-curricular activities include: the Jr. High Students’ Union, Sr. High Students’ Union, Grade 12 Graduation Executive Membership, Grade 1-12 Intramural Sports, and a wide variety of Extra-Curricular Sports (i.e., Golf, Cross-County Running, Volleyball, Basketball, Badminton, Team Handball, Track & Field, and Curling). Go Rams and Lams!
We suggest parents and guardians become involved in their child’s education and we recognize the importance of parents’ interest. Remember, you are your child’s first teacher!
We encourage our Grade 1-12 Parents/Guardians to become involved in the School (Parent) Council and Grade 12 Parents/Guardians to become involved with the Parent Graduation Society. Please contact the school for details if you are interested.
SCHOOL MOTTOS
‘In Pursuit of Excellence’‘No Victory Without a Struggle’‘Home of the Rams and Lams’
_____________ School Division # __________Three-Year Education Plan
2005/2006 – 2007/2008
ACCOUNTABILITY STATEMENTThe Education Plan for __________ School Division #__ for the three years commencing
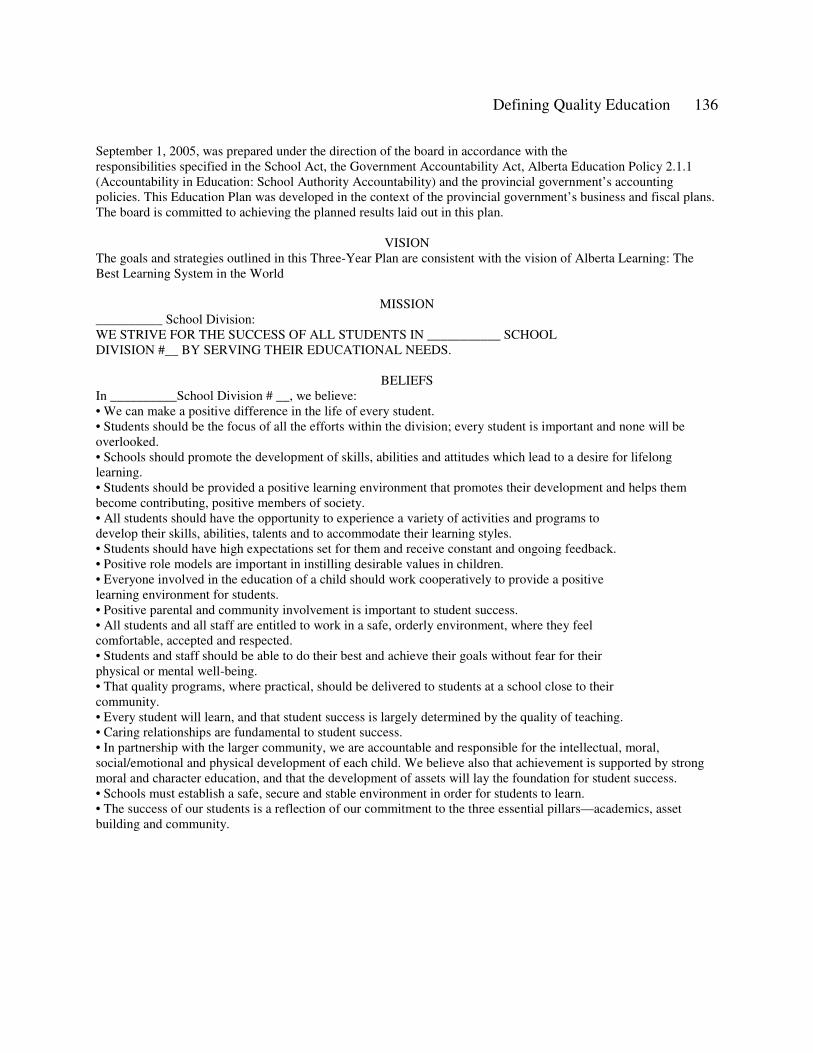
Defining Quality Education 136
September 1, 2005, was prepared under the direction of the board in accordance with theresponsibilities specified in the School Act, the Government Accountability Act, Alberta Education Policy 2.1.1 (Accountability in Education: School Authority Accountability) and the provincial government’s accounting policies. This Education Plan was developed in the context of the provincial government’s business and fiscal plans. The board is committed to achieving the planned results laid out in this plan.
VISIONThe goals and strategies outlined in this Three-Year Plan are consistent with the vision of Alberta Learning: The Best Learning System in the World
MISSION__________ School Division:WE STRIVE FOR THE SUCCESS OF ALL STUDENTS IN ___________ SCHOOL DIVISION #__ BY SERVING THEIR EDUCATIONAL NEEDS.
BELIEFSIn __________School Division # __, we believe:• We can make a positive difference in the life of every student.• Students should be the focus of all the efforts within the division; every student is important and none will be overlooked.• Schools should promote the development of skills, abilities and attitudes which lead to a desire for lifelong learning.• Students should be provided a positive learning environment that promotes their development and helps them become contributing, positive members of society.• All students should have the opportunity to experience a variety of activities and programs todevelop their skills, abilities, talents and to accommodate their learning styles.• Students should have high expectations set for them and receive constant and ongoing feedback.• Positive role models are important in instilling desirable values in children.• Everyone involved in the education of a child should work cooperatively to provide a positivelearning environment for students.• Positive parental and community involvement is important to student success.• All students and all staff are entitled to work in a safe, orderly environment, where they feelcomfortable, accepted and respected.• Students and staff should be able to do their best and achieve their goals without fear for theirphysical or mental well-being.• That quality programs, where practical, should be delivered to students at a school close to theircommunity.• Every student will learn, and that student success is largely determined by the quality of teaching.• Caring relationships are fundamental to student success.• In partnership with the larger community, we are accountable and responsible for the intellectual, moral, social/emotional and physical development of each child. We believe also that achievement is supported by strong moral and character education, and that the development of assets will lay the foundation for student success.• Schools must establish a safe, secure and stable environment in order for students to learn.• The success of our students is a reflection of our commitment to the three essential pillars—academics, asset building and community.
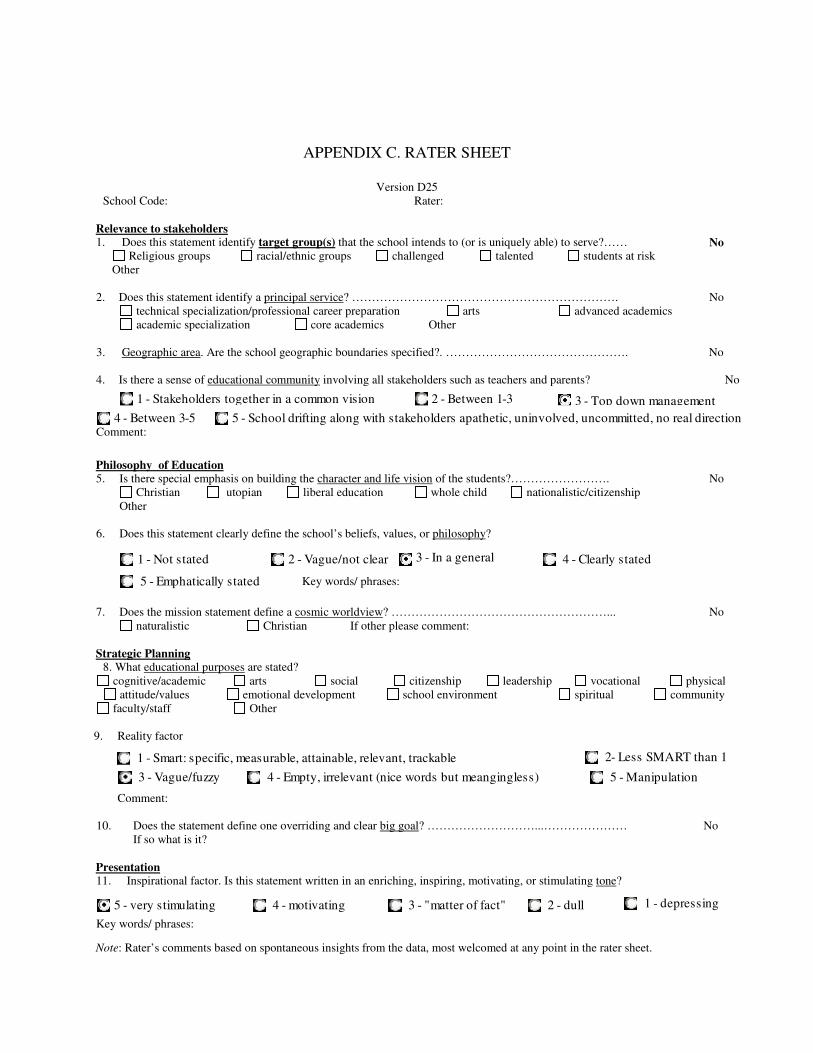
APPENDIX C. RATER SHEET
Version D25School Code: Rater:
Relevance to stakeholders1. Does this statement identify target group(s) that the school intends to (or is uniquely able) to serve?…… No
Religious groups racial/ethnic groups challenged talented students at risk Other
2. Does this statement identify a principal service? …………………………………………………………. No technical specialization/professional career preparation arts advanced academics academic specialization core academics Other
3. Geographic area. Are the school geographic boundaries specified?. ………………………………………. No
4. Is there a sense of educational community involving all stakeholders such as teachers and parents? No
1 - Stakeholders together in a common vision 2 - Between 1-3 3 - Top down management4 - Between 3-5 5 - School drifting along with stakeholders apathetic, uninvolved, uncommitted, no real direction
Comment:
Philosophy of Education5. Is there special emphasis on building the character and life vision of the students?……………………. No
Christian utopian liberal education whole child nationalistic/citizenship Other
6. Does this statement clearly define the school’s beliefs, values, or philosophy?
1 - Not stated 2 - Vague/not clear 3 - In a general 4 - Clearly stated
5 - Emphatically stated Key words/ phrases:
7. Does the mission statement define a cosmic worldview? ………………………………………………... No naturalistic Christian If other please comment:
Strategic Planning8. What educational purposes are stated?
cognitive/academic arts social citizenship leadership vocational physical attitude/values emotional development school environment spiritual community
faculty/staff Other
9. Reality factor
1 - Smart: specific, measurable, attainable, relevant, trackable 2- Less SMART than 1
3 - Vague/fuzzy 4 - Empty, irrelevant (nice words but meangingless) 5 - Manipulation
Comment:
10. Does the statement define one overriding and clear big goal? ………………………...………………… NoIf so what is it?
Presentation11. Inspirational factor. Is this statement written in an enriching, inspiring, motivating, or stimulating tone?
5 - very stimulating 4 - motivating 3 - "matter of fact" 2 - dull 1 - depressing
Key words/ phrases:
Note: Rater’s comments based on spontaneous insights from the data, most welcomed at any point in the rater sheet.
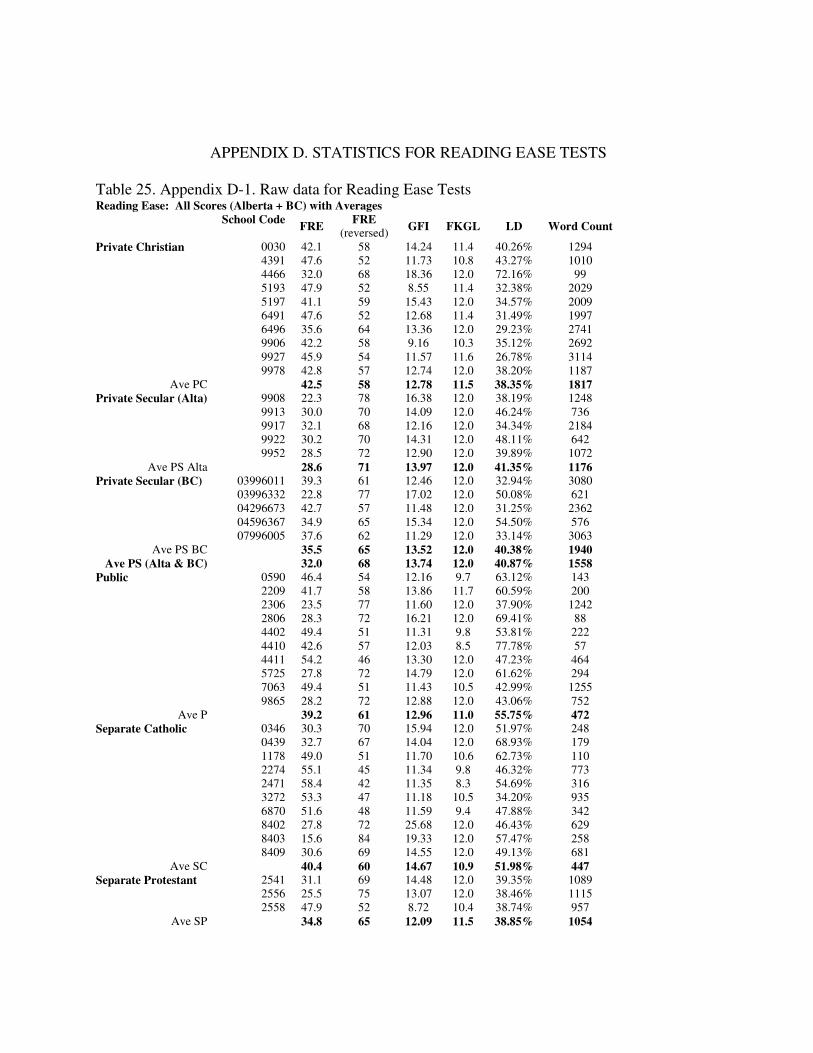
APPENDIX D. STATISTICS FOR READING EASE TESTS
Table 25. Appendix D-1. Raw data for Reading Ease TestsReading Ease: All Scores (Alberta + BC) with Averages
School Code FRE FRE (reversed) GFI FKGL LD Word Count
Private Christian 0030 42.1 58 14.24 11.4 40.26% 12944391 47.6 52 11.73 10.8 43.27% 10104466 32.0 68 18.36 12.0 72.16% 995193 47.9 52 8.55 11.4 32.38% 20295197 41.1 59 15.43 12.0 34.57% 20096491 47.6 52 12.68 11.4 31.49% 19976496 35.6 64 13.36 12.0 29.23% 27419906 42.2 58 9.16 10.3 35.12% 26929927 45.9 54 11.57 11.6 26.78% 31149978 42.8 57 12.74 12.0 38.20% 1187
Ave PC 42.5 58 12.78 11.5 38.35% 1817Private Secular (Alta) 9908 22.3 78 16.38 12.0 38.19% 1248
9913 30.0 70 14.09 12.0 46.24% 7369917 32.1 68 12.16 12.0 34.34% 21849922 30.2 70 14.31 12.0 48.11% 6429952 28.5 72 12.90 12.0 39.89% 1072
Ave PS Alta 28.6 71 13.97 12.0 41.35% 1176Private Secular (BC) 03996011 39.3 61 12.46 12.0 32.94% 3080
03996332 22.8 77 17.02 12.0 50.08% 62104296673 42.7 57 11.48 12.0 31.25% 236204596367 34.9 65 15.34 12.0 54.50% 57607996005 37.6 62 11.29 12.0 33.14% 3063
Ave PS BC 35.5 65 13.52 12.0 40.38% 1940Ave PS (Alta & BC) 32.0 68 13.74 12.0 40.87% 1558
Public 0590 46.4 54 12.16 9.7 63.12% 1432209 41.7 58 13.86 11.7 60.59% 2002306 23.5 77 11.60 12.0 37.90% 12422806 28.3 72 16.21 12.0 69.41% 884402 49.4 51 11.31 9.8 53.81% 2224410 42.6 57 12.03 8.5 77.78% 574411 54.2 46 13.30 12.0 47.23% 4645725 27.8 72 14.79 12.0 61.62% 2947063 49.4 51 11.43 10.5 42.99% 12559865 28.2 72 12.88 12.0 43.06% 752
Ave P 39.2 61 12.96 11.0 55.75% 472Separate Catholic 0346 30.3 70 15.94 12.0 51.97% 248
0439 32.7 67 14.04 12.0 68.93% 1791178 49.0 51 11.70 10.6 62.73% 1102274 55.1 45 11.34 9.8 46.32% 7732471 58.4 42 11.35 8.3 54.69% 3163272 53.3 47 11.18 10.5 34.20% 9356870 51.6 48 11.59 9.4 47.88% 3428402 27.8 72 25.68 12.0 46.43% 6298403 15.6 84 19.33 12.0 57.47% 2588409 30.6 69 14.55 12.0 49.13% 681
Ave SC 40.4 60 14.67 10.9 51.98% 447Separate Protestant 2541 31.1 69 14.48 12.0 39.35% 1089
2556 25.5 75 13.07 12.0 38.46% 11152558 47.9 52 8.72 10.4 38.74% 957
Ave SP 34.8 65 12.09 11.5 38.85% 1054
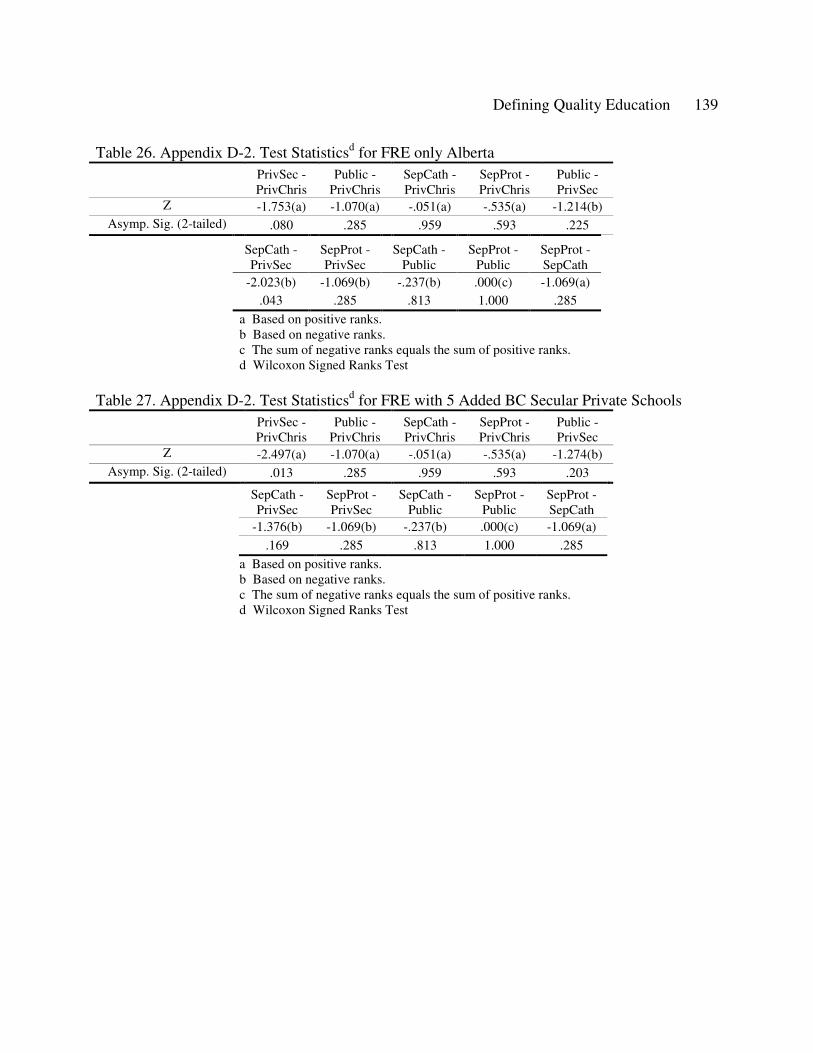
Defining Quality Education 139
Table 26. Appendix D-2. Test Statisticsd for FRE only Alberta PrivSec -PrivChris
Public -PrivChris
SepCath -PrivChris
SepProt -PrivChris
Public -PrivSec
Z -1.753(a) -1.070(a) -.051(a) -.535(a) -1.214(b)Asymp. Sig. (2-tailed) .080 .285 .959 .593 .225
SepCath -PrivSec
SepProt -PrivSec
SepCath -Public
SepProt -Public
SepProt -SepCath
-2.023(b) -1.069(b) -.237(b) .000(c) -1.069(a).043 .285 .813 1.000 .285
a Based on positive ranks.b Based on negative ranks.c The sum of negative ranks equals the sum of positive ranks.d Wilcoxon Signed Ranks Test
Table 27. Appendix D-2. Test Statisticsd for FRE with 5 Added BC Secular Private SchoolsPrivSec -PrivChris
Public -PrivChris
SepCath -PrivChris
SepProt -PrivChris
Public -PrivSec
Z -2.497(a) -1.070(a) -.051(a) -.535(a) -1.274(b)Asymp. Sig. (2-tailed) .013 .285 .959 .593 .203
SepCath -PrivSec
SepProt -PrivSec
SepCath -Public
SepProt -Public
SepProt -SepCath
-1.376(b) -1.069(b) -.237(b) .000(c) -1.069(a)
.169 .285 .813 1.000 .285
a Based on positive ranks.b Based on negative ranks.c The sum of negative ranks equals the sum of positive ranks.d Wilcoxon Signed Ranks Test
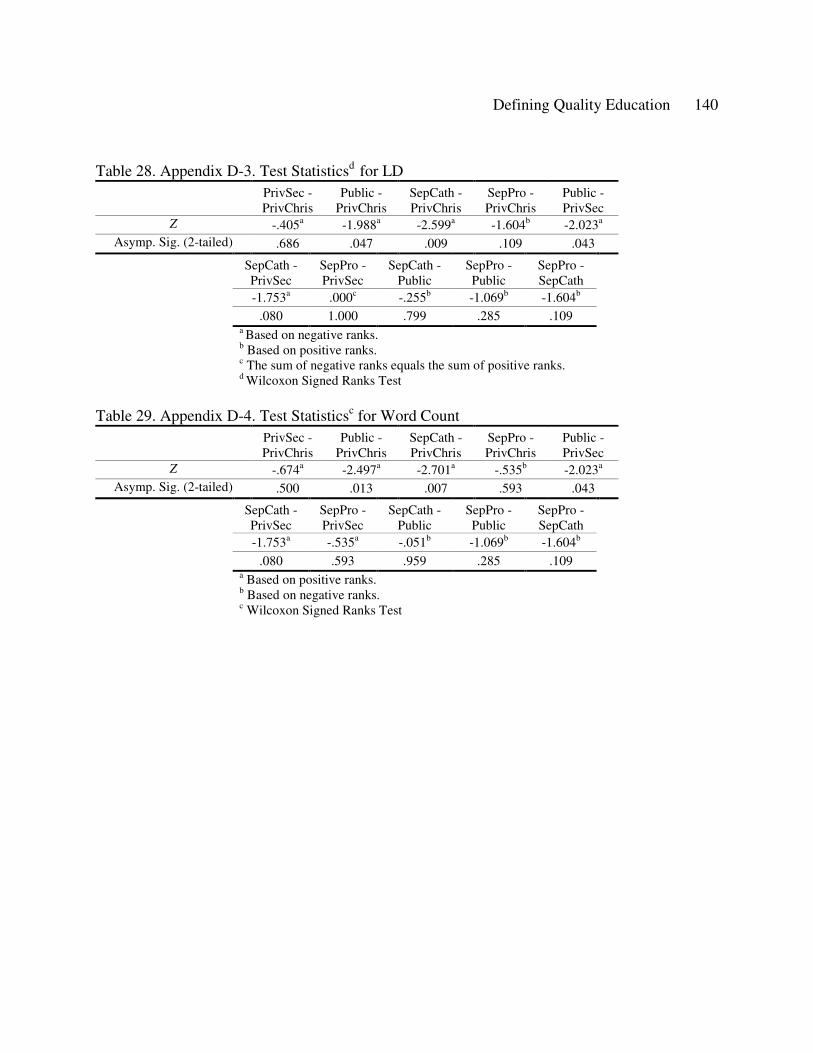
Defining Quality Education 140
Table 28. Appendix D-3. Test Statisticsd for LDPrivSec -PrivChris
Public -PrivChris
SepCath -PrivChris
SepPro -PrivChris
Public -PrivSec
Z -.405a -1.988a -2.599a -1.604b -2.023a
Asymp. Sig. (2-tailed) .686 .047 .009 .109 .043
SepCath -PrivSec
SepPro -PrivSec
SepCath -Public
SepPro -Public
SepPro -SepCath
-1.753a .000c -.255b -1.069b -1.604b
.080 1.000 .799 .285 .109a Based on negative ranks.b Based on positive ranks.c The sum of negative ranks equals the sum of positive ranks.d Wilcoxon Signed Ranks Test
Table 29. Appendix D-4. Test Statisticsc for Word Count PrivSec -PrivChris
Public -PrivChris
SepCath -PrivChris
SepPro -PrivChris
Public -PrivSec
Z -.674a -2.497a -2.701a -.535b -2.023a
Asymp. Sig. (2-tailed) .500 .013 .007 .593 .043
SepCath -PrivSec
SepPro -PrivSec
SepCath -Public
SepPro -Public
SepPro -SepCath
-1.753a -.535a -.051b -1.069b -1.604b
.080 .593 .959 .285 .109a Based on positive ranks.b Based on negative ranks.c Wilcoxon Signed Ranks Test
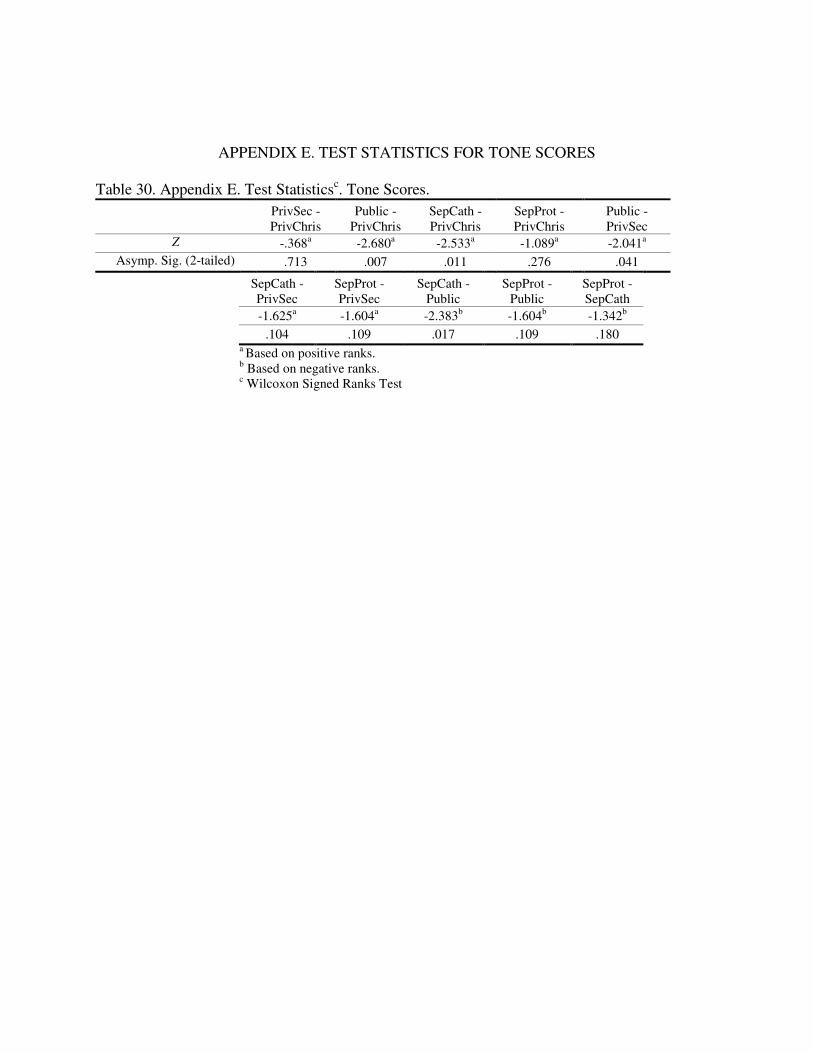
APPENDIX E. TEST STATISTICS FOR TONE SCORES
Table 30. Appendix E. Test Statisticsc. Tone Scores. PrivSec -PrivChris
Public -PrivChris
SepCath -PrivChris
SepProt -PrivChris
Public -PrivSec
Z -.368a -2.680a -2.533a -1.089a -2.041a
Asymp. Sig. (2-tailed) .713 .007 .011 .276 .041
SepCath -PrivSec
SepProt -PrivSec
SepCath -Public
SepProt -Public
SepProt -SepCath
-1.625a -1.604a -2.383b -1.604b -1.342b
.104 .109 .017 .109 .180a Based on positive ranks.b Based on negative ranks.c Wilcoxon Signed Ranks Test
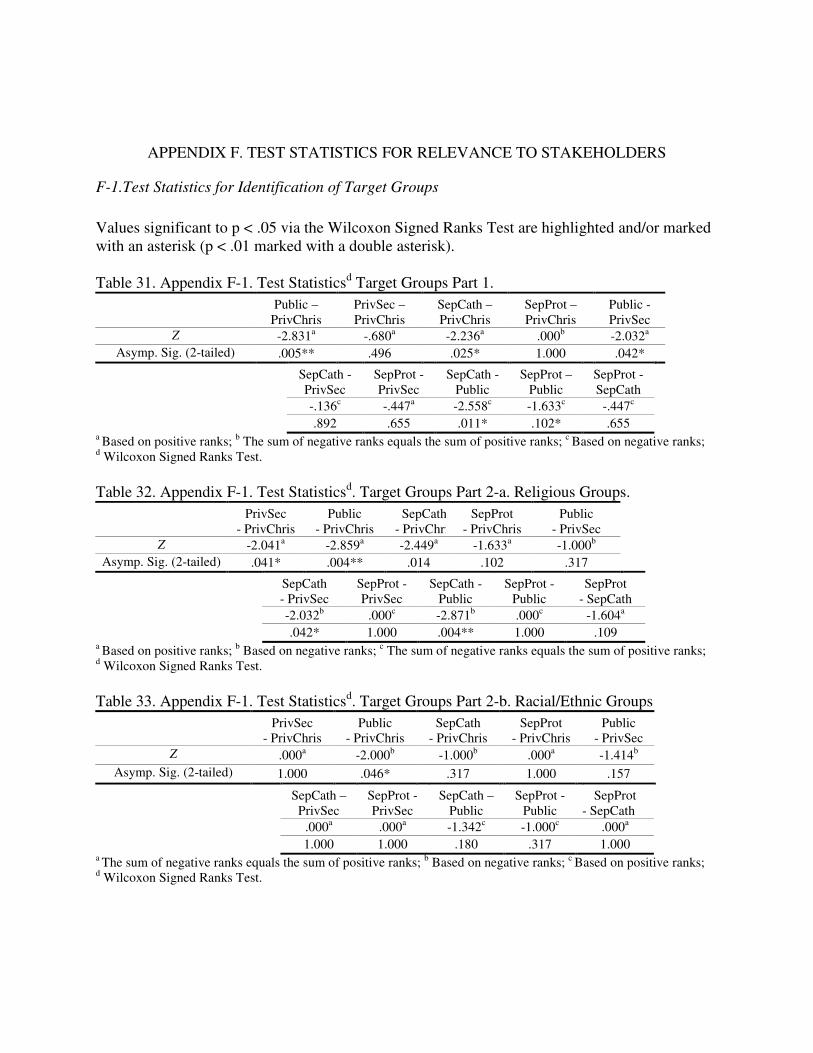
APPENDIX F. TEST STATISTICS FOR RELEVANCE TO STAKEHOLDERS
F-1.Test Statistics for Identification of Target Groups
Values significant to p < .05 via the Wilcoxon Signed Ranks Test are highlighted and/or marked with an asterisk (p < .01 marked with a double asterisk).
Table 31. Appendix F-1. Test Statisticsd Target Groups Part 1. Public –
PrivChrisPrivSec –PrivChris
SepCath –PrivChris
SepProt –PrivChris
Public -PrivSec
Z -2.831a -.680a -2.236a .000b -2.032a
Asymp. Sig. (2-tailed) .005** .496 .025* 1.000 .042*
SepCath -PrivSec
SepProt -PrivSec
SepCath -Public
SepProt –Public
SepProt -SepCath
-.136c -.447a -2.558c -1.633c -.447c
.892 .655 .011* .102* .655a Based on positive ranks; b The sum of negative ranks equals the sum of positive ranks; c Based on negative ranks;d Wilcoxon Signed Ranks Test.
Table 32. Appendix F-1. Test Statisticsd. Target Groups Part 2-a. Religious Groups.PrivSec
- PrivChrisPublic
- PrivChrisSepCath
- PrivChrisSepProt
- PrivChrisPublic
- PrivSecZ -2.041a -2.859a -2.449a -1.633a -1.000b
Asymp. Sig. (2-tailed) .041* .004** .014 .102 .317
SepCath- PrivSec
SepProt -PrivSec
SepCath -Public
SepProt -Public
SepProt- SepCath
-2.032b .000c -2.871b .000c -1.604a
.042* 1.000 .004** 1.000 .109a Based on positive ranks; b Based on negative ranks; c The sum of negative ranks equals the sum of positive ranks; d Wilcoxon Signed Ranks Test.
Table 33. Appendix F-1. Test Statisticsd. Target Groups Part 2-b. Racial/Ethnic GroupsPrivSec
- PrivChrisPublic
- PrivChrisSepCath
- PrivChrisSepProt
- PrivChrisPublic
- PrivSecZ .000a -2.000b -1.000b .000a -1.414b
Asymp. Sig. (2-tailed) 1.000 .046* .317 1.000 .157
SepCath –PrivSec
SepProt -PrivSec
SepCath –Public
SepProt -Public
SepProt- SepCath
.000a .000a -1.342c -1.000c .000a
1.000 1.000 .180 .317 1.000a The sum of negative ranks equals the sum of positive ranks; b Based on negative ranks; c Based on positive ranks; d Wilcoxon Signed Ranks Test.
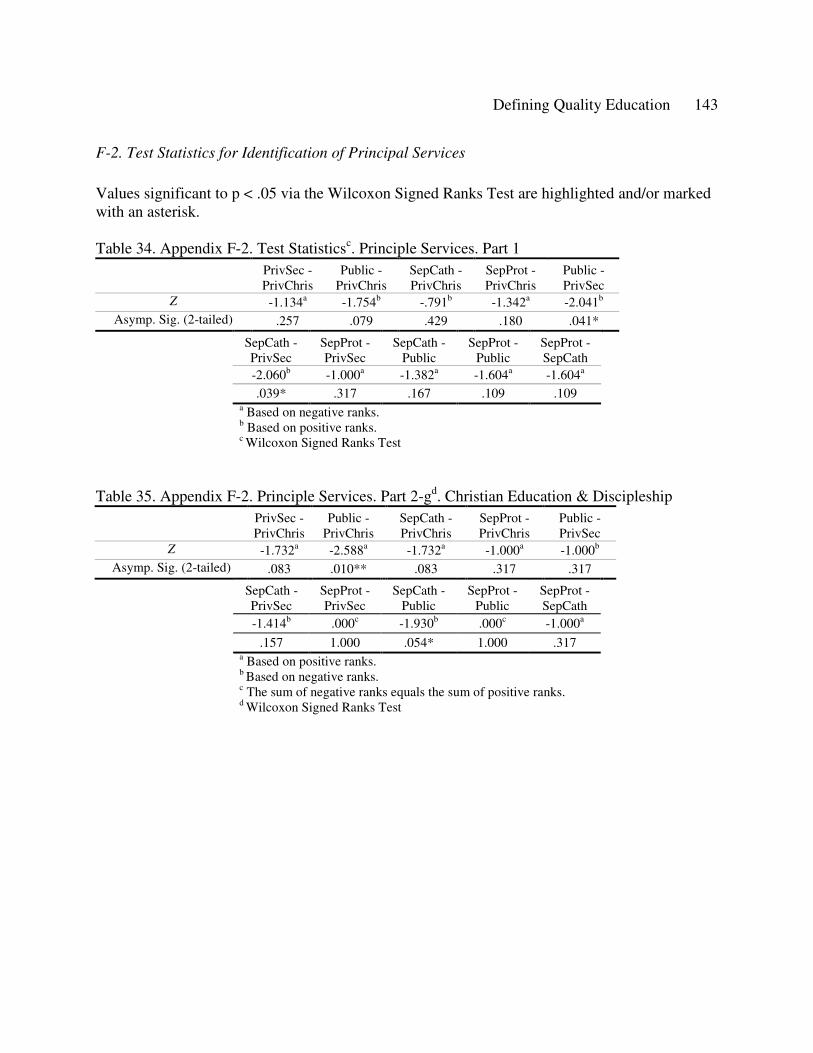
Defining Quality Education 143
F-2. Test Statistics for Identification of Principal Services
Values significant to p < .05 via the Wilcoxon Signed Ranks Test are highlighted and/or marked with an asterisk.
Table 34. Appendix F-2. Test Statisticsc. Principle Services. Part 1PrivSec -PrivChris
Public -PrivChris
SepCath -PrivChris
SepProt -PrivChris
Public -PrivSec
Z -1.134a -1.754b -.791b -1.342a -2.041b
Asymp. Sig. (2-tailed) .257 .079 .429 .180 .041*
SepCath -PrivSec
SepProt -PrivSec
SepCath -Public
SepProt -Public
SepProt -SepCath
-2.060b -1.000a -1.382a -1.604a -1.604a
.039* .317 .167 .109 .109a Based on negative ranks.b Based on positive ranks.c Wilcoxon Signed Ranks Test
Table 35. Appendix F-2. Principle Services. Part 2-gd. Christian Education & DiscipleshipPrivSec -PrivChris
Public -PrivChris
SepCath -PrivChris
SepProt -PrivChris
Public -PrivSec
Z -1.732a -2.588a -1.732a -1.000a -1.000b
Asymp. Sig. (2-tailed) .083 .010** .083 .317 .317
SepCath -PrivSec
SepProt -PrivSec
SepCath -Public
SepProt -Public
SepProt -SepCath
-1.414b .000c -1.930b .000c -1.000a
.157 1.000 .054* 1.000 .317a Based on positive ranks.b Based on negative ranks.c The sum of negative ranks equals the sum of positive ranks.d Wilcoxon Signed Ranks Test
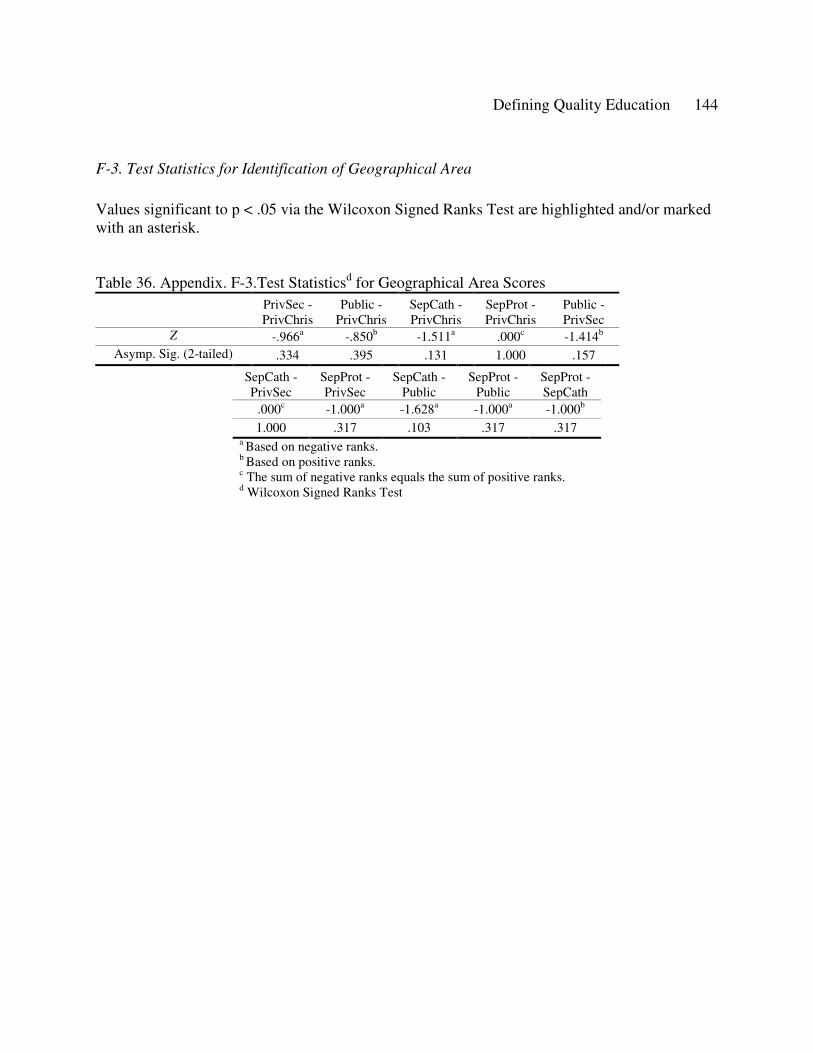
Defining Quality Education 144
F-3. Test Statistics for Identification of Geographical Area
Values significant to p < .05 via the Wilcoxon Signed Ranks Test are highlighted and/or marked with an asterisk.
Table 36. Appendix. F-3.Test Statisticsd for Geographical Area Scores PrivSec -PrivChris
Public -PrivChris
SepCath -PrivChris
SepProt -PrivChris
Public -PrivSec
Z -.966a -.850b -1.511a .000c -1.414b
Asymp. Sig. (2-tailed) .334 .395 .131 1.000 .157
SepCath -PrivSec
SepProt -PrivSec
SepCath -Public
SepProt -Public
SepProt -SepCath
.000c -1.000a -1.628a -1.000a -1.000b
1.000 .317 .103 .317 .317a Based on negative ranks.b Based on positive ranks.c The sum of negative ranks equals the sum of positive ranks.d Wilcoxon Signed Ranks Test
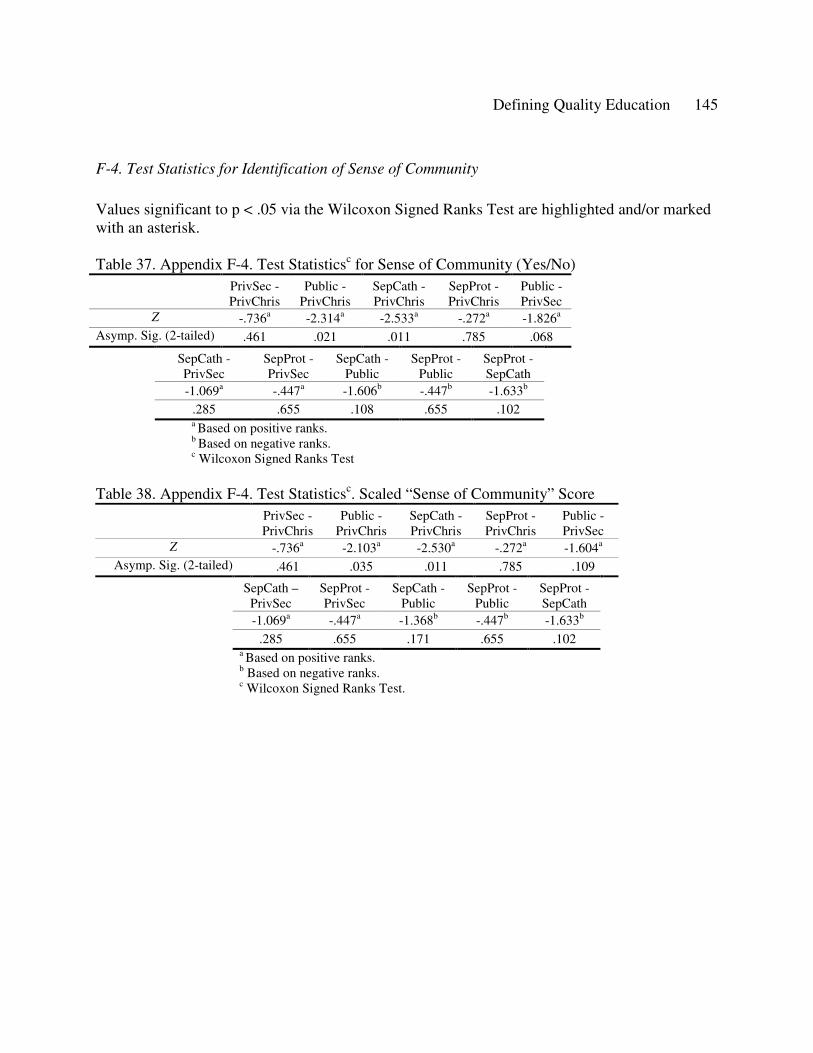
Defining Quality Education 145
F-4. Test Statistics for Identification of Sense of Community
Values significant to p < .05 via the Wilcoxon Signed Ranks Test are highlighted and/or marked with an asterisk.
Table 37. Appendix F-4. Test Statisticsc for Sense of Community (Yes/No) PrivSec -PrivChris
Public -PrivChris
SepCath -PrivChris
SepProt -PrivChris
Public -PrivSec
Z -.736a -2.314a -2.533a -.272a -1.826a
Asymp. Sig. (2-tailed) .461 .021 .011 .785 .068
SepCath -PrivSec
SepProt -PrivSec
SepCath -Public
SepProt -Public
SepProt -SepCath
-1.069a -.447a -1.606b -.447b -1.633b
.285 .655 .108 .655 .102a Based on positive ranks.b Based on negative ranks.c Wilcoxon Signed Ranks Test
Table 38. Appendix F-4. Test Statisticsc. Scaled “Sense of Community” Score PrivSec -PrivChris
Public -PrivChris
SepCath -PrivChris
SepProt -PrivChris
Public -PrivSec
Z -.736a -2.103a -2.530a -.272a -1.604a
Asymp. Sig. (2-tailed) .461 .035 .011 .785 .109
SepCath –PrivSec
SepProt -PrivSec
SepCath -Public
SepProt -Public
SepProt -SepCath
-1.069a -.447a -1.368b -.447b -1.633b
.285 .655 .171 .655 .102a Based on positive ranks.b Based on negative ranks.c Wilcoxon Signed Ranks Test.
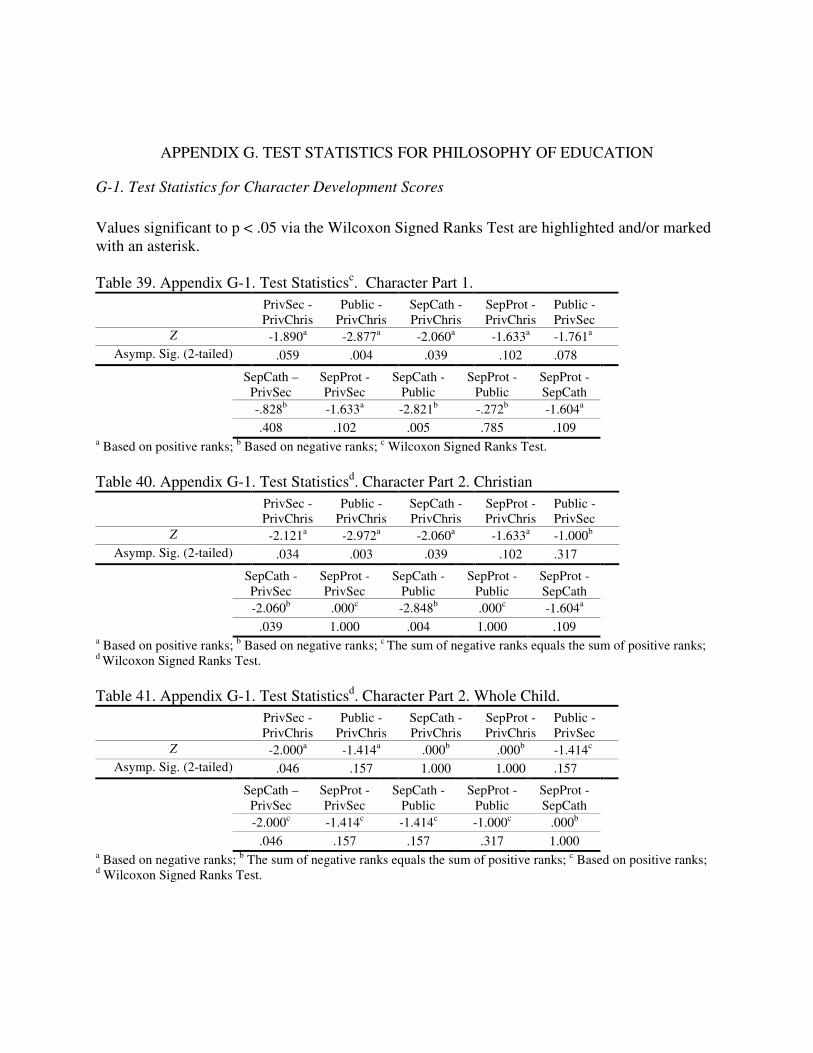
APPENDIX G. TEST STATISTICS FOR PHILOSOPHY OF EDUCATION
G-1. Test Statistics for Character Development Scores
Values significant to p < .05 via the Wilcoxon Signed Ranks Test are highlighted and/or marked with an asterisk.
Table 39. Appendix G-1. Test Statisticsc. Character Part 1. PrivSec -PrivChris
Public -PrivChris
SepCath -PrivChris
SepProt -PrivChris
Public -PrivSec
Z -1.890a -2.877a -2.060a -1.633a -1.761a
Asymp. Sig. (2-tailed) .059 .004 .039 .102 .078
SepCath –PrivSec
SepProt -PrivSec
SepCath -Public
SepProt -Public
SepProt -SepCath
-.828b -1.633a -2.821b -.272b -1.604a
.408 .102 .005 .785 .109a Based on positive ranks; b Based on negative ranks; c Wilcoxon Signed Ranks Test.
Table 40. Appendix G-1. Test Statisticsd. Character Part 2. Christian PrivSec -PrivChris
Public -PrivChris
SepCath -PrivChris
SepProt -PrivChris
Public -PrivSec
Z -2.121a -2.972a -2.060a -1.633a -1.000b
Asymp. Sig. (2-tailed) .034 .003 .039 .102 .317
SepCath -PrivSec
SepProt -PrivSec
SepCath -Public
SepProt -Public
SepProt -SepCath
-2.060b .000c -2.848b .000c -1.604a
.039 1.000 .004 1.000 .109a Based on positive ranks; b Based on negative ranks; c The sum of negative ranks equals the sum of positive ranks; d Wilcoxon Signed Ranks Test.
Table 41. Appendix G-1. Test Statisticsd. Character Part 2. Whole Child. PrivSec -PrivChris
Public -PrivChris
SepCath -PrivChris
SepProt -PrivChris
Public -PrivSec
Z -2.000a -1.414a .000b .000b -1.414c
Asymp. Sig. (2-tailed) .046 .157 1.000 1.000 .157
SepCath –PrivSec
SepProt -PrivSec
SepCath -Public
SepProt -Public
SepProt -SepCath
-2.000c -1.414c -1.414c -1.000c .000b
.046 .157 .157 .317 1.000a Based on negative ranks; b The sum of negative ranks equals the sum of positive ranks; c Based on positive ranks; d Wilcoxon Signed Ranks Test.
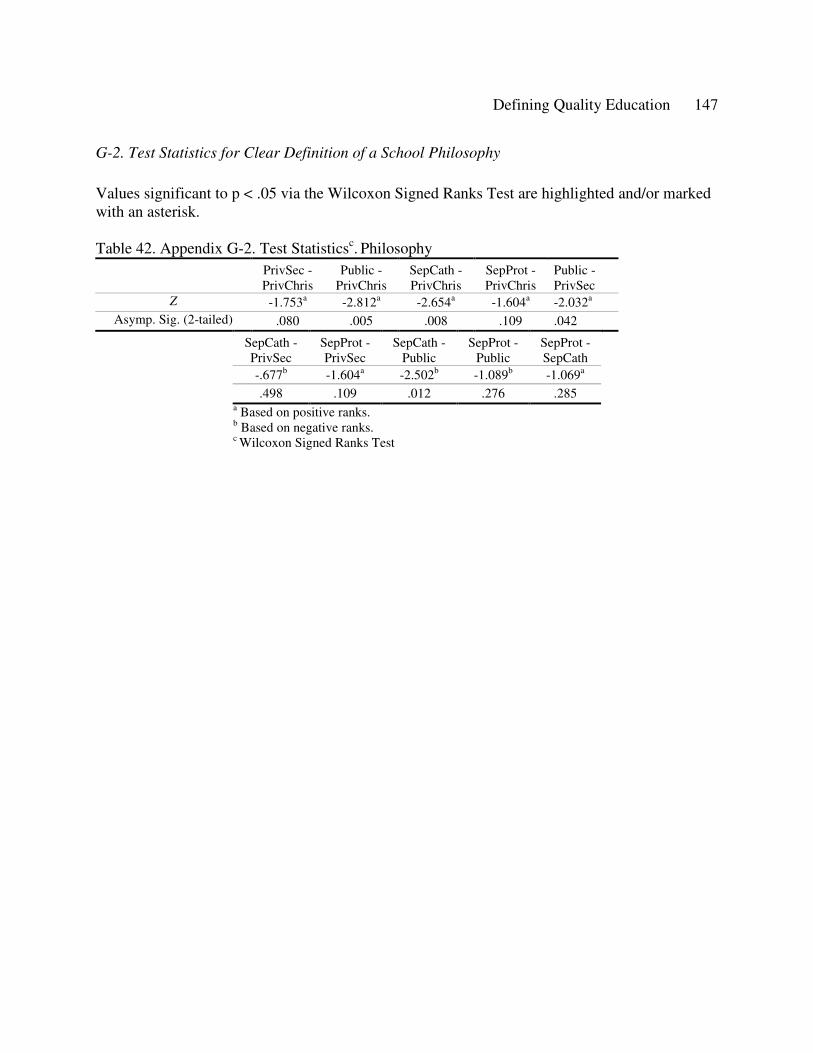
Defining Quality Education 147
G-2. Test Statistics for Clear Definition of a School Philosophy
Values significant to p < .05 via the Wilcoxon Signed Ranks Test are highlighted and/or marked with an asterisk.
Table 42. Appendix G-2. Test Statisticsc. PhilosophyPrivSec -PrivChris
Public -PrivChris
SepCath -PrivChris
SepProt -PrivChris
Public -PrivSec
Z -1.753a -2.812a -2.654a -1.604a -2.032a
Asymp. Sig. (2-tailed) .080 .005 .008 .109 .042
SepCath -PrivSec
SepProt -PrivSec
SepCath -Public
SepProt -Public
SepProt -SepCath
-.677b -1.604a -2.502b -1.089b -1.069a
.498 .109 .012 .276 .285a Based on positive ranks.b Based on negative ranks.c Wilcoxon Signed Ranks Test
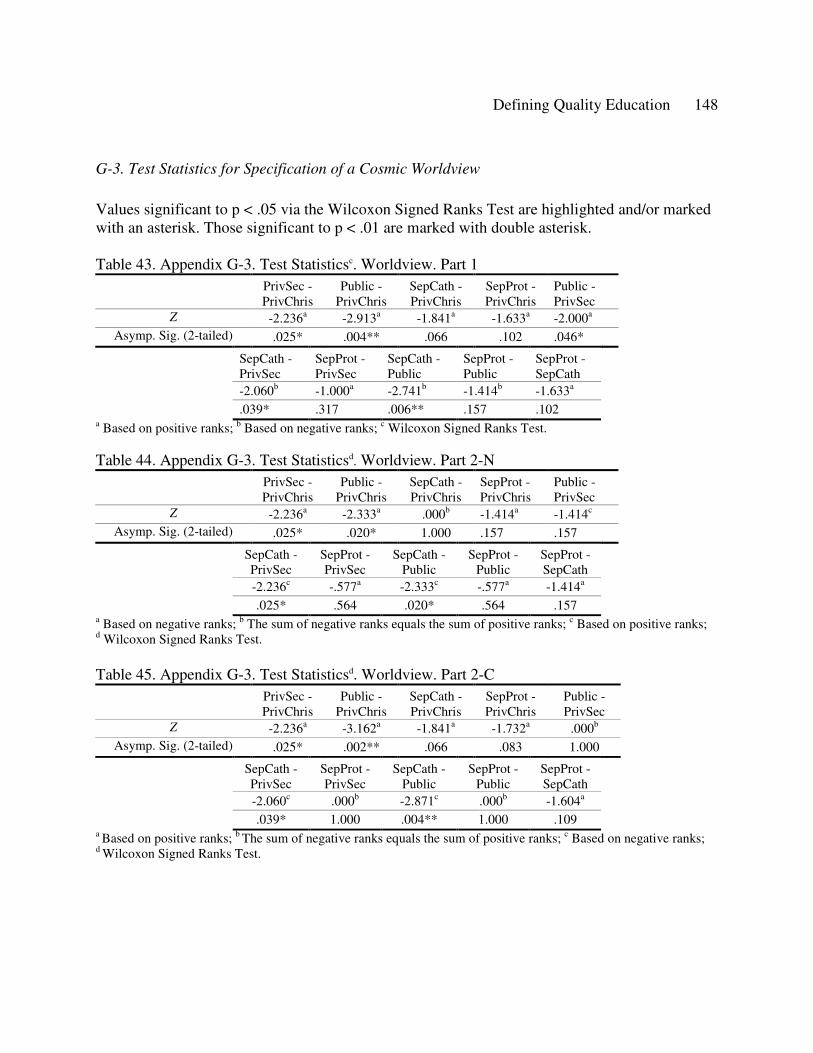
Defining Quality Education 148
G-3. Test Statistics for Specification of a Cosmic Worldview
Values significant to p < .05 via the Wilcoxon Signed Ranks Test are highlighted and/or marked with an asterisk. Those significant to p < .01 are marked with double asterisk.
Table 43. Appendix G-3. Test Statisticsc. Worldview. Part 1PrivSec -PrivChris
Public -PrivChris
SepCath -PrivChris
SepProt -PrivChris
Public -PrivSec
Z -2.236a -2.913a -1.841a -1.633a -2.000a
Asymp. Sig. (2-tailed) .025* .004** .066 .102 .046*
SepCath -PrivSec
SepProt -PrivSec
SepCath -Public
SepProt -Public
SepProt -SepCath
-2.060b -1.000a -2.741b -1.414b -1.633a
.039* .317 .006** .157 .102a Based on positive ranks; b Based on negative ranks; c Wilcoxon Signed Ranks Test.
Table 44. Appendix G-3. Test Statisticsd. Worldview. Part 2-N PrivSec -PrivChris
Public -PrivChris
SepCath -PrivChris
SepProt -PrivChris
Public -PrivSec
Z -2.236a -2.333a .000b -1.414a -1.414c
Asymp. Sig. (2-tailed) .025* .020* 1.000 .157 .157
SepCath -PrivSec
SepProt -PrivSec
SepCath -Public
SepProt -Public
SepProt -SepCath
-2.236c -.577a -2.333c -.577a -1.414a
.025* .564 .020* .564 .157a Based on negative ranks; b The sum of negative ranks equals the sum of positive ranks; c Based on positive ranks; d Wilcoxon Signed Ranks Test.
Table 45. Appendix G-3. Test Statisticsd. Worldview. Part 2-C PrivSec -PrivChris
Public -PrivChris
SepCath -PrivChris
SepProt -PrivChris
Public -PrivSec
Z -2.236a -3.162a -1.841a -1.732a .000b
Asymp. Sig. (2-tailed) .025* .002** .066 .083 1.000
SepCath -PrivSec
SepProt -PrivSec
SepCath -Public
SepProt -Public
SepProt -SepCath
-2.060c .000b -2.871c .000b -1.604a
.039* 1.000 .004** 1.000 .109a Based on positive ranks; b The sum of negative ranks equals the sum of positive ranks; c Based on negative ranks; d Wilcoxon Signed Ranks Test.
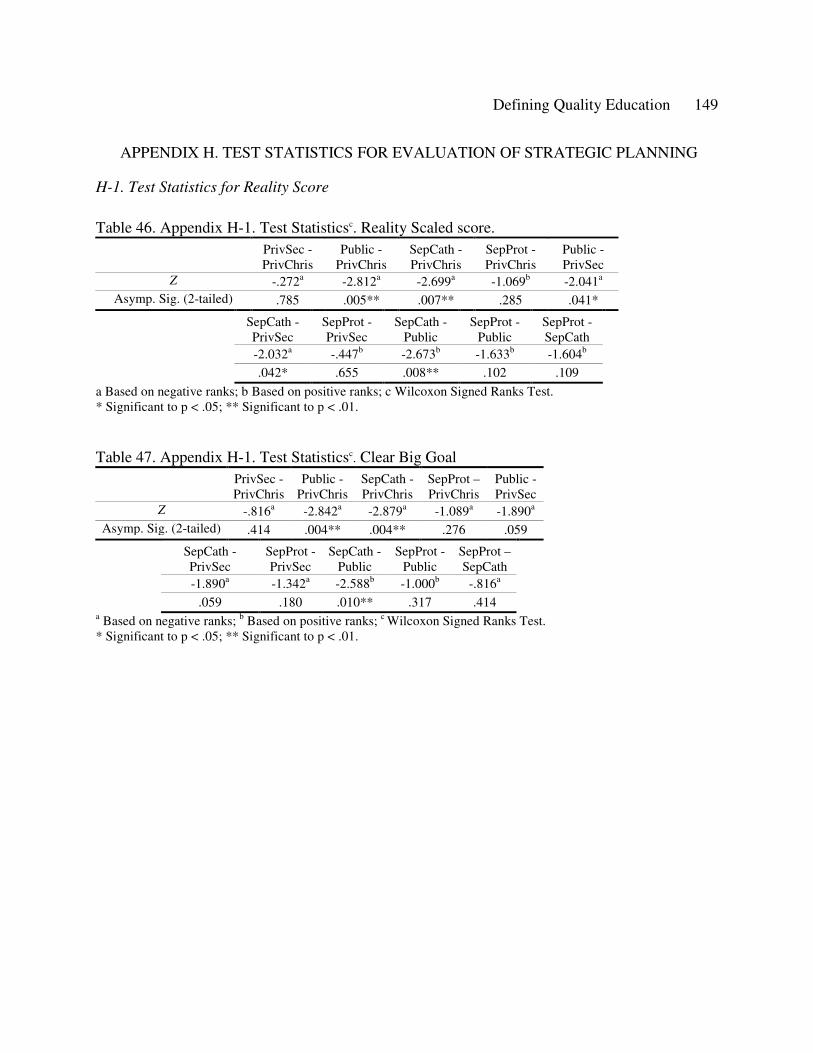
Defining Quality Education 149
APPENDIX H. TEST STATISTICS FOR EVALUATION OF STRATEGIC PLANNING
H-1. Test Statistics for Reality Score
Table 46. Appendix H-1. Test Statisticsc. Reality Scaled score. PrivSec -PrivChris
Public -PrivChris
SepCath -PrivChris
SepProt -PrivChris
Public -PrivSec
Z -.272a -2.812a -2.699a -1.069b -2.041a
Asymp. Sig. (2-tailed) .785 .005** .007** .285 .041*
SepCath -PrivSec
SepProt -PrivSec
SepCath -Public
SepProt -Public
SepProt -SepCath
-2.032a -.447b -2.673b -1.633b -1.604b
.042* .655 .008** .102 .109
a Based on negative ranks; b Based on positive ranks; c Wilcoxon Signed Ranks Test.* Significant to p < .05; ** Significant to p < .01.
Table 47. Appendix H-1. Test Statisticsc. Clear Big GoalPrivSec -PrivChris
Public -PrivChris
SepCath -PrivChris
SepProt –PrivChris
Public -PrivSec
Z -.816a -2.842a -2.879a -1.089a -1.890a
Asymp. Sig. (2-tailed) .414 .004** .004** .276 .059
SepCath -PrivSec
SepProt -PrivSec
SepCath -Public
SepProt -Public
SepProt –SepCath
-1.890a -1.342a -2.588b -1.000b -.816a
.059 .180 .010** .317 .414a Based on negative ranks; b Based on positive ranks; c Wilcoxon Signed Ranks Test.* Significant to p < .05; ** Significant to p < .01.
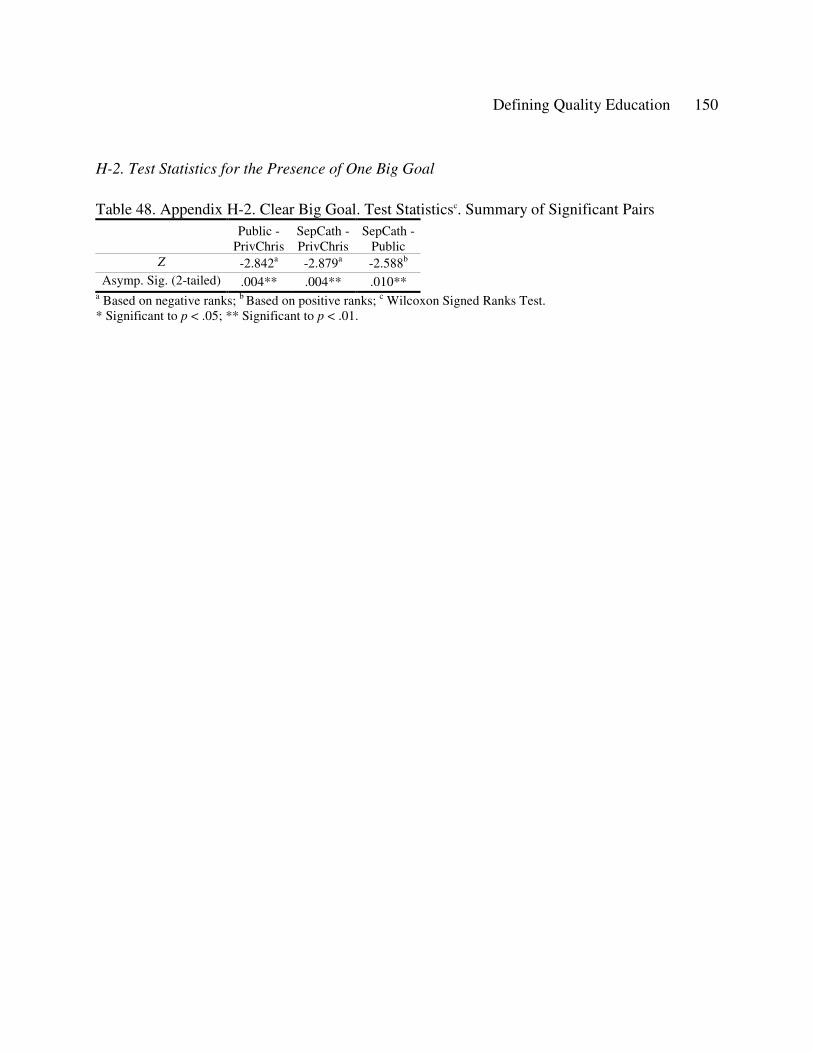
Defining Quality Education 150
H-2. Test Statistics for the Presence of One Big Goal
Table 48. Appendix H-2. Clear Big Goal. Test Statisticsc. Summary of Significant PairsPublic -
PrivChrisSepCath -PrivChris
SepCath -Public
Z -2.842a -2.879a -2.588b
Asymp. Sig. (2-tailed) .004** .004** .010**a Based on negative ranks; b Based on positive ranks; c Wilcoxon Signed Ranks Test.* Significant to p < .05; ** Significant to p < .01.
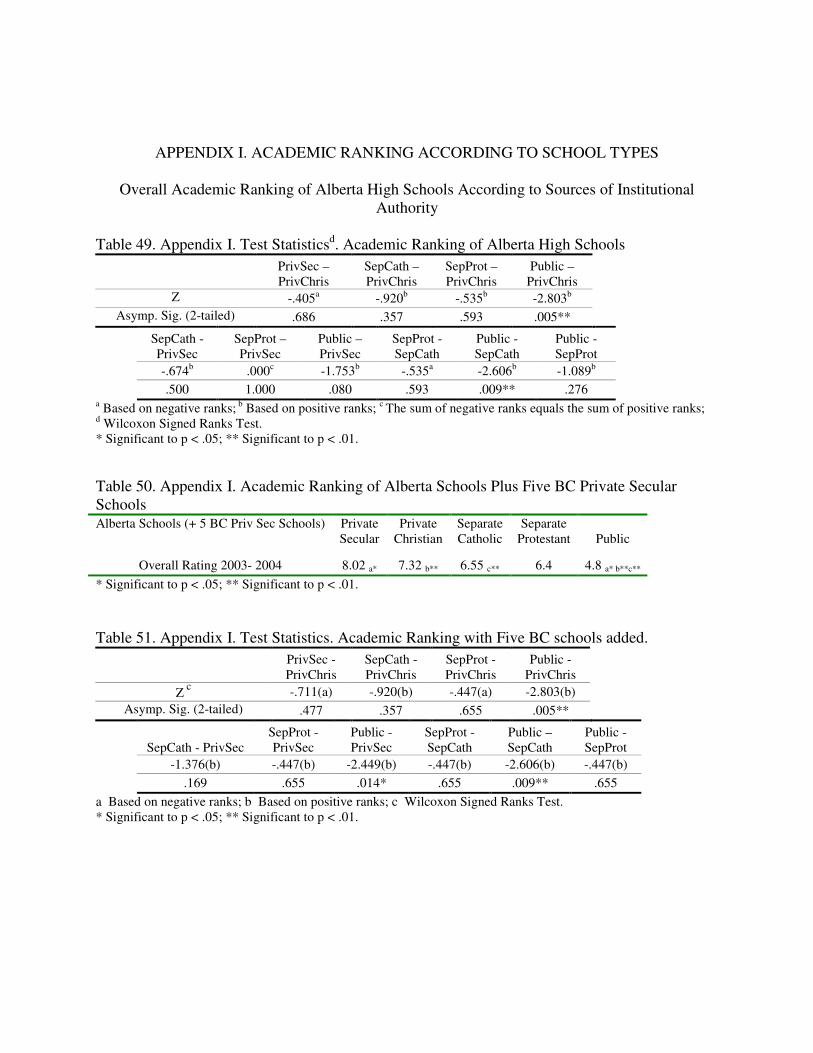
APPENDIX I. ACADEMIC RANKING ACCORDING TO SCHOOL TYPES
Overall Academic Ranking of Alberta High Schools According to Sources of Institutional Authority
Table 49. Appendix I. Test Statisticsd. Academic Ranking of Alberta High Schools PrivSec –PrivChris
SepCath –PrivChris
SepProt –PrivChris
Public –PrivChris
Z -.405a -.920b -.535b -2.803b
Asymp. Sig. (2-tailed) .686 .357 .593 .005**
SepCath -PrivSec
SepProt –PrivSec
Public –PrivSec
SepProt -SepCath
Public -SepCath
Public -SepProt
-.674b .000c -1.753b -.535a -2.606b -1.089b
.500 1.000 .080 .593 .009** .276a Based on negative ranks; b Based on positive ranks; c The sum of negative ranks equals the sum of positive ranks;d Wilcoxon Signed Ranks Test.* Significant to p < .05; ** Significant to p < .01.
Table 50. Appendix I. Academic Ranking of Alberta Schools Plus Five BC Private Secular SchoolsAlberta Schools (+ 5 BC Priv Sec Schools) Private
SecularPrivate
ChristianSeparateCatholic
SeparateProtestant Public
Overall Rating 2003- 2004 8.02 a* 7.32 b** 6.55 c** 6.4 4.8 a* b**c**
* Significant to p < .05; ** Significant to p < .01.
Table 51. Appendix I. Test Statistics. Academic Ranking with Five BC schools added. PrivSec -PrivChris
SepCath -PrivChris
SepProt -PrivChris
Public -PrivChris
Z c -.711(a) -.920(b) -.447(a) -2.803(b)Asymp. Sig. (2-tailed) .477 .357 .655 .005**
SepCath - PrivSecSepProt -PrivSec
Public -PrivSec
SepProt -SepCath
Public –SepCath
Public -SepProt
-1.376(b) -.447(b) -2.449(b) -.447(b) -2.606(b) -.447(b)
.169 .655 .014* .655 .009** .655
a Based on negative ranks; b Based on positive ranks; c Wilcoxon Signed Ranks Test.* Significant to p < .05; ** Significant to p < .01.
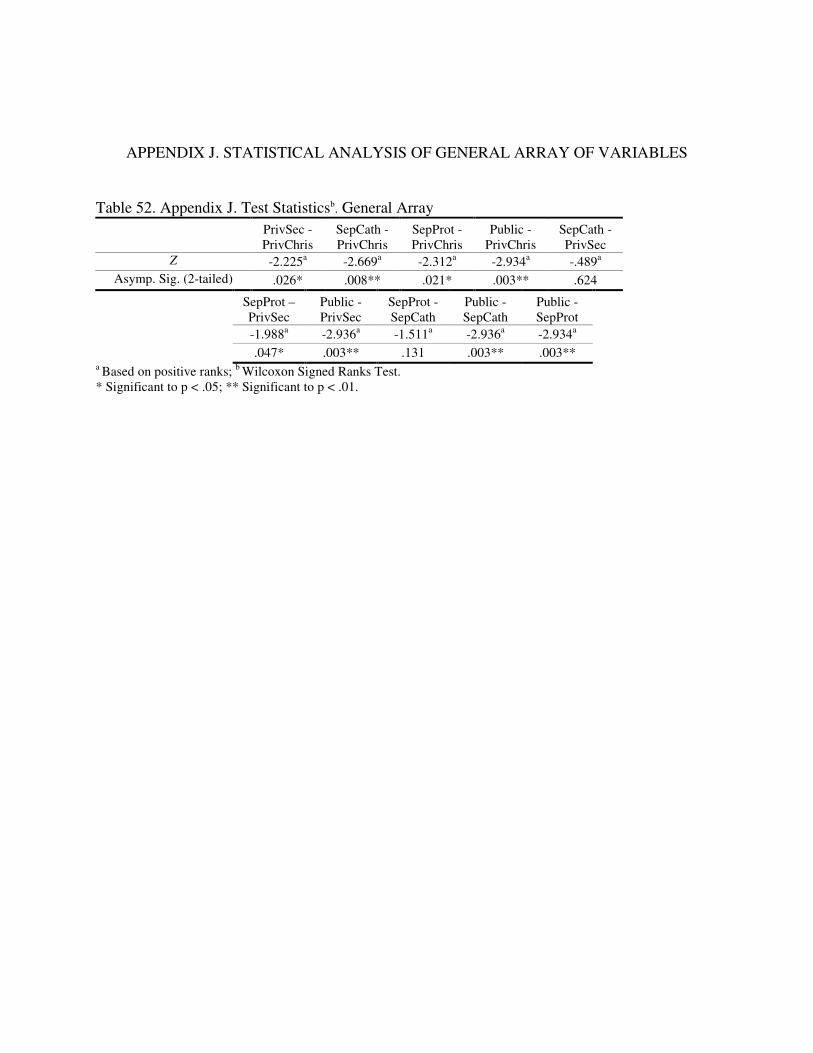
APPENDIX J. STATISTICAL ANALYSIS OF GENERAL ARRAY OF VARIABLES
Table 52. Appendix J. Test Statisticsb. General ArrayPrivSec -PrivChris
SepCath -PrivChris
SepProt -PrivChris
Public -PrivChris
SepCath -PrivSec
Z -2.225a -2.669a -2.312a -2.934a -.489a
Asymp. Sig. (2-tailed) .026* .008** .021* .003** .624
SepProt –PrivSec
Public -PrivSec
SepProt -SepCath
Public -SepCath
Public -SepProt
-1.988a -2.936a -1.511a -2.936a -2.934a
.047* .003** .131 .003** .003**a Based on positive ranks; b Wilcoxon Signed Ranks Test.* Significant to p < .05; ** Significant to p < .01.
APPENDIX K. NAMES OF THE INDEPENDENT RATERS
This study is modeled on the methodology of Stober who himself followed others who used independent raters in their analyses (Cochran & David, 1986; Newsom & Hayes, 1991; Pearce, 1982; Pearce & David, 1987). Stemler and Bebell, on the other hand, did not use independent raters except to make a check on the reliability on their judgments (1999). Stober, whose study focused on colleges and universities, chose three people with doctorates who were in different fields of tertiary education. He states: “Bias error was reduced by selecting professional educators with varied backgrounds: an academic biologist, a professor of education, and a college administrator” (Stober, 1997, p. 45). It is not clear that being in a different field of study or kind of educational responsibility reduces ideological bias, but in any case that is what Stober did.
Since this study is of high school mission statements, it was thought that educators who have some experience at the high school level would best qualify. Two of the raters are more mature with a rich background in teaching. One of these has been a high school principal for most of his career while the other while having more experience with university level instruction has spent extra time coaching gifted highschoolers for the mathematics Olympics. A third while qualified professionally and academically is young enough to remember his high school experiences first hand.
The following raters independently evaluated statements during October and November of 2005.
Professor Ping Kwan Tam, Ph.D.Dr. Tam is a research professor at the South West University in Chongqing, PRC. He has
recently retired from a professorship in Mathematics at the Chinese University of Hong Kong. Dr. Tam’s field of expertise is in pure mathematics in the area of functional analysis. What makes Dr. Tam particularly qualified as a rater for high school mission statements lies in his extra-curricular giftedness in working with talented high school mathematics students to prepare them for the International Mathematical Olympics.
Mr. Keith Davies, B.A., Dip. Ed.Mr. Davies is a former high school principal and now acts as Chairman of the Board of
Scarborough Christian School in Toronto.
Mr. Daniel Tam, M. Eng.Mr. Tam is a graduate in computer engineering at the University of Michigan (Ann
Arbor). His master’s research and interests are related to content analysis particularly in the area of using artificial intelligence to summarize text. He has worked as a software engineer for IBM. He now does product search for A9.com, Inc. a subsidiary of Amazon.com which researches and builds innovative technologies powering search engines. His youth makes him the rater closest to the actual high school experience.
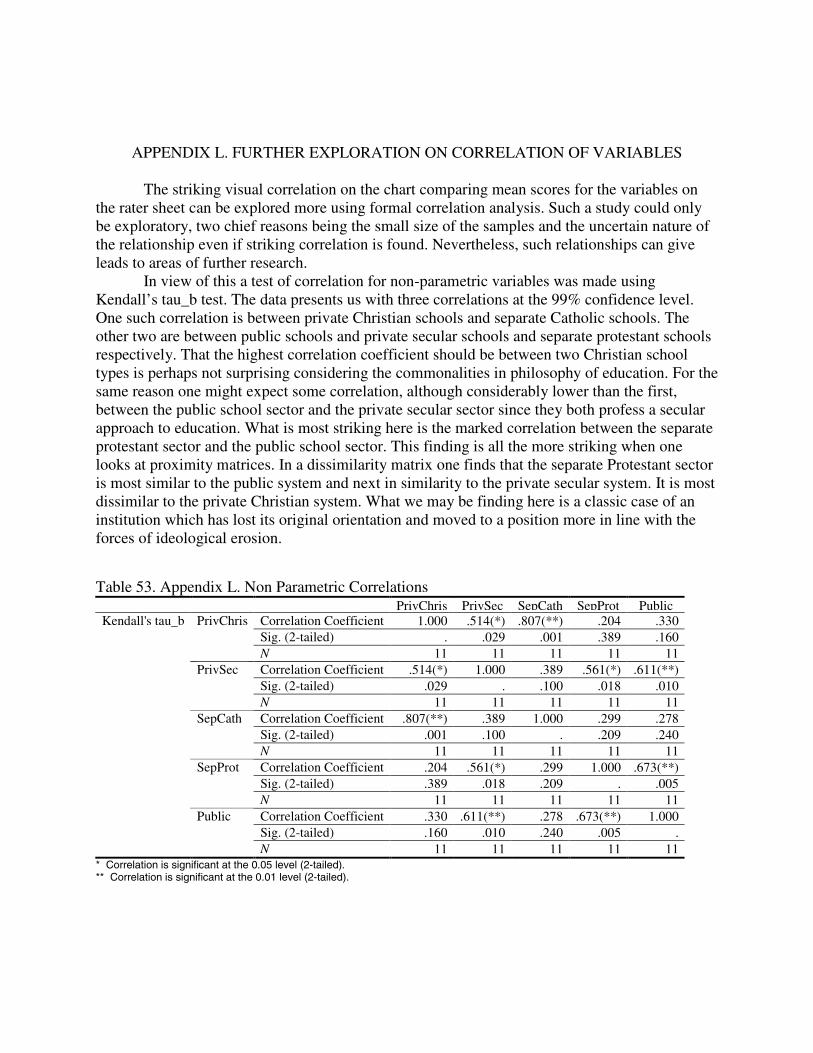
APPENDIX L. FURTHER EXPLORATION ON CORRELATION OF VARIABLES
The striking visual correlation on the chart comparing mean scores for the variables on the rater sheet can be explored more using formal correlation analysis. Such a study could only be exploratory, two chief reasons being the small size of the samples and the uncertain nature of the relationship even if striking correlation is found. Nevertheless, such relationships can give leads to areas of further research.
In view of this a test of correlation for non-parametric variables was made using Kendall’s tau_b test. The data presents us with three correlations at the 99% confidence level. One such correlation is between private Christian schools and separate Catholic schools. The other two are between public schools and private secular schools and separate protestant schools respectively. That the highest correlation coefficient should be between two Christian school types is perhaps not surprising considering the commonalities in philosophy of education. For the same reason one might expect some correlation, although considerably lower than the first, between the public school sector and the private secular sector since they both profess a secular approach to education. What is most striking here is the marked correlation between the separate protestant sector and the public school sector. This finding is all the more striking when one looks at proximity matrices. In a dissimilarity matrix one finds that the separate Protestant sector is most similar to the public system and next in similarity to the private secular system. It is most dissimilar to the private Christian system. What we may be finding here is a classic case of an institution which has lost its original orientation and moved to a position more in line with the forces of ideological erosion.
Table 53. Appendix L. Non Parametric CorrelationsPrivChris PrivSec SepCath SepProt Public
Correlation Coefficient 1.000 .514(*) .807(**) .204 .330Sig. (2-tailed) . .029 .001 .389 .160
PrivChris
N 11 11 11 11 11Correlation Coefficient .514(*) 1.000 .389 .561(*) .611(**)Sig. (2-tailed) .029 . .100 .018 .010
PrivSec
N 11 11 11 11 11Correlation Coefficient .807(**) .389 1.000 .299 .278Sig. (2-tailed) .001 .100 . .209 .240
SepCath
N 11 11 11 11 11Correlation Coefficient .204 .561(*) .299 1.000 .673(**)Sig. (2-tailed) .389 .018 .209 . .005
SepProt
N 11 11 11 11 11Correlation Coefficient .330 .611(**) .278 .673(**) 1.000Sig. (2-tailed) .160 .010 .240 .005 .
Kendall's tau_b
Public
N 11 11 11 11 11* Correlation is significant at the 0.05 level (2-tailed).** Correlation is significant at the 0.01 level (2-tailed).
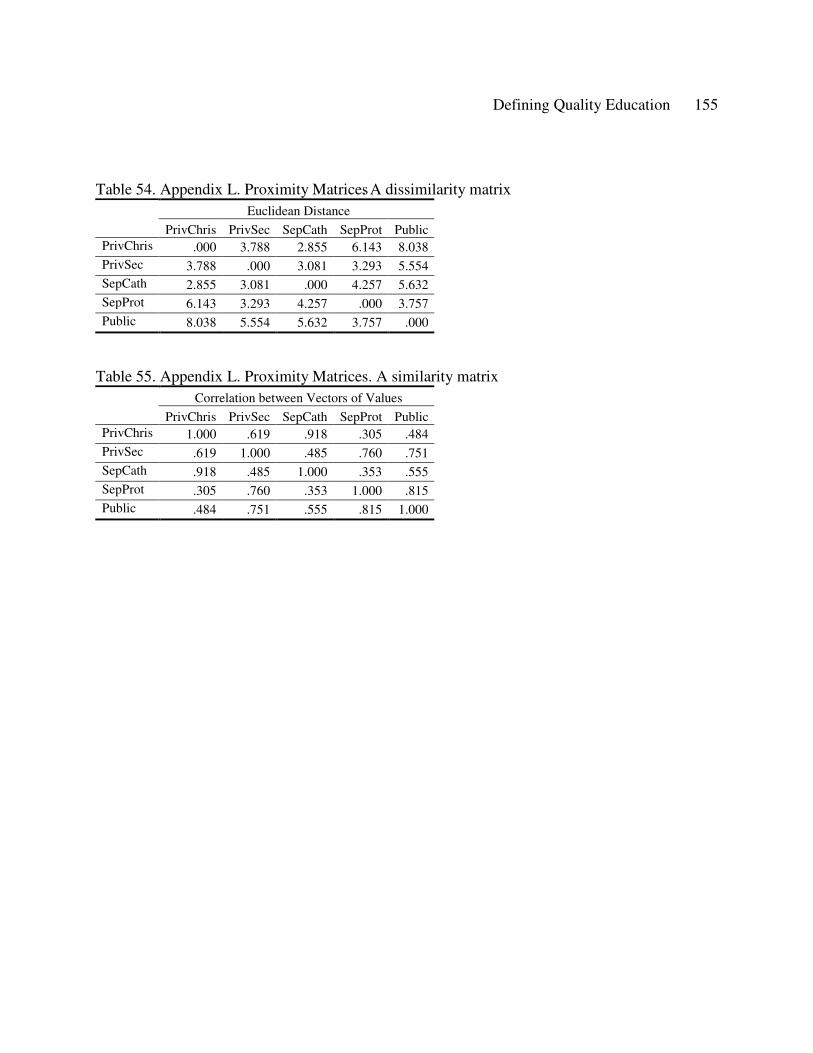
Defining Quality Education 155
Table 54. Appendix L. Proximity Matrices. A dissimilarity matrix Euclidean Distance
PrivChris PrivSec SepCath SepProt PublicPrivChris .000 3.788 2.855 6.143 8.038PrivSec 3.788 .000 3.081 3.293 5.554SepCath 2.855 3.081 .000 4.257 5.632SepProt 6.143 3.293 4.257 .000 3.757Public 8.038 5.554 5.632 3.757 .000
Table 55. Appendix L. Proximity Matrices. A similarity matrix Correlation between Vectors of Values
PrivChris PrivSec SepCath SepProt PublicPrivChris 1.000 .619 .918 .305 .484PrivSec .619 1.000 .485 .760 .751SepCath .918 .485 1.000 .353 .555SepProt .305 .760 .353 1.000 .815Public .484 .751 .555 .815 1.000
APPENDIX M. GLOSSARY
Cosmic WorldviewCosmic worldview refers to worldviews that underlie ways we in the Western world
think about ourselves, other people, the natural world and God or ultimate reality. A list of such worldviews as given by James Sire would be: Christian theism, deism, naturalism, nihilism, existentialism, pantheistic monism, the New Age, postmodernism, and pluralism. However, at this point in our Western society there are still basically two major worldviews which encompass the others: Judeo-Christian theism and naturalism. The one holding to a conception of the universe in which the God revealed through Jesus Christ transcends the universe having created it and sustains it. Naturalism which includes all other Western conceptions including postmodernism (a blend of East and West) rests on two key notions: (1) that the cosmos is all there is—no God of any kind exists and (2) the autonomy of human reason (Sire, 1997).