Embed Size (px)
Citation preview
Volume 30Number 385 Defrosting and cooking frozen meat: Theeffect of method of defrosting and of the manner andtemperature of cooking upon weight loss andpalatability
Article 1
April 1952
Defrosting and cooking frozen meat: The effect ofmethod of defrosting and of the manner andtemperature of cooking upon weight loss andpalatabilityBelle LoweIowa State College
Elma CrainIowa State College
Georgia AmickIowa State College
Mildred RiedeselIowa State College
Louise J. PeetIowa State College
This Article is brought to you for free and open access by the Iowa Agricultural and Home Economics Experiment Station Publications at Iowa StateUniversity Digital Repository. It has been accepted for inclusion in Research Bulletin (Iowa Agriculture and Home Economics Experiment Station) byan authorized editor of Iowa State University Digital Repository. For more information, please contact [email protected].
Recommended CitationLowe, Belle; Crain, Elma; Amick, Georgia; Riedesel, Mildred; Peet, Louise J.; Smith, Florence Busse; McClurg, Buford R.; andShearer, P. S. (1952) "Defrosting and cooking frozen meat: The effect of method of defrosting and of the manner and temperature ofcooking upon weight loss and palatability," Research Bulletin (Iowa Agriculture and Home Economics Experiment Station): Vol. 30 : No.385 , Article 1.Available at: http://lib.dr.iastate.edu/researchbulletin/vol30/iss385/1
See next page for additional authors
Follow this and additional works at: http://lib.dr.iastate.edu/researchbulletin
Part of the Agriculture Commons, Animal Sciences Commons, Food Science Commons, HomeEconomics Commons, and the Nutrition Commons
Defrosting and cooking frozen meat: The effect of method of defrostingand of the manner and temperature of cooking upon weight loss andpalatability
AuthorsBelle Lowe, Elma Crain, Georgia Amick, Mildred Riedesel, Louise J. Peet, Florence Busse Smith, Buford R.McClurg, and P. S. Shearer
This article is available in Research Bulletin (Iowa Agriculture and Home Economics Experiment Station): http://lib.dr.iastate.edu/researchbulletin/vol30/iss385/1
I Defrosting and Cooking
Frozen Meat The Effect of Method of Defrosting and of the Manner
and Temperature of Cooking Upon Weight Loss and Palatability
by Belle Lowe, Elmo Crain, Georgia Amick, Mildred Riedesel, Louise J. Peet, Florence Busse Smith, Buford R. McClurg and P. S. Shearer
Foods and Nutrition Department Household Equipment Department
Animal Husbandry Department
AGRICULTURAL EXPERIMENT STATION, IOWA STATE
• • •
COLLEGE
RESEARCH BULLETIN 385 • •• APRIL, 1952 ••• AMES, IOWA
CONTENTS Page
General summary .......................................................................................... 516
Review of literature .................................................................................... 519
Procedure ........................................................................................................ 521 History of the animals .......................................................................... 521
Beef ....................................... :.............................................................. 521 Veal ...................................................................................................... 521 Lamb .................................................................................................... 521 Pork ...................................................................................................... 522
Treatment of carcasses and cuts ...................................................... 522 Aging .................................................................................................... 522 Cutting .......................................................... __ ...................... ____ .......... 522 Wrapping ............................................................................................ 523 Freezing and storage temperatures ............................................ 523 Length of frozen storage of cuts ....... __ ......................................... 523 Defrosting the cuts ........................................................................ 525 End point for defrosting __ .......•........................................ __ ............ 526 Defrosting procedure __ ...................................................................... 527 Weight losses during thawing ................................................... _.. 527
Statistics ....................................... __ ........................................................... 528 The score card ........................................................................ __ .............. 528
Roasts ..................................................................... __ .................................... ____ . 529 Weight of roasts ...................................................................... ,............... 529 Defrosting time ....... __ ........................................... :................................... 530 Appearance after defrosting ................................................. __ ............. 534 Defrosting weight losses .................................................................... 534 Interior temperature at start of cooking ........... __ ....................... 535 The cooking time ......... __ ......................................................................... 535 Fuel for cooking .................... __ .............. __ ............................... ______ ....... __ 540 Cooking weight losses .......................................................................... 541
Frozen 'or thawed ............................................................................ 542 Stage of doneness ............................................................................ 543 Oven tem perature ............................................................................ 543 Bone in or boned ........ __ ............................................................... ~.... 544 Extent of cut surface ....................... __ ..................................... __ ...... 544 Drippings .... __ ... __ .................... __ ........................................................... 545
Description of cooked roasts ................................................................ 545 Palatability of roasts ............................................................................ 546
Carcass grade ....................................................... __ ........................... 552 Animal variation .............................................................................. 552 Muscle variation .............................................................................. 553 Initial condition of carcass ............................................................ 553 Boned or bone in ................................................................................ 554 Length of frozen storage ................................................................ 554 Stage of cookery ....................................... __ ..................................... 554 Oven temperature .... __ .......................................... __ ... __ ..................... 555 Aroma ............................................... __ ............................................. __ .... 555 Flavor ............................. __ ................................................................... 556 Texture ............................ __ ............... __ ................................................. 556 Tenderness ............. __ ........................................................................... 556 Juiciness .............................................................................................. 556 Paired roasts ............ __ ........................................................................ 557
Cooked frozen ............................................ __ ............................................ 557 Summary, conclusions and recommendations ................................ 559
Braised beef pot roasts .................................................................... :......... 561 Procedure .................................................................................................. 561 Weight of pot roasts .............................................................................. 562
Page Defrosting time ...................................................................................... 562 Defrosting weight losses ...................................................................... 563 Cooking time ............................................................................................ 563 Weight losses during cooking ............................................................ 563 Palatability ................................................................................................ 566 Summary .................................................................................................. 567
Broiled steaks and chops .......................................................................... 568 Procedure .................................................................................................. 568
Wrapping ............................................................................................ 568 Cooking .................................................................................... :........... 569
Defrosting time ........................................................................................ 570 Weight losses during defrosting ........................................................ 574 The cooking time .................................................................................... 575 Fuel for cooking .................................................................................... 575 Cooking weight losses ............................................................................ 575 Total weight losses ................................................................................ 578 Appearance of broiled steaks and chops .......................................... 578 Palatability .............................................................................................. 582 Summary .................................................................................................... 584
Pan· broiled, pan·fried and braised steaks and chops ........................ 586 Cooking ...................................................................................................... 588 Weight of chops ...................................................................................... 591 Defrosting time ........................................................................................ 593 Defrosting weight losses ...................................................................... 596 Uniformity of cooking by pan·broiling and pan-frying ................ 596 Cooking time ............................................................................................ 597 Cooking weight losses .......................................................................... 597 Total weight losses ................................................................................ 602 Fuel ............................................................................................................ 602 Pal a ta bility ....................... : ............................................................... :...... 602
Patties .............................................................................................................. 608 Source of meat and its grinding ........................................................ 608 Seasoning of the pork patties .............................................................. 608 \Vrapping the patties ............................................................................ 608 Defrosting .................................................................................................. 609 Cooking ...................................................................................................... 609 Defrosting time ........................................................................................ 611 Defrosting weight losses ...................................................................... 611 Cooking time ............................................................................................ 614 Spattering of fat .................................................................................... 614 Appearance of cooked patties ............................................................ 614 Cooking weight losses ............................................................................ 615 Fuel consumption .................................................................................... 615 Palatability ................................................................................................ 615
Sausage patties .................................................................................. 620 Summary and conclusions .................................................................... 622
Beef knuckles, beef and veal stew, beef sbanks, beef heels of round, and pork hocks cooked in water .................................... 623
Source of cuts ............................................................................. _........... 623 \Vrapping .................................................................................................. 624 Defrosting .................................................................................................. 624 Cooking ...................................................................................................... 625 Defrosting time ...................................................................................... 625 Defrosting weight losses ...................................................................... 625 Cooking time ............................................................................................ 626 Cooking and total weight losses ........................................................ 627 PalatablI1ty .............................................................................................. 628 Summary and conclusion.; .................................................................... 630
References cited ............................................................................................ 631
516
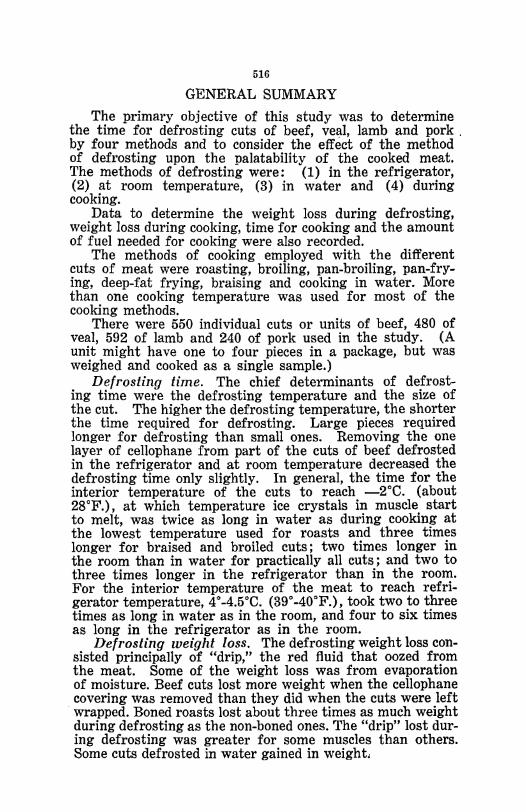
GENERAL SUMMARY
The primary objective of this study was to determine the time for defrosting cuts of beef, veal, Iamb and pork . by four methods and to consider the effect of the method of defrosting upon the palatability of the cooked meat. The methods of defrosting were: (1) in the refrigerator, (2) at room temperature, (3) in water and (4) during cooking.
Data to determine the weight loss during defrosting, weight loss during cooking, time for cooking and the amount of fuel needed for cooking were also recorded.
The methods of cooking employed with the different cuts of meat were roasting, broiling, pan-broiling, pan-frying, deep-fat frying, braising and cooking in water. More than one cooking temperature was used for most of the cooking methods.
There were 550 individual cuts or units of beef, 480 of veal, 592 of lamb and 240 of pork used in the study. (A unit might have one to four pieces in a package, but was weighed and cooked as a single sample.)
Defrosting time. The chief determinants of defrosting time were the defrosting temperature and the size of the cut. The higher the defrosting temperature, the shorter the time required for defrosting. Large pieces required longer for defrosting than small ones. Removing the one layer of cellophane from part of the cuts of beef defrosted in the refrigerator and at room temperature decreased the defrosting time only slightly. In general, the time for the interior temperature of the cuts to reach _2°C. (about 28°F.), at which temperature ice crystals in muscle start to melt, was twice as long in water as during cooking at the lowest temperature used for roasts and three times longer for braised and broiled cuts; two times longer in the room than in water for practically all cuts; and two to three times longer in the refrigerator than in the room. For the interior temperature of the meat to reach refrigerator temperature, 4° _4.5°C. (39°-40°F.), took two to three times as long in water as in the room, and four to six times as long in the refrigerator as in the room.
Defrosting weight loss. The defrosting weight loss consisted principally of "drip," the red fluid that oozed from the meat. Some of the weight loss was from evaporation of moisture. Beef cuts lost more weight when the cellophane covering was removed than they did when the cuts were left wrapped. Boned roasts lost about three times as much weight during defrosting as the non-boned ones. The "drip" lost during defrosting was greater for some muscles than others. Some cuts defrosted in water gained in weight,
517
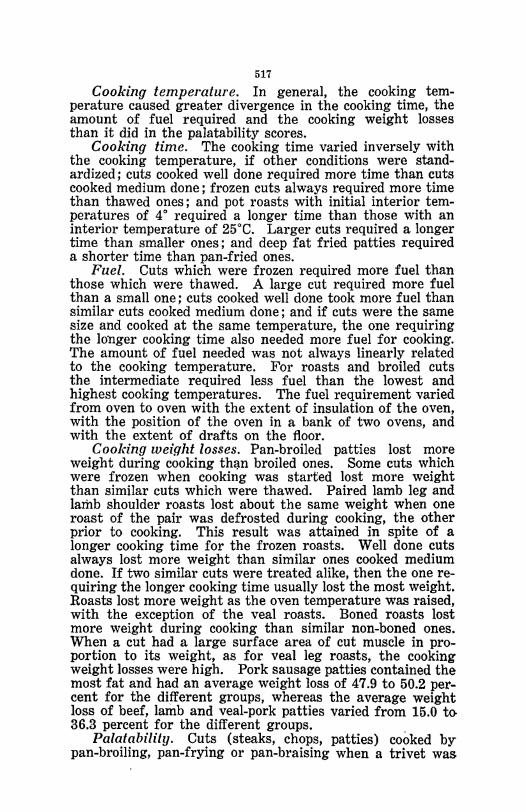
Cooking temperature. In general, the cooking temperature caused greater divergence in the cooking time, the amount of fuel required and the cooking weight losses than it did in the palatability scores.
Cooking time. The cooking time varied inversely with the cooking temperature, if other conditions were standardized; cuts cooked well done required more time than cuts cooked medium done; frozen cuts always required more time than thawed ones; and pot roasts with initial interior temperatures of 4° required a longer time than those with an interior temperature of 25°C. Larger cuts required a longer time than smaller ones; and deep fat fried patties required a shorter time than pan-fried ones.
Fuel. Cuts which were frozen required more fuel than those which were thawed. A large cut required more fuel than a small one; cuts cooked well done took more fuel than similar cuts cooked medium done; and if cuts were the same size and cooked at the same temperature, the one requiring the longer cooking time also needed more fuel for cooking. The amount of fuel needed was not always linearly related to the cooking temperature. For roasts and broiled cuts the intermediate required less fuel than the lowest and highest cooking temperatures. The fuel requirement varied from oven to oven with the extent of insulation of the oven, with the position of the oven in a bank of two ovens, and with the extent of drafts on the floor.
Cooking weight losses. Pan-broiled patties lost more weight during cooking thl},n broiled ones. Some cuts which were frozen when cooking was started lost more weight than similar cuts which were thawed. Paired lamb leg and lamb shoulder roasts lost about the same weight when one roast of the pair was defrosted during cooking, the other prior to cooking. This result was attained in spite of a longer cooking time for the frozen roasts. Well done cuts always lost more weight than similar ones cooked medium done. If two similar cuts were treated alike, then the one requiring the longer cooking time usually lost the most weight. Roasts lost more weight as the oven temperature was raised, with the exception of the veal roasts. Boned roasts lost more weight during cooking than similar non-boned ones. When a cut had a large surface area of cut muscle in proportion to its weight, as for veal leg roasts, the cooking weight losses were high. Pork sausage patties contained the most fat and had an average weight loss of 47.9 to 50.2 percent for the different groups, whereas the average weight loss of beef, lamb and veal-pork patties varied from 15.0 to-36.3 percent for the different groups.
Palatability. Cuts (steaks, chops, patties) cooked by pan-broiling, pan-frying or pan-braising when a trivet was
518
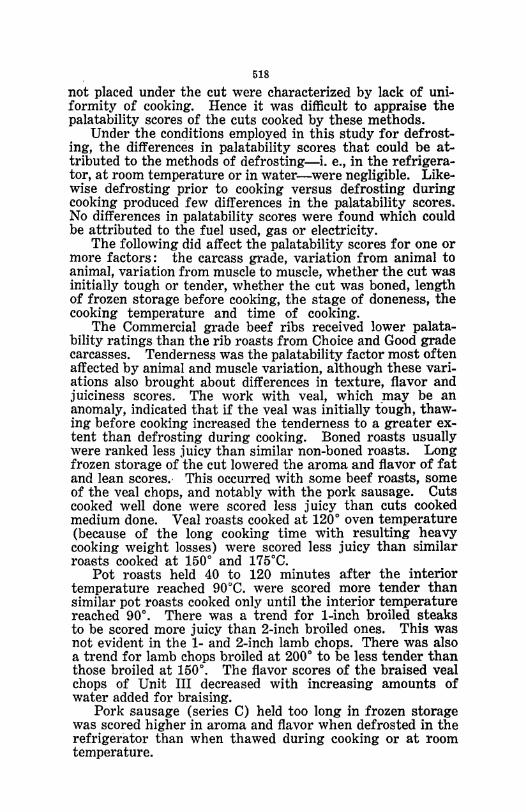
not placed under the cut were characterized by lack of uniformity of cooking. Hence it was difficult to appraise the palatability scores of the cuts cooked by these methods.
Under the conditions employed in this study for defrosting, the differences in palatability scores that could be attributed to the methods of defrosting-i. e., in the refrigerator, at room temperature or in water-were negligible. Likewise defrosting prior to cooking versus defrosting during cooking produced few differences in the palatability scores. No differences in palatability scores were found which could be attributed to the fuel used, gas or electricity.
The following did affect the palatability scores for one or more factors: the carcass grade, variation from animal to animal, variation from muscle to muscle, whether the cut was initially tough or tender, whether the cut was boned, length of frozen storage before cooking, the stage of doneness, the cooking temperature and time of cooking.
The Commercial grade beef ribs received lower palatability ratings than the rib roasts from Choice and Good grade carcasses. Tenderness was the palatability factor most often affected by animal and muscle variation, although these variations also brought about differences in texture, flavor and juiciness scores. The work with veal, which may be an anomaly, indicated that if the veal was initially tough, thawing before cooking increased the tenderness to a greater extent than defrosting during cooking. Boned roasts usually were ranked less juicy than similar non-boned roasts. Long frozen storage of the cut lowered the aroma and flavor of fat and lean scores.· This occurred with some beef roasts, some of the veal chops, and notably with the pork sausage. Cuts cooked well done were scored less juicy than cuts cooked medium done. Veal roasts cooked at 120° oven temperature (because of the long cooking time with resulting heavy cooking weight losses) were scored less juicy than similar roasts cooked at 1500 and 175°C.
Pot roasts held 40 to 120 minutes after the interior temperature reached 90°C. were scored more tender than similar pot roasts cooked only until the interior temperature reached 900 • There was a trend for I-inch broiled steaks to be scored more juicy than 2-inch broiled ones. This was not evident in the 1- and 2-inch lamb chops. There was also a trend for lamb chops broiled at 200° to be less tender than those broiled at 150°. The flavor scores of the braised veal chops of Unit III decreased with increasing amounts of water added for braising.
Pork sausage (series C) held too long in frozen storage was scored higher in aroma and flavor when defrosted in the refrigerator than when thawed during cooking or at room temperature.
Defrosting and Cooking Frozen Meat l
The Effect of Method of Defrosting and of the Manner and Temperature of Cooking U pan Weight Loss and Palatability
By BELLE LOWE, ELlI[A CRAIN, GEORGIA Al'.lICK, MILDRED RIEDESEL,
LOUISE J. PEET, FLORENCE BUSSE SMITH, BUFORD R. McCLURG
AND P. S. SIIEARER 2
REVIEW OF LITERATURE ON THAWING MEAT
Paul and Ohild (13) thawed beef and pork cuts (1) during cooking, (2) in a cabinet (the temperature of which was kept at 24°_25°0. with 65 percent relative humidity), and (3) in a refrigerator at 2°_4°0. They found that the palatability of the pork and beef was unaffected by freezing or by use of the three different thawing methods. The press fluid content of cooked frozen pork thawed at 24°-25°0. was higher than that obtained from unfrozen pork, although frozen beef thawed during cooking had less press fluid than unfrozen beef.
Vail, Jeffery. Forney and Wiley (20) defrosted 33 pairs of 2-inch loin steaks and 48 pairs of loin pork roasts to determine the effect of the method of thawing upon losses. shear force and press fluid. The steaks were thawed by three methods: (1) holding for 15 hours at room temperature, (2) 23 hours in the refrigerator 'at 3.30 0. and (3) in the oven at 200°0. These steaks were cooked to an interior temperature of 65.6°0. The pork loin roasts were also thawed by three different methods: (1) holding 15 hours at room temperature, (2) 48 hours in the refrigerator and (3) in the oven at 176.7°0. All roasts were cooked to an interior temperature of 82.2°0. When the results were analyzed none of the differences brought about by the method 1 This study was made possible b~' grants from the National Live Stock and
Meat Board. Iowa Agricultural Experiment Station project 907.
• Miss Crain cooked ~ll the lamb and aU the beef cuts except the knuckles. shanks and heels "'" round. Miss Amick (1) cooked the veal and part of the sausage. Miss Riedesel cooked the remainder of the cuts.
520
of defrosting were statistically significant for either steaks or roasts.
Ary and McLean (2) found that the time for thawing lamb legs that had been frozen and held at -100, 0°, 10° and 20°F., then transferred to a refrigerator (40°_45°F.), varied only slightly. The average time needed to reach 30°F. varied from 20 to 21 hours, to reach 40°F. varied from 32.5 to 34.5 hours, whereas to reach the maximum temperature obtained in the refrigerator required 37 to 38.5 hours. No appreciable differences were observed in eating quality of the lamb legs frozen at the different temperatures.
Kalen, Miller, Tinklin and Vail (11) cooked paired chuck pot roasts. One roast of each pair was defrosted in the room overnight, the other was kept frozen and thawed during cooking. They found no differences in the weight losses during cooking or in palatability that were attributable to the defrosting methods. The grade of carcass, however, did affect the palatability scores.
These same authors in later studies thawed one each of 15 pairs of steaks overnight at room temperature and the other in a warming oven set at 73°C. In the second part of this steak study, nine paired packages (five steaks per package) were thawed, one package at refrigerator temperature (about 3°C.) and the other package in running water. In the third part of the study, which included 36 packages (5 steaks per package), nine packages were thawed by each of the four methods given above. Pork steaks were cut from fresh hams. Mter freezing they were thawed by infrared heat, at room temperature and in a warming oven at 73°C. The steaks were braised by standardized methods. From these studies it was concluded that both beef and pork steaks were similar whether thawed as part of the cqoking process, at refrigerator temperature, in a warming oven at 73° C., at room temperature or by infrared rays. Those thawed in running water were rated lower than similar cuts defrosted in the refrigerator, in the room or in the warming oven for aroma, flavor of fat and lean, and juiciness.
Westerman, Vail, Tinklin and Smith (21) thawed frozen steaks in the refrigerator, at room temperature, at 73°C. in a warming oven, and in running tap water. The flavor scores obtained by the different methods of defrosting were, in the order given, 5.5, 5.5, 5.8 and 4.8. Steaks defrosted in running water received a significantly lower flavor score and were less juicy than those defrosted by other methods.
521
PROCEDURE HISTORY OF THE ANIMALS
BEEF
The prime ribs from 35 carcasses were purchased from four packing establishments. Nothing was known of the heritage or feeding of the animals. Beef was rationed and scarce. The initial plan included the use of only one grade of beef. Deliveries were to be made at monthly intervals, but were irregular and frequently short. When different grades and weights of beef from those ordered were sent, they were accepted in order to avoid delay with the study. The ribs came from 6 Commercial, 19 Good and 10 Choice U. S. grade carcasses. The killing dates of the animals from which the prime ribs were obtained were staggered from Sept. 27, 1944, to Jan. 27, 1945.
For the beef cuts other than roasts, four animals were killed at the college station. They had been fed on corn plus pasture. The ages varied from 14 to 16 months. The carcasses of these four animals graded "Good." Animals 1 and 2 were killed Sept. 25, 1944, animal 4 on Oct. 23, and animal 3 on Oct. 24.
VEAL
The 18 U. S. Good veal carcasses were purchased from the Iowa Packing Company. Nine of the carcasses were delivered Nov. 7, 1946, the other nine on Nov. 14. Nothing was known concerning the. heritage, feeding history or slaughter dates of these animals. Dissimilar previous history was apparent from the wide variation in color, texture and shape of the muscles from these different carcasses. The appearance of some carcasses also suggested varying holding periods after slaughter. The carcasses varied in weight from 87 to 141 pounds, and averaged 113.6 pounds.
LA:\lB
The 45 U. S. Choice lamb carcasses were also purchased from the Iowa Packing Company. Nothing was known of their heritage or feeding history, except that they were Western lambs. A representative of the National Live Stock and Meat Board aided in selection of the carcasses. This selection was made from a large number and the carcasses were very uniform. The lambs were slaughtered on Nov. 14, 1945, cooled overnight, and shipped to Ames on Nov. 15.
522
PORK
The 30 hogs came from the Iowa State College Agricultural Foundation farm near Churchville, Iowa. The history and feeding of the animals was known. The animals were slaughtered at the Iowa Packing Company plant. Half of the animals were slaughtered on Nov. 7, 1945, the other half on Nov. 8. The total weight of the loins from the first lot of animals was 321, from the second lot 323 pounds.
TREATMENT OF CARCASSES AND CUTS
AGING
The interval between the killing of the animals and the freezing of the cuts was 2 days for pork, 7 days for lamb (with exception of the rolled shoulder roasts and the 112 x 4 inch patties, which were 5 and 6 days, respectively), 10 days for the beef ribs, and 8, 9 or 10 days for the other beef cuts. The date of killing for veal was not known. The cuts of veal were aged 6, 7 or 8 days after the carcasses were received.
CUTTING
All the meat was cut by experienced meat cutters. The beef and veal were cut by personnel of the Animal Husbandry Department of Iowa State College, the lamb and pork by personnel of the National Live Stock and Meat Board. The steaks and chops, after thorough chilling, were power sawed, thus insuring steaks and chops of uniform thickness for cooking.
Each beef rib was divided into two roasts. These roasts consisted of ribs 10-12 and 7-9. The beef knuckles,
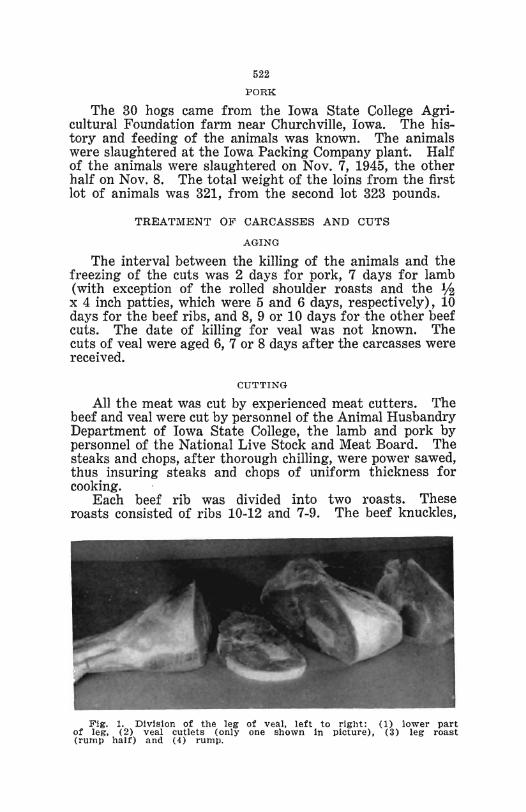
Fig. 1. DIvIsion of the leg of veal, left to right: (1) lower part of leg, (2) veal cutlets (only one shown In picture), (3) leg roast (rump half) and (4) rump.
523
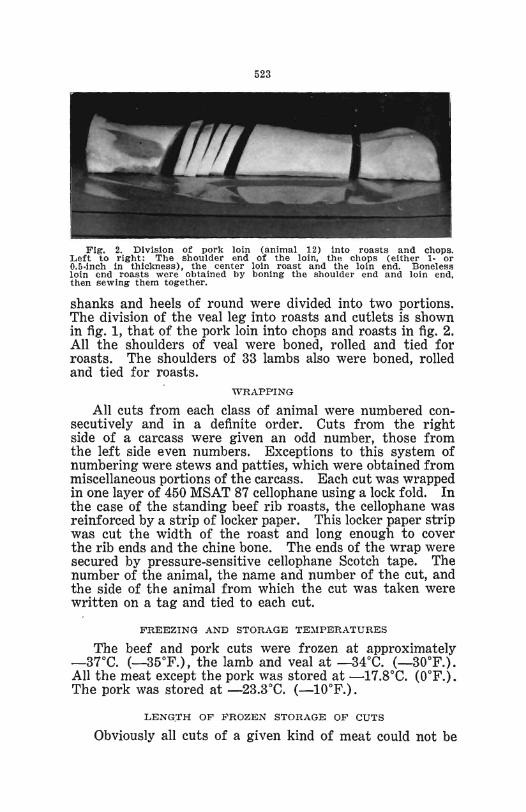
Fig. 2. Division of pork loin (animal 12) into roasts and chops. Left to right : The shoulder end of the loin. the chops (either 1· or O.5·inch In thickness). the center loin roast and the loin end. Boneles s loin end roasts were obtained by boning the shoulder end and loin end. then sewing them together.
shanks and heels of round were divided into two portions. The division of the veal leg into roasts and cutlets is shown in fig. 1, that of the pork loin into chops and roasts in fig. 2. All the shoulders of veal were boned, rolled and tied for roasts. The shoulders of 33 lambs also were boned, rolled and tied for roasts.
WRAPPING
All cuts from each class of animal were numbered consecutively and in a definite order. Cuts from the right side of a carcass were given an odd number, those from the left side even numbers. Exceptions to this system of numbering were stews and patties, which were obtained from miscellaneous portions of the carcass. Each cut was wrapped in one layer of 450 MSAT 87 cellophane using a lock fold. In the case of the standing beef rib roasts, the cellophane was reinforced by a strip of locker paper. This locker paper strip was cut the width of the roast and long enough to cover the rib ends and the chine bone. The ends of the wrap were secured by pressure-sensitive cellophane Scotch tape. The number of the animal, the name and number of the cut, and the side of the animal from which the cut was taken were written on a tag and tied to each cut.
FREEZING AND STORAGE TE:\IPERATURES
The beef and pork cuts were frozen at approximately _37°C. (-35°F.), the lamb and veal at _34°C. (-30°F.). All the meat except the pork was stored at -17.8°C. (O°F.). The pork was stored at -23.3°C. (-10°F.).
LENG.TH OF FROZEN STORAGE OF CUTS
Obviously all cuts of a given kind of meat could not be
524
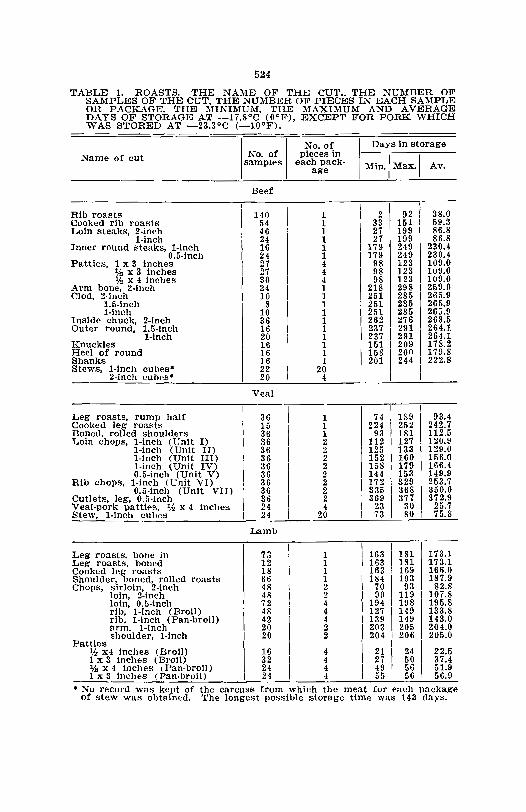
TABLE 1. ROASTS. THE NAME OF THE CUT,. THE NU:\fBER OF SAMPLES OF THE CUT, THE NUMBER OF PIECES IN EACH SA:\1PLE OR PACKAGE, THE MINIMUM, THE MAXIMU)-I AND AVERAGE DAYS OF STORAGE AT -17.SoC (OaF), EXCEPT FOR PORK WHICH WAS STORED AT -23.3°C (-lOaF).
Name of cut
Rib roasts Cooked rib roasts Loin steaks, 2·inch
l·inch Inner round steaks, l·inch
0.5·inch Patties, I x 3 inches
'h x 3 inches 'h x 4 inches
Arm bone, 2·inch Clod, 2·inch
1.5·inch l·inch
Inside chuck, 2·inch Outer round, 1.5·inch
I-inch Knuckles Heel of round Shanks Stews, l·inch cubes'
2·inch cubes'
Leg roasts, rump half Cooked leg roasts Boned, rolled shoulders Loin chops, l·inch (Unlt I)
I-inch (Unit II) I-inch (Unlt III) I-inch (Unit IV) 0.5-inch (Unit V)
Rib chops, I-inch (Unit VI) 0.5-lnch (Unit VII)
Cutlets, leg, 0.5-inch Veal-pork patties, 'h x 4 inches Stew, I-inch cubes
Leg roasts, bone in Leg roasts, boned Cooked leg roasts Shoulder, boned, rolled roasts Chops, sirloin, 2-lnch
Patties
loin, 2·inch loin, 0.5·lnch rib, I-inch (Broil) rib, l·inch (Pan·broil) arm, I-inch shoulder, I-inch
If., x4 inches (Broil) 1 x 3 inches (Broil) ',1, x 4 Inches (Pan·broil) 1 x 3 Inches (Pan.broil)
No. of I samples
Beef
140 54 46 24 16 24 27 27 30 24 10
8 10 36 16 20 16 16 16 22 20
Veal
36 15 36 36 36 36 36 36 36 36 36 24 24
Lamb
73 12 18 66 48 48 72 48 42 20 20
16 32 24 24
No. of pieces in
each pack· age
I 1 1 1 1 1 4 4 4 1 1 1 1 1 1 1 1 1 1
20 4
1 1 1 2 2 2 2 2 2 2 2 4
20
1 1 1 1 2 2 4 4 4 2 2
4 4 4 4
I Days in storage
:\Iin.1 Max., Av.
2 92 38,0 33 151 59.3 27 199 86.8 27 199 86.8
179 249 230A 179 249 230.4
98 123 109.0 98 123 109.0 98 123 109.0
218 298 259.0 251 285 265.9 251 285 265.9 251 285 265.9 262 276 268.5 237 291 264.1. 237 291 264.1 151 209 178.2 158 200 179.8 201 244 222.8
74 224
93 112 125 152 158 144 172 335 369
23 73
I I
1891
252
IHLI 160 179 153
\ ~~~ 1
377 30 80
93.4 242.7 112.6 120.9 129.0 156.0 166.4 149.9 253.7 350.0 372.9
25.7 75.8
163181173.1 163 181 "173.1 163 169 166.0 184 193 187.9
70 93 82.8 90 119 107.8
194 198 195.8 127 149 133.8 139 149 143.0 203 205 204.0 204 206 205.0
21 24 22.5 27 50 37.4 49 56 51.9 55 56 56.9
• No record was kept of the carcass from which the meat for each package of stew was obtained. The longest possible storage time was 143 days.
525
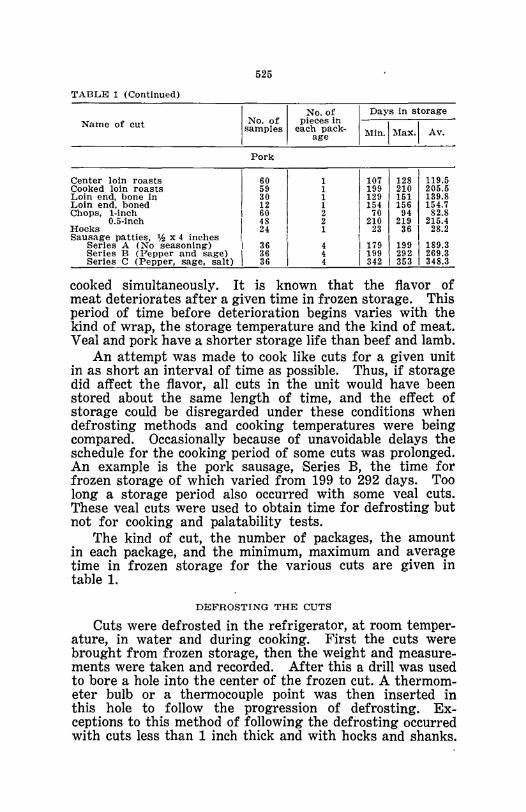
TABLE 1 (Continued)
No. of I Days in storage Name of cut I No. of I pieces in
Min. ! Max. I Av. samples each pack-
age
Pork
I I I Center loin roasts 60 1 I 1071128 119.5 Cooked loin roasts 59 1 1199 210 205.5 Loin end, bone in 30 1 129 151 139.8 Loin end, boned 12 1 1154 156 154.7 Chops, I-inch 60 2 70 I 94 82.8
0.5-inch 48 2 1 210 219 215.4 Hocks 24 1 23 36 I 28.2 Sausage patties, lh x 4 inches
I I I Series A (No seasoning) 36 4 I 179 199 1189.3 Series B (Pepper and sage) 36 4 1199 292 269.3 Series C (Pepper, sage, salt) 36 4 342 I 353 I 348.3
cooked simultaneously. It is known that the flavor of meat deteriorates after a given time in frozen storage. This period of time before deterioration begins varies with the kind of wrap, the storage temperature and the kind of meat. Veal and pork have a shorter storage life than beef and lamb.
An attempt was made to cook like cuts for a given unit in as short an interval of time as possible. Thus, if storage did affect the flavor, all cuts in the unit would have been stored about the same length of time, and the effect of storage could be disregarded under these conditions wheIi defrosting methods and cooking temperatures were being compared. Occasionally because of unavoidable delays the schedule for the cooking period of some cuts was prolonged. An example is the pork sausage, Series B, the time for frozen storage of which varied from 199 to 292 days. Too long a storage period also occurred with some veal cuts. These veal cuts were used to obtain time for defrosting but not for cooking and palatability tests.
The kind of cut, the number of packages, the amount in each package, and the minimum, maximum and average time in frozen storage for the various cuts are given in table 1.
DEFROSTING THE CUTS
Cuts were defrosted in the refrigerator, at room temper~ ature, in water and during cooking. First the cuts were brought from frozen storage, then the weight and measure~ ments were taken and recorded. After this a drill was used to bore a hole into the center of the frozen cut. A thermom~ eter bulb or a thennocouple point was then inserted in this hole to follow the progression of defrosting. Exceptions to this method of following the defrosting occurred with cuts less than 1 inch thick and with hocks and shanks.
526
Accurate temperature readings cannot be obtained with halfinch cuts. ,The bone of hocks and shanks prevented insertion of the thermometer bulb or the thermocouple to the center of the cut. The completion of defrosting for these cuts was determined by feeling or insertion of the tines of a fork. During the time that one cut was being prepared for study, the other cuts which were to be defrosted that day were kept in the freezing compartment of the refrigera tor .
. The refrigerator was set to maintain a temperature of 4_4.5"0. (about 39.2"F.).
An effort was made to keep the room temperature about 25°0. (77"F;) when the meat was being defrosted. Some variation of the room temperature did occur, but in general it was' not great.
No ground meat was defrosted in water. All cuts defrosted in water were unwrapped. Water defrosting can be handled in many ways. The following procedure was used: The temperature of the water was 49"0. (120"F.) when the meat was placed in the water. The meat, water and container were then left at room temperature. For large cuts the temperature of the water could have varied widely without affecting the defrosting time very much, for the frozen meat immediately chilled the water.. If the cut was to be cooked in water, the amount of water used for defrosting was the volume that was planned for cooking that particular cut. It was cooked in this defrosting water. Otherwise the amount of water added was twice the weight of the cut. The container used allowed the water to cover the cut. Exceptions occurred when cuts which were cooked in water were not covered by the small quantity of water used.· .
Outs were always unwrapped if defrosted during cooking. About half the beef cuts defrosted in the refrigerator or in the room were wrapped, the other half were unwrapped.
END POINT FOR ~EFROSTING'
For uniformity it was decided to record the time required for the temperature of the cuts to reach _2°0. (28.4°F.) and 4°0. (39.2°F.). If a cut is to be considered defrosted when all the ice crystals have melted, the exact defrosting point is between these two periods. The temperature of the frozen meat rises until it reaches _2°0. At approximately this temperature ice crystals begin to melt. After a temperature of _2°0. is reached, considerable time may elapse before all the ice crystals disappear. During this period the temperature remains constant.
527
DEFROSTINq PROCEDURE
. The temperature of the refrigerator sometimes dropped a whole degree at night, the extent of the drop depending on the amount of meat being defrosted. The temperature of the refrigerator rose during the day, the increase and its extent depending on the frequency of the opening of the refrigerator doors. The temperature was once observed to be 5°C. higher than that for which the refrigerator was set. - This was temporary, and the average increase over 4-4.5°C. during the day seldom exceeded 1 "C. However, divergence in temperature did cause considerable variation in defrosting time for some cuts, but the conditions were similar to those found in the home. Another factor which caused some variation in defrosting time was the place or shelf upon which the cut was placed. The recording pyrometer was usually used to follow the progression of the refrigerator defrosting of cuts, whereas the temperature of those defrosted during cooking, in the room or in water was determined by use of thermometers.
The one layer of cellophane increased the defrosting time of the beef cuts slightly. A heavier wrap would have made a greater difference in the defrosting time between wrapped and unwrapped cuts. All the cuts of veal, lamb and pork which were defrosted in the refrigerator or in the room were wrapped.
WEtGHT LOSSES DURING THAWING
If freshly cut meat is wrapped and held at refrigerator temperature, a certain amount of fluid oozes out of the cut muscle, but the amount of fluid is greater for meat that has been frozen than for fresh meat. As frozen meat thaws, and particularly if evaporation is nearly prevented during the thawing process, drip accumulates. The loss of this fluid and the weight loss by evaporation of moisture do not end as soon as the ice crystals have disappeared, but continue throughout the holding period· before cooking is begun. Thus, thawing weight losses may vary considerably, depending on whether they are computed for the period during which the ice is thawing or for the thawing plus the holding period.
It was desirable to have the initial temperature of all defrosted cuts approximately the same when cooking was started. Hence, most of the cuts defrosted in the room and in water were refrigerated overnight before cooking. Some chops and steaks were cooked immediately after room, water or refrigerator defrosting. The weight lost during thawing, as reported in this study, is based on the weight of the
528
cut when the interior temperature reached 4 ac. and does not include the holding period. Exceptions are the cuts defrosted in the refrigerator, which reached an interior temperature of 4°C. during the night. These cuts were weighed when the attendant arrived in the morning. Weight losses during the cooking are based on the initial weight at the start of cooking. Total weight losses include weight lost during thawing, holding and cooking.
STATISTICS
No tests of significance, of variance, covariance or correlation, were made on the data in this study. The minimum and maximum data as well as the means were studied. Graphs and scatter diagrams were made to aid in interpreting the data. No tests of significance were necessary, however, to show that the time for defrosting varied widely with the different temperatures of the four methods used for defrosting.
The data indicated that the method of defrosting, particularly for the cuts defrosted before cooking, had little effect on the palatability scores. Hence, to conserve space, the data for the cuts defrosted in the refrigerator, at room temperature and in water have been combined and listed in the tables under the heading "Defrosted before cooking." In a few instances, differences appeared to be attributable to the method of, defrosting. These differences will be discussed later under the appropriate headings.
Weight losses, both defrosting and cooking, often showed wide variation.
When the means of palatability scores were the same or practically the same, no tests of significance were necessary. No differences in the results were indicated. Likewise no tests of significance were necessary when the variation in mean scores was great. Interpretation of the data was more difficult when the differences in palatability scores were small. Previous studies have shown that significant differences usually result with a lO-point scale, if there is a whole numerical point or still greater difference between scores. For example, a rating of 8 indicated a preference over a score of 7 for a particular characteristic.
THE SCORE CARD
We were requested to use the score card developed by the Committee on Cooking and Palatability of Meats of the Cooperative Meat Investigations (5). This score card has a 1-7-point scale. To simplify the scoring the intensity
529
characteristics were omitted and only desirability characteristics of aroma, flavor of fat and flavor of lean were scored. The Cooperative Meat Investigations score card is arranged to score the intensity and desirability of both quantity and quality of juice. This necessitafes scoring the juice separately from the meat. Many of the cuts in this study were to be cooked well done. Little juice is obtained from well done cuts. Hence the comparative moistness or juiciness of the meat itself was scored.
The use of the 1-7 -point scale was a mistake. The initial members of the scoring panel were accustomed to a 1-10-point scale and were experienced in using it. When a scorer can detect more than seven degrees of difference in a palatability factor, it leads to poor scoring to try and compress these differences into a seven-point scale. Then too, there is the question of reproducibility by the different scales. Peryam (15) analyzed scoring scales used at the Food Research Division of the Quartermaster Food and Container Institute for the Armed Forces. It was found that a nine-point scale had higher reproducibility with less variations than a seven-point scale. Variability of reproduction of scores was greater with some foods than with others.
ROASTS
All roasts were cooked in open pans. A rack was placed under boned and rolled roasts and under leg roasts, but not under standing rib roasts. The standing rib roasts were held above the drippings by the chine bone and rib ends. Both electricity and gas were used for cooking beef rib roasts. Results with beef roasts indicated no differences in the roasts that could be attributed to the use of gas or electricity. Hence, to save energy and time, since roasts cooked by electricity were cooked in a different part of the Home Economics Building, only gas was used for the veal, lamb and pork roasts.
WEIGHTS OF ROASTS
Because of differences in size of various carcasses, the weights, particularly of the beef and veal roasts, varied considerably. There was less variation in the weight of the pork and lamb roasts than for the beef and veal. The
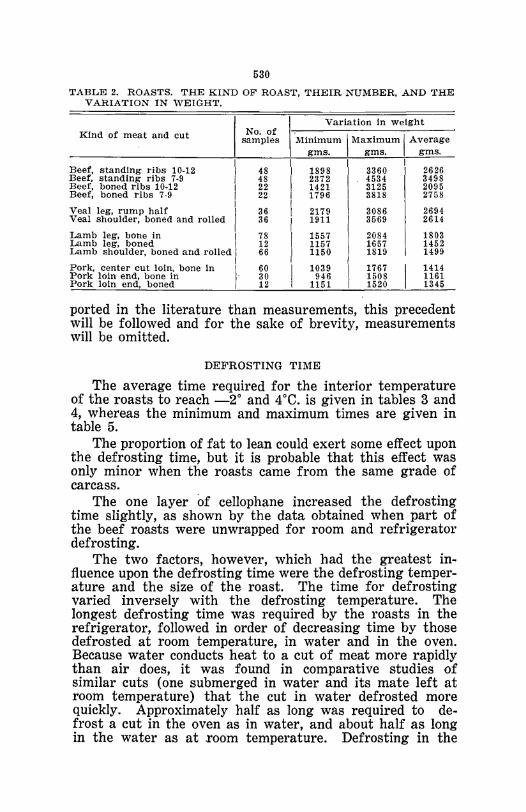
- number of roasts, with the minimum, maximum and average weights are given in table 2. Measurements of the roasts were also taken. The shortest distance to the center of the roasts is a more accurate index of the time required for defrosting and cooking different cuts of meat than the weight of the cut. Since weights are more frequently re-
530
TABLE 2. ROASTS. THE KIND OF ROAST, THEIR NUMBER. AND THE VARIATION IN WEIGHT.
Kind of meat and cut
Beef, standing ribs 10-12 Beef, standing ribs 7·9 Beef, boned ribs 10-12 Beef, boned ribs 7-9
~ I
Veal leg, rump half I Veal shoulder, boned and rolled I Lamb leg, bone in I Lamb leg, boned \ Lamb shoulder, boned and rolled
I
Pork loin end, bone in . Pork. center cut loin. bone in I Pork loin end, boned
No. of samples
48 48 22 22
36 36
78 12 66
60 30 12
Variation In weight
Minimum I Maximum I Average gms. gms. gms.
1898 2372 1421 1796
2179 1911
1557 1157 1150
1039 946
1151
3360 4534 3125 3818
3086 3569
2084 1657 1819
1767 1508 1520
2626 3498 2095 2758
2694 2614
1803 1452 1499
1414 1161 1345
ported in the literature than measurements, this precedent will be followed and for the sake of brevity, measurements will be omitted.
DEFROSTING TIME
The average time required for the interior temperature of the roasts to reach _2° and 4°C. is given in tables 3 and 4, whereas the minimum and maximum times are given in table 5.
The proportion of fat to lean could exert some effect upon the defrosting time, but it is probable that this effect was only minor when the roasts came from the same grade of carcass.
The one layer of cellophane increased the defrosting time slightly, as shown by the data obtained when part of the beef roasts were unwrapped for room and refrigerator defrosting.
The two factors, however, which had the greatest influence upon the defrosting time were the defrosting temperature and the size of the roast. The time for defrosting varied inversely with the defrosting temperature. The longest defrosting time was required by the roasts in the refrigerator, followed in order of decreasing time by those defrosted at room temperature, in water and in the oven. Because water conducts heat to a cut of meat more rapidly than air does, it was found in comparative studies of similar cuts (one submerged in water and its mate left at room temperature) that the cut in water defrosted more quickly. Approximately half as long was required to defrost a cut in the oven as in water, and about half as long in the water as at .room temperature. Defrosting in the
531
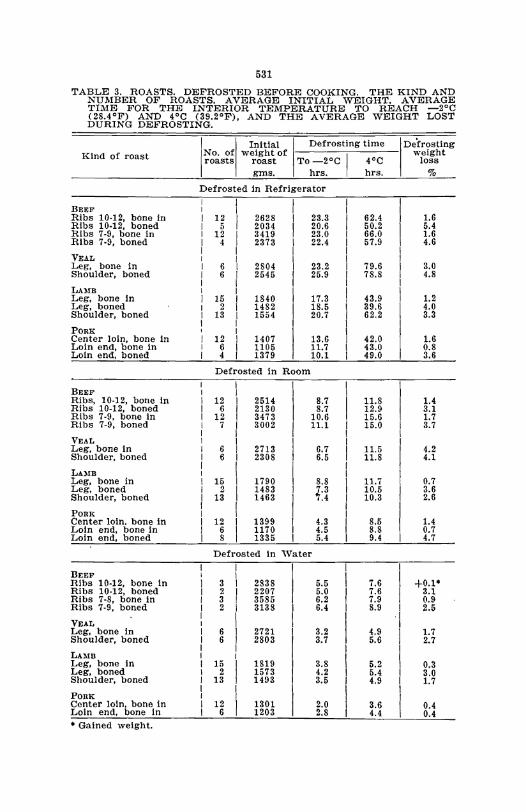
TABLE 3. ROASTS. DEFROSTED BEFORE COOKING. THE KIND AND NUMBER OF ROASTS. AVERAGE INITIAL WEIGHT. AVERAGE TIME FOR THE INTERIOR TEMPERATURE TO REACH -2°C (28.4°F) AND 4°C (39.2°F), AND THE AVERAGE WEIGHT LOST DURING DEFROSTING.
Kind of roast
BEEF Ribs 10·12, bone In Ribs 10.12. boned Ribs 7-9. bone in Ribs 7-9, boned
VEAL Leg, bone In Shoulder, boned
LAMB Leg, bone in Leg. boned Shoulder, boned
PORK Center loin, bone in Loin end. bone in Loin end, boned
BEEF Ribs, 10-12, bone in Ribs 10-12, boned Ribs 7-9, bone In Ribs 7-9, boned
VEAL Leg, bone In Shoulder, boned
LAlIIB Leg, bone in Leg, boned Shoulder, boned
PORK Center loin. bone In Loin end, bone in Loin end, boned
BEEF Ribs 10-12, bone in Ribs 10-12, boned Ribs 7-8, bone in Ribs 7-9, boned
VEAL Leg, bone in Shoulder, boned
LAlIIB Leg, bone in Leg, boned Shoulder, boned
PORK Center loin. bone in Loin end. bone In
• Gained weight.
I I Initial I Defrosting time No. of weight of roasts roast To -2°C 14°C
gms. hrs. hrs.
Defrosted in Refrigerator
12 5
12 4
6 6
15 2
13
12 6 4
2628 2034 3419 2373
2804 2545
1840 1482 1554
1407 1105 1379
Defrosted in Room
12 6
12 7
6 6
15 2
13
12 6 8
2514 2130 3473 3002
2713 2308
1790 1483 1463
1399 1170 1335
23.3 20.6 23.0 22.4
23.2 25.9
17.3 18.5 20.7
13.6 11.7 10.1
8.7 8.7
10.6 11.1
6.7 6.5
8.8 7.3 "1.4
4.3 4.5 5.4
Defrosted In 'Vater
3 2 3 2
6 6
15 2
13
12 6
2838 2207 3585 3138
2721 2803
1819 1573 1493
1301 1203
5.5 5.0 6.2 6.4
3.2 3.7
3.8 4.2 3.5
2.0 2.8
62.4 50.2 66.0 57.9
79.6 78.8
43.9 39.6 62.2
42.0 43.0 49.0
11.8 12.9 15.6 15.0
11.5 11.8
11.7 10.5 10.3
8.5 8.8 9.4
7.6 7.6 7.9 8.9
4.9 5.6
5.2 5.4 4.9
3.6 4.4
I Defrosting
weight loss
%
I '1
I
1.6 5.4 1.6 4.6
3.0 4.8
1.2 4.0 3.3
1.6 0.8 3.6
1.4 3.1 1.7 3.7
4.2 4.1
0.7 3.6 2.6
1.4 0.7 4.7
+0.1· 3.1 0.9 2.5
1.7 2.7
0.3 3.0 1.7
0.4 0.4
532
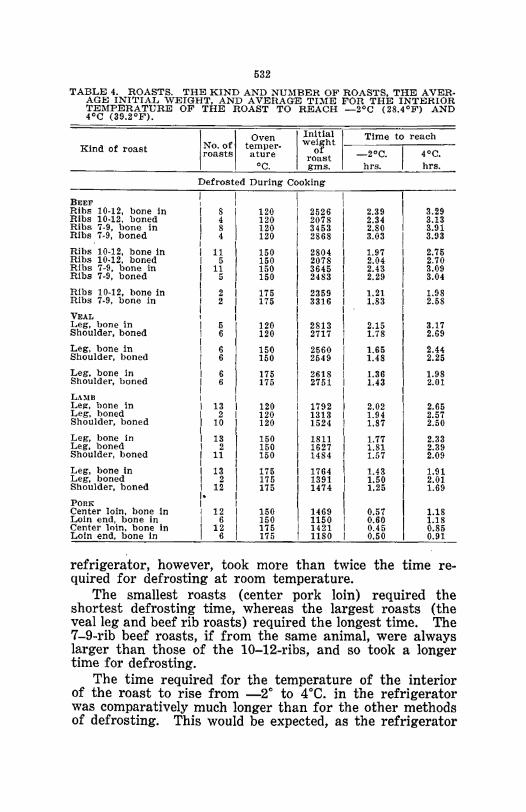
TABLE 4. ROASTS. THE KIND AND NUMBER OF ROASTS, THE AVER· AGE INITIAL WEIGHT, AND AVERAGE TIME FOR THE INTERIOR TEMPERATURE OF THE ROAST TO REACH _2°C (28.4°F) AND 4°C (39.2°F).
Kind of roast
BEEF Ribs 10·12, bone In Ribs 10·12, boned Ribs 7.9, bone in Ribs 7·9, boned
Ribs 10·12, bone in Ribs 10·12, boned Ribs 7·9, bone in Ribs 7·9, boned
Ribs 10·12, bone in Ribs 7·9, bone in
VEAL Leg, bone in Shoulder, boned
Leg, bone in Shoulder, boned
Leg, bone In Shoulder, boned
LAllI! LeII', bone in Leg, boned Shoulder, boned
Leg, bone in Leg, boned Shoulder, boned
Leg, bone In Leg, boned Shoulder, boned
PORK Center loin, bone In Loin end, bone in Center loin, bone in Loin end, bone In
I I Oven No. of temper. roasts ature
°C.
I Initial I weight of
roast gms.
Defrosted During Cooking , I
I I
8 4 8 4
I 1~ , 11
I i , I , ! I , I I
5 6
6 6
6 6
, 13
/, 1~ 13
I Ii I , 13
" 2
12 ,. I I 12
I Ii
120 120 120 120
150 150 150 150
175 175
120 120
150 150
175 175
120 120 120
150 150 150
175 175 175
150 150 175 175
2526 2078 3453 2868
2804 2078 3645 2483
2359 3316
2813 2717
2560 2549
2618 2751
1792 1313 1524
1811 1627 1484
1764 1391 1474
1469 1150 1421 1180
Time to reach
_2°C. 4°C. hrs. hrs.
2.39 2.34 2.80 3.03
1.97 2.04 2.43 2.29
1.21 1.83
2.15 1.78
1.65 1.48
1.36 1.43
2.02 1.94 1.87
1.77 1.81 1.57
1.4:1 1.50 1.25
0.57 0.60 0.45 0.50
3.29 3.13 3.91 3.93
2.75 2.70 3.09 3.04
1.98 2.58
3.17 2.69
2.44 2.25
1.98 2.01
2.65 2.57 2.50
2.33 2.39 2.09
1.91 2.01 1.69
1.18 1.18 0.85 0.91
refrigerator, however, took more than twice the time required for defrosting at room temperature.
The smallest roasts (center pork loin) required the shortest defrosting time, whereas the largest roasts (the veal leg and beef rib roasts) required the longest time. The 7-9-rib beef roasts, if from the same animal, were always larger than those of the lO-12-ribs, and so took a longer time for defrosting.
The time required for the temperature of the interior of the roast to rise from _2° to 4°e. in the refrigerator was comparatively much longer than for the other methods of defrosting. This would be expected, as the refrigerator
533
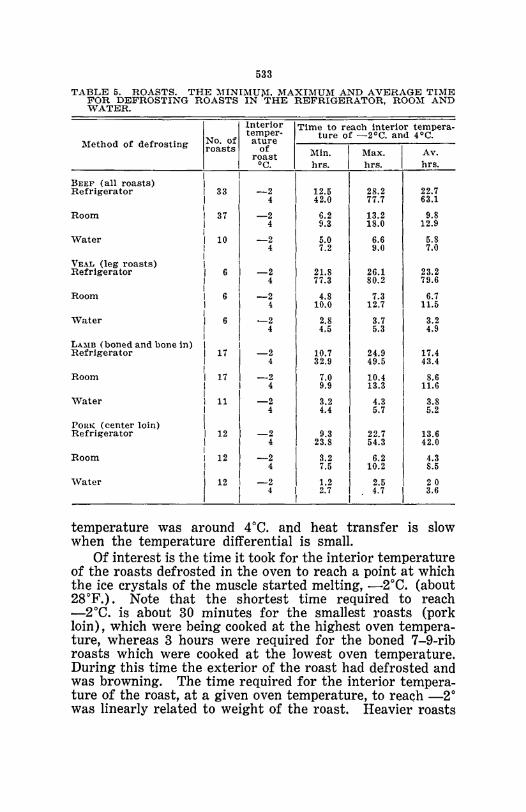
TABLE 5. ROASTS. THE MINIMUj\1. MAXIMUM AND AVERAGE TIME FOR DEFROSTING ROASTS IN THE REFRIGERATOR, ROO:-.r AND WATER.
Interior Time to reach Interior tempera· temper· tUre of -2°C. and 4°C.
Method of defrosting No. of ature roasts of Min.
I Max. I Av. roast
°e. hrs. hrs. hrs. I I I
I BEEF (all roasts) I I I 22.7 Refrigerator I 33 -2 12.5 28.2
I 4 42.0 77.7 63.1 I
I I Room I 37 -2 6.2 13.2 9.8 I 4 9.3 18.0 12.9
'Water 10 -2 5.0 6.6 5.8 4 7.2 9.0 7.0
YEAL (leg roasts) Refrigera tor 6 -2 21.8 26.1 23.2
4 77.3 80.2 79.6
Room 6 -2 4.8 7.3 6.7 4 10.0 12.7 11.5
'Yater 6 -2 2.8 3.7 3.2 4 4.5 5.3 4.9
LA~1B (boned and bone in) Refrigerator 17 -2 10.7 24.9 17.4
4 32.9 49.5 43.4
Room 17 -2 7.0 10.4 8.6 4 9.9 13.3 11.6
'Vater 11 -2 3.2 4.3 3.8 4 4.4 5.7 5.2
POltK (center loin) Refrigerator 12 -2 9.3 22.7 13.6
4 23.8 54.3 42.0
Room 12 -2 3.2 6.2 4.3 4 7.5 10.2 8.5
'Yater 12 -2 1.2 2.5 20 4 2.7 4.7 3.6
temperature was around 4°C. and heat transfer is slow when the temperature differential is small.
Of interest is the time it took for the interior temperature of the roasts defrosted in the oven to reach a point at which the ice crystals of the muscle started melting, _2°C. (about 28°F.). Note that the shortest time required to reach _2°C. is about 30 minutes for the smallest roasts (pork loin), which were being cooked at the highest oven temperature, whereas 3 hours were required for the boned 7-9-rib roasts which were cooked at the lowest oven temperature. During this time the exterior of the roast had defrosted and was browning. The time required for the interior temperature of the roast, at a given oven temperature, to reach _2° was linearly related to weight of the roast. Heavier roasts
534
required a longer defrosting time at a given oven tempera~ ture than the smaller roasts.
Note that for the lamb, veal and pork roasts, table 5, the maximum time for defrosting in water is always shorter than the minimum time for defrosting in the room. In turn the longest time for defrosting in the room is shorter than the minimum time for defrosting in the refrigerator. The above was not always true for the beef roasts defrosted in the room and in water. Since there was a greater variation in the weight of the beef roasts than for those of other types of animals and also more variation in composition (grade), they showed a greater variation in defrosting time. But, when the defrosting time for beef roasts was adjusted to roasts of a common weight, the same relationship held as for the veal, lamb and pork roasts.
APPEARANCE OF ROASTS AFTER DEFROSTING
Defrosting at refrigerator or room temperature did not noticeably affect the appearance of the roasts, but water de~ frosting bleached the color of the muscles. After refri~ geration of the water-thawed roasts, some of the color was regained and no effect of the water defrosting was noticeable in the color of the cooked roasts.
DEFROSTING WEIGHT LOSSES
During defrosting most of the roasts lost weight. The major portion of this loss for wrapped roasts was drip, exuding from the muscles. Some of the loss was water by evaporation. This evaporation was greater for the beef roasts which were unwrapped for defrosting in the refrigerator or in the room than it was for similar roasts which were wrapped. Defrosting weight losses were not determined for the roasts which were thawed in the oven during cooking. The average weight losses during defrosting in the refrigerator, at room temperature and in water are given in table 3. Some roasts defrosted in water gained, others lost weight. If they gained weight, most of the gain was lost during refrigeration before cooking.
Boned roasts lost approximately three times more weight during defrosting than similar non-boned roasts. Boning increased the cut surfaces of the muscles, and the greater drip and evaporation loss for the boned roasts can be attributed to this factor. Ramsbottom and Koonz (16) also found that the amount of drip increased as the cut surface of the muscle was increased.
535
INTERIOR TEMPERATURE OF ROASTS AT START OF COOKING
The temperature of all cuts rose to a lesser or greater extent as they were prepared for cooking. This rise was less for larger cuts. The average interior temperature of frozen roasts which had been stored at -17.SoC. as they went into the oven was: beef _14.3°, veal -12.7°, lamb leg _14.5° and lamb shoulder -15°C. The pork roasts were stored at -23.3°C. and had an average temperature of -15.6°C. at the start of cooking.
When the interior temperature of the roasts defrosted in the room or in water reached 4°C., the temperature near the exterior was much higher. These roasts were refrigerated overnight before cooking. Thus the temperature of all roasts defrosted prior to cooking was approximately that of the refrigerator when their preparation for cooking was started. The average temperature of all these roasts, beef, veal, lamb and pork, was between 40 and 5°C. at the start of cooking.
'rHE COOKING TIME
The time required for cooking was influenced by the oven temperature, how well done the roast was cooked, whether frozen or thawed when cooking was started, and the size of the roast, particularly the distance to the center of the roast. The difference in size and measurements was not a planned variable, but caused variation in cooking time when the sizes of the roasts were dissimilar (table 6).
The cooking time varied inversely with the oven temperature. The cooking time at 120°C. (about 250°F.) was about a third longer for beef ribs than at 150°C. (about 300°F.) provided the roasts were about the same size and were cooked to the same stage of doneness. For beef roasts there was only slight variation between the time for cooking at 150 0 and 175°C. (about 350°F.). Veal roasts required about twice as long at 120 0 as at 150°, and in turn about a third longer at 150° than at 175°. Lamb roasts, if cooked to an interior temperature of 75°C. (about 165°F.) required slightly more than a third longer at 120° than at 150° and slightly less than a third longer at 1500 than at 175°. Pork roasts required about a third longer at 150° than at 175°.
Beef roasts cooked to an interior temperature of 58°C. required less time than similar roasts cooked under the same conditions but to an interior temperature of 75°. Likewise lamb roasts cooked to 67° required less time than those cooked to 75°.
The 7-9 beef rib roasts, if from the same animal, were thicker and heavier than the 10-12-rib roasts. With no
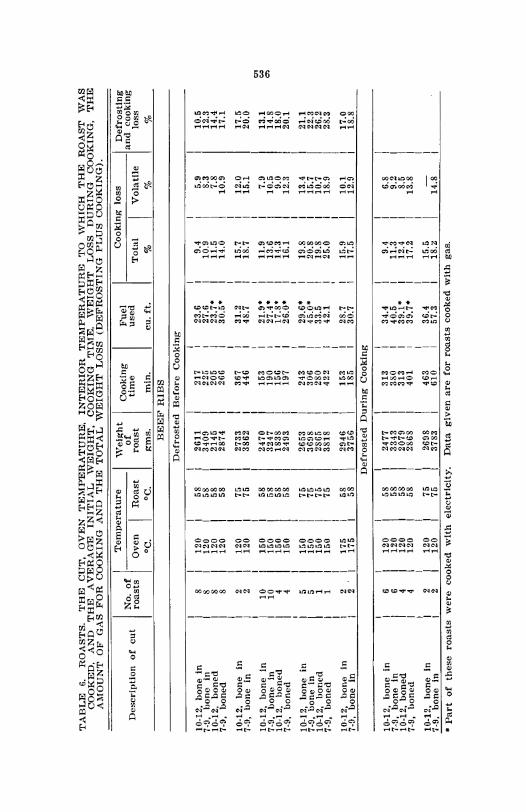
TABLE 6. ROASTS. THE CUT, OVEN TE;\'IPERATURE, INTERIOR TEMPERATURE TO ·WHICH THE ROAST WAS COOKED, AND THE AVERAGE INITIAL WEIGHT, COOKING TIME, 'VEIGHT LOSS DURING COOKING, THE AMOUNT OF GAS FOR COOKING AND THE TOTAL WEIGHT LOSS (DEFROSTING PLUS COOKING).
Description of cut
10·12, bone in 7·9, hone In 10-12. boned 7-9, boned
10-12. bone In 7-9, bone in
10-12, bone in 7-9, bone in 10·12, boned 7-9, boned
10-12, bone in 7-9, bone in 10-12, boned 7·9, boned
10·12, bone in 7-9, bone in
1 0-12, bone in 7-9, bone In 10·12, boned 7-9, boned
10-12. bone In 7-9, bone In
I No. of I roasts
8 8 8 8
2 2
10 10
4 4
5 5 1 1
2 2
6 6 4 4
2 2
Temperature
Oven Roast 0C. °C.
120 120 120 120
120 120
150 150 150 150
150 150 150 150
175 175
120 120 120 120
120 120
58 58 58 58
7G 75
58 58 58 58
75 75 75 75
58 58
58 58 58 58
75 75
"'eight Cooking of time
roast ~ms. min.
BEEF RIBS
Defrosted Before Cooking
2611 3409 2145 2874
2733 3862
2470 3247 1838 2493
2653 3698 2865 3818
2946 3756
217 225 205 266
367 446
153 190 156 197
243 306 280 422
153 185
Defrosted During Cooking
2477 3343 2079 2868
2698 3783
H3 380 313 401
463 610
Fuel used
cu. ft.
23.6 27.6 23.7' 30.5'
31.2 48.7
21.9" 27.4' 17.8' 26.0'
29.6" 45.0' 33.5 42.1
28.7 30.7
34.4 40.5 39.1" 39.7'
36.4 57.3
I Defrosting
I------------.-----------and cooking Total Volatile loss
% % %
Cooking loss
9.4 10.9 11.5 14.0
15.7 18.7
11.9 13.6 14.3 16.1
19.8 20.8 19.8 25.0
15.9 17.5
9.4 11.3 12.4 17.2
15.5 18.~
5.9 8.3 7.8
10.9
12.0 15.1
7.9 10.5
9.0 12.3
13.4 15.7 10.7 18.9
10.1 12.9
6.8 9.2 8.5
13.8
14.8
10.5 12.3 14.4 17.1
17.5 20.0
13.1 14.8 18.0 20.1
21.1 22.3 26.2 28.3
17.0 18.8
• Part of these roasts were cooked with electricity. Data given are for roasts cooked with gas.
<Tr
""" ""
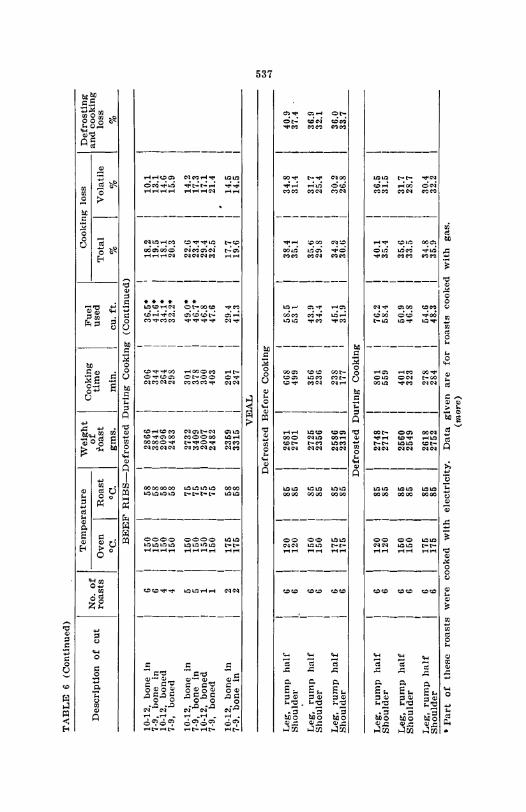
TABLE 6 (Continued)
Temperature
\
Weight \ Cooking Fuel Cooking loss \ Defrosting I No. of of and cooking Description of cut roasts Oven I Roast roast time used Total Volatile loss °C. °C. gms. min. cu. ft. % % %
BEEF RIBS-Defrosted During Cooking (Continued)
I I t I I 10·12, bone In 6 150 I 58
I
2866 I 206 36.5* , 18.2 t 10.1 7·9, bone in 6 150 58 3841 I 344 41.6· 19.5 t 13.1 10·12, boned 4 150 I 58 2096 264 34.1* 18.1 I 14.6 7·9, boned 4 150 68 2483 I 298 32.2· 20.3 t 15.9
I t t 10·12, bone in 5 150 75 2732 I 301 49.0· 22.6 t 14.2 7·9, bone in 5 150 75 3409 I 378 46.7· 23.4 I 17.3 10·12, boned 1 150 I 75 2007 300 46.8 29.4 I 17.1 7·9, boned 1 150 75 2482 I 403 47.6 32.5 21.4
I t I I • 10-12, bone in 2 175 58 I 2359 I 201 29.4 17.7 t 14.5 7-9, bone in 2 175 58 3315 t 247 41.3 19.6 t 14.5
VEAL en
Defrosted Before Cooking e<o
"" t t I Leg, ruml) half
!. 6 120 85 I 2681 668 I 58.5 38.4 34.8 40.9
Shouldel' 6 120 85 2701 499 I 531 35.1 31.4 37.4 I I
Leg, rump half 6 150 85 I 2725 356 I 43.9 35.6 31.7 36.9 Shoulder I 6 150 85 I 2356 236 34.4 29.8 25.4 32.1
I I I Leg, rump half I 6 175 85 I 2586 238 I 46.1 34.2 30.2 36.0 Shoulder 6 175 85 2319 177 I 31.9 30.6 26.8 33.7
Defrosted During Cooking
I Leg, rump half 6 120 85 2748 I 801 76.2 40.1 36.5 Shoulder 6 120 85 2717 559 58.4 35.4 31.5
I Leg, rump half 6 150 85 2560 I 401 50.9 35.6 31.7 Shoulder 6 150 85 2549 I 323 46.8 33.5 28.7
6 I
34.8 30.4 Leg, rump half 175 85 2618 I 278 54.6 Shoulder 6 175 85 2752 I 284 48.3 35.9 32.2
• Part of these roasts were cooked with electricity. Data given are for roasts cooked with gas. (more)
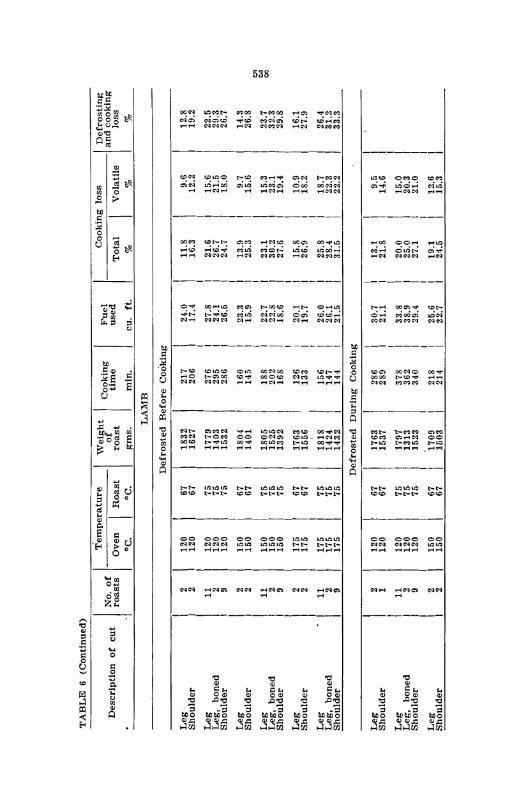
TABLE 6 (Continued)
Description of cut .1
Leg ShoUlder
Leg Leg, boned Shoulder
Leg Shoulder
Leg Leg, boned SI:lOulder
Leg Shoulder
Leg Leg, boned Shoulder
Leg Shoulder
Leg Leg, boned Shoulder
Leg Shoulder
No. of roasts
2 2
11 2 9
2 2
11 2 9
2 2
11 2 9
2 1
11 2 9
2 2
Temperature
Oven Roast 0C. cC.
120 120
120 120 120
160 150
150 150 150
175 175
175 175 175
120 120
120 120 120
150 150
67 67
75 75 75
67 67
75 75 75
67 67
75 75 75
67 67
75 75 75
67 67
'Weight Cooking of time
roast gms. min.
LAMB
Defrosted Before Cooking
1832 1627
1779 1403 1532
1804 1401
1805 1525 1392
1763 1556
1818 1424 1432
Defrosted
1763 1537
1791 1313 1523
1709 1503
217 206
276 295 286
160 145
188 202 168
126 133
156 147 144
During Cooking
286 289
378 362 340
218 214
Fuel used
cu. ft.
2~0 1~4
27.8 24.1 2L5
23.3 1L9
2L7 22.8 1L6
2~1 19.7
26.0 26.1 21.5
30.7 21.1
33.8 38.9 29.4
25.6 22.7
Cookin!!: loss
Total %
11.8 16.3
21.6 26.7 24.7
13.9 25.3
23.1 30.2 27.6
15.8 26.9
25.8 28.4 31.5
13.1 21.8
20.0 25.0 27.1
19.1 24.5
Volatile
%
9.6 12.2
15.6 21.5 18.0
9.7 15.6
15.3 23.1 19.4
10.9 18.2
18.7 22.3 22.2
9.5 14.6
15.0 20.3 21.0
12.6 15.3
1 Defrosting
and cooking loss
%
12.8 19.2
22.5 29.3 26.7
14.3 26.8
23.7 32.3 29.8
16.1 27.9
26.4 31.2 33.3
Q1 ... ao
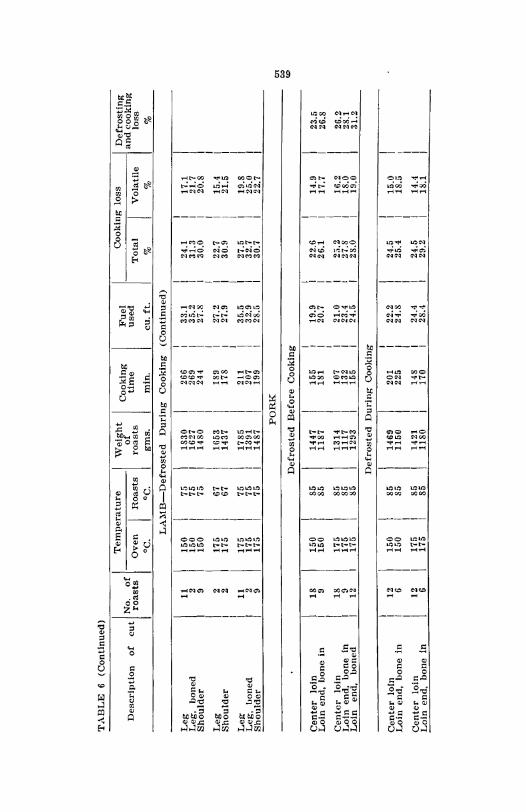
TABLE 6 (Continued)
. . No. of of. g and cookmg I I Temperature I Weight I Cookln Fuel Cooking loss I Defrosti.ng DescrIptIon of cut roasts Oven I Roasts roasts tIme used Total Volatile loss
DC. DC. gms. min. cu. ft. % % %
LA:\lB-Defrostcd During Cooking (Continued)
I Leg 11 150 75 1830 266 I 33.1 24.1 17.1 Leg, boned 2 150 75 1627 269 I 35.2 31.3 21.7 Shoulder 9 150 75 1480 244 I 27.8 30.0 20.8
I Leg 2 175 67 1653 189 I 27.2 22.7 15.4 Shoulder 2 175 67 1437 178 I 27.9 30.9 21.5
I Leg 11 175 75 1785 211 I 35.5 27.5 19.8 Leg, boned 2 175 75 1391 207 I 32.9 32.7 25.0 Shoulder 9 175 75 1487 199 I 28.5 30.7 22.7
PORK ~
"" Defrosted Before Cooking ""
Center loin 18 150 85 1447 155 19.9 22.6 14.9 23.5 Loin end,bone In 9 150 85 1187 181 20.7 26.1 17.7 ~6.8
Center loin 18 175 85 1314 107 21.0 25.2 16.2 262 Loin end, bone in 9 175 85 1117 132 23.4 27.8 18.0 28:1 Loin end, boned 12 175 85 1293 155 24.5 28.0 19.0 31.2
Defrosted During Cooking
I Center loin 12 150 85 1469 201 I 22.2 24.5 15.0 Loin end, bone In 6 150 85 1150 225 I 24.8 25.4 18.5
I Center loin 12 175 85 1421 148 I 24.4 24.5 14.4 Loin end. bone In 6 175 85 1180 170 I 28.4 29.2 18.1
540
exceptions the groups of 7-9-rib roasts required more time for cooking than the 10-12-rib roasts, if cooked to the same stage of doneness and at the same oven temperature. Although the boned and rolled shoulder veal roasts were about the same weight as the leg roasts, the diameter of the shoulder roasts was slightly less than the thickness of the leg roasts, hence a shorter cooking time was required for the shoulder roasts. The length and width of the lamb legs varied considerably, but only the thickness was related to the cooking time. The thicker the roast, the longer the cooking time.
Roasts which were still frozen when cooking was started required a longer time for cooking than those which had been thawed, provided the distance to the center of the roast was about the same and the same oven temperature was used, with one exception. The group of beef roasts boned and cooked at 150 0 c. to an interior temperature of 75°C., required longer for the thawed than for the frozen roast (table 6). This was accounted for by the small number of roasts used in this group (one defrosted before and one during cooking) and by the fact that the thawed roast was much heavier than the frozen one. The average increase in time of cooking (for all 41 groups of roasts) of the frozen over the thawed roasts was about 36 percent, although the variation for individual groups was from -4.5 to 80.8 percent.
FUEL FOR COOKING
Several factors influenced the fuel requirement for cooking the roasts. Some of these factors were: the oven used, the initial internal temperature of the roast, the size of the roast, the degree of doneness to which the roast was cooked, the cooking time and the oven temperature. All the figures for the amount of fuel needed for cooking (table 6) are for the gas-cooked roasts. Only 32 beef roasts were cooked with electricity.
Five ovens were used for cooking the roasts. Four of the ovens were the same size and had similar insulation. The placement of these four ovens was in two banks, with one oven above the other. The fifth oven was smaller and better insulated than the others. If the same oven temperature was maintained, the small oven required less fuel than the other four ovens. The upper oven of a bank needed less fuel than the oven directly below it. The requirement for the upper oven was still less if the lower oven was being used simultaneously with the upper one. More fuel was required by the lower oven on windy days when there were
541
drafts on the floor than 01) days when there was relatively little wind. There were 46 beef rib roasts cooked in the upper ovens, 46 in the lower ones. With one exception the same oven temperatures were used for roasts of both groups. The average cubic feet of gas used in the upper ovens was 29.6, for the lower ones 37.7.
All 41 of the groups of roasts which were frozen when cooking was started required more fuel than the corresponding groups which were thawed prior to cooking. This result was obtained in spite of the fact that the size of the roast and the oven used were disregarded in the averages.
The size of the roast or the shortest distance to the center of the roast affects the cooking time of all roasts. Scatter diagrams were made which showed this relationship, but otherwise no attempt was made to segregate these data.
The roasts cooked to an interior temperature of 580
and 67° required less fuel than similar roasts cooked to 75°C., if the same oven temperature was used.
The amount of fuel required was linearly related to the cooking time, if the same oven temperature was used for similar roasts.
Oven temperatures of 120°, 150° and 175°C. were" used for beef, veal and lamb roasts, but only 150° and 175° were used for pork roasts. More fuel was required for similar roasts cooked at 120° than at 150°, provided the roasts were cooked to the same stage of doneness. With these two oven temperatures the time required for cooking at 120 0 had greater influence than maintenance of the oven temperature. A longer cooking time was required for roasts at 120° than for roasts at 150°. On the other hand, more gas was required to cook the roasts at 175° than at 150° in spite of the fact that the cooking time was shorter at 175° than at 150°C. Here maintenance of the higher temperature was the influential factor in determining the amount of fuel needed.
The average amount of fuel needed for the 32 roasts cooked in electrically heated ovens was 2.41 kilowatt-ho·urs.
COOKING WEIGHT LOSSES OF ROASTS
Heavy weight losses are undesirable since they result in a smaller number of servings from the cooked meat. The total and volatile weight losses are given in table 6. The last column (for roasts thawed prior to cooking) gives the total weight losses (defrosting, holding and cooking).
Factors affecting the extent of the weight loss during cooking were: whether the roast was frozen or thawed at the start of cooking, the stage of doneness, the cooking
542
time, the oven temperature, whether the roast was boned or not boned, the surface area (particularly the cut surface of muscles), and the composition of the roast. The effect of some of these factors is readily evident by a study of the data in table 6 or in the detailed data in the reports sent to the National Live Stock and Meat Board. It is more difficult to segregate the results for other factors.
FROZEN OR THAWED
It is well to recall that the average cooking time for roasts which were frozen when cooking was started was about a third longer than for roasts cooked under similar conditions but thawed prior to cooking. Hence, it might be stated offhand that the frozen roasts would have greater weight losses during cooking than the thawed ones. A study of the data indicates that the question cannot be answered readily.
Half of the roasts of veal, lamb and pork were defrosted during cooking, the other half prior to cooking. Of the 140 beef rib roasts 60 were defrosted during cooking. Beef was the first meat cooked. From the data obtained, it appeared that little or no difference in palatability of these roasts could be attributed to the method of defrosting. Data are reported in table 6 for 41 groups of roasts defrosted both before and during cooking. In 31 of these groups the cooking weight loss was greater for the roasts which were still frozen when cooking was started, but opposite findings resulted with the other 10 groups. Other work in this laboratory has shown that when thawed or fresh paired roasts were cooked alike, except for the initial temperature of the roasts, the roast with the lower temperature at the start of cooking required a longer time for cooking and had greater weight losses during cooking than the roast with the higher initial interior temperature.
In this connection it is interesting to study the data for the paired lamb leg roasts; one roast of each pair was thawed, the other frozen when cooking was started. Otherwise the two roasts of a pair were treated alike. This unit with paired lamb leg roasts was planned to answer some puzzling questions indicated by the data from the pork and beef roast studies.
In this unit with lamb roasts, as with other paired cuts, the paired muscles (right and left from the same animal) were similar as to age of the animal, the breed, the effect of previous feeding, the composition of the muscle, the surrounding fatty tissues, the ash content, the pH values, the behavior of the colloidal proteins in loss of or binding
543
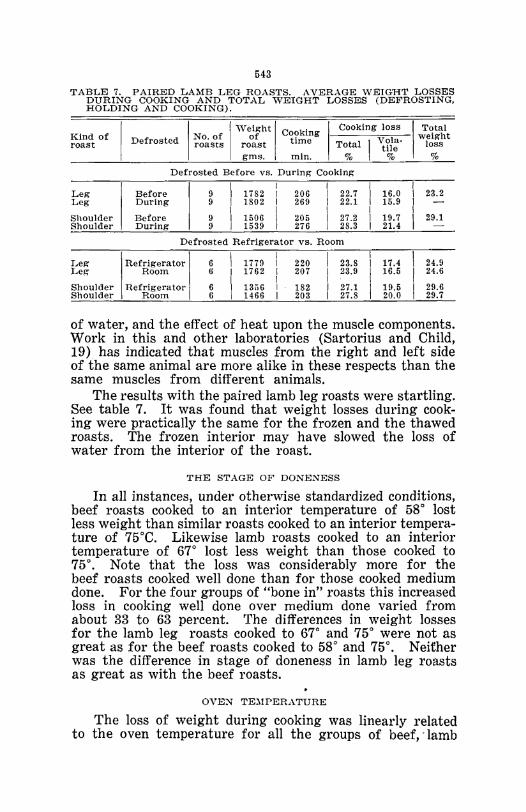
TABLE 7. PAIRED LAMB LEG ROASTS. AVERAGE WEIGHT LOSSES DURING COOKING AND TOTAL WEIGHT LOSSES (DEFROSTING. HOLDING AND COOKING).
Kind of roast
Leg Leg
Shoulder Shoulder
Leg Le~
Shoulder Shoulder
I No. of I W~fht I Co?king I Cooking loss I ,;e~~1;t Defrosted roasts roast tll~e Total 1 vSf:- loss
gms. mm. % % %
Defrosted Before Vs. Durin~ Cooking
\ I I I I
Before 9 1782 I 206 I 22.7 I 16.0 I 23.2 During 9 I 1802 I 269 I 22.1 I 15.9 I -
I I I I I Before 9 I 1506 I 205 I 27.2 I 19.7 I 29.1 During 9 I 1539 I 276 I 28.3 I 21.4 -
Defrosted Refrigerator VS. Room
I I I I I Refrigerator 6 I 1779 I 220 I 23.8 I 17.4 I 24.9
Room 6 I 1762 I 207 I 23.9 I 16.5 I 24.6
I I I I I
Refrigera tor 6 13;;6 I 182 I 27.1 I 19.5 I 29.6 Room 6 1466 I 203 I 27.8 I 20.0 I 29.7
of water, and the effect of heat upon the muscle components. Work in this and other laboratories (Sartorius and Child, 19) has indicated that muscles from the right and left side of the same animal are more alike in these respects than the same muscles from different animals.
The results with the paired lamb leg roasts were startling. See table 7. It was found that weight losses during cooking were practically the same for the frozen and the thawed roasts. The frozen interior may have slowed the loss of water from the interior of the roast.
THE STAGE OF DONE""ESS
In all instances, under otherwise standardized conditions, beef roasts cooked to an interior temperature of 58° lost less weight than similar roasts cooked to an interior temperature of 75°C. Likewise lamb roasts cooked to an interior temperature of 67° lost less weight than those cooked to 75°. Note that the loss was considerably more for the beef roasts cooked well done than for those cooked medium done. For the four groups of "bone in" roasts this increased loss in cooking well done over medium done varied from about 33 to 63 percent. The differences in weight losses for the lamb leg roasts cooked to 67° and 75° were not as great as for the beef roasts cooked to 58° and 75°. Neither was the difference in stage of doneness in lamb leg roasts as great as with the beef roasts.
OVE"" TE~lPERATURE
The loss of weight during cooking was linearly related to the oven temperature for all the groups of beef, . lamb
~44
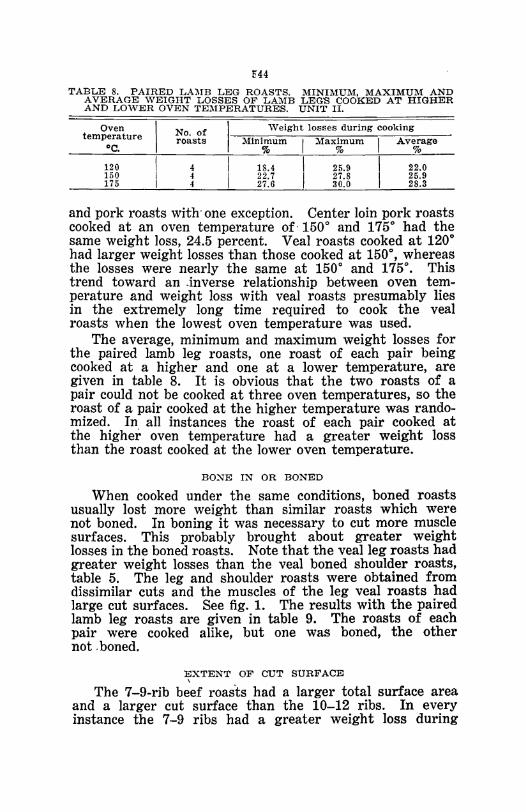
TABLE 8. PAIRED LAMB LEG ROASTS. MINIMUM, MAXIMUM AND AVERAGE WEIGHT LOSSES OF LAMB LEG'S COOKED AT HIGHER AND LOWER OVEN TEMPERATURES. UNIT II.
Oven No. of Weight losses during cooking temperature roasts Minimum Maximum Average
°C. $ % %
120 4 18.4 25.9 22.0 150 4 22.7 27.8 25.9 175 4 27.6 30.0 28.3
and pork roasts with' one exception. Center loin pork roasts cooked at an oven temperature of' 150· and 1750 had the same weight loss, 24.5 percent. Veal roasts cooked at 1200
had larger weight losses than those cooked at 1500, whereas
the losses were nearly the same at 150· and 175·. This trend toward an .inverse relationship between oven temM perature and weight loss with veal roasts presumably lies in the extremely long time required to cook the veal roasts when the lowest oven temperature was used.
The average, minimum and maximum weight losses for the paired lamb leg roasts, one roast of each pair being cooked at a higher and one at a lower temperature, are given in table 8. It is obvious that the two roasts of a pair could not be cooked at three oven temperatures, so the roast of a pair cooked at the higher temperature was randOM mized. In all instances the roast of each pair cooked at the higher oven temperature had a greater weight loss than the roast cooked at the lower oven temperature.
BO~E IN OR BONED
When cooked under the same conditions, boned roasts usually lost more weight than similar roasts which were not boned. In boning it was necessary to cut more muscle surfaces. This probably brought about greater weight losses in the boned roasts. Note that the veal leg roasts had greater weight losses than the veal boned shoulder roasts, table 5. The leg and shoulder roasts were obtained from dissimilar cuts and the muscles of the leg veal roasts had large cut surfaces. See fig. 1. The results with the paired lamb leg roasts are given in table 9. The roasts of each pair were cooked alike, but one was boned, the other not .boned.
EXTENT OF CUT SURFACE \
The 7-9-rib beef roasts had a larger total surface area and a larger cut surface than the 10-12 ribs. In every instance the 7-9 ribs had a greater weight loss during
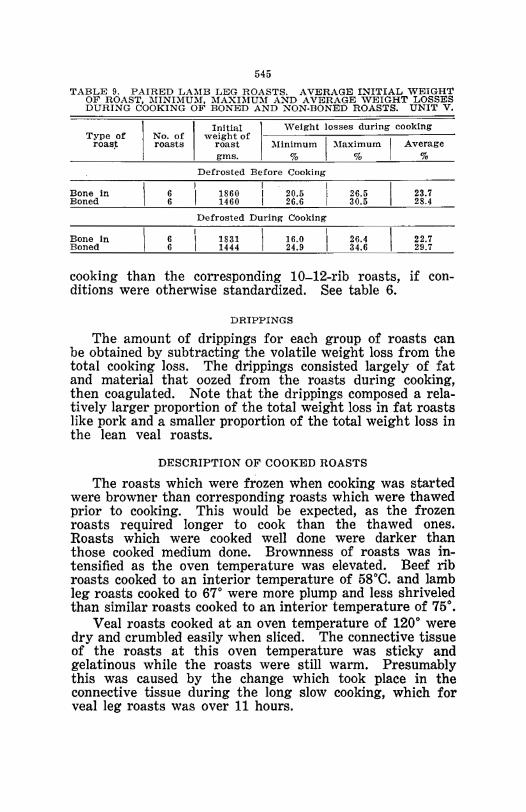
545
TABLE 9. PAIRED LA~IB LEG ROASTS. AVERAGE INITIAL WEIGHT OF ROAST, MINIMUM, MAXIl\IU~1 AND AVERAGE WEIGHT LOSSES DURING COOKING OF BONED AND NON·BONED ROASTS. UNIT V.
Type of roas~
Bone in Boned
Bone In Boned
I Initial I Weight losses during cooking No. of weight of I roasts roast l\linlmum ~Iaxlmum I Average
gms. % % %
6 6
I 6 I 6 I
Defrosted Before Cooking
1860 20.6 1460 26.6
Defrosted During' Cooking
I 1831 16.0 I 1444 24.9 I
26.5 30.5
26.4 34.6
23.7 28.4
22.7 29.7
cooking than the corresponding 10-12-rib roasts, if conditions were otherwise standardized. See table 6.
DRIPPINGS
The amount of drippings for each group of roasts can be obtained by subtracting the volatile weight loss from the total cooking loss. The drippings consisted largely of fat and material that oozed from the roasts during cooking, then coagulated. Note that the drippings composed a relatively larger proportion of the total weight loss in fat roasts like pork and a smaller proportion of the total weight loss in the lean veal roasts.
DESCRIPTION OF COOKED ROASTS
The roasts which were frozen when cooking was started were browner than corresponding roasts which were thawed prior to cooking. This would be expected, as the frozen roasts required longer to cook than the thawed ones. Roasts which were cooked well done were darker than those cooked medium done. Brownness of roasts was intensified as the oven temperature was elevated. Beef rib roasts cooked to an interior temperature of 58°C. and lamb leg roasts cooked to 67° were more plump and less shriveled than similar roasts cooked to an interior temperature of 75°.
Veal roasts cooked at an oven temperature of 120· were dry and crumbled easily when sliced. The connective tissue of the roasts at this oven temperature was sticky and gelatinous while the roasts were still warm. Presumably this was caused by the change which took place in the connective tissue during the long slow cooking, which for veal leg roasts was over 11 hours.
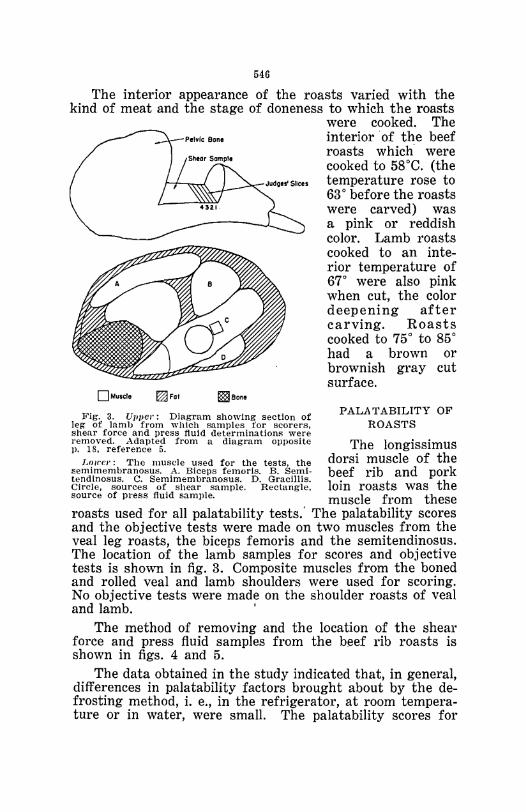
546
The interior appearance of the roasts varied with the kind of meat and the stage of doneness to which the roasts
Pelylc Bone
were cooked. The interior of the beef roasts which were cooked to 58°C. (the
Judg.s'SII... temperature rose to
DMuscle [i] Fat ~BDn.
Fig. 3. UlltJe,': Diagram showing section of le~ of lamb from which samples for scorers, shear force and press fluid determinations were
63° before the roasts were carved) was a pink or reddish color. Lamb roasts cooked to an interior temperature of 67° were also pink when cut, the color deepening after carving. Roasts cooked to 75° to 85° had a brown or brownish gray cut surface.
P ALA T ABILITY OF ROASTS
removed. Adapted from a diagram opposite The longissimus [l. 18, reference 5.
J,owC/': The muscle used for the tests, the dorsi muscle of the semimembrano,ms. A. Biceps femoris. B. Semi· beef rib and pork tendinosus. C. Semimembranosus. D. Gracillis. Circle, sourCeS of shear sample. Rectangle, loin roasts was the source of press fluid sample. muscle from these roasts used for all palatability tests.' The palatability scores and the objective tests were made on two muscles from the veal leg roasts, the biceps femoris and the semitendinosus. The location of the lamb samples for scores and objective tests is shown in fig. 3. Composite muscles from the boned and rolled veal and lamb shoulders were used for scoring. No objective tests were made on the shoulder roasts of veal and lamb. .
The method of removing and the location of the shear force and press fluid samples from the beef rib roasts is shown in figs. 4 and 5.
The data obtained in the study indicated that, in general, differences in palatability factors brought about by the defrosting method, i. e., in the refrigerator, at room temperature or in water, were small. The palatability scores for
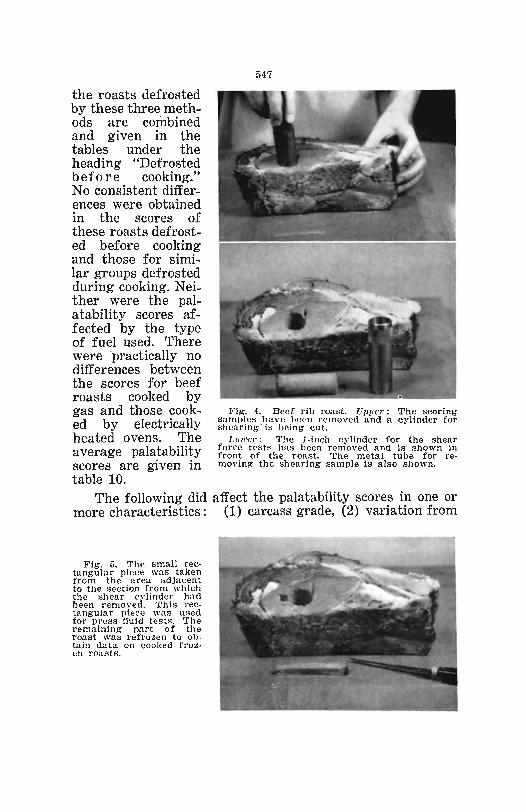
the roasts defrosted by these three methods are combined and given in the tables under the heading "Defrosted before cooking." No consistent differences were obtained in the scores of these roasts defrosted before cooking and those for similar groups defrosted during cooking. Neither were the palatability scores affected by the type of fuel used. There were ·practically no differences between the scores for beef roasts cooked by gas and those cooked by electrically heated ovens. The average palatability scores are given in table 10.
547
Fig. 4. Bee:( rib roast. Up/Ie,.: The scoring samples have been removed and a cylinder for shearing· is being cut.
LOlrel·: The I-inch cylinder for the shear force tests has been removed and Is shown in front of the roast. The metal tube for removing the shearing sample is also shown.
The following did affect the palatability scores in one or more characteristics: (1) carcass grade, (2) variation from
Fig. 5. The small reCtangular piece was taken from the area adjacent to the section from which the shear cylinder had been removed. This rectangular piece was used for press fluid teRts. The remaining part of the roast ,,~as refrozen to obtain data on cooked frozen roasts.
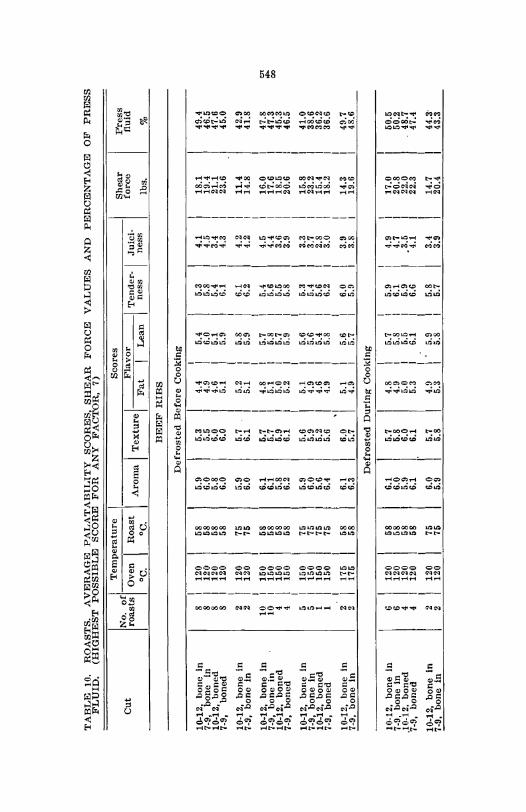
TABLE 10. ROASTS. AVERAGE PALATABILITY SCORES, SHEAR FORCE VALUES AND PERCENTAGE OF PRESS FLUID. (HIGHEST POSSIBLE SCORE FOR ANY FACTOR, 7)
I I Temperature I Scores Shear Press Cut ~gasti °o~.n I R~~~t Aroma I Texture I Flavor I Tender-' Juici- force fluid
Fat Lean ness ness Ibs. %
BEEF RIBS
Defrosted Before Cooking
I I 10-12, bone in 8 120 58 5.9 5.3 4.4 I 5.4 5.3 4.1 18.1 49.4 7-9, bone in 8 120 58 6.0 5.5 I 4.9 I 6.0 5.8 4.5 19.4 46.5 10-12, boned 8 120 58 5.8 6.0 I 4.6 I 5.1 5.4 3.4 21.1 47.6 7-9, boned 8 120 58 6.0 6.0 I 5.1 I 5.9 6.1 4.3 23.6 45.0
10-12, bone in 2 120 75 5.9 5.7 I 5.2 I
5.8 6.1 4.2 11.4 42.9 7 -9, bone In 2 120 75 6.0 6.1 I 5.1 5.9 6.2 4.2 14_8 41.8
1 l(}-12, bone in 10 150 58 6.1 5.7 1 4.8 5.7 5.4 4.5 16.0 47.8 "" 7-9, bone in 10 150 58 6.1 5.7 I 5.1 5.8 5.6 4.4 17.6 47.3 01>0-
10-12, boned 4 150 58 5.8 5.9 I 5.0 5.7 5.5 3.6 18.5 45.3 00
7-9, boned 4 150 58 6.2 6.1 I 5.2 5.9 5.8 3.9 20.6 46.5
10-12, bone In 5 150 75 5.9 5.6 I 5.1 5.6 5.3 3.3 15.8 41.0 7·9, bone In 5 150 75 6.0 5.9 4.9 5.6 5.4 3.7 23.2 38.6 10-12, boned 1 150 75 5.6 5.2 I 4.6 5.4 5.6 2.8 15.4 36.2 7·9, boned 1 150 75 6.4 5.6 I 4.9 5.8 6.2 3.0 18.2 36.6
'I 1 0-12, bone in 2 175 58 6.1 6.0 I 5.1 5.6 6.0 3.9 14.3 49.7 7-9, bone in 2 175 58 6.3 5.7 4.9 5.7 5.9 3.8 19.6 48.6
Defrosted During Cooking
I I 10-12, bone In 6 120 58 6.1 5.7
I 4.8 I 5.7 5.9 4.9 17.0 50.5
7-9, bone In 6 120 58 6.0 5.8 4.9 I 5.8 6.1 4.7 20.8 50.2 .10-12, boned 4 120 58 5.9 6.0 5.0 1 5.5 5.9 .3.5 22.0 48.7 7-9, boned 4 120 58 6.1 6.1 5.3 I 6.1 6.6 4.1 22.3 47.4
I I 10-12, bone in 2 120 75 6.0 5.7 I 4.9 I' 5.9 5.8 3.4 14.7 44.3' 7-9, bone in 2 120 75 5.9 5.8 5.3 I 5.8 5.7 3.9 20.4 43.3
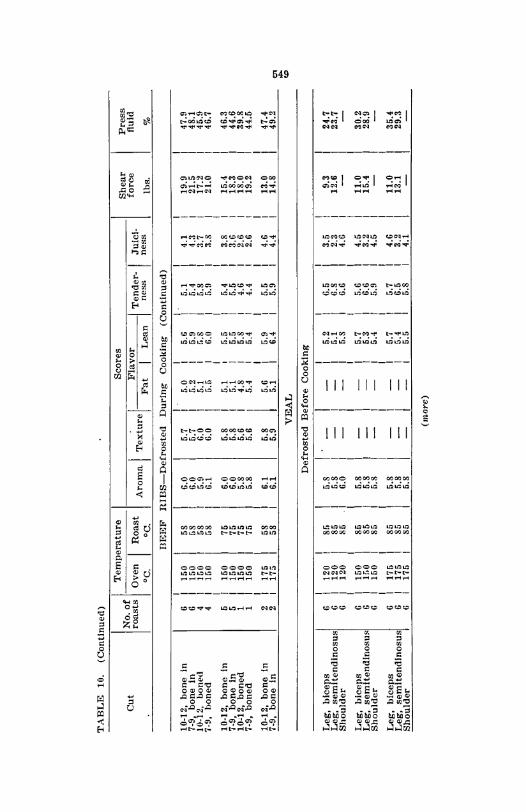
TABLE 10. (Continued)
I I Temperature I Scores Shear Press Cut ~~·s~; °o\~.n I R~~~t Aroma I Texture I Flavor I Tender-I Juici- force fluid
Fat Lean ness ness Ibs. %
BEEF RIBS-Defrosted During Cooking (Continued)
I I 10-12, bone in 6 150 58 6.0 5.7 I 5.0 5.6 I 5.1 4.1 19.9 47.9 7-9, bone in 6 150 58 6.0 5.7 5.2 5.9 I 5.4 4.3 21.5 48.1 10-12, boned <\ 150 58 5.9 6.0 I 5.1 fi..S I fi.8 3.7 17.2 45.9 7·9, boned 4 150 58 6.1 6.0 I G.G 6.1) I 5.9 3.8 21.0 46.7
I I 46.3 10-12, bone in 6 150 75 6.0 6.8 I 5.1 5.5 I 5.4 3.8 15.4
7·9, bone In 5 150 75 6.0 6.8 I 5.1 5.5 I 5.5 3.6 18.3 44.6 10'12, boned 1 150 75 5.8 6.6 I 4.8 5.8 I 4.6 2.6 18.0 39.8 7-9, boned 1 150 75 5.8 5.6 I 5.4 5.4 I 4.4 2.6 19.2 44.5
10-12, bone In 2 175 58 I
6.1 6.8 I 5.6 I
5.9 I 5.5 4.6 13.0 47.4 7-9, bone In 2 175 58 6.1 5.9 I 5.1 6.4 I 5.9 4.4 14.8 49.2 Cl1
"'-VEAL .."
Defrosted Before Cooking
I I Leg, biceps 6 120 85 5.8 I 5.2 6.5 3.6 9.3 24.7 Leg, semitendinosus G 120 85 I 5.8 I 5.1 6.S 2.3 12.6 23.7 Shoulder G 120 85 I G.O I 5.8 6.G 4.G
\ I
Leg, bleeps G 150 85 5.8 I 5.7 5.6 4.5 11.0 30.2 Leg, sem!tend!nosu~ 6 1[,0 85 I 5.8 I 0.3 6.6 3.2 15.4 28.9 Shoulder 6 150 85 I 5.8 I 5.4 5.9 4.5
\ I
Leg, biceps 6 175 85 5.8 I 5.7 5.7 4.G 11.0 35.4 Leg, semitendinosus 6 175 85 I 5.8 I 5.4 6.5 3.2 13.1 29.3 Shoulder 6 175 86 I 5.8 I 5.5 6.8 4.1
(llwre)
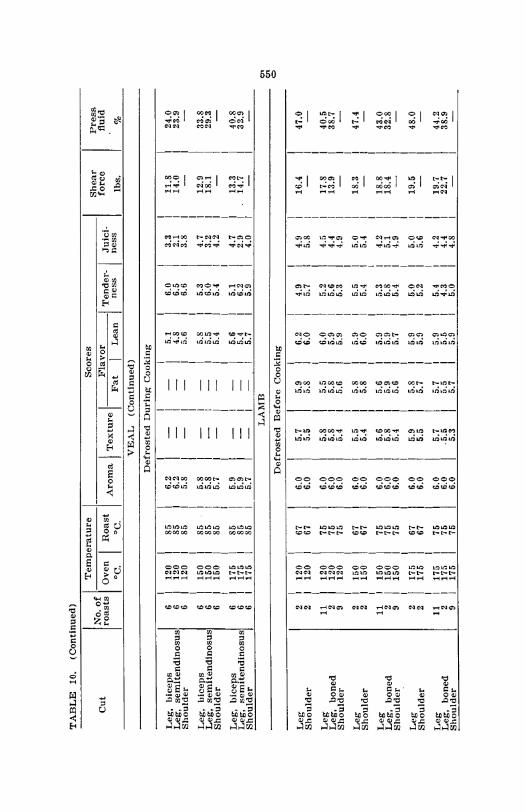
TABLE 10. (Continued)
I I Temperature Scores Shear Press No. of Cut roasts Oven Roast
Aroma I Texture I Flavor I Tender-i Juici- force fluid
0C. 0C. Fat Lean ness ness Ibs. % VEAL (Continued)
Defrosted During Cooking
Leg, biceps 6 120 85 6.2 5.1 6.0 3.3 11.8 24.0 Leg, semitendinosus 6 120 85 6.2 4.8 6.5 2.1 14.0 23.9 Shoulder 6 120 85 5.8 5.6 6.6 3.8
Leg, biceps 6 150 85 5.8 5.8 5.3 4.7 12.9 33.8 Leg, semitendinosus 6 150 85 5.8 5.5 6.0 3.2 18.1 29.3 Shoulder 6 150 85 5.7 5.4 5.4 4.2
Leg, biceps 6 175 85 5.9 5.6 5.1 4.7 13.3 40.8 Leg, semitendinosus 6 175 85 5.9 5.4 6.2 2.9 14.7 32.9 Shoulder 6 175 85 5.7 5.7 5.9 4.0
LAMB ." ."
Defrosted Before Cooking <:>
Leg 2 120 67 6.0 5.7 5.9 6.2 4.9 4.9 16.4 47.0 Shoulder 2 120 67 6.0 5.5 5.8 6.0 5.7 5.8
Leg 11 120 75 6.0 5.8 5.5 6.0 5.2 4.5 17.8 40.5 Leg, boned 2 120 75 6.0 1i.8 5.8 5.9 5.6 4.4 13.9 38.7 Shoulder 9 120 75 6.0 5.4 5.6 5.9 5.3 4.9
Leg 2 150 67 6.0 5.5 5.8 5.9 5.5 5.0 18.3 47.4 Shoulder 2 150 67 6.0 5.4 5.8 6.0 5.4 5.4
Leg 11 150 75 6.0 5.6 5.6 5.9 5.3 4.2 18.8 43.0 Leg, boned 2 150 75 6.0 5.8 5.9 5.9 5.8 5.1 18.4 32.8 Shoulder 9 150 75 6.0 5.4 5.6 5.7 5.4 4.9
Leg 2 175 67 6.0 5.9 5.8 5.9 5.0 Ii.O 19.5 48.0 Shoulder 2 175 67 6.0 1i.6 6.7 5.9 5.2 5.6
Leg 11 175 75 6.0 5.7 5.7 5.9 5.4 4.2 19.7 44.2 Leg, boned 2 175 75 6.0 .6.6 5.5 5.5 4.3 4.4 22.7 38.9 Shoulder 9 175 75 6.0 lUI 5.7 5.9 1i.0 4.8
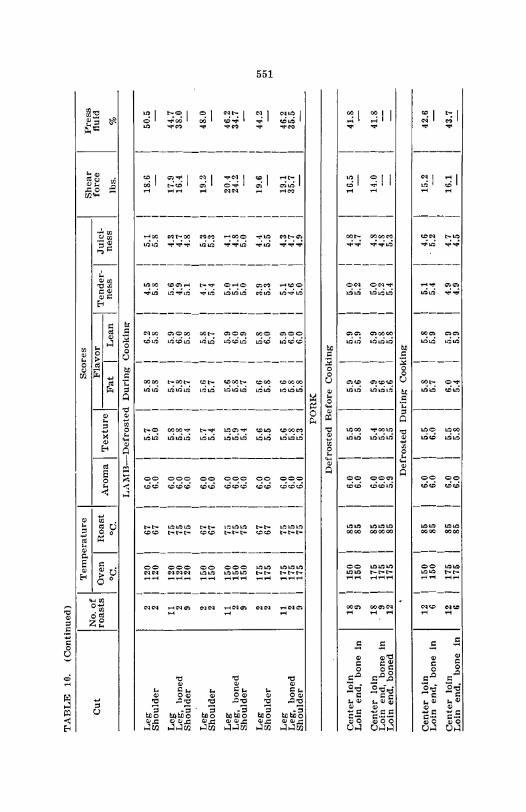
TABLE 10. (Continued) -I -I Temperature Scores Shear Press
Cut No. of
Aroma \ Texture \ Flavor force fluid roasts Oven Roast I Tender-I Juici-
DC. DC. Fat Lean ness ness Ills. % LAMB-Defrosted During Cooking
1 Leg 2 120 67 6.0 5.7 5.8 I 6.2 4.5 5.1 18.6 50.6 Shoulder 2 120 67 6.0 6.0 5.8 1 5.8 5.8 5.8
I Leg 11 120 75 6.0 5.8 5.7 I 5.9 5.6 4.3 17.9 44.7 Leg, boned 2 120 75 6.0 5.8 5.8 1 6.0 4.9 4.7 16.4 38.0 Shoulder 9 120 75 6.0 5.4 5.7 I 5.8 5.1 4.8
Leg 2 150 67 6.0 5.7 5.6 5.8 4.7 5.3 19.2 48.0 Shoulder 2 150 67 6.0 5.4 5.7 5.7 5.4 5.3
Leg 11 150 75 6.0 5.5 5.6 5.9 5.0 4.1 20.4 46.2 Leg, honed 2 150 75 6.0 5.9 5.8 6.0 5.1 4.8 24.2 34.7 Shoulder 9 150 75 6.0 5.4 5.7 5.9 5.0 5.0
Leg 2 175 67 6.0 5.6 5.6 5.8 3.9 4.4 19.6 44.2 <TI
Shoulder 2 175 67 6.0 5.5 5.8 6.0 5.3 5.5 <TI ,.... Leg 11 175 75 6.0 5.6 56 5.9 5.1 4.3 19.1 46.2 Leg, boned 2 175 75 6.0 5.8 5.8 6.0 4.6 4.7 35.7 35.5 Shoulder 9 175 75 6.0 5.3 5.8 6.0 5.0 4.9
PORK
Defrosted Before Cooking
Center loin 18 150 85 6.0 5.5 5.9 5.9 5.0 4.8 16.5 41.8 Loin end, bone in 9 150 85 6.0 5.8 5.6 6.9 5.2 4.7
Center loin 18 175 85 6.0 5.4 5.9 5.9 5.0 4.8 14.0 41.8 Loin end, bone in 9 175 85 6.0 5.8 5.6 5.8 5.2 4.8 Loin end. boned 12 175 85 6.9 5.5 5.6 5.8 5.4 5.3
Defro8ted During Cooking
Center loin 12 150 85 6.0 5.5 5.8 5.8 5.1 4.6 15.2 42.6 Loin end, bone in 6 150 85 6.0 6.0 5.7 5.9 5.4 5.2
Center loin 12 175 85 6.0 5.5 6.0 5.9 4.9 4.7 16.1 43.7 Loin end. bone in 6 176 86 6.0 5.8 5.4 5.9 4.9 4.5
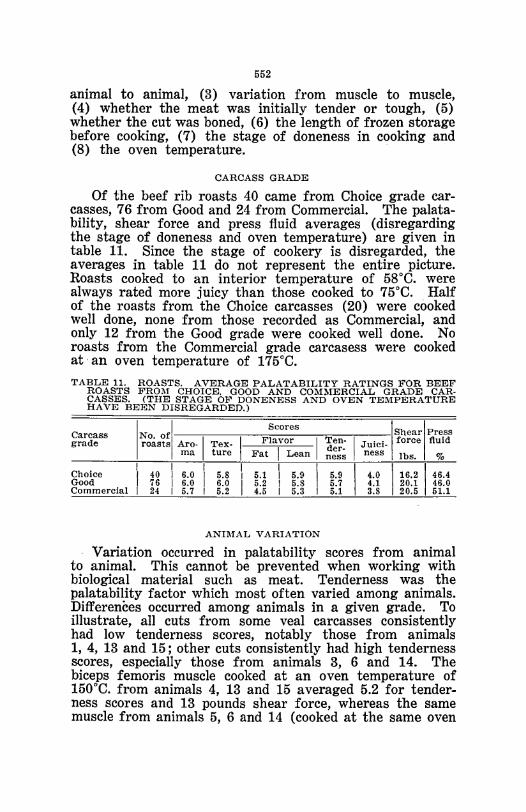
552
animal to animal, (3) variation from muscle to muscle, (4) whether the meat was initially tender or tough, (5) whether the cut was boned, (6) the length of frozen storage before cooking, (7) the stage of doneness in cooking and (8) the oven temperature. .
CARCASS GRADE
Of the beef rib roasts 40 came from Choice grade carcasses, 76 from Good and 24 from Commercial. The palatability, shear force and press fluid averages (disregarding the stage of doneness and oven temperature) are given in table 11. Since the stage of cookery is disregarded, the averages in table 11 do not represent the entire picture. Roasts cooked to an interior temperature of 58°C. were always rated more juicy than those cooked to 75aC. Half of the roasts from the Choice carcasses (20) were cooked well done, none from those recorded as Commercial, and only 12 from the Good grade were cooked well done. No roasts from the Commercial grade carcasess were cooked at 'an oven temperature of 175°C.
TABLE 11. ROASTS. AVERAGE PALATABILITY RATINGS FOR BEEF ROASTS FROM CHOICE, GOOD AND COMMERCIAL GRADE CAR· CASSES. (THE STAGE OF DONENESS AND OVEN TEMPERATURE HAVE BEEN DISREGARDED.)
Scores Isnearlpress Carcass
INO.Ofl I grade roasts Aro· Tex- Flavor I Ten· I Juici· force Iluld rna ture Fat I Lean
der. ness ness Ibs. %
I I I I
I 1
116.2146.4 Choice 40 I 6.0 I 5.8 5.1 I 5.9 5.9 4.0 Good 76 I 6.0 I 6.0 5.2 I 5.S 5.7 4.1 20.1 46.0 Commercial I 24 I 5.7 I 5.2 4.5 I 5.3 I 5.1 3.8 20.5 51.1
ANIMAL VARIATION
Variation occurred in palatability scores from animal to animal. This cannot be prevented when working with biological material such as meat. Tenderness was the palatability factor which most often varied among animals. Differences occurred among animals in a given grade. To iIlustrate, all cuts from some veal carcasses consistently had low tenderness scores, notably those from animals 1, 4, 13 and 15; other cuts consistently had high tenderness scores, especially those from animals 3, 6 and 14. The biceps femoris muscle cooked at an oven temperature of 150°C. from animals 4, 13 and 15 averaged 5.2 for tenderness scores and 13 pounds shear force, whereas the same muscle from animals 5, 6 and 14 (cooked at the same oven
553
temperature) rated 5.S for tenderness and 10.9 for shear force. The semitendinosus muscle in the same order averaged 6.1 and 6.6 for scores and 20.1 and 13.4 pounds for shear force. Variation in tenderness also occurred within a given grade of beef. To illustrate, the average tenderness scores for· the four beef roasts from animal 5 averaged 6.2, whereas those from animal 16 (same carcass grade as animal 5) averaged 4.7.
Variation in animals sometimes caused variations in flavor scores. The average flavor scores for the four beef rib roasts of animal· 5 averaged 6.2, whereas those from animal 14 averaged 5.3. The beef carcass grade for both animals was Good.
MUSCLE VARIATION
It is common knowledge that the different muscles within a single carcass vary in tenderness. In this study only one muscle was scored for all roasts except the veal leg roasts. The biceps femoris of the veal leg always rated lower tenderness scores than the semitendinosus muscle from the same roast (see table 10). These results agree with those obtained by Ramsbottom, 8trandine and Koonz (17) and with those of Paul, Lowe and McClurg (14).
INITIAL CONDITION OF CARCASS
The observations concerning effect of defrosting before, versus defrosting during, cooking on tenderness of roasts from the less tender carcasses were also interesting. The results with veal roasts (all cooked at 150°C.) from the left side of some of the less tender carcasses (4, 13, 15) defrosted before and those from the right side defrosted during cooking follow. Both the biceps femoris and semitendinosus muscle from the left side of these animals (defrosted before cooking) rated higher in tenderness scores and lower shear force than roasts from the right side of these same animals (defrosted during cooking). The biceps femoris averaged 5.7 for tenderness scores when defrosted before and 4.7 when defrosted during cooking. The shear force in the same order was 11.9 and 14.2 pounds. The scores for the semitendinosus in the same order were 6.7 and 5.4, whereas the shear force was 18.4 and 21.9 pounds. It is possible that these results are an anomaly, but they merit further investigation.
The differences in tenderness scores of the roasts from the more tender veal carcasses (5, 6, 14) were less marked than for the roasts from the less tender carcasses, when
554
one roast of a pair was defrosted before, the other during cooking. The average tenderness scores for the biceps femoris (before vs. during cooking) were 5.6 and 5.7, whereas the shear force in the same order was 10.1 and 11.6 pounds. The scores and shear force for the semitendinosus muscle in .the same order were 6.5 vs. 6.7 and 12.4 vs. 14.4 pounds. If the cut of meat is initially tough and the foregoing observations are not an anomaly, then defrosting before cooking may achieve greater tenderness than defrosting during cooking. If the meat is initially tender, then these two methods of defrosting (during vs.-before cooking) may bring about no or only small differences in tenderness of the roasts.
BONED OR BONE IN
The juiciness scores for the boned beef roasts were consistently lower than those for similar non-boned roasts, provided the cooking conditions were standardized. In some instances the differences between the average juciness scores for the two groups were small, for other groups the differences were large (table 10). The amount of press fluid for the boned beef roasts was also consistently smaller for boned than for the non-boned roasts. On the other hand the boned leg of lamb roasts, with the exception of one group, had higher juiciness scores than the non-boned roasts, yet the weight loss during defrosting and cooking was always larger for the boned roasts. The amount of press fluid obtained for the boned leg of lamb roasts did not check with the scores. The amount of press fluid was lower for the boned leg roasts than for the non-boned ones. Thus for the lamb roasts the press fluid data showed better correlation with the weight losses than the juiciness scores.
LENGTH OF FROZEN STORAGE
One beef roast from a pair was held 90 days whereas one from a second pair was held 92 days before cooking; the corresponding roasts from each pair were held in frozen storage 11 and 16 days, respectively. The roast held the longer time rated lower than its mate in aroma, flavor of fat for one pair (not the other), flavor of lean, and juiciness.
STAGE OF COOKERY
In general, beef and lamb cooked to a lower interior temperature were scored more juicy than similar roasts cooked more well done. Except for the one group of lamb leg roasts defrosted during cooking (oven 175°C.) the per-
555
centage of press fluid obtained was always greater for the roasts cooked medium than for the roasts cooked well done. Child and Fogarty (3) found the differences in the amount of press fluid obtained from beef roasts cooked to an in~ terior temperature of 58° and 75°C. to be highly significant. Approximately 11 percent more press fluid was obtained at 58° than at 75°. Sartorius and Child (19) suggest that when irregularities occur between organoleptic scores and the amount of press fluid, the judge's scores may be affected by constituents of the roast which stimulate the flow of saliva.
The percentage of press fluid obtained from beef roasts cooked to an -interior temperature of 58° and lamb roasts cooked to 67° varied from about 45 to 50 percent, whereas for similar roasts cooked to 75° the amount of press fluid varied from about 35 to 44 percent. Veal roasts cooked to an interior temperature of 85°C. yielded about 24 to 40 percent press fluid. The amount of press fluid varied from about 42 to 44 percent for pork roasts cooked to an interior temperature of 85°. Since the fat of pork roasts is soft, there is the possibility that some fat as well as fluid may have been pressed from the roast.
OVEN TEMPERATURE
There was little difference among juiciness scores or percentage of press fluid of beef roasts cooked at an oven temperature of 120·, 150° or 175°C. provided the roasts were cooked to the same interior temperature. The results for the lamb and pork roasts were similar to those for the beef roasts, but the veal roasts cooked at 120° were scored less juicy and had a lower percentage of press fluid than the roasts cooked at 150° and 175°. The dryness of the veal roasts cooked at 120° can be attributed to the large cooking loss brought about by the unusually long cooking time at this temperature. I
Cover (6) has reported that a high oven temperature did- not consistently produce tough meat and on the other hand cooking at a low temperature did not always produce tender roasts. Cover's results were obtained by cooking different cuts of beef, half~ham roasts of pork, and leg of lamb. This study confirms Cover's findings. No consistent differences in tenderness of roasts were found that could be attributed solely to oven temperature.
AROMA
Aroma scores were affected by the length of frozen storage. Roasts stored the longer periods had the lower
556
aroma scores. It should also be reported that the scoring panel, from comments on score cards, considered that the distinctive lamb aroma and flavor were more pronounced in the roasts cooked to an interior temperature of 67° than in those cooked to 75°C. No members of the panel disliked this distinctive lamb flavor, as the aroma and flavor scores of the roasts cooked to 67° were as high as those cooked to 75°. Cr()cker (7) has reported that the distinctive flavor of lamb decreases with longer cooking of the meat.
Before freezing, half of the lamb shoulders were stored in a cold room, which contained some freshly smoked and cured hams. The smoke aroma was absorbed -and was still noticeable in the cooked roasts. Although not natural to fresh lamb, it proved a pleasant and not a disagreeable aroma.
FLAVOR
Flavor scores were influenced by animal variation, by the length of time the roast was in frozen storage. and by the carcass grade.
TEXTURE
The texture scores of beef roasts were affected by the carcass grade, animal variation and muscle variation. Commercial grade roasts were coarser than roasts from Choice or Good grades and also had distinct chewy areas. The judges tended to give lamb shoulder roasts slightly lower texture scores than the lamb leg roasts.
TENDERNESS
Tenderness was influenced by the carcass grade. The roasts from Commercial grade carcasses had lower tenderness scores than those from Choice and Good grade carcasses. Tenderness varied from animal to animal within the same carcass grade and from muscle to muscle within the same carcass. Initially tough meat from some veal carcasses was more tender if thawed before cooking was started than if defrosted during cooking.
JUICINESS
Juiciness scores were influenced by the kind of roast~ whether boned or not, the stage of cookery and the oven temperature. For veal, possibly the method of defrosting also influenced the juiciness of the meat. Boned beef roasts were usually ranked less juicy for both scores and press fluid values that the non-boned roasts. However, for lamb leg the juiciness scores were higher for the boned than the nqn-
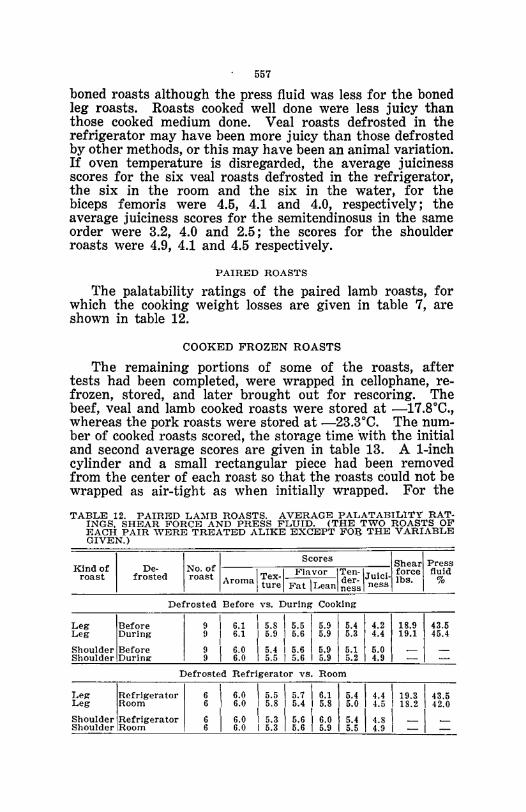
557
boned roasts although the press fluid was less for the boned leg roasts. Roasts cooked well done were less juicy than those cooked medium done. Veal roasts defrosted in the refrigerator may have been more juicy than those defrosted by other methods, or this may have been an animal variation. If oven temperature is disregarded, the average juiciness scores for the six veal roasts defrosted in the refrigerator, the six in the room and the six in the water, for the biceps femoris were 4.5, 4.1 and 4.0, respectively; the average juiciness scores for the semitendinosus in the same order were 3.2, 4.0 and 2.5; the scores for the shoulder roasts were 4.9, 4.1 and 4.5 respectively.
PAIRED ROASTS
The palatability ratings of the paired lamb roasts, for which the cooking weight losses are given in table 7, are shown in table 12.
COOKED FROZEN ROASTS
The remaining portions of some of the roasts, after tests had been completed, were wrapped in cellophane, refrozen, stored, and later brought out for rescoring. The beef, veal and lamb cooked roasts were stored at _17.8°C., whereas the pork roasts were stored at -23.3°C. The number of cooked roasts scored, the storage time with the initial and second average scores are given in table 13. A 1-inch cylinder and a small rectangular piece had been removed from the center of each roast so that the roasts could not be wrapped as air-tight as when initially wrapped. For the
TABLE 12. PAIRED LAMB ROASTS. AVERAGE PALATABILITY RAT· INGS. SHEAR FORCE AND PRESS FLUID. (THE TWO ROASTS OF EACH PAIR WERE TREATED ALIKE EXCEPT Fon THE VARIABLE GIVEN.)
Kind of I roast
Leg Leg
Shoulder Shoulder
Leg Leg
Shoulder Shoulder
De· frosted I
N f I Scores IShearl Press r~a~t 1 Tex· 1 Flavor ITen-IJUICi. force fluid
Aroma ture Fat lLean ~:~~ ness lbs. %
Defrosted Before VB. During Cooking
I I I I I 4.2 Before 9 I 6.1 I 5.S I 5.5 I 5.9 5.4 18.9 43.5 During 9 I 6.1 I 5.9 I 5.6 5.9 \ 5.3 4.4 19.1 45.4
I \ 5.4 I 5.6 \5.9 5.1 Before 9 I 6.0 5.0 - -
Durin .. 9 6.0 5.5 '5.6 5.9 5.2 4.9 - -Defrosted Refrigerator vs. Room
Refrigerator 6 l 6.0 I 5.5 1 5.7 1 6.1 5.414.4 119.3 143.5 Room 6 6.0 I 5.8 I 5.4 I 5.8 5.0 4.5 I 18.2 42.0
I , 5.4 1 4.8 1 - 1 -Refrigerator 6 I 6.0 I 5.3 I 5.6 I 6.0
Room 6 6.0 I 5.3 5.6 5.9 5.5 4.9 I - -
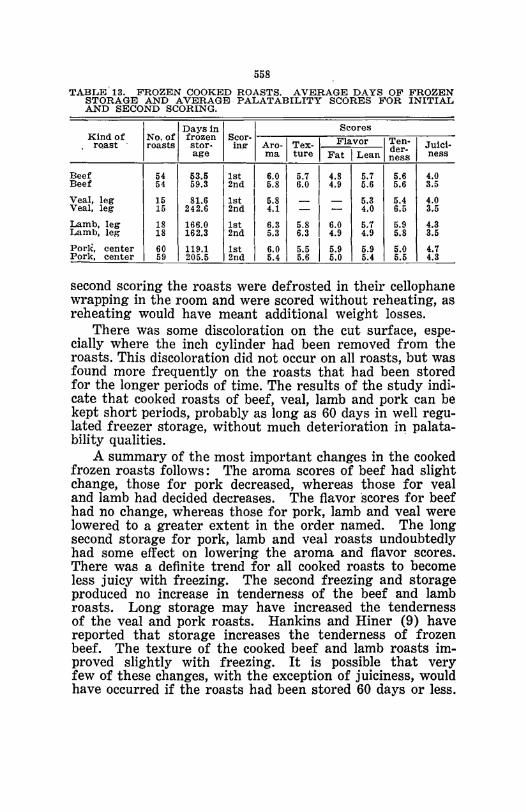
558
TABLE 13. FROZEN COOKED ROASTS. AVERAGE DAYS OF FROZEN STORAGE AND AVERAGE PALATABILITY SCORES FOR INITIAL AND SECOND SCORING.
Kind of . rQast
Beef Beef
Veal, leg Veal, leg
Lamb, leg Lamb, leg
PorK, center Pork, center
I No. of I ~~l:e~ I scor-I-----;--.--~s~c:_:o=re::_s___;__.n:c::____;---roasts stor- ing- Aro-i Tex-I Flavor i a:~: I JUiel-
age rna ture Fat I Lean ness ness
54 I
53.5 1st I 6.0 5.7 I 4.8 I 5.7 I
5.6 4.0 54 59.3 2nd I 5.8 6.0 4.9 5.6 5.6 3.5
I I 4.0 15 81.6 1st 5.8 - I - 5.3 5.4
15 242.6 2nd I 4.1 - I - 4.0 6.5 3.5 I
18 166.0 1st I 6.3 5.8 I 6.0 5.7 5.9 4.3 18 162.3 2nd I 5.3 6.3 4.9 4.9 5.8 3.5
i 60 119.1 1st I 6.0 5.5
I 5.9 5.9 5.0 4.7
59 205.5 2nd 5.4 5.6 5.0 5.4 5.5 4.3
second scoring the roasts were defrosted in their cellophane wrapping in the room and were scored without reheating, as reheating would have meant additional weight losses.
There was some discoloration on the cut surface, especially where the inch cylinder had been removed from the roasts. This discoloration did not occur on all roasts, but was found more frequently on the roasts that had been stored for the longer periods of time. The results of the study indicate that cooked roasts of beef, veal, lamb and pork can be kept short periods, probably as long as 60 days in well regulated freezer storage, without much deterioration in palata-bility qualities. .
A summary of the most important changes in the cooked frozen roasts follows: The aroma scores of beef had slight change, those for pork decreased, whereas those for veal and lamb had decided decreases. The flavor scores for beef had no change, whereas those for pork, lamb and veal were lowered to a greater extent in the order named. The long second storage for pork, lamb and veal roasts undoubtedly had some effect on lowering the aroma and flavor scores. There was a definite trend for all cooked roasts to become less juicy with freezing. The second freezing and storage produced no increase in tenderness of the beef and lamb roasts. Long storage may have increased the tenderness of the veal and pork roasts. Hankins and Hiner (9) have reported that storage increases the tenderness of frozen beef. The texture of the cooked beef and lamb roasts improved slightly with freezing. It is possible that very few of these changes, with the exception of juiciness, would have occurred if the roasts had been stored 60 days or less.
559
SUMMARY, CONCLUSIONS AND RECOMMENDATIONS FOR ROASTS
The roasts were frozen and stored at _17.8°C. (O°F.), with the exception of pork which was stored at -23.3°C. (-10°F.). The 140 beef roasts consisted of ribs 10-12 and 7-9. Of this number 44 were boned and rolled. There were 36 veal leg and 36 boned and rolled veal shoulder roasts; 78 lamb leg, 12 boned Iamb leg, and 66 boned and rolled Iamb shoulder roasts; and 60 center loin pork roasts, 30 pork loin end roasts and 12 boned pork loin end roasts.
DEFROSTING TIME
The principal determinants of defrosting time, when roasts were wrapped in a single covering, were the defrosting temperature and the size of the roast. The defrosting time was inversely proportional to the defrosting temperature, and large roasts required longer than small ones. Estimating roughly, about half as long a time was required to defrost in the oven at 120°C. as in water, about half as long in water as in the room, and more than twice as long a time in the refrigerator as in the room. The defrosting' time during cooking was shortened as the oven temperature was elevated. The average defrosting time during cooking for the various groups of roasts in an oven at 120°0. was as follows: beef roasts from 2.34 to 3.03 hours, veal 1.78 to 2.15, and lamb 1.87 to 1.98 hours. No pork was cooked at 120°. The defrosting time in the oven at 150· for pork roasts varied from 0.57 to 0.60 hours.
WEIGHT LOSSES
Boned cuts lost about three times as much weight during defrosting as the non-boned ones.
Weight losses during cooking increased as the roasts were cooked more well done, with elevation of the oven temperature, with increase of cut surface of the muscle, and with boning of the cut. Sometimes the cooking weight loss was greater for roasts defrosted during cooking, sometimes the weight losses of non-defrosted and defrosted roasts were similar.
FUEL
The amount of fuel needed for cooking varied with several factors. These factors included the size of the roast, the stage of doneness and the oven temperature. Under otherwise standardized conditions, less fuel was
560
needed for the 150·C. cooked roasts and more at 120· and 175°.
COOKING' TIME
The cooking time varied with the oven temperature, the stage of cookery, the size of the roasts and the condition of the roasts-i. e., thawed or frozen at start of cooking. Frozen roasts required about a third longer cooking time than the thawed ones, although the increase in time for cooking of frozen over thawed roasts varied from --4 to 80 percent. One frozen roast, which was much smaller than the thawed one, required less time for cooking than a thawed one, which accounts for the --4 percent.
PALATABILITY
Palatability scores were affected by variation in animals, variation in muscles, the kind of roasts, the stage of doneness and the oven temperature. Palatability scores were not appreciably affected by the method of defrosting.
RECO:\L\fENDATIONS
The data of the study i"ndicate that an oven temperature of 120·0. is a poor one for roasts which were frozen when cooking was started, for the following reasons: (1) The cooking time was unduly long, (2) more fuel was required at 120° than at 150·, and (3) there was no rewarding increase in palatability, though a few roasts did seem more tender. Besides, it was found that at 120·0. there was a greater oozing and coagUlation of fluids over the cut surface of the roasts than at higher oven temperatures. Then, too, some ranges will not safely maintain as low a temperature as 120· O. (250°F.).
The results obtained in this study indicate that 150·C. is an excellent temperature for roasts which were frozen when cooking was started. This temperature for frozen roasts is the same as that recommended by the Committee on Preparation Factors, of the National Cooperative Meat Investigations (4, p. 90), for fresh beef, veal and lamb roasts. This committee recommends 175°C. for pork roasts.
There were only minor differences, if any, in the palatability scores between roasts cooked at 150· and 1750
• The advantage of the 1750 temperature over the 150° oven was the shorter cooking time required. The disadvantages of the 175° oven over that of the 150° were the greater weight loss of the roast during cooking plus the larger amount of fuel necessary.
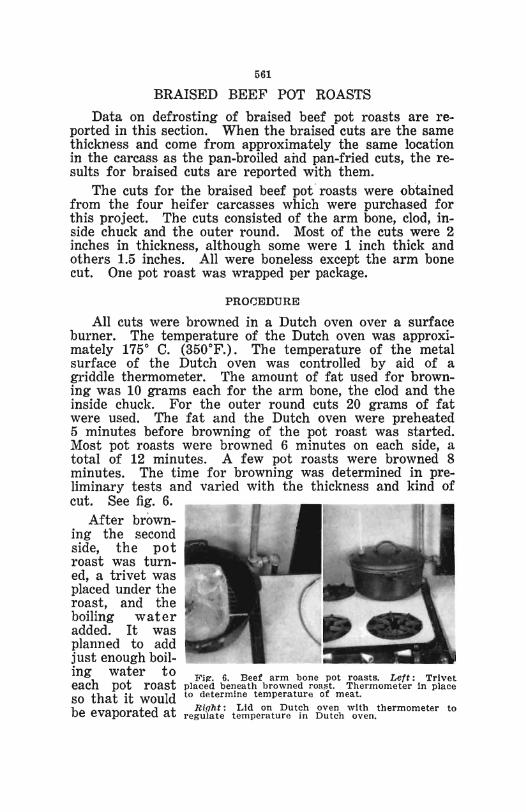
561
BRAISED BEEF POT ROASTS
Data on defrosting of braised beef pot roasts are re· ported in this section. When the braised cuts are the same thickness and come from approximately the same location in the carcass as the pan-broiled and pan.fried cuts, the results for braised cuts are reported with them.
The cuts for the braised beef pot roasts were obtained from the four heifer carcasses which were purchased for this project. The cuts consisted of the arm bone, clod, in· side chuck and the outer round. Most of the cuts were 2 inches in thickness, although some were 1 inch thick and others 1.5 inches. All were boneless except the arm bone cut. One pot roast was wrapped per package.
PROCEDURE
All cuts were browned in a Dutch oven over a surface burner. The temperature of the Dutch oven was approxi. mately 1750 C. (350°F.). The temperature of the metal surface of the Dutch oven was controlled by aid of a griddle thermometer. The amount of fat used for brown· ing was 10 grams each for the arm bone, the clod and the inside chuck. For the outer round cuts 20 grams of fat were used. The fat and the Dutch oven were preheated 5 minutes before browning of the pot roast was started. Most pot roasts were browned 6 minutes on each side, a total of 12 minutes. A few pot roasts were browned 8 minutes. The time for browning was determined in pre· liminary tests and varied with the thickness and kind of cut. See fig. 6.
After browning the second side, the pot roast was turn· ed, a trivet was placed under the roast, and the boiling water added. It was planned to add just enough boil· ing water to each pot roast so that it would be evaporated at
Fil!'. 6. Beef arm bone pot roasts. Left: Trivet placed beneath browned roa~t. Thermometer In place to determine temperature of meat.
Ri(1ht: Lid on Dutch oven with thermometer to regulate temperature in Dutch oven.
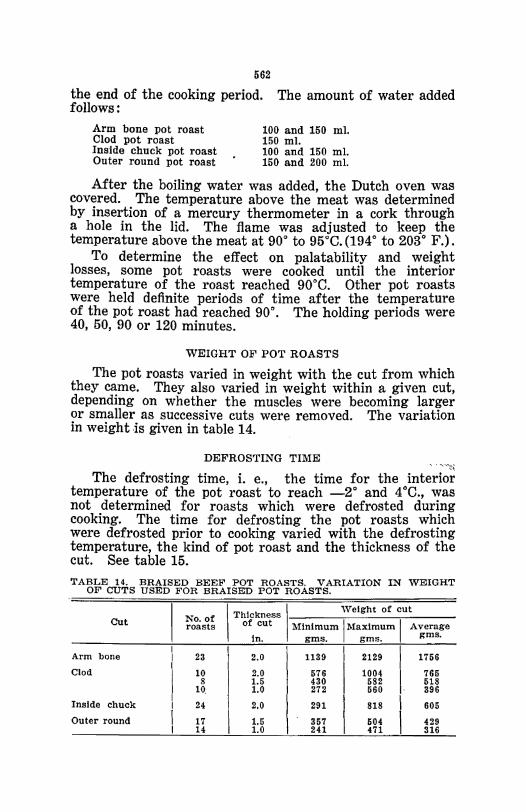
562
the end of the cooking period. The amount of water added follows:
Arm bone pot roast Clod pot roast Inside chuck pot roast Outer round pot roast
100 and 150 m!. 150 m!. 100 and 150 ml. 150 and 200 ml.
Mter the boiling water was added, the Dutch oven was covered. The temperature above the meat was determined by insertion of a mercury thermometer in a cork through a hole in the lid. The flame was adjusted to keep the temperature above the meat at 90° to 95°C. (194° to 203° F.).
To determine the effect on palatability and weight losses, some pot roasts were cooked until the interior temperature of the roast reached 90°C. Other pot roasts were held definite periods of time after the temperature of the pot roast had reached 90°. The holding periods were 40, 50, 90 or 120 minutes.
WEIGHT OF POT ROASTS
The pot roasts varied in weight with the cut from which they came. They also varied in weight within a given cut, depending on whether the muscles were becoming larger or smaller as successive cuts were removed. The variation in weight is given in table 14.
DEFROSTING TIME
The defrosting time, i. e., the time for the interior temperature of the pot roast to reach _2° and 4°C., was not determined for roasts which were defrosted during cooking. The time for defrosting the pot roasts which were defrosted prior to cooking varied with the defrosting temperature, the kind of pot roast and the thickness of the cut. See table 15. TABLE 14. BRAISED BEEF POT ROASTS. VARIATION IN WEIGHT
OF CUTS USED FOR BRAISED POT ROASTS.
No. of I Thickness I 'Velght of cut Cut roasts of cut Minimum I Maximum I Average
in. gms. gms. gms. I
1139 2129 1756 Arm bone 23 I 2.0
Clod 10 2.0 576 1004 765 8 1.5 430 582 518
10. 1.0 272 560 396
Inside chuck 24 2.0 291 818 605
Outer round 17 1.5 357 504 429 14 1.0 241 471 316
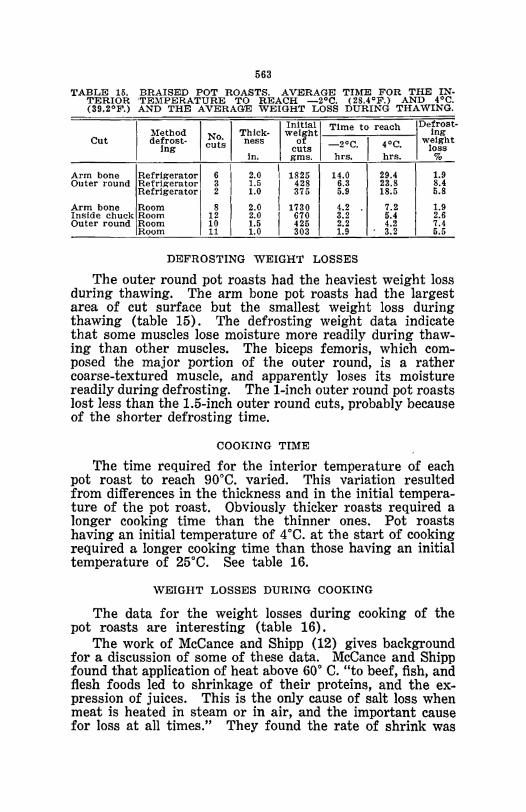
563
TABLE 15. BRAISED POT ROASTS. AVERAGE TIME FOR THE INTERIOR "TEMPERATURE TO REACH _2°e. (28.4°F.) AND 4°C. (39.2°F.) AND THE AVERAGE WEIGHT LOSS DURING THAWING.
Cut
Arm bone Outer round
Arm bone Inside chuck Outer round
Method defrost
ing
Refrigerator Refrigerator Refrigerator
Room Room Room Room
I No·1 cuts
I 6
I 3 2 , 8 I 12
10 I 11
I
Ini.tlal I Time to reach IDefrost-Thick- weight ing ness of -20C 1 4°C weight cuts . . loss in gms hrs hrs %
I
I
2.0 I 1825 14.0 29.4 1.9 1.5 I 428 6.3 23.8 8.4 1.0 375 5.9 18.5 5.8
I 2.0 I 1730
I 4.2 7.2 1.9
2.0 I 670 3.2 5.4 2.6 1.5 I 425 2.2 4.2 7.4 1.0 I 303 1.9 I" 3.2 5.5
DEFROSTING WEIGHT LOSSES
The outer round pot roasts had the heaviest weight loss during thawing. The arm bone pot roasts had the largest area of cut surface but the smallest weight loss during thawing (table 15). The defrosting weight data indicate that some muscles lose moisture more readily during thawing than other muscles. The biceps femoris, which composed the major portion of the outer round, is a rather coarse-textured muscle, and apparently loses its moisture readily during defrosting. The 1-inch outer round pot roasts lost less than the L5-inch outer round cuts, probably because of the shorter defrosting time.
COOKING TIME
The time required for the interior temperature of each pot roast to reach 90°C. varied_ This variation resulted from differences in the thickness and in the initial temperature of the pot roast. Obviously thicker roasts required a longer cooking time than the thinner ones. Pot roasts having an initial temperature of 4°C. at the start of cooking required a longer cooking time than those having an initial temperature of 25°C. See table 16.
WEIGHT LOSSES DURING COOKING
The data for the weight losses during cooking of the pot roasts are interesting (table 16).
The work of McCance and Shipp (12) gives background for a discussion of some of these data. McCance and Shipp found that application of heat above 60° C. "to beef, fish, and flesh foods led to shrinkage of their proteins, and the expression of juices. This is the only cause of salt loss when meat is heated in steam or in air, and the important cause for loss at all times." They found the rate of shrink was
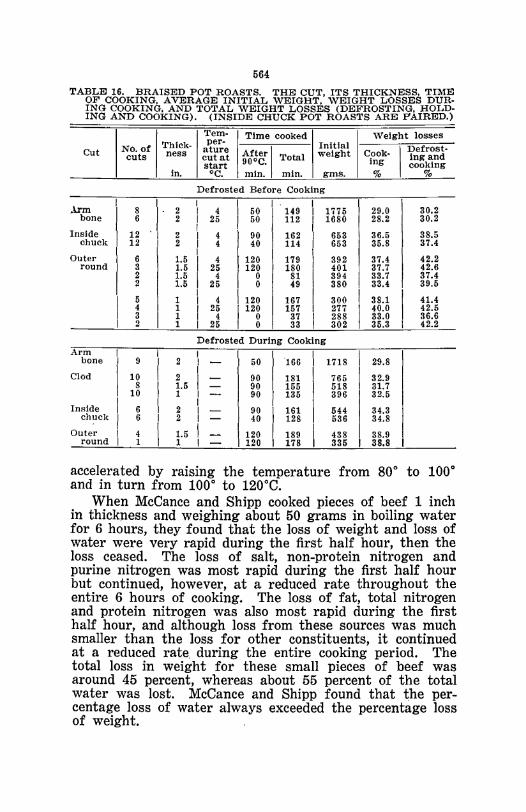
564 TABLE 16. BRAISED POT ROASTS. THE CUT. ITS THICKNESS. TIME
OF COOKING. AVERAGE INITIAL WEIGHT. WEIGHT LOSSES DURING COOKING. AND TOTAL WEIGHT LOSSES (DEFROSTING. HOLDING AND COOKING). (INSIDE CHUCK POT ROASTS ARE PAIRED.)
Tem- Time cooked Weight losses
No. of Thlck- per- Initial I Defrost-Cut ness ature t!!cf I Total weight Cook-cuts cut at Ing ingand
start cooking In. °C. min. min. gms. % %
Defrosted Before Cooking
.\rm 8
.1' 2 4 I 50 I'" 1775 29.0 30.2
bone 6 2 25 50 112 1680 28.2 30.2
Inside 12 2 4 90 162 653 36.5 38.5 chuck 12 I 2 4 40 114 653 35.8 37.4
Outer 6 1.5 4 120 179 392 37.4 42.2 round 3 1.5 25 120 180 401 37.7 42.6
2 1.5 4 0 81 394 33.7 37.4 2 1.5 25 0 49 380 33.4 39.5
5 1 4 \120 167 300 38.1 41.4 4 1 25 lag 157 277 40.0 42.5 3 1 4 37 288 33.0 36.6 2 1 25 33 302 35.3 42.2
Defrosted During Cooking Arm I I I I
\ bone I 9
I 2 I - 50 '166 1718 29.8
Clod
1 10 2 I - 90 181 I 765 32.9
8 1.5 - 90 155 518 31.7 10 1 I - 90 135 396 32.5
Inside I I I I i 6 I 2 I - 90 161 544 34.3 chUCk
! 6 I 2 I - 40 128 536 34.8
I Outer 4 \
1.5 I - 120 I 189 I 438 38.9 round I 1 1 I - 120 178 335 38.8
accelerated by raIsmg the temperature from 80° to 1000
and in turn from 100 0 to 120°C. When McCance and Shipp cooked pieces of beef 1 inch
in thickness and weighing about 50 grams in boiling water for 6 hours, they found that the loss of weight and loss of water were very rapid during the first half hour, then the loss ceased. The loss of salt, non-protein nitrogen and purine nitrogen was most rapid during the first half hour but continued, however, at a reduced rate throughout the entire 6 hours of cooking. The loss of fat, total nitrogen and protein nitrogen was also most rapid during the first half hour, and although loss from these sources was much smaller than the loss for other constituents, it continued at a reduced rate. during the entire cooking period. The total loss in weight for these small pieces of beef was around 45 percent, whereas about 55 percent of the total water was lost_ McCance and Shipp found that the percentage loss of water always exceeded the percentage loss of weight.
565
McCance and Shipp also cooked pieces of beef weighing 1,500 grams in boiling water for 6 hours. Here they found the loss in weight to b~ the same as for the 50-gram pieces. But the loss in weight of the 50-gram pieces occurred during the first half hour of cooking with little or no loss during the remainder of the 6-hour cooking period. At the end of the first hour, the 1,500-gram pieces had lost about 20 percent in weight, and 5 hours of cooking were required before the weight loss of the large pieces was equal to that of the smaller ones.
The work of McCance and Shipp seems to warrant the following conclusion: When cooked in boiling water, the time for a given weight loss (up to maximum) to occur depends upon the size of the piece of beef. This time will be less for a smaller piece, longer for a larger one. When cuts are cooked in air or fat instead of water, the rate of heat conductance through the particular cooking medium must also be considered.
During browning of the pot roasts heat transfer should have been rapid, as the meat was in contact with the metal surface of the Dutch oven. After browning, the pot roast was placed on a trivet, which held the meat above the small amount of water. The gaseous medium surrounding the roast was a mixture of steam and air. Steam probably replaced most of the air during cooking. The temperature of this gaseous medium was held at 90-95°C. Hence, the interior temperature of the meat, though held at 90-95° for 2 hours, did not exceed 95°C.
The data, table 16, indicate that the greatest loss in weight of the pot roasts had occurred by the time the interior temperature reached 90° and that continued cooking beyond this period did not increase the cooking weight losses to a great extent. The work of McCance and Shipp suggests that this is a logical result. Note, table 16, that the paired inside chuck pot roasts were cooked to an interior temperature of 90°. One roast of the pair, taken from one side of the animal, was held at this temperature 90 minutes, whereas its mate taken from the other side of the same animal was held at this temperature 40 minutes. Both had nearly the same wei~ht losses, 36.5 and 35.8 percent, respectively. Yet the cooking time of the former was 162, of the latter 114 minutes. The paired inside chuck pot roasts (defrosted during cooking) had losses of 34.3 and 34.8 percent, respectively, when held under conditions similar to the preceding pot roasts.
Losses for similar pot roasts were practically the same
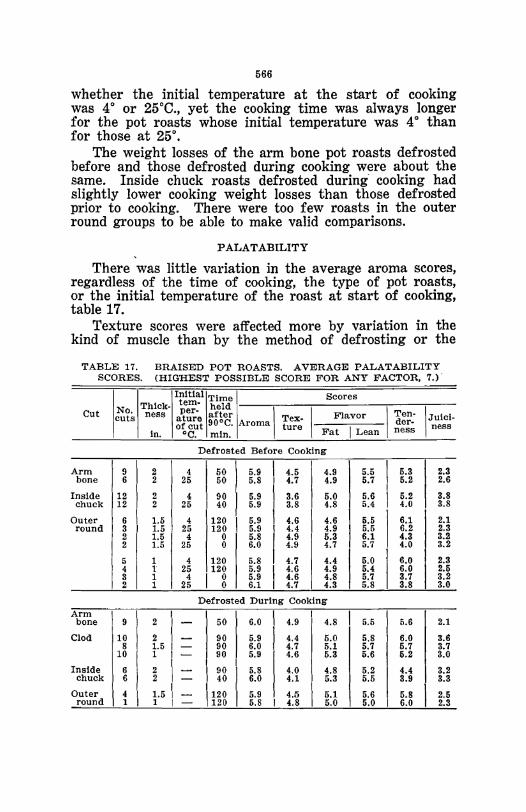
566
whether the initial temperature at the start of cooking was 4° or 25°C., yet the cooking time was always longer for the pot roasts whose initial temperature was 4 0 than for those at 25°.
The weight losses of the arm bone pot roasts defrosted before and those defrosted during cooking were about the same. Inside chuck roasts defrosted during' cooking had slightly lower cooking weight losses than those defrosted prior to cooking. There were too few roasts in the outer round groups to be able to make valid comparisons.
P ALAT ABILITY
There was little variation in the average aroma scores, regardless of the time of cooking, the type of pot roasts, or the initial temperature of the roast at start of cooking, table 17.
Texture scores were affected more by variation in the kind of muscle than by the method of defrosting or the
TABLE 17. BRAISED POT ROASTS. AVERAGE PALATABILITY SCORES. (HIGHEST POSSIBLE SCORE FOR ANY FACTOR, 7.)'
Initial Time Scores
No. Thick- tem- held
Aroma \ \. Cut cuts ness !t~~-e af~er Tex- Flavor \ Ten· \JUICi' of cut 90 C. der-ture Fat I Lean ness ness
In. ·C. min.
Defrosted Before Cooking
1 1
Arm 9 2 4 50 5.9 4.5
I 4.9 5.5 5.3 2.3
bone 6 2 25 50 5.8 4.7 4.9 5.7 5.2 2.6
Inside 12 2 4 90 5.9 3.6 5.0 5.6 5.2 3.8 chuck 12 2 25 40 5.9 3.8 4.8 5.4 4.0 3.8
Outer 6 1.5 4 120 1
5.9 4.6 I 4.6
I 5.5
I 6.1
I 2.1
round 3 1.5 25 120 5.9
I 4.4 4.9 5.5 6.2 2.3
2 1.5 4 0 5.8 4.9 5.3 6.1 4.3 3.2 2 1.5 25 0 6.0 4.9 4.7 5.7 4.0 3.2
5 1 4 120 5.8 4.7 4.4
I 5.0
I 6.0
I 2.3
4 l' 25 1120 5.9 I 4.6 4.9 5.4 6.0 2.5 3 1 4 I 0 5.9 4.6 4.8 5.7 3.7 3.2 2 1 1 25 0 6.1 4.7 4.3 5.8 3.8 3.0
Defrosted During Cooking Arm
\ I 1
\ I bone 9
l 2 I - 50 6.0 4.9 4.8 5.5 5.6 2.1
Clod 10 2 \ - 90 5.9 I 4.4 5.0 5.8 6.0 3.6 8 1.5 I - 90 6.0 4.7 5.1 5.7 5.7 3.7
10
I 1 1 - 90 5.9 4.6 5.3 5.6 5.2 3.0
Inside ~ ) \
1 6 - 90
I 5.8 4.0 4.8 5.2 4.4 3.2
chuck 6 - 40 6.0 4.1 5.3 5.5 3.9 3.3
Outer 1 I 4 I 1.5 1 -1120 5.9 4.5 5.1 5.6 5.8 2.5
round 1 1 1 - 120 5.8 1 4.8 5.0 5.0 6.0 2.3
567
time of cooking. The average texture scores (the method of defrosting, the time of cooking, the initial temperature and the thickness of the pot roast being disregarded) for all inside chuck pot roasts was 3.8, for arm bone 4.7, clod 4.6, and for the outer round 4.6.
Flavor scores varied very little. Scores for the flavor of lean were not affected by the method of defrosting. Average flavor of lean scores were about the same for arm bone, clod and inside chuck roasts. There was a trend for the flavor scores of the outer round pot roasts to be lower for those held 120 minutes after the interior temperature of 90· was reached than for similar roasts cooked only until an interior temperature of 90· was reached.
The average tenderness scores were affected by the time of cooking. Inside chuck roasts cooked 90 minutes after the interior temperature had reached 90· were rated more tender, by· both tenderness scores and shear force values, than those cooked only 40 minutes after the interior temperature reached 90·. The difference in tenderness scores for outer round pot roasts is more striking than for the inside chuck roasts. The average tenderness score of all outer round pot roasts held 120 minutes after an interior temperature of 90· was reached was 6.0, whereas that of the pot roasts cooked only until 90· was reached was 4.3.
The juiciness scores for all pot roasts were low. This was expected, for the weight losses of braised meat during cooking have been found to be high. Outer round pot roasts held 120 minutes after their interior temperature reached 90· were scored less juicy than similar pot roasts which were not held after an interior temperature of 90· was reached.
SUMMARY FOR BRAISED POT ROASTS
The braised pot roasts consisted of arm bone, clod, inside chuck and outer round cuts. Pot roasts were cut 1, 1.5 and 2 inches in thickness.
The data indicate that the greatest loss in weight during cooking of the pot roasts had occurred by the time the interior temperature of the roast had reached 90· and that continued cooking beyond this period increased the cooking weight losses only slightly.
The aroma and flavor scores varied very little, and in general were not affected by the method of defrosting or the kind of pot roast. Texture scores varied with the kind of roast. Tenderness scores were higher for roasts cooked for varying periods of time after an interior temperature
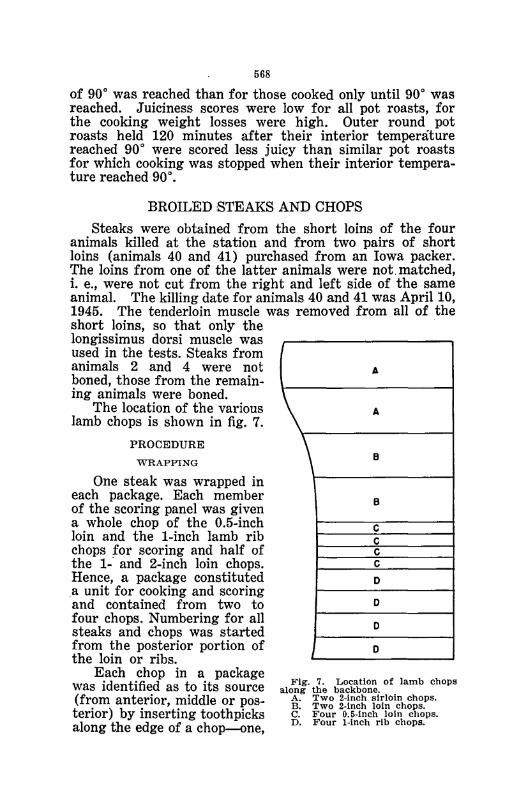
568
of 90 0 was reached than for those cooked only until 90° was reached. Juiciness scores were low for all pot roasts, for the cooking weight losses were high. Outer round pot roasts held 120 minutes after their interior temperature reached 90 0 were scored less juicy than similar pot roasts for which cooking was stopped when their interior temperature reached 90 0
•
BROILED 8TEAKS AND CHOPS
Steaks were obtained from the short loins of the four animals killed at the station and from two pairs of short loins (animals 40 and 41) purchased from an Iowa packer. The loins from one of the latter animals were not. matched, i. e., were not cut from the right and left side of the same animal. The killing date for animals 40 and 41 was April 10, 1945. The tenderloin muscle was removed from all of the short loins, so that only the longissimus dorsi muscle was used in the tests. Steaks from animals 2 and 4 were not boned, those from the remaining animals were boned.
The location of the various lamb chops is shown in fig. 7.
PROCEDURE WRAPPING
One steak was wrapped in each package. Each member of the scoring panel was given a whole chop of the 0.5-inch loin and the 1-inch lamb rib chops for scoring and half of the 1-· and 2-inch loin chops. Hence, a package constituted a unit for cooking and scoring and contained from two to four chops. Numbering for all steaks and chops was started from the posterior portion of the loin or ribs.
Each chop in a package was identified as to its source (from anterior, middle or posterior) by inserting toothpicks along the edge of a chop-one,
A
\ A
\ B
B
C C C C
0
0
0
0
Fig. 7. Location of lamb chops along the backbone.
A. Two 2-inch sirloin chops. B. Two 2-inch loin chops. C. Four O.5-lnch loin chops. D. Four 1-1nch rib chops.
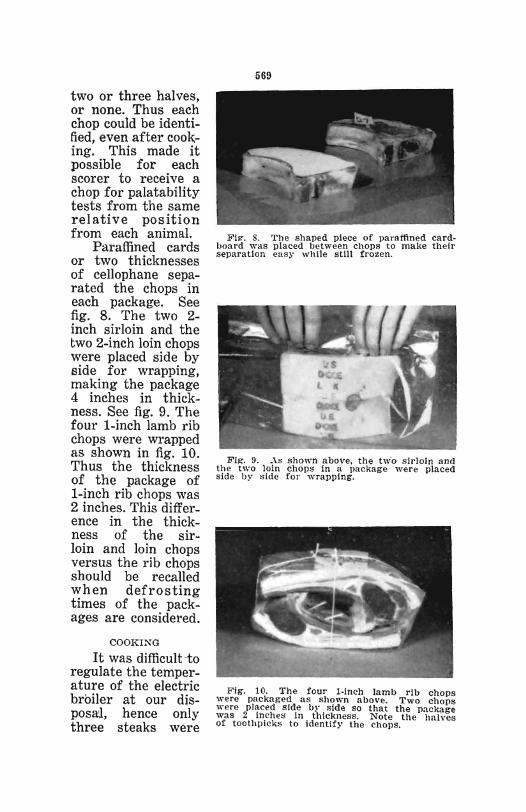
two or three halves, or none. Thus each chop could be identified, even after cooking. This made it possible for each scorer to receive a chop for palatability tests from the same relative position from each animal.
Paraffined cards or two thicknesses of cellophane separated the chops in each package. See fig. 8. The two 2-inch sirloin and the two 2-inch loin chops were placed side by side for wrapping, making the package 4 inches in thickness. See fig. 9. The four 1-inch lamb rib chops were wrapped as shown in fig. 10. Thus the thickness of the package of 1-inch rib chops was 2 inches. This difference in the thickness of the sirloin and loin chops versus the rib chops should be recalled when defrosting times of the packages are considered.
COOKING
It was difficult-to regulate the temperature of the electric broiler at our disposal, hence only three steaks were
669
FIg". 8. The shaped piece of paraffined cardboard was placed between chops to make their separation easy while sUII frozen.
Fig. 9. _\s shown above. the tw'o sirloin and th e two loin chops in a package were placed side by side for wrapping.
Fig. 10. The four l·inch lamb rib chops were packaged as shown above. Two chops were Jllaced side by side so that the package was 2 inches in thickness. Note the halves of toothpicks to identlf~' the chops.
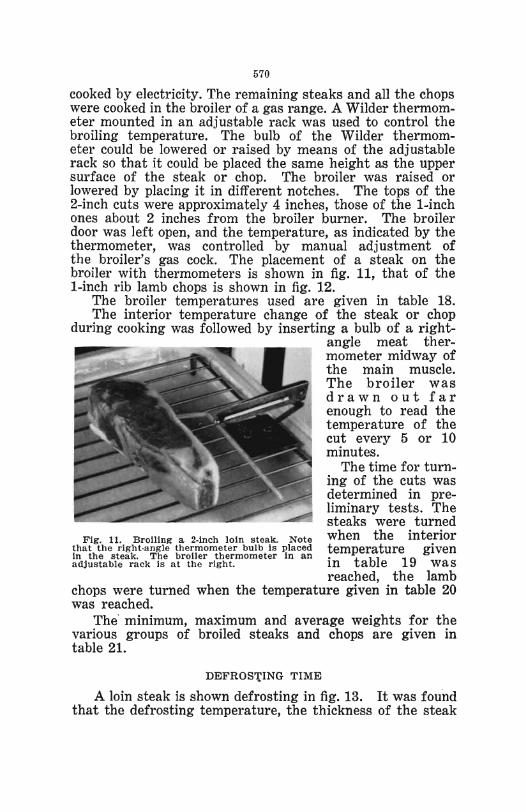
570
cooked by electricity. The remaining steaks and all the chops were cooked in the broiler of a gas range. A Wilder thennometer mounted in an adjustable rack was used to control the broiling temperature. The bulb of the Wilder thennometer could be lowered or raised by means of the adjustable rack so that it could be placed the same height as the upper surface of the steak or chop. The broiler was raised or lowered by placing it in different notches. The tops of the 2-inch cuts were approximately 4 inches, those of the I-inch ones about 2 inches from the broiler burner. The broiler door was left open, and the temperature, as indicated by the thermometer, was controlled by manual adjustment of the broiler's gas cock. The placement of a steak on the broiler with thermometers is shown in fig. 11, that of the I-inch rib lamb chops is shown in fig. 12.
The broiler temperatures used are given in table 18. The interior temperature change of the steak or chop
during cooking was followed by inserting a bulb of a right
Fig. 11. Broiling a 2-inch loin steak. Note that the right-angle thermometer bulb Is placed In the steak. The broiler thermometer In an adjustable rack is at the right.
angle meat thermometer midway of the main muscle. The broiler was drawn out far enough to read the temperature of the cut every 5 or 10 minutes.
The time for turning of the cuts was determined in preliminary tests. The steaks were turned when the interior temperature given in table 19 was reached, the lamb
chops were turned when the temperature given in table 20 was reached.
The' minimum, maximum and average weights for the various groups of broiled steaks and chops are given in table 21.
DEFROSTING TIME
A loin steak is shown defrosting in fig. 13. It was found that the defrosting temperature, the thickness of the steak
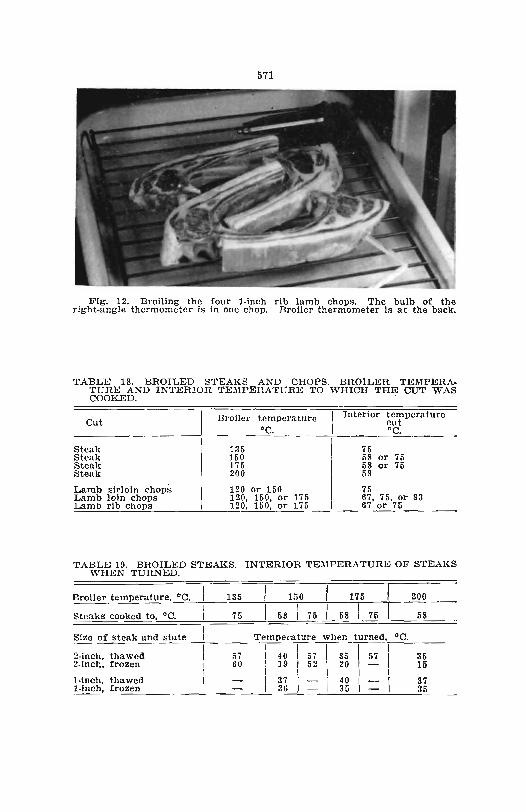
571
Fig. 12. Broiling the four l·inch rib lamb chops. The bulb of the right·angle thermometer is in one chop. BroHer thermometer is at the back.
TABLE 18. BROILED STEAKS AND CHOPS. BROILER TEMPERA. TURE AND INTERIOR TE:\IPERATURE TO WHICH THE CUT WAS COOKED. .
Cut
Steak Steak Steak Steak
Lamb sirloin chops Lamb loin chops Lamb rib chops
Broiler temperature °C.
135 160 175 200
120 or 150 120, 150, or 175 120, 150, or 175
I Interior temperature cut °C.
76 58 or 75 58 or 75 58
75 67, 75, Or 83 67 or 75
TABLE 19. BROILED STEAKS. INTERIOR TE:\[PERATURE OF STEAKS WHEN TURNED.
Broiler temperature, °C. 135 150 175 200 I I Steaks cooked to, °C. 75 58 I 75 58 75 58
Size of steak and state Temperature when turned, °C. I I I I I
2-inch, thawed fi7 I 40 I 57 35
I 57 I 35
2·lncn, frozen 60 I 19 I 52 I 20 I 15 I
I I I
1·lnch, thawed I 37 I 40 I 37 I·inch, frozen 36 35 35
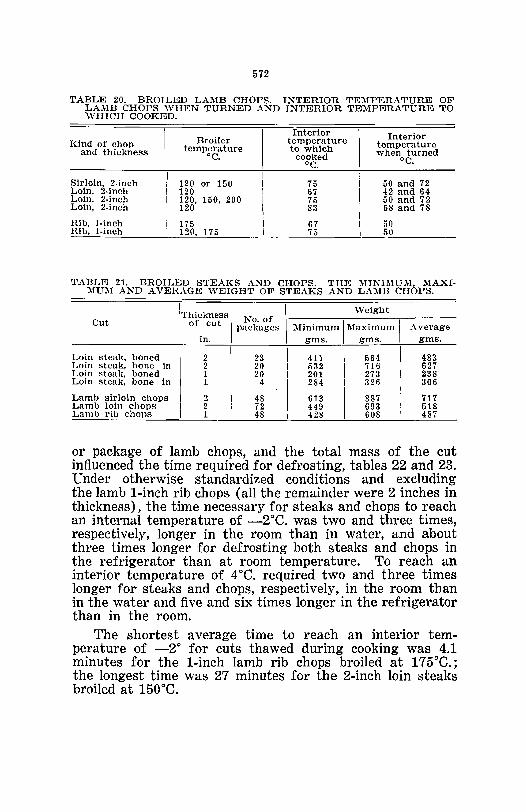
572
TABLE 20. BROILED LAMB CHOPS. INTERIOR TEMPERATURE OF LAMB CHOPS WHEN TURNED AND INTERIOR TEMPERATURE TO WHICH COOKED.
Interior Interior Kind of chop Broiler temperature temperature temperature to which and thickness ·C. cooked when turned
·C. °C.
Sirloin, 2-inch 120 or 150 75 50 and 72 Loin, 2-inch 120 67 42 and 64 Loin, 2-lnch 120, 150, 200 75 50 and 72 Loin, 2-inch 120 83 58 and 78
Rib, I-Inch 175 67 50 Rib, 1-inch 120, 175 75 50
TABLE 21. BROILED STEAKS AND CHOPS. THE MINIMUM, MAXIMUM AND AVERAGE WEIGHT OF STEAKS AND LAMB CHOPS.
I' I I Weight ThIckness No. of Cut Of. cut packages :\1inlmum I Maximum I Average
m. gms_ gms. gms.
Loin steak, boned I I I I I 2 I 23 411 564 483
Loin steak, bone in 2 20 I 532 I 716 627 Loin steak, boned I 1 I 20 I 201 I 273 I 238 Loin steak, bone in
I 1 I 4 284 326 I 306
Lamb Sirloin chops I
I I I
2 I 48 613 887 I 717 Lamb loin chops 2 I 72 449 693 518 Lamb rib chops I 1 I 48 428 608 I 487
or package of lamb chops, and the total mass of the cut influenced the time required for defrosting, tables 22 and 23. Under otherwise standardized conditions and excluding the lamb I-inch rib chops (all the remainder were 2 inches in thickness), the time necessary for steaks and chops to reach an internal temperature of _2°C. was two and three times, respectively, longer in the room than in water, and about three times longer for defrosting both steaks and chops in the refrigerator than at room temperature. To reach an interior temperature of 4 ·C. required two and three times longer for steaks and chops, respectively, in the room than in the water and five and six times longer in the refrigerator than in the room.
The shortest average time to reach an interior temperature of -2· for cuts thawed during cooking was 4.1 minutes for the I-inch lamb rib chops broiled at I75·C.; the longest time was 27 minutes for the 2-inch loin steaks broiled at I50°C.
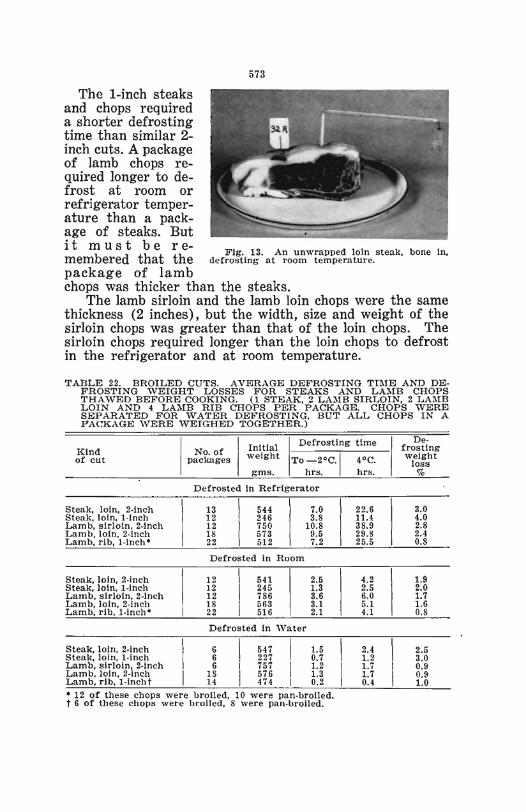
The 1-inch steaks and chops required a shorter defrosting time than similar 2-inch cuts. A package of lamb chops required longer to defrost at room or refrigerator temperature than a package of steaks. But i t m u s t b e r emembered that the package of lamb
573
Fig. 13. An unwrapped loin steak. bone In. defrosting at room temperature.
chops was thicker than the steaks. The lamb sirloin and the lamb loin chops were the same
thickness (2 inches), but the width, size and weight of the sirloin chops was greater than that of the loin chops. The sirloin chops required longer than the loin chops to defrost in the refrigerator and at room temperature.
TABLE 22. BROILED CUTS. AVERAGE DEFROSTING TIME AND DE· FROSTING WEIGHT LOSSES FOR STEAKS AND LAMB CHOPS THAWED BEFORE COOKING. (1 STEAK. 2 LA~m SIRLOIN. 2 LAMB LOIN AND 4 LAMB RIB CHOPS PER PACKAGE. CHOPS WERE SEPARATED FOR WATER DEFROSTING, BUT ALL CHOPS IN A PACKAGE WERE WEIGHED TOGETHER.)
Kind of cut
Steak, loin, 2-inch Steak, lOin, I-Inch Lamb, sirloin, 2-lnch Lamb, lOin, 2-lnch Lamb, rib, I-Inch"
Steak, loin, 2-inch Steak, loin, I-Inch Lamb, sirloin, 2-lnch Lamb, loin, 2-lnch Lamb, rib, I-inch·
Steak, loin, 2-inch Steak, loin, I-InCh Lamb, sirloin, 2-lnch Lamb, loin, 2-lnch Lamb, rib, l-Incht
I I I . t' I I Defrosting time No of m la
packages weight To _2 0C.j 40C.
gms. hrs. hrs.
I I
\
I
Defrosted In Refrigerator
13 544 7.0 12 246 3.8 12 750 10.8 18 573 9.5 22 512 7.2
Defrosted In Room
12 \ 541 2.5 12
I 245 1.3
12 786 3.6 18 563 3.1 22 516 2.1
Defrosted In 'Vater
6 6 6
18 14
547 227 757 576 474
1.5 0.7 1.2 1.3 0.2
\
I I
I
22.6 11.4 38.9 29.8 25.5
4.2 2.5 6.0 5.1 4.1
2.4 1.2 1.7 1.7 0.4
• 12 of these chops were broiled, 10 were pan-broiled. t 6 of these chops were broiled, 8 were pan-broiled.
Defrosting weight
loss %
3.0 4.0 2.8 2.4 0.8
1.9 2.0 1.7 1.6 0.8
2.5 3.0 0.9 0.9 1.0
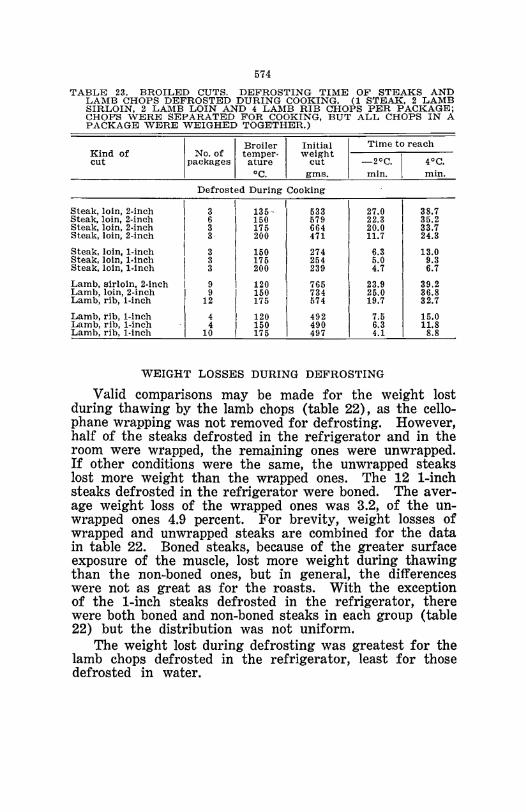
574
TABLE 23. BROILED CUTS. DEFROSTING TIME OF STEAKS AND LAMB CHOPS DEFROSTED DURING COOKING. (1 STEAK, 2 LAMB SIRLOIN, 2 LAMB LOIN AND 4 LAMB RIB CHOPS PER PACKAGE; CHOPS WERE SEPARATED FOR COOKING, BUT ALL CHOPS IN A PACKAGE WERE WEIGHED TOGETHER.)
Kind of cut
Steak, loin, 2·inch Steak, loin, 2-inch Steak, loin, 2·inch Steak, loin, 2-inch
Steak, loin, I-inch Steak, loin, 1·lnch Steak, loin, I-Inch
Lamb, sirloin, 2-inch Lamb, loin, 2·inch Lamb, rib, I-inch
Lamb, rib, I-Inch Lamb, rib, I-Inch Lamb, rib, 1·lnch
I I Broiler I No. of temper. packages ature
"C.
Initial weight
cut gms.
Defrosted During Cooking
\ I I
3 I 135 '
I 533
I 6
)
150 579 I 3 175 664 I 3 200
! 471
II 3
I 150 274
I 3 175 254 3 200 I 239
I I I I 9 I 120 I 765 I 9 I 150 I 734 I 12 I 175 I 574
\ I I
4 I 120
I 492
I 4 I 150 490 10 175 497
Time to reaeh
-20C. 4°C. min. min.
27.0 38.7 22.3 35.2 20.0 33.7 11.7 24.3
6.3 13.0 5.0 9.3 4.7 6.7
23.9 39.2 25.0 36.8 19.7 32.7
7.5 15.0 6.3 11.8 4.1 8.8
WEIGHT LOSSES DURING DEFROSTING
Valid comparisons may be made for the weight lost during thawing by the lamb chops (table 22), as the cellophane wrapping was not removed for defrosting. However, half of the steaks defrosted in the refrigerator and in the room were wrapped, the remaining ones were unwrapped. If other conditions were the same, the unwrapped steaks lost more weight than the wrapped ones. The 12 I-inch steaks defrosted in the refrigerator were boned. The average weight loss of the wrapped ones was 3.2, of the unwrapped ones 4.9 percent. For brevity, weight losses of wrapped and unwrapped steaks are combined for the data in table 22. Boned steaks, because of the greater surface exposure of the muscle, lost more weight during thawing than the non-boned ones, but in general, the differences were not as great as for the roasts. With the exception of the I-inch steaks defrosted in the refrigerator, there were both boned and non-boned steaks in each group (table 22) but the distribution was not uniform.
The weight lost during defrosting was greatest for the lamb chops defrosted in the refrigerator, least for those defrosted in water.
575
THE COOKING TIME
The cooking time was influenced by the broiler temperature, the stage of doneness to which the cut was cooked, the thickness of the cut, whether frozen or thawed at the start of cooking, and the total mass of the cut (table 24).
The cooking time decreased with the elevation of the broiler temperature.. Cuts cooked well done required more time for cooking than those cooked less well done. The 2-inch cuts needed more time for cooking than the I-inch cuts. The cuts defrosted during cooking averaged about 44 percent more time for cooking than those defrosted prior to cooking, although the record shows considerable variation (table 24), from 6 to 88 percent. The lamb sirloin chops, although the same thickness as the lamb loin chops, needed a longer cooking time than the loin chops, provided the conditions were similar.
FUEL FOR COOKING
More fuel was required for the steaks and chops which were frozen when cooking was started than for those which were thawed beforehand (table 24), provided other conditions were standardized. More fuel was used for cuts cooked well done than for those cooked medium done. An exception was the 2-inch loin steaks broiled at 175°C.
The effect of broiler temperature on the amount of fuel needed was similar to that noted for roasts. The amount of fuel used was not linearly related to the broiler temperature. Loin lamb chops broiled to an interior temperature of 75° needed more fuel at 120° than at 1500 and more at 200 0 than at 150°. The amount of fuel for the loin I-inch steaks was linearly related to the oven temperature, but the differences in amounts of gas consumed at the various broiler temperatures were not great.
COOKING WEIGHT LOSSES
The weight lost during cooking varied with the oven temperature, the stage of cookery, whether the cut was defrosted before or during cooking, and the thickness of the chops (table 24). For results with paired lamb chops see table 25. Other factors which might have affected the cooking weight losses to a greater or lesser extent, but are not readily apparent in the data in table 24, are the time of cooking and the composition of the cut.
The differences in weight losses for similar groups of steaks and chops cooked to the same stage of doneness but
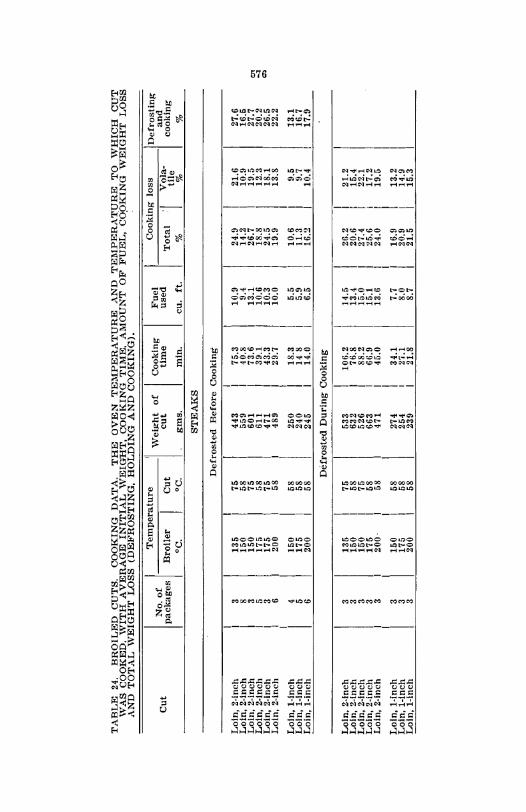
TABLE 24. BROILED CUTS. COOKING DATA. THE OVEN TE:\IPERATURE AND TEIIIPERATURE TO WHICH CUT WAS COOKED. WITH AVERAGE INITIAL WEIGHT, COOKING TIME. AMOUNT OF FUEL, COOKING WEIGHT LOSS AND TOTAL WEIGHT LOSS (DEFROSTING, HOLDING AND COOKING). :
Temperature 'Vei~ht of I Cooking
I
Fuel
I
Cooking loss IDefrOSting I No. of I and Cut packages Broiler Cut cut time used Total 'I Vola- cooking tile
°C. °C. gms. min. cu. ft. % % %
STEAKS
Defrosted Before Cooking
Loin, 2-inch 3 135 75 443 75.3 10.9 24.9 21.6 27.6 Loin, 2-lnch 8 150 58 559 40.8 9.4 14.2 10.9 16.5 Loin, 2·inch 3 150 75 601 73.6 13.1 26.7 19.5 27.7 01 Loin, 2·lnch 5 175 58 611 39.1 10.6 18.8 12.3 20.2 -J
Loin, 2-inch 3 175 75 471 43.3 10.3 24.5 18.1 26.5 ."
Loin, 2-inch 6 200 58 489 29.7 10.0 19.9 13.S 22.2
Loin, I-inch 4 150 58 250 18.3 5.5 10.6 9.5 13.1 Loin, I-Inch 5 175 58 240 148 5.9 11.3 9.7 16.7 Loin, I-inch 6 200 58 245 14.0 6.5 16.2 10.4 17.9
Defrosted During Cooking
Loin, 2-inch 3 135 75 533 106.2 14.5 26.2 21.2 Loin, 2-lnch 3 150 58 632 76.8 13.4 20.6 15.4 Loin, 2-lnch 3 150 75 526 88.2 15.0 27.4 22.1 Loin, 2-inch 3 175 58 663 66.9 15.1 ~5.6 17.2 Loin, 2·inch 3 200 58 471 45.0 13.6 24.0 19.5
Loin, I-inch 3 150 58 274 34.1 7.7 16.9 13.2 Loin, I-inch 3 175 58 254 27.1 8.0 20.9 14.9 Loin, I-inch 3 200 58 239 21.8 8.7 21.5 15.3
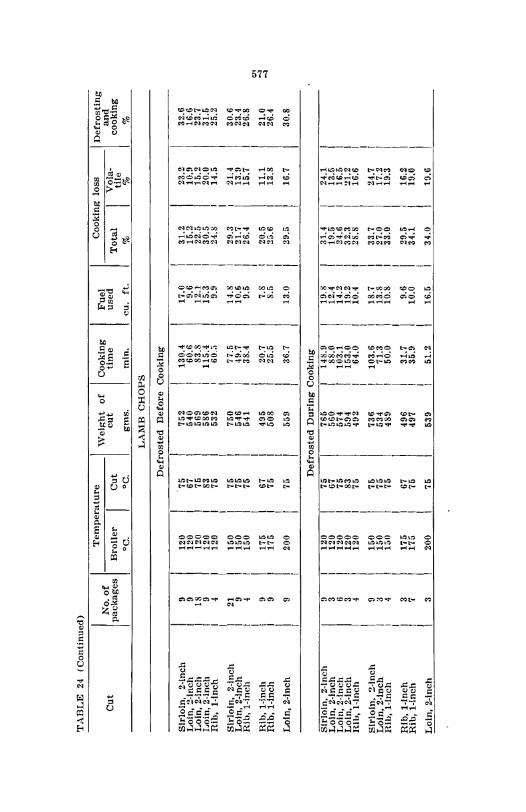
TABLE 24 (Continued)
Temperature I \Velght of I Cooking Fuel Cooking loss ID'''~U"~ I No. of I and Cut packages Broiler Cut cut time used Total Vola- cooking tile
°C. °C. gms. min. cu. ft. % % %
LAMB CHOPS
Defrosted Before Cooking
Sirloin, 2·inch 9 120 75 7il2 130.4 17.0 31.2 23.2 32.6 Loin, 2-lnch 9 120 67 540 60.6 9.6 15.2 10.9 16.6 Loin, 2·lnch 18 120 75 569 83.8 12.1 22.5 15.2 23.7 Loin, 2-lnch 9 120 83 586 115.4 15.3 30.5 20.0 31.5 Rib, I-inch 4 120 75 532 60.~ 9.9 24.8 14.5 25.2
Sirloin, 2-lnch 21 150 75 750 77.5 14.8 29.3 21.4 30.6 Loin, 2-lnch 9 150 75 546 49.7 10.6 21.7 13.9 23.4 Rlh, I-Inch 4 150 75 541 38.4 9.5 26.4 15.7 26.8
on Rib, I-inch 9 175 67 495 20.7 7.8 20.5 11.1 21.0 "'" Rlb,l·lnch 9 175 75 508 25.5 8.5 25.6 13.8 26.4 "'" Loin, 2-lnch 9 200 75 559 36.7 13.0 29.5 16.7 30.8
Defrosted During Cooking
Sirloin, 2-lnch 9 120 75 765 I 148.9 19.8 31.4 24.1 Loin, 2-lnch 3 120 67 560 I 88.0 12.4 19.5 13.5 Loin, 2-lnch 6 120 75 574 I 103.1 14.2 24.6 16.5 Loin, 2-lnch 3 120 83 594 I 153.0 19.2 32.3 !11.2 Rlh, I-Inch 4 120 75 492 I 64.0 10.4 28.8 16.6
I Sirloin, 2·lnch 9 150 75 736 I 103.6 18.7 33.7 24.7 Loin, 2·lnch :I 150 75 534 I 71.3 13.8 27.0 17.2 Rib, l·lncll 4 150 75 489 I 50.0 10.8 33.0 19.3
Rib, I-Inch 3 175 67 496 \ 31.7 9.6 29.5 16.2 Rib, I-Inch 7 175 75 497 I 35.9 10.0 34.1 19.0
I Loin, 2-lnch 3 200 75 539 I 51.2 16.5 34.0 19.6
578
at different broiler temperatures were not always consistent. In general, the total weight losses during cooking of the 1- and 2-inch loin steaks (cooked medium done) increased with the elevation of the broiler temperature. Sometimes this increase was large, sometimes only slight, and in one instance (l-inch steaks defrosted before cooking and broiled at 200°) the loss was less at the higher temperature. The weight losses of the 2-inch steaks (cooked well done) were greater at 150° than at 135·C. The data for paired lamb chops, Unit II, table 25, indicate that the total cooking weight losses increased with elevation of the oven temperature.
Steaks and chops cooked more well done always lost more weight than those cooked less well done. These results were consistent for all cuts. The groups of chops cooked well done averaged slightly more than 35 percent greater weight loss than those cooked medium done. The total weight loss during cooking was greater for the steaks and chops defrosted during cooking than for those defrosted prior to cooking. This is logical, for the former always required a longer cooking time than the latter. However, the paired lamb leg roasts lost about the same weight, whether defrosted during or before cooking. The 2-inch steaks and chops required a longer time for cooking and had greater weight losses than those 1-inch thick.
TOT AL WEIGHT LOSSES
The total weight losses, i. e., the defrosting, holding and cooking losses for the cuts thawed before cooking, were greater in 18 out of 19 comparable groups (table 24) than the total cooking losses of the chops defrosted during cooking.
APPEARANCE OF BROILED STEAKS AND CHOPS
Steaks were broiled at 135·, 150°, 175· and 200°C.; chops were broiled at 120·, 150·, 175° and 200°. Under comparable cooking conditions the steaks and chops became browner as the broiler temperature was elevated. Steaks and chops defrosted during cooking always had browner exteriors than similar steaks or chops which had been thf'wed before cooking. As the steaks or chops were cooked more well done the exterior became a darker brown, with charred areas for the thicker steaks or chops at the higher proiler temperatures. The 2-inch steaks or chops were browner under the same cooking conditions than those 1-inch thick.
Spattering of the fat occurred during broiling at 200·.
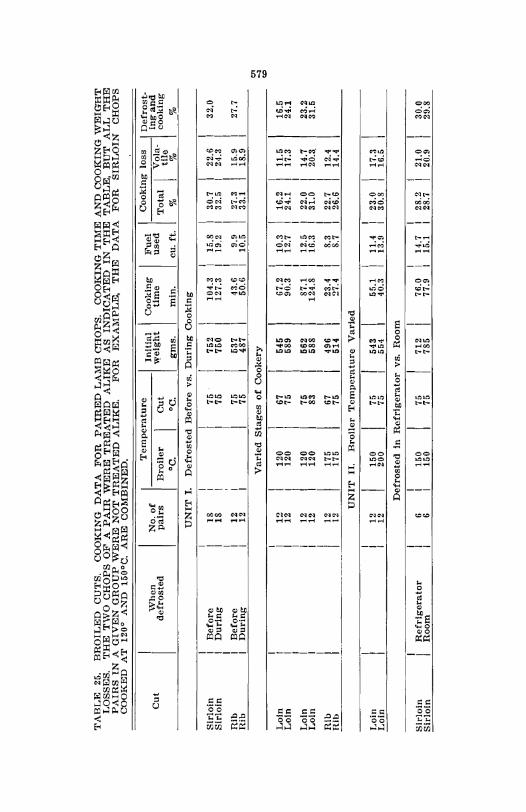
TABLE 25. BROILED CUTS. COOKING DATA FOR PAIRED LAMB CHOPS. COOKING TIME AND COOKING WEIGHT LOSSES. THE TWO CHOPS OF A PAIR WERE TREATED ALIKE AS INDICATED IN THE TABLE. BUT ALL THE PAIRS IN A GIVEN GROUP WERE NOT TREATED ALIKE. FOR EXAMPLE. THE DATA FOR SIRLOIN CHOPS COOKED AT 120 0 AND 150oe. ARE COMBINED.
Temperature I Initial I Cooking I Fu I I Cooking loss \ I?efrost. Cut \Vhen No. of ed mgand
defrosted pairs Broiler Cut weight time use Total ';W;- cooking DC. DC. gms. min. cu. ft. % % %
UNIT I. Defrosted Before vs. During Cooking
I Sirloin Before 18 I 75 . 752 104.3 15.8 30.7 22.6 32.0 Sirloin During 18 I 75 750 127.3 19.2 32.5 24.3
Rib Before 12 75 537 43.6 9.9 27.3 15.9 27.7 Rib During 12 75 487 50.6 10.5 33.1 18.9
Varied Stages of Cookery tTl ...., <J:>
I I Loin 12 120 I 67 I 545 67.2 10.3 16.2 11.5 16.5 Loin 12 120 I 75 589 90.3 12.7 24.1 17.3 24.1
I I Loin 12 120 I 75 I 562 87.1 12.5 22.0 14.7 23.2 Loin 12 120 83 588 124.8 16.3 31.0 20.3. 31.5
I I
Rib 12 175 67 I 496 23.4 8.3 22.7 12.4 Rib 12 175 75 514 27.4 S.7 26.6 14.4
UNIT II. Broiler '.rem perature Varied
Loin 12 150 75 543 55.1 11.4 23.0 17.3 Loin 12 200 75 554 40.3 13.9 30.S 16.5
Defrosted In Refrigerator vs. Room
Sirloin Refrigerator 6 150 75 712 76.0 14.7 28.2 21.0 30.0 Sirloin Room 6 150 75 785 77.9 15.1 28.7 20.9 29.8
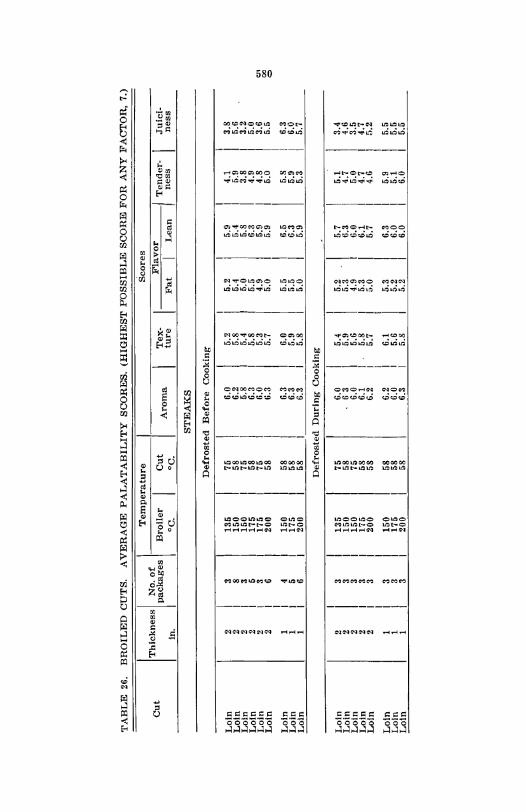
TABLE 26. BROILED CUTS. AVERAGE PALATABILITY SCORES. (HIGHEST POSSIBLE SCORE FOR ANY FACTOR, 7.)
Temperature Scores
Cut I Thickness I No. of I Flavor packages Broiler Cut Aroma Tex- Tender- .Yulci-In. ec. °c. ture Fat Lean ness ness
STEAKS
Defrosted Before Cooking
Loin 2 3 135 75 6.0 5.2 5.2 5.9 4.1 3.8 Loin 2 8 150 58 6.2 5.8 5.4 5.4 5.9 5.6 Loin 2 3 150 75 5.8 5.4 5.0 5.8 3.8 3.2 Loin 2 6 175 58 6.3 5.8 5.5 6.3 4.9 5.0 Loin 2 3 175 75 6.0 5.3 4.9 5.9 4.8 3.6 "" Loin 2 6 200 58 6.3 5.7 5.0 5.9 5.0 5.5 00
<:>
Loin 1 4 150 58 6.3 6.0 5.5 6.5 5.8 6.3 Loin 1 5 175 58 6.3 5.9 5.5 6.3 5.9 6.0 Loin 1 6 200 58 6.3 5.8 5.0 5.9 5.3 5.7
Defrosted During Cooking
Loin 2 3 135 75 6.0 5.4 5.2 5.7 5.1 3.4 Loin 2 3 150 58 63 5.9 5.3 6.3 4.7 4.6 Loin 2 3 150 75 6.0 5.6 4.9 6.0 5.0 3.5 Loin 2 3 175 68 6.1 5.8 5.3 6.1 4.7 4.7 Loin 2 3 200 58 6.2 5.7 5.0 5.7 4.6 ".2 Loin 1 3 150 58 6.2 6.1 5.3 6.3 5.9 5.5 Loin 1 3 175 58 6.0 5.6 5.2 6.0 5.1 5.5 Loin 1 3 200 58 6.3 5.8 5.2 6.0 6.0 5.5
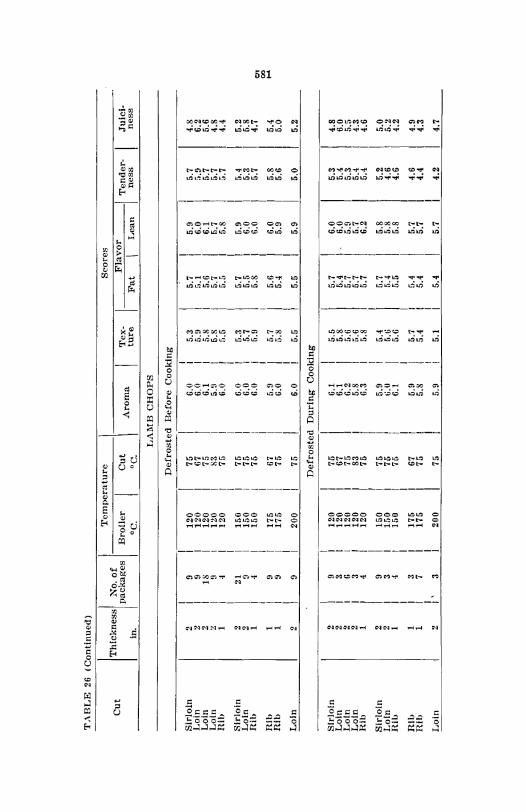
TABLE 26 (Continued)
Temperature Scores
Cut I 'l'hlckness I No. of I Flayor packages Broiler Cut Aroma Tex· Tender· Juici-In. ec. °c. ture Fat I Lean ness ness
LAMB CHOPS
Defrosted Before Cooking
Sirloin 2 9 120 75 6.0 5.3 5.7 5.9 5.7 4.8 Loin 2 9 120 67 6.0 5.9 !j.1 6.0 !i.9 6.2 Loin 2 18 120 75 6.1 5.8 5.6 6.1 5.7 5.6 Loin 2 !l 120 83 5.9 5.8 5.7 5.7 5.7 4.8 Rib 1 4 120 75 6.0 a.5 5.5 5.8 a.7 4.4
Sirloin 21 150 75 6.0 5.3 5.7 5.9 5.4 5.2 Loin 2 9 150 75 6.0 5.7 5.5 6.0 5.3 5.8 Rib 4 150 75 6.0 6.9 5.8 6.0 5.7 4.7 en
co Rib 1 9 175 67 5.9 5.7 5.6 6.0 5.8 5.4 I-' Rib 1 9 175 75 6.0 a.S 5.4 5.9 6.6 5.0
Loin 2 9 200 75 6.0 5.5 5.5 5.9 5.0 5.2
Defrosted During Cooking
Sirloin 2 I 9 120 76 6.1 5.5 6.7 I 6.0 5.3 4.8 Loin 2 I 3 120 67 6.1 5.8 5.4
I 6.0 6.4 6.0
Loin 2 I 6 120 75 6.2 5.6 5.7 5.9 5.3 5.5 Loin 2 I 3 120 83 5.8 5.6 5.7 5.7 5.4 4.3 Rih 1 I 4 120 75 6.3 5.8 5.7 6.2 6.4 4.6
I Sirloin 2 9 150 75 5.9 5.4 5.7 I 5.8 5.2 5.0 Loin 2 I 3 150 75 6.0 5.0 5.4 I 5.8 4.6 5.2 Rib 1 I 4 150 75 6.1 5.6 5.5 I 5.8 4.6 4.2
I I Rib 1 I 3 175 67 5.9 5.7 5.4 I 5.7 4.6 4.9 Rlh 1 I 7 175 75 5.S 5.4 5.4 5.7 4.4 4.3
Loin 2 I, 3 200 75 5.9 5.1 5.4 I 6.7 4.2 4.7
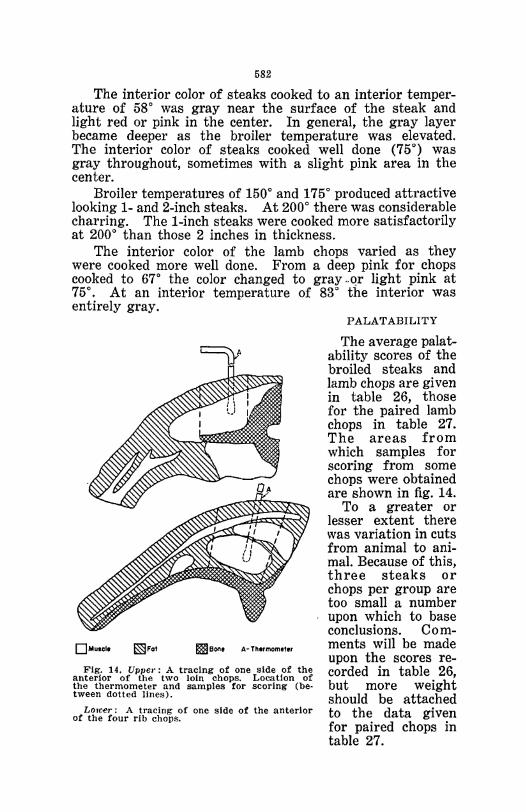
582
The interior color of steaks cooked to an interior temperature of 58° was gray near the surface of the steak and light red or pink in the center. In general, the gray layer became deeper as the broiler temperature was elevated. The interior color of steaks cooked well done (75°) was gray throughout, sometimes with a slight pink area in the center.
Broiler temperatures of 150° and 175° produced attractive looking 1- and 2-inch steaks. At 200° there was considerable charring. The 1-inch steaks were cooked more satisfactorily at 200° than those 2 inches in thickness.
The interior color of the lamb chops varied as they were cooked more well done. From a deep pink for chops cooked to 67° the color changed to graY"Qr light pink at 75°. At an interior temperature of 83° the interior was entirely gray.
~F.' m Bone A- Thermometer
Fig. 14. UPlle,': A tracing of one side of the anterior of the two loin chops. Location of the thermometer and samples for scoring (between dotted Jines).
LOlcer: A tracing of one side of the anterior of the four rib chops.
PALATABILITY
The average palatability scores of the broiled steaks and lamb chops are given in table 26, those for the paired lamb chops in table 27. The areas from which samples for scoring from some chops were obtained are shown in fig. 14.
To a greater or lesser extent there was variation in cuts from animal to animal. Because of this, three steaks or chops per group are too small a number upon which to base conclusions. Comments will be made upon the scores recorded in table 26, but more weight should be attached to the data given for paired chops in table 27.
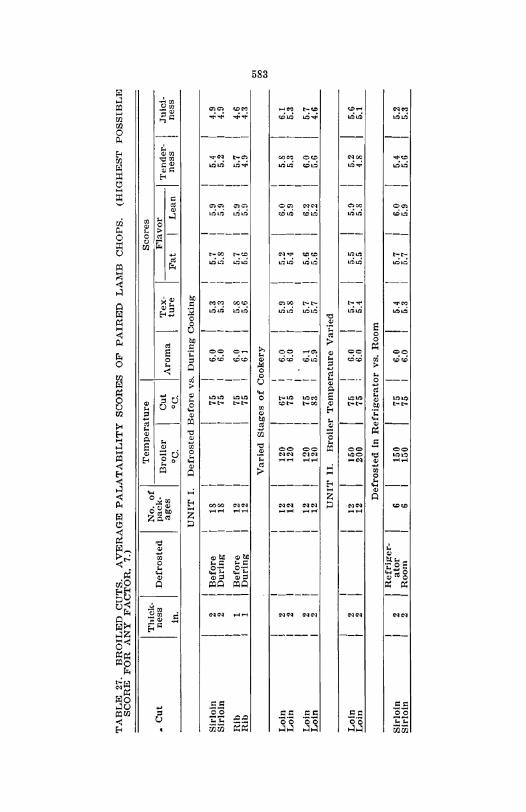
TABLE 27. BROILED CUTS. AVERAGE PALATABILITY SCORES OF PAIRED LAMB CHOPS. (HIGHEST POSSIBLE SCORE FOR ANY FACTOR, 7.)
I ThiCk·r r No. of I Tcmperature
I Aroma
Scores
• Cut n~:.s Defrosted pack· Broiler Cut I Tex- Flavor I Tender- I Juici· ages ture Fat Lean ness ness °C. °C.
UNIT I. Defrosted Before vs. During Cooking
I Sirloin 2 Before 18 I 75 6.0 5.3 5.7 5.9 5.4 4.9 Sirloin 2 During 18 I 75
I 6.0 5.3 5.8 5.9 5.2 4.9
Rib 1 Before 12 I 75 6.0 5.8 5.7 5.9 5.7 4.6 Rib 1 During 12 I 75 61 5.6 5.6 5.9 4.9 4.3
'" Varied Stages of Cookery 00 ... Loin 2 12 120 67 6.0 5.9 5.2 6.0 5.8 6.1 Loin 2 12 120 75 6.0 5.8 5.4 5.9 5.3 5.3
Loin 2 12 120 75 6.1 5.7 5.6 6.2 6.0 5.7 Loin 2 12 120 83 5.9 5.7 5.6 5.2 5.6 4.6
UNIT II. Broilcr Temperature Varied
I Loin 2 12 I 150 75 6.0 5.7 5.5 5.9 5.2 5.6 Loin 2 12 I 200 75 6.0 5.4 5.5 5.8 4.8 5.1
Defrosted in Refrigerator vs. Room
Refriger. Sirloin 2 ator 6 150 75 6.0 5.4 5.7 6.0 5.4 5.2 Sirloin 2 Room 6 150 75 6.0 5.3 5.7 5.9 5.6 5.3
584
The steaks which were cooked well done were always scored less juicy than those which were cooked medium done. This same result was also obtained with lamb chops. There may be a trend for the well done steaks to be scored lower in flavor of lean and tenderness than those less well done. The I-inch steaks were rated more juicy than the 2-inch thick ones, if broiled under the same conditions.
When the two chops of a pair were treated alike except for one variable, the average scores for the matched pairs of lamb chops indicate that defrosting in the refrigerator versus at room temperature had no effect upon any of the palatability factors. However, both the sirloin and rib lamb chops defrosted during cooking tended to be less tender than those defrosted prior to cooking. The chops cooked less well done were scored more juicy than those cooked more well done. There was also a trend for the more well done chops to be rated less tender than the chops cooked less well done. The chops of pairs cooked to an interior temperature of 67° and 75°C. received the same scores for flavor of lean, but the chops of the pairs cooked to 83° were rated lower for flavor of lean than those cooked to 75°. Lamb chops cooked to an interior temperature of 67° had the most intense lamb flavor and were the juiciest of all the chops. For most people the fat might seem slightly undercooked. Chops cooked to 83° were bland in flavor and shriveled in appearance. They were charred to the extent that the flavor was affected. There was a trend for the chops broiled at 200° to be scored less tender and less juicy than those broiled at 1500
•
SUMMARY FOR BROILED STEAKS AND CHOPS
The defrosting temperature, the thickness of the steak or the package of lamb chops, and the total mass of the cut influenced the time required for defrosting. For both defrosting in water and defrosting during cooking, steaks were unwrapped and lamb chops were unwrapped and separated.
The defrosting time was shortened with elevation of the I defrosting temperature. The average time for all 2-inch steaks and chops to reach _2°C., when defrosted in water, was 1.3 hours; to reach 4°C., 1.9 hours. In comparing the time for room and water defrosting, it was found that steaks required twice as long, Iamb sirloin and lamb loin chops three times longer in the room than in water. The lamb rib chops, however, required 10 times longer in the room than in water. Steaks and chops required about
585
three times longer in the refrigerator than in the room to reach _2°, but it took approximately five times longer for the steaks and six times longer for the lamb chops to reach 4°C. The defrosting time during cooking was shorter with the higher broiler temperature.
The 1-inch steaks and chops required a shorter time for thawing than the 2-inch ones. When steaks or chops were the same thickness, a longer defrosting time was necessary for the heavier cuts.
Boned steaks usually lost more weight during thawing than the non-boned ones.
When the thickness of the cuts was the same, the cooking time was shorter with the higher broiler temperatures, for the cuts cooked less well done, for cuts thawed before cooking and for smaller cuts.
With otherwise standardized conditions more fuel was required to cook the frozen than the thawed cuts, and more for the well done cuts than for those less well done. Fuel consumption was not always linearly related to the broiler temperature. The intermediate broiler temperatures required the least fuel.
Cooking weight losses for paired chops increased with elevation of the broiler temperature, with cooking more well done, and for cuts defrosted during cooking.
The defrosting method did not affect the palatability scores with the possible exception of those of the sirloin and rib Iamb chops defrosted prior to cooking. Well done steaks and lamb chops were always scored less juicy than those less well done. There was also a trend for the well done chops to be scored less tender than those less well done and for the chops broiled at 200° to be scored less tender, less juicy and of poorer flavor than those broiled at 150°C.
RECOMMENDATIONS
All the steaks used in this study were obtained from Good grade carcasses, all the lamb chops from those of Choice grade. With these and the limitations indicated in tables 26 and 27 the following recommendations are made. Desirable steaks are obtained at broiler temperatures of 135°, 150° and 175°C. and chops at 120°, 150° and 175°C. The two lower broiler temperatures did not increase the palatability of the cuts and required a long time for cooking. A broiler temperature of 120° required more fuel for chops than 150°. A broiler temperature of 200° was too high for the 2-inch cuts, both thawed and frozen.
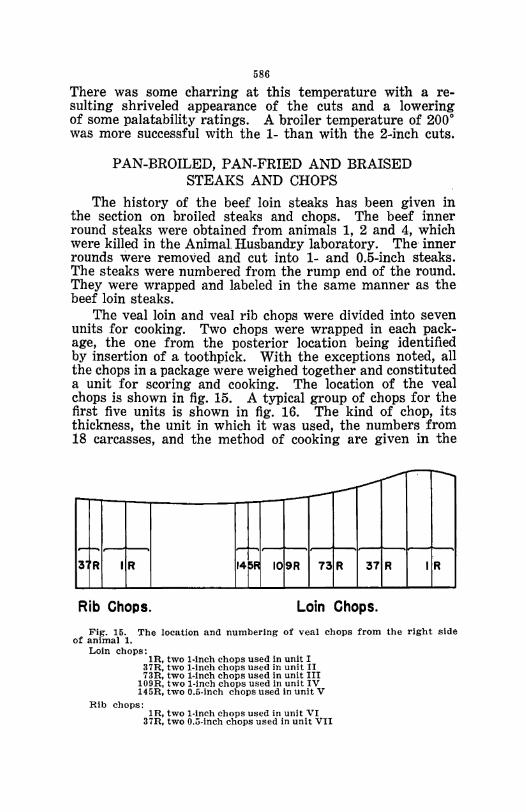
586
There was some charring at this temperature with a resulting shriveled appearance of the cuts and a lowering of some palatability ratings. A broiler temperature of 2000
was more successful with the 1- than with the 2-inch cuts.
PAN-BROILED, PAN-FRIED AND BRAISED STEAKS AND CHOPS
The history of the beef loin steaks has been given in the section on broiled steaks and chops. The beef inner round steaks were obtained from animals 1, 2 and 4, which were killed in the Animal Husbandry laboratory. The inner rounds were removed and cut into 1- and 0.5-inch steaks. The steaks were numbered from the rump end of the round. They were wrapped and labeled in the same manner as the beef loin steaks.
The veal loin and veal rib chops were divided into seven units for cooking. Two chops were wrapped in each package, the one from the posterior location being identified by insertion of a toothpick. With the exceptions noted, all the chops in a package were weighed together and constituted a unit for scoring and cooking. The location of the veal chops is shown in fig. 15. A typical group of chops for the first five units is shown in fig. 16. The kind of chop, its thickness, the unit in which it was used, the numbers from 18 carcasses, and the method of cooking are given in the
~ -----,--1..-r 3 R I R 14rA I09R 73 R 37 R IR
Rib Chops. Loin Chops. Fig. 15. The location and numbering of veal chops from the right side
of animal 1. Loin chops:
IR, two 1·lnch chops used in unit I 37R, two 1·inch chops used in unit II 73R, two l·lnch chops used in unit III
109R, two l·lnch chops used In unit IV 145R, two O.5·inch chops used in unit V
Rib chops: 1R, two l·lnch chops used in unit VI
37R, two O.li·inch chops used in unit VII
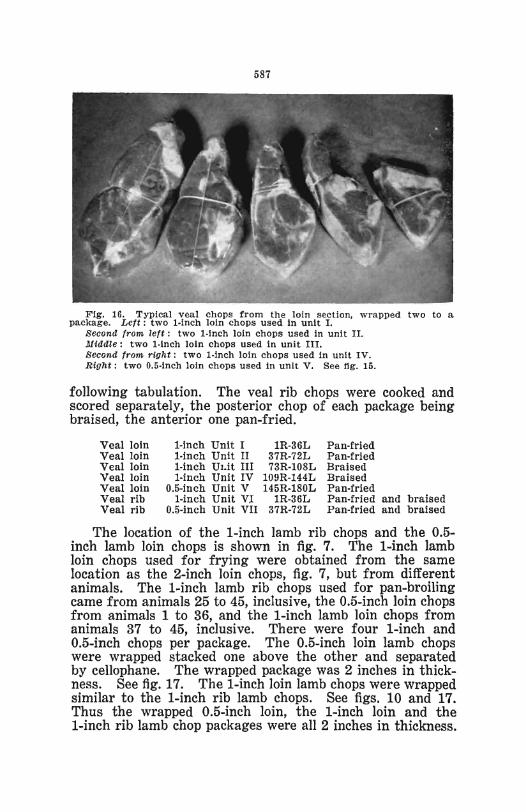
587
FIg. 16. Typical veal chops from the loin section. wrapped two to a package. Left: two l·inch loin chops used in unit I.
Second from left: two l·Inch loin chops used In unit II. Mtddle: two l·lnch loin chops used in unit III. Second from right: two 1·inch loin chops used In unIt IV. Right: two O.5·lnch loin chops used In unit V. See fig. 15.
following tabulation. The veal rib chops were cooked and scored separately, the posterior chop of each package being braised, the anterior one pan-fried.
Veal loin Veal loin Veal loin Veal loin Veal loin Veal rib Veal rib
l·lnch Unit I iR·36L i·inch Unit II 37R·72L i·inch Uz.it III 73R·i08L i·inch Unit IV 109R·144L
O.5·lnch Unit V i45R·180L i·inch Unit Vl iR·36L
O.5·inch Unit VII 37R·72L
Pan·fried Pan·fried Braised Braised Pan·fried Pan·fried and braised Pan·fried and braised
The location of the 1-inch lamb rib chops and the 0.5-inch lamb loin chops is shown in fig. 7. The 1-inch lamb loin chops used for frying were obtained from the same location as the 2-inch loin chops, fig. 7, but from different animals. The 1-inch lamb rib chops used for pan-broiling came from animals 25 to 45, inclusive, the O.5-inch loin chops from animals 1 to 36, and the 1-inch lamb loin chops from animals 37 to 45, inclusive. There were four I-inch and O.5-inch chops per package. The 0.5-inch loin lamb chops were wrapped stacked one above the other and separated by cellophane. The wrapped package was 2 inches in thickness. See fig. 17. The I-inch loin lamb chops were wrapped similar to the 1-inch rib lamb chops. See figs. 10 and 17. Thus the wrapped 0.5-inch loin, the I-inch loin and the I-inch rib lamb chop packages were all 2 inches in thickness.
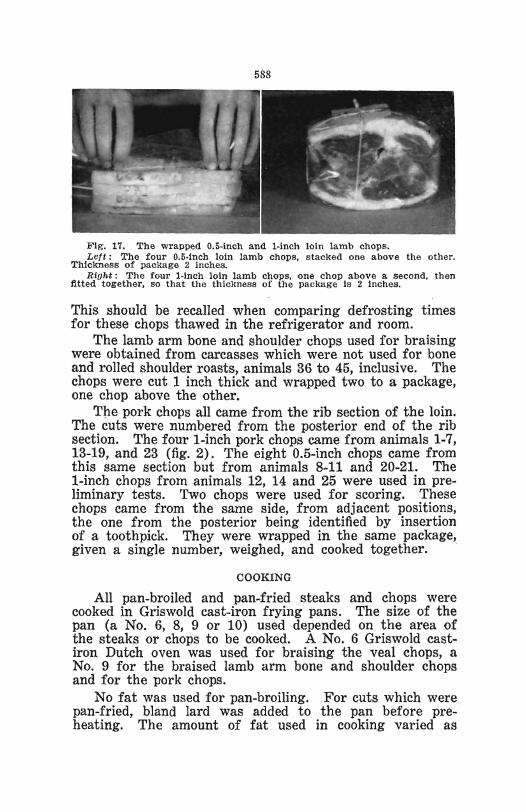
588
Fig. 17. The wrapped O.5-inch and 1-inch loin lamb chops. Lett: The four O.5-lnch loin lamb chops, stacked one above the other.
Thickness of package 2 inches. Right: The four l-Inch loin lamb chops, one chop above a second, then
fitted together, so that the thickness of the package Is 2 Inches.
This should be recalled when comparing defrosting times for these chops thawed in the refrigerator and room.
The lamb arm bone and shoulder chops used for braising were obtained from carcasses which were not used for bone and rolled shoulder roasts, animals 36 to 45, inclusive. The chops were cut 1 inch thick and wrapped two to a package, one chop above the other.
Tpe pork chops all came from the rib section of the loin. The cuts were numbered from the posterior end of the rib section. The four I-inch pork chops came from animals 1-7, 13-19, and 23 (fig. 2). The eight 0.5-inch chops came from this same section but from animals 8-11 and 20-21. The I-inch chops from animals 12, 14 and 25 were used in preliminary tests. Two chops were used for scoring. These chops came from the same side, from adjacent positions, the one from the posterior being identified by insertion of a toothpick. They were wrapped in the same package, given a single number, weighed, and cooked together. .
COOKING
All pan-broiled and pan-fried steaks and chops were cooked in Griswold cast-iron frying pans. The size of the pan (a No.6, 8, 9 or 10) used depended on the area of the steaks or chops to be cooked. A No. 6 Griswold castiron Dutch oven was used for braising the veal chops, a No.9 for the braised lamb arm bone and shoulder chops and for the pork chops.
No fat was used for pan-broiling. For cuts which were pan-fried, bland lard was added to the pan before preheating. The amount of fat used in cooking varied as
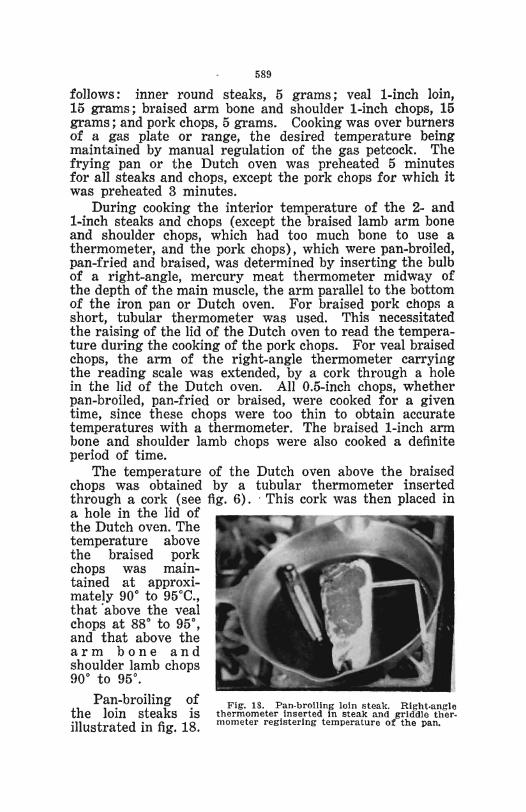
589
follows: inner round steaks, 5 grams; veal i-inch loin, 15 grams.; braised arm bone and shoulder 1-inch chops, 15 grams; and pork chops, 5 grams. Cooking was over burners of a gas plate or range, the desired temperature being maintained by manual regulation of the gas petcock. The frying pan or the Dutch oven was preheated 5 minutes for all steaks and chops, except the pork chops for which it was preheated 3 minutes.
During cooking the interior temperature of the 2- and i-inch steaks and chops (except the braised lamb arm bone and shoulder chops, which had too much bone to use a thermometer, and the pork chops), which were pan-broiled, pan-fried and braised, was determined by inserting the bulb of a right-angle, mercury meat thermometer midway of the depth of the main muscle, the arm parallel to the bottom of the iron pan or Dutch oven. For braised pork chops a short, tubular thermometer was used. This necessitated the raising of the lid of the Dutch oven to read the temperatUre during the cooking of the pork chops. For veal braised chops, the arm of the right-angle thermometer carrying the reading scale was extended, by a cork through a hole in the lid of the Dutch oven. All 0.5-inch chops, whether pan-broiled, pan-fried or braised, were cooked for a given time, since these chops were too thin to obtain accurate temperatures with a thermometer. The braised i-inch arm bone and shoulder lamb chops were also cooked a definite period of time.
The temperature of the Dutch oven above the braised chops was obtained by a tubular thermometer inserted through a cork (see fig. 6) . . This cork was then placed in a hole in the lid of the Dutch oven. The temperature above the braised pork chops was maintained at approximately 90° to 95°C., that 'above the veal chops at 88° to 95°, and that above the arm bone and shoulder lamb chops 90° to 95°.
Pan-broiling of the loin steaks is illustrated in fig. 18.
Fig. IS. Pan·broillng loin steak. Right·angle thermometer inserted in steak and griddle ther. mometer registering temperature of the pan.
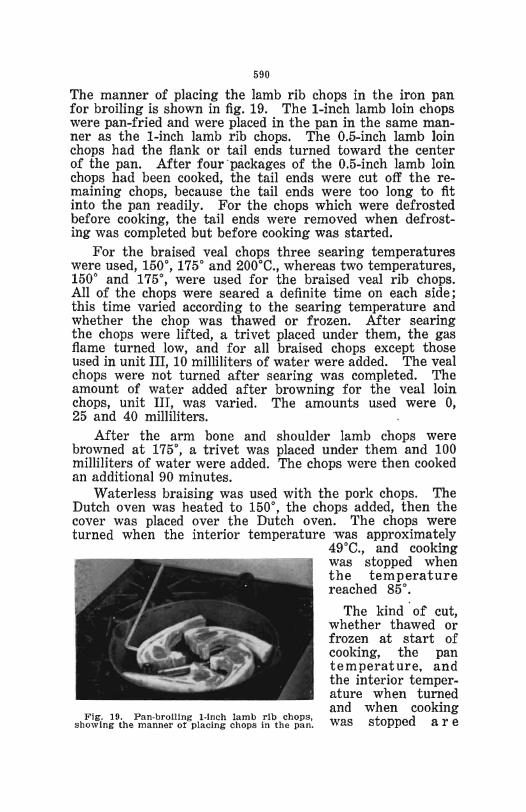
590
The manner of placing the lamb rib chops in the iron pan for broiling is shown in fig. 19. The I-inch lamb loin chops were pan-fried and were placed in the pan in the same manner as the I-inch lamb rib chops. The 0.5-inch lamb loin chops had the flank or tail ends turned toward the center of the pan. Mter four ·packages of the 0.5-inch lamb loin chops had been cooked, the tail ends were cut off the remaining chops, because the tail ends were too long to fit into the pan readily. For the chops which were defrosted before cooking, the tail ends were removed when defrosting was completed but before cooking was started.
For the braised veal chops three searing temperatures were used, 150°, 1750 and 200°C., whereas two temperatures, 1500 and 1750
, were used for the braised veal rib chops. All of the chops were seared a definite time on each side; this time varied according to the searing temperature and whether the chop was thawed or frozen. Mter searing the chops were lifted, a trivet placed under them, the gas flame turned low, and for all braised chops except those used in unit III, 10 milliliters of water were added. The veal chops were not turned after searing was completed. The amount of water added after browning for the veal loin chops, unit III, was varied. The amounts used were 0, 25 and 40 milliliters.
After the arm bone and shoulder lamb chops were browned at 175°, a trivet was placed under them and 100 milliliters of water were added. The chops were then cooked an additional 90 minutes.
Waterless braising was used with the pork chops. The Dutch oven was heated to 1500
, the chops added, then the cover was placed over the Dutch oven. The chops were turned when the interior temperature was approximately
Fig. 19. P a n-broiling 1-lnch lamb rib chops, showing the manner or placing chops in the pan.
49°C., and cooking was stopped when the temperature reached 85°.
The kind of cut, whether thawed or frozen at start of cooking, the pan temperature, and the interior temperature when turned and when cooking was stopped are
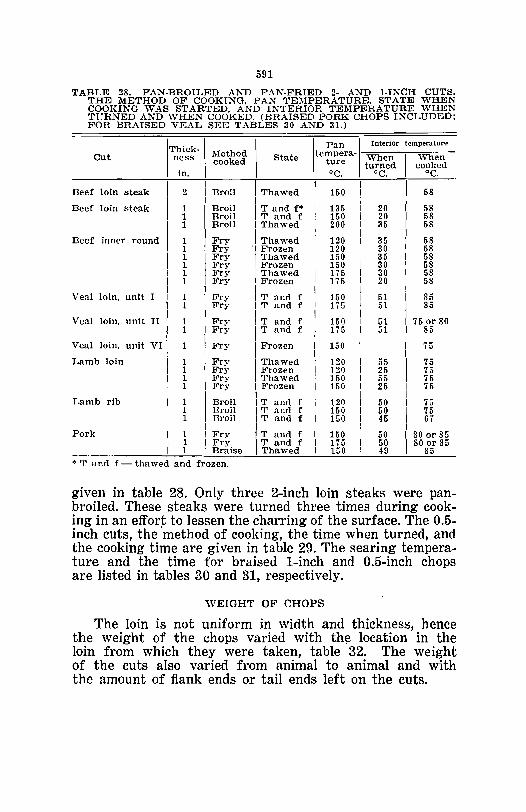
591
TABLE 28. PAN·BROILF.D AND PAN·FRIED 2· AND l·INCH CUTS. THE METHOD OF COOKING, PAN TE~IPERATURE, STATE WHEN COOKING WAS STARTED, AND INTERIOR TEMPERATURE WHEN TURNED AND WHEN COOKED. (BRAISED PORK CHOPS INCLUDED; FOR BRAISED VEAL SEE 'I'ABLES 30 AND 31.)
Cut !ThiCk.! Method ness cooked In.
Beef loin steak ,I
Beef loin steak
",'f inn" .. nnd I I
I Veal loin, unit I I
1 Veal loin, unit II I
Veal loin,
Lamb loin
Lamb rib
Pork
I unit VI j
i 1 I
I I I I I I I
2
1 1 1
1 1 1 1 1 1
1 1
1
1 1 1 1
1 1 1
1 1 1
Broil
Broil Broil Broil
Fry Fry
I Fry I Fry I Fry I Fry I I Fry I Fry
I Fry I Fry I I Fry
I Fry I Fry I Fry I Fry I
'
Broil Broil
I Broil I I Fry I Fry I Braise
• T and f - thawed and frozen.
State
, Thawed I I T and f* I T and f I Thawed
I Thawed I Frozen
Thawed Frozen Thawed Frozen
T and f T and f
T and f T and f
Frozen
Thawed Frozen Thawed Frozen
T and f
IT and f T and f
I I T and f
'
T and f Thawed
!
Pan ! Interior temperature
tempera· When I ·When ture turned cooked cc. cC. cC.
150
135 150 200
120 120 150 150 175 175
150 175
150 175
150
120 120 150 150
120 150 150
150 175 150
20 20 35
35 30 35 30 30 20
51 51
51 51
55 25 55 25
50 50 45
50 50 49
58
i 58 I 58
58
! I
58 58 58 58 58 58
I 85 I 85
1 75 or 80 85
I I 75 I
1
I 75 7;; 75 75
1 75
\ ~¥ I I 80 Or 85 I 80 or 85 I 85
given in table 28. Only three 2-inch loin steaks were panbroiled. These steaks were turned three times during cooking in an effort to lessen the charring of the surface. The 0.5-inch cuts, the 'method of cooking, the time when turned, and the cooking time are given in table 29. The searing temperature and the time for braised 1-inch and 0.5-inch chops are listed in tables 30 and 31, respectively.
WEIGHT OF CHOPS
The loin is not uniform in width and thickness, hence the weight of the chops varied with the location in the loin from which they were taken, table 32. The weight of the cuts also varied from animal to animal and with the amount of flank ends or tail ends left on the cuts.
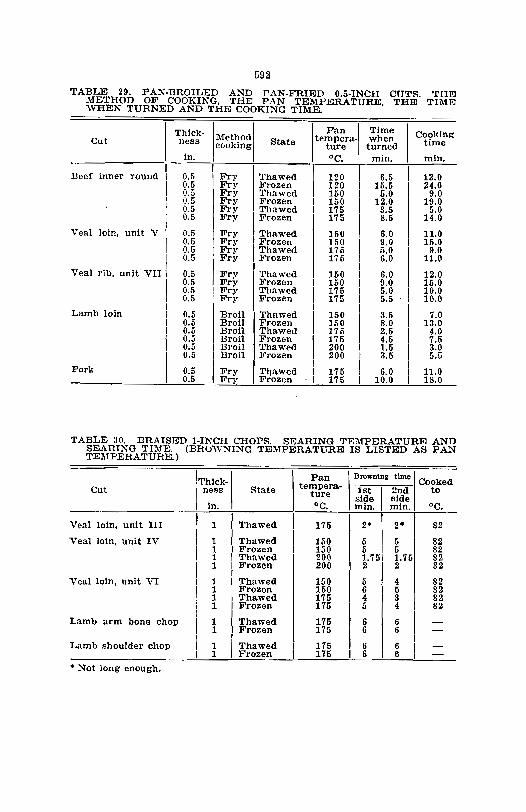
592
TABLE 29. P AN·BROILED AND PAN·FRIED 0.5·INCH CUTS. THE METHOD OF COOKING, THE PAN TEMPERATURE, THE TIME WHEN TURNED AND THE COOKING TIME.
Thick- Pan I Time
I
Cooking Cut ness IMet~odl State tempera- when· time cookmg ture turned
in. °C. min. min. I I
I I Beef inner round I 0.5 I Fry Thawed 120 6.5 13.0 I 0.5 Fry Frozen 120 15.5
I
24.0 I 0.5
I Fry Thawed 150 I 5.0 9.0
I 0.5 Fry Frozen 150 I 12.0 19.0 I 0.5 Fry I Thawed 175 I 3.5 5.0 I 0.5 Fry Frozen 175 I 8.5 14.0 I I I Veal loin, unit V I 0.5 Fry Thawed 150 I 6.0 11.0 I 0.5 Fry Frozen 150
\ 9.0 I 15.0
I 0.5 Fry Thawed 175 5.0 I 9.0 I 0.5 Fry Frozen 175 I 6.0 11.0 I I I Veal rib, unit VII I 0.5 Fry Thawed 150 I 6.0 12.0 I 0.5 Fry Frozen 150 I 9.0 I 15.0 I 0.5 Fry Thawed 175 I 5.0 10.0 I 0.5 Fry Frozen 175 I 5.5 10.0 I I I Lamb loin I 0.5 Broil Thawed 150 I 3.5 7.0 I 0.5 Broil Frozen 150 I 8.0 I 13.0 I 0.5 Broil Thawed 175 2.5 I 4.0 I 0.5 Broil Frozen 175 \ 4.5 7.5 I 0.5 I Broil Thawed 200 I 1.5
I
3.0 I 0.5 Broil Frozen 200 I 3.5 5.5
Pork I I I 0.5 I Fry TlIawed 175 I 6.0 11.0 I 0.5 Fry Frozen 175 I 10.0 18.0
TABLE 30. BRAISED 1-INCH CHOPS. SEARING TEMPERATURE AND SEARING TIME. (BRUWNING TEMPERATURE IS LISTED AS PAN TEMPERATURE.)
Cut IThICk-1 ness
in
State I Pan I nl'Ownlng time I C k d
tempera- 1st I 2nd o~o e ture side side °C min min °C
I Thawed I 175 2· I 2· 82 Veal loin, unit III I 1
I I tJ Veal loin, unit IV I 1 Thawed 150 5 82
I 1 Frozen. 150 5 82 1 Thawed I 200 1.75 82
I 1 Frozen 200 2 2 82
Veal loin, unit VI
I 1 Thawed I 150 5 4
I
82 1 Frozen 150 6 5 82 1 Thawed
I
175 4 3 82 1 Frozen 175 5 4 82
I 175 6 Lamb arm bone chop
I 1 Thawed 6 -1 Frozen 175 6 6 -
Lamb shoulder chop 1 Thawed ! 175 6 6 -I 1 Frozen 175 I 6 I 6 -
• Not long enough.
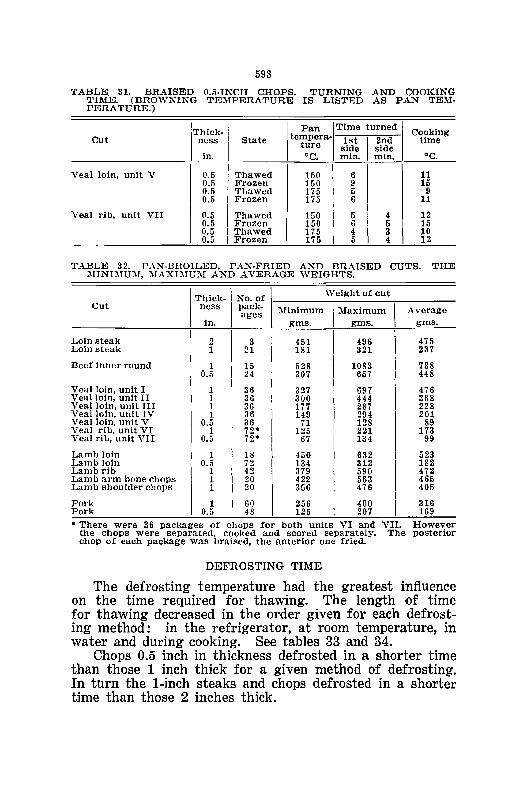
593
TABLE. 31. BRAISED 0.5·INCH CHOPS. TURNING AND COOKING TIME. (BROWNING TEMPERATURE IS LISTED AS PAN TEMPERATURE.)
Cut IThiCk-1 ness
in
State
Veal loin, unit V 0.5 I Thawed 0.5 Frozen 0.5 Thawed 0.5 I Frozen
Veal rib, unit VII 0.5 I Thawed 0.5 Frozen 0.5 I Thawed 0.5 I Frozen
I Pan I Time turned I
tempera- 1st I 2nd ture side side °C min mIn
150
I
6
I
150 9 175 5 175 6
I I 150 5 I 4 150
\
6 5 175 4
\ 3
175 5 4
Cooking time
°C
11 15
9 11
12 15. 10 12
TABLE 32. PAN-BROILED, PAN-FRIED AND BRAISED CUTS. THE :\IINIl\IU:\I, :\IAXIMUl\1 AND AVERAGE WEIGHTS.
I ThiCk-I No. of I Weight of cut Cut ness pack- l\llnlmum I :\Iaxlmum Average ages "
in. gms. gms. gms.
Loin steak I
I I I 2 3 451 496 475 Loin steak I 1 21 181 321 237
Beef Inner round I I
I 1 I 15 528 I 1083 788 0.5 I 24 307 657 448
Veal loin, unit I I
I
I
I 1 36 327 I 697 476 Veal loin, unit II 1 36 300 I 444 368 Veal loin, unit III I 1 36 177 I 287 228 Veal loin, unit IV
I 1 36 149 I 294 201
Veal loin, unit V 0.5 I 36 71 I 128 89 Veal rib, unit VI 1 I 72" 125 221 173 Veal rib, unit VII I 0.5 I 72" 67 I 134 99
I
I I
Lamb loin I 1 18 450 I 632 523 Lamb loin I 0.5 72 134 I 312 182 Lamb rib 1
\ 42 379 I 590 472
Lamb arm bone chops I 1 20 422 I 563 465 Lamb shoulder chops I 1 I 20 356 I 476 405
I Pork I 1 I 60 256 I 400 316 Pork 0.5 I 48 125 I 207 169
"There were 36 packages of chops for both units VI and VII. However the chops were separated, cooked and scored separately. The posterior chop of each package was braised, the anterior one fried.
DEFROSTING TIME
The defrosting temperature had the greatest influence on the time required for thawing. The length of time for thawing decreased in the order given for each defrosting method: in the refrigerator, at room temperature, in water and during cooking. See tables 33 and 34.
Chops 0.5 inch in thickness defrosted in a shorter time than those 1 inch thick for a given method of defrosting. In turn the l-inch steaks and chops defrosted in a shorter time than those 2 inches thick.
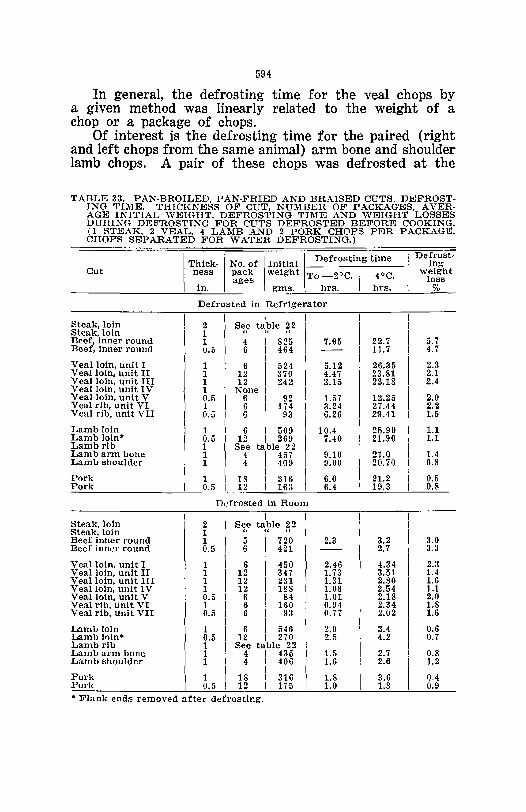
594
In general, the defrosting time for the veal chops by a given method was linearly related to the weight of a chop or a package of chops.
Of interest is the defrosting time for the paired (right and left chops from the same animal) arm bone and shoulder lamb chops. A pair of these chops was defrosted at the
TABLE 33. PAN·BROILED, PAN·FRIED AND BRAISED CUTS. DEFROST· ING TIME. THICKNESS OF CUT, NUMBER OF PACKAG'ES, AVER· AGE INITIAL WEIGHT, DEFROSTING TIME AND WEIGHT LOSSES DURING DEFROSTING FOR CUTS DEFROSTED BEFORE COOKING. (1 STEAK, 2 VEAL, 4 LAMB AND 2 PORK CHOPS PER PACKAGE. CHOPS SEPARATED FOR WATER DEFROSTING.)
Cut
Steak, loin Steak, loin Beef, inner round Beef, inner round
Veal loin, unit I Veal loin, unit II Veal loin, unit III Veal loin, unit IV Veal loin, unit V Veal rib, unit VI Veal rib, unit VII
Lamb loin Lamb loin· Lamb rib Lamb arm bone Lamb shoulder
Pork Pork
Steak, loin Steak, loin Beef inner round Beef inner round
Veal loin, unit I Veal loin, unit II Veal loin, unit III Veal loin, unit IV Veal loin, unit V Veal rib, unit VI Veal rib, unit VII
Lamb loin Lamb loin' Lamb rib Lam b arm bone Lamb shoulder
Pork Pork
I Thick· I No. of I Initial I Defrosting time ness pack· weight To _20C 1 4°C ages .. in. gms. hI's. hI's.
Defrosted in Refrigerator
2 1 1 0.5
1 1 1 1 0.5 1 0.5
1 0.5 1 1 1
1 0.5
2 1 1 0.5
1 1 1 1 0.5 1 0.5
1 0.5 1 1 1
1 0.5
I S~~ tll;~le ~2
4 I 825 6 I 464
I 6 I 524
12 I 370 12 I 242
None I 6~ /1 92 174
93
6 I 509 12 I 269
See table 22 4 I 457 4 I 409
I 18 I 316 12 I 163
Defrosted in Room
I See table 22
II U U
~ I g~ I
6 I 450 12 347
g 1m 6 I 84 6 I 160 6 I 93
6 I 546 12 I 270
See table 22 4 I 435 4 I 406
I 18 I 316 12 I 175
7.05
5.12 4.47 3.15
1.57 3.24 6.26
10.4 7.40
9.10 9.00
6.0 6.4
2.3
2.46 1. 73 1.31 1.08 1.01 0.94 0.77
2.0 2.5
1.5 1.6
1.8 1.0
22.7 11.7
26.35 23.81 23.18
12.25 27.44 29.41
25.90 21.90
21.0 20.70
21.2 19.3
3.2 2.7
4.34 3.51 2.80 2.54 2.18 2.34 2.02
3.4 4.2
2.7 2.6
3.6 1.8
• Flank ends removed after defrosting.
Defrost· ing
weight loss
%
5.7 4.7
2.3 2.1 2.4
2.0 2.2 1.5
1.1 1.1
1.4 0.8
0.5 0.8
3.0 3.3
2.3 1.4 1.6 1.1 2.0 1.8 1.6
0.6 0.7
0.8 1.2
0.4 0.9
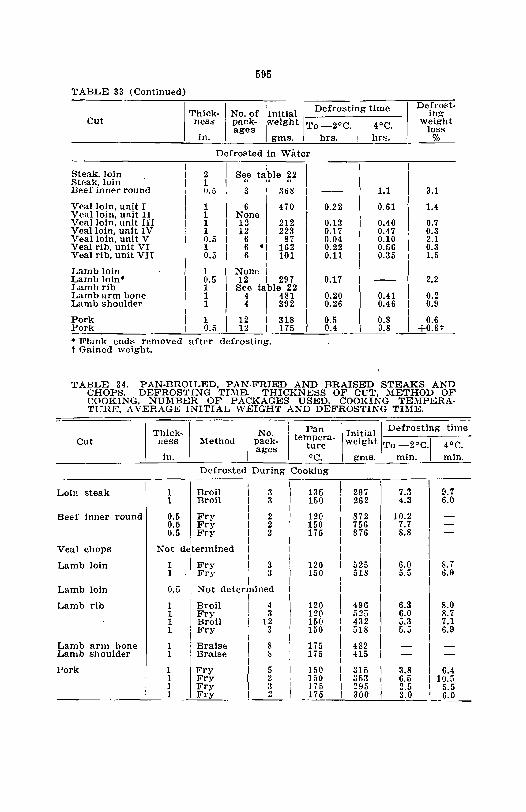
595
TABLE 33 ( Continued)
I ThiCk-I No. of IInitial I Defrosting time Defrost·
ing Cut ness pack- weight To _20C' 40C weight
ages .. loss in. gms. hrs. hrs. %
Defrosted in Water
Steak, loin I
2 S~~ ta,\Jle ?,2 Steak, loin 1 Beef inner round U.5 3 368 1.1 3.1
Veal loin, unit I 1 6 I 470 0.22 0.61 1.4 Veal loin, unit II 1 None , Veal loin, unit III 1 12 212 0.13 0.40 0.7 Veal loin, unit IV 1 12 223 0.17 0.47 0.3 Veal loin, unit V 0.5 6 1 87 0.04 0.10 2.1 Veal rib, unit VI 1 6 0, 162 0.22 0.56 0.3 Veal rib, unit VII 0.5 6 1 101 0.11 0.35 1.5
I Lamb loin 1 None' Lamb loin' 0.5 12 , 297 0.17 2.2 Lamb rib 1 See table 22 Lamb arm bone 1 4 , 481 0.20 0.41 0.2 Lamb shoulder 1 4 I 392 0.26 0.46 0.9
Pork 1 12 I , 318 0.5 0.8 0.6
Pork 0.5 12 I 175 0.4 0.8 +O.8t • Flank ends removed t Gained weight.
after defrosting.
TABLE 34. PAN·BROILED, PAN-FRIED AND BRAISED STEAKS AND CHOPS. DEFROSTING TIME. THICKNESS OF CUT, METHOD OF COOKDW. NUll!BER OF PACKAGES USED, COOKING TE:\IPERATURE, AVERAGE INITIAL WEIGHT AND DEFROSTING TIME.
Cut
Loin steak
Beef Inner round
Veal chops
Lamb loin
Lamb loin
Lamb rib
Lamb arm bone Lamb shoulder
Pork
Thick· ness
in.
1 1
0.5 0.5 0.5
I No. I Pan :\T ethod pack- tempera-ages ture
°C. Defrosted During Cooking
I I Broil I 3 I 135 Broil , 3 , 150
I I Fry I 2 , 120 Fry , 2 , 150 Fry I 2 I 175
I I Not determined I I
I I 1 Fry , 3 I 120 1 Fry I 3 I 150
I , 0.5 Not determined I , I 1 Broil I 4 , 120 1 Fry 3 , 120 1 Broil I 12 I 150 1 Fry I 3 I 150
I I 1 Braise I 8 I 175 1 Braise I 8 I 175
I , 1 Fry I 5 I 150 1 Fry I 2 I 150 1 Fry I :1 I 175 1 Fry I 2 i 175
I
Initial I Defrosting time
weight To _2 0 C., 4°C. gms. min. min.
I I 297 7.3 9.7 I 262 4.3 6.0
I I 872 10.2 -I 756 7.7 -I 876 I 8.8 -I , I I I I I 525 6.0 8.7 I 518 I 5.5 6.9 I I I , , , ,
I I I 496 6.3 8.0 525 6.0 8.7 , 432 I 5.3 I 7.1
I 518 I 5.5 6.9 I I I
I 482 , -
I -
415 I - -I I I 315 I 3.8 6.4 I 353 ! 6.5 , 10.5 I 295 2.5 I 5.5 I 300 i 3.0 I 6.0
596
same time and by the same method so that room or refrigerator temperature (unless placed on different shelves in the refrigerator) was not a variant. In general, the pairs defrosted in the refrigerator reached _2° and 40
in about the same time. The greatest variation in refrigerator defrosting of these paired chops was for a pair of shoulder chops, one of the pair taking 21.6, the other 18.1 hours to reach 4°C. Their weights were 377 and 357, respectively.
Since chops defrost more rapidly in the room than in the refrigerator, it was surprising to note that 1.3 and 2.2 hours were required for the two packages of a pair of arm bone chops to reach -2°, whereas the same pair required 2.5 and 3.6 hours in the same order to reach 4°; The weight of the two packages, respectively, was 433 and 426 grams.
DEFROSTING WEIGHT LOSSES
The weight lost during the thawing period, particularly for steaks, was rather large (table 33). The extent of the weight loss was similar to weight losses of boned roasts. The same explanation for this large loss holds in each case, i. e., a large cut area of the muscle increased the drip loss. There may have been variation in susceptibility to drip in the meat from different animals, for based on the results of refrigerator and room defrosting, beef steaks lost the greatest weight, veal losses were intermediate, whereas lamb and pork had about the same losses, which were smaller than those for beef and veal.
UNIFORMITY OF COOKING BY PAN-BROILING AND PAN-FRYING
Analyzing cooking weight losses and palatability data for cuts of meat cooked by pan-broiling and pan-frying should be a nightmare for a statistician. Cuts cooked by these methods are not cooked as uniformly as by broiling or roasting. Since the cooking weight losses are for all chops cooked at the same time, the figures for cooking losses probably do not vary as much as the palatability scores. It would appear from looking at fig. 18 that the lamb chops should cook uniformly, as they are very even in thickness.
Here is an illustration: The compiler of this report had finished scoring a O.5-inch, pan-broiled lamb chop. Its interior was brown. It was dry, wizened, and had a poor flavor_ Another panel member was scoring a similar chop from the same lot, cooked at the same time. It was pink,
597
plump and juicy in appearance. Panel members doing a , good scoring job should have scored the two chops differently.
The chops did receive different ratings. Anyone who has tried to analyze data knows what a statistician would think, and rightly, when he sees the panel members' scores for the same sample of chops, unless he knows the reason for the difference in ratings.
The explanation for the lack of uniformity is clear. Heat causes the muscle fibers to shrink along their length. In certain areas ,the muscle will pull away from the bone and form a pocket. The part not touching the pan cooks more slowly. Connective tissue around the edge of a cut will shrink and cause cupping, an area in which a portion of the meat stands up in a half sphere from the pan. Cupping will occur in patties, which do not have a layer of connective tissue around the edge of the cut.
Steaks, chops and patties which are frozen at the start of cooking also will cook unevenly. Even if the sample is uniform in width, some irregularities of the surface usually occur in freezing. Unexplained irregularities occur in cooking any kind of meat. But they occur more frequently in pan-broiled and pan-fried cuts.
COOKING TIME,
There were 33 groups of similar steaks or chops cooked under the same conditions, except that part of the steaks were frozen, the others thawed when cooking was started. The cooking time was longer in 31 of these groups for the chops defrosting during than for those thawed before cooking. In two groups the time was tied. See table 35.
If other conditlons remained the same, the cooking time was longer for the thicker steaks or chops than for the thinner ones.
The cooking time was inversely related to the pan or searing temperature, with two exceptions. The cooking time was sometimes longer for chops cooked more well done, sometimes the opposite was true.
COOKING WEIGHT LOSSES
All groups of beef steaks were pan-broiled, and if conditions were otherwise unchanged, those defrosted during cooking lost more weight than those thawed prior to cooking. Sometimes the weight lost during cooking was far more than for similar steaks thawed prior to cooking, sometimes it was only slightly more. See table 35.
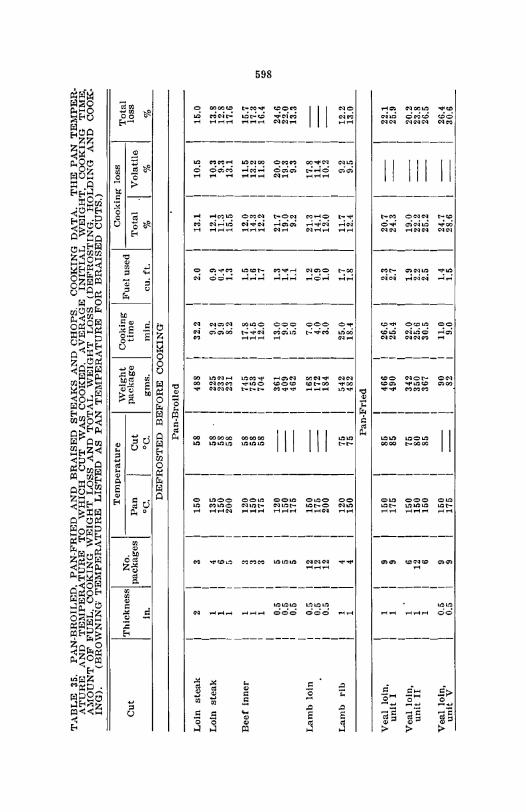
TABLE 35. PAN-BROILED. PAN-FRIED AND BRAISED STEAI<:S AND CHOPS. COOKING DATA. THE PAN TEMPER-ATURE AND TEMPERATURE TO WHICH CUT WAS COOKED. AVERAGE INITIAL WEIGHT, COOKING TIME, A~roUNT OF FUEL, COOKING WEIGHT LOSS AND TOTAL WEIGHT LOSS (DEFROSTING, HOLDING AND COOK-ING). (BROWNING TEMPERATURE LISTED AS PAN TEMPERATURE FOR BRAISED CUTS.)
Temperature I Weight I Co,?king I Fuel used I Cooking loss Total
Cut I ThiCknessl No. I loss packages Pan Cut package tIme Total ., Volatile in. °C. °C. gms. min. cu. ft. % % %
DEFROSTED BEFORE COOKING
Pan-Broiled
Loin steak 2 3 150 58 488 32.2 2.0 13.1 10.5 15.0
Loin steak 1 4 135 58 225 9.2 0.9 12.1 10.3 13.8 1 6 150 58 232 9.9 0.4 11.3 9.3 12.8 1 5 200 58 231 8.2 1.3 15.5 13.1 17.6
Beef inner 1 3 120 58 745 17.8 1.5 12.0 11.5 15.7 1 3 150 58 753 14.5 1.6 14.3 13.2 17.3
<:1l 1 3 175 58 704 12.0 1.7 12.2 11.8 16.4 ~ 00
0.5 5 120 361 13.0 1.3 21.7 20.0 24.6 0.5 5 150 409 9.0 1.4 19.0 19.3 22.0 0.5 5 175 462 5.0 1.1 9.2 9.3 13.3
Lamb loin 0.5 12 150 168 7.0 1.2 21.3 17.8 0.5 12 175 172 4.0 0.9 14.1 11.4 0.5 12 200 184 3.0 1.0 12.0 10.2
Lamb rib 1 4 120 75 542 25.0 1.7 11.7 9.2 12.2 1 4 150 75 482 18.4 1.8 12.4 9.5 13.0
Pan-Fried
Veal loin, 1 9 150 85 466 26.6 2.3 20.7 22.1 unit I 1 9 175 85 490 25.4 2.7 24.3 25.9
Veal loin, 1 6 150 75 342 22.0 1.9 19.0 20.2 unit II 1 12 150 80 350 25.6 2.2 22.2 23.8
1 6 150 85 367 30.5 2.5 25.2 26.5
Veal loin, 0.5 9 150 90 11.0 1.4 24.7 26.4 unit V 0.5 9 175 82 9.0 1.5 28.6 30.6
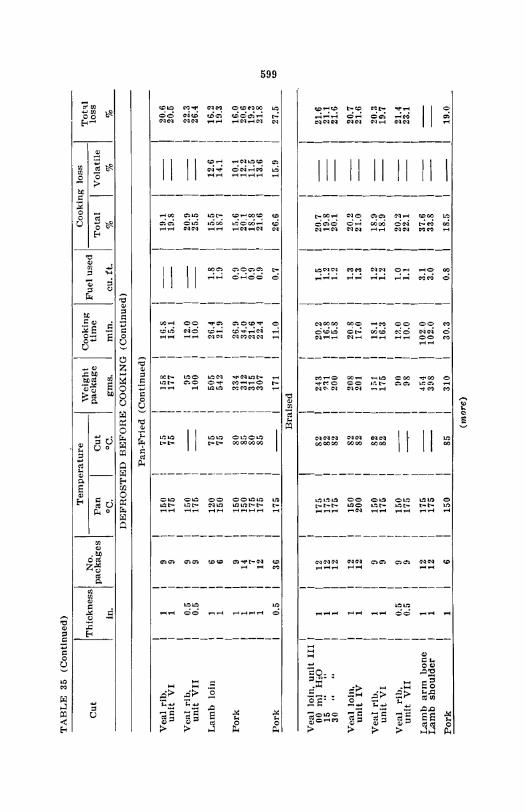
TABLE 35 (Continued)
'1'empcrature I Weight I Cooking I Fuel used I Cooking loss Tot'll Cut IThiCknessl No. I loss packages Pan Cut package time Total Volatile
in. . °C. °C. gms. min.. cu. ft. % % % DEFROSTED BEFORE COOKING (Continued)
Pan-Fried (Continued)
I I Veal rib, 1 9 150 75 I 158 I 16.8 19.1 20.6
unit VI 1 ~ 176 75 I 177 I 15.1 19.8 20.5 I I
Veal rib, 0.5 9 150 I 95 I 12.0 20.9 22.3 unit VII 0.5 9 175 I 100 I 10.0 25.5 26.4
I I Lamb loin I 6 120 75 I 505 I 26.4 1.8 15.5 12.6 16.2
1 6 150 75 I 542 I 21.9 1.9 18.7 14.1 19.3 I I
Pork 1 9 150 80 I 334 I 26.!I 0.9 15.6 10.1 16.0 1 14 150 8a I 312 I 34.0 1.0 20.1 12.2 20.6 1 7 175 80 I 315 I 21.6 0.9 18.8 11.5 19.3 1 12 175 85 I 307 I 22.4 0.9 21.6 13.6 :11.8 01
I I <0 Pork 0.5 36 175 I 171 I 11.0 0.7 26.6 15.9 27.5 <0
Braised
I -~~--~
Veal loin, unit III I 00 ml H;O I 1 12 175 82 243 20.2 1.5 20.7 21.6 15 .. I 1 12 115 82 nl 16.8 1.2 19.8 21.1 30 I 1 12 175 82 200 15.8 1.2 20.1 21.6
I Veal loill. I 1 12 160 82 208 20.8 1.3 20.2 20.7
unit IV I 1 12 200 82 201 17.0 1.3 21.0 21.6 I
Veal rib. I 9 150 82 1 ;'1 18.1 1.2 18.9 20.3 ullit VI I 9 175 82 175 16.3 1.2 18.9 19.7
I Veal rib, I 0.5 9 150 90 1?.0 1.0 20.2 21.4
unit VII I 0.5 9 175 98 10.0 1.1 22.1 23.1 I
Lamb arm bone I 1 12 175 4ii4 102.0 3.1 37.6 Lamb shoulder I 1 12 176 398 102.0 3.0 33.8
I Pork I 6 150 85 310 30.3 0.8 18.5 19.0
(more)
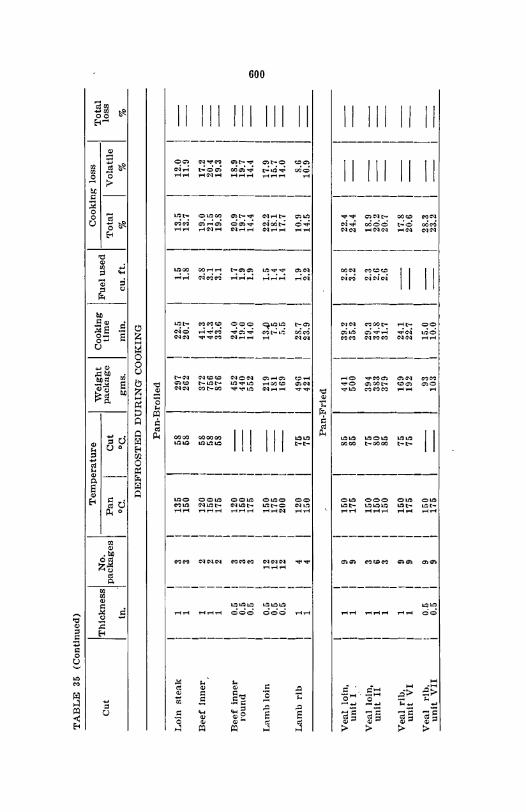
TABLE 35 (Continued)
Temperature I Weight I Cooking I Fuel used I
Cooking loss Total
IThlCknessl No. I Cut packages Pan Cut package time Total Volatile loss
tn. . °C. °C. gms. min. cu. ft. % % %
DEFROSTED DURING' COOKING
Pan-Broiled
Loin steal, 1 3 135 58 297 22.5 1.5 13.5 12.0 1 3 150 58 262 20.7 1.8 13.7 11.9
Beef Inner 1 2 120 58 372 41.3 2.8 19.0 17.2 1 2 150 58 756 44.3 3.1 21.5 20.4 1 2 175 68 876 33.6 3.1 19.8 19.3
Beef inner 0.5 3 120 452 24.0 1.7 20.9 18.9 round 0.5 3 150 440 19.0 1.9 19.7 19.7
0.5 3 175 552 14.0 1.9 14.4 14.4 CO> C>
Lamb loin 0.5 12 150 219 13,Jl 1.5 22.2 17.9 C>
0.5 12 175 181 7.5 1.4 18.1 15.7 0.5 12 200 169 5.5 1.4 17.7 14.0
Lamb rib 1 4 120 75 4% 28.7 1.9 10.9 8.6 1 4 150 75 421 23.9 2.2 14.5 10.9
Pan-Fried
Veal loin, 1 9 150 85 441 39.2 2.8 22.4 unit I 1 9 175 85 500 35.2 3.2 24.4
Veal loin, 1 3 150 75 394 29.3 2.3 18.9 unit II 1 6 150 80 383 34.8 2.6 20.2
1 3 150 85 379 31.7 2.6 20.7
Veal rib, 1 9 150 75 169 24.1 17.8 unit VI 1 9 175 75 192 22.7 20.6
Veal rib. 0.5 9 150 93 15.0 28.3 unit VII 0.5 9 175 103 10.0 23.2
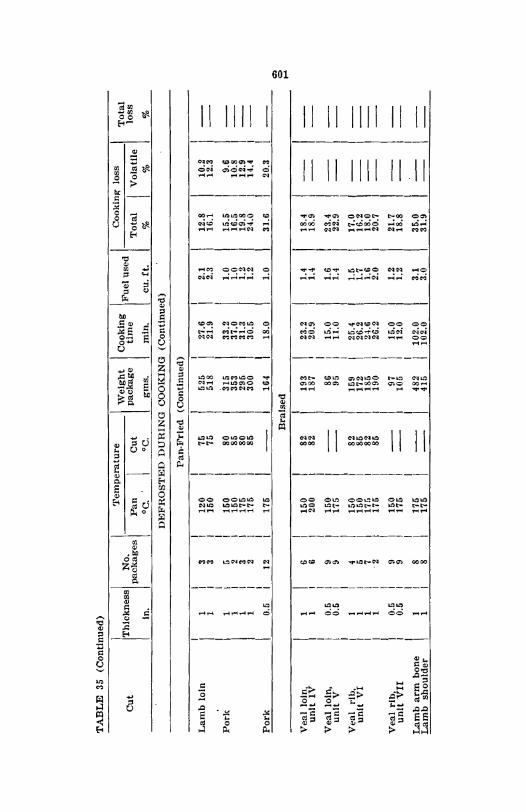
TABLE 35 (Continued)
Temperature I Weight I Cooking
Cooking loss Total IThlCknessl No. I IFuel used I Cut packages Pan Cut package time Total Volatile loss
In. °C. °C. gms. min. Cll. ft. % % %
DEFROSTED DURING COOKING (Continued)
Pan·Frled (Continued)
Lamb loin 1 3 I
120 75 I 525 27.6 2.1 12.8 10.2 1 3 150 75 I 518 21.9 2.3 16.1 12.3
I 315 Pork 1 r. 160 80 I 33.2 1.0 15.5 9.6
1 2 150 85 I 353 37.0 1.0 16.5 10.8 1 3 175 80 295 31.3 1.2 19.8 12.9 1 2 175 85 I 300 30.5 1.2 24.0 14.4
I Pork 0.5 12 176 I 164 18.0 1.0 31.6 20.3 ...
Braised co .... Veal loin, 1 6 150 82 193 23.2 1.4 18.4
unit IV 1 6 200 82 187 20.9 1.4 18.9
Veal loin, 0.5 9 150 86 15.0 1.6 23.4 unit V 0.5 9 175 95 11.0 1.4 22.9
Veal rib, 1 4 150 82 159 25.4 1.5 17.0 unit VI 1 6 150 86 172 26.2 1.7 16.2
1 7 175 82 185 24.6 1.6 18.0 1 2 175 85 190 26.2 2.0 20.7
Veal rib, 0.5 9 150 97 15.0 1.2 21.7 unit VII 0.5 9 176 105 12,0 1.2 18.8
Lamb arm bone 1 8 175 482 102.0 3.1 35.0 Lamb shoulder 1 8 176 415 102.0 3.0 31.9
602
The pan-fried veal loin steaks of unit I lost slightly more weight if defrosted during cooking than if thawed prior to cooking. Opposite results were obtained with unit II. For lamb loin and rib chops the cooking weight losses were sometimes greater for those defrosted during cooking, sometimes for those defrosted prior to cooking. With the exception of one group, the pork chops frozen at start of cooking lost more weight than those which were thawed.
In general, cooking weight losses were greater for chops (veal and pork) cooked more well done than for those cooked less well done. '
In general, there was progressive increase in cooking weight losses for steaks and chops as the cooking or searing temperature was elevated. However, for the O.5-inch inner round and the 0.5-inch lamb loin chops, losses decreased as the temperature was elevated. Further work on the cooking of steaks and chops of less than an inch in thickness, particularly with pan-broiling and pan-frying at different cooking temperatures, may be indicated.
TOTAL WEIGHT LOSSES
The total weight losses (defrosting, holding and cooking losses) for cuts defrosted before cooking were greater than the total weight losses for the steaks and chops defrosted during cooking (total cooking losses) in 24 out of 32 groups that can be compared (table 35). Since the tails of the 0.5-inch loin lamb chops were too long to fit into the cooking pan, they were removed. This was done after defrosting but before cooking, hence the total weight losses for these chops were not calculated. The defrosting weight loss of the 12 0.5-inch loin lamb chops defrosted, in the refrigerator and in the room was 0.4 percent for both groups.
FUEL
The average amount of fuel required for cooking the cuts of the different groups of steaks and chops is given in table 35. The most striking result for the fuel requirement is the very small amount required for pan-broiling or pan-frying as compared with broiling.
PALATABILITY
Comment has been made upon the lack of uniformity of cooking of pan-broiled or pan-fried steaks and chops. This should be considered in studying the scores given in table 36.
There was not much variation in the .aroma scores of the pan-broiled steaks and chops. In general, the aroma scores of the pan-fried chops were similar to those which were
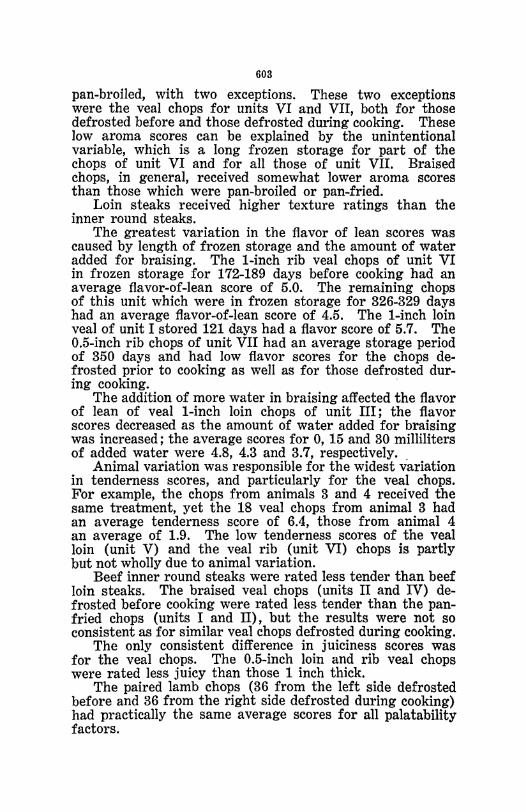
603
pan-broiled, with two exceptions. These two exceptions were the veal chops for units VI and VII, both for those defrosted before and those defrosted during cooking. These low aroma scores can be explained by the unintentional variable, which is a long frozen storage for part of the chops of unit VI and for all those of unit VII. Braised chops, in general, received somewhat lower aroma scores than those which were pan-broiled or pan-fried.
Loin steaks received higher texture ratings than the inner round steaks.
The greatest variation in the flavor of lean scores was caused by length of frozen storage and the amount of water added for braising. The I-inch rib veal chops of unit VI in frozen storage for 172-189 days before cooking had an average flavor-of-Iean score of 5.0. The remaining chops of this unit which were in frozen storage for 326-329 days had an average flavor-of-Iean score of 4.5. The I-inch loin veal of unit I stored 121 days had a flavor score of 5.7. The 0.5-inch rib chops of unit VII had an average storage period of 350 days and had low flavor scores for the chops defrosted prior to cooking as well as for those defrosted during cooking.
The addition of more water in braising affected the flavor of lean of veal I-inch loin chops of unit III; the flavor scores decreased as the amount of water added for braising was increased; the average scores for 0, 15 and 30 milliliters of added water were 4.8, 4.3 and 3.7, respectively.
Animal variation was responsible for the widest variation in tenderness scores, and particularly for the veal chops. For example, the chops from animals 3 and 4 received the same treatment, yet the 18 veal chops from animal 3 had an average tenderness score of 6.4, those from animal 4 an average of 1.9. The low tenderness scores of the veal loin (unit V) and the veal rib (unit VI) chops is partly but not wholly due to animal variation.
Beef inner round steaks were rated less tender than beef loin steaks. The braised veal chops (units II and IV) defrosted before cooking were rated less tender than the panfried chops (units I and II), but the results were not so consistent as for similar veal chops defrosted during cooking.
The only consistent difference in juiciness scores was for the veal chops. The 0.5-inch loin and rib veal chops were rated less juicy than those 1 inch thick.
The paired lamb chops (36 from the left side defrosted before and 36 from the right side defrosted during cooking) had practically the same average scores for all palatability factors.
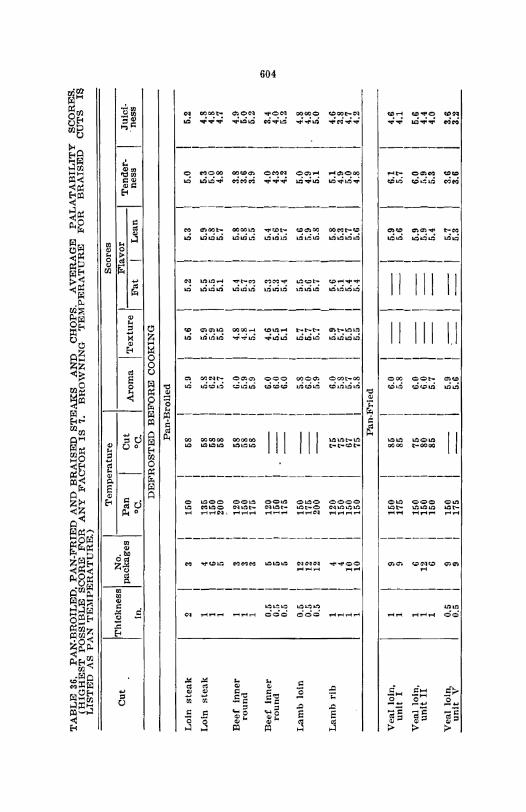
TABLE 36, PAN· BROILED, PAN·FRIED AND BRAISED STEAKS AND CHOPS. AVERAGE PALATABILITY SCORES. (HIGHEST POSSIBLE SCORE FOR ANY FACTOR IS 7. BROWNING TEMPERATURE FOR BRAISED CUTS IS LISTED AS PAN TE:.\IPERATURE.)
Temperature
I Aroma
Scores
Cut IThlCknessl No. I I Texture I Flavor packages Pan Cut Tender· Juici· In. °C. °C. Fat I Lean ness . ness
DEFROSTED BEFORE COOKING
Pan·Broiled
Loin steak 2 3 150 58 5.9 5.6 5.2 5.3 5.0 I 5.2 I
Loin steak 1 4 135 58 5.8 5.9 5.5 5.9 5.3 \
4.8 1 6 160 68 6.2 5.9 5.5 5.8 5.0 4.8 1 5 200 58 5.7 5.5 5.1 5.7 4.8 1 4.7
Beef inner I
1 3 120 58 G.O 4.8 5.4 5.8 3.8 I 4.9 round I 3 150 58 5.9 4.8 5.7 5.8 3.6 5.0
1 3 175 58 5.9 5.1 5.3 5.5 3.9 I 6.2
Beef Inner I ~
0.5 5 120 G.O 4.6 5.3 5.4 4.0 I 3.4 <:> round O.!'i 5 150 6.0 5.5 5.3 5.6 4.3 I 4.0 ....
0.5 5 175 6.0 5.1 5.4 5.7 4.2 I 5.2
Lamb loin I
0.5 12 150 5.8 5.7 5.5 5.6 5.0 I 4.8 0.5 12 175 G.O 5.7 5.6 5.9 4.9 I. 4.8 0.5 12 200 5.9 5.7 5.7 5.8 5.1 I 5.0
Lamb rib I
1 4 120 75 6.0 5.9 5.6 5.8 5.1 I 4.6 1 4 150 75 5.8 5.7 5.1 5.3 4.9
! 3.8
1 10 150 67 5.7 5.5 5.4 5.7 5.0 4.7 1 10 150 75 5.8 5.5 5.4 5.6 4.8 4.2
Pan·Fried
Veal loin. 1 9 150 85 6.0 1i.9 6.1 4.6 unit I 1 9 175 85 5.8 -- 5.6 5.7 4.1
Veal loin. 1 6 150 75 6.0 5.9 6.0 5.6 unit II 1 12 150 80 6.0 5.9 5.9 4.4
1 6 150 85 5.7 5.4 5.3 4.0
Veal loin, 0.5 9 150 5.9 6.7 3.6 3.6 unit V 0.5 9 175 5.6 5.3 3.6 3.2
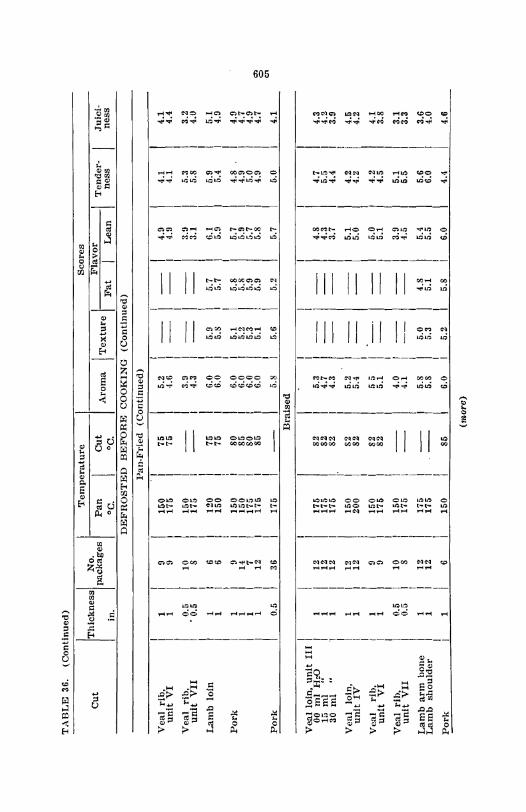
TABLE 36. ( Continued)
Temperature
! Aroma
Scores
Cut !ThiCkness! No. ! I Texture I Flavor packages Pan Cut Tender- Juiei· in. °C. °C. Fat Lean ness ness
DEFROSTED BEFORE COOKING (Continued)
Pan·Fried (Continued) '1
Veal rib, 1 9 150 I 75 5.2 4.9 4.1 4.1 unit VI 1 9 175 I 75 4.6 4.9 4.1 4,4
I Veal rib, 0.5 10 150 I 3.9 3.9 5.3 3.2
unit VII . 0.5 8 175 I 4.3 3.1 5.8 4.0 I
Lamb loin 1 6 120 I 75 6.0 5.9 5.7 6.1 5.9 5.1 1 6 150 ! 75 6.0 5.S 5.7 5.9 5.4 4.9
Pork 1 9 150 i 80 6.0 5.1 5.8 5.7 4.8 4.9 1 14 150 I 85 6.0 5.2 5.8 5.9 4.9 4.7 1 7 175 I 80 6.0 5.3 5.9 5.7 5.0 4.9 1 12 175 1 85 6.0 5.1 5.9 5.8 4.9 4.7 "" 00
1 .,. Pork 0.5 36 175 I 5.8 5.6 5.2 5.7 5.0 4.1
Braised
I Veal loin, unit III 1
82 00 ml H,O I 12 175 5.3 4.8 4.7 4.3 1" ml .. 12 175 82 4.7 4.3 5.5 4.2 30 ml '1 12 175 82 4.3 3.7 4.4 3.9
I Veal loin, I 1 12 150 82 5.2 5.1 4.2 4.5
unit IV I 1 12 200 82 5.4 5.0 4.2 4.2 I
Veal rib, I 1 9 150 82 55 5,0 4,2 4.1 unit VI I 1 9 175 82 5.1 5.1 4.5 3.8
I Veal rib, I 0.5 10 150 4.0 3,9 5.1 3.1
unit VII I 0.5 8 175 4,1 4.5 5.5 3,3 I
Lamb arm bone I 1 12 175 5.8 5.0 4.8 5.4 5.6 3.6 Lamb shoulder 1 1 12 175 5.8 5.3 5.1 5.5 6.0 4.0
I Pork 1 1 6 150 85 6.0 5.2 5.8 6,0 4.4 4.6
(more)
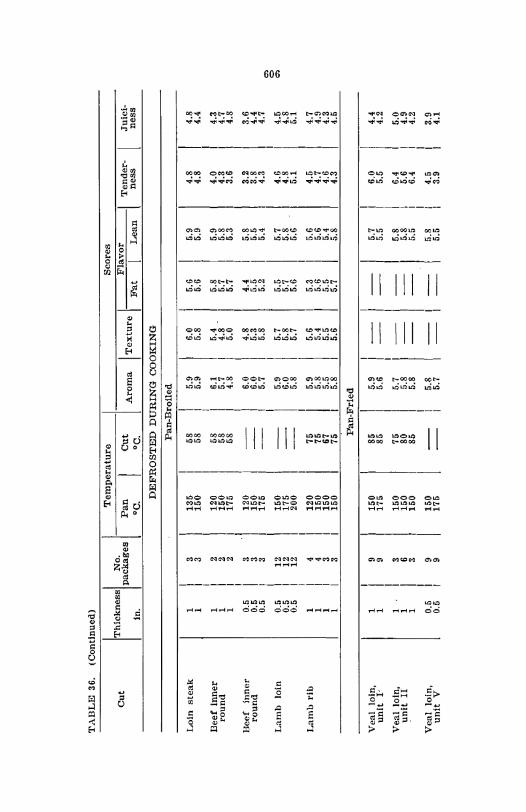
TABLE 36. ( Continued)
Temperature
I Aroma
Scores
Cut IThiCknessl No. I I Texture I Flavor packages Pan Cut Tender- Juici-in. DC. °C. Fat Lean ness ness
DEFROSTED DURING COOKING
Pan-Broiled
I Loin steak 1 3 I 135 58 5.9 6.0 5.6 5.9 4.8 4.8
1 3 150 58 5.9 5.8 5.6 5.9 4.8 4.4
Beef inner 1 2 I 120 58 6.1 5.4 5.8 5.9 4.0 4.3 round 1 2 150 58 5.7 4.8 5.7 5.8 4.3 4.7
1 2 I 175 58 4.8 5.0 5.7 5.3 3.6 4.8
Beef inner 0.5 3 I 120 6.0 4.8 4.4 5.8 3.2 3.6 round 0.5 3 150 6.0 5.3 5.5 5.5 3.8 4.4
0.5 3 175 5.7 5.8 5.2 5.4 4.3 4.7 "" Lamb loin 0.5 12 I 150 5.9 5.7 5.5 4.6 4.5 0
5.7 "" 0.5 12 I 175 6.0 5.8 5.7 5.8 4.8 4.8 0.5 12 I 200 5.8 5.7 5.6 5.6 5.1 5.1
Lamb rib 1 4 I 120 75 5.9 5.6 5.3 5.6 4.5 4.7 1 4 150 75 5.8 5.4 5.6 5.6 4.7 4.9 1 3 I 150 67 5.5 5.5 5.5 5.4 4.6 4.3 1 3 I 150 75 5.8 5.6 5.7 5.8 4.3 4.5
Pan-Fried
Veal loin, 1 9 150 85 5.9 5.7 6.0 4.4 unit I' 1 9 175 85 5.6 5.5 5.5 4.2
Veal loin, 1 3 150 75 5.7 5.8 6.4 5.0 unit II 1 6 150 80 5.8 5.8 5.6 4.9
1 3 150 85 5.8 5.5 6.4 4.2
Veal loin, 0.5 9 150 5.8 5.8 4.5 3.9 unit V 0.5 9 175 5.7 5.5 3.9 4.1
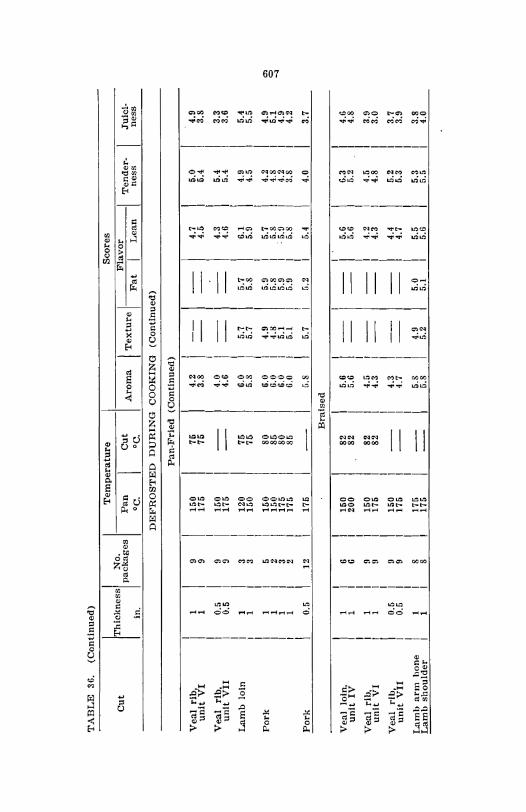
TABLE 36. (Continued)
Temperature
I Aroma
Scores
Cut IThiCkness! No. I I Texture I Flavor packages Pan Cut Tender- .Tulci-in. °C. °C. Fat Lean ness ness
DEFROSTED DURING COOKING (Continued)
Pan-Fried (Continued)
I Veal rib, 1 9 150 76 4.2 I 4.7 5.0 4.9
unit VI 1 9 176 76 3.8 I 4.6 6.4 3.8 I
Veal rib, 0.5 9 150 4.0 I 4.3 5.4 3.3 unIt VII 0.5 9 175 4.6 4.6 5.4 3.6
I Lamb loin 1 3 120 75 6.0 I 5.7 5.7 6.1 4.9 5.4
1 3 150 75 5.8 I 5.7 5.8 5.9 4.5 5.5 I
Pork 1 5 150 80 6.0 I 4.9 5.9 5.7 4.2 4.9 0> 1 2 150 85 6.0 I 4.8 5.8 5.8 4.8 5.1 co 1 3 175 SO 6.0 I 5.1 5.9 ·5.9 4.2 4.9 -'I
1 2 175 85 6.0 I 5.1 5.9 5.8 3.8 4.2
Pork 0.5 12 176 5.8 I 5.7 5.2 5.4 4.0 3.7
Braised
Veal loin. 1 6 150 82 5.6 5.6 6.3 4.6 unIt IV 1 6 200 82 5.6 5.6 5.2 4.S
Veal rlh. 1 9 150 82 4.5 4.2 4.5 3.9 unit VI 1 9 175 82 4.3 4.3 4.S 3,0
Veal rih, 0.5 9 150 4.3 4.4 5.2 3.7 unit VII 0.5 9 175 4.7 4.7 5.3 3.9
Lamh arm hone 1 8 175 5.8 4.9 5.0 5.5 5.3 3.8 Lamu shoulder 1 8 175 5.8 5.2 5.1 5.6 5.5 4.0
608
PATTIES
The time for defrosting frozen patties during cooking, at room temperature and in the refrigerator was determined. Since the meat was ground no patties were defrosted in water. Secondary objectives to be sought varied somewhat with the different types of patties. Frying in shallow and in deep fat at different temperatures were compared for beef patties. The unseasoned veal-pork patties consisted of three-fourths veal and one-fourth pork. They were panbroiled at two temperatures. Lamb patties were broiled and pan-broiled, two cooking temperatures being used for each method. Part of the pork sausage patties were seasoned, part were unseasoned.
The sausage was pan-broiled, using two temperatures.
SOURCE OF MEAT AND ITS GRINDING
The meat for patties was obtained from portions of the carcasses or cuts not used for other parts of the study. The meat for all types of patties was ground in an Enterprise electric grinder. The meat was run through the grinder twice, once using a No. 10 plate with 3Js-inch holes, and once using a No. 12 plate with 5/32-inch holes.
SEASONING OF THE PORK PATTIES
The ground pork was divided into three lots. No seasoning was added to lot A; pepper and sage were added to lot B; and salt, pepper and sage were added to lot C. The proportion of seasoning added to the ground pork was that given in "Farm Meats," by Helser (10). These proportions gave a rather highly seasoned sausage. The proportions of seasoning were: to each 50 pounds of ground pork, 1 pound of fine salt, 2.5 ounces of finely ground black pepper and 3.0 ounces of finely powdered sage.
WRAPPING THE PATTIES
About 4 ounces of ground meat are considered an average serving, except when it is to be served in buns. For buns, 2.5 ounces is considered a good serving. The amount of meat in each 4-ounce patty was approximately 120 grams for beef and 112 grams for the other meats. It was necessary to wrap the patties rapidly, hence no attempt was made to weigh closer than 2 grams of the intended quantity. The 2.5-ounce patties contained about 70 grams of meat. The 4-ounce patties were made in two sizes, thick and thin. The measurement of each patty was 1 x 3 or 0.5 x 4 inches. The 2.5-ounce patties measured 0.5 x 3 inches. It is more
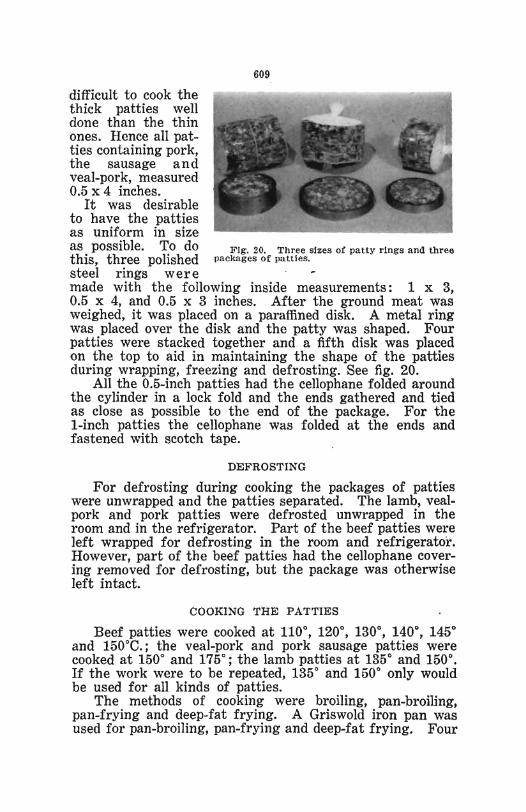
difficult to cook the thick patties well done than the thin ones. Hence all patties containing pork, the sausage and veal-pork, measured 0.5 x 4 inches.
It was desirable to have the patties as uniform in size
609
as possible. To do Fig. 20. Three sizes of patty rings and three this, three polished packages of pa tties.
steel rings were made with the following inside measurements: 1 x 3, 0.5 x 4, and 0.5 x 3 inches. Mter the ground meat was weighed, it was placed on a paraffined disk. A metal ring was placed over the disk and the patty was shaped. Four patties were stacked together and a fifth disk was placed on the top to aid in maintaining the shape of the patties during wrapping, freezing and defrosting. See fig. 20.
All the 0.5-inch patties had the cellophane folded around the cylinder in a lock fold and the ends gathered and tied as close as possible to the end of the package. For the 1-inch patties the cellophane was folded at the ends and fastened with scotch tape.
DEFROSTING
For defrosting during cooking the packages of patties were unwrapped and the patties separated. The lamb, vealpork and pork patties were defrosted unwrapped in the room and in the refrigerator. Part of the beef patties were left wrapped for defrosting in the room and refrigerator. However, part of the beef patties had the cellophane covering removed for defrosting, but the package was otherwise left intact.
COOKING THE PATTIES
Beef patties were cooked at 1100, 1200
, 1300, 1400
, 1450
and 150°C.; the veal-pork and pork sausage patties were cooked at 1500 and 1750
; the lamb patties at 1350 and 1500•
If the work were to be repeated, 135° and 1500 only would be used for all kinds of patties.
The methods of cooking were broiling, pan-broiling, pan-frying and deep-fat frying. A Griswold iron pan was used for pan-broiling, pan-frying and deep-fat frying. Four
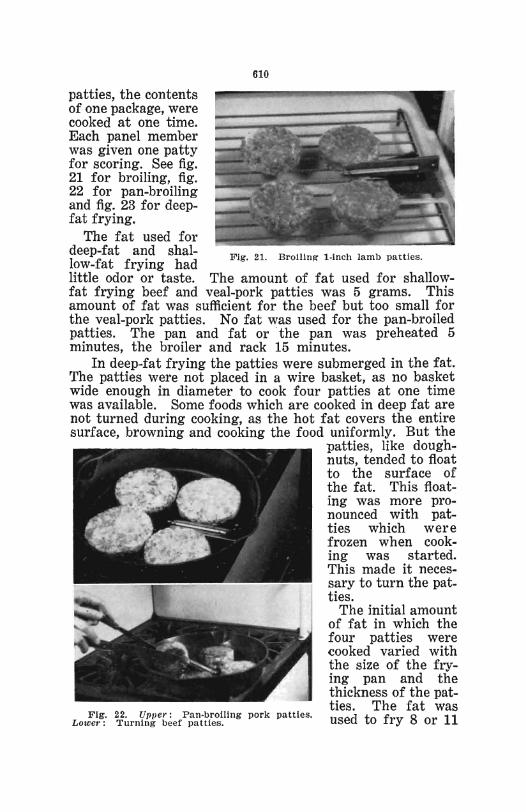
patties, the contents of one package, were cooked at one time. Each panel member was given one patty for scoring. See fig. 21 for broiling, fig. 22 for pan-broiling and fig. 23 for deepfat frying.
The fat used for deep-fat and shallow-fat frying had
610
Fig. 21. Brolling l ·inch lamb patties.
little odor or taste. The amount of fat used for shallowfat frying beef and veal-pork patties was 5 grams. This amount of fat was sufficient for the beef but too small for the veal-pork patties. No fat was used for the pan-broiled patties. The pan and fat or the pan was preheated 5 minutes, the broiler and rack 15 minutes.
In deep-fat frying the patties were submerged in the fat. The patties were not placed in a wire basket, as no basket wide enough in diameter to cook four patties at one time was available. Some foods which are cooked in deep fat are not turned during cooking, as the hot fat covers the entire surface, browning and cooking the food uniformly. But the
Fig. 22. Up/Jer: Pan·broiling pork patties. Lower: Turning beef patties.
patties, like doughnuts, tended to float to the surface of the fat. This floating was more pronounced with patties which were frozen when cooking was started. This made it necessary to turn the patties.
The initial amount of fat in which the four patties were cooked varied with the size of the frying pan and the thickness of the patties. The fat was used to fry 8 or 11
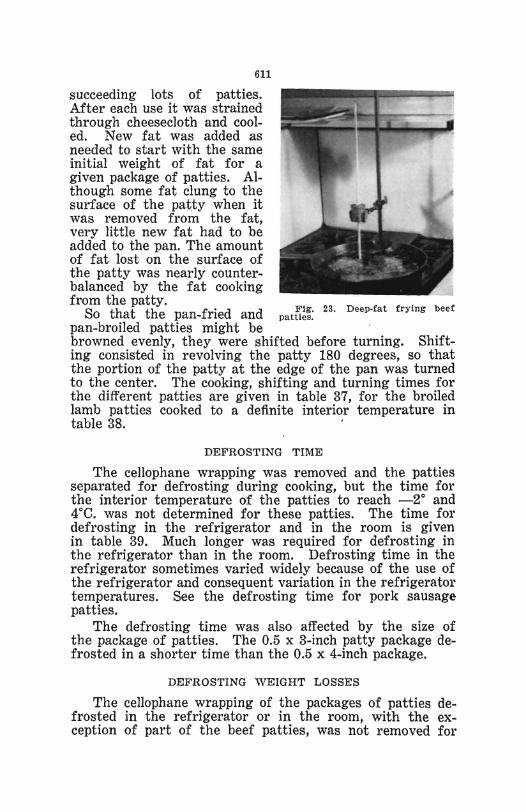
611
succeeding lots of patties. After each use it was strained through cheesecloth and cooled. New fat was added as needed to start with the same initial weight of fat for a given package of patties. Although some fat clung to the surface of the pat,ty when it was removed from the fat, very little new fat had to be added to the pan. The amount of fat lost on the surface of the patty was nearly counterbalanced by the fat cooking from the patty.
So that the pan-fried and patB~~: 23. D eep-fat frying beef
pan-broiled patties might be browned evenly, they were shifted before turning. Shifting consisted in revolving the patty 180 degrees, so that the portion of the patty at the edge of the pan was turned to the center. The cooking, shifting and turning times for the different patties are given in table 37, for the broiled lamb patties cooked to a definite interior temperature in table 38.
DEFROSTING TIME
The cellophane wrapping was removed and the patties separated for defrosting during cooking, but the time for the interior temperature of the patties to reach _2° and 4°C. was not determined for these patties. The time for defrosting in the refrigerator and in the room is given in table 39. Much longer was required for defrosting in the refrigerator than in the room. Defrosting time in the refrigerator sometimes varied widely because of the use of the refrigerator and consequent variation in the refrigerator temperatures. See the defrosting time for pork sausage patties.
The defrosting time was also affected by the size of the package of patties. The 0.5 x 3-inch patty package defrosted in a shorter time than the 0.5 x 4-inch package.
DEFROSTING WEIGHT LOSSES
The cellophane wrapping of the packages of patties defrosted in the refrigerator or in the room, with the exception of part of the beef patties, was not removed for
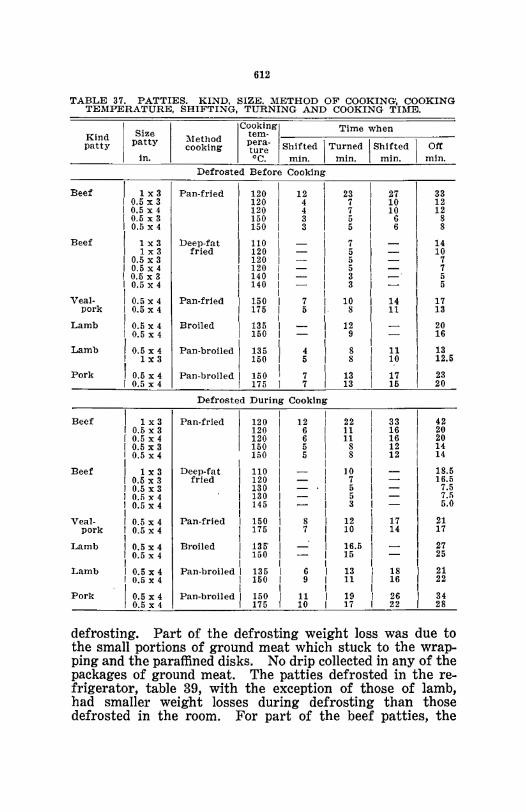
612
TABLE 37. PATTIES. KIND, SIZE. :METHOD OF COOKING, COOKING TEMPERATURE, SHIFTING. TURNING AND COOKING TIME.
Kind patty
Beef
Beef
Vealpork
Lamb
Lamb
Pork
Beef
Beef
Vealpork
Lamb
Lamb
Pork
Size patty
in.
I lx3 I 0.5 x 3 I 0.5 x 4 I 0.5 x 3 I 0.5 x 4
II 1 x 3
1 x 3 0.5 x 3
I 0.5 x 4 I 0.5 x 3 I 0.5 x 4 I I 0.5 x 4 I 0.5 x 4
I 0.5 x 4 I 0.5 x 4
I 0.5 x 4 I 1x3
! 0.5 x 4 I 0.5 x 4
I 1x3 I 0.5 x 3 r 0.5 x 4 I 0.5 x 3 I 0.5 x 4
II 1 x 3 0.5 x 3
I 0.5 x 3 I 0.5 x 4 I 0.5 x 4 I I 0.5 x 4 I 0.5 x 4 , II 0.5 x 4
0.5 x 4 , I 0.5 x 4 I 0.5 x 4
I 0.5 x 4 I 0.5 x 4
Method cooking I
COOkingl Time when tem-
~~~~- Shifted I Tu~ned I Shi~ted C. min. min. mm.
Defrosted Before Cooking
Pan-fried I I
Deep-fat II fried
I I
I Pan·fried I
Broiled I I I
Pan-broiled I I
Pan-broiled I I
120 120 120 150 150
110 120 120 120 140 140
150 175
135 150
135 150
150 175
12 4 4 3 3
7 5
4 5
7 7
Defrosted During Cooking
Pan-fried
Deep-fat II fried I
I I I
Pan-fried I
Broiled I I I
Pan-broiled I I I
Pan-broiled I I
I 120 I 120 120 150 150
110 120 130 130 145
150 175
135' 150
135 150
150 175
12 6 6 5 5
8 7
6 9
11 10
23 7 7 5 5
7 5 5 5 3 3
10 8
12 9
8 8
13 13
22 11 11
8 8
10 7 5 5 3
12 10
16.5 15
13 11
19 17
27 10 10
6 6
14 11
11 10
17 15
33 16 16 12 12
17 14
18 16
26 22
I Off min.
33 12 12
8 8
14 10
7 7 5 5
17 13
20 16
13 12.5
23 20
42 20 20 14 14
18.5 16.5
7.5 7.5 5.0
21 17
27 25
21 22
34 28
defrosting. Part of the defrosting weight loss was due to the small portions of ground meat which stuck to the wrapping and the paraffined disks. No drip collected in any of the packages of ground meat. The patties defrosted in the refrigerator, table 39, with the exception of those of lamb, had smaller weight losses during defrosting than those defrosted in the room. For part of the beef patties, the
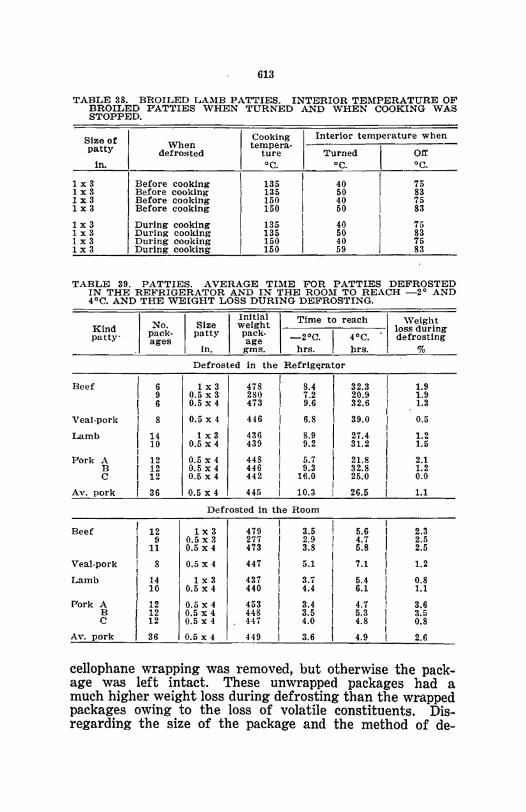
613
TABLE 38. BROILED LAMB PATTIES. INTERIOR TEMPERATURE OF BROILED PATTIES WHEN TURNED AND WHEN COOKING WAS STOPPED.
Size of Cooking Interior temperature when patty When tempera·
defrosted ture Turned Off in. DC. °C. DC.
1x3 I Before cooking 135 40 76 1x3 Before cooking 135 50 83 1x3 I Before cooking 150 40 75 1x3 Before cooking 150 50 83
1x3 I During cooking 135 40 75 1x3 During cooking 135 50 83 1x3 During cooking 150 40 75 1x3 During cooking 150 59 83
TABLE 39. PATTIES. AVERAGE TIME FOR PATTIES DEFROSTED IN THE REFRIGERATOR AND IN THE ROOM TO REACH _2° AND 4°C. AND THE WEIGHT LOSS DURING DEFROSTING.
Kind patty·
Beef
Veal·pork
Lamb
Pork A B C
Av. pork
Beef
Veal.pork
Lamb
Pork A B C
Av. pork
I No. I pack. ages I Initial I Time to reach I Size weight
patty p:~~. _20C. 1 4°C. . In. gms. hra. hrs.
Defrosted In the Refrlgllrator
I I I
I 6 lx3 478 I 8,4
I 32.3
9 0.5 x 3 280 I 7.2 20.9
I 6 0.5 x 4 473 9.6 32.6 I I I I
8 0.5 x 4 446 I 6.8 39.0 I I
I I
14 1x3 436 I 8.9 27.4 I 10 0.5 x 4 439 9.2 31.2 I I I I I 12 0.5 x 4 448 5.7 21.8 I I 12 0.5 x 4 446 9.3 I 32.S
12 0.5 x 4 442 I 16.0 25.0
I I I I 36 0.5 x 4 445 10.3 I 26.5 I
Defrosted In the Room
I I I I 12 lxS 479 I 3.5 5.6 ,
I 9 0.5 x 3 277 I 2.9 I 4.7 I 11 0.5 x 4 473 3.8 I 5.8
I 8 0.5 x 4 447 I 5.1 7.1 I
I I I I
14 lx3 437 I 3.7 5.4 I 10 0.5 x 4 440 I 4.4 6.1 I 12 0.5 x 4 453 I 3.4 I 4.7 I
I 12 0.5 x 4 448 3.5 I 5.3 I 12 0.5 x 4 447 I 4.0 4.8 I
I I I 36 0.5 x 4 449 I 3.6 4.9 I
Weight loss during defrosting
%
1.9 1.9 1.3
0.5
1.2 1.5
2.1 1.2 0.0
1.1
2.3 2.5 2.5
1.2
0.8 1.1
3.6 3.5 0.8
2.6
cellophane wrapping was removed, but otherwise the package was left intact. These unwrapped packages had a much higher weight loss during defrosting than the wrapped packages owing to the loss of volatile constituents. Disregarding the size of the package and the method of de-
614
frosting, the 32 unwrapped packages lost 3.1 percent whereas the 21 wrapped packages lost 0.6 percent.
COOKING TIME
The time for cooking varied with the thickness of the patty, the method of cooking and the cooking temperature. Most of the patties were cooked a definite time, which had been determined in preliminary tests. It was found that the cooking time was shortened as the cooking temperature was elevated. Cooking in deep fat required a shorter time than cooking .in shallow fat. The broiled 1 x 3-inch lamb patties were cooked to a definite interior temperature. The cooking time for the fried and pan-broiled patties is given in table 40, for the broiled 1 x 3-inch patties in table 41.
SPATTERING OF THE FAT
There was little spattering of the fat at temperatures of 1200 or lower. :Spattering of the fat increased as the temperature of the pan was raised above 1200
• There was no spattering of the fat in deep-fat cooking. During the cooking in deep fat, the escaping steam from the patty gave the fat the appearance of boiling. See fig. 23.
APPEARANCE OF THE COOKED PATTIES
The pan-fried and pan-broiled patties, like the pan-fried and pan-broiled chops, often cupped or humped in the center. When this occurred the patties were unevenly browned on the surface and unevenly cooked in the interior. Beef patties cooked in deep fat were sometimes hollow in the center. Because not enough time was spent in the preliminary tests with beef patties, there was uneven cooking of the different sized patties at different temperatures. Beef patties cooked in deep fat tended to have crisper and browner crusts than similar patties cooked at the same temperature in shallow fat. The deep-fat fried beef patties had less pink in the interior than similar pan-fried patties.
Broiled lamb 'patties tended to stick to the rack of the broiler and had a more ragged appearance than those which were pan-broiled.
The veal-pork and pork patties were all 0.5 inch in thickness and were cooked until the interior was gray or brown in color. The surface might be unevenly browned when the patties cupped during cooking.
615
COOKING WEIGHT LOSSES
The weight losses during cooking varied with the kind of patty, the method of cooking and the stage of cookery, tables 40 and 41. Defrosting before versus during cooking had no consistent effect upon the cooking weight losses. Sometimes the weight losses were higher for the patties defrosted during cooking, sometimes for those defrosted before cooking. There were also no consistent weight losses owing to the cooking temperature.
Pork sausage patties had the highest weight losses during cooking, approximately 48 percent, nearly half the weight of the patty. Part of this heavy loss was undoubtedly caused by the loss of fat from the sausage during cooking. This is shown by the large drippings weight loss, which was principally fat. The reader can find drippings loss by subtracting the volatile loss from the total cooking weight loss, table 40. For the pork sausage the drippings weight losses averaged about 18 percent. The drippings weight loss of the beef and lamb patties averaged about 8 percent.
Pan-broiled lamb patties had heavier weight losses than broiled patties of the, same thickness and diameter. There were only three groups of pan-fried and deep-fat fried beef patties which were comparable, i. e., patties of the same size cooked at the same temperature. In two of these groups the weight loss was greater for the deep-fat fried patties; in the third group the loss was about the same.
Broiled lamb patties cooked to an interior temperature of 83° had greater cooking losses than those cooked to an interior temperature of 75°0., table 41.
In general, the weight losses of the patties were high, but this is typical of pan-fried and pan-broiled cut~.
FUEL CONSUMPTION
Broiling requires approximately four times as much fuel as pan-frying or pan-broiling. The amount of fuel required was greater for the I-inch than the 0.5-inch patties under otherwise unchanged conditions. Likewise the 0.5 x 4-inch patties required more fuel than those 0.5 x 3 inches in size.
PALATABILITY
The beef patties were in frozen storage from 98 to 123 days, the veal-pork patties from 23 to 30 days, and the lamb patties from 21 to 59 days. The sausage patties will be discussed later.
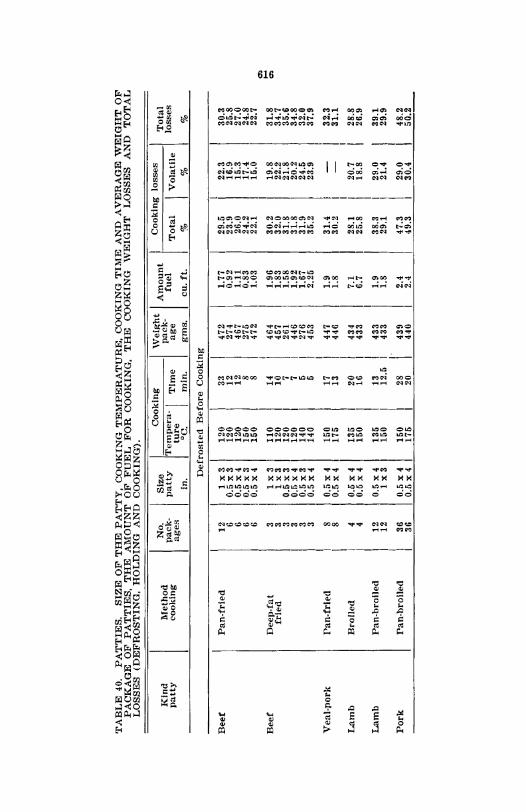
TABLE 40. PATTIES. SIZE OF THE PATTY, COOKING TEMPERATURE, COOKING TIME AND AVERAGE WEIGHT OF PACKAGE OF PATTIES, THE AMOUNT OF FUEL FOR COOKING, THE COOKING WEIGHT LOSSES AND TOTAL LOSSES (DEFROSTING, HOLDING AND COOKING).
Beef
Beef
Kind patty
Veal-pork
Lamb
Lamb
Pork
Method cooking
Pan·frled
Deep·fat fried
Pan-frie(1
Broiled
Pan-broiled
Pan-broiled
I No. I pack· ages
Size patty
In. I Cooking Weight I Amount
pack· fuel Tempera· I Time age t~g min. gms. cu. ft.
Defrosted Before Cooking
\ \ I 12 1x3 120 33 472 1.77 6 0.5x3 120
I 12 I 274 0.92
6 0.5 x 4 120 12 I 467 1.11 6 0.5 x 3 150 8 275 0.83 6 0.5 x 4 160 I 8 I 472 1.03
1 I
3 1x3 110 14 I 464 1.96 3 1x3 120 10 457 1.83 3 0.6 x 3 120 I 7 I 261 1.68 3 0.5 x 4 120
1
7 I 446 1.92 3 0.6 x 3 140 5
\ 276 1.67
3 0.6 x" 140 5 453 2.25
I 8 0.5 x 4 150 17 447 1.9
I 8 0.5 x 4 l75
1
13 446 1.8 I
I I 4 0.5 x 41 135 20 r 434 7.1 I 4 0.5 x 4 150 16 r 433 6.7
I I r 12 I 0.5 x 41 135 I 13 433
I 1.9
I 12 I 1x3 150 I 12.5 I 433 1.8
I I' I I 36 0.5 x" 150 I 28 \
439 2.4 r 36 0.5 x 4 r 175 20 440 I 2.4
I I I
Cooking losses
Total I Volatile % %
I 29.5 I 22.3 23.9 16.9 26.0 15.3 24.2 I 17.4 22.1 I 15.0
30.2 19.8 32.0 22.2 31.8 21.8 31.8 20.2 31.9 24.5 35.2 23.9
I 31.4 I -30.2 I -
I 28.1 I 20.7 25.8 18.8
r 38.3 I 29.0 29.1 21.4
I
I I
I I
47.3 I 29.0 ~_I 49.3 30.4 ~ ~----.--
Total losses
%
30.3 25.8 27.0 24.8 22.7
31.8 34.7 35.6 34.8 32.0 37.9
32.3 31.1
28.8 26.9
39.1 29.9
48.2 50.2
.,. .... .,.
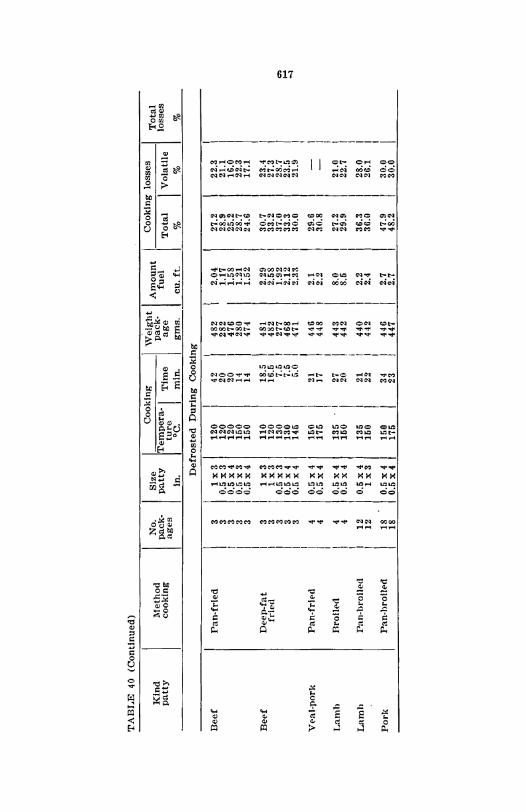
TABLE 40 (Continued)
No. Size I Cooking I Weight I Amount Cooking losses
Total Kind Method patty cooking pack- patty Tempera- I Time pack- fuel
Total I Volatile losses
ages ture age In. °C. min. gms. cu. ft. % % %
Defrosted During Cooking
Beef Pan-fried 3 1x3 120 42 482 2.04 27.2 22.3 3 0.5 x 3 120 20 282 1.17 28.9 21.1 3 0.5 x 4 120 20 476 1.5& 25.2 16.0 3 0.5 x 3 150 14 280 1.21 28.7 22.3 3 0.5 x 4 150 14 474 1.52 24.6 17.1
Bed Deep-fat 3 1x3 110 18.5 481 2.29 30.7 23.4 fried 3 lx3 120 16.5 482 2.58 33.2 27.3
3 0.5 x 3 130 7.5 277 1.92 37.0 28.7 '" 3 0.5 x 4 130 7.5 468 2.12 33.3 23.5 .... 3 0.5 x 4 145 5.0 471 2.33 30.0 21.9
-1
Veal-porle Pan-frip(1 4 0.5 x 4 150 21 4411 2.1 29.6 4 0.5 x 4 175 17 448 2.2 30.8
Lamh Bronecl 4 0.5 x 4 135 27 443 8.0 27.2 21.0 4 0.5 x 4 150 20 442 8.5 29.9 22.7
Lamh Pan-hrolled 12 0.5 x 4 135 21 440 2.2 36.3 28.0 12 lx3 150 22 442 2.4 36.0 26.1
Pork Pan-hrolled 18 0.5 x 4 150 34 446 2.7 47.9 30.0 18 0.6 x 4 175 23 447 2.7 48.2 30.0
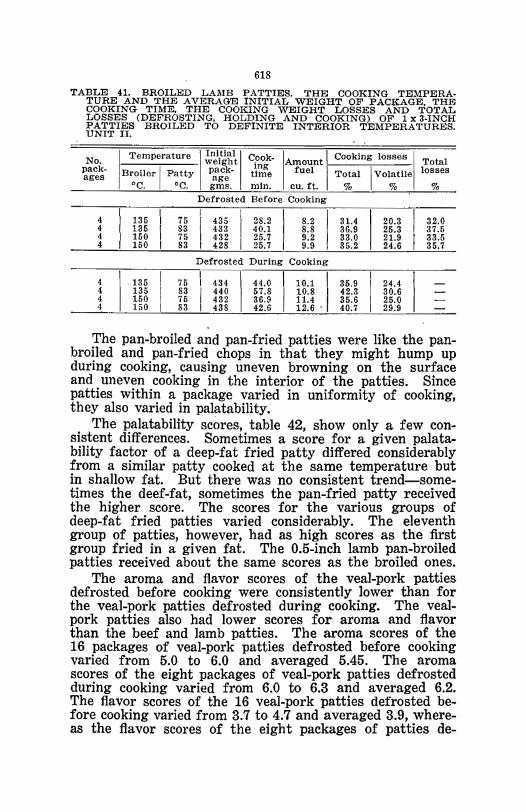
618
TABLE 41. BROILED LAMB PATTIES. THE COOKING TEMPERA· TURE AND THE AVERAGE INITIAL WEIGHT OF PACKAGE, THE COOKING TIME, THE COOKING WEIGHT LOSSES AND TOTAL LOSSES (DEFROSTING, HOLDING AND COOKING) OF 1 x 3·INCH PATTIES BROILED TO DEFINITE INTERIOR TEMPERATURES. UNIT II.
No. I Temperature I Inl.tl~\ I COOk·IA t I Cooking losses ITt I welg Ing moun 0 a pack· Broiler I Patty p~:. time fuel Total I Volatile losses ages
°c. °C. gms. min. cu. ft. % % % Defrosted Before Cooking I
I I
4 135 75
I 435 28.2 8.2 31.4 20.3 32.0
4 135 83 433 40.1 8.8 36.9 25.3 37.5 4 150 75 432 25.7 9.2 33.0 21.9 33.5 4 150 83 I 428 25.7 9.9 35.2 24.6 35.7
Defrosted During Cooking I
I I
I I I
4 135 75 I 434 44.0 10.1 35.9 24.4 4 135 83 I 440 57.8 10.8 42.3 30.6 4 150 75 I 432 36.9 11.4 I 35.6 25.0 4 150 83 I 438 42.6 12.6 ' 40.7 29.9
The pan-broiled and pan-fried patties were like the panbroiled and pan-fried chops in that they might hump up during cooking, causing uneven browning on the surface and uneven cooking in the interior of the patties. Since patties within a package varied in uniformity of cooking, they also varied in palatability.
The palatability scores, table 42, show only a few consistent differences. Sometimes a score for a given palatability factor of a deep-fat fried patty differed considerably from a similar patty cooked at the same temperature but in shallow fat. But there was no consistent trend-sometimes the deef-fat, sometimes the pan-fried patty received the higher score. The scores for the various groups of deep-fat fried patties varied considerably. The eleventh group of patties, however, had as high scores as the first group fried in a given fat. The 0.5-inch lamb pan-broiled patties received about the same scores as the broiled ones.
The aroma and flavor scores of the veal-pork patties defrosted before cooking were consistently lower than for the veal-pork patties defrosted during cooking. The vealpork patties also had lower scores for aroma and flavor than the beef and lamb patties. The aroma scores of the 16 packages of veal-pork patties defrosted before cooking varied from 5.0 to 6.0 and averaged 5.45. The aroma scores of the eight packages of veal-pork patties defrosted during cooking varied from 6.0 to 6.3 and averaged 6.2. The flavor scores of the 16 veal-pork patties defrosted before cooking varied from 3.7 to 4.7 and averaged 3.9, whereas the flavor scores of the eight packages of patties de-
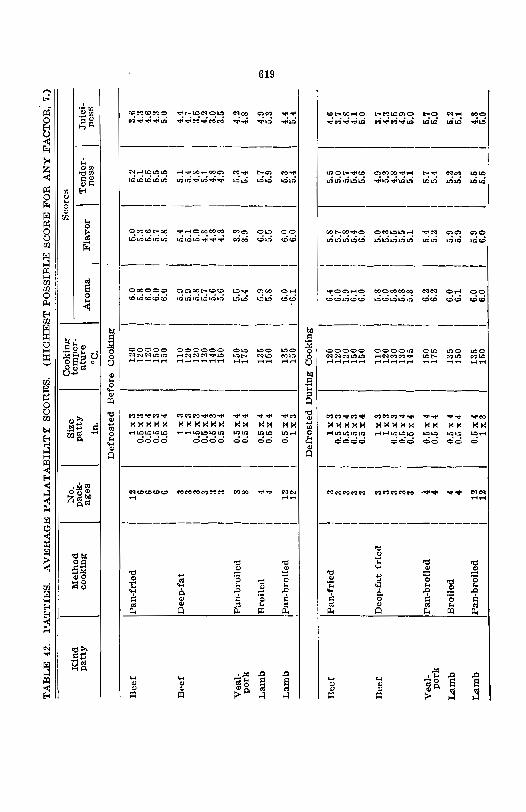
TABLE 42. PATTIES. AVERAGE PALATABILITY SCORES. (HIGHEST POSSIBLE SCORE FOR ANY FACTOR, 7.)
Cooking Scores Method No. Size temper-Kind pack- patty ature Tender- Juici-patty cooking ages Aroma Flavor ness ness In . ·C.
. Defrosted Before Cooking
I
I I I
Beef Pan-fried I 12 lx3 120 I 6.0 I 5.0 5.2 3.6 I 6 0.5 x 3 120 I 5.8 5.3 6.1 4.3 I 6
I 0.5 x 4 120 I 6.0 I 5.6 6.5 4.6
I 6 0.5 x 3 150 I 6.0 I 5.7 5.6 4.3 I 6 0.5 x 4 150 6.0 I 5.8 5.5 5.0 I I
I I I I
Beef Deep-fat I 3 I Ix3 110 5.9 5.4 I 5.1 I 4.4 I 3 lx3 120 5.9 5.1 I 5.4 4.7 I 3 I 0.6 x 3 120 I 5.8 I 5.0 I 4.8
I 3.5
I 3 0.6 x 4 120 5.7 I 4.8 I 5.1 4_2 I 3 I 0.5 x 3 140 I 6.6 I 4_S I 4.S 3.0 I 3 0.5 x 4 150 I 5.6 4.8 I 4.9 I 3.5 I
\ I I I I
Veal- Pan-broiled I S 0.5 x 4 150 I 5.5 I 3.8 I 5.3 I 4.2 pork I 8 I 0.5 x 4 175 I 5.4 I 3.9 I 5.4 4.8
I I I I I I Lamb Broiled I 4 I 0.6 x 4 135 I 5.9 I 6.0 5.7 4.9 I 4 0.6 x 4 150 I 5.8 5.5 I 5.9 6.3 I I I I
I Lamb Pan-broiled I 12 0.5 x 4 135 I 6.0 I 6.0 I 5.3 4.4 .... ' I 12 I 1x3 150 I . 6.1 I 6.0 I 6.4 6.4 _ .. _-
Defrosted During Cooking
I Beef IPan-frled 3 1x3 120 I 6.4 5.8 5.5 4.6
3 0.5 x 3 120 I 6.0 5.7 6.0 3.7 3 0.5 x 4 120 I 5.9 5.S 5.7 4.8 3 0.6 x 3 150 I 6.1 5.4 5.4 4.1 3 0.6 x 4 150 I 6.0 6.0 5.6 5.0
I Beef. IDeep-fat fried 3 1x3 110 I 5.8 5.0 4.9 3.7
3 Ix3 120 I 6.0 5.3 5.3 4.3 3 0.5 x 3 130 I 5.8 5.6 4.8 3.5 3 0.5 x 4 130 I 6_S 5.6 5.4 4.9 3 0.6 x 4 145 I 5.8 5_1 5.1 5.0
4-I
Veal- ran-brOiled 0.5 x 4 150 I 6.2 6.4 5.7 5.7 pork 4 0.5 x 4 175 I 6.2 5.2 5.4 5.0
I Lamb Broiled 4 0.5 x 4 135 I 6.0 6.9 5.2 5.2
4 0.5 x 4 150 I 6.1 5.9 6.3 6.1
Lamb JPan-brolled 12 0.6 x 4 136 I 6.0 5.9 5.5 4.8 12 1x3 150 I 6.0 6.0 5.5 6.0
'" .... ....
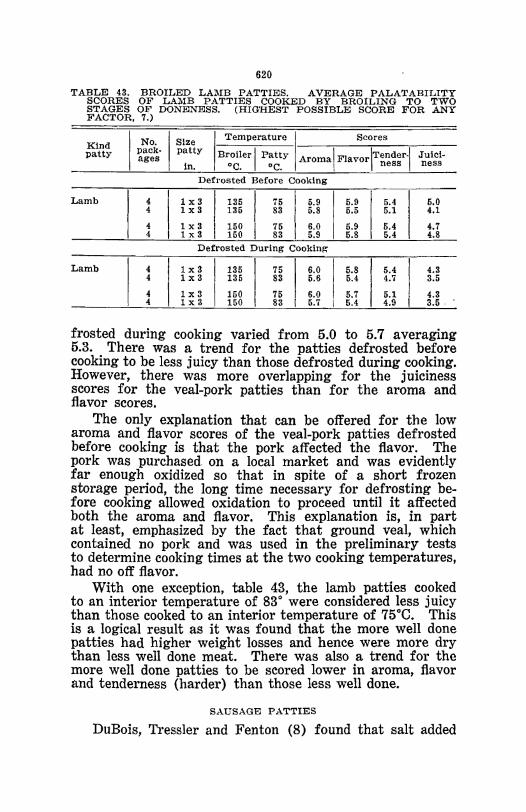
620
TABLE 43. BROILED LAMB PATTIES. AVERAGE PALATABILITY SCORES OF LA:"I1B PATTIES COOKED BY BROILING TO TWO STAGES OF DONENESS. (HIGHEST POSSIBLE SCORE FOR ANY FACTOR. 7.)
Kind patty
Lamb
Lamb
IN I SI I Temperature I Scores
~~~~. p:t~y Broiler I Patty Aromai FlavorlTender'i Juici· in. 0C. 0C. ness ness
Defrosted Before Cooking
I
I I 5.0 4
I lx3 135 75 5.9 5.9 5.4
4 1x3 135 83
I 5.8 5.5 5.1 4.1
4 1x3 150 75 6.0 5.9 5.4 4.7 4 I 1 x 3 I 150 83 5.9 5.8 5.4 4.8
Defrosted During Cooking
I
I I 4 1 x 3 I 135 75 6.0 5.8 5.4 4.3
4 lx3 135 I 83 5.6 5.4 4.7 3.5
4 1x3 I 150 I 75 6.0 I 5.7 5.1 4.3 4 lx3 150 83 I 5.7 5.4 4.9 3.5 .
frosted during cooking varied from 5.0 to 5.7 averaging 5.3. There was a trend for the patties defrosted before cooking to be less juicy than those defrosted during cooking. However, there was more overlapping for the juiciness scores for the veal-pork patties than for the aroma and flavor scores.
The only explanation that can be offered for the low aroma and flavor scores of the veal-pork patties defrosted before cooking is that the pork affected the flavor. The pork was purchased. on a local market and was evidently far enough oxidized so that in spite of a short frozen storage period, the long time necessary for defrosting before cooking allowed oxidation to proceed until it affected both the aroma and flavor. This explanation is, in part at least, emphasized by the fact that ground veal, which contained no pork and was used in the preliminary tests to determine cooking times at the two cooking temperatures, had no off flavor.
With one exception, table 43, the lamb patties cooked to an interior temperature of 83° were considered less juicy than those cooked to an interior temperature of 75°C. This is a logical result as it was found that the more well done patties had higher weight losses and hence were more dry than less well done meat. There was also a trend for the more well done patties to be scored lower in aroma, flavor and tenderness (harder) than those less well done.
SAUSAGE PATTIES
DuBois, Tressler and Fenton (8) found that salt added
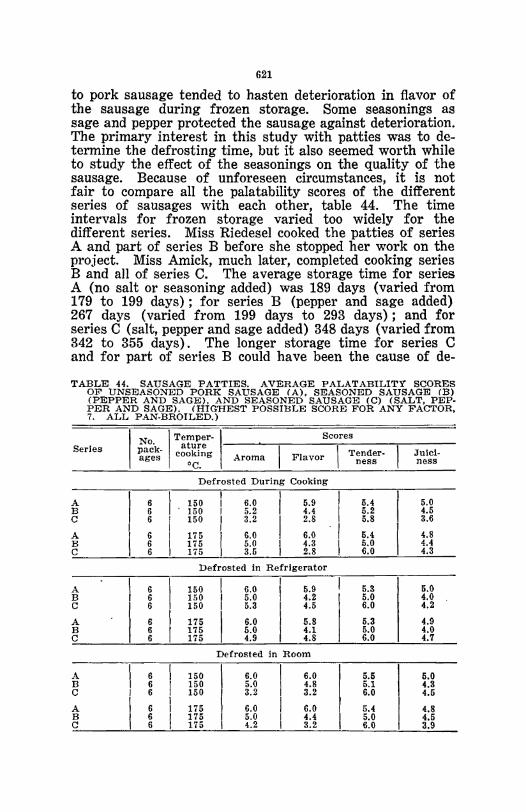
621
to pork sausage tended to hasten deterioration in flavor of the sausage during frozen storage. Some seasonings as sage and pepper protected the sausage against deterioration. The primary interest in this study with patties was to de~ termine the defrosting time, but it also seemed worth while to study the effect of the seasonings on the quality of the sausage. Because of unforeseen circumstances, it is not fair to compare all the palatability scores of the different series of sausages with each other, table 44. The time intervals for frozen storage varied too widely for the different series. Miss Riedesel cooked the patties of series A and part of series B before she stopped her work on the project. Miss Amick, much later, completed cooking series B and all of series C. The average storage time for series A (no salt or seasoning added) was 189 days (varied from 179 to 199 days); for series B (pepper and sage added) 267 days (varied from 199 days to 293 days); and for series C (salt, pepper and sage added) 348 days (varied from 342 to 355 days). The longer storage time for series C and for part of series B could have been the cause of de~
TABLE 44. SAUSAGE PATTIES. AVERAGE PALATABILITY SCORES OF UNSEASONED PORK SAUSAGE (A), SEASONED SAUSAGE (B) (PEPPER AND SAGE), AND SEASONED SAUSAGE (C) (SALT, PEP· PER AND SAGE). (HIGHEST POSSIBLE SCORE FOR ANY FACTOR, 7. ALL PAN·BROILED.)
I No I Temper-I Scores
Series . ature
I I pack- cooking Tender- Jule!-ages Aroma Flavor ness ness °c. Defrosted During Cooking
I· I
I A 6 150 I 6.0 5.9 5.4 5.0 B 6 150 I 5.2 4.4 5.2 4.5 C 6 I 150 I 3.2 2.8 5.8 3.6
I I -! A 6 I 175 I 6.0 6.0 5.4 4.8 B 6 I 175 5.0 4.3 5.0 4.4 C 6 175 3.5 2.8 6.0 4.3
Defrosted in Refrigerator
I I I I I A 6 150 6.0
I 5.9 5.3 5.0
B 6 150 I 5.0 4.2 5.0 4.0 C 6 I 150 5.3 4.5 6.0 4.2
A 6 I 175 I 6.0 5.8 5.3 4.9 B 6 I 175 5.0 I 4.1 5.0 4.0 C 6 175 4.9 4.8 6.0 4.7
Defrosted in Room
A I 6 I 150 6.0 I 6.0 5.5 5.0 B 6 I 150 5.0 4.8 5.1 4.3 C I 6 150 3.2 I 3.2 6.0 4.5
A I 6 I 175 6.0 I 6.0 5.4 4.8 B 6 I 175 5.0 I 4.4 5.0 4.5 C 6 175 I 4.2 3.2 6.0 3.9
622
terioration in flavor as well as the saIto It was also found that the sausage was too highly seasoned for many palates. None of the members of the panel scoring the C series was on the panel for scoring the A series. The average palatability scores of the sausage are interesting, even with the differences in storage time and of the scoring personnel. In general, the aroma and flavor scores decreased with lengthening storage of the sausage, particularly for patties defrosted during cooking and at room temperature. The most interesting scores, however, are those for series C (same storage time throughout the cooking period and the same scoring personnel). The average flavor scores for the 12 patties of series C defrosted during cooking was 2.8; for the 12 defrosted at room temperature 3.2; and for the 12 defrosted in the refrigerator, 4.65. The only explanation that can be offered is that during the long defrosting period in the refrigerator the deteriorated products had time to volatilize. This is the opposite explanation from that offered for the veal-pork patties, but the storage time was long for the pork and short for the veal-pork patties. These scores, however, varied too widely and the variations were too consistent to be ignored.
In general, there were no great differences between the palatability scores for a given series of pork sausages when cooked at 1500 or 1750
•
SUMMARY AND CONCLUSIONS
Defrosting times, as in the other sections of this study, were affected to the greatest extent by the thawing temperature and to a lesser extent by the size of the package. Thawing times were longest in the refrigerator, intermediate in the room, and shortest during cooking. The weight lost during defrosting was greater for the patties thawed in the room than for patties thawed in the refrigerator.
The cooking time varied with the thickness of the patty, the method of cooking and the cooking temperature. Deepfat fried patties cooked in a shorter time than those which were pan-fried.
Cooking weight losses varied with the kind of patty, the method of cooking and the stage of cookery. Pork sausage patties lost more weight, approximately 48 percent, than the other types of meat. Patties which are panfried and pan-broiled may be browned· and cooked unevenly because of humping of the patties during cooking.
Palatable patties may be obtained by broiling, panbroiling, pan-frying or deep-fat frying. A cooking tempera-
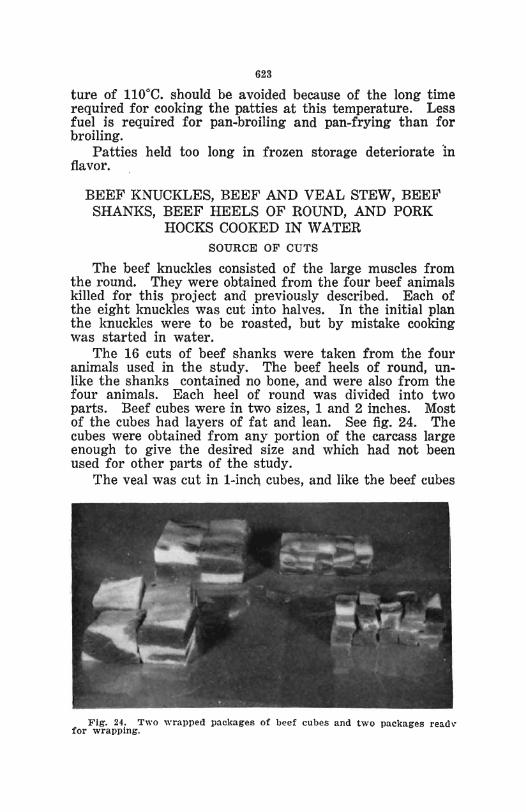
623
ture of 110°C. should be avoided because of the long time required for cooking the patties at this temperature. Less fuel is required for pan-broiling and pan-frying than for broiling.
Patties held too long in frozen storage deteriorate in flavor.
BEEF KNUCKLES, BEEF AND VEAL STEW, BEEF SHANKS, BEEF HEELS OF ROUND, AND PORK
HOCKS COOKED IN WATER SOURCE OF CUTS
The beef knuckles consisted of the large muscles from the round. They were obtained from the four beef animals killed for this project and previously described. Each of the eight knuckles was cut into halves. In the initial plan the knuckles were to be roasted, but by mistake cooking was started in water.
The 16 cuts of beef shanks were taken from the four animals used in the study. The beef heels of round, unlike the shanks contained no bone, and were also from the four animals. Each heel of round was divided into two parts. Beef cubes were in two sizes, 1 and 2 inches. Most of the cubes had layers of fat and lean. See fig. 24. The cubes were obtained from any portion of the carcass large enough to give the desired size and which had not been used for other parts of the study.
The veal was cut in I-inch cubes, and like the beef cubes
~.-....... ------ ,,-: ~
~-
• .. ~.-...... --~~~'-e ....,.--- AI ... ~"~ ...... ~r~.
. ---. -
Fig. 24, Two wrapped packages of beef cubes and two packages read,for wrappmg.
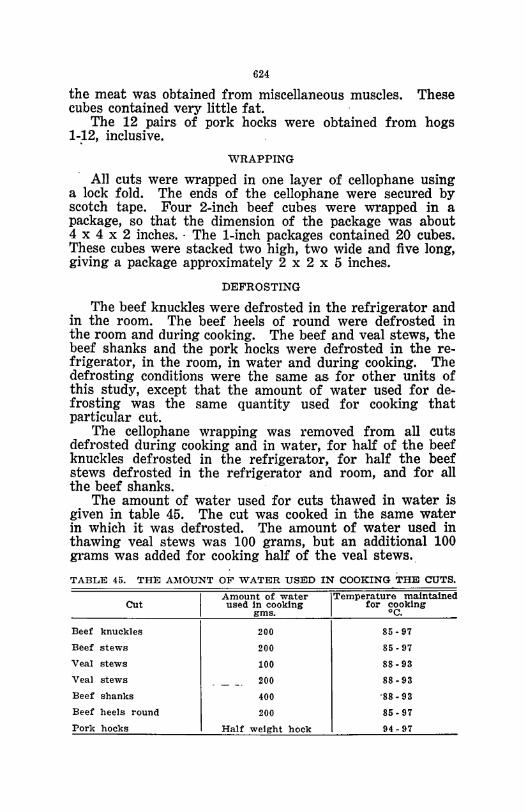
624
the meat was obtained from miscellaneous muscles. These cubes contained very little fat.
The 12 pairs of pork hocks were obtained from hogs 1-,12, inclusive.
WRAPPING
. All cuts were wrapped in one layer of cellophane using a lock fold. The ends of the cellophane were secured by scotch tape. Four 2-inch beef cubes were wrapped in a package, so that the dimension of the package was about 4 x 4 x 2 inches .. The 1-inch packages contained 20 cubes. These cubes were stacked two high, two wide and five long, giving a package approximately 2 x 2 x 5 inches.
DEFROSTING
The beef knuckles were defrosted in the refrigerator and in the room. The beef heels of round were defrosted in the room and during cooking. The beef and veal stews, the beef shanks and the pork hocks were defrosted in the refrigerator, in the room, in water and during cooking. The defrosting conditions were the same as for other units of this study, except that the amount of water used for defrosting was the same quantity used for cooking that particular cut.
The cellophane wrapping was removed from all cuts defrosted during cooking and in water, for half of the beef knuckles defrosted in the refrigerator, for half the beef stews defrosted in the refrigerator and room, and for all the beef shanks.
The amount of water used for cuts thawed in water is given in table 45. The cut was cooked in the same water in which it was defrosted. The amount of water used in thawing veal stews was 100 grams, but an additional 100 grams was added for cooking half of the veal stews ..
TABLE 45. THE Al\IOUNT OF WATER USED IN COOKING THE CUTS.
Amount of water ITemperature maintained Cut used in cooking for cooking
gms. °C.
Beef knuckles 200 85 - 97
Beef stews 200 85 - 97
Veal stews 100 88 -93
Veal stews 200 88 - 93
Beef shanks 400 '88 - 93
Beef heels round 200 85 - 97
Pork hocks Half weight hock 94 - 97
625
COOKING
The cuts were all cooked in covered saucepans. A thennometer was placed through a cork and the cork then inserted in a hole in the lid so temperature could be regulated. All these cuts, with the exceptions noted, were cooked at a simmering temperature. A simmering temperature is low enough so that the water does not boil, but may and did vary considerably in this study. In addition, in maintaining the low temperature, sometimes the flame under the pan was extinguished. The veal stews were cooked more uniformly than the other cuts. It was not necessary to add more water for cooking these simmered cuts. The cuts were cooked until they were easily pierced with a fork and the fork could be readily withdrawn from the meat. Both the cooking temperature and the manner of determining the end point for cooking contributed to many irregularities in cooking time, doneness of the meat and the palatability scores, particularly tenderness and juiciness.
Four of the l-inch and two of the 2-inch beef cube packages were cooked in boiling water. Boiling is an easy way to regulate the cooking temperature. A comparison of the effect of simmering versus boiling upon the cooking time, fuel consumption and palatability scores seemed worthwhile.
DEFROSTING TIME
The chief determinants of defrosting time were the size of the cut and the thawing temperature. The larger cuts required a longer defrosting time than the smaller ones. The defrosting time varied inversely" with the thawing temperature, being longest in the refrigerator and shortest during cooking. The time for a given cut to reach _20 and 4°C. during cooking was not determined. See table 46. For the beef half knuckles, 2-inch beef stews, the beef shanks and the pork "hocks, there was very little difference in the time required to defrost in the room and in water. The amount of water used for these cuts was not enough to cover them so that defrosting in water was practically the same as defrosting in the room.
DEFROSTING WEIGHT LOSSES
The defrosting weight losses of the half knuckles appear to be related to the time required for defrosting, table 46. The half knuckles defrosted in the refrigerator had heavier defrosting weight losses, 4.75 percent, than those defrosted in the room or water, 3.2 and 3.9 percent respectively. Note
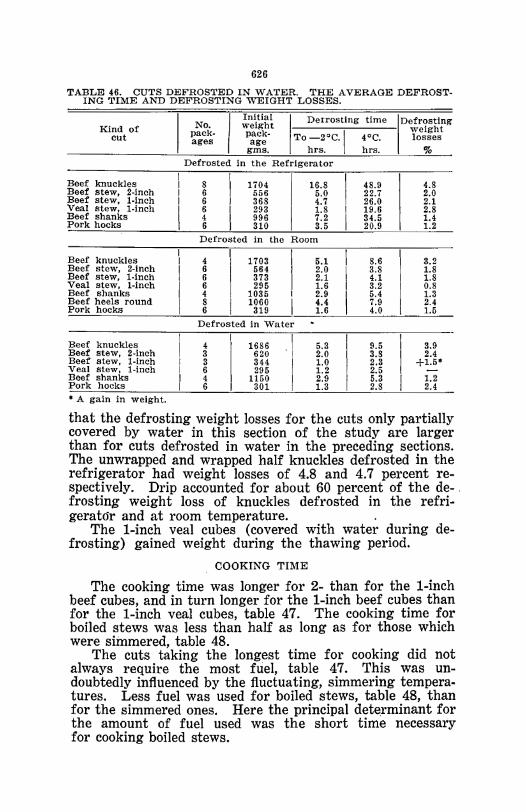
626
TABLE 46. CUTS DEFROSTED IN WATER. THE AVERAGE DEFROSTING TIME AND DEFROSTING WEIGHT LOSSES.
Kind of cut
Beef knuckles Beef stew, 2-inch Beef stew, l-inch Veal stew, l-inch Beef shanks Pork hocks
Beef knuckles Beef stew, 2-lnch Beef stew, l-inch Veal stew, I-inch Beef shanks Beef heels round Pork hocks
Beef knuckles Beet stew, 2-inch Beef stew, l-inch Veal stew, 1-inch Beef shanks Pork hocks
• A gain in weight.
I I Ini.tial I Delrosting time No. weIght pack- pack- To _20C 1 4°C ages age ..
gms. hrs. hrs. Defrosted in the Refrigerator
\ I
\ 8 I 1704 16.8 48.9 I 6 556 5.0 I 22.7 I 6 I 368 4.7 26.0
I 6
I 293 1.8
I 19.6
4 996 7.2 34.5 6 310 3.5 20.9
Defrosted in the Room
4 1703 5.1 8.6 6 564 2.0 3.8 6 373 2.1 4.1 6 295 1.6 3.2 4 1035 2.9 5.4 8 1060 4.4 7.9 6 319 1.6 4.0
Defrosted In Water
4 1686 .\ 5.3 9.5 3 620 2.0 3.8 3 344 I 1.0 2.3 6 295 1.2 2.5 4 1150 I 2.9 5.3 6 301 1.3 2.8
IDefrosting
weight losses
%
4.8 2.0 2.1 2.8 1.4 1.2
3.2 1.8 1.8 0.8 1.3 2.4 1.5
3.9 2.4
+1.5· -1.2 2.4
that the defrosting weight losses for the cuts only partially covered by water in this section of the study are larger than for cuts defrosted in water in the preceding sections. The unwrapped and wrapped half knuckles defrosted in the refrigerator had weight losses of 4.8 and 4.7 percent respectively. Drip accounted for about 60 percent of the de- . frosting weight loss of knuckles defrosted in the refri-gerat6r and at room temperature. .
The I-inch veal cubes (covered with water during defrosting) gained weight during the thawing period.
COOKING TIME
The cooking time was longer for 2- than for the I-inch beef cubes, and in turn longer for the I-inch beef cubes than for the I-inch veal cubes, table 47. The cooking time for boiled stews was less than half as long as for those which were simmered, table 48.
The cuts taking the longest time for cooking did not always require the most friel, table 47. This was undoubtedly influenced by the fluctuating, simmering temperatures. Less fuel was used for boiled stews, table 48, than for the simmered ones. Here the principal determinant for the amount of fuel used was the short time necessary for cooking boiled stews.
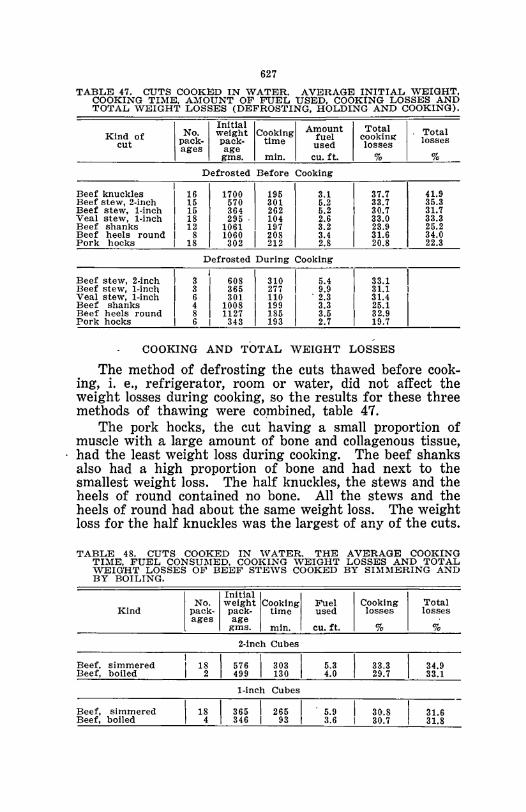
627
TABLE 47. CUTS COOKED IN WATER. AVERAGE INITIAL WEIGHT, COOKING TnlE, AMOUNT OF FUEL USED, COOKING LOSSES AND TOTAL WEIGHT LOSSES (DEFROSTING, HOLDING AND COOKING).
Kind of cut
Beef knuckles Beef stew, 2·inch Beef stew, l·inch Veal stew, I-inch Beef shanks Beef heels round Pork hocks
Beef stew, 2-inch Ileef stew, I-Inch Veal stew, I-inch Beef shanks Beef heels round Pork hocks
pack. pack. time fuel I
No. I !,~\~~~ ICOOklngl Amount ages age used
gms. min. cu. ft.
Defrosted Before Cooking
I
I
I 16 1700 195 3.1 15 570 301 5.2
I 15 364 262 5.2
I 18 295 . 104 2.6 12 I 1061 197 3.2
I 8 I 1060 I 208 3.4 I 18 302 212 2.8
Defrosted During Cooking
3 608 310 5.4 3 365 277 9.9 6 301 110 ' 2.3 4 1008 199 3.3 8 1127 185 3.5 6 343 193 2.7
COOKING AND TOTAL WEIGHT
Total I cookinll.' . losses
%
37.7 33.7 30.7 33.0 23.9 31.6 20.8
33.1 31.1 31.4 25.1 32.9 19.7
LOSSES
Total losses
%
41.9 35.3 31.7 33.3 25.2 34.0 22.3
The method of defrosting the cuts thawed before cooking, i. e., refrigerator, room or water, did not affect the weight losses during cooking, so the results for these three methods of thawing were combined, table 47.
The pork hocks, the cut having a small proportion of muscle with a large amount of bone and collagenous tissue, had the least weight loss during cooking. The beef shanks also had a high proportion of bone and had next to the smallest weight loss. The half knuckles, the stews and the heels of round contained no bone. All the stews and the heels of round had about the same weight loss. The weight loss for the half knuckles was the largest of any of the cuts.
TABLE 48. CUTS COOKED IN WATER. THE AVERAGE COOKING Tnm, FUEL CONSUl\lED. COOKING WEIGHT LOSSES AND TOTAL WEIGHT LOSSES OF BEEF STEWS COOKED BY SHIMERING AND BY BOILING.
I I Initial I I No. weight CO~king Fuel I Cooking Total Kind pack- pack. tIme used losses losses
ages age gms. min. cu. ft. % %
2-inch Cubes
I
I Beef. simmered 18 576 I 303 5.3 33.3 34.9 Beef, boiled 2 499 130 4.0 29.7 33.1
I-Inch Cubes
Beef, simmered 18 365 I 265 I 5.9 30.8 31.6 Beef, boiled 4 346 I 93 I 3.6 30.7 31.8
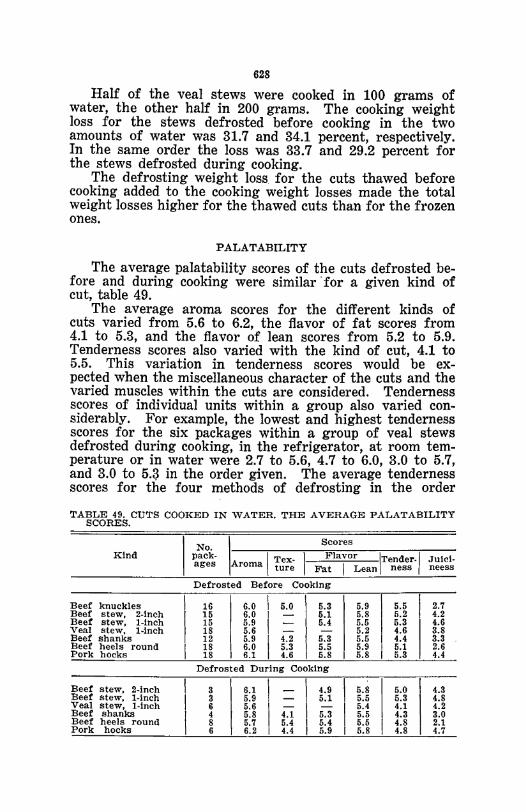
628
Half of the veal stews were cooked in 100 grams of water, the other half in 200 grams. The cooking weight loss for the stews defrosted before cooking in the two amounts of water was 31.7 and 34.1 percent, respectively. In the same order the loss was 33.7 and 29.2 percent for the stews defrosted during cooking.
The defrosting weight loss. for the cuts thawed before cooking added to the cooking weight losses made the total weight losses higher for the thawed cuts than for the frozen ones.
PALATABILITY
The average palatability scores of the cuts defrosted before and during cooking were similar' for a given kind of cut, table 49.
The average aroma scores for the different kinds of cuts varied from 5.6 to 6.2, the flavor of fat scores from 4.1 to 5.3, and the flavor of lean scores from 5.2 to 5.9. Tenderness scores also varied with the kind of cut, 4.1 to 5.5. This variation in tenderness scores would be expected when the miscellaneous character of the cuts and the varied muscles within the cuts are considered. Tenderness scores of individual units within a group also varied considerably. For example, the lowest and highest tenderness scores for the six packages within a group of veal stews defrosted during cooking, in the refrigerator, at room temperature or in water were 2.7 to 5.6, 4.7 to 6.0, 3.0 to 5.7, and 3.0 to 5.S in the order given. The average tenderness scores for the four methods of defrosting in the order
TABLE 49. CUTS COOKED IN WATER. THE AVERAGE PALATABILITY SCORES.
Kind No. I Scores
pack. I Tex· I Flavor \Tender./ Julcl· ages Aroma ture Fat I Lean ness neess
Defrosted Before Cooking
I I Beef knuckles 16 6.0 I 6.0 6.3 5.9 6.5 2.7 Beef stew, 2·lnch 15 6.0 I - 5.1 5.8 6.2 4.2 Beef stew, I-Inch 15 5.9 I - 5.4 5.5 5.3
I 4.6
Veal stew, l·lnch 18 5.6 - - 5.2 4.6 3.8 Beef shanks 12 5.9 I 4.2 5.3 5.5 4.4 3.3 Beef heels round I 18 6.0 5.3 5.5 5.9 I 5.1 2.6 Pork hocks 18 6.1 4.6 5.8 5.8 I 5.3 4.4
Defrosted During Cooking
Beef stew, 2-inch I 3 6.1 - I 4.9 I 5.8 5.0 4.3 Beef stew, I-inch I 3 5.9 - 5.1 5.5 5.3 4.8 Veal stew, I-Inch 6 5.6 -
I -
I 5.4 4.1 4.2
Beef shanks
I 4 5.8 4.1 5.3 5.5 4.3 3.0
Beef heels round 8 5.7 5.4 5.4 5.5 4.8 2.1 Pork hocks 6 6.2 4.4 5.9 5.8 4.8 4.7
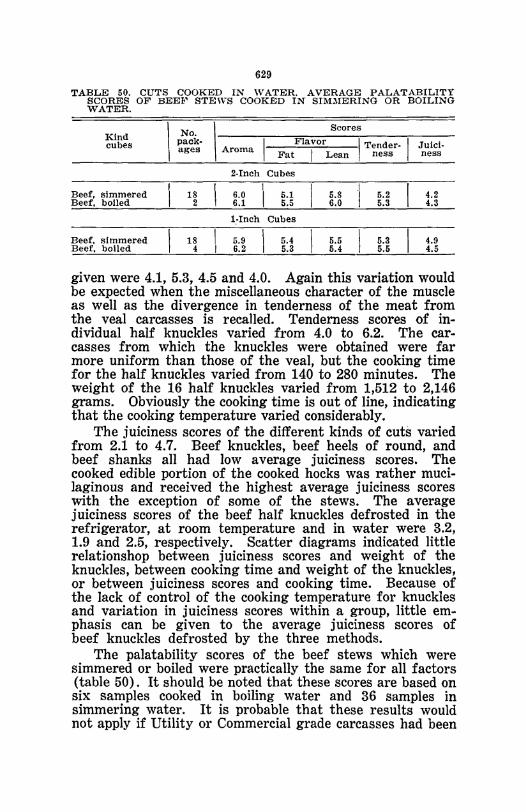
629
TABLE 50. CUTS COOKED IN WATER. AVERAGE PALATABILITY SCORES OF BEEl<' STEWS COOKED IN SIl\DIERING OR BOILING WATER.
\ No. \ Aroma
Scores Kind cubes pack-
I Flavor I Tender- I Juici. ages
Fat I Lean ness ness
2·Inch Cubes
Beef, simmered 18 6.0 5.1 5.8 5.2 4.2 Beef, boiled 2 6.1 5.5 6.0 5.3 4.3
i.-Inch Cubes
Beef, simmered 18 5.9 5.4 5.5 5.3 4.9 Beef, boiled 4 6.2 5.3 5.4 5.5 4.5
given were 4.1, 5.3, 4.5 and 4.0. Again this variation would be expected when the miscellaneous character of the muscle as well as the divergence in tenderness of the meat from the veal carcasses is recalled. Tenderness scores of in· dividual half knuckles varied from 4.0 to 6.2. The car· casses from which the knuckles were obtained were far more uniform than those of the veal, but the cooking time for the half knuckles varied from 140 to 280 minutes. The weight of the 16 half knuckles varied from 1,512 to 2,146 grams. Obviously the cooking time is out of line, indicating that the cooking temperature varied considerably.
The juiciness scores of the different kinds of cuts varied from 2.1 to 4.7. Beef knuckles, beef heels of round, and beef shanks all had low average juiciness scores. The cooked edible portion of the cooked hocks was rather muci· laginous and received the highest average juiciness scores with the exception of some of the stews. The average juiciness scores of the beef half knuckles defrosted in the refrigerator, at room temperature and in water were 3.2, 1.9 and 2.5, respectively. Scatter diagrams indicated little relations hop between juiciness scores and weight of the knuckles, between cooking time and weight of the knuckles, or between juiciness scores and cooking time. Because of the lack of control of the cooking temperature for knuckles and variation in juiciness scores within a group, little em· phasis can be given to the average juiciness scores of beef knuckles defrosted by the three methods.
The palatability scores of the beef stews which were simmered or boiled were practically the same for all factors (table 50). It should be noted that these scores are based on six samples cooked in boiling water and 36 samples in simmering water. It is probable that these results would not apply if Utility or Commercial grade carcasses had been
630
used instead of those of Good grade. The results, however, are interesting and may warrant further investigation.
SUMMARY AND CONCLUSIONS
The cuts cooked in water were a mixed collection. The cubes of beef and veal for'the stews were obtained from miscellaneous muscles or groups of muscles. Because of the miscellaneous character of the cuts, considerable variation was to be expected in weight of the cuts, cooking time, amount of fuel required, cooking weight losses and palatability ratings.
The cuts, with the exception of six stews, were cooked at a simmering temperature. Unfortunately the simmering temperatures varied widely. This led to variable cooking time. Cuts were tested for doneness by piercing with the tines of a fork, which also gave variable results.
The weight losses during cooking were high, which is reflected in the low juiciness scores. The cuts containing bone lost less than the cuts consisting only of muscles. And, in addition, if' the cut had considerable collagenous material, which held water rather tenaciously, as in pork hocks, the cooking weight loss was low.
The average palatability scores for all factors of a given cut were very similar for cuts defrosted before' and for those defrosted during cooking. The average palatability scores for a given factor varied widely within a group of cuts. When the variation in cooking temperature and time is considered, this would be expected. Divergence in average palatability, scores was also great between the different kinds of cuts. This divergence would also be expected when the miscellaneous character of the cuts is considered.
The six beef stews which were cooked in boiling water had about the same ,average palatability scores as the 36 beef stews cooked in simmering water; they also cooked in about half as much time as the simmered stews and required less fuel for cooking. The results with boiled and' simmered stews might not apply if meat from Commercial or Utility carcasses were used.
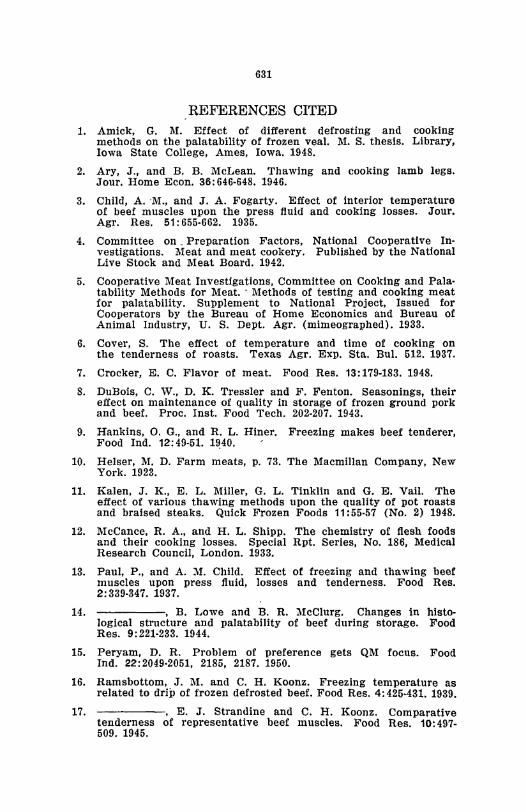
631
REFERENCES CITED 1. Amick, G. M. Effect of different defrosting and cooking
methods on the palatability of frozen veal. M. S. thesis. Library, Iowa State College, Ames, Iowa. 1948.
2. Ary, J., and B. B. McLean. Thawing and cooking lamb legs. Jour. Home Econ. 36: 646·648. 1946.
3. Child, A. -M., and J. A. Fogarty. Effect of interior temperature of beef muscles upon the press fluid and cooking losses. Jour. Agr. Res. 51: 655·662. 1935.
4. Committee on _ Preparation Factors, National Cooperative In· vestigations. Meat and meat cookery. Published by the National Live Stock and Meat Board. 1942.
5. Cooperative Meat Investigations, Committee on Cooking and Pala· tability Methods for Meat .. Methods of testing and cooking meat for palatability. Supplement to National Project, Issued for Cooperators by the Bureau of Home Economics and Bureau of Animal Industry, U. S. Dept. Agr. (mimeographed). 1933.
6. Cover, S. The effect of temperature and time of cooking on the tenderness of roasts. Texas Agr. Exp. Sta. Bul. 512. 1937.
7. Crocker, E. C. Flavor of meat. Food Res. 13:179·183. 1948.
8. DuBois, C. 'V., D. K. Tressler and F. Fenton. Seasonings, their effect on maintenance of quality in storage of frozen ground pork and beef. Proc. Inst. Food Tech. 202-207. 1943.
9. Hankins, O. G., and R. L. Hiner. Freezing makes beef tenderer, Food Ind. 12: 49·51. 1~40.
10. Helser, M. D. Farm meats, p. 73. The Macmillan Company, New York. 1923.
11. Kalen, J. K., E. L. Miller, G. L. Tinklin and G. E. Vail. The effect of various thawing methods upon the quality of pot roasts and braised steaks. Quick Frozen Foods 11 :55·57 (No.2) 1948.
12. McCance, R. A., and H. L. Shipp. The chemistry of flesh foods and their cooking losses. Special Rpt. Series, No. 186, Medical Research Council, London. 1933.
13. Paul, P., and A. M. Child. Effect of freezing and thawing beef muscles upon press fluid, losses and tenderness. Food Res. 2: 339·347. 1937.
14. , B. Lowe and B. R. McClurg. Changes in histo-logical structure and palatability of beef during storage. Food Res. 9: 221·233. 1944.
15. Peryam, D. R. Problem of preference gets QM focus. Food Ind. 22: 2049·2051, 2185, 2187. 1950.
16. Ramsbottom, J. M. and C. H. Koonz. Freezing temperature as related to drip of frozen defrosted beef. Food Res. 4: 425·431. 1939.
17. , E. J. Strandine and C. H. Koonz. Comparative tenderness of representative beef muscles. Food Res. 10: 497-509. 1945.
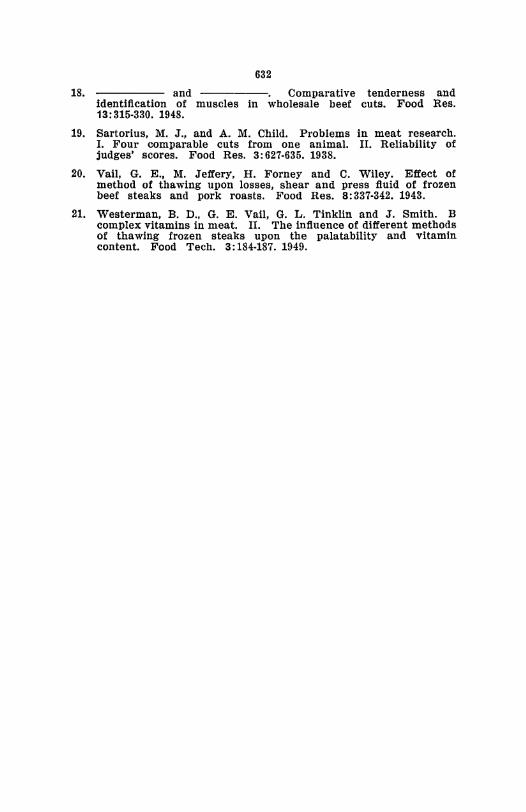
632
18. and ------ Comparative tenderness and identification of muscles in wholesale beef cuts. Food Res. 13: 315-330. 1948.
19. Sartorius, M. J., and A_ M. Child. Problems in meat research. I. Four comparable cuts from one animal. II. Reliability of judges' scores. Food Res. 3: 627-635. 1938.
20. Vail, G. E., M. Jeffery, H. Forney and C. Wiley. Effect of method of thawing upon losses, shear and press fluid of frozen beef steaks and pork roasts. Food Res. 8: 337-342. 1943.
21. Westerman, B. D., G. E. Vail, G. L. Tinklin and J. Smith. B complex vitamins in meat. II. The infiuence of different methods of thawing frozen steaks upon the palatability and vitamin content. Food Tech. 3: 184-187. 1949.