Embed Size (px)
Citation preview
Estuarine, Coastal and Shelf Science 60 (2004) 445–456
www.elsevier.com/locate/ECSS
Demersal fish and epifauna associatedwith sandbank habitats
M.J. Kaisera,), M. Bergmanna, H. Hinza, M. Galanidia, R. Shucksmitha,E.I.S. Reesa, T. Darbyshireb, K. Ramsayc
aSchool of Ocean Sciences, University of Wales-Bangor, Menai Bridge, Anglesey LL59 5AB, UKbNational Museums and Galleries of Wales, Cathays Park, Cardiff CF10 3NP, UK
cCountryside Council for Wales, Maes-y-Ffynnon, Penrhosgarnedd, Bangor, Gwynedd LL57 2DW, UK
Received 15 December 2003; accepted 16 February 2004
Abstract
A habitat specific survey of the epifauna and fish fauna of sandbanks off the Welsh coastline was undertaken in 2001. Of these,three sandbanks were considered to represent extensions of shallow nearshore soft-sediment communities, while a further sixsandbanks were considered to be distinct sandbanks; seabed features clearly defined in comparison with surrounding sediments.
Multivariate community analyses revealed that the distinct sandbanks had both fish and epifaunal assemblages that were distinctfrom those sandbanks considered to be extensions of nearshore sediments. The distinct sandbanks were typified by low speciesdiversity and shared indicator species such as the weever fish Echiichthys vipera, the shrimp Philocheras trispinosus and the hermit
crab Pagurus bernhardus. Differences occurred in species composition among the distinct sandbanks, in particular, southernsandbanks were typified by sand sole Solea lascaris and small-eyed ray Raja microocellata. The sandbanks considered as extensionsof nearshore sediments shared many similarities with the Pleuronectes platessa–Limanda limanda assemblage, identified by Ellis et al.(Estuar. Coastal Shelf Sci. 51 (2000) 299), which is widespread in the Irish Sea. Sandbanks, as a habitat definition under the EU
habitats directive, are likely to incorporate a number of physically and biologically distinct habitats of which two have beendescribed in the present study.� 2004 Elsevier Ltd. All rights reserved.
Keywords: sandbank habitat; fish; epifauna; quantitative survey; conservation
1. Introduction
The study of offshore seabed sediment habitats requiresthe use of remote sampling methodologies such as the useof grabs, dredges, towed video camera surveys, remoteoperated vehicles and trawls, all ofwhichpresent their owninherent sampling artefacts and expense. These samplingconstraints may explain the absence of an intensive andsystematic sampling approach that might quantify theextent and variety of seabed habitats and the spatial andtemporal variation in their associated assemblages. Sur-veys of offshore communities undertaken to date haveencompassed a wide range of habitats with an emphasis
) Corresponding author.
E-mail address: [email protected] (M.J. Kaiser).
0272-7714/$ - see front matter � 2004 Elsevier Ltd. All rights reserved.
doi:10.1016/j.ecss.2004.02.005
on description of the distribution of habitat and speciesassemblages made on the basis of individual sample sitesseparated by many kilometres and sampled with limitedstatistical power (e.g. Jones, 1951; Jones, 1952; Holme,1953).Other surveysof seabedcommunities haveoccurredopportunistically as a secondary aimof large-scale surveysdesigned for other purposes, e.g. groundfish surveys (seeEllis et al., 2000 for a review of studies undertaken). Evenwhere such surveys exist, for western waters off the BritishIsles they are undertaken at a wide scale with no site-specific replication within the same year (Rees et al., 1999;Ellis et al., 2000). Few, if any, large-scale offshore subtidalsurveys of soft-sediments have been conducted ona habitat specific basis over a wide scale.
While isolated sandbanks have been the focus ofa number of studies in the past (Holme, 1949, 1953;

446 M.J. Kaiser et al. / Estuarine, Coastal and Shelf Science 60 (2004) 445–456
Perkins, 1956; Warwick and Davies, 1977; Withers andThorp, 1978; Tyler and Shackley, 1980) these were site-specific studies and as such a systematic study ofsandbanks within a distinct geographic region (e.g. theeastern Irish Sea) is currently lacking. Furthermore,sandbanks are difficult habitats to sample in a quantita-tive manner, partly due to difficulties associated withnavigation (e.g. shallow water, tidal races) and thetypically variable and low abundance of fauna that areencountered (Shepherd, 1983). For these reasons, sand-banks previously may have been overlooked by biolo-gists. Sandbanks are generally formed by the physicalprocesses of seabed currents that act in conjunction withcoastal or seabed topography to lead to their formation.As a result of their unique physical regime, sandbanksmay hold their own distinct assemblage of flora andfauna that is particularly well adapted to such condi-tions or that uses these habitats in an opportunistic man-ner (e.g. at slack water). The extent to which sandbanksare characterised by a distinct set of taxa howeverremains unknown.
Under the European Habitats Directive, sandbanksare defined as ‘sublittoral sandbanks, permanently sub-merged’ over which the ‘water depth is seldom morethan 20 m below chart datum’ and are a habitat featurethat requires conservation under the directive. The pre-sent study was designed to examine the fish andepifaunal biota of 9 sandbanks each of which is locatedwithin a candidate Special Area for Conservation(cSAC) (Fig. 1; Table 1).
2. Methods
Of the sandbanks chosen for study, Red Wharf Bay(Four Fathom Bank), Conwy Bay (Four Fathom Bank)and west of Newquay were considered to be extensions ofshallow coastal sediments adjacent to the coastline,whereas the remaining sites were considered to be distinctsandbanks that are clearly defined from the surroundingseabed features and sediments (Table 1). Hyperbenthic,infaunal, epifaunal and fish samples were collected ateach site from the RV Prince Madog and a full sampleinventory is given in Darbyshire et al. (2002). The presentstudy reports only the latter two components of thematerial collected.
At each site, five replicate tows were made with a 2-mbeam trawl fitted with a chain matrix and 1-cm squaremeshed net with a 1-mm codend liner (Jennings et al.,1999). The 2-m beam trawl was towed at a speed of 1.5–2 knots for a standard duration of 5 min timed from themoment the trawl landed on the seabed to the momentthe winches began to retrieve the net. The positions ofthe tows were designed such that two tows were madealong the shoulders of the sandbank and three tows weremade on the crest of the sandbank, one of which was
aligned along the centre of the sandbank (where sucha feature existed). This sampling design was not alwayspossible given the topography of some of the sandbanks(e.g. the Tripods). The 2-m beam trawl is a devicespecifically designed to sample epifaunal biota and smallfish. Samples were sorted on-board ship, and were sievedover a 5-mmmesh if a large amount of inert material waspresent (e.g. broken shell debris). Fauna were countedand identified on-board and the total weight of each taxondetermined using a motion compensated balance (G1 g).Taxa that could not be identified were retained in 4%buffered formalin for later analysis in the laboratory.
The fish fauna was sampled using a 4-m commercialbeam trawl fitted with a chain matrix and 82-mm dia-mond mesh codend with a 40-mm square meshed liner(Kaiser and Spencer, 1994). At most sites, four replicatetows were made with the 4-m beam trawl which wastowed at a speed of 4 knots for a standard duration of20 min as above. At two sites only three or two replicatetows were made with the 4-m beam trawl due to timeconstraints or difficulties associated with vessel position-ing relative to the sandbank and other navigationalconstraints. Catches were sorted on-board and processedas for the 2-m beam trawl.
At each site, sediment samples were taken usinga Van Veen grab and immediately frozen on-board.In the laboratory, particle size fractions, percentageorganic matter and calcium carbonate were determined
12
3
45
6
7
8 9
°6 °5 °4 °3
53°
52°
Fig. 1. Map showing the approximate positions of the sandbanks
considered in the present study. 1ZConwy Bay, 2ZRed Wharf Bay,
3ZTripods, 4Z Bastram Shoal, 5ZDevil’s Ridge, 6Zwest of
Newquay, 7Z Bais Bank, 8ZTurbot Bank, 9ZHelwick Bank (east
and west).

Table 1
Summary data for species, total number of individuals, Pielou’s evenness and Hill’s N1 and N2
indices of diversity rawl and the 4-m beam trawl
Sandbank type D D D D D
Sandbank name Bais
Bank
Helwick Bank
(west)
Helwick Bank
(east)
Turbot
Bank
Bastram
Shoal
cSAC PM CBE CBE PM PLS
Environmental par
Depth range (m 8 3.3–5.0 3.5 # 5.3
Percentage sand 99.9G 0.1 93.6G 16.7 99.5G 0.8 100.0G 0.0 85.1G 23.5
Percentage carb .1 25.0G 9.8 13.5G 8.4 9.0G 3.5 22.9G 3.6 23.6G 12.9
Percentage orga 2.0G 1.3 1.6G 0.5 1.7G 0.6 2.6G 0.9 6.1G 7.1
2-m beam trawl (e
n 5 5 3 5 5
Total number o 16.0G 2.9 17.3G 9.0 17.3G 2.1 11.5G 6.5 11.5G 5.4
Total number o .7 43.0G 13.8 109.3G 121.0 50.7G 7.4 51.0G 53.5 43.5G 34.0
Pielou’s J 0.8G 0.1 0.8G 0.1 0.8G 0.1 0.8G 0.2 0.8G 0.2
Hill N1 9.0G 2.4 7.9G 0.7 9.3G 2.8 5.4G 0.6 6.3G 1.7
Hill N2 6.0G 2.2 5.8G 1.5 5.9G 2.4 3.9G 0.5 4.8G 1.9
4-m beam trawl (fi
n 4 4 2 4
Total number o 3.5G 1.0 4.8G 1.9 5.5G 2.1 5.0G 1.8
Total number o .9 63.0G 33.1 44.3G 21.4 36.0G 0.0 98.0G 24.4
Pielou’s J 0.3G 0.2 0.8G 0.1 0.8G 0.2 0.4G 0.2
Hill N1 1.4G 0.4 3.1G 0.9 3.7G 0.2 2.1G 0.9
Hill N2 1.2G 0.2 2.5G 0.5 3.1G 0.4 1.6G 0.6
For each sandbank y; PLS, Pen Llyn a’r Sarnau; PM, Pembrokeshire Marine; CBE, Carmarthen
Bay and Estuaries emainder are all distinct (D) from surrounding sediments.a One sample d
447
M.J.Kaiser
etal./
Estu
arin
e,Coasta
landShelf
Scien
ce60(2004)445–456
each sandbank site sampled giving the environmental parameters and meanGs.d., total number of
for each sandbank site based on the abundance of fish and benthos sampled with the 2-m beam t
Ext Ext Ext D D
West of
Newquay
Red Wharf Bay;
Four Fathom Bank
Conwy Bay;
Four Fathom Bank
Devil’s
Ridge
Tripods
CB MSCB MSCB PLS PLS
ameters
) 17.7–18.3 7 5.2–7.3 8.5–9.9 10
73.8G 32.5 85.1G 12.1 99.4G 0.7 91.2G 16.6 96.6G 5.9
onate 9.4G 2.6 10.9G 2.8 5.9G 0.5 12.2G 4.5 46.0G 11
nic 2.4G 0.9 2.8G 2.3 1.5G 0.3 2.1G 1.2 3.1G 1.7
pifauna)
5 5 5 5 5
f species 30.6G 9.4 19.2G 3.4 26.4G 5.7 23.3G 10.4 15.8G 5.3
f individuals 103.4G 59.4 16576.0G 29056.2 469.8G 448.8 544.3G 826.0 34.4G 21
0.8G 0.1 0.2G 0.1 0.7G 0.1 0.7G 0.2 0.8G 0.2
15.2G 1.7 2.0G 0.5 10.5G 3.9 9.3G 3.5 9.4G 4.3
8.6G 0.9 1.4G 0.2 7.2G 3.1 7.0G 3.3 7.1G 5.2
sh only)
3 3a 4 4
f species 19.3G 1.5 12.7G 4.0 8.3G 2.1 5.0G 0.8
f individuals 66.3G 18.6 437.7G 212.2 41.8G 20.7 43.5G 21
0.9G 0.0 0.7G 0.1 0.8G 0.1 0.7G 0.2
13.9G 2.6 5.5G 1.1 5.7G 0.8 3.2G 1.6
11.2G 2.6 4.4G 1.3 4.6G 1.2 2.6G 1.7
, the cSAC in which it is located is indicated (CB, Cardigan Bay; MSCB, Menai Strait and Conwy Ba
. West of Newquay, Red Wharf Bay and Conwy Bay are all extension sandbanks (Ext), while the r
iscarded from the analysis due to the atypically small catch for this sandbank.

448 M.J. Kaiser et al. / Estuarine, Coastal and Shelf Science 60 (2004) 445–456
(see Holme and McIntyre, 1984 for methods) and thedata categorised into the following sediment fractions:mud, muddy sand, sand, silt, carbonates and organicmatter (Darbyshire et al., 2002).
At three sites (Devil’s Ridge, west of Newquay andBastram Shoal) plaice Pleuronectes platessa were col-lected for the purpose of dietary analyses. Dead fish hadtheir entire stomach removed which was preserved in4% buffered formalin. Each stomach was preservedseparately in a fine-meshed bag to retain the contentssuch that these could be related to individual fish. Eachfine-meshed bag was labelled with the total length (mm)and weight (after removal of the stomach) (g) of thefish from which the stomach was removed. In the lab-oratory, stomach contents were identified to the lowesttaxonomic level possible, counted and weighed afterblotting on absorbent paper to an accuracy of 0.001 g.
2.1. Statistical analyses
The univariate characteristics of the biologicalcommunity data were calculated for the mean (Gs.d.),total number of species, total number of individuals,Pielou’s measure of evenness (J), Hill N1 and Hill N2indices of diversity. Hill N1 is the exponential of theShannon–Wiener diversity index (H) and Hill N2 is theinverse of Simpson’s dominance index (D) (Clarke andWarwick, 1994). Differences between sites were testedusing one way ANOVA after testing that data met thecriteria of normality and equal variance, and a Tukeymultiple comparison test applied when significant differ-ences were found.
The data were subjected to multivariate analysesusing the PRIMER v.5 (Clarke and Warwick, 1994)software package. The entire community data set wasclustered using a Bray-Curtis index of similarity onroot–root transformed data. MDS ordination plots werecreated from the resulting similarity matrix. Differencesamong sites were tested a priori for statistical differenceat the level of individual sites and at a broader scale totest for differences between those sites considered to beextensions of inshore soft-sediment habitats and thoseconsidered to be distinct sandbanks, using an analysis ofsimilarities procedure (ANOSIM). In cases were repli-cation was low (less than four), normal tests forsignificant differences between sites would never achievea probability of significance lower than 0.1. As a resultthe criterion for acceptance of significant differences inpair-wise comparisons of the fish fauna was set atP ¼ 0:1 for those comparisons were n! 4 at one of thesites. For all other comparisons the level of significancewas set at P ¼ 0:05. Indicator species for sites that werefound to be significantly different were ascertained froman analysis of the contribution of similarity (SIMPER)made by each taxon within the samples taken at eachsite or broad-scale grouping of sites.
Community characteristics were related to theenvironmental parameters measured at each of thesandbank sites using the programme BIOENV whichcorrelates single environmental variables individually orin multiple combinations with the similarity matrixgenerated from the biological data.
3. Results
3.1. Epifauna (2-m beam trawl samples)
A cluster analysis revealed that the sandbanks thatare extensions of inshore shallow soft sediment (RedWharf Bay, Conwy Bay and west of Newquay) hada greater level of similarity than sites that wereconsidered to be distinct sandbanks (Figs. 2, 3). Theoutcome of this analysis was not affected by removingtaxa for which there were fewer than 5 individuals in theentire data set. Significant differences occurred incommunity composition among sites (Figs. 2, 3,ANOSIM, R ¼ 0:675, P! 0:001). Pair-wise compari-sons among sites revealed that the epifaunal communityat Helwick Bank (east) was not significantly differentfrom either Helwick Bank (west), Turbot Bank, Devil’sRidge or Bastram Shoal and that Devil’s Ridge was notsignificantly different from Bastram Shoal (ANOSIM,all P > 0:054). The lack of differences between HelwickBank (east) and the other sites may be partly due to thefact that there were only three replicate tows for this sitec.f. a minimum of five tows for all other sites. Ata broader scale, the sandbanks that were considered asextensions of shallow subtidal sand substrata weresignificantly different from those considered as distinctsandbanks (Figs. 2, 3, ANOSIM R ¼ 0:55, P! 0:001).The common hermit crab Pagurus bernhardus wasamong the most important species that contributed tosimilarity among samples at each site at all sites apartfrom Red Wharf Bay and Tripods. Similarly, the lesserweever fish Echichthys vipera was one of the mostprominent species in terms of its contribution to thesimilarity among samples at each site except at RedWharf Bay and Devil’s Ridge (Table 2). The sandeelsAmmodytes tobianus and Hyperoplus lanceolatus werefound to be good indicator species at Tripods andDevil’s Ridge, respectively (Table 2). In general, fewerspecies contributed to the overall similarity between sam-ples collected at each site with respect to the distinctsandbanks that also had a lower mean similarity com-pared with the sandbanks that are extensions of adjacentsubtidal sediments (from 18.1% to 50.4%, c.f. 36.7% to70.7%; Table 2).
None of the measured environmental parametersindicated any major gradients that may have explainedthe similarity between different sandbanks based ontheir community composition. The best correlation was

449M.J. Kaiser et al. / Estuarine, Coastal and Shelf Science 60 (2004) 445–456
TBR
WB
RW
Bw
NR
WB
RW
BR
WB
CB
CB
CB
CB
CB
wN
wN
wN
wN T T T T
BS
hTB Hw
Hw
Hw
Hw BB
Hw He
DR
DR
BS
hTB TB
TTB DR BB
BS
hH
w He
He
BS
hB
BB
Sh
DR BB
BB
100
80
60
40
20
0
Per
cent
age
sim
ilarit
y
Extension sandbanks Distinct sandbanks
Fig. 2. Cluster diagram showing the Bray-Curtis percentage of similarity among epifaunal samples collected with a 2-m beam trawl coded by site (BB,
Bais Bank; BSh, Bastram Shoal; CB, Conwy Bay; DR, Devil’s Ridge; Hw, Helwick Bank west; He, Helwick Bank east; RWB, Red Wharf Bay;
T, Tripods; TB, Turbot Bank; wN, west of Newquay).
obtained with the percentage content of sand, but thecorrelation coefficient was only 0.18. However, anexamination of the univariate environmental parametersrevealed that the percentage of carbonate material wassignificantly higher in distinct sandbanks compared withsandbanks that were extensions of adjacent subtidalsoft-sediments (meanG s.d.; distinct sandbanks 20.9G13.2, extension sandbanks 8.6G 2.98, t ¼ �5:24, P!0:0001). Neither of the other variables was found to
differ significantly between the two types of sandbanks(percentage sand, t ¼ �1:38, P ¼ 0:10, percentage or-ganic content, t ¼ �0:86, P ¼ 0:20).
3.2. Fish fauna (4-m beam trawl samples)
A total of 35 different species of fish were encoun-tered across the different sites of which 21 species wererepresented by 5 or more individuals in the data set. The
CB
RWB
RWB
RWB
RWB
RWB
CBCB
CBCB
DR
DRDR
DR
wN
wNwN
wN
wN
T
T
TT
T
Hw
HwHw
wH
Hw Hw
He
He
He
BB
B
BB
BB BB
TB
TBTB
TB
TB
BShBSh
BSh
BSh
BSh
Stress: 0.19
Fig. 3. MDS ordination plot giving the 2-dimensional representation of the similarity among epifaunal samples collected at each site. Site coding as
for Fig. 2.

450 M.J. Kaiser et al. / Estuarine, Coastal and Shelf Science 60 (2004) 445–456
Table 2
The outcome of a SIMPER analysis on root–root transformed data for each of the sites studied listing those species that contributed most to the
similarity among samples at each site (cut-off set at 75% contribution to total similarity) with ‘distinct sandbanks’ shown to the right of the table
Av. Ab Av. Sim. Ratio Per. Con. Av. Ab Av. Sim. Ratio Per. Con.
West of Newquay Devil’s Ridge
Average similarity: 36.7 Average similarity 19.2
Pagurus bernhardus 13.4 4.4 5.2 11.9 Pagurus bernhardus 14.4 11.2 1.1 58.2
Callionymus lyra 3.6 4.3 3.3 11.6 Hyperoplus lanceolatus 2.0 4.9 0.6 25.7
Arnoglossus laterna 3.0 2.8 1.1 7.6
Echiichthys vipera 1.6 2.6 1.1 7.1 Tripods
Pleuronectes platessa 0.8 2.4 1.1 6.6 Average similarity 50.4
Liocarcinus depurator 1.6 2.4 1.1 6.6
Astropecten irregularis 1.4 2.1 1.1 5.8 Echiichthys vipera 4.4 14.8 6.4 29.3
Eutrigla gurnardus 1.4 2.0 1.1 5.4 Ammodytes tobianus 1.4 11.6 7.3 23.1
Ammodytes tobianus 5.2 1.7 0.5 4.6 Liocarcinus holsatus 2.6 8.0 1.1 15.9
Antalis entalis 3.0 1.5 0.6 4.1 Urothoe sp. (?) 8.0 4.9 0.6 9.7
Macropodia rostrata 6.0 1.3 0.6 3.5
Philocheras trispinosus 8.8 1.2 0.6 3.2 Bais Bank
Average similarity 40.6
Conwy Bay
Average similarity 70.7 Pagurus bernhardus 24.8 10.9 2.6 24.5
Philocheras trispinosus 3.0 9.5 2.5 21.2
Pagurus bernhardus 38.8 6.5 6.1 9.2 Mysidacea 5.0 8.9 2.2 19.9
Ophiura ophiura 222.6 6.4 8.5 9.0 Echiichtys vipera 3.5 7.7 1.0 17.2
Pomatoschistus minutus 40.6 6.0 12.6 8.5
Asterias rubens 30.6 5.4 14.9 7.6 Helwick Bank (west)
Limanda limanda 30.6 4.9 8.5 7.0 Average similarity 50.4
Merlangius merlangus 19.4 4.3 2.0 6.1
Buglossidium luteum 22.2 4.0 5.1 5.7 Pagurus bernhardus 19.7 12.8 8.8 29.5
Echiicthys vipera 5.4 3.9 4.8 5.5 Asterias rubens 6.3 10.2 10.5 23.5
Crangon crangon 8.4 3.7 6.8 5.2 Solea lascaris 2.7 3.3 0.6 7.6
Corystes cassivelaunus 6.2 3.6 10.0 5.1 Pomatoschistus minutus 2.7 3.1 0.6 7.0
Eutrigla gurnardus 3.0 3.6 6.7 5.0 Liocarcinus holsatus 1.0 2.5 0.6 5.8
Ammodytes tobianus 3.4 3.5 7.3 4.9 Echiichthys vipera 1.7 2.7 0.6 5.8
Red Wharf Bay Helwick Bank (east)
Average similarity 42.2 Average similarity 33.8
Asterias rubens 129.8 7.5 5.4 17.9 Mysidacea 7.2 17.9 2.2 53.1
Liocarcinus holsatus 156.6 6.7 5.1 15.8 Pagurus bernhardus 19.4 3.8 0.6 11.2
Ophiura ophiura 1046.6 5.1 0.6 12.0 Echiichthys vipera 1.6 3.3 0.6 10.0
Macropodia rostrata 17.8 3.6 1.2 8.6
Nucula nitidosa 13064.8 3.1 1.1 7.4 Turbot Bank
Astropecten irregularis 10.4 2.3 1.1 5.4 Average similarity 37.3
Polinices puchellus 4.6 2.3 1.1 5.4
Pagurus bernhardus 21.8 6.3 3.1 17.0
Echiichthys vipera 10.8 5.5 1.1 14.6
Nudibrancha indet. 77.2 5.2 2.5 14.0
Philocheras trispinosus 8.8 5.1 1.1 13.5
Liocarcinus holsatus 4.6 2.5 1.1 6.6
Ammodytes tobianus 5.4 1.8 0.6 4.8
Tunicata 0.6 1.6 0.5 4.2
Hyperoplus lanceolatus 5.0 1.5 0.6 4.1
Bastram Shoal
Average similarity 18.1
Echiichthys vipera 5.8 8.4 0.5 46.1
Pagurus bernhardus 11.2 5.2 0.6 28.8
Philocheras trispinosus 2.2 2.7 0.3 15.1
Av. AbZ average abundance, Av. Sim.Z average contribution to overall similarity among samples, RatioZ the ratio of the average contribution to
the overall similarity among samples to the standard deviation of the average contribution to the overall similarity, Per. Con.Z percentage
contribution to overall similarity among samples. In cases were the ratio exceeds a value of 1.5, these species are considered to be indicator species for
that site.

451M.J. Kaiser et al. / Estuarine, Coastal and Shelf Science 60 (2004) 445–456
highest mean number of fish taxa was encountered onthe two sandbanks that are extensions of shallowsubtidal sand substrata (Table 3). The mean numberof fish taxa was highest at the sandbank west ofNewquay followed by Red Wharf Bay, then Devil’sRidge (Table 3). The remaining sites were not signifi-cantly different from each other (T-K PO 0:05). Clusteranalysis and subsequent MDS ordination clearly dem-onstrated that the fish assemblages differed significantlyamong some of the sites (Fig. 4, ANOSIM, R ¼ 0:67,P! 0:001). As before, elimination of taxa for whichthere were fewer than 5 individuals in the data set didnot alter the outcome of the analysis. Pair-wise com-parisons among sites revealed that the fish communityat Turbot Bank was not significantly different from
Table 3
MeanG s.d. abundance of those species that contributed most to the
similarity among samples (*) collected from distinct sandbanks and
those collected from sites considered to be extensions of shallow
subtidal areas (shallow areas) for both the 4-m and 2-m beam trawl
data
True sandbanks Shallow areas
4-m beam trawl data
Echiichthys vipera 37.0 G 33.6* 4.8 G 5.3*
Pleuronectes platessa 3.5 G 3.3* 12.0 G 8.8*
Limanda limanda 4.2 G 4.5* 74.5 G 118.3*
Eutrigla gurnardus 3.8 G 5.4* 5.8 G 6.1*
Scophthalamus rhombus 0.6 G 1.0* 0.0 G 0.0
Callionymus lyra 0.3 G 0.9 33.0 G 31.3*
Arnoglossus laterna 0.0 G 0.0 16.8 G 17.4*
Buglossidium luteum 0.0 G 0.0 35.0 G 42.7*
Scyliorhinus canicula 0.4 G 0.8 3.5 G 3.4*
Agonus cataphractus 0.1 G 0.5 2.7 G 2.1*
Pomatoschistus minutus 0.0 G 0.0 50.5 G 70.4*
Syngnathus acus 0.2 G 0.6 1.0 G 1.1*
Merlangius merlangus 0.1 G 0.5 1.0 G 1.1*
Raja montagui 2.1 G 7.1 2.7 G 3.7*
2-m beam trawl data
Pagurus bernhardus 20.6 G 24.6* 24.9 G 19.5*
Asterias rubens 5.8 G 8.4* 62.2 G 100.6*
Macropodia rostrata 22.2 G 44.7 11.7 G 14.2*
Ophiura ophiura 5.0 G 5.7 793.3 G 1175.0*
Liocarcinus holsatus 3.9 G 4.1* 76.2 G 169.2*
Astropecten irregularis 0.0 G 0.0 5.8 G 11.0*
Echiichthys vipera 6.0 G 7.1* 3.9 G 2.5*
Eutrigla gurnardus 2.1 G 1.6 2.4 G 1.0*
Pomatoschistus minutus 3.0 G 2.2 25.9 G 29.6*
Ammodytes tobianus 3.4 G 5.3* 5.4 G 4.7*
Buglossidium luteum 0.0 G 0.0 16.6 G 20.4*
Crangon crangon 2.0 G 0.0 54.9 G 129.9*
Corystes cassivelaunus 0.0 G 0.0 5.5 G 3.5*
Alcyonium digitatum 0.0 G 0.0 6.9 G 15.8*
Pleuronectes platessa 1.6 G 0.9 2.4 G 2.5*
Arnoglossus laterna 0.0 G 0.0 3.0 G 2.3*
Limanda limanda 1.8 G 0.8 25.8 G 30.4*
Sepiola atlantica 1.0 G 0.0 2.0 G 1.5*
Philocheras trispinosus 4.5 G 5.4* 9.2 G 15.7*
Merlangius merlangus 0.0 G 0.0 16.3 G 17.0*
Mysidacea 5.8 G 5.5* 0.0 G 0.0
Hyperoplus lanceolatus 3.8 G 6.4* 0.0 G 0.0
either Bais Bank, Helwick Bank (west), or BastramShoal (with P ¼ 0:1 as only two samples were collectedfor Turbot Bank). Similarly, the fish community at BaisBank was not significantly different from that at eitherHelwick Bank (west) or Bastram Shoal (ANOSIM, allPO 0:06). As for the epifauna, the fish fauna at the twosites that were considered to be extensions of shallownearshore sediments were significantly different fromany of the other sites (Fig. 4, ANOSIM, R ¼ 0:64,P! 0:001).
A SIMPER analysis revealed those species that con-tributed most to the similarity between samples collectedat each site. Echiichthys vipera occurred at all sites andin all but three samples. Accordingly, E. vipera wasfrequently the most important indicator species for mostof the sites except for the Tripods and Red Wharf Bay.At a broader scale, E. vipera contributed most (46.5%)to the similarity between sites that were considered asdistinct sandbanks, followed by plaice Pleuronectesplatessa, dab Limanda limanda, grey gurnard Eutriglagurnardus and brill Scophthalamus rhombus (Table 3).For those sandbanks considered to be extensions ofshallow subtidal areas, 13 species contributed most tothe similarity between these sites of which the dragonetCallionymus lyra was the most important species(12.6%) followed by scaldfish Arnoglossus laterna,plaice, dab, and thickback sole Buglossidium luteum,which contributed 57% to the overall similarity betweenthese stations. The difference among sites best correlatedwith a single environmental variable: the percentagecarbonate content of the sediment (correlation coeffi-cientZ 0.32) (Fig. 5).
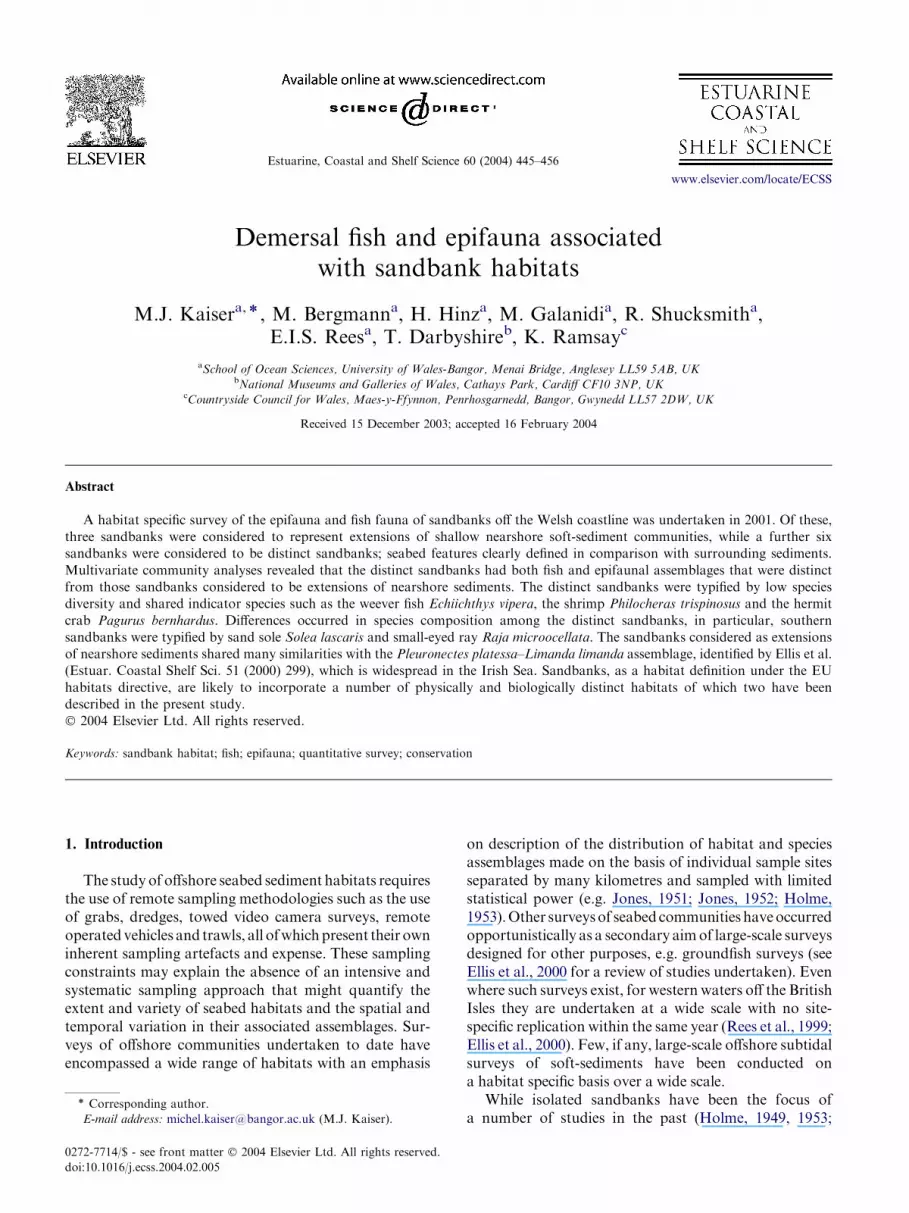
Although not highlighted in the SIMPER analysis,the occurrence of ray species was of interest given theconservation sensitivity of these fishes due to over-fishing and their vulnerability to capture as a by-catchspecies. The abundance of each ray species was overlaidas a relative bubble plot on the ordination plot based onthe fish fauna (Fig. 6). Three of the ray species were sitespecific within the context of the present study. In-terestingly, Raja clavata were only encountered at thesandbanks that were extensions of adjacent shallow soft-sediments and were not found on the distinct sand-banks. Raja brachyura and Raja microocellata were onlyencountered on distinct sandbanks, the latter on south-ern sandbanks and the former on more northerly sand-banks. Raja microocellata captured in the present studywere mainly mature adult fish. Raja montagui were morebroadly distributed across all sandbank types.
3.3. Plaice diets
The plaice sampled were on average smallest atwest of Newquay (64.0G 61.2, comparison with bothDevil’s Ridge and Bastram Shoal; t ¼ 4:75, P! 0:0001),whereas they were of similar size at Devil’s Ridge and

452 M.J. Kaiser et al. / Estuarine, Coastal and Shelf Science 60 (2004) 445–456
Hw
wN
wN
wN
RW
B
RW
B
RW
B
DR
DR
DR
DR
Hw TB B
Sh
BS
h
BB
BB
BB
BS
h
BS
h
Hw
Hw TB BB T T T T
100
80
60
40
20
0
Per
cent
age
sim
ilarit
y
Extension sandbanks Distinct sandbanks
Fig. 4. Cluster diagram showing the Bray-Curtis percentage of similarity among fish samples collected with a 4-m beam trawl coded by site as for
Fig. 2.
Bastram Shoal (meanG s.d., Devil’s Ridge 151.0G62.0 g, Bastram Shoal 183.0G 106.7 g; t ¼ �1:30,P ¼ 0:10). At each site, relatively few stomachs con-tained prey (Devil’s Ridge (10), west of Newquay (14),Bastram Shoal (14)). Accordingly, the number of dif-
ferent species of prey that occurred in the diet of fishsampled from Devil’s Ridge was lower (8 species) thanat the other sites (west of Newquay (14 species), BastramShoal (11 species)), but this was probably related tolower sampling effort. Of the prey eaten, sandeels
RWB
RWB
RWB
T
T
T
T
wN
wNwN
BBBBBB
BB
Hw
Hw
Hw
HwTBBT
DR
DR
DR
DRBShBSh
BSh BSh
Stress: 0.12
Fig. 5. MDS ordination plot giving the 2-dimensional representation of the similarity among fish fauna samples collected at each site with the relative
percentage carbonate content of the sediment of those sites overlaid as bubble plots. The larger the bubble the greater the percentage carbonate
content of the sediment. Extension sandbanks (RWB and wN) have the lowest carbonate content.
453M.J. Kaiser et al. / Estuarine, Coastal and Shelf Science 60 (2004) 445–456
RWB
RWB
RWB
T
TT
T
wN
wNwN
BBBBBB
BB
Hw
Hw
Hw
HwTBTB
DR
DR
DR
DRBShBSh
BSh BSh
RWB
RWB
RWB
T
TT
T
wN
wNwN
BBBBBB
BB
Hw
Hw
Hw
HwTBTB
DR
DR
DR
DRBShBSh
BSh BShRWB
RWB
RWB
T
TT
T
wN
wNwN
BBBBBB
BB
Hw
Hw
Hw
HwTBTB
DR
DR
DR
DRBShBSh
BSh BSh
RWB
RWB
RWB
T
TT
T
wN
wNwN
BBBBBB
BB
Hw
Hw
Hw
HwTBTB
DR
DR
DR
DRBShBSh
BSh BSh
Raja brachyura Raja clavata
Raja microcellata Raja montagui
Fig. 6. MDS ordination plot giving the 2-dimensional representation of the similarity among fish fauna samples collected at each site with the relative
abundance of four ray species that occurred at certain sites overlaid as bubble plots. The larger the bubble the greater the number of rays of
a particular species captured at that site.
Ammodytes tobianus contributed most to total weight ofprey in the diet at the two distinct sandbanks, whereasthe importance of prey (by weight) west of Newquaywas spread among sandeels, polychaetes and solenidae.As the fish sampled west of Newquay were on averagesmaller, it is perhaps not surprising that they incorpo-rated a relatively larger range of small body-sized preyin their diet (Fig. 7).
4. Discussion
More generally, the few specific surveys of thebenthos of sand bank habitats have tended to focus onthe infaunal components that are sampled with benthic
grabs (e.g. Warwick and Davies, 1977; Vanosmael et al.,1982; Rees and Eleftheriou, 1989; Degraer et al., 1999;Rees et al., 1999) which reduces comparability with thepresent study. Although there are previous studies of themacrozoobenthos and fish fauna of the North Sea andEnglish Channel, these were not habitat specific to sand-banks and encompassed a wide range of habitats (e.g.Jennings et al., 1999; Kaiser et al., 1999). Indeed, thesamples collected in these studies may represent thefauna sampled from several different habitats duringthe period the sampling gear was towed over the seabed,some of which may incorporate sandbank fauna mixedwith fauna from adjacent habitats. Thus, as so fewauthors have sampled sandbanks specifically using quan-titative sampling devices, wider comparison is difficult

454 M.J. Kaiser et al. / Estuarine, Coastal and Shelf Science 60 (2004) 445–456
0.0
10.0
20.0
30.0
40.0
50.0
60.0
70.0
Prey types
Pe
rc
en
ta
ge
fre
qu
en
cy
o
cc
urre
nc
eP
erc
en
ta
ge
fre
qu
en
cy
o
cc
urre
nc
e
DR
w N
BSh
A
0.0
10.0
20.0
30.0
40.0
50.0
60.0
70.0
Nem
atod
a
Biva
lva
Nep
htys
sp.
Amm
odyt
es
Poly
chae
ta
Spis
ula
sp.
Lioc
arci
nus
Sole
nida
e
Eteo
ne s
p.
Lioc
arci
nus
Lutra
ria s
p.
Biva
lve
Brac
hyur
a
Cap
itella
sp.
Gly
cera
sp.
Lagi
s ko
reni
Lum
brin
eris
Ner
eis
sp.
Paria
mbu
s
Scal
ibre
gma
Sthe
nela
is
Uni
dent
ified
Nem
atod
a
Biva
lva
Nep
htys
sp.
Amm
odyt
es
Poly
chae
ta
Spis
ula
sp.
Lioc
arci
nus
Sole
nida
e
Eteo
ne s
p.
Lioc
arci
nus
Lutra
ria s
p.
Biva
lve
Brac
hyur
a
Cap
itella
sp.
Gly
cera
sp.
Lagi
s ko
reni
Lum
brin
eris
Ner
eis
sp.
Paria
mbu
s
Scal
ibre
gma
Sthe
nela
is
Uni
dent
ified
Prey types
DR
w N
BSh
B
Fig. 7. The percentage frequency occurrence of different prey types identified from the stomach contents of plaice sampled at three sites (Devil’s
Ridge (DR), Bastram Shoal (BSh) and west of Newquay (wN)) based on abundance (A) and biomass (B).
although it is likely that the present general communityobservations are applicable to sandbanks elsewhere.
Previous studies undertaken in the Irish Sea havebeen conducted with different objectives and have useda variety of different sampling devices from grabs, tobox corers to trawls (e.g. Jones, 1951; Swift 1993; Elliset al., 2000). Even when such surveys overlap, it isdifficult to compare directly the results obtained becauseeach sampling device samples at a different scale (0.1 m2
for grabs; 0.2 m2 for box corers; 100s–1000s m2 fortrawls). Furthermore, individual devices sample effec-tively on only a proportion of the benthic assemblage,hence the grain of information gained varies betweenstudies such that they are not comparable if a wide-scaleinterpretation of the data is to be undertaken. Whena full understanding of community structure is requiredit is necessary to adopt a variety of sampling method-ologies to sample adequately at all scales. In the presentstudy, two scales of sampling 600 m2 (2-m beam trawl)and 9600 m2 (4-m beam trawl) were used to quantify theepibenthic and fish fauna of sandbank habitats. While
the 4-m beam trawl will sample epifauna effectively(Kaiser et al., 1999; Ellis et al., 2000) it will tend tosample only larger macrofauna efficiently and will missmany of the smaller body-sized (!10 mm) fauna orunder-represent their importance in the assemblage. Forwide-scale surveys in which the objective is to providea comprehensive description of the broad distribution ofcommunity types, low (no) replication is the norm giventhe trade-off of sampling effort required to samplea large number of stations. In the present studyhowever, the main aim was to undertake a detaileddescription of communities at a relatively small numberof sites spread across a regional area, thus samplereplication was of paramount importance especiallygiven the experience of previous authors who haveattempted to describe the communities associated withsandbanks in the past (e.g. Shepherd, 1983).
In the present study, it is clear that the sandbanks thatare extensions of shallow nearshore soft-sediments arewell defined from the distinct sandbank habitats both interms of their fish and epifaunal communities. In general,

455M.J. Kaiser et al. / Estuarine, Coastal and Shelf Science 60 (2004) 445–456
species diversity and abundance of individuals were lowerfor distinct sandbanks, which is not surprising given thedynamic environment in which most of these sandbankswere located. The percentage of carbonate content of thesediment sampled at the distinct sandbanks was higherthan that for the other sites which would concur withareas of the seabed subjected to strong tidal scour thatwillhave larger sediment particles in sandy habitats. In thepresent study, much of the sandy sediment sampled hada large proportion of shell-hash of varying particle sizeswhich would explain the higher percentage carbonatecontent (MJKpersonal observations). At one site (Devil’sRidge) the 2-m beam trawl catch contained an extraor-dinary number of empty and scoured common whelkBuccinum undatum shells that were not occupied byhermit crabs despite the prevalence of the latter. Many ofthese shells were highly degraded in condition, but werenot encrusted with epibiota. The distinct sandbanks weretypified by a very restricted number of species thatincluded Pagurus bernhardus, Asterias rubens, Liocarci-nus holsatus, Echichthys vipera, Ammodytes tobianus,Philocheras trispinosus, Hyperoplus lanceolatus, andMysidacea for the epifaunal community (sampled withthe 2-m beam trawl) and Pleuronectes platessa, Limandalimanda, Eutrigla gurnardus, Scophthalamus rhombus forthe fish community. Ellis et al. (2000) undertook a similaranalysis of data from a wide-scale survey of groundfishand benthos sampled with a 4-m beam trawl as used in thepresent study. They described a distinct faunistic associ-ation for inshore sandy areas that extended from south tonorth Wales (Pleuronectes platessa–Limanda limandaassociation) (Ellis et al., 2000). A comparison of theassemblages identified for the distinct sandbanks targetedin the present study matches only 5 species witha compliment of 21 identified by Ellis et al. (2000) forthe inshore sandy habitats. However, a comparison of thesandbanks considered to be extensions of inshore sandyareas in the present study with the same associationyielded 13 species in common. It should be noted that theassociation identified by Ellis et al. (2000) was based ona sample of 43 stations. This indicates that there is closeagreement between the assemblage identified for thesandbanks considered to be extensions of inshore shallowsediments and that defined by Ellis et al. (2000). Thedistinct sandbanks defined in the present study aretypified by a much more restricted set of species whichranged from only two at Devil’s Ridge to eight at TurbotBank. Furthermore, common weevers were often themost important species at these sites and these did notfeature in any of Ellis et al.’s (2000) assemblages. Otherkey indicator species for the distinct sandbanks includedcommon hermit crabs, greater and lesser sandeels, Solealascarisda southern species of soledthe goby Pomato-schistus minutus, Mysidacea, and P. trispinosus.
Although not listed as those species that contributedmost to the similarity between stations, rays are of
conservation interest given their vulnerability to over-fishing (Dulvy and Reynolds, 2002). Four different rayspecies were encountered during the survey of which threeshowed differences in habitat preference. The thornbackray Raja clavata occurred only on the sandbanks consi-dered to be extensions of inshore soft-sediment habitatsand did not occur on the more dynamic distinct sand-banks which is noteworthy. In contrast the blonde rayRaja brachyura only occurred at more northerly sand-banks while the small-eyed ray Raja microocellataoccurred only at southerly sandbanks, and in particularlyhigh numbers at Helwick Bank (Fig. 5). The latter alsotended to co-occur with another southern species thesand sole Solea lascaris. The present study does notimply that R. microocellata is found exclusively on sand-bank habitats as it is known that they are also found insandy bays in the southern Irish Sea and Bristol Channel(J.R. Ellis, pers. comm.).
Although plaice were sampled in order to examinetheir diet in relation to food available on the sandbanks,they were caught in sufficient numbers at too few sitesfor meaningful analysis. However, is was clear that fishfrom the distinct sandbanks Devil’s Ridge and BastramShoal were on average larger than those caught west ofNewquay. At both of the former sites, sandeels Ammo-dytes tobianus were the most important prey in terms oftheir contribution to the overall diet. The smaller fishsampled west of Newquay had a broader diet thatincluded mostly small prey-types such as polychaetes,which concurs with earlier studies (Fig. 6) (Jones, 1952).
The distinct sandbanks studied herein would appearto be different from the assemblages identified by Elliset al. (2000). However, the sites considered to be exten-sions of nearshore shallow soft-sediments appear to bevery similar to the Pleuronectes platessa–Limanda lim-anda assemblage described by Ellis et al. (2000), whichappears to be widespread throughout the Irish Sea belowthe 20 m depth contour. Thus while the sandbanks con-sidered to be extensions of shallow nearshore sediments inthe present study are considered to be representative ofthis widespread benthic and fish assemblage, Devil’sRidge, Tripods, Bais Bank,HelwickBank (east andwest),Turbot Bank andBastramShoal would all appear to havedistinct assemblages of their own with some commonconstituents (e.g. weever fish and hermit crabs) and othergeographically restricted components (e.g.Solea lascaris).
Acknowledgements
The authors wish to thank the Master and crew of theRV Prince Madog, colleagues of the National Museumof Wales Cardiff and the Countryside Council for Walesand David Cocks for field work assistance. Jim Ellis isthanked for his constructive comments on an earlierversion of the manuscript.

456 M.J. Kaiser et al. / Estuarine, Coastal and Shelf Science 60 (2004) 445–456
References
Clarke, K.R., Warwick, R.M., 1994. Change in Marine Communities:
an Approach to Statistical Analysis and Interpretation. Natural
Environmental Research Council, Plymouth Marine Laboratory,
Plymouth, UK, 144 pp.
Darbyshire, T., Mackie, A.S.Y., May, S.J., Rostron, D., 2002. Macro-
faunal survey of Welsh sandbanks 2001. Countryside Council of
Wales Contract Report No. 539, Countryside Council for Wales,
Bangor, UK, 113 pp.
Degraer, S., Vincx, M., Meire, P., Offringa, H., 1999. The macro-
zoobenthos of an important wintering area of the common scoter
(Melanitta nigra). Journal of the Marine Biological Association of
the United Kingdom 79, 243–251.
Dulvy, N.K., Reynolds, J.D., 2002. Predicting extinction vulnerability
in skates. Conservation Biology 16, 440–450.
Ellis, J.R., Rogers, S.I., Freeman, S.M., 2000. Demersal assemblages in
the Irish Sea, St George’s Channel and Bristol Channel. Estuarine,
Coastal and Shelf Science 51, 299–315.
Holme, N.A., 1949. The fauna of sand and mud banks near the mouth
of the Exe Estuary. Journal of the Marine Biological Association of
the United Kingdom 28, 189–237.
Holme, N.A., 1953. The biomass of the bottom fauna in the English
Channel off Plymouth. Journal of the Marine Biological Associ-
ation of the United Kingdom 32, 1–32.
Holme, N.A., McIntyre, A.D., 1984. Methods for the Study of Marine
Benthos. Blackwell Scientific Publications, Oxford, UK, 387 pp.
Jennings, S., Lancaster, J.E., Woolmer, A., Cotter, J., 1999.
Distribution, diversity and abundance of epibenthic fauna in the
North Sea. Journal of the Marine Biological Association of the
United Kingdom 79, 385–399.
Jones, N.S., 1951. The bottom fauna off the south of the Isle of Man.
Journal of Animal Ecology 20, 132–144.
Jones, N.S., 1952. The bottom fauna and the food of flatfish off the
Cumberland coast. Journal of Animal Ecology 21, 182–205.
Kaiser, M.J., Spencer, B.E., 1994. Fish scavenging behaviour in
recently trawled areas. Marine Ecology Progress Series 112, 41–49.
Kaiser, M.J., Rogers, S.I., Ellis, J.R., 1999. Importance of benthic ha-
bitat complexity for demersal fish assemblages. American Fisheries
Society Symposium 22, 212–223.
Perkins, E.J., 1956. The fauna of a sandbank in the mouth of the Dee
estuary. Annals of the Magazine of the Natural History Series 12,
112–128.
Rees, H., Eleftheriou, A., 1989. North Sea benthos: a review of field
investigations into the biological effects of man’s activities. Journal
du Conseil, Conseil International pour l’Exploration de la Mer 45,
284–305.
Rees, H.L., Pendle, M.A., Waldock, R., Limpenny, D.S., Boyd, S.E.,
1999. A comparison of benthic biodiversity in the North Sea,
English Channel and Celtic Seas. ICES Journal of Marine Science
56, 228–246.
Shepherd, S.A., 1983. The epifauna of megaripples: species’ adapta-
tions and population responses to disturbance. Australian Journal
of Ecology 8, 3–8.
Swift, D.J., 1993. The macrobenthic infauna off Sellafield (North-
eastern Irish Sea) with special reference to bioturbation. Journal
of the Marine Biological Association of the United Kingdom 73,
143–162.
Tyler, P.A., Shackley, S.E., 1980. The benthic ecology of linear
sandbanks: a modified Spisula sub-community. In: Collins, M.B.,
Banner, F.T., Tyler, P.A., Wakefield, S.J., James, A.E. (Eds.),
Industrial Embayments and Their Environmental Problems. A
Case Study of Swansea Bay. Pergamon Press, Oxford, UK, pp.
539–551.
Vanosmael, C., Willems, K.A., Claeys, D., Vincx, M., Heip, C., 1982.
Macrobenthos of a sublittoral sandbank in the Southern Bight of
the North Sea. Journal of the Marine Biological Association of the
United Kingdom 62, 521–534.
Warwick, R.M., Davies, J.R., 1977. The distribution of sublittoral
macrofauna communities in the Bristol Channel in relation to the
substrate. Estuarine, Coastal and Shelf Science 5, 267–288.
Withers, R.G., Thorp, C.H., 1978. The macrobenthos inhabiting
sandbanks in Langstone Harbour, Hampshire. Journal of Natural
History 12, 445–455.


