Embed Size (px)
Citation preview

Densitometric Comparison of thePerformance of Stahl-Type and Sandwich-Type Planar Chromatographic Chambers
M. Sajewicz,1 A. Pieniak,1 R. Pietka,1 K. Kaczmarski,2
and T. Kowalska1,*
1Institute of Chemistry, Silesian University, Katowice, Poland2Faculty of Chemistry, Technical University of Rzeszow,
Rzeszow, Poland
ABSTRACT
Over the years, conventional Stahl-type thin-layer chromatography (TLC)
chambers (i.e., N-chambers) have attracted criticism for more than one
reason. For example, practitioners have questioned the value of the time-
consuming procedure of saturating these chambers with mobile-phase
vapor, and those who focus on the theory of planar chromatography,
have complained that the well-known stepwise diminishing of the rate of
capillary flow of the mobile phase in the ascending mode makes compu-
tational optimization of solute retention more difficult and less accurate
than it could be at constant flow. Everybody also readily agrees that mobile
phase consumption is much higher in N-chambers than in sandwich
2019
DOI: 10.1081/JLC-120039414 1082-6076 (Print); 1520-572X (Online)
Copyright # 2004 by Marcel Dekker, Inc. www.dekker.com
*Correspondence: T. Kowalska, Institute of Chemistry, Silesian University, 9 Szkolna
Street, 40-006 Katowice, Poland; E-mail: [email protected].
120039414_JLC_027_013_R2_052604 Techset Composition Ltd, Salisbury, U.K.—120039414
1
2
3
4
5
6
7
8
9
10
11
12
13
14
15
16
17
18
19
20
21
22
23
24
25
26
27
28
29
30
31
32
33
34
35
36
37
38
39
40
41
42
JOURNAL OF LIQUID CHROMATOGRAPHY & RELATED TECHNOLOGIESw
Vol. 27, No. 13, pp. 2019–2030, 2004

chambers (S-chambers). The economic superiority of S-chambers cannot,
however, be regarded as a decisive factor when it comes to making a choice
of the TLC equipment, because physicochemical aspects of the chromato-
graphic process are more important. In the work discussed in this paper, we
compared the N-type and S-type chambers in terms of mobile phase flow
rate, the RF values obtained, and the densitometrically established concen-
tration profiles of the test analytes. For this comparison, we selected several
phenyl-substituted alcohols and acids, low-activity adsorbents (cellulose
powder and chromatographic paper), and low-polarity solvents (n-octane
and decalin) as the components of the chromatographic systems investi-
gated. The overall conclusion from the results obtained is that the physico-
chemical performance of the S-chamber is comparable with that of the
N-chamber, and the only indisputable superiority of the S-chamber is the
more economical use of the mobile phases.
Key Words: Planar chromatography; Densitometry; Concentration
profiles of bands; Microcrystalline cellulose; Chromatographic paper;
Stahl-type chamber (i.e., N-chamber); Sandwich-type chamber (i.e.,
S-chamber).
INTRODUCTION
Planar chromatography performed in conventional Stahl-type chambers
(N-chambers) is regarded as inferior to column chromatography, because
the stationary phase (either chromatographic paper or thin layer) is used in
the form of an “open bed.” There is awareness that the “closed bed” of station-
ary phase contained in chromatographic columns eliminates a number of
physicochemical shortcomings inherent in the planar mode.
For this reason, the development of planar chromatography has sometimes
consisted of imitating working conditions typical of column chromatography, in
the first instance by converting the open bed of stationary phase to a less open
bed. The simplest way of achieving this goal was to introduce Sandwich-type
chambers (S-chambers), in which the void volume surrounding the plate (or
the chromatographic paper) is much smaller than in the N-chambers.
Thorough comparison of the N-type and the S-type chambers in terms of
the quality of the respective chromatographic bands is still pending. One
reason is the difficult choice of reliable analytical tools and of adequate
physicochemical criteria for such a comparison. It seems, however, that
with the increasing popularity of densitometry, the lack of such a thorough
comparison can no longer be excused.
The aim of the work discussed in this paper, was to compare retention in
N- and S-type chromatographic chambers. As criteria for our comparison, we
120039414_JLC_027_013_R2_052604 Techset Composition Ltd, Salisbury, U.K.—120039414
43
44
45
46
47
48
49
50
51
52
53
54
55
56
57
58
59
60
61
62
63
64
65
66
67
68
69
70
71
72
73
74
75
76
77
78
79
80
81
82
83
84
Sajewicz et al.2020

selected the mobile phase flow rate, RF values of the test analytes used, and the
densitometrically established concentration profiles. We selected analytes (i.e.,
the alcohols and acids) able to interact effectively by hydrogen bonding and
low-activity/low-polarity chromatographic systems, to minimize interference
of the stationary and mobile phases with the self-association of the test analytes.
The practical usefulness of similar chromatographic systems has been success-
fully demonstrated in earlier work.[1–3] The results obtained and the conclusions
drawn, are presented in the forthcoming sections of this paper.
EXPERIMENTAL
Test Solutes
Selected Alcohols
In this study, we used solutions of 4-phenyl-1-butanol (0.5, 1.0, 1.5, and
2.0 mol L21) and 5-phenyl-1-pentanol (0.25, 0.5, 0.75, 1.0, 1.5, and
2.0 mol L21) in carbon tetrachloride. Both alcohols were analytical-grade
products manufactured by Merck KGaA (Darmstadt, Germany).
Selected Acids
We used solutions of 3-phenylpropionic acid (0.2, 0.3, 0.4, and
0.5 mol L21), 2-phenylbutyric acid (0.2, 0.3, 0.4, and 0.5 mol L21), and
4-phenylbutyric acid (0.2, 0.3., 0.4, 0.5, 0.75, and 1.0 mol L21) in 2-propanol.
All these acids were analytical-grade products manufactured by Merck.
Thin-Layer Chromatography
Thin-layer chromatography (TLC) was performed on glass-backed plates
precoated with microcrystalline cellulose (10 cm � 20 cm; Merck, cat.
#1.05730). After spotting the solutions of the alcohols and acids (3mL), the
layers were developed with n-octane (alcohols) or decalin (acids) to a distance
of 15 cm, at ambient temperature, in the two types of chromatographic
chambers: (i) ascending mode in a conventional N-chamber (Camag, Muttenz,
Switzerland) previously saturated with mobile phase vapor for 20 min; and
(ii) horizontal mode in a DS-II S-chamber (Chromdes, Lublin, Poland) satu-
rated with mobile phase vapors in the same way. The volume of mobile
phase used in the N-chamber was 20 mL; in the S-chamber it was 6 mL.
After development, the chromatograms were carefully dried with a hairdryer.
120039414_JLC_027_013_R2_052604 Techset Composition Ltd, Salisbury, U.K.—120039414
85
86
87
88
89
90
91
92
93
94
95
96
97
98
99
100
101
102
103
104
105
106
107
108
109
110
111
112
113
114
115
116
117
118
119
120
121
122
123
124
125
126
Densitometric Comparison of N-Type and S-Type Chambers 2021

Paper Chromatography
Paper chromatography was performed on Whatman-1 and Whatman-3
chromatographic paper (Whatman, Maidstone, UK) cut into 10 cm � 20 cm
rectangles. After spotting the solutions of the alcohols and acids (5mL), the
paper sheets were developed with n-octane (alcohols) or decalin (acids) to a
distance of 15 cm, at ambient temperature, in the two types of chromato-
graphic chamber: (i) ascending mode in a conventional N-chamber previously
saturated for 20 min; and (ii) horizontal mode in a DS-II S-chamber, saturated
in the same way. Again, the volumes of mobile phase used in the N-type and
S-type chambers were 20 mL and 6 mL, respectively. After development, the
chromatograms were carefully dried with a hairdryer.
Densitometric Detection
Densitometric detection of developed zones was performed with the
Desaga (Heidelberg, Germany) model CD 60 densitometer equipped with
the Windows-compatible ProQuant program package. Concentration profiles
were recorded in ultraviolet (UV) light (in the reflectance mode) at a wave-
length of 260 nm; the dimensions of the rectangular light beam were
0.4 mm width and 0.02 mm height.
RESULTS AND DISCUSSION
The results obtained are shown in Tables 1–7 and the selected densito-
grams are given in Figs. 1–4. Because of the importance of the comparison
discussed, we decided to present our data in numerical form (Tables 1–7),
thus enabling detailed inspection of the respective RF values and the concen-
tration profile baseline widths, w. The numerical values given in the tables are
mean values calculated from results of replicate analyses (the number of repli-
cates, n, was usually between 3 and 10). The reproducibility of the results (i.e.,
RF and w values) obtained by use of the N- and S-chambers, was of exactly the
same order (despite the moderate reproducibility of results from S-chambers
articulated elsewhere[4]). It was an ultimate goal of this study to compare
the simplest physicochemical characteristics of solute retention in planar chro-
matography (the two parameters RF and w, and the respective concentration
profiles) for the N-type and S-type chromatographic chambers. The results
obtained revealed several general trends, although with occasional exceptions.
In general, the higher the velocity of development of the chromatogram,
the lower the w value of the chromatographic band. This regularity is
120039414_JLC_027_013_R2_052604 Techset Composition Ltd, Salisbury, U.K.—120039414
127
128
129
130
131
132
133
134
135
136
137
138
139
140
141
142
143
144
145
146
147
148
149
150
151
152
153
154
155
156
157
158
159
160
161
162
163
164
165
166
167
168
Sajewicz et al.2022

readily understandable if we reflect on the relationship between chromato-
gram development time and the impact of diffusion (the shorter the
development time, the less pronounced is diffusion and the lower the peak
width).
With all of the test solutes considered, the smaller the amount of sample
developed (i.e., the lower the concentration of the spotted solution), the closer
to each another become the pairs of the RF values, irrespective of the chroma-
tographic chamber used (occasionally the values are even identical). This is
because the smaller the amount of sample developed, the greater is the
probability of partitioning of the analyte between the stationary and mobile
phases in the linear range of the adsorption isotherm. Evidently, differences
between the construction and use of the two types of chambers differentiates
Table 1. Numerical values of the RF coefficients and concentration profile widths (w)
of chromatographic bands of 4-phenyl-1-butanol developed with n-octane on
whatman-3 chromatographic paper.
Concentration
(mol L21)
N-chamber
(mean development
velocity: 5.16 mm min21)
S-chamber
(mean development
velocity: 6.23 mm min21)
RF w (mm) RF w (mm)
0.5 0.95 14.0 0.95 13.5
1.0 0.92 24.0 0.89 20.2
1.5 0.88 31.5 0.82 27.9
2.0 0.83 38.6 0.78 38.5
Table 2. Numerical values of the RF coefficients and concentration profile widths (w)
of chromatographic bands of 5-phenyl-1-pentanol developed with n-octane on
whatman-1 chromatographic paper.
Concentration
(mol L21)
N-chamber
(mean development
velocity: 4.71 mm min21)
S-chamber
(mean development
velocity: 5.95 mm min21)
RF w (mm) RF w (mm)
0.25 0.97 14.2 0.95 15.4
0.50 0.89 20.8 0.92 20.4
0.75 0.82 28.4 0.89 24.3
1.00 0.79 35.6 0.82 31.1
120039414_JLC_027_013_R2_052604 Techset Composition Ltd, Salisbury, U.K.—120039414
169
170
171
172
173
174
175
176
177
178
179
180
181
182
183
184
185
186
187
188
189
190
191
192
193
194
195
196
197
198
199
200
201
202
203
204
205
206
207
208
209
210
Densitometric Comparison of N-Type and S-Type Chambers 2023
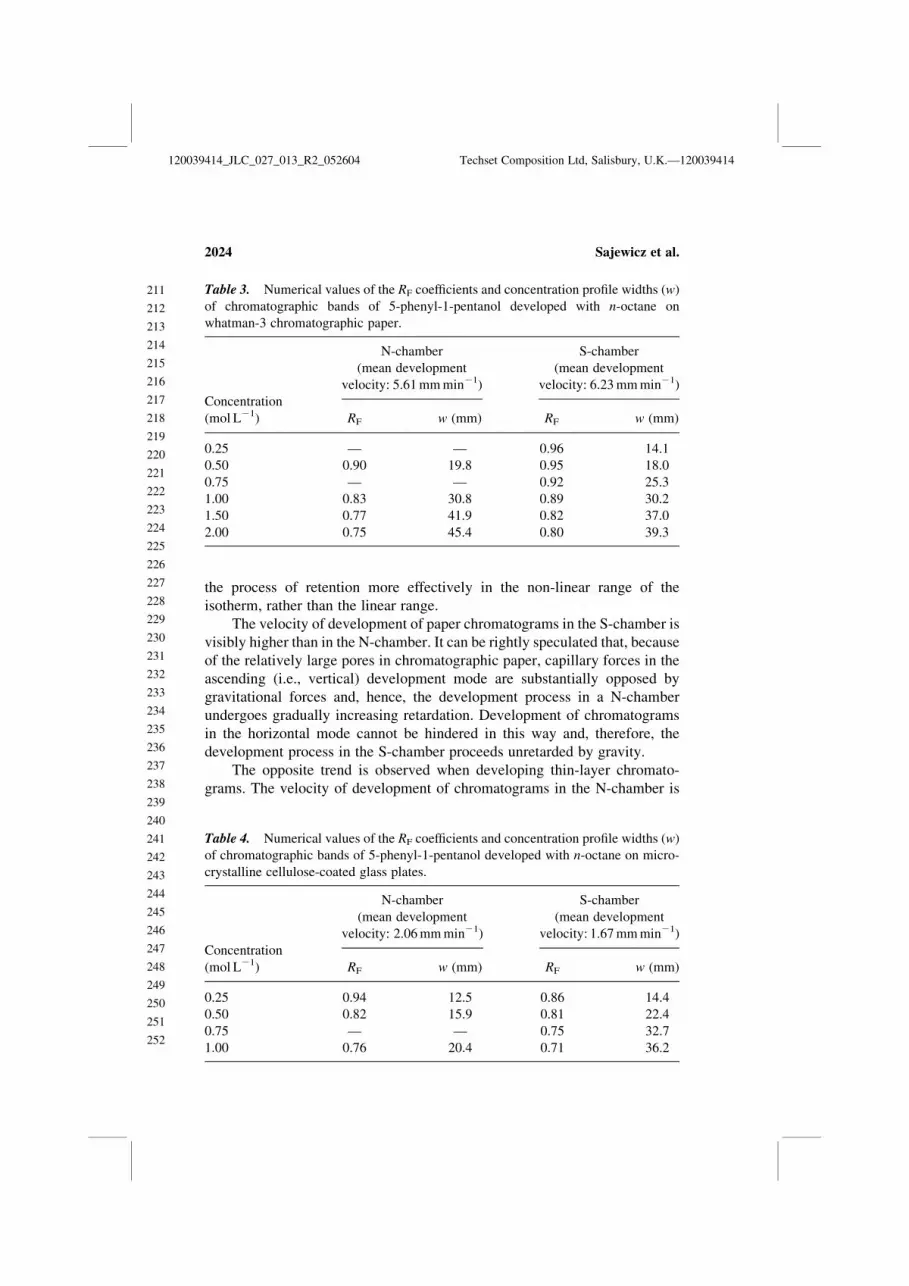
the process of retention more effectively in the non-linear range of the
isotherm, rather than the linear range.
The velocity of development of paper chromatograms in the S-chamber is
visibly higher than in the N-chamber. It can be rightly speculated that, because
of the relatively large pores in chromatographic paper, capillary forces in the
ascending (i.e., vertical) development mode are substantially opposed by
gravitational forces and, hence, the development process in a N-chamber
undergoes gradually increasing retardation. Development of chromatograms
in the horizontal mode cannot be hindered in this way and, therefore, the
development process in the S-chamber proceeds unretarded by gravity.
The opposite trend is observed when developing thin-layer chromato-
grams. The velocity of development of chromatograms in the N-chamber is
Table 3. Numerical values of the RF coefficients and concentration profile widths (w)
of chromatographic bands of 5-phenyl-1-pentanol developed with n-octane on
whatman-3 chromatographic paper.
Concentration
(mol L21)
N-chamber
(mean development
velocity: 5.61 mm min21)
S-chamber
(mean development
velocity: 6.23 mm min21)
RF w (mm) RF w (mm)
0.25 — — 0.96 14.1
0.50 0.90 19.8 0.95 18.0
0.75 — — 0.92 25.3
1.00 0.83 30.8 0.89 30.2
1.50 0.77 41.9 0.82 37.0
2.00 0.75 45.4 0.80 39.3
Table 4. Numerical values of the RF coefficients and concentration profile widths (w)
of chromatographic bands of 5-phenyl-1-pentanol developed with n-octane on micro-
crystalline cellulose-coated glass plates.
Concentration
(mol L21)
N-chamber
(mean development
velocity: 2.06 mm min21)
S-chamber
(mean development
velocity: 1.67 mm min21)
RF w (mm) RF w (mm)
0.25 0.94 12.5 0.86 14.4
0.50 0.82 15.9 0.81 22.4
0.75 — — 0.75 32.7
1.00 0.76 20.4 0.71 36.2
120039414_JLC_027_013_R2_052604 Techset Composition Ltd, Salisbury, U.K.—120039414
211
212
213
214
215
216
217
218
219
220
221
222
223
224
225
226
227
228
229
230
231
232
233
234
235
236
237
238
239
240
241
242
243
244
245
246
247
248
249
250
251
252
Sajewicz et al.2024

Table 6. Numerical values of the RF coefficients and concentration profile widths (w)
of chromatographic bands of 2-phenylbutyric acid developed with decalin on micro-
crystalline cellulose-coated glass plates.
Concentration
(mol L21)
N-chamber
(mean development
velocity: 0.75 mm min21)
S-chamber
(mean development
velocity: 0.73 mm min21)
RF w (mm) RF w (mm)
0.2 0.91 7.9 0.93 10.4
0.3 0.86 12.8 0.90 13.5
0.4 — — 0.86 14.6
0.5 0.80 15.8 0.84 13.7
Table 5. Numerical values of the RF coefficients and concentration profile widths (w)
of chromatographic bands of 3-phenylpropionic acid developed with decalin on micro-
crystalline cellulose-coated glass plates.
Concentration
(mol L21)
N-chamber
(mean development
velocity: 0.77 mm min21)
S-chamber
(mean development
velocity: 0.73 mm min21)
RF w (mm) RF w (mm)
0.2 0.93 8.3 0.94 11.4
0.3 0.91 9.4 0.90 17.8
0.4 0.89 9.7 0.86 20.8
0.5 0.79 17.7 0.78 26.0
Table 7. Numerical values of the RF coefficients and concentration profile widths (w)
of chromatographic bands of 4-phenylbutyric acid developed with decalin on micro-
crystalline cellulose-coated glass plates.
Concentration
(mol L21)
N-chamber
(mean development
velocity: 0.75 mm min21)
S-chamber
(mean development
velocity: 0.73 mm min21)
RF w (mm) RF w (mm)
0.2 0.90 12.5 0.90 13.5
0.3 0.87 14.9 0.86 19.8
0.4 0.85 19.0 0.80 40.6
0.5 0.82 25.0 0.79 43.8
1.0 0.68 54.7 0.64 67.7
120039414_JLC_027_013_R2_052604 Techset Composition Ltd, Salisbury, U.K.—120039414
253
254
255
256
257
258
259
260
261
262
263
264
265
266
267
268
269
270
271
272
273
274
275
276
277
278
279
280
281
282
283
284
285
286
287
288
289
290
291
292
293
294
Densitometric Comparison of N-Type and S-Type Chambers 2025

somewhat (sometimes insignificantly) higher than in the S-chamber, which
obviously cannot be attributed to the impact of gravity. Because the diameters
of the pores in microcrystalline cellulose layers are usually much smaller than
in chromatographic papers, capillary forces are much more pronounced and
far less susceptible to gravity. Feeding of horizontally developing chromato-
grams with mobile phase is, however, substantially different from feeding
Figure 1. Comparison of the concentration profiles of 5-phenyl-1-pentanol developed
with n-octane on whatman-3 chromatographic paper in (a) N-chamber and (b) S-chamber
(showing the dependence on the concentrations of the test analyte solutions).
120039414_JLC_027_013_R2_052604 Techset Composition Ltd, Salisbury, U.K.—120039414
295
296
297
298
299
300
301
302
303
304
305
306
307
308
309
310
311
312
313
314
315
316
317
318
319
320
321
322
323
324
325
326
327
328
329
330
331
332
333
334
335
336
Sajewicz et al.2026

them in the vertical position. In the N-chamber, the lower edge of the verti-
cally placed chromatogram (either thin-layer or paper) is dipped in the mobile
phase, whereas in the S-chamber, the edge of the horizontally placed chroma-
togram is fed with mobile phase from a trough through a slit, by capillary
action. It seems, that the evident hydrodynamic difference in the mode of
Figure 2. Comparison of the concentration profiles of 5-phenyl-1-pentanol devel-
oped with n-octane on microcrystalline cellulose in (a) N-chamber and (b) S-chamber
(showing the dependence on the concentrations of the test analyte solutions).
120039414_JLC_027_013_R2_052604 Techset Composition Ltd, Salisbury, U.K.—120039414
337
338
339
340
341
342
343
344
345
346
347
348
349
350
351
352
353
354
355
356
357
358
359
360
361
362
363
364
365
366
367
368
369
370
371
372
373
374
375
376
377
378
Densitometric Comparison of N-Type and S-Type Chambers 2027

feeding negatively affects development of thin-layer chromatographic plates
(by prolonging the development time), whereas it has no perceptible effect
on the development of paper chromatograms.
Selected densitograms obtained from chromatograms developed in
N-type and S-type chambers are compared in Figs. 1–4. For all the analytes
Figure 3. Comparison of the concentration profiles of 2-phenylbutyric acid developed
with decalin on microcrystalline cellulose-coated glass plates in (a) N-chamber and
(b) S-chamber (showing the dependence on the concentrations of the test analyte solutions).
120039414_JLC_027_013_R2_052604 Techset Composition Ltd, Salisbury, U.K.—120039414
379
380
381
382
383
384
385
386
387
388
389
390
391
392
393
394
395
396
397
398
399
400
401
402
403
404
405
406
407
408
409
410
411
412
413
414
415
416
417
418
419
420
Sajewicz et al.2028

and the two chromatographic chambers investigated, the lengthwise
concentration profiles of the chromatographic bands resemble anti-Langmuir-
type peak profiles (the best examples of anti-Langmuir profiles can be seen in
Fig. 2). These results persuasively suggest that lateral interactions play the
predominant role in the formation of these concentration profiles.
Other important information contained in these results is that the deterio-
ration of the lengthwise concentration profiles of chromatograms developed in
Figure 4. Comparison of the concentration profiles of 4-phenylbutyric acid devel-
oped with decalin on microcrystalline cellulose-coated glass plates in (a) N-chamber
and (b) S- chamber (showing the dependence on the concentrations of the test analyte
solutions).
120039414_JLC_027_013_R2_052604 Techset Composition Ltd, Salisbury, U.K.—120039414
421
422
423
424
425
426
427
428
429
430
431
432
433
434
435
436
437
438
439
440
441
442
443
444
445
446
447
448
449
450
451
452
453
454
455
456
457
458
459
460
461
462
Densitometric Comparison of N-Type and S-Type Chambers 2029

the S-chamber (particularly for the largest amounts of the analytes) is worse
than for their counterparts obtained in the N-chamber. In general, the diffusive
parts of these peaks are less emphasized and their triangular anti-Langmuir
shape is distorted, resulting in a trapezoidal-like shape (see, for example,
Fig. 4). Occasionally (e.g., Fig. 3), the multi-peak profiles for the highest
concentrations of the analytes developed in the S-chamber give evidence of
a limited hydrodynamic stability of the eluent flow in this chamber. The reason
for these multi-peak profiles is most probably the hydrodynamic instability of
the eluent flow in the S-chamber.
From these results, the overall conclusions are that the physicochemical
performance of the S-chamber is comparable with (and occasionally worse than)
that of the N-chamber, and that the only indisputable superiority of the S-chamber
over the N-chamber consists in more economical use of the mobile phase.
ACKNOWLEDGMENT
The authors wish to thank Merck KGaA (Darmstadt, Germany) for
supplying the test compounds and precoated cellulose plates used in this study.
REFERENCES
1. Prus, W.; Kaczmarski, K.; Tyrpien, K.; Borys, M.; Kowalska, T. The role
of the lateral analyte–analyte interactions in the process of TLC band
formation. J. Liq. Chromatogr. Relat. Technol. 2001, 24, 1381–1396.
2. Kaczmarski, K.; Prus, W.; Dobosz, C.; Bojda, P.; Kowalska, T. The role
of the lateral analyte–analyte interactions in the process of TLC band
formation. II. Dicarboxylic acids as the test analytes. J. Liq. Chromatogr.
Relat. Technol. 2002, 25, 1469–1482.
3. Sajewicz, M.; Pieniak, A.; Pietka, R.; Kaczmarski, K.; Kowalska, T.
Densitometric acquisition of concentration profiles in planar chromato-
graphy and its possible shortcomings. Part 1. 4-Phenylbutyric acid as an
analyte. Acta Chromatogr. 2004, 14, 5–15.
4. Dzido, T.H. Modern TLC Chambers. In Planar Chromatography—
A Retrospective View for the Third Millennium; Nyiredy, Sz., Ed.; Springer:
Budapest, 2001; 68–87.
Received September 29, 2003
Accepted November 3, 2003
Manuscript 6346I
120039414_JLC_027_013_R2_052604 Techset Composition Ltd, Salisbury, U.K.—120039414
463
464
465
466
467
468
469
470
471
472
473
474
475
476
477
478
479
480
481
482
483
484
485
486
487
488
489
490
491
492
493
494
495
496
497
498
499
500
501
502
503
504
Sajewicz et al.2030

CMS ID number (DOI): 120039414
Article title:Densitometric Comparison of the Performance of Stahl-Type and Sandwich-Type Planar Chromatographic Chambers
Article type: ResearchClassification: Category:Primary subcategory:Subcategpry(ies):Topic(s):
Key words:
Planar chromatography; Densitometry; Concentration profiles of bands; Microcrystalline cellulose; Chromatographic paper; Stahl-type chamber (i.e., N-chamber); Sandwich-type chamber (i.e., S-chamber)
Copyright holder:
Author Sequence Number 5Author first name or first initial: T.Author middle initial:Author last name: KowalskaSuffix to last name:Degrees:Author StatusAuthor e-mail address: [email protected] fax:Author phone:
Title or PositionDepartment(s) Institute of ChemistryInstitution or Company Silesian UniversityDomestic (U.S.A.) or International InternationalSuite, floor, room no.Street address 9 Szkolna StreetCity KatowiceState/ProvincePostal code 40-006Country Poland
Title or PositionDepartment(s)Institution or CompanyDomestic (U.S.A.) or InternationalSuite, floor, room no.Street addressCityState/ProvincePostal codeCountry
Title or PositionDepartment(s)Institution or CompanySuite, floor, room no.Street addressCityState/ProvincePostal codeCountry
Department(s)Institution or CompanyStreet addressSuite, floor, room no.CityState/ProvincePostal codeCountry
e-mail address to receive proofs: [email protected] to receive proofs:Mailing address to receive proofs:
Article data: Submission date:Reviewed date: 29-Sep-03Revision date:Accepted date: 3-Nov-03
Recipient of R1 proofs:
ARTICLE INFORMATION SHEET: Contact or Corresponding Author
Primary Affiliation(s) at time of authorship:
Secondary Affiliation(s) at time of authorship:
Current affiliation(s):
Mailing address:


![[Type text] [Type text] [Type text] - Halaman utama Website](https://img.pdfslide.net/doc/110x75/6312eee6c72bc2f2dd03d889/type-text-type-text-type-text-halaman-utama-website-.jpg)

![N I [Type text] [Type text] [Type text](https://img.pdfslide.net/doc/110x75/635769693cd558f04e04d194/n-i-type-text-type-text-type-text.jpg)


