Embed Size (px)
Citation preview

Research article
Density-dependent habitat selection in migratory
passerines during stopover: what causes the deviation
from IFD?
E. SHOCHAT1,2,*, Z. ABRAMSKY1,2, B. PINSHOW1,2
and M.E.A. WHITEHOUSE2
1Department of Life Sciences, Ben-Gurion University of the Negev, P.O. Box 653, Beer-Sheva 84105,
Israel; 2Mitrani Department for Desert Ecology, Jacob Blaustein Institute for Desert Research, Ben-
Gurion University of the Negev, Midreshet Ben-Gurion 84990, Israel
(*author for correspondence, address: Center for Environmental Studies, Arizona State University,
P.O. Box 873211, Tempe, AZ 85287-3211, USA, e-mail: [email protected])
Received 21 June 2001; accepted 14 June 2002
Co-ordinating editor: P. Lundberg
Abstract. We studied the distribution of migratory warblers (genus: Sylvia) in poor and high
quality habitat patches at a stopover site in the northern Negev, Israel. The purpose of our study
was to test predictions based on the ideal free distribution (IFD) model by using a natural eco-
system which has a high turnover of individuals moving between unfamiliar foraging patches. We
trapped birds in two groves of Pistacia atlantica embedded within a coniferous forest. The fruit-
density ratio between these groves was 45:1. We compared bird density, body condition and habitat
matching (the ratio between bird density and resource density) at the two sites. To analyse the data
we integrated two approaches to density-dependent habitat selection: the isodar method and the
habitat matching rule. As predicted by the IFD model, we found that habitat suitability decreased
with bird density with a high correlation between warbler densities in the two habitat patches.
Contrary to IFD predictions, warbler density in the poor patch was higher than expected by the
habitat-matching rule. This habitat under-matching, had a cost: in the rich habitat the average
energy gain per individual bird was higher than in the poor habitat. Further analysis suggests that
the apparent habitat under-matching is not due to interference or differences in warbler competitive
abilities. Therefore, we suggest that this migratory bird community is not at equilibrium because
the birds possess imperfect knowledge of resource distribution. We propose that this lack of
knowledge leads to free, but not ideal distributions of migrant birds in unfamiliar stopover sites.
Key words: density dependence, habitat matching, habitat selection, ideal free distribution, non-
equilibrium, stopover
Introduction
The ideal free distribution (IFD) model (Fretwell and Lucas, 1969) describes an
evolutionary stable strategy for the distribution of organisms across habitats or
resource patches that maximizes individual fitness or payoff. It assumes that
Evolutionary Ecology 16: 469–488, 2002.� 2002 Kluwer Academic Publishers. Printed in the Netherlands.

competition increases as more individuals compete for resources in a given
patch. Consequently, it would pay for some of the competitors to move to a less
profitable habitat or patch. In such a patch the accompanying lower level of
competition would compensate for the lower resource density. The process of
density-dependent habitat selection thereby results in equal fitness of foragers
across all patches. The concept of density-dependent habitat selection has
provided major advances in ecological studies and has given the impetus for
further theoretical developments (Fretwell, 1972; Morris, 1987, 1988, 1989;
Milinski and Parker, 1991). However, while many studies claimed to support
the IFD model, it has been criticized, as many organisms from different taxa
deviate from its predictions (for review see Kennedy and Gray, 1993).
Two approaches to study the density-dependent habitat selection are the
isodar method and the habitat-matching rule. The first, the isodar method, is
based only on density surveys. The original isodar theory, applied to IFD, was
developed to overcome the problem that fitness is impossible to measure in
most cases (Morris, 1987). It assumed that animals are ideally and freely dis-
tributed in two habitats that differ in resource density, and therefore that
animal densities in the two habitats are highly correlated. The regression line
that describes the relationship between the density of individuals in two ad-
jacent habitats is a line of equal fitness (an ‘isodar’ sensu Morris, 1987, 1988).
The intercept and the slope of the isodar are the estimators of the quantitative
and the qualitative differences between the habitats (Morris, 1987, 1988).
The second approach, the resource-matching rule (Parker, 1978) rephrased
as the habitat-matching rule (Pulliam and Caraco, 1984), is based on habitat or
patch quality in terms of resource distribution across habitats/patches. If fit-
ness or payoff is equal across habitats or patches and among all individuals,
then the distribution of the resources in the environment must correlate with
the distribution of consumers. The result is that the ratio of consumers across
habitats/patches should match the ratio of resources.
The application of the IFD model to short term studies that measured in-
stant payoff across resource patches led to misconceptions of the IFD (Treg-
enza, 1994). A basic assumption of the habitat-matching rule that has been
repeatedly ignored is that habitat matching is only expected when there is
‘continuous resource input’ (Morris, 1994; Tregenza, 1994; Sutherland, 1996).
In this situation resources that are repeatedly added to the environment are
immediately consumed by foraging individuals (Parker, 1978). But even under
experimental conditions of continuous resource input, an under-matching be-
tween the densities of the resources and the consumers in two foraging patches
of different qualities has been reported (e.g. Gray, 1994; Gray and Kennedy,
1994; Kennedy, et al., 1994). It is apparent from these studies that, even under
simplified conditions, some basic assumptions of the IFD theory are violated.
These violations include unequal competitive abilities of the foragers (Parker
470

and Sutherland, 1986; Houston and McNamara, 1988), interference (Suther-
land, 1983), and imperfect knowledge of resource distribution (Abrahams,
1986). Kennedy and Gray (1993) also suggested that travel costs may cause
deviations from the IFD (but see Astrom, 1994).
There are two additional assumptions that are often violated by foraging
animals. One is that individuals are ideal, i.e. possess perfect information about
the amount of resources in the environment. The second is that they are free to
select where to forage in order to maximize their fitness. The first assumption
of complete knowledge of the neighbourhood is permissible when individuals
live at one site all their lives and when habitats are adjoining, at least at the
scale of the organism studied. However, it is readily violated when animals are
exploiting an unfamiliar habitat. Abrahams (1986) showed in a simulation
model (the perceptual limit model) that imperfect knowledge can affect animal
distribution in two or more habitats. The model predicts an increase in habitat
under-matching as the population grows, since more foragers allocate them-
selves randomly between sites. In Abrahams’ model, consumer densities always
under-match the resources since individuals over exploit the poor habitat.
Can an IFD be achieved in an unfamiliar environment, and can it be main-
tained as new individuals keep arriving and departing? This question is of par-
ticular relevance to migrating birds during their brief stopovers to rest, forage,
and replenish fat reserves, suggesting that migrating birds may provide a good
system to test Abrahams (1986) perceptual limit model. Firstly, migrating birds
arriving at unfamiliar foraging habitats may not be able to assess differences
between them. They may not posses any knowledge about resource distribution
across the habitats, and they do not have time to gain sufficient knowledge.
Secondly, bird densities at a habitat can change rapidly. Migration waves of
different populations, or even changes in weather conditions, may cause dra-
matic changes in bird densities at the same site within days or even hours.
Thirdly, the rapid turnover of individuals prevents pseudoreplication. Many
studies on IFD used the same individuals at different resource densities. As
shown byMilinsky (1994) past experiencemay bias habitat use by individuals, or
affect movement between patches. The high turnover of individuals at stopover
sites enables quick, repeated sampling at the same stopover site of completely
new individuals. This can be easily confirmed by marking individual birds.
Most importantly, the payoff of foraging on different patches can be mea-
sured. Density-dependent habitat selection should work in the short term just
as it does in the long term because there must be a connection between im-
mediate rewards and the long-term fitness of individuals (Kennedy and Gray,
1993). Therefore, though fitness is hard to measure, any of its short-term
components, like changes in body mass or fat stores, would be appropriate.
This is especially true for migratory birds. According to the optimal migration
theory there is a major importance for food-rich stopover site selection in order
471

to minimise predation risk and to maximise the speed of migration and energy
economy during migration (Alerstam and Lindstrom, 1990). High fat deposi-
tion rate is especially important in our case since for many migrants, the
northern Negev represents the last opportunity to refuel before crossing the
Saharan desert. On their southbound migration, birds that do not manage to
store enough fat may not complete their journey and perish. Therefore, rapid
fat deposition has an important role in natural selection (Alerstam, 1990).
We studied habitat selection among migratory passerines during autumn
migration in two stopover sites. These sites were Pistachio groves that differ in
fruit density. It has been shown that fruits, rather than insects, are often the
main source for fat gain in passerines during migration (Fry et al., 1970; Izhaki,
1986). Our goal was to test whether habitat selection by ‘naive’ warblers is a
density-dependent process, in which birds trade-off between food density and
competition. According to the perceptual limit model predictions (Abrahams,
1986) we hypothesized that bird distribution would be free but non-ideal. This
may emerge from imperfect knowledge about the environment due to insuffi-
cient time to gain that knowledge. Consequently, we predicted that: (1) the poor
habitat would be over-exploited and (2) deviations from habitat matching
would increase with bird density. We also tested a second hypothesis, that over-
exploitation of the poor habitat has a cost (fitness in the poor habitat should be
lower than in the rich one). We predicted that the overall average body con-
dition in the poor habitat would be lower than in the rich one, due to a lower
energy gain. This important outcome of over-exploitation has not been inves-
tigated in any of the continuous input studies.
Methods
Study area
Our study was done in the Lahav forest, northern Negev, Israel. The mostly
coniferous Lahav forest has been planted by the Jewish National Fund since
1956 in a semi-arid zone about 10–20 km north of Beer-Sheva. During the last
15 years broad-leaf groves were planted, mainly in the southern part of Lahav
woods. These included several Pistachio orchards that yield fruit during the
autumn, and therefore serve as an important habitat for migratory passerines
during stopover (Sapir, 2001). We studied habitat selection in two Atlantic Pis-
tachio (Pistacia atlantica) groves surrounded by coniferous lots. Both Pistachio
stands were planted in 1981, and are of the same size (about 4 ha). The distance
between them is about 1 km. For an unknown reason, the trees in one grove, plot
20, were rich in fruits during the study period, while those in plot 19 bore very few
fruits. Hereafter, we define these groves as the rich habitat and the poor habitat.
472

Studied species
From among the large variety of passerine species captured, we concentrated
on two groups: warblers of the genus Sylvia, and chats (family: Turdidae).
Although both groups are known to be mostly insectivores, analysis of drop-
pings and observations on feeding birds (Sapir, 1999, 2001) revealed that
during stopover, warblers fed mainly on Pistachio berries, while chats fed
mainly on insects. Since we did not quantify insect density, we were unable to
correlate resource densities and chat densities.
Bird sampling
In autumn 1995 we sampled birds using mist nets in the rich habitat. Mist
netting was conducted on 19 days between 17/8 and 18/11. In Autumn 1996
birds were sampled in the rich habitat for 19 days between 27/7 and 30/11. In
15 out of the 19 days (between 5/8 and 9/11) birds were also sampled in plot 19
(the poor habitat). In each plot, 96 m of mist net were opened from first light
for 4 h. Birds were collected every 30 min. For each bird we recorded species,
wing length (an estimator for body size), body mass, and fat score on a scale of
0–5. According to the sampling method, all densities are given as (number of
birds)/(96 m mist net · 4 h).
Resource density
We estimated fruit density by counting the number of fruiting trees in each
plot, assuming that variation between trees was not different between plots.
There were 179 fruiting trees in the rich habitat and only four in the poor
habitat. These numbers were constant between years and throughout Autumn
1996. Therefore, the resource ratio between the two plots was 45:1 in favour of
the rich plot. A more precise estimation of fruit density in autumn 1998 also
confirmed this resource ratio (Sapir, 2001). Kennedy and Gray (1993), and
Kennedy et al. (1994) noted that in order to detect deviations from habitat
matching, several resource ratios between two habitats should be used, in-
cluding extreme differences between food density in the two habitats. In our
two sites, however, we had to deal with a given permanent situation.
Evaluating body condition
Usually energy gain is evaluated in birds by measuring changes in the body
mass of recaptured individuals. However, the number of birds we recaptured
during 15 sampling periods was too low for statistical analysis. Therefore we
evaluated body condition by using two methods. First, we measured fat score
473

(from 0 to 5) for each bird captured by checking the amount of fat present in
the sternum fat reserves.
Next, we regressed body mass vs. wing length for each species and used the
residuals of the regression to indicate body condition for each individual. We
defined the ‘body condition index’ of an individual as the residual value of its
body mass divided by the expected value (obtained from the regression). We
found that the residuals were highly correlated with the fat score (For Black-
cap, the most common species n ¼ 94, r ¼ 0:74, p < 0:001), indicating that
after removing the effect of body size, higher body mass is largely the result of
increased fat storage. However, since the fat score is measured on an arbitrary
scale (0–5) it is not normally distributed. In contrast, the normal distribution of
the calculated body condition index makes this method appropriate for sta-
tistical analysis. We plotted (for each day) the average value of the body
condition index against density (suitability lines, Fretwell and Lucas, 1969).
Habitat selection
We used the isodar method (Morris, 1987) to evaluate quantitative and qual-
itative differences between the two groves. We further tested whether habitat
matching best fit the predictions of a continuous input or a consumer-resource
model (i.e., a situation where consumers forage over a very large scale, and
resource renewal may exceed the intake rate of single individuals). In partic-
ular, Morris (1994) suggested that the consumer-resource model would yield a
linear isodar on an arithmetic scale, whereas the continuous input yields a
linear isodar on a logarithmic scale.
Statistical analysis
Linear regressions were applied to data which were normally distributed. We
followed Dixon (1950 in: Sokal and Rohlf, 1981) to detect and remove outliers.
Results
During our census, we recorded nine species of Sylvia warblers (common and
scientific names are given in Appendix 1) of which three species were wide-
spread: Lesser Whitethroat, Blackcap and Orphean Warbler (Appendix 1). In
1995 bird densities in the rich habitat were much higher than in 1996 (Table 1,
n ¼ 19, t ¼ 4:073, p ¼ 0:001). Among the warblers – Blackcap, Lesser White-
throat and Common Whitethroat were significantly more abundant in 1995.
There were no significant differences in the densities of Orphean Warbler be-
tween years.
474

In 1996, the total bird species densities in the rich habitat were significantly
higher than in the food-poor one (Table 1, n ¼ 15, t ¼ 5:293, p < 0:001). In the
food-rich habitat all three widespread species of warblers were significantly
more common than in the food-poor habitat. We tested whether the differences
in bird densities were due to differences in fruit densities between the rich and
the poor plot.
Temporal migration patterns
Five common species of chats stop over in Lahav woods during autumn:
Rufous Bush Robin, Black-eared Wheatear, Common Redstart, Robin and
Black Redstart (scientific names are given in Appendix 1). We excluded chats
from the habitat selection data analysis for two reasons. First, analysis of feces
showed that the diet of those species that were present at very high densities in
the groves, consisted mainly of insects (Sapir, 2001). Furthermore, direct ob-
servations revealed that all of them are highly territorial (Sapir, 2001). During
stopover, inter- and intra-specific aggressive encounters were frequently seen.
These negative interactions suggested that in general, chats were not free to
select their habitat.
It is hard to asses whether the seasonal partitioning of the chats at the study
site (Fig. 1a) is a result of different distances of the breeding and/or wintering
grounds from the study site, or a direct result of competition (e.g. Abramsky
and Safriel, 1980). The negative relationship between the two most com-
mon chats during the short period of overlap (Common Redstart density¼95.2 � 64 · [log] Black-eared Wheatear density, n ¼ 9, r2 ¼ 0:73, p ¼ 0:024)
suggests that aggressive interactions may explain to some extent the observed
pattern.
Table 1. The number of sampling days and bird densities in stop over sites in Lahav woods during
autumn 1995 and autumn 1996. The number of birds includes all species trapped.
1995 1996 1996
Habitat Rich Rich Poor
Sampling days 19 19 15
Period 17/8–23/11 27/7–30/11 5/8–9/11
Birds/day (SE) 82.0±(7.61) 46.4±(5.24) 11.0±(1.12)
t-test Between years (Rich habitat) Between habitats (1996)
n 19 15
t 4.073 5.293
p =0.001 <0.001
475

In contrast with chats, warblers fed mainly on fruits and occasionally on
insects. Moreover, they seldom showed aggressive behaviour (Sapir, 1999,
2001). Often, a few individuals of the same or different species were seen
feeding on the same branch. Unlike the chats, the migration waves of the two
most common warblers, Lesser Whitethroat and Blackcap, overlapped. The
migration waves of these two species also coincided with those of Orphean
Warbler during early migration (Fig. 1b). The densities of Blackcap and Lesser
Whitethroat were positively correlated (Blackcap density ¼ 6.93 + 0.77 ·Lesser Whitethroat density, n ¼ 18, r2 ¼ 0:66, p < 0:01).
These differences in migration patterns between chats and warblers are im-
portant since they suggest that warblers do not interfere with each other.
Therefore, rather than interference competition, it is more likely that warblers
Figure 1. Changes in species densities with time in the food-rich Pistachio grove in the Lahav forest
during autumn 1995 for (a) five common species of chats (family: Turdidae) and (b) three common
species of Warblers (genus: Sylvia). Similar patterns were observed in autumn 1996.
476

experience scramble competition (where all individuals have an equal chance of
acquiring food, and obtaining food depends largely on order of arrival at the
resource; Nicholson, 1954). In other words, warbler distribution seems to be
free. The question is whether it is ideal.
Habitat selection
The simultaneous migration of Sylvids, the lack of interference and the
similar diet of the species studied, suggested that density-dependent habitat
selection should be studied at the genus, rather than at the species level. That
is, if density-dependent habitat selection exists, newly arriving individuals
selecting a habitat should consider the number of all Sylvids in the habitat,
rather than just the density of their own species. Because we did not notice
any inter- or intra-specific negative interactions between warblers, we con-
cluded that scramble competition is more likely in warblers than interference
competition. Therefore, we calculated a ‘guild’ isodar and suitability lines for
the whole Sylvia genus, rather than for each species on its own. Previous
studies on migratory warblers (reviewed by Hutto, 1985) have also shown a
high correlation between resources and bird ‘guild density’ rather then a
single species.
Suitability
To test whether habitat selection was density dependent, we calculated habitat
suitability by regressing bird body condition against bird density. In 1995 we
found a significant negative correlation between Sylvid densities and the av-
erage body condition of the birds in the rich plot (linear regression, n ¼ 19,
r ¼ �0:47, p ¼ 0:022) (Shochat, 1999). In 1996 we sampled birds in both the
rich and the poor habitats. Expected body mass and average fat score of
Sylvids decreased as density increased in both plots, while the regression lines
diverged (Fig. 2a). This indicated that the density-dependent effect is stronger
in the poor plot. The fit of the suitability line in the rich habitat is low
(r2 ¼ 0:195), suggesting that body condition is also affected by other factors,
not only competition.
Under IFD, one would expect that on any given day the average body
condition of birds in the two habitats would be equal. Therefore, connecting
densities of the same day on the suitability lines of the two habitats should yield
lines parallel to the x axis. However, in 12 cases, the average body condition in
the rich plot was higher than in the poor plot (Fig. 2b, paired t-test, n ¼ 13,
t ¼ 4:46, p ¼ 0:001), suggesting that indeed, distribution was not ideal-free.
The opposite trend was observed only on 1 day, when densities and sample
sizes were low.
477

Isodars
Quantitative and qualitative differences between habitats can be detected by
the isodar method (Morris, 1988; Ovadia and Abramsky, 1995). We found a
very high correlation between the density of Sylvids in the rich and the poor
habitat (Fig. 3a). The quantitative difference between the plots (intercept) is
about five birds/(96 m net · 4 h). This means that according to the regression
model the first bird entered the poor habitat when there were five birds already
in the rich one. The slope of the isodar, about 2.5, reflects the divergence of the
Figure 2. (a) The relations between body condition index and warbler densities (suitability lines
sensu Fretwell and Lucas 1969) in both food-rich and food-poor groves in autumn 1996. The
average body condition of warblers decreased as their density increased in both groves. The two
suitability lines diverge, suggesting that in the food-poor grove, any new individual entering has a
higher negative effect on other individual’s energy gain, compared with the food-rich grove. (b) The
same data as in 2a, with lines connecting data that were collected on the same day in the two groves.
On all but 1 day the average body condition was higher at the food-rich patch. Two points are
missing for the food-poor plot, one with no warblers trapped (seven warblers in the food-rich
patch), and another removed as an outlier (11 warblers in the food-poor patch and 37 in the food-
rich patch).
478
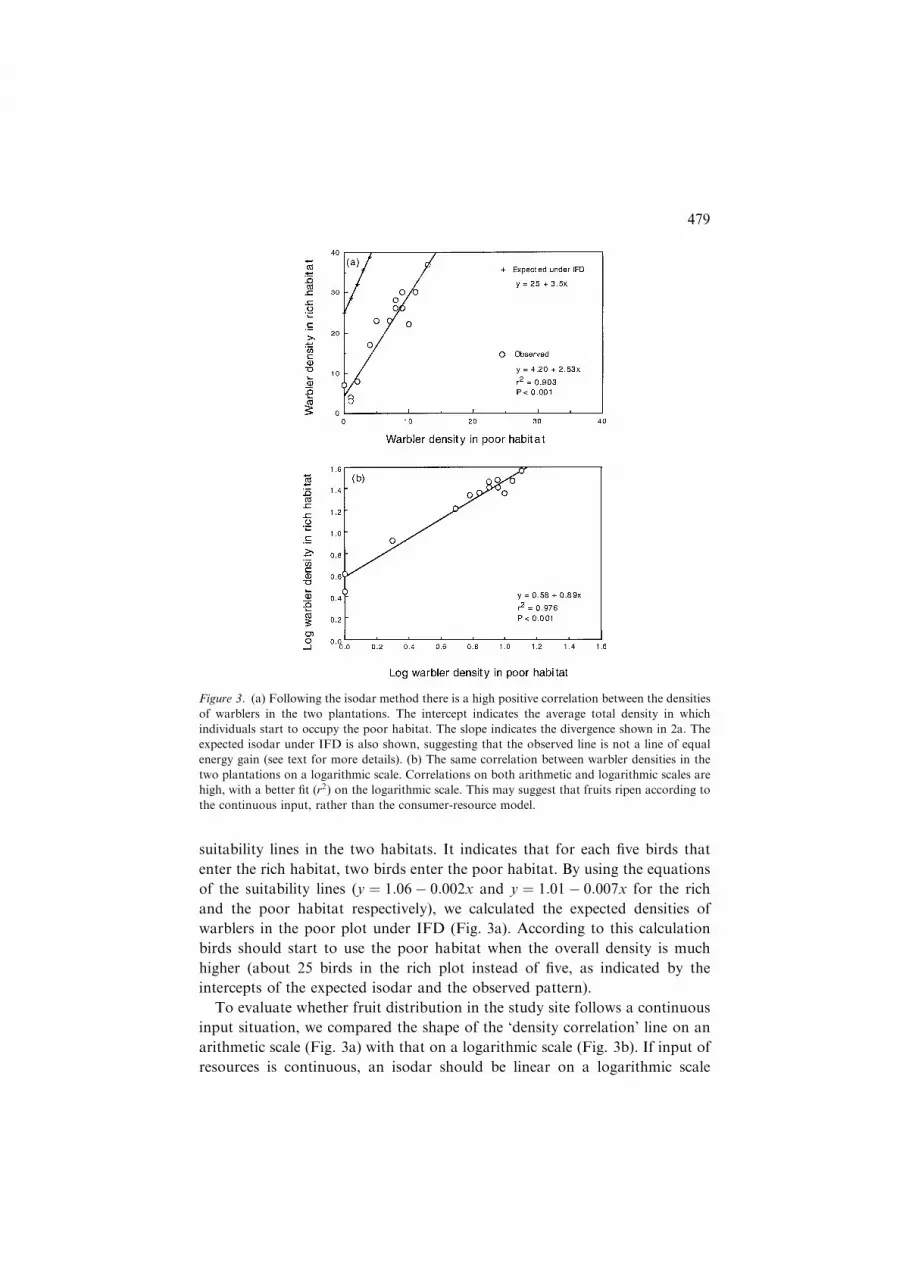
suitability lines in the two habitats. It indicates that for each five birds that
enter the rich habitat, two birds enter the poor habitat. By using the equations
of the suitability lines (y ¼ 1:06� 0:002x and y ¼ 1:01� 0:007x for the rich
and the poor habitat respectively), we calculated the expected densities of
warblers in the poor plot under IFD (Fig. 3a). According to this calculation
birds should start to use the poor habitat when the overall density is much
higher (about 25 birds in the rich plot instead of five, as indicated by the
intercepts of the expected isodar and the observed pattern).
To evaluate whether fruit distribution in the study site follows a continuous
input situation, we compared the shape of the ‘density correlation’ line on an
arithmetic scale (Fig. 3a) with that on a logarithmic scale (Fig. 3b). If input of
resources is continuous, an isodar should be linear on a logarithmic scale
Figure 3. (a) Following the isodar method there is a high positive correlation between the densities
of warblers in the two plantations. The intercept indicates the average total density in which
individuals start to occupy the poor habitat. The slope indicates the divergence shown in 2a. The
expected isodar under IFD is also shown, suggesting that the observed line is not a line of equal
energy gain (see text for more details). (b) The same correlation between warbler densities in the
two plantations on a logarithmic scale. Correlations on both arithmetic and logarithmic scales are
high, with a better fit (r2) on the logarithmic scale. This may suggest that fruits ripen according to
the continuous input, rather than the consumer-resource model.
479

(Morris, 1994). When we plotted the warbler density in the rich plot against the
warbler density in the poor plot, the fit (r2) of the regression line on logarithmic
scale was better than on the arithmetic scale (Fig. 3). This trend did not change
after removing Sardinian Warbler densities (a resident species in the Lahav
area which may bias in density measures by having a high site fidelity, data not
shown). The better fit on logarithmic scale may suggest continuous input (i.e.,
fruits ripen and are eaten by birds immediately). Note however that both
regression lines in Figure 3 yield a very high fit (r2) and that the differences
between the r2 of the two regression lines are small so that this suggestion is
only weakly supported by the data (see Discussion).
Resource matching
As mentioned earlier, the ratio between fruit densities in the two groves was
45:1 (log ratio ¼ 1.65). Under an IFD, the ratio of resources per individuals in
the two habitats should be equal. Subsequently, based on predictions of the
resource-matching rule, we tested whether the average ratio between warbler
densities was equal to the ratio between resources. We assumed that the two
groves did not differ in predation risk, and that birds were distributed ac-
cording to food abundance. This assumption is supported by a long-term study
on bird abundance in the studied groves (Sapir, 2001).
In contrast to the habitat-matching rule predictions, we found that on all
15 days, the ratio between warbler densities (0:58� 0:13) was lower than
the ratio between resources, indicating habitat under-matching (CI0:001;13 ¼0:53� 0:99). Thus it appears that the poor habitat was over-exploited (more
individuals than expected by IFD). Consequently, we hypothesized that there
must be a cost for over-exploitation.
We tested whether there was a cost to over-exploitation of the poor habitat
by comparing the average body condition of birds on each day between the two
habitats. We found that the average body condition index of warblers in the
food-poor plot (1.02) was significantly lower than in the food-rich plot (0.97)
(ANOVA, n ¼ 15, r2 ¼ 0:418, p ¼ 0:024), suggesting that average energy gain
in this habitat was lower.
The observed habitat under-matching pattern could be a consequence of
unequal competitive abilities since the different species of warblers differ sig-
nificantly in body size. Therefore, in order to compensate for a possible bias of
unequal competitive abilities, one should consider biomass rather than densi-
ties when checking if consumers match resources. In order to ascertain whether
differences in competitive abilities may have caused the deviation from IFD, we
calculated the total bird body mass ratio between the rich and the poor habitats
for each day. We then tested whether the values matched the resource ratio
between the habitats. We used here the expected body mass of each individual
480

which was calculated by regressing the body mass against wing length and not
the observed mass values, since the observed values are affected by density
and by habitat. This compensation for body mass did not change the ob-
served pattern of habitat under-matching when comparing the densities
(CI0:001;13 ¼ 0:53� 0:23).
One of the predictions of the perceptual limit model (Abrahams, 1986) is
that deviations from IFD should increase with total consumer density. When
we plotted the deviations from habitat matching against densities, we found
a significant positive relationship (linear regression, r2 ¼ 0:249, p ¼ 0:035;
Fig. 4a). To test whether this was caused by differences in competitive abilities,
we also used the deviations from habitat matching that were calculated by
using body mass instead of densities. As shown in Figure 5b, not only did the
observed pattern persist, the fit (r2) of the regression line is higher. It indicates
Figure 4. (a) The deviations from IFD increase with density, as predicted by the perceptual limit
model (Abrahams, 1986). The deviations were calculated using warbler densities. (b) When the
deviations were calculated using warbler body mass instead of warbler density, linear regression
yielded an even better fit. Therefore, taking into account unequal competitive abilities did not
compensate for the deviations from IFD.
481

that after taking into account the competitive abilities of each species there is
still an increase in deviations from IFD with an increase in density.
Discussion
In this study we tested whether (1) there is a density-dependent process of habitat
selection among migratory passerines during stopover, and (2) whether imper-
fect knowledge of resource distribution leads to deviations from IFD as sug-
gested by Abrahams (1986). We found that at any given time there were more
birds in the rich habitat than the poor habitat. Yet the distribution of birds was
not ideal free; habitat under-matching (the poor habitat was over-exploited) was
evident. The degree of under-matching may be even greater than we estimated.
When calculating the ratio between resource densities at the two sites we did not
take into account rapid fruit depletion in the poor habitat. It may result in an
even higher resource density ratio than we reported. Still, the habitat under-
matching led to a fitness cost in the poor habitat, where the average body con-
dition of the birds was worse than that of birds in the rich habitat.
Can these deviations from the IFD be explained? The habitat matching rule is
only expected when resource input to the environment is continuous. In the
absence of a continuous input situation, the habitat matching rule is violated no
matter how the birds are distributed (Tregenza, 1994; Sutherland, 1996). Fol-
lowing Morris (1994) our results suggest that there is a continuous input of fruit
in the Pistachio groves (Fig. 3). However, since the correlation between warbler
densities in the two groves was highly linear on both arithmetic and logarithmic
scale, this interpretation should be made with caution. It seems that it is difficult
to obtain a clear separation between continuous input and resource–consumer
situations by this method. Morris (1994) also used isodars to study rodent dis-
tribution and he too found small differences between isodars that were plotted
on arithmetic and logarithmic scales. However the continuous input of re-
sources, which is an excellent experimental variable to use in the study of animal
distribution among foraging patches, is a rare situation in nature (Morris, 1994;
Tregenza, 1994; Sutherland, 1996). Moreover, in the Pistachio groves in Lahav
woods, the dynamics of fruit ripening is slow and continuous throughout the
autumn, unlike in a continuous input situation (Sapir, 1999, 2001). Therefore, it
is likely that fruit ripening dynamics and their consumption by warblers may be
more closely approximated by the consumer–resource model (Morris, 1994).
Since fruit renewal at the rich habitat exceeds the intake rate by warblers it
violates the IFD assumption of a continuous input of resources.
Can the lack of resource-matching between the two groves be explained by
the lack of continuous input of fruits in the Lahav Pistachio groves? To address
this question, animal distribution under different situations should be com-
482

pared. Tregenza (1994) explained how interference influences the directions of
deviations from habitat matching. According to him, high interference should
lead to over-exploitation of the poor habitat, whereas low interference will
cause under-exploitation of the poor habitat. When there is no interference
competition and no continuous input of resources, foragers may not enter the
poor habitat even when densities are high, since they are free to enter the rich
habitat (Tregenza, 1994). As we found no evidence of interference competition
in this study, we would expect most birds to use only the rich habitat at low
bird densities, while at very high densities the birds should under-exploit the
poor habitat. The results, however, show that at any population density there
is always an over-exploitation of the poor habitat. Consequently the lack of
continuous input is not sufficient to explain the deviations from IFD.
Since there is no interference, the question should be whether there is
competition at all. In other words: is there a density-dependent habitat selec-
tion process in the Lahav woods? The results support the idea that habitat
selection during migration is density dependent: as density increases, there is a
decline in average body condition (Fig. 2). These differences should be inter-
preted with caution, since fat storage may represent fat depositions in remote
sites north of ours. However, data from other sites in the study area, from both
spring and autumn indicate that in most cases body condition is negatively
correlated with density (Sapir, 2001; Shochat, unpublished). Specifically in this
study, we had no reason to assume that factors that bias body condition will
behave differently in the two groves. Therefore, it appears that density has a
strong effect, which concurs with other studies on different bird species at
stopover sites (e.g. Hansson and Petterson, 1989; Moore and Yong, 1991). We
also found a strong link between densities in the two habitats (Fig. 3), despite
the distance between them. In addition to the very high correlation, the slope of
the isodar in Figure 3 indicates the divergence of the suitability lines in
Figure 2, and exemplifies the strength of the isodar method as a tool to assess
qualitative differences between different habitats (Ovadia and Abramsky,
1995). However, the regression line that describes this correlation is not an IFD
isodar since each point on the line always represents lower fat gain in the poor
habitat. Such a linear relationship between densities is possible not only when
fitness in the two studied habitats is equal, but also in cases where fitness, or
energy gain, in one habitat is linearly correlated with fitness/gain values in the
other habitat (Morris, 1994).
In this study we applied for the first time a ‘guild’ isodar (Fig. 3). Following
Hutto (1985), who found a pattern of habitat matching only when he used the
densities of all warbler species and compared it with insect density, we suggest
that when there is no interference, this can be done also when plotting an
isodar and when species with a similar diet coexist in the same space at the
same time. Such a case can also agree with the ‘shared habitat preference’
483

(Pimm et al., 1985) where all species show the same primary and secondary
habitat preference. Regelmann (1984) and Houston and McNamara (1988)
showed that after all the large individuals or good competitors distributed
themselves ideally in two habitats, smaller individuals or bad competitors can
in turn distribute themselves according to the densities of the large ones. This
may be the case whether interference is taking place or not.
The deviations from IFD found here are not the result of interference. Two
alternative explanations for the deviations can be either unequal competitive
abilities (such as those that occur during scramble competition; Parker and
Sutherland, 1986; Houston and McNamara, 1988) or imperfect knowledge of
resource distribution (the perceptual limit model; Abrahams, 1986). Separating
these two models is difficult. The perceptual limit model (Abrahams, 1986) has
two major predictions. One is that the bias in densities will always be towards
the poor habitat. The second prediction is that an increase in the overall density
should increase the degree of under-matching, because more and more indi-
viduals will randomly select where to go. In contrast, Parker and Sutherland
(1986) showed how competitive abilities can be matched to the food input ratio,
by either density under- or over-matching. Houston and McNamara (1988)
further developed this model and demonstrated that in most cases of unequal
competitive abilities the overall distribution of consumers will under-match the
input ratio. According to their model, the degree of under-matching should be
higher at high overall consumer density. Therefore these two models (perceptual
limit and different competitive abilities) have more or less the same predictions.
The systematic bias we found towards the poor habitat and the tendency of
the deviations to increase with total bird density (Fig. 4) agree with the per-
ceptual constraint model of imperfect knowledge (Abrahams, 1986). Though
there are differences in scramble competitive abilities between the warblers,
especially of different species, we found no evidence that the habitat under-
matching pattern was a result of these differences. However, imperfect
knowledge of the environment is more than the inability to evaluate slight
differences between patches of different resource densities. That is, individuals
in a new environment simply may not know their choices beyond their visual
horizon. How this fact affects their ability to discriminate between patches of
slightly different qualities remains unclear. The increase in deviations from IFD
as density increases (Fig. 4) may suggest a link between these two aspects of
imperfect knowledge: the perceptual limit (Abrahams, 1986) and the simple
lack of knowledge on where the food patches are, suggested here. At this stage
we have no idea how these are connected.
How would the distance between the two study plots lead to habitat under-
matching? Density-dependent habitat selection requires a choice between two
or more habitats. Most studies on IFD were conducted in two adjacent
patches. However, if each habitat patch is at equilibrium with its nearest
484

neighbour, one should expect an IFD and habitat matching across all patches
on a larger scale. This may be true in a landscape where all patches are suitable
for the individuals, although these patches may differ in quality. However,
when the area between two suitable patches is hostile, namely, the patches are
to some extent isolated islands, the densities of consumers in these patches may
under-match resource distributions. In our study, a local resource peak in the
environment may have led to the observed under-matching. Birds that landed
near the poor habitat may have stayed in it because the whole area around it
was completely hostile, and chances of moving to the rich habitat remained low
since it was not in sight. Regelmann (1984) also considered travel cost effects.
Though it did not affect the final distribution which appeared to be ideal free, it
affected switching rate of fish between two food patches. He also found dif-
ferences in switching rates between good and bad competitors.
In conclusion, our work indicates that equilibrium, as it is defined by the
IFD model (no individual gain by switching patch), is not likely to develop in
the short term in stopover sites of migrating birds. In the long term it is not
clear whether differences in body condition between habitat patches of different
qualities affect their total fitness. However, high fat depositions are crucial for a
successful journey to migrate over harsh conditions, i.e. the crossing of the
Saharan desert. Since body condition significantly differed between the two
habitat patches we studied, a direct effect on bird inclusive fitness is possible. In
terms of immediate pay-off, the results suggest that an IFD cannot be achieved
in an unfamiliar environment, and cannot be maintained as new individuals
keep arriving and departing. Yet, food density can be a good estimator of
migratory bird density. Furthermore, bird densities across habitat patches may
be highly correlated (even though the birds are not ideally distributed) yielding
a very high-fit isodar. Altogether, confirmation of an IFD may not only require
the study of animal distribution, but also research on body condition/fitness,
and on the distribution of resources. Among migratory passerines, we detected
an under-matching situation, resulting in a cost to birds in the fruit-poor
habitat. The resource under-matching appeared to be the result of imperfect
knowledge about the distribution of food patches. This suggests that temporal
communities formed during stop over are not ideally distributed. Such com-
munities may always be on the verge of, but never at equilibrium, since by the
time it takes a transient population to explore its environment, it would need to
move on and then would be replaced by another naive group.
Acknowledgements
Financial support for this research was provided by the Jewish National Fund.
We thank Ido Tsurim, Nir Sapir and Yoni Witztum for their assistance in the
485

field. We also thank Douglas Morris and Niclas Jonzen for comments that
greatly improved the manuscript. This is publication number 343 of the Mit-
rani Department of Desert Ecology.
References
Abrahams, M.V. (1986) Patch choice under perceptual constraints: a cause for departures from an
ideal free distribution. Behav. Ecol. Sociobiol. 19, 409–415.
Abramsky, Z. and Safriel, U. (1980) Seasonal patterns in Mediterranean bird community com-
posed of transient, wintering and resident passerines. Ornis Scand. 11, 201–216.
Alerstam, T. (1990) Bird Migration. Cambridge University Press, Cambridge.
Alerstam, T. and Lindstrom, A. (1990) Optimal bird migration: the relative importance of time,
energy, and safety. In E. Gwinner (ed.) Bird Migration: Physiology and Ecophysiology. Springer-
Verlag, Berlin, pp. 251—331.
Appendix 1
Common and Latin names of migrant warblers of the genus Sylvia and chats (family: Turdidae)
that were captured in Pistachio plantations in Lahav forest, the northern Negev during autumn
1995 and autumn1996
Species Status Total captured
1995 1996
Warblers
Common Whitethroat (Sylvia communis) PM 18 10
Lesser Whitethroat (Sylvia curruca) PM 319 73
Garden Warbler (Sylvia borin) PM 5
Barred Warbler (Sylvia nisoria) PM 3 2
Blackcap (Sylvia atricapilla) PM 375 94
Orphean Warbler (Sylvia hortensis) PM 101 146
Sardinian Warbler (Sylvia melanocephala) PM, W, R 25 26
Ruppel’s Warbler (Sylvia rueppelli) PM 1 1
Subalpine Warbler (Sylvia cantillans) PM 3
Chats
Stonechat (Saxicola torquata) W 1 1
Whinchat (Saxicola rubetra) PM 2
Common Wheatear (Oenanthe oenanthe) PM 2 2
Isabelline Wheatear (Oenanthe isabellina) PM 2
Black-eared Wheatear (Oenanthe hispanica) PM 185 174
Common Redstart (Phoenicurus phoenicurus) PM 214 34
Black Redstart (Phoenicurus ochruros) PM, W 26 14
European Robin (Erithacus rubecula) PM, W 18 3
Nightingale (Luscinia megarhynchos) PM 2
Thrush Nightingale (Luscinia luscinia) PM 1 3
Rufous Bush Robin (Cercotrichas galactotes) PM, SB 74 65
Blackbird (Turdus merula) R 9 7
Status: PM – Passage migrant, R – Resident, SB – Summer Breeder, W – Wintering. Bird numbers
in 1996 are the total numbers captured in the rich and the poor habitat patches.
486

Astrom, M. (1994) Travel cost and the ideal free distribution. Oikos 69, 516–519.
Fagen, R. (1987) A generalized habitat matching rule. Evol. Ecol. 1, 5–10.
Fretwell, S.D. (1972) Populations in a Seasonal Environment. Princeton University Press, Princeton,
NJ.
Fretwell, S.D. and Lucas, H.L. (1969) On territorial behavior and other factors influencing habitat
distribution in birds. I. Theoretical development. Acta Biotheor. 19, 16–36.
Fry, C.H., Ash, J.S. and Ferguson-Lees, I.J. (1970) Spring weights of some Palearctic migrants at
lake Chad. Ibis 112, 58–82.
Gray, R.D. (1994) Sparrows, matching and the ideal free distribution: can biological and psy-
chological approaches be synthesized? Anim. Behav. 48, 411–423.
Gray, R.D. and Kennedy, M. (1994) Perceptual constraints on optimal foraging: a reason for
departures from ideal free distribution. Anim. Behav. 47, 469–471.
Halama, K.J. and Dueser, R.D. (1994) Of mice and habitats: tests for density dependent habitat
selection. Oikos 69, 107–114.
Hansson, M. and Petterson, J. (1989) Competition and fat deposition in goldcrests (Regulus reg-
ulus) at a migration stop-over site. Vogelwarte 31, 21–31.
Houston, A.I. and McNamara, J.M. (1988) The ideal free distribution when competitive abilities
differ: an approach based on statistical mechanics. Anim. Behav. 36, 166–174.
Hutto, R.L. (1985) Habitat selection by nonbreeding, migratory land birds. In M.L. Cody (ed.)
Habitat Selection in Birds. Academic Press, London, pp. 455–476.
Izhaki, I. (1986) Seed dispersal by birds in an eastern Mediterranean scrub. PhD thesis, The
Hebrew university, Jerusalem, Israel.
Kennedy, M. and Gray, R.D. (1993) Can ecological theory predict the distribution of forag-
ing animals? A critical analysis of experiments in the ideal free distribution. Oikos 68, 158–
166.
Kennedy, M., Shave, C.R., Spencer, H.G. and Gray, R.D. (1994) Quantifying the effect of pre-
dation risk on foraging bullies: no need to assume an IFD. Ecology 75, 2220–2226.
Milinski, M. (1994) Long-term memory for food patches and implications for ideal free distribu-
tions in sticklebacks. Ecology 75, 1150–1156.
Milinski, M. and Parker, G.A. (1991) Competition for resources. In J.R. Krebs and N.B. Davies
(eds) Behavioral Ecology, 3rd edn. Blackwell Scientific Publications, Oxford, pp. 137–168.
Moore, F.R. and Yong, W. (1991) Evidence of food-based competition among passerine migrants
during stopover. Behav. Ecol. Sociobiol. 28, 85–90.
Morris, D.W. (1987) Tests of density-dependent habitat selection in a patchy environment. Ecol.
Monogr. 57, 269–281.
Morris, D.W. (1988) Habitat-dependent population regulation and community structure. Evol.
Ecol. 2, 253–269.
Morris, D.W. (1989) Habitat-dependent estimates of competitive interaction. Oikos 55, 111–120.
Morris, D.W. (1994) Habitat matching: alternatives and implications to populations and com-
munities. Evol. Ecol. 8, 387–406.
Nicholson, A.J. (1954) An outline of the dynamics of animal populations. Austral. J. Zool. 2, 9–65.
Ovadia, O. and Abramsky, Z. (1995) Density-dependent habitat selection: evaluation of the isodar
method. Oikos 73, 86–94.
Parker, G.A. (1978) Searching for mates. In J.R. Krebs and N.B. Davies (eds) Behavioral Ecology:
an Evolutionary Approach. Oxford, Blackwell, pp. 214–244.
Parker, G.A. and Sutherland, W.J. (1986) Ideal free distribution when individuals differ in com-
petitive ability: phenotype-limited ideal free distribution. Anim. Behav. 34, 1222–1242.
Pimm, S.L., Rosenzweig, M.L. and Mitchell, W. (1985) Competition and food selection: field tests
of a theory. Ecology 66, 798–807.
Pulliam, R.H. and Caraco, T. (1984) Living in groups: is there an optimal group size? In J.R. Krebs
and N.B. Davies (eds) Behavioral Ecology, 2nd edn. Blackwell Scientific Publications, Oxford,
pp. 122–147.
Regelmann, K. (1984) Competitive resource sharing: a simulation model. Anim. Behav. 32, 226–
232.
487
Recer, G.M., Blackhorn, W.U., Newman, J.A. and Tuttle, E.M. (1987) Temporal resource vari-
ability and the habitat-matching rule. Evol. Ecol. 1, 363–378.
Sapir, N. (1999) Do fruit density and foliage density affect the abundance of stop-over autumn
migrants in Atlantic Pistachio groves? In Proceedings of the 36th Meeting of the Zoological
Society of Israel (Tel-Aviv, Israel). Isr. J. Zool. 46, 171–172.
Sapir, N. (2001) Stopover ecology of autumn migratory passerines in a man-made wood at desert
edge. MSc thesis, Ben-Gurion University of the Negev, Israel.
Shochat, E. (1999) The effect of scrub fragmentation by planted woods on bird communities in the
northern Negev. PhD thesis, Ben-Gurion University of the Negev, Israel.
Sokal, R.R. and Rohlf, F.J. (1981) Biometry: The principles and Practice of Statistics in Biological
Research 2nd edn. W.H. Freeman and Company, New York.
Sutherland, W.J. (1983) Aggregation and the ‘ideal free’ distribution. J. Anim. Ecol. 52, 821–828.
Sutherland, W.J. (1996) From Individual Behavior to Population Ecology. Oxford University Press.
Tregenza, T. (1994) Common misconceptions in applying the ideal free distribution. Anim. Behav.
47, 485–487.
Tregenza, T., Parker, G.A. and Thompson, D.J. (1996) Interference and the ideal free distribution:
models and tests. Behav. Ecol. 7, 379–386.
Tregenza, T., Shaw, J.J. and Thompson, D.J. (1996) An experimental investigation of a new ideal
free distribution model. Evol. Ecol. 10, 45–49.
488


