Embed Size (px)
Citation preview
Dental Arch Asymmetry in an Isolated AdriaticCommunity
Katrin Schaefer,1* Tomislav Lauc,2 Philipp Mitteroecker,1 Philipp Gunz,1 and Fred L. Bookstein1–3
1Institute for Anthropology, University of Vienna, 1091 Vienna, Austria2Institute for Anthropological Research, 10000 Zagreb, Croatia3Department of Statistics, University of Washington, Seattle, Washington 98195
KEY WORDS geometric morphometrics; human isolates; endogamy; fluctuating asymmetry;directional asymmetry
ABSTRACT Developmental stability reflects the abil-ity of a genotype to develop in the same way under vary-ing environmental conditions. Deviations from develop-mental stability, arising from disruptive effects of envi-ronmental and genetic stresses, can be measured interms of fluctuating asymmetry, a particularly sensitiveindicator of the ability to cope with these stresses duringontogeny. In an inbred Adriatic island population, weexpected dental arch fluctuating asymmetry 1) to behigher than in an outbred sample from the same island,and 2) within this population, to increase with the levelof inbreeding. Due to environmental stress, we alsoexpected to find higher fluctuating asymmetry in theoutbred island population than in an urban referencegroup from the same country. The material consisted of506 dental casts of 253 children from 1) the island ofHvar, and 2) Zagreb, Croatia. Three-dimensional coordi-nates of 26 landmarks spanning the arches were digi-tized. The analysis partitioned the asymmetry of arch
forms into components for directional and fluctuatingbilateral asymmetry, using the appropriate Procrustesmethod (geometric morphometrics). The results corrobo-rated the hypotheses. Fluctuating asymmetry was foundto be higher on the island than in Zagreb in all groupsand in both jaws, and increased significantly with endo-gamy level in the lower jaw. There was no significantdirectional asymmetry in the Zagreb sample and like-wise none in the upper jaws of the outbred island group,but significant directional asymmetry in both jaws of theinbred population and also in the lower jaws of the out-bred island group. These results suggest an environmen-tal as well as a genetic influence on dental arch asymme-try. Although the lower jaws expressed these twostresses almost additively, the upper jaws appeared to bebetter buffered. The role of directional asymmetry as apotential indicator of craniofacial developmental instabil-ity clearly merits further attention. Am J Phys Anthro-pol 129:132–142, 2006. VVC 2005 Wiley-Liss, Inc.
Developmental stability reflects the ability of a geno-type to undergo stable development of a phenotype undergiven environmental conditions; its opposite, developmen-tal instability, is presumed to arise from disruptive effectsof environmental and genetic stresses. In bilaterally sym-metric traits, some deviations from symmetry measurethe inability of an organism to cope with stresses duringontogeny. The asymmetry of a bilateral object is a formalsum of directional asymmetry and fluctuating asymmetry.In the case of directional asymmetry, one side is consis-tently different from the other in conformation or size.Directional asymmetry implies (but does not demonstratethe presence of) repeatable effects of environment or geno-type on asymmetry, and thus conventionally does notqualify for use as a measure of developmental impreci-sion.Increased fluctuating asymmetry may occur for various
genetic reasons (homozygosity for deleterious recessivealleles, presence of certain dominant mutant alleles, dele-terious gene combinations, aneuploidy, or chromosomeaberrations) in combination with various stressors in theenvironment (malnutrition, extreme temperatures, orparasites: Markow, 1994, 1995; Woolf and Markow, 2003).Disruption of the genetic composition of coadapted genecomplexes by inbreeding or selection for traits, so that thebuffering potential is diminished, may increase the mag-nitude of developmental instability, resulting in increasedfluctuating asymmetry. Many studies show overall fluctu-
ating asymmetry to be higher in homozygotes than in het-erozygotes (e.g., Leary et al., 1984; Palmer and Strobeck,1986; Livshits and Smouse, 1993; Leamy et al., 2002), andsome reports in the literature support the hypothesis thatdevelopmental instability, resulting in increased fluctuat-ing asymmetry, is associated with inbreeding and homo-zygosity. Others found no evidence for this relationship(reviewed in Markow, 1995). Patterson and Patton (1990)and Clarke (1993) argued that the foundation of the het-erozygosity hypothesis (the demonstration of increased
Grant sponsor: Croatian Ministry of Science and Technology;Grant numbers: 0196001, 0196005, 0108330; Grant sponsor: Well-come Trust; Grant sponsor: Austrian Ministry of Culture, Scienceand Education; Grant sponsor: Austrian Council for Science andTechnology; Grant numbers: P200.049/3-VI/I/2001, P200.093/I–VI/2004; Grant sponsor: Austrian Science Foundation; Grant number:P14738.
*Correspondence to: Katrin Schaefer, Institute for Anthropology,University of Vienna, Althanstrasse 14, 1091 Vienna, Austria.E-mail: [email protected]
Received 21 May 2004; accepted 15 October 2004.
DOI 10.1002/ajpa.20224Published online 14 October 2005 in Wiley InterScience
(www.interscience.wiley.com).
VVC 2005 WILEY-LISS, INC.
AMERICAN JOURNAL OF PHYSICAL ANTHROPOLOGY 129:132–142 (2006)
fluctuating asymmetry in more homozygous populations;Soule, 1979; Vrijenhoek and Lerman, 1982) is ambiguousas long as one cannot exclude confounding effects relatedto the evolutionary history of the population that mayindependently influence fluctuating asymmetry, such asan undetected breakdown in coadaptation or differencesin environmental conditions experienced during the devel-opment of individuals. Indeed, Albert and Auffray (2003)proposed within-population studies reporting correlationsbetween individual estimates of heterozygosity. They sug-gested that these might provide more convincing evidencethat the maintenance of developmental stability is de-pendent on heterozygosity (Biemont, 1983; Leary et al.,1983, 1984, 1992).Studies on laboratory mice (Bader, 1965) and in Japa-
nese children (Niswander and Chung, 1965) suggestedthat an increase in the fluctuating asymmetry of dentaldimensions may be related to inbreeding, but neitherstudy showed a clear effect of inbreeding on dental fluctu-ating asymmetry. In a sample of highly inbred Tristanites,Bailit et al. (1970) found increased fluctuating asymmetryof dental dimensions (compared to the Nasioi of Bougain-ville, the Kwaio of Malaita, and Bostonian children), butthe variation in degree of inbreeding was not found to berelated to variation in degree of asymmetry of the denti-tion. Moreover, the investigated population had low ca-loric intake and poor medical care, relative to other popu-lation groups, circumstances that might both have in-creased fluctuating asymmetry. Suarez (1974) proposedinbreeding as responsible for increased dental fluctuatingasymmetry in Neanderthals, but Doyle and Johnston(1977) suggested that values of dental fluctuating asym-metry similar to those among Neanderthals can be foundin modern populations with a low inbreeding coefficient,so that fluctuating asymmetry should be attributed toenvironmental stress rather than inbreeding. Since then,numerous studies have considered fluctuating dental asym-metry as an indirect measure of genetic and environmentalstress in various prehistoric and living human populations(e.g., DiBennardo and Bailit, 1978; Barden, 1980; Harrisand Nweeia, 1980; Townsend and Brown, 1980; Ben-Davidet al., 1992; Hershkovitz et al., 1993).In contrast to the relatively large number of studies
about the influence of inbreeding on the fluctuatingasymmetry of dental dimensions, there is little informa-tion about the influence of inbreeding on the directionaland fluctuating asymmetry of dental arch form per se.Dental arch asymmetry is a common finding in normal(orthodontically untreated) children, and congenital mal-formations, finger-sucking, extractions, interproximalcaries, and other extrinsic factors can increase dentalarch asymmetry (Bishara et al., 1994). But during themixed dentition, environmental factors may accountbetter for asymmetry (Maurice and Kula, 1998; Slajet al., 2003), because growth and developmental changesare accelerated after the relatively stable period of thedeciduous dentition. Maurice and Kula (1998), quantify-ing and describing dental arch asymmetry in children,suggested that small values of asymmetry were commonand found a high degree of interarch association betweenthe spatial positions of opposing dental landmarks, sothat any asymmetry noted in one arch was usually alsofound in the other. In a study of siblings, Cassidy et al.(1998) showed that the left side of the human dental archis slightly but systematically larger than the right side.They noted that the degree of asymmetry is significantlymore similar within sibships than between them. How-
ever, the genetic control of dental arch asymmetry is farfrom understood.The purpose of the present study was to evaluate fluctu-
ating asymmetry of the human dental arch in the repro-ductively isolated population on the Adriatic island ofHvar. We hypothesized that fluctuating asymmetry indental arches 1) would be higher in an inbred Adriaticisland population than in an outbred sample from thesame island, and 2) within this population, would increasewith the level of inbreeding.
MATERIALS AND METHODS
Studied populations and material
The population of the island of Hvar as well as of otherEastern Adriatic island isolates has been the object ofanthropological studies since the early 1970s. Complexethnohistorical events, migrational patterns, and sociocul-tural differences (Rudan et al., 1982a,b, 1987; Jovanovic,1996) contribute to a population structure on the island ofHvar that is very suitable for analyses of genetic influen-ces on various anthropometric traits (Rudan et al., 1986).Extensive studies of this island population include basicvocabulary (Sujoldzic, 1997), anthropometric head andbody dimensions (Rudan et al., 1986), physiological (car-diorespiratory) properties (Smolej-Narancic et al., 1991;Smolej-Narancic and Rudan, 2001), quantitative andqualitative dermatoglyphic traits of the digito-palmarcomplex (Rudan and Schmutzer, 1976), metacarpal boneX-rays (Skaric Juric and Rudan, 1997), analysis of eryth-rocytic antigens, serum proteins, and erythrocyte enzymesystems (Janicijevic et al., 1994), VNTR and STR DNApolymorphisms (Martinovic et al., 1998, 1999), mtDNA(Tolk et al., 2000), and Y-chromosome analyses (Baracet al., 2003).The subdivision of the Hvar population into several vil-
lages is an important factor in reproductive isolation andin reducing intrapopulation variation for various biocul-tural, sociocultural, and anthropometric traits (Simic andRudan, 1990). The reproductive isolation, along with thesmall effective size of the population, results in a limitedchoice of reproductive partners and subsequent inbreed-ing (Rudan and Rudan, 2000) and a positive tendencytoward isonymous marriages (which in some villagesreach a proportion of 40%: Roguljic et al., 1997), thus con-tributing to the overall deficit of heterozygotes (Rudanand Rudan, 2000). The inbreeding coefficient of 0.0233 inthis Hvar island sample is unusually high, even for an iso-late population. All this renders the Hvar population suit-able for investigating the influence of inbreeding on orofa-cial and odontometric traits (Lauc et al., 2003). Moreover,outbred individuals living under the same medicallyunderserved circumstances serve as controls for environ-mental stress on the island.From this population, we selected a sample, matched
for age and sex distribution to the total elementary schoolpopulation of the island, covering 20% of the total: 222children aged 7–15 years (98 girls and 124 boys), withearly mixed to complete permanent dentition. Upper andlower alginate impressions were taken and poured intodental stone. T.L. took all casts and recorded all data inMay 1999. As reference sample, we used 31 Zagreb chil-dren aged 8–16 years (14 girls and 17 boys). The referencesample was matched to the Hvar sample for distributionof dentition (Lauc et al., 2000) and occlusal traits (over-bite, overjet, buccal segment relationships, posteriorcrossbite, and medial diastema: Lauc, 2003).
133DENTAL ARCH ASYMMETRY IN ISOLATED COMMUNITY
Endogamy assessment
The degree of inbreeding in offspring of consanguineousunions can be measured by the ‘‘inbreeding coefficient’’ F,the proportion of an autosomal genome that is expected tobe homozygous through inheritance of identical genesfrom common ancestors (i.e., proportion of alleles identicalby descent (IBD) or autozygosity). Several previous stud-ies in the Hvar island population showed that grandpar-ental endogamy is a very reliable indicator of inbreedingin small villages, as most (if not all) pairs of individualswill eventually be related at some point in their ancestry(Rudan and Rudan, 2000; Smolej-Narancic and Rudan,2001). This conclusion is supported by the observation ofan endogamy level of 75.5% during the 19th century(Jovanovic et al., 1984), while the fraction of newcomers tothe island among parents of the current populationamounts to about 2%. Complete endogamy in these popu-lations will be related to a greater expected coefficient ofinbreeding in the individuals of our sample, and will (atleast in some instances) potentially discriminate inbredfrom noninbred individuals even better than can theactual genealogical reconstruction, as the latter tends tounderestimate the remote component of inbreeding (Bro-man and Weber, 1999; Shifman and Darvasi, 2001).For the endogamy assessment, each child’s parents pro-
vided a complete two-generation genealogical record,including places of birth and residences of the grandpar-ents. This enabled us to assess the individual’s degree ofinbreeding according to his/her four grandparents. Wedivided the sample into three groups: a ‘‘highly endoga-mous’’ group 1 (at least three grandparents born in thesame village) of 73 individuals, a ‘‘less endogamous’’ group2 (two grandparents born in the same village, the othertwo from different villages or all grandparents from differ-ent villages of the island of Hvar) of 135 individuals, andan outbred group 3 of 14 individuals with one or moregrandparents born outside the island of Hvar.
Landmarks and preprocessing
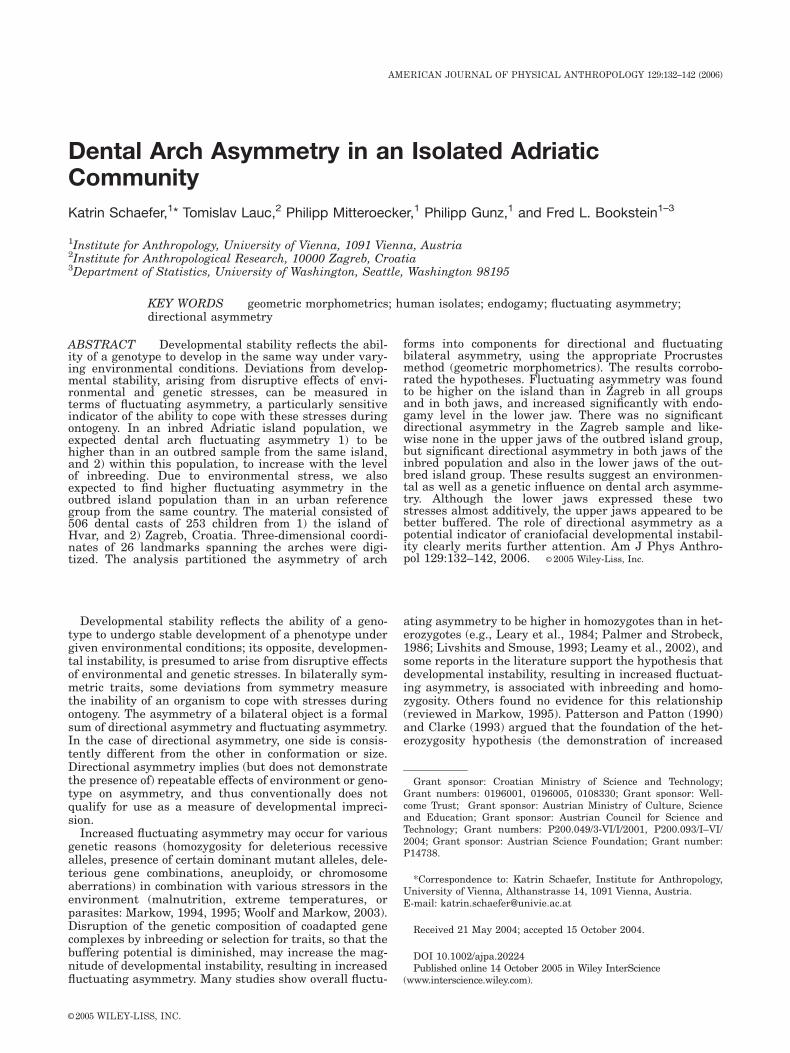
As the mixed dentition is characterized by attrition(wear and abrasion) of the primary teeth as well as by thegrowth of secondary teeth, the tops of cusps could not beused as appropriate reference points for a registration ofthe arches. Instead, we selected 26 nonocclusal landmarksfor this study, 13 per jaw: the vestibular, most cervicalpoint of the tooth on the edge of the gingiva for the firstsix on either side of the midline, together with one pointat the top of the medial papilla dentalis (Fig. 1). Missingteeth were noted, and the landmark was taken on theedge of the gingiva at the same position as it would havehad with the tooth inserted. Digitization of landmarkswas done using a Polhemus Fastrak1 three-dimensional(3D) digitizer.
Statistics and basic analyses
We approached this topic through a geometric morpho-metric (Bookstein, 1991) method. This way, analyses canbe based on multiple traits, providing better methods fordetecting stress (Leung et al., 2000), and circumventingthe confounding of directional with fluctuating asymmetrythat usually afflicts these studies. Palmer and Strobeck(2003) recommended that as a rule, traits that exhibit sig-nificant directional asymmetry should be excluded fromfluctuating asymmetry analyses, because even if direc-tional asymmetry is factored out statistically (Graham
et al., 1998), the remaining bilateral variation is likely acomplex mix of directional genetic effects, directional envi-ronmental effects, and developmental instability. Instead,we quantify directional and fluctuating asymmetry ascomponents of the total asymmetry of the complete land-mark configuration under consideration. To do so, weapply the Procrustes asymmetry assessment method fromMardia et al. (2000).The standard approach to asymmetry in anthropology
is based on terms of separate measures on the left andright sides of organisms. These methods are the topic of agood-sized biometric literature (for solid reviews, see Bok-lage, 1992; Palmer and Strobeck, 2003; for applications todental asymmetry, see Harris, 1992; Townsend andFarmer, 1998; Townsend et al., 1999). This classic litera-ture begins with lists of measured variables that may ormay not pertain to the positions of homologous land-marks. Our Procrustes approach is not an extension ofthis. Instead, it shares with other tools of geometric mor-phometrics the general strategy of characterizing thelandmark configuration as a whole as a single geometricobject. The classic language of fluctuating and directionalcomponents of asymmetry of single measures goes overwithout any biotheoretical change to apply in this quitedifferent algebraic context.Digitizing the landmarks as 3D coordinates enables us
to test object symmetry by interchanging pairs of land-marks and comparing the original configurations withtheir relabeled reflections. The total sum of squares forsquared shape distance between the original configura-tions and their relabeled reflections expresses what is con-ventionally identified with total asymmetry. The sum ofsquares for mean asymmetry, i.e., the squared shape dis-tance between these two group means (original and mir-rored data), corresponds to directional asymmetry, andthe within-cases sum of squares around this average,which expresses the extent to which the sample fluctuatesabout its own mean asymmetry, corresponds to fluctuatingasymmetry. For details, see the Appendix.The main procedural steps in this method are as fol-
lows: 1) For each single form, a mirrored and appropri-ately relabeled form is produced. 2) The original forms,
Fig. 1. Landmark positions on dental arches. The 24 bilat-eral points (12 in upper and 12 in lower jaw) were placed onedge of gingiva, vestibularly, at most cervical point of tooth. Twomidpoints were located at top of median papilla interdentalis.
134 K. SCHAEFER ET AL.
together with their mirrored counterparts, are projectedinto shape space using a GLS Procrustes superimposition(Rohlf and Slice, 1990). 3) The vector of shape differencebetween each shape and its relabeled reflection is a meas-ure of asymmetry; the sample average of these vectors isan estimate of directional asymmetry. 4) The total sum ofsquares of these individual vector differences is decom-posed into two components, one for directional and theother for fluctuating asymmetry. In our analysis, wetested for significant directional asymmetry within sev-eral subgroups of the sample. Values of fluctuating asym-metry, averaged over subgroup, were compared betweensubgroups by F-tests and permutation tests (Good, 2000).Comparisons were made for upper and lower arches sepa-rately.As Palmer and Strobeck (2003) noted, measurement
error poses a serious challenge for fluctuating asymmetryanalyses. We assessed measurement error by digitizing 10randomly selected casts 10 times. The variances in fluctu-ating asymmetry of these sets of measurements were com-pared to the fluctuating asymmetry variances within thedifferent groups under study and also to the smallest dif-ference in fluctuating asymmetry variance between thesegroups. In all cases, we observed the within-group orbetween-group variance to be at least eight times the var-iance due to measurement error.
RESULTS
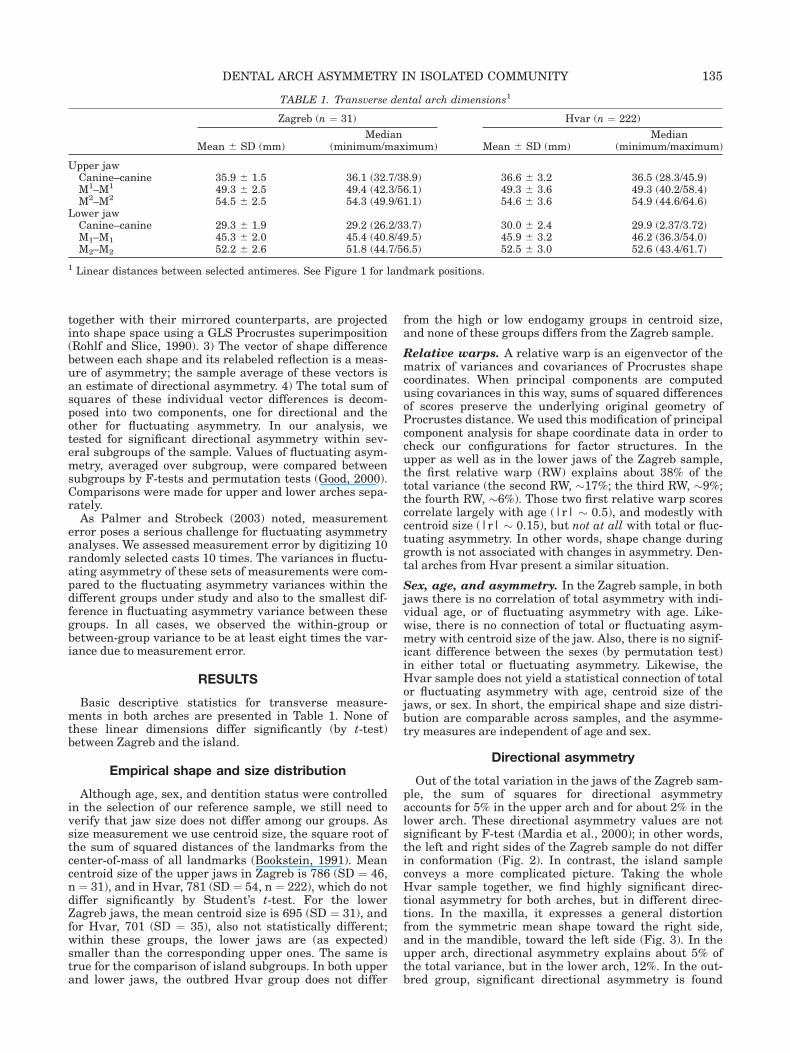
Basic descriptive statistics for transverse measure-ments in both arches are presented in Table 1. None ofthese linear dimensions differ significantly (by t-test)between Zagreb and the island.
Empirical shape and size distribution
Although age, sex, and dentition status were controlledin the selection of our reference sample, we still need toverify that jaw size does not differ among our groups. Assize measurement we use centroid size, the square root ofthe sum of squared distances of the landmarks from thecenter-of-mass of all landmarks (Bookstein, 1991). Meancentroid size of the upper jaws in Zagreb is 786 (SD ¼ 46,n ¼ 31), and in Hvar, 781 (SD ¼ 54, n ¼ 222), which do notdiffer significantly by Student’s t-test. For the lowerZagreb jaws, the mean centroid size is 695 (SD ¼ 31), andfor Hvar, 701 (SD ¼ 35), also not statistically different;within these groups, the lower jaws are (as expected)smaller than the corresponding upper ones. The same istrue for the comparison of island subgroups. In both upperand lower jaws, the outbred Hvar group does not differ
from the high or low endogamy groups in centroid size,and none of these groups differs from the Zagreb sample.
Relative warps. A relative warp is an eigenvector of thematrix of variances and covariances of Procrustes shapecoordinates. When principal components are computedusing covariances in this way, sums of squared differencesof scores preserve the underlying original geometry ofProcrustes distance. We used this modification of principalcomponent analysis for shape coordinate data in order tocheck our configurations for factor structures. In theupper as well as in the lower jaws of the Zagreb sample,the first relative warp (RW) explains about 38% of thetotal variance (the second RW, �17%; the third RW, �9%;the fourth RW, �6%). Those two first relative warp scorescorrelate largely with age (|r| � 0.5), and modestly withcentroid size (|r| � 0.15), but not at all with total or fluc-tuating asymmetry. In other words, shape change duringgrowth is not associated with changes in asymmetry. Den-tal arches from Hvar present a similar situation.
Sex, age, and asymmetry. In the Zagreb sample, in bothjaws there is no correlation of total asymmetry with indi-vidual age, or of fluctuating asymmetry with age. Like-wise, there is no connection of total or fluctuating asym-metry with centroid size of the jaw. Also, there is no signif-icant difference between the sexes (by permutation test)in either total or fluctuating asymmetry. Likewise, theHvar sample does not yield a statistical connection of totalor fluctuating asymmetry with age, centroid size of thejaws, or sex. In short, the empirical shape and size distri-bution are comparable across samples, and the asymme-try measures are independent of age and sex.
Directional asymmetry
Out of the total variation in the jaws of the Zagreb sam-ple, the sum of squares for directional asymmetryaccounts for 5% in the upper arch and for about 2% in thelower arch. These directional asymmetry values are notsignificant by F-test (Mardia et al., 2000); in other words,the left and right sides of the Zagreb sample do not differin conformation (Fig. 2). In contrast, the island sampleconveys a more complicated picture. Taking the wholeHvar sample together, we find highly significant direc-tional asymmetry for both arches, but in different direc-tions. In the maxilla, it expresses a general distortionfrom the symmetric mean shape toward the right side,and in the mandible, toward the left side (Fig. 3). In theupper arch, directional asymmetry explains about 5% ofthe total variance, but in the lower arch, 12%. In the out-bred group, significant directional asymmetry is found
TABLE 1. Transverse dental arch dimensions1
Zagreb (n ¼ 31) Hvar (n ¼ 222)
Mean 6 SD (mm)Median
(minimum/maximum) Mean 6 SD (mm)Median
(minimum/maximum)
Upper jawCanine–canine 35.9 6 1.5 36.1 (32.7/38.9) 36.6 6 3.2 36.5 (28.3/45.9)M1–M1 49.3 6 2.5 49.4 (42.3/56.1) 49.3 6 3.6 49.3 (40.2/58.4)M2–M2 54.5 6 2.5 54.3 (49.9/61.1) 54.6 6 3.6 54.9 (44.6/64.6)
Lower jawCanine–canine 29.3 6 1.9 29.2 (26.2/33.7) 30.0 6 2.4 29.9 (2.37/3.72)M1–M1 45.3 6 2.0 45.4 (40.8/49.5) 45.9 6 3.2 46.2 (36.3/54.0)M2–M2 52.2 6 2.6 51.8 (44.7/56.5) 52.5 6 3.0 52.6 (43.4/61.7)
1 Linear distances between selected antimeres. See Figure 1 for landmark positions.
135DENTAL ARCH ASYMMETRY IN ISOLATED COMMUNITY
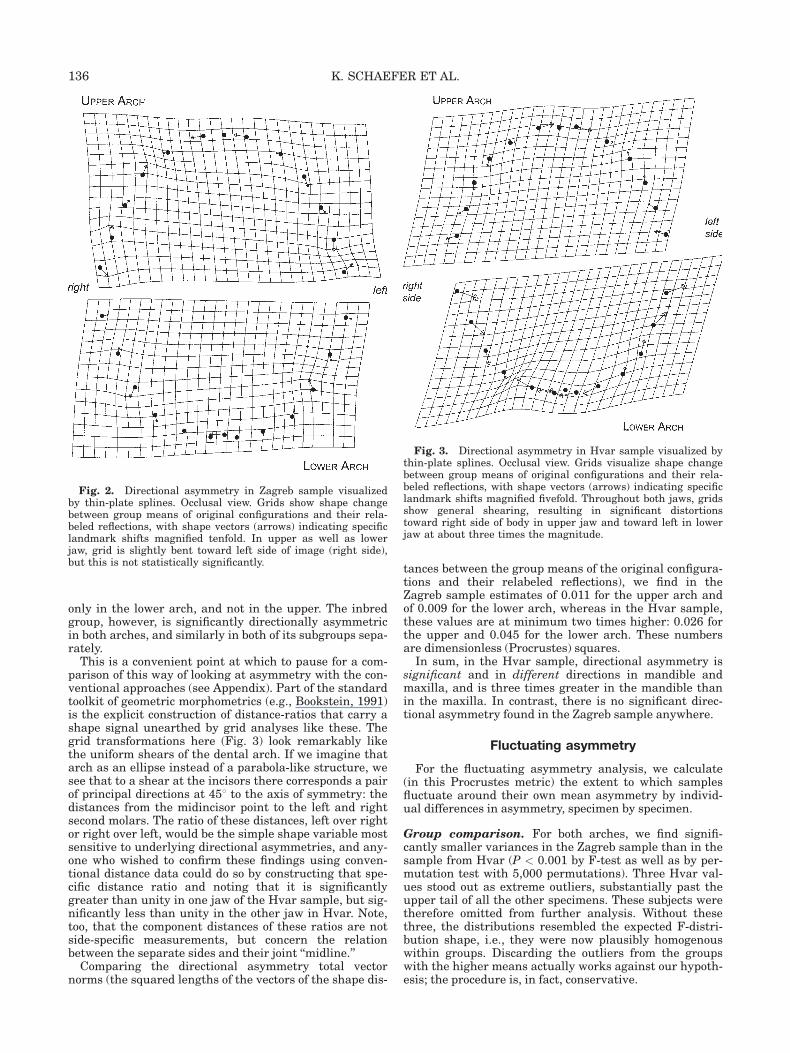
only in the lower arch, and not in the upper. The inbredgroup, however, is significantly directionally asymmetricin both arches, and similarly in both of its subgroups sepa-rately.This is a convenient point at which to pause for a com-
parison of this way of looking at asymmetry with the con-ventional approaches (see Appendix). Part of the standardtoolkit of geometric morphometrics (e.g., Bookstein, 1991)is the explicit construction of distance-ratios that carry ashape signal unearthed by grid analyses like these. Thegrid transformations here (Fig. 3) look remarkably likethe uniform shears of the dental arch. If we imagine thatarch as an ellipse instead of a parabola-like structure, wesee that to a shear at the incisors there corresponds a pairof principal directions at 458 to the axis of symmetry: thedistances from the midincisor point to the left and rightsecond molars. The ratio of these distances, left over rightor right over left, would be the simple shape variable mostsensitive to underlying directional asymmetries, and any-one who wished to confirm these findings using conven-tional distance data could do so by constructing that spe-cific distance ratio and noting that it is significantlygreater than unity in one jaw of the Hvar sample, but sig-nificantly less than unity in the other jaw in Hvar. Note,too, that the component distances of these ratios are notside-specific measurements, but concern the relationbetween the separate sides and their joint ‘‘midline.’’Comparing the directional asymmetry total vector
norms (the squared lengths of the vectors of the shape dis-
tances between the group means of the original configura-tions and their relabeled reflections), we find in theZagreb sample estimates of 0.011 for the upper arch andof 0.009 for the lower arch, whereas in the Hvar sample,these values are at minimum two times higher: 0.026 forthe upper and 0.045 for the lower arch. These numbersare dimensionless (Procrustes) squares.In sum, in the Hvar sample, directional asymmetry is
significant and in different directions in mandible andmaxilla, and is three times greater in the mandible thanin the maxilla. In contrast, there is no significant direc-tional asymmetry found in the Zagreb sample anywhere.
Fluctuating asymmetry
For the fluctuating asymmetry analysis, we calculate(in this Procrustes metric) the extent to which samplesfluctuate around their own mean asymmetry by individ-ual differences in asymmetry, specimen by specimen.
Group comparison. For both arches, we find signifi-cantly smaller variances in the Zagreb sample than in thesample from Hvar (P < 0.001 by F-test as well as by per-mutation test with 5,000 permutations). Three Hvar val-ues stood out as extreme outliers, substantially past theupper tail of all the other specimens. These subjects weretherefore omitted from further analysis. Without thesethree, the distributions resembled the expected F-distri-bution shape, i.e., they were now plausibly homogenouswithin groups. Discarding the outliers from the groupswith the higher means actually works against our hypoth-esis; the procedure is, in fact, conservative.
Fig. 2. Directional asymmetry in Zagreb sample visualizedby thin-plate splines. Occlusal view. Grids show shape changebetween group means of original configurations and their rela-beled reflections, with shape vectors (arrows) indicating specificlandmark shifts magnified tenfold. In upper as well as lowerjaw, grid is slightly bent toward left side of image (right side),but this is not statistically significantly.
Fig. 3. Directional asymmetry in Hvar sample visualized bythin-plate splines. Occlusal view. Grids visualize shape changebetween group means of original configurations and their rela-beled reflections, with shape vectors (arrows) indicating specificlandmark shifts magnified fivefold. Throughout both jaws, gridsshow general shearing, resulting in significant distortionstoward right side of body in upper jaw and toward left in lowerjaw at about three times the magnitude.
136 K. SCHAEFER ET AL.
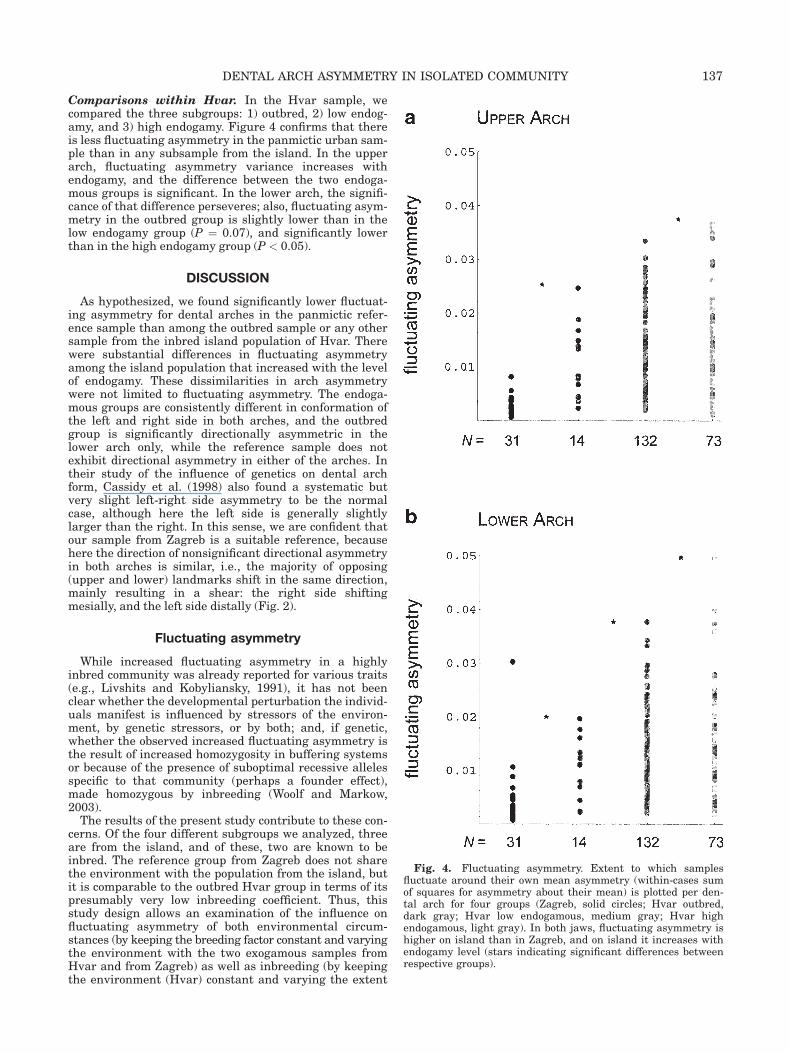
Comparisons within Hvar. In the Hvar sample, wecompared the three subgroups: 1) outbred, 2) low endog-amy, and 3) high endogamy. Figure 4 confirms that thereis less fluctuating asymmetry in the panmictic urban sam-ple than in any subsample from the island. In the upperarch, fluctuating asymmetry variance increases withendogamy, and the difference between the two endoga-mous groups is significant. In the lower arch, the signifi-cance of that difference perseveres; also, fluctuating asym-metry in the outbred group is slightly lower than in thelow endogamy group (P ¼ 0.07), and significantly lowerthan in the high endogamy group (P < 0.05).
DISCUSSION
As hypothesized, we found significantly lower fluctuat-ing asymmetry for dental arches in the panmictic refer-ence sample than among the outbred sample or any othersample from the inbred island population of Hvar. Therewere substantial differences in fluctuating asymmetryamong the island population that increased with the levelof endogamy. These dissimilarities in arch asymmetrywere not limited to fluctuating asymmetry. The endoga-mous groups are consistently different in conformation ofthe left and right side in both arches, and the outbredgroup is significantly directionally asymmetric in thelower arch only, while the reference sample does notexhibit directional asymmetry in either of the arches. Intheir study of the influence of genetics on dental archform, Cassidy et al. (1998) also found a systematic butvery slight left-right side asymmetry to be the normalcase, although here the left side is generally slightlylarger than the right. In this sense, we are confident thatour sample from Zagreb is a suitable reference, becausehere the direction of nonsignificant directional asymmetryin both arches is similar, i.e., the majority of opposing(upper and lower) landmarks shift in the same direction,mainly resulting in a shear: the right side shiftingmesially, and the left side distally (Fig. 2).
Fluctuating asymmetry
While increased fluctuating asymmetry in a highlyinbred community was already reported for various traits(e.g., Livshits and Kobyliansky, 1991), it has not beenclear whether the developmental perturbation the individ-uals manifest is influenced by stressors of the environ-ment, by genetic stressors, or by both; and, if genetic,whether the observed increased fluctuating asymmetry isthe result of increased homozygosity in buffering systemsor because of the presence of suboptimal recessive allelesspecific to that community (perhaps a founder effect),made homozygous by inbreeding (Woolf and Markow,2003).The results of the present study contribute to these con-
cerns. Of the four different subgroups we analyzed, threeare from the island, and of these, two are known to beinbred. The reference group from Zagreb does not sharethe environment with the population from the island, butit is comparable to the outbred Hvar group in terms of itspresumably very low inbreeding coefficient. Thus, thisstudy design allows an examination of the influence onfluctuating asymmetry of both environmental circum-stances (by keeping the breeding factor constant and varyingthe environment with the two exogamous samples fromHvar and from Zagreb) as well as inbreeding (by keepingthe environment (Hvar) constant and varying the extent
Fig. 4. Fluctuating asymmetry. Extent to which samplesfluctuate around their own mean asymmetry (within-cases sumof squares for asymmetry about their mean) is plotted per den-tal arch for four groups (Zagreb, solid circles; Hvar outbred,dark gray; Hvar low endogamous, medium gray; Hvar highendogamous, light gray). In both jaws, fluctuating asymmetry ishigher on island than in Zagreb, and on island it increases withendogamy level (stars indicating significant differences betweenrespective groups).
137DENTAL ARCH ASYMMETRY IN ISOLATED COMMUNITY
of inbreeding). We find both to be significantly connectedwith fluctuating asymmetry. In the environmental com-parison, fluctuating asymmetry turns out to be signifi-cantly higher in Hvar than in Zagreb, while in theinbreeding comparison, fluctuating asymmetry is higherin the inbred groups than in the outbred one. Thus, weconfirm that detrimental environmental circumstances(namely, little medical care) increase fluctuating asymme-try, and likewise we confirm that inbreeding increasesfluctuating asymmetry in the human dental arch. Theenvironmental impact on fluctuating asymmetry seems toexceed the inbreeding effect, inasmuch as we find consid-erable differences in magnitude of fluctuating asymmetrybetween the Zagreb and outbred Hvar group in both jaws,but a weaker signal for the ‘‘within-Hvar comparisons,’’especially in the upper jaw. The latter may be due to astronger morphological integration of the upper jaw intothe craniofacial complex and thus a higher sensitivity todevelopmental perturbations in the lower jaw. Althoughthis interpretation would be supported by the contentionthat tooth dimensions along the upper and lower dentalarches are largely independently determined (Garn et al.,1968; Kieser et al., 1985), it contradicts the notion thatmaxillary teeth are less well-buffered than mandibularteeth (Garn et al., 1966; Harris and Nweeia, 1980; Kieseret al., 1986). However, a recent study of mice in a pollutedindustrial area reported an increase in chromosomal aber-rations and lesions as well as in cranial fluctuating asym-metry, specifically in lower jaw dimensions (Velickovic,2004).An immediate shortcoming in these group comparisons
may be the fairly low sample size of the outbred group (n¼ 14) as well as of the reference sample (n ¼ 31). The per-mutation tests and F-tests incorporate considerations ofsample size, namely by losing power at smaller sizes. Anyeffects that either finds are thus not mere artifacts ofsmall samples. Note also that fluctuating asymmetry, as amean square, is not itself confounded by sample size inany way.The question of whether fluctuating asymmetry
increases because of homozygosity in buffering systems orbecause of suboptimal recessive alleles specific to thatcommunity cannot be answered with this one additionalstudy. Still, Dobzhansky and Lerner’s balance or overdom-inance hypothesis (discussed in Woolf and Markow, 2003)gains support from our study, as it did from Livshits andKobyliansky (1991).
Directional asymmetry
In keeping with the ‘‘widely held—yet poorly substanti-ated—belief that fluctuating asymmetry can act as a uni-versal measure of developmental stability and predictor ofstress’’ (Lens et al., 2002), we assumed that fluctuatingasymmetry signaled developmental precision. Yet oursamples yielded consistent differences in the extent ofdirectionality, depending on environmental and/or geneticstress levels. Although some earlier studies did not findsignificant directional asymmetry in human isolates, suchas Townsend and Brown (1980) in the dentition of Austral-ian Aborigines, or Noss et al. (1983) in Pima Indians,Hershkovitz et al. (1987) in South Sinai Bedouin childrendid find such asymmetries, and went on to emphasize theimportance of directional asymmetry in fluctuating asym-metry studies. And, indeed, Harris (1992) then observedthat while some tooth crown diameters exhibited lateral-
ity within studies, the pattern within and between archesappeared to be random and variable among groups. In hisstudy of the second dentition in several human popula-tions, he noticed the general tendency for teeth in oppositearches to exhibit opposite dominance within a populationsample, in that maxillary and mandibular homologueswere likely to be complementary, and conjectured that thedegree of directional asymmetry was keyed to the individ-ual’s ontogenetic stability, while cautioning about sub-suming directional asymmetry within conventional meas-ures of fluctuating asymmetry (Harris, 1992). Townsendand Farmer (1998) and Townsend et al. (1999) confirmedthis intriguing reversed pattern of directional asymmetryfor the deciduous dentition, but found no relationshipbetween the left-right differences and the direction ofskewness, as reported by Harris (1992). The pattern ofdental arch shape we found in the mixed dentition comple-ments findings and expectations of these studies, includ-ing the conjecture (Harris, 1992) that the degree of direc-tional asymmetry may reflect a population’s level of devel-opmental stress, while the specific direction may bedetermined by its genetic background. Along this line, ourreference sample was expected to exhibit a very low direc-tional asymmetry in comparison to the island sample, andwithin the inbred island sample, the arches should haveshown identical patterns: right-side dominance in one jaw,paired with left-side dominance in the other. Both of thesepredictions were corroborated by our results.Graham et al. (1993) found that fruit flies exposed to
10,000 mg/kg benzene showed a transition from fluctuat-ing asymmetry to directional asymmetry (they becamemore right-handed for sternopleural bristles), and alsosuggested that directional asymmetry may be a potentialindicator of developmental (in)stability. Leamy (1999)encouraged the use of directional asymmetry in compari-sons among variously stressed/nonstressed or outbred/inbred populations, as he found evidence for genetic varia-tion in directional asymmetry rather than fluctuatingasymmetry for mandible characters in random-bred mice,but he reported the level of this variation to be so low thathe proposed an environmental origin for phenotypic direc-tional asymmetry variation.In our data, directional asymmetry appears with envi-
ronmental stress in the lower jaw and is present in bothjaws with further inbreeding stress, and fluctuating asym-metry increases with environmental stress in both jawsand with additional inbreeding stress in the lower jaw.These results do not replicate the transition from fluctuat-ing asymmetry to directional asymmetry with increasingstress, but rather demonstrate significant directionalasymmetry to co-occur with it, and therefore support thenotion that directional asymmetry itself may be an indica-tor of stress (Graham et al., 1993). Moreover, the resultsimply that the lower jaw is more prone to both environ-mental and also breeding stress than the upper jaw.Our study suggests a fundamental environmental influ-
ence on dental arch asymmetry, as well as, sensitivity toinbreeding. But while the lower jaw indicates thesestresses almost cumulatively, the upper jaw appears to bebetter buffered. The role of directional asymmetry as apotential indicator of developmental instability clearlymerits further attention.Theoretical interpretation of findings like ours must be
cautious. We have very carefully operationalized thequantities here that can be operationalized (directionalasymmetry, fluctuating asymmetry, and a crude sum-mary coefficient of inbreeding), but we cannot tell from
138 K. SCHAEFER ET AL.
these data whether the effect of inbreeding on these asym-metry components is via the role of inbreeding as a proxyfor stress or by some other mechanism. Algebraically, wepointed to a two-way interaction (jaw by subgroup, as inFigure 4), and although we observed that the directions ofcontrasts underlying this complex pattern are consistentwith (most of) the earlier literature, and also consistent withthe interpretation of homozygosity as stress, we did notmeasure any other aspect of development, and so the inter-pretation remains just that: an interpretation, not yet aninference.
APPENDIX
The Procrustes approach to asymmetry:a graphical introduction
Several reviewers of an earlier draft of this article notedthat the Procrustes approach to asymmetry we wereexploiting was more familiar to other audiences than tothe readership of this Journal. In addition to the mathe-matical reference by Mardia et al. (2000) that we cite inthe main text, there are many earlier appearances in text-books (Bookstein, 1991) and in primary research publica-tions in mammalogy (e.g., Auffray et al., 1999), entomol-ogy (e.g., Smith et al., 1997; Klingenberg and McIntire,1998; Klingenberg, 2003), and elsewhere. In Schaeferet al. (2002), we recommended this approach for generaluse in anthropology, and we took our own advice in suchapplications as Bookstein and Schaefer (2003) and Schae-fer et al. (2003). For the convenience of the AJPA reader,we use this Appendix to summarize the basic approach inthese earlier publications.The explanation here, a version of that in Mardia et al.
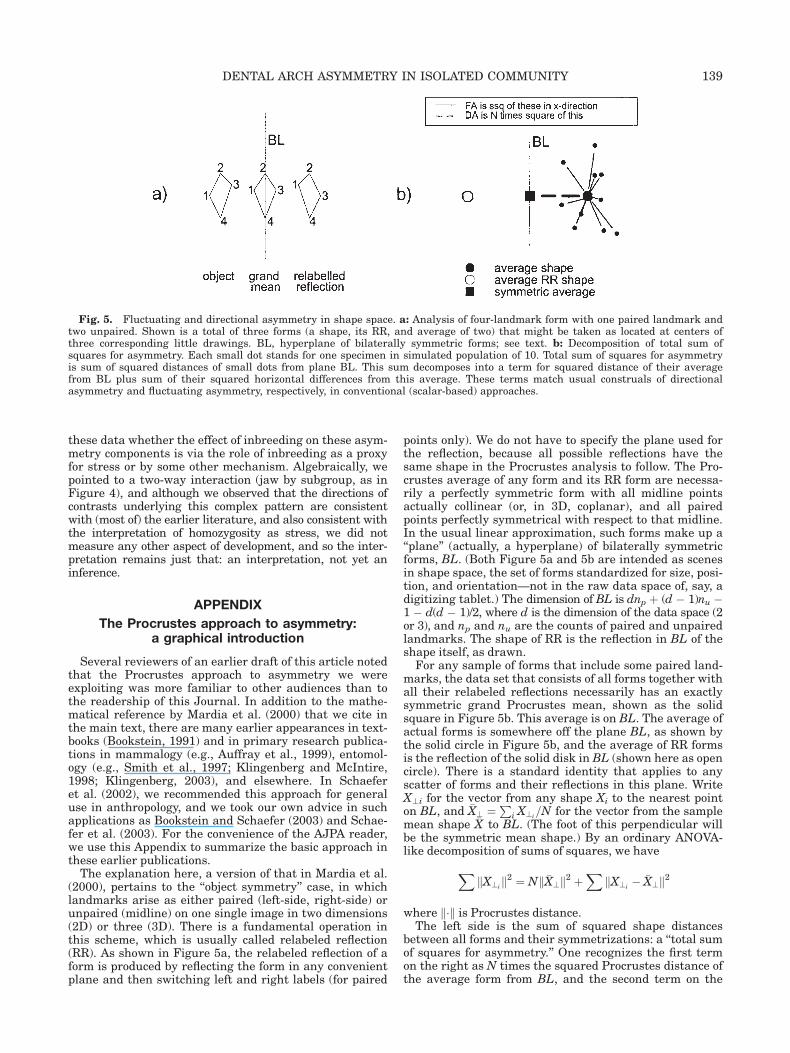
(2000), pertains to the ‘‘object symmetry’’ case, in whichlandmarks arise as either paired (left-side, right-side) orunpaired (midline) on one single image in two dimensions(2D) or three (3D). There is a fundamental operation inthis scheme, which is usually called relabeled reflection(RR). As shown in Figure 5a, the relabeled reflection of aform is produced by reflecting the form in any convenientplane and then switching left and right labels (for paired
points only). We do not have to specify the plane used forthe reflection, because all possible reflections have thesame shape in the Procrustes analysis to follow. The Pro-crustes average of any form and its RR form are necessa-rily a perfectly symmetric form with all midline pointsactually collinear (or, in 3D, coplanar), and all pairedpoints perfectly symmetrical with respect to that midline.In the usual linear approximation, such forms make up a‘‘plane’’ (actually, a hyperplane) of bilaterally symmetricforms, BL. (Both Figure 5a and 5b are intended as scenesin shape space, the set of forms standardized for size, posi-tion, and orientation—not in the raw data space of, say, adigitizing tablet.) The dimension of BL is dnp þ (d � 1)nu �1 � d(d � 1)/2, where d is the dimension of the data space (2or 3), and np and nu are the counts of paired and unpairedlandmarks. The shape of RR is the reflection in BL of theshape itself, as drawn.For any sample of forms that include some paired land-
marks, the data set that consists of all forms together withall their relabeled reflections necessarily has an exactlysymmetric grand Procrustes mean, shown as the solidsquare in Figure 5b. This average is on BL. The average ofactual forms is somewhere off the plane BL, as shown bythe solid circle in Figure 5b, and the average of RR formsis the reflection of the solid disk in BL (shown here as opencircle). There is a standard identity that applies to anyscatter of forms and their reflections in this plane. WriteX\i for the vector from any shape Xi to the nearest pointon BL, and �X? ¼ P
i X?i=N for the vector from the sample
mean shape �X to BL. (The foot of this perpendicular willbe the symmetric mean shape.) By an ordinary ANOVA-like decomposition of sums of squares, we have
XkX?i
k2 ¼ Nk�X?k2 þX
kX?i� �X?k2
where k�k is Procrustes distance.The left side is the sum of squared shape distances
between all forms and their symmetrizations: a ‘‘total sumof squares for asymmetry.’’ One recognizes the first termon the right as N times the squared Procrustes distance ofthe average form from BL, and the second term on the
Fig. 5. Fluctuating and directional asymmetry in shape space. a: Analysis of four-landmark form with one paired landmark andtwo unpaired. Shown is a total of three forms (a shape, its RR, and average of two) that might be taken as located at centers ofthree corresponding little drawings. BL, hyperplane of bilaterally symmetric forms; see text. b: Decomposition of total sum ofsquares for asymmetry. Each small dot stands for one specimen in simulated population of 10. Total sum of squares for asymmetryis sum of squared distances of small dots from plane BL. This sum decomposes into a term for squared distance of their averagefrom BL plus sum of their squared horizontal differences from this average. These terms match usual construals of directionalasymmetry and fluctuating asymmetry, respectively, in conventional (scalar-based) approaches.
139DENTAL ARCH ASYMMETRY IN ISOLATED COMMUNITY
right as the summed squared Procrustes distances of theseparate forms from their average in the direction perpen-dicular to BL, i.e., the sum of squares for asymmetry ofthe forms around their average asymmetry. These corre-spond perfectly to the classic notions of fluctuating anddirectional asymmetry of scalar variables as they havearisen in the literature (e.g., Palmer and Strobeck, 1986,2003), and so we copied those terms over to this new con-text. (Note that the ANOVA here is only over subjects, incontrast to the two-way analysis, i.e., side by subjects, inthe conventional treatment; see Boklage, 1992).Mardia et al. (2000) presented two statistical tests for
directional asymmetry. One version, a parametric F-test,presumes that asymmetry of landmark locations is dis-tributed independently, with identical variance at alllandmarks in all directions of the original image.In our experience, this assumption is unrealistic in most
applications. We recommend instead a permutation testthat, in effect, flips a coin N times, over and over, to deter-mine which of the paired shapes is the real version andwhich is the RR version. Because the total sum of squares(left side of the ANOVA above) is not affected by this per-mutation, the pivotal statistic is just the squared Pro-crustes distance between mean ‘‘pseudoleft’’ and ‘‘pseudo-right’’ shapes. These are the permutation tests reported inthe analyses of this paper. The grids depicted of this paperlikewise express the geometry: they are warps depictingthe effect of a transformation in shape space that is justdouble the heavy line in Figure 5b, and so allow theviewer to understand just what is asymmetrical about anydirectional asymmetry that is detected.
ACKNOWLEDGMENTS
We thank the children and parents from the island ofHvar for their participation and patience, Lovorka Barac,Karl Grammer, Martina Ivanec Sapunar, Hermann Pros-singer, Pavao Rudan, Igor Rudan, Horst Seidler, NinaSmolej-Narancic, and Gerhard W. Weber for support invarious ways, and two anonymous referees for their veryhelpful comments. This study was supported by CroatianMinistry of Science and Technology grants 0196001 to N.Smolej-Narancic, 0196005 to P. Rudan, and 0108330 to I.Rudan; by a Wellcome Trust grant to H. Campbell and I.Rudan; by Austrian Ministry of Culture, Science and Edu-cation and Austrian Council for Science and Technologygrants P200.049/3-VI/I/2001 and P200.093/I–VI/2004 toH. Seidler; and by Austrian Science Foundation grantP14738 to G.W. Weber.
LITERATURE CITED
Albert P, Auffray J-C. 2003. Genomic coadaptation, outbreedingdepression, and developmental instability. In: Polak M, editor.Developmental instability: causes and consequences. NewYork: Oxford University Press. p 116–134.
Auffray J-C, Debat V, Alibert P. 1999. Shape asymmetry anddevelopmental stability. In: Chaplain MAJ, Singh GD, McLa-chlan JC, editors. On growth and form: spacio-temporal pat-tern formation in biology. Chichester: John Wiley & Sons.p 309–324.
Bader RS. 1965. Fluctuating asymmetry in the dentition of thehouse mouse. Growth 29:219–300.
Bailit HL, Workman PL, Niswander JD, MacLean CJ. 1970.Dental asymmetry as an indicator of genetic and environmen-tal conditions in human populations. Hum Biol 42:626–638.
Barac L, Pericic M, Klaric IM, Rootsi S, Janicijevic B, KivisildT, Parik J, Rudan I, Villems R, Rudan P. 2003. Y chromoso-mal heritage of Croatian population and its island isolates.Eur J Hum Genet 11:535–542.
Barden H. 1980. Fluctuating dental asymmetry: a measure ofdevelopmental instability in Down syndrome. Am J PhysAnthropol 52:169–173.
Ben-David Y, Hershkovitz I, Rupin D, Moscona D, Ring B. 1992.Inbreeding effects on tooth size, eruption age, and dentaldirectional and fluctuating asymmetry among South SinaiBedouins. In: Smith P, Tchernov E, editors. Structure, func-tion and evolution of teeth. London: Freund PublishingHouse, Ltd. p 361–389.
Biemont C. 1983. Homeostasis, enzymatic heterozygosity andinbreeding depression in natural populations of Drosophilamelanogaster. Genetica 61:179–189.
Bishara SE, Burkey PS, Kharouf JG. 1994. Dental and facialasymmetries: a review. Angle Orthod 64:89–98.
Boklage CE. 1992. Method and meaning in the analysis of devel-opmental asymmetries. J Hum Ecol Special Issue 2:147–156.
Bookstein FL. 1991. Morphometric tools for landmark data:geometry and biology. Cambridge: Cambridge University Press.
Bookstein FL, Schaefer K. 2003. Decomposing directional asym-metry for bilateral landmark data: applications to the adulthuman face and body [abstract]. Am J Phys Anthropol 120:70.
Broman KW, Weber JL. 1999. Method for constructing confi-dently ordered linkage maps. Genet Epidemiol 6:337–343.
Cassidy KM, Harris EF, Tolley EA, Keim RG. 1998. Geneticinfluence on dental arch form in orthodontic patients. AngleOrthod 68:445–454
Clarke GM. 1993. The genetic basis of developmental instability.Relationships between stability, heterozygosity and genomiccoadaptation. Genetica 89:15–23.
DiBennardo R, Bailit HL. 1978. Stress and dental asymmetry inpopulation of Japanese children. Am J Phys Anthropol 48:89–94.
Doyle WJ, Johnston O. 1977. On the meaning of increased fluc-tuating dental asymmetry: a cross populational study. Am JPhys Anthropol 46:127–134.
Garn SM, Lewis AB, Kerewsky RS. 1966. The meaning of bilat-eral asymmetry in the permanent dentition. Angle Orthod36:55–62.
Garn SM, Lewis AB, Kerewsky RS. 1968. Relationships betweenbuccolingual and mesiodistal diameters. J Dent Res 47:495.
Good PI. 2000. Permutation tests: a practical guide to resam-pling methods for testing hypotheses for testing hypothe-ses.2nd ed. New York: Springer-Verlag.
Graham JH, Roe KE, West TB. 1993. Effects of lead and ben-zene on the developmental stability of Drosophila mela-nogaster. Ecotoxicology 2:185–195.
Graham JH, Emlen JM, Freeman DC, Leamy LJ, Kieser JA.1998. Directional asymmetry and the measurement of devel-opmental instability. Biol J Linn Soc 64:1–16.
Harris E. 1992. Laterality in human odontometrics: analysis ofa contemporary American white series. J Hum Ecol SpecialIssue 2:157–190.
Harris EF, Nweeia M. 1980. Dental asymmetry as a measure ofenvironmental stress in the Ticuna Indians of Colombia. AmJ Phys Anthropol 53:133–142.
Hershkovitz I, Moskona D, Arensburg B, Kobyliansky E. 1987.Directional dental asymmetry in South Sinai Bedouin iso-lates. Anthropol Anz 45:269–274.
Hershkovitz I, Livshits G, Moskona D, Arensburg B, Kobylian-sky E. 1993. Variables affecting dental fluctuating asymmetryin human isolates. Am J Phys Anthropol 91:349–365.
Janicijevic B, Bakran M, Papiha SS, Chaventre A, Roberts DF.1994. Serogenetic analysis in the study of population struc-ture of the eastern Adriatic (Croatia). Hum Biol 66:991–1003.
Jovanovic V. 1996. The relationship between migration, geneticand sociocultural variables—a log-linear approach. Coll Antro-pol 20:251–262.
Jovanovic V, Macarol B, Roberts DF, Rudan P. 1984. Migrationon the island of Hvar. In: Boyce AJ, editor. Migration andmobility. London: Taylor and Francis. p 143–160.
140 K. SCHAEFER ET AL.
Kieser JA, Groeneveld HT, Preston CB. 1985. An odontometricanalysis of the Lengua Indian dentition. Hum Biol 57:611–620.
Kieser JA, Groeneveld HT, Preston CB. 1986. Fluctuating den-tal asymmetry as a measure of odontometric canalization inman. Am J Phys Anthropol 71:437–444.
Klingenberg CP. 2003. Developmental instability as a researchtool: using patterns of fluctuating asymmetry to infer thedevelopmental origins of morphological integration. In: PolakM, editor. Developmental instability: causes and consequen-ces. New York: Oxford University Press. p 427–442.
Klingenberg CP, McIntire GS. 1998. Geometric morphometricsof developmental instability: analyzing patterns of fluctuatingasymmetry with Procrustes methods. Evolution 52:1363–1375.
Lauc T. 2003. Orofacial analysis on the Adriatic islands: an epi-demiological study of malocclusions on Hvar island. Eur JOrthod 25:273–278.
Lauc T, Schaefer K, Prossinger H, Slaj M. 2000. Orofacial analy-sis of the Adriatic islands: 1. The island of Hvar as a modelfor odontogenetic researches. Coll Antropol [Suppl]24:63–69.
Lauc T, Rudan P, Rudan I, Campbell H. 2003. Effect of inbreed-ing and endogamy on occlusal traits in human isolates.J Orthod 30:301–308.
Leamy LJ. 1999. Heritability of directional and fluctuatingasymmetry for mandibular characters in randombred mice.J Evol Biol 12:146–155.
Leamy LJ, Routman EJ, Cheverud JM. 2002. An epistaticgenetic basis for fluctuating asymmetry of mandible size inmice. Evolution 56:642–653.
Leary RF, Allendorf FW, Knudsen KL. 1983. Developmentalstability and enzyme heterozygosity in rainbow trout. Nature301:71–72.
Leary RF, Allendorf FW, Knudsen KL. 1984. Superior develop-mental stability of heterozygotes at enzyme loci in salmonidfishes. Am Nat 124:540–551.
Leary RF, Allendorf FW, Knudsen KL. 1992. Genetic, environ-mental, and developmental causes of meristic variation inrainbow trout. Acta Zool Fenn 191:79–98.
Lens L, Van Dongen S, Kark S, Matthysen E. 2002. Fluctuatingasymmetry as an indicator of fitness: can we bridge the gapbetween studies? Biol Rev 77:27–38.
Leung B, Forbes MR, Houle D. 2000. Fluctuating asymmetry asa bioindicator of stress: comparing efficacy of analysis involv-ing multiple traits. Am Nat 155:101–115.
Livshits G, Kobyliansky E. 1991. Fluctuating asymmetry as apossible measure of developmental homeostasis in humans: areview. Hum Biol 63:441–466.
Livshits G, Smouse PE. 1993. Multivariate fluctuating asymme-try in Israeli adults. Hum Biol 65:547–78.
Mardia KV, Bookstein FL, Moreton IJ. 2000. Statistical assess-ment of bilateral symmetry of shapes. Biometrika 87:285–300.
Markow TA. 1994. Developmental instability: its origins andevolutionary implications. Dordrecht: Kluwer.
Markow TA. 1995. Evolutionary ecology and developmentalinstability. Annu Rev Entomol 40:105–120.
Martinovic I, Mastana S, Janicijevic B, Jovanovic V, Paphia SS,Roberts DF, Rudan P. 1998. VNTR DNA variation in the pop-ulation of the island of Hvar, Croatia. Ann Hum Biol 25:489–499.
Martinovic I, Barac L, Furac I, Janicijevic B, Kubat M, PericicM, Vidovic B, Rudan P. 1999. STR polymorphisms in the pop-ulation of the island of Hvar. Hum Biol 71:341–352.
Maurice TJ, Kula K. 1998. Dental arch asymmetry in the mixeddentition. Angle Orthod 68:37–44.
Niswander JD, Chung CS. 1965. The effects of inbreeding ontooth size in Japanese children. Am J Hum Genet 17:390–398.
Noss JF, Scott GR, Yap Potter RH, Dahlberg AA. 1983. Fluctuat-ing asymmetry in molar dimensions and discrete morphologicaltraits in Pima Indians. Am J Phys Anthropol 61:437–445.
Palmer AR, Strobeck C. 1986. Fluctuating asymmetry:measurement, analysis, patterns. Annu Rev Ecol Syst 17:391–421.
Palmer AR, Strobeck C. 2003. Fluctuating asymmetry analysesrevisited. In: Polak M, editor. Developmental instability:causes and consequences. New York: Oxford University Press.p 279–319.
Patterson PD, Patton JL. 1990. Fluctuating asymmetry andallozymic heterozygosity among natural populations of pocketgophers (Thomomys bottae). Biol J Linn Soc 40:21–36
Roguljic D, Rudan I, Rudan P. 1997. Estimation of inbreeding,kinship, genetic distances and population structure from sur-names: example from the island of Hvar, Croatia. Am J HumBiol 9:595–608.
Rohlf FJ, Slice D. 1990. Extensions of the Procrustes method forthe optimal superimposition of landmarks. Syst Zoo 39:40–59.
Rudan I, Rudan P. 2000. Comparison between coefficients ofinbreeding computed from deficit of heterozygotes for codomi-nant autosomal genetic polymorphisms and from isonymydata: a study of Hvar island isolates, Croatia. In: Susanne C,Bodszar EB, editors. Human population genetics in Europe.Budapest: Biennale Book of European Anthropological Associ-ation. p 117–128.
Rudan P, Schmutzer L. 1976. Dermatoglyphs of the inhabitantsof the island of Hvar, Yugoslavia. Hum Hered 26:425–434.
Rudan P, Roberts DF, Sujoldzic A, Macarol B, Smolej N, Kaste-lan A. 1982a. Geography, ethnohistory and demography ofthe island of Hvar. Coll Antropol 6:47–68.
Rudan P, Roberts DF, Sujoldzic A, Macarol B, Smolej N, Kaste-lan A. 1982b. Strategy of anthropological research on theisland of Hvar. Coll Antropol 6:39–46.
Rudan P, Roberts DF, Janicijevic B, Smolej N, Szirovicza L, Kas-telan A. 1986. Anthropometry and the biological structure ofthe Hvar population. Am J Phys Anthropol 70:231–240.
Rudan P, Simic D, Smolej-Narancic N, Bennett LA, JanicijevicB, Jovanovic V, Lethbridge MF, Milicic J, Roberts DF,Sujoldzic A, Szirovicza L. 1987. Isolation by distance in Mid-dle Dalmatia—Yugoslavia. Am J Phys Anthropol 74:417–426.
Schaefer K, Mitteroecker P, Lauc T, Grammer K. 2002. A moredetailed look at fluctuating asymmetry in anthropology[abstract]. Coll Antropol 26:182.
Schaefer K, Mitteroecker P, Gunz P, Bookstein FL, Grammer K.2003. Female attractiveness—physical appearance as shape[abstract]. Am J Phys Anthropol 120:183.
Shifman S, Darvasi A. 2001. The value of isolated populations.Nat Genet 28:309–310.
Simic D, Rudan P. 1990. Isolation by distance and correlationanalysis of distance measures in the study of populationstructure: example from the island of Hvar. Hum Biol 62:113–130.
Skaric Juric T, Rudan P. 1997. Family correlations of metacar-pal bones—heritable (h(2)) and environmental (c(2)) compo-nents of total phenotypic variation. Coll Antropol 21:447–459.
Slaj M, Jezina AM, Lauc T, Rajic-Mestrovic S, Miksic M. 2003.Longitudinal dental arch changes in the mixed dentition.Angle Orthod 73:509–514.
Smith DB, Crespi BL, Bookstein FL. 1997. Fluctuating asymme-try in the honey bee (Apis mellifera): effects of ploidy andhybridization. J Evol Biol 10:551–574.
Smolej-Narancic N, Pavlovic M, Rudan P. 1991. Ventilatoryparameters in healthy nonsmoking adults of Adriatic islands(Yugoslavia). Eur Respir J 4:955–964.
Smolej-Narancic N, Rudan I. 2001 Endogamy and variation inblood pressure levels in Croatian island isolates. J PhysiolAnthropol Appl Hum Sci 20:85–94.
Soule ME. 1979. Heterozygosity and developmental stability:another look. Evolution 331:986–989.
Suarez BK. 1974. Neandertal dental asymmetry and the prob-able mutation effect. Am J Phys Anthropol 41:411–416.
Sujoldzic A. 1997. Continuity and change reflected in synchronicand diachronic linguistic variation of Middle Dalmatia. CollAntropol 21:285–299.
Tolk HV, Pericic M, Barac L, Martinovic Klaric I, Janicijevic B,Rudan I, Parik J, Villems R, Rudan P. 2000. mtDNA hap-logroups in the populations of Croatian Adriatic islands. CollAntropol 24:267–279.
141DENTAL ARCH ASYMMETRY IN ISOLATED COMMUNITY

Townsend GC, Brown T. 1980. Dental asymmetry in AustralianAboriginals. Hum Biol 52:661–673.
Townsend GC, Farmer V. 1998. Dental asymmetry in the decid-uous dentition of South Australian children. In: Lukacs JR,editor. Human dental development, morphology, and patho-logy. Eugene, Oregon: University of Oregon. p 245–257.
Townsend GC, Dempsey P, Richards L. 1999. Asymmetry in thedeciduous dentition: fluctuating and directional components.Perspect Hum Biol 4:45–52.
Velickovic M. 2004. Chromosomal aberrancy and the level of
fluctuating asymmetry in black-striped mouse (Apodemusagrarius): effects of disturbed environment. Herditas 140:112–122.
Vrijenhoek RC, Lerman S. 1982. Heterozygosity and develop-mental stability and sexual and asexual breeding systems.Evolution 36:768–776.
Woolf CM, Markow TA. 2003. Genetic models for developmentalhomeostasis: historical perspectives. In: Polak M, editor. De-velopmental instability: causes and consequences. New York:Oxford University Press. p 99–115.
142 K. SCHAEFER ET AL.


