Embed Size (px)
Citation preview
DEPARTMENT OF HEALTH
PO BOX 361 TRENTON, N.J. 08625-0361
www.nj.gov/health
November 2018 To: Blood Bank Directors, Supervisors and Personnel From: Robert R. Rees, MHA, Manager, Blood Bank Program Martha M. Smith, MPA, Director
Clinical Laboratory Improvement Services (CLIS) Public Health and Environmental Laboratories (PHEL)
Subject: 2016 and 2017 Statistical Summaries of Blood Use in New Jersey
The Department has compiled the information regarding blood and blood component collections, transfusions and other applicable blood related activities to prepare the “2016 and 2017 Statistical Summaries of Blood Use in New Jersey” report in order to provide the regulated community an overview of the blood collections and transfusions in New Jersey. The information was submitted by 6 Blood Centers (BC); 72 Hospitals; 25 Umbilical Cord Blood (UCB) and Hematopoietic Progenitor Cell (HPC) facilities; 2 Brokers; 28 Out of Hospital Transfusion (OOHT) facilities which includes 17 off-site and 11 on-site; 50 Dialysis facilities and 85 Perioperative Autologous Blood Collection/Administration (PABCA) facilities which includes 17 hospitals, 60 Ambulatory Surgery Centers (ASC) and 8 Licensed Contract Providers (LCP). CLIS hopes this information is helpful and welcomes any comments and suggestions you may have towards improving the value and usefulness of this report for future years. CLIS would like to thank the licensed facilities that submitted statistical data. New Jersey continues to have a deficit in blood collection and must regularly import blood from other states to meet the transfusion needs of our citizens. Refer to Tables I, II and III and the summaries of each.
Table I Blood Collections in New Jersey As noted in Table I, the total blood collected in New Jersey has continually
decreased. BC were responsible for the collection of 219,842 and 213,019 units or 96%, in 2016
and 2017; while hospitals collected 9,186 and 9,488 units or 4% of the total blood collected in 2016 and 2017. Autologous donations decreased from 1,119 units or 0.5% in 2015 to 443 units or 0.2% in 2017 of the total blood collected while directed donations decreased from 709 units or 0.3% in 2015 to 385 units or 0.2% in 2017.
Four BC and the hospitals that collect blood reported a decrease of 14,935 units of blood collected in 2016 as compared to their 2015 total collections. Two BC reported an increase of 644 units of blood collected in 2016 as compared to their 2015 total collections. This resulted in a net decrease of 14,291 units of blood collected or 5.9% in 2016 as compared to the 2015 total collections.
PHILIP D. MURPHY Governor
SHEILA Y. OLIVER Lt. Governor
SHEREEF M. ELNAHAL, MD, MBA Commissioner
2
Five BC reported a decrease of 9,697 units of blood collected in 2017 as compared to their 2016 total collections. One BC and the hospitals that collect blood reported an increase of 3,176 units of blood collected in 2017 as compared to their 2016 total collections. This resulted in a net decrease of 6,521 units of blood collected or 2.8% in 2017 as compared to the 2016 total collections. Five BC and two hospitals that collect blood reported collecting 29,658 RBC units from single and/or double red cell apheresis donors in 2016, an increase of 1,968 units or 7.1% when compared to 27,690 RBC units collected in 2015. Six BC and two hospitals that collect blood reported collecting 31,656 RBC units from single and/or double red cell apheresis donors in 2017, an increase of 1,998 units or 6.7% when compared to 29,658 RBC units collected in 2016.
Table II Number of Red Blood Cell (RBC) and Whole Blood (WB) Units Collected vs. Number of RBC and WB Units Transfused
CLIS has been tracking and reporting the total blood collected and RBC/WB units transfused annually in New Jersey to determine statewide trends in the collection and transfusion of blood. The total blood collected in New Jersey has failed to meet the transfusion needs of NJ citizens since 1996 with the exceptions of 2001 and 2008. It was observed that the total blood collected decreased from 243,319 units in 2015 to 222,507 units in 2017 or by 8.5%. CLIS observed that the total number of WB and RBC transfusions in 2016 was 288,096 units, an increase of 391 units or 0.1% from 2015 but decreased 8,242 units or by 2.9% in 2017. The total number of WB and RBC units collected versus transfused from 2008 to 2017 is graphically illustrated in the Table II chart.
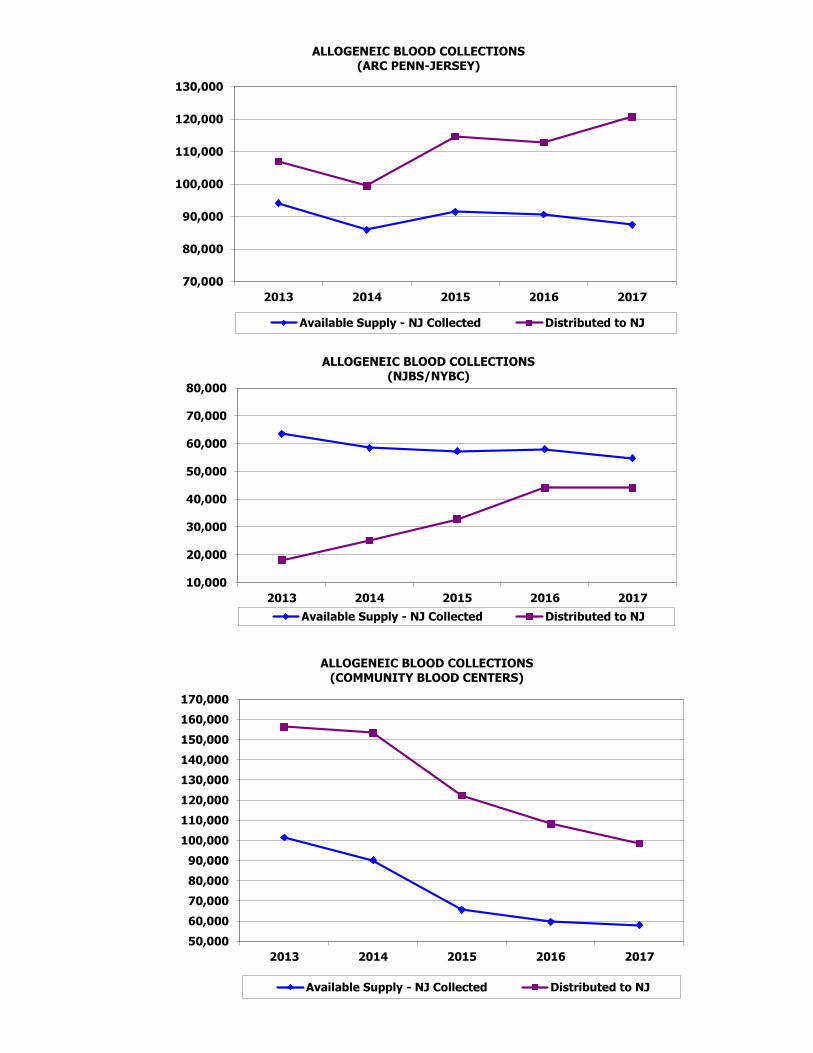
Table III Allogeneic Blood Collections and Distribution In 2017, the total allogeneic blood collected by American Red Cross Penn-Jersey Region (ARC), New Jersey Blood Services/NYBC (NJBS), the Community Blood Centers (CBC), and the hospital blood banks was 221,679 units and of that allogeneic blood collected, 12,446 units were discarded for the reasons noted in the summary of Table IV – Discard Totals. ARC has consistently shown a significant deficit in the amount of allogeneic blood collected and available for transfusion when compared to the number of allogeneic units distributed in New Jersey. CLIS observed the number of allogeneic units collected and available for distribution by ARC decreased 4.4% or 4,041 units from 2015 to 2017. ARC distributed 120,714 allogeneic units to New Jersey in 2017, an increase of 5.3% or 6,076 units when compared to 2015. ARC experienced a deficit of 33,237 allogeneic units in 2017. NJBS has consistently shown a significant surplus in the amount of blood collected and available for transfusion when compared to the number of allogeneic units distributed in New Jersey. The number of allogeneic units collected and available for distribution by NJBS decreased 4.4% or 2,534 units from 2015 to 2017. NJBS distributed 44,145 allogeneic units to New Jersey in 2017, an increase of 34.7% or 11,365 units when compared to 2015. NJBS experienced a surplus of 10,557 allogeneic units in 2017.
3
The CBC have consistently shown a significant deficit in the amount of allogeneic blood collected and available for transfusion when compared to the number of allogeneic units distributed in New Jersey. The number of allogeneic units collected and available for distribution by the CBC decreased 11.6% or 7,598 units from 2015 to 2017. CBC distributed 98,518 allogeneic units to New Jersey in 2017, a decrease of 19.4% or 23,713 units. CBC experienced a deficit of 40,546 allogeneic units in 2017. Thus, the total supply of allogeneic blood collected in and available for distribution to New Jersey hospitals was 209,233 units and the total allogeneic units distributed to the New Jersey hospitals for transfusion were 274,028. NOTE: The number of units distributed to New Jersey hospitals includes 1,569 units distributed by two licensed CBCs located out of state. The difference between the total available supply of allogeneic blood collected in New Jersey and allogeneic units distributed to New Jersey hospitals for transfusion from 2013 to 2017 can be referenced in Table III and is graphically illustrated in the Table III charts.
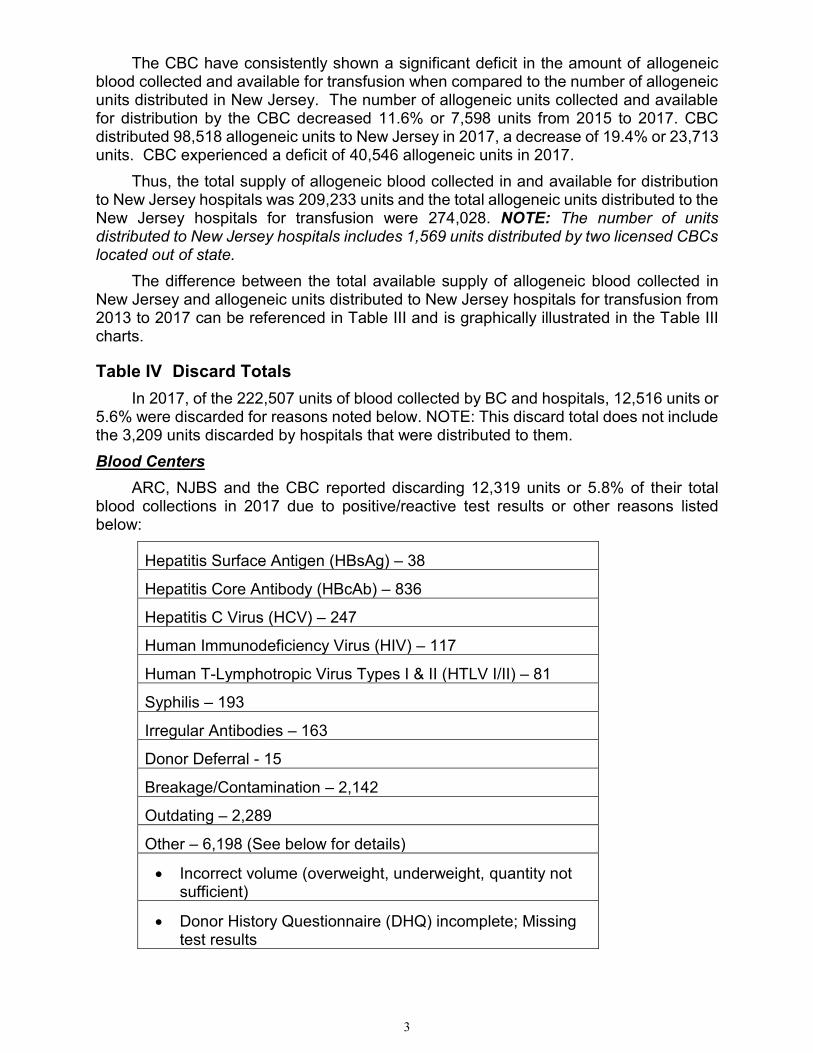
Table IV Discard Totals In 2017, of the 222,507 units of blood collected by BC and hospitals, 12,516 units or
5.6% were discarded for reasons noted below. NOTE: This discard total does not include the 3,209 units discarded by hospitals that were distributed to them. Blood Centers ARC, NJBS and the CBC reported discarding 12,319 units or 5.8% of their total blood collections in 2017 due to positive/reactive test results or other reasons listed below:
Hepatitis Surface Antigen (HBsAg) – 38
Hepatitis Core Antibody (HBcAb) – 836
Hepatitis C Virus (HCV) – 247
Human Immunodeficiency Virus (HIV) – 117
Human T-Lymphotropic Virus Types I & II (HTLV I/II) – 81
Syphilis – 193
Irregular Antibodies – 163
Donor Deferral - 15
Breakage/Contamination – 2,142
Outdating – 2,289
Other – 6,198 (See below for details)
• Incorrect volume (overweight, underweight, quantity not sufficient)
• Donor History Questionnaire (DHQ) incomplete; Missing test results
4
• Product failures (bloody, lipemic, clotted); Chagas; Zika virus
• Temperature failures (storage, transport)
• QA issues (Standard Operating Procedure (SOP) not followed, Quality Control (QC) failures)
CLIS observed that the total number of collected units discarded by BC decreased from 17,593 in 2015 to 12,319 in 2017. Specifically, the total number of units discarded by ARC, NJBS and CBC decreased from 9.9%, 0.9% and 9.5%, respectively, in 2015 to 6.3%, 0.7% and 9.4%, respectively, in 2017. Hospitals
In 2017, New Jersey hospitals reported discarding a total of 3,406 units (including 197 units collected by and 3,209 units distributed to them). Outdating accounted for 66.0% or 2,232 units that were discarded and of the outdated units, 92.0% or 2,045 were allogeneic units, 8% or 180 were autologous units and 7 were directed units.
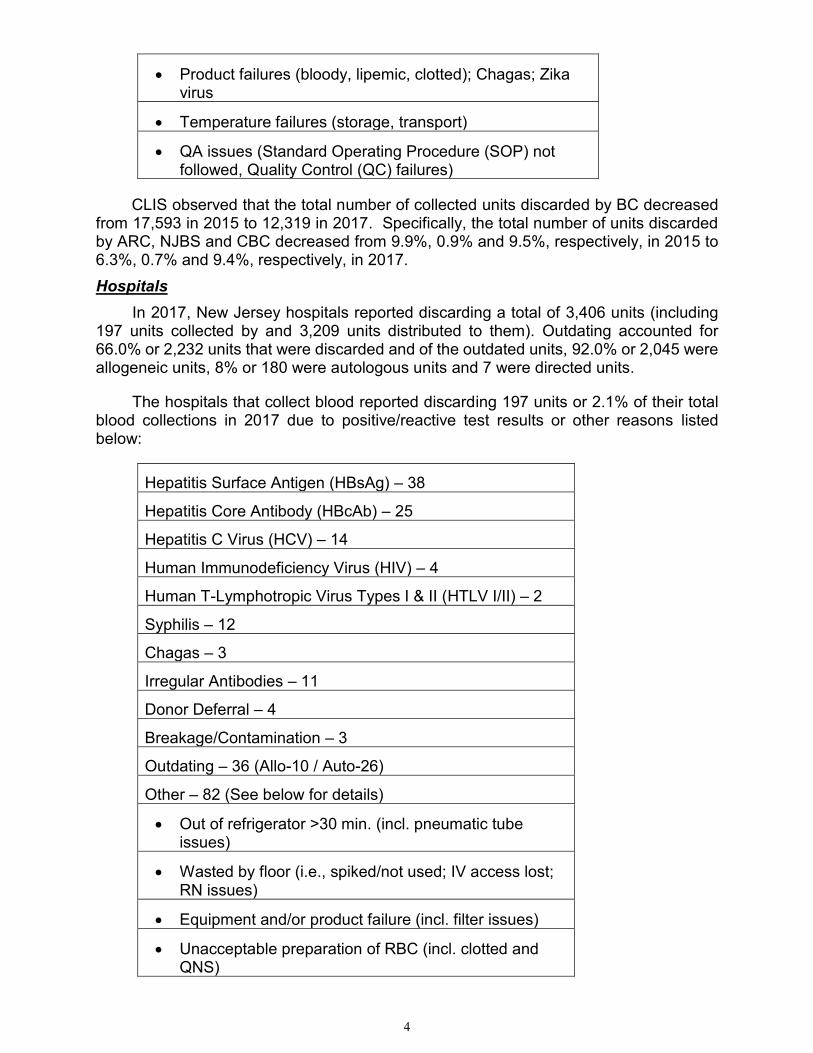
The hospitals that collect blood reported discarding 197 units or 2.1% of their total blood collections in 2017 due to positive/reactive test results or other reasons listed below:
Hepatitis Surface Antigen (HBsAg) – 38
Hepatitis Core Antibody (HBcAb) – 25
Hepatitis C Virus (HCV) – 14
Human Immunodeficiency Virus (HIV) – 4
Human T-Lymphotropic Virus Types I & II (HTLV I/II) – 2
Syphilis – 12
Chagas – 3
Irregular Antibodies – 11
Donor Deferral – 4
Breakage/Contamination – 3
Outdating – 36 (Allo-10 / Auto-26)
Other – 82 (See below for details)
• Out of refrigerator >30 min. (incl. pneumatic tube issues)
• Wasted by floor (i.e., spiked/not used; IV access lost; RN issues)
• Equipment and/or product failure (incl. filter issues)
• Unacceptable preparation of RBC (incl. clotted and QNS)
5
CLIS observed that the total number of units collected and subsequently discarded by hospitals decreased 134 units or 41% in 2017 when compared to 2016 and decreased 155 units or 32% in 2016 when compared to 2015. Also, it was observed that the total number of units discarded by hospitals (collected by and distributed to them) decreased 126 units or 4% in 2017 when compared to 2016 and decreased 1,146 units or 25% in 2016 when compared to 2015.
Table V Hemapheresis Volunteer Apheresis Volunteer apheresis collections increased 51,827 units or 79.6% in 2017 from 65,134 units in 2015 to 116,961 units and as reported by four hospitals, five BC, and two plasmapheresis centers. Refer to Table V for the total number of volunteer apheresis donors and units collected from 2015 to 2017. Therapeutic Apheresis Therapeutic apheresis procedures reported by hospitals and LCP decreased 19.6% from 4,728 in 2015 to 3,799 in 2017. Refer to Table V for the total number of therapeutic apheresis procedures and patients from 2015 to 2017.
Table VI Perioperative Autologous Blood Collection and Administration In 2017, twelve hospitals, five LCP and one ASC reported performing 10,167
Intraoperative Autologous Blood Collection and Administration procedures and five hospitals, three LCP and one ASC reported performing 1,013 Post-Operative Autologous Blood Collection and Administration procedures.
Three hospitals, three LCP and one ASC reported performing 420, 48 and 89 Acute Normovolemic Hemodilution (ANH) procedures, respectively.
Two hospitals and six LCP reported collecting/processing/administering 179 and 716 Platelet Rich Plasma (PRP) products, respectively and fifty-six ASC reported collecting/processing/administering 2,186 PRP products.
Refer to Table VI for the total number of different PABCA procedures performed from 2015 to 2017.
Table VII Salvaged Plasma Refer to Table VII for the total number of units collected and the volume in liters of salvaged plasma that were distributed for further manufacture as reported by licensed plasma brokers, BC and hospitals that collect blood from 2015 to 2017.
Table VIII Transfusion Reactions Reported by Hospitals and OOHT Facilities The hospitals and transfusion only service facilities (off-site of and within the
hospital) reported transfusing 288,096 WB and RBC units and 132,272 blood components in 2016 and 279,854 WB and RBC units and 127,472 blood components in 2017. Of the 420,368 total transfusions in 2016, 1,473 recipients or 0.4% experienced suspected adverse reactions to the transfusions which included three acute hemolytic, one delayed hemolytic and ninety-three delayed serologic and of the 407,326 total transfusions in 2017, 1,459 recipients or 0.4% experienced suspected adverse reactions to the transfusions which included six delayed hemolytic and ninety-four delayed serologic.
6
In 2016, the three acute hemolytic transfusion reactions occurred within 3 hours of cessation of the transfusions and the recipient’s exhibited onset of signs and symptoms of suspected adverse reactions. One reaction was due to the transfusion of an incompatible SDP product, one was due to the transfusion of a least incompatible RBC unit and one was due to the presence of Anti-Dib. The delayed hemolytic reaction developed 28 days from cessation of the transfusion and the recipient exhibited onset of signs and symptoms of a suspected adverse reaction. The reaction was due to the presence of newly-identified clinically-significant antibodies to S and HLA.
In 2017, the six delayed hemolytic transfusion reactions developed between 24 hours and 18 days of cessation of the transfusions with a positive direct antiglobulin test (DAT) for antibodies and a positive elution test with an alloantibody present on the transfused red blood cells or a newly-identified red blood cell alloantibody in the recipient’s serum. The blood banks detected and identified the following alloantibodies that caused the delayed hemolytic reactions: Fy3, Jka, Jkb, M and S.
In all delayed serologic transfusion reactions, there were no clinical signs of hemolysis and there was demonstration of newly-identified alloantibodies by either a positive DAT and/or antibody screen and identification. The blood banks detected and identified the following alloantibodies that caused the delayed serologic reactions: C, c, D, E, e, f, M, N, S, U, Cw, Dob, Fya, Fyb, He, Jka, Jkb, Jsa, K, K1, Lea and Lua.
In the Non-Specific/Other transfusion reactions, the blood banks reported Anxiety, Back Pain, Chest Pain, Dyspnea, Hypotensive, Immune-related (i.e., Cytokines), Nausea/Vomiting, Shortness of Breath (SOB), Tachycardia, Symptoms not related to the transfusion (i.e., Underlying disease), and no evidence of an adverse reaction. Refer to Table VIII for the different types of suspected adverse reactions reported from 2015 to 2017.
Table IX Donor Reactions Reported by BC and two Plasmapheresis Centers The BC reported a decrease in the number of adverse donor reactions from 5,546 in 2015 to 4,876 in 2017. Refer to Table IX for the specific reaction types and their percentages from 2015 to 2017.
Table X Breakdown of WB and RBC Transfusions by Site (Hospital and OOHT Facilities)
Seventy-two hospitals transfused 271,621 WB and RBC units or 97.1% of the transfusions while sixteen OOHT facilities (off-site) transfused 8,233 WB and RBC units or 2.9% of the transfusions in 2017. Refer to Table X for the total number of WB and RBC transfusions reported by hospitals and OOHT facilities from 2015 to 2017.
Table XI WB, RBC and Other Blood Components Transfused in New Jersey Refer to Table XI for the breakdown of the total number of WB, RBC and other blood components transfused in the hospitals and Transfusion Only Services facilities (off-site) from 2015 to 2017. The grand total of transfusions increased from 419,475 in 2015 to 420,368 in 2016 but deceased to 407,326 in 2017.
7
Table XII Hospital and Out of Hospital Use of WB and RBC Categorized by Donor Type and County
Refer to Table XII for the proportion of WB to RBC units transfused in 2016 and 2017. In 2016, blood transfusions consisted of 99.9% RBC units and 0.1% WB units which remained the same as in 2015. The number of WB units transfused in 2016 decreased to 166 from 198 in 2015 and the WB units transfused to autologous recipients decreased from one hundred percent to ninety-one percent while nine percent were transfused to allogeneic recipients. For RBC units, allogeneic transfusions accounted for 99.9% and directed accounted for 0.1%. In 2017, blood transfusions consisted of 100% RBC units and 0% WB units. The number of WB units transfused in 2017 decreased to 120 from 166 in 2016 and the WB units transfused to autologous recipients decreased from ninety-one percent to fifty-seven percent while forty-three percent were transfused to allogeneic recipients. For RBC units, allogeneic transfusions accounted for 99.9% and directed accounted for 0.1%.
Table XIII Distribution of Blood to Transfusion Services by County Please refer to Table XIII for the distribution of WB and RBC units to New Jersey
hospitals by county in 2017. The numbers are reported by the hospitals as compared to those reported by the CBC, ARC and NJBS/NYBC.
Errors and Accidents The BC, Hospitals that collect blood (CH) and Transfusion Services reported 281
Error/Accident incidents to the Department in 2017 compared to 309 incidents reported in 2016 and 329 reported in 2015. In 2017, 158 incidents were classified as accidents and 123 as errors and of the 158 accidents, 153 or 97% were Post Donation Information (PDI). In 2016, 175 incidents were classified as accidents and 134 as errors and of the 175 accidents, 164 or 94% were PDI. In 2017, 212 incidents were reported by BC, fifty-seven were reported by hospitals and thirteen were reported by CH. In 2016, 222 incidents were reported by BC, eighty-two were reported by hospitals and five were reported by CH.
Errors/Accidents reported by BC and CH were as follows: • Travel to malarial endemic area; risk factors associated with CJD travel; male donor
had sex with another male; female donor had sex with a male who had sex with another male
• Donor diagnosed with Babesiosis (or implicated in possible transfusion transmission of Babesia), Zika Virus, Lyme’s Disease, Multiple Myeloma, Factor V Leiden and/or Von Willebrand’s Disease
• Donor history of hepatitis, HIV, syphilis, leukemia, melanoma, cancer, cellulitis, sexually-transmitted disease; IV drug or steroid use; accidental needlestick; blood transfusion; previous pregnancy
• Subsequent testing confirmed positive for HCV, HBV, and/or HIV; confirmed positive HBsAg; repeat reactive and/or confirmed positive anti-HBc
• Donor history of receiving a bone and/or dental graft; receiving money for sex; receiving a tattoo and/or self-piercing; exhibiting self-mutilation/cutting
8
• Donor took Accutane, Aspirin, Aubagio, Avodart, Coumadin, Mesalamine, Plavix, Propecia, Proscar, Warfilone and/or Xarelto medications
• Donor presented as female with prior history of donations as a male and donor presented as male with prior history of donations as a female
• Duplicate donors due to incomplete and/or incorrect donor history records (discrepancies with name, date of birth), improper donor health assessments (vital signs, hematocrit) and incorrect review of donor deferral and/or previous donation records (including for RBC/Plasma losses)
• Distribution of RBC units that were hemolyzed/icteric, FFP/RBC units with clots and SDP units that subsequently tested positive for bacteria
• Inappropriate distribution of RBC/SDP units to hospital consignees due to inadequate testing performed (CMV) and/or incorrect test results (Zika virus); inadequate preparation of products (defective leukocyte filters); inadequate and/or incomplete product QC (WBC, hematocrit, antigen typing) and equipment QC (Hemocue, Cell-Dyne); use of expired reagents, culture bottles and/or processing kits
• RBC/SDP units leukocyte reduced and/or irradiated per SOP but relabeled incorrectly and distributed to hospital consignees
• RBC/SDP units distributed to hospital consignees at unacceptable temperatures (use of incorrect shipping containers and/or unacceptable transport packing materials, excessive transport times from BC to hospital)
• Distribution of RBC units with incorrect antigen testing results
• Distribution of products mislabeled with incorrect volumes, DINs, blood types, unit attributes and/or expiration dates/times
• Failure to follow and/or inadequate SOPs (donor screening, product testing, quality control)
Errors reported by Transfusion Services were as follows: • Technical errors in testing/interpretation of antibody screening/identification, antigen
typing and/or cross matching (IS only when AHG required, no detection of ABO incompatibility performed)
• Failure of Blood Bank and/or Nursing personnel to positively identify blood/blood components and/or recipients at the time of: ➢ Issue from the blood bank and/or Trauma refrigerator ➢ Administration, resulting in the transfusion of blood/blood components to incorrect
recipients and/or incorrect blood/blood components to recipients
• Issued and transfused RBC and SDP units that were non-irradiated when “irradiated” units were ordered/required; RBC units that were non-leukocyte reduced when “leukocyte reduced” units were ordered; CMV positive units when “CMV negative” units were ordered; and RBC units that were not antigen typed or incorrectly antigen typed for recipients with an antibody
• Issued and/or transfused SDP and FFP units when RBC units were ordered and RBC units when SDP and FFP units were ordered; issued and transfused allogeneic RBC unit when patient had directed unit
9
• Issued and/or transfused expired units of RBC, FFP and SDP; transfused RBC units beyond the approved timeframe
• Issued and/or transfused blood/blood components with incorrect recipient names/ MRNs, DINs, blood types (unit/recipient), unit attributes, volumes and/or expiration dates/times
• Mislabeled and expired specimens used for compatibility testing; expired reagents used for compatibility testing
• Inadequate or incomplete equipment and/or reagent QC
• Blood/blood components issued and transfused but not released electronically in the Blood Bank Computer System; incorrect components issued/released electronically in the Blood Bank Computer System and transfused
• Failure to follow and/or inadequate SOPs (patient testing, administration of blood/blood components, quality control, preventive maintenance)
Umbilical Cord Blood Collections Twenty-three facilities are licensed by the Department to collect, process and/or store umbilical cord blood (UCB) from prospective mother’s in New Jersey. These licensed facilities include twenty out-of-state facilities located in Arizona, California, Colorado, Connecticut, Florida, Georgia, Indiana, Illinois, Kentucky, Massachusetts, Nevada, New York, Puerto Rico and Washington. These facilities reported collecting 6,481 UCB units; processing 4,952 UCB units; storing 4,855 UCB units and transplanting 15 UCB units in 2016 and collecting 5,877 UCB units; processing 4,529 UCB units; storing 4,363 UCB units and transplanting 5 UCB units in 2017.
Hematopoietic Progenitor Cell Collections Nine facilities are licensed by the Department to collect, process and/or store
hematopoietic progenitor cells (HPC) from the citizens of New Jersey. Seven facilities reported performing 1,114 HPC collections in NJ hospitals, processing/storing 964 HPC units for future transplantation and transplanting 1,076 HPC units in 2016. Only two facilities reported statistics in 2017 of which 859 HPC collections were performed in NJ hospitals and 863 HPC units were transplanted. NOTE: The number of transplanted HPC units includes units collected in and stored from previous years.
Other Information Reported to the Department by Hospitals, Transfusion Only Service Facilities (off-site of and within the hospital), and ASCs
• Fifty-five hospitals reported transfusing 343 patients with 1,104 least incompatible units in 2016 and sixty hospitals reported transfusing 386 patients with 1,202 least incompatible units in 2017.
• Thirteen Transfusion Only Service facilities (off-site of the hospitals) reported transfusing 3,226 Single Donor Platelet (SDP) units and 39 Fresh Frozen Plasma (FFP) units in 2016 and sixteen facilities reported transfusing 4,121 SDP units and 86 FFP units in 2017. NOTE: These figures are included in the transfusions reported by the hospital blood banks providing the blood components to these facilities.
10
• In 2016, forty-four licensed facilities (located within the hospitals) reported transfusing 6,429 RBC units, forty-two SDP units, one random platelet unit, 1,091 FFP units and ten Cryoprecipitate units during hemodialysis treatments and twelve licensed Long-Term Acute Care (LTAC) and/or Specialty Care facilities (located within the hospitals) reported transfusing 2,988 RBC units, 232 SDP units, and 146 FFP units. In 2017, forty-three licensed facilities (located within the hospitals) reported transfusing 5,768 RBC units, twenty-one SDP units, one random platelet unit and 863 FFP units during hemodialysis treatments and eleven licensed Long-Term Acute Care (LTAC) and/or Specialty Care facilities (located within the hospitals) reported transfusing 2,472 RBC units, 125 SDP units, 126 FFP units and 27 Cryoprecipitate units. NOTE: These figures are included in the transfusions reported by the blood banks in the hospitals where these facilities are located.
• Fifty-three hospitals and sixteen OOH facilities (off-site) reported performing 4,926 and 1,624 Therapeutic Phlebotomy Collections, respectively, in 2016 and forty-two hospitals and sixteen OOH facilities (off-site) reported performing 4,922 and 2,249 Therapeutic Phlebotomy Collections, respectively, in 2017.
• Seventy-one hospitals reported a total bed capacity of 24,269 beds in 2016 and 24,151 beds in 2017 and sixty-nine hospitals reported performing 535,228 surgical procedures in 2016 and sixty-seven hospitals reported performing 548,145 surgical procedures in 2017.
NOTES:
• It is the responsibility of each licensed facility to ensure that blood collection facilities distributing blood/blood components to them and companies that contract with them to perform Perioperative Autologous Blood Collection/Administration procedures (inclusive of providers of Platelet Rich Plasma), umbilical cord blood and/or hematopoietic progenitor cell collections, Therapeutic apheresis procedures, transfusion only services (inclusive of LTAC and/or Specialty Care facilities) and/or dialysis services (inclusive of transfusions performed during hemodialysis treatments) have a blood bank license to operate in New Jersey (inclusive of companies located out of state).
• Websites: ➢ State of New Jersey: https://www.nj.gov ➢ Department of Health: https://www.nj.gov/health ➢ Clinical Laboratory Improvement Services:
https://www.nj.gov/health/phel/clinical-lab-imp-services
• Error/Accident and Transfusion Reaction Reports should be electronically submitted to: [email protected]
• For questions about this report, please contact Robert Rees at (609) 406-6826 or e-mail Mr. Rees at [email protected].
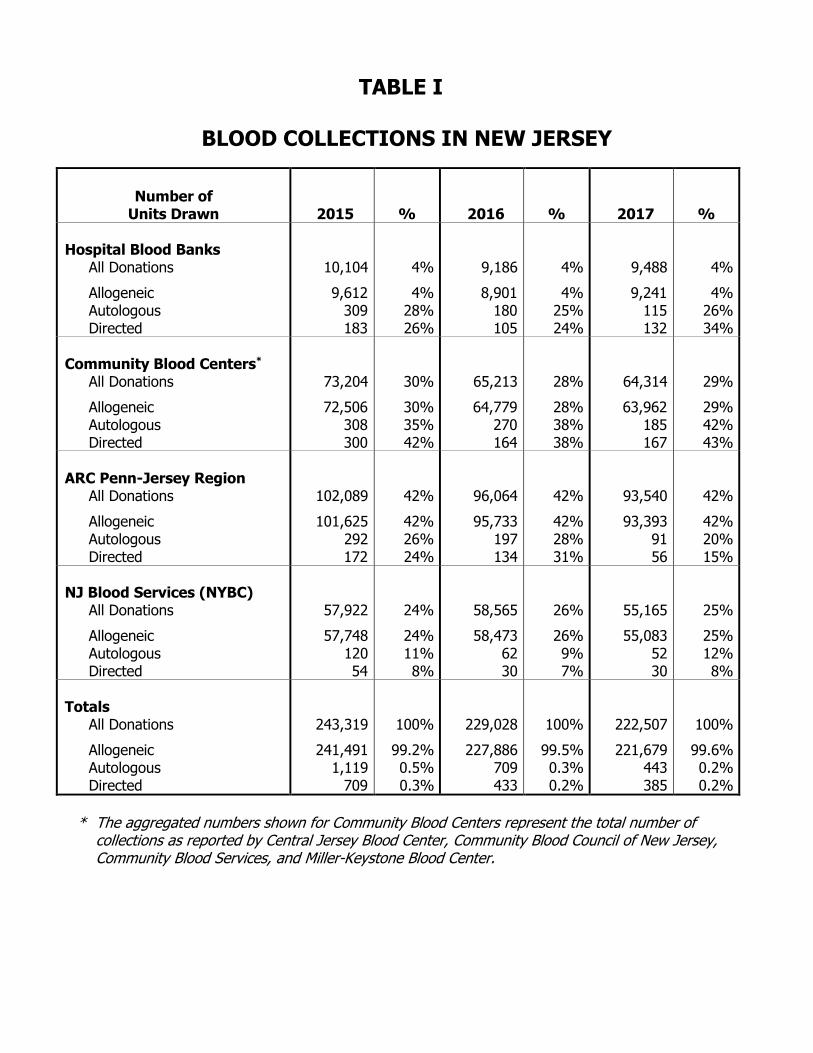
TABLE I
BLOOD COLLECTIONS IN NEW JERSEY
Number of Units Drawn
2015
%
2016
%
2017
% Hospital Blood Banks
All Donations Allogeneic Autologous Directed
10,104 9,612
309 183
4% 4%
28% 26%
9,186 8,901
180 105
4% 4%
25% 24%
9,488 9,241
115 132
4% 4%
26% 34%
Community Blood Centers*
All Donations Allogeneic Autologous Directed
73,204 72,506
308 300
30% 30% 35% 42%
65,213 64,779
270 164
28% 28% 38% 38%
64,314 63,962
185 167
29% 29% 42% 43%
ARC Penn-Jersey Region
All Donations Allogeneic Autologous Directed
102,089 101,625
292 172
42% 42% 26% 24%
96,064 95,733
197 134
42% 42% 28% 31%
93,540 93,393
91 56
42% 42% 20% 15%
NJ Blood Services (NYBC)
All Donations Allogeneic Autologous Directed
57,922 57,748
120 54
24% 24% 11% 8%
58,565 58,473
62 30
26% 26% 9% 7%
55,165 55,083
52 30
25% 25% 12% 8%
Totals
All Donations Allogeneic Autologous Directed
243,319 241,491
1,119 709
100% 99.2% 0.5% 0.3%
229,028 227,886
709 433
100% 99.5% 0.3% 0.2%
222,507 221,679
443 385
100% 99.6% 0.2% 0.2%
* The aggregated numbers shown for Community Blood Centers represent the total number of
collections as reported by Central Jersey Blood Center, Community Blood Council of New Jersey, Community Blood Services, and Miller-Keystone Blood Center.
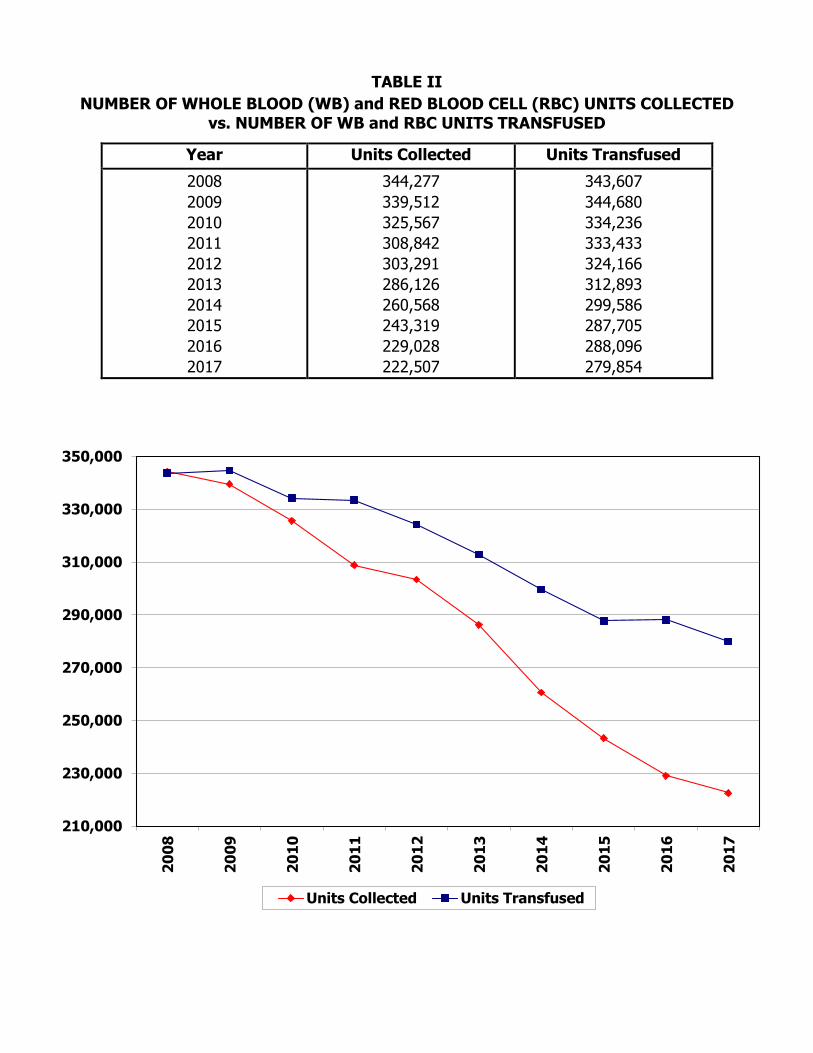
TABLE II NUMBER OF WHOLE BLOOD (WB) and RED BLOOD CELL (RBC) UNITS COLLECTED
vs. NUMBER OF WB and RBC UNITS TRANSFUSED
Year Units Collected Units Transfused 2008 2009 2010 2011 2012 2013 2014 2015 2016 2017
344,277 339,512 325,567 308,842 303,291 286,126 260,568 243,319 229,028 222,507
343,607 344,680 334,236 333,433 324,166 312,893 299,586 287,705 288,096 279,854
210,000
230,000
250,000
270,000
290,000
310,000
330,000
350,000
2008
2009
2010
2011
2012
2013
2014
2015
2016
2017
Units Collected Units Transfused
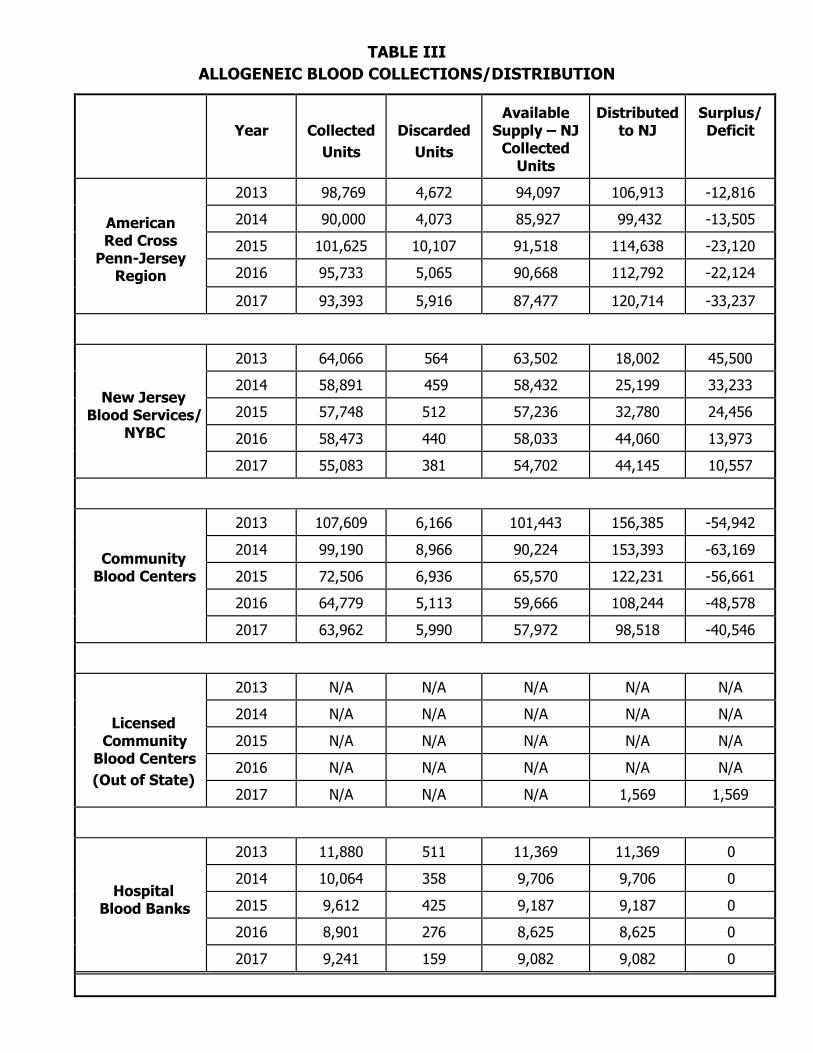
TABLE III ALLOGENEIC BLOOD COLLECTIONS/DISTRIBUTION
Year
Collected Units
Discarded Units
Available
Supply – NJ Collected
Units
Distributed
to NJ
Surplus/ Deficit
American Red Cross
Penn-Jersey Region
2013 98,769 4,672 94,097 106,913 -12,816 2014 90,000 4,073 85,927 99,432 -13,505
2015 101,625 10,107 91,518 114,638 -23,120
2016 95,733 5,065 90,668 112,792 -22,124
2017 93,393 5,916 87,477 120,714 -33,237
New Jersey Blood Services/
NYBC
2013 64,066 564 63,502 18,002 45,500 2014 58,891 459 58,432 25,199 33,233
2015 57,748 512 57,236 32,780 24,456
2016 58,473 440 58,033 44,060 13,973
2017 55,083 381 54,702 44,145 10,557
Community Blood Centers
2013 107,609 6,166 101,443 156,385 -54,942
2014 99,190 8,966 90,224 153,393 -63,169
2015 72,506 6,936 65,570 122,231 -56,661 2016 64,779 5,113 59,666 108,244 -48,578
2017 63,962 5,990 57,972 98,518 -40,546
Licensed Community
Blood Centers (Out of State)
2013 N/A N/A N/A N/A N/A 2014 N/A N/A N/A N/A N/A
2015 N/A N/A N/A N/A N/A
2016 N/A N/A N/A N/A N/A
2017 N/A N/A N/A 1,569 1,569
Hospital Blood Banks
2013 11,880 511 11,369 11,369 0
2014 10,064 358 9,706 9,706 0
2015 9,612 425 9,187 9,187 0 2016 8,901 276 8,625 8,625 0
2017 9,241 159 9,082 9,082 0
10,000
20,000
30,000
40,000
50,000
60,000
70,000
80,000
2013 2014 2015 2016 2017
ALLOGENEIC BLOOD COLLECTIONS(NJBS/NYBC)
Available Supply - NJ Collected Distributed to NJ
50,00060,00070,00080,00090,000
100,000110,000120,000130,000140,000150,000160,000170,000
2013 2014 2015 2016 2017
ALLOGENEIC BLOOD COLLECTIONS(COMMUNITY BLOOD CENTERS)
Available Supply - NJ Collected Distributed to NJ
70,000
80,000
90,000
100,000
110,000
120,000
130,000
2013 2014 2015 2016 2017
ALLOGENEIC BLOOD COLLECTIONS(ARC PENN-JERSEY)
Available Supply - NJ Collected Distributed to NJ
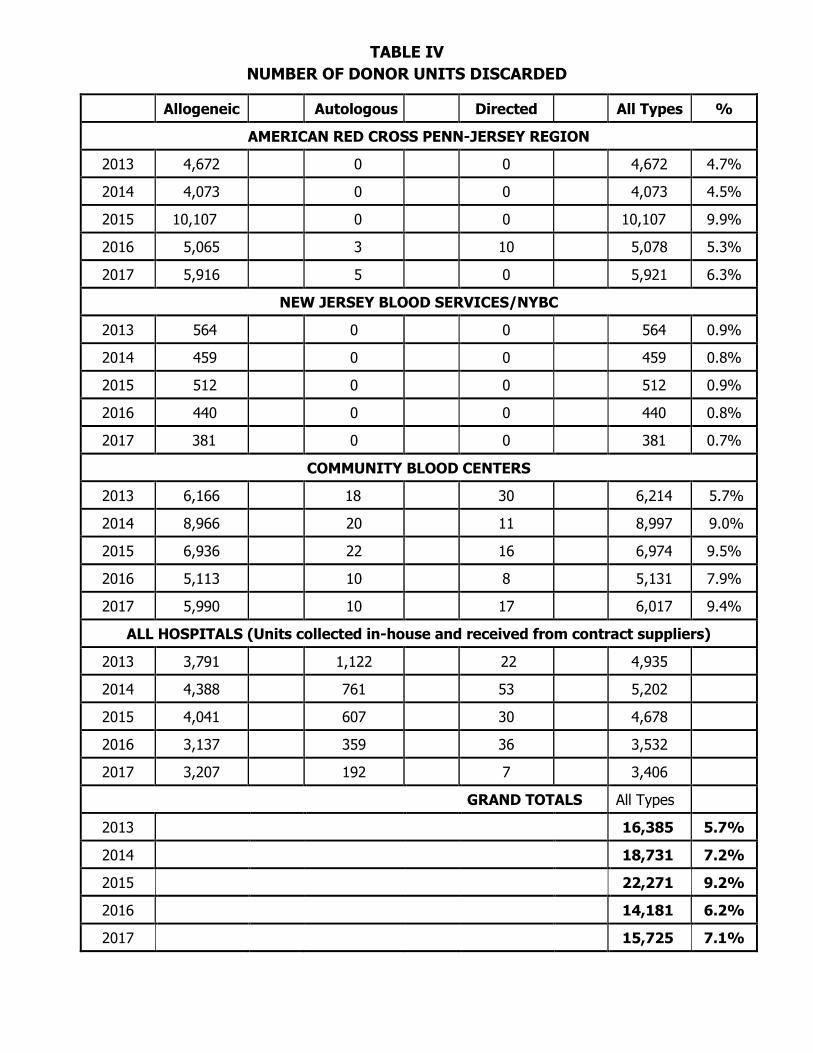
TABLE IV NUMBER OF DONOR UNITS DISCARDED
Allogeneic Autologous Directed All Types %
AMERICAN RED CROSS PENN-JERSEY REGION
2013 4,672 0 0 4,672 4.7%
2014 4,073 0 0 4,073 4.5%
2015 10,107 0 0 10,107 9.9%
2016 5,065 3 10 5,078 5.3%
2017 5,916 5 0 5,921 6.3%
NEW JERSEY BLOOD SERVICES/NYBC
2013 564 0 0 564 0.9%
2014 459 0 0 459 0.8%
2015 512 0 0 512 0.9%
2016 440 0 0 440 0.8%
2017 381 0 0 381 0.7%
COMMUNITY BLOOD CENTERS
2013 6,166 18 30 6,214 5.7%
2014 8,966 20 11 8,997 9.0%
2015 6,936 22 16 6,974 9.5%
2016 5,113 10 8 5,131 7.9%
2017 5,990 10 17 6,017 9.4%
ALL HOSPITALS (Units collected in-house and received from contract suppliers)
2013 3,791 1,122 22 4,935
2014 4,388 761 53 5,202
2015 4,041 607 30 4,678
2016 3,137 359 36 3,532
2017 3,207 192 7 3,406
GRAND TOTALS All Types
2013 16,385 5.7%
2014 18,731 7.2%
2015 22,271 9.2%
2016 14,181 6.2%
2017 15,725 7.1%
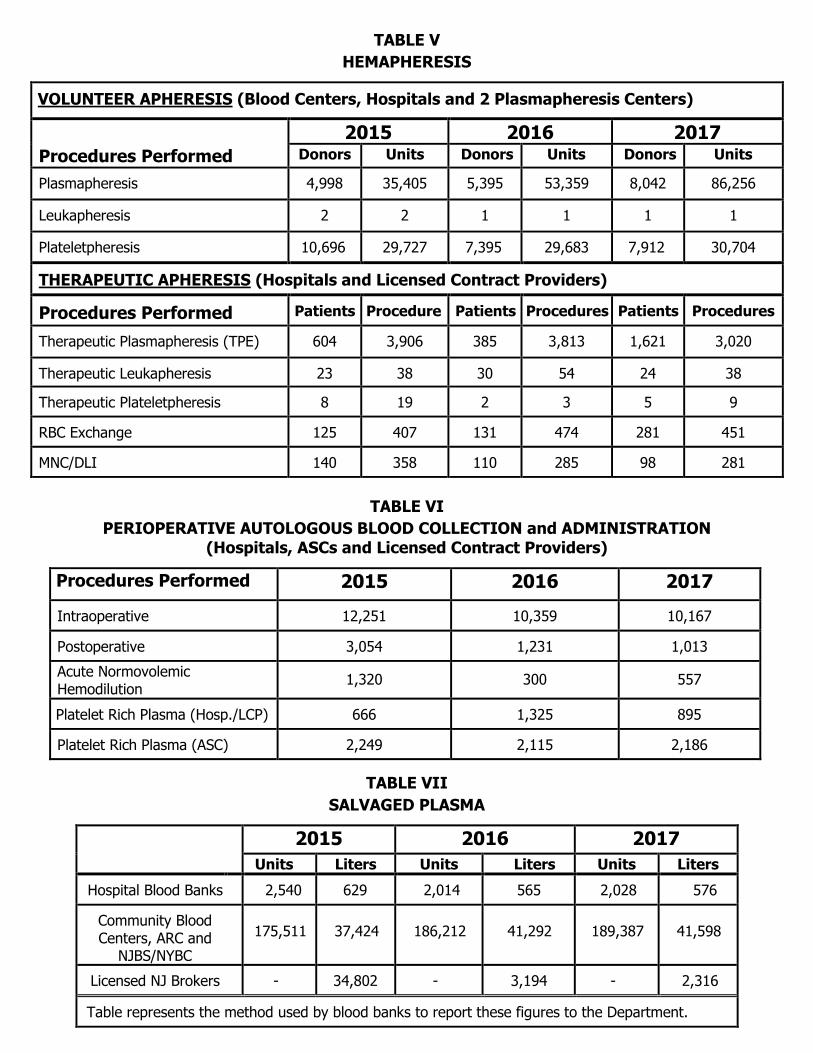
TABLE V HEMAPHERESIS
VOLUNTEER APHERESIS (Blood Centers, Hospitals and 2 Plasmapheresis Centers)
2015 2016 2017 Procedures Performed Donors Units Donors Units Donors Units
Plasmapheresis
4,998 35,405 5,395 53,359 8,042 86,256
Leukapheresis 2 2 1 1 1 1
Plateletpheresis 10,696 29,727 7,395 29,683 7,912 30,704
THERAPEUTIC APHERESIS (Hospitals and Licensed Contract Providers)
Procedures Performed Patients Procedures
Patients Procedures Patients Procedures
Therapeutic Plasmapheresis (TPE) 604 3,906 385 3,813 1,621 3,020
Therapeutic Leukapheresis 23 38 30 54 24 38
Therapeutic Plateletpheresis 8 19 2 3 5 9
RBC Exchange 125 407 131 474 281 451
MNC/DLI 140 358 110 285 98 281
TABLE VI PERIOPERATIVE AUTOLOGOUS BLOOD COLLECTION and ADMINISTRATION
(Hospitals, ASCs and Licensed Contract Providers)
Procedures Performed 2015 2016 2017 Intraoperative 12,251 10,359 10,167
Postoperative 3,054 1,231 1,013 Acute Normovolemic Hemodilution 1,320 300 557
Platelet Rich Plasma (Hosp./LCP) 666 1,325 895
Platelet Rich Plasma (ASC) 2,249 2,115 2,186
TABLE VII SALVAGED PLASMA
2015 2016 2017 Units Liters Units Liters Units Liters
Hospital Blood Banks 2,540 629 2,014 565 2,028 576
Community Blood Centers, ARC and
NJBS/NYBC 175,511 37,424 186,212 41,292 189,387 41,598
Licensed NJ Brokers - 34,802 - 3,194 - 2,316
Table represents the method used by blood banks to report these figures to the Department.
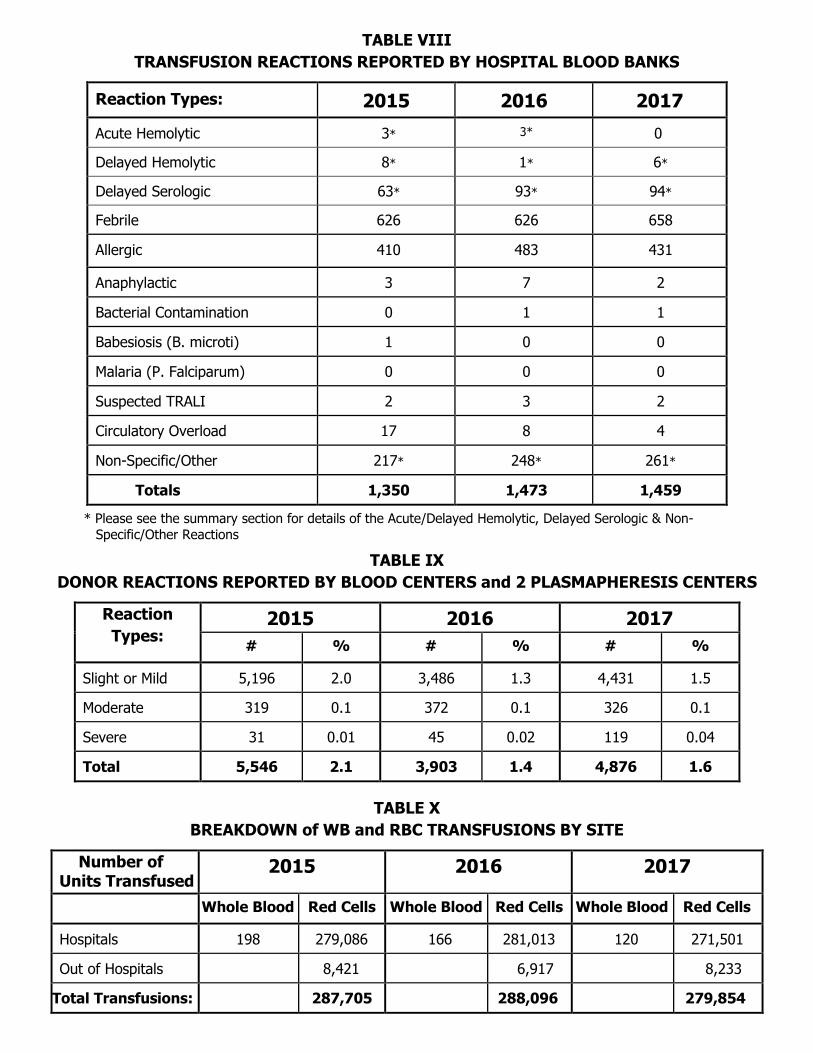
TABLE VIII TRANSFUSION REACTIONS REPORTED BY HOSPITAL BLOOD BANKS
Reaction Types: 2015 2016 2017 Acute Hemolytic 3* 3* 0
Delayed Hemolytic 8* 1* 6*
Delayed Serologic 63* 93* 94*
Febrile 626 626 658
Allergic 410 483 431
Anaphylactic 3 7 2
Bacterial Contamination 0 1 1
Babesiosis (B. microti) 1 0 0
Malaria (P. Falciparum) 0 0 0
Suspected TRALI 2 3 2
Circulatory Overload 17 8 4
Non-Specific/Other 217* 248* 261*
Totals 1,350 1,473 1,459
* Please see the summary section for details of the Acute/Delayed Hemolytic, Delayed Serologic & Non- Specific/Other Reactions
TABLE IX DONOR REACTIONS REPORTED BY BLOOD CENTERS and 2 PLASMAPHERESIS CENTERS
Reaction Types:
2015 2016 2017 # % # % # %
Slight or Mild 5,196 2.0 3,486 1.3 4,431 1.5
Moderate 319 0.1 372 0.1 326 0.1
Severe 31 0.01 45 0.02 119 0.04
Total 5,546 2.1 3,903 1.4 4,876 1.6
TABLE X BREAKDOWN of WB and RBC TRANSFUSIONS BY SITE
Number of Units Transfused
2015 2016 2017
Whole Blood Red Cells Whole Blood Red Cells Whole Blood Red Cells
Hospitals 198 279,086 166 281,013 120 271,501
Out of Hospitals 8,421 6,917 8,233
Total Transfusions: 287,705 288,096 279,854
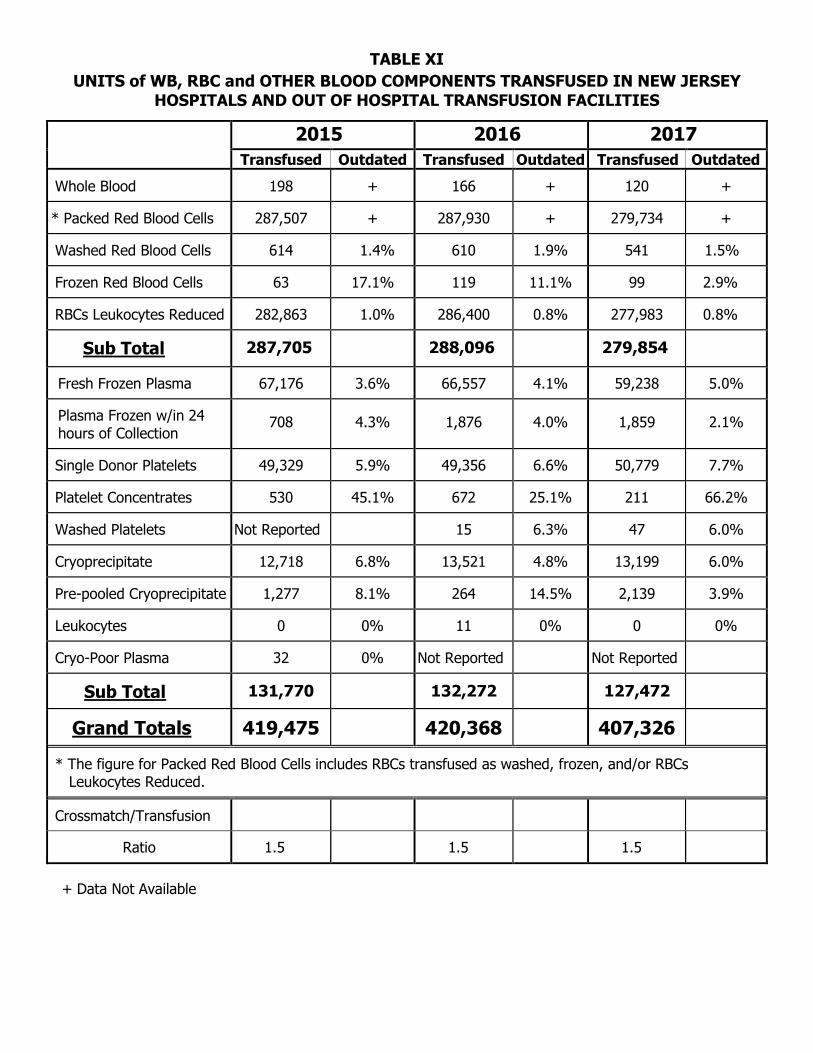
TABLE XI
UNITS of WB, RBC and OTHER BLOOD COMPONENTS TRANSFUSED IN NEW JERSEY HOSPITALS AND OUT OF HOSPITAL TRANSFUSION FACILITIES
2015 2016 2017 Transfused Outdated Transfused Outdated Transfused Outdated
Whole Blood 198 + 166 + 120 +
* Packed Red Blood Cells 287,507 + 287,930 + 279,734 +
Washed Red Blood Cells 614 1.4% 610 1.9% 541 1.5%
Frozen Red Blood Cells 63 17.1% 119 11.1% 99 2.9%
RBCs Leukocytes Reduced 282,863 1.0% 286,400 0.8% 277,983 0.8%
Sub Total 287,705 288,096 279,854 Fresh Frozen Plasma 67,176 3.6% 66,557 4.1% 59,238 5.0%
Plasma Frozen w/in 24 hours of Collection
708 4.3% 1,876 4.0% 1,859 2.1%
Single Donor Platelets 49,329 5.9% 49,356 6.6% 50,779 7.7%
Platelet Concentrates 530 45.1% 672 25.1% 211 66.2%
Washed Platelets Not Reported 15 6.3% 47 6.0%
Cryoprecipitate 12,718 6.8% 13,521 4.8% 13,199 6.0%
Pre-pooled Cryoprecipitate 1,277 8.1% 264 14.5% 2,139 3.9%
Leukocytes 0 0% 11 0% 0 0%
Cryo-Poor Plasma 32 0% Not Reported Not Reported
Sub Total 131,770 132,272 127,472
Grand Totals 419,475 420,368 407,326
* The figure for Packed Red Blood Cells includes RBCs transfused as washed, frozen, and/or RBCs Leukocytes Reduced.
Crossmatch/Transfusion
Ratio 1.5 1.5 1.5 + Data Not Available

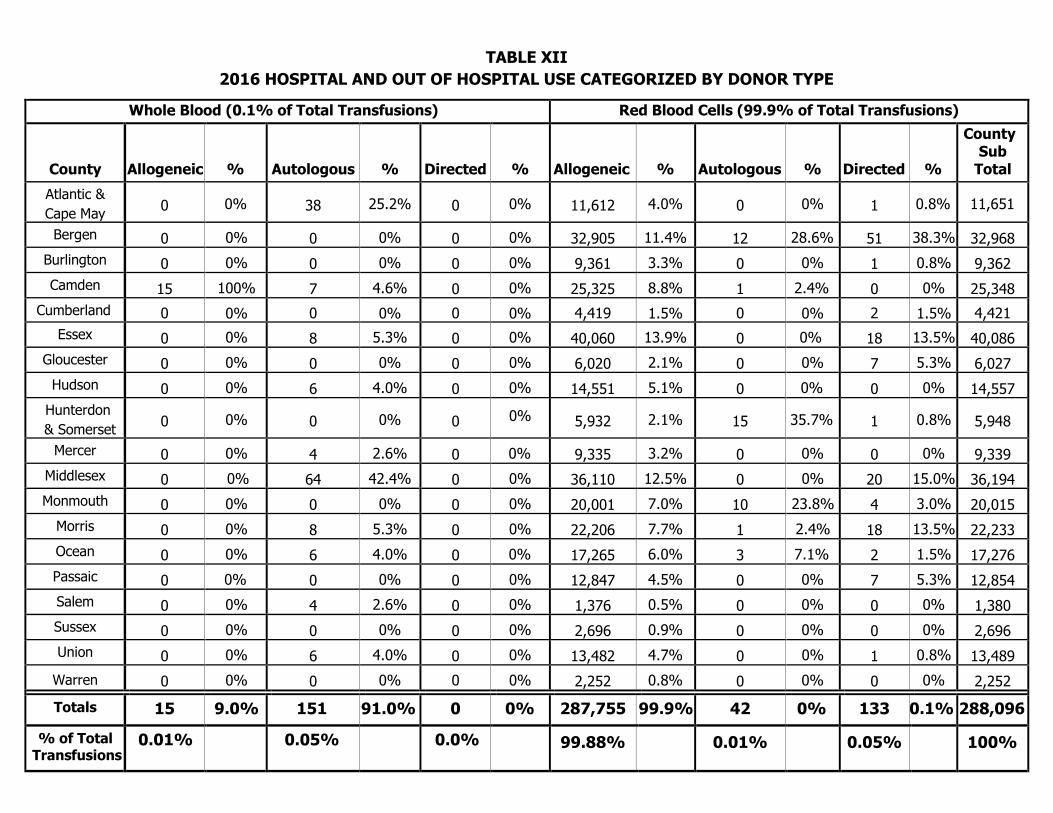
TABLE XII 2016 HOSPITAL AND OUT OF HOSPITAL USE CATEGORIZED BY DONOR TYPE
Whole Blood (0.1% of Total Transfusions) Red Blood Cells (99.9% of Total Transfusions)
County
Allogeneic
%
Autologous
%
Directed
%
Allogeneic
%
Autologous
%
Directed
%
County Sub
Total Atlantic & Cape May 0 0% 38 25.2% 0 0% 11,612 4.0% 0 0% 1 0.8% 11,651
Bergen 0 0% 0 0% 0 0% 32,905 11.4% 12 28.6% 51 38.3% 32,968 Burlington 0 0% 0 0% 0 0% 9,361 3.3% 0 0% 1 0.8% 9,362 Camden 15 100% 7 4.6% 0 0% 25,325 8.8% 1 2.4% 0 0% 25,348
Cumberland 0 0% 0 0% 0 0% 4,419 1.5% 0 0% 2 1.5% 4,421 Essex 0 0% 8 5.3% 0 0% 40,060 13.9% 0 0% 18 13.5% 40,086
Gloucester 0 0% 0 0% 0 0% 6,020 2.1% 0 0% 7 5.3% 6,027 Hudson 0 0% 6 4.0% 0 0% 14,551 5.1% 0 0% 0 0% 14,557
Hunterdon & Somerset 0 0% 0 0% 0 0% 5,932 2.1% 15 35.7% 1 0.8% 5,948
Mercer 0 0% 4 2.6% 0 0% 9,335 3.2% 0 0% 0 0% 9,339 Middlesex 0 0% 64 42.4% 0 0% 36,110 12.5% 0 0% 20 15.0% 36,194 Monmouth 0 0% 0 0% 0 0% 20,001 7.0% 10 23.8% 4 3.0% 20,015
Morris 0 0% 8 5.3% 0 0% 22,206 7.7% 1 2.4% 18 13.5% 22,233 Ocean 0 0% 6 4.0% 0 0% 17,265 6.0% 3 7.1% 2 1.5% 17,276 Passaic 0 0% 0 0% 0 0% 12,847 4.5% 0 0% 7 5.3% 12,854 Salem 0 0% 4 2.6% 0 0% 1,376 0.5% 0 0% 0 0% 1,380 Sussex 0 0% 0 0% 0 0% 2,696 0.9% 0 0% 0 0% 2,696 Union 0 0% 6 4.0% 0 0% 13,482 4.7% 0 0% 1 0.8% 13,489
Warren 0 0% 0 0% 0 0% 2,252 0.8% 0 0% 0 0% 2,252 Totals 15 9.0% 151 91.0% 0 0% 287,755 99.9% 42 0% 133 0.1% 288,096
% of Total Transfusions
0.01% 0.05% 0.0% 99.88% 0.01% 0.05% 100%
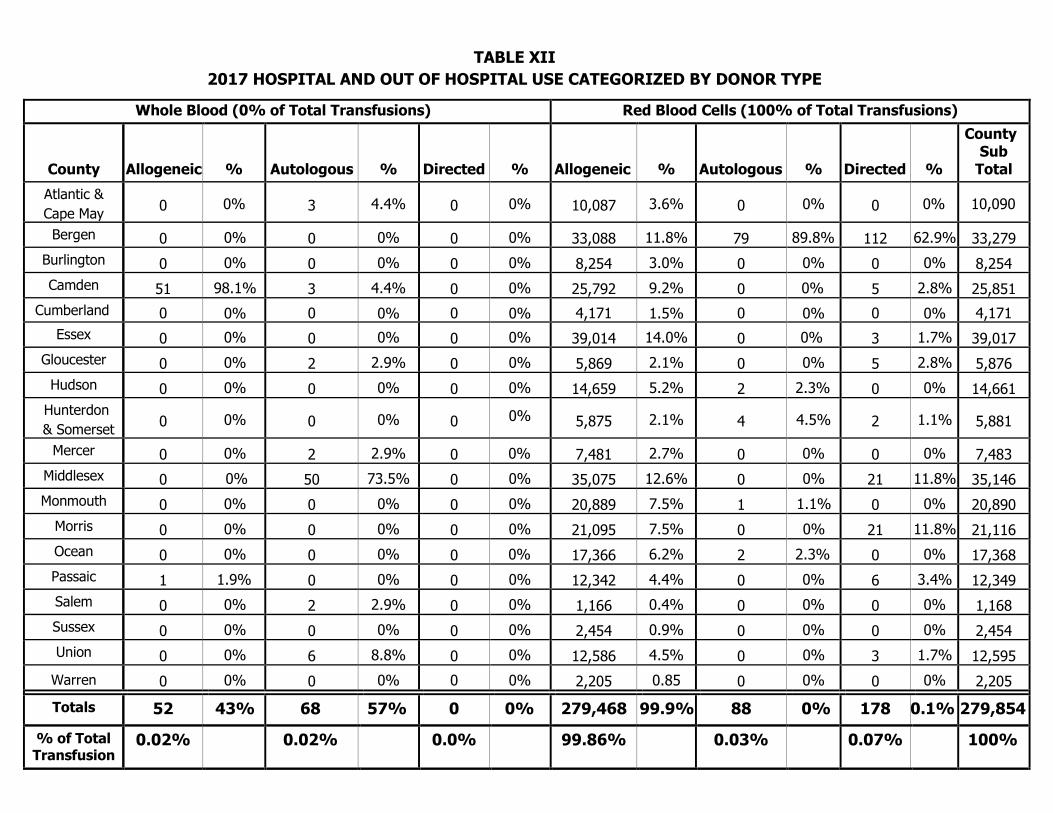
TABLE XII 2017 HOSPITAL AND OUT OF HOSPITAL USE CATEGORIZED BY DONOR TYPE
Whole Blood (0% of Total Transfusions) Red Blood Cells (100% of Total Transfusions)
County
Allogeneic
%
Autologous
%
Directed
%
Allogeneic
%
Autologous
%
Directed
%
County Sub
Total Atlantic & Cape May 0 0% 3 4.4% 0 0% 10,087 3.6% 0 0% 0 0% 10,090
Bergen 0 0% 0 0% 0 0% 33,088 11.8% 79 89.8% 112 62.9% 33,279 Burlington 0 0% 0 0% 0 0% 8,254 3.0% 0 0% 0 0% 8,254 Camden 51 98.1% 3 4.4% 0 0% 25,792 9.2% 0 0% 5 2.8% 25,851
Cumberland 0 0% 0 0% 0 0% 4,171 1.5% 0 0% 0 0% 4,171 Essex 0 0% 0 0% 0 0% 39,014 14.0% 0 0% 3 1.7% 39,017
Gloucester 0 0% 2 2.9%
0 0% 5,869 2.1% 0 0% 5 2.8% 5,876 Hudson 0 0% 0 0% 0 0% 14,659 5.2% 2 2.3% 0 0% 14,661
Hunterdon & Somerset 0 0% 0 0% 0 0% 5,875 2.1% 4 4.5% 2 1.1% 5,881
Mercer 0 0% 2 2.9% 0 0% 7,481 2.7% 0 0% 0 0% 7,483 Middlesex 0 0% 50 73.5% 0 0% 35,075 12.6% 0 0% 21 11.8% 35,146 Monmouth 0 0% 0 0% 0 0% 20,889 7.5% 1 1.1% 0 0% 20,890
Morris 0 0% 0 0% 0 0% 21,095 7.5% 0 0% 21 11.8% 21,116 Ocean 0 0% 0 0% 0 0% 17,366 6.2% 2 2.3% 0 0% 17,368 Passaic 1 1.9% 0 0% 0 0% 12,342 4.4% 0 0% 6 3.4% 12,349 Salem 0 0% 2 2.9% 0 0% 1,166 0.4% 0 0% 0 0% 1,168 Sussex 0 0% 0 0% 0 0% 2,454 0.9% 0 0% 0 0% 2,454 Union 0 0% 6 8.8% 0 0% 12,586 4.5% 0 0% 3 1.7% 12,595
Warren 0 0% 0 0% 0 0% 2,205 0.85 0 0% 0 0% 2,205 Totals 52 43% 68 57% 0 0% 279,468 99.9% 88 0% 178 0.1% 279,854
% of Total Transfusion
s
0.02% 0.02% 0.0% 99.86% 0.03% 0.07% 100%
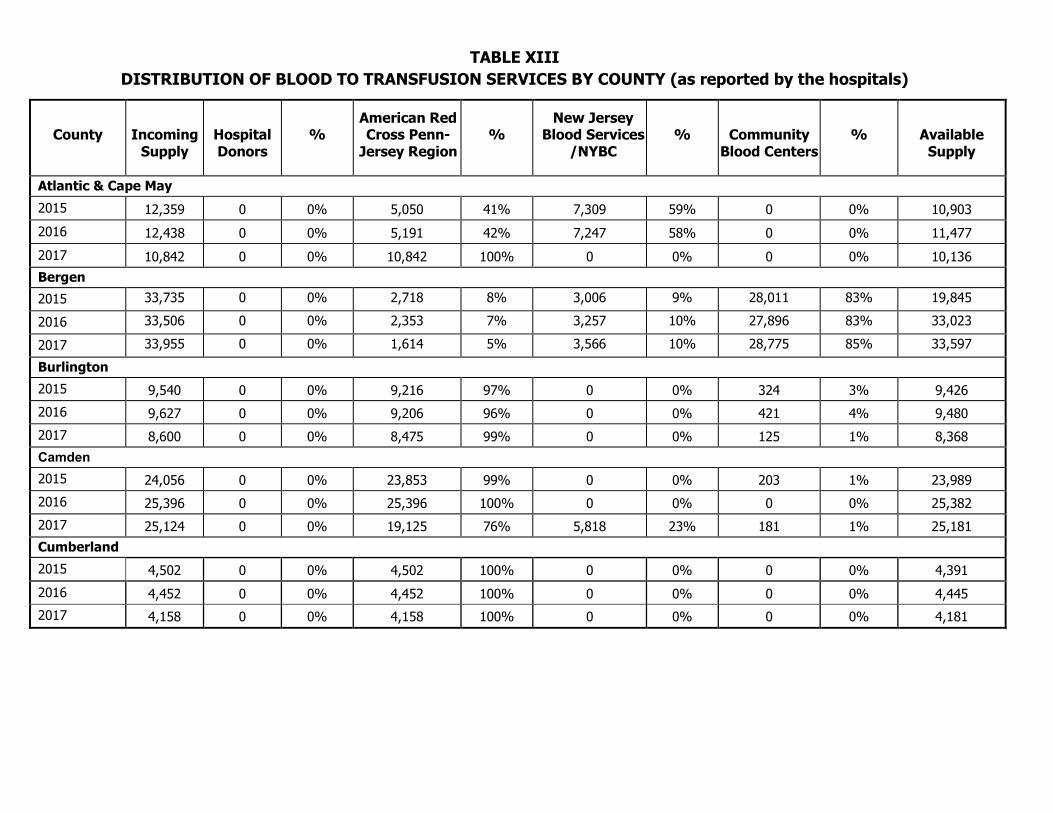
TABLE XIII DISTRIBUTION OF BLOOD TO TRANSFUSION SERVICES BY COUNTY (as reported by the hospitals)
County
Incoming Supply
Hospital Donors
%
American Red Cross Penn-
Jersey Region
%
New Jersey
Blood Services /NYBC
%
Community Blood Centers
%
Available Supply
Atlantic & Cape May 2015 12,359 0 0% 5,050 41% 7,309 59% 0 0% 10,903 2016 12,438 0 0% 5,191 42% 7,247 58% 0 0% 11,477 2017 10,842 0 0% 10,842 100% 0 0% 0 0% 10,136 Bergen 2015 33,735 0 0% 2,718 8% 3,006 9% 28,011 83% 19,845
2016 33,506 0 0% 2,353 7% 3,257 10% 27,896 83% 33,023
2017 33,955 0 0% 1,614 5% 3,566 10% 28,775 85% 33,597 Burlington 2015 9,540 0 0% 9,216 97% 0 0% 324 3% 9,426 2016 9,627 0 0% 9,206 96% 0 0% 421 4% 9,480 2017 8,600 0 0% 8,475 99% 0 0% 125 1% 8,368 Camden 2015 24,056 0 0% 23,853 99% 0 0% 203 1% 23,989 2016 25,396 0 0% 25,396 100% 0 0% 0 0% 25,382 2017 25,124 0 0% 19,125 76% 5,818 23% 181 1% 25,181 Cumberland 2015 4,502 0 0% 4,502 100% 0 0% 0 0% 4,391 2016 4,452 0 0% 4,452 100% 0 0% 0 0% 4,445 2017 4,158 0 0% 4,158 100% 0 0% 0 0% 4,181
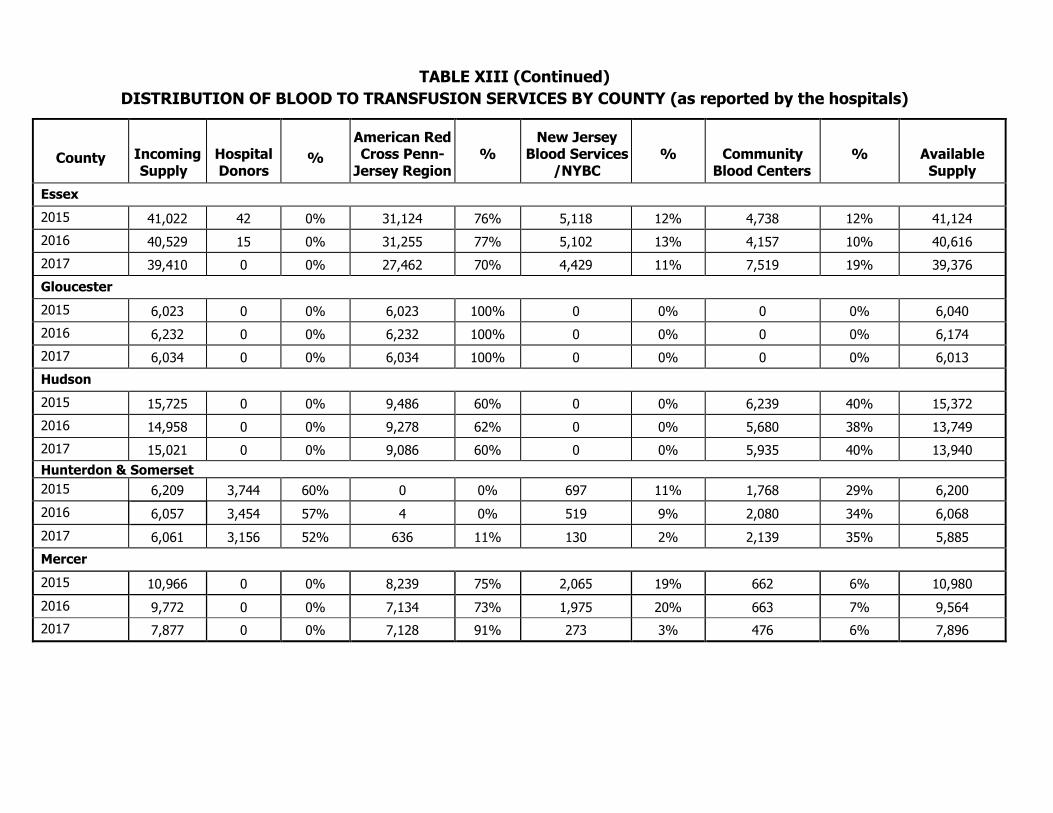
TABLE XIII (Continued)
DISTRIBUTION OF BLOOD TO TRANSFUSION SERVICES BY COUNTY (as reported by the hospitals)
County
Incoming Supply
Hospital Donors
%
American Red Cross Penn-
Jersey Region
%
New Jersey
Blood Services /NYBC
%
Community Blood Centers
%
Available Supply
Essex 2015 41,022 42 0% 31,124 76% 5,118 12% 4,738 12% 41,124 2016 40,529 15 0% 31,255 77% 5,102 13% 4,157 10% 40,616 2017 39,410 0 0% 27,462 70% 4,429 11% 7,519 19% 39,376 Gloucester 2015 6,023 0 0% 6,023 100% 0 0% 0 0% 6,040 2016 6,232 0 0% 6,232 100% 0 0% 0 0% 6,174 2017 6,034 0 0% 6,034 100% 0 0% 0 0% 6,013 Hudson 2015 15,725 0 0% 9,486 60% 0 0% 6,239 40% 15,372 2016 14,958 0 0% 9,278 62% 0 0% 5,680 38% 13,749 2017 15,021 0 0% 9,086 60% 0 0% 5,935 40% 13,940 Hunterdon & Somerset 2015 6,209 3,744 60% 0 0% 697 11% 1,768 29% 6,200 2016 6,057 3,454 57% 4 0% 519 9% 2,080 34% 6,068 2017 6,061 3,156 52% 636 11% 130 2% 2,139 35% 5,885 Mercer 2015 10,966 0 0% 8,239 75% 2,065 19% 662 6% 10,980 2016 9,772 0 0% 7,134 73% 1,975 20% 663 7% 9,564 2017 7,877 0 0% 7,128 91% 273 3% 476 6% 7,896

TABLE XIII (Continued) DISTRIBUTION OF BLOOD TO TRANSFUSION SERVICES BY COUNTY (as reported by the hospitals)
County
Incoming Supply
Hospital Donors
%
American Red Cross Penn-
Jersey Region
%
New Jersey
Blood Services /NYBC
%
Community Blood Centers
%
Available Supply
Middlesex 2015 35,646 2,236 6% 5,757 16% 11,072 31% 16,581 47% 35,046 2016 37,292 2,154 6% 6,537 17% 11,824 32% 16,777 45% 36,970 2017 37,764 2,560 7% 16,720 44% 7,352 20% 11,132 29% 37,498 Monmouth 2015 20,791 0 0% 3,568 17% 3 0% 17,220 83% 20,393 2016 20,474 0 0% 3,356 16% 4 0% 17,114 84% 20,082 2017 21,102 0 0% 2,743 13% 14 0% 18,345 87% 21,026 Morris 2015 22,522 4,071 18% 4,415 20% 1,153 5% 12,883 57% 21,706 2016 23,748 3,563 15% 4,300 18% 9,109 38% 6,776 29% 23,356 2017 22,628 3,772 17% 4,145 18% 12,416 55% 2,295 10% 22,075 Ocean 2015 17,983 0 0% 10,953 61% 0 0% 7,030 39% 17,919 2016 17,365 0 0% 10,300 59% 0 0% 7,065 41% 17,344 2017 17,461 0 0% 8,399 48% 0 0% 9,062 52% 17,441 Passaic 2015 13,414 0 0% 2,354 18% 0 0% 11,060 82% 13,281 2016 12,989 0 0% 1,929 15% 18 0% 11,042 85% 13,040 2017 12,751 0 0% 1,957 16% 47 0% 10,747 84% 12,593
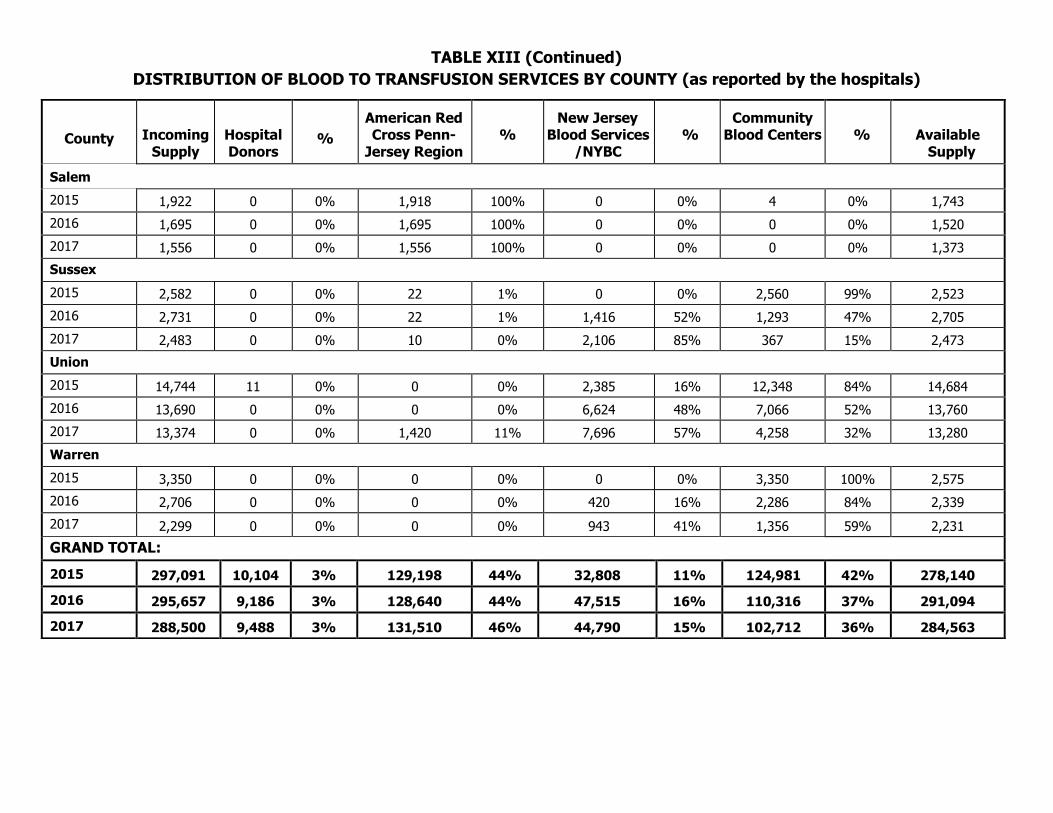
TABLE XIII (Continued) DISTRIBUTION OF BLOOD TO TRANSFUSION SERVICES BY COUNTY (as reported by the hospitals)
County
Incoming Supply
Hospital Donors
%
American Red Cross Penn-
Jersey Region
%
New Jersey
Blood Services /NYBC
%
Community
Blood Centers
%
Available Supply
Salem 2015 1,922 0 0% 1,918 100% 0 0% 4 0% 1,743 2016 1,695 0 0% 1,695 100% 0 0% 0 0% 1,520 2017 1,556 0 0% 1,556 100% 0 0% 0 0% 1,373 Sussex 2015 2,582 0 0% 22 1% 0 0% 2,560 99% 2,523 2016 2,731 0 0% 22 1% 1,416 52% 1,293 47% 2,705 2017 2,483 0 0% 10 0% 2,106 85% 367 15% 2,473 Union 2015 14,744 11 0% 0 0% 2,385 16% 12,348 84% 14,684 2016 13,690 0 0% 0 0% 6,624 48% 7,066 52% 13,760 2017 13,374 0 0% 1,420 11% 7,696 57% 4,258 32% 13,280 Warren 2015 3,350 0 0% 0 0% 0 0% 3,350 100% 2,575 2016 2,706 0 0% 0 0% 420 16% 2,286 84% 2,339 2017 2,299 0 0% 0 0% 943 41% 1,356 59% 2,231 GRAND TOTAL: 2015 297,091 10,104 3% 129,198 44% 32,808 11% 124,981 42% 278,140
2016 295,657 9,186 3% 128,640 44% 47,515 16% 110,316 37% 291,094
2017 288,500 9,488 3% 131,510 46% 44,790 15% 102,712 36% 284,563


