Embed Size (px)
Citation preview
Dependency Discovery in Data Quality
Daniele Barone1, Fabio Stella2, and Carlo Batini2
1 Department of Computer Science, University of Toronto, Toronto, ON, [email protected]
2 Department of Informatics, Systems and Communication,University of Milano-Bicocca, Milano, Italy
{stella,batini}@disco.unimib.it
Abstract. A conceptual framework for the automatic discovery of de-pendencies between data quality dimensions is described. Dependencydiscovery consists in recovering the dependency structure for a set ofdata quality dimensions measured on attributes of a database. This taskis accomplished through the data mining methodology, by learning aBayesian Network from a database. The Bayesian Network is used toanalyze dependency between data quality dimensions associated withdifferent attributes. The proposed framework is instantiated on a realworld database. The task of dependency discovery is presented in thecase when the following data quality dimensions are considered; accu-racy, completeness, and consistency. The Bayesian Network model showshow data quality can be improved while satisfying budget constraints.
Keywords: Data quality, Bayesian networks, Data mining.
1 Introduction
In the last two decades, research and practical efforts to improve data qualitydid not recognize, with the exception of a few works (e.g., logical interdependenceanalysis [1], tradeoff analysis [2,3,4,5,6] and data dependency analysis [7]), therelevance of studying and analyzing potential dependencies among data qualitydimensions, namely, correlations and reciprocal influences among them. To givean example, data that are up-to-date (thus having a low currency) have a highchance to be incorrect too.
Nowadays, the issue of data quality and of dependencies among quality di-mensions is gaining more and more importance in the life of organizations. Forexample, concerning those Information Systems used for decision-making andproblem solving in business, i.e., Decision Support Systems (DSSs) and Manage-ment Information Systems (MISs), it is well known [8] that their effectiveness isstrictly related to the quality of information resources involved in the decisionmaking process. Making correct decisions is clearly dependent on the qualityof data used [9]; however, complete knowledge regarding the quality of datacannot be gained without knowing what the existing relationships are amongdata quality dimensions. In fact, as shown in the following examples, dimensions
B. Pernici (Ed.): CAiSE 2010, LNCS 6051, pp. 53–67, 2010.c© Springer-Verlag Berlin Heidelberg 2010
54 D. Barone, F. Stella, and C. Batini
can be strictly related to each other and dependencies among them can play animportant role in a decision making process:
– Accuracy and Timeliness : Often the information becomes better over time,i.e., more accurate. However, it is also possible that for a given context, theinformation becomes less relevant and critical over time [2]. Consider an airtraffic control center which receives data from several controller stations.To regulate air traffic, the traffic control center has to cope with uncertaindata. Thus, the decision process must balance the delay in receiving moreaccurate data of airplane positions and the critical period of time in whichan “effective” decision must be made to regulate traffic;
– Consistency vs Completeness: often the information is based on incompletebut consistent data or on complete but less consistent data [4]. A classicsituation concerns human resource data in which different evaluators (i.e.,data sources), provide information regarding a particular employee. Thoseevaluators could have used different attributes to characterize an employeeand could have evaluated him over a potentially extended time period. In ascenario where the goal is to promote one out of several employees to a posi-tion in senior management, the decision process can use different strategies;it can use all available data even though some items are inconsistent, or onlyuse recent data obtained by a common evaluator.
Therefore, taking into account data quality dependencies is a basic ingredientfor rationale decision making and activity planning. Moreover, the knowledgeof data quality dependencies can also be extremely important for improvementactivities; in fact, it contributes to: i) diagnose which is the most probable causeof the bad quality for the considered data quality dimensions and thus helps toidentify error sources in an Information System; ii) select the most effective dataquality improvement strategy, i.e., the one which maximizes data quality whenwe are subject to budget constraints. Finally, since the quality of data quicklydegenerates over time1, a complete “knowledge” of quality issues represents afundamental set of quality requirements in those (Evolution) Information Sys-tems [11] in which the capability to actively react to organization changes mustalso take into account data quality problems2.
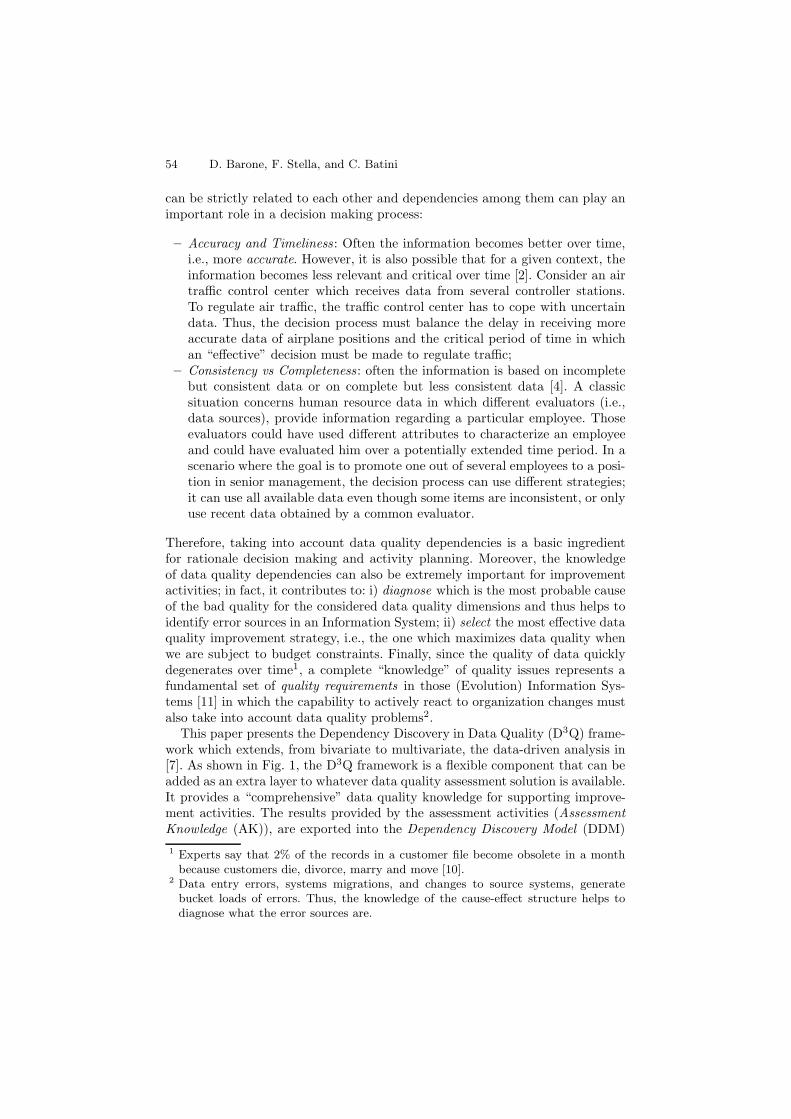
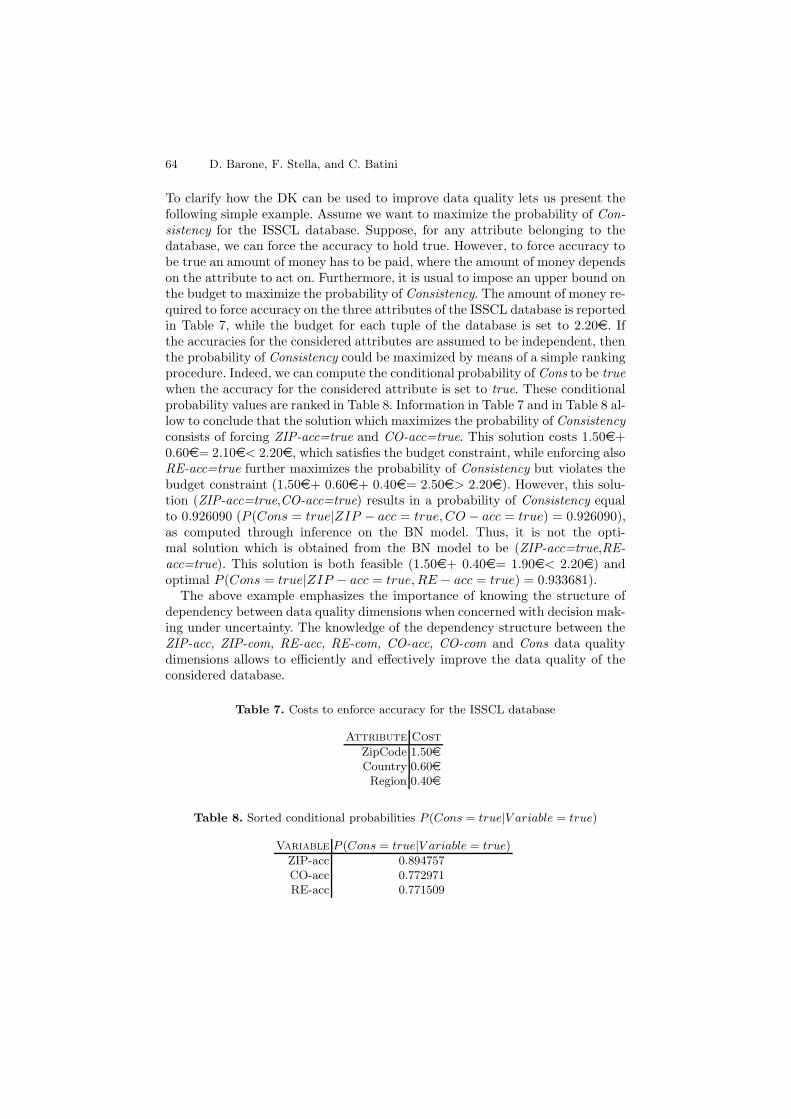
This paper presents the Dependency Discovery in Data Quality (D3Q) frame-work which extends, from bivariate to multivariate, the data-driven analysis in[7]. As shown in Fig. 1, the D3Q framework is a flexible component that can beadded as an extra layer to whatever data quality assessment solution is available.It provides a “comprehensive” data quality knowledge for supporting improve-ment activities. The results provided by the assessment activities (AssessmentKnowledge (AK)), are exported into the Dependency Discovery Model (DDM)
1 Experts say that 2% of the records in a customer file become obsolete in a monthbecause customers die, divorce, marry and move [10].
2 Data entry errors, systems migrations, and changes to source systems, generatebucket loads of errors. Thus, the knowledge of the cause-effect structure helps todiagnose what the error sources are.
Dependency Discovery in Data Quality 55
Fig. 1. The D3Q framework
which feeds the Dependency Discovery Algorithm (DDA) implemented by a datamining algorithm to provide the Dependency Knowledge (DK). The assessmentactivity plays a critical role for an “effective” discovery of dependencies, since thebenefit of the proposed approach is directly influenced by the results obtainedduring the assessment phase. This paper focuses on the data quality dependencydiscovery, while assessment that received much attention from the data qualitycommunity is not discussed. The interested reader can refer to [12] for a richand comprehensive survey on data quality assessment methodologies and tech-niques. Bayesian Networks have been used to implement the DDA component.The D3Q framework has been tested on a real world database, namely the Ital-ian Social Security Contributors’ Anagraph database, which is assessed alongthe three most important data quality dimensions, i.e., syntactic accuracy, com-pleteness, consistency, and the most adopted metrics3. However, it is worthwhileto mention that it can be applied to any given number and type of data qualitydimensions.
The rest of the paper is organized as follows. Section 2 describes the D3Qframework together with its main components, i.e., the DDM and the DDA.Section 3 reports on the instantiation of D3Q framework to the selected database,namely the Italian Contributors’ Anagraph database. This section describes themain features of the Italian contributors’ anagraph database, the related assess-ment activities and the results of a rich set of numerical experiments concerningthe task of D3Q. The last section is devoted to conclusions and directions forfurther research.
2 The D3Q Framework
The proposed framework aims to discover the dependency structure of the as-sessed data quality dimensions for a set of attributes belonging to a targetdatabase. In this paper the authors focus their attention on the case where thedata quality dimensions are described by means of binary variables, i.e., (true,
3 In [12], about 70% of the reviewed methodologies use syntactic accuracy, and about60% adopt the NULL value as a completeness measure. Moreover, these dimensionsand the associated metrics are also part of the ISO/IEC 25012:2008 - SQuaRE -Data Quality Model [13], in which they appear in the first three positions of the listof dimensions belonging to the model.
56 D. Barone, F. Stella, and C. Batini
false). However, it is possible to extend the proposed approach to include the casewhere the data quality dimensions are represented through discrete multi-valueand/or continuous variables.
2.1 The Dependency Discovery Model
The Dependency Discovery Model receives the results of the data quality assess-ment component in input in order to build the corresponding learning datasetLDDDM , i.e., the dataset used to discover the dependency structure of the as-sessed data quality dimensions. To clarify how the DDM is used to solve theD3Q problem and how the LDDDM is obtained, we need to introduce severalquantities. Let X = {xi, i = 1, ..., N} be the set of instances of a database con-sisting of M attributes A = {A1, ..., AM} on which K data quality dimensionsD = {d1, ..., dK} have been assessed. Furthermore, let the data quality dimensiondj for the attribute Al be described by means of a binary variable Y(l,j). Then, forthe instance xi we have that Y
(i)(l,j) = true in the case where the value of the at-
tribute Al for the instance xi, Al(xi), is correct w.r.t the data quality dimensiondj . The DDM(X) = {Y i
(l,j)(X) | i = 1, ..., N, l = 1, ..., M, j = 1, ..., K} modelconsists of N realizations of M · K binary variables Y(l,j). The learning datasetLDDDM (X) (hereafter LD(X)) is obtained exploiting the results provided bythe assessment component.
2.2 The Dependency Discovery Algorithm
The Dependency Discovery Algorithm is implemented through a Bayesian Net-work (BN) which exploits the information stored using the DDM, i.e., the learn-ing dataset LDDDM , to discover the dependency structure. Bayesian Networks(BNs) implement an optimal trade-off between complexity and interpretabilitywhen we have to cope with highly dimensional domains. BNs are an alternativeto rule based models. BNs differ from rule based models in three ways: i) insteadof modeling the knowledge of the domain expert, they model the domain; ii)instead of using a non-coherent uncertainty calculus tailored for rules, they useclassical probability calculus and decision theory; iii) instead of replacing the ex-pert, they support her/him. The main problem of rule based models is coherence.Indeed, rule based models do not deal properly with uncertainty which naturallyarises for the following reasons; observations may be uncertain, the informationmay be incomplete, the relations in the domain may be of a non-deterministictype. A way to incorporate uncertainty in rule based models is to extend theproduction rule to include the concept of certainty for both the left and theright part of the rule. The rule based model must be extended with new infer-ence rules, which shall ensure a coherent reasoning under uncertainty. However,it is not possible to capture reasoning under uncertainty with inference rules.Inference rules are context free; while coherent reasoning under uncertainty issensitive to the context in which the certainties have been established [14].
A BN B consists of n discrete random variables X1, ..., Xn and an underlyingDirected Acyclic Graph (DAG) G = (V, E), where V is the set of vertices while
Dependency Discovery in Data Quality 57
E is the set of directed links. Each random variable is uniquely associated witha vertex of the DAG. The BN model B is fully specified by means of the DAGG, together with a set of conditional probability tables P (Xi|pa[Xi]), i = 1,..., n, where pa[Xi] denotes the parents of node Xi, i.e., the set of variableswhich directly influence the random variable Xi. The main characteristic of theBN model B is that the joint probability distribution for the random vector(X1, ..., Xn) can be represented through the following factorization:
P (X1, ..., Xn) =n∏
i=1
P (Xi|pa[Xi]). (1)
In the case where the random variable Xi has no parents (no directed links ori-ented towards the node associated with Xi), P (Xi|pa[Xi]) is simply its marginalprobability P (Xi). One of the interesting features of BNs is that one can inferconditional variable dependencies by visually inspecting the DAG and exploit-ing the concept of conditional independence [15]. Another interesting aspect isthat many algorithms are available for learning their structure from data [16].The main structural learning algorithms, namely PC and NPC [17], are basedon making dependence tests that calculate a test statistic which is asymptoti-cally chi-squared distributed when assuming (conditional) independence. If thetest statistic is large for a given independence hypothesis, the hypothesis isrejected; otherwise, it is accepted. The probability of rejecting a true indepen-dence hypothesis is given by the level of significance. Heckerman [17] providesa full discussion of how the Bayesian estimation approach can be exploited toconstruct BNs from data. It is worthwhile to mention that inference and learn-ing algorithms are available for multi-valued and continuous random variables.However, for multi-valued random variables the complexity grows exponentiallywith the number of parents for each node. While for continuous random vari-ables, inference and learning are restricted to gaussian and conditionally gaussiandistributions.
3 Dependency Structure Discovery
This section is devoted to present the Italian Social Security Contributors’ Listdatabase together with the corresponding BN model, learnt from the availablelearning dataset. The BN model is queried to show how it can be used forinference on data quality dimensions dependency. A simple example illustratinghow the BN model could be exploited for data quality improvement is given.
3.1 Italian Social Security Contributors’ List
The Italian Social Security Contributors’List (ISSCL) database, maintained bythe Italian social security administration, contains data related to Italian con-tributors on social security for retirement funds. The ISSCL database consistsof the following six attributes; Social Security Number/Value Added Tax Num-ber, Juridical/Physical Person Name, Street, ZipCode, Country, and Region. A
58 D. Barone, F. Stella, and C. Batini
portion of the ISSCL database, containing 1,483,712 records, is used; while forprivacy reasons, only the following three attributes (M = 3): ZipCode, Country,and Region, have been included in the dataset X. Three data quality dimensions(K = 3) have been considered: namely accuracy, completeness and consistency.The (syntactic) accuracy has been assessed by using a comparison function,which computes the distance between the value v of a given attribute and thetrue values belonging to a domain look-up table. A relevant example of compari-son function is offered by the Edit distance [18]. Through the DDM we addressedonly exact matching by means of binary variables. However, it is worthwhile tomention that it is possible to use a threshold value to deal with approximatematching. The assessment of the completeness dimension is based on i) the closeworld assumption [19], which states that only the values actually present in arelation, and no other values, represent true facts of the real world, and ii) therelational data model with NULL values. The consistency, which is defined asthe logical coherence of different information [20], has been assessed by findingthe violations of semantic rules. A semantic rule is defined over data items (a setof), where the items can be either tuples (e.g., xi) of relational tables or recordsbelonging to a given file. In regard to X, the following business rule is applied:
IF ZipCode(xi) = z THEN (Country(xi) = u AND Region(xi) = v), (2)
means that if, for a given tuple xi, the attribute Zip equals z, then the values ofCountry (u) and Region (v) are univocally determined by means of a domainlook-up table.
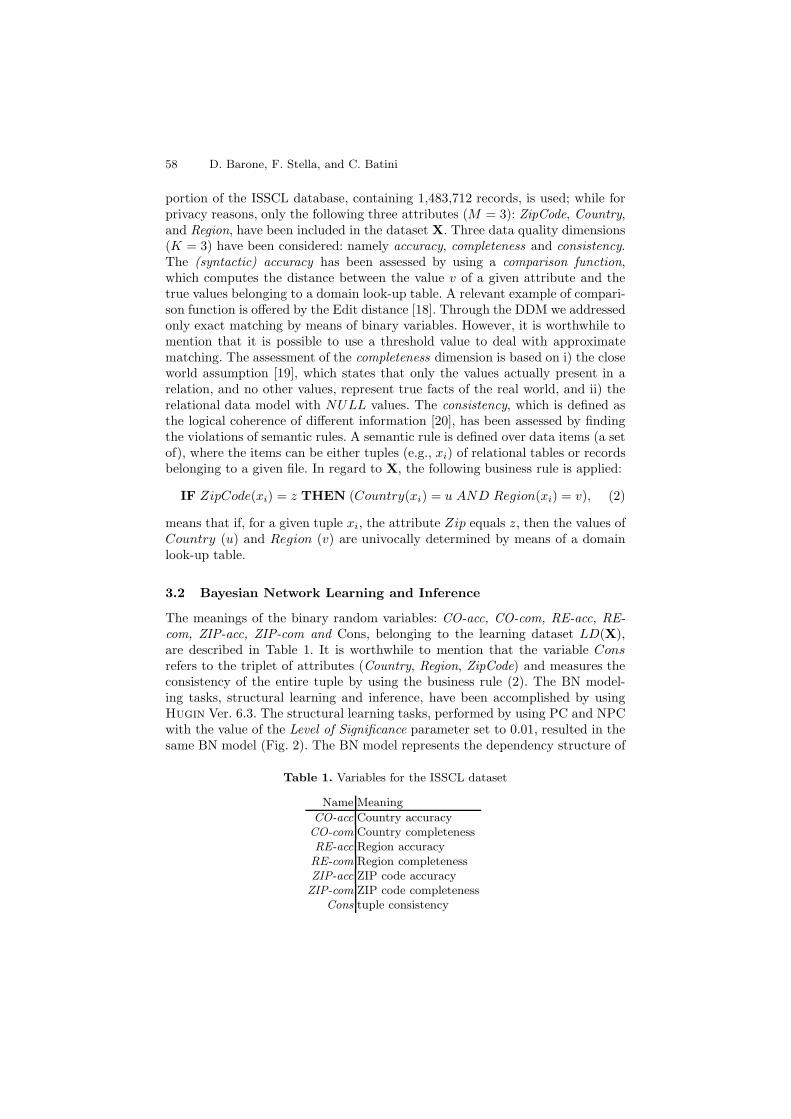
3.2 Bayesian Network Learning and Inference
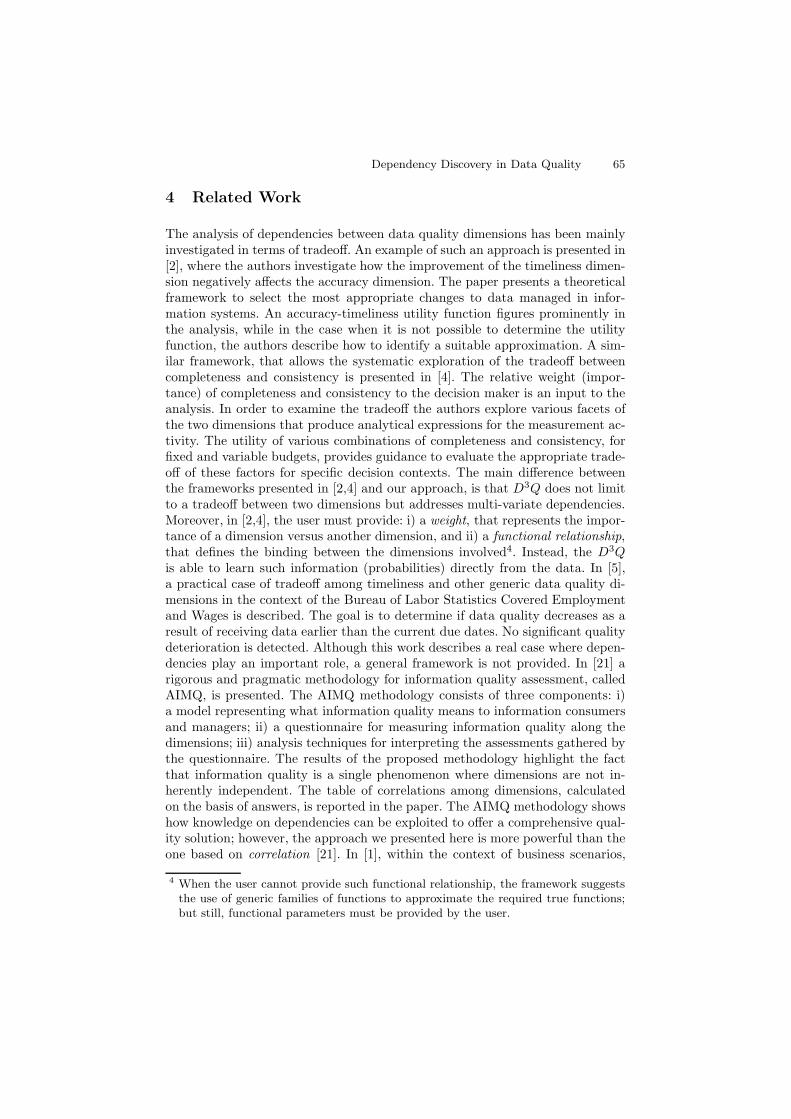
The meanings of the binary random variables: CO-acc, CO-com, RE-acc, RE-com, ZIP-acc, ZIP-com and Cons, belonging to the learning dataset LD(X),are described in Table 1. It is worthwhile to mention that the variable Consrefers to the triplet of attributes (Country, Region, ZipCode) and measures theconsistency of the entire tuple by using the business rule (2). The BN model-ing tasks, structural learning and inference, have been accomplished by usingHugin Ver. 6.3. The structural learning tasks, performed by using PC and NPCwith the value of the Level of Significance parameter set to 0.01, resulted in thesame BN model (Fig. 2). The BN model represents the dependency structure of
Table 1. Variables for the ISSCL dataset
Name Meaning
CO-acc Country accuracyCO-com Country completenessRE-acc Region accuracyRE-com Region completenessZIP-acc ZIP code accuracyZIP-com ZIP code completeness
Cons tuple consistency
Dependency Discovery in Data Quality 59
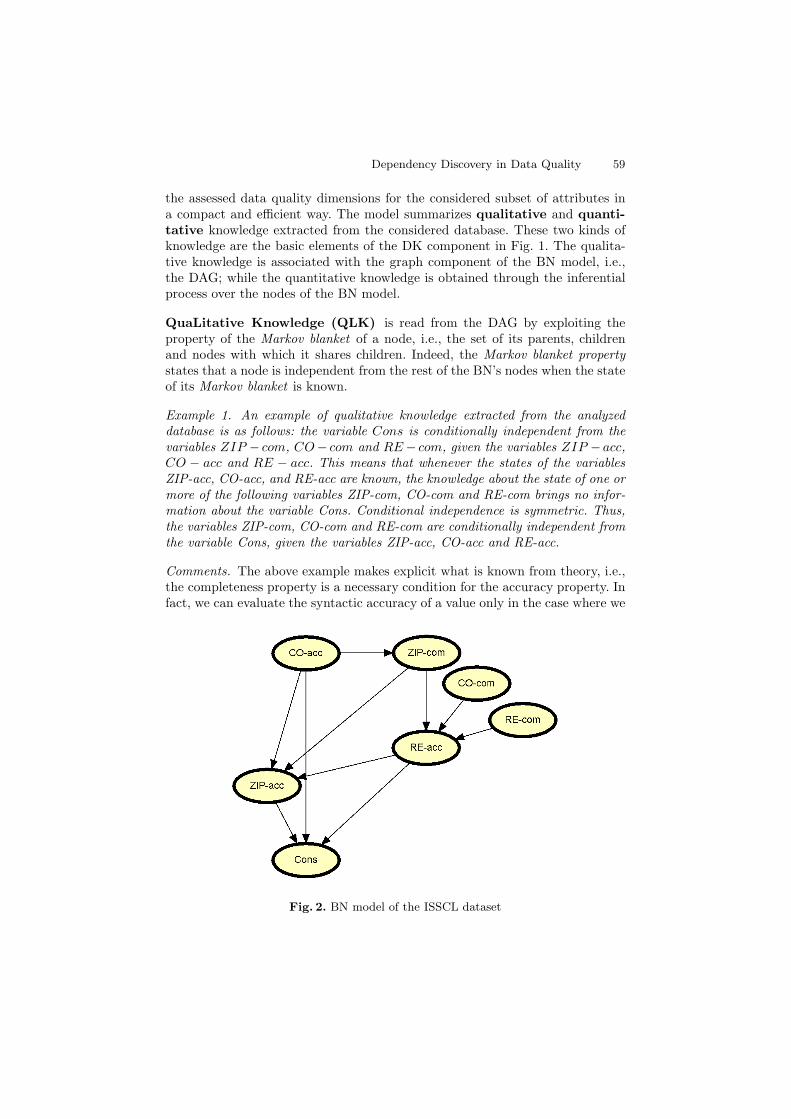
the assessed data quality dimensions for the considered subset of attributes ina compact and efficient way. The model summarizes qualitative and quanti-tative knowledge extracted from the considered database. These two kinds ofknowledge are the basic elements of the DK component in Fig. 1. The qualita-tive knowledge is associated with the graph component of the BN model, i.e.,the DAG; while the quantitative knowledge is obtained through the inferentialprocess over the nodes of the BN model.
QuaLitative Knowledge (QLK) is read from the DAG by exploiting theproperty of the Markov blanket of a node, i.e., the set of its parents, childrenand nodes with which it shares children. Indeed, the Markov blanket propertystates that a node is independent from the rest of the BN’s nodes when the stateof its Markov blanket is known.
Example 1. An example of qualitative knowledge extracted from the analyzeddatabase is as follows: the variable Cons is conditionally independent from thevariables ZIP − com, CO− com and RE − com, given the variables ZIP − acc,CO − acc and RE − acc. This means that whenever the states of the variablesZIP-acc, CO-acc, and RE-acc are known, the knowledge about the state of one ormore of the following variables ZIP-com, CO-com and RE-com brings no infor-mation about the variable Cons. Conditional independence is symmetric. Thus,the variables ZIP-com, CO-com and RE-com are conditionally independent fromthe variable Cons, given the variables ZIP-acc, CO-acc and RE-acc.
Comments. The above example makes explicit what is known from theory, i.e.,the completeness property is a necessary condition for the accuracy property. Infact, we can evaluate the syntactic accuracy of a value only in the case where we
Fig. 2. BN model of the ISSCL dataset
60 D. Barone, F. Stella, and C. Batini
have some information to assess. Therefore, it is also true that a value which isnot complete is also not accurate. Notice that, a missing value does not alwaysrepresent an error of completeness. For instance, in a table of employees thathas a column for the name of the employeers’s manager, that value will bemissing for the president of the company. In this case, no value is applicable forthe president and therefore, no information can be assessed along the accuracydimension. However, in this scenario, the NULL value can be seen as completeinformation (in referring to the semantic expressed by the employees table) butalso accurate, though we have no information to assess.
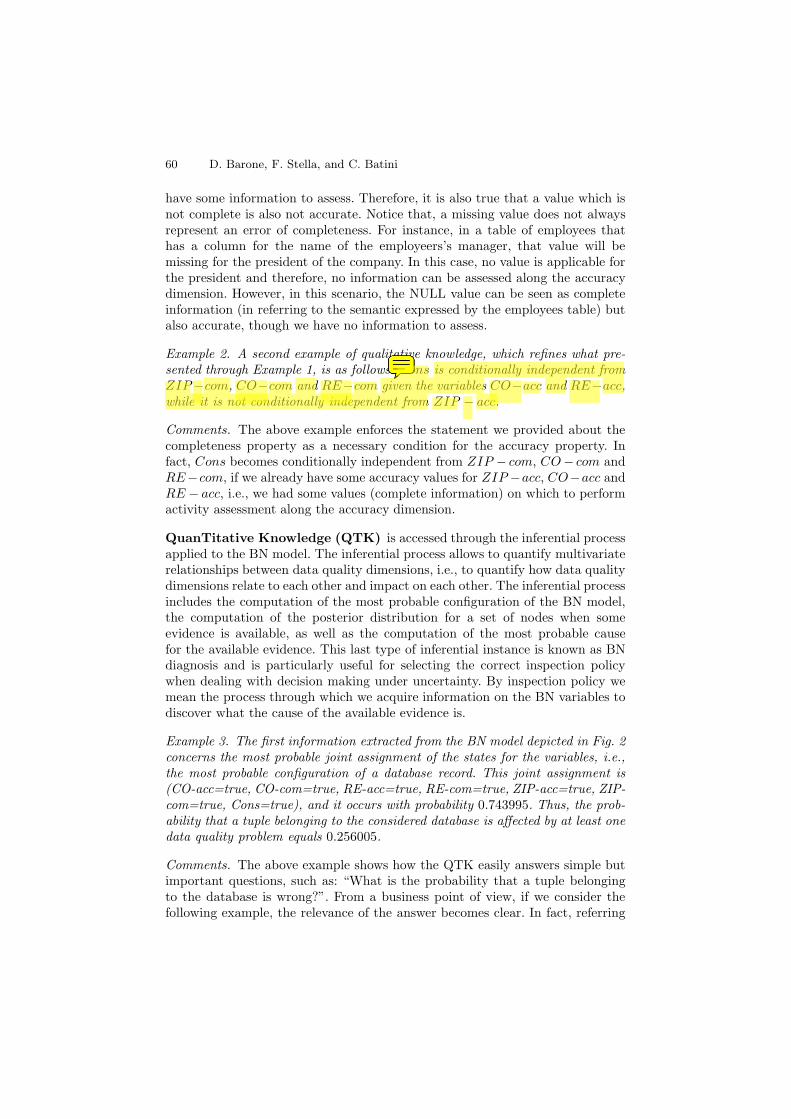
Example 2. A second example of qualitative knowledge, which refines what pre-sented through Example 1, is as follows. Cons is conditionally independent fromZIP−com, CO−com and RE−com given the variables CO−acc and RE−acc,while it is not conditionally independent from ZIP − acc.
Comments. The above example enforces the statement we provided about thecompleteness property as a necessary condition for the accuracy property. Infact, Cons becomes conditionally independent from ZIP − com, CO− com andRE−com, if we already have some accuracy values for ZIP −acc, CO−acc andRE − acc, i.e., we had some values (complete information) on which to performactivity assessment along the accuracy dimension.
QuanTitative Knowledge (QTK) is accessed through the inferential processapplied to the BN model. The inferential process allows to quantify multivariaterelationships between data quality dimensions, i.e., to quantify how data qualitydimensions relate to each other and impact on each other. The inferential processincludes the computation of the most probable configuration of the BN model,the computation of the posterior distribution for a set of nodes when someevidence is available, as well as the computation of the most probable causefor the available evidence. This last type of inferential instance is known as BNdiagnosis and is particularly useful for selecting the correct inspection policywhen dealing with decision making under uncertainty. By inspection policy wemean the process through which we acquire information on the BN variables todiscover what the cause of the available evidence is.
Example 3. The first information extracted from the BN model depicted in Fig. 2concerns the most probable joint assignment of the states for the variables, i.e.,the most probable configuration of a database record. This joint assignment is(CO-acc=true, CO-com=true, RE-acc=true, RE-com=true, ZIP-acc=true, ZIP-com=true, Cons=true), and it occurs with probability 0.743995. Thus, the prob-ability that a tuple belonging to the considered database is affected by at least onedata quality problem equals 0.256005.
Comments. The above example shows how the QTK easily answers simple butimportant questions, such as: “What is the probability that a tuple belongingto the database is wrong?”. From a business point of view, if we consider thefollowing example, the relevance of the answer becomes clear. In fact, referring
Dependency Discovery in Data Quality 61
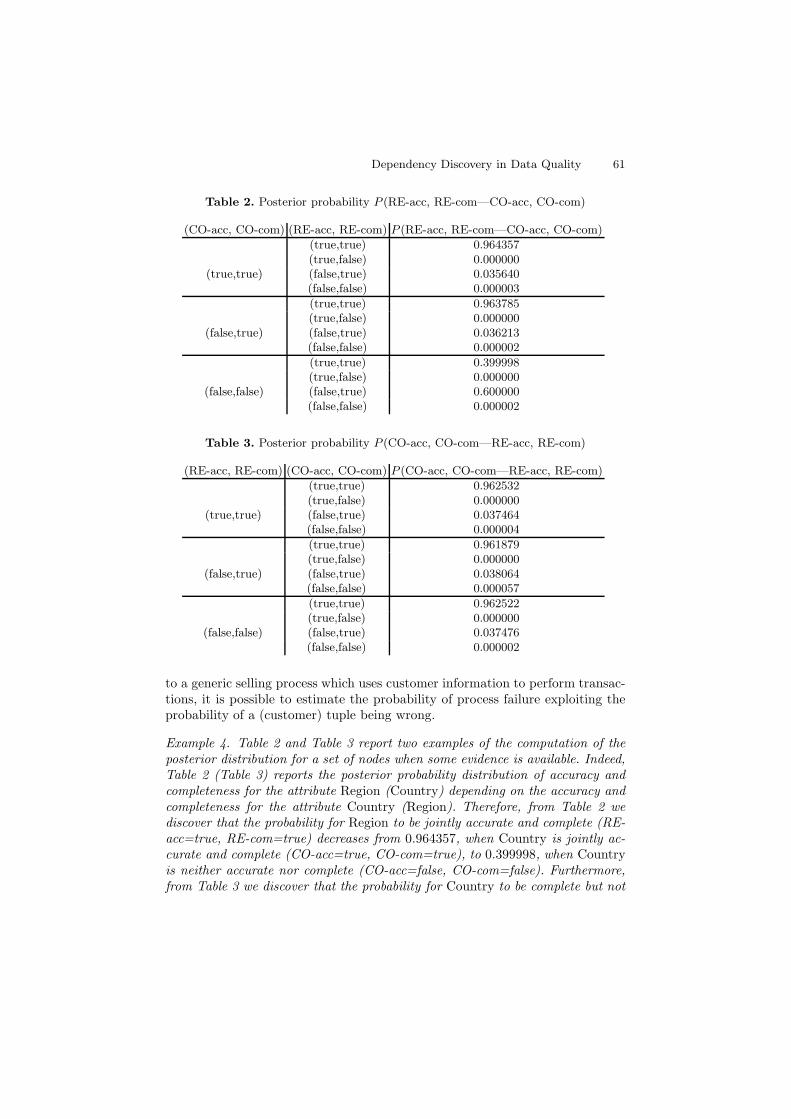
Table 2. Posterior probability P (RE-acc, RE-com—CO-acc, CO-com)
(CO-acc, CO-com) (RE-acc, RE-com) P (RE-acc, RE-com—CO-acc, CO-com)
(true,true) 0.964357(true,false) 0.000000
(true,true) (false,true) 0.035640(false,false) 0.000003
(true,true) 0.963785(true,false) 0.000000
(false,true) (false,true) 0.036213(false,false) 0.000002
(true,true) 0.399998(true,false) 0.000000
(false,false) (false,true) 0.600000(false,false) 0.000002
Table 3. Posterior probability P (CO-acc, CO-com—RE-acc, RE-com)
(RE-acc, RE-com) (CO-acc, CO-com) P (CO-acc, CO-com—RE-acc, RE-com)
(true,true) 0.962532(true,false) 0.000000
(true,true) (false,true) 0.037464(false,false) 0.000004
(true,true) 0.961879(true,false) 0.000000
(false,true) (false,true) 0.038064(false,false) 0.000057
(true,true) 0.962522(true,false) 0.000000
(false,false) (false,true) 0.037476(false,false) 0.000002
to a generic selling process which uses customer information to perform transac-tions, it is possible to estimate the probability of process failure exploiting theprobability of a (customer) tuple being wrong.
Example 4. Table 2 and Table 3 report two examples of the computation of theposterior distribution for a set of nodes when some evidence is available. Indeed,Table 2 (Table 3) reports the posterior probability distribution of accuracy andcompleteness for the attribute Region (Country) depending on the accuracy andcompleteness for the attribute Country (Region). Therefore, from Table 2 wediscover that the probability for Region to be jointly accurate and complete (RE-acc=true, RE-com=true) decreases from 0.964357, when Country is jointly ac-curate and complete (CO-acc=true, CO-com=true), to 0.399998, when Countryis neither accurate nor complete (CO-acc=false, CO-com=false). Furthermore,from Table 3 we discover that the probability for Country to be complete but not
62 D. Barone, F. Stella, and C. Batini
accurate (CO-acc=false, CO-com=true) increases from 0.037464, when Region isjointly accurate and complete (RE-acc=true, RE-com=true), to 0.038064, whenRegion is complete but not accurate (RE-acc=false, RE-com=true).
Comments. The QTK allows the following considerations: i) if Country is com-plete and accurate then Region tends to be accurate; ii) if Country is not completeand therefore not accurate, the quality of Region significantly decreases; and iii)the probability for Country being complete but not accurate is slightly affectedby the accuracy of Country, given that Country is complete. In fact, a possiblecase for i) is to suppose that a sales employee is registering information about anew customer who lives in “Castelfiorentino” in the province of “Florence” andthat he/she is able to correctly type “Castelfiorentino” since he/she knows thisplace; then there is a high probability that he/she correctly inputs the associatedRegion “Florence”. Analogous cases can be found for ii) and iii).
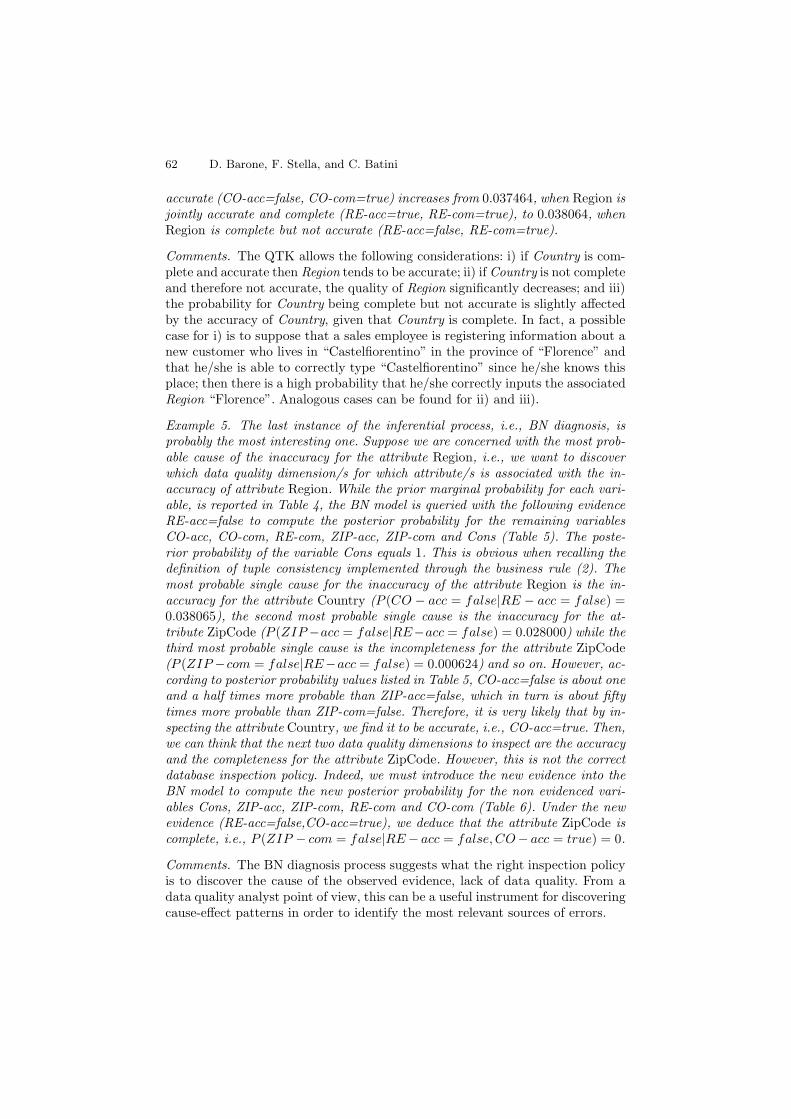
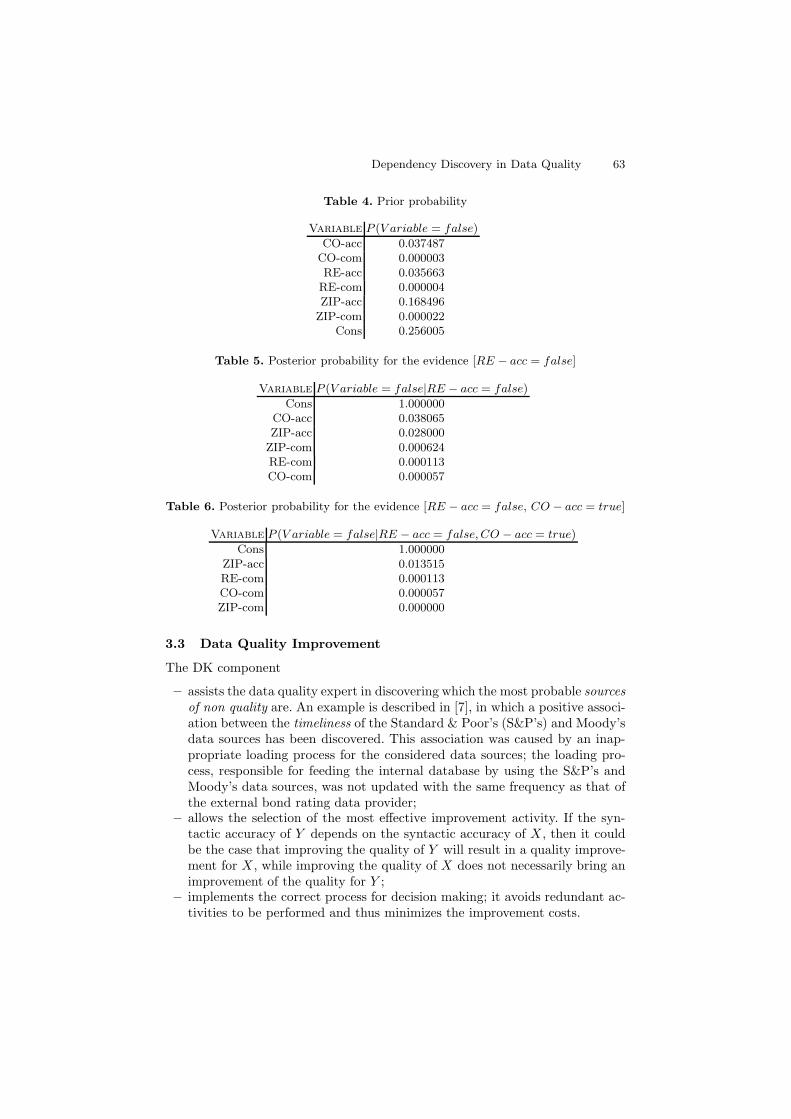
Example 5. The last instance of the inferential process, i.e., BN diagnosis, isprobably the most interesting one. Suppose we are concerned with the most prob-able cause of the inaccuracy for the attribute Region, i.e., we want to discoverwhich data quality dimension/s for which attribute/s is associated with the in-accuracy of attribute Region. While the prior marginal probability for each vari-able, is reported in Table 4, the BN model is queried with the following evidenceRE-acc=false to compute the posterior probability for the remaining variablesCO-acc, CO-com, RE-com, ZIP-acc, ZIP-com and Cons (Table 5). The poste-rior probability of the variable Cons equals 1. This is obvious when recalling thedefinition of tuple consistency implemented through the business rule (2). Themost probable single cause for the inaccuracy of the attribute Region is the in-accuracy for the attribute Country (P (CO − acc = false|RE − acc = false) =0.038065), the second most probable single cause is the inaccuracy for the at-tribute ZipCode (P (ZIP −acc = false|RE−acc = false) = 0.028000) while thethird most probable single cause is the incompleteness for the attribute ZipCode(P (ZIP −com = false|RE−acc = false) = 0.000624) and so on. However, ac-cording to posterior probability values listed in Table 5, CO-acc=false is about oneand a half times more probable than ZIP-acc=false, which in turn is about fiftytimes more probable than ZIP-com=false. Therefore, it is very likely that by in-specting the attribute Country, we find it to be accurate, i.e., CO-acc=true. Then,we can think that the next two data quality dimensions to inspect are the accuracyand the completeness for the attribute ZipCode. However, this is not the correctdatabase inspection policy. Indeed, we must introduce the new evidence into theBN model to compute the new posterior probability for the non evidenced vari-ables Cons, ZIP-acc, ZIP-com, RE-com and CO-com (Table 6). Under the newevidence (RE-acc=false,CO-acc=true), we deduce that the attribute ZipCode iscomplete, i.e., P (ZIP − com = false|RE − acc = false, CO− acc = true) = 0.
Comments. The BN diagnosis process suggests what the right inspection policyis to discover the cause of the observed evidence, lack of data quality. From adata quality analyst point of view, this can be a useful instrument for discoveringcause-effect patterns in order to identify the most relevant sources of errors.
Dependency Discovery in Data Quality 63
Table 4. Prior probability
Variable P (V ariable = false)
CO-acc 0.037487CO-com 0.000003RE-acc 0.035663
RE-com 0.000004ZIP-acc 0.168496
ZIP-com 0.000022Cons 0.256005
Table 5. Posterior probability for the evidence [RE − acc = false]
Variable P (V ariable = false|RE − acc = false)
Cons 1.000000CO-acc 0.038065ZIP-acc 0.028000
ZIP-com 0.000624RE-com 0.000113CO-com 0.000057
Table 6. Posterior probability for the evidence [RE − acc = false, CO − acc = true]
Variable P (V ariable = false|RE − acc = false, CO − acc = true)
Cons 1.000000ZIP-acc 0.013515RE-com 0.000113CO-com 0.000057ZIP-com 0.000000
3.3 Data Quality Improvement
The DK component
– assists the data quality expert in discovering which the most probable sourcesof non quality are. An example is described in [7], in which a positive associ-ation between the timeliness of the Standard & Poor’s (S&P’s) and Moody’sdata sources has been discovered. This association was caused by an inap-propriate loading process for the considered data sources; the loading pro-cess, responsible for feeding the internal database by using the S&P’s andMoody’s data sources, was not updated with the same frequency as that ofthe external bond rating data provider;
– allows the selection of the most effective improvement activity. If the syn-tactic accuracy of Y depends on the syntactic accuracy of X , then it couldbe the case that improving the quality of Y will result in a quality improve-ment for X , while improving the quality of X does not necessarily bring animprovement of the quality for Y ;
– implements the correct process for decision making; it avoids redundant ac-tivities to be performed and thus minimizes the improvement costs.
64 D. Barone, F. Stella, and C. Batini
To clarify how the DK can be used to improve data quality lets us present thefollowing simple example. Assume we want to maximize the probability of Con-sistency for the ISSCL database. Suppose, for any attribute belonging to thedatabase, we can force the accuracy to hold true. However, to force accuracy tobe true an amount of money has to be paid, where the amount of money dependson the attribute to act on. Furthermore, it is usual to impose an upper bound onthe budget to maximize the probability of Consistency. The amount of money re-quired to force accuracy on the three attributes of the ISSCL database is reportedin Table 7, while the budget for each tuple of the database is set to 2.20e. Ifthe accuracies for the considered attributes are assumed to be independent, thenthe probability of Consistency could be maximized by means of a simple rankingprocedure. Indeed, we can compute the conditional probability of Cons to be truewhen the accuracy for the considered attribute is set to true. These conditionalprobability values are ranked in Table 8. Information in Table 7 and in Table 8 al-low to conclude that the solution which maximizes the probability of Consistencyconsists of forcing ZIP-acc=true and CO-acc=true. This solution costs 1.50e+0.60e= 2.10e< 2.20e, which satisfies the budget constraint, while enforcing alsoRE-acc=true further maximizes the probability of Consistency but violates thebudget constraint (1.50e+ 0.60e+ 0.40e= 2.50e> 2.20e). However, this solu-tion (ZIP-acc=true,CO-acc=true) results in a probability of Consistency equalto 0.926090 (P (Cons = true|ZIP − acc = true, CO − acc = true) = 0.926090),as computed through inference on the BN model. Thus, it is not the opti-mal solution which is obtained from the BN model to be (ZIP-acc=true,RE-acc=true). This solution is both feasible (1.50e+ 0.40e= 1.90e< 2.20e) andoptimal P (Cons = true|ZIP − acc = true, RE − acc = true) = 0.933681).
The above example emphasizes the importance of knowing the structure ofdependency between data quality dimensions when concerned with decision mak-ing under uncertainty. The knowledge of the dependency structure between theZIP-acc, ZIP-com, RE-acc, RE-com, CO-acc, CO-com and Cons data qualitydimensions allows to efficiently and effectively improve the data quality of theconsidered database.
Table 7. Costs to enforce accuracy for the ISSCL database
Attribute Cost
ZipCode 1.50eCountry 0.60eRegion 0.40e
Table 8. Sorted conditional probabilities P (Cons = true|V ariable = true)
Variable P (Cons = true|V ariable = true)
ZIP-acc 0.894757CO-acc 0.772971RE-acc 0.771509
Dependency Discovery in Data Quality 65
4 Related Work
The analysis of dependencies between data quality dimensions has been mainlyinvestigated in terms of tradeoff. An example of such an approach is presented in[2], where the authors investigate how the improvement of the timeliness dimen-sion negatively affects the accuracy dimension. The paper presents a theoreticalframework to select the most appropriate changes to data managed in infor-mation systems. An accuracy-timeliness utility function figures prominently inthe analysis, while in the case when it is not possible to determine the utilityfunction, the authors describe how to identify a suitable approximation. A sim-ilar framework, that allows the systematic exploration of the tradeoff betweencompleteness and consistency is presented in [4]. The relative weight (impor-tance) of completeness and consistency to the decision maker is an input to theanalysis. In order to examine the tradeoff the authors explore various facets ofthe two dimensions that produce analytical expressions for the measurement ac-tivity. The utility of various combinations of completeness and consistency, forfixed and variable budgets, provides guidance to evaluate the appropriate trade-off of these factors for specific decision contexts. The main difference betweenthe frameworks presented in [2,4] and our approach, is that D3Q does not limitto a tradeoff between two dimensions but addresses multi-variate dependencies.Moreover, in [2,4], the user must provide: i) a weight, that represents the impor-tance of a dimension versus another dimension, and ii) a functional relationship,that defines the binding between the dimensions involved4. Instead, the D3Qis able to learn such information (probabilities) directly from the data. In [5],a practical case of tradeoff among timeliness and other generic data quality di-mensions in the context of the Bureau of Labor Statistics Covered Employmentand Wages is described. The goal is to determine if data quality decreases as aresult of receiving data earlier than the current due dates. No significant qualitydeterioration is detected. Although this work describes a real case where depen-dencies play an important role, a general framework is not provided. In [21] arigorous and pragmatic methodology for information quality assessment, calledAIMQ, is presented. The AIMQ methodology consists of three components: i)a model representing what information quality means to information consumersand managers; ii) a questionnaire for measuring information quality along thedimensions; iii) analysis techniques for interpreting the assessments gathered bythe questionnaire. The results of the proposed methodology highlight the factthat information quality is a single phenomenon where dimensions are not in-herently independent. The table of correlations among dimensions, calculatedon the basis of answers, is reported in the paper. The AIMQ methodology showshow knowledge on dependencies can be exploited to offer a comprehensive qual-ity solution; however, the approach we presented here is more powerful than theone based on correlation [21]. In [1], within the context of business scenarios,
4 When the user cannot provide such functional relationship, the framework suggeststhe use of generic families of functions to approximate the required true functions;but still, functional parameters must be provided by the user.
66 D. Barone, F. Stella, and C. Batini
a set of logical interdependencies among dimensions is presented. The authorsdefine a taxonomy for data quality dimensions composed of direct and indirectattributes. Direct attributes represent the main dimensions which directly influ-ence the results of business operations when a change in their values occurs. Theindirect attributes determine and also contribute to the direct attributes; henceindirectly influence the results. The D3Q could be used in a complementary waywith [1] to evaluate if such logical interdependencies are satisfied in a real sce-nario and, therefore, allowing to validate such taxonomy. Finally, a data-driventool for data quality management is described in [22] which suggests rules andidentifies conformant and non-conformant records. The authors focused on thediscovery of context-dependent rules, namely conditional functional dependen-cies (CFDs), i.e., that hold only over a data portion. The tool outputs a set offunctional dependencies together with the context in which they hold. To avoidreturning an unnecessarily large number of CFDs a set of interest metrics areevaluated, and comparative results using real datasets are reported.
5 Conclusions
A framework to discover the dependency structure between data quality di-mensions is described. The Dependency Discovery Algorithm uses the learningdataset, compiled by the Dependency Discovery Model, to learn the BN modelfor the data quality dimensions assessed on a real world database. The BNmodel implements the Dependency Knowledge component. Accuracy, complete-ness, and consistency are assessed on three attributes of the Italian Social Secu-rity Contributors’s List database. The framework is general while the obtainedBN model is context dependent, i.e., it depends on the specific database whichhas been analyzed. The obtained results allow to conclude that BNs
– provide the database analyst with an intuitive and efficient representationof the dependency structure between data quality dimensions;
– allow consistent evaluation of the data quality level associated with eachtuple of the database to be certified;
– allow to compare alternative data quality improvement strategies, to performcosts/benefits analysis and thus to implement optimal decision making.
Directions for future work concern the evaluation of the proposed approach ona richer set of data quality dimensions and on a larger number of attributes. Itis relevant to study how BNs can be exploited to develop effective data qual-ity improvement strategies in an information system, by implementing a trade-off between the cost of non quality and the budget available for data qualityimprovement.
Acknowledgments
The authors are grateful to the anonymous referees whose insightful commentsenabled to make significant improvements to the paper. Daniele Barone wouldlike to acknowledge the many valuable suggestions made by Fabrizio De Amicis,BSI Bank.
Dependency Discovery in Data Quality 67
References
1. Gackowski, Z.: Logical interdependence of some attributes of data/informationquality. In: Proc. of the 9th Intl. Conference on Information Quality, Cambridge,MA, USA, pp. 126–140 (2004)
2. Ballou, D.P., Pazer, H.L.: Designing information systems to optimize the accuracy-timeliness tradeoff. Information Sys. Research 6(1), 51–72 (1995)
3. Han, Q., Venkatasubramanian, N.: Addressing timeliness/accuracy/cost tradeoffsin information collection for dynamic environments. In: Proc. of the 24th IEEEIntl. Real-Time Systems Symposium, Washington, DC, USA, p. 108 (2003)
4. Ballou, D.P., Pazer, H.L.: Modeling completeness versus consistency tradeoffs in in-formation decision contexts. IEEE Trans. Knowl. Data Eng. 15(1), 240–243 (2003)
5. Sadeghi, A., Clayton, R.: The quality vs. timeliness tradeoffs in the BLS ES-202administrative statistics. In: Federal Committee on Statistical Methodology (2002)
6. Fisher, C., Eitel, L., Chengalur-Smith, S., Wang, R.: Introduction to InformationQuality, p. 126. The MIT Press, Poughkeepsie (2006)
7. DeAmicis, F., Barone, D., Batini, C.: An analytical framework to analyze depen-dencies among data quality dimensions. In: Proc. of the 11th Intl. Conference onInformation Quality, pp. 369–383. MIT, Cambridge (2006)
8. Burstein, F. (ed.): Handbook on decision support systems. Intl. handbooks oninformation systems. Springer, Heidelberg (2008)
9. Berner, E., Kasiraman, R., Yu, F., Ray, M.N., Houston, T.: Data quality in theoutpatient setting: impact on clinical decision support systems. In: AMIA Annu.Symp. Proc., vol. 41 (2005)
10. Eckerson, W.: Data Quality and the Bottom Line: Achieving Business Successthrough a Commitment to High Quality Data. Technical report, The Data Ware-housing Institute (2002)
11. Oei, J.L.H., Proper, H.A., Falkenberg, E.D.: Evolving information systems: meetingthe ever-changing environment. Information Sys. Journal 4(3), 213–233 (1994)
12. Batini, C., Cappiello, C., Francalanci, C., Maurino, A.: Methodologies for dataquality assessment and improvement. ACM Comput. Surv. 41(3), 1–52 (2009)
13. International Organization for Standardization: Software engineering – Softwareproduct Quality Requirements and Evaluation (SQuaRE) – data quality model.In: ISO/IEC 25012 (2008)
14. Jensen, F.V.: Bayesian Networks and Decision Graphs. Springer, Heidelberg (2001)15. Pearl, J.: Probabilistic Reasoning in Intelligent Systems: Networks of Plausible
Inference. Morgan Kaufmann Publishers Inc., San Francisco (1988)16. Baldi, P., Frasconi, P., Smyth, P.: Modeling the internet and the WEB: Probabilis-
tic methods and algorithms. Wiley, Chichester (2003)17. Heckerman, D.: A tutorial on learning Bayesian networks. Technical Report MSR-
TR-95-06, Microsoft Research (1995)18. Elmagarmid, A.K., Ipeirotis, P.G., Verykios, V.S.: Duplicate record detection: A
survey. IEEE Trans. Knowl. Data Eng. 19(1), 1–16 (2007)19. Reiter, R.: On closed world data bases. In: Logic and Data Bases, pp. 55–76 (1977)20. Jarke, M., Jeusfeld, M., Quix, C., Vassiliadis, P.: Architecture and quality in data
warehouses: an extended repository approach (1999)21. Lee, Y.W., Strong, D.M., Kahn, B.K., Wang, R.Y.: AIMQ: a methodology for
information quality assessment. Information Management 40(2), 133–146 (2002)22. Chiang, F., Miller, R.J.: Discovering data quality rules. PVLDB 1(1), 1166–1177
(2008)