Embed Size (px)
Citation preview
Depth-dependent acoustic features of diving sperm whales(Physeter macrocephalus) in the Gulf of Mexicoa)
Aaron Thodeb)
Ocean Engineering Department, Massachusetts Institute of Technology, Cambridge, Massachusetts 02139
David K. MellingerCooperative Institute for Marine Resources Studies, Oregon State University, Newport, Oregon 97365
Sarah StienessenAlaska Fisheries Science Center, National Marine Fisheries Service, Seattle, Washington 98115
Anthony MartinezSoutheast Fisheries Science Center, National Marine Fisheries Service, Miami, Florida 33149
Keith MullinSoutheast Fisheries Science Center, National Marine Fisheries Service, Pascagoula, Mississippi 39568
~Received 25 September 2001; revised 25 March 2002; accepted 4 April 2002!
Three-dimensional dive trajectories of three sperm whales in the Gulf of Mexico have been obtainedby measuring the relative arrival times and bearings of the animals’ acoustic multipath reflections,using two elements of a towed hydrophone array deployed at an unknown depth and orientation.Within the first 6–12 min of the start of a dive, the intervals between successive ‘‘clicks’’ of all threewhales corresponded closely with the two-way travel time of an acoustic pulse traveling verticallybetween the animals’ position and the ocean bottom. The click spectra contained multiple peaks,including a faint band of energy originally centered near 10 kHz. As the animals descended over 500m in depth, the center frequency of this band shifted to nearly 15 kHz, but subsequently remainednear this value during the rest of the dive. This frequency shift is consistent with that expected fromenergy scattering from an ensemble of incompressible small-scale air-filled resonators, withdiameters on the order of 4 mm. One possible candidate for such an ensemble is proposed to residein the collapsed frontal sac of the animal. A comparison of the received levels for the bottom anddirect multipath arrivals indicates that the whales’ acoustic directivity must range between 10–30dB in the 5–20-kHz region. ©2002 Acoustical Society of America.@DOI: 10.1121/1.1482077#
PACS numbers: 43.80.Ka, 43.30.Sf@WA#
onc
oi-lle
embod
nt
ionofal-ple/ore-
tof
ical
:30
nalnly
gde-heaceonedi-oth
asn
a
I. INTRODUCTION
In 1957 sperm whales were reported to produce6–10-ms pulse called a ‘‘click.’’1–5 Since that discovery, aconsiderable body of knowledge has accumulated abthese sounds, including statistics on their time-frequecharacteristics6 and repetition rates,7 possible correlationsbetween animal size and click structure,8–10 and the identifi-cation of regional differences between the acoustic repertof separate populations.11 The function of these sounds remains unknown, although certain acoustic patterns, ca‘‘codas,’’ seem associated with social communication.11,12
The use of these sounds to detect individual prey has bpostulated,4,13–15 and evidence is emerging that sperwhales might echolocate off larger-scale features on thetom or in the water column.5,16–19 The mechanisms behinsperm whale sound production remain uncertain,8,13 despiteextensive research into the capabilities of its smaller odocete relatives.20
a!Portions of this work have been presented at the 140th~Newport! and141st~Chicago! Meetings of the Acoustical Society of America, as wellthe 14th Biennial Conference on the Biology of Marine Mammals, Vacouver 2001.
b!Current address: Marine Physical Laboratory, Scripps Institution of Oceography, La Jolla, CA 92093. Electronic mail: [email protected]
308 J. Acoust. Soc. Am. 112 (1), July 2002 0001-4966/2002/
a
uty
re
d
en
t-
o-
Here, we present quantitative indications of echolocatbehavior from three diving sperm whales in the GulfMexico, and identify depth-dependent features in their vocization spectra that are consistent with predictions of simresonator models of small, air-filled swimbladders andbubbles.8,21–24To obtain these results, multiple acoustic rflections off the ocean surface and bottom25,26were exploitedto obtain three-dimensional positions of the animalswithin a left/right ambiguity. This method is a variant ostandard acoustic methods for tracking transient biologsounds.27–32
On the evening of 3 July 2000, between 22:00 and 23Central Daylight Time~CDT!, a fortuitous set of circum-stances converged in the Gulf that allowed three-dimensioacoustic tracking of three diving sperm whales, using otwo hydrophones spaced 2 m apart. During this time theNational Oceanic and Atmospheric Administration ship GOR-
DON GUNTER was cruising slowly among a group of divinanimals, recording their sounds on a hydrophone arrayployed at an unknown depth and horizontal tilt behind tship. Due to very calm ocean conditions on the sea surfand a flat bottom bathymetry, sounds were received atarray element multiple times: from the direct path, and inrect paths reflecting from the surface, the bottom, and b
-
n-
112(1)/308/14/$19.00 © 2002 Acoustical Society of America
pectrogramrfaceth is used
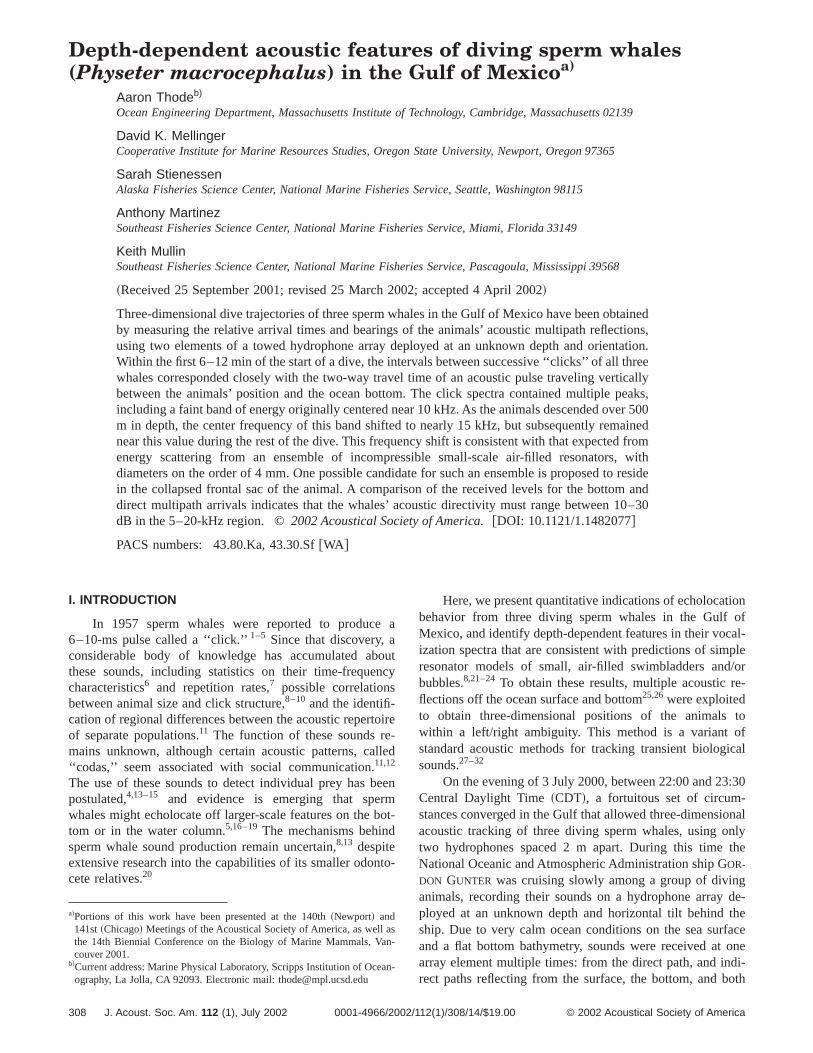
FIG. 1. Illustration of the straight-line ray paths for multiple reflections detected on a five-element array towed by the NOAA ship GORDON GUNTER. On theevening of 3 July 2000, the ship was moving north at 0.5 to 1.5 kn, a speed that allowed the array to sink to depths between 60 and 80 m. Inset: Sof a direct arrivalPd and associated reflectionsPs , Pb , and Pt , which arose from the direct path, surface bounce, bottom bounce, and bottom-subounces, respectively. The sampling rate is 48 kHz, the FFT size is 256 points with a Hanning window, and the overlap is 75%. The short FFT lengto illustrate the three-part temporal structure of the bottom and bottom-surface returns.
yn
ouelth
ogeio
ei
rleyd
rm
ne
ee
arvha
-ith
obet tzi
s
de-
f thele.ectifi-dsto antom-r a
tedo-theepth. Aan
re-fter
.re-
aper--
. In
the bottom and surface~Fig. 1!. The use of a second arraelement allowed estimation of arrival angles of the direct asurface-reflected paths. Five independent variables cthus be measured for each individual vocalization: three rtive arrival times and two array bearings. Thus, bothwhale’s location~three variables! and the array position~twovariables! could be derived simultaneously. The detectionbottom returns effectively enabled the creation of a laraperture vertical array that could achieve high-resolutdepth estimates.
The whales’ acoustic behavior in relationship to thdepths was investigated. Several authors5,6,15,17,18have noteda relationship between click rate and water depth, and acent paper16 presents data which suggest that sperm whamay also use sounds to estimate distances to reflective lawithin the water column. In this current work, the derivewhale depths are compared with their interclick interval~ICI!to investigate possible bottom-ranging behavior by spewhales during the first 6–12 min of a dive cycle.
A possible correlation between vocalization depth afrequency maxima in the click spectra is also discussWhile changes in depth spectra with dive time have bnoted in the literature,33 the ability to track the animal indepth enables a more detailed analysis. Simple bubbleair-bladder resonator models show a good fit to one obserelationship in the 10-kHz region. The model fit assumes tthe resonators involved have dimensions smaller thanacoustic wavelength~on the order of millimeters for a 10kHz wave!, that the resonator volume remains fixed wdepth, and that all the resonators have volumes with 30%the mean. Possible anatomical candidates for these restors are identified in the frontal sac. If the assumptionshind these models prove valid, then these results suggespassive detection of acoustic resonances inside vocalideep-diving whales is possible.
Finally, the directivity of clicks emitted by sperm whale
J. Acoust. Soc. Am., Vol. 112, No. 1, July 2002
dld
a-e
f-n
r
e-s
ers
dd.n
ndedatn
ofna--
hatng
is studied. This directivity has been the subject of somebate by sperm whale researchers.14,31Detecting directivity, oran angular beam pattern, requires the measurement osame signal at different orientations relative to the whaThis approach is used here: in a situation in which the dirand bottom-reflection paths depart from the whale at signcantly different angles, the relative energy of click sounreceived on these two paths is measured and comparedestimate based on a simple acoustic propagation and botreflection model. The comparison provides evidence fo10–30-dB directivity in the whales’ beam patterns.
II. THEORY
A. Estimation of whale range and depth, usingreflection arrival times
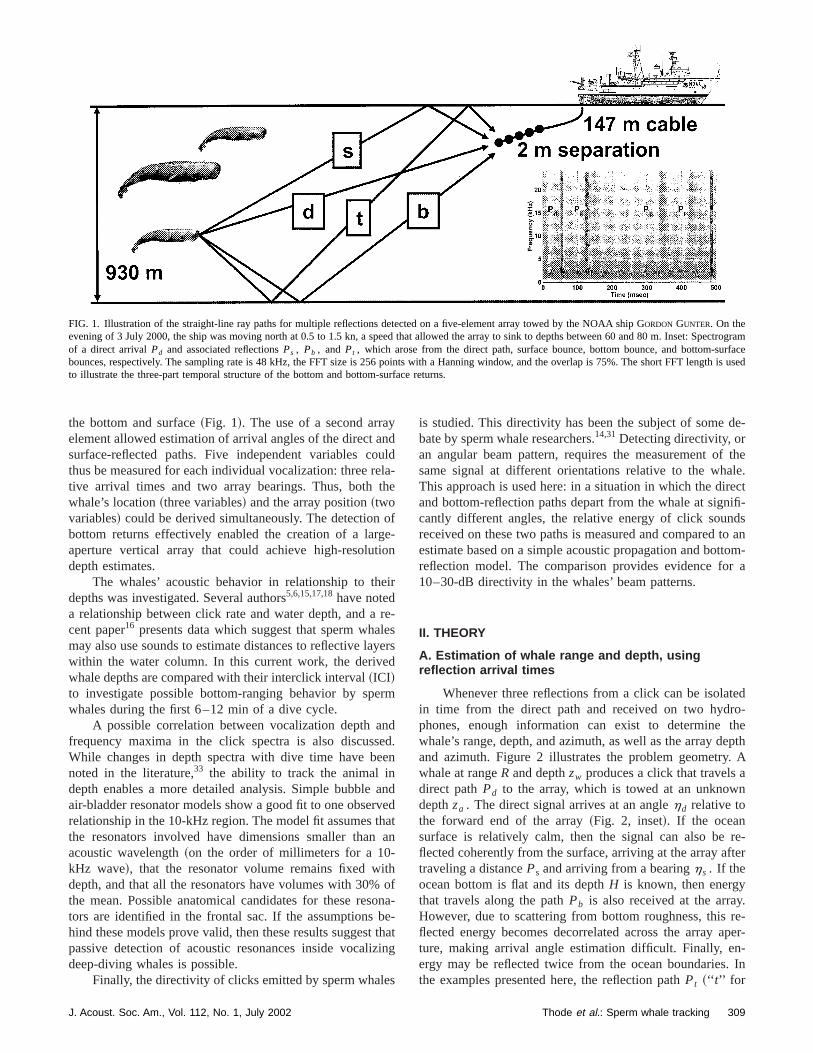
Whenever three reflections from a click can be isolain time from the direct path and received on two hydrphones, enough information can exist to determinewhale’s range, depth, and azimuth, as well as the array dand azimuth. Figure 2 illustrates the problem geometrywhale at rangeR and depthzw produces a click that travelsdirect pathPd to the array, which is towed at an unknowdepthza . The direct signal arrives at an anglehd relative tothe forward end of the array~Fig. 2, inset!. If the oceansurface is relatively calm, then the signal can also beflected coherently from the surface, arriving at the array atraveling a distancePs and arriving from a bearinghs . If theocean bottom is flat and its depthH is known, then energythat travels along the pathPb is also received at the arrayHowever, due to scattering from bottom roughness, thisflected energy becomes decorrelated across the arrayture, making arrival angle estimation difficult. Finally, energy may be reflected twice from the ocean boundariesthe examples presented here, the reflection pathPt ~‘‘ t’’ for
309Thode et al.: Sperm whale tracking
e
FIG. 2. Geometry of the problem discussed in Sec. II. The array is assumed to lie in the plane of the ship motion~no turns!. The dashed lines represent thdirect path (Pd) and the surface-reflected path (Ps). Inset: Array angular geometry. The horizontal azimuth of the direct path~dashed line! is f, the anglebetween the direct path and the vertical isud , and the array tilt from the horizontalx axis isa. The angle between the direct-path arrival alongPd ~dashedline! and the array axis ishd .le1-
, ai
eeseve
ana
ctecthr-
lte
n
oneions
nlly,timetomectbeup
ngim-rceing
ateesti-noter-onepa-
-3Don
twice! involves a bottom-surface reflection, the only doubreflection path that can account for the final arrival in Fig.
An analytical solution for the whale location is presented below. It assumes the ray paths are straight linesthus neglects potential effects of sound-speed variation wdepth. An analysis of the effects of ray refraction concludthat they were negligible for horizontal source ranges lthan a kilometer and source depths greater than 200 m,under the highly downward-refracting conditions undwhich the data were collected.
Given that the ray paths are straight lines, the directreflected path lengths can be directly related to the whalesensor locations
Pd5AR21~zw2za!2, Ps5AR21~zw1za!2,
Pb5AR21~2H2zw2za!2, ~1!
Pt5AR21~2H2zw1za!2.
Unfortunately, these quantities cannot be measured direonly relative differences in arrival times between the dirpath and each reflection path are available. Assumingsound speedc is constant with depth and range, the diffeence between the direct path and reflection pathx can bedefined
Lx[Px2Pd5c~ tx2td!. ~2!
From ~1! and ~2!, the following relationships are obtained:
Lb22Ls
2[4H~H2za2zw!12Pd~Ls2Lb!, ~3a!
L t22Lb
2[4~2H2zw!za12Pd~Lb2L t!, ~3b!
Ps22Pd
254zazw . ~3c!
Solving Eqs.~3a! and ~3b! for Pd , and setting each resuequal to the other yields the following relationship betweza andzw :
za5a01a1H~H2zw!
2H1a1H2zw, ~4!
where
a05 14~Lb2L t!~Ls2L t!, a15~Lb2L t!/~Ls2Lb!.
The addition of Eq.~3c! yields a quadratic equation that cabe solved for the whale depthzw
310 J. Acoust. Soc. Am., Vol. 112, No. 1, July 2002
-.
ndthdsenr
dnd
ly;te
n
05@a2H~21a1!2~a01a1H2!a3H#1zw@a1a3H2
2a22~a01a1H2!a4#1zw2 Ha1a4 , ~5!
where
a252Ls~Lb2L t!~Ls2L t2Lb!,
a3516Ls , a458~Lb2L t2Ls!.
Finally, the whale rangeR can be shown to be
R5A@L t22Lb
224~2H2zw!za#2
4~Lb2L t!2 2~za2zw!2. ~6!
For most situations, only one root from Eq.~5! yields a depthless thanH. For source depths near the bottom~typicallygreater than 900 m for the data presented here!, both rootsyield depths between the surface and seafloor, but onlyyields a possible location when inserted into the expressfor array depth and source range.
A numerical analysis of the effects of timing errors othe localization results is straightforward. Experimentathe greatest measurement errors arise from the arrivalestimates for the two bottom returns, because the botreturn was usually decorrelated with respect to the dirsignal. As a result, the initial bottom arrival times had toestimated manually, producing estimation uncertainties ofto 0.01 s, or a 480-point uncertainty for a 48-kHz samplirate. The localization uncertainties generated by a fixed ting error increase with source depth. At the maximum soudepth discussed here, 700 m, and for a maximum timerror of 0.01 s, the expected range error is6400 m, the deptherror is 650 m, and the array depth error is620 m, for areceiver depth of 70 m. Generally, the source range estimhas the greatest error percentage, and the source depthmate has the least. The precision of the depth estimate issurprising, as the bottom reflections effectively create a vtical array with nearly 1.8-km aperture. Previous literatureacoustic tracking discusses in detail how a large spatial sration between sensors aids localization precision.27
B. Recovery of whale azimuth and array tilt
Equations~1!–~6! require the use of only one hydrophone. However, to obtain the azimuth, and thus the fulllocation of the whale, the direct signal must be recorded
Thode et al.: Sperm whale tracking
ltstft–
i’sr.
ise
ct
g.
gl
a
adiig
oncydfie
actp
1dBblab
seo
rs.
rayosehipay tohip
ed
eree8 8
re-alse-red
ship
gtheseda
bero-
-
et
andM
skles
zns.dataeres aoisetede-ec-ch-t of
ingvilytheas
aceul-
e-nsal-ectple
ckshed
two spatially separated hydrophones. If the towed array tiunknown, the bearing from a reflection must also be emated to recover the two unknown angles, to within a leright ambiguity.
The angular geometry of the towed array is displayedthe Fig. 2 inset. Thex axis is oriented parallel to the shipvelocity, and the positivez axis points toward the ocean flooThe array is assumed to lie in thex–z plane, titled at anangle a relative to thex axis. When energy arrives fromazimuthf ~measured from thex axis! and elevationu ~mea-sured from the vertical!, its bearing relative to the array axwill be measured ash. The relationships between thesangles are provided by
coshx5cosux sina1sinux cosa cosf, ~7!
where the indexx refers to the array bearing of the direpath ~‘‘d’’ ! or surface reflection~‘‘s’’ !. Equation ~7! thusyields two equations for the direct (hd) and surface (hs)bearings. As horizontal refraction effects are assumed negible, the horizontal azimuthf is the same for both pathsFrom the relationships
sinud5R/Pd , sinus5R/Ps ,
cosud5~za2zw!/Pd , cosus5~za1zw!/Ps ,
these equations can be inverted, yielding the desired an
sina5@Ps coshs2Pd coshd#/2zw ,~8!
cosf5@Pd coshd~zw1za!2~zw2za!Ps coshs#/
2Rzw cosa.
As a must lie between690°, its value is determineduniquely. The azimuthf can then be resolved to withinleft/right ambiguity.
Estimating the arrival angles for the bottom returns wnot found to be feasible, as the cross correlation of thefuse returns between hydrophones yielded multiple ambous maxima.
III. METHODS
A. Equipment
The data were recorded on a five-element hydropharray built by Sonatech, Inc. The elements were ceramicinders spaced 2 m apart, with 75 m of trailing cable behinthe last element. The individual elements have unampliomnidirectional sensitivities of 185 to2187 dBre: 1 V/mPabetween 1.5 and 20 kHz. A preamplifier embedded in esensor provided 57-dB signal gain, so that the array ousensitivities were effectively2128 to2130 dBre: 1 V/mPa.A high-pass single-pole filter with a break frequency ofkHz was embedded in the electronics, producing a 6-octave rolloff at low frequencies, in order to reduce caand ship-induced noise. The array was deployed from a c147 m behind the NOAA ship GORDON GUNTER, a formerU.S. Navy vessel equipped with vibration-isolated dieelectric engines to minimize acoustic noise. Sixty poundsweight were added approximately 20 m in front of the fiarray element to keep the array deep at high tow speeds
J. Acoust. Soc. Am., Vol. 112, No. 1, July 2002
isi-
n
li-
es
sf-u-
el-
d
hut
/ele
lf
t
During the time period to be discussed here, the arwas being used to track a group of sperm whales in clproximity to the ship. To remain near the animals, the shad to slow to 0.5–1.5 knots, a speed that caused the arrsink 60–80 m beneath the surface. Over 90 min the sslowly cruised over the animals while maintaining a fixheading and speed.
Sound signals captured by the array hydrophones wfirst routed through a Mackie 1604-VLZ PRO Mic/Linpreamp mixer, then passed through an Avens model 422dual channel variable frequency filter. The latter furtherduced the substantial flow noise below 1 kHz. The signwere then recorded onto a TASCAM DA-78HR digital rcording system for later analysis. Water depth was measuand recorded by a Simrad EK-500 depth sounder as thetraveled.
To permit real-time monitoring the TASCAM analooutputs were then entered back into the mixer, wheresignal could be monitored by an operator and/or pasthrough to a Data Translation DT-3809 A/D card insideDell Workstation 410. The digitized signals could theninspected visually via scrolling spectrograms using the pprietary software packageISHMAEL,34 which also had the capability of calculating bearings to animals in real time.
B. Data analysis procedures
When reflections like those shown in the Fig. 1 inswere either observed on theISHMAEL display or detectedover headphones, the time and water depth were notedrecorded. Back on shore the digital data on the TASCAtapes were converted directly into WAV-format hard-difiles, using a Spectral Dynamics digital converter. The fiwere then imported intoMATLAB for analysis. A simple click-detection algorithm digitally filtered the signals above 5 kHand estimated the onset time of clicks and click reflectioOnsets were detected by comparing the variance of asample with the mean variance of 50 samples that wknown to contain no signal, and classifying the result aclick if the sample variance exceeded the measured nvariance by a factor of 10. The onsets were hand-correcby visual inspection of the extracted time series. While dtecting and adjusting the onset of direct and surface refltions was easily automated using cross-correlation teniques, human judgment was required to select the onsethe diffuse bottom results. The resulting bottom onset timerrors could reach 0.01 s, even when the signals were heafiltered to emphasize the energy from the bottom, due tolong rise times of the return envelope. Human judgment walso required to classify the arrival as a direct path, surfreflection, etc., a task that required some practice when mtiple animals were vocalizing.
The greatest potential difficulty in the analysis was dtermining which set of bottom/bottom-surface reflectiocorresponded with a particular direct/surface arrival. At shlow whale depths, the recorded interval between the dirarrival and its associated bottom bounce could in princiexceed the interclick interval~ICI! between direct arrivals. Insituations where such confusion was possible, two chewere performed. First, sudden changes in ICI were matc
311Thode et al.: Sperm whale tracking
esi
a.mble
setiotsvuasm
thth
is%
ghaWieerhtwr
ra
ead
ch
aesiirdetinnt
-blntien
helnu-ith
edesol-
dur-raya-hipay.ro-s ofeir
hethisa-
ig.
euite
DT,
. Alls rep-entolidlines
with corresponding changes in the bottom-reflection intvals. Second, the computations in Sec. II were redone uthe interval between the direct arrival and thesecondsubse-quent bottom and bottom-surface reflections as input datthe ICI was indeed less than the direct-bottom arrival tidifference, then this procedure yielded physically realizaanswers. Otherwise, negative or imaginary distances wobtained.
The first two adjacent hydrophone elements were uto estimate bearings, using standard cross-correlatechniques.35,36While in theory clicks recorded from the firsand fifth element would have provided greater bearing relution, the surface reflections were found to decorrelate oshort spatial distances, making bearing estimation difficwhen using sensors separated more than 2 m. The rebehind this difficulty was most likely surface roughness frothe relatively calm swell, or even the wake produced byGUNTER. Once the times and bearings were estimated,animal and array positions were computed using Eqs.~4!–~6!. Unphysical locations were rejected from the analyswhich resulted in rejection rates at times exceeding 25whenever the bottom returns were particularly weak.
IV. RESULTS
A. Data description
The data presented here were collected on the evenin3 July, 2000 between 22:00 and 23:30 CDT. During tperiod, the GUNTER cruised between 27.8875 N, 89.4823and 27.9197 N, 89.4822 W, in water whose depth varbetween only 930 to 953 m over tens of square kilometThe GUNTER maintained a heading of 352 deg in a sligcurrent, at a speed between 0.5 and 1.5 kn. The seasrelatively calm, with a wave height and 1-m swell, both ariving from 70 deg true. The starting times of the three tjectories shown here were 22:23:20~whale 1!, 22:46:40~whale 2!, and 23:15:01~whale 3!.
B. Recovered dive profiles
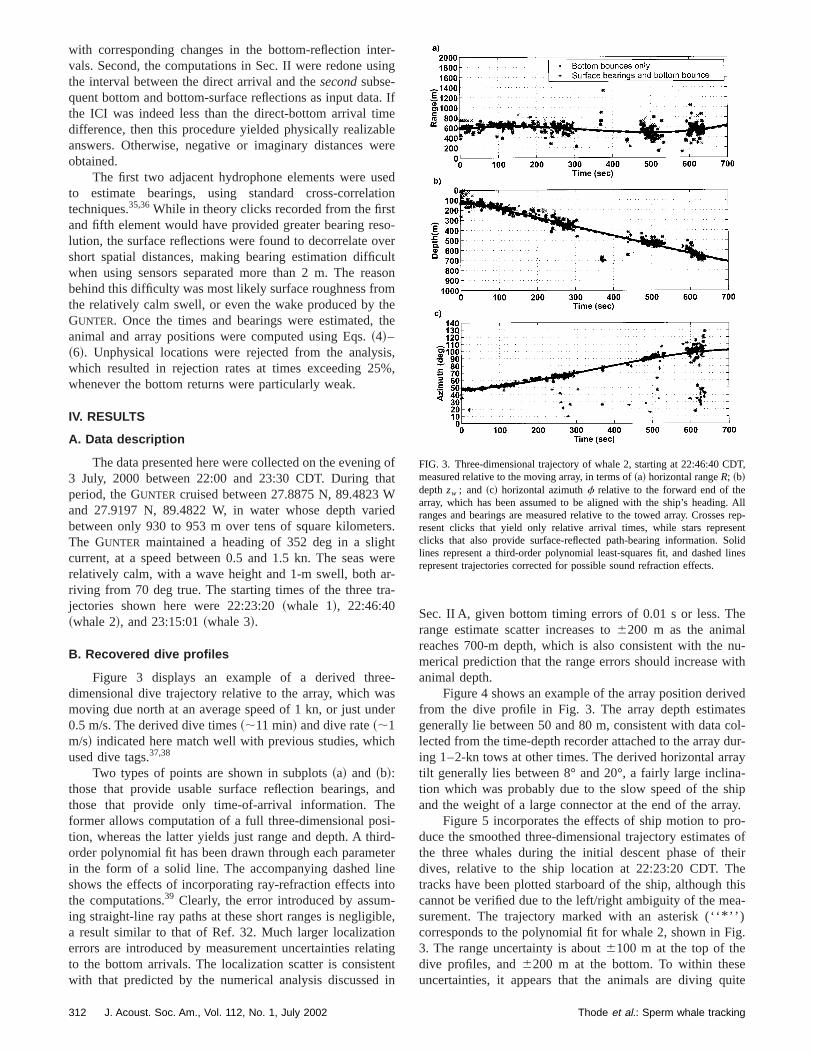
Figure 3 displays an example of a derived thredimensional dive trajectory relative to the array, which wmoving due north at an average speed of 1 kn, or just un0.5 m/s. The derived dive times~;11 min! and dive rate~;1m/s! indicated here match well with previous studies, whiused dive tags.37,38
Two types of points are shown in subplots~a! and ~b!:those that provide usable surface reflection bearings,those that provide only time-of-arrival information. Thformer allows computation of a full three-dimensional potion, whereas the latter yields just range and depth. A thorder polynomial fit has been drawn through each paramin the form of a solid line. The accompanying dashed lshows the effects of incorporating ray-refraction effects ithe computations.39 Clearly, the error introduced by assuming straight-line ray paths at these short ranges is negligia result similar to that of Ref. 32. Much larger localizatioerrors are introduced by measurement uncertainties relato the bottom arrivals. The localization scatter is consistwith that predicted by the numerical analysis discussed
312 J. Acoust. Soc. Am., Vol. 112, No. 1, July 2002
r-ng
Ifeere
dn
o-erlton
ee
,,
oft
ds.
ere--
-ser
nd
--ereo
e,
ngt
in
Sec. II A, given bottom timing errors of 0.01 s or less. Trange estimate scatter increases to6200 m as the animareaches 700-m depth, which is also consistent with themerical prediction that the range errors should increase wanimal depth.
Figure 4 shows an example of the array position derivfrom the dive profile in Fig. 3. The array depth estimatgenerally lie between 50 and 80 m, consistent with data clected from the time-depth recorder attached to the arraying 1–2-kn tows at other times. The derived horizontal artilt generally lies between 8° and 20°, a fairly large inclintion which was probably due to the slow speed of the sand the weight of a large connector at the end of the arr
Figure 5 incorporates the effects of ship motion to pduce the smoothed three-dimensional trajectory estimatethe three whales during the initial descent phase of thdives, relative to the ship location at 22:23:20 CDT. Ttracks have been plotted starboard of the ship, althoughcannot be verified due to the left/right ambiguity of the mesurement. The trajectory marked with an asterisk (‘ ‘* ’ ’)corresponds to the polynomial fit for whale 2, shown in F3. The range uncertainty is about6100 m at the top of thedive profiles, and6200 m at the bottom. To within thesuncertainties, it appears that the animals are diving q
FIG. 3. Three-dimensional trajectory of whale 2, starting at 22:46:40 Cmeasured relative to the moving array, in terms of~a! horizontal rangeR; ~b!depthzw ; and ~c! horizontal azimuthf relative to the forward end of thearray, which has been assumed to be aligned with the ship’s headingranges and bearings are measured relative to the towed array. Crosseresent clicks that yield only relative arrival times, while stars represclicks that also provide surface-reflected path-bearing information. Slines represent a third-order polynomial least-squares fit, and dashedrepresent trajectories corrected for possible sound refraction effects.
Thode et al.: Sperm whale tracking

ori-is-
in-ra-la-
etherentesde-toereap-
re-velndjec-lsew-last
eeaf thben
od
t to
hedaredthat
FIG. 4. Example of computed~a! array depthza , and ~b! array tilt a,extracted from the dive trajectory displayed in Fig. 3.
FIG. 5. Smoothed three-dimensional trajectories of whale 1~‘‘ 3’’ !, whale 2~‘‘ * ’’ !, and whale 3~‘‘ s’’ !, plotted in a stationary reference frame with thorigin centered at the ship location at 22:23:20 CDT. The ship track appas a black horizontal line at the surface. Two-dimensional projections otracks in the E–W and N–S plane are also displayed. The tracks haveassumed to be on the starboard side of the ship, although they may be oport side as well, due to the left/right ambiguity of the localization meth
J. Acoust. Soc. Am., Vol. 112, No. 1, July 2002
steeply, at angles ranging between 45° and 90° from the hzontal plane. This observation has implications for the dcussion in Sec. V.
C. Relationship between ICI and whale depth
The interval between subsequent clicks, or interclickterval ~ICI!, has been a topic of some interest in the liteture, as outlined in the Introduction. Figure 6 plots the retionship between the ICI and the derived two-way travel timof an acoustic pulse between the animals’ location andocean floor, where each subplot corresponds to a diffeanimal. The regions to the left of the vertical dashed lincorrespond to times where bottom bounces were oftentected, allowing a full three-dimensional fix. The regionsthe right correspond to times wherein bottom returns wabsent, precluding any precise localization beyond anproximate bearing.
In the region left of the dashed lines, the crosses repsent the ICI, and the solid lines represent the two-way tratime of a pulse traveling vertically between the whale athe ocean floor, using the smoothed polynomial depth tratory fit. The dashed line represents the travel time for a putraveling at an angle of 45° from the horizontal, the shalloest angle apparent from the trajectories in Fig. 5. This
rseenthe.
FIG. 6. Relationship between interclick interval~crosses!, vertical two-wayacoustic travel time between three whales and the ocean floor~solid line!,and two-way travel time of a directed pulse along a path 45° with respecthe horizontal~dashed line!. Subplots~a!–~c! correspond to the dive profilesof whales 1–3, respectively. The travel times shown in subplot~b! werecomputed using the depths from whale 2, displayed in Fig. 3. The dasvertical lines indicate the times after which the bottom bounces disappeand 3D localization became impossible. Note the sudden change in ICIoccurs after the bottom bounces vanish.
313Thode et al.: Sperm whale tracking
or
be-m,ar-m
8edthel-theheny
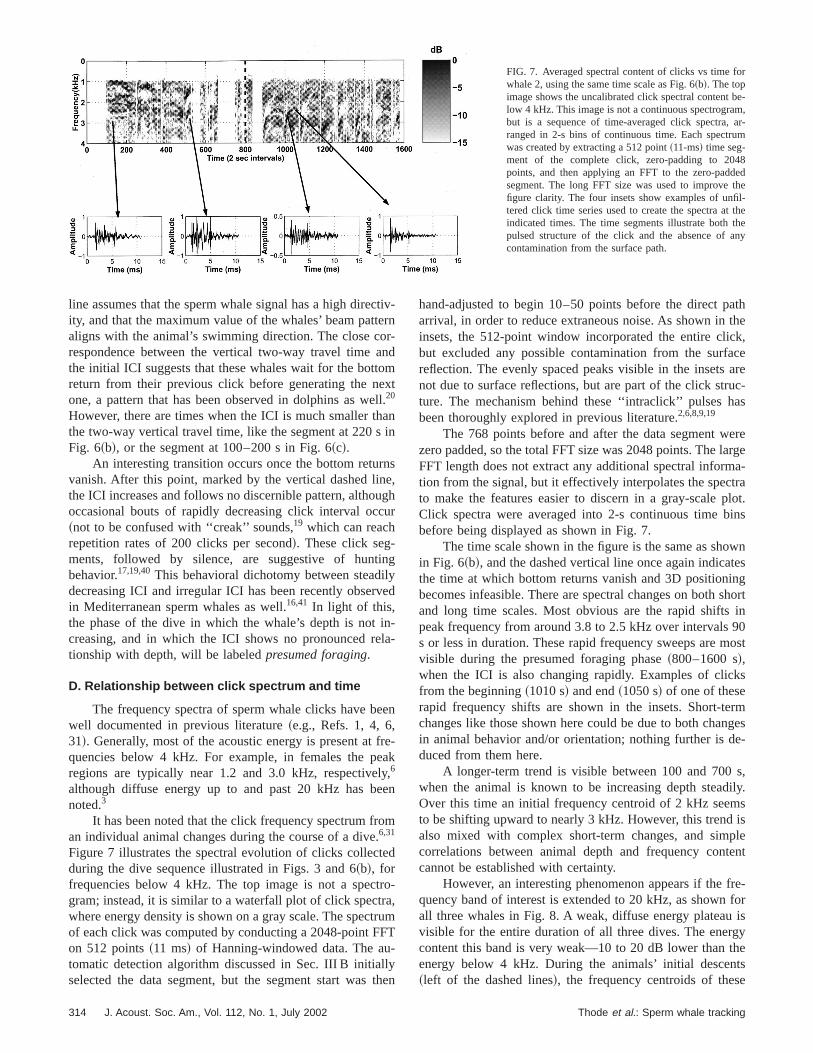
FIG. 7. Averaged spectral content of clicks vs time fwhale 2, using the same time scale as Fig. 6~b!. The topimage shows the uncalibrated click spectral contentlow 4 kHz. This image is not a continuous spectrograbut is a sequence of time-averaged click spectra,ranged in 2-s bins of continuous time. Each spectruwas created by extracting a 512 point~11-ms! time seg-ment of the complete click, zero-padding to 204points, and then applying an FFT to the zero-paddsegment. The long FFT size was used to improvefigure clarity. The four insets show examples of unfitered click time series used to create the spectra atindicated times. The time segments illustrate both tpulsed structure of the click and the absence of acontamination from the surface path.
cterr
anomexelai
rne
ugcu
inilyve
inla
ee
freealyee
om.ed
troatruF-
llyth
aththe
ck,aceare
uc-as
erearge
a-tralot.ins
wntesingshort
in90ost
ks
rmngese-
s,ily.sispletent
fre-foris
gythetse
line assumes that the sperm whale signal has a high direity, and that the maximum value of the whales’ beam pattaligns with the animal’s swimming direction. The close corespondence between the vertical two-way travel timethe initial ICI suggests that these whales wait for the bottreturn from their previous click before generating the none, a pattern that has been observed in dolphins as w20
However, there are times when the ICI is much smaller ththe two-way vertical travel time, like the segment at 220 sFig. 6~b!, or the segment at 100–200 s in Fig. 6~c!.
An interesting transition occurs once the bottom retuvanish. After this point, marked by the vertical dashed linthe ICI increases and follows no discernible pattern, althooccasional bouts of rapidly decreasing click interval oc~not to be confused with ‘‘creak’’ sounds,19 which can reachrepetition rates of 200 clicks per second!. These click seg-ments, followed by silence, are suggestive of huntbehavior.17,19,40This behavioral dichotomy between steaddecreasing ICI and irregular ICI has been recently obserin Mediterranean sperm whales as well.16,41 In light of this,the phase of the dive in which the whale’s depth is notcreasing, and in which the ICI shows no pronounced retionship with depth, will be labeledpresumed foraging.
D. Relationship between click spectrum and time
The frequency spectra of sperm whale clicks have bwell documented in previous literature~e.g., Refs. 1, 4, 6,31!. Generally, most of the acoustic energy is present atquencies below 4 kHz. For example, in females the pregions are typically near 1.2 and 3.0 kHz, respective6
although diffuse energy up to and past 20 kHz has bnoted.3
It has been noted that the click frequency spectrum fran individual animal changes during the course of a dive6,31
Figure 7 illustrates the spectral evolution of clicks collectduring the dive sequence illustrated in Figs. 3 and 6~b!, forfrequencies below 4 kHz. The top image is not a specgram; instead, it is similar to a waterfall plot of click spectrwhere energy density is shown on a gray scale. The specof each click was computed by conducting a 2048-point Fon 512 points~11 ms! of Hanning-windowed data. The automatic detection algorithm discussed in Sec. III B initiaselected the data segment, but the segment start was
314 J. Acoust. Soc. Am., Vol. 112, No. 1, July 2002
iv-n-d
tl.nn
s,hr
g
d
--
n
-k
,n
-,m
T
en
hand-adjusted to begin 10–50 points before the direct parrival, in order to reduce extraneous noise. As shown ininsets, the 512-point window incorporated the entire clibut excluded any possible contamination from the surfreflection. The evenly spaced peaks visible in the insetsnot due to surface reflections, but are part of the click strture. The mechanism behind these ‘‘intraclick’’ pulses hbeen thoroughly explored in previous literature.2,6,8,9,19
The 768 points before and after the data segment wzero padded, so the total FFT size was 2048 points. The lFFT length does not extract any additional spectral informtion from the signal, but it effectively interpolates the specto make the features easier to discern in a gray-scale pClick spectra were averaged into 2-s continuous time bbefore being displayed as shown in Fig. 7.
The time scale shown in the figure is the same as shoin Fig. 6~b!, and the dashed vertical line once again indicathe time at which bottom returns vanish and 3D positionbecomes infeasible. There are spectral changes on bothand long time scales. Most obvious are the rapid shiftspeak frequency from around 3.8 to 2.5 kHz over intervalss or less in duration. These rapid frequency sweeps are mvisible during the presumed foraging phase~800–1600 s!,when the ICI is also changing rapidly. Examples of clicfrom the beginning~1010 s! and end~1050 s! of one of theserapid frequency shifts are shown in the insets. Short-techanges like those shown here could be due to both chain animal behavior and/or orientation; nothing further is dduced from them here.
A longer-term trend is visible between 100 and 700when the animal is known to be increasing depth steadOver this time an initial frequency centroid of 2 kHz seemto be shifting upward to nearly 3 kHz. However, this trendalso mixed with complex short-term changes, and simcorrelations between animal depth and frequency concannot be established with certainty.
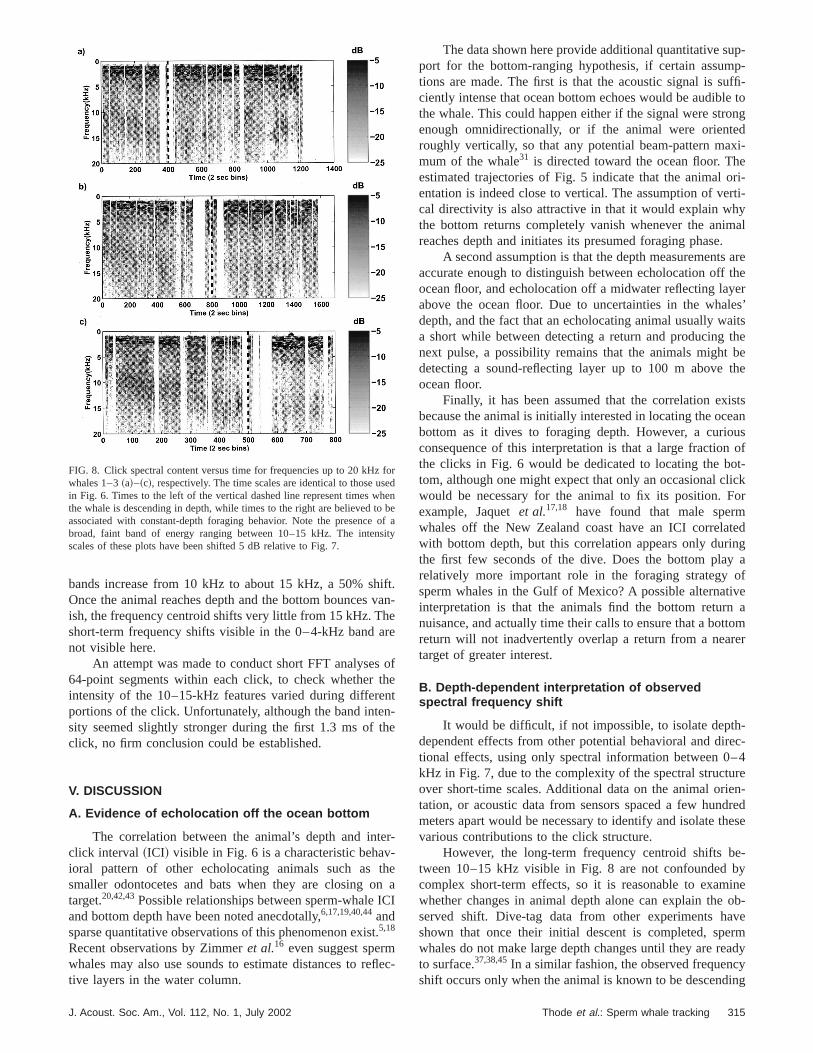
However, an interesting phenomenon appears if thequency band of interest is extended to 20 kHz, as shownall three whales in Fig. 8. A weak, diffuse energy plateauvisible for the entire duration of all three dives. The enercontent this band is very weak—10 to 20 dB lower thanenergy below 4 kHz. During the animals’ initial descen~left of the dashed lines!, the frequency centroids of thes
Thode et al.: Sperm whale tracking
ifv
hear
sthnn
th
e-thn
IC
t.
fl
up-p-ffi-e tongdxi-eri-rti-ymal.
arethe
yerles’aitsthebethe
istseanusof
ot-lickor
tedng
aofve
atomer
-ec-–4re
en-dredese
e-byineob-vermady
cying
foseheo bosi
bands increase from 10 kHz to about 15 kHz, a 50% shOnce the animal reaches depth and the bottom bouncesish, the frequency centroid shifts very little from 15 kHz. Tshort-term frequency shifts visible in the 0–4-kHz bandnot visible here.
An attempt was made to conduct short FFT analyse64-point segments within each click, to check whetherintensity of the 10–15-kHz features varied during differeportions of the click. Unfortunately, although the band intesity seemed slightly stronger during the first 1.3 ms ofclick, no firm conclusion could be established.
V. DISCUSSION
A. Evidence of echolocation off the ocean bottom
The correlation between the animal’s depth and intclick interval ~ICI! visible in Fig. 6 is a characteristic behavioral pattern of other echolocating animals such assmaller odontocetes and bats when they are closing otarget.20,42,43Possible relationships between sperm-whaleand bottom depth have been noted anecdotally,6,17,19,40,44andsparse quantitative observations of this phenomenon exis5,18
Recent observations by Zimmeret al.16 even suggest spermwhales may also use sounds to estimate distances to retive layers in the water column.
FIG. 8. Click spectral content versus time for frequencies up to 20 kHzwhales 1–3~a!–~c!, respectively. The time scales are identical to those uin Fig. 6. Times to the left of the vertical dashed line represent times wthe whale is descending in depth, while times to the right are believed tassociated with constant-depth foraging behavior. Note the presencebroad, faint band of energy ranging between 10–15 kHz. The intenscales of these plots have been shifted 5 dB relative to Fig. 7.
J. Acoust. Soc. Am., Vol. 112, No. 1, July 2002
t.an-
e
ofet-e
r-
ea
I
ec-
The data shown here provide additional quantitative sport for the bottom-ranging hypothesis, if certain assumtions are made. The first is that the acoustic signal is suciently intense that ocean bottom echoes would be audiblthe whale. This could happen either if the signal were stroenough omnidirectionally, or if the animal were orienteroughly vertically, so that any potential beam-pattern mamum of the whale31 is directed toward the ocean floor. Thestimated trajectories of Fig. 5 indicate that the animal oentation is indeed close to vertical. The assumption of vecal directivity is also attractive in that it would explain whthe bottom returns completely vanish whenever the anireaches depth and initiates its presumed foraging phase
A second assumption is that the depth measurementsaccurate enough to distinguish between echolocation offocean floor, and echolocation off a midwater reflecting laabove the ocean floor. Due to uncertainties in the whadepth, and the fact that an echolocating animal usually wa short while between detecting a return and producingnext pulse, a possibility remains that the animals mightdetecting a sound-reflecting layer up to 100 m aboveocean floor.
Finally, it has been assumed that the correlation exbecause the animal is initially interested in locating the ocbottom as it dives to foraging depth. However, a curioconsequence of this interpretation is that a large fractionthe clicks in Fig. 6 would be dedicated to locating the btom, although one might expect that only an occasional cwould be necessary for the animal to fix its position. Fexample, Jaquetet al.17,18 have found that male spermwhales off the New Zealand coast have an ICI correlawith bottom depth, but this correlation appears only durithe first few seconds of the dive. Does the bottom playrelatively more important role in the foraging strategysperm whales in the Gulf of Mexico? A possible alternatiinterpretation is that the animals find the bottom returnnuisance, and actually time their calls to ensure that a botreturn will not inadvertently overlap a return from a neartarget of greater interest.
B. Depth-dependent interpretation of observedspectral frequency shift
It would be difficult, if not impossible, to isolate depthdependent effects from other potential behavioral and dirtional effects, using only spectral information between 0kHz in Fig. 7, due to the complexity of the spectral structuover short-time scales. Additional data on the animal oritation, or acoustic data from sensors spaced a few hunmeters apart would be necessary to identify and isolate thvarious contributions to the click structure.
However, the long-term frequency centroid shifts btween 10–15 kHz visible in Fig. 8 are not confoundedcomplex short-term effects, so it is reasonable to examwhether changes in animal depth alone can explain theserved shift. Dive-tag data from other experiments hashown that once their initial descent is completed, spewhales do not make large depth changes until they are reto surface.37,38,45In a similar fashion, the observed frequenshift occurs only when the animal is known to be descend
rdne
f aty
315Thode et al.: Sperm whale tracking
ethtinutham
no
roHa
shtop
Hisaie1
ethncttell
frethne
se
hith
nioouth
onauanresrekHuzhibechsothivir-
e a
ies,sticd.ithts
ese isldb-nceed,res-
nsusby a
thetaind-
ob-
illple,ved
herthe
h for-in-
mayby
theof
e sacd air
-
in depth, and shows no further shifts during the presumforaging phase. As the observed frequency shifts trackmeasured and expected depth changes during two disphases of the dive cycle, it is reasonable to propose a camechanism between the two. This section proposesdepth-dependent resonances in incompressible air-filled cties a few millimeters in size provide one such mechanis
1. Discussion of alternative explanations forfrequency shift
There are three reasons why the observed frequeshift seems unlikely to be caused by directional effects,changes in the animals’ orientations relative to the hydphone. First, the observed frequency shifts in the 10-kband for all three whales occur only during the descent ph~times left of the vertical black lines!. During the presumedforaging phases shown in Fig. 8, the frequency centroidall three whales shift only slightly from 15 kHz, even thougone would expect that the animals’ orientations relativethe hydrophones would be changing extensively throughthe dive. Second, the 10-kHz band shows none of the rachanges in peak frequency clearly visible in the 0–4-kband~Fig. 7! over the same time interval. This observationsurprising, because one might expect that energy generat 10 kHz would display even greater directional propertthan energy in the 0–4-kHz band, as the wavelength ofkHz is 2–3 times smaller than the peak frequencies visiblFig. 7. The apparent lack of any correlation betweenshifts in peak frequency between 0–4 kHz and the frequecentroid in the 10–15-kHz region suggests that the laarises from a independent source, with dimensions smathan a 10-kHz acoustic wavelength. Finally, the samequency shift is visible for all three animals, even thoughpositions of the animals relative to the towed hydrophowere different, as can be seen in Fig. 5.
The possibility that the whales systematically adjutheir spectral structure above 10 kHz during the initial dscent, and then fix the frequency maxima near 15 kHz wpresumably foraging, cannot be discounted. However,energy intensity distributed across the 10–15-kHz band10–20 dB less than the energy content in the 0–4-kHz baand from a sonar engineering perspective it seems suspicthat the animals would manipulate this spectral band withdedicating more acoustic power to the band. Granted,ability to detect and interpret returns in the 10-kHz regiwould be expected to be evolutionary advantageous, becin general higher frequencies would aid in the detectionidentification of 10-cm objects, such as squid. However, fquencies in this region also suffer higher absorption lossewater,46 and returns from water-filled targets like squid aexpected to be weak. Therefore, if the energy above 10were truly useful to the animals’ foraging success, it is pzling why their clicks have not dedicated more power to tspectral region. Thus, in this paper the shifts in Fig. 8 willassumed to be by-products of the sound production menism, and not actively manipulated by the animal. Thiscalled ‘‘generator noise’’ assumption does not precludepossibility that this faint band may serve a communicatpurpose, just as the low-frequency omnidirectional ‘‘a
316 J. Acoust. Soc. Am., Vol. 112, No. 1, July 2002
dect
salatvi-.
cyr-zse
of
outidz
teds0
ineyr
er-
es
t-leeisd,uste
sed-in
z-s
a--ee
borne components’’ of other odontocete clicks may servuseful communicative purpose.47
Before restricting subsequent discussion to air cavitthe possibility of depth-dependent effects on the acouproperties of oil-filled cavities should also be considereThe compressional velocity of spermaceti oil does vary wpressure and temperature.48 However, careful measuremenhave found that this speed varies by only 11% over extremin pressure and temperature, and only 2% if temperaturconstant.48 Therefore, the properties of spermaceti oil couaccount for at most 20% of the total frequency shift oserved, unless a formula with a strong nonlinear dependeon the sound speed of the cavity material can be identifior unless the animal can generate enormous internal psures via muscular contraction.
2. Anatomical evidence for air-filled cavities smallerthan an acoustic wavelength
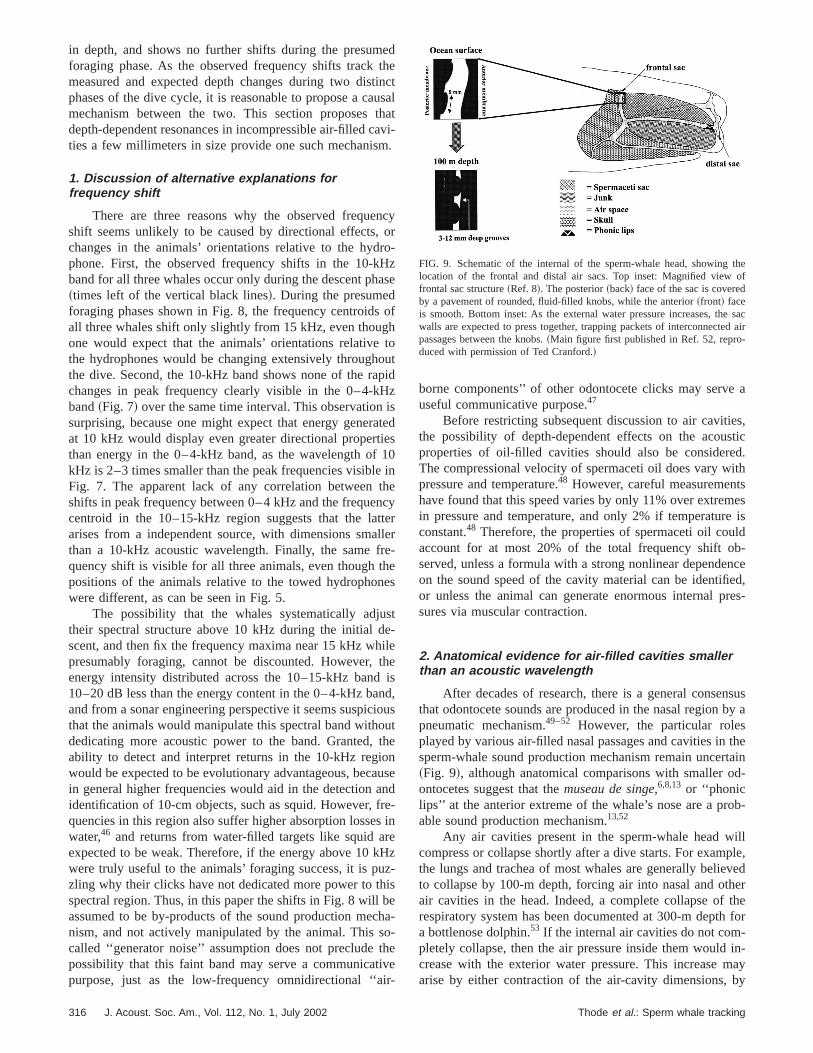
After decades of research, there is a general consethat odontocete sounds are produced in the nasal regionpneumatic mechanism.49–52 However, the particular rolesplayed by various air-filled nasal passages and cavities insperm-whale sound production mechanism remain uncer~Fig. 9!, although anatomical comparisons with smaller oontocetes suggest that themuseau de singe,6,8,13 or ‘‘phoniclips’’ at the anterior extreme of the whale’s nose are a prable sound production mechanism.13,52
Any air cavities present in the sperm-whale head wcompress or collapse shortly after a dive starts. For examthe lungs and trachea of most whales are generally belieto collapse by 100-m depth, forcing air into nasal and otair cavities in the head. Indeed, a complete collapse ofrespiratory system has been documented at 300-m depta bottlenose dolphin.53 If the internal air cavities do not completely collapse, then the air pressure inside them wouldcrease with the exterior water pressure. This increasearise by either contraction of the air-cavity dimensions,
FIG. 9. Schematic of the internal of the sperm-whale head, showinglocation of the frontal and distal air sacs. Top inset: Magnified viewfrontal sac structure~Ref. 8!. The posterior~back! face of the sac is coveredby a pavement of rounded, fluid-filled knobs, while the anterior~front! faceis smooth. Bottom inset: As the external water pressure increases, thwalls are expected to press together, trapping packets of interconnectepassages between the knobs.~Main figure first published in Ref. 52, reproduced with permission of Ted Cranford.!
Thode et al.: Sperm whale tracking
asth
emocea
ryth
i-h
nflebla
icc
thti
erest
on
ett
actillity
aly
ro-en
n-of a
iscaleicalbser-
l air
ol-re-to
r
-is
reredion,t ofe
om-en-cav-
nda ineenvestheeerlyible
edm--m
uesn-al-
6of
m-vi-nu-
the transfer of air from other contracting or collapsing psages in the respiratory system, or by a combination oftwo.
Anatomical studies of the sperm-whale nose have donstrated the presence of at least two large air sacs,located anterior and the other posterior of the spermaorgan, which have been appropriately named the distalfrontal sacs, respectively8,13,52,54~Fig. 9!. A dissection of thefrontal sac revealed the following structure~Fig. 9, top in-set!:
‘‘The posterior wall of the sac is covered with apavement of smooth, rounded, fluid-filled knobs...These knobs vary in diameter from 4 to 13 mm witha mean diameter of 9 mm... Between the knobs liegrooves varying from 3 to 12 mm deep. Scatteredthroughout these channels are thin membranoustransverse septa that divide the channels into manydiscrete parts...’’8
By contrast, the anterior wall of the frontal sac is vesmooth, so that when the two faces of the sac press toge~Fig. 9, bottom inset!, a network of interconnected air cavties forms, with cavity dimensions much smaller than tacoustic wavelength of a 10-kHz sound in water~15 cm! orair ~34 mm!.
Norris and Harvey, who made the above observatiospeculated that this interconnected mesh of air helps reacoustic energy generated by the phonic lips, and that suquent reflections between the distal and frontal sacs expcertain features of the sperm-whale click structure.2,6,9 Evenan air film only 1-mm thick will act as a perfect acoustreflector at frequencies above 3 kHz, and will still refle20% of the incident acoustic energy at 1 kHz, assumingthe opposite faces of the sac are not driven together byacoustic pulse. Therefore, if the Norris and Harvey theorytrue, the collapsed frontal and distal sacs play prominroles in the sound production mechanism, and the air filigtrapped inside the frontal sac is exposed to high acouintensities.
3. A simple depth-dependent resonator model forfrequency shifts
If small air cavities are indeed excited by the passagereflection of an incident acoustic pulse, they will have a tedency to radiate energy at a resonant frequency that is dmined by a balance between the radiation impedance ofcavity, and the acoustic compliance of the air inside the city. If a typical cavity dimensiona is smaller than an acoustiwavelengthl ~that is, 2pa/l!1!, and its boundaries are noinfinitely rigid, then the energy radiated by the cavity wtend to be omnidirectional, regardless of the cavshape.55,56 In addition, whenever 2pa/l!1, the cavity’sfundamental resonant frequency will be determined primrily by the cavity volume, and the cavity can be effectivemodeled as a sphere~or ellipsoid!, with a being the sphereradius. For example, even an extremely flattened sphewith a ratio of major-to-minor axis of 16 will have a frequency only 30% higher than a sphere of equivalvolume.23,57 The limited data from Norris and Harvey8 sug-
J. Acoust. Soc. Am., Vol. 112, No. 1, July 2002
-e
-neti
nd
er
e
s,ct
se-in
tathesnteic
r-er-hev-
-
id
t
gest major–minor axis ratios of around 3, which would geerate resonant frequencies only 5% greater than thatsphere of equivalent volume. Thus, if the 10-kHz bandassumed to be the product of an ensemble of small-sresonators of similar volumes, then a very simple spherresonator model can be reasonably tested against the ovations.
The fundamental resonance frequency for a sphericacavity with 2pa/l!1 is provided by the following twoexpressions.21–24The first expression assumes the cavity vume remains fixed with increasing water pressure, whichquires that the cavity be connected, at least indirectly,another compressible cavity
f incompressible51
2paA2gPwater1X
rwater. ~9a!
Here,a is the cavity radius,g is the ratio of specific heats foan ideal gas,Pwater is the external water pressure, andrwater
is the water density. The quantityX depends on the characteristics of material surrounding the cavity. If the materialwater, Eq.~9a! represents a freely oscillating bubble, andX50. If the material is an infinite elastic solid~the Andreevamodel24!, X54 m, where m is the real part of the sheamodulus. A widely accepted model of a fish swimbladd~the Love model23! assumes that the air cavity is surroundby a thin membrane capable of sustaining surface tensembedded in a viscous fluid. The derivation yields a resulX52s(g21)/a, wheres is the surface tension of the tissuat the air/shell interface.
The second expression assumes that the cavity is cpletely isolated from other air sources, so the cavity dimsions compress under increased pressure. If the originality radius isa0 at water pressureP0 , then from Boyle’s lawthe appropriate expression is
f compressible5P0
21/3
2pa0A 3g
rwaterPwater
5/6 . ~9b!
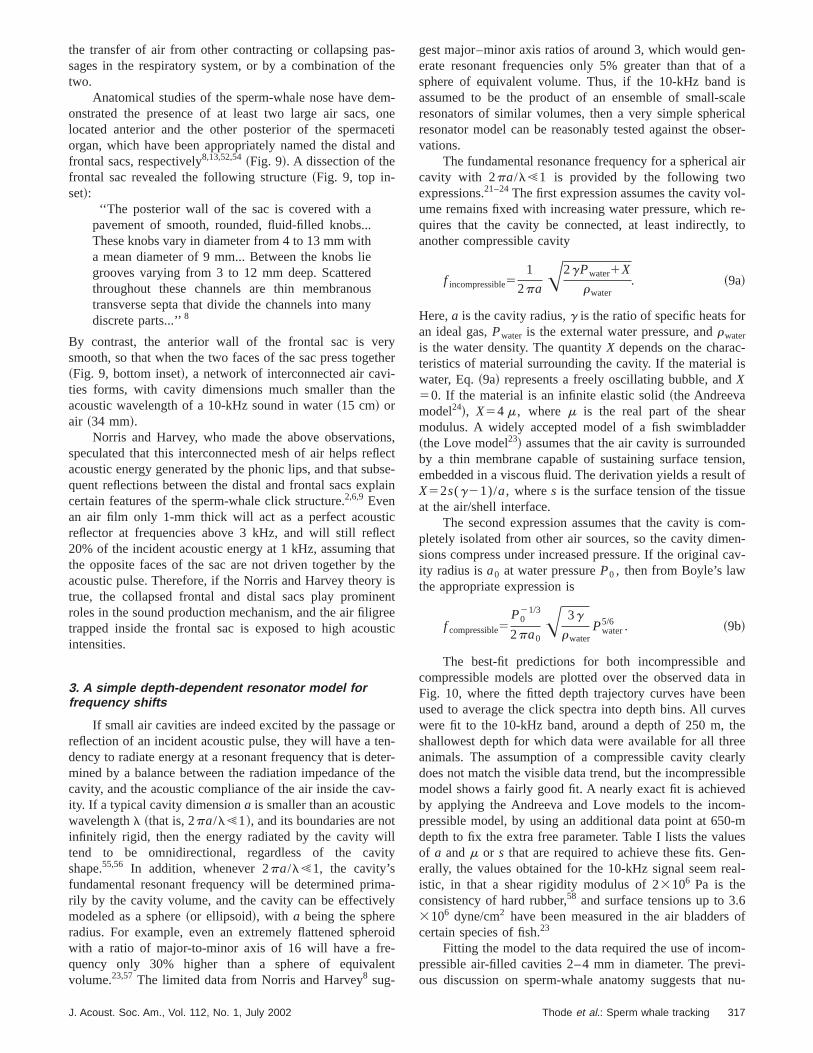
The best-fit predictions for both incompressible acompressible models are plotted over the observed datFig. 10, where the fitted depth trajectory curves have bused to average the click spectra into depth bins. All curwere fit to the 10-kHz band, around a depth of 250 m,shallowest depth for which data were available for all thranimals. The assumption of a compressible cavity cleadoes not match the visible data trend, but the incompressmodel shows a fairly good fit. A nearly exact fit is achievby applying the Andreeva and Love models to the incopressible model, by using an additional data point at 650depth to fix the extra free parameter. Table I lists the valof a andm or s that are required to achieve these fits. Geerally, the values obtained for the 10-kHz signal seem reistic, in that a shear rigidity modulus of 23106 Pa is theconsistency of hard rubber,58 and surface tensions up to 3.3106 dyne/cm2 have been measured in the air bladderscertain species of fish.23
Fitting the model to the data required the use of incopressible air-filled cavities 2–4 mm in diameter. The preous discussion on sperm-whale anatomy suggests that
317Thode et al.: Sperm whale tracking
al
5-m
le
us
FIG. 10. Comparison of click spectra versus animdepth for whales 1–3~a!–~c!, respectively, for the 10-kHz band. Spectra have been depth-averaged overintervals. The circles~‘‘ s’’ ! represent predictions of theincompressible model in Eq.~9a! ~with X50!. Crosses~‘‘ 3’’ ! represent predictions of the simple compressibbubble model described in Eq.~9b!. The solid lines dis-play the predictions of the fitted elastic and viscoswimbladder models.
tcosmitipith
s
r
mc
drnain
e
sithot-
oss.d of
s’’ate
merous interconnected small passages may exist ingrooves between the knobs on the posterior face of thelapsed frontal sac. Whether these passages remain fixedwith increasing water depth, due to additional air inputs froother air passages, is unknown but plausible, as the cavare interconnected to each other and the rest of the restory tract. Other small-scale air cavities may also exist indistal sac and surrounding themuseau de singe.
The greatest weakness of the model is that it assumeof the proposed resonators have volumes within630% ofthe mean volumes derived in Table I, assuming that the pposed resonances lie within61 kHz of the centroid fre-quency. This is a stringent requirement, and furthercroanatomical information is required to judge whether sua uniform distribution of small-air cavities is unrealistic.
C. Some comments on signal directivity
The circumstances under which bottom returns aretected are intriguing. As mentioned in Sec. IV C, the retuare always detected when the animal is descending towthe ocean floor, but are never detected once the animaltiates presumed foraging behavior, even though surfac
TABLE I. Parameters used to fit 10-kHz curves in Fig. 10. ‘‘Bubble radiuis the radius obtained by assuming the air cavity is surrounded by w‘‘Elastic bubble radius’’ refers to radius obtained using Andreeva~Ref. 24!or Love ~Ref. 23! model.
Bubbleradius
~Refs. 21, 22!~mm!
Elasticbubbleradius~mm!
Andreeva~Ref. 24!shear rigiditymodulusm
~MPa!
Love ~Ref. 23!Surface tensions(106 dyne/cm)
Whale 1 1.7 2.0 4.5 0.5Whale 2 1.5 2.0 1.7 2.2Whale 3 1.7 2.0 1.0 1.2
318 J. Acoust. Soc. Am., Vol. 112, No. 1, July 2002
hel-ize
esra-e
all
o-
i-h
e-srdi-re
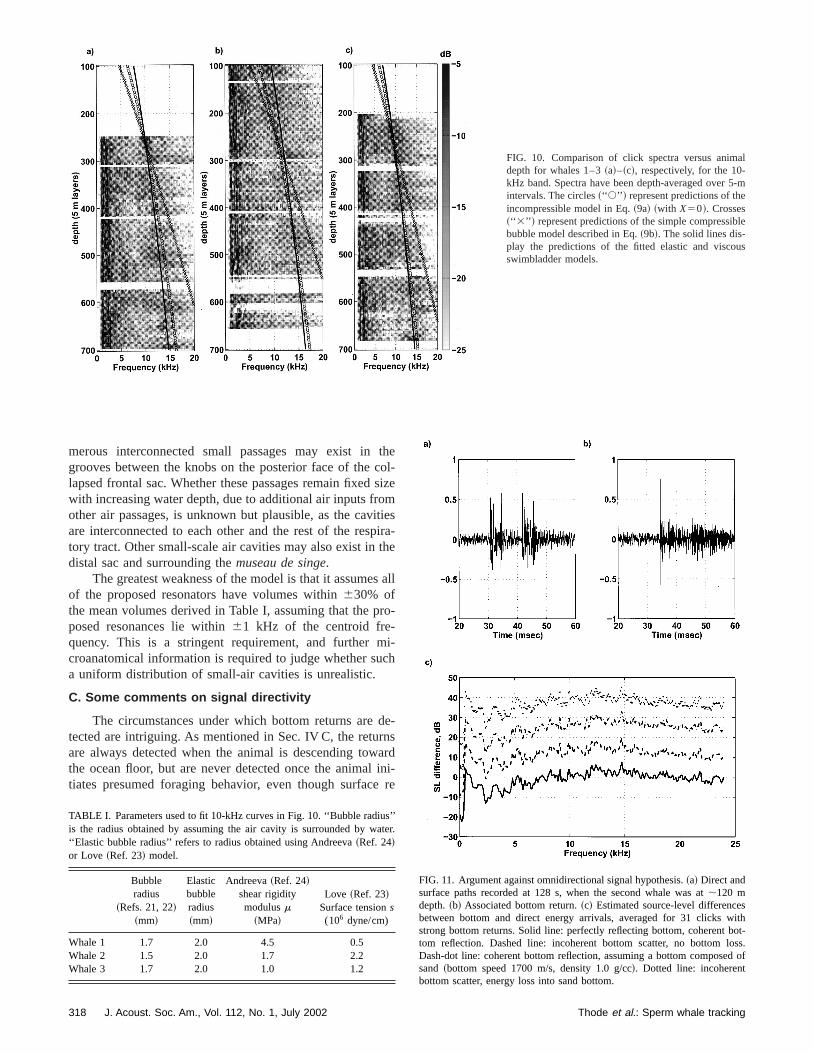
FIG. 11. Argument against omnidirectional signal hypothesis.~a! Direct andsurface paths recorded at 128 s, when the second whale was at;120 mdepth.~b! Associated bottom return.~c! Estimated source-level differencebetween bottom and direct energy arrivals, averaged for 31 clicks wstrong bottom returns. Solid line: perfectly reflecting bottom, coherent btom reflection. Dashed line: incoherent bottom scatter, no bottom lDash-dot line: coherent bottom reflection, assuming a bottom composesand ~bottom speed 1700 m/s, density 1.0 g/cc!. Dotted line: incoherentbottom scatter, energy loss into sand bottom.
r.
Thode et al.: Sperm whale tracking
vrecurnai
ive
iioxav
ergesth
oufo
mT
co
reesDaralerct
nw
th
ksa
vThefe70naecinB
anthe
bo
ma
on-
ingith-on-eal-ol-
ndher-
dro-lt tos iscedre
bered
tomoniona-ta-g
ksonswo
pth-fre-ing,
iresis-alethe
m-so-
sy anted
o-illhat
flatticse
n-reae in
flections are clearly present throughout the sequence. Eduring the initial descent phase, the detection of bottomturns is sporadic. After long periods during which only direand surface-reflection paths are recorded, the bottom retoften fade in within seconds, with a 10-dB increase in sigenergy that is typically accompanied by energy variationthe direct signal arrival of less than 3 dB. These qualitatobservations suggest that the sperm-whale signals havrectional properties~see also Ref. 31!, also defined as‘‘directivity.’’ 46
While the 3D localization resolution presented heretoo coarse to estimate the whales’ instantaneous orientatand thus their potential directivities, enough information eists to argue that some of the recorded clicks could not hbeen generated by an omnidirectional source.
By using the sonar equation and crude bottom reverbtion models,46 the original source levels for energy arrivinalong the bottom and direct propagation paths can bemated. If the derived source levels are different betweentwo paths, then the signal cannot be omnidirectional. Varimodels of the ocean bottom can be invoked to accountthe transmission loss into the ocean bottom, ranging froperfect coherent reflector, to a lossy incoherent scatterer.latter model best fits empirical measurements of datalected over the past 40 years from both the sonar46 andradar36,59 communities.
The following data analysis is based on 31 clickscorded during the dive profile shown in Fig. 3, during timbetween 127–130, 375–380, 552–590, and 730–737 s.ing these times the bottom return intensities increased medly over an interval of a few seconds. If the omnidirectionhypothesis is correct, the estimated bottom-path sourceels should be equal to or lower than the direct path soulevel estimate, if one uses equal-time data segments frombeginningof both the direct and bottom path arrivals. Aaccurate analysis thus requires direct and bottom returnssteep rise times, as shown in Figs. 11~a! and~b! for a signalrecorded at 128 s from a whale roughly 800 m aboveocean floor. Energy was measured during the firstt56 ms ofboth the direct and bottom-reflected arrivals of the 31 clic
The mean differences between these source levelsplotted as a function of frequency and bottom [email protected]~c!#. The solid and dashed curves show the source-ledifferences assuming no energy loss into the bottom.dash-dot and dotted curves incorporate a reflection cocient assuming a sandy-silty bottom half-space, with a dsity equal to that of seawater and a bottom speed of 1m/s.60 The results support the concept of an omnidirectiosource only in the extreme limit of a perfect coherent refltor, which is highly unlikely to represent the ocean bottomthe Gulf. Generally, in the 5–20-kHz region, a 10–30-ddifference in source level must exist between the directbottom paths, with the bottom-reflected path containinglarger source level. The true directivity probably lies betwethese extremes. The precise shape of Fig. 11~c! is not infor-mative, because the reflection coefficient from the oceantom is definitely frequency dependent.
Regardless of the exact bottom composition, the bottopath arrival most likely had a greater initial source level th
J. Acoust. Soc. Am., Vol. 112, No. 1, July 2002
en-
tnsl
nedi-
sns,-e
a-
ti-esrahel-
-
ur-k-lv-ehe
ith
e
.re
ele
fi-n-0l-
den
t-
-n
the direct-path arrival. This analysis thus supports the cclusion of sperm whale directivity by Whitney29 and Mohlet al.31
VI. CONCLUSION
Three-dimensional localization of sperm whales usmultiple reflections from the ocean surface and bottom, wout any knowledge of the array position, has been demstrated for three animals in the Gulf of Mexico. While thalgorithm presented here works well, its long-term practicity is restricted for two reasons. First, the data must be clected in a relatively shallow region with flat bathymetry, athe surface conditions must be calm enough to ensure coence between surface reflections recorded on two hyphones. Second, the procedures listed here are difficuautomate, because the classification of the various returna complex process that currently requires the experienjudgment of a human, particularly when multiple animals acalling. Consequently, the localization procedure is slow.
Improvements on the methods used here canachieved by deploying a second towed array a few hundmeters behind the first array, to remove the need for botreflections for localization. In addition, depth and orientatiinformation from a tagged animal can be used in conjunctwith a towed array to provide much more detailed informtion on the three-dimensional trajectory and relative oriention of the animal.16,45 Both approaches are currently beinpursued.
While the particular algorithm described in Sec. II woronly under specialized ocean conditions, the conclusireached from their use may have broader applications. Taspects of the sperm-whale click, the interclick interval~ICI!and the frequency spectrum, appear to contain dedependent features. The interpretation of the observedquency shifts as depth-dependent resonances is intrigubut validation of the assumptions used in the model requfurther anatomical knowledge of the locations and size dtributions of small-scale air passages in the sperm-whhead. This issue is important because recent debate onphysical effects of anthropogenic sounds on marine mamals has assigned particular prominence to potential renant effects inside the animal.61 The present work suggestthat internal resonances may be at least weakly excited banimal’s own vocalizations, and might thus be investigaby passive acoustic methods.
Additional acoustic data collection from different gegraphical locations, using different array deployments, wbe required to solidify the conclusions presented here. Wseems certain, though, is that the relatively shallow,bathymetry of the Gulf of Mexico is an excellent acouslaboratory for gleaning insight into the acoustic lives of themammals.
ACKNOWLEDGMENTS
The authors wish to thank the crew of NOAA ship GOR-
DON GUNTER, whose expertise is exceeded only by their ethusiasm for trying something new. We thank Cadet AndStieger, Peter Tyack, and Jonathan Gordon for assistanc
319Thode et al.: Sperm whale tracking
cketha
r o
usanfoug-thor
m
s
sti
J.
r-
,,
o
nt
le
c
an
al
ins,
En
givi
erm
atdin
a,
r,’’
h,’’
nd
s of
oder,’’
es
ngog-
s,’’No.
ruc-ci-
c.
on’’ J.
al,
e
.v-
the.
theura,–74
o,lesan
st-
oo,
orSoc.
’’ in
ure-
monitoring and tracking groups overnight. Peter TyaRebecca Thomas, and Patrick Miller also generously allowaccess to their transcription and recording equipment atWoods Hole Oceanographic Institution. Walter Zimmerthe SACLANT center generously shared a draft of a papethe recent successful SACLANT SIRENA cruise. JonathanGordon, Bill Watkins, Ted Cranford, and two anonymoreviewers provided helpful comments on the manuscript,Ted Cranford provided permission to use Fig. 9. Fundingthe sperm-whale research pilot study was provided throan Interagency Agreement~15958! between the U.S. Department of the Interior Minerals Management Service andNational Marine Fisheries Service, with additional suppprovided by the Office of Naval Research~ONR!. ONR pro-vided support for the first and second@ONR Contract No.N00014-00-F-0395# authors of this paper.
1L. V. Worthington and W. E. Schevill, ‘‘Underwater sounds heard frosperm whales,’’ Nature~London! 180, 291–293~1957!.
2J. H. Backus and W. E. Schevill, ‘‘Physeter Clicks,’’ inWhales, Dolphins,and Porpoises, edited by K. S. Norris~University Press, Berkeley, 1966!,pp. 510–527.
3W. A. Watkins, ‘‘Acoustic behaviors of sperm whales,’’ Oceanus20,50–58~1977!.
4W. A. Watkins, ‘‘Acoustic and the Behavior of Sperm Whales,’’ inAnimalSonar Systems, edited by R.-G. Busnel and J. F. Fish~Plenum, New York,1980!, pp. 283–290.
5J. Gordon, ‘‘The acoustic world of sperm whales,’’ Eur. Res. Cetacean9,29–33~1995!.
6J. C. Goold and S. E. Jones, ‘‘Time and frequency domain characteriof sperm whale clicks,’’ J. Acoust. Soc. Am.98, 1279–1291~1995!.
7H. Whitehead and L. Weilgart, ‘‘Click rates from sperm whales,’’Acoust. Soc. Am.87, 1799–1806~1990!.
8K. S. Norris and G. W. Harvey, ‘‘A Theory for the Function of the Spemaceti Organ of the Sperm Whale~Physeter CatodonL.!,’’ in AnimalOrientation and Navigation, edited by S. R. Galler, K. Schmidt-KoeingG. J. Jacobs, and R. E. Belleville~NASA Scientific and Technical OfficeWashington, D.C., 1972!.
9J. C. D. Gordon, ‘‘Evaluation of a method for determining the lengthsperm whales~Physeter catodon! from their vocalizations,’’ J. Zool.224,301–314~1991!.
10J. C. Goold, ‘‘Signal processing techniques for acoustic measuremesperm whale body lengths,’’ J. Acoust. Soc. Am.100, 3431–3441~1996!.
11L. Weilgart and H. Whitehead, ‘‘Coda communication by sperm whaoff the Galapagos Islands,’’ Can. J. Zool.71, 744–752~1993!.
12W. A. Watkins and W. E. Schevill, ‘‘Sperm whale codas,’’ J. Acoust. SoAm. 62, 1485–1490~1977!.
13T. W. Cranford, ‘‘The sperm whale’s nose: Sexual selection on a grscale?,’’ Marine Mammal Sci.15, 1133–1157~1999!.
14W. A. Watkins and M. A. Daher, ‘‘Variable Spectra and NondirectionCharacter of Clicks From Near-Surface Sperm Whales~Physeter Cat-odon!,’’ in Advances in the Study of Echolocation of Bats and Dolph,edited by J. Thomas, C. Moss, and M. Vater~Chicago University PressChicago, 2002!.
15P. L. Tyack, ‘‘Studying How Cetaceans Use Sound to Explore Theirvironment,’’ in Perspectives in Ethology, edited by D. H. Owings, M. D.Beehcer, and N. S. Thompson~Plenum, New York, 1997!, Vol. 12, pp.251–297.
16W. Zimmer, M. P. Johnson, A. D’Amico, and P. L. Tyack, ‘‘Combinindata from a multisensor tag and passive sonar to determine the dbehavior of a sperm whale~Physeter macrocephalus!,’’ J. Ocean Eng.~tobe published!.
17N. Jaquet, S. Dawson, and L. Douglas, ‘‘Vocal behavior of male spwhales: Why do they click?,’’ J. Acoust. Soc. Am.109, 2254–2259~2001!.
18L. Douglas, ‘‘Click counting: An acoustic censusing method for estiming sperm whale abundance,’’ M.Sc. thesis, University of Otago, DuneNew Zealand, 2000.
19J. C. Gordon, ‘‘The behavior and ecology of sperm whales off Sri LankPh.D. dissertation, University of Cambridge, 1987.
320 J. Acoust. Soc. Am., Vol. 112, No. 1, July 2002
,de
tn
drh
et
cs
f
of
s
.
d
-
ng
-,
’’
20Whitlow W. L. Au, The Sonar of Dolphins~Springer Verlag, New York,1995!.
21M. Minnaert, ‘‘On musical air-bubbles and the sounds of running watePhilos. Mag.16, 235–248~1933!.
22N. H. Fletcher,Acoustic Systems in Biology~Oxford University Press,New York, 1992!.
23R. H. Love, ‘‘Resonant acoustic scattering by swimbladder-bearing fisJ. Acoust. Soc. Am.64, 571–579~1978!.
24L. B. Andreeva, ‘‘Scattering of sound by air bladders of fish in deep souscattering ocean layers,’’ Sov. Phys. Acoust.10, 17–20~1964!.
25D. H. Cato, ‘‘Simple methods of estimating source levels and locationmarine animal sounds,’’ J. Acoust. Soc. Am.104, 1–12~1998!.
26R. Aubauer, M. O. Lammers, and W. W. L. Au, ‘‘One-hydrophone methof estimating distance and depth of phonating dolphins in shallow watJ. Acoust. Soc. Am.107, 2744–2749~2000!.
27W. A. Watkins and W. E. Schevill, ‘‘Sound source location by arrival timon a non-rigid three-dimensional hydrophone array,’’ Deep-Sea Res.19,691–706~1972!.
28J. L. Spiesberger and K. M. Fristrup, ‘‘Passive localization of callianimals and sensing of their acoustic environment using acoustic tomraphy,’’ Am. Nat.135, 107–153~1990!.
29W. Whitney, ‘‘Observations of Sperm Whale Sounds from Great DepthMarine Physical Laboratory, Scripps Institute Oceanography ReportMPL-U-11/68, 1968.
30D. E. McGehee, ‘‘1997 Sperm Whale Abundance and Population Stture Cruise Leg II Sonobuoy Project, Final Report,’’ Tracor Applied Sences Report No. T-97-56-0002-U, 1997.
31B. Mohl, M. Wahlberg, P. Madsen, L. Miller, and A. Surlykke, ‘‘Spermwhale clicks: Directionality and source level revisited,’’ J. Acoust. SoAm. 107, 638–648~2000!.
32M. Wahlberg, B. Mohl, and P. T. Madsen, ‘‘Estimating source positiaccuracy of a large-aperture hydrophone array for bioacoustics,Acoust. Soc. Am.109, 397–406~2001!.
33William Watkins and Mary Ann Daher,Features of Sperm Whale ClickTransmission~Proc. Biological Sonar Conference, Carvoeiro, Portug1998!.
34D. K. Mellinger, ISHMAEL 1.0 User’s Guide, NOAA/PMEL, 2002.35C. W. Clark, ‘‘A real-time direction-finding device for determining th
bearing to underwater sounds of Southern Right Whales,Eubalaena aus-tralias,’’ J. Acoust. Soc. Am.68, 508–511~1980!.
36M. I. Skolnik, Introduction to Radar Systems~McGraw-Hill, New York,1962!.
37W. A. Watkins, M. A. Daher, N. A. DiMarzio, A. Samuels, D. Wartzok, KM. Fristrup, P. W. Howey, and R. R. Maiefski, ‘‘Sperm whale dive behaior from radio tag telemetry,’’ Marine Mammal Sci.18, 55–68~2002!.
38V. Papastavrou, S. C. Smith, and H. Whitehead, ‘‘Diving behavior ofsperm whalePhyster macrocephalus, off the Galapagos Islands,’’ Can. JZool. 67, 839–846~1989!.
39G. Frisk,Ocean and Seabed Acoustics~Prentice-Hall, Englewood Cliffs,NJ, 1994!.
40J. C. Gordon and R. Leaper, ‘‘Effects of whale watching vessels onsurface and under-water acoustic behavior of sperm whales off KaikoNew Zealand,’’ NZ Dep. Conserv. Science & Research Series 52, 64~1992!.
41V. Teloni, W. Zimmer, C. Fossati, M. Manghi, G. Pavan, and M. Prian‘‘Variability of temporal and spectral click characteristics of sperm wha~Physeter macrocephalus!,’’ 14th Annual Conference European CetaceSociety, Cork, Ireland, 4-2-2000.
42E. K. V. Kalko, ‘‘Insect pursuit, prey capture and echolocation in pipirelle bats~Microchiroptera!,’’ Anim. Behav. 50, 861–880~1995!.
43J. W. Bradbury and S. L. Vehrencamp,Principles of Animal Communica-tion ~Sinauer, Sunderland, MA, 1998!.
44J. C. Gordon and D. Gillespie,Playback of low power ATOC-like sound tsperm whales~World Marine Mammal Science Conference, Monac1998!.
45M. Johnson, P. Tyack, and D. Nowacek, ‘‘A digital recording tag fmeasuring the response of marine mammals to sound,’’ J. Acoust.Am. 108, 2582–2583~2000!.
46R. J. Urick, Principles of Underwater Sound, 3rd ed. ~Peninsula, LosAltos, CA, 1983!.
47T. W. Cranford, ‘‘In Search of Impulse Sound Sources in Odontocetes,Hearing in Whales and Dolphins, edited by W. W. L. Au, A. N. Popper,and R. R. Fay~Springer, New York, 2000!, pp. 109–156.
48J. C. Goold, J. D. Bennell, and S. E. Jones, ‘‘Sound velocity meas
Thode et al.: Sperm whale tracking
a
ise
ray
c-D
yun
the
oc.
by
s in
foroust.
ineof
ments in spermaceti oil under the combined influences of temperaturepressure,’’ Deep-Sea Res., Part I43, 961–969~1996!.
49K. S. Norris and G. W. Harvey, ‘‘Sound transmission in the porpohead,’’ J. Acoust. Soc. Am.56, 659–664~1974!.
50K. S. Norris, ‘‘Cetacean Biosonar: Part 1—Anatomical and BehavioStudies,’’ inBiochemical and Biophysical Perspectives in Marine Biolog,edited by D. C. Malins and J. R. Sargent~Academic, New York, 1975!, pp.215–234.
51S. H. Ridgway, D. A. Carder, R. F. Green, and S. L. L. Gaunt, ‘‘Eletromyographic and Pressure Events in the Nasolaryngeal System ofphins During Sound Production,’’ inAnimal Sonar Systems, edited byR.-G. Busnel and J. F. Fish~Plenum, New York, 1980!, pp. 239–250.
52T. W. Cranford, M. Amundin, and K. S. Norris, ‘‘Functional morphologand homology in the odontocete nasal complex: Implications for sogeneration,’’ J. Morphol.228, 223–285~1996!.
53S. H. Ridgway and B. L. Scronce, ‘‘Respiration and deep diving inbottlenose porpoise,’’ Science166, 1651–1653~1969!.
J. Acoust. Soc. Am., Vol. 112, No. 1, July 2002
nd
l
ol-
d
54M. G. P. and H. Beauregard, ‘‘Sur ‘l’organe des spermaceti’,’’ C. R. SBiol. 11, 343–344~1885!.
55G. G. Harris, ‘‘Considerations on the Physics of Sound ProductionFishes,’’ in Marine Bio-acoustics, edited by W. N. Tavolga~Macmilan,New York, 1964!, pp. 233–252.
56Earl G. Williams,Fourier Acoustics~Academic, London, 1999!.57M. Strasberg, ‘‘The pulsation frequency of nonspherical gas bubble
liquids,’’ J. Acoust. Soc. Am.25, 536–537~1953!.58C. Feuillade and R. W. Nero, ‘‘A viscous-elastic swimbladder model
describing enhanced-frequency resonance scattering from fish,’’ J. AcSoc. Am.103, 3245–3255~1998!.
59N. Levanon,Radar Principles~Wiley, New York, 1988!.60F. B. Jensen, W. A. Kuperman, M. B. Porter, and H. Schmidt,Computa-
tional Ocean Acoustics~American Institute of Physics, New York, 1994!.61W. T. Hogarth and H. T. Johnson, ‘‘Joint Interim Report, Bahamas Mar
Mammal Stranding Event of 15–16 March 2000,’’ U.S. DepartmentCommerce, 2001.
321Thode et al.: Sperm whale tracking


