Embed Size (px)
Citation preview
Design Tool Development - eCAADe 29 225
Parametric urban design
An interactive sketching system for shaping neighborhoods
José N. Beirão1, Pirouz Nourian2, Bardia Mashhoodi3
1TU Delft / TU Lisbon, Netherlands / Portugal, 2,3TU Delft, Netherlands.1(http://www.urbangrammars.com)[email protected], [email protected], [email protected]
Abstract. In this paper we show the structure of an urban design parametric system. The system is dynamic and builds an interactive relation with the designer updating the layout and related data at each input change. The responsiveness of the system allows the designer to gain awareness on the qualitative consequences of each design move by comparing a design state with a set of urban indicators and density measures which are automatically calculated along with the geometrical updates.Keywords. Parametric urban design, city modelling, urban planning.
INTRODUCTIONComplexity and uncertainty of urban environment raise doubts about static and solid decisions in field of urban design. Cities, as all other open sys-tems, are complex and self-organizing. The context of a project, as a starting point of urban design, is changing constantly in non-linear way (Portugali, 2000). Moreover, various stakeholders are involved in design and realization of an urban plan. Uncer-tainty of economic, social, and political atmosphere results in vibrant policies and decisions from stake-holders. Therefore basic inputs of a design process, for instance total size of investment or functions, may change from time to time. However, the inter-relations between elements of urban form can be fixed and predefined by designers. Current urban design practices ignore urban ‘processes’ and ‘time’. Urban design almost always presents a fixed blue-print based on a snapshot of a situation. This ap-proach is not capable of fulfilling the necessities of urban regeneration process. Therefore, objective of urban design need to move from static design of
a specific layout toward complex and dynamic de-sign of generic solutions.
It can be argued that experienced designers can do proper judgments on the qualities of a de-sign just by visually assessing partial or incomplete stages of a design but the quality of that judgment can be improved by giving extra information includ-ing density indicators and performance measures needed to complement the plan. Typically in urban design, density measures play an important role in the assessment of the plan layout. A correct visual interface should provide such information as part of the visual output. To approach that, we developed an urban design system based on the concept of arranging design moves in the form of parametric design patterns (Woodbury, 2010), programmed in a parametric design software which the designer can use to build up a dynamic design. The design patterns generate urban types which can be ap-plied and manipulated through the available param-eters. The suggested types refer to commonly used
226 eCAADe 29 - Design Tool Development
composition elements in the field of urban design such as main streets, grid types, main buildings or public spaces. The use of types for designing is ar-gued by several authors as an approach to enhance the quality of designs as they carry the intrinsic qual-ities embedded in the recognized evidence of com-monly used types (Habraken 1988), (Kelbaugh 1996).
Most past and present discussions on the sustainability of urban fabrics concern the pros and cons of compact cities versus sprawl. There is among many researchers and professionals a consensus that compact settlements are more sustainable than sprawl, and that dense cities will somehow halt an unsustainable increase of consumption of transport, energy and resources (Newman and Kenworthy, 2006). Moreover, great-er density is considered to be positively associated with the vitality of urban areas. However, denser urban environments do not automatically mean more sustainable and vital urban spaces. It needs to be seen in combination with other factors as accessibility, layout, land use pattern, etc. On the other hand, density measures provide an appro-priate platform for parametric urban design due to their relation with the shape of built environment. In this research we explore holistic generic solu-tions based on density measures, neighborhood layout and mixed-use pattern. Spacematrix meth-od (Berghauser-Pont and Haupt, 2010) provides an adequate platform for parametric abstraction of the urban form in terms of density measures. Results show that basic density measures are ad-equate to describe the configuration of urban form in various scales in different cities. This meth-od also suggests a set of performance measures such as daylight exposure, accessibility measured by means of network density and parking per-formance index. However, design exploration is needed to support decision. Being able to sketch a design and continuously getting feedback on the urban indicators is therefore a desired feature in the urban design process. In this paper we show the basic concepts for such a design tool.
PREVIOUS WORK – THE PROBLEM OF DE-SIGNING NEIGHBORHOODS One of the most successful algorithmic concepts was the concept of patterns (Alexander et al, 1977) which has been used in many knowledge areas namely in the field of urban design. The main con-cept proposes that a recurrent occurrence in the (urban) environment may be solved by applying a generic solution whenever such occurrence is detected in a particular context. In other words, it involves a problem recognition and a generic solution for which specific parameters should be provided to obtain an adequate solution. A set of patterns defines a pattern language. Previous work showed that urban design generic patterns can be encoded using generative rules in the form of discursive grammars (Duarte, 2001) to provide formal solutions to particular design moves that urban designers recurrently use in their design practice (Beirão et al, 2011). Discursive grammars provide a rigorous formalism to describe an occur-rence in the design context, the specifications for designing a particular design move in the form of description grammars (Stiny, 1981), and the de-sign rules in the form of shape grammars (Stiny and Gips, 1972) to instantiate the design move. Beirão et al (2010) present an implementation in a CAD software (AutoCad) which provides a few sets of toolbars to generate the design moves. They show a set of tools for designing main streets, grid types, public spaces, building types, a set of inputs for program specifications and other tools to man-age building height and mixed uses. The urban design model presented in this paper was inspired on this structure but defined on a parametric de-sign platform.
Defining a neighborhood and what a neighbor-hood should contain is a common and controversial research topic. In the development of our tool we implemented the features that are mostly consid-ered common ground for planning neighborhoods. However, we found some consistencies in special-ized literature used to structure the design tool:
Design Tool Development - eCAADe 29 227
• Many authors agree in the interval 5000-10000 people per neighborhood / community as parts of districts with 20000 to 100000 people.
• This size has enough critical mass to have at least a school and a community building, a main street with shops, a central square and a local square.
• The neighborhood has mixed uses, both verti-cally and horizontally. The degree of mixture raises as it closes the neighborhood centre.
• Block size varies between 1 acre and 1 hectare. However, there are many successful counter exam-ples with bigger blocks (e.g., Berlin, Amsterdam).
• Squares present a wider variation, but still the same range between 1 acre and 1 hectare is acceptable.
(Alexander et al, 1977); (Barton et al, 2003); (Marshall, 2005); (Moughtin, 2003); (Moughtin and Shirley, 2005); (Jacobs, 1961).
Marshall (2005) shows a large survey on urban grid types identified by several authors on their writ-ing on urban morphology (Appendix 4). At least the rectangular, the radial and the irregular (organic) grid patterns seem to be present almost everywhere in urban design literature. We used the two first as our main design drivers. The organic grid pattern should be regarded as an emergent pattern and therefore we did not use it as a designing pattern. However, Marshall refers some characteristics of the common structure of street networks which are usu-ally perceived as pleasant urban environments. Such street structures have short and long routes, a rela-tively great amount of ‘T’ junctions, some crossroads and some few cul-de-sacs. To integrate such ideas we added to our set of street grid types a third street pattern which we called the recursive street genera-tor and it is described ahead.
HOW URBAN DESIGNERS DEAL WITH UR-BAN DESIGN DECISION?According to Schön (1983) design evolves by a series of incremental reflective moves with a see-move-see structure where the double ap-pearance of ‘see’ underlines the importance of
reflection on both an existing state and the con-secutive transformed state of a design. Lawson defines design as a negotiation between prob-lem and solution through the processes of analy-sis, synthesis and evaluation (2006). This struc-ture seems also consistent with the one found in the City Induction research project (Duarte et al, forthcoming) where an urban design system is proposed based on three integrated models aimed at formulating, generating and evaluating urban designs. In urban design the structure of design problems is said to contain some deter-mined components (Dorst, 2004) with objective definitions that can be computed and undeter-mined which are intrinsic to design problems. Density indicators (Berghauser-Pont and Haupt, 2010) fall in such category and can be incorporat-ed in a design tool providing continuous updates on such measures. Our main goal in this research was to keep the reflective features of the design practice in our design tool providing by compu-tational means continuous calculations updat-ing information on determined components of urban design problems at each designer’s move. Such a system should enable a designer to have precise information on indicators and properties of the designs being produced and allow him/her to manipulate common urban design inputs to control the design outputs.
THE DESIGN PROCESS ON A PARAMETRIC PLATFORM – THE WORKFLOWAccording to the previous considerations, an urban design system should be able to: • be applicable in every design context for any
district size and be able to apply different kinds of design programs;
• be interactive and responsive providing good visualization output both in terms of design lay-out and associated analytical data (indicators, attributes, indexes, etc);
• be able to implement and design the main fea-tures that compose a neighborhood.
228 eCAADe 29 - Design Tool Development
Considering these aspects we implemented a parametric urban design system using a NURBS-CAD environment using a parametric programming interface. The CAD environment used in this work was Rhinoceros® and the programming interface was Grasshopper®. The system aims at designing ur-ban plans at the neighborhood level or district level to use Berghauser-Pont and Haupt’s terminology (2010, page 103).
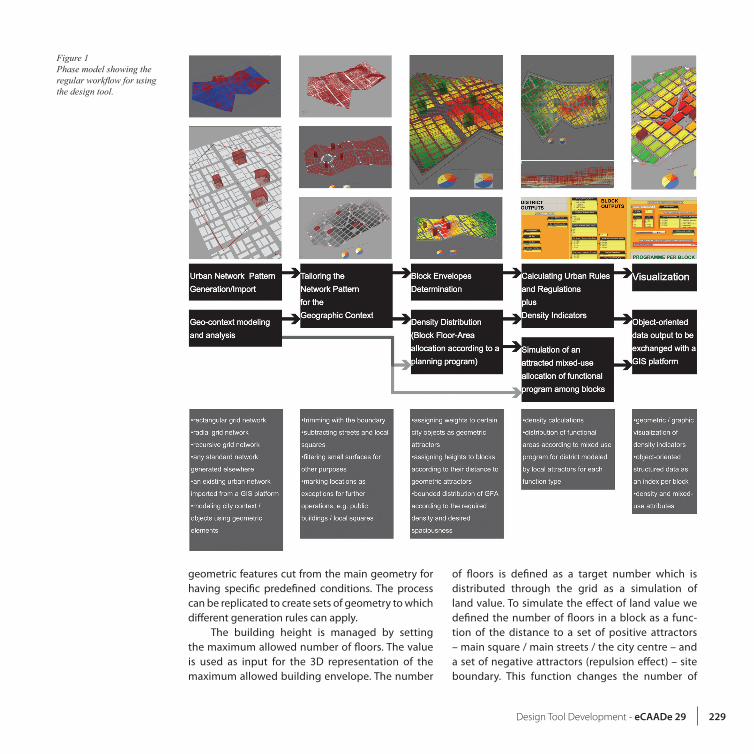
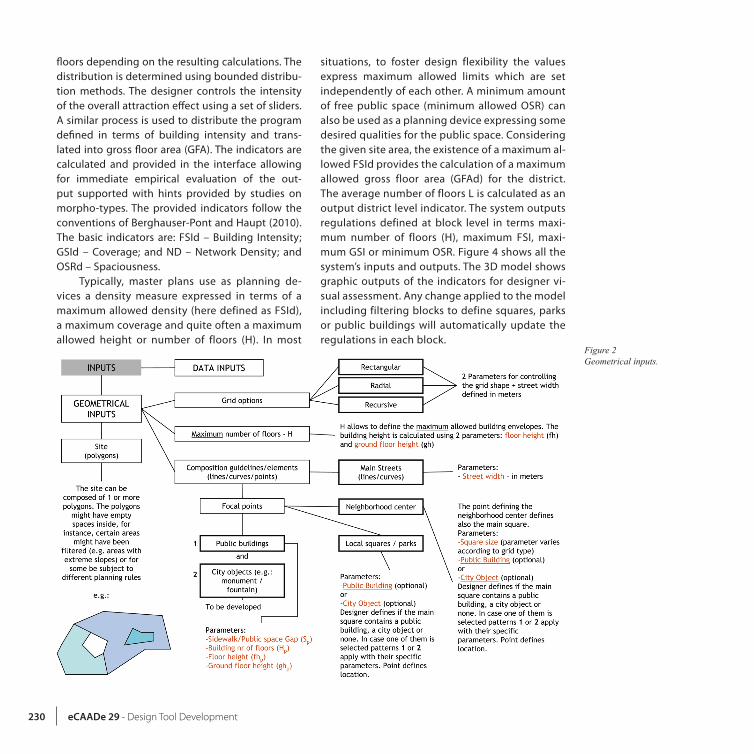
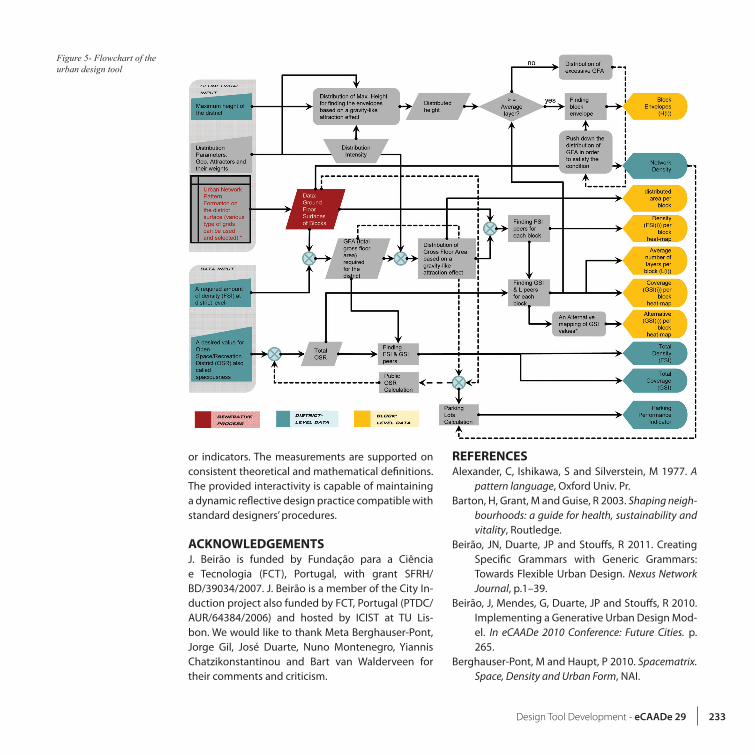
A particular kind of urban design workflow was considered starting from a specific set of inputs for which a specific set of outputs is produced. Figure 1 shows the phase model describing the generic workflow. There are two types of inputs – geometri-cal inputs and data inputs. In Figure 2 we can see the set of geometrical inputs which is divided in 4 types: site (defined by polygons); composition elements which are subdivided into main streets (defined by lines and curves) and focal points representing the location of the neighborhood centre, local squares, public buildings and city objects in general; a ver-tical parameter defines the maximum number of floors; and a set of grid types (rectangular, radial and recursive). Each of these inputs has a set of associ-ated parameter inputs. For instance, a main street has as attributed street width.
The elements are located anywhere inside the site boundary by the designer and they may be re-located at anytime during the design process simply by dragging them elsewhere or changing them by moving their grip points. A selected grid type (rect-angular, radial or recursive) is tailored for the site boundary and the algorithm combines the grids with the other urban elements subtracting them from the main grid geometry. Some inputs refer to options which are defined as switches in the design interface. They allow the designer to choose, for instance, which grid type to apply. The other input parameters allow changing the output appearance of each type.
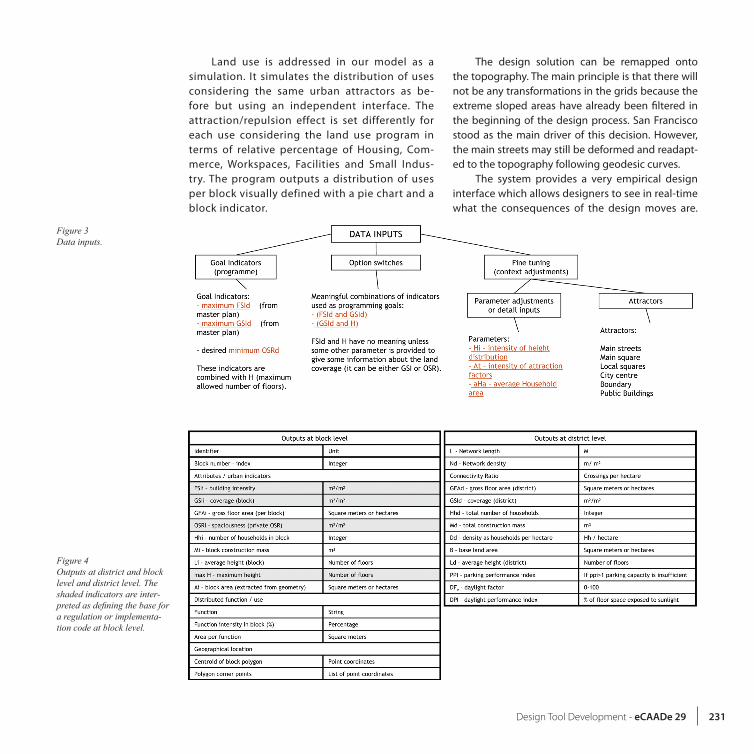
The data inputs are shown in Figure 3. There are 3 types of data inputs: goal indicators which define the density goals or constraints of the urban
program, option switches and context adjustments which are input parameters regarded as design options that can be manipulated by the designer to fine tune the design. The designer explores the options following the workflow sketched in Fig-ure 1. The designer considers the topography and the contextual conditions of the site, extracts the areas that are considered too steep and eventually identifies zones for which different planning rules or strategies should be applied. This can be a tra-ditional analytical process or enhanced using GIS tools providing the information to set the primary elements of the design. As a final result we obtain a site area subdivided in several zones for which different planning strategies may be applied (see also Figure 2). The site geometry is inserted in the designing environment. The designer defines the position of the main composition elements of the design, namely a focal point and the main streets within the site boundaries. This is drawn directly in the NURBS-CAD drawing environment. Accuracy re-garding the composition of elements is not an issue as they may be moved or changed at any time dur-ing the design process. Then the designer chooses between three available grid patterns (rectangular, radial and recursive) and explores the available pa-rameters. The selected grid is dynamically updated in the drawing interface. The orientation of the grid is a common parameter that allows the designer to change and fine tune the grid orientation. The re-cursive street generator designs street grids based on a rectangle dissection rule. The rule applies if the area of the rectangle (block) is bigger than a user predefined area and the block side is constrained to a minimum value corresponding to a user defined number of pixels. The pixel size is also predefined by the designer.
The designer filters several areas in the main model to which exceptional rules or design goals can be assigned. For instance, certain blocks can be set to be small public squares and others to be filled by public buildings. The main process is defined as a filter, a design pattern that isolates particular sets of
Design Tool Development - eCAADe 29 229
geometric features cut from the main geometry for having specific predefined conditions. The process can be replicated to create sets of geometry to which different generation rules can apply.
The building height is managed by setting the maximum allowed number of floors. The value is used as input for the 3D representation of the maximum allowed building envelope. The number
of floors is defined as a target number which is distributed through the grid as a simulation of land value. To simulate the effect of land value we defined the number of floors in a block as a func-tion of the distance to a set of positive attractors – main square / main streets / the city centre – and a set of negative attractors (repulsion effect) – site boundary. This function changes the number of
Figure 1Phase model showing the regular workflow for using the design tool.
230 eCAADe 29 - Design Tool Development
floors depending on the resulting calculations. The distribution is determined using bounded distribu-tion methods. The designer controls the intensity of the overall attraction effect using a set of sliders. A similar process is used to distribute the program defined in terms of building intensity and trans-lated into gross floor area (GFA). The indicators are calculated and provided in the interface allowing for immediate empirical evaluation of the out-put supported with hints provided by studies on morpho-types. The provided indicators follow the conventions of Berghauser-Pont and Haupt (2010). The basic indicators are: FSId – Building Intensity; GSId – Coverage; and ND – Network Density; and OSRd – Spaciousness.
Typically, master plans use as planning de-vices a density measure expressed in terms of a maximum allowed density (here defined as FSId), a maximum coverage and quite often a maximum allowed height or number of floors (H). In most
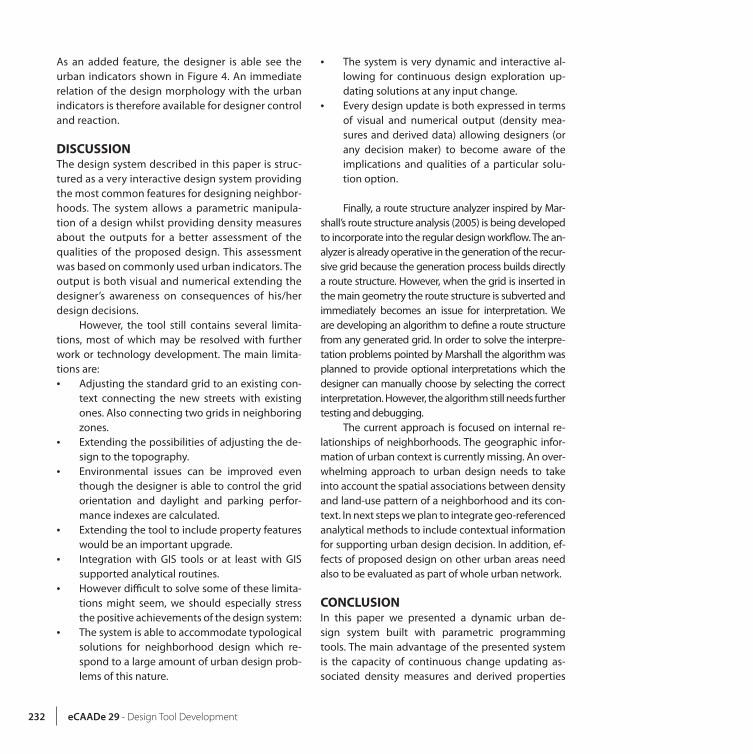
situations, to foster design flexibility the values express maximum allowed limits which are set independently of each other. A minimum amount of free public space (minimum allowed OSR) can also be used as a planning device expressing some desired qualities for the public space. Considering the given site area, the existence of a maximum al-lowed FSId provides the calculation of a maximum allowed gross floor area (GFAd) for the district. The average number of floors L is calculated as an output district level indicator. The system outputs regulations defined at block level in terms maxi-mum number of floors (H), maximum FSI, maxi-mum GSI or minimum OSR. Figure 4 shows all the system’s inputs and outputs. The 3D model shows graphic outputs of the indicators for designer vi-sual assessment. Any change applied to the model including filtering blocks to define squares, parks or public buildings will automatically update the regulations in each block.
Figure 2 Geometrical inputs.
Design Tool Development - eCAADe 29 231
Land use is addressed in our model as a simulation. It simulates the distribution of uses considering the same urban attractors as be-fore but using an independent interface. The attraction/repulsion effect is set differently for each use considering the land use program in terms of relative percentage of Housing, Com-merce, Workspaces, Facilities and Small Indus-try. The program outputs a distribution of uses per block visually defined with a pie chart and a block indicator.
The design solution can be remapped onto the topography. The main principle is that there will not be any transformations in the grids because the extreme sloped areas have already been filtered in the beginning of the design process. San Francisco stood as the main driver of this decision. However, the main streets may still be deformed and readapt-ed to the topography following geodesic curves.
The system provides a very empirical design interface which allows designers to see in real-time what the consequences of the design moves are.
Figure 4 Outputs at district and block level and district level. The shaded indicators are inter-preted as defining the base for a regulation or implementa-tion code at block level.
Figure 3 Data inputs.
232 eCAADe 29 - Design Tool Development
As an added feature, the designer is able see the urban indicators shown in Figure 4. An immediate relation of the design morphology with the urban indicators is therefore available for designer control and reaction.
DISCUSSIONThe design system described in this paper is struc-tured as a very interactive design system providing the most common features for designing neighbor-hoods. The system allows a parametric manipula-tion of a design whilst providing density measures about the outputs for a better assessment of the qualities of the proposed design. This assessment was based on commonly used urban indicators. The output is both visual and numerical extending the designer’s awareness on consequences of his/her design decisions.
However, the tool still contains several limita-tions, most of which may be resolved with further work or technology development. The main limita-tions are: • Adjusting the standard grid to an existing con-
text connecting the new streets with existing ones. Also connecting two grids in neighboring zones.
• Extending the possibilities of adjusting the de-sign to the topography.
• Environmental issues can be improved even though the designer is able to control the grid orientation and daylight and parking perfor-mance indexes are calculated.
• Extending the tool to include property features would be an important upgrade.
• Integration with GIS tools or at least with GIS supported analytical routines.
• However difficult to solve some of these limita-tions might seem, we should especially stress the positive achievements of the design system:
• The system is able to accommodate typological solutions for neighborhood design which re-spond to a large amount of urban design prob-lems of this nature.
• The system is very dynamic and interactive al-lowing for continuous design exploration up-dating solutions at any input change.
• Every design update is both expressed in terms of visual and numerical output (density mea-sures and derived data) allowing designers (or any decision maker) to become aware of the implications and qualities of a particular solu-tion option.
Finally, a route structure analyzer inspired by Mar-shall’s route structure analysis (2005) is being developed to incorporate into the regular design workflow. The an-alyzer is already operative in the generation of the recur-sive grid because the generation process builds directly a route structure. However, when the grid is inserted in the main geometry the route structure is subverted and immediately becomes an issue for interpretation. We are developing an algorithm to define a route structure from any generated grid. In order to solve the interpre-tation problems pointed by Marshall the algorithm was planned to provide optional interpretations which the designer can manually choose by selecting the correct interpretation. However, the algorithm still needs further testing and debugging.
The current approach is focused on internal re-lationships of neighborhoods. The geographic infor-mation of urban context is currently missing. An over-whelming approach to urban design needs to take into account the spatial associations between density and land-use pattern of a neighborhood and its con-text. In next steps we plan to integrate geo-referenced analytical methods to include contextual information for supporting urban design decision. In addition, ef-fects of proposed design on other urban areas need also to be evaluated as part of whole urban network.
CONCLUSIONIn this paper we presented a dynamic urban de-sign system built with parametric programming tools. The main advantage of the presented system is the capacity of continuous change updating as-sociated density measures and derived properties
Design Tool Development - eCAADe 29 233
or indicators. The measurements are supported on consistent theoretical and mathematical definitions. The provided interactivity is capable of maintaining a dynamic reflective design practice compatible with standard designers’ procedures.
ACKNOWLEDGEMENTSJ. Beirão is funded by Fundação para a Ciência e Tecnologia (FCT), Portugal, with grant SFRH/BD/39034/2007. J. Beirão is a member of the City In-duction project also funded by FCT, Portugal (PTDC/AUR/64384/2006) and hosted by ICIST at TU Lis-bon. We would like to thank Meta Berghauser-Pont, Jorge Gil, José Duarte, Nuno Montenegro, Yiannis Chatzikonstantinou and Bart van Walderveen for their comments and criticism.
REFERENCESAlexander, C, Ishikawa, S and Silverstein, M 1977. A
pattern language, Oxford Univ. Pr.Barton, H, Grant, M and Guise, R 2003. Shaping neigh-
bourhoods: a guide for health, sustainability and vitality, Routledge.
Beirão, JN, Duarte, JP and Stouffs, R 2011. Creating Specific Grammars with Generic Grammars: Towards Flexible Urban Design. Nexus Network Journal, p.1–39.
Beirão, J, Mendes, G, Duarte, JP and Stouffs, R 2010. Implementing a Generative Urban Design Mod-el. In eCAADe 2010 Conference: Future Cities. p. 265.
Berghauser-Pont, M and Haupt, P 2010. Spacematrix. Space, Density and Urban Form, NAI.
Figure 5- Flowchart of the urban design tool
234 eCAADe 29 - Design Tool Development
Dorst, K 2004. The Problem of Design Problems. Avail-able at: http://citeseerx.ist.psu.edu/viewdoc/summary?doi=10.1.1.105.6547 [Accessed 8/6/2011].
Duarte, JP 2001. Customizing mass housing: a discur-sive grammar for Siza’s Malagueira houses. PhD Dissertation. MIT.
Duarte, JP, Beirão, J, Gil, J and Montenegro, N forth-coming. City Induction: formulating, generat-ing, and evaluating urban plans. In Digital Urban Modelling and Simulation. CCIS Series Communi-cations in Computer and Information Science Se-ries. Springer-Verlag.
Habraken, NJ 1988. Type as a social agreement. In Proceedings of the Asian Congress of Architects, Seoul.
Jacobs, J 1961. The death and life of great American cities, Vintage.
Kelbaugh, D 1996. Typology - an architecture of lim-its. Architectural Theory Review, 1(2), p.33–52.
Lawson, B 2006. How designers think: the design pro-cess demystified, Architectural Pr.
Marshall, S 2005. Streets & patterns, Routledge.Moughtin, C 2003. Urban design: street and square,
Architectural Pr.Moughtin, C and Shirley, P 2005. Urban design: green
dimensions, Architectural Pr.Newman, P and Kenworthy, J 2006. Urban design to
reduce automobile dependence. Opolis, 2(1).Portugali, J 2000. Self-organization and the City,
Springer Verlag.Schön, DA 1983. The reflective practitioner, Basic
books New York.Stiny, G 1981. A note on the description of designs.
Environment and Planning B, 8(3), p.257–267.Stiny, G and Gips, J 1972. Shape grammars and the
generative specification of painting and sculp-ture. Information processing, 71, p.1460–1465.
Woodbury, R 2010. Elements of parametric design. Routledge.


