Embed Size (px)
Citation preview
arX
iva
stro
-ph
0502
073v
1 3
Feb
200
5
Astronomy amp Astrophysics manuscript no fgvir6 February 2 2008(DOI will be inserted by hand later)
Detection of 75+ pulsation frequencies in the δ Scuti star FG Vir
M Breger1 P Lenz1 V Antoci1 E Guggenberger1 R R Shobbrook2 G Handler1 B Ngwato3F Rodler1 E Rodriguez4 P Lopez de Coca4 A Rolland4 and V Costa4
1 Institut fur Astronomie der Universitat Wien Turkenschanzstr 17 Andash1180 Wien Austriae-mail michelbregerunivieacat
2 Research School of Astronomy and Astrophysics Australian National University Canberra ACT Australia3 Theoretical Astrophysics Programme University of the North-West Private Bag X2046 Mmabatho 2735 South
Africa4 Instituto de Astrofisica de Andalucia CSIC Apdo 3004 E-18080 Granada Spain
Received date accepted date
Abstract Extensive photometric multisite campaigns of the δ Scuti variable FG Vir are presented For the years2003 and 2004 926 hours of photometry at the millimag precision level were obtained The combinations withearlier campaigns lead to excellent frequency resolution and high signalnoise A multifrequency analysis yields79 frequencies This represents a new record for this type of star The modes discovered earlier were confirmedPulsation occurs over a wide frequency band from 57 to 443 cd with amplitudes of 02 mmag or larger Withinthis wide band the frequencies are not distributed at random but tend to cluster in groups A similar feature is seenin the power spectrum of the residuals after 79 frequencies are prewhitened This indicates that many additionalmodes are excited The interpretation is supported by a histogram of the photometric amplitudes which showsan increase of modes with small amplitudes The old question of the rsquomissing modesrsquo may be answered now thelarge number of detected frequencies as well as the large number of additional frequencies suggested by the powerspectrum of the residuals confirms the theoretical prediction of a large number of excited modesFG Vir shows a number of frequency combinations of the dominant mode at 127162 cd (m = 0) with othermodes of relatively high photometric amplitudes The amplitudes of the frequency sums are higher than those ofthe differences A second mode (202878 cd) also shows combinations This mode of azimuthal order m = -1 iscoupled with two other modes of m = +1
Key words stars variables δ Sct ndash Stars oscillations ndash Stars individual FG Vir ndash Techniques photometric
1 Introduction
The δ Scuti variables are stars of spectral type A andF in the main-sequence or immediate post-main-sequencestage of evolution They generally pulsate with a largenumber of simultaneously excited radial and nonradialmodes which makes them well-suited for asteroseismolog-ical studies The photometric amplitudes of the dominantmodes in the typical δ Scuti star are a few millimag It isnow possible for ground-based telescopes to detect a largenumber of simultaneously excited modes with submillimagamplitudes in stars other than the Sun (eg Breger et al2002 Frandsen et al 2001) Because photometric stud-ies measure the integrated light across the stellar surfacethey can detect low-degree modes only This is a simplifi-cation for the interpretation because of fewer possibilitiesin mode identification
A typical multisite photometric campaign allows thediscovery of about five to ten frequencies of pulsationfrom about 200 to 300 hours of high-precision photometry
(e g V351 Ori Ripepi et al 2003 V534 Tau Li et al2004) These excellent observational studies are then com-pared to theoretical pulsation models but the fit is hardlyunique (eg θ2 Tau Breger et al 2002b) The uniquenessproblem can be lessened by studies with even lower noisein the power spectrum This can be achieved by the veryaccurate measurements from space and by larger ground-based studies with more data which concentrate on a sin-gle selected star These more extensive ground-based stud-ies also lead to to higher frequency resolution The latteris important because δ Scuti stars can show a large num-ber of very close frequency pairs (or groups) which canonly be resolved through long-term studies lasting manymonths or years The question of frequency resolution isan important aspect in planning asteroseismological spacemissions (eg see Handler 2004 Garrido amp Poretti 2004)
The Delta Scuti Network (DSN) is a network of tele-scopes situated on different continents The collaborationreduces the effects of regular daytime observing gaps The
2 M Breger et al Detection of 75+ pulsation frequencies in the δ Scuti star FG Vir
network is engaged in a long-term program (1000+ hoursof observation 10+ years photometry and spectroscopy)to determine the structure and nature of the multiple fre-quencies of selected δ Scuti stars situated in different partsof the classical instability strip The star FG Vir is thepresent main long-term target of the network This 7500Kstar (Mantegazza Poretti amp Bossi 1994) is at the end ofits main-sequence evolution The projected rotational ve-locity is very small (213 plusmn 10 km sminus1 Mittermayer ampWeiss 2003 see also Mantegazza amp Poretti 2002)
A number of photometric studies of the variability ofFG Vir are available a lower-accuracy study by Dawsonfrom the years 1985 and 1986 (Dawson Breger amp Lopezde Coca 1995 data not used here) high-accuracy stud-ies from 1992 (Mantegazza Poretti amp Bossi 1994) aswell as previous campaigns by the Delta Scuti Networkin 1993 1995 and 2002 (Breger et al 1995 1998 2004)Furthermore for the year 1996 additional uvby photom-etry is available (Viskum et al 1998) 12 nights of datawere of high accuracy and could be included
Because of the large scope of the long-term project onthe pulsation of FG Vir the photometric spectroscopicand pulsation-model results cannot be presented in onepaper Here we present the extensive new photometricdata from 2003 and 2004 as well as multifrequency analy-ses to extract the multiple frequencies excited in FG VirThe analyses concentrate on the available three years ofextensive coverage (2002ndash2004) and also consider the pre-vious data (1992ndash1996)
Separate studies presently in progress will (i) presentmode identifications based mainly on high-dispersion line-profile analyses and the data presented in this paper (ii)examine the nature of close frequencies (iii) compute as-teroseismological models of stellar structure to fit the ob-served frequency spectrum
2 New photometric measurements
During 2003 and 2004 photometric measurements of thestar FG Vir were scheduled for sim 350 nights at four ob-servatories Of these 218 nights were of high photometricquality at the millimag level with no instrumental prob-lems These are listed in Table 1 together with the addi-tional details
1 The APT measurements were obtained with the T6075 m Vienna Automatic Photoelectric Telescope(APT) situated at Washington Camp in Arizona(Strassmeier et al 1997 Breger amp Hiesberger 1999)The telescope has been used before for several lengthycampaigns of the Delta Scuti Network which con-firmed the long-term stability and millimag precisionof the APT photometry
2 The OSN measurements were obtained with the 090 mtelescope located at 2900m above sea level in theSouth-East of Spain at the Observatorio de SierraNevada in Granada Spain The telescope is equippedwith a simultaneous four-channel photometer (uvby
Stromgren photoelectric photometer) The observersfor 2003 were E Rodriguez P Lopez de Coca ARolland and V Costa
3 The SAAO measurements were made with theModular Photometer attached to the 05 m and theUCT photometer attached to the 075 m telescopes ofthe South African Astronomical Observatory The ob-servers were V Antoci E Guggenberger G Handlerand B Ngwato
4 The 06-m reflector at Siding Spring ObservatoryAustralia was used with a PMT detector The ob-servers were P Lenz and R R Shobbrook
The measurements were made with Stromgren v andy filters Since telescopes and photometers at different ob-servatories have different zero-points the measurementsneed to be adjusted This was done by zeroing the averagemagnitude of FG Vir from each site and later readjustingthe zero-points by using the final multifrequency solutionThe shifts were in the submillimag range We also checkedfor potential differences in the effective wavelength at dif-ferent observatories by computing and comparing the am-plitudes of the dominant mode No problems were found
The measurements of FG Vir were alternated withthose of two comparison stars Details on the three-startechnique can be found in Breger (1993) We used thesame comparison stars as during the previous DSN cam-paigns of FG Vir viz C1 = HD 106952 (F8V) and C2 =HD 105912 (F5V) No variability of these comparison starswas found The two comparison stars also make it possibleto check the precision of the different observing sites Theresiduals from the assumed constancy were quite similarie for the (C1ndashC2) difference we find a standard devi-ation of plusmn 3 mmag for all observatories and passbandsexcept for plusmn 2 mmag (2004 SAAO75 v as well as y pass-bands) and plusmn 4 mmag (2004 APT75 v and 2003 OSN90 y
measurements The power spectrum of the C1ndashC2 differ-ences does not reveal any statistically significant peaks
The resulting light curves of FG Vir are shown in Figs1 and 2 where the observations are also compared withthe fit to be derived in the next section
3 Multiple frequency analysis
The pulsation frequency analyses were per-formed with a package of computer programswith single-frequency and multiple-frequencytechniques (PERIOD04 Lenz amp Breger 2005httpwwwastrounivieacatsimdsndsnPeriod04)which utilize Fourier as well as multiple-least-squares al-gorithms The latter technique fits up to several hundredsof simultaneous sinusoidal variations in the magnitudedomain and does not rely on sequential prewhiteningThe amplitudes and phases of all modesfrequenciesare determined by minimizing the residuals between themeasurements and the fit The frequencies can also beimproved at the same time
M Breger et al Detection of 75+ pulsation frequencies in the δ Scuti star FG Vir 3
Table 1 Journal of the PMT observations of FG Vir for 2003 and 2004
Start Length Obs Start Length Obs Start Length Obs Start Length ObsHJD hours Tel HJD hours Tel HJD hours Tel HJD hours Tel
245 000+ Year 2003 274829 46 SAAO50 278889 45 SSO60 310863 48 APT75265699 17 APT75 274864 65 APT75 279266 29 APT75 310962 69 APT75266781 57 APT75 274889 49 SSO60 279666 27 APT75 311026 20 SAAO50266891 36 APT75 274925 59 SAAO50 279867 23 APT75 311063 69 APT75267081 58 APT75 274964 65 APT75 280266 24 APT75 311163 68 APT75267164 07 OSN90 274989 67 SSO60 280366 23 APT75 311323 65 SAAO50267379 61 APT75 275026 55 SAAO50 280566 22 APT75 311464 53 APT75267461 34 OSN90 275070 50 APT75 280666 20 APT75 311563 65 APT75267562 31 OSN90 275093 58 SSO60 280988 28 SSO60 311763 59 APT75267663 30 OSN90 275136 29 OSN90 281266 16 APT75 311863 63 APT75267778 44 APT75 275137 23 SAAO50 281366 18 APT75 311963 61 APT75268681 07 APT75 275191 28 SSO60 281387 18 SSO60 312063 60 APT75269275 60 APT75 275290 34 SSO60 281465 08 APT75 312374 32 APT75269382 42 APT75 275324 60 SAAO50 281666 14 APT75 312563 58 APT75269996 19 APT75 275364 62 APT75 Year 2004 313064 51 APT75270377 18 APT75 275425 57 SAAO50 302283 53 APT75 313165 48 APT75270671 73 APT75 275464 60 APT75 302383 50 APT75 313266 46 APT75270772 15 APT75 275490 44 SSO60 303181 13 APT75 313664 48 APT75270971 74 APT75 275525 54 SAAO50 303281 58 APT75 313725 31 SAAO50271071 73 APT75 275566 55 APT75 303393 28 APT75 313764 47 APT75271171 61 APT75 275625 55 SAAO50 303485 49 APT75 313823 27 SAAO50271267 12 OSN90 275765 56 APT75 303582 51 APT75 313864 44 APT75271370 40 APT75 275864 39 APT75 304998 16 APT75 313924 31 SAAO50271444 31 OSN90 275895 46 SSO60 305100 10 APT75 313964 44 APT75271977 53 APT75 275965 56 APT75 305180 59 APT75 314022 32 SAAO50272002 24 SSO60 275988 48 SSO60 305276 59 APT75 314164 19 APT75272081 42 APT75 276037 36 OSN90 305390 08 APT75 314222 31 SAAO50272098 61 SSO60 276064 56 APT75 305774 72 APT75 314423 39 SAAO75272168 74 APT75 276093 54 SSO60 306076 66 APT75 314574 16 APT75272267 74 APT75 276172 37 APT75 306173 74 APT75 314620 17 SAAO75272298 57 SSO60 276188 46 SSO60 306290 09 APT75 314665 33 APT75272375 43 APT75 276236 41 OSN90 306473 68 APT75 314721 44 SAAO75272469 68 APT75 276264 55 APT75 307569 19 APT75 314764 38 APT75272576 50 APT75 276288 56 SSO60 307971 68 APT75 314864 37 APT75272675 53 APT75 276336 36 OSN90 308072 65 APT75 314965 37 APT75272766 67 APT75 276465 48 APT75 308168 76 APT75 315220 41 SAAO75272964 76 APT75 276565 40 APT75 308267 77 APT75 315365 33 APT75272995 15 SSO60 276675 25 APT75 308674 48 APT75 315520 31 SAAO75273064 76 APT75 276803 06 SSO60 308766 76 APT75 315619 40 SAAO75273364 74 APT75 276865 49 APT75 308879 46 APT75 315730 15 SAAO75273463 76 APT75 276936 36 OSN90 309084 08 APT75 316065 17 APT75273563 75 APT75 276989 17 SSO60 309165 39 APT75 316165 27 APT75273599 12 SSO60 277036 23 OSN90 309266 73 APT75 316265 27 APT75273663 74 APT75 277108 12 SSO60 309364 75 APT75 316365 21 APT75273694 10 SSO60 277565 41 APT75 309466 71 APT75 316565 24 APT75273763 73 APT75 277665 45 APT75 309537 24 SAAO50 316665 23 APT75273864 41 APT75 277775 19 APT75 310124 68 SAAO50 316765 25 APT75274065 67 APT75 277865 40 APT75 310224 68 SAAO50 316865 25 APT75274399 44 SSO60 277966 40 APT75 310273 49 APT75 317165 22 APT75274428 51 SAAO50 278165 41 APT75 310363 73 APT75 317265 22 APT75274526 18 SAAO50 278467 33 APT75 310462 07 APT75 317365 21 APT75274590 46 SSO60 278565 38 APT75 310626 61 SAAO50 317465 18 APT75274710 17 SSO60 278590 32 SSO60 310728 58 SAAO50 317565 19 APT75274766 61 APT75 278667 25 APT75 310765 66 APT75 317765 18 APT75274794 53 SSO60 278766 19 APT75 310824 67 SAAO50 318765 10 APT75
4 M Breger et al Detection of 75+ pulsation frequencies in the δ Scuti star FG Vir
7587 758850
0
-50
-100
7590 7591 7597 7598 7599 76007597 7598 7599 7600 7604 7605 7607 7608 7609 7610 76117607 7608 7609 7610 7611
761150
0
-50
-100
7617 7618 7619 76207617 7618 7619 7620 7624 7625 7626 7627 7628 7629 7630 76317624 7625 7626 7627 7628 7629 7630 76317624 7625 7626 7627 7628 7629 7630 7631 7634 7635
7647 764850
0
-50
-100
7657 7658 7668 76805 7687 7688 7694 7695 7699 7704 7711 7757 7758
7767 776850
0
-50
-100
7778 7787 7788 7797 7798 7817 7818 7847 7848 7857 7858 7859 78607857 7858 7859 7860
50
0
-50
50
0
-50
50
0
-50
50
0
-50
7440 7441 7442 7443 7444 74457440 7441 7442 7443 7444 7445 7453 7459 7460 7461 7471 7472
7477 7478 7479 7480 748150
0
-50
-100
7483 7484 7487 7488 7489 7490 7493 7494 7495
50
0
-50
50
0
-50
7477 7478 7479 7480 7481 7487 7488 7489 7490
7497 7498 7499 7500 7501 7502 7503 750450
0
-50
-100
7507 7508 7509 7510 7511 7514
50
0
-50
7519 752050
0
-50
-100
7529 7530 7532 7533 7534 7535 7536 7537 7538 7539 7543 7544 7545
50
0
-50
50
0
-50
-100
7553 7554 7557 7558 7563 7564 7577 7578
50
0
-50
7497 7498 7499 7500 7501 7502 7503 7504
7547 7548 7549 7550
7407 7408 740950
0
-50
-100
657050
0
-50
-100
6678 6679 6680 6689 6690 6708 6709 6710 67165 6738 6739 6740 6746 6747 6757
676750
0
-50
-100
6778 6779 68680 6928 6929 6930 6939 6940 7000 7067 7068 70697038
7097 7098 7099 710050
0
-50
-100
7107 7108 7109 7110 7117 7118 7119 7127 7137 7138 7145
7198 7199 7200 720150
0
-50
-100
7209 7210 7211 7212 7217 7218 7219 7227 7228 7229 7230
7231 723250
0
-50
-100
7238 7239 7247 7248 7249 7258 7259 7268 7269 7277 7278 7279
7297 7298 7299 730050
0
-50
-100
7307 7308 7309 7337 7338 7339 7347 7348 7349
7356 7357 7358 7359 736050
0
-50
-100
7356 7357 7358 7359 7360 7366 7367 7368 7369 73707366 7367 7368 7369 7370 7377 7378 7379 7387 7388
50
0
-50
50
0
-50
50
0
-50
50
0
-50
50
0
-50
50
0
-50
50
0
-50
7198 7199 7200 7201 7209 7210 7211 7212
7297 7298 7299 7300
7227 7228 7229 7230
∆v [m
mag
]
∆y [m
mag
]
HJD 245 2000+ APT SAAO OSN SSO
Fig 1 Multisite photoelectric three-star-photometry of FG Vir obtained during the 2003 and 2004 DSN campaigns∆y and ∆v are the observed magnitude differences (variable ndash comparison stars) normalized to zero in the narrowbanduvby system The fit of the 79-frequency solution derived in this paper is shown as a solid curve Note the excellent
M Breger et al Detection of 75+ pulsation frequencies in the δ Scuti star FG Vir 5
APT SAAO OSN SSOHJD 245 0000+
11097 11098 11099
11103
11106 11107 11108 11109
11116 11117 11118 11119
11133 11134 11135
-50
0
50
11147 11148
11156 11157 11158 11159
11177 11178 11179
11187 11188 11189
11197 11198 11199
-50
0
50
11207 11208 11209
11238
11257 11258
11307 11308
11317 11318
11327 11328
-50
0
50
11367 11368
11373 11374
11377 11378
11383
11387 11388
11393
11397 11398
11403
-50
0
50
11417
11423
11443 11444
11458
11462
11467
11472 11473 11474
11477 11478
11487 11488
-50
0
50
11497 11498
11522 11523
11537
11552 11553
11562 11563
11573
11607
11617
11627
11637
-50
0
50
11657
11667
11677
11687
11717
11727
11737
11747
11757
11777
11877
-50
0
50
-100
-50
0
50
-100
-50
0
50
-100
-50
0
50
-100
-50
0
50
-100
-50
0
50
-100
-50
0
50
-100
-50
0
50
10238 10239 10240 10328 10329 10330 10340 10349 10350 10358 10359 10360
-50
0
50
10229 10230
10318
10500
10510
10518 10519 10520
10528
10530
105390
10578 10579 10580
10608 10609 10610
-50
0
50
10618 10619 10620
10629
10648 10649 10650
10757
10797 10798 10799 10800
10808 10809 10810
-50
0
50
10817 10818 10819 10820
10827 10828 10829 10830
10868 10869
10877 10878 10879
10888 10889 10890
-50
0
50
109085
10917 10918
10927 10928 10929
10937 10938 10939
10947 10948 10949
10954 10955
11013
-50
0
50
11015
11022 11023 11024 11025
11028 11029
11037 11038 11039
11046
11063 11064 11065
-50
0
50
11073 11074 11075 11076 11077 11078 11079
11082 11083 11084 11085 11086 11087 11088
-50
0
50
-100
-50
0
50
-100
-50
0
50
-100
-50
0
50
-100
-50
0
50
-100
-50
0
50
-100
-50
0
50
-100
-50
0
50
∆v [m
mag
]
∆y [m
mag
]
Fig 2 Multisite photoelectric three-star-photometry of FG Vir obtained during the 2003 and 2004 DSN campaignscontinued
6 M Breger et al Detection of 75+ pulsation frequencies in the δ Scuti star FG Vir
Fig 3 Example of power spectra of the 1992ndash2004 data Top Spectral windows showing effects of the daily andannual aliasing Bottom New frequencies detected in the most difficult frequency region with the lowest amplitudesThe diagram shows that in the 40ndash45 cd region pulsation modes are present and have been detected The choice ofwhich peaks are statistically significant depends somewhat on the details of the analysis
Our analysis consists of two parts We first examinethe extensive 2002 - 2004 data and then add the available1992 - 1996 data
31 Frequencies detected in the 2002 - 2004 data
The following approach was used in an iterative way
(i) The data were divided into two data sets to sepa-rate the y and v filters each covering the total time pe-riod from 2002 - 2004 This is necessary because the am-plitudes and phasing of the pulsation are strongly wave-length dependent In principle the different amplitudescould be compensated for by multiplying the v data by anexperimentally determined factor of 070 and increasingthe weights of the scaled v data accordingly (Anticipatingthe results presented later in Table 2 we note that thisratio is confirmed by the average amplitude ratio of theeight modes with highest amplitudes) However the smallphase shifts of a few degrees cannot be neglected for thelarger-amplitude modes Consequently the data were an-alyzed together for exploratory analysis but not for thefinal analyses
(ii) We started with the single-frequency solution forthe two data sets using the program PERIOD04 For theFourier analyses the two data sets were combined to de-crease the noise while for the actual fits to the data sep-arate solutions were made
(iii) A Fourier analysis was performed to look foradditional frequenciesmodes from the combined residu-als of the previous solutions Additional frequencies werethen identified and their signalnoise ratio calculatedFollowing Breger et al (1993) a significance criterion ofamplitude signalnoise = 40 (which corresponds to powersignalnoise of sim126) was adopted for non-combinationfrequencies The most clearly detected additional frequen-cies were included in a new multifrequency solution Inorder for a new frequency to be accepted as real thesignalnoise criterion also had to be fulfilled in the mul-tifrequency solution This avoids false detections due tospill-over effects because the Fourier technique is a single-frequency technique Furthermore since there exist reg-ular annual gaps trial annual alias values (separated by00027 cd) were also examined We note that the choiceof an incorrect annual alias value usually has little or noeffect on the subsequent search for other frequencies Thechoice of an incorrect daily alias (separated by 1 cd)would be more serious and we carefully examined differentfrequency values
(iv) The previous step was repeated adding further fre-quencies until no significant frequencies were found Notethat only the Fourier analyses assume prewhitening themultiple-frequency solutions do not
In this paper we omit the presentation of very lengthydiagrams showing the sequential detection of new frequen-
M Breger et al Detection of 75+ pulsation frequencies in the δ Scuti star FG Vir 7
cies except for the example shown in the next subsectionA detailed presentation of our approach and its results canbe found in our analysis of the 2002 data (Breger et al2004)
FG Vir contains one dominant frequency 127162 cdwith a photometric amplitude five times higher than thatof the next strongest mode To avoid potential problemscaused by even small amplitude variability for this fre-quency we calculated amplitudes on an annual basis Theresults of the multifrequency analysis are shown in Table 2The numbering scheme of the frequencies corresponds tothe order of detection ie the amplitude signalnoise ra-tio and therefore differs from that used in previous paperson FG Vir
32 Further frequencies detected in the 1992 - 2004data
An extensive photometric data set covering 13 years is es-sentially unique in the study of δ Scuti stars promisingnew limits in frequency resolution and noise reduction inFourier space The noise reduction is especially visible athigh frequencies where the effects of systematic observa-tional errors are small The analysis of the combined datahad to work around two problems the earlier data is notas extensive as the 2002 - 2004 data and there exists alarge time gap between 1996 and 2002
The time gap did lead to occasional uniqueness prob-lems for the frequencies with amplitudes in the 02 mmagrange next to the annual aliasing of 00027 cd we findpeaks spaced 000026 cd corresponding to a sim 10 yearspacing (see Fig 3 top right) Fortunately the excellentcoverage from 2002 - 2004 minimized these ambiguities
The relatively short coverage of the data from 1992 and1996 excluded the computation of 79-frequency solutionsfor individual years (to avoid overinterpretation) We haveconsequently combined all the y measurements from 1992to 1996 as well as the available 1995 and 1996 v dataTogether with the y and v data sets from 2002 - 2004 wehad four data sets
Fig 3 illustrates some examples of the resulting powerspectra Due to the large amount of APT data from 2002- 2004 which therefore dominates the 1 cd aliases arenot zero (top left) Nevertheless due to the excellent fre-quency resolution these aliases are very narrow so thatthe aliasing problem is not severe The figure also showsthe power spectrum of the measurements in the 40 - 45cd region which was the most difficult region for us toanalyze due to the small amplitudes of all the detectedfrequencies
The new detections are included in Table 2
A comparison with the frequencies published in ear-lier papers shows that all the previously detected frequen-cies were confirmed This also includes those previouslydetected modes not found to be statistically significantin the 2002 data alone In a few cases different annual
aliases were selected However the main result is the in-
crease in the number of detected frequencies to 79 whichmore than doubles the previous results
Fig 4 shows the distribution of frequencies in fre-quency space We note the wide range of excited frequen-cies which is unusual for δ Scuti stars as well as the clus-tering of the excited frequencies This clustering persistseven after the suspected combination frequencies and 2fharmonics are removed
A new feature is the detection of frequencies with val-ues between 40 and 45 cd They all have small amplitudesof ∆y sim02 mmag The lower noise of the new data nowmade their detection possible
33 Color effects
The light curves of pulsating stars are not identical at dif-ferent wavelengths In fact amplitude ratios and phaseshifts provide a tool for the identification of nonradialmodes (eg see Garrido et al 1990 Moya et al 2004)For δ Scuti stars the amplitude ratios between differentcolors are primarily dependent on the surface tempera-ture For the individual pulsation modes the phase dif-ferences and deviations from the average amplitude ratioare small This means that observational errors need tobe small and any systematic errors between the differentcolors should be avoided
For most nights there exist both v and y passbanddata so that amplitude ratios as well as phase differencescan be derived However our 79-frequency solution is notperfect In order not to introduce systematic errors in thephase differences and amplitude ratios for the calculationof amplitude ratios and phase differences we have omittedthose nights for which two-color data are not availableConsequently no data from 1992 and 1993 were used andall 1995 (single-color) CCD measurements were omitted
Table 3 lists the derived phase differences and am-plitude ratios for the modes with relatively high ampli-tudes The uncertainties listed were derived from error-propagation calculations based on the standard formulaegiven by Breger et al (1999) The results can now be usedtogether with spectroscopic line-profile analyses to iden-tify the pulsation modes
4 Combination frequencies
We have written a simple program to test which of the 79frequencies found can be expressed as the sum or differ-ences of other frequencies Due to the excellent frequencyresolution of the 2002 - 2004 data we could be very restric-tive in the identification of these combinations A generouslimit of plusmn 0001 cd was adopted The probability of incor-rect identifications is correspondingly small A number ofcombinations was found and these are marked in Table 2They generally agreed to plusmn 00002 cd
How many accidental agreements do we expect Wehave calculated this number through a large number ofnumerical simulations assuming a reasonable agreement
8 M Breger et al Detection of 75+ pulsation frequencies in the δ Scuti star FG Vir
Table 2 Frequencies of FG Vir from 2002 to 2004
Frequency Detection(1) Amplitude Frequency Detection Amplitudecdminus1 Name Type Amplitude v filter y filter cdminus1 Name Type Amplitude v filter y filter
SN ratio millimag SN ratio millimag
plusmn 004 plusmn005 plusmn 004 plusmn005
57491 f47 57 048 028 233974 f12(2) 22 173 125
79942 f44 59 042 034 234034 f4(2) 71 565 402
83353 f78 f6-f1 3 8 033 017 234258 f53 49 037 02891991 f7 53 382 278 234389 f24 90 068 05296563 f5 71 520 361 238074 f48 55 045 032101687 f25 86 064 042 240040 f58 46 035 031106872 f79 f4-f1 35 026 015 241940 f10 29 226 158111034 f20 11 067 065 242280 f3 74 579 420112098 f38 64 035 043 243485 f18 12 099 063115117 f70 f3-f1 40 030 018 248703 f36 f1+f2 64 048 038116114 f50 53 035 027 251788 f30 73 059 039117016 f33 69 042 044 253793 f45 57 037 031118755 f63 44 027 025 254324 f15 2f1 16 123 089119421 f29 76 055 038 256387 f68 40 030 026
121541 f2(2) 85 609 421 265266 f71 4 7 030 020
121619 f14(2) 16 113 083 268929 f61 45 034 027
122158 f52 51 038 024 269094 f75 4 2 034 019127162 f1 442 3174 2192 281359 f19 11 087 055127944 f17 13 088 066 294869 f51 f7+f11 52 039 028132365 f27 83 045 056 309146 f60 45 031 027147354 f49 53 029 038 311955 f57 46 035 027160711 f13 20 156 107 319307 f34 66 049 040160909 f31 73 055 039 321895 f32 70 056 038
191642 f26 86 055 059 330437 f74(4) 4 3 029 019
192278 f9 30 251 169 337677 f43 f1+f6 59 044 031193259 f41 63 053 034 341151 f22 98 075 049196439 f65 43 040 022 341192 f72 4 7 021 025
198679 f8(3) 55 444 319 341864 f54 49 037 025
198680 (3) 30 240 178 343946 f55 46 031 028202878 f11 26 213 145 345737 f23 93 069 045202925 f56 46 031 039 358858 f76 4 1 022 021205112 f35 66 041 052 361196 f40 f1+f4 63 040 031208348 f39 63 053 038 369442 f37 f1+f3 64 043 027210515 f6 55 443 308 392165 f69 40 027 016212323 f16 14 106 080 395156 f59 f9+f11 45 024 025214004 f46 57 052 033 421030 f64 2f6 43 022 028215507 f28 79 061 042 421094 f62 45 024 025223725 f42 f1+f5 62 052 035 430134 f73 4 4 021 015230253 f66 41 030 023 439651 f67 40 026 017233943 f21 11 085 060 442591 f77 4 0 020 018
(1) The noise for the amplitude signalnoise ratios were calculated over a 4 cdminus1 range Limits for a significant detection are40 for independent frequencies and 35 for combination modes with known values Numbers in italics indicate 1992 - 2004data (see text)(2) The close frequencies 121541 and 121619 as well as 233974 and 234034 cd are all separate modes In short data setsthis could lead to an erroneous identification as single modes with variable amplitude(3) For the possible frequency pair near 19868 cd the existence of two separate modes cannot be proved at this point Asingle frequency with a slowly variable amplitude (beat period sim215 years) is also possible(4) The 2002ndash2004 data clearly show a mode at 33044 cd though with considerably reduced amplitudes from 1992-1995data Breger et al (1998) listed the value of the frequency as 33056 cd which was the highest peak from a broad selection ofpeaks separated by annual aliases 00027 cd apart We note that in the new data a value separated by 1 annual alias viz330461 cd is also possible
M Breger et al Detection of 75+ pulsation frequencies in the δ Scuti star FG Vir 9
01
1
10
0 5 10 15 20 25 30 35 40 45 50
01
1
10
0 5 10 15 20 25 30 35 40 45 50
Am
plitu
de (
mill
imag
)
FG VirAll detections
Frequency (cd)
Omitting combinations and harmonics
Fig 4 Distribution of the frequencies of the detected modes The diagram suggests that the excited pulsation modesare not equally distributed in frequency
Table 3 Phase differences and amplitude ratios
Frequency Phase differences in degrees Amplitude ratioscd φv minus φy vy
2002ndash2004 1995ndash20041) 2002ndash2004 1995ndash2004
f1 12716 ndash17 plusmn 01 ndash15 145 plusmn 000 145f2 12154 +31 plusmn 07 +28 144 plusmn 002 144f3 24227 ndash30 plusmn 07 ndash30 138 plusmn 002 140f4 23403 ndash35 plusmn 07 ndash33 140 plusmn 002 142f5 9656 ndash51 plusmn 08 ndash45 144 plusmn 002 143f6 21051 ndash37 plusmn 10 -42 144 plusmn 002 145f7 9199 ndash67 plusmn 11 ndash66 138 plusmn 003 140
f8 198682) ndash43 plusmn 19 ndash29 145 plusmn 005 144f9 19228 ndash46 plusmn 17 ndash39 148 plusmn 005 146f10 24194 ndash12 plusmn 19 -06 143 plusmn 007 138
1) Error estimates omitted usually lower than for 2002ndash2004 but some instability is possible due to large time gap2) Using single frequency with annual amplitude variations
of the observed frequency to within 00002 cd of the pre-dicted frequency We obtain an average of 093 acciden-tal matchings of peaks with combination frequencies Weconclude that most or all detected combination frequen-cies are not accidental The argument is strengthened bythe fact that the combinations detected by us all containone of two specific modes which reduces the chance ofaccidental agreements to essentially zero
We also note that the lowest frequency detected f47 at5749 cd can be expressed as a triple combination of f1f3 and f57 This may be accidental
41 Combinations of the dominant mode at 127163cd
Due to the presence of a dominant mode at 127163 cd(f1) it is not surprising that some combination frequen-cies f1plusmnfi exist and are detected (see Table 2) In order
10 M Breger et al Detection of 75+ pulsation frequencies in the δ Scuti star FG Vir
0 10 20 30 40 50 60 70 80
0
1
2
3
4
20
Am
plitu
de (
mill
imag
)
Detected Pulsation Mode
FG Vir2002 - 2004
Fig 5 Distribution of the amplitudes of the frequencies with significant detections To increase the accuracy we havecomputed amplitudes from 05(y amplitude + 070 v amplitude) to simulate the amplitude in the y passband Notethe large number of detected modes with amplitudes near the detection limit of 02 mmag This suggests that evenmoderate increases in the amount of data lead to considerably higher number of detections
0 10 20 30 40 50 60 70 80 90 1000
1
2
3
Pow
er (
mag
2 ) x
10-9
Frequency (cd)
Residual noiseafter prewhitening 80 frequencies (1992 - 2004)
Fig 6 Power of the residual noise of the 1992 ndash 2004 data after subtracting 80 (79) frequencies (The additionalfrequency is the close doublet at 19868 cd adopted for the long time span) The average amplitude in the amplitudespectrum was calculated for 2 cd regions and squared to give power The strong increase towards lower frequenciesis caused by observational noise and standard in terrestrial photometry Note the excess power in 10 - 50 cd regionshown above the dotted curve This shows that many additional pulsation modes exist in the same frequency regionin which the already detected frequencies occur
to examine this further we have performed additional cal-culations with the 2002 - 2004 data We have repeated ourmultifrequency solutions described earlier while omittingall frequency combinations of f1 The residuals of the y andv data were combined to form the sum (y + 070v) to ac-
count for the different amplitudes at the two passbands Anew multifrequency solution containing the possible com-binations of the dominant mode with f2 through f8 wasmade The results are shown in Table 4 in which smalldifferences compared to Table 2 are caused by the different
M Breger et al Detection of 75+ pulsation frequencies in the δ Scuti star FG Vir 11
Table 4 Combination frequencies involving the dominantmode
f1plusmn Amplitude in y (2002ndash2004)Sum of frequencies Difference of frequencies
mmag mmag
f2 035 (006)f3 028 019f4 031 017f5 033 (016)f6 039 021f7 (010) (007)f8 (007) (013)
The amplitudes in brackets are too low for fulfilling theadopted criterion of statistical significance
procedures of our analyses The amplitudes of the sums(f1+fi) are higher than those of the differences (f1-fi) Webelieve the result to be real and intrinsic to the star Thedifferences are generally found at low frequencies wherethe observational noise is higher Increased noise shouldlead to higher amplitudes which are not found
42 Combinations of the 202878 cd mode
Apart from the mode combinations involving the dom-inant mode f1 two other two-mode combinations arefound both involving f11 at 202878 cd While the modeidentifications are still in progress this mode can to a highprobability be identified as a ℓ=1 m=-1 mode (Zima etal 2003) At first sight this appears surprising since thephotometric amplitude is only 15 mmag However for theknown inclination and mode identification we calculate ageometric cancellation factor of sim36 so that the real am-plitude of this mode is 5 mmag or larger
The fact that the m value is not equal to zero has someinteresting consequences for the observations of combina-tion frequencies The reason is that there are two framesof reference the stellar frame corotating with the star andthat of the observer For nonradial modes of m values 6=0 (ie waves traveling around the star) the frequenciesbetween the two frames of reference differ by mΩ where Ωis the rotation frequency of the star (see Cox 1984 for anexcellent discussion) The frequency combinations occurin the corotating (stellar) frame and not the observerrsquosframe of reference Consequently many possible combina-tions involving non-axisymmetric modes should not be ob-served as simple sums or differences of observed frequencyvalues
It follows that for the non-axisymmetric (m=-1) modeat 202878 cd our simple method to search for combina-tion frequencies from the observed frequency values mayonly detect combinations fi + fj with m = +1 modes
This strict requirement is met by the two identifiedcombinations of 202878 cd Both coupled modes f9 =192278 cd as well as f11 = 202878 cd have been iden-
tified as m = +1 modes Such a combination of m valuesof opposite sign can be detected because the combinationis invariant to the transformation between the two framesof reference minusmΩ + mΩ = 0
5 The problem of missing frequencies solved
δ Scuti star models predict pulsational instability in manyradial and nonradial modes The observed number of low-degree modes is much lower than the predicted numberThe problem of mode selection is most severe for post-main-sequence δ Scuti stars which comprise about 40percent of the observed δ Scuti stars The theoretical fre-quency spectrum of unstable modes is very dense Mostmodes are of mixed character they behave like p-modesin the envelope and like g-modes in the interior For ex-ample for a model of the relatively evolved star 4 CVnthe models predict 554 unstable modes of ℓ = 0 to 2 ie6 for ℓ = 0 168 for ℓ = 1 and 380 for ℓ = 2 (see Bregeramp Pamyatnykh 2002) However only 18 (and additional16 combination frequencies) were observed (Breger et al1999) The problem also exists for other δ Scuti stars Acomplication occurs since the models so far cannot predictthe amplitudes of the excited modes
Two explanations offer themselves the missing modesexist but have amplitudes too small to have been ob-served or there exists a mode selection mechanism whichneeds to be examined in more detail Promising scenariosinvolve the selective excitation of modes trapped in theenvelope (Dziembowski amp Krolikowska 1990) or randommode selection
Let us turn to the star FG Vir Unpublished mod-els computed by A A Pamyatnykh predict 80 unstablemodes with ℓ = 0 1 and 2 in the 8 - 40 cd range Thisnumber is smaller than that mentioned previously for themore evolved star 4 CVn but until now this large numberwas not observed either The present study addresses thequestion by lowering the observational amplitude thresh-old to 02 mmag We have detected 79 frequencies ofwhich 12 could be identified as harmonics or combina-tion frequencies This leaves 67 independent frequenciesThere also exists considerable evidence that many moremodes are excited
(i) Consider the amplitude distribution of the detectedmodes shown in Fig 5 There is a rapid increase in thenumber of modes as one goes towards low amplitudesThe present limit near 02 mmag is purely observationalConsequently the number of excited modes must be muchlarger
(ii) Consider the power spectrum of the residuals aftersubtraction of the multifrequency solution (Fig 6) We seeexcess power in the 10 - 50 cd range This is exactly theregion in which the previously detected modes were foundThis indicates that many additional modes similar to theones detected previously are excited at small amplitude
We can exclude the possibility that the large numberof observed frequencies is erroneous because of imperfectprewhitening due to amplitude variability We have ex-
12 M Breger et al Detection of 75+ pulsation frequencies in the δ Scuti star FG Vir
amined this possibility in great detail with literally thou-sands of different multifrequency solutions allowing foramplitude variability In no case was it possible to sig-nificantly reduce the structure in the power spectrum ofthe residuals In fact the rsquobestrsquo multifrequency solutionadopted treated the two colors as well as the 1992 - 1996and 2002 - 2004 data separately and allowed annual am-plitude variability of the dominant mode at 127162 cdAmplitude variability therefore cannot explain the excesspower
Consequently the problem that the number of detected
modes is much smaller than the number of predicted low-ℓ
modes no longer exists at least for FG Vir Of course wecannot conclude that each theoretically predicted modeis really excited and has been detected This would re-quire much more extensive mode identifications than areavailable at this stage
In the previous discussion we have concentrated onthe low-ℓ modes which are easily observed photometri-cally One also has to consider that at low amplitudesvariability from modes of higher ℓ values might also beseen photometrically The geometric cancellation effectscaused by the integration over the whole surface only be-come important for ℓ ge 3 This is shown by Daszynska-Daszkiewicz et al (2002) who calculated the amplitudereduction factors caused by temperature variations acrossthe disk From this paper we can roughly estimate a can-cellation factor of sim50 in the y passband for ℓ = 3 modesimplying that only the largest-amplitude modes could bephotometrically detected Such modes would have ampli-tudes similar to or larger than that of the observed dom-inant (ℓ = 1) mode at 127162 cd and might thereforebe expected to be few Regrettably the situation is some-what more complicated The results presented in Fig 2 ofthe Daszynska-Daszkiewicz et al paper are actually basedon models with higher surface temperatures and could fitthe β Cep variables A Pamyatnykh has kindly calculatedspecific models fitting the star FG Vir Here the geomet-ric cancellation factor becomes smaller by a factor of twoor three Consequently some of the low-amplitude modesobserved by us could also be ℓ = 3 modes
We conclude that the large number of detected fre-quencies as well as the large number of additional fre-quencies suggested by the power spectrum of the residu-als confirms the theoretical prediction of a large number ofexcited modes A mode-by-mode check for each predictedmode is not possible at this stage
Acknowledgements
This investigation has been supported by the AustrianFonds zur Forderung der wissenschaftlichen ForschungThe Spanish observations were supported by the Junta deAndaluca and the DGI under project AYA2000-1580 Weare grateful to P Reegen for help with the APT measure-ments M Viskum for providing a table of the individualmeasurements of the 1996 photometry not listed in his pa-per A A Pamyatnykh and J Daszynska-Daszkiewicz for
preliminary pulsation models as well as W Dziembowskiand W Zima for important discussions
References
Breger M 1993 in Stellar Photometry - Current Techniquesand Future Developments ed C J Butler I Elliott IAUColl 136 106
Breger M amp Pamyatnykh A A 2002 ASP Conf Ser 259388
Breger M amp Hiesberger F 1999 AampAS 135 547Breger M Stich J Garrido R et al 1993 AampA 271 482Breger M Handler G Nather R E et al 1995 AampA 297
473Breger M Zima W Handler G et al 1998 AampA 331 271Breger M Handler G Garrido R et al 1999 AampA 349
225Breger M Garrido R Handler G et al 2002a MNRAS
329 531Breger M Pamyatnykh A A Zima W et al 2002b
MNRAS 336 249Breger M Rodler F Pretorius M L et al 2004 AampA 419
695Cox J P 1984 PASP 96 577Daszynska-Daszkiewicz J Dziembowski W A Pamyatnykh
A A amp Goupil M-J et al 2002 AampA 392 151Dawson D W Breger M amp Lopez de Coca P 1995 PASP
107 517Dziembowski W Krolikowska M 1990 Acta Astron 40 19FrandsenS PigulskiA NusplJ et al 2001 AampA376 175Garrido R amp Poretti E 2004 ASP Conf Ser 310 560Garrido R Garcia-Lobo E amp Rodriguez E 1990 AampA
234 262Handler G 2004 ESA SP-538 127Lenz P amp Breger M 2005 CoAst in pressLi Z-P Michel E Fox Machado L et al 2004 AampA 420
283Mantegazza L amp Poretti E 2002 AampA 396 911Mantegazza L Poretti E amp Bossi M 1994 AampA 287 95Mittermayer P amp Weiss W W 2003 AampA 407 1097Moya A Garrido R amp Dupret M A 2004 AampA 414 1081Ripepi V Marconi M Bernabei S et al 2003 AampA 1047
2003Strassmeier K G Boyd L J Epand D Hamp Granzer T
H 1997 PASP 109 697Viskum M Kjeldsen H Bedding T R et al 1998 AampA
335 549Zima W Heiter U Cottrell P L et al 2003 in
Asteroseismology across the HR Diagram eds M JThompson M S Cunha M J P F G Monteiro KluwerAcademic Publishers 489
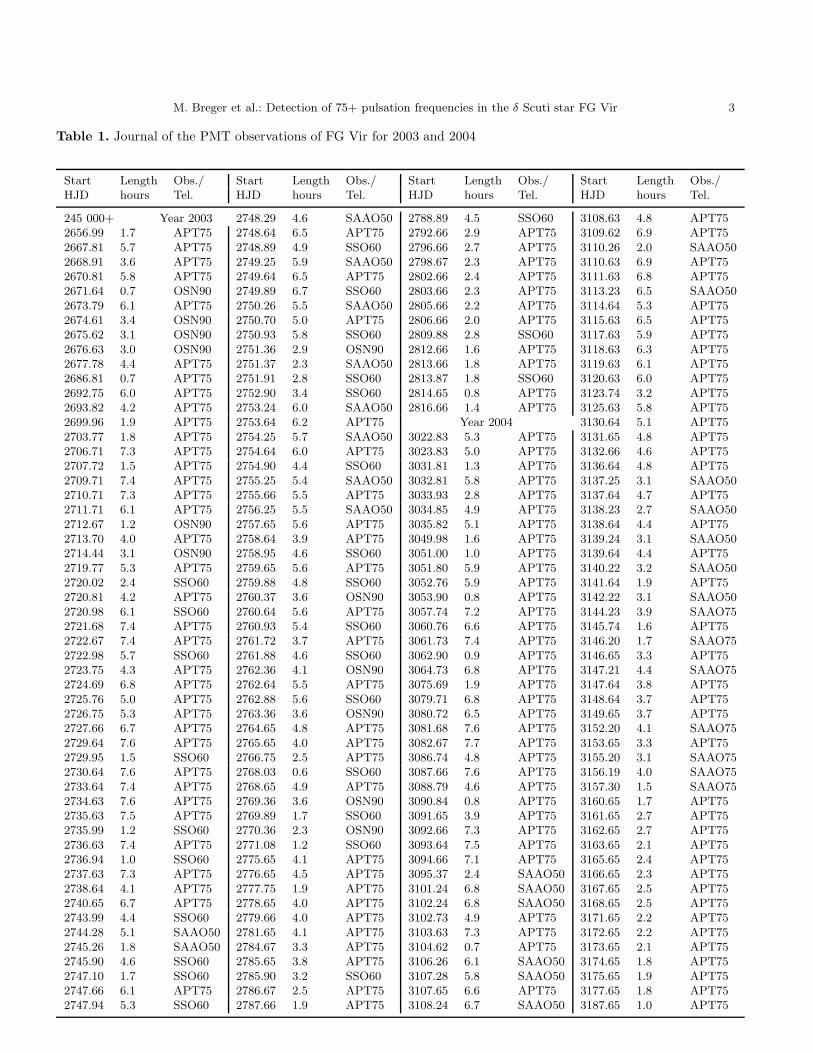
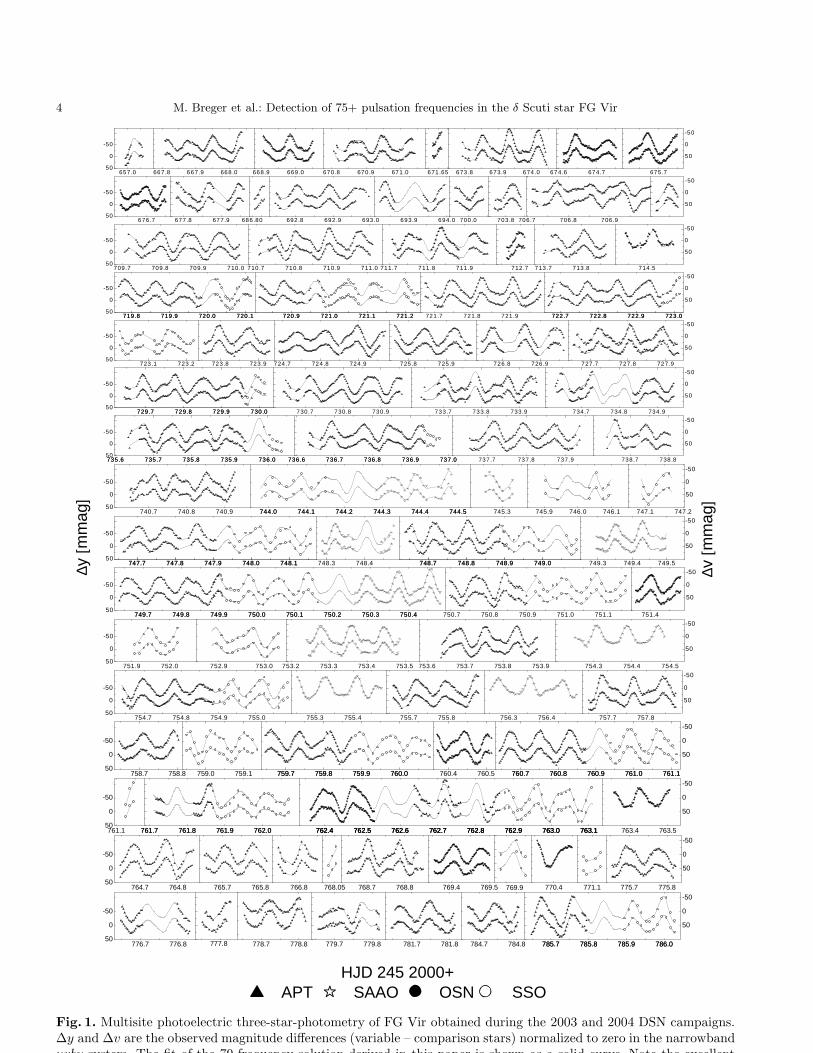
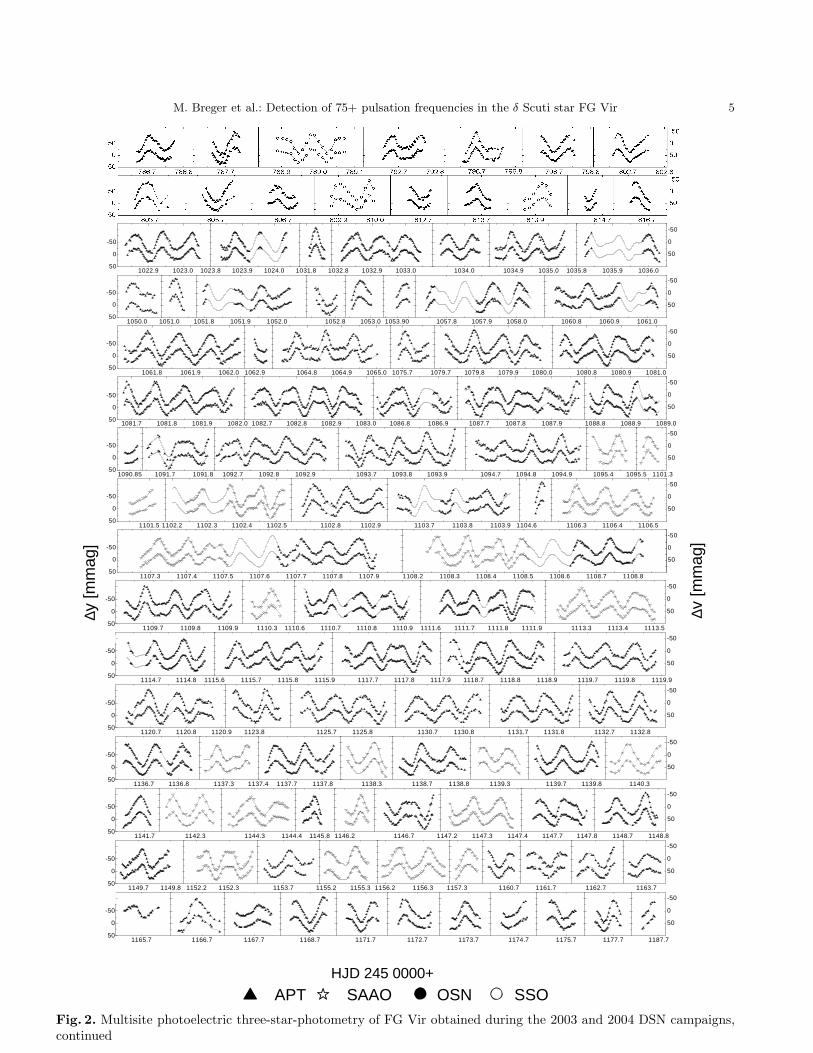
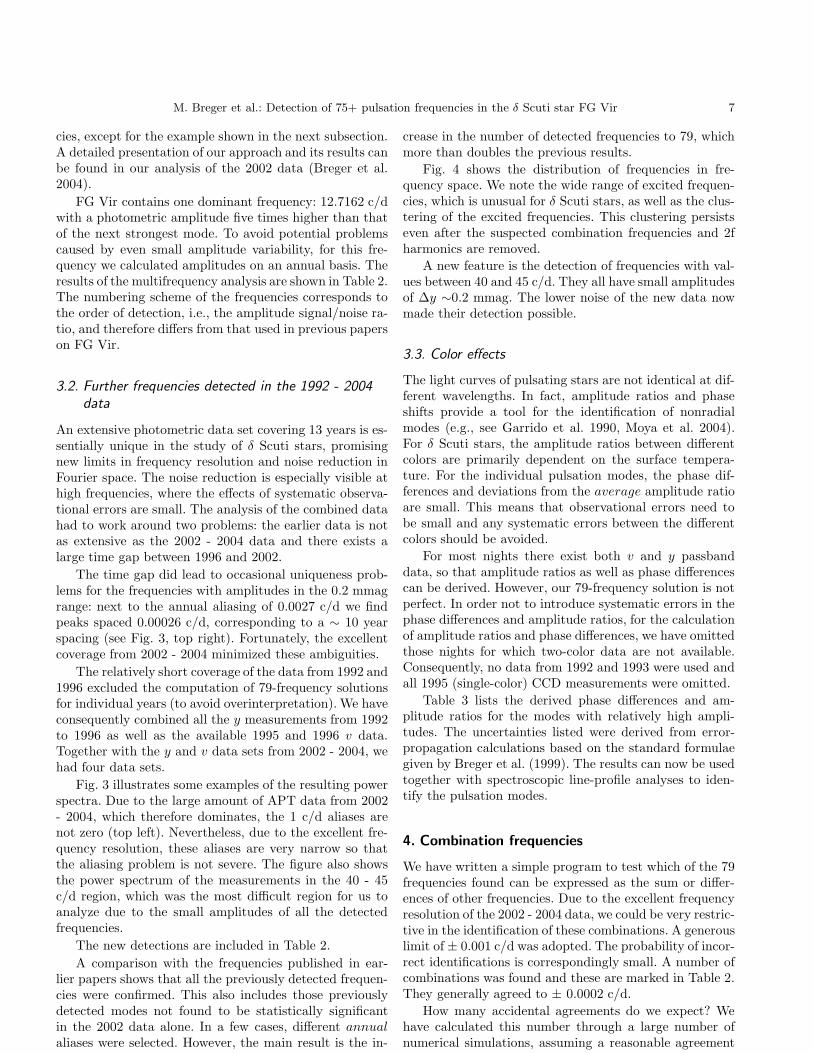
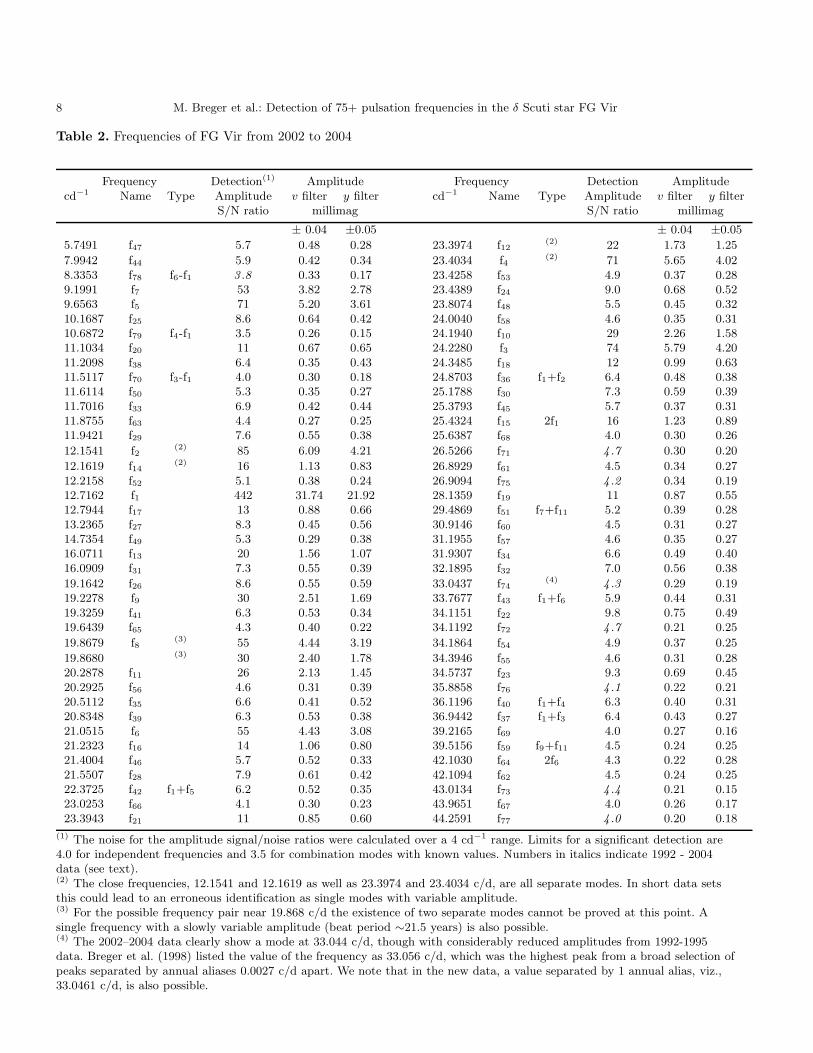
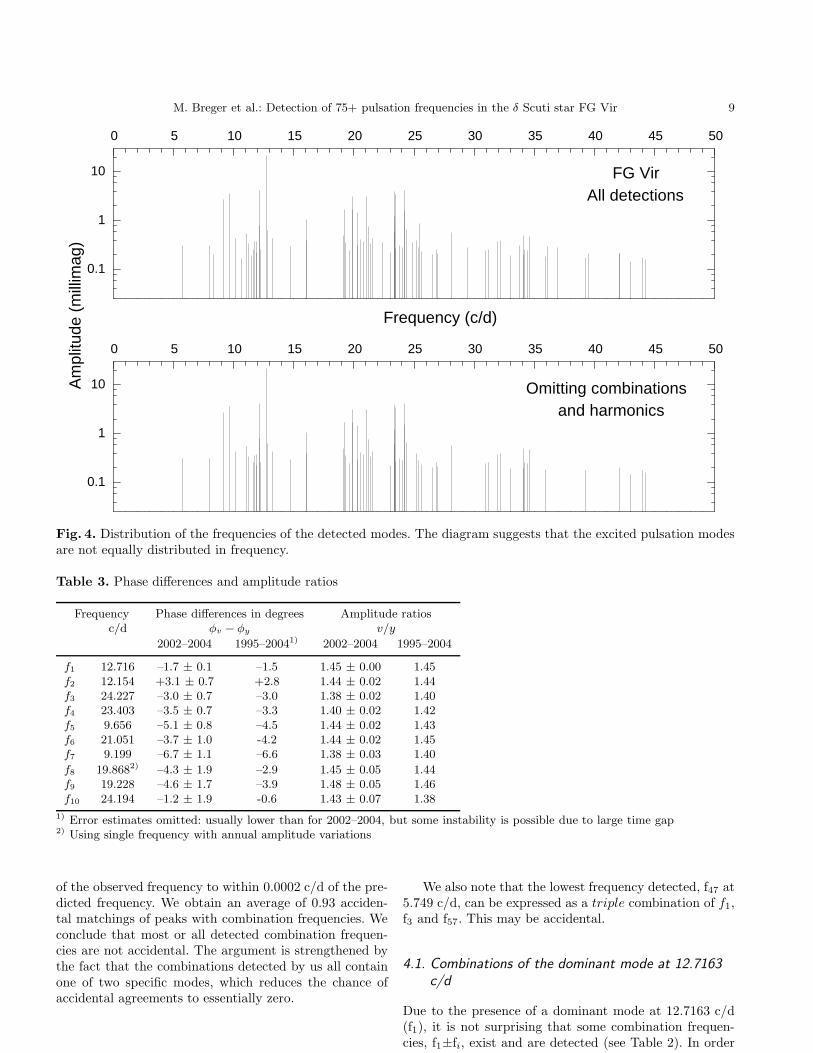
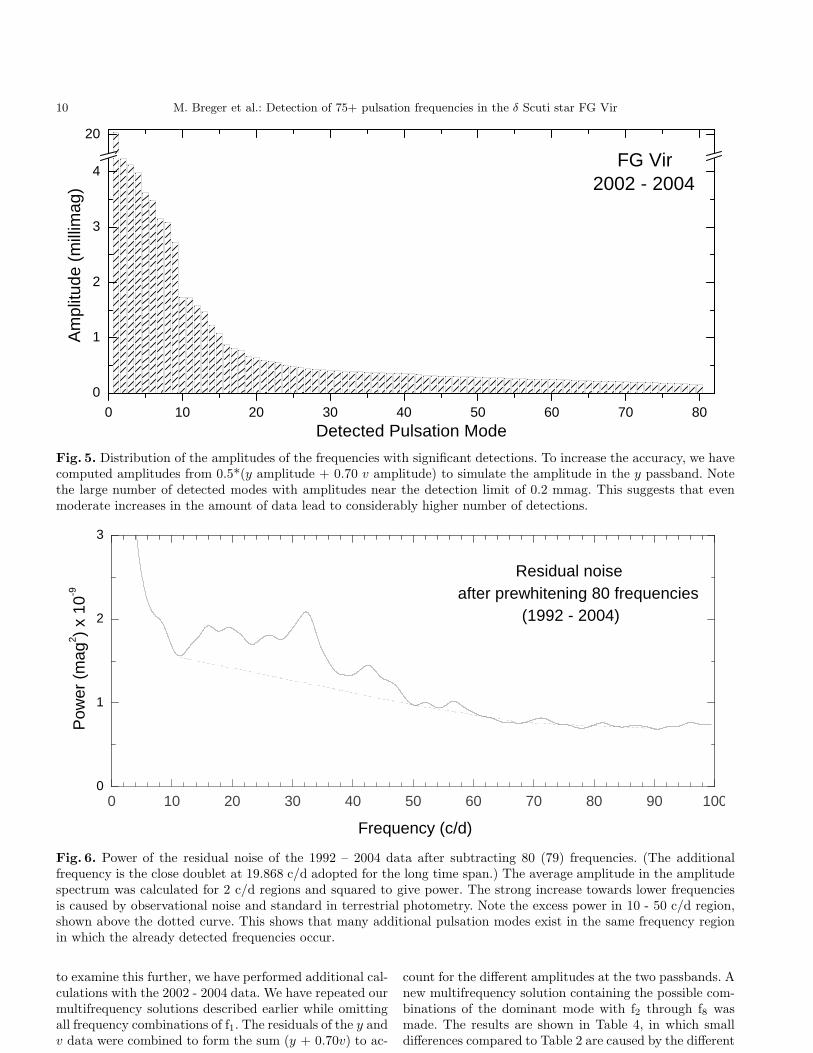
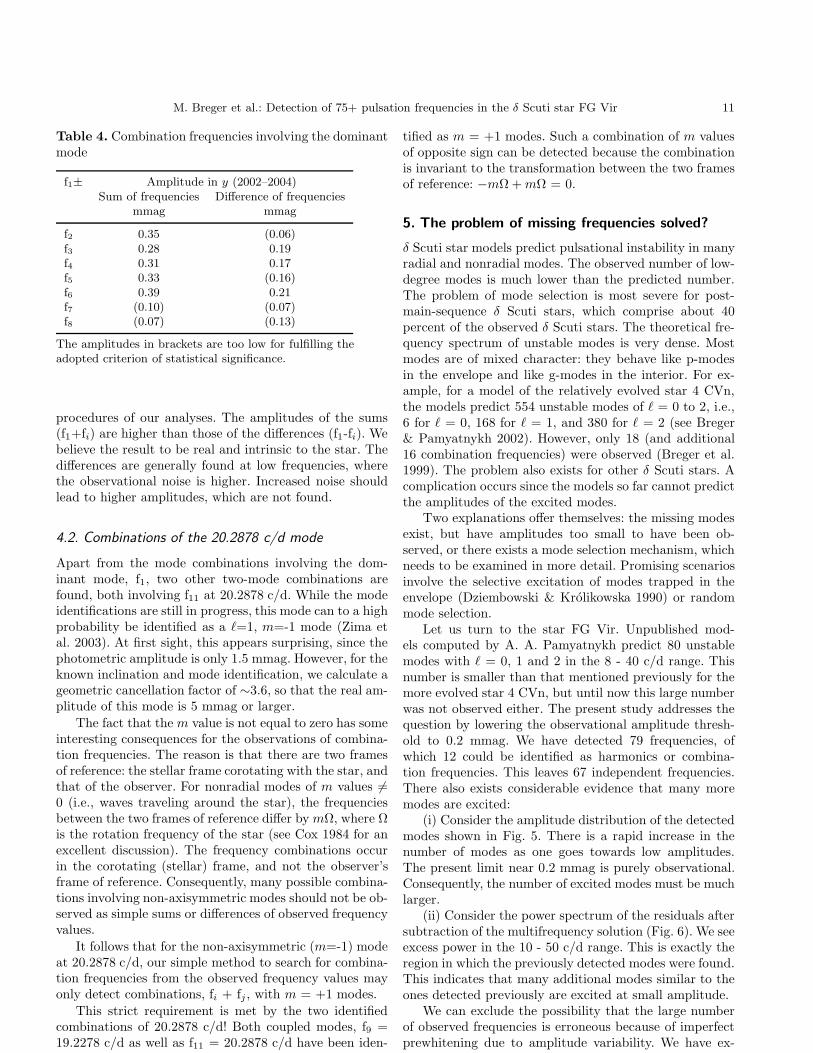


