Embed Size (px)
Citation preview

DETERMINANTS OF PRIMATE DIVERSITY WITH IMPLICATIONS FOR COMPARATIVE BIOLOGY AND
CONSERVATION
Maria J. A. Creighton
Department of Biology McGill University, Montréal
November 2020
A thesis submitted to McGill University in partial fulfilment of the requirements of the degree of Master of Science
© Maria J. A. Creighton 2020

2
TABLE OF CONTENTS
Abstract …………………………………………………………………………………………. 3 Résumé .…………………………………………………………………………………………. 5 Acknowledgements ……………………………………………………………………………... 7 Contribution to original knowledge …………………………………………………………… 8 Contribution of authors ………………..……………………………….…………………….… 9 Chapter 1: General introduction ……………………………………………………………... 10 Species and species diversity ………………………………………………………….…….….. 11 Evolution as a determinant of species diversity – with a focus on behaviour …………..……… 12 Systematics as a determinant of species diversity – with a focus on taxonomic inflation ……… 15 Primate species diversity ………………………….……………………………………….….… 16 Thesis overview ……………………………..………………….………………………………. 18 Chapter 2: The role of behavioural flexibility in primate diversification …………………. 21 Abstract ………………………….……………………………………………………………... 22 Introduction …………………………………………………………………………………..… 23 Methods ………………………………………………………………………………………… 25 Results ....………………………….………………………………….….……………………... 33 Discussion ……………………………………………………………………………………… 35 References ………………..……….……………………………………………………………. 40 Supplementary materials ……………………………………………………………………….. 50 Linking statement ……………………………………………………………………………... 85 Chapter 3: Predictors of taxonomic inflation and its role in primate conservation ……… 86 Abstract ………………………………………………………………………………………… 87 Introduction …………………………………………………………………………………….. 88 Methods ………………………………………………………………………………………… 93 Results ....………………………….……………………………………………………………. 98 Discussion …………………………………………………………………………………….. 102 References …………………………………………………………………………………….. 106 Supplementary materials ………………………….………………..………………….……… 111 Chapter 4: General discussion ……………………………………………………………… 126 Major findings ………………………………………………………………………………… 127 On the use of species ……………………………………………………………………..……. 128 Implications …………………………………………………………………………………… 133 Directions for future research ………………………….……………………………………… 134 General conclusions and summary ………………………….………………….……………… 135 References (General introduction and discussion) ………………………….………………… 137

3
ABSTRACT
Variation in species diversity across the Tree of Life has long been of interest to biologists. Despite
this interest, a great deal of variation in species richness across the Tree of Life remains
unexplained. Species are used as an important unit of comparison across many areas of biology,
making it important to further our understanding of the processes by which species originate. In
this thesis I explore determinants of species diversity across primates – one of the more species
rich and rapidly evolving groups of mammals, with over 500 described species. I address two
major determinants of extant species diversity across higher taxa: (i) evolutionary processes; (ii)
the application of species concepts leading to the formal recognition of species by scientists – and
explore hypotheses related to each. In Chapter 2, I investigate the role of evolutionary processes
in shaping primate diversity. Specifically, I test the hypothesis that behavioural flexibility leads to
higher rates of speciation, thereby increasing rates of evolutionary diversification in behaviourally
flexible clades. I test the relationship between multiple measures of behavioural flexibility and
primate diversification rate, and find that behavioural flexibility does not seem to be driving recent,
shallow divergences, in contrast to findings in other taxa (i.e. subspecific diversification of birds).
I do, however, find positive associations deeper in the tree which may support a role for
behavioural flexibility enhancing lineage persistence, as opposed to driving speciation events.
When testing this hypothesis, taxonomic instability and rapid inflation in species numbers
complicated estimates of primate diversification rate – requiring me to produce a method of
accounting for biases associated with applications of the ‘phylogenetic species concept’ (PSC) in
primate taxonomy. Thus, in Chapter 3, I opted to further investigate the role of systematic biases
in determining extant species richness across primate clades. More specifically, I explore
predictors of taxonomic inflation under the PSC. I also investigate whether the PSC is influencing
trends in conservation by testing whether taxonomic inflation is associated with primate threat
scores. I find that neither biological processes (i.e. diversification rate) nor estimates of human
imposed bias (i.e. measures of research effort) are significant predictors of inflation among primate
genera. However, when testing whether the PSC influences trends in primate conservation, I find
an association between inflation and genus threat score that is region specific, where highly
inflated genera are perceived as the most at risk in some regions, but the least at risk in others. I
suggest that this could be a result of other factors (e.g. the total geographic range size of genera)
influencing how inflation impacts threat score. Together, these chapters improve our

4
understanding of species diversity and have implications for how species are used across many
disciplines of biology that rely on species as an important unit of comparison.

5
RÉSUMÉ
La variation de la diversité en espèces à travers l'Arbre de Vie intéresse depuis longtemps les
biologistes. Malgré cet intérêt, une grande partie de la variation de la richesse en espèces de l’Arbre
de Vie reste inexpliquée. Les espèces sont utilisées comme une unité de comparaison importante
dans de nombreux domaines de la biologie, ce qui montre l’importance de comprendre les
processus déterminants de l’origine des espèces. Dans cette thèse, j'explore les facteurs de diversité
des espèces chez les primates - l'un des groupes de mammifères les plus riches en espèces et en
évolution rapide, avec plus de 500 espèces décrites. J'aborde deux facteurs majeurs de la diversité
des espèces existantes dans les taxons supérieurs: (i) les processus évolutifs; (ii) l'application des
concepts d’espèces conduisant à la reconnaissance formelle des espèces par les scientifiques – et
j’explore plusieurs hypothèses liées a chacun des facteurs. Au deuxième chapitre, j'étudie le rôle
des processus évolutifs dans la formation de la diversité des primates. Plus précisément, je teste
l’hypothèse selon laquelle la flexibilité comportementale entraîne des taux de spéciation plus
élevés, augmentant ainsi les taux de diversification évolutive dans les groupes à flexibilité
comportementale. Je teste la relation entre plusieurs mesures de flexibilité comportementale et le
taux de diversification des primates et détecte que la flexibilité comportementale ne semble pas
être à l'origine de divergences récentes et peu profondes contrairement à ce qui a été démontré
dans d'autres taxons (c.-à-d. Diversification sous-spécifique des oiseaux). Cependant, je trouve des
associations à un niveau plus profond de l’arbre qui supportent l’idée que la flexibilité
comportementale améliorerait la persistance de la lignée au lieu de générer des générer des
événements de spéciation. Au cours de ces analyses, j’ai détecté que l’instabilité taxonomique et
l’inflation rapide des espèces compliquent les estimations du taux de diversification des primates
- m’obligeant à utiliser une méthode de comptabilisation des biais associés aux applications du
«concept d'espèce phylogénétique» (CEP) dans la taxonomie des primates. Ainsi, dans le troisième
chapitre, j'ai choisi d'étudier plus en détail le rôle des biais systématiques dans la détermination de
la richesse des espèces existantes à travers les clades de primates. Plus précisément, j'explore les
prédicteurs de l'inflation taxonomique dans le cadre du CEP. J'étudie également si le CEP influence
les tendances de conservation des primates en testant si l'inflation taxonomique est associée au
score de menace des primates. Je détecte que ni les processus biologiques (c'est-à-dire le taux de
diversification) ni les estimations du biais imposé par l'homme (c'est-à-dire les mesures de l'effort
de recherche) ne sont des prédicteurs significatifs de l'inflation parmi les genres de primates.
6
Cependant, les analyses visant à tester l’influence du CEP sur les tendances de conservation des
primates révèlent qu’il existe une association spécifique aux régions entre l’inflation taxonomique
et le score de menace. C’est-à-dire, les genres pour lesquels il y a une forte inflation sont perçus
comme étant les plus à risque dans certaines régions, mais dans d’autres régions sont perçus
comme étant les moins à risque. Je suggère que cela pourrait être le résultat d'autres facteurs (par
exemple, la taille de l'aire géographique totale d'un genre) qui pourraient influencer la façon dont
l’inflation affecte le score de menace du genre. Ensemble, ces chapitres approfondissent notre
compréhension de la diversité des espèces et ont des implications sur la façon dont la notion
d’espèces est utilisée dans les disciplines de la biologie qui se basent sur les espèces comme unité
de comparaison importante.

7
ACKNOWLEDGEMENTS
I would like to start by thanking my amazing collaborator Arne Mooers for all his guidance
throughout the past few years. Arne, your advice has been pivotal in shaping my thesis and I am
so grateful for all the time you have invested in helping me – thank you. In the same breath, I’d
like to thank Dan Greenberg for all the time (and patience) he’s put toward helping me with
statistical analyses. Dan, you have given me great suggestions and taught me so much that has
helped to make my thesis possible – I truly appreciate it. Thank you to my supervisor Simon Reader
for the opportunity to work in his lab and for all the encouragement, feedback and financial support
he has provided me with throughout my degree. Many thanks to my co-supervisor William Wcislo
and supervisory committee members Hans Larsson and Brian Leung for their counsel. All of your
contributions have helped to improve my work and I am so grateful to each of you.
I would like to extend my sincere thanks to Raina Fan, Wyatt Toure, Paul Sims and Mélanie
Guigueno, along with other past and present members of the Reader and Guigueno labs for their
advice, friendship and encouragement. It has been a pleasure working alongside each of you and I
look forward staying in touch. An additional thanks to Paul for his invaluable statistics and coding
advice, as well as for beautiful accommodations on our lab trip to Vermont.
I must also thank the Biodiversity Ecosystem Services and Sustainability (BESS) program for their
financial support and the amazing opportunity to travel and gain new research experiences. Special
thanks to the lovely people of the Crofoot lab and Osa Conservation for allowing me to join their
research teams, and to those involved in the BESS and Neotropical Environment Option (NEO)
programs at McGill for an amazing sense of community.
My deepest appreciation goes to Alice Luo and Aiman Hadif for volunteering their time to
collecting and organizing data. You have saved me many hours of work and demonstrated such
positive and enthusiastic attitudes while doing so. Your efforts have helped to enhance my research
and I thoroughly enjoyed working with both of you!
Lastly, thank you to my family and friends who show me endless support in all that I do. Your
encouragement means the world to me.

8
CONTRIBUTION TO ORIGINAL KNOWLEDGE
The present thesis is manuscript based. All chapters herein contain original work and contributions
to knowledge. In Chapter 2, I provide evidence for behavioural flexibility mediating net rates of
evolution across primates. Although behavioural flexibility has often been suggested to influence
rates of evolution, to the best of my knowledge this is the first large-scale comparative study to
test this hypothesis in primates. Patterns in my results suggest that the association between proxies
of behavioural flexibility and diversification rate observed in my study may be a product of
behavioural flexibility buffering against extinction, rather than enhancing speciation as previously
suggested. In Chapter 3, I explore the role of taxonomic inflation and its associated biases in
dictating species richness across primate clades. My results do not suggest that a strong biological
nor a strong interest-driven mechanism is responsible for variation in observed inflation across
primate genera. I do, however, find an association between inflation and threat score that is region
specific, where highly inflated genera are considered most at risk in some regions, but least at risk
in others. This could indicate that other factors (e.g. total geographic range size) impact how
inflation influences a genera’s perceived extinction risk. These findings add to our understanding
of the causes and consequences of taxonomic inflation.

9
CONTRIBUTION OF AUTHORS
Chapter 1: General introduction
Maria J.A. Creighton wrote the chapter with feedback from Simon M. Reader.
Chapter 2: The role of behavioural flexibility in primate diversification
Maria J.A. Creighton, Arne Ø. Mooers and Simon M. Reader designed the study. Maria J.A.
Creighton collected the data. Maria J.A. Creighton and Dan A. Greenberg analysed the data with
input from Arne Ø. Mooers. Maria J.A. Creighton wrote the manuscript with input from Arne Ø.
Mooers, Dan A. Greenberg and Simon M. Reader. All authors approve the submission of this
manuscript as part of the present thesis. Manuscript in review at Animal Behaviour.
Chapter 3: Predictors of taxonomic inflation and its role in primate conservation
Maria J.A. Creighton designed the study. Maria J.A. Creighton collected and analysed the data
with input from Arne Ø. Mooers. Maria J.A. Creighton wrote the manuscript with input from Arne
Ø. Mooers and Simon M. Reader. All authors approve the submission of this manuscript as part
of the present thesis.
Chapter 4: General discussion
Maria J.A. Creighton wrote the chapter with feedback from Simon M. Reader.

10
CHAPTER 1: GENERAL INTRODUCTION

11
SPECIES AND SPECIES DIVERSITY:
Biologists have long been fascinated by the incredible range of biological diversity exhibited by
organisms across the Tree of Life. In nature, variation in organism diversity is not continuous,
thereby allowing scientists to group them together based on distinctive traits (e.g. morphology,
behaviour, karyotype) (Ereshefsky, 1992; Schemske, 2000). ‘Species’ were employed as the
lowest level of biological unity by Carl Linnaeus (Linnaeus, 1753; Svenson, 1953) and provide
biologists with a means of categorizing the natural world. Species are intended to reflect organism
diversity and, as a result, species diversity (most simply estimated by counting species – i.e. species
richness; MacArthur, 1965) is often used to estimate biological diversity (Clarke, 1975; Wilson,
1988). Species richness and thus perceived biological diversity is shown to be extremely variable
across the Tree of Life.
Animal phyla can contain one (e.g. Micrognathozoa) to upwards of 1.3 million (e.g. Arthropoda)
described species and show considerable within phyla variance in species richness (Zhang, 2013;
Scholl & Wiens, 2016). At large phylogenetic scales (i.e. across higher taxa), variation in species
richness among taxa is suggested to be driven by a range of intricate and mutually dependant
biological, historical and geographic factors (Rabosky, et al., 2012). Evolutionary biologists and
ecologists have done considerable work to elucidate the factors shaping species richness (e.g.
Coyne & Orr, 2004; Futuyma, 2009). Still, much variation remains unexplained and many putative
drivers of variation in species richness have yet to be empirically explored. Identifying the sources
of this variation is important since biologists rely on species as the fundamental unit of comparison
across many sub-disciplines of biology (Zink & McKitrick, 1995; De Queiroz, 2005). As a result,
understanding what determines species richness across the Tree of Life has implications for both
fundamental and applied areas of biology.
“Because the species is one of, if not the most significant of, the units of evolution, of systematics,
of ecology, and of ethology, the species is as important a unit of biology as is the cell at a lower
level of integration.”
― Ernst Mayr (1982, pp. 296–297)

12
Species serve many purposes across different sub-disciplines of biology. For instance, in studies
of behaviour, anatomy and physiology, studies of sample populations are often taken as being
reflective of the species as a whole (Mayr, 1982). Species are also used as the primary unit of
conservation, with species lists being used to determine which biological units should receive
conservation attention (Mace, 2004). Meanwhile, species are widely regarded as the principal unit
of evolution, with evolutionary biologists using species as a measure of evolutionary relationships
and distinctiveness (Mayr, 1969; Mayr, 1982; Mayr, 1996). Notably, the term ‘species’ can be
used to describe two biological entities that are linked to one another by necessity: the species
category (a rank in the Linnaean hierarchy) and the species taxon (which includes taxonomic
groups at the level of the species category following the application of the species category in
systematics) (Mayr, 1982). Species taxa are recognized with help of explicit definitions detailed
by various species concepts. Henceforth, I will use the term ‘species’ in reference to species taxa
rather than the species category.
As biologists, it is essential that we have a thorough understanding of the processes involved in
determining the species we rely on in our respective areas of study. Across many fields, species
are considered a result of biological and evolutionary processes, however, the role of scientists in
naming and defining species inevitably plays a role in determining species lists. Here, I discuss
two distinct determinants of extant species diversity: (i) evolutionary processes; (ii) the application
of systematic processes leading to the formal recognition of species by scientists. I explore some
notable ways in which each of these factors has been suggested to drive described species diversity,
and go on to empirically test these supposed associations in Chapters 2 and 3.
EVOLUTION AS A DETERMINANT OF SPECIES DIVERSITY – WITH A FOCUS ON
BEHAVIOUR:
Famously regarded as the ‘mystery of mysteries’ by Charles Darwin, the processes leading to the
emergence of new species remain largely unresolved (Darwin, 1859; Coyne & Orr, 2004). When
considering the determinants of species diversity across the Tree of Life one typically thinks of
the evolutionary processes involved. This is because evolutionary processes are directly
responsible for the addition of new species (through speciation) and the subtraction of existing
species (through extinction), thereby controlling the number of species within clades through time

13
(Scholl & Wiens, 2016). Historically, much work has been done to identify the determinants of
geographical species diversity (e.g. the latitudinal gradient hypothesis; Pianka, 1966; Rohde,
1992), but less focus has been put on identifying the causes of differences in diversity across clades
(Scholl & Wiens, 2016). Some extrinsic factors and intrinsic features of lineages have been
proposed to influence diversity across taxa (Sayol, et al., 2019). Empirical tests have provided
support for several of these factors indeed influencing diversity. For instance, recent evidence has
shown that metamorphosis may drive extant species diversity across insects (Rainford, et al.,
2014), impressive species diversity in African cichlid fishes has been attributed to key innovations
(McGee, et al., 2016), and urbanization has been shown to be negatively associated with diversity
across bird clades (Sol, et al., 2017). Meanwhile, factors previously thought to influence variation
in species numbers across taxa have now been shown to play a lesser role than previously
suggested. For example, sexual selection has been repeatedly suggested to drive diversity across
clades (see references in Panhuis, et al., 2001). However, measures of sexual selection (sexual size
dimorphism and degree of polyandry) have now been shown to share no association with species
richness across mammals, butterflies or spiders (Gage, et al., 2002). Thus, more work is needed to
identify the macroevolutionary processes that drive species diversity across clades.
Behaviour has long been thought to have particularly consequential impacts on evolution (see
Wcislo, 1989 for an overview). For brevity, I here mention some notable contributions. Lamarck
made many biological contributions during the early nineteenth century, a majority of which have
since been refuted. However, Lamarck did advocate that species and genera exhibit special and
diverse adaptations rather than a linear sequence toward perfection because animals must remain
in harmony with their environment (Lamarck, 1809; Mayr, 1982). Although he never suggested
an explicit process, Lamarck did suggest that it is an animals’ behaviour that reestablishes this
harmony when it becomes disturbed (Lamarck, 1809; Mayr, 1982). Thus, while many of his
theories have been discredited, Lamarck was correct in emphasizing that behaviour plays an
important role in changing the form of an organism (Wcislo, 1989). The turn of the twentieth
century marked the proposal of an explicit hypothesis describing the origins of organism
adaptation. This hypothesis emphasized a role for behaviour in influencing organism adaptation,
and – due to the important role adaptation plays in evolution – this hypothesis was influential for
views on animal behaviour and its role in evolutionary processes. In this hypothesis, later termed

14
‘the Baldwin effect’, behavioural adaptability and other non-heritable modifications are suggested
to impact an organism’s ability to persist in an ecological niche, with the ability to acquire new
behaviours impacting the reproductive success of an organism, thus affecting the genetic makeup
of a species (Osborn, 1896; Morgan, 1896; Baldwin, 1902; Simpson, 1958). For instance, if a new
predator is introduced in an organism’s external environment, individuals who adopt new
behaviours to avoid predation will increase their chances of survival, opening the door for natural
selection to act. While some assumptions made by the Baldwin effect have been criticized (e.g.
Mayr, 1963), the idea that behaviour influences evolution has remained widely advocated.
Due to its supposed role in influencing evolutionary processes, behaviour is also thought to be an
important driver of biological diversity. Specifically, behavioural flexibility (also known as
behavioural plasticity – i.e. the ability of an organism to change their behaviour in response to their
internal or external environment) has been suggested to lead to evolved increases in trait disparity
(the "behavioural drive hypothesis"; Wyles, et al., 1983; Wilson, 1985). Divergent selection can
also drive speciation events and thus, it has been suggested that behaviourally flexible taxa may
undergo faster rates of speciation, and eventual evolutionary diversification, compared to less
flexible taxa (Nicolakakis, et al., 2003; Sol, et al., 2005). If behavioural flexibility influences
evolution by increasing diversification events as suggested, this would make behaviour partially
responsible for determining species diversity across lineages. The relationship between
behavioural flexibility and species diversification has been tested with some support for
behavioural flexibility increasing net rates of diversification (e.g. Nicolakakis, et al., 2003; Sol, et
al., 2005). However, conflicting reports on the way in which behaviour is suggested to influence
evolution (e.g. evidence for behavioural flexibility inhibiting evolutionary rates over short time
scales; Huey, et al., 2003; Duckworth, 2009; Scott-Phillips, et al., 2014) and the fact that large
macroevolutionary studies have been limited to one class (Aves), makes it important to continue
investigating the role of behavioural flexibility in influencing diversity across the Tree of Life.

15
SYSTEMATICS AS A DETERMINANT OF SPECIES DIVERSITY – WITH A FOCUS ON
TAXONOMIC INFLATION:
"The so-called species problem in biology can be reduced to a simple choice between two
alternatives: Are species realities of nature or are they simply theoretical constructs of the human
mind?"
― Ernst Mayr (1982, pp. 285)
While evolution is often thought of as the primary driver of species diversity, the role of biologists
in naming and defining species plays a role in determining species richness and thus perceived
diversity across taxa. In its broadest form, the term ‘species’ refers to “the unknown element of a
distant act of creation” (Darwin, 1859, pp. 42), and is associated with more explicit definitions
detailed by various species concepts. Biologists’ interpretation of species has changed drastically
through time, with many influential naturalists including Darwin, Mayr and Simpson working
toward a common definition of ‘species’ that satisfies our understanding of biological diversity
while allowing us to identify them accurately and agreeably (Hey, 2001). Despite this work,
biologists have failed to reach a consensus on what constitutes a ‘species’ and how it should be
defined. Some argue that species represent divisions of nature made for human convenience, and
are consequently completely subjective (Coyne & Orr, 2004). As suggested by Cracraft (1987),
species are vital across biology but species concepts serve two masters: taxonomy and evolutionary
theory. This is because taxonomists must be able to operationalize a given species concept and
apply it across many groups of organisms while the resulting species taxa are often expected to
reflect distinct and comparable evolutionarily units. Changing definitions of species have led to
fluctuations in species numbers over time (Coyne & Orr, 2004; Tattersall, 2007), thereby
influencing perceived biological diversity.
The inherent instability of species lists makes it so that when considering the determinants of
species diversity across the Tree of Life, one must consider the role of taxonomy and systematics
in addition to evolutionary processes. While the previously widely used ‘biological species
concept’ (BSC) put emphasis on reproductive barriers as the defining characteristic of species
(Mayr, 1963), the ‘phylogenetic species concept’ (PSC) defines species as the smallest population
or meta-population that is distinct in heritable differences from other populations or meta-

16
populations (Cracraft, 1983; Groves & Grubb, 2011; Groves, 2014). Recent applications of the
PSC have led to a dramatic increase in species numbers across many taxa as a result of its tendency
to split taxa into a greater number of less inclusive units in comparison to the BSC (Agapow, et
al., 2004) – a phenomena which has now been referred to as ‘taxonomic inflation’. This trend has
made applications of the PSC extremely controversial. Taxonomic inflation has been widely
criticized for introducing potential biases in how ‘species’ are defined across lineages (Agapow,
et al., 2004; Zachos, et al., 2013; Zachos & Lovari, 2013). As a result, discrepancies in present-
day species richness across taxa has been suggested to be partially driven by biases associated with
applications of the PSC, rather than biological processes (Agapow, et al., 2004; Zachos, et al.,
2013; Zachos & Lovari, 2013). Some have argued that the PSC, while causing some increase in
species numbers, is still the best method of recognizing species and that criticisms of bias are in
many cases unfounded (Groves, 2013). Others have argued that observed inflation is artificial and
reflects shortcomings of the PSC and reliance on insufficient data (Zachos, et al., 2013; Zachos &
Lovari, 2013). Much of the aforementioned contention stems from the fact that little work has been
done to empirically test trends in inflation or validate supposed biases. The reliance on species as
a fundamental unit of comparison across many biological sub-disciplines makes it of vital
importance to determine if and how changes in taxonomic practices (e.g. applications of the PSC)
bias variability in species numbers across taxa which might otherwise be interpreted as being
representative of some underlying biological reality. This could have implications for how
scientists choose to use species in disciplines like evolutionary biology, where units of comparison
must be comparable across taxa.
PRIMATE SPECIES DIVERSITY:
Primates are one of the most species rich (over 500 species; IUCN/SSC Primate Specialist Group,
2018) and rapidly diversifying (Upham, et al., 2019a) mammal clades. Similar to patterns noted in
other taxonomic groups (e.g. birds; Nicolakakis, et al., 2003), primates exhibit a great deal of
asymmetry in species richness among higher taxa (Upham, et al., 2019a; 2019b). For example,
primate families like Cercopithecidae are incredibly species rich (comprising approximately 155
species; IUCN/SSC Primate Specialist Group, 2018; see Figure 1.1). Meanwhile, other families
like Daubentoniidae are depauperate (comprising a single species; IUCN/SSC Primate Specialist

17
Group, 2018; see Figure 1.1) – illustrating a clear imbalance in species diversity across primate
clades.
Primates serve as a particularly interesting model system for studying asymmetry in described
species diversity because they are one of the more highly studied groups of organisms (Nunn, et
al., 2004; 2010) and have, therefore, undergone persistent reassessment of species richness since
the 1960s (Rylands & Mittermeier, 2014). As a result, there are few gaps in our knowledge of
primate taxonomy compared to lesser studied taxa where new discoveries are being made regularly
and lineage relationships are considerably unresolved (e.g. invertebrates – see Kur, et al., 2016).
This research charisma has resulted in the relatively comprehensive application of multiple species
concepts in primate taxonomy through time including the BSC (e.g. Honacki, et al., 1982) and the
PSC (e.g. Groves, 2001 to present day International Union for Conservation of Nature (IUCN)
species lists). Primates additionally present considerable among-lineage variation in traits
suggested to drive speciation (e.g. behavioural flexibility), and have large amounts of available
data on many aspects of their behaviour, ecology and life history. This make them a good study
system for large comparative studies of macroevolutionary trends. In primates, a few variables
have been positively associated with increased species diversity across higher taxa including
diversification rate shifts (Arbour & Santana, 2017; Upham, et al., 2019a), parasitism (Nunn, et
al., 2004) and taxonomic reevaluation of particular groups (e.g. increase in species numbers across
the Neotropical primates; Isaac & Purvis, 2004). However, the mechanisms underlying these
associations remain undiscovered and many suggested determinants of described species diversity
have yet to be empirically explored.

18
Figure 1.1: Bar graph illustrating variation in species richness among primate families according
to the IUCN/SSC Primate Specialist Group (2018) where ‘n’ equals the total number of species in
each family. Legend colours denote primate parvorder/infraorder.
THESIS OVERVIEW:
Here, I have introduced the two major determinants of species diversity across taxa: evolutionary
processes and systematic practices involved in classifying species. In this thesis I explore how
these two factors influence species diversity across primates. In Chapter 2, I explore the role of
evolutionary processes in driving species diversity across primate clades by testing how
behavioural flexibility influences primate diversification. The ‘behavioural drive hypothesis’
posits that behavioural flexibility increases rates of evolution and diversification, as novel
behaviours expose individuals to new selection regimes (Wyles, et al., 1983; Wilson, 1985). As a
result one would expect that behaviourally flexible taxa diversify more quickly and thus undergo
speciation more rapidly in comparison to less behaviourally flexible taxa. I use comparative
techniques to explore the relationship between multiple proxies of behavioural flexibility and
diversification rate in primates. In doing so I present a new method to help account for biases
associated with recent taxonomic reclassifications when generating classic estimates of

19
diversification rate. This approach allows me to consider the diversification of recently evolved
lineages (e.g. subspecies), often omitted from higher-order phylogenies (i.e. species trees) and thus
often not considered by alternative diversification rate metrics (e.g. the DR measure from Jetz, et
al., 2012). Using these methods I show that some measures of behavioural flexibility share a
positive association with primate diversification rate – consistent with the idea that behavioural
flexibility drives evolutionary diversification. However, I find these associations when examining
the diversification of well-established and persistent lineages, in comparison to diversification
metrics incorporating more recently evolved lineages. Given that I find associations between
behavioural flexibility and diversification rate when examining older as opposed to newer
diversification events even after controlling for potential sampling biases, I suggest that extinction
resistance, rather than speciation, may be an important mechanism linking behavioural flexibility
and diversification rate in primates.
In Chapter 3 I explore the role of systematic practices in driving species richness and thus
perceived diversity across primate clades. More specifically I explore predictors of taxonomic
inflation under the PSC – a phenomena that presented complications requiring new approaches for
estimating lineage diversification rate in Chapter 2 due to its disparate effects across primate taxa.
I find that neither research effort in fields suggested to be associated with inflation (i.e. molecular
genetics and conservation) nor the rate at which lineages evolve explain inflation across primate
genera. In addition to complicating evolutionary measures as discussed in Chapter 2, inflation has
also been suggested to have implications in applied fields of biology – most notably conservation.
It has been suggested that inflation may result in a greater number of threatened species and more
imperilled threat statuses for species that are already listed (Agapow, et al., 2004; Isaac, et al.,
2007). As a consequence, rare but poorly-defined taxa may be prioritized over well-defined and
perhaps biologically more distinctive taxa (Pillon & Chase, 2007). Therefore, I go on to explore
whether taxonomic inflation contributes to driving threat score across primate genera. I find that
associations between inflation and threat score vary by region, sharing a positive association in
Africa and Asia, no association in Madagascar, and a negative association in the Neotropics. I
suggest these differences may indicate that other factors (e.g. the total geographic range size of
genera) influence how inflation affects threat score. Regardless, I suggest that organizations
involved in conservation (e.g. the IUCN) may benefit from adopting their own species criteria or

20
shifting more resources toward regional management efforts that are less likely to be impacted by
changing species designations. Overall, my thesis contributes new insights into the mechanisms
suggested to drive species diversity across primate clades and provides considerations for sub-
disciplines of biology relying on species as a fundamental unit of comparison.

21
CHAPTER 2: THE ROLE OF BEHAVIOURAL FLEXIBILITY IN
PRIMATE DIVERSIFICATION
Maria J.A. Creighton, Dan A. Greenberg, Simon M. Reader & Arne Ø. Mooers In review at Animal Behaviour

22
ABSTRACT:
Identifying the factors that influence species diversification is fundamental to our understanding
of the evolutionary processes underlying extant biodiversity. Behavioural innovation, coupled with
the social transmission of new behaviours, has been proposed to increase rates of evolutionary
diversification, as novel behaviours expose populations to new selection regimes. Thus, it is
believed that behavioural flexibility may play an important role in driving evolutionary
diversification across animals. We test this hypothesis within the primates, a taxonomic group with
considerable among-lineage variation in both species diversity and behavioural flexibility. We
employ a time cut-off in our phylogeny to help account for biases associated with recent taxonomic
reclassifications and compare three alternative measures of diversification rate that consider
different phylogenetic depths. We find that the presence of behavioural innovation and social
learning are positively correlated with diversification rates among primate genera, but not at
shallower taxonomic depths. Given that we find stronger associations when examining older as
opposed to more recent diversification events, we suggest that extinction resistance, as opposed to
speciation, may be an important mechanism linking behavioural flexibility and primate
diversification. Our results contrast with work linking behavioural flexibility with diversification
of birds at various phylogenetic depths. We offer a possible dispersal-mediated explanation for
these conflicting patterns, such that the influence behavioural flexibility plays in dictating
evolutionary trajectories differs across clades. Our results suggest that behavioural flexibility may
act through several different pathways to shape the evolutionary trajectories of lineages.
KEYWORDS: behavioural drive; behavioural flexibility; evolutionary diversification; extinction;
primates; speciation

23
INTRODUCTION:
Extant species diversity is remarkably variable across the Tree of Life (Willis, 1922; Williams,
1964). For clades of the same age, differences in net diversification rate (i.e. speciation rate minus
extinction rate) ultimately drive differences in clade size. Both the external environment (e.g.
Badgley, 2010; Kozak & Wiens, 2010; Frey, 2010) and intrinsic features of a lineage (e.g. Raikow,
1986; Heard & Hauser, 1995) can influence net diversification. Despite ongoing study, there
remains considerable debate over the factors that lead to differences in diversification rate among
lineages, and their relative importance (e.g. Lewontin, 1983; West-Eberhard, 1989; Isaac, et al.,
2005; Rabosky, 2009; see review by Wiens, 2017).
Plasticity has been repeatedly proposed to play a major role in shaping evolutionary trajectories in
general, and speciation in particular (Baldwin, 1902; Lewontin, 1983; Bateson, 1988; Wcislo,
1989; Odling-Smee, et al., 2003; West-Eberhard, 2003; Pelletier, et al., 2009), and theoretical
modelling supports its potential influence (e.g. Hinton & Nowlan, 1987; Anderson, 1995; Behera
& Nanjundiah, 1995; Ancel, 1999; 2000). Behavioural development and expression often allow
for more rapid responses than other forms of plasticity such as induced morphological changes
(Duckworth, 2009; Snell-Rood, 2013; West-Eberhard, 2003). Thus, plasticity of behaviour has
been hypothesized to play a particularly important role in influencing evolutionary trajectories of
animal lineages (Wyles, et al., 1983; Wilson, 1985; West-Eberhard, 2003). The propensity to adopt
new behaviours can greatly and quickly alter ecological niches for populations, exposing those
populations to new and potentially divergent selective regimes. This can lead to increased trait
disparity (the "behavioural drive hypothesis"; Wyles, et al., 1983; Wilson, 1985); and importantly,
divergent selection also drives speciation events. As a result, it has been suggested that
behaviourally flexible taxa (i.e. those taxa exhibiting high propensities for behavioural change due
to, for example, learning or readiness to transition to new conditions; Sol & Lefebvre, 2000; Audet
& Lefebvre, 2017) may undergo faster rates of speciation, and eventual evolutionary
diversification, compared to less flexible taxa (Sol, et al., 2005; Grant & Grant, 2008; Price, 2008;
Sol & Price, 2008; Tebbich, et al., 2010). However, despite support from theoretical modelling
(e.g. Price, et al., 2003; Lachlan & Servedio, 2004; Lapiedra, et al., 2013), the idea that behavioural
flexibility enhances diversification rates remains contested. Some dispute the extent to which
behaviour plays an active role in dictating animal diversity (e.g. Scott-Phillips, et al., 2014).
24
Meanwhile, an alternative hypothesis posits that behavioural flexibility may inhibit, rather than
enhance, species diversification: populations that can utilize new resources or transition to new
environments are shielding their genomes from bouts of strong directional selection (Bogert, 1949;
Huey, et al., 2003).
Duckworth (2009) suggests that behavioural flexibility could both dampen and promote
evolutionary rates depending on the time scale. Under this proposed framework, behavioural
flexibility inhibits evolution on short time scales by buffering against abrupt environmental
changes that may otherwise result in a population bottleneck or strong bouts of directional
selection. Over longer time scales, the same behavioural shift can lead to speciation, either by
setting the stage for allopatric speciation or by exposing the newly situated population to novel
selection regimes (Huey, et al., 2003; Losos, et al., 2004; Duckworth, 2009; see example in Muñoz
& Losos, 2018).
Previous studies have provided support for behavioural flexibility both driving (e.g. Yeh, 2004;
Yeh & Price, 2004; Tebbich, et al., 2010, Riesch, et al., 2012; Foote, et al., 2016) and inhibiting
(e.g. Losos, et al., 2004; Weber, et al., 2004; Shultz, et al., 2005; Gonzalez-Voyer, et al., 2016)
evolution. However, many of these studies have primarily considered the effects of behavioural
flexibility on microevolutionary change at short time scales (e.g. recent speciation events or
population decline). One notable exception is in birds, where behavioural flexibility has been
associated with multiple estimates of lineage diversification (Nicolakakis, et al., 2003; Sol, et al.,
2005 – also see Sol, 2003; Sayol, et al., 2019). These studies have employed two proposed
correlates of behavioural flexibility: brain size relative to body size (a structural measure presumed
and shown elsewhere to be associated with behavioural flexibility; e.g. Lefebvre, et al., 2004) and
innovation rate (a behavioural measure) taken from literature surveys. Both large relative brain
size and high innovation rates were associated with heightened diversification in birds
(Nicolakakis, et al., 2003; Sol, et al., 2005; Sayol, et al., 2019), consistent with the idea that
behavioural flexibility positively impacts diversification. However, such tests have yet to be
applied across other taxa, making it difficult to generalize the role of behaviour in shaping the Tree
of Life.

25
Here, we explore the relationship between four proxies of behavioural flexibility and several
measures of diversification rate in primates, a taxonomic group with considerable among-lineage
variation in both behavioural flexibility (Reader & Laland, 2002; Reader, et al., 2011) and extant
species diversity (Upham, et al., 2019a; 2019b). Variables associated with diversity of other taxa
(e.g. geographic range size and latitude) have been shown to be poor predictors of primate
diversification (Arbour & Santana, 2017; Upham, et al., 2019a), leaving a great deal of what shapes
extant primate diversity unexplained. We focus on two behavioural measures of behavioural
flexibility, the presence or absence of published reports of innovation and of social learning, and
two brain size measures widely thought to be associated with ability to exhibit flexible behaviours.
Consistent with what has been reported for birds (Nicolakakis, et al., 2003; Sol, et al., 2005; Sayol,
et al., 2019) and Duckworth (2009)’s proposal that behavioural flexibility promotes diversification
events over longer evolutionary time scales, we predict that our separate measures of behavioural
flexibility will covary positively with diversification rates across primate lineages. To examine
how this association changes at different phylogenetic depths, we examine how behavioural
flexibility correlates with diversification over both shallow and deep time depths in our phylogeny.
Understanding how behaviour and ecology may interact to shape evolutionary patterns provides a
glimpse into some of the processes that have shaped primate biological diversity and could, in
turn, dictate future diversity.
METHODS:
Data
Diversification Rate
Estimating diversification rates is challenging because it depends on an accurate assessment of
both the taxonomic richness and divergence time of a given lineage. A previous study testing
whether behavioural flexibility drives shallow divergences used subspecies per species as a
measure of subspecific diversification (Sol, et al., 2005). Using this subspecies metric could
introduce considerable bias when applied in primates, however, as primate taxonomic richness has
changed drastically over recent decades (Tattersall, 2007; Groves, 2014; Rylands & Mittermeier,
2014), with much of this change attributed to application of the ‘phylogenetic species concept’
(PSC) and its tendency to raise former subspecies and variants to the full species rank (Tattersall,
2007). Importantly, it has been suggested that these elevations in subspecies status have been

26
biased toward certain taxa (Isaac, et al., 2004), which would lead to inconsistent estimates of
species versus subspecies richness across lineages. Studies using other estimates of primate
diversification (i.e. diversification analyses using TreePar; Stadler, 2011) have been hindered by
the applications of the PSC, particularly when it comes to accurately estimating shallow
divergences (Springer, et al., 2012). Modern primate phylogenies are also not reflective of modern
primate taxonomies, including some phylogenetic species and omitting others, preventing us from
using recently described evolutionary rate measures (e.g. Jetz, et al., 2012; Mitchell & Rabosky,
2017) that rely on a comprehensive phylogeny with consistent species estimates among clades.
Instead, we used well-resolved “lineages” that putatively reflect stable species complexes. We
started with the most widely used, dated primate tree publicly available at the time of this study,
the GenBank taxonomy consensus tree provided on the 10kTrees website (version 3) (Arnold, et
al., 2010), containing 301 tips. We then created a time cut-off in the tree at the time when we
determined a majority of robust biological species described in Honacki et al. (1982) had evolved
(1.1mya). We chose Honacki et al. (1982) as it was the last major primate taxonomy published
before the introduction of the PSC (Cracraft, 1983). After creating this time cut-off, we
subsequently eliminated shallow divergences occurring after 1.1mya from the consensus tree (see
Figure S2.1). Each branch in the tree that was extant at 1.1mya was retained in the tree and
designated as a stable "lineage". We then additionally pruned species from this phylogeny that
were no longer recognized by modern taxonomies (IUCN/SSC Primate Specialist Group, 2018).
This resulted in 241 identifiable lineages to compare in terms of taxonomic richness and
divergence times. Using the most recently published primate species and subspecies list from the
IUCN/SSC Primate Specialist Group (2018), we referenced taxonomic and phylogenetic works to
assign each of the 705 species and subspecies to one of these 241 lineages. This allowed us to
assign each lineage an agnostic “taxon richness” score (i.e. the sum of all monotypic species and
subspecies in a lineage; see Figure S2.1) that accounts for the discrepancies in subspecies
elevations across lineages. Each species or subspecies listed by the IUCN/SSC Primate Specialist
Group (2018) was also assigned to one of the 66 genera named in our 10kTrees phylogeny (Arnold,
et al., 2010). After eliminating two individual species and one genus in our tree that could not be
resolved using these methods (see supplementary material), our study considered 703 taxa (species
or subspecies) assigned to 239 lineages and 65 genera.
27
To estimate lineage diversification rate we used the method-of-moments estimator (Magallon &
Sanderson, 2001) that divides the natural log of “taxon richness” (species and subspecies) by
lineage stem age to produce a ‘Taxa per Lineage Diversification Rate’ that should be less biased
by recent subspecies elevations. This method was repeated at the genus level where the natural log
of “taxon richness” for each genus was divided by the stem age of that genus (hereafter ‘Taxa per
Genus Diversification Rate’). We note that all log transformations referenced hereafter refer to
natural log transformations (loge). Lastly, we created a second, and perhaps more conservative
estimate of genus diversification rate where richness scores were generated using the number of
lineages (n=239) per genus, rather than the number of taxa described by the IUCN/SSC Primate
Specialist Group (2018), hereafter ‘Lineage per Genus Diversification Rate’. A few genera were
not monophyletic on our tree, and we considered these on a case by case basis (see the
supplementary material).
We illustrate these methods and present associated calculations using genus Aotus as an example
in the supplementary material to provide some considerations on the potential uses and limitations
of this approach.
Behavioural Proxies of Behavioural Flexibility
We focused on two key behaviours to infer behavioural flexibility: innovation and social learning.
Innovation and social learning are both important in determining the macroevolutionary effects of
behavioural flexibility because multiple individuals must acquire an innovation through social
learning or independent innovation to have population-level effects (Wyles, et al., 1983; Wilson,
1985; Duckworth, 2009). In addition to facilitating the transmission of innovations throughout a
population, social learning can also be a valuable measure of population-level behavioural
flexibility on its own as it reflects the ability of individuals within a population to pick up
behaviours that are novel to them but not necessarily novel to the population. We note that social
learning and innovation are taxonomically widespread (Reader & Biro, 2010; Snell-Rood, et al.,
2015). However, we assume that species with no published accounts of social learning or
innovation are likely relying on these behaviours infrequently. Moreover, the innovation and social
learning data used here have been positively associated with other measures of behavioural
flexibility (e.g. brain size measures; Reader, et al., 2011; Navarrete, et al., 2016). For innovation,

28
we focus on technical innovations (classified as those involving tool use following Navarrete, et
al., 2016) because these more easily defined behaviours have been linked to complex cognition
(Overington, et al., 2009), and reports of other classes of innovation (e.g. food type innovation)
can be highly influenced by opportunistic events (Ducatez, et al., 2015). Combined with the fact
that taxa with reports of technical innovation also tended to be those with evidence of other
innovation types (see data in Navarrete, et al., 2016), this likely makes technical innovation a
robust estimate of innovativeness across primates.
Counts of innovation and social learning per lineage came from Reader et al. (2011) and Navarrete
et al. (2016). Reader et al. (2011) established this dataset through a survey of over 4000 published
articles for examples of social learning and behavioural innovation. Reader et al. (2011, p. 1018)
define an innovation as the tendency to “discover novel solutions to environmental or social
problems”. These data were later subdivided into different innovation categories by Navarrete et
al. (2016), including ‘technical’ innovations, defined as innovations involving tool use. Reader et
al. (2011, p. 1018) define social learning as the tendency to “learn skills and acquire information
from others”, including instances of social learning from both kin and unrelated individuals. Social
learning was often inferred from observational data in the original reports.
As an alternative to treating behavioural data as a binary metric (e.g. innovativeness in Ducatez,
et al., 2020) some studies have used “rate” measures of behaviours: residuals from a log-log plot
of the total number of recorded instances of a behaviour (e.g. social learning) and an estimate of
research effort (e.g. the number of papers published on that taxa; e.g. Sol, et al., 2005; Reader, et
al., 2011; Navarrete, et al., 2016; Ducatez, et al., 2020). However, the choice of how to model the
relationship between total number of recorded innovation or social learning instances and research
effort matters considerably when creating these residual rate measures. For our data, the
relationship between the total number of innovation or social learning instances and research effort
was non-linear. This made the choice of model structure non-trivial, with different models proving
difficult to justify over one another. Residuals from these models additionally showed further
structural issues, including failure to meet assumptions about homoscedasticity. Thus, we opted to
use binary measures, which allowed us to use data imputation methods to minimize biases caused
by under-studied taxa, statistically account for potential biases associated with summarizing

29
behavioural data at higher taxonomic levels, and run simulations to address the assumptions
underlying our analyses. We therefore assigned each lineage or genus binary scores of 1 (presence
of innovation or social learning) or 0 (absence of innovation or social learning). Further
considerations regarding the use of literature-based estimates of behavioural flexibility can be
found in the supplementary material.
Structural Proxies of Behavioural Flexibility
Literature-based evidence for behavioural flexibility across taxa has its limitations and so we chose
to also consider structural correlates of behavioural flexibility. It is widely thought that particular
brain regions are associated with flexible behaviour – particularly the neocortex (see, e.g.,
Keverne, et al., 1996; Mikhalevich, et al., 2017) and cerebellum (Vandervert, 2003; Vandervert,
et al., 2007; Barton, 2012). Therefore, in addition to total brain size (relative to body mass), we
considered the sum of neocortical and cerebellar volumes relative to rest of total brain volume as
another proxy for behavioural flexibility. Using both behavioural measures and structural
correlates of behavioural flexibility, we were able to compare the consistency of results across
different proxies for behavioural flexibility.
Lineage-level estimates for all brain measures were calculated by taking the geometric mean of
taxon volumes for each lineage. Brain volume relative to body size (hereafter ‘relative brain
volume’) was estimated by regressing lineage-level estimates of logarithmic endocranial volume,
in cm3, (ECV) (Powell, et al., 2017) (hereafter ‘brain volume’) as a function of logarithmic body
mass, in grams (Jones, et al., 2009), and retaining the residuals (Dunbar & Schultz, 2007). While
some recent studies have used phylogenetically correct residuals to model relative brain volume
(e.g. Sayol, et al., 2019), heteroscedasticity among residuals obtained from phylogenetic models
led us to prefer our ordinary least squares residuals. Importantly, these residuals were analysed
downstream in a phylogenetic framework where a phylogenetic autocorrelation was incorporated
in the diversification analyses. Similar to relative brain volume, neocortex and cerebellum volume
relative to rest-of-brain volume (hereafter ‘relative neocortex and cerebellum volume’) was
estimated by taking the residuals from a log-log regression of the combined neocortex and
cerebellum volumes on the rest-of-brain volumes (i.e. total brain volume minus neocortex and
cerebellum volumes) taken from Navarrete et al. (2018) and the compilation in DeCasien &

30
Higham (2019). Genus-level estimates for structural proxies of flexibility were calculated by
taking the geometric mean of the lineage estimates within each genus. Further details, and
considerations regarding the use of structural proxies of behavioural flexibility, and residual brain
measures can be found in the supplementary materials along with correlation coefficients for all
predictor variables (Table S2.1).
Phylogenetic signal of all predictor and response variables are reported in the supplementary
material (Table S2.2).
Analysis
All analyses used R version 3.6.3 (R Core Team, 2020).
Trait Imputation
While we collected data for brain size, body mass, and behavioural flexibility from the most
comprehensive datasets and compilations available, research biases and the persistent
reassessment of primate taxonomy has resulted in inconsistent data coverage across lineages, and
there were still many lineages that were missing data (see Figure S2.2). To maximize our
evolutionary inferences on diversification and allow for the inclusion of data-poor lineages, we
chose to impute missing predictor variables using phylogenetic imputation methods (see
supplementary material for details and reports of predictive accuracy from model cross-validation;
Table S2.3 and Figure S2.3). Data on relative neocortex and cerebellum volume were sparse and
unevenly distributed across the phylogeny (82.4% of lineages missing data; Table S2.3), making
it infeasible to reliably impute missing values. We thus only ran models of relative neocortex and
cerebellum volume on the original, non-imputed dataset. All of the regressions we report below
were repeated for the original, non-imputed datasets (see Results and the supplementary material
Tables S2.4, S2.5 and S2.6) and except as noted gave a similar pattern of results.
Predictors of Diversification
To assess the relationship between our measures of behavioural flexibility and diversification rate
at the lineage-level (Taxa per Lineage Diversification Rate) we used phylogenetic generalized least
squares (PGLS) regressions implemented using the nlme package (Pinheiro, et al., 2020) with the

31
10kTrees consensus tree including our 239 defined lineages. PGLS is a common regression
method used to investigate evolutionary associations while accounting for the fact that closely-
related lineages tend to be similar (e.g. in body size, life history and ecology; see Freckleton, et
al., 2002). Continuous data were log-transformed and scaled by 2 standard deviations in all models
for both the lineage and genus-level analyses to make effect sizes comparable to those reported for
binary variables (Gelman, 2008). After imputing missing values, our dataset contained 54 lineages
scored as having evidence of social learning (scored as 1) and 28 lineages scored as having
evidence of technical innovation (scored as 1). Wyles et al. (1983) predicted accelerated evolution
in species with a dual capacity for innovation and social propagation of new behaviours, therefore,
we also tested a combined measure of technical innovation and social learning. In this combined
measure 26 lineages with the presence of both behaviours were scored as 1, and those exhibiting
only one or neither behaviour were scored as 0.
To assess the relationship between our measures of behavioural flexibility and diversification rate
deeper in the tree we repeated the same analysis at the genus-level using two different estimates
of diversification rate: Taxa per Genus Diversification Rate and the more conservative Lineage
per Genus Diversification Rate. After imputing missing values, our dataset of 60 genera contained
21 genera scored as having evidence of social learning, 9 genera scored as having evidence of
technical innovation and 8 genera with evidence of both behaviours.
Body mass and attendant life history traits have been predicted to impact diversification rates in
some taxa, albeit with conflicting results (e.g. Cardillo, et al., 2003; Paradis, 2005; Fontanillas, et
al., 2007; Thomas, et al., 2010), and body mass is closely correlated with many primate life history
traits (e.g. age at first reproduction, maximum lifespan; Charnov & Berrigan, 1993; Purvis, et al.,
2003; Street, et al., 2017). To examine whether our results could stem from confounding effects
of body mass and its correlates, we ran PGLS analyses to test body mass as an independent
predictor of our diversification rate measures. Results from these tests were non-significant across
all measures of diversification (see supplementary material Tables S2.4 to S2.6).

32
Genus-Level Simulations
Genera were considered behaviourally flexible if any of their daughter lineages had evidence of
innovation or social learning, which potentially introduces a statistical bias if more lineage-rich
genera (which will generally have higher diversification rates) are more likely by chance to include
at least one lineage that expresses technical innovation or social learning. To account for this
possible bias, we simulated the neutral evolution of technical innovation and social learning across
the primate phylogeny 1000 times using the Mk model of discrete trait evolution (Lewis, 2001).
We opted to model the evolution of these behaviours under a symmetrical model of trait evolution
since with smaller datasets such as ours, there is no power to prefer asymmetric models (Mooers
& Schluter, 1999). From these stochastic distributions of the two traits, we repeated our analyses
of diversification rate and created a distribution of expected effect sizes under a null evolutionary
scenario. More diverse genera may also be more likely, by chance, to have well-studied lineages,
which could create a bias toward observing the presence of innovation or social learning in diverse
genera (Ducatez & Lefebvre, 2014). Although data did not suggest that lineage-rich clades were
more likely to have intensely investigated lineages in our dataset (see Figures S2.4 and S2.5), we
nonetheless opted to take research effort into account in our analysis and expanded upon our first
simulation to consider a scenario where the presence of technical innovation or social learning
may go unobserved if insufficient research effort was directed at a lineage. We took the 1000
simulations of neutral evolution of technical innovation and social learning, and then randomly
‘evolved’ research effort on each, independently of the evolution of technical innovation and social
learning. We then converted the presence of these behaviours to absences in our simulated datasets
if a lineage’s ‘evolved’ research effort was below the minimum threshold of studies for a lineage
with observed technical innovation (as it contained the higher research effort threshold than social
learning; Figure S2.6). By repeating our analyses of diversification rate with these new simulated
datasets where lineages with low research effort were assigned ‘hidden states’, we were able to
see if a bias towards having better studied lineages in diverse genera could drive a positive
association between behavioural proxies of flexibility and diversification rate by chance and
independent of biological mechanisms. Importantly, this simulation makes the assumption that
research effort and behavioural flexibility are independent, and if this is not true (i.e. if
behaviourally flexible lineages attract research effort; we discuss this possibility in the ‘Research
Effort Bias’ section of supplementary material) then the results of this simulation would actually

33
be conservative. We detail both simulations, along with considerations about using research effort
as a covariate in binary models (Ducatez, et al., 2020), in the supplementary material.
Ethical Note
This research was comparative and was based on data available in previously published literature.
RESULTS:
Lineage-Level Predictors of Diversification
We found no support for an association between behavioural flexibility and diversification rates
when testing our measures of behavioural flexibility at the lineage level (results summarized in
Figures 2.1 and S7; Table S2.4). Social learning (p= 0.171), technical innovation (p= 0.792), the
combined presence of technical innovation and social learning (p= 0.979), relative brain volume
(p= 0.215), relative neocortex and cerebellum volume (p= 0.664), and body mass (p= 0.764; Table
S2.4) did not exhibit noteworthy associations with Taxa per Lineage Diversification Rate in either
direction.
Genus-Level Predictors of Diversification
Technical innovation (p= 0.577), social learning (p= 0.442), the combined presence of technical
innovation and social learning (p= 0.411), relative neocortex and cerebellum volume (p= 0.930),
and body mass (p= 0.204) did not exhibit noteworthy associations with Taxa per Genus
Diversification Rate (Figures 2.1 and S2.7; Table S2.5). Relative brain volume was insignificantly
(p= 0.108), but positively, related to diversification rate, and this positive relationship was
significant and positive in the non-imputed dataset (p= 0.004).
In contrast to the other diversification measures, Lineage per Genus Diversification Rate was
positively associated with all three behavioural measures of behavioural flexibility (results
summarized in Figures 2.1 and S2.7; Table S2.6). Genera with records of technical innovation
were shown to have a faster mean Lineage per Genus Diversification Rate (0.136 lineages my-1)
than those with no reports (0.070 lineages my-1; ß [95% CI] =0.066 [0.002-0.130]; p= 0.048).
Genera with records of social learning similarly exhibited a faster mean Lineage per Genus
Diversification Rate (0.137 lineages my-1) than those without (0.049 lineages my-1; ß [95% CI]

34
=0.088 [0.043-0.132]; p< 0.001). Genera with reports of both technical innovation and social
learning also exhibited a faster mean Lineage per Genus Diversification Rate (0.153 lineages my-
1) compared to those with evidence for only one or neither behaviour (0.068 lineages my-1; ß [95%
CI] =0.085 [0.018-0.151]; p= 0.015). Based on our simulation testing for a lineage-richness
sampling bias, we found that these effect sizes were unlikely to be due to chance alone for technical
innovation (p= 0.028), social learning (p= 0.002) and the combined presence of both behaviours
(p= 0.008) (see Figure S2.8 and supplementary results). After expanding our simulation to consider
a research effort bias, significance of these effects remained for social learning (p= 0.019) and its
combined presence with technical innovation (p= 0.027), but the effect of technical innovation
alone was no longer nominally significant (p= 0.109) (see Figure S2.9 and supplementary results).
No structural proxies of behavioural flexibility shared notable associations with Lineage per Genus
Diversification Rate (Figures 2.1 and S2.7; Table S2.6).

35
Figure 2.1: Results from PGLS analyses showing the association of proxies of behavioural
flexibility with Taxa per Lineage Diversification Rate (DR), Taxa per Genus Diversification Rate
and Lineage per Genus Diversification Rate across primates. 95% confidence intervals are
represented by horizontal lines around the associated value. Diamonds indicate diversification
rates estimated with species/subspecies richness, and squares indicate diversification rates
estimated with lineage richness. Results presented include imputed data when available and brain
measures were standardized (ln x/(2sd)). Significance indicated as: +P≤0.1; *P≤0.05; **P≤0.01.
DISCUSSION:
We find little to no compelling support for an association between our proxy measures of
behavioural flexibility and recent primate diversification rates of young species and subspecies,
however we do find some evidence supporting a positive association when looking at the
diversification of older primate lineages. This pattern could be explained in several ways, and
interpretation of these results depend on the assumptions one makes about our different measures
of diversification rate.

36
One benefit of our study design is that it allowed us to consider taxa that are commonly overlooked
(i.e. subspecies and species omitted from higher order phylogenies), many of which likely
represent very recent splitting events. The weak associations with behavioural flexibility that we
observed at shallower time scales could be explained in several ways. On one hand, this pattern
could be reflective of biases in describing taxa (species and subspecies) among groups. While our
time cut-off, and use of both species and subspecies, mitigates against biases associated with the
elevation of subspecies under the PSC, if less flexible species are more likely to have a larger
number of taxa described overall (e.g. based on regional biases in designating species or subspecies
that favour inflexible clades) then this could obscure underlying biological patterns. If this is the
case, then behavioural flexibility may enhance diversification by acting on speciation, and we
observe stronger associations when ignoring shallow splits because our diversification rate metric
calculated using lineage-richness is less biased by this phenomenon. On the other hand, if we take
our results at face value, a pattern of stronger associations deeper in the phylogeny could indicate
that time plays an even larger role in the relationship between behavioural flexibility and
diversification than previously suggested by Duckworth (2009).
Under Mayr’s ‘ephemeral speciation model’ (Mayr, 1963; Rosenblum, et al., 2012) and the related
‘ephemeral divergence hypothesis’ (Futuyma, 1979; 2010), divergence can occur rapidly and
often, but many newly diversifying lineages do not persist, instead being eradicated via extinction
or ‘reabsorption’ by hybridization (see, e.g., Rosenblum, et al., 2012). It is possible that a number
of the described species and subspecies used here (IUCN/SSC Primate Specialist Group, 2018)
represent such ephemeral diversification events, especially considering that the PSC has facilitated
the splitting of very closely related populations. If so, our results could be explained if behavioural
flexibility buffers against extinction through behavioural shifts. Behavioural flexibility would then
promote diversification through bolstering lineage persistence rather than the rate of splitting; and
would be revealed when comparing the accumulation of lineages that have escaped extinction (i.e.
looking deeper in the tree). This would be complementary to findings from Arbour & Santana
(2017), who show that decreased extinction preceded a shift to increased evolutionary rates in the
most speciose primate family (Cercopithecidae), and with evidence suggesting behavioural
flexibility is beneficial for population persistence in birds (e.g. Shultz, et al., 2005; Rossmanith, et

37
al., 2006; Sol, et al., 2007, Ducatez, et al., 2020). Under this scenario, the positive associations we
find are not the result of behavioural flexibility enhancing evolutionary rates by facilitating
divergence events, and instead indicate that extinction resistance may be an important mechanism
linking behavioural flexibility and primate diversification. Our results stand in contrast with
consistent reports of behavioural flexibility enhancing diversification of birds even at shallow
phylogenetic depths (Nicolakakis, et al., 2003; Sol, et al., 2005; Sayol, et al., 2019).
A potential explanation for differing effects of behavioural flexibility in birds versus primates
could be that the heightened dispersal capabilities (i.e. flight) of birds makes behavioural flexibility
particularly beneficial for these taxa when it comes to establishing in new environments. This
could cause behavioural flexibility to enhance bird speciation via increased success in dispersal
events while also buffering against extinction – leading to the strong effects that have been
observed on their net rates of evolution (Nicolakakis, et al., 2003; Sol, 2003; Sol, et al., 2005;
Sayol, et al., 2019). Comparatively, primates have much more limited dispersal capabilities and
thus behavioural flexibility may buffer against extinction, but have little effect on promoting
allopatric establishment and subsequent speciation. If true, it is possible that behavioural flexibility
affects evolutionary trajectories via different mechanisms in these clades.
Directly testing whether behavioural flexibility buffers against extinction may be difficult, because
measuring extinction rates at macroevolutionary scales is notoriously imprecise (Rabosky et al.,
2017; Louca and Pennell 2020). Future studies could test proxies of primate behavioural flexibility
against estimates of extinction vulnerability (see, e.g., Nicolakakis, et al., 2003; Ducatez, et al.,
2020). Another prediction concerns the rate of genetic divergence within flexible versus less
flexible, recent clades (e.g. subspecies within species): our conjecture would be that these would
not be different, because flexibility does not lead to increased divergence over the short term.
Notably, not all of our results are consistent with a significantly positive association between
behavioural flexibility and diversification of older primate lineages. While the non-significant
association between Lineage per Genus Diversification Rate and neocortex and cerebellum volume
might be explained by data limitations (discussed below), the non-significant association with
relative brain volume illustrates that not all proxies of behavioural flexibility capture the same

38
thing. While relative brain volume is a known structural correlate of measures of primate and avian
behavioural flexibility (Lefebvre, et al., 2004), the brain has many functions and thus is a less
direct measure of behavioural flexibility than behavioural measures. Brain size has been linked to
diversification rate in birds (Nicolakakis, et al., 2003; Sol, et al., 2005; Sayol, et al., 2019), but
notably the sample for birds is much larger, and is likely to contain a broader range of variation,
which would make it easier to detect a brain size effect. Additionally, results of our simulation
accounting for potential research effort biases indicate that a positive association between technical
innovation and diversification rate in primate genera could be driven by a research effort bias.
However, this simulation assumes that research effort and behavioural flexibility are independent
and, if instead research effort tends to be directed toward groups where innovation is expected,
then this research bias may actually have a low contribution to the observed relationship between
technical innovation and diversification rate. Thus, our results paint a complicated picture, and
emphasize the need to compare methodologies and measures and avoid a focus on single
explanations of complex phenomena.
Although our results do not support a role for behavioural flexibility in recent primate
diversification, there are several caveats on the limits of our inferences. First, one measure thought
to be associated with behavioural flexibility – neocortex and cerebellum volume – had very little
data available for lineages reported as inflexible (e.g. among lemurs, tarsiers, titis and sakis). This
meant our ability to test this measure as a driver of diversification was limited. Additionally, to
examine the relationship between different measures of behavioural flexibility and diversification
rate, we had to run multiple tests, increasing the likelihood of observing Type I error. Our study is
also limited by the lineages present in the phylogeny. Available primate phylogenies, (e.g. Arnold,
et al., 2010; Upham, et al., 2019b) do not reflect the most recent taxon lists, and such limited
taxonomic scope prevented us from using diversification rate estimates that require a fully-
resolved tree (e.g. the DR measures from Jetz, et al., 2012). Lastly, many factors will contribute to
true diversification, and although we test for an effect of body mass, there are many biological and
ecological factors (e.g. geographic discontinuities, habitat affiliations, or presence on islands) yet
to be explored that could mediate any relationship between behavioural flexibility and primate
diversification rate.

39
While our results provide some evidence for the hypothesis that behavioural flexibility drives
diversification of primate lineages, they raise important questions about its underlying
mechanisms. Importantly, our results are not consistent in supporting a significant association
between behavioural flexibility and diversification rate, and depend largely upon the proxy
measures employed. The positive associations we do find may point to behavioural flexibility
dampening extinction of young primate lineages, rather than accelerating diversification via
splitting of behaviourally shifted individuals/populations as previously suggested (Wilson, 1985).
Thus, expanding tests of whether and how behavioural flexibility is associated with diversification
to other taxa may help us interpret the results we report here.
ACKNOWLEDGEMENTS: This work was supported by the Natural Sciences and Engineering
Research Council of Canada (NSERC) Discovery Grants Program (SMR and AOM, grants #2017-
04720 and #2019-04950) and the Canada Foundation for Innovation (SMR, grant #29433). MJAC
was supported by awards from the Biodiversity, Ecosystem Services, and Sustainability (BESS)
program and McGill University. We thank the Reader and Guigueno labs, Brian Leung, Hans
Larsson at McGill, William Wcislo, and the Crawford Lab for Evolutionary Studies at SFU for
feedback on portions of the manuscript and study design, as well as Isabella Capellini and two
anonymous reviewers for their commentaries.
DECLARATIONS OF INTEREST: None.
Manuscript is currently under review. Data and code accompanying the manuscript will be made
available on publication through Dryad or a similar repository.

40
REFERENCES:
Anderson, R. W. (1995). Learning and evolution: A quantitative genetics approach. Journal of
Theoretical Biology, 175: 89–101.
Ancel, L. W. (1999). A quantitative model of the Simpson–Baldwin effect. Journal of Theoretical
Biology, 196: 197–209.
Ancel, L. W. (2000). Undermining the Baldwin expediting effect: does phenotypic plasticity
accelerate evolution? Theoretical Population Biology, 58: 307–319.
Arbour, J. H., & Santana, S. E. (2017). A major shift in diversification rate helps explain
macroevolutionary patterns in primate species diversity. Evolution, 71: 1600–1613.
Arnold, C., Matthews, L. J., & Nunn, C. L. (2010). The 10kTrees website: a new online resource
for primate phylogeny. Evolutionary Anthropology, 19: 114–118.
Audet, J. N., & Lefebvre, L. (2017). What’s flexible in behavioural flexibility? Behavioural
Ecology, 28: 943–947.
Badgley, C. (2010). Tectonics, topography, and mammalian diversity. Ecography, 33: 220–231.
Baldwin, J. M. (1902). Development and evolution. MacMillan, New York.
Barton, R. A. (2012). Embodied cognitive evolution and the cerebellum. Philosophical
Transactions of the Royal Society B: Biological Sciences, 367: 2097–2107.
Bateson, P. (1988). The active role of behaviour in evolution. In M. –W. Ho & S. W. Fox (Eds.),
Evolutionary processes and metaphors (p. 191–207). John Wiley and Sons, Ltd., New York.
Behera, N., & Nanjundiah, V. (1995). An investigation into the role of phenotypic plasticity in
evolution. Journal of Theoretical Biology, 172: 225–234.
Bogert, C. M. (1949). Thermoregulation in reptiles, a factor in evolution. Evolution, 3: 195–211.
Cardillo, M., Huxtable, J. S., & Bromham, L. (2003). Geographic range size, life history and rates
of diversification in Australian mammals. Journal of Evolutionary Biology, 16: 282–288.
Charnov, E. L., & Berrigan, D. (1993). Why do female primates have such long lifespans and so
few babies? Or life in the slow lane. Evolutionary Anthropology, 1: 191–194.

41
DeCasien, A. R., & Higham, J. P. (2019). Primate mosaic brain evolution reflects selection on
sensory and cognitive specialization. Nature Ecology & Evolution, 3: 1483–1493.
Ducatez, S., Clavel, J., & Lefebvre, L. (2015). Ecological generalism and behavioural
innovation in birds: technical intelligence or the simple incorporation of new foods?
Journal of Animal Ecology, 84: 79–89.
Ducatez, S., & Lefebvre, L. (2014). Patterns of research effort in birds. PLoS One, 9: e89955.
Ducatez, S., Sol, D., Sayol, F., & Lefebvre, L. (2020). Behavioural plasticity is associated with
reduced extinction risk in birds. Nature Ecology & Evolution, 4: 788–793.
Duckworth, R. A. (2009). The role of behaviour in evolution: a search for mechanism.
Evolutionary Ecology, 23: 513–531.
Dunbar, R. I., & Shultz, S. (2007). Understanding primate brain evolution. Philosophical
Transactions of the Royal Society B: Biological Sciences, 362: 649–658.
Fontanillas, E., Welch, J. J., Thomas, J. A., & Bromham, L. (2007). The influence of body size
and net diversification rate on molecular evolution during the radiation of animal phyla. BMC
Evolutionary Biology, 7: 95.
Foote, A. D., Vijay, N., Ávila-Arcos, M. C., Baird, R. W., Durban, J. W., Fumagalli, M., … &
Wolf, J. B. W. (2016). Genome-culture coevolution promotes rapid divergence of killer whale
ecotypes. Nature Communications, 7: 11693.
Freckleton, R. P., Harvey, P. H., & Pagel, M. (2002). Phylogenetic analysis and comparative data:
a test and review of evidence. The American Naturalist, 160: 712–726.
Frey, M. A. (2010). The relative importance of geography and ecology in species diversification:
evidence from a tropical marine intertidal snail (Nerita). Journal of Biogeography, 37: 1515–
1528.
Futuyma, D. J. (1979). Evolutionary biology. Sinauer Associates, Sunderland.
Futuyma, D. J. (2010). Evolutionary constraint and ecological consequences. Evolution, 64: 1865–
1884.

42
Gelman, A. (2008). Scaling regression inputs by dividing by two standard deviations. Statistics in
Medicine, 27: 2865–2873.
Gonzalez-Voyer, A., González-Suárez, M., Vilà, C., & Revilla, E. (2016). Larger brain size
indirectly increases vulnerability to extinction in mammals. Evolution, 70: 1364–1375.
Grant, P. R., & Grant, B. R. (2008). How and why species multiply: the radiation of Darwin's
finches. Princeton University Press, Princeton.
Groves, C. P. (2014). Primate taxonomy: inflation or real? Annual Review of Anthropology, 43:
27–36.
Heard, S. B., & Hauser, D. L. (1995). Key evolutionary innovations and their ecological
mechanisms. Historical Biology, 10: 151–173.
Hinton, G. E., & Nowlan, S. J. (1987). How learning can guide evolution. Complex Systems, 1:
495–502.
Honacki, J. H., Kinman, K. E., & Koeppl, J. W. (1982). Mammal species of the world: a taxonomic
and geographic reference. Allen Press, Inc. and Association of Systematic Collections,
Lawrence.
Huey, R. B., Hertz, P. E., & Sinervo, B. (2003). Behavioural drive versus behavioural inertia in
evolution: a null model approach. The American Naturalist, 161: 357–366.
Isaac, N. J., Jones, K. E., Gittleman, J. L., & Purvis, A. (2005). Correlates of species richness in
mammals: body size, life history, and ecology. The American Naturalist, 165: 600–607.
Isaac, N. J., Mallet, J., & Mace, G. M. (2004). Taxonomic inflation: its influence on macroecology
and conservation. Trends in Ecology & Evolution, 19: 464–469.
IUCN/SSC Primate Specialist Group. (2018). Retrieved from http://www.primate-
sg.org/red_list_threat_status/ [accessed 10 November 2018].
Jetz, W., Thomas, G. H., Joy, J. B., Hartmann, K., & Mooers, A. O. (2012). The global diversity
of birds in space and time. Nature, 491: 444–448.

43
Jones, K. E., Bielby, J., Cardillo, M., Fritz, S. A., O'Dell, J., Orme, C. D. L., ... & Connolly, C.
(2009). PanTHERIA: a species‐level database of life history, ecology, and geography of extant
and recently extinct mammals: Ecology, 90: 2648–2648.
Keverne, E. B., Martel, F. L., & Nevison, C. M. (1996). Primate brain evolution: genetic and
functional considerations. Proceedings of the Royal Society B: Biological Sciences, 263: 689–
696.
Kozak, K. H., & Wiens, J. J. (2010). Accelerated rates of climatic‐niche evolution underlie rapid
species diversification. Ecology Letters, 13: 1378–1389.
Lachlan, R. F., & Servedio, M. R. (2004). Song learning accelerates allopatric speciation.
Evolution, 58: 2049–2063.
Lapiedra, O., Sol, D., Carranza, S., & Beaulieu, J. M. (2013). Behavioural changes and the adaptive
diversification of pigeons and doves. Proceedings of the Royal Society B: Biological Sciences,
280: 20122893.
Lefebvre, L., Reader, S. M., & Sol, D. (2004). Brains, innovations and evolution in birds and
primates. Brain, Behaviour and Evolution, 63: 233–246.
Lewis, P. O. (2001). A likelihood approach to estimating phylogeny from discrete morphological
character data. Systematic Biology, 50: 913–925.
Lewontin, R. C. (1983). Gene, organism and environment. In D. S. Bendall (Eds.), Evolution from
molecules to men (p. 273–285). Cambridge University Press, New York.
Losos, J. B., Schoener, T. W., & Spiller, D. A. (2004). Predator-induced behaviour shifts and
natural selection in field-experimental lizard populations. Nature, 432: 505–508.
Magallon, S., & Sanderson, M. J. (2001). Absolute diversification rates in angiosperm clades.
Evolution, 55: 1762–1780.
Mayr, E. (1963). Animal species and evolution. Belknap Press, Cambridge.
Mikhalevich, I., Powell, R., & Logan, C. (2017). Is behavioural flexibility evidence of cognitive
complexity? How evolution can inform comparative cognition. Interface Focus, 7:
20160121.

44
Mitchell, J. S., & Rabosky, D. L. (2017). Bayesian model selection with BAMM: effects of the
model prior on the inferred number of diversification shifts. Methods in Ecology and
Evolution, 8: 37–46.
Mooers, A. Ø., & Schluter, D. (1999). Reconstructing ancestor states with maximum likelihood:
support for one-and two-rate models. Systematic Biology, 48: 623–633.
Muñoz, M. M., & Losos, J. B. (2018). Thermoregulatory behaviour simultaneously promotes and
forestalls evolution in a tropical lizard. The American Naturalist, 191: E15–E26.
Navarrete, A. F., Blezer, E. L., Pagnotta, M., de Viet, E. S., Todorov, O. S., Lindenfors, P., ...
& Reader, S. M. (2018). Primate brain anatomy: new volumetric MRI measurements
for neuroanatomical studies (with Erratum). Brain, Behaviour and Evolution, 91: 109–
117.
Navarrete, A. F., Reader, S. M., Street, S. E., Whalen, A., & Laland, K. N. (2016). The
coevolution of innovation and technical intelligence in primates. Philosophical
Transactions of the Royal Society B: Biological Sciences, 371: 20150186.
Nicolakakis, N., Lefebvre, L. & Sol, D. (2003). Behavioural flexibility predicts species richness
in birds, but not extinction risk. Animal Behaviour, 65: 445–452.
Odling-Smee, F. J., Laland, K. N., & Feldman, M. W. (2003). Niche construction: the neglected
process in evolution. Princeton University Press, Princeton.
Overington, S. E., Morand-Ferron, J., Boogert, N. J., & Lefebvre, L. (2009). Technical
innovations drive the relationship between innovativeness and residual brain size in
birds. Animal Behaviour, 78: 1001–1010.
Paradis, E. (2005). Statistical analysis of diversification with species traits. Evolution, 59: 1–
12.
Pelletier, F., Garant, D., & Hendry, A. P. (2009). Eco-evolutionary dynamics. Philosophical
Transactions of the Royal Society B: Biological Sciences, 364: 1483–1489.

45
Pinheiro, J., Bates, D., DebRoy, S., Sarkar, D., & R Core Team. (2020). Linear and nonlinear
mixed effects models. R package version 3.1-144. https://CRAN.R-
project.org/package=nlme.
Powell, L. E., Isler, K., & Barton, R. A. (2017). Re-evaluating the link between brain size and
behavioural ecology in primates. Proceedings of the Royal Society B: Biological
Sciences, 284: 20171765.
Price, T. (2008). Speciation in birds. Roberts and Company, Greenwood Village.
Price, T. D., Qvarnström, A., & Irwin, D. E. (2003). The role of phenotypic plasticity in driving
genetic evolution. Proceedings of the Royal Society B: Biological Sciences, 270: 1433–
1440.
Purvis, A., Webster, A. J., Agapow, P. M., Jones, K. E., & Isaac, N. J. (2003). Primate life
histories and phylogeny. In P. M. Kappeler & M. E. Pereira (Eds.), Primate life histories
and socioecology (p. 25–40). University of Chicago Press, Chicago.
R Core Team. (2020). R: A Language and environment for statistical computing. R Foundation
for Statistical Computing, Vienna, Austria. http://www.R-project.org/
Rabosky, D. L. (2009). Ecological limits and diversification rate: alternative paradigms to
explain the variation in species richness among clades and regions. Ecology Letters, 12:
735–743.
Raikow, R. J. (1986). Why are there so many kinds of passerine birds? Systematic Zoology, 35:
255–259.
Reader, S. M., & Biro, D. (2010). Experimental identification of social learning in wild animals.
Learning & Behaviour, 38: 265–283.
Reader, S. M., Hager, Y., & Laland, K. N. (2011). The evolution of primate general and cultural
intelligence. Philosophical Transactions of the Royal Society B, 366: 1017–1027.
Reader, S. M., & Laland, K. N. (2002). Social intelligence, innovation, and enhanced brain size
in primates. Proceedings of the National Academy of Sciences, 99: 4436–4441.

46
Riesch, R., Barrett-Lennard, L. G., Ellis, G. M., Ford, J. K. B., & Deecke, V. B. (2012). Cultural
traditions and the evolution of reproductive isolation: ecological speciation in killer whales?
Biological Journal of the Linnean Society, 106: 1–17.
Rosenblum, E. B., Sarver, B. A., Brown, J. W., Des Roches, S., Hardwick, K. M., Hether, T. D.,
... & Harmon, L. J. (2012). Goldilocks meets Santa Rosalia: an ephemeral speciation model
explains patterns of diversification across time scales. Evolutionary Biology, 39: 255–261.
Rossmanith, E., Grimm, V., Blaum, N., & Jeltsch, F. (2006). Behavioural flexibility in the mating
system buffers population extinction: lessons from the lesser spotted woodpecker Picoides
minor. Journal of Animal Ecology, 75: 540–548.
Rylands, A. B., & Mittermeier, R. A. (2014). Primate taxonomy: species and conservation.
Evolutionary Anthropology, 23: 8–10.
Sayol, F., Lapiedra, O., Ducatez, S., & Sol, D. (2019). Larger brains spur species diversification
in birds. Evolution, 73: 2085–2093.
Scott-Phillips, T. C., Laland, K. N., Shuker, D. M., Dickins, T. E., & West, S. A. (2014). The
niche construction perspective. A critical appraisal. Evolution, 68: 1231–1243.
Shultz, S. B., Bradbury, R. L., Evans, K. D., Gregory, R., & Blackburn, T. M. (2005). Brain size
and resource specialization predict long-term population trends in British birds. Proceedings
of the Royal Society B: Biological Sciences, 272: 2305–2311.
Snell-Rood, E. (2013). An overview of the evolutionary causes and consequences of behavioural
plasticity. Animal Behaviour, 85: 1004–1011.
Snell-Rood, E., Swanson, E., & Jaumann, S. (2015). Insects as a model system to understand the
evolutionary implications of innovation. In A. B. Kaufman & J. C. Kaufman (Eds.), Animal
creativity and innovation (p. 459–478). Academic Press, London.
Sol, D. (2003). Behavioural flexibility: a neglected issue in the ecological and evolutionary
literature? In S. M. Reader & K. N. Laland (Eds.), Animal innovation (p. 63–82). Oxford
University Press, Oxford.

47
Sol, D., & Lefebvre, L. (2000). Behavioural flexibility predicts invasion success in birds
introduced to New Zealand. Oikos, 90: 599–605.
Sol, D., & Price, T. D. (2008). Brain size and the diversification of body size in birds. The
American Naturalist, 172: 170–177.
Sol, D., Stirling, D. G., & Lefebvre, L. (2005). Behavioural drive or behavioural inhibition in
evolution: subspecific diversification in holarctic passerines. Evolution, 59: 2669–2677.
Sol, D., Székely, T., Liker, A., & Lefebvre, L. (2007). Big-brained birds survive better in nature.
Proceedings of the Royal Society B: Biological Sciences, 274: 763–769.
Springer, M. S., Meredith, R. W., Gatesy, J., Emerling, C. A., Park, J., Rabosky, D. L., ... &
Fisher, C. A. (2012). Macroevolutionary dynamics and historical biogeography of
primate diversification inferred from a species supermatrix. PLoS One, 7: e49521.
Stadler, T. (2011). Mammalian phylogeny reveals recent diversification rate shifts. Proceedings
of the National Academy of Sciences, 108: 6187–6192.
Street, S. E., Navarrete, A. F., Reader, S. M., & Laland, K. N. (2017). Coevolution of cultural
intelligence, extended life history, sociality, and brain size in primates. Proceedings of
the National Academy of Sciences, 114: 7908-7914.
Tattersall, I. (2007). Madagascar's lemurs: cryptic diversity or taxonomic inflation?
Evolutionary Anthropology, 16: 12–23.
Tebbich, S., Sterelny, K., & Teschke, I. (2010). The tale of the finch: adaptive radiation and
behavioural flexibility. Philosophical Transactions of the Royal Society B: Biological
Sciences, 365: 1099–1109.
Thomas, J. A., Welch, J. J., Lanfear, R., & Bromham, L. (2010). A generation time effect on
the rate of molecular evolution in invertebrates. Molecular Biology and Evolution, 27:
1173–1180.
Upham, N., Esselstyn, J. A., & Jetz, W. (2019a). Ecological causes of uneven diversification
and richness in the mammal tree of life (Preprint). bioRxiv, 504803.

48
Upham, N. S., Esselstyn, J. A., & Jetz, W. (2019b). Inferring the mammal tree: Species-level
sets of phylogenies for questions in ecology, evolution, and conservation. PLoS
Biology, 17: 1–44.
Vandervert, L. (2003). The neurophysiological basis of innovation. In L. Shavinina (Eds.), The
international handbook on innovation (p. 17–30). Elsevier Science, Oxford.
Vandervert, L. R., Schimpf, P. H., & Liu, H. (2007). How working memory and the cerebellum
collaborate to produce creativity and innovation. Creativity Research Journal, 19: 1–18.
Wcislo, W. T. (1989). Behavioural environments and evolutionary change. Annual Review of
Ecology and Systematics, 20: 137–169.
Weber, E. U., Shafir, S., & Blais, A.-R. (2004). Predicting risk sensitivity in humans and lower
animals: risk as variance or coefficient of variation. Psychological Review, 111: 430–445.
West-Eberhard, M. J. (1989). Phenotypic plasticity and the origins of diversity. Annual review of
Ecology and Systematics, 20: 249–278.
West-Eberhard, M. J. (2003). Developmental plasticity and evolution. Oxford University Press,
Oxford.
Wiens, J. J. (2017). What explains patterns of biodiversity across the Tree of Life? New research
is revealing the causes of the dramatic variation in species numbers across branches of
the Tree of Life. BioEssays, 39: 1600128.
Williams, C. B. (1964). Patterns in the balance of nature and related problems of quantitative
ecology. Academic Press, London & New York.
Willis, J. C. (1922). Area and age: A study of geographical distribution and origin in species.
Cambridge University Press, Cambridge.
Wilson, A. C. (1985). The molecular basis of evolution. Scientific American, 253: 164–173.
Wyles, J. S., Kunkel, J. G., & Wilson, A. C. (1983). Birds, behaviour, and anatomical evolution.
Proceedings of the National Academy of Sciences, 80: 4394–4397.
Yeh, P. J. (2004). Rapid evolution of a sexually selected trait following population
establishment in a novel habitat. Evolution, 58: 166–174.

49
Yeh, P. J., & Price, T. D. (2004). Adaptive phenotypic plasticity and the successful colonization
of a novel environment. The American Naturalist, 164: 531–542.

50
“The role of behavioural flexibility in primate diversification” —
Supplementary Material
SUPPLEMENTARY METHODS:
Diversification Rate
When assigning species and subspecies listed by the IUCN/SSC Primate Specialist Group (2018)
to each lineage >1.1my old in the 10kTrees consensus phylogeny (Arnold, et al., 2010), there were
two species that could not be assigned to any of our lineages, and were removed as a result:
Galagoides kumbirensis (Svensson, et al., 2017) and Callithrix humilis (van Roosmalen, et al.,
1998). In addition, one genus, Presbytis (comprising the surilis), was so unresolved that lineage
richness was impossible to estimate given the lineages available in 10kTrees. This genus and its
comprised species were also removed prior to analyses.
We estimated ‘Taxa per Lineage Diversification Rate’ using the method-of-moments estimator
based on stem age, i.e. the natural log of richness divided by the stem age of that lineage (see
Figure S2.1) (Magallon & Sanderson, 2001). Notably, all log transformations referenced in this
document and in the main text refer to natural log transformations (loge). In the example in Figure
S2.1B, Taxa per Lineage Diversification Rate for the Aotus azarai lineage would be log(3)/1.29
taxa per my. For genus-level diversification rates we delineated genera in our phylogeny and
extracted stem ages for each genus, and subsequently used the method-of-moments approach for
two estimates of diversification rate. For the first estimate (hereafter ‘Taxa per Genus
Diversification Rate’) richness score was estimated based on assignments of the same 705 taxa
method-of-moments estimates. ‘Taxa per Genus Diversification Rate’ thus is based on “taxon
richness” (so, for Aotus in Figure S2.1, Taxa per Genus Diversification Rate=log(13)/19.49 taxa
per my, where 19.49my is the stem age of genus Aotus, and 13 is the number of species and
subspecies in the genus). For the second estimate, ‘Lineage per Genus Diversification Rate’,
richness was equal to the sum of >1.1 million-year old lineages from our tree (so, for Aotus in
Figure S2.1, Lineage per Genus Diversification Rate=log(5)/19.49 lineages per my).

51
Figure S2.1: Illustration of the method used to estimate diversification rate at the lineage-level
using genus Aotus as an example. (A): the 10kTrees consensus phylogeny for Aotus where splitting
events in the tree occurring more recently than 1.1 million-years ago are represented by dotted
lines. (B): the revised phylogeny after collapsing taxa diverging after the 1.1 million-year time cut-
off to their corresponding 5 lineages, and appending the taxon richness (total species and
subspecies) from the 2018 IUCN taxonomy. Branch lengths (=stem age) are labelled in million
years (my). The stem genus age for Aotus is 19.49 my (not shown). Species and subspecies listed
by the IUCN/SSC Primate Specialist Group (2018) were assigned to lineages to create taxon
richness estimates: 1Aotus azarae azarae, Aotus azarae boliviensis, Aotus azarae infulatus; 2Aotus
nigriceps; 3Aotus vociferans, Aotus brumbacki, Aotus jorgehernandezi; 4Aotus nancymaae, Aotus
miconax; 5Aotus trivirgatus, Aotus lemurinus, Aotus griseimembra, Aotus zonalis (nomenclature
here follows IUCN/SSC Primate Specialist Group, 2018).
We found that there were several instances of non-monophyletic genera within the phylogeny
(Galagoides, Otolemur, Galago and Euoticus). As such, we elected to retain these lineages in our

52
lineage-level tree (as their unresolved nature may simply be due to taxonomic issues; Masters, et
al., 2017), but removed these genera from genus-level analysis as it is unclear how to assign a stem
age to these clades. We additionally removed the genus Semnopithecus, which comprised a single
lineage nested within the genus Trachypithecus. Thus, while our lineage-level dataset contained
lineages from 65 genera, our genus-level analysis considered only 60 genera. Lineages of
Cercopithecus were also resolved as polyphyletic in the phylogeny, with a small fraction of
lineages forming a clade sister to Erythrocebus. Since a majority of Cercopithecus lineages were
resolved as monophyletic, we opted to assign Cercopithecus the divergence date that separates it
from the clade of Chlorocebus and Erythrocebus; we note that removing Cercopithecus in its
entirety did not qualitatively change the results we report here.
We note that this approach to measuring diversification rate does have its limitations, specifically
that it can result in a loss of relevant information (i.e. phylogenetic distances between closely
related species). This method additionally relies on taxonomic assignments that inherently carry
some subjectivity since what is considered a subspecies, species or genera is ultimately determined
by taxonomists who must make decisions based on whatever e.g. genetic, morphological, and
geographical information that is available for a given population. However, this method allowed
us to readily incorporate shallow divergences (in terms of both species and subspecies) since
current primate phylogenies do not contain comparable species numbers across clades.
Applications of the phylogenetic species concept (PSC) have favoured elevations of subspecies to
the full species status non-uniformly across the primate tree. As a result, relying on diversification
estimates that only consider species would result in disproportionally high diversification rate
estimates being assigned to lineages where elevations of subspecies to the full species status have
been favoured (e.g. strepsirrhines and platyrrhines; Isaac, et al., 2004).
Structural Proxies of Behavioural Flexibility
In addition to behavioural measures, we used brain volume measures as a proxy of behavioural
flexibility. We note that while brains perform many functions, and the link between volume and
function is not well established (e.g. Healy & Rowe, 2007; Logan, et al., 2018), behavioural
flexibility measures such as innovation rate, social learning rate and learning performance in the
laboratory do correlate with brain volume measures across species (Reader, 2003; Lefebvre, et al.,

53
2004; Reader, et al., 2011). This suggests that primate brain volume measures are useful secondary
proxies of behavioural flexibility. While direct measures of behavioural flexibility under
standardized testing conditions would be valuable, such measures are not available for the large-
scale comparative tests we conduct here. We can however compare the consistency of results
across different proxies for behavioural flexibility.
Data on brain size, estimated as endocranial volume (ECV) in cm3 (hereafter ‘brain volume’), were
obtained from Powell et al. (2017) (a compilation containing data from Isler, et al., 2008 and van
Woerden, et al., 2010; 2012; 2014). Powell et al. (2017) calculated species means for endocranial
volume (ECV) across males and females for species that were not considered sexually dimorphic.
For sexually dimorphic species (size difference > 10%), Powell et al. (2017) used only female
measures of ECV to create means. When assigning these values to species and subspecies in our
own dataset, one species, Semnopithecus dussumieri, was no longer considered to be a valid taxon
(Roos, et al., 2014), and was omitted from our dataset.
Data for neocortex, cerebellum and rest-of-brain volume were obtained from the compilation in
DeCasien & Higham (2019) and Navarrete et al. (2018). Navarrete et al. (2018) obtained data
through measurements of MRI scans. The DeCasien & Higham (2019) compilation includes data
from the prior Reader & Macdonald (2003) compilation and contains brain component volumes
(mm3) from multiple studies, including data from both MRI and serial section measurements:
Stephan et al. (1970); Stephan et al. (1981); Frahm et al. (1984); Stephan et al. (1988); Rilling &
Insel (1998); Rilling & Insel (1999); MacLeod et al. (2003); Bush & Allman (2004a); Bush &
Allman (2004b); Sherwood et al. (2004); Sherwood et al. (2005); Barger et al. (2007); De Sousa
et al. (2010); Barger et al. (2014); Barks et al. (2015); Bauernfeind et al. (2013); Stimpson et al.
(2016). Where necessary, DeCasien & Higham (2019) converted brain component masses to
volumetric measurements by dividing mass by the density of fresh tissue (1.036 grams per cubic
centimeter). DeCasien & Higham (2019) apply the dataset corrections detailed in Reader &
Macdonald (2003).
We only included data on neocortex, cerebellum and rest-of-brain volumes from either source
when all these measures were made on the same individuals. We were interested in the underlying

54
neural activity that contributes to behavioural flexibility – often attributed to neuron density (see
references in Mikhalevich, et al., 2017) – thus we opted to use only neocortical grey matter volume
(regions containing neural cell bodies). In some cases volume estimates were reported as means
for multiple individuals (n >1 individuals); estimates from each source were therefore multiplied
by their respective n values to ensure each individual brain was weighted equally. These values
were then summarized across taxa by summing the individual estimates (previously multiplied by
n) and then dividing by the total n value for that species/subspecies across studies prior to creating
lineage and genus-level estimates. Brain size and behavioural measures of flexibility (e.g.
innovation rate) are often summarized at the genus level (e.g. Riska & Atchley, 1985; Barton,
2006; Deaner, et al., 2007; Lefebvre, 2013). However, there is considerable variation in species’
propensity to exhibit flexible behaviour within many primate families and subfamilies (e.g.
subfamily Cercopithecinae contains genus Macaca – a highly flexible genus, and genus
Theropithecus – a relatively low scoring genus in terms of flexible behaviour and brain size
correlates; see Figure S2.2), thus we opted to not summarize any of our data beyond the genus
level.
We used residuals from log-log regressions to estimate brain volume relative to body mass, and
neocortex and cerebellum volume relative to rest of brain volume at the lineage-level. These
lineage-level residuals were then averaged to get genus-level estimates (see ‘Methods’ section of
main text). We are limited to averaging data among taxa (subspecies and species) at the lineage
level because our phylogenetic imputation of missing brain volume and body mass data relied on
a phylogeny, and thus had to be done at the lineage level. However, we note that our lineages are
typically equivalent to the species for which brain data are available. Past studies using comparable
primate brain volume residuals have relied on much more conservative species taxonomies (e.g.
Reader & Laland, 2002) which are comparable to our 239 species-complexes (i.e. lineages). Thus,
averaging brain volume and body mass estimates at the lineage-level before taking the residuals is
the equivalent of calculating residuals at the species level for most comparative studies of primates.
Residual analyses may lead to an inflation of Type II error as it is a very conservative method of
controlling for body size (Darlington & Smulders, 2001). However, including both variables in a
multiple regression as suggested by some (e.g. Freckleton, 2002) caused errors in parameter
estimation in the PGLS models due to the very high correlation between brain volume and body

55
mass resulting in exceptionally large and opposing effect sizes. As a result, we opted to use the
more conservative approach based on residual brain volume where subsequent parameter estimates
were similarly conservative.
Behavioural Proxies of Behavioural Flexibility
We matched behavioural data from Reader et al. (2011) to our own species and subspecies list
provided by the IUCN/SSC Primate Specialist Group (2018). One species used by Reader et al.
(2011), Aotus hershkovitzi, has since been reclassified as a junior synonym of species Aotus
lemurinus (Defler & Bueno, 2007), and was thus omitted from our analysis. Some species in the
Reader et al. (2011) dataset were reported to have zero accounts of technical innovation and social
learning with no recorded measure of research effort or a research effort of zero papers. Data from
these species were also omitted from our dataset. Technical innovation data for species used by
Reader et al. (2011), but not Navarrete et al. (2016), were supplemented by examining and
categorizing innovation reports provided by Reader et al. (2011). Reader et al. (2011) additionally
provide a measure of research effort for each species, recorded as the number of published articles
per species published in a survey of the Zoological Record. Research effort from Reader et al.
(2011) was also summarized at both the lineage and genus levels as a sum of the total number of
published articles recorded for each species or subspecies assigned to the given lineage or genus
to inform imputation models on the reliability of our observed trait values and to test possible data
collection biases associated with research effort.
Experimental data on behavioural innovations and social learning would be preferred to
observational data from the literature (Reader & Biro, 2010), but these data are not available for
the wide taxonomic spread of our study. The innovation and social learning accounts from
literature sources provide quantitative comparative data for a large number of species, typically
from observations in the wild. Despite acknowledged weaknesses of such observational data
(discussed in Lefebvre, et al., 1997; Laland & Reader, 1999; Reader, 2003; Reader & MacDonald,
2003; Reader, et al., 2011), the taxonomic spread allows for tests of large-scale macroevolutionary
trends that can then be followed up by targeted experimental approaches.

56
Correlation of Predictors
Correlation between predictor variables varied greatly (Table S2.1). Powell et al. (2017) provide
their own body mass data from previous compilations, which were highly correlated with body
mass estimates from PanTHERIA (Jones, et al., 2009; Table S2.1). Therefore, we chose to use the
more extensive body mass data provided by PanTHERIA in analyses.
Phylogenetic Patterns
To visualize phylogenetic patterns in our measures of innovation, social learning, brain size, and
diversification rate we painted our 10kTrees consensus tree with these data using the
“plotBranchbyTrait” function in the R package phytools (Revell, 2012; 2014), which implements
an ancestral-state reconstruction based on symmetric models under maximum likelihood. We also
used geiger (Harmon, et al., 2008) to estimate the symmetrical transition rate for the gain and loss
of innovation and social learning at the lineage level, needed to produce the null distribution of
lineages with innovation and social learning through simulations. We also estimated the
phylogenetic signal for all variables of interest. For continuous variables phylogenetic signal was
estimated using Pagel’s λ (Freckleton, et al., 2002), where a λ value nearing 1 denotes stronger
signal, using the “phylosig” function in phytools. For discrete variables, we used Fritz and Purvis's
(2010) D statistic, where a D approaching 0 denotes stronger signal. Results are in Table S2.2.
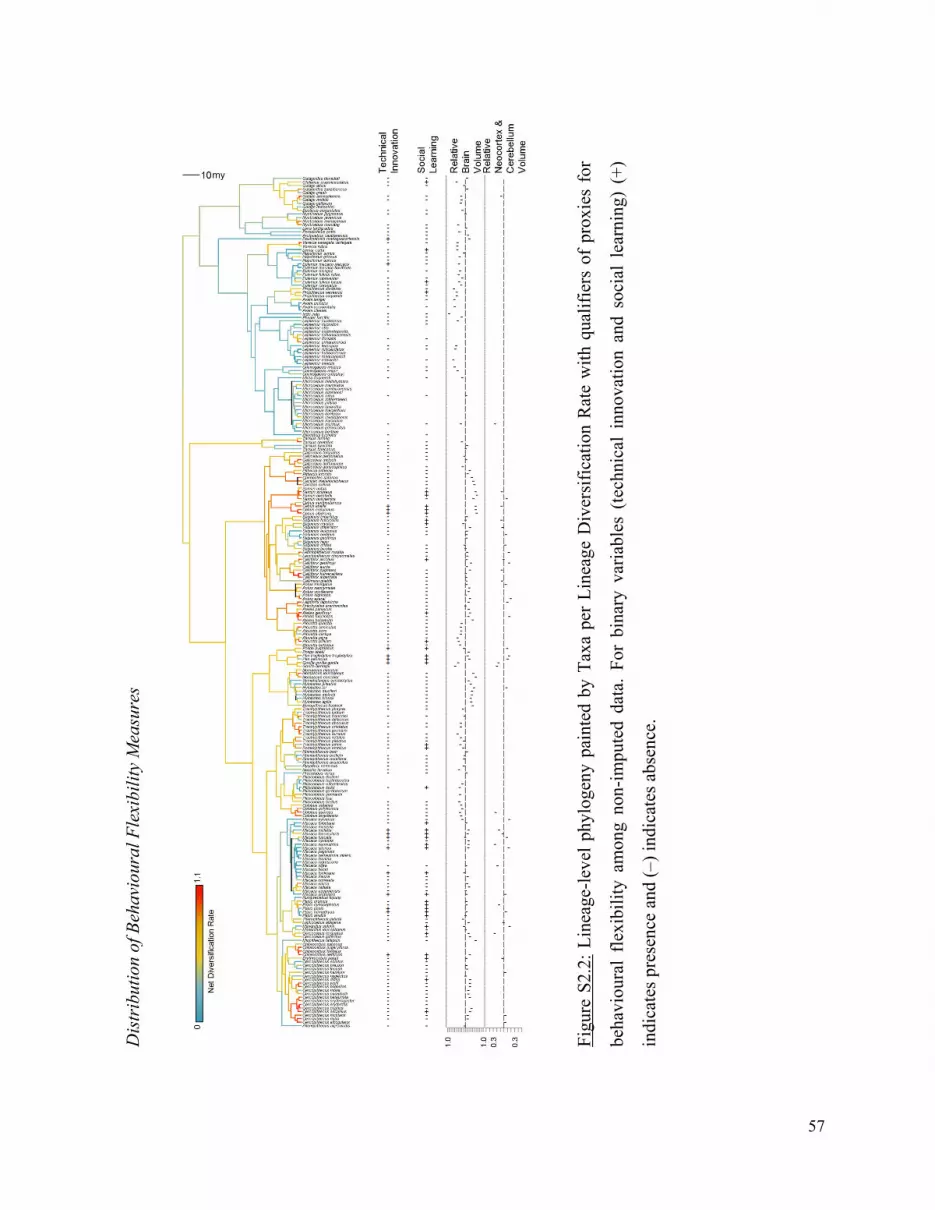
57
Fig
ure
S2.
2: L
inea
ge-l
evel
phy
loge
ny p
aint
ed b
y T
axa
per
Lin
eage
Div
ersi
fica
tion
Rat
e w
ith
qual
ifie
rs o
f pr
oxie
s fo
r
beha
viou
ral
flex
ibil
ity
amon
g no
n-im
pute
d da
ta.
For
bin
ary
vari
able
s (t
echn
ical
inn
ovat
ion
and
soci
al l
earn
ing)
(+
)
indi
cate
s pr
esen
ce a
nd (
–) in
dica
tes
abse
nce.
Dis
trib
utio
n of
Beh
avio
ural
Fle
xibi
lity
Mea
sure
s

58
Phylogenetic Imputations of Behavioural Flexibility Measures
For many of the lineages in our dataset, we were missing data for our different measures and co-
variates. Brain data and body mass data are not available for some lineages, while technical
innovation and social learning data were collected under a different taxonomy than the one used
in this study, meaning that some lineages were not represented in the search done by Reader et al.
(2011) due to changes in naming conventions. Additionally, some species searched for by Reader
et al. (2011) had no published papers, in which case we considered them to be missing data points.
The proportion of missing data varied greatly among variables with body mass (n=196; 82.0%)
and relative brain volume (n=186; 77.8%) having the most available data, technical innovation
(n=176; 73.6%) and social learning (n=176; 73.6%) having fewer data, and our measures of
neocortex, cerebellum and brain volume (n=42; 17.6%) having the least available data (Table
S2.3). Many of the predictors that we examined exhibited strong phylogenetic patterns (Table
S2.2), allowing us to use phylogenetically-informed prediction to estimate the missing traits for
these lineages (Pagel, 1999; Guénard, et al., 2013; Swenson, 2014; Penone, et al., 2014). We
created a phylogenetic variance-covariance matrix of our pruned 10kTrees phylogeny using the
MCMCglmm package (Hadfield, 2010) in R. We decomposed this phylogenetic variance-
covariance matrix into 238 eigenvectors using the “PVRdecomp” function from the R package
PVR (Santos, et al., 2013), where each eigenvector represents a node in the phylogeny following
the order of bifurcation from root to tips. We built phylogenetic models for each proxy of
behavioural flexibility (relative brain volume, technical innovation and social learning), using
forward model selection to determine the phylogenetic eigenvectors (and covariates) that had the
best support for inclusion based on Akaike Information Criterion (AICc) scores. We implemented
this stepwise model selection for phylogenetic models of each covariate using the “stepAIC”
function from the MASS R package (Venables & Ripley, 2002).
Our goal for phylogenetic imputation was to maximize the predictive accuracy in our models using
phylogenetic position and other covariates to estimate missing data. We ordered our imputation of
traits so that we could use imputed information to inform subsequent model fits – for example,
body mass is required to estimate brain size. Although there may be concern that this introduces
circularity to the analyses, the correlation structure of these covariates is already present in the
observed data (Table S2.1) and imputing with these covariates merely propagates the already

59
present correlations. We first performed model selection on the missing body masses (18.2% of
the data) using ordinary least squares regression (on the natural log of body mass) of the first 50
phylogenetic eigenvectors (corresponding to the 50 deepest splits in the tree). We then used the
phylogenetic eigenvectors with logarithmic body mass as a covariate to estimate brain volume
(natural log transformed) with an ordinary least squares regression. We used generalized linear
models, with a Bernoulli error distribution, for the presence (1) or absence (0) of technical
innovation and social learning, with observations weighted by the square-root of research effort.
Weighting by research effort, i.e. the number of published articles per species published in the
Zoological Record documented by Reader et al. (2011), informs the model about the strength of
evidence for a given lineage exhibiting either of these measures of behavioural flexibility: higher
research effort indicates a higher certainty that a lineage does or does not display a given
behaviour. Innovation and social learning are moderately correlated (r = 0.533; Table S2.1), so we
first modelled technical innovation and then used this as a predictive covariate for social learning.
The coefficients used in each model can be found in Table S2.3. We used a larger number of
eigenvectors (50; see Table S2.3) to impute data for variables with high phylogenetic signal and
less missing data (e.g. body mass and brain volume) to potentially capture variation presenting
itself in shallower splits in the phylogeny. In cases where phylogenetic signal was lower (e.g.
technical innovation and social learning) and we had less observed data, we opted to use a lesser
number of eigenvectors (40; see Table S2.3) to avoid problems of overfitting.
We performed a leave-one-out cross-validation to assess the performance of all models. This
procedure involved serially removing each species’ data and using the remaining dataset to
replicate our same model-building procedure and predicting that now “missing” species’ data from
the best-fit model. The resulting estimate can then be compared to each species observed value to
evaluate how closely we are able to recreate observed data from the models. We evaluated this for
continuous variables (body mass and brain volume) based on each model’s predictive accuracy
(p²):
Equation S1:
1mean ŷ yvariance y

60
where ŷ is the predicted value and y is the observed trait value (Greenberg, et al., 2017). Predictive
accuracy was high (approaching p²=1) in all cases (Table S2.3). For our binary variables, technical
innovation and social learning, we instead used an approach that quantified whether models could
discriminate the presence or absence of these behaviours based on phylogenetic position and
covariates. To do this, we constructed receiver operating characteristic curves that compare the
true positive and false positive rate across different model predicted probability thresholds for
classifying the presence or absence of each behaviour in a species. An accurate model will have a
high rate of true positives and negatives, relative to false positives and negatives. The overall
model performance (across thresholds) can be assessed by taking the integral of the receiver
operating curve: the area under the curve (AUC). The AUC was taken as a measure of classifier
performance for binary data. The AUC describes how accurately a given model can predict binary
outcomes, and is scored between 1 (describing a perfect fit; model predictions are all correct) and
0 (model predictions are all incorrect), with a score of 0.5 describing chance performance (Bradley,
1997). Receiver operating characteristic curves and AUC values were calculated using the ROCR
package (Sing, et al., 2005) (Figure S2.3). For these binary traits, the AUC was moderate to high
(Table S2.3), indicating good model performance. For prediction of missing data, we had to choose
a predicted threshold as a cut-off for binary classification of each behaviour, we chose this
threshold by comparing the accuracy (the ratio of true positives + true negatives: false positives +
false negatives) of each probability threshold value in the receiver operating characteristic curve
and selecting the cut-off associated with optimal accuracy. The genus Tarsius consisted of two
pairs of sister lineages that were very distantly related to all other primates. Due to their
phylogenetic distance from all other lineages it is expected that phylogenetic imputation will
perform poorly. As the missing data was generally clustered in species with close relatives we
removed genus Tarsius from our cross-validation tests to obtain a more representative estimate of
model performance for the species that were missing data.
Lineage-Richness Sampling Bias
To test whether lineage-rich genera are more likely by chance to have reports of technical
innovation or social learning, and to quantify this sampling effect, we simulated the evolution of
these traits on our tree independently of diversification rate and tested whether observed
correlations depart from this expectation. We simulated the evolution of lineage-specific technical

61
innovation and social learning on the phylogeny over 1000 iterations using the symmetrical rate
Mk model of discrete trait evolution (Lewis, 2001) implemented through the geiger package
(Harmon, et al., 2008). We parameterized the transition rates for the simulation with the Mk model
based on the observed presence and absence of both behaviours across the primate phylogeny. We
included imputed data for estimating transition rates of these behaviours, noting that removal of
these points did not meaningfully influence estimated transition rates. After simulating the random
evolution of technical innovation and social learning across the primate phylogeny 1000 times, we
repeated genus-level PGLS analyses over the resulting datasets. From these analyses on the
simulated datasets, we obtained a distribution of null effect sizes and compared our estimated
effect sizes from the real data to calculate the probability of randomly observing an effect size of
that magnitude.
Research Effort Bias
Research effort varies considerably across primate lineages, and there is the potential that unknown
innovative behaviours exist in currently data-limited species. If well-studied lineages are more
likely to have reports of technical innovation or social learning then it is possible that genera
containing a greater number of lineages could be more likely to include a well-studied lineage by
chance. If true, this could create a bias towards these diverse genera displaying technical
innovation or social learning and in turn erroneously suggest that the presence of these behaviours
increase diversification rate. Though our data did not suggest a bias toward clades with higher
taxonomic richness having lineages with higher research effort (Figures S2.4 and S2.5), we also
wanted to take research effort into account in our analysis. Previous studies have controlled the
total number of innovation or social learning instances recorded for a given lineage by research
effort, however, this was not possible in our case (for rationale, see Methods section of main text)
and we thus used binary data. When testing binary measures of innovation against diversification
rate, others have accounted for research effort by including it as a covariate in the model (Ducatez,
et al., 2020). However, we found a similar approach problematic for primates. Large-brained and
innovative primates are extensively studied due to their complex behaviour and, in some cases,
perhaps of their close relationship to humans (e.g. primates that exhibit habitual tool use are studied
to elucidate the origins of human and animal material culture; McGrew, 1992; Visalberghi, 1994;
van Schaik, et al., 1999; van Schaik, et al., 2003; Koops, et al., 2014). Thus, some part of research

62
effort on a given species may be driven by such work, making it difficult to disentangle research
effort and behavioural flexibility measures. Inspection of residuals from models including research
effort as a covariate alongside our binary behavioural measures additionally revealed that this
approach resulted in numerous irregularities in terms of which lineages are considered better
innovators or social learners given a typical level of research effort (i.e. positive residuals). Well-
studied primates such as chimpanzees have hundreds of reports of innovation and social learning,
as well as hundreds of publications in the Zoological Record survey used to estimate research
effort. The binary measure effectively caps these behaviours at 1, meaning that accounting for
research effort with a binary technical innovation or social learning measure will unfairly penalize
well-studied but ‘truly’ innovative species, making it appear that their propensity to innovate is
falsely low. Therefore, we instead extended our simulation to consider whether a bias towards
having better studied lineages in diverse genera could drive a positive association between
behavioural proxies of flexibility and diversification rate by chance.
In this second simulation we “evolved” research effort onto the phylogeny over 1000 iterations in
tandem, but independently, of the evolution of technical innovation or social learning. We assume
research effort (on the log-scale, bounding it above zero) would change across the tree according
to a Brownian motion model, with the rate of change (σ) and ancestral state being estimated from
the distribution of the natural log of research effort in our lineage dataset. Of course, the research
effort directed by scientists is not a trait that evolves, but certainly there are a number of lineage
characteristics and traits that are likely to attract research effort (e.g. geographic location,
diurnality, social group size and behaviour) and we can expect many of these characteristics to be
shaped by common descent and share phylogenetic inertia. Based on our empirical dataset, we
defined a minimum threshold of 8 studies (or log(research effort) = 2.07) to observe social learning
or technical innovation, based on the least-studied species with a record of technical innovation
(as it contained the higher threshold; Figure S2.6). In our simulation we then changed evolved data
points for any lineages that had evolved the presence of social learning and technical innovation,
turning these lineages into non-innovators, if that lineage’s independently simulated research effort
was below 8 studies. With these lineages assigned ‘hidden states’, we then repeated our genus-
level analyses testing behavioural proxies of behavioural flexibility against diversification rate
over these simulated datasets to get a distribution of expected neutral effect sizes that also include

63
this potential research effort bias. This simulation was designed to mimic the effect false negatives
(i.e. understudied innovators or social learners) may have on our results, illustrating whether
having better studied lineages in diverse genera by chance could drive a positive association
between the presence of technical innovation or social learning and diversification rate
independent of biological mechanisms.
SUPPLEMENTARY RESULTS:
Phylogenetic Patterns
At the lineage-level relative brain volume showed high phylogenetic signal (λ=0.989; where λ
closer to 1 indicates strong phylogenetic signal), with a moderate signal for technical innovation
(D=0.187; where D closer to 0 indicates strong phylogenetic signal), and a modest signal for social
learning (D=0.521), and none for relative neocortex and cerebellum volume (λ<0.001) as has
previously been described when testing other relative measures of neocortex volume (possibly as
a result of limited power; Shultz & Dunbar, 2006). Taxa per Lineage Diversification Rate also had
a very low phylogenetic signal (λ=0.179) (see Figure S2.2; Table S2.2).
At the genus-level relative brain volume again showed high phylogenetic signal (λ=0.827).
Technical innovation (D=0.438) and social learning (D=0.486) showed modest phylogenetic
correlations, while relative neocortex and cerebellum volume (λ<0.001) showed almost no
relationship with phylogeny. Taxa per Genus Diversification Rate again had a relatively low
phylogenetic signal (λ=0.293) while Lineage per Genus Diversification Rate showed almost no
phylogenetic signal (λ<0.001) (Table S2.2).
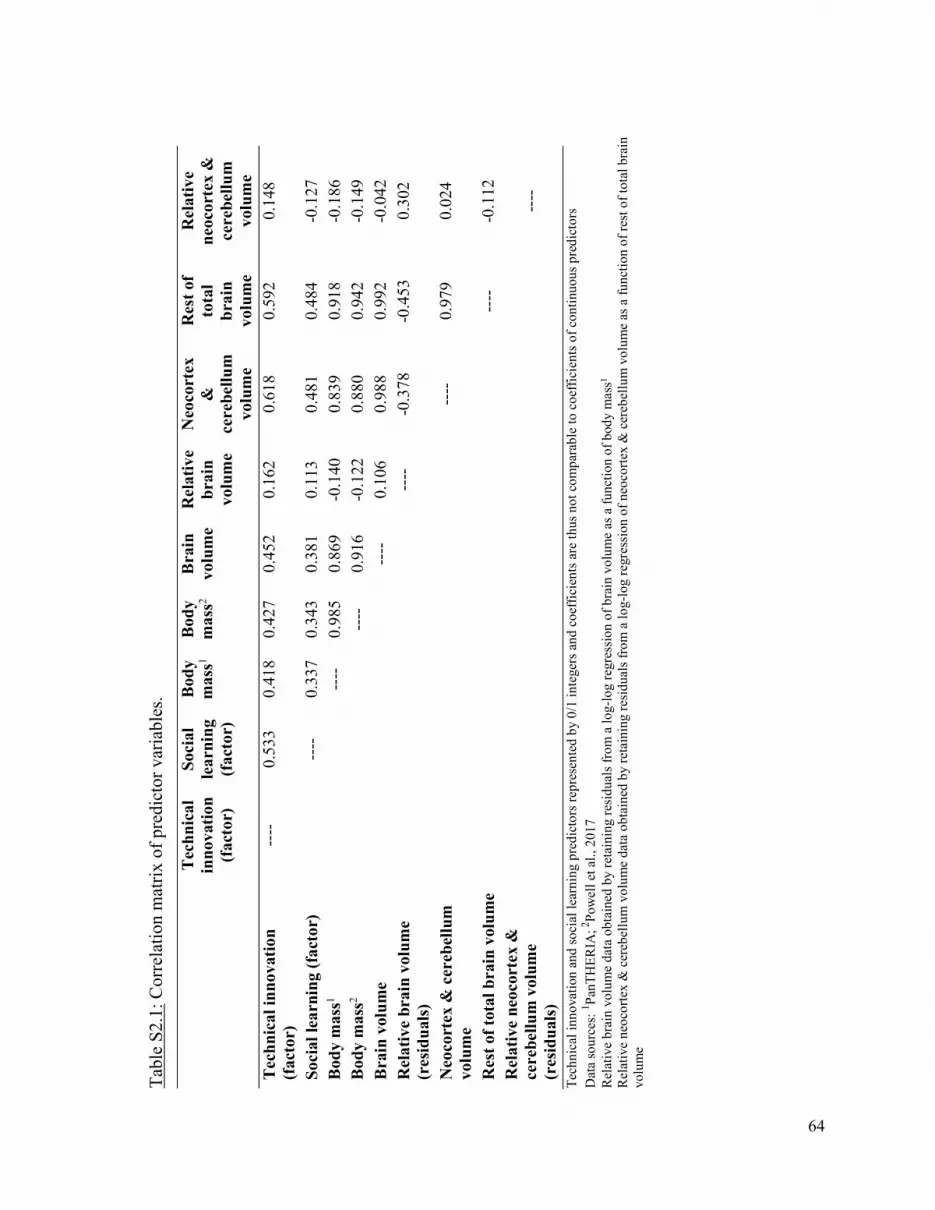
64
Tab
le S
2.1:
Cor
rela
tion
mat
rix
of p
redi
ctor
var
iabl
es.
T
ech
nic
al
inn
ovat
ion
(fac
tor)
Soc
ial
lear
nin
g (f
acto
r)
Bod
y m
ass1
Bod
y m
ass2
Bra
in
volu
me
Rel
ativ
e b
rain
vo
lum
e
Neo
cort
ex
&
cere
bellu
m
volu
me
Res
t of
to
tal
bra
in
volu
me
Rel
ativ
e n
eoco
rtex
&
cere
bellu
m
volu
me
Tec
hn
ical
inn
ovat
ion
(f
acto
r)
----
0.
533
0.41
8 0.
427
0.45
2 0.
162
0.61
8 0.
592
0.14
8
Soc
ial l
earn
ing
(fac
tor)
----
0.
337
0.34
3 0.
381
0.11
3 0.
481
0.48
4 -0
.127
B
ody
mas
s1
--
--
0.98
5 0.
869
-0.1
40
0.83
9 0.
918
-0.1
86
Bod
y m
ass2
--
--
0.91
6 -0
.122
0.
880
0.94
2 -0
.149
B
rain
vol
um
e
--
--
0.10
6 0.
988
0.99
2 -0
.042
Rel
ativ
e br
ain
vol
ume
(res
idu
als)
----
-0
.378
-0
.453
0.
302
Neo
cort
ex &
cer
ebel
lum
vo
lum
e
--
--
0.97
9 0.
024
Res
t of
tot
al b
rain
vol
um
e
----
-0
.112
R
elat
ive
neoc
orte
x &
ce
rebe
llum
vol
ume
(res
idu
als)
--
--
Tec
hnic
al in
nova
tion
and
soc
ial l
earn
ing
pred
icto
rs r
epre
sent
ed b
y 0/
1 in
tege
rs a
nd c
oeff
icie
nts
are
thus
not
com
para
ble
to c
oeff
icie
nts
of c
onti
nuou
s pr
edic
tors
D
ata
sour
ces:
1 Pan
TH
ER
IA; 2
Pow
ell e
t al.,
201
7 R
elat
ive
brai
n vo
lum
e da
ta o
btai
ned
by r
etai
ning
res
idua
ls f
rom
a lo
g-lo
g re
gres
sion
of
brai
n vo
lum
e as
a f
unct
ion
of b
ody
mas
s1 R
elat
ive
neoc
orte
x &
cer
ebel
lum
vol
ume
data
obt
aine
d by
ret
aini
ng r
esid
uals
fro
m a
log-
log
regr
essi
on o
f ne
ocor
tex
& c
ereb
ellu
m v
olum
e as
a f
unct
ion
of r
est o
f to
tal b
rain
vo
lum
e

65
Table S2.2: Phylogenetic signal of predictor variables and diversification rate recorded as Pagel’s
λ (for continuous variables; where λ closer to 1 indicates signal) or the D-statistic (for binary
variables; where D closer to 0 indicates signal).
Variable (Units) Lineage-level Pagel’s λ or D-statistic
Genus-level Pagel’s λ or D-statistic
Technical innovation (factor) D= 0.187 D= 0.438 Social learning (factor) D= 0.521 D= 0.486 Brain volume (cm3) λ= 1.000 λ= 1.000 Body mass (g) λ= 1.000 λ= 0.818 Relative brain volume (residuals) λ= 0.989 λ= 0.827 Neocortex & cerebellum volume (mm3) λ= 1.000 λ= 1.000
Rest of brain volume (mm3) λ= 1.000 λ= 1.000
Relative neocortex & cerebellum volume (residuals) λ< 0.001 λ< 0.001
Taxa per Lineage Diversification Rate λ= 0.179 ----
Taxa per Genus Diversification Rate ---- λ= 0.293
Lineage per Genus Diversification Rate ---- λ< 0.001
Table S2.3: Available data (%), predictive accuracy (p2) and AUC scores for predictors across the
lineage-level dataset (239 lineages), with selected coefficients and the number of eigenvectors
included in imputation models. N/A: not applicable since imputation was not attempted.
Variable (Units) # Lineages with available data (%)
Selected coefficients (including # of eigenvectors selected by model from the phylogeny)
# of eigenvectors
Predictive accuracy (p²) or area under the ROC curve (AUC)
Body mass (g) 196 (82.0%) 10KTrees consensus phylogeny (27 eigenvectors)
50 p²=0.999
ECV (brain volume) (cm3)
186 (77.8%) Body Mass + 10KTrees consensus phylogeny (32 eigenvectors)
50 p²=0.990
Technical innovation (factor)
176 (73.6%) ECV + 10KTrees consensus phylogeny (9 eigenvectors)
40 AUC= 0.928
Social learning (factor)
176 (73.6%) Technical innovation + ECV + 10KTrees consensus phylogeny (21 eigenvectors)
40 AUC= 0.699
Neocortex & cerebellum volume (mm3)
42 (17.6%) N/A N/A N/A
Rest of total brain volume (mm3)
42 (17.6%) N/A N/A N/A

66
Figure S2.3: Receiver operating characteristic curves from leave-one-out cross-validation models
for predicting the presence or absence of: (a) technical innovation (maximum accuracy=0.926;
AUC=0.928) and (b) social learning (maximum accuracy=0.801; AUC=0.699) imputations.
Figure S2.4: Square-root of lineage per genus richness versus the square-root of lineage-level
research effort. The dotted line represents the fewest number of papers in the research effort survey
for an observation of technical innovation to be made in a lineage (log(research effort) = 2.07; see
Figure S2.6). There was no trend between lineage research effort and the richness of its genus (ß=-
0.239; p=0.343).
(a) (b)

67
Figure S2.5: Lineage per genus richness versus (a) the square-root of the average research effort
per lineage in each genus, and (b) the square-root of the maximum research effort per lineage in
each genus. The dotted line represents the fewest number of papers in the research effort survey
for an observation of technical innovation to be made in a lineage (log(research effort) = 2.07; see
Figure S2.6).
(a)
(b)

68
Figure S2.6: Presence and absence of (a) technical innovation and (b) social learning versus
research effort per lineage. The dotted line represents the fewest number of papers in the research
effort survey for an observation of technical innovation to be made in a lineage (log(research
effort) = 2.07).
(a)
(b)

69
Tab
le S
2.4:
Res
ults
of
line
age-
leve
l ana
lyse
s us
ing
Tax
a pe
r L
inea
ge D
iver
sifi
cati
on R
ate
from
all
impu
ted
and
non-
impu
ted
mod
els
+P≤0
.1; *
P≤0
.05;
**P≤0
.01.
Eac
h ro
w r
epre
sent
s a
sepa
rate
ana
lysi
s.
Var
iabl
e (U
nits
) Im
pu
ted
N
on-i
mp
ute
d
M
in
95%
CI
Max
95
%C
I ß
SE
t
p M
in
95%
CI
Max
95
%C
I ß
SE
t
p
Tec
hn
ical
inn
ovat
ion
(fac
tor)
-0
.143
0.
109
-0.0
17
0.06
4 -0
.264
0.
792
-0.1
66
0.14
9 -0
.009
0.
080
-0.1
10
0.91
2
Soc
ial l
earn
ing
(fac
tor)
-0
.029
0.
163
0.06
7 0.
049
1.37
4 0.
171
-0.0
20
0.20
5 0.
092
0.05
7 1.
605
0.11
0 T
ech
nic
al in
nov
atio
n
and
soc
ial l
earn
ing
(fac
tor)
-0.1
33
0.13
0 -0
.002
0.
067
-0.0
26
0.97
9 -0
.151
0.
185
0.01
7 0.
086
0.20
0 0.
841
Rel
ativ
e br
ain
vol
ume*
-0
.036
0.
159
0.06
2 0.
050
1.24
3 0.
215
-0.0
07
0.21
8 0.
106
0.05
7 1.
844
0.06
7+
Rel
ativ
e ne
ocor
tex
&
cere
bellu
m v
olum
e*
-0
.240
0.
152
-0.0
44
0.10
0 -0
.437
0.
664
Bod
y m
ass*
-0
.107
0.
145
0.01
9 0.
064
0.30
0 0.
764
-0.1
11
0.14
7 0.
018
0.06
6 0.
270
0.78
7
* =
log e
-tra
nsfo
rmed
and
sca
led
by 2
sta
ndar
d de
viat
ion

70
Tab
le S
2.5:
Res
ults
of
genu
s-le
vel a
naly
ses
usin
g T
axa
per
Gen
us D
iver
sifi
cati
on R
ate
from
all
impu
ted
and
non-
impu
ted
mod
els
+P≤0
.1; *
P≤0
.05;
**P≤0
.01.
Eac
h ro
w r
epre
sent
s a
sepa
rate
ana
lysi
s.
Var
iabl
e (U
nits
) Im
pu
ted
N
on-i
mp
ute
d
M
in
95%
CI
Max
95
%C
I ß
SE
t
p M
in
95%
CI
Max
95
%C
I ß
SE
t
p
Tec
hn
ical
inn
ovat
ion
(f
acto
r)
-0.0
89
0.16
0 0.
036
0.06
4 0.
562
0.57
7 -0
.093
0.
154
0.03
1 0.
063
0.48
6 0.
629
Soc
ial l
earn
ing
(fac
tor)
-0
.057
0.
130
0.03
7 0.
048
0.77
4 0.
442
-0.0
65
0.12
1 0.
028
0.04
8 0.
589
0.55
8 T
ech
nic
al in
nov
atio
n
and
soc
ial l
earn
ing
(fac
tor)
-0.0
75
0.18
5 0.
055
0.06
6 0.
828
0.41
1 -0
.081
0.
177
0.04
8 0.
066
0.73
3 0.
467
Rel
ativ
e br
ain
vol
ume*
-0
.017
0.
183
0.08
3 0.
051
1.63
5 0.
108
0.04
9 0.
228
0.13
8 0.
046
3.02
0 0.
004*
* R
elat
ive
neoc
orte
x &
ce
rebe
llum
vol
ume*
-0
.141
0.15
4
0.00
7
0.07
5
0.08
9
0.93
0
Bod
y m
ass*
-0
.039
0.
186
0.07
4 0.
057
1.28
5 0.
204
-0.0
34
0.19
4 0.
080
0.05
8 1.
379
0.17
3
* =
log e
-tra
nsfo
rmed
and
sca
led
by 2
sta
ndar
d de
viat
ion

71
Tab
le S
2.6:
Res
ults
of
genu
s-le
vel a
naly
ses
usin
g L
inea
ge p
er G
enus
Div
ersi
fica
tion
Rat
e fr
om a
ll im
pute
d an
d no
n-im
pute
d m
odel
s
+P≤0
.1; *
P≤0
.05;
**P≤0
.01.
Eac
h ro
w r
epre
sent
s a
sepa
rate
ana
lysi
s.
Var
iabl
e (U
nits
) Im
pu
ted
Non
-im
pu
ted
M
in
95%
CI
Max
95
%C
I ß
SE
t
p M
in
95%
CI
Max
95
%C
I ß
SE
t
p
Tec
hn
ical
inn
ovat
ion
(f
acto
r)
0.00
2 0.
130
0.06
6 0.
033
2.02
5 0.
048*
0.
000
0.12
9 0.
065
0.03
3 1.
973
0.05
3+
Soc
ial l
earn
ing
(fac
tor)
0.
043
0.13
2 0.
088
0.02
3 3.
884
< 0
.001
**
0.04
2 0.
131
0.08
6 0.
023
3.78
9 <
0.0
01**
T
ech
nic
al in
nov
atio
n
and
soc
ial l
earn
ing
(fac
tor)
0.01
8 0.
151
0.08
5 0.
034
2.50
4 0.
015*
0.
017
0.15
0 0.
083
0.03
4 2.
452
0.01
7*
Rel
ativ
e br
ain
vol
ume*
-0
.022
0.
072
0.02
5 0.
024
1.03
7 0.
304
-0.0
19
0.07
8 0.
030
0.02
5 1.
203
0.23
4 R
elat
ive
neoc
orte
x &
ce
rebe
llum
vol
ume*
-0
.112
0.
074
-0.0
19
0.04
7 -0
.400
0.
693
Bod
y m
ass*
-0
.020
0.
074
0.02
7 0.
024
1.11
8 0.
268
-0.0
17
0.07
8 0.
030
0.02
4 1.
247
0.21
8
* =
log e
-tra
nsfo
rmed
and
sca
led
by 2
sta
ndar
d de
viat
ion

72
Figure S2.7: Relationships between technical innovation (a-c), social learning (d-f), combined
technical innovation and social learning (g-i), relative brain volume (j-l) (all including imputed
data) and relative neocortex & cerebellum volume (m-o) (non-imputed) on three measures of
primate diversification rate. Imputed lineage-level data points are indicated in red. Horizontal
bars indicate group means. Significance indicated as: +P≤0.1; *P≤0.05; **P≤0.01.

73
Lineage-Richness Sampling Bias
From our simulations, we confirmed that there is a bias towards a positive relationship between
diversification rate and the presence of each behavioural flexibility measure (Figure S2.8). For
Taxa per Genus Diversification Rate, the probabilities of the observed effect sizes (ß) occurring
by chance were p=0.392 for presence of technical innovation, p=0.420 for presence of social
learning, and p=0.260 for combined presence of technical innovation and social learning. For
Lineage per Genus Diversification Rate, the probabilities of the observed effect sizes (ß)
occurring by chance were p=0.028 for presence of technical innovation, p=0.002 for presence
of social learning, and p=0.008 for combined presence of technical innovation and social
learning. That is, the effect sizes generated by this bias for the association with Lineage per
Genus Diversification Rate were considerably lower than the observed effect size from the
empirical data.

74
Figure S2.8: Distribution of effect sizes (ß) from PGLS tests on 1000 simulations of the random
evolution of technical innovation and social learning. The neutral effect sizes for technical
innovation on (a) Taxa per Genus Diversification Rate (DR) (median ß=0.009) and (b) Lineage
per Genus DR (median ß=0.020); effect sizes for social learning on (c) Taxa per Genus DR
(median ß=0.025) and (d) Lineage per Genus DR (median ß=0.031); Effect sizes for the
combined presence of technical innovation and social learning on (e) Taxa per Genus DR
(median ß=0.012) and (f) Lineage per Genus DR (median ß=0.023). Vertical line indicates the
observed effect size for each predictor.
(a) (b)
(c) (d)
(e) (f)

75
Research Effort Bias
Positive correlations between our measures of behavioural flexibility and genus-level estimates
of diversification rate could also be further biased by asymmetry in research effort. If many
understudied lineages scored as zero are truly technical innovators or social learners (i.e. false
negatives), and these lineages tend to be in depauperate clades, then heightened observation of
behavioural flexibility in diverse clades could bias our results. Testing this potential bias with
a simulation where observed behaviours were hidden based on simulated research effort, we
found that this scenario generated a slightly greater bias towards a positive relationship between
diversification rate and the presence of each behavioural flexibility measure (Figure S2.9). Our
results for Taxa per Genus Diversification Rate remained non-significant, and for Lineage per
Genus Diversification Rate remained significant except for technical innovation. For Taxa per
Genus Diversification Rate, the probabilities of the observed effect sizes (ß) occurring by
chance were p=0.408 for presence of technical innovation, p=0.439 for presence of social
learning, and p=0.281 for combined presence of technical innovation and social learning. For
Lineage per Genus Diversification Rate, the probabilities of the observed effect sizes (ß)
occurring by chance were p=0.109 for presence of technical innovation, p=0.019 for presence
of social learning, and p=0.027 for combined presence of technical innovation and social
learning.

76
Figure S2.9: Null distribution of effect sizes (ß) from PGLS tests on 1000 simulated technical
innovation/social learning datasets censoring the presence of these behaviours when a lineage
has a simulated research effort < 8 papers, testing the effect of technical innovation on (a) Taxa
per Genus Diversification Rate (DR) (median ß=0.023) and (b) Lineage per Genus DR (median
ß=0.033); social learning on (c) Taxa per Genus DR (median ß=0.028) and (d) Lineage per
Genus DR (median ß=0.040); and the combined presence of technical innovation and social
learning on (e) Taxa per Genus DR (median ß=0.020) and (f) Lineage per Genus DR (median
ß=0.032). Vertical line indicates the observed effect size.
(a) (b)
(c) (d)
(e) (f)

77
SUPPLEMENTARY REFERENCES:
Arnold, C., Matthews, L. J., & Nunn, C. L. (2010). The 10kTrees website: a new online resource
for primate phylogeny. Evolutionary Anthropology, 19: 114–118.
Barks, S. K., Calhoun, M. E., Hopkins, W. D., Cranfield, M. R., Mudakikwa, A., Stoinski, T.
S., ... & Sherwood, C. C. (2015). Brain organization of gorillas reflects species
differences in ecology. American Journal of Physical Anthropology, 156: 252–262.
Barger, N., Hanson, K. L., Teffer, K., Schenker-Ahmed, N. M., & Semendeferi, K. (2014).
Evidence for evolutionary specialization in human limbic structures. Frontiers in
Human Neuroscience, 8: 277.
Barger, N., Stefanacci, L., & Semendeferi, K. (2007). A comparative volumetric analysis of the
amygdaloid complex and basolateral division in the human and ape brain. American
Journal of Physical Anthropology, 134: 392–403.
Barton, R. A. (2006). Primate brain evolution: integrating comparative, neurophysiological, and
ethological data. Evolutionary Anthropology, 15: 224–236.
Bauernfeind, A. L., De Sousa, A. A., Avasthi, T., Dobson, S. D., Raghanti, M. A.,
Lewandowski, A. H., ... & Hof, P. R. (2013). A volumetric comparison of the insular
cortex and its subregions in primates. Journal of Human Evolution, 64: 263–279.
Bradley, A. P. (1997). The use of the area under the ROC curve in the evaluation of machine
learning algorithms. Pattern Recognition, 30: 1145–1159.
Bush, E. C., & Allman, J. M. (2004a). The scaling of frontal cortex in primates and carnivores.
Proceedings of the National Academy of Sciences, 101: 3962–3966.
Bush, E. C., & Allman, J. M. (2004b). Three‐dimensional structure and evolution of primate
primary visual cortex. The Anatomical Record Part A, 281: 1088–1094.
Darlington, R. B., & Smulders, T. V. (2001). Problems with residual analysis. Animal
Behaviour, 62: 599–602.

78
Deaner, R. O., Isler, K., Burkart, J., & Van Schaik, C. (2007). Overall brain size, and not
encephalization quotient, best predicts cognitive ability across non-human primates.
Brain, Behaviour and Evolution, 70: 115–124.
DeCasien, A. R., & Higham, J. P. (2019). Primate mosaic brain evolution reflects selection on
sensory and cognitive specialization. Nature Ecology & Evolution, 3: 1483–1493.
Defler, T. R., & Bueno, M. L. (2007). Aotus diversity and the species problem. Primate
Conservation, 22: 55–70.
De Sousa, A. A., Sherwood, C. C., Mohlberg, H., Amunts, K., Schleicher, A., MacLeod, C. E.,
... & Zilles, K. (2010). Hominoid visual brain structure volumes and the position of the
lunate sulcus. Journal of Human Evolution, 58: 281–292.
Ducatez, S., Sol, D., Sayol, F., & Lefebvre, L. (2020). Behavioural plasticity is associated with
reduced extinction risk in birds. Nature Ecology & Evolution, 4: 788–793.
Frahm, H. D., Stephan, H., & Baron, G. (1984). Comparison of brain structure volumes in
insectivora and primates. V. Area striata (AS). Journal für Hirnforschung, 25: 537–557.
Freckleton, R. P. (2002). On the misuse of residuals in ecology: regression of residuals vs.
multiple regression. Journal of Animal Ecology, 71: 542–545.
Freckleton, R. P., Harvey, P. H., & Pagel, M. (2002). Phylogenetic analysis and comparative data:
a test and review of evidence. The American Naturalist, 160: 712–726.
Fritz, S. A., & Purvis, A. (2010). Selectivity in mammalian extinction risk and threat types: a new
measure of phylogenetic signal strength in binary traits. Conservation Biology: 24: 1042–
1051.
Guénard, G., Legendre, P., & Peres‐Neto, P. (2013). Phylogenetic eigenvector maps: a
framework to model and predict species traits. Methods in Ecology and Evolution, 4:
1120–1131.
Greenberg, D. A., Palen, W. J., & Mooers, A. Ø. (2017). Amphibian species traits, evolutionary
history and environment predict Batrachochytrium dendrobatidis infection patterns, but
not extinction risk. Evolutionary Applications, 10: 1130–1145.

79
Hadfield, J. D. (2010). MCMC methods for multi-response generalized linear mixed models:
the MCMCglmm R package. Journal of Statistical Software, 33: 1–22.
Harmon, L. J., Weir, J. T., Brock, C. D., Glor, R. E., & Challenger, W. (2008). GEIGER:
investigating evolutionary radiations. Bioinformatics, 24: 129–131.
Healy, S. D., & Rowe, C. (2007). A critique of comparative studies of brain size. Proceedings of
the Royal Society B: Biological Sciences, 274: 453–464.
Isaac, N. J., Mallet, J., & Mace, G. M. (2004). Taxonomic inflation: its influence on macroecology
and conservation. Trends in Ecology & Evolution, 19: 464–469.
Isler, K., Kirk, E. C., Miller, J. M., Albrecht, G. A., Gelvin, B. R., & Martin, R. D. (2008).
Endocranial volumes of primate species: scaling analyses using a comprehensive and
reliable data set. Journal of Human Evolution, 55: 967–978.
IUCN/SSC Primate Specialist Group. (2018). Retrieved from http://www.primate-
sg.org/red_list_threat_status/ [accessed 10 November 2018].
Jones, K. E., Bielby, J., Cardillo, M., Fritz, S. A., O'Dell, J., Orme, C. D. L., ... & Connolly, C.
(2009). PanTHERIA: a species‐level database of life history, ecology, and geography
of extant and recently extinct mammals: Ecology, 90: 2648–2648.
Koops, K., Visalberghi, E., & van Schaik, C. P. (2014). The ecology of primate material culture.
Biology Letters, 10: 20140508.
Laland, K. N., & Reader, S. M. (1999). Foraging innovation in the guppy. Animal Behaviour, 57:
331–340.
Lefebvre, L. (2013). Brains, innovations, tools and cultural transmission in birds, non-human
primates, and fossil hominins. Frontiers in Human Neuroscience, 7: 245.
Lefebvre, L., Reader, S. M., & Sol, D. (2004). Brains, innovations and evolution in birds and
primates. Brain, Behaviour and Evolution, 63: 233–246.
Lefebvre, L., Whittle, P., Lascaris, E., & Finkelstein, A. (1997). Feeding innovations and forebrain
size in birds. Animal Behaviour, 53: 549–560.
80
Lewis, P. O. (2001). A likelihood approach to estimating phylogeny from discrete morphological
character data. Systematic Biology, 50: 913–925.
Logan, C. J., Avin, S., Boogert, N., Buskell, A., Cross, F. R., Currie, A., … & Montgomery, S. H.
(2018). Beyond brain size: Uncovering the neural correlates of behavioural and cognitive
specialization. Comparative Cognition & Behaviour Reviews, 13: 55–89.
MacLeod, C. E., Zilles, K., Schleicher, A., Rilling, J. K., & Gibson, K. R. (2003). Expansion
of the neocerebellum in Hominoidea. Journal of Human Evolution, 44: 401–429.
Magallon, S., & Sanderson, M. J. (2001). Absolute diversification rates in angiosperm clades.
Evolution, 55: 1762–1780.
Masters, J. C., Génin, F., Couette, S., Groves, C. P., Nash, S. D., Delpero, M., & Pozzi, L.
(2017). A new genus for the eastern dwarf galagos (Primates: Galagidae). Zoological
Journal of the Linnean Society, 181: 229–241.
McGrew, W. C. (1992). Chimpanzee material culture: implications for human evolution.
Cambridge University Press, Cambridge.
Mikhalevich, I., Powell, R., & Logan, C. (2017). Is behavioural flexibility evidence of cognitive
complexity? How evolution can inform comparative cognition. Interface Focus, 7:
20160121.
Navarrete, A. F., Blezer, E. L., Pagnotta, M., de Viet, E. S., Todorov, O. S., Lindenfors, P., ...
& Reader, S. M. (2018). Primate brain anatomy: new volumetric MRI measurements
for neuroanatomical studies (with Erratum). Brain, Behaviour and Evolution, 91: 109–
117.
Navarrete, A. F., Reader, S. M., Street, S. E., Whalen, A., & Laland, K. N. (2016). The
coevolution of innovation and technical intelligence in primates. Philosophical
Transactions of the Royal Society B: Biological Sciences, 371: 20150186.
Pagel, M. (1999). Inferring the historical patterns of biological evolution. Nature, 401: 877–
884.

81
Penone, C., Davidson, A. D., Shoemaker, K. T., Di Marco, M., Rondinini, C., Brooks, T. M.,
... & Costa, G. C. (2014). Imputation of missing data in life‐history trait datasets: which
approach performs the best? Methods in Ecology and Evolution, 5: 961–970.
Powell, L. E., Isler, K., & Barton, R. A. (2017). Re-evaluating the link between brain size and
behavioural ecology in primates. Proceedings of the Royal Society B: Biological
Sciences, 284: 20171765.
Reader, S. M. (2003). Innovation and social learning: individual variation and brain evolution.
Animal Biology, 53: 147–158.
Reader, S. M., Hager, Y., & Laland, K. N. (2011). The evolution of primate general and cultural
intelligence. Philosophical Transactions of the Royal Society B: Biological Sciences,
366: 1017–1027.
Reader, S. M., & Laland, K. N. (2002). Social intelligence, innovation, and enhanced brain size
in primates. Proceedings of the National Academy of Sciences, 99: 4436–4441.
Reader, S. M., & MacDonald, K. (2003). Environmental variability and primate behavioural
flexibility. In S. M. Reader & K. N. Laland (Eds.), Animal innovation (p. 83–116).
Oxford University Press, Oxford.
Revell, L. J. (2012). phytools: an R package for phylogenetic comparative biology (and other
things). Methods in Ecology and Evolution, 3: 217–223.
Revell, L. J. (2014). Package ‘phytools’. https://cran.r-project.org/web/packages/phytools.
Riska, B., & Atchley, W. R. (1985). Genetics of growth predict patterns of brain-size evolution.
Science, 229: 668–671.
Roos, C., Boonratana, R., Supriatna, J., Fellowes, J. R., Groves, C. P., Nash, S. D., ... &
Mittermeier, R. A. (2014). An updated taxonomy and conservation status review of
Asian primates. Asian Primates Journal, 4: 2–38.
Santos, T., Diniz-Filho, J. A. F., Rangel, T., & Bini, L. M. (2013). PVR: Computes phylogenetic
eigenvectors regression (PVR) and phylogenetic signal-representation curve (PSR)

82
(with null and Brownian expectations). R package version 0.2.1.
http://github.com/cran/PVR.
Sherwood, C. C., Cranfield, M. R., Mehlman, P. T., Lilly, A. A., Garbe, J. A. L., Whittier, C.
A., ... & Tang, C. Y. (2004). Brain structure variation in great apes, with attention to the
mountain gorilla (Gorilla beringei beringei). American Journal of Primatology: Official
Journal of the American Society of Primatologists, 63: 149–164.
Sherwood, C. C., Hof, P. R., Holloway, R. L., Semendeferi, K., Gannon, P. J., Frahm, H. D., &
Zilles, K. (2005). Evolution of the brainstem orofacial motor system in primates: a
comparative study of trigeminal, facial, and hypoglossal nuclei. Journal of Human
Evolution, 48: 45–84.
Shultz, S., & Dunbar, R. I. (2006). Both social and ecological factors predict ungulate brain
size. Proceedings of the Royal Society B: Biological Sciences, 273: 207–215.
Sing, T., Sander, O., Beerenwinkel, N., & Lengauer, T. (2005). ROCR: visualizing classifier
performance in R. Bioinformatics, 21: 3940–3941.
Stephan, H., Baron, G., & Frahm, H. (1988). Comparative size of brains and brain structures.
In H. Steklis & J. Erwin (Eds.), Comparative Primate Biology Vol. 4 (p. 1–38). Alan R.
Liss, New York.
Stephan, H., Bauchot, R., & Andy, O. J. (1970). The allocortex in primates. In C. Noback &
W. Montagna (Eds.), The primate brain: Advances in primatology (p. 289–297).
Appleton-Century-Crofts, New York.
Stephan, H., Frahm, H., & Baron, G. (1981). New and revised data on volumes of brain
structures in insectivores and primates. Folia Primatologica, 35: 1–29.
Stimpson, C. D., Barger, N., Taglialatela, J. P., Gendron-Fitzpatrick, A., Hof, P. R., Hopkins,
W. D., & Sherwood, C. C. (2016). Differential serotonergic innervation of the amygdala
in bonobos and chimpanzees. Social Cognitive and Affective Neuroscience, 11: 413–
422.

83
Svensson, M. S., Bersacola, E., Mills, M. S., Munds, R. A., Nijman, V., Perkin, A., ... &
Bearder, S. K. (2017). A giant among dwarfs: a new species of galago (Primates:
Galagidae) from Angola. American Journal of Physical Anthropology, 163: 30–43.
Swenson, N. G. (2014). Phylogenetic imputation of plant functional trait databases. Ecography,
37: 105–110.
van Roosmalen, M. G. M., van Roosmalen, T., Mittermeier, R. A., & Rylands, A. B. (1998). A
new and distinctive species of marmoset (Callitrichidae, Primates) from the lower Rio
Aripuanã, state of Amazonas, central Brazilian Amazonia. Goeldiana Zoologia, 22: 1–
27.
van Schaik, C. P., Ancrenaz, M., Borgen, G., Galdikas, B., Knott, C. D., Singleton, I., ... &
Merrill, M. (2003). Orangutan cultures and the evolution of material culture. Science,
299: 102–105.
van Schaik, C. P., Deaner, R. O., & Merrill, M. Y. (1999). The conditions for tool use in
primates: implications for the evolution of material culture. Journal of Human
Evolution, 36: 719–741.
van Woerden, J. T., Willems, E. P., van Schaik, C. P., & Isler, K. (2012). Large brains buffer
energetic effects of seasonal habitats in catarrhine primates. Evolution, 66: 191–199.
van Woerden, J. T., van Schaik, C. P., & Isler, K. (2010). Effects of seasonality on brain size
evolution: evidence from strepsirrhine primates. The American Naturalist, 176: 758–
767.
van Woerden, J. T., van Schaik, C. P., & Isler, K. (2014). Brief Communication: Seasonality of
diet composition is related to brain size in New World Monkeys. American Journal of
Physical Anthropology, 154: 628–632.
Venables, W. N., & Ripley, B. D. (2002). Modern Applied Statistics with S, 4th ed. Springer,
New York.
Visalberghi, E. (1994). Capuchin monkeys: a window into tool use in apes and humans. In K.
R. Gibson & T. Ingold (Eds.), Tools, language and cognition in human evolution (p.
138–150). Cambridge University Press, Cambridge.

84
Rilling, J. K., & Insel, T. R. (1998). Evolution of the cerebellum in primates: differences in
relative volume among monkeys, apes and humans. Brain, Behaviour and Evolution,
52: 308–314.
Rilling, J. K., & Insel, T. R. (1999). The primate neocortex in comparative perspective using
magnetic resonance imaging. Journal of Human Evolution, 37: 191–223.

85
LINKING STATEMENT
One of the main obstacles I encountered when attempting to measure diversification rate in Chapter
2 was the unreliable estimate of species and subspecies richness across primate lineages ascribable
to recent applications of the ‘phylogenetic species concept’ (PSC). In particular, the PSC has a
tendency of splitting lineages into a greater number of less inclusive units in comparison to
previous species concepts. As a result, there has been an observable “inflation” in the number of
species listed in many primate groups since the introduction of the PSC in 1983. This phenomena
has now been referred to as ‘taxonomic inflation’ and has been criticized for being heterogeneous
and biased toward certain clades. Taxonomic inflation has complicated evolutionary measures as
discussed in Chapter 2, however, inflation has also been suggested to have implications in applied
fields of biology – most notably conservation. Therefore, in Chapter 3 I explore the predictors of
taxonomic inflation across primate taxa and its role in conservation.

86
CHAPTER 3: PREDICTORS OF TAXONOMIC INFLATION
AND ITS ROLE IN PRIMATE CONSERVATION
Maria J.A. Creighton, Simon M. Reader & Arne Ø. Mooers
Unpublished manuscript

87
ABSTRACT:
Species are the main unit used to measure biodiversity but different preferred diagnostic criteria
can lead to very different delineations. For instance, named primate species have more than
doubled since 1982. Such increases have been termed "taxonomic inflation" and have been
attributed to the widespread adoption of the ‘phylogenetic species concept’ (PSC) in preference to
the previously popular ‘biological species concept’ (BSC). Criticisms of the PSC have suggested
taxonomic inflation may be biased toward particular taxa and pose unpropitious consequences for
conservation. Here, we explore predictors of taxonomic inflation across primate taxa since the
initial application of the PSC nearly 40 years ago. We do not find evidence that diversification
rate, the rate of lineage formation over evolutionary time, is linked to inflation, contrary to
expectations if the PSC identifies incipient species. Research effort in fields suggested to be
associated with inflation also exhibited no significant association with increases in species
numbers among genera. To test the suggestion that splitting groups is likely to increase their threat
score, we additionally examined whether genera that have undergone more inflation are more at
risk. We find that associations between inflation and threat score vary by region, with a positive
association in Asia and Africa, no significant association in Madagascar, and a negative association
in the Neotropics. We suggest these differences may indicate that other factors (e.g. total
geographic range size of a genus) impact how inflation affects threat score. Regardless, we echo
warnings that it is unwise for conservation to be reliant on taxonomic stability. Species (however
defined) are not independent from one another, and thus monitoring and managing them as such
may not meet the overarching goal of conserving biodiversity.
KEYWORDS: species; phylogenetic species concept; primates; taxonomic inflation;
conservation

88
INTRODUCTION:
“Species” are an integral unit of biodiversity used across many sub-disciplines of biology, yet how
scientists define species has been subject to change. As of 2004, over 24 different species
definitions were recorded in the scientific literature (Coyne & Orr, 2004; Tattersall, 2007). New
species definitions have led to dramatic shifts in the number of species listed in many taxonomic
groups throughout time. Notably, in the last 40 years, the widespread popularization of the
phylogenetic or ‘diagnostic’ species concept (PSC) (Cracraft, 1983; Isaac, et al., 2004; Cotton, et
al., 2016) has led to large increases in species numbers across many taxa (Agapow, et al., 2004).
Groves (2014) provides a brief overview of popular species definitions employed by taxonomists
through the late nineteenth to twentieth century. One notable phenomenon is the considerable
decrease in diagnosed species following the rapid adoption of the polytypic species concept from
the 1890’s onward. The polytypic species concept emphasizes that species should be inclusive and
that one should delineate taxa that resemble one another as subspecies (Groves, 2014). The
popularization of the polytypic species concept was eventually accompanied by the widespread
adoption of the ‘biological species concept’ (BSC) beginning in the early 1960’s (Groves, 2014).
The BSC, proposed by Theodosius Dobzhansky and Ernst Mayr (Mayr, 1963), states that species
are populations/meta-populations that do not interbreed with other populations/meta-populations
under natural conditions (Mayr, 1963; Groves, 2014). While this definition has been subject to
revisions, the central premise of the BSC is that reproductive barriers are key to diagnosing species
(Groves, 2014). The BSC was widely accepted and layered onto the pre-existing polytypic species
concept, creating a period of relative taxonomic stability for vertebrates from the 1960’s to 1980’s
(Isaac, et al., 2004). However, various criticisms of the BSC did emerge, the most notable being
the practical difficulty of diagnosing species under the BSC because of the need for information
on reproductive barriers. Closely related lineages sharing parapatric (i.e. separate but contiguous)
distributions are especially difficult to diagnose under the BSC (Tattersall, 2007). In many
instances limited records of potential mating interactions or of hybrid forms do not provide
researchers with enough information to confirm whether parapatric populations belong to a single
species. In these cases, genetic evidence is required to show that gene pools are still actively
reintegrating after being geographically separated (Tattersall, 2007). Collecting such evidence in

89
every case of parapatry would be a daunting task, and these critiques suggested the need for a
species concept with higher diagnostic power.
In the last 40 years the ‘phylogenetic’ or ‘diagnostic’ species concept (Cracraft, 1983; Isaac, et al.,
2004) has been widely popularized in vertebrate taxonomy due to its diagnosable advantages over
the BSC. Under the phylogenetic species concept (PSC), a species is diagnosed as the smallest
population or meta-population that is distinct in heritable differences from other populations or
meta-populations (Cracraft, 1983; Groves & Grubb, 2011; Groves, 2014). According to its
proponents, the emphasis on more easily diagnosable evidence under the PSC creates a scientific
proposition that can be tested. As a result, the PSC began being used almost immediately after its
inception, with influential taxonomists quickly advocating for its use over the BSC (see, e.g.
Donoghue, 1985).
Although the PSC offers diagnostic advantages over the BSC, it has also been subject to criticism.
Notably, the PSC has been criticized for its tendency of splitting species into a range of less-
inclusive units compared to previous species concepts (Agapow, et al., 2004; Zachos, et al., 2013;
Zachos & Lovari, 2013). Under the PSC many populations previously recognized as subspecies or
morphological variants have been elevated to full species status, resulting in a large increase in the
number of listed species. For instance, 181 species of primates were listed by Honacki et al. (1982),
one year prior to Cracraft’s proposal of the PSC (Cracraft, 1983). Today the IUCN (International
Union for Conservation of Nature)/SSC (Species Survival Commission) Primate Specialist Group
lists over 500 distinct primate species (IUCN/SSC Primate Specialist Group, 2018). Figure 3.1
illustrates the increase in species numbers among primate families listed by Honacki et al. (1982)
over time. Some families (e.g. Cheirogaleidae and Indriidae) have more than tripled in species
numbers since the introduction of the PSC. While some of these species have been added as a
result of new discoveries, a majority are populations previously identified at a lower taxonomic
level that have since been elevated to species status following the application of the PSC. For
instance, 391 of the 509 primate species listed by the IUCN as of 2018 (IUCN/SSC Primate
Specialist Group, 2018) have names and discovery dates that pre-date the publication of Honacki
et al. (1982). This means at least 210 are populations previously considered to be subspecies or
morphological variants of other species under the BSC that have since been elevated to full species
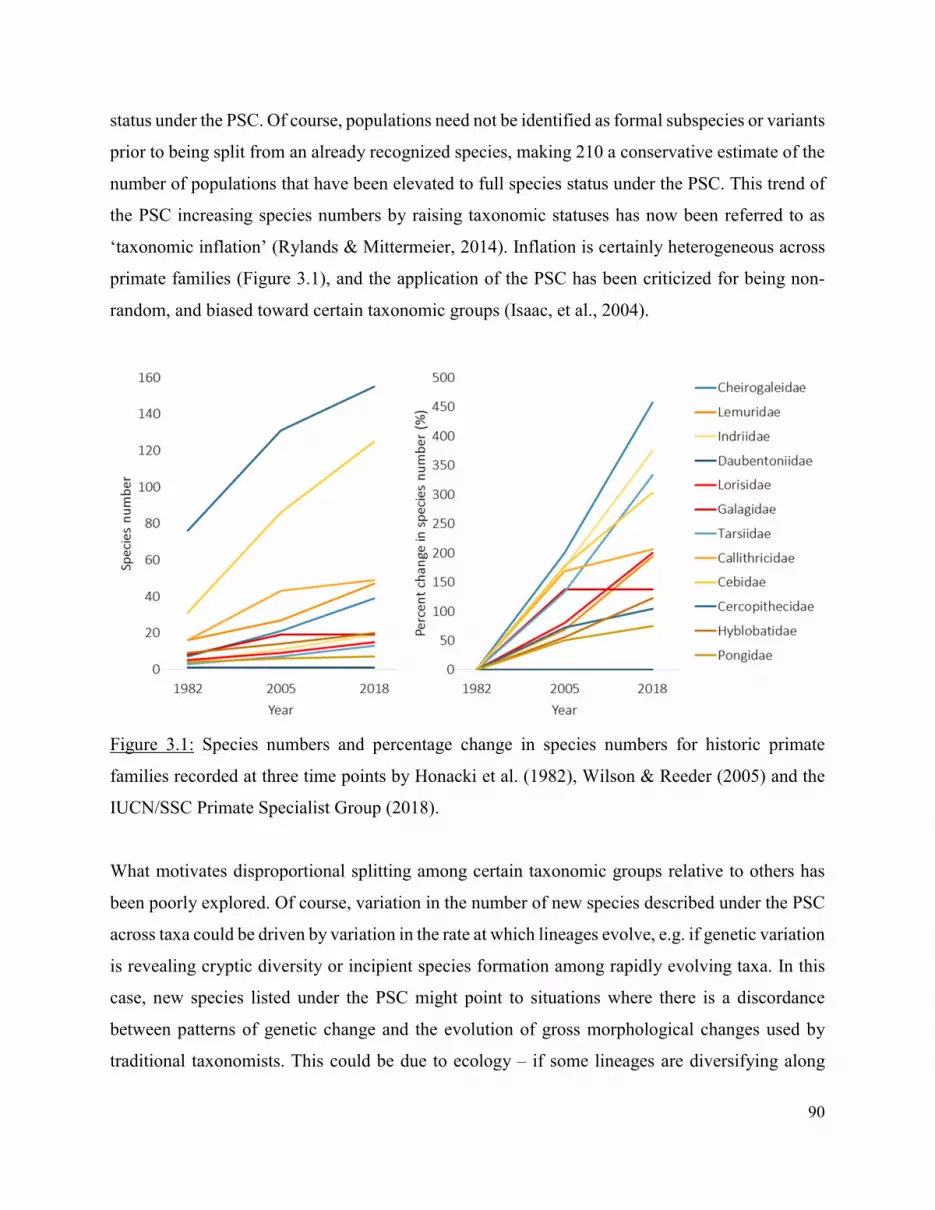
90
status under the PSC. Of course, populations need not be identified as formal subspecies or variants
prior to being split from an already recognized species, making 210 a conservative estimate of the
number of populations that have been elevated to full species status under the PSC. This trend of
the PSC increasing species numbers by raising taxonomic statuses has now been referred to as
‘taxonomic inflation’ (Rylands & Mittermeier, 2014). Inflation is certainly heterogeneous across
primate families (Figure 3.1), and the application of the PSC has been criticized for being non-
random, and biased toward certain taxonomic groups (Isaac, et al., 2004).
Figure 3.1: Species numbers and percentage change in species numbers for historic primate
families recorded at three time points by Honacki et al. (1982), Wilson & Reeder (2005) and the
IUCN/SSC Primate Specialist Group (2018).
What motivates disproportional splitting among certain taxonomic groups relative to others has
been poorly explored. Of course, variation in the number of new species described under the PSC
across taxa could be driven by variation in the rate at which lineages evolve, e.g. if genetic variation
is revealing cryptic diversity or incipient species formation among rapidly evolving taxa. In this
case, new species listed under the PSC might point to situations where there is a discordance
between patterns of genetic change and the evolution of gross morphological changes used by
traditional taxonomists. This could be due to ecology – if some lineages are diversifying along

91
ecological axes that we do not notice, or due to demographics – if some lineages have ecologies
and/or histories that lead to faster local genetic coalescent times and so diagnosability. Under either
of these scenarios, inflation would not lead to a bias per se, but simply reflect underlying biological
reality. However, it is also possible that splitting is driven by other factors that may indeed be
prone to bias. Many have argued that most of the inflation among groups is artificial, simply
reflecting major shortcomings of applying the PSC and reliance on insufficient data (Zachos, et
al., 2013; Zachos & Lovari, 2013). Zachos et al. (2013) provides some evidence suggesting
unwarranted splitting in select cases, advocating that the PSC has been taken to the “molecular
extreme”. In one cited example, Sumatran tigers (previously Panthera tigris sumatrae, raised to
Panthera sumatrae) were split by Cracraft et al. (1998) and further split by Mazák & Groves
(2006), based on diagnosable mitochondrial and craniometrics differences, respectively. Zachos et
al. (2013) argues that if such fine diagnosable distinctions were applied to groups like domestic
dogs, or even humans one could just as well advocate for their splitting. By this logic, groups may
continue to be split as an increasing amount of molecular work supports more splitting (i.e. we are
likely to find more PSC species the more we look for them).
It has additionally been suggested that conservation interest in particular groups may motivate
splitting. Funding for conservation research is increasingly focused on ‘biodiversity hotspots’ and
it has been suggested that – due to the limited supply of conservation resources – researchers could
have a vested interest in declaring taxa in these regions as endemic species (Karl & Bowen, 1999;
Isaac, et al., 2004). There is indeed evidence among well-studied and charismatic taxa for species
receiving more conservation attention and funding when comprised of multiple, small and
taxonomically distinct populations (e.g. African apes; Stanford, 2001; Oates, 2006; Gippoliti &
Amori, 2007). This is because species lists are often used to determine which groups should receive
conservation attention (Mace, 2004) and changing the way we define species can also change
which groups receive action. This has led to another major criticism of the PSC which suggests
that it may create a burden on conservation efforts (Agapow, et al., 2004; Mace, 2004; Isaac, et
al., 2004; Frankham, et al., 2012; Zachos, et al., 2013; Zachos, 2015).
Along with being potentially biased toward certain groups, splitting under the PSC has been
suggested to result in populations that are considered to be more imperilled (Agapow, et al., 2004;

92
Isaac, et al., 2004; Morrison, et al., 2009; Robuchon, et al., 2019). One criterion used by the IUCN
to classify “Vulnerable” species is that fewer than 1000 mature individuals should be found in the
wild. Species identified as “Endangered” should have fewer than 250 mature individuals left in
the wild (Agapow, et al., 2004; Frankham, et al., 2012). Thus splitting an already vulnerable
species into several new species may result in one or more receiving a more imperilled status, in
addition to generally increasing the number of recognized threatened species (Agapow, et al.,
2004; Isaac, et al., 2007). This could also lead to seemingly rare but poorly-defined species being
prioritized over well-defined and perhaps biologically more distinctive species (Pillon & Chase,
2007). Criticisms of the PSC have sparked division across many fields of biology, with many still
advocating that the PSC is the best method of defining species (e.g. Groves, 2013).
Here, we set out to better understand taxonomic inflation in primates by exploring predictors of
taxonomic inflation across primate genera and testing how inflation interacts with risk status across
primate genera. We test to determine (i) whether taxonomic inflation is associated with the amount
of research being done in fields suggested to motivate splitting, or whether it is associated with a
lineage's underlying diversification rate, and, (ii) whether rates of inflation dictate which groups
are considered to be most imperilled.
We consider whether biological factors or measures of human-induced bias explain increases in
species numbers among primate taxa. To test potential human-induced biases in splitting, we
consider estimates of research effort for each taxon, and predict that more research done on a given
taxon may increase splitting. We examine research effort in two fields: molecular genetics (since
molecular work could cause species to be split continuously as finer molecular distinctions are
made) and conservation (since splitting has been suggested to be motivated by conservation
interests: Karl & Bowen, 1999; Isaac, et al., 2004). To explore possible biological explanations for
inflation trends, we test to see if inflation is explained by diversification rate, using a diversification
measure designed to be uncoupled from changes in species naming conventions (see Methods).
Lineages with high past diversification rates are expected to contain more incipient or cryptic
species than lineages diversifying at a lower rate, such that diversification rate would be expected
to correlate positively with PSC-induced taxonomic inflation.

93
To explore our second question linking inflation and risk, we would ideally test for an association
between inflation per genus and changes in genus-level risk status between 1982 and 2016.
However, Red List criteria for threat categories have changed considerably over time (e.g. see
criteria and statuses in IUCN Conservation Monitoring Centre, 1986) and an ever-increasing
number of species have now been evaluated (Collen, et al., 2016). Additionally, prior to the 1990s
Red Lists were determined based upon nominations by experts in the field, rather than any
systematic review process (Mace, et al., 1992; Mace & Collar, 1995). Therefore, changes in risk
status between 1982 and 2016 could well reflect adjustments in listing criteria and a general
improvement in assessments for many taxa (particularly those which were previously
understudied). As a result, we instead specifically test whether inflation is associated with which
taxa are considered to be at the greatest risk today. We test this using a genus-level estimate of
threat score (hereafter “threat score”), estimated based on a modified version of the Red List Index
(RLI) (a compound measures of IUCN Red List Status; IUCN Red List of Threatened Species,
2019) equation provided in Butchart et al. (2007) and Bubb et al. (2009). In our adjusted measure,
high threat score (approaching 1) indicates high risk taxa and low threat score (approaching 0)
indicates low risk taxa. We ask whether genera with species that have been split more frequently
following the implementation of the PSC have higher threat scores compared to genera with
species that have been split less frequently. If splitting drives which taxa are considered to be at
the greatest risk, we predict that we should observe a positive association between inflation and
threat score after accounting for other know predictors of genus-level threat scores (e.g. region).
METHODS:
Data
To measure the number of primate species before the introduction of the PSC, we used the last
pre-PSC taxonomy, that of Honacki et al. (1982). This taxonomy contains 181 species, and is
considered a reliable estimate of the number of species thought to exist during the popularity of
the BSC (see Rylands & Mittermeier, 2014). This taxonomy was contrasted with the IUCN
taxonomy from 2016 and attendant data documented in Estrada et al. (2017), which lists 503
species. For each of these 503 species we noted their taxonomic placement (genus and family),
threat status (LC=Least Concern, NT=Near Threatened, VU=Vulnerable, EN=Endangered,
CR=Critically Endangered, EX=Extinct, NE = no evaluation exists or DD = data deficient),

94
biogeographic region, and assigned them a corresponding threat level score (LC=0, NT=1, VU=2,
EN=3, CR=4, EX=5, NE=NA or DD=NA) following Butchart et al. (2007) and Bubb et al. (2009).
For each other species described by the IUCN in 2016 that was not listed in Honacki et al. (1982),
we scored whether the species was a “de novo” species description (Burgin, et al., 2018). De novo
species descriptions included 40 cases where a new species had not been previously formally
identified as a subspecies or subpopulation of another species prior to splitting.
We compiled all the species listed by the IUCN in 2016 into the 12 families and 50 genera they
corresponded with in Honacki et al. (1982). Family “Callimiconidae” in Honacki et al. (1982) was
not used as this taxon has since been recognized as a genus of the larger family “Callitrichidae”
(Wilson & Reeder, 2005). Species Rungwecebus kipunji was removed from IUCN species list from
2016 as it represents a newly discovered genus and as such, does not collapse into any of the genera
provided by Honacki et al. (1982). Total threat scores were calculated for each genus by summing
the threat scores of all species assigned that genus. A maximum possible threat score was also
assigned to each genus (assuming all species are EX) as 5 times the number of species in that
genus. The 34 NE and 23 DD species (which have no status weight) were not included in
calculations of maximum possible score (following Butchart, et al., 2007).
Research effort in the fields of molecular genetics and conservation were estimated for each genus
through a literature review of publications in the Web of Science Core Collection published
between 1983 (the year the PSC was first proposed) and 2016. To obtain papers in the field of
conservation we searched the genus name AND “conservation” (hereafter ‘conservation research
effort’). To obtain papers in the field of molecular genetics we searched the same combination of
genus name AND the following terms: "mitochondrial DNA" OR "barcoding" OR "bar-coding"
OR "cytochrome b" OR "phylogeography" OR "microsatellites" OR "micro-satellites" OR
"population genetics" OR (species AND genetics) OR (taxonomy AND genetics) OR "SNP"
(hereafter ‘molecular genetics research effort’). All hits from these searches were reviewed and
irrelevant papers were eliminated (see supplementary materials; Tables S3.1 and S3.2). In this
study we used the genera listed in Honacki, et al. (1982) (n=50), many of which have since been
further separated into multiple genera. Thus, when appropriate we included new genera names in
addition to those listed by Honacki, et al. (1982) in the literature search (see Table S3.3). The

95
supplementary material describes how searches were conducted and how changes in nomenclature
and ambiguous genera names were accounted for.
Diversification rate was estimated per the method-of-moments approach described in Magallon &
Sanderson (2001) (i.e. ln(taxa richness)/stem age). Diversification rate estimates generated using
this method often rely on species numbers as their estimate of taxa richness, meaning that
diversification rate estimates are inherently biased by the inflation phenomenon we are studying
(i.e. highly inflated genera will receive disproportionally high diversification rates). Therefore,
richness scores for our diversification rate calculations were determined as the counts of the well-
resolved “lineages” described in Creighton et al. (2020). These lineages were determined by
creating a time cut-off in the 10kTrees consensus primate phylogeny (Arnold, et al., 2010) in an
attempt to eliminate very young PSC species descriptions and obtain a consistent (unbiased)
estimate of diversity across clades. These lineages were assigned to each of the 50 genera described
in Honacki, et al. (1982). Diversification rate was then estimated by taking the natural log lineage
richness for each genus and dividing by the stem age of that genus (Magallon & Sanderson, 2001).
We note that all log transformations referenced hereafter refer to natural log transformations (loge).
Stem ages for each genus were extracted from the 10kTrees consensus phylogeny (version 3)
(Arnold, et al., 2010) trimmed to contain a single branch representing each genus. During this
process, there were several instances where genera described in Honacki et al. (1982) were non-
monophyletic within the more recent primate phylogeny we used (Arnold, et al., 2010), making it
unclear how to assign a divergence date for these clades. We therefore removed eight genera from
analyses where diversification rate was a variable of interest: Presbytis, Lemur, Galago, Cebuella,
Cercocebus, Cercopithecus, Papio, and Pygathrix. This left 42 genera for subsequent analyses.
Data were analysed using R version 3.6.3 (R Core Team, 2020).
Analysis
Predictors of Inflation
To determine if measures of potential human bias (i.e. research effort) or diversification rate
explain discrepancies in inflation across taxa, we tested to see if these variables were significantly
associated with the number of species added to primate genera since the introduction of the PSC
while controlling for the original number of described species (i.e. species number prior to the
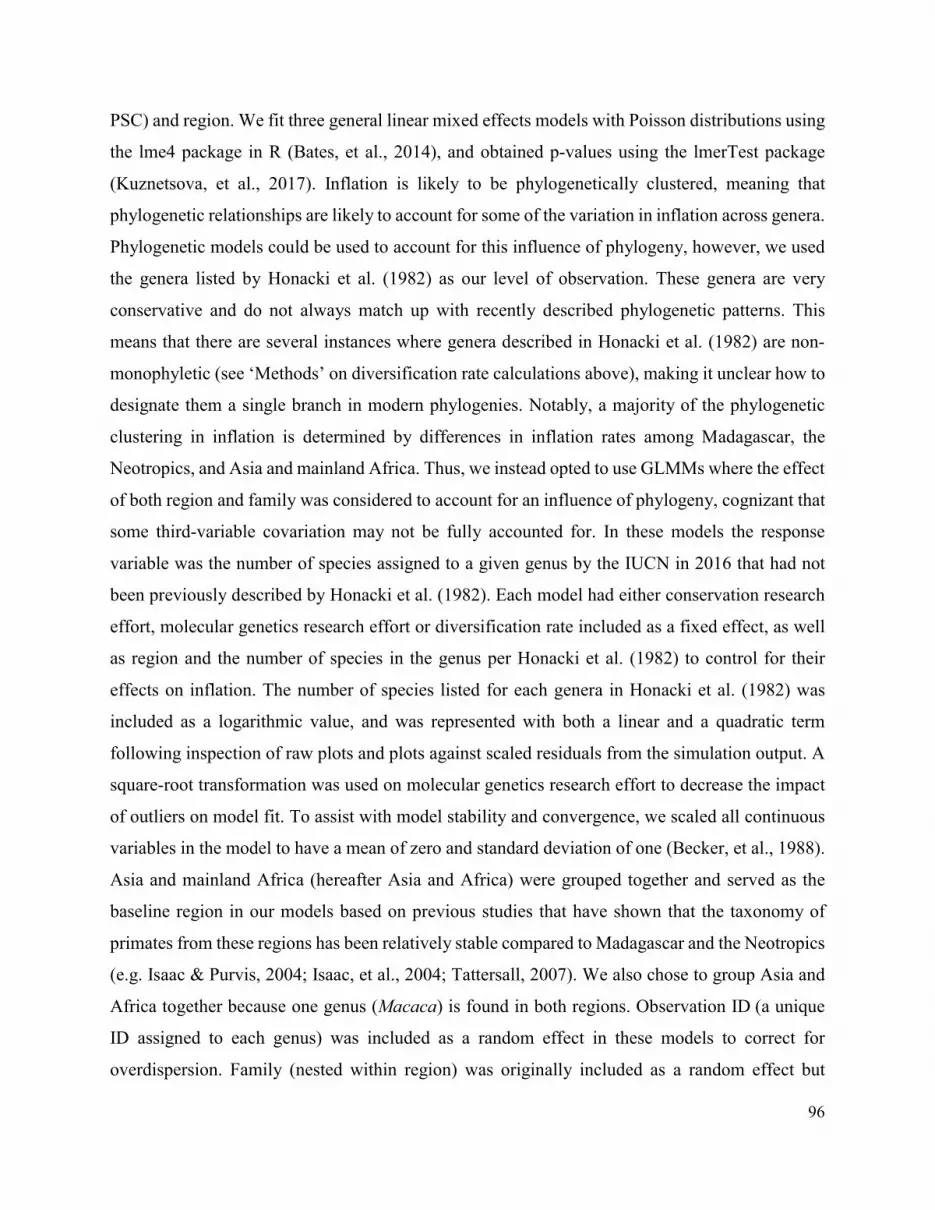
96
PSC) and region. We fit three general linear mixed effects models with Poisson distributions using
the lme4 package in R (Bates, et al., 2014), and obtained p-values using the lmerTest package
(Kuznetsova, et al., 2017). Inflation is likely to be phylogenetically clustered, meaning that
phylogenetic relationships are likely to account for some of the variation in inflation across genera.
Phylogenetic models could be used to account for this influence of phylogeny, however, we used
the genera listed by Honacki et al. (1982) as our level of observation. These genera are very
conservative and do not always match up with recently described phylogenetic patterns. This
means that there are several instances where genera described in Honacki et al. (1982) are non-
monophyletic (see ‘Methods’ on diversification rate calculations above), making it unclear how to
designate them a single branch in modern phylogenies. Notably, a majority of the phylogenetic
clustering in inflation is determined by differences in inflation rates among Madagascar, the
Neotropics, and Asia and mainland Africa. Thus, we instead opted to use GLMMs where the effect
of both region and family was considered to account for an influence of phylogeny, cognizant that
some third-variable covariation may not be fully accounted for. In these models the response
variable was the number of species assigned to a given genus by the IUCN in 2016 that had not
been previously described by Honacki et al. (1982). Each model had either conservation research
effort, molecular genetics research effort or diversification rate included as a fixed effect, as well
as region and the number of species in the genus per Honacki et al. (1982) to control for their
effects on inflation. The number of species listed for each genera in Honacki et al. (1982) was
included as a logarithmic value, and was represented with both a linear and a quadratic term
following inspection of raw plots and plots against scaled residuals from the simulation output. A
square-root transformation was used on molecular genetics research effort to decrease the impact
of outliers on model fit. To assist with model stability and convergence, we scaled all continuous
variables in the model to have a mean of zero and standard deviation of one (Becker, et al., 1988).
Asia and mainland Africa (hereafter Asia and Africa) were grouped together and served as the
baseline region in our models based on previous studies that have shown that the taxonomy of
primates from these regions has been relatively stable compared to Madagascar and the Neotropics
(e.g. Isaac & Purvis, 2004; Isaac, et al., 2004; Tattersall, 2007). We also chose to group Asia and
Africa together because one genus (Macaca) is found in both regions. Observation ID (a unique
ID assigned to each genus) was included as a random effect in these models to correct for
overdispersion. Family (nested within region) was originally included as a random effect but

97
contributed very little to model fit and created issues with convergence due to overfitting, and thus
was dropped from the final models. We tested potential interaction terms with all variables and
region to test for regional effects, but none were significant and so these terms were also dropped
from the final models. We ran all models a second time after removing species with no evidence
of previously being a subspecies or subpopulation of another species in our dataset (i.e. de novo
species descriptions) from our response (Tables S3.4, S3.5 and S3.6). We checked model
assumptions and fit by plotting residuals versus the fitted values and versus each covariate in the
model. Residual plots and analyses with the Diagnostics for Hierarchical Regression Models
(DHARMa) R package (Hartig, 2017) indicated acceptable model fits.
Inflation and Threat Score
To test whether inflation is associated with higher risk levels across genera today, we fit a general
linear mixed effects model with a binomial distribution using the lme4 package in R (Bates, et al.,
2014), and obtained p-values using the lmerTest package (Kuznetsova, et al., 2017). As with
inflation, phylogenetic relationships are likely to account for some of the variation in risk status
across primate genera. However, as with inflation, phylogenetic patterns in risk status are largely
mediated by geography. Thus, for reasons noted above, we opted to use GLMMs where family
and biogeography were considered as explicit covariates to probe these patterns and account for
an influence of phylogeny. The response variable was the threat score estimated based on the
equation provided in Butchart et al. (2007) which returns a proportional overall extinction risk for
taxa between 0 and 1. Therefore, we modeled threat score using a proportional count model, where
the sum of the actual threat scores for species in a given genus were regarded as the number of
‘successes’ and the number of ‘fails’ were calculated as the total possible threat score minus the
successes. Importantly, we note that equation provided in Butchart et al. (2007) scales RLI from 1
(all least concern) whereas our model estimating threat score using successes and fails did not.
Thus, a model estimate of 1 using our measure denotes all species in a genus are extinct and an
estimate of 0 indicates all evaluated species qualify as least concern. The standardized proportional
change in species within each genus (# of new species in the IUCN species list from 2016 / original
# of species in Honacki et al. (1982)) (our measure of "inflation") and region were entered as fixed
effects. We chose to use proportional change in species numbers as our estimate of inflation since
splitting occurs at the species level, and thus, each species listed prior to the PSC should present

98
an opportunity for splitting to occur. In other words, our inflation variable modelled the number
of new species listed in a primate genus for every one species that existed prior to the PSC,
accounting for the fact that there is an increased opportunity for splitting in originally speciose
genera. We were also interested in assessing whether there would be regional differences in the
association between inflation and threat score, therefore, an inflation × region interaction term was
included in the final model. We dummy coded region and releveled the baseline in order to test if
the conditional effect of inflation was significantly different from zero for each region. Family was
nested within region and entered in the model as a random effect to control for relatedness among
genera, and behaved well. We repeated these analyses after removing taxa with de novo species
descriptions that may represent novel discoveries from our inflation estimate and present these
results in the supplementary materials (Table S3.7). We checked model assumptions and fit by
plotting residuals versus the fitted values and versus each covariate in the model. Residual plots
and analyses with the DHARMa R package (Hartig, 2017) indicated acceptable model fits.
RESULTS:
Predictors of Inflation
None of our measures – conservation research effort (β = -0.220; p = 0.180; Table 3.1), molecular
genetics research effort (β= -0.188; p= 0.212; Table 3.2) nor diversification rate (β= 0.132; p=
0.477; Table 3.3) – were significantly associated with taxonomic inflation of primate genera.
Notably, the quadratic term added for the original number of species in 1982 was significant in the
model with diversification rate sharing a downwardly concave association with inflation (β= -
1.890; p= 0.042; Table 3.3) and approached significance in models including conservation and
molecular genetics research effort as predictors (β= -1.529; p= 0.072; Table 3.1 and β= -1.626; p=
0.057; Table 3.2), illustrating that number of species added to genera since the introduction of the
PSC is not completely proportional to the original number of species listed in genera in 1982 after
accounting for other predictors of inflation (see Figure S3.1). Removing de novo species did not
impact this pattern of results (Tables S3.4, S3.5 and S3.6).

99
Table 3.1: Results of a general linear effects model testing the effect of conservation research effort
on inflation. Model set-up: number of species added to primate genera since 1982 (dependent
variable) vs. original number of species in each genus in 1982 (included as a linear (1) and quadratic
(2) term), conservation research effort and region using Asia/Africa as the baseline (all independent
variables), with observation ID included as a random effect. +P≤0.1; * P<0.05; ** P<0.01.
Effect Estimate SE z p
(Intercept) 0.904 0.220 4.107 <0.001**
Conservation research effort -0.220 0.164 -1.342 0.180
Region Madagascar 0.581 0.338 1.721 0.085+
Region Neotropics 0.559 0.301 1.859 0.063+
log(# of species in 1982)1 7.647 1.057 7.234 <0.001**
log(# of species in 1982)2 -1.529 0.849 -1.802 0.072+
Continuous variables scaled to have a mean of zero and standard deviation of one
Table 3.2: Results of a general linear effects model testing the effect of genetics research effort on
inflation. Model set up: the number of species added to primate genera since 1982 (dependent
variable) vs. original number of species in each genus in 1982 (included as a linear (1) and quadratic
(2) term), molecular genetics research effort and region using Asia/Africa as the baseline (all
independent variables) where observation ID included as a random effect. +P≤0.1; * P<0.05; **
P<0.01.
Effect Estimate SE z p
(Intercept) 0.889 0.222 4.012 <0.001**
sqrt(Molecular genetics research effort) -0.188 0.151 -1.247 0.212
Region Madagascar 0.646 0.334 1.932 0.053+
Region Neotropics 0.550 0.305 1.806 0.071+
log(# of species in 1982)1 7.613 1.066 7.145 <0.001**
log(# of species in 1982)2 -1.626 0.854 -1.904 0.057+
Continuous variables scaled to have a mean of zero and standard deviation of one

100
Table 3.3: Results of a general linear effects model testing the effect of diversification rate on
inflation. Model set up: the number of species added to primate genera since 1982 (dependent
variable) vs. original number of species in each genus in 1982 (included as a linear (1) and quadratic
(2) term), diversification rate and region using Asia/Africa as the baseline (all independent
variables) where observation ID included as a random effect. +P≤0.1; * P<0.05; ** P<0.01.
Effect Estimate SE z p
(Intercept) 0.623 0.288 2.166 0.030*
Diversification rate 0.132 0.186 0.712 0.477
Region Madagascar 0.819 0.398 2.056 0.040*
Region Neotropics 0.648 0.375 1.729 0.084+
log(# of species in 1982)1 5.303 1.186 4.469 <0.001**
log(# of species in 1982)2 -1.890 0.931 -2.030 0.042*
Continuous variables scaled to have a mean of zero and standard deviation of one
Inflation and Threat Score
We found some evidence for an association between inflation and threat score, where region and
inflation interacted to predict threat scores for primate genera. For the baseline region Asia/Africa,
genus-level threat score increased with inflation (β= 0.328; p= 0.005), and the associations
between inflation and threat score in Madagascar and the Neotropics were significantly different
from the association observed in the baseline region of Asia and Africa (β= -0.374; p= 0.004 and
β= -0.402; p= 0.001, respectively; Table 3.4; Figure 3.2). Inflation was negatively associated with
threat score in the Neotropics (β= -0.074; p= 0.004) while there was no significant association
between inflation and threat score in Madagascar (β= -0.045; p= 0.422). Removing de novo species
impacted this pattern of results in that the relationship observed in Madagascar no longer differed
significantly from the baseline region (Table S3.7; Figure S3.2).

101
Table 3.4: Results of general linear effects model comparing genus threat score (dependent) to
inflation (the proportional increase in species between 1982 and 2016), region using Asia/Africa
as the baseline and inflation × region interaction term (independent) where family (nested within
region) is a random effect. +P≤0.1; * P<0.05; ** P<0.01.
Effect Estimate SE z p
(Intercept) -0.973 0.366 -2.656 0.008**
Inflation 0.328 0.117 2.812 0.005**
Region Madagascar 1.474 0.590 2.498 0.012*
Region Neotropics 0.060 0.646 0.093 0.926
Inflation: Region Madagascar -0.374 0.130 -2.879 0.004**
Inflation: Region Neotropics -0.402 0.120 -3.362 0.001**
Figure 3.2: The interaction between inflation and region on threat score for genera of primates.
Threat score approaching 1 denotes high risk of extinction and threat score approaching 0 denotes
low risk. Points represent raw values with trend-lines estimated from a general linear mixed effects
model. Points are transparent with darker values corresponding to overlapping points.

102
DISCUSSION:
Our results support neither a strong biological nor a strong interest-driven mechanism for variation
in species designations across primate genera. If inflation captures true incipient speciation, we
predicted that diversification rate might predict inflation. However, we found no evidence for this
as diversification rate was not a significant predictor of inflation in our models. We also tested the
prediction that splitting is motivated by conservation interest (Karl & Bowen, 1999; Isaac, et al.,
2004) or by increasing molecular research within certain taxa, with for example more new species
designations arising as finer molecular distinctions are made (Zachos, et al., 2013; Zachos &
Lovari, 2013). However, we found no evidence that research effort in either of these areas was
associated with inflation across taxa. We did find that the number of species originally listed in
primate genera in 1982 shared a downward concave quadratic relationship with inflation in most
models. This could indicate that inflation is being driven by something not captured by our models.
Therefore, future studies could aim to elucidate the origins of this decelerating association.
We found that associations between inflation and threat score varied by region. Inflation among
genera in Asia and Africa shared a positive association with threat score, while a negative
association was observed in the Neotropics and no significant association was found for
Madagascar. In regions like Madagascar where a large number of species have imperilled statuses,
we might have expected a different relationship between threat score and inflation in comparison
to Asia and Africa which contain fewer at risk species. Threatened species often have a small
number of mature individuals left in the wild (Agapow, et al., 2004; Frankham, et al., 2012).
Species that were already greatly imperilled prior to applications of the PSC might be less likely
to present genetic or morphological variations among populations that are typically used as
evidence to justify species-level splitting under the PSC (Zachos, et al., 2013). As a result, it is
possible that genera already containing a very large number of threatened species prior to the PSC
might not observe high rates of inflation due to their (already) small population sizes. We also
observed that the trend in Madagascar was no longer significantly different from the baseline
region if we removed de novo species descriptions. Figure S3.2 shows that the removal of de novo
species greatly reduces estimates of inflation for Malagasy genera represented as being most
inflated in Figure 3.2. This could indicate that primate diversity was previously underestimated in
the most inflated Malagasy genera in Honacki et al. (1982)’s application of the BSC (perhaps as a

103
result of being previously understudied). If so, some increases in species numbers across these
genera may be a result of taxonomy of these genera catching up to other (perhaps better studied)
primate clades. De novo species descriptions would likely capture these new discoveries, and these
new species may not contribute to heightened threat status because they are not products of over-
splitting. However, neither of the aforementioned explanations of regional differences would
explain why inflation and threat score are negatively related across Neotropical genera.
An alternative explanation is that some distinguishing aspect of the biology of taxa from these
regions influences the association between inflation and threat score. Neotropical primate genera
listed by Honacki et al. (1982) that have undergone the greatest increase in species numbers under
the PSC are Callithrix, Callicebus and Aotus (represented by the rightmost blue data points in
Figure 3.2). Despite being split frequently these genera have relatively low threat scores, and these
drive the observed negative association between inflation and threat score. Prior to applications of
the PSC these genera contained few species (three, three and one, respectively; Honacki, et al.,
1982) with geographic ranges spanning large portions of Central and South America. Conversely,
genera with the highest inflation in Asia and Africa: Tarsius, Nycticebus and Cercocebus
(represented by the rightmost yellow data points in Figure 3.2) – are geographically less
widespread. Splitting of species in these genera may be expected to have a larger resulting effect
on criteria considered in conservation listing (i.e. geographic range size and number of mature
individuals left in the wild; Agapow, et al., 2004; Frankham, et al., 2012). Thus, splitting of large
and geographically widespread genera (as has been the case in the Neotropics) may not lead to
more imperilled statuses if resulting species still support large ranges and many individuals. If true,
this would result in widespread genera with high rates of inflation having few imperilled species
and thus explain the negative trend observed in the Neotropics (Figure 3.2). Meanwhile, in regions
where splitting has occurred in geographically less widespread genera (e.g. Asia and Africa),
splitting may result in increasingly imperilled statuses for already small populations. This is, of
course, speculative, and future work should aim to tease apart the relationship between region,
inflation and geographic range size. Overall, our results do not provide evidence for inflation
driving threat priority among genera from Madagascar and the Neotropics, however, inflation may
have some effect in Asia and Africa.

104
Our analyses do have some limitations. First, quantifying research effort of any kind is difficult
due to the abundance of work published in different mediums. As such, our estimate of research
effort in conservation and molecular genetics is indeed merely an estimate. More work should be
done to determine if additional estimates of research bias can explain increases in species numbers.
For instance, cumulative funding estimates from various sources (e.g. the IUCN, non-
governmental organizations and regional governments) per taxa could be used as an additional or
alternative measure of conservation interest. Second, it was necessary to remove eight non-
monophyletic genera from our analyses that included diversification rate, leading to a reduction in
statistical power for those analyses. Third, due to changes in Red List criteria and improved
assessment efforts, we were not able to look at changes in threat score over time, and instead had
to rely on present day threat status data. This means that while our study design allowed us to
determine which groups are receiving conservation attention relative to inflation, we cannot make
any inferences regarding the effect of inflation on threat scores through time. Future studies could
attempt to map changes in listing criteria (e.g. number of individuals in the wild, geographic range
size) for taxa that were well studied and reliably evaluated prior to the 1980s and document how
measures for each of these criteria change as a result of splitting across species. Doing so could
inform how inflation affects threat status and conservation activity on smaller scales (i.e. among
closely-related species). Future studies could also look at the association of inflation and threat
status over time using a more recent starting point (i.e. after 1982) to ensure all threat scores are
assigned using comparable criteria.
Overall, we do not find support for biological processes (i.e. diversification rate) or human
imposed bias (i.e. measures of research effort) driving inflation across primates. However, we do
find an association between threat score and inflation that differs among regions that is consistent
with the notion that inflation has stronger effects on threat score for genera encompassing smaller
geographic ranges. Generally speaking, relying on species as the central unit of conservation and
primary object of study behooves taxonomy to remain stable, while changing ideas about the
concept of species makes taxonomy inherently unstable. We suggest that areas of research
requiring consistent estimates of diversity (i.e. conservation) may benefit from either (i) adopting
species criteria which eliminate the PSC criteria that may be particularly subject to human-induced
bias (e.g. molecular distinctions based on few diagnostic sites in the mitochondrial cytochrome b

105
gene; Zachos, et al., 2013) or, for applied conservation specifically; (ii) shifting more resources
toward regional management efforts that are less likely to be influenced by changing species
designations. It is well-known that closely related species are more similar to one another than
they are to more distantly related taxa. Thus, treating all species independently and of equal
weights in conservation listing may not lead to desired outcomes. As of 2016, approximately 60
percent of all primate species were threatened with extinction according to the IUCN Red List of
Threatened Species (Estrada, et al., 2017), making it imperative that conservation efforts are spent
wisely to ensure optimal conservation of primate biodiversity writ large.
ACKNOWLEDGEMENTS: This work was supported by the Natural Sciences and Engineering
Research Council of Canada (NSERC) Discovery Grants Program (SMR and AOM, grants #2017-
04720 and #2019-04950) and the Canada Foundation for Innovation (CFI) (SMR, grant #29433).
MJAC was supported by awards from the Biodiversity, Ecosystem Services, and Sustainability
(BESS) program and McGill University. We thank the Reader and Guigueno labs at McGill, Brian
Leung, Hans Larsson, William Wcislo and the Crawford Lab for Evolutionary Studies at SFU for
feedback on portions of the manuscript and study design. Special thanks to Alice Luo and Aiman
Hadif for their assistance in collecting and organizing data and Paul Sims for statistical advice.
DECLARATIONS OF INTEREST: None.
Data and code accompanying the manuscript will be made available on publication through Dryad
or a similar repository.

106
REFERENCES:
Agapow, P. M., Bininda-Emonds, O. R., Crandall, K. A., Gittleman, J. L., Mace, G. M., Marshall,
J. C., & Purvis, A. (2004). The impact of species concept on biodiversity studies. The
Quarterly Review of Biology, 79: 161–179.
Arnold, C., Matthews, L. J., & Nunn, C. L. (2010). The 10kTrees website: a new online resource
for primate phylogeny. Evolutionary Anthropology, 19: 114–118.
Bates, D., Maechler, M., Bolker, B., & Walker, S. (2014). lme4: Linear mixed-effects models
using Eigen and S4. R package version 1.1.21. https://cran.r-
project.org/web/packages/lme4.
Becker, R. A., Chambers, J. M., & Wilks, A. R. (1988). The new S language: A programming
environment for data analysis and graphics. Wadsworth & Brooks/Cole, Pacific Grove.
Bubb, P. J., Butchart, S. H. M., Collen, B., Dublin, H., Kapos, V., Pollock, C., Stuart, S. N., &
Vié, J. –C. (2009). IUCN Red List Index—guidance for national and regional use. IUCN,
Gland.
Burgin, C. J., Colella, J. P., Kahn, P. L., & Upham, N. S. (2018). How many species of mammals
are there? Journal of Mammalogy, 99: 1–14.
Butchart, S. H., Akçakaya, H. R., Chanson, J., Baillie, J. E., Collen, B., Quader, S., ... & Hilton-
Taylor, C. (2007). Improvements to the Red List Index. PLoS One, 2: e140.
Collen, B., Dulvy, N. K., Gaston, K. J., Gärdenfors, U., Keith, D. A., Punt, A. E., ... & Butchart,
S. H. (2016). Clarifying misconceptions of extinction risk assessment with the IUCN Red
List. Biology Letters, 12: 20150843.
Cotton, A., Clark, F., Boubli, J. P., & Schwitzer, C. (2016). IUCN Red List of threatened primate
species. In S. A. Wich & A .J. Marshall (Eds.), An introduction to primate conservation (p.
31–38). Oxford University Press, Oxford.
Coyne, J. A., & Orr, H. A. (2004). Speciation. Sinauer, Sunderland.
Cracraft, J. (1983). Species concepts and speciation analysis. In R. F. Johnson (Ed.), Current
ornithology (p. 159–187). Plenum Press, New York.

107
Cracraft, J., Feinstein, J., Vaughn, J., & Helm-Bychowski, K. (1998). Sorting out tigers (Panthera
tigris): mitochondrial sequences, nuclear inserts, systematics, and conservation genetics.
Animal Conservation, 1: 139–150.
Creighton, M. J. A., Greenberg, D. A., Reader, S. M., & Mooers, A. Ø. (2020). The role of
behavioural flexibility in primate diversification (Preprint). bioRxiv, 341859.
Donoghue, M. J. (1985). A critique of the biological species concept and recommendations for a
phylogenetic alternative. Bryologist, 88: 172–181.
Estrada, A., Garber, P. A., Rylands, A. B., Roos, C., Fernandez-Duque, E., Di Fiore, A., ... &
Rovero, F. (2017). Impending extinction crisis of the world’s primates: Why primates
matter. Science Advances, 3: e1600946.
Frankham, R., Ballou, J. D., Dudash, M. R., Eldridge, M. D., Fenster, C. B., Lacy, R. C., ... &
Ryder, O. A. (2012). Implications of different species concepts for conserving biodiversity.
Biological Conservation, 153: 25–31.
Gippoliti, S., & Amori, G. (2007). The problem of subspecies and biased taxonomy in conservation
lists: the case of mammals. Folia Zoologica, 56: 113–117.
Groves, C. P. (2013). The nature of species: A rejoinder to Zachos et al. Mammalian Biology, 78:
7–9.
Groves, C. P. (2014). Primate taxonomy: inflation or real? Annual Review of Anthropology, 43:
27–36.
Groves, C., & Grubb, P. (2011). Ungulate taxonomy. JHU Press, Baltimore.
Hartig, F. (2017). DHARMa: residual diagnostics for hierarchical (multi-level/mixed) regression
models. R package version 0.3.0. https://cran.r-project.org/web/packages/DHARMa.
Honacki, J. H., Kinman, K. E., & Koeppl, J. W. (1982). Mammal species of the world; a taxonomic
and geographic reference. Allen Press, Inc. and Association of Systematic Collections,
Lawrence.
Isaac, N. J., Mallet, J., & Mace, G. M. (2004). Taxonomic inflation: its influence on macroecology
and conservation. Trends in Ecology & Evolution, 19: 464–469.

108
Isaac, N. J., & Purvis, A. (2004). The ‘species problem’ and testing macroevolutionary
hypotheses. Diversity and Distributions, 10: 275–281.
Isaac, N. J., Turvey, S. T., Collen, B., Waterman, C., & Baillie, J. E. (2007). Mammals on the
EDGE: conservation priorities based on threat and phylogeny. PLoS One, 3: e296.
IUCN Conservation Monitoring Centre. (1986). 1986 IUCN Red List of threatened animals.
IUCN, Gland and Cambridge.
IUCN Red List of Threatened Species. (2019). Retrieved from https://www.iucnredlist.org/
[accessed 2 April 2019].
IUCN/SSC Primate Specialist Group. (2018). Retrieved from http://www.primate-
sg.org/red_list_threat_status/ [accessed 10 November 2018].
Karl, S. A., & Bowen, B. W. (1999). Evolutionary significant units versus geopolitical taxonomy:
molecular systematics of an endangered sea turtle (genus Chelonia). Conservation
Biology, 13: 990–999.
Kuznetsova, A., Brockhoff, B., & Christensen, H. B. (2017). lmerTest Package: Tests in Linear
Mixed Effects Models. Journal of Statistical Software, 82: 1–26.
Mace, G. M. (2004). The role of taxonomy in species conservation. Philosophical Transactions of
the Royal Society B: Biological Sciences, 359: 711–719.
Mace, G. M., & Collar, N. J. (1995). Extinction risk assessment for birds through quantitative
criteria. Ibis, 137: S240–S246.
Mace, G. M., Collar, N., Cooke, J., Gaston, K., Ginsberg, J., Leader-Williams, N., ... & Milner-
Gulland, E. J. (1992). The development of new criteria for listing species on the IUCN Red
List. Species, 19: 16–22.
Magallon, S., & Sanderson, M. J. (2001). Absolute diversification rates in angiosperm clades.
Evolution, 55: 1762–1780.
Mayr, E. (1963). Animal species and evolution. Belknap Press, Cambridge.
Mazák, J. H., & Groves, C. P. (2006). A taxonomic revision of the tigers (Panthera tigris) of
Southeast Asia. Mammalian Biology, 71(5): 268–287.

109
Morrison, W. R., Lohr, J. L., Duchen, P., Wilches, R., Trujillo, D., Mair, M., & Renner, S. S.
(2009). The impact of taxonomic change on conservation: Does it kill, can it save, or is it
just irrelevant? Biological Conservation, 142: 3201–3206.
Oates, J. F. (2006). Is the chimpanzee, Pan troglodytes, an endangered species? It depends on what
“endangered” means. Primates, 47: 102–112.
Pillon, Y., & Chase, M. W. (2007). Taxonomic exaggeration and its effects on orchid
conservation. Conservation Biology, 21: 263–265.
R Core Team. (2020). R: A Language and environment for statistical computing. R Foundation
for Statistical Computing, Vienna, Austria. http://www.R-project.org/.
Robuchon, M., Faith, D. P., Julliard, R., Leroy, B., Pellens, R., Robert, A., ... & Pavoine, S. (2019).
Species splitting increases estimates of evolutionary history at risk. Biological
Conservation, 235: 27–35.
Rylands, A. B., & Mittermeier, R. A. (2014). Primate taxonomy: species and
conservation. Evolutionary Anthropology, 23: 8–10.
Stanford, C. B. (2001). The subspecies concept in primatology: the case of mountain gorillas.
Primates, 42: 309–318.
Tattersall, I. (2007). Madagascar's lemurs: cryptic diversity or taxonomic inflation? Evolutionary
Anthropology, 16: 12–23.
Wilson, D. E., & Reeder, D. M. (2005). Mammal species of the world: a taxonomic and geographic
reference (vol. 1). JHU Press, Baltimore.
Zachos, F. E. (2015). Taxonomic inflation, the phylogenetic species concept and lineages in the
tree of life–a cautionary comment on species splitting. Journal of Zoological Systematics
and Evolutionary Research, 53: 180–184.
Zachos, F. E., Apollonio, M., Bärmann, E. V., Festa-Bianchet, M., Göhlich, U., Habel, J. C., ... &
Pertoldi, C. (2013). Species inflation and taxonomic artefacts—A critical comment on
recent trends in mammalian classification. Mammalian Biology, 78: 1–6.

110
Zachos, F. E., & Lovari, S. (2013). Taxonomic inflation and the poverty of the Phylogenetic
Species Concept-a reply to Gippoliti and Groves. Hystrix, 24: 142–144.

111
“Predictors of Taxonomic Inflation and its Role in Primate
Conservation” – Supplementary Material
SUPPLEMENTARY METHODS:
Research Effort
Estimates of research effort for each genus listed by Honacki et al. (1982) in the fields of
conservation and molecular genetics were determined through an extensive literature review of
papers in the Web of Science Core Collection (Tables S3.1, S3.2 and S3.3). The search included
studies published between 1983 – the year the ‘phylogenetic species concept’ (PSC) was first
proposed, and 2016 – the year the IUCN species list and associated data documented in Estrada et
al. (2017) were collected. In this study we used the 50 genera listed in Honacki et al. (1982), many
of which have since been further separated into multiple genera. Thus, when appropriate we
included new genera names in the literature search in addition to those listed by Honacki et al.
(1982) to ensure our search returned all relevant papers (Table S3.3). Four genera included names
that were associated with unrelated topics or doubled as a common name for species in other genera
(e.g. genus Lemur). For these genera, all possible species names were added to the search to
prevent irrelevant hits (Table S3.3).
To obtain papers in the field of conservation we searched the genus name/names AND
“conservation”. To obtain papers in the field of molecular genetics we searched the genus
name/names AND the following terms: "mitochondrial DNA" OR "barcoding" OR "bar-coding"
OR "cytochrome b" OR "phylogeography" OR "microsatellites" OR "micro-satellites" OR
"population genetics" OR (species AND genetics) OR (taxonomy AND genetics) OR "SNP". All
hits from these initial searches were reviewed on a case by case basis and NOT terms were created
to eliminate unrelated hits (see Tables S3.1 and S3.2). We did this rather than manually removing
records from the research effort so that searches could be replicated. We reran searches on a subset
of genera to confirm that this procedure did not eliminate relevant papers. Searches for some
genera returned hits that were not relevant to the genus of interest, but were relevant to others in
which case NOT terms specific to each genus were included in the search (see Table S3.3). When
it came to molecular genetics, we were interested in the contribution of new molecular work that

112
could lead to splitting, therefore, results in this search were filtered by articles and letters to exclude
material like reviews that would not make such contributions. Once the final search terms were
established, the searches were repeated with the full list of NOT terms and the number of results
returned for each genus using these terms was recorded, providing us with a comprehensive
estimate of research effort on each topic per genus. These searches can be replicated in the Web
of Science databases using the terms included in Tables S3.1, S3.2 and S3.3.

113
Tab
le S
3.1:
Ter
ms
used
for
lit
erat
ure
revi
ew t
o ob
tain
an
esti
mat
ed r
esea
rch
effo
rt i
n th
e fi
eld
of c
onse
rvat
ion
per
gene
ra i
n H
onac
ki e
t al
. (19
82)
betw
een
1983
and
201
6. T
erm
s in
inve
rted
com
mas
are
thos
e en
tere
d in
to th
e se
arch
eng
ine.
“G
enus
A”,
G
enus
B”
etc.
repr
esen
t the
alt
erna
tive
gen
us n
ames
pre
sent
ed in
Tab
le S
3.3.
Ast
eris
k in
sea
rch
term
den
otes
a w
ildc
ard
char
acte
r re
pres
enti
ng a
ny g
roup
of
char
acte
rs, i
nclu
ding
no
char
acte
r.
Top
ic
Sea
rch
Con
serv
atio
n D
atab
ase:
Web
of
Sci
ence
Cor
e C
olle
ctio
n
Yea
r R
ange
: 19
83-2
016
"Gen
usA
" O
R "
Gen
usB
" [S
earc
h fi
eld:
TO
PIC
] A
ND
"C
onse
rvat
ion"
[S
earc
h fi
eld:
TO
PIC
] N
OT
"P
atha
log*
" O
R "
Sem
inal
" O
R "
Sem
en"
OR
"P
rote
in"
OR
"N
umer
ical
Com
pete
nce"
OR
"*s
tero
ne"
OR
"M
emor
y" O
R "
Chr
omos
ome"
OR
"D
NA
" O
R "
Mol
ecul
*" O
R "
Eut
erpe
edu
lis"
OR
"M
ico-
part
icle
s" O
R "
Gut
pas
sage
tim
e" O
R "
MH
C"
OR
"P
AX
BP
1" O
R "
Cat
hem
eral
ity"
OR
"A
rabi
c" O
R
"Vom
eron
asal
Rec
epto
r" O
R "
CT
Rep
eats
" O
R "
But
terf
ly"
OR
"m
icro
RN
A"
OR
"M
irro
rs"
OR
"K
inem
atic
s" O
R "
geog
enet
ic"
OR
"ar
chae
olog
y" O
R
"mon
umen
ts"
OR
"qu
antu
m"
OR
"po
liti
cal
cris
is"
OR
"ne
utra
l th
eory
" O
R "
baob
abs"
OR
"to
r m
acro
lepi
s" O
R e
ichh
orni
a cr
assi
pes"
or
"eth
nobo
tany
" O
R "
mov
emen
t co
rrid
ors"
OR
"nu
ll er
rors
" O
R "
skel
etal
ind
ices
" O
R "
reso
urce
def
ense
" O
R "
ener
geti
c de
man
d" O
R "
chro
mos
omes
" O
R "
flor
isti
c co
mpo
siti
on"
OR
"si
ckne
ss b
ehav
ior"
OR
"ap
pear
ance
-rea
lity
" O
R "
obje
ct p
erm
anen
ce"
OR
"nu
mbe
r pr
oces
sing
" O
R "
quan
tity
jud
gem
ent"
OR
"q
uant
ity
disc
rim
inat
ion"
OR
"vi
sual
illu
sion
s" O
R "
oil e
xtra
ctio
n" O
R "
obje
ct m
anip
ulat
ion"
OR
"pi
aget
ian"
OR
"pe
rson
alit
y" O
R "
fore
st r
egen
erat
ion"
O
R "
Ber
gman
n's
Rul
e" O
R "
fem
ale
dom
inan
ce"
OR
"pu
blic
atio
n" O
R "
rhin
ocer
os"
OR
"ph
otop
igm
ents
" O
R "
opsi
n" O
R "
FS
H"
OR
"IF
ITM
10"
OR
"I
FIT
M5"
OR
"en
ergy
exp
endi
ture
" O
R "
myo
pia"
OR
"fo
vea"
OR
"m
useu
m"
OR
"ca
cao
culti
vatio
n" O
R "
cabr
uca
plan
tatio
n" O
R c
abru
cas"
OR
"d
iscr
imin
atio
n le
arni
ng"
OR
"ar
chit
ectu
re"
OR
"to
copl
asm
a go
ondi
i" O
R "
dung
bee
tle"
OR
"m
eat s
cien
ce"
OR
"ye
ar s
pan"
OR
"lo
s to
xtla
s" O
R "
lipi
d dr
ople
ts"
OR
"ne
phro
path
y" O
R "
batt
elle
" O
R "
lunc
heon
add
ress
" O
R "
frui
t-ea
ting
fis
h" O
R "
parr
ots"
OR
"ne
st f
ate"
OR
"bi
rd c
omm
unit
y" O
R "
reti
nal
deve
lopm
ent"
OR
"ed
inge
r-w
estp
hal
nucl
eus"
OR
"fu
r m
ites
" O
R "
alli
ance
s" O
R "
ener
gy m
etab
olis
m"
OR
"nu
cleo
tide
seq
uenc
e" O
R "
tran
scri
ptio
nal
effe
ctor
" O
R "
lym
phot
ropi
c" O
R "
RN
A s
econ
dary
" O
R "
isch
emic
str
oke"
OR
"li
feti
me
achi
evem
ent a
war
d" O
R "
num
ber r
epre
sent
atio
n" O
R "
met
abol
ic
acti
vity
" O
R "
natu
recu
ltur
e" O
R "
frui
t fl
y" O
R "
plur
ipot
ent
stem
cel
ls"
OR
"lo
cus
ER
VW
E1"
OR
"du
ffy
bloo
d gr
oup
syst
em"
OR
"p5
8" O
R "
cora
co-
clav
icul
ar jo
int"
OR
"ka
ya"
OR
"S
hann
on-W
eine
r ind
ex"
OR
"ki
sspe
ptin
" O
R "
link
age
map
" O
R "
kill
er w
hale
s" O
R "
fem
ale
athl
ete"
OR
"ac
etyl
sal
icyl
ic
acid
" O
R "
peri
aque
duct
al g
ray"
OR
"D
QA
1" O
R "
dent
ate
gran
ule
cell
s" O
R "
desc
arte
s" O
R "
hapl
otyp
e ne
twor
k an
alys
is"
OR
"O
CO
M-6
" O
R
"Par
tici
pato
ry r
isk
map
ping
" O
R "
Fri
bour
g-B
lanc
gen
ome"
OR
"br
owse
r" O
R "
athe
rosc
lero
sis"
OR
"ra
pid
late
ral
flow
" O
R "
VB
EK
AP
" O
R "
supe
r-er
uptio
n" O
R "
foss
il m
amm
als"
OR
"ev
olut
ion
of d
ance
" O
R "
biat
e tr
ibe"
OR
"an
tiph
onal
son
gs"
OR
"en
ergy
con
serv
atio
n" O
R "
stro
ngyl
e eg
g ex
cret
ion"
O
R "
dive
rgen
ce d
ate"
OR
"ph
ylog
enic
nic
he c
onse
rvat
ion"
OR
"sp
atia
l au
toco
rrel
atio
n" O
R "
cons
erva
tion
of
heat
" O
R "
loca
l te
rres
tria
l tr
aditi
on"
OR
"f
irst
fos
sil
reco
rd"
OR
"no
nhum
an p
rim
ate
amyg
dala
" O
R "
skin
cel
l pr
olif
erat
ive
pote
ntia
l" O
R "
nucl
ear
horm
one
rece
ptor
s" O
R "
preh
isto
ric
popu
latio
ns"
OR
"la
st g
laci
al m
axim
um"
OR
"pr
ehis
tori
c de
mog
raph
ic e
vent
" O
R "
suga
r-ri
ch f
ruit
pul
p" O
R "
quan
tity
con
serv
atio
n"
[Sea
rch
fiel
d: T
OP
IC]
AN
D *
Inse
rt 'S
peci
es N
ames
(if
app
lica
ble)
' – s
ee T
able
S3.
3* [
Sea
rch
fiel
d: T
OP
IC]
NO
T *
Inse
rt 'G
enus
-spe
cifi
c N
OT
Ter
ms
(if a
pplic
able
)' –
see
Tab
le S
3.3*
[S
earc
h fi
eld:
TO
PIC
]

114
Tab
le S
3.2:
Ter
ms
used
for
lite
ratu
re r
evie
w to
obt
ain
an e
stim
ated
res
earc
h ef
fort
in th
e fi
eld
of m
olec
ular
gen
etic
s pe
r ge
nera
in
Hon
acki
et
al.
(198
2) b
etw
een
1983
and
201
6. T
erm
s in
inv
erte
d co
mm
as a
re t
hose
ent
ered
int
o th
e se
arch
eng
ine.
“G
enus
A”,
G
enus
B”
etc.
rep
rese
nt th
e al
tern
ativ
e ge
nus
nam
es p
rese
nted
in T
able
S3.
3. A
ster
isk
in s
earc
h te
rm d
enot
es a
wil
dcar
d ch
arac
ter
repr
esen
ting
any
gro
up o
f ch
arac
ters
, inc
ludi
ng n
o ch
arac
ter.
Top
ic
Sea
rch
Mol
ecul
ar g
enet
ics
Dat
abas
e: W
eb o
f S
cien
ce C
ore
Col
lect
ion
Y
ear
Ran
ge:
1983
-201
6 "G
enus
A"
OR
"G
enus
B"
[Sea
rch
fiel
d: T
OP
IC]
A
ND
"M
itoc
hond
rial
DN
A"
OR
"B
arco
ding
" O
R "
Bar
-cod
ing"
OR
"cy
toch
rom
e b"
OR
"P
hylo
geog
raph
y" O
R "
Mic
rosa
tell
ites
" O
R "
Mic
ro-s
atel
lite
s"O
R "
Pop
ulat
ion
Gen
etic
s" O
R (
Spe
cies
AN
D G
enet
ics)
OR
(T
axon
omy
AN
D G
enet
ics)
OR
"S
NP
" [S
earc
h fi
eld:
TO
PIC
] N
OT
"D
isea
se"
OR
"V
irus
" O
R "
Par
asit
e" O
R "
Sin
gle
Ori
gin"
OR
"C
olor
Vis
ion"
OR
"C
olou
r V
isio
n" O
R "
Cyp
rini
ne f
ishe
s" O
R "
Sch
izot
hora
x" O
R"G
roun
d bo
a*"
OR
"T
enre
cida
e" O
R "
Cli
mat
e-C
hang
e" O
R "
Gal
axy
Too
ls"
OR
"P
rim
atol
ogy
in C
hina
" O
R "
Han
d m
orph
olog
y" O
R "
Hum
an G
enom
e"O
R "
Bif
idob
acte
ri*"
OR
"P
lasm
odiu
m"
OR
"S
pond
ias"
OR
"V
estig
ial s
truc
ture
s" O
R "
Soc
ial b
ehav
ior,
rep
rodu
ctiv
e st
rate
gies
" O
R "
Tub
ercu
losi
s" O
R"S
ocia
l dy
nam
ics
of m
ale"
OR
"S
kull
sha
pe"
OR
"D
iet
dive
rsit
y" O
R "
Fun
ctio
nal
cues
" O
R "
Vid
eo s
tim
uli"
OR
"H
uman
spe
cifi
c" O
R "
Car
rion
fly
"O
R "
Arc
toce
phal
us"
OR
"B
ushm
eat"
OR
"E
leph
ants
" O
R "
Hum
an-P
opul
atio
n G
enet
ics"
OR
"A
ntim
icro
bial
" O
R "
Ver
tebr
al f
orm
ulae
" O
R "
HIV
-1*"
OR
"G
enot
oxic
ity"
OR
"H
abit
at f
ragm
enta
tion
" O
R "
Pri
mer
des
ign"
OR
"P
lant
DN
A"
OR
"P
aras
itic
lice
" O
R "
Pri
mat
es o
f G
asha
ka"
OR
"M
arm
ot"
OR
"Cap
tive
bre
edin
g" O
R "
Cap
tive
-bre
d" O
R "
Beh
avio
ral
gene
tics
" O
R "
Tox
icol
o*"
OR
"P
harm
acol
o*"
OR
"B
lood
typ
e" O
R "
Tis
sue
expr
essi
on"
OR
"Beh
avio
ral
plas
tici
ty"
OR
"M
edic
ine"
OR
"Im
mun
o*"
OR
"In
fect
ion"
OR
"R
epro
duct
ive
effi
cien
cy"
OR
"P
inw
orm
" O
R "
Dif
fusi
on t
enso
r" O
R"F
emal
e ho
mos
exua
l beh
avio
r" O
R "
Cry
odam
age"
OR
"A
dult
mor
tali
ty"
OR
"iS
CN
T"
OR
"R
esou
rces
for
gene
tic
man
agem
ent"
OR
"H
eari
ng lo
ss"
OR
"Mac
ular
deg
ener
atio
n" O
R "
Bio
med
ical
Inf
orm
atio
n R
esea
rch
Net
wor
k" O
R "
Kor
ean
catt
le"
OR
"S
inus
vol
ume"
OR
" A
lcoh
olis
m"
OR
"D
omin
ance
rank
" O
R "
The
rape
utic
clo
ning
" O
R "
Lit
erat
ure
surv
ey"
OR
"G
rass
hopp
er*"
OR
"L
epti
n" O
R "
Mac
aca-
rabb
it"
OR
"N
itra
te t
oler
ance
" O
R "
Hum
anev
olut
ion"
OR
"S
outh
Am
eric
an r
oden
ts"
OR
"he
pati
c C
YP
2C"
OR
"B
aror
ecep
tor-
rela
ted
neur
ons"
OR
"N
asal
is p
oste
rior
" O
R "
Sal
aman
der"
OR
"Gas
tero
phil
us n
asal
is"
OR
"G
room
ing
bout
s" O
R "
Rai
nfal
l" O
R "
Cra
niof
acia
l" O
R "
Dia
bete
s" O
R "
Sex
ual s
ize
dim
orph
ism
" O
R "
Mes
opit
hecu
s" O
R"H
ybri
d or
igin
of
the
kipu
nji"
OR
"S
chis
toso
ma
man
soni
" O
R "
Lim
b bo
nes"
OR
"A
cino
nyx
juba
tus"
OR
"E
arly
lif
e m
orta
lity
" O
R "
Hum
anpi
gmen
tatio
n" O
R "
Mod
ern
Hum
ans"
OR
"B
alsa
min
acea
e" O
R "
Mea
t co
nsum
ptio
n" O
R "
Tra
ckin
g of
a g
orill
a de
ath"
OR
"A
ntro
cary
on k
lain
eanu
m"
OR
"A
TP
syn
thet
ase
in o
rang
utan
" O
R "
Hum
an m
itoc
hond
rial
DN
A"
OR
"M
axim
al li
fesp
an"
OR
"M
umm
ifie
d ba
boon
" O
R "
Kin
bon
ds"
OR
"K
insh
ip"
OR
"B
ipol
ar d
isor
der"
OR
"C
ultu
ral
diff
eren
ces"
OR
"S
ex-s
peci
fic
disp
ersa
l" O
R "
Nes
t-bu
ildin
g" O
R "
Voc
aliz
atio
ns"
OR
"N
euro
ticis
m"
OR
"S
tone
hand
ling"
OR
"B
owhe
ad w
hale
" O
R "
Can
is r
ufus
" O
R "
Cal
edon
ian
crow
s" O
R "
Pat
erni
ty"
OR
"B
lack
rhi
noce
ros"
OR
"E
ptes
icus
fus
cus"
OR
"4q
synd
rom
e" O
R "
Mon
ozyg
otic
twin
" O
R "
Aut
ism
spe
ctru
m"
OR
"S
kele
tal a
naly
sis"
OR
"F
urci
fer l
ater
alis
" O
R "
Lon
g-fi
nger
ed b
ats"
OR
"Jo
mon
per
iod"
OR
"C
rani
al n
erve
per
fora
tion
s"
[Sea
rch
fiel
d: T
OP
IC]
NO
T "
Tox
icol
o*"
OR
"P
harm
acol
o*"
OR
"Im
mun
o*"
OR
"M
edic
ine"
[S
earc
h fi
eld:
PU
BL
ICA
TIO
N N
AM
E]
AN
D *
Inse
rt 'S
peci
es N
ames
(if
app
lica
ble)
' – s
ee T
able
S3.
3* [
Sea
rch
fiel
d: T
OP
IC]
NO
T *
Inse
rt 'G
enus
-spe
cifi
c N
OT
Ter
ms
(if a
pplic
able
)' –
see
Tab
le S
3.3*
[S
earc
h fi
eld:
TO
PIC
]
Ref
ined
by:
Art
icle
or
Let
ter

115
Tab
le S
3.3:
Gen
era
nam
es i
nclu
ded
in e
ach
liter
atur
e re
view
for
res
earc
h ef
fort
wit
h sp
ecie
s na
mes
and
add
itio
nal
NO
T t
erm
s in
clud
ed i
n ea
ch s
earc
h w
here
app
lica
ble.
Gen
us n
ames
wer
e m
atch
ed t
o H
onac
ki e
t al
. (1
982)
fro
m t
he I
UC
N s
peci
es l
ist
docu
men
ted
in E
stra
da e
t al
. (2
017)
. A
ddit
iona
l al
tern
ativ
e ge
nus
nam
es w
ere
obta
ined
fro
m t
he I
UC
N R
ed L
ist
of T
hrea
tene
d S
peci
es (
2019
). A
ster
isk
in s
earc
h te
rm d
enot
es a
wild
card
cha
ract
er r
epre
sent
ing
any
grou
p of
cha
ract
ers,
incl
udin
g no
cha
ract
er.
Gen
us N
ame/
Nam
es
AN
D S
peci
es N
ames
(if
ap
plic
able
)
Mol
ecul
ar g
enet
ics
gen
us-s
peci
fic
NO
T
Ter
ms
(if a
ppli
cabl
e)
Con
serv
atio
n ge
nus
-sp
ecif
ic N
OT
Ter
ms
(if a
ppli
cabl
e)
"A
lloc
ebus
"
"C
heir
ogal
eus"
"Mic
roce
bus"
OR
"M
irza
"
"S
agui
nus
mys
tax"
OR
"S
port
ive
lem
urs
(Lep
ilem
ur, P
rim
ates
)" O
R "
Bor
nean
or
ang-
utan
s (P
ongo
pyg
mae
us)"
OR
"B
lack
-and
-whi
te r
uffe
d le
mur
"
"P
han
er"
"H
apal
emu
r" O
R "
Pro
lem
ur"
"L
emur
" O
R "
Eul
emu
r"
"alb
ifro
ns"
OR
"ci
nere
icep
s"
OR
"co
llar
is"
OR
"co
rona
tus"
O
R "
fulv
us"
OR
"m
acac
o" O
R
"fla
vifr
ons"
OR
"m
ongo
z" O
R
"rub
rive
nter
" O
R "
rufu
s" O
R
"san
ford
i" O
R "
sanf
ordi
" O
R
"alb
ocol
lari
s" O
R
"may
otte
nsis
" O
R "
pett
erus
" O
R "
catt
a" O
R "
rufi
fron
s"
"Mic
roce
bus"
OR
"M
ouse
lem
ur"
"div
erge
nce
from
oth
er m
ouse
lem
ur c
lade
s" O
R "
pref
erre
d ha
bita
t typ
e of
Pro
lem
ur s
imus
" O
R "
the
Cri
tica
lly
End
ange
red
grea
ter
bam
boo
lem
ur P
role
mur
sim
us"
OR
"(
Tar
sius
spe
ctru
m)
in T
angk
oko
Nat
ure
Res
erve
" O
R
"pre
senc
e of
Pro
lem
ur s
imus
at 1
8 si
tes"
OR
" c
riti
call
y en
dang
ered
gre
ater
bam
boo
lem
ur P
role
mur
sim
us"
OR
"(
All
oceb
us tr
icho
tis)
to d
eter
min
e ha
bita
t nee
ds"
OR
"th
e th
ird
spec
ies,
Mic
roce
bus
mit
term
eier
i" O
R "
the
thir
d sp
ecie
s, M
icro
cebu
s m
itte
rmei
eri"
OR
"20
5 M
icro
cebu
s ra
velo
bens
is"
OR
"fo
cal i
ndiv
idua
ls o
f th
e w
ease
l spo
rtiv
e le
mur
" O
R "
low
rep
rodu
ctio
n ra
te f
or L
epil
emur
edw
ards
i"
OR
"A
vahi
occ
iden
tali
s ex
tend
s no
rth
and
east
of
the
Bet
sibo
ka R
iver
" O
R "
gene
tic
stru
ctur
e of
the
soli
tary
gre
y m
ouse
lem
ur"
OR
"ph
ysio
logi
cal p
aram
eter
s in
hea
lthy
wil
d V
arec
ia p
opul
atio
ns"
OR
"un
even
dis
trib
utio
n pa
tter
n of
the
gold
en-b
row
n m
ouse
lem
ur"
OR
"su
bspe
cies
of
the
sing
le
spec
ies
Var
ecia
var
iega
ta"
OR
"F
irst
dis
cove
ry o
f th
e ha
iry-
eare
d dw
arf
lem
ur (
All
oceb
us tr
icho
tis)
" O
R "
alm
ost
exti
nct l
emur
spe
cies
, All
oceb
us tr
icho
tis"
OR
"la
rge
bree
ding
cen
ter
for
ruff
ed le
mur
s (V
arec
ia v
arie
gata
)" O
R
"Red
isco
very
of
All
oceb
us-T
rich
otis
Gun
ther
"
(Con
tinu
es o
n ne
xt p
age)

116
"
Var
ecia
"
"M
ouse
lem
ur"
"C
heir
ogal
eus"
OR
"L
emur
" O
R "
Can
ariu
m"
OR
"c
him
panz
ee"
"L
epil
emu
r"
"In
dri
"
"A
vahi
or
Lic
hano
tus"
"P
ropi
thec
us"
"Lem
ur c
atta
" "A
tele
s" O
R "
Chi
ropo
tes"
"D
aube
nton
ia"
"A
rcto
ceb
us"
"L
oris
"
"tar
digr
adus
" O
R "
lyde
kker
ianu
s"
"M
irza
" O
R "
Nyc
tice
bus"
"N
ycti
cebu
s"
"P
erod
icti
cus"
"G
alag
o" O
R "
Gal
agoi
des"
O
R "
Par
agal
ago"
OR
"
Sci
uric
hei
rus"
OR
"
Euo
ticu
s"
"ele
gant
ulus
" O
R "
pall
idus
" O
R
"dem
idof
f" O
R "
thom
asi"
OR
"o
rinu
s" O
R "
rond
oens
is"
OR
"g
rant
i" O
R "
coco
s" O
R
"zan
ziba
ricu
s" O
R "
sene
gale
nsis
" O
R "
gall
arum
" O
R "
moh
oli"
OR
"m
atsc
hiei
" O
R "
alle
ni"
OR
"al
leni
ca
mer
onen
sis"
OR
"ga
bone
nsis
" O
R "
mak
ande
nsis
" O
R "
dem
idov
ii"
OR
"in
ustu
s" O
R "
tons
or"
OR
"a
pica
lis"
OR
"ta
lbot
i" O
R
"pal
lida
" O
R "
dem
idov
ii"
OR
"u
dzun
gwen
sis"
OR
"za
nzib
aric
us"
O
R "
nyas
ae"
OR
"br
adfi
eldi
" O
R
"cam
eron
ensi
s"
"O
tole
mu
r"
(Con
tinu
es o
n ne
xt p
age)

117
"T
arsi
us"
OR
"C
arli
to"
OR
"
Cep
halo
pac
hus"
"C
alli
mic
o"
"O
wl m
onke
y*"
"C
ebue
lla"
"A
loua
tta"
"C
alli
thri
x" O
R "
Mic
o" O
R
"C
alib
ella
"
"O
wl m
onke
y*"
"Sag
uinu
s" O
R "
Lem
ur"
OR
"li
tter
siz
e of
wil
d co
tton
-top
ta
mar
ins"
OR
"re
prod
ucti
ve p
oten
tial
of
wil
d- a
nd c
apti
ve-
born
gol
den-
head
ed li
on ta
mar
ins"
OR
"tw
o ta
mar
in
spec
ies
(Sag
uinu
s fu
scic
olli
s an
d S
. oed
ipus
)"
"L
eont
opit
hecu
s"
"Sag
uinu
s" O
R "
thre
ats
to p
opul
atio
ns o
f A
loua
tta
guar
iba
clam
itan
s "
"S
agui
nus"
OR
"L
eont
oceb
us"
"L
eont
opit
hecu
s ca
issa
ra"
OR
"R
ondo
n's
Mar
mos
et"
OR
"C
ebus
ape
lla
para
guay
anus
" O
R "
skul
l of
Cat
arrh
ini"
O
R "
mas
tica
tory
app
arat
us o
f G
alag
os"
OR
"cr
ania
l div
ersi
fica
tion
of
neot
ropi
cal
mon
keys
"
"cux
ius
form
ed a
ssoc
iati
ons"
OR
"br
east
hei
ght,
42.2
+/-
21
.9 c
m"
OR
"(C
alli
cebu
s cu
preu
s) to
ada
pt to
for
est
edge
s" O
R "
Cal
lim
ico
goel
dii i
s a
rare
pri
mat
e" O
R "
dung
in
latr
ines
" O
R "
mat
rix
diag
onal
izat
ion"
OR
"S
leep
ing
Sit
es o
f R
hino
pith
ecus
bre
lich
i" O
R "
Leo
ntop
ithe
cus
rosa
lia L
inna
eus,
176
6" O
R "
nigh
t mon
keys
Aot
us
voci
fera
ns"
OR
"H
abit
at u
se b
y C
hiro
pote
s sa
tana
s ut
ahic
ki "
OR
"20
Alo
uatt
a sp
ecie
s an
d su
bspe
cies
"
"A
loua
tta"
"Ow
l mon
key*
" O
R "
Hoo
ded
capu
chin
" O
R "
Squ
irre
l mon
key"
"R
hino
pith
ecus
" O
R "
Lem
ur"
OR
"H
arpi
a" O
R
"Col
eopt
era"
OR
"E
ulem
ur"
OR
"S
cara
baei
dae"
OR
"C
hiro
pote
s" O
R "
Hyl
obat
es"
OR
"po
pula
tion
of
whi
te-
bell
ied
spid
er m
onke
ys (
Ate
les
belz
ebut
h)"
OR
"1
adul
t an
d su
badu
lt b
row
n sp
ider
mon
keys
" O
R "
abil
ity
of s
pide
r (A
tele
s ge
offr
oyi)
" O
R "
Ate
les
mar
gina
tus,
is e
ndem
ic to
B
razi
lian
Am
azon
" O
R "
A. g
eoff
royi
live
in h
ighl
y fr
agm
ente
d la
ndsc
apes
"
"A
otus
"
"W
ooll
y m
onke
y" O
R "
Sag
uinu
s" O
R
"MH
C P
olym
orph
ism
s"
"A
tele
s"
"Rhi
nopi
thec
us"
OR
"P
apio
" O
R "
Ceb
idae
" O
R "
Inga
" O
R
"(A
loua
tta
pall
iate
s, A
loua
tta
pigr
a an
d" O
R "
Dem
ogra
phic
fe
atur
es o
f A
loua
tta
pigr
a po
pula
tions
" O
R "
20 A
loua
tta
spec
ies
and
subs
peci
es"
(Con
tinu
es o
n ne
xt p
age)

118
"
Bra
chyt
eles
"
"H
owle
r m
onke
y*"
"Chi
ropo
tes"
OR
"T
apir
" O
R "
brow
n ho
wle
r m
onke
y (A
loua
tta
clam
itan
s)"
OR
"br
own-
how
ler-
mon
key
Alo
uatt
a gu
arib
a cl
amit
ans
" O
R "
20 A
loua
tta
spec
ies
and
subs
peci
es"
"C
acaj
ao"
"P
ithe
ciid
"
"C
alli
ceb
us"
OR
"
Che
race
bus
" O
R
"P
lect
uroc
ebu
s"
"Pit
heci
id"
"C
ebus
" O
R "
Sap
ajus
"
"S
agui
nus
mys
tax"
OR
"H
owle
r m
onke
y*"
"Pap
io"
OR
"ca
lith
rix"
OR
"P
resb
ytis
" O
R "
Har
pia"
OR
"D
asyp
us"
OR
"L
eopa
rdus
" O
R "
Mac
aca"
OR
"9
heal
thy
capt
ive
ring
-tai
led
lem
urs"
OR
"cu
xius
(ge
nus
Chi
ropo
tes)
for
m"
OR
"no
rthe
rn b
eard
ed s
akis
(C
hiro
pote
s sa
gula
tus)
in G
uyan
a"
OR
"re
cent
ly-d
isco
vere
d ti
ti, C
alli
cebu
s co
imbr
ai"
OR
"la
st in
-de
pth
revi
ew o
f S
aim
iri b
iolo
gy"
OR
"L
. ros
alia
is a
legi
tim
ate
seed
dis
pers
er"
OR
"en
dem
ic C
hiro
pote
s sa
tana
s ut
ahic
ki"
OR
"2
0 A
loua
tta
spec
ies
and
subs
peci
es"
OR
"C
entr
al A
mer
ican
sq
uirr
el m
onke
ys, S
aim
iri o
erst
edi"
"C
hiro
pote
s"
"Pit
heci
id"
OR
"P
ithec
iina
e"
"L
agot
hrix
" O
R "
Ore
onax
"
"Nom
ascu
s" O
R "
Bur
sera
ceae
" O
R "
Var
ecia
" O
R "
Bra
chyt
eles
" O
R "
Chi
ropo
tes"
"P
ithe
cia"
"2
0 A
loua
tta
spec
ies
and
subs
peci
es"
"S
aim
iri"
"Col
obin
e m
onke
ys"
OR
"S
agui
nus"
OR
"O
wl m
onke
y*"
OR
"H
owle
r m
onke
y*"
"rhe
sus
mon
keys
(M
acac
a m
ulat
ta)
succ
eede
d" O
R "
20
Alo
uatt
a sp
ecie
s an
d su
bspe
cies
"
"A
llen
opit
hec
us"
"C
erco
ceb
us"
OR
"
Lop
hoce
bus
"
"R
ungw
eceb
us"
"dri
ll p
opul
atio
n ec
olog
y"
"C
erco
pith
ecus
" O
R
"A
lloc
hroc
ebus
" O
R
"C
hlor
oceb
us"
OR
"M
iopi
thec
us"
"Alo
uatt
ta"
OR
"M
acac
a" O
R "
Can
is"
OR
"E
ryth
roce
bus"
OR
"e
ndem
ic U
dzun
gwa
red
colo
bus
(Pro
colo
bus
gord
onor
um)"
OR
"d
rill
s on
25
occa
sion
s" O
R "
conf
lict
in th
e gu
anac
o (L
ama
guan
icoe
)" O
R "
15,0
00 P
apio
ham
adry
as h
amad
ryas
" O
R
"gor
illa
nes
t-si
te d
ensi
ties
" O
R "
leop
ard
was
asc
erta
ined
onl
y "
(Con
tinu
es o
n ne
xt p
age)

119
"E
ryth
roce
bus
"
"C
olob
us"
OR
"P
roco
lob
us"
O
R "
Pil
ioco
lobu
s"
"Chi
ropo
tes"
OR
"E
ulem
ur"
OR
"C
alli
cebu
s" O
R
"Pre
sbyt
is"
OR
"S
imia
s" O
R "
Sem
nopi
thec
us"
OR
"R
hino
pith
ecus
" O
R "
Tra
chyp
ithe
cus"
OR
"L
epil
emur
" O
R "
vill
age-
dwel
ling
pop
ulat
ions
(L
agw
a an
d A
kpug
oeze
)" O
R "
cerc
opit
heci
d co
nser
vati
on"
OR
"S
uppl
emen
tati
on in
Bla
ck h
owle
rs (
Alo
uatt
a pi
gra)
" O
R "
Bou
tour
lini's
blu
e m
onke
ys (
Cer
copi
thec
us m
itis
bo
utou
rlin
ii)"
OR
"F
orag
ing
Beh
avio
r of
Red
How
ler
Mon
keys
" O
R "
dril
ls o
n 25
occ
asio
ns"
OR
"C
erco
cebu
s sa
njei
in th
e U
dzun
gwa
Mou
ntai
ns"
"Mac
aca"
"Rhi
nopi
thec
us r
oxel
la*"
OR
"R
hino
pith
ecus
bie
ti"
OR
"In
fra-
orde
r ca
tarr
hini
" O
R "
Sou
ther
n A
fric
an b
aboo
ns"
OR
"H
ylob
ates
lar"
OR
"W
ild
oran
guta
ns"
OR
"ca
ptiv
e gr
oup
of c
him
panz
ees
(Pan
tr
oglo
dyte
s)"
OR
"C
erco
pith
ecus
aet
hiop
s ae
thio
ps"
OR
"w
ild
livi
ng c
omm
unit
y of
B
onob
os (
Pan
pan
iscu
s)"
OR
"B
oliv
ian
squi
rrel
mon
keys
(S
aim
iri b
oliv
iens
is)"
OR
"C
apti
ve lo
wla
nd g
oril
las
and
oran
guta
ns"
OR
"P
opul
atio
n ge
neti
cs in
Eul
emur
"
"Rhi
nopi
thec
us"
OR
"N
eofo
lis"
OR
"C
alli
thri
x" O
R
"Cer
copi
thec
ine"
OR
"P
ropi
thec
us"
OR
"C
ebus
" O
R
"The
ropi
thec
us"
OR
"in
dian
gia
nt s
quir
rel"
OR
"t
erre
stri
alit
y in
ora
ngut
ans
(Pon
go s
pp.)
" O
R "
zoo
-ho
used
Jav
an g
ibbo
ns (
Hyl
obat
es m
oloc
h)"
OR
"ab
itua
ted
oran
guta
ns (
Pon
go p
ygm
aeus
mor
io)"
OR
"cr
op-r
aidi
ng
by o
rang
utan
s (P
ongo
abe
lii)
" O
R "
disc
rim
inat
ion
skil
ls
of c
him
panz
ees
" O
R "
Pan
ther
a pa
rdus
hav
e a
cath
olic
di
et "
OR
"B
FM
S a
lso
cont
ain
C. v
elle
rosu
s"
"N
asal
is"
OR
"S
imia
s"
"Rhi
nopi
thec
us"
OR
"C
erco
pith
ecid
ae"
"P
apio
" O
R "
Man
dril
lus"
"C
erco
pith
ecin
e" O
R "
Pro
sopi
s" O
R "
Wes
t Afr
ican
sa
vann
a ch
impa
nzee
s (P
an tr
oglo
dyte
s ve
rus)
" O
R
"par
asit
es o
f sa
vann
a ch
impa
nzee
s (P
an tr
oglo
dyte
s sc
hwei
nfur
thii
)" O
R "
(Pan
trog
lody
tes)
mis
perc
eive
d fo
od"
OR
"E
ndan
gere
d L
ion-
Tai
led
Mac
aque
s (M
acac
a si
lenu
s)"
OR
"C
erco
cebu
s sa
njei
in th
e U
dzun
gwa
Mou
ntai
ns"
OR
"in
fect
ing
grea
ter
spot
-nos
ed m
onke
ys
(Cer
copi
thec
us n
icti
tans
)" O
R "
Tib
etan
mac
aque
s (M
acac
a th
ibet
ana)
at M
t. E
mei
"
"P
resb
ytis
" O
R
"S
emno
pith
ecus
" O
R
"T
rach
ypit
hec
us"
"S
ichu
an s
nub-
nose
d m
onke
ys"
"A
ndri
as"
OR
"P
ongo
" O
R "
Sai
mir
i" O
R "
Par
dofe
lis"
OR
"i
ndia
n gi
ant s
quir
rel"
OR
"S
imia
s co
ncol
or (
sim
akob
u or
pi
g-ta
iled
lang
ur)"
OR
"(R
hino
pith
ecus
bie
ti)
14"
OR
"F
ood
habi
ts o
f ti
gers
Pan
ther
a tig
ris"
(Con
tinu
es o
n ne
xt p
age)

120
"
Pyg
athr
ix"
OR
"
Rhi
nop
ithe
cus"
"E
ndan
gere
d S
hort
ridg
e's
capp
ed la
ngur
T
rach
ypit
hecu
s sh
ortr
idge
i" O
R "
(Pre
sbyt
is
rubi
cund
a) in
Sab
anga
u" O
R "
Res
pons
es o
f C
ao
Vit
Gib
bon
(Nom
ascu
s N
asut
us)"
OR
"(
Tra
chyp
ithe
cus
dela
cour
i) in
Van
Lon
g N
atur
e R
eser
ve"
"T
hero
pith
ecus
"
"M
acac
a ar
ctoi
des"
"H
ylob
ates
" O
R "
Hoo
lock
"
OR
"N
omac
us"
OR
"
Nom
ascu
s" O
R
"S
ymp
hala
ngus
" O
R
"B
runo
pith
ecu
s"
"C
erco
pith
ecid
ae"
OR
"N
ew W
orld
M
onke
y"
"Neo
feli
s" O
R "
Sai
mir
i" O
R "
Gar
cini
a" O
R
"Cho
eros
pond
ias"
OR
"(T
rach
ypit
hecu
s cr
epus
culu
s) in
the
Wul
iang
Mou
ntai
ns"
OR
"on
e w
ild
troo
p of
nor
ther
n pi
gtai
led
mac
aque
s "
"G
oril
la"
"Wil
d ch
impa
nzee
s (P
an tr
oglo
dyte
s)"
OR
"U
nhab
itua
ted
chim
panz
ees"
OR
"L
eont
opit
hecu
s ca
issa
ra"
OR
"W
hite
-ha
nded
gib
bon"
OR
"C
omm
on g
ibbo
n"
"Hyl
obat
es"
OR
"A
loua
tta"
OR
"N
eofe
lis"
OR
"c
apti
ve h
amad
ryas
bab
oons
(P
apio
ham
adry
as
ham
adry
as)"
OR
"C
erco
pith
ecus
mit
is k
andt
i, th
e go
lden
mon
key"
"P
an"
"p
anis
cus"
OR
"tr
oglo
dyte
s"
"nat
ural
pop
ulat
ions
of
oran
g-ut
an (
Pon
go
pygm
aeus
)" O
R "
Mit
ocho
ndri
al D
NA
di
vers
ity
in g
oril
las"
OR
"B
arba
ry m
acaq
ues
(Mac
aca
sylv
anus
)"
"Leo
ntop
ithe
cus"
OR
"C
hlor
oceb
us"
OR
"c
erco
pith
ecid
s" O
R "
Japa
nese
mac
aque
s (M
acac
a fu
scat
a ya
kui)
" O
R "
Vul
nera
ble
owl-
face
d m
onke
y C
erco
pith
ecus
ham
lyni
" O
R
"(T
rach
ypit
hecu
s ph
ayre
i cre
pusc
ulus
) in
Phu
K
hieo
" O
R "
cap
uchi
n m
onke
ys' q
uant
ific
atio
n"
"P
ongo
"
"B
row
n S
pide
r M
onke
y" O
R "
Gor
illa
sy
stem
atic
s" O
R "
Too
th m
orph
olog
y" O
R
"Whi
te-h
ande
d gi
bbon
"
"Ceb
us"
OR
"T
apir
idae
" O
R "
Try
pano
som
a "
OR
"N
iger
ian/
Cam
eroo
n ch
impa
nzee
(P
an tr
oglo
dyte
s el
liot
i)"
OR
"ch
impa
nzee
s' f
ood
pref
eren
ces"
OR
"(
Pan
trog
lody
tes)
mis
perc
eive
d fo
od"
OR
"C
him
panz
ees
mad
e ju
dgm
ents
" O
R
"chi
mpa
nzee
s (P
an tr
oglo
dyte
s) d
iscr
imin
ate"

121
SUPPLEMENTARY RESULTS:
Predictors of Inflation (removing de novo species descriptions from inflation estimates)
Table S3.4: Results of a general linear effects model testing the effect of conservation research
effort on inflation. Model set-up: the number of species added to primate genera since 1982
excluding those determined to have de novo species descriptions (dependent variable) vs. original
number of species in each genus in 1982 (included as a linear (1) and quadratic (2) term),
conservation research effort and region using Asia/Africa as the baseline (all independent
variables), with observation ID included as a random effect. +P≤0.1; * P<0.05; ** P<0.01.
Effect Estimate SE z p
(Intercept) 0.873 0.214 4.084 <0.001**
Conservation research effort -0.157 0.156 -1.011 0.312
Region Madagascar 0.237 0.337 0.702 0.483
Region Neotropics 0.597 0.288 2.071 0.038*
log(# of species in 1982)1 7.178 1.017 7.060 <0.001**
log(# of species in 1982)2 -1.413 0.821 -1.722 0.085+
Continuous variables scaled to have a mean of zero and standard deviation of one
Table S3.5: Results of a general linear effects model testing the effect of genetics research effort
on inflation. Model set up: the number of species added to primate genera since 1982 excluding
those determined to have de novo species descriptions (dependent variable) vs. original number of
species in each genus in 1982 (included as a linear (1) and quadratic (2) term), molecular genetics
research effort and region using Asia/Africa as the baseline (all independent variables) where
observation ID included as a random effect. +P≤0.1; * P<0.05; ** P<0.01.
Effect Estimate SE z p
(Intercept) 0.867 0.213 4.074 <0.001**
sqrt(Molecular genetics research effort) -0.173 0.145 -1.194 0.232
Region Madagascar 0.281 0.330 0.851 0.395
Region Neotropics 0.585 0.289 2.025 0.043*
log(# of species in 1982)1 7.239 1.011 7.160 <0.001**
log(# of species in 1982)2 -1.449 0.818 -1.772 0.076+
Continuous variables scaled to have a mean of zero and standard deviation of one

122
Table S3.6: Results of a general linear effects model testing the effect of diversification rate on
inflation. Model set up: the number of species added to primate genera since 1982 excluding those
determined to have de novo species descriptions (dependent variable) vs. original number of
species in each genus in 1982 (included as a linear (1) and quadratic (2) term), diversification rate
and region using Asia/Africa as the baseline (all independent variables) where observation ID
included as a random effect. +P≤0.1; * P<0.05; ** P<0.01.
Effect Estimate SE z p
(Intercept) 0.603 0.274 2.204 0.028*
Diversification rate 0.099 0.174 0.567 0.570
Region Madagascar 0.406 0.391 1.040 0.298
Region Neotropics 0.708 0.352 2.011 0.044*
log(# of species in 1982)1 4.877 1.126 4.330 <0.001**
log(# of species in 1982)2 -1.830 0.887 -2.064 0.039*
Continuous variables scaled to have a mean of zero and standard deviation of one
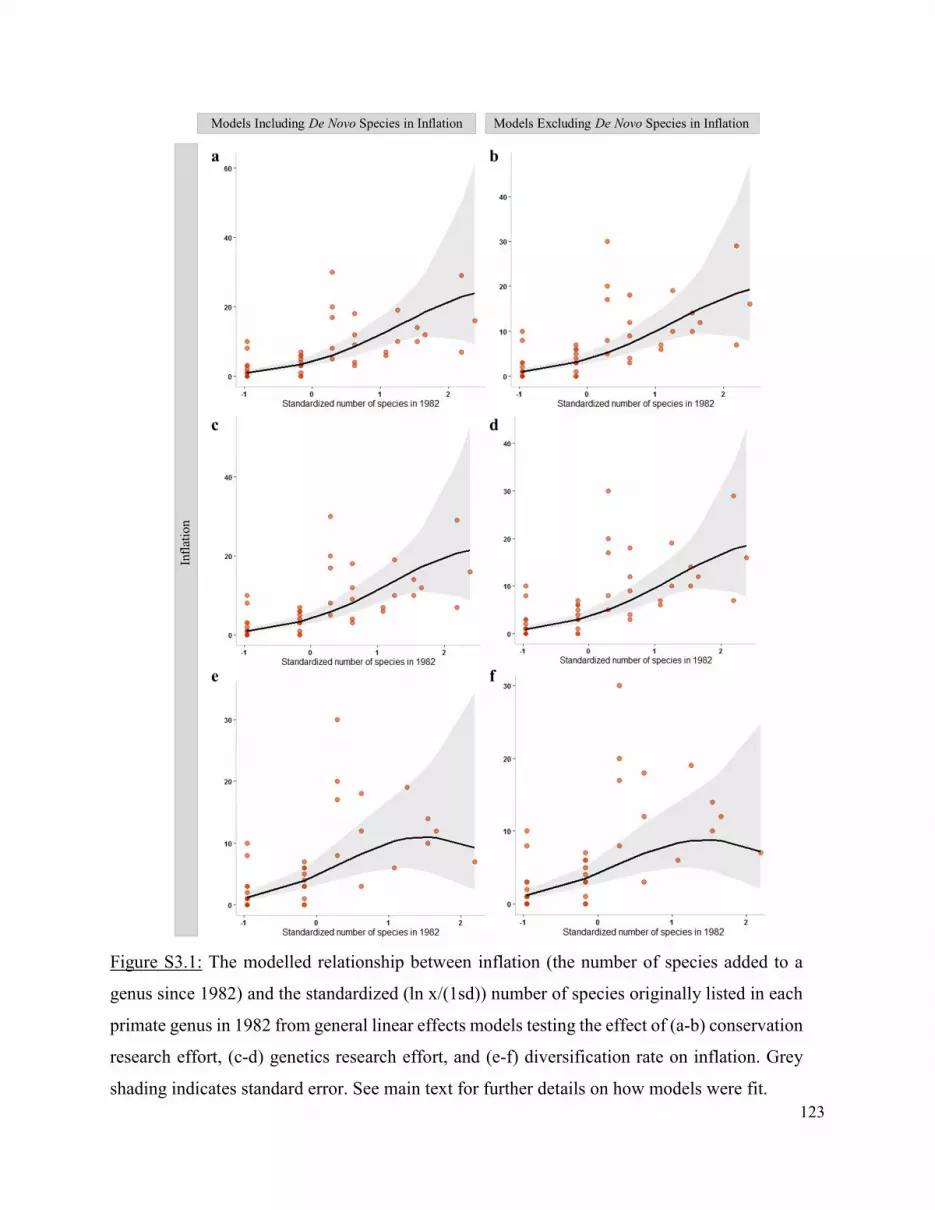
123
Figure S3.1: The modelled relationship between inflation (the number of species added to a
genus since 1982) and the standardized (ln x/(1sd)) number of species originally listed in each
primate genus in 1982 from general linear effects models testing the effect of (a-b) conservation
research effort, (c-d) genetics research effort, and (e-f) diversification rate on inflation. Grey
shading indicates standard error. See main text for further details on how models were fit.

124
Inflation and Threat Score (removing de novo species descriptions from inflation estimates)
Table S3.7: Results of general linear effects model comparing genus threat score (dependent) to
inflation (the proportional increase in species between 1982 and 2016 excluding those determined
to have de novo species descriptions), region using Asia/Africa as the baseline and inflation ×
region interaction term (independent) where family (nested within region) is a random effect.
+P≤0.1; * P<0.05; ** P<0.01.
Effect Estimate SE z p
(Intercept) -0.829 0.355 -2.339 0.019*
Inflation 0.266 0.114 2.327 0.020*
Region: Madagascar 1.058 0.613 1.726 0.084+
Region: Neotropics -0.090 0.639 -0.140 0.889
Inflation1: Region Madagascar -0.222 0.176 -1.260 0.208
Inflation1: Region Neotropics -0.342 0.118 -2.910 0.004**
Figure S3.2: The interaction between inflation excluding de novo species descriptions and region
on threat score for genera of primates. Threat score approaching 1 denotes high risk of extinction
and threat score approaching 0 denotes low risk. Points represent raw values with trend-lines
estimated from a general linear effects model. Points are transparent with darker values
corresponding to overlapping points.

125
SUPPLEMENTARY REFERENCES:
Estrada, A., Garber, P. A., Rylands, A. B., Roos, C., Fernandez-Duque, E., Di Fiore, A., ... &
Rovero, F. (2017). Impending extinction crisis of the world’s primates: Why primates
matter. Science Advances, 3: e1600946.
Honacki, J. H., Kinman, K. E., & Koeppl, J. W. (1982). Mammal species of the world; a taxonomic
and geographic reference. Allen Press, Inc. and Association of Systematic Collections,
Lawrence.
The IUCN Red List of Threatened Species. (2019). Retrieved from https://www.iucnredlist.org/
[accessed 2 April 2019].

126
CHAPTER 4: GENERAL DISCUSSION

127
In my thesis I have explored the determinants of species diversity across primate clades,
emphasizing the role of both evolutionary processes and naming conventions in driving variation.
I have additionally discussed the possible consequences of these two related but also potentially
confounding determinants of species diversity for fields of biology which rely on species as
primary objects of study. Here, I will briefly review the major findings of my research, provide
some cautionary notes on the use of species as it pertains to the relevant areas of study, highlight
the implications of my work and recommend some directions for future research not discussed in
earlier chapters.
MAJOR FINDINGS:
In Chapter 2 I focused on the evolutionary consequences of behavioural flexibility, specifically
examining whether behavioural flexibility promotes primate diversification while also attempting
to control for systematic biases which may influence diversification rate estimates. In Chapter 3 I
investigated determinants of taxonomic inflation following applications of the ‘phylogenetic
species concept’ (PSC) in primate taxonomy, and went on to explore the potential consequences
for applied conservation. I found that behavioural measures of behavioural flexibility (i.e.
innovation and social learning) were positively associated with some but not all diversification
measures. The strongest associations between these behavioural measures and diversification rate
were found deeper in the primate tree which may support a role for behavioural flexibility
enhancing lineage persistence, as opposed to driving speciation events. Turning to inflation, I
found that neither biological processes (i.e. diversification rate) nor interest-driven mechanisms
(i.e. measures of research effort) predicted inflation among primate genera. However, a
decelerating association shared by the number of species originally listed in primate genera in 1982
and inflation could point to influences on inflation not captured in these tests. When assessing how
inflation interacted with threat scores (i.e. extinction risk), I found that associations between
inflation and threat score varied by region, sharing a positive association in Asia and mainland
Africa, no detectable association in Madagascar, and a negative association in the Neotropics.
These regional differences may indicate that other factors (e.g. the total geographic range size of
genera) impact how inflation affects threat score. Together, these chapters provide useful insights
into the factors influencing described species diversity across primate taxa, and meaningful
considerations for the use of ‘species’ across biological disciplines.

128
ON THE USE OF SPECIES:
Species are often assumed to reflect biological diversity (Clarke, 1975; Wilson, 1988). Acting as
the lowest level of biological unity (Linnaeus, 1753; Svenson, 1953), species have become primary
objects of study across many fields of biology (Zink & McKitrick, 1995; De Queiroz, 2005).
However, for primates, the number of species added to genera under the PSC is not proportional
to the number of species originally listed in each genera under the BSC. This indicates that not
only ultimate (total species richness), but also relative species richness changes across taxa based
on which species concept is employed i.e. a primate genus that is speciose relative to other genera
under the BSC may not be speciose relative to other genera under the PSC and vice versa. Notably,
both ultimate and relative changes in species richness across taxa can pose problems for fields
relying on species as reliable units of comparison.
Species as an Evolutionary Metric
In Chapter 2 I discussed the potential biases associated with changing species definitions when it
comes to estimating diversification rate – especially with regards to recent applications of the PSC.
In particular, different species definitions result in different estimates of species diversification
(Zink & McKitrick, 1995), potentially influencing the results of comparative macroevolutionary
studies such as Chapter 2. For instance, genus Leontopithecus (Lesson, 1840) contains one
biological species (L. rosalia) with four subspecies according to Honacki et al. (1982)’s application
of the ‘biological species concept’ (BSC; see Chapter 3). Therefore, following methods in
Magallon & Sanderson (2001) the subspecific diversification rate of this species would be
estimated as ln(4)/ 15.03 taxa per million years (my), where 15.03 my is the stem age of L. rosalia
(Arnold, et al., 2010). However, following the emergence of mitochondrial and phylogenetic
evidence provided in Perez-Sweeney et al. (2008), all L. rosalia subspecies have since been
elevated to the full species status in modern species lists (e.g. see IUCN/SSC Primate Specialist
Group, 2018). Thus, when referencing modern species lists, L. rosalia contains no subspecific
diversity and genus Leontopithecus quadruples in species diversity compared to Honacki et al.
(1982). This illustrates that overall estimates of diversification rate change based on taxonomic
reassessment. Moreover, this creates the potential for taxonomic reassessments to influence how
diversification rates of lineages compare to one another, thus influencing observed
macroevolutionary trends.

129
In Chapter 2 I attempted to minimize biases associated with the PSC when estimating shallow
divergences by creating a time cut-off in the primate tree which acted as a secondary criteria in
defining our “species”, which I termed “lineages”. This reduced biases caused by subspecies being
elevated to the full species rank more persistently in some taxonomic groups than others. However,
the taxa used to estimate richness scores (i.e. species and subspecies) were still determined via
systematic processes, so while our method avoided biases in subspecies elevations across
taxonomic groups, we could not be certain that some groups did not have biases associated with
the processes determining how many taxa (species and subspecies) they contained overall (e.g. if
some primate clades observe disproportional additions of new species that are never formally
recognized as subspecies). Approaches relying directly on phylogenies to infer evolutionary rates
(e.g. QuaSSE estimates from FitzJohn, 2012) are also influenced by taxonomic reclassifications
since phylogenies and taxonomies inform one another (Hillis, 1998; Wheeler, 2000; Hinchliff, et
al., 2015).
In this sense, macroevolutionary studies serve as a great example of why it is important for
biologists to have a comprehensive understanding of all the processes involved in determining
described species diversity. Understanding how systematic discrepancies influence our respective
areas of work can help us to account for them when possible – and when not possible – allow us
to speculate as to how they may influence observed results. In our case, we observed positive
associations among proxies of behavioural flexibility and diversification rate of well-established
lineages, but not among proxies of behavioural flexibility and diversification rate estimates
considering recently evolved taxa. We suggested that this pattern could be a result of behavioural
flexibility buffering against ephemeral extinction events and that this would be consistent with
previous studies (e.g. Shultz, et al., 2005; Rossmanith, et al., 2006; Sol, et al., 2007, Ducatez, et
al., 2020). However, we also acknowledged that this could alternatively be an effect of biases in
the total numbers of described taxa (species and subspecies) across clades obscuring underlying
biological patterns if, for some reason, less flexible clades are more likely to have a larger number
of taxa described overall. Therefore, we went on to suggest how future studies could determine if
this is a likely explanation for our results. In this case, considering the caveats of relying on
taxonomic stability and consistency helped to improve our study design, making us less likely to

130
experience Type I or Type II errors, while also helping us to develop suggested avenues for future
research.
Species-Level Observations in Comparative Biology
In addition to influencing evolutionary metrics, changes in species designations can complicate
the process of generating species-level data. Many large species-level datasets (e.g. Jones, et al.,
2009; Storchová & Hořák, 2018) rely on taxonomy when creating quantitative estimates of species
traits (e.g. life history, ecological and geographical traits). Creating species-levels estimates from
existing literature is particularly challenging because one must account for changes in taxonomic
classifications through time. In Chapter 2 our analysis relied on summarized behavioural and
morphological data. Troubles can arise when summarizing species traits from different sources
due to changing nomenclature. For instance, measures of brain volume or body mass originally
recorded under one species name might come from a specimen which represents a completely
different species under a revised or more speciose taxonomy. Similar problems apply to compiling
behavioural data that has been recorded over many years, leading researchers to favour lumping
over splitting of taxa (Reader, et al., 2011). This is particularly relevant when it comes to
applications of the PSC since species in older datasets have often been subsequently split into
multiple species in newer taxonomies. Details on specimens are not always well documented,
making it difficult to account for these changes in nomenclature. In Chapter 2 we estimated trait
values for well-established lineages, referencing very liberal taxa names therein to assign and
summarize data. This allowed us to avoid discrepancies in nomenclature since our lineages were
very conservative, thus, data were placed in the correct lineage regardless of discrepancies in
nomenclature among comprised taxa. However, taxonomic instability – particularly those caused
by applications of the PSC for primates – can pose problems when compiling data for less inclusive
taxonomic units and may compromise analyses at shallower taxonomic depths.
Species as a Unit for Conservation
Species lists are often used to determine which taxa should receive conservation attention (Mace,
2004), and drastic changes in species designations as a result of e.g. changing species concepts,
have been suggested to influence which groups are prioritized. In particular, some have speculated
that inflation in species numbers following applications of the PSC may put a strain on primate

131
conservation by increasing numbers of threatened species (Agapow, et al., 2004; Isaac, et al., 2007)
and causing poorly-defined taxa to be prioritized over well-defined and biologically unique ones
(Pillon & Chase, 2007). Results presented in Chapter 3 show that extinction risk and inflation in
species numbers under the PSC are only positively associated across genera from Asia and Africa,
sharing no association in Madagascar and sharing a negative association in the Neotropics. This,
of course, does not rule out any influence from the PSC in increasing threat scores for Malagasy
or Neotropical taxa, but simply indicates that splitting is not resulting in a general pattern of
inflated groups being prioritized over lesser inflated groups in these regions. In some cases,
inflation could very well still be leading to more imperilled species statuses among taxa in
Madagascar and the Neotropics. For instance, many newly described Malagasy mouse lemur
(Microcebus) populations elevated to the full species status by Louis et al. (2006; 2008) based on
molecular data (M. mittermeieri, M. jollyae, M. simmonsi, M. mamiratra) are now classified as
endangered or critically endangered by the IUCN. The species these populations were previously
assigned to: M. rufus, is considered to be vulnerable according to its latest assessment. In the
assessment details, the description of new species by Louis et al. (2006; 2008) is quoted as a
contributing factor causing the now reduced geographic range size of M. rufus (Wright, et al.,
2020). Thus, in this case it seems there is some suggestive evidence in support of the PSC
influencing listing of at risk species, even in Madagascar where it does not result in an overall
trend of inflated groups being prioritized.
While many have been critical of the PSC, it does have some advantages over the BSC when it
comes to listing and management of at risk species. The use of less inclusive conservation units
can help ensure less diversity is lost to extinction. When populations are lumped together and
managed as such, some biodiversity may be overlooked and subsequently lost. In a world where
conservation funding and resources were unlimited, listing and management of species described
under the PSC would be ideal as it would help to preserve the greatest amount of biological
diversity. The problem, of course, is that in reality conservation funding and resources are quite
limited, and those involved in conservation listing and management often have to make decisions
about which units should receive priority. Therefore, we must consider whether it is better to (i)
list conservative conservation units that may overlook some biological diversity but often result in
the most imperilled and evolutionarily distinct units receiving highest priority and ample resources,

132
or (ii) list less inclusive conservation units, risking the division of resources but ultimately
preventing biological diversity presented by closely related yet phylogenetically distinct
populations from being neglected. In this sense neither species concept results in infallible units
for conservation purposes. When using less inclusive units (i.e. those described under the PSC),
incorporating evolutionary measures in conservation is one method of ensuring biologically unique
species are still prioritized. The Evolutionarily Distinct and Globally Endangered (EDGE)
conservation program combines information on a species’ conservation status and their genetic
distinctiveness in order to determine which species should be prioritized (Redding & Mooers,
2006; Isaac, et al., 2007). Among primates specifically, it has been demonstrated that species with
high EDGE scores capture a large range of biological diversity (Redding, et al., 2010). Using
EDGE scores and related metrics (e.g. I-HEDGE; Jensen, et al., 2016) in applied conservation can
help to ensure that evolutionarily distinct populations are still prioritized when relying on species
lists determined using the PSC, while still allowing less evolutionarily distinct populations to be
listed and managed independently.
Other Considerations
While I have discussed the particular ways that aspects of comparative biology and conservation
may be directly impacted by recent taxonomic changes, these are not the only fields relying on
species as primary objects of study. As discussed in the general introduction, many other areas of
biology are reliant on species lists. For instance, Zink & McKitrick (1995) show how changing
species concepts can influence studies of historical biogeography if conservative species lists
conceal important information required to create biogeographic reconstructions if, for instance,
investigators that are not familiar with a taxon overlook events that separate gene pools among
populations because they are described under one biological species. Carrasco et al. (2016) discuss
the potential implications of taxonomic instability for toxinology and public health research when
it comes to treating snake bites. Changing nomenclature and taxonomic inaccuracy is suggested to
interfere with the reliable identification of venom samples while also adversely affecting the
interpretation of related studies (e.g. studies of venom composition) and repeatability of
experiments (e.g. experiments isolating toxins that may be of value to the pharmaceutical industry)
(Carrasco, et al., 2016). Thus, the specific ways in which changing species designations influence

133
studies relying on species as a central unit of comparison should continue to be explored across
other sub-disciplines biology not discussed here.
IMPLICATIONS:
Understanding the processes involved in determining described species diversity improves our
understanding of biological diversity and allows us to better evaluate the use of species across
various areas of biology. Evidence presented in Chapter 2 indicates that behavioural flexibility is
associated with rates of evolution across primates. If patterns observed in our results are indeed a
function of behavioural flexibility buffering against ephemeral extinction events as we suggest,
this could be informative in helping biologists anticipate how different organisms may respond to
external change (e.g. habitat modification). This would, in turn, allow biologists to better anticipate
which organisms might be particularly vulnerable to extinction in a changing world, especially
when it comes to anticipating extinction events among recently diverged species or subspecies (i.e.
ephemeral lineages). In Chapter 3 we discussed the potential implications of taxonomic inflation
for applied conservation. While results indicated that inflation has not led to the prioritization of
highly inflated groups – at least within Madagascar and the Neotropics where a great deal of
inflation has occurred – we discussed how increasing designations of new species units should still
be a consideration for conservation efforts. As described in Chapter 2, it is likely that many species
units used by the IUCN represent recent diversification events considering that the PSC has
facilitated the splitting of very closely related populations. Thus, while some may view an increase
in the overall number of at risk species a burden for conservation (e.g. Zachos, et al., 2013; Zachos
& Lovari, 2013), in this sense listing and management of less inclusive species units (i.e. those
described under the PSC) can actually assist us in projecting the ephemeral extinction events
discussed above, since these populations are already being assessed, monitored and managed as
independent units. This is one potential benefit of using less conservative species concepts for
conservation listing.
In addition to having implications for conservation, my thesis additionally draws attention to the
possible problems associated with creating quantitative estimates of recent evolutionary events
(i.e. species diversification) while failing to account for influence from biases in systematic
processes. This is an important consideration for other studies of macroevolutionary trends among
134
taxonomic groups that have undergone or are continuing to undergo substantial taxonomic
revision. Finding ways to account for such biases can allow evolutionary biology to make
advancements while also allowing taxonomy to progress. Finally, in addition to the implications
of results presented in Chapters 2 and 3 (discussed in their respective chapters), my thesis generally
provides important insights into the processes involved in determining described primate species
diversity and thus has implications for our understanding of biological diversity observed across
the Tree of Life.
DIRECTIONS FOR FUTURE RESEARCH:
Here, I will suggest some additional areas of research to those discussed in Chapters 2 and 3 that
could provide useful insights into the causal factors determining species diversity more broadly.
In Chapter 2, we provided evidence for behavioural flexibility promoting primate evolution after
attempting to control for systematic biases which may influence diversification estimates. I suggest
that future studies relying on evolutionary rate estimates could test macroevolutionary hypotheses
using rate estimates generated from different taxonomic or phylogenetic sources. One could test
the same hypothesis using these different estimates of evolutionary rate keeping all other data
sources constant to see how results vary based on the taxonomy or phylogeny used. This would
help determine how influential choices of taxonomic or phylogenetic references are in driving
observed macroevolutionary trends.
In Chapter 3, we explored some potential predictors of species inflation and did not find significant
effects from biological processes (i.e. diversification rate) or interest-driven mechanisms (i.e.
measures of research effort) in driving inflation. While we focused on primates, inflation and
general taxonomic instability are widespread across many taxa. Many vertebrates including birds
(Barrowclough, et al., 2016), reptiles (Uetz, 2000; Torstrom, et al., 2014) and amphibians (Hanken,
1999) have experienced drastic changes in described species diversity following an increased use
of molecular data and the applications of phylogenetic systematics. Thus, a large scale study across
a variety of vertebrates may be useful in revealing what makes taxa particularly susceptible to
splitting (e.g. research interest, region, cryptic diversity). Addressing this is complicated as many
factors likely contribute to which groups undergo splitting, however, identifying some common
characteristics among highly split groups would be useful for determining how taxonomic change

135
is likely to bias other areas of study. For instance, using our Chapter 2 tests as an example, if it
were determined that highly charismatic groups are more likely to be split, and these groups are
also likely to be large brained and successful innovators (i.e. behaviourally flexible), failing to
account for biases in species inflation when estimating diversification rates may have led us to
falsely infer an association between behavioural flexibility and diversification rate.
Lastly, I focused specifically on applications of species concepts and subsequent re-evaluations of
lesser taxa because I was interested in estimating diversification rates of shallow lineages (i.e.
species and subspecies) and because conservation listing and management occurs at the species
level (Chapters 2 and 3, respectively). However, classifications of higher taxa (e.g. genera and
families) have also been impacted by taxonomic change. These changes are not dictated by
changing species concepts but could be impactful to some of the areas of study discussed above.
Thus, more work could be done to elucidate how changes in nomenclature at higher taxonomic
levels influence these areas of biological research.
GENERAL CONCLUSIONS AND SUMMARY:
In summary, the aim of my thesis was to delve into the complex determinants of species richness
and diversity across primate clades. When testing evolutionary drivers of diversity, I found some
evidence that behavioural flexibility promotes the rate at which primates evolve – ultimately
having some influence on extant species diversity across clades. However, this finding was
dependent on the measure of flexibility and diversification rate employed. Further research will be
required to confirm whether this influence stems from behavioural flexibility (i) promoting
speciation – if taxonomic biases are obscuring biological patterns among recent splitting events,
or (ii) buffering against extinction of recently evolved lineages. When exploring potential
explanations for differences in taxonomic inflation across primate clades, I did not find significant
influence from biological processes (i.e. diversification rate) or interest-driven mechanisms (i.e.
measures of research effort). The appearance of a quadratic relationship shared by the number of
species originally listed in primate genera in 1982 and inflation may, however, suggest that
inflation is influenced by underlying process not captured by these models. Along with exploring
determinants of primate diversity, I additionally addressed the role of taxonomic instability in
influencing areas of biology which remain reliant on species as primary objects of study. In

136
particular, I focused on the problems changing species designations pose for comparative studies
of macroevolution, which I addressed when attempting to estimate primate diversification rate. I
also examined how recent taxonomic re-classifications have influenced conservation. In doing so
I found that the association between rates of taxonomic inflation and threat score vary by region,
with highly inflated genera being considered most at risk in some regions, but least at risk in others.
In short, both evolutionary and systematic processes have played a role in driving described
primate species diversity and inconsistencies in the latter can result in implications for many areas
of research. Future studies will be essential in further explaining the determinants of primate
species diversity and their relative contributions. Species are used as the fundamental unit of
comparison across many areas of biology (De Queiroz, 2005). Thus, continuing to tackle questions
regarding the processes governing species diversity across taxa and the biological significance of
species realities is essential to shaping our understanding of biological diversity.

137
REFERENCES:
Agapow, P. M., Bininda-Emonds, O. R., Crandall, K. A., Gittleman, J. L., Mace, G. M., Marshall,
J. C., & Purvis, A. (2004). The impact of species concept on biodiversity studies. The
Quarterly Review of Biology, 79: 161–179.
Arbour, J. H., & Santana, S. E. (2017). A major shift in diversification rate helps explain
macroevolutionary patterns in primate species diversity. Evolution, 71: 1600–1613.
Arnold, C., Matthews, L. J., & Nunn, C. L. (2010). The 10kTrees website: a new online resource
for primate phylogeny. Evolutionary Anthropology, 19: 114–118.
Baldwin, J. M. (1902). Development and evolution. Macmillan, New York.
Barrowclough, G. F., Cracraft, J., Klicka, J., & Zink, R. M. (2016). How many kinds of birds are
there and why does it matter? PLoS One, 11: e0166307.
Carrasco, P. A., Venegas, P. J., Chaparro, J. C., & Scrocchi, G. J. (2016). Nomenclatural instability
in the venomous snakes of the Bothrops complex: Implications in toxinology and public
health. Toxicon, 119: 122–128.
Clarke, B. (1975). The causes of biological diversity. Scientific American, 233: 50–61.
Coyne J. A., & Orr H. A. (2004). Speciation. Sinauer, Sunderland.
Cracraft, J. (1983). Species concepts and speciation analysis. In R. F. Johnson (Ed.), Current
ornithology (p. 159–187). Plenum Press, New York.
Cracraft, J. (1987). Species concepts and the ontology of evolution. Biology and Philosophy, 2:
329–346.
Darwin, C. (1859). On the origin of species by means of natural selection or the preservation of
favored races in the struggle for life. J. Murray, London.
De Queiroz, K. (2005). Ernst Mayr and the modern concept of species. Proceedings of the National
Academy of Sciences, 102: 6600–6607.
Ducatez, S., Sol, D., Sayol, F., & Lefebvre, L. (2020). Behavioural plasticity is associated with
reduced extinction risk in birds. Nature Ecology & Evolution, 4: 788–793.
138
Duckworth, R. A. (2009). The role of behavior in evolution: a search for mechanism. Evolutionary
Ecology, 23: 513–531.
Ereshefsky, M. (1992). The units of evolution: Essays on the nature of species. MIT Press,
Cambridge.
FitzJohn, R. G. (2012). Diversitree: comparative phylogenetic analyses of diversification in R.
Methods in Ecology and Evolution, 3: 1084–1092.
Futuyma, D. J. (2009). Evolution. Sinauer, Sunderland.
Gage, M. J., Parker, G. A., Nylin, S., & Wiklund, C. (2002). Sexual selection and speciation in
mammals, butterflies and spiders. Proceedings of the Royal Society B: Biological Sciences,
269: 2309–2316.
Groves, C. P. (2001). Primate taxonomy. Smithsonian Institution Press, Washington.
Groves, C. P. (2013). The nature of species: A rejoinder to Zachos et al. Mammalian Biology, 78:
7–9.
Groves, C. P. (2014). Primate taxonomy: inflation or real? Annual Review of Anthropology, 43:
27–36.
Groves, C. P., & Grubb, P. (2011). Ungulate taxonomy. JHU Press, Baltimore.
Hanken, J. (1999). Why are there so many new amphibian species when amphibians are declining?
Trends in Ecology & Evolution, 14: 7–8.
Hey, J. (2001). The mind of the species problem. Trends in Ecology & Evolution, 16: 326–329.
Hillis, D. M. (1998). Taxonomic sampling, phylogenetic accuracy, and investigator bias.
Systematic Biology, 47: 3–8.
Hinchliff, C. E., Smith, S. A., Allman, J. F., Burleigh, J. G., Chaudhary, R., Coghill, L. M., ... &
Gude, K. (2015). Synthesis of phylogeny and taxonomy into a comprehensive tree of life.
Proceedings of the National Academy of Sciences, 112: 12764–12769.

139
Honacki, J. H., Kinman, K. E., & Koeppl, J. W. (1982). Mammal species of the world; a taxonomic
and geographic reference. Allen Press, Inc. and Association of Systematic Collections,
Lawrence.
Huey, R. B., Hertz, P. E., & Sinervo, B. (2003). Behavioral drive versus behavioral inertia in
evolution: a null model approach. The American Naturalist, 161: 357–366.
Isaac, N. J., & Purvis, A. (2004). The ‘species problem’ and testing macroevolutionary hypotheses.
Diversity and Distributions, 10: 275–281.
Isaac, N. J., Turvey, S. T., Collen, B., Waterman, C., & Baillie, J. E. (2007). Mammals on the
EDGE: conservation priorities based on threat and phylogeny. PLoS One, 2: e296.
IUCN/SSC Primate Specialist Group. (2018). Retrieved from http://www.primate-
sg.org/red_list_threat_status/ [accessed 10 November 2018].
Jensen, E. L., Mooers, A. Ø., Caccone, A., & Russello, M. A. (2016). I-HEDGE: determining
the optimum complementary sets of taxa for conservation using evolutionary isolation.
PeerJ, 4: e2350.
Jetz, W., Thomas, G. H., Joy, J. B., Hartmann, K., & Mooers, A. O. (2012). The global diversity
of birds in space and time. Nature, 491: 444–448.
Jones, K. E., Bielby, J., Cardillo, M., Fritz, S. A., O'Dell, J., Orme, C. D. L., ... & Connolly, C.
(2009). PanTHERIA: a species‐level database of life history, ecology, and geography of extant
and recently extinct mammals. Ecology, 90: 2648–2648.
Kur, J., Mioduchowska, M., & Petković, M. (2016). Trying to solve current issues with
invertebrate taxonomy–the conceptual web-based application. World Scientific News, 57:
664–673.
Lamarck, J. B. (1809). Zoological philosophy (1984 reprint). University of Chicago Press,
Chicago.
Lesson, R. –P. (1840). Species des mammiferes: Bimanes et quadrumanes. J-B Bailliére, Paris.
Linnaeus, C. 1753. Species plantarum. Laurentius Salvius, Stockholm.

140
Louis, E. E., Coles, M. S., Andriantompohavana, R., Sommer, J. A., Engberg, S. E., Zaonarivelo,
J. R., ... & Brenneman, R. A. (2006). Revision of the mouse lemurs (Microcebus) of eastern
Madagascar. International Journal of Primatology, 27: 347–389.
Louis, E. E., Engberg, S. E., McGuire, S. M., McCormick, M. J., Randriamampionona, R.,
Ranaivoarisoa, J. F., ... & Lei, R. (2008). Revision of the mouse lemurs, Microcebus
(Primates, Lemuriformes), of northern and northwestern Madagascar with descriptions of two
new species at Montagne d'Ambre National Park and Antafondro Classified Forest. Primate
Conservation, 23: 19–38.
MacArthur, R. H. (1965). Patterns of species diversity. Biological Reviews, 40: 510–533.
Mace, G. M. (2004). The role of taxonomy in species conservation. Philosophical Transactions of
the Royal Society B: Biological Sciences, 359: 711–719.
Magallon, S., & Sanderson, M. J. (2001). Absolute diversification rates in angiosperm clades.
Evolution, 55: 1762–1780.
Mayr, E. (1963). Animal species and evolution. Belknap Press, Cambridge.
Mayr, E. (1969). The biological meaning of species. Biological Journal of the Linnean Society, 1:
311–320.
Mayr, E. (1982). The growth of biological thought: Diversity, evolution, and inheritance. Harvard
University Press, Cambridge.
Mayr, E. (1996). What is a species, and what is not? Philosophy of Science, 63: 262–277.
McGee, M. D., Faircloth, B. C., Borstein, S. R., Zheng, J., Darrin Hulsey, C., Wainwright, P. C.,
& Alfaro, M. E. (2016). Replicated divergence in cichlid radiations mirrors a major vertebrate
innovation. Proceedings of the Royal Society B: Biological Sciences, 283: 20151413.
Morgan, C. L. (1896). On modification and variation. Science, 4: 733–740.
Nicolakakis, N., Lefebvre, L., & Sol, D. (2003). Behavioural flexibility predicts species
richness in birds, but not extinction risk. Animal Behaviour, 65: 445–452.

141
Nunn, C. L., Altizer, S., Sechrest, W., Jones, K. E., Barton, R. A., & Gittleman, J. L. (2004).
Parasites and the evolutionary diversification of primate clades. The American
Naturalist, 164: S90–S103.
Nunn, C. L., McNamara, P., Capellini, I., Preston, B. T., & Barton, R. A. (2010). Primate sleep
in phylogenetic perspective. In P. McNamara, R. A. Barton and C. L. Nunn (Eds.),
Evolution of sleep: Phylogenetic and functional perspectives (p. 123–145). Cambridge
University Press, New York.
Osborn, H. F. (1896). Ontogenic and phylogenic variation. Science, 4: 786–789.
Panhuis, T. M., Butlin, R., Zuk, M., & Tregenza, T. (2001). Sexual selection and speciation.
Trends in Ecology & Evolution, 16: 364–371.
Perez-Sweeney, B. M., Valladares-Padua, C., Martins, C. S., Morales, J. C., & Melnick, D. J.
(2008). Examination of the taxonomy and diversification of Leontopithecus using the
mitochondrial control region. International Journal of Primatology, 29: 245–263.
Pianka, E. R. (1966). Latitudinal gradients in species diversity: a review of concepts. The
American Naturalist, 100: 33–46.
Pillon, Y., & Chase, M. W. (2007). Taxonomic exaggeration and its effects on orchid
conservation. Conservation Biology, 21: 263–265.
Rabosky, D. L., Slater, G. J., & Alfaro, M. E. (2012). Clade age and species richness are
decoupled across the eukaryotic tree of life. PLoS Biology: 10: e1001381.
Rainford, J. L., Hofreiter, M., Nicholson, D. B., & Mayhew, P. J. (2014). Phylogenetic
distribution of extant richness suggests metamorphosis is a key innovation driving
diversification in insects. PLoS One, 9: e109085.
Reader, S. M., Hager, Y., & Laland, K. N. (2011). The evolution of primate general and cultural
intelligence. Philosophical Transactions of the Royal Society B: Biological Sciences,
366: 1017–1027.
Redding, D. W., DeWolff, C. V., & Mooers, A. Ø. (2010). Evolutionary distinctiveness, threat
status, and ecological oddity in primates. Conservation Biology, 24: 1052–1058.
142
Redding, D. W., & Mooers, A. Ø. (2006). Incorporating evolutionary measures into
conservation prioritization. Conservation Biology, 20: 1670–1678.
Rohde, K. (1992). Latitudinal gradients in species diversity: the search for the primary cause.
Oikos, 65: 514–527.
Rossmanith, E., Grimm, V., Blaum, N., & Jeltsch, F. (2006). Behavioural flexibility in the
mating system buffers population extinction: lessons from the lesser spotted
woodpecker Picoides minor. Journal of Animal Ecology, 75: 540–548.
Rylands, A. B., & Mittermeier, R. A. (2014). Primate taxonomy: species and conservation.
Evolutionary Anthropology, 23: 8–10.
Sayol, F., Lapiedra, O., Ducatez, S., & Sol, D. (2019). Larger brains spur species diversification
in birds. Evolution, 73: 2085–2093.
Schemske, D. W. (2000). Understanding the origin of species. Evolution, 54: 1069–1073.
Scholl, J. P., & Wiens, J. J. (2016). Diversification rates and species richness across the Tree of
Life. Proceedings of the Royal Society B: Biological Sciences, 283: 20161334.
Scott-Phillips, T. C., Laland, K. N., Shuker, D. M., Dickins, T. E., & West, S. A. (2014). The niche
construction perspective. A critical appraisal. Evolution, 68: 1231–1243.
Shultz, S. B., Bradbury, R. L., Evans, K. D., Gregory, R., & Blackburn, T. M. (2005). Brain size
and resource specialization predict long-term population trends in British birds. Proceedings
of the Royal Society B: Biological Sciences, 272: 2305–2311.
Simpson, G. G. (1958). The study of evolution: methods and present status of theory. In A. Roe
and G. G. Simpson (Eds.), Behaviour and evolution (p. 7–26). Yale University Press, New
Haven.
Sol, D., Bartomeus, I., González‐Lagos, C., & Pavoine, S. (2017). Urbanisation and the loss of
phylogenetic diversity in birds. Ecology Letters, 20: 721–729.
Sol, D., Stirling, D. G., & Lefebvre, L. (2005). Behavioral drive or behavioral inhibition in
evolution: subspecific diversification in holarctic passerines. Evolution, 59: 2669–2677.

143
Sol, D., Székely, T., Liker, A., & Lefebvre, L. (2007). Big-brained birds survive better in nature.
Proceedings of the Royal Society B: Biological Sciences, 274: 763–769.
Storchová, L., & Hořák, D. (2018). Life‐history characteristics of European birds. Global Ecology
and Biogeography, 27: 400–406.
Svenson, H. K. (1953). Linnaeus and the species problem. Taxon, 2: 55–58.
Tattersall, I. (2007). Madagascar's lemurs: cryptic diversity or taxonomic inflation? Evolutionary
Anthropology, 16: 12–23.
Torstrom, S. M., Pangle, K. L., & Swanson, B. J. (2014). Shedding subspecies: the influence of
genetics on reptile subspecies taxonomy. Molecular Phylogenetics and Evolution, 76: 134–
143.
Uetz, P. (2000). How many reptile species? Herpetological Review, 31: 13–15.
Upham, N., Esselstyn, J. A., & Jetz, W. (2019a). Ecological causes of uneven diversification and
richness in the mammal tree of life (Preprint). bioRxiv, 504803.
Upham, N. S., Esselstyn, J. A., & Jetz, W. (2019b). Inferring the mammal tree: Species-level sets
of phylogenies for questions in ecology, evolution, and conservation. PLoS Biology, 17: 1-
44.
Wcislo, W. T. (1989). Behavioral environments and evolutionary change. Annual Review of
Ecology and Systematics, 20: 137–169.
Wheeler, Q. D., & Meier, R. (2000). Species concepts and phylogenetic theory: a debate. Columbia
University Press, New York.
Wilson, A. C. (1985). The molecular basis of evolution. Scientific American, 253: 164–173.
Wilson, E. O. (1988). The current state of biological diversity. Biodiversity, 521: 3–18.
Wright, P., Hearthstone, E., Zakamanana, F., Andrianoely, D., & Donohue, M. E. (2020).
Microcebus rufus. The IUCN Red List of Threatened Species 2020:
e.T59544947A115588845. Retrieved from https://dx.doi.org/10.2305/IUCN.UK.2020-
2.RLTS.T59544947A115588845.en [accessed 17 September 2020].

144
Wyles, J. S., Kunkel, J. G., & Wilson, A. C. (1983). Birds, behavior and anatomical evolution.
Proceedings of the National Academy of Sciences, 80: 4394–4397.
Zachos, F. E., Apollonio, M., Bärmann, E. V., Festa-Bianchet, M., Göhlich, U., Habel, J. C., ...
& Pertoldi, C. (2013). Species inflation and taxonomic artefacts—A critical comment
on recent trends in mammalian classification. Mammalian Biology, 78: 1–6.
Zachos, F. E., & Lovari, S. (2013). Taxonomic inflation and the poverty of the Phylogenetic
Species Concept– a reply to Gippoliti and Groves. Hystrix, 24: 142–144.
Zhang, Z. Q. (2013). Animal biodiversity: an outline of higher-level classification and survey
of taxonomic richness (Addenda 2013). Zootaxa, 3703: 1–82.
Zink, R. M., & McKitrick, M. C. (1995). The debate over species concepts and its implications
for ornithology. The Auk, 112: 701–719.