Embed Size (px)
Citation preview

Determinants of Serum Sclerostin in Healthy Pre- andPostmenopausal Women
Mohammed-Salleh M Ardawi,1,2 Hanan A Al-Kadi,1,3 Abdulrahim A Rouzi,1,4 and Mohammed H Qari1,5
1Center of Excellence for Osteoporosis Research, Faculty of Medicine and King Abdulaziz University Hospital, King Abdulaziz University,Jeddah, Saudi Arabia
2Department of Clinical Biochemistry, Faculty of Medicine and King Abdulaziz University Hospital, King Abdulaziz University,Jeddah, Saudi Arabia
3Department of Medical Physiology, Faculty of Medicine and King Abdulaziz University Hospital, King Abdulaziz University,Jeddah, Saudi Arabia
4Department of Obstetrics & Gynecology, Faculty of Medicine and King Abdulaziz University Hospital, King Abdulaziz University,Jeddah, Saudi Arabia
5Department of Hematology, Faculty of Medicine and King Abdulaziz University Hospital, King Abdulaziz University, Jeddah,Saudi Arabia
ABSTRACTSclerostin is a secreted Wnt antagonist produced almost exclusively by osteocytes that regulates bone mass. However, there is currently
limited information on the determinants of sclerostin in a large population-based study. The main objectives of the present study were
to: (1) establish reference normative interval values for serum sclerostin in randomly selected healthy premenopausal women; (2) study
the changes in serum sclerostin in relation to age in premenopausal and postmenopausal women and the factors that may influence
bone turnover; and (3) determine the effect of menopausal status on serum sclerostin. A total of 1803 women were studied (including
[n¼ 1235] premenopausal, and [n¼ 568] postmenopausal women, respectively, aged 20 to 79 years). A total of 443 healthy
premenopausal women (aged 35 to 45 years) were used to establish reference normative intervals for serum sclerostin. All women
studied were medically examined and had their bone mineral density values obtained for the lumbar spine (L1–L4) and femoral neck
according to a detailed inclusion criteria. In all women, values of serum sclerostin increased with increasing age up to the age of 45 years,
and remained increased in postmenopausal women. Significant increases were evident in serum sclerostin in postmenopausal women
with increasing years since menopause. Using stepwise multiple linear regression analysis, several variables were identified as
determinants of serum sclerostin, including age, parathyroid hormone, estradiol (E2), and follicle-stimulating hormone (FSH) for
premenopausal women; age, FSH, and E2 for postmenopausal women; and age, serum osteocalcin, FSH, and E2 in the entire sample
studied. Further studies are needed to establish the potential role of this increase in mediating the known age-related impairment in
bone formation. � 2011 American Society for Bone and Mineral Research.
KEY WORDS: SCLEROSTIN; BONE TURNOVER MARKERS; BONE DENSITY; PRE- AND POST- MENOPAUSAL WOMEN
Introduction
Based on the work of the past decade, it is now well
established that the Wnt/b-catenin signaling pathway is a
major regulator of bone mass.(1,2) Activation of this pathway
results in increased proliferation and differentiation of osteo-
progenitor cells and reduced apoptosis of mature osteoblasts,
favoring higher bone formation and increased bone density.(3–5)
In addition, the Wnt signaling may inhibit osteoclastogenesis.(6)
Activation of the Wnt/b-catenin canonical signaling pathway in
osteoblasts is mediated via binding of any of multiple Wnt
ligands to a seven-transmembrane domain-spanning frizzled
receptor and either of two coreceptors, namely, low-density
lipoprotein receptor-related proteins (LRPs) 5 or 6.(7)
Sclerostin is a glycoprotein secreted almost exclusively by
osteocytes and to a lesser extent other cell types (kidney,
vascular),(1) which travels through osteocytic canaliculi to the
bone surface and binds to LRP-5 and LRP-6 to inhibit the Wnt/
b-catenin canonical signaling pathway,(8–10) thereby decreasing
osteoblastogenesis and bone formation. In humans, the
importance of sclerostin is highlighted by two genetic disorders
associated with significant progressive increases in bone
mass,(11–14) namely: sclerosteosis (caused by loss-of-function
mutation in the gene encoding sclerostin, resulting in an
ORIGINAL ARTICLE JJBMR
Received in original form May 29, 2011; revised form June 19, 2011; accepted July 7, 2011. Published online August 2, 2011.
Address correspondence to: Mohammed-Salleh M Ardawi, PhD, FRCPath, PO Box No. 20724, Jeddah 21465, Saudi Arabia. E-mail: [email protected]
Additional Supporting Information may be found in the online version of this article.
Journal of Bone and Mineral Research, Vol. 26, No. 12, December 2011, pp 2812–2822
DOI: 10.1002/jbmr.479
� 2011 American Society for Bone and Mineral Research
2812

improperly spliced SOST-mRNA)(11–12); and Van Buchem’s
disease (caused by a deletion of an enhancer element that is
normally downstream of the SOST-gene),(13,14) respectively.
Furthermore, SOST-null mice have a high-bone-mass pheno-
type,(15) and over-expression of normal human SOST-alleles in
mice causes osteopenia.(16) These observations suggested that
inhibition of sclerostin may have therapeutic potential for the
treatment of low-bone-mass disorders. Indeed, recent studies
showed that using anti-sclerostin neutralizing antibodies
in rats(17) and primates(18) increased bone density and bone
strength. Similarly, in rodent models of fracture healing,
sclerostin antibodies treatment resulted in increased callus
density and bone strength at fracture sites and accelerated bone
repair.(19) This increased bone formation and bone mass by
sclerostin antibody was not blunted in ovariectomized rats
pretreated with alendronate.(20) More recently, Padhi et al.
showed that treatment of postmenopausal women with anti-
sclerostin antibody resulted in dose-dependent increased bone
formation markers.(21)
There are very limited reports in the literature on the serum
levels of sclerostin in humans: Mirza et al. showed elevated
sclerostin levels in 20 postmenopausal women compared with
an equal number of premenopausal women.(22) Modder et al.
reported similar results in 152 postmenopausal women
compared with 123 premenopausal women and showed a
sex difference whereby men exhibited higher sclerostin levels
than corresponding women.(23) Moreover, Gaudio et al. showed
increased circulating sclerostin levels in 40 long-term immobi-
lized patients.(24) Given the availability of a commercially
validated immunoassay for sclerostin and no available informa-
tion on a large-population studies, the main objectives of the
present study are to: (1) establish age-specific normative interval
values of serum sclerostin in randomly selected premenopausal
women; (2) study the changes in sclerostin in relation to age,
bone mineral density (BMD), and bone turnover markers (BTMs)
(namely: serum osteocalcin [s-OC]; serum procollagen type 1 N-
terminal propeptide [s-PINP]; serum cross-linked C-terminal
telopeptide of type 1 collagen [s-CTX]; and urinary N-telopeptide
of type 1 collagen [u-NTX)]) in pre- and postmenopausal
women; and factors reported to influence bone turnover; and
(3) determine the effect of menopausal status on serum
sclerostin.
Subjects and Methods
Study Design
Over a period of 50 months (October 2005 to November 2009), a
total of 5850 Saudi women were prospectively recruited at
random during a health survey from 40 primary health care
centers (PHCCs) scattered around the city of Jeddah (divided into
7 geographical areas) to ensure that the average health status
of the studied group reflected a randomly selected adult
population. The sample size was calculated using the sample-size
determination option in Epi-Info Statistical Package (version 6)
(USD, Stone Mountain, GA, USA). A description of the study
design and rationale has been reported previously.(25) Women
who agreed to participate in the study were asked to visit a
special clinic at the CEOR, King Abdulaziz University, Jeddah,
Saudi Arabia, to be enrolled in the study. Age, body weight,
height, body mass index (BMI) calculated as the weight (kg)
divided by height (m) squared (kg/m2), and waist-to-hip ratio
(WHR) were recorded. All women were medically examined and
interviewed using a locally developed and validated standard-
ized questionnaire to collect information on lifestyle, smoking
habits, and level of physical activity in leisure time; coffee and tea
consumption and the use of vitamins and medications. Women
with chronic diseases, including osteoarthritis or established
osteoporosis; with evident endocrine disorders; on any form of
drug therapy with possible effect on bone metabolism (eg
selective estrogen receptor modulators, calcitonin, phytoestro-
gens, glucocorticoids, anticonvulsants thyroid hormones and/or
estrogen therapy); or with cancer were excluded from the final
analysis. Women who were pregnant or lactating, taking oral
contraceptives, vitamin-D deficient with serum 25-hydroxy-
vitamin D [25(OH)D] levels being< 50 nmol/L,(26) smokers, or
who reported a recent fracture (within two years) were also
excluded. In addition, all participants in the present study
showed: (1) normal blood counts; (2) normal values for
renal creatinine (serum creatinine in women< 105mmol/L);
and (3) normal hepatic function tests (serum aspartate
aminotransferase< 30U/L; alanine aminotransferase< 30U/L;
alkaline phosphatase between 80U/L and 280U/L; and
gamma-glutamyl transferase< 60U/L). Premenopausal women
were included if they were between 20 and 45 years of age, and
had serum FSH levels< 15mIU/L, and were cycling regularly.
Postmenopausal women were included if they had experienced
their last menstrual cycle at least one year before and were
not taking any medications that are known to affect bone
metabolism. The levels of FSH in postmenopausal women
were> 15mIU/L. Accordingly, a total of 1803 healthy Saudi
women (age range 20 to 79 years) (premenopausal, n¼ 1235;
postmenopausal, n¼ 568) living in the Jeddah area, participated
in the present study and were included in the final analysis
(see Fig. 1). Demographic characteristics, hormones, and BTMs
together with BMD values for these women are presented in
Table 1.
Bone Mineral Densitometry Measurements
BMD (g/cm2) was determined for the anteroposterior lumbar
spine (L1–L4) andmean of proximal right and left femur (total and
subregions) by dual-energy X-ray absorptiometry (DXA), using
LUNAR Prodigy Model (Lunar Corp., Madison, WI, USA) according
to standard protocol. Quality-control procedures were carried
out in accordance with the manufacturer’s recommendations as
described previously.(25) BMD values were classified according
to WHO criteria: a T-score between �1 and �2.5 is indicative
of osteopenia, whereas a T-score of �2.5 and below reflects
osteoporosis, and a T-score of �1.0 and above is considered
normal.(27)
Specimen Collection
Venous blood samples were collected in the morning under
standardized conditions. Second-void morning urine samples
were collected on the same day of blood sampling. Serum and
SCLEROSTIN IN RELATION TO AGE, BMD, AND BTMS IN WOMEN Journal of Bone and Mineral Research 2813
urine samples were stored at �858C within 30minutes after
centrifugation at 2500 g for 10minutes. All samples were
collected between 9:00 and 11:00 a.m., after an overnight fast.
The samples were stored until analyzed for the determinations
of serum sclerostin, s-OC, s-PINP, s-CTX, and u-NTX. Serum
sclerostin and all biochemical BTMs together with other
hormones, and other analytes were carried out at the same
time-point, according to the manufacturer’s instructions.
Measurements of Sclerostin and Biochemical BTMs
Serum sclerostin levels were measured on coded specimen by
enzyme-linked immunosorbent assay (ELISA) supplied by
Biomedica (Biomedica Gruppe, Biomedica Medizinprodukte
GmbH & Co KG, Wien, Austria). This assay uses a polyclonal
goat anti-human sclerostin antibody as a capture antibody and a
biotin-labeled mouse monoclonal anti-sclerostin antibody for
detection. The intra-assay and interassay coefficients of varia-
tions (CVs) were 4.5% and 5.6%, respectively. Further validation
studies were performed for this assay. Linearity was assessed
serially diluting serum samples with sample diluents (dilutions
1:2, 1:4, and 1:8) and comparing observed values with expected
values (observed recoveries ranged from 102% to 108%) (data
not shown). Also, recovery of spiked standards was tested by
adding different concentrations of human recombinant scler-
ostin (three different concentrations) into eight different human
serum samples presenting with various levels of endogenous
sclerostin. Spiked recovery ranged from 92% to 108% (data not
shown). Serum OC was measured using electrochemilumines-
cence immunoassay (ECLIA) Elecsys autoanalyzer (Roche
Diagnostics GmbH, D-68298 Mannheim, Germany). The intra-
assay and interassay CVs were 1.8% and 1.2%, respectively.
Serum PINP was measured using ECLIA Elecsys autoanalyzer
[Roche Diagnostics GmbH, D-68298 Mannheim, Germany]. The
intra-assay and interassay CVs were 2.3% and 2.1%, respectively
with a sensitivity of< 5mg/L. Serum CTX was measured by
Elecsys b-CrossLaps assay using ECLIA Elecsys autoanalyzer.
The intra-assay and interassay CVs were 4%. Urinary NTX was
determined by utilizing a competitive-inhibition ELISA using
Osteomark kits (Ostex International, Seattle, USA). The intra-assay
and interassay CVs were 7.8% and 4.5%, respectively. In all
manual assays, a standard curve was run simultaneously with the
samples, and the curve was fitted for serum sclerostin and u-NTX;
the results were calculated using MultCalc (Wallac, Turku,
Finland). The results of all u-NTX were corrected for creatinine
(creat) concentration (mmol creat/l).
Measurements of Hormones and Other Analytes
Serum FSH, luteinizing hormone (LH), E2, and intact-PTH
were measured by commercially available immunoassays using
Elecsys autoanalyzer (Roche Diagnostics GmbH, D-68298
Mannheim, Germany). The intra-assay and interassay CVs were
less than 4.0%. Serum 25(OH)D was measured by direct
competitive chemiluminescence immunoassay using LIASON
autoanalyzer (DiaSorin Inc, Stillwater, MN, USA). The intra-assay
and interassay CVs were 7.8% and 3.8%, respectively. Serum
creatinine (creat), calcium (Ca), phosphate (PO4), magnesium
(Mg), and other biochemical analytes were measured by kits
and reagents supplied by Ortho-Clinical Diagnostics, USA using
Vitros 250 Chemistry System Autoanalyzer (Ortho-Clinical
Diagnostics–Johnson & Johnson Co., USA).
Statistical Analysis
Results are presented as means or Geometric means (� SD) and
categorical variables are expressed as frequencies as appropri-
ate. Data were analyzed using SPSS-Statistical Package (version
15.0 for Windows Smart Viewer) supplied by SPSS Inc. 2000,
Mapinfo Corp. (Troy, NY, USA). Results that were not normally
distributed were log-transformed before analysis. A 95%
reference intervals for serum sclerostin together with that for
s-OC, s-PINP, s-CTX, and u-NTX measured were calculated for
each as mean� 1.96 SD, and the confidence intervals (CI) for the
lower and upper bounds of the reference intervals were
computed as boundary� 1.96 standard error (SE). Initially locally
weighted scatterplot smoothing (LOWESS) curve analysis was
used to establish the trend of serum sclerostin and measured
biochemical BTMs data among the various age groups (five-year
bands). The LOWESS curve analysis is used to fit a curve to data
without selecting a model and cannot be used to obtain the
best-fit values; however, it is very useful in providing a simple
approach to produce smoothing of the data.(28) Thus, in the
present analysis of serum sclerostin and the biochemical BTMs
measured, the LOWESS curve analysis was applied to establish
the general trend and distribution of the scatter of BTMs data
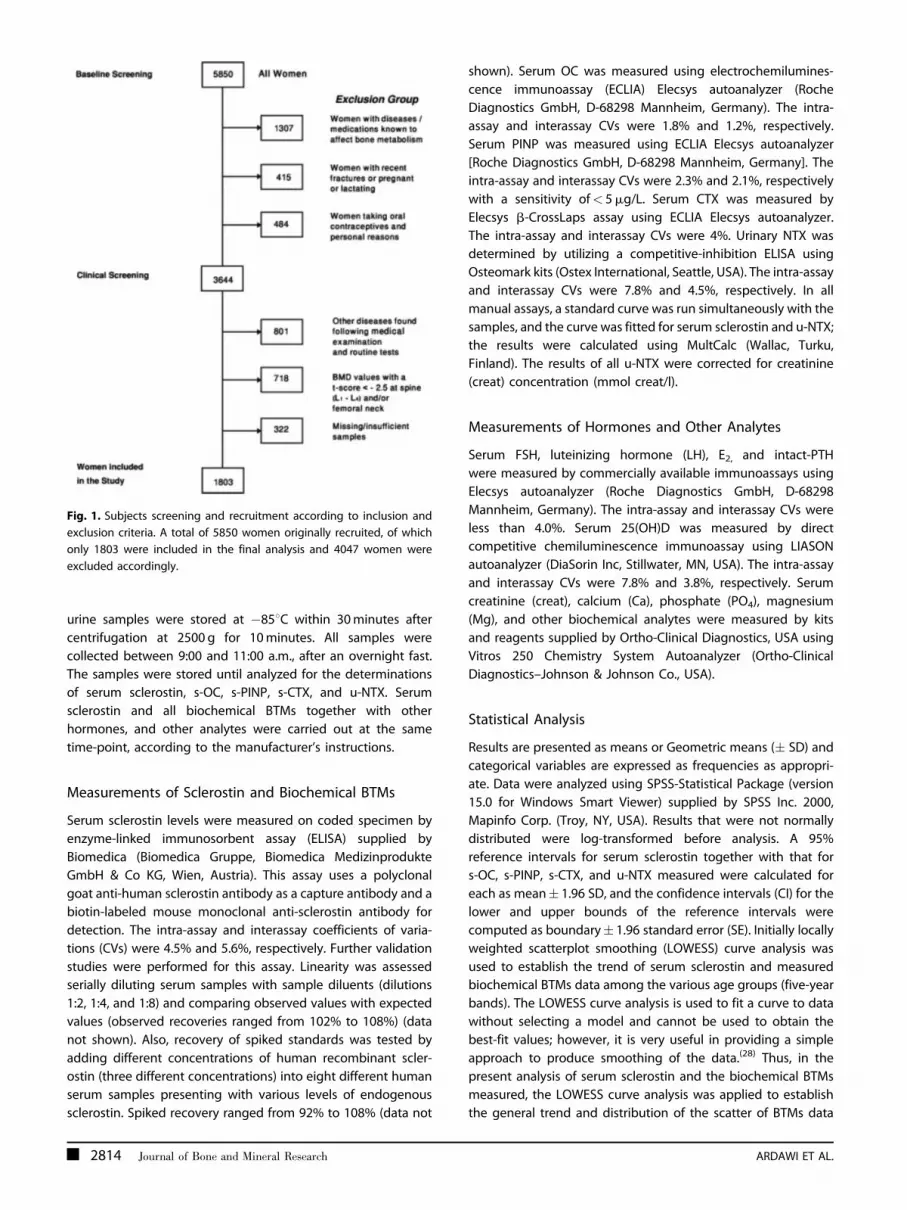
Fig. 1. Subjects screening and recruitment according to inclusion and
exclusion criteria. A total of 5850 women originally recruited, of which
only 1803 were included in the final analysis and 4047 women were
excluded accordingly.
2814 Journal of Bone and Mineral Research ARDAWI ET AL.

among the various age groups. This approach was followed by
segmental linear regression analysis to fit two regression lines to
serum sclerostin and BTMs data by using suitable critical cut-off
point. Accordingly, the gradient of each regression line
generated was used to compare differences between the lines.
Further, ANOVA testing (independent two-samples t-test) was
applied to examine whether serum sclerostin and measured
BTMs values differ among women aged 30 to 34 or younger
versus women who were 35- to 45-years-old. Based on the above
two approaches, women aged 35- to 45-years-old were used for
further analysis to examine other determinants of serum
sclerostin and measured BTMs values to remove the confound-
ing effects of age. All women were stratified by 10-years age and
also by quartiles of serum FSH, LH, PTH, and E2 to assess
variations in serum sclerostin among these variables using one-
way ANOVA testing. Associations between continuous variables
were examined by Pearson’s correlation coefficient. ANOVA was
used to examine differences among the groups for different
variables, and the Bonferroni criterion was used when signifi-
cance tests were made. Independent relationships between
serum sclerostin and that of measured biochemical BTMs and
other variables were assessed by multiple regression and partial
correlation analysis.
Results
Table 1 shows the basic demographic, anthropometric char-
acteristics, various hormones, BTMs, and BMD values of
the studied premenopausal (n¼ 1235) and postmenopausal
(n¼ 568) women with a mean age of 42.82� 15.69 years.
Of the women studied, 24.9%, 34.9%, and 40.2% were lean
(BMI< 25.0 kg/m2); overweight (BMI� 25.0 to< 30.0 kg/m2); and
obese (BMI � 30 kg/m2), respectively. Postmenopausal women
exhibited higher parity (p< 0.0001), BMI (p< 0.0001), and WHR
(p< 0.0001) values compared with premenopausal women
(Table 1). Postmenopausal women exhibited higher levels of
serum FSH (p< 0.0001), LH (p< 0.0001), and intact-PTH
(p< 0.0001), but lower E2 (p< 0.0001) compared with premen-
opausal women. All premenopausal women exhibited normal
BMD values for lumbar spine (L1–L4) and femoral neck with lower
values for postmenopausal women. However, postmenopausal
Table 1. Demographic, Anthropometric Characteristics, Various Hormones, 25(OH)D, BTMs, Minerals, and BMD Values of the Studied
Healthy Pre- and Postmenopausal Women
Variables
Menopausal Status
ANOVA (p-value)Premenopausal (n¼ 1235) Postmenopausal (n¼ 568)
Age (yrs) 33.83� 8.41 62.38� 8.34 < 0.0001
Age at menarche (yrs) 12.46� 3.82 14.20� 4.16 < 0.051
Age at menopause (yrs) — 47.51� 6.18 —
Years since menopause (yrs) — 15.62� 8.75 —
Parity 3.28� 2.61 4.18� 3.23 < 0.0001
BMI (kg/m2) 27.97� 5.30 31.63� 6.07 < 0.0001
Lean (BMI< 25) 30.4% 12.9% < 0.001
Overweight (BMI � 25 –< 30) 37.6% 29.0% < 0.001
Obese (BMI � 30) 32.0% 58.1% < 0.0001
WHR 0.817� 0.082 0.897� 0.082 < 0.001
FSH (IU/L) 4.57� 2.48 28.72� 7.47 < 0.0001
LH (IU/L) 8.07� 2.10 25.59� 7.34 < 0.0001
E2 (pmol/L) 369.2� 87.3 135.1� 56.6 < 0.0001
Intact-PTH (pmol/L) 2.72� 0.76 4.55� 0.96 < 0.0001
25(OH)D (nmol/L) 66.47� 13.02 55.74� 5.32 < 0.0001
s-OC (ng/mL) 13.30� 4.51 17.18� 3.61 < 0.0001
s-PINP (mg/L) 51.33� 22.73 47.38� 5.52 < 0.0001
s-CTX (pg/ml) 279.5� 67.8 338.9� 43.7 < 0.0001
u-NTX (nmol/mmol creat) 34.49� 7.81 57.69� 8.36 < 0.0001
Serum Ca (mmol/L) 2.38� 0.13 2.38� 0.09 0.145
Serum PO4 (mmol/L) 1.25� 0.16 1.27� 0.16 < 0.015
Serum Mg (mmol/L) 0.891� 0.09 0.791� 0.16 < 0.031
BMD (g/cm2)
Lumbar spine (L1–L4) 1.079� 0.279 0.991� 0.074 < 0.001
Neck femur 1.107� 0.144 0.928� 0.075 < 0.001
BMI¼body mass index; WHR¼waist-to-hip ratio; FSH¼ follicle-stimulating hormone; LH¼ luteinizing hormone; E2¼ estradiol; intact-PTH¼ intact
parathyroid hormone; 25(OH)D¼ 25-hydroxyvitamin D; s-OC¼ serum osteocalcin; s-PINP¼ serum procollagen type-1 N-terminal propeptide;
s-CTX¼ serum cross-linked C-terminal telopeptide of type 1 collagen; u-NTX¼urinary N-telopeptide of type 1 collagen; Creat¼ creatinine;
Ca¼ calcium; PO4¼phosphate; Mg¼magnesium; BMD¼bone mineral density.Mean� SD, or as percentage.
SCLEROSTIN IN RELATION TO AGE, BMD, AND BTMS IN WOMEN Journal of Bone and Mineral Research 2815
women showed significantly higher s-OC, s-PINP, s-CTX, and u-
NTX values and significantly lower s-PINP and serum 25(OH)D
levels compared with premenopausal women (Table 1).
Using LOWESS curve analysis, the sclerostin values exhibited a
general trend showing that women under the age of 35 years
showed decreased sclerostin values: accordingly, segmental
linear regression analysis was performed using the critical values
of 35 (Fig. 2). Supplemental Table 1 shows two types of analysis:
(1) calculation of gradients of segmental linear regression for
95% CIs for women in the age group 30 to 34 years compared
with that of 35 to 45 years; and (2) independent t-testing
between the age group 30 to 34 years compared with that of 35
to 39 years, 40 to 45 years, and 35 to 45 years. Using the gradient
of segmental regression line for women aged 30 to 34, it was
significantly different from zero compared with the same values
obtained for women in the age group 35 to 45 years (which was
not significantly different from zero), as indicated by the CI values
(Supplemental Table 1). The ANOVA testing showed significantly
lower values for serum sclerostin for the age group 30 to 34 years
compared with that observed in the age group 35 to 45 years
(see Supplemental Table 1). Similar trends with higher values
among the age group 30 to 34 years compared with that among
the age group 35 to 45 years were obtained for the BTMs: s-OC,
s-PINP, s-CTX, and u-NTX. Accordingly, a total of 443 premeno-
pausal women (age 35 to 45 years) were used to establish
sclerostin reference normative values, and their demographic
characteristics and other variables are given in Table 2.
In the present study, the levels of serum sclerostin were stable
among the age group 35 to 45 years, and the reference
normative intervals of serum sclerostin are given in Supplemen-
tal Table 2, including values for geometric mean; log10mean� SD; 95% reference interval; and lower and upper limits
of 95% CIs. The geometric mean and SD values for serum
sclerostin for the 10-year age grouping of women studied are
presented in Table 3, together with relevant BTMs, compared
with that of the reference normative intervals group. Serum
sclerostin showed a general linear increase with age (Fig. 3), with
serum sclerostin showing a steep increase until the age of 35,
and remaining stable in those between 35 and 45 years of age;
then, serum sclerostin exhibited an increase with increasing age.
Stratifying women according to BMI (kg/m2) showed that obese
women (� 30) had significantly higher serum sclerostin values by
26.4% over that for lean (< 25) women (p< 0.049) (data not
shown). However, stratifying women by quartiles of WHR
showed no significant differences among the groups (data
not shown). Supplemental Table 3 shows the mean values of
serum sclerostin in relation to years since menopause (YSM) in
postmenopausal women studied compared with the premeno-
pausal values. Significant increases were observed for serum
sclerostin among postmenopausal women according to YSM
periods. Similar trends were evident for the BTMs examined
(Supplemental Table 3).
In premenopausal women, serum sclerostin showed signifi-
cant positive correlations with the following variables:
age (r¼ 0.879; p< 0.0001); BMI (r¼ 0.223; p< 0.0001); parity
(r¼ 0.368; p< 0.0001); serum FSH (r¼ 0.595; p< 0.0001); and
serum LH (r¼ 0.538; p< 0.001), respectively. Negative correla-
tions were evident between serum sclerostin and the following
variables: s-OC (r¼�0.671; p< 0.0001); s-PINP (r¼�0.713;
p< 0.0001); s-CTX (r¼�0.767; p< 0.0001); u-NTX (r¼�0.432;
p< 0.0001); serum E2 (r¼�0.519; p< 0.0001); serum intact-PTH
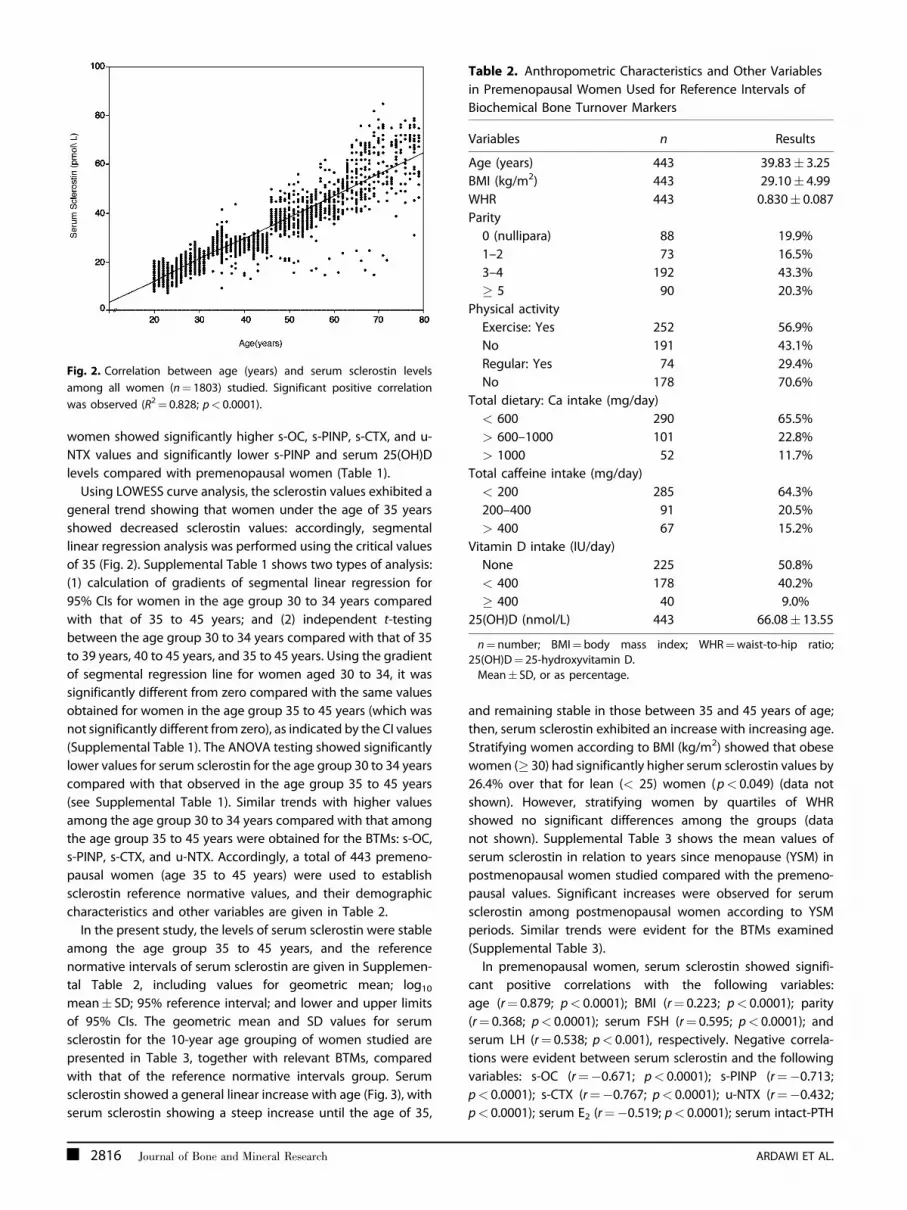
Fig. 2. Correlation between age (years) and serum sclerostin levels
among all women (n¼ 1803) studied. Significant positive correlation
was observed (R2¼ 0.828; p< 0.0001).
Table 2. Anthropometric Characteristics and Other Variables
in Premenopausal Women Used for Reference Intervals of
Biochemical Bone Turnover Markers
Variables n Results
Age (years) 443 39.83� 3.25
BMI (kg/m2) 443 29.10� 4.99
WHR 443 0.830� 0.087
Parity
0 (nullipara) 88 19.9%
1–2 73 16.5%
3–4 192 43.3%
� 5 90 20.3%
Physical activity
Exercise: Yes 252 56.9%
No 191 43.1%
Regular: Yes 74 29.4%
No 178 70.6%
Total dietary: Ca intake (mg/day)
< 600 290 65.5%
> 600–1000 101 22.8%
> 1000 52 11.7%
Total caffeine intake (mg/day)
< 200 285 64.3%
200–400 91 20.5%
> 400 67 15.2%
Vitamin D intake (IU/day)
None 225 50.8%
< 400 178 40.2%
� 400 40 9.0%
25(OH)D (nmol/L) 443 66.08� 13.55
n¼number; BMI¼body mass index; WHR¼waist-to-hip ratio;25(OH)D¼ 25-hydroxyvitamin D.
Mean� SD, or as percentage.
2816 Journal of Bone and Mineral Research ARDAWI ET AL.

(r¼�0.123; p< 0.001); serum 25(OH)D (r¼�0.072; p< 0.011);
BMD lumbar spine (L1–L4) (r¼�0.168; p< 0.0001); and BMD
neck femur (r¼�0.545; P< 0.0001), respectively. In premeno-
pausal women age- and BMI-adjusted correlations persisted for
s-OC (r¼�0.095; p< 0.014); s-CTX (r¼�0.289; p< 0.0001);
u-NTX (r¼�0.359; p< 0.0001); intact-PTH (r¼�0.111; p< 0.01);
FSH (r¼�0.122; p< 0.002); and E2 (r¼ 0.091; p< 0.020),
respectively. In postmenopausal women, serum sclerostin
showed significantly positive correlations with age (r¼ 0.696;
p< 0.0001); BMI (r¼ 0.120; p< 0.039); WHR (r ¼0.131; p< 0.042);
parity (r¼ 0.153; p< 0.0001); YSM (r¼ 0.672; p< 0.0001) and
s-OC (r¼ 0.479; p< 0.0001), respectively. However, significant
negative correlations were observed between serum sclerostin
and various variables including: serum FSH (r¼�0.622;
p< 0.0001); LH (r¼�0.646; p< 0.0001); serum E2 (r¼�0.256;
p< 0.001); serum intact-PTH (r¼�0.172; p< 0.004); serum
25(OH)D (r¼� 0.303; p< 0.0001); BMD lumbar spine (L1–L4)
(r¼�0.354; p< 0.0001); and BMD neck femur (r¼�0.372;
p< 0.0001), respectively (data not shown). In postmenopausal
women, age-adjusted and BMI-adjusted correlations persisted
for FSH (r¼�0.101; p< 0.018); and E2 (r¼�0.122; p< 0.002),
respectively. Moreover, when combining both pre- and
postmenopausal women (n¼ 1803), serum sclerostin showed
significant correlations with various variables examined, includ-
ing: age (r¼ 0.893; p< 0.0001); BMI (r¼ 0.271; p< 0.0001); WHR
(r¼ 0.146; p< 0.012); parity (r¼ 0.299; p< 0.0001); YSM
(r¼ 0.731; p< 0.0001); FSH (r¼ 0.587; p< 0.0001); LH
(r¼ 0.520; p< 0.0001); intact-PTH (r¼ 0.679; p< 0.0001); and
s-OC (r¼ 0.076; P <0.001), respectively. Significant negative
correlations were evident between serum sclerostin and other
variables: s-PINP (r¼�0.441; p< 0.0001); s-CTX (r¼�0.080;
p< 0.001); u-NTX (r¼�0.121; p< 0.001); serum E2 (r¼�0.751;
p< 0.0001); serum 25(OH)D (r¼�0.350; p< 0.0001); serum
calcium (r¼�0.055; p< 0.018); BMD lumbar spine (L1–L4)
(r¼�0.670; p< 0.0001) and BMD neck femur (r¼�0.312;
p< 0.0001), respectively (data not shown). In all women, age-
adjusted and BMI-adjusted correlations persisted for s-OC
(r¼ 0.165; p< 0.0001); s-PINP (r¼ 0.115; p< 0.0001); s-CTX
(r¼ 0.087; p< 0.0001); u-NTX (r¼ 0.123; p< 0.0001); FSH
(r¼ 0.187; p< 0.001); LH (r 0.112; p< 0.001); and E2 (r¼ 0.109;
p< 0.0001), respectively.
Serum sclerostin is identified as an independent variable in the
multiple linear stepwise regression analysis, whereas variables
showing a significant correlations (age, BMI, parity, FSH, LH, E2,
intact-PTH, 25[OH]D, s-OC, s-PINP, s-CTX, u-NTX, BMD lumbar
spine [L1–L4] and BMD neck femur) are identified as dependent
variables; the best predictors in all women were age, s-OC, FSH,
and E2, accounting for about 84% of the variance in serum
sclerostin (Supplemental Table 4). We also analyzed predictors
of serum sclerostin separately for pre- and postmenopausal
women. In premenopausal women, age, intact-PTH, E2, and FSH
were the best predictors of serum sclerostin, accounting for
about 73% of the variance. Whereas, in postmenopausal women
only age, FSH, and E2 were found to be predictors of serum
sclerostin, accounting for about 62% of the variance in serum
sclerostin (Supplemental Table 4).
Discussion
This study provides the first and the largest population-based
study of pre- and postmenopausal women using a commercially
available validated immunoassay for serum sclerostin. We have
shown that serum sclerostin levels are stable between the ages
of 35 and 45 in this group of premenopausal women. In the
present study the reference normative intervals for serum
sclerostin were identified to be in the age group of 35 to 45 years.
Women under the age of 30 years were excluded from the
reference normative intervals group: this lowered the possibility
of including women with lowered serum sclerostin as a result
of skeletal immaturity, lowered osteocytes activity, or both.
Further, women over 45 years were also excluded, because
detailed analysis showed that serum sclerostin increased beyond
this cut-off age. Similar observations were evident for the
analysis of the measured BTMs confirming previous studies.(25,29)
The study shows that serum sclerostin levels increased
Table 3. Geometric Mean and 95% Confidence Interval (95% CI) Age-Specific Values of Sclerostin and Bone Turnover Markers Among
Women Studied
Age group n Sclerostin (pmol/L) s-OC (ng/mL) s-PINP (mg/L) s-CTX (pg/mL)
u-NTX
(nmol/mmol creat)
20–29 435 16.87a (16.54–17.20) 17.27a (17.11–17.43) 78.79a (77.49–80.09) 360.9a (358.3–363.5) 29.05 (28.62–29.48)
30–39 435 25.04 (24.68–25.40) 11.18a (10.81–11.55) 33.90 (33.28–34.52) 200.9a (197.4– 204.4) 18.74a (18.31–19.17)
40–49 365 30.80a (30.15–31.45) 9.66 (9.35–9.97) 35.30 (34.63–35.97) 198.0 (195.1–200.9) 25.09 (23.75–26.43)
50–59 246 40.29a (39.41–41.17) 14.45a (14.06–14.84) 46.63a (45.98–47.27) 334.6a (330.4–338.8) 51.78a (51.23–52.34)
60–69 196 51.01a (49.48–52.54) 19.34a (19.08–19.60) 49.37a (48.67–50.07) 373.2a (369.5–376.9) 63.86a (62.74–64.98)
70–79 126 61.95a (59.98–63.91) 19.16a (18.64–19.68) 45.75a (44.66–46.84) 294.4a (287.4–301.4) 59.65a (58.45–60.85)
Total (20–79) 1803 31.72 (31.03–32.41) 14.24 (14.02–14.46) 49.31 (48.40–50.22) 282.4 (278.6–286.2) 34.79 (33.95–35.63)
Reference
valueb (35–45)
443 26.68 (26.39–26.97) 9.09 (2.54–15.20) 31.8 (21.90–32.31) 181.7 (179.3–230.2) 30.84 (19.35–46.32)
CI¼ confidence interval; n¼ number of women; s-OC¼ serum osteocalcin; s-PINP¼ serum procollagen type-1 N-terminal propeptide; s-CTX¼ serumcross-linked C-terminal telopeptide of type 1 collagen; u-NTX¼urinary N-telopeptide of type 1 collagen; Creat¼ creatinine.
All values are presented as geometric means with (95% CI).aStatistically significant from reference values.bReference values were calculated for the age group 35 to 45 years as geometric mean with (95% CI).
SCLEROSTIN IN RELATION TO AGE, BMD, AND BTMS IN WOMEN Journal of Bone and Mineral Research 2817

significantly with age in women. Thus, serum sclerostin levels
increased over life by an average of 3.7-fold (p< 0.0001): this
suggests that increased sclerostin production by osteocytes may
be involved in the age-related impairment of bone formation.
Moreover, given that sclerostin is produced almost exclusively
by osteocytes,(1,30,31) this observation is concurrent with the
expected changes in bone mass associated with aging. However,
it is possible that the increase with age of serum sclerostin was
related, at least partly, to decreased clearance of the protein, but
the increased serum sclerostin with age was minimally affected
after adjustment for the expected age-related decreases in
creatinine clearance. The large number of women studied
ensured a small uncertainty around the upper- and lower-
reference limits and thus, providing reliable reference ranges for
serum sclerostin in studied women. Women using hormonal
contraceptives were excluded from the study, because several
previous studies showed that bone remodeling, bone turnover,
or both are markedly decreased in women receiving combined
oral contraception, particularly women over 35 years of age.(25,29)
The mean reference normative interval values obtained for
serum sclerostin in the present study were similar to that given
by the manufacturer and the ranges for the values reported here
are higher than that reported for premenopausal women
(n¼ 123) by Modder et al. (15.1� 1.2 pmol/L) using the same
immunoassay system.(23) Such differences are most likely
because of differences in the selection criteria of women
studied as well as the mean age of the group studied by Modder
et al., although no information was given on the mean of the age
of women studied.(23) It is possible, however, that environmental
or lifestyle and/or genetic influences on bone mass, and
consequently serum sclerostin, not accounted for in the present
study should be taken into consideration to account for any
differences in serum sclerostin levels among the women studied
or to be studied in the future.
In the present study, the pattern of age-related changes
in serum sclerostin among women is shown by the increase in
bone turnover at menopause. Postmenopausal women showed
significantly higher serum sclerostin levels (48.79� 12.68 pmol/L;
n¼ 568) than premenopausal women (26.90� 9.71 pmol/L;
n¼ 1235). The higher serum sclerostin levels in postmenopausal
women maybe a cause, an effect, or both of the increased bone
turnover occurring in the postmenopausal state. These observa-
tions are consistent with previously reported studies by Modder
et al.(23) and by Polyzos et al.(32) Similar changes were obtained
for the BTMs studied confirming previous studies in different
populations.(25,29) However, it is uncertain whether the onset
of the changes in serum sclerostin takes place early in the
menopausal transition or before the cessation of menstruation.
In addition, the results of the present study showed that serum
sclerostin continued to increase with increasing YSM and
remained elevated in the elderly (Supplemental Table 3). This
is possibly related to the expected increased bone turnover (and
possibly osteocytic activities) associated with estrogen imbal-
ance,(33) with the rate of bone turnover slowing down after 4 to
8 years for most women,(34) whereas serum sclerostin continued
to increase with increasing YSM in the present study. To our
knowledge, there is no information in the literature on the
changes of serum sclerostin in relation to YSM.
Fig. 3. Scatterplots showing segmental regression analysis for age
and serum sclerostin (A), together with that for serum osteocalcin (B);
serum procollagen type 1 N-terminal propeptide (s-PINP) (C); serum
cross-linked C-terminal telopeptide of type 1 collagen (s-CTX) (D); urinary
N-telopeptide of type 1 collagen (u-NTX) (E), respectively, among
668 women aged 30 to 45 years.
2818 Journal of Bone and Mineral Research ARDAWI ET AL.

Previous studies have shown that BMI is an important
determinant of bone turnover and BMI plays a major role in bone
mass in women regardless of gonadal status and is a key risk
factor for osteoporotic fractures.(35,36) In the present study,
women with higher BMI exhibited significantly higher serum
sclerostin: thus serum sclerostin was 26.4% higher in obese
versus lean women (p< 0.0001). Conversely, women with higher
BMI exhibited significantly lower s-CTX and u-NTX values and a
trend toward lower s-OC and s-PINP values (data not shown).
Based on the previously known effects of sclerostin in inhibiting
bone formation,(1,30) bone-formation markers would be
expected to be inversely related to serum sclerostin levels.
Indeed, in the present study, premenopausal women exhibited
significantly negative correlations between serum sclerostin and
BTMs examined (namely, s-OC, s-PINP, s-CTX, and u-NTX);
however, such correlations disappeared after adjustment for age
and BMI. Conversely, in postmenopausal women, significant
positive correlations with s-OC, but negative weak correlations
with bone resorption markers (namely, s-CTX and u-NTX) with
serum sclerostin were observed, respectively; however, none
of these correlations persisted after adjustment for age and
BMI. These findings are consistent with that obtained for both
pre- and postmenopausal women reported previously(22) and
contrast with that reported by Modder et al. for postmenopausal
women studied.(23) However, these results indicate that in
healthy women serum sclerostin may provide information on
bone metabolism, ie, osteocyte functional activity, which is not
reflected and/or captured by measured BTMs.
In the present study, significant negative correlations were
evident between serum sclerostin and BMD for both lumbar
spine (L1–L4) and neck femur for both pre- and postmenopausal
women, which persisted when the entire population was
examined. However, these correlations disappeared after
adjustment for age and BMI, in contrast to what was reported
previously for elderly women, but concurrent with what was
reported in premenopausal women.(23)
In the present study, serum FSH and LH levels in postmeno-
pausal women are 6.3 and 3.2 times greater, respectively, than
those in premenopausal women (Table 1). Several studies
showed that serum FSH levels are not only related to age and
menopause but also to ethnic backgrounds.(37–39) Our results
showed that a decline in ovarian function, as indicated indirectly
by menopausal rise in serum FSH levels, is associated with higher
serum sclerostin and bone loss. Furthermore, serum FSH levels in
the studied women showed significantly positive correlations
with serum sclerostin. In addition, serum FSH exhibited positive
correlations with the BTMs examined (data not shown),
suggesting that bone turnover speed becomes more rapid in
women with menopausal rise in FSH; such finding for BTMs is
similar to those of other studies.(40) In contrast, however, Vural
et al.(41) found no correlation between serum FSH and that of
s-OC. Our results also show that serum sclerostin in quartile
groups with high serum FSH (Q3 and Q4) are higher than those in
the quartile groups with lower FSH levels (Q1 and Q2) (data not
shown). Moreover, we have examined and compared the effects
of serum FSH and LH on serum sclerostin and BTMs using
multiple linear regression analysis, and we have found that the
association between serum FSH and serum sclerostin and BTMs
is greater than that with serum LH. These phenomena indicate
that FSH in circulation is more significantly associated with
osteoblasts and possibly osteocytes than with osteoclasts, results
that contrast from those of previous in vitro cellular and
experimental animal studies.(42,43) However, the recent work by
Drake et al. showed that FSH did not directly regulate bone
resorption in postmenopausal women after suppression of their
FSH secretion.(44) The significant association between serum
sclerostin, FSH, and LH are considered to be the first reported in
the literature, and further studies in other populations should be
conducted to further our understanding of this association,
particularly at the cellular levels (ie, osteocytes).
Estradiol deficiency is considered to be partly responsible for
the rapid bone loss after menopause.(43) In the present study,
serum E2 showed significant negative correlations with serum
sclerostin in both pre- and postmenopausal women, which
persisted after adjustment for age and BMI. Further, serum E2 was
significantly associated with serum sclerostin in both pre- and
postmenopausal women. Modder et al., observed among
postmenopausal women that serum sclerostin levels were
significantly lower in women on estrogen therapy (ET) compared
with women not on ET.(45) These observations were concurrent
with the recent observations from the same group showing that
ET of postmenopausal women for 4 weeks resulted in a 27%
decrease in serum sclerostin levels.(47) Such observations are
consistent with the correlation analysis of the present study and
consistent with previous findings by both Mirza et al.(22) and
Modder et al.,(45) but contrast with that reported more recently
by Modder et al. for both pre- and postmenopausal women.(23)
Parathyroid hormone has been shown to decrease sclerostin
transcription in vitro,(46,47) and continuous or intermittent
chronic administration of PTH to rodents is associated with
decreased SOST-mRNA and sclerostin expression in osteo-
cytes.(48,49) Moreover, van Lierop et al. showed significantly
lowered serum sclerostin in patients with primary hyperpara-
thyroidism compared with euparathyroid controls.(48) The
present study showed an inverse relationship between serum
sclerostin and intact-PTH levels: such a relationship was stronger
for postmenopausal (r¼�0.172; p< 0.004) compared with that
of premenopausal (r¼�0.111; p< 0.01) women, respectively.
Also, stratifying women into quartiles of serum intact-PTH
showed that serum sclerostin was significantly lower in women
with the highest quartile (Q4) of intact-PTH compared with the
lowest quartile (Q1) (p< 0.001) (data not shown). Furthermore,
PTH contributed significantly to serum sclerostin variation
among the premenopausal women. Thus, our results are
consistent with the observations of Mirza et al.(22) for
postmenopausal women but contrast with that observed by
Modder et al. for both pre- and postmenopausal women.(23) Also,
our results are indirectly consistent with the recent report by
Drake and colleague, on the observed significant reduction in
circulating sclerostin levels after intermittent PTH 1-34 treatment
of postmenopausal women.(49) Interestingly, in this latter study,
bone marrow plasma and peripheral serum sclerostin levels
were significantly correlated (p< 0.0001), suggesting that the
circulating levels may be a good index of local bone production.
Taken all together, these observations including the results of the
present study, lend further support to the hypothesis that, in
SCLEROSTIN IN RELATION TO AGE, BMD, AND BTMS IN WOMEN Journal of Bone and Mineral Research 2819

humans and experimental animals, at least part of the anabolic
effect of PTH on bone may be mediated via an inhibition of
sclerostin production and/or stimulation of its clearance.
The present study has several strengths and limitations. The
strengths of our study include its large sample size and
acceptable sampling errors; its random selection of women from
the local population and covering a wide range of ages, thus,
avoiding sampling bias; and its very strict detailed inclusion
criteria and comprehensive details of lifestyle characteristics and
BMDmeasurements. In addition, another strength of our study is
that minimizing pre-analytical variations as a result of possible
circadian rhythm and/or food intake was ensured by standard-
ized sampling time and that all women studied were fasting
overnight. However, currently there is no published information
on the effects of various pre-analytical factors (eg, variations
related to food intake or fasting, seasonal changes, or circadian
rhythm) on serum sclerostin; such information requires further
study. The principal limitation of the present study was its cross-
sectional design, and thus the causative nature of the
associations between sclerostin and other variables cannot be
established. Moreover, another limitation of our study is the
single fasting measurement of serum sclerostin and other
analytes (eg, PTH, E2). The accuracy of self-reported data
concerning lifestyle practices may have been subject to report
bias, as can be the case with such type of studies; we
acknowledge that there may be unrecognized confounding.
Women who participated in the present study may have chosen
to take part because they are more aware of health issues and
healthier than average. Also, women in the present study
exhibited low dietary calcium intake (about 65.5% of women had
daily calcium intake estimated at< 600mg/day); that this will
affect the observations of the present study cannot be ruled out,
and further studies are needed in this regard. Furthermore, our
results were based on premenopausal women living in Jeddah,
Saudi Arabia, with quite rigorous inclusion criteria; thus, whether
the findings reported here will be completely applicable to other
populations remains to be determined in other populations.
Finally, we recognize that there is currently no information on the
metabolism or renal clearance of sclerostin and/or the stability of
sclerostin or its degradation in circulation and/or upon storage at
�858C; further studies are needed in this regard.
In summary, our study represents the first randomly selected,
large population-based assessment of circulating sclerostin
levels and provides reference normative interval values among
pre- and postmenopausal women over a wide age range using
a well-validated immunoassay. The study protocol specified
detailed inclusion criteria, which combined BMD measurement
and through medical examination, allowed a well-defined and
characterized study population to be examined. The results of
the present study point to the need for future further studies
examining the mechanisms for the age-related changes in
serum sclerostin levels described in pre- and postmenopausal
women, and also the contribution of sclerostin in mediating
the well-established age-related decrease in bone formation in
humans.(1,30) Serum FSH together with that of E2 showed
significant associations with serum sclerostin in both pre- and
postmenopausal women. The results have confirmed that the
levels of serum sclerostin increase in women with increasing
serum FSH and LH levels, and that FSH showed stronger
association with serum sclerostin than LH, particularly in
postmenopausal women. Serum sclerostin was poorly associated
with BTMs (except for s-OC), and based on its relationship with
measured BTMs in the present study indicate that serum
sclerostin measurements provide additional information on
bone metabolism that are not captured by currently available
BTMs, including the activity of osteocytes in vivo and the
modulation of their functions by mechanical loading and
therapeutic intervention in osteoporosis and other bone
diseases. However, measuring serum sclerostin and BTMs
simultaneously may prove helpful in evaluating and/or monitor-
ing the changes in the rate of bone turnover and ostecytic
function caused by aging or menopause in women or in bone-
diseased states in humans.
Disclosures
All the authors state that they have no conflicts of interest.
Acknowledgments
We are grateful to the Ministry of Higher Education for financial
support to the Center of Excellence for Osteoporosis Research
(CEOR) at King Abdulaziz University, Jeddah, Saudi Arabia. This
study was supported by grants from the Ministry of Higher
Education to the Center of Excellence for Osteoporosis Research
(CEOR) at King Abdulaziz University (grants # CEOR/001-08 and
CEOR/004-08), Jeddah, Saudi Arabia. It was approved by the
Human Research Ethical Committee of the Center of Excellence
for Osteoporosis Research, and the study protocol was in agree-
ment with King Abdulaziz University Hospital (KAUH) ethical
standards and the Helsinki Declaration of 1975, as revised in
1989. We thank all the subjects who participated in the study,
and we thank all the staff and colleagues at CEOR, King Abdulaziz
University Hospital, and the Primary Care Health Centers for their
invaluable assistance during the execution of the study. Special
thanks are due to Ms Veronica Orbacedo for her excellent help in
preparing the manuscript. Professor MSM Ardawi was awarded
grants CEOR/001-08 and CEOR/004-08 from Center of Excellence
for Osteoporosis Research, Supported by MOHE, Saudi Arabia.
Authors’ roles: All authors have contributed to the design of
the study, analysis and interpretation of data, the writing of the
article, and approval of the version to be published.
References
1. Barons R, Rawadi G. Targeting the Wnt/b-catenin pathway to regu-
late bone formation in the adults skeleton. Endocrinology. 2007;148:2635–43.
2. Krishnan V, Bryant HU, MacDougald OA. Regulation of bone mass by
Wnt signaling. J Clin Invest. 2006;116:1202–9.
3. Yavropoulou MP, Yovos JG. The role of the Wnt signaling pathway inosteoblast commitment and differentiation. Hormones (Athens).
2007;6:279–94.
4. Clevers H. Wnt/b-catenin signaling in development and disease. Cell.
2006;127:469–80.
2820 Journal of Bone and Mineral Research ARDAWI ET AL.
5. Johnson ML, Kamel MA. The Wnt signaling pathway and bonemetabolism. Curr Opin Rheumatol. 2007;19:376–82.
6. Spencer GJ, Utting JC, Etheridge SL, Arnett TR, Genever PG. Wnt
signaling in osteoblasts regulates expression of the receptor activator
of NFkB ligand and inhibits osteoclastogenesis in vitro. J Cell Sci.2006;119:1283–96.
7. He X, Semenov M, Tamai K, Zeng X. LDL receptor-related proteins 5
and 6 in Wnt/b-catenin signaling: arrows point the way. Develop-ment. 2004;131:1663–77.
8. Semenov M, Tamai K, He X. SOST is a ligand for LRP5/LRP6 and a Wnt
signaling inhibitor. J Biol Chem. 2005;280:26770–75.
9. Ellies DL, Viviano B, McCarthy J, Rey JP, Itasaki N, Saunders S, KrumlaufR. Bone density ligand, sclerostin, directly interacts with LRP5 but
not LRP5/6 and antagonizes canonical Wnt signaling. J Biol Chem.
2006;21:1738–49.
10. Li X, Zhang Y, Kang H, Liu W, Liu P, Zhang J, Harris SE, Wu D. Sclerostinbinds to LRP5/6 and antagonizes canonical Wnt signaling. J Biol
Chem. 2005;280:19883–87.
11. Brunkow ME, Gardner JC, Van Ness J, Paeper BW, Kovacevich BR,
Proll S, Zhao L, Sabo PJ, Fu Y, Alisch RS, Gillett L, Colbert T, Tacconi P,Galas D, Hamersma H, Beighton P, Mulligan J. Bone dysplasia
sclerosteosis results from loss of the SOST gene product, a novel
cystine knot-containing protein. Am J Hum Genet. 2001;68:577–89.
12. Balemans W, Ebeling M, Patel N, van Hul E, Olson P, Dioszegi M, Lacza
C, Wuyts W, van Den Ende J, Willems PJ, Paes-Alves AF, Hill S, Bueno
M, Ramos FJ, Tacconi P, Dikkers G, Stratakis C, Lindpainter K, Vickery B,
Foernzler D, van Hul W. Increased bone density in sclerosteosis is dueto the deficiency of a novel secreted protein (SOST). Hum Mol Genet.
2001;10:537–43.
13. Staehling-Hampton K, Proll S, Paeper BW, Zhao L, Charmely P, Brown
A, Gardner JC, Galas D, Schatzman RC, Beighton P, Papapoulos S,Hamersma H, Brunkow ME. A 52-kb deletion in the SOST-MEOX1
intergenic region on 17q12-q21 is associated with van Buchem
disease in the Dutch population. Am J Med Genet. 2002;110:144–52.
14. BalemansW, Patel N, EbelingM, van Hul E, WuytsW, Lacza C, Dioszegi
M, Dikkers FG, Hildering P, Willems PJ, Verheij JB, Lindpaintner K,
Vickery B, Foernzler D, van Hul W. Identification of a 52kb deletiondownstream of the SOST gene in patients with van Buchem disease.
J Med Genet. 2002;39:91–7.
15. Li X, Ominsky MS, Niu Q-T, Sun N, Daugherty B, D’Agostin D, Kurahara
C, Gao Y, Cao J, Gong J, Asuncion F, Barrero M, Warmington K, DwyerD, Stolina M, Morony S, Sarosi I, Kostenuik PJ, Lacey DL, Simonet WS,
Ke HZ, Paszty C. Targeted deletion of the sclerostin gene in mice
results in increased bone formation and bone strength. J Bone Miner
Res. 2008;23(6):860–9.
16. Winkler DG, Sutherland MK, Geoghegan JC, Yu C, Hayes T, Skonier JE,
Shpektor D, Jonas M, Kovacevich BR, Staehling-Hampton K, Appleby
M, Brunkow ME, Latham JA. Osteocyte control of bone formation viasclerostin, a novel of BMP antagonist. EMBO J. 2003;22:6267–76.
17. Li X, Omnisky MS, Warmington KS, Morony S, Gong J, Cao J, Gao Y,
Shlhoub V, Tipton B, Haldankar R, Chen Q, Winters A, Boone T, Geng
Z, Niu QT, Ke HZ, Kostenuik PJ, Simonet WS, Lacey DL, Paszty C.
Sclerostin antibody treatment increases bone formation, bone massand bone strength in a rat model of postmenopausal osteoporosis.
J Bone Miner Res. 2009;24(4):578–88.
18. Ominsky MS, Vlasseros F, Jolette J, Smith SY, Stouch B, Doellgast G,
Gong J, Gao Y, Cao J, Graham K, Tipton B, Cai J, Deshpande R, ZhouL, Hale MD, Lightwood DJ, Henry AJ, Popplewell AG, Moore AR,
Robinson MK, Lacey DL, Simonet WS, Paszty C. Two doses of
sclerostin antibody in cynomolgus monkeys increases bone forma-tion, bone mineral density, and bone strength. J Bone Miner Res.
2010;25(5):948–59.
19. Ke HZ, Xiang JJ, Li X. ‘‘Inhibition of sclerostin by systemic treatment
with a sclerostin monoclonal antibody enhances fracture healing in
mice and rats,’’ in Proceedings of the 55th Annual OrthopedicResearch Society Meeting, Las Vegas, USA, February 22–25, 2009.
20. Li X, Warmington K, Niu Q, Asuncion FJ, Barrero M, Xiz X, Grisauti M,
Lee E, Wronski T, OminskyMS, SimonetWS, Paszty C, Ke HZ. Increased
bone formation and bone mass by sclerostin antibody was notblunted by pretreatment with alendronate in ovariectomized rats
with established osteopenia. J Bone Miner Res. (Suppl 1), 2010: 580.
21. Padhi D, Jang G, Stouch B, Fang L, Posvar E. Single-dose, placebo-controlled, randomized study of AMG785, a sclerostin monoclonal
antibody. J Bone Miner Res. 2011;26(1):19–26.
22. Mirza FS, Padhi ID, Raisz LG, Lorenzo JA. Serum sclerostin levels
negatively correlate with parathyroid hormone levels and free estro-gen index in postmenopausal women. J Clin Endocrinol Metab.
2010;95:1991–7.
23. Modder UI, Hoey KA, Amin S, Mc Cready LK, Achenbach SJ, Riggs BL,
Melton LJ III, Khosla S. Relation of age, gender, and bone mass tocirculating sclerostin levels in women and men. J Bone Miner Res.
2011;26(2):373–9.
24. Gaudio A, Pennisi P, Bratengeier C, Torrisi V, Linder B, Mangiafico RA,
Pulvirenti I, Hawa G, Tringali G, Fiorce CE. Increased sclerostin serumlevels associated with bone formation and resorption markers in
patients with immobilization-induced bone loss. J Clin Endocrinol
Metab. 2010;95:2248–53.
25. Ardawi M-SM, Maimani AA, Bahksh TA, Rouzi AA, Qari MH, Radaddi
RM. Reference intervals of biochemical bone turnover markers for
Saudi Arabian women: a cross-sectional study. Bone. 2010;47:804–14.
26. HolickMF. High prevalence of vitamin D inadequacy and implicationsfor health. Mayo Clin Proc. 2006;81:353–73.
27. World Health Organization. Assessment of fracture risk and its
application to screening for postmenopausal osteoporosis. Technical
Report Series. Geneva: WHO; 1994 No. 843.
28. Cleveland WS. Robust locally weighted regression and smoothing
scatterplots. JA Stat Assoc. 1979;74:829–36.
29. Glover SJ, Garnero P, Naylor K, Rogers A, Eastell R. Establishing areference range for bone turnovermarkers in young, healthy women.
Bone. 2008;42:623–30.
30. van Bezooijen RL, Roelen BAJ, Visser A, van der Wee-pals L, de Wilt E,
Karperien M, Hamersma H, Papapoulos SE, ten Dijke P, Loqwik CW.Sclerostin is an osteocyte-expressed negative regulator of bone
formation, but not a classical BMP antagonist. J Exp Med. 2004;
199:805–14.
31. van Bezooijen RL, ten-Dijke P, Papapoulos SE, Lowik CW. SOST/sclerostin, an osteocyte-derived negative regulator of bone forma-
tion. Cytokine Growth Factor Rev. 2005;16:319–27.
32. Polyzos SA, Anastasilakis AD, Bratengeier C, Woloszczuk W,
Papatheodorou A, Terpos E. Serum sclerostin levels positively corre-late with lumbar spinal bone mineral density in postmenopausal
women—the six-month effect of risedronate and teriparatide.
Osteoporos Int. 2011; 10.1007/s00198-010-1525-6.
33. Garnero P, Sornay-Rendu E, Chapuy MC, Delmas PD. Increased bone
turnover in late postmenopausal women is a major determinant of
osteoporosis. J Bone Miner Res. 1996;11:337–49.
34. Overlie I, Morkrid L, Andersson AM, Skakebaek NE, MoenMH, Holte A.Inhibin A and B as markers of menopause: a five-year prospective
longitudinal study of hormonal changes during the menopausal
transition. Acta Obstet Gynecol Scand. 2005;84:281–5.
35. Rico H, Arribas U, Casanova FJ, Duce AM, Hernandez ER, Cortes-PrietoJ. Bonemass, bonemetabolism, gonadal status and bodymass index.
Osteoporos Int. 2002;13:379–87.
36. Reid IR. Relationships among body mass, its components and bone.Bone. 2002;31:547–55.
37. Burger HG, Dudley EC, Hopper JL, Groome N, Guthrie JR, Green A,
Dennerstein L. Prospectively measured levels of serum follicle-
stimulating hormone, estradiol, and the dimeric inhibins during
SCLEROSTIN IN RELATION TO AGE, BMD, AND BTMS IN WOMEN Journal of Bone and Mineral Research 2821

the menopausal transition in a population-based cohort of women.J Clin Endocrinol Metab. 1999;84:4025–30.
38. Melton LJ III, Looker AC, Shepherd JA, O’Connor MK, Achenbach SJ,
Riggs BL, Khosla S. Osteoporosis assessment by whole body region
vs. site-specific DXA. Osteoporos Int. 2005;16:1558–64.
39. Randolph JF Jr, Sowers M, Gold EB, Mohr BA, Luborsky J, Santoro N,
McConnell DS, Finkelstein JS, Korenman SG, Matthews KA, Sternfeld
B, Lasley BL. Reproductive hormones in the early menopausal transi-tion: relationship to ethnicity, body size andmenopausal status. J Clin
Endocrinol Metab. 2003;88:1516–22.
40. Wu X-Y, Wu X-P, Xie H, Zhang H, Peng Y-Q, Yuan L-Q, Su X, Luo X-H,
Liao E-Y. Age-related changes in biochemical markers of boneturnover and gonadotropin levels and their relationship among
Chinese adult women. Osteoporos Int. 2010;21:275–85.
41. Vural F, Vural B, Yucesoy I, Badur S. Ovarian aging and bone
metabolism in menstruating women aged 35–50 years. Maturitas.2005;52:147–53.
42. Iqbal J, Sun L, Kumar TR, Blair HC, Zaidi M. Follicle-stimulating
hormone stimulates TNF production from immune cells to enhance
osteoblasts and osteoclast formation. Proc Natl Acad Sci USA. 2006;103:14925–30.
43. Zaidi M, Blair HC, Iqbal J, Zhu LL, Kumar TR, Zallone A, Sun L.
Prospective actions of FSH and bone loss. Ann NY Acad Sci. 2007;116:376–81.
44. Drake MT, McCready LK, Hoey KA, Atkinson EJ, Khosla S. Effects ofsuppression of follicle-stimulating hormone secretion on bone
resorption markers in postmenopausal women. J Clin Endocrinol
Metab. 2010;95(11):5063–8.
45. Modder UIL, Clowes JA, Hoey K, Peterson JM, McCready L, Oursler MJ,
Riggs BL, Khosla S. Regulation of circulating sclerostin levels by sex
steroids in women and men. J Bone Miner Res. 2011;26(1):27–34.
46. Bellido T, Ali AA, Gubrij I, Plotkin LI, Fu Q, O’Brien CA, Manolagas SC,
Jilka RL. Chronic elevation of parathyroid hormone in mice reducesexpression of sclerostin by osteocytes: a noval mechanism for
hormonal control of osteoblastogenesis. Endocrinology. 2005;146:
4577–83.
47. O’Brien CA, Plotkin LI, Galli C, Goellner JJ, Gortazar AR, Allen MR,
Robling AG, Bouxsein M, Schipani E, Turner CH, Jilka RL, Weinstein RS,Manolagas SC, Bellido T. Control of bone mass and remodeling by
PTH receptor signaling in osteocytes. PLoS ONE. 2008;3:e2942.
48. van Lierop AH, Witteveen JE, Hamdy NAT, Papapoulos SE. Patients
with primary hyperparathyroidism have lower circulating sclerostin
levels than euparathyroid controls. Euro J Endocrinol. 2010;163:
833–7.
49. Drake MT, Srinivasan B, Modder UI, Peterson JM, McCready LK, Riggs
BL, Dwyer D, Stolina M, Kostenuik D, Khosla S. Effects of parathyroid
hormone treatment on circulating sclerostin levels in postmenopaus-al women. J Bone Miner Res. 2010;95(11):5056–62.
2822 Journal of Bone and Mineral Research ARDAWI ET AL.


